
Sustainable Energy Demand Analysis for Nepal 2009-2050
15
1 Sustainable Energy Demand Analysis for Nepal 2009 - 2050 Manika Manandhar Department of Mechanical Engineering, Pulchowk Campus, Institute of Engineering, Tribhuvan University, Nepal [email protected] Amrit Man Nakarmi Department of Mechanical Engineering, Pulchowk Campus, Institute of Engineering, Tribhuvan University, Nepal Abstract - This paper aims to project the energy demand for the period 2009-2050 in Nepal, a developing country with large hydropower potential. A bottom up energy system of Nepal based on Model for Analysis of Energy Demand (MAED) framework has been developed to access the effect of meeting part of end use demand in different sectors of economy with electricity. It shows that the final energy demand in Nepal will increase by 2.4 times to 963 PJ by 2050 as compared to 397 PJ in 2009 under reference scenario which have been developed based on a Gross Value Added (GVA) growth rate of 5.8 percent. With the increased penetration of electricity in the end use demand of various sectors the final energy demand will increase only by 1.2 times by 2050.The share of imported energy reduces to 21% of the total energy consumption by 2050 in the sustainable energy scenario as compared to 25% in the reference scenario from the base year share of 9%. The 2% electricity share in 2009 will increase to 5% by 2050 in the reference scenario whereas in case of the sustainable scenario it will increase to about 39% of the total energy consumption by 2050. The electricity consumption per capita will increase from 85 kWh in 2009 to 348 kWh in 2050 in the reference scenario. In case of sustainable scenario this value will rise to 1,227 kWh by 2050. Sustainable scenario will demand 49 TWh of electricity at the end of analysis period as compared to only 14 TWh electricity of the Reference scenario. Index Terms – Petroleum products, Electricity, Energy demand I. INTRODUCTION Petroleum Product constitutes about 10% of total energy consumption in Nepal [1]. The consumption of petroleum products has increased by more than 2 folds in 15 years (1995/96 to 2010/11) with annual growth rate of 5.23% as compared to 2.81% growth rate of total energy consumption which has increased only by 1.5% [2]. Nepal has no proven resource of petroleum products and has been meeting its petroleum demand through imports from India. In fiscal year 2010/11 Rs 76.74 billion was spent on import of petroleum products which exceeded the total export earnings of Rs 64.33 billion by 2% [1]. Despite such huge expenditure on the import of petroleum products, the supply is not consistent with the demand. There are frequent shortages of petroleum products in the market. The price of crude oil which is basically the raw materials for petroleum products such as petrol, diesel, kerosene, liquefied petroleum gas (LPG) etc., has been on a steady rise. The crude oil was below $23.12/barrel in 2001 which hit to $107.46/barrel in 2011 [3]. Nepal cannot stay aloof from such rapidly changing global oil price fluctuation as a result of which Nepal Oil Corporation (NOC), the state owned Oil Company, has increased price of petroleum products accordingly in the market. Increasing dependence on non-renewable energy is making the consumption pattern unsustainable in the long run. Owing to such rapid increase in the consumption rate, trade deficit and the price, the consumption of petroleum products needs to be replaced with alternative energy sources. Despite the huge potential of hydropower resources in the country, the share of electricity in the national energy scenario is less than 3% [1]. The heavy dependence on traditional fuel such as fuel wood, agricultural residue and animal dung for cooking purpose is one of the major causes of indoor air pollution. Still 40% of the world population relies on unclean traditional resources for cooking and around 2 million people including 80,000 children lose their life annually by breathing in toxic smoke produced by unclean burning of traditional fuel [4]. There is a crucial need to change the present consumption mix dominated by traditional and imported fuel to a more desirable energy mix with high share of renewable energy especially electricity. II. METHODOLOGY Energy demand forecasting is an essential component for energy planning, formulating strategies and recommending energy policies. Projected energy demands are often found to deviate from the actual demands due to limitations in the model structure or inappropriate assumptions. The task is challenging especially in developing country like Nepal where necessary data, appropriate models
Transcript of Sustainable Energy Demand Analysis for Nepal 2009-2050
1
Sustainable Energy Demand Analysis for Nepal 2009 -
2050
Manika Manandhar
Department of Mechanical Engineering, Pulchowk Campus,
Institute of Engineering, Tribhuvan University, Nepal
Amrit Man Nakarmi
Department of Mechanical Engineering, Pulchowk Campus,
Institute of Engineering, Tribhuvan University, Nepal
Abstract - This paper aims to project the energy demand for the
period 2009-2050 in Nepal, a developing country with large
hydropower potential. A bottom up energy system of Nepal based
on Model for Analysis of Energy Demand (MAED) framework
has been developed to access the effect of meeting part of end use
demand in different sectors of economy with electricity. It shows
that the final energy demand in Nepal will increase by 2.4 times
to 963 PJ by 2050 as compared to 397 PJ in 2009 under reference
scenario which have been developed based on a Gross Value
Added (GVA) growth rate of 5.8 percent. With the increased
penetration of electricity in the end use demand of various sectors
the final energy demand will increase only by 1.2 times by
2050.The share of imported energy reduces to 21% of the total
energy consumption by 2050 in the sustainable energy scenario as
compared to 25% in the reference scenario from the base year
share of 9%. The 2% electricity share in 2009 will increase to 5%
by 2050 in the reference scenario whereas in case of the
sustainable scenario it will increase to about 39% of the total
energy consumption by 2050. The electricity consumption per
capita will increase from 85 kWh in 2009 to 348 kWh in 2050 in
the reference scenario. In case of sustainable scenario this value
will rise to 1,227 kWh by 2050. Sustainable scenario will demand
49 TWh of electricity at the end of analysis period as compared to
only 14 TWh electricity of the Reference scenario.
Index Terms – Petroleum products, Electricity, Energy
demand
I. INTRODUCTION
Petroleum Product constitutes about 10% of total
energy consumption in Nepal [1]. The consumption of
petroleum products has increased by more than 2 folds in 15
years (1995/96 to 2010/11) with annual growth rate of 5.23%
as compared to 2.81% growth rate of total energy
consumption which has increased only by 1.5% [2].
Nepal has no proven resource of petroleum products
and has been meeting its petroleum demand through imports
from India. In fiscal year 2010/11 Rs 76.74 billion was spent
on import of petroleum products which exceeded the total
export earnings of Rs 64.33 billion by 2% [1]. Despite such
huge expenditure on the import of petroleum products, the
supply is not consistent with the demand. There are frequent
shortages of petroleum products in the market.
The price of crude oil which is basically the raw
materials for petroleum products such as petrol, diesel,
kerosene, liquefied petroleum gas (LPG) etc., has been on a
steady rise. The crude oil was below $23.12/barrel in 2001
which hit to $107.46/barrel in 2011 [3]. Nepal cannot stay
aloof from such rapidly changing global oil price fluctuation
as a result of which Nepal Oil Corporation (NOC), the state
owned Oil Company, has increased price of petroleum
products accordingly in the market. Increasing dependence on
non-renewable energy is making the consumption pattern
unsustainable in the long run. Owing to such rapid increase in
the consumption rate, trade deficit and the price, the
consumption of petroleum products needs to be replaced with
alternative energy sources.
Despite the huge potential of hydropower resources in
the country, the share of electricity in the national energy
scenario is less than 3% [1]. The heavy dependence on
traditional fuel such as fuel wood, agricultural residue and
animal dung for cooking purpose is one of the major causes of
indoor air pollution. Still 40% of the world population relies
on unclean traditional resources for cooking and around 2
million people including 80,000 children lose their life
annually by breathing in toxic smoke produced by unclean
burning of traditional fuel [4].
There is a crucial need to change the present
consumption mix dominated by traditional and imported fuel
to a more desirable energy mix with high share of renewable
energy especially electricity.
II. METHODOLOGY
Energy demand forecasting is an essential component
for energy planning, formulating strategies and
recommending energy policies. Projected energy demands are
often found to deviate from the actual demands due to
limitations in the model structure or inappropriate
assumptions. The task is challenging especially in developing
country like Nepal where necessary data, appropriate models

2
and required institutions are lacking. Some common energy
system characteristics of developing countries include poor
performance of the power sector and traditional energies,
transition from traditional to modern energies, and structural
deficiencies in the economy, society and in the energy
systems which result in “urban-rural divide, inadequate
investment decisions and misdirected subsidies [5].
The International Atomic Energy Agency (IAEA)’s energy
planning tool MAED has been used for this study. MAED
uses a bottom-up approach to project future energy demand
based on medium- to long-term scenarios of socio-economic,
technological and demographic development. Through
scenarios, the model specifically captures structural changes
and evolution in the end-use demand markets. For competing
forms of energies, the demand is first calculated in useful
energy form and the final demand is derived taking market
penetration and end-use efficiency into consideration [6].
A. Energy demand calculations
Energy demand is disaggregated into a large number
of end-use categories corresponding to different goods and
services. The influences of social, economic and
technological driving factors are estimated and combined in
each different category to present an overall picture of future
energy demand growth under the assumptions of that
scenario. The energy demand is aggregated into four sectors:
industry, transport, households and service.
Industry sector includes four economic sectors:
Agriculture, Construction, Mining, and Manufacturing
industries. Energy demand of each economic subsector is
driven by the level of economic activity of the subsector
evaluated in terms of its value added and the energy intensity
of each energy form. The end-use categories considered for
this sector are: motive power, thermal uses (boiler and
process heat), specific uses of electricity (lighting etc.) and
other uses.
The energy demand of transport sector is calculated
directly in terms of final energy as a function of the total
demand for transportation of passengers (passenger-
kilometers) and freight (tonkilometers), the breakdown of this
demand by competing modes (car, bus, plane, truck, train
etc.) and the specific energy needs and load factors of each
mode. For transport of passengers, the distinction is made for
urban (intracity) and intercity transport. The total demand for
transport is calculated separately for freight and passengers
according to macro-economic and life-style factors. In the
case of freight transportation, the demand is calculated as a
function of the GVA contribution (tkm/NRs). On the other
hand, the demand for transport of passengers is determined
from total population, population living in large cities, and
the average intercity and intracity distance travelled per
person.
The scenario parameters and related equations which
characterize the energy consumption in the Service sector are
related to the economic level of activity of this sector
(subsectorial value added and labor force in the sector). The
end-use categories considered for the Service sector are:
space heating, other thermal uses (essentially water heating,
cooking), air conditioning, specific uses of electricity (motive
power for small motors, computers, lighting etc.) and other
uses. The energy consumption for space heating and air
conditioning is calculated on the basis of the specific space
heating and cooling requirements (kWh/sqm/yr), while that
for other thermal uses, specific uses of electricity and other
uses is calculated as a function of the value added and energy
intensity at the subsector level within Service sector. When
the demand of a given end-use category can be provided by
various energy forms (space heating, other thermal uses and
air conditioning), this is calculated in terms of useful energy.
The final energy demand is then calculated from the
penetration into the potential market and the efficiency of
each energy form (relative to that of electricity for the same
use) as specified in the scenario.
Household sector energy demand determining factors
are of demographic nature (population, number of dwellings
etc.) The categories of energy use considered in Household
are: space heating, water heating, cooking, air conditioning
and electrical appliances (refrigerators, lighting, washing
machines etc.). When the demand of a given end-use category
can be provided by various energy forms (space heating,
water heating, cooking and air conditioning), this is
calculated in terms of useful energy and not in terms of final
energy. The final energy demand is then calculated from the
penetration into the potential market and the efficiency of
each energy form (relative to that of electricity for the same
use) as specified in the scenario. The energy consumption for
secondary appliances is calculated separately for electrified
dwellings, for which the use of electric appliances is
assumed, and for the non-electrified dwellings, for which
alternative appliances using fossil fuels are considered
(kerosene lighting, refrigerators on natural gas etc.).
The demand is essentially determined by relating the
activity level of an economic activity to the energy intensity.
The demand is first determined at the disaggregated level and
then added up using a consistent accounting framework to
arrive at the overall final demand. The model focuses only on
the final demand and does not cover the energy used in the
energy conversion sector.

3
Energy demand is driven by the GVA and population
growth. Population projections were considered to reflect
trends in population growth while GVA growth rate was used
to develop economic growth scenario. These population and
GVA figures were used to estimate end-use demand in the
five sectors of the economy (agriculture, commercial,
residential, industrial, and transport) over the modelling
period. The modelling time frame is from 2009 to 2050, and
2009 i.e. fiscal year 2008/09 was taken as the base year for
the study for reasons of data availability.
B. Demographic Assumptions
National Population and Housing Census 2011 put the
national population of Nepal at 26.4 million with population
growth rate of 1.35% per annum [7]. From an annual average
of 2.62% during the period 1971-1981, the present population
growth rate has fallen to 1.35%.
The United Nations estimated that by 2010 the
population of Nepal had increased to 29.9 million [8] and by
2050 the population will grow to a 46.49 million. For the
purpose of study, the population for base year 2009 has been
calculated by considering annual exponential growth rate of
1.35% from total population of 23.15 million in 2001.
Population for the base year 2009 has been calculated to be
25.79 million.
Population over the analysis period has been projected
assuming the annual exponential growth rate as of United
Nations Population Division (UNPD) i.e. 1.60% for 2010-20,
1.27% for 2020-30, 0.91% for 2030-40 and 0.60% for 2040-
50. With such assumptions the 25.79 million populations is
estimated to increase to 40.56 million by 2050 as given in
TABLE I.
The urban population constitutes 17% (4.5 million) of
the total population [7]. Between 1952/54 and 2011, the
urban population size has increased by 19 times whereas in
terms of urban population as percent of total population it
increased by more than fivefold. ([7] & [9])
TABLE I
POPULATION FORECAST 2010-2050
Year Population in million Annual exponential growth rate
2020 30.68 1.60%
2030 34.85 1.27%
2040 38.17 0.91%
2050 40.56 0.61%
The world population prospects, has projected the
percentage of urban population in the total population to be
23.9% in 2020, 30.6% in 2030, 38.2% in 2040 and 46.3% in
2050 [8][8]. For the projection of urban population, same
urban population growth has been assumed in this study.
Through this assumption the urban population is expected to
grow to more than 21 million by 2050. TABLE II shows the
urban population projection over the study period.
As per the population census of 2011, the average
household size in urban area has decreased to 4.32 in 2011
from 4.85 in 2001. Similarly in case of rural area the average
household size has decreased from 5.55 in 2001 to 5.02 in
2001. The average household size of the urban and rural area
has been projected to reach 3.03 and 4.0 by 2050 respectively.
TABLE II
PROJECTION OF URBAN POPULATION
Year Total population
in million
% of urban
population
Urban Population in
million
2020 30.68 23.90% 8.4
2030 34.85 30.60% 12.2
2040 38.17 38.20% 16.7
2050 40.56 46.30% 21.5
C. Economic Growth Targets
GVA indicates the economic status of the country to
a great extend. Nepalese economy grew at an average rate of
4.09% during the period 1994-2010[10]. Total GVA at
current prices in the year 2010/11 was about NRs. 1369.43
billion. Per capita GVA has reached Rs. 57,726 or US$ 735 in
the same year [1].
TABLE III
CURRENT PRICE GVA FOR FISCAL YEAR 2010/11
in billion rupees
Agriculture 475.4
Mining 7.0
Manufacturing 79.5
Electricity, gas, and water 15.3
Construction 89.4
Tradea 204.3
Transport and communications 102.7
Financeb 161.7
Public Administration 24.8
Othersc 128.5
Gross Value Added 1,288.5
(Source: [10])
a refers to wholesale and retail trade and hotels and restaurants b refers to financial inte`rmediation, real estate, renting, and business activities c refers to education, health, and social work; and other community, social, and personal activities

4
TABLE III shows the current price GVA structure of Nepal for
year 2010/11. Observation of the structure of GVA shows that
among the production sector of the economy, agriculture
occupied 37 percent, followed by trade 15 percent, and finance
13 percent. Among other sub sectors transport and
communication occupies 8 %, industry 6 %, and construction
and mining 7 %. Likewise public administration and defense,
electricity, gas and water and others have their respective 2 %
and %, 10 % shares in GVA.
The structure of the economy has undergone
significant changes during the last 16 years. Fig. 1 shows the
historical shares of GVA of the economic sectors.
Fig. 1 Historical GVA structure (source: [10])
The share of agriculture in GVA has declined from
39% in 1994 to 34% in 2010. In the same period, the share of
the service sector has increased from 44% to 49%. There has
been no significant change in mining, construction and
energy. However the manufacturing GVA has decreased from
8 % in 1994 to 6% in 2010.
The National Planning Commission has projected
5.8% annual growth of GVA during the period 2011-2013 in
the Three Year Interim Plan. Of the overall economic growth
rate, the agriculture sector is estimated to grow by 3.9 percent
and non-agriculture sector by 6.4 percent. With this growth
rate, per capita income will increase by 3.5 percent and
employment will increase by 3.6 percent on an annual
average basis [11].
In this study the GVA is assumed to grow at an annual
rate of 5.8% i.e. same as that of Three Year Interim Plan.
GVA has been calculated at 2000 constant price. With this
assumption the 590 billion GVA (at 2000 constant price) in
2010 is expected to grow to 5,627 billion (at 2000 constant
price) in 2050 i.e. almost by ten folds. For the purpose of
GVA sub sector projection, the same sub sector growth as
projected by NPC has been assumed. Further it has been
assumed that the GVA is expected to grow at a constant rate
to 2050.
According to this assumption, the share of agriculture
in GVA will fall to 13.79% in 2050, and the share of the
service sector will increase to 68.67%, while the share of the
manufacturing sector will fall to 4.04% in 2050. Similarly
construction, mining and energy will be contributing 6.27%,
0.26% and 6.98% respectively in 2050. In order to obtain the
absolute vale of the sub-sectors of GVA, the GVA structure
has been normalized against total GVA (which is expected to
grow at annual rate of 5.8 %) for corresponding year. The
projected absolute value of GVA at 2000 constant price along
with its subsectors is given in TABLE IV below:
TABLE IV
GVA FORECAST AT 2000 CONSTANT PRICE IN BILLION NRS
Sectors 2020 2030 2040 2050
Agriculture 300 425 583 776
Construction 66 119 208 353
Mining 4 7 10 15
Industry 65 102 155 227
Service 570 1,094 2,071 3,865
Energy 32 76 176 393
Total 1,037 1,822 3,202 5,628
The manufacturing sector of GVA has further been
divided into eight subsectors. The subsectors with their
relative share in the manufacturing GVA is given in TABLE V.
TABLE V
MANUFACTURING SECTOR GVA COMPOSITION IN FISCAL YEAR
2008/09
Manufacturing sub sector % share in manufacturing
GVA in billion
Food beverage & tobacco 41.5 16.24
Textile & leather goods 12.2 4.77
Chemical, rubber & plastic product 16.9 6.61
Mechanical Engineering & metallurgy 12.6 4.93
Electrical engineering products 2.0 0.78
Wood products & paper 5.0 1.95
Other manufacturing 2.0 0.78
Cement and brick 7.8 3.05
Total 39.13
(Source: [12])
D. Energy Consumption Pattern in Nepal
Total energy consumption in Nepal was 425 million
GJ in year 2010/11[1]. Between 2001 and 2011 the total
energy demand has increased with an average annual growth
rate of 2.6%. The share of various fuels in the total energy is
shown in Fig. 2. Traditional fuel such as fuel wood,
agricultural residue and animal dung accounts for more than
80% in the energy mix which is followed by petroleum
products with a share of 10%. Coal has a share of about 3%
0%
20%
40%
60%
80%
100%
1994 1998 2002 2006 2010
Fiscal Year
energy
manufacturing
construction
Agriculture
Service

5
and electricity has a share of only 2%. Renewable energy has
a very little share, less than 1% in the national energy mix.
Between 2001 and 2011, traditional fuel consumption has
increased with average annual rate of 2%, electricity by10%,
petroleum product by 3%, coal by 6% and renewable by 15%.
Fig. 3 Sectoral energy consumption in Nepal 2008/09shows
the sectoral energy consumption in Nepal. Most of the energy
is consumed in the household sector. The sectors that
contribute to the Gross Value Added i.e. agriculture, industrial
and commercial sector has share of only 5.5% in the total
energy. Transport sector account for 5% share in the energy
mix
Fig. 2 Energy consumption by fuel type 2010/11
(Source: [1])
Fig. 3 Sectoral energy consumption in Nepal 2008/09
(Source: [13])
III. RESULTS AND FINDINGS
This study analyses two scenarios, Reference scenario and
Alternative Scenario.
A. Reference Scenario
This scenario assumes that the average GVA growth
rate will be according to interim plan i.e. with an average
GVA growth rate of 5.8 percent. It further assumes that the
share of each demand technology in the energy supply in
future years will be the same as in the base year.
With the assumed population and economic growth
rates, the overall final energy demand is projected to increase
2.4 times over the study period 2009-2050, with an average
annual growth rate of 3.5 %. The projected final consumptions
of various fuels in this scenario have been given in TABLE VI
TABLE VI
TOTAL ENERGY CONSUMPTION IN REFERENCE SCENARIO ( PJ)
Fuel Type 2009 2020 2030 2040 2050
Traditional fuels 348.9 426.5 510.2 589.8 667.6
Biogas 2.8 3.1 3.4 3.6 3.5
Electricity 7.9 14.4 22.5 34.1 50.7
Kerosene 2.5 4.0 6.1 9.1 13.5
LPG 5.6 11.0 19.2 32.7 54.5
Diesel 16.9 27.4 43.1 68.7 111.1
Petrol 3.6 6.2 8.9 12.2 15.7
Coke & steam coal 7.8 12.9 20.2 30.6 45.0
Other oil 0.1 0.2 0.3 0.5 0.7
Jet fuel 1.0 1.1 1.3 1.4 1.5
Total 397.0 506.8 635.3 782.7 963.7
The traditional fuel will grow at an average annual
growth rate of 2.23%, electricity at 13.25% and petroleum product at 4.13% also shown in Fig. 4.
In this scenario, traditional fuel will be dominant
throughout the study period 2009-2050. However the share of
traditional fuel will reduce from 88 %in 2009 to 83% in 2025
and 69% in 2050. The share of petroleum products will
increase from 7 % in 2009 to 11% in 2025 to 20% in 2050.
Similarly electricity share will increase from 2% in 2009 to
3% in 2025 and to 5 % in 2050 as depicted in Fig. 5 and Fig.
6.
Fig. 4 Total final energy demand 2009-2050 in Reference Scenario
Petroleum 10.42%
Coal 2.89%
Electricity 2.26%
Renewable 0.74%
agri residue 3.26%
animal dung 5.54%
Fuelwood 74.90%
89.1%
3.3% 1.3% 5.2% 0.9% 0.2%0%
20%
40%
60%
80%
100%
0
100
200
300
400
500
600
700
2009 2020 2030 2040 2050
PJ
Traditional
Petroleum
electricity
coal
biogas

6
Fig. 5 Energy mix by fuel type in 2025 in Reference Scenario
Fig. 6 Energy mix by fuel type in 2050 in Reference Scenario
TABLE VII shows the final energy demand of five
economic subsectors over the study period in the reference
scenario.
TABLE VII
SECTORAL FINAL ENERGY DEMAND IN REFERENCE SCENARIO
Sector PJ
2009 2020 2030 2040 2050
Manufacturing 13.3 22.2 34.7 52.7 77.4
Agriculture 3.6 5.4 7.7 10.5 14.0
Transportation 17.9 29.3 45.6 71.6 113.9
Household 356.6 438.6 525.9 608.0 685.0
Service 5.5 11.3 21.4 39.9 73.4
Total 397.0 506.8 635.3 782.7 963.7
The share of residential sector in the total energy
consumption reduces from 90% in 2009 to 85% in 2025 and
71% in 2050. Manufacturing sector energy share will increase
to 4.8% in 2025 to 8%in 2050 as compared to 3% in 2009.
The transport sector energy consumption will increase to 6%
in 2025 to 11 % in 2050. Similarly, the share of agriculture
sector and service sector will continue to rise to 5% and 3% in
2025 to 8% and 7.6% in 2050 respectively.
The per capita energy consumption will increase 1.5 times by
2050 to 23.76 GJ as compared to 15.50 GJ in the base year
2009. Similarly energy intensity of GVA will reduce by 4
folds till 2050 from 2009 value.
Fig. 7 Energy intensity of GVA and per capita energy consumption
B. Sustainable Scenario
SUSTAINABLE ENERGY FOR ALL is an initiative
launched by the United Nations Secretary-General to make
sustainable energy for all a reality by 2030. Developed
countries face the combined challenge and opportunity of
transforming existing infrastructure, and developing countries
have the opportunity to adopt cleaner, more efficient
technology from the start. The three objectives of sustainable
energy for all are as follows:
1. Ensure universal access to modern energy services
2. Double the global rate of improvement in energy
efficiency
3. Double the share of renewable energy in the global
energy mix.
These three objectives reinforce each other in many
instances, and achieving the three together will power
opportunity, maximize development benefits and help stabilize
climate change [4].
The same demographic and economic assumptions
considered in the Reference Scenario have been assumed in
this scenario as well. In addition, energy demand grows with
technological intervention.
As stated above in order to access clean energy access
by 2030 various technological intervention in different sectors
of the economy have been considered. The technological
interventions are listed below:
Household Sector
Urban household
1. 100% electricity access by 2020
2. 100% penetration of electricity in space heating, water
heating & cooking by 2030
Rural household
83%
11%
3%3% 1%
Traditional fuels
petroleum
electricity
coal
biogas
69%
20%
5%5% 0%
Traditional fuels
petroleum
electricity
coal
biogas
0
0.4
0.8
1.2
1.6
2
2009 2020 2030 2040 2050
indexed figure (2009=1)
Final Energy per capita
Final energy per GVA

7
1. 100% electricity access by 2030
2. By 2035, 40% penetration of biogas in cooking along with 10% electricity and remaining improved cook stove
Service sector
1. Kerosene used in space heating completely replaced by
electricity by 2030.
2. Kerosene used in lighting replaced by electricity by 2015.
3. Traditional fuel, kerosene and LPG used for cooking and water heating gradually replaced with electricity by 2030.
Transport Sector 1. Introduction of electric railway for freight transport
2. Introduction of electric metro and electric car in intra-city
transport
3. Introduction of passenger trains for electric mass transport in intercity transport.
Industrial sector
1. Replacement of Traditional fuel, coal, diesel and other oil
used in boiler with electricity by 50% until 2050.
2. Replacement of Traditional fuel, coal, diesel and other oil
used in process heat completely with electricity by 2050.
With the assumed technological interventions in the
reference scenario, the overall final energy demand is
projected to increase 1.2 times over the analysis period 2009-
2050. The projected final consumptions of various fuels in
this scenario have been given in TABLE VI and the growth
pattern of the various fuel type over period 2009-2050 has
been shown in Fig. 8.
TABLE VIII
TOTAL ENERGY CONSUMPTION IN SUSTAINABLE SCENARIO (PJ)
Fuel Type 2010 2020 2030 2040 2050
Traditional fuels 349 261 194 187 163 biogas 3 6 19 21 21 Electricity 8 32 69 114 179 Kerosene 3 2 1 1 1 LPG 6 7 5 5 6 Diesel 17 21 30 42 63 Petrol 4 5 6 7 9 Coke & steam coal 8 11 14 17 17 other oil 0 0 0 0 0 Jet Fuel 1 1 1 1 1 Total 397 347 338 394 459
Fig. 8 Total final energy demand 2009-2050 in Sustainable Scenario
Technology intervention in the household sector
Household sector that accounts for about 90% of the
total energy consumption in Nepal spends most of the energy
for cooking purpose as shown in TABLE IX.
TABLE IX
END USE CONSUMPTION PATTERN IN HOUSEHOLD SECTOR
End uses Rural household Urban household
cooking 65% 71%
space heating 8% 3%
space cooling 0% 1%
water boiling 2% 6%
electric appliance 0% 3%
lighting 1% 7%
others 24% 9%
(Source: [14])
Still 18 percent of the total household (including urban
and rural) uses kerosene for lighting purpose [7]. With the
increase in access to electricity, households will switch from
kerosene to electricity for lighting. The luminous flux of
electricity lamps is more than 20 times that of kerosene lamps
[15].
Technology intervention in urban household
With 100% electricity access by 2020 in the urban
household, all household is expected to switch to electricity
for lighting. Further increasing the penetration of electricity in
thermal uses is expected to completely replace other fuels
(traditional, coal, kerosene and LPG) by 2030 with electricity.
The comparison of the final energy demand for the Reference
Scenario and Sustainable Scenario can be seen from Fig. 1 and
Fig. 10.
0
100
200
300
400
2009 2020 2030 2040 2050
PJ
Traditional fuels
Petroleum
electricity
coal
biogas
8
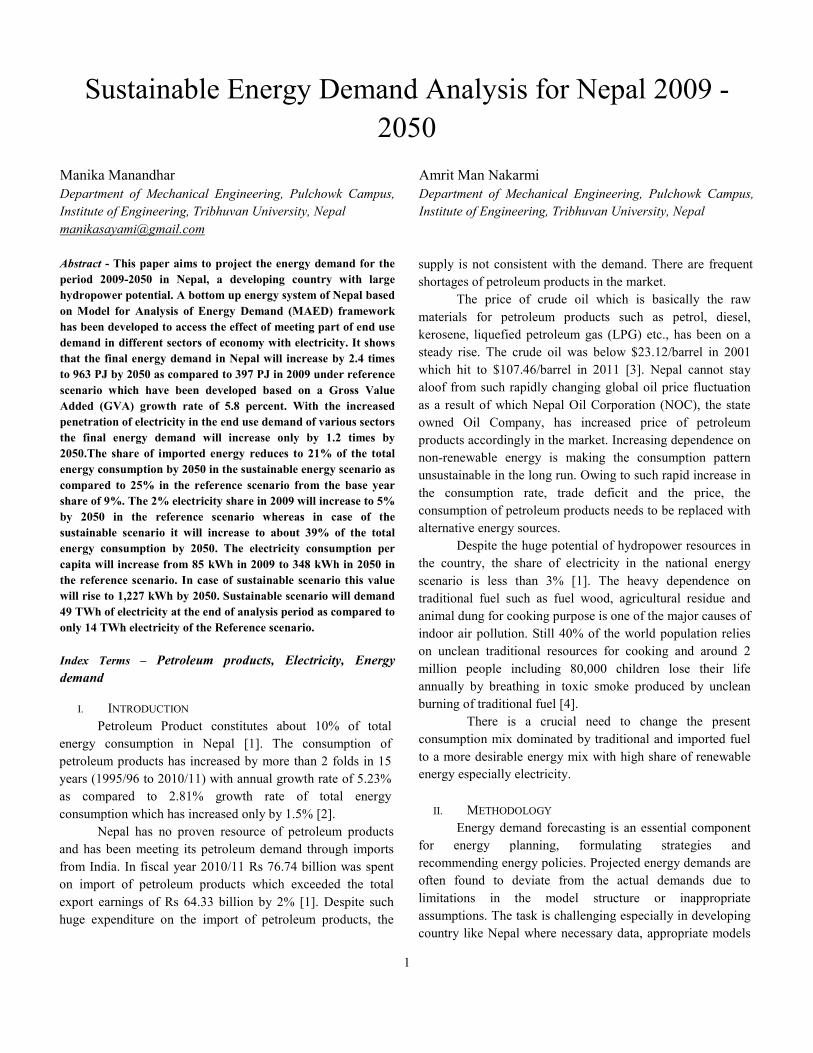
Fig. 9 Final energy demand in urban household in reference scenario
Fig. 10 Final energy demand in urban household in sustainable scenario
From the figures it can clearly be seen that the
traditional fuel dominated energy demand will switch to
electricity dominated demand from 2030 onwards in the
urban household sector. Electricity share will increase to 76%
in the sustainable scenario as compared to 8 % in the
reference scenario in 2050. Similarly the share of traditional
fuel will drop to 22 % in the sustainable scenario as compared
to 80% in the reference scenario. LPG share will also reduce
to 2% as compared to 9% in the reference scenario in 2050.
Besides the changes in the energy mix, increasing the
penetration of electricity will also reduce the final energy
demand as depicted in Fig. 11. The final energy demand in the
reference scenario will be 244 million GJ in 2050. The final
energy demand in case of the sustainable scenario will reduce
by 155 million GJ to only 89 million GJ in 2050. This
reduction is mainly achieved because of the higher end use
efficiency of electricity as compared to other fuels.
Fig. 11 Comparison of final energy demand between reference and sustainable
scenario in urban household
Technology intervention in rural household
In case of rural household, the electricity access is assumed to
reach 100% by 2030 as compared to 49% in reference
scenario. With such assumptions, kerosene used for lighting
will be displaced completely with electricity by 2030. Nepal’s
20 year Renewable Energy Perspective Plan has a goal to
achieve 1.5 million household with biogas and 2 million
household with improved cook stove by 2030.
TABLE X
RENEWABLE PERSPECTIVE PLAN 2011-2030 TARGET
Year No. of household in thousand
2015 2020 2025 2030
Biogas 300 500 900 1500
ICS 600 1000 1500 2000
(Source: [16])
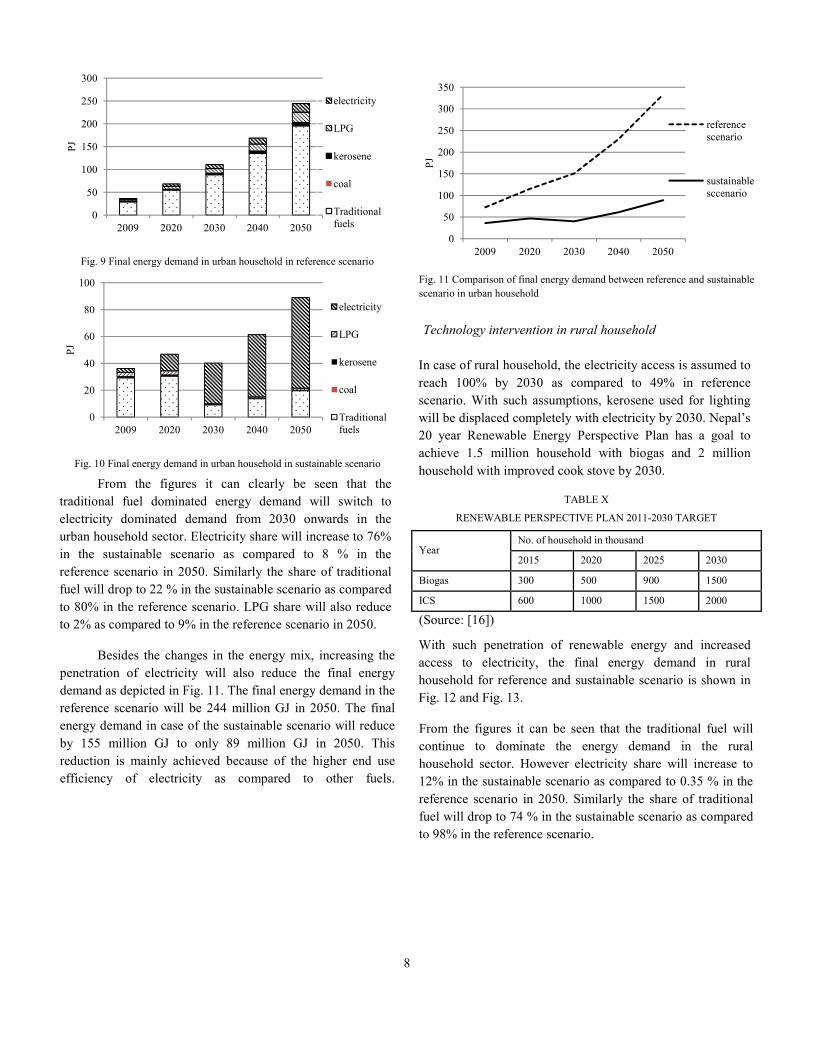
With such penetration of renewable energy and increased
access to electricity, the final energy demand in rural
household for reference and sustainable scenario is shown in
Fig. 12 and Fig. 13.
From the figures it can be seen that the traditional fuel will
continue to dominate the energy demand in the rural
household sector. However electricity share will increase to
12% in the sustainable scenario as compared to 0.35 % in the
reference scenario in 2050. Similarly the share of traditional
fuel will drop to 74 % in the sustainable scenario as compared
to 98% in the reference scenario.
0
50
100
150
200
250
300
2009 2020 2030 2040 2050
PJ
electricity
LPG
kerosene
coal
Traditional fuels
0
20
40
60
80
100
2009 2020 2030 2040 2050
PJ
electricity
LPG
kerosene
coal
Traditional fuels
0
50
100
150
200
250
300
350
2009 2020 2030 2040 2050
PJ
reference scenario
sustainable sccenario
9
Fig. 12 Final energy demand in rural household in reference scenario
Fig. 13 Final energy demand in rural household in sustainable scenario
Besides the changes in the energy mix, increasing the
penetration of electricity will also reduce the final energy
demand as depicted in Fig. 14.
Fig. 14 Comparison of final energy demand between reference and sustainable
scenario in rural household
TABLE XI
EFFICIENCY OF DIFFERENT TYPE OF STOVES
(Source: [17])
Technology intervention in the service sector
Service sector consumes only about 1.3% of the total energy
consumption in Nepal [13] whereas it accounts for 49% in the
GVA in the country. Service sector has a high share of
commercial fuel. 40% of the energy demand in the service
sector is met by LPG and 20% by electricity. Traditional fuels
meet about 32% of the service sector energy demand. The end
uses in the service sector are given in TABLE XII.
TABLE XII
END USES IN SERVICE SECTOR
End Uses percentage share
Cooking 77.9%
Space Heating 6.2%
Space Cooling 1.6%
Water Boiling 0.9%
Electric Appliance 0.8%
Lighting 12.5%
Others 0.1%
(Source:[18])
With gradual increase in the penetration of electricity in the
end uses in the service sector, most of the energy demand is
expected to be fulfilled with electricity by 2030 and onwards.
The comparison of the final energy demand for the Reference
Scenario and Sustainable Scenario can be seen from Error!
Reference source not found. and Error! Reference source not found..
Fig. 15 Final energy demand in service sector in reference scenario
From the figures it can clearly be seen that the LPG dominated
energy demand mix in the reference scenario will change to
electricity dominated energy demand mix by 2030. In
addition, there will be considerable decrease in the final
energy demand in the sustainable scenario by 40 PJ in the year
2050 as compared to that in the reference scenario (Error!
Reference source not found.).
0
100
200
300
400
500
2009 2020 2030 2040 2050
PJ
electricity
Biogas
LPG
kerosene
coal
Traditional fuels
0
50
100
150
200
250
300
350
2009 2020 2030 2040 2050
PJ
electricity
Biogas
LPG
kerosene
coal
Traditional fuels
0
100
200
300
400
500
2009 2020 2030 2040 2050
PJ
sustainable scenario
reference scenario 0
20
40
60
80
2009 2020 2030 2040 2050
million GJ
Electricty
LPG
Kerosene
Traditional fuels
Type of stove Efficiency
Biogas stove 45%
LPG stove 60%
Kerosene Stove 43%
Wood Stove 10%
ICS 20%
Electric stove 70%

10
Fig. 16 Final energy demand in service sector in sustainable scenario
Fig. 17 comparison of final energy demand between reference and sustainable
scenario in service sector
Technology intervention in the transport sector
About 5% of the total fuel consumed in the 2008/09 was
spent on the transport sector [13]. A total of 1.17 million
vehicles has been registered in Nepal by fiscal year 2010-2011
[19]. The various modes of the transport for the same year
with their respective share is shown in the TABLE XIII and
technical characteristics of transport technoloies considered
have been listed in Annex I.
In the sustainable scenario analysis, electric railway for
freight and intercity passenger transport and electric metro for
the intracity transport has been assumed to be available from
2020 onwards (10 years from the base year) considering the
long lead time required for the infrastructure development. It
has further been assumed that the share of electric car will
increase from 5 % in 2020 to 15% in 2050 in intracity
transport. Feasibility study of the Mechi-Mahakali and
Pokhara-Kathmandu Electric Railway has estimated the share
of traffic that would be diverted to electric railway after its
commencement as given in TABLE XIV.
TABLE XIII
TRANSPORT MODE WITH FUEL TYPE WITH RESPECTIVE SHARE
Freight
Transport mode Fuel % share
truck, tankers Diesel 84.8
tractors Diesel 8.4
pickups Diesel 6.8
Intracity
Large Bus Diesel 95.77
mini bus Diesel 1.00
car Diesel 0.04
Car Petrol 0.42
diesel micro Diesel 0.35
aviation Aviation Fuel 2.42
Intercity
Car Petrol 8.3
Car Diesel 0.9
taxi Diesel 4.6
Minibus Diesel 31.7
bike Petrol 43.5
Van Diesel 4.5
Van LPG 1.2
three wheeler LPG 2.0
three wheeler Electric 3.2
TABLE XIV
TRAFFIC DIVERTED TO ELECTRIC RAILWAY
2020 2025 2030 2035
Freight transport 25% 30% 35% 40%
Car 25% 30% 35% 40%
Bus 40% 45% 50% 55%
Air transport 25% 35% 45% 45%
(Source: [20])
With such assumptions the final energy demand in the
transport sector in the sustainable scenario will be as shown in
Fig. 18. And Fig. 19 explains the transport sector energy
consumption in the reference scenario.
The above figures show that diesel fuel will continue to be
dominant in both the scenarios. However the share of
electricity will considerably increase in the sustainable
scenario. The share of electricity in the sustainable scenario
will be 17% in 2050 as compared to 0.014% in the reference
scenario. Diesel fuel will account for 69 % in sustainable
scenario as compared to 84 % in the reference scenario in
2050. The share of petrol will be 13% in both scenarios
whereas the share of Aviation fuel will reduce to 1 % as
compared to 1.3% in the reference scenario.
0
10
20
30
40
50
2009 2020 2030 2040 2050
PJ
Electricty
LPG
Kerosene
Traditional fuels
0
20
40
60
80
2009 2020 2030 2040 2050
PJ
Year
reference scenario
Sustainable Scenario

11
Fig. 18 Final energy demand in transport sector in sustainable scenario
Fig. 19 Final energy demand in transport sector in reference scenario
Fig. 20 Comparison of final energy demand between reference and sustainable
scenario in transport sector
Technology intervention in the manufacturing sector
Manufacturing sector accounted for 3.3 % of the total energy
consumed in 2008/09 in Nepal. The various end uses
considered in this sector is given in TABLE XV.
TABLE XV
END USES IN THE INDUSTRIAL SECTOR IN 2008/09
End Use percentage share
motive power 21%
boiler 6%
process heat 48%
lighting 3%
others 22%
(Source:[18])
With the increase in the penetration of electricity in the
manufacturing sector, the traditional and fossil fuel will be
gradually replaced with electricity as shown in Fig. 21 and
Fig. 22. Share of electricity will increase from 22% in
reference scenario to 62% in sustainable scenario in 2050.The
final energy demand in the industrial sector will reduce from
77 PJ in the reference scenario to 55 PJ in the sustainable
scenario (i.e. reduction by 21 PJ) in 2050.
Fig. 21 Final energy demand in manufacturing sector in reference scenario
Fig. 22 Final energy demand in manufacturing sector in sustainable scenario
Fig. 23 Comparison of final energy demand between reference and sustainable
scenario in manufacturing sector
Reduction in final energy demand in the sustainable scenario
0
20
40
60
80
2009 2020 2030 2040 2050
PJ
LPG
Jet fuel
Gasoline
Diesel
Electricity
0
40
80
120
2009 2020 2030 2040 2050
PJ
LPG
Jet fuel
Gasoline
Diesel
Electricity
0
20
40
60
80
100
120
2009 2020 2030 2040 2050
PJ sustainable
scenario
reference scenario
0
20
40
60
80
100
2009 2020 2030 2040 2050
million GJ
electricity
Diesel
LPG
kerosene
coal
Traditional fuels
0
20
40
60
2009 2020 2030 2040 2050
million GJ
electricity
Diesel
LPG
kerosene
coal
Traditional fuels
0
20
40
60
80
100
2009 2020 2030 2040 2050
PJ Sustainable
Scenario
Reference Scenario
12
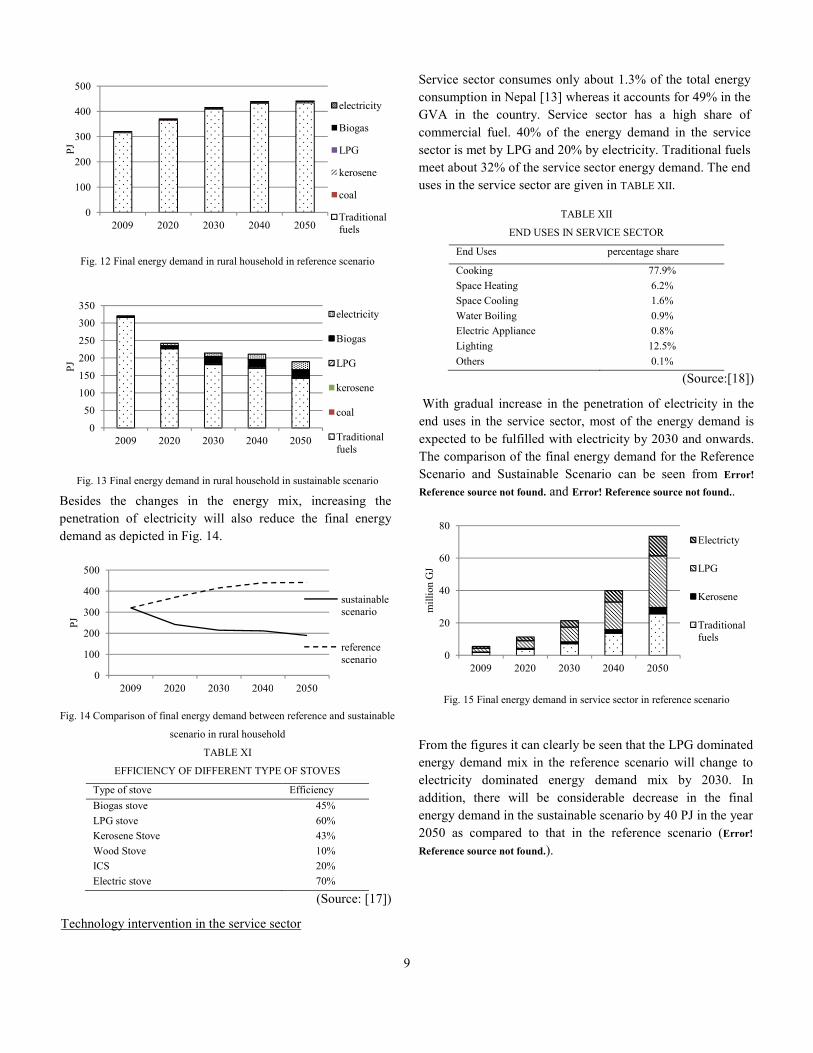
There is considerable reduction in the sustainable scenario
through various technological interventions. The total
reduction in the energy demand in different analysis period is
given in TABLE XVI.
TABLE XVI
TOTAL FINAL ENERGY DEMAND REDUCTION IN THE
SUSTAINABLE SCENARIO
Sectors Million GJ
2020 2030 2040 2050
Manufacturing 1.5 4.8 11.0 21.5
service 2.4 9.0 17.1 31.9
transport 5.6 12.3 24.9 44.8
household 150.0 271.6 335.6 406.4
Total 159.5 297.7 388.6 504.6
With the increase in penetration level of electricity in
household, service, transport and manufacturing, the level of
electricity share in the total energy demand increases rapidly
in the sustainable scenario. The 2% electricity share in 2009
will increase to 5% by 2050 in the reference scenario whereas
in case of the sustainable scenario it will increase to about
40% by 2050.
Fig. 24 Share of electricity in the reference and sustainable scenario
Fig. 25 Electricity consumption per capita in the reference and sustainable
scenario
The electricity consumption per capita will increase from 85
kWh in 2009 to 348 kWh in 2050 in the reference scenario. In
case of sustainable scenario this value will rise to 1227 kWh
by 2050.
Calculation of hydropower plant capacity required
Total NEA hydropower installed in 2011(including major &
small hydro) = 477.53 MW
Total Available Energy from NEA Hydro in same year =
2,122.08 GWh [21]
Capacity Utilisation Factor = �������������
������� �������� = 0.5072
Electricity requirement in 2050 in reference scenario =
14 TWh
Required installation capacity = 3,150 MW
Electricity requirement in 2050 in sustainable scenario =
49 TWh
Required installation capacity = 11,026 MW
Fig. 26 share of imported fuel in the reference and sustainable scenario
The share of imported fossil fuel will continue to increase in
both scenarios (Fig. 26). But the rate of increase is slower in
the sustainable scenario. Imported fuel will account for 25%
share by 2050 in the reference scenario as compared to 20%
share in the sustainable scenario.
Fig. 27 Share of traditional fuel in the reference and sustainable scenario
The share of traditional fuel will continue to decrease
in both scenarios as explained by Fig. 27. But the rate of
0%
10%
20%
30%
40%
50%
2009 2020 2030 2040 2050
reference scenario
sustainable scenario
0
400
800
1200
1600
2009 2020 2030 2040 2050
kWh
reference scenario
sustainable scenario
0%
5%
10%
15%
20%
25%
30%
2009 2020 2030 2040 2050
reference scenario
sustainable scenario
0%
20%
40%
60%
80%
100%
2009 2020 2030 2040 2050
reference scenario
sustainable scenario
13
decrease is much rapid in the sustainable scenario. Traditional
fuel will account for 69% share by 2050 in the reference
scenario as compared to 39% share in the sustainable
scenario.
IV CONCLUSION
This paper has examined effects of sustainable
technology intervention in the energy demand of Nepal over
the period 2009-2050. This analysis shows that in the
reference scenario, the energy consumption will increase by
2.4 folds during 2009-2050. The final energy demand in the
reference scenario will reach to 963 PJ in 2050 from base year
value of 397 PJ in 2009. In the case of sustainable scenario,
the final energy demand will only be 460 PJ in 2050. This
reduction is achieved due to increase in the electricity
penetration in the energy system. Electricity has high end use
efficiency as compared to other technologies presently being
used that consume traditional and fossil fuel.
The share of imported fossil fuel will be 25% (241 PJ)
in the reference scenario in 2050. Petroleum export already
exceeds the country's export earnings. Owing to growing trend
in the global fossil fuel market, Nepal may not be able to
sustain the oil import with its export earnings only. This
means that the country will need to arrange funding from other
sources for import of petroleum product. The present analysis
reveals that implication of sustainable technologies would
reduce dependency on the imported fossil fuel. The share of
petroleum product in the national energy system will reduce to
21% (96 PJ) in the sustainable scenario. Such large reduction
can make noticeable improvement in the energy security of the
country. This would reduce the burden of huge expenditure
presently being spent on the import of fossil fuel by greater
extent and contribute towards the import and export trade
balance.
This paper also reveals that increase in the electricity
penetration into the energy system would promote sustainable
development of indigenous hydropower resource in the
country. The reference scenario demands 14 TWh electricity
by 2050 which is equivalent to 3,150 MW installed capacity
(capacity utilization factor for hydropower plants taken as
0.5072, [21]). With the increase in electricity share in the
sustainable scenario, the electricity demand will be 49 TWh in
2050 equivalent to 11,026 MW. Further electricity
consumption per capita will increase from 85 kWh in 2009 to
348 kWh in 2050 in the reference scenario. In case of
sustainable scenario this value will rise to 1,227 kWh by
2050.The present electricity generation capacity of Nepal is
only 3.8 TWh with installed capacity of only 705.56 MW
(includes hydro, thermal and solar) [21]. To meet the
electricity demand of the sustainable scenario additional
hydropower plants of 10,320MW need to be constructed in
Nepal by 2050.
In the present study, the traditional fuel will continue to
decrease from base year share of 88% to 69% in the reference
scenario and to 35% in the sustainable scenario by 2050.The
share of electricity will increase from 2% in the base year to
5% in the reference scenario and to 40% in the sustainable
scenario at the end of analysis period. This indicates a huge
change in the consumption pattern of energy in Nepal in future
years. From these figures it can be concluded that with the
employment of sustainable energy technologies, Nepal will
continue to climb up in the energy ladder rapidly.
REFERENCES
[1] Ministry of Finance (MoF), 2012. Economic Survey: FY
2011/2012, Kathmandu.
[2] Nepal Oil Corporation (NOC), 2012. Prabhaat 2069 - The Annual
Publication, Kathmandu.
[3] Organisation of Petroleum Exporting Countries (OPEC), 2012.
Annual Statistical Bulletin 2012.
[4] United Nations-Sustainable Energy for all (UN),2013;
http://www.sustainableenergyforall.org/objectives, Latest access:
March 10, 2013
[5] Bhattacharya S.C., Timilsina G.R., 2009. Energy Demand
Models for Policy Formulation: A Comparative Study of Energy
Demand Model, The World Bank
[6] International Atomic Energy Agency (IAEA), 2006. Model for
Analysis of Energy Demand (MAED-2), User’s Manual, Vienna.
[7] Central Bureau of Statistics (CBS), 2012. National Population
and Housing Census 2011. National Planning Commission
Secretariats, Kathmandu
[8] United Nations Population Division (UNPD), 2013. World
Population Prospects: The 2011 Revision, Department of
Economic and Social Affairs;
http://esa.un.org/unup/unup/index_panel1.html, Latest access:
March 10,2013
[9] Ministry of Health and Population Nepal (MoHP), 2011. Nepal
Population Report 2011, Government of Nepal, Kathmandu.
[10] Asian Development Bank (ADB), 2012. Key Indicators for Asia
and the Pacific 2012.

14
[11] National Planning Commission (NPC), 2010.Three Year Plan
(2010/11 - 2012/13), Kathmandu.
[12] Central Bureau of Statistics (CBS), 2008. Census of
Manufacturing Establishments Nepal 2006/07. National Planning
Commission Secretariats, Kathmandu
[13] Water and Energy Commission Secretariat (WECS) 2010, Energy
Synopsis Report 2010, Kathmandu.
[14] Water and Energy Commission Secretariat (WECS), 1997a.
Update and Compilation of Energy Resources and Consumption
Profile of Nepal. Final Report Volume II: Annexes, Kathmandu.
[15] International Energy Agency (IEA), 2010. Energy Technology
Perspective. Scenarios and Strategy to 2050, France.
[16] Alternative Energy Promotion Centre (AEPC), 2011. Nepal’s 20
Years Renewable Energy Perspective Plan, 2011-2030 (Draft),
Lalitpur.
[17] Biogas Support Programme (BSP), 2001. A Study Report on
Efficiency Measurement of Biogas, Kerosene and LPG Stoves.
Lalitpur.
[18] Water and Energy Commission Secretariat (WECS), 1997b.
Update and Compilation of Energy Resources and Consumption
Profile of Nepal. Final Report Volume III: Annexes, Kathmandu.
[19] Department of Transport Management (DOTM), 2013. Vehicle
registration type wise. Ministry of Physical Planning, Works and
Transport Management, Kathmandu.
http://dotm.gov.np/uploads/files/type.pdf, Latest access: March
10, 2013
[20] RITES Ltd. and SILT Consultants (RITES/SILT), 2010.
Feasibility Study of Mechi-Mahakali and Pokhara-Kathmandu
Electric Railway. Kathmandu.
[21] Nepal Electricity Authority (NEA), 2012. Nepal Electricity
Authority: FY 2011/2012, A Year in Review, Kathmandu
[22] Dhakal S.,2003, "Implications of transportation policies on energy
and environment in Kathmandu Valley, Nepal",Energy Policy,
vol.31, pp. 1493–1507
[23] Dhakal, S., 2006. In: Urban Transportation and the Environment
in Kathmandu Valley, Nepal. Integrating Global Carbon Concerns
into Local Air Pollution Management, Institute for Global
Environmental Strategies (IGES), Japan.
[24] Shakya SR, Shrestha RM., 2011, "Transport sector electrification
in a hydropower resource rich developing country: Energy
security, environmental and climate change co-benefits", Energy
for Sustainable
[25] United Nations Economic and Social Commission for Asia and
the Pacific (UNESCAP), 2011. Statistical Abstract of Transport in
Asia and the Pacific, Transport Division, December 2011

15
Annex I: Technical characteristics of transport technologies considered in the study
Transport mode life time yrs
Energy intensity (GJ/1000 pkm, GJ/1000 tkm)a
annual km per vehicle
Occupancy (ton, passenger)
truck 12 1.26 37,500 6
tractor 10 2.68 18,000 2
pickup 10 2.23 44,500 2
Large Bus 14 0.16 33,522 50
mini bus 12 0.23 31,790 30
bike 7 0.3 10,950 1.6
diesel car 8 0.91 16,349 2.6
gasoline Car 8 0.87 16,349 2.6
taxi 0.87 37,125 2.6
diesel Van 12 0.14 37,125 12
LPG Van 12 0.14 37,125 12
LPG three wheeler 7 0.2 29,848 10
Electric three wheeler 7 0.08 29,848 10
Electric car 8 0.25 16,349 2.6
Electric freight train 15 0.07 600
Electric passenger train 15 0.1 740
Electric metro 15 0.17 296
(Source: [22], [23], [24], [25])