Political comedy engagement Genre work, political identity ...
LUISS Guido CarliDipartimento
di Scienze politiche
Working Paper5/2014
Towards a “Global” PoliticalRisk Analysis
Raffaele MarchettiMattia Vitale
Leonardo Morlino (chair)Paolo Boccardelli Matteo Caroli Giovanni Fiori Daniele Gallo Nicola Lupo Stefano Manzocchi Giuseppe Melis Marcello Messori Gianfranco Pellegrino Giovanni Piccirilli Arlo Poletti Andrea Prencipe Pietro Reichlin
1
−−
−
1 This paper is part of a collective endeavor developed within the Research Unit on Political Risk, part
of the ICEED-LUISS (website: http://icedd.luiss.it/reseach-unit-political-risk-analysis). It was first presented at the annual conference of the Italian Political Science Association in Florence (SISP, 2013) and then at the annual convention of the International Studies Association in Toronto (ISA, 2014). We would like to thanks all the participants in those events, especially the two discussants: Carlo Gallo and Francesco Giumelli.
2
3
4
5
•
•
•
•
•
•
•
•
6
•
•
•
•
•
•
•
•
•
2 http://graphics.eiu.com/upload/eb/Benefits_CountryRiskService.pdf
3 http://www.prsgroup.com/ICRG_Methodology.aspx.#Background
7
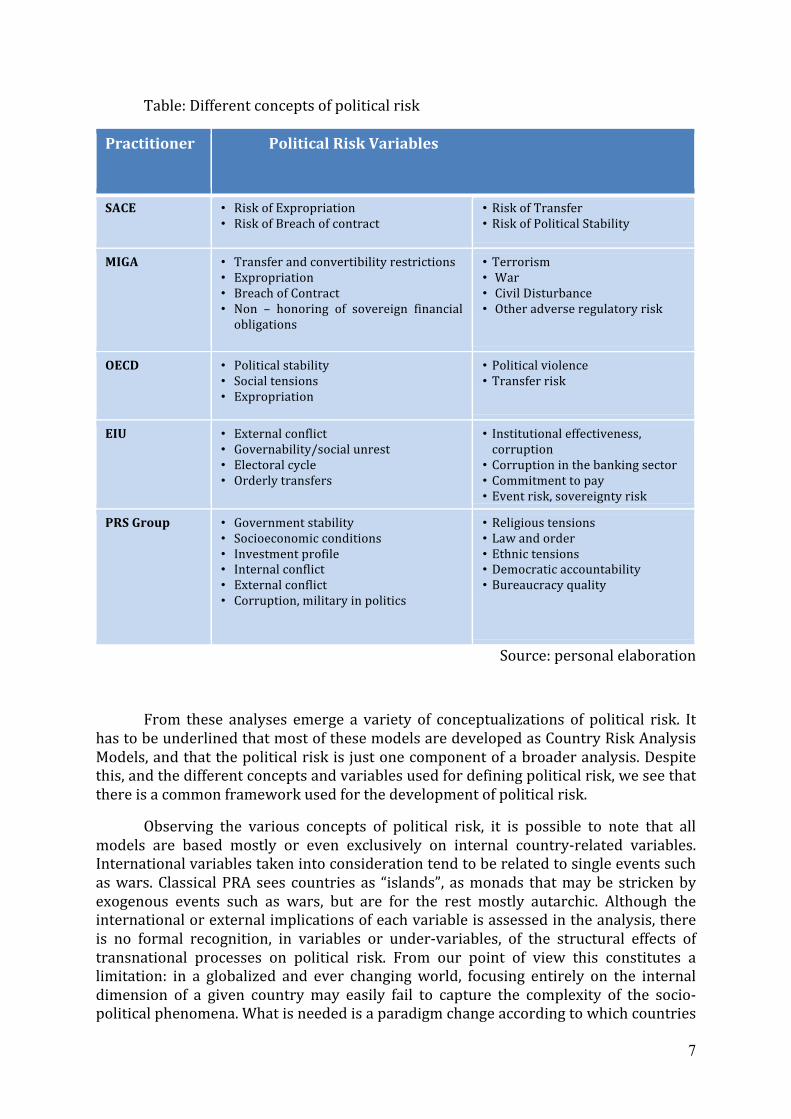
• •
• •
• • • •
• • • •
• • •
• •
• • • •
•
• • •
• • • • • •
• • • • •
8
9
10
•
•
•
•
11
12

13

14
15
16
17

18
• • • • • •
19
20
21
22
23
24
4 These preliminary results will be tested with a stronger statistical analysis in the future research. We
expect the results to be confirmed.
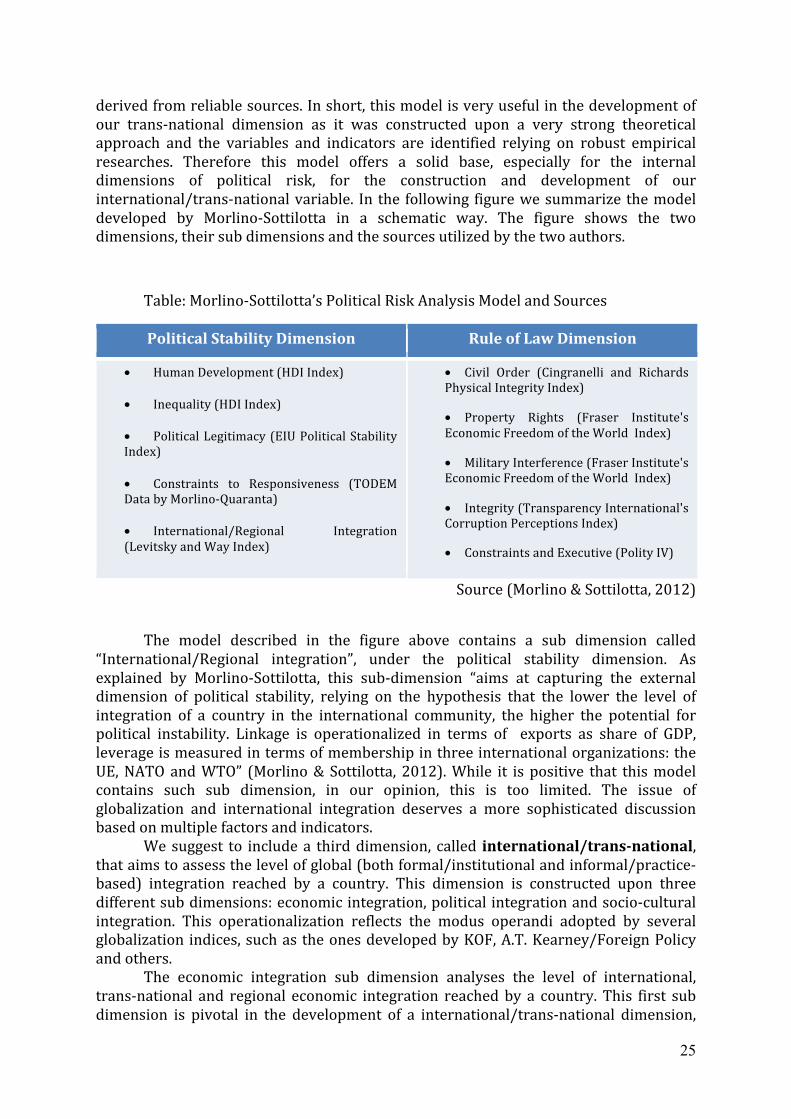
25
•
•
•
•
•
•
•
•
•
•
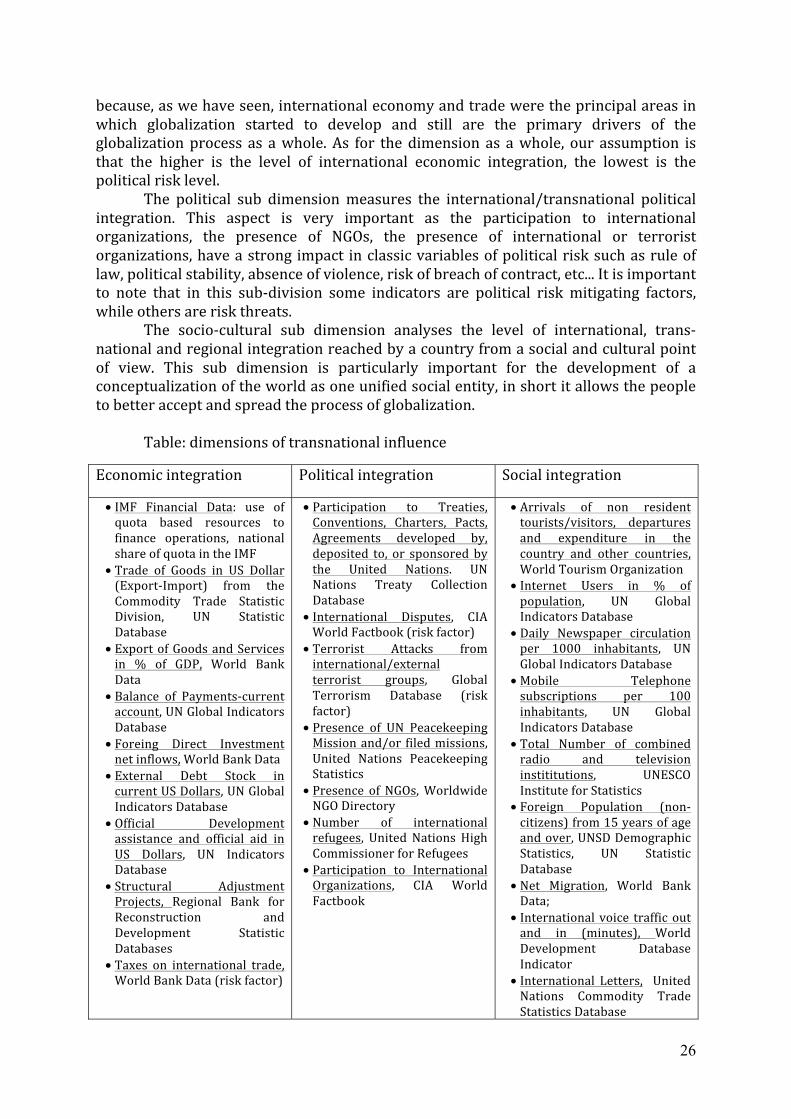
26
•
•
•
•
•
•
•
•
•
•
•
•
•
•
•
•
•
•
•
•
•
•
•
•
•
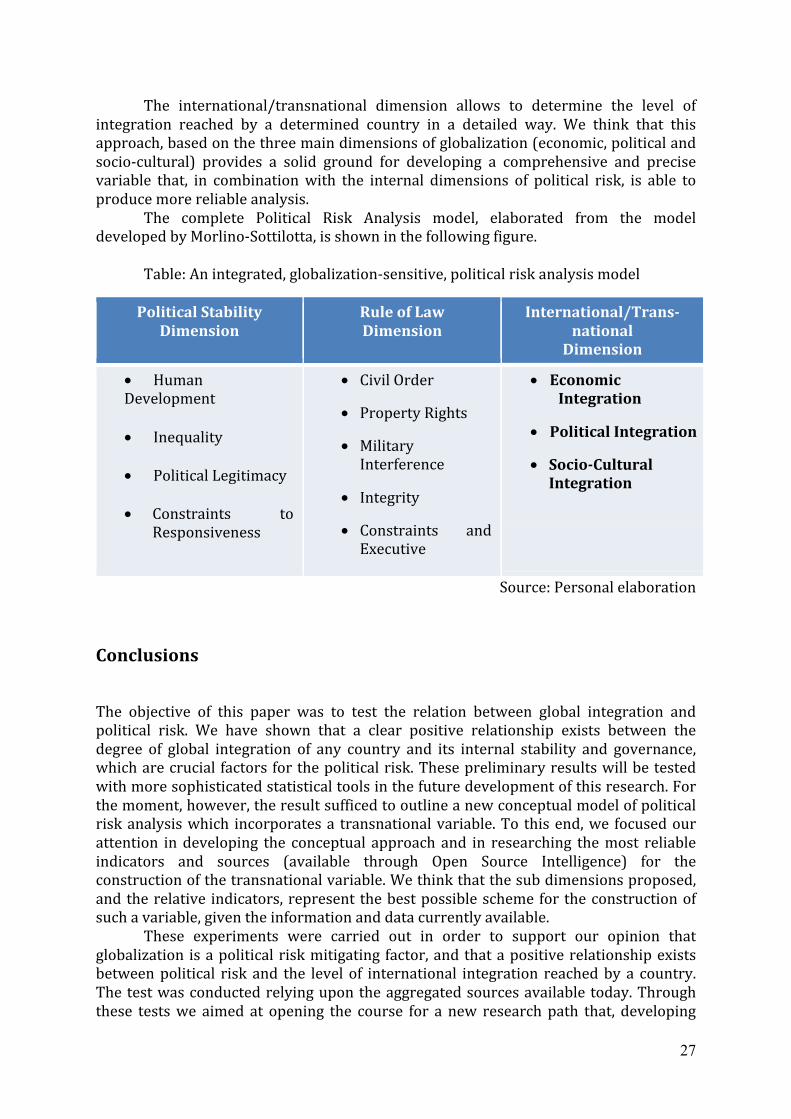
27
•
•
•
•
•
•
•
•
•
•
•
•

28
29
30
31
Annexes
Annex 1 – KOF Index of Globalization: Methodology and sources ........................ 32
Annex 2 - EIU Political Instability Index: Methodology and Sources .................... 36
Annex 3 – KOF and EIU Indexes Juxtaposed .......................................................... 41
Annex 4 - Worldwide Governance Indicators: Methodology and Sources ............. 54
Annex 5 – KOF and WGI Indexes Juxtaposed ........................................................ 63
32
5
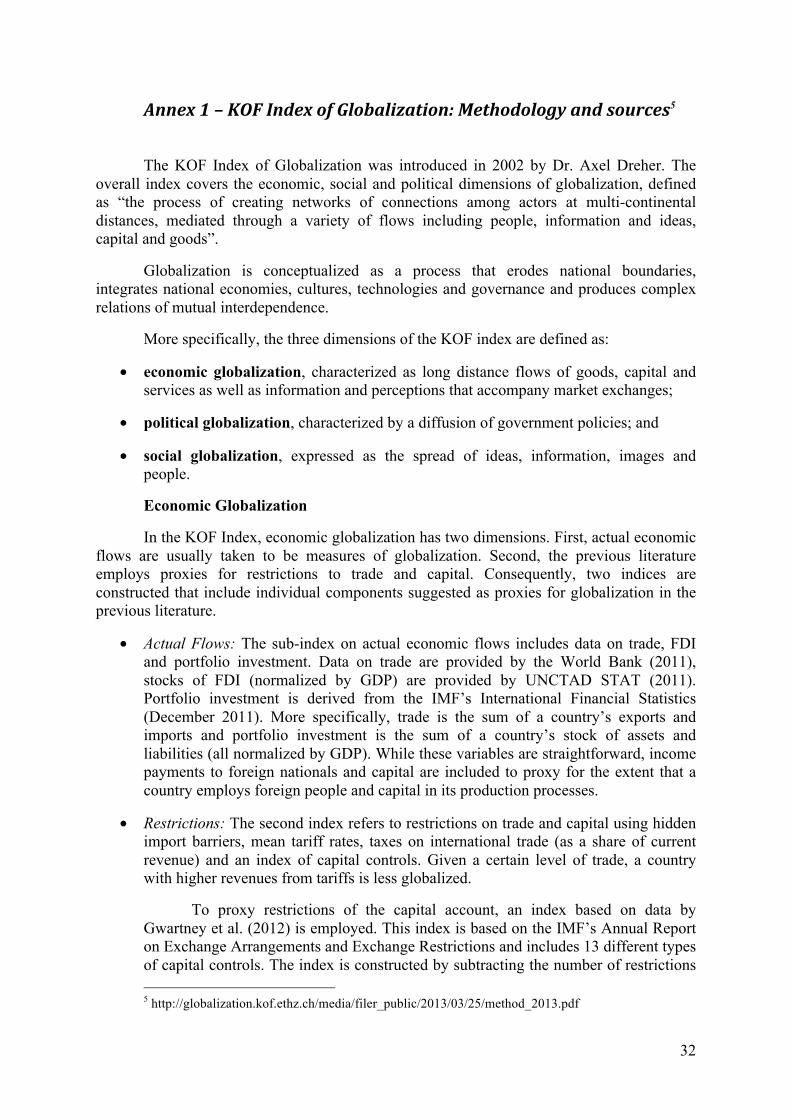
The KOF Index of Globalization was introduced in 2002 by Dr. Axel Dreher. The overall index covers the economic, social and political dimensions of globalization, defined as “the process of creating networks of connections among actors at multi-continental distances, mediated through a variety of flows including people, information and ideas, capital and goods”.
Globalization is conceptualized as a process that erodes national boundaries, integrates national economies, cultures, technologies and governance and produces complex relations of mutual interdependence.
More specifically, the three dimensions of the KOF index are defined as:
• economic globalization, characterized as long distance flows of goods, capital and services as well as information and perceptions that accompany market exchanges;
• political globalization, characterized by a diffusion of government policies; and
• social globalization, expressed as the spread of ideas, information, images and people.
Economic Globalization
In the KOF Index, economic globalization has two dimensions. First, actual economic flows are usually taken to be measures of globalization. Second, the previous literature employs proxies for restrictions to trade and capital. Consequently, two indices are constructed that include individual components suggested as proxies for globalization in the previous literature.
• Actual Flows: The sub-index on actual economic flows includes data on trade, FDI and portfolio investment. Data on trade are provided by the World Bank (2011), stocks of FDI (normalized by GDP) are provided by UNCTAD STAT (2011). Portfolio investment is derived from the IMF’s International Financial Statistics (December 2011). More specifically, trade is the sum of a country’s exports and imports and portfolio investment is the sum of a country’s stock of assets and liabilities (all normalized by GDP). While these variables are straightforward, income payments to foreign nationals and capital are included to proxy for the extent that a country employs foreign people and capital in its production processes.
• Restrictions: The second index refers to restrictions on trade and capital using hidden import barriers, mean tariff rates, taxes on international trade (as a share of current revenue) and an index of capital controls. Given a certain level of trade, a country with higher revenues from tariffs is less globalized.
To proxy restrictions of the capital account, an index based on data by Gwartney et al. (2012) is employed. This index is based on the IMF’s Annual Report on Exchange Arrangements and Exchange Restrictions and includes 13 different types of capital controls. The index is constructed by subtracting the number of restrictions
5 http://globalization.kof.ethz.ch/media/filer_public/2013/03/25/method_2013.pdf
33
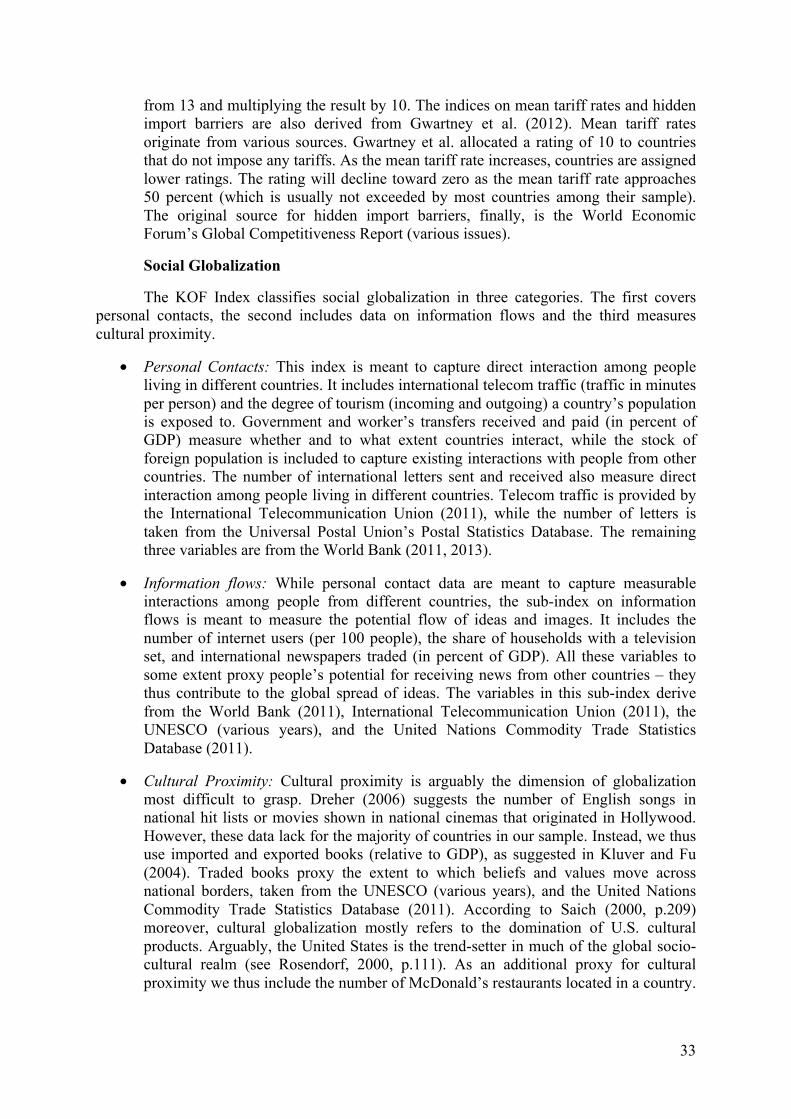
from 13 and multiplying the result by 10. The indices on mean tariff rates and hidden import barriers are also derived from Gwartney et al. (2012). Mean tariff rates originate from various sources. Gwartney et al. allocated a rating of 10 to countries that do not impose any tariffs. As the mean tariff rate increases, countries are assigned lower ratings. The rating will decline toward zero as the mean tariff rate approaches 50 percent (which is usually not exceeded by most countries among their sample). The original source for hidden import barriers, finally, is the World Economic Forum’s Global Competitiveness Report (various issues).
Social Globalization
The KOF Index classifies social globalization in three categories. The first covers personal contacts, the second includes data on information flows and the third measures cultural proximity.
• Personal Contacts: This index is meant to capture direct interaction among people living in different countries. It includes international telecom traffic (traffic in minutes per person) and the degree of tourism (incoming and outgoing) a country’s population is exposed to. Government and worker’s transfers received and paid (in percent of GDP) measure whether and to what extent countries interact, while the stock of foreign population is included to capture existing interactions with people from other countries. The number of international letters sent and received also measure direct interaction among people living in different countries. Telecom traffic is provided by the International Telecommunication Union (2011), while the number of letters is taken from the Universal Postal Union’s Postal Statistics Database. The remaining three variables are from the World Bank (2011, 2013).
• Information flows: While personal contact data are meant to capture measurable interactions among people from different countries, the sub-index on information flows is meant to measure the potential flow of ideas and images. It includes the number of internet users (per 100 people), the share of households with a television set, and international newspapers traded (in percent of GDP). All these variables to some extent proxy people’s potential for receiving news from other countries – they thus contribute to the global spread of ideas. The variables in this sub-index derive from the World Bank (2011), International Telecommunication Union (2011), the UNESCO (various years), and the United Nations Commodity Trade Statistics Database (2011).
• Cultural Proximity: Cultural proximity is arguably the dimension of globalization most difficult to grasp. Dreher (2006) suggests the number of English songs in national hit lists or movies shown in national cinemas that originated in Hollywood. However, these data lack for the majority of countries in our sample. Instead, we thus use imported and exported books (relative to GDP), as suggested in Kluver and Fu (2004). Traded books proxy the extent to which beliefs and values move across national borders, taken from the UNESCO (various years), and the United Nations Commodity Trade Statistics Database (2011). According to Saich (2000, p.209) moreover, cultural globalization mostly refers to the domination of U.S. cultural products. Arguably, the United States is the trend-setter in much of the global socio-cultural realm (see Rosendorf, 2000, p.111). As an additional proxy for cultural proximity we thus include the number of McDonald’s restaurants located in a country.
34
For many people, the global spread of McDonald’s became a synonym for globalization itself. In a similar vein, we also use the number of Ikea per country.
Political Globalization
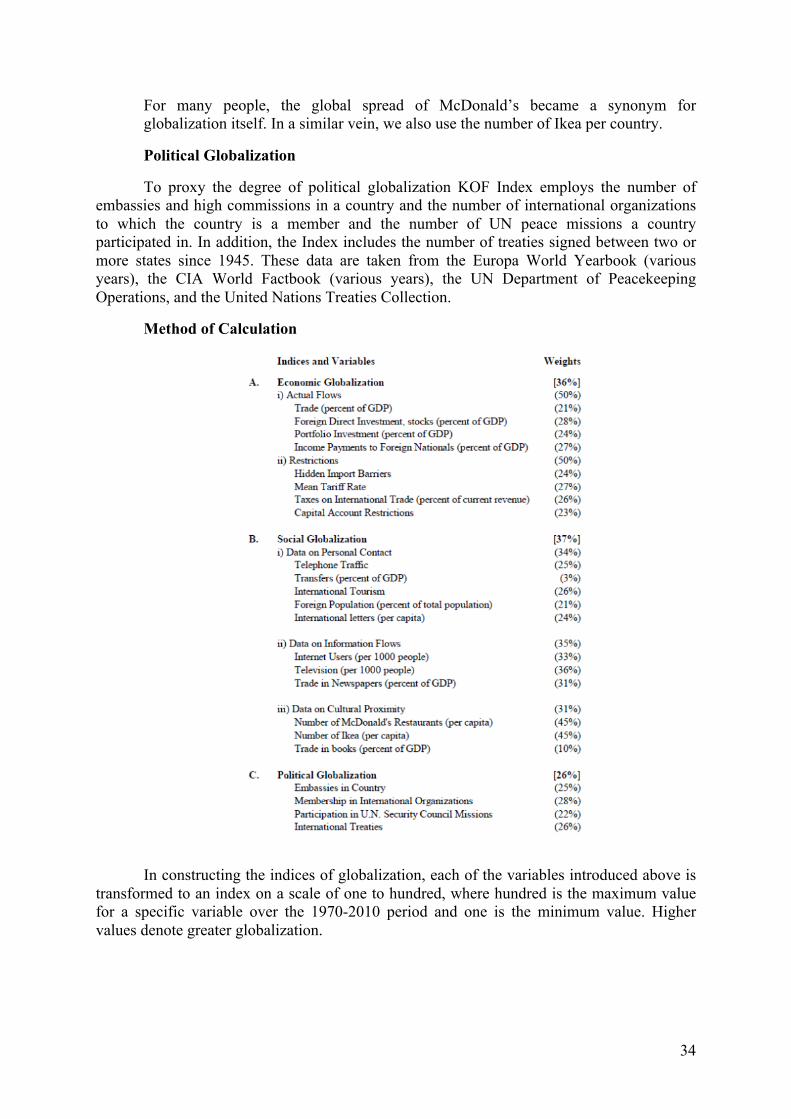
To proxy the degree of political globalization KOF Index employs the number of embassies and high commissions in a country and the number of international organizations to which the country is a member and the number of UN peace missions a country participated in. In addition, the Index includes the number of treaties signed between two or more states since 1945. These data are taken from the Europa World Yearbook (various years), the CIA World Factbook (various years), the UN Department of Peacekeeping Operations, and the United Nations Treaties Collection.
Method of Calculation
In constructing the indices of globalization, each of the variables introduced above is transformed to an index on a scale of one to hundred, where hundred is the maximum value for a specific variable over the 1970-2010 period and one is the minimum value. Higher values denote greater globalization.
35
The data are transformed according to the percentiles of the original distribution. The weights for calculating the sub-indices are determined with the help of principal components analysis for the entire sample of countries and years. The analysis partitions the variance of the variables used in each sub-group. The weights are then determined in a way that maximizes the variation of the resulting principal component, so that the indices capture the variation as fully as possible. The same procedure is applied to the subindices in order to derive the overall index of globalization.
Data are calculated on a yearly basis. However, not all data are available for all countries and all years. In calculating the indices, all variables are linearly interpolated before applying the weighting procedure. Instead of linear extrapolation, missing values at the border of the sample are substituted by the latest data available. When data are missing over the entire sample period, the weights are readjusted to correct for this. When observations with value zero do not represent missing data, they enter the index with weight zero. Data for sub-indices and the overall index of globalization are not calculated, if they rely on a small range of variables in a specific year and country. Observations for the index are reported as missing if more than 40 percent of the underlying data are missing or at least two out of the three subindices cannot be calculated. The indices on economic, social and political globalization as well as the overall index are calculated employing the weighted individual data series instead of using the aggregated lower-level globalization indices. This has the advantage that data enter the higher levels of the index even if the value of a sub-index is not reported due to missing data.
36
6
The index draws on recent insights of the political science literature that seeks to identify and quantify the main social, economic and political factors and traits that are causally associated with, or that can predict, political instability. In particular, it draws on the work of the so-called Political Instability Task Force (PITF) based at George Mason University in the US. The PITF has created a simple model that has a rate of success of over 80% in identifying, ex post, outbreaks of serious instability for a data set that stretches back to 1955.
These attempts to predict the occurrence of unrest on the basis of quantitative models was borne of a dissatisfaction with the experience of traditional, qualitative analysis and assessments, which have had a poor record in predicting outbreaks of social and political turmoil. Some recent analyses have pointed to the need to combine quantitative models with traditional qualitative assessment by country experts. Although quantitative models have greater predictive success, they can miss out possibly pertinent specific features in countries that are not captured by the general model and the data that the model uses may also contain errors or may not always be up to date.
The final PITF model that had the greatest predictive power is a simple model that is based on only four factors: the level of development as measured by the infant mortality rate; extreme cases of economic or political discrimination against minorities (according to assessments and codings by the Minorities at Risk Project); "a bad neighbourhood" (if a country has at least four neighbours that suffered violent conflicts); and regime type (intermediate regimes that are neither consolidated democracies nor autocratic regimes combined with the existence in these regimes of intense factionalism in domestic politics, as coded by the Polity Project on democracy). Although over 80% of outbreaks of instability could be predicted (a very high "hit rate"), the model cannot predict the intensity or duration of the instability, or its exact timing.
The developers of EIU Index also look and measure other factors associated with instability that have been identified in the literature, such as inequality, a prior history of instability, ethnic fragmentation, poor governance, a proclivity to labour unrest, the level of provision of public services and state strength.
Economic distress and dislocation tend to be associated causally with instability, that is they precede, not only accompany, instability. Indeed, of the 50 cases of instability (instances of "adverse regime change") identified since 1980 by the PITF (about one-half of these were in Africa), in the vast majority of cases (46) the country that had an outbreak of instability had suffered a decline in GDP per head in at least one of the two years prior to the occurrence of instability.
Economic distress appears to be almost a necessary condition for serious instability, but it is not a sufficient one. There are many instances of declines in GDP per head that have not been followed by political instability. It is only when economic distress is accompanied by other, underlying or structural features of vulnerability that there is a high vulnerability to or risk of serious outbreaks of political and social unrest.
6Citation, http://viewswire.eiu.com/index.asp?layout=VWArticleVW3&article_id=874361472

37
Political unrest: those events or developments that pose a serious extra-parliamentary or extra-institutional threat to governments or the existing political order. The events will almost invariably be accompanied by some violence as well as public disorder. These need not necessarily be successful in the sense that they end up toppling a government or regime. Even unsuccessful episodes result in turmoil and serious disruption. The assessment of what constitutes a "serious threat" still requires judgment and can be arbitrary, but this is a step forward from having no definition at all.
Political Instability Index: the overall index on a scale of 0 (no vulnerability) to 10 (highest vulnerability) has two component indexes—an index of underlying vulnerability and an economic distress index.
The overall index is a simple average of the two component indexes. There are 15 indicators in all—12 for the underlying and 3 for the economic distress index.
I. Underlying vulnerability
. Inequality
Measured by Gini coefficient if lower than 40 if 40-50 if higher than 50
Sources: World Bank, World Development Indicators 2008; Economist Intelligence Unit estimates.
. State history
Measured according to date of independence if before 1900 if between 1900 and 1950 if after 1950
Source: CIA, Factbook.
. Corruption
Economist Intelligence Unit ratings for low for moderate for high
Source: Economist Intelligence Unit.
. Ethnic fragmentation
Ethnic fractionalisation index (0 to 100 scale) if lower than 30 if 30 to 50 if higher than 50
Source: Alesina Alberto et al, "Fractionalization", NBER Working Paper 9411, 2003.
38
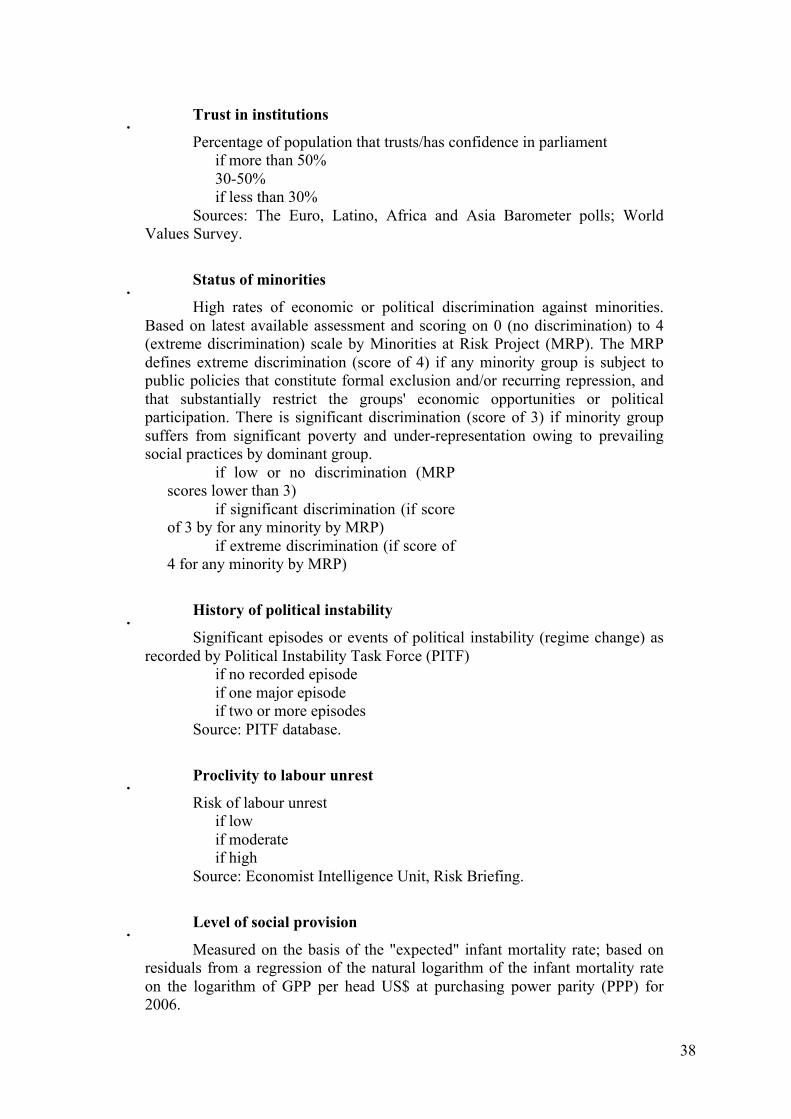
. Trust in institutions
Percentage of population that trusts/has confidence in parliament if more than 50% 30-50% if less than 30%
Sources: The Euro, Latino, Africa and Asia Barometer polls; World Values Survey.
. Status of minorities
High rates of economic or political discrimination against minorities. Based on latest available assessment and scoring on 0 (no discrimination) to 4 (extreme discrimination) scale by Minorities at Risk Project (MRP). The MRP defines extreme discrimination (score of 4) if any minority group is subject to public policies that constitute formal exclusion and/or recurring repression, and that substantially restrict the groups' economic opportunities or political participation. There is significant discrimination (score of 3) if minority group suffers from significant poverty and under-representation owing to prevailing social practices by dominant group.
if low or no discrimination (MRP scores lower than 3)
if significant discrimination (if score of 3 by for any minority by MRP)
if extreme discrimination (if score of 4 for any minority by MRP)
. History of political instability
Significant episodes or events of political instability (regime change) as recorded by Political Instability Task Force (PITF)
if no recorded episode if one major episode if two or more episodes
Source: PITF database.
. Proclivity to labour unrest
Risk of labour unrest if low if moderate if high
Source: Economist Intelligence Unit, Risk Briefing.
. Level of social provision
Measured on the basis of the "expected" infant mortality rate; based on residuals from a regression of the natural logarithm of the infant mortality rate on the logarithm of GPP per head US$ at purchasing power parity (PPP) for 2006.

39
if the actual infant mortality rate is lower than predicted, or if the actual rate does not exceed the predicted rate by a significant margin
if ratio between actual and predicted infant mortality rate is greater than 1.1 but less than 1.5
if ratio between actual and predicted infant mortality rate is greater than 1.5
Sources: Economist Intelligence Unit; World Bank, World Development Indicators 2008.
0. A country's neighbourhood
Based on the average vulnerability index (calculated on the basis of all indicators except the neighbourhood indicator) for all of the country's geographic neighbours.
if index is less than 5.8 if index is 5.8 to 6.3 if index is higher than 6.3
Source: Economist Intelligence Unit.
1. Regime type
Based on classification of political regimes, according to the Economist Intelligence Unit's Index of Democracy
if either a full democracy or authoritarian regime
if either a non-consolidated, "flawed" democracy or a hybrid regime (neither a democracy nor an autocracy)
Source: Economist Intelligence Unit.
2. Regime type and factionalism
The interaction of regime type with the existence of political factionalism (according to Polity IV database). According to Polity, factionalism is defined as polities with parochial (possibly, but not necessarily, ethnic-based) political factions that regularly compete for political influence to promote particularist agendas and favour heavily group members to the detriment of a common agenda.
if a country is both an intermediate regime and suffers from factionalism
if not
II. Economic distress
. Growth in incomes
Growth in real GDP per head in 2009
40
if forecast growth in real GDP per head is positive, with minimal risks that it could be negative
if a fall in GDP per head is forecast or there is a significant risk of that occurring, but the decline is less than by 4%
if a forecast decline in GDP per head is greater than by 4% or there is a significant risk that this could occur
Source: Economist Intelligence Unit.
. Unemployment
Unemployment rate, %. if forecast unemployment rate is less
than 6% and there are only minimal risks that it could be higher than 6%
if a forecast unemployment rate is higher than 6% or there is a significant risk of that occurring, but the rate does not surpass 10%
if a forecast unemployment rate is higher than 10% or there is a significant risk that this could occur
Sources: Economist Intelligence Unit; International Labour Organisation.
. Level of income per head
Measured by GDP per head at PPP, US$ in 2007, on the assumption that richer countries can more easily withstand economic distress
if more than US$12,000 if between US$3,000 and US$12,000 if less than US$3,000

41
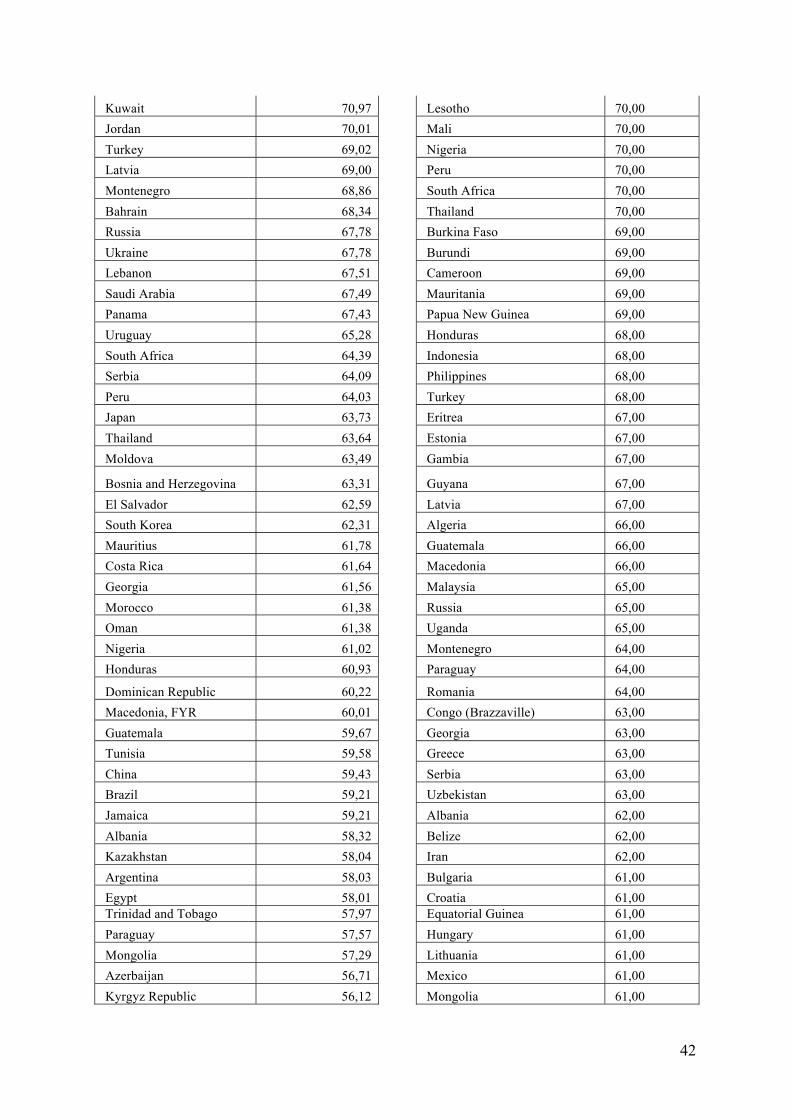
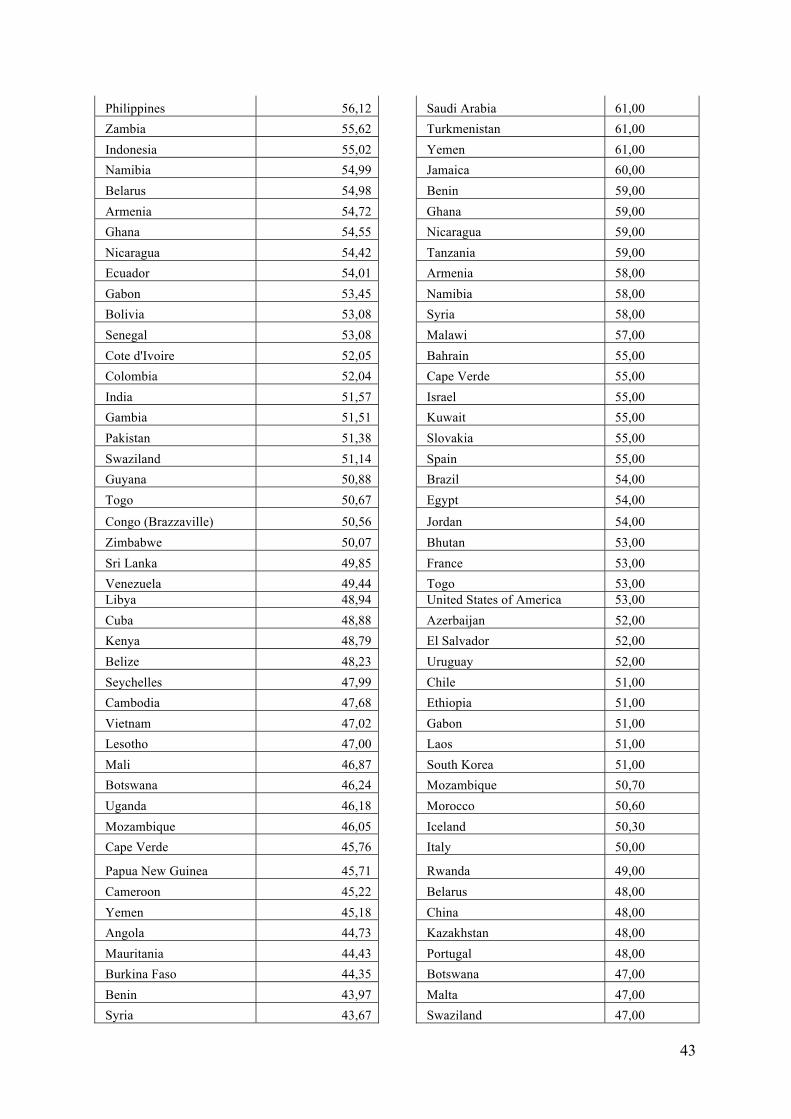
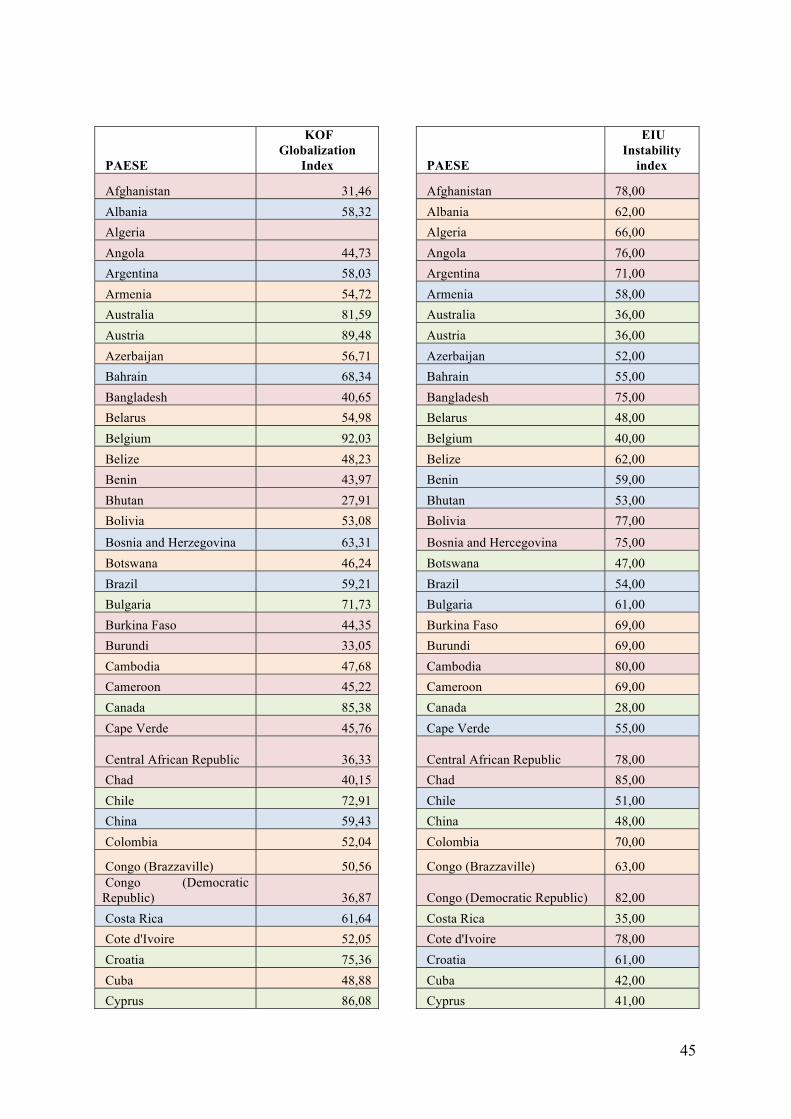
PAESE
KOF Globalization
Index PAESE
EIU Instability
index
Belgium 92,03 Zimbabwe 88,00
Ireland 91,79 Chad 85,00
Netherlands 91,33 Congo (Democratic Republic) 82,00
Austria 89,48 Cambodia 80,00
Singapore 88,89 Sudan 80,00
Denmark 88,12 Iraq 79,00
Sweden 87,63 Afghanistan 78,00
Portugal 87,07 Central African Republic 78,00
Hungary 86,85 Cote d'Ivoire 78,00
Switzerland 86,28 Haiti 78,00
Cyprus 86,08 Pakistan 78,00
United Kingdom 85,39 Zambia 78,00
Canada 85,38 Bolivia 77,00
Luxembourg 85,15 Ecuador 77,00
Czech Republic 84,86 North Korea 77,00
Finland 84,85 Angola 76,00
Spain 84,21 Dominican Republic 76,00
France 83,86 Ukraine 76,00
Slovakia 83,49 Bangladesh 75,00
Norway 81,99 Bosnia and Herzegovina 75,00
Australia 81,59 Guinea 75,00
Germany 81,08 Guinea Bissau 75,00
Italy 81,01 Kenya 75,00
Greece 80,31 Moldova 75,00
Estonia 79,72 Nepal 75,00
Poland 79,01 Niger 75,00
Malaysia 78,23 Senegal 75,00
New Zealand 78,22 Liberia 74,00
Israel 77,27 Sri Lanka 73,00
Slovenia 76,85 Timor Leste 73,00
Malta 76,09 Venezuela 73,00
United Arab Emirates 75,66 Sierra Leone 72,00
Croatia 75,36 Argentina 71,00
United States of America 74,76 Kyrgyz Republic 71,00
Chile 72,91 Madagascar 71,00
Lithuania 72,79 Myanmar 71,00
Iceland 72,73 Panama 71,00
Romania 72,53 Tajikistan 71,00
Qatar 72,03 Colombia 70,00
Bulgaria 71,73 Lebanon 70,00
42
Kuwait 70,97 Lesotho 70,00
Jordan 70,01 Mali 70,00
Turkey 69,02 Nigeria 70,00
Latvia 69,00 Peru 70,00
Montenegro 68,86 South Africa 70,00
Bahrain 68,34 Thailand 70,00
Russia 67,78 Burkina Faso 69,00
Ukraine 67,78 Burundi 69,00
Lebanon 67,51 Cameroon 69,00
Saudi Arabia 67,49 Mauritania 69,00
Panama 67,43 Papua New Guinea 69,00
Uruguay 65,28 Honduras 68,00
South Africa 64,39 Indonesia 68,00
Serbia 64,09 Philippines 68,00
Peru 64,03 Turkey 68,00
Japan 63,73 Eritrea 67,00
Thailand 63,64 Estonia 67,00
Moldova 63,49 Gambia 67,00
Bosnia and Herzegovina 63,31 Guyana 67,00
El Salvador 62,59 Latvia 67,00
South Korea 62,31 Algeria 66,00
Mauritius 61,78 Guatemala 66,00
Costa Rica 61,64 Macedonia 66,00
Georgia 61,56 Malaysia 65,00
Morocco 61,38 Russia 65,00
Oman 61,38 Uganda 65,00
Nigeria 61,02 Montenegro 64,00
Honduras 60,93 Paraguay 64,00
Dominican Republic 60,22 Romania 64,00
Macedonia, FYR 60,01 Congo (Brazzaville) 63,00
Guatemala 59,67 Georgia 63,00
Tunisia 59,58 Greece 63,00
China 59,43 Serbia 63,00
Brazil 59,21 Uzbekistan 63,00
Jamaica 59,21 Albania 62,00
Albania 58,32 Belize 62,00
Kazakhstan 58,04 Iran 62,00
Argentina 58,03 Bulgaria 61,00
Egypt 58,01 Croatia 61,00 Trinidad and Tobago 57,97 Equatorial Guinea 61,00
Paraguay 57,57 Hungary 61,00
Mongolia 57,29 Lithuania 61,00
Azerbaijan 56,71 Mexico 61,00
Kyrgyz Republic 56,12 Mongolia 61,00
43
Philippines 56,12 Saudi Arabia 61,00
Zambia 55,62 Turkmenistan 61,00
Indonesia 55,02 Yemen 61,00
Namibia 54,99 Jamaica 60,00
Belarus 54,98 Benin 59,00
Armenia 54,72 Ghana 59,00
Ghana 54,55 Nicaragua 59,00
Nicaragua 54,42 Tanzania 59,00
Ecuador 54,01 Armenia 58,00
Gabon 53,45 Namibia 58,00
Bolivia 53,08 Syria 58,00
Senegal 53,08 Malawi 57,00
Cote d'Ivoire 52,05 Bahrain 55,00
Colombia 52,04 Cape Verde 55,00
India 51,57 Israel 55,00
Gambia 51,51 Kuwait 55,00
Pakistan 51,38 Slovakia 55,00
Swaziland 51,14 Spain 55,00
Guyana 50,88 Brazil 54,00
Togo 50,67 Egypt 54,00
Congo (Brazzaville) 50,56 Jordan 54,00
Zimbabwe 50,07 Bhutan 53,00
Sri Lanka 49,85 France 53,00
Venezuela 49,44 Togo 53,00 Libya 48,94 United States of America 53,00
Cuba 48,88 Azerbaijan 52,00
Kenya 48,79 El Salvador 52,00
Belize 48,23 Uruguay 52,00
Seychelles 47,99 Chile 51,00
Cambodia 47,68 Ethiopia 51,00
Vietnam 47,02 Gabon 51,00
Lesotho 47,00 Laos 51,00
Mali 46,87 South Korea 51,00
Botswana 46,24 Mozambique 50,70
Uganda 46,18 Morocco 50,60
Mozambique 46,05 Iceland 50,30
Cape Verde 45,76 Italy 50,00
Papua New Guinea 45,71 Rwanda 49,00
Cameroon 45,22 Belarus 48,00
Yemen 45,18 China 48,00
Angola 44,73 Kazakhstan 48,00
Mauritania 44,43 Portugal 48,00
Burkina Faso 44,35 Botswana 47,00
Benin 43,97 Malta 47,00
Syria 43,67 Swaziland 47,00
44
Guinea-Bissau 42,58 Trinidad and Tobago 47,00
Madagascar 42,53 Ireland 46,00
Guinea 42,31 Tunisia 46,00
Rwanda 42,24 India 45,00
Malawi 42,06 Poland 45,00
Tajikistan 40,79 Libya 43,00
Bangladesh 40,65 Sao Tome & Principe 43,00
Iran 40,24 Vietnam 43,00
Chad 40,15 Cuba 42,00
Iraq 40,01 Cyprus 41,00
Tanzania 39,12 Qatar 41,00
Sierra Leone 38,97 Seychelles 41,00
Nepal 38,05 United Arab Emirates 41,00
Niger 37,81 United Kingdom 41,00
Ethiopia 37,46 Singapore 40,70
Congo (Democratic Republic) 36,87 Mauritius 40,50
Central African Republic 36,33 Belgium 40,00
Sudan 36,19 Netherlands 40,00
Turkmenistan 36,06 Oman 39,00
Haiti 35,02 Japan 38,00 Sao Tome and Principe 35,00 Slovenia 38,00
Uzbekistan 34,41 Czech Republic 37,00
Burundi 33,05 Australia 36,00
Myanmar 31,98 Austria 36,00
Afghanistan 31,46 Luxembourg 36,00
Liberia 30,81 New Zealand 36,00
Bhutan 27,91 Costa Rica 35,00
Eritrea 27,34 Switzerland 34,00
Laos 26,52 Finland 32,00
Equatorial Guinea 26,26 Sweden 32,00
Timor-Leste 24,35 Germany 30,80
Mexico 0,00 Canada 28,00
Algeria Denmark 22,00
North Korea Norway 12,00
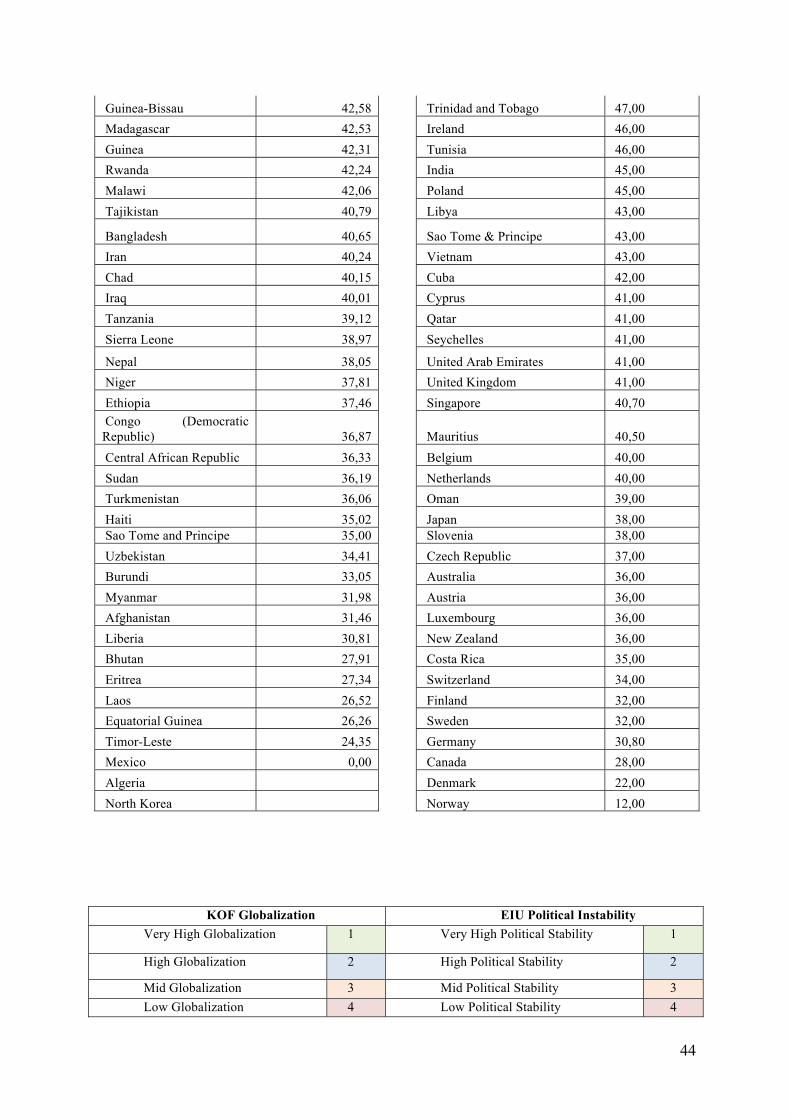
KOF Globalization EIU Political Instability Very High Globalization 1 Very High Political Stability 1
High Globalization 2 High Political Stability 2
Mid Globalization 3 Mid Political Stability 3
Low Globalization 4 Low Political Stability 4
45
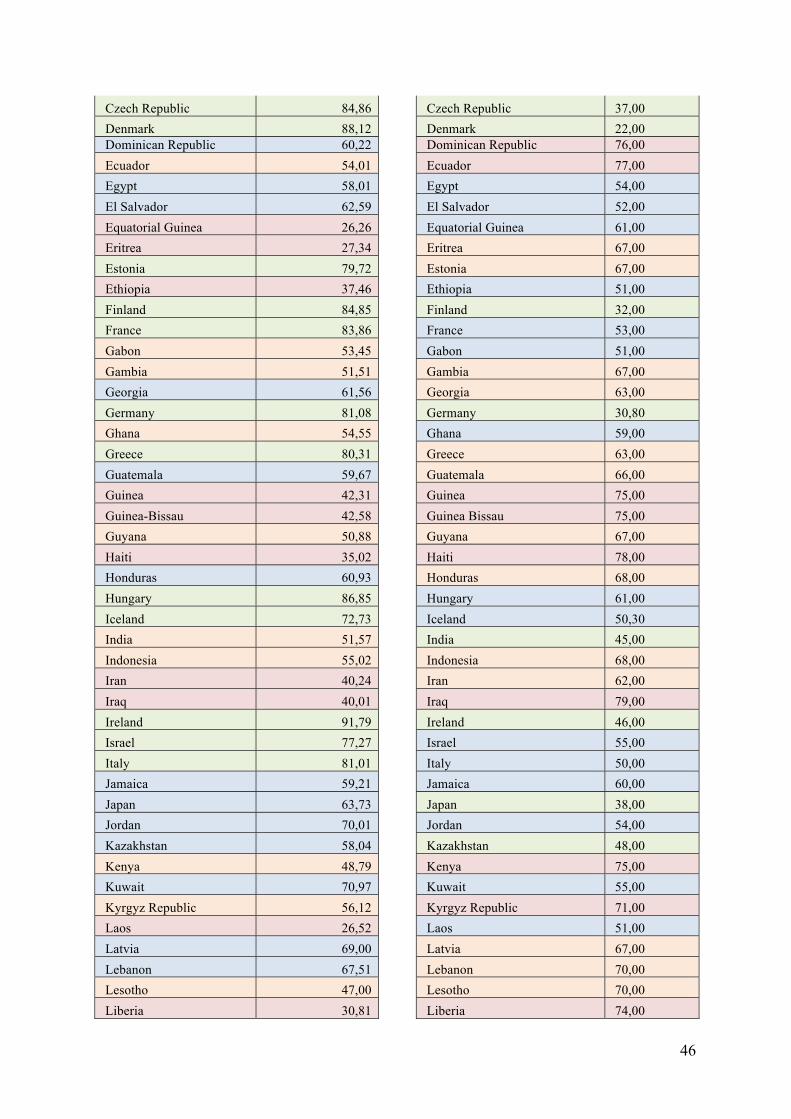
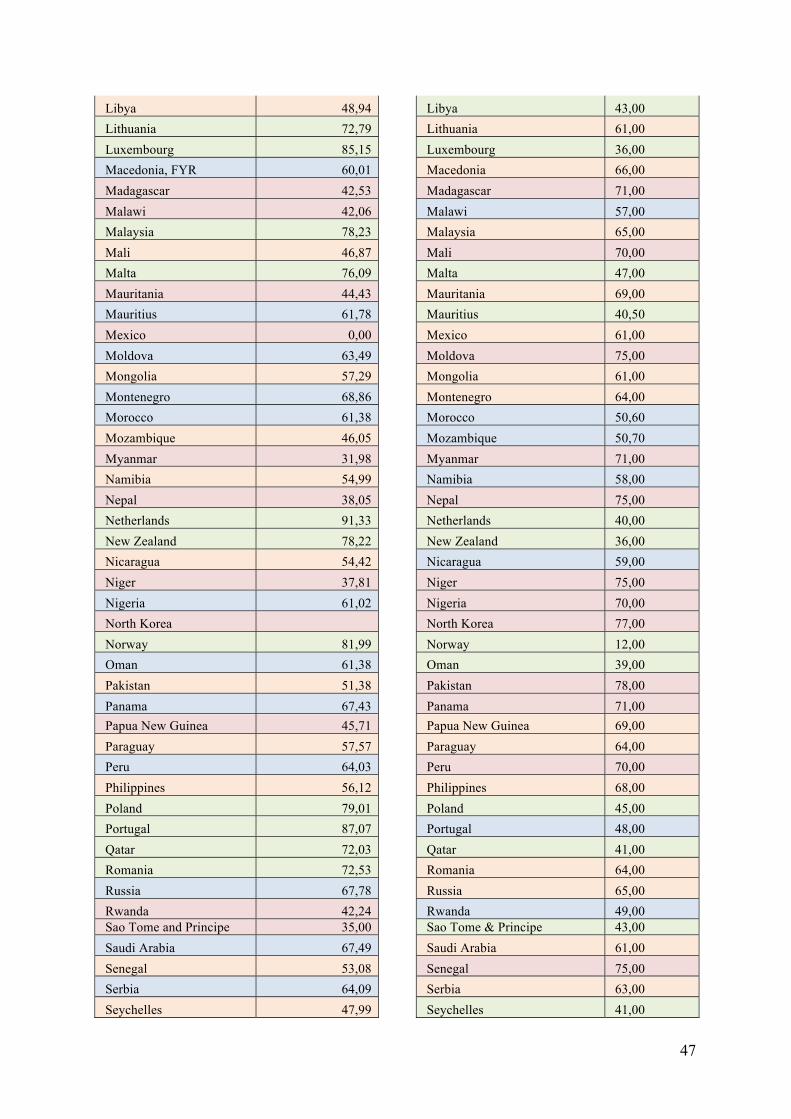
PAESE
KOF Globalization
Index PAESE
EIU Instability
index
Afghanistan 31,46 Afghanistan 78,00 Albania 58,32 Albania 62,00 Algeria Algeria 66,00 Angola 44,73 Angola 76,00 Argentina 58,03 Argentina 71,00 Armenia 54,72 Armenia 58,00 Australia 81,59 Australia 36,00 Austria 89,48 Austria 36,00 Azerbaijan 56,71 Azerbaijan 52,00 Bahrain 68,34 Bahrain 55,00 Bangladesh 40,65 Bangladesh 75,00 Belarus 54,98 Belarus 48,00 Belgium 92,03 Belgium 40,00 Belize 48,23 Belize 62,00 Benin 43,97 Benin 59,00 Bhutan 27,91 Bhutan 53,00 Bolivia 53,08 Bolivia 77,00
Bosnia and Herzegovina 63,31 Bosnia and Hercegovina 75,00 Botswana 46,24 Botswana 47,00 Brazil 59,21 Brazil 54,00 Bulgaria 71,73 Bulgaria 61,00 Burkina Faso 44,35 Burkina Faso 69,00 Burundi 33,05 Burundi 69,00 Cambodia 47,68 Cambodia 80,00 Cameroon 45,22 Cameroon 69,00 Canada 85,38 Canada 28,00 Cape Verde 45,76 Cape Verde 55,00
Central African Republic 36,33 Central African Republic 78,00 Chad 40,15 Chad 85,00 Chile 72,91 Chile 51,00 China 59,43 China 48,00 Colombia 52,04 Colombia 70,00
Congo (Brazzaville) 50,56 Congo (Brazzaville) 63,00 Congo (Democratic Republic) 36,87 Congo (Democratic Republic) 82,00 Costa Rica 61,64 Costa Rica 35,00 Cote d'Ivoire 52,05 Cote d'Ivoire 78,00 Croatia 75,36 Croatia 61,00 Cuba 48,88 Cuba 42,00 Cyprus 86,08 Cyprus 41,00
46
Czech Republic 84,86 Czech Republic 37,00 Denmark 88,12 Denmark 22,00 Dominican Republic 60,22 Dominican Republic 76,00 Ecuador 54,01 Ecuador 77,00 Egypt 58,01 Egypt 54,00 El Salvador 62,59 El Salvador 52,00 Equatorial Guinea 26,26 Equatorial Guinea 61,00 Eritrea 27,34 Eritrea 67,00 Estonia 79,72 Estonia 67,00 Ethiopia 37,46 Ethiopia 51,00 Finland 84,85 Finland 32,00 France 83,86 France 53,00 Gabon 53,45 Gabon 51,00 Gambia 51,51 Gambia 67,00 Georgia 61,56 Georgia 63,00 Germany 81,08 Germany 30,80 Ghana 54,55 Ghana 59,00 Greece 80,31 Greece 63,00 Guatemala 59,67 Guatemala 66,00 Guinea 42,31 Guinea 75,00 Guinea-Bissau 42,58 Guinea Bissau 75,00 Guyana 50,88 Guyana 67,00 Haiti 35,02 Haiti 78,00 Honduras 60,93 Honduras 68,00 Hungary 86,85 Hungary 61,00 Iceland 72,73 Iceland 50,30 India 51,57 India 45,00 Indonesia 55,02 Indonesia 68,00 Iran 40,24 Iran 62,00 Iraq 40,01 Iraq 79,00 Ireland 91,79 Ireland 46,00 Israel 77,27 Israel 55,00 Italy 81,01 Italy 50,00 Jamaica 59,21 Jamaica 60,00 Japan 63,73 Japan 38,00 Jordan 70,01 Jordan 54,00 Kazakhstan 58,04 Kazakhstan 48,00 Kenya 48,79 Kenya 75,00 Kuwait 70,97 Kuwait 55,00 Kyrgyz Republic 56,12 Kyrgyz Republic 71,00 Laos 26,52 Laos 51,00 Latvia 69,00 Latvia 67,00 Lebanon 67,51 Lebanon 70,00 Lesotho 47,00 Lesotho 70,00 Liberia 30,81 Liberia 74,00
47
Libya 48,94 Libya 43,00
Lithuania 72,79 Lithuania 61,00
Luxembourg 85,15 Luxembourg 36,00
Macedonia, FYR 60,01 Macedonia 66,00
Madagascar 42,53 Madagascar 71,00
Malawi 42,06 Malawi 57,00
Malaysia 78,23 Malaysia 65,00
Mali 46,87 Mali 70,00
Malta 76,09 Malta 47,00
Mauritania 44,43 Mauritania 69,00
Mauritius 61,78 Mauritius 40,50
Mexico 0,00 Mexico 61,00
Moldova 63,49 Moldova 75,00
Mongolia 57,29 Mongolia 61,00
Montenegro 68,86 Montenegro 64,00
Morocco 61,38 Morocco 50,60
Mozambique 46,05 Mozambique 50,70
Myanmar 31,98 Myanmar 71,00
Namibia 54,99 Namibia 58,00
Nepal 38,05 Nepal 75,00
Netherlands 91,33 Netherlands 40,00
New Zealand 78,22 New Zealand 36,00
Nicaragua 54,42 Nicaragua 59,00
Niger 37,81 Niger 75,00
Nigeria 61,02 Nigeria 70,00
North Korea North Korea 77,00
Norway 81,99 Norway 12,00
Oman 61,38 Oman 39,00
Pakistan 51,38 Pakistan 78,00
Panama 67,43 Panama 71,00
Papua New Guinea 45,71 Papua New Guinea 69,00
Paraguay 57,57 Paraguay 64,00
Peru 64,03 Peru 70,00
Philippines 56,12 Philippines 68,00
Poland 79,01 Poland 45,00
Portugal 87,07 Portugal 48,00
Qatar 72,03 Qatar 41,00
Romania 72,53 Romania 64,00
Russia 67,78 Russia 65,00
Rwanda 42,24 Rwanda 49,00 Sao Tome and Principe 35,00 Sao Tome & Principe 43,00
Saudi Arabia 67,49 Saudi Arabia 61,00
Senegal 53,08 Senegal 75,00
Serbia 64,09 Serbia 63,00
Seychelles 47,99 Seychelles 41,00

48
Sierra Leone 38,97 Sierra Leone 72,00
Singapore 88,89 Singapore 40,70
Slovakia 83,49 Slovakia 55,00
Slovenia 76,85 Slovenia 38,00
South Africa 64,39 South Africa 70,00
South Korea 62,31 South Korea 51,00
Spain 84,21 Spain 55,00
Sri Lanka 49,85 Sri Lanka 73,00
Sudan 36,19 Sudan 80,00
Swaziland 51,14 Swaziland 47,00
Sweden 87,63 Sweden 32,00
Switzerland 86,28 Switzerland 34,00
Syria 43,67 Syria 58,00
Tajikistan 40,79 Tajikistan 71,00
Tanzania 39,12 Tanzania 59,00
Thailand 63,64 Thailand 70,00
Timor-Leste 24,35 Timor Leste 73,00
Togo 50,67 Togo 53,00
Trinidad and Tobago 57,97 Trinidad and Tobago 47,00
Tunisia 59,58 Tunisia 46,00
Turkey 69,02 Turkey 68,00
Turkmenistan 36,06 Turkmenistan 61,00
Uganda 46,18 Uganda 65,00
Ukraine 67,78 Ukraine 76,00 United Arab Emirates 75,66 United Arab Emirates 41,00
United Kingdom 85,39 United Kingdom 41,00 United States of America 74,76 United States of America 53,00
Uruguay 65,28 Uruguay 52,00
Uzbekistan 34,41 Uzbekistan 63,00
Venezuela 49,44 Venezuela 73,00
Vietnam 47,02 Vietnam 43,00
Yemen 45,18 Yemen 61,00
Zambia 55,62 Zambia 78,00
Zimbabwe 50,07 Zimbabwe 88,00
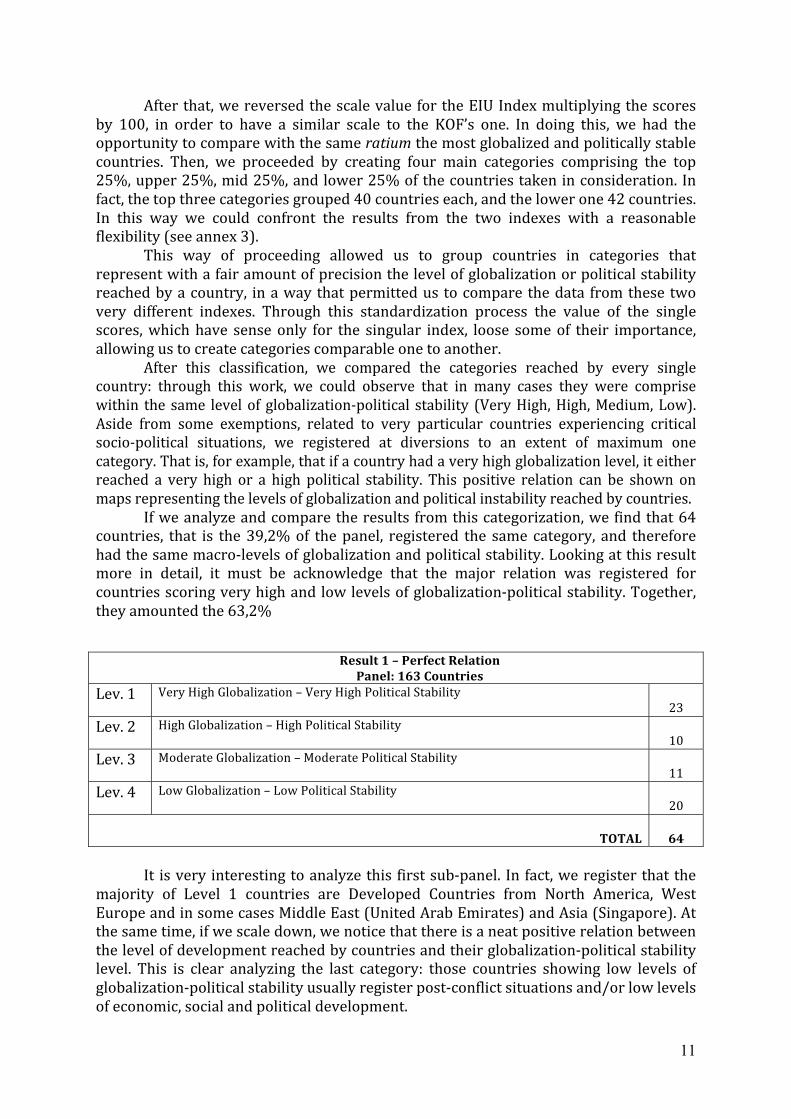
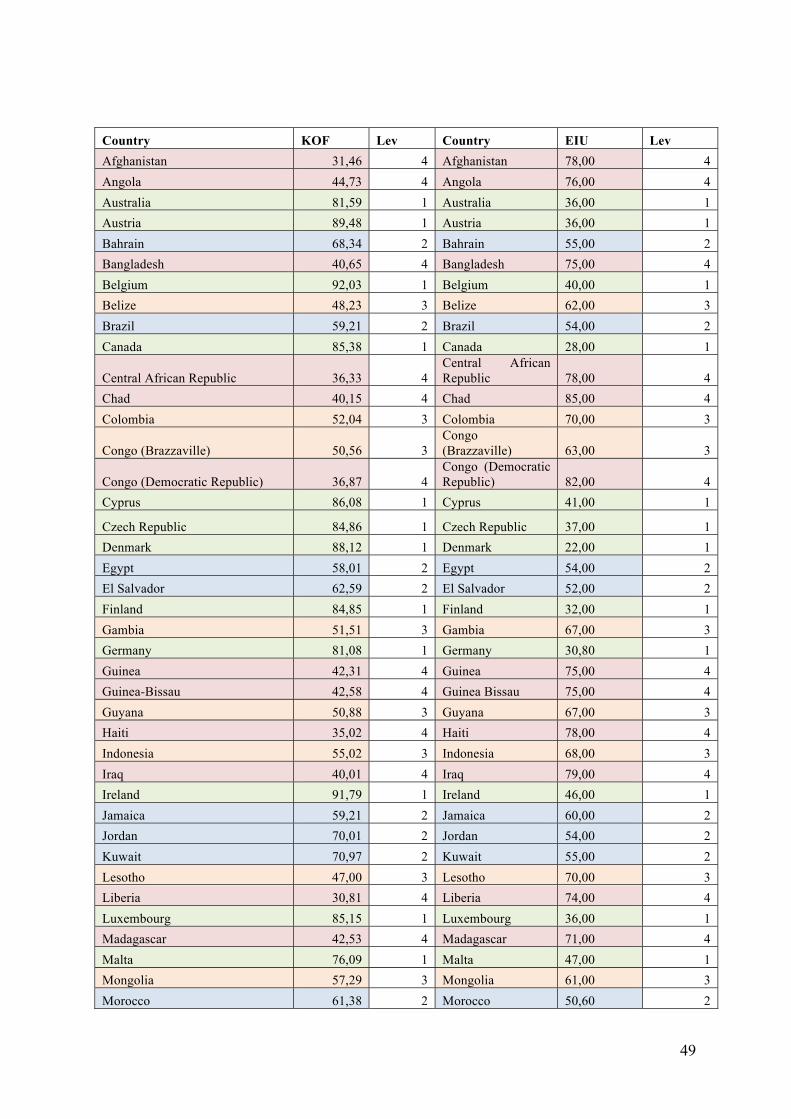
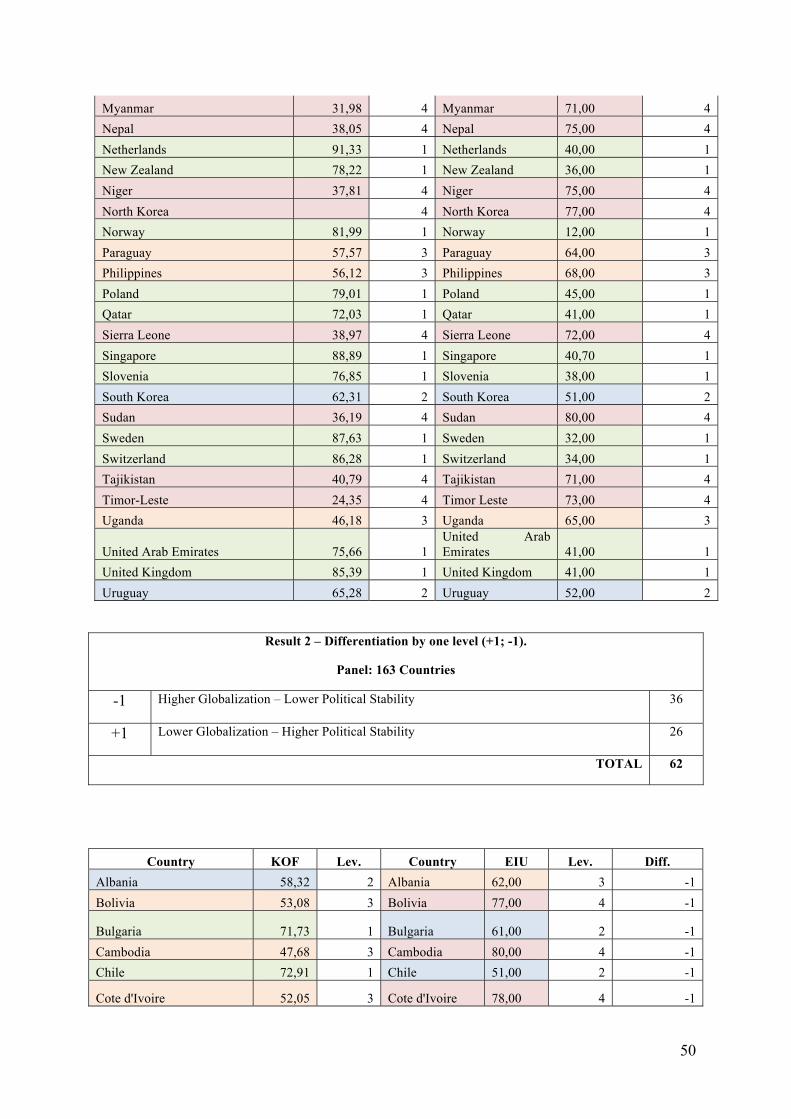
Result 1 – Perfect Relation Panel: 163 Countries
Lev. 1 Very High Globalization – Very High Political Stability 23
Lev. 2 High Globalization – High Political Stability 10
Lev. 3 Moderate Globalization – Moderate Political Stability 11
Lev. 4 Low Globalization – Low Political Stability 20
TOTAL 64
49
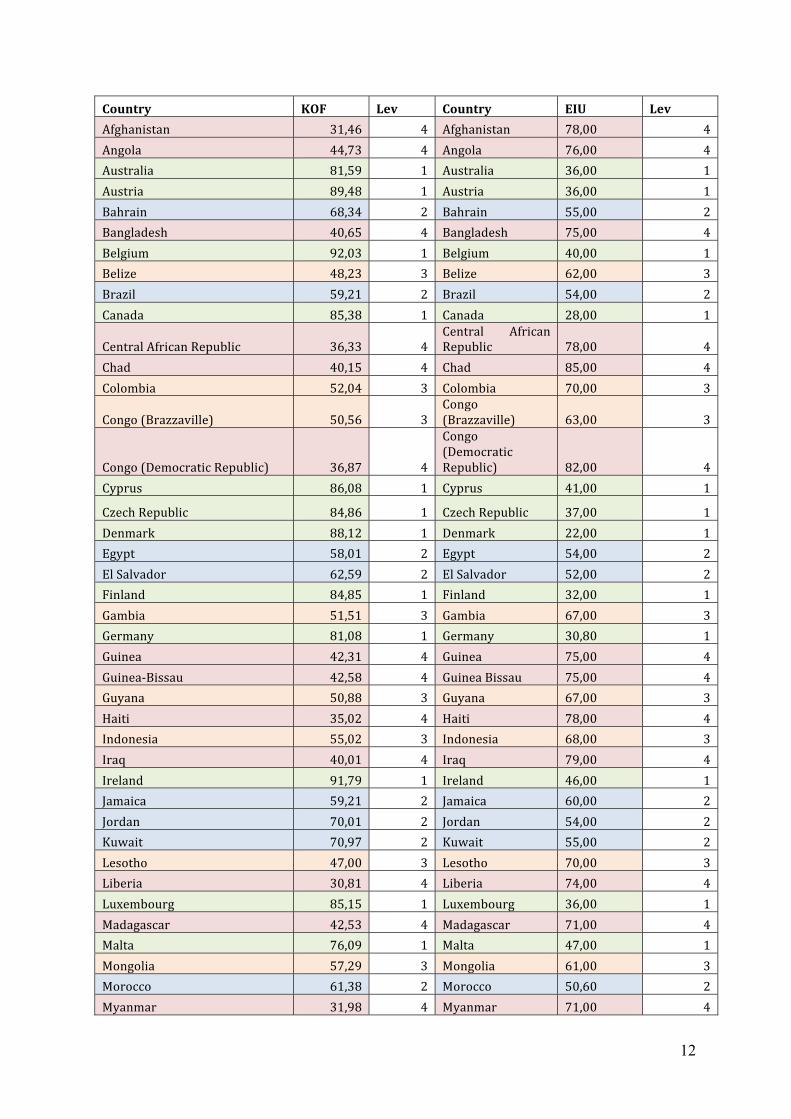
Country KOF Lev Country EIU Lev Afghanistan 31,46 4 Afghanistan 78,00 4 Angola 44,73 4 Angola 76,00 4 Australia 81,59 1 Australia 36,00 1 Austria 89,48 1 Austria 36,00 1 Bahrain 68,34 2 Bahrain 55,00 2 Bangladesh 40,65 4 Bangladesh 75,00 4 Belgium 92,03 1 Belgium 40,00 1 Belize 48,23 3 Belize 62,00 3 Brazil 59,21 2 Brazil 54,00 2 Canada 85,38 1 Canada 28,00 1
Central African Republic 36,33 4 Central African Republic 78,00 4
Chad 40,15 4 Chad 85,00 4 Colombia 52,04 3 Colombia 70,00 3
Congo (Brazzaville) 50,56 3 Congo (Brazzaville) 63,00 3
Congo (Democratic Republic) 36,87 4 Congo (Democratic Republic) 82,00 4
Cyprus 86,08 1 Cyprus 41,00 1
Czech Republic 84,86 1 Czech Republic 37,00 1 Denmark 88,12 1 Denmark 22,00 1 Egypt 58,01 2 Egypt 54,00 2 El Salvador 62,59 2 El Salvador 52,00 2 Finland 84,85 1 Finland 32,00 1 Gambia 51,51 3 Gambia 67,00 3 Germany 81,08 1 Germany 30,80 1 Guinea 42,31 4 Guinea 75,00 4 Guinea-Bissau 42,58 4 Guinea Bissau 75,00 4 Guyana 50,88 3 Guyana 67,00 3 Haiti 35,02 4 Haiti 78,00 4 Indonesia 55,02 3 Indonesia 68,00 3 Iraq 40,01 4 Iraq 79,00 4 Ireland 91,79 1 Ireland 46,00 1 Jamaica 59,21 2 Jamaica 60,00 2 Jordan 70,01 2 Jordan 54,00 2 Kuwait 70,97 2 Kuwait 55,00 2 Lesotho 47,00 3 Lesotho 70,00 3 Liberia 30,81 4 Liberia 74,00 4 Luxembourg 85,15 1 Luxembourg 36,00 1 Madagascar 42,53 4 Madagascar 71,00 4 Malta 76,09 1 Malta 47,00 1 Mongolia 57,29 3 Mongolia 61,00 3 Morocco 61,38 2 Morocco 50,60 2
50
Myanmar 31,98 4 Myanmar 71,00 4
Nepal 38,05 4 Nepal 75,00 4
Netherlands 91,33 1 Netherlands 40,00 1
New Zealand 78,22 1 New Zealand 36,00 1
Niger 37,81 4 Niger 75,00 4
North Korea 4 North Korea 77,00 4
Norway 81,99 1 Norway 12,00 1
Paraguay 57,57 3 Paraguay 64,00 3
Philippines 56,12 3 Philippines 68,00 3
Poland 79,01 1 Poland 45,00 1
Qatar 72,03 1 Qatar 41,00 1
Sierra Leone 38,97 4 Sierra Leone 72,00 4
Singapore 88,89 1 Singapore 40,70 1
Slovenia 76,85 1 Slovenia 38,00 1
South Korea 62,31 2 South Korea 51,00 2
Sudan 36,19 4 Sudan 80,00 4
Sweden 87,63 1 Sweden 32,00 1
Switzerland 86,28 1 Switzerland 34,00 1
Tajikistan 40,79 4 Tajikistan 71,00 4
Timor-Leste 24,35 4 Timor Leste 73,00 4
Uganda 46,18 3 Uganda 65,00 3
United Arab Emirates 75,66 1 United Arab Emirates 41,00 1
United Kingdom 85,39 1 United Kingdom 41,00 1
Uruguay 65,28 2 Uruguay 52,00 2
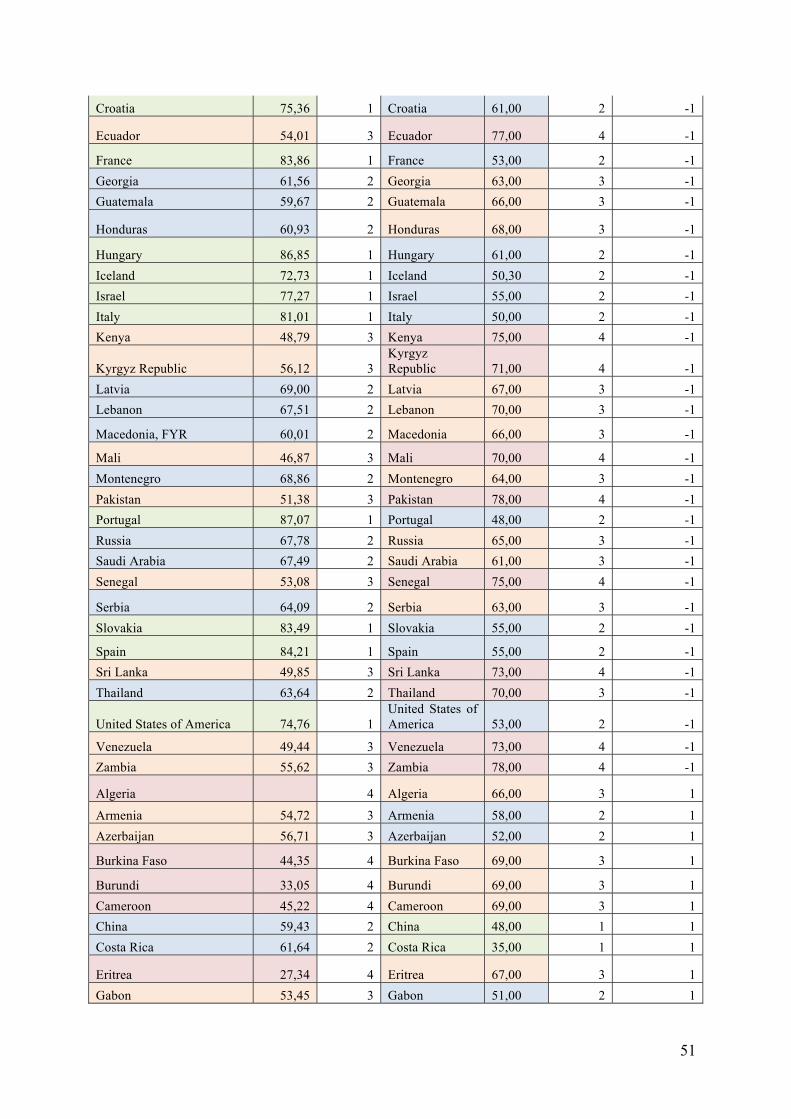
Result 2 – Differentiation by one level (+1; -1).
Panel: 163 Countries
-1 Higher Globalization – Lower Political Stability 36
+1 Lower Globalization – Higher Political Stability 26
TOTAL 62
Country KOF Lev. Country EIU Lev. Diff.
Albania 58,32 2 Albania 62,00 3 -1
Bolivia 53,08 3 Bolivia 77,00 4 -1
Bulgaria 71,73 1 Bulgaria 61,00 2 -1
Cambodia 47,68 3 Cambodia 80,00 4 -1
Chile 72,91 1 Chile 51,00 2 -1
Cote d'Ivoire 52,05 3 Cote d'Ivoire 78,00 4 -1
51
Croatia 75,36 1 Croatia 61,00 2 -1
Ecuador 54,01 3 Ecuador 77,00 4 -1
France 83,86 1 France 53,00 2 -1
Georgia 61,56 2 Georgia 63,00 3 -1
Guatemala 59,67 2 Guatemala 66,00 3 -1
Honduras 60,93 2 Honduras 68,00 3 -1
Hungary 86,85 1 Hungary 61,00 2 -1
Iceland 72,73 1 Iceland 50,30 2 -1
Israel 77,27 1 Israel 55,00 2 -1
Italy 81,01 1 Italy 50,00 2 -1
Kenya 48,79 3 Kenya 75,00 4 -1
Kyrgyz Republic 56,12 3 Kyrgyz Republic 71,00 4 -1
Latvia 69,00 2 Latvia 67,00 3 -1
Lebanon 67,51 2 Lebanon 70,00 3 -1
Macedonia, FYR 60,01 2 Macedonia 66,00 3 -1
Mali 46,87 3 Mali 70,00 4 -1
Montenegro 68,86 2 Montenegro 64,00 3 -1
Pakistan 51,38 3 Pakistan 78,00 4 -1
Portugal 87,07 1 Portugal 48,00 2 -1
Russia 67,78 2 Russia 65,00 3 -1
Saudi Arabia 67,49 2 Saudi Arabia 61,00 3 -1
Senegal 53,08 3 Senegal 75,00 4 -1
Serbia 64,09 2 Serbia 63,00 3 -1
Slovakia 83,49 1 Slovakia 55,00 2 -1
Spain 84,21 1 Spain 55,00 2 -1
Sri Lanka 49,85 3 Sri Lanka 73,00 4 -1
Thailand 63,64 2 Thailand 70,00 3 -1
United States of America 74,76 1 United States of America 53,00 2 -1
Venezuela 49,44 3 Venezuela 73,00 4 -1
Zambia 55,62 3 Zambia 78,00 4 -1
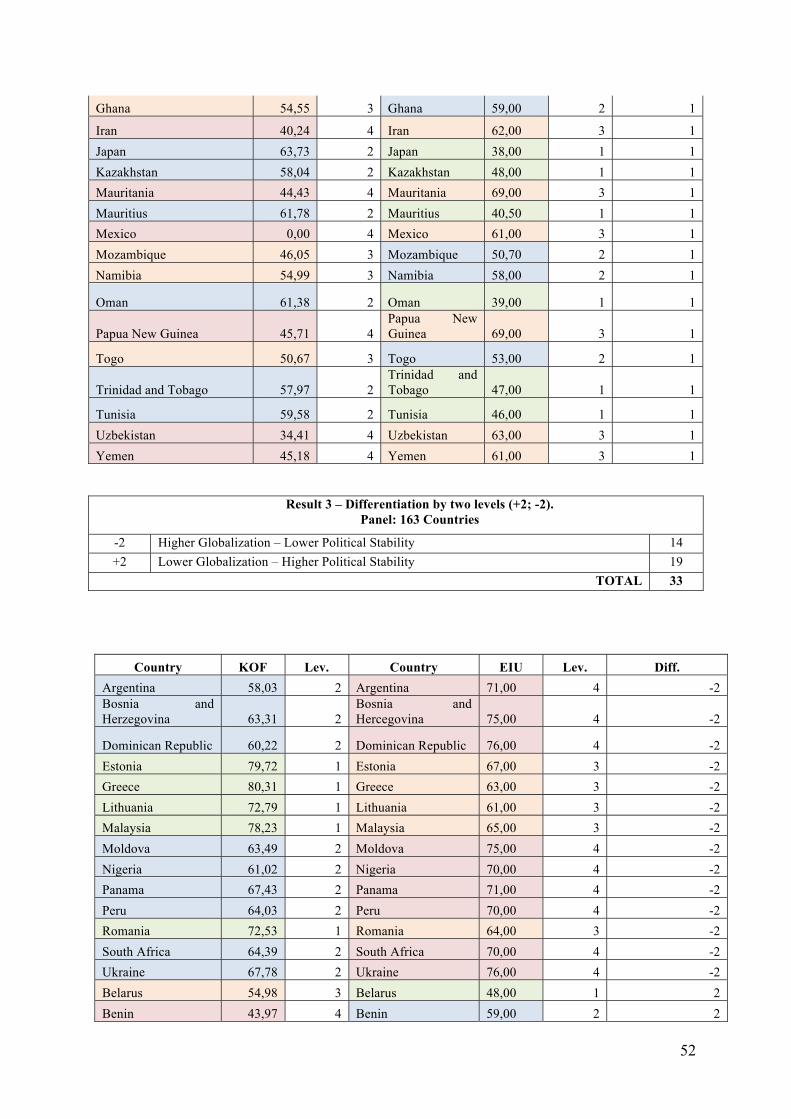
Algeria 4 Algeria 66,00 3 1
Armenia 54,72 3 Armenia 58,00 2 1
Azerbaijan 56,71 3 Azerbaijan 52,00 2 1
Burkina Faso 44,35 4 Burkina Faso 69,00 3 1
Burundi 33,05 4 Burundi 69,00 3 1
Cameroon 45,22 4 Cameroon 69,00 3 1
China 59,43 2 China 48,00 1 1
Costa Rica 61,64 2 Costa Rica 35,00 1 1
Eritrea 27,34 4 Eritrea 67,00 3 1
Gabon 53,45 3 Gabon 51,00 2 1
52
Ghana 54,55 3 Ghana 59,00 2 1
Iran 40,24 4 Iran 62,00 3 1
Japan 63,73 2 Japan 38,00 1 1
Kazakhstan 58,04 2 Kazakhstan 48,00 1 1
Mauritania 44,43 4 Mauritania 69,00 3 1
Mauritius 61,78 2 Mauritius 40,50 1 1
Mexico 0,00 4 Mexico 61,00 3 1
Mozambique 46,05 3 Mozambique 50,70 2 1
Namibia 54,99 3 Namibia 58,00 2 1
Oman 61,38 2 Oman 39,00 1 1
Papua New Guinea 45,71 4 Papua New Guinea 69,00 3 1
Togo 50,67 3 Togo 53,00 2 1
Trinidad and Tobago 57,97 2 Trinidad and Tobago 47,00 1 1
Tunisia 59,58 2 Tunisia 46,00 1 1
Uzbekistan 34,41 4 Uzbekistan 63,00 3 1
Yemen 45,18 4 Yemen 61,00 3 1
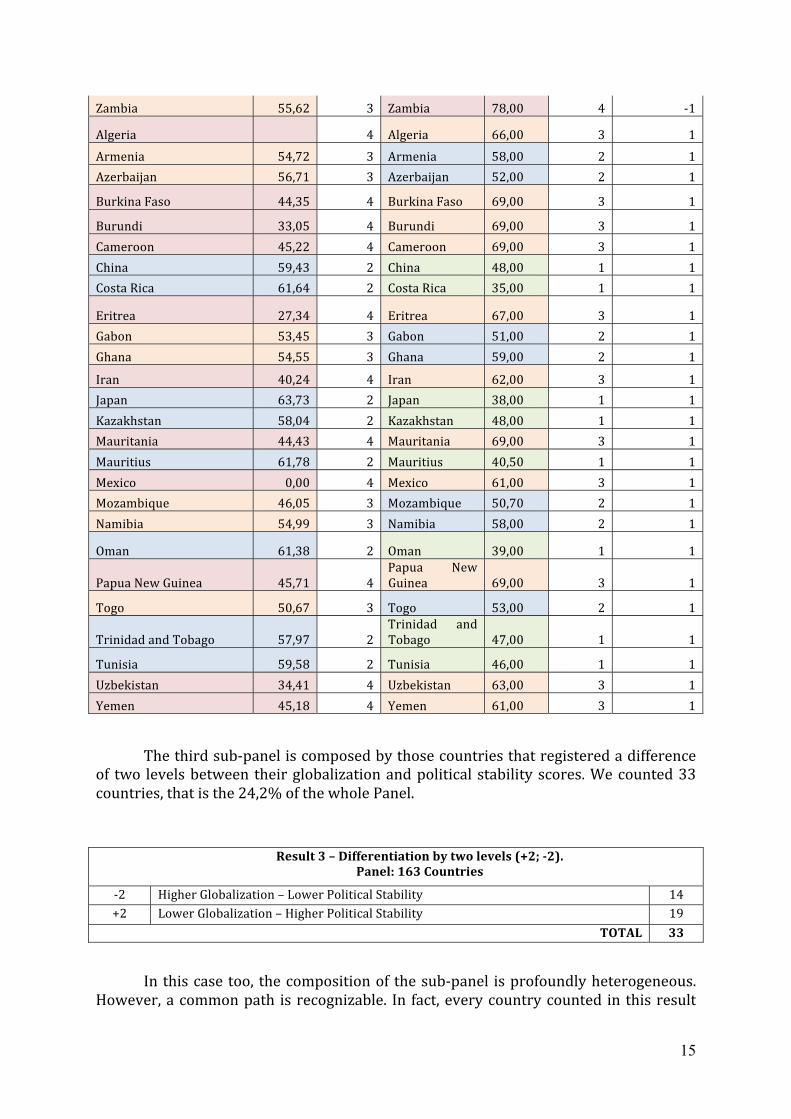
Result 3 – Differentiation by two levels (+2; -2). Panel: 163 Countries
-2 Higher Globalization – Lower Political Stability 14
+2 Lower Globalization – Higher Political Stability 19
TOTAL 33
Country KOF Lev. Country EIU Lev. Diff.
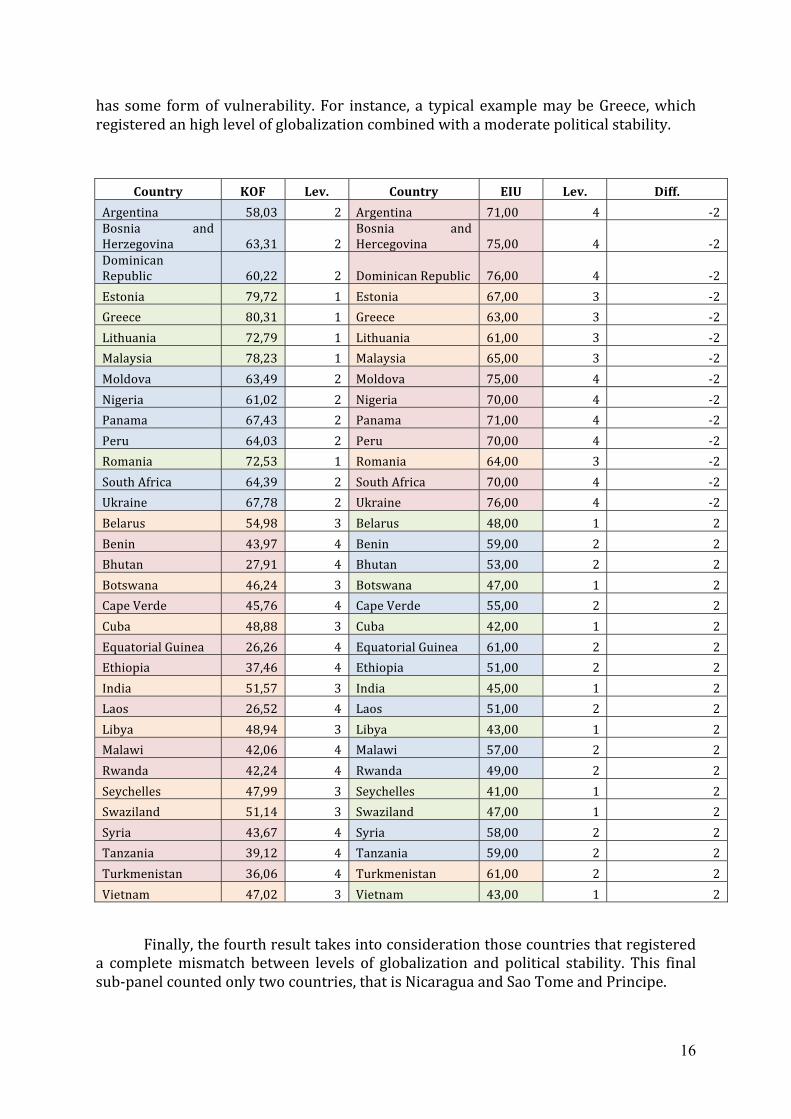
Argentina 58,03 2 Argentina 71,00 4 -2 Bosnia and Herzegovina 63,31 2
Bosnia and Hercegovina 75,00 4 -2
Dominican Republic 60,22 2 Dominican Republic 76,00 4 -2
Estonia 79,72 1 Estonia 67,00 3 -2
Greece 80,31 1 Greece 63,00 3 -2
Lithuania 72,79 1 Lithuania 61,00 3 -2
Malaysia 78,23 1 Malaysia 65,00 3 -2
Moldova 63,49 2 Moldova 75,00 4 -2
Nigeria 61,02 2 Nigeria 70,00 4 -2
Panama 67,43 2 Panama 71,00 4 -2
Peru 64,03 2 Peru 70,00 4 -2
Romania 72,53 1 Romania 64,00 3 -2
South Africa 64,39 2 South Africa 70,00 4 -2
Ukraine 67,78 2 Ukraine 76,00 4 -2
Belarus 54,98 3 Belarus 48,00 1 2
Benin 43,97 4 Benin 59,00 2 2

53
Bhutan 27,91 4 Bhutan 53,00 2 2
Botswana 46,24 3 Botswana 47,00 1 2
Cape Verde 45,76 4 Cape Verde 55,00 2 2
Cuba 48,88 3 Cuba 42,00 1 2
Equatorial Guinea 26,26 4 Equatorial Guinea 61,00 2 2
Ethiopia 37,46 4 Ethiopia 51,00 2 2
India 51,57 3 India 45,00 1 2
Laos 26,52 4 Laos 51,00 2 2
Libya 48,94 3 Libya 43,00 1 2
Malawi 42,06 4 Malawi 57,00 2 2
Rwanda 42,24 4 Rwanda 49,00 2 2
Seychelles 47,99 3 Seychelles 41,00 1 2
Swaziland 51,14 3 Swaziland 47,00 1 2
Syria 43,67 4 Syria 58,00 2 2
Tanzania 39,12 4 Tanzania 59,00 2 2
Turkmenistan 36,06 4 Turkmenistan 61,00 2 2
Vietnam 47,02 3 Vietnam 43,00 1 2
Country KOF Lev. Country EIU Lev. Diff.
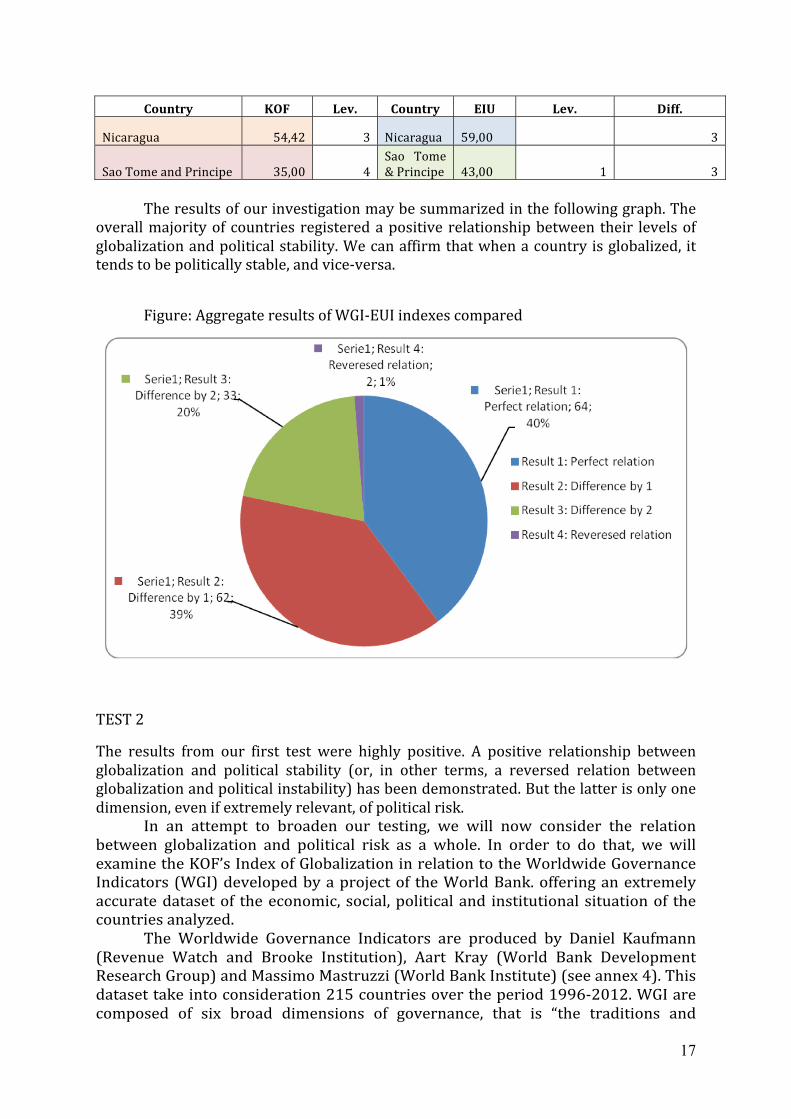
Nicaragua 54,42 3 Nicaragua 59,00 3
Sao Tome and Principe 35,00 4 Sao Tome & Principe 43,00 1 3
54
7
Sources
The WGI compile and summarize information from 31 existing data sources that report the views and experiences of citizens, entrepreneurs, and experts in the public, private and NGO sectors from around the world, on the quality of various aspects of governance. The WGI draw on four different types of source data:
• Surveys of households and firms (9 data sources including the Afrobarometer surveys, Gallup World Poll, and Global Competitiveness Report survey);
• Commercial business information providers (4 data sources including the Economist Intelligence Unit, Global Insight, Political Risk Services);
• Non-governmental organizations (10 data sources including Global Integrity, Freedom House, Reporters Without Borders);
• Public sector organizations (8 data sources including the CPIA assessments of World Bank and regional development banks, the EBRD Transition Report, French Ministry of Finance Institutional Profiles Database).
Methodology
Each of six aggregate WGI measures are constructed by averaging together data from the underlying sources that correspond to the concept of governance being measured. This is done in the three steps described below.
STEP 1: Assigning data from individual sources to the six aggregate indicators. Individual questions from the underlying data sources are assigned to each of the six aggregate indicators. For example, a firm survey question on the regulatory environment would be assigned to Regulatory Quality, or a measure of press freedom would be assigned to Voice and Accountability. A full description of the individual variables used in the WGI and how they are assigned to the six aggregate indicators, can be found by clicking on the names of the six aggregate indicators listed above. Note that not all of the data sources cover all countries, and so the aggregate governance scores are based on different sets of underlying data for different countries.
STEP 2: Preliminary rescaling of the individual source data to run from 0 to 1. The questions from the individual data sources are first rescaled to range from 0 to 1, with higher values corresponding to better outcomes. If, for example, a survey question asks for responses on a scale from a minimum of 1 to a maximum of 4, we rescale a score of 2 as (2-min)/(max-min)=(2-1)/3=0.33. When an individual data source provides more than one question relating to a particular dimension of governance, we average together the rescaled scores.
The 0-1 rescaled data from the individual sources are available interactively through the WGI website here, in the country data sheets, and in the data files for each individual
7 http://info.worldbank.org/governance/wgi/index.aspx#doc

55
source. Although nominally in the same 0-1 units, this rescaled data is not necessarily comparable across sources. For example, one data source might use a 0-10 scale but in practice most scores are clustered between 6 and 10, while another data source might also use a 0-10 scale but have responses spread out over the entire range. While the max-min rescaling above does not correct for this source of non-comparability, the procedure used to construct the aggregate indicators does (see below).
STEP 3: Using an Unobserved Components Model (UCM) to construct a weighted average of the individual indicators for each source. A statistical tool known as an Unobserved Components Model (UCM) is used to make the 0-1 rescaled data comparable across sources, and then to construct a weighted average of the data from each source for each country. The UCM assumes that the observed data from each source are a linear function of the unobserved level of governance, plus an error term. This linear function is different for different data sources, and so corrects for the remaining non-comparability of units of the rescaled data noted above. The resulting estimates of governance are a weighted average of the data from each source, with weights reflecting the pattern of correlation among data sources. Click here for the weights applied to the component indicators.
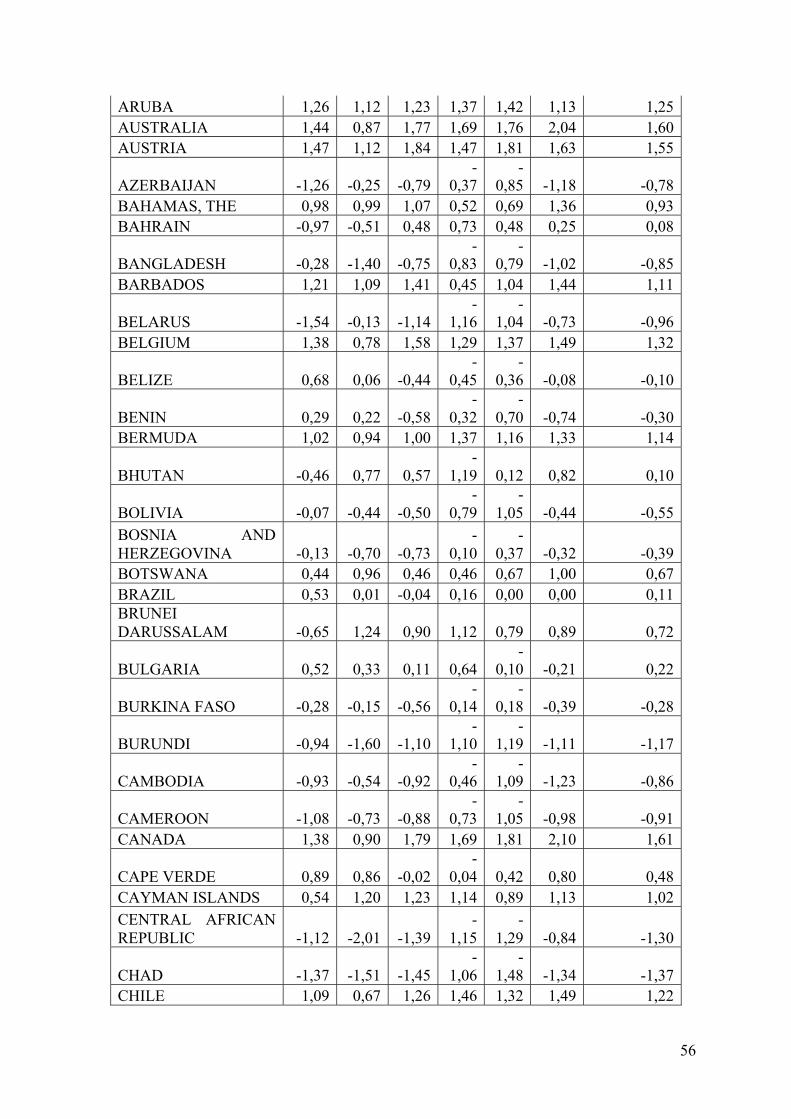
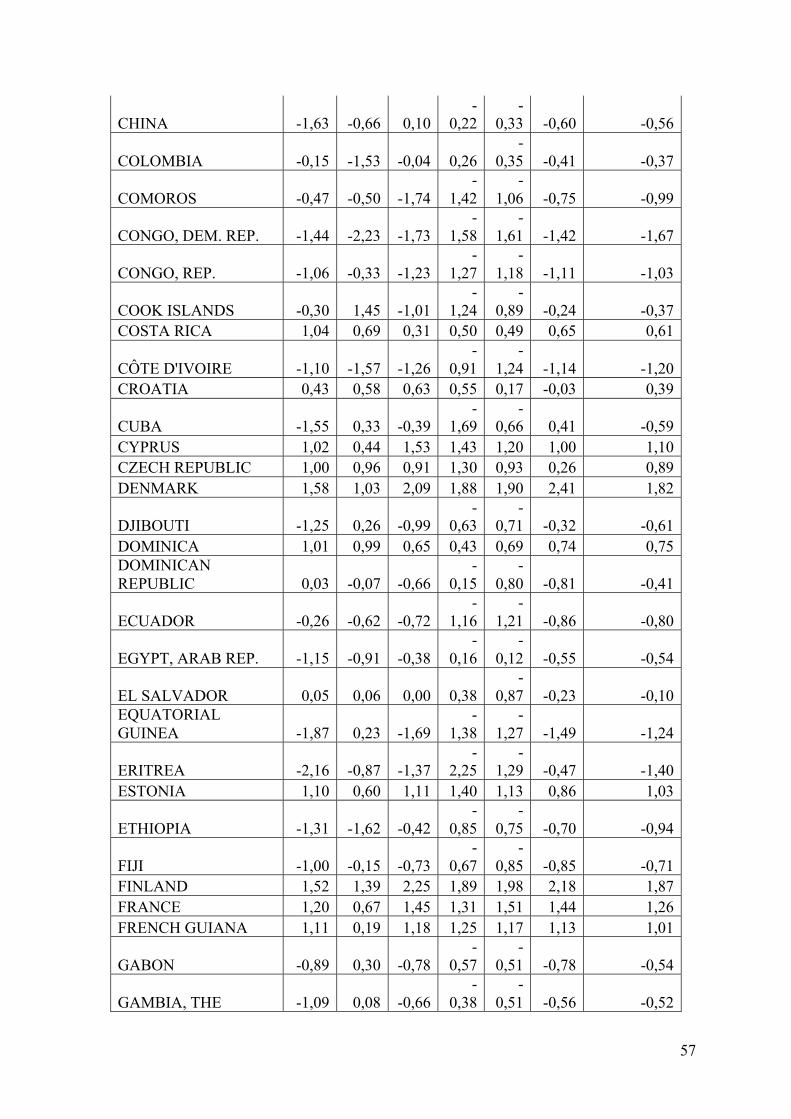
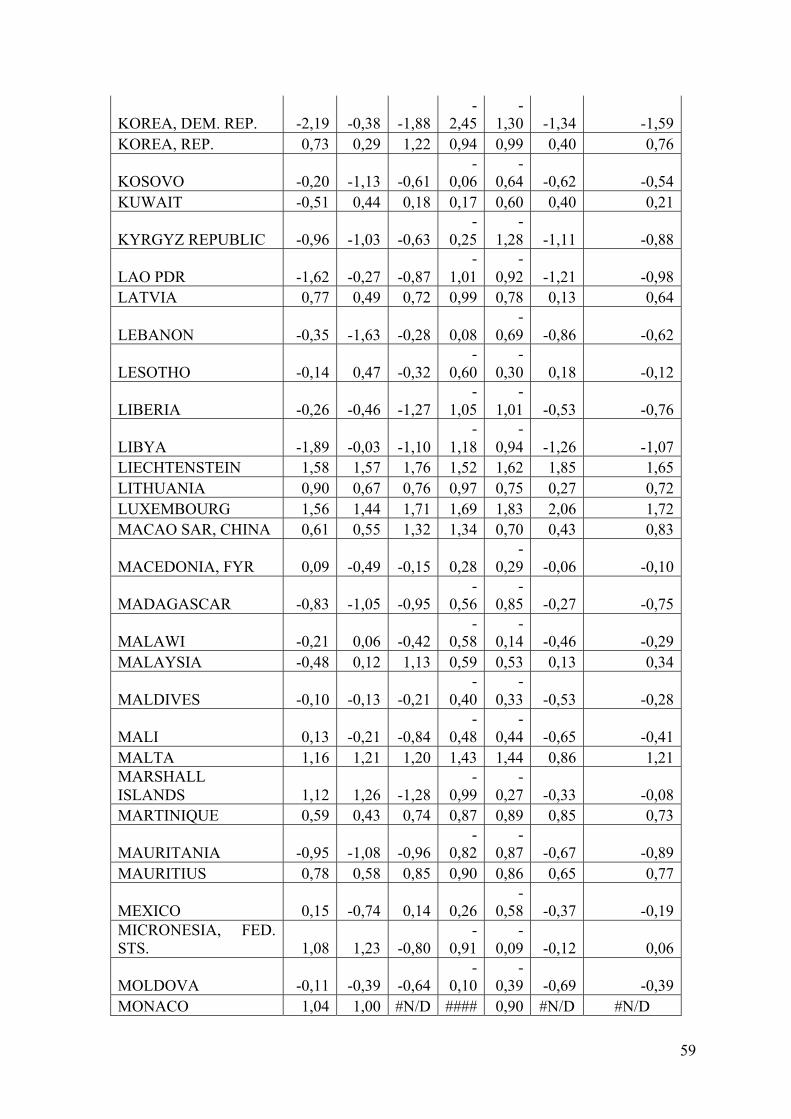
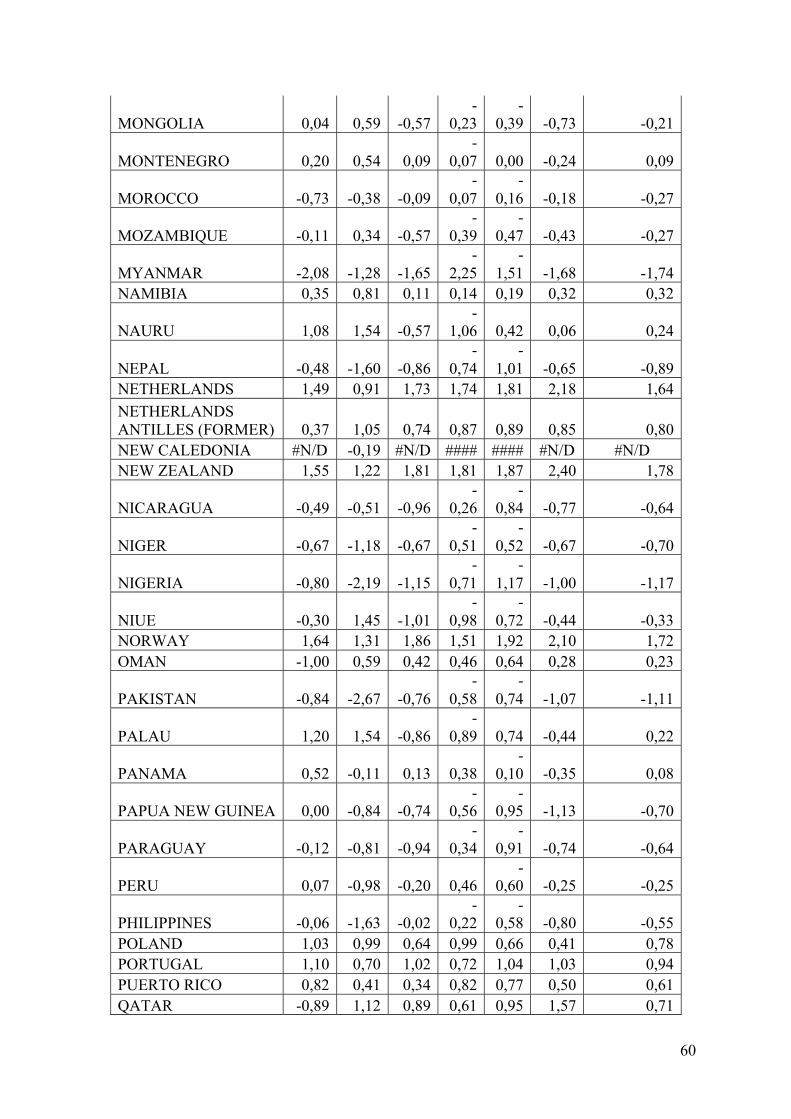
The UCM assigns greater weight to data sources that tend to be more strongly correlated with each other. While this weighting improves the statistical precision of the aggregate indicators, it typically does not affect very much the ranking of countries on the aggregate indicators. The composite measures of governance generated by the UCM are in units of a standard normal distribution, with mean zero, standard deviation of one, and running from approximately -2.5 to 2.5, with higher values corresponding to better governance. We also report the data in percentile rank term, ranging from 0 (lowest rank) to 100 (highest rank).
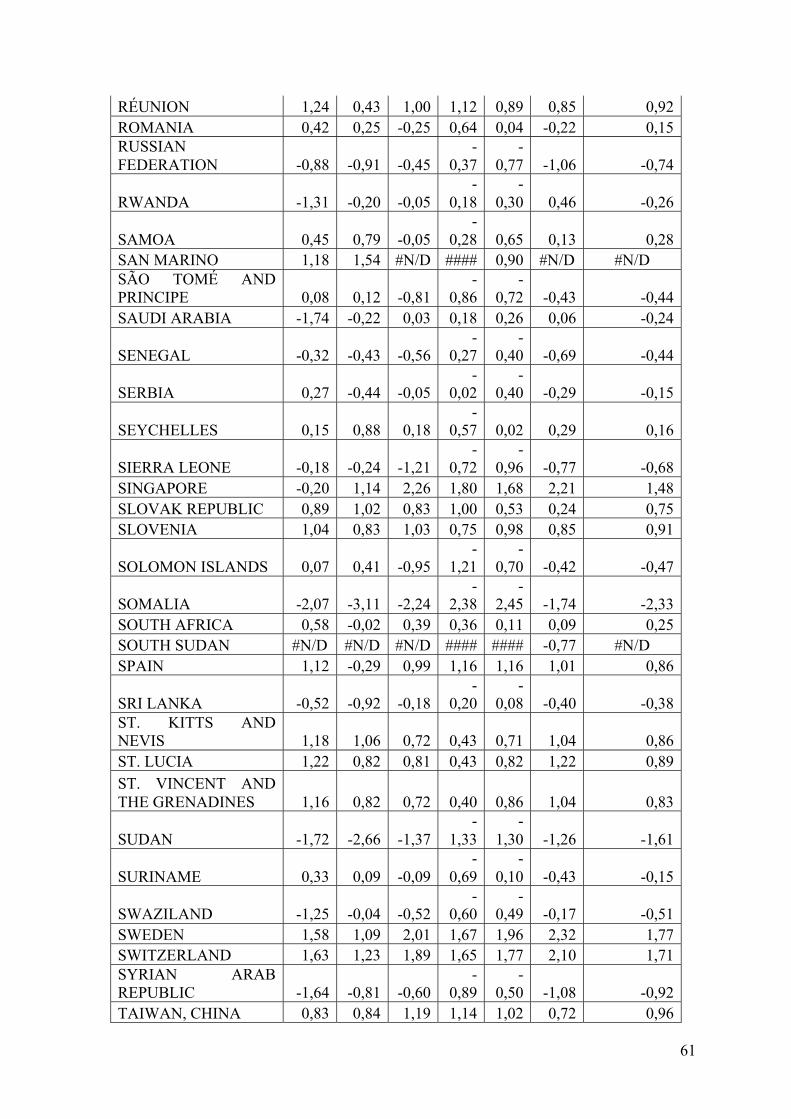
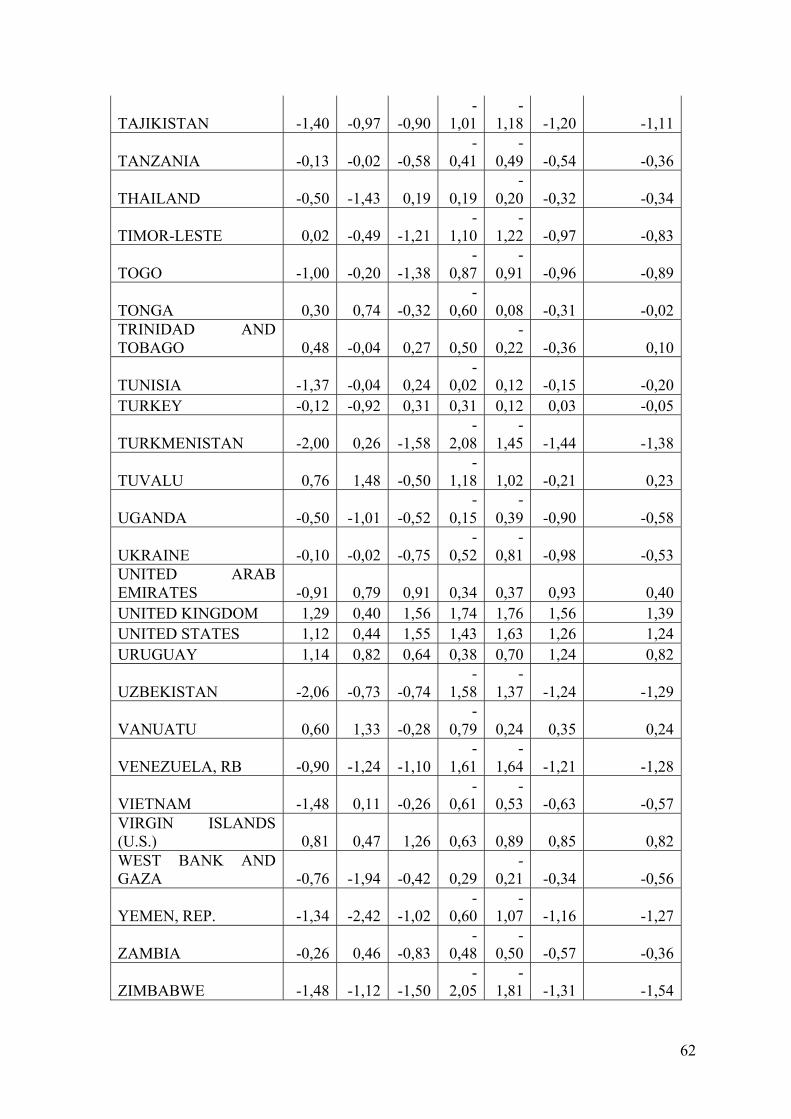
Country 1 2 3 4 5 6 WGI
Aggregate
AFGHANISTAN -1,48 -2,55 -1,47 -
1,53 -
1,90 -1,62 -1,76
ALBANIA 0,11 -0,19 -0,27 0,23 -
0,44 -0,49 -0,17
ALGERIA -1,03 -1,26 -0,48 -
1,17 -
0,75 -0,49 -0,86
AMERICAN SAMOA 1,02 0,94 0,49 0,38 1,16 0,37 0,73
ANDORRA 1,33 1,31 1,51 1,37 1,23 1,33 1,35
ANGOLA -1,12 -0,22 -1,13 -
1,02 -
1,26 -1,32 -1,01
ANGUILLA 1,02 1,44 1,51 1,37 1,42 1,33 1,35 ANTIGUA AND BARBUDA 0,51 0,93 0,49 0,63 0,99 1,33 0,81
ARGENTINA 0,33 -0,09 -0,19 -
0,76 -
0,62 -0,41 -0,29
ARMENIA -0,85 0,03 -0,17 0,30 -
0,47 -0,65 -0,30
56
ARUBA 1,26 1,12 1,23 1,37 1,42 1,13 1,25
AUSTRALIA 1,44 0,87 1,77 1,69 1,76 2,04 1,60
AUSTRIA 1,47 1,12 1,84 1,47 1,81 1,63 1,55
AZERBAIJAN -1,26 -0,25 -0,79 -
0,37 -
0,85 -1,18 -0,78
BAHAMAS, THE 0,98 0,99 1,07 0,52 0,69 1,36 0,93
BAHRAIN -0,97 -0,51 0,48 0,73 0,48 0,25 0,08
BANGLADESH -0,28 -1,40 -0,75 -
0,83 -
0,79 -1,02 -0,85
BARBADOS 1,21 1,09 1,41 0,45 1,04 1,44 1,11
BELARUS -1,54 -0,13 -1,14 -
1,16 -
1,04 -0,73 -0,96
BELGIUM 1,38 0,78 1,58 1,29 1,37 1,49 1,32
BELIZE 0,68 0,06 -0,44 -
0,45 -
0,36 -0,08 -0,10
BENIN 0,29 0,22 -0,58 -
0,32 -
0,70 -0,74 -0,30
BERMUDA 1,02 0,94 1,00 1,37 1,16 1,33 1,14
BHUTAN -0,46 0,77 0,57 -
1,19 0,12 0,82 0,10
BOLIVIA -0,07 -0,44 -0,50 -
0,79 -
1,05 -0,44 -0,55
BOSNIA AND HERZEGOVINA -0,13 -0,70 -0,73
-0,10
-0,37 -0,32 -0,39
BOTSWANA 0,44 0,96 0,46 0,46 0,67 1,00 0,67
BRAZIL 0,53 0,01 -0,04 0,16 0,00 0,00 0,11 BRUNEI DARUSSALAM -0,65 1,24 0,90 1,12 0,79 0,89 0,72
BULGARIA 0,52 0,33 0,11 0,64 -
0,10 -0,21 0,22
BURKINA FASO -0,28 -0,15 -0,56 -
0,14 -
0,18 -0,39 -0,28
BURUNDI -0,94 -1,60 -1,10 -
1,10 -
1,19 -1,11 -1,17
CAMBODIA -0,93 -0,54 -0,92 -
0,46 -
1,09 -1,23 -0,86
CAMEROON -1,08 -0,73 -0,88 -
0,73 -
1,05 -0,98 -0,91
CANADA 1,38 0,90 1,79 1,69 1,81 2,10 1,61
CAPE VERDE 0,89 0,86 -0,02 -
0,04 0,42 0,80 0,48
CAYMAN ISLANDS 0,54 1,20 1,23 1,14 0,89 1,13 1,02
CENTRAL AFRICAN REPUBLIC -1,12 -2,01 -1,39
-1,15
-1,29 -0,84 -1,30
CHAD -1,37 -1,51 -1,45 -
1,06 -
1,48 -1,34 -1,37
CHILE 1,09 0,67 1,26 1,46 1,32 1,49 1,22
57
CHINA -1,63 -0,66 0,10 -
0,22 -
0,33 -0,60 -0,56
COLOMBIA -0,15 -1,53 -0,04 0,26 -
0,35 -0,41 -0,37
COMOROS -0,47 -0,50 -1,74 -
1,42 -
1,06 -0,75 -0,99
CONGO, DEM. REP. -1,44 -2,23 -1,73 -
1,58 -
1,61 -1,42 -1,67
CONGO, REP. -1,06 -0,33 -1,23 -
1,27 -
1,18 -1,11 -1,03
COOK ISLANDS -0,30 1,45 -1,01 -
1,24 -
0,89 -0,24 -0,37
COSTA RICA 1,04 0,69 0,31 0,50 0,49 0,65 0,61
CÔTE D'IVOIRE -1,10 -1,57 -1,26 -
0,91 -
1,24 -1,14 -1,20
CROATIA 0,43 0,58 0,63 0,55 0,17 -0,03 0,39
CUBA -1,55 0,33 -0,39 -
1,69 -
0,66 0,41 -0,59
CYPRUS 1,02 0,44 1,53 1,43 1,20 1,00 1,10
CZECH REPUBLIC 1,00 0,96 0,91 1,30 0,93 0,26 0,89
DENMARK 1,58 1,03 2,09 1,88 1,90 2,41 1,82
DJIBOUTI -1,25 0,26 -0,99 -
0,63 -
0,71 -0,32 -0,61
DOMINICA 1,01 0,99 0,65 0,43 0,69 0,74 0,75 DOMINICAN REPUBLIC 0,03 -0,07 -0,66
-0,15
-0,80 -0,81 -0,41
ECUADOR -0,26 -0,62 -0,72 -
1,16 -
1,21 -0,86 -0,80
EGYPT, ARAB REP. -1,15 -0,91 -0,38 -
0,16 -
0,12 -0,55 -0,54
EL SALVADOR 0,05 0,06 0,00 0,38 -
0,87 -0,23 -0,10 EQUATORIAL GUINEA -1,87 0,23 -1,69
-1,38
-1,27 -1,49 -1,24
ERITREA -2,16 -0,87 -1,37 -
2,25 -
1,29 -0,47 -1,40
ESTONIA 1,10 0,60 1,11 1,40 1,13 0,86 1,03
ETHIOPIA -1,31 -1,62 -0,42 -
0,85 -
0,75 -0,70 -0,94
FIJI -1,00 -0,15 -0,73 -
0,67 -
0,85 -0,85 -0,71
FINLAND 1,52 1,39 2,25 1,89 1,98 2,18 1,87
FRANCE 1,20 0,67 1,45 1,31 1,51 1,44 1,26
FRENCH GUIANA 1,11 0,19 1,18 1,25 1,17 1,13 1,01
GABON -0,89 0,30 -0,78 -
0,57 -
0,51 -0,78 -0,54
GAMBIA, THE -1,09 0,08 -0,66 -
0,38 -
0,51 -0,56 -0,52

58
GEORGIA -0,18 -0,72 0,29 0,59 -
0,21 -0,12 -0,06
GERMANY 1,31 0,78 1,57 1,58 1,62 1,74 1,43
GHANA 0,49 0,02 -0,04 0,12 -
0,06 0,06 0,10
GREECE 0,88 -0,13 0,55 0,64 0,61 -0,16 0,40
GREENLAND 1,24 1,63 0,98 1,36 1,72 1,20 1,35
GRENADA 0,82 0,51 0,17 0,33 0,11 0,44 0,40
GUAM 0,81 0,43 -0,03 0,63 1,16 0,85 0,64
GUATEMALA -0,33 -0,87 -0,70 -
0,13 -
1,00 -0,48 -0,59
GUINEA -0,95 -1,68 -1,13 -
1,08 -
1,50 -1,19 -1,26
GUINEA-BISSAU -0,90 -0,66 -1,04 -
1,14 -
1,35 -1,06 -1,02
GUYANA 0,05 -0,44 -0,12 -
0,58 -
0,48 -0,55 -0,35
HAITI -0,73 -0,99 -1,63 -
1,01 -
1,39 -1,21 -1,16
HONDURAS -0,51 -0,54 -0,64 -
0,21 -
0,89 -0,87 -0,61 HONG KONG SAR, CHINA 0,51 0,88 1,70 1,91 1,54 1,97 1,42
HUNGARY 0,90 0,67 0,67 1,02 0,75 0,25 0,71
ICELAND 1,48 1,01 1,59 0,88 1,70 1,94 1,43
INDIA 0,43 -1,23 0,02 -
0,37 -
0,04 -0,51 -0,29
INDONESIA -0,07 -0,85 -0,20 -
0,39 -
0,64 -0,75 -0,48
IRAN, ISLAMIC REP. -1,57 -1,62 -0,48 -
1,70 -
0,98 -0,99 -1,22
IRAQ -1,06 -2,26 -1,22 -
1,05 -
1,62 -1,31 -1,42
IRELAND 1,34 0,98 1,34 1,61 1,77 1,70 1,46
ISRAEL 0,56 -1,32 1,37 1,22 0,90 0,67 0,57
ITALY 0,95 0,47 0,45 0,89 0,38 0,00 0,52
JAMAICA 0,42 -0,41 0,20 0,28 -
0,50 -0,38 -0,06
JAPAN 1,04 0,85 1,52 1,03 1,33 1,57 1,22 JERSEY, CHANNEL ISLANDS #N/D #N/D #N/D #### #### #N/D #N/D
JORDAN -0,80 -0,31 0,13 0,25 0,20 0,06 -0,08
KAZAKHSTAN -1,10 0,45 -0,43 -
0,34 -
0,61 -0,98 -0,50
KENYA -0,23 -1,17 -0,54 -
0,07 -
0,99 -0,94 -0,66
KIRIBATI 0,68 1,48 -0,85 -
1,35 0,07 -0,04 0,00
59
KOREA, DEM. REP. -2,19 -0,38 -1,88 -
2,45 -
1,30 -1,34 -1,59
KOREA, REP. 0,73 0,29 1,22 0,94 0,99 0,40 0,76
KOSOVO -0,20 -1,13 -0,61 -
0,06 -
0,64 -0,62 -0,54
KUWAIT -0,51 0,44 0,18 0,17 0,60 0,40 0,21
KYRGYZ REPUBLIC -0,96 -1,03 -0,63 -
0,25 -
1,28 -1,11 -0,88
LAO PDR -1,62 -0,27 -0,87 -
1,01 -
0,92 -1,21 -0,98
LATVIA 0,77 0,49 0,72 0,99 0,78 0,13 0,64
LEBANON -0,35 -1,63 -0,28 0,08 -
0,69 -0,86 -0,62
LESOTHO -0,14 0,47 -0,32 -
0,60 -
0,30 0,18 -0,12
LIBERIA -0,26 -0,46 -1,27 -
1,05 -
1,01 -0,53 -0,76
LIBYA -1,89 -0,03 -1,10 -
1,18 -
0,94 -1,26 -1,07
LIECHTENSTEIN 1,58 1,57 1,76 1,52 1,62 1,85 1,65
LITHUANIA 0,90 0,67 0,76 0,97 0,75 0,27 0,72
LUXEMBOURG 1,56 1,44 1,71 1,69 1,83 2,06 1,72
MACAO SAR, CHINA 0,61 0,55 1,32 1,34 0,70 0,43 0,83
MACEDONIA, FYR 0,09 -0,49 -0,15 0,28 -
0,29 -0,06 -0,10
MADAGASCAR -0,83 -1,05 -0,95 -
0,56 -
0,85 -0,27 -0,75
MALAWI -0,21 0,06 -0,42 -
0,58 -
0,14 -0,46 -0,29
MALAYSIA -0,48 0,12 1,13 0,59 0,53 0,13 0,34
MALDIVES -0,10 -0,13 -0,21 -
0,40 -
0,33 -0,53 -0,28
MALI 0,13 -0,21 -0,84 -
0,48 -
0,44 -0,65 -0,41
MALTA 1,16 1,21 1,20 1,43 1,44 0,86 1,21 MARSHALL ISLANDS 1,12 1,26 -1,28
-0,99
-0,27 -0,33 -0,08
MARTINIQUE 0,59 0,43 0,74 0,87 0,89 0,85 0,73
MAURITANIA -0,95 -1,08 -0,96 -
0,82 -
0,87 -0,67 -0,89
MAURITIUS 0,78 0,58 0,85 0,90 0,86 0,65 0,77
MEXICO 0,15 -0,74 0,14 0,26 -
0,58 -0,37 -0,19 MICRONESIA, FED. STS. 1,08 1,23 -0,80
-0,91
-0,09 -0,12 0,06
MOLDOVA -0,11 -0,39 -0,64 -
0,10 -
0,39 -0,69 -0,39
MONACO 1,04 1,00 #N/D #### 0,90 #N/D #N/D
60
MONGOLIA 0,04 0,59 -0,57 -
0,23 -
0,39 -0,73 -0,21
MONTENEGRO 0,20 0,54 0,09 -
0,07 0,00 -0,24 0,09
MOROCCO -0,73 -0,38 -0,09 -
0,07 -
0,16 -0,18 -0,27
MOZAMBIQUE -0,11 0,34 -0,57 -
0,39 -
0,47 -0,43 -0,27
MYANMAR -2,08 -1,28 -1,65 -
2,25 -
1,51 -1,68 -1,74
NAMIBIA 0,35 0,81 0,11 0,14 0,19 0,32 0,32
NAURU 1,08 1,54 -0,57 -
1,06 0,42 0,06 0,24
NEPAL -0,48 -1,60 -0,86 -
0,74 -
1,01 -0,65 -0,89
NETHERLANDS 1,49 0,91 1,73 1,74 1,81 2,18 1,64
NETHERLANDS ANTILLES (FORMER) 0,37 1,05 0,74 0,87 0,89 0,85 0,80
NEW CALEDONIA #N/D -0,19 #N/D #### #### #N/D #N/D
NEW ZEALAND 1,55 1,22 1,81 1,81 1,87 2,40 1,78
NICARAGUA -0,49 -0,51 -0,96 -
0,26 -
0,84 -0,77 -0,64
NIGER -0,67 -1,18 -0,67 -
0,51 -
0,52 -0,67 -0,70
NIGERIA -0,80 -2,19 -1,15 -
0,71 -
1,17 -1,00 -1,17
NIUE -0,30 1,45 -1,01 -
0,98 -
0,72 -0,44 -0,33
NORWAY 1,64 1,31 1,86 1,51 1,92 2,10 1,72
OMAN -1,00 0,59 0,42 0,46 0,64 0,28 0,23
PAKISTAN -0,84 -2,67 -0,76 -
0,58 -
0,74 -1,07 -1,11
PALAU 1,20 1,54 -0,86 -
0,89 0,74 -0,44 0,22
PANAMA 0,52 -0,11 0,13 0,38 -
0,10 -0,35 0,08
PAPUA NEW GUINEA 0,00 -0,84 -0,74 -
0,56 -
0,95 -1,13 -0,70
PARAGUAY -0,12 -0,81 -0,94 -
0,34 -
0,91 -0,74 -0,64
PERU 0,07 -0,98 -0,20 0,46 -
0,60 -0,25 -0,25
PHILIPPINES -0,06 -1,63 -0,02 -
0,22 -
0,58 -0,80 -0,55
POLAND 1,03 0,99 0,64 0,99 0,66 0,41 0,78
PORTUGAL 1,10 0,70 1,02 0,72 1,04 1,03 0,94
PUERTO RICO 0,82 0,41 0,34 0,82 0,77 0,50 0,61
QATAR -0,89 1,12 0,89 0,61 0,95 1,57 0,71
61
RÉUNION 1,24 0,43 1,00 1,12 0,89 0,85 0,92
ROMANIA 0,42 0,25 -0,25 0,64 0,04 -0,22 0,15 RUSSIAN FEDERATION -0,88 -0,91 -0,45
-0,37
-0,77 -1,06 -0,74
RWANDA -1,31 -0,20 -0,05 -
0,18 -
0,30 0,46 -0,26
SAMOA 0,45 0,79 -0,05 -
0,28 0,65 0,13 0,28
SAN MARINO 1,18 1,54 #N/D #### 0,90 #N/D #N/D SÃO TOMÉ AND PRINCIPE 0,08 0,12 -0,81
-0,86
-0,72 -0,43 -0,44
SAUDI ARABIA -1,74 -0,22 0,03 0,18 0,26 0,06 -0,24
SENEGAL -0,32 -0,43 -0,56 -
0,27 -
0,40 -0,69 -0,44
SERBIA 0,27 -0,44 -0,05 -
0,02 -
0,40 -0,29 -0,15
SEYCHELLES 0,15 0,88 0,18 -
0,57 0,02 0,29 0,16
SIERRA LEONE -0,18 -0,24 -1,21 -
0,72 -
0,96 -0,77 -0,68
SINGAPORE -0,20 1,14 2,26 1,80 1,68 2,21 1,48
SLOVAK REPUBLIC 0,89 1,02 0,83 1,00 0,53 0,24 0,75
SLOVENIA 1,04 0,83 1,03 0,75 0,98 0,85 0,91
SOLOMON ISLANDS 0,07 0,41 -0,95 -
1,21 -
0,70 -0,42 -0,47
SOMALIA -2,07 -3,11 -2,24 -
2,38 -
2,45 -1,74 -2,33
SOUTH AFRICA 0,58 -0,02 0,39 0,36 0,11 0,09 0,25
SOUTH SUDAN #N/D #N/D #N/D #### #### -0,77 #N/D
SPAIN 1,12 -0,29 0,99 1,16 1,16 1,01 0,86
SRI LANKA -0,52 -0,92 -0,18 -
0,20 -
0,08 -0,40 -0,38 ST. KITTS AND NEVIS 1,18 1,06 0,72 0,43 0,71 1,04 0,86
ST. LUCIA 1,22 0,82 0,81 0,43 0,82 1,22 0,89
ST. VINCENT AND THE GRENADINES 1,16 0,82 0,72 0,40 0,86 1,04 0,83
SUDAN -1,72 -2,66 -1,37 -
1,33 -
1,30 -1,26 -1,61
SURINAME 0,33 0,09 -0,09 -
0,69 -
0,10 -0,43 -0,15
SWAZILAND -1,25 -0,04 -0,52 -
0,60 -
0,49 -0,17 -0,51
SWEDEN 1,58 1,09 2,01 1,67 1,96 2,32 1,77
SWITZERLAND 1,63 1,23 1,89 1,65 1,77 2,10 1,71 SYRIAN ARAB REPUBLIC -1,64 -0,81 -0,60
-0,89
-0,50 -1,08 -0,92
TAIWAN, CHINA 0,83 0,84 1,19 1,14 1,02 0,72 0,96
62
TAJIKISTAN -1,40 -0,97 -0,90 -
1,01 -
1,18 -1,20 -1,11
TANZANIA -0,13 -0,02 -0,58 -
0,41 -
0,49 -0,54 -0,36
THAILAND -0,50 -1,43 0,19 0,19 -
0,20 -0,32 -0,34
TIMOR-LESTE 0,02 -0,49 -1,21 -
1,10 -
1,22 -0,97 -0,83
TOGO -1,00 -0,20 -1,38 -
0,87 -
0,91 -0,96 -0,89
TONGA 0,30 0,74 -0,32 -
0,60 0,08 -0,31 -0,02 TRINIDAD AND TOBAGO 0,48 -0,04 0,27 0,50
-0,22 -0,36 0,10
TUNISIA -1,37 -0,04 0,24 -
0,02 0,12 -0,15 -0,20
TURKEY -0,12 -0,92 0,31 0,31 0,12 0,03 -0,05
TURKMENISTAN -2,00 0,26 -1,58 -
2,08 -
1,45 -1,44 -1,38
TUVALU 0,76 1,48 -0,50 -
1,18 1,02 -0,21 0,23
UGANDA -0,50 -1,01 -0,52 -
0,15 -
0,39 -0,90 -0,58
UKRAINE -0,10 -0,02 -0,75 -
0,52 -
0,81 -0,98 -0,53 UNITED ARAB EMIRATES -0,91 0,79 0,91 0,34 0,37 0,93 0,40
UNITED KINGDOM 1,29 0,40 1,56 1,74 1,76 1,56 1,39
UNITED STATES 1,12 0,44 1,55 1,43 1,63 1,26 1,24
URUGUAY 1,14 0,82 0,64 0,38 0,70 1,24 0,82
UZBEKISTAN -2,06 -0,73 -0,74 -
1,58 -
1,37 -1,24 -1,29
VANUATU 0,60 1,33 -0,28 -
0,79 0,24 0,35 0,24
VENEZUELA, RB -0,90 -1,24 -1,10 -
1,61 -
1,64 -1,21 -1,28
VIETNAM -1,48 0,11 -0,26 -
0,61 -
0,53 -0,63 -0,57 VIRGIN ISLANDS (U.S.) 0,81 0,47 1,26 0,63 0,89 0,85 0,82 WEST BANK AND GAZA -0,76 -1,94 -0,42 0,29
-0,21 -0,34 -0,56
YEMEN, REP. -1,34 -2,42 -1,02 -
0,60 -
1,07 -1,16 -1,27
ZAMBIA -0,26 0,46 -0,83 -
0,48 -
0,50 -0,57 -0,36
ZIMBABWE -1,48 -1,12 -1,50 -
2,05 -
1,81 -1,31 -1,54
63
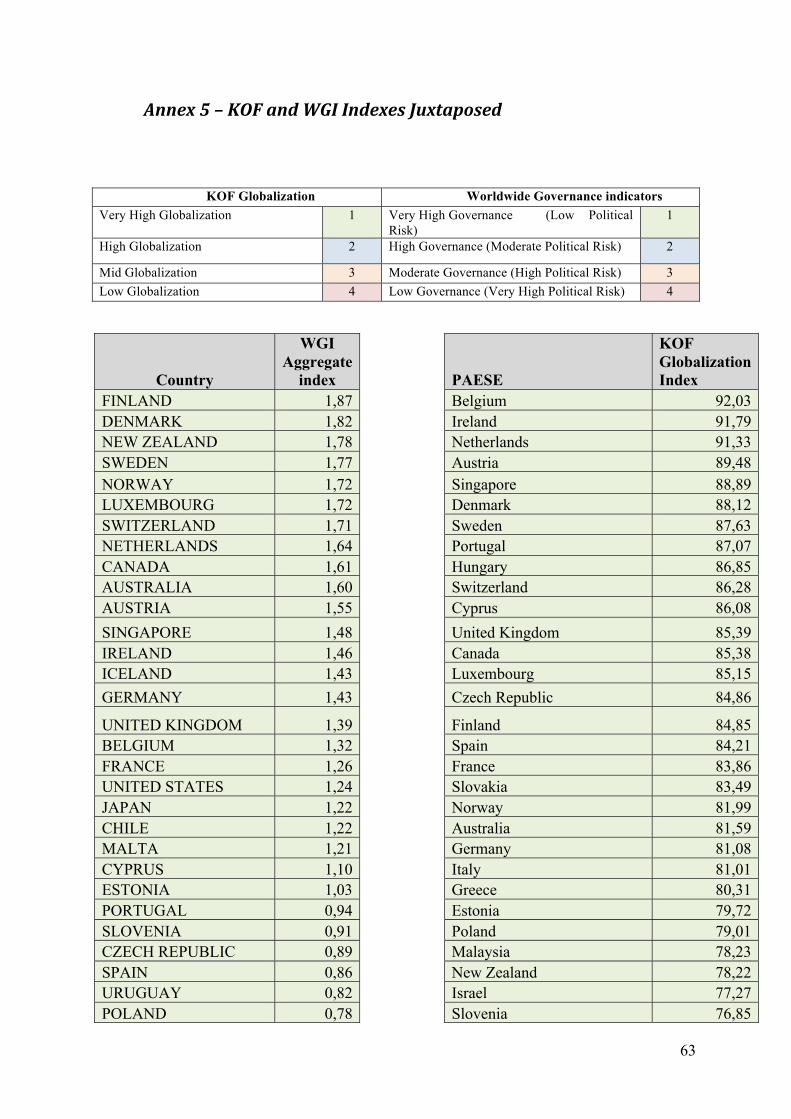
KOF Globalization Worldwide Governance indicators Very High Globalization 1 Very High Governance (Low Political
Risk) 1
High Globalization 2 High Governance (Moderate Political Risk) 2
Mid Globalization 3 Moderate Governance (High Political Risk) 3
Low Globalization 4 Low Governance (Very High Political Risk) 4
Country
WGI Aggregate
index PAESE
KOF Globalization Index
FINLAND 1,87 Belgium 92,03
DENMARK 1,82 Ireland 91,79
NEW ZEALAND 1,78 Netherlands 91,33
SWEDEN 1,77 Austria 89,48
NORWAY 1,72 Singapore 88,89
LUXEMBOURG 1,72 Denmark 88,12
SWITZERLAND 1,71 Sweden 87,63
NETHERLANDS 1,64 Portugal 87,07
CANADA 1,61 Hungary 86,85
AUSTRALIA 1,60 Switzerland 86,28
AUSTRIA 1,55 Cyprus 86,08
SINGAPORE 1,48 United Kingdom 85,39
IRELAND 1,46 Canada 85,38
ICELAND 1,43 Luxembourg 85,15
GERMANY 1,43 Czech Republic 84,86
UNITED KINGDOM 1,39 Finland 84,85
BELGIUM 1,32 Spain 84,21
FRANCE 1,26 France 83,86
UNITED STATES 1,24 Slovakia 83,49
JAPAN 1,22 Norway 81,99
CHILE 1,22 Australia 81,59
MALTA 1,21 Germany 81,08
CYPRUS 1,10 Italy 81,01
ESTONIA 1,03 Greece 80,31
PORTUGAL 0,94 Estonia 79,72
SLOVENIA 0,91 Poland 79,01
CZECH REPUBLIC 0,89 Malaysia 78,23
SPAIN 0,86 New Zealand 78,22
URUGUAY 0,82 Israel 77,27
POLAND 0,78 Slovenia 76,85
64
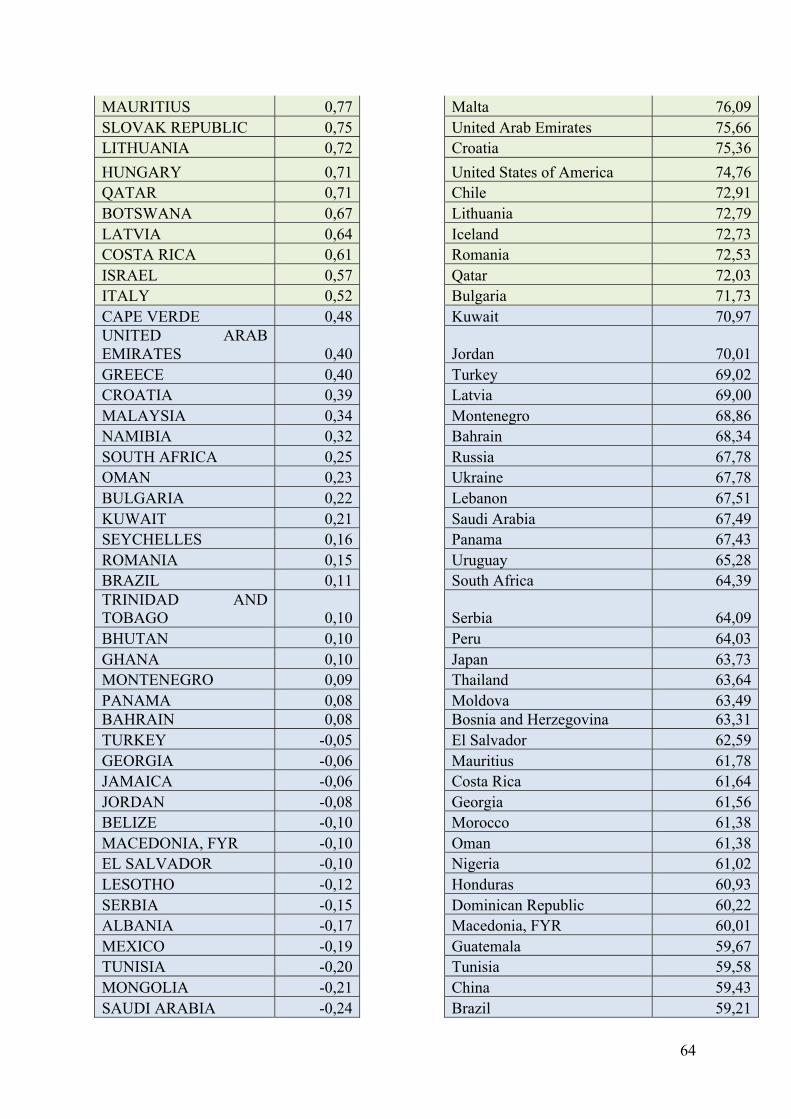
MAURITIUS 0,77 Malta 76,09
SLOVAK REPUBLIC 0,75 United Arab Emirates 75,66
LITHUANIA 0,72 Croatia 75,36
HUNGARY 0,71 United States of America 74,76
QATAR 0,71 Chile 72,91
BOTSWANA 0,67 Lithuania 72,79
LATVIA 0,64 Iceland 72,73
COSTA RICA 0,61 Romania 72,53
ISRAEL 0,57 Qatar 72,03
ITALY 0,52 Bulgaria 71,73
CAPE VERDE 0,48 Kuwait 70,97 UNITED ARAB EMIRATES 0,40 Jordan 70,01
GREECE 0,40 Turkey 69,02
CROATIA 0,39 Latvia 69,00
MALAYSIA 0,34 Montenegro 68,86
NAMIBIA 0,32 Bahrain 68,34
SOUTH AFRICA 0,25 Russia 67,78
OMAN 0,23 Ukraine 67,78
BULGARIA 0,22 Lebanon 67,51
KUWAIT 0,21 Saudi Arabia 67,49
SEYCHELLES 0,16 Panama 67,43
ROMANIA 0,15 Uruguay 65,28
BRAZIL 0,11 South Africa 64,39 TRINIDAD AND TOBAGO 0,10 Serbia 64,09
BHUTAN 0,10 Peru 64,03
GHANA 0,10 Japan 63,73
MONTENEGRO 0,09 Thailand 63,64
PANAMA 0,08 Moldova 63,49 BAHRAIN 0,08 Bosnia and Herzegovina 63,31
TURKEY -0,05 El Salvador 62,59
GEORGIA -0,06 Mauritius 61,78
JAMAICA -0,06 Costa Rica 61,64
JORDAN -0,08 Georgia 61,56
BELIZE -0,10 Morocco 61,38
MACEDONIA, FYR -0,10 Oman 61,38
EL SALVADOR -0,10 Nigeria 61,02
LESOTHO -0,12 Honduras 60,93
SERBIA -0,15 Dominican Republic 60,22
ALBANIA -0,17 Macedonia, FYR 60,01
MEXICO -0,19 Guatemala 59,67
TUNISIA -0,20 Tunisia 59,58
MONGOLIA -0,21 China 59,43
SAUDI ARABIA -0,24 Brazil 59,21
65
PERU -0,25 Jamaica 59,21
RWANDA -0,26 Albania 58,32
MOROCCO -0,27 Kazakhstan 58,04
MOZAMBIQUE -0,27 Argentina 58,03
BURKINA FASO -0,28 Egypt 58,01
INDIA -0,29 Trinidad and Tobago 57,97
ARGENTINA -0,29 Paraguay 57,57
MALAWI -0,29 Mongolia 57,29
ARMENIA -0,30 Azerbaijan 56,71
BENIN -0,30 Kyrgyz Republic 56,12
THAILAND -0,34 Philippines 56,12
GUYANA -0,35 Zambia 55,62
ZAMBIA -0,36 Indonesia 55,02
TANZANIA -0,36 Namibia 54,99
COLOMBIA -0,37 Belarus 54,98
SRI LANKA -0,38 Armenia 54,72
MOLDOVA -0,39 Ghana 54,55 BOSNIA AND HERZEGOVINA -0,39 Nicaragua 54,42 DOMINICAN REPUBLIC -0,41 Ecuador 54,01
MALI -0,41 Gabon 53,45 SÃO TOMÉ AND PRINCIPE -0,44 Bolivia 53,08
SENEGAL -0,44 Senegal 53,08
INDONESIA -0,48 Cote d'Ivoire 52,05
KAZAKHSTAN -0,50 Colombia 52,04
SWAZILAND -0,51 India 51,57
GAMBIA, THE -0,52 Gambia 51,51
UKRAINE -0,53 Pakistan 51,38
GABON -0,54 Swaziland 51,14
EGYPT, ARAB REP. -0,54 Guyana 50,88
BOLIVIA -0,55 Togo 50,67
PHILIPPINES -0,55 Congo (Brazzaville) 50,56
CHINA -0,56 Zimbabwe 50,07
VIETNAM -0,57 Sri Lanka 49,85
UGANDA -0,58 Venezuela 49,44
GUATEMALA -0,59 Libya 48,94
CUBA -0,59 Cuba 48,88
HONDURAS -0,61 Kenya 48,79
LEBANON -0,62 Belize 48,23
NICARAGUA -0,64 Seychelles 47,99
PARAGUAY -0,64 Cambodia 47,68
KENYA -0,66 Vietnam 47,02
SIERRA LEONE -0,68 Lesotho 47,00
66
NIGER -0,70 Mali 46,87
PAPUA NEW GUINEA -0,70 Botswana 46,24 RUSSIAN FEDERATION -0,74 Uganda 46,18
MADAGASCAR -0,75 Mozambique 46,05
LIBERIA -0,76 Cape Verde 45,76
AZERBAIJAN -0,78 Papua New Guinea 45,71
ECUADOR -0,80 Cameroon 45,22
TIMOR-LESTE -0,83 Yemen 45,18
BANGLADESH -0,85 Angola 44,73
ALGERIA -0,86 Mauritania 44,43
CAMBODIA -0,86 Burkina Faso 44,35
KYRGYZ REPUBLIC -0,88 Benin 43,97
NEPAL -0,89 Syria 43,67
TOGO -0,89 Guinea-Bissau 42,58
MAURITANIA -0,89 Madagascar 42,53
CAMEROON -0,91 Guinea 42,31 SYRIAN ARAB REPUBLIC -0,92 Rwanda 42,24
ETHIOPIA -0,94 Malawi 42,06
BELARUS -0,96 Tajikistan 40,79
LAO PDR -0,98 Bangladesh 40,65
ANGOLA -1,01 Iran 40,24
GUINEA-BISSAU -1,02 Chad 40,15
CONGO, REP. -1,03 Iraq 40,01
LIBYA -1,07 Tanzania 39,12
TAJIKISTAN -1,11 Sierra Leone 38,97
PAKISTAN -1,11 Nepal 38,05
HAITI -1,16 Niger 37,81
NIGERIA -1,17 Ethiopia 37,46
CÔTE D'IVOIRE -1,20 Congo (Democratic Republic) 36,87
IRAN, ISLAMIC REP. -1,22 Central African Republic 36,33 EQUATORIAL GUINEA -1,24 Sudan 36,19
GUINEA -1,26 Turkmenistan 36,06
YEMEN, REP. -1,27 Haiti 35,02
VENEZUELA, RB -1,28 Sao Tome and Principe 35,00
UZBEKISTAN -1,29 Uzbekistan 34,41 CENTRAL AFRICAN REPUBLIC -1,30 Myanmar 31,98
CHAD -1,37 Afghanistan 31,46
TURKMENISTAN -1,38 Liberia 30,81
ERITREA -1,40 Bhutan 27,91
IRAQ -1,42 Eritrea 27,34
67
ZIMBABWE -1,54 Laos 26,52
SUDAN -1,61 Equatorial Guinea 26,26
CONGO, DEM. REP. -1,67 Timor-Leste 24,35
MYANMAR -1,74 Mexico 0,00
AFGHANISTAN -1,76 Algeria
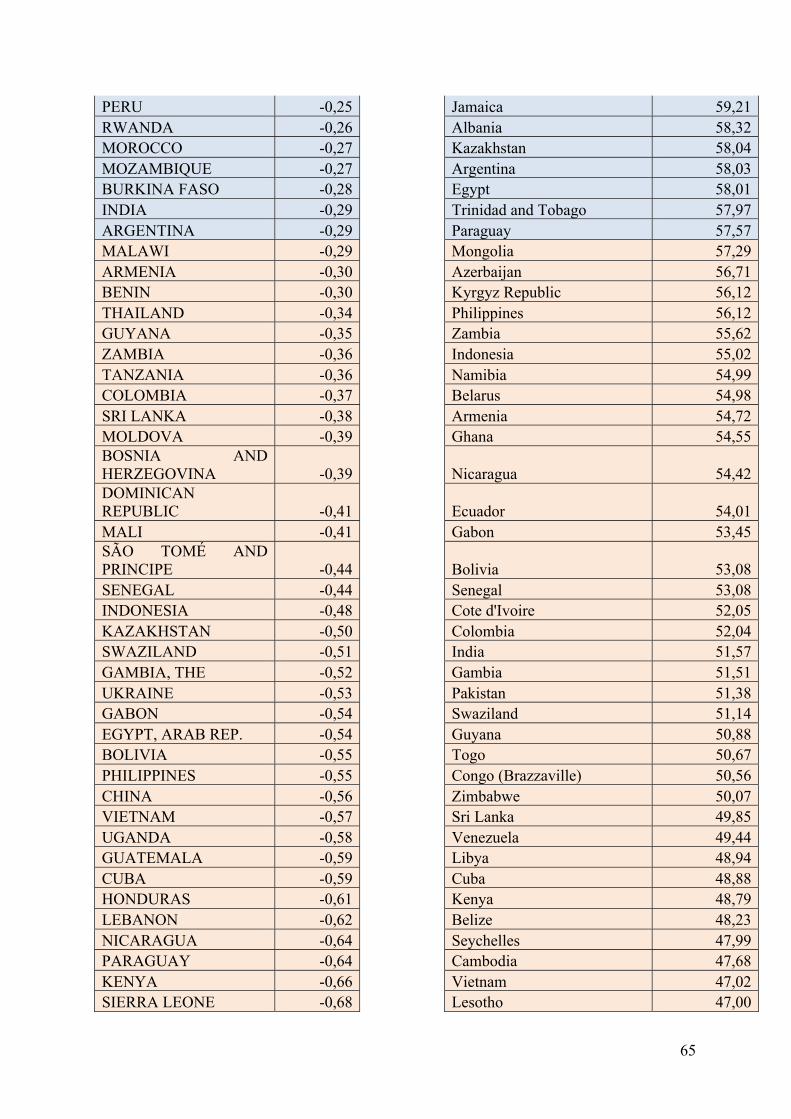
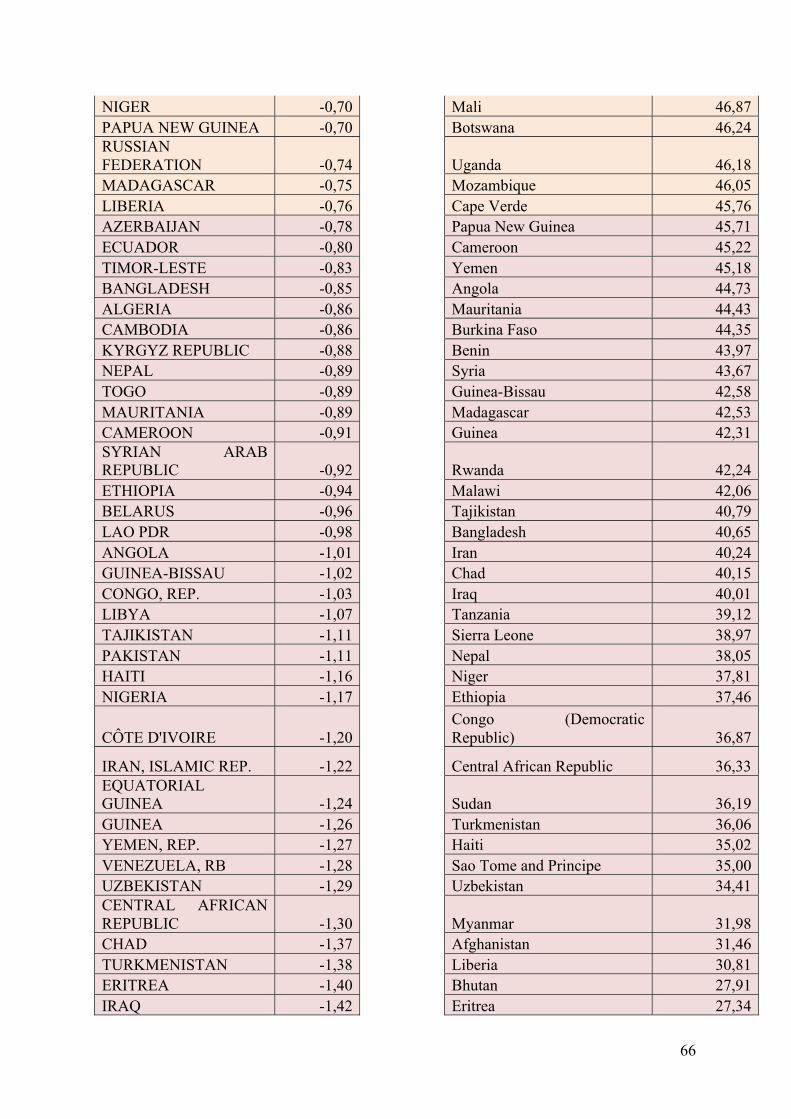
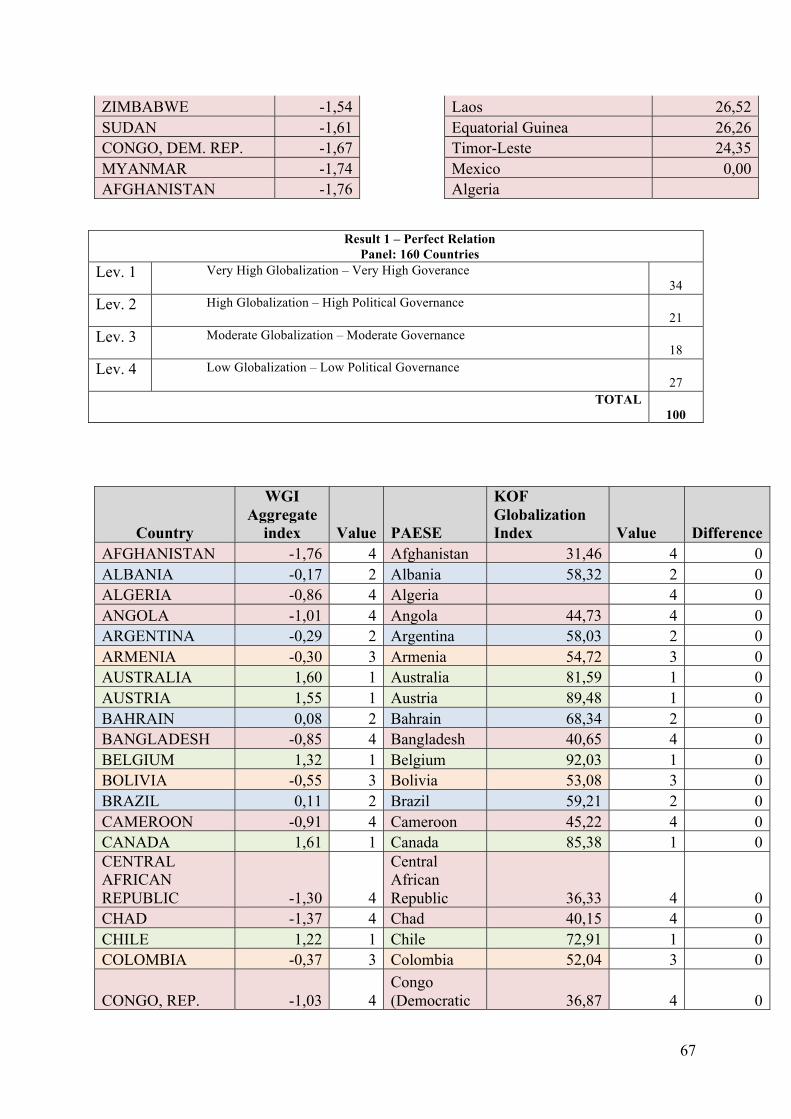
Result 1 – Perfect Relation Panel: 160 Countries
Lev. 1 Very High Globalization – Very High Goverance 34
Lev. 2 High Globalization – High Political Governance 21
Lev. 3 Moderate Globalization – Moderate Governance 18
Lev. 4 Low Globalization – Low Political Governance 27
TOTAL 100
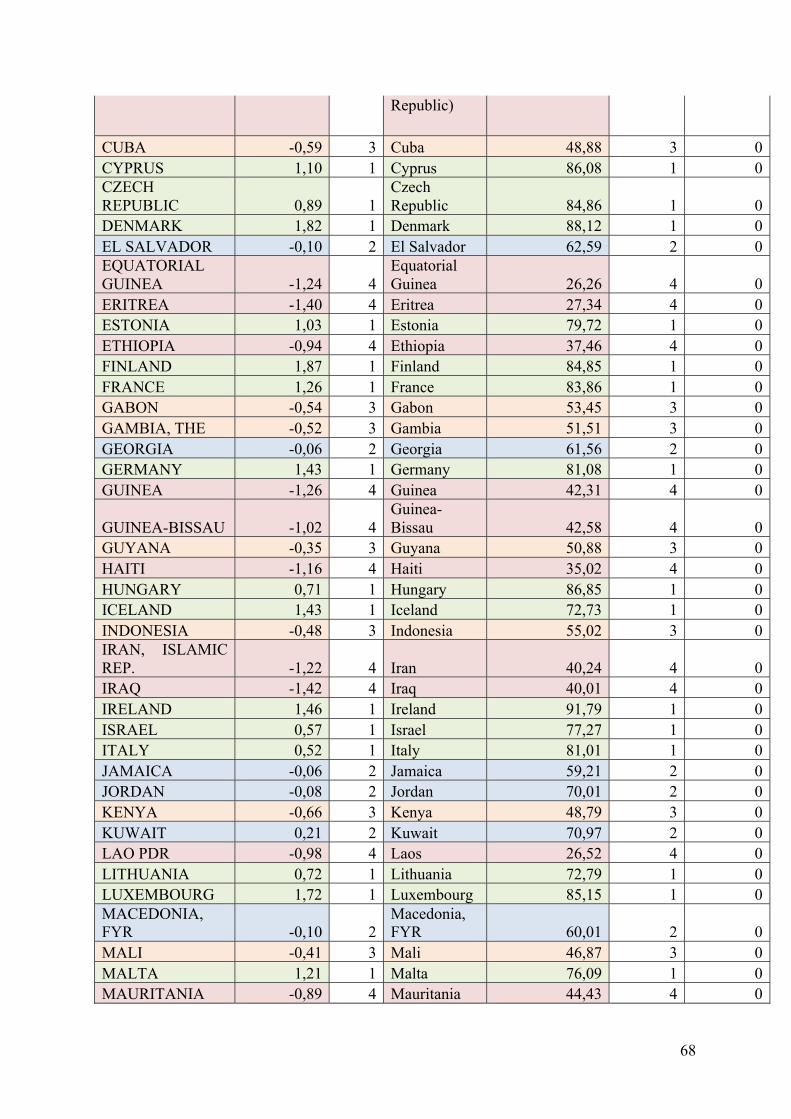
Country
WGI Aggregate
index Value PAESE
KOF Globalization Index Value Difference
AFGHANISTAN -1,76 4 Afghanistan 31,46 4 0
ALBANIA -0,17 2 Albania 58,32 2 0
ALGERIA -0,86 4 Algeria 4 0
ANGOLA -1,01 4 Angola 44,73 4 0
ARGENTINA -0,29 2 Argentina 58,03 2 0
ARMENIA -0,30 3 Armenia 54,72 3 0
AUSTRALIA 1,60 1 Australia 81,59 1 0
AUSTRIA 1,55 1 Austria 89,48 1 0
BAHRAIN 0,08 2 Bahrain 68,34 2 0
BANGLADESH -0,85 4 Bangladesh 40,65 4 0
BELGIUM 1,32 1 Belgium 92,03 1 0
BOLIVIA -0,55 3 Bolivia 53,08 3 0
BRAZIL 0,11 2 Brazil 59,21 2 0
CAMEROON -0,91 4 Cameroon 45,22 4 0
CANADA 1,61 1 Canada 85,38 1 0 CENTRAL AFRICAN REPUBLIC -1,30 4
Central African Republic 36,33 4 0
CHAD -1,37 4 Chad 40,15 4 0
CHILE 1,22 1 Chile 72,91 1 0
COLOMBIA -0,37 3 Colombia 52,04 3 0
CONGO, REP. -1,03 4 Congo (Democratic 36,87 4 0
68
Republic)
CUBA -0,59 3 Cuba 48,88 3 0
CYPRUS 1,10 1 Cyprus 86,08 1 0 CZECH REPUBLIC 0,89 1
Czech Republic 84,86 1 0
DENMARK 1,82 1 Denmark 88,12 1 0
EL SALVADOR -0,10 2 El Salvador 62,59 2 0 EQUATORIAL GUINEA -1,24 4
Equatorial Guinea 26,26 4 0
ERITREA -1,40 4 Eritrea 27,34 4 0
ESTONIA 1,03 1 Estonia 79,72 1 0
ETHIOPIA -0,94 4 Ethiopia 37,46 4 0
FINLAND 1,87 1 Finland 84,85 1 0
FRANCE 1,26 1 France 83,86 1 0
GABON -0,54 3 Gabon 53,45 3 0
GAMBIA, THE -0,52 3 Gambia 51,51 3 0
GEORGIA -0,06 2 Georgia 61,56 2 0
GERMANY 1,43 1 Germany 81,08 1 0
GUINEA -1,26 4 Guinea 42,31 4 0
GUINEA-BISSAU -1,02 4 Guinea-Bissau 42,58 4 0
GUYANA -0,35 3 Guyana 50,88 3 0
HAITI -1,16 4 Haiti 35,02 4 0
HUNGARY 0,71 1 Hungary 86,85 1 0
ICELAND 1,43 1 Iceland 72,73 1 0
INDONESIA -0,48 3 Indonesia 55,02 3 0 IRAN, ISLAMIC REP. -1,22 4 Iran 40,24 4 0
IRAQ -1,42 4 Iraq 40,01 4 0
IRELAND 1,46 1 Ireland 91,79 1 0
ISRAEL 0,57 1 Israel 77,27 1 0
ITALY 0,52 1 Italy 81,01 1 0
JAMAICA -0,06 2 Jamaica 59,21 2 0
JORDAN -0,08 2 Jordan 70,01 2 0
KENYA -0,66 3 Kenya 48,79 3 0
KUWAIT 0,21 2 Kuwait 70,97 2 0
LAO PDR -0,98 4 Laos 26,52 4 0
LITHUANIA 0,72 1 Lithuania 72,79 1 0
LUXEMBOURG 1,72 1 Luxembourg 85,15 1 0 MACEDONIA, FYR -0,10 2
Macedonia, FYR 60,01 2 0
MALI -0,41 3 Mali 46,87 3 0
MALTA 1,21 1 Malta 76,09 1 0
MAURITANIA -0,89 4 Mauritania 44,43 4 0

69
MONTENEGRO 0,09 2 Montenegro 68,86 2 0
MOROCCO -0,27 2 Morocco 61,38 2 0
MYANMAR -1,74 4 Myanmar 31,98 4 0
NEPAL -0,89 4 Nepal 38,05 4 0
NETHERLANDS 1,64 1 Netherlands 91,33 1 0
NEW ZEALAND 1,78 1 New Zealand 78,22 1 0
NICARAGUA -0,64 3 Nicaragua 54,42 3 0
NORWAY 1,72 1 Norway 81,99 1 0
OMAN 0,23 2 Oman 61,38 2 0
PANAMA 0,08 2 Panama 67,43 2 0
PERU -0,25 2 Peru 64,03 2 0
PHILIPPINES -0,55 3 Philippines 56,12 3 0
POLAND 0,78 1 Poland 79,01 1 0
PORTUGAL 0,94 1 Portugal 87,07 1 0
QATAR 0,71 1 Qatar 72,03 1 0
SAUDI ARABIA -0,24 2 Saudi Arabia 67,49 2 0
SENEGAL -0,44 3 Senegal 53,08 3 0
SERBIA -0,15 2 Serbia 64,09 2 0
SINGAPORE 1,48 1 Singapore 88,89 1 0 SLOVAK REPUBLIC 0,75 1 Slovakia 83,49 1 0
SLOVENIA 0,91 1 Slovenia 76,85 1 0
SOUTH AFRICA 0,25 2 South Africa 64,39 2 0
SPAIN 0,86 1 Spain 84,21 1 0
SRI LANKA -0,38 3 Sri Lanka 49,85 3 0
SUDAN -1,61 4 Sudan 36,19 4 0
SWAZILAND -0,51 3 Swaziland 51,14 3 0
SWEDEN 1,77 1 Sweden 87,63 1 0
SWITZERLAND 1,71 1 Switzerland 86,28 1 0 SYRIAN ARAB REPUBLIC -0,92 4 Syria 43,67 4 0
TAJIKISTAN -1,11 4 Tajikistan 40,79 4 0
TIMOR-LESTE -0,83 4 Timor-Leste 24,35 4 0
TRINIDAD AND TOBAGO 0,10 2
Trinidad and Tobago 57,97 2 0
TUNISIA -0,20 2 Tunisia 59,58 2 0
TURKEY -0,05 2 Turkey 69,02 2 0
TURKMENISTAN -1,38 4 Turkmenistan 36,06 4 0
UGANDA -0,58 3 Uganda 46,18 3 0 UNITED KINGDOM 1,39 1
United Kingdom 85,39 1 0
UNITED STATES 1,24 1 United States of America 74,76 1 0
UZBEKISTAN -1,29 4 Uzbekistan 34,41 4 0
VIETNAM -0,57 3 Vietnam 47,02 3 0
70
YEMEN, REP. -1,27 4 Yemen 45,18 4 0
ZAMBIA -0,36 3 Zambia 55,62 3 0
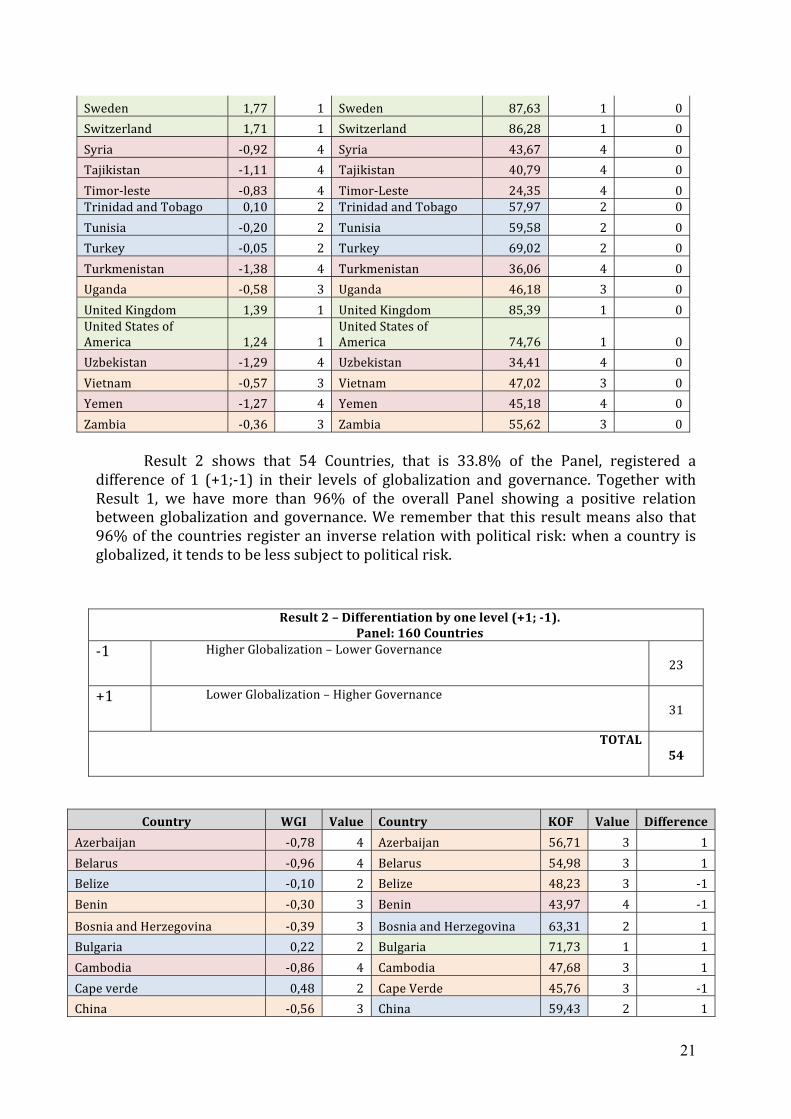
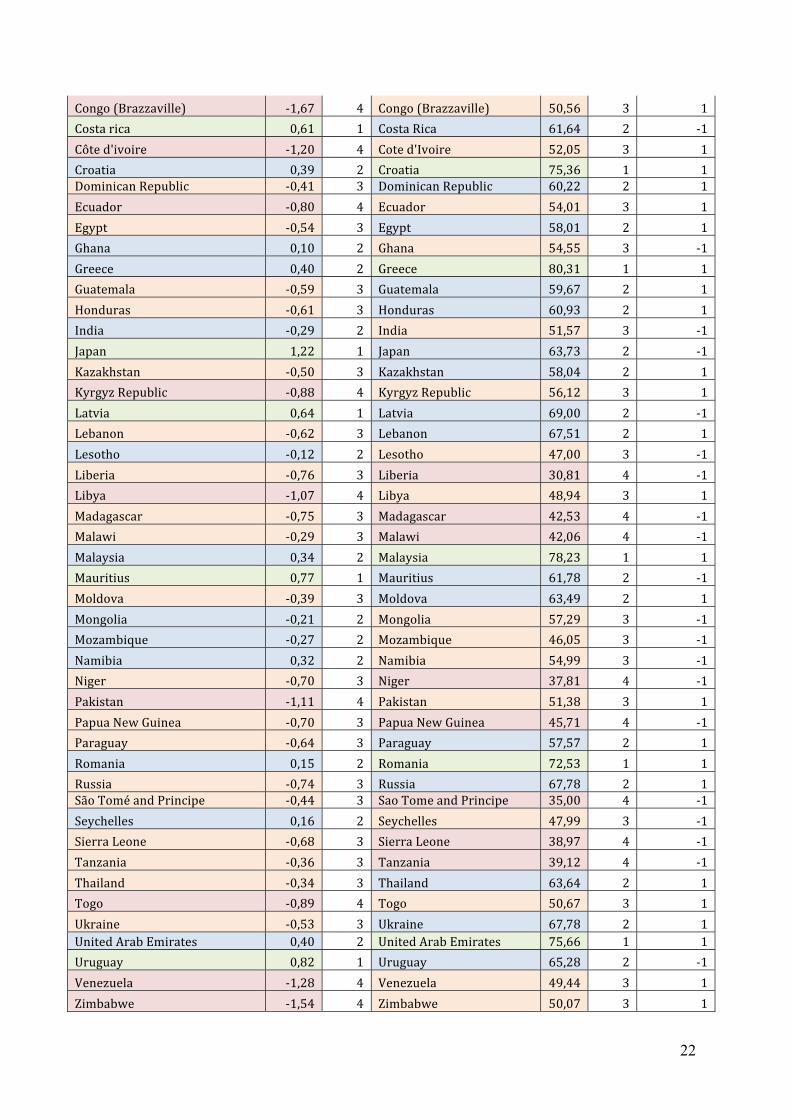
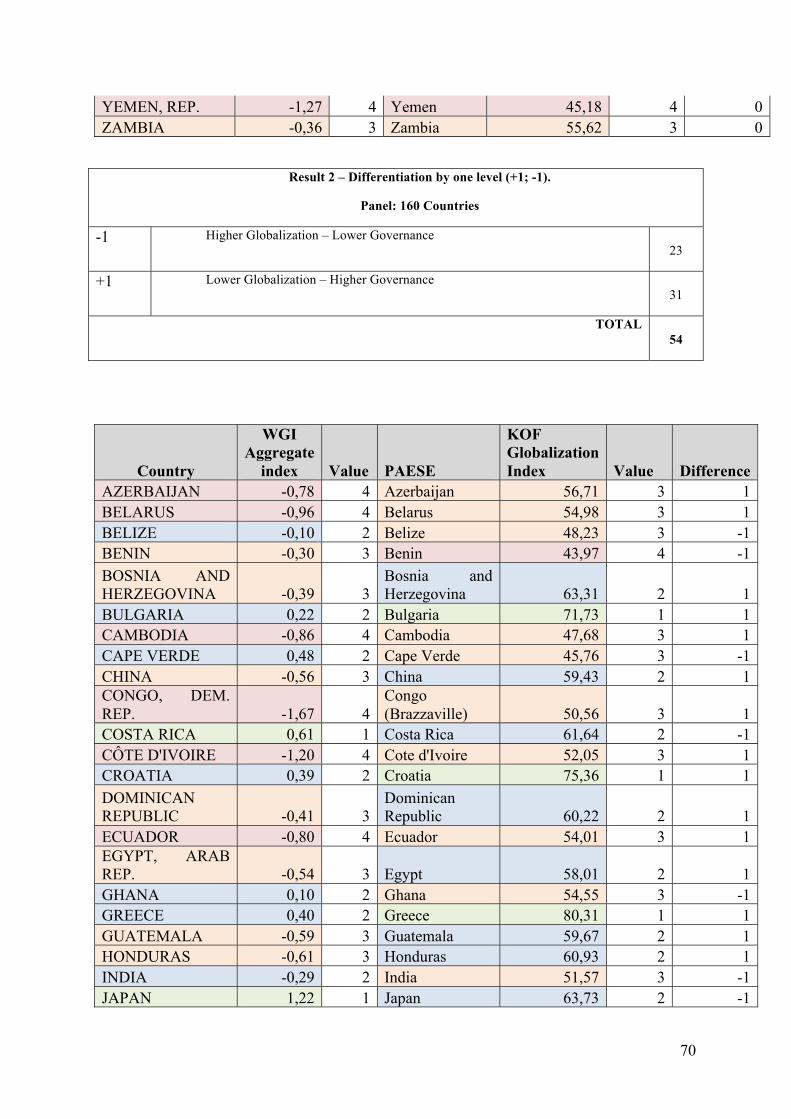
Result 2 – Differentiation by one level (+1; -1).
Panel: 160 Countries
-1 Higher Globalization – Lower Governance 23
+1 Lower Globalization – Higher Governance 31
TOTAL 54
Country
WGI Aggregate
index Value PAESE
KOF Globalization Index Value Difference
AZERBAIJAN -0,78 4 Azerbaijan 56,71 3 1
BELARUS -0,96 4 Belarus 54,98 3 1
BELIZE -0,10 2 Belize 48,23 3 -1
BENIN -0,30 3 Benin 43,97 4 -1
BOSNIA AND HERZEGOVINA -0,39 3
Bosnia and Herzegovina 63,31 2 1
BULGARIA 0,22 2 Bulgaria 71,73 1 1
CAMBODIA -0,86 4 Cambodia 47,68 3 1
CAPE VERDE 0,48 2 Cape Verde 45,76 3 -1
CHINA -0,56 3 China 59,43 2 1 CONGO, DEM. REP. -1,67 4
Congo (Brazzaville) 50,56 3 1
COSTA RICA 0,61 1 Costa Rica 61,64 2 -1
CÔTE D'IVOIRE -1,20 4 Cote d'Ivoire 52,05 3 1
CROATIA 0,39 2 Croatia 75,36 1 1
DOMINICAN REPUBLIC -0,41 3
Dominican Republic 60,22 2 1
ECUADOR -0,80 4 Ecuador 54,01 3 1 EGYPT, ARAB REP. -0,54 3 Egypt 58,01 2 1
GHANA 0,10 2 Ghana 54,55 3 -1
GREECE 0,40 2 Greece 80,31 1 1
GUATEMALA -0,59 3 Guatemala 59,67 2 1
HONDURAS -0,61 3 Honduras 60,93 2 1
INDIA -0,29 2 India 51,57 3 -1
JAPAN 1,22 1 Japan 63,73 2 -1
71
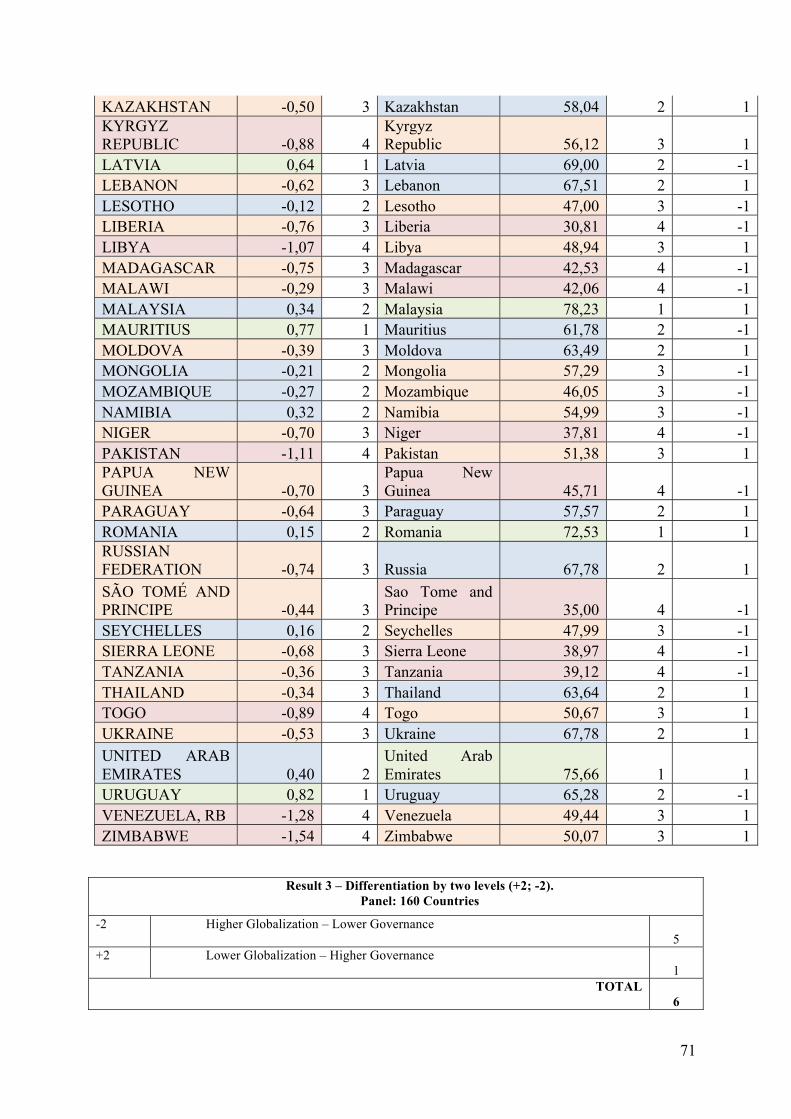
KAZAKHSTAN -0,50 3 Kazakhstan 58,04 2 1 KYRGYZ REPUBLIC -0,88 4
Kyrgyz Republic 56,12 3 1
LATVIA 0,64 1 Latvia 69,00 2 -1
LEBANON -0,62 3 Lebanon 67,51 2 1
LESOTHO -0,12 2 Lesotho 47,00 3 -1
LIBERIA -0,76 3 Liberia 30,81 4 -1
LIBYA -1,07 4 Libya 48,94 3 1
MADAGASCAR -0,75 3 Madagascar 42,53 4 -1
MALAWI -0,29 3 Malawi 42,06 4 -1
MALAYSIA 0,34 2 Malaysia 78,23 1 1
MAURITIUS 0,77 1 Mauritius 61,78 2 -1
MOLDOVA -0,39 3 Moldova 63,49 2 1
MONGOLIA -0,21 2 Mongolia 57,29 3 -1
MOZAMBIQUE -0,27 2 Mozambique 46,05 3 -1
NAMIBIA 0,32 2 Namibia 54,99 3 -1
NIGER -0,70 3 Niger 37,81 4 -1
PAKISTAN -1,11 4 Pakistan 51,38 3 1 PAPUA NEW GUINEA -0,70 3
Papua New Guinea 45,71 4 -1
PARAGUAY -0,64 3 Paraguay 57,57 2 1
ROMANIA 0,15 2 Romania 72,53 1 1 RUSSIAN FEDERATION -0,74 3 Russia 67,78 2 1
SÃO TOMÉ AND PRINCIPE -0,44 3
Sao Tome and Principe 35,00 4 -1
SEYCHELLES 0,16 2 Seychelles 47,99 3 -1
SIERRA LEONE -0,68 3 Sierra Leone 38,97 4 -1
TANZANIA -0,36 3 Tanzania 39,12 4 -1
THAILAND -0,34 3 Thailand 63,64 2 1
TOGO -0,89 4 Togo 50,67 3 1
UKRAINE -0,53 3 Ukraine 67,78 2 1
UNITED ARAB EMIRATES 0,40 2
United Arab Emirates 75,66 1 1
URUGUAY 0,82 1 Uruguay 65,28 2 -1
VENEZUELA, RB -1,28 4 Venezuela 49,44 3 1
ZIMBABWE -1,54 4 Zimbabwe 50,07 3 1
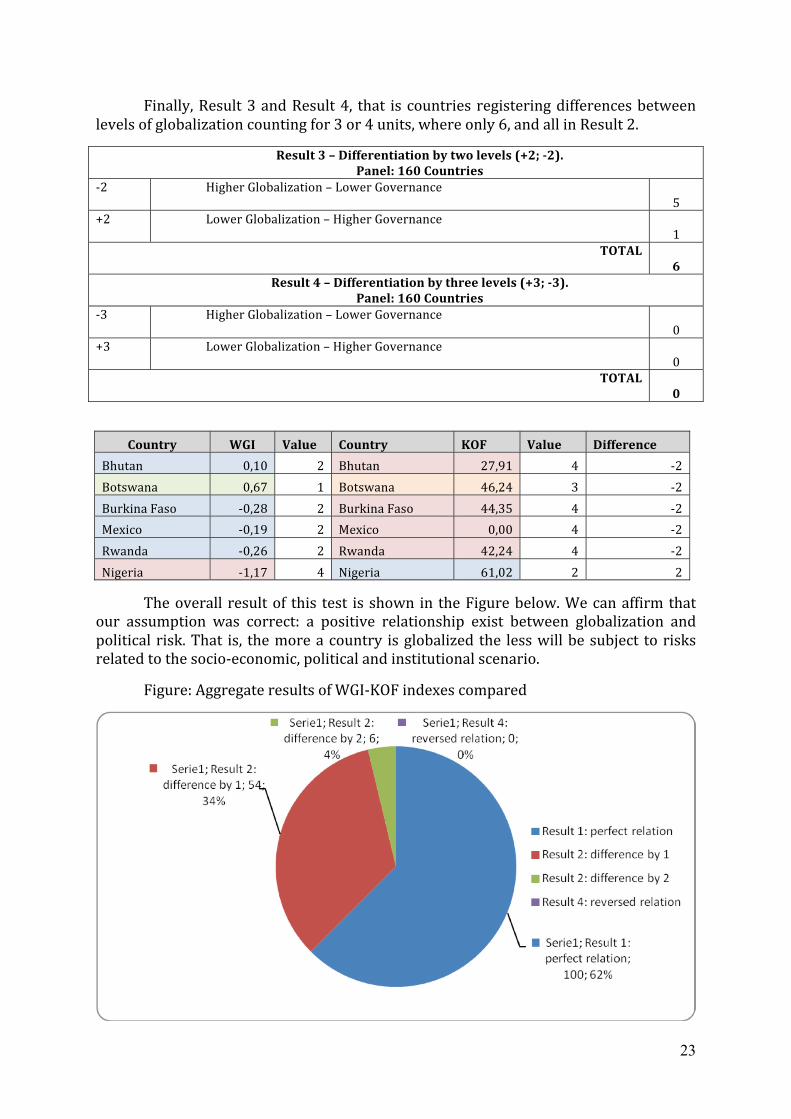
Result 3 – Differentiation by two levels (+2; -2). Panel: 160 Countries
-2 Higher Globalization – Lower Governance 5
+2 Lower Globalization – Higher Governance 1
TOTAL 6
72
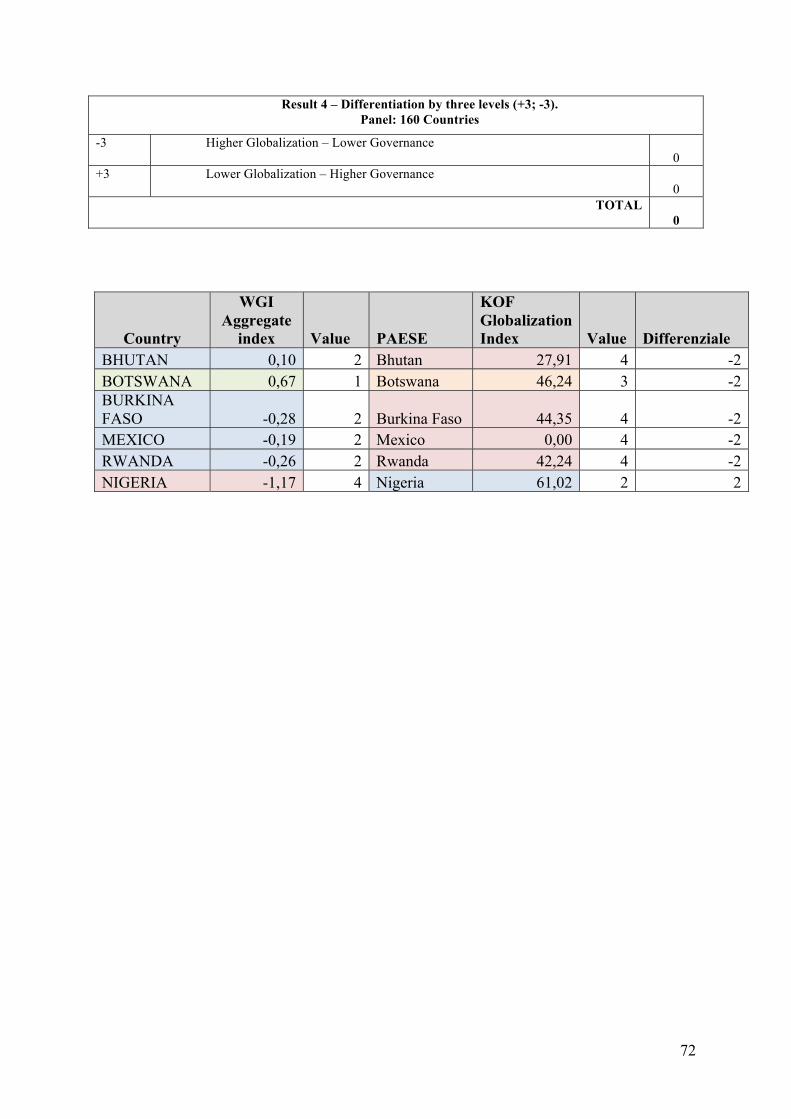
Result 4 – Differentiation by three levels (+3; -3). Panel: 160 Countries
-3 Higher Globalization – Lower Governance 0
+3 Lower Globalization – Higher Governance 0
TOTAL 0
Country
WGI Aggregate
index Value PAESE
KOF Globalization Index Value Differenziale
BHUTAN 0,10 2 Bhutan 27,91 4 -2
BOTSWANA 0,67 1 Botswana 46,24 3 -2 BURKINA FASO -0,28 2 Burkina Faso 44,35 4 -2
MEXICO -0,19 2 Mexico 0,00 4 -2
RWANDA -0,26 2 Rwanda 42,24 4 -2
NIGERIA -1,17 4 Nigeria 61,02 2 2
Copyright © 2022 FDOKUMEN