Citizens' Attitude towards Political Corruption and the Impact ...
256
Doctoral Programme in Economics and Business Universitat Jaume I Doctoral School Citizens’ Attitude towards Political Corruption and the Impact of Social Media Report submitted by Guillermo Belda Mullor in order to be eligible for a doctoral degree awarded by the Universitat Jaume I Guillermo Belda Mullor Javier Sánchez García & John Cardiff Castelló de la Plana, November 2018
-
Upload
khangminh22 -
Category
Documents
-
view
2 -
download
0
Transcript of Citizens' Attitude towards Political Corruption and the Impact ...

Doctoral Programme in Economics and Business
Universitat Jaume I Doctoral School
Citizens’ Attitude towards Political Corruption
and the Impact of Social Media
Report submitted by Guillermo Belda Mullor in order to be eligible for a
doctoral degree awarded by the Universitat Jaume I
Guillermo Belda Mullor Javier Sánchez García & John Cardiff
Castelló de la Plana, November 2018


Funding
VALi+d Programme (ACIF/2014), Grant for predoctoral contracts awarded by
the Regional Ministry of Education, Research, Culture and Sports of the
Generalitat Valenciana.


Acknowledgements
I would like to thank my supervisors, Dr. Javier Sánchez García and Dr. John
Cardiff, for all the guidance and advice I received from them. All their support has been
the key to carry out this research. They taught me how to do research and also how to
summarise the results, giving me continuous feedback and suggestions and being
available at any time for all my questions.
Finally, I would like also to thank my family, as their support is always essential in
each one of my achievements.


Table of Contents
Chapter 1. Introduction ................................................................................................... 15
1.1 Motivation for this Research ................................................................................ 15
Research Topic Contextualization ................................................................. 15 1.1.1
The suitability of the Spanish case ................................................................ 16 1.1.2
The Spanish Political Landscape ................................................................... 18 1.1.3
1.2 Research Statements ............................................................................................. 21
1.3 Contributions of this Thesis .................................................................................. 25
1.4 Organisation of this Thesis ................................................................................... 26
Chapter 2. Literature Review.......................................................................................... 27
2.1 Introduction .......................................................................................................... 27
Political Corruption Definition ...................................................................... 27 2.1.1
Political Corruption’s Impact ........................................................................ 28 2.1.2
Political Corruption's electoral consequences ............................................... 32 2.1.3
2.2 Citizens’ attitudes towards political corruption: The key variables ..................... 37
Introduction ................................................................................................... 37 2.2.1
Political Awareness ....................................................................................... 38 2.2.2
Political Leaning ............................................................................................ 44 2.2.3
Political Sympathy ......................................................................................... 50 2.2.4
Economic context .......................................................................................... 57 2.2.5
The New Parties’ Emergence ........................................................................ 61 2.2.6
Social Pressure ............................................................................................... 68 2.2.7
2.3 Social media role on politics ................................................................................ 73
Introduction ................................................................................................... 73 2.3.1
Analysing the impact of social media on political attitudes and behaviour .. 75 2.3.2
Twitter Platform Analysis ............................................................................. 80 2.3.3

Detecting and Measuring Influence on Twitter ............................................. 82 2.3.4
Political Debate on Twitter ............................................................................ 85 2.3.5
Analysing Political Conversations on Twitter ............................................... 88 2.3.6
2.4 Conclusions .......................................................................................................... 95
Chapter 3. Hypotheses Formulation ............................................................................... 97
3.1 Introduction .......................................................................................................... 97
3.2 Hypotheses related to “Real World” .................................................................... 97
Hypothesis 1: Economic Context and Attitude towards Political Corruption 97 3.2.1
Hypothesis 2: Social Pressure vs. Factual Information ................................. 98 3.2.2
Hypothesis 3: Political Awareness and Attitude towards Political Corruption3.2.3
................................................................................................................................ 99
Hypothesis 4: Political Leaning and Attitude towards Political Corruption 100 3.2.4
Hypothesis 5: New parties’ emergence and Attitude towards Political 3.2.5
Corruption ............................................................................................................. 101
Hypothesis 6: Political Sympathy and Attitude towards Political Corruption3.2.6
.............................................................................................................................. 102
3.3 Hypotheses related to “Virtual World” .............................................................. 102
Hypothesis 7: Political Leaning and Attitude towards Political Corruption in 3.3.1
the online debate ................................................................................................... 103
Hypothesis 8: New parties’ emergence and Attitude towards Political 3.3.2
Corruption in the online debate ............................................................................ 105
Hypothesis 9: Political Sympathy and Attitude towards Political Corruption 3.3.3
in the online debate ............................................................................................... 106
3.4 Model of the Thesis ............................................................................................ 107
Chapter 4. Citizens’ attitudes towards political corruption in the Real World:
Experiments and analysis ............................................................................................. 111
4.1 Introduction ........................................................................................................ 111
4.2 Survey design ..................................................................................................... 112

Survey structure ........................................................................................... 113 4.2.1
Sample ......................................................................................................... 114 4.2.2
Procedures ................................................................................................... 115 4.2.3
4.3 Methodology and Experiments ........................................................................... 120
Hypothesis 1: Experiments and outcomes ................................................... 120 4.3.1
Hypothesis 2: Experiments and outcomes ................................................... 127 4.3.2
Hypothesis 3: Experiments and outcomes ................................................... 134 4.3.3
Hypothesis 4: Experiments and outcomes ................................................... 140 4.3.4
Hypothesis 5: Experiments and outcomes ................................................... 145 4.3.5
Hypothesis 6: Experiments and outcomes ................................................... 155 4.3.6
4.4 Analysis of results .............................................................................................. 177
4.5 Conclusions ........................................................................................................ 182
Chapter 5. Political debate in the Online World: Experiments and analysis ................ 187
5.1 Introduction ........................................................................................................ 187
5.2 Datasets ............................................................................................................... 189
Dataset Analysis: Structure and Content ..................................................... 191 5.2.1
Dataset Analysis: Tweet Authorship ........................................................... 193 5.2.2
Procedures ................................................................................................... 196 5.2.3
5.3 Methodology and Experiments ........................................................................... 197
Hypothesis 7: Experiments and outcomes ................................................... 197 5.3.1
Hypothesis 8: Experiments and outcomes ................................................... 203 5.3.2
Hypothesis 9: Experiments and outcomes ................................................... 208 5.3.3
5.4 Analysis of results .............................................................................................. 215
5.5 Conclusions ........................................................................................................ 218
Chapter 6. Conclusions ................................................................................................. 221

List of Figures
FIGURE 1-1 PARTIES’ POLITICAL IDEOLOGY PERCEIVED ............................................................................................ 19
FIGURE 1-2 ELECTORAL RESULTS 2011 VS. 2016 .................................................................................................. 20
FIGURE 1-3 SPANISH VOTERS' DISTRIBUTION BY AGE ............................................................................................. 20
FIGURE 3-1 MODEL OF THE THESIS ................................................................................................................... 108
FIGURE 4-1 CITIZENS WITH A NEGATIVE ASSESSMENT (%) (1996 – 2017) ............................................................... 125
FIGURE 4-2 GROWTH RATES OF CONCERN OVER CORRUPTION AND GDP (%) (2003 – 2017) ..................................... 126
FIGURE 4-3 EVOLUTION OF THE CRITICISM’S LEVEL TOWARDS POLITICAL CORRUPTION SINCE THE ECONOMIC CRISIS STARTED
........................................................................................................................................................ 126
FIGURE 4-4 ATTITUDE TOWARDS POLITICAL CORRUPTION VS. SCENARIO .................................................................. 132
FIGURE 4-5 PIECES OF NEWS’ IMPACT ............................................................................................................... 133
FIGURE 4-6 ATTITUDE TOWARDS POLITICAL CORRUPTION VS. POLITICAL AWARENESS .................................................. 140
FIGURE 4-7 ATTITUDE TOWARDS POLITICAL CORRUPTION VS. POLITICAL LEANING ...................................................... 144
FIGURE 4-8 ATTITUDE TOWARDS POLITICAL CORRUPTION VS. TRADITIONAL/NEW PARTIES’ SUPPORTERS ........................ 153
FIGURE 4-9 ATTITUDE TOWARDS POLITICAL CORRUPTION VS. PREFERRED PARTY ........................................................ 154
FIGURE 5-1 DISTRIBUTION OF USERS’ REACTIONS ON TWITTER ............................................................................... 192
FIGURE 5-2 POLITICAL LEANING OF USERS WHO ARE SPREADING THE MOST RETWEETED MESSAGES AGAINST POLITICAL
CORRUPTION ON TWITTER ..................................................................................................................... 201
FIGURE 5-3 POLITICAL LEANING OF PARTIES MOST REPORTED ON CORRUPTION IN TWITTER.......................................... 201
FIGURE 5-4 PREFERRED PARTIES’ GROUP OF USERS WHO ARE SPREADING THE MOST RETWEETED MESSAGES AGAINST POLITICAL
CORRUPTION ON TWITTER ..................................................................................................................... 206
FIGURE 5-5 PARTIES’ GROUP OF PARTIES REPORTED ON CORRUPTION ON TWITTER .................................................... 207
FIGURE 5-6 PREFERRED PARTY OF USERS WHO ARE SPREADING THE MOST RETWEETED MESSAGES AGAINST POLITICAL
CORRUPTION ON TWITTER ..................................................................................................................... 212
FIGURE 5-7 PARTIES REPORTED ON CORRUPTION ON TWITTER ............................................................................... 213

List of Tables
TABLE 3-1 HYPOTHESES OF THE THESIS ............................................................................................................. 107
TABLE 4-1 HYPOTHESES RELATED TO THE REAL WORLD ......................................................................................... 111
TABLE 4-2 INTERVIEWS’ DISTRIBUTION .............................................................................................................. 114
TABLE 4-3 TECHNICAL FORM OF THE SURVEY ...................................................................................................... 114
TABLE 4-4 SCENARIOS PROPOSED ..................................................................................................................... 116
TABLE 4-5 ATTITUDE TOWARDS POLITICAL CORRUPTION ....................................................................................... 117
TABLE 4-6 ECONOMIC AND SOCIAL CONSEQUENCES VS. FACTUAL INFORMATION ....................................................... 117
TABLE 4-7 ATTITUDE TOWARDS POLITICAL CORRUPTION IN THEIR OWN PARTY ........................................................... 119
TABLE 4-8 HYPOTHESES – BIVARIATE CORRELATION H1A1 - ................................................................................... 123
TABLE 4-9 PEARSON’S CORRELATION COEFFICIENT FOR H1A1 ................................................................................. 123
TABLE 4-10 HYPOTHESES – BIVARIATE CORRELATION H1A2 - ................................................................................. 124
TABLE 4-11 PEARSON’S CORRELATION COEFFICIENT FOR H5A2 ............................................................................... 124
TABLE 4-12 EVOLUTION OF THE CRITICISM’S LEVEL TOWARDS POLITICAL CORRUPTION FOR H1A3 .................................. 124
TABLE 4-13 HYPOTHESES –T-TEST ANALYSIS H2A1- ............................................................................................. 130
TABLE 4-14 HYPOTHESES - LEVENE'S TEST FOR H2A1- .......................................................................................... 130
TABLE 4-15 LEVENE’S TEST FOR H2A1 ............................................................................................................... 131
TABLE 4-16 T-TEST ANALYSIS H2A1 .................................................................................................................. 131
TABLE 4-17 PIECES OF NEWS’ IMPACT FOR H2A2 ................................................................................................. 131
TABLE 4-18 RELIABILITY AND VALIDITY CONDITIONS ............................................................................................ 135
TABLE 4-19 RELIABILITY STATISTICS .................................................................................................................. 135
TABLE 4-20 ITEM-TOTAL STATISTICS ................................................................................................................. 135
TABLE 4-21 KAISER-MEYER-OLKIN MEASURE OF SAMPLING ADEQUACY ................................................................. 136
TABLE 4-22 BARTLETT’S TEST OF SPHERICITY ...................................................................................................... 136
TABLE 4-23 TOTAL VARIANCE EXPLAINED .......................................................................................................... 136
TABLE 4-24 COMPONENT MATRIX ................................................................................................................... 136
TABLE 4-25 HYPOTHESES -ANOVA ANALYSIS H3A1- ........................................................................................... 137
TABLE 4-26 HYPOTHESES - LEVENE'S TEST FOR H3A1- .......................................................................................... 138
TABLE 4-27 LEVENE’S TEST FOR H3A1 ............................................................................................................... 138
TABLE 4-28 ANOVA ANALYSIS H3A1................................................................................................................ 138
TABLE 4-29 BONFERRONI TEST FOR H3A1 .......................................................................................................... 139
TABLE 4-30 HYPOTHESES -ANOVA ANALYSIS H4A1- ........................................................................................... 142
TABLE 4-31 HYPOTHESES - LEVENE'S TEST FOR H3A1- .......................................................................................... 142
TABLE 4-32 LEVENE’S TEST FOR H4A1 ............................................................................................................... 142
TABLE 4-33 ANOVA ANALYSIS H4A1................................................................................................................ 142
TABLE 4-34 GAMES-HOWELL’S TEST FOR H4A1 .................................................................................................. 143
TABLE 4-35 HYPOTHESES –T-TEST ANALYSIS H5A1- ............................................................................................. 147

TABLE 4-36 HYPOTHESES - LEVENE'S TEST FOR H5A1- .......................................................................................... 148
TABLE 4-37 LEVENE’S TEST FOR H5A1 ............................................................................................................... 148
TABLE 4-38 T-TEST ANALYSIS H5A1 .................................................................................................................. 148
TABLE 4-39 HYPOTHESES –CROSSTABS ANALYSIS H5A2- ....................................................................................... 148
TABLE 4-40 CHI-SQUARED TEST FOR H5A2 ........................................................................................................ 149
TABLE 4-41 CRAMER’S V TEST FOR H5A2 .......................................................................................................... 149
TABLE 4-42 HYPOTHESES -ANOVA ANALYSIS H5A3- ........................................................................................... 149
TABLE 4-43 HYPOTHESES - LEVENE'S TEST FOR H5A3- .......................................................................................... 150
TABLE 4-44 LEVENE’S TEST FOR H5A3 ............................................................................................................... 150
TABLE 4-45 ANOVA ANALYSIS H5A3................................................................................................................ 150
TABLE 4-46 GAMES-HOWELL’S TEST FOR H5A3 .................................................................................................. 151
TABLE 4-47 HYPOTHESES –CROSSTABS ANALYSIS H5A4- ....................................................................................... 152
TABLE 4-48 CHI-SQUARED TEST FOR H5A4 ........................................................................................................ 152
TABLE 4-49 CONTINGENCY COEFFICIENT TEST FOR H5A4 ...................................................................................... 152
TABLE 4-50 VOTER’S DISTRIBUTION BY AGE AND PARTIES’ GROUP SUPPORTED .......................................................... 154
TABLE 4-51 PARTIES SUPPORTERS’ DISTRIBUTION BY AGE ...................................................................................... 155
TABLE 4-52 HYPOTHESES -ANOVA ANALYSIS H6A1- ........................................................................................... 158
TABLE 4-53 HYPOTHESES - LEVENE'S TEST FOR H6A1- .......................................................................................... 159
TABLE 4-54 LEVENE’S TEST FOR H6A1 ............................................................................................................... 159
TABLE 4-55 ANOVA ANALYSIS H6A1................................................................................................................ 159
TABLE 4-56 GAMES-HOWELL’S TEST FOR H6A1 .................................................................................................. 160
TABLE 4-57 HYPOTHESES -ANOVA ANALYSIS H6A2- ........................................................................................... 161
TABLE 4-58 HYPOTHESES - LEVENE'S TEST FOR H6A2- .......................................................................................... 161
TABLE 4-59 LEVENE’S TEST FOR H6A2 ............................................................................................................... 161
TABLE 4-60 ANOVA ANALYSIS H6A2................................................................................................................ 161
TABLE 4-61 GAMES-HOWELL’S TEST FOR H6A2 .................................................................................................. 162
TABLE 4-62 HYPOTHESES -ANOVA ANALYSIS H6A3- ........................................................................................... 163
TABLE 4-63 HYPOTHESES - LEVENE'S TEST FOR H6A3- .......................................................................................... 163
TABLE 4-64 LEVENE’S TEST FOR H6A3 ............................................................................................................... 163
TABLE 4-65 ANOVA ANALYSIS H6A3................................................................................................................ 163
TABLE 4-66 GAMES-HOWELL’S TEST FOR H6A3 .................................................................................................. 164
TABLE 4-67 HYPOTHESES -ANOVA ANALYSIS H6A4- ........................................................................................... 165
TABLE 4-68 HYPOTHESES - LEVENE'S TEST FOR H6A4- .......................................................................................... 165
TABLE 4-69 LEVENE’S TEST FOR H6A4 ............................................................................................................... 165
TABLE 4-70 ANOVA ANALYSIS H6A4................................................................................................................ 166
TABLE 4-71 BONFERRONI TEST FOR H6A4 .......................................................................................................... 166
TABLE 4-72 HYPOTHESES -ANOVA ANALYSIS H6A5- ........................................................................................... 167
TABLE 4-73 HYPOTHESES - LEVENE'S TEST FOR H6A5- .......................................................................................... 167
TABLE 4-74 LEVENE’S TEST FOR H6A5 ............................................................................................................... 168
TABLE 4-75 ANOVA ANALYSIS H6A5................................................................................................................ 168
TABLE 4-76 GAMES-HOWELL’S TEST FOR H6A5 .................................................................................................. 168
TABLE 4-77 HYPOTHESES -ANOVA ANALYSIS H6A6- ........................................................................................... 169
TABLE 4-78 HYPOTHESES - LEVENE'S TEST FOR H6A6- .......................................................................................... 170
TABLE 4-79 LEVENE’S TEST FOR H6A6 ............................................................................................................... 170
TABLE 4-80 ANOVA ANALYSIS H6A6................................................................................................................ 170
TABLE 4-81 GAMES-HOWELL’S TEST FOR H6A6 .................................................................................................. 171
TABLE 4-82 HYPOTHESES -ANOVA ANALYSIS H6A7- ........................................................................................... 172
TABLE 4-83 HYPOTHESES - LEVENE'S TEST FOR H6A7- .......................................................................................... 172
TABLE 4-84 LEVENE’S TEST FOR H6A7 ............................................................................................................... 172
TABLE 4-85 ANOVA ANALYSIS H6A7................................................................................................................ 172
TABLE 4-86 GAMES-HOWELL’S TEST FOR H6A7 .................................................................................................. 173
TABLE 4-87 CORRUPTION PERCEIVED IN EACH PARTY CONSIDERING THE PREFERRED PARTY .......................................... 174
TABLE 4-88 ATTITUDE TOWARDS CORRUPTION PERCEIVED IN A SPECIFIC CASE OF CORRUPTION ..................................... 175
TABLE 5-1 HYPOTHESES RELATED TO THE VIRTUAL WORLD ..................................................................................... 188
TABLE 5-2 DISTRIBUTION OF TWEETS ................................................................................................................ 191
TABLE 5-3 EXAMPLES OF RETWEET AUTHORS CLASSIFICATION ............................................................................... 194
TABLE 5-3 EXAMPLES OF RETWEET AUTHORS CLASSIFICATION (CONTINUATION) ....................................................... 195
TABLE 5-4 USER’S POLITICAL LEANING FOR H7A1 ................................................................................................ 199
TABLE 5-5 PARTIES’ POLITICAL LEANING FOR H7A2 .............................................................................................. 199
TABLE 5-6 HYPOTHESES –CROSSTABS ANALYSIS H7A3- ......................................................................................... 200
TABLE 5-7 CHI-SQUARED TEST FOR H7A3 .......................................................................................................... 200
TABLE 5-8 CRAMER’S V TEST FOR H7A3 ............................................................................................................ 200
TABLE 5-9 USERS’ REPORTS DISTRIBUTION BY POLITICAL LEANING OF THE PARTY REPORTED.......................................... 202
TABLE 5-10 USER’S PREFERRED PARTIES’ GROUP FOR H8A1 ................................................................................... 204
TABLE 5-11 PARTIES’ GROUP FOR H8A2 ............................................................................................................ 205
TABLE 5-12 HYPOTHESES –CROSSTABS ANALYSIS H8A3- ....................................................................................... 205
TABLE 5-13 CHI-SQUARED TEST FOR H8A3 ........................................................................................................ 205
TABLE 5-14 CRAMER’S V TEST FOR H8A3 .......................................................................................................... 206
TABLE 5-15 USERS’ REPORTS DISTRIBUTION BY PARTIES’ GROUP ............................................................................. 207
TABLE 5-16 USER’S PREFERRED PARTY H9A1 ..................................................................................................... 210
TABLE 5-17 PARTIES FOR H9A2 ........................................................................................................................ 210
TABLE 5-18 HYPOTHESES –CROSSTABS ANALYSIS H9A3- ....................................................................................... 211
TABLE 5-19 CHI-SQUARED TEST FOR H9A3 ........................................................................................................ 211
TABLE 5-20 CONTINGENCY COEFFICIENT TEST FOR H9A3 ...................................................................................... 211
TABLE 5-21 USERS’ REPORTS DISTRIBUTION BY PARTY REPORTED ............................................................................ 213


15
Chapter 1. Introduction
1.1 Motivation for this Research
Research Topic Contextualization 1.1.1
Citizens are increasingly concerned about political corruption, and parties,
especially during the electoral campaigns, promise voters not only that they will
implement strictly measurements to avoid it, but also that they will expel of their parties
those politicians involved in corruption. However, although the politicians not always
keep these promises, there are several electoral processes which show they are not as
much penalized as it could be expected. Citizens’ attitude towards political corruption
seems to be the key to explain what is behind of this behaviour.
Political corruption is damaging democracies’ quality. In political corruption, it can
be distinguished two different levels of responsibility: legal and political. Although they
are naturally connected and citizens’ attitude towards political corruption impacts on
both of them, it is necessary to analyse each one independently.
From a legal perspective, there is a legislative branch, which develops the laws
against political corruption; and a judicial branch, which judges it based on them.
Regarding this perspective, in a short term, it seems citizens cannot do too much,
although it is worth noting that the legislation also depends on citizens’ attitudes and
behaviour. History shows a multitude of laws which have been modified after citizens’
mobilizations.
Nevertheless, from a political perspective, citizens’ attitude towards political
corruption has a quicker impact. When a corruption case comes to light, the politician
involved should left his position immediately and his party should expel him.
Unfortunately, it does not happen always and citizens are forced to keep being governed
by corrupted politicians who claim they are not convicted. In these cases, on one hand,
citizens can show their disapproval through citizens’ movements. It has not always a
direct and immediate impact, but, as discussed before, it can contribute in a long term to
modify the legislation. On the other hand, citizens can effectively punish corrupted
politicians and also the parties which hold them, by exerting their right of voting.

16
Citizens would be expected to punish those politicians who have been involved in
corruption, however, not always political corruption has major electoral consequences.
Taking as a starting point the situation described above, the main goal of the thesis
is the analysis of citizens’ attitude towards political corruption. For this purpose, it will
be identified and analysed the factors which play a key role. The information extracted,
on one side, will allow developing better strategies in order to reach a greater impact on
citizens’ attitude towards political corruption; and on the other side, it will help to
understand the results of some electoral processes.
The first part of this thesis will be focused on the analysis of what it has been called
“Real World”. In this part, it will be analysed the role played in citizens’ tolerance
towards political corruption by the following variables: economic context, social
pressure, political awareness, political leaning, the new parties’ emergence and political
sympathy. For this purpose, on one hand, it will be used information provided by two
independent entities: Centro de Investigaciones Sociológicas1 (CIS) and Instituto
Nacional de Estadística2 (INE); and on the other hand, it will be designed and
conducted a specific survey where participants will face questions related to each of the
previous variables.
Then, it will be studied what it has been called “Virtual World”. In this part, it will
be analysed the online debate generated about political corruption. For this purpose, it
will be selected the social network Twitter, one of the most popular forums globally
increasingly considered by scholars as political platform. Furthermore, in general, the
conversations on Twitter are open and accessible to all, and consequently, it is relatively
easy to identify and collect conversations relating to any debate in progress.
The suitability of the Spanish case 1.1.2
Recently, Cordero and Blais (2017) underlined that Spain clearly illustrates how
corruption does not have the electoral consequences it could be expected. In particular,
they highlighted firstly, how during the period 2011-2015 where Spain was going
through an economic crisis, the party in the government was affected for multitude
cases of corruption. Secondly, that these cases of corruption were widely covered by the
1 http://www.cis.es/cis/opencms/EN/index.html
2 http://www.ine.es/en/welcome.shtml

17
media: newspapers, radio, TV, and social media. Thirdly, that the vast majority of
Spanish society was aware and worried about corruption. Concretely, a consequence of
all the corruption scandals, following the CIS3, while in 2011 just 2% of the population
mentioned corruption as one of the main Spanish problems, this percentage increased
until 56% in 2015. In fact, corruption became the second greatest problem for Spaniards
after unemployment4 and the Spain’s score on the Corruption Perception Index by
Transparency International5, on a scale anchored at 0 (highly corrupt) to 100 (very
clean), fell from 65 in 2011 to 58 in 2015. Finally, they stressed how in this context, the
party which was in the government, although being party plagued of corruption, was
still able to win the General Election of December 2015.
Accordingly, Fernández-Vázquez et al. (2016) considered that Spain was an
excellent case to analyse citizens’ attitudes towards political corruption as this country
is a clear example where although voters disliked corruption, incumbents rarely suffered
electoral consequences for their illegal actions. Besides, they pointed out how on a scale
anchored at 0 (highly corrupt) to 10 (very clean), Spain generally scored poorly in all
cross-country rankings of perception of corruption at all administrative levels. Finally,
they emphasised that, as most of the Spanish corruption scandals are investigated by
judicial authorities, there is an extensive press coverage which increased citizens’
political awareness.
Previously, Anduiza et al. (2013) also found Spain was a clear example where
political corruption has not the electoral consequences it could be expected. They
justified the convenience of focusing on Spain the study of citizens’ attitudes towards
political corruption underlining that at the time in which their research was conducted,
political corruption was a salient issue in the country. Particularly, they highlighted on
one side, how the Spain’s score on the Corruption Perception Index by Transparency
International was 6.1 on a scale anchored at 0 (highly corrupt) to 10 (very clean); and on
the other side, that Spain had an institutionalised party system with more than 60% of
its population reporting feeling close to a political party, which in their opinion clearly
benefited the goal of measuring the political sympathy impact.
3 CIS January 2011 and January 2015
4 CIS January 2015
5 https://www.transparency.org/cpi2015

18
Summarising, this research will be focused on Spain because it constitutes a
suitable case to the study of citizens’ attitudes towards political corruption. Firstly, the
last years, Spanish citizens have been facing a multitude scandals of corruption in which
their government has been involved. Secondly, it has recently broken into the political
scene two new parties which claim to be the solution to regenerate a democracy strongly
affected by political corruption: “Podemos” (We can) and “Ciudadanos” (Citizens). The
irruption of these new parties on one hand, has divided the electorate breaking the
traditional bipartisanship; and on the other hand, has contributed to the impossibility of
reaching agreements after the General Elections of December 2015. As a consequence,
the General Elections were repeated on June 2016. Noted that, in the last General
Elections of 2016, Podemos presented a single list in coalition with “Izquierda Unida”
(United Left) under the name “Unidos Podemos” (Together We Can). Finally, Spain, as
mentioned, represents a clear case where political corruption, although Spaniards
declare to be concerned, has not the electoral consequences it could be expected. The
party which was in the government, in despite of being plagued with corruption, not
only won the General Elections in December 2015 with a vote share of 28.7%, but also
the repeated General Elections in June 2016 increasing their support until 33%.
In the following section, it will be described the recent evolution of the Spanish
political situation, how the main parties are perceived in the left-right axis, their last
electoral results, and the electorate’s distribution by age. These characteristics also
make this country especially interesting for this research.
The Spanish Political Landscape 1.1.3
Once it has been explained the reasons to focus the research on Spain, the aim of
this section is to briefly introduce the lector into the current Spanish political situation.
Traditionally, the main parties in Spain have been “Partido Popular” (Popular Party) and
“Partido Socialista Obreo Español” (Social Worker Spanish Party), which have been
associated with the right and left political leaning respectively, and have represented
more than 70% of the Spanish voters. However, in recent years, as a consequence of the
multitude scandals of political corruption and the economic and social crisis, it has
appeared the new parties mentioned before: Podemos, which since the last General
Elections of 2016 is presented in coalition with Izquierda Unida as Unidos Podemos;
and Ciudadanos. For convenience of reference in the discussions, the four main parties

19
will be referred by the acronyms as follows: “Partido Popular” as PP; “Partido
Socialista Obreo Español” as PSOE; “Unidos Podemos” as UP; and “Ciudadanos” as
C’s.
In order to draw a quick picture of the four main Spanish parties, firstly, it will be
analysed where Spaniards place political parties in the traditional left-right axis. Then, it
will be shown the electoral results of the last General Elections which were in June
2016 and those obtained in 2011 in order to better understand the recent evolution of the
Spanish political situation. Finally, it will be studied the age distribution of Spanish
voters.
Regarding the Spaniards’ perception about parties’ political leaning, following the
CIS6, in Figure 1-1 it is shown how being 1 left political leaning and 10 right political
leaning, UP and PSOE are identified as having a left political leaning while C’s and PP
as having a right political leaning.
Figure 1-1 Parties’ Political Ideology perceived
Source: CIS May 2016
Concretely the mean of the citizens’ perceptions are 8.4 for PP, 6.4 for C’s, 4.6 for
PSOE and 2.2 for UP. It is especially relevant how in spite of the efforts that new
parties have made to avoid being classified following the left-right axis, Spaniards
clearly identify them as having a left and a right political leaning. Accordingly, Orriols
and Cordero (2016), when characterising the new parties’ voters, found that UP voters
were mainly politically disaffected citizens with a left political leaning while C’s voters
were citizens with lower levels of political trust and ideologically moderate.
Related to the electoral results, in Figure 1-2 it is represented the recent evolution
of the parties’ support, by comparing the electoral results of June 2016 with those
obtained in November 2011.
6 CIS May 2016

20
Figure 1-2 Electoral results 2011 vs. 2016
Source: www.elpais.com
It is highlighted how traditional parties PP and PSOE have lost supporters,
concretely 13.6pp and 6pp; while new parties UP and C’s have strongly burst into the
political scene with a vote share of 21.1% and 13.1% respectively.
Related to the voter’s distribution by age, following the CIS7, in Figure 1-3 it is
shown how voters between 18 and 44 years feel closer to new parties while those with
more than 55 years clearly prefer traditional parties, therefore, it is underlined how new
parties especially engage with younger voters.
Figure 1-3 Spanish Voters' Distribution by Age
Source: CIS January-March 2016
Finally, it is worth noting how in May 2018, a sentence that condemned for
corruption the government of PP, led to a wide agreement among several parties of the
opposition which allowed PSOE to win a no-confidence motion in June 2018.
7 CIS January-March 2016
44,6%
33,0% 28,7%
22,7%
0%
21,1%
0%
13,1%
26,7%
10,1%
0,0%
5,0%
10,0%
15,0%
20,0%
25,0%
30,0%
35,0%
40,0%
45,0%
50,0%
2011 2016
PP
PSOE
UP
C's
Others
0
5
10
15
20
25
30
35
18 to 24years
25 to 34years
35 to 44years
45 to 54years
55 to 64years
65 or moreyears
PP
PSOE
UP
C's

21
Conclusion
Analysing all the information above, the main conclusion is that the Spanish
political situation has recently lived the greatest revolution of the last decades. Two new
parties have appeared and one of them has been really close to reach the second position
in its first General Elections.
Considering new parties’ ideology, it has been highlighted how both have been
clearly identified as having a left and a right political leaning, which is not a big
difference with the traditional parties. However, the new parties’ emergence has
introduced the age as a decisive variable when classifying voters. New parties’
supporters are clearly younger than those who support traditional parties. Youth
support, being currently a handicap in a society where more than 45% of the population
with voting right is more than 50 years old, is also the main strength of new parties, as
traditional parties will need to attract younger voters if they want to stay in power.
1.2 Research Statements
The main research question of this thesis, based on the fact that political corruption
has not the electoral consequences expected and in order to design better strategies to
promote citizens’ political criticism and achieve a higher quality democracy is: Which
are the factors that have a greater impact on citizens’ attitude towards political
corruption and which is the role played by social media?
In order to address this issue, it will be studied the following aspects:
What is the tolerance’s level towards political corruption? Does it vary
during an economic crisis?
It will be analysed citizens’ evaluation about the economic and political
situation to determine if it is possible to establish a positive correlation
between both indicators. It will be used public data from the CIS, an
independent entity whose main objective is “to contribute scientific
knowledge on Spanish society”. The CIS carries out surveys which allow
finding out the Spaniards opinion in a very different fields and its evolution
over time. For this purpose, it will be studied the evolution of citizens’

22
opinion on economic and political situation measured through the following
indicators: “Economic situation assessment” and “Political situation
assessment”.
Moreover, it will be analysed the relationship between the Gross Domestic
Product (GDP) and the concern over corruption to determine if it is possible
to establish a negative correlation between both indicators. In this case it will
be used data from the INE, an independent entity whose main objective is “to
collect, produce and disseminate relevant, high-quality, official statistical
information”; and also from the CIS. Concretely, it will be studied the
evolution of the following indicators: “GDP growth rate” and “Growth rate
of the concern over corruption”.
Finally, and taking into account that Spain has recently moved from a
situation of economic expansion to an economic crisis, participants will be
directly asked in the survey how is their criticism’s level towards political
corruption since the economic crisis started.
The impact of social pressure on citizens’ attitude towards political
corruption. Has the information emphasizing other citizens’ reactions
against political corruption any effect? Has the information focused on
citizens’ losses a greater impact than the provision of factual
information?
It will be designed two versions of the survey with different scenarios
assigning each one aleatory to half of the sample. The scenario of the first
version will exclusively describe a political corruption case discovered while
in the scenario of the second version, this description will be accompanied by
information about how citizens are reacting. After reading the scenarios,
participants will be asked to indicate their opinion. In order to be able to
focus exclusively on the impact of the different scenarios, these responses
will be compared with the responses expressed by participants in a previous
question where they will be required to indicate their opinion about the same

23
case of political corruption, in this case presented just with a short sentence
without any contextualization.
Besides, in order to analyse if it possible to reach a higher impact on citizens’
criticism towards political corruption through information focused on
citizens’ losses, it will be presented a list of four hypothetical pieces of news
about political corruption (two of them just providing factual information,
and the other two emphasizing the economic and social losses they provoke).
After reading the four hypothetical pieces of news, participants will be asked
to choose the one which they feel as the most serious.
Are citizens with a higher political awareness less tolerant towards
political corruption?
For the purpose of measuring the level of political awareness, participants
will be asked about two questions related to politics; then, they will be
classified taking into account the number of correct questions. Regarding the
analysis of the attitude towards political corruption, participants will be asked
to indicate their opinion on four different cases of political corruption; then,
it will be considered the mean of these opinions.
The effect of citizens' political leaning on their tolerance towards
corruption. Do progressive citizens and conservative citizens exhibit
different level of tolerance?
In order to find out participants’ political leaning, they will be required to
place themselves on a left-right scale. Regarding the analysis of the attitude
towards political corruption, as it has been already described, it will be used
the mean of participants’ evaluations of four political corruption cases.
The impact of the new parties’ emergence. Have new parties’ supporters
different attitude towards political corruption compared with traditional
parties’ supporters?

24
Participants will be asked to indicate the party which they feel closer to their
ideas among a list containing the four main Spanish parties (PP, PSOE, UP
and C’s) and also the option “Other Party”; then, they will be classified as
new parties’ supporters when they select UP or C’s, and as traditional
parties’ supporters when they chose PP, PSOE or the option “Other party”.
Regarding the analysis of the attitude towards political corruption, it will be
also used the mean of participants’ evaluations of four political corruption
cases.
Citizens’ perception about corruption in political parties. How strong do
citizens associate different parties with corruption? Does this association
vary among party’s supporters? Does citizens’ attitude towards a
political case of corruption change when it affects to their own party?
In order to measure the association between parties and corruption,
participants will be asked about the level of corruption perceived in each of
the four main Spanish parties (PP, PSOE, UP and C’s).
For the purpose of analysing if the attitude towards political corruption varies
when it is the preferred party the one involved, participants will face a
hypothetical case of corruption where their preferred party is involved and
they will be required to indicate their opinion. In order to isolate the
partisanship effect, these responses will be compared with the responses
expressed by participants in a previous question where they will be required
to indicate their opinion about the same case of political corruption but
without specifying the party involved.
Who is leading the online debate held on Twitter related to political
corruption? Which is their political leaning? Which is their preferred
party?
It will be analysed the online debate about politics held on Twitter to detect
the political leaning and the preferred party of those users who are

25
contributing to disseminate the messages with the highest rate of diffusion
against political corruption. For this purpose, it will be exhaustively
performed a detailed analysis of the Twitter accounts of those users: their
tweets, their websites, and the information provided in their profiles.
Which are the parties most reported on corruption in the online debate
about political corruption held on Twitter?
It will be also examined the content of the messages most retweeted against
political corruption in the online debate about politics held on Twitter in
order to identify which political parties are the most reported on corruption.
Is it possible to establish any association between users’ preferred party
and parties reported on corruption in the online debate about political
corruption held on Twitter?
Finally, it will be studied the relationship between users’ preferred party of
those users who are spreading the most retweeted messages about political
corruption, and parties reported on corruption in the corruption most reported
on Twitter.
1.3 Contributions of this Thesis
In this section it will be briefly summarised the major contributions of this thesis:
It has been established that an economic crisis impacts on citizens’ attitude
towards political corruption, turning them less tolerant.
It has been found how in order to increase citizens’ criticism towards
political corruption, social pressure is more effective than factual
information.
It has been proved the political awareness’ impact on citizens’ attitude
towards political corruption, being less tolerant as higher it is.
It has been shown the role played by political leaning in citizens’ attitude
towards political corruption, being less tolerant as more progressive they are.

26
It has been demonstrated the effect of the new parties’ emergence, which are
being supported by younger and less tolerant towards political corruption
citizens than traditional parties’ supporters.
It has been established the political sympathy’s impact, which makes citizens
to downplay political corruption when it affects to their preferred party.
The characterisation of the most active users in the online debate about
political corruption held on Twitter as users who feel closer to UP, the new
party with a left political leaning.
The establishment that the party most reported on corruption in the online
debate about political corruption held on Twitter is PP, the traditional party
with a right political leaning.
It has been proved the political sympathy’s impact in the online debate about
political corruption held on Twitter, establishing an association between the
preferred party of the most active users and the parties reported.
1.4 Organisation of this Thesis
This thesis is divided into six chapters. Chapter 1, the current chapter, is an
introduction to the work that will be developed in the following chapters. Chapter 2
contains the literature review while in Chapter 3 it is established and motivated the
hypotheses. The hypotheses themselves are tested in the following two chapters, with
Chapter 4 describing the “Real World” experiments and Chapter 5 containing those
related to the “Virtual World”. Finally, in Chapter 6 it is presented the conclusions of
the thesis.

27
Chapter 2. Literature Review
2.1 Introduction
Political Corruption Definition 2.1.1
Political corruption’s definition can be approached from different perspectives.
Peters and Welch (1978) identified three different general criteria based on legality,
public interest and public opinion.
Following the legal criteria, Nye (1967) stated that a political act is corrupt when it
deviates from the formal duties of a public role because of private-regarding wealth or
status gains; or violates rules against the exercise of certain types of private-regarding
influence. This includes bribery, nepotism and misappropriation. Berg et al. (1976)
pointed out that all corrupt acts are not necessary illegal.
Based on the public interest criteria, Rogow and Lasswell (1963) considered a
political act as corrupt when it violates responsibility towards at least one system of
public or civic order. This definition would enable a politician to justify almost any act
by claiming that it is in the public interest (Peters and Welch, 1978).
Accordingly to the third criteria, a political act is corrupt when the weight of public
opinion determines it (Peters and Welch, 1978; Rundquist and Hansen, 1976). If it is
difficult to agree what is “public interest”, it is even harder to consider a definition
involving the public opinion, as it clearly varies depending on the citizens who are
judging a particular act. Heidenheimer (1970) concluded that an act is corrupt when it is
considered by the general public and also by political elites.
Peters and Welch (1978) designed a study to analyse the attitudes about corruption
held by a large group of public officials. One of their findings was that even if the vast
majority of the public officials were aware that most of the public would identify a
particular act as corrupt, some of them kept not considering it a corrupt act. As an
example, the act of holding a large amount of stock in Standard Oil by a member of
Congress who is working to maintain the oil depletion allowance was viewed as corrupt
just by 55% of the public officials even if 81% considered that this act would be
condemned by the most of the public.

28
As it has been just shown, there are different criteria to approach the corruption,
and all of them seem to be unable by themselves to define this term. In this thesis, it will
be considered a general definition of corruption given by the online Merriam-Webster
Dictionary as “dishonest or illegal behaviour especially by powerful people (such as
government officials or police officers)”8.
Political Corruption’s Impact 2.1.2
It has been empirically demonstrated the negative impact of political corruption on
a society (Charron and Bågenholm, 2016). There is a wide agreement about the harmful
effects not only from a political perspective (Cordero and Blais, 2017; Anderson and
Tverdova, 2003; Seligson, 2002; Nye, 1967); but also from an economic and social
perspective (Cordero and Blais, 2017; Weitz-Shapiro and Winters, 2010; Lambsdorff,
2006; Svensson, 2005; Mauro, 1995; Treisman, 2000). Although most of the effects are
connected, in this thesis they will be classified into three different categories: political,
economic and social.
Regarding the political consequences, it has been shown how political corruption
affects political trust (Cordero and Blais, 2017; Burlacu, 2011; Morris and Klesner,
2010; Chang and Chu, 2006); reduces citizens’ support for political institutions
(Cordero and Blais, 2017; Anderson and Tverdova, 2003) and damages regime
legitimacy (Cordero and Blais, 2017; Burlacu, 2011; Bowler and Karp, 2004; Anderson
and Tverdova 2003; Della Porta, 2000; Rose-Ackerman, 1999). Besides, it has been
found that as higher is the corruption perceived, as lower is the percentage of citizens
going to the polls (Chong et al., 2015; Stockemer et al., 2013). Finally, is has been
demonstrated how high level of corruption represents an opportunity for new parties to
emerge (Ecker et al., 2016).
From an economic perspective, corruption is associated with less economic
development (Charron and Bågenholm, 2016). The World Bank underlined that it is the
most important impediment for development, having a negative impact on efficiency
(Olken and Pande, 2012), deterring investment (Wei, 2000; Kaufman et al., 1999;
Mauro, 1995) and reducing growth (Costas-Pérez et al., 2010; Mauro, 1995).
8 http://www.merriam-webster.com/dictionary/corruption

29
Focusing on the social effects, Charron and Bågenholm (2016) highlighted the
negative relationship between corruption and inequality, Olken and Pande (2012)
underlined how corruption has an adverse effect for equity and Sandholtz and Koetzle
(2000) for fairness. Li et al. (2000) emphasized the association between corruption and
the increase of income inequality and poverty. Mauro (1995) concluded that political
corruption creates distortions on the allocation of public spending damaging the
education and health systems.
The Spanish case
Since 2008, on one hand, Spain is going through an economic and social crisis; and
on the other hand, the traditional parties PP and PSOE have been involved in a
multitude of corruption scandals. As a consequence, following the CIS9, in May 2011
Spaniards were overwhelmingly concerned with the unemployment (which rate was
over 20% of the active population), the economic situation and the party political
system.
In this precarious context, the political debate moved onto blogs and online social
networks as Facebook and Twitter (Vallina-Rodriguez et al., 2012), which managed to
channel the collective indignation (Anduiza et al., 2014). The online political debate
quickly gained adherents and, as a result of merging more than 200 smaller citizen
grassroots organisations, student organisations and other civil movements, it was born
the collective “¡Democracia Real, Ya!” (Real Democracy, Now!), which had a definite
bias to the left (Peña-López et al., 2014; Anduiza et al., 2012). This collective called for
public protests against the established situation to be held on 15 May 2011 in more than
fifty cities across Spain, which led to activists setting up camps in many of the cities,
originating the well-known “Movimiento 15M” (15M Movement), which members
called themselves “Los Indignados” (The Indignant) (Vallina-Rodriguez et al., 2012).
The role played by the online social networks was crucial to generate and spread the call
(Piñeiro-Otero and Costa-Sánchez, 2012; González-Bailón et al., 2011). The interaction
between the physical and the virtual world was essential for this movement to succeed,
feeding both each other with information, coordination and a sense of collective identity
(Peña-López et al., 2014). This movement managed to communicate the Spanish feeling
of indignation to the whole world (Giraldo-Luque, 2018).
9 CIS May 2011

30
In November 2011, PSOE, which had been in the government since 2004, lost the
General Elections; and PP, not only won but also reached the outright majority. During
the period 2011-2015 PP was affected for multitude cases of corruption which were
widely covered by the media. In the following lines it will be summarised four of the
most popular cases of corruption which are still in trial, the so-called “Gürtel case”,
“Barcenas’ papers”, “Púnica operation” and “Brugal case”.
The “Gürtel case” consists in a corrupt organisation which laundered money and
evaded taxes, bribing many PP local and regional leaders mostly in Valencia and
Madrid (Cordero and Blais, 2017; Orriols and Cordero, 2016; Cordero and Montero
2015). One of the consequences of this scandal was the resignation in June 2011, of the
Regional President of Valencia, Francisco Camps.
The “Barcenas’ papers” which is considered as a piece of the “Gürtel case”, is
probably the case of corruption with the strongest impact on PP (Cordero and Blais,
2017). In January 2013, it was published and widely diffused an alleged double
counting of the PP between 1990 and 2009. In these papers, it was registered illegal
bonus payments to several leaders of the party, including Prime Minister Mariano
Rajoy. Concretely, following this information, he was accused to receive 25000 €
between 1997 and 2008.
The “Púnica operation” refers to an investigation of a corruption plot which
involves politicians, officials and businessmen. This corrupt plot operated mainly in
Madrid and, following the information published, it was awarded public services worth
250 million euros in two years in exchange for illegal payments and commissions,
which were subsequently laundered through a societal network (Orriols and Cordero,
2016). One of the main consequences was the arrest in October 2014 of the PP’s
General Secretary of Madrid, Francisco Granados. Nowadays, he is still in prison.
The “Brugal case” involves a corrupt organization of local and provincial leaders of
the PP of Valencia who were investigated for improper awarding of public tenders
(Cordero and Blais, 2017). One of the consequences of this scandal was the resignation
in December 2014, of the Mayor of Alicante (Valencia), Sonia Castedo.
As a consequence of all the corruption scandals, the majority of Spanish society
was aware and worried about corruption and many Spaniards were actively participating

31
in demonstrations against it (Cordero and Blais, 2017; Robles-Egea and Delgado-
Fernandez, 2014). Following the CIS10
, while in 2011 just 2% of the population
mentioned corruption as one of the main Spanish problems, this percentage increased
until 56% in 2015. In fact, corruption became the second greatest problem for Spaniards
after unemployment11
. Accordingly, the Spain’s score on the Corruption Perception
Index by Transparency International12
during the government of PP, on a scale anchored
at 0 (highly corrupt) to 100 (very clean), fell from 65 to 58.
In this context, Podemos and C’s broke into the national political scene claiming to
be the solution to regenerate a democracy strongly affected by political corruption.
Podemos was closely related to the Movimiento 15M (15M Movement) (Kioupkiolis
and Katsambekis, 2018; Franzé, 2017) while C’s was a regional party of Catalonia
opposed to Catalonian nationalism (Rodríguez-Teruel and Barrio, 2016) which jumped
into the national scene focused on the defence of territorial centralisation (Orriols and
Cordero, 2016). These parties reached to break the traditional bipartisanship in the
General Elections of December 2015 and also in the repeated General Elections of June
2016. Concretely, the bipartisanship’s support fell from 73.3% in 2011 to 55.7% in
2016. Orriols and Cordero (2016), when analysing the electoral results, concluded that
the irruption of the new parties supposed the end of the bipartisanship.
However, PP was still able to win both General Elections reaching a vote share of
33% in June 2016. This party has remained in the government until June 2018, when a
sentence that condemned this party for corruption led to a wide agreement among
several parties of the opposition which allowed PSOE to win a no-confidence motion.
Its mandates have been plagued with scandals of corruption which are still in trial and
constantly on the focus of the media, nevertheless, it is remarkable how PP is still today
the first political force with 7906185 votes and 137 seats out of 350.
The Spanish case clearly illustrate how political corruption impacts from a political,
economic and social point of views. Summarising the information above, political
corruption contributed to impoverish population, which in 2011 participated in massive
protests against the established party system and its corruption originating the so-called
“Movimiento 15M” (15M Movement). In turn, this movement contributed to the
10
CIS January 2011 and January 2015 11
CIS January 2015 12
https://www.transparency.org/cpi2015

32
emergence of the new party Podemos in 2014, which has shaken Spanish politics
putting an end to the two-party political system (Sola and Rendueles, 2017).
Political Corruption's electoral consequences 2.1.3
The democratic theory holds that elections act as mechanisms of accountability
against politics who abuse power for their own personal gain (Charron and Bågenholm,
2016). Accordingly, Fernández-Vázquez et al. (2016) underlined that elections are a
citizens’ tool to select and discipline politicians. Therefore, it could be theorised that
voters punish corrupted parties, however, parties’ electoral results are not penalised as
much as it could be expected (Cordero and Blais, 2017; Ecker et al., 2016; Fernández-
Vázquez et al., 2016; Ferraz and Finan, 2008; Golden, 2007; Davis, Camp, and
Coleman, 2004; Jiménez and Caínzos, 2004; McCann and Dominguez, 1998; Dobratz
and Whitfield, 1992; Rundquist et al., 1977). Despite the general disdain for corruption,
it is a high re-election rate of corrupted politicians not only in developing countries but
also in developed democratic countries (Chang and Kerr, 2009). The lack of
consequences have been documented in different countries as Spain (Muñoz et al.,
2016; Anduiza et al., 2013), Canada (Blais et al., 2015), Mexico (Chong et al., 2015;
Chong et al., 2011), the United Kingdom (Vivyan et al., 2012; Egger, 2011), Italy
(Chang et al., 2010), and the US (Dimock and Jacobson, 1995; Peters and Welch, 1980;
Rundquist et al., 1977).
There are citizens who do not consider political corruption as an important problem
to take into account before voting compared with other elements (Anduiza et al., 2013).
There are corrupt politicians who are enjoying repeated electoral success (Cordero and
Blais, 2017; Charron and Bågenholm, 2016) even in countries where citizens have a
high perception of political corruption (Chang and Kerr, 2009).
Many researches have analysed how politics being tried in court have not suffered
serious electoral consequences or even have been re-elected. For instance, Eggers
(2011), when analysing the electoral consequences of the 2009 UK parliamentary
expenses scandal on the 2010 General Elections, demonstrated that the support of those
MPs implicated was reduced only by 1.5 pp.
Chang et al. (2007) showed how in post-war Italy, during ten legislatures, Italian
voters did not penalize legislators being involved in corruption. They also found that the

33
probability of a legislator to be re-elected under judicial investigation for political
malfeasance was over 50%. Chang and Kerr (2009) underlined how Silvio Berlusconi
was re-elected as Prime Minister in Italy in three times, despite of being involved in a
variety of corruption cases, including malfeasance charges and alleged links to the
mafia.
Reed (2005) found that between 1947 and 1993, the 62% of legislators in Japan
who had been convicted of corruption charges were re-elected. Johnson (1986) analysed
how the Japanese Prime Minister, Tanaka Kakuei, being involved in the Lockheed
sandal, was re-elected after the 1983 “Tanaka Verdict Election”.
Peters and Welch (1980) showed that in the U.S. House of Representatives
elections, corruption charges only reduced candidates’ vote share by 6 to 11% and were
unable to avoid corrupted candidates won.
The Spanish case
Cordero and Blais (2017) analysed how corruption could impact on the Spanish
electoral results in the context of the electoral pre-campaign of the Spanish General
Elections of 2015. For this purpose, it was used data from an online survey conducted in
Spain by the Universitat Pompeu Fabra in June 2015 which had a sample size of 2410
respondents. It is remarkable that at the time in which the data was collected political
corruption was a salient issue. The incumbent party (PP) which had won the General
Elections in 2011 with a support of the 44.6%, had had a mandate (2011-2015) plagued
with scandals of corruption as the so-called “Gürtel case”, “Barcenas’ papers”, “Púnica
operation” and “Brugal case”. These corruption cases are still in trial and were on the
focus of the media during the electoral campaign in December 2015.
As a consequence of all the corruption scandals, following the CIS13
, while in 2011
just 2% of the population mentioned corruption as one of the main Spanish problems,
this percentage increased until 56% in 2015. In fact, corruption became the second
greatest problem for Spaniards after unemployment14
. Accordingly, the Spain’s score on
13
CIS January 2011 and January 2015 14
CIS January 2015

34
the Corruption Perception Index by Transparency International15
during the government
of PP, on a scale anchored at 0 (highly corrupt) to 100 (very clean), fell from 65 to 58.
Cordero and Blais (2017) justified the convenience to focus their research on Spain
because this country clearly illustrate how corruption does not have the electoral
consequences it could be expected. Firstly, during the period 2011-2015 where Spain
was going through an economic crisis, the party in the government was affected for
multitude cases of corruption; secondly, these cases of corruption were widely covered
by the media: newspapers, radio, TV, and social media; thirdly, the majority of Spanish
society was aware and worried about corruption and many Spaniards were actively
participating in demonstrations against it; and finally, the incumbent party plagued of
corruption was still able to win the General Election in December 2015. PP lost
electoral support in 2015 in reference to the previous General Elections of 2011,
concretely, PP obtained a 44.6% of votes in November 2011 while in December 2015
its support was 28.7%. It is worth noting that this decrease must be relativized taking
into account the emergence of the new parties Podemos and C’s. However, in despite of
its corruption and the emergence of new parties which were traduced in electoral losses
of 17pp, PP still reached the first position in the General Elections in 2015 with more
than 7 million of votes and 123 seats.
In this context, these researchers were interested in investigating citizens’
willingness to support a corrupt party. In order to address this issue, participants were
required to indicate the likelihood in which they would vote for the incumbent
government (PP) which was strongly affected by corruption on a scale anchored at 0
(not at all likely) to 10 (very likely). This variable was recoded following a very
conservative criterion as follows: “1”, when participants completely reject the idea of
voting for the government; and “0”, otherwise.
The results showed that 35% of respondents considered it was not totally
unacceptable to support the incumbent government in despite of being plagued with
corruption scandals. These results contribute to explain why political corruption has not
the electoral results it could be expected.
15
https://www.transparency.org/cpi2015

35
Previously, Fernández-Vázquez et al. (2016) analysed the impact of corruption on
the electoral results of the Spanish Local Elections held in May 2011. For this purpose,
it was prepared an original dataset with the electoral results of the Local Elections in
May 2007 and May 2011. Besides, following an exhaustive process, it was identified
the corruption scandals between both Local Elections and the municipalities affected.
The result of this process yielded a dataset of 75 municipalities affected by corruption
(1% of Spanish municipalities).
These authors justified the convenience to choose Spain for the study of corruption
underlining how at that time this country was a clear example where although voters
disliked corruption, incumbents rarely suffered electoral consequences for their illegal
actions. Besides, on a scale anchored at 0 (highly corrupt) to 10 (very clean), Spain
generally scored poorly in all cross-country rankings of perception of corruption at all
administrative levels. Finally, they emphasised that, as most of the Spanish corruption
scandals are investigated by judicial authorities, there was an extensive press coverage
which increased citizens’ political awareness.
The results showed on one side, how while 67.9% of the incumbent mayors were
re-elected, this rate was just slightly lower when considering exclusively those mayors
involved in scandals of corruption (62.7%); and on the other side, focusing on the vote
share, how the average loss for the incumbent mayors was -3.4%, while it was slightly
higher when considering exclusively those mayors involved in scandals of corruption (-
8.5%). Moreover, when estimating the impact of political corruption on the vote share
of the incumbent mayors controlling potential confounders, it was found that mayors
involved in corruption scandals just lost an average of 1.8pp. As a consequence, it was
concluded that political corruption has not the electoral consequences it could be
expected.
These results are in agreement with those obtained by Vallina-Rodriguez et al.
(2012) when analysing citizens’ attitude towards political corruption and the established
political system in the online debate held on Twitter during the electoral pre-campaign
of May 2011. For this purpose, these authors identified on one hand, 400 hashtags and
key words related to the political debate; and on the other hand, a set of 200 Twitter
accounts used by political parties, their candidates, the “Democracia Real, Ya!” (Real
Democracy, Now!) organisation, which was against the established political system and,

36
the main media sources. Then, it was collected through the Twitter Streaming API those
tweets between 10 and 24 May 2011 which contained one hashtag of the list, were
mentioning a Twitter account of the list or, were published by a Twitter account of the
list. This process yielded a dataset of 3 million tweets sent by about 500000 Twitter
users. These tweets contained more than 115000 different hashtags.
These researchers found especially interesting to study Spain as at that time this
country was going through a convulsed political, economic and social situation. Since
2008, Spain was going through an economic and social crisis like many other European
countries. Following the CIS16
, in May 2011 Spaniards were overwhelmingly concerned
with the unemployment (which rate was over 20% of the active population), the
economic situation and the party political system. Besides, Spain was facing Regional
and Local Elections. Concretely, 13 out of 17 Spanish autonomous areas and more than
8000 municipalities were facing elections.
The results showed how although the vast majority of the tweets were against the
traditional party system and its corruption, it was still able to reach a vote share of the
65.3% in the Local Elections, which meant a loss of just 6pp with respect to the Local
Elections of May 2007. Once again, it is shown how political corruption has not the
electoral consequences it could be expected.
In this chapter it will be reviewed the literature related to the most relevant
variables which influence citizens’ attitude towards political corruption. Concretely, the
chapter is structured as follows: in section 2.2, it will be reviewed the literature
regarding the role played by political awareness in citizens’ attitude towards political
corruption; it will be studied if there is any difference between individuals with a
different political leaning; it will be investigated the effect of the political sympathy
when citizens are analysing the information about corruption; it will be examined the
impact of the economic context on the attitude towards corruption; it will be studied the
impact of the new parties’ emergence; and finally, it will be deeply analysed the effect
of social pressure in different domains and how it is spread. Then, in section 2.3, it will
be studied the role played social media on politics. For this purpose it will be analysed
the impact of social media on citizens’ political attitudes and behaviours; it will be
investigated different approaches that have been proposed in order to measure influence
16
CIS May 2011

37
on Twitter; it will be characterised the political debate held on Twitter; and finally, it
will be analysed Twitter conversations on politics. At the end, it will be highlighted the
most relevant conclusions in section 2.4.
2.2 Citizens’ attitudes towards political corruption: The key
variables
Introduction 2.2.1
Citizens’ attitude towards political corruption is heterogeneous and depends on
several factors (Ecker et al., 2016). When political corruption is studied, it has been
identified the following variables as the most important: political awareness, political
leaning, political sympathy, economic context, new parties’ emergence and social
pressure.
Jennings et al. (2017) underlined that in order to make rational voting decisions,
citizens need to be aware of who the candidates are and, at least, their main political
proposals. Cordero and Blais (2017), Anduiza et al. (2013) and Weitz-Shapiro and
Winters (2010) proved a negative relationship between citizens’ political awareness and
their tolerance towards political corruption. Accordingly, Arceneaux (2007) and Kam
(2005) pointed out that sophisticated citizens tend to be more critical with parties than
those who are not interested in political issues. On the basis of the previous findings, in
this thesis, it will be investigated if citizens with higher levels of political awareness are
less tolerant towards political corruption.
Festinger (1962) stated that the existence of dissonance, being psychological
uncomfortable, motivates the person to try to reduce it and achieve consonance.
Besides, this author also underlined that citizens tend to actively avoid situations and
information which would likely increase that dissonance. It explains why do exist
consistency between one citizen’s social and political attitudes, and between what that
citizen knows or believes and his acts. Citizens tend to analyse political information
accordingly with their political predispositions (Jennings et al., 2017; Lodge and Taber,
2013; Brader and Tucker, 2009; Anderson and Singer, 2008; Coan et al., 2008;
Malhotra and Kuo, 2008; Anderson et al., 2005; Bartels, 2002, 2000; Gerber and Green,
1999; Miller and Shanks, 1996; Zaller, 1992; Sherrod, 1971). As a consequence, it is

38
expected that political leaning and political sympathy will play interesting roles on
citizens’ attitude towards political corruption.
Many authors agree that citizens’ criticism towards political corruption differs
when the country’s economy is growing or decreasing. Citizens tend to be more tolerant
when their country is in a stage of economic growth (Cordero and Blais, 2017; Charron
and Bågenholm, 2016; Anduiza et al., 2013; Klasnja and Tucker, 2013; Winters and
Weitz-Shapiro, 2013; Zechmeister and Zizumbo-Colunga, 2013; Jerit and Barabas,
2012; Weitz-Shapiro and Winters, 2010; Manzetti and Wilson, 2007; Golden, 2007;
Diaz-Cayeros et al., 2000; Duch et al., 2000; Mauro, 1995). As a consequence, it will be
considered the economic context as one of the variables which has a relevant role when
analysing citizens’ attitude towards political corruption.
The economic, social and political crisis has recently shaken the traditional political
system contributing to the emergence of new parties (Altiparmakis and Lorenzini, 2018;
Muro and Vidal, 2017; Della Porta, 2015). It represents an opportunity for citizens to
punish traditional parties affected by political corruption (Cordero and Blais, 2017).
Engler (2015), Pop-Eleches (2010) and Mainwaring et al. (2009) found that corruption
benefits new parties pushing voters away from all the traditional parties, not only from
the one which is in the government. In this thesis, it will be studied if those citizens who
feel closer to new parties are less tolerant towards political corruption than those who
support traditional parties.
In a context of an economic, social and political crisis, it has been proved how
social pressure plays a key role in mobilising citizens against the established political
system and its corruption (Giraldo-Luque, 2018; Anduiza et al., 2014; Peña-López et
al., 2014; Toret, 2013; Anduiza et al., 2012; Piñeiro-Otero and Costa-Sánchez, 2012;
Vallina-Rodriguez et al., 2012; González-Bailón et al., 2011). In this this thesis, it will
be analysed the impact of social pressure in citizens’ criticism towards political
corruption.
Political Awareness 2.2.2
There is a wide agreement among scholars in pointing out that political awareness
is a salient factor in explaining citizens’ attitude towards corruption. Siegel (2018)
highlighted how democracy depends on citizens’ political awareness, being necessary to

39
become educated politically. Bode (2016) underlined that a basic tenet of democracy
theory is that voters’ political choices must be based on informed thinking about
political issues. Accordingly, Jennings et al. (2017) emphasised that in order to make
educated and rational voting decisions, citizens need information about candidates and
issues. Habermas (1962) stated that an informed electorate is fundamental to a
deliberative democracy.
It has been shown how as higher is the political awareness as lower is the level of
tolerance towards corruption (Cordero and Blais, 2017; Anduiza et al., 2013; Weitz-
Shapiro and Winters, 2010). Sophisticated citizens tend to be more critical with parties
than those who are not interested in political issues (Arceneaux, 2007; Kam, 2005).
One of the theories which could explain why citizens keep voting for corrupt
politicians is the lack of information. Charron and Bågenholm (2016) underlined how to
reach an efficient electoral accountability mechanism, the first prerequisite is that the
information on political corruption is reliable, available and comes to the knowledge of
the voters. Fackler and Lin (1995) established a negative relationship between
information published about corruption cases and electoral results. As greater is the
amount of information about corruption being spread through the media, as higher is the
impact on the electoral results of the party which was in the government. As a
consequence, the role of the media is absolutely crucial, citizens who do not have access
to plural and high quality information will be more likely to vote for corrupt politicians
(Winters and Weitz-Shapiro, 2013; Geddes, 1994; Rose-Ackerman et al., 1980).
Following this theory, it would be expected that if the information is available and
citizens perceive an increase in the level of corruption, they will vote against corrupt
politicians (Cordero and Blais, 2017; Fernández-Vázquez et al., 2016; Anduiza et al.,
2013; Costas-Pérez et al., 2010; Figueiredo et al., 2010; Weitz-Shapiro and Winters,
2010; Chang and Kerr, 2009; Ferraz and Finan, 2008; Tavits, 2007; Gerring and
Thacker, 2005; Adserá et al., 2003; Treisman, 2000; Rundquist et al., 1977). In the rest
of this section, it will be analysed some researches in which it has been studied the role
played by political awareness in citizens’ attitude towards political corruption.
Cordero and Blais (2017) analysed the effect of political awareness in Spaniards’
attitude towards political corruption. For this purpose, it was used data from an online

40
survey conducted in Spain by the Universitat Pompeu Fabra in June 2015 which had a
sample size of 2410 respondents. It is remarkable that at the time in which the data was
collected political corruption was a salient issue. The incumbent party (PP) which had
won the General Elections in 2011 with a support of the 44.6%, had had a mandate
(2011-2015) plagued with scandals of corruption as the so-called “Gürtel case”,
“Barcenas’ papers”, “Púnica operation” and “Brugal case”.
As a consequence of all the corruption scandals, following the CIS17
, while in 2011
just 2% of the population mentioned corruption as one of the main Spanish problems,
this percentage increased until 56% in 2015. In fact, corruption became the second
greatest problem for Spaniards after unemployment18
. Accordingly, the Spain’s score on
the Corruption Perception Index by Transparency International19
during the government
of PP, on a scale anchored at 0 (highly corrupt) to 100 (very clean), fell from 65 to 58.
Cordero and Blais (2017) justified the convenience to focus their research on Spain
because this country clearly illustrate how corruption does not have the electoral
consequences it could be expected. Firstly, during the period 2011-2015 where Spain
was going through an economic crisis, the incumbent party was affected for multitude
cases of corruption; secondly, these cases of corruption were widely covered by the
media: newspapers, radio, TV, and social media; thirdly, the majority of Spanish society
was aware and worried about corruption and many Spaniards were actively participating
in demonstrations against it; and finally, the incumbent party plagued of corruption was
still able to win the General Election in December 2015. PP lost electoral support in
2015 in reference to the previous General Elections of 2011, concretely, PP obtained a
44.6% of votes in November 2011 while in December 2015 its support was 28.7%. It is
worth noting that this decrease must be relativized taking into account the emergence of
the new parties Podemos and C’s. However, in despite of its corruption and the
emergence of new parties which were traduced in electoral losses of 17pp, PP still
reached the first position in the General Elections in 2015 with more than 7 million of
votes and 123 seats.
In this context, these researchers were interested in analysing the relationship
between citizens’ perception of corruption in the government and the likelihood to
17
CIS January 2011 and January 2015 18
CIS January 2015 19
https://www.transparency.org/cpi2015

41
support it. Concretely, these authors hypothesised that as higher is the perception of
corruption in the incumbent government, as higher is the propensity to consider
completely unacceptable to vote for it. In order to address this issue, on one side,
participants were required to indicate the likelihood in which they would vote for the
incumbent government (PP) on a scale anchored at 0 (not at all likely) to 10 (very
likely). This variable was recoded following a very conservative criterion as follows:
“1”, when participants completely reject the idea of voting for the government; and “0”,
otherwise. On the other side, they were asked to manifest their perceptions of corruption
in the government on a scale anchored at 0 (the government is not corrupt at all) to 10
(the government is very corrupt).
The results showed that the difference in the predicted probability to completely
reject the idea of voting for the incumbent government between those respondents who
perceived it was not corrupt at all and those who perceived it was very corrupt was -
40pp. In other words, the likelihood of totally rejecting the idea of supporting PP of
those who perceived this party was not affected by corruption was 40pp lower than
those who perceived PP was involved in a multitude of corruption scandals.
As a consequence, it was concluded that political awareness plays a key role on
citizens’ attitude towards political corruption: as higher it is, as higher is the propensity
to punish the party affected by corruption.
Fernández-Vázquez et al. (2016) also studied how political awareness impacts on
Spaniards’ attitude towards political corruption. For this purpose, it was prepared an
original dataset with the electoral results of the Spanish Local Elections in May 2007
and May 2011. Besides, following an exhaustive process, it was identified the
corruption scandals between both Local Elections and the municipalities affected. Then,
these cases of corruption were classified according to the economic externalities they
generated, i.e., it was distinguished between those cases where corruption provoked
welfare decreasing and those which provoked welfare enhancing. The result of this
process yielded a dataset of 75 municipalities affected by corruption (1% of Spanish
municipalities), being 46 classified as welfare enhancing and 29 as welfare decreasing.
These authors justified the convenience to choose Spain for the study of corruption
underlining how at that time this country was a clear example where although voters

42
disliked corruption, incumbents rarely suffered electoral consequences for their illegal
actions. Particularly, between 2003 and 2007, the 70% of mayors who were involved in
corruption were re-elected. Accordingly, Costas-Pérez et al. (2012) found that the
electoral cost of corruption was on average just a 4%. Besides, on a scale anchored at 0
(highly corrupt) to 10 (very clean), Spain generally scored poorly in all cross-country
rankings of perception of corruption at all administrative levels. Moreover, and taking
into account the classification of the scandals of corruption used to test their hypothesis,
where it was distinguished those cases where corruption provoked welfare decreasing
and welfare increasing, Spain represented a suitable case as it offered a significant
number of cases in which mayors irregularly changed the established land use allowing
an excess of construction which benefited the local economy in the short time (Villoria
and Jiménez, 2012). Finally, Fernández-Vázquez et al. (2016) emphasised that, as most
of the Spanish corruption scandals are investigated by judicial authorities, there was an
extensive press coverage which increased citizens’ political awareness.
The results showed how as higher the media coverage of the corruption scandal
was, as higher was the magnitude of the electoral punishment. Accordingly, when
comparing the electoral results of the Spanish Local Elections in 2003 and 2007,
Costas-Pérez et al. (2010) found how the vote losses were around 9% when the
corruption cases were widely reported while the effect was just around 3% when voters
were not properly informed about it.
Distinguishing those corruption cases which provoked welfare decreasing and
welfare increasing for the municipality, Fernández-Vázquez et al. (2016) found that, in
order to reach a larger electoral punishment, those cases classified as provoking welfare
increasing needed higher media coverage. As a consequence, it was concluded that
political awareness plays a key role when analysing citizens’ attitude towards political
corruption.
Previously, Anduiza et al. (2013) analysed the impact of political awareness on
Spaniards’ attitude towards political corruption as well. For this purpose, it was
designed and conducted an online survey focused on the political attitudes and
behaviours. The universe studied was the population resident in Spain, and the sampling
was carried out in this country in November 2010. The sampling units were men and
women with Internet access, older than 15 and younger than 45. These age limits were

43
selected because the percentage of people with access to Internet in that age range was
over 83% while the Internet diffusion rate above this age was much lower. The sample
size was 2300 respondents.
These authors justified their research was focused on Spain underlining that at the
time in which the data was collected, political corruption was a salient issue.
Accordingly, the Spain’s score on the Corruption Perception Index by Transparency
International was 6.1 on a scale anchored at 0 (highly corrupt) to 10 (very clean). In this
context, the researchers expected more realistic answers. Besides, Spain had an
institutionalised party system with more than 60% of its population reporting feeling
close to a political party which clearly benefited the goal of measuring the political
sympathy impact. Finally, it was also pointed out that Spain was a clear example where
political corruption has not the electoral consequences it could be expected.
These researchers were interested in testing their belief that citizens are more
tolerant towards political corruption as higher is their political awareness. In order to
address this issue, firstly, participants were required to indicate which their preferred
party was and, in order to measure their political awareness, to respond four questions
related to politics. Then, they faced a randomly assigned vignette in which it was briefly
reported a hypothetical corruption case related to one of the followings: a mayor of their
preferred party; a mayor of a different party; a mayor of a party not specified. This
design allowed isolating the impact of partisanship. After reading the vignette,
respondents were asked to indicate how serious they considered the situation was on a
scale anchored at 0 (not serious at all) to 10 (very serious).
The analysis was restricted to the supporters of the main parties (PP and PSOE)
which at this time represented the 83.8% of the population. The reason was that this
restriction ensured that the distance between “preferred party” and “different (rival)
party” was the same for both parties’ supporters.
On one hand, it was performed a multivariate test, which dependent variable was
their opinion about the scandal of corruption, including political awareness as a factor.
The conclusion was that, on average, political awareness plays a key role on the
citizens’ attitude towards political corruption, being severely judged by those citizens
with a higher level.

44
On the other hand, taking into account the type of vignette participants faced, it was
calculated the average values of the attitude towards political corruption for each of the
three groups in which the sample was randomly divided (citizens who faced a scandal of
corruption in their preferred party, in the rival party and in a party not specified) with
the political awareness as moderator. The main conclusion was that among those
respondents whit a high level of political awareness, the difference between the three
groups was not statistically significant. However, among those respondents with the
lowest level of political awareness, there was a difference statistically significant
between the group who evaluated the scandal of corruption in their preferred party and
the group who evaluated the scandal of corruption in their rival party. Concretely, the
mean of the attitude towards political corruption was 1.6 higher in the group who faced
the scandal in the rival party. In other words, while there was a widespread consensus
about the seriousness of the scandal of corruption among those citizens with a high level
of political awareness, citizens with a lower level of political awareness tended to
downplay corruption, especially when it was their preferred party the one which was
being involved.
There are other studies where it has been analysed the political awareness impact.
For instance, Figueiredo et al. (2010) found in the 2008 São Paulo Mayoral Race, that
the information about corruption spread about one of the candidates, had a negative
impact on his electoral support. Acordingly, Ferraz and Finan (2008) showed how in the
2004 Brazil municipalities those incumbent Mayors who were involved in a multiple
cases of corruption, had less electoral support than those who were perceived as less
corrupt. Concretely, they found that when there was evidence of corruption, Mayors lost
between 10% and 30% of the votes, and this percentage was even higher when there
was a local radio station.
Political Leaning 2.2.3
It has been already proved that the attitude towards political corruption depends on
the degree to which citizens are aware that a politician is involved in corruption, but it is
worth noting that two citizens having the same degree of awareness may have different
attitude towards political corruption (Chang and Kerr, 2009), therefore, it will be
necessary to take into account other variables. In this section, it will be analysed the role

45
played by political leaning, which has been identified as crucial when analysing
citizens’ attitude towards political corruption (Charron and Bågenholm, 2016).
It has been shown that citizens tend to analyse political information accordingly
with their political predispositions (Jennings et al., 2017; Lodge and Taber, 2013;
Brader and Tucker, 2009; Anderson and Singer, 2008; Coan et al., 2008; Malhotra and
Kuo, 2008; Anderson et al., 2005; Bartels, 2002, 2000; Gerber and Green, 1999; Miller
and Shanks, 1996; Zaller, 1992; Sherrod, 1971).
Political leaning provides a shared values and beliefs system that allows individuals
with the same ideology to view and react to many issues of the world around them in a
similar way (Knight, 2006; Feldman, 2003). There are substantial differences among
people on the left and right leanings, and a high degree of coincidence between people
belonging to the same political leaning (McCright and Dunlap, 2011; Dunlap et al.,
2001). The scale left-right or alternatively, progressive and conservative, summarizes
political positions on a wide range of issues and the vast majority of the citizens can
position themselves and parties on this scale (Mair, 2009). The Comparative Study of
Electoral Systems (CSES)20
, accordingly with other cross-national studies which
specifically ask citizens to place themselves and parties along a left-right scale,
concluded that almost 90% of citizens are able to indicate their position and parties’
position on this scale (Dalton and McAllister, 2015; Rohrschneider, 2015; Esaiasson
and Holmberg, 1996).
Researchers have found a wide variety of variables which are useful to identify the
main differences between left and right parties. The predisposition to change is a
commonly analysed variable when studying these differences, being left, associated
with an openness to change; while right, with conservativism (Anderson and Singer,
2008; Devos et al., 2002; Schwartz, 1992).
Freire (2006) and Knutsen (1997) studied on one side, the role played by social
class, concluding that left is linked with the working class while right represents the
interests of the middle class and professionals; and on the other side, the role played by
religion, finding that from the left position it is claimed the limited social and political
20
http://www.cses.org/

46
role for religious organisations while the right position defends a greater relevance of
religion in society.
Hellwig (2014); Dalton (2006); Knutsen (1995); Inglehart and Klingemann (1976)
and Downs (1957) found that when studying economic issues, there are substantial
differences between citizens’ positions depending on their political leaning. There is a
broad agreement to highlight the level of government’s intervention in an economy as
one of them. Left is traditionally associated with a greater intervention while right with
free market and few restrictions in the economy.
Regarding the inequality, there is a wide agreement to note that those citizens who
identify themselves as having a right political leaning tend to legitimate and justify
inequality while those who feel themselves as having a left political leaning are more
sensitive to this issue (Alesina et al., 2004; Jost et al., 2003a; Jost et al., 2003b; Jost and
Hunyady, 2002; Listhaug and Aalberg, 1999; Tyler and McGraw, 1986; Lane, 1962).
It has been also identified a set of cultural variables which are key classifiers to
discern if an individual has a left or right political leaning: issues of gender equality,
immigration, multiculturalism, lifestyle choices, quality of life and environmental
policy (Inglehart, 1990).
As it has been shown, political leaning involves and summarizes citizens’ position
in a wide variety of social, economic and cultural issues (Jou and Dalton, 2017). Left
and right are the most common tags to place parties into a common framework (Mair,
2009), which is useful in many parliamentary systems where citizens face a wide variety
of parties and, as a consequence, to evaluate all the proposals in order to decide how to
cast the vote becomes a challenging task (Best and McDonald, 2011; Converse, 1964).
These tags are an efficient way to understand, organise and store political information
and, therefore, they clearly simplify the parties’ evaluation and vote’s decision (Jou and
Dalton, 2017; Downs, 1957). It has been found how the relation between political
leaning and party choice is stronger than the relation between other social, economic or
cultural variables and party choice.
Focusing on the topic of this thesis, Rundquist, et al. (1977) proved that when
corrupt politicians have a policy position on an important issue to the voter according
with him, his reaction towards corruption is less negative. In the rest of this section, it

47
will be analysed some researches in which it has been studied the role played by
political leaning in citizens’ attitude towards political corruption.
Charron and Bågenholm (2016) analysed the role played by political leaning in
Europeans’ attitude towards political corruption. Their analysis was based on the largest
multi-country survey focused on the matters of governance and corruption. The universe
studied was the population resident in Europe, and the sampling was carried out in 24
European countries between February and April 2013 by the authors in collaboration
with the European Commission. The sampling units were men and women over 18
years old and the sample size was roughly 85000 respondents.
Participants, on one hand, were required to place themselves in the left-right axis on
a scale anchored at 1 (extreme left) to 7 (extreme right); and on the other hand, were
asked about which would be their most likely reaction if their first party choice was
involved in a corruption scandal. They had to choose among the following three
options: keep voting for their first party choice; vote for an alternative party not
involved in corruption; or not vote at all.
The results showed that in a multiparty system, i.e., when citizens have reasonable
ideological alternatives, voters with a right political leaning were more likely to keep
supporting their party than voters with a left political leaning. Besides, when focusing
on those who decide not to keep sustaining their corrupted party, it was found that the
percentage of voters who decide to not vote at all was higher for citizens with a right
political leaning while the percentage of voters who switch to an alternative party was
higher for citizens with a left political leaning.
In other words, compared with those citizens with a left political leaning, those on
the right found harder to stop sustaining their party and, when they did, they had more
difficulties to vote for an alternative party and decided to abstain from voting in a higher
proportion.
When analysing each country separately, these researchers found that Spaniards
were those with the highest difference on the attitude towards political corruption
between those with a left and right political leaning. The overall results indicated that
the vast majority was against to keep supporting its corrupted party, concretely, a 52%
selected the abstention and a 34% to vote for an alternative party. The percentage of

48
participants who expressed their desire to keep sustaining their party in despite of
corruption was a 10% (a 4% declined to answer the question). However, Charron and
Bågenholm (2016) emphasised the contrast between Spanish supporters with a left and
right political leaning underlining how while those on the left were strongly against to
keep supporting their corrupted party, the likelihood of a citizen with a right political
leaning to keep voting for his or her corrupted party was the highest of all the European
countries studied.
In addition, it is worth to highlight that the Spanish results are even more relevant
when taking into account the period in which the data was collected (February - April
2013). At this time, Spain was going through an economic crisis and the incumbent
party was PP, the traditional Spanish party with a right political leaning. The
government which was in the middle of its first mandate (2011-2015) was plagued with
a multitude of corruption cases. Besides, part of the Spanish civil society was actively
participating in protest movements against corruption and the economic and social
situation. Both, scandals of corruption and protest movements were widely covered by
the media and, as a consequence, Spaniards were aware about of the salient corruption.
In this context, not only a 10% of participants selected the option of keep voting for
their corrupted party when the data of the multi-country survey was collected in 2013,
but also the party most involved in corruption was re-elected with a vote share of 28.7%
in the the General Elections of 2015.
Anduiza et al. (2013) analysed the role played by political leaning in the Spaniards’
attitude towards political corruption. For this purpose, it was designed and conducted an
online survey focused on the political attitudes and behaviours. The universe studied
was the population resident in Spain, and the sampling was carried out in this country in
November 2010. The sampling units were men and women with Internet access, older
than 15 and younger than 45. These age limits were selected because the percentage of
people with access to Internet in that age range was over 83% while the Internet
diffusion rate above this age was much lower. The sample size was 2300 respondents.
These authors justified their research was focused on Spain underlining that at the
time in which the data was collected, political corruption was a salient issue.
Accordingly, the Spain’s score on the Corruption Perception Index by Transparency
International was 6.1 on a scale anchored at 0 (highly corrupt) to 10 (very clean). In this

49
context, the researchers expected more realistic answers. Besides, Spain had an
institutionalised party system with more than 60% of its population reporting feeling
close to a political party which clearly benefited the goal of measuring the political
sympathy impact. Finally, it was also pointed out that Spain was a clear example where
political corruption has not the electoral consequences it could be expected.
These researchers analysed the differences between PP supporters and PSOE
supporters in relation with their tolerance towards political corruption. In order to
address this issue, participants, who had been previously required to indicate which
their preferred party was, faced a randomly assigned vignette in which it was briefly
reported a hypothetical corruption case related to one of the followings: a mayor of their
preferred party; a mayor of a different party; a mayor of a party not specified. This
design allowed isolating the impact of partisanship. After reading the vignette,
respondents were asked to indicate how serious they considered the situation was on a
scale anchored at 0 (not serious at all) to 10 (very serious).
The analysis was restricted to the supporters of the main parties, PP and PSOE,
which at this time represented the 83.8% of the population and were clearly identified as
having a right and left political leaning respectively. The reason was that this restriction
ensured that the distance between “preferred party” and “different (rival) party” was the
same for both parties’ supporters.
The main conclusion was that in all the cases, i.e., when participants faced a case of
corruption in which the party affected was their preferred party, was a different party, or
was a party not specified, sympathizers of PP were more tolerant towards political
corruption.
Accordingly, when comparing the electoral results of the Spanish Local Elections
in 2003 and 2007, Costas-Pérez et al. (2010) concluded that when corruption was
widely reported, left voters punished corruption cases more than right voters.
Concretely, it was found how corruption detracted 22.3% of the votes in a municipality
controlled by a left-wing party, while just 12.8% in a municipality controlled by a right-
wing party.

50
Political Sympathy 2.2.4
After studying the role played by political leaning, it is worth analysing the specific
role played by citizens’ political sympathy towards their preferred party. When citizens’
preferred party is involved in corruption, they have to face a crucial decision: keep
supporting their party, not vote or vote for an alternative party. In order to punish a
corrupted party, support an alternative one represents the most effective option,
however, it has been widely proved how certain voters not only decide not voting but
also continue supporting their party even being aware it is plagued of corruption
scandals and having reasonable ideological alternatives. Charron and Bågenholm (2016)
highlighted how when citizens face a scandal of corruption affecting to their preferred
party, the “home team” psychology factor makes them find hard assigning blame. In
this section, it will be studied the role played by political sympathy in citizens’ attitude
towards political corruption.
Cordero and Blais (2017) underlined that those citizens who feel closer to an
incumbent party involved in corruption tend to be more tolerant towards it. Anduiza et
al. (2013) found that citizens evaluate information differently depending on if that
information affects or not the party they are supporting. Mullainathan and Washington
(2009) and Beasley and Joslyn (2001) showed that party’s supporters evaluate more
positively its candidate than the rival. There is a wide agreement among scholars in
pointing out that voters’ political sympathy can balance the impact of corruption on the
electoral results, being even the candidate involved in a corruption case re-elected
(Cordero and Blais, 2017; Charron and Bågenholm, 2016; Welch and Hibbing, 1997;
Peters and Welch, 1980). According with this finding, Ecker et al. (2016) found that
citizens have a strong predisposition to keep voting the same party in despite of
corruption. The role played by political sympathy in the attitude towards political
corruption has been documented in different countries as Canada (Blais et al., 2015),
Spain (Anduiza et al., 2013), the UK (Vivyan et al., 2012), Mexico (Chong et al., 2011),
Italy (Chang et al., 2010), and the US (Dimock and Jacobson, 1995; Peters and Welch,
1980; Rundquist et al., 1977).
A citizen who is informed about corruption in his preferred party may experiment a
contradiction between two cognitions: on one hand, the preference for the political
party; and on the other hand, his preferred party is affected by corruption. As the

51
dissonance is psychological uncomfortable, the citizen may try to modify one of his two
cognitions, his party’s preference or his degree of tolerance towards political corruption.
Anduiza et al. (2013) underlined that modifying the second cognition may be easier.
Party’s supporters may find difficulties to believe information about corruption in
their party (Blais et al., 2015), especially, when it is not confirmed by court corruption
(Rundquist et al., 1977). It may be easier to think that this information is just the result
of the partisan conflict, especially, in contentious political contexts. Anduiza et al.
(2013) highlighted how partisans are more likely to believe corruption scandals when
they affect to other party rather than when it is their preferred party involved. In these
cases, partisans tend to consider political noise made by competing parties and
magnified by media and, when the scandal of corruption is too obvious to deny, it is
easier for partisans to think that the other parties are also corrupt (Charron and
Bågenholm, 2016). However, it is not just a question of credibility. There are cases
where although citizens know and believe the political corruption information which is
being spread about their party, they choose to downplay it and focus on other benefits
the politicians are delivering (Anduiza et al., 2013). In the following lines, it will be
analysed some researches in which it has been studied the role played by political
sympathy in citizens’ attitude towards political corruption.
Charron and Bågenholm (2016) analysed the political sympathy’s effect on
Europeans’ attitude towards political corruption. Their analysis was based on the largest
multi-country survey focused on the matters of governance and corruption. The universe
studied was the population resident in Europe, and the sampling was carried out in 24
European countries between February and April 2013 by the authors in collaboration
with the European Commission. The sampling units were men and women over 18
years old and the sample size was roughly 85000 respondents.
Concretely, these authors analysed the likelihood of European citizens to keep
supporting their preferred party being aware it was involved in corruption. In order to
address this issue, participants were asked about which would be their most likely
reaction if their preferred party was involved in a corruption scandal. They had to
choose among the following three options: keep voting for their preferred party; vote for
an alternative party not involved in corruption; or not vote at all.

52
The results showed that a 21% of all respondents would support their preferred
party in despite of corruption, a 34% would vote for an alternative party and a 39%
would abstain from voting (a 6% declined to answer the question).
Anduiza et al. (2013) analysed the role played by political sympathy in the
Spaniards’ attitude towards political corruption. For this purpose, it was designed and
conducted an online survey focused on the political attitudes and behaviours. The
universe studied was the population resident in Spain, and the sampling was carried out
in this country in November 2010. The sampling units were men and women with
Internet access, older than 15 and younger than 45. These age limits were selected
because the percentage of people with access to Internet in that age range was over 83%
while the Internet diffusion rate above this age was much lower. The sample size was
2300 respondents.
These authors justified their research was focused on Spain underlining that at the
time in which the data was collected, political corruption was a salient issue.
Accordingly, the Spain’s score on the Corruption Perception Index by Transparency
International was 6.1 on a scale anchored at 0 (highly corrupt) to 10 (very clean). In this
context, the researchers expected more realistic answers. Besides, Spain had an
institutionalised party system with more than 60% of its population reporting feeling
close to a political party which clearly benefited the goal of measuring the political
sympathy impact. Finally, it was also pointed out that Spain was a clear example where
political corruption has not the electoral consequences it could be expected.
These researchers theorised that citizens are more tolerant towards political
corruption when it is their preferred party the one which is being involved in a
corruption scandal. In order to address this issue, participants, who had been previously
required to indicate which their preferred party was, faced a randomly assigned vignette
in which it was briefly reported a hypothetical corruption case related to one of the
followings: a mayor of their preferred party; a mayor of a different party; a mayor of a
party not specified. This design allowed isolating the impact of partisanship. After
reading the vignette, respondents were asked to indicate how serious they considered
the situation was on a scale anchored at 0 (not serious at all) to 10 (very serious).

53
The analysis was restricted to the supporters of the main parties (PP and PSOE)
which at this time represented the 83.8% of the population. The reason was that this
restriction ensured that the distance between “preferred party” and “different (rival)
party” was the same for both parties’ supporters.
The main conclusion was that those participants who faced a scandal of corruption
in which their party was involved were more tolerant towards political corruption than
those who faced a scandal of corruption in their rival party. Concretely, the mean of the
attitude towards political corruption was 7.6 and 8 respectively, and the difference was
statistically significant.
Deeply analysing the difference between sympathizers of PP and PSOE, it was
found that although sympathizers of both parties evaluated hardly corruption when it
affected their rival party than when it was their preferred party the one which was being
involved, that difference was just statistically significant in PP supporters.
The attitude towards political corruption clearly depends on how close citizens feel
to the party which is being affected. When analysing what is behind the political
sympathy towards a party, it has been identified two different sources which will be
analysed in the rest of this section: clientelism and political identification (Chang and
Kerr, 2009).
Clientelism and political identification
Clientelism can be considered as the informal, mutually beneficial exchange
relationship in which a party offers material benefits in return for the electoral support
(Stokes 2007). There are citizens who keep supporting parties involved in corruption
because of the expectation of benefits (Cordero and Blais, 2017; Charron and
Bågenholm, 2016; Fernández-Vázquez et al., 2016; Kurer, 2010). Chang and Kerr
(2009) and Lemarchand (1972) identified a “norm of reciprocity”, which considers that
a citizen feels obliged to reciprocate after receiving some benefit from the party.
Clientelism tends to be stable and persistent (Brusco et al., 2004). Stokes (2005)
underlined the “perverse accountability”, which bases the explanation of the
clientelism’s persistency on the clients’ fear to lose their benefits.

54
Chang and Kerr (2009) underlined how on one side, it is easier to realise party’s
corruption when someone forms part of the corrupted system; and on the other side,
how it is more difficult to criticise corruption when someone is being benefited from it.
Citizens belonging to a patronage network, even if perceiving a high level corruption,
are more tolerant (Chang and Kerr, 2009). Manzetti and Wilson (2007) argued that a
corrupt government keeps its public support by satisfying their clientelist networks.
Fernández-Vázquez et al. (2016) analysed how clientelism impacts on Spaniards’
attitude towards political corruption. Concretely, they theorised that when corruption
provokes gains for a wide segment of the electorate in a short term, these voters tend to
keep supporting the incumbent government in despite of their corrupted practices. For
the purpose of testing their hypothesis, it was prepared an original dataset with the
electoral results of the Spanish Local Elections in May 2007 and May 2011. Besides,
following an exhaustive process, it was identified the corruption scandals between both
Local Elections and the municipalities affected. Then, these cases of corruption were
classified according to the economic externalities they generated, i.e., it was
distinguished between those cases where corruption provoked welfare decreasing and
those which provoked welfare enhancing. The result of this process yielded a dataset of
75 municipalities affected by corruption (1% of Spanish municipalities), being 46
classified as welfare enhancing and 29 as welfare decreasing.
These authors justified the convenience to choose Spain for the study of corruption
underlining how at that time this country was a clear example where although voters
disliked corruption, incumbents rarely suffered electoral consequences for their illegal
actions. Particularly, between 2003 and 2007, the 70% of mayors who were involved in
corruption were re-elected. Accordingly, Costas-Pérez et al. (2012) found that the
electoral cost of corruption was on average just a 4%. Besides, on a scale anchored at 0
(highly corrupt) to 10 (very clean), Spain generally scored poorly in all cross-country
rankings of perception of corruption at all administrative levels. Moreover, and taking
into account the classification of the scandals of corruption used to test their hypothesis,
where it was distinguished those cases where corruption provoked welfare decreasing
and welfare increasing, Spain represented a suitable case as it offered a significant
number of cases in which mayors irregularly changed the established land use allowing
an excess of construction which benefited the local economy in the short time (Villoria

55
and Jiménez, 2012). Finally, Fernández-Vázquez et al. (2016) emphasised that, as most
of the Spanish corruption scandals are investigated by judicial authorities, there was an
extensive press coverage which increased citizens’ political awareness.
The results proved that clientelism plays a key role when analysing citizens’
attitude towards political corruption. Concretely, those mayors involved in corruption
without benefits for the municipality reduced their vote share by a statistically
significant 4.2%, while those mayors involved in corrupt practices which exerted
benefits for the municipality increased their vote share by 1.9%.
There are other studies where it has been analysed the impact of clientelism. For
instance, Bratton and van de Walle (1997), analysing the democratic transitions in
Africa, found that the elites which had access to patronage benefits were more tolerant
with the incumbent regime than the other elites which were being excluded from those
benefits.
As seen, when citizens’ sympathy towards a corrupted party comes from the
obtaining of direct benefits, it becomes harder to find a strong criticism towards
political corruption (Chang and Kerr, 2009). Bratton (2007) concluded that clientelism
and corruption are the two sides of the same coin. However, not always political
sympathy towards a party comes from the expectation of material benefits, many times
it is based on a sense of shared identity with the political party (Charron and
Bågenholm, 2016; Campbell et al. 1960). There are citizens who feel close to the social
groups that comprise the party base and develop an affective identity towards the party
(Goren, 2005). Party identification provides citizens with a partisan orientation through
which they analyse political information and build their opinions (Zaller, 1992;
Campbell et al. 1960). As higher is the party identification as higher is the tolerance
towards corruption in this party (Chang and Kerr, 2009). Rundquist, et al. (1977)
concluded that there are citizens who overlook corruption just in exchange for
ideological satisfaction.
Cordero and Blais (2017) analysed the role played by political identification in
Spaniards’ attitude towards political corruption. For this purpose, it was used data from
an online survey conducted in Spain by the Universitat Pompeu Fabra in June 2015
which had a sample size of 2410 respondents. It is remarkable that at the time in which

56
the data was collected political corruption was a salient issue. The incumbent party (PP)
which had won the General Elections in 2011 with a support of the 44.6%, had had a
mandate (2011-2015) plagued with scandals of corruption as the so-called “Gürtel
case”, “Barcenas’ papers”, “Púnica operation” and “Brugal case”.
As a consequence of all the corruption scandals, following the CIS21
, while in 2011
just 2% of the population mentioned corruption as one of the main Spanish problems,
this percentage increased until 51% in 2015. In fact, corruption became the second
greatest problem for Spaniards after unemployment22
. Accordingly, the Spain’s score on
the Corruption Perception Index by Transparency International during the government
of PP, on a scale anchored at 0 (highly corrupt) to 100 (very clean), fell from 65 to 58.
Cordero and Blais (2017) justified the convenience to focus their research on Spain
because this country clearly illustrate how corruption does not have the electoral
consequences it could be expected. Firstly, during the period 2011-2015 where Spain
was going through an economic crisis, the party in the government was affected for
multitude cases of corruption; secondly, these cases of corruption were widely covered
by the media: newspapers, radio, TV, and social media; thirdly, the majority of Spanish
society was aware and worried about corruption and many Spaniards were actively
participating in demonstrations against it; and finally, the incumbent party plagued of
corruption was still able to win the General Election in December 2015. PP lost
electoral support in 2015 in reference to the previous General Elections of 2011,
concretely, PP obtained a 44.6% of votes in November 2011 while in December 2015
its support was 28.7%. It is worth noting that this decrease must be relativized taking
into account the emergence of the new parties Podemos and C’s. However, in despite of
its corruption and the emergence of new parties which were traduced in electoral losses
of 17pp, PP still reached the first position in the General Elections in 2015 with more
than 7 million of votes and 123 seats.
In this context, these researchers were interested in analysing the relationship
between citizens’ ideologically identification with the party in the government plagued
with corruption and the likelihood to support it. Concretely, these authors hypothesised
that as ideologically closer is perceived the incumbent government involved in
21
CIS January 2011 and January 2015 22
CIS January 2015

57
corruption, as lower is the propensity to consider completely unacceptable to vote for it.
In order to address this issue, on one side, participants were required to indicate the
likelihood in which they would vote for the incumbent government (PP) on a scale
anchored at 0 (not at all likely) to 10 (very likely). This variable was recoded following
a very conservative criterion as follows: “1”, when participants completely reject the
idea of voting for the government; and “0”, otherwise. On the other side, they were
asked to locate themselves and the incumbent party (PP) on the traditional left-right axis
anchored at 0 (extreme left) to 10 (extreme right). Then, it was constructed a new
variable: “Ideological distance from the government”. This variable had a range of
values fluctuating from 0 (when respondents locate themselves and the party in the
government on the same score) to 10 (when respondents perceived the party in the
government as being ideologically very far from their position).
The results showed that the difference in the predicted probability to completely
reject the idea of voting for the incumbent government affected by corruption between
those respondents who were ideologically the closest to the government and those who
were the most distant was 74pp. In other words, the likelihood of totally rejecting the
idea of supporting PP of those who felt this party exactly represented their ideology was
74pp lower than those who felt PP was the most distant party to their ideology.
As a consequence, it was concluded that political sympathy towards a party is a key
variable when studying citizens’ attitude towards political corruption: as higher it is, as
lower is the propensity to punish the party in despite of being aware of its corruption.
There are other studies where it has been analysed the impact of political
identification. For instance, Banerjee and Pande (2009) showed how in North India
were elected more corrupt politicians as a consequence of the voter ethnicization, i.e., as
a greater preference for the party representing one's ethnic group.
Economic context 2.2.5
Once it has been reviewed the role played by political awareness, political leaning
and political sympathy, in this section it will be analysed the impact of the economic
context.
It has been established in numerous empirical studies how the economic context is
one of the key variables when explaining why political corruption is not always as

58
penalized as it could be expected. Cordero and Blais (2017) and Zechmeister and
Zizumbo-Colunga (2013) highlighted how citizens tend to be more tolerant towards
political corruption when the government is perceived to handle the economy
satisfactorily. There are certain voters who keep supporting incumbent governments in
despite of corruption when they perceive a good job in managing the economy (Charron
and Bågenholm, 2016). Conversely, the worse is perceived the governments’ economy
performance, the more corruption becomes salient, especially in countries with a high
level of corruption (Charron and Bågenholm, 2016; Klasnja and Tucker, 2013). The
punishment of corruption clearly varies depending on the country’s economic situation
(Jerit and Barabas 2012; Duch et al., 2000; Mauro, 1995).
The problem of corruption is not only the extractive behaviour of some politicians,
but also the society who tolerates such behaviour (Hutter et al., 2018). Weitz-Shapiro
and Winters (2010), Manzetti and Wilson (2007), Golden (2007) and Diaz-Cayeros et
al. (2000) found that there were citizens who kept supporting a corrupt politician
because of the material benefits they were delivering to their constituency. These
citizens perceived that there was a risk to stop the flow of those benefits by punishing
the corrupt politician.
There are many cases in the literature where it has been proved that only when the
country is going through an economic crisis, citizens react against political corruption.
In the rest of this section, it will be analysed some researches in which it has been
studied the role played by the economic context in citizens’ attitude towards political
corruption.
Charron and Bågenholm (2016) analysed the impact of the economic context on
Europeans’ attitude towards political corruption. Their analysis was based on the largest
multi-country survey focused on the matters of governance and corruption. The universe
studied was the population resident in Europe, and the sampling was carried out in 24
European countries between February and April 2013 by the authors in collaboration
with the European Commission. The sampling units were men and women over 18
years old and the sample size was roughly 85000 respondents.
These authors theorised that when citizens are satisfied with the economic situation,
they are more likely to keep supporting their preferred party in despite of corruption. In

59
order to address this issue, participants, on one hand, were required to indicate their
level of satisfaction with the economy; and on the other hand, were asked about which
would be their most likely reaction if their first party choice was involved in a
corruption scandal. They had to choose among the following three options: keep voting
for their first party choice; vote for an alternative party not involved in corruption; or
not vote at all.
The results indicated how there was a relationship statistically significant between
citizens’ satisfaction with the economy and their likelihood to still vote for their first
party choice in despite of corruption. This relationship was strongly and positive, i.e., as
higher was the economic satisfaction, as higher was the likelihood to keep supporting
their first party choice in despite of corruption.
Anduiza et al. (2013) analysed the role played by the economic context in the
Spaniards’ attitude towards political corruption. For this purpose it was designed and
conducted an online survey focused on the political attitudes and behaviours. The
universe studied was the population resident in Spain, and the sampling was carried out
in this country in November 2010. The sampling units were men and women with
Internet access, older than 15 and younger than 45. These age limits were selected
because the percentage of people with access to Internet in that age range was over 83%
while the Internet diffusion rate above this age was much lower. The sample size was
2.300 respondents.
These authors justified their research was focused on Spain underlining that at the
time in which the data was collected, political corruption was a salient issue.
Accordingly, the Spain’s score on the Corruption Perception Index by Transparency
International was 6.1 on a scale anchored at 0 (highly corrupt) to 10 (very clean). In this
context, the researchers expected more realistic answers. Besides, Spain had an
institutionalised party system with more than 60% of its population reporting feeling
close to a political party which clearly benefited the goal of measuring the political
sympathy impact. Finally, it was also pointed out that Spain was a clear example where
political corruption has not the electoral consequences it could be expected.
These researchers were interested in analysing if citizens are more tolerant towards
political corruption when they have a positive evaluation of the economic situation. In

60
order to address this issue, firstly, participants were required to express their opinion
about the Spanish economic situation on a scale anchored at 1 (very bad) to 5 (very
good). Then, they faced a vignette in which it was briefly reported a hypothetical
corruption case. After reading the vignette, respondents were asked to indicate how
serious they considered the situation was on a scale anchored at 0 (not serious at all) to
10 (very serious).
It was performed a multivariate test, whose dependent variable was their opinion
about the scandal of corruption, including their evaluation of the Spanish economic
situation as a factor. The conclusion was that the economic context plays a key role on
citizens’ attitude towards political corruption, being severely judged by those with a
negative evaluation.
Analysing the electoral results of the Spanish Local and Regional Elections held in
May 2011 it is found how the economic context played a stronger role than political
corruption. At that time Spain was going through an economic and social crisis which
started in 2008 and, on one side, the government’s economy performance was being
strongly criticised for opposition media groups and political parties which claimed that
the government (PSOE) was not adopting the measures needed to tack the crisis; and on
the other side, PP was being affected by corruption (Vallina-Rodriguez et al., 2012). In
this context, in the Local Elections of May 2011, PSOE lost 7.5pp. while PP won 1.5pp.
with respect to the Local Elections of May 2007 in despite of being involved in
corruption scandals. Similarly, in the General Elections of November 2011, PSOE lost
15.1pp and PP won the elections increasing their support by 4.7pp.
Winters and Weitz-Shapiro (2013), exposed that in 1995, when Argentine’s
economy was growing, even if citizens knew that there were accusations of corruption
against President Carlos Menem, they not only supported a constitutional change to
permit their President to run for re-election, but also he won by a large margin.
However, in 1999, when the Argentine’s economy was in decline, citizens did not
support their President to run for a third term. In agreement, Manzetti and Wilson
(2007) underlined how in Argentina, those citizens with a positive opinion about the
regime’s economic performance were more tolerant with political corruption.

61
A similar case happened in Brazil, where two Brazilian Presidents whose
collaborators were involved in political corruption cases suffered different
consequences. While Fernando Collor de Melo (1990-1992), who did not success in
economic issues, had to resign after corruptions allegations; Luis Ignácio Lula da Silva
(2003–2010), in the context of economic growth, was elected to a second term and
enjoyed high levels of public support (Winters and Weitz-Shapiro, 2013).
The New Parties’ Emergence 2.2.6
The economic, social and political crisis shakes the traditional political system and
contributes to the emergence of new parties (Altiparmakis and Lorenzini, 2018; Muro
and Vidal, 2017; Della Porta, 2015). In this section, it will be studied the impact of
news parties on citizens’ attitudes towards political corruption.
The definition of “new party” has been widely discussed in the literature. Powell
and Tucker (2014) labeled as new parties all those which take part in the elections with
a new brand, regardless of whether the new party is the result of the union or separation
of already existing parties (except when the new party is the result of the sum of one or
several insignificant parties with an existing major party). Authors as Engler (2015),
Tavits (2008) and Hug (2001) excluded those which are the result of merging existing
parties and others researchers as Sikk (2005) excluded also those which appear as a
consequence of the separation of existing parties. In this thesis, it will be followed the
strictest definition, excluding those parties which are the result of the mix or division of
traditional parties in order to be able to clearly figure out if there are differences in the
attitudes towards political corruption between traditional and new parties’ supporters.
The stabilization of the party system is usually noted as a relevant factor for the
well-functioning democracy (Mainwaring and Zoco, 2007; Bielasiak, 2002), while the
emergence of new parties is associated with volatility (Powell and Tucker, 2014). Party
systems have been traditionally stable, making hard for new parties to burst onto the
scene (Lipset and Rokkan, 1967), however, after the third wave of democratization,
electoral volatility has been installed in many countries. Electoral volatility measures
the aggregate of change in party systems (Mainwaring et al., 2009; Tavits, 2008, 2005;
Lane and Ersson, 2007; Caramani, 2006; Gunther, 2005; Madrid, 2005; Mozaffar and
Scarritt, 2005; Sikk, 2005; Tavits, 2005; Birch, 2003; Bielasiak, 2002; Roberts and
Wibbels, 1999; Toka, 1998; Bartolini and Mair, 1990; Shamir, 1984; Pedersen, 1983,

62
1979). Mainwaring et al. (2009) emphasized the importance to distinguish between
within-system volatility (the electoral volatility among established parties) and extra-
system volatility (the electoral volatility among established parties and new parties),
noting the second option as the one which represents the strongest change in the party
system.
Mainwaring et al. (2009), analyzing the new parties’ success along the twentieth
century, found how the third wave of democratization was an impulse for the new
parties’ emergence. Their vote share increased from 2.4% to 13.4%. Considering what
they labeled as “young parties”, i.e., those parties with 10 years or less, the evolution of
the vote share was from 8.2% to 26.6%.
Hutter et al. (2018) pointed out that the party systems are more institutionalised in
the Northwest than in the Southern Europe. These researchers underlined that the party
systems in the Northwest have been transformed on one side, in 1970s and early 1980s
by new parties with a left political leaning which advocated individual autonomy, the
free choice of lifestyle and other universalistic values; and on the other side, since 1990s
by new parties with a right political leaning focused on immigration and European
integration as threats to the homogenous nation-state. The new left and the new right
were labelled as “Green-Alternative-Libertarian (GAL)” and “Traditional-
Authoritarian-Nationalist (TAN)” by Hooghe et al. (2002) and, as “Integration” and
“Demarcation” by Kriesi et al. (2012). Conversely, in Southern Europe the party
systems have been less transformed and the left-right axis still plays a strong role.
Nevertheless, the recent economic, social and political crisis has shaken the
traditional political system of many countries in Southern Europe, being austerity,
political renewal and political corruption the salient conflicts (Muro and Vidal, 2017;
Della Porta, 2015). A large share of population has felt frustrated with the established
political system and, this frustration has been translated into mobilisations on the street
(Altiparmakis and Lorenzini, 2018). In turn, these mobilisations have contributed to the
emergence of new political parties.
There is a wide set of democracies where it has appeared new political parties
which have successfully broken into the political scene making the fight against
corruption their leitmotif (Bågenholm and Charron, 2014; Hanley and Sikk, 2014;

63
Bågenholm, 2013; Sikk, 2012; Bélanger, 2004). In the following lines it will be
summarised the emergence of new parties which have reached remarkable electoral
results in three countries of Southern Europe (Greece, Italy and Spain), which besides of
being suffering an economic, social and political crisis, were affected by political
corruption (Hutter et al., 2018).
In Greece, in 2004 was founded Syriza, an electoral coalition of radical left political
parties and extra parliamentarian organisations. This party is closely related to the
Greek mobilisations on the street against the established political system (Hutter et al.,
2018) and evolved into a formal party in 2012. Stavrakakis and Katsambekis (2014)
emphasised how Syriza’s discourse is focused on the dilemma between “us” (the
people) as opposed of “them” (the elite). Besides, these authors underlined that this
party specially supports equal right for immigrants, gender equality and LGTB rights. In
reference to its electoral results, Syriza increased its support from 4.6% in October 2009
to 26.9% in June 2012 which led it to gain unprecedented visibility in Europe
(Stavrakakis and Katsambekis, 2014). Its quick growth is related to the fact that this
party was perceived as being the only viable hope for an alternative way out of the crisis
(Spourdalakis, 2013). More recently, in the General Elections of January 2015 and
September 2015, Syriza won with a vote share of 36.3% and 35.5% respectively.
In Italy, in 2009 was founded the “Movimento Cinque Stelle” (Five Star
Movement). This party engaged with citizens with a left but also with a right political
leaning (Ceccarini and Bordignon 2016). The discourse of Movimento Cinque Stelle is
focused on the “good citizens” versus “the elite” (existing parties, media and business
leaders) who is oppressing people’s well-being and democratic rights (Bobba and
McDonnell, 2015). This party advocates to remove the corrupt and incapable elite and
to empower citizens by online direct democracy (Hutter et al., 2018). With respect to its
electoral results, this party caused a major impact at the General Elections in 2013,
becoming the most voted party with a vote share of 25.6% (Tronconi, 2018). Passarelli
and Tuorto (2016) underlined how its success is mainly attributed to its ability to
represent those citizens disenchanted with the old politics. In the recent General
Elections of March 2018, its support increased until 32.7%.
In Spain, as mentioned, in 2014 was founded Podemos, a left new party which is
closely related to the Movimiento 15M (15M Movement) (Kioupkiolis and

64
Katsambekis, 2018; Franzé, 2017), a movement of citizens disgruntled with the
established party system and its corruption (Vallina-Rodriguez et al., 2012).
Accordingly, Kioupkiolis and Pérez (2018) underlined that this party was born in
response to a crisis of political representation. Podemos claims greater citizens’
participation in the policy-making and its discourse is focused on defending the “social
majority” against the “casta” (the degenerate political elite) (Ramiro and Gomez, 2017).
Regarding its electoral results, this party reached in the General Elections of December
2015 a vote share of 20.7% and, after the coalition with “Izquierda Unida” which
originated the current party UP, in the General Elections of June 2016 its support was
21.1%.
The emergence of new parties represents an opportunity for citizens to punish
traditional parties affected by political corruption and, therefore, a threat of losing
power for existing parties (Cordero and Blais, 2017). Engler (2015), Pop-Eleches
(2010) and Mainwaring et al. (2009) found that corruption benefits new parties pushing
voters away from all the traditional parties, not only from the one which is in the
government. It has been proved a negative relationship between corruption and citizen’s
trust in government, administration, parliament and political parties (Kostadinova,
2012; Anderson and Tverdova, 2003; Seligson, 2002; Mishler and Rose, 2001); and a
positive relationship between citizens’ disenchantment with traditional parties as a
consequence of corruption and the new parties’ share of votes (Böhler and Falathová,
2013; Haughton and Krašovec, 2013).
In the rest of this section, it will be analysed some researches in which it has been
proved how the existence of reasonable ideological alternatives not perceived as
corrupted impacts positively on the attitude towards political corruption, increasing
citizens’ punishment to parties involved.
Cordero and Blais (2017) analysed how the perception of a widespread corruption
impacts on Spaniards’ attitude towards political corruption. For this purpose, it was
used data from an online survey conducted in Spain by the Universitat Pompeu Fabra in
June 2015 which had a sample size of 2410 respondents. It is remarkable that at the time
in which the data was collected political corruption was a salient issue. The incumbent
party (PP) which had won the General Elections in 2011 with a support of the 44.6%,

65
had had a mandate (2011-2015) plagued with scandals of corruption as the so-called
“Gürtel case”, “Barcenas’ papers”, “Púnica operation” and “Brugal case”.
As a consequence of all the corruption scandals, following the CIS23
, while in 2011
just 2% of the population mentioned corruption as one of the main Spanish problems,
this percentage increased until 56% in 2015. In fact, corruption became the second
greatest problem for Spaniards after unemployment24
. Accordingly, the Spain’s score on
the Corruption Perception Index by Transparency International25
during the government
of PP, on a scale anchored at 0 (highly corrupt) to 100 (very clean), fell from 65 to 58.
Cordero and Blais (2017) justified the convenience to focus their research on Spain
because this country clearly illustrate how corruption does not have the electoral
consequences it could be expected. Firstly, during the period 2011-2015 where Spain
was going through an economic crisis, the incumbent party was affected for multitude
cases of corruption; secondly, these cases of corruption were widely covered by the
media: newspapers, radio, TV, and social media; thirdly, the majority of Spanish society
was aware and worried about corruption and many Spaniards were actively participating
in demonstrations against it; and finally, the incumbent party plagued of corruption was
still able to win the General Election in December 2015. PP lost electoral support in
2015 in reference to the previous General Elections of 2011, concretely, PP obtained a
44.6% of votes in November 2011 while in December 2015 its support was 28.7%. It is
worth noting that this decrease must be relativized taking into account the emergence of
the new parties Podemos and C’s. However, in despite of its corruption and the
emergence of new parties which were traduced in electoral losses of 17pp, PP still
reached the first position in the General Elections in 2015 with more than 7 million of
votes and 123 seats.
In this context, these researchers were interested in analysing the relationship
between citizens’ perception of corruption in the parliament and the likelihood to
support the incumbent government plagued with corruption. Concretely, these authors
hypothesised that as higher is the perception of corruption in the parliament, as lower is
the propensity to consider completely unacceptable to vote for the incumbent
government involved in corruption. In order to address this issue, on one side,
23
CIS January 2011 and January 2015 24
CIS January 2015 25
https://www.transparency.org/cpi2015

66
participants were required to indicate the likelihood in which they would vote for the
incumbent government (PP) on a scale anchored at 0 (not at all likely) to 10 (very
likely). This variable was recoded following a very conservative criterion as follows:
“1”, when participants completely reject the idea of voting for the government; and “0”,
otherwise. On the other side, they were asked to manifest their perceptions of corruption
in the parliament on a scale anchored at 0 (the parliament is not corrupt at all) to 10 (the
parliament is very corrupt).
The results showed that the difference in the predicted probability to completely
reject the idea of voting for the incumbent government affected by corruption between
those respondents who perceived the parliament was not corrupt at all and those who
perceived it was very corrupt was 19pp. In other words, the likelihood of totally
rejecting the idea of supporting PP of those who perceived the parliament was not
affected by corruption was 19pp higher than those who perceived the corruption was
widespread in the entire parliament.
This finding emphasises the importance of the emergence of new and clean parties
in order to fight against political corruption. Following Cordero and Blais (2017), the
presence of new alternatives not involved in corruption reduce the perception of
corruption in the parliament and, therefore, increase the probability to punish those
incumbent governments plagued with corruption.
Charron and Bågenholm (2016) analysed the impact of the presence of reasonable
ideological alternatives on Europeans’ attitude towards political corruption. Their
analysis was based on the largest multi-country survey focused on the matters of
governance and corruption. The universe studied was the population resident in Europe,
and the sampling was carried out in 24 European countries between February and April
2013 by the authors in collaboration with the European Commission. The sampling
units were men and women over 18 years old and the sample size was roughly 85000
respondents.
These authors theorised that when citizens are considering voting for a different
party, the presence of reasonable ideological alternatives plays a key role. Concretely,
these authors hypothesised that when the voters’ first party choice is affected by
scandals of corruption, the likelihood to switch to an alternative party was higher as

67
higher was the number of viable alternatives. In order to address this issue, participants
were asked about which would be their most likely reaction if their first party choice
was involved in a corruption scandal. They had to choose among the following three
options: keep voting for their first party choice; vote for an alternative party not
involved in corruption; or not vote at all.
The results indicated how when citizens are facing corruption scandals affecting to
their first party choice, in a strong multiparty system, voters became more likely to
switch to an alternative party not involved in corruption compared with those party
systems with less number of parties. On one side, in limited party systems, the
percentage of citizens who would keep supporting their first party choice affected by a
scandal of corruption is higher and, among those citizens who would not support the
corrupted party, to abstain from voting was the preferred option for most of
respondents. On the other side, in multiparty systems, the percentage of citizens who
would keep supporting their first party choice affected by a scandal of corruption is
lower and, among those citizens who would not support the corrupted party, to vote for
an alternative party was the preferred option for most of participants.
As it has been shown, the emergence of new parties is a key factor to fight against
political corruption, not only because it decreases the probability to keep supporting a
corrupted party, but also because it increases the probability to vote for an alternative
party to the detriment of the abstention.
The key role played by the new parties’ emergence has been also demonstrated
when comparing the electoral results of the Spanish General Elections held in
November 2011 with those of the General Elections held in December 2015.
In November 2011, Spain was going through a convulsive political, economic and
social situation. Following the CIS26
, Spaniards were mainly concerned with the
unemployment, the economic situation and the party political system. Moreover, the so
called “Movimiento 15M” (15M Movement), which was born in May 2011 during the
Spanish Revolution was still actively fighting against the established party system and
its corruption. Finally, the traditional parties PSOE and PP were being strongly
criticised because of its poor management of the economy and its corruption
26
CIS November 2011

68
respectively (Vallina-Rodriguez et al., 2012). In this context, without the presence of
new alternatives not involved in corruption, in the General Elections of November
2011, PSOE reached a vote share of 28.8% and PP won the elections with a rate of
44.6% in despite of its corruption. However, in the General Elections of December
2015, in a similar economic and social situation but with the presence of new
alternatives not affected by corruption (Podemos and C’s), PSOE was supported by the
22% of the electorate; and PP, still won the elections but with a vote share of 28.7%.
Simplifying, with the presence of reasonable ideological alternatives, PSOE lost 6.7pp.
and PP 15.9pp. Besides, the turnout was 4pp higher in the General Elections of 2015 in
respect to General Elections of 2011. Orriols and Cordero (2016), when analysing the
electoral results of the General Elections of 2015, concluded that the irruption of the
new parties Podemos and C’s supposed the end of the bipartisanship.
Social Pressure 2.2.7
The last variable analysed in this thesis will be social pressure, which has been
identified as a key variable when analysing citizens’ attitude and behaviour in a wide
variety of domains (Giraldo-Luque, 2018; Belda et al., 2015; Anduiza et al., 2014;
Peña-López et al., 2014; Piñeiro-Otero and Costa-Sánchez, 2012; Vallina-Rodriguez et
al., 2012; Allcott, 2011; DellaVigna et al., 2010; Gerber and Rogers, 2009; Gerber et
al., 2008; Nolan et al., 2008; Schultz et al., 2007; Frey and Meier, 2004). Social
pressure is defined by the online Psychology Dictionary as “the influence that is exerted
on a person or group by another person or group. It includes rational argument,
persuasion, conformity and demands”27
. Citizens act different when they believe their
actions are going to be public (Cialdini and Goldstein, 2004; Cialdini and Trost, 1998;
Lerner and Tetlock, 1999).
As analysed in Belda et al. (2015), managing communities can be extremely useful
to disseminate knowledge, opinions or propaganda and, as a consequence, to exert
influence on the community members (Dholakia et al., 2004; Dholakia and Bagozzi,
2001). In the following lines, it will be explained the processes by which social pressure
is spread in a social network.
27
http://psychologydictionary.org/social-pressure/

69
From a psychological perspective, a social influence network is a cognitive process
where actors integrate conflicting influential opinions to form revised opinions on an
issue and, as a result, social influence pressures towards the mean of the initial opinions
(McGarty et al., 1992; Turner and Oakes, 1989; Asch, 1951; Sherif, 1936). From a
sociological perspective, there is wide agreement among researchers that a social
influence network involves a social structure that deals with an influence network
defined by the pattern and strengths of the interpersonal influences among the members
of the group. As a consequence, it results in a structure of stratification or domination
(Friedkin and Johnsen, 1999; Isenberg, 1986; Lamm and Myers, 1978), which considers
other options of group's agreement different from the mean of initial opinions.
Friedkin and Johnsen (1999) developed a model of social influence where the
process of opinion change in a group is an interpersonal accommodation. In this model,
each member of the community weighs his own and others members' opinions on an
issue, and repetitively modifies his opinion until a settled opinion on the issue is
formed. The result of this process has different options: the opinion settle on the mean
of group members' initial opinion; on a compromise opinion that is different from the
mean of initial opinions; on an initial opinion of a group member; on an opinion that is
outside the range of group members' initial opinions because of a reinforcement
process; or the group is not able to reach an agreement.
Assuming that it is possible to settle the group's agreement in a different point of
the mean of initial members' opinions, it will be studied how to propagate social
pressure through a network from different perspectives.
The processes by which ideas and influence are spread through a social network
have been analysed by several researchers in different domains. For instance,
Richardson and Domingos (2002), Domingos and Richardson (2001), Goldenberg et al.
(2001a), Goldenberg et al. (2001b), Mahajan et al. (1990), Brown and Reinegen (1987)
and Bass (1969) investigated the “word of mouth” and “viral marketing” processes
related to the adoption of a new product; Young (2002), Morris (2000), Young (1998),
Blume (1993) and Ellison (1993) studied the sudden and widespread adoption of
various strategies in game theoretic settings; and Valente (1995) and Coleman et al.
(1966) analysed the diffusion of medical and agricultural innovations.

70
The traditional view assumes that there is a small and well-connected group in a
society perceived as informed, which has the ability to propagate ideas to others (Cha et
al., 2010). Gladwell (2002) referenced them as the hubs, connectors, or mavens.
Previously, Rogers (1962) identified them as innovators in his Diffusion of innovations
theory and Katz and Lazarsfeld (1955) as the opinion leaders in their Two-step flow
theory.
These theories have been criticised because its information flow process does not
consider the role of ordinary users. Watts and Dodds (2007) analysed both type of users,
influential and ordinary, and concluded that although influential users were those who
initiated more frequent and larger cascades, they were not enough to explain all
diffusions. These authors found that the spread of influence depends on how susceptible
the society is overall to the idea or innovation more than on the person who starts it. In
other words, being both necessaries it is more relevant the topic than the influential
users. Domingos and Richardson (2001) underlined how in the new information age,
people take into account the opinions of their friends and peers rather than the
traditional influential users’ opinions.
There are many papers which show the evidence of social pressure in a wide variety
of domains: studies related to energy efficiency (Belda et al., 2015); crime (Ludwig et
al., 2001; Glaeser et al., 1996; Case and Katz, 1991), educational outcomes (Sacerdote,
2001), health (Katz et al., 2001), unemployment (Topa, 2001), welfare participation
(Bertrand et al., 2000), and social mobility (Borjas, 1994, 1992). Below, it will be
exposed the main conclusions of some interesting researches collected in Belda et al.
(2015).
Belda et al. (2015), when studying citizens’ attitudes and behaviours towards
energy efficiency, proved the effectiveness of social pressure in order to motivate
improvements in consumers' energy behaviour. Specifically, it was theorised that
among the variables which influence people to adopt energy efficient behaviours, social
pressure had a higher impact than factual information related to the climate change. In
order to address this issue, it was conducted a survey where participants randomly faced
a vignette in which it was described one of the following scenarios: an scenario
warming of the risks of the climate change through factual information; or an scenario
emphasizing their neighbours were saving on their energy bills by following energy tips

71
received on their mobile phone. After reading the vignette, participants were asked to
indicate how much they were more likely to adopt an energy efficiency behaviour in a
scale anchored at 1 (not at all) to 5 (completely). The results showed that although both
scenarios had a positive impact, social pressure was more effective than factual
information in order to motivate improvements in the consumers' energy behaviour.
Concretely, the mean of the citizens who faced the “social pressure scenario” was 4.27
while the mean of those who faced the “factual information scenario” was 3.45.
DellaVigna et al. (2010) found how social pressure is crucial when analysing
charitable donations. Most of Americans (90%) give money to charities, but not all of
them have the same motivations. There are altruistic people, but there are also people
who prefer not to give money although they do because they feel uncomfortable saying
no. They carried out a study where fliers were placed on the front door of a household,
informing residents when the collection of a door-to-door fund raiser will be conducted.
The results of this experiment was that the households opening the door decreased by
10-25% (being even stronger when homeowners had the option of ticking a “Do Not
Disturb” box). This study also showed how about half of donors would prefer not to be
contacted by the fundraiser, to donate less or directly to not donate.
Christakis and Fowler (2007) demonstrated that social pressure affects the spread of
obesity in a large social network. They showed how the chances of becoming obese of
an individual increased by 57% if he had a friend who became obese; by 40% if he had
a sibling who became obese; and by 37% if his spouse became obese. This influence
was stronger between people of the same sex.
Social pressure has also proved its effectiveness when analysing the workers'
productivity. Falk and Ichino (2006) conducted an experiment where workers were
putting letters into envelopes for an independent of output remuneration and found that
those who were working in pairs in the same room were more productive than those
who worked alone. Workers’ productivity increased because they knew they were being
observed and/or because they were observing other workers. Accordingly with the
previous research, Mas and Moretti (2009) conducted an experiment in a supermarket
and found that the cashiers’ productivity increased when they were observed by other
cashiers with a higher productivity. Charness and Kuhn (2011) found that workers
working side by side, without interaction but observing each other's activity were more

72
productive. Moreover, Georganas et al. (2013) showed how workers being observed
increased their productivity at least initially when compensation was team based.
Dohmen (2005) and Garicano et al. (2005) showed that social pressure is a
determinant of corruption. Dohmen (2005) found that professional soccer referees tend
to assist the local team. Concretely, it was concluded how professional soccer referees
on one hand, awarded more injury time in close matches when the home team was
behind; and on the other hand, awarded goals and penalty kicks to aid the home team.
This behaviour was even stronger as higher was the size of the crowd, as closer was the
crowd to the stadium and as higher was the importance of the game (Garicano, et al.,
2005).
Finally, it will be analysed the role played by social pressure on citizens’ attitude
towards political corruption. Concretely, it will be studied the Spanish Revolution of
May 2011 as it is directly related to the social pressure exerted by Spaniards in the field
of politics. Firstly, it will be briefly contextualised the Spanish political situation at this
time. Since 2008, Spain was going through an economic and social crisis which was
impoverishing the population. Following the CIS28
, in May 2011, Spaniards were
particularly worried with the unemployment, the economic situation and the party
political system. Besides, the incumbent party (PSOE) was being accused to do not
make the efforts needed at tackling the crisis while the main party of the opposition (PP)
was being accused of corruption.
In this context where many citizens were dissatisfied with the Spanish economic
and social situation and disaffected with the traditional parties, it was born the collective
“¡Democracia Real, Ya!” (Real Democracy, Now!). This collective, by exerting social
pressure reached to mobilize thousands of citizens who participated on 15 May 2011 in
protests in more than fifty cities across Spain (Toret, 2013). In turn, these protesters by
the contagious effect, influenced other citizens creating the broad movement
“Movimiento 15M” (15M Movement) (Vallina-Rodriguez et al., 2012) which was able
to communicate the Spanish feeling of indignation to the whole world (Giraldo-Luque,
2018).
28
CIS May 2011

73
As it has been seen, social pressure, when exerted positively, is able to impact on
citizens’ attitude by encouraging them to fight against political corruption, and
therefore, to contribute to the goal of achieving a higher quality democracy.
2.3 Social media role on politics
Introduction 2.3.1
Social pressure can be exerted in both, real and virtual world. Social media has
broken into the field of communication and is considered a powerful tool to spread
social pressure (Belda et al., 2016; Demirhan and Çakır-Demirhan, 2016; Zhu et al.,
2012; Hui and Buchegger, 2009). Dholakia et al. (2004) developed a social influence
model of online community participation which considered individual motives, social
influences and, finally, the decisions and behaviours. These researchers concluded that
higher levels of value perceptions lead to a stronger social identity which leads in turn
higher levels of participation in the online community. Social pressure is the key to
understand how virtual communities behave (Belda et al., 2015).
Nowadays, following the 2018 Global digital suite of reports29
published by We are
social and Hootsuite, there are more than 4 billion people using internet around the
world (53% of the world population), being nearly a 250 million of new users in 2017,
which supposes an increase of 7%. Besides, each user spends by average around 6
hours.
Social media is defined as “websites and applications that enable users to create
and share content or to participate in social networking”30
. Regarding their use, in 2018
there are near of 3.2 billion people of active users (42% of the world population), a 13%
more than 2017. Facebook is at the top, being used by almost 2.2 billion people,
followed by Youtube (1.5) and WhatsApp (1.3).
Social media is seen as platforms for interactive and public discussions (Demirhan
and Çakır-Demirhan, 2016). From a creators of content point of view, social media
represents an opportunity to reach a larger audience; and from a consumers of content
perspective, it supposes not only an opportunity to reach a greater amount of
29
https://wearesocial.com/blog/2018/01/global-digital-report-2018 30
https://en.oxforddictionaries.com/definition/social_media

74
information by free, but also, to share and comment that information, which also
converts them into creators. In the following lines, it will be briefly introduced some
examples collected in Belda et al. (2015) which show how information and influence
flow through the virtual world.
Belda et al. (2015) analysed the role played by online social pressure in the energy
efficiency debate held on Twitter. Concretely, these researchers analysed the
conversation about energy efficiency held on Twitter from July to December 2014. On
one side, it was shown how the top mentioned users were altruistic; and on the other
side, that the information which was being spread on Twitter was written by mostly
altruistic users. These authors concluded that the energy efficiency debate was not
dominated by people who had a commercial interest and, therefore, that Twitter was an
interesting platform to spread information and tips about energy efficiency and motivate
consumers to engage with better practices.
Zhu et al. (2012) proved the ability of social pressure to impact on citizens’ online
choices. They conducted an online experiment to test how often people’s choices were
changed by others’ recommendations when facing different levels of pressure.
Participants were first asked to choose between pairs of items and once they had
finished, they were provided about the preferences of others. Then, they were asked to
make second choices about the same pairs of items. The results depicted that other
people’s opinions significantly sway people’s own online choices. This influence was
stronger when people were required to make their second decision sometime later
(22.4%) than immediately (14.1%); when individuals were facing a moderate, as
opposed to large number of opposing opinions; and when they spent a short amount of
time making the first decision. However, the demographic variables such as age and
gender did not affect the results.
Hui and Buchegger (2009) conducted a study which demonstrated the neighbours’
influence on the probability of a particular person to join a group on four popular Online
Social Networks: Orkut, YouTube, LiveJournal, and Flickr. The “neighbours” in these
networks had a mutually acknowledged relationship, most often defined as friendship,
and they were directly connected on a graph of a social network. Users could join
groups of users which represented common areas of interest. The results indicated that a

75
set of neighbours was about 100 times more powerful in influencing a user to join a
group than the same number of strangers.
Focusing on the topic of this thesis, social media is a new tool in political
communication and it is used by an increasing number of politicians and citizens to
critique and advocate for policies, candidates and protests (Siegel, 2018).
On one side, social media has noticeably changed the way politics work (Dimitrova
and Bystrom 2013). Politicians use social media to disseminate information and connect
with voters (Siegel, 2018). It represents a new communication channel which allows
politics to be more accessible (Koc-Michalska et al., 2016). Murthy (2015) underlined
that it is a low cost channel which enables to reach a great audience.
On the other side, it has been proved how citizens, especially young adults, tend to
rely on social media when seeking political information rather than on traditional media
as newspapers or radio broadcasts (Baumgartner and Morris, 2010; Kushin and
Yamamoto, 2010). Viewing political information through the social networks has
become popular (Bode, 2016). Besides, social media also provides opportunity for
sharing political content and set up political debates (Diehl et al., 2016).
In the following sections, it will be analysed the impact of social media on citizens’
political attitudes and behaviour; it will be investigated different approaches that have
been proposed in order to measure influence on Twitter; it will be characterised the
political debate held on Twitter; and finally, it will be analysed Twitter conversations on
politics.
Analysing the impact of social media on political attitudes and 2.3.2
behaviour
Social media has been shown as a powerful tool when studying political science
(Barbera, 2014; Settle, 2014; Messing et al., 2014; Aragón et al., 2013; Bond et al.,
2012). It has been found a strong relationship between social media use and political
engagement (Manrique and Manrique, 2016; Demirhan, 2016a; Xenos et al., 2012).
Christensen (2011) proved a positive relationship between online and offline political
participation.

76
Hendricks and Denton (2010) and Williams and Gulati (2008) concluded that the
use of social media as a political communication platform was a key factor to explain
the Barack Obama’s success in the 2008 U.S. Presidential Election. However, it is seen
by some governments as a threat (Gusinki, 2015; Gohdes, 2014, Zuckerman, 2014; and
Wong and Brown, 2013), as the social pressure exerted through social media has proved
its capacity to involve people to sign petitions and contribute to different causes
(Coppock et al., 2014; Hale et al., 2014; McClendon, 2014). Tufekci and Wilson (2012)
underlined the key role of social media to encourage people to take part in anti-regime
protests. Social media contributes to create, organize and implement social movements
around the world (Giraldo-Luque, 2018; Elantawy and Wiest, 2011).
Focusing on political corruption, Zinnbauer (2014) highlighted how social media
allows citizens to complain loudly, visibly, and nearly instantaneously when they
perceive corruption (Zinnbauer, 2014). It has been proved its potential to fight against
political corruption in cases as WikiLeaks (Demirhan, 2016b; Jha, 2016; Waller, 2016).
Marinov and Schimmelfennig (2015) emphasized that social media is not as easily
silenced as traditional media which has stronger ties with the economic and political
forces (Essien, 2016). Herkman and Matikainen (2016) underlined its capacity to keep
the scandals in the public eye.
In the rest of this section, it will be summarised some researches where it has been
analysed the impact of social media on politics. Marinov and Schimmelfennig (2015)
proved the ability of online social pressure to impact on civic activism and politics.
They conducted an experiment with 3000 respondents between the ages 18 to 60 in all
Bulgaria’s towns with population of 50.000 or more. Firstly, they filtered them by
considering just those who had a Facebook account and found that almost 66% of their
random sample was a member of the social network. These users were invited to
participate in the experiment and 1.000 agreed. Then, they were randomly classified
into three different groups: “Facebook group”, who received a message encouraging to
like a Facebook page devoted to the preservation of a threatened natural resource, the
country's Black Sea coast; “E-mail newsletter group” who received a message
encouraging to sign up for an email newsletter promoting the same campaign; and
“Control group”. After two months, it was asked the participants’ opinion about the
likelihood of success of different civic initiatives. The results depicted that the

77
“Facebook group” was the one who had a more positive attitude towards the success of
the campaign. Besides, it was also found that about 40% considered social media as the
most reliable resource when they were looking for political information. As a
consequence, these authors concluded that social pressure when promoting activism had
a greater impact when it was spread through an online social network rather than
through an email newsletter, and therefore, that online social pressure was an effective
tool to fight against corruption.
Bond et al. (2012) found how the social pressure spread through an online network
is also able to impact on political behaviour. Concretely, they conducted a randomized
controlled trial in US with Facebook users of at least 18 years who accessed on 2nd
November 2010, the day of the US Congressional Elections. Users were randomly
classified into three different groups: “Social message group”, “Informational message
group” and “Control group”.
The “Social message group” received a message at the top of their “News Feed”
encouraging them to vote where it was provided a link to find local polling places, a
clickable button in which it was written “I Voted”, a counter indicating how many other
Facebook users had reported they had voted, and finally, six randomly “profile pictures”
of user’s Facebook friends who had already indicated they had voted. The
“Informational message group” received the same message with the only difference that
it was not shown any picture of user’s Facebook friends who had already reported they
had voted. Finally, the “Control group” did not receive any message. The researchers
distinguished among the following direct and indirect impact.
Focusing on the direct impact, the results showed that users who received the social
message where they could see the face of six of his Facebook’s friends were more likely
to report they had already voted than those who received the informational message
where it was not any picture. Besides, users belonging to the “Social message group”
were also more likely to seek information about the polling places than those belonging
to the informational group. Finally, it was found that users receiving the social message
were more likely to vote than those who received the informational message or did not
received any message. However, it was not any difference between users belonging to
the informational group and those belonging to the control group.

78
They concluded that social pressure exerted through an online community had
impact on political self-expression (user’s desire to report their vote to their social
community); on political information seeking (user’s desire to seek political information
about the polling places); and on voting behaviour.
Regarding the indirect impacts, i.e., the social pressure that a person who has been
directly influenced can exert towards his friends through an online network, Bond et al.
(2012) proved that the effectiveness of spreading online influence depended on the
closeness of the relationship. For this purpose, they classified individuals by decile
analysing the degree to which they interacted with each other on Facebook and then,
considered two different groups: “Close friends”, those in the eighth decile or higher;
and “Friends”, the rest of the Facebook’s friends.
The results depicted that users were more likely to report they had already voted, to
seek information about the polling places, and also to vote, when they had a close friend
who had received a social message than when their close friend had not received any
message. However, they were just more likely to report they had already voted, when it
was a friend who received the message.
In this case, they concluded that while close friends were able to impact on political
self-expression, political information seeking and voting behaviour; friends were able to
impact on online expressive behaviour (as users were more likely to report their
Facebook’s friends they had already vote), but not on private or real world behaviour
(as it was no effect on increasing the probability to seek political information or to
vote).
Eltantawy and Wiest (2011) studied the effectiveness of social media during the
Egyptian revolution. Concretely, they analysed the role played by social media in the
anti-government protests occurred between 25th
January and 11th
February of 2011
which led to the resignation of the Egyptian President Honsi Mubarak. These authors
emphasized how social media allowed implementing greater speed and interactivity in
the traditional dynamics of social mobilizations. Networks as Facebook and Twitter
played a key role to engage citizens in online discussions about the political situation in
Egypt. The exchange and diffusion of the information was not only helpful to mobilize
and organize citizens before the protests, but also to report what it was happening
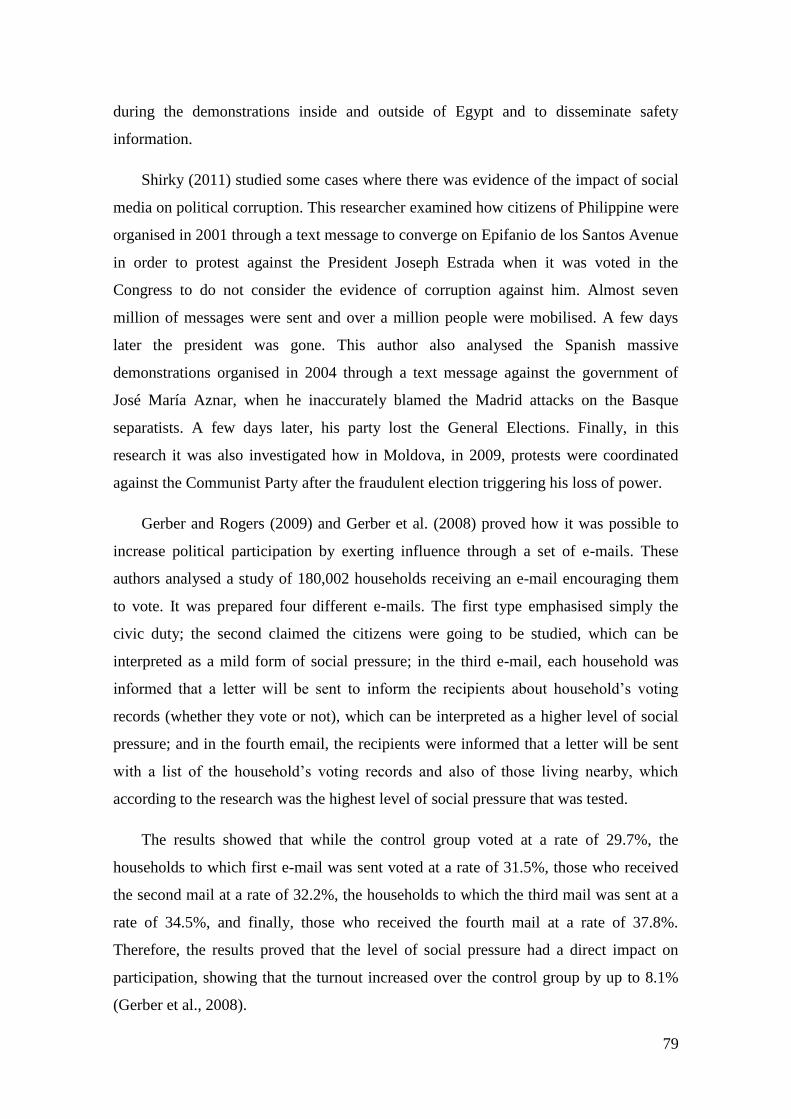
79
during the demonstrations inside and outside of Egypt and to disseminate safety
information.
Shirky (2011) studied some cases where there was evidence of the impact of social
media on political corruption. This researcher examined how citizens of Philippine were
organised in 2001 through a text message to converge on Epifanio de los Santos Avenue
in order to protest against the President Joseph Estrada when it was voted in the
Congress to do not consider the evidence of corruption against him. Almost seven
million of messages were sent and over a million people were mobilised. A few days
later the president was gone. This author also analysed the Spanish massive
demonstrations organised in 2004 through a text message against the government of
José María Aznar, when he inaccurately blamed the Madrid attacks on the Basque
separatists. A few days later, his party lost the General Elections. Finally, in this
research it was also investigated how in Moldova, in 2009, protests were coordinated
against the Communist Party after the fraudulent election triggering his loss of power.
Gerber and Rogers (2009) and Gerber et al. (2008) proved how it was possible to
increase political participation by exerting influence through a set of e-mails. These
authors analysed a study of 180,002 households receiving an e-mail encouraging them
to vote. It was prepared four different e-mails. The first type emphasised simply the
civic duty; the second claimed the citizens were going to be studied, which can be
interpreted as a mild form of social pressure; in the third e-mail, each household was
informed that a letter will be sent to inform the recipients about household’s voting
records (whether they vote or not), which can be interpreted as a higher level of social
pressure; and in the fourth email, the recipients were informed that a letter will be sent
with a list of the household’s voting records and also of those living nearby, which
according to the research was the highest level of social pressure that was tested.
The results showed that while the control group voted at a rate of 29.7%, the
households to which first e-mail was sent voted at a rate of 31.5%, those who received
the second mail at a rate of 32.2%, the households to which the third mail was sent at a
rate of 34.5%, and finally, those who received the fourth mail at a rate of 37.8%.
Therefore, the results proved that the level of social pressure had a direct impact on
participation, showing that the turnout increased over the control group by up to 8.1%
(Gerber et al., 2008).

80
Twitter Platform Analysis 2.3.3
As summarised in Belda et al. (2015), Twitter is one of the most popular and
relevant online social networks. It was created in 2006 by Jack Dorsey, Evan Williams,
Biz Stone and Noah Glass. In 2007, 1.600.000 tweets were posted but its popularity
increased rapidly and nowadays this social network has 3.3 billion of active users who
post 500 million tweets per day.
This social network allows registered users to publish short messages called
“tweets” with a maximum length of 280 characters. Users can also become “followers”
of people they find interesting, thereby receiving all the information they publish.
In additional to publishing messages, users can also re-publish messages of interest
from others through a mechanism called a “retweet” (often abbreviated to RT). Users
can make their messages to be read by other users by using a “mention”, which consists
in adding the character “@” in front of a username anywhere in the body of the tweet,
allowing them to see the tweet. A variation of a “mention” is a “replies to”, where the
character “@” in front of the username appears at the beginning of the tweet, which can
be used to send a private direct message that can be just read for the user mentioned.
Finally, users can also group posts together by topic using “hashtags”, which are
descriptive words with the “#” character in front of them (a “tag”). When a hashtag is
tagged in large amounts, the hashtag is said to become a “trending topic”. This can
occur as a result of a concerted effort by users, but also as a consequence of the interest
of an event by itself, which prompts people to talk about this specific topic. These topics
aid users and communities to understand what is happening in the world.
In the rest of this section, it will be presented interesting results of some researches
collected in Belda et al. (2015) in which it has been successfully applied the social
network analysis on Twitter. Schwartz et al. (2013) and Wagner and Strohmaier (2010)
proved that it was possible to predict the happiness of one set of people from the tweets
of other people living in the same county by analysing sets of co-occurring words. It
was especially interesting to discover how donating money and job satisfaction were
discussed more than material possessions in happier communities.
Lumezanu et al. (2012) focused their research on how users sent their tweets and
identified four extreme patterns: sending high volumes of tweets over short periods of

81
time; retweeting while publishing little original content; quickly retweeting; and
colluding with others users, seemingly unrelated, to send duplicate or near duplicate
messages on the same topic simultaneously. Besides, these authors compared
hyperadvocated users (those who consistently disseminate content which subscribe to a
single ideology or opinion), with neutral users. The main conclusion was that they
exhibited different publishing behaviour patterns, but also that the tweeting behaviour
of the hyperadvocates was affected by the specific characteristics of the community
being analysed. In communities with a higher than average number of tweets and
fraction of retweets, hyperadvocates tended to adopt volume-based patterns, i.e., sent
many tweets over short periods of time and retweeted without publishing much original
content; while in communities with a lower average of tweets and fraction of retweets,
they tended to adopt time-based patterns, i.e., sent similar messages close in time and
retweeted quickly.
Quercia et al. (2012) demonstrated how established sociological theories of real
world (offline) social networks worked on Twitter. These researchers detected that
social brokers (those who connect various set of users in a network) were opinion
leaders with a higher network status who tweeted about diverse topics (while influential
users tended to be specialised in concrete topics). In addition, it was observed that while
social brokers expressed positive and negative emotions and had geographically wide
networks; the vast majority of users expressed their emotions in intimate networks
(although negative emotions were expressed in less constrained networks) and had
geographically local networks.
Kouloumpis et al. (2011) analysed the utility of linguistic features for detecting the
sentiment of Twitter messages. These authors focused their research on part-of-speech
features (POS), hashtags and emoticons to identify positive, neutral and negative tweets.
Their main finding was that while POS seemed to be not useful for sentiment analysis;
hashtags and emoticons were powerful to detect the sentiments behind the tweets,
especially when both were used together.
Hughes and Palen (2009) analysed how users’ behaviour changed in mass
convergence events (two related with national security and two with emergency
situations). These researchers concluded that Twitter had evolved over time to offer
more of an information-sharing purpose. Besides, it was seen that users who join

82
Twitter during a mass convergence event tended to become long-term users. Comparing
the users’ behaviour during mass convergence events with the general behaviour pattern
in Twitter, it was detected on one hand, that the number of replies posted during the
mass convergence events was higher; and on the other hand, that the number of tweets
containing URLs was lower. Finally, related to the distribution of tweets among users
during mass convergence events, the pattern observed was similar to the general
behaviour pattern in Twitter, i.e, the number of messages sent increased as the number
of senders decreased. In other words, there were a few people that act like “information
hubs” (collecting and deploying information), while the majority of members had
minimal participation.
Detecting and Measuring Influence on Twitter 2.3.4
In this section, it will be presented the research related to how to detect and
measure influence on Twitter conducted by Belda et al. (2015).
Social network analysis not only helps to identify specific nodes but also to
describe the structure of the entire communicative network (Kleinberg, 1999;
Wasserman and Faust, 1994). Directed links represent anything from intimate
friendships to common interests about a relative topic.
Analysing these connections on Twitter, Cha et al. (2010) concluded that those
links show the flow of information and, as a consequence, that they are a good indicator
to determine the users’ influence. This influence appears when a user’s action inspires a
reaction from a second user (Berger and Strathearn, 2013). In order to analyse influence
on Twitter, it is necessary to identify a relationship between two users in which at least
one of them (X) follows another one (Y) because X is interested in the updates of Y.
Using Twitter terminology, the previous relationship implies that X is a follower of Y.
Once X has consumed the content, there are two possibilities: passive consumption,
when X just read (or even ignore) the tweet published by Y; or active consumption,
when X takes some action based on the original message. This action could be one of
following: a) X sends a private direct message to the original publisher; b) X
communicates with the original publisher by using the reply option; c) X post a message
in which the original publisher is mentioned; or d) X amplifies the message by
retweeting it. In these cases where X is choosing an active consumption option, it is
concluded that X has been influenced by Y (Anger and Kittl, 2011).

83
For a better understanding of the reasons that explain why X adopts an active or
passive consumption after reading a tweet of Y, Anger and Kittl (2011) propose the
following classification based on Kelman (1958):
- Identification, which means that X follows an influential person who is liked,
respected and/or has a celebrity status. In this case, it is expected that X replies to Y
because of the status of Y rather than the content of the tweet.
- Compliance, which means that X publicly agrees with Y and keeps any
disagreeing thoughts and opinions to himself. It could trigger a retweet if X perceives
the content published by Y as popular and helpful for establishing its own reputation
and social status on Twitter.
- Internalisation, which means that X accepts a belief or behaviour both publicly
and privately. This is the most impacting social influence process and could involve
recommendations, retweets and also dialogues.
- Neglect, which means that X ignores the content posted by Y.
- Disagreement, which means that X strongly disagrees with B, and as a result, X
express his disagreement or even decides to unfollow Y.
It has found that a relatively small group of users can be considered as influencers.
An influencer has a large and active number of followers that consume and spread the
content published by him (Bakshy et al., 2011). As a result, this content not only
reaches a large number of followers, but also a larger circle of users that are not direct
followers (Anger and Kittl, 2011).
Once it has been identified from where the influence comes and that there are a
reduced group of users that amass a lot of influence, it is valuable to describe several
indicators in order to measure their influence.
A popular indicator of the influence of a user is his number of followers. However,
Anger and Kittl (2011) underlined that solely taking into account the number of
followers a person has can be misleading as many users follow a large number of other
users just to increase their own following. Besides, it should be also considered that
there are several companies that offer “follow” clicks for payment.

84
These researchers considered the follower/following ratio. It compares the number
of users who have subscribed to the updates of a user with the number of users that the
relative user is following. If this ratio is well below 1, it will mean the user needs to
show interest in other users in order to gain more followers. However, if this ratio is
well above 1, it will mean that this user is being followed by a relative large number of
users without showing interest in too many users. However, these authors also
highlighted that considering just this metric could lead to misinterpretations, as it clearly
depends on the number of users that are being considered. As an example, a result of
this ratio equal to 2 when it comes from a user who is followed by 200 users and
follows 100 should not be interpreted as if it comes from a user who is followed by 2
users and follows 1.
Cha et al. (2010), when studying the user’s influence on Twitter, pointed out how
the number of mentions (as the user’s name value) and the number of retweets (as the
tweet’s content value) are better indicators of the user’s popularity than the number of
followers, i.e., instead of having a large volume of followers, it is more effective to have
an active audience mentioning the user and retweeting his tweets. When selecting those
users with the highest number of followers, mentions and retweets, it was discovered
that there is a little overlap. Moreover, these researches found on one hand, that the
most influential users hold significant influence over a variety of topics; and on the
other hand, that the best way to gain influence is by being creative and insightful.
Bruns and Stieglitz (2013) emphasised the importance of considering on one side,
the number of tweets sent by a user with a particular hashtag, as it shows how strong
the commitment of the user is to a specific topic; and on the other side, the tweets
received (replies, mentions and retweets), as it shows the number of other users who
take notice of or engage with him. Considering both measures, the ratio tweets
received/tweets sent could be considered as a measure of the social pressure of a
specific user on the overall hashtag conversation. If this ratio is well below 1, it will
mean he is tweeting frequently but receiving few replies, mentions and retweets,
therefore, his impact is limited and cannot be considered an influencer. However, if this
ratio is well above 1, it will mean that user is tweeting considerably less than the replies,
mentions and retweets he is receiving and, as a consequence, that he has the significant
impact necessary to be considered an influencer.

85
In addition, these researchers also highlighted the relevance of counting the number
of tweets containing URLs, as it provides a powerful insight into the number of external
resources a user is introducing or retweeting.
Anger and Kittl (2011), taking into account the ratio follower/following and tweets
received/tweets sent proposed the Social Networking Potential (SNP) metric, which
consists of the sum of both ratios divided by 2:
SNP = [(Follower/Following)*100 + (tweets received/tweets sent)*100] / 2
The interpretation of this metric is as follows: as higher is the SNP score, as more
influential the user is.
Finally, there are other commercial approaches with proprietary algorithms focused
on the analysis of user’s online influence (Anger and Kittl, 2011). One of the most used
online rating services is Klout31
, which uses a proprietary algorithm that considers more
than 25 variables. Klout measures the user’s overall online influence on Twitter (and
also on Facebook and LinkedIn) with a score ranging from 1 (lowest) to 100 (highest)
amount of influence. Once the score is calculated, Klout also places the user in a so-
called influence matrix with 16 possible classifications created from the combination of
eight attributes. Other commercial services which offer measures of influence on
Twitter are Brandwatch32
or Website Grader33
.
Political Debate on Twitter 2.3.5
Twitter is increasingly considered by scholars as political platform, where
politicians, media professionals and citizens engage in a personal type of political
communication (Murthy, 2015; Ekman and Widholm, 2014; Aragón et al., 2013). Peña-
López et al. (2014) underlined that this platform is mainly used to broadcast opinions, to
voice discontent and to call for gatherings in real time. Publishing a political opinion
through a tweet, which means an intellectual processing of analysis, criticism and
synthesis of political arguments, is becoming usual among a growing number of citizens
(Jennings et al., 2017). Anger and Kittl (2011) and Leavitt et al. (2009) emphasised how
Twitter is as a network where users exchange information around topics and subjects
31
https://klout.com 32
https://www.brandwatch.com/ 33
https://website.grader.com/

86
rather than personal issues like others platforms. Political conversations on Twitter have
been more successfully normalized than on other social media such as Facebook and
Instagram (Ausserhofer and Maireder, 2013).
Investigating how Twitter is used in politics, it has been established a positive
correlation between political events in the offline world and the use of Twitter (Aragón
et al., 2013; Lehmann, 2012). Accordingly, Christensen (2011) proved how the
engagement in online political debates correlates positively with offline political
participation. Besides, McKinney et al. (2013) established that the online political
debate held on Twitter contributes positively to the political knowledge. In agreement,
Jennings et al. (2017) demonstrated a positive relationship between the frequency of
tweeting about politics and the acquisition of knowledge.
Analysing online political debates held on Twitter, Peña-López et al. (2014) noted
that Twitter is also being used to focus users’ attention on specific topics. Aragón et al.
(2013) and Wu et al. (2011) warmed the risk of homophily, i.e., as users choose which
conversations to participate in and which users to follow, there is a high likelihood that
it appears clusters of users engaged in a political conversation where most of them have
the same political leaning or even the same preferred party. Guadián-Orta et al. (2012),
studying the relationship between users and message proved that it works in both ways:
based in a specific topic is created a social network, but then, the social network shapes
the message over the time.
In the following lines, it will be summarised the use of Twitter as a platform to
spread propaganda and generate political debate during the electoral campaigns
(Jennings et al., 2017; Aragón et al., 2013); as a mobilizing platform for social
movements (Vallina-Rodriguez et al., 2012); and as a predictor of electoral outcomes
(Tumasjan et al., 2010).
Twitter has shown its usefulness as a platform to spread propaganda and generate
political debate during the electoral campaigns (Aragón et al., 2013). For instance, this
platform has been actively used during political events as the elections in Iran, Spain or
USA (Vallina-Rodriguez et al., 2012). In particular, it has been found how it increases
the use of Twitter during political debates (Siegel, 2018; Bruns and Burgess, 2011).

87
Jennings et al. (2017) underlined that Twitter shows, in real time, not only the salience
of political issues, but also the successes or failures of public sphere arguments.
Twitter has also shown its usefulness as a mobilizing platform for social
movements (Peña-López et al., 2014), allowing marginalized or oppressed groups to
coordinate and express their concerns (Gladwell, 2010). This social network was crucial
in the Women’s Marches, which started in 2017 in Washington and used Twitter to
spread information; in the Black Lives Matter movement, which started in 2013 with
the hashtag #blacklivesmatters, allowing citizens to communicate with other like-
minded citizens, supportive communities and legislators (Ince et al., 2017); in the Arab
Spring, which started in 2010 and owes part of its success to the strategic use of Twitter
(Vallina-Rodriguez et al., 2012).
In the case of Spain, Twitter played an essential role on the birth and development
of the Movimiento 15M (15M Movement). In a precarious context of an economic,
social and political crisis, Twitter was used not only as a platform for political debate
(Vallina-Rodriguez et al., 2012), allowing citizens to channel their outrage (Anduiza et
al., 2014); but also as channel to spread the call for protests (Piñeiro-Otero and Costa-
Sánchez, 2012; González-Bailón et al., 2011). Peña-López et al. (2014) underlined how
the interaction between the physical and the virtual world was crucial for this movement
to succeed, as it facilitated the sharing of information and a better coordination, giving
their members a sense of collective identity.
Moreover, it is worth noting how some researches have even highlighted the
usefulness of analysing the online political debate in order to predict electoral outcomes
as real world political coalitions and parties’ vote share (Skoric et al., 2012; Vallina-
Rodriguez et al., 2012; Bermingham and Smeaton, 2011; Congosto et al., 2011, Livne et
al., 2011; Sang and Bos, 2011; O’Connor et al., 2010; Tumasjan et al., 2010).
However, it is fair noting that there are also other studies that have questioned the
previous results (Metaxas et al., 2011; Jungherr, 2010).
Finally, it will be briefly described some results of the literature review conducted
about the role played by users’ political leaning, the emergence of new parties and
users’ political sympathy on the online political debate held on Twitter.

88
Peña-López et al. (2014) and Anduiza et al. (2012), when characterising the
Spaniards political leaning of those users who actively participate in the online political
debate held on Twitter against the established system and its corruption, found how the
majority has a left political leaning. This result is consistent with the one obtained by
Robles-Morales (2008) when studying the political ideology of Spanish Internet users,
since he discovered that they were significantly more likely to be left-wing than the
average Spaniard. Besides, Vallina-Rodriguez et al. (2012) found how, before the
emergence of the new Spanish party Podemos, the vast majority of users in the political
debate held on Twitter against the economic, social and political crisis did not feel
represented for the traditional parties strongly affected by corruption and, were
demanding alternative political actors to represent their interests. Finally, Jennings et al.
(2017) demonstrated how, as suspected, political sympathy not only impacts on
citizens’ attitudes towards political corruption in the face to face conversations, but also
in the online debate about politics held on Twitter. When analysing the political debate
held on Twitter, there is a high probability to find users having the same political
preferences within a conversation (Aragón et al., 2013). Summarising the information
above, political leaning, the emergence of new parties and political sympathy also play
a key role when analysing the online debate about political corruption held on Twitter.
Due to the huge volumes of data being continually published on Twitter, it is
unsurprising that a significant amount of research is taking place to analyse the structure
and content of the information. In the following section, it will be discussed different
results obtained in previous researches where political conversations held on Twitter
have been analysed.
Analysing Political Conversations on Twitter 2.3.6
In the following lines, it will be analysed some researches related to the use of
Twitter as a platform to spread propaganda and generate political debate during the
electoral campaigns, to the effectiveness of Twitter as a mobilizing platform for social
movements, and to the ability of Twitter as a predictor of electoral outcomes.
Regarding the use of Twitter as a platform to spread propaganda and generate
political debate during the electoral campaigns, Jennings et al. (2017) studied the
Twitter conversation generated during the Democrat and Republican presidential
primary debates held on TV in 2016. Concretely, the experiment consisted in analysing

89
the tweets posted while viewing the primary debate of their preferred party by a set of
individuals. Therefore, on their arrival, participants were asked about their partisan
leaning and classified into two groups: Democrats and Republicans. Then, each group
was in turn divided into three new groups. The first group was indicated to follow the
“control condition”, i.e., participants were required to simply tweet their thoughts. The
second group was indicated to follow the “directional condition”, i.e., participants were
required to tweet their evaluations about the candidates and were told that these
evaluations would be reviewed in order to determine the winner and report to the media.
The third group was indicated to follow the “accuracy condition”, i.e., participants were
required to tweet their honest, non-partisan and unbiased evaluations about the
candidates and were told that these evaluations would be reviewed and evaluated by
experts in presidential debates in order to determine their accuracy. Each group was
assigned a specific hashtag and participants were told to use the designated hashtag.
Finally, after viewing the debate, all participants completed a post-test survey to
establish their knowledge acquisition.
These researchers hypothesised that as greater issue elaboration as greater is the
knowledge acquisition. In order to address this issue, a total of 1082 tweets were
analysed and classified manually as follows: “Image tweet”, when it referred to physical
or mental attributes of a given candidate; “Issue tweet”, when it referred to a meaningful
policy consideration present in the campaign; “Image and issue tweet”, when it referred
to both; “Neither image nor issue”, when it did not refer to any. The results showed that
those tweets related to issues led to more knowledge acquisition, therefore, it was
concluded that tweeting about the specific policies while viewing a political debate on
TV impacts positively on citizens’ knowledge about politics.
Moreover, these authors investigated the frequency in which participants tweeted
while viewing the primary debate on TV. The results depicted that the group of
participants who tweeted following the “directional condition” had a higher frequency
than those who tweeted following the “accuracy condition”. Considering that the
“directional condition” was aiming to evaluate candidates in order to determine the
winner and publish it by the media, it is reasonable that participants posted more tweets
than when they were required to be critic and express unbiased assessments, being told
that their impartiality was going to be evaluated by experts to establish their accuracy.

90
In other words, the reason which explains that participants following the “directional
condition” tweeted with a higher frequency is because this condition led participants to
evaluate candidates according with their predispositions while those participants
following the “accuracy condition” may experiment any contradiction between their
predispositions and the perceptions about how their preferred candidate is performing
on the debate. The confirmatory bias directly impacts on citizens’ assessments and, as a
consequence, participants under the “directional condition” find more pleasant to tweet
than those under the “accuracy condition”. As it has been demonstrated, the
confirmatory bias, which in this context can be interpreted as political sympathy, also
plays a key role when analysing the online debate about politics held on Twitter.
Aragón et al. (2013) analysed the Twitter conversation generated during the
campaign of the Spanish General Elections held in November 2011. For this purpose, it
was collected those tweets published between 4 and 24 November 2011 which satisfied
at least one of the following conditions: contained a hashtag linked to the campaign;
belonged to an official party account or to someone holding a position in one of the
main Spanish parties; belonged to a user previously identified as activist, journalist,
mass-media channel, radio or TV program focused on the campaign; mentioned a party
or a candidate. This process yielded a dataset of 3074312 political tweets published by
380164 distinct users.
These authors justified their research was focused on Spain underlining on one
hand, how the political use of Twitter in Spain had increased considerably since the
Spanish protest in May 2011; and on the other hand, that while the Spanish electoral
law regulated the offline campaign, there was no regulation for party campaigning on
Twitter.
These researchers were interested in testing their belief that the volume of tweets
over time reflects the involvement of different parties in the key moments of the
electoral campaign. In order to address this issue, they analysed the volume of tweets
per day to identify if the most relevant events of the electoral campaign led to a higher
activity on Twitter. The results, according with previous researches (Barberá and
Rivero, 2012; Congosto and Aragón, 2012; Bruns and Burgess, 2011) verified their
hypothesis as the higher volume of tweets (19% of the dataset), corresponded with the
electoral debate day between the two leading candidates; the second peak (14% of the

91
dataset), was found in the election day; and the third peak (7% of the dataset), belonged
to the day of the end of campaign. Besides, it is worth noting, that the reflection day,
i.e., the day preceding the Election Day, it was registered less activity. The Spanish
electoral law establishes an election silence in order to promote the reflection without
influence from political parties prior to voting the Election Day, and as it was registered
less activity on Twitter, it can be concluded that it was partially followed also on this
platform in despite of this law does not regulate the online campaign.
Related to the above, Hu et al. (2012) also investigated the crowd’s tweeting
behavior, but in this case, within a political event. Concretely, these authors analysed
two large sets of tweets related to President Obama’s speech on the Middle East in May
2011 (22,000 tweets), and a Republican Primary debate in September 2011 (110,000
tweets). These tweets were classified into two categories: “Steady tweets”, which were
referred to the event in general; and “Episodic tweets”, which were related to specific
topics. The results showed how the “Episodic tweets” were more posted during the
event than before or after it. Besides, as the event evolved, the crowd tended to
comment any topic independently if it had been discussed before, was being discussed,
or was expected to be discussed later on.
Moreover, Aragón et al. (2013) were also interested in testing their belief that the
Spanish political Twittersphere was polarized. In order to address this issue, they
analysed the communication between parties through the network of retweets and
replies to identify if they cross party borders. The results, according with previous
researches (Conover et al., 2012; Feller et al., 2011), also verified their hypothesis as the
vast majority of retweets and replies were among members of the same party. Regarding
the retweets network, it was found that members of PSOE and PP were retweeting
messages of their own party, in the 99.2% and 99.7% of the cases respectively. Related
to the replies network, it was found that members of PSOE and PP were replying mostly
to messages from their own party, in the 85% and 84% of the cases respectively.
Accordingly, Conover et al. (2011), when analysing the network of political
retweets, demonstrated how it exhibits a highly segregated partisan structure with
extremely limited connectivity between progressive and conservative users. These
researchers suggested that what is behind this finding could be a users’ preference to
retweet other users’ tweets with whom they agree politically. This high polarisation

92
shows how political sympathy plays a key role when analysing the online debate about
politics held on Twitter. In addition, it was also found how the likelihood of a user to
interact with other user with a different ideology increase as lower is his partisanship.
In reference to the effectiveness of Twitter as a mobilizing platform for social
movements, it will be reviewed the research conducted by Vallina-Rodriguez et al.
(2012), who analysed the use of Twitter during the Spanish Revolution in May 2011. In
the following lines it will be contextualised the political, economic and social situation
at that time, which led to the well-known “Movimiento 15M” (15M Movement).
Since 2008, Spain was going through an economic and social crisis like many other
European countries. Following the CIS34
, in May 2011 Spaniards were overwhelmingly
concerned with the unemployment (which rate was over 20% of the active population),
the economic situation and the party political system. Besides, Spain was facing
Regional and Local Elections. Concretely, 13 out of 17 Spanish autonomous areas and
more than 8000 municipalities were facing elections. Focusing on the main parties, on
one side, the incumbent party (PSOE) was being accused to do not adopt the measures
needed to tack the crisis; and on the other side, members of PP were accused of being
involved in corruption scandals.
In this precarious context, the political debate moved onto blogs and online social
networks as Facebook and Twitter (Vallina-Rodriguez et al., 2012), which managed to
channel the collective indignation (Anduiza et al., 2014). The online political debate
quickly gained adherents and, as a result of merging more than 200 smaller citizen
grassroots organisations, student organisations and other civil movements, it was born
the collective “¡Democracia Real, Ya!” (Real Democracy, Now!), which had a definite
bias to the left (Peña-López et al., 2014; Anduiza et al., 2012). This collective called for
public protests against the established situation to be held on 15 May 2011 in more than
fifty cities across Spain, which led to activists setting up camps in many of the cities,
originating the well-known “Movimiento 15M” (15M Movement), which members
called themselves “Los Indignados” (The Indignant) (Vallina-Rodriguez et al., 2012).
The role played by the online social networks was crucial to generate and spread the call
(Piñeiro-Otero and Costa-Sánchez, 2012; González-Bailón et al., 2011). The interaction
between the physical and the virtual world was crucial for this movement to succeed,
34
CIS May 2011

93
feeding both each other with information, coordination and a sense of collective identity
(Peña-López et al., 2014). Toret (2013) emphasized how this movement used actively
Twitter as a channel to organise themselves and discuss their positions.
Vallina-Rodriguez et al. (2012) were interested in studying the way in which
Twitter was used in this period. For this purpose, it was identified on one hand, 400
hashtags and key words related to the political debate; and on the other hand, a set of
200 Twitter accounts used by political parties, their candidates, the “Democracia Real,
Ya!” (Real Democracy, Now!) organisation and the main media sources. Then, it was
collected through the Twitter Streaming API those tweets between 10 and 24 May 2011
which contained one hashtag of the list, were mentioning a Twitter account of the list
or, were published by a Twitter account of the list. This process yielded a dataset of 3
million tweets sent by about 500000 Twitter users. These tweets contained more than
115000 different hashtags.
The results showed that the most popular hashtags were: #acampadasol (716434
tweets), which was related to Madrid’s camps and protests; #spanishrevolution (642149
tweets), which comprised all the Spanish protests; #acampadabcn (352088 tweets),
which was related to Barcelona’s camps and protests; #nonosvamos (175.127 tweets),
which means “we are not leaving” and was proclaiming the intention of not to leave the
camps; and #nolesvotes (172093 tweets), which means “do not vote” and was
encouraging citizens not to vote for the traditional parties PSOE and PP. The main
conclusion was that the vast majority of the tweets expressed an alternative political
orientation outside the traditional parties PSOE and PP.
Concretely, on one side, when analysing the top 300 hashtags with a political scope,
the 80% had an alternative scope while just the 10% had a traditional left and the 10%
had a traditional right political scope. On the other side, when analysing the users’
accounts with more than 1000 mentions with a political scope, the 67% had an
alternative scope while just the 19% had a traditional left and the 14% had a traditional
right political scope.
As a consequence, it is possible to establish that the online political debate was
dominated for people who did not feel represented by the traditional parties. In fact, one
of the mottos of the protests was “no nos representan” which means “they do not

94
represent us” and was referred mainly to PSOE and PP. The crowd was demanding
alternative solutions to the economic and social crisis different from those offered by
traditional parties, which were seriously affected by corruption. In other words, citizens
needed new political actors to represent their interests. In turn, taking into account that
this context served as the basis for the appearance of the new party Podemos
(Kioupkiolis and Katsambekis, 2018; Franzé, 2017), the idea that the online political
debate is dominated by users with a left political leaning is reinforced.
Finally, regarding the ability of Twitter as a predictor of electoral outcomes, it will
be summarised the main results of the research conducted by Congosto et al. (2011) and
Tumasjan et al. (2010) related to the Catalan Elections of 2010 and the German General
Elections of 2009 respectively.
Congosto et al. (2011) analysed the political conversation related to the Catalan
Elections of November 2010. Concretely, it was collected a total of 84000 tweets
mentioning parties and candidates during 18 days previous to the Election Day. These
researchers found a positive correlation between the number of mentions received for
each party or candidate and the number of votes reached. They concluded emphasizing
the usefulness of Twitter to measure the public opinion.
Tumasjan et al. (2010), when analysing the political conversation related to the
German General Elections of September 2009, found firstly, that Twitter is a platform
for political deliberation, although such forums tend to be dominated by a small number
of users with a high level of participation. Secondly, how parties and politicians’
profiles were seen as very similar, which was associated with the political proximity
between parties in the weeks before the election. Thirdly, it was also discovered that
joint mentions of two parties were in line with real world political ties and coalitions.
Finally, the most surprising conclusion was that Twitter worked as a predictor of the
results, as the percentage of messages mentioning each of the parties reflected its vote
share. Related to this conclusion, it is necessary to underline that although the activity
prior to the election validated the election outcome, the German political Twittersphere
is not a representative sample of the German electorate.

95
2.4 Conclusions
In this chapter it has been firstly, approached the definition of political corruption
from different criteria; described its impact from different perspectives; and investigated
the electoral consequences. Secondly, it has been reviewed and summarise the literature
related to political awareness, political leaning, political sympathy, economic context,
the news party’s emergence and social pressure. It has been concluded that these are
decisive variables when studying citizens’ attitude towards political corruption.
Finally, it has been studied the role played social media on politics. Concretely, it
has been studied a set of researches in which it has been demonstrated the effectiveness
of social media to impact on political attitude and behaviour; it has been described the
platform Twitter and how to detect and measure the influence on this platform; it has
been characterised the political debate held on Twitter; and finally, it has been reviewed
a set of researches where it has been analysed political conversations held on this
platform.
Based on the literature review carried out in this chapter, in Chapter 3 it will be
raised the hypotheses of this thesis which will be subsequently attempt to validate in
chapters 4 and 5.


97
Chapter 3. Hypotheses Formulation
3.1 Introduction
In the previous chapter, it has been reviewed the literature related to the main
variables which have impact on citizens’ attitude towards political corruption: economic
context, social pressure, political awareness, political leaning, the new parties’
emergence and political sympathy. The main goal of this thesis is to shed light on the
puzzle of why political corruption does not seem to have the electoral consequences it
could be expected, and even more important, to find out key factors to develop better
strategies to promote citizens’ political criticism and achieve a higher quality
democracy.
In this chapter it will be stated and justified a number of hypotheses relevant to
these questions. These will be tested in the following two chapters, with the hypotheses
related to what it has been called “Real World” being tested in Chapter 4, and those
related to “Virtual World” in Chapter 5. The current chapter is organised as follows: it
will be stated, set in context, and justified the hypotheses related to the real world in
section 3.2, and those related to the virtual world in section 3.3. Finally, in section 3.4 it
will be presented the model of the thesis.
3.2 Hypotheses related to “Real World”
In this section it will be stated and justified the hypotheses related to the real world
(H1-H6), which involve all the variables mentioned previously, i.e., economic context,
social pressure, political awareness, political leaning, the new parties’ emergence and
political sympathy.
Hypothesis 1: Economic Context and Attitude towards Political 3.2.1
Corruption
The economic context plays a crucial role in citizens’ attitude towards political
corruption. Scholars have analysed citizens’ electoral behaviour in periods of economic
expansion and crisis in different countries and have concluded that citizens’ criticism
towards political corruption increases when the country is going through an economic
crisis (Cordero and Blais, 2017; Charron and Bågenholm, 2016; Anduiza et al., 2013;

98
Klasnja and Tucker, 2013; Winters and Weitz-Shapiro, 2013; Zechmeister and
Zizumbo-Colunga, 2013; Jerit and Barabas 2012; Weitz-Shapiro and Winters, 2010;
Manzetti and Wilson, 2007; Golden, 2007; Diaz-Cayeros et al., 2000; Duch et al., 2000;
Mauro, 1995). Therefore, it is established the following hypothesis:
H1- Citizens’ level of tolerance towards political corruption is lower when the
country’s economy is in crisis.
In other words, it will be analysed if citizens’ punishment is higher when the
corruption cases are discovered while they are suffering the social and economic
consequences of an economic crisis.
If it proved to be the case, it would show that an economic crisis supposes an
opportunity to impact on citizens’ political attitude and, as a result, to improve the
democracy’s quality.
Hypothesis 2: Social Pressure vs. Factual Information 3.2.2
There is a wide agreement among scholars in pointing out that social pressure plays
a key role on citizens’ political attitude and behaviour. Concretely, it has been proved
how social pressure plays a key role in mobilising citizens against the established
political system and its corruption (Giraldo-Luque, 2018; Marinov and Schimmelfennig,
2015; Anduiza et al., 2014; Peña-López et al., 2014; Toret, 2013; Anduiza et al., 2012;
Piñeiro-Otero and Costa-Sánchez, 2012; Vallina-Rodriguez et al., 2012; Eltantawy and
Wiest, 2011; González-Bailón et al., 2011; Shirky, 2011); Bond et al. (2012) have found
how it impacts on political self-expression, political information seeking and on voting
behaviour; and finally, Gerber and Rogers (2009) and Gerber et al. (2008) have
demonstrated how by exerting it, political participation increases.
Based on the results obtained in the researches above, it is theorized that social
pressure is more effective than factual information when analysing their impact on
citizens’ attitude towards political corruption. Therefore, it is raised the following
hypothesis:
H2- Among the variables which influence the citizens’ attitude towards
political corruption, social pressure has a higher impact than factual information.

99
In other words, it will be studied if the impact of an individual being informed
about political corruption emphasizing there are already other people mobilizing against
it and focusing on citizens’ economic and social losses is higher than just spreading
factual information.
If this hypothesis was verified, it would show the key influence that other
individuals’ attitudes towards political corruption exert on citizens and, therefore, the
greater effectiveness to reach a higher impact on citizens’ criticism towards political
corruption of the information focused on other citizens’ reactions against it. In addition,
it would indicate how emphasizing the social and economic consequences of corruption
is also a more effective strategy than the spread of factual information.
Hypothesis 3: Political Awareness and Attitude towards Political 3.2.3
Corruption
Citizens with a different level of knowledge about politics show different levels of
tolerance towards political corruption (Cordero and Blais, 2017; Anduiza et al., 2013;
Weitz-Shapiro and Winters, 2010; Arceneaux, 2007; Kam, 2005).
Scholars have analysed how an increase in the level of corruption perceived by
citizens plays against the electoral results of corrupt politicians (Cordero and Blais,
2017; Fernández-Vázquez et al., 2016; Anduiza et al., 2013; Costas-Pérez et al., 2010;
Figueiredo et al., 2010; Weitz-Shapiro and Winters, 2010; Chang and Kerr, 2009;
Ferraz and Finan, 2008; Tavits, 2007; Gerring and Thacker, 2005; Adserá et al., 2003;
Treisman, 2000; Fackler and Lin, 1995; Rundquist et al., 1977).
Political awareness seems to play a decisive role to explain the attitude towards
political corruption, therefore, it is proposed the following hypothesis:
H3- Citizens’ level of tolerance towards political corruption is lower as higher
is their political awareness.
In other words, it will be investigated if there are significant differences in the
attitude towards political corruption between citizens with a different level of political
awareness in order to find out if those citizens with a higher political awareness are less
tolerant.

100
If it proved to be the case, it would show that citizens’ attitude towards political
corruption can be modified by involving citizens in the political debate and therefore,
the key role of the media.
Hypothesis 4: Political Leaning and Attitude towards Political 3.2.4
Corruption
Citizens tend to analyse political information accordingly with their political
predispositions (Jennings et al., 2017; Lodge and Taber, 2013; Brader and Tucker,
2009; Anderson and Singer, 2008; Coan et al., 2008; Malhotra and Kuo, 2008;
Anderson et al., 2005; Bartels, 2002, 2000; Gerber and Green, 1999; Miller and Shanks,
1996; Zaller, 1992; Sherrod, 1971). Political leaning involves a position about a set of
variables as the predisposition to change (Anderson and Singer, 2008; Devos et al.,
2002; Schwartz, 1992); social class and religion (Freire, 2006; Knutsen, 1997);
economic issues (Hellwig, 2014; Dalton, 2006; Knutsen, 1995; Inglehart and
Klingemann, 1976; Downs, 1957); inequality (Alesina et al., 2004; Jost et al., 2003a;
Jost et al., 2003b; Jost and Hunyady, 2002; Listhaug and Aalberg, 1999; Tyler and
McGraw, 1986; Lane, 1962); and issues related to immigration, multiculturalism,
gender equality, lifestyle choices, quality of life and environmental policy (Inglehart,
1990).
Focusing on the topic of this thesis, it seems that political leaning also plays a key
role in explaining the different levels of tolerance towards political corruption. It has
been found that supporters of right parties are more tolerant towards corruption
(Charron and Bågenholm, 2016; Anduiza et al., 2013; Costas-Pérez et al., 2010).
Considering this finding, it is established the following hypothesis:
H4- Citizens’ level of tolerance towards political corruption is lower as more
politically progressive they are.
In other words, it will be analysed if there are significant differences in the attitude
towards political corruption between citizens with different political leaning in order to
find out if those citizens with a left political leaning are less tolerant.
If this hypothesis was verified, it would indicate that the electorate of left parties is
more sensitive towards political corruption and, therefore, that these parties would need

101
to make greater efforts to fight against corruption. Besides, it would contribute to
explain the success, in certain electoral campaigns, of right parties involved in
corruption.
Hypothesis 5: New parties’ emergence and Attitude towards 3.2.5
Political Corruption
The economic, social and political crisis has recently shaken the traditional political
system contributing to the emergence of new parties (Altiparmakis and Lorenzini, 2018;
Muro and Vidal, 2017; Della Porta, 2015). There is a wide set of democracies where it
has emerged new political parties which have successfully broken into the political
scene making the fight against corruption their leitmotif (Bågenholm and Charron,
2014; Hanley and Sikk, 2014; Bågenholm, 2013; Sikk, 2012; Bélanger, 2004). For
instance, it has recently appeared new parties which have reached remarkable electoral
results in three countries of Southern Europe which were not only affected by the
economic, social and political crisis; but also by political corruption (Hutter et al.,
2018): Syriza in Greece, Movimento Cinque Stelle in Italy and Podemos in Spain.
The emergence of new parties represents an opportunity for citizens to punish
traditional parties affected by political corruption (Cordero and Blais, 2017; Charron
and Bågenholm, 2016). In this thesis, it will be studied if those citizens who feel closer
to new parties are less tolerant towards political corruption than those who support
traditional parties.
Taking into account the previous findings, it is raised the following hypothesis:
H5- Citizens’ level of tolerance towards political corruption is lower in those
citizens who are supporting new parties.
In other words, it will be studied if there are significant differences in the attitude
towards political corruption between citizens supporting different parties in order to find
out if those citizens who are supporting new parties are less tolerant.
If it proved to be the case, it would show that new parties’ supporters are more
sensitive towards political corruption and, therefore, the effectiveness of the new
parties’ strategy based on showing themselves as anti-corruption parties.

102
Hypothesis 6: Political Sympathy and Attitude towards Political 3.2.6
Corruption
Citizens evaluate a corruption scandal differently depending on which is the party
affected, being more tolerant when it affects their preferred party (Cordero and Blais,
2017; Ecker et al., 2016; Anduiza et al., 2013). Charron and Bågenholm (2016) have
explained how that is due to the “home team” psychology factor, which makes hard
blaming the party they are supporting. There is a wide agreement among scholars in
pointing out that voters’ political sympathy can balance the impact of corruption on the
electoral results, being even the candidate involved in a corruption case re-elected
(Cordero and Blais, 2017; Charron and Bågenholm, 2016; Welch and Hibbing, 1997;
Peters and Welch, 1980).
Considering the previous findings, it is proposed the following hypothesis:
H6- Citizens’ level of tolerance towards corruption is higher as higher is the
political sympathy towards the party involved.
In other words, it will be investigated if there are significant differences in the
attitude towards political corruption between citizens evaluating corruption when it is
not indicated the party involved and when it is specified it is their preferred party the
one affected. It will be studied if citizens are more tolerant when the case of corruption
involves the party they are supporting.
If this hypothesis was verified, it would clearly contribute to explain why political
corruption is not as much penalized as it could be expected and, therefore, it would
indicate how necessary is citizens to become aware of the importance to fight against
political corruption independently of the party affected in order to reach a higher quality
democracy.
3.3 Hypotheses related to “Virtual World”
The second part of this research will be focused on the analysis of the conversations
about politics held on Twitter. There is a wide agreement among scholars in pointing
out that Twitter is becoming a political platform, where politicians, media professionals
and citizens engage in a personal type of political communication (Murthy, 2015;
Ekman and Widholm, 2014; Aragón et al., 2013). This platform has been identified as a

103
network where users exchange information around topics rather than personal issues
like others platforms as Facebook or Instagram (Ausserhofer and Maireder, 2013;
Anger and Kittl, 2011; Leavitt et al., 2009). There are many researches in which it has
been successfully analysed the political debate held on Twitter (Jennings et al., 2017;
Peña-López et al., 2014; Aragón et al., 2013; Hu et al., 2012; Vallina-Rodriguez et al.,
2012; Conover et al., 2011; Tumasjan et al., 2010).
It has been proved the effectiveness of this platform to spread social pressure and
impact on citizens’ political attitudes and behaviour. For instance, it has been
demonstrated the usefulness of this platform to spread propaganda and generate political
debate during the electoral campaigns (Jennings et al., 2017; Aragón et al., 2013), and
also as a mobilizing platform for social movements (Vallina-Rodriguez et al., 2012).
In this section it will be stated and justified the hypotheses related to the virtual
world (H7-H9). Considering on one hand, that the main topic of the thesis is the analysis
of citizens’ attitude towards political corruption; and on the other hand, the
extraordinary capacity of Twitter to impact on citizens’ attitudes and behaviour, it will
be studied the roles played by political leaning, preferred party and political sympathy
in the online debate about political corruption held on this platform.
The goal of the hypotheses H7, H8 and H9 is to analyse if the results of the real
world analysis (concretely of H4, H5 and H6) are consistent in the virtual world.
Hypothesis 7: Political Leaning and Attitude towards Political 3.3.1
Corruption in the online debate
As it has been proved, citizens tend to analyse political information accordingly
with their political predispositions (Jennings et al., 2017; Lodge and Taber, 2013;
Brader and Tucker, 2009; Anderson and Singer, 2008; Coan et al., 2008; Malhotra and
Kuo, 2008; Anderson et al., 2005; Bartels, 2002, 2000; Gerber and Green, 1999; Miller
and Shanks, 1996; Zaller, 1992; Sherrod, 1971). It has been studied how political
leaning involves a position about a set of variables as the predisposition to change
(Anderson and Singer, 2008; Devos et al., 2002; Schwartz, 1992); social class and
religion (Freire, 2006; Knutsen, 1997); economic issues (Hellwig, 2014; Dalton, 2006;
Knutsen, 1995; Inglehart and Klingemann, 1976; Downs, 1957); inequality (Alesina et
al., 2004; Jost et al., 2003a; Jost et al., 2003b; Jost and Hunyady, 2002; Listhaug and

104
Aalberg, 1999; Tyler and McGraw, 1986; Lane, 1962); and issues related to
immigration, multiculturalism, gender equality, lifestyle choices, quality of life and
environmental policy (Inglehart, 1990).
Political leaning has been found as a key variable when analysing citizens’ attitude
towards political corruption. Charron and Bågenholm (2016), Anduiza et al. (2013) and
Costas-Pérez et al. (2010) showed how left voters tend to punish corruption more than
right voters. Regarding the political debate held on Twitter, Peña-López et al. (2014)
and Anduiza et al. (2012) found that the Spanish users who actively participate in the
online political conversations held on Twitter against the established system and its
corruption have mainly a left political leaning.
In the hypotheses related to real world, it has been theorised that more politically
progressive citizens are less tolerant towards political corruption than conservative. The
goal of this hypothesis is to analyse if the previous theory can be verified when studying
the online conversations about politics held on Twitter. Therefore, it is established the
following hypothesis:
H7- In the online debate about politics held on Twitter, users’ level of tolerance
towards political corruption is lower in progressive users.
In other words, it will be analysed if when reporting corruption in the online debate
about politics, there are significant differences in the attitude towards political
corruption between users with different political leaning. It will be studied if those users
with a left political leaning are more active.
If this proved to be the case, it would show that the electorate of left parties is
dominating the online debate about political corruption. It would also indicate that those
users who support left parties are more sensitive towards political corruption and,
therefore, that these parties would need to make greater efforts to fight against
corruption. Moreover, it would contribute to explain the success, in certain electoral
campaigns, of right parties involved in corruption.

105
Hypothesis 8: New parties’ emergence and Attitude towards 3.3.2
Political Corruption in the online debate
As it has been seen, the economic, social and political crisis has recently shaken the
traditional political system contributing to the emergence of new parties (Altiparmakis
and Lorenzini, 2018; Muro and Vidal, 2017; Della Porta, 2015). There is a wide set of
democracies where it has emerged new political parties which have successfully broken
into the political scene making the fight against corruption their leitmotif (Bågenholm
and Charron, 2014; Hanley and Sikk, 2014; Bågenholm, 2013; Sikk, 2012; Bélanger,
2004). For instance, it has recently appeared new parties which have reached
remarkable electoral results in three countries of Southern Europe which were not only
affected by the economic, social and political crisis; but also by political corruption
(Hutter et al., 2018): Syriza in Greece, Movimento Cinque Stelle in Italy and Podemos
in Spain.
The emergence of new parties represents an opportunity for citizens to punish
traditional parties affected by political corruption (Cordero and Blais, 2017; Charron
and Bågenholm, 2016). Related to the political debate held on Twitter, Vallina-
Rodriguez et al. (2012) found how, before the emergence of the new party Podemos, the
vast majority of Spanish users in the online political conversations held on Twitter
against the economic, social and political crisis did not feel represented for the
traditional parties strongly affected by corruption and, were demanding alternative
political actors to represent their interests. Therefore, it is expected that when analysing
the online debate about politics held on Twitter, those users who nowadays support the
new parties which have recently emerged to fight against political corruption, will be
less tolerant towards the scandals of corruption.
In the hypotheses related to real world, it has been theorised that new parties’
supporters are less tolerant towards political corruption than traditional parties’
supporters. The goal of this hypothesis is to analyse if the previous theory can be
verified when studying the online conversations about politics held on Twitter. For this
purpose, it is raised the following hypothesis:
H8 statement- In the online debate about politics held on Twitter, users’ level
of tolerance towards political corruption is lower in those users who are
supporting new parties.

106
In other words, it will be studied if when reporting corruption in the online debate
about politics, there are significant differences in the attitude towards political
corruption between users supporting new and traditional parties. It will be investigated
if those users supporting new parties are more active.
If this hypothesis was verified, it would show that new parties’ supporters are more
sensitive towards political corruption and, therefore, the effectiveness of the new
parties’ strategy based on showing themselves as anti-corruption parties.
Hypothesis 9: Political Sympathy and Attitude towards Political 3.3.3
Corruption in the online debate
As it has been demonstrated, citizens evaluate a corruption scandal differently
depending on which is the party affected, being more tolerant when it affects their
preferred party (Cordero and Blais, 2017; Ecker et al., 2016; Anduiza et al., 2013).
Charron and Bågenholm (2016) have explained how that is due to the “home team”
psychology factor, which makes hard blaming the party they are supporting. Voters’
sympathy towards a party can reduce the impact of corruption on the electoral results of
a corrupt politician (Cordero and Blais, 2017; Charron and Bågenholm, 2016; Welch
and Hibbing, 1997; Peters and Welch, 1980).
In reference to the political debate held on Twitter, Aragón et al. (2013) established
that in the Spanish political Twittersphere there was a high probability to find users
having the same political preferences within a conversation. It seems that political
sympathy not only impacts on citizens’ attitudes towards political corruption in the face
to face conversations, but also in the online debate about politics held on Twitter.
In the hypotheses related to real world, it has been theorised that party’s supporters
are more tolerant towards political corruption when it is their preferred party the one
which is being involved. The goal of this hypothesis is to analyse if the previous theory
can be verified when studying the online conversations about politics held on Twitter.
As a consequence, it is proposed the following hypothesis:
H9 statement- In the online debate about politics held on Twitter, users’ level
of tolerance towards political corruption is higher as higher is the political
sympathy towards the party involved.

107
In other words, it will be investigated if when reporting corruption in the online
debate about politics, there are significant differences in the attitude towards political
corruption between the supporters of each party when they are facing corruption in
another party and when it affects their party. It will be studied if users are more tolerant
when it is their preferred party the one which is being involved.
If this proved to be the case, it would clearly contribute to explain why political
corruption is not as much penalized as it could be expected and, therefore, it would
indicate how, in order to reach a higher quality democracy, it would be crucial citizens
to become aware of the importance to fight against political corruption independently of
the party affected.
3.4 Model of the Thesis
In this chapter it has been presented and justified the hypotheses of the thesis,
which will be subsequently examined and tested in detail in the following chapters. The
hypotheses themselves, and the environments in which they will be tested are
summarised in Table 3-1, and the model of this thesis is presented in diagrammatic form
in Figure 3-1.
Table 3-1 Hypotheses of the Thesis
Hypotheses
Real
World
H1- Citizens’ level of tolerance towards political corruption is lower when the
country’s economy is in crisis.
H2- Among the variables which influence the citizens’ attitude towards political
corruption, social pressure has a higher impact than factual information.
H3- Citizens’ level of tolerance towards political corruption is lower as higher is
their political awareness.
H4- Citizens’ level of tolerance towards political corruption is lower as more
politically progressive they are.
H5- Citizens’ level of tolerance towards political corruption is lower in those
citizens who are supporting new parties.
H6- Citizens’ level of tolerance towards political corruption is higher as higher is
the political sympathy towards the party involved.
Virtual
World
H7- In the online debate about politics held on Twitter, users’ level of tolerance
towards political corruption is lower in progressive users.
H8- In the online debate about politics held on Twitter, users’ level of tolerance
towards political corruption is lower in those users who are supporting new parties.
H9- In the online debate about politics held on Twitter, users’ level of tolerance
towards political corruption is higher as higher is the political sympathy towards
the party involved.

108
Figure 3-1 Model of the Thesis
Following the diagram above, in this thesis it will be analysed the impact of the
variables which have been previously identified as the most relevant when studying the
citizens' attitude towards political corruption (economic context, social pressure,
political awareness, political leaning, preferred party and political sympathy) from two
different perspectives, real and virtual world.
Related to the real world, firstly, it will be analysed if citizens' attitude towards
political corruption varies depending on the country’s economic situation (H1).
Secondly, it will be studied if exerting social pressure, i.e., emphasizing other citizens’
reactions against political corruption and spreading information focused on the
economic and social consequences it provokes, is a better strategy to increase citizens’
criticism towards political corruption than just providing factual information (H2).
Thirdly, it will be investigated the impact of citizens’ political awareness on the attitude
towards political corruption (H3). Then, it will be analysed if more politically
progressive citizens have a lower level of tolerance towards political corruption (H4).
Moreover, it will be studied if citizens' attitude towards political corruption varies

109
depending on citizens’ preferred party (H5). Finally, it will be investigated the role
played by political sympathy in citizens’ attitude towards political corruption (H6).
Regarding the virtual world, it will be analysed the debate about politics held on
Twitter. Firstly, it will be studied if there is any difference between progressive and
conservative users in their attitude towards political corruption (H7). Then, it will be
investigated if it is possible to establish any difference between traditional and new
parties’ supporters (H8). Finally, it will be analysed if users’ attitude towards political
corruption varies depending on the sympathy they feel towards the party involved (H9).
In order to test each of the hypotheses of the model, in the remaining chapters it
will be developed experiments for both scenarios (real and virtual world) and presented
the results, analysis and conclusions. Chapter 4 will be focused on the “Real World” to
test hypotheses H1-H6, while Chapter 5 will be focused on the “Virtual World” to test
hypotheses H7-H9. Finally, in Chapter 6 it will be summarised the main conclusions of
the thesis.


111
Chapter 4. Citizens’ attitudes towards political
corruption in the Real World: Experiments and
analysis
4.1 Introduction
In this chapter, it will be presented the design and outcomes of the experiments
which test the hypotheses relating to the “Real World” described in Chapter 3. These
are repeated here in Table 4-1 for convenience.
Table 4-1 Hypotheses related to the real world
Hypotheses
Real
World
H1- Citizens’ level of tolerance towards political corruption is lower when
the country’s economy is in crisis
H2- Among the variables which influence the citizens’ attitude towards
political corruption, social pressure has a higher impact than factual
information.
H3- Citizens’ level of tolerance towards political corruption is lower as
higher is their political awareness.
H4- Citizens’ level of tolerance towards political corruption is lower as more
politically progressive they are.
H5- Citizens’ level of tolerance towards political corruption is lower in those
citizens who are supporting new parties.
H6- Citizens’ level of tolerance towards political corruption is higher as
higher is the political sympathy towards the party involved.
The experiments presented here are focused on the role played by the economic
context, social pressure, political awareness, political leaning, the new parties’
emergence and political sympathy, in the study of the attitude towards political
corruption. Firstly, it will be analysed if citizen’s criticism towards political corruption
is higher when the country is in a context of economic crisis. Secondly, it will be
studied which is the best strategy to impact on citizens’ attitude towards political
corruption, analysing if it is possible to reach a greater impact emphasizing other
citizens’ reactions against political corruption and focusing on citizens’ losses rather
than just providing factual information. Thirdly, it will be investigated the impact of
political awareness, studying if it reduces the level of tolerance towards political
corruption. Then, it will be analysed if progressive citizens and conservative citizens
show different level of criticism towards political corruption. Moreover, it will be

112
studied if there is any difference in the level of tolerance towards political corruption
between those citizens who are supporting new parties and those who are supporting
traditional parties. Finally, it will be investigated if citizens’ criticism towards political
corruption varies depending on the sympathy they feel towards the party which is being
involved.
The data needed to test the hypotheses above is provided on one hand, by two
independent entities: CIS and INE; and on the other hand, by a survey specifically
developed for this purpose. The data collection process of this survey was April 2017
and participants faced questions related to all the variables of the model.
The structure of the rest of the chapter is as follows: in section 4.2 it will be
explained the survey design, focusing on its structure, the sample and the procedures for
each of the experiments conducted. In section 4.3, it will be tested the hypotheses,
presenting the methodology followed and describing the main results and analysis. In
section 4.4, it will be reported the analysis of the results obtained. Finally, in section 4.5
it will be summarised the main conclusions.
4.2 Survey design
The technique used to collect the data needed to test the hypotheses H1- H6 was the
personal interview. The main reasons are its high reliability and the possibility it offers
to personally attend to any questions from the interviewees.
In the following lines, it will be briefly contextualised the Spanish political
situation of the last years focusing on the period in which the dataset was collected.
In November 2011, PP won the General Elections reaching the outright majority.
Since the beginning of its mandate, this party has been involved in a multitude of
corruption scandals as the so-called “Gürtel case”, “Barcenas’ papers”, “Púnica
operation” and “Brugal case”. As a consequence of all the corruption scandals, the
majority of Spanish society has been aware and worried about political corruption and
many Spaniards have been actively participating in demonstrations (Cordero and Blais,
2017; Robles-Egea and Delgado-Fernandez, 2014). In this context, Podemos and C’s
broke into the national political scene claiming to be the solution to regenerate a
democracy strongly affected by political corruption and broke the traditional

113
bipartisanship in the General Elections of December 2015 and also in the repeated
General Elections of June 2016.
PP has remained in the government until June 2018, when a sentence that
condemned this party for corruption led to a wide agreement among several parties of
the opposition which allowed PSOE to win a no-confidence motion. Its mandates have
been plagued with corruption cases. These cases are still in trial and have been
constantly on the focus of the media, also in April 2017 when dataset was collected. As
a consequence, at that time, the vast majority of Spanish society was aware and worried
about corruption. Concretely, following the CIS35
, in April 2017, the 42% of the
population mentioned corruption as one of the main Spanish problems, becoming the
second greatest concern for Spaniards after unemployment.
In the following subsections, it will be considered in detail the survey structure, the
sample and the procedures.
Survey structure 4.2.1
The first part of the survey is a short introduction in which participants were
informed about the purpose of this research, the voluntary nature of the participation,
and the confidentiality of the data to be collected. Then, participants faced a set of
questions related to each of the variables of this thesis. In those questions where
participants had to express their opinion, it was asked them to indicate their position on
a scale anchored at 1 to 5 (indicating in each case the values of the extremes). In order
to design these questions properly, it was followed several authors who have proven
their goodness in previous researches (Cordero and Blais, 2017; Charron and
Bågenholm, 2016; Anduiza et al., 2013; Gromet et al., 2013; Pollitt and Shaorshadze,
2011; Allcott, 2011; Nolan et al., 2008; Schultz et al., 2007; Gatti et al., 2003;
McClelland and Cook, 1980).
Finally, the questionnaire concludes with a set of socio-demographic questions
related to gender, age, civil status, studies completed, current job, number of people
living at home and the household’s income.
35
CIS April 2017
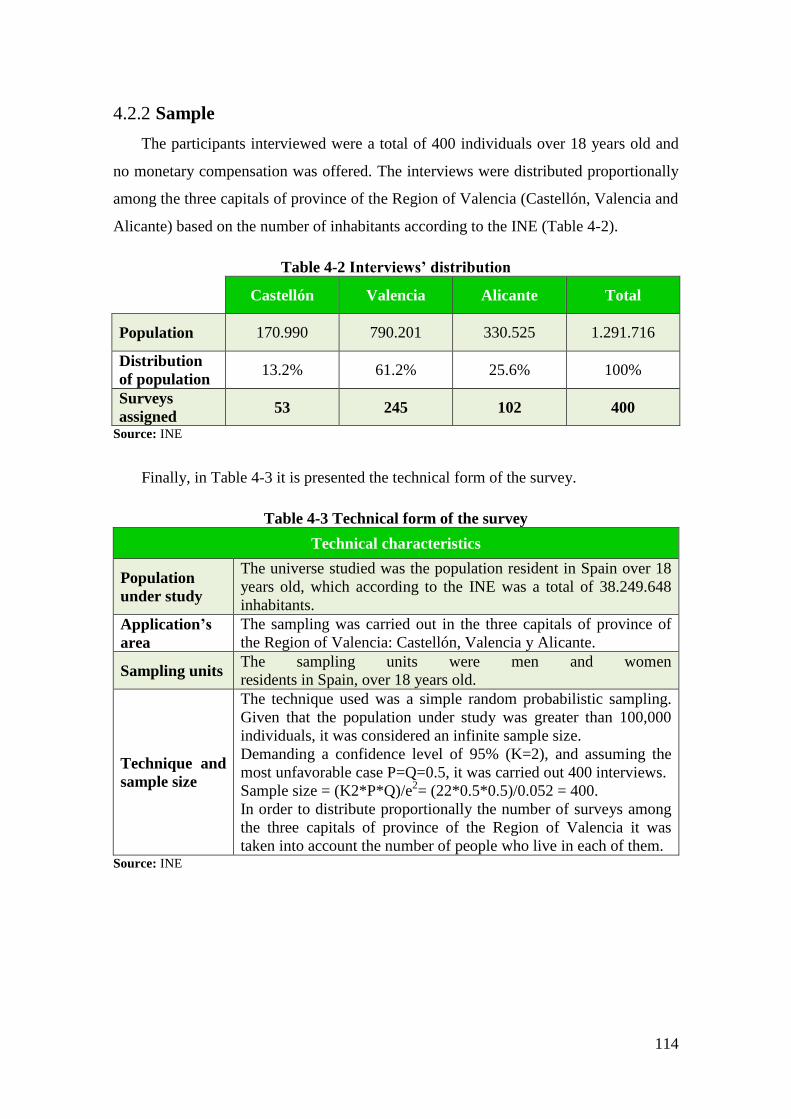
114
Sample 4.2.2
The participants interviewed were a total of 400 individuals over 18 years old and
no monetary compensation was offered. The interviews were distributed proportionally
among the three capitals of province of the Region of Valencia (Castellón, Valencia and
Alicante) based on the number of inhabitants according to the INE (Table 4-2).
Table 4-2 Interviews’ distribution
Castellón Valencia Alicante Total
Population 170.990 790.201 330.525 1.291.716
Distribution
of population 13.2% 61.2% 25.6% 100%
Surveys
assigned 53 245 102 400
Source: INE
Finally, in Table 4-3 it is presented the technical form of the survey.
Table 4-3 Technical form of the survey
Technical characteristics
Population
under study
The universe studied was the population resident in Spain over 18
years old, which according to the INE was a total of 38.249.648
inhabitants.
Application’s
area
The sampling was carried out in the three capitals of province of
the Region of Valencia: Castellón, Valencia y Alicante.
Sampling units The sampling units were men and women
residents in Spain, over 18 years old.
Technique and
sample size
The technique used was a simple random probabilistic sampling.
Given that the population under study was greater than 100,000
individuals, it was considered an infinite sample size.
Demanding a confidence level of 95% (K=2), and assuming the
most unfavorable case P=Q=0.5, it was carried out 400 interviews.
Sample size = (K2*P*Q)/e2= (22*0.5*0.5)/0.052 = 400.
In order to distribute proportionally the number of surveys among
the three capitals of province of the Region of Valencia it was
taken into account the number of people who live in each of them. Source: INE

115
Procedures 4.2.3
Experiment 1: The effect of the economic context on citizens´ attitude towards
political corruption.
In this experiment, it is studied if citizens’ criticism towards political corruption
varies depending on the country’s economic situation. It has been hypothesised that it
will be higher when the country is going through an economic crisis.
One of the main factors which citizens consider when they are evaluating political
issues is the economic situation. It is believed that if a citizen feels that his country is
going through an economic crisis, his opinion about the political situation will be
probably negative. In order to test this belief, it will be analysed citizens’ evaluation
about the economic and political situation to determine if it is possible to establish a
relation between both indicators. It will be used public data from the CIS, an
independent entity whose main objective is “to contribute scientific knowledge on
Spanish society”. The CIS carries out surveys which allow finding out the Spaniards
opinion in a very different fields and its evolution over time. For this purpose, it will be
studied the evolution of citizens’ opinion on economic and political situation measured
through the following indicators: “Economic situation assessment” and “Political
situation assessment”.
Moreover, it has been considered interesting to analyse the relationship between the
Gross Domestic Product (GDP) and the concern over corruption. It is believed that it
will be possible to establish a negative relationship between both indicators, i.e., the
concern over corruption will increase when the GDP decreases. In this case it will be
used data from the INE, an independent entity whose main objective is “to collect,
produce and disseminate relevant, high-quality, official statistical information”; and also
from the CIS. Concretely, it will be studied the evolution of the following indicators:
“GDP growth rate” and “Growth rate of the concern over corruption”.
Finally, and taking into account that Spain has recently moved from a situation of
economic expansion to an economic crisis, participants were directly asked in the
survey how was their criticism’s level towards political corruption since the economic
crisis started.

116
Experiment 2: The effect of social pressure on citizens´ attitude towards political
corruption.
The goal of this experiment is to investigate whether there is a different impact on
citizens’ attitude towards political corruption between social pressure and factual
information. It has been hypothesised that social pressure has a greater impact than
factual information, i.e., the impact of an individual facing a scenario where it is being
explained that other citizens are strongly against to a specific case of corruption or the
impact of facing the citizens’ losses caused by political corruption is higher than just
spreading factual information about it.
In order to test this belief, it was designed two versions of the survey. Each one
contains a different scenario and was assigned aleatory to half of the sample. In the
version measuring the impact of factual information, it is just explained a corruption
case which has been discovered; while in the version containing the social pressure
scenario, the information about the corruption case is accompanied by information
about how citizens are reacting. The specific scenarios are presented in Table 4-4. After
reading the scenarios below, participants were asked to indicate their opinion about the
corruption case showed on a scale anchored at 1 (not serious at all) to 5 (very serious).
Table 4-4 Scenarios proposed
Factual information Social pressure
A mayor has hired his son as one of his
consultants
It has been discovered that a politician has
hired his soon as one of his consultants in
despite of his qualifications. His son has
not the qualification expected to hold this
position, usually held by economists or
lawyers.
A mayor has hired his son as one of his
consultants
It has been discovered that a politician has
hired his soon as one of his consultants in
despite of his qualifications. His son has
not the qualification expected to hold this
position, usually held by economists or
lawyers.
Citizens consider completely
unacceptable this situation and have
organised a protest in front of the Town
Hall next Saturday at 8pm.
In order to be able to focus exclusively on the impact of the different scenarios, it
will be needed to compare the opinion expressed by participants after reading the
scenario, with the opinion expressed previously; otherwise it would not be possible to
discern between how much their response were based on their attitude towards the

117
political corruption case, and how much they were modified by the scenario’s impact.
For this purpose, it will be considered the information provided in a previous question
where participants expressed their opinion about four different situations corresponding
with four different cases of political corruption on a scale from 1 to 5 where 1 means “it
is not serious at all” and 5 means “it is very serious” (Table 4-5).
Table 4-5 Attitude towards political corruption
Situations of political corruption
1- A politician gets money to change the established land use of a plot.
2- A politician hires a relative or close friend, regardless of his/her professional skills.
3- A politician uses his official car for private trips.
4- A politician accepts valuable presents.
Concretely, it will be used the information provided in the second item, which can
be interpreted as a summary of the case of corruption explained with more detail in both
scenarios.
Besides, in order to analyse if it possible to reach a higher impact on citizens’
criticism towards political corruption through information focused on citizens’ losses, it
was presented the four hypothetical pieces of news about political corruption described
in Table 4-6 to participants: two of them just providing factual information, and the
other two emphasizing the economic and social losses they provoke. Then, participants
were asked to choose the one which they felt as the most serious.
Table 4-6 Economic and Social consequences vs. Factual Information
Pieces of news of political corruption
1- As a consequence of the political corruption, it will not be possible to build a new
hospital in the city.
2- It is necessary to increase the taxes because all losses caused by political
corruption.
3-The political corruption cases have increased in the last year.
4-The Mayor of the city has been involved in a corruption case.
Experiment 3: The effect of political awareness on citizens´ attitude towards
political corruption.
The purpose of this experiment is to examine whether there is a significant
difference in citizens’ attitude towards political corruption related to political

118
awareness. It has been hypothesised that citizens with higher awareness will be less
tolerant towards corruption.
In order to analyse citizens’s political awareness, participants were asked about two
questions related to politics. Concretely, in the first question they were asked about a
name of a corrupted politician or a corruption case; while in the second one they were
asked about the position which Maria Dolores de Cospedal held in the Spanish
Government.
Regarding the analysis of the attitude towards political corruption, it was presented
the four situations corresponding with four different cases of political corruption
described before (Table 4-5), and then, participants were asked about their opinion on
each one on a scale anchored at 1 (not serious at all) to 5 (very serious).
Experiment 4: The effect of political leaning on citizens´ attitude towards political
corruption.
In this experiment it is studied whether there is a significant difference in citizens’
attitude towards political corruption depending on their political leaning. It has been
hypothesised that more politically progressive citizens will be less tolerant towards
corruption.
In order to find out participants’ political leaning, they were asked to place
themselves on a scale anchored at 1 (extreme left) to 5 (extreme right). The attitude
towards political corruption, as it has been already explained, was measured with the
information provided in Table 4-5.
Experiment 5: The effect of new parties’ emergence on citizens´ attitude towards
political corruption.
The purpose of this experiment is to investigate whether there is a significant
difference in citizens’ attitude towards political corruption between those citizens who
support traditional and new parties. It has been hypothesised that new parties’
supporters will be less tolerant towards corruption.
In order to find out participants’ preferred party, they were asked to indicate the
party which they felt closer to their ideas. The four main parties were presented: PP,

119
PSOE, UP and C’s. It was also provided the option “Other Party”, although even in
those cases where an individual is not supporting one of the 4 main parties, he may also
feel relatively closer to one of them. Once again, it was used the information provided
in Table 4-5 to take into account participants’ attitude towards political corruption.
Finally, it will be used the information provided in the question related to the age to
investigate if the relation between this variable and preferred party drew by the Spanish
CIS, i.e., new parties are supported by younger citizens than traditional parties, keeps
being true in our study.
Experiment 6: The effect of political sympathy on citizens´ attitude towards
political corruption.
The goal of this experiment is to examine whether there is a significant difference
in citizens’ attitude towards political corruption depending on the proximity they feel to
the party which is being involved in corruption. It has been hypothesised that citizens
will be more tolerant towards corruption when it affects to their own party.
For this purpose, firstly, it was asked participants about the corruption perceived in
each of the four main Spanish parties (PP, PSOE, UP and C’s) on a scale anchored at 1
(not corrupted at all) to 5 (completely corrupted).
Moreover, it was considered the information provided in the previous experiment
where participants indicated the party they felt closer to their ideas to formulate a new
question in which participants faced a hypothetical case of corruption where their
preferred party was involved (Table 4-7).
Table 4-7 Attitude towards political corruption in their own party
This situation represents the same corruption case it is summarised in the fourth
item of Table 4-5, with the only difference that this time it is specified the party
involved is their preferred party. Participants were asked to indicate, as they did when
evaluating the corruption case without the specification of the party affected, how
Corruption in (Preferred) Party: Mayor may have accepted a present
from a company
The anti-corruption prosecution has evidence that the politician of the
(Preferred party) has accepted an expensive present from a company.

120
serious they felt the situation was on a scale anchored at 1 (not serious at all) to 5 (very
serious). It will be needed to compare both responses in order to be able to isolate the
partisanship effect.
4.3 Methodology and Experiments
In this section, it will be performed the experiments needed in order to empirically
test the hypotheses related to the “Real World” with the statistical program SPSS
(Statistical Package for the Social Sciences) and it will be shown the results indicating if
they have been or not verified.
Hypothesis 1: Experiments and outcomes 4.3.1
In hypothesis H1 it will be tested the belief that criticism towards political
corruption is higher when the country is going through an economic crisis. The
statement of H1 is as follows:
H1 statement- Citizens’ level of tolerance towards political corruption is lower
when the country’s economy is in crisis.
If validated, H1 would show that a crisis represents an opportunity to impact on
citizens’ attitude towards political corruption and, as a consequence, it would contribute
to the goal of reaching a higher quality democracy.
Experiment Description
To test this hypothesis H1 it has been considered the following variables:
1. Economic situation assessment. The information used to construct this
variable was provided by the CIS Data Bank. The CIS elaborates a monthly
survey where participants are asked, among other questions, to ass the
current economic situation. They have to place their assessment in one of the
following five alternatives: “Very good”; “Good”; “Acceptable”; “Bad”; and
“Very bad”.
In reference to the construction of this variable, it is specified:
- The information available starts in January 1996, therefore, the period
studied was January 1996 - September 2017.

121
- In order to focus on those who had a negative opinion about the
economic situation, it was taken into account the percentage of
participants whose assessment had been “Bad” or “Very bad”.
- With the aim of simplifying the graphic information, it was calculated the
mean per year of the percentage of participants whose assessment had
been “Bad” or “Very bad”.
2. Political situation assessment. The information used to construct this
variable was also provided by the CIS Data Bank. The CIS, in its monthly
survey, ask participants to ass the current political situation as well. Again,
they have to place their assessment in one of the following five alternatives:
“Very good”; “Good”; “Acceptable”; “Bad”; and “Very bad”. The
specifications explained in the construction of the previous variable also
applied in this case, i.e., the period studied was January 1996 - September
2017; it was considered the percentage of participants whose assessment had
been “Bad” or “Very bad”; and the information was summarized by
calculating annual averages.
3. GDP growth rate. The information about the annual growth rate of the GDP
was directly provided by the INE. It starts in 1996 and currently, the last data
corresponds to the year 2016. As it was needed to compare the GDP growth
rate with the following variable, the growth rate of the concern over
corruption, and the information available of this variable starts in 2003, the
period studied was 2003 - 2016.
4. Growth rate of the concern over corruption. The CIS, in its monthly
survey, ask participants to indicate the three principal problems of the
country in a list that currently has 54 options. It was taken into account those
citizens who had mentioned “corruption” as one of the main three problems.
The specifications for the construction of this variable are the following:
- In order to compare this variable with the previous one, it was calculated,
firstly, the mean per year of the percentage of participants who had

122
indicated “corruption and fraud” as one of the three main problems; then,
it was calculated the growth rate.
- The “corruption” became one of the options on a regular basis in 2002,
therefore, as the goal was to calculate annual growth rates, the period
studied was 2003 - 2016.
5. Evolution of the criticism’s level towards political corruption. The
information to construct this variable was collected through the survey
specifically designed for this thesis. Concretely, participants were asked how
was their criticism' level towards political corruption since the economic
crisis started. They were requested to place themselves on a scale anchored at
1 (much lower) to 5 (much higher). This variable was recoded as follows: as
“Lower”, when participants answered “1” or “2”; as “Equal”, when they
answered “3”; and as “Higher”, when they answered “4” or “5”.
The goal of this hypothesis is to test if citizens’ level of tolerance towards political
corruption depends on the country’s economic context. For this purpose, it will be
performed the following analysis:
1. H1A1: Bivariate correlation to find out if it is possible to establish a
relationship statistically significant between citizens’ Economic situation
assessment and citizens’ Political situation assessment throughout the period
1996-2017.
2. H1A2: Bivariate correlation to find out if it is possible to establish a
relationship statistically significant between GDP growth rate and Growth
rate of the concern over corruption throughout the period 2003-2017.
3. H1A3: A descriptive analysis of the Evolution of the criticism’s level towards
political corruption since the economic crisis started compared with how
they felt before.
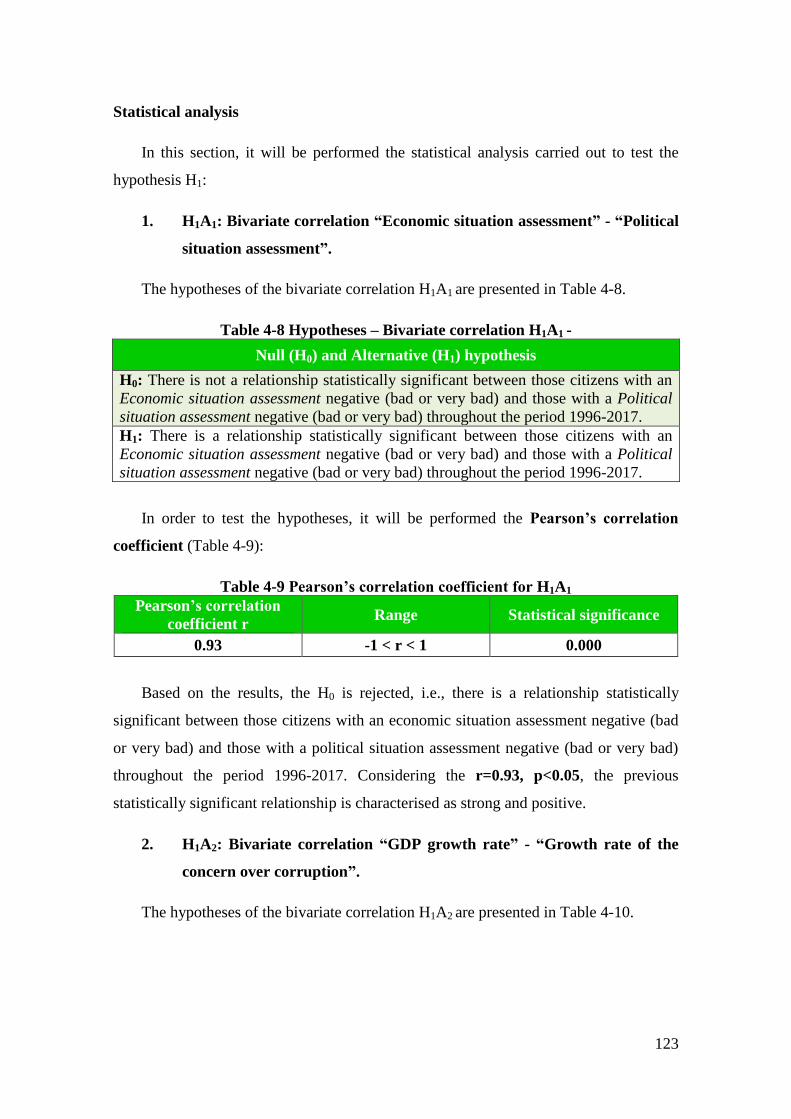
123
Statistical analysis
In this section, it will be performed the statistical analysis carried out to test the
hypothesis H1:
1. H1A1: Bivariate correlation “Economic situation assessment” - “Political
situation assessment”.
The hypotheses of the bivariate correlation H1A1 are presented in Table 4-8.
Table 4-8 Hypotheses – Bivariate correlation H1A1 -
Null (H0) and Alternative (H1) hypothesis
H0: There is not a relationship statistically significant between those citizens with an
Economic situation assessment negative (bad or very bad) and those with a Political
situation assessment negative (bad or very bad) throughout the period 1996-2017.
H1: There is a relationship statistically significant between those citizens with an
Economic situation assessment negative (bad or very bad) and those with a Political
situation assessment negative (bad or very bad) throughout the period 1996-2017.
In order to test the hypotheses, it will be performed the Pearson’s correlation
coefficient (Table 4-9):
Table 4-9 Pearson’s correlation coefficient for H1A1
Pearson’s correlation
coefficient r Range Statistical significance
0.93 -1 < r < 1 0.000
Based on the results, the H0 is rejected, i.e., there is a relationship statistically
significant between those citizens with an economic situation assessment negative (bad
or very bad) and those with a political situation assessment negative (bad or very bad)
throughout the period 1996-2017. Considering the r=0.93, p<0.05, the previous
statistically significant relationship is characterised as strong and positive.
2. H1A2: Bivariate correlation “GDP growth rate” - “Growth rate of the
concern over corruption”.
The hypotheses of the bivariate correlation H1A2 are presented in Table 4-10.

124
Table 4-10 Hypotheses – Bivariate correlation H1A2 -
Null (H0) and Alternative (H1) hypothesis
H0: There is not a relationship statistically significant between GDP growth rate and
Growth rate of the concern over corruption throughout the period 2003-2016.
H1: There is a relationship statistically significant between GDP growth rate and
Growth rate of the concern over corruption throughout the period 2003-2016.
In order to test the hypotheses, it will be performed the Pearson’s correlation
coefficient (Table 4-11):
Table 4-11 Pearson’s correlation coefficient for H5A2
Pearson’s correlation
coefficient r Range Statistical significance
-0.56 -1 < r < 1 0.039
Based on the results, the H0 is rejected, i.e., there is a relationship statistically
significant between GDP growth rate and Growth rate of the concern over corruption
throughout the period 2003-2016. Considering the r= -0.56, p<0.05, the previous
statistically significant relationship is characterised as moderate and negative.
3. H1A3: Descriptive analysis “Evolution of the criticism’s level towards
political corruption”.
In Table 4-12 it is presented the frequency response when participants were asked
about how was their criticism’ level towards political corruption since the economic
crisis started.
Table 4-12 Evolution of the criticism’s level towards political corruption for H1A3
How is your criticism’s level towards political corruption since the
economic crisis started? Frequency
Much lower 53
Lower 41
Equal 74
Higher 111
Much higher 121
As it is depicted, most of participants feel their criticism’s level towards political
corruption is higher or much higher since the economic crisis started.

125
Report
In this section, it will be reported the most relevant conclusions of the statistical
analysis carried out in the previous section.
The first analysis it has been performed is the correlation between the assessments
of political and economic situation throughout the period 1996-2017 (Figure 4-1). It is
reminded that this analysis has been focused on those citizens with a negative opinion,
i.e., those who assessed “bad” or “very bad” the political and economic situation.
It has been proved a relationship statistically significant, concretely, strong and
positive. It means that those citizens with a negative opinion about the political situation
have also a negative opinion about the economic situation. In Figure 4-1, it is
graphically shown the annual evolution of citizens’ percentage whit a negative opinion
about the political and economic situation throughout the period 1996-2017.
Figure 4-1 Citizens with a negative assessment (%) (1996 – 2017)
Source: CIS Data Bank
The second analysis it has been performed is the correlation between the GDP
growth rate and the growth rate of the concern over corruption throughout the period
2003-2017.
It has been proved a relationship statistically significant, concretely, moderate and
negative. It means that an increase in the GDP growth rate is associated with a decrease
in the growth rate of the concern over corruption. In Figure 4-2, it is graphically shown
the annual evolution of both variables throughout the period 2003-2016. Note- In order
0,0
10,0
20,0
30,0
40,0
50,0
60,0
70,0
80,0
90,0
100,0
19
96
19
97
19
98
19
99
20
00
20
01
20
02
20
03
20
04
20
05
20
06
20
07
20
08
20
09
20
10
20
11
20
12
20
13
20
14
20
15
20
16
20
17
Political situation Economic situation

126
to see the negative relationship between these variables, it has been represented the
GDP growth rate in percentage as usually, however, the growth rate of the concern over
corruption is represented in decimal. The reason is that throughout the period studied
the concern over corruption reaches such high rates that it would be impossible to
appreciate graphically the negative correlation between both variables.
Figure 4-2 Growth rates of concern over corruption and GDP (%) (2003 – 2017)
Source: CIS Data Bank and INE
Finally, focusing on the results obtained in the survey specifically designed for this
thesis, it is indicated how citizens find their criticism’s level towards political corruption
higher since the economic crisis started. Concretely, 58% find it is higher, 18.5% equal
and 23.5% lower (Figure 4-3).
Figure 4-3 Evolution of the criticism’s level towards political corruption since the
economic crisis started
-4,0
-3,0
-2,0
-1,0
0,0
1,0
2,0
3,0
4,0
5,0
2003 2004 2005 2006 2007 2008 2009 2010 2011 2012 2013 2014 2015 2016
Growth rate of concern over corruption GDP growth rate (%)
23,5% 18,5%
58%
0%
10%
20%
30%
40%
50%
60%
70%
80%
90%
100%
Lower Equal Higher

127
Summarising all the conclusions obtained in this section, firstly, it has been proved
that there is a strong and positive correlation between citizens’ economic and political
assessment which indicates how citizens’ attitude towards political issues are clearly
affected by the economic context; secondly, it has been established a negative
correlation between the GDP growth rate and the growth rate of the concern over
corruption, which shows how citizens’ criticism towards political corruption is greater
when the country is going through an economic crisis; and finally, asking citizens
directly about how is their criticism’s level since the economic crisis started, the
majority responds it is higher, which reinforces the previous conclusion about how an
economic crisis impacts on citizens attitude towards political corruption.
As a consequence of all the conclusions summarised above, the hypothesis H1 has
been verified, i.e., citizens’ level of tolerance towards political corruption is lower when
the country’s economy is in crisis. This finding is consistent with previous researches
where it was shown how citizens’ tolerance towards political corruption depends on
country’s economy situation, being more tolerant when it is positive (Cordero and Blais,
2017; Charron and Bågenholm, 2016; Anduiza et al., 2013; Klasnja and Tucker, 2013;
Winters and Weitz-Shapiro, 2013; Zechmeister and Zizumbo-Colunga, 2013; Jerit and
Barabas 2012; Weitz-Shapiro and Winters, 2010; Manzetti and Wilson, 2007; Golden,
2007; Diaz-Cayeros et al., 2000; Duch et al., 2000; Mauro, 1995).
The validation of this hypothesis would show that an economic crisis can be seen as
an opportunity to increase citizens’ criticism towards political corruption and, therefore,
to achieve a higher quality democracy. However, to reach this goal, once the crisis is
overcome, it would be necessary to keep the level of tolerance towards political
corruption over the level it was before the crisis started.
Hypothesis 2: Experiments and outcomes 4.3.2
In Hypothesis H2 it will be tested the belief that social pressure has a greater impact
on citizens’ attitude towards political corruption than just spreading factual information.
The statement of H2 is as follows:
H2 statement- Among the variables which influence the citizens’ attitude
towards political corruption, social pressure has a higher impact than factual
information.

128
If verified, H2 would show that in order to increase citizens’ criticism towards
political corruption, the social pressure exerted by other citizens is a key factor, i.e., the
attitude towards political corruption of a citizen is influenced by other citizens´ attitude
towards political corruption. Besides, it would indicate how the information which
emphasises the social and economic losses that political corruption provokes is more
effective than just spreading factual information.
Experiment Description
To test this hypothesis H2 it has been considered the following variables:
1. Scenario. It was designed the two scenarios already explained (see Table
4-4) in order to be able to analyse the attitude towards a specific political
corruption case related to nepotism with and without social pressure.
Therefore, this variable has two different values: social pressure and factual
information. This variable has not needed any recoding; it has been worked
directly with the data from the survey.
2. Attitude towards political corruption (Nepotism) pre scenario. The
information needed for this variable was provided by the second item of the
Table 4-5, where participants, before reading any of the two scenarios,
evaluated the following corruption case related to nepotism “A politician
hires a relative or close friend, regardless of his/her professional skills”,
indicating how serious they perceived it on a scale anchored at 1 (not serious
at all) to 5 (very serious). It has been worked directly with the data provided
by the survey without any recoding.
3. Attitude towards political corruption (Nepotism) post scenario. After
reading one of the previous scenarios which represent the same political
corruption case related to nepotism that it has been considered in the previous
variable, participants were asked to indicate how serious they perceived it on
a scale anchored at 1 (not serious at all) to 5 (very serious). As the previous
variable, this one has not needed any recoding; it has been worked with the
data from the survey directly.

129
4. Differential attitude towards political corruption (Nepotism) post-pre
scenario. Considering the variable Attitude towards political corruption
(Nepotism) post scenario, and the variable Attitude towards political
corruption (Nepotism) pre scenario, it was constructed a new variable:
Differential attitude towards political corruption (Nepotism) post-pre
scenario. It measures the difference between the corruption perceived in a
specific corruption case related to nepotism after reading the information
provided in the scenario assigned, and the corruption perceived in the same
specific corruption related to nepotism before the scenario was presented.
This variable has not needed any recoding, it has been worked directly with
the data from the survey.
It was necessary to construct this variable because the goal was to ensure that
it was being strictly measured the impact of the scenario. If it was considered
just the attitude towards political corruption post scenario, it would not have
been possible to analyse which scenario has a greater impact, as the attitude
towards a political corruption case is not only affected by the scenario in
which it is presented, but also by the attitude towards the political corruption
case independently of the scenario.
5. Pieces of news. A list of four hypothetical pieces of news about political
corruption was presented to participants (see Table 4-6): in the first one,
corruption is directly related to a decrease in the welfare state which clearly
affects citizens; in the second news, corruption is related to an increase in
taxes; the third one, states that corruption increased the last year; and finally,
the fourth news is about an specific case of local corruption. Participants
were requested to choose the one which they considered as the most serious.
The objective of this hypothesis is to test if social pressure has a higher impact than
the spread of factual information. For this purpose, it will be performed the following
analysis:
1. H2A1: T-test to study if the Differential attitude towards political corruption
post-pre scenario varies significantly between those participants who faced

130
the Factual information scenario and those who faced the Social pressure
scenario.
2. H2A2: A descriptive analysis of the impact that different Pieces of news have
on the Attitude towards political corruption.
Statistical analysis
In this section, it will be performed the statistical analysis carried out to test the
hypothesis H2:
1. H2A1: T-test analysis “Differential attitude towards political corruption
post-pre scenario” – “Scenario”.
The hypotheses of the T-test analysis H2A1 are presented in Table 4-13.
Table 4-13 Hypotheses –T-test analysis H2A1-
Null (H0) and Alternative (H1) hypothesis
H0: Homogeneity of mean, i.e., the mean of the Differential attitude towards political
corruption post-pre scenario is equal for both scenarios: factual information and
social pressure.
H1: Heterogeneity of mean, i.e., the mean of the Differential attitude towards political
corruption post-pre scenario is not equal for both scenarios: factual information and
social pressure.
In order to decide which statistic will be used to perform T-test analysis, the first
step will be to find out if the assumption of homoscedasticity is met. For this purpose, it
will be performed the Levene's Test. The null and the alternative hypotheses are shown
in Table 4-14:
Table 4-14 Hypotheses - Levene's Test for H2A1-
Null (H0) and Alternative (H1) hypothesis
H0: Homogeneity of variance, i.e., the variance of the Differential attitude towards
political corruption post-pre scenario is equal for both scenarios: factual information
and social pressure.
H1: Heterogeneity of variance, i.e., the variance of the Differential attitude towards
political corruption post-pre scenario is not equal for both scenarios: factual
information and social pressure.

131
In Table 4-15 it is depicted the results of the Levene’s test. As the Levene’s
statistic=258, p<0.05, the H0 is rejected, i.e., it is not possible to assume that the
variances are equal for both groups.
Table 4-15 Levene’s Test for H2A1
Levene’s Statistic Statistical significance
258 0.000
The assumption of homoscedasticity is not met; therefore, it will be used the t
statistic for the case where the variance is not equal for both groups (Table 4-16).
Table 4-16 T-test analysis H2A1
T-statistic df Mean
Difference
Std. error
Difference Sig.
95% Confidence Interval
of the Difference
Lower Upper
9.8 260 0.54 0.055 0.000 0.43 0.65
Based on the results, the H0 is rejected, i.e., there is a statistically significant
difference in the differential attitude towards political corruption post-pre scenario
between those citizens who faced the “Factual Information” scenario and those who
faced the “Social Pressure” scenario t(260)= 9.8, p<0.05.
2. H2A2: Descriptive analysis “Pieces of news”.
In Table 4-17 are presented the four pieces of news which participants faced, and
the frequency in which each one was selected as the most serious.
Table 4-17 Pieces of news’ impact for H2A2
News Frequency
As a consequence of the political corruption, it will not be possible to
build a new hospital in the city. 240
It is necessary to increase the taxes because all losses caused by
political corruption. 103
The political corruption cases have increased in the last year. 26
The Mayor of the city has been involved in a corruption case. 31
As it is shown, those pieces of news where citizens’ losses in welfare and
economics are emphasized are found as the most serious for the vast majority of
participants.

132
Report
In this section, it will be reported the most relevant conclusions of the statistical
analysis carried out in the previous section.
Once it has been proved that there is a statistically significant difference in the
differential attitude towards political corruption between citizens who face a factual
information scenario and those who face a social pressure scenario, it is presented the
mean of the attitude towards political corruption for each group before and after facing
the scenario (Figure 4-4).
Figure 4-4 Attitude towards political corruption vs. Scenario
The main conclusion is that the impact of social pressure on citizens’ attitude
towards political corruption is higher than the factual information. Concretely, when
participants are evaluating a specific case of corruption related to nepotism, it is shown
how on a scale from 1 to 5 where 1 means “it is not serious at all” and 5 means “it is
very serious”, those participants who face the factual information scenario show
practically the same attitude towards the political corruption case that they showed
previously (+0.07), while those who face the social pressure scenario clearly increase
their criticism towards the political corruption case (+0.61).
Analysing the pieces of news’ impact proposed (Figure 4-5), the main conclusion is
that the most part of citizens find most serious those pieces of news in which citizens’
losses caused by political corruption are emphasized (Local decrease in the welfare
state 60% and General tax increase 25.8%) than those in which it is being spread factual
Pre-Scenario
Post-Scenario
1
2
3
4
5
Factual informationSocial Pressure
3,84 3,89
3,91 4,50
Att
itu
de
to
war
ds
p
olit
ical
co
rru
pti
on

133
information (General corruption information 6.5% and Local case of corruption
information 7.7%).
Figure 4-5 Pieces of News’ impact
As a result of the previous findings, the hypothesis H2 has been verified, i.e., among
the variables which influence the citizens’ attitude towards political corruption, social
pressure has a higher impact than factual information. This result is consistent with
previous researches where it was proved the impact of social pressure on mobilising
citizens against the established political system and its corruption (Giraldo-Luque,
2018; Marinov and Schimmelfennig, 2015; Anduiza et al., 2014; Peña-López et al.,
2014; Toret, 2013; Anduiza et al., 2012; Piñeiro-Otero and Costa-Sánchez, 2012;
Vallina-Rodriguez et al., 2012; Eltantawy and Wiest, 2011; González-Bailón et al.,
2011; Shirky, 2011); on political self-expression, political information seeking and on
political participation (Bond et al., 2012; Gerber and Rogers, 2009; and Gerber et al.,
2008). Besides, analysing the impact on citizens’ attitude of the different pieces of news
about political corruption, it has been found how it is greater when underlining citizens’
losses in welfare and economics.
The verification of this hypothesis would indicate how, by exerting social pressure,
parties, media or any citizen group can reach a greater amount of supporters against
political corruption.
60,0%
25,8%
6,5% 7,7%
0,0%
10,0%
20,0%
30,0%
40,0%
50,0%
60,0%
70,0%
80,0%
90,0%
100,0%
Local decrease in thewelfare state
General tax increase General corruptioninformation
Local case ofcorruption
information

134
Hypothesis 3: Experiments and outcomes 4.3.3
In Hypothesis H3 it will be tested the belief that those citizens with higher political
awareness have a lower level of tolerance. The statement of H3 is as follows:
H3 statement- Citizens’ level of tolerance towards political corruption is lower
as higher is their political awareness.
If this hypothesis was validated, it would show how important is to involve citizens
in political issues in order to increase their criticism towards corruption.
Experiment Description
To test this hypothesis H3 it has been considered the following two variables:
1. Political awareness. This variable involves two different questions: “Could
you indicate some corrupted politician or corruption case you have heard
about?” and “Could you tell me which position holds Maria Dolores de
Cospedal in the current government?” This variable has been recoded as
“High”, when participants answered correctly both questions; as “Medium”,
when they answered correctly just one of the two questions; and as “Low”,
when they did not know any answer.
Attitude towards political corruption. This variable was measured through
a scale which contains four items related to political corruption. Participants
evaluated them on a scale anchored at 1 (it is not serious at all) to 5 means (it
is very serious).
The first step was to analyse the reliability and validity of the scale. In Table
4-18 are summarised the conditions necessaries for a scale to achieve the
reliability and validity required.

135
Table 4-18 Reliability and Validity Conditions
Reliability
conditions
Cronbach’s Alpha Statistic > 0.5
Correlation between each item with total correlation > 0.5
Validity
conditions
Kaiser-Meyer-Olkin (KMO) statistic > 0.5
Bartlett test p < 0.05
Number of concepts measured = 1 (Just one Initial
Eingenvalues > 1 + Values for each item on the
Component Matrix > 0.5)
Reliability Analysis
The results of the reliability analysis are presented in Table 4-19 and Table
4-20.
Table 4-19 Reliability Statistics
Cronbach’s Alpha Range Nº of items
0.908 0 < Cronbach’s Alpha < 1 4
Table 4-20 Item-Total Statistics
Items Corrected Item –
Total Correlation
Cronbach’s Alpha
if Item deleted
A politician gets money to
change the established land
use of a plot. 0.701 0.920
A politician hires a relative
or close friend, regardless of
his/her professional skills. 0.884 0.847
A politician uses his official
car for private trips. 0.832 0.873
A politician accepts
valuable presents. 0.824 0.869
As it is shown, the Cronbach’s Alpha = 0.908 > 0.5; and the correlation
between each item of the scale with the total correlation is greater than 0.5;
therefore, it was possible to conclude that the scale was reliable.
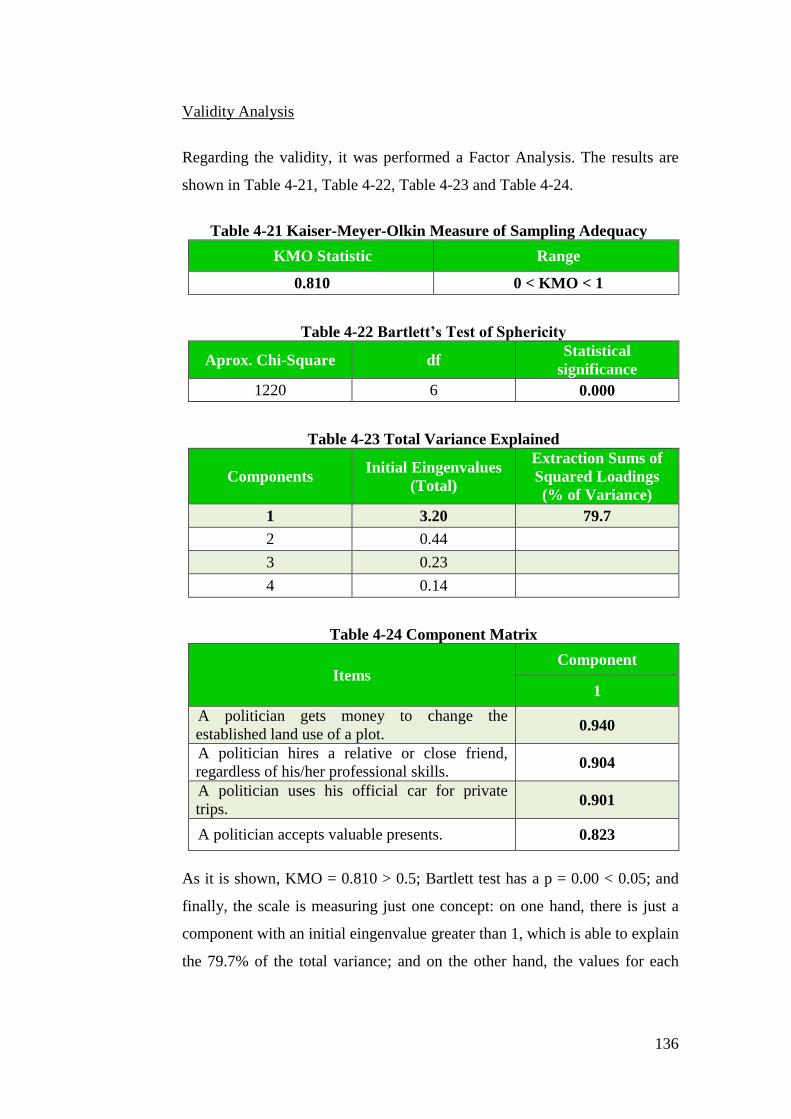
136
Validity Analysis
Regarding the validity, it was performed a Factor Analysis. The results are
shown in Table 4-21, Table 4-22, Table 4-23 and Table 4-24.
Table 4-21 Kaiser-Meyer-Olkin Measure of Sampling Adequacy
KMO Statistic Range
0.810 0 < KMO < 1
Table 4-22 Bartlett’s Test of Sphericity
Aprox. Chi-Square df Statistical
significance
1220 6 0.000
Table 4-23 Total Variance Explained
Components Initial Eingenvalues
(Total)
Extraction Sums of
Squared Loadings
(% of Variance)
1 3.20 79.7
2 0.44
3 0.23
4 0.14
Table 4-24 Component Matrix
Items Component
1
A politician gets money to change the
established land use of a plot. 0.940
A politician hires a relative or close friend,
regardless of his/her professional skills. 0.904
A politician uses his official car for private
trips. 0.901
A politician accepts valuable presents. 0.823
As it is shown, KMO = 0.810 > 0.5; Bartlett test has a p = 0.00 < 0.05; and
finally, the scale is measuring just one concept: on one hand, there is just a
component with an initial eingenvalue greater than 1, which is able to explain
the 79.7% of the total variance; and on the other hand, the values for each

137
item on the component matrix are in all the cases greater than 0.5. As a
consequence, it was possible to conclude that the scale was valid.
Once it was proved the reliability and validity of the scale, it was created the
variable “Attitude towards political corruption” which summarises the
information of this scale by considering the mean of the scores in each item
for each citizen.
The aim of this hypothesis H3 is to test if different levels of political awareness
have a different impact on citizens’ attitude towards corruption. For this purpose, it will
be performed the following analysis:
1. H3A1: ANOVA analysis to find out if the mean of the Attitude towards
political corruption varies significantly with the level of Political awareness.
Statistical analysis
In this section, it will be performed the statistical analysis carried out to test the
hypothesis H3:
1. H3A1: ANOVA analysis “Attitude towards political corruption” –
“Political awareness”.
The hypotheses of the ANOVA analysis H3A1 are presented in Table 4-25.
Table 4-25 Hypotheses -ANOVA analysis H3A1-
Null (H0) and Alternative (H1) hypothesis
H0: Homogeneity of mean, i.e., the mean of the Attitude towards political corruption
is equal for all groups: low, medium and high level of awareness.
H1: Heterogeneity of mean, i.e., the mean of the Attitude towards political corruption
is not equal for all groups: low, medium and high level of awareness.
In order to decide which statistic will be used to perform the ANOVA analysis, the
first step will be to find out if the assumption of homoscedasticity is met. For this
purpose, it will be performed the Levene's Test. The null and the alternative hypotheses
are shown in Table 4-26:

138
Table 4-26 Hypotheses - Levene's Test for H3A1-
Null (H0) and Alternative (H1) hypothesis
H0: Homogeneity of variance, i.e., the variance of the Attitude towards political
corruption is equal for all groups: low, medium and high level of awareness.
H1: Heterogeneity of variance, i.e., the variance of the Attitude towards political
corruption is not equal for all groups: low, medium and high level of awareness.
In Table 4-27 it is depicted the results of the Levene’s test. As the Levene’s
statistic=0.10, p>0.05, the H0 is not rejected, i.e., it is possible to assume that the
variances are equal across all the groups.
Table 4-27 Levene’s Test for H3A1
Levene’s Statistic df1 df2 Statistical
significance
0.10 2 397 0.907
The assumption of homoscedasticity is met; therefore, it will be used the F statistic
to perform the ANOVA analysis (Table 4-28).
Table 4-28 ANOVA analysis H3A1
Sum of
Squares df
Mean
Square F Sig.
Between
Groups 58.7 2 29.3 40.2 0.000
Within
Groups 290 397 0.73
Total 348 399
Based on the results, the H0 is rejected, i.e., there is a statistically significant
difference in the attitude towards corruption between citizens with a different level of
political awareness F(2,397)=40.2, p<0.05.
Once it has been proved the attitude towards political corruption varies with the
level of political awareness, it will be deeply analysed in which pair of groups it is
possible to establish a difference statistically significant. For this purpose, as the
assumption of homoscedasticity is met and the number of groups to be compared are
just three, it will be performed the Bonferroni’s Test (Table 4-29).

139
Table 4-29 Bonferroni Test for H3A1
Political Awareness
Categories Mean
Difference
(A – B)
Std.
error Sig.
95% Confidence Interval
A B Lower Upper
High Low 1.65 0.19 0.000 1.20 2.10
Medium 0.41 0.09 0.000 0.19 0.63
Medium Low 1.24 0.18 0.000 0.80 1.68
High -0.41 0.09 0.000 -0.63 -0.19
Low Medium -1.24 0.18 0.000 -1.68 -0.80
High -1.65 0.19 0.000 -2.10 -1.20
As it is indicated, it is possible to establish differences statistically significant in the
attitude towards political corruption between the group of citizens with a high level of
political awareness and those with a low level of political awareness t(397)=8.7,
p<0.05. Besides, between those with a high level and those with a medium level
t(397)=5.3, p<0.05. Finally, it is also possible to establish differences statistically
significant between the group of citizens with a medium level of political awareness and
those with a low level t(397)=10.5, p<0.05.
The conclusion of the previous analysis is that when studying the impact of the
political awareness on the attitude towards political corruption, there are differences
statistically significant between the three groups of citizens considered.
Report
In this section, it will be reported the most relevant conclusions of the statistical
analysis carried out in the previous section.
Once it has been proved that there is a statistically significant difference in the
attitude towards political corruption between citizens with a different level of political
awareness, it is presented the mean of the attitude towards political corruption for each
of the three groups in Figure 4-6.

140
Figure 4-6 Attitude towards political corruption vs. Political awareness
The main conclusion is that citizens are less tolerant towards political corruption as
higher is their political awareness. Concretely, when participants are evaluating a set of
political corruption cases, it is shown how the mean of the attitude towards political
corruption on a scale from 1 to 5 where 1 means “it is not serious at all” and 5 means “it
is very serious”, is 2.6, for those who have a low level; 3.8, for those who have a
medium level; and 4.2, for those who have a high level.
As a consequence, the hypothesis H3 has been verified, i.e., citizens’ level of
tolerance towards political corruption is lower as higher is their political awareness.
This conclusion is consistent with previous researches where it was proved how citizens
with a different level of knowledge about politics show different levels of tolerance
towards political corruption (Cordero and Blais, 2017; Anduiza et al., 2013; Weitz-
Shapiro and Winters, 2010; Arceneaux, 2007; Kam, 2005).
The validation of this hypothesis would show that the attitude towards political
corruption can be modified by bringing citizens into politics and, therefore, the key role
of the media to achieve a higher quality democracy.
Hypothesis 4: Experiments and outcomes 4.3.4
In Hypothesis H4 it will be tested the belief that more progressive citizens have a
lower level of tolerance. The statement of H4 is as follows:
H4 statement- Citizens’ level of tolerance towards political corruption is lower
as more politically progressive they are.
2,6
3,8 4,2
0,0
1,0
2,0
3,0
4,0
5,0
Low Medium High
Att
itu
de
to
war
ds
p
olit
ical
co
rru
pti
on
Political Awareness

141
If this hypothesis was verified, it would indicate that the electorate of left parties is
more sensitive towards political corruption and, as a consequence, that parties with a
left political leaning would need to fight against corruption stronger than parties with a
right political leaning which are less penalised by corruption. Besides, it would help to
explain the electoral success of some right parties involved in corruption.
Experiment Description
To test this hypothesis H4 it has been considered the following variables:
1. Political leaning. Participants were asked to indicate their political position
on a scale anchored at 1 (extreme left) to 5 (extreme right). This variable has
not needed any recoding, it has been worked with the data provided by the
survey directly.
2. Attitude towards political corruption. As it has been already seen, this
variable was measured through a scale with four items about political
corruption which participants evaluated on a scale anchored at 1 (it is not
serious at all) to 5 means (it is very serious). As it has been shown, the
reliability and validity of the scale was proved.
The goal of this hypothesis H4 is to test if different political leanings have a
different impact on citizens’ attitude towards political corruption. For this purpose, it
will be performed the following analysis:
1. H4A1: ANOVA analysis to explore if the mean of the Attitude towards
political corruption varies significantly with the Political leaning.
Statistical analysis
In this section, it will be performed the statistical analysis carried out to test the
hypothesis H4:
1. H4A1: ANOVA analysis “Attitude towards political corruption” –
“Political leaning”.
The hypotheses of the ANOVA analysis H4A1 are presented in Table 4-30.

142
Table 4-30 Hypotheses -ANOVA analysis H4A1-
Null (H0) and Alternative (H1) hypothesis
H0: Homogeneity of mean, i.e., the mean of the Attitude towards political corruption
is equal for all groups: extreme left, left, center, right and extreme right political
leaning.
H1: Heterogeneity of mean, i.e., the mean of the Attitude towards political corruption
is not equal for all groups: extreme left, left, center, right and extreme right political
leaning.
In order to decide which statistic will be used to perform the ANOVA analysis, the
first step will be to find out if the assumption of homoscedasticity is met. For this
purpose, it will be performed the Levene's Test. The null and the alternative hypotheses
are shown in Table 4-31:
Table 4-31 Hypotheses - Levene's Test for H3A1-
Null (H0) and Alternative (H1) hypothesis
H0: Homogeneity of variance, i.e., the variance of the Attitude towards political
corruption is equal for all groups: extreme left, left, center, right and extreme right
political leaning.
H1: Heterogeneity of variance, i.e., the variance of the Attitude towards political
corruption is not equal for all groups: extreme left, left, center, right and extreme right
political leaning.
In Table 4-32 it is depicted the results of the Levene’s test. As the Levene’s
statistic=14.6, p<0.05, the H0 is rejected, i.e., it is not possible to assume that the
variances are equal across all the groups.
Table 4-32 Levene’s Test for H4A1
Levene’s Statistic df1 df2 Statistical
significance
14.6 4 395 0.000
The assumption of homoscedasticity is not met; therefore, it will be used the Welch
statistic to perform the ANOVA analysis (Table 4-33).
Table 4-33 ANOVA analysis H4A1
Welch’s Statistic df1 df2 Statistical
significance
99.1 4 40.6 0.000

143
Based on the results, the H0 is rejected, i.e., there is a statistically significant
difference in the attitude towards corruption between citizens with a different political
leaning Welch’s statistic=99.1, p<0.05.
Once it has been proved the attitude towards political corruption varies with the
political leaning, it will be deeply analysed in which pair of groups it is possible to
establish a difference statistically significant. For this purpose, as the assumption of
homoscedasticity is not met, it will be performed the Games-Howell’s Test (Table
4-34).
Table 4-34 Games-Howell’s Test for H4A1
Political Leaning
Categories Mean
Difference
(A – B)
Std.
error Sig.
95% Confidence Interval
A B Lower Upper
Extreme
Left
Left 0.64 0.06 0.000 0.46 0.81
Centre 1.21 0.10 0.000 0.93 1.50
Right 1.54 0.10 0.000 1.27 1.81
Extreme
Right 2.72 0.35 0.001 1.41 4.04
Left
Extreme
Left -0.64 0.06 0.000 -0.81 -0.46
Centre 0.58 0.11 0.000 0.29 0.87
Right 0.91 0.10 0.000 0.62 1.19
Extreme
Right 2.08 0.36 0.005 0.77 3.40
Centre
Extreme
Left -1.21 0.10 0.000 -1.50 -0.93
Left -0.58 0.11 0.000 -0.87 -0.29
Right 0.33 0.13 0.091 -0.03 0.68
Extreme
Right 1.51 0.36 0.026 0.20 2.81
Right
Extreme
Left -1.54 0.10 0.000 -1.81 -1.27
Left -0.91 0.10 0.000 -1.19 -0.62
Centre -0.33 0.13 0.091 -0.68 0.03
Extreme
Right 1.18 0.36 0.077 -0.13 2.49
Extreme
Right
Extreme
Left -2.72 0.35 0.001 -4.04 -1.41
Left -2.08 0.36 0.005 -3.40 -0.77
Centre -1.51 0.36 0.026 -2.81 -0.20
Right -1.18 0.36 0.077 -2.49 0.13

144
As it is indicated, it is possible to establish differences statistically significant in the
attitude towards political corruption between the group of citizens with an extreme left
political leaning and those with a left t(40.6)=10.2 p<0.05, centre t(40.6)=12, p<0.05,
right t(40.6)=16, p<0.05 and extreme right t(40.6)=7.7, p<0.05 political leaning;
between those citizens with a left political leaning and those with a centre t(40.6)=5.5,
p<0.05, right t(40.6)=8.9, p<0.05 and extreme right t(40.6)=5.9, p<0.05 political
leaning; and finally, between the group of citizens who locate themselves in the centre
and those with an extreme right t(40.6)=4.1, p<0.05 political leaning. However, it is not
possible to establish differences statistically significant in the attitude towards political
corruption between the group of citizens who locate themselves in the centre and those
with a right t(40.6)=2.5, p>0.05 political leaning; and neither between those citizens
with a right political leaning and those with an extreme right t(40.6)=3.3, p>0.05
political leaning.
The conclusion of the previous analysis is that when studying the impact of the
political leaning on the attitude towards political corruption, among the ten possible
comparisons pairs, there are differences statistically significant in eight of them.
Report
In this section, it will be reported the most relevant conclusions of the statistical
analysis carried out in the previous section.
Once it has been proved that there is a statistically significant difference in the
attitude towards political corruption between citizens with a different political leaning, it
is presented the mean of the attitude towards political corruption for each group in
Figure 4-7.
Figure 4-7 Attitude towards political corruption vs. Political leaning
4,9 4,3
3,7 3,4
2,2
0,0
1,0
2,0
3,0
4,0
5,0
Extreme left Left Centre Right Extreme right
Att
itu
de
to
war
ds
p
olit
ical
co
rru
pti
on
Political Leaning

145
The main conclusion is that citizens are less tolerant towards political corruption as
more progressive they are. Concretely, when participants are evaluating a set of political
corruption cases, the mean of the attitude towards political corruption on a scale from 1
to 5 where 1 means “it is not serious at all” and 5 means “it is very serious”, is 4.9, for
those who identify themselves as having an extreme left political leaning; 4.3, for those
who identify themselves as having a left political leaning; 3.7, for those who place
themselves on the centre; 3.4, for those who identify themselves as having an right
political leaning; and finally, 2.2 for those who identify themselves as having an
extreme right political leaning.
As a consequence, the hypothesis H4 has been verified, i.e., citizens’ level of
tolerance towards political corruption is lower as more politically progressive they are.
This finding is consistent with previous researches where it was proved how left parties’
supporters punish corruption more than right parties’ supporters (Charron and
Bågenholm, 2016; Anduiza et al., 2013; Costas-Pérez et al., 2010).
The verification of this hypothesis could be seen, at least in a short term, as a
disadvantage for parties with a left political leaning, which would need to make greater
efforts to fight against corruption. Moreover, this conclusion would contribute to
explain the success of some right parties involved in corruption in certain electoral
campaigns.
Hypothesis 5: Experiments and outcomes 4.3.5
In Hypothesis H5 it will be tested the belief that those citizens who feel closer to
new parties have a lower level of tolerance towards political corruption. The statement
of H5 is as follows:
H5 statement- Citizens’ level of tolerance towards political corruption is lower
in those citizens who are supporting new parties.
If validated, it would show the effectiveness of the new parties’ strategy focused on
the fight against corruption.
Experiment Description
To test this hypothesis H5 it has been considered the following variables:

146
1. Preferred party. A list with the main parties (PP, PSOE, UP and C’s) and
the option “Other party” was shown to participants, who were asked to
choose the one which they felt closer to their ideas. This variable has not
needed any recoding; it has been worked with the data from the survey
directly.
2. Preferred parties’ group (New vs. Traditional). Taking as a starting point
the previous variable “preferred party”, it was recoded as follows: as “New
party”, when participants chose UP or C’s; and as “Traditional party”, when
they chose PP, PSOE or the option “Other party”.
3. Attitude towards political corruption. As it has been already explained,
this variable was measured through four items evaluated on a scale anchored
at 1 (it is not serious at all) to 5 means (it is very serious). Besides, it was
proved its reliability and validity.
4. Age. In order to simplify the analysis, this variable was recoded as follows:
as “18-45”, for participants who belonged to the “18-30” and “31-45” age
ranges; and as “>45” for participants who belonged to the “45-60” and “>60”
age ranges.
The objective of this hypothesis H5 is to test if those citizens who are supporting
new parties are less tolerant towards political corruption than those who are supporting
traditional parties. For this purpose, it will be performed the following analysis:
1. H5A1: T-test to study if the mean of the Attitude towards political corruption
varies significantly between New parties’ supporters and Traditional parties’
supporters.
2. H5A2: A crosstabs analysis to find out if it is possible to establish a
relationship statistically significant between Voters’ age (18-45 vs. > 45) and
Preferred parties’ group (New vs. Traditional).

147
Then, once the hypothesis will be tested, it will be analysed the previous
relationships considering directly the preferred party. For this purpose, it will be
performed the following analysis:
3. H5A3: ANOVA analysis to find out if the mean of the Attitude towards
political corruption varies significantly taking into account the Preferred
party.
4. H5A4: A crosstabs analysis to find out if it is possible to establish a
relationship statistically significant between Voters’ age (18-45 vs. > 45) and
Preferred Party.
Statistical analysis
In this section, it will be performed the statistical analysis carried out to test the
hypothesis H5:
1. H5A1: T-test analysis “Attitude towards political corruption” –
“Preferred parties’ group (New vs. Traditional)”.
The hypotheses of the T-test analysis H5A1 are presented in Table 4-35.
Table 4-35 Hypotheses –T-test analysis H5A1-
Null (H0) and Alternative (H1) hypothesis
H0: Homogeneity of mean, i.e., the mean of the Attitude towards political corruption
is equal for both groups: new parties’ supporters and traditional parties’ supporters.
H1: Heterogeneity of mean, i.e., the mean of the Attitude towards political corruption
is not equal for both groups: new parties’ supporters and traditional parties’
supporters.
In order to decide which statistic will be used to perform T-test analysis, the first
step will be to find out if the assumption of homoscedasticity is met. For this purpose, it
will be performed the Levene's Test. The null and the alternative hypotheses are shown
in Table 4-36:

148
Table 4-36 Hypotheses - Levene's Test for H5A1-
Null (H0) and Alternative (H1) hypothesis
H0: Homogeneity of variance, i.e., the variance of the Attitude towards political
corruption is equal for both groups: new parties’ supporters and traditional parties’
supporters.
H1: Heterogeneity of variance, i.e., the variance of the Attitude towards political
corruption is not equal for both groups: new parties’ supporters and traditional
parties’ supporters.
In Table 4-37 it is depicted the results of the Levene’s test. As the Levene’s
statistic=32.6, p<0.05, the H0 is rejected, i.e., it is not possible to assume that the
variances are equal for both groups.
Table 4-37 Levene’s Test for H5A1
Levene’s Statistic Statistical significance
32.6 0.000
The assumption of homoscedasticity is not met; therefore, it will be used the t
statistic for the case where the variance is not equal for both groups (Table 4-38).
Table 4-38 T-test analysis H5A1
T-statistic df Mean
Difference
Std. error
Difference Sig.
95% Confidence Interval
of the Difference
Lower Upper
-11.7 378 -0.93 0.08 0.000 -1.09 -0.78
Based on the results, the H0 is rejected, i.e., there is a statistically significant
difference in the attitude towards corruption between supporters of new and traditional
parties t(378)= -11.7, p<0.05.
2. H5A2: Crosstabs analysis “Voters’ age (18-45 vs. > 45)” – “Preferred
parties’ group (New vs. Traditional)”.
The hypotheses of the Crosstabs analysis H5A2 are presented in Table 4-39.
Table 4-39 Hypotheses –Crosstabs analysis H5A2-
Null (H0) and Alternative (H1) hypothesis
H0: There is not association between Voters’ age (18-45 vs. > 45) and Preferred
parties’ group (New vs. Traditional).
H1: There is association between Voters’ age (18-45 vs. > 45) and Preferred parties’
group (New vs. Traditional).

149
In order to test the hypotheses, it will be performed the Chi-Squared Test (Table
4-40):
Table 4-40 Chi-Squared Test for H5A2
Pearson Chi-Square df1 Statistical significance
71.1 1 0.000
Based on the results, the H0 is rejected, i.e., there is a statistically significant
association between Voters’ age (18-45 vs. > 45) and Preferred parties’ group (New vs.
Traditional), χ2
(1) = 71.1, p < 0.05. Besides, in order to characterise the relationship, as
the crosstab is 2x2, it will be performed the Cramer’s V Test (Table 4-41).
Table 4-41 Cramer’s V Test for H5A2
Cramer’s V Statistic Range Statistical significance
0.421 0 < Cramer’s V < 1 0.000
Considering the Cramer’s V Statistic = 0.421, p<0.05 the previous statistically
significant relationship is characterised as moderate.
3. H5A3: ANOVA analysis “Attitude towards political corruption” –
“Preferred party”.
The hypotheses of the ANOVA analysis H5A3 are presented in Table 4-42.
Table 4-42 Hypotheses -ANOVA analysis H5A3-
Null (H0) and Alternative (H1) hypothesis
H0: Homogeneity of mean, i.e., the mean of the Attitude towards political corruption
is equal for all groups: supporters of PP, PSOE, UP, C’s and Other party.
H1: Heterogeneity of mean, i.e., the mean of the Attitude towards political corruption
is not equal for all groups: supporters of PP, PSOE, UP, C’s and Other party.
In order to decide which statistic will be used to perform the ANOVA analysis, the
first step will be to find out if the assumption of homoscedasticity is met. For this
purpose, it will be performed the Levene's Test. The null and the alternative hypotheses
are shown in Table 4-43:

150
Table 4-43 Hypotheses - Levene's Test for H5A3-
Null (H0) and Alternative (H1) hypothesis
H0: Homogeneity of variance, i.e., the variance of the Attitude towards political
corruption is equal for all groups: supporters of PP, PSOE, UP, C’s and Other party.
H1: Heterogeneity of variance, i.e., the variance of the Attitude towards political
corruption is not equal for all groups: supporters of PP, PSOE, UP, C’s and Other
party.
In Table 4-44 it is depicted the results of the Levene’s test. As the Levene’s
statistic=3.9, p<0.05, the H0 is rejected, i.e., it is not possible to assume that the
variances are equal across all the groups.
Table 4-44 Levene’s Test for H5A3
Levene’s Statistic df1 df2 Statistical
significance
3.9 4 395 0.004
The assumption of homoscedasticity is not met; therefore, it will be used the Welch
statistic to perform the ANOVA analysis (Table 4-45).
Table 4-45 ANOVA analysis H5A3
Welch’s Statistic df1 df2 Statistical
significance
44.6 4 7.9 0.000
Based on the results, the H0 is rejected, i.e., there is a statistically significant
difference in the attitude towards corruption between supporters of different parties
Welch’s statistic=44.6, p<0.05.
Once it has been proved the attitude towards political corruption varies with the
preferred party, it will be deeply analysed in which pair of groups it is possible to
establish a difference statistically significant. For this purpose, as the assumption of
homoscedasticity is not met, it will be performed the Games-Howell’s Test (Table
4-46).

151
Table 4-46 Games-Howell’s Test for H5A3
Preferred Party Mean
Difference
(A – B)
Std.
error Sig.
95% Confidence Interval
A B Lower Upper
PP
PSOE -0.92 0.11 0.000 -1.22 -0.62
UP -1.44 0.10 0.000 -1.71 -1.18
C’s -1.12 0.12 0.000 -1.45 -0.79
Other -1.56 0.38 0.290 -9.58 6.47
PSOE
PP 0.92 0.11 0.000 0.62 1.22
UP -0.52 0.09 0.000 -0.77 -0.28
C’s -0.20 0.10 0.408 -0.51 0.11
Other -0.63 0.38 0.641 -9.03 7.76
UP
PP 1.44 0.10 0.000 1.18 1.71
PSOE 0.52 0.09 0.000 0.28 0.77
C’s 0.33 0.10 0.015 0.04 0.61
Other 1.12 0.38 0.996 -9.09 8.87
C’s
PP -1.54 0.12 0.000 0.79 1.45
PSOE 0.20 0.11 0.408 -0.11 0.51
UP -0.33 0.10 0.015 -0.61 -0.04
Other -0.44 0.39 0.798 -8.27 7.40
Other
PP 1.56 0.38 0.290 -6.47 9.58
PSOE 0.63 0.38 0.641 -7.76 9.03
UP 0.11 0.38 0.996 -8.87 9.09
C’s 0.44 0.39 0.798 -7.40 8.27
As it is indicated, it is possible to establish differences statistically significant in the
attitude towards political corruption between PP supporters and PSOE supporters
t(7.9)= -8.5, p<0.05, UP supporters t(7.9)= -14.8, p<0.05, and C’s supporters t(7.9)= -
9.4, p<0.05; between PSOE supporters and UP supporters t(7.9)= -5.9, p<0.05; and
finally, between UP supporters and C’s supporters t(7.9)=3.2, p<0.05. However, it is
not possible to establish differences statistically significant in the attitude towards
political corruption between PSOE supporters and C’s supporters t(7.9)= -1.8, p>0.05;
and between those who are supporting “other party” (a party different from the main
four parties) and those who are supporting one of the main four parties, i.e., PP
supporters t(7.9)=4.1, p>0.05, PSOE supporters t(7.9)=1.7, p>0.05, UP supporters
t(7.9)=0.29, p>0.05, and C’s supporters t(7.9)=1.1, p>0.05.

152
The conclusion of the previous analysis is that when studying the impact of the
preferred party on the attitude towards political corruption, there are differences
statistically significant only in half of the possible comparison pairs. However, focusing
on the main parties, the differences are statistically significant in five of the six possible
comparison pairs, concretely, in all pair of parties’ supporters except between PSOE and
C’s supporters.
4. H5A4: Crosstabs analysis “Voters’ age (18-45 vs. > 45)” – “Preferred
Party (PP, PSOE, UP or C’s)”. Note- In order to simplify the analysis, it
will be excluded the option “Other party”, which was selected just by 2
participants.
The hypotheses of the Crosstabs analysis H5A4 are presented in Table 4-47.
Table 4-47 Hypotheses –Crosstabs analysis H5A4-
Null (H0) and Alternative (H1) hypothesis
H0: There is not association between Voters’ age (18-45 vs. > 45) and Preferred
Party (PP, PSOE, UP or C’s).
H1: There is association between Voters’ age (18-45 vs. > 45) and Preferred Party
(PP, PSOE, UP or C’s).
In order to test the hypotheses, it will be performed the Chi-Squared Test (Table
4-48):
Table 4-48 Chi-Squared Test for H5A4
Pearson Chi-Square df1 Statistical significance
76.1 3 0.000
Based on the results, the H0 is rejected, i.e., there is a statistically significant
association between Voters’ age (18-45 vs. > 45) and Preferred Party (PP, PSOE, UP or
C’s), χ2
(3) = 76.1, p < 0.05. Besides, in order to characterise the relationship, as the
crosstab is larger than 2x2, it will be performed the Contingency Coefficient Test
(Table 4-49).
Table 4-49 Contingency Coefficient Test for H5A4
Contingency Coefficient
Statistic C Range Statistical significance
0.401 0 < C < 0.707 0.000

153
Considering the C = 0.401, p<0.05, the previous statistically significant
relationship is characterised as moderate.
Report
In this section, it will be reported the most relevant conclusions of the statistical
analysis carried out in the previous section.
Firstly, it will be reported the results obtained when it has been proved that there is
a statistically significant difference in the attitude towards political corruption between
those citizens who support traditional parties and those who support new parties. In
Figure 4-8 it is presented the mean of the attitude towards political corruption of each of
the groups.
Figure 4-8 Attitude towards political corruption vs. Traditional/New parties’
supporters
As it is depicted, new parties’ supporters are less tolerant towards political
corruption than traditional parties’ supporters. Concretely, when participants are
evaluating a set of political corruption cases on a scale from 1 to 5 where 1 means “it is
not serious at all” and 5 means “it is very serious”, the mean of the attitude towards
political corruption is 3.46 for traditional parties’ supporters and 4.40 for new parties’
supporters.
Secondly, it will be reported the results obtained in when it has been demonstrated
that it is possible to establish a relationship statistically significant between voters’ age
and preferred parties’ group (Table 4-50).
4,4
3,5
0,0
0,5
1,0
1,5
2,0
2,5
3,0
3,5
4,0
4,5
5,0
New parties' supporters Traditional parties' supporters
Att
itu
de
to
war
ds
p
olit
ical
co
rru
pti
on

154
Table 4-50 Voter’s distribution by age and parties’ group supported
New parties’ supporters Traditional parties’ supporters
18-45 years 66% 34%
> 45 years 23.9% 76.1%
As it is indicated, the 66% of younger voters prefer new parties while the 76.1% of
older voters feel closer to traditional parties. This finding is according with the
information provided by the CIS (Figure 1-3) where it was shown that voters between
18 and 44 years felt closer to new parties while those with more than 45 years clearly
preferred traditional parties.
Thirdly, it will be reported the results obtained when it has been proved that the
attitude towards political corruption varies significantly when considering directly the
preferred party. In Figure 4-9 it is displayed the mean of the attitude towards political
corruption for the supporters of each of the main parties.
Figure 4-9 Attitude towards political corruption vs. Preferred party
As it is seen, when participants are evaluating a set of political corruption cases on
a scale from 1 to 5 where 1 means “it is not serious at all” and 5 means “it is very
serious”, the mean of the attitude towards political corruption is 3.1 for PP supporters, 4
for PSOE supporters, 4.5 for UP supporters and 4.2 for C’s supporters.
Finally, it will be reported the results obtained in the crosstabs analysis performed
in order to find out if it is possible to establish a relationship statistically significant
between voters’ age and preferred party. As it has been already demonstrated, there is
an association statistically significant, on one hand, the most part of younger voters feel
3,1
4 4,5
4,2
0
1
2
3
4
5
PP PSOE UP C's
Att
itu
de
to
war
ds
p
olit
ical
co
rru
pti
on
Preferred party
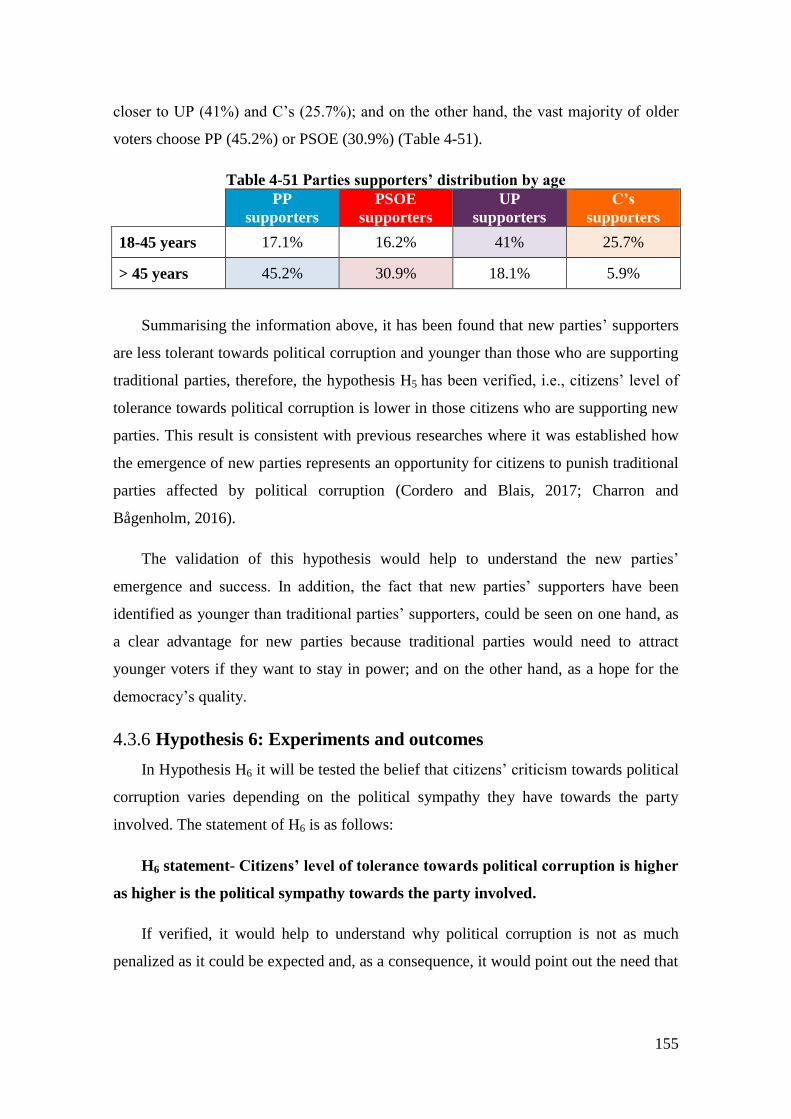
155
closer to UP (41%) and C’s (25.7%); and on the other hand, the vast majority of older
voters choose PP (45.2%) or PSOE (30.9%) (Table 4-51).
Table 4-51 Parties supporters’ distribution by age
PP
supporters
PSOE
supporters
UP
supporters
C’s
supporters
18-45 years 17.1% 16.2% 41% 25.7%
> 45 years 45.2% 30.9% 18.1% 5.9%
Summarising the information above, it has been found that new parties’ supporters
are less tolerant towards political corruption and younger than those who are supporting
traditional parties, therefore, the hypothesis H5 has been verified, i.e., citizens’ level of
tolerance towards political corruption is lower in those citizens who are supporting new
parties. This result is consistent with previous researches where it was established how
the emergence of new parties represents an opportunity for citizens to punish traditional
parties affected by political corruption (Cordero and Blais, 2017; Charron and
Bågenholm, 2016).
The validation of this hypothesis would help to understand the new parties’
emergence and success. In addition, the fact that new parties’ supporters have been
identified as younger than traditional parties’ supporters, could be seen on one hand, as
a clear advantage for new parties because traditional parties would need to attract
younger voters if they want to stay in power; and on the other hand, as a hope for the
democracy’s quality.
Hypothesis 6: Experiments and outcomes 4.3.6
In Hypothesis H6 it will be tested the belief that citizens’ criticism towards political
corruption varies depending on the political sympathy they have towards the party
involved. The statement of H6 is as follows:
H6 statement- Citizens’ level of tolerance towards political corruption is higher
as higher is the political sympathy towards the party involved.
If verified, it would help to understand why political corruption is not as much
penalized as it could be expected and, as a consequence, it would point out the need that

156
citizens show themselves against political corruption independently of the party affected
in order to reach a higher quality democracy.
Experiment Description
To test this hypothesis H6 it has been considered the following variables:
1. Preferred party. It has been worked directly with the data provided by the
survey, where respondents indicated the party which they felt closer to their
ideas. In this case, in order to simplify the analysis, it will be excluded the
option “Other party”, which was selected just by 2 participants.
2. Corruption perceived in political parties (PP, PSOE, UP and C’s). In
order to measure this variable, participants were asked to indicate the level of
corruption they perceived in the Spanish main parties on a scale anchored at
1 (not corrupted at all) to 5 (completely corrupted). This variable has not
needed any recoding, it has been worked directly with the data from the
survey.
3. Attitude towards political corruption (Receiving valuable presents)
without specifying the party involved. The information needed for this
variable was provided by the fourth item of Table 4-5, where participants
evaluated the corruption case “A politician accepts valuable presents” where
it was not specified the party involved, on a scale anchored at 1 (not serious
at all) to 5 (very serious). It has been worked directly with the data provided
by the survey without any recoding.
4. Attitude towards political corruption (Receiving valuable presents)
specifying the party involved is their preferred party. Participants faced
the same corruption case related to a valuable present that it has been
considered in the previous variable, but in this case, it was indicated that the
party involved was their preferred party (Table 4-7). Then, they were asked
to indicate how serious they perceived it on a scale anchored at 1 (not serious
at all) to 5 (very serious). This variable has not needed any recoding; it has
been worked with the data from the survey directly.

157
5. Differential attitude towards political corruption (Receiving valuable
presents) post-pre specifying the party involved. Considering the variable
Attitude towards political corruption (Receiving valuable presents) post
specifying the party involved is their preferred party, and the variable
Attitude towards political corruption (Receiving valuable presents) pre
specifying the party involved is their preferred party, it was constructed a
new variable: Differential attitude towards political corruption (Receiving
valuable presents) post-pre specifying the party involved. It measures the
difference between the corruption perceived in a specific corruption case
related to a valuable present when it is specified that their preferred party is
the one involved and the corruption perceived in the same specific corruption
related to a valuable present when it is not specified which is the party
involved. This variable has not needed any recoding, it has been worked
directly with the data from the survey.
It was necessary to construct this variable because the goal was to ensure that
it was being strictly measured the impact of being aware that it is their party
the one which is involved. If it was considered just the attitude towards
political corruption post specifying the party involved, it would not have
been possible to analyse the impact of the preferred party, as the attitude
towards a political corruption case is not only affected by the party involved,
but also by the attitude towards this political corruption case independently
of the corrupted party.
The aim of this hypothesis is to test if citizens’ criticism towards political
corruption varies significantly when it is their party the one which is being involved in
corruption. For this purpose, it will be performed the following analysis:
1. H6A1: ANOVA analysis to find out if the mean of the Corruption perceived
in PP varies significantly considering the Preferred party.
2. H6A2: ANOVA analysis to find out if the mean of the Corruption perceived
in PSOE varies significantly considering the Preferred party.

158
3. H6A3: ANOVA analysis to find out if the mean of the Corruption perceived
in UP varies significantly considering the Preferred party.
4. H6A4: ANOVA analysis to find out if the mean of the Corruption perceived
in C’s varies significantly considering the Preferred party.
5. H6A5: ANOVA analysis to find out if the mean of the Attitude towards
political corruption without specifying the party involved in a specific
corruption case related to receiving valuable presents varies significantly
considering the Preferred party.
6. H6A6: ANOVA analysis to find out if the mean of the Attitude towards
political corruption specifying the party involved is their preferred party in
the same specific corruption case related to receiving valuable presents varies
significantly considering the Preferred party.
7. H6A7: ANOVA analysis to find out if the Differential attitude towards
political corruption post-pre specifying the party involved varies significantly
considering the Preferred party.
Statistical analysis
In this section, it will be performed the statistical analysis carried out to test the
hypothesis H6:
1. H6A1: ANOVA analysis “Corruption perceived in PP” – “Preferred
party”.
The hypotheses of the ANOVA analysis H6A1 are presented in Table 4-52.
Table 4-52 Hypotheses -ANOVA analysis H6A1-
Null (H0) and Alternative (H1) hypothesis
H0: Homogeneity of mean, i.e., the mean of the Corruption perceived in PP is equal
for all groups: supporters of PP, PSOE, UP and C’s.
H1: Heterogeneity of mean, i.e., the mean of the Corruption perceived in PP is not
equal for all groups: supporters of PP, PSOE, UP and C’s.

159
In order to decide which statistic will be used to perform the ANOVA analysis, the
first step will be to find out if the assumption of homoscedasticity is met. For this
purpose, it will be performed the Levene's Test. The null and the alternative hypotheses
are shown in Table 4-53:
Table 4-53 Hypotheses - Levene's Test for H6A1-
Null (H0) and Alternative (H1) hypothesis
H0: Homogeneity of variance, i.e., the variance of the Corruption perceived in PP is
equal for all groups: supporters of PP, PSOE, UP and C’s.
H1: Heterogeneity of variance, i.e., the variance of Corruption perceived in PP is not
equal for all groups: supporters of PP, PSOE, UP and C’s.
In Table 4-54 it is depicted the results of the Levene’s test. As the Levene’s
statistic=124, p<0.05, the H0 is rejected, i.e., it is not possible to assume that the
variances are equal across all the groups.
Table 4-54 Levene’s Test for H6A1
Levene’s Statistic df1 df2 Statistical
significance
124 3 394 0.000
The assumption of homoscedasticity is not met; therefore, it will be used the Welch
statistic to perform the ANOVA analysis (Table 4-55).
Table 4-55 ANOVA analysis H6A1
Welch’s Statistic df1 df2 Statistical
significance
76.4 3 150 0.000
Based on the results, the H0 is rejected, i.e., there is a statistically significant
difference in the corruption perceived in PP between supporters of different parties
Welch’s statistic=76.4, p<0.05.
Once it has been proved the corruption perceived in PP varies with the preferred
party, it will be deeply analysed in which pair of groups it is possible to establish a
difference statistically significant. For this purpose, as the assumption of
homoscedasticity is not met, it will be performed the Games-Howell’s Test (Table
4-56).

160
Table 4-56 Games-Howell’s Test for H6A1
Preferred Party Mean
Difference
(A – B)
Std.
error Sig.
95% Confidence Interval
A B Lower Upper
PP
PSOE -1.35 0.10 0.000 -1.61 -1.08
UP -1.41 0.10 0.000 -1.66 -1.16
C’s -1.22 0.11 0.000 -1.51 -0.94
PSOE
PP 1.35 0.10 0.000 1.08 1.61
UP -0.07 0.04 0.384 -0.18 0.04
C’s 0.12 0.07 0.275 -0.05 0.30
UP
PP 1.41 0.10 0.000 1.16 1.66
PSOE 0.07 0.04 0.384 -0.04 0.18
C’s 0.20 0.06 0.005 0.05 0.34
C’s
PP 1.22 0.11 0.000 0.94 1.51
PSOE -0.12 0.07 0.275 -0.30 0.05
UP -0.20 0.06 0.005 -0.34 -0.05
As it is indicated, it is possible to establish differences statistically significant in the
corruption perceived in PP between PP supporters and PSOE supporters t(150)= -13,
p<0.05, UP supporters t(150)= -14.8, p<0.05, and C’s supporters t(150)= -11.1 p<0.05;
and between UP supporters and C’s supporters t(150)=3.5, p<0.05. However, it is not
possible to establish differences statistically significant in the perception of corruption
in PP between PSOE supporters and UP supporters t(150)= -1.6, p>0.05C’s’, and C’s
supporters t(150)= 1.8, p>0.05.
The conclusion of the previous analysis is that when studying the impact of the
preferred party on the perception of corruption in PP, there are differences statistically
significant in four of the six possible comparison pairs, concretely, in all pair of parties’
supporters except between PSOE and UP supporters, and between PSOE and C’s
supporters.
2. H6A2: ANOVA analysis “Corruption perceived in PSOE” – “Preferred
party”.
The hypotheses of the ANOVA analysis H6A2 are presented in Table 4-57.

161
Table 4-57 Hypotheses -ANOVA analysis H6A2-
Null (H0) and Alternative (H1) hypothesis
H0: Homogeneity of mean, i.e., the mean of the Corruption perceived in PSOE is
equal for all groups: supporters of PP, PSOE, UP and C’s.
H1: Heterogeneity of mean, i.e., the mean of the Corruption perceived in PSOE is not
equal for all groups: supporters of PP, PSOE, UP and C’s.
In order to decide which statistic will be used to perform the ANOVA analysis, the
first step will be to find out if the assumption of homoscedasticity is met. For this
purpose, it will be performed the Levene's Test. The null and the alternative hypotheses
are shown in Table 4-58:
Table 4-58 Hypotheses - Levene's Test for H6A2-
Null (H0) and Alternative (H1) hypothesis
H0: Homogeneity of variance, i.e., the variance of the Corruption perceived in PSOE
is equal for all groups: supporters of PP, PSOE, UP and C’s.
H1: Heterogeneity of variance, i.e., the variance of Corruption perceived in PSOE is
not equal for all groups: supporters of PP, PSOE, UP and C’s.
In Table 4-59 it is depicted the results of the Levene’s test. As the Levene’s
statistic=6.1, p<0.05, the H0 is rejected, i.e., it is not possible to assume that the
variances are equal across all the groups.
Table 4-59 Levene’s Test for H6A2
Levene’s Statistic df1 df2 Statistical
significance
6.1 3 394 0.000
The assumption of homoscedasticity is not met; therefore, it will be used the Welch
statistic to perform the ANOVA analysis (Table 4-60).
Table 4-60 ANOVA analysis H6A2
Welch’s Statistic df1 df2 Statistical
significance
80.5 3 209 0.000
Based on the results, the H0 is rejected, i.e., there is a statistically significant
difference in the corruption perceived in PSOE between supporters of different parties
Welch’s statistic=80.5, p<0.05.

162
Once it has been proved the corruption perceived in PSOE varies with the preferred
party, it will be deeply analysed in which pair of groups it is possible to establish a
difference statistically significant. For this purpose, as the assumption of
homoscedasticity is not met, it will be performed the Games-Howell’s Test (Table
4-61).
Table 4-61 Games-Howell’s Test for H6A2
Preferred Party Mean
Difference
(A – B)
Std.
error Sig.
95% Confidence Interval
A B Lower Upper
PP
PSOE 1.22 0.13 0.000 0.90 1.55
UP -0.13 0.11 0.637 -0.40 0.15
C’s -0.61 0.10 0.000 -0.86 -0.37
PSOE
PP -1.22 0.13 0.000 -1.55 -0.90
UP -1.35 0.13 0.000 -1.68 -1.02
C’s -1.84 0.12 0.000 -2.15 -1.53
UP
PP 0.13 0.11 0.637 -0.15 0.40
PSOE 1.35 0.13 0.000 1.02 1.68
C’s -0.49 0.10 0.000 -0.74 -0.24
C’s
PP 0.61 0.10 0.000 0.37 0.86
PSOE 1.84 0.12 0.000 1.53 2.15
UP 0.49 0.10 0.000 0.24 0.74
As it is indicated, it is possible to establish differences statistically significant in the
corruption perceived in PSOE between PP supporters and PSOE supporters t(209)= 9.7,
p<0.05, and C’s supporters t(209)= -6.4, p<0.05; between PSOE supporters and UP
supporters t(209)= -10.7, p<0.05, and C’s supporters t(209)= -15.6, p<0.05; and finally,
between UP supporters and C’s supporters t(209)= -5.1, p<0.05. However, it is not
possible to establish differences statistically significant in the corruption perceived in
PSOE between PP supporters and UP supporters t(209)= -1.2, p>0.05.
The conclusion of the previous analysis is that when studying the impact of the
preferred party on the perception of corruption in PSOE, there are differences
statistically significant in five of the six possible comparison pairs, concretely, in all
pair of parties’ supporters except between PP and UP supporters.

163
3. H6A3: ANOVA analysis “Corruption perceived in UP” – “Preferred
party”.
The hypotheses of the ANOVA analysis H6A3 are presented in Table 4-62.
Table 4-62 Hypotheses -ANOVA analysis H6A3-
Null (H0) and Alternative (H1) hypothesis
H0: Homogeneity of mean, i.e., the mean of the Corruption perceived in UP is equal
for all groups: supporters of PP, PSOE, UP and C’s.
H1: Heterogeneity of mean, i.e., the mean of the Corruption perceived in UP is not
equal for all groups: supporters of PP, PSOE, UP and C’s.
In order to decide which statistic will be used to perform the ANOVA analysis, the
first step will be to find out if the assumption of homoscedasticity is met. For this
purpose, it will be performed the Levene's Test. The null and the alternative hypotheses
are shown in Table 4-63:
Table 4-63 Hypotheses - Levene's Test for H6A3-
Null (H0) and Alternative (H1) hypothesis
H0: Homogeneity of variance, i.e., the variance of the Corruption perceived in UP is
equal for all groups: supporters of PP, PSOE, UP and C’s.
H1: Heterogeneity of variance, i.e., the variance of the Corruption perceived in UP is
not equal for all groups: supporters of PP, PSOE, UP and C’s.
In Table 4-64 it is depicted the results of the Levene’s test. As the Levene’s
statistic=19.1, p<0.05, the H0 is rejected, i.e., it is not possible to assume that the
variances are equal across all the groups.
Table 4-64 Levene’s Test for H6A3
Levene’s Statistic df1 df2 Statistical
significance
19.1 3 394 0.000
The assumption of homoscedasticity is not met; therefore, it will be used the Welch
statistic to perform the ANOVA analysis (Table 4-65).
Table 4-65 ANOVA analysis H6A3
Welch’s Statistic df1 df2 Statistical
significance
376 3 173 0.000

164
Based on the results, the H0 is rejected, i.e., there is a statistically significant
difference in the corruption perceived in UP between supporters of different parties
Welch’s statistic=376, p<0.05.
Once it has been proved the corruption perceived in UP varies with the preferred
party, it will be deeply analysed in which pair of groups it is possible to establish a
difference statistically significant. For this purpose, as the assumption of
homoscedasticity is not met, it will be performed the Games-Howell’s Test (Table
4-66).
Table 4-66 Games-Howell’s Test for H6A3
Preferred Party Mean
Difference
(A – B)
Std.
error Sig.
95% Confidence Interval
A B Lower Upper
PP
PSOE 1,24 0,14 0,000 0,87 1,62
UP 2,95 0,10 0,000 2,68 3,21
C’s 0,19 0,16 0,649 -0,23 0,61
PSOE
PP -1,24 0,14 0,000 -1,62 -0,87
UP 1,71 0,12 0,000 1,39 2,02
C’s -1,06 0,17 0,000 -1,50 -0,61
UP
PP -2,95 0,10 0,000 -3,21 -2,68
PSOE -1,71 0,12 0,000 -2,02 -1,39
C’s -2,76 0,14 0,000 -3,13 -2,39
C’s
PP -0,19 0,16 0,649 -0,61 0,23
PSOE 1,06 0,17 0,000 0,61 1,50
UP 2,76 0,14 0,000 2,39 3,13
As it is indicated, it is possible to establish differences statistically significant in the
corruption perceived in UP between PP supporters and PSOE supporters t(173)= 8.6,
p<0.05, and UP supporters t(173)= 28.8, p<0.05; between PSOE supporters and UP
supporters t(173)= 14.2, p<0.05, and C’s supporters t(173)= -6.1, p<0.05; and finally,
between UP supporters and C’s supporters t(173)= -19.7, p<0.05. However, it is not
possible to establish differences statistically significant in the corruption perceived in
UP between PP supporters and C’s supporters t(173)= 1.2, p>0.05.
The conclusion of the previous analysis is that when studying the impact of the
preferred party on the perception of corruption in UP, there are differences statistically

165
significant in five of the six possible comparison pairs, concretely, in all pair of parties’
supporters except between PP and C’s supporters.
4. H6A4: ANOVA analysis “Corruption perceived in C’s” – “Preferred
party”.
The hypotheses of the ANOVA analysis H6A4 are presented in Table 4-67.
Table 4-67 Hypotheses -ANOVA analysis H6A4-
Null (H0) and Alternative (H1) hypothesis
H0: Homogeneity of mean, i.e., the mean of the Corruption perceived in C’s is equal
for all groups: supporters of PP, PSOE, UP and C’s.
H1: Heterogeneity of mean, i.e., the mean of the Corruption perceived in C’s is not
equal for all groups: supporters of PP, PSOE, UP and C’s.
In order to decide which statistic will be used to perform the ANOVA analysis, the
first step will be to find out if the assumption of homoscedasticity is met. For this
purpose, it will be performed the Levene's Test. The null and the alternative hypotheses
are shown in Table 4-68:
Table 4-68 Hypotheses - Levene's Test for H6A4-
Null (H0) and Alternative (H1) hypothesis
H0: Homogeneity of variance, i.e., the variance of the Corruption perceived in C’s is
equal for all groups: supporters of PP, PSOE, UP and C’s.
H1: Heterogeneity of variance, i.e., the variance of Corruption perceived in C’s is not
equal for all groups: supporters of PP, PSOE, UP and C’s.
In Table 4-69 it is depicted the results of the Levene’s test. As the Levene’s
statistic=2.4, p>0.05, the H0 is not rejected, i.e., it is possible to assume that the
variances are equal across all the groups.
Table 4-69 Levene’s Test for H6A4
Levene’s Statistic df1 df2 Statistical
significance
2.4 3 394 0.066
The assumption of homoscedasticity is met; therefore, it will be used the F statistic
to perform the ANOVA analysis (Table 4-70).

166
Table 4-70 ANOVA analysis H6A4
Sum of
Squares df
Mean
Square F Sig.
Between
Groups 224 3 74.7 68.2 0.000
Within
Groups 432 394 1.10
Total 656 397
Based on the results, the H0 is rejected, i.e., there is a statistically significant
difference in the perception of corruption in C’s between supporters of different parties
F(3,394)=68.2, p<0.05.
Once it has been proved the corruption perceived in C’s varies with the preferred
party, it will be deeply analysed in which pair of groups it is possible to establish a
difference statistically significant. For this purpose, as the assumption of
homoscedasticity is met and the number of groups to be compared are just four, it will
be performed the Bonferroni’s Test (Table 4-71).
Table 4-71 Bonferroni Test for H6A4
Preferred Party Mean
Difference
(A – B)
Std.
error Sig.
95% Confidence Interval
A B Lower Upper
PP
PSOE -0,27 0,14 0,368 -0,66 0,11
UP -0,77 0,13 0,000 -1,12 -0,41
C’s 1,51 0,16 0,000 1,08 1,93
PSOE
PP 0,27 0,14 0,368 -0,11 0,66
UP -0,50 0,15 0,004 -0,88 -0,11
C’s 1,78 0,17 0,000 1,33 2,23
UP
PP 0,77 0,13 0,000 0,41 1,12
PSOE 0,50 0,15 0,004 0,11 0,88
C’s 2,27 0,16 0,000 1,85 2,70
C’s
PP -1,51 0,16 0,000 -1,93 -1,08
PSOE -1,78 0,17 0,000 -2,23 -1,33
UP -2,27 0,16 0,000 -2,70 -1,85
As it is indicated, it is possible to establish differences statistically significant in the
corruption perceived in C’s between PP supporters and UP supporters t(394)= -5.7,
p<0.05, and C’s supporters t(394)= 9.4, p<0.05; between PSOE supporters and UP
supporters t(394)= -3.4, p<0.05, and C’s supporters t(394)= 10.5, p<0.05; and finally,

167
between UP supporters and C’s supporters t(394)= 14.1, p<0.05. However, it is not
possible to establish differences statistically significant in the corruption perceived in
C’s between PP supporters and PSOE supporters t(394)= -1.9, p>0.05.
The conclusion of the previous analysis is that when studying the impact of the
preferred party on the perception of corruption in C’s, there are differences statistically
significant in five of the six possible comparison pairs, concretely, in all pair of parties’
supporters except between PP and PSOE supporters.
5. H6A5: ANOVA analysis “Attitude towards political corruption in a
specific corruption case” – “Preferred party”.
The hypotheses of the ANOVA analysis H6A5 are presented in Table 4-72.
Table 4-72 Hypotheses -ANOVA analysis H6A5-
Null (H0) and Alternative (H1) hypothesis
H0: Homogeneity of mean, i.e., the mean of the Attitude towards political corruption
in a specific corruption case is equal for all groups: supporters of PP, PSOE, UP and
C’s.
H1: Heterogeneity of mean, i.e., the mean of the Attitude towards political corruption
in a specific corruption case is not equal for all groups: supporters of PP, PSOE, UP
and C’s.
In order to decide which statistic will be used to perform the ANOVA analysis, the
first step will be to find out if the assumption of homoscedasticity is met. For this
purpose, it will be performed the Levene's Test. The null and the alternative hypotheses
are shown in Table 4-73:
Table 4-73 Hypotheses - Levene's Test for H6A5-
Null (H0) and Alternative (H1) hypothesis
H0: Homogeneity of variance, i.e., the variance of the Attitude towards political
corruption in a specific corruption case is equal for all groups: supporters of PP,
PSOE, UP and C’s.
H1: Heterogeneity of variance, i.e., the variance of the Attitude towards political
corruption in a specific corruption case is not equal for all groups: supporters of PP,
PSOE, UP and C’s.
In Table 4-74 it is depicted the results of the Levene’s test. As the Levene’s
statistic=4.9, p<0.05, the H0 is rejected, i.e., it is not possible to assume that the
variances are equal across all the groups.

168
Table 4-74 Levene’s Test for H6A5
Levene’s Statistic df1 df2 Statistical
significance
4.9 3 394 0.003
The assumption of homoscedasticity is not met; therefore, it will be used the Welch
statistic to perform the ANOVA analysis (Table 4-75).
Table 4-75 ANOVA analysis H6A5
Welch’s Statistic df1 df2 Statistical
significance
74.6 3 187 0.000
Based on the results, the H0 is rejected, i.e., there is a statistically significant
difference in the attitude towards political corruption in a specific corruption case
between supporters of different parties Welch’s statistic=74.6, p<0.05.
Once it has been proved the attitude towards political corruption in a specific
corruption case varies with the preferred party, it will be deeply analysed in which pair
of groups it is possible to establish a difference statistically significant. For this purpose,
as the assumption of homoscedasticity is not met, it will be performed the Games-
Howell’s Test (Table 4-76).
Table 4-76 Games-Howell’s Test for H6A5
Preferred Party Mean
Difference
(A – B)
Std.
error Sig.
95% Confidence Interval
A B Lower Upper
PP
PSOE -1,25 0,13 0,000 -1,58 -0,91
UP -1,68 0,11 0,000 -1,96 -1,39
C’s -1,27 0,15 0,000 -1,65 -0,88
PSOE
PP 1,25 0,13 0,000 0,91 1,58
UP -0,43 0,10 0,000 -0,69 -0,17
C’s -0,02 0,14 0,999 -0,39 0,35
UP
PP 1,68 0,11 0,000 1,39 1,96
PSOE 0,43 0,10 0,000 0,17 0,69
C’s 0,41 0,13 0,008 0,08 0,74
C’s
PP 1,27 0,15 0,000 0,88 1,65
PSOE 0,02 0,14 0,999 -0,35 0,39
UP -0,41 0,13 0,008 -0,74 -0,08

169
As it is indicated, it is possible to establish differences statistically significant in the
attitude towards political corruption in a specific corruption case between PP supporters
and PSOE supporters t(187)= -9.7, p<0.05, UP supporters t(187)= -15, p<0.05, and C’s
supporters t(187)= -8.5, p<0.05; between PSOE supporters and UP supporters t(187)= -
4.3, p<0.05; and finally, between UP supporters and C’s supporters t(187)= 3.3, p<0.05.
However, it is not possible to establish differences statistically significant in the attitude
towards political corruption in a specific corruption case between PSOE supporters and
C’s supporters t(187)= -0.14, p>0.05.
The conclusion of the previous analysis is that when studying the impact of the
preferred party on the attitude towards political corruption in a specific corruption case,
there are differences statistically significant in five of the six possible comparison pairs,
concretely, in all pair of parties’ supporters except between PSOE and C’s supporters.
6. H6A6: ANOVA analysis “Attitude towards political corruption in a
specific corruption case in which the preferred party is involved” –
“Preferred party”.
The hypotheses of the ANOVA analysis H6A6 are presented in Table 4-77.
Table 4-77 Hypotheses -ANOVA analysis H6A6-
Null (H0) and Alternative (H1) hypothesis
H0: Homogeneity of mean, i.e., the mean of the Attitude towards political corruption
in a specific corruption case in which the preferred party is involved is equal for all
groups: supporters of PP, PSOE, UP and C’s.
H1: Heterogeneity of mean, i.e., the mean of the Attitude towards political corruption
in a specific corruption case in which the preferred party is involved is not equal for
all groups: supporters of PP, PSOE, UP and C’s.
In order to decide which statistic will be used to perform the ANOVA analysis, the
first step will be to find out if the assumption of homoscedasticity is met. For this
purpose, it will be performed the Levene's Test. The null and the alternative hypotheses
are shown in Table 4-78:

170
Table 4-78 Hypotheses - Levene's Test for H6A6-
Null (H0) and Alternative (H1) hypothesis
H0: Homogeneity of variance, i.e., the variance of the Attitude towards political
corruption in a specific corruption case in which the preferred party is involved is
equal for all groups: supporters of PP, PSOE, UP and C’s.
H1: Heterogeneity of variance, i.e., the variance of the Attitude towards political
corruption in a specific corruption case in which the preferred party is involved is not
equal for all groups: supporters of PP, PSOE, UP and C’s.
In Table 4-79 it is depicted the results of the Levene’s test. As the Levene’s
statistic=3.98, p<0.05, the H0 is rejected, i.e., it is not possible to assume that the
variances are equal across all the groups.
Table 4-79 Levene’s Test for H6A6
Levene’s Statistic df1 df2 Statistical
significance
4 3 394 0.008
The assumption of homoscedasticity is not met; therefore, it will be used the Welch
statistic to perform the ANOVA analysis (Table 4-80).
Table 4-80 ANOVA analysis H6A6
Welch’s Statistic df1 df2 Statistical
significance
78.7 3 189 0.000
Based on the results, the H0 is rejected, i.e., there is a statistically significant
difference in the attitude towards political corruption in a specific corruption case in
which the preferred party is involved between supporters of different parties Welch’s
statistic=78.7, p<0.05.
Once it has been proved the attitude towards political corruption in a specific
corruption case in which the preferred party is involved varies with the preferred party,
it will be deeply analysed in which pair of groups it is possible to establish a difference
statistically significant. For this purpose, as the assumption of homoscedasticity is not
met, it will be performed the Games-Howell’s Test (Table 4-81).

171
Table 4-81 Games-Howell’s Test for H6A6
Preferred Party Mean
Difference
(A – B)
Std.
error Sig.
95% Confidence Interval
A B Lower Upper
PP
PSOE -0,95 0,16 0,000 -1,35 -0,55
UP -2,01 0,13 0,000 -2,36 -1,67
C’s -1,47 0,18 0,000 -1,94 -0,99
PSOE
PP 0,95 0,16 0,000 0,55 1,35
UP -1,06 0,14 0,000 -1,42 -0,70
C’s -0,52 0,19 0,032 -1,00 -0,03
UP
PP 2,01 0,13 0,000 1,67 2,36
PSOE 1,06 0,14 0,000 0,70 1,42
C’s 0,54 0,17 0,009 0,11 0,98
C’s
PP 1,47 0,18 0,000 0,99 1,94
PSOE 0,52 0,19 0,032 0,03 1,00
UP -0,54 0,17 0,009 -0,98 -0,11
As it is indicated, it is possible to establish differences statistically significant in the
attitude towards political corruption in a specific corruption case in which the preferred
party is involved between PP supporters and PSOE supporters t(189)= -6.1, p<0.05, UP
supporters t(189)= -15.1, p<0.05, and C’s supporters t(189)= -8, p<0.05; between
PSOE supporters and UP supporters t(189)= -7.7, p<0.05, and C’s supporters t(189)= -
2.8, p<0.05; and finally, between UP supporters and C’s supporters t(189)= 3.3, p<0.05.
The conclusion of the previous analysis is that when studying the impact of the
preferred party on the attitude towards political corruption in a specific corruption case
in which the preferred party is involved, there are differences statistically significant
between all the pair of parties’ supporters.
7. H6A7: ANOVA analysis “Differential attitude towards political
corruption post-pre specifying the party involved” – “Preferred party”.
The hypotheses of the ANOVA analysis H6A7 are presented in Table 4-82.

172
Table 4-82 Hypotheses -ANOVA analysis H6A7-
Null (H0) and Alternative (H1) hypothesis
H0: Homogeneity of mean, i.e., the mean of the Differential attitude towards political
corruption post-pre specifying the party involved is equal for all groups: supporters
of PP, PSOE, UP and C’s.
H1: Heterogeneity of mean, i.e., the mean of the Differential attitude towards political
corruption post-pre specifying the party involved is not equal for all groups:
supporters of PP, PSOE, UP and C’s.
In order to decide which statistic will be used to perform the ANOVA analysis, the
first step will be to find out if the assumption of homoscedasticity is met. For this
purpose, it will be performed the Levene's Test. The null and the alternative hypotheses
are shown in Table 4-83:
Table 4-83 Hypotheses - Levene's Test for H6A7-
Null (H0) and Alternative (H1) hypothesis
H0: Homogeneity of variance, i.e., the variance of the Differential attitude towards
political corruption post-pre specifying the party involved is equal for all groups:
supporters of PP, PSOE, UP and C’s.
H1: Heterogeneity of variance, i.e., the variance of the Differential attitude towards
political corruption post-pre specifying the party involved is not equal for all groups:
supporters of PP, PSOE, UP and C’s.
In Table 4-84 it is depicted the results of the Levene’s test. As the Levene’s
statistic=4.7, p<0.05, the H0 is rejected, i.e., it is not possible to assume that the
variances are equal across all the groups.
Table 4-84 Levene’s Test for H6A7
Levene’s Statistic df1 df2 Statistical
significance
4.7 3 394 0.003
The assumption of homoscedasticity is not met; therefore, it will be used the Welch
statistic to perform the ANOVA analysis (Table 4-85).
Table 4-85 ANOVA analysis H6A7
Welch’s Statistic df1 df2 Statistical
significance
12.9 3 197 0.000

173
Based on the results, the H0 is rejected, i.e., there is a statistically significant
difference in the differential attitude towards political corruption post-pre specifying the
party involved between supporters of different parties Welch’s statistic=12.9, p<0.05.
Once it has been proved the differential attitude towards political corruption post-
pre specifying the party involved varies with the preferred party, it will be deeply
analysed in which pair of groups it is possible to establish a difference statistically
significant. For this purpose, as the assumption of homoscedasticity is not met, it will be
performed the Games-Howell’s Test (Table 4-86).
Table 4-86 Games-Howell’s Test for H6A7
Preferred Party Mean
Difference
(A – B)
Std.
error Sig.
95% Confidence Interval
A B Lower Upper
PP
PSOE 0,29 0,11 0,054 0,00 0,59
UP -0,34 0,09 0,002 -0,58 -0,09
C’s -0,20 0,11 0,253 -0,49 0,08
PSOE
PP -0,29 0,11 0,054 -0,59 0,00
UP -0,63 0,11 0,000 -0,91 -0,35
C’s -0,50 0,12 0,000 -0,81 -0,18
UP
PP 0,34 0,09 0,002 0,09 0,58
PSOE 0,63 0,11 0,000 0,35 0,91
C’s 0,13 0,10 0,540 -0,13 0,40
C’s
PP 0,20 0,11 0,253 -0,08 0,49
PSOE 0,50 0,12 0,000 0,18 0,81
UP -0,13 0,10 0,540 -0,40 0,13
As it is indicated, it is possible to establish differences statistically significant in the
differential attitude towards political corruption post-pre specifying the party involved
between PP supporters and UP supporters t(197)= -3.6, p<0.05; and also between PSOE
supporters and UP supporters t(197)= -5.9, p<0.05, and C’s supporters t(197)= -4.1,
p<0.05. However, it is not possible to establish differences statistically significant in the
differential attitude towards political corruption post-pre specifying the party involved
between PP supporters and PSOE supporters t(197)= 2.6, p>0.05, and C’s supporters
t(197)= -8.5, p>0.05; and neither between UP supporters and C’s supporters t(197)=
1.3, p>0.05.

174
The conclusion of the previous analysis is that when studying the impact of the
preferred party on the differential attitude towards political corruption post-pre
specifying the party involved, there are differences statistically significant just in three
of the six possible comparison pairs, concretely, between PP supporters and UP
supporters, and between PSOE supporters and the supporters of UP and C’s.
Report
In this section, it will be reported the most relevant conclusions of the statistical
analysis carried out in the previous section.
Firstly, it will be reported the results obtained in the four ANOVA analysis of the
corruption perceived in PP, PSOE, UP and C’s in relation with the preferred party,
which were performed in order to find out if the corruption perceived in each party
varies significantly depending on the party that citizens feel closer to their ideas. As it
has been already proved, for all the parties, there is a statistically significant difference
in the perception of corruption between citizens with a different preferred party. In
Table 4-87 it is presented the mean of corruption perceived in each party for the
supporters of each of the main parties.
Table 4-87 Corruption perceived in each party considering the preferred party
PP
supporters
PSOE
supporters
UP
supporters
C’s
supporters Mean
PP 3.6 4.9 5 4.8 4.5
PSOE 4 2.8 4.1 4.6 3.9
UP 4.3 3.0 1.3 4.1 3.1
C’s 3 3.3 3.8 1.5 3.1
The main conclusion is that party’s supporters perceive less corruption in their
party than other parties’ supporters. Classifying citizens by the party they feel closer
and comparing their perception of corruption in each party, it is shown how in all the
cases party supporters perceive their party as being less corrupted than those who feel
closer to other parties, and these differences are significant. Concretely, on a scale from
1 to 5 where 1 means “not corrupted at all” and 5 means “completely corrupted”, PP is
perceived by their supporters as 3.6 while the mean is 4.5; PSOE supporters perceive
their party as 2.8 and the mean is 3.9; UP is perceived by their supporters as 1.3 while

175
the mean is 3.1; and finally, C’s supporters perceive their party as 1.5 and the mean is
also 3.1.
It is remarkable how even if citizens perceive PP as the most corrupted party in
Spain, this party won the last General Elections of June 2016 and has remained in the
government until June 2018, when a sentence where it was condemned for corruption
led to a wide agreement among several parties of the opposition which allowed PSOE to
win a no-confidence motion. Besides, it is interesting how the supporters of all parties
perceive their preferred party as the least corrupted except PP supporters who consider
C’s less corrupted than their own party. Finally, it is also underlined the fact that new
parties which have broken into the political scene emphasizing the fight against
corruption are perceived as less corrupted than traditional parties.
Then, in Table 4-88 it will be reported the results obtained in the following three
analyses: ANOVA analysis of the attitude towards political corruption without
specifying the party involved considering the supporters of each party; ANOVA
analysis of the attitude towards political corruption specifying the party involved
considering the supporters of each party; ANOVA analysis of the Differential attitude
towards political corruption post-pre specifying the party involved considering the
supporters of each party.
Table 4-88 Attitude towards corruption perceived in a specific case of corruption
PP
supporters
PSOE
supporters
UP
supporters
C’s
supporters Mean
Pre-Specifying 2.95 4.2 4.63 4.22 3.95
Post-Specifying 2.36 3.32 4.38 3.83 3.43
Difference -0.59 -0.88 -0.25 -0.38 -0.52
Firstly, it is depicted how when the party involved in a specific case of corruption is
not specified, PP supporters are the most tolerant while UP supporters are the least.
Concretely, when participants are evaluating the corruption case “A politician accepts
valuable presents” on a scale from 1 to 5 where 1 means “not serious at all” and 5
means “very serious”, the mean of the attitude towards political corruption is 2.95 for
PP supporters and 4.63 for UP supporters. Besides, according with the analysis
performed in the previous section, where it has been proved that the differences are
statistically significant between all pair of parties’ supporters except between PSOE and

176
C’s supporters, it is seen how the mean of the attitude towards corruption without
specifying the party involved for these groups of supporters are practically the same,
4.20 and 4.22 respectively.
Secondly, when citizens are asked about the same specific case of corruption with
the only difference that it appears their party as the one which is being involved, the
conclusion is the same: PP supporters are the most tolerant while UP supporters are the
least tolerant. In this case, it has been proved that the differences are statistically
significant between all pair of parties’ supporters, and accordingly, it is seen how the
means are quite different, concretely: 2.36 for PP supporters, 3.32 for PSOE supporters,
4.38 for UP supporters, and 3.83 for C’s supporters.
Finally, focusing on the differences between when it is not specified the party and
when it is, it is found that even if the supporters of all the parties tend to downplay the
importance of the corruption case when it is specified that their party is the one which is
being involved, new parties’ supporters are those who less minimize the corruption
when it affects to their own party. Concretely, the differences are -0.59 for PP
supporters, -0.88 for PSOE supporters; -0.25 for UP supporters; and -0.38 for C’s
supporters.
Summarizing all the information above, it has been found on one hand, how
citizens’ general perception about the level of corruption in the main parties varies
depending on how close they feel to the party, being in all the cases party’s supporters
those who perceive less corruption in their party than other parties’ supporters; and on
the other hand, how citizens’ level of tolerance towards an specific case of corruption
also varies depending on which party is being involved, downplaying it when it is their
party the one which is being affected. As a consequence, the hypothesis H6 has been
verified, i.e., citizens’ level of tolerance towards political corruption is higher as higher
is the political sympathy towards the party involved. This conclusion is consistent with
previous researches where it was proved that citizens’ level of tolerance towards
political corruption depends on which is the party involved in the corruption case, being
more tolerant when the corruption case affects to the party they are supporting (Cordero
and Blais, 2017; Ecker et al., 2016; Anduiza et al., 2013).

177
The verification of this hypothesis would contribute to explain why political
corruption is not as much penalized as it could be expected. It interferes with the well-
functioning of the political, economic and social system and, therefore, it clearly plays
against the goal of reaching a higher quality democracy. In order to change it, it would
be necessary citizens to show themselves against political corruption independently of
the party which is being involved.
4.4 Analysis of results
The main objective of this thesis is to shed light on the puzzle of why political
corruption does not seem to have the electoral consequences it could be expected and,
even more important, to find out key factors to develop better strategies in order to
encourage citizens to be less tolerant towards political corruption and, therefore, to
achieve a higher quality democracy.
For this purpose, this chapter has been focused on the hypothesis related to what it
has been defined as “Real World”. The goal has been the analysis of the role played in
the attitude towards political corruption by the economic context, social pressure,
political awareness, political leaning, the new parties’ emergence and political
sympathy. For this purpose, on one hand, it has been used data provided by two
independent entities: CIS and INE; and on the other hand, it has been designed a
specific survey in which participants faced questions related to each of the previous
variables. In this section, it will be summarised the main conclusions obtained when
analysing the impact of each of the variables on the attitude towards political corruption.
Firstly, when analysing the effect of the economic context on citizens´ attitude
towards political corruption, it has been found that citizens’ level of tolerance towards
political corruption is lower when the country’s economy is in crisis (H1). It has been
established on one hand, a positive and strong relationship between the negative
assessments of political and economic situation, which shows how citizens’ attitude
towards political issues are clearly affected by the economic context; and on the other
hand, a negative correlation between the GDP growth rate and the growth rate of the
concern over corruption, which proves how citizens’ criticism towards political
corruption is greater when the country is going through an economic crisis. Besides,
accordingly with the previous finding, when asking citizens directly about their

178
criticism’s level towards political corruption since the economic crisis started, most of
them respond it is higher, reinforcing the previous conclusion about the impact that an
economic crisis has on citizens’ attitude towards political corruption. These findings are
consistent with previous researches where it was established that citizens are less
tolerant towards political corruption when the country’s economy is in crisis (Cordero
and Blais, 2017; Charron and Bågenholm, 2016; Anduiza et al., 2013; Klasnja and
Tucker, 2013; Winters and Weitz-Shapiro, 2013; Zechmeister and Zizumbo-Colunga,
2013; Jerit and Barabas, 2012; Weitz-Shapiro and Winters, 2010; Manzetti and Wilson,
2007; Golden, 2007; Diaz-Cayeros et al., 2000; Duch et al., 2000; Mauro, 1995).
As a consequence, an economic crisis could be seen as an opportunity to increase
citizens’ criticism towards political corruption. However, once the crisis is overcome, it
would be necessary to keep it over the level before the crisis started in order to reach a
higher quality democracy.
Secondly, when examining the effect of social pressure on citizens´ attitude towards
political corruption, it has been found how among the variables which influence the
citizens’ attitude towards political corruption, social pressure has a higher impact than
factual information (H2). It has been proved on one hand, how those citizens who face a
case of political corruption in which other citizens´ reactions against it are emphasized,
become less tolerant than those who face a scenario in which they are being informed
through factual information exclusively; and on the other hand, how the piece of news
which have a higher impact on the attitude towards political corruption are those in
which it is underlined the social and economic losses it provokes rather than other in
which the information about corruption is provided without being related with any
social or economic consequence. As a result, it has been concluded that exerting social
pressure based on other citizens´ reactions towards political corruption or emphasizing
citizens’ losses in welfare and economics, is a better strategy to impact on citizens’
attitude towards political corruption than just providing factual information. These
findings are consistent with previous researches where it was demonstrated the
effectiveness of social pressure in mobilising citizens against the established political
system and its corruption (Giraldo-Luque, 2018; Marinov and Schimmelfennig, 2015;
Anduiza et al., 2014; Peña-López et al., 2014; Toret, 2013; Anduiza et al., 2012;
Piñeiro-Otero and Costa-Sánchez, 2012; Vallina-Rodriguez et al., 2012; Eltantawy and

179
Wiest, 2011; González-Bailón et al., 2011; Shirky, 2011); in political self-expression,
political information seeking and political participation (Bond et al., 2012; Gerber and
Rogers, 2009; and Gerber et al., 2008).
As a consequence of the effectiveness of social pressure on the attitude towards
political corruption, it could be expected that if a political party, a media or any citizen
group managed to mobilize a part of society against political corruption, the effect of
social pressure would attract new supporters, which would contribute to achieve a
higher quality democracy.
Thirdly, when studying the effect of political awareness on citizens´ attitude
towards political corruption, it has been found that citizens’ level of tolerance is lower
as higher is their political awareness (H3). Based on citizens’ responses on questions
about politics, citizens have been classified into three different groups according to their
level of political awareness, and it has been demonstrated that as higher it is, citizens are
less tolerant. These findings are consistent with previous researches where it was shown
that citizens with a different level of knowledge about politics show different levels of
tolerance towards political corruption (Cordero and Blais, 2017; Anduiza et al., 2013;
Weitz-Shapiro and Winters, 2010; Arceneaux, 2007; Kam, 2005). It was established
how an increase in the level of corruption perceived by citizens plays against the
electoral results of corrupt politicians (Cordero and Blais, 2017; Fernández-Vázquez et
al., 2016; Anduiza et al., 2013; Costas-Pérez et al., 2010; Figueiredo et al., 2010; Weitz-
Shapiro and Winters, 2010; Chang and Kerr, 2009; Ferraz and Finan, 2008; Tavits,
2007; Gerring and Thacker, 2005; Adserá et al., 2003; Treisman, 2000; Fackler and Lin,
1995; Rundquist et al., 1977).
The previous conclusion would prove that the attitude towards political corruption
can be modified by bringing citizens into politics and, therefore, that involving citizens
in political issues would also contribute to achieve a higher quality democracy. As a
consequence, this conclusion would also emphasize the crucial role played by the
media.
Fourthly, when analysing the effect of political leaning on citizens´ attitude towards
political corruption, it has been found that citizens’ level of tolerance towards political
corruption is lower as more politically progressive they are (H4). When asking citizens

180
about their political leaning, it has been shown how those who proclaim to be more
progressive are less tolerant towards political corruption than those who identify
themselves as being more conservative. This conclusion is consistent with previous
researches where it was found the key role played by political leaning, being left
parties’ supporters those who punish corruption more than right parties’ supporters
(Charron and Bågenholm, 2016; Anduiza et al., 2013; Costas-Pérez et al., 2010).
Political parties should consider the result obtained when they are designing their
communication policy to face a corruption case. Besides, attending this result, left
parties would need to make greater efforts to fight against corruption, not only
implementing strictly measurements to avoid it, but also expelling of their parties those
politicians who are involved in a case of political corruption. However, downplay
corruption would be less harmful for those parties with a right political leaning. This
finding, at least in a short term, could be seen as a disadvantage for parties with a left
political leaning, as they would be stronger penalized in contrast with right parties,
which have an electorate less sensitive towards political corruption. Finally, this finding
would contribute to explain the success of some right parties in certain electoral
campaigns in despite of being clearly involved in corruption.
Fifthly, when examining the effect of new parties’ emergence on citizens´ attitude
towards political corruption, it has been found how citizens’ level of tolerance towards
political corruption is lower in those citizens who are supporting new parties (H5).
Citizens who declare to feel closer to the emerging parties UP and C’s are less tolerant
than those who indicate to feel closer to the traditional parties PP and PSOE. This
finding is consistent on one hand, with previous researches where it was established
how the emergence of new parties represents an opportunity for citizens to punish
traditional parties affected by political corruption (Cordero and Blais, 2017; Charron
and Bågenholm, 2016); and on the other hand, with those in which it was identified the
fight against corruption as a key factor to explain the new parties success (Bågenholm
and Charron, 2014; Hanley and Sikk, 2014; Bågenholm, 2013; Sikk, 2012; Bélanger,
2004). Besides, there is also consistency with other researchers who demonstrated that
corruption benefits new parties pushing voters away not only from the party which is in
the government, but also from all the traditional parties (Engler, 2015; Pop-Eleches,
2010; Mainwaring et al., 2009). In addition, when evaluating deeply the results, they are

181
internally consistent with those obtained when analysing the political leaning impact.
On one side, among traditional parties’ supporters, those who are supporting the left
party PSOE are less tolerant than those who are supporting the right party PP; and on
the other side, among the new parties’ supporters, it is found the same pattern, i.e., those
who are supporting the left party UP are less tolerant than those who are supporting the
right party C’s.
Moreover, when investigating if it was possible to characterise these groups taking
into account their age, it has been concluded, according with the data provided by the
CIS, that those who prefer new parties can be characterised as younger than the
traditional parties’ supporters.
The fact that new parties’ supporters are less tolerant towards political corruption
would be the key factor to explain the new parties’ emergence and success, as they have
broken into the political scene emphasizing they are anti-corruption parties. Besides, the
fact that their supporters have been identified as being younger than traditional parties’
supporters would suppose in a medium and long term a clear advantage, as traditional
parties would need to attract younger voters if they want to stay in power. In addition,
the fact that younger voters are less tolerant would show a positive evolution of the
citizens’ attitude towards political corruption which could be interpreted as a hope for
the democracy’s quality.
Sixthly, when studying the effect of political sympathy on citizens´ attitude towards
political corruption it has been found that citizens’ level of tolerance towards political
corruption is higher as higher is the sympathy towards the party involved (H6). On one
hand, it has been seen how citizens’ perception of corruption in their preferred party is
lower than the corruption perceived by other parties’ supporters; and on the other hand,
how when citizens are facing a specific case of political corruption, they definitely
downplay corruption if it is their party the one which is being affected. These findings
are consistent with previous researches where it was shown that citizens’ level of
tolerance towards political corruption depends on which was the party involved in the
corruption case, being more tolerant when it affects their preferred party (Cordero and
Blais, 2017; Ecker et al., 2016; Anduiza et al., 2013). Besides, it is also consistent with
other researchers who demonstrated that voters’ sympathy towards a party reduces the
impact of corruption on the electoral results of a corrupt politician (Cordero and Blais,

182
2017; Charron and Bågenholm, 2016; Welch and Hibbing, 1997; Peters and Welch,
1980). Moreover, evaluating deeply the results, they are internally consistent with those
obtained when analysing both, the political leaning's impact and the emergence of new
parties’ impact, as UP supporters, the new party identified as being progressive, are
those who not only have the least tolerance towards political corruption, but also who
least downplay corruption when it affects to their own party.
The previous findings would clearly contribute to explain why political corruption
is not as much penalized as it could be expected. Parties’ supporters not only have lower
perception of corruption in their party, but also when it is presented a specific case of
corruption in their preferred party tend to minimize it. As a consequence, citizens’
attitude towards political corruption in their preferred party would play against to the
well-functioning of the political, economic and social system. In order to achieve a
higher quality democracy, it would be necessary citizens to be aware of the importance
to fight against political corruption independently of the party affected, even being more
demanding when it is their preferred party the one which is being involved.
4.5 Conclusions
The main goal of this chapter has been to test the hypotheses related to the real
world in order to analyse the impact of the economic context, social pressure, political
awareness, political leaning, the new parties’ emergence and political sympathy, on
citizens’ attitude towards political corruption. In the following lines, it will be briefly
summarised the main conclusions of the experiments conducted to test each of the
hypotheses.
Firstly, when analysing the impact of the economic context on citizens´ attitude
towards political corruption, it has been found that citizen’s criticism towards political
corruption is higher when the country is in a context of economic crisis (H1).
Secondly, when examining the impact of social pressure on citizens´ attitude
towards political corruption, it has been showed how among the variables which
influence citizens’ attitude towards political corruption, social pressure has a higher
impact than factual information, i.e., how it is possible to reach a greater impact

183
emphasizing other citizens’ reactions against political corruption and focusing on
citizens’ losses rather than just providing factual information (H2).
Thirdly, when studying the impact of political awareness on citizens´ attitude
towards political corruption, it has been proved that higher levels of political awareness
increase citizens’ criticism towards political corruption (H3).
Fourthly, when analysing the impact of political leaning on citizens´ attitude
towards political corruption, it has been established that progressive citizens and
conservative citizens show different level of criticism towards political corruption,
being less tolerant those who identify themselves as being politically more progressive
(H4).
Fifthly, when examining the impact of the new parties’ emergence on citizens´
attitude towards political corruption, it has been found out how there are differences
between supporters of new and traditional parties, being those who feel closer to new
parties less tolerant towards political corruption (H5). Besides, new parties’ supporters
have been characterised as being younger than traditional parties’ supporters.
Finally, when studying the impact of political sympathy on citizens´ attitude
towards political corruption, it has been concluded that citizens’ criticism towards
political corruption varies depending on the sympathy they feel towards the party which
is being affected, being more tolerant when it is their preferred party the one involved
(H6).


187
Chapter 5. Political debate in the Online World:
Experiments and analysis
5.1 Introduction
The second part of the thesis is focused on the analysis of the conversations about
politics in the online world. Online social networks have become hugely important in
recent years, with information on every conceivable topic flowing continuously between
people around the world. Their impact on citizens’ attitude and behaviour has been
proved in a multitude of domains. Focusing on the topic of this thesis, it has been
considered especially interesting to analyse what is being said about politics and the
interaction and influence of actors in this debate.
In the previous chapter, it has been seen that political leaning, the emergence of
new parties and political sympathy play a key role to find out substantial differences in
the attitude towards political corruption among citizens. The goal of this chapter is to
analyse if the relationships established can be proved in the online world. For this
purpose, it has been selected the social network Twitter. There are a variety of reasons
for this choice. Firstly, this social network is completely open, which allows to collect
all messages (“tweets”) related to a determinant hashtag. Secondly, Twitter is
increasingly considered by scholars as a political platform, where politicians, media
professionals and citizens engage in a personal type of political communication
(Murthy, 2015; Ekman and Widholm, 2014; Aragón et al., 2013). Finally, Twitter has
been successfully investigated through social network analysis in a wide variety of
political researches in which it has been proved its usefulness as a platform to spread
propaganda and generate political debate during the electoral campaigns (Jennings et
al., 2017; Aragón et al., 2013), as a mobilizing platform for social movements (Vallina-
Rodriguez et al., 2012), and as a predictor of electoral outcomes (Tumasjan et al., 2010).
In particular, Siegel (2018), Aragón et al. (2013) and Bruns and Burgess (2011)
proved that the use of Twittter increases during political debates; Jennings et al. (2017)
found how Twitter showed, in real time, not only the salience of political issues, but
also the successes or failures of public sphere arguments; Vallina-Rodriguez et al.
(2012) demonstrated the crucial role played by Twitter on the birth and development of
the Spanish Movimiento 15M (15M Movement), allowing citizens to channel their

188
outrage (Anduiza et al., 2014), spreading the call for protests (Piñeiro-Otero and Costa-
Sánchez, 2012; González-Bailón et al., 2011), facilitating the sharing of information and
a better coordination and giving their members a sense of collective identity (Peña-
López et al., 2014); and Congosto et al. (2011) and Tumasjan et al. (2010) proved its
capacity to predict electoral outcomes in the Catalan Elections of 2010 and the German
General Elections of 2009 respectively.
In this chapter, it will be presented the design and outcomes of the experiments
which test the hypotheses H7 H8 and H9 relating to the “Virtual World” described in
Chapter 3. For the reader’s convenience, these are reproduced in Table 5-1.
Table 5-1 Hypotheses related to the virtual world
Hypotheses
Virtual
World
H7- In the online debate about politics held on Twitter, users’ level of
tolerance towards political corruption is lower in progressive users.
H8- In the online debate about politics held on Twitter, users’ level of
tolerance towards political corruption is lower in those users who are
supporting new parties.
H9- In the online debate about politics held on Twitter, users’ level of
tolerance towards political corruption is higher as higher is the political
sympathy towards the party involved.
Firstly, it will be investigated if in the debate about politics held on Twitter,
progressive and conservative users show different attitude towards political corruption.
Secondly, it will be studied if there is any difference in the level of tolerance towards
political corruption showed on Twitter between those citizens who are supporting new
and traditional parties. Finally, it will be analysed if users’ criticism towards political
corruption on Twitter varies depending on the political sympathy they feel towards the
party which is being involved.
The structure of the rest of the chapter is as follows: in section 5.2 it will be
explained the construction and usage of the dataset and the procedures for each of the
experiments conducted. In section 5.3 it will be tested the hypotheses, presenting the
methodology followed and describing the main results and analysis. In section 5.4, it
will be reported the analysis of the results obtained. Finally, in section 5.5 it will be
summarised the main conclusions.

189
5.2 Datasets
For the purpose of testing the hypotheses related to the “Virtual World”, it was
analysed the political debate during the pre-campaign of the last Spanish General
Elections of June 2016.
In the following lines, it will be briefly contextualised the Spanish political
situation of the last years, which has contributed to the growth of the use of Twitter as a
platform for political debates, focusing on the period in which the Twitter dataset was
collected.
Since 2008, Spain is going through an economic, social and political crisis in which
the traditional parties PSOE and PP have been involved in corruption. In 2011, the
political debate moved onto blogs and online social networks as Facebook and Twitter
(Vallina-Rodriguez et al., 2012) managed to channel the collective indignation (Anduiza
et al., 2014). It was born the collective “¡Democracia Real, Ya!” (Real Democracy,
Now!), which led to the “Movimiento 15M” (15M Movement) and massive protests
against the established situation on May 2011, the so-called Spanish revolution.
There is a wide agreement among scholars in pointing out the key role played by
the online social networks, especially by Twitter. Piñeiro-Otero and Costa-Sánchez
(2012) and González-Bailón et al. (2011) underlined that social networks were crucial
to generate and spread the call for protests. Peña-López et al. (2014) emphasised how
the interaction between the physical and the virtual world was essential for this
movement to succeed, feeding both each other with information, coordination and a
sense of collective identity. Aragón et al. (2013) concluded that political use of Twitter
in Spain increased considerably since the Spanish protests in May 2011.
In November 2011, PP won the General Elections reaching the outright majority.
Since the beginning of its mandate, this party has been involved in a multitude of
corruption scandals as the so-called “Gürtel case”, “Barcenas’ papers”, “Púnica
operation” and “Brugal case”. Spanish society has been aware and worried about
political corruption and many Spaniards have been actively participating in
demonstrations (Cordero and Blais, 2017; Robles-Egea and Delgado-Fernandez, 2014).
In this context, Podemos and C’s broke into the national political scene claiming to be
the solution to regenerate a democracy strongly affected by political corruption. Their

190
irruption ended with the traditional bipartisanship in the General Elections of December
2015 and also in the repeated General Elections of June 2016.
PP has remained in the government until June 2018, when a sentence that
condemned this party for corruption led to a wide agreement among several parties of
the opposition which allowed PSOE to win a no-confidence motion. Its mandates have
been plagued with scandals of corruption which are still in trial and have been
constantly on the focus of the media, also during the pre-campaign of June 2016 when
the Twitter dataset was collected. At that time, the vast majority of Spanish society was
aware and worried about corruption. Concretely, following the CIS36
, in June 2016, the
44.6% of the population mentioned corruption as one of the main Spanish problems,
becoming the second greatest concern for Spaniards after unemployment.
In this period, citizens have been increasingly worried and interested in political
issues and, as a consequence, they have been continuously and deeply analysed in
newspapers, radio and TV. Concretely, Spanish TV has lived a political revolution. It
has appeared a multitude of programs in which politicians and journalists debate about
political issues usually focused on scandals of corruption. Besides, these programs
propose their audience hashtags which bring to their viewers the opportunity to express
their own opinion in Twitter. It has definitely contributed to involve citizens on the
online political debate. In fact, during all these years in general and also when the
dataset was collected in particular, political hashtags, especially those related to political
corruption, have become trending topics daily, i.e., corruption scandals have been the
topics that have generated a greater debate on Twitter.
Focusing on the period in which the dataset was collected, it was chose the pre-
campaign because once the campaign started the voting intention polls became daily
and Twitter was widely used to diffuse their results, becoming these tweets the most
popular messages in the network. Concretely, in order to build datasets of sufficient
size, it was collected through the Twitter API tweets from the 2nd
to the 13th
of June
2016 containing the following hashtags related to each of the main parties: #PP, #PSOE,
#Podemos and #Ciudadanos. It was selected the acronyms for traditional parties while
the full name for new parties because it is the way in which they are commonly referred.
36
CIS June 2016

191
This process yielded a dataset of 38449 tweets, which allows to discern different
types of conversations and users, and to identify messages/users which are clearly
regarded as being more important than others.
In the following subsections, it will be considered in detail the two principal aspects
of the datasets that are relevant in testing the hypotheses, i.e., the structure and content
and the tweet authorship.
Dataset Analysis: Structure and Content 5.2.1
The information and opinions expressed about politics have two principal paths of
action on Twitter: provoke some reaction or be ignored. When the information or
opinion provoke some reaction, users react whether replying or mentioning another
users using the “replies to” and “mentions” conventions; or directly republishing him
using the “retweet” convention. In these cases it will be inferred that those users have a
certain degree of influence (Berger and Strathearn, 2013); otherwise, when they are
ignored, it will be concluded those information or opinion does not spread online
influence.
The distribution of tweets of the dataset is depicted in Table 5-2. Original tweets
refer to those tweets which are published by users who are not mentioning, replying or
retweeting other users, while mentions, replies and retweets correspond with the three
possible user’s reactions explained above when the information and opinions about
politics provoke some reaction on Twitter.
Table 5-2 Distribution of tweets
Original
Tweets Mentions Replies to Retweets Total
6332 2834 841 28163 38170
The relevant messages for the purpose of this thesis are those which show user’s
reactions, i.e., mentions, replies and retweets. In Figure 5-1 it is presented the
distribution of the three types of users’ reactions.

192
Figure 5-1 Distribution of users’ reactions on Twitter
As it is indicated, retweets are clearly the most common option used by users to
react on Twitter to the opinions and information about politics (88.5%). The vast
majority of users choose to directly republish other users’ messages, which represents
the quickest way to spread information. As a consequence, this part of the thesis will be
focused on the analysis of the tweets with the highest rate of diffusion, i.e., on the most
popular retweets which contain the information that is being disseminated most through
the network. It is noted that “messages with the highest rate of diffusion” concretely
refers to tweets which were retweeted 20 or more times.
For this purpose, after removing the duplicate tweets, firstly, it was identified the
retweets of the dataset by the “RT” convention at the beginning of the tweet. Secondly,
the conversational connections were extracted and converted into a network using the
NodeXL Social Network Analysis Software37
. The analysis performed by NodeXL led
to clusters in which nodes represent users and edges the connections between them. The
connections “A → B” means that user A is retweeting an original tweet created by B.
Thirdly, as this part of the thesis is focused on the analysis of the tweets with the highest
rate of diffusion, it was extracted those tweets which were retweeted 20 or more times.
This process yielded a dataset of 9645 retweets.
Finally, following Jennings et al. (2017), these tweets were examined manually in
order to determine which were related to political corruption. In order to provide the
reader with a better understanding of this classification, it will be illustrated with a
couple of examples:
37
http://nodexl.codeplex.com/
8,9% 2,6%
88,5%
Mentions
Replies
Retweets

193
- On 09/06/2016 at 1:50pm, a user retweeted the following tweet:
“#EnCampañaARV al #PSOE Andalucia le crecen los imputados. La mano derecha de
Manuel Chaves” (#InCampaignARV the number of accused of the Andalusian #PSOE
is increasing. Manuel Chaves’ right arm), which was classified as related to political
corruption.
- On 07/06/2016 at 4:33pm, a user retweeted the following tweet: “Proponemos
bajar el IVA cultural, tienen que saber que el #PP voto en contra…” (We propose to
lower the cultural VAT, you have to know that the #PP voted against ...) which was
conversely classified as not related to political corruption.
Dataset Analysis: Tweet Authorship 5.2.2
As the hypotheses to be tested are concerned with users’ political preferences, in
order to identify them, it was necessary to perform a detailed analysis of the Twitter
account of each user: their tweets, their websites, and the information provided in their
profiles. Following Jennings et al. (2017), these analyses were performed manually.
The first classification (C1) was done considering the user’s political leaning. It
was distinguished between those users with a left political leaning and those with a right
political leaning.
Then, by analysing deeply the tweets related to political issues published by users,
it was assigned the party which seemed to be closer to their ideas (C2). In this
classification, it was considered the following options which represent the main parties:
PP, PSOE, UP and C’s.
These processes yielded a dataset of 2192 retweets related to political corruption
and classified by the political leaning and the preferred party of their authors.
In the following Table 5-3 and 5-4 it is shown four examples of users’
classification. As mentioned, this classification was constructed analysing the
information provided in the users’ accounts, specially, taking into account their profiles
and key tweets about politics.

194
Table 5-3 Examples of Retweet Authors Classification
PP SUPPORTER
Profile’s
user
Madridista de corazón y no de ocasión, amante del Real Madrid, de la
música y sobre todo de mi país. En defensa de la unidad y valores de
España
(Real supporter of Real Madrid, not occasionally. Lover of Real Madrid,
music and especially my country. In defence of the unity and values of
Spain)
Dataset’s
Retweet
Corrupción #PSOE Canarias enchufa 1,2millones a familiares, #Cs
#podemos, pediréis la dimisión de #SanchezT5 algún día?
(Corruption #PSOE Canarias gives 1.2 million to relatives, #Cs
#Podemos, will you ask for the resignation of # SanchezT5 someday?)
Key
Tweet
@Albiol_XG Como muchos miércoles en el mercadillo de #Badalona
esta vez con @marianorajoy saludando a los vecinos y a los
comerciantes #LaSoluciónEsPP
(@Albiol_XG Like many Wednesdays at the #Badalona market this
time with @marianorajoy greeting neighbours and merchants
#TheSolutionIsPP)
C1 Right
C2 PP
PSOE SUPPORTER
Profile’s
user
Mujer, maestra, feminista, jubilada activa, solidaria, comprometida con
la igualdad, vocal consejo andaluz, participación de las mujeres
(Woman, teacher, feminist, retired active, supportive, committed to
equality, Andalusian council vocal, participation of women)
Dataset’s
Retweet
A juicio varios miembros del #PP de Lugo por llevar a ancianos en sillas
de ruedas a votar
(Several members of Lugo's #PP go to trial because they have taken
elderly people in wheelchairs to vote)
Key
Tweet
Si antes no quiso Pablo ahora hará que se agache y volverá a reírse.
Orgullosa de ser del PSOE
(If Pablo did not want before, now he will make him bend over and he
will laugh again. Proud to be a PSOE supporter)
C1 Left
C2 PSOE

195
Table 5-4 Examples of Retweet Authors Classification (Continuation)
UP SUPPORTER
Profile’s
user
La esperanza tiene dos hijas: la ira, para indignarse por la realidad, y el
valor para enfrentar esa realidad e intentar cambiarla
(Hope has two daughters: anger, to be outraged by reality, and the
courage to face that reality and try to change it)
Dataset’s
Retweet
En un país decente sería un escándalo, menos en la España del #PP de
Gürtel, Púnica, Rato...
(In a decent country it would be a scandal, but not in the Spain of the
#PP of Gürtel, Púnica, Rato...)
Key
Tweet
Quien paga manda, y nosotros queremos que mandes tú. Por eso no
pedimos un euro a los bancos y te pedimos el préstamo a ti. Apoya la
campaña de @CatEnComu_Podem aquí 👉
http://microcreditos.podemos.info #AhoraEntrasTú
(Who pays decides, and we want you to decide. That's why we do not
ask the banks for a euro and we ask you for the loan. Support the
campaign of @CatEnComu_Podem here 👉
http://microcreditos.podemos.info # NowYouEnter
C1 Left
C2 UP
C’s SUPPORTER
Profile’s
user
40 años. Afiliado y defensor de proyecto C'S desde 2012. Grupo
Ciudadanos, Diputación Provincial de León. #TiempodeAcuerdo
#TiempodeCambio
(40 years. Affiliate and supporter of C's’ project since 2012. Ciudadanos
Group, Provincial Council of León. #TimeofAgreement
#TimeofChange)
Dataset’s
Retweet
La Asamblea venezolana investigará la financiación del Chavismo a
#Podemos
(The Assembly of Venezuela will investigate the financing of Chavismo
to #Podemos)
Key
Tweet
Este sábado 16 de diciembre, te esperamos en nuestra mesa informativa
en la Plaza de Roger de Flor, 12 (San Isidro), acompañando a nuestr@s
vecin@s. #CsxMadrid
(This Saturday, December 16, we are waiting for you at our information
table in the Plaza de Roger de Flor, 12 (San Isidro), accompanying our
neighbours. #CsxMadrid)
C1 Right
C2 C’s

196
Procedures 5.2.3
Experiment 7: The effect of political leaning on users´ attitude towards political
corruption in the online debate.
In this experiment it is studied the online debate about politics held on Twitter to
detect whether there is a significant difference in the attitude towards political
corruption between users with a left and right political leaning. It has been hypothesised
that politically progressive users will be less tolerant towards corruption.
This chapter is focused on the messages most retweeted against political corruption.
Therefore, once extracted the retweets with the highest rate of diffusion related to
political corruption following the process already explained, the goal was to determine
the authors’ political leaning. For this purpose, it was exhaustively examined their
accounts and classified following the C1 criteria explained in the previous section into
users with a left or right political leaning.
Experiment 8: The effect of new parties’ emergence on users’ attitude towards
political corruption in the online debate.
The goal of this experiment is to investigate the online debate about politics held on
Twitter to analyse whether there is a significant difference in the attitude towards
political corruption between users who support new and traditional parties. It has been
hypothesised that new party supporters will be less tolerant towards corruption.
For this purpose, it was used the dataset of the previous experiment, i.e., the
retweets with the highest rate of diffusion related to political corruption. To find out
authors’ preferred party, it was deeply analysed their accounts focusing on their tweets
about politics. Then, following the C2 criteria explained above, they were classified as
being closer to one of the following main parties: PP, PSOE, UP and C’s. Finally, in
order to be able to test H8 they were regrouped into two groups: new parties’ supporters,
when they were supporting UP or C’s; and traditional parties’ supporters, when they
were supporting PP or PSOE.

197
Experiment 9: The effect of political sympathy on users’ attitude towards political
corruption in the online debate.
The goal of this experiment is to examine the online debate about politics held on
Twitter to discover whether there is a significant difference in users’ attitude towards
political corruption when it affects to the party they feel closer to their ideas compared
with when it is other party the one involved. Concretely, it is believed that it is not
possible to establish any difference between party supporters when the online debate
about political corruption involves their own party, i.e., it is expected that parties’
supporters will focus their reports on corruption mainly on any other party but not their
preferred party. As a consequence, it has been hypothesised that citizens will be more
tolerant towards corruption when it affects to their own party.
For this purpose, it was also used the dataset containing those retweets related to
political corruption with the highest rate of diffusion. In this case, it was directly applied
C2 criteria stated in the previous section. The focus of this experiment was on those
retweets where party’s supporters were reporting political corruption on their preferred
party.
5.3 Methodology and Experiments
In this section, it will be performed the experiments needed in order to empirically
test the hypotheses related to the “Virtual World” with the statistical program SPSS and
it will be presented the results indicating if they have been or not verified.
Hypothesis 7: Experiments and outcomes 5.3.1
In Hypothesis H7 it will be tested the belief that in the online conversations about
politics, progressive users have a lower level of tolerance. The statement of H7 is as
follows:
H7- In the online debate about politics held on Twitter, users’ level of tolerance
towards political corruption is lower in progressive users.
If this hypothesis was validated, it would show that the results obtained in the study
of the “Real world” are consistent when analysing the online debate about political
corruption held on Twitter. As a consequence, parties with a left political leaning would

198
need to fight against corruption stronger than parties with a right political leaning which
are less penalised by corruption.
Experiment Description
To test this hypothesis H7 it has been considered the following variables:
1. Users’ political leaning. Users retweeting those messages about political
corruption with the highest rate of diffusion were classified into two
categories according the C1 criteria stated before: Left parties’ supporters vs.
Right parties’ supporters.
2. Parties’ political leaning. Messages about political corruption with the
highest rate of diffusion were classified by the party which was being
involved in the corruption reported on Twitter: PP, PSOE, UP and C’s.
Then, they were regrouped into two groups as follows: “Left parties”, when
the party reported was PSOE or UP; and “Right parties”, when the party
reported was PP or C’s.
The goal of this hypothesis H7 is to test if different political leanings have a
different impact on users’ attitude towards political corruption in the online debate held
on Twitter. For this purpose, it will be performed the following analysis:
1. H7A1: A descriptive analysis of the Users’ political leaning of those users
who are spreading the most retweeted messages about political corruption.
2. H7A2: A descriptive analysis of the Parties’ political leaning of those parties
involved in the corruption most reported on Twitter.
3. H7A3: A crosstabs analysis to find out if it is possible to establish a
relationship statistically significant between Users’ political leaning of those
users who are spreading the most retweeted messages about political
corruption and Parties’ political leaning of those parties involved in the
corruption most reported on Twitter.

199
Statistical analysis
In this section, it will be performed the statistical analysis carried out to test the
hypothesis H7:
1. H7A1: Descriptive analysis “Users’ political leaning”.
In Table 5-5 it is presented the frequency of the political leaning of those users who
are spreading the most retweeted messages about political corruption.
Table 5-5 User’s Political Leaning for H7A1
Political Leaning Frequency
Left 1790
Right 402
As it is depicted, the vast majority of the users who are spreading the most
retweeted messages about political corruption are classified as having a left political
leaning.
2. H7A2: Descriptive analysis “Parties’ political leaning”.
In Table 5-6 it is presented the frequency of the political leaning of those parties
involved in the corruption most reported on Twitter.
Table 5-6 Parties’ Political Leaning for H7A2
Political Leaning Frequency
Left 717
Right 1475
As it is seen, the corruption most reported on Twitter involves mainly traditional
parties with a right political leaning.
3. H7A3: Crosstabs analysis “Users’ political leaning (Left vs. Right)” and
“Parties' political leaning (Left vs. Right)”.
The hypotheses of the Crosstabs analysis H7A3 are presented in Table 5-7.

200
Table 5-7 Hypotheses –Crosstabs analysis H7A3-
Null (H0) and Alternative (H1) hypothesis
H0: There is not association between Users’ political leaning (Left vs. Right) of those
users who are spreading the most retweeted messages about political corruption and
Parties’ political leaning (Left vs. Right) of those parties involved in the corruption
most reported on Twitter.
H1: There is association between Users’ political leaning (Left vs. Right) of those
users who are spreading the most retweeted messages about political corruption and
Parties’ political leaning (Left vs. Right) of those parties involved in the corruption
most reported on Twitter.
In order to test the hypotheses, it will be performed the Chi-Squared Test (Table
5-8):
Table 5-8 Chi-Squared Test for H7A3
Pearson Chi-Square df1 Statistical significance
1013 1 0.000
Based on the results, the H0 is rejected, i.e., when analysing the online
conversations about political corruption held on Twitter there is a statistically
significant association between Users’ political leaning (Left vs. Right) of those users
who are spreading the most retweeted messages about political corruption and Parties’
political leaning of those parties involved in the corruption most reported on Twitter
(Left vs. Right), χ2
(1) = 1013, p < 0.05. Besides, in order to characterise the
relationship, as the crosstab is 2x2, it will be performed the Cramer’s V Test (Table
5-9).
Table 5-9 Cramer’s V Test for H7A3
Cramer’s V Statistic Range Statistical significance
0.680 0 < Cramer’s V < 1 0.000
Considering the Cramer’s V Statistic = 0.680, p<0.05, the previous statistically
significant relationship is characterised as moderate-strong.
Report
In this section, it will be reported the most relevant conclusions of the statistical
analysis carried out in the previous section.

201
Firstly, in Figure 5-2 it is indicated how the vast majority of the users who are
diffusing the most retweeted messages against political corruption on Twitter have a left
political leaning (81.7%).
Figure 5-2 Political leaning of users who are spreading the most retweeted
messages against political corruption on Twitter
When analysing the political leaning of those parties which are being involved in
the corruption most reported on Twitter, it is found how right parties are more reported
than left parties, 67.3% and 37.2% respectively (Figure 5-3).
Figure 5-3 Political leaning of parties most reported on corruption in Twitter
Finally, it will be reported the results obtained when it has been proved that there is
a relationship statistically significant between the political leaning of those users who
are spreading the political corruption most diffused on Twitter and the political leaning
of the parties which are being reported (Table 5-10).
81,7%
18,3%
0%
10%
20%
30%
40%
50%
60%
70%
80%
90%
100%
Left Right
32,7%
67,3%
0%
10%
20%
30%
40%
50%
60%
70%
80%
90%
100%
Left parties Right parties

202
Table 5-10 Users’ reports distribution by political leaning of the party reported
Left parties Right parties
Reports of left parties’
supporters 17.6% 82.4%
Reports of right parties’
supporters 100% 0%
Considering the messages about political corruption with the highest rate of
diffusion on Twitter, it is depicted how left parties’ supporters are reporting mostly
corruption in right parties (82.4%) while right parties’ supporters are exclusively
reporting corruption in left parties (100%).
Summarising the information above, it has been found on one hand, how
progressive users are those who most actively display against political corruption on the
online debate held on Twitter; and on the other hand, how right parties are those which
are being most reported. Besides, when analysing the relationship between users’
political leaning who are reporting political corruption and parties' political leaning
which are being reported, it has been proved a statistically significant difference, as
expected, left parties’ supporters report mainly right parties while right parties’
supporters report left parties.
As a consequence of the previous results, the hypothesis H7 has been verified, i.e.,
in the online debate about politics held on Twitter, users’ level of tolerance towards
political corruption is lower in progressive users.
This result is internally consistent with the analysis of the “Real World”, i.e., the
electorate of left parties is more sensitive towards political corruption and progressive
users are those who most actively show themselves against corruption on Twitter.
Besides, it is also externally consistent with previous researches where it was found on
one hand, that left voters tend to punish corruption cases more than right voters
(Charron and Bågenholm, 2016; Anduiza et al., 2013; Costas-Pérez et al., 2010); and on
the other hand, how specifically in the political debate held on Twitter, Spanish users
who actively participate in the online political conversations held on Twitter against the
established system and its corruption have mainly a left political leaning (Peña-López et
al., 2014; Anduiza et al., 2012).

203
The verification of this hypothesis could be seen as a left parties’ disadvantage, as
they would need to make greater efforts to fight against corruption because their
electorate is more sensitive than right parties’ supporters; but also as a left parties’
advantage, as they are clearly dominating the online debate about politics and, as it has
been proved, social media is a powerful tool to spread social pressure.
Hypothesis 8: Experiments and outcomes 5.3.2
In Hypothesis H8 it will be tested the belief that in the online conversations about
politics, new parties’ supporters have a lower level of tolerance towards political
corruption. The statement of H8 is as follows:
H8 statement- In the online debate about politics held on Twitter, users’ level
of tolerance towards political corruption is lower in those users who are
supporting new parties.
If this hypothesis was verified, it would also show that the results obtained in the
study of the “Real World” are consistent when analysing the online debate about
political corruption held on Twitter. As a consequence, the effectiveness of the new
parties’ strategy focused on the fight against corruption would be confirmed.
Experiment Description
To test this hypothesis H8 it has been considered the following variables:
1. Users’ preferred parties’ group (New vs. Traditional). Users retweeting
those messages about political corruption with the highest rate of diffusion
were classified into four categories according the C2 criteria stated
previously: PP, PSOE, UP and C’s. Then, they were regrouped into two
groups as follows: “New parties’ supporters”, when users were assigned as
being closer to UP or C’s; and “Traditional parties’ supporters”, when they
were assigned as being closer to PP or PSOE.
2. Parties’ group (New vs. Traditional). Messages about political corruption
with the highest rate of diffusion were classified by the party which was
being involved in the corruption reported on Twitter: PP, PSOE, UP and
C’s. Then, they were regrouped into two groups as follows: “New party”,

204
when the party reported was UP or C’s; and “Traditional party”, when the
party reported was PP or PSOE.
The aim of this hypothesis H8 is to test if there is any difference between supporters
of new and traditional parties regarding their tolerance towards political corruption in
the online debate held on Twitter. For this purpose, it will be performed the following
analysis:
1. H8A1: A descriptive analysis of the Users’ preferred parties’ group (New vs.
Traditional) of those users who are spreading the most retweeted messages
about political corruption.
2. H8A2: A descriptive analysis of the Parties’ group (New vs. Traditional) of
those parties involved in the corruption most reported on Twitter.
3. H8A3: A crosstabs analysis to find out if it is possible to establish a
relationship statistically significant between Users’ preferred parties’ group
(New vs. Traditional) of those users who are spreading the most retweeted
messages about political corruption and Parties’ group (New vs. Traditional)
of those parties involved in the corruption most reported on Twitter.
Statistical analysis
In this section, it will be performed the statistical analysis carried out to test the
hypothesis H8:
1. H8A1: Descriptive analysis “Users’ preferred parties’ group (New vs.
Traditional)”.
In Table 5-11 it is presented the frequency of the users’ preferred parties’ group
(New vs. Traditional) of those users who are spreading the most retweeted messages
about political corruption.
Table 5-11 User’s preferred parties’ group for H8A1
Parties’ group Frequency
New 1783
Traditional 409

205
As it is indicated, the vast majority of the users who are spreading the most
retweeted messages about political corruption are classified as closer to a new party.
2. H8A2: Descriptive analysis “Parties’ group (New vs. Traditional)”.
In Table 5-12 it is presented the frequency of the Parties’ group (New vs.
Traditional) of those parties involved in the corruption most reported on Twitter.
Table 5-12 Parties’ group for H8A2
Parties’ group Frequency
New 599
Traditional 1593
As it is seen, the corruption most reported on Twitter involves mainly traditional
parties.
3. H8A3: Crosstabs analysis “Users’ preferred parties’ group (New vs.
Traditional)” and “Parties’ group (New vs. Traditional)”.
The hypotheses of the Crosstabs analysis H8A3 are presented in Table 5-13.
Table 5-13 Hypotheses –Crosstabs analysis H8A3-
Null (H0) and Alternative (H1) hypothesis
H0: There is not association between Users’ preferred parties’ group (New vs.
Traditional) of those users who are spreading the most retweeted messages about
political corruption and Parties’ group (New vs. Traditional) of those parties involved
in the corruption most reported on Twitter.
H1: There is association between Users’ preferred parties’ group (New vs.
Traditional) of those users who are spreading the most retweeted messages about
political corruption and Parties’ group (New vs. Traditional) of those parties involved
in the corruption most reported on Twitter.
In order to test the hypotheses, it will be performed the Chi-Squared Test (Table
5-14):
Table 5-14 Chi-Squared Test for H8A3
Pearson Chi-Square df1 Statistical significance
177.3 1 0.000
Based on the results, the H0 is rejected, i.e., when analysing the online
conversations about political corruption held on Twitter there is a statistically

206
significant association between Users’ preferred parties’ group (New vs. Traditional) of
those users who are spreading the most retweeted messages about political corruption
and Parties’ group (New vs. Traditional) of those parties involved in the corruption
most reported on Twitter, χ2
(1) = 177.3, p < 0.05. Besides, in order to characterise the
relationship, as the crosstab is 2x2, it will be performed the Cramer’s V Test (Table
5-15).
Table 5-15 Cramer’s V Test for H8A3
Cramer’s V Statistic Range Statistical significance
0.284 0 < Cramer’s V < 1 0.000
Considering the Cramer’s V Statistic = 0.284, p<0.05, the previous statistically
significant relationship is characterised as moderate.
Report
In this section it will be reported the most relevant conclusions of the statistical
analysis carried out in the previous section.
Firstly, in Figure 5-4 it is depicted how the vast majority of users who are diffusing
the most retweeted messages against political corruption on Twitter are new parties’
supporters (81.3%).
Figure 5-4 Preferred parties’ group of users who are spreading the most retweeted
messages against political corruption on Twitter
81,3%
18,7%
0%
10%
20%
30%
40%
50%
60%
70%
80%
90%
100%
New parties' supporters Traditional parties' supporters

207
When analysing the parties’ group of those parties which are being involved in the
corruption most reported on Twitter it is found how traditional parties are more reported
than new parties, 72.7% and 27.3% respectively (Figure 5-5).
Figure 5-5 Parties’ group of parties reported on corruption on Twitter
Finally, it will be reported the results obtained when it has been proved that there is
a relationship statistically significant between the preferred parties’ group of those users
who are spreading the political corruption most diffused on Twitter and the parties’
group of the parties which are being reported (Table 5-16).
Table 5-16 Users’ reports distribution by parties’ group
New parties Traditional parties
Reports of new parties’
supporters 21.3% 78.7%
Reports of traditional
parties’ supporters 53.8% 46.2%
Considering the messages about political corruption with the highest rate of
diffusion on Twitter, it is indicated how new parties’ supporters are reporting mostly
corruption in traditional parties (78.7%) while traditional parties’ supporters are slightly
reporting more corruption in new parties than in traditional parties, 53.8% and 46.2%
respectively.
Summarising the information above, it has been found on one hand, how new
parties’ supporters are those who most actively display against political corruption on
the online debate held on Twitter; and on the other hand, how traditional parties are
those which are being most reported. Besides, when analysing the relationship between
27,3%
72,7%
0%
10%
20%
30%
40%
50%
60%
70%
80%
90%
100%
New parties Traditional parties

208
the preferred parties’ group of the users who are reporting political corruption and the
parties’ group of the parties which are being reported, it has been proved a statistically
significant difference, new parties’ supporters are reporting corruption mainly on
traditional parties while traditional parties’ supporters on both group of parties, although
emphasizing a little bit more the corruption on new parties.
As a result of the previous findings, the hypothesis H8 has been verified, i.e., in the
online debate about politics held on Twitter, users’ level of tolerance towards political
corruption is lower in those users who are supporting new parties. This conclusion is
internally consistent with the analysis of the “Real World”, i.e., the electorate of new
parties is more sensitive towards political corruption and new parties’ supporters are
those who most actively show themselves against corruption on Twitter. Besides it is
also externally consistent with previous researches where it was established on one
hand, how the emergence of new parties represents an opportunity for citizens to punish
traditional parties affected by political corruption (Cordero and Blais, 2017; Charron
and Bågenholm, 2016); and on the other hand, how specifically in the political debate
held on Twitter, before the emergence of the new party Podemos, the vast majority of
Spanish users in the online political conversations held on Twitter against the economic,
social and political crisis did not feel represented for the traditional parties strongly
affected by corruption and, were demanding alternative political actors to represent their
interests (Vallina-Rodriguez et al., 2012).
The validation of this hypothesis could be seen as a new parties’ advantage, as they
are clearly dominating the online debate about politics and, as it has been proved, social
media is a powerful tool to spread social pressure.
Hypothesis 9: Experiments and outcomes 5.3.3
In hypothesis H9 it will be tested the belief that in the online conversations about
politics, users’ criticism towards political corruption varies depending on the political
sympathy they have towards the party involved. The statement of H9 is as follows:
H9 statement- In the online debate about politics held on Twitter, users’ level
of tolerance towards political corruption is higher as higher is the political
sympathy towards the party involved.

209
If validated, it would show once again that the results obtained in the study of the
“Real world” are also in this case consistent when analysing the online debate about
political corruption held on Twitter, i.e., that the attitude towards political corruption
varies depending on the users’ proximity to the party which is being affected, which
would contribute to understand why corruption is not punished as much as it could be
expected.
Experiment Description
To test this hypothesis H9 it has been considered the following variables:
1. Users’ preferred party. Users retweeting those messages about political
corruption with the highest rate of diffusion were classified into four
categories according the C2 criteria stated previously: PP, PSOE, UP and
C’s. This variable has not needed any recoding.
2. Party reported on corruption. Messages about political corruption with the
highest rate of diffusion were classified by the party which was being
involved in the corruption reported on Twitter: PP, PSOE, UP and C’s. This
variable has not needed any recoding.
The objective of this hypothesis H9 is to test if users’ attitude towards political
corruption varies when corruption affects to their own party in the online debate held on
Twitter. For this purpose, it will be performed the following analysis:
1. H9A1: A descriptive analysis of the Users’ preferred party of those users
who are spreading the most retweeted messages about political corruption.
2. H9A2: A descriptive analysis of the Parties reported on corruption in the
corruption most reported on Twitter.
3. H9A3: A crosstabs analysis to find out if it is possible to establish a
relationship statistically significant between Users’ preferred party of those
users who are spreading the most retweeted messages about political
corruption and Parties reported on corruption in the corruption most
reported on Twitter.

210
Statistical analysis
In this section, it will be performed the statistical analysis carried out to test the
hypothesis H9:
1. H9A1: Descriptive analysis “Users’ preferred party”.
In Table 5-17 it is presented the frequency of the preferred party of those users who
are spreading the most retweeted messages about political corruption.
Table 5-17 User’s Preferred Party H9A1
Parties Frequency
PP 305
PSOE 104
UP 1686
C’s 97
As it is seen, UP supporters are clearly dominating the online debate about political
corruption.
2. H9A2: Descriptive analysis “Parties reported on corruption”.
In Table 5-18 it is presented the frequency of the parties involved in the corruption
most reported on Twitter.
Table 5-18 Parties for H9A2
Parties Frequency
PP 1193
PSOE 400
UP 317
C’s 282
As it is depicted, the party most reported on Twitter as being involved in political
corruption is PP.
3. H9A3: Crosstabs analysis “Users’ preferred party (PP, PSOE, UP and
C’s)” and “Parties reported on corruption (PP, PSOE, UP and C’s)”.
The hypotheses of the Crosstabs analysis H9A3 are presented in Table 5-19.

211
Table 5-19 Hypotheses –Crosstabs analysis H9A3-
Null (H0) and Alternative (H1) hypothesis
H0: There is not association between Users’ preferred party (PP, PSOE, UP and C’s)
of those users who are spreading the most retweeted messages about political
corruption and Parties reported on corruption (PP, PSOE, UP and C’s) in the
corruption most reported on Twitter.
H1: There is association between Users’ preferred party (PP, PSOE, UP and C’s) of
those users who are spreading the most retweeted messages about political corruption
and Parties reported on corruption (PP, PSOE, UP and C’s) in the corruption most
reported on Twitter.
In order to test the hypotheses, it will be performed the Chi-Squared Test (Table
5-20):
Table 5-20 Chi-Squared Test for H9A3
Pearson Chi-Square df1 Statistical significance
1682 9 0.000
Based on the results, the H0 is rejected, i.e., when analysing the online
conversations about political corruption held on Twitter there is a statistically
significant association between Users’ preferred party (PP, PSOE, UP and C’s) of those
users who are spreading the most retweeted messages about political corruption and
Parties reported on corruption (PP, PSOE, UP and C’s) in the corruption most reported
on Twitter, χ2
(9) = 1682, p < 0.05. Besides, in order to characterise the relationship, as
the crosstab is larger than 2x2, it will be performed the Contingency Coefficient Test
(Table 5-21).
Table 5-21 Contingency Coefficient Test for H9A3
Contingency Coefficient
Statistic C Range Statistical significance
0.659 0 < C < 0.87 0.000
Considering the C = 0.659, p<0.05, the previous statistically significant
relationship is characterised as moderate.
Report
In this section, it will be reported the most relevant conclusions of the statistical
analysis carried out in the previous section.

212
Firstly, in Figure 5-6 it is indicated how the vast majority of the users who are
diffusing the most retweeted messages against political corruption on Twitter are UP
supporters (76.9%). In second position it is found PP supporters (13.9%), while PSOE
and C’s supporters are those least active in the online debate.
Figure 5-6 Preferred party of users who are spreading the most retweeted
messages against political corruption on Twitter
These results are especially useful as they allow to deepen the analysis carried out
previously. Being true that new parties’ supporters are those who most actively show
their criticism towards political corruption in the online debate held on Twitter, the
distribution of the users who are spreading the messages about political corruption with
the highest rate of diffusion by their preferred party, indicates that the previous
conclusion is held exclusively by UP supporters, in fact, C’s supporters are the least
active in the online debate.
This conclusion could be relativized considering the followings:
1. Parties’ support (Figure 1-2). As higher it is, without taking into account
any other consideration, it would be expected a higher presence of online
supporters on Twitter. This consideration would especially play against C’s,
as it is the party with the least support.
2. Twitter users’ age. Twitter has a relatively young audience and PP and
PSOE supporters tend to be older that UP and C’s supporters (Figure 1-3).
This consideration would play against traditional parties.
13,9% 4,7%
76,9%
4,4%
0%
10%
20%
30%
40%
50%
60%
70%
80%
90%
100%
PP PSOE UP C's

213
However, in order to simplify, as the results obtained show clear evidence about
which is the dominant profile on the online debate about political corruption held on
Twitter, it will not be taken into account the considerations above.
Focusing on the parties involved in the corruption most reported on Twitter, in
Figure 5-7 it is found how PP (54.4%) is the party most reported while UP (14.5%) is
the least.
Figure 5-7 Parties reported on corruption on Twitter
Finally, it will be reported the results obtained when it has been proved that there is
a relationship statistically significant between the preferred party of those users who are
spreading the political corruption most diffused on Twitter and the parties which are
being reported (Table 5-22).
Table 5-22 Users’ reports distribution by party reported
PP PSOE UP C’s
PP supporters 0% 38.4% 61.6% 0%
PSOE supporters 69.2% 0% 30.8% 0%
UP supporters 66.5% 16.8% 0% 16.7%
C’s supporters 0% 0% 100% 0%
The most relevant conclusion when analysing the messages about corruption with
the highest diffusion on Twitter is that there is not a case where a party’s supporter is
displaying against the corruption on his own party. As it is highlighted the main
diagonal of the table is 0% in all the cases.
54,4%
18,2% 14,5% 18,2%
0%
10%
20%
30%
40%
50%
60%
70%
80%
90%
100%
PP PSOE UP C's

214
Deeply analysing, it is found how PP supporters report corruption on parties with a
left political leaning, especially on the new party UP (61.6%), but also on the traditional
party PSOE (38.4%); PSOE supporters mainly on the traditional party with a right
political leaning PP (69.2%), but also on UP (30.8%); UP supporters display against
corruption in the rest of the parties, but especially on PP (66.5%); and finally, C’s
supporters focus their reports on corruption exclusively on UP (100%).
Summarising the information above, it has been found that UP’ supporters are those
who most actively display against political corruption on the online debate held on
Twitter while PP is the party most reported on corruption. Then, when analysing the
relationship between users’ preferred party and the party they are reporting on
corruption, it has been shown that there is no a case where a party’s supporter report
corruption on his own party. Besides, it has been found that: PP and C’s supporters
report corruption mainly on UP while PSOE and UP supporters mainly on PP. It would
indicate how in the online debate about political corruption held on Twitter users’
political leaning plays a stronger role than users’ preferred parties’ group (new vs.
traditional).
As a consequence of the previous findings, the hypothesis H9 has been verified, i.e.,
in the online debate about politics held on Twitter, users’ level of tolerance towards
political corruption is higher as higher is the political sympathy towards the party
involved. This result is internally consistent with the analysis of the “Real World”, i.e.,
parties’ supporters downplay corruption and do not report it on Twitter when it is their
preferred party the one which is being involved. Besides, it is also externally consistent
with previous researches where it was proved on one hand, that citizens’ level of
tolerance towards political corruption depends on which is the party involved in the
corruption case, being more tolerant when the corruption case affects to the party they
are supporting (Cordero and Blais, 2017; Ecker et al., 2016; Anduiza et al., 2013); and
on the other hand, how in the Spanish political Twittersphere, there is a high probability
to find clusters of users engaged in a political conversation having the same political
preferences.
The verification of this hypothesis would contribute to explain why political
corruption is not as much penalized as it could be expected. Besides, taking into account
that social media has been identified as a powerful tool to spread social pressure, the

215
fact that UP supporters are those users who clearly dominate the online debate could be
seen as an advantage for UP.
5.4 Analysis of results
The main objective of this thesis is to shed light on the puzzle of why political
corruption does not seem to have the electoral consequences it could be expected, and
even more important, to find out key factors to develop better strategies in order to
encourage citizens to be less tolerant towards political corruption, and therefore, to
achieve a higher quality democracy.
For this purpose, this chapter has been focused on the hypothesis related to what it
has been defined as “Virtual World”. Online social networks have become hugely
important in recent years, and their impact on citizens’ attitudes and behaviour related to
politics has been widely studied (Marinov and Schimmelfennig, 2015; Bond et al.,
2012; Shirky, 2011). As a consequence, it has been considered especially interesting to
analyse the online conversations about political corruption and the interaction and
influence of actors in this debate. In the previous chapter, it has been shown that
political leaning, the emergence of new parties and political sympathy towards a party
play a key role to find out substantial differences in citizens’ attitude towards political
corruption. The goal of this chapter has been to analyse if the relationships established
could be proved also in the online world. For this purpose, it has been selected the
social network Twitter because of a variety of reasons. This social network is
completely open, which allows to collect all messages (“tweets”) related to a
determinant hashtag. Besides, it is increasingly considered by scholars as a political
platform, where politicians, media professionals and citizens engage in a personal type
of political communication (Murthy, 2015; Ekman and Widholm, 2014; Aragón et al.,
2013). Finally, it has been proved its usefulness as a platform to spread propaganda and
generate political debate during the electoral campaigns (Jennings et al., 2017; Aragón
et al., 2013), as a mobilizing platform for social movements (Vallina-Rodriguez et al.,
2012), and as a predictor of electoral outcomes (Tumasjan et al., 2010).
Firstly, when analysing the effect of political leaning on users’ attitude towards
political corruption in the online debate about politics held on Twitter, it has been found
that users’ level of tolerance towards political corruption is lower in progressive users

216
(H7). Analysing the messages about political corruption with the highest rate of
diffusion, it has been seen on one hand, that the majority of users who are displaying
against political corruption have a left political leaning; and on the other hand, that right
parties are those which are being more reported. Moreover, when analysing the
relationship between users’ political leaning who are reporting political corruption and
political leaning of those parties which are being involved in the corruption most
reported, it has been established a statistically significant difference, left parties’
supporters report mainly right parties while right parties’ supporters report left parties.
These results are not only internally consistent, i.e., the results obtained when
analysing the online debate about political corruption held on Twitter are consistent
with those obtained in the previous chapter through the personal interviews, but also
externally consistent with previous researches where it was found on one hand, that
voters with a left political leaning tend to punish corruption cases more than voters with
a right political leaning (Charron and Bågenholm, 2016; Anduiza et al., 2013; Costas-
Pérez et al., 2010); and on the other hand, how, when analysing the political debate held
on Twitter, Spaniards actively participating in the online political conversations against
the established system and its corruption have mainly a left political leaning (Peña-
López et al., 2014; Anduiza et al., 2012).
On one side, these findings could be seen as a left parties’ disadvantage as they
would need to make greater efforts to fight against corruption, not only implementing
strictly measurements to avoid it, but also expelling of their parties those politicians
who are involved in a case of political corruption. However, downplay corruption
would be less harmful for those parties with a right political leaning. On the other side,
these findings could be seen as a left parties’ advantage, as they are clearly dominating
the online debate about politics and, as it has been proved, social media is a powerful
tool to spread social pressure. In addition, this finding contributes to explain the success
of right parties in certain electoral campaigns, in despite of being clearly involved in
corruption.
Secondly, when analysing the effect of new parties’ emergence on users’ attitude
towards political corruption in the online debate about politics held on Twitter, it has
been shown how users’ level of tolerance towards political corruption is lower in those
users who are supporting new parties (H8). Analysing the messages about political

217
corruption with the highest rate of diffusion on Twitter, it has been shown on one hand,
that new parties’ supporters are those who most actively display against political
corruption; and on the other hand, that traditional parties are those which are being more
reported. Moreover, when analysing the relationship between users’ preferred parties’
group who are reporting political corruption and parties’ group which are being
reported, it has been established a statistically significant difference, new parties’
supporters report corruption mainly on traditional parties while traditional parties’
supporters on both group of parties, although a little bit more on new parties.
These results are also not only internally consistent, but also externally consistent
with previous researches where it was found on one hand, that the emergence of new
parties represents an opportunity for citizens to punish traditional parties affected by
political corruption (Cordero and Blais, 2017; Charron and Bågenholm, 2016); and on
the other hand, how when analysing the political debate held on Twitter before the
emergence of the new party Podemos, Spaniards actively participating in the online
political conversations against the economic, social and political crisis did not feel
represented for the traditional parties strongly affected by corruption and, were
demanding alternative political actors to represent their interests (Vallina-Rodriguez et
al., 2012).
The fact that new parties’ supporters are clearly dominating the online debate about
politics could be seen as a new parties’ advantage, as it has been proved how social
media is a powerful tool to spread social pressure. In addition, the fact that new parties’
supporters are less tolerant towards political corruption could be seen as one of the key
factors to explain the new parties’ emergence and success.
Thirdly, when analysing the effect of political sympathy on users’ attitude towards
political corruption in the online debate about politics held on Twitter, it has been
established that users’ level of tolerance towards political corruption is higher as higher
is the political sympathy towards the party involved (H9). Analysing the messages about
political corruption with the highest rate of diffusion on Twitter, it has been seen on one
hand, that UP’ supporters are those who most actively display against political
corruption, which taking into account that social media has been identified as a
powerful tool to spread social pressure could be seen as a UP’ advantage; and on the
other hand, that PP is the party most reported.

218
Moreover, when analysing the relationship between users’ preferred party who are
reporting political corruption and parties which are being reported, it has been
established a statistically significant differences. On one side, it has been shown that PP
and C’s supporters report corruption mainly on UP while PSOE and UP supporters
mainly on PP. It would indicate how users’ political leaning plays a stronger role than
users’ preferred parties’ group (new vs. traditional) when studying their impact on the
attitude towards political corruption in the online debate about political corruption held
on Twitter. On the other side, it has been found how all the parties’ supporters report
corruption exclusively on other parties, i.e., there is not a case where a party’s supporter
displays against the corruption on his own party.
This result is once again not only internally consistent, but also externally
consistent with previous researches where it was proved on one hand, that voters’
political sympathy towards a party plays a key role on their attitude towards a specific
case of political corruption being more tolerant when the corruption case affects to their
preferred party (Cordero and Blais, 2017; Ecker et al., 2016; Anduiza et al., 2013); and
on the other hand, how, when analysing the Spanish political debate held on Twitter,
there is a high probability to find clusters of users engaged in a political conversation
having the same political preferences.
The political sympathy impact on the attitude towards political corruption would
contribute to explain why political corruption is not as much penalized as expected.
Users’ attitude towards political corruption in their preferred party plays clearly against
to the well-functioning of the political, economic and social system. It would be
necessary a society disapproving political corruption independently of the party affected
in order to reach a higher quality democracy.
5.5 Conclusions
The main goal of this chapter has been to test the hypotheses related to the virtual
world in order to analyse the role played by political leaning, new parties’ emergence
and political sympathy, on citizens’ attitude towards political corruption in the online
debate held on Twitter. It is especially interesting to analyse if the relationships
established in the previous chapter related to the real world can be proved also in the

219
online world. In the following lines, it will be briefly summarised the main conclusions
of the experiments conducted to test each of the hypotheses.
Firstly, when analysing the effect of political leaning on users’ attitude towards
political corruption in the online debate about politics held on Twitter, it has been
demonstrated that users’ level of tolerance towards political corruption is lower in
progressive users (H7).
Secondly, when analysing the effect of new parties’ emergence on users’ attitude
towards political corruption in the online debate about politics held on Twitter, it has
been proved how users’ level of tolerance towards political corruption is lower in those
users who are supporting new parties (H8).
Thirdly, when analysing the effect of political sympathy on users’ attitude towards
political corruption in the online debate about politics held on Twitter, it has been
concluded that users’ level of tolerance towards political corruption is higher as higher
is the political sympathy towards the party involved (H9).


221
Chapter 6. Conclusions
The main topic of this thesis is the analysis of citizens’ attitude towards political
corruption. Political corruption is severely damaging the quality of the democracy, and
in recent years, it has become one of the biggest citizens’ concerns.
Political parties need the citizens’ confidence to obtain a greater representation,
therefore, it should be expected that in order to prove their honesty, they were the first
to react against their own corruption, recognising it and expelling those members who
have been involved. However, even if during the electoral campaigns, political parties
commit themselves to fight against corruption, once the legislature starts, they tend to
emphasize the others parties’ corruption while downplay or even ignore their own
corruption.
It could be theorised that those parties who do not react against corruption as they
should, will suffer a considerable loss of support, nevertheless, the evidence proves that
this theory cannot be generalised. Although it seems that a vast majority of citizens are
strongly against political corruption, there are several electoral processes in which
corrupted politicians keep being re-elected.
The goal of this thesis is to shed light on the puzzle of why political corruption does
not seem to have the electoral consequences it would be expected, and even more
important, to find out key factors to develop better strategies in order to encourage
citizens to be less tolerant towards political corruption, and therefore, to achieve a
higher quality democracy.
For this purpose, it has been identified those factors which have a greater impact on
citizens’ attitude towards political corruption and it has been set out the nine hypotheses
of the model related to each of them. The studies conducted to test these hypotheses
spanned both, real world (H1-H6), where it has been analysed the information obtained
in the personals interviews; and virtual world (H7-H9), where it has been analysed the
online debate about political corruption held on Twitter.
The objective of the hypotheses related to the real world (H1-H6) has been to
analyse the role played in the attitude towards political corruption by the economic
context, social pressure, political awareness, political leaning, the new parties’

222
emergence and political sympathy. For this purpose, on one hand, it has been used data
provided by the independent entities CIS and INE; and on the other hand, it has been
designed a specific survey in which participants faced questions related to each of the
previous variables. The objective of the hypotheses related to the virtual world (H7-H9)
has been to demonstrate if the relationships established when studying the impact of
political leaning, the emergence of new parties and the political sympathy towards a
party in the real world, could be proved also in the virtual world. For this purpose, it has
been analysed the online debate about political corruption held on Twitter. In the
following lines, it will be summarised the main conclusions obtained when analysing
the impact of each of the variables on the attitude towards political corruption.
Regarding the effect of the economic context on citizens´ attitude towards political
corruption, in agreement with previous results (Cordero and Blais, 2017; Charron and
Bågenholm, 2016; Anduiza et al., 2013; Klasnja and Tucker, 2013; Winters and Weitz-
Shapiro, 2013; Zechmeister and Zizumbo-Colunga, 2013; Jerit and Barabas, 2012;
Weitz-Shapiro and Winters, 2010; Manzetti and Wilson, 2007; Golden, 2007; Diaz-
Cayeros et al., 2000; Duch et al., 2000; Mauro, 1995), it has been demonstrated how
citizens’ tolerance towards political corruption depends on the country’s economic
situation, being lower when it is going through a crisis. It has been established on one
hand, a positive and strong relationship between the negative assessments of political
and economic situation, which would show how citizens’ attitude towards political
issues are clearly affected by the economic context; and on the other hand, a negative
correlation between the GDP growth rate and the growth rate of the concern over
corruption, which would prove how citizens’ criticism towards political corruption is
greater when the country is going through an economic crisis. Besides, analysing the
information provided by the personal interviews, it has been found that the majority find
itself less tolerant towards political corruption since the economic crisis started. As a
consequence, an economic crisis could be seen as an opportunity to increase citizens’
criticism towards political corruption. However, once the crisis is overcome, it would be
necessary to keep it over the level before the crisis started in order to reach a higher
quality democracy.
Related to the effect of social pressure on citizens´ attitude towards political
corruption, it has been proved their effectiveness to reach a higher impact than factual

223
information. This finding is consistent with previous researches where it was already
demonstrated the effectiveness of social pressure in mobilising citizens against the
established political system and its corruption (Giraldo-Luque, 2018; Marinov and
Schimmelfennig, 2015; Anduiza et al., 2014; Peña-López et al., 2014; Toret, 2013;
Anduiza et al., 2012; Piñeiro-Otero and Costa-Sánchez, 2012; Vallina-Rodriguez et al.,
2012; Eltantawy and Wiest, 2011; González-Bailón et al., 2011; Shirky, 2011); in
political self-expression, political information seeking and political participation (Bond
et al., 2012; Gerber and Rogers, 2009; and Gerber et al., 2008). Concretely, in this
thesis, it has been established on one hand, how those citizens who face a case of
political corruption in which other citizens´ reactions against it are emphasized, become
less tolerant than those who face a scenario in which they are being informed through
factual information exclusively; and on the other hand, how the pieces of news which
have a higher impact on the attitude towards political corruption are those in which it is
underlined citizens’ losses in welfare and economics rather than other in which the
information about corruption is provided without being related with any social or
economic consequence. As a result, if a political party, a media or any citizen group
managed to mobilize a part of society against political corruption, the impact of social
pressure would attract new supporters and, therefore, it would contribute to achieve a
higher quality democracy.
In reference to the effect of political awareness on citizens´ attitude towards
political corruption, in agreement with previous researches (Cordero and Blais, 2017;
Anduiza et al., 2013; Weitz-Shapiro and Winters, 2010; Arceneaux, 2007; Kam, 2005),
it has been found how as higher it is, as lower is their tolerance towards political
corruption. This finding would indicate that the attitude towards political corruption
could be modified by bringing citizens into politics and, therefore, involving citizens in
political issues would also contribute to achieve a higher quality democracy.
Regarding the effect of political leaning on citizens’ attitude towards political
corruption, it has been shown how as more progressive citizens are, as lower is their
tolerance towards political corruption. This conclusion is externally consistent with
previous researches where it was found how left voters tend to punish corruption cases
more than right voters (Charron and Bågenholm, 2016; Anduiza et al., 2013; Costas-
Pérez et al., 2010).

224
Moving to the virtual world analysis, it has been found that in the online debate
about politics held on Twitter, politically progressive users are also less tolerant towards
corruption than those users who support right parties. Concretely, when analysing the
messages about political corruption with the highest rate of diffusion on Twitter, it has
been seen on one hand, that the majority of users who are displaying against political
corruption have a left political leaning; and on the other hand, that right parties are those
which are being more reported. Moreover, when analysing the relationship between
users’ political leaning who are reporting political corruption and parties' political
leaning which are being reported, it has been established a statistically significant
difference, left parties’ supporters report mainly right parties while right parties’
supporters report left parties. Therefore, there is an internal consistency between the
results obtained with the analysis of the online debate about political corruption held on
Twitter and those obtained when analysing the real world through the personal
interviews. Besides, there is also an external consistency with previous researches
where it was proved how, when analysing the political debate held on Twitter,
Spaniards actively participating in the online political conversations against the
established system and its corruption, have mainly a left political leaning (Peña-López
et al., 2014; Anduiza et al., 2012).
These results would indicate that left parties should be more carefully when
designing their communication policy to face a corruption case. Besides, they would
probably need to make greater efforts to fight against corruption, not only implementing
strictly measurements to avoid it, but also expelling of their parties those politicians
who are involved in a case of political corruption. Therefore, at least in a short term, this
finding would play against parties with a left political leaning, as they would be more
penalized than right parties, which have an electorate less sensitive towards political
corruption. However, the fact that users with a left political leaning are those who
dominate the online debate about political corruption could be seen as a left parties’
strength, as social media has been identified as a powerful tool to spread social pressure.
Finally, the higher level of tolerance towards political corruption of conservative
citizens would contribute to explain the success of right parties in certain electoral
campaigns, in despite of being clearly involved in corruption.

225
Related to the effect of new parties’ emergence on citizens´ attitude towards
political corruption, it has been demonstrated how new party’ supporters are less
tolerant towards political corruption than traditional parties’ supporters. In previous
researches, it was proved that the emergence of new parties represents an opportunity
for citizens to punish traditional parties affected by political corruption (Cordero and
Blais, 2017; Charron and Bågenholm, 2016); how corruption benefits new parties
pushing voters away not only from the party which is in the government, but also from
all the traditional parties (Engler, 2015; Pop-Eleches, 2010; Mainwaring et al., 2009);
and the effectiveness of focusing the new parties’ message on the fight against
corruption in order to succeed (Bågenholm and Charron, 2014; Hanley and Sikk, 2014;
Bågenholm, 2013; Sikk, 2012; Bélanger, 2004). Accordingly with these findings, in this
thesis it has been found how citizens who declare to feel closer to the emerging parties
UP and C’s are less tolerant towards political corruption than those who indicate they
feel closer to the traditional parties PP and PSOE. Besides, evaluating deeply the
results, they are internally consistent with those obtained when analysing the political
leaning impact: among traditional parties’ supporters, those who are supporting the left
party PSOE are less tolerant than those who are supporting the right party PP; and
among the new parties’ supporters, UP supporters are less tolerant than C’s supporters.
Finally, according with the data provided by the CIS, in this thesis new parties’
supporters have been also characterised as being younger than traditional parties’
supporters. It would play against traditional parties in a medium and long term, as they
would need to attract younger voters if they want to stay in power. In addition, the fact
that younger voters are less tolerant would show a positive evolution of the citizens’
attitude towards political corruption which could be interpreted as a hope for the
democracy’s quality.
Moving to the virtual world analysis, it has been found that in the online debate
about politics held on Twitter, users closer to new parties are also less tolerant towards
political corruption than those users closer to traditional parties. Concretely, when
analysing the messages about political corruption with the highest rate of diffusion on
Twitter, it has been shown on one hand, that new parties’ supporters are those who most
actively display against political corruption which could be seen as a new parties’
strength, as social media has been identified as a powerful tool to spread social pressure;
and on the other hand, that traditional parties are those which are being more reported.

226
Moreover, when analysing the relationship between users’ preferred parties’ group who
are reporting political corruption and parties’ group which are being reported, it has
been established a statistically significant difference, new parties’ supporters report
corruption mainly on traditional parties while traditional parties’ supporters on both
group of parties, although a little bit more on new parties. Therefore, there is also an
internal consistency between the results obtained with the analysis of the online debate
about political corruption held on Twitter and those obtained when analysing the real
world through the personal interviews, and all of them would contribute to understand
the new parties’ emergence and success. Besides, there is also an external consistency
with previous researches where it was established how, when analysing the political
debate held on Twitter before the emergence of the new party Podemos, Spaniards
actively participating in the online political conversations against the economic, social
and political crisis did not feel represented for the traditional parties strongly affected by
corruption and, were demanding alternative political actors to represent their interests
(Vallina-Rodriguez et al., 2012).
Finally, when analysing the effect of political sympathy on citizens´ attitude
towards political corruption, it has been seen how as higher is citizens’ sympathy
towards the party involved in corruption, as higher is their tolerance. This finding is
consistent with previous researches where it was found how citizens’ level of tolerance
towards political corruption depends on which was the party involved in the corruption
case, being more tolerant when the corruption case affects to the party they are
supporting (Cordero and Blais, 2017; Ecker et al., 2016; Anduiza et al., 2013), and also
with other researches where it was proved that voters’ sympathy towards a party
reduces the impact of corruption on the electoral results of a corrupt politician (Cordero
and Blais, 2017; Charron and Bågenholm, 2016; Welch and Hibbing, 1997; Peters and
Welch, 1980). Concretely, in this thesis, it has been established on one hand, how
citizens’ perception of corruption in their preferred party is lower than the corruption
perceived by other parties’ supporters; and on the other hand, how when citizens are
facing a specific scandal of corruption, they definitely downplay corruption if it is their
party the one which is being affected. Besides, evaluating deeply the results, they are
internally consistent with those obtained when analysing both, the political leaning's
impact and the emergence of new parties’ impact, as UP supporters, the new party
identified as being progressive, are those who not only have the least tolerance towards

227
political corruption, but also who least downplay corruption when it affects to their own
party.
Moving to the virtual world analysis, it has been found that in the online debate
about politics held on Twitter, users’ tolerance towards political corruption is also
higher as higher is the sympathy towards the party involved. Concretely, when
analysing the messages about political corruption with the highest rate of diffusion on
Twitter, it has been shown on one hand, that UP’ supporters are those who most actively
display against political corruption, which taking into account that social media has
been identified as a powerful tool to spread social pressure could be seen as a UP’
advantage; and on the other hand, that PP is the most reported party. Moreover, when
analysing the relationship between users’ preferred party who are reporting political
corruption and parties which are being reported, it has been established a statistically
significant differences. On one side, it has been shown that PP and C’s supporters report
corruption mainly on UP while PSOE and UP supporters mainly on PP. It would
indicate how users’ political leaning plays a stronger role than users’ preferred parties’
group (new vs. traditional) when studying their impact on the attitude towards political
corruption in the online debate about political corruption held on Twitter. On the other
side, it has been found how all the parties’ supporters report corruption exclusively on
other parties, i.e., there is not a case where a party’s supporter displays against the
corruption on his own party. Therefore, there is once again an internal consistency
between the results obtained with the analysis of the online debate about political
corruption held on Twitter and those obtained when analysing the real world through
the personal interviews. Besides, there is also an external consistency with previous
researches where it was concluded how, when analysing the Spanish political debate
held on Twitter, there is a high probability to find clusters of users engaged in a political
conversation having the same political preferences.
The previous findings would clearly contribute to understand why political
corruption is not as much penalized as it could be expected. Parties’ supporters not only
have lower perception of corruption in their party, but also when it is presented a
specific case of corruption they tend to minimize and even ignore it in the online debate.
Therefore, citizens’ attitude towards political corruption in their preferred party would
play against to the well-functioning of the political, economic and social system. It

228
would be necessary citizens to be intolerant towards all political corruption
independently the party involved in order to achieve a higher quality democracy.

229
References
Adserá A.; Boix C. and Mark Payne (2003) “Are You Being Served? Political
Accountability and the Quality of Government” in Journal of Law, Economics and
Organization, 19 pp. 445-90.
Alesina, A.; Di Tella, R. and R. MacCulloch (2004) “Inequality and happiness: Are
Europeans and Americans different?” in Journal of Public Economics, 88(9-10), pp.
2009-2042.
Allcott, H. (2011) “Social norms and energy conservation” in Journal of Public
Economics, 95, pp.1082-1095.
Altiparmakis, A. and J. Lorenzini (2018) “Disclaiming national representatives: protest
waves in Southern Europe during the crisis” in Party Politics, 24(1), pp.78-89.
Anderson, C.J. et al. (2005) “Losers’ consent: Elections and democratic legitimacy” in
New York: Oxford University Press.
Anderson, C.J., and M.M. Singer (2008) “The Sensitive Left and the Impervious Right
Multilevel Models and the Politics of Inequality, Ideology, and Legitimacy in Europe”
in Comparative Political Studies, 41, pp. 564-599.
Anderson, C.J. and Y.Tverdova (2003) “Corruption, political allegiances, and attitudes
toward government in contemporary democracies” in American Journal of Political
Science, 47, pp. 91-109.
Anduiza, E.; Cristancho, C. and J.M. Sabucedo (2014) “Mobilization through online
social networks: the political protest of the indignados in Spain” in Information,
Communication & Society, 17(6), pp.750-764.
Anduiza, E; Gallego, A and J. Muñoz (2013) “Turning a blind eye: Experimental
evidence of partisan bias in attitudes toward corruption” in Comparative Political
Studies 46(12), pp. 1664–1692.
Anduiza, E.; Martín, I. and A. Mateos (2012) “Las consecuencias electorales del 15M
en las elecciones generales de 2011” in Arbor. Ciencia, Pensamiento y Cultura,
188(756).

230
Anger, I. and Kittl C. (2011) “Measuring Influence on Twitter” in Proc. 11th
International Conference on Knowledge Management and Knowledge Technologies,
ACM.
Aragón, P. et al., (2013) “Communication dynamics in twitter during political
campaigns: The case of the 2011 Spanish national election” in Policy and Internet, 5(2),
pp.183-206.
Arceneaux, K. (2007) “Can partisan cues diminish democratic accountability?” in
Political Behavior, 30, pp. 139-160.
Asch, S.E., (1951) “Effects of Group Pressure upon the Modification and Distortion of
Judgement” in Groups, Leadership and Men, edited by M.H. Guetzkow., Pittsburgh,
PA: Carnegie Press, pp. 117-190.
Ausserhofer, J. and A. Maireder (2013) “National Politics on Twitter” in Information,
Communication & Society, 16(3), pp.291-314.
Avnit, A., (2009) “The Million Followers Fallacy” in Internet Draft, Pravda Media.
http://tinyurl.com/nshcjg.
Bågenholm, A. (2013) “The Electoral Fate and Policy Impact of “Anti-Corruption
Parties” in Central and Eastern Europe” in Human Affairs, 23, pp. 174-195.
Bågenholm, A. and N.s Charron (2014) “Do Politics in Europe Benefit from Politicising
Corruption?” in West European Politics, 37:5, pp. 903-931.
Bakshy, E. et al. (2011) “Everyone's an influencer: quantifying influence on twitter” in
WSDM '11 Proceedings of the fourth ACM international conference on Web search and
data mining, pp. 65-74.
Banerjee, A. V. and R. Pande (2009) “Parochial Politics: Ethnic Preferences and
Politician Corruption” Working Paper.
Barberá, P. and G. Rivero (2012) “Un tweet, un voto? Desigualdad en la discusión
política en Twitter” in I Congreso Internacional en Comunicación Política y
Estrategias de Campaña.

231
Barberá, P. (2014) “How Social Media Reduces Mass Political Polarization: Evidence
from Germany, Spain, and the U.S.” in Job Market Paper, New York University.
Bartels, L. M. (2000) “Partisanship and voting behavior, 1952-1996” in American
Journal of Political Science, 44, pp. 35-50.
Bartels, L. M. (2002) “Beyond the running tally: Partisan bias in political perceptions”
in Political Behaviour, 24, pp. 117-150.
Bartolini, S. and P. Mair (1990) “Identity, Competition and Electoral Availability: The
Stabilisation of European Electorates, 1885-1985” in Cambridge University Press.
Bass, F., (1969) “A new product growth model for consumer durables” in Management
Science 15, pp. 215-227.
Baumgartner, J. C. and J. S. Morris (2010) “MyFaceTube Politics: Social Networking
Web Sites and Political Engagement of Young Adults” in Social Science Computer
Review, 28(1), pp.24-44.
Beasley, R. K. and M. R. Joslyn (2001) “Cognitive dissonance and post-decision
attitude change in six presidential elections” in Political Psychology, 22, pp. 521-540.
Bélanger, E. (2004) “Antipartyism and the Third-Party Vote Choice. A Comparison of
Canada, Britain, and Australia” in Comparative Political Studies, 37:9, pp. 1054-1078.
Belda, G.; Cardiff, J. and J. Sánchez (2015) “Energy Efficiency: Attitudes and
Behaviour and the Influence of Social Pressure” in Institute of Technology Tallaght,
Dublin, Ireland.
Belda, G.; Cardiff, J. and J. Sánchez (2016) “Harnessing Social Pressure in Altruistic
Domains: A Twitter Case Study” in Innodoct 2016, Lean education and Innovation.
Berg, L. L.; Harlan H. and J. R. Schmidhauser (1976) “Corruption in the American
Political System” in Morristown, N.J., General Learning Press.
Berger, J.M., and B. Strathearn (2013) “Who Matters Online: Measuring influence,
evaluating content and countering violent extremism in online social networks” in
ICSR.

232
Bermingham, A. and A. Smeaton (2011) “On using Twitter to monitor political
sentiment and predict election results” in Proceedings of the Workshop on Sentiment
Analysis where AI meets Psychology, pp.2-10.
Bertrand, M.; Luttmer E. F. P. and S. Mullainathan (2000) “Network effects and welfare
cultures” in Quarterly Journal of Economics, 115, pp. 1019-1055.
Best, R., and M. McDonald (2011) “The role of party policy positions in the operation
of democracy” in Dalton, R. and C. Anderson (Eds.) “Citizens, context, and choice:
How context shapes citizens’ electoral choices” in Oxford: Oxford University Press.
Bielasiak, J. (2002) “The Institutionalization of Electoral and Party Systems in
Postcommunist States” in Comparative Politics, 34:2, pp. 189-210.
Birch, S. (2003) “Electoral Systems and Political Transformation in Post-Communist
Europe” in Basingstoke, Hampshire, England: Palgrave Macmillan.
Blais, A.; Gidengil E. and A. Kilibarda (2015) “Partisanship, Information, and
Perceptions of Government Corruption” in International Journal of Public Opinion
Research, 29:1.
Blume, L. (1993) “The Statistical Mechanics of Strategic Interaction” in Games and
Economic Behavior 5, 1993, pp. 387-424.
Bobba, G. and D. McDonnell (2015) “Italy–A Strong and Enduring Market for
Populism” in Kriesi, H., and Pappas, TS, eds, pp.163-179.
Bode, L. (2016) in “Political News in the News Feed: Learning Politics from Social
Media” in Mass Communication & Society, 19(1), pp. 24-48.
Böhler, W. and A. Falathová (2013) “Parlamentswahlen in Tschechien: Wähler rechnen
mit der Post-89er Demokratie” in Länderberichte: Konrad-Adenauer Stiftung.
Bond R.M. et al. (2012) “A 61-million-person Experiment in Social Inuence and
Political Mobilization” in Nature, 489. pp. 295-298.
Borjas, G. J. (1992) “Ethnic Capital and Intergenerational Mobility” in The Quarterly
Journal of Economics, 107, pp. 123-50.

233
Borjas, G. J. (1994) “Long-Run Convergence of Ethnic Skill Differentials: The
Children and Grandchildren of the Great Migration” in Industrial and Labor Relations
Review, 47, pp. 553-73.
Bowler, S. and J.A. Karp (2004) “Politicians, scandals and trust in government” in
Political Behaviour, 26(3), pp. 271-287.
Brader, T. and J. Tucker (2009) “What’s left behind when the party’s over: Survey
experiments on the effects of partisan cues in Putin’s Russia” in Politics & Policy, 37,
pp. 843-868.
Bratton, M. (2007) “Formal Versus Informal Institutions in Africa” in Journal of
Democracy, 18(3 pp. 96-110.
Bratton, M. and N. van de Walle (1997) “Democratic Experiments in Africa: Regime
Transitions in Comparative Perspective” in Cambridge Studies in Comparative Politics.
Cambridge University Press.
Brown, J. and P., Reinegen, (1987) “Social ties and word-of-mouth referral behavior” in
Journal of Consumer Research 14:3, 1987, pp. 350-362.
Bruns, A., and J. Burgess (2011) “# ausvotes: How Twitter covered the 2010 Australian
federal election” in Communication, Politics & Culture, 44(2).
Bruns, A. and S. Stieglitz (2013) “Towards More Systematic Twitter Analysis: Metrics
for Tweeting Activities” in International Journal of Social Research Methodology 16
(2), pp. 91-108.
Brusco, V.; Nazareno, M. and S. Stokes (2004) “Vote Buying in Argentina” in Latin
American Research Review 39(2) pp. 66-88.
Burlacu, D. E. (2011) “The Consequences of Corruption on Electoral Behaviour. Leader
vs. Party Effects. Do Voters Choose the Lesser Evil?” in European Conference on
Comparative Electoral Research.
Campbell, et al. (1960) in The American Voter. New York: John Wiley.

234
Caramani, D. (2006) “Is There a European Electorate and What Does It Look Like?
Evidence from Electoral Volatility Measures, 1976-2004” in West European Politics 29
No. 1 pp. 1-27.
Case, A. C. and L. F. Katz, (1991) “The company you keep: The effects of family and
neighborhood on disadvantaged youths” in NBER Working Paper 3705.
Ceccarini, L. and F. Bordignon (2016) “The Five Stars continue to shine: The
consolidation of Grillo’s ‘movement party’in Italy” in Contemporary Italian Politics,
8(2), p.131-159.
Cha, M. et al. (2010) “Measuring User Influence in Twitter: The Million Follower
Fallacy in Proceedings International AAAI Conference on Weblogs and Social Media
(ICWSM).
Chang, E.C.C.; Golden M. A. and S. J. Hill (2010) “Legislative Malfeasance and
Political Accountability” in World Politics, 62, pp. 177-220.
Chang, E.C.C.; Golden M. A. and S. J. Hill (2007) “Electoral Consequences of
Political Corruption” in Annual Meeting of American Political Science Association.
Chang, E.C.C. and N. N. Kerr (2009) “Do Voters Have Different Attitudes Toward
Corruption? The Sources and Implications of Popular Perceptions and Tolerance of
Political Corruption” in Afrobarometer, 116.
Chang, E.C.C. and Y. Chu (2006) “Corruption and trust: Exceptionalism in Asian
democracies? in Journal of Politics 68(2), pp.259–271.
Charness, G. and P. Kuhn (2011) “Lab Labor: What Can Labor Economists Learn in the
Lab?” in Handbook of Labor Economics, Volume 4a, pp. 229-330.
Charron, N., and A. Bagenholm (2016) “Ideology, Party Systems and Corruption
Voting in European Democracies” in Electoral Studies, 41, pp. 35-49.
Chen, J. et al. (2013) “CrowdE: Filtering Tweets For Direct Customer Engagements” in
IBM Almaden Research Center.
Chong, A. et al. (2011) “Looking beyond the Incumbent: The Effects of Exposing
Corruption on Electoral Outcomes” in National Bureau of Economic Research.

235
Chong, A. et al. (2015) “Does corruption information inspire the fight or quash the
hope? A field experiment in Mexico on voter turnout, choice and party identification” in
The Journal of Politics, 77:1, pp. 55-71.
Christakis, N.A. and J. Fowler (2007) “The Spread of Obesity in a Large Social
Network over 32 Years” in The New England Journal of Medicine 357, pp. 370-379.
Christensen, H.S. (2011) “Political activities on the Internet: Slacktivism or political
participation by other means?” in First Monday, 16(2).
Cialdini, R.B. and N.J. Goldstein (2004) “Social Influence: Compliance and
Conformity” in Annual Review of Psychology 55, February 2004, pp. 591-621.
Cialdini R.B. and M. R. Trost (1998) “Social Influence: Social Norms, Conformity, and
Compliance” in Gilbert D. T.; Fiske, S. T. and G. Lindzey (ed.), The Handbook of
Social Psychology, 4th edition. Boston, McGraw-Hill, pp. 151-192.
Clauset A.; Newman M. and C. Moore (2004) “Finding community structure in very
large networks” in Phys. Rev. E 70, 066111.
Coan, T. G. et al. (2008). “It’s not easy being green: minor party labels as heuristic
aids” in Political Psychology, 29, pp. 389-405.
Coleman, J.; Menzel, H. and E. Katz, (1966) “Medical Innovations: A Diffusion Stud”
in Bobbs Merrill.
Congosto, M. and P. Aragón (2012) “Twitter, del sondeo a la sonda: nuevos canales de
opinión, nuevos métodos de análisis” in I Congreso Internacional en Comunicación
Política y Estrategias de Campaña.
Congosto, M.; Fernández, M. and E. Moro (2011) “Twitter y Política: Información,
Opinión y ¿Predicción?” in Cuadernos de Comunicación Evoca, 4.
Conover, M. D., et al. (2011) “Political Polarization on Twitter” in Center for Complex
Networks and Systems Research School of Informatics and Computing Indiana
University, Bloomington, IN, USA.
Conover, M.D., et al. (2012) “Partisan Asymmetries in Online Political Activity” in EPJ
Data Science, 1(1), pp.1-19.

236
Converse, P. (1964) “The nature of belief systems in mass publics” in Apter, D. (Ed.),
“Ideology and discontent” in New York: Free Press.
Coppock, A.; Guess A. and J. Ternovski (2014) “When Treatments Are Tweets: A
Network Mobilization Experiment Over Twitter” in APSA Conference Paper.
Cordero, G. and A. Blais (2017) “Is a corrupt government totally unacceptable?” in
West European Politics, 40:4, pp. 645-662.
Cordero, G., and J.R. Montero (2015) “Against Bipartyism, towards Dealignment? The
2014 European Election in Spain” in South European Society and Politics, 20:3, pp.
357-379.
Costas-Pérez, E., Solé-Ollé, A. and P. Sorribas-Navarro (2010) “Do voters really
tolerate corruption? Evidence from Spanish Mayors” Retrieved from
http://www.polisci.ucla.edu/department-workshops/cp-workshop-pdfs/ Do Voters
Tolerate Corruption-Nov2010.pdf
Costas-Pérez, E., Solé-Ollé, A. and P. Sorribas-Navarro (2012) “Corruption Scandals,
Voter Information, and Accountability” in European Journal of Political Economy,
28(4), pp. 469–84.
Dalton, R. (2006) “Social modernization and the end of ideology debate” in Japanese
Journal of Political Science, 7, pp. 1-22.
Dalton, R. and I. McAllister (2015) “Random walk or planned excursion? Continuity
and change in the Left-Right positions of political parties” in Comparative Political
Studies, 48, pp. 759-787.
Davis, C. L.; Camp, R. and K. M. Coleman, (2004) “The influence of party systems on
citizens’ perceptions of corruption and electoral response in Latin America” in
Comparative Political Studies, 37, pp. 677-703.
Della Porta, D. (2000) “Social capital, beliefs in government, and political corruption.
In disaffected democracies: What’s troubling the trilateral countries” in Princeton
University Press.

237
Della Porta, D. (2015) “Social Movements in Times of Austerity” in Cambridge Polity
Press.
DellaVigna, S.; List, J. A. and U. Malmendier (2010) “Testing for Altruism and Social
Pressure in Charitable Giving” in UC Berkeley, U Chicago and NBER.
Demirhan, K. (2016a) “Participation, civil society and the Facebook use of NGOs in
Turkey” in Political Scandal, Corruption, and Legitimacy in the Age of Social Media,
IGI Global, pp. 223-246.
Demirhan, K. (2016b) “Scandal politics and political scandals in the era of digital
interactive” in Political Scandal, Corruption, and Legitimacy in the Age of Social
Media, IGI Global, pp. 26-50.
Demirhan, K. and D. Çakır-Demirhan (2016) “Political Scandal, Corruption, and
Legitimacy in the Age of Social Media” in IGI Global, pp. 1-295.
Devos, T.; Spini, D. and S.H. Schwartz (2002) “Conflicts among human values and
trust in institutions” in British Journal of Social Psychology, 41(4), 481-494.
Dholakia, U. M. and R. P. Bagozzi, (2001) “Consumer behavior in digital
environments” in Wind, J. and V. Mahajan (Eds.), Digital marketing: Global strategies
from the world’s leading experts. New York, Wiley, pp. 163-200.
Dholakia, U. M.; Bagozzi, R. P. and L. K. Pearo (2004) “A social influence model of
consumer participation in network- and small-group-based virtual communities” in
International Journal of Research of Marketing 21, 2004, pp. 241-263.
Diaz-Cayeros, A.; Magaloni, B., and B. Weingast (2000) “Federalism and
democratization in Mexico” presented at The Annual Meeting of the American Political
Science Association, Washington, DC.
Diehl, T.; Brian E. W. and de Z. Gil (2016) “Political Persuasion on Social Media:
Tracing Direct and Indirect Effects of News use and Social Interaction” in New Media
& Society, 18(9), pp.1875-1895.

238
Dimitrova, D. V. and D. Bystrom (2013) “The Effects of Social Media on Political
Participation and Candidate Image Evaluations in the 2012 Iowa Caucuses” in
American Behavioral Scientist, 57(11), pp.1568-1583.
Dimock, M.A., and G.C. Jacobson (1995) “Checks and Choices: The House Bank
Scandal’s Impact on Voters in 1992” in The Journal of Politics, 57, pp. 1143-1159.
Dobratz, B. A. and S. Whitfield (1992) “Does scandal influence voters’ party
preference? The case of Greece during the papandreou era” in European Sociological
Review, 8, pp. 167-180.
Dohmen, T. J., (2005) “Social Pressure Influences Decisions of Individuals: Evidence
from the Behavior of Football Referees” in IZA DP 7595.
Domingos, P. and M. Richardson, (2001) “Mining the Network Value of Customers” in
ACM Seventh International Conference on Knowledge Discovery and Data Mining,
2001.
Downs, A. (1957) “An economic theory of democracy” in New York: Harper & Row.
Duch R.M.; Palmer H.D. and C. J. Anderson (2000) “Heterogeneity in perceptions of
national economic conditions” in American Journal of Political Science, 44(4), pp.
635-652.
Dunlap R. E.; Xiao C. and A. M. McCright (2001) “Politics and environment in
America: Partisan and ideological cleavages in public support for environmentalism” in
Env Polit, 10(4), pp. 23-48.
Ecker, A.; Glinitzer, K. and T. M. Meyer (2016) “Corruption performance voting and
the electoral context” in European Political Science Review, 8:3, pp. 333-354.
Eggers, A. and A. Fisher (2011) “Electoral Accountability and the UK Parliamentary
Expenses Scandal: Did Voters Punish Corrupt MPs’?” in SSRN Electronic Journal.
Ekman, M. and A. Widholm (2014) “Twitter and the Celebritisation of Politics” in
Celebrity Studies, 5(4), pp.518-520.
Ellison, G., (1993) “Learning, Local Interaction, and Coordination” in Econometrica
61:5, 1993, pp. 1047-1071.

239
Eltantawy N. and J. B. Wiest (2011), “Social Media in the Egyptian Revolution:
Reconsidering Resource Mobilization Theory”, in International Journal of
Communication, 5, pp. 1207-1224.
Engler, S. (2015) “The Role of Corruption in Explaining the Electoral Success of New
Political Parties in Central and Eastern Europe” in ECPR Joint Sessions Warsaw.
Esaiasson, P. and S. Holmberg (1996) “Representative from above: Members of
Parliament and representative democracy in Sweden” in Brookfield, VT: Dartmouth
Publishing.
Essien, D. (2016) “Navigating the Nexus between Social Media, Political Scandal, and
Good Governance in Nigeria: Its Ethical Implications” in Political Scandal, Corruption,
and Legitimacy in the Age of Social Media, IGI Global, pp. 157-184.
Fackler, T. and T. Lin (1995) “Political corruption and presidential elections, 1929-
1992” in Journal of Politics, 57, pp. 971-993.
Falk, A. and A. Ichino (2006) “Clean Evidence on Peer Effects” in Journal of Labor
Economics, 24, 39-58.
Feldman, S. (2003) “Oxford Handbook of Political Psychology” in Oxford University
Press, pp. 477-508.
Feller, A. et al., (2011) “Divided They Tweet: The Network Structure of Political
Microbloggers and Discussion Topics” in International Conference on Weblogs and
Social Media (ICWSM).
Fernández-Vázquez, P.; Barberá, P. and G. Rivero (2016) “Rooting Out Corruption or
Rooting for Corruption? The Heterogeneous Electoral Consequences of Scandals” in
Political Science Research and Methods, 4:2, pp. 379-397.
Ferraz, C., and F. Finan (2008) “Exposing corrupt politicians: The effects of Brazil’s
publicly released audits on electoral outcomes” in Quarterly Journal of Economics, 123,
pp. 703-745.
Festinger, L. (1962) “A theory of cognitive dissonance” in Stanford University Press.

240
Figueiredo, M. F.; Hidalgo D. and Y. Kasahara (2010) “When Do Voters Punish
Corrupt Politicians? Experimental Evidence from Brazil” Yale University.
Franzé, J. (2017) “Podemos’ discourse trajectory: From antagonism to agonism” in
Revista Española de Ciencia Política, 44, pp.219-246.
Freire, A. (2006) “Bringing social identities back in: The social anchors of Left-Right
orientation in Western Europe” in International Political Science Review, 27, pp. 359-
378.
Friedkin, N. E., and E. C. Johnsen, (1999) “Social Influence Networks and Opinion
Change” in Advances in Group Processes 16, pp. 1-29.
Frey, B. and S. Meier, (2004) “Social Comparisons and Pro-Social Behavior: Testing
‘Conditional Cooperation’ in a Field Experiment” in American Economic Review 94
(5), December 2004, pp. 1717-1722.
Garicano, L.; Palacios-Huerta, I. and C. Prendergast (2005) “Favoritism under social
pressure” in The Review of Economics and Statistics 87(2), May 2005, pp. 208-216.
Gatti, R.; Paternostro, S., and J. Rigolini (2003) “Individual attitudes toward corruption:
do social effects matter?” in World Bank Policy Research Working Paper 3122.
Geddes, B. (1994) “Politician’s Dilemma” in University of California Press.
Georganas S.; Tonin M. and M. Vlassopoulos (2013) “Peer Pressure and Productivity:
The Role of Observing and Being Observed” in IZA DP, 7523.
Gerber, A. and T. Rogers (2009) “Descriptive Social Norms and Motivation to Vote:
Everybody's Voting and So Should You” in Journal of Politics 71, pp. 1-14.
Gerber, A. and D. Green (1999) “Misperceptions about perceptual bias” in Annual
Review of Political Science 2, pp. 189-210.
Gerber A.; Green D. and C. W. Larimer (2008) “Social Pressure and Voter Turnout:
Evidence from a Large-Scale Field Experiment” in American Political Science Review
Vol. 102, nº 1, February 2008.
Gerring, J. and S. Thacker (2005) “Do Neoliberal Policies Deter Political Corruption?”
in International Organization, 59 pp. 233-54.

241
Giraldo-Luque, S. (2018) “Protesta social y estadios del desarrollo moral: una propuesta
analítica para el estudio de la movilización social del siglo XXI” in Palabra Clave,
21(2), pp.469-498.
Gladwell, M. (2010) “Small Change: Why the revolution will not be tweeted” in The
New Yorker.
Gladwell, M. (2002) “The Tipping Point: How Little Things Can Make a Big
Difference” in Back Bay Books.
Glaeser, E. L.; Sacerdote B. and J. A. Scheinkman (1996) “Crime and social
interactions” in Quarterly Journal of Economics 111, p. 507-548.
Gohdes, A. (2014) “Repression in the Digital Age: Communication Technology and the
Politics of State Violence” Doctoral Dissertation, University of Mannheim.
Golden, M. A. (2007) “Some puzzles of political corruption in modern advanced
Democracies” in Researchgate. Retrieved from https://www.researchgate.net/
publication/228652944_Some_Puzzles_of_Political_Corruption_in_Modern_Advanced
_Democracies.
Goldenberg, J.; Libai, B. and E. Muller, (2001a) “Talk of the Network: A Complex
Systems Look at the Underlying Process of Word-of-Mouth” in Marketing Letters 12:3,
2001, pp. 211-223.
Goldenberg, J.; Libai, B. and E. Muller, (2001b) “Using Complex Systems Analysis to
Advance Marketing Theory Development” in Academy of Marketing Science Review,
2001.
González-Bailón, et al (2011) “The dynamics of protest recruitment through an online
network” in Scientific reports, 1(197).
Goren, P. (2005) “Party Identification and Core Political Values” in American Journal
of Political Science, 49(4), pp. 881-896.
Gromet, D.M.; Kunreuther, H. and R.P. Larrick, R.P (2013) “Political ideology affects
energy-efficiency attitudes and choices” in PNAS, 110 (23), 9191-9192.

242
Guadián-Orta, C.; Pardo, F.M.R. and J.L. Salas (2012) “Análisis de Redes de Influencia
en Twitter” in II Congreso Español de Recuperación de Información (CERI 2012),
Universitat Politècnica de València.
Gunther, R. (2005) “Parties and Electoral Behavior in Southern Europe” in
Comparative Politics 37 No. 3 pp. 253-275.
Gusinski, S. (2015) “Corrupting the Cyber-Commons: Social Media as a Tool of
Autocratic Stability” in Perspectives on Politics, 13.
Habermas, J. (1962) “The structural transformation of the public sphere: An inquiry into
a category of bourgeois society” in Cambridge Press.
Hale S. A. et al. (2014) “Investigating Political Participation and Social Information
Using Big Data and a Natural Experiment” in Annual Meeting of the American Political
Science Association.
Hanley, S. and A. Sikk (2014) “Economy, Corruption or Floating voters? Explaining
the Breakthroughs of Anti-Establishment Reform Parties in Eastern Europe” in Party
Politcs 22(4) pp. 522-533.
Haughton, T. and A. Krašovec (2013) “The 2011 parliamentary elections in Slovenia”
in Electoral Studies, 32, pp. 197-208.
Heidenheimer, A. J. (1970) “Political Corruption: Readings in Comparative Analysis”
in New York: Holt.
Hendricks, J.A. and R.E. Denton (2010) “Communicator-in-Chief: How Barack Obama
Used New Media Technology to Win the White House” in Lanham: Lexington Books.
Hellwig, T. (2014) “The structure of issue voting in postindustrial democracies” in
Sociological Quarterly, 55, pp. 596-624.
Hooghe L., Marks G. and C. Wilson (2002) “Does Left/Right Structure Party Positions
on European Integration?” in Comparative Political Studies, 35(8), pp.965-989.
Hu, Y. et al. (2012) “What were the Tweets about? Topical Associations between Public
Events and Twitter Feeds” in Department of Computer Science, Arizona State
University.

243
Hug, S. (2001) “Altering Party Systems. Strategic Behavior and the Emergence of New
Political Parties in Western Democracies” in Ann Arbor: University of Michigan Press.
Hughes, A. L. and L. Palen (2009) “Twitter Adoption and Use in Mass Convergence
and Emergency Events” in University of Colorado at Boulder.
Hui, P. and S. Buchegger (2009) “Groupthink and Peer Pressure: Social Influence in
Online Social Network Groups” in Deutsche Telekom Laboratories, TU-Berlin.
Hutter, S., Kriesi, H. and G. Vidal (2018) “Old versus new politics: The political spaces
in Southern Europe in times of crises” in Party Politics, 24(1), pp.10-22.
Ince, J.; Rojas, F. and C. A. Davis (2017) “The Social Media Response to Black Lives
Matter: How Twitter Users Interact with Black Lives Matter through Hashtag Use” in
Ethnic & Racial Studies, 40(11), pp.1814-1830.
Inglehart, R. (1990) “Culture shift in advanced industrial societies” in Princeton, NJ:
Princeton University Press.
Inglehart, R. and H.D. Klingemann (1976) “Party identification, ideological preference,
and the left-right dimension among Western mass publics” in Budge, I; Crew, I. and D.
Farlie (Eds.), “Party identification and beyond” in New York: Wiley.
Isenberg, D.J. (1986) “Group Polarization: A Critical Review and Meta Analysis” in
Journal of Personality and Social Psychology 50, pp. 1141-1151.
Jennings, F. J. et al. (2017) “Tweeting Presidential Primary Debates: Debate Processing
through Motivated Twitter Instruction” in American Behavioral Scientist, 61(4),
pp.455-474.
Jerit, J. and J. Barabas (2012) “Partisan Perceptual Bias and the Information
Environment” in The Journal of Politics, 74, pp. 672-684.
Jha C. K. (2016) “Information control, transparency, and social media: Implications for
corruption” in Political Scandal, Corruption, and Legitimacy in the Age of Social
Media, IGI Global, pp. 51-75.
Jiménez, F. and M. Caínzos (2004) “The electoral consequences of political scandals”
in Revista Española de Ciencia Política, 10, pp. 141-170.

244
Johnson, C. (1986) “Tanaka Kakuei, Structural corruption and the advent of Machine
Politics in Japan” in Journal of Japanese Studies, 12(1), 1-28.
Jost, J. T. and O. Hunyady (2002) “The psychology of system justification and the
palliative function of ideology” in European Review of Social Psychology, 13(1),
pp.111-153.
Jost, J. T. et al. (2003a) “Exceptions that prove the rule: Using a theory of motivated
social cognition to account for ideological incongruities and political anomalies” in
Psychological Bulletin, 129(3), pp.383-393.
Jost, J. T. et al. (2003b) “Political conservatism as motivated social cognition” in
Psychological Bulletin, 129(3), pp.339-375.
Jou W. and R.J. Dalton (2017) “Left-Right Orientations and Voting Behavior” in
Oxford Research Encyclopedia of Politics.
Jungherr, A. (2010) “Twitter in Politics: Lessons Learned During the German
Superwahljahr 2009” in CHI 2010, April 10–15, Atlanta, Georgia.
Kam, C. D. (2005) “Who toes the party line? Cues, values, and individual differences”
in Political Behavior, 27, pp. 163-182.
Katz, E. and P. Lazarsfeld (1955) “Personal Influence: The Part Played by People in the
Flow of Mass Communications” in New York: The Free Press.
Katz, L. F.; Kling J. R. and J. B. Liebman (2001) “Moving to Opportunity in Boston:
Early Result of a Randomized Mobility Experiment” in The Quarterly Journal of
Economics, 116(2), pp. 607-54.
Kaufman, D.; Kraay A. and P. Zoido-Lobaton (1999) “Governance Matters” in World
Bank Policy Research Working Paper, 2196.
Kelman, H. C. (1958) “Compliance, identification, and internalization: Three Processes
of attitude change” in Journal of Conflict Resolution 2, pp. 51-60.
Kioupkiolis, A. and F. S. Pérez (2018) “Reflexive technopopulism: Podemos and the
search for a new left-wing hegemony” in European Political Science, pp.1-13.

245
Kioupkiolis, A. and G. Katsambekis, (2018) “Radical Left Populism from the Margins
to the Mainstream: A Comparison of Syriza and Podemos” In Podemos and the New
Political Cycle, pp.201-226. Palgrave Macmillan, Cham.
Klasnja, M. and J.A. Tucker (2013) “The economy, corruption, and the vote: evidence
from experiments in Sweden and Moldova” in Electoral Studies, 32:3, pp. 536-543.
Kleinberg, J., (1999) “Authoritative sources in a hyperlinked environment” in Journal
ACM, 46(5), pp. 604–632.
Knight, K. (2006) “Transformations of the concept of ideology in the twentieth century”
in Am Polit Sci Rev, 100(4), pp.619-626.
Knutsen, O. (1997) “The partisan and the value-based component of Left-Right
selfplacement: A comparative study” in International Political Science Review, 18, pp.
191–225.
Knutsen, O. (1995) “Value orientations, political conflicts and left-right identification:
A comparative study in European Journal of Political Research, 28, pp. 63-93.
Koc-Michalska, K.; Darren G. L. and T. Vedel (2016) “Civic Political Engagement and
Social Change in the New Digital Age” in New Media & Society, 18(9), pp.1807-1816.
Kostadinova, T. (2012) “Political Corruption in Eastern Europe. Politics After
Communism” in London: Lynne Rienner Publishers.
Kouloumpis, E.; Wilson, T. and J. Moore (2011) “Twitter Sentiment Analysis: The
Good the Bad and the OMG!” in University of Edinburgh, Edinburgh, UK.
Kriesi H., et al. (2012) “Political Conflict in Western Europe” in Cambridge University
Press.
Kurer, O. (2010) “Why Do Voters Support Corrupt Politicians?” in The Political
Economy of Corruption, pp. 63-85.
Kushin, M. J. and M. Yamamoto (2010) “Did Social Media really Matter? College
Students' use of Online Media and Political Decision Making in the 2008 Election” in
Mass Communication & Society, 13(5), pp.608-630.

246
Lambsdorff, J. G. (2006) “Causes and consequences of corruption: What do we know
from a cross-section of countries?” in S. Rose-Ackerman (Ed.), International handbook
on the economics of corruption (pp. 3-52). Northampton, MA: Edward Elgar.
Lamm, H., and D.G. Myers (1978). “Group-Induced Polarization of Attitudes and
Behavior.” in Advances in Experimental Social Psychology 11, pp. 145-195.
Lane, J. E. and S. Ersson. (2007) “Party System Instability in Europe: Persistent
Differences in Volatility between West and East” in Democratization 14 No. 1, pp. 92-
110.
Lane, R. E. (1962) “Political ideology: Why the American common man believes what
he does” in New York: Free Press.
Leavitt, A. et al. (2009) “The Influentials: New Approaches for Analyzing Influence on
Twitter” in Web Ecology Project, http://tinyurl.com/lzjlzq.
Lehmann, J. et al. (2012) “Dynamical classes of collective attention in twitter” in
Proceedings of the 21st international conference on World Wide Web, pp.251-260.
Lemarchand, R. (1972) “Political Clientelism and Ethnicity in Tropical Africa:
Competing Solidarities in Nation-Building” in The American Political Science Review
66(1), pp. 68-90.
Lerner, J. S. and P. E. Tetlock (1999) “Accounting for the effects of accountability” in
Psychological Bulletin 125 (March) pp. 255-75.
Li, H.; Xu, L.C. and Z. Heng-Fu Zoum (2000) “Corruption, Income Distribution and
Growth” in Economics and Politics, 12 pp. 155-82.
Lipset, S. M. and S. Rokkan (1967) “Cleavage Structures, Party Systems, and Voter
Alignments: An Introduction”, in Lipset, S. M. and S. Rokkan (eds.) “Party Systems
and Voter Alignments. Cross-National Perspectives” in New York: The Free Press, pp.
1-64.
Listhaug, O. and T. Aalberg (1999) “Comparative public opinion on distributive
justice” in International Journal of Comparative Sociology, 40(1), pp. 117-140.

247
Livne, A. et al. (2011) “The Party Is Over Here: Structure and Content in the 2010
Election” in International Conference on Weblogs and Social Media, 11, pp.17-21.
Lodge, M. and C. S. Taber (2013) “The rationalizing voter” in Cambridge University
Press.
Ludwig, J.; Duncan G. J. and P. Hirschfield (2001) “Urban Poverty and Juvenile Crime:
Evidence from a Randomized Housing-Mobility Experiment” in Quarterly Journal of
Economics, 116 (2), pp. 655-80.
Lumezanu C., Feamster N. and H. Klein (2012) “#bias: Measuring the Tweeting
Behavior of Propagandists” in NEC Laboratories America and Georgia Tech.
Madrid, R. (2005) “Ethnic Cleavages and Electoral Volatility in Latin America” in
Comparative Politics, 38 pp. 1-20.
Mahajan, V.; Muller, E. and F. Bass, (1990) “New Product Diffusion Models in
Marketing: A Review and Directions for Research” in Journal of Marketing 54:1, 1990
pp. 1-26.
Mainwaring, S. and E. Zoco (2007) “Political Sequences and the Stabilization of
Interparty Competition. Electoral Volatility in Old and New Democracies” in Party
Politics, 13:2, pp. 155-178.
Mainwaring, S.; España, A. and C. Gervasoni (2009) “Extra System Electoral Volatility
and the Vote Share of Young Parties” in Annual meeting of the Canadian Political
Science Association.
Mair, P. (2009) “Left-Right orientations” in Dalton, R. and H.D. Klingemann (Eds.)
“Oxford handbook of political behavior” in Oxford: Oxford University Press.
Malhotra, N. and A. G. Kuo (2008) “Attributing blame: The public’s response to
hurricane Katrina” in Journal of Politics, 70, pp. 120-135.
Manrique, C. G. and G. G. Manrique (2016) “Social media’s role in alleviating political
corruption and scandals: The Philippines during and after the Marcos regime” in
Political Scandal, Corruption, and Legitimacy in the Age of Social Media, IGI Global,
pp. 205-222.

248
Manzetti, L. and C. Wilson, (2007) “Why do corrupt governments maintain public
support?” in Comparative Political Studies, 40, pp. 949-970.
Marinov, N. and F. Schimmelfennig (2015) “Does Social Media Promote Civic
Activism? Evidence from a Field Experiment” in Spring Colloqium of the Center for
Comparative and International Studies, Zürich, Germany.
Mas, A. and E. Moretti (2009) “Peers at Work” in American Economic Review, 99(1),
pp. 112-145.
Mauro, P. (1995) “Corruption and growth” in Quarterly Journal of Economics 110(3),
pp. 681-712.
McCann, J. A. and J. I. Dominguez (1998) “Mexicans react to electoral fraud and
political corruption: An assessment of public opinion and voting behaviour” in
Electoral Studies, 17, pp. 483-503.
McClelland, L. and S. W. Cook (1980) “Promoting Energy Conservation in Master-
Metered Apartments through Group Financial Incentives” in Journal of Applied Social
Psychology, 10, pp. 20–31.
McClendon, G. (2014) “Social Esteem and Participation in Contentious Politics: A
Field Experiment at an LGBT Pride Rally” in American Journal of Political Science,
pp. 279-290.
McCright A.M. and Dunlap R. E. (2011) “The politicization of climate change and
polarization in the American’s public view of global warming, 2001-2010” in Sociol Q,
52(2), pp.155-194.
McGarty, C. et al. (1992) “Group Polarization as Conformity to the Prototypical Group
Member.” in British Journal of Social Psychology 31, pp. 1-20.
McKinney, M. S.; Houston, J. B. and J. Hawthorne (2013) “Social watching a 2012
Republican presidential primary debate” in American Behavioral Scientist, 58, pp.556-
573.

249
Messing, S.; Bakshy E. and A. Fiore. (2014) “Social Inuence and Participation: How
Socially Shared Content Boosts Civic Participation” Working Paper, Facebook
Research Team, Menlo Park.
Metaxas, P.T.; Mustafaraj, E. and D. Gayo-Avello (2011) “How (not) to predict
elections” in 2011 IEEE Third International Conference on Privacy, Security, Risk and
Trust (PASSAT) and 2011 IEEE Third International Conference on Social Computing,
pp.165-71.
Miller, W. and M. Shanks (1996) “The new American voter” in Harvard University
Press.
Mishler, W. and R. Rose (2001) “What are the Origins of Political Trust? Testing
Institutional and Cultural Theories in Post-Communist Societies” in Comparative
Political Studies, 34 (1), pp. 30-62.
Morris, S. D. (2000) “Contagion” in Review of Economic Studies 67, 2000.
Morris, S. D. and J. L. Klesner (2010) “Corruption and trust: Theoretical considerations
and evidence from Mexico” in Comparative Political Studies, 43(10), pp. 1258-1285.
Mozaffar, S. and J. R. Scarritt (2005) “The Puzzle of African Party Systems” in Party
Politics 11 No. 4 pp. 399-421.
Mullainathan, S., and E. Washington, (2009) “Sticking with your vote: Cognitive
dissonance and political attitudes” in American Economic Journal: Applied Economics,
1, pp. 86-111.
Muñoz, J.; Anduiza E. and A. Gallego (2016) “Why Do Voters Forgive Corrupt
Politicians? Implicit exchange, credibility of information and clean alternatives” in
Local Government Studies, 42:4, pp. 598-615.
Muro, D. and G. Vidal (2017) “Political mistrust in Southern Europe since the Great
Recession” in Mediterranean Politics, 22(2), pp.197-217.
Murthy, D. (2015) “Twitter and Elections: Are Tweets, Predictive, Reactive, Or a Form
of Buzz?” in Information, Communication & Society, 18(7), pp. 816-831.

250
Nolan, J et al. (2008) “Normative Influence is Underdetected. Personality and Social
Psychology” in Bulletin 34, pp. 913-923.
Nye, J. S. (1967) “Corruption and political development: A cost-benefit analysis” in
American Political Science Review, 61, pp. 417-427.
O'Connor et al., (2010) “From tweets to polls: Linking text sentiment to public opinion
time series” in International Conference on Weblogs and Social Media, 11, pp. 122-
129).
Olken, B. A. and R. Pande (2012) “Corruption in developing countries” in Ann. Rev.
Econ., 4(1), pp. 479-509.
Orriols, L. and G. Cordero (2016) “The Breakdown of the Spanish Two-Party System:
The Upsurge of Podemos and Ciudadanos in the 2015 General Elections” in South
European Society and Politics, 26(4), pp. 469-492.
Passarelli, G. and D. Tuorto (2016) “The Five Star Movement: purely a matter of
protest? The rise of a new party between political discontent and reasoned voting” in
Party Politics, 24(2).
Pedersen, M. N. (1983) “Changing Patterns of Electoral Volatility in European Party
Systems: Explorations in Explanation” in Daalder, H. and P. Mair (eds) “Western
European Party Systems: Continuity and Change” in Beverly Hills, CA and London:
Sage, pp. 29-66.
Pedersen, M. N. (1979) “The Dynamics of European Party Systems: Changing Patterns
of Electoral Volatility” in European Journal of Political Research, 7 pp. 1-26.
Peña-López, I., Congosto, M. and P. Aragón (2014) “Spanish Indignados and the
evolution of the 15M movement on Twitter: towards networked para-institutions” in
Journal of Spanish Cultural Studies, 15(1-2), pp.189-216.
Peters, J. and S. Welch (1980) “The Effects of Charges of Corruption on Voting
Behavior in Congressional Elections” in American Political Science Review 74(3) pp.
697-708.

251
Piñeiro-Otero, T. and C. Costa-Sánchez (2012) “Ciberactivismo y redes sociales. El uso
de facebook por uno de los colectivos impulsores de la ‘spanish revolution’,
Democracia Real Ya (DRY)” in Observatorio, 6(3).
Pollitt, M.G. and I. Shaorshadze (2011) “The Role of Behavioural Economis in Energy
and Climate Policy” in CWPE 1165 and EPRG 1130.
Pop-Eleches, G. (2010) “Throwing Out the Bums. Protest Voting and Unorthodox
Parties after Communism” in World Politics, 62:2, pp. 221-260.
Powell, E. N. and J. A. Tucker (2014) “Revisiting Electoral Volatility in Post-
Communist Countries: New Data, New Results and New Approaches” in British
Journal of Political Science, 44:1, pp. 123-147.
Quercia, D.; Capra L. and J. Crowcroft (2012) “The SocialWorld of Twitter: Topics,
Geography, and Emotions” in The Computer Laboratory, University of Cambridge and
University College London, UK.
Ramiro, L. and R. Gomez (2017) “Radical-left populism during the great recession:
Podemos and its competition with the established radical left” in Political Studies,
65(1_suppl), pp.108-126.
Reed, S. (2005) “Japan: Haltingly Toward a Two-Party System.” in The Politics of
Electoral Systems, in Oxford University Press.
Richardson, M. and P. Domingos, (2002) “Mining Knowledge-Sharing Sites for Viral
Marketing” in Eighth Intl. Conf. on Knowledge Discovery and Data Mining, 2002.
Roberts, K. M. and E. Wibbels (1999) “Party Systems and Electoral Volatility in Latin
America: A Test of Economic, Institutional, and Structural Explanations” in American
Political Science Review, 93 pp. 575-90.
Robles-Egea A and S. Delgado-Fernández (2014) “Corruption in democratic Spain.
Causes, cases and consequences” in ECPR General Conference, Glasgow.
Rodríguez-Teruel, J. and A. Barrio (2016) “Going National: Ciudadanos from Catalonia
to Spain” in South European Society and Politics, 21(4), pp.587-607.
Rogers, E., (1962) “Diffusion of innovations” in Free Press.

252
Rogow, A. A. and H. Lasswell (1963) “Power, Corruption and Rectitude” in Englewood
Cliffs, N.J., Prentice-Hall.
Rohrschneider, R. (2015) “Is there a regional cleavage in Germany’s party system?
Ideological congruence in Germany 1980–2013” in German Politics, 24(3), pp. 354-
376.
Rose-Ackerman, S. (1999) “Corruption and Government. Causes, Consequences, and
Reform” in Cambridge University Press.
Rose-Ackerman, S.; Peters J.G. and S. Welch (1980) “The Effects of Charges of
Corruption on Voting Behavior in Congressional Elections” in American Political
Science Review, 74, pp. 697-708.
Rundquist, B. S. and S. Hansen (1976) “On Controlling Official Corruption: Elections
vs. Laws” Unpublished manuscript.
Rundquist, B. S.; Strom, G. and J. Peters, J. (1977) “Corrupt politicians and their
electoral support: some experimental observations in American Political Science
Review, 71 pp. 954-963.
Sacerdote, B. (2001) “Peer effects with random assignment: Results for Dartmouth
roommates” in Quarterly Journal of Economics, 116, pp. 681-704.
Sandholtz, W. and W. Koetzle (2000) “Accounting for corruption: economic structure,
democracy, and trade” in International Studies Quarterly, 44(1), pp. 31-50.
Sang, E.T.K. and J. Bos (2012) “Predicting the 2011 Dutch Senate Election results with
twitter” in Proceedings of the workshop on semantic analysis in social media,
Association for Computational Linguistics, pp.53-60.
Schultz W. et al. (2007) “The Constructive, Destructive, and Reconstructive Power of
Social Norms” in Psychological Science 18, pp. 429-434.
Schwartz H. A. et al. (2013) “Characterizing Geographic Variation in Well-Being using
Tweets” in University of Pennsylvania.

253
Schwartz, S. H. (1992) “Universals in the content and structure of values: Theoretical
advances and empirical tests in 20 countries” in Zanna, M. P. (Ed.) “Advances in
experimental social psychology” in San Diego, CA: Academic Pres, pp 1-65.
Seligson, M. A., (2002) “The impact of corruption on regime legitimacy: A comparative
study of four Latin American countries” in Journal of Politics, 64, pp. 408-433.
Settle, J. (2014) “Newspaper to News Feed: How Social Media Has Changed the Way
We Access News and Discuss Politics” Manuscript, College of William and Mary.
Shamir, M . (1984) “Are Western Party Systems “Frozen”? A Comparative Dynamic
Analysis” in Comparative Political Studies 17 pp. 35-79.
Sherif, M. (1936) “The Psychology of Social Norms” in New York: Free Press.
Sherrod, D. (1971) “Selective perception of political candidates” in Public Opinion
Quarterly, 35, pp. 554-562.
Shirky, C. (2011) “The political power of social media: Technology, the public sphere,
and political change” in Foreign affairs, pp. 28-41.
Siegel, R. (2018) “Life, Liberty and the Pursuit of Social Media: Understanding the
Relationship Between Facebook, Twitter, and Political Understanding” in Sociology
Senior Theses, 3.
Sikk, A. (2005) “How Unstable? Volatility and the Genuinely New Parties in Eastern
Europe” in European Journal of Political Research, 44, pp. 391-412.
Sikk, A. (2012) “Newness as a Winning Formula for New Political Parties” in Party
Politics,18 (4), pp. 465-486.
Skoric, M. et al. (2012) “Tweets and votes: A study of the 2011 Singapore General
Election” in Proceedings of 45th Hawaii International International Conference on
Systems Science, pp. 2583-2591.
Sola, J. and C. Rendueles (2017) “Podemos, the upheaval of Spanish politics and the
challenge of populism” in Journal of Contemporary European Studies, pp.1-18.
Spourdalakis, M. (2013) “Left strategy in the Greek cauldron: Explaining Syriza’s
success” in Socialist Register, 49, pp.98-119.

254
Stavrakakis Y. and G. Katsambekis (2014) “Left-wing populism in the European
periphery: the case of SYRIZA” in Journal of Political Ideologies, 19(2), pp.119-142.
Stockemer, D.; LaMontagne, B., and L. Scruggs, (2013) “Bribes and ballots: The
impact of corruption on voter turnout in democracies” in International Political Science
Review, 34(1), pp. 74-90.
Stokes, S. (2005) “Perverse Accountability: A Formal Model of Machine Politics” in
American Political Science Review 99(3) pp. 315-325.
Stokes, S. (2007) “Political Clientelism” in The Oxford Handbook of Comparative
Politics. Oxford University Press.
Svensson, J. (2005) “Eight questions about corruption” in Journal of Economic
Perspectives, 19, pp. 19-42.
Tavits, M. (2007) “Clarity of Responsibility and Corruption” in American Journal of
Political Science, 51 pp. 218-29.
Tavits, M. (2005) “The Development of Stable Party Support: Electoral Dynamics in
Post-Communist Europe” in American Journal of Political Science 49 pp. 283-98.
Tavits, M. (2008) “Party Systems in the Making: The Emergence and Success of New
Parties in New Democracies” in British Journal of Political Science, 38:1, pp. 113-133.
Toka, G. (1998) “Party Appeals and Voter Loyalty in New Democracies” in Political
Studies 46 No. 3 pp. 589-610.
Tyler, T. R. and K. M. McGraw (1986) “Ideology and the interpretation of personal
experience: Procedural justice and political quiescence” in Journal of Social Issues,
42(2), pp. 115-128.
Topa, G. (2001) “Social interactions, local spillovers, and unemployment” in Review of
Economic Studies, 68, pp. 261-295.
Toret, J. (2013) “Tecnopolítica: la potencia de las multitudes conectadas. El sistema red
15M, un nuevo paradigma de la política distribuid” in. IN3 Working Paper Series.
Treisman D. (2000) “The causes of corruption: A cross-national study” in Journal of
Public Economics, 76(3), pp. 399-457.

255
Tronconi F. (2018) “The Italian Five Star Movement during the Crisis: Towards
Normalisation?” in South European Society and Politics, 23(1), pp.163-180.
Tufekci, Z. and C. Wilson (2012) “Social Media and the Decision to Partici-pate in
Political Protest: Observations From Tahrir Square” in Journal of Communication, pp.
363-379.
Tumasjan A., et al. (2010) “Predicting Elections with Twitter: What 140 Characters
Reveal about Political Sentiment” in Technische Universität München.
Turner, J.C., and P.J. Oakes (1989) “Self-Categorization Theory and Social Influence.”
in Psychology of Group Influence, pp 233-275, edited by P.B. Paulus. Hillssdale, NJ:
Lawrence Erlbaum.
Valente, T., (1995) “Network Models of the Diffusion of Innovations” in Hampton
Press
Vallina-Rodriguez N. et al. (2012) “Los Twindignados: The Rise of the Indignados
Movement on Twitter” in International Conference on Privacy, Security, Risk and Trust
and International Confernece on Social Computing, pp. 496-501.
Villoria, M. and F. Jiménez (2012) “La corrupción en españa (2004–2010): Datos,
percepción y efectos” in Revista Española de Investigaciones Sociológicas, 138, pp.
109-34.
Vivyan, N.; Wagner, M. and J. Tarlov (2012) “Representative Misconduct, Voter
Perceptions and Accountability: Evidence from the 2009 House of Commons Expenses
Scandal” in Electoral Studies, 31, pp. 750-763.
Waller, L.G. (2016) “There is an App for that too: citizen-centric approach to combating
corruption in the digital age through the use of ICTs” in Political Scandal, Corruption,
and Legitimacy in the Age of Social Media, IGI Global, pp. 76-100.
Wagner C. and M. Strohmaier (2010) “The Wisdom in Tweetonomies: Acquiring
Latent Conceptual Structures from Social Awareness Streams” in WWW2010, April
2630, 2010, Raleigh, North Carolina.

256
Wasserman, S. and K. Faust, (1994) “Social Network Analysis: Methods and
Applications” in Cambridge University Press.
Watts, D., and P. Dodds (2007) “Influentials, Networks, and Public Opinion Formation”
in Journal of Consumer Research.
Wei, S. (2000) “How Taxing is Corruption on International Investors?,” in Economics
and Statistics 82 (1) pp. 1-11.
Weitz-Shapiro, R. and M. Winters, (2010) “Lacking information or condoning
corruption? Voter attitudes toward corruption in Brazil” in SSRN eLibrary. Retrieved
from http://papers.ssrn.com/sol3/papers.cfm?abstract_id=1641615.
Welch, S. and J. R. Hibbing (1997) “The Effects of Charges of Corruption on Voting
Behavior in Congressional Elections, 1982–1990.” in Journal of Politics 59(1) pp. 226-
239.
Weng, J. et al. (2010) “TwitterRank: Finding Topic-Sensitive Influential Twitterers” in
ACM WSDM.
Williams, C. and G. Gulati (2008) “What is a social network worth? Facebook and vote
share in the 2008 presidential primaries” in American Political Science Association.
Winters M. S. and R. Weitz-Shapiro (2013) “Lacking Information or Condoning
Corruption When Do Voters Support Corrupt Politicians?” in Comparative Politics,
July, pp. 418-436.
Wong, W. H. and P. A. Brown (2013) “E-Bandits in Global Activism: WikiLeaks,
Anonymous, and the Politics of No One” in Perspectives on Politics, 11, 1015-1033.
Wu, S. et al., (2011) “Who says what to whom on twitter” in Proceedings of the 20th
international conference on World wide web, pp.705-714.
Xenos M.; Vromen A. and B. D. Loader (2012) “The Great Equalizer? Patterns of
Social Media Use and Youth Political Engagement in Three Advanced Democracies” in
Information, Communication and Society, 17, pp. 151-167.
Young, P. H., (2002) “The Diffusion of Innovations in Social Networks” in Santa Fe
Institute Working Paper.

257
Young, P. H., (1998) “Individual Strategy and Social Structure: An Evolutionary
Theory of Institutions” in Princeton.
Zaller, J. R. (1992) “The Nature and Origins of Mass Opinion” in Cambridge
University Press.
Zechmeister, E.J. and D. Zizumbo-Colunga (2013) “The Varying Political Toll of
Concerns about Corruption in Good versus Bad Economic times” in Comparative
Political Studies, 46, pp. 1190-1218.
Zhu, H.; Huberman, B. A. and Y. Luon (2012) “To Switch or Not To Switch:
Understanding Social Influence in Online Choices” in Carnegie Mellon University.
Zinnbauer, D. (2015) ”Crowdsourced Corruption Reporting: What Petrified Forests,
Street Music, Bath Towels, and the Taxman Can Tell Us About the Prospects for Its
Future” in Policy & Internet, 7 (1), pp. 1-24.
Zuckerman, E. (2014) “Cute Cats to the Rescue? Participatory Media and Political
Expression” in Youth, New Media and Political Participation.