Towards a bottom-up reconstitution of the nuclear pore complex
252
Delft University of Technology Towards a bottom-up reconstitution of the nuclear pore complex Fragasso, A. DOI 10.4233/uuid:c717460d-eb79-495a-b239-4d030d0412c6 Publication date 2021 Document Version Final published version Citation (APA) Fragasso, A. (2021). Towards a bottom-up reconstitution of the nuclear pore complex. https://doi.org/10.4233/uuid:c717460d-eb79-495a-b239-4d030d0412c6 Important note To cite this publication, please use the final published version (if applicable). Please check the document version above. Copyright Other than for strictly personal use, it is not permitted to download, forward or distribute the text or part of it, without the consent of the author(s) and/or copyright holder(s), unless the work is under an open content license such as Creative Commons. Takedown policy Please contact us and provide details if you believe this document breaches copyrights. We will remove access to the work immediately and investigate your claim. This work is downloaded from Delft University of Technology. For technical reasons the number of authors shown on this cover page is limited to a maximum of 10.
-
Upload
khangminh22 -
Category
Documents
-
view
1 -
download
0
Transcript of Towards a bottom-up reconstitution of the nuclear pore complex

Delft University of Technology
Towards a bottom-up reconstitution of the nuclear pore complex
Fragasso, A.
DOI10.4233/uuid:c717460d-eb79-495a-b239-4d030d0412c6Publication date2021Document VersionFinal published versionCitation (APA)Fragasso, A. (2021). Towards a bottom-up reconstitution of the nuclear pore complex.https://doi.org/10.4233/uuid:c717460d-eb79-495a-b239-4d030d0412c6
Important noteTo cite this publication, please use the final published version (if applicable).Please check the document version above.
CopyrightOther than for strictly personal use, it is not permitted to download, forward or distribute the text or part of it, without the consentof the author(s) and/or copyright holder(s), unless the work is under an open content license such as Creative Commons.
Takedown policyPlease contact us and provide details if you believe this document breaches copyrights.We will remove access to the work immediately and investigate your claim.
This work is downloaded from Delft University of Technology.For technical reasons the number of authors shown on this cover page is limited to a maximum of 10.

TOWARDS A BOTTOM-UP RECONSTITUTION
OF THE NUCLEAR PORE COMPLEX


TOWARDS A BOTTOM-UP RECONSTITUTION
OF THE NUCLEAR PORE COMPLEX
Dissertation
for the purpose of obtaining the degree of doctorat Delft University of Technology,
by the authority of the Rector Magnificus, Prof.dr.ir. T.H.J.J. van der Hagen,chair of the Board for Doctorates to be defended publicly on
Friday 12th November 2021 at 15:00 o’ clock
by
Alessio FRAGASSO
Master of Science in Nanotechnologies for ICTs,Politecnico di Torino, Grenoble INP Phelma, and École
Polytechnique Fédérale de Lausanne,born in Camposampiero, Italy.

This dissertation has been approved by the
promotor: Prof. dr. C. Dekker
Composition of the doctoral committee:
Rector Magnificus chairpersonProf. dr. C. Dekker Delft University of Technology
Independent members:Prof. dr. M. Dogterom Delft University of TechnologyProf. dr. R. Lim University of BaselProf. dr. A. Zilman University of TorontoProf. dr. L. M. Veenhoff University of GroningenDr. S. Caneva Delft University of TechnologyProf. dr. B. Rieger Delft University of Technology, reserve member
Other members:Prof. dr. P. R. Onck University of Groningen
Keywords: nuclear pore complex; nanopores; FG nups; intrinsically disorderedproteins; biomimetics; DNA origami; 1/f noise
Printed by: Gildeprint
Front & Back: Erik Major
Copyright © 2021 by A. Fragasso
Casimir PhD Series, Delft-Leiden 2021-28
ISBN 978.90.8593.494.3
An electronic version of this dissertation is available athttp://repository.tudelft.nl/.

CONTENTS
1 General Introduction 11.1 Introduction . . . . . . . . . . . . . . . . . . . . . . . . . . . . . . . . 21.2 The nuclear pore complex . . . . . . . . . . . . . . . . . . . . . . . . . 31.3 Bottom-up approaches to unravel the NPC . . . . . . . . . . . . . . . . . 71.4 Single-molecule sensing with nanopores . . . . . . . . . . . . . . . . . . 71.5 DNA origami nanotechnology . . . . . . . . . . . . . . . . . . . . . . . 101.6 In this thesis . . . . . . . . . . . . . . . . . . . . . . . . . . . . . . . . 12References . . . . . . . . . . . . . . . . . . . . . . . . . . . . . . . . . . . . 14
2 Comparing current noise in biological and solid-state nanopores 212.1 Introduction . . . . . . . . . . . . . . . . . . . . . . . . . . . . . . . . 222.2 Noise sources in nanopores . . . . . . . . . . . . . . . . . . . . . . . . . 232.3 Noise in biological nanopores. . . . . . . . . . . . . . . . . . . . . . . . 262.4 Noise in solid-state nanopores . . . . . . . . . . . . . . . . . . . . . . . 282.5 Comparing the performance of biological and solid-state nanopores . . . . 292.6 Approaches to overcome noise limitations . . . . . . . . . . . . . . . . . 322.7 Conclusion . . . . . . . . . . . . . . . . . . . . . . . . . . . . . . . . . 34References . . . . . . . . . . . . . . . . . . . . . . . . . . . . . . . . . . . . 35
3 1/f noise in solid-state nanopores is governed by access and surface regions 453.1 Introduction . . . . . . . . . . . . . . . . . . . . . . . . . . . . . . . . 463.2 Results . . . . . . . . . . . . . . . . . . . . . . . . . . . . . . . . . . . 473.3 Conclusion . . . . . . . . . . . . . . . . . . . . . . . . . . . . . . . . . 533.4 Supporting Information. . . . . . . . . . . . . . . . . . . . . . . . . . . 55References . . . . . . . . . . . . . . . . . . . . . . . . . . . . . . . . . . . . 62
4 Nanopores: beyond DNA sequencing 694.1 Introduction . . . . . . . . . . . . . . . . . . . . . . . . . . . . . . . . 704.2 Characterization of single proteins with nanopores . . . . . . . . . . . . . 724.3 Single-Molecule Chemistry . . . . . . . . . . . . . . . . . . . . . . . . . 754.4 Synthetic nanopores as a tool to study biological questions . . . . . . . . . 784.5 Nanopore sensors for biomarker identification and quantification in clin-
ical samples . . . . . . . . . . . . . . . . . . . . . . . . . . . . . . . . . 804.6 Conclusion and perspectives . . . . . . . . . . . . . . . . . . . . . . . . 83References . . . . . . . . . . . . . . . . . . . . . . . . . . . . . . . . . . . . 84
5 A designer FG-Nup that reconstitutes the selective transport barrier of thenuclear pore complex 935.1 Introduction . . . . . . . . . . . . . . . . . . . . . . . . . . . . . . . . 945.2 Results . . . . . . . . . . . . . . . . . . . . . . . . . . . . . . . . . . . 95
v

vi CONTENTS
5.3 Conclusion . . . . . . . . . . . . . . . . . . . . . . . . . . . . . . . . . 1095.4 Methods . . . . . . . . . . . . . . . . . . . . . . . . . . . . . . . . . . 1115.5 Supporting information. . . . . . . . . . . . . . . . . . . . . . . . . . . 119References . . . . . . . . . . . . . . . . . . . . . . . . . . . . . . . . . . . . 138
6 Studying karyopherins occupancy in the nuclear pore complex using biomimeticnanopores 1456.1 Introduction . . . . . . . . . . . . . . . . . . . . . . . . . . . . . . . . 1466.2 Results . . . . . . . . . . . . . . . . . . . . . . . . . . . . . . . . . . . 1476.3 Conclusion . . . . . . . . . . . . . . . . . . . . . . . . . . . . . . . . . 1536.4 Methods . . . . . . . . . . . . . . . . . . . . . . . . . . . . . . . . . . 1556.5 Supporting information. . . . . . . . . . . . . . . . . . . . . . . . . . . 157References . . . . . . . . . . . . . . . . . . . . . . . . . . . . . . . . . . . . 159
7 Reconstitution of ultrawide DNA origami pores in liposomes for transmem-brane transport of macromolecules 1637.1 Introduction . . . . . . . . . . . . . . . . . . . . . . . . . . . . . . . . 1647.2 Results . . . . . . . . . . . . . . . . . . . . . . . . . . . . . . . . . . . 1647.3 Conclusion . . . . . . . . . . . . . . . . . . . . . . . . . . . . . . . . . 1737.4 Methods . . . . . . . . . . . . . . . . . . . . . . . . . . . . . . . . . . 1767.5 Supporting information. . . . . . . . . . . . . . . . . . . . . . . . . . . 181References . . . . . . . . . . . . . . . . . . . . . . . . . . . . . . . . . . . . 215
8 Future directions 2198.1 Designer FG-Nups – a playground for studying NPC selectivity . . . . . . . 2208.2 Study how the Kaps regulate the FG-Nup barrier . . . . . . . . . . . . . . 2228.3 Towards building an artificial nucleus. . . . . . . . . . . . . . . . . . . . 2248.4 Final outlook . . . . . . . . . . . . . . . . . . . . . . . . . . . . . . . . 226References . . . . . . . . . . . . . . . . . . . . . . . . . . . . . . . . . . . . 227
Summary 231
Samenvatting 235
Acknowledgements 239
Curriculum Vitæ 243
List of Publications 245

1GENERAL INTRODUCTION
In this chapter I present a general introduction to the thesis. While the main interest is tounderstand the mechanism by which the nuclear pores in our cells operate, various topicsand techniques are touched upon. Starting from a brief overview of the cellular organiza-tion, I narrow down into the nuclear pore complex, from the first discoveries of its archi-tecture and composition to recent theories describing how nuclear transport is regulated.Furthermore, I discuss the importance of biomimetic approaches to study nuclear trans-port, with a particular emphasis on solid-state-nanopore and DNA-origami technologies.
1

1
2 CHAPTER 1
1.1. INTRODUCTIONLife on earth is extremely diverse and variegated, from single-cell entities like bacteriaor yeast, to complex multi-tissue organisms such as humans. To achieve the sophis-tication found in more complex systems like eukaryotes, molecules are organized intoorganelles which, just like the organs in our body, carry out different specialized tasks(Figure 1.1a) [1]. For example, mitochondria produce the chemical energy needed toperform biochemical reactions in the cell, ribosomes read strings of mRNA to synthesizenew proteins, while the nucleus stores the hereditary information in the form of DNA[2].To safely protect the genetic material, eukaryotic cells feature a double membrane nu-clear envelope (NE) that encloses and physically isolates the nucleus from the rest of thecell [3].
Nuclear Pore Complexes (NPCs) are large protein assemblies that form ∼40nm-widechannels across the NE and behave as gatekeepers by controlling the trafficking of RNAs,proteins, and metabolites between the nucleus and the cytoplasm (Fig.1.1b) [4]. In a sin-gle cell, the number of nuclear pores can vary from 75–150 in a yeast cell [5] to ∼3000-5000 pores in a human cell [6], to ∼ 5×10⁷ in a mature Xenopus oocyte [7]. A fascinatingaspect of the NPC is its unique combination of high versatility while retaining speci-ficity. In fact, up to 30 different types of transporter proteins are recognized and allowedto efficiently translocate through the NPC, while precluding the transport to all otherlarge molecules [8]. The secret for such highly selective transport relies in a group of keyproteins, called FG-Nups, which form a tangled spaghetti-like mesh within the centralchannel of the NPC [9].
a ��������������� ������������������� ����b
������
��������
���� �
������������ ���
�������
� ������������ ���
�������
��������������������
����������
���� �
�������������
����������������
������
�������������� ������ ���
������������
~40 nm
Figure 1.1: a, Schematic of an eukaryotic cell, adapted from [10]. b, Illustration of the nuclear pore complexembedded in the nuclear envelope. FG-Nups (blue) line the central channel forming a spaghetti-like mesh.Adapted from a design of Samir Patel.
In this thesis, we work towards understanding the physical principles underlying thisremarkable NPC selectivity, leveraging on techniques from molecular biology to nan-otechnology. To understand and properly interpret the signal coming from our nanode-vices, we first delve into a physical characterization of the noise sources that affect ioncurrent measurements in solid-state nanopores. We then move on to engineer a fully

1. GENERAL INTRODUCTION
1
3
synthetic FG-Nup from scratch and study its selective properties by reconstituting anartificial mimic of the NPC transport barrier using such a designer protein. Addition-ally, we provide supporting evidence that point to a mechanistic description of nucleartransport by studying the behavior of a purified native FG-Nup. Finally, we take a majorstep towards the reconstitution of an artificial nucleus by embedding 30nm-wide DNA-origami pores into the membrane of a lipid vesicle. The present work opens the wayto multiple exciting applications and follow-up projects towards the recapitulation andphysical understanding of nuclear transport, as well as creating artificial models of thenucleus that can be employed in synthetic cells.
1.2. THE NUCLEAR PORE COMPLEX
1.2.1. ARCHITECTURE AND COMPOSITION
First evidence of the existence of the NE and nuclear pores was provided in 1950 byCallan and Tomlin [11], who performed imaging of the nuclear membrane of oocytesfrom amphibia using electron microscopy (EM). Further investigation by Gall in 1967[12] revealed the octagonal symmetry of nuclear pores (Figure 1.2a,b), which was con-firmed by other follow-up studies [13, 14]. Further refinements of the NPC structureusing EM allowed to resolve other peripheral parts of the NPC, which include the cyto-plasmic filaments and nuclear basket (Fig.1.2c–e, [refs]) [15, 16]. The biochemical com-position of the NPC consists of ∼30 different types of nucleoporins (Nups) repeated inmultiple copies following the octagonal symmetry of the pore. The distribution of Nupsis modular and they can be distinguished in three categories [17, 18]: (1) transmem-brane Nups that anchor the NPC to the NE; (2) scaffold Nups that form a rigid ring-like
a b
d
c
e
Figure 1.2: a,b, Negative staining EM showing octagonal cross-sections of nuclear pore complexes extractedfrom Triturus alpestrus nuclei (adapted from [12]). c, Electron microscopy structure of the nuclear pore com-plex from the nucleoplasmic side. Adapted from [15]. d, Negative staining EM of the nuclear envelope featuringembedded NPCs (pointed by arrows). Adapted from [16]). e, Transmission electron microscopy image of a nu-clear pore complex. Adapted from [19].

1
4 CHAPTER 1
structure to which intrinsically disordered (3) FG-Nups, rich in tandem ‘Phenylalanine-Glycine’ (FG) repeats, are anchored by their C-terminal domain and fill up the NPC cen-tral channel forming a gel-like mesh.
1.2.2. FG-NUPS – TYPES AND MOTIFSThe central channel of the NPC is lined with intrinsically disordered FG-Nups (11 dif-ferent types in yeast [20]). Based on their amino-acid sequence, FG-Nups appear quiteredundant, with all of them featuring tandem Phe-Gly (FG) repeats separated by spacersequences of ∼5-20 amino-acids (Fig.1.3a) [21]. Moreover, they are evolutionary con-served in their overall composition and structure [22]. FG-Nups can be broadly dividedinto two main categories [20, 21]: (1) FXFG-Nups which are abundant in Phe-Any-Phe-Gly (FXFG) repeats, where ‘X’ can be any amino-acid, featuring spacers relatively high incharge (∼26-36% of amino-acids has a charge), which confer FXFG-Nups with an overallextended and dynamic conformation; (2) GLFG-Nups that instead are rich in Gly-Leu-Phe-Gly (GLFG) repeats with spacer sequences enriched in ‘Q’ and ‘N’ amino-acids. Un-like FXFG-Nups, these possess a low amount of charged amino-acids (2-3%) resulting ina more collapsed coil configuration. Strikingly, deletion of all FG-Nups other than theGLFG-Nups Nup100, Nup116, and Nup145, was shown to still support efficient nucleartransport in vivo without impairing the viability of the cell, which showcases the out-standing robustness and redundancy of the FG-Nup barrier [24].
Cyt
Nucl
Cyt
Nucl
b c
a
Figure 1.3: a, Representation of a characteristic FG-Nup protein sequence. b, Structure of the NPC scaffold(grey) with highlighted FG-Nups anchor domains (light green) and FG-repeat emanating points (dark green).c, Heat map of the GLFG (purple) and FXFG (red) domains from Brownian dynamics simulations. b and c wereadapted from [23].

1. GENERAL INTRODUCTION
1
5
1.2.3. NUCLEOCYTOPLASMIC TRANSPORT
FG-Nups are key players in regulating molecular transport across the NE [9]. While al-lowing the passive diffusion of small molecules, e.g. water, ions, and proteins up to asize cut-off of ∼40 kDa, transport of large molecules (>40 kDa) occurs selectively [25]:inert macromolecules are hindered by the FG-mesh unless they are bound to a nucleartransport receptor (NTR). Karyopherins (or Kaps) constitute the largest family of NTRs[26], with importin-β (Impβ, Kap95 in yeast) being the most characterized as it plays acentral role in nuclear import [27]. It features ∼9-10 hydrophobic pockets on its convexsurface that can specifically bind FG-motifs [28], which in turn facilitates its partition-ing into the NPC channel. In this way, cargoes that feature a nuclear localization signal(NLS) sequence can form a complex with a NTR and be ferried across the NPC within afew milliseconds (∼5 ms [29]).
While maintenance of an efficient and selective transport by the FG-mesh comes atno energy cost, energy is spent in form of GTP hydrolysis to enforce transport direction-ality of cargoes [30, 31].For nuclear import (Fig.1.4) of cargo from the cytoplasm into thenucleus, cargo-bound NTRs bind to the nuclear factor RanGTP which induces a NTRconformational change that causes the release of the cargo into the nucleus. The NTR-RanGTP complex is subsequently recycled back into the cytoplasm, where RanGTP ishydrolyzed into RanGDP by the cytoplasmic factor RanGAP1. Such release of energyinduces a conformational change that causes the dissociation of the RanGDP-NTR com-plex, making the NTR available for a new import cycle. RanGDP is then transported backinto the nucleus by the transport factor NTF2, where it finally gets converted back intoRanGTP by RanGEF. Nuclear export occurs in an analogous way to the import [33].
Figure 1.4: Schematic of the RanGTP-regulated nuclear transport and their cargoes. Adapted from [32].

1
6 CHAPTER 1
1.2.4. MODELS OF SELECTIVE TRANSPORTWhile nucleocytoplasmic transport is well characterized in terms of key players and reg-ulation processes, the exact mechanism governing the selective transportation of cargo-bound NTRs through the NPC channel is still disputed. In fact, a number of models havebeen proposed which can be broadly classified into two opposing theories, termed ‘FG-centric’ and ‘Kap-centric’ models:
FG-centric models: The first class of models includes the ‘virtual gate model’[36], ‘selective-phase’ or ‘hydrogel model’ [37, 38], and ‘forest model’ [20], which predict that FG-Nupsare the sole necessary ingredient in establishing the selective barrier. As a corollary, thisimplies that Kaps act as mere transporters of cargo molecules, without in any way alter-ing the structure of the FG-mesh or taking part into forming the selective barrier (Fig.1.5,left).
= Fast-phase Kap (high KD >10 μM)= Slow-phase Kap (low KD < 1 μM)
Only fast translocating kaps are presentOnly fast translocating kaps are present
FG-centric control Kap-centric control
Figure 1.5: Simplified schematic of ‘FG-centric’ (left) and ‘Kap-centric’ (right) transport. Black curved linesrepresent FG-Nups, light and dark green circles correspond to the fast-phase and slow-phase Kap population,respectively, dashed black arrow (left) represent a Kap trajectory, dashed red lines (right) indicate the centralchannel opening. Inspired by [34] and [35].

1. GENERAL INTRODUCTION
1
7
Kap-centric models: The second class of models, such as the ‘reduction of dimension-ality model’ [39], ‘molecular velcro model’ [40], and further refinements [34, 35, 41–43],supports the existence of two distinct populations of Kaps – a ‘slow-phase’ and a ‘fast-phase’, where the slow-phase Kaps are involved in reshaping the FG-mesh while open-ing a central channel by means of avid multivalent binding to FG-repeats, whereas fast-phase Kaps are the actual transporters that shuttle the cargo across the NPC (Fig.1.5,right). Importantly, occupation of the FG-mesh by the slow-phase Kaps would result ina partial depletion of the available FG-repeats hence lowering the affinity between theKap-laden FG-mesh and the fast-phase Kaps.
1.3. BOTTOM-UP APPROACHES TO UNRAVEL THE NPCStudying transport through the nuclear pore complex in vivo still faces significant chal-lenges and limitations due to a lack of spatiotemporal resolution. The NPC is a complexmachine, comprising ∼200 intrinsically disordered FG-Nups confined into a ∼40nm-wide central lumen, with ∼1000 molecules per second being transported across in bothdirections [44]. Gaining mechanistic information on the translocation process of Kap-cargo complexes through the FG-mesh has thus far remained prohibitively difficult.
To overcome such challenges, biomimetic techniques have emerged as an alterna-tive approach to study nuclear transport, where the FG-mesh that is found in the cen-tral channel of the NPC is reconstituted in vitro and characterized using a variety oftools. Notable examples include surface techniques, such as ellipsometry and QCM-D [45, 46], SPR [34, 47], and AFM force spectroscopy [40, 48], which contributed greatlyto the characterization of the binding affinity between Kaps and FG-Nup brushes, wheresuch brushes were formed by anchoring FG-Nups to a planar surface with a graftingdensity comparable to the one found in the real NPC. Importantly, such techniques re-vealed the presence of distinct binding modes between Kaps and FG-Nup brushes thatvary as a function of Kap concentration and that stem from the multivalent nature of theinteraction.
While studying the affinity between transporters and FG-Nups is beneficial and in-sightful, selective transmembrane transport is arguably the most crucial, yet puzzling,feature of the NPC. To study such important aspect, in the last decade NPC mimics basedon artificial nanopores have been built by tethering purified FG-Nups to the inner wallsof a nanopore [49, 50]. The appeal of this approach resides in the possibility to recon-stitute the selective FG-Nup barrier into a confined nanopore system with virtually thesame geometry and FG-Nup density as the NPC central channel. We will now introducetwo major realizations of biomimetic nanopores that take advantage of state-of-the-artsolid-state and DNA-origami nanotechnology.
1.4. SINGLE-MOLECULE SENSING WITH NANOPORESAdvancements in nanotechnology have enabled the fabrication and development of solid-state nanopores [51, 52]. In simple terms, a solid-state nanopore can be described as ananometer-sized hole formed across a thin (typically ∼20 nm) freestanding membranebuilt from a solid-state material. Over the years, a variety of membranes have been em-ployed as substrates for nanopore fabrication, from the more common low stress sili-

1
8 CHAPTER 1
con nitride [53, 54](SiN) to silicon dioxide (SiO2), as well as ultrathin 2D-materials suchas graphene [55, 56], hexagonal boron nitride (hBN)[57, 58], or molybdenum disulfide(MoS2) [59]. To create such nanoholes various techniques have been developed that re-spond to different needs in terms of precision, cost, and throughput. To create pores withnanometer-precision a transmission electron microscope (TEM) is usually the preferredchoice (Fig.1.6a,b), where a beam of electrons is focused onto a freestanding membranewhich results in removal of atoms from the material and the formation of a hole [60]. Amore high-throughput, though less precise, method to fabricate pores is milling usinga focused ion beam (FIB) [61, 62], which works analogously to the TEM but with ions(typically Ga+ or He+) instead of electrons. Other techniques are dielectric breakdown[63, 64], laser etching [65], reactive ion etching (RIE) [66], and mechanical pulling of glasscapillaries [67].
The most common application of nanopore technology consists in single-moleculesensing, which is achieved by encasing the nanopore chip in a flow cell where the nanopo-re constitutes the sole connection between two otherwise insulated compartments [68].Such compartments are filled with a saline aqueous solution, e.g. potassium chloride(KCl), which results in free K+ and Cl- ions. Application of a voltage difference across thefreestanding membrane results in an electric field across the pore that drives positiveions K+ to the side with negative potential and Cl- to the positive one. Such flow of ionsacross the pore results in an ionic current which can be sensed by the electronics andthat serves as the signal to perform sensing [69].
The basic principle of nanopore sensing is illustrated in Figure 1.6c,d, where the ana-lyte of interest, such as a protein or a DNA molecule, is electrophoretically driven acrossthe pore by the applied voltage difference which causes the flow of ions to be temporar-ily interrupted due to the presence of the molecule. This effectively results in a transient,detectable decrease of the ionic current (Fig.1.6d). Single-molecule translocation eventsare associated with such current ‘spikes’ and are typically characterized in terms of am-plitude (or blockade), namely the depth of the current decrease which is roughly propor-
a
b
c dTEM electron beam
Figure 1.6: a, Illustration of nanopore fabrication by TEM drilling. b, TEM micrograph of a nanopore. Scalebar, 30nm. c–d Principle of nanopore sensing: molecules are electrically driven through the pore by an appliedpotential difference causing transient dips (d) in the ionic current. a, c, d, were adapted from [52].

1. GENERAL INTRODUCTION
1
9
tional to the size of the analyte, and dwell time which corresponds to the duration of theevent and, to a first approximation, reflects how much time the molecule spends in thepore.
1.4.1. BIOMIMETIC SOLID-STATE NANOPORES
While nanopores are usually thought of as next-generation sequencers of DNA [70] andproteins [71], an exciting application consists in mimicking biological processes by re-capitulating the behavior of naturally occurring pores such as the NPC. In the contextof this thesis, a biomimetic solid-state nanopore consists of a solid-state nanopore thatis functionalized with FG-nucleoporins from the nuclear pore complex with the aim tomimic as closely as possible the native FG-mesh in terms of spatial confinement, ge-ometry, and protein density, while being able to probe the transport across the porewith single-molecule resolution by measuring the ionic current (Fig.1.7a). Functional-ization of the nanopore surface is generally carried out by a chemical conjugation proto-col [50, 72], which ensures proper covalent attachment of the proteins to the solid-statematerial. To test the selective properties of the reconstituted FG-mesh, transporter pro-teins, such as Impβ, are used as positive control since they are naturally capable of in-teracting with and overcoming the FG-Nup barrier. On the contrary, inert proteins likeBSA that lack binding sites for FG-repeats are repelled by the FG-mesh and thereby failto traverse the pore.
Current measurements are carried out similarly as in a standard nanopore exper-iment, where the current flowing across the FG-Nup-coated pore reports in real-timeon the passage of proteins (Fig1.7b), and thus allows to assess the selective transportproperties in terms of event rate, i.e. number of translocations per second, which is ameasure of the transport efficiency of the analyte across the pore. Notably, such currentmeasurements revealed that biomimetic pores built using a single type of FG-Nup (e.g.,Nup98 or Nup153) were enough to impart a selective barrier, where Impβ can efficientlytranslocate while BSA is blocked (Fig.1.7c) [49, 50, 72].
Even
t fre
quen
cy (H
z)
Nup98-coated
Nup153-coated
Bare pore
ImpβBSA ImpβBSA ImpβBSA
a b
c
Figure 1.7: a, Schematic of a biomimetic solid-state nanopore system. b, Examples of translocation events ofImpβ through a FG-Nup coated pore. c, Event rate of translocations of BSA and Impβ through a bare (left),Nup98-coated (center), and Nup153-coated (right) pores. Adapted from [50].

1
10 CHAPTER 1
1.5. DNA ORIGAMI NANOTECHNOLOGYWhile DNA (deoxyribonucleic acid) in biology assumes the passive role of mere informa-tion carrier, as unlike proteins it does not perform any sensory or actuatory function inthe cell, in the last three decades scientists have been able to use DNA molecules to build3D nanostructures from scratch in a fully programmable way [73, 74]. Such promisingtechnology, known as ‘DNA origami’, exploits the structure of the DNA molecule thatconsists of two strands of nitrogenous bases (adenine (A), guanine (G), thymine (T), andcytosine (C)) that are mutually held together by hydrogen bonds resulting in a doublehelix, where such bonds can occur only between complementary bases A-T and G-C.
Creation of DNA nanostructures relies on using a long single strand of DNA as a scaf-fold which, upon adding many short DNA strands that staple different parts of the scaf-fold, is folded into a 3D shape (Fig 1.8a) [75]. Using this relatively simple concept it hasbeen possible to build a multitude of nanostructure for various purposes, from regularshapes such as 2D-sheets and cubes (Fig.1.8b) [73], to more complex structures such asspirals and rings (Fig.1.8c) [76].
Scaffold
Staples
Stapled DNA
Folded structure
a
b c
Figure 1.8: a, Illustration of the typical DNA origami workflow. A long scaffold of DNA is stapled together byshort pieces of DNA to form a stably folded structure. Adapted from [75]. b, Examples of design (top) andAFM images (bottom) of simple DNA-origami structures. Adapted from [73]. c, Examples of complex twistedDNA-origami structures. Scale bars, 20nm. Adapted from [76].

1. GENERAL INTRODUCTION
1
11
1.5.1. DNA ORIGAMI NANOPORES AND NPC MIMICSA relevant application in the context of this thesis is the construction of DNA-origamipores that mimic the pore-forming properties of naturally occurring protein pores suchas α-hemolysin [77]. Similarly to a biological pore, DNA-origami pores from the liter-ature have been engineered with hydrophobic moieties, such as cholesterols or por-phyrins, that aid in the insertion of the highly hydrophilic DNA-object into a lipid bi-layer membrane (Fig.1.9) [78]. Using this approach, pores with inner diameters from afew nanometers [79, 80] up to 10 nm [81, 82] have been constructed and shown to spon-taneously insert into a lipid membrane by allowing the transmembrane transport of ions[79, 83], fluorophores [81, 84], and short artificial polymers such as PEG [80] and dextran[81, 82].
An exciting feature of DNA-origami pores is the possibility to functionalize the innerwalls of the pore to build a mimic of the NPC where FG-Nups distribution and densityof the anchor points can be programmed by design. Using this approach, it has beenpossible to reconstitute NPC mimics by folding DNA-origami rings of∼35-40 nm in innerdiameter (similar to the native NPC) and by attaching FG-Nups to their inner surface[85, 86]. However, one major limitation of this approach is the impossibility to measuretransport across the reconstituted FG-mesh, since it is extremely challenging to insertsuch large DNA-objects into a lipid bilayer.
DNA-origami
FG-Nups
Cholesterol anchors
b
c
a d
Figure 1.9: a, First reported DNA-origami pore with a inner diameter of 2 nm, functionalized with 26 choles-terol anchors (orange). Adapted from [79]. b, Funnel-shaped transmembrane DNA-pore with 6 nm innerdiameter. Adapted from [83]. c, T-shaped DNA-origami pore with ∼4 nm inner diameter. Adapted from [84].d, DNA-origami ring scaffold (grey) for FG-Nup (yellow) attachment. Adapted from [85].

1
12 CHAPTER 1
1.6. IN THIS THESISThis thesis aims to contribute with novel bottom-up approaches to the field of nucleartransport using biomimetic nanopores. We propose a new model system to understandand capture the essence of FG-Nups, as well as alternative strategies to circumvent thecurrent technical difficulties in current biomimetic DNA-origami nanopore systems. Thenext two chapters following the introduction are focused on characterization of the noisesources in solid-state nanopores. Chapter 2, provides a side-by-side comparison of thenoise and performance of biological and solid-state pores. First, the physical origin ofthe noise at different frequencies is provided together with literature studies and mea-surements on a few exemplary nanopore systems. Second, the performance of the mostrelevant biological and solid-state nanopores is compared in terms of signal-to-noiseratio (SNR). We find that SiNx pores offer the highest SNR of ∼37 when measuring freetranslocations of short DNA homopolymers through the pores. Introducing a slowdownmechanism using a DNA-translocating motor protein on top of a MspA pore was shownto boost the SNR by >160-fold. Finally, we review reported methods from the literaturethat were shown to lower the noise for various nanopore systems and frequency ranges.In Chapter 3, we explore the low-frequency 1/f noise in solid-state nanopores for varyingpore diameters and find that the 1/f noise magnitude decreases for increasing diameterof the pore. To capture this behavior, we build a generalized version of the previouslyproposed Hooge’s model for nanopores that includes explicit contributions from accessregion and pore surface. Additionally, we define different Hooge parameters for bulkand surface 1/f noise, which represent different mechanisms of fluctuations affectingthe ionic current. Such model refinement allows for a more accurate characterizationof the 1/f noise in solid-state nanopore systems. Chapter 4 reviews the state-of-the-artin the field of nanopores, with particular emphasis on applications beyond sequencing.These include single-molecule proteomics, biomarker detection by single-molecule liq-uid biopsy, pore nanoreactors to confine and study the chemistry of single polymers,and biomimetic nanopore-based approaches to study biological questions.
In Chapter 5 we introduce a novel, fully bottom-up approach to study nuclear trans-port by designing an artificial protein, termed ‘NupX’, that mimics and models nativeFG-Nups. To design such sequence, we proceed by first analyzing the properties of thenaturally occurring GLFG-Nups from yeast. We hypothesize that a finite set of prop-erties characteristic of GLFG-Nups is sufficient for recapitulating their selective behav-ior, namely: (i) regularly spaced FG and GLFG repeats, (ii) a bimodal distribution ofamino acids forming a repulsive and a cohesive domain, and (iii) intrinsic disorder ofthe amino acid sequence. We first assess the affinity between brushes of our designerNupX and transporter Kap95 using QCM-D, finding that Kap95 binds the protein brushin a concentration-dependent manner. On the contrary, flushing the inert protein BSAdoes not result in any detectable interaction, thereby proving the binding specificity be-tween Kap95 and NupX. Next, we reconstitute NupX in biomimetic nanopores and testits selective properties, finding that while Kap95 can efficiently translocate through thepore resulting in frequent current spikes, BSA is blocked. Our experiments are com-plemented by molecular dynamics simulations which provide insights into microscopicfeatures of NupX brushes and coated pores. In summary, this work validates our initial

1. GENERAL INTRODUCTION
1
13
hypothesis that a rationally designed FG-Nup can reconstitute the archetypal selectivityof the nuclear pore complex.
In Chapter 6 we reconstitute biomimetic solid-state nanopores using a native FG-Nup,Nsp1, and test its transport properties as a function of Kap95 concentration with theaim to provide new evidence that can aid to discriminate between the different modelsof transport, specifically between ‘FG-centric’ and ‘Kap-centric’ models. Upon titrat-ing Kap95 onto a Nsp1-coated pore we observe a Kap95 concentration-dependent step-wise decrease of the pore conductance, which indicates Kap95 incorporation into theNsp1-mesh. Additionally, fast Kap translocations are also observed on top of the cur-rent decrease at low (∼100 nM) Kap concentrations, similarly to previous reports. Onthe contrary, flushing inert BSA on a Nsp1-coated pore at increasing concentrations didnot result in any detectable current decrease, nor fast translocations, confirming that theobserved incorporation of Kap95 into the Nsp1-mesh originates from specific protein-protein interactions and not merely as an effect of the applied bias. Next to a decreasein the pore conductance, we also report a decrease of the low-frequency 1/f noise whichis consistent with a stiffening of the Nsp1-mesh upon binding of Kap95. Ion currentmeasurements are corroborated with QCM-D data that, similarly, show a concentration-dependent binding and incorporation of Kap95 into the Nsp1 brush. Altogether, ourdata are consistent with the ‘slow-phase’ and ‘fast-phase’ Kaps notions introduced bythe Kap-centric models.
Chapter 7 provides an alternative approach to solve the current challenges faced byDNA-origami nanopore systems, namely the difficulty of inserting large DNA-origamiobjects into lipid membranes. To mimic the eight-fold symmetry and geometry of theNPC, we first design an octagonal DNA-origami scaffold with a nominal inner diameterof 35 nm. Next, we chemically decorate its external surface with hydrophobic moietieswhich are meant to facilitate the partitioning of the DNA-origami structure into the hy-drophobic lipid bilayer. We show that, while DNA-pores do not spontaneously insertinto pre-formed lipid bilayers, as expected given the large size, it is possible to circum-vent this problem by administering the pores during the vesicle formation by employingan inverted-emulsion cDICE technique to produce the vesicles. To assess the correct in-sertion of the pores, we carry out influx experiments with the fluorescent protein GFPand find that ∼50% of the vesicle population features open pores. We quantify the influxrate by using a FRAP assay and, using a diffusion model to fit the FRAP data, find thatup to hundreds of pores can be properly reconstituted into the membrane of a singlevesicle. Furthermore, we show that our pores are size-selective, since dextran moleculeswith sizes up 28 nm can translocate the pores, whereas larger molecules are excluded.In Chapter 8, finally, I provide my perspective on future possible directions and key ex-periments aimed to address some major open questions in the field of nuclear transport.

1
14 REFERENCES
REFERENCES[1] L. H, B. A, Z. SL, and E. Al., Molecular Cell Biology, 4th ed. (W. H. Freeman, New
York, 2000).
[2] D. L. Nelson and M. Cox, Principles of biochemistry (W.H. Freeman and Company,New York, 2008).
[3] M. W. Hetzer, The Nuclear Envelope, Cold Spring Harbor perspectives in biology 2,1 (2010).
[4] S. R. Wente and M. P. Rout, The nuclear pore complex and nuclear transport. ColdSpring Harbor perspectives in biology 2, 1 (2010).
[5] M. Winey, D. Yarar, T. H. Giddings, and D. N. Mastronarde, Nuclear pore complexnumber and distribution throughout the Saccharomyces cerevisiae cell cycle by three-dimensional reconstruction from electron micrographs of nuclear envelopes, Molec-ular Biology of the Cell 8, 2119 (1997).
[6] D. Görlich and U. Kutay, Transport between the cell nucleus and the cytoplasm, 15,607 (1999).
[7] V. C. Cordes, S. Reidenbach, and W. W. Franke, High content of a nuclear pore com-plex protein in cytoplasmic annulate lamellae of Xenopus oocytes, European Journalof Cell Biology 68, 240 (1995).
[8] M. Mackmull, B. Klaus, I. Heinze, M. Chokkalingam, A. Beyer, R. B. Russell, A. Ori,and M. Beck, Landscape of nuclear transport receptor cargo specificity, MolecularSystems Biology 13, 962 (2017).
[9] S. R. Wente, Gatekeepers of the Nucleus, Science 288, 1374 (2000).
[10] https://www.genome.gov/genetics-glossary/Organelle, .
[11] H. G. Callan and S. G. Tomlin, Experimental studies on amphibian oocyte nuclei. I.Investigation of the structure of the nuclear membrane by means of the electron mi-croscope. Proceedings of the Royal Society of London. Series B, Containing papersof a Biological character. Royal Society (Great Britain) 137, 367 (1950).
[12] J. G. Gall, Octagonal nuclear pores. The Journal of cell biology 32, 391 (1967).
[13] R. P. Aaronson and G. Blobel, On the attachment of the nuclear pore complex, TheJournal of Cell Biology 62, 746 (1974).
[14] W. W. Franke and U. Scheer, The ultrastructure of the nuclear envelope of amphibianoocytes: a reinvestigation. II. The immature oocyte and dynamic aspects, Journal ofUltrasructure Research 30, 317 (1970).
[15] M. W. Goldberg, J. M. Cronshaw, E. Kiseleva, and T. D. Allen, Nuclear-pore-complexdynamics and transport in higher eukaryotes, Protoplasma 209, 144 (1999).

REFERENCES
1
15
[16] N. Pante and U. Aebi, Molecular dissection of the nuclear pore complex, Critical Re-views in Biochemistry and Molecular Biology 31, 153 (1996).
[17] D. Devos, S. Dokudovskaya, R. Williams, F. Alber, N. Eswar, B. T. Chait, M. P. Rout,and A. Sali, Simple fold composition and modular architecture of the nuclear porecomplex, Proceedings of the National Academy of Sciences of the United States ofAmerica 103, 2172 (2006).
[18] E. Onischenko, J. H. Tang, K. R. Andersen, K. E. Knockenhauer, P. Vallotton, C. P.Derrer, A. Kralt, C. F. Mugler, L. Y. Chan, T. U. Schwartz, and K. Weis, Natively Un-folded FG Repeats Stabilize the Structure of the Nuclear Pore Complex, Cell 171, 904(2017).
[19] R. Y. Lim, U. Aebi, and B. Fahrenkrog, Towards reconciling structure and function inthe nuclear pore complex, Histochemistry and Cell Biology 129, 105 (2008).
[20] J. Yamada, J. L. Phillips, S. Patel, G. Goldfien, A. Calestagne-Morelli, H. Huang,R. Reza, J. Acheson, V. V. Krishnan, S. Newsam, A. Gopinathan, E. Y. Lau, M. E.Colvin, V. N. Uversky, and M. F. Rexach, A Bimodal Distribution of Two DistinctCategories of Intrinsically Disordered Structures with Separate Functions in FG Nu-cleoporins, Molecular and Cellular Proteomics 9, 2205 (2010).
[21] L. J. Terry and S. R. Wente, Flexible Gates: Dynamic Topologies and Functions for FGNucleoporins in Nucleocytoplasmic Transport, Eukaryotic Cell 8, 1814 (2009).
[22] M. Peyro, M. Soheilypour, B. L. Lee, and M. R. Mofrad, Evolutionarily ConservedSequence Features Regulate the Formation of the FG Network at the Center of theNuclear Pore Complex, Scientific Reports 5, 1 (2015).
[23] S. J. Kim, J. Fernandez-Martinez, I. Nudelman, Y. Shi, W. Zhang, B. Raveh, T. Her-ricks, B. D. Slaughter, J. A. Hogan, P. Upla, I. E. Chemmama, R. Pellarin, I. Echeverria,M. Shivaraju, A. S. Chaudhury, J. Wang, R. Williams, J. R. Unruh, C. H. Greenberg,E. Y. Jacobs, Z. Yu, M. J. de la Cruz, R. Mironska, D. L. Stokes, J. D. Aitchison, M. F.Jarrold, J. L. Gerton, S. J. Ludtke, C. W. Akey, B. T. Chait, A. Sali, and M. P. Rout, In-tegrative structure and functional anatomy of a nuclear pore complex, Nature 555,475 (2018).
[24] R. L. Adams, L. J. Terry, and S. R. Wente, A Novel Saccharomyces cerevisiae FG Nucle-oporin Mutant Collection for Use in Nuclear Pore Complex Functional Experiments,G3: Genes|Genomes|Genetics 6, 51 (2016).
[25] A. Zilman, S. Di Talia, B. T. Chait, M. P. Rout, and M. O. Magnasco, Efficiency, selec-tivity, and robustness of nucleocytoplasmic transport, PLoS Computational Biology3, 1281 (2007).
[26] L. C. Tu and S. M. Musser, Single molecule studies of nucleocytoplasmic transport,Biochimica et Biophysica Acta - Molecular Cell Research 1813, 1607 (2011).
[27] A. Harel and D. J. Forbes, Importin beta: Conducting a much larger cellular sym-phony, Molecular Cell 16, 319 (2004).

1
16 REFERENCES
[28] R. Bayliss, T. Littlewood, and M. Stewart, Structural basis for the interaction betweenFxFG nucleoporin repeats and importin-β in nuclear trafficking, Cell 102, 99 (2000).
[29] T. Dange, D. Grünwald, A. Grünwald, R. Peters, and U. Kubitscheck, Autonomyand robustness of translocation through the nuclear pore complex: A single-moleculestudy, Journal of Cell Biology 183, 77 (2008).
[30] D. Görlich, N. Panté, U. Kutay, U. Aebi, and F. R. Bischoff, Identification of differentroles for RanGDP and RanGTP in nuclear protein import, EMBO Journal 15, 5584(1996).
[31] T. Jovanovic-Talisman and A. Zilman, Protein Transport by the Nuclear Pore Com-plex: Simple Biophysics of a Complex Biomachine. Biophysical journal 113, 6 (2017).
[32] J. D. Aitchison and M. P. Rout, The yeast nuclear pore complex and transport throughit, Genetics 190, 855 (2012).
[33] B. Cautain, R. Hill, N. De Pedro, and W. Link, Components and regulation of nucleartransport processes, FEBS Journal 282, 445 (2015).
[34] L. E. Kapinos, R. L. Schoch, R. S. Wagner, K. D. Schleicher, and R. Y. Lim,Karyopherin-centric control of nuclear pores based on molecular occupancy and ki-netic analysis of multivalent binding with FG nucleoporins, Biophysical Journal 106,1751 (2014).
[35] L. E. Kapinos, B. Huang, C. Rencurel, and R. Y. Lim, Karyopherins regulate nu-clear pore complex barrier and transport function, Journal of Cell Biology 216, 3609(2017).
[36] M. P. Rout, J. D. Aitchison, M. O. Magnasco, and B. T. Chait, Virtual gating andnuclear transport: The hole picture, Trends in Cell Biology 13, 622 (2003).
[37] S. Frey, FG-Rich Repeats of Nuclear Pore Proteins with Hydrogel-Like Properties, Sci-ence (New York, N.Y.) 314, 815 (2006).
[38] S. Frey and D. Görlich, A Saturated FG-Repeat Hydrogel Can Reproduce the Perme-ability Properties of Nuclear Pore Complexes, Cell 130, 512 (2007).
[39] R. Peters, Translocation through the nuclear pore complex: Selectivity and speed byreduction-of-dimensionality, Traffic 6, 421 (2005).
[40] K. D. Schleicher, S. L. Dettmer, L. E. Kapinos, S. Pagliara, U. F. Keyser, S. Jeney, andR. Y. Lim, Selective transport control on molecular velcro made from intrinsicallydisordered proteins, Nature Nanotechnology 9, 525 (2014).
[41] R. Y. Lim and L. E. Kapinos, How to operate a nuclear pore complex by kap-centriccontrol, Nucleus 6, 366 (2015).
[42] R. S. Wagner, L. E. Kapinos, N. J. Marshall, M. Stewart, and R. Y. Lim, Promiscuousbinding of karyopherinβ1 modulates FG nucleoporin barrier function and expeditesNTF2 transport kinetics, Biophysical Journal 108, 918 (2015).

REFERENCES
1
17
[43] S. Barbato*, L. E. Kapinos*, C. Rencurel, and R. Y. Lim, Karyopherin enrichmentat the nuclear pore complex attenuates Ran permeability, Journal of Cell Science(2020).
[44] T. Jamali, Y. Jamali, M. Mehrbod, and M. R. Mofrad, International Review of Cell andMolecular Biology, 1st ed., Vol. 287 (Elsevier Inc., 2011) pp. 233–286.
[45] N. B. Eisele, S. Frey, J. Piehler, D. Görlich, and R. P. Richter, Ultrathin nucleoporinphenylalanine-glycine repeat films and their interaction with nuclear transport re-ceptors, EMBO Reports 11, 366 (2010).
[46] N. B. Eisele, A. A. Labokha, S. Frey, D. Görlich, and R. P. Richter, Cohesiveness tunesassembly and morphology of FG nucleoporin domain meshworks - Implications fornuclear pore permeability, Biophysical Journal 105, 1860 (2013).
[47] R. L. Schoch, L. E. Kapinos, and R. Y. Lim, Nuclear transport receptor binding avid-ity triggers a self-healing collapse transition in FG-nucleoporin molecular brushes,Proceedings of the National Academy of Sciences of the United States of America109, 16911 (2012).
[48] R. Y. H. Lim, B. Fahrenkrog, J. Köser, K. Schwarz-Herion, J. Deng, and U. Aebi,Nanomechanical basis of selective gating by the nuclear pore complex, Science 318,640 (2007).
[49] T. Jovanovic-Talisman, J. Tetenbaum-Novatt, A. S. McKenney, A. Zilman, R. Peters,M. P. Rout, and B. T. Chait, Artificial nanopores that mimic the transport selectivityof the nuclear pore complex, Nature 457, 1023 (2009).
[50] S. W. Kowalczyk, L. Kapinos, T. R. Blosser, T. Magalhães, P. van Nies, R. Y. H. Lim,and C. Dekker, Single-molecule transport across an individual biomimetic nuclearpore complex, Nature Nanotechnology 6, 433 (2011).
[51] C. Dekker, Solid-state nanopores (Review Article), Nature Nanotechnology , 1 (2007).
[52] L. Xue, H. Yamazaki, R. Ren, M. Wanunu, A. P. Ivanov, and J. B. Edel, Solid-statenanopore sensors, Nature Reviews Materials (2020), 10.1038/s41578-020-0229-6.
[53] A. Balan, B. Machielse, D. Niedzwiecki, J. Lin, P. Ong, R. Engelke, K. L. Shepard, andM. Drndic, Improving signal-to-noise performance for DNA translocation in solid-state nanopores at MHz bandwidths, Nano Letters 14, 7215 (2014).
[54] K. Venta, G. Shemer, M. Puster, J. A. Rodríguez-Manzo, A. Balan, J. K. Rosen-stein, K. Shepard, and M. Drndic, Differentiation of short, single-stranded DNA ho-mopolymers in solid-state nanopores, ACS Nano 7, 4629 (2013).
[55] C. a. Merchant, K. Healy, M. Wanunu, V. Ray, N. Peterman, J. Bartel, M. D. Fischbein,K. Venta, Z. Luo, a. T. C. Johnson, and M. Drndic, DNA translocation throughgraphene nanopores, Nano Letters 10, 2915 (2010).

1
18 REFERENCES
[56] G. F. Schneider, S. W. Kowalczyk, V. E. Calado, G. Pandraud, H. W. Zandbergen,L. M. Vandersypen, and C. Dekker, DNA translocation through graphene nanopores,Nano Letters 10, 3163 (2010).
[57] Z. Zhou, Y. Hu, H. Wang, Z. Xu, W. Wang, X. Bai, X. Shan, and X. Lu, DNA Transloca-tion through hydrophilic nanopore in hexagonal boron nitride, Scientific Reports 3,1 (2013).
[58] K. B. Park, H. J. Kim, H. M. Kim, S. A. Han, K. H. Lee, S. W. Kim, and K. B. Kim,Noise and sensitivity characteristics of solid-state nanopores with a boron nitride 2-D membrane on a pyrex substrate, Nanoscale 8, 5755 (2016).
[59] M. Graf, M. Lihter, M. Thakur, V. Georgiou, J. Topolancik, B. R. Ilic, K. Liu, J. Feng,Y. Astier, and A. Radenovic, Fabrication and practical applications of molybdenumdisulfide nanopores, Nature Protocols 14, 1130 (2019).
[60] A. J. Storm, J. H. Chen, X. S. Ling, H. W. Zandbergen, and C. Dekker, Fabricationof solid-state nanopores with single-nanometre precision, Nature Materials 2, 537(2003).
[61] Y. H. Lanyon, G. De Marzi, Y. E. Watson, A. J. Quinn, J. P. Gleeson, G. Redmond, andD. W. Arrigan, Fabrication of nanopore array electrodes by focused ion beam milling,Analytical Chemistry 79, 3048 (2007).
[62] B. Schiedt, L. Auvray, L. Bacri, G. Oukhaled, A. Madouri, E. Bourhis, G. Patriarche,J. Pelta, R. Jede, and J. Gierak, Direct FIB fabrication and integration of "singlenanopore devices" for the manipulation of macromolecules, Microelectronic Engi-neering 87, 1300 (2010).
[63] H. Kwok, K. Briggs, and V. Tabard-Cossa, Nanopore fabrication by controlled dielec-tric breakdown, PLoS ONE 9 (2014), 10.1371/journal.pone.0092880.
[64] S. Pud, D. Verschueren, N. Vukovic, C. Plesa, M. P. Jonsson, and C. Dekker, Self-Aligned Plasmonic Nanopores by Optically Controlled Dielectric Breakdown, NanoLetters 15, 7112 (2015).
[65] T. Gilboa, E. Zvuloni, A. Zrehen, A. H. Squires, and A. Meller, Automated, Ultra-FastLaser-Drilling of Nanometer Scale Pores and Nanopore Arrays in Aqueous Solutions,Advanced Functional Materials 1900642, 1 (2019).
[66] D. V. Verschueren, W. Yang, and C. Dekker, Lithography-based fabrication ofnanopore arrays in freestanding SiN and graphene membranes, 29, 145302 (2018),arXiv:15334406 .
[67] J. D. Piper, R. W. Clarke, Y. E. Korchev, L. Ying, and D. Klenerman, A renewablenanosensor based on a glass nanopipette, Journal of the American Chemical Soci-ety 128, 16462 (2006).
[68] G. Maglia, A. J. Heron, D. Stoddart, D. Japrung, and H. Bayley, Methods in Enzymol-ogy, 1st ed., Vol. 475 (Elsevier Inc., 2010) pp. 591–623, arXiv:NIHMS150003 .
REFERENCES
1
19
[69] S. Howorka and Z. Siwy, Nanopore analytics: Sensing of single molecules, ChemicalSociety Reviews 38, 2360 (2009).
[70] E. Manrao, T. Z. Butler, M. Pavlenok, M. D. Collins, M. Niederweis, J. H. Gundlach,and I. M. Derrington, Nanopore DNA sequencing with MspA, Proceedings of the Na-tional Academy of Sciences 107, 16060 (2010).
[71] H. Brinkerhoff, A. S. W. Kang, J. Liu, A. Aksimentiev, and C. Dekker, Infinite re-reading of single proteins at single-amino-acid resolution using nanopore sequenc-ing, bioRxiv , 2021.07.13.452225 (2021).
[72] A. N. Ananth, A. Mishra, S. Frey, A. Dwarkasing, R. Versloot, E. van der Giessen,D. Görlich, P. Onck, and C. Dekker, Spatial structure of disordered proteins dictatesconductance and selectivity in nuclear pore complex mimics, eLife 7, 1 (2018).
[73] P. W. Rothemund, Folding DNA to create nanoscale shapes and patterns, Nature 440,297 (2006), arXiv:0202466 [cond-mat] .
[74] K. F. Wagenbauer, F. A. Engelhardt, E. Stahl, V. K. Hechtl, P. Stömmer, F. Seebacher,L. Meregalli, P. Ketterer, T. Gerling, and H. Dietz, How We Make DNA Origami,ChemBioChem 18, 1873 (2017).
[75] K. Sanderson, What to make with DNA origami, Nature 464, 158 (2010).
[76] H. Dietz, S. M. Douglas, and W. M. Shih, Folding DNA into twisted and curvednanoscale shapes, Science 325, 725 (2009), arXiv:9910002 [quant-ph] .
[77] T. Sugawara, D. Yamashita, K. Kato, Z. Peng, J. Ueda, J. Kaneko, Y. Kamio, Y. Tanaka,and M. Yao, Structural basis for pore-forming mechanism of staphylococcal α-hemolysin, Toxicon 108, 226 (2015).
[78] S. Hernández-Ainsa and U. F. Keyser, DNA origami nanopores: Developments, chal-lenges and perspectives, Nanoscale 6, 14121 (2014).
[79] T. G. Martin, F. C. Simmel, V. Arnaut, M. Mayer, H. Dietz, M. Langecker, S. Renner,and J. List, Synthetic Lipid Membrane Channels Formed by Designed DNA Nanos-tructures, Science 338, 932 (2012).
[80] J. R. Burns, A. Seifert, N. Fertig, and S. Howorka, A biomimetic DNA-based channelfor the ligand-controlled transport of charged molecular cargo across a biologicalmembrane, Nature Nanotechnology 11, 152 (2016).
[81] R. P. Thomsen, M. G. Malle, A. H. Okholm, S. Krishnan, S. S. Bohr, R. S. Sørensen,O. Ries, S. Vogel, F. C. Simmel, N. S. Hatzakis, and J. Kjems, A large size-selectiveDNA nanopore with sensing applications, Nature Communications 10 (2019),10.1038/s41467-019-13284-1.
[82] S. Iwabuchi, I. Kawamata, S. Murata, and S.-i. M. Nomura, Large, square-shaped,DNA origami nanopore with sealing function on giant vesicle membrane, ChemicalCommunications (2021), 10.1039/d0cc07412h.

1
20 REFERENCES
[83] K. Göpfrich, C.-Y. Li, M. Ricci, S. P. Bhamidimarri, J. Yoo, B. Gyenes, A. Ohmann,M. Winterhalter, A. Aksimentiev, and U. F. Keyser, Large-Conductance Transmem-brane Porin Made from DNA Origami, ACS Nano 10, 8207 (2016).
[84] S. Krishnan, D. Ziegler, V. Arnaut, T. G. Martin, K. Kapsner, K. Henneberg, A. R.Bausch, H. Dietz, and F. C. Simmel, Molecular transport through large-diameterDNA nanopores, Nature Communications 7, 1 (2016).
[85] P. Ketterer, A. N. Ananth, D. S. Laman Trip, A. Mishra, E. Bertosin, M. Ganji, J. VanDer Torre, P. Onck, H. Dietz, and C. Dekker, DNA origami scaffold for studying in-trinsically disordered proteins of the nuclear pore complex, Nature Communications9, 1 (2018).
[86] P. D. E. Fisher, Q. Shen, B. Akpinar, L. K. Davis, K. K. H. Chung, D. Baddeley,A. Šaric, T. J. Melia, B. W. Hoogenboom, C. Lin, and C. P. Lusk, A ProgrammableDNA Origami Platform for Organizing Intrinsically Disordered Nucleoporins withinNanopore Confinement, ACS Nano 12, 1508 (2018).

2COMPARING CURRENT NOISE IN
BIOLOGICAL AND SOLID-STATE
NANOPORES
Nanopores bear great potential as single-molecule tools for bioanalytical sensing and se-quencing, due to their exceptional sensing capabilities, high-throughput, and low cost.The detection principle relies on detecting small differences in the ionic current as biomo-lecules traverse the nanopore. A major bottleneck for the further progress of this technol-ogy is the noise that is present in the ionic current recordings, because it limits the signal-to-noise ratio and thereby the effective time resolution of the experiment. Here, we reviewthe main types of noise at low and high frequencies and discuss the underlying physics.Moreover, we compare biological and solid-state nanopores in terms of the signal-to-noiseratio (SNR), the important figure of merit, by measuring translocations of a short ssDNAthrough a selected set of nanopores under typical experimental conditions. We find thatSiNx solid-state nanopores provide the highest SNR, due to the large currents at whichthey can be operated and the relatively low noise at high frequencies. However, the realgame-changer for many applications is a controlled slowdown of the translocation speed,which for MspA was shown to increase the SNR >160-fold. Finally, we discuss practicalapproaches for lowering the noise for optimal experimental performance and further de-velopment of the nanopore technology.
This chapter has been published as: Alessio Fragasso, Sonja Schmid, Cees Dekker. "Comparing Current Noisein Biological and Solid-State Nanopores". ACS Nano 14(2), 1338–1349, (2020) [1].
21

2
22 CHAPTER 2
2.1. INTRODUCTIONNanopores are promising tools for biosensing applications and sequencing of DNA andproteins, as they can resolve single analyte molecules, resolve structural modifications ofmolecules, and even discriminate between nucleotide sequences [2–11]. The detectionmechanism is simple: while passing through the pore, a (part of a) molecule transientlyblocks the ionic current, thereby inducing a small dip in the current signal, which is de-tectable by the electronics (Fig.2.1). The electrical read-out is carried out by an amplifier,which senses and amplifies the current signal, followed by a digitizer that performs theanalog-to-digital conversion (ADC) of the data. Digital low-pass (LP) filtering is typi-cally used to reduce the high-frequency noise, and thus improve the signal-to-noise ra-tio (SNR). Such a gain in SNR comes, however, at the expense of a lower time resolution,thereby imposing an inherent trade-off.
Figure 2.1: Fundamental principle of nanopore sensing. (a) A nanopore separates two aqueous compart-ments filled with electrolyte solution (e.g. potassium chloride) and small molecules (e.g. DNA) are electrokinet-ically pulled through the pore by an applied potential. (b) While passing through the nanopore, the moleculetemporarily induces a partial current blockade which is detected by an amplifier. The signature of a single-molecule translocation event is generally characterized by the amplitude of the current blockade, which isproportional to the volume of the molecule in the nanopore, and by the dwell time, which depends on theelectrophoretic driving force and transient interactions between the passing molecule and the pore surface.
The detection of analytes with nanopores thus is, on the one hand, limited by the ioniccurrent noise which requires LP filtering that sets a finite operating bandwidth [12, 13],but on the other hand, by the fast speed (typically sub-milliseconds) at which moleculestranslocate through the pore, which conversely requires a high time resolution for ac-curate sampling. Various approaches have been investigated in order to slow down themolecular translocation. For biological nanopores, a DNA-translocating motor protein(such as a helicase or polymerase) has been used to slowly feed a ssDNA strand intoa protein pore for DNA sequencing [14–16]. For solid-state nanopores fabricated inthin SiNx membranes [17–19] or 2D materials (graphene [20–22], boron nitride [23–25],molybdenum disulfide [26–28]), various efforts have been made to either increase time

2. COMPARING CURRENT NOISE IN BIOLOGICAL AND SOLID-STATE NANOPORES
2
23
resolution [17–19, 29–31], or slow down the translocation process [32] by the use of ionicliquids [28], pore surface engineering [33] mechanical manipulation with a double poresystem [34], optical trapping [35], and sequential DNA unzipping [36]. Nevertheless,while fingerprinting approaches have been developed to detect individual portions of aDNA sequence using dCas9 [8, 37], streptavidin [38], DNA hairpins [39], or DNA-origamias probes [40], the SNR has not yet allowed de novo DNA sequencing with solid-statepores. An understanding of the noise sources that affect nanopore systems and howthese govern the SNR is key for achieving signals wherein molecular structures can beresolved fast and reliably. Noise characteristics of nanopores have been reported in var-ious isolated reports, but a systematic overview and comparison between biological andsolid-state nanopores is lacking.
In this review, we first describe the typical noise sources that affect the ionic cur-rent recordings of biological and solid-state nanopores, both at low and high frequen-cies. Next, we compare their respective performances of various nanopores using ssDNApoly(dT) translocations as a test system. We assess the SNR under typical experimentalconditions for different protein pores Mycobacterium smegmatis porin A (the M2 mutantwith a neutral constriction and positively charged vestibule, subsequently referred to asMspA)[41], Staphylococcus aureus alpha-hemolysin (α-HL)[42, 43], Fragaceatoxin C (themutant of FraC with a positively charged constriction, referred to as ReFraC) [44, 45],and SiNx[19] and MoS2[26] solid state nanopores. We find that biological pores generallyexhibit lower noise (Fig.2.2a). Nevertheless, solid-state nanopores achieve the best SNR,largely because of the higher voltages and bandwidths that such devices can operate at,as compared to biological nanopores. Finally, we discuss approaches for lowering theionic current noise and improving the SNR in biological and solid-state nanopores.
2.2. NOISE SOURCES IN NANOPORESNoise refers to any statistical fluctuation of a signal. It can be characterized by the stan-dard deviation σ or root-mean-square (rms) variation around the average value as mea-sured over the full bandwidth B of the signal, and by its power spectral density (PSD).Generally, noise is undesirable, as it can distort or even completely mask the actualsignal. Nanopores typically operate by measuring a through-pore ionic current that isdriven by a constant applied bias voltage. For the open-pore current measurement,where no analyte molecules are present, any deviation from the baseline current canbe regarded as noise (Fig.2.2a).
Understanding the origins of noise is fundamental for optimizing signal detection.Nanopore systems exhibit a range of different noise sources [47, 48]. In Fig.2.2b, we il-lustrate the major current noise sources that affect nanopore systems at different fre-quencies. Generally, these can be divided in: (i) low-frequency (>100 Hz) 1/f noise andprotonation noise; (ii) shot noise and thermal current noise (∼0.1-2 kHz), which are bothwhite noise sources (i.e., frequency-independent); (iii) high-frequency dielectric (∼1-10kHz) and (iv) capacitive (>10 kHz) noise.
In the low-frequency range, 1/f noise (also referred to as ‘flicker’ or ‘pink’ noise)typically is the dominant source of noise. Its power decreases with frequency f fol-lowing a 1/fβ scaling, with β ≈ 1. While this type of noise is found in many biologicaland physical systems, a fundamental understanding of it is still missing [49]. Based on

2
24 CHAPTER 2
Figure 2.2: Ionic current noise in nanopores. (a) Example current traces for a 1.3 nm diameter solid-state SiNxnanopore (red) and a 1.4 nm diameter biological α-HL pore (green), performed at a constant applied bias of100 mV in 1 M KCl buffer at pH 7 at a bandwidth of 10 kHz (light) and 1 kHz (dark). α-HL pore was measuredusing the typical Montal-Muller approach [46], with a bilayer diameter of 100 µm, as described by Maglia etal. (2010)[4]. The solid-state pore was fabricated on a Si-supported 20 nm-thick SiNx freestanding membraneusing transmission electron microscopy. Currents through both pores were amplified with Axopatch 200B. (b)Schematic of the current Power Spectral Density (PSD) for a typical nanopore. Common types of noise arehighlighted in the various frequency ranges.
phenomenological evidence, 1/f noise in nanopores has been associated with physicalprocesses such as slow fluctuations in the number and mobility of the charge carriers[50–53], nanometer-sized bubbles in the pore channel [54], noise arising from the elec-trodes [55], mechanical fluctuations of the freestanding membrane (e.g. for 2D materi-als) [24, 56, 57], and conformational changes in the case of biological nanopores [58, 59].Smeets et al. (2008) [60] found that Hooge’s phenomenological formula [53] could effec-tively describe the 1/f noise in solid-state [55, 60–63] nanopores,

2. COMPARING CURRENT NOISE IN BIOLOGICAL AND SOLID-STATE NANOPORES
2
25
S I ,1/ f =αH I 2
Nc f β, (2.1)
where Hooge’s constant αH is an empirical parameter that quantifies the magnitude of1/f noise fluctuations, I the ionic current, and Nc the number of charge carriers in thepore volume, which was further validated by follow-up studies [55, 61–63]. As discussedbelow, solid-state nanopores typically feature a relatively pronounced 1/f noise, whosemicroscopic origin often remains unresolved. For biological pores, the low-frequencynoise is typically dominated by protonation noise, which is generated by protonation/de-protonation of ionizable sites within the protein channel [64–66]. It can be described byfluctuations between two different current levels with mean lifetimes τ1 and τ2 for theprotonated and deprotonated states, respectively, yielding a Lorentzian-shaped compo-nent in the frequency spectrum (for a complete derivation see Machlup et al., 1954 [67]),
S I ,pr otonati on = 4(∆i )2τ2
τ1 +τ2
1
1+ (2π f τ)2 , (2.2)
where ∆i is the difference in current between the two levels, and τ is the characteristicrelaxation time, that can be expressed as τ = (τ1τ2)/(τ1 +τ2). For alpha-hemolysin, forexample, τ was found to be 3.1×10⁻⁵ s[66]. A distribution of multiple Lorentzian pro-cesses such as in Eq.2.2 can lead to 1/f noise [50]. Temporal conformational changes ofthe pore channel can also generate conductance fluctuations resulting in 1/f noise. Sucha phenomenon, also known as ‘channel breathing’, was reported to affect protein poressuch as bacterial porin channels [58, 59].
In the mid-frequency range (typically ∼0.1-2 kHz), a frequency-independent whitenoise is observed that derives from thermal noise (also known as Johnson-Nyquist noise)and shot noise. Thermal current noise is fundamental to any dissipative element [68, 69]and adds to the current noise as
S I ,ther mal =4kB T
R, (2.3)
where kB is the Boltzmann constant, T is temperature, and R the equivalent resistanceof the nanopore. Shot noise, on the other hand, is due to the quantization of charge andis generated when charge carriers flow across a potential barrier [70, 71]. Its current-dependent contribution to the noise can be expressed as
S I ,shot = 2I q, (2.4)
where q is the charge of a single carrier. In practice, shot noise and thermal noise arecomparable in magnitude for the conditions that are typically used in nanopore experi-ments.
Another contribution to the nanopore noise originates from the loss conductanceof the membrane and chip support [47, 48]. Such dissipation, resulting from dipolarrelaxation and charge carrier migration (details can be found in Chen et al., 2014 [72]),generates thermal energy causing thermal noise, also known as dielectric noise [73, 74].As this loss conductance scales linearly with frequency, this noise can be described by

2
26 CHAPTER 2
S I ,di electr i c = 8kTπCchi p D f , (2.5)
where Cchi p is the parasitic capacitance and D a dissipation factor of the dielectric ma-terials constituting the membrane and support chip. This source of noise typically dom-inates in the 2-10 kHz frequency range. To estimate Cchi p , one can simply use the ex-pression for a parallel plate capacitor C = εA/d , where ε is the dielectric constant of themembrane material and A and d are the area and the thickness of the membrane, re-spectively. For f > 10 kHz, the current noise is determined by the input-referred thermalvoltage noise vn across the total capacitance Ctot at the amplifier input [47, 48],
S I ,capaci t ance = 4π2C 2tot v2
n f 2, (2.6)
where vn is the input voltage noise (3 nV/Hz-1for the commonly used amplifier Axopatch200B [74], Molecular Devices, San Jose, USA). Ctot is the total capacitance including themembrane and support chip capacitance Cchi p , the capacitance Camp at the input ofthe amplifier, and the capacitance Cw of the wiring between the electronics and the pore.Notably, S I ,capaci t ance has an even stronger, f 2, frequency dependence than S I ,di el ectr i c .The total current noise of a nanopore system over its full bandwidth is the sum of allcontributions (Fig.2.2b), i.e., the sum of Eqs.2.1–2.6.
2.3. NOISE IN BIOLOGICAL NANOPORESBiological nanopores are formed by the spontaneous insertion of membrane proteinsinto a lipid bilayer, which creates nanopores with typical diameters ranging from ∼1-4nm [75], although larger pores with diameters up to ∼40 nm, e.g. the nuclear pore com-plex [76], are also found in nature. Figure 2.3a shows a schematic of a standard setupfor measuring the ionic current through such a protein pore. Briefly, a thick (tens ofmicrometers) insulating film of amorphous polytetrafluoro-ethylene (PTFE, or Teflon)separates two liquid compartments and contains a ∼50-100 µm sized hole where thelipid bilayer is assembled [4, 77]. Teflon is the preferred support material due to the rela-tively low high-frequency noise, and ease of fabrication [78]. Insertion of a protein pore(Fig.2.3b) short-circuits the insulating bilayer membrane and an ionic current betweenthe two reservoirs can be measured by a pair of Ag/AgCl electrodes. The current sig-nal is amplified by a transimpedance amplifier (e.g. Axopatch 200B) and digitized by ananalog-to-digital converter (ADC, e.g. Axon Digidata, same supplier). To shield from ex-ternal radiative electric noise, the flow-cell and the amplifier headstage are enclosed in ametallic Faraday cage [4]. For biological nanopores, ionic conductances are typically onthe order of 0.1-2 nS.
Characteristic examples of the current PSD for 3 biological nanopores (α-HL [42],MspA, and ReFraC [44]) are shown in Figure 2.3c, as measured at 1 M KCl, pH 7.5, under50 mV applied bias. Noticeably, both α-HL and MspA exhibit a noise plateau at lowfrequencies (< 1 kHz) which is due to protonation noise, cf. Eq.2.2 for f ¿ 1/τ. Theassociated PSD is ∼ 10−4 to 10−3 pA2/Hz, which is higher than the corresponding whitenoise of ∼ 10−5 pA2/Hz, set by the sum of thermal and shot noise, Eq.2.3 and 2.4. In thecontext of single-molecule sensing, protonation noise in biological nanopores was firstinvestigated by Bezrukov and Kasianowicz in the mid 1990s [65, 66].

2. COMPARING CURRENT NOISE IN BIOLOGICAL AND SOLID-STATE NANOPORES
2
27
Figure 2.3: Noise in biological and solid-state nanopores. (a) Standard setup used for measuring theionic current through a biological nanopore embedded within a lipid membrane. (b) Sketch of a biologi-cal MspA nanopore [15]. Adapted with permission from Derrington, I. M. et al., 2010; (c) Typical currentPSD for three biological nanopores, ReFraC (D10R/K159E mutant of FraC)[44] (red), α-HL (blue), and theD90N/D91N/D93N/D118R/E139K/D134R mutant of MspA (green), measured in the same setup at 50 mV ap-plied voltage, 1 M KCl salt, pH 7. (d) Low-frequency protonation noise of α-HL as a function of pH.67 Adaptedwith permission from Kasianowicz, J. J. et al. 1995. (e) Current noise Irms measured at a 4.3 kHz bandwidthof a lipid bilayer setup (where no pore was inserted) vs the size of the bilayer membrane [78]. Adapted withpermission from Mayer, M. et al., 2003 (f) Schematic of a typical flow cell for measuring the ionic currentthrough a solid-state nanopore [5]. Adapted with permission from Feng, Y. et al., 2015. (g) Sketch of a solid-state nanopore fabricated onto a Si-supported SiNx membrane. (h) Current PSD for a 15.6 nm SiNx solid-statenanopore. Data were measured at 100 mV applied voltage for 1 M KCl salt [60]. (i) Relative low-frequency noiseSI/I2 at 1 Hz versus salt concentration [60]. Solid line shows a fit to the data using Hooge’s relation, cf. Eq.2.1.(h) and (i) were adapted with permission from Smeets, R. M. M. et al., 2008. (j) Current noise Irms measuredat a 1 MHz bandwidth vs capacitance of the nanopore chip[17]. Adapted with permission from Balan, A. et al.,2014.

2
28 CHAPTER 2
Spectral analysis of the current noise of alpha-hemolysin pores revealed the presenceof a Lorentzian-shaped component at low-frequencies (0.2–2 kHz). Given the strong de-pendence on pH (Fig.2.3d), this noise source was associated to the reversible protona-tion of ionizable residues occurring in the alpha-hemolysin constriction. This notionwas further established in a later work by Nestorovich et al. [64], where the bacterialporin, OmpF, was shown to produce a similar pH-dependence of the protonation noise.ReFraC instead shows a pronounced 1/f noise with a PSD of ∼10-1 pA2/Hz at 1 Hz, whichis almost three times more than for α-HL and MspA. 1/f noise in biological nanoporeswas first studied by Benz and coworkers [58, 79], and described using Hooge’s model,Eq.2.1. The low-frequency fluctuations observed in a family of bacterial porins were as-sociated with a number of possible phenomena, e.g. gating of the pore channel[58]. Inlater work by Bezrukov and Winterhalter [59], conformational changes of the proteinpore channel, termed ‘channel breathing’ [80], were discussed as the main cause for theobserved 1/f noise.
At higher frequencies (> 1 kHz), the noise in biological nanopores is dominated by di-electric noise arising from the loss conductance of the lipid membrane. In fact, since thedielectric loss and dielectric constant of the teflon are relatively low (D = (0.8−2)×10−4
and εr = 1.89− 1.93, respectively), the major contribution to the dielectric noise is setby the capacitance of the thin lipid bilayer membrane. This can be attenuated by re-ducing the area of the teflon hole (Fig.2.3e) [78, 81]. A noise characterization at evenhigher frequencies (MHz-GHz; above the experimentally accessible frequency range)was performed using molecular dynamics simulations based on a comprehensive modelof MspA [82].
2.4. NOISE IN SOLID-STATE NANOPORESSolid-state nanopores are generally fabricated in a freestanding membrane of a solid-state material such as silicon nitride (SiNx) [83], graphene [20], hexagonal boron ni-tride (h-BN) [84], or molybdenum disulfide (MoS2) [26], with thicknesses ranging from∼0.3-30 nm. In common nanopore chips (Fig.2.3g), such a membrane is structurallysupported by a ∼200-500 µm thick substrate material, typically silicon (Si) [83], glass(SiO2) [17], or Pyrex [85, 86]. Nanopores can be drilled into the membrane in a vari-ety of ways, e.g. by using a transmission electron microscope (TEM) [87, 88], focusedion beam milling (FIB) [89, 90], reactive ion etching (RIE) ][91]], laser-etching [92, 93],or by dielectric breakdown [94, 95], resulting in pore diameters from sub-1 nm to tensof nanometers. In a standard solid-state-nanopore experiment, the chip is sandwichedbetween two rubber O-rings that seal two compartments containing the electrolyte solu-tion (Fig.2.3f). Alternatively, solid-state pores of ∼5-50 nm size can be made by mechan-ical pulling of hollow glass (SiO2) pipettes [96–98], which are immersed in electrolyteduring the measurement. Current sensing, amplification, and recording is the same asfor biological nanopores.
Figure 2.3h displays a typical current PSD measured for a 15 nm diameter SiNx solid-state nanopore [60] in a 20 nm thick membrane. Characteristic of solid-state nanoporesis the pronounced 1/f noise that dominates the low-frequency part of the spectrum(< 100 Hz). It can originate from a range of physical processes, see Eq.2.1 and associ-ated discussion. Smeets et al. 2006 [54] showed that poor wettability of the pore surface,

2. COMPARING CURRENT NOISE IN BIOLOGICAL AND SOLID-STATE NANOPORES
2
29
associated with the formation of nanobubbles, resulted in high 1/f noise in SiNx. Tabard-Cossa et al. [99] discussed that high 1/f noise in SiNx pores correlates with surface con-tamination: inhomogeneities of the pore surface resulted in fluctuations of the numberand mobility of charge carriers due to trapping at the pore surface [62, 99], analogous to1/f noise found in semiconductors [100]. As shown by Smeets et al. [60, 61], such low-frequency noise in SiNx pores obeys Hooge’s relation, Eq.2.1, which describes an inverseproportionality between the 1/f current noise power and the number of charge carrierspresent within the nanopore volume (Fig.2.3i) [53]. For nanopores made in 2D materials,the 1/f noise depends strongly on the size of the freestanding area [23, 56, 57, 101], in-dicating that mechanical fluctuations of the ultrathin 2D membrane (thickness < 1 nm)are the main source. The high-frequency noise in solid-state nanopores is dominated bydielectric (∼2-10 kHz) and capacitive noise (> 10 kHz) [17, 102], see Fig.2.3j. The PSDof these noise sources depends mostly on the capacitance of the chip, cf. Eq.2.5 and2.6, which in turn is set by the membrane and substrate size, thickness, and dielectricconstant. Additionally, parasitic capacitances from the amplifier and the interconnectsbetween nanopore and amplifier contribute to the total capacitance at the amplifier in-put.
2.5. COMPARING THE PERFORMANCE OF BIOLOGICAL AND SO-LID-STATE NANOPORES
So far, we provided a general overview of the typical noise sources in biological and solid-state nanopores. We now turn to a mutual comparison between these two classes ofnanopores. We compare their performances in terms of the SNR – a more relevant figureof merit than the mere magnitude of the current noise. We define the SNR as the ratiobetween the signal modulation ∆I produced by the translocation of a ssDNA molecule,and the baseline current rms (Irms) measured at the operating bandwidth (Fig.2.4a). Al-though other definitions of SNR are found in the literature, e.g. as the ratio between openpore current and baseline current noise Io/Irms [103] or the capability to discern currentlevels when sequencing DNA [14, 41], we find this definition the most appropriate forthe diverse nanopore systems compared in our study.
Given that the experimental conditions reported in the literature differ considerably,we carried out a dedicated comparative study by complementing reported data with newdata that were, to the extent possible, obtained in our lab under the same experimen-tal conditions. The bandwidth was chosen such as to fully resolve the current block-ade ∆I generated by the poly(dT) substrate (avoiding a reduced ∆I due to a too narrowbandwidth). The translocation time in turn, is determined by a combination of elec-trophoresis, electro-osmosis, and interactions between the passing molecule and thepore surface, which will depend on each individual nanopore system. The applied biaswas chosen as to maximize the current signal and is limited by experimental conditions,as will be discussed below. We selected 5 popular nanopore systems, MspA , α-HL, Re-FraC, MoS2, and SiNx, that are commonly used and that were shown to possess goodspatiotemporal resolution, allowing for accurate discrimination of short homopolymers[14, 19, 28, 44, 105]. All pores considered had a similar diameter of ∼1.3 nm. Figure 2.4billustrates the relative sizes of the different pores.

2
30 CHAPTER 2
Figure 2.4: Detection of DNA homopolymer poly(dT) with protein and solid-state nanopores. (a) Exampleof a translocation event, illustrating the signal-to-noise ratio. (b) Schematic comparing the relative sizes ofMspA (green),α-HL (red), ReFraC (blue), MoS2 (black), and solid-state SiNx (purple). Adapted with permissionfrom Carson, S. et al., 2015. (c) Example of translocation events of poly(dT) molecules through MspA [15]channel (green), α-HL pore (red), ReFraC pore (blue), 1.4 nm MoS2 pore (black), and 1.4 nm SiNx pore (purple,Adapted with permission from Venta, K. et al., 2013) all in 1 M KCl solution at a transmembrane voltage of180 mV, 180 mV, 180 mV, 300mV, and 1V, and at a bandwidth of 30 kHz, 10 kHz, 10 kHz, 10 kHz, and 500 kHz,respectively. Experiments for biological pores were done using an Axopatch 200B amplifier, a teflon-supportedlipid membrane (∼50-100 µm wide; DPhPC lipids), 10-30 kHz bandwidth, 1 M KCl, pH 7.5, and a forward biasvoltage of 180 mV, as in Ref.[104]. The solid-state SiNx pore was built on a glass chip and measured with theVC100 high-bandwidth, low-noise voltage-clamp amplifier (Chimera Instruments, New York, NY, USA) whichallowed for low-noise measurements at high bandwidth. A broad bandwidth of 500 kHz was required in orderto fully resolve the fast translocations (∼22µs) [19] of poly(dT)30 through the solid-state SiNx pore. Notably, thepositively charged constriction of ReFraC causes the negatively charged poly(dT)50 to translocate with muchslower (491±114 µs) translocation times compared to MspA (17.7±1.1 µs), which permitted to filter out morehigh-frequency noise. (d) Comparison of various figures of merit for different nanopore systems under typicalexperimental conditions. I0 indicates the open pore ionic current at the applied bias V.

2. COMPARING CURRENT NOISE IN BIOLOGICAL AND SOLID-STATE NANOPORES
2
31
Nanopore experiments probing the translocation of poly(dT)50 were carried out in-house using three biological pores, MspA, α-HL, and ReFraC. We compared these datato experimental results on two types of solid-state nanopores, SiNx [19] and MoS2[28]that were measured at the same electrolyte conditions. Translocation data of poly(dT)80
through a 1.4 nm MoS2 pore were kindly shared by the Radenovic lab [26], whereaspoly(dT)30 data for a 1.4 nm SiNx pore with ∼5 nm length were taken from the litera-ture [19]. Figure 2.4c shows examples of single-molecule poly(dT) translocations for the5 pores. A range of SNR values are observed, with, at face value, a better performance forSiNx and ReFraC than for MoS2, α-HL, and MspA.
Figure 2.4d quantitatively compares the data for the different nanopore systems. Forthe biological nanopores, ReFraC gives the best SNR = 15, while MspA resulted in a muchlower SNR of 4. This is mainly due to the faster translocations of poly(dT) through MspA,which required a higher bandwidth (30 kHz), and hence larger noise, in order to resolvethe translocation events. Conversely, translocations through the positively charged con-striction of ReFraC were significantly slower, thus permitting to employ a lower band-width (10 kHz).
Amongst the solid-state nanopores, SiNx showed the best SNR: an impressive valueof 37, which was higher than the SNR = 5 obtained for MoS2, as well as higher than thevalues for all biological nanopores. The greater SNR for SiNx results from the very highvoltage applied (1000 mV vs 300 mV for MoS2), producing a particularly large currentsignal ∆I. The applied voltage for MoS2 pores was limited by the degradation of the 2Dmembrane and pore growth under high bias voltages, which typically limited the appliedbias to < 400 mV.
In biological nanopores the range of bias voltages is limited by the membrane stabil-ity, affected by electroporation and rupture around 200-300 mV [106, 107]. Note further-more that the SiNx nanopore system was operated at a much higher bandwidth (500 kHzvs 10 kHz for MoS2), the regime where dielectric and capacitive noise dominate.
This is advantageous for high-voltage sensing, since these noise sources do not scalewith voltage, cf. Eq.2.5 and Eq.2.6. As a result, the high bias voltage improves the signal(∆I) while it does not affect the noise. Lastly, we note that, while MoS2 has a lower SNRthan SiNx, it features a better spatial resolution along the molecule, given its 0.7 nm porelength, as compared to the ∼ 5 nm of SiNx.
Finally, it is important to point out that the above comparison was carried out forvoltage-driven translocation of DNA through nanopores. A controlled slowdown of thetranslocation speed can change these numbers dramatically. Indeed, despite the factthat Figure 2.4d shows that the best SNR was obtained for the solid-state SiNx nanopores,with values exceeding those of biological nanopores, todays commercialized nanopore-based DNA sequencers employ protein pores to read off DNA bases with (sub)-nucleotideresolution over very long reads [16, 108]. Using a helicase to slow down ssDNA moleculesthrough MspA, allowed Laszlo et al. [41] to use a very low LP filter frequency of ∼200 Hz,and fully resolve the step-wise DNA translocation at half-base resolution. By compar-ing the noise at a 200 Hz bandwidth with the signal obtained for voltage-driven poly(dT)translocations in our experiments, we find an exquisite SNR of ∼650 for MspA – twoorders of magnitude higher than the SNR = 4 noted above. Applying the same reason-ing to α-HL and ReFraC increases their SNR to ∼270 and ∼220, respectively, i.e., some-

2
32 CHAPTER 2
what lower values, consistent with their higher low-frequency noise compared to MspA(Fig.2.3c). Thus, in the context of DNA sequencing, the real game-changer lies in theenzymatic control over the translocation speed by use of an additional motor protein[14, 16, 41, 105, 109]. For solid-state nanopores, despite the progresses in slowing downthe DNA translocation [28, 32–36], time control has so far remained a challenge, andaccordingly, DNA sequencing has not yet been realized with such nanopores. Further-more, mechanical instability of solid-state nanopores over time, which particularly af-fects smaller pores, should be minimized in order to achieve sufficiently long observa-tion times.
2.6. APPROACHES TO OVERCOME NOISE LIMITATIONSFigure 2.5 shows important approaches to lower the ionic current noise in nanopores.We first describe efforts to reduce the low-frequency noise. As protonation noise isthe main source of low-frequency noise in biological nanopores, it is advantageous tochoose a pH value that is far away from the pKa of the ionizable amino acids to atten-uate the noise. Another way to reduce it, is to remove charged amino acids near theconstriction site, which is expected to yield lower noise levels. Furthermore, increasingthe conformational stiffness of biological pores can help to reduce conductance fluctu-ations associated with channel breathing.
For solid-state nanopores, the low-frequency 1/f noise can be efficiently suppressedby surface functionalization of the SiNx nanopore with a hydrophilic surface layer, suchas Al2O3 or SiO2 [110–113]. In principle, any surface treatment that reduces the amountof contaminants and improves hydrophilicity of the pore surface will lower the 1/f noise.Indeed, Tabard-Cossa et al. [99] showed that piranha treatment (30% H2O2/H2SO4, 1:3)substantially reduced the 1/f noise by up to three orders of magnitude. Beamish et al.[114] demonstrated that cyclic application of high electric fields to the nanopore alsosuppressed this noise source. Similar to protein pores, work from Wen et al. [55] showedthat the 1/f noise could be minimized by choosing a pH that is far from the isoelectricpoint of the nanopore material (∼5 for Si3N4) [115, 116]. Nanopores built with 2D ma-terials suffer from pronounced 1/f noise that was found to correlate with the area andthickness of the freestanding 2D-membrane [46, 47]. A decrease of the freestanding areawas shown to reduce the 1/f noise, while employing multi-layer membranes was alsohelpful for obtaining less noise, though that approach is less desirable due to a loss ofspatial resolution [24, 56, 57]. Use of freestanding 2D-membranes that are directly grownon a SiNx-supporting membrane was also shown to lower the 1/f noise for both graphene[117] and MoS2 [118] pores, as compared to transferred 2D-membranes [20, 56].
The noise at higher frequencies, constituted by dielectric and capacitive noise, has awell-characterized physical origin, namely the thermal voltage noise in conjunction withthe loss conductance of the membrane and substrate materials as well as the amplifierinput capacitance. Suppression of dielectric noise is generally achieved by minimizingthe capacitance Cchi p and dielectric loss D of the chip, cf. Eq.2.5. To effectively decreasecapacitive noise, the total input capacitance Ctot needs to be reduced, see Eq.2.6 andrelated discussion. In biological nanopores, the high-frequency noise can be reduced bydecreasing the area of the lipid bilayer. Mayer et al.[78] fabricated teflon holes of only∼25 µm in diameter with soft lithography using SU-8 resist as master mold, providing

2. COMPARING CURRENT NOISE IN BIOLOGICAL AND SOLID-STATE NANOPORES
2
33
Figure 2.5: Approaches to reduce the noise in nanopore systems. For biological nanopores, low-frequency pro-tonation noise can be minimized by adjusting the pH far from pKa of the amino acids in the pore constriction,as reported in Ref.[65], or by mutating the ionizable amino acids (Arg, Lys, Asp, Glu) to neutral ones (e.g., Asn),as was done for MspA . Reprinted with permission from Butler, T. Z. et al., 2008 [104]. Low-frequency 1/f noiseinstead can only be avoided by selecting a pore that is mechanically stable under an applied bias, e.g. MspAor α-HL. High-frequency noise can be minimized by reducing the size of the freestanding lipid membrane by,e.g., employing a nanocapillary as a support (Reprinted with permission from Gornall, J. L. et al., 2011 [121])and by reducing the capacitance of the interconnects by smart CMOS integration (Reprinted with permissionfrom Rosenstein, J. K. et al.). For solid-state nanopores, low-frequency 1/f noise can be reduced by coating thesurface with a hydrophilic, homogeneous material, e.g. Al2O3, as reported in Ref.[113]. For 2D-materials, 1/fnoise can be suppressed by lowering the area of the freestanding 2D membrane . Adapted with permissionfrom Balan, A. et al., 2015 [18]. High-frequency noise can be minimized by employing dielectric chip substratematerials, e.g. glass (adapted with permission from Balan, A. et al., 2015 [18], or by tight integration of theamplifier and nanopore chip (adapted with permission from Rosenstein, J. K. et al., 2012 [29].

2
34 CHAPTER 2
a Cchi p of 10-28 pF. By using a U-shaped teflon patch tube as the support, Akeson andcoworkers [81, 104] built horizontal bilayers < 20 µm in diameter. Lipid bilayers witha comparable size were also created with the droplet-interface-bilayer (DIB) technique[119]. Kitta et al. [120] reported on the fabrication of yet smaller bilayers, with sizes downto 2-3 µm in diameter, by using a heated tungsten tip to create a microhole across theteflon film. Similarly sized 1-3 µm bilayers can be obtained by inserting protein poresinto GUVs (Giant Unilamellar Vescicles) and using patch-clamp pipets to measure theconductance of the pores [122, 123]. More recently, Gornall et al. [121] showed thatborosilicate glass nanopipets with diameters as low as 230 nm could be fabricated andused for current recordings on an OmpF protein channel. Hartel et al. [124] achievedhigh-bandwidth (> 500 kHz) recordings with biological pores with CMOS-suspended(Complementary Metal-Oxide-Semiconductor) membranes that were built directly overa ∼30 µm well on top of a CMOS-amplifier chip. This offered a reduction of the totalinput capacitance Ctot to < 4 pF and provided a bandwidth as high as 1 MHz and a SNR> 8 at 500 kHz, for detecting the gating of a RyR1 pore (type 1 ryanodine receptor) [124].Combined with extended β distribution data analysis [125] (which exploits the charac-teristics of the excess current noise to reconstruct the true current signal), it was possibleto achieve a time resolution of 35 ns [124].
For reducing the high-frequency noise in SiNx solid-state nanopores, an establishedmethod, first reported by Tabard-Cossa et al. [99], is to lower Cchi p by coating the areaof the chip around the pore with a dielectric, e.g. PDMS, thereby providing additionalthickness to the chip membrane surrounding the pore and thus a low series capaci-tance. Similarly, a substantial reduction of Cchi p was achieved by employing a dielec-tric, e.g. amorphous glass [17, 18] or Pyrex [24, 86] as substrate material instead of thecommonly used crystalline silicon which is intrinsically conductive. In work by Balanet al., [18] glass chips were shown to reduce Cchi p to < 1 pF, compared to > 300 pF forstandard silicon chips [60]. Similarly to biological nanopores, the highest working band-widths were so far achieved by integrating a low Cchi p nanopore device with an on-chipCMOS-amplifier [29, 30], which lowered the total input capacitance to Ctot ≈ 4 pF. In thisway, ssDNA molecules were recorded using ultrathin (< 4 nm) sub-2 nm pores yieldinga SNR> 10 at 5 MHz [30]. In 2D nanopores, the high-frequency noise can be addressedin similar ways to SiNx pores. The use of glass as substrate material, combined with asmall ∼300 nm freestanding 2D-membrane of graphene or MoS2, resulted in a Cchi p < 2pF [18].
2.7. CONCLUSIONIn this paper, we illustrated the main sources of noise affecting various nanopore sys-tems, with a particular emphasis on comparing biological and solid-state nanopores,and we discussed practical approaches to lower the noise. We compared the SNR ofpoly(dT) translocations through a representative set of biological and solid-state pores,and found that silicon nitride nanopores gave the highest SNR. This can be attributed tothe higher currents (i.e. larger signals) that solid-state systems offer, and to the relativelylow high-frequency noise. Despite these good noise characteristics, prominent applica-tions such as DNA or protein sequencing have so far remained out of reach for solid-statenanopores, because the fast translocation speed provides only a short observation time

REFERENCES
2
35
per single molecule. There are two ways to improve this: one can either shift the sam-pling rate into even higher frequencies (À MHz), or alternatively slow down the translo-cation of the molecule. The latter strategy has led to the successful commercialization ofDNA sequencers based on protein nanopores that are coupled with an enzymatic step-ping motor. In our comparison, we found that the SNR of MspA increased > 160-fold bysuch speed control, mainly due to the decoupling of the signal from the high-frequencynoise. Additionally, the motor protein provides a ratcheting mechanism that translo-cates the substrate with a constant discrete step size. Since the sensing region of the poreis typically larger than the individual monomer size (nucleotide or amino-acid), such amechanism is indispensable to reproducibly resolve and identify the sequence. Futureimprovements of the solid-state nanopore system could thus be directed towards eithera further increase of the temporal resolution, e.g. by reducing even more the overallparasitic capacitances, or by creating an efficient slowdown mechanism, similar to bio-logical nanopores. In general, the understanding of noise sources, associated timescales,and techniques to lower the noise at both low and high frequencies are greatly beneficialto maximize the sensitivity of nanopore detection and thereby extend the range of itsapplications.
REFERENCES[1] A. Fragasso, S. Schmid, and C. Dekker, Comparing Current Noise in Biological and
Solid-State Nanopores, ACS Nano , acsnano.9b09353 (2020).
[2] C. Dekker, Solid-state nanopores (Review Article), Nature Nanotechnology , 1(2007).
[3] S. Carson and M. Wanunu, Challenges in DNA motion control and sequence read-out using nanopore devices, Nanotechnology 26, 74004 (2015).
[4] G. Maglia, A. J. Heron, D. Stoddart, D. Japrung, and H. Bayley, Methods in Enzy-mology, 1st ed., Vol. 475 (Elsevier Inc., 2010) pp. 591–623, arXiv:NIHMS150003 .
[5] Y. Feng, Y. Zhang, C. Ying, D. Wang, and C. Du, Nanopore-based fourth-generationDNA sequencing technology, Genomics, Proteomics and Bioinformatics 13, 4(2015), arXiv:NIHMS150003 .
[6] Y. Lin, Y. L. Ying, and Y. T. Long, Nanopore confinement for electrochemical sensingat the single-molecule level, Current Opinion in Electrochemistry 7, 172 (2018).
[7] E. Atas, A. Singer, and A. Meller, DNA sequencing and bar-coding using solid-statenanopores, (2012).
[8] W. Yang, A. Birnie, L. Restrepo-Pérez, J. van der Torre, M. Bengtson, S. J. Heerema,and C. Dekker, Detection of CRISPR-dCas9 on DNA with Solid-State Nanopores,Nano Letters 18, 6469 (2018).
[9] A. H. Squires, J. S. Hersey, M. W. Grinstaff, and A. Meller, A nanopore-nanofibermesh biosensor to control DNA translocation, Journal of the American ChemicalSociety 135, 16304 (2013).

2
36 REFERENCES
[10] B. N. Miles, A. P. Ivanov, K. a. Wilson, F. Dogan, D. Japrung, and J. B. Edel, Singlemolecule sensing with solid-state nanopores: novel materials, methods, and appli-cations, Chemical Society Reviews 42 (2012), 10.1039/c2cs35286a.
[11] D. Wu, S. Bi, L. Zhang, and J. Yang, Single-molecule study of proteins by biologicalnanopore sensors, Sensors (Switzerland) 14, 18211 (2014).
[12] A. J. Storm, C. Storm, J. Chen, H. Zandbergen, J. F. Joanny, and C. Dekker, Fast DNAtranslocation through a solid-state nanopore, Nano Letters 5, 1193 (2005).
[13] C. Plesa, S. W. Kowalczyk, R. Zinsmeester, A. Y. Grosberg, Y. Rabin, and C. Dekker,Fast translocation of proteins through solid state nanopores, Nano Letters 13, 658(2013).
[14] E. a. Manrao, I. M. Derrington, A. H. Laszlo, K. W. Langford, M. K. Hopper, N. Gill-gren, M. Pavlenok, M. Niederweis, and J. H. Gundlach, Reading DNA at single-nucleotide resolution with a mutant MspA nanopore and phi29 DNA polymerase,Nature Biotechnology 30, 349 (2012).
[15] I. M. Derrington, T. Z. Butler, M. D. Collins, E. Manrao, M. Pavlenok, M. Nieder-weis, and J. H. Gundlach, Nanopore DNA sequencing with MspA, Proceedings ofthe National Academy of Sciences 107, 16060 (2010).
[16] J.-M. Carter and S. Hussain, Robust long-read native DNA sequencing using theONT CsgG Nanopore system, Wellcome Open Research 2, 1 (2018).
[17] A. Balan, B. Machielse, D. Niedzwiecki, J. Lin, P. Ong, R. Engelke, K. L. Shepard,and M. Drndic, Improving signal-to-noise performance for DNA translocation insolid-state nanopores at MHz bandwidths, Nano Letters 14, 7215 (2014).
[18] A. Balan, C. C. Chien, R. Engelke, and M. Drndic, Suspended Solid-state Mem-branes on Glass Chips with Sub 1-pF Capacitance for Biomolecule Sensing Applica-tions, Scientific Reports 5, 1 (2015).
[19] K. Venta, G. Shemer, M. Puster, J. A. Rodríguez-Manzo, A. Balan, J. K. Rosen-stein, K. Shepard, and M. Drndic, Differentiation of short, single-stranded DNAhomopolymers in solid-state nanopores, ACS Nano 7, 4629 (2013).
[20] C. a. Merchant, K. Healy, M. Wanunu, V. Ray, N. Peterman, J. Bartel, M. D. Fis-chbein, K. Venta, Z. Luo, a. T. C. Johnson, and M. Drndic, DNA translocationthrough graphene nanopores, Nano Letters 10, 2915 (2010).
[21] G. F. Schneider, S. W. Kowalczyk, V. E. Calado, G. Pandraud, H. W. Zandbergen, L. M.Vandersypen, and C. Dekker, DNA translocation through graphene nanopores,Nano Letters 10, 3163 (2010).
[22] G. F. Schneider, Q. Xu, S. Hage, S. Luik, J. N. Spoor, S. Malladi, H. Zandbergen,and C. Dekker, Tailoring the hydrophobicity of graphene for its use as nanopores forDNA translocation, Nature Communications 4, 1 (2013).

REFERENCES
2
37
[23] Z. Zhou, Y. Hu, H. Wang, Z. Xu, W. Wang, X. Bai, X. Shan, and X. Lu, DNA Transloca-tion through hydrophilic nanopore in hexagonal boron nitride, Scientific Reports3, 1 (2013).
[24] K. B. Park, H. J. Kim, H. M. Kim, S. A. Han, K. H. Lee, S. W. Kim, and K. B. Kim,Noise and sensitivity characteristics of solid-state nanopores with a boron nitride2-D membrane on a pyrex substrate, Nanoscale 8, 5755 (2016).
[25] K. Liu, M. Lihter, A. Sarathy, S. Caneva, H. Qiu, D. Deiana, V. Tileli, D. T. Alexander,S. Hofmann, D. Dumcenco, A. Kis, J. P. Leburton, and A. Radenovic, GeometricalEffect in 2D Nanopores, Nano Letters 17, 4223 (2017).
[26] M. Graf, M. Lihter, M. Thakur, V. Georgiou, J. Topolancik, B. R. Ilic, K. Liu, J. Feng,Y. Astier, and A. Radenovic, Fabrication and practical applications of molybdenumdisulfide nanopores, Nature Protocols 14, 1130 (2019).
[27] K. Liu, J. Feng, A. Kis, and A. Radenovic, Atomically thin molybdenum disulfidenanopores with high sensitivity for dna translocation, ACS Nano 8, 2504 (2014).
[28] J. Feng, K. Liu, R. D. Bulushev, S. Khlybov, D. Dumcenco, A. Kis, and A. Radenovic,Identification of single nucleotides in MoS 2 nanopores, Nature Nanotechnology10, 1070 (2015).
[29] J. K. Rosenstein, M. Wanunu, C. A. Merchant, M. Drndic, and K. L. Shepard, Inte-grated nanopore sensing platform with sub-microsecond temporal resolution, Na-ture Methods 9, 487 (2012).
[30] S. Shekar, D. J. Niedzwiecki, C. C. Chien, P. Ong, D. A. Fleischer, J. Lin, J. K. Rosen-stein, M. Drndic, and K. L. Shepard, Measurement of DNA translocation dynam-ics in a solid-state nanopore at 100 ns temporal resolution, Nano Letters 16, 4483(2016).
[31] G. Thiel, K. L. Shepard, A. J. Hartel, S. Shekar, I. Schroeder, and P. Ong, High band-width approaches in nanopore and ion channel recordings – A tutorial review, An-alytica Chimica Acta 1061 (2019), 10.1016/j.aca.2019.01.034.
[32] U. F. Keyser, Controlling molecular transport through nanopores, Journal of theRoyal Society Interface 8, 1369 (2011).
[33] M. Wanunu and A. Meller, Chemically modified solid-state nanopores, Nano Let-ters 7, 1580 (2007).
[34] S. Pud, S. H. Chao, M. Belkin, D. Verschueren, T. Huijben, C. Van Engelen-burg, C. Dekker, and A. Aksimentiev, Mechanical Trapping of DNA in a Double-Nanopore System, Nano Letters 16, 8021 (2016).
[35] T. Gilboa and A. Meller, Optical sensing and analyte manipulation in solid-statenanopores, Analyst 140, 4733 (2015).

2
38 REFERENCES
[36] H. Yamazaki, R. Hu, Q. Zhao, and M. Wanunu, Photothermally Assisted Thinningof Silicon Nitride Membranes for Ultrathin Asymmetric Nanopores, ACS Nano 12,12472 (2018).
[37] N. E. Weckman, N. Ermann, R. Gutierrez, K. Chen, J. Graham, R. Tivony, A. Heron,and U. F. Keyser, Multiplexed DNA Identification Using Site Specific dCas9 Barcodesand Nanopore Sensing, ACS Sensors 4, 2065 (2019).
[38] K. Chen, M. Juhasz, F. Gularek, E. Weinhold, Y. Tian, U. F. Keyser, and N. A. Bell,Ionic Current-Based Mapping of Short Sequence Motifs in Single DNA MoleculesUsing Solid-State Nanopores, Nano Letters 17, 5199 (2017).
[39] K. Chen, J. Kong, J. Zhu, N. Ermann, P. Predki, and U. F. Keyser, Digital Data StorageUsing DNA Nanostructures and Solid-State Nanopores, Nano Letters 19, 8 (2019).
[40] N. A. Bell and U. F. Keyser, Digitally encoded DNA nanostructures for multiplexed,single-molecule protein sensing with nanopores, Nature Nanotechnology 11, 645(2016).
[41] A. H. Laszlo, I. M. Derrington, and J. H. Gundlach, MspA nanopore as a single-molecule tool: From sequencing to SPRNT, Methods 105, 75 (2016).
[42] L. Song, M. R. Hobaugh, C. Shustak, S. Cheley, H. Bayley, and J. E. Gouaux, Struc-ture of staphylococcal α-hemolysin, a heptameric transmembrane pore, Science274, 1859 (1996).
[43] G. Menestrina, Ionic Channels Formed by Staphylococcus aureus Alpha-Toxin:Voltage-Dependent Inhibition by Divalent and Trivalent Cations, The Journal ofMembrane Biology 90, 177 (1986).
[44] C. Wloka, N. L. Mutter, M. Soskine, and G. Maglia, Alpha-Helical Fragaceatoxin CNanopore Engineered for Double-Stranded and Single-Stranded Nucleic Acid Anal-ysis, Angewandte Chemie - International Edition 55, 12494 (2016).
[45] G. Huang, K. Willems, M. Soskine, C. Wloka, and G. Maglia, Electro-osmoticcapture and ionic discrimination of peptide and protein biomarkers with FraCnanopores, Nature Communications 8, 1 (2017).
[46] M. Montal and P. Mueller, Formation of bimolecular membranes from lipid mono-layers and a study of their electrical properties. Proceedings of the NationalAcademy of Sciences of the United States of America 69, 3561 (1972).
[47] B. Sakmann and E. Neher, Single-channel recording (2009).
[48] V. Tabard-Cossa, Instrumentation for Low-Noise High-Bandwidth NanoporeRecording, in Engineered Nanopores for Bioanalytical Applications: A Volume inMicro and Nano Technologies (2013) pp. 59–93.
[49] E. Milotti, 1/F Noise: a Pedagogical Review, arXiv (2002), arXiv:0204033 [physics] .

REFERENCES
2
39
[50] P. Dutta and P. M. Horn, Low-frequency fluctuations in solids: 1/f noise, Reviews ofModern Physics 53 (1981).
[51] D. Zhang, P. Solomon, S. L. Zhang, and Z. Zhang, An impedance model for thelow-frequency noise originating from the dynamic hydrogen ion reactivity at thesolid/liquid interface, Sensors and Actuators, B: Chemical 254, 363 (2018).
[52] R. P. Jindal and A. Van Der Ziel, Model for mobility fluctuation 1/f noise, AppliedPhysics Letters 38, 290 (1981).
[53] F. Hooge, 1/F Noise, Physica B+C 83, 14 (1976).
[54] R. M. M. Smeets, U. F. Keyser, M. Y. Wu, N. H. Dekker, and C. Dekker, Nanobubblesin solid-state nanopores, Physical Review Letters 97, 1 (2006).
[55] C. Wen, S. Zeng, K. Arstila, T. Sajavaara, Y. Zhu, Z. Zhang, and S. L. Zhang, Gener-alized Noise Study of Solid-State Nanopores at Low Frequencies, ACS Sensors 2, 300(2017).
[56] S. J. Heerema, G. F. Schneider, M. Rozemuller, L. Vicarelli, H. W. Zandbergen,and C. Dekker, 1/F Noise in Graphene Nanopores, Nanotechnology 26 (2015),10.1088/0957-4484/26/7/074001.
[57] Z.-Y. Zhang, Y.-S. Deng, H.-B. Tian, H. Yan, H.-L. Cui, and D.-Q. Wang, Noise Analy-sis of Monolayer Graphene Nanopores, International Journal of Molecular Sciences19, 2639 (2018).
[58] F. Wohnsland and R. Benz, 1/f-Noise of open bacterial porin channels, Journal ofMembrane Biology 158, 77 (1997).
[59] S. M. Bezrukov and M. Winterhalter, Examining noise sources at the single-molecule level: 1/f noise of an open maltoporin channel, Physical Review Letters85, 202 (2000).
[60] R. M. M. Smeets, U. F. Keyser, N. H. Dekker, and C. Dekker, Noise in solid-statenanopores, Proceedings of the National Academy of Sciences of the United Statesof America 105, 417 (2008).
[61] R. M. M. Smeets, N. H. Dekker, and C. Dekker, Low-frequency noise in solid-statenanopores, Nanotechnology 20 (2009), 10.1088/0957-4484/20/9/095501.
[62] A. Fragasso, S. Pud, and C. Dekker, 1/F Noise in Solid-State Nanopores Is GovernedBy Access and Surface Regions, Nanotechnology 30, 395202 (2019).
[63] C. Tasserit, A. Koutsioubas, D. Lairez, G. Zalczer, and M. C. Clochard, Pink noiseof ionic conductance through single artificial nanopores revisited, Physical ReviewLetters 105, 1 (2010).
[64] E. M. Nestorovich, T. K. Rostovtseva, and S. M. Bezrukov, Residue Ionization andIon Transport through OmpF Channels, Biophysical Journal 85, 3718 (2003).

2
40 REFERENCES
[65] J. J. Kasianowicz and S. M. Bezrukov, Current Noise Reveals Protonation Kineticsand Number of Ionizable Sites in an Open Protein Ion Channel, Physical ReviewLetters 70, 2352 (1993).
[66] J. J. Kasianowicz and S. M. Bezrukov, Protonation dynamics of the alpha-toxin ionchannel from spectral analysis of pH-dependent current fluctuations, BiophysicalJournal 69, 94 (1995).
[67] S. Machlup, Noise in semiconductors: Spectrum of a two-parameter random signal,Journal of Applied Physics 25, 341 (1954).
[68] J. Johnson, Thermal agitation of electricity in conductors, Physical Review 32(1928).
[69] H. Nyquist, Thermal agitation of electric charge in conductors, Physical Review 32(1928).
[70] Y. M. Blanter and M. Büttiker, Shot noise in mesoscopic conductors, Physics Report336, 1 (2000).
[71] W. Schottky, Über spontane Stromschwankungen in verschiedenen Elektrizitätsleit-ern, Annalen der physik 362, 541 (1918).
[72] L. F. Chen, C. K. Ong, C. P. Neo, V. V. Varadan, and V. K. Varadan, Microwave Elec-tronics: Measurement and Materials Characterization, edited by John Wiley & Sons(Wiley, 2004) pp. 7–15.
[73] J. D. Uram, K. Ke, and M. L. Mayer, Noise and bandwidth of current recordings fromsubmicrometer pores and nanopores, ACS Nano 2, 857 (2008).
[74] R. Sherman-Gold, The Axon CNS Guide to Electrophysiology and Biophysics Labo-ratory Techniques (2012).
[75] M. Ayub and H. Bayley, Engineered transmembrane pores, Current Opinion inChemical Biology 34, 117 (2016).
[76] Z. Yu, M. F. Jarrold, R. Williams, S. J. Ludtke, I. Echeverria, B. D. Slaughter, I. E.Chemmama, J. R. Unruh, R. Mironska, M. J. de la Cruz, J. A. Hogan, M. Shiv-araju, A. S. Chaudhury, B. Raveh, J. Wang, R. Pellarin, P. Upla, S. J. Kim, T. Herricks,I. Nudelman, A. Sali, W. Zhang, D. L. Stokes, J. D. Aitchison, M. P. Rout, Y. Shi, C. W.Akey, C. H. Greenberg, J. Fernandez-Martinez, B. T. Chait, J. L. Gerton, and E. Y.Jacobs, Integrative structure and functional anatomy of a nuclear pore complex,Nature 555, 475 (2018).
[77] J. W. Robertson, Engineered Nanopores for Bioanalytical Applications: A Volume inMicro and Nano Technologies, first edit ed. (Elsevier Inc., 2013) pp. 95–119.
[78] M. Mayer, J. K. Kriebel, M. T. Tosteson, and G. M. Whitesides, MicrofabricatedTeflon membranes for low-noise recordings of ion channels in planar lipid bilayers,Biophysical Journal 85, 2684 (2003).

REFERENCES
2
41
[79] S. Nekolla, C. Andersen, and R. Benz, Noise analysis of ion current through theopen and the sugar-induced closed state of the LamB channel of Escherichia coliouter membrane: evaluation of the sugar binding kinetics to the channel interior,Biophysical Journal 66, 1388 (1994).
[80] P. Läuger, Structural fluctuations and current noise of ionic channels, BiophysicalJournal 48, 369 (1985).
[81] M. Akeson, E. Brandin, D. Branton, D. W. Deamer, and J. J. Kasianowicz, Microsec-ond Time-Scale Discrimination Among Polycytidylic Acid, Polyadenylic Acid, andPolyuridylic Acid as Homopolymers or as Segments Within Single RNA Molecules,Biophysical Journal 77, 3227 (2009).
[82] S. Bhattacharya, J. Yoo, and A. Aksimentiev, Water Mediates Recognition of DNASequence via Ionic Current Blockade in a Biological Nanopore, ACS Nano 10, 4644(2016).
[83] T. Gibb and M. Ayub, Solid-State Nanopore Fabrication, Engineered Nanopores forBioanalytical Applications: A Volume in Micro and Nano Technologies , 121 (2013).
[84] S. M. Gilbert, G. Dunn, A. Azizi, T. Pham, B. Shevitski, E. Dimitrov, S. Liu,S. Aloni, and A. Zettl, Fabrication of Subnanometer-Precision Nanopores in Hexag-onal Boron Nitride, Scientific Reports 7, 1 (2017).
[85] M. H. Lee, A. Kumar, K. B. Park, S. Y. Cho, H. M. Kim, M. C. Lim, Y. R. Kim, andK. B. Kim, A low-noise solid-state nanopore platform based on a highly insulatingsubstrate, Scientific Reports 4, 1 (2014).
[86] W. H. Pitchford, H. J. Kim, A. P. Ivanov, H. M. Kim, J. S. Yu, R. J. Leatherbarrow,T. Albrecht, K. B. Kim, and J. B. Edel, Synchronized optical and electronic detectionof biomolecules using a low noise nanopore platform, ACS Nano 9, 1740 (2015).
[87] A. J. Storm, J. H. Chen, X. S. Ling, H. W. Zandbergen, and C. Dekker, Fabricationof solid-state nanopores with single-nanometre precision, Nature Materials 2, 537(2003).
[88] M. Van Den Hout, A. R. Hall, M. Y. Wu, H. W. Zandbergen, C. Dekker, and N. H.Dekker, Controlling nanopore size, shape and stability, Nanotechnology 21 (2010),10.1088/0957-4484/21/11/115304.
[89] Y. H. Lanyon, G. De Marzi, Y. E. Watson, A. J. Quinn, J. P. Gleeson, G. Redmond,and D. W. Arrigan, Fabrication of nanopore array electrodes by focused ion beammilling, Analytical Chemistry 79, 3048 (2007).
[90] B. Schiedt, L. Auvray, L. Bacri, G. Oukhaled, A. Madouri, E. Bourhis, G. Patriarche,J. Pelta, R. Jede, and J. Gierak, Direct FIB fabrication and integration of "singlenanopore devices" for the manipulation of macromolecules, Microelectronic Engi-neering 87, 1300 (2010).

2
42 REFERENCES
[91] D. V. Verschueren, W. Yang, and C. Dekker, Lithography-based fabrication ofnanopore arrays in freestanding SiN and graphene membranes, 29, 145302 (2018),arXiv:15334406 .
[92] T. Gilboa, E. Zvuloni, A. Zrehen, A. H. Squires, and A. Meller, Automated, Ultra-Fast Laser-Drilling of Nanometer Scale Pores and Nanopore Arrays in Aqueous So-lutions, Advanced Functional Materials 1900642, 1 (2019).
[93] T. Gilboa, A. Zrehen, A. Girsault, and A. Meller, Optically-Monitored Nanopore Fab-rication Using a Focused Laser Beam, Scientific Reports 8, 1 (2018).
[94] S. Pud, D. Verschueren, N. Vukovic, C. Plesa, M. P. Jonsson, and C. Dekker, Self-Aligned Plasmonic Nanopores by Optically Controlled Dielectric Breakdown, NanoLetters 15, 7112 (2015).
[95] H. Kwok, K. Briggs, and V. Tabard-Cossa, Nanopore fabrication by controlled di-electric breakdown, PLoS ONE 9 (2014), 10.1371/journal.pone.0092880.
[96] J. D. Piper, R. W. Clarke, Y. E. Korchev, L. Ying, and D. Klenerman, A renewablenanosensor based on a glass nanopipette, Journal of the American Chemical Soci-ety 128, 16462 (2006).
[97] X. Xu, C. Li, Y. Zhou, and Y. Jin, Controllable Shrinking of Glass CapillaryNanopores Down to sub-10 nm by Wet-Chemical Silanization for Signal-EnhancedDNA Translocation, ACS Sensors 2, 1452 (2017).
[98] J. A. Bafna and G. V. Soni, Fabrication of Low Noise Borosilicate Glass Nanopores forSingle Molecule Sensing, PloS one 11, e0157399 (2016).
[99] V. Tabard-Cossa, D. Trivedi, M. Wiggin, N. N. Jetha, and A. Marziali, Noise analysisand reduction in solid-state nanopores, Nanotechnology 18 (2007), 10.1088/0957-4484/18/30/305505.
[100] L. K. J. Vandamme and D. Rigaud, 1/f noise in MOS devices, mobility or numberfluctuations? IEEE Trans. Electron Devices 41, 1936 (1994).
[101] S. Garaj, S. Liu, J. A. Golovchenko, and D. Branton, Molecule-hugging graphenenanopores, Proceedings of the National Academy of Sciences of the United Statesof America 110, 12192 (2013).
[102] Z. Roelen, J. A. Bustamante, A. Carlsen, A. Baker-Murray, and V. Tabard-Cossa,Instrumentation for low noise nanopore-based ionic current recording under laserillumination, Review of Scientific Instruments 89 (2018), 10.1063/1.5006262.
[103] J. K. Rosenstein, S. Ramakrishnan, J. Roseman, and K. L. Shepard, Single ionchannel recordings with CMOS-anchored lipid membranes, Nano Letters 13, 2682(2013).
[104] T. Z. Butler, M. Pavlenok, I. M. Derrington, M. Niederweis, and J. H. Gundlach,Single-molecule DNA detection with an engineered MspA protein nanopore, Pro-ceedings of the National Academy of Sciences 105, 20647 (2008).
REFERENCES
2
43
[105] E. Manrao, T. Z. Butler, M. Pavlenok, M. D. Collins, M. Niederweis, J. H. Gundlach,and I. M. Derrington, Nanopore DNA sequencing with MspA, Proceedings of theNational Academy of Sciences 107, 16060 (2010).
[106] M. Pavlin, T. Kotnik, D. Miklavcic, P. Kramar, and A. Macek Lebar, Electroporationof Planar Lipid Bilayers and Membranes, in Advances in Planar Lipid Bilayers andLiposomes, Vol. 6 (2008) pp. 165–226.
[107] M. Tarek, Membrane electroporation: A molecular dynamics simulation, Biophysi-cal Journal 88, 4045 (2005).
[108] M. Jain, S. Koren, K. H. Miga, J. Quick, A. C. Rand, T. A. Sasani, J. R. Tyson, A. D.Beggs, A. T. Dilthey, I. T. Fiddes, S. Malla, H. Marriott, T. Nieto, J. O’Grady, H. E.Olsen, B. S. Pedersen, A. Rhie, H. Richardson, A. R. Quinlan, T. P. Snutch, L. Tee,B. Paten, A. M. Phillippy, J. T. Simpson, N. J. Loman, and M. Loose, Nanopore se-quencing and assembly of a human genome with ultra-long reads, Nature Biotech-nology 36, 338 (2018).
[109] M. Jain, H. E. Olsen, B. Paten, and M. Akeson, The Oxford Nanopore MinION: de-livery of nanopore sequencing to the genomics community, Genome Biology 17, 1(2016).
[110] C. M. Wang, D. L. Kong, Q. Chen, and J. M. Xue, Surface engineering of syntheticnanopores by atomic layer deposition and their applications, Frontiers of MaterialsScience 7, 335 (2013).
[111] J. Nilsson, J. R. Lee, T. V. Ratto, and S. E. Létant, Localized functionalization ofsingle nanopores, Advanced Materials 18, 427 (2006).
[112] C. Danelon, C. Santschi, J. Brugger, and H. Vogel, Fabrication and functionaliza-tion of nanochannels by electron-beam-induced silicon oxide deposition, Langmuir22, 10711 (2006).
[113] P. Chen, T. Mitsui, D. B. Farmer, J. Golovchenko, R. G. Gordon, and D. Branton,Atomic layer deposition to fine-tune the surface properties and diameters of fabri-cated nanopores, Nano Letters 4, 1333 (2004).
[114] E. Beamish, H. Kwok, V. Tabard-Cossa, and M. Godin, Precise control of the size andnoise of solid-state nanopores using high electric fields, Nanotechnology 23 (2012),10.1088/0957-4484/23/40/405301.
[115] M. Kosmulski, The pH-dependent surface charging and the points of zero charge,Journal of Colloid and Interface Science 253, 77 (2002).
[116] M. Firnkes, D. Pedone, J. Knezevic, M. Döblinger, and U. Rant, Electrically facil-itated translocations of proteins through silicon nitride nanopores: Conjoint andcompetitive action of diffusion, electrophoresis, and electroosmosis, Nano Letters10, 2162 (2010).

2
44 REFERENCES
[117] P. Waduge, J. Larkin, M. Upmanyu, S. Kar, and M. Wanunu, Programmed synthesisof freestanding graphene nanomembrane arrays, Small 11, 597 (2015).
[118] P. Waduge, I. Bilgin, J. Larkin, R. Y. Henley, K. Goodfellow, A. C. Graham, D. C. Bell,N. Vamivakas, S. Kar, and M. Wanunu, Direct and Scalable Deposition of Atomi-cally Thin Low-Noise MoS2 Membranes on Apertures, ACS Nano 9, 7352 (2015).
[119] H. Bayley, B. Cronin, A. Heron, M. a. Holden, W. L. Hwang, R. Syeda, J. Thompson,and M. Wallace, Droplet interface bilayers RID B-8725-2008, Molecular Biosystems4, 1191 (2008).
[120] M. Kitta, H. Tanaka, and T. Kawai, Rapid fabrication of Teflon micropores for arti-ficial lipid bilayer formation, Biosensors and Bioelectronics 25, 931 (2009).
[121] J. L. Gornall, K. R. Mahendran, O. J. Pambos, L. J. Steinbock, O. Otto, C. Chimerel,M. Winterhalter, and U. F. Keyser, Simple reconstitution of protein pores in nanolipid bilayers, Nano Letters 11, 3334 (2011).
[122] M. Criado and B. U. Keller, A membrane fusion strategy for single-channel record-ings of membranes usually non-accessible to patch-clamp pipette electrodes, FEBSLetters 224, 172 (1987).
[123] G. Riquelme, E. Lopez, L. M. Garcia-segura, J. A. Ferragut, and J. M. Gonzalez-ros,Giant Liposomes : A Model System in Which To Obtain Patch-Clamp Recordings,Society , 11215 (1990).
[124] A. J. W. Hartel, P. Ong, I. Schroeder, M. H. Giese, S. Shekar, O. B. Clarke, R. Zalk,A. R. Marks, W. A. Hendrickson, and K. L. Shepard, Single-channel recordings ofRyR1 at microsecond resolution in CMOS-suspended membranes, Proceedings ofthe National Academy of Sciences 115, E1789 (2018).
[125] I. Schroeder, How to resolve microsecond current fluctuations in single ion chan-nels: The power of beta distributions, Channels 9, 262 (2015).

31/F NOISE IN SOLID-STATE
NANOPORES IS GOVERNED BY
ACCESS AND SURFACE REGIONS
The performance of solid-state nanopores as promising biosensors is severely hampered bylow-frequency 1/f noise in the through-pore ionic current recordings. Here, we develop amodel for the 1/f noise in such nanopores, that, unlike previous reports, accounts for con-tributions from both the pore-cylinder, pore-surface, and access regions. To test our model,we present measurements of the open-pore current through solid-state nanopores of dif-ferent diameters (1-50 nm). To describe the observed trends, it appears essential to includethe access resistance in the modelling of the 1/f noise. We attribute a different Hooge con-stant for the charge carrier fluctuations occurring in the bulk electrolyte and at the poresurface. The model reported here can be used to accurately analyze different contributionsto the nanopore low-frequency noise, rendering it a powerful tool for characterizing andcomparing different membrane materials in terms of their 1/f-noise properties.
This chapter has been published as: A. Fragasso, S. Pud, and C. Dekker. Nanotechnology 30, 395202 (2019) [1].
45
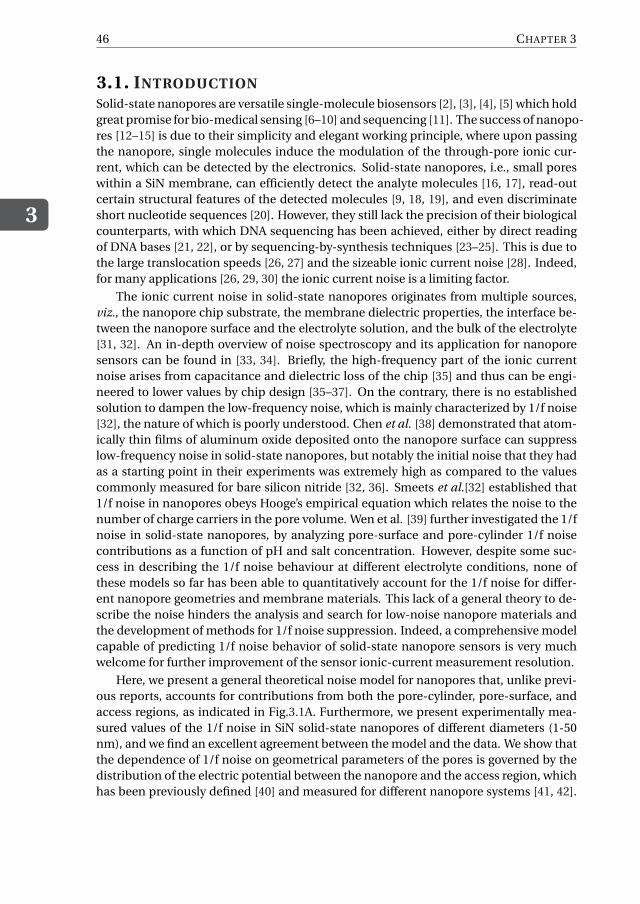
3
46 CHAPTER 3
3.1. INTRODUCTIONSolid-state nanopores are versatile single-molecule biosensors [2], [3], [4], [5] which holdgreat promise for bio-medical sensing [6–10] and sequencing [11]. The success of nanopo-res [12–15] is due to their simplicity and elegant working principle, where upon passingthe nanopore, single molecules induce the modulation of the through-pore ionic cur-rent, which can be detected by the electronics. Solid-state nanopores, i.e., small poreswithin a SiN membrane, can efficiently detect the analyte molecules [16, 17], read-outcertain structural features of the detected molecules [9, 18, 19], and even discriminateshort nucleotide sequences [20]. However, they still lack the precision of their biologicalcounterparts, with which DNA sequencing has been achieved, either by direct readingof DNA bases [21, 22], or by sequencing-by-synthesis techniques [23–25]. This is due tothe large translocation speeds [26, 27] and the sizeable ionic current noise [28]. Indeed,for many applications [26, 29, 30] the ionic current noise is a limiting factor.
The ionic current noise in solid-state nanopores originates from multiple sources,viz., the nanopore chip substrate, the membrane dielectric properties, the interface be-tween the nanopore surface and the electrolyte solution, and the bulk of the electrolyte[31, 32]. An in-depth overview of noise spectroscopy and its application for nanoporesensors can be found in [33, 34]. Briefly, the high-frequency part of the ionic currentnoise arises from capacitance and dielectric loss of the chip [35] and thus can be engi-neered to lower values by chip design [35–37]. On the contrary, there is no establishedsolution to dampen the low-frequency noise, which is mainly characterized by 1/f noise[32], the nature of which is poorly understood. Chen et al. [38] demonstrated that atom-ically thin films of aluminum oxide deposited onto the nanopore surface can suppresslow-frequency noise in solid-state nanopores, but notably the initial noise that they hadas a starting point in their experiments was extremely high as compared to the valuescommonly measured for bare silicon nitride [32, 36]. Smeets et al.[32] established that1/f noise in nanopores obeys Hooge’s empirical equation which relates the noise to thenumber of charge carriers in the pore volume. Wen et al. [39] further investigated the 1/fnoise in solid-state nanopores, by analyzing pore-surface and pore-cylinder 1/f noisecontributions as a function of pH and salt concentration. However, despite some suc-cess in describing the 1/f noise behaviour at different electrolyte conditions, none ofthese models so far has been able to quantitatively account for the 1/f noise for differ-ent nanopore geometries and membrane materials. This lack of a general theory to de-scribe the noise hinders the analysis and search for low-noise nanopore materials andthe development of methods for 1/f noise suppression. Indeed, a comprehensive modelcapable of predicting 1/f noise behavior of solid-state nanopore sensors is very muchwelcome for further improvement of the sensor ionic-current measurement resolution.
Here, we present a general theoretical noise model for nanopores that, unlike previ-ous reports, accounts for contributions from both the pore-cylinder, pore-surface, andaccess regions, as indicated in Fig.3.1A. Furthermore, we present experimentally mea-sured values of the 1/f noise in SiN solid-state nanopores of different diameters (1-50nm), and we find an excellent agreement between the model and the data. We show thatthe dependence of 1/f noise on geometrical parameters of the pores is governed by thedistribution of the electric potential between the nanopore and the access region, whichhas been previously defined [40] and measured for different nanopore systems [41, 42].

3. 1/F NOISE IN NANOPORES IS GOVERNED BY ACCESS AND SURFACE REGIONS
3
47
Figure 3.1: (A) Schematic representation of the relevant nanopore regions: access region (blue), pore-cylinderregion (green), pore-surface (purple). (B) Equivalent circuit of the nanopore sensor. Nanopore regions aremodelled as resistive elements connected in parallel to noise current generators.
Fitting the model to our experimental data, we deduce that the 1/f noise generated bythe bulk (access and pore-cylinder) and surface regions stem from different noise mech-anisms and should be described by distinct Hooge constants that differ by more than 3orders of magnitude. We find that the surface noise dominates the nanopore noise forsmall pores up to 20 nm in diameter, which emphasizes the importance of surface prop-erties for the nanopore performance. For larger pores, the access resistance dominatesthe noise properties. Our findings provide a framework for a fair comparison of the low-frequency properties of different membrane materials for nanopore experiments andthus may be of use in the search for new approaches to minimize 1/f noise in solid-statenanopores.
3.2. RESULTSWe develop our model for the low-frequency ionic current noise of the nanopore systembased on the equivalent electric circuit of the nanopore, see Fig.3.1B. The access regionis modelled as a resistor (Racc ) that is connected in series to the resistances of the pore-cylinder (Rc yl ) and pore surface (Rsur f ) that are connected in parallel. Rc yl accountsfor the dissipative transport of ions in the cylindrical volume of the nanopore, whereasRsur f accounts for the contribution of the counterions that are shielding the nanoporesurface charge [43].
We thus define
Rpor e = Rsur f ||Rc yl , (3.1)
Rtot = Rpor e +Racc . (3.2)
From basic considerations of ion mobilities and geometry [42], [43], these resistancescan be expressed as

3
48 CHAPTER 3
Racc = 1
ecNa(µC l− +µK + )d, (3.3)
Rc yl =4L
πecNa(µC l− +µK + )d 2 , (3.4)
Rsur f =L
πσsur f µK +d, (3.5)
where L is the membrane thickness (approximated as L = 8.6nm due to the hourglassshape of the nanopore [44]), d is the diameter, e is the electron charge, c is the molarconcentration of the electrolyte, NA is the Avogadro’s number, µC l− and µK + are the car-rier mobilities, and σsur f is the surface charge density. Noise sources are modelled asnoise-current generators that are connected in parallel to the noiseless resistors. Thetotal current noise power spectra l density S I ,tot can now be expressed as
S I ,tot = S I ,acc
(Racc
Rtot
)2
+ (S I ,c yl +S I ,sur f )
(Rpor e
Rtot
)2
. (3.6)
Derivation of Eq.3.6 is a result of application of Kirchoff’s law for the circuit in Fig.3.1.In our model for the low-frequency noise, we consider only the 1/f noise for each of thenanopore regions (nanopore cylinder, nanopore surface, access region), which in eachcase is given by Hooge’s model [45],
S I = αH I 2
Nc f(3.7)
where αH is the Hooge parameter which is an empirical constant that indicates thestrength of the 1/f noise, I is the dc current, Nc is the number of charge carriers par-ticipating in generating the ionic current, and f is the frequency. By measuring currentfluctuations in bulk samples of different metals and semiconductors [45], Hooge foundthat low-frequency noise stems from fluctuations of sample conductance, which is in-versely proportional to the amount of charge carriers. Importantly, this relation wasfound to suitably describe 1/f noise of the ionic current in solid-state nanopores [32],[39]. To account for the different contributions to the 1/f noise, the ionic currents andnumber of charge carriers need to be expressed separately for the three regions. We de-fine the number of charge carriers present in the access region, Nc,acc , pore-cylinderregion, Nc,c yl , and pore-surface region, Nc,sur f , as
Nc,acc =πcNAd 3
6, (3.8)
Nc,c yl =πcNALd 2
4, (3.9)
Nc,sur f =πσsur f Ld
e, (3.10)
where Nc,acc is defined as the number of carriers in both hemispherical access regions(as shown in Fig.3.1A), which account for most of (∼ 95%) the total 1/f noise occurring

3. 1/F NOISE IN NANOPORES IS GOVERNED BY ACCESS AND SURFACE REGIONS
3
49
in the access regions (details in section 3.4.6). Referring to the equivalent circuit modelof Figure 3.1B, we can express the currents for the access Iacc , pore-cylinder Ic yl , andpore-surface Isur f , simply using Ohm’s law and the voltage divider rule,
Iacc = V
Rtot, (3.11)
Ic yl =Vc yl
Rc yl= V
Rbulk
Rpor e
Rtot, (3.12)
Isur f =Vsur f
Rsur f= V
Rsur f
Rpor e
Rtot, (3.13)
where V is the applied bias across the entire circuit. Isur f represents the current gener-ated by the counterions adjacent to the pore walls. Since the conductance through suchlayer is different from the pore-cylinder it needs to be accounted as a separate term.To express the total 1/f current noise of the nanopore system, we substitute Equations3.11–3.13 into Equation 3.7 to obtain
S I ,acc =αH I 2
acc
Nc,acc f= αH ,b
Nc,acc f
V 2
R2tot
, (3.14)
S I ,c yl =αH I 2
c yl
Nc,c yl f= αH ,b
Nc,c yl f
V 2
R2c yl
R2por e
R2tot
, (3.15)
S I ,sur f =αH I 2
sur f
Nc,sur f f= αH ,s
Nc,sur f f
V 2
R2sur f
R2por e
R2tot
. (3.16)
Finally, combining Equations 3.14–3.16 into 3.6, we can express the total 1/f noise S I ,tot
as
S I ,tot = V 2
f R4tot
αH ,bR2acc
Nc,acc+ V 2
f R4tot
αH ,bR4por e
R2c yl Nc,c yl
+ V 2
f R4tot
αH ,s R4por e
R2sur f Nc,sur f
(3.17)
where αH ,b and αH ,s are the Hooge parameters for the bulk and surface 1/f noise. Notethat this model has only two fit parameters αH ,b and αH ,s whereas all other quantitiesare given or can be calculated explicitly.
We experimentally tested this model by carefully examining the dependence of the1/f noise on nanopore diameter, since the voltage drop over access and inner nanoporeregions varies strongly with nanopore diameter Eq.3.3–3.5. We thus prepared and stud-ied a range of solid-state nanopores with sizes from 1.3 nm to 46 nm that were drilledwithin 20 nm-thick free-standing Si-supported membranes of silicon nitride using atransmission electron microscope (TEM). The details of the fabrication process and ex-perimental setup are described elsewhere [46],[47]. Briefly, the membrane with a drillednanopore was mounted into a microfluidic flow-cell, such that the nanopore was sur-rounded by two compartments filled with electrolyte solution. A buffer with 1 M KCl,10 mM Tris-HCl, 1 mM EDTA, at pH 7 was used for measuring the ionic current through

3
50 CHAPTER 3
Figure 3.2: (A) TEM micrographs of the measured pores. Diameters were calculated from conductance mea-surements using Eq.S3.23. (B) Current power spectral density of nanopores with different diameters between1.3 and 46 nm. The inset shows a zoom-in of the low frequency regions. (C) Example fit of the low-frequencyionic current power spectral density for a 2.4 nm pore. Dotted black line is the fit to the data (red) as reportedby Equation 3.19, which comprises 1/f (blue), Lorentzian (green) and white noise (orange) contributions. Therest of the spectrum, out of the fitted region, is shown in light grey. Extracted values of A, B , and the calculatedSwhi te are reported in Table S3.1.
the nanopores. The ionic current through the nanopore was run using Ag/AgCl elec-trodes connected to an amplifier (Axopatch 200B, Axon Instruments) operating in re-sistive feedback mode. Current signals were acquired at a bandwidth of 100 kHz anddigitized at 250 kHz. All experiments were performed at the room temperature. To en-sure consistency, all chips were fabricated from the same wafer and handled equally.Nanopore diameters were calculated from the measured resistance (using Eq.S3.23), andgenerally found to be close (within 5-10%) to the values measured by TEM imaging (Fig.3.2A). Nanopores, which were hard to wet or that demonstrated an excessively noisyionic current baseline (several orders of magnitude larger than across the whole set ofnanopores) were excluded from the study. Ionic currents were recorded under a con-stant 100 mV applied bias. The power spectral density (PSD) of the ionic currents wascomputed over a time span of up to 60 seconds using a custom-written Matlab script.We fitted the spectra in the low-frequency range (<100 Hz) to extract the 1/f component.All fits were computed using the Matlab Curve Fitting Toolbox.
The acquired current power spectral density spectra are shown in Fig.3.2B. These are

3. 1/F NOISE IN NANOPORES IS GOVERNED BY ACCESS AND SURFACE REGIONS
3
51
characteristic for nanopore noise behavior: at the low-frequency range, the 1/f noisedominates the PSD, then it transitions into a white noise region represented by shot andthermal noise, and subsequently into dielectric and capacitive noise for high-frequencies[48]. Notably, for pores larger than ∼3 nm, the low-frequency noise decreases with in-creasing nanopore size. On the contrary, the white noise contribution, which we observein the frequency range from 0.1-1 kHz, increases for larger pores. This is expected as thewhite noise, constituted by thermal and shot current noise scales linearly with the con-ductance G as
S I ,whi te = S I ,ther mal +S I ,shot =G(4kT +2V q), (3.18)
where G is the total conductance, k is the Boltzmann constant, T is the absolute temper-ature in Kelvin (here 290 K), and q is the effective charge of the current carrying species.To extract the magnitude of 1/f noise from the PSD, we used a fitting function constitutedby the sum of different low-frequency noise contributions, (Fig.3.2C), namely
S I ,tot | f =1H z = S I ,whi te +A
f+ B
f 2 . (3.19)
Here, the first term comprises the white noise contributions (i.e., both the thermal andshot noise), the second term represents the 1/f noise, and the third term accounts fora Lorentzian-shaped noise component, which is particularly pronounced in the smallersize nanopores. It can be attributed to fluctuations of the surface charge due to cap-ture/release of ions from the electrolyte onto the nanopore surface [49–51]. This Loren-tzian-shaped component is very slow (the characteristic crossover frequency is sub-1Hz)and unlike 1/f noise, is not inherent in all our nanopore data. It is not of major impor-tance but is included in the fits to enable the most accurate determination of the 1/fnoise level. Note that the higher-frequency dielectric or capacitive noise contributionsare not included into Equation 3.19 as their magnitude is negligible in the low-frequencyrange considered. By contrast, the white noise needs to be taken into account, as it is notnegligible for the large pores (> 20 nm) in the 1-100 Hz range (Figure S3.5).
A major result of the current paper is presented in Fig.3.3A which plots the extracted1/f noise magnitudes versus nanopore size. We observe a decrease of 1/f noise of almosttwo orders of magnitude upon going from sub-5 nm pores to > 40 nm diameter pores.Notably the variation in the 1/f noise is much weaker below a pore size of ∼10 nm. Todescribe this behavior, we first consider previously developed models [28], [32], [39] thatmodel the 1/f noise as coming only from the cylindrical nanopore, neglecting an accessresistance contribution. Following this assumption, the total 1/f noise can be expressed[39] as
S I ,por e =αH I 2
sur f
Nc,sur f f+αH I 2
c yl
Nc,c yl f(3.20)
where the first term describes the pore-surface 1/f noise, the second term describes thepore-cylinder 1/f noise, αH is the (single) Hooge parameter, and Ic yl , Isur f , Nc,c yl , andNc,sur f are calculated explicitly using Equations 3.9–3.10 and 3.12–3.13. Equation 3.20describes a monotonic increase of the magnitude of 1/f noise with pore size (for de-tails, see Supporting Information), as illustrated by the green dashed line (Fig.3.3A). Even

3
52 CHAPTER 3
qualitatively, this clearly contradicts our experimental observations and shows that it iscrucial to take the access region into account to describe the size dependence of the1/f noise. The pink line denotes such a model that accounts for the access resistance,where we have considered the simplest case of an equal Hooge parameter for the 1/fnoise from the nanopore bulk and surface, i.e., we fitted Equation 3.17 to the data withαH ,s =αH ,b =αH as the only fit parameter. This model qualitatively describes the trendof the data, but quantitatively clearly fails to fit well. However, by using two differentHooge constants for the 1/f noise at the surface of the nanopore and in the bulk of theelectrolyte as fit parameters, an excellent fit to the experimental data can be obtained,as depicted by the purple line. This indicates that 1/f noise arising from the bulk andsurface of the nanopore do differ substantially.
The decrease of the total 1/f noise for increasing pore diameter can be attributedto two underlying causes: (i) a voltage drop redistribution across access and pore re-gion as determined by their resistances (Fig.3.1B), which strongly depend on the porediameter (Eq.3.3–3.5): whereas the pore resistance dominates for smaller pore diame-ters, the access resistance dominates for larger pores (Fig.S3.4); and (ii), the magnitudeof 1/f fluctuations is much larger for the surface contribution than for the bulk noise. Asa result of these two points, the surface 1/f noise dominates for small pores while the to-tal 1/f noise decreases for larger pores where the weaker access noise dominates. Fromthe fit, we find the surface and bulk Hooge parameters to be αH ,s = (2.1±0.2) ·10−3 andαH ,b = (1.4±1.5) · 10−6, respectively. Notably, the value we found for the surface noisecoefficient is more than three orders of magnitude higher than the bulk value, showingthat surface noise dominates. In passing we find it interesting to note that low-frequencynoise studies in solid-state semiconductor devices also feature surface currents with amuch higher Hooge parameter compared to the bulk ones [52] that arise from fluctu-ations of electrophoretic mobility of ions in the electrolyte [53]. Our value for αH ,s isalso higher than the value of ∼ 1.1 ·10−4 published previously for solid-state nanopores[32]. However, this value has been extracted using the ‘pore-only’ model and representsa convolution between αH ,s and αH ,b . If we calculate the αH using a model as in [32] fora ∼10 nm nanopore from our data set (similar size to the one used in [32]), then we findvalues that agree well with this reference.
A mechanism responsible for the high surface 1/f noise can possibly be charge car-rier number fluctuations occurring at the pore-electrolyte interface due trapping at thesurface. Whereas a single adsorption/dissociation process would lead to a Lorentziannoise spectrum, inhomogeneities at the pore surface will lead to a variety of trappingstrengths which yields a 1/f spectrum [54], [49]. Such mechanism will strongly dependon the surface properties of the material (in this case SiNx). 1/f noise measurements onsolid-state nanopores fabricated from two different wafers (Fig.S3.6) yielded a factor 3difference in αH ,s , consistent with this notion. Obviously, our finding of the dominanceof surface noise suggests strategies to lower the noise of nanopores, e.g. by surface engi-neering and choice of surface materials.
Fig.3.3B sketches the relative contributions of access, pore-cylinder, and pore-surfaceregions to the total 1/f noise S I ,tot . Using Eq.3.6 and 3.14–3.17, the various colored lines
plot the access S I ,acc
(RaccRtot
)2/SI ,tot (blue), pore-cylinder S I ,c yl
(Rpor e
Rtot
)2/S I ,tot (green), and

3. 1/F NOISE IN NANOPORES IS GOVERNED BY ACCESS AND SURFACE REGIONS
3
53
Figure 3.3: (A) Low-frequency 1/f noise plotted as a function of the pore diameter (black circles). We observea decreasing trend of 1/f noise with increasing nanopore size, which spans more than one order of magnitudeover the analyzed pore diameter range. Error bars represent standard deviations. The three lines representmodel fits to the nanopore data: The green dotted line accounts for the model with no access resistance con-tribution; pink dashed line includes the access resistance, but treats 1/f noise as coming from one mecha-nism with a single Hooge parameter; and the purple curve shows the model comprising the access resistanceand two independent Hooge parameters associated with bulk and surface noise. (B) Relative contribution tothe total 1/f noise originating from the three different nanopore regions: pore-surface (purple), pore-cylinder(green), and access region (blue), as a function of the nanopore diameter.
pore-surface S I ,sur f
(Rpor e
Rtot
)2/S I ,tot (purple) contributions as a function of pore diameter.
Clearly, the 1/f noise for small pores is dominated by surface noise, while for larger pores(> 20 nm) the noise mainly comes from the bulk noise associated with the nanopore ac-cess region. The latter may appear remarkable given that its αH ,b is three orders of mag-nitude lower than αH ,s , but is explained by the fact that the access resistance stronglydominates the pore resistance for pore diameters larger than 20 nm. More generally, ourmodel allows to quantify and predict 1/f noise behavior for nanopores of different ge-ometries. It is clear that ultra-small pores (< 5 nm) are mainly showing surface 1/f noiseand the large ones (> 40 nm) mainly demonstrate the bulk noise of the access region.However, our model allows to quantify that the mid-range pores, which are most oftenlyused for biosensing applications, still have a surprisingly strong contribution from thesurface 1/f noise (Fig.3.3B). Therefore, the noise of these pores can be significantly im-proved by selection of the nanopore material or coating. Moreover, our model is alsosuitable for nanopores made in ultrathin membranes (e.g. 2D materials) and it predictsa lower 1/f current noise coming from the nanopore itself because of the major role ofthe access region even for the smaller nanopore diameters.
3.3. CONCLUSIONSumming up, we have developed a generalized predictive model for the 1/f noise insolid-state nanopores, which accounts for the dominant role of the access region of thenanopore sensor and for the different origins of 1/f noise in the solid-state nanopore. We

3
54 CHAPTER 3
find that 1/f noise of a solid-state nanopore derives from two sources, the nanopore sur-face and the bulk electrolyte, with Hooge parameters that differ by three orders of mag-nitude. Although the surface noise is more pronounced, the noise coming from the bulkelectrolyte in the access region is the predominant source of noise for nanopore diame-ters larger than 20 nm. The developed model fits the experimental data remarkably welland can thus be used to compare 1/f noise performance of different nanopore materials.Importantly, it may be used to describe the 1/f noise for nanopores in very thin mem-branes, such as 2D-materials (graphene, boron nitride, molybdenum disulfide), wherethe access region is reported to dominate also for the smaller pore diameters.

3. 1/F NOISE IN NANOPORES IS GOVERNED BY ACCESS AND SURFACE REGIONS
3
55
3.4. SUPPORTING INFORMATION
3.4.1. MODELFrom Reference [42, 43] the Rpor e ,Racc , and Rtot can be expressed as
Rpor e = Rc yl ||Rsur f =L
πd
[ecNA(µC l− +µK + )
d
4+σsur f µK +
]−1
, (S3.21)
Racc =[ecNA(µC l− +µK + )d
]−1 (S3.22)
Rtot = Rpor e +Racc , (S3.23)
Figure S3.4: Access and nanopore resistances vs pore diameter. Inset: Ratio of access resistance over nanoporeresistance vs pore diameter.
where L is the membrane thickness (assumed to be 8.6 nm, due to the hourglass shapeof the nanopore [42]), d is the diameter, e is the charge of the electron, c is the molarconcentration, NA is the Avogadro’s number, µC l− and µK + the carrier mobilities, andσsur f the surface charge density.
3.4.2. FITTING THE CURRENT NOISE SPECTRAL DENSITY VERSUS PORE DI-AMETER
To remove one free parameter and improve the goodness of the fit, the analysis was re-stricted to the frequency region of the spectra where f À fc , such that the fit functioncould be well approximated to
S I ,tot | f =1H z =A
f+ B ′
1+(
ffc
)2 +S I ,whi te ≈A
f+ B
f 2 +S I ,whi te . (S3.24)

3
56 CHAPTER 3
where B ′ and fc are factors defining the Lorentzian function, Swhi te was calculated fromthe pore conductance, and A and B were fit parameters. The results of the fitting ofEq.S3.24 are illustrated in Figure S3.5, and the extracted parameters are reported in TableS3.1.
Figure S3.5: Current power spectral density for different pore diameters. Black dashed line shows the fit tothe data, using Equation 3.19. Red line shows the region of the spectrum where the fit was computed. Greendashed line represents the white noise, calculated using Equation 3.18.
Pore diameter (nm) A (pA2) B (pA2 · Hz) Swhi te (pA2/Hz)1.3 1.24±0.13 8.8±1.1 2.9 ·10−4
2.4 1.32±0.17 13.7±1.4 4.3 ·10−4
3.9 1.21±0.12 5.62±0.23 8.5 ·10−4
8 1.05±0.06 0.11±0.19 2.3 ·10−3
18 0.34±0.03 1.82±0.10 6.5 ·10−3
37 0.09±0.02 0.84±0.03 15.4 ·10−3
46 0.04±0.01 1.50±0.02 19.7 ·10−3
Table S3.1: Fit parameters for different pore diameters. A and B were free parameters. SI ,whi te was calculatedfrom the measured conductance and the voltage applied according to Equation 3.18.
3.4.3. FITTING 1/F NOISE VERSUS DIAMETER WITH THE ALTERNATIVE MOD-ELS
FITTING THE ‘PORE ONLY ’ MODEL
The green dashed line in Figure 3.3A represents a 1/f noise model where the access re-sistance is omitted. In such a scenario, Equations 3.9–3.10 and 3.12–3.13 are still used

3. 1/F NOISE IN NANOPORES IS GOVERNED BY ACCESS AND SURFACE REGIONS
3
57
to express the number of charge carriers and currents for the surface and bulk regions.However, the total 1/f noise S I ,por e expression would differ from Equation 3.17, as in thiscase
S I ,por e = S I ,c yl +S I ,sur f . (S3.25)
Substituting Eq.3.12–3.13 into Eq.3.7 and into S3.25, and noting that Rtot = Rpor e , onegets
S I ,por e =αH I 2
c yl
Nc,c yl f+αH I 2
sur f
Nc,sur f f= αH V 2
f
[1
Nc,c yl R2c yl
+ 1
Nc,sur f R2sur f
]. (S3.26)
Note that here only one Hooge constantαH is taken to describe both the bulk and surfacecontributions. From Eq. 3.4–3.5 and 3.9–3.10 we can extract the scaling for Rc yl , Rsur f ,Nc,c yl , and Nc,sur f as a function of the pore diameter D .
Rc yl =4L
πecNA(µC l− +µK + )D2 ∝ d−2, (S3.27)
Rsur f =L
πσsur f µK +D∝ d−1, (S3.28)
Nc,c yl =πcNALd 2
4∝ d 2, (S3.29)
Nc,sur f =πσsur f Ld
e∝ d . (S3.30)
We can thus rewrite Eq.S3.26 as
S I ,por e = p ·d 2 +·d , (S3.31)
where p and q are constants. This explains the monotonic increasing behavior observedin Figure 3.3A for the green dotted line.
FITTING THE ‘αH ,s =αH ,b ’ MODEL
The pink dashed curve in Figure 3.3A is obtained by fitting the model described by Equa-tion 3.17 with only one fit Hooge parameter α = αH ,s = αH ,b , which was found to beα= (1.2±1.0) ·10−5.

3
58 CHAPTER 3
Parameter Value Ref.Effective membrane thickness L 8.6 nm [42]
Potassium ion mobility µK + 7.616 ·10−8[
m2
V ·s]
[55]
Chloride ion mobility µC l− 7.909 ·10−8[
m2
V ·s]
[55]
Surface charge density for Si3N4 at pH 7-8, σsur f 0.02[
Cm2
][56]
Bulk conductivity at 1 M KCl σbulk 10.5[ S
m
][57]
Table S3.2: Parameters used.
3.4.4. WAFER-TO-WAFER VARIABILITY OF αH ,s
Figure S3.6: Low-frequency 1/f noise plotted as a function of the pore size. Nanopores fabricated from differ-ent wafers display different surface Hooge constant. We find αH ,s = (2.1±0.2) ·10−3 for the first batch of pores
(purple circles), whereas αH ,s = (6.6±3.4) ·10−4for the second one (green triangles). Purple and green curvesrepresent the model fitting the 1/f noise data. Error bars represent standard deviations due to the fitting.
3.4.5. OTHER NOISE SOURCES
BACKGROUND NOISE
DIELECTRIC NOISE
In the frequency range 3-10 kHz, dielectric noise can be fitted using the linear function
Sdi el ectr i c = 8πkT DCchi p f = a · f (S3.32)
where kT = 4.11 ·10−21 J at room temperature, D is the dielectric loss, Cchi p is the chipcapacitance, f is the frequency, and a is the fit parameter, found to be a = (5.03±0.01) ·10−6 (pA/Hz)2. We find the dielectric noise contribution to be negligible, being morethan one order of magnitude lower in the frequency range of interest (1-100 Hz).

3. 1/F NOISE IN NANOPORES IS GOVERNED BY ACCESS AND SURFACE REGIONS
3
59
Figure S3.7: Comparison of PSD spectra for 1.3 nm (purple) and 46 nm (yellow) vs background noise (blue)coming from the open head-stage of the amplifier. We find the background noise to be at least an order ofmagnitude lower than the 1/f noise coming from the nanopores in the frequency range of interest (1-100 Hz).
Figure S3.8: PSD spectrum of the ionic current for a 1.3 nm pore (purple) with a fit to the dielectric noise (lightgreen,3-10 kHz). Green straight line represents the fit. Dielectric noise was fitted using Equation S3.32. Arrowsand dashed lines highlight that dielectric noise is negligible in the frequency range of interest (1-100 Hz).

3
60 CHAPTER 3
3.4.6. 1/F NOISE IN THE ACCESS REGIONIn this section, we estimate what volume of the access region contributes most to the1/f noise. Using the formalism developed by Hille [58], we derive the amount of 1/fnoise coming from the infinite region outside the hemisphere of nanopore radius (FigureS3.9A). We define the total SV coming from this region as SVi n f . To quantify this value,one can imagine the space as a series connection of hollow hemispheres of electrolytesolution, each with the thickness of dr (Figure S3.9B). Since all the hollow hemispheresare connected in series, the total voltage PSD is a sum of voltage PSD’s of all hollow hemi-spheres dSVi n f . The voltage PSD of hollow hemisphere can be defined as follows:
dSVi n f = dS Ii n f R2hh = αH I 2
f NhhR2
hh , (S3.33)
where Rhh is the resistance of the hollow hemisphere:
Rhh = 1
σ
dr
2πr 2 , (S3.34)
and Nhh is the amount of charge carriers in the hollow hemisphere:
Nhh = cNA2πr 2dr. (S3.35)
Substituting these values yields the final differential form of dSVi n f :
dSVi n f =αH I 2
8 f cNAπ3σ2
dr
r 6 . (S3.36)
Finally, the total SVi n f is derived by integration of dSVi n f from the pore radius to infinity
dSVi n f =αH I 2
8 f cNAπ3σ2
∫ ∞
rpor e
dr
r 6 = αH I 2
40 f cNAπ3σ2r 5por e
. (S3.37)
These calculations do not take into account the region within the hemisphere of the poreradius (the volume of electrolyte closest to the pore). To quantify this, we need to derivethe resistance and amount of carriers within this hemisphere:
SVhemi spher e =αH I 2
f Nhemi spher eR2
hemi spher e . (S3.38)
The resistance of the hemisphere of the nanopore radius can be calculated as a differ-ence between resistances of the access region derived using Hall [40]and Hille [58] mod-els (Figure S3.9)
Rhemi spher e = RH al l −RHi l le =1
4σrpor e− 1
4πσrpor e= π−1
4πσrpor e. (S3.39)
The amount of carriers within the hemisphere is given by:
Nhemi spher e = cNA2
3πr 3
por e . (S3.40)
Therefore the 1/f noise within the hemisphere is:

3. 1/F NOISE IN NANOPORES IS GOVERNED BY ACCESS AND SURFACE REGIONS
3
61
SVhemi spher e =3αH I 2(π−1)2
32 f cNAπ3σ2r 5por e
. (S3.41)
Figure S3.9: A. Representation of total voltage PSD of a nanopore sensor as an equivalent circuit with voltagegenerators defined by nanopore region, hemisphere around the nanopore, infinite space of the electrolyte. B.Schematic to illustrate the representation of voltage PSD of 1/f noise in the infinite bulk solution as a sum ofvoltage PSD’s of hollow hemispheres. C. Illustration of the volumes considered by Hall and Hille models of theaccess regions. Blue color indicates the volume taken into account for estimation of the access resistance.
Now we can analytically derive which part of the access region contributes most to 1/fnoise:
SVhemi spher e
SVhemi spher e +SVi n f
=3(π−1)2
323(π−1)2
32 + 140
≈ 0.95. (S3.42)

3
62 REFERENCES
We conclude that 95% of the 1/f noise of the access region derives from the hemispheredirectly adjacent to the pore.
3.4.7. 1/F NOISE VS VOLTAGE APPLIED ON A 45 NM PORE
PSD spectra of the ionic current were acquired at different excitation voltages (20-100mV) for a 45 nm pore. We find that, as expected, the 1/f noise increases with the squareof the current.
Figure S3.10: A. PSD spectra of the ionic current for a 45 nm pore at different bias voltages. B. PSD spectra ofthe same pore normalized by square of the bias current.
3.4.8. EXAMPLE OF CURRENT TRACE FOR A 1.3 NM PORE
Figure S3.11: Example of ionic current trace measured across a small 1.3 nm pore filtered at 10 kHz (light red)and 1 kHz (dark red).
REFERENCES[1] A. Fragasso, S. Pud, and C. Dekker, 1/F Noise in Solid-State Nanopores Is Governed
By Access and Surface Regions, Nanotechnology 30, 395202 (2019).
[2] C. Dekker, Solid-state nanopores (Review Article), Nature Nanotechnology , 1 (2007).
[3] Y. L. Ying, J. Zhang, R. Gao, and Y. T. Long, Nanopore-based sequencing and detec-tion of nucleic acids, Angewandte Chemie - International Edition 52, 13154 (2013).

REFERENCES
3
63
[4] X. Shi, Q. Li, R. Gao, W. Si, S. C. Liu, A. Aksimentiev, and Y. T. Long, Dynamics of aMolecular Plug Docked onto a Solid-State Nanopore, Journal of Physical ChemistryLetters 9, 4686 (2018).
[5] Y. Lin, Y. L. Ying, and Y. T. Long, Nanopore confinement for electrochemical sensingat the single-molecule level, Current Opinion in Electrochemistry 7, 172 (2018).
[6] E. Atas, A. Singer, and A. Meller, DNA sequencing and bar-coding using solid-statenanopores, (2012).
[7] A. H. Squires, J. S. Hersey, M. W. Grinstaff, and A. Meller, A nanopore-nanofibermesh biosensor to control DNA translocation, Journal of the American Chemical So-ciety 135, 16304 (2013).
[8] B. N. Miles, A. P. Ivanov, K. a. Wilson, F. Dogan, D. Japrung, and J. B. Edel, Singlemolecule sensing with solid-state nanopores: novel materials, methods, and appli-cations, Chemical Society Reviews 42 (2012), 10.1039/c2cs35286a.
[9] J. Y. Sze, A. P. Ivanov, A. E. Cass, and J. B. Edel, Single molecule multiplexed nanoporeprotein screening in human serum using aptamer modified DNA carriers, NatureCommunications 8, 1 (2017).
[10] W. Yang, A. Birnie, L. Restrepo-Pérez, J. van der Torre, M. Bengtson, S. J. Heerema,and C. Dekker, Detection of CRISPR-dCas9 on DNA with Solid-State Nanopores,Nano Letters 18, 6469 (2018).
[11] C. a. Merchant, K. Healy, M. Wanunu, V. Ray, N. Peterman, J. Bartel, M. D. Fischbein,K. Venta, Z. Luo, a. T. C. Johnson, and M. Drndic, DNA translocation throughgraphene nanopores, Nano Letters 10, 2915 (2010).
[12] S. Howorka and Z. Siwy, Nanopore analytics: Sensing of single molecules, ChemicalSociety Reviews 38, 2360 (2009).
[13] J. J. Kasianowicz, J. W. Robertson, E. R. Chan, J. E. Reiner, and V. M. Stanford,Nanoscopic Porous Sensors, Annual Review of Analytical Chemistry 1, 737 (2008).
[14] D. Deamer, M. Akeson, D. Branton, J. J. Kasianowicz, and S. M. Bezrukov, Threedecades of nanopore sequencing, Nature Biotechnology 34, 481 (2016).
[15] J. J. Kasianowicz and S. M. Bezrukov, On ’three decades of nanopore sequencing’, Na-ture Biotechnology 34, 481 (2016).
[16] R. Wei, V. Gatterdam, R. Wieneke, R. Tampé, and U. Rant, Stochastic sensing of pro-teins with receptor-modified solid-state nanopores, Nature Nanotechnology 7, 257(2012).
[17] S. W. Kowalczyk, L. Kapinos, T. R. Blosser, T. Magalhães, P. van Nies, R. Y. H. Lim,and C. Dekker, Single-molecule transport across an individual biomimetic nuclearpore complex, Nature Nanotechnology 6, 433 (2011).

3
64 REFERENCES
[18] N. A. Bell and U. F. Keyser, Digitally encoded DNA nanostructures for multiplexed,single-molecule protein sensing with nanopores, Nature Nanotechnology 11, 645(2016).
[19] C. Plesa, D. Verschueren, S. Pud, J. van der Torre, J. W. Ruitenberg, M. J. Witteveen,M. P. Jonsson, A. Y. Grosberg, Y. Rabin, and C. Dekker, Direct observation of DNAknots using a solid-state nanopore, Nature Nanotechnology , 1 (2016).
[20] K. Venta, G. Shemer, M. Puster, J. A. Rodríguez-Manzo, A. Balan, J. K. Rosen-stein, K. Shepard, and M. Drndic, Differentiation of short, single-stranded DNA ho-mopolymers in solid-state nanopores, ACS Nano 7, 4629 (2013).
[21] J. J. Kasianowicz, E. Brandin, D. Branton, and D. W. Deamer, Characterization ofindividual polynucleotide molecules using a membrane channel, Proceedings of theNational Academy of Sciences 93, 13770 (2002).
[22] E. a. Manrao, I. M. Derrington, A. H. Laszlo, K. W. Langford, M. K. Hopper, N. Gill-gren, M. Pavlenok, M. Niederweis, and J. H. Gundlach, Reading DNA at single-nucleotide resolution with a mutant MspA nanopore and phi29 DNA polymerase,Nature Biotechnology 30, 349 (2012).
[23] S. Kumar, C. Tao, M. Chien, B. Hellner, A. Balijepalli, J. W. F. Robertson, Z. Li,J. J. Russo, J. E. Reiner, J. J. Kasianowicz, and J. Ju, PEG-labeled nucleotides andnanopore detection for single molecule DNA sequencing by synthesis, Scientific Re-ports 2, 1 (2012).
[24] J. W. F. Robertson, C. G. Rodrigues, V. M. Stanford, K. A. Rubinson, O. V. Krasilnikov,and J. J. Kasianowicz, Single-molecule mass spectrometry in solution using a solitarynanopore, Proceedings of the National Academy of Sciences 104, 8207 (2007).
[25] C. W. Fuller, S. Kumar, M. Porel, M. Chien, A. Bibillo, P. B. Stranges, M. Dorwart,C. Tao, Z. Li, W. Guo, S. Shi, D. Korenblum, A. Trans, A. Aguirre, E. Liu, E. T.Harada, J. Pollard, A. Bhat, C. Cech, A. Yang, C. Arnold, M. Palla, J. Hovis, R. Chen,I. Morozova, S. Kalachikov, J. J. Russo, J. J. Kasianowicz, R. Davis, S. Roever, G. M.Church, and J. Ju, Real-time single-molecule electronic DNA sequencing by synthesisusing polymer-tagged nucleotides on a nanopore array, Proceedings of the NationalAcademy of Sciences 113, 5233 (2016).
[26] C. Plesa, S. W. Kowalczyk, R. Zinsmeester, A. Y. Grosberg, Y. Rabin, and C. Dekker,Fast translocation of proteins through solid state nanopores, Nano Letters 13, 658(2013).
[27] A. J. Storm, C. Storm, J. Chen, H. Zandbergen, J. F. Joanny, and C. Dekker, Fast DNAtranslocation through a solid-state nanopore, Nano Letters 5, 1193 (2005).
[28] R. M. M. Smeets, N. H. Dekker, and C. Dekker, Low-frequency noise in solid-statenanopores, Nanotechnology 20 (2009), 10.1088/0957-4484/20/9/095501.

REFERENCES
3
65
[29] P. Ketterer, A. N. Ananth, D. S. Laman Trip, A. Mishra, E. Bertosin, M. Ganji, J. VanDer Torre, P. Onck, H. Dietz, and C. Dekker, DNA origami scaffold for studying in-trinsically disordered proteins of the nuclear pore complex, Nature Communications9, 1 (2018).
[30] S. J. Heerema, G. F. Schneider, M. Rozemuller, L. Vicarelli, H. W. Zandbergen,and C. Dekker, 1/F Noise in Graphene Nanopores, Nanotechnology 26 (2015),10.1088/0957-4484/26/7/074001.
[31] J. D. Uram, K. Ke, and M. L. Mayer, Noise and bandwidth of current recordings fromsubmicrometer pores and nanopores, ACS Nano 2, 857 (2008).
[32] R. M. M. Smeets, U. F. Keyser, N. H. Dekker, and C. Dekker, Noise in solid-statenanopores, Proceedings of the National Academy of Sciences of the United States ofAmerica 105, 417 (2008).
[33] Z. Roelen, J. A. Bustamante, A. Carlsen, A. Baker-Murray, and V. Tabard-Cossa, In-strumentation for low noise nanopore-based ionic current recording under laser il-lumination, Review of Scientific Instruments 89 (2018), 10.1063/1.5006262.
[34] L. J. DeFelice, Introduction to Membrane Noise, 1st ed. (Springer US, 1981) pp. 1–516.
[35] V. Tabard-Cossa, D. Trivedi, M. Wiggin, N. N. Jetha, and A. Marziali, Noise analysisand reduction in solid-state nanopores, Nanotechnology 18 (2007), 10.1088/0957-4484/18/30/305505.
[36] A. Balan, C. C. Chien, R. Engelke, and M. Drndic, Suspended Solid-state Membraneson Glass Chips with Sub 1-pF Capacitance for Biomolecule Sensing Applications, Sci-entific Reports 5, 1 (2015).
[37] K. B. Park, H. J. Kim, H. M. Kim, S. A. Han, K. H. Lee, S. W. Kim, and K. B. Kim,Noise and sensitivity characteristics of solid-state nanopores with a boron nitride 2-D membrane on a pyrex substrate, Nanoscale 8, 5755 (2016).
[38] P. Chen, T. Mitsui, D. B. Farmer, J. Golovchenko, R. G. Gordon, and D. Branton,Atomic layer deposition to fine-tune the surface properties and diameters of fabri-cated nanopores, Nano Letters 4, 1333 (2004).
[39] C. Wen, S. Zeng, K. Arstila, T. Sajavaara, Y. Zhu, Z. Zhang, and S. L. Zhang, Gener-alized Noise Study of Solid-State Nanopores at Low Frequencies, ACS Sensors 2, 300(2017).
[40] J. E. Hall, Access resistance of a small circular pore, The Journal of General Physiology66, 531 (1975).
[41] S. M. Bezrukov, I. Vodyanoy, R. A. Brutyan, and J. J. Kasianowicz, Dynamics and FreeEnergy of Polymers Partitioning into a Nanoscale Pore, Macromolecules 29, 8517(1996).
3
66 REFERENCES
[42] S. W. Kowalczyk, A. Y. Grosberg, and Y. Rabin, Modeling the conductance and DNAblockade of solid-state nanopores, 22 (2011), 10.1088/0957-4484/22/31/315101.
[43] R. M. M. Smeets, U. F. Keyser, M. Y. Wu, N. H. Dekker, and C. Dekker, Nanobubblesin solid-state nanopores, Physical Review Letters 97, 1 (2006).
[44] M. J. Kim, M. Wanunu, D. C. Bell, and A. Meller, Rapid fabrication of uniformly sizednanopores and nanopore arrays for parallel DNA analysis, Advanced Materials 18,3149 (2006).
[45] F. Hooge, 1/F Noise, Physica B+C 83, 14 (1976).
[46] X. J. a. Janssen, M. P. Jonsson, C. Plesa, G. V. Soni, C. Dekker, and N. H. Dekker,Rapid manufacturing of low-noise membranes for nanopore sensors by trans-chipillumination lithography, Nanotechnology 23, 475302 (2012).
[47] M. Van Den Hout, A. R. Hall, M. Y. Wu, H. W. Zandbergen, C. Dekker, and N. H.Dekker, Controlling nanopore size, shape and stability, Nanotechnology 21 (2010),10.1088/0957-4484/21/11/115304.
[48] A. Balan, B. Machielse, D. Niedzwiecki, J. Lin, P. Ong, R. Engelke, K. L. Shepard, andM. Drndic, Improving signal-to-noise performance for DNA translocation in solid-state nanopores at MHz bandwidths, Nano Letters 14, 7215 (2014).
[49] Z.-Y. Zhang, Y.-S. Deng, H.-B. Tian, H. Yan, H.-L. Cui, and D.-Q. Wang, Noise Analy-sis of Monolayer Graphene Nanopores, International Journal of Molecular Sciences19, 2639 (2018).
[50] S. Bezrukov and J. J. Kasianowicz, Current Noise Reveals Protonation Kinetics andNumber of Ionizable Sites in an Open Protein Ion Channel, Physical Review Letters70, 2352 (1993).
[51] D. P. Hoogerheide, S. Garaj, and J. A. Golovchenko, Probing surface charge fluctua-tions with solid-state nanopores, Physical Review Letters 102 (2009), 10.1103/Phys-RevLett.102.256804.
[52] L. K. J. Vandamme and D. Rigaud, 1/f noise in MOS devices, mobility or number fluc-tuations? IEEE Trans. Electron Devices 41, 1936 (1994).
[53] R. P. Jindal and A. Van Der Ziel, Model for mobility fluctuation 1/f noise, AppliedPhysics Letters 38, 290 (1981).
[54] P. Dutta and P. M. Horn, Low-frequency fluctuations in solids: 1/f noise, Reviews ofModern Physics 53 (1981).
[55] D. R. Lide, CRC Handbook of Chemistry and Physics, 85th ed. (2005).
[56] J. Sonnefeld, Determination of surface charge density parameters of silicon nitride,Colloids and Surfaces A: Physicochemical and Engineering Aspects 108, 27 (1996).
[57] W. M. Haynes, CRC Handbook of Chemistry and Physics, 91st ed. (2010).

REFERENCES
3
67
[58] B. Hille, Pharmacological Modifications of the Sodium Channels of Frog Nerve, TheJournal of General Physiology 51, 199 (1968).

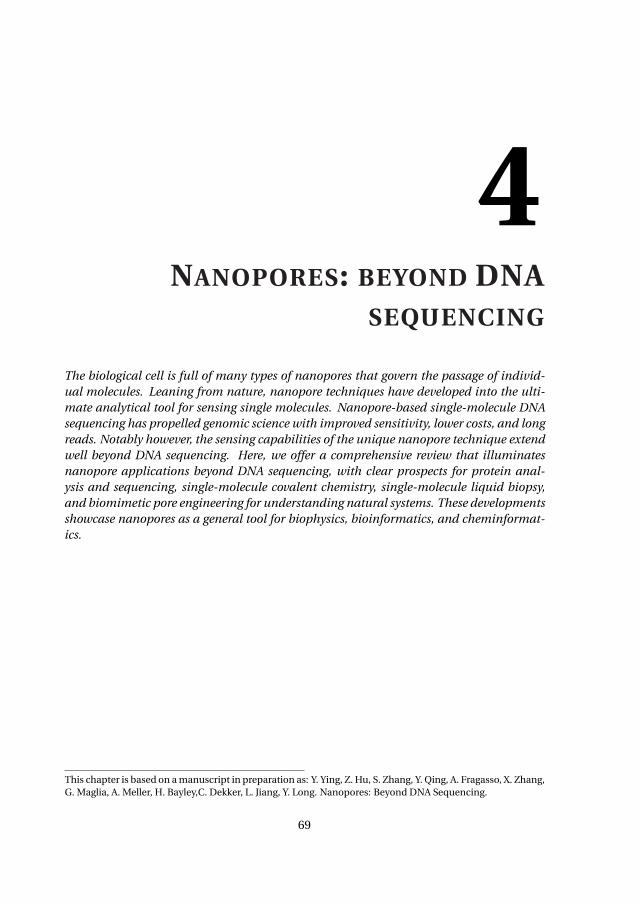
4NANOPORES: BEYOND DNA
SEQUENCING
The biological cell is full of many types of nanopores that govern the passage of individ-ual molecules. Leaning from nature, nanopore techniques have developed into the ulti-mate analytical tool for sensing single molecules. Nanopore-based single-molecule DNAsequencing has propelled genomic science with improved sensitivity, lower costs, and longreads. Notably however, the sensing capabilities of the unique nanopore technique extendwell beyond DNA sequencing. Here, we offer a comprehensive review that illuminatesnanopore applications beyond DNA sequencing, with clear prospects for protein anal-ysis and sequencing, single-molecule covalent chemistry, single-molecule liquid biopsy,and biomimetic pore engineering for understanding natural systems. These developmentsshowcase nanopores as a general tool for biophysics, bioinformatics, and cheminformat-ics.
This chapter is based on a manuscript in preparation as: Y. Ying, Z. Hu, S. Zhang, Y. Qing, A. Fragasso, X. Zhang,G. Maglia, A. Meller, H. Bayley,C. Dekker, L. Jiang, Y. Long. Nanopores: Beyond DNA Sequencing.
69

4
70 CHAPTER 4
4.1. INTRODUCTIONNanopores are an emerging class of single-molecule biosensors which have been devel-oped primarily for ultra-sensitive DNA sequencing, as well as for other label-free biomol-ecular sensing. Nanopores can be formed by several ways: biological nanopores areformed by self-assembly of either protein sub-units, peptides or even DNAs scaffold inlipid bilayers or in block copolymer membranes. Solid-state nanopores are crafted infreely suspended thin membrane by a variety of nanoscale milling tools including elec-tron/ion/laser beam drilling, by laser-based optical-etching method, or using dielectricbreakdown of ultrathin solid membranes [1–4]. Alternatively, nanopores can be formedby controlled pulling of glass capillaries in designated instruments [5].
Nanopores provides a geometric confinement to molecules that are temporarily lo-dged in its interior volume, to allow label free sensing. Additionally, nanopores may of-fer a controllable chemical environment for single molecules and ions used to facilitatechemical reactions in this nanoscale volume. Both features may be utilized for single-molecule manipulation and sensing. In the most common nanopore measurement, theindividual analyte is inserted inside the nanopore under applied potentials, hence alter-ing the physical free flow of ions through the nanopore and permitting a straightforwardtemporal Ohmic measurement. Ideally, the geometry of the nanopore should be compa-rable to that of the analyte, to produce a significant change in the ion current amplitudefrom the presence of the analyte above the noise level. Additionally, a tight fit betweenthe nanopore and analyte enhances the interactions between them, which accounts forthe overall sensitivity and selectivity of the device [6]. The size, shape and chemical prop-erties of the nanopore could be tuned and manipulated at nanometer to subnanometerscale to further enhance its properties. For example, site-direct mutagenesis of proteinnanopores may contribute to optimal interactions in nanopore confinement for specificanalyte recognitions. This feature allows nanopore to controllably capture, identify, andtransport any molecules and ions from the bulk solution.
Nanopore sensors were initially used to stochastically characterize single moleculesin a relatively simple, high-throughput, label-free format. By analyzing modulations ofthe ionic current in blockade amplitude, duration and frequency, nanopores have ap-plied to sense and characterize a vast range of molecules, including DNAs, messengerand transfer RNAs, peptides, proteins, protein-DNA complexes and even metabolites[7–14]. Today, the success of nanopore-based DNA sequencing has stimulated potentialapplications in many fields.
Although DNA sequencing has been the main focus for the nanopore method in thepast two decades, the technique currently extends well beyond sequencing, as it hassbeen adapted to analyze molecular heterogeneities and stochastic processes in manydifferent biochemical systems with single-molecule precision. This is due to a numberof factors. First, a key advantage of nanopores lies in its ability to successively capturemany single molecules one after the other at relatively high rate. This feature permitsnanopores to explore large populations of molecules at single-molecule level in reason-able timeframes to understand their properties and dynamic behavior. Consequently,nanopores can be used to gain new molecular and mechanistic insights in a broad spec-trum of molecular biosystems. Second, as nanopores essentially convert structural andchemical properties of the analytes into a measurable ion current signal, the nanopore

4. NANOPORES: BEYOND DNA SEQUENCING
4
71
Figure 4.1: Nanopore techniques beyond DNA sequencing. The figure illustrates five areas of research wherenanopores have great potential to contribute to new knowledge and new technologies.

4
72 CHAPTER 4
can be used to report on multiple molecular features while circumventing the use oflabelling chemistries, which complicate the analysis process and may affect the molec-ular structures. For example, recent studies showed that nanopore could discriminate13 amino acids in a label-free manner, including some minute structural differences[15]. An important aspect is the ability of nanopores to identify rare or aberrant species,which lack suitable labels for the signal amplification or whose information are hid-den in the noise of analytical devices. Consequently, the nanopore may serve well inmolecular diagnostic applications required for precision medicine, which make use ofprotein analyses, as well as other biomarker identification. Third, nanopores provide awell-defined scaffold to controllably design and construct biomimetic systems, whichinvolve complex network of biomolecular interactions. These nanopore systems may beused to study the binding dynamics of transport biomolecules as they interact with thenanopore surfaces, hence serving as a sophisticated platform for unraveling complexbiological processes [16, 17]. Forth, chemical groups can be spatially aligned along thesensing interface of the protein nanopore, providing a sterically confined chemical en-vironment for site-selective or regioselective covalent chemistry. This strategy has beenused to engineer biological nanopores to serve as nanoreactors for the analysis of single-molecule reactions, such as the making and breaking of disulfide bonds [18, 19].
In this review paper, we discuss the state of the art in current nanopore research, aswell as opportunities and the main challenges for the next decade, as the field shifts be-yond DNA sequencing applications. We specifically address emerging nanopore meth-ods for protein analysis and protein sequencing, single-molecule liquid biopsy, single-molecule covalent chemistry, and insights of biomimetic pores in analyzing complex bi-ological processes.
4.2. CHARACTERIZATION OF SINGLE PROTEINS WITH
NANOPORESAfter the spectacular success following the sequencing of nucleic acids by nanopores,academic efforts are now shifting towards studying proteins. As an organism such as our-selves exhibits millions of different proteins, the challenge in proteomics involve iden-tifying proteins, quantifying their abundance, and characterizing the choreography ofpost translational modifications that underlie their function. Several approaches to pro-tein identifications are being explored.
Folded proteins have been sensed using solid-state [20] and biological [21] nanopores.Properties such as protein volume, dipole and shape can be inferred by analyzing thetranslocation dynamics of proteins through nanopores [22], indicating that nanoporesare useful for extracting generic properties of proteins. Alternatively, ligands such asbiotin [23], aptamers [24], protein domains [25], or antibodies [26] directly attached tonanopores or ligands attached to DNA carriers have been used to identify specific pro-teins (Fig. 4.2a), even in the presence of complex media such as serum [27]. Beyondcharacterizing single proteins, nanopore arrays or specific fractionation protocols willbe required to address the complexity of a proteome.
Work is underway to use nanopores to detect single peptides as an alternative tomass spectrometry, the workhorse of proteomic analysis. Following initial work with
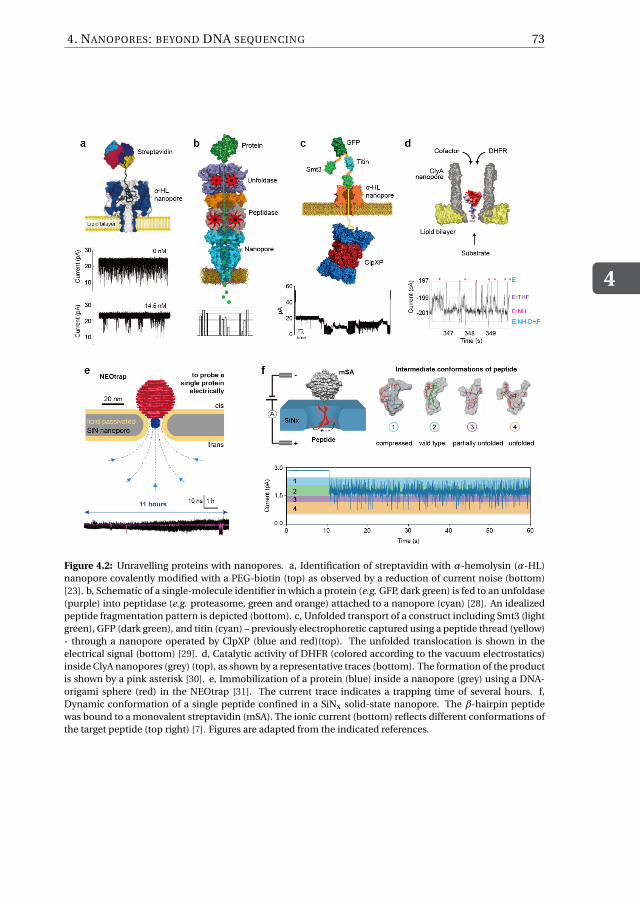
4. NANOPORES: BEYOND DNA SEQUENCING
4
73
Figure 4.2: Unravelling proteins with nanopores. a, Identification of streptavidin with α-hemolysin (α-HL)nanopore covalently modified with a PEG-biotin (top) as observed by a reduction of current noise (bottom)[23]. b, Schematic of a single-molecule identifier in which a protein (e.g. GFP, dark green) is fed to an unfoldase(purple) into peptidase (e.g. proteasome, green and orange) attached to a nanopore (cyan) [28]. An idealizedpeptide fragmentation pattern is depicted (bottom). c, Unfolded transport of a construct including Smt3 (lightgreen), GFP (dark green), and titin (cyan) – previously electrophoretic captured using a peptide thread (yellow)- through a nanopore operated by ClpXP (blue and red)(top). The unfolded translocation is shown in theelectrical signal (bottom) [29]. d, Catalytic activity of DHFR (colored according to the vacuum electrostatics)inside ClyA nanopores (grey) (top), as shown by a representative traces (bottom). The formation of the productis shown by a pink asterisk [30]. e, Immobilization of a protein (blue) inside a nanopore (grey) using a DNA-origami sphere (red) in the NEOtrap [31]. The current trace indicates a trapping time of several hours. f,Dynamic conformation of a single peptide confined in a SiNx solid-state nanopore. The β-hairpin peptidewas bound to a monovalent streptavidin (mSA). The ionic current (bottom) reflects different conformations ofthe target peptide (top right) [7]. Figures are adapted from the indicated references.

4
74 CHAPTER 4
model peptides [32] and their post-translational modifications [33], it has been reportedthat, as observed earlier for PEG molecules [34], peptide signals relate to their volume[35] (hence to a first approximation to the peptide mass). Another important step wasthe realization that by lowering the pH to <∼4, all peptides can be captured despite theirchemical composition [36]. Based on peptide-volume recognition, a single-moleculeprotein identifier has been proposed, in which a protease is placed directly above ananopore, and the fragmented peptides are sequentially read by a nanopore sensor (Fig.4.2b) [37]. Initial steps to integrate a peptidase with a nanopore have been made [28].
The ideal approach to nanopore proteomics, however, would be de novo protein se-quencing, where proteins are unfolded, linearly translocated across a nanopore aminoacid by amino acid, and individual amino acids recognized by specific current signa-tures. Among the many challenges in such a de novo sequencing, amino acid recognitionappears tractable. Several laboratories could observe differences in single amino acids,on either peptides [15] or stretched polypeptides [38], and even differences between iso-meric molecules have been reported [39]. Therefore, at least a subset of amino acids orpost translational modifications should be addressable by nanopore currents. Attemptshave also been made to control of the translocation of linearized proteins using un-foldases - enzymes that unfold protein using ATP as fuel. In a first example, transport wasobtained using ClpXP which was used to pull on proteins pre-threaded through anα-HLnanopore. The narrow entry of the nanopore was then used as a sieve to forcefully unfoldthe proteins (Fig. 4.2c) [40]. Differences between proteins or modifications that affectedthe folded state of the protein have been reported [29]. Another approach used a pro-teolytically inactivated proteasome – a cylindrical multicomplex system that degradesproteins – genetically fused atop of a β-barrel nanopore [28]. The proteasome acted as adocking station for an unfoldase, which would then feed unfolded protein to the protea-some chamber and eventually through the nanopore. Both approaches require furtherdevelopments, either to reduce the electrical signal generated by the unfolding processat the mouth of the nanopore [29], or to control the stretching of the proteins as theytranslocate across the nanopore [28]. Recent work appears to provide a breakthroughtowards protein sequencing, where a helicase was used to pull a DNA-peptide hybridmolecule through a nanopore in single amino acids steps, and single amino-acid substi-tutions were reliably detected within individual peptides [41].
Beside identifying proteins, nanopores can be used as single-molecule sensors tocharacterize protein activity, dynamics, and conformational changes. Among the uniqueadvantages of nanopores is the ability to sample native proteins at the single-moleculelevel with microsecond resolution with no intrinsic limitation on the observation period.In first implementations of nanopore enzymology, nanopores were used to monitor theformation of the product of bulk enzymatic reactions [42], which might be useful whena straightforward spectroscopic assay is not available. However, this approach does notallow sampling the activities of individual enzymes. The latter has been first achievedby following the enzymatic ratcheting of a DNA strand across a nanopore [43], a methoddeveloped for DNA sequencing applications. For example, these studies revealed thatHel308 helicase moves a distance corresponding to half a DNA base during nucleotidebinding and half a base during nucleotide hydrolysis, and that Phi29 DNA polymeraseoccasionally backsteps during amino acid incorporations [44]. Another approach has

4. NANOPORES: BEYOND DNA SEQUENCING
4
75
been to monitor the enzymes binding to the nanopore itself. Conformational changesof GroEL binding to a GroES-nanopore [35], or kinases binding or phosphorylating apeptide introduced within the transmembrane region of a nanopore [45] have been ob-served. However, the relatively complex engineering of nanopores is likely to limit thisapproach to bespoke examples.
A more generic approach is to temporarily trap a protein inside a nanopore. Confor-mational changes or dynamics can then be monitored through changes in the nanoporesignal (Fig. 4.2d-e). Proteins of 20-65 kDa can be captured by the electroosmotic flowwithin asymmetric biological nanopores, such as ClyA21 or PlyAB [46], for variable peri-ods. Importantly, at moderate voltages (<150 mV) no evidence of protein unfolding wasobserved [47]. Ligand-induced conformational changes for a range of proteins [48, 49]have been reported. This included the tiny conformational changes of dihydrofolatereductase during ligand-binding [48] and catalysis [30], which previously could not beattained by single-molecule FRET studies [50]. These studies revealed that DHFR ex-ists in multiple fixed conformation – conformers –, which exchange during catalysis ismost likely used to tune the enzyme’s efficiency [30, 48]. Solid-state nanopores have alsobeen used to sample proteins conformations [51]. However, the fast transport across thenanopores often prevents addressing multiple exchanges within single enzymes. Thislimitation has been addressed recently. In one example, a protein stopper was intro-duced to immobilize a biotinylated peptide inside a nanopore [7], allowing the mea-surement of multiple conformational exchanges. In another recent report a DNA lidwas added to one side of a lipid-coated nanopore and proteins were added to the op-posite side (Fig. 4.2e-f) [31]. The electrophoretic force allowed the DNA sphere to coverthe nanopore, and the induced electroosmotic flow was used to trap a range of differ-ent proteins on the opposite side [31]. Multiple conformational transitions of individualchaperone Hsp90 protein could be observed with this so-called NEOtrap.
4.3. SINGLE-MOLECULE CHEMISTRYSingle-molecule sensing generally involves non-covalent interactions [52]. Advancesin this area suggested that covalent chemistry may be examined in a similar manner,and indeed bond making and bond breaking events of individual molecules attached tothe interior wall of a nanopore can be analysed based on their modulation of the ioniccurrent [53]. Nanopores engineered to contain reactive sites are referred to as proteinnanoreactors.
Examples include many aspects of the chemistry of thiols, introduced as cysteineside chains [54]. Groups other than thiols can be examined after they have been intro-duced by site-directed chemical modification [55] or as non-canonical amino acids in-corporated by native chemical ligation [56]. The nanoreactor approach has been used toexamine various aspects of photochemistry [57], to unravel the stereochemical courseof transformations [54], to observe polymerization step-by-step [58], and to monitor aprimary isotope effect [59]. Catalytic cycles have been reconstituted by sampling partialreaction sequences in a nanopore after extricating intermediates from solution [60] andreaction networks of considerable complexity that would be hard to deconvolute by sayNMR have been disentangled [54].
The strengths and weaknesses of the nanoreactor approach to single-molecule cova-

4
76 CHAPTER 4
lent chemistry must be considered. On the plus side, no tagging of reactants is required.Because the pores formed by bacterial proteins are generally tough, a wide range of pHvalues, salt concentrations, and temperatures [61] can be used. However, at this point,only aqueous chemistry has been examined. Both irreversible and reversible chemistryhas been explored, and, because there are two compartments in a bilayer set up, incom-patible spatially-separated reactants can be employed [62]. While attachment to the wallof the lumen is required to beat diffusion, it also prevents kinetic complications, such asthe dimerisation of intermediates [56]. If repeated turnover at a defined site is consid-ered to be catalysis, examples have been observed [62], but further progress on the useof nanopores to alter the course and rate of reactions is expected. Computer analysisof the frequency and lifetime of current states produces reaction schemes and kineticconstants for covalent chemistry with time resolution that can reach the 100-µs range[63]. In general, standard deviations in rate constants are more than ±5%, which canbe limiting, e.g. only large isotope effects can be detected [59]. While the nanoreac-tor approach provides a single-molecule reaction trajectory in which all steps are visiblewhether or not they are rate limiting [59], the molecular identification of intermediatescan be problematic, as in any single-molecule approach.
In early work, the kinetics of covalent chemistry within a nanoreactor were assumedto approximate the kinetics of ensemble reactions in bulk solution, and this is roughlycorrect for small molecules [53]. More recently, interest has turned to considerations ofhow the environment within a nanopore, notably confinement, neighbouring groups,and chirality can affect chemistry, especially that of polymers, and how electrophoresisand electroosmosis [64] can drive reactants into and out of pores. To enable chemistryon a polymer, its translocation through a nanoreactor can be arrested by either a termi-nal stopper protein or covalent linkage to the internal wall (Fig. 4.3a). In the presenceof a pulling force, imposed by either electrophoresis or electroosmosis [64], the poly-mer will extend and elongate within the tubular structure (Fig. 4.3a). Additional forceis exerted as the polymer emerges from confinement and regains conformational en-tropy (Fig. 4.3a). Two features of nanopore confinement are advantageous for chemicalmanipulation. First, reactive groups spatially separated along the polymer chain canbe aligned with inward-facing reactive side-chains. Second, the direction of the pullingforce on a covalently-attached polymer, and thereby the polymer’s orientation, can beswitched by reversing the applied potential (Fig. 4.3a), resetting the chemical landscape.
Alignment within a nanoreactor has been exploited to effect selective chemistry un-der confinement [19]. As proof-of-concept, the interchange between disulfides withinpolymer backbones and cysteine thiols at different positions within a nanopore was ex-amined (Fig. 4.3b). The turnover of polymer substrates was enabled by using a compet-ing small-molecule reductant (1,4-dithiothreitol, DTT, Fig. 4.3b). Site selectivity was as-sessed as the fraction of a particular polymer that reacted at a particular location withina nanoreactor. The regioselectivity between two chemically equivalent sulfur atomswithin a disulfide was determined by observing the characteristic currents associatedwith each reaction product (Fig. 4.3b). Both site selectivity and regioselectivity showedstrong dependences on the locations of cysteines in the nanopore and the disulfide inthe polymer. This strategy might be adapted to other synthetic tubular nano-systems,such as metal-organic frameworks, to deliver site-selective or regioselective chemistry.
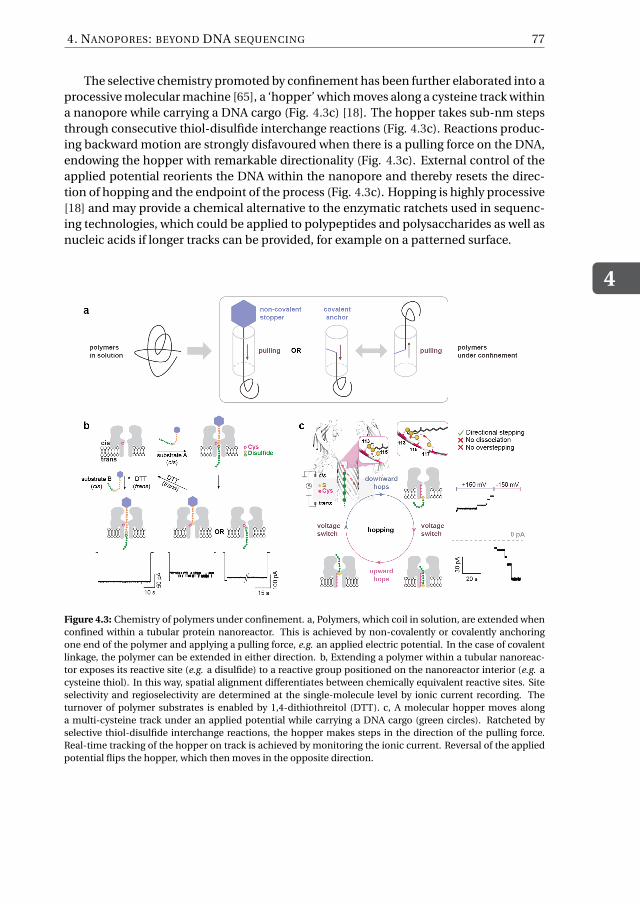
4. NANOPORES: BEYOND DNA SEQUENCING
4
77
The selective chemistry promoted by confinement has been further elaborated into aprocessive molecular machine [65], a ‘hopper’ which moves along a cysteine track withina nanopore while carrying a DNA cargo (Fig. 4.3c) [18]. The hopper takes sub-nm stepsthrough consecutive thiol-disulfide interchange reactions (Fig. 4.3c). Reactions produc-ing backward motion are strongly disfavoured when there is a pulling force on the DNA,endowing the hopper with remarkable directionality (Fig. 4.3c). External control of theapplied potential reorients the DNA within the nanopore and thereby resets the direc-tion of hopping and the endpoint of the process (Fig. 4.3c). Hopping is highly processive[18] and may provide a chemical alternative to the enzymatic ratchets used in sequenc-ing technologies, which could be applied to polypeptides and polysaccharides as well asnucleic acids if longer tracks can be provided, for example on a patterned surface.
Figure 4.3: Chemistry of polymers under confinement. a, Polymers, which coil in solution, are extended whenconfined within a tubular protein nanoreactor. This is achieved by non-covalently or covalently anchoringone end of the polymer and applying a pulling force, e.g. an applied electric potential. In the case of covalentlinkage, the polymer can be extended in either direction. b, Extending a polymer within a tubular nanoreac-tor exposes its reactive site (e.g. a disulfide) to a reactive group positioned on the nanoreactor interior (e.g. acysteine thiol). In this way, spatial alignment differentiates between chemically equivalent reactive sites. Siteselectivity and regioselectivity are determined at the single-molecule level by ionic current recording. Theturnover of polymer substrates is enabled by 1,4-dithiothreitol (DTT). c, A molecular hopper moves alonga multi-cysteine track under an applied potential while carrying a DNA cargo (green circles). Ratcheted byselective thiol-disulfide interchange reactions, the hopper makes steps in the direction of the pulling force.Real-time tracking of the hopper on track is achieved by monitoring the ionic current. Reversal of the appliedpotential flips the hopper, which then moves in the opposite direction.

4
78 CHAPTER 4
4.4. SYNTHETIC NANOPORES AS A TOOL TO STUDY BIOLOGI-CAL QUESTIONS
While nanopores understandably attract most attention for their use in sequencing andbioanalytical applications, they also offer exciting opportunities to study questions thatarise in cell biology. Cells feature a wide variety of nanometer-sized pores within theirmembranes (Fig. 4.4a), that act as gateways for molecular transport between compart-ments. For example, the flow of ions and small molecules (e.g. ATP) is regulated byion channels and transporters, with crucial roles in homoeostasis, energy production,cellular communication, and sensory transduction [66]. Larger pores, such as the mito-chondrial translocase [67] and the nuclear pore complex (NPC) [68] are responsible forregulating the transport of proteins and RNAs between cellular compartments. Yet otherexamples are the SecYEG protein-secretion pore [69], the ClpXP protease [70] used forprotein degradation, ceramide pores involved in cellular apoptosis [71], pore-formingtoxins like α-HL [72], and the viral motor protein for packaging of DNA [73]. Biomolecu-lar transport across all these pores poses many mechanistic questions, which often canbe studied by extracting pores from the cell and docking them within a planar lipid mem-brane for in vitro characterization of their transport properties. Yet, more complex poressuch as NPCs defy such a reconstitution approach.
With advances in solid-state nanopores [74], protein nanopore engineering [75], andDNA nanotechnology [76], it is now possible to build artificial systems that recapitu-late the functionality of biological pores in vitro. Examples include the realization ofion pumps using asymmetrical solid-state nanopores [77], or the mimicking of a ligand-gated ion channel using a synthetic DNA pore [78]. Beyond reproducing the behavior ofbiological channels, such biomimetic pores bear great potential for understanding com-plex biological processes that cannot be probed directly in vivo.
A notable example is the nuclear pore complex, a huge (∼52 MDa in yeast [68]) multi-protein complex that forms large pores (∼40 nm) within the nuclear envelope to regu-late all molecular trafficking in and out of the nucleus (Fig. 4.4b). Although much isknown about its biological function [79], a solid understanding of the transport proper-ties is lacking. In fact, the astounding complexity of the in vivo environment, combinedwith the fact that the NPC central channel is composed of intrinsically disordered pro-teins (IDPs), prevents to draw a full mechanistic picture of nuclear transport. The NPCconduit is filled with a ‘spaghetti-like’ mesh of IDPs, called FG-Nups (rich in ‘F’ and ‘G’amino-acid repeats) that are the key element of the gatekeeper function. While smallmolecules can freely pass, larger cargo (>40 kDa proteins or mRNA) is blocked, unless itis bound to nuclear transport receptors (NTRs), which can actively partition into the FG-mesh. The basis for such selectivity is still debated, and many open questions remain,e.g. on the spatial arrangement of FG-Nups and whether NTRs are an integral part of theselective barrier beyond being mere transporters. The NPC is a prime example wherebiomimetic nanopores can help to disentangle such major mechanistic questions.
Biomimetic NPCs were developed in the past decade. Jovanovic-Talisman et al. [80]showed that 30 nm pore arrays functionalized with purified FG-Nups could behave se-lectively, i.e., allowing NTRs to efficiently pass but blocking other proteins. This provedfor the first time that the FG-Nup mesh alone is sufficient to impart a selective transport

4. NANOPORES: BEYOND DNA SEQUENCING
4
79
Figure 4.4: a, Sketch of the interior of a eukaryotic cell (adapted fromhttps://gaelmcgill.artstation.com/projects/Pm0JL1). Yellow circles indicate a nuclear pore com-plex (left) and three mitochondrial pores (right). b, Schematic of the NPC (adapted fromhttps://sites.google.com/site/sspatel/nuclearporecomplex2). The blue filaments represent the FG-Nupmesh. Import (purple) and export (orange) transport pathways are indicated. c, Schematic of a biomimeticsolid-state nanopore, where FG-Nups are grafted onto a solid-state nanopore, whereupon transport ofbiomolecules can be measured electrically or optically. d, Sketch of a biomimetic NPC, built by attachingFG-Nups (blue) to a DNA-origami scaffold (grey).

4
80 CHAPTER 4
barrier – a striking finding considering that the biomimetic NPCs consisted of only 1 typeof FG-Nups while native NPCs feature more than 10 different FG-Nups types. Kowalczyket al. [81] measured selective transport across individual biomimetic nanopores, formedby grafting FG-Nups to the inner walls of a solid-state nanopore (Fig. 4.4c), where ioncurrent measurements provided single-molecule resolution. These biomimetic NPCsprovided first insights into the FG-Nups conformation within the pore by examining thebehavior of the conductance as a function of pore diameter. Follow-up work by Ananth etal. [82] emphasized the key role of the hydrophobic residues of the FG-Nups, as a mutantwhere hydrophobic amino acids were replaced by hydrophilic ones lost the selectivityaltogether. These experiments, coupled with molecular dynamics simulations, revealedthe important role of cohesiveness of the FG-mesh for achieving proper selective behav-ior. More recently, nanopores functionalized with user-defined protein sequences thatmimic native FG-Nups were also shown to be selective, demonstrating the outstandingrobustness of FG-Nups to drastic changes in their amino acid sequence [16]. A creativealternative approach to mimic NPCs is the use of a DNA-origami ring as a scaffold withprogrammable sites for anchoring FG-Nups (Fig. 4.4d) [83, 84]. This platform was em-ployed for imaging the spatial arrangements of confined FG-Nups using cryo-electronmicroscopy and atomic force microscopy, and allows the exploration more complex FG-meshes that combine different types of FG-Nups.
4.5. NANOPORE SENSORS FOR BIOMARKER IDENTIFICATION AND
QUANTIFICATION IN CLINICAL SAMPLESThe adaptation of nanopore sensing technologies for clinical samples presents new chal-lenges associated with the greater complexity and heterogenous nature of medical spec-imens, as compared to lab-made samples (Fig. 4.5). Additionally, clinical sensing oftenrequires extremely high precision, specificity, and sensitivity which further complicateits implementation. Nevertheless, the potential ability of nanopores to offer a genericand highly flexible sensing platform for liquid biopsy stands out as a high-impact op-portunity that has begun to be addressed only in recent years.
Two primary factors can be identified as the main roadblocks in realizing this vision:First, unlike lab-made ‘analytical samples’, the target biomolecules in clinical samples(often nucleic acids or protein biomarkers) span large range of concentrations from aslow as tens of aM (10−18 M) for some blood pathogenic infections and circulating tumorDNAs to sub-nM (10−9 M) concentrations for SARS, influenza as well as other biomark-ers [85]. In many cases the super low biomarkers concentration severely limit the useof standard purification/concentration techniques [9]. Second, most clinical samplescontain an abundancy of constituents that may interfere with the nanopore sensor itself(i.e. blocking the nanopore or causing false translocation events). In particular, bodilyfluids such as plasma, urine, and nasal secretions can clog the nanopore prematurely. Atthe same time bulk purification assays, including liquid chromatography and ‘clean-up’columns, that are broadly used in life sciences research, are not optimal for nanoporebased single-molecule sensing as they are lossy, time-consuming, and may not transferwell to point-of-care applications.
In recent years researchers have begun to tackle these challenges by developing smart

4. NANOPORES: BEYOND DNA SEQUENCING
4
81
assays and devices for treatment of clinical samples, which take advantage of some ofthe unique capabilities of nanopore sensors. Particularly, owing to their extremely smalland compact form factor, nanopore sensors can be integrated in microfluidic devicesserving either sample preparation or analyte concentration, further increasing its yieldof detection [9]. Moreover, biophysical concentration strategies involving for exampledielectrophoretic trapping or isotacophoresis focusing can in principle concentrate thetarget species by several orders of magnitude, and therefore bear potential towards thefuture development of liquid biopsy applications involving biomolecule-based diseaseprognostics and diagnostics [86, 87].
To enhance molecular specificity and circumvent the negative effects of backgroundmolecules on nanopore functionality, a number of biochemical assays have already beendeveloped. These assays involve minimal losses of target molecules during the samplepreparation while at the same time they protect the nanopore by selective degradationof background molecules. For example, nanopore-based direct, digital counting of sin-gle nucleotide polymorphic sites marked with Locked Nucleic Acids synthetic moleculeswas used for detection of Shiga toxin producing Escherichia coli serotype and cancer-derived driver mutations [88, 89]. Another approach utilized the extremely high speci-ficity of DNA ligase to pull-down selected circulating tumor DNA mutations associatedwith breast cancer genes (i.e. ERBB2 and PIK3Ca) in blood samples [90]. These muta-tions were sensed optically by tagging the probe oligonucleotides with fluorescent dyesand supplementing the electrical sensing of the nanopore with a single-molecule opticaldetection approach. In another recent studies the high selectivity of DNA aptamers wasused to fabricate specific DNA ‘carriers’ with high affinity for specific protein biomarkersin plasma sample, producing characteristic electrical current traces when translocatedthrough a nanopore formed at the end of glass-pulled pipettes [91]. Taking advantage of
Figure 4.5: Adapting nanopore sensing to biological samples and clinical diagnostics. A variety of biomedi-cal samples sources including bodily fluids or tissue biopsies or biological specimen including cell cultures,bacteria and viruses can be harvested in a minimal and non-lossy biochemical treatment for single-moleculesensing with protein or solid-state nanopores. The ultra-small sample volume (e.g. µL or less) required for theanalysis lends itself for hands-free assay development utilizing on-chip microfluids and/or magnetic beads.Nanopore sensing may involve either pure electrical digital counting of biomolecules or a combined electro-optical sensing to enhance the system multiplexing ability. Data analysis is supported by advanced machinelearning approaches to classify and count the target biomolecules.

4
82 CHAPTER 4
electro-optical sensing, short hairpin structure oligonucleotide containing fluorophoreand quencher moieties (‘molecular beacons’) were used to mark and identify specificcDNA molecules from human serum and urine, as they were forced through the tip of ananopipette [92].
An alternative strategy for sensing of protein biomarkers in bio-fluids involved thecreation of a protein bait antibody connected to a biological nanopore hence serving asa local ‘trap’ for the target protein [26, 93, 94]. Specifically, Fahie and coworkers modifiedthe outer membrane protein G (OmpG) with a short, biotinylated polymer chain thatwas used as a sensing probe. The binding/unbinding kinetics of several anti-biotin an-tibodies (including mAb, pAb.1 and pAb.2) were studied in buffered solution of dilutedserum. Interestingly the different anti-biotin antibodies showed remarkably differentbinding/unbinding kinetic rates presumably due to different antibodies size, shape orcharge. A similar approach demonstrated by Thakur and Movileanu involved the trun-cated t-FhuA protein pore, equipped with a short hexapeptide tether, a barnase (Bn)protein receptor and a dodecapeptide adapter. The capture and release events of a pro-tein analyte by the tethered protein bait occur outside the nanopore and are accompa-nied by uniform current openings, whereas nonspecific pore penetrations by nontargetcomponents of serum, involve irregular current blockades. As a result of this unique pe-culiarity of the readout between specific protein captures and nonspecific pore penetra-tion events which result in a highly dynamic ion-current signature, this selective sensorcould quantitatively sample proteins and potentially provides richer information on thedetected analytes than classical immunosorbent assays.
Theα-hemolysin protein pore was used to selectively detect microRNAs (miR) mole-cules hybridized in solution to oligonucleotides probes, allowing the quantification ofthe miR-155 biomarker from purified plasma samples of lung cancer patients [95]. Spe-cific binding of the miR to the probe molecules generated long voltage driven unzip-ping events, that were readily sensed by analyzing the ion current traces [96]. Morerecently, a purification-free method for nanopore based digital counting of mRNA ex-pression was demonstrated [97]. The method involves Reverse Transcription (RT) of thetarget genes, directly followed by enzymatic degradation of the background moleculeswith no intermediate purification stages [97]. The accuracy of the assay relies on design-ing highly specific RT primers and avoiding PCR amplification, which could lead to er-roneous amplification in cases where the clinical sample contains small amounts of thetarget mRNA biomarker. The method was used to quantify mRNA cancer biomarkers,such as MACC1, as well as for PCR-free sensing of SARS-Cov-2 clinical samples, poten-tially showing greater accuracy than the gold standard RT-qPCR method [9, 95].
Nanopore sensing of clinical samples is not limited only to nucleic acids and pro-teins. Recently, Galenkamp and co-workers demonstrated that the cytolysin A (ClyA)nanopore can be used to sense the concentration of metabolites such as glucose andasparagine, directly from bodily fluids (blood, sweat, urine, saliva) [9]. Glucose-bindingprotein (GBP) or substrate-binding domain analogous to GBP were used to sense glucoseand asparagine molecules, respectively, by inducing shifts in the dwell-time of the openand closed conformations of the probing proteins, as they were lodged in the nanopore.In all the examples provided for nanopore based sensing of clinical biomarkers, the abil-ity to sense multiple species (DNAs, RNAs, metabolites, etc.) using the same nanopore is

4. NANOPORES: BEYOND DNA SEQUENCING
4
83
a direct consequence of the single-molecule nature of the technique in which only onemolecule is sensed at the time and a dynamical ion current trajectory over time is usedas the basis for target multiplexing. This illustrates the great potential nanopore sens-ing holds for future complex bio-fluids characterization often involving a multitude ofbiomarkers.
4.6. CONCLUSION AND PERSPECTIVESThis review outlined diverse nanopore research directions and applications beyond DNAsequencing. Tremendous progress has been made. Specifically, over the past two decades,nanopores have become an essential single-molecule tool in multiple disciplines in-cluding chemistry, biophysics, nanoscience, and others. The ongoing refinement ofnanopores structures and shapes provide a well-defined confinement for single-moleculereaction catalysis. By taking advantage of designable nanopores at the molecular scale,the protein nanopore reactor is expected to provide a bottom-up approach for in situproduction of customized chemicals. The nanopore has also found growing use as aforce transducer allowing controlled localization and trapping of a diverse range of bio-molecules for single-molecule biophysics studies. Finally, nanopore-based biomedicalapplications have grown beyond single DNA sequencing and epigenetic modificationanalyses, and is currently used in diverse fields from sensing molecular biomarkers (pro-teins, metabolites and nucleic acids) in biofluids, and other biological specimen. Basedon the fast growth rate of nanopore applications, it is likely that it may become theprominent future technique in single-molecule in vitro diagnostics.
However, challenges remain for nanopores to meet its full potential. For example,in order to uncover the exact chemical compositions of single molecules (e.g., protein,polysaccharides and glycoprotein), improvements in sensing accuracy and temporal res-olution will be necessary. Unlike the relatively simple primary structure of the four cano-nic DNAs nucleobases, many biopolymers are composed of larger number of chemicallydiverse building blocks. Specifically, proteins consist of 20 different amino-acids, andpolysaccharides of 8-10 monosaccharides units. Therefore, nanopores must be ratio-nally tailored to meet the resolution requirement for each application: their sensing vol-ume should be as small to match the size of a single unit of the sensed monomer, but nottoo small to allow it to smoothly slide through the nanopore under the applied electricfield. More important, the nanopore should be optimally sensitive to the chemical orphysical properties of the building blocks, producing distinguishable ionic current sig-natures for each unit. This could be achieved by carefully functionalizing of the poreinner surfaces to manipulate the interactions between the biopolymer moiety and thenanopore, hence providing the required sensitivity and selectivity.
To achieve this long-term vision joint efforts of multi-disciplinary fields will be re-quired, including engineering of motor proteins to finely control the biopolymers’ translo-cation rate through the nanopore, as well as molecular dynamic simulations and ad-vanced analysis methods involving machine learning. In parallel with advances in futurenanopore designs, the ability to produce large-scale nanopore devices consisting of mil-lions of individual pores on an small footprint, may greatly impact bioinformatics, pro-ducing enormous volumes of sensing data at high speeds. The ongoing developmentsin nanopore-based sensing strategies will also be beneficial for future venturing in the

4
84 REFERENCES
promising field of molecular-based data storage and retrieval, offering new solutions forsome of the most pressing challenges in this area.
REFERENCES[1] N. Varongchayakul, J. Song, A. Meller, and M. W. Grinstaff, Single-molecule protein
sensing in a nanopore: a tutorial. Chemical Society reviews 47, 8512 (2018).
[2] Y.-L. Ying, C. Cao, Y.-X. Hu, and Y.-T. Long, A single biomolecule interface for ad-vancing the sensitivity, selectivity and accuracy of sensors, National Science Review5, 450 (2018).
[3] L. Restrepo-Pérez, C. Joo, and C. Dekker, Paving the way to single-molecule proteinsequencing, Nature Nanotechnology 13, 786 (2018).
[4] S. McGinn, D. Bauer, T. Brefort, L. Dong, A. El-Sagheer, A. Elsharawy, G. Evans,E. Falk-Sörqvist, M. Forster, S. Fredriksson, P. Freeman, C. Freitag, J. Fritzsche,S. Gibson, M. Gullberg, M. Gut, S. Heath, I. Heath-Brun, A. J. Heron, J. Hohlbein,R. Ke, O. Lancaster, L. Le Reste, G. Maglia, R. Marie, F. Mauger, F. Mertes,M. Mignardi, L. Moens, J. Oostmeijer, R. Out, J. N. Pedersen, F. Persson, V. Picaud,D. Rotem, N. Schracke, J. Sengenes, P. F. Stähler, B. Stade, D. Stoddart, X. Teng, C. D.Veal, N. Zahra, H. Bayley, M. Beier, T. Brown, C. Dekker, B. Ekström, H. Flyvbjerg,A. Franke, S. Guenther, A. N. Kapanidis, J. Kaye, A. Kristensen, H. Lehrach, J. Man-gion, S. Sauer, E. Schyns, J. Tost, J. M. L. M. van Helvoort, P. J. van der Zaag, J. O.Tegenfeldt, A. J. Brookes, K. Mir, M. Nilsson, J. P. Willcocks, and I. G. Gut, New tech-nologies for DNA analysis – a review of the READNA Project, New Biotechnology 33,311 (2016).
[5] R.-J. Yu, Y.-L. Ying, R. Gao, and Y.-T. Long, Confined Nanopipette Sensing: FromSingle Molecules, Single Nanoparticles, to Single Cells, Angewandte Chemie Inter-national Edition 58, 3706 (2019).
[6] A. Meller, Dynamics of polynucleotide transport through nanometre-scale pores,Journal of Physics Condensed Matter 15, 581 (2003).
[7] S.-C. Liu, Y.-L. Ying, W.-H. Li, Y.-J. Wan, and Y.-T. Long, Snapshotting the transientconformations and tracing the multiple pathways of single peptide folding using asolid-state nanopore, Chemical Science 12, 3282 (2021).
[8] C. Cao, Y.-L. Ying, Z.-L. Hu, D.-F. Liao, H. Tian, and Y.-T. Long, Discrimination ofoligonucleotides of different lengths with a wild-type aerolysin nanopore, NatureNanotechnology 11, 713 (2016).
[9] N. S. Galenkamp, M. Soskine, J. Hermans, C. Wloka, and G. Maglia, Direct electricalquantification of glucose and asparagine from bodily fluids using nanopores, NatureCommunications 9, 4085 (2018).
[10] D. Zhang, P. Solomon, S. L. Zhang, and Z. Zhang, Correlation of Low-FrequencyNoise to the Dynamic Properties of the Sensing Surface in Electrolytes, ACS Sensors2, 1160 (2017).
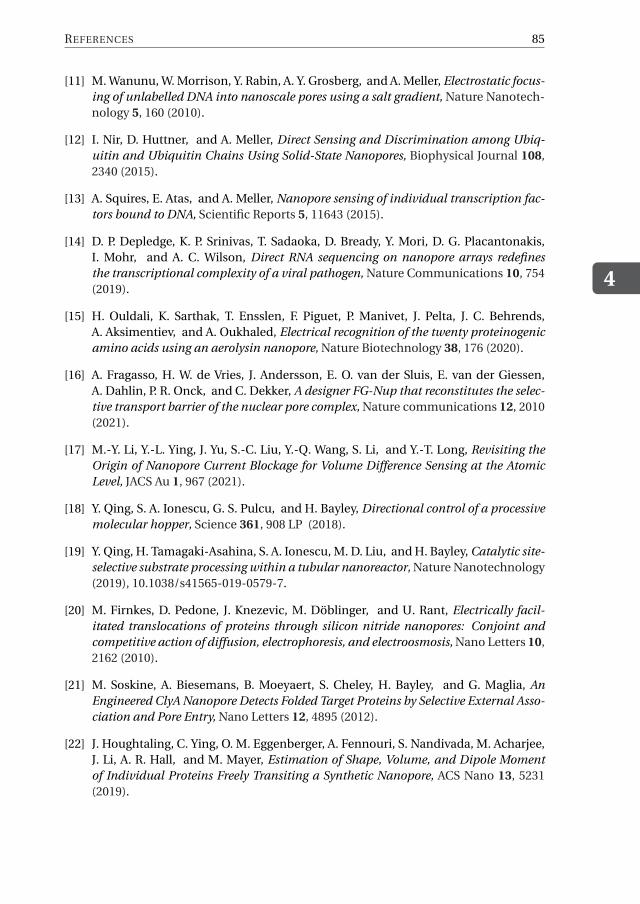
REFERENCES
4
85
[11] M. Wanunu, W. Morrison, Y. Rabin, A. Y. Grosberg, and A. Meller, Electrostatic focus-ing of unlabelled DNA into nanoscale pores using a salt gradient, Nature Nanotech-nology 5, 160 (2010).
[12] I. Nir, D. Huttner, and A. Meller, Direct Sensing and Discrimination among Ubiq-uitin and Ubiquitin Chains Using Solid-State Nanopores, Biophysical Journal 108,2340 (2015).
[13] A. Squires, E. Atas, and A. Meller, Nanopore sensing of individual transcription fac-tors bound to DNA, Scientific Reports 5, 11643 (2015).
[14] D. P. Depledge, K. P. Srinivas, T. Sadaoka, D. Bready, Y. Mori, D. G. Placantonakis,I. Mohr, and A. C. Wilson, Direct RNA sequencing on nanopore arrays redefinesthe transcriptional complexity of a viral pathogen, Nature Communications 10, 754(2019).
[15] H. Ouldali, K. Sarthak, T. Ensslen, F. Piguet, P. Manivet, J. Pelta, J. C. Behrends,A. Aksimentiev, and A. Oukhaled, Electrical recognition of the twenty proteinogenicamino acids using an aerolysin nanopore, Nature Biotechnology 38, 176 (2020).
[16] A. Fragasso, H. W. de Vries, J. Andersson, E. O. van der Sluis, E. van der Giessen,A. Dahlin, P. R. Onck, and C. Dekker, A designer FG-Nup that reconstitutes the selec-tive transport barrier of the nuclear pore complex, Nature communications 12, 2010(2021).
[17] M.-Y. Li, Y.-L. Ying, J. Yu, S.-C. Liu, Y.-Q. Wang, S. Li, and Y.-T. Long, Revisiting theOrigin of Nanopore Current Blockage for Volume Difference Sensing at the AtomicLevel, JACS Au 1, 967 (2021).
[18] Y. Qing, S. A. Ionescu, G. S. Pulcu, and H. Bayley, Directional control of a processivemolecular hopper, Science 361, 908 LP (2018).
[19] Y. Qing, H. Tamagaki-Asahina, S. A. Ionescu, M. D. Liu, and H. Bayley, Catalytic site-selective substrate processing within a tubular nanoreactor, Nature Nanotechnology(2019), 10.1038/s41565-019-0579-7.
[20] M. Firnkes, D. Pedone, J. Knezevic, M. Döblinger, and U. Rant, Electrically facil-itated translocations of proteins through silicon nitride nanopores: Conjoint andcompetitive action of diffusion, electrophoresis, and electroosmosis, Nano Letters 10,2162 (2010).
[21] M. Soskine, A. Biesemans, B. Moeyaert, S. Cheley, H. Bayley, and G. Maglia, AnEngineered ClyA Nanopore Detects Folded Target Proteins by Selective External Asso-ciation and Pore Entry, Nano Letters 12, 4895 (2012).
[22] J. Houghtaling, C. Ying, O. M. Eggenberger, A. Fennouri, S. Nandivada, M. Acharjee,J. Li, A. R. Hall, and M. Mayer, Estimation of Shape, Volume, and Dipole Momentof Individual Proteins Freely Transiting a Synthetic Nanopore, ACS Nano 13, 5231(2019).
4
86 REFERENCES
[23] L. Movileanu, S. Howorka, O. Braha, and H. Bayley, Detecting protein analytes thatmodulate transmembrane movement of a polymer chain within a single proteinpore, Nature Biotechnology 18, 1091 (2000).
[24] D. Rotem, L. Jayasinghe, M. Salichou, and H. Bayley, Protein Detection by NanoporesEquipped with Aptamers, Journal of the American Chemical Society 134, 2781(2012).
[25] A. K. Thakur and L. Movileanu, Real-time measurement of protein–protein interac-tions at single-molecule resolution using a biological nanopore, Nature Biotechnol-ogy 37, 96 (2019).
[26] M. Fahie, C. Chisholm, and M. Chen, Resolved Single-Molecule Detection of In-dividual Species within a Mixture of anti-Biotin Antibodies Using an EngineeredMonomeric Nanopore, ACS Nano 9, 1089 (2015).
[27] K. Chuah, Y. Wu, S. R. C. Vivekchand, K. Gaus, P. J. Reece, A. P. Micolich, and J. J.Gooding, Nanopore blockade sensors for ultrasensitive detection of proteins in com-plex biological samples, Nature Communications 10, 2109 (2019).
[28] S. Zhang, G. Huang, R. Versloot, B. M. Herwig, P. C. T. de Souza, S.-J. Marrink, andG. Maglia, Bottom-up fabrication of a multi-component nanopore sensor that un-folds, processes and recognizes single proteins, bioRxiv , 2020.12.04.411884 (2020).
[29] J. Nivala, L. Mulroney, G. Li, J. Schreiber, and M. Akeson, Discrimination amongProtein Variants Using an Unfoldase-Coupled Nanopore, ACS Nano 8, 12365 (2014).
[30] N. S. Galenkamp and G. Maglia, Substrate binding and turnover modulate the affin-ity landscape of dihydrofolate reductase to increase its catalytic efficiency, bioRxiv ,2020.04.14.040733 (2020).
[31] S. Schmid, P. Stömmer, H. Dietz, and C. Dekker, Nanopore electro-osmotic trap forthe label-free study of single proteins and their conformations, Nature Nanotechnol-ogy 18, 2 (2021).
[32] T. C. Sutherland, Y.-T. Long, R.-I. Stefureac, I. Bediako-Amoa, H.-B. Kraatz, and J. S.Lee, Structure of Peptides Investigated by Nanopore Analysis, Nano Letters 4, 1273(2004).
[33] L. Restrepo-Pérez, C. H. Wong, G. Maglia, C. Dekker, and C. Joo, Label-Free De-tection of Post-translational Modifications with a Nanopore, Nano Letters 19, 7957(2019).
[34] J. W. F. Robertson, C. G. Rodrigues, V. M. Stanford, K. A. Rubinson, O. V. Krasilnikov,and J. J. Kasianowicz, Single-molecule mass spectrometry in solution using a solitarynanopore, Proceedings of the National Academy of Sciences 104, 8207 (2007).
[35] A. E. Chavis, K. T. Brady, G. A. Hatmaker, C. E. Angevine, N. Kothalawala, A. Dass,J. W. F. Robertson, and J. E. Reiner, Single Molecule Nanopore Spectrometry for Pep-tide Detection, ACS Sensors 2, 1319 (2017).

REFERENCES
4
87
[36] G. Huang, K. Willems, M. Soskine, C. Wloka, and G. Maglia, Electro-osmotic captureand ionic discrimination of peptide and protein biomarkers with FraC nanopores,Nature Communications 8, 1 (2017).
[37] G. Huang, A. Voet, and G. Maglia, FraC nanopores with adjustable diameter identifythe mass of opposite-charge peptides with 44 dalton resolution, Nature Communi-cations 10, 835 (2019).
[38] L. Restrepo-Pérez, G. Huang, P. R. Bohländer, N. Worp, R. Eelkema, G. Maglia, C. Joo,and C. Dekker, Resolving Chemical Modifications to a Single Amino Acid within aPeptide Using a Biological Nanopore, ACS Nano 13, 13668 (2019).
[39] A. J. Boersma and H. Bayley, Continuous Stochastic Detection of Amino Acid Enan-tiomers with a Protein Nanopore, Angewandte Chemie International Edition 51,9606 (2012).
[40] J. Nivala, D. B. Marks, and M. Akeson, Unfoldase-mediated protein translocationthrough an α-hemolysin nanopore, Nature Biotechnology 31, 247 (2013).
[41] H. Brinkerhoff, A. S. W. Kang, J. Liu, A. Aksimentiev, and C. Dekker, Infinite re-reading of single proteins at single-amino-acid resolution using nanopore sequenc-ing, bioRxiv , 2021.07.13.452225 (2021).
[42] M. Kukwikila and S. Howorka, Nanopore-Based Electrical and Label-Free Sensing ofEnzyme Activity in Blood Serum, Analytical Chemistry 87, 9149 (2015).
[43] J. Chu, M. González-López, S. L. Cockroft, M. Amorin, and M. R. Ghadiri, Real-Time Monitoring of DNA Polymerase Function and Stepwise Single-Nucleotide DNAStrand Translocation through a Protein Nanopore, Angewandte Chemie Interna-tional Edition 49, 10106 (2010).
[44] E. a. Manrao, I. M. Derrington, A. H. Laszlo, K. W. Langford, M. K. Hopper, N. Gill-gren, M. Pavlenok, M. Niederweis, and J. H. Gundlach, Reading DNA at single-nucleotide resolution with a mutant MspA nanopore and phi29 DNA polymerase,Nature Biotechnology 30, 349 (2012).
[45] S. Cheley, H. Xie, and H. Bayley, A Genetically Encoded Pore for the Stochastic Detec-tion of a Protein Kinase, ChemBioChem 7, 1923 (2006).
[46] G. Huang, K. Willems, M. Bartelds, P. van Dorpe, M. Soskine, and G. Maglia, Electro-Osmotic Vortices Promote the Capture of Folded Proteins by PlyAB Nanopores, NanoLetters 20, 3819 (2020).
[47] S. Zernia, N. J. van der Heide, N. S. Galenkamp, G. Gouridis, and G. Maglia, Cur-rent Blockades of Proteins inside Nanopores for Real-Time Metabolome Analysis, ACSNano 14, 2296 (2020).
[48] N. S. Galenkamp, A. Biesemans, and G. Maglia, Directional conformer exchangein dihydrofolate reductase revealed by single-molecule nanopore recordings, NatureChemistry 12, 481 (2020).

4
88 REFERENCES
[49] V. Van Meervelt, M. Soskine, S. Singh, G. K. Schuurman-Wolters, H. J. Wijma,B. Poolman, and G. Maglia, Real-Time Conformational Changes and ControlledOrientation of Native Proteins Inside a Protein Nanoreactor, Journal of the Ameri-can Chemical Society 139, 18640 (2017).
[50] P. T. R. Rajagopalan, Z. Zhang, L. McCourt, M. Dwyer, S. J. Benkovic, and G. G.Hammes, Interaction of dihydrofolate reductase with methotrexate: Ensemble andsingle-molecule kinetics, Proceedings of the National Academy of Sciences 99,13481 LP (2002).
[51] P. Waduge, R. Hu, P. Bandarkar, H. Yamazaki, B. Cressiot, Q. Zhao, P. C. Whitford,and M. Wanunu, Nanopore-Based Measurements of Protein Size, Fluctuations, andConformational Changes, ACS Nano 11, 5706 (2017).
[52] H. Bayley and P. S. Cremer, Stochastic sensors inspired by biology, Nature 413, 226(2001).
[53] H. Bayley, T. Luchian, S.-H. Shin, and M. Steffensen, Single Molecule CovalentChemistry in a Protein Nanoreactor (2008) pp. 251–277.
[54] M. B. Steffensen, D. Rotem, and H. Bayley, Single-molecule analysis of chirality in amulticomponent reaction network, Nature Chemistry 6, 603 (2014).
[55] W. J. Ramsay and H. Bayley, Single-Molecule Determination of the Isomers of d-Glucose and d-Fructose that Bind to Boronic Acids, Angewandte Chemie Interna-tional Edition 57, 2841 (2018).
[56] J. Lee and H. Bayley, Semisynthetic protein nanoreactor for single-molecule chem-istry, Proceedings of the National Academy of Sciences 112, 13768 LP (2015).
[57] T. Luchian, S.-H. Shin, and H. Bayley, Kinetics of a Three-Step Reaction Observedat the Single-Molecule Level, Angewandte Chemie International Edition 42, 1926(2003).
[58] G. S. Pulcu, N. S. Galenkamp, Y. Qing, G. Gasparini, E. Mikhailova, S. Matile, andH. Bayley, Single-Molecule Kinetics of Growth and Degradation of Cell-PenetratingPoly(disulfide)s, Journal of the American Chemical Society 141, 12444 (2019).
[59] S. Lu, W.-W. Li, D. Rotem, E. Mikhailova, and H. Bayley, A primary hydro-gen–deuterium isotope effect observed at the single-molecule level, Nature Chemistry2, 921 (2010).
[60] W. J. Ramsay, N. A. W. Bell, Y. Qing, and H. Bayley, Single-Molecule Observationof the Intermediates in a Catalytic Cycle, Journal of the American Chemical Society140, 17538 (2018).
[61] X.-f. Kang, L.-Q. Gu, S. Cheley, and H. Bayley, Single Protein Pores ContainingMolecular Adapters at High Temperatures, Angewandte Chemie International Edi-tion 44, 1495 (2005).

REFERENCES
4
89
[62] T. Luchian, S.-H. Shin, and H. Bayley, Single-Molecule Covalent Chemistry withSpatially Separated Reactants, Angewandte Chemie International Edition 42, 3766(2003).
[63] Y. Qing, G. S. Pulcu, N. A. W. Bell, and H. Bayley, Bioorthogonal Cycloadditions withSub-Millisecond Intermediates, Angewandte Chemie International Edition 57, 1218(2018).
[64] L.-Q. Gu, S. Cheley, and H. Bayley, Electroosmotic enhancement of the binding of aneutral molecule to a transmembrane pore, Proceedings of the National Academy ofSciences 100, 15498 LP (2003).
[65] R. D. Astumian, Microscopic reversibility as the organizing principle of molecularmachines, Nature Nanotechnology 7, 684 (2012).
[66] S. M. W. Dale Purves, George J. Augustine, David Fitzpatrick, Lawrence C. Katz,Anthony-Samuel LaMantia, James O. McNamara, Channels and Transporters, 2nded., edited by Neuroscience (Sinauer Associates, Sunderland (MA), 2001) p. Chap-ter 4.
[67] P. J. T. Dekker, M. T. Ryan, J. Brix, H. Müller, A. Hönlinger, and N. Pfanner, Prepro-tein Translocase of the Outer Mitochondrial Membrane: Molecular Dissection andAssembly of the General Import Pore Complex, Molecular and Cellular Biology 18,6515 (1998).
[68] S. J. Kim, J. Fernandez-Martinez, I. Nudelman, Y. Shi, W. Zhang, B. Raveh, T. Her-ricks, B. D. Slaughter, J. A. Hogan, P. Upla, I. E. Chemmama, R. Pellarin, I. Echeverria,M. Shivaraju, A. S. Chaudhury, J. Wang, R. Williams, J. R. Unruh, C. H. Greenberg,E. Y. Jacobs, Z. Yu, M. J. de la Cruz, R. Mironska, D. L. Stokes, J. D. Aitchison, M. F.Jarrold, J. L. Gerton, S. J. Ludtke, C. W. Akey, B. T. Chait, A. Sali, and M. P. Rout, In-tegrative structure and functional anatomy of a nuclear pore complex, Nature 555,475 (2018).
[69] N. Driessen, Arnold J. M. and Nouwen, Protein Translocation Across the BacterialCytoplasmic Membrane, Annu. Rev. Biochem. 77, 643 (2008).
[70] T. A. Baker and R. T. Sauer, ClpXP, an ATP-powered unfolding and protein-degradation machine, Biochimica et Biophysica Acta - Molecular Cell Research1823, 15 (2012).
[71] A. H. Delcour, Electrophysiology of Unconventional Channels and Pores, Vol. 18(Springer, 2015) pp. 75–100.
[72] T. Sugawara, D. Yamashita, K. Kato, Z. Peng, J. Ueda, J. Kaneko, Y. Kamio, Y. Tanaka,and M. Yao, Structural basis for pore-forming mechanism of staphylococcal α-hemolysin, Toxicon 108, 226 (2015).
[73] S. Wang, Z. Ji, E. Yan, F. Haque, and P. Guo, Three-step channel conformationalchanges common to DNA packaging motors of bacterial viruses T3, T4, SPP1, andPhi29, Virology 500, 285 (2017).

4
90 REFERENCES
[74] L. Xue, H. Yamazaki, R. Ren, M. Wanunu, A. P. Ivanov, and J. B. Edel, Solid-statenanopore sensors, Nature Reviews Materials (2020), 10.1038/s41578-020-0229-6.
[75] S. Wang, Z. Zhao, F. Haque, and P. Guo, Engineering of protein nanopores for se-quencing, chemical or protein sensing and disease diagnosis, Current Opinion inBiotechnology 51, 80 (2018).
[76] H. Ramezani and H. Dietz, Building machines with DNA molecules, Nature ReviewsGenetics 21, 5 (2020).
[77] Z. Siwy and A. Fulinski, Fabrication of a Synthetic Nanopore Ion Pump, Physical Re-view Letters 89, 4 (2002).
[78] J. R. Burns, A. Seifert, N. Fertig, and S. Howorka, A biomimetic DNA-based channelfor the ligand-controlled transport of charged molecular cargo across a biologicalmembrane, Nature Nanotechnology 11, 152 (2016).
[79] T. Jovanovic-Talisman and A. Zilman, Protein Transport by the Nuclear Pore Com-plex: Simple Biophysics of a Complex Biomachine. Biophysical journal 113, 6 (2017).
[80] T. Jovanovic-Talisman, J. Tetenbaum-Novatt, A. S. McKenney, A. Zilman, R. Peters,M. P. Rout, and B. T. Chait, Artificial nanopores that mimic the transport selectivityof the nuclear pore complex, Nature 457, 1023 (2009).
[81] S. W. Kowalczyk, L. Kapinos, T. R. Blosser, T. Magalhães, P. van Nies, R. Y. H. Lim,and C. Dekker, Single-molecule transport across an individual biomimetic nuclearpore complex, Nature Nanotechnology 6, 433 (2011).
[82] A. N. Ananth, A. Mishra, S. Frey, A. Dwarkasing, R. Versloot, E. van der Giessen,D. Görlich, P. Onck, and C. Dekker, Spatial structure of disordered proteins dictatesconductance and selectivity in nuclear pore complex mimics, eLife 7, 1 (2018).
[83] P. Ketterer, A. N. Ananth, D. S. Laman Trip, A. Mishra, E. Bertosin, M. Ganji, J. VanDer Torre, P. Onck, H. Dietz, and C. Dekker, DNA origami scaffold for studying in-trinsically disordered proteins of the nuclear pore complex, Nature Communications9, 1 (2018).
[84] P. D. E. Fisher, Q. Shen, B. Akpinar, L. K. Davis, K. K. H. Chung, D. Baddeley,A. Šaric, T. J. Melia, B. W. Hoogenboom, C. Lin, and C. P. Lusk, A ProgrammableDNA Origami Platform for Organizing Intrinsically Disordered Nucleoporins withinNanopore Confinement, ACS Nano 12, 1508 (2018).
[85] S. O. Kelley, What Are Clinically Relevant Levels of Cellular and Biomolecular Ana-lytes? ACS Sensors 2, 193 (2017).
[86] K. J. Freedman, L. M. Otto, A. P. Ivanov, A. Barik, S.-H. Oh, and J. B. Edel, Nanoporesensing at ultra-low concentrations using single-molecule dielectrophoretic trap-ping, Nature Communications 7, 10217 (2016).

REFERENCES
4
91
[87] J. D. Spitzberg, X. F. van Kooten, M. Bercovici, and A. Meller, Microfluidic device forcoupling isotachophoretic sample focusing with nanopore single-molecule sensing,Nanoscale 12, 17805 (2020).
[88] K. Tian, X. Chen, B. Luan, P. Singh, Z. Yang, K. S. Gates, M. Lin, A. Mustapha, andL.-Q. Gu, Single Locked Nucleic Acid-Enhanced Nanopore Genetic Discrimination ofPathogenic Serotypes and Cancer Driver Mutations, ACS Nano 12, 4194 (2018).
[89] Y. Wang, K. Tian, R. Shi, A. Gu, M. Pennella, L. Alberts, K. S. Gates, G. Li, H. Fan, M. X.Wang, and L.-Q. Gu, Nanolock–Nanopore Facilitated Digital Diagnostics of CancerDriver Mutation in Tumor Tissue, ACS Sensors 2, 975 (2017).
[90] N. Burck, T. Gilboa, A. Gadi, M. Patkin Nehrer, R. J. Schneider, and A. Meller,Nanopore Identification of Single Nucleotide Mutations in Circulating Tumor DNAby Multiplexed Ligation, Clinical Chemistry (2021), 10.1093/clinchem/hvaa328.
[91] J. Y. Sze, A. P. Ivanov, A. E. Cass, and J. B. Edel, Single molecule multiplexed nanoporeprotein screening in human serum using aptamer modified DNA carriers, NatureCommunications 8, 1 (2017).
[92] S. Cai, J. Y. Y. Sze, A. P. Ivanov, and J. B. Edel, Small molecule electro-optical bindingassay using nanopores, Nature Communications 10, 1797 (2019).
[93] M. A. Fahie, B. Yang, M. Mullis, M. A. Holden, and M. Chen, Selective Detection ofProtein Homologues in Serum Using an OmpG Nanopore, Analytical Chemistry 87,11143 (2015).
[94] A. K. Thakur and L. Movileanu, Single-Molecule Protein Detection in a Biofluid Usinga Quantitative Nanopore Sensor, ACS Sensors 4, 2320 (2019).
[95] Y. Wang, D. Zheng, Q. Tan, M. X. Wang, and L.-Q. Gu, Nanopore-based detectionof circulating microRNAs in lung cancer patients, Nature Nanotechnology 6, 668(2011).
[96] J. Mathé, H. Visram, V. Viasnoff, Y. Rabin, and A. Meller, Nanopore Unzipping ofIndividual DNA Hairpin Molecules, Biophysical Journal 87, 3205 (2004).
[97] Y. Rozevsky, T. Gilboa, X. F. van Kooten, D. Kobelt, D. Huttner, U. Stein, and A. Meller,Quantification of mRNA Expression Using Single-Molecule Nanopore Sensing, ACSNano 14, 13964 (2020).


5A DESIGNER FG-NUP THAT
RECONSTITUTES THE SELECTIVE
TRANSPORT BARRIER OF THE
NUCLEAR PORE COMPLEX
Nuclear Pore Complexes (NPCs) regulate bidirectional transport between the nucleus andthe cytoplasm. Intrinsically disordered FG-Nups line the NPC lumen and form a selec-tive barrier, where transport of most proteins is inhibited whereas specific transporter pro-teins freely pass. The mechanism underlying selective transport through the NPC is stilldebated. Here, we reconstitute the selective behaviour of the NPC bottom-up by intro-ducing a rationally designed artificial FG-Nup that mimics natural Nups. Using QCM-D,we measure selective binding of the artificial FG-Nup brushes to the transport receptorKap95 over cytosolic proteins such as BSA. Solid-state nanopores with the artificial FG-Nups lining their inner walls support fast translocation of Kap95 while blocking BSA, thusdemonstrating selectivity. Coarse-grained molecular dynamics simulations highlight theformation of a selective meshwork with densities comparable to native NPCs. Our findingsshow that simple design rules can recapitulate the selective behaviour of native FG-Nupsand demonstrate that no specific spacer sequence nor a spatial segregation of differentFG-motif types are needed to create selective NPCs.
This chapter has been published as: Alessio Fragasso, Hendrik W. de Vries, John Andersson, Eli O. van der Sluis,Erik van der Giessen, Andreas Dahlin, Patrick R. Onck, Cees Dekker. A designer FG-Nup that reconstitutes theselective transport barrier of the Nuclear Pore Complex. Nature Communications 12, 2010 (2021) [1].
93
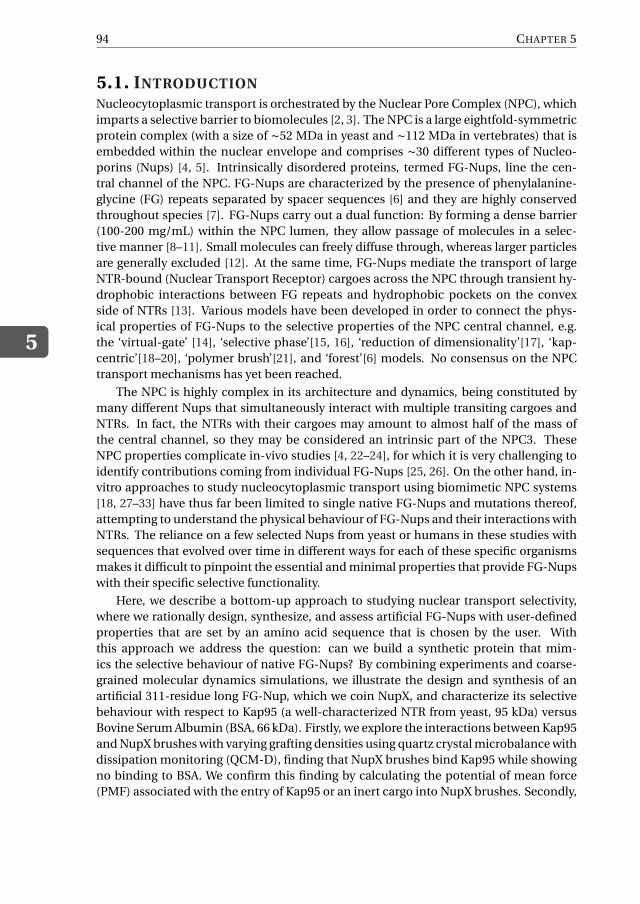
5
94 CHAPTER 5
5.1. INTRODUCTIONNucleocytoplasmic transport is orchestrated by the Nuclear Pore Complex (NPC), whichimparts a selective barrier to biomolecules [2, 3]. The NPC is a large eightfold-symmetricprotein complex (with a size of ∼52 MDa in yeast and ∼112 MDa in vertebrates) that isembedded within the nuclear envelope and comprises ∼30 different types of Nucleo-porins (Nups) [4, 5]. Intrinsically disordered proteins, termed FG-Nups, line the cen-tral channel of the NPC. FG-Nups are characterized by the presence of phenylalanine-glycine (FG) repeats separated by spacer sequences [6] and they are highly conservedthroughout species [7]. FG-Nups carry out a dual function: By forming a dense barrier(100-200 mg/mL) within the NPC lumen, they allow passage of molecules in a selec-tive manner [8–11]. Small molecules can freely diffuse through, whereas larger particlesare generally excluded [12]. At the same time, FG-Nups mediate the transport of largeNTR-bound (Nuclear Transport Receptor) cargoes across the NPC through transient hy-drophobic interactions between FG repeats and hydrophobic pockets on the convexside of NTRs [13]. Various models have been developed in order to connect the phys-ical properties of FG-Nups to the selective properties of the NPC central channel, e.g.the ‘virtual-gate’ [14], ‘selective phase’[15, 16], ‘reduction of dimensionality’[17], ‘kap-centric’[18–20], ‘polymer brush’[21], and ‘forest’[6] models. No consensus on the NPCtransport mechanisms has yet been reached.
The NPC is highly complex in its architecture and dynamics, being constituted bymany different Nups that simultaneously interact with multiple transiting cargoes andNTRs. In fact, the NTRs with their cargoes may amount to almost half of the mass ofthe central channel, so they may be considered an intrinsic part of the NPC3. TheseNPC properties complicate in-vivo studies [4, 22–24], for which it is very challenging toidentify contributions coming from individual FG-Nups [25, 26]. On the other hand, in-vitro approaches to study nucleocytoplasmic transport using biomimetic NPC systems[18, 27–33] have thus far been limited to single native FG-Nups and mutations thereof,attempting to understand the physical behaviour of FG-Nups and their interactions withNTRs. The reliance on a few selected Nups from yeast or humans in these studies withsequences that evolved over time in different ways for each of these specific organismsmakes it difficult to pinpoint the essential and minimal properties that provide FG-Nupswith their specific selective functionality.
Here, we describe a bottom-up approach to studying nuclear transport selectivity,where we rationally design, synthesize, and assess artificial FG-Nups with user-definedproperties that are set by an amino acid sequence that is chosen by the user. Withthis approach we address the question: can we build a synthetic protein that mim-ics the selective behaviour of native FG-Nups? By combining experiments and coarse-grained molecular dynamics simulations, we illustrate the design and synthesis of anartificial 311-residue long FG-Nup, which we coin NupX, and characterize its selectivebehaviour with respect to Kap95 (a well-characterized NTR from yeast, 95 kDa) versusBovine Serum Albumin (BSA, 66 kDa). Firstly, we explore the interactions between Kap95and NupX brushes with varying grafting densities using quartz crystal microbalance withdissipation monitoring (QCM-D), finding that NupX brushes bind Kap95 while showingno binding to BSA. We confirm this finding by calculating the potential of mean force(PMF) associated with the entry of Kap95 or an inert cargo into NupX brushes. Secondly,

5. A DESIGNER FG-NUP THAT RECONSTITUTES THE SELECTIVITY OF THE NPC
5
95
we explore the transport properties of NupX-functionalized solid-state nanopores andshow that NupX-lined pores constitute a selective transport barrier. Similar to FG-Nupspreviously studied with the same technique [29, 31], the NPC-mimicking nanoporesallow fast and efficient passage of Kap95 molecules, while blocking transport of BSA.Coarse-grained MD simulations of NupX-functionalized nanopores highlight the forma-tion of a dense FG-rich meshwork with similar protein densities as in native NPCs, whichexcludes inert molecules but allows entry and passage of Kap95.
The current work provides the proof of concept that a designer FG-Nup can recon-stitute NPC-like selectivity, and the results show that no specific spacer sequence nor aspatial segregation of different FG-motifs (as observed in recent work [4, 34]) are requiredfor achieving selectivity. This work lays the foundation for multiple future directions infollow-up work as the approach opens the route to systematically study the essentialmicroscopic motifs that underlie the unique selectivity of NPCs.
5.2. RESULTS
5.2.1. DESIGN OF THE SYNTHETIC NUPXIn the design of our synthetic NupX protein, we aim to reconstitute nuclear transportselectivity while operating under a minimal set of simple design rules. The design pro-cedure that we outline below uses the following four rules: i) we design a protein thatincorporates the physical properties of GLFG-Nups (a specific class of essential FG Nupsthat are particularly cohesive and contain many GLFG-motifs), ii) it comprises two parts,with a cohesive domain at one end and a repulsive domain at the other end, where eachdomain is characterized by the ratio C/H of the number of charged and the number ofhydrophobic residues, iii) FG and GLFG motifs are present in an alternating and uni-formly spaced fashion within the protein’s cohesive domain, and iv) the protein is in-trinsically disordered throughout its full length, similar to native FG-Nups.
We implemented our design rules in a step-wise design process as follows: First,we selected and analysed an appropriate set of native FG-Nups (design rule i), namelyGLFG-Nups, which differ from other FG-Nups in terms of the type of FG repeats and theproperties of the spacer regions11. The emphasis on GLFG-Nups follows from their lo-calization in the central channel [4] of the yeast NPC (Figure 5.1a), where they stronglycontribute to the nuclear transport selectivity. Indeed, a small subset of GLFG-Nups(e.g., either Nup100 or Nup116 in combination with Nup145N) was shown to be essen-tial and sufficient for cell viability [22, 35]. To derive the amino acid content of NupX,we therefore characterized the archetypical GLFG-Nup sequence by determining theamino acid content of the disordered regions of Nup49, Nup57, Nup145N, Nup116, andNup100 from yeast. Of these, the most essential GLFG-Nups (i.e. Nup100, Nup116,and Nup145N) comprise a collapsed domain with a low C/H-ratio and abundance ofFG/GLFG repeats, and an extended domain with a high C/H-ratio and absence of FG re-peats [6]5. This distinction is highlighted in Figures 5.1b,5.2a, where non-FG/GLFG/chargedresidues are highlighted in light green and pink for the collapsed and extended domainsin respectively – a colouring scheme used throughout this work. The division into twodomains of these essential GLFG-Nups led us to phrase design rule ii in our design pro-cess of NupX, with each domain comprising ∼150 amino acid residues (see Figures 5.1b,

5
96 CHAPTER 5
Figure 5.1: De novo design of an artificial FG-Nup. a, Left: Frontal view on three spokes of the Saccharomycescerevisiae NPC (PDB-DEV, entries 11 and 12, Ref.[4]) that shows how the GLFG-Nups (red) are predominantlyanchored in the inner ring, as opposed to the FxFG/FG-Nups (green). Right: Anchoring points of individualNups in a single spoke. The GLFG-Nups Nup100, Nup116, Nup49, and Nup57 (red) contribute strongly to thepermeability barrier of the NPC3, where Nup100 and Nup116 are known to be indispensable for NPC viability[22, 35]. This image and other visualizations of protein structures were rendered using VMD [36]. b, Simulationsnapshots of isolated native yeast GLFG-Nups at one amino acid resolution. The conformations of Nup145N,Nup116, Nup100 highlight a bimodality of the Nups [6], with a collapsed and extended domain. FG repeats,GLFG repeats, and charged residues are displayed in bright green, red, and white, respectively. Other aminoacids in the cohesive and extended domains are depicted in light green and pink, respectively. NupX adoptsthe same bimodal conformations as essential GLFG-Nups Nup100 and Nup116.
5.2a). Whereas the extended domain of NupX is of quite similar length to the corre-sponding extended domains of Nup100, Nup116 and Nup145N (190 residues on aver-age), the cohesive domain is notably shorter than the collapsed domains of native GLFG-Nups (390 residues on average).
Assigning the amino acid (AA) content to NupX, as derived from the sequence in-formation of the GLFG-Nups, was performed separately for the two domains: we com-puted the cumulative amino acid contents (excluding FG and GLFG motifs) for boththe collapsed domains of all five GLFG-Nups, and for the extended domains of Nup100,Nup116 and Nup145N (design rule ii). Upon normalizing for the total length of the col-lapsed or extended domains of all native GLFG-Nups, this analysis resulted in the distri-butions presented in 5.2b, plotted separately for the collapsed (light green, top) and theextended (light red, bottom) domains. Based on these histograms, we assigned aminoacids to the collapsed and extended domains of NupX separately. Following design ruleiii, we then placed FG and GLFG repeats in the collapsed domain with a fixed spacer

5. A DESIGNER FG-NUP THAT RECONSTITUTES THE SELECTIVITY OF THE NPC
5
97
Figure 5.2: a, Comparison of the full-length sequences between yeast GLFG-Nups and NupX. Sequence high-lights follow the colour-scheme of Fig.5.1b, folded domains are indicated in dark-grey. b, Amino acid contentsof yeast GLFG-Nups (averaged) and NupX for the collapsed (top panel) and extended (bottom panel) domains.Bar heights denote the average amino acid fraction within GLFG-Nup domains, where N=5 (all GLFG-Nups)for the collapsed domain and N=3 (Nup100, Nup116, Nup145) for the extended domain. Error bars indicatestandard deviations in the average occurrence of amino acids. FG and GLFG-motifs were excluded from thisanalysis. c, Sequence of NupX, following the colour scheme of figures 5.1b and panel a. FG and GLFG re-peats are spaced by 10 residues in the cohesive domain. d, Charge-and-hydrophobicity plot of NupX and yeastGLFG-Nup domains. For both the collapsed (green shading) and extended (red shading) domains, the chargedand hydrophobic amino acid contents of NupX agree with the properties of individual GLFG-Nups. e, Disorderprediction scores for the unfolded domains of GLFG-Nups (coloured lines) and full-length NupX (black curve)from two different predictors (see Materials and Methods). Disorder prediction scores higher than 0.5 (dashedline) count as fully disordered. f, Distribution of Stokes radii from 10 µs of coarse-grained molecular dynamicssimulations for NupX (red) and 25 design variations (light blue). NupX is, on average, slightly more compactedthan other design variants.
length of 10 AAs. This value was chosen based on the spacer length of ∼5-15 AAs in na-tive GLFG-Nups. An analysis of the charged and hydrophobic amino acid content of thedomains of NupX and native GLFG-Nups shows that the assigned sequence propertiesare indeed reproduced by our design method (Figure 5.2d). Finally, the sequences ofthe collapsed and extended domains of NupX were repetitively shuffled (except for theFG and GLFG motifs that we kept fixed) until a desirable level of disorder was achieved

5
98 CHAPTER 5
(design rule iv), as predicted by PONDR[37] and DISOPRED [38, 39] (Figure 5.2e). Thisresulted in the NupX sequence shown in Figure 5.2c. Whereas PONDR predicts oneshort folded segment between residues 189 and 209 (normalized position of 0.65 in Fig-ure 5.2e), additional structure prediction [40] (Materials and Methods) did not yield anyhigh-confidence folded structures for this segment.
To assess the robustness of our design procedure, we tested how permutations of theNupX sequence (which shuffle amino acids while retaining the FG/GLFG sequences andthe definition of both domains) affect the Stokes radius Rs , as computed from 1-bead-per-amino-acid MD-simulations developed for intrinsically disordered proteins (Figure5.2f, see Materials and Methods). We found that over 25 different designs for NupX (TableS5.2) yielded an average Rs of 4.2±0.2 nm (errors are S.D.). This is close to the simulated(3.9±0.4 nm) and measured (3.7±1.1 nm by DLS, Table S5.1) Rs value of the NupX proteindesign (Figure 5.2c).
Summing up, using a minimal set of rules, we designed a NupX protein that incorpo-rates the average properties that characterize GLFG-Nups [6, 12]. Moreover, by creating25 different designs that all showed similar behaviour in our simulations, we showedthat the physical properties such as the Stokes radius and the division of NupX into acohesive and repulsive domain are recovered in a reliable way.
5.2.2. QCM-D EXPERIMENTS AND MD SIMULATIONS SHOW SELECTIVE BIND-ING OF KAP95 TO NUPX BRUSHES
To assess the interaction between NupX and Kap95, we employed a Quartz-Crystal-Micro-balance with Dissipation monitoring (QCM-D), with gold-coated quartz chips and phosphate-buffered saline (PBS, pH 7.4) as running buffer, unless stated otherwise. First, C-terminus-thiolated NupX molecules were injected into the chamber at a constant flow-rate (20µL/min) where they chemically reacted with the gold surface. Binding of NupX to thegold surface could be monitored in real-time by measuring the shift in resonance fre-quency ∆f of the quartz chip (Figure 5.3a). We applied the NupX coating by admin-istering a protein concentration ranging from 100 nM to 2 µM (Figure S5.92) until aplateau in the frequency shift was reached, which typically occurred after ∼1hr of in-cubation. To gain insight into the areal mass density of the deposited layers, we em-ployed Surface Plasmon Resonance (SPR) measurements (Figure S5.10), where we usedthe same coating protocol for consistency. From these measurements of the areal massdensity, we found grafting distances of 7.7± 0.5 nm (mean ± S.D.) for chips incubatedwith a 60 nM NupX solution, and 2.91±0.02 nm (mean ± S.D.) for 2 µM. In determiningthe grafting density from the areal mass density, we assumed a triangular lattice (sincean equilateral triangulated (sometimes also denoted as hexagonal) lattice is the dens-est type of packing that can be described by a unique length scale that sets the graftingdensity). Figure 5.3a shows a typical frequency shift over time for the binding of 1 µMNupX to a gold surface. After the Nup-layer was formed, a 1-mercapto-11-undecylte-tri(ethyleneglycol) molecule (MUTEG), which is expected to form a ∼2 nm thin passi-vating film [18], was added to passivate any remaining bare gold that was exposed inbetween NupX molecules (Figure S5.11). This minimizes unintentional interactions be-tween Kap95 and gold for subsequent binding experiments (Figure S5.12) [18, 19, 41].

5. A DESIGNER FG-NUP THAT RECONSTITUTES THE SELECTIVITY OF THE NPC
5
99
Figure 5.3: Binding affinity of Kap95 to NupX, Nsp1 and Nsp1-S brushes, using QCM-D and MD simulations.a-c, Change in frequency shift upon coating of gold surface with NupX (dark blue), Nsp1 (green), and Nsp1-S (light blue) proteins, respectively, at 1 µM protein concentration. Red curves indicate the correspondingshift in dissipation. d-f, Change in frequency shift upon titration of Kap95 (with concentration in the range∼10-3000 nM) on NupX (dark blue), Nsp1 (green), and Nsp1-S (light blue) coated surfaces. Numbers indicatethe concentration in nM of Kap95 for each titration step. Large changes in frequency shift are observed forNupX and Nsp1, whereas no detectable shift is measured for Nsp1-S. Red curves indicate the correspondingshift in dissipation. g, Frequency (dark blue) and dissipation (red) shift upon adsorption of 2.5 µM BSA ontothe NupX-coated sensor. h, Side-view snapshot of the umbrella sampling simulation setup for a NupX brushwith 4.0 nm grafting distance, where a model Kap95 particle (8.5 nm diameter grey sphere with binding sitesdepicted in brown) or inert particle (7.5 nm diameter, not shown) is restrained along different z-coordinates.Scaffold beads are shown in grey, NupX proteins follow the same colour scheme as presented in Figure 5.1b. i,Top panel: Time and laterally averaged protein density distributions for the NupX brushes (blue) and for theFG-motifs (green) and GLFG-motifs (red) present inside the NupX brushes with a grafting distance of 4.0 nm.The density profiles of the GLFG and FG motifs within the NupX brush are multiplied by 5 for clarity. Darkcentral lines and light shades indicate the mean and standard deviation in density profiles, respectively. Thesemeasures were obtained by averaging over the density profiles of trajectory windows 50 ns in length (N=60).High-density regions (up to almost 400 mg/mL) form near the attachment sites (z = 0 to 2 nm) and near thefree surface of the brush layer (at z ∼15 nm). FG and GLFG-motifs predominantly localize near the free surfaceof the brush. Bottom: Free-energy profiles (PMF-curves) of the center of mass of the 8.5 nm-sized model Kap95(blue) and inert particle (red) along the z-coordinate, where z = 0 coincides with the substrate. The differencein sign between the PMF-curves of both particles indicates a strong preferential adsorption of the model Kap95to NupX brushes and a repulsive interaction with the inert particle.

5
100 CHAPTER 5
After thus setting up a NupX-coated layer, we flushed in Kap95 at stepwise increasingconcentrations (∼10-3000 nM, Figure 5.3d) and monitored binding to the NupX-coatedsurface. We observed a clear concentration-dependent amount of Kap95 molecules boundto the NupX brush. For reference, we repeated the experiment on brushes of Nsp1 (anative FG-Nup from yeast), as well as Nsp1-S, a Nsp1-mutant where the hydrophobicamino acids F, I, L, V are replaced by the hydrophilic amino acid Serine (S) (Figure 5.3b,c).The latter was employed as a negative control since it is expected to not bind Kap95 dueto the lack of FG repeats [15, 16]. Gold surfaces coated with Nsp1 or Nsp1-S were char-acterized with SPR under similar coating conditions as for QCM-D, yielding grafting dis-tances of 4.9± 0.1 nm for Nsp1 and 5.8± 0.4 nm for Nsp1-S. Upon flushing Kap95, wefound, consistent with previous studies [28, 41], a concentration-dependent adsorptionto Nsp1 brushes (Figure 5.3e), whereas we did not observe any detectable interactionbetween Kap95 and Nsp1-S (Figure 5.3f). The latter is consistent with the lack of FGrepeats in the Nsp1-S sequence which makes the Nsp1-S film devoid of binding sitesfor Kap95. We note that non-linear effects, e.g., coverage-dependent changes in waterentrapment within the layer [42], as well as mass transport limitations inherent to theQCM-D technique [41] are likely to affect the observed binding kinetics, which, togetherwith a relatively slow dissociation of Kap95 from both the NupX and Nsp1 brushes, leadus to refrain from extracting a dissociation constant. Adsorbed molecules could be com-pletely removed upon flushing 0.2 M NaOH however (Figure S5.13). Finally, we investi-gated whether the inert molecule BSA could bind to the NupX brush. Upon flushing 2.5µM of BSA (Figure 5.3g) we did not observe any appreciable change in the resonancefrequency, indicating that the NupX brush efficiently excludes these inert molecules.This measurement was repeated for all the grafting conditions used in this study (FigureS5.14) showing that BSA did not produce any detectable shift in frequency, while Kap95showed clear binding to the NupX films. Importantly, the data show that the NupX brushselectively interacts with Kap95 over a range of grafting densities.
In order to study the morphology and physical properties of NupX brushes at the mi-croscopic level, we employed coarse-grained molecular dynamics (MD) simulations (seeMaterials and Methods), which resolved the density distribution within the NupX brushlayer and the preferential adsorption of Kap95 over inert molecules of similar size suchas BSA. 36 NupX proteins were tethered on a triangular lattice with a fixed spacing of 4.0nm (Figure 5.3h) or 5.7 nm (Figure S5.18), well in the range of grafting distances from 2.9nm to 7.7 nm as measured by SPR. Averaged over a simulation time of 3 µs, we foundthat the NupX brushes with a 4.0 nm grafting distance form a laterally homogeneousmeshwork with densities ranging from ∼400 mg/mL near the substrate to around ∼200mg/mL in the central region and to ∼300 mg/mL near the free surface of the brush (Fig-ure 5.3i, top panel). The interface near the free surface of the brush contains the highestrelative concentration of FG and GLFG motifs (see Figure 5.3i, top panel). Notably, theprotein density throughout the brush is of the same order of magnitude as the densityobtained in simulations of the yeast NPC [43]. Upon increase of the grafting distance to5.7 nm, we find that the NupX brush attains different and less dense conformations: thedensity profile plateaus at a value of 170 mg/mL and slowly decays without showing apeak density near the free surface of the brush (Figure S5.18). We translated our densityprofiles into height estimates in a similar fashion as other computation efforts on FG-

5. A DESIGNER FG-NUP THAT RECONSTITUTES THE SELECTIVITY OF THE NPC
5
101
Nup brushes [44, 45]. We consider the z-coordinates at which 90% of the protein mass isincorporated as the effective brush heights. This approach yields brush heights of 12 and18 nm for the NupX brushes with 5.7 and 4.0 nm grafting distances, respectively. Thesevalues coincide quite well with the inflection point of the decaying tail of the densityprofiles in Figures 5.3l and Figure S5.18.
The simulated density profiles yield notably higher brushes than expected from theSauerbrey equation: For example, assuming a density of the hydrated brush of ∼1.05g/mL45, one can estimate a brush height of 6.4 nm for the NupX brush in Figure 5.3a(that was incubated at 1 µM, which we expect to have a grafting distance at the higherend of the values used in our simulations). Importantly, however, the Sauerbrey equa-tion does not account for viscoelastic effects and only provides a lower limit to the brushheight [42]. Indeed, given the dissipation-to-frequency ratio of ∼ 0.045×10⁻⁶ Hz-1 (Fig-ure S5.16), one expects that the actual experimental brush height will be larger than 6.4nm, an effect also seen in other QCM-D studies of FG-Nups [28, 46]. Notably, a quanti-tative difference between the NupX brush height estimations of the computational andexperimental results does not affect the major conclusions of the study, namely the se-lective transport across biomimetic nanopores with a rationally designed artificial FG-Nup and the selective binding of Kap95 over BSA to NupX.
To assess the selective properties of the NupX brushes, we performed umbrella sam-pling simulations of the adsorption of Kap95 and an inert molecule to NupX brushes(Materials and Methods), again for two grafting densities of 4 nm and 5.7 nm. We mod-elled Kap95 (Figure S5.19) as an 8.5 nm sized sterically repulsive (i.e., modelling onlyrepulsive, excluded volume interactions) particle with 10 hydrophobic binding sites [9,31, 47, 48] and a total net charge similar to that of Kap95 (–43e). The inert molecule wasmodelled as a sterically inert spherical particle of 7.5 nm diameter [11]. We obtainedpotential-of-mean-force (PMF) curves associated with the adsorption of Kap95 and inertparticles by means of the weighted histogram analysis method (WHAM)[49]. We foundthat for the dense brush (4.0 nm grafting density), a significant (–52 kJ/mol) negative freeenergy is associated with the entry of Kap95 in the NupX brush, as is visible in Figure 5.3i(bottom panel). By contrast, the PMF curve of the inert particle steeply increased whenthe protein entered into the NupX meshwork, showing that adsorption of non-specificproteins of comparable size as Kap95 will not occur. The large free energy differencesbetween Kap95 (corresponding to ∼nM binding affinity) and inert particle adsorptionqualitatively support the experimental findings. When increasing the grafting distanceto 5.7 nm, the inert particle and Kap95 protein are repelled and adsorbed less strongly(µM binding affinity, similar to other in vitro works [19, 50]), respectively (Figure S5.18).The data indicate that dense brushes bind more strongly to Kap95 and that selectivity ismaintained for less densely coated NupX brushes, which is in line with our experimentalobservation of selective adsorption in chips coated with NupX brushes of varying graft-ing densities (Figure S5.14).
5.2.3. SINGLE-MOLECULE TRANSLOCATION EXPERIMENTS WITH NUPX-COATED
NANOPORES DEMONSTRATE SELECTIVITY
In order to test whether our synthetic FG-Nup do indeed form a transport barrier thatmimics the selective properties of the NPC, we performed electrophysiological exper-
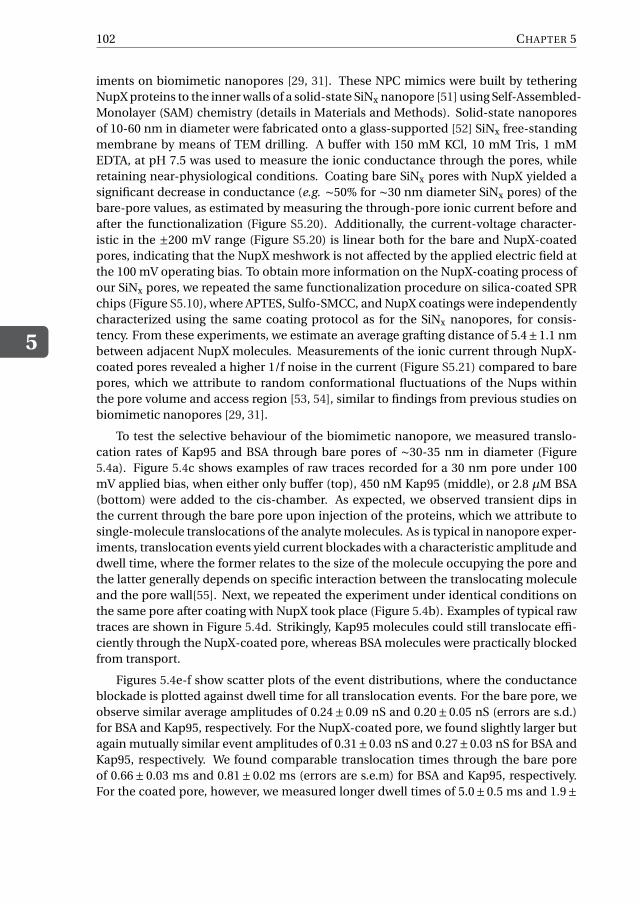
5
102 CHAPTER 5
iments on biomimetic nanopores [29, 31]. These NPC mimics were built by tetheringNupX proteins to the inner walls of a solid-state SiNx nanopore [51] using Self-Assembled-Monolayer (SAM) chemistry (details in Materials and Methods). Solid-state nanoporesof 10-60 nm in diameter were fabricated onto a glass-supported [52] SiNx free-standingmembrane by means of TEM drilling. A buffer with 150 mM KCl, 10 mM Tris, 1 mMEDTA, at pH 7.5 was used to measure the ionic conductance through the pores, whileretaining near-physiological conditions. Coating bare SiNx pores with NupX yielded asignificant decrease in conductance (e.g. ∼50% for ∼30 nm diameter SiNx pores) of thebare-pore values, as estimated by measuring the through-pore ionic current before andafter the functionalization (Figure S5.20). Additionally, the current-voltage character-istic in the ±200 mV range (Figure S5.20) is linear both for the bare and NupX-coatedpores, indicating that the NupX meshwork is not affected by the applied electric field atthe 100 mV operating bias. To obtain more information on the NupX-coating process ofour SiNx pores, we repeated the same functionalization procedure on silica-coated SPRchips (Figure S5.10), where APTES, Sulfo-SMCC, and NupX coatings were independentlycharacterized using the same coating protocol as for the SiNx nanopores, for consis-tency. From these experiments, we estimate an average grafting distance of 5.4±1.1 nmbetween adjacent NupX molecules. Measurements of the ionic current through NupX-coated pores revealed a higher 1/f noise in the current (Figure S5.21) compared to barepores, which we attribute to random conformational fluctuations of the Nups withinthe pore volume and access region [53, 54], similar to findings from previous studies onbiomimetic nanopores [29, 31].
To test the selective behaviour of the biomimetic nanopore, we measured translo-cation rates of Kap95 and BSA through bare pores of ∼30-35 nm in diameter (Figure5.4a). Figure 5.4c shows examples of raw traces recorded for a 30 nm pore under 100mV applied bias, when either only buffer (top), 450 nM Kap95 (middle), or 2.8 µM BSA(bottom) were added to the cis-chamber. As expected, we observed transient dips inthe current through the bare pore upon injection of the proteins, which we attribute tosingle-molecule translocations of the analyte molecules. As is typical in nanopore exper-iments, translocation events yield current blockades with a characteristic amplitude anddwell time, where the former relates to the size of the molecule occupying the pore andthe latter generally depends on specific interaction between the translocating moleculeand the pore wall[55]. Next, we repeated the experiment under identical conditions onthe same pore after coating with NupX took place (Figure 5.4b). Examples of typical rawtraces are shown in Figure 5.4d. Strikingly, Kap95 molecules could still translocate effi-ciently through the NupX-coated pore, whereas BSA molecules were practically blockedfrom transport.
Figures 5.4e-f show scatter plots of the event distributions, where the conductanceblockade is plotted against dwell time for all translocation events. For the bare pore, weobserve similar average amplitudes of 0.24±0.09 nS and 0.20±0.05 nS (errors are s.d.)for BSA and Kap95, respectively. For the NupX-coated pore, we found slightly larger butagain mutually similar event amplitudes of 0.31±0.03 nS and 0.27±0.03 nS for BSA andKap95, respectively. We found comparable translocation times through the bare poreof 0.66± 0.03 ms and 0.81± 0.02 ms (errors are s.e.m) for BSA and Kap95, respectively.For the coated pore, however, we measured longer dwell times of 5.0±0.5 ms and 1.9±

5. A DESIGNER FG-NUP THAT RECONSTITUTES THE SELECTIVITY OF THE NPC
5
103
Figure 5.4: Electrical measurements on NupX-coated solid-state nanopores. a-b, Schematic of the nanoporesystem before (a) and after (b) NupX functionalization. c-d, Examples of raw current traces through bare (c)and NupX-coated (d) pores, recorded under 100 mV applied bias for different analyte conditions. Currenttraces are recorded in the presence of buffer only (top), upon addition of 450 nM Kap95 (middle), and 2.8 µMBSA (bottom). Traces were filtered at 5 kHz. e, Scatter plot showing conductance blockades and dwell timedistributions of translocation events of the analytes Kap95 (black, N=506) and BSA (red, N=387) through a bare30 nm pore, recorded over the same time interval. f, Scatter plot showing conductance blockades and dwelltime distributions of translocation events of the analytes Kap95 (yellow, N=686) and BSA (blue, N=28) througha NupX-coated 30 nm pore, recorded over the same time interval. Top and right panels in e and f show log-normal fits to the distribution of dwell times and conductance blockades, respectively. Dashed vertical linesin top panels indicate the mean values for the dwell time distributions. g, Average event rate of translocationsfor Kap95 through a bare pore (black), BSA through a bare pore (red), Kap95 through a NupX-coated pore (yel-low), and BSA through a NupX-coated pore (blue). Error bars indicate standard deviations from independentmeasurements (circles) on three different pores, N=3.
0.1 ms for BSA and Kap95, respectively, which indicates that the presence of the NupXmolecules in the pore significantly slows down the translocation process of the passing

5
104 CHAPTER 5
molecules. Notably, BSA molecules were slower in translocating through the coated poreas compared to Kap95, which we attribute to the lower affinity between BSA and theNupX mesh as compared to Kap95. The transient and multivalent interactions betweenKap95 and the FG-repeats in the NupX meshwork lead to a reduced energy barrier ascompared to BSA permeation, which may explain the observed differences in dwellingtimes[11]. Repeating the same experiment on a larger 60 nm NupX-coated pore (FigureS5.22) yielded selective pores with faster translocations for both Kap95 (0.65±0.05 ms)and BSA (1.6±1.3 ms), consistent with the presence of an open central channel. Smallerpores (< 25 nm) did not result in any detectable signal for either Kap95 or BSA, due tothe poor signal-to-noise ratio attainable at such low conductances.
Most importantly, these data clearly show selectivity of the biomimetic pores. Fig-ure 5.4g compares the event rate of translocations for Kap95 and BSA through bare andNupX-coated pores under 100 mV applied bias. Event rates were 0.7±0.04 Hz and 1.10±0.04 Hz (N=3 different nanopores; errors are s.d.) for BSA and Kap95 through the barepore, respectively, whereas upon coating the pore with NupX, the event rates changedto 0.02± 0.02 Hz and 0.90± 0.04 Hz (N=3 different nanopores) for BSA and Kap95, re-spectively. The sharp decrease in event rate for BSA upon NupX coating of the poresindicates that BSA molecules are strongly hindered by the NupX meshwork formed in-side the pore. In contrast, the transport rate of Kap95 through the coated pore is nearlyunaffected when compared to the bare pore. From these experiments, we conclude thatthe user-defined NupX does impart a selective barrier, very similar to native FG-Nups[27, 29, 31], by allowing efficient transportation of Kap95 while hindering the passage ofBSA.
5.2.4. MD SIMULATIONS OF NUPX-LINED NANOPORES REVEAL THEIR PRO-TEIN DISTRIBUTION AND SELECTIVITY
We used coarse-grained MD simulations (Materials and Methods) to understand the se-lective properties of NupX-lined nanopores as obtained in our experiments. The 20 nmheight of these nanopores is the same as the SiNx membrane thickness, while we varythe diameter from 15 to 70 nm. Multiple copies of NupX are tethered to the nanopore lu-men by their C-terminal domain in an equilateral triangular lattice with a spacing of 5.5nm, based on estimates obtained from the SPR experiments (Figure S5.10, Materials andMethods). We note that the geometrical confinement by the nanopore may affect thegrafting distance on the concavely curved interior pore wall (parallel to the pore axis) ascompared to the planar geometry [56]. Based on 6 µs of coarse-grained MD simulations,we obtained the protein density distribution in the (r ,z)-plane (averaged over time andangle θ) within a NupX-lined nanopore of 30 nm in diameter (Figure 5.5b), similar in sizeas the translocation experiments.
High-density regions form close to the attachment sites (i.e. the four dots at each wallin Figure 5.5b) and along the central axis of the nanopore. Since the triangulated lattice(comprising four rows) does not strictly exhibit a symmetry plane along the z = 0 axis, aslight asymmetry (< 10% in terms of protein density) occurs between the top and bottomof the density map. From these data, we obtained a radial protein density profile, aver-aged over the pore height for the pore region (|z| < 10 nm, Figure 5.5c), which exhibits amaximum of 230 mg/mL at the pore center for the 30 nm NupX nanopore system and is

5. A DESIGNER FG-NUP THAT RECONSTITUTES THE SELECTIVITY OF THE NPC
5
105
Figure 5.5: Protein distribution and conductance of NupX-coated pores. a, Snapshot of a biomimeticnanopore simulation. NupX proteins (following the colouring scheme of Figure 5.1) were tethered with agrafting distance of 5.5 nm (yellow, top inset) to a cylindrical occlusion made of inert beads (grey). Pore di-ameters ranged from 15-70 nm, where the pore thickness was 20 nm throughout. Bottom inset: highlight ofa single NupX-protein (purple) within the NupX-meshwork. b, Axi-radial map (averaged over time and in theazimuthal direction) of the protein density within a 30 nm NupX-lined nanopore, from 6 µs simulations. Darkcolours indicate regions of low density, brighter colours indicate regions of high density. The collapsed do-mains of the NupX proteins form a high-density central plug. The high-density regions near the pore radius(15 nm) coincide with the anchoring sites of the NupX proteins. c, Density distributions (thick lines) for thepore (blue, |z| < 10 nm) and access (red, 10 nm < |z| < 40 nm) regions. Dashed curves indicate the averagedensity within 1 nm thick slices in the z-direction. d, Radial density distributions (z-averaged) for NupX-linednanopores with diameters ranging from 15 to 70 nm (darker and lighter colours denote smaller and larger di-ameters, resp.). The curve for 30 nm is emphasized. An increase in pore size beyond 30 nm leads to a decreasein the pore density along the pore’s central channel.
insensitive to the aforementioned small asymmetry. This density agrees well with valuesin the range of 200-300 mg/mL observed in earlier computational studies of the yeastNPC central channel [34, 43]. We attribute the central localization of the NupX proteinsto the combination of repulsion between the high C/H ratio extended domains near thepore wall and attraction between the cohesive, low C/H ratio collapsed domains of op-posing NupX proteins. Since the average density in the access region (10 nm < |z| < 40nm, Figure 5.5c) is found to be low in comparison to the average density within the poreregion, we conclude that the NupX proteins predominantly localize within the nanopore.When the grafting distance is perturbed by ∼ 10% in either direction (Figure S5.24) tovalues of 5.0 or 6.0 nm, similar density profiles are obtained. So even though the exper-imental grafting distance might be somewhat larger for the nanopore compared to the

5
106 CHAPTER 5
Figure 5.6: a, Side-view and top-view visualizations of 20 nm, 30 nm, and 45 nm diameter NupX-linednanopores. For nanopores with diameters smaller than 25 nm, the pore region density decreases due to anexpulsion of the collapsed NupX domains towards the access region. For nanopore diameters larger than 40nm, the pore density decreases and a hole forms. For nanopore diameters of 25-30 nm, the pore region issealed by the NupX cohesive domains. b, Conductance scaling for bare and NupX-coated nanopores. Opencircles indicate conductance measurements for bare (red) and NupX-coated (green) pores. Squares indicatetime-averaged conductance values obtained from MD simulations via a density-conductance relation (Mate-rials and Methods). Error bars indicate the standard deviation in the conductance and are smaller than themarker. Second-order polynomial fits to the bare pore (experimental) and the simulated conductance valuesare included as a guide to the eye. c,d, Axi-radial density maps for FG and GLFG motifs, respectively. Bothtypes of motif localize in the dense central region, indicating that there is no spatial segregation of differenttypes of FG-motifs in NupX-coated nanopores.
planar brushes due to the different geometrical confinement, similar profiles would beexpected for more sparsely coated pores.
The organization of the NupX proteins inside the nanopore geometry changes no-tably with pore diameter (Figures 5.5d,5.6a). For large diameter pores, the density pro-file of NupX proteins protruding from the pore surface quite well resembles that of aplanar brush (cf. Figure S5.18), resulting in a central opening for pores that are > 45 nm.When the pore diameter reaches values < 45 nm, NupX-coated nanopores are effectivelysealed. This 45 nm length scale is remarkable, given the quickly decaying density profileof a planar NupX brush with a similar grafting distance (Figure S5.18). Upon further de-creasing the pore diameter to values < 25 nm, we find that the NupX collapsed domainsare being expelled from the pore region towards the access region, resulting in decreased

5. A DESIGNER FG-NUP THAT RECONSTITUTES THE SELECTIVITY OF THE NPC
5
107
densities in the central pore region (Figures 5.5d,5.6a). Interestingly, we find that thesechanges in NupX morphology as a function of pore diameter are in good qualitativeagreement with predictions from earlier works on polymer-coated nanopores [57, 58],which point to a curvature-dependent modulation of the brush height. More specifically,an increase in curvature (i.e., a decrease in pore diameter) of a concave brush substrateis expected to lead to a relative extension of the brush as compared to the planar geom-etry. Additionally, attractive interactions between the cohesive head groups of NupX an-chored at opposing pore walls will also contribute to the sealing of NupX pores. Finally,we note that a central opening in the NupX nanopore meshwork, present for diametersfrom 45 nm upwards, is consistent with the increased event frequency and translocationspeed observed in large (60 nm) NupX-coated pores (Figure S5.22).
Using a relation between the local protein density and the local conductivity sepa-rately for the pore and access regions [31], we calculated the conductance of the NupXnanopores for varying diameters (Figure 5.5d, Figure S5.25, Materials and Methods). Thecalculated conductance from the simulated NupX-lined pores is shown in Figure 5.6b(black squares) together with the experimental conductances for bare and NupX-coatedpores (open circles). Note that we adopted a critical protein density of 85 mg/ml fromthe earlier work on Nsp1 [31] in our density-conductivity relation, but assume a differ-ent dependency of the local conductivity on the local protein density (Materials andMethods). Rather than assuming an abrupt complete blockage of conductance abovethe critical protein density of 85 mg/mL, we now use an exponential relation that pro-vides a more gradual reduction in conductance with density. The necessity of a differentdensity-conductance relationship indicates that the conductivity of the NupX nanoporemeshwork depends non-linearly on the average protein density. Interestingly, the slopeof the conductance-diameter curve for NupX-lined pores converges to that of bare poresalready at relatively small pore sizes. This is due to the formation of a hole within theNupX meshwork (Figure 5.5d) already in pores with diameters over 40 nm, renderingthese effectively similar to bare nanopores of smaller diameter.
A spatial segregation of different types of FG-motifs, as was observed in recent com-putational studies [4, 34], is not studied here explicitly. However, we find both types ofFG-motifs localize similarly in the high-density central region within the NupX nanoporechannel (Figures 5.6c,d). From these distributions and the observed selective transportof these pores (Figures 5.4e-g), we can infer that a spatial segregation of different FG-motifs is not required for selective transport.
Finally, in order to assess the selective properties of NupX-lined nanopores, we sim-ulated a 30 nm diameter NupX-lined nanopore in the presence of 10 Kap95 or 10 inertparticles. We released Kap95/inert particles in the access region at the top and recordedtheir location in over 5µs of simulation time (see Materials and Methods, Figures 5.7c,d).The Kap95 particles entered and left the NupX meshwork and sampled the pore lumenby traversing in the z-direction (Figure 5.7c). They localized preferentially at positionsradially halfway between the central pore axis and the edge of the nanopore, where theirtime-averaged density distribution takes the shape of a concave cylindrical region, as isshown in Figure 5.7a. Kap95 was found to be capable of (re-)entering and leaving themeshwork on either side (Figure 5.7c). Since no external electric field was applied, exit-ing and subsequent re-absorption of Kap95 into the NupX meshwork occurred and there

5
108 CHAPTER 5
was no directional preference for the motion of the Kap95 molecules, in contrast to theexperiments.
Figure 5.7: Effect of transporters on NupX-lined biomimetic pores. a, Contour graphs of the Kap95 num-ber density (grey contours) superimposed on the NupX protein density distributions (in presence of Kap95)within a 30 nm NupX-lined nanopore (NupX-density follows the same colouring scheme as in Figure 5.5b andis shown separately in Figure S5.26). The protein meshwork adapts (as compared to the distribution in Figure5.5b) to accommodate the permeating Kap95 particles. b, Density distribution of inert particles superimposedon the NupX protein density distribution in a 30 nm diameter NupX-lined nanopore. Inert particles remainin the top compartment and do not permeate the NupX-protein meshwork. c, d, Simulation snapshots of 30nm NupX-lined nanopores in the presence of Kap95 particles (c, black spheres with orange binding spots) andinert particles (d, black spheres), which were released in the top compartment. Kap95 particles enter and exitthe NupX meshworks at either side of the nanopore, whereas inert particles remain in the top compartment. e,PMF curves of Kap95 (blue) and inert particles (red) along the z-coordinate, obtained via Boltzmann inversionof the normalized density profile along the z-axis. The pore region coincides with an energy well of over 3 kBTfor Kap95, whereas inert particles experience a steep energy barrier of ∼7 kBT.
Interestingly, the NupX-meshwork adapted itself to the presence of the Kap95 particlesby expanding towards the access region (compare Figures 5.5b and Figure S5.26): theprotein density in the pore region decreased due to the presence of the Kap95, whereasthe protein density increased in the access region. In contrast to the findings for Kap95,we observed that the inert particles, simulated under the same conditions, remained inthe top compartment (Figure 5.7b,d) and did not permeate into the NupX-meshworkover the 5 µs time span of the simulation.
To quantify the selectivity of the 30 nm NupX-lined nanopores, we calculated PMF-curves along the z-axis for both cargo types (Figure 5.7e, see Materials and Methods).

5. A DESIGNER FG-NUP THAT RECONSTITUTES THE SELECTIVITY OF THE NPC
5
109
Kap95 experienced a negative free energy difference of approximately 8 kJ/mol, whichamounts to a binding energy of just over 3 kBT per Kap95. On the other hand, inert parti-cles experience a steep energy barrier of approximately 18 kJ/mol, which corresponds toover 7kBT per protein. The obtained Kap95 free energy profiles are similar to those foundin other simulation studies of cargo permeation through NPCs [9, 48] or NPC mimickingsystems [31, 59]. The Kap95 binding free energy differences along the nanopore axis areconsiderably smaller than the computed free energy profiles for NupX-brushes (Figure5.3i). This most probably relates to the fact that the two studied reaction coordinatesdiffer notably and cannot easily be compared: the reaction coordinate in Figure 5.3idescribes orthogonal entry into a brush that extends infinitely in the lateral direction,whereas the coordinate in Figure 5.7e describes lateral entry and exit into the NupX as-sembly within the pore. As a result, one would not expect the free energy differences fortransport through the nanopores to be similar to those obtained for entry into a brushgeometry. Note that large free energy differences in our nanopores would also yield res-idence times that are orders of magnitude larger than the observed ∼ms dwell times inour nanopore experiments[60] (Figure 5.4f). From our combined experimental and sim-ulation results, we conclude that NupX-lined nanopores indeed reproduce the NPC’sremarkable selectivity towards Kap95.
5.3. CONCLUSIONIn this work, we introduced a 311-residue long artificial FG-Nup, termed NupX, that werationally designed de novo based on the average properties of GLFG-type Nups (Nup49,Nup57, Nup100, Nup116, Nup145N) and which faithfully mimics the selective behaviourof the nuclear pore complex. We experimentally found that substrates coated with NupXbrushes of varying grafting densities bind selectively to Kap95, while they did not in-teract with the control BSA proteins – a finding confirmed through coarse-grained MDsimulations of the adsorption of Kap95 and inert particles. Consistent with these results,we found that Kap95 translocates through both uncoated and NupX-lined nanoporeson a physiological (∼ms) timescale [61], whereas BSA passage through the NupX-coatedpores was effectively excluded. Coarse-grained MD simulations revealed how the NupXproteins form a dense (> 150 mg/mL) phase that allows passage of Kap95 particles whileexcluding inert particles. Interestingly, we find that the high densities of the FG-richNupX meshworks are comparable to those obtained in earlier simulation studies of yeastNPCs [43]. A comparison of the intrinsic protein density (i.e. the protein density ofan individual molecule in solution, quantified by the mass per unit Stokes volume) ofNupX (219 mg/mL) with that of Nsp1 (74 mg/mL) explains why our NupX-meshworkshave the tendency to localize more compactly inside nanopore channels than Nsp1 inearlier work [31]. The increased conductance of the denser NupX-lined nanopores (ascompared to Nsp1) required a non-linear relation between the average protein densityand the local conductivity, and indicates that the average protein density is not the onlyfactor that describes conductivity; the dynamics of the unfolded proteins and the localcharge distribution might be important as well.
The design strategy presented in this work allows us to assess the role of the aminoacid sequence of the spacer regions in GLFG-Nups. Spacer residues were reported tobe involved in the interaction interface of Nup-NTR complexes [62–64], highlighting a

5
110 CHAPTER 5
possible specific role of these domains in the binding of NTRs. In the current work, weassigned the positions of spacer residues along the NupX amino acid sequence entirelyrandomly, in both the collapsed, FG-rich low C/H ratio domain, and the extended highC/H ratio domain. This indicates that no specific spacer sequence motifs are requiredto facilitate the fast and selective transport of NTRs like Kap95. The consistency of theStokes’ radii of different NupX designs within our simulations (Figure 5.2f) supports thisfinding.
Furthermore, our results shed light on the functional role of the spatial segregationof FG and GLFG motifs that was observed in earlier work [4, 34]. Although these recentcomputational studies observed such a feature and suggested that it plays a role in se-lective transport, the coinciding distributions of FG and GLFG motifs (Figures 5.6c,d)show that no spatial segregation of different types of FG motifs exists within our selec-tive nanopores. Notably, this does not rule out a different functional role for the spatialsegregation of different types of FG-motifs, which can be explored in future work.
The combined design and characterization approach presented here, with brush-adsorption and nanopore-transport measurements on the one hand and coarse-grainedMD simulations on the other, provides a powerful and exciting platform for future stud-ies of artificial FG-Nups: one can now start to systematically examine the relation be-tween FG-Nup amino acid sequence and size selectivity of the NPC. Such studies could,for example, entail the design of FG-Nups with radically different physicochemical prop-erties (i.e. FG-spacing, FG motif type, spacer domain C/H ratios, sequence complexity)to assess the selective properties of nanopore systems functionalized with these designerFG-Nups. Indeed, solid-state nanopores modified with a single type of FG-Nup wereshown in this and other works [27, 29, 31] to reproduce NPC selectivity, justifying theuse of a single type of artificial Nups within an environment structurally similar to theNPC. Moreover, in view of the similarity [6] and redundancy [22, 35] of different FG-Nupswithin the NPC and the ability of our method to robustly reproduce FG-Nup properties(Figure 5.2f and Figure S5.27), we are confident that a single artificial FG-Nup can cap-ture the selective barrier function the NPC. However, given that even minimally viablenative NPCs [22, 35] contain several different FG-Nups, it is worth mentioning that NPCmimics with a heterogeneous set of (artificial) FG-Nups can be created as well: DNAorigami scaffolds [33] potentially allow to position different artificial FG-Nups with greatcontrol, thus enabling systematic studies of how the interplay of different (artificial) FG-Nups gives rise to various transport properties of the NPC.
Finally, the design procedure that we introduced here is not limited to applicationsin nucleocytoplasmic transport. It may, for example, be possible to use a comparable ap-proach to create de novo selective molecular filters (e.g. for use in artificial cells [65, 66]),systems that would rely on selective partitioning of molecules in meshworks of unfoldedproteins with assigned properties. Control can be asserted over the composition andgeometry of the meshwork e.g. by means of recently developed DNA-origami scaffolds[32, 33]. More generally, the approach illustrated here may enable future studies of thephysical properties underlying phase separation of intrinsically disordered proteins[30].One could, for example include degrees of freedom such as the proteins’ second virialcoefficient (B22), or the charge patterning (κ), which have been linked to the phase be-havior of intrinsically disordered proteins [67, 68]. We envision that just like the field

5. A DESIGNER FG-NUP THAT RECONSTITUTES THE SELECTIVITY OF THE NPC
5
111
of de novo protein design has come to fruition with improved understanding of proteinfolding [69], the design of unstructured proteins like NupX will enable a versatile plat-form to study the intriguing functionality of intrinsically disordered proteins.
5.4. METHODS
5.4.1. ANALYSIS OF GLFG-NUPS AND DESIGN OF SYNTHETIC NUPS
Protein sequences of Saccharomyces cerevisiae GLFG-type Nups (i.e. Nup100, Nup116,Nup49, Nup57 and Nup145N) were analyzed using a script custom-written with R pro-gramming package (version 3.3.1). Following the definitions of high C/H-ratio and lowC/H-ratio unfolded FG-Nup domains as given in Ref. [6], we obtained histograms ofthe amino acid frequencies in both the collapsed (low C/H-ratio) and extended (highC/H-ratio) domains. The collapsed / extended domain sequences of NupX were thenassigned in three steps: First, the collapsed and extended domains of NupX were as-signed equal lengths of 150 residues each. Then, by normalizing the distributions inFigure 5.2b to the number of available residues within each domain, the total pool ofamino acids within each domain was obtained. Lastly, these amino acids were randomlyassigned a sequence index within each domain, with a boundary condition of the pres-ence of FG and GLFG repeats spaced by 10 residues within the low C/H-ratio domain.This approach was repeated iteratively in combination with disorder predictions usingthe on-line PONDR disorder prediction utility [37] until a sufficiently disordered designwas obtained. The final version of the NupX amino acid sequence was also analyzedfor secondary structure using DISOPRED [38, 39] and Phyre2 [40]. A 6-histidine tag wasadded to the N-terminus of the NupX sequence in order to facilitate protein purification(see Protein purification section). Finally, on the C-terminus a cysteine was included toallow the covalent coupling of the NupX protein to the surface.
5.4.2. EXPRESSION AND PURIFICATION OF NUPX AND KAP95The synthetic NupX gene (Genscript), appended with codons for an N-terminal His6-tagand a C-terminal cysteine residue, was cloned into pET28a and expressed in Escherichiacoli ER2566 cells (New England Biolabs, fhuA2 lacZ ::T7 gene1 [lon] ompT gal sulA11R(mcr73::miniTn10–TetS )2 [dcm] R(zgb-210::Tn10–TetS ) endA1 ∆(mcrCmrr)114::IS10).To minimize proteolysis of NupX, the cells were co-transformed with plasmid pED4, apGEX-derivative encoding GST-3C-Kap95 under control of the tac promoter. Kap95 wasexpressed as a C-terminal GST fusion protein in Escherichia coli ER2566 cells from plas-mid pED4, a pGEX derived construct in which the thrombin cleavage site was replacedby a 3C protease cleavage site using primers ed7 and ed8 (Table S5.4). Cells were cul-tured in shake flasks at 37◦C in Terrific Broth supplemented with 100 µg/mL ampicillinand 50 µg/mL kanamycin, and expression was induced at OD600∼0.6 with 1 mM IPTG.After 3 hours of expression the cells were harvested by centrifugation, washed with PBS,resuspended in buffer A1 (50 mM Tris/HCl pH 7.5, 300 mM NaCl, 8 M urea, 5 mg/mL6-aminohexanoic acid supplemented with one tablet per 50 mL of EDTA-free cOmpleteULTRA protease inhibitor cocktail) and frozen as “nuggets” in liquid nitrogen. Cells werelysed with a SPEX cryogenic grinder, after thawing 1,6-hexanediol was added to a finalpercentage of 5%, and the lysate was centrifuged for 30 minutes at 125000 xg in a Ti45 ro-

5
112 CHAPTER 5
tor (Beckman Coulter). The supernatant was loaded onto a 5 mL Talon column mountedin an Akta Pure system, the column was washed with buffer A2 (50 mM Tris/HCl pH7.5, 300 mM NaCl, 800 mM urea, 5 mg/mL 6-aminohexanoic acid, 2.5% 1,6-hexanediol)and NupX was eluted with a linear gradient of 0-200 mM imidazole. Peak fractions werepooled, diluted tenfold with buffer A2 lacking sodium chloride, loaded onto a 1 mL Hi-Trap SP sepharose HP column and NupX was eluted with a linear gradient of 0-1 M NaCl.
Kap95 was expressed as a C-terminal GST fusion protein in Escherichia coli ER2566cells from plasmid pED4, a pGEX derived construct (kindly provided by Jaclyn Novatt)in which the thrombin cleavage site was replaced by a 3C protease cleavage site. Cellswere grown in shake flasks at 30◦C on LB medium supplemented with 100 µg/mL ampi-cillin, induction was induced at OD600∼0.6 with 1 mM IPTG, and growth was contin-ued overnight. Cells were harvested by centrifugation, washed with PBS, resuspendedin TBT buffer (20 mM HEPES/NaOH pH 7.5, 110 mM KOAc, 2 mM MgCl2, 0.1% (w/v)Tween20, 10 µM CaCl2 and 1 mM β-mercaptoethanol), and lysed by a cell disruptor(Constant Systems) at 20 kpsi. Following centrifugation for 30 minutes at 125000 xg in aTi45 rotor (Beckman Coulter), the supernatant was loaded onto a 2 mL GSTrap 4B col-umn mounted in an Akta Pure system. The column was washed with TBT buffer, TBT +1 M NaCl and TBT + 0.1 mM ATP, and the fusion protein was eluted with TBT + 10 mMreduced glutathione. The GST moiety was cleaved off by overnight digestion with home-made 3C protease, and Kap95 was separated from GST and the protease by size exclusionchromatography on a Superdex S200 column pre-equilibrated with TBT buffer.
5.4.3. QCM-D SAMPLE PREPARATION AND DATA ACQUISITION
QSense Analyzer gold- and SiN-coated quartz QCM-D chips were purchased from Bi-olin Scientific, Västra Frölunda, Sweden. Prior to the experiment, chips were immersedin RCA-1 solution, which consisted of 30% Ammonium Hydroxide, 30% Hydrogen Per-oxide, and deionized (DI) water in 1:1:5 ratio, for ∼30 minutes at 75◦C. This step wasused to clean the surface from carbon species, as well as to enrich the surface with hy-droxyl groups in case of the SiN-coated chips. Chips were further rinsed with DI wa-ter, sonicated for ∼10 minutes in pure ethanol, and blow-dried with a nitrogen stream.Before each experiment, flow-cells were disassembled, cleaned by sonication for 20-30minutes in freshly prepared 2% SDS, rinsed with DI water, and blow-dried with a nitro-gen stream. For SiN-coated quartz sensors, the SiN surface was chemically engineeredin order to add free maleimide groups (see Preparation of NupX-coated nanopores fordetails). Prior to the coating of the gold surface, protein solutions containing eitherNupX, Nsp1, or Nsp1-S, were incubated in PBS with 1mM TCEP for at least half an hour,which was also present during the coating step. Similarly, MUTEG solutions includedalso 10mM TCEP. QMC-D data were monitored and recorded with sub-second resolu-tion using Qsoft, which was provided by the company together with Qsense Analyzer.Buffer was injected into the flow-cell chamber at constant flow-rate of 20 µL/min usinga syringe pump. Experiments were all performed at room temperature. Shift in the res-onance frequency (∆f) and dissipation (∆D) can be, in first approximation, attributed tochanges in deposited mass and viscoelastic properties of the film, respectively. ∆f and∆D were acquired at the fundamental tone (n = 1) and the 5 overtones (n = 3, 5, 7, 9, 11).
The normalized second overtone ∆ f55 was used for display and analysis. Data processing

5. A DESIGNER FG-NUP THAT RECONSTITUTES THE SELECTIVITY OF THE NPC
5
113
and plotting were performed using a custom-written Matlab script.
5.4.4. SPR MEASUREMENTS AND ANALYSIS
All measurements were performed using a Bionavis MP-SPR NaviTm 220A instrumentequipped with two 670 nm laser diodes focused on two different spots on the sample sur-face. Both gold and silicon dioxide coated sensor slides were used (Bionavis). Grafting ofproteins or MUTEG to the gold and silica coated sensors was performed using the sameprotocol as for the gold-coated QCM-D chips and for the nanopore chips, respectively.After the final incubation step, the chips were rinsed with milliQ water, ethanol, andgently blow-dried with pure nitrogen. Immediately before measurements of the sensorsin air, the backside of each sensor was cleaned by carefully rubbing lint-free lens tissuesoaked in 2-propanol (Sigma Aldrich) followed by blow-drying both sides with nitrogen.At least two repeat measurements were performed for all sensor slides to verify no sig-nal drifting occurred due to adsorption of moisture. The background signal from eachsensor was measured before grafting the adlayers to the sensor surfaces and was usedas a starting point for modelling the adlayer thickness, d . The silicon dioxide thin filmthickness was evaluated to 15.1±0.5 nm across the different samples and surface spotsprior to surface grafting. Three replicate sensor slides were used for each type of adlayer(except for MUTEG which used 1 sensor slide per concentration measurement).
Adlayer thickness was determined from least-square fitting measurements with Fres-nel models using an approach similar to those used in previous works [70, 71], whichwe briefly describe here. The following information was used to obtain adlayer thick-ness: a fit performed on the angular reflectivity spectra close to the resonance angle(see Figure S5.10), knowledge of the sensor layer thicknesses and refractive indices [72],the bulk refractive index of air in the measurement cell, as determined from the totalinternal reflection angle of each measurement, and the assumption that the adlayer re-fractive index n is the same as its dry bulk counterpart (npr otei n = 1.53 73, nAPT ES = 1.42,nMU T EG = 1.456 74). The formed adlayers were further assumed to be homogeneous andnot containing solvent and to be free of contaminants. Grafting densities, Γ, of MUTEG,Nsp1, Nsp1-S and NupX were obtained from the Fresnel model determined d using therelation:
Γ= ρd NA
M(5.1)
where ρ is the density (ρMU T EG = 1.09 g/cm3, ρpr otei n = 1.35 g/cm3; Ref. 70), NA isAvogadro’s constant, and M is the molecular weight (MMU T EG = 380 Da, MN sp1 = 65.7kDa, MN sp1−S = 62.1 kDa, MNup X = 32.5 kDa).
5.4.5. PREPARATION OF NUPX-COATED NANOPORES AND CURRENT DATA
ACQUISITIONSolid-state nanopores with diameters from 10-60 nm were drilled using TEM in glass-supported SiNx free-standing membranes. Glass chips were purchased from Goeppert.We refer to Ref. [52, 73] for details on the fabrication of the chip substrate and free-standing membrane. Freshly drilled solid-state nanopores were rinsed with ultrapurewater, ethanol, acetone, and isopropanol, followed by 2-5 minutes of oxygen plasma

5
114 CHAPTER 5
treatment, which was performed in order to further clean and activate the nanoporesurface with hydroxyl groups. Next, chips were incubated in 2% APTES (3-aminopropyl-triethoxysilane) (Sigma Aldrich) in anhydrous toluene (Alfa Aesar) for 45-60 min at roomtemperature, shaking at 400 rpm, followed by 15 minutes in anhydrous toluene for wash-ing. These two steps were performed in a glove-box under constant nitrogen stream inorder to prevent the APTES from polymerizing. Then, chips were further rinsed with ul-trapure water, ethanol, and heated at 110◦C for at least 30 minutes. This step was usedto fixate the APTES layer by favouring further binding between the unreacted ethoxygroups.
The nanopore surface was thus covered with primary amines, which were subse-quently reacted to Sulfo-SMCC (sulphosuccinimidyl-4-(N-maleimidomethyl)-cyclohexane-1-carboxylate) (2 mg no-weight capsules (Pierce)), a crosslinker that contains NHS-ester(reacts to amines) and maleimide (reacts to thiols) groups at opposite ends, for > 3 hrsat room temperature, shaking at 400 rpm. Chips were subsequently washed in PBS for15 minutes and incubated with thiolated proteins for 2-3 hours, which were pretreatedwith 5 mM TCEP for ∼30 minutes in order to reduce the thiol groups. Chips were fur-ther washed in PBS before the electrical measurement. Raw ionic current traces wererecorded at 100 kHz bandwidth with an Axopatch 200B (Molecular devices) amplifier,and digitized (Digidata 1322A DAQ) at 250 kHz. Traces were monitored in real-time us-ing Clampex software (Molecular devices). Data were digitally filtered at 5 kHz using aGaussian low-pass filter and analysed using a custom-written Matlab script76.
5.4.6. DYNAMIC LIGHT SCATTERING (DLS) MEASUREMENT OF THE HYDRO-DYNAMIC DIAMETER
DLS experiments were performed using Zetasizer Nano ZS (Malvern). Cuvette of 100 µL(Brand GMBH) were used for the measurement. All protein hydrodynamic diameterswere measured in 150 mM KCl, 10 mM Tris, 1mM EDTA, at pH 7.5, and averaged overthree experiments. Mean value and standard deviation for each of the proteins used arereported in Table S5.1. Proteins which contained exposed cysteines (NupX, Nsp1, andNsp1-S) were pre-treated with TCEP (present in at least 100× excess) in order to breakdisulfide bonds.
5.4.7. COARSE-GRAINED MODEL FOR UNFOLDED PROTEINS
All coarse-grained MD-simulations were performed using our earlier developed one-bead-per-amino acid (1BPA) model for unfolded proteins [43, 74]. This model mapscomplete amino acids to single beads with a mass of 124 amu placed on the Cα posi-tion, separated by an average bond length (modelled as a stiff harmonic potential) withan equilibrium distance of 0.38 nm. Backbone potentials were assigned via an explicitcoarse-grained mapping of Ramachandran data of a library of the coil regions of pro-teins that distinguishes flexible (i.e. Glycine), stiff (i.e. Proline) and regular amino acids[74]. Non-bonded interactions between different amino acid residues are based on theirrespective hydrophobicity (normalized between 0 and 1 and based on the free energy oftransfer between polar and apolar solvents) and obey the following interaction potential[43]:

5. A DESIGNER FG-NUP THAT RECONSTITUTES THE SELECTIVITY OF THE NPC
5
115
ΦHP =
εr ep
(σr
)8−εi j
[4
3
(σr
)6− 1
3
], r ≤σ (5.2)
(εr ep −εi j )(σ
r
)8, σ≤ r (5.3)
where εr ep = 10 kJ/mol and εi j = 13 ·√(εi ε j )α kJ/mol, with εi the normalized (between0 and 1) hydrophobicity of a residue i and α= 0.27 a scaling exponent. The electrostaticinteractions within the 1BPA model are described by a modified Coulomb law:
ΦEL = qi q j
4πε0εr (r )rexp(κr ), (5.4)
where the electrostatic interactions are modulated via a Debye screening component.This form of electrostatics takes into account the salt concentration (set at 150 mM here,via a screening length κ = 1.27 nm-1) together with a solvent polarity at short distancesvia a distance-dependent dielectric constant:
εr (r ) = 80
1− r 2
z2
erz(
erz −1
)2
, (5.5)
where z = 0.25. Non-bonded interactions are cut-off at 2.5 nm (hydrophobic interac-tions) or 5.0 nm (electrostatic interactions). Since the 1BPA model operates without ex-plicit solvent, we apply stochastic dynamics with a coupling frequency τT of 50 ps-1.Stochastic dynamics handles temperature coupling implicitly, ensuring that the systemoperates within a canonical ensemble at a reference temperature of 300 K. We refer thereader to the original work for further details on the used 1BPA model [43, 74]. Un-less otherwise mentioned, all simulations were performed using the above forcefieldand corresponding settings, employing the GROMACS [75] molecular dynamics soft-ware (version 2016.1/2016.3) on a parallelized computer cluster. A complete overviewof all simulations in this work is provided in Table S5.3.
5.4.8. CALCULATING STOKES RADIUS OF NUPX AND VARIATIONSIntrinsically disordered proteins were modelled using the 1BPA model [43, 74], startingfrom an extended configuration. After energy minimization (steepest descent) and abrief (5 ns) equilibration step, we simulated the individual proteins for 5 ·108 steps usinga timestep of 20 fs (total simulation time: 10 µs). Conformations were extracted every10000 frames (i.e., every 200 ps). In order to calculate the Stokes radii (Rs ) from the MDtrajectories, we extracted protein conformations every 2 ns and applied the HYDRO++software [76] in order to calculate the Rs -values. This procedure yields a total of 5000Stokes radii per protein.
5.4.9. CALCULATING NUPX BRUSH DENSITY PROFILES AND PMF CURVES
OF CARGO ADSORPTIONWe modelled the brush substrate as a fully triangulated (sometimes denoted as hexago-nally) closed-packed array of sterically inert beads with a diameter of 3 nm. NupX pro-
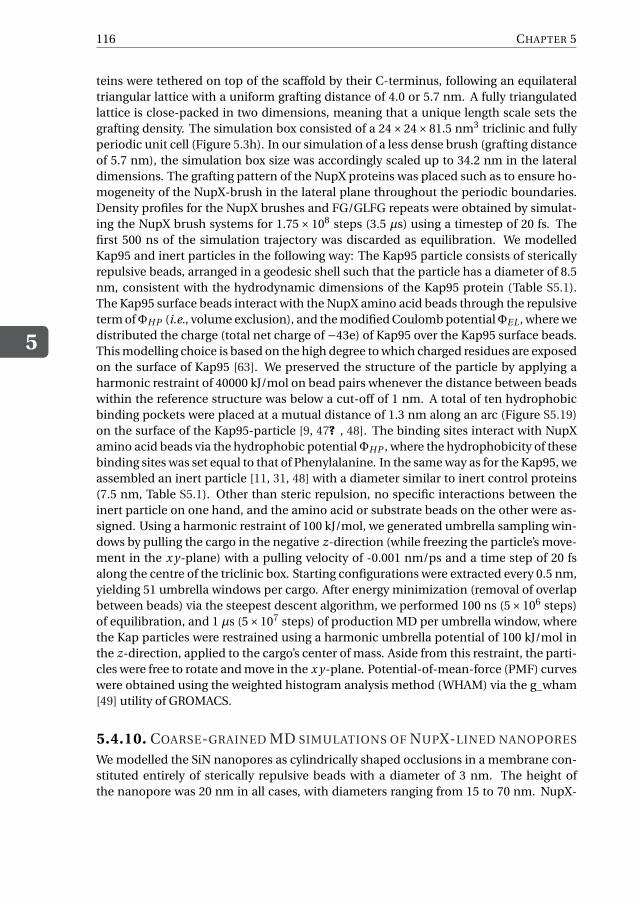
5
116 CHAPTER 5
teins were tethered on top of the scaffold by their C-terminus, following an equilateraltriangular lattice with a uniform grafting distance of 4.0 or 5.7 nm. A fully triangulatedlattice is close-packed in two dimensions, meaning that a unique length scale sets thegrafting density. The simulation box consisted of a 24×24×81.5 nm3 triclinic and fullyperiodic unit cell (Figure 5.3h). In our simulation of a less dense brush (grafting distanceof 5.7 nm), the simulation box size was accordingly scaled up to 34.2 nm in the lateraldimensions. The grafting pattern of the NupX proteins was placed such as to ensure ho-mogeneity of the NupX-brush in the lateral plane throughout the periodic boundaries.Density profiles for the NupX brushes and FG/GLFG repeats were obtained by simulat-ing the NupX brush systems for 1.75× 10⁸ steps (3.5 µs) using a timestep of 20 fs. Thefirst 500 ns of the simulation trajectory was discarded as equilibration. We modelledKap95 and inert particles in the following way: The Kap95 particle consists of stericallyrepulsive beads, arranged in a geodesic shell such that the particle has a diameter of 8.5nm, consistent with the hydrodynamic dimensions of the Kap95 protein (Table S5.1).The Kap95 surface beads interact with the NupX amino acid beads through the repulsiveterm ofΦHP (i.e., volume exclusion), and the modified Coulomb potentialΦEL , where wedistributed the charge (total net charge of −43e) of Kap95 over the Kap95 surface beads.This modelling choice is based on the high degree to which charged residues are exposedon the surface of Kap95 [63]. We preserved the structure of the particle by applying aharmonic restraint of 40000 kJ/mol on bead pairs whenever the distance between beadswithin the reference structure was below a cut-off of 1 nm. A total of ten hydrophobicbinding pockets were placed at a mutual distance of 1.3 nm along an arc (Figure S5.19)on the surface of the Kap95-particle [9, 47? , 48]. The binding sites interact with NupXamino acid beads via the hydrophobic potentialΦHP , where the hydrophobicity of thesebinding sites was set equal to that of Phenylalanine. In the same way as for the Kap95, weassembled an inert particle [11, 31, 48] with a diameter similar to inert control proteins(7.5 nm, Table S5.1). Other than steric repulsion, no specific interactions between theinert particle on one hand, and the amino acid or substrate beads on the other were as-signed. Using a harmonic restraint of 100 kJ/mol, we generated umbrella sampling win-dows by pulling the cargo in the negative z-direction (while freezing the particle’s move-ment in the x y-plane) with a pulling velocity of -0.001 nm/ps and a time step of 20 fsalong the centre of the triclinic box. Starting configurations were extracted every 0.5 nm,yielding 51 umbrella windows per cargo. After energy minimization (removal of overlapbetween beads) via the steepest descent algorithm, we performed 100 ns (5×10⁶ steps)of equilibration, and 1 µs (5×10⁷ steps) of production MD per umbrella window, wherethe Kap particles were restrained using a harmonic umbrella potential of 100 kJ/mol inthe z-direction, applied to the cargo’s center of mass. Aside from this restraint, the parti-cles were free to rotate and move in the x y-plane. Potential-of-mean-force (PMF) curveswere obtained using the weighted histogram analysis method (WHAM) via the g_wham[49] utility of GROMACS.
5.4.10. COARSE-GRAINED MD SIMULATIONS OF NUPX-LINED NANOPORES
We modelled the SiN nanopores as cylindrically shaped occlusions in a membrane con-stituted entirely of sterically repulsive beads with a diameter of 3 nm. The height ofthe nanopore was 20 nm in all cases, with diameters ranging from 15 to 70 nm. NupX-

5. A DESIGNER FG-NUP THAT RECONSTITUTES THE SELECTIVITY OF THE NPC
5
117
proteins were modelled using the 1BPA model described earlier and tethered to the innersurface of the cylinder in an equilateral triangular lattice with a grafting distance of 5.5nm. This value was estimated from NupX immobilization on silica surfaces using theSPR technique and should be taken as a lower limit given that molecular adsorption innanopores can be influenced by steric repulsion and geometric confinement [56]. Sim-ulations were carried out for 2×10⁸ steps using a timestep of 15 fs (3 µs), or 4×10⁸ steps(6 µs) for the single case of a 30 nm diameter NupX-lined nanopore.
5.4.11. DENSITY DISTRIBUTIONS AND NANOPORE CONDUCTANCE FROM NA-NOPORE SIMULATIONS
Axi-radial density maps were obtained from NupX nanopore simulation trajectories us-ing the ‘gmx_densmap’ utility of GROMACS, where a bin size of 0.5 nm was used to con-struct number densities within a cylinder centred on the nanopore. Average densitieswere extracted for the pore and access regions by averaging the axi-radial density distri-butions over the coordinate ranges |z| ≤ 10 nm and 10 nm < |z| < 40 nm, respectively[31].
The conductance of NupX-lined nanopores was obtained by assuming that the con-ductance G(d) is governed by a modified Hall-formula [31, 53]:
G(d) =(
4l
σpor eπd 2 + 1
σaccess d
)−1
, (5.6)
where l = 20 nm is the height of the nanopore, d denotes the diameter (15-70 nm), andσpor e and σaccess denote the conductivities in the pore and access regions, respectively.The conductivities in both regions can be extracted from the axi-radial density distribu-tions by integrating and normalizing the local conductivity over the pore diameter andcorresponding height ranges:
σpor e = 1
πl 14 d 2
∫ z=+ l2
z=− l2
∫ r= d2
r=02πσbulk rσ(r, z)dr d z, (5.7)
σaccess = 1
πl 14 d 2
∫ z= l2 +h
z= l2
∫ r= d2
r=02πσbulk rσ(r, z)dr d z. (5.8)
The local conductivityσ(r, z) follows from the local axi-radial density distribution ρ(r, z):
σ(r, z) = exp
(− 3
√ρ(r, z)
ρc
), (5.9)
where ρc is set to 85 mg/mL31. Whereas this relation is a zero-parameter fit, the de-pendency of the conductivity on the local protein density is different from the linearmodel with a strict cut-off used in earlier work [31]. Here, the conductivity drops quicklywith protein density initially while decreasing only slowly at high protein densities. Thischange in dependence was necessary since NupX-lined pores show a higher conduc-tance at higher densities than the NPC mimics in earlier work. Axi-radial density dis-tributions and the corresponding conductance were calculated for 100 ns windows to

5
118 CHAPTER 5
obtain an average conductance for each pore size. The sensitivity of this method wastested against the time averaging window of the density distributions and was found toonly be marginally influenced by the window size, nor did the conductance change withtime.
5.4.12. SELECTIVITY OF NUPX-LINED NANOPORESWe probed the selectivity of a NupX-lined nanopore with a diameter of 30 nm by in-serting either 10 Kap95 molecules or 10 inert particles to the cis-side of the nanopore.To speed up sampling, Kap95 or inert particles were confined to the periphery of thenanopore using a cylindrical constraint that prevents Kap95 or inert particles from en-tering regions with |z| >40 nm or r > 35 nm [77]. This occlusion consisted entirely ofsterically repulsive beads with a diameter of 3 nm, which only interact with Kap95 orinert particles. The size of the cylindrical constraint was set such that Kap95 moleculesor inert particles can only leave the access region by entering the NupX-lined nanopore.The total simulation time spanned 3.33×10⁸ steps (5 µs), where we discarded the first10% (500 ns) of the trajectory as equilibration. Axi-radial density maps for the proteindensity and contour graphs for the Kap95 and inert particle densities were obtained us-ing the ‘gmx_densmap’ utility using a bin size of 0.5 nm. We reported a cargo numberdensity in lieu of a mass density, since the number of beads that constitute the Kap95 orinert particles does not necessarily correspond to the number of amino acids in eitherprotein.
To calculate the PMF curve along the z-axis for Kap95 and inert particles, we inte-grated the axi-radial number density of the centre-of-mass of the particles in the radialdirection, resulting in a one-dimensional axial number density n(z). Normalizing n(z)with the number of bins in the z-direction results in a probability distribution p(z), fromwhich the PMF can be calculated by using the inverse Boltzmann relation:
P MF (z) =−kB T ln p(z). (5.10)
The PMF curves for both Kap95 and inert particles (Figure 5.7e) were shifted such thatthe curves were zero at z = 35 nm. Regions with zero density (leading to divergence ofthe ln p(z)-term) were set equal to the maximum of the PMF curve.

5. A DESIGNER FG-NUP THAT RECONSTITUTES THE SELECTIVITY OF THE NPC
5
119
5.5. SUPPORTING INFORMATION
5.5.1. AMINO ACID SEQUENCES OF ALL PROTEINS USED IN THIS WORK (NUPX,NSP1, NSP1-S, KAP95, BSA).
NupX:MGHHHHHHFNQGSGLLTTFGKASSTSTQASGLFGNGGLNNQQTGFGNIKTGPNPTSGLFGQTGNSANSSGFGAANTNAFSSGGLFGSQQNGSVQANFGNGSNNGNSTQGLFGGPMPQTPSAPFGTQQNMTGNNNGLFGSTGGTVTGGSFGNNASASKTQNGLFGDRARNQSGFDNPYNKLLRSENSKSEFIVSIDVKSEMAASIKLTAFFGQSTAKNKALSNIGTLIDKDLKAKKDGTKSRSNPIKLIPNAPFQSKPDNYTPEQDSKNKDSEEETAESAQLLSVQVETPDTNTRDLNMSPHSSNSSSMNQLWC
Nsp1:MSKHHHHSGHHHTGHHHHSGSHHHTGENLYFQGSNFNTPQQNKTPFSFGTANNNSNTTNQNSSTGAGAFGTGQSTFGFNNSAPNNTNNANSSITPAFGSNNTGNTAFGNSNPTSNVFGSNNSTTNTFGSNSAGTSLFGSSSAQQTKSNGTAGGNTFGSSSLFNNSTNSNTTKPAFGGLNFGGGNNTTPSSTGNANTSNNLFGATANANKPAFSFGATTNDDKKTEPDKPAFSFNSSVGNKTDAQAPTTGFSFGSQLGGNKTVNEAAKPSLSFGSGSAGANPAGASQPEPTTNEPAKPALSFGTATSDNKTTNTTPSFSFGAKSDENKAGATSKPAFSFGAKPEEKKDDNSSKPAFSFGAKSNEDKQDGTAKPAFSFGAKPAEKNNNETSKPAFSFGAKSDEKKDGDASKPAFSFGAKPDENKASATSKPAFSFGAKPEEKKDDNSSKPAFSFGAKSNEDKQDGTAKPAFSFGAKPAEKNNNETSKPAFSFGAKSDEKKDGDASKPAFSFGAKSDEKKDSDSSKPAFSFGTKSNEKKDSGSSKPAFSFGAKPDEKKNDEVSKPAFSFGAKANEKKESDESKSAFSFGSKPTGKEEGDGAKAAISFGAKPEEQKSSDTSKPAFTFGAQKDNEKKTETSC
Nsp1-S:MSKHHHHSGHHHTGHHHHSGSHHHTGENLYFQGSNSNTPQQNKTPSSSGTANNNSNTTNQNSSTGAGASGTGQSTSGSNNSAPNNTNNANSSSTPASGSNNTGNTASGNSNPTSNSSGSNNSTTNTSGSNSAGTSSSGSSSAQQTKSNGTAGGNTSGSSSSSNNSTNSNTTKPASGGSNSGGGNNTTPSSTGNANTSNNSSGATANANKPASSSGATTNDDKKTEPDKPASSSNSSSGNKTDAQAPTTGSSSGSQSGGNKTSNEAAKPSSSSGSGSAGANPAGASQPEPTTNEPAKPASSSGTATSDNKTTNTTPSSSSGAKSDENKAGATSKPASSSGAKPEEKKDDNSSKPASSSGAKSNEDKQDGTAKPASSSGAKPAEKNNNETSKPASSSGAKSDEKKDGDASKPASSSGAKPDENKASATSKPASSSGAKPEEKKDDNSSKPASSSGAKSNEDKQDGTAKPASSSGAKPAEKNNNETSKPASSSGAKSDEKKDGDASKPASSSGAKSDEKKDSDSSKPASSSGTKSNEKKDSGSSKPASSSGAKPDEKKNDESSKPASSSGAKANEKKESDESKSASSSGSKPTGKEEGDGAKAASSSGAKPEEQKSSDTSKPASTSGAQKDNEKKTESTSC
Kap95:MSTAEFAQLLENSILSPDQNIRLTSETQLKKLSNDNFLQFAGLSSQVLIDENTKLEGRILAALTLKNELVSKDSVKTQQFAQRWITQVSPEAKNQIKTNALTALVSIEPRIANAAAQLIAAIADIELPHGAWPELMKIMVDNTGAEQPENVKRASLLALGYMCESADPQSQALVSSSNNILIAIVQGAQSTETSKAVRLAALNALADSLIFIKNNMEREGERNYLMQVVCEATQAEDIEVQAAAFGCLCKIMSLYYTFMKPYMEQALYALTIATMKSPNDKVASMTVEFWSTICEEEIDIAYELAQFPQSPLQSYNFALSSIKDVVPNLLNLLTRQNEDPEDDDWNVSMSAGACLQLFAQNCGNHILEPVLEFVEQNITADNWRNREAAVMAFGSIMDGPDKVQRTYYVHQALPSILNLMNDQSLQVKETTAWCIGRIADSVAESIDPQQHLPGVVQACLIGLQDHPKVATNCSWTIINLVEQLAEATPSPIYNFYPALVDGLIGAANRIDNEFNARASAFSALTTMVEYATDTVAETSASISTFVMDKLGQ

5
120 CHAPTER 5
TMSVDENQLTLEDAQSLQELQSNILTVLAAVIRKSPSSVEPVADMLMGLFFRLLEKKDSAFIEDDVFYAISALAASLGKGFEKYLETFSPYLLKALNQVDSPVSITAVGFIADISNSLEEDFRRYSDAMMNVLAQMISNPNARRELKPAVLSVFGDIASNIGADFIPYLNDIMALCVAAQNTKPENGTLEALDYQIKVLEAVLDAYVGIVAGLHDKPEALFPYVGTIFQFIAQVAEDPQLYSEDATSRAAVGLIGDIAAMFPDGSIKQFYGQDWVIDYIKRTRSGQLFSQATKDTARWAREQQKRQLSLBSA:MKWVTFISLLLLFSSAYSRGVFRRDTHKSEIAHRFKDLGEEHFKGLVLIAFSQYLQQCPFDEHVKLVNELTEFAKTCVADESHAGCEKSLHTLFGDELCKVASLRETYGDMADCCEKQEPERNECFLSHKDDSPDLPKLKPDPNTLCDEFKADEKKFWGKYLYEIARRHPYFYAPELLYYANKYNGVFQECCQAEDKGACLLPKIETMREKVLASSARQRLRCASIQKFGERALKAWSVARLSQKFPKAEFVEVTKLVTDLTKVHKECCHGDLLECADDRADLAKYICDNQDTISSKLKECCDKPLLEKSHCIAEVEKDAIPENLPPLTADFAEDKDVCKNYQEAKDAFLGSFLYEYSRRHPEYAVSVLLRLAKEYEATLEECCAKDDPHACYSTVFDKLKHLVDEPQNLIKQNCDQFEKLGEYGFQNALIVRYTRKVPQVSTPTLVEVSRSLGKVGTRCCTKPESERMPCTEDYLSLILNRLCVLHEKTPVSEKVTKCCTESLVNRRPCFSALTPDETYVPKAFDEKLFTFHADICTLPDTEKQIKKQTALVELLKHKPKATEEQLKTVMENFVAFVDKCCAADDKEACFAVEGPKLVVSTQTALA
5.5.2. OVERVIEW OF MEASURED STOKES DIAMETERS FOR THE PROTEIN USED
BY DLS.
Protein Average Stokes diameter (nm) Standard deviation (nm)NupX 7.4 ±2.2Nsp1 14.9 ±3.9Nsp1-S 13.5 ±3.1Kap95 9.2 ±1.2BSA 8.5 ±3.3
Table S5.1: Hydrodynamic diameter measured with Dynamic Light Scattering (DLS) of the proteins used. Datawere all acquired in 150 mM KCl, 10 mM Tris, 1mM EDTA, at pH 7.5, room temperature.
5.5.3. SEQUENCES OF 25 NUPX VARIANTS.
Variant number Sequence1 HHHHHHTGGGNTPNGNFGGGSAGQANAFGLFGTANGSGQ
QSGFGQNSNTGTNSNGLFGQNGNFVANASFGTQSGNSPSGSGLFGPKSIMPQPQSFGNAVSSNSTSTGLFGTTTLNQNTTLFGTGNNTGTSPKGLFGMAANNQQGNNFGSGTSLQSQAKGLFGDGLMRKFKKPKQLPGLSNAMLNEHEPSNTLLAAQSPSFISSIKNNNSSKRKNSGEDIIQDNGRTDPNCVFSSINDRYANDDTATATMSPISSAQTYKDDNPAQEKSTSQKTDSKQESKLSFESEKRKLVAEAWLNLNKSPSIFDVLTEV

5. A DESIGNER FG-NUP THAT RECONSTITUTES THE SELECTIVITY OF THE NPC
5
121
2 HHHHHHQTAGGQNPNAFGSGQNSLNNPKGLFGSNTNGNQTSTFGPAGTQSSSGSGLFGGNGNQTMQLGFGSGSAQGNSTGGLFGNSSQQVGTNAFGVSTNAGITNQGLFGGQFKNNGTAPFGTKLSSANATNGLFGTASGQPMNTSFGSNGSFNNPTTGLFGDSTLLWITSSLPSDKTPKLSKYRNEAVKDDSPTIVLNNKIVNELKNDGNKNFDQTAKSLGIRLRDLPNRNEQNESNCAVMIDQLFDDPSQSMKAFFSPSQETHAETKSFKELAIKTDSSSGSNASPKSKRSSIAQAGNSYAEKNPQMTE
3 HHHHHHNSGSPNNNQQFGASQTQNAKTTGLFGQTKGATTQSNFGPGNPTIQSNNGLFGGNAMGNSNSTFGSGQNTSLNNSGLFGTGANGSNNQAFGGSGLSSAFTQGLFGNASGVSTGGKFGPTSQLNTAPNGLFGQMTTPGSSGNFGFSANGTVQGGGLFGQSDGRSSKSLNADSYLLNSSHLDNNSDKRNKFPIAFKTPFIKNSQTSSSALAEMFASNKDDPFEQINAQKVIKEIEKLALNMDCNKIQLAPVTSTIPQDSGSDSPSEMTDLKPTSKSKGYWLPGDQSEENVKRNELSKATTRTRNNAVE
4 HHHHHHNVSGVGPSTNFGQGGGTNNTNGGLFGGFNNSSPLSSFGQNPATTSNASGLFGTNNAGTAGGAFGQQKMGQNNQQGLFGSGNNNNSKASFGTNQTGITPSAGLFGSNNGGNTKLQFGGPLQFTTQGQGLFGSSNSMNTTTTFGSASGPSASQAGLFGLLNMFSANTFLTSHDQQIKKPEMDNNGSVETSLNDSRKSRKANPCDIISQTSRSNNIDILNQSSGPQNAKEAIVRNSFPESPDDEKTLLAYKSFNKSEESPSRKSKDTTLTQLSKENWADGMAAGISKVYQKSLNPLKKPASFTEDVDA
5 HHHHHHSTGTTSKTNTFGQQSSLGNALTGLFGSSNPSSAMSSFGAAGNSGGATIGLFGSAGNTNNGQQFGTNPQAANPGMGLFGTTSQNPSKNTFGSQGPSNNGNNGLFGTFSTTTANQNFGLGSGVQNNPVGLFGGNSTSFGQQAFGGNNGQQNKGGGLFGVPNNDESISQPQEENFKDLEGFLSRSKSLLANLEVATIKTEKKSQPVAAKYNSSIKPANPKDNGQISTALPMKFCGPLDSSKSDISSIDMTNDDRTSHWSRENSNTDSTIKALFKLSNVLSQNRAQPKSKDYEQAFLMAKDTNSTNGRE
6 HHHHHHGSAASGSSGNFGGNSAPFSSTQGLFGSSGGIVTNTKFGTNGNQATGTNGLFGFQGQSNQGNKFGNQGMAAATKNGLFGTQTPPGTSNNFGNQSNTPNNGSGLFGTTLGNTTSAAFGAPMLNQSTSGGLFGQSNPQSNQGSFGTNVQGNNSLGGLFGKSQPSIWENSQMDRSPDNSNYEDLMGSPNFYPLKNSADIQLPEKKRKSLTSLKQAIESGFEDSLSDEFRPTDKMKTKNCEFNDKDTKINVAAKIEPASNFKNNLIQIAEGSDVSRNDRAASTTSLSTLTVLHSGQSSPATNNKKASLVQ

5
122 CHAPTER 5
7 HHHHHHGSGSPGSGNSFGGQPQGQNGGPGLFGQAQNTSQQAMFGATANMTNTASGLFGGGSNNSSGNTFGTKANNGNVSPGLFGSNSTTNSLNSFGKQLTPNQSLNGLFGTIVTSGNNQTFGNTAGNTPSSQGLFGASSGNGNFGAFGTTTGKQAFNQGLFGDNNNSEIDSFQYFNPETKDVRMKNEEAKFPEPKDLLINPSWGRPKSTLSQSRKFTSNDISTCNEADSKSLSNLSEKQAMVLGRPKLKSNKLSSATEDGMGILAAVEDKSAQDYTSAIPKSQSRFSHNDIKSLKTNNQTAQIPVSALDTN
8 HHHHHHQATVNFNQNAFGAAQAGSMAGNGLFGGGMQSSSNKAFGTINGGGSQNAGLFGTTSGSPNNSTFGTSQSQKGGNTGLFGFSPSQTQGSGFGNGSSTVSNPNGLFGNNGLPTNLQGFGNTSTTNQAGTGLFGTSSPQQPAGNFGNNGTKNSLNTGLFGGDNSDQDINHLISNSKLDSLAESNTLFMKQEEKAKYWKSNPDETLAEKTSNSDTPNINLSLSPTSSNPARAQAQSSMRVILASTTSFKVLTGLKNSENKFKFQPLKQGKMNSINADRCKQSPDSDDPEYKSVRNSETIIVKDARAEPFG
9 HHHHHHGGTASQNNSAFGSGSTTSAQNNGLFGTKSNTGQFPNFGSVGNNTPGSNGLFGSSATGTQQSNFGTNGTNKMPSSGLFGSGAMTLTFNSFGNQVTAGNNGAGLFGNQLTQTNPSQFGGPSANNSNGTGLFGNGLSPQAIKQFGGQGGGQTASNGLFGAQKPKNKAQNGQATDKIPIAAPLFDIWKNLKKLRNSVLSEEKSTFKAEPNNQSKKNCLAVPQNDDHSSTKRNEVDTPSALTRISRMSGGNMEKLFLRTNPEIYDESNSSSAESTSKNSDKDIFQNSDYTSQIDATSLSEFLMDLGSVPS
10 HHHHHHFQTKNNGNNSFGTSQTGQGSATGLFGNNANSSPASTFGNSGLATTNNGGLFGGNGNSNNTLGFGSANSQQSQGMGLFGSGTSNPGQATFGNGQSFSAGTNGLFGPQVPGGAKNNFGITTATSQPQPGLFGSSTNTVQTQMFGLAGNSGNSKGGLFGNRDGTIDEAGDSTQKAPSLIELGSELLTESPAATIESLNREEKRTNPKSMLSSYFNEKSKTKLDISNEFNNTKNVSTNSDVPAAAPRPCSKSSLFTNIMQFDKSKDRLFSKNVKLAKPAQDVMQNDQIDDKSKWIHQYLQANPSSSSGN
11 HHHHHHTSGSSNGVNPFGQTNFQPNNVGGLFGGTGGSAPNKNFGAANSNNSTSNGLFGMGNSNQQGSPFGTAAQNSSGTTGLFGGNSNGTPSLSFGTSNSSGTGLNGLFGNPSGNTAQGAFGQQNMSGFGQTGLFGQGTANLQNQIFGSATQTTTKKAGLFGQNNELLSAHDKNKSPKNMAAESANRSFKSLEVQATIIKSNRYGNNSKSILLRFEKEPIMQNPPKTNDPCVTVSLSSDNQLTSSSAEDPASGEFNRTDIWLTESLDKYGGDVATNQAQASSSSIMLLKQDEFIRKDKPTSDDKNSFKPTK

5. A DESIGNER FG-NUP THAT RECONSTITUTES THE SELECTIVITY OF THE NPC
5
123
12 HHHHHHAQGQGKKAQSFGLSTTSNSSNNGLFGQNNQTGNQTNFGTGQGQSTANSGLFGSGGNSNTQNGFGAGFPGSPMSVGLFGSNQNGNANGTFGGTSSLNLIPTGLFGNSGNANSMTTFGSTPQVFQATSGLFGNGAGTPPSGTFGGQNSATKNNAGLFGEMNTSVTIEQIDAKKNSDNSFEIESYQSTVRSTWNLKSLQDDNSNSNSPLDGDPIPIRNSQSSYSEDNTDSLKMKTAMKEGELDSERSSGAVDFSNNFIDSNKPICTKKKSQTFTKVGAKQAPKNLAAQHAPLAFKSPKRLENRLLLPA
13 HHHHHHSGGNNGGTSGFGLSVQSQGASPGLFGVQPKTTNGNQFGQNQSQANTGSGLFGPGSSASNNLSFGGNPTAANANAGLFGTGANNSSSIMFGAMTLSNPNNQGLFGKKGNSGTSSNFGQGFTGNNSTQGLFGPTNTQANGFNFGTTGQTQTGTSGLFGCGISNNIYRDESPQSISFSSESSHADENKKNPPSIAKMSDNKSIIVALDSVMVEPTPKATNKDKVFSQSLSQYTKINDSDLAALNEFGQLQKNSELPNSQRLDESSLRPSRNELSRFDKGAQMGKKKDDNNATKWTALLKTTANTFEPT
14 HHHHHHGQQTPSLTKNFGTGSTGTASGAGLFGTNNSTTSVTTFGNGNALSQNNTGLFGGSSQGSPGPNFGNANNNNTGGIGLFGGTTNGMNGFTFGSQASQQSFSNGLFGNSGASSSNASFGPQPQGNQAALGLFGNKSNVNQNPMFGTQGGGKTQASGLFGTSPLNNFQPFQMNQVNNIRSDVLLKQPVWPKSSLSSCQTIDKSRSQNMIAELNDLLAKFDQSIIKEFKSNMSANKTSAENASVRKTDDTSASLEGEYEDLTLDSRYGIGNSDFNKTPPNATDPTNSKDKKLSEIHSAAAKPEERGKKSS
15 HHHHHHLNNSSGNGTNFGSSQSGANNQNGLFGQTNSSGLPQTFGQGTSSTNNTNGLFGGGGQMASFTGFGASAQGSATNVGLFGPQTQQPKNTSFGAGNKGNPGNNGLFGSGTAQGTAFAFGSQANGSSPTNGLFGQVGNTGMNLTFGSSSKTTINNPGLFGLELSFKNKANISTLMWKDKALLKPNASTSQFEKIPDITDSDKFTEAAVKPDDERPKENISSDARLDSSQESHIAKLKSNRLNANLSTGRSKNGVPQATNIQEITQSKSDDYSTPFKVQNNVKLATMSSNPSCSGQNNYRGFLPSMEEDS
16 HHHHHHSMAMFSQTTPFGQGTTQNNPNIGLFGGAALTGASNSFGGQAQSGGTNGGLFGSTNPSQSSKSFGNQSGSGSTNTGLFGQSQQNSNGAAFGNNNNKSGNTAGLFGAGNVGGSNSPFGNTNKGAQVTTGLFGQQTNNSGSTNFGPGPTNGLLTFGLFGPESTSLVSKKDISTIDLANKANNQHDPDNFNPSVKVDKVQPNGDETQPQDLSMELSMPRQKGANQKNASCQERSWKAFSSFKLKNANDTIFSILNKKPLSSLYETKKLSGTRAMTGKDFAESAPTSNDRSSTANLSNIDESIIRELEYS

5
124 CHAPTER 5
17 HHHHHHTSNTQGQAGNFGGTPAGSNNSTGLFGITGQNQSGNQFGQGKMNTPQGPGLFGQNSGGSTNNNFGNATSNTVFNSGLFGQNAASQGGNQFGTQNMTTKFANGLFGTNLNVLSPSSFGNGGSSSGNKLGLFGSPSGNSGGASFGAAATSPTQTTGLFGEEQLTSDLNCVPTSDQNNSDIRFTTKQETLSNAGALMPKQSSSDDWNAENKAKYLEIDTEKEQFPINKTPSMDATSNRTVLKERSSFNPRKKASNSFSKDYSFSKNIAKPVISDISGRELKSHSSNDKLQALANINPPAQMDVKLGGSL
18 HHHHHHQGQNQGPSSTFGSSGNQAGVTLGLFGNPSNMNVNQFFGANSTSGAPNGGLFGNTAMNAQTGGFGTGNTSQSTPAGLFGKQSPNGKNATFGITSGGNQSNNGLFGNANGQQKNPFFGLGTSTASSGSGLFGTGNSNTGNTSFGNALSTQSQTGGLFGNLNRNTQINEKSQRASLSSKAISDATSQENTQVNCLNNYNESKSDQNHPVEKKDSAWQKSGTSKTSSESSQKAERSIFDVISFLPLTRDVGSLAKKTTPDFDGENMKFSDELGKSFRSKANPAPLIAPKNLSDITYDMNAMLPDKLEPI
19 HHHHHHTTASFNNGGTFGSSNPNTSNKGGLFGTSGQNSTSSTFGNQAAQIGGGNGLFGMVQANSNQPPFGAQKNNTQNSTGLFGSQFSGSPLASFGGLTSNTNASTGLFGNATMVNSSSTFGAGQGGNQQQGGLFGQPNLTAGNNGFGPGKTTSGNGNGLFGIQANRSISPNSDQNEHKVKWESSTLDGKTAFDADQSAISANDSNKNIGNKSLPQDGLSCSAAMNPLTSRESSTKLLFSNNKLIIRYERSLFSDRLTENPDSEKDSTMKKNDQKFSKGTVVYQVFPTLPQKEAANPELESKPASITMDNK
20 HHHHHHPPSQNNQKQTFGNQNSTANNSSGLFGANNGTSQAANFGVNQNTGTQTSGLFGSSTSQAQSGGFGTTPAGQTNNTGLFGGNTNANNPGSFGTSKGNPIGQAGLFGGQGSFASKPAFGVMSGNGNSGGGLFGSSQSTFGNLLFGNGTLSTMTNGGLFGQSDKNSNSISDFNCTIDDKAITKVLAKALQNKEDVFRPNSSKKAVSPKSKSETINDDLVRTSPDGYTESLSILNSSSAMPRKGTTLLTAQFKSQLYEFPDENSKDRKPKSMDWSNERGKNGENLISAFQLANQISMPAATSENLQPHNE
21 HHHHHHVQGNGGQKTQFGTSSNNAGPNQGLFGQAKNTNSQGQFGAGPAGPTNSNGLFGTNGNSNAGGQFGKNMSFSNFGTGLFGSSNQAQLPASFGSTNVSNPTQPGLFGTNSIATAMSGFGQGGSSGTNANGLFGNGSTSNTNLTFGTTSLQTSGNGGLFGKQARPSSADPQIKSSMDSSQVDPLQNKPEKLSHDEANLKPLSPDEEKFITYINTSRQNELKSSKELYIMNDGWGNRNKKFDSSTSKIFSNFTTEANRLNELDGDLAPKSNDKMPRTSVAKSNSFQVSAETSGNCKTTQIDNAASILVLA

5. A DESIGNER FG-NUP THAT RECONSTITUTES THE SELECTIVITY OF THE NPC
5
125
22 HHHHHHPTSTTATSNTFGNTSNNNNGNGGLFGTNQKTSQNTSFGGGILTAGTSSGLFGFFNGNTTNKAFGPPGGNAQGASGLFGSPAPQGKSSGFGSGNTNMNSQTGLFGMQSGQTGQLSFGQSPANANNQNGLFGSGGANVSSALFGTNVSGQGNQQGLFGTGSRAFKRPINSSCDETPSNAIKNQLKSKDGKNDDRDNPDVQTEANESSMAQSAELDTPAKYREDFIFQSELKTANALKTDASLGNSDLINQTSVDSPLLESIQSKKLTTPLSRMNFKLSMKKESSKNHGSPEWVAFSQKYINVNSINP
23 HHHHHHNNTTQPNQNNFGLSQGSTQTSSGLFGSQQMNNGTNPFGGQNGTGSSAGGLFGQGGNGSGTSTFGGAGKNNTGFPGLFGPKAAGSNLPSFGGNSLTQNATGGLFGTAISTPVQSTFGAMNNSTGASNGLFGKNTGNSTQVNFGFSSAQQNNSAGLFGLEKSSENSMTDKFSAKSSISKVAQEAVPVLGARPSDFAKFNPTYGPSKLQLNTDQEAIRKNSKQQNTMSENDTFKTRVNELNDQQSDWACPNRHDSKNEETKALILAPGSNASPTNYSILLIDLKFSEPKNISSMLSDKSNIGDTSRKD
24 HHHHHHASGLASSSNGFGTSQTTGTSQPGLFGANSKGGQAPAFGGAGSPNGNQTGLFGQSMQSTAGTAFGNTNNMTSKGQGLFGGTNQSANQNSFGPVGNSNGNGPGLFGNGNQGTKQNSFGQLQATNTLNGGLFGTVNNTSPSNNFGITSFNSFGTSGLFGRNNISLSKYLRKLNCEPAKGFSRKEAATTWPQSKSAKINDESSQASQTMITVNFSTSSVAETKKELSPNFSQSSLFDDIKHSYADTEDSSADGTIVPPPVDLENLNQSGSMSAKNKGDLDKQKPKNKNNEFEARLLQDMINNSDITRPL
25 HHHHHHAQGNTSQNAGFGQPTSTGTTNFGLFGTNSTAQQNNNFGGQQAAPSGNNGLFGLSSNSTLTKTFGTNNIQNPSASGLFGNKSASSAVSGFGMGLNVQSGGAGLFGQNPNSNGGTNFGSPNGKQGTSNGLFGNGTPMGANSSFGGTGTFTSQGQGLFGSLISPENTERSEIPTKVWSKVGSPKPIFNYLQTSLSTLINQNKSYQSLQSSGRFNKNSKEPALELLRDFDGKEMENLTNKKDDSKDDNRNKTKSTCMQASPFASLASHFDNTKGDDPIEDASVSEVQAIAMSPRTKAAKLSNIANQDSN
Table S5.2: Sequences of 25 NupX variants.
5.5.4. SIMULATION PARAMETERS USED FOR MD-SIMULATIONS
System description Systemsize(no. ofbeads)
No. ofsim-ula-tions
Forcefield Timestep(ps)
Simulationtime(steps)
Temperature(K)
NupX protein 311 1 1-BPA 0.02 5.00E+08 300NupX variants 311 25 1-BPA 0.02 5.00E+08 300NupX brush, 5.7 nmspacing
12060 1 1-BPA 0.02 1.75E+08 300

5
126 CHAPTER 5
NupX brush, PMF,Kap
12233 46 1-BPA 0.02 5.00E+07 300
NupX brush, PMF,Kap equilibration
12233 46 1-BPA 0.02 5.00E+06 300
NupX brush, PMF, in-ert particle
12223 47 1-BPA 0.02 5.00E+07 300
NupX brush, PMF, in-ert particle equilibra-tion
12223 47 1-BPA 0.02 5.00E+06 300
NupX brush, 4 nmspacing
11991 1 1-BPA 0.02 1.75E+08 300
NupX brush, PMF,Kap
12164 51 1-BPA 0.02 5.00E+07 300
NupX brush, PMF,Kap equilibration
12164 51 1-BPA 0.02 5.00E+06 300
NupX brush, PMF, in-ert particle
12154 51 1-BPA 0.02 5.00E+07 300
NupX brush, PMF, in-ert particle equilibra-tion
12154 51 1-BPA 0.02 5.00E+06 300
NupX nanopore, 15nm
11407 1 1-BPA 0.015 2.00E+08 300
NupX nanopore, 15nm, equilibration
11407 1 1-BPA 0.015 5.00E+06 270
NupX nanopore, 20nm
15551 1 1-BPA 0.015 2.00E+08 300
NupX nanopore, 20nm, equilibration
15551 1 1-BPA 0.015 5.00E+06 270
NupX nanopore, 25nm
19694 1 1-BPA 0.015 2.00E+08 300
NupX nanopore, 25nm, equilibration
19694 1 1-BPA 0.015 5.00E+06 270
NupX nanopore, 30nm
23834 1 1-BPA 0.015 4.00E+08 300
NupX nanopore, 30nm, equilibration
23834 1 1-BPA 0.015 5.00E+06 270
NupX nanopore, 35nm
27977 1 1-BPA 0.015 2.00E+08 300
NupX nanopore, 35nm, equilibration
27977 1 1-BPA 0.015 5.00E+06 270
NupX nanopore, 40nm
32121 1 1-BPA 0.015 2.00E+08 300

5. A DESIGNER FG-NUP THAT RECONSTITUTES THE SELECTIVITY OF THE NPC
5
127
NupX nanopore, 40nm, equilibration
32121 1 1-BPA 0.015 5.00E+06 270
NupX nanopore, 45nm
36260 1 1-BPA 0.015 2.00E+08 300
NupX nanopore, 45nm, equilibration
36260 1 1-BPA 0.015 5.00E+06 270
NupX nanopore, 50nm
39160 1 1-BPA 0.015 2.00E+08 300
NupX nanopore, 50nm, equilibration
39160 1 1-BPA 0.015 5.00E+06 270
NupX nanopore, 60nm
47443 1 1-BPA 0.015 2.00E+08 300
NupX nanopore, 60nm, equilibration
47443 1 1-BPA 0.015 5.00E+06 270
NupX nanopore,70nm
55726 1 1-BPA 0.015 2.00E+08 300
NupX nanopore, 70nm, equilibration
55726 1 1-BPA 0.015 5.00E+06 270
NupX variants innanopores, 30nm
23834 25 1-BPA 0.015 2.00E+08 300
NupX variants innanopores, 30nm(equilibration)
23834 25 1-BPA 0.015 5.00E+06 270
30nm NupXnanopore with 10Kap95p particles andcylindrical occlusion
38574 1 1-BPA 0.015 3.33E+08 300
30nm NupXnanopore with 10inert particles andcylindrical occlusion
38474 1 1-BPA 0.015 3.33E+08 300
Table S5.3: Simulation parameters used for MD-simulations.
5.5.5. LIST OF PRIMERS FOR GST-3C-KAP95
Name Sequenceed7 5’-TTCCAGGGGCCCGCATCTGTTGGATCCATGTCCACC
-3’ed8 5’-CAGAACTTCCAGATCCGATTTTGGAGGATGGTC-3’
Table S5.4: List of primers for GST-3C-Kap95.

5
128 CHAPTER 5
5.5.6. NUPX AND KAP95 SDS-PAGE
Figure S5.8: SDS-PAGE gel shows the band for the 32.5 kDa NupX molecule (left, thick bend running at ∼37kDa) and the 95kDa Kap95 molecule (right) after purification. This experiment was reproduced more thanthree times yielding similar results.
5.5.7. NUPX COATING OF GOLD SURFACES UNDER DIFFERENT CONCENTRA-TIONS
Figure S5.9: Real-time monitoring of NupX-coating of gold-coated quartz chips under concentrations of 100nM (a), 1 µM (b), and 2 µM (c) at constant flow-rate (20 µL/min), using QCM-D. The slight increase in fre-quency at the end of the incubation represents the washing step, which induces a subsequent release of non-specifically bound NupX molecules. The NupX solution included also 1 mM of TCEP in order to reduce thecysteines, which was present during the coating step.

5. A DESIGNER FG-NUP THAT RECONSTITUTES THE SELECTIVITY OF THE NPC
5
129
5.5.8. SPR MEASUREMENTS OF PROTEIN- AND MUTEG-FUNCTIONALIZED
CHIPS
Figure S5.10: Angular reflectivity spectra of SPR measurements for dried samples in air. a Data for APTES(blue crosses), APTES + Sulfo-SMCC (red asterisks), and APTES + Sulfo-SMCC + NupX (black triangles) onsilicondioxide-coated sensors. b Data for MUTEG (380 Da) on gold sensors grafted using 1 mM concentration.c Data for 1 µM Nsp1 (blue crosses), 1 µM Nsp1-S (red asterisks), 2 µM (black triangles) and 60 nM NupX (pinkdiamonds) on gold sensors. ∆θSPR denotes the angular shift in millidegrees of the resonance angle. Solid linesshow Fresnel model fits (which are offset in the y-direction to match the measurement reflectivity minima),which are used to determine the thickness of each adlayer.
5.5.9. PASSIVATION OF NUPX-COVERED AU-SURFACES USING MUTEG
Figure S5.11: Real-time monitoring of 1 mM MUTEG binding to gold chips that were pre-functionalized withNupX at NupX concentrations of 100 nM (a), 1 µM (b), and 2 µM (c) at constant flow-rate (20 µL/min), usingQCM-D. Note that final dissipation shifts were all close to zero, while (negative) frequency shifts were found inthe range of ∼10-14 Hz, indicating the formation of a thin monolayer. The MUTEG solution included also 10mM of TCEP in order to reduce the thiols, which was present during the coating step (same for Fig.S5.10a).

5
130 CHAPTER 5
5.5.10. KAP95 BINDING TO PASSIVATED GOLD QCM-D CHIP
Figure S5.12: Real-time monitoring of Kap95 interacting with a MUTEG-passivated gold surface. a, Frequencyshift over time upon flushing of 1 mM of 1-mercapto-11-undecylte-tra(ethyleneglycol) (MUTEG) onto a goldsurface. From an independent measurement using SPR (Fig.S5.10b) where the same incubation time and con-centration were used, the MUTEG coating of a bare gold surface yielded a dense monolayer with a 0.59±0.01nm average grafting distance. b, Frequency shift over time upon flushing of 730 nM of Kap95 to a MUTEG-passivated gold layer. Only minor interactions (< 2 Hz) were detected.
5.5.11. KAP95 DISSOCIATION FROM NUPX BY 0.2 M NAOH
Figure S5.13: Real-time monitoring of Kap95 interacting with a NupX-coated surface with subsequent disso-ciation upon flushing of 0.2 M NaOH.

5. A DESIGNER FG-NUP THAT RECONSTITUTES THE SELECTIVITY OF THE NPC
5
131
5.5.12. KAP95 VS BSA BINDING TO DIFFERENT NUPX-COATED GOLD SUR-FACES
Figure S5.14: Real-time monitoring of ∼10-3000 nM Kap95 and 2500 nM BSA binding to gold chips function-alized with NupX at a concentration of 100 nM (a-b, respectively) and 2 µM (c-d, respectively), at constantflow-rate (20 µL/min), using QCM-D.
5.5.13. TESTING THE STABILITY OF NUPX COATINGS AGAINST MILLIQ AND
50% PURE ETHANOL
Figure S5.15: Real-time monitoring of milliQ and 50% pure ethanol rinsing of gold surfaces that were pre-coated with NupX and subsequently passivated with 1 mM MUTEG, at different NupX concentrations of 100nM (a,d, respectively), 1 µM (b,e, respectively), and 2 µM (c,f, respectively), at constant flow-rate (20 µL/min),using QCM-D. Note that final frequency and dissipation shifts are all close to zero, indicating that our proteinand MUTEG layers are stably bound to the gold surface.

5
132 CHAPTER 5
5.5.14. DISSIPATION-TO-FREQUENCY RATIO CHANGE UPON QCM-D COAT-ING
Figure S5.16: Dissipation-to-frequency ratio∆D5/∆ f5/5 for NupX (with concentrations as in Figure ??), Nsp1,Nsp1-S coating of a gold-coated quartz chip. When comparing the 3 proteins (NupX, Nsp1, and Nsp1-S) for thesame incubation concentration of 1 µM, NupX produced the lowest dissipation-to-frequency ratio, consistentwith the higher hydrophobic character of GLFG-type Nups (e.g. Nup98 [1]), and hence of NupX, as comparedto FXFG-Nups. Note that these∆D5/∆ f5/5 values are for the FG-Nup films only, i.e. prior MUTEG passivation.
5.5.15. DISSIPATION-TO-FREQUENCY RATIO OF A NUPX LAYER UPON IN-CREASING KAP95 CONCENTRATION
Figure S5.17: Dissipation-to-frequency ratio ∆D5/∆ f5/5 for Kap95 absorption to a NupX-coated surface forincreasing concentrations (from 12 nM to 3100 nM).

5. A DESIGNER FG-NUP THAT RECONSTITUTES THE SELECTIVITY OF THE NPC
5
133
5.5.16. COARSE-GRAINED SIMULATIONS OF CARGO ADSORPTION IN A NUPXBRUSH WITH A 5.7 NM GRAFTING DISTANCE
Figure S5.18: NupX brush system, simulated for a grafting distance of 5.7 nm. a,b Snapshots of the simulations(see also: Figure 5.3h). c, Top panel: Time and laterally averaged protein density distributions for the NupXbrushes and for the two different types of FG motifs present inside the NupX brushes. The density profiles ofthe GLFG and FG motifs within the NupX brush are multiplied by 5 for clarity of display. Dark central lines andlight shades indicate the mean and standard deviation in density profiles, respectively. These measures wereobtained by averaging over the density profiles of trajectory windows 50 ns in length (N=60). A high-densityregion (up to a maximum of 300 mg/mL) forms near the attachment sites of the NupX to the surface (z = 0 to2 nm). Further away from the scaffold, the protein density remains at a constant value of ∼170 mg/mL up toa distance of ∼8 nm, after which it decays. FG and GLFG motifs predominantly localize near the transitioningpoint (8 nm). Bottom panel: Free-energy profiles (PMF-curves) of the center of mass of the model Kap95 andinert particle along the z-coordinate, where z = 0 coincides with the substrate. The PMF-curves originate froma z-value where the distance between the center of mass of either particle and the substrate approaches onehalf of the former’s diameter. The difference in sign between the PMF-curves of both particles indicates astrong preferential absorption of the model Kap95 to NupX brushes and a repulsive interaction of the inertparticle. Compared to the brush with a lower grafting distance (see Figs. 5.3h,i in the main text), the repulsionand adsorption are less strong, which is due to the decrease in the density of the NupX brush and FG/GLFG-motifs, respectively (see c top panel).
5.5.17. MODEL KAP95 PARTICLE
Figure S5.19: The computational model of the Kap95 particle used in this work, rendered using VMD2. TheKap95 (and the inert particle) consists of sterically repulsive beads (i.e., only repulsive excluded volume inter-actions with its surroundings, here shown in dark grey) arranged in a geodesic shell. In the case of the Kap95particle a strip of 10 hydrophobic binding sites (brown-orange) is placed on the surface, and the net charge(−43e) is distributed equally over all the surface beads. Binding sites are modeled as Phenylalanine beads andare spaced 1.3 nm apart on an arc. Phe-beads are the most hydrophobic particle type in our 1-BPA model. Thediameter of Kap95 is equal to two times the Stokes radius (see Table S5.1).

5
134 CHAPTER 5
5.5.18. CONDUCTANCE DECREASE UPON NUPX-COATING OF SOLID-STATE
NANOPORES
Figure S5.20: NupX-coating of solid-state nanopores. a, I-V characteristics for a bare (red) and NupX-coated(blue) 30 nm pore. b, Ionic conductance of differently sized nanopores over a range of 10-60 nm is plotted vsdiameter for bare (red) and coated (blue) pores.
5.5.19. CURRENT POWER SPECTRAL DENSITY BEFORE AND AFTER NUPX-COATING
Figure S5.21: Power Spectral Density of the ionic current noise before (yellow curve) and after (purple) NupX-coating for a 30 nm pore.

5. A DESIGNER FG-NUP THAT RECONSTITUTES THE SELECTIVITY OF THE NPC
5
135
5.5.20. SELECTIVITY MEASUREMENTS THROUGH DIFFERENT PORE SIZES (30NM, 35 NM AND 60 NM)
Figure S5.22: Selectivity measurements on NupX-coated pores of different sizes. Scatter plots show eventdistributions for translocations of 2.8 µM BSA and 450 nM Kap95 under 100 mV applied bias, in 150 mM KCl,pH 7.4 buffer. a-b, Scatter plot and bar plot showing (a) conductance blockades (0.24±0.07 nS for Kap95,0.24±0.02 nS for BSA; errors in s.d.) vs dwell times (2.4±0.4 ms for Kap95, 4.2±1.2 ms for BSA; errors in s.e.m.)(b) and event rates (0.9 Hz for Kap95, 0.04 Hz for BSA) for translocations of Kap95 (N=369) and BSA (N=22)through a NupX-coated 30 nm pore. c-d, Scatter plot and bar plot showing (c) conductance blockades (0.3±0.1nS for Kap95, 0.28±0.04 nS for BSA; errors in s.d.) vs dwell times (2.5±0.2 ms for Kap95, 5.2±0.9 ms for BSA;errors in s.e.m.) and (d) event rates (0.95 Hz for Kap95, 0.04 Hz for BSA) for translocations of Kap95 (N=482) andBSA (N=23) through a NupX-coated 35 nm. e-f, Scatter plot and bar plot showing (e) conductance blockades(0.45±0.03 nS for Kap95, 0.30±0.02 nS for BSA; errors in s.d.) vs dwell times (0.65±0.05 ms for Kap95, 1.6±1.3ms for BSA; errors in s.e.m.) and (f) event rates (1.1 Hz for Kap95, 0.04 Hz for BSA) for translocations of Kap95(N=314) and BSA (N=32) through a NupX-coated 60 nm pore.

5
136 CHAPTER 5
5.5.21. EVENT RATE OF KAP95 TRANSLOCATION THROUGH NUPX-COATED
PORES VS KAP95 CONCENTRATION
Figure S5.23: Event rate of translocation of Kap95 molecules through a NupX-coated pore, at increasing con-centrations from 90 nM, 225 nM, to 450 nM. The translocation frequency increases linearly with concentration,as expected.
5.5.22. DENSITY DISTRIBUTIONS OF NUPX FOR DIFFERENT GRAFTING DEN-SITIES
Figure S5.24: Sensitivity of the average pore and access region protein densities against a change in graftingdistance dg . a, Upon increase resp. decrease of the grafting distance with approx. 10% (6.0/5.0 nm as com-pared to 5.5 nm used for SiN in the main text), we observe a corresponding decrease (−17%) and increase(+22%) in the maximal pore region density (light blue and dark blue curves, resp.). The maximal access re-gion density (red) is only sensitive to a decrease in grafting distance, where a 10% decrease in grafting distanceyields a large density increase of +60% due to NupX proteins being expelled from the pore region (light red).b, Axi-radial density distributions of 30 nm NupX-lined nanopores upon an approximate 10% decrease (leftpanel) or increase (right panel) in grafting distance. The high-density region towards the central axis of thenanopore increases in density and extends over a larger range in the z-direction when the grafting distanceis decreased, whereas the opposite occurs for an increase in grafting distance. The overall morphology of theNupX-meshwork in the nanopore remains consistent under an increase of approximately 10% in grafting dis-tance.

5. A DESIGNER FG-NUP THAT RECONSTITUTES THE SELECTIVITY OF THE NPC
5
137
5.5.23. DENSITY DISTRIBUTIONS OF NUPX IN THE ACCESS REGION
Figure S5.25: Access region densities for NupX-lined nanopores with diameters ranging from 15 nm to 70 nm.Lighter colors and increasing line thicknesses indicate larger diameter pores. A preferred localization of NupXproteins towards the central axis of the pore region occurs for a pore diameter of 30 nm and smaller.
5.5.24. DENSITY DISTRIBUTION OF NUPX IN A 30 NM PORE IN THE PRES-ENCE OF KAP95 MOLECULES
Figure S5.26: Axi-radial density map of the protein density distribution in a 30 nm NupX-lined nanopore thatinteracts with Kap95 particles. The density distribution shifts towards the interface between the pore andaccess regions, rather than focus centrally in the pore, which is the case when no Kap95 particles are present(as shown in Figure 5.5b).

5
138 REFERENCES
5.5.25. DENSITY DISTRIBUTIONS OF NUPX VARIATIONS IN NANOPORES
Figure S5.27: Density distributions in the pore (blue dotted lines, left) and access (red dotted lines, right)regions for 25 NupX variants from Table S5.22. NupX (bold lines) is shown for reference.
REFERENCES[1] A. Fragasso, H. W. de Vries, J. Andersson, E. O. van der Sluis, E. van der Giessen,
A. Dahlin, P. R. Onck, and C. Dekker, A designer FG-Nup that reconstitutes the selec-tive transport barrier of the nuclear pore complex, Nature communications 12, 2010(2021).
[2] S. R. Wente, Gatekeepers of the Nucleus, Science 288, 1374 (2000).
[3] S. R. Wente and M. P. Rout, The nuclear pore complex and nuclear transport. ColdSpring Harbor perspectives in biology 2, 1 (2010).
[4] S. J. Kim, J. Fernandez-Martinez, I. Nudelman, Y. Shi, W. Zhang, B. Raveh, T. Her-ricks, B. D. Slaughter, J. A. Hogan, P. Upla, I. E. Chemmama, R. Pellarin, I. Echeverria,M. Shivaraju, A. S. Chaudhury, J. Wang, R. Williams, J. R. Unruh, C. H. Greenberg,E. Y. Jacobs, Z. Yu, M. J. de la Cruz, R. Mironska, D. L. Stokes, J. D. Aitchison, M. F.Jarrold, J. L. Gerton, S. J. Ludtke, C. W. Akey, B. T. Chait, A. Sali, and M. P. Rout, In-tegrative structure and functional anatomy of a nuclear pore complex, Nature 555,475 (2018).
[5] R. Reichelt, A. Holzenburg, E. L. Buhle, Jr., M. Jarnik, A. Engel, and U. Aebi, Corre-lation between structure and mass distribution of the nuclear pore complex and ofdistinct pore complex components, Journal of Cell Biology 110, 883 (1990).
[6] J. Yamada, J. L. Phillips, S. Patel, G. Goldfien, A. Calestagne-Morelli, H. Huang,R. Reza, J. Acheson, V. V. Krishnan, S. Newsam, A. Gopinathan, E. Y. Lau, M. E.
REFERENCES
5
139
Colvin, V. N. Uversky, and M. F. Rexach, A Bimodal Distribution of Two DistinctCategories of Intrinsically Disordered Structures with Separate Functions in FG Nu-cleoporins, Molecular & Cellular Proteomics 9, 2205 (2010).
[7] L. J. Terry and S. R. Wente, Flexible Gates: Dynamic Topologies and Functions for FGNucleoporins in Nucleocytoplasmic Transport, Eukaryotic Cell 8, 1814 (2009).
[8] R. Bayliss, K. Ribbeck, D. Akin, H. M. Kent, C. M. Feldherr, D. Görlich, and M. Stew-art, Interaction between NTFP and xFxFG-containing nucleoporins is required tomediate nuclear import of RanGDP, Journal of Molecular Biology 293, 579 (1999).
[9] A. Ghavami, E. van der Giessen, and P. R. Onck, Energetics of Transport through theNuclear Pore Complex, PLOS ONE 11, e0148876 (2016).
[10] P. Popken, A. Ghavami, P. R. Onck, B. Poolman, and L. M. Veenhoff, Size-dependentleak of soluble and membrane proteins through the yeast nuclear pore complex,Molecular Biology of the Cell 26, 1386 (2015).
[11] B. L. Timney, B. Raveh, R. Mironska, J. M. Trivedi, S. J. Kim, D. Russel, S. R. Wente,A. Sali, and M. P. Rout, Simple rules for passive diffusion through the nuclear porecomplex, The Journal of Cell Biology , jcb.201601004 (2016).
[12] R. Y. H. Lim, N.-P. Huang, J. Koser, J. Deng, K. H. A. Lau, K. Schwarz-Herion,B. Fahrenkrog, and U. Aebi, Flexible phenylalanine-glycine nucleoporins as entropicbarriers to nucleocytoplasmic transport, Proceedings of the National Academy ofSciences 103, 9512 (2006).
[13] R. Bayliss, T. Littlewood, and M. Stewart, Structural basis for the interaction betweenFxFG nucleoporin repeats and importin-β in nuclear trafficking, Cell 102, 99 (2000).
[14] M. P. Rout, J. D. Aitchison, M. O. Magnasco, and B. T. Chait, Virtual gating andnuclear transport: The hole picture, Trends in Cell Biology 13, 622 (2003).
[15] S. Frey, FG-Rich Repeats of Nuclear Pore Proteins with Hydrogel-Like Properties, Sci-ence (New York, N.Y.) 314, 815 (2006).
[16] S. Frey and D. Görlich, A Saturated FG-Repeat Hydrogel Can Reproduce the Perme-ability Properties of Nuclear Pore Complexes, Cell 130, 512 (2007).
[17] R. Peters, Translocation through the nuclear pore complex: Selectivity and speed byreduction-of-dimensionality, Traffic 6, 421 (2005).
[18] L. E. Kapinos, R. L. Schoch, R. S. Wagner, K. D. Schleicher, and R. Y. Lim,Karyopherin-centric control of nuclear pores based on molecular occupancy and ki-netic analysis of multivalent binding with FG nucleoporins, Biophysical Journal 106,1751 (2014).
[19] L. E. Kapinos, B. Huang, C. Rencurel, and R. Y. Lim, Karyopherins regulate nu-clear pore complex barrier and transport function, Journal of Cell Biology 216, 3609(2017).

5
140 REFERENCES
[20] K. D. Schleicher, S. L. Dettmer, L. E. Kapinos, S. Pagliara, U. F. Keyser, S. Jeney, andR. Y. Lim, Selective transport control on molecular velcro made from intrinsicallydisordered proteins, Nature Nanotechnology 9, 525 (2014).
[21] R. Y. H. Lim, B. Fahrenkrog, J. Köser, K. Schwarz-Herion, J. Deng, and U. Aebi,Nanomechanical Basis of Selective, Science 318, 640 (2007).
[22] R. L. Adams, L. J. Terry, and S. R. Wente, A Novel Saccharomyces cerevisiae FG Nucle-oporin Mutant Collection for Use in Nuclear Pore Complex Functional Experiments,G3: Genes|Genomes|Genetics 6, 51 (2016).
[23] W. Yang, J. Gelles, and S. M. Musser, Imaging of single-molecule translocationthrough nuclear pore complexes. Proceedings of the National Academy of Sciencesof the United States of America 101, 12887 (2004).
[24] J. Ma, A. Goryaynov, and W. Yang, Super-resolution 3D tomography of interactionsand competition in the nuclear pore complex, Nature Structural & Molecular Biology23, 239 (2016).
[25] M. Beck and E. Hurt, The nuclear pore complex: understanding its function throughstructural insight, Nature Reviews Molecular Cell Biology 18, 73 (2016).
[26] D. H. Lin and A. Hoelz, The Structure of the Nuclear Pore Complex (An Update), An-nual Review of Biochemistry 88, annurev (2019).
[27] T. Jovanovic-Talisman, J. Tetenbaum-Novatt, A. S. McKenney, A. Zilman, R. Peters,M. P. Rout, and B. T. Chait, Artificial nanopores that mimic the transport selectivityof the nuclear pore complex, Nature 457, 1023 (2009).
[28] N. B. Eisele, S. Frey, J. Piehler, D. Görlich, and R. P. Richter, Ultrathin nucleoporinphenylalanine-glycine repeat films and their interaction with nuclear transport re-ceptors, EMBO Reports 11, 366 (2010).
[29] S. W. Kowalczyk, L. Kapinos, T. R. Blosser, T. Magalhães, P. van Nies, R. Y. H. Lim,and C. Dekker, Single-molecule transport across an individual biomimetic nuclearpore complex, Nature Nanotechnology 6, 433 (2011).
[30] H. B. Schmidt and D. Görlich, Nup98 FG domains from diverse species spontaneouslyphase-separate into particles with nuclear pore-like permselectivity, eLife 2015, 1(2015).
[31] A. N. Ananth, A. Mishra, S. Frey, A. Dwarkasing, R. Versloot, E. van der Giessen,D. Görlich, P. Onck, and C. Dekker, Spatial structure of disordered proteins dictatesconductance and selectivity in nuclear pore complex mimics, eLife 7, 1 (2018).
[32] P. D. E. Fisher, Q. Shen, B. Akpinar, L. K. Davis, K. K. H. Chung, D. Baddeley,A. Šaric, T. J. Melia, B. W. Hoogenboom, C. Lin, and C. P. Lusk, A ProgrammableDNA Origami Platform for Organizing Intrinsically Disordered Nucleoporins withinNanopore Confinement, ACS Nano 12, 1508 (2018).

REFERENCES
5
141
[33] P. Ketterer, A. N. Ananth, D. S. Laman Trip, A. Mishra, E. Bertosin, M. Ganji, J. VanDer Torre, P. Onck, H. Dietz, and C. Dekker, DNA origami scaffold for studying in-trinsically disordered proteins of the nuclear pore complex, Nature Communications9, 1 (2018).
[34] K. Huang, M. Tagliazucchi, S. H. Park, Y. Rabin, and I. Szleifer, Nanocompartmen-talization of the Nuclear Pore Lumen, Biophysical Journal 118, 219 (2020).
[35] L. A. Strawn, T. Shen, N. Shulga, D. S. Goldfarb, and S. R. Wente, Minimal nuclearpore complexes define FG repeat domains essential for transport, Nature Cell Biology6, 197 (2004).
[36] W. Humphrey, A. Dalke, and K. Schulten, VMD: Visual molecular dynamics, Journalof Molecular Graphics 14, 33 (1996).
[37] K. Peng, P. Radivojac, S. Vucetic, A. K. Dunker, and Z. Obradovic, Length-dependentprediction of protein intrinsic disorder. BMC bioinformatics 7, 208 (2006).
[38] D. T. Jones and D. Cozzetto, DISOPRED3: precise disordered region predictions withannotated protein-binding activity, Bioinformatics 31, 857 (2015).
[39] J. J. Ward, J. S. Sodhi, L. J. McGuffin, B. F. Buxton, and D. T. Jones, Prediction andFunctional Analysis of Native Disorder in Proteins from the Three Kingdoms of Life,Journal of Molecular Biology 337, 635 (2004).
[40] L. A. Kelley, S. Mezulis, C. M. Yates, M. N. Wass, and M. J. E. Sternberg, The Phyre2web portal for protein modeling, prediction and analysis, Nature Protocols 10, 845(2015).
[41] R. Hayama, M. Sorci, J. J. Keating, L. M. Hecht, J. L. Plawsky, G. Belfort, B. T. Chait,and M. P. Rout, Interactions of nuclear transport factors and surface-conjugated FGnucleoporins: Insights and limitations, PloS one 14, e0217897 (2019).
[42] I. Reviakine, D. Johannsmann, and R. P. Richter, Hearing what you cannot see andvisualizing what you hear: Interpreting quartz crystal microbalance data from sol-vated interfaces, Analytical Chemistry 83, 8838 (2011).
[43] A. Ghavami, L. M. Veenhoff, E. Van Der Giessen, and P. R. Onck, Probing the dis-ordered domain of the nuclear pore complex through coarse-grained molecular dy-namics simulations, Biophysical Journal 107, 1393 (2014).
[44] R. Zahn, D. Osmanovic, S. Ehret, C. Araya Callis, S. Frey, M. Stewart, C. You, D. Gör-lich, B. W. Hoogenboom, and R. P. Richter, A physical model describing the interac-tion of nuclear transport receptors with FG nucleoporin domain assemblies, eLife 5,1 (2016).
[45] L. K. Davis, I. J. Ford, A. Šaric, and B. W. Hoogenboom, Intrinsically disordered nu-clear pore proteins show ideal-polymer morphologies and dynamics, Physical Re-view E 101, 22420 (2020).

5
142 REFERENCES
[46] N. B. Eisele, F. I. Andersson, S. Frey, and R. P. Richter, Viscoelasticity of thin biomolec-ular films: A case study on nucleoporin phenylalanine-glycine repeats grafted to ahistidine-tag capturing QCM-D sensor, Biomacromolecules 13, 2322 (2012).
[47] T. A. Isgro and K. Schulten, Binding Dynamics of Isolated Nucleoporin Repeat Re-gions to Importin-β, Structure 13, 1869 (2005).
[48] M. Tagliazucchi, Y. Rabin, I. Szleifer, O. Peleg, and M. Kröger, Effect of charge, hy-drophobicity, and sequence of nucleoporins on the translocation of model particlesthrough the nuclear pore complex, Proceedings of the National Academy of Sciences110, 3363 (2013).
[49] J. S. Hub, B. L. de Groot, and D. van der Spoel, gw ham—A Free Weighted His-togram Analysis Implementation Including Robust Error and Autocorrelation Esti-mates, Journal of Chemical Theory and Computation 6, 3713 (2010).
[50] R. S. Wagner, L. E. Kapinos, N. J. Marshall, M. Stewart, and R. Y. Lim, Promiscuousbinding of karyopherinβ1 modulates FG nucleoporin barrier function and expeditesNTF2 transport kinetics, Biophysical Journal 108, 918 (2015).
[51] C. Dekker, Solid-state nanopores (Review Article), Nature Nanotechnology , 1 (2007).
[52] A. Balan, C. C. Chien, R. Engelke, and M. Drndic, Suspended Solid-state Membraneson Glass Chips with Sub 1-pF Capacitance for Biomolecule Sensing Applications, Sci-entific Reports 5, 1 (2015).
[53] S. W. Kowalczyk, A. Y. Grosberg, and Y. Rabin, Modeling the conductance and DNAblockade of solid-state nanopores, 22 (2011), 10.1088/0957-4484/22/31/315101.
[54] A. Fragasso, S. Pud, and C. Dekker, 1/F Noise in Solid-State Nanopores Is GovernedBy Access and Surface Regions, Nanotechnology 30, 395202 (2019).
[55] N. Varongchayakul, J. Song, A. Meller, and M. W. Grinstaff, Single-molecule proteinsensing in a nanopore: a tutorial. Chemical Society reviews 47, 8512 (2018).
[56] A. G. Koutsioubas, N. Spiliopoulos, D. L. Anastassopoulos, A. A. Vradis, andC. Toprakcioglu, Formation of polymer brushes inside cylindrical pores: A computersimulation study, Journal of Chemical Physics 131 (2009), 10.1063/1.3179686.
[57] D. Dimitrov, A. Milchev, and K. Binder, Polymer brushes in cylindrical pores: simu-lation versus scaling theory, J Chem Phys. 125, 34905 (2006).
[58] O. Peleg, M. Tagliazucchi, M. Kröger, Y. Rabin, and I. Szleifer, Morphology Controlof Hairy Nanopores, ACS Nano 5, 4737 (2011).
[59] S. Ro, A. Gopinathan, and Y. W. Kim, Interactions between a fluctuating polymerbarrier and transport factors together with enzyme action are sufficient for selectiveand rapid transport through the nuclear pore complex, Physical Review E 98, 12403(2018).

REFERENCES
5
143
[60] J. Tetenbaum-Novatt, L. E. Hough, R. Mironska, A. S. McKenney, and M. P. Rout,Nucleocytoplasmic transport: A role for nonspecific competition in karyopherin-nucleoporin interactions, in Molecular and Cellular Proteomics, Vol. 11 (MCP Papersin Press, 2012) pp. 31–46.
[61] K. Ribbeck and D. Görlich, Kinetic analysis of translocation through nuclear porecomplexes, The EMBO journal 20, 1320 (2001).
[62] S. Milles, D. Mercadante, I. Aramburu, M. Jensen, N. Banterle, C. Koehler, S. Tyagi,J. Clarke, S. Shammas, M. Blackledge, F. Gräter, and E. Lemke, Plasticity of an Ul-trafast Interaction between Nucleoporins and Nuclear Transport Receptors, Cell 163,734 (2015).
[63] S. M. Liu and M. Stewart, Structural Basis for the High-affinity Binding of Nucleo-porin Nup1p to the Saccharomyces cerevisiae Importin-β Homologue, Kap95p, Jour-nal of Molecular Biology 349, 515 (2005).
[64] B. Raveh, J. M. Karp, S. Sparks, K. Dutta, M. P. Rout, A. Sali, and D. Cowburn, Slide-and-exchange mechanism for rapid and selective transport through the nuclear porecomplex, Proceedings of the National Academy of Sciences 113, E2489 (2016).
[65] B. C. Buddingh’ and J. C. M. van Hest, Artificial Cells: Synthetic Compartmentswith Life-like Functionality and Adaptivity, Accounts of Chemical Research 50, 769(2017).
[66] W. K. Spoelstra, S. Deshpande, and C. Dekker, Tailoring the appearance: what willsynthetic cells look like? Current Opinion in Biotechnology 51, 47 (2018).
[67] R. K. Das and R. V. Pappu, Conformations of intrinsically disordered proteins are in-fluenced by linear sequence distributions of oppositely charged residues, Proceedingsof the National Academy of Sciences 110, 13392 (2013).
[68] G. L. Dignon, W. Zheng, R. B. Best, Y. C. Kim, and J. Mittal, Relation between single-molecule properties and phase behavior of intrinsically disordered proteins. Pro-ceedings of the National Academy of Sciences of the United States of America 115,9929 (2018).
[69] P. S. Huang, S. E. Boyken, and D. Baker, The coming of age of de novo protein design,Nature 537, 320 (2016).
[70] G. Emilsson, R. L. Schoch, L. Feuz, F. Höök, R. Y. Lim, and A. B. Dahlin, Stronglystretched protein resistant poly(ethylene glycol) brushes prepared by grafting-to, ACSApplied Materials and Interfaces 7, 7505 (2015).
[71] G. Emilsson, R. L. Schoch, P. Oertle, K. Xiong, R. Y. Lim, and A. B. Dahlin, Surfaceplasmon resonance methodology for monitoring polymerization kinetics and mor-phology changes of brushes—evaluated with poly(N-isopropylacrylamide), AppliedSurface Science 396, 384 (2017).

5
144 REFERENCES
[72] G. Ferrand-Drake Del Castillo, G. Emilsson, and A. Dahlin, Quantitative Analysisof Thickness and pH Actuation of Weak Polyelectrolyte Brushes, Journal of PhysicalChemistry C 122, 27516 (2018).
[73] A. Balan, B. Machielse, D. Niedzwiecki, J. Lin, P. Ong, R. Engelke, K. L. Shepard, andM. Drndic, Improving signal-to-noise performance for DNA translocation in solid-state nanopores at MHz bandwidths, Nano Letters 14, 7215 (2014).
[74] A. Ghavami, E. van der Giessen, and P. R. Onck, Coarse-Grained Potentials for LocalInteractions in Unfolded Proteins, Journal of Chemical Theory and Computation 9,432 (2013).
[75] D. Van Der Spoel, E. Lindahl, B. Hess, G. Groenhof, A. E. Mark, and H. J. C. Berend-sen, GROMACS: Fast, flexible, and free, Journal of Computational Chemistry 26,1701 (2005).
[76] A. Ortega, D. Amorós, and J. García de la Torre, Prediction of Hydrodynamic andOther Solution Properties of Rigid Proteins from Atomic- and Residue-Level Models,Biophysical Journal 101, 892 (2011).
[77] A. Mishra, W. Sipma, L. Veenhoff, E. Van der Giessen, P. Onck, A. Mishra, W. Sipma,L. M. Veenhoff, E. Van der Giessen, and P. R. Onck, The Effect of FG-Nup Phosphory-lation on NPC Selectivity: A One-Bead-Per-Amino-Acid Molecular Dynamics Study,International Journal of Molecular Sciences 20, 596 (2019).

6STUDYING KARYOPHERINS
OCCUPANCY IN THE NUCLEAR PORE
COMPLEX USING BIOMIMETIC
NANOPORES
Nuclear Pore Complexes (NPCs) regulate all molecular transport between the nucleus andthe cytoplasm in eukaryotic cells. Intrinsically disordered Phe-Gly nucleoporins (FG Nups)line the central conduit of NPCs and impart a selective barrier, where large proteins are ex-cluded unless bound to a transport receptor (Karyopherin; Kap), which can freely pass thebarrier. Two classes of models have been proposed to describe nuclear transport mech-anistically, ‘FG-centric’, where FG Nups are the sole mediator of nuclear transport, and‘Kap-centric’, where karyopherins participate in establishing the selective barrier. A con-sensus has not been reached yet. Here, we employ biomimetic nanopores, formed by teth-ering FG Nups to the inner wall of a solid-state nanopore, to show that a first populationof Kaps are rapidly transported across the pore in ∼ms time, whereas a second populationis stably assembled into the FG-mesh in the pore in a concentration-dependent manner.By analyzing the current noise fluctuations, we observe that such Kap binding inducesan increase in rigidity of the FG-mesh as a function of concentration, a finding which wefurther corroborate with QCM-D experiments on FG Nup brushes. Our data show thatKaps do take part in forming the FG-barrier providing evidence for a ‘Kap-centric’ modelof nuclear transport.
This chapter is based on a manuscript in preparation as: A. Fragasso, C.Dekker. Studying Karyopherins occu-pancy in the nuclear pore complex using biomimetic nanopores.
145

6
146 CHAPTER 6
6.1. INTRODUCTIONMolecular traffic between nucleus and cytoplasm is exclusively controlled by the NuclearPore Complex (NPC), a large protein complex (52 MDa in yeast[1]) that forms a ∼40nm-diameter pore across the nuclear envelope that encloses the nucleus[2, 3]. The NPCcentral channel is filled with a meshwork of intrinsically disordered FG-Nucleoporins(FG-Nups), that feature tandem phenylalanine-glycine (FG) amino acid sequences[4, 5].Strikingly, such a FG-mesh appears to behave as a selective gate[4]: while moleculessmaller than ∼40kDa (∼5 nm in size) can pass through the pore unhindered, macro-molecules with size >40kDa are blocked, unless they are bound to specific nuclear trans-port receptors (NTRs), such as karyopherins (Kaps), which can actively interact, parti-tion, and translocate through the FG-Nup barrier. Major NTRs involved in nuclear im-port are Importin-β in humans and Kap95 in yeast[6].
In an effort to describe nuclear transport mechanistically, many models have beenproposed[7, 8] which can be broadly categorized into two major classes: ‘FG-centric’ and‘Kap-centric’ models. The first class of FG-centric models, which include the ‘virtual-gate’[9], ‘selective-phase’[10, 11], and ‘forest’[5] models, regard the FG-Nup barrier asthe sole important ingredient to achieve selective transport. In such scenario, Kaps actas mere transporters, i.e. they do not take part in establishing the selective barrier.
By contrast, Kap-centric models[12], such as the ‘reduction of dimensionality’[13],‘reversible collapse’[14], and ‘molecular velcro’[15] models, predict that a part of the pop-ulation of Kaps (‘slow-phase’) acts an integral, resident component of the NPC[12, 16],while a second population of Kaps consists of transporters (‘fast-phase’). According tothis idea[8], Kaps that feature binding affinities (KD) to the FG-mesh <1 µM, would bindstrongly and occupy most of the available FG-repeats as a result of multivalent interac-tions, hence forming the slow-phase population. Notably, each Kap can bind multipleFG-repeats (up to ∼10 FG-binding sites in Kapβ1[17]), while at the same time a singleFG-Nup can bind multiple Kaps, thus giving rise to a complex multivalent-binding con-densate. Saturation of available FG-repeats by the slow-phase Kaps would then result ina lowered affinity between the Kap-laden FG-mesh and additional free Kaps (fast-phase)down to KD>10µM. Importantly, such a decreased affinity would explain the exception-ally fast transit times of Kaps (∼5 ms) observed in vivo[18].
While experimental evidence has been provided in support of both classes of models,a general consensus has not yet been achieved. The difficulty in settling the debate stemsfrom the complexity of the NPC in its physiological state, featuring a central mesh of∼200 unstructured FG-Nups that are confined into a∼40nm pore that is constantly beingcrossed by NTR-cargo molecules (∼1000 molecules per second) in both directions, com-bined with the limited spatiotemporal resolution of current imaging techniques[1, 2, 19].
To probe nuclear transport through the FG-mesh, artificial mimics of the NPC havebeen successfully reconstituted that recapitulate the selective binding and transport be-havior observed in vivo[20–25]. Prominent examples are the biomimetic nanopores,where ∼30-50 nm solid-state nanopores are chemically functionalized using a singletype of FG-Nup (e.g. Nsp1 or Nup98) and translocations of Kaps through the reconsti-tuted FG-mesh are monitored in real-time optically[20] or electrically[21, 26, 27]. Al-though much knowledge has been gained in terms of a physical understanding of theFG-mesh and its ability to impart a selective barrier, a direct assessment is still lacking

6. STUDYING KARYOPHERINS OCCUPANCY USING BIOMIMETIC NANOPORES
6
147
of the properties of such pore-confined FG-mesh as a function of Kap concentration inlight of the various transport models.
Here, we employ biomimetic nanopores to obtain experimental evidence on the in-teraction between Kaps and Nsp1 in nanopores, in an attempt to discriminate betweenthe two major theories of transport. Building on previous work from Ananth et al.[26],which established that Nsp1-coated pores behave selectively, i.e. allowing Kap95 throughwhile blocking other inert molecules of similar size, we investigate here the behavior ofNsp1-coated pores against increasing concentrations of Kaps.
Our data are found to support a Kap-centric model. Measurements of the ionic cur-rent through the biomimetic nanopores show that fast translocations of Kaps are ob-served, consistent with previous findings[26], but on top of that, a population of Kapsis found that resides permanently in the pore, and this population grows as a functionof Kap concentration. By studying the noise spectra of the current traces, we observea gradual decrease in 1/f noise as more Kaps are incorporated into the pore, consis-tent with a decrease in the collective fluctuations of the FG-Nups and an increase in therigidity of the Nsp1 mesh. We complement our nanopore data with QCM-D affinity ex-periments that show a similar concentration-dependent occupancy of Kap95 into Nsp1brushes as well as an increase in layer rigidity. By thus showing that a population of Kapsis stably bound to the Nsp1 mesh in a biomimetic nanopore at any given concentration,these data support the idea that Kaps do take part in establishing the NPC barrier, whichshould be accounted for in any mechanistic modeling of nuclear transport.
6.2. RESULTS
6.2.1. ELECTRICAL TRANSPORT THROUGH NSP1-COATED PORES SHOWS AN
INCREASE IN KAP95 OCCUPANCY AS A FUNCTION OF KAP95 CON-CENTRATION
To perform ion current measurements through Nsp1-coated pores (Fig.6.1a), solid-statenanopores were fabricated onto glass-supported freestanding 20nm-thick SiNx mem-branes using a transmission electron microscope (TEM, see ‘Methods’ section). Chipswere mounted in a custom-built Teflon flow-cell system to allow for quick exchangeof bulk solution from the two opposite compartments surrounding the chip. Conduc-tance measurements were initially performed on freshly drilled nanopores, which, asexpected, exhibited fully ohmic behavior, i.e. linear current-voltage (I-V) characteristics.Figure 6.1a shows the I-V plot of a bare 55 nm pore. Subsequently, pores were functional-ized with Nsp1 using a 3-step self-assembled-monolayer chemistry (SAM) as describedin previous work[27] (see ‘Methods’), which yielded a ∼50% decrease in conductance(Fig.6.1b).
Next, Kap95 was flushed on the cis-chamber which resulted in a further decrease ofthe pore conductance. This in itself directly provides a first sign that Kap95 was incor-porated within the pore volume. Figure 6.1c (bottom) compares the three (I,V) charac-teristics of a bare pore (black), Nsp1-coated (red), and Nsp1-coated pore with 1.9 µM ofKap95 present in bulk solution (green), where the latter shows a further ∼50% decreasein conductance compared to the Nsp1-coated pore, indicating the presence of Kap95molecules in the pore.

6
148 CHAPTER 6
To assess the pore-occupancy of Kap95 as a function of concentration, we titratedKap95 from about 100-2000 nM (Figure 6.2a), finding the pore conductance to decreasemonotonously in a step-wise manner as higher concentrations of Kaps were flushed intothe cis-chamber, which clearly indicates that additional Kaps are being incorporated intothe Nsp1-mesh for increasing Kap95 concentration. Interestingly, we found that tran-sient dips in the current, corresponding to fast Kap95 translocation events, were simul-taneously present as well on top of the decreased current baseline, which occurred onlywhen the bulk concentration was ∼100nM, in line with previous measurements[26]. Weattribute the absence of current spikes at higher Kap95 concentrations to excessive porecrowding which negatively affects the SNR in such current-based detection system.
SiNx
A
SiNx
A
-100 0 100Voltage (V)
-10
0
10
Cur
rent
(nA)
-100 0 100Voltage (V)
-10
0
10
Cur
rent
(nA)
-100 0 100Voltage (V)
-10
0
10
Cur
rent
(nA)
SiNx
A
1) Fabricate solid-state nanopore
Bare pore Bare pore
Nsp1
2) Functionalize with FG-Nups
Bare pore
Nsp1 pore
Nsp1+Kap95
3) Add Kap95a b c
Figure 6.1: Current measurements of Nsp1-coated pores as a function of Kap95 concentration. a, Top:schematic showing the bare pore measurement system. Bottom: (I,V) characteristics of a bare 55 nm pore.b-c, Same as (a) but for a Nsp1-coated pore without (b) and with (c) 1.9µM Kap95 present in the cis-chamber(top part).
As a control, we repeated the same experiment by injecting increasing concentra-tions of BSA (Bovine Serum Albumine) in the cis-chamber from ∼2-20 µM (Figure 6.2c).Here we found that, unlike for Kap95, no significant change in the current baseline wasobserved. Importantly, this indicates that the interaction observed between Kap95 andNsp1 is a result of specific protein-protein interactions, and not merely due to, e.g., elec-trostatic pulling of the protein into the Nsp1-mesh. Repeating the experiment on differ-ent pore sizes resulted in a similar decreasing trend of the pore conductance as a func-tion of Kap95 concentration (Fig.6.2d).
Next, we analyzed the power spectral density (PSD) of the ionic current as a func-tion of Kap95 concentration, i.e. the frequency spectrum of the power of the currentsignal. For biomimetic nanopores, the increase in low-frequency (1-100 Hz) 1/f noiseupon addition of the Nups has been typically associated to spatiotemporal fluctuationsof FG-Nup proteins in the pore channel[21, 26, 27]. Indeed we also report an increasein 1/f noise when comparing the bare vs Nsp1-coated pore (Fig.S6.6). More interest-ingly, we furthermore observe an overall decreasing trend in the 1/f noise as a func-

6. STUDYING KARYOPHERINS OCCUPANCY USING BIOMIMETIC NANOPORES
6
149
Frequency (Hz)
S I (nA
2 /Hz)
100 102 104
10-8
10-7
10-6
10-9
10-4
10-5
Rel
ativ
e cu
rrent
I/I 0 (
%) 100
80
60
300100 1500 20050 250
100
80
60
Rel
ativ
e cu
rrent
I/I 0 (
%)
10010-5
Time (s) Probability
a b
c d
119nMBuffer 237nM 475nM 950nM 1900nM
e
fittedregion
350
Rel
ativ
e cu
rrent
I/I 0 (
%)
100
60
80
300100 1500 20050 250Time (s)
2.1µMBuffer 4.25µM 8.5µM 17.5µM Buffer
f
BufferKap95 in bulk solution
BSA in bulk solution
0
0.4
0.8
1.2
0 1000 2000Kap95 concentration (nM)
Nor
mal
ized
Noi
se S
I/I2 @
1Hz
(·10-6
)
0 2 4 6 8Kap95 concentration (µM)
0
20
40
60
80
100
Nor
mal
ized
con
duct
ance
(%)
10 202060
100BSA
055nm
55nm40nm
Figure 6.2: a, Concatenated current traces representing a Kap95 titration from 119-1900nM, revealing a de-crease of the nanopore current up to almost ∼50% of the initial value. b, Histogram of the current traces il-lustrated in (a). c, Concatenated current traces representing a BSA titration from 2-20µM, showing no signof current decrease. d, Normalized conductance for different nanopores vs Kap95 concentration. Inset: nor-malized conductance for a 55 nm pore vs BSA concentration (same units as in d applies). e, PSD spectra ofthe current traces shown in (a), same color coding as in (a) applies. f, Normalized noise A = SI (1H z)/I 2, asa function of Kap95 concentration. Fit to the noise data for 119 nM concentration was excluded due to thepresence of a pronounced Lorentzian component originating from the Kap95 translocations (see Refs.[28, 29])which yielded a poor fit of Hooge’s model to the data.

6
150 CHAPTER 6
tion of Kap concentration (Fig.6.2e,f). To properly compare the magnitude of 1/f noisefor different current traces, we fitted the low-frequency region (5-100 Hz) of the PSD(grey area in Fig.6.2e) using Hooge’s model[30], which is commonly used to describe 1/fnoise in solid-state nanopores[28, 31–33], where the current PSD (S I ) is expressed asS I =αH I 2/Nc f = AI 2/ f , where, αH is the Hooge parameter that quantifies the strengthof the 1/f noise, I is the through-pore current, Nc is the number of charge carriers withinthe pore volume which depends on salt concentration and pore geometry, f is the fre-quency, and A = αH /Nc = S I (1H z)/I 2 is the fit parameter, which is a measure of thenoise magnitude normalized by the square of the current. Figure 6.2f shows a clear de-creasing trend for A as a function of Kap95 concentration, indicating that a higher Kapoccupancy resulted in a decrease of the 1/f noise. This is suggestive of an increase inoverall rigidity of the Nsp1-mesh in the pore. This finding is in line with the observedincrease in rigidity of Nsp1 brushes grafted on a planar geometry upon Kap95 binding asreported in our QCM-D measurements (see below), as well as in previous works[22, 34].
6.2.2. ANALYSIS OF FAST KAP95 TRANSLOCATIONS THROUGH AN NSP1 PORE
We then characterized the translocation events of Kap95 (fast phase) when increasingthe applied voltage from 50 to 200mV. For each event, we measured the current block-ade, which to a first approximation is proportional to the volume of the translocatingmolecule, and dwell time, which corresponds to the time the translocating protein spendsin the pore which depends on the specific protein-pore interactions. In Figure 6.3a weshow examples of current traces where each current spike correspond to a single Kap95translocation event. Figure 6.3b illustrates some characteristic translocation events atdifferent voltages in higher resolution.
As expected, conductance blockades at different voltages are found to be compa-rable: 76±2 nS at 50mV (N=310, errors are S.E.M.), 80±2 nS at 100mV (N=1206), 77±3nS at 150mV (N=687), and (64±3 nS) at 200mV (N=820). By contrast, for values of theapplied bias >50mV we observed a drastic decrease of the resident time of the proteinbeing in the pore due to a stronger electrophoretic force driving the protein, which goesfrom 7.8±0.8ms for 50mV (N=310, errors are S.E.M.) to about ∼1ms at higher voltages:1.2±0.1ms for 100mV (N=1206), 0.8±0.2ms for 150mV (N=687), and 1.1±0.1ms for 200mV(N=820). Notably, the translocation events that are the least affected by the applied bias,namely acquired under 50mV, result in dwell times of ∼8ms that are remarkably close tothe ∼5ms observed in vivo. Additional examples of current traces are show in Fig.S6.7.
Lastly, the event rate of translocations, calculated as number of translocation eventsper second, was observed to increase as a function of applied voltage by almost an orderof magnitude when increasing the bias from 50mV to 200mV (Fig.6.3d). This is indicativeof an increase in the capture radius as a function of voltage[35], defined as the radius ofthe hemisphere surrounding the pore wherein the electrostatic force driving the proteinto the pore overtakes simple diffusion.

6. STUDYING KARYOPHERINS OCCUPANCY USING BIOMIMETIC NANOPORES
6
151
Figure 6.3: Event analysis of Kap95 translocations. a, Current traces showing single-molecule translocations ofKap95 through a Nsp1-coated pore under 50mV (purple), 100mV (blue), 150mV (red), 200mV (yellow). Addi-tional examples are shown in Figure S6.7. b, Characteristic Kap95 translocation events at different voltages. c,Scatter plot of the current blockade vs dwell time of the translocation events for different voltages. Histogramsfor both dwell time and current blockade are logarithmically binned. d, Event rate of the translocations, de-fined as number of events per second, for increasing applied voltage. Color coding of b-d are the same as for a.

6
152 CHAPTER 6
6.2.3. KAP95 OCCUPANCY IN A NSP1 BRUSH INCREASES WITH KAP95 CON-CENTRATION
To assess the binding of Kap95 to Nsp1 brushes, we complemented our nanopore datawith measurements using a quartz-crystal-microbalance with dissipation monitoring(QCM-D). For this, we monitored the resonance frequency shift (∆f) of the crystal, whichis proportional to amount of adsorbed mass, and the dissipation shift (∆D), which de-pends on the viscoelastic properties of the adsorbed layer.
-50
-40
-30
-20
-10
0
10
∆f (H
z)
-4
0∆D∆f
c
b 62.5
nM
Buffer
250n
M50
0 nM
1000
nM
2000
nM
125 n
MBuff
er
-2
∆D (·
10-6)
-3
-5
Kap95
-60
-50
-40
-30
-20
-10
0
10
-50
-40
-30
-20
-10
0
10
d
0 10 20 305 15 25Time (min)
∆f (H
z)
a
∆f, ∆D
Nsp1
Nsp1 (1000 nM)Buffer
∆D (·
10-6)
-600 10 20 40 50 6030 70 80
Time (min)
-1
Figure 6.4: Probing Kap95 binding to Nsp1 with QCM-D. a,c, Schematics showing Nsp1 coating (a) and Kap95injection (b) onto the quartz chip. b, Recordings of frequency (blue) and dissipation (red) shifts vs time wheninjecting 1000 nM Nsp1 onto the gold-coated chip surface. Binding of the molecule is revealed by the negativeshift in resonance frequency, whereas the increase in dissipation is consistent with the formation of a hydratedNsp1 brush. d, Frequency and dissipation shifts vs time upon Kap95 injection onto a Nsp1-coated surface atincreasing concentrations from 62.5-2000 nM.
After a cleaning routine (see Methods), gold-coated chips were first functionalized withNsp1 (Fig.6.4a,b) which features a cysteine on its C-terminus that is used for conjugationto the gold surface. Incubation of the Nsp1 protein with the gold surface resulted in a∆f∼−58Hz, indicating the formation of a dense Nsp1-brush (cf. Ref.[36]). Subsequently wepassivated the remaining gold exposed in between Nsp1 molecules using 1-mercapto-11-undecylte-tri(ethyleneglycol) (MUTEG) (see details in Ref.[27]).
Kap95 was flushed in at increasing concentrations in the range (62.5-2000 nM), whichresulted in a step-wise decrease in frequency shift – indicating a concentration-dependentKap95 adsorption onto the Nsp1-brush (Fig.6.4c,d). This observation is perfectly in line

6. STUDYING KARYOPHERINS OCCUPANCY USING BIOMIMETIC NANOPORES
6
153
with previous reports[22, 34], as well as our nanopore data where we report a concentration-dependent incorporation of Kap95 into the Nsp1 pore mesh.
Additionally, we observed a striking decrease in dissipation ∆D ∼ −1×10⁻⁶ as soonas the lowest Kap95 concentration (62.5 nM) was injected, which indicates an increaseof the layer rigidity[22, 37, 38]. This finding is in line with the notion of ‘collapse’ ofthe Nsp1 brush, consistent with a decrease in brush height upon Kap binding, reportedby Wagner et al.[34], where the interaction between Nsp1 and Kapβ1 was monitoredoptically by surface-plasmonic-resonance (SPR). Importantly, such an increase in layerrigidity measured by QCM-D is consistent with the decrease in 1/f noise observed in ournanopore experiments.
6.2.4. SUPPORT FOR THE KAP-CENTRIC MODEL OF NUCLEAR TRANSPORT
It is of interest to discuss these data in the context of the various models for nuclear trans-port. Most importantly, our nanopore data show that while a population of fast Kaps arerapidly translocating through the pore in a timescale of milliseconds, a second popula-tion of quasi-permanent Kaps is also present (Fig.6.5a) which appears in the ion currentdata as a stable, concentration-dependent, decrease of the current baseline. Moreover,binding of Kap95 appears to have a ‘stiffening’ effect on the Nsp1-mesh, as observed bythe overall decrease of the 1/f noise in the nanopore and the dissipation in QCM-D.
A possible arrangement of the two Kap95 populations (fast vs slow) within the nanoporewas suggested by Kapinos et al. 2014[12] and illustrated in Figure 6.5b. Here, slow Kapsthat bind the Nsp1 mesh with high avidity (<1µM) would induce a collapse of the Nsp1-mesh towards the pore rim, resulting in the opening of a central channel (Fig. 6.5b, reddashed lines), through which fast Kaps can rapidly diffuse through in ∼ms time. Thisis in line with our data showing a stable drop of the baseline due to slow Kaps bind-ing to the FG-mesh while increasing its stiffness (Fig.6.2a,f), which may be associatedwith the formation of a central opening for the fast-diffusing Kaps resulting in the ob-served fast (∼7.8 ms at 50mV, Fig.6.4) translocation events. Our data are also compati-ble with the ‘reduction-of-dimensionality’[13] and ‘molecular velcro’[15] models, wheretranslocating Kaps would cross the pore following a 2D-random walk on the collapsed,Kap-saturated layer of FG-Nups. Formation of a channel opening upon Kap binding isalso consistent with in vivo super-resolution data from Ma et al.[39], where increasingthe concentration of Impβ from 1 nM to 15 µM in human cells resulted in higher NPCpermeability to large 70 kDa Dextran molecules.
6.3. CONCLUSIONIn this work, we investigated the interaction between the yeast transporter Kap95 andFG-nucleoporin Nsp1 using biomimetic nanopores. We identified two distinct Kap95populations: slow Kaps that bind stably to the Nsp1 mesh causing a permanent de-crease in the current baseline, and fast Kaps that rapidly translocate the pore on a ∼mstimescale. The population of slow Kaps was found to increase in a concentration-dependentmanner as revealed by the step-wise decrease of the pore conductance. The net decreasein 1/f noise in the current signal, together with the decrease in dissipation measured byQCM-D, for increasing Kap95 concentrations points to an increased rigidity of the Nsp1-
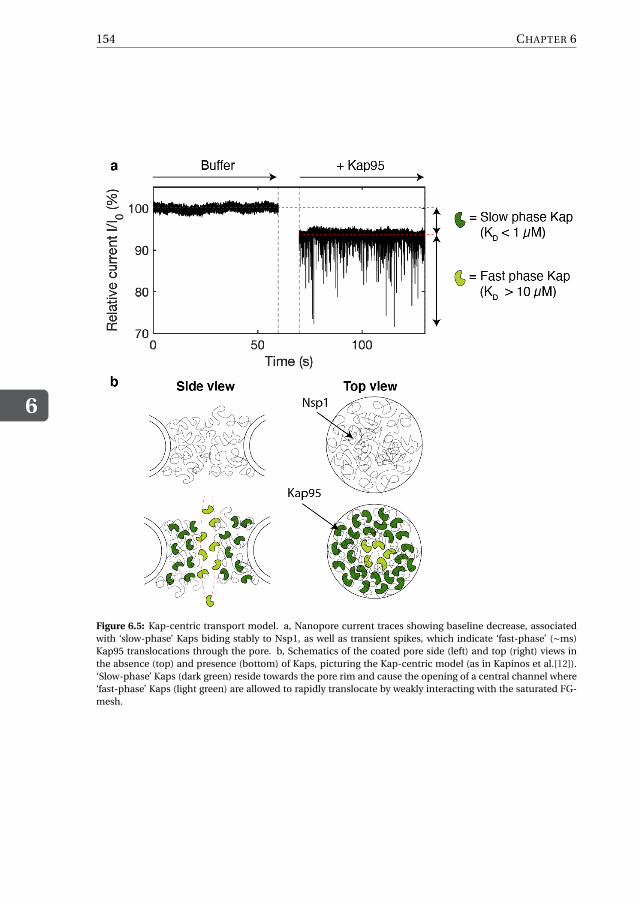
6
154 CHAPTER 6
Figure 6.5: Kap-centric transport model. a, Nanopore current traces showing baseline decrease, associatedwith ‘slow-phase’ Kaps biding stably to Nsp1, as well as transient spikes, which indicate ‘fast-phase’ (∼ms)Kap95 translocations through the pore. b, Schematics of the coated pore side (left) and top (right) views inthe absence (top) and presence (bottom) of Kaps, picturing the Kap-centric model (as in Kapinos et al.[12]).‘Slow-phase’ Kaps (dark green) reside towards the pore rim and cause the opening of a central channel where‘fast-phase’ Kaps (light green) are allowed to rapidly translocate by weakly interacting with the saturated FG-mesh.
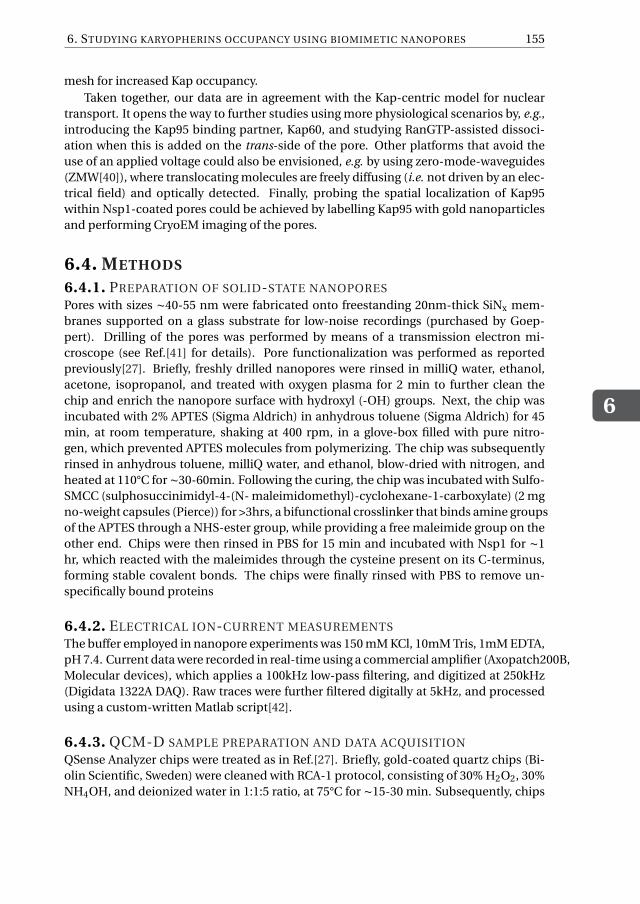
6. STUDYING KARYOPHERINS OCCUPANCY USING BIOMIMETIC NANOPORES
6
155
mesh for increased Kap occupancy.Taken together, our data are in agreement with the Kap-centric model for nuclear
transport. It opens the way to further studies using more physiological scenarios by, e.g.,introducing the Kap95 binding partner, Kap60, and studying RanGTP-assisted dissoci-ation when this is added on the trans-side of the pore. Other platforms that avoid theuse of an applied voltage could also be envisioned, e.g. by using zero-mode-waveguides(ZMW[40]), where translocating molecules are freely diffusing (i.e. not driven by an elec-trical field) and optically detected. Finally, probing the spatial localization of Kap95within Nsp1-coated pores could be achieved by labelling Kap95 with gold nanoparticlesand performing CryoEM imaging of the pores.
6.4. METHODS
6.4.1. PREPARATION OF SOLID-STATE NANOPORES
Pores with sizes ∼40-55 nm were fabricated onto freestanding 20nm-thick SiNx mem-branes supported on a glass substrate for low-noise recordings (purchased by Goep-pert). Drilling of the pores was performed by means of a transmission electron mi-croscope (see Ref.[41] for details). Pore functionalization was performed as reportedpreviously[27]. Briefly, freshly drilled nanopores were rinsed in milliQ water, ethanol,acetone, isopropanol, and treated with oxygen plasma for 2 min to further clean thechip and enrich the nanopore surface with hydroxyl (-OH) groups. Next, the chip wasincubated with 2% APTES (Sigma Aldrich) in anhydrous toluene (Sigma Aldrich) for 45min, at room temperature, shaking at 400 rpm, in a glove-box filled with pure nitro-gen, which prevented APTES molecules from polymerizing. The chip was subsequentlyrinsed in anhydrous toluene, milliQ water, and ethanol, blow-dried with nitrogen, andheated at 110°C for ∼30-60min. Following the curing, the chip was incubated with Sulfo-SMCC (sulphosuccinimidyl-4-(N- maleimidomethyl)-cyclohexane-1-carboxylate) (2 mgno-weight capsules (Pierce)) for >3hrs, a bifunctional crosslinker that binds amine groupsof the APTES through a NHS-ester group, while providing a free maleimide group on theother end. Chips were then rinsed in PBS for 15 min and incubated with Nsp1 for ∼1hr, which reacted with the maleimides through the cysteine present on its C-terminus,forming stable covalent bonds. The chips were finally rinsed with PBS to remove un-specifically bound proteins
6.4.2. ELECTRICAL ION-CURRENT MEASUREMENTS
The buffer employed in nanopore experiments was 150 mM KCl, 10mM Tris, 1mM EDTA,pH 7.4. Current data were recorded in real-time using a commercial amplifier (Axopatch200B,Molecular devices), which applies a 100kHz low-pass filtering, and digitized at 250kHz(Digidata 1322A DAQ). Raw traces were further filtered digitally at 5kHz, and processedusing a custom-written Matlab script[42].
6.4.3. QCM-D SAMPLE PREPARATION AND DATA ACQUISITION
QSense Analyzer chips were treated as in Ref.[27]. Briefly, gold-coated quartz chips (Bi-olin Scientific, Sweden) were cleaned with RCA-1 protocol, consisting of 30% H2O2, 30%NH4OH, and deionized water in 1:1:5 ratio, at 75°C for ∼15-30 min. Subsequently, chips

6
156 CHAPTER 6
were rinsed with deionized water, sonicated in pure ethanol for ∼10min, and blow-driedwith nitrogen. QCM-D flow-cells were sonicated in 2% SDS for ∼30min, rinsed in deion-ized water, and blow-dried with nitrogen. Prior to the experiment, Nsp1 proteins wereincubated with 100×TCEP to break disulfide bonds. QCM-D data were recorded at sub-ms temporal resolution using Qsoft (Biolin scientific), and analysed using a custom-written Matlab script. Plotted dissipation and normalized frequency shifts correspondto the 5th harmonic, namely ∆D5 and ∆ f5/5, respectively.
6.4.4. PURIFICATION OF KAP95We refer to Ref.[27] for details on the purification of Kap95.

6. STUDYING KARYOPHERINS OCCUPANCY USING BIOMIMETIC NANOPORES
6
157
6.5. SUPPORTING INFORMATION
6.5.1. 1/F NOISE COMPARISON OF BARE PORE VS NSP1-COATED PORE
Figure S6.6: Current PSD spectra for a bare pore (black) vs a Nsp1-coated pore (red), illustrating the pro-nounced increase in 1/f noise upon coating the pore with Nsp1.

6
158 CHAPTER 6
6.5.2. ADDITIONAL TRACES OF FAST KAP95 TRANSLOCATIONS
Figure S6.7: Additional current traces showing fast Kap95 translocation events through a Nsp1-coated poreunder 50mV (left, purple) and 100mV (right, blue).

REFERENCES
6
159
REFERENCES[1] S. J. Kim, J. Fernandez-Martinez, I. Nudelman, Y. Shi, W. Zhang, B. Raveh, T. Her-
ricks, B. D. Slaughter, J. A. Hogan, P. Upla, I. E. Chemmama, R. Pellarin, I. Echeverria,M. Shivaraju, A. S. Chaudhury, J. Wang, R. Williams, J. R. Unruh, C. H. Greenberg,E. Y. Jacobs, Z. Yu, M. J. de la Cruz, R. Mironska, D. L. Stokes, J. D. Aitchison, M. F.Jarrold, J. L. Gerton, S. J. Ludtke, C. W. Akey, B. T. Chait, A. Sali, and M. P. Rout, In-tegrative structure and functional anatomy of a nuclear pore complex, Nature 555,475 (2018).
[2] L. M. Veenhoff, J. Kipper, O. Karni-Schmidt, S. Dokudovskaya, W. Zhang, A. Sali,D. Devos, M. P. Rout, A. Suprapto, F. Alber, R. Williams, and B. T. Chait, Determiningthe architectures of macromolecular assemblies, Nature 450, 683 (2007).
[3] S. R. Wente, Gatekeepers of the Nucleus, Science 288, 1374 (2000).
[4] L. J. Terry and S. R. Wente, Flexible Gates: Dynamic Topologies and Functions for FGNucleoporins in Nucleocytoplasmic Transport, Eukaryotic Cell 8, 1814 (2009).
[5] J. Yamada, J. L. Phillips, S. Patel, G. Goldfien, A. Calestagne-Morelli, H. Huang,R. Reza, J. Acheson, V. V. Krishnan, S. Newsam, A. Gopinathan, E. Y. Lau, M. E.Colvin, V. N. Uversky, and M. F. Rexach, A Bimodal Distribution of Two DistinctCategories of Intrinsically Disordered Structures with Separate Functions in FG Nu-cleoporins, Molecular and Cellular Proteomics 9, 2205 (2010).
[6] M. Stewart, Molecular mechanism of the nuclear protein import cycle, Nature Re-views Molecular Cell Biology 8, 195 (2007).
[7] G. David, S. R. H, and M. P. Rout, Nuclear export dynamics of RNA-protein com-plexes, Journal of Chemical and Pharmaceutical Research 6, 504 (2014).
[8] R. Y. Lim and L. E. Kapinos, How to operate a nuclear pore complex by kap-centriccontrol, Nucleus 6, 366 (2015).
[9] M. P. Rout, J. D. Aitchison, M. O. Magnasco, and B. T. Chait, Virtual gating andnuclear transport: The hole picture, Trends in Cell Biology 13, 622 (2003).
[10] S. Frey, FG-Rich Repeats of Nuclear Pore Proteins with Hydrogel-Like Properties, Sci-ence (New York, N.Y.) 314, 815 (2006).
[11] S. Frey and D. Görlich, A Saturated FG-Repeat Hydrogel Can Reproduce the Perme-ability Properties of Nuclear Pore Complexes, Cell 130, 512 (2007).
[12] L. E. Kapinos, R. L. Schoch, R. S. Wagner, K. D. Schleicher, and R. Y. Lim,Karyopherin-centric control of nuclear pores based on molecular occupancy and ki-netic analysis of multivalent binding with FG nucleoporins, Biophysical Journal 106,1751 (2014).
[13] R. Peters, Translocation through the nuclear pore complex: Selectivity and speed byreduction-of-dimensionality, Traffic 6, 421 (2005).
6
160 REFERENCES
[14] R. Y. H. Lim, B. Fahrenkrog, J. Köser, K. Schwarz-Herion, J. Deng, and U. Aebi,Nanomechanical basis of selective gating by the nuclear pore complex, Science 318,640 (2007).
[15] K. D. Schleicher, S. L. Dettmer, L. E. Kapinos, S. Pagliara, U. F. Keyser, S. Jeney, andR. Y. Lim, Selective transport control on molecular velcro made from intrinsicallydisordered proteins, Nature Nanotechnology 9, 525 (2014).
[16] L. E. Kapinos, B. Huang, C. Rencurel, and R. Y. Lim, Karyopherins regulate nu-clear pore complex barrier and transport function, Journal of Cell Biology 216, 3609(2017).
[17] R. Bayliss, T. Littlewood, and M. Stewart, Structural basis for the interaction betweenFxFG nucleoporin repeats and importin-β in nuclear trafficking, Cell 102, 99 (2000).
[18] T. Dange, D. Grünwald, A. Grünwald, R. Peters, and U. Kubitscheck, Autonomyand robustness of translocation through the nuclear pore complex: A single-moleculestudy, Journal of Cell Biology 183, 77 (2008).
[19] K. Ribbeck and D. Görlich, Kinetic analysis of translocation through nuclear porecomplexes, The EMBO journal 20, 1320 (2001).
[20] T. Jovanovic-Talisman, J. Tetenbaum-Novatt, A. S. McKenney, A. Zilman, R. Peters,M. P. Rout, and B. T. Chait, Artificial nanopores that mimic the transport selectivityof the nuclear pore complex, Nature 457, 1023 (2009).
[21] S. W. Kowalczyk, L. Kapinos, T. R. Blosser, T. Magalhães, P. van Nies, R. Y. H. Lim,and C. Dekker, Single-molecule transport across an individual biomimetic nuclearpore complex, Nature Nanotechnology 6, 433 (2011).
[22] N. B. Eisele, S. Frey, J. Piehler, D. Görlich, and R. P. Richter, Ultrathin nucleoporinphenylalanine-glycine repeat films and their interaction with nuclear transport re-ceptors, EMBO Reports 11, 366 (2010).
[23] B. Malekian, L. E. Kapinos, R. L. Schoch, G. Ferrand -Drake del Castillo, K. Xiong,R. Y. H. Lim, G. Emilsson, A. Dahlin, and T. Robson, Detecting Selective ProteinBinding Inside Plasmonic Nanopores: Toward a Mimic of the Nuclear Pore Complex,Frontiers in Chemistry 6 (2018), 10.3389/fchem.2018.00637.
[24] R. L. Schoch, L. E. Kapinos, and R. Y. Lim, Nuclear transport receptor binding avid-ity triggers a self-healing collapse transition in FG-nucleoporin molecular brushes,Proceedings of the National Academy of Sciences of the United States of America109, 16911 (2012).
[25] H. B. Schmidt and D. Görlich, Nup98 FG domains from diverse species spontaneouslyphase-separate into particles with nuclear pore-like permselectivity, eLife 2015, 1(2015).

REFERENCES
6
161
[26] A. N. Ananth, A. Mishra, S. Frey, A. Dwarkasing, R. Versloot, E. van der Giessen,D. Görlich, P. Onck, and C. Dekker, Spatial structure of disordered proteins dictatesconductance and selectivity in nuclear pore complex mimics, eLife 7, 1 (2018).
[27] A. Fragasso, H. W. de Vries, J. Andersson, E. O. van der Sluis, E. van der Giessen,A. Dahlin, P. R. Onck, and C. Dekker, A designer FG-Nup that reconstitutes the selec-tive transport barrier of the nuclear pore complex, Nature communications 12, 2010(2021).
[28] A. Fragasso, S. Schmid, and C. Dekker, Comparing Current Noise in Biological andSolid-State Nanopores, ACS Nano , acsnano.9b09353 (2020).
[29] S. Machlup, Noise in semiconductors: Spectrum of a two-parameter random signal,Journal of Applied Physics 25, 341 (1954).
[30] F. Hooge, 1/F Noise, Physica B+C 83, 14 (1976).
[31] R. M. M. Smeets, N. H. Dekker, and C. Dekker, Low-frequency noise in solid-statenanopores, Nanotechnology 20 (2009), 10.1088/0957-4484/20/9/095501.
[32] R. M. M. Smeets, U. F. Keyser, N. H. Dekker, and C. Dekker, Noise in solid-statenanopores, Proceedings of the National Academy of Sciences of the United States ofAmerica 105, 417 (2008).
[33] A. Fragasso, S. Pud, and C. Dekker, 1/F Noise in Solid-State Nanopores Is GovernedBy Access and Surface Regions, Nanotechnology 30, 395202 (2019).
[34] R. S. Wagner, L. E. Kapinos, N. J. Marshall, M. Stewart, and R. Y. Lim, Promiscuousbinding of karyopherinβ1 modulates FG nucleoporin barrier function and expeditesNTF2 transport kinetics, Biophysical Journal 108, 918 (2015).
[35] O. Otto and U. F. Keyser, DNA Translocation, in Engineered Nanopores for Bioana-lytical Applications: A Volume in Micro and Nano Technologies (2013) pp. 31–58.
[36] A. Ananth, M. Genua, N. Aissaoui, L. Díaz, N. B. Eisele, S. Frey, C. Dekker, R. P.Richter, and D. Görlich, Reversible Immobilization of Proteins in Sensors and Solid-State Nanopores, Small 14, 1703357 (2018).
[37] I. Reviakine, D. Johannsmann, and R. P. Richter, Hearing what you cannot see andvisualizing what you hear: Interpreting quartz crystal microbalance data from sol-vated interfaces, Analytical Chemistry 83, 8838 (2011).
[38] N. B. Eisele, A. A. Labokha, S. Frey, D. Görlich, and R. P. Richter, Cohesiveness tunesassembly and morphology of FG nucleoporin domain meshworks - Implications fornuclear pore permeability, Biophysical Journal 105, 1860 (2013).
[39] J. Ma, A. Goryaynov, A. Sarma, and W. Yang, Self-regulated viscous channel inthe nuclear pore complex, Proceedings of the National Academy of Sciences of theUnited States of America 109, 7326 (2012).

6
162 REFERENCES
[40] N. Klughammer and C. Dekker, Palladium zero-mode waveguides for optical single-molecule detection with nanopores, Nanotechnology 32, 18LT01 (2021).
[41] M. Van Den Hout, A. R. Hall, M. Y. Wu, H. W. Zandbergen, C. Dekker, and N. H.Dekker, Controlling nanopore size, shape and stability, Nanotechnology 21 (2010),10.1088/0957-4484/21/11/115304.
[42] C. Plesa and C. Dekker, Data analysis methods for solid-state nanopores, Nanotech-nology 26, 84003 (2015).

7RECONSTITUTION OF ULTRAWIDE
DNA ORIGAMI PORES IN
LIPOSOMES FOR TRANSMEMBRANE
TRANSPORT OF MACROMOLECULES
Molecular traffic across lipid membranes is a vital process in cell biology that involvesspecialized biological pores with a great variety of pore diameters, from fractions of ananometer to >30 nm. Creating artificial membrane pores covering similar size and com-plexity will aid the understanding of transmembrane molecular transport in cells, whileartificial pores are also a necessary ingredient for synthetic cells. Here, we report the con-struction of DNA origami nanopores that have an inner diameter as large as 30 nm. Wedeveloped methods to successfully insert these ultrawide pores into the lipid membrane ofgiant unilamellar vesicles (GUVs) by administering the pores concomitantly with vesicleformation in an inverted-emulsion cDICE technique. The reconstituted pores permit thetransmembrane diffusion of large macromolecules such as folded proteins, which demon-strates the formation of large membrane-spanning open pores. The pores are size selectiveas dextran molecules with a diameter up to 28 nm can traverse the pores, whereas largerdextran molecules are blocked. By FRAP measurements and modelling of the GFP influxrate, we find that up to hundreds of pores can be functionally reconstituted into a sin-gle GUV. Our technique bears great potential for applications across different fields frombiomimetics, synthetic biology, to drug delivery.
This chapter has been published as: Alessio Fragasso, Nicola De Franceschi, Pierre Stömmer, Eli O. van derSluis, Hendrik Dietz, Cees Dekker. Reconstitution of ultrawide DNA origami pores in liposomes for transmem-brane transport of macromolecules. ACS Nano 15(8), 12768-12779 (2021) [1].
163

7
164 CHAPTER 7
7.1. INTRODUCTIONIn the last decade, advancements in the field of DNA nanotechnology have enabled thefabrication of a great variety of ‘DNA origami’ nanostructures[2, 3], including transmem-brane structures that resemble the biological pores found in cells[4]. Drawing inspi-ration from protein pores such as alpha-hemolysin[5], artificial pores have been engi-neered with DNA origami[2, 3] that can insert into lipid bilayers and allow for trans-membrane diffusion of ions[6, 7] and small molecules such as fluorophores[8, 9], DNAoligomers[6, 8], short PEG[10], and dextran[9, 11]. To favor partitioning into the lipid bi-layer, a popular strategy relies on the chemical modification of the outer nanopore sur-face with hydrophobic groups, e.g. cholesterols, that anchor and stabilize the stronglyhydrophilic DNA-based nanopores into the lipid membrane[4]. As DNA origami struc-tures can be designed with virtually any shape or size[12] up to the dimensions com-parable to those of viruses[13], the approach bears great potential for various applica-tions, from recapitulating the function of complex enzymes like flippase[14], to mimick-ing large protein transporters such as the nuclear pore complex[15, 16].
However, so far only small pores with an inner diameter of a few nm have beenrealized[9, 11], which is because wider pores are increasingly difficult to insert into amembrane. A commonly used strategy to reconstitute pores into a bilayer relies on spon-taneous insertion into a preformed lipid membrane[4]. This method relies on transientmembrane instabilities[17] and becomes quickly ineffective for larger size objects. Thisis because the work required to open up a hole in a membrane grows quadratically withthe diameter of the hole[7, 9, 18], and spontaneous creation of such a hole occurs in aBoltzmann weighted fashion, which exponentially decreases the chances of success forinserting large pores into spontaneously occurring membrane defects. Scaling up thesize of artificial pores thus requires an alternative insertion process that can circumventthe barriers associated with spontaneous insertion.
Here, we overcome these challenges by employing a continuous droplet interfacecrossing encapsulation (cDICE) technique[19] to incorporate ultrawide (∼30 nm innerdiameter, ∼55 nm outer diameter) DNA origami pores into the membrane of giant unil-amellar vesicles (GUVs). As we show below, by administering the pores concomitantlywith vesicle formation, the pores can be localized efficiently at the membrane. To demon-strate the transmembrane transport through the pores, we measured the influx of mul-tiple fluorescent macromolecules with different sizes using confocal microscopy. Wefind that the origami pores indeed support the transit of large (up to 28 nm) molecularstructures, consistent with the 30 nm inner diameter of the pores. Using fluorescencerecovery after photobleaching (FRAP), we estimate that up to hundreds of pores can befunctionally reconstituted in a single liposome. These ultrawide pores represent an ex-citing tool for various applications, from the mimicking of large biological pores such asthe nuclear pore complex, to applications in synthetic biology and drug delivery.
7.2. RESULTS
7.2.1. DESIGN AND ASSEMBLY OF ULTRAWIDE DNA ORIGAMI PORES
Using DNA origami folding of a template strand[2, 3], we designed and assembled a rigidoctagonal ring-like structure, see Fig.7.1. A multi-layer DNA origami object was designed

7. RECONSTITUTION OF ULTRAWIDE DNA ORIGAMI PORES IN LIPOSOMES
7
165
in square-lattice helical packing and folded from a 7560 bases long scaffold single strandwith 240 individual oligonucleotide single strands, arranged in a 4×4 double-helical pat-tern. It was designed to form a closed-loop octagonal shape, formed by 8 corner designmotifs[20] with single-stranded poly-T strands at the corner sites.
Figure 7.1: DNA origami pore design and incorporation approach. a, DNA origami pore in front (left) and sideview (right). Blue cylinders represent DNA double helices. The outer diameter is 55 nm, the inner diameter is35 nm. Green objects along the outer side of the DNA origami pore indicate the 32 cholesterol modifications.They vertically span over a width of ∼3 nm (purposely slightly less than the hydrophobic thickness of ∼3.7 nmof a DOPC-lipid bilayer[21]). Black cylinders represent an asymmetric feature that was introduced for classaveraging of single particles from TEM. Violet spots along the outer surface of the DNA origami pore indicatethe positions of 12 Atto647N dye modifications. The pore is designed with a height of 10 nm. b, Schematicrepresentation of K10-PEG5k coating of the origami pore. c, Schematic representation of the DNA origamipore incorporated into the lipid bilayer of a GUV. Left: a GUV with pores incorporated in the lipid bilayer;middle: zoom-in on one of the incorporated origami pores resulting in a 30 nm diameter hole; right: a furtherzoom-in showing individual lipid molecules of the bilayer; white spheres represent lipid heads, white strokesrepresent lipid tails, the green object represents a cholesterol.
Deletions were introduced every 32 bases to correct for global twist[22]. The origamipore was designed with a nominal outer diameter of 55 nm, an inner diameter of 35 nm,and a height of 10 nm (Fig.7.1a) which represents the channel length. The design in-cludes 48 single stranded handles that were distributed evenly on the interior surfacefacing the central cavity, as sites for future functionalization purposes (Fig.S7.24). Theoctagon furthermore included 32 cholesterol modifications on the outer surface thatwere arranged evenly with a ∼5.5 nm horizontal spacing and ∼3 nm vertical distance be-tween neighboring cholesterols (Fig.7.1a). An asymmetric feature was added (Fig.7.1b)
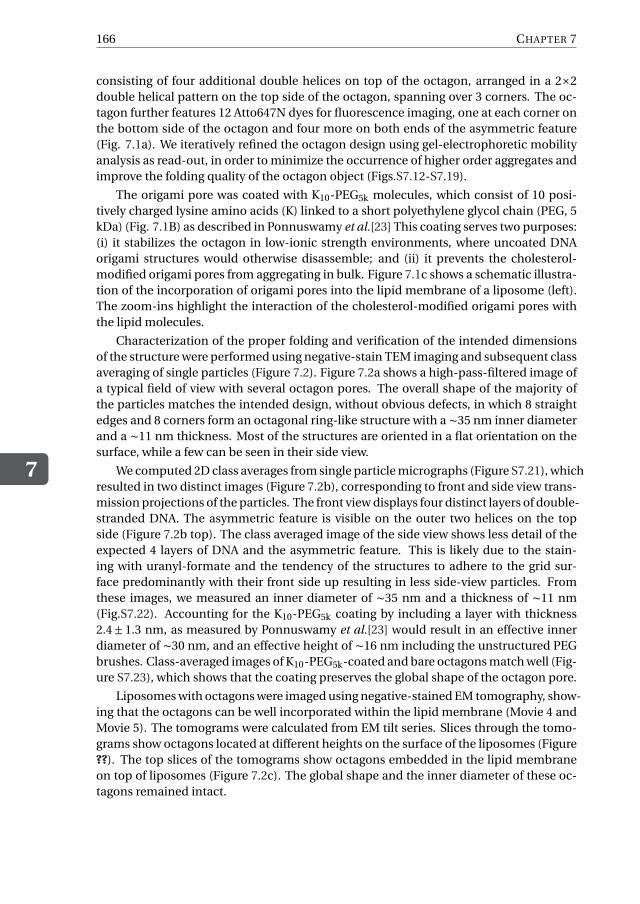
7
166 CHAPTER 7
consisting of four additional double helices on top of the octagon, arranged in a 2×2double helical pattern on the top side of the octagon, spanning over 3 corners. The oc-tagon further features 12 Atto647N dyes for fluorescence imaging, one at each corner onthe bottom side of the octagon and four more on both ends of the asymmetric feature(Fig. 7.1a). We iteratively refined the octagon design using gel-electrophoretic mobilityanalysis as read-out, in order to minimize the occurrence of higher order aggregates andimprove the folding quality of the octagon object (Figs.S7.12-S7.19).
The origami pore was coated with K10-PEG5k molecules, which consist of 10 posi-tively charged lysine amino acids (K) linked to a short polyethylene glycol chain (PEG, 5kDa) (Fig. 7.1B) as described in Ponnuswamy et al.[23] This coating serves two purposes:(i) it stabilizes the octagon in low-ionic strength environments, where uncoated DNAorigami structures would otherwise disassemble; and (ii) it prevents the cholesterol-modified origami pores from aggregating in bulk. Figure 7.1c shows a schematic illustra-tion of the incorporation of origami pores into the lipid membrane of a liposome (left).The zoom-ins highlight the interaction of the cholesterol-modified origami pores withthe lipid molecules.
Characterization of the proper folding and verification of the intended dimensionsof the structure were performed using negative-stain TEM imaging and subsequent classaveraging of single particles (Figure 7.2). Figure 7.2a shows a high-pass-filtered image ofa typical field of view with several octagon pores. The overall shape of the majority ofthe particles matches the intended design, without obvious defects, in which 8 straightedges and 8 corners form an octagonal ring-like structure with a ∼35 nm inner diameterand a ∼11 nm thickness. Most of the structures are oriented in a flat orientation on thesurface, while a few can be seen in their side view.
We computed 2D class averages from single particle micrographs (Figure S7.21), whichresulted in two distinct images (Figure 7.2b), corresponding to front and side view trans-mission projections of the particles. The front view displays four distinct layers of double-stranded DNA. The asymmetric feature is visible on the outer two helices on the topside (Figure 7.2b top). The class averaged image of the side view shows less detail of theexpected 4 layers of DNA and the asymmetric feature. This is likely due to the stain-ing with uranyl-formate and the tendency of the structures to adhere to the grid sur-face predominantly with their front side up resulting in less side-view particles. Fromthese images, we measured an inner diameter of ∼35 nm and a thickness of ∼11 nm(Fig.S7.22). Accounting for the K10-PEG5k coating by including a layer with thickness2.4± 1.3 nm, as measured by Ponnuswamy et al.[23] would result in an effective innerdiameter of ∼30 nm, and an effective height of ∼16 nm including the unstructured PEGbrushes. Class-averaged images of K10-PEG5k-coated and bare octagons match well (Fig-ure S7.23), which shows that the coating preserves the global shape of the octagon pore.
Liposomes with octagons were imaged using negative-stained EM tomography, show-ing that the octagons can be well incorporated within the lipid membrane (Movie 4 andMovie 5). The tomograms were calculated from EM tilt series. Slices through the tomo-grams show octagons located at different heights on the surface of the liposomes (Figure??). The top slices of the tomograms show octagons embedded in the lipid membraneon top of liposomes (Figure 7.2c). The global shape and the inner diameter of these oc-tagons remained intact.

7. RECONSTITUTION OF ULTRAWIDE DNA ORIGAMI PORES IN LIPOSOMES
7
167
Figure 7.2: Negative-staining TEM and class averaging of the DNA origami pores. a, Typical field of view ofa negative-stained DNA-origami sample. The pores in this image were prepared as described in the Methodssection. The image is high-pass filtered with a radius of 20 nm and auto leveled in Photoshop. Scale bar: 50nm. b, Top: Front view class average of N=682 single particles (Fig.S7.21, left). Bottom: Side view class averageof N=80 single particles (Fig.S7.21, right). Scale bar: 25 nm. c, Two exemplary slices of negative-stained TEMtomograms calculated from EM tilt series, showing octagons (indicated by white arrows) embedded in themembrane of liposomes at a z-height away from the TEM support surface. See SI Fig.?? for a z-stack of theTEM tomography data. Scale bar: 50 nm.

7
168 CHAPTER 7
7.2.2. DNA ORIGAMI PORE RECONSTITUTION IN LIPOSOMES BY CDICEWe first tested spontaneous insertions observed for our 55 nm (outer diameter) largeDNA origami pores into free-standing planar lipid bilayers or into pre-formed GUVs, un-der various conditions and with different nanopore versions with either 32 or 64 choles-terols. As expected, these attempts were unsuccessful. While membrane interactionsdrove the DNA origami objects to adhere on the GUVs (Fig.S7.25), there was a total lackof influx of molecules (Fig.S7.27), indicating that no actual pores were created with afunctional transmembrane opening.
Figure 7.3: Reconstitution of wide DNA origami pores in GUVs by cDICE. Schematics of the cDICE workflow.A section of the rotating chamber is depicted, including the oil and outer buffer phases. Origami pores areindicated in yellow.
We therefore used an alternative approach where we incorporate the DNA origamipores during the process of the formation of the GUVs. We employed an inverted emul-sion technique called cDICE[19] which yields unilamellar liposomes with good encap-sulation of a large variety of macromolecules[24]. Briefly, in cDICE, layers of buffer so-lution and lipid-in-oil suspension are deposited subsequently in a rotating chamber. Asillustrated in Fig.7.3, an inner buffer solution containing the origami pores is then in-jected through a capillary into the rotating lipid-in-oil suspension at a constant flow rate.Shear forces due to the rotation result in detachment of droplets from the capillary ori-fice. While travelling through the oil phase, these droplets acquire a first monolayer oflipids where the origami pores can insert. A second monolayer is subsequently formedwhen the droplets cross the oil-water interface, resulting in GUVs that are eventuallycollected from the outer buffer solution. In this cDICE process, we thus aimed to recon-stitute the pore within the lipid monolayer that is formed in the water-in-oil dropletsduring the first step of cDICE. Whereas the origami rings with 64 cholesterols mainly re-sulted in formation of large aggregates at the droplet interface (Fig.S7.28), the rings with32-cholesterols appeared to interact with the lipid monolayer without inducing signifi-cant aggregation, suggesting a more promising route. Hereafter, we report the results forthe 32-cholesterols version of the DNA origami rings.
In a standard cDICE protocol[24], the inner buffer solution that is injected containseither sucrose or Optiprep[24] to obtain an optimal density of the inner GUV solution.We found, however, that in these conditions the reconstitution of 32-cholesterols origamirings was inefficient, with most of the origami pores remaining in solution after vesicle
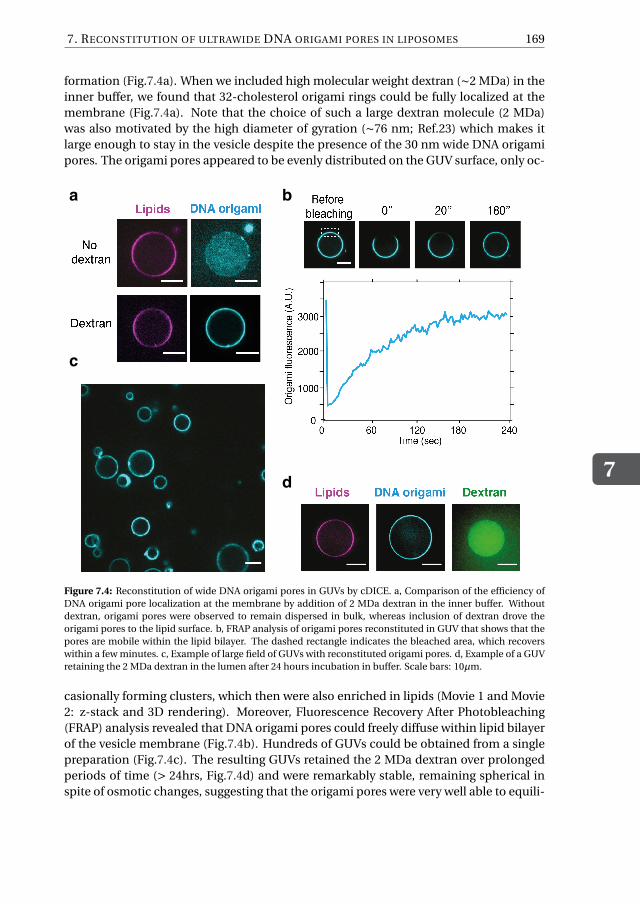
7. RECONSTITUTION OF ULTRAWIDE DNA ORIGAMI PORES IN LIPOSOMES
7
169
formation (Fig.7.4a). When we included high molecular weight dextran (∼2 MDa) in theinner buffer, we found that 32-cholesterol origami rings could be fully localized at themembrane (Fig.7.4a). Note that the choice of such a large dextran molecule (2 MDa)was also motivated by the high diameter of gyration (∼76 nm; Ref.23) which makes itlarge enough to stay in the vesicle despite the presence of the 30 nm wide DNA origamipores. The origami pores appeared to be evenly distributed on the GUV surface, only oc-
a b
c
d
Figure 7.4: Reconstitution of wide DNA origami pores in GUVs by cDICE. a, Comparison of the efficiency ofDNA origami pore localization at the membrane by addition of 2 MDa dextran in the inner buffer. Withoutdextran, origami pores were observed to remain dispersed in bulk, whereas inclusion of dextran drove theorigami pores to the lipid surface. b, FRAP analysis of origami pores reconstituted in GUV that shows that thepores are mobile within the lipid bilayer. The dashed rectangle indicates the bleached area, which recoverswithin a few minutes. c, Example of large field of GUVs with reconstituted origami pores. d, Example of a GUVretaining the 2 MDa dextran in the lumen after 24 hours incubation in buffer. Scale bars: 10µm.
casionally forming clusters, which then were also enriched in lipids (Movie 1 and Movie2: z-stack and 3D rendering). Moreover, Fluorescence Recovery After Photobleaching(FRAP) analysis revealed that DNA origami pores could freely diffuse within lipid bilayerof the vesicle membrane (Fig.7.4b). Hundreds of GUVs could be obtained from a singlepreparation (Fig.7.4c). The resulting GUVs retained the 2 MDa dextran over prolongedperiods of time (> 24hrs, Fig.7.4d) and were remarkably stable, remaining spherical inspite of osmotic changes, suggesting that the origami pores were very well able to equili-

7
170 CHAPTER 7
brate osmotic differences by allowing osmolytes to rapidly cross the membrane. All in all,the data indicate the successful insertion of wide DNA origami pores in the membraneof GUVs.
7.2.3. PROTEIN INFLUX THROUGH THE PORES DEMONSTRATES THEIR TRANS-MEMBRANE TRANSPORT CAPABILITIES
To assess whether the DNA origami pores were functional, i.e., inserted in the intendedorientation that allows for transmembrane transport through the central cavity of theoctagon, we tested the influx of IBB-mEGFP-Cys, a 34.6 kDa variant of the soluble greenfluorescent protein that includes an importinβ binding domain[25] (see supporting in-formation 7.5.23), henceforth referred to as ‘GFP’ for simplicity.
Figure 7.5: Schematic of the influx experiment. Left: Sketch of a vesicle (red) containing pores (blue), thatis incubated with GFP (green). Right: Fluorescence intensities Iin and Iout that are expected to be measuredin a time-lapse experiment on the dashed purple and yellow areas, respectively. The right part of the graphillustrates the end-point intensities after ∼24hrs, after an initial transient.
We measured the normalized fluorescence intensity difference In,diff=(Iout-Iin)/Iout
of the vesicles, i.e., the difference between in-vesicle intensity (Iin) and the outer bulk(Iout) divided by Iout (Fig.7.5) after overnight incubation of the GUVs in an outer solutionwith 2.3µM of GFP. While pore-less vesicles (control, Fig.7.6a) remained empty yieldinga finite value In,diff= 0.13± 0.05 (errors are S.D., N=34), the pore-containing liposomesshowed influx of GFP for about 50% of the vesicles (Fig.7.6b): Half of the vesicles ex-hibited an almost complete saturation to In1,diff= 0.01±0.03 (N=45), while the other halfyielded In2,diff= 0.09± 0.03 (N=45), i.e., no significant change compared to the control.We note that heterogeneity in GUV samples is a widely reported phenomenon[26], thathere apparently is associated with variations in the efficiency of pore insertion duringvesicle formation in cDICE. Most importantly, a clear fraction of the liposomes unam-biguously showed transmembrane transport of the folded proteins, indicating transportthrough the ultrawide DNA origami pores.

7. RECONSTITUTION OF ULTRAWIDE DNA ORIGAMI PORES IN LIPOSOMES
7
171
a b
Figure 7.6: a, Influx experiment with vesicles that were not subjected to DNA-pore insertion. Top right: sketchof a pore-less vesicle that excludes GFP. Top left: example of fluorescence image for a pore-less vesicle (cyan)that prevents GFP (green) from entering the vesicle, showing up as a darker area signifying the absence of GFP.Bottom: histogram of the normalized end-point intensity difference (Iout-Iin)/Iout for the pore-less vesicles,verifying that no vesicles showed GFP influx. b, Influx experiment with vesicles that were functionalized withorigami pores. Top right: sketch of a pore-containing vesicle filled with GFP. Top left: example of fluorescenceimage for a pore-containing vesicle (cyan) that allows GFP to diffuse (green) into the vescicle, resulting in Iout-Iin≈0. Bottom: histogram showing normalized end-point intensity difference (Iout-Iin)/Iout for the pore-lessvesicles. We find that ∼50% of the vesicle population manifested GFP influx. Scale bars: 10µm.

7
172 CHAPTER 7
Next, we characterized the GFP influx rate quantitatively using a FRAP assay (Fig.7.7a).In this experiment, we selected pore-containing vesicles that showed that influx oc-curred during the overnight incubation (i.e., those with In,diff≈0), then photobleachedthe inner part, and subsequently measured the recovery of the fluorescence signal. Anexample of FRAP experiment is shown in Fig.7.7b (top) and Movie 3. Starting from anequilibrium state where Iin≈Iout (Fig.7.7b, left), the vesicle fluorescence drops upon pho-tobleaching to a level comparable to the one of an empty vesicle, to subsequently fullyrecover within a few minutes (Fig.7.7b, right). Notably this timescale is much faster com-pared to those of previously reported fluorescence recovery with DNA origami pores[8,9]. A control with vesicles lacking pores (Fig.7.7b, bottom) resulted in no appreciable re-covery upon photobleaching. Figure 7.7c displays Iin and Iout for a pore-containing GUVas a function of time where, after initial transient behavior (grey area), Iout is constant,whereas Iin continues to slowly increase over time, which represents the influx of GFPthrough the ultrawide DNA origami pores.
To obtain the number of functional pores, we model the influx rate using a diffusionmodel derived from the Fick’s first law[27]
Φ=−Ddc
d x, (7.1)
which describes the fluxΦ of GFP molecules with diffusion constant D , as a result of theconcentration gradient dc
d x between the outer (cout ) and inner (ci n) environment of theGUV. The fluxΦ is defined as number of molecules d N crossing a membrane area d A ina time d t . Since the vesicle volume V is constant over time, the in-vesicle concentrationci n(t ) is a time-dependent variable that reflects the fact that the vesicle is filling up over
time, i.e., dci n (t )d t = 1
Vd Nd t .
The outside concentration cout instead is assumed to be constant over time, whichis reasonable given the large volume (∼ 200 µL) of the bulk solution as compared to the∼pL volume of the vesicle. Assuming that the diffusion occurs through a number Np ofDNA origami pores that each have a length Lp and an area Ap , yielding a total integratedarea A = Ap Np , we can rewrite 7.1 as the first order differential equation
dci n(t )
d t= AD
V
cout − ci n(t )
Lp, (7.2)
which, with ci n(t = 0) = ci n,st ar t , has a solution
ci n(t ) = cout − (cout − ci n,st ar t )e− De f f A
V Lpt. (7.3)
Note, however, that for the transport through the pores, we need to employ an effectivediffusion constant De f f which is reduced compared to the bulk diffusion constant D toaccount for the confined transport through the pores, as reported by Dechadilok andDeen[28]. For our pore dimensions, this results in almost a factor of 2 decrease of theGFP diffusivity, i.e., De f f = 0.54Dbulk . Upon rearranging Equation 7.3, we then finallyobtain
cout − ci n(t )
cout=
(1− ci n,st ar t
cout
)e− De f f Ap Np
V Lpt. (7.4)

7. RECONSTITUTION OF ULTRAWIDE DNA ORIGAMI PORES IN LIPOSOMES
7
173
As the measured fluorescence intensities are a good measure for the protein concen-trations of the fluorescent GFP, we can use Equation 7.4 to fit the In,diff(t) data, withci n,st ar t /cout and Np as fit parameters. Figure 7.7d provides an example, showing anexcellent fit to the FRAP data. From fitting FRAP curves acquired from different vesicles,we find that the estimated number of pores Np varies between a few to a few hundredper GUV. Despite the substantial scatter in the extracted Np (grey circles in Fig.7.7e),which we attribute to the stochasticity inherent to the vesicle production and origamiinsertion during cDICE, we do observe an overall increase of Np with the vesicle diam-eter. Assuming that all origami pores would move from the volume into the membraneduring GUV formation, Np should scale with the cube of the vesicle diameter, which isconsistent with the behavior observed (black line in Fig.7.7e).
7.2.4. THE ULTRAWIDE DNA ORIGAMI PORES ACT AS A MOLECULAR SIEVE
WITH ∼30 NM CUT OFF.To provide evidence that our DNA origami pores indeed form open channels with aneffective size of the order of the inner pore diameter of 30 nm, we tested the influx ofdextran-FITC molecules with a variety of sizes, viz, Dg ≈ 15 nm (70 kDa), 22 nm (150kDa), 28 nm (250 kDa), 39 nm (500 kDa), and 76 nm (2 MDa), see Fig.7.8, where Dg is thediameter of gyration as measured by Hanselmann and Burchard[29].
As in the GFP influx experiment, we incubated the pore-containing vesicles with 2 µMof dextran-FITC, and measured the normalized intensity difference In,diff after ∼24 hrs.This was done independently for each of the 5 molecules, keeping the same molar con-centration of dextran-FITC molecules in bulk solution. Similar to the GFP experiments(Fig. 7.6b), In,diff of pore-containing vesicles yielded two populations when incubatedwith 70kDa dextran-FITC (Fig.7.9, left), where 58% manifested influx (In1,diff,70k= 0.02±0.03, errors are S.D., N=47), while 42% remained empty (In2,diff,70k= 0.13± 0.02, N=34).Incubation with 150 kDa dextran-FITC (Fig.7.9, center-left) led to a similar result, with47% GUVs that were filled (In1,diff,150k= 0.03±0.03, N=24), against 53% of empty vesicles(In2,diff,150k= 0.11±0.03, N=27). Influx of the larger 250 kDa dextran-FITC (Fig.7.9, cen-ter) resulted in a reduced (19%), yet present, population of filled vesicles (In1,diff,250k=0.01 ± 0.02, N=8), while 79% (In2,diff,250k= 0.10 ± 0.02, N=34) showed no sign of influx.Importantly, this demonstrates that very large (250 kDa; 28 nm) macromolecules canbe transported across the ultrawide DNA origami nanopores. By contrast, incubationwith the even larger 500 kDa and 2 MDa dextran-FITC (Fig.7.9, center-right and right)resulted in only one population of empty vesicles, with In,diff,500k= 0.13± 0.03 (N=49),and In,diff,2M= 0.09± 0.04 (N=98), respectively, indicating a lack of any transmembranetransport during 24 hours. This is fully consistent with expectations as their size clearlyexceeds the 30 nm size of the origami pore. It is also consistent with the use of 2 MDadextran as a macromolecular crowder, cf. Fig. 7.4d.
7.3. CONCLUSIONIn this work, we achieved functional reconstitution of ultrawide DNA origami pores ingiant liposomes, obtaining stable transmembrane pores of 30 nm inner diameter withinthe lipid bilayer. We successfully achieved the pore reconstitution by inserting of the

7
174 CHAPTER 7
regi
onno
n-fit
ted
a
b
c d
2) Photobleaching 3) Recovery1) Equilibrium state
e
Norm
alize
d inte
nsity
diffe
renc
e
t = 04’ 45’’ t = 01’15’’ t = 00’15’’
Iin
Iout
1.1
1.2
1.3
1.4
Inte
nsity
(a.u
.)
2 3 4 5Time (min)
10
GFP
t = 20’ 00’’ t = 10’00’’ t = 05’00’’ t = 15’ 00’’
t = 02’15’’
GFP
GFP
- origami pores No recovery after photobleaching
Full recovery after photobleaching
Atto647N
DNA origami
+ origami pores
DNA origami
0.02
0.04
0.06
0.08
0.1
2 3 4 5Time (min)
10
Vesicle diameter (µm)86 10 12 14 16
0
100
200
300
Num
ber o
f orig
ami p
ores
Figure 7.7: FRAP assay, modelling, and extraction of number of functional pores. a, Schematic of the FRAPassay: 1) the vesicle is left to equilibrate with bulk solution containing GFP; 2) GFP molecules inside the vesicleare photobleached; 3) new GFP molecules are driven through the ultrawide origami pores from the outer solu-tion, causing a recovery of the fluorescence signal. b, Example of a FRAP experiment. Top: (left) image showingthe pore-containing vesicle (origami pores in cyan) at equilibrium with the outer GFP (green) solution. Right:series of frames showing recovery (within minutes) of the GFP signal after photobleaching. Bottom: (left) im-age showing a pore-less vesicle (cyan) that excludes GFP (green) present in the outer solution. Right: seriesof frames showing the absence of a signal increase after photobleaching. c, Fluorescence intensities Iin (red)and Iout (purple) that reduce and recover after photobleaching for the vesicle shown in b. Grey area denotesthe initial transient, after which Iout can be considered constant. Inset: highlight of the regions where Iin (red)and Iout (purple) were measured. d, Normalized intensity difference In,diff over time for the vesicle illustratedin b. Data are fitted by Equation 7.4. Grey area was excluded from the fit as the model assumes a constant Iout.For such 13.3 µm diameter vesicle we estimated a number of functional pores Np = 250. e, Number of origamipores extracted from fits for different vesicles, as a function of vesicle diameter (grey circles). Averaged dataover 2.5 µm bins (red squares, error bars are S.D.) show an increase of the number of pores as a function ofvesicle diameter. Black line represents a cubic fit to the data. Scale bars: 10 µm.

7. RECONSTITUTION OF ULTRAWIDE DNA ORIGAMI PORES IN LIPOSOMES
7
175
2 MDa70kDa 150kDa
20 10 0 12 8 4 0 30 20 10 0Counts Counts Counts
-0.1
-0.05
0
0.05
0.1
0.15
0.2
Norm
alize
d in
tens
ity d
iffer
ence
(In,
diff)
2 MDa
origami pore ~ 30nm
150kDa70kDa
Dextran molecular weight (kDa)
0
20
40
60
80
Dia
met
er o
f gyr
atio
n (n
m)
102 103
500 kDa
20 10 0Counts
250kDa
250kDa
500 kDa
20 10 0Counts
a
bFigure 7.8: Diameter of gyration of dextran Dg vs molecular weight Mw . Black line is a fit of Dg = 0.072 ·M0.48
w (Ref.[29]). Dextran sizes of 70 kDa, 150 kDa, 250 kDa, 500 kDa, and 2 MDa employed in our study arehighlighted in blue, yellow, magenta, and black, respectively. Grey area underlies dextran sizes larger than theorigami pore (red) which are not expected to translocate.
2 MDa70kDa 150kDa
20 10 0 12 8 4 0 30 20 10 0Counts Counts Counts
-0.1
-0.05
0
0.05
0.1
0.15
0.2No
rmal
ized
inte
nsity
diff
eren
ce (I
n,di
ff)
2 MDa
origami pore ~ 30nm
150kDa70kDa
Dextran molecular weight (kDa)
0
20
40
60
80
Dia
met
er o
f gyr
atio
n (n
m)
102 103
500 kDa
20 10 0Counts
250kDa
250kDa
500 kDa
20 10 0Counts
a
b
Figure 7.9: Size selectivity of DNA origami nanopores. Histograms showing normalized intensity difference ofpore-containing vesicles after overnight incubation the dextran molecules. Blue indicate vesicles that showedinflux of 70 kDa, yellow bars for 150 kDa, magenta bars for 250 kDa, whereas grey bars represent empty vesicles.Dashed lines represent hypothetical populations of vesicles that would have been present if influx of 500 kDaor 2 MDa through the origami pores had occurred.

7
176 CHAPTER 7
origami pore into a lipid monolayer followed by bilayer formation. This methodologylowers the energy barrier for pore insertion, allowing functional reconstitution of poreswith much larger diameter than previously possible.
Our results open the way to a number of biomimetic applications. For example, fu-ture efforts can be directed towards the functionalization of the origami pore with FG-nucleoporins from the Nuclear Pore Complex (NPC), the macromolecular complex me-diating transport across the nuclear envelope in eukaryotes[30], as reported in previousworks[15, 16]. This will enable the creation of selective biomimetic pores that permitthe exclusive transport of specific transport receptor proteins. While such biomimeticpores constitute an exciting platform for investigating nucleocytoplasmic transport invitro, it may also be employed as a building block for synthetic cells, thus paving the waytowards the in vitro reconstitution of an artificial model of a nucleus. This will, for exam-ple, aid the study of emergent properties of liposome-confined genomes[31], by allowingthe controlled injection of genome-processing proteins. Indeed, our DNA origami poresmay be a great asset for building a synthetic cell as they provide a stable portal that islarge enough for biological macromolecules like proteins and RNAs to enter a liposome.The long-term stability and functionality of these liposomes is a particularly useful fea-ture in such synthetic-biology applications. Finally, responsive drug-delivery systemsthat release clinically relevant macromolecules such as antibodies upon stimulation byspecific biomolecules could be envisioned as well. We expect that the ultrawide DNAorigami nanopores may thus find a broad variety of different applications.
7.4. METHODS
7.4.1. DESIGN OF SCAFFOLDED DNA ORIGAMI OBJECTS
The objects were designed using caDNAno v0.2[32].
7.4.2. OPTIMAL FOLDING CONDITIONS OF THE OCTAGON
The folding reaction mixture for the octagon contained scaffold DNA[33] at a final con-centration of 10 nM and oligonucleotide strands (IDT Integrated DNA Technologies) at300 nM each. The folding reaction buffer contained 5 mM TRIS, 1 mM EDTA, 5 mM NaCl(pH 8) and 24 mM MgCl2. The folding reaction mixtures were subjected to the followingthermal annealing ramp using TETRAD (MJ Research, now Biorad) thermal cycling de-vices: 15 minutes at 65°C, followed by 16 hours at 50°C, followed by incubation at 20°Cbefore further sample preparation steps.
7.4.3. PURIFICATION OF DNA ORIGAMI NANOSTRUCTURES
Excess oligonucleotides were removed via ultrafiltration (Amicon Ultra 0.5 ml Ultracelfilters, 50K) with FoB5 (5 mM TRIS, 1 mM EDTA, 5 mM NaCl and 5 mM MgCl2) buffer[20].All centrifugation steps were performed at 10 kG for 3 minutes at 25°C. Step 1: 0.5 mlof FoB5 buffer was added to the filters and centrifuged. Step 2: 0.1 ml of folded objectsample and 0.4 ml of FoB5 buffer was added to the filters and centrifuged. Step 3: 0.45 mlFoB5 buffer was added to the filters and centrifuged. Step 3 was repeated 3 times beforea final retrieving step: the filter insets were turned upside down, placed into a new tubeand centrifuged. This concludes one round of ultrafiltration.

7. RECONSTITUTION OF ULTRAWIDE DNA ORIGAMI PORES IN LIPOSOMES
7
177
7.4.4. COATING OF THE OCTAGON
Different volumes of purified octagons were mixed with PEG-oligolysine (K10-PEG5k).The optimal amount of K10-PEG5k added was determined based on the ratio of nitrogenin amines to the phosphates in DNA (Ponnuswamy et al.[23]), to a final ratio of 0.75:1(N:P).
7.4.5. NEGATIVE-STAIN TEMA carbon Formvar grid (Electron Microscopy Sciences) was plasma-treated (45 s, 35 mA)right before use. 5 µL of uncoated octagon sample (10-50 nM DNA object concentra-tions, 5–20 mM MgCl2 concentration) was pipetted onto the grid. Coated octagon sam-ples were pipetted onto the grids without plasma-treatment, in order to reduce positivestaining effects. The sample droplets were incubated for 30-120 s on the grids and thenblotted away with filter paper. A 5 µL droplet of 2% aqueous uranyl formate (UFO) so-lution containing 25 mM sodium hydroxide was pipetted onto the grid and immediatelyblotted away. A 20 µL UFO droplet was then pipetted onto the grid, incubated for 30s and blotted away. The grids were then air dried for 20 minutes before imaging in aPhilips CM100 and an FEI Tecnai 120 microscope. Particles were picked automaticallyusing crYOLO[34] and subsequently class averaged using Relion3.0[35].
Negative stain EM tomography was used to visualize octagons at the surface of li-posomes. The samples (5 µL) containing liposomes with incorporated octagons wereincubated on the grid surface until the liquid evaporated (∼15 min). The sample was notblotted away using filter paper in an effort not to damage the liposomes through shearforces. All other grid preparation steps were the same as described before.
The tilt series were acquired at a magnification of 30000× using an FEI Tecnai 120.The stage was tilted from -50° to 50° and micrographs were acquired every 2°. The tiltseries were then processed using Etomo (IMOD)[36] to acquire tomograms. The micro-graphs were first aligned by calculating a cross correlation of the consecutive images.The tomograms were then generated using a filtered back projection. The Gaussian-Filter used a cutoff of 0.35 and a fall-off of 0.035.
7.4.6. GEL ELECTROPHORESIS OF OCTAGON SAMPLES
Octagon samples were electrophoresed on 1.5 and 2.0% agarose gels containing 0.5×tris-borate-EDTA and 5 mM MgCl2 (unless noted otherwise) for around 1-2 hours at 70 or 90V bias voltage in a gel box, cooled in a water or ice water bath. The loaded samplescontained final monomer concentrations of 10 nM (unless otherwise noted). The gelswere scanned with a Typhoon FLA 9500 laser scanner (GE Healthcare) at a resolution of25 or 50µm/pixel. Further enhancing resulting images or parts of images was performedusing Photoshop CS5.
7.4.7. DNA ORIGAMI SAMPLE PREPARATION PROTOCOL
1. Folding of DNA origami samples at previously described optimal folding condi-tions.
2. Three rounds of ultrafiltration to purify the samples of excess oligonucleotides.

7
178 CHAPTER 7
3. Addition of Atto647N modified oligonucleotide at a final oligonucleotide:DNA origamiratio of 48:1 (12 handles per DNA origami; effective 4:1 ratio).
4. One round of ultrafiltration to purify the samples of excess Atto647N oligonu-cleotides.
5. Addition of PEG-oligolysine at N:P ratio of 0.75:1, incubate at room temperatureovernight.
6. Addition of cholesterol modified oligonucleotide at a final oligonucleotide: DNAorigami ratio of 128:1 (32 handles per DNA origami; effective 4:1 ratio).
7. One round of ultrafiltration to purify the samples of excess cholesterol oligonu-cleotides.
7.4.8. REAGENTSThe 2MDa dextran (D5376), MgCl2 (M8266), glucose (G7021), Optiprep (60% (w/v) iodix-anol in water, D1556), Silicon oil (317667) and Mineral oil (M3516-1L) were purchasedfrom Sigma Aldrich. Tris-HCl (10812846001) was purchased from Roche. DOPC (1,2-dioleoyl-sn-glycero-3-phosphocholine) (850375) and DOPE-Rhodamine (1,2-dioleoyl-sn-glycero-3-phosphoethanolamine-N-(lissamine rhodamine B sulfonyl) (ammoniumsalt)) (810150C) were purchased from Avanti Lipids. Lipids were stored and resuspendedin anhydrous chloroform (288306, Sigma Alrich). Sodium dodecyl sulfate (SDS) em-ployed for cleaning steps was purchased from Sigma Aldrich. UltraPure Bovine SerumAlbumine (BSA) used for passivation of the glass coverslips was purchased by ThermoFisher.For the influx experiments, we employed 70kDa dextran-FITC (FITC:Glucose (mol/mol)= 0.004) (Sigma Aldrich), 150kDa dextran-FITC (FITC:Glucose (mol/mol) = 0.004) (SigmaAldrich) , 250kDa dextran-FITC (FITC:Glucose (mol/mol) = 0.003-0.020) (Sigma Aldrich), 500kDa dextran-FITC (FITC:Glucose (mol/mol) = 0.003-0.020) (Sigma Aldrich), and2MDa dextran-FITC (FITC:glucose (mol/mol) = 0.001-0.004) (Sigma Aldrich).
7.4.9. EXPRESSION AND PURIFICATION OF IBB-EGFPFor the expression of His14-TEV-IBB-mEGFP-Cys (‘IBB-GFP’) plasmid pSF807 (Eiseleet al.[37]) was transformed into Escherichia coli BLR cells. Cultures were grown in TBmedium supplemented with 50 µg/mL kanamycin, and expression was induced with 0.5mM IPTG during overnight incubation at 18°C, shaking at 150 rpm in baffled flasks. Cellswere harvested by centrifugation (10 min 4000 rpm, JLA8.1000 rotor), washed in 1×PBSbuffer and lysed using a French Press (Constant Systems) at 20 kpsi at 4°C in buffer A (2 MNaCl, 50 mM Tris/HCl pH 8.0, 5 mM MgCl2). Unbroken cells, debris and aggregates werepelleted in a Ti45 rotor (30 min, 40.000 rpm, 4°C), and the lysate resulting from 1 liter cellculture was applied to 2 mL (bed volume) of Ni-NTA matrix pre-washed with buffer A. Af-ter 60 min incubation while slowly inverting the tube in a cold room (4°C) the matrix waswashed extensively with buffer A supplemented with 60 mM imidazole, and buffer B (50mM Tris/HCl pH 7.5, 300 mM NaCl, 5 mM MgCl2, 1 mM βME, 10% glycerol). Followingovernight elution by homemade TEV protease in buffer B, the eluate was concentratedby ultracentrifugation and further purified by size exclusion chromatography on a Su-perdex 200 column (GE Healthcare) pre-equilibrated with buffer B supplemented with

7. RECONSTITUTION OF ULTRAWIDE DNA ORIGAMI PORES IN LIPOSOMES
7
179
0.5 mM EDTA. The final IBB-GFP sample with a concentration of 138 µM was aliquoted,snap frozen in liquid nitrogen, and stored at -80°C.
7.4.10. CDICE BUFFERS AND SOLUTIONS
The encapsulated inner solution contains 50mM Tris-HCl pH 7.4, 5mM MgCl2, 15µM2MDa dextran, 2 nM DNA origami pores. The outer solution contains glucose in milliQwater and is osmotically matched to the inner solution. The oil phase is a mixture ofsilicone and mineral oil (4:1 ratio) and contains lipids dissolved at 0.2mg/mL. The lipid-in-oil suspension was prepared as in Van de Cauter et al.[24] and used immediately.
7.4.11. PREPARATION OF LIPID-IN-OIL SUSPENSION
DOPC and DOPE-Rhodamine lipids solubilized in chloroform were mixed at 99.9:0.1 ra-tio and blow-dried with pure nitrogen. Inside a glove-box filled with pure nitrogen, lipidswere subsequently resolubilized with anhydrous chloroform. The freshly prepared mix-ture of silicon and mineral oil was added to the lipids dropwise while vortexing at 1400rpm. The lipid-in-oil solution was finally vortexed at 2800 rpm for two minutes, furthersonicated in an ice bath for 15 minutes.
7.4.12. CDICE EQUIPMENT AND GUV PRODUCTION
The rotating component of the cDICE device is built from a Magnetic stirrer L-71 (LAbinco).A Teflon adaptor connects the rotating shaft with the cDICE chamber, assembled from astandard 3.5 cm cell culture dish (corning) modified to decrease the height. The cham-ber has an inner height of 8 mm and a circular opening of 10 mm on the top to allowinsertion of the capillary and collection of the GUVs. The detailed protocol for GUV pro-duction is reported in Van de Cauter et al.[24], while here we describe it briefly. First,the cDICE chamber is set to rotate at 300 rpm. 350 µL of outer aqueous solution is in-jected into the rotating the chamber, followed by 1 mL of lipid-in-oil solution, resultingin the two phases being stacked as depicted in Fig.7.3. The tip of a 100 µm PEEK cap-illary tube (211633-3, BGB) is then inserted into the oil phase of the rotating chamber,allowing for a continuous supply of inner aqueous solution into the oil phase by a pres-sure pump (MFCS-EZ, Fluigent) set at 900 mbar. After 15 min, the rotating speed is setto zero, and GUVs are collected from the outer aqueous solution and moved to a pre-passivated imaging well to carry out the fluorescence experiments.
7.4.13. DATA COLLECTION AND ANALYSIS
Fluorescence images were acquired using spinning disk confocal laser microscopy (Olym-pus IXB1/BX61 microscope, 60× objective, iXon camera) with Andor iQ3 software. To in-duce GFP photobleaching, we employed raster scanning 491 nm laser (at 9.8 mW) overthe region of interest. To measure the recovery signal, frames were collected every 15seconds, starting right after the photobleaching event. Fluorescence images were ana-lyzed and processed using ImageJ (v2.1.0). The extracted fluorescence data were plottedand fitted using MATLAB.

7
180 CHAPTER 7
7.4.14. DIFFUSION MODELFluorescence recovery data were fitted with a diffusion model, described by Equation7.4, derived from the Fick’s law of diffusion. While
ci n,st ar tcout
and Np were free parameters ofthe fit, all the other parameters were known or could be calculated. More particularly, thearea of the pore Ap = 745.6 nm2 was calculated from assuming an octagonal pore withan effective radius of 15 nm (as discussed in the text). The effective diffusion constantDe f f = 47 µm2/s of GFP was calculated using the formula provided by Dechadilok andDeen[28]
De f f
Dbulk=1+ 9
8
(Rg
Rp
)ln
(Rg
Rp
)−1.56034
(Rg
Rp
)+0.528155
(Rg
Rp
)2
+1.91521
(Rg
Rp
)3
−2.81903
(Rg
Rp
)4
+0.270788
(Rg
Rp
)5
+1.10115
(Rg
Rp
)6
−0.435933
(Rg
Rp
)7
,
(7.5)
where Rg is the molecule radius of gyration (for GFP, Rg = 1.77 nm), Rp is the pore radius(here 15 nm), and Dbulk is the diffusion constant of the molecule in free solution (forGFP, Dbulk =87 µm2/s, Ref.[38]). The channel length L = 16 nm was assumed to equalthe effective height of the origami, which was measured by TEM imaging (Fig.S7.22b).Finally, V was the volume of the vesicle which was estimated from the fluorescence im-ages.

7. RECONSTITUTION OF ULTRAWIDE DNA ORIGAMI PORES IN LIPOSOMES
7
181
7.5. SUPPORTING INFORMATION
7.5.1. OLIGONUCLEOTIDE SEQUENCES OF THE DNA ORIGAMI NANOPORE
STRUCTURE
core_1 ACGGATTTTTTGATTTGTATCATGACAATGTATGATAcore_2 GTTACTTTTTTTTAGCCGGAACGTCGGTTTAACTAAAcore_3 ACTTTTTTTTTGAAAGAGGACAGTAATAATGAGTAGAcore_4 TTCATTTTTTTCAAGAGTAATCTAAACAACTTTTCATcore_5 ACGGATTTTTTAATTATTCATTAGATCTAAATCCAATcore_6 CGACTTGTAAAGTATCGCTATATTTTGTAGTGTTGcore_7 CGGGAGGTTTTTTTTTTGAAGCCTTTTTTCGAGGGGATGAT
AAGCATATTAAAcore_8 CACCCAGACAACGCAACGCCAATCAGAAGCGAAAAcore_9 CTACAATTTTTTTTTTATCCTGAATGCTTAATCGTTGTAAGC
ATGTCTACGTGcore_10 TCCAGAGTACCAGTCTCAGGAAAGAGAATGGGGTCcore_11 CCTAATTTGCTTTTTTCAGTTACAAGTATCATCTTCTAATCA
GGTCGAACCCTcore_12 CTTCAAAGGAATCAACGCTGAGTAGCTATGACGGGcore_13 TATCGCGTTTTTTTTTTAATTCGAGAAGGCGTTTATCAACGT
TCTAAGGAAGGcore_14 CGAACCAGACCGGAAGGTTGGGAATCGAAATCCGCGACCT
CTTAAAAATGCTGcore_15 CAAACTCAATTGCTTTTTAACTATATTTTAGGGCGcore_16 CAACAGGTCATTTTTTGGATTAGAGCATTTTTTATATAAAAG
ACAACGCGTAAcore_17 TAATTGCTCCAAGAACTGAATTACTCATAAGGGAACCGAAA
AAAGGCATATAAcore_18 GGGTATTTCTTTCCTCGTAACTCACGTTCGCCGCTcore_19 AAACCAAGTATTTTTTCCGCACTCAGTAGAAAAGGGGACAC
AAACGTGACGAGcore_20 AAGCAAGCCGTTTTTAACGAGTAGCCAGGCGCATAGGCTAA
TAGAATCGCAAAcore_21 TTTTCATAAAATAAATCGCACCGAGTAAAGAATCAcore_22 CGTAGGAATCTTTTTTATTACCGCGAACAATAACCGCTTGTA
GCCAATTAAAGcore_23 CAAGCAAATCAGATATCAAAGCTGTTCATTACCCAAATCAGT
AAATCATCAATcore_24 AGAAGGCGTTCAGCGCCATTCCCATCAACAGAATCcore_25 TTATCCGGTATTTTTTTTCTAAGAATCCAGACCTGTTGGAAA
TCAGGAGGCCAcore_26 GTTTTAGCGAACCTCCAAAGACAAGTCACCGAcore_27 CTCAGAGCGTACAAAC

7
182 CHAPTER 7
core_28 GAGAAGCCCGGCTACAcore_29 ATGCCTGAGGCCGCTTcore_30 ACCATCAAACAACAACcore_31 AAATATGCATCAGCTTcore_32 CTGCGAACTTTTTCACcore_33 TAGCTATATTTCAACAcore_34 GCATTAACAGTTTTGTcore_35 GCGCAAAGTAATTACTAGAAAAAGAGCGATTAAGAAAGATcore_36 TAAGTGTCGCCATATTATTTAAGATTACAGGTcore_37 ATGCGGCCTTCGTCGTTTTTAGTCCACAATATTTAcore_38 ATGCGGCCTTCGTCGTTTTTTGGCCCACAATCATAcore_39 ATGCGGCCTTCGTCGTTTTTTAAATCGATTGCCTGcore_40 ATGCGGCCTTCGTCGTTTTTGCGAGAAGCTGATAAcore_41 ATGCGGCCTTCGTCGTTTTTCACGCTGAGAACGCGcore_42 ATGCGGCCTTCGTCGTTTTTGTTGCTTGCGGATTGcore_43 ATGCGGCCTTCGTCGTTTTTGAGGCCGGCTTTCATcore_44 ATGCGGCCTTCGTCGTTTTTAATCAGTCTCATTTTasym_1 AATTATTTTTTGAGCCAGCAATTTTCACCGGAGTTTTCATasym_2 AATACTTTTTTGTAATCCACCTTTACCCTCAGGGGTCAGTasym_3 ACTAATTTTTTAACACGAGGTTTTTGACAGGATCCAGTAAasym_4 TACCAAGCTAGCCCGGGCCTTGATGAATGGAAasym_5 ATTAGTTGCTATTTTGTAAGTTTAGGAAGTTTCAAGCCCACT
CCCTCAAAACAGTTasym_6 CGCTAACGAGCGTCTTTAATGCAGAAACGAAAACCGCCACC
CAGAACCTACAGGAGasym_7 ACCAATGCTTGAGCTTCCACATTAGCAAasym_8 AGCACCATTACCATTAGCAAAAGTCACCAATAAAGCasym_9 GGGATAGCCATTAAAAGACTTATGACCCasym_10 CTCAGAGGCCACTAGTAGCAATTTATTTasym_11 CCTCAGAGAGGCAACTCAGCAAACCCTCasym_12 TATCACCGTACTCAGTCATCTTAGTTAAAGTAATGTasym_13 ATGCGGCCTTCGTCGTTTTTTGATATAAGTAGCGAAACCCG
ATATGAAAGGCasym_14 ATGCGGCCTTCGTCGTTTTTAAACCATAGCCCCCTTATTasym_15 TTGTAATCAGTAGCGTAGCGCACCAGAGasym_16 AATGCCCCCTGCCTACCCGTATGAGCCGCasym_17 TTTATTCTGAAACATTTAACGAGCCACCasym_18 CTGAGACTCCTCAAGTTGATGAACCACCAasym_19 TTTTAGCGGGGTTTTTACCGTGGTTGAGasym_20 ATGCGGCCTTCGTCGTTTTTATCCTCATTAAAGCCAATTCA
CAAACAAATAAasym_21 ATGCGGCCTTCGTCGTTTTTAGCGTTTGCCATCTTTTCATC
TGTAGCACATTTGGGAGAGAATA

7. RECONSTITUTION OF ULTRAWIDE DNA ORIGAMI PORES IN LIPOSOMES
7
183
handle_1 CGACGAAGGCCGCATCATTTTTTTAAGCAACTCTTCCACTTTGGGGAACAGGATTAGCAGAGCGAGG
handle_2 CGACGAAGGCCGCATATTTTTTTAACCTTATGATATACATTTGGGGAACAGGATTAGCAGAGCGAGG
handle_3 CGACGAAGGCCGCATATTTTTTTGCTTCTGTAAGCGAATTTTGGGGAACAGGATTAGCAGAGCGAGG
handle_4 CGACGAAGGCCGCATGATTTTTTGAGTAAACAGATAAAGTTTGGGGAACAGGATTAGCAGAGCGAGG
handle_5 TTTTGTCACAATCAATCTGGCATGGAGAATTATTTGGGGAACAGGATTAGCAGAGCGAGG
handle_6 TCATCAGTCATAGTAAAAGAAACGTTTGGGGAACAGGATTAGCAGAGCGAGG
handle_7 CTTATGCGATTTTAAGCCAGAGGGAATCAGGTTTTGGGGAACAGGATTAGCAGAGCGAGG
handle_8 CTCATTCAGTGAATAACCCTTTTTATAATAAGTTTGGGGAACAGGATTAGCAGAGCGAGG
handle_9 AAAGAAAGAAAATTCTTTTTATATGGTTTACATACCCTTTGGGGAACAGGATTAGCAGAGCGAGG
handle_10 CAAACGAAAAGAAACTTTTTTGCAAAGACACATGTTAGTTAACATAATTTGGGGAACAGGATTAGCAGAGCGAGG
handle_11 ACGAGGTGAGATTTATTTTTTGGAATACCACAGGAATTTTGGGGAACAGGATTAGCAGAGCGAGG
handle_12 GACGACTAAAACGAATTTTTTCTAACGGAACTTTACCATTTTAAGAGTTTGGGGAACAGGATTAGCAGAGCGAGG
handle_13 GTTTTGAACTGGCTCTTTTTTATTATACCAGAAAAGATTTGGGGAACAGGATTAGCAGAGCGAGG
handle_14 GTCCAATGGTTTAATTTTTTTTTCAACTTTAGGATAGCTTTTCAGAATTTGGGGAACAGGATTAGCAGAGCGAGG
handle_15 CCGAAGGGCTTGCCCTTTTTTTGACGAGAAATATCTTTTTGGGGAACAGGATTAGCAGAGCGAGG
handle_16 TACCAGCGATTGAGGTTTTTTGAGGGAAGGTACAAAGTTTAGATAACTTTGGGGAACAGGATTAGCAGAGCGAGG
handle_17 AAATCAAGTGCGGCCCACGAGCCGGCCAACGCTTTGGGGAACAGGATTAGCAGAGCGAGG
handle_18 CTTACCAAGCTTCTAATGAGCTTTGGGGAACAGGATTAGCAGAGCGAGG
handle_19 AATAAACACTTAGTGCTACCTTTTAATTGCGTTTTGGGGAACAGGATTAGCAGAGCGAGG
handle_20 CTTCAAAGCCTTAGAATTTGATTTGGGGAACAGGATTAGCAGAGCGAGG
handle_21 AGTACCTTTGTGAGTGTTCAATTACAGAAGATTTTGGGGAACAGGATTAGCAGAGCGAGG

7
184 CHAPTER 7
handle_22 TCGAGAACATTTCATTAAACATTTGGGGAACAGGATTAGCAGAGCGAGG
handle_23 CCCAATAGCTCCTGGTATCCCCGGGACAATATTTTGGGGAACAGGATTAGCAGAGCGAGG
handle_24 CGCGAGGCCCTTGAATTTTCCTTTGGGGAACAGGATTAGCAGAGCGAGG
handle_25 AACGCTCACCAACCTAAAAGGTGGCAACATATTAGAATTTGGGGAACAGGATTAGCAGAGCGAGG
handle_26 CGACCGTGAAATTGTGGAAAAATCTACGTTAAGATAATTTGGGGAACAGGATTAGCAGAGCGAGG
handle_27 CCTAATTTTGTACAGATAAATTGGGCTTGAGATACTGTTTGGGGAACAGGATTAGCAGAGCGAGG
handle_28 AGGTAAAGTTATCACCAAGGGCGACATTCAACAAGGATTTGGGGAACAGGATTAGCAGAGCGAGG
handle_29 TCTATTTACTTTTTTGCTCGCCCTGGGTGCCTTTACCTGTCTTTGGGGAACAGGATTAGCAGAGCGAGG
handle_30 TCCTTGAAATTTTTTACATAGCGATTTCGCCTTTAATTATTTTTGGGGAACAGGATTAGCAGAGCGAGG
handle_31 TGAATTACCTTTTTTTTTTTTAATGACAAACATTCGCCATTTTTGGGGAACAGGATTAGCAGAGCGAGG
handle_32 CGGCTGACGTTTTTTCATTTCACATATGGTCATTCCAGTGATTTGGGGAACAGGATTAGCAGAGCGAGG
handle_33 CCCCTTTATTAGAGGCGGTTTGCGTATTTTGGGGAACAGGATTAGCAGAGCGAGG
handle_34 CCCCTTTAAGTGTAAGAAGCGCATTAGACGGATTAAGACTTTGGGGAACAGGATTAGCAGAGCGAGG
handle_35 CCCCTTTGTTTCAGGTTTAACGTCTGCTTTGGGGAACAGGATTAGCAGAGCGAGG
handle_36 CCCCTTTAGAAACAAGAATCCCAATCCAAATGAGCAACATTTGGGGAACAGGATTAGCAGAGCGAGG
handle_37 CCCCTTTTTTGAGGTGAGGCGGTCAGTTTTGGGGAACAGGATTAGCAGAGCGAGG
handle_38 CCCCTTTAAAGAAGAATGACCATAAATCAAAGGTAATAGTTTGGGGAACAGGATTAGCAGAGCGAGG
handle_39 CCCCTTTATTATGGCTATTAGTCTTTATTTGGGGAACAGGATTAGCAGAGCGAGG
handle_40 CCCCTTTCTCGAATTAATTGAGTTAAGCCCAAAGAAAAGTTTGGGGAACAGGATTAGCAGAGCGAGG
handle_41 CCCCTTTGTGCCAGCTGCATTAATGAATCGGAAGCATATTTGGGGAACAGGATTAGCAGAGCGAGG
handle_42 CCCCTTTGCTCACTGCCCGCCTCACATTAATTGCGTAATTTTGGGGAACAGGATTAGCAGAGCGAGG

7. RECONSTITUTION OF ULTRAWIDE DNA ORIGAMI PORES IN LIPOSOMES
7
185
handle_43 CCCCTTTTGCACGTAAAACAGAAATAAAGAACATCGGGTTTGGGGAACAGGATTAGCAGAGCGAGG
handle_44 CCCCTTTATTAACACCGCCTCCAAGTTACAAAATCGTCATTTGGGGAACAGGATTAGCAGAGCGAGG
handle_45 CCCCTTTAAAAATACCGAACGAACCACCAGCCTGAGCATTTGGGGAACAGGATTAGCAGAGCGAGG
handle_46 CCCCTTTATGCGCGAACTGATTAATTACGTGCTTGTCATTTTGGGGAACAGGATTAGCAGAGCGAGG
handle_47 CCCCTTTGACGGGCAACAATACGTGGCACAGTACCGAGTTTGGGGAACAGGATTAGCAGAGCGAGG
handle_48 CCCCTTTTGGGCGCCAGGGTGTGAAATTGTTATCCGTCATTTGGGGAACAGGATTAGCAGAGCGAGG
handle_49 CCCCTTTATTCACCCTGAACAAAGCTCACAAGTCGGTGGCTGGTTCGAGATA
handle_50 CCCCTTTTCCTTATTACGCAGTCACGGAAhandle_51 CCCCTTTAATTTTACAGAGAGAATTTAATGAGhandle_52 CCCCTTTTTTTGTTTAACGTCAAAAGATGAACAATGTCAGAT
GATCAATTCGhandle_53 CCCCTTTCTATCATAACCCTCGAACATTAhandle_54 CCCCTTTAAATTGCATCAAAAAGATTGATTGChandle_55 CCCCTTTATTCCTGACTATTATAGCGCAGAGATCGTCGTGA
AAAAAAAGGAAhandle_56 CCCCTTTTAAAATGTTTAGACTATCATTGhandle_57 CCCCTTTCGGAATGCTTTAAACAGTTTCAAGAhandle_58 CCCCTTTATTAAACAATGAAATAGTACCTCGGGCTTAAACAT
TCTACAATAThandle_59 CCCCTTTTAAGCAGATAGCCGAAACGTAAhandle_60 CCCCTTTAACCGCTAATATCAGAGTTTAGCTGhandle_61 CCCCTTTACTGAATTCAACATTGCCATCTGTTThandle_62 CCCCTTTAAACAGGAGCCTGGGAGTGACACAAAGAGAGTAA
Chandle_63 CCCCTTTGAAAATAGCAGCCACATACATATACATAACGCCAA
AATTCAAChandle_64 CCCCTTTATTTTTTTTAACAGTGAATTGTCTTThandle_65 CCCCTTTGAAGCCCTAACGGAAGCTTAGAATAATGTTAGAG
Chandle_66 CCCCTTTGAAGCAAAGCGGACCAAAATAGCGAGAGGCTTTT
GCTCAGGAChandle_67 CCCCTTTCTTTACTTATTCATAATAACCTTTTThandle_68 CCCCTTTAACGAGATGATGAAGAAACAGGATTATTTTGACG
Chandle_69 CCCCTTTTGAATCCCCCTCAAATCGTCATAAATATTCAATAG
CCACCAGA

7
186 CHAPTER 7
handle_70 CCCCTTTAGCAAGTTCGGAGGTGGTGTAATTTThandle_71 CCCCTTTCCACAAGCGTAATCAAATCATTGATTGCCATCACThandle_72 CCCCTTTGAGGGTAATTGAGCGAGGAAACGCAATAATAACG
GACAGCGCChandle_73 CCCCTTTTAATTTCCAGTCGGGAAhandle_74 CCCCTTTATAGCAACAGTTATCAAhandle_75 CCCCTTTAAATAGCCCTAAAACAThandle_76 CCCCTTTTGTGGTTTTTCTTTTCAhandle_77 CCCCTTTGCGGGGGAAAATTCCCTTATAAATTThandle_78 CCCCTTTAGATTTTATAATCATTTAGAAGTATTThandle_79 CCCCTTTAAAACACTTGCTTGGTCAGTTGGCTThandle_80 CCCCTTTTTTTGAAGAACCATCGGCCTTGCTTTcore2_1 ATGGTGGTTTTGCGGATCTATGATAGTTGGGTCAACATGTA
ATTTAGGCCATGTACcore2_2 GATTTTTTAGGAGCGGACGAACGTTATTATTcore2_3 TTGGATTATACTTCTGATTCGACTcore2_4 AGTTTTTTAACCTACCATTTAGGAGCACTTTcore2_5 AATATCAACTGAAATGTACATAAATGGGCGCATTATCATTCC
TTTTGAACGGTCAAcore2_6 CATTTTTTGATTCACCAAAACGCTCATGGTTcore2_7 CTGAAAGCGTAAGAGCTTCTCCGAGGCAAAGCTAATGCAGA
ACGCGCCACCGGATAcore2_8 GCTTTTTTCTGGCCCTGGCAATACTTCTTTTcore2_9 GGGTCACGGTCCATTGTAAAATTCcore2_10 ATTATCATGTCAAAGGAAGCCCCAcore2_11 ACAACTCGAAGTTTTTTCGATGAAcore2_12 CGTCAATATTAGAGCTTTTTTGAGcore2_13 TTGAGGAAGCGGGCGCTAGTTAATcore2_14 TCAATCGTGCTTAATGGGTGTAGAcore2_15 TACCGCCATCCTCGTTCAACCCGTcore2_16 TGCCTGAGCGGTACGCAAATAATTcore2_17 CGGCATTTTCGGTCATCGATAGCAGAAACGTCcore2_18 CCTTTAGCGTCAGACTGACAGAATcore2_19 GCCTTGAGTAACAGTGTTTCGGAACATTTTCAcore2_20 TGTACTGGTAATAAGTTGAAAGTACCGCCACCcore2_21 GCGTCATACATGGCTTAGAAGGATACCGCCACcore2_22 AGCGCAGTCTCTGAATTGCTCAGTcore2_23 CCACCACCTGAGTTTCTCACCAGTCAGAGGCAcore2_24 CACCCTCAGAGGACTAACGGGTAACATATTTAcore2_25 ACCCTCAGGAACGAGGCGAAGGCAACAGTAGGcore2_26 GAGCCGCCTCGTCACCAAGAATACCAAATTCTcore2_27 GCAGGTCATTGCAGGGTGACCCCCCCTGTTTAcore2_28 CATATTCCTGATTATCCCGCCAAACAAGCTTTATAAAGCC

7. RECONSTITUTION OF ULTRAWIDE DNA ORIGAMI PORES IN LIPOSOMES
7
187
core2_29 GAGAGCCAGCAGCAAACTATTAATGACTACCTGAAAATACcore2_30 ACCAGTAATAAAAGGGGCTACGTGTCAGGAAGTATCCCATcore2_31 GCAGCAAGCGGTCCACGGCACGAAGGGCCTCTCCGACAAAchol_anchor_1 TTTTTTTTTTAATTAAGCACGTTAATTACGCCAGGAATAGCC
TGCCCCAGchol_anchor_2 TTTTTTTTTTTAAATCGGAAGATTGTTGCTGCAACGGCAAAA
CCTGTTTGchol_anchor_3 TTTTTTTTTTTGTAATACGGTTGATAGGGTTTTCAAAAGTTT
AACCACCAchol_anchor_4 TTTTTTTTTTCAACGCAAGTAAAACTAAACGACGCCTTTGCC
ATTATCATchol_anchor_5 TTTTTTTTTTATATATTTGAGCAAACGAAGCCAGTTTACAAA
GGCAATTCchol_anchor_6 TTTTTTTTTTGTAGGTAAAAAGGCTAGTGGTTGTATTTGAG
GCTGATTGTchol_anchor_7 TTTTTTTTTTCGGAGACACGGAGAGGGAAGAGTCCTAATAG
AGAAGGGTTchol_anchor_8 TTTTTTTTTTTTCCTAAATTTAATGGTTTGATATCAGCTTGAchol_anchor_9 TTTTTTTTTTTAGCTCAATTTTCAAACTCCGGCTAACAGTTG
TCTAAAGCchol_anchor_10 TTTTTTTTTTGTACGGTGCCAATCGCCTATATGTTCAATATC
GAACCTCAchol_anchor_11 TTTTTTTTTTCAGTTGATGGGATAGGCGTGCATCCCTACAT
TTACATTGGchol_anchor_12 TTTTTTTTTTTTTAGTTTCCGTGGGAGACGACAGAACAGGA
AGTCACACGchol_anchor_13 TTTTTTTTTTTGGTCAATAATGTGAGTCCAGCCATATCCAGA
GGCCAACAchol_anchor_14 TTTTTTTTTTTTGGGGCGGCCTTCCTCTGGTGCCCTCAAAC
TCTTCTGACchol_anchor_15 TTTTTTTTTTTCTACTAATAGGAACGGCCATTCAAGTAATAA
CCTTCACCchol_anchor_16 TTTTTTTTTTAAATCATATTTTTTTTTTGTTGAAGGGCGCCG
TTGTAAGAGAGTTchol_anchor_17 TTTTTTTTTTAATTGTAAAATAAAGCTTTTAATAchol_anchor_18 TTTTTTTTTTAAAACAGGTTGTACCAAAAACATTTTTTTTTTC
ATGAchol_anchor_19 TTTTTTTTTTTGTACCCCTTTTGCGGTTTATCGCchol_anchor_20 TTTTTTTTTTCGGTAATCGGATAAAAATTTTTTTTTTAGGCG
AAAGAchol_anchor_21 TTTTTTTTTTAGAGTCTGTAAATGCATTTTTTTTTTATAchol_anchor_22 TTTTTTTTTTAGATCTACAGATTCAAAAGGGTGAATTCGGTCchol_anchor_23 TTTTTTTTTTATTAATGCGTCAAATCTTTAAGAA

7
188 CHAPTER 7
chol_anchor_24 TTTTTTTTTTTTCATCTTCTGACAACAATCATAGAAAATATCGCCACGCT
chol_anchor_25 TTTTTTTTTTAGAAAACTCATGTTTTTTTTTTTTTGGCTchol_anchor_26 TTTTTTTTTTATGCAAATTCTGGAAGTTTCATTCCTCCAAAAchol_anchor_27 TTTTTTTTTTACCGTAATTCCCAATTTTTTTTTTCAATAchol_anchor_28 TTTTTTTTTTCGGATTCTGACCATTAGATACATTAGGAACAAchol_anchor_29 TTTTTTTTTTCAACATTAAACCTGTTTTTTTTTTGTCCTchol_anchor_30 TTTTTTTTTTCGCGTCTGCGAGCTGAAAAGGTGGGAATTTT
Cchol_anchor_31 TTTTTTTTTTTTAACCAATAGTAGTATTTCAATAchol_anchor_32 TTTTTTTTTTGCATTAAACAGGCAAGGCAAAGAAGACAGCC
Ccore3_1 TACAACGCAATCAAAATTTGGCCGGCACCTTcore3_2 CGTAACACGGAACCGCATAGGAACCAAGTTTGcore3_3 GAGGCTTTGAACCGCCTTTACCCTCCTATTTcore3_4 CAGCATCGAGCCGCCACCTCAGAATTAAGAGGcore3_5 TTGCGGGAGCCAGCATTTTTTAGTTAGGATTcore3_6 GCTGAGGCGACGATTGAATAGGTGACCAGGCGGATAAGTG
CCGTCGAGAGGcore3_7 CATCGCCCACGCATAAAAAGTACATAAACACCcore3_8 TACCGATAGTTGCGCCCGCCTGATTGATAAATcore3_9 GCTTTCGAGGTGAATTTGCTCCATTAGAGCTTcore3_10 GGAGCCTTTAATTGTAAGGCGCAGTAAGAGGTcore3_11 GTTGAAAATCTCCAAAACTGACCAATCGGCTGcore3_12 CTAAAGGAATTGCGAAATGAACGGACGAGCATcore3_13 GTTTCAGCGGAGTGAGGGCTGACCGAACAAGAcore3_14 TGTATGGGATTTTGCTTGACAAGATGTTTATCcore3_15 CGTCTTTCCAGACGTTAAATATTGAACAACATcore3_16 TCATAGTTAGCGTAACAAGGTGAATAATTCTGcore3_17 TTCCAGTTTGGAACAATTTCAAAACTGGCTTTTTTGAAAGGC
CAGTTTcore3_18 GAACGTGGACTCCAACTCCGAAATGGCGATTAACCGACAGcore3_19 ACCGTCTATCAGGGCGTTTATTTTCCAGTTTTTTTCACGAT
GAGATTTcore3_20 AACCATCACCCAAATCTATTAAATGCCAGTGCATAACCCCcore3_21 GAGGTGCCGTAAAGCATTTTAGACGGTGGTTTTTTATGTTA
TGCGTTTcore3_22 AAAGGGAGCCCCCGATGATAATACGAATTCATcore3_23 GAAAGCCGGCGAACGTTTTAACAAAATAGTTTTTTTGAATTA
AATTTTcore3_24 GAAGAAAGCGAAAGGAGGTTATCTGTCTGAGATAATTTTCcore3_25 CTGGCAAGTGTAGCGGTTTAAATCTAGGTTTTTTTTGGGTG
CGGATTT

7. RECONSTITUTION OF ULTRAWIDE DNA ORIGAMI PORES IN LIPOSOMES
7
189
core3_26 CCACCACACCCGCCGCACCCTCAAAAATGCTGTCAATATAcore3_27 ACAGGGCGCGTACTATTTTAAATATGCCATTTTTTGTTTGC
CAATTTTcore3_28 CACGTATAACGTGCTTGCCATTGCTATCGGCCATTTAACAcore3_29 GAGCGGGAGCTAAACATTTGGTAAGCTTTTTTTTTCCGGCG
ATAATTTcore3_30 GGATTTTAGACAGGAATAGAAGAAGGAAACCAACTCTGACcore3_31 CTGAGAAGTGTTTTTATTTTGATTGGCTGTTTTTTCGCAAGA
CGATTTcore3_32 CCGAGTAAAAGAGTCTCAAATTAAATCGGTGCTATAGGGGcholesterol-oligo AAAAAAAAAA-TEG-CholATTO-dye-oligo CGACGAAGGCCGCA/3ATTO647NN/
Table S7.1: Oligonucleotide sequences employed for the DNA origami nanopore structure.
7.5.2. SEQUENCE OF THE 7560 BASE LONG SCAFFOLDTGATAGACGGTTTTTCGCCCTTTGACGTTGGAGTCCACGTTCTTTAATAGTGGACTCTTGTTCCAAACTGGAACAACACTCAACCCTATCTCGGGCTATTCTTTTGATTTATAAGGGATTTTGCCGATTTCGGAACCACCATCAAACAGGATTTTCGCCTGCTGGGGCAAACCAGCGTGGACCGCTTGCTGCAACTCTCTCAGGGCCAGGCGGTGAAGGGCAATCAGCTGTTGCCCGTCTCACTGGTGAAAAGAAAAACCACCCTGGCGCCCAATACGCAAACCGCCTCTCCCCGCGCGTTGGCCGATTCATTAATGCAGCTGGCACGACAGGTTTCCCGACTGGAAAGCGGGCAGTGAGCGCAACGCAATTAATGTGAGTTAGCTCACTCATTAGGCACCCCAGGCTTTACACTTTATGCTTCCGGCTCGTATGTTGTGTGGAATTGTGAGCGGATAACAATTTCACACAGGAAACAGCTATGACCATGATTACGAATTCGAGCTCGGTACCCGGGGATCCTCCGTCTTTATCGAGGTAACAAGCACCACGTAGCTTAAGCCCTGTTTACTCATTACACCAACCAGGAGGTCAGAGTTCGGAGAAATGATTTATGTGAAATGCGTCAGCCGATTCAAGGCCCCTATATTCGTGCCCACCGACGAGTTGCTTACAGATGGCAGGGCCGCACTGTCGGTATCATAGAGTCACTCCAGGGCGAGCGTAAATAGATTAGAAGCGGGGTTATTTTGGCGGGACATTGTCATAAGGTTGACAATTCAGCACTAAGGACACTTAAGTCGTGCGCATGAATTCACAACCACTTAGAAGAACATCCACCCTGGCTTCTCCTGAGAAAGCTTGGCACTGGCCGTCGTTTTACAACGTCGTGACTGGGAAAACCCTGGCGTTACCCAACTTAATCGCCTTGCAGCACATCCCCCTTTCGCCAGCTGGCGTAATAGCGAAGAGGCCCGCACCGATCGCCCTTCCCAACAGTTGCGCAGCCTGAATGGCGAATGGCGCTTTGCCTGGTTTCCGGCACCAGAAGCGGTGCCGGAAAGCTGGCTGGAGTGCGATCTTCCTGAGGCCGATACTGTCGTCGTCCCCTCAAACTGGCAGATGCACGGTTACGATGCGCCCATCTACACCAACGTGACCTATCCCATTACGGTCAATCCGCCGTTTGTTCCCACGGAGAATCCGACGGGTTGTTACTCGCTCACATTTAATGTTGATGAAAGCTGGCTACAGGAAGGCCAGACGCGAATTATTTTTGATGGCGTTCCTATTGGTTAAAAAATGAGCTGATTTAACAAAAATTTAATGCGAATTTTAACAAAATATTAACGTTTACAATTTAAATATTTGCTTATACAATCTTCCTGTTTTTGGGGCTTTTCTGATTATCAACCGGGGTACATATGATTGACATGCTAGTTTTACGATTACCGTTCATCGATTCTCTTGTTTGCTCCAGACTCTCAGGCAATGACCTGATAGCCTTTGTAGATCTCTCAAAAATAGCTACCCTCTCCGGCATTAATTTATCAGCTAGAACGGTTGAATATCATATTGATGGTGATTTGACTGTCTCCGGCCTTTCTCACCCTTTTGAATCTTTACCTACACATTACTCAGGCATTGCATTTAAAATATATGAGGGTTCTAAAAATTTTTATCCTTGCGTTGAAATAAA

7
190 CHAPTER 7
GGCTTCTCCCGCAAAAGTATTACAGGGTCATAATGTTTTTGGTACAACCGATTTAGCTTTATGCTCTGAGGCTTTATTGCTTAATTTTGCTAATTCTTTGCCTTGCCTGTATGATTTATTGGATGTTAATGCTACTACTATTAGTAGAATTGATGCCACCTTTTCAGCTCGCGCCCCAAATGAAAATATAGCTAAACAGGTTATTGACCATTTGCGAAATGTATCTAATGGTCAAACTAAATCTACTCGTTCGCAGAATTGGGAATCAACTGTTATATGGAATGAAACTTCCAGACACCGTACTTTAGTTGCATATTTAAAACATGTTGAGCTACAGCATTATATTCAGCAATTAAGCTCTAAGCCATCCGCAAAAATGACCTCTTATCAAAAGGAGCAATTAAAGGTACTCTCTAATCCTGACCTGTTGGAGTTTGCTTCCGGTCTGGTTCGCTTTGAAGCTCGAATTAAAACGCGATATTTGAAGTCTTTCGGGCTTCCTCTTAATCTTTTTGATGCAATCCGCTTTGCTTCTGACTATAATAGTCAGGGTAAAGACCTGATTTTTGATTTATGGTCATTCTCGTTTTCTGAACTGTTTAAAGCATTTGAGGGGGATTCAATGAATATTTATGACGATTCCGCAGTATTGGACGCTATCCAGTCTAAACATTTTACTATTACCCCCTCTGGCAAAACTTCTTTTGCAAAAGCCTCTCGCTATTTTGGTTTTTATCGTCGTCTGGTAAACGAGGGTTATGATAGTGTTGCTCTTACTATGCCTCGTAATTCCTTTTGGCGTTATGTATCTGCATTAGTTGAATGTGGTATTCCTAAATCTCAACTGATGAATCTTTCTACCTGTAATAATGTTGTTCCGTTAGTTCGTTTTATTAACGTAGATTTTTCTTCCCAACGTCCTGACTGGTATAATGAGCCAGTTCTTAAAATCGCATAAGGTAATTCACAATGATTAAAGTTGAAATTAAACCATCTCAAGCCCAATTTACTACTCGTTCTGGTGTTTCTCGTCAGGGCAAGCCTTATTCACTGAATGAGCAGCTTTGTTACGTTGATTTGGGTAATGAATATCCGGTTCTTGTCAAGATTACTCTTGATGAAGGTCAGCCAGCCTATGCGCCTGGTCTGTACACCGTTCATCTGTCCTCTTTCAAAGTTGGTCAGTTCGGTTCCCTTATGATTGACCGTCTGCGCCTCGTTCCGGCTAAGTAACATGGAGCAGGTCGCGGATTTCGACACAATTTATCAGGCGATGATACAAATCTCCGTTGTACTTTGTTTCGCGCTTGGTATAATCGCTGGGGGTCAAAGATGAGTGTTTTAGTGTATTCTTTTGCCTCTTTCGTTTTAGGTTGGTGCCTTCGTAGTGGCATTACGTATTTTACCCGTTTAATGGAAACTTCCTCATGAAAAAGTCTTTAGTCCTCAAAGCCTCTGTAGCCGTTGCTACCCTCGTTCCGATGCTGTCTTTCGCTGCTGAGGGTGACGATCCCGCAAAAGCGGCCTTTAACTCCCTGCAAGCCTCAGCGACCGAATATATCGGTTATGCGTGGGCGATGGTTGTTGTCATTGTCGGCGCAACTATCGGTATCAAGCTGTTTAAGAAATTCACCTCGAAAGCAAGCTGATAAACCGATACAATTAAAGGCTCCTTTTGGAGCCTTTTTTTTGGAGATTTTCAACGTGAAAAAATTATTATTCGCAATTCCTTTAGTTGTTCCTTTCTATTCTCACTCCGCTGAAACTGTTGAAAGTTGTTTAGCAAAATCCCATACAGAAAATTCATTTACTAACGTCTGGAAAGACGACAAAACTTTAGATCGTTACGCTAACTATGAGGGCTGTCTGTGGAATGCTACAGGCGTTGTAGTTTGTACTGGTGACGAAACTCAGTGTTACGGTACATGGGTTCCTATTGGGCTTGCTATCCCTGAAAATGAGGGTGGTGGCTCTGAGGGTGGCGGTTCTGAGGGTGGCGGTTCTGAGGGTGGCGGTACTAAACCTCCTGAGTACGGTGATACACCTATTCCGGGCTATACTTATATCAACCCTCTCGACGGCACTTATCCGCCTGGTACTGAGCAAAACCCCGCTAATCCTAATCCTTCTCTTGAGGAGTCTCAGCCTCTTAATACTTTCATGTTTCAGAATAATAGGTTCCGAAATAGGCAGGGGGCATTAACTGTTTATACGGGCACTGTTACTCAAGGCACTGACCCCGTTAAAACTTATTACCAGTACACTCCTGTATCATCAAAAGCCATGTATGACGCTTACTGGAACGGTAAATTCAGAGACTGCGCTTTCCATTCTGGCTTTAATGAGGATTTATTTGTTTGTGAATATCAAGGCCAATCGTCTGACCTGCCTCAACCTCCTGTCAATGCTGGCGGCGGCTCTGGTGGTGGTTCTGGTGGCGGCTCTGAGGGTGGTGGCTCTGAGGGTGGCGGTTCTGAGGGTGGCGGCTCTGAGGGAGGCGGTTCCGGTGGTGGCTCTGGTTCCGGTGATTTTGATTATGAAAAGATGGCAAACGCTAATAAGGGGGCTATGACCGAAAATGCCGATGAAAACGCGCTACAGTCTGACGCTAAAGGCAAACTTGATTCTGTCGCTACTGATTACGGTGCTGCTATCGAT

7. RECONSTITUTION OF ULTRAWIDE DNA ORIGAMI PORES IN LIPOSOMES
7
191
GGTTTCATTGGTGACGTTTCCGGCCTTGCTAATGGTAATGGTGCTACTGGTGATTTTGCTGGCTCTAATTCCCAAATGGCTCAAGTCGGTGACGGTGATAATTCACCTTTAATGAATAATTTCCGTCAATATTTACCTTCCCTCCCTCAATCGGTTGAATGTCGCCCTTTTGTCTTTGGCGCTGGTAAACCATATGAATTTTCTATTGATTGTGACAAAATAAACTTATTCCGTGGTGTCTTTGCGTTTCTTTTATATGTTGCCACCTTTATGTATGTATTTTCTACGTTTGCTAACATACTGCGTAATAAGGAGTCTTAATCATGCCAGTTCTTTTGGGTATTCCGTTATTATTGCGTTTCCTCGGTTTCCTTCTGGTAACTTTGTTCGGCTATCTGCTTACTTTTCTTAAAAAGGGCTTCGGTAAGATAGCTATTGCTATTTCATTGTTTCTTGCTCTTATTATTGGGCTTAACTCAATTCTTGTGGGTTATCTCTCTGATATTAGCGCTCAATTACCCTCTGACTTTGTTCAGGGTGTTCAGTTAATTCTCCCGTCTAATGCGCTTCCCTGTTTTTATGTTATTCTCTCTGTAAAGGCTGCTATTTTCATTTTTGACGTTAAACAAAAAATCGTTTCTTATTTGGATTGGGATAAATAATATGGCTGTTTATTTTGTAACTGGCAAATTAGGCTCTGGAAAGACGCTCGTTAGCGTTGGTAAGATTCAGGATAAAATTGTAGCTGGGTGCAAAATAGCAACTAATCTTGATTTAAGGCTTCAAAACCTCCCGCAAGTCGGGAGGTTCGCTAAAACGCCTCGCGTTCTTAGAATACCGGATAAGCCTTCTATATCTGATTTGCTTGCTATTGGGCGCGGTAATGATTCCTACGATGAAAATAAAAACGGCTTGCTTGTTCTCGATGAGTGCGGTACTTGGTTTAATACCCGTTCTTGGAATGATAAGGAAAGACAGCCGATTATTGATTGGTTTCTACATGCTCGTAAATTAGGATGGGATATTATTTTTCTTGTTCAGGACTTATCTATTGTTGATAAACAGGCGCGTTCTGCATTAGCTGAACATGTTGTTTATTGTCGTCGTCTGGACAGAATTACTTTACCTTTTGTCGGTACTTTATATTCTCTTATTACTGGCTCGAAAATGCCTCTGCCTAAATTACATGTTGGCGTTGTTAAATATGGCGATTCTCAATTAAGCCCTACTGTTGAGCGTTGGCTTTATACTGGTAAGAATTTGTATAACGCATATGATACTAAACAGGCTTTTTCTAGTAATTATGATTCCGGTGTTTATTCTTATTTAACGCCTTATTTATCACACGGTCGGTATTTCAAACCATTAAATTTAGGTCAGAAGATGAAATTAACTAAAATATATTTGAAAAAGTTTTCTCGCGTTCTTTGTCTTGCGATTGGATTTGCATCAGCATTTACATATAGTTATATAACCCAACCTAAGCCGGAGGTTAAAAAGGTAGTCTCTCAGACCTATGATTTTGATAAATTCACTATTGACTCTTCTCAGCGTCTTAATCTAAGCTATCGCTATGTTTTCAAGGATTCTAAGGGAAAATTAATTAATAGCGACGATTTACAGAAGCAAGGTTATTCACTCACATATATTGATTTATGTACTGTTTCCATTAAAAAAGGTAATTCAAATGAAATTGTTAAATGTAATTAATTTTGTTTTCTTGATGTTTGTTTCATCATCTTCTTTTGCTCAGGTAATTGAAATGAATAATTCGCCTCTGCGCGATTTTGTAACTTGGTATTCAAAGCAATCAGGCGAATCCGTTATTGTTTCTCCCGATGTAAAAGGTACTGTTACTGTATATTCATCTGACGTTAAACCTGAAAATCTACGCAATTTCTTTATTTCTGTTTTACGTGCAAATAATTTTGATATGGTAGGTTCTAACCCTTCCATTATTCAGAAGTATAATCCAAACAATCAGGATTATATTGATGAATTGCCATCATCTGATAATCAGGAATATGATGATAATTCCGCTCCTTCTGGTGGTTTCTTTGTTCCGCAAAATGATAATGTTACTCAAACTTTTAAAATTAATAACGTTCGGGCAAAGGATTTAATACGAGTTGTCGAATTGTTTGTAAAGTCTAATACTTCTAAATCCTCAAATGTATTATCTATTGACGGCTCTAATCTATTAGTTGTTAGTGCTCCTAAAGATATTTTAGATAACCTTCCTCAATTCCTTTCAACTGTTGATTTGCCAACTGACCAGATATTGATTGAGGGTTTGATATTTGAGGTTCAGCAAGGTGATGCTTTAGATTTTTCATTTGCTGCTGGCTCTCAGCGTGGCACTGTTGCAGGCGGTGTTAATACTGACCGCCTCACCTCTGTTTTATCTTCTGCTGGTGGTTCGTTCGGTATTTTTAATGGCGATGTTTTAGGGCTATCAGTTCGCGCATTAAAGACTAATAGCCATTCAAAAATATTGTCTGTGCCACGTATTCTTACGCTTTCAGGTCAGAAGGGTTCTATCTCTGTTGGCCAGAATGTCCCTTTTATTACTGGTCGTGTGACTGGTGAATCTGCCAATGTAAATAATCCATTTCAGACGATTGAGCGTCAAAATGTAGGTATTTCCATGAGCGTTTTTCCTGTTGCAATGGCTGGCGGTA

7
192 CHAPTER 7
ATATTGTTCTGGATATTACCAGCAAGGCCGATAGTTTGAGTTCTTCTACTCAGGCAAGTGATGTTATTACTAATCAAAGAAGTATTGCTACAACGGTTAATTTGCGTGATGGACAGACTCTTTTACTCGGTGGCCTCACTGATTATAAAAACACTTCTCAGGATTCTGGCGTACCGTTCCTGTCTAAAATCCCTTTAATCGGCCTCCTGTTTAGCTCCCGCTCTGATTCTAACGAGGAAAGCACGTTATACGTGCTCGTCAAAGCAACCATAGTACGCGCCCTGTAGCGGCGCATTAAGCGCGGCGGGTGTGGTGGTTACGCGCAGCGTGACCGCTACACTTGCCAGCGCCCTAGCGCCCGCTCCTTTCGCTTTCTTCCCTTCCTTTCTCGCCACGTTCGCCGGCTTTCCCCGTCAAGCTCTAAATCGGGGGCTCCCTTTAGGGTTCCGATTTAGTGCTTTACGGCACCTCGACCCCAAAAAACTTGATTTGGGTGATGGTTCACGTAGTGGGCCATCGCCC

7. RECONSTITUTION OF ULTRAWIDE DNA ORIGAMI PORES IN LIPOSOMES
7
193
7.5.3. CADNANO STRAND DIAGRAM OF THE ORIGAMI PORE
GGGCTGTCTGT GGAATGCTACAGGCGTTGTAGTTTGTACTGG TGACGAAACTCAGTGTTACGTCATGAAAAAG TCTTTAGTCCTCAAAGCCTCTGTAGCCGTTG CTACCCTCGTTCCGATGCTGTCTTTCGCTGC TGAGGGTGACGATCCCGCAAAAGCGGCCTTT AACTCCCTGCAAGCCTCAGCGACCGAATATA TCGGTTATGCGTGGGCGATGGTTGTTGTCAT TGTCGGCGCAACTATCGGTATCAAGCTGTTT AAGAAATTCACCTCGAAAGCAA
TAATTCCCAAATGGCTC AAGTCGGTGAC
ACTGGTGATTTT GCTGGCTC
GTACATGG
GTATTTTACCCGTTTAA TGGAAACTTCC
TTAGTGTATTCTTTTGC CTCTTTCGTTTTAGGTTGGTGCCTTCGTAGT GGCATTAC
TCCGTTGTACTTTGTTT CGCGCTTGGTATAATCGCTGGGGGTCAAAGA TGAGTGTT
GTAACATGGAGCAGGTC GCGGATTTCGACACAATTTATCAGGCGATGA TACAAATC
TTGTCTTTGGC GCTGGTAAACCATAT
GAATT TTCTATTGATTGTGACAAAATAAACTTATTC CGTGGTGTCTTTGC
GTTTC TTTTATATGTTGCCACCTTTCTGCATTAGTT GAATGTGGTATTCC
TAAAT CTCAACTGATGAATCTTTCTACCTGTAATAA TGTTGTTCCGTTAG
TTCGT TTTATTAACGTAGATTTTTCTTCCCAACGTC CTGACTGGTATAAT
TGGGTATTCCG TTATTATTGCG
CTAACATACTG CGTAATAAGGAGTCTTAATCATGCCAGTTCT TT
ATGTATGTATTTTCTACGTT TG
AATTCCTTTTG GCGTTATGTAT
TGGTAAACGAG GGTTATGATAGTGTTGCTCTTACTATGCCTC GT
TTCTTTTGCAA AAGCCTCTCGCTATTTTGGTTTTTATCGTCG TC
TGACTT TGTTCAGGGTG
TT CAGTTAATTCTCCCGTCTAATGCGCTTCCCT GTTTTTATGTT
AT TCTCTCTGTAAAGGCTGCTATTTTCATTTTT GACGTTAAACA
AA AAATCGTTTCTTATTTGGATTGGGATTCGGG CTTCCTCTTAA
TC TTTTTGATGCAATCCGCTTTGCTTCTGACTA TAATAGTCAGG
AAACCTCCCGCAAG TCGGGA
AAAATTGTAGCTGG GTGCAAAATAGCAACTAATCTTGATTTAAGG CTTCA
GCAAATTAGGCTCT GGAAAGACGCTCGTTAGCGTTGGTAAGATTC AGGAT
TAAATAATATGGCTGTTTATTTTGT AACTG
AAACGCGATATTTG AAGTCT
TGACCTGTTGGAGT TTGCTTCCGGTCTGGTTCGCTTTGAAGCTCG AATTA
CGGTAC TTTATATTCTCTTATTA
CTGGCTCG AAAATGCCTCTGCCTAAATTACATGTTGGCG TTGTTAAATATGGCGAT
TCTCAATT AAGCCCTACTGTTGAGCGTTGGCTTTATACT GGTAAGAATTTGTATAA
CGCATATG ATACTAAACAGGCTTTTTCTAGTAATTATGA TTCCGGTGTTTATTCTT
ATTTAACG CCTTATTTATCACACGGTCGGTATTTTCAGC AATTAAGCTCTAAGCCA
GAATATC ATATTGATGGTGATTTGACTGTCTCCGGCCT TTCTCACCCTTTTGAATCTTTACCTACACAT TACTCAGGCATTGCATTTAAAATATATGAGG GTTCTAAAAATTTTTATCCTTGCGTTGAAAT AAAGGCTTCTCCCGCAAAAGTATTACAGGGT CATAATGTTTTTGGTACAACCGATTTAGCTT TATGCTCTGAGGCTTTATTGCTTAATTTTGC TAATTC
TCAAACCATTAAATTTAG
TAAAACATGTTGAGCTACAGC ATTATA
GAATTTTAACA AAATATTAACGTTTACAATTTAAATATTTGC TTATACAATCTTCCTGTTTTTGGGGCTTTTC TGATTATCAACCGGGGTACATATGATTGACA TGCTAGTTTTACGATTACCGTTCATCGATTC TCTTGTTTGCTCCAGACTCTCAGGCAATGAC CTGATAGCCTTTGTAGATCTCTCAAAAATAG CTACCCTCTCCGGCATTAATTTATCAGCTAG AACGGTTGTCAGAAGATGAAATTAACTAAAA TATATTTGAAAAAGTTTTCTC
GCCAGCTGGCGTAATAG CGAAGAGGCCC
ACTGGGAAAACCCTGGC GTTACCCAACTTAATCGCCTTGCAGCACATC CCCCTTTC
CCACCCTGGCTTCTCCT GAGAAAGCTTGGCACTGGCCGTCGTTTTACA ACGTCGTG
TGCGCATGAATTCACAACCACTTAG AAGAACAT
CTATTGACTCTTCTCAG CGTCTT
ACCTAAGCCGGAGGTTA AAAAGGTAGTCTCTCAGACCTATGATTTTGA TAAATTCA
TTCGTGCCCAC CGACGAGTTGCTTA
CAGAT GGCAGGGCCGCACTGTCGGTATCATAGAGTC ACTCCAGGGCGAGC
GTAAA TAGATTAGAAGCGGGGTTATTTTGGCGGGAC ATTGTCATAAGGTT
GACAA TTCAGCACTAAGGACACTTAAGTCGAATCTA AGCTATCGCTATGT
TTTCA AGGATTCTAAGGGAAAATTAATTAATAGCGA CGATTTACAGAAGC
TGTGGAATTGT GAGCGGATAAC
AGGCACCCCAG GCTTTACACTTTATGCTTCCGGCTCGTATGT TG
ACGCAATTAATGTGAGTTAGCTCACTCA TT
CTGTATATTCA TCT
AGGCGAATCCG TTATTGTTTCTCCCGATGTAAAAGGTACTGT TA
AATTCGCCTCT GCGCGATTTTGTAACTTGGTATTCAAAGCAA TC
ATACGC AAACCGCCTCT
CC CCGCGCGTTGGCCGATTCATTAATGCAGCTG GCACGACAGGT
TT CCCGACTGGAAAGCGGGCAGTGAGCGCAGAC GTTAAACCTGA
AA ATCTACGCAATTTCTTTATTTCTGTTTTACG TGCAAATAATT
TT GATAACTGTTGCAGGCGGTGTTAATACTGAC CGCCTCACCTC
TGCTGGGGCAAACC AGCGTG
ACCACCATCAAACAGGATTT TCGCC
TCTGGTGGTTTCTT TGTTCCGCAAA
ATGAATTGCCATCA TCTGATAATCAGGAATATGATGATAATTCCG CTCCT
CTAACCCTTCCATT ATTCAGAAGTATAATCCAAACAATCAGGATTATATTG
TGGT AGGTT
ATGCTTTAGATTTT TCATTTGCTGCTGGCTCTCAGCGTGGC
CCCTAT CTCGGGCTATTCTTTTG
ATTTATAA GGGATTTTGCCGATTTCGGAATGATAATGTT ACTCAAACTTTTAAAAT
TAATAACG TTCGGGCAAAGGATTTAATACGAGTTGTCGA ATTGTTTGTAAAGTCTA
ATACTTCT AAATCCTCAAATGTATTATCTATTGACGGCT CTAATCTATTAGTTGTT
AGTGCTCC TAAAGATATTTTAGATAACCTTCCTCAATTC CTTTCAACTGTTGATTT
TGATAGACGGTTTTT CGCCCTTTGACGTTGGAGTCCACGTTCTTTA ATAGTGGACTCTTGTTCCAAACTGGAACAAC ACTCAA
ACCGCTACACTTGCCAGCGCC CTAGCGCCCGCTCCTTTCGCTTTCTTCCCTT CCTTTCTCGCCACGTTCGCCGGCTTTCCCCG TCAAGCTCTAAATCGGGGGCTCCCTTTAGGG TTCCGATTTAGTGCTTTACGGCACCTCGACC CCAAAAAACTTGATTTGGGTGATGGTTCACG TAGTGGGCCATCGCCC
CAT TGGTGACGTTTCCGGCC
TTGCTAAT GGTAATGGTGCTGTTCCTATTGGGCTTGCTA TCCCTGAAAATGAGGGT
GGTGGCTC TGAGGGTGGCGGTTCTGAGGGTGGCGGTTCT GAGGGTGGCGGTACTAA
ACCTCCTG AGTACGGTGATACACCTATTCCGGGCTATACTTATATCAA
GGTGCTGCTATCGATGG TTT
CAAACTTGATTCTGTCGCTA CTGATTAC
ATAGGTTCCGAAATAGG CAGGGGGCATT
TCCTAATCCTTCTCTTG AGGAGTCTCAGCCTCTTAATACTTTCATGTT TCAGAATA
CCCTCTCGACGGCACTTATCCGCCTGGTACTGAGCAAAAC CCCGCTAA
AATAAGGG GGCTATGACCGAAAATGCCGATGAAAACGCG CTACAGTCTGACGCTAAAGGAACTGTTTATA CGGGCACTGTTACTCAAGGCACTGACCCCGT TAAAACTTATTACCAGTACACTCCTGTATCA TCAAAAGCCATGTATGACGCTTACTGGAACG GTAAATTCAGAGACTGCGCTTTCCATTCTGGCTTTAATGAGGATT
TATTTGTTTGTGAATATCAAGGCCAATCGTCTGACCTGCCTCA ACCTCCTGTCAATGCTGGCGGCGGCTCTGGT GGTGGTTCTGGTGGCGGCTCTGAGGGTGGTG GCTCTGAGGGTGGCGGTTCTGAGGGTGGCGG CTCTGAGGGAGGCGGTTCCGGTGGTGGCTCT GGTTCCGGTGATTTTGATTATGAAAAGATGG CAAACGCT
GACAGCCC
ACA
TTCC
CTGTAGCA
TACAACGC
GTACAAAC
CCA
GTCA
TGAGTTTC
CGTAACAC
TTTCATGA
CTT
AAGA
GAGGACTA
GAGGCTTT
CGGCTACA
CAA
GTAG
GAACGAGG
CAGCATCG
GCGAAAGA
GCA
CTCA
TCGTCACC
TTGCGGGA
GGCCGCTT
AAA
AGTT
TTGCAGGG
GCTGAGGC
ATTCGGTC
TAT
CCGA
CATCGCCCACGCATAA
ACAACAAC
ATG
GACA
TACCGATAGTTGCGCC
CAGCTTGA
AAA
TCTT
GCTTTCGAGGTGAATT
TT
GTCACCGACTT
GAGCCATTTGGGAATTA
GAGCCAGC
AAAATCACCAGTCCATGTACGGAAGTTTCCA
TTAAACGGGTAAAATAC
GTAATGCC
ACTACGAAGGCACCAACCTAAAACGAAAGAG
GCAAAAGAATACACTAA
AACACTCA
TCTTTGACCCCCAGCGATTATACCAAGCGCG
AAACAAAGTACAACGGA
GATTTGTA
TCATCGCCTGATAAATTGTGTCGAAATCCGC
GACCTGCTCCATGTTAC
AAAGACAA
GCC
CAGC
ATATGGTTTAC
AATTC
AGAA
TTTTGTCACAATCAAT
TAAGTTTA
GAA
CACG
GCAAAGACAC
GAAAC
AAAA
AAAGGTGGCAACATAT
TAATGCAG
AAC
ATTC
GGAATACCAC
ATTTA
TGAG
TCATCAGT
AGAAAGAT
TTACAGGT
TTA
AACA
CTAACGGAAC
ACGAA
TAAA
GAAAAATCTACGTTAA
GTTGGGAA
GAC
TCAG
ATTATACCAG
CGCAATAATAA
CGGAATACCCA
AA
AGAACTGGCATGATTAAGACTCCTTATTACG
CAGTATGTTAG
CA
AACGTAGAAAATACATACATATACATAACGC
CAAAAGGAATT
AC
GAGGCATAGTAAGAGCAACACTATCATAACC
CTCGTTTACCA
GA
CGACGATAAAAACCAAAATAGCGAGAGGCTT
TTGCAAAAGAA
TCA
AAG
CACCCTGAACA
AA
ACTG
GAGAATTA
GAAGCGCATTAGACGG
AGG
AAAC
AACATAA
AT
TTTACAGAGAGA
GAAAATAGCAGCC
AAT
AAA
TGTTTAACGTC
TT
ATTT
AAGAAACG
GAATCCCAATCCAAAT
CCC
GAAG
TTAAGAG
GA
TTGCATCAAAAA
GAAGCAAAGCGGA
TCA
TAG
CCTGACTATTA
TCCCGA
CTTGCGGGAGGTTT
TGAAG
CCTTAAATCAAGATTAGTTGCTATTTTGCAC
CCAGCTACAATTTT
ATCCT
GAATCTTACCAACGCTAACGAGCGTCTTTCC
AGAGCCTAATTTGC
CAGTT
ACAAAATAAACAGCCATATTATTTAAGACTT
CAAATATCGCGTTT
TAATT
CGAGCTTCAAAGCGAACCAGACCGGAAGCAA
ACTCCAACAGGTCA
CCG
GTA
TAAA
AGAGAATA
TAATA
GCCAG
CGA
TTTT
CAGAGGCA
CAACATGTAATTTAGG
CGC
ACAA
CATATTTA
ATCGC
TGAGA
AAT
GCTT
ACAGTAGG
AACGCTCA
ATAAAGCC
AGT
TACC
CAAATTCT
TTATA
ATGCG
CAT
GTAT
CCTGTTTA
TAATTACTAGAAAAAG
TCA
GGAA
TAAACACC
AAGAA
TAAAT
CGT
AAGG
TGATAAAT
CGACCGTG
GAAAATAC
GCT
AATT
TAGAGCTT
TGGCT
GAATTA
GCAAAATTAAGCAATAAAGCCTCAGAGCATA
AAGCTAAATCGGTTGTACCAAAAACATTATG
ACCCTGTAATACTTTTGCGGGAGAAGCCTTT
ATTTCAACGCAAGGATAAAAATTTTTAGAAC
CCTCATATATTTTAAATGCAATGCCTGAGTA
ATGTGTAGGTAAAGATTCAAAAGGGTGAGAA
AGGCCGGAGACAGTCAAATCACCATCAATAT
GATATTCCTAAATTTAATGGTTTGATATAAT
GCTGTAGCTCAACATGTTTTA
TAAAATTC
TGT
ATTT
ACGTTAAT
AATTGTAA
AATATTTA
GCA
ATAA
AAGATTGT
AAAACAGG
AAGCCCCA
GAA
ATCA
GGTTGATA
TGTACCCC
CAATCATA
TGT
AGCA
GTAAAACT
CGGTAATC
TCGATGAA
GAA
AAGA
GAGCAAAC
AGAGTCTG
ATTGCCTG
GTC
TCAG
AAAGGCTA
AGATCTAC
TTTTTGAG
CTA
GTAG
CGGAGAGG
ATTAATGC
GCTGATAA
CTA
CGTT
TTCATCTTCTGACAAC
TAGTTAAT
TTT
TATA
TTTTCAAA
AGAAAACT
G
GGGCCTCTTCG
CTATTACGCCAGCTGGC
GAAAGGGG
GATGTGCTGCAAGGCGATTAAGTTGGGTAAC
GCCAGGGTTTTCCCAGT
CACGACGT
TGTAAAACGACGGCCAGTGCCAAGCTTTCTC
AGGAGAAGCCAGGGTGG
ATGTTCTT
CTAAGTGGTTGTGAATTCATGCGCAAAGACG
CTGAGAAGAGTCAATAG
TGAATTTA
TCAAAATCATAGGTCTGAGAGACTACCTTTT
TAACCTCCGGCTTAGGT
GGCACGAA
GTG
GTCG
TAAGCAACTC
ATCTG
TGCC
TGCGGCCC
ACCGACAG
TCTATGAT
GAC
GAGT
GCTCGCCCTG
TTTAC
TCTA
GCTTCTAA
ATAACCCC
CCGCCAAA
GTC
CAAT
AACCTTATGA
TTGTC
TGAA
CTTAGTGC
TAAGTGTC
ATTCGACT
TAG
AGCT
ACATAGCGAT
TGAAA
TCCT
CCTTAGAA
TAATTTTC
CTATTAAT
TCG
ATCG
GCTTCTGTAA
GTTATCCGCTC
ACAATTCCACA
CA
ACATACGAGCCGGAAGCATAAAGTGTAAAGC
CTGGGGTGCCT
AA
TGAGTGAGCTAACTCACATTAATTGCGTAGA
TGAATATACAG
TA
ACAGTACCTTTTACATCGGGAGAAACAATAA
CGGATTCGCCT
GA
TTGCTTTGAATACCAAGTTACAAAATCGCGC
AGAGGCGAATT
GCGTAT
AGAGGCGGTTT
GG
GCGG
GCCAACGC
CAGCTGCATTAATGAATCG
GTGC
ACCTGTC
AA
TTTCCAGTCGGG
GCTCACTGCCCGC
GTCTGC
TCAGGTTTAAC
TT
AGAT
AATTGCGT
CGTAAAACAGAAATAAAGA
TGCA
AATTATT
AA
GCAACAGTTATC
ATTAACACCGCCT
GTCAGT
GAGGTGAGGCG
CACGCT
GGTTTGCCCCAGCA
GA
AAATCCTGTTTGATGGTGGTTTTGCGGAACA
AAGAAACCACCAGA
AGGAG
CGGAATTATCATCATATTCCTGATTATCAGA
TGATGGCAATTCAT
TATAATCCTGATTGTTTGGATTATACTTCTGAAT
AATGGAAGGGTTAG
AACCT
ACCAGCCACGCTGAGAGCCAGCAGCAAATGA
AAAATCTAAAGCAT
GGG
ATA
CGAG
GAATAGCC
CAAAA
TTATAAAT
TCCC
CGGCAAAA
TCCGAAAT
ATTATCAT
AAC
GAGT
AAAAGTTT
ATTTT
CGTTATTA
CGAA
CCTTTGCC
TATTAAAT
ACAACTCG
TCG
CAAT
TTTACAAA
TAGAC
AGAAGTAT
ATTT
ATTTGAGG
GATAATAC
CGTCAATA
AGC
TTAG
CTAATAGA
AACAA
GGAGCACT
TTTA
AAAATATC
GGTTATCT
TTGAGGAA
GAA
AAAG
AACAGTTG
AAATC
TTGAGT
GTTGTTCCAGTTTGGAACAA
AGTCCACTAT
TAAAGAACGTGGACTCCAACGTCAAAGGGCG
AAAAACCGTCTATCAGGGCG
TGGCCCACTA
CGTGAACCATCACCCAAATCAAGTTTTTTGG
GGTCGAGGTGCCGTAAAGCA
TAAATCGGAA
CCCTAAAGGGAGCCCCCGATTTAGAGCTTGA
CGGGGAAAGCCGGCGAACGT
GCGAGAAAGG
AAGGGAAGAAAGCGAAAGGAGCGGGCGCTAG
GGCGCTGGCAAGTGTAGCGG
ATG
ACCA
GAAACGTC
GGCCG
AGCAA
ATT
AGCACCATTACC
ATAGGAAC
CAAGCCCA
TAG
GGGA
CATTTTCA
ACCCT
CCACC
GAG
CTCA
CCGCCACC
CCTCAGAA
ACCGCCAC
AGA
CCTC
ACCGCCAC
TTAGT
GAGGT
CAG
TATCACCGTACT
AATAGGTG
TAGCCCGG
TGATATAAGTA
AAA
CCATCGATAGCAGCACC
GTAATCAG
TAGCGACAGAATCAAGTTTGAATGCCCCCTG
CCTATTTCGGAACCTAT
TATTCTGA
AACATGAAAGTATTAAGAGGCTGAGACTCCT
CAAGAGAAGGATTAGGA
TTAGCGGG
GTTTTGCTCAGTACCAGGCGGATAAGTGCCGTCGAGAGG
CCCTTATT
AGCC
CGGCATTTTCGGTCAT
GTTTTCAT
CGC
GTAG
CCTTTAGCGTCAGACT
AAACAGTT
TAT
CCCG
GCCTTGAGTAACAGTG
GGGTCAGT
ACG
TTTA
TGTACTGGTAATAAGT
TACAGGAG
TGA
TTGA
GCGTCATACATGGCTT
TCCAGTAA
CGT
TTAC
AGCGCAGTCTCTGAAT
GAATGGAA
ATCCTCATTAAAGCCA
AGCGTTTG
CCATCTTTTCATAATCAAAATCACCGGAACC
AGAGCCACCACCGGAACCGCCTCCCTCAGAG
CCGCCACCCTCAGAACCGCCACCCTCAGAGC
CACCACCCTCAGAGCCGCCACCAGAACCACC
ACCAGAGCCGCCGCCAGCATTGACAGGAGGT
TGAGGCAGGTCAGACGATTGGCCTTGATATTCACAAACAAATAA
AGCTGATAAA CCGATACAATTAAAGGCTCCTTTTGGAGCCT TTTTTTTGGAGATTTTCAACGTGAAAAAATT ATTATTCGCAATTCCTTTAGTTGTTCCTTTC TATTCTCACTCCGCTGAAACTGTTGAAAGTT GTTTAGCAAAATCCCATACAGAAAATTCATT TACTAACGTCTGGAAAGACGACAAAACTTTA GATCGTTACGCTAACTATGA
AAAGTTGGTCAGTTCGG TTCCCTTATGATTGACCGTCTGCGCCTCGTT CCGGCTAA
ATGAAGGTCAGCCAGCC TATGCGCCTGGTCTGTACACCGTTCATCTGT CCTCTTTC
GATT TGGGTAATGAATATCCGGTTCTTGTCAAGAT TACTCTTG
TCCGTCAATATTT
GGTGATAATTCACCTTTAAT GAATAATT
GAGCC AGTTCTTAAAATCGCATAAGGTAATTCACAA TGATTAAAGTTGAA
ATTAA ACCATCTCAAGCCCAATTTACTACTCGTTCT GGTGTTTCTCGTCA
GGGCA AGCCTTATTCACTGAATGAGCAGCTTTGTTA CGTTACCTTCCCTC
CCTCA ATCGGTTGAATGTCGCCCTT
GCTATCCAGTC TAAACATTTTACTATTACCCCCTCTGGCAAA AC
AATATTTATGACGATTCCGCAGTATTGG AC
TAAGATAGCTA TTG
ACTTTGTTCGG CTATCTGCTTACTTTTCTTAAAAAGGGCTTC GG
TTTCCTCGGTTTCCTTCTGG TA
GT AAAGACCTGATTTTTGATTTATGGTCATTCT CGTTTTCTGAA
CT GTTTAAAGCATTTGAGGGGGATTCAATGCTA TTTCATTGTTT
CT TGCTCTTATTATTGGGCTTAACTCAATTCTT GTGGGTTATCT
CT CTGATATTAGCGCTCAATTACCCTC
AGCAATTAAAGGTACTCTCT AATCC
TACTTGGTTTAATA CCCGTTCTTGG
GATTCCTACGATGA AAATAAAAACGGCTTGCTTGTTCTCGATGAG TGCGG
TACCGGATAAGCCT TCTATATCTGATTTGCTTGCTATTGGGCGCG GTAAT
GGTTCGCTAAAACGCCTCGCGTTCT TAGAA
TCCGCAAA AATGACCTCTTATCAAAAGGAATGATAAGGA AAGACAGCCGATTATTG
ATTGGTTT CTACATGCTCGTAAATTAGGATGGGATATTA TTTTTCTTGTTCAGGAC
TTATCTAT TGTTGATAAACAGGCGCGTTCTGCATTAGCT GAACATGTTGTTTATTG
TCGTCGTC TGGACAGAATTACTTTACCTTTTGTT
TTGCCTTGCCTGTATGATTTATTG GATGTTAATGCTACTACTATTAGTAGAATTG ATGCCACCTTTTCAGCTCGCGCCCCAAATGA AAATATAGCTAAACAGGTTATTGACCATTTG CGAAATGTATCTAATGGTCAAACTAAATCTA CTCGTTCGCAGAATTGGGAATCAACTGTTAT ATGGAATGAAACTTCCAGACACCGTACTTTA GTTGCATATT
GCGTTCTTTG TCTTGCGATTGGATTTGCATTCTACACCAAC GTGACCTATCCCATTACGGTCAATCCGCCGT TTGTTCCCACGGAGAATCCGACGGGTTGTTA CTCGCTCACATTTAATGTTGATGAAAGCTGG CTACAGGAAGGCCAGACGCGAATTATTTTTG ATGGCGTTCCTATTGGTTAAAAAATGAGCTG ATTTAACAAAAATTTAATGC
CAGCATTTACATATAGTTAT ATAACCCA
TGGCAGATGCACGGTTA CGATGCGCCCA
AAAGCTGGCTGGAGTGC GATCTTCCTGAGGCCGATACTGTCGTCGTCC CCTCAAAC
CAGCCTGAATGGCGAAT GGCGCTTTGCCTGGTTTCCGGCACCAGAAGC GGTGCCGG
GCACCGATCGCCCTTCCCAA CAGTTGCG
AAGGT TATTCACTCACATATATTGATTTATGTACTG TTTCCATTAAAAAA
GGTAA TTCAAATGAAATTGTTAAATCACGTAGCTTA AGCCCTGTTTACTC
ATTAC ACCAACCAGGAGGTCAGAGTTCGGAGAAATG ATTTATGTGAAATG
CGTCA GCCGATTCAAGGCCCCTATA
TGTTTGTTTCA TCATCTTCTTTTGCTCAGGTAATTGAAATGA AT
GTAATTAATTTTGTTTTCTT GA
TCTTTATCGAG GTAACAAGCAC
TGACCATGATT ACGAATTCGAGCTCGGTACCCGGGGATCCTC CG
AATTTCACACAGGAAACAGC TA
TG TTTTATCTTCTGCTGGTGGTTCGTTCGGTAT TTTTAATGGCG
AT GTTTTAGGGCTATCAGTTCGCGCATTAAAGA CTAATAGCCAT
TC AAAAATATTGTCTGTGCCACGTATTGTTGCC CGTCTCACTGG
TG AAAAGAAAAACCACCCTGGCGCCCA
TTGATATTTGAGGTTCAGCA AGGTG
TGCCAATGTAAATA ATCCATTTCAG
TCTGTTGGCCAGAA TGTCCCTTTTATTACTGGTCGTGTGACTGGT GAATC
CTTACGCTTTCAGGTCAGAAGGGTT CTATC
GCGGTGAAGGGCAA TCAGCT
GACCGCTTGCTGCAACTCTCTCAGG GCCAG
GCCAACTG ACCAGATATTGATTGAGGGTACGATTGAGCG TCAAAATGTAGGTATTT
CCATGAGC GTTTTTCCTGTTGCAATGGCTGGCGGTAATA TTGTTCTGGATATTACC
AGCAAGGC CGATAGTTTGAGTTCTTCTACTCAGGCAAGT GATGTTATTACTAATCA
AAGAAGTA TTGCTACAACGGTTAATTTGCGTGAT
GGACAGACTCTTTTACTCGGTGGC CTCACTGATTATAAAAACACTTCTCAGGATT CTGGCGTACCGTTCCTGTCTAAAATCCCTTT AATCGGCCTCCTGTTTAGCTCCCGCTCTGAT TCTAACGAGGAAAGCACGTTATACGTGCTCG TCAAAGCAACCATAGTACGCGCCCTGTAGCG GCGCATTAAGCGCGGCGGGTGTGGTGGTTAC GCGCAGCGTG
ATCAGCT
TTT
TCGG
GGAGCCTTTAATTGTA
CTCCAAAA
AGG
AAAA
GTTGAAAATCTCCAAA
TTTTTCAC
AAT
TAAT
CTAAAGGAATTGCGAA
AGGAACAA
GAA
AATA
GTTTCAGCGGAGTGAG
TTTCAACA
AAC
AAAC
TGTATGGGATTTTGCT
GAATTTTC
AAT
AGTA
CGTCTTTCCAGACGTT
AGTTTTGT
TAA
GATC
TCATAGTTAGCGTAAC
TTAGCCGG
AACGAGGCGCAGACGGTCAATCATAAGGGAA
CCGAACTGACCAACTTT
GAAAGAGG
ACAGATGAACGGTGTACAGACCAGGCGCATA
GGCTGGCTGACCTTCAT
CAAGAGTA
ATCTTGACAAGAACCGGATATTCATTACCCA
AATCAAATATTGACGGA
AATTATTC
ATTAAAGGTGAATTATCACC
GGCTC
AACT
CTTATGCGATTTTAAG
TGAATTAC
TTG
ATCA
TTCAACTTTA
TTAAT
TGGT
TAAATTGGGCTTGAGA
ACGAGTAG
AGA
CACC
TGACGAGAAA
TGCCC
GGCT
CTCATTCAGTGAATAA
CAAAGCTG
TAA
AACG
GAGGGAAGGT
TGAGG
CGAT
AAGGGCGACATTCAAC
GT
TTTGCCAGAGGGGGTAATAGTAAAATGTTTA
GACTGGATAGC
GT
CCAATACTGCGGAATCGTCATAAATATTCAA
TAGCTATCTTA
CC
GAAGCCCTTTTTAAGAAAAGTAAGCAGATAG
CCGAACAAAGT
TA
CCAGAAGGAAACCGAGGAAA
AC
CTTT
AATCAGGT
ATGACCATAAATCAAA
AGA
AACG
TTCAGAA
AG
AATGCTTTAAAC
TGAATCCCCCTCA
CAT
TAG
AAACAATGAAA
AG
AGCA
ATAATAAG
AATTGAGTTAAGCCCA
AAG
CCAC
AGATAAC
AG
CGCTAATATCAG
GAGGGTAATTGAG
GGATT
AGAGAGTACCTTTAATTGCTCCAAGAACGGG
TATTAAACCAAGTA
CCGCA
CTCATCGAGAACAAGCAAGCCGTTTTTATTT
TCATCGTAGGAATC
ATTAC
CGCGCCCAATAGCAAGCAAATCAGATATAGA
AGGCTTATCCGGTA
TTCTA
AGAACGCGAGGCGTTTTAGCGAACC
GCGGA
TTT
CATT
TAAGAGGT
TTATCATTCCTTTTGA
TCC
TCTT
ATCGGCTG
CAATA
CCAAT
AAA
GTAG
ACGAGCAT
CCTAATTT
TATCCCAT
TAA
AAAA
GAACAAGA
GTCCT
GATAA
ATA
AACA
TGTTTATC
TAATGCAGAACGCGCC
AGC
GTTC
AACAACAT
CAATA
GACGA
GAC
TCCA
TAATTCTG
AGGTAAAG
ACAAA
AATATGCAAC
TAAAGTACGGTGTCTGGAAGTTTCATTCCAT
ATAACAGTTGATTCCCAATTCTGCGAACGAG
TAGATTTAGTTTGACCATTAGATACATTTCG
CAAATGGTCAATAACCTGTTTAGCTATATTT
TCATTTGGGGCGCGAGCTGAAAAGGTGGCAT
CAATTCTACTAATAGTAGTAGCATTAACATC
CAATAAATCATACAGGCAAGGCAAA
AGAACGC
CAA
AAGA
CCAATCGC
ATGCAAAT
GGTGTAGA
GTT
TCAC
GGGATAGG
ACCGTAAT
GCGGATTG
ACG
ACAA
CCGTGGGA
CGGATTCT
CAACCCGT
TAA
CGAG
AATGTGAG
CAACATTA
GCTTTCAT
CCA
GTAG
GCCTTCCT
CGCGTCTG
AAATAATT
CAA
CCAT
TAGGAACG
TTAACCAA
CTCATTTT
CAG
AAAT
TTTTTGTT
GCATTAAA
TGGGTTAT
ATAACTATATGTAAATGCTGTGGGCGCATCG
TAACCGTGCATCTGCCA
GTTTGAGG
GGACGACGACAGTATCGGCCTCAGGAAGATC
GCACTCCAGCCAGCTTT
CCGGCACC
GCTTCTGGTGCCGGAAACCAGGCAAAGCGCC
ATTCGCCATTCAGGCTG
CGCAACTG
TTGGGAAGGGCGATCGGTGC
ACCTT
AATA
TGTGAGTG
TCAATATA
TACATAAA
CAG
GAAA
TTTTTTAATG
TTACC
TGAA
ATTTCATT
ATTTAACA
GCTACGTG
TAA
GGCT
GAGTAAACAG
GTAAT
TGGT
CTCCTGGT
ACTCTGAC
TTCTCCGA
CAT
AAAT
CATTTCACAT
TGACG
CGGC
CCTTGAAT
TATAGGGG
AT
TCATTTCAATTACCTGAGCAAAAGAAGATGA
TGAAACAAACA
TC
AAGAAAACAAAATTAATTACGTGCTTGTTAC
CTCGATAAAGA
CG
GAGGATCCCCGGGTACCGAGCTCGAATTCGT
AATCATGGTCA
TA
GCTGTTTCCTGTGTGAAATT
CA
AAAA
CAGAAGAT
ATACCGAACGAACCACCAG
AAAA
CGCCATT
AT
TAGCCCTAAAAC
ATGCGCGAACTGA
TCTTTA
ATGGCTATTAG
GA
TTTT
GACAATAT
GGCAACAATACGTGGCACA
GACG
CCAGTGA
CA
GGTTTTTCTTTT
TGGGCGCCAGGGT
CT
TGCTGAACCTCAAATATCAACTGAAATGGAT
TATTTACATTGGCA
GATTC
ACCAGTCACACGACCAGTAATAAAAGGGACA
TTCTGGCCAACAGA
AG
AACCCTTCTGACCTGAAAGCGTAAGAGCTGA
TTGCCCTTCACCGC
CTGGC
CCTGAGAGAGTTGCAGCAAGCGGTC
CAGTTGGC
TGGT
TCAATATC
ACCCTCAA
TCAATCGT
CGC
TTGA
CCTACATT
AAATA
GCTCATGG
AAAC
AACAGGAA
GCCATTGC
TACCGCCA
TAT
ACAA
TATCCAGA
GGTAA
GCCTTGCT
ATCG
CTCAAACT
TAGAAGAA
TGCCTGAG
ACT
CATC
AGTAATAA
TGATT
TACTTCTT
GCAA
CCGTTGTA
CAAATTAA
TCACG
CACGCTGCGC
GTAACCACCACACCCGCCGCGCTTAATGCGC
CGCTACAGGGCGCGTACTAT
GTTGCTTTGA
CGAGCACGTATAACGTGCTTTCCTCGTTAGA
ATCAGAGCGGGAGCTAAACA
GAGGCCGATT
AAAGGGATTTTAGACAGGAACGGTACGCCAG
AATCCTGAGAAGTGTTTTTA
AATCAGTGAG
GCCACCGAGTAAAAGAGTCTGTCCA
...
...
Figure S7.10: CaDNAno diagram of the DNA origami nanopore.

7
194 CHAPTER 7
7.5.4. INITIAL FOLDING SCREEN OF THE ORIGAMI PORE
PL LSS 1 2 T1 T2 T3 T4 T5 T6 T7 T8 M1 M2 M3 M5M4 M6
P
a
b L LSS 1 2 T1 T2 T3 T4 T5 T6 T7 T8 M1 M2 M3 M5M4 M6
Figure S7.11: Initial folding screen of the DNA origami nanopore. a and b show the same laser-scanned imageof a 2% agarose gel with 5.5 mM MgCl2 run on a water bath. b, The red box indicates that this region wasauto-leveled. The following samples were electrophoresed at 90 V for 90 min: L, 1kb ladder; S, 7560 bases longscaffold; 1, folding interval 60-44°C, 20 mM, 5× staple-to-scaffold excess; 2, 60-44°C, 1 h/°C, 20 mM MgCl2,10× staple-to-scaffold excess; lanes T1-T8: 20 mM MgCl2; T1, folding interval 50-47°C; T2, folding interval 52-49°C; T3, folding interval 54-51°C; T4, folding interval 56-53°C; T5, folding interval 58-55°C; T6, folding interval60-57°C; T7, folding interval 62-59°C; T8, folding interval 64-61°C; lanes M1-M6, folding interval 60-44°; M1, 5mM MgCl2; M2, 10 mM MgCl2; M3, 15 mM MgCl2; M4, 20 mM MgCl2; M5, 25 mM MgCl2; M6, 30 mM MgCl2.P: Pocket.

7. RECONSTITUTION OF ULTRAWIDE DNA ORIGAMI PORES IN LIPOSOMES
7
195
7.5.5. ADVANCED FOLDING SCREEN 1
PL61 2 43 5
Figure S7.12: Temperature folding screen of the DNA origami nanopore. Laser-scanned image of a 2% agarosegel with 5.5 mM MgCl2 run on a water bath on which the following samples were electrophoresed at 90 V for90 min: lanes 1-6: 20 mM MgCl2; 1, 60-44°C, 1 h/°C; 2, folding interval 42-39°C; 3, folding interval 44-41°C; 4,folding interval 46-43°C; 5, folding interval 48-45°C; 6, folding interval 50-47°C; L, 1kb ladder. P: Pocket.
7.5.6. ADVANCED FOLDING SCREEN 2
PL LA 1_1 2_1 3_1 4_1 1_2 2_2 3_2 4_2 1_3 2_3 3_3 4_3
Figure S? Temperature folding screen of the Octagon Laser-scanned image of a 2% agarose gel with 5.5 mM MgCl2 run on a water bath on which the following samples were electrophoresed at 90 V for 90 min: L, 1kb ladder; all other lanes: 20 mM MgCl2; A, 60-44°C, 1 h/°C; lanes 1_1 - 4_1, 1h /°C; 1_1, 44-41°C; 2_1, 46-43°C, 3_1, 48-45°C; 4_1, 50-47°C; lanes 1_2 - 4_2, 1h /°C; 1_2, 44-41°C; 2_2, 46-43°C, 3_2, 48-45°C; 4_2, 50-47°C; lanes 1_3 - 4_3, 1h /°C; 1_3, 44-41°C; 2_3, 46-43°C, 3_3, 48-45°C; 4_3, 50-47°C.
Figure S7.13: Temperature folding screen of the DNA origami nanopore. Laser-scanned image of a 2% agarosegel with 5.5 mM MgCl2 run on a water bath on which the following samples were electrophoresed at 90 V for90 min: L, 1kb ladder; all other lanes: 20 mM MgCl2; A, 60-44°C, 1 h/°C; lanes 1_1 - 4_1, 1h /°C; 1_1, 44-41°C;2_1, 46-43°C, 3_1, 48-45°C; 4_1, 50-47°C; lanes 1_2 - 4_2, 1h /°C; 1_2, 44-41°C; 2_2, 46-43°C, 3_2, 48-45°C; 4_2,50-47°C; lanes 1_3 - 4_3, 1h /°C; 1_3, 44-41°C; 2_3, 46-43°C, 3_3, 48-45°C; 4_3, 50-47°C. P: Pocket.

7
196 CHAPTER 7
7.5.7. ADVANCED FOLDING SCREEN 3
PLA 1 3 42
Figure S7.14: Folding screen of the DNA origami nanopore. Laser-scanned image of a 2% agarose gel with 5.5mM MgCl2 run on a water bath on which the following samples were electrophoresed at 70 V for 90 min: alllanes except L: 20 mM MgCl2; A, 60-44°C, 1 h/°C; 1, 5h at 50°C; 2, 10h at 50°C; 3, 5h at 52°C; 4, 10h at 52°C; L,1kb ladder. P: Pocket.
7.5.8. ADVANCED FOLDING SCREEN 4
PS 111 2 3 4 5 6 7 8 9 10
Figure S7.15: Magnesium folding screen of the DNA origami nanopore. Laser-scanned image of a 2% agarosegel with 5.5 mM MgCl2 run on a water bath on which the following samples were electrophoresed at 70 V for60 min: S, 7560 bases long scaffold; lanes 1-11, 60-44°C, 1 h/°C; 1, 20 mM MgCl2; 2, 21 mM MgCl2; 3, 22 mMMgCl2; 4, 23 mM MgCl2; 5, 24 mM MgCl2; 6, 25 mM MgCl2; 7, 26 mM MgCl2; 8, 27 mM MgCl2; 9, 28 mMMgCl2; 10, 29 mM MgCl2; 11, 30 mM MgCl2. P: Pocket.

7. RECONSTITUTION OF ULTRAWIDE DNA ORIGAMI PORES IN LIPOSOMES
7
197
7.5.9. ADVANCED FOLDING SCREEN 5
L LS 1 2 3 4 5 6 7 8 9P
a
bP
L LS 1 2 3 4 5 6 7 8 9
Figure S? Scaffold to oligo ratio folding screen of the Octagon Laser-scanned image of a 2% agarose gel with 5.5 mM MgCl2 run on a water bath on which the following samples were electrophoresed at 70 V for 60 min: L, 1kb ladder; S, 7560 bases long scaffold; lanes 1-9, 24 mM MgCl2, 60-44°C, 1 h/°C; 1, 50 nM scaffold, 175 nM oligos; 2, 20 nM scaffold, 300 nM oligos; 3, 20 nM scaffold, 200 nM oligos; 4, 20 nM scaffold, 100 nM oligos; 5, 10 nM scaffold, 400 nM oligos; 6, 10 nM scaffold, 300 nM oligos; 7, 10 nM scaffold, 200 nM oligos; 8, 10 nM scaffold, 100 nM oligos; 9, 10 nM scaffold, 50 nM oligos.
Figure S7.16: Scaffold to oligo ratio folding screen of the DNA origami nanopore. a and b show the same laser-scanned image of a 2% agarose gel with 5.5 mM MgCl2 run on a water bath. b, The red box indicates thatthis region was auto-leveled. The following samples were electrophoresed at 70 V for 60 min: L, 1kb ladder; S,7560 bases long scaffold; lanes 1-9, 24 mM MgCl2, 60-44°C, 1 h/°C; 1, 50 nM scaffold, 175 nM oligos; 2, 20 nMscaffold, 300 nM oligos; 3, 20 nM scaffold, 200 nM oligos; 4, 20 nM scaffold, 100 nM oligos; 5, 10 nM scaffold,400 nM oligos; 6, 10 nM scaffold, 300 nM oligos; 7, 10 nM scaffold, 200 nM oligos; 8, 10 nM scaffold, 100 nMoligos; 9, 10 nM scaffold, 50 nM oligos. P: Pocket.

7
198 CHAPTER 7
7.5.10. ADVANCED FOLDING SCREEN 6
P
a
b
S 1 2 3 4 6 7 8 95
PS 1 2 3 4 6 7 8 95
Figure S7.17: Scaffold to oligo ratio folding screen of the DNA origami nanopore. a and b show the same laser-scanned image of a 2% agarose gel with 5.5 mM MgCl2 run on a water bath. b, The red box indicates thatthis region was auto-leveled. The following samples were electrophoresed at 70 V for 90 min: S, 7560 baseslong scaffold; lanes 1-9, 24 mM MgCl2, 10 nM scaffold, 300 nM oligos, 15min at 56°C followed by differenttemperatures; 1, 24h at 54°C, 24h at 53°C; 2, 15h at 49°C; 3, 15h at 50°C; 4, 15h at 51°C; 5, 15h at 52°C; 6, 15h at53°C; 7, 15h at 54°C; 8, 15h at 55°C; 9, 15h at 56°C. P: Pocket.

7. RECONSTITUTION OF ULTRAWIDE DNA ORIGAMI PORES IN LIPOSOMES
7
199
7.5.11. ADVANCED FOLDING SCREEN 7
PL S 1 2 4 L3
Figure S7.18: Scaffold to oligo ratio folding screen of the DNA origami nanopore. Laser-scanned image of a 2%agarose gel with 5.5 mM MgCl2 run on a water bath on which the following samples were electrophoresed at70 V for 90 min: L, 1kb ladder; S, 7560 bases long scaffold; lanes 1-4, 15min at 65°C, 24h at 50 °C, 10 nM scaffold,24 mM MgCl2; 1, 50 nM oligos; 2, 100 nM oligos; 200 nM oligos, 300 nM oligos. P: Pocket.
7.5.12. ADVANCED FOLDING SCREEN 8
PL S 2 L1
Figure S7.19: Scaffold to oligo ratio folding screen of the DNA origami nanopore. Laser-scanned image of a 2%agarose gel with 5.5 mM MgCl2 run on an ice water bath on which the following samples were electrophoresedat 70 V for 90 min: L, 1kb ladder; S, 7560 bases long scaffold; 1, filter purified, uncoated DNA origami nanopore;2, filter purified, K10-PEG5k coated DNA origami nanopore. P: Pocket.

7
200 CHAPTER 7
7.5.13. SINGLE PARTICLE MONTAGE FOR CLASS AVERAGING OF THE UNCOATED
ORIGAMI PORE
Figure S7.20: Library of negative-stain TEM particles for class averaging of the uncoated DNA origaminanopore in the front (left) and side (right) view. Scale bar: 50 nm.

7. RECONSTITUTION OF ULTRAWIDE DNA ORIGAMI PORES IN LIPOSOMES
7
201
7.5.14. SINGLE PARTICLE MONTAGE FOR CLASS AVERAGING OF THE COATED
ORIGAMI PORE
Figure S7.21: Library of negative-stain TEM particles for class averaging of the PEG-oligolysine-coated DNAorigami nanopore in the front (left) and side (right) view. Scale bar: 50 nm.

7
202 CHAPTER 7
7.5.15. INNER DIAMETER AND HEIGHT ESTIMATES FROM NEGATIVE-STAINING
TEM AND CLASS AVERAGING OF THE PEG-OLIGOLYSINE-COATED
DNA ORIGAMI NANOPORES
Figure S7.22: a, Front view class averaged image of the DNA origami nanopore (sample preparation as men-tioned in methods section). The yellow box indicates the region of interest for the cross-section plot. A diam-eter of ∼35 nm was estimated from the full-width-half maximum (FWHM) as indicated by the dashed lines. b,Side view class averaged image of the DNA origami nanopore (sample preparation as mentioned in methodssection). The yellow box indicates the region of interest for the cross-section plot. A height of ∼11 nm wasestimated from the full-width-half maximum (FWHM) as indicated by the dashed lines.
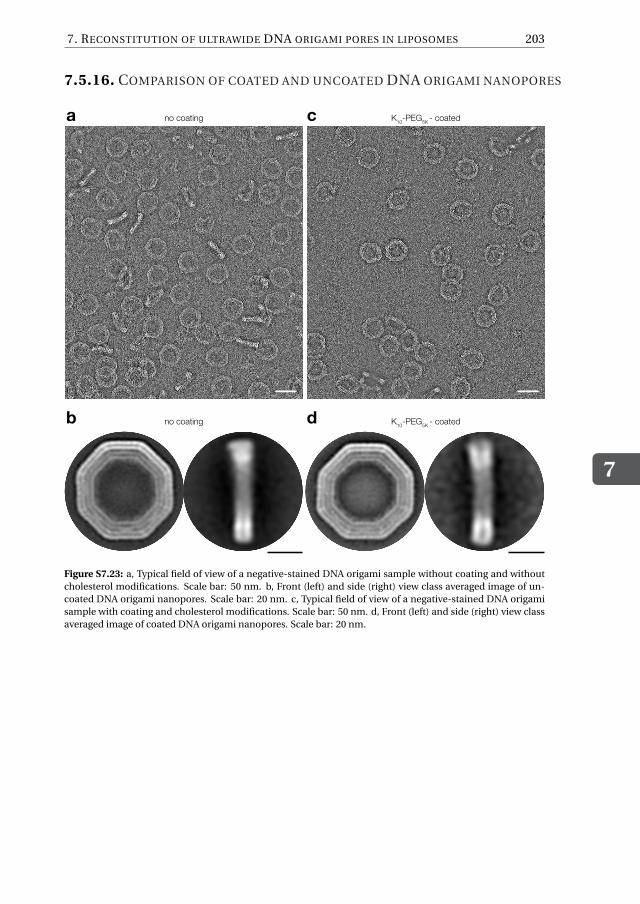
7. RECONSTITUTION OF ULTRAWIDE DNA ORIGAMI PORES IN LIPOSOMES
7
203
7.5.16. COMPARISON OF COATED AND UNCOATED DNA ORIGAMI NANOPORES
a
b
c
d K10-PEG5K - coated
K10-PEG5K - coatedno coating
no coating
Figure S7.23: a, Typical field of view of a negative-stained DNA origami sample without coating and withoutcholesterol modifications. Scale bar: 50 nm. b, Front (left) and side (right) view class averaged image of un-coated DNA origami nanopores. Scale bar: 20 nm. c, Typical field of view of a negative-stained DNA origamisample with coating and cholesterol modifications. Scale bar: 50 nm. d, Front (left) and side (right) view classaveraged image of coated DNA origami nanopores. Scale bar: 20 nm.

7
204 CHAPTER 7
7.5.17. ILLUSTRATION OF SINGLE-STRANDED DNA HANDLES ON THE IN-SIDE WALL OF THE DNA ORIGAMI NANOPORE
Figure S7.24: Top left: Front view class averaged image of coated DNA origami nanopores. The black boxhighlights density on the inner wall of the DNA origami nanopore. Top right: Front view model of the DNAorigami nanopore. Black stripes on the inside wall resemble single-stranded DNA handles. Bottom left: Zoomin on the single-stranded handles. Bottom right: Illustration of the single-stranded handle sequence, whichcan be used in the future to attach macromolecules inside of the pore.

7. RECONSTITUTION OF ULTRAWIDE DNA ORIGAMI PORES IN LIPOSOMES
7
205
7.5.18. EFFECT OF THE AMOUNT OF CHOLESTEROLS THAT ARE ATTACHED
TO THE DNA ORIGAMI NANOPORES
Figure S7.25: DNA origami pores were added from the outside to preformed GUVs. Top: DNA origami withoutany cholesterol anchor did not show detectable membrane localization. Center: 32-cholesterol DNA-origamipores showed increased localization at the membrane, resulting in a relatively homogeneous signal. The pres-ence of bulk fluorescence in the origami channel indicates that some origami pores remained in solution anddid not precipitate. Bottom: 64-cholesterol DNA-origami pores showed strong interaction with the lipid mem-brane, resulting in the formation of large aggregates.

7
206 CHAPTER 7
7.5.19. TEST INFLUX OF GFP THROUGH DNA ORIGAMI PORES ADDED FROM
THE OUTSIDE TO PREFORMED GUVS
Figure S7.26: For both cholesterol-less origami pores (top), 32-cholesterols (center), and 64-cholesterols (bot-tom), administration of GFP from the bulk solution at the outside did not result in influx, indicating that addi-tion of DNA origami pores to preformed vesicles does not result in formation of functional pores that embedwithin the membrane to create open pores that allow transmembrane diffusion of GFP.

7. RECONSTITUTION OF ULTRAWIDE DNA ORIGAMI PORES IN LIPOSOMES
7
207
7.5.20. RECONSTITUTION OF DNA ORIGAMI PORES INTO THE LIPID MONO-LAYER OF WATER-IN-OIL DROPLETS
Figure S7.27: Top: cholesterol-less origami pores did, as expected, not result in localization to the monolayerlipid membrane in water in oil droplets, as indicated by the homogeneous fluorescence origami signal in thebulk of the vesicle and the absence of an increased intensity at the lipid membrane. Center: 32-cholesterolorigami pores, by contrast, showed clear localization at the droplet membrane. Bottom: 64-cholesterol origamipores resulted in aggregates localized at the membrane, which we attribute to the higher hydrophobicitycaused by the relatively large number of cholesterol groups.

7
208 CHAPTER 7
7.5.21. CDICE WITH CHOLESTEROL-LESS DNA ORIGAMI PORES
Figure S7.28: Example of a GUV with cholesterol-less origami pores that manifested poor membrane localiza-tion, while a large amount of origami signal was present in the bulk of the vesicle.
7.5.22. AMINO ACID SEQUENCE OF THE HIS14-TEV-IBB-MEGFP-CYS PRO-TEIN
(MSKHHHHSGHHHTGHHHHSGSHHHTGENLYFQ)cleavedHis14-tagGSDNGTDSSTSKFVPEYRRTNFKNKGRFSADELRRRRDTQQVELRKAKRDEALAKRR
NFIPPTDGTSKGEELFTGVVPILVELDGDVNGHKFSVSGEGEGDATYGKLTLKFICTTGKLPVPWPTLVTTLTYGVQCFSRYPDHMKQHDFFKSAMPEGYVQERTIFFKDDGNYKTRAEVKFEGDTLVNRIELKGIDFKEDGNILGHKLEYNYNSHNVYIMADKQKNGIKVNFKIRHNIEDGSVQLADHYQQNTPIGDGPVLLPDNHYLSTQSALSKDPNEKRDHMVLKEFVTAAGITLGMDELYKTGC

7. RECONSTITUTION OF ULTRAWIDE DNA ORIGAMI PORES IN LIPOSOMES
7
209
7.5.23. SDS-PAGE OF THE IBB-MEGFP-CYS PROTEIN
Figure S7.29: SDS-PAGE shows the band for the 34.6 kDa IBB-mEGFP-Cys protein (right, thick band runningat ∼37 kDa).
7.5.24. DNA ORIGAMI PORE SIGNAL ESTIMATION
6 8 10 12 14 16Vesicle diameter (
0
50
100
150
200
250
300
350
I DN
A-or
igam
i (a.u
.)
0 1 2 3 4 5 6 7Radial distance ( m)
20
40
60
80
100
120
140
160
Nor
mal
ized
inte
grat
ed in
tens
ity (a
.u.)
IDNA-origami
a b c
m)
Figure S7.30: a, Fluorescence image showing DNA origami (cyan) at the vesicle membrane. Yellow circle andstraight line indicate the area and corresponding radius where the radial profile was computed. b, Normalizedintegrated intensity measured over the radial distance for the vesicle shown in (a), calculated as the integratedintensity over concentric circles starting from the center of the vesicle divided by the number of pixels in thecircle. The peak intensity, marked as IDNA-origami, was taken as the measure of interest for quantifying the DNAorigami signal intensity at the membrane. Intensity values were further normalized by the laser power usedduring acquisition. c, IDNA-origami calculated as described in (b) as a function of vesicle diameter, measuredfor all vesicles where FRAP was performed. Notably, IDNA-origami does not show any apparent correlation withthe vesicle diameter.

7
210 CHAPTER 7
7.5.25. RAW DATA AND FITS USED IN THE ESTIMATION OF NP FOR EACH
VESICLE IN FIG.7.7E
Time (min)
6000
7000
8000
9000
10000
11000In
tens
ity (a
.u.)
0.02
0.04
0.06
0.08
0.1
0.12
Nor
mal
ized
inte
nsity
1)
2)
3)
D=15.3 µmNp=360
0 1 2 3 4 5
0.8
0.9
1
1.1
1.2
1.3
Inte
nsity
(a.u
.)
104
0 2 4 6 8 10Time (min)
0.02
0.04
0.06
0.08
0.1
Nor
mal
ized
inte
nsity
1)
2)
3)
D=14.13 µmNp=192
1)
2)
3)
6000
8000
10000
12000
Inte
nsity
(a.u
.)
0 2 4 6 8 10Time (min)
0.02
0.04
0.06
0.08
0.1
Nor
mal
ized
inte
nsity D=10.6 µm
Np=96
5000
6000
7000
8000
9000
Inte
nsity
(a.u
.)
0 2 4 6 8 10Time (min)
0.04
0.06
0.08
0.1
0.12
0.14
Norm
alize
d in
tens
ity
1)
2)
3)
6000
7000
8000
9000
10000
Inte
nsity
(a.u
.)
0 2 4 6 8 10Time (min)
0.13
0.14
0.15
0.16
Nor
mal
ized
inte
nsity
D=10.9 µmNp=46
D=15.1 µmNp=6
6000
7000
8000
9000
10000
Inte
nsity
(a.u
.)
0 2 4 6 8 10Time (min)
0.02
0.04
0.06
0.08
0.1
0.12
Nor
mal
ized
inte
nsity
1)
2)
3)
1)
2)
3)
D=12.4 µmNp=96
6000700080009000
1000011000
Inte
nsity
(a.u
.)
10 15Time (min)
0.020.040.060.080.1
0.12
Nor
mal
ized
inte
nsity
1)
2)
3)
50
D=15.9 µmNp=220
6000
7000
8000
9000
10000
11000
Inte
nsity
(a.u
.)
0 5 10 15Time (min)
0.05
0.1
0.15
Nor
mal
ized
inte
nsity
1)
2)
3)
D=12.7 µmNp=26

7. RECONSTITUTION OF ULTRAWIDE DNA ORIGAMI PORES IN LIPOSOMES
7
211
5000
6000
7000
8000
9000
10000
Inte
nsity
(a.u
.)
10 15 20 25Time (min)
0.02
0.04
0.06
0.08
0.1
0.12
Nor
mal
ized
inte
nsity
1)
2)
3)
D=7.8 µmNp=7
50
5000
6000
7000
8000
9000
10000
Inte
nsity
(a.u
.)
10 15 20Time (min)
0.05
0.1
0.15
Nor
mal
ized
inte
nsity
50
1)
2)
3)
D=11.5 µmNp=25
6000
7000
8000
9000
10000
11000
Inte
nsity
(a.u
.)
10 15Time (min)
0
0.05
0.1
Nor
mal
ized
inte
nsity
50
7000
8000
9000
10000
11000
Inte
nsity
(a.u
.)
10 15 20 25Time (min)
0.020.040.060.080.1
0.120.14
Nor
mal
ized
inte
nsity
1)
2)
3)
1)
2)
3)
10 15 20 25Time (min)
0
0.05
0.1
0.15
Nor
mal
ized
inte
nsity
6000
7000
8000
9000
10000
Inte
nsity
(a.u
.)
1)
2)
3)
D=13.3 µmNp=89 D=12.1 µm
Np=52
D=11.5 µmNp=60
50
50
0.9
1
1.1
1.2
Inte
nsity
(a.u
.)
10 15 20 25Time (min)
0.02
0.04
0.06
0.08
0.1
0.12
Nor
mal
ized
inte
nsity
1)
2)
3)
50
D=11.7 µmNp=25
0.9
1
1.1
1.2
Inte
nsity
(a.u
.)
104
0 2 4 6 8 10Time (min)
0
0.02
0.04
0.06
0.08
Nor
mal
ized
inte
nsity
1)
2)
3)
D=8.4 µmNp=67
1.1
1.2
1.3
Inte
nsity
(a.u
.)
104
Time (min)
0.02
0.04
0.06
0.08
Nor
mal
ized
inte
nsity
0 1 2 3 54
1)
2)
3)
D=13.3 µmNp=132
104
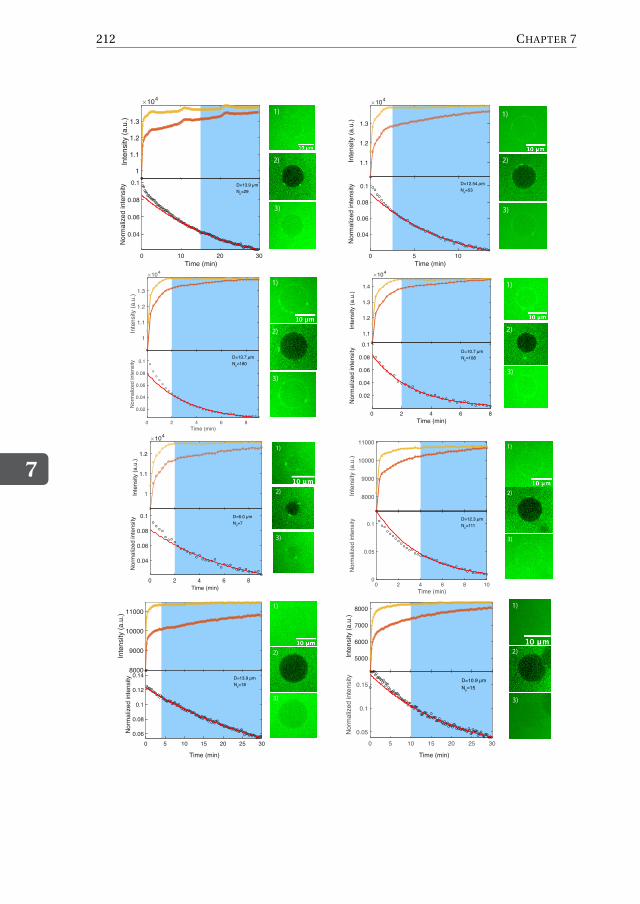
7
212 CHAPTER 7
1
1.1
1.2
1.3In
tens
ity (a
.u.)
104
0 10 20 30Time (min)
0.04
0.06
0.08
0.1
Nor
mal
ized
inte
nsity D=13.9 µm
Np=29
0 5 10Time (min)
0.04
0.06
0.08
0.1
Nor
mal
ized
inte
nsity
1.1
1.2
1.3
Inte
nsity
(a.u
.)
104
D=12.54 µmNp=53
1
1.1
1.2
1.3
Inte
nsity
(a.u
.)
104
0 2 4 6 8Time (min)
0.02
0.04
0.06
0.08
0.1
Nor
mal
ized
inte
nsity
D=13.7 µmNp=180
1.1
1.2
1.3
1.4
Inte
nsity
(a.u
.)
0 2 4 6 8Time (min)
0.02
0.04
0.06
0.08
0.1N
orm
aliz
ed in
tens
ity D=10.7 µmNp=108
104
1)
2)
3)
1)
2)
3)
1)
2)
3)
1)
2)
3)
1
1.1
1.2
Inte
nsity
(a.u
.)
104
0 2 4 6 8Time (min)
0.04
0.06
0.08
0.1
Nor
mal
ized
inte
nsity
1)
2)
3)
D=6.0 µmNp=7
8000
9000
10000
11000
Inte
nsity
(a.u
.)
0 2 4 6 8 10Time (min)
0
0.05
0.1
Nor
mal
ized
inte
nsity
1)
2)
3)
8000
9000
10000
11000
Inte
nsity
(a.u
.)
0 5 10 15 20 25 30
Time (min)
0.06
0.08
0.1
0.12
0.14
Nor
mal
ized
inte
nsity
1)
2)
3)
D=12.3 µmNp=111
D=13.9 µmNp=18
5000
6000
7000
8000
Inte
nsity
(a.u
.)
0 5 10 15 20 25 30
0.05
0.1
0.15
Nor
mal
ized
inte
nsity
1)
2)
3)
D=10.9 µmNp=15
Time (min)

7. RECONSTITUTION OF ULTRAWIDE DNA ORIGAMI PORES IN LIPOSOMES
7
213
6000
7000
8000
9000
Inte
nsity
(a.u
.)
0 5 10 15 20 25Time (min)
0.05
0.1
0.15
Nor
mal
ized
inte
nsity
1)
2)
3)
D=9.6 µmNp=20
1)
2)
3)
7000
8000
9000
10000
Inte
nsity
(a.u
.)
0 5 10 15 20 25Time (min)
0.05
0.1
0.15
Nor
mal
ized
inte
nsity D=11.1 µm
Np=27
6000
7000
8000
9000
Inte
nsity
(a.u
.)
0 10 20 30Time (min)
0.1
0.12
0.14
0.16
Norm
alize
d in
tens
ity D=10.1 µmNp=4
1)
2)
3)
Figure S7.31: For each vesicle, 5 panels are shown: Top left: Yellow and red curves indicate the outer (Iout) andinner (Iin) vesicle intensities, respectively. Light blue area denotes the fitted region. Bottom left: Black circlesindicate the normalized intensity difference (Iout-Iin)/(Iout). Red line shows a fit to the data points using Eq.7.4.Vesicle diameter (D) and extracted number of pores (Np) are reported. Right: Fluorescence images showingthe vesicle before photobleaching (1,top), right after photobleaching (2,center), and at the end of recovery(3,bottom).

7
214 CHAPTER 7
7.5.26. SLICES THROUGH TOMOGRAMS OF LIPOSOMES WITH INCORPORATED
OCTAGONS
Figure S7.32: Left: Slices through a model, representing liposomes on a grid surface. The grey spheres rep-resent liposomes, black lines represent the borders of a grid surface, colored (a, top slice; b, middle slice; c,bottom slice) dotted lines represent different slices through the liposomes at different heights. Middle andright: negative-stained TEM tomogram slices (a, top slice; b, middle slice; c, bottom slice) of vesicles with in-corporated octagons.

REFERENCES
7
215
REFERENCES[1] A. Fragasso, N. De Franceschi, P. Stömmer, E. O. Van Der Sluis, H. Dietz, and
C. Dekker, Reconstitution of Ultrawide DNA Origami Pores in Liposomes for Trans-membrane Transport of Macromolecules, ACS Nano 15, 12768 (2021).
[2] P. W. Rothemund, Folding DNA to create nanoscale shapes and patterns, Nature 440,297 (2006), arXiv:0202466 [cond-mat] .
[3] S. M. Douglas, H. Dietz, T. Liedl, B. Högberg, F. Graf, and W. M. Shih, Self-assemblyof DNA into nanoscale three-dimensional shapes, Nature 459, 414 (2009).
[4] S. Hernández-Ainsa and U. F. Keyser, DNA origami nanopores: Developments, chal-lenges and perspectives, Nanoscale 6, 14121 (2014).
[5] T. Sugawara, D. Yamashita, K. Kato, Z. Peng, J. Ueda, J. Kaneko, Y. Kamio, Y. Tanaka,and M. Yao, Structural basis for pore-forming mechanism of staphylococcal α-hemolysin, Toxicon 108, 226 (2015).
[6] T. G. Martin, F. C. Simmel, V. Arnaut, M. Mayer, H. Dietz, M. Langecker, S. Renner,and J. List, Synthetic Lipid Membrane Channels Formed by Designed DNA Nanos-tructures, Science 338, 932 (2012).
[7] B. Gyenes, K. Göpfrich, M. Winterhalter, C.-Y. Li, A. Ohmann, J. Yoo, A. Aksimentiev,M. Ricci, S. P. Bhamidimarri, and U. F. Keyser, Large-Conductance TransmembranePorin Made from DNA Origami, ACS Nano 10, 8207 (2016).
[8] S. Krishnan, D. Ziegler, V. Arnaut, T. G. Martin, K. Kapsner, K. Henneberg, A. R.Bausch, H. Dietz, and F. C. Simmel, Molecular transport through large-diameterDNA nanopores, Nature Communications 7, 1 (2016).
[9] R. P. Thomsen, M. G. Malle, A. H. Okholm, S. Krishnan, S. S. Bohr, R. S. Sørensen,O. Ries, S. Vogel, F. C. Simmel, N. S. Hatzakis, and J. Kjems, A large size-selectiveDNA nanopore with sensing applications, Nature Communications , 1.
[10] J. R. Burns, A. Seifert, N. Fertig, and S. Howorka, A biomimetic DNA-based channelfor the ligand-controlled transport of charged molecular cargo across a biologicalmembrane, Nature Nanotechnology 11, 152 (2016).
[11] S. Iwabuchi, I. Kawamata, S. Murata, and S.-i. M. Nomura, Large, square-shaped,DNA origami nanopore with sealing function on giant vesicle membrane, ChemicalCommunications (2021), 10.1039/d0cc07412h.
[12] H. Ramezani and H. Dietz, Building machines with DNA molecules, Nature ReviewsGenetics 21, 5 (2020).
[13] K. F. Wagenbauer, C. Sigl, and H. Dietz, Gigadalton-scale shape-programmable DNAassemblies, Nature 552, 78 (2017).

7
216 REFERENCES
[14] A. Ohmann, C. Y. Li, C. Maffeo, K. Al Nahas, K. N. Baumann, K. Göpfrich, J. Yoo,U. F. Keyser, and A. Aksimentiev, A synthetic enzyme built from DNA flips 107lipids per second in biological membranes, Nature Communications 9 (2018),10.1038/s41467-018-04821-5.
[15] P. Ketterer, A. N. Ananth, D. S. Laman Trip, A. Mishra, E. Bertosin, M. Ganji, J. VanDer Torre, P. Onck, H. Dietz, and C. Dekker, DNA origami scaffold for studying in-trinsically disordered proteins of the nuclear pore complex, Nature Communications9, 1 (2018).
[16] P. D. E. Fisher, Q. Shen, B. Akpinar, L. K. Davis, K. K. H. Chung, D. Baddeley,A. Šaric, T. J. Melia, B. W. Hoogenboom, C. Lin, and C. P. Lusk, A ProgrammableDNA Origami Platform for Organizing Intrinsically Disordered Nucleoporins withinNanopore Confinement, ACS Nano 12, 1508 (2018).
[17] D. Exerowa, D. Kashchiev, and D. Platikanov, Stability and permeability of am-phiphile bilayers, Advances in Colloid and Interface Science 40, 201 (1992).
[18] S. A. Akimov, P. E. Volynsky, T. R. Galimzyanov, P. I. Kuzmin, K. V. Pavlov, and O. V.Batishchev, Pore formation in lipid membrane I: Continuous reversible trajectoryfrom intact bilayer through hydrophobic defect to transversal pore, Scientific Reports7, 1 (2017).
[19] M. Abkarian, E. Loiseau, and G. Massiera, Continuous droplet interface crossingencapsulation (cDICE) for high throughput monodisperse vesicle design, Soft Matter7, 4610 (2011).
[20] K. F. Wagenbauer, F. A. Engelhardt, E. Stahl, V. K. Hechtl, P. Stömmer, F. Seebacher,L. Meregalli, P. Ketterer, T. Gerling, and H. Dietz, How We Make DNA Origami,ChemBioChem 18, 1873 (2017).
[21] D. Marquardt, F. A. Heberle, D. V. Greathouse, R. E. Koeppe, R. F. Standaert, B. J. VanOosten, T. A. Harroun, J. J. Kinnun, J. A. Williams, S. R. Wassall, and J. Katsaras, Lipidbilayer thickness determines cholesterols location in model membranes, Soft Matter12, 9417 (2016).
[22] H. Dietz, S. M. Douglas, and W. M. Shih, Folding DNA into twisted and curvednanoscale shapes, Science 325, 725 (2009), arXiv:9910002 [quant-ph] .
[23] N. Ponnuswamy, M. M. Bastings, B. Nathwani, J. H. Ryu, L. Y. Chou, M. Vinther,W. A. Li, F. M. Anastassacos, D. J. Mooney, and W. M. Shih, Oligolysine-based coatingprotects DNA nanostructures from low-salt denaturation and nuclease degradation,Nature Communications 8, 1 (2017).
[24] L. Van de Cauter, F. Fanalista, L. van Buren, N. De Franceschi, E. Godino, S. Bouw,C. Danelon, C. Dekker, G. Koenderink, and K. Ganzinger, Optimized cDICE forefficient reconstitution of biological systems in giant unilamellar vesicles, bioRxivpreprint (2021).

REFERENCES
7
217
[25] D. Görlich, P. Henklein, R. A. Laskey, and E. Hartmann, A 41 amino acid motif inimportin-α confers binding to importin-β and hence transit into the nucleus, EMBOJournal 15, 1810 (1996).
[26] E. Baykal-Caglar, E. Hassan-Zadeh, B. Saremi, and J. Huang, Preparation of giantunilamellar vesicles from damp lipid film for better lipid compositional uniformity,Biochimica et Biophysica Acta - Biomembranes 1818, 2598 (2012).
[27] A. Fick, Über Diffusion [Translated: (1995) "On liquid diffusion". Journal of Mem-brane Science], Poggendorff’s Annalen der Physik und Chemie 94, 59 (1855).
[28] P. Dechadilok and W. M. Deen, Hindrance factors for diffusion and convection inpores, Industrial and Engineering Chemistry Research 45, 6953 (2006).
[29] R. Hanselmann, W. Burchard, R. Lemmes, and D. Schwengers, Charac-terization of DEAE-dextran by means of light scattering and combined size-exclusion chromatography/low-angle laser light scattering/viscometry, Macromolec-ular Chemistry and Physics 196, 2259 (1995).
[30] S. R. Wente and M. P. Rout, The nuclear pore complex and nuclear transport. ColdSpring Harbor perspectives in biology 2, 1 (2010).
[31] A. Birnie and C. Dekker, Genome-in-a-Box: Building a Chromosome from the Bot-tom up, ACS Nano (2021), 10.1021/acsnano.0c07397.
[32] S. M. Douglas, A. H. Marblestone, S. Teerapittayanon, A. Vazquez, G. M. Church,and W. M. Shih, Rapid prototyping of 3D DNA-origami shapes with caDNAno, Nu-cleic Acids Research 37, 5001 (2009).
[33] B. Kick, F. Praetorius, H. Dietz, and D. Weuster-Botz, Efficient Production of Single-Stranded Phage DNA as Scaffolds for DNA Origami, Nano Letters 15, 4672 (2015).
[34] T. Wagner, F. Merino, M. Stabrin, T. Moriya, C. Antoni, A. Apelbaum, P. Hagel, O. Sit-sel, T. Raisch, D. Prumbaum, D. Quentin, D. Roderer, S. Tacke, B. Siebolds, E. Schu-bert, T. R. Shaikh, P. Lill, C. Gatsogiannis, and S. Raunser, SPHIRE-crYOLO is a fastand accurate fully automated particle picker for cryo-EM, Communications Biology2, 1 (2019).
[35] J. Zivanov, T. Nakane, B. Forsberg, D. Kimanius, W. J. Hagen, E. Lindahl, and S. H.Scheres, New tools for automated high-resolution cryo-EM structure determinationin RELION-3, bioRxiv , 1 (2018).
[36] J. R. Kremer, D. N. Mastronarde, and J. R. McIntosh, Computer visualization ofthree-dimensional image data using IMOD, Journal of Structural Biology 116, 71(1996).
[37] N. B. Eisele, S. Frey, J. Piehler, D. Görlich, and R. P. Richter, Ultrathin nucleoporinphenylalanine-glycine repeat films and their interaction with nuclear transport re-ceptors, EMBO Reports 11, 366 (2010).

7
218 REFERENCES
[38] E. O. Potma, W. P. De Boeij, L. Bosgraaf, J. Roelofs, P. J. Van Haastert, and D. A.Wiersma, Reduced protein diffusion rate by cytoskeleton in vegetative and polarizedDictyostelium cells, Biophysical Journal 81, 2010 (2001).

8FUTURE DIRECTIONS
In this thesis, I presented new approaches to study nuclear transport, from creating syn-thetic FG-Nups bottom up using a rationally designed sequence that mimic NPC selec-tivity (Chapter 5), to studying the interaction between a reconstituted FG-mesh and Kaptransporters at varying Kap concentrations (Chapter 6), to embedding large DNA-origamipores into the membrane of giant liposomes as a potential new platform to mimic nucleartransport (Chapters 7). In this final chapter, I explore new possibilities for follow-up stud-ies that aim to resolve some remaining open issues in the field of nuclear transport, as wellas present a brief overview of current outstanding questions in the field.
219

8
220 CHAPTER 8
There are multiple ways that one can follow to achieve a mechanistic description of nu-clear transport. While taking a bottom-up approach may seem far from providing a com-plete representation of the complex in vivo system, it allows us to study, dissect, inspect,and play around with all various components that take part in the intriguing transportprocess. Upon measuring and understanding how a few selected components interacttogether, one can scale up the complexity and the number of components to reach ascenario that is progressively closer to the native biological system.
In this thesis, I made steps towards a bottom-up reconstitution of the nuclear porecomplex, starting from single molecules to building up fully functional synthetic pro-teins that can mimic the NPC selectivity. Furthermore,the last two chapters introducednovel ways to study and mimic transport through the Nuclear Pore Complex (NPC). Iwill now discuss some possible future directions that I consider feasible to achieve in theshort term, while bearing great potential for new insights and discoveries.
8.1. DESIGNER FG-NUPS – A PLAYGROUND FOR STUDYING NPCSELECTIVITY
In Chapter 5, we showed how it is possible to create an artificial protein ‘NupX’ thatmimics the selectivity of native FG-Nups by following a few simple design rules [1]. Inessence, we modelled FG-Nups following the stickers-and-spacers model that describesthe formation of multivalent protein condensates [2], where intrinsically disordered pro-teins (IDPs) feature short attractive motifs (stickers), interspaced by flexible linkers (spac-ers) (Fig.8.1).
Figure 8.1: Stickers-and-spacers model of condensate-forming intrinsically disordered proteins. Adapted from[2].
While the notion of phase separation has recently become relevant in biology to describethe behavior of associative polymers found in the cell [3], such as proteins and RNAs, itappears to also fit well in modelling the behavior of FG-Nups. Both native and artificialFG-Nups have been shown to phase separate when present in physiological buffer abovea certain critical concentration. Remarkably, the resulting droplets featured NPC-likeselectivity [4–6].
Given such promising indications that a relatively simple framework can describethe complex multivalent interactions of FG-Nups, while conferring them with NPC-like

8. FUTURE DIRECTIONS
8
221
selectivity, a few questions arise: (1) Can we pinpoint all the necessary and sufficientconditions that are needed for a protein to impart a NPC-like selective barrier? (2) Canwe tune the ‘selective power’ of a designer FG-mesh by varying simple parameters, suchas the composition or distribution of the spacers and stickers? (3) How robust is the setof properties incorporated into the NupX sequence?
To answer such questions, a possible approach could be to systematically vary somekey parameters of a starting amino acid sequence and study the effects on its selectiveproperties. From analysing the amino acid sequence of native FG-Nups it can be ob-served that, just like in the stickers-and-spacers model, short sticky FG-motifs are sep-arated by flexible, disorderd spacers [7]. Having proven in Chapter 5 that such a simplescheme is sufficient for building a selective protein, one may start altering parameterssuch as the spacer length, namely the distance between consecutive FG-repeats, or thephysicochemical properties of the spacers by changing, e.g., their charge-to-hydropho-bicity ratio (C/H) (Fig.8.2).
������������������������������ ���(controls binding sites and a�nity to NTRs)
������
�����
���
� � �����
� �����
� (c
ontr
ols
barr
ier m
esh
size
cut
-o�
and
leak
ines
s)
������ � ��
(Tra
nsit
rate
s of
NTR
s/in
ert m
olec
ules
)
Figure 8.2: Phase diagram for NPC selectivity as a function of spacer length and charge-to-hydrophobicityratio (C/H).
Increasing the spacer length while keeping the C/H the same would result in a reduc-tion of overall FG-repeats, namely a depletion of binding sites for transporter proteinslike Kaps, which would, in principle, render the Kap partitioning into the FG-mesh lessand less favorable. In this way, it would be possible to understand what spacer length isneeded to achieve an efficient, energetically favorable permeation of transporters into

8
222 CHAPTER 8
the NPC. At the same time, changing the C/H of the spacers while keeping a fixed spacerlength will modulate the overall cohesiveness of the FG-mesh. Increasing the C/H wouldindeed result in a looser mesh-size due to the more repulsive nature of the spacers,thereby diminishing the blocking capability of the FG-mesh while increasing the leak-iness to larger cargoes. Acting independently on these two parameters may thus shedlight on how the NPC central channel carries out its twofold function of transport fa-cilitator (of cargo-bound NTRs) and size-selective molecular sieve (of inert molecules),ultimately explaining why FG-Nups have naturally evolved into their final sequences.
Ultimately, the capability to rationally design new proteins with tunable selectiveproperties may enable the creation of molecular nanofilters for sample purification orselection and identification of specific biomarkers for diagnostics.
8.2. STUDY HOW THE KAPS REGULATE THE FG-NUP BARRIERIn Chapter 6 we provided new compelling evidence that supports a recent model fornuclear transport, namely the Kap-centric model [8]. Employing biomimetic nanoporesreconstituted by grafting a native FG-Nup from yeast, Nsp1, to a solid-state nanopore,we explored the behavior of transporter Kap95 at increasing concentrations, finding thatwhile a ’slow-phase’ population of Kaps permanently resides in the pore, a ’fast-phase’is also present causing transient dips in the ionic current that correspond to fast (∼ms)translocation events.
While such observations are insightful, we are left now with yet other questions: (1)Is there a preferential spatial localization/segregation of slow-phase vs fast-phase Kapswithin the NPC channel? (2) Would Kaps behave the same in a more ’physiological’FG-mesh, composed by different types of FXFG- and GLFG-Nups, with the correct stoi-chiometry and positioning within the pore? (3) How do other transport factors (such asNTF2 or Mex67) enter into the Kap-centric picture? (4) While FG-Nups have been shownto phase separate in bulk solution forming micrometer-size gel-like particles, how doesthe presence of Kaps affects such phase state? Although the ideal platform to answer all
FG-Nup
TEM grid Pore array on a membrane
100 µm 50 nm
gold
Kap
Figure 8.3: CryoEM approach for resolving Kap localization within biomimetic nanopores. TEM micrographon the top right shows a negative-staining image of a single Kap (white) bound to a 1.4 nm gold nanocluster.Scale bar: 10nm.

8. FUTURE DIRECTIONS
8
223
such questions would always be the real NPC, the astounding complexity of the cellularenvironment makes biomimetic NPCs still very attractive tools to probe the interactionbetween FG-Nups and NTRs. For instance, to test whether slow- and fast-phase Kapsare spatially segregated within the FG-mesh it would be possible to perform transmis-sion electron microscopy in cryogenic conditions (cryoEM) of biomimetic nanopores,and resolve where Kaps reside in the pore (Fig.8.3). Detection of Kaps could be achievedby labelling them with tiny gold nanoclusters (∼1-2 nm), whereas focused ion beam(FIB) [9] or reactive ion etching (RIE) [10] could be employed as high-throughput tech-niques to fabricate large pore arrays achieving thousands of pores in one single mem-brane. Given that slow-phase Kaps are expected to be constantly residing within the pore(nearly 100% of the time), such population would result in a much higher signal (higheramount of gold particles) compared to the fast population which, in our biomimeticnanopores (Chapter 6), statistically occupies the pore for only <0.02% of the time. Byclass-averaging over thousands of pores it would then be possible to build 2D (or even3D by tilting the grid in TEM) probability distributions of where Kaps preferentially re-side within the pore.
An alternative approach where the positioning and stoichiometry of FG-Nups canbe achieved programmatically consists in using a DNA-origami scaffold (similar to thestructure presented in Chapter 7) to spatially organize FG-Nups in a similar octagonalarrangement to the NPC (Fig.8.4) [11, 12]. By combining such platform with cryoEM
FG-Nup
oligonucleotide
gold KapBare DNA-origami pore FG-Nup coated pore
Figure 8.4: Reconstitution of the FG-mesh using a DNA-origami scaffold and oligo-conjugated FG-Nups. Ad-dition and localization of gold-labelled Kaps can be resolved with cryoEM imaging.
it would be possible to resolve the localization of gold-labelled Kaps within the recon-stituted FG-mesh and study how they spatially organize within the pore when differenttypes of FG-Nups, and combinations thereof, are present (Fig.8.5). This would providenew insights into how Kaps interact with a more physiological FG-mesh.
Probing how different transport factors such as NTF2 participate in such Kap-centricpicture could be achieved with both suggested approaches by, for instance, labellingNTF2 with gold nanoparticles while leaving Kaps unlabelled in the background at phys-iological concentrations. By doing the reverse configuration (labelled Kaps, unlabelledNTF2) and subsequently overlaying the reconstructed spatial localization maps of bothKaps and NTF2 from independent experiments it would then be possible to observewhether a spatial segregation of different transporters occurs, as predicted in previousstudies [14, 15].

8
224 CHAPTER 8
Nsp1Nup100Nup57Nup1
Real NPC NPC mimic
Figure 8.5: Left: Illustration of the NPC scaffold (grey) with highlighted FG-Nup anchor domains (light green)and emanating points (dark green). Adapted from [13]. Right: Side view of a FG-Nup coated DNA-origamiscaffold with four different types of FG-Nups to mimic the FG-Nup distribution of the real NPC (left).
Another interesting approach may involve the use of biomimetic zero-mode-waveguide(ZMW) nanopores [16] that are built by attaching FG-Nups to a nanopore made intoa metal membrane (e.g. gold or palladium). With this technique it would be possi-ble to measure translocations through a biomimetic pore of fluorescently labelled pro-teins with different colors at single-molecule resolution, thus allowing, unlike for stan-dard electrical measurements, for parallel detection (multiplexing) of the various pro-teins within the same experiment. A number of key experiments could be performed onbiomimetic ZMWs: (1) test how the presence of Kaps affects the transport efficiency ofother transporters such as NTF2 or Mex67, hence addressing the hypothesis that Kapscan facilitate partitioning while speeding up transit times of the other NTRs through theNPC; (2) measure transport efficiency of differently sized inert molecules in the absenceor presence of Kaps to assess whether and how Kaps play a role in strengthening theselective barrier; (3) Mimic the Kap-guided import process of cargo molecules and char-acterize the effect of RanGTP-induced cargo dissociation on the trans-side of the porewith single-molecule resolution. Similarly, minimal export machineries based, e.g., onMex67-RNA complexes could be tested as well.
Finally, characterizing FG-Nups condensates in the presence of Kaps and in the phys-iological FG-Nup-to-Kap stoichiometry, may shed light on the actual in vivo phase stateof the FG-mesh. Even better would be to characterize the phase of confined FG-Nups us-ing biomimetic DNA-origami pores (built as in Fig.8.4 and 8.5), which could be achievedby fluorescently labelling different parts of the FG-Nup chain and measure the chaindynamics in real time using a Förster resonance energy transfer (FRET) assay. Impor-tantly, studying the behavior of FG-mesh dynamics and phase separation as a functionof Kap concentration will bring new insights that may resolve the current discrepanciesbetween the models of transport.
8.3. TOWARDS BUILDING AN ARTIFICIAL NUCLEUSIn Chapter 7 we presented a novel approach to insert large DNA-origami objects in themembrane of giant unilamellar vesicles using an inverted-emulsion technique (cDICE)[17]. The creation of large 30nm-passageways that span the membrane of a vesicle rep-resents a significant step forward compared to previous works, where the largest DNA-origami pores ever formed across a lipid bilayer were at most 10nm-wide [18, 19].

8. FUTURE DIRECTIONS
8
225
In the context of this thesis, an exciting application of this new development consists infunctionalizing the origami pores with FG-Nups to reconstitute a NPC-like selective FG-mesh within the origami pore (Figures 8.4 and 8.5), as it was similarly reported in previ-ous works [11, 12]. By combining the exquisite versatility and control that DNA-origamipores offer in terms of FG-Nup anchors positioning and distribution, together with ournewly developed platform for embedding DNA-origami pores into a lipid membrane, itwill be possible to recapitulate nuclear transport selectivity in a much more well-definedsystem.
A number of experiments that are of interest for the field of nuclear transport canbe envisioned: (1) Characterizing how different combinations of FG-Nups impact thetransport of NTRs and selectivity; (2) Testing whether the positioning of the differentFG-Nups within the lumen, as is found in the real NPC, serves a particular task, such ascreating an affinity gradient to impart a certain transport directionality for specific NTRs[20]; (3) Reconstitute a minimal nucleocytoplasmic transport cycle in vitro by includingNTRs, RanGTP/GDP gradient, together with cytoplasmic (RanGAP1) and nucleoplas-mic (RanGEF) factors in the outer and inner compartment of the vesicle, respectively(Fig.8.6). Importantly, this would represent the first model of an artificial nucleus thatmay be used as an in vitro mimic for studying nucleocytoplasmic transport.
RanGAP1
RanGEF
NLS-cargo
NTR
NLS-cargo
RanGTP
NLS-cargoDNA-origami
pore
FG-Nups
vesicle membrane
RanGDP
NLS-cargo
NTF2
NTF2
NTF2
Figure 8.6: Reconstitution in vitro of nucleocytoplasmic transport in an artificial nucleus using biomimeticDNA-origami pores.

8
226 CHAPTER 8
8.4. FINAL OUTLOOKIn the last two decades, the field of nuclear transport has seen a tremendous growth,from the ‘virtual gate’ [21] and ‘selective phase’ models [22, 23] being proposed in theearly 2000s, which first speculated on the intrinsic mechanism underlying NPC selectiv-ity, up to the most recent formulations of the Kap-centric model [24, 25] where Kaps, to-gether with the FG-Nups, assist in orchestrating the selective transport barrier. Notably,a great contribution to our understanding of the FG-Nup barrier and its interaction withKaps has been provided by in vitro techniques, where the FG-Nups are extracted fromthe cell and immobilized onto a surface or inside a nanopore, or let to phase-separatein bulk, with the aim to reconstitute and study a near-physiological system that mimicsthe NPC central channel. While a great deal of new information and insights have beenproduced over the years, there is still a lack of a general consensus as for how selectivetransport through the NPC proceeds mechanistically. Major outstanding questions per-tain to:
What is the phase of the FG-mesh?A number of works have reported the tendency to phase-separate for the most cohesiveFG-Nups, namely the native GLFG-Nups (Nup100 [4], Nup98 [4], Nup49 [5]) or a designerGLFG-Nup version [6], when these are present in physiological buffer beyond a certaincritical concentration. Yet, it still doubtable whether such FG-Nup condensates are agood representation of the in vivo FG-mesh. In fact, a number of non-negligible differ-ences are present between such in vitro system and in vivo: (1) while FG-condensatesare made from one single type of FG-Nup, e.g. Nup100, the NPC features many differenttypes of FG-Nups (11 in yeast [26]), which possess different amounts and types of FG-motifs, different physicochemical properties of the spacers, as well as varying lengths ofthe FG-domain. Importantly, an FG-mesh constituted by a more physiological FG-Nupcomposition may behave rather differently from a GLFG-Nup only condensate. (2) Thegeometry and well-defined organisation of FG-Nups in the NPC with FG-domains firmlyanchored along the central lumen, is drastically different from a condensate where FG-Nups can freely diffuse around. Further studies should be carried out in order to charac-terize the phase state of more physiological FG-Nup mixtures.
What is the effect of Kaps on the FG-mesh?In vitro experiments have shown that the interaction between Kaps and the FG-mesh canbe broadly described as bimodal [24, 27, 28], with a first Kap population binding stronglyto the FG-mesh, while a second Kap population features fast association/dissociation tothe remaining FG-repeats. While such binding mechanism points to the presence of twodistinct Kap populations in the real NPC (fast and slow phases), the effect of Kaps onthe phase state and spatial arrangement of the real FG-mesh is still poorly understood.Indeed, given that phase separation is driven by FG-FG interactions [29], and the factthat Kaps bind FG-repeats as well, there may be a regime (e.g., at high enough Kap con-centration) where Kaps sequester enough FG-repeats that cause the dissolution of thecondensate. Experiments targeted to drawing a phase diagram for FG-Nups phase be-havior at varying Kap concentrations are essential to understand the real phase of the invivo FG-mesh and ultimately discriminate among the current models of transport.

REFERENCES
8
227
What is the spatial distribution of the different FG-Nups and NTRs?Finally, open questions also revolve around the presence of distinct, spatially segregatedregions within the NPC central channel, which may originate from a number of contri-butions: (1) The structure of the NPC scaffold is far from being a perfect cylinder (Figure8.5, left), but rather consists of a hour-glass shaped structure [13]. Together with theasymmetrical distribution of the different FG-Nups along the channel length, this mayresult in a heterogenous distribution of protein mass and FG-repeat density along thechannel with effects on nuclear transport that are still unexplored [13]; (2) The hetero-geneous, often bimodal [26], amino acid composition of FG-Nups may as well lead toregions with higher or lower density in terms of both protein mass and FG-repeat den-sity. This may in turn result in different pathways to facilitate the transport of differentNTRs and inert molecules [26]; (3) Finally, the arrangement and density distribution ofthe FG-mesh should also account for the presence of NTRs, which may alter the overallconformation and phase behavior of the FG-Nup barrier. Furthermore, as binding affini-ties between NTRs and FG-Nups vary widely depending on the specific NTR or FG-Nup[20], spatial segregation effects of the different NTRs, such as Kaps vs NTF2 [14, 15], oreven from the same NTR class, e.g. slow-phase vs fast-phase Kaps [28], within the NPCcentral channel may occur.
Aside for being a fascinating subject of investigation for many scientists, nuclear trans-port constitutes a vital process for the survival of the cell. In fact, functional impairmentof nucleoporins has been associated with a number of disorders, from various forms ofcancer [30], to autoimmune diseases [31]. Understanding NPC function mechanism ingreater detail will ultimately aid in developing effective treatments for such diseases.
REFERENCES[1] A. Fragasso, H. W. de Vries, J. Andersson, E. O. van der Sluis, E. van der Giessen,
A. Dahlin, P. R. Onck, and C. Dekker, A designer FG-Nup that reconstitutes the selec-tive transport barrier of the nuclear pore complex, Nature communications 12, 2010(2021).
[2] J. M. Choi, A. S. Holehouse, and R. V. Pappu, Physical Principles Underlying theComplex Biology of Intracellular Phase Transitions, Annual Review of Biophysics 49,107 (2020).
[3] S. Alberti, Phase separation in biology, Current Biology 27, R1097 (2017).
[4] H. B. Schmidt and D. Görlich, Nup98 FG domains from diverse species spontaneouslyphase-separate into particles with nuclear pore-like permselectivity, eLife 2015, 1(2015).
[5] G. Celetti, G. Paci, J. Caria, V. VanDelinder, G. Bachand, and E. A. Lemke, The liq-uid state of FG-nucleoporins mimics permeability barrier properties of nuclear porecomplexes, The Journal of cell biology 219, 1 (2019).

8
228 REFERENCES
[6] S. C. Ng, T. Güttler, and D. Görlich, Recapitulation of selective nuclear import andexport with a perfectly repeated 12mer GLFG peptide, Nature Communications 12,1 (2021).
[7] L. J. Terry and S. R. Wente, Flexible Gates: Dynamic Topologies and Functions for FGNucleoporins in Nucleocytoplasmic Transport, Eukaryotic Cell 8, 1814 (2009).
[8] R. Y. Lim and L. E. Kapinos, How to operate a nuclear pore complex by kap-centriccontrol, Nucleus 6, 366 (2015).
[9] Y. H. Lanyon, G. De Marzi, Y. E. Watson, A. J. Quinn, J. P. Gleeson, G. Redmond, andD. W. Arrigan, Fabrication of nanopore array electrodes by focused ion beam milling,Analytical Chemistry 79, 3048 (2007).
[10] D. V. Verschueren, W. Yang, and C. Dekker, Lithography-based fabrication ofnanopore arrays in freestanding SiN and graphene membranes, 29, 145302 (2018),arXiv:15334406 .
[11] P. Ketterer, A. N. Ananth, D. S. Laman Trip, A. Mishra, E. Bertosin, M. Ganji, J. VanDer Torre, P. Onck, H. Dietz, and C. Dekker, DNA origami scaffold for studying in-trinsically disordered proteins of the nuclear pore complex, Nature Communications9, 1 (2018).
[12] P. D. E. Fisher, Q. Shen, B. Akpinar, L. K. Davis, K. K. H. Chung, D. Baddeley,A. Šaric, T. J. Melia, B. W. Hoogenboom, C. Lin, and C. P. Lusk, A ProgrammableDNA Origami Platform for Organizing Intrinsically Disordered Nucleoporins withinNanopore Confinement, ACS Nano 12, 1508 (2018).
[13] S. J. Kim, J. Fernandez-Martinez, I. Nudelman, Y. Shi, W. Zhang, B. Raveh, T. Her-ricks, B. D. Slaughter, J. A. Hogan, P. Upla, I. E. Chemmama, R. Pellarin, I. Echeverria,M. Shivaraju, A. S. Chaudhury, J. Wang, R. Williams, J. R. Unruh, C. H. Greenberg,E. Y. Jacobs, Z. Yu, M. J. de la Cruz, R. Mironska, D. L. Stokes, J. D. Aitchison, M. F.Jarrold, J. L. Gerton, S. J. Ludtke, C. W. Akey, B. T. Chait, A. Sali, and M. P. Rout, In-tegrative structure and functional anatomy of a nuclear pore complex, Nature 555,475 (2018).
[14] L. K. Davis, I. J. Ford, and B. W. Hoogenboom, Crowding-induced phase separationof nuclear transport receptors in FG nucleoporin assemblies, (2021).
[15] R. S. Wagner, L. E. Kapinos, N. J. Marshall, M. Stewart, and R. Y. Lim, Promiscuousbinding of karyopherinβ1 modulates FG nucleoporin barrier function and expeditesNTF2 transport kinetics, Biophysical Journal 108, 918 (2015).
[16] N. Klughammer and C. Dekker, Palladium zero-mode waveguides for optical single-molecule detection with nanopores, Nanotechnology 32, 18LT01 (2021).
[17] A. Fragasso, N. De Franceschi, P. Stömmer, E. O. Van Der Sluis, H. Dietz, andC. Dekker, Reconstitution of Ultrawide DNA Origami Pores in Liposomes for Trans-membrane Transport of Macromolecules, ACS Nano 15, 12768 (2021).

REFERENCES
8
229
[18] S. Iwabuchi, I. Kawamata, S. Murata, and S.-i. M. Nomura, Large, square-shaped,DNA origami nanopore with sealing function on giant vesicle membrane, ChemicalCommunications (2021), 10.1039/d0cc07412h.
[19] R. P. Thomsen, M. G. Malle, A. H. Okholm, S. Krishnan, S. S. Bohr, R. S. Sørensen,O. Ries, S. Vogel, F. C. Simmel, N. S. Hatzakis, and J. Kjems, A large size-selectiveDNA nanopore with sensing applications, Nature Communications 10 (2019),10.1038/s41467-019-13284-1.
[20] B. Pyhtila and M. Rexach, A Gradient of Affinity for the Karyopherin Kap95p alongthe Yeast Nuclear Pore Complex, Journal of Biological Chemistry 278, 42699 (2003).
[21] M. P. Rout, J. D. Aitchison, M. O. Magnasco, and B. T. Chait, Virtual gating andnuclear transport: The hole picture, Trends in Cell Biology 13, 622 (2003).
[22] K. Ribbeck and D. Görlich, Kinetic analysis of translocation through nuclear porecomplexes, The EMBO journal 20, 1320 (2001).
[23] K. Ribbeck and D. Görlich, The permeability barrier of nuclear pore complexes ap-pears to operate via hydrophobic exclusion, EMBO Journal 21, 2664 (2002).
[24] L. E. Kapinos, B. Huang, C. Rencurel, and R. Y. Lim, Karyopherins regulate nu-clear pore complex barrier and transport function, Journal of Cell Biology 216, 3609(2017).
[25] S. Barbato*, L. E. Kapinos*, C. Rencurel, and R. Y. Lim, Karyopherin enrichmentat the nuclear pore complex attenuates Ran permeability, Journal of Cell Science(2020).
[26] J. Yamada, J. L. Phillips, S. Patel, G. Goldfien, A. Calestagne-Morelli, H. Huang,R. Reza, J. Acheson, V. V. Krishnan, S. Newsam, A. Gopinathan, E. Y. Lau, M. E.Colvin, V. N. Uversky, and M. F. Rexach, A Bimodal Distribution of Two DistinctCategories of Intrinsically Disordered Structures with Separate Functions in FG Nu-cleoporins, Molecular and Cellular Proteomics 9, 2205 (2010).
[27] N. B. Eisele, S. Frey, J. Piehler, D. Görlich, and R. P. Richter, Ultrathin nucleoporinphenylalanine-glycine repeat films and their interaction with nuclear transport re-ceptors, EMBO Reports 11, 366 (2010).
[28] L. E. Kapinos, R. L. Schoch, R. S. Wagner, K. D. Schleicher, and R. Y. Lim,Karyopherin-centric control of nuclear pores based on molecular occupancy and ki-netic analysis of multivalent binding with FG nucleoporins, Biophysical Journal 106,1751 (2014).
[29] S. Frey, FG-Rich Repeats of Nuclear Pore Proteins with Hydrogel-Like Properties, Sci-ence (New York, N.Y.) 314, 815 (2006).
[30] J. M. Cronshaw and M. J. Matunis, The nuclear pore complex: Disease associationsand functional correlations, Trends in Endocrinology and Metabolism 15, 34 (2004).

8
230 REFERENCES
[31] C. Duarte-Rey, D. Bogdanos, C. Y. Yang, K. Roberts, P. S. Leung, J. M. Anaya, H. J.Worman, and M. E. Gershwin, Primary biliary cirrhosis and the nuclear pore com-plex, Autoimmunity Reviews 11, 898 (2012).

SUMMARY
At first glance nanopores may appear simple, almost intuitive, to understand given thatthey are, quite literally, ‘just’ very small pores in a membrane. In fact, one may evenwonder why at all we need trained scientists to study such seemingly simple entities.The short answer is that nanopores, as the word suggests, are nanoscale entities and, assuch, one can not directly see or experience any of the events that occur down there.The long answer can be found in this thesis. Here, I present and discuss a wide arrayof nanopores, from biological nanopores like the nuclear pore complex (NPC), to solid-state nanopores, and DNA-origami nanopores. While the central focus of my researchis to understand the inner workings of the NPC, a short journey into the world of iontransport in solid-state nanopores is first undertaken, with special emphasis on the ran-dom fluctuations of the ion flow within the nanopore, referred to as current noise. Next,I introduce the concept of biomimetic nanopores, where a solid-state nanopore is ‘cam-ouflaged’ by coating its inner surface with purified proteins, resulting in an entity thatbehaves somewhat like a real NPC. Biomimetic nanopores have enabled us to mimic,study, and gain new insights into how the real NPC works, and bear great potential forfurther developments and discoveries.
Chapter 1 provides a general introduction to the basic concepts used this thesis. Startingfrom a short overview of the cellular organization, I narrow down to the NPC, from thefirst discoveries of its architecture and biochemical composition, to the key role of FG-Nups in establishing the selective barrier. The current theories of nuclear transport arealso illustrated, with emphasis on the two opposing ’FG-centric’ and ’Kap-centric’ mod-els. Our experiments take advantage of many tools from nanotechnology. Therefore, Ifirst introduce the nanopore technology, outlining common techniques of fabricationas well as illustrating the basic principles of single-molecule sensing. Following up, Ipresent how engineered solid-state nanopores with FG-Nups have been shown to reca-pitulate NPC-like selective transport in vitro. I end up by explaining the basic principlesbehind the DNA origami technique, and highlight important literature contributions tothe field of DNA-origami nanopores.
Chapter 2 features a side-by-side comparison of the noise characteristics and perfor-mances of biological vs solid-state nanopores. We start by introducing the various typesof low- and high-frequency noise sources in the two systems. While they both sufferfrom the same noise sources at high frequencies, namely dielectric and capacitive noise,at low frequencies solid-state nanopores are largely dominated by 1/f noise, whereasbiological pores typically feature protonation noise. We move on to confront the per-formances of a few selected nanopore systems in terms of signal-to-noise ratio (SNR)for free translocations of short homopolymers. We collected data both from literature,our own lab, as well as external labs, and found that SiNx solid-state pores featured the
231

8
232 SUMMARY
highest SNR (∼37), which results from the combination of higher currents, hence highersignal, and low high-frequency noise that are attainable in such system. We note how-ever that introducing a slow-down mechanism using a DNA-motor protein to feed theDNA molecule into the pore, as it was shown for the biological pore MspA, was shownto boost the SNR by >160-fold. We conclude with an overview of the most notable ap-proaches to lower the noise at low and high frequency, for both biological and solid-statenanopores.
To this date, there is still one noise source that puzzles many nanopore researchers,namely the 1/f noise. In Chapter 3 we characterize the low-frequency spectrum of oursolid-state nanopores and find that the magnitude the of 1/f noise fluctuations decreasesfor larger pores. While such behavior is interesting and appeared as well in previousworks, no theoretical model has yet been able to express such trend analytically. We findthat including the access region contribution into the picture, which had been dismissedin previous models, is sufficient to fit the general observed trend. We further adopt twodifferent Hooge parameters for surface and bulk fluctuations, which reflect the presenceof two different mechanisms of ion fluctuations occurring near the pore surface and inthe pore bulk and access regions, respectively. Our model represents a generalization ofthe Hooge’s model for solid-state nanopores that works well for varying nanopore diam-eters.
Chapter 4 provides a general overview of the nanopore field, with particular emphasison nanopore applications beyond sequencing of DNA or RNA. By listing major contri-butions to the nanopore field from different areas of expertise, we showcase the highversatility of both biological and solid-state nanopore platforms and their applicabilityto solve a broad range of challenges. The high versatility of nanopores stems from thepossibility to control the pore geometry, such as diameter and length, as well as to engi-neer the pore surface to tune and customize the interaction with the analyte molecules.In this review chapter, we cover a range of applications that involve both biological andsolid-state nanopores, from single-molecule proteomics, single-molecule liquid biopsyfor detection of relevant biomarkers, creation of nanoreactors to study polymers in con-finement, to biomimetic nanopores to mimic and understand complex biological pro-cesses. In this thesis, we employ such biomimetic nanopores to investigate the physicalprinciples of the NPC selective barrier.
Building on previous works that showed the successful reconstitution of biomimetic nu-clear pore complexes using purified native FG-Nups and solid-state nanopores, we takea step forward in Chapter 5 and reconstitute fully artificial biomimetic NPCs in solid-state nanopores using a rationally designed FG-Nup protein that we coined ‘NupX’. Wehypothesise that building a designer protein following a few simple design rules is suf-ficient for recapitulating a functional, selective biomimetic NPC. From studying the se-quence of native yeast GLFG-Nups, known to be essential for proper nuclear transportand cell viability, we identify three recurring properties: (i) a bimodal distribution ofamino acids featuring a N-terminal cohesive, low charge domain, and a C-terminal re-pulsive, high charge domain; (ii) regularly spaced FG and GLFG repeats in the cohe-

SUMMARY
8
233
sive domain, at intervals of ∼ 5−20 amino acid spacers; (iii) intrinsically disordered se-quences.
To assess the selective properties of our designed sequence, we reconstitute NupX brusheson QCM-D and monitor binding to increasing concentrations of transporter Kap95, find-ing that Kap95 binds efficiently to NupX in a concentration-dependent manner, simi-lar to native FG-Nups. Conversely, flushing inert BSA yielded no detectable binding toNupX, indicating that NupX binds selectively to Kap95. Next, we reconstituted NupX inbiomimetic nanopores and tested the selective transport properties of the reconstitutedNupX-mesh. We find that, while flushing transporter Kap95 results in frequent currentspikes that indicates efficient transportation of the protein through the pore, inert BSA isvirtually blocked as it yields only few sporadic translocation events. Experimental workis complemented by molecular dynamics simulations that provide microscopic insightsinto the NupX-brushes conformation and NupX-mesh density distribution within thepore. Altogether, our data show the successful recapitulation of nuclear transport selec-tivity using a rationally designed protein.
In Chapter 6 we study the interaction between transporter Kap95 and a native FG-nucleo-porin, Nsp1, using biomimetic nanopores. While mere selective properties of the recon-stituted Nsp1-mesh have been characterized in earlier studies, we here assess the behav-ior of the Nsp1-mesh as a function of Kap95 concentration with the aim to provide newevidence that aids in discriminating between the current models of transport. First, wecreate biomimetic nanopores by grafting Nsp1 proteins to the inner wall of a solid-statenanopore. Upon flushing Kap95 in the bulk solution surrounding the pore, we observe asteady-state decrease of the ionic current, indicating that a portion of Kap95 moleculesbinds with high affinity to the Nsp1-mesh. Furthermore, fast (∼millisecond) conduc-tance blockades are observed on top of the current decrease, indicating the presence of asecond population of fast translocating Kap95 molecules. We analyse the low-frequencynoise of the ionic current, which in biomimetic nanopores is dominated by the FG-Nupfluctuations within the pore, and find a progressive decrease of the 1/f noise at increas-ing Kap95 concentration, which is consistent with an increase in overall rigidity of theFG-mesh. We corroborate our electrical measurements with QCM-D, where, similar toprevious reports, we observe a concentration-dependent incorporation of Kap95 intothe Nsp1 brush, consistent with the nanopore experiments. To sum up, our data sup-port the presence of two distinct Kap populations within the FG-mesh, one slow andone fast, which is consistent with predictions from Kap-centric models of transport.
The search for improved NPC mimics led scientists to develop DNA-origami scaffoldsto accommodate and spatially organize FG-Nups in a controlled fashion. While NPCmimics based on DNA origami have been reported, it has not been possible, so far, toassess the transport properties of the reconstituted FG-mesh. In Chapter 7 we addressthis important issue and work out a novel method to embed very large 30nm-wide DNA-origami pores across the membrane of giant liposomes. To overcome the high energybarrier for insertion of large objects into the lipid bilayer, we adopt an inverted-emulsioncDICE technique which allows us to incorporate the pores into the vesicle membraneduring the process of membrane formation. We assess the correct insertion of the pores

8
234 SUMMARY
by studying the influx of different fluorescent molecules into the vesicle, finding that arange of molecules can pass through the pore, from the smaller ∼30 kDa protein GFP,to large 250 kDa (∼28 nm) dextran molecules, whereas larger dextran molecules are ex-cluded, consistently with the pore size cut-off. Furthermore, we quantify the numberof pores per vesicle using a FRAP assay and modelling the diffusion of GFP through thepores, finding that up to hundreds of pores can be functionally reconstituted into themembrane of a single vesicle. Altogether, these data show the successful reconstitutionof large DNA-origami pores into a lipid bilayer, paving the way to further developmentsfrom mimicking nuclear transport to recapitulating an artificial nucleus.
To conclude, in Chapter 8 we look back at the results provided in this thesis and pro-pose new possible developments and follow-up projects that will further shed light onremaining unresolved issues. We first hypothesize that a simple framework that de-scribes necessary and sufficient requirements for FG-Nup selectivity can be achievedby studying the behavior of designer FG-Nups upon systematic variations of the aminoacid sequence. In light of the compelling evidence showing the participation of Karyo-pherins into establishing the selective barrier, we also point to new possible experimentsand expansions of the current techniques to further our understanding of the complexKap-Nup interaction. Next, we point to possible routes for exploiting the newly devel-oped DNA-origami nanopore platform for studying transport through a potentially morecontrolled, tunable, and physiologically relevant FG-mesh. To conclude, we zoom outto the broad field of nuclear transport and provide our perspective on remaining out-standing questions. I am confident that tackling the current unresolved issues related toour understanding of FG-Nup phase separation, the interplay with Kaps, and the fuzzyarchitecture of NPC central channel will ultimately provide a satisfying mechanistic un-derstanding of selective nuclear transport.

SAMENVATTING
Op het eerste gezicht lijken nanoporiën misschien eenvoudig om te doorgronden, wanthet zijn (letterlijk) slechts heel kleine gaatjes in een membraan. En u zou zich zelfs kun-nen afvragen waarom we überhaupt zoveel hoogopgeleide wetenschappers nodig heb-ben om zulke eenvoudige objecten te bestuderen. Het korte antwoord is omdat nanopo-riën, zoals de naam al doet vermoeden, objecten zijn op de nanometer schaal, die mendus niet zo makkelijk kan zien of anderszins kan waarnemen. Het uitgebreide antwoordkunt u vinden in dit proefschrift, waarin ik mijn onderzoek aan vele verschillende typenvan nanoporiën beschrijf en bediscussieer. De typen variëren van biologische nano-poriën tot vaste-stof nanoporiën en DNA-origami nanoporiën. Het centrale thema vanmijn onderzoek is echter het moleculaire complex dat zich bevindt in de kernporie (nu-clear pore complex, of kortweg ‘NPC’ in het Engels): de nanoporie in het biologischemembraan dat de celkern, met daarin het erfelijk DNA materiaal, scheidt van het cyto-plasma. Maar voordat ik daartoe kom zal ik u eerste meenemen naar de wondere we-reld van ionen die door vaste-stof nanoporiën stromen en de fluctuaties die zich daarinvoordoen, beter bekend als stroomruis. Vervolgens komen we aan bij het concept vande biomimetische nanoporiën, oftewel vaste-stof nanoporiën die we in het laborato-rium zo veel mogelijk laten lijken op biologische nanoporiën, door ze te bedekken metbiologische membranen en/of biologische eiwitten. Hierdoor komt het gedrag van dezebiomimetische nanoporiën verbazingwekkend dicht in de buurt van dat van de echtekernporie in de cel. Deze biomimetische nanoporiën stellen ons dus in staat om beter tedoorgronden hoe de kernporiën van onze cellen zich gedragen, en bieden veel potentievoor nieuwe wetenschappelijke ontdekkingen.
Hoofdstuk 1 is de algemene inleiding op dit proefschrift, waarin de benodigde natuur-kundige basisprincipes aan de orde komen, alsmede een kort overzicht van de opbouwvan een biologische cel. Vervolgens zal ik inzoomen op de kernporie, door te beschrijvenhoe deze werd ontdekt, hoe ze eruit ziet, en uit welke eiwitten ze is opgebouwd. Ook zalik uitleggen hoe de zogenaamde FG-Nup eiwitten een cruciale poortwachter-achtige rolvervullen, waardoor alleen een selecte groep van biologische moleculen getransporteerdkan worden door de kernporie. Daarnaast zal ik in dit hoofdstuk de gangbare theorieënaanstippen voor het mechanisme van transport door de kernporie, waarbij de nadrukzal liggen op het ‘FG-centrische’ model en het conflicterende ‘Kap-centrische’ model.Omdat wij in onze experimenten veel gebruik maken van nanotechnologie zal ik in dithoofdstuk ook de methoden en technieken beschrijven waarmee we onze onderzoeks-objecten fabriceren, en hoe we één enkel molecuul kunnen detecteren. Tevens laat ikzien hoe vaste-stof nanoporiën (net als de echte kernporie) bepaalde biologische mole-culen kunnen selecteren voor transport, tenminste, wanneer we de porie bekleden metFG-Nup eiwitten. Dit hoofdstuk sluit ik vervolgens af met een beschrijving van de basis-principes van DNA origami, en een overzicht van belangrijke wetenschappelijke artike-
235

8
236 SAMENVATTING
len die verschenen zijn op het gebied van DNA-origami nanoporiën.
In Hoofdstuk 2 vergelijk ik vaste-stof nanoporiën met biologische nanoporiën, dat wilzeggen, ik vergelijk hun algemene karakteristieken en hun stroomruis. Ik begin met hetidentificeren van de verschillende oorzaken van hoogfrequente en laagfrequente ruis.Want hoewel de oorzaak van de hoogfrequente ruis in beide systemen hetzelfde is, na-melijk dielectrische ruis en capacitieve ruis, verschilt de oorzaak van de laagfrequenteruis: bij vaste-stof nanoporiën is het vooral 1/f ruis, terwijl het bij biologische nanopo-riën vooral protonatieruis is. Vervolgens vergelijk ik de signaal/ruis verhouding (SRV)van verschillende nanoporiën tijdens het transport van korte homopolymeren. Op ba-sis van literatuurgegevens en data van zowel ons eigen lab als die van andere labs blijktdat SiNx vaste-stof nanoporiën de hoogste SRV hebben (∼37). Dit komt doordat er in ditsysteem relatief weinig laagfrequente ruis is, maar juist een relatief hoge stroomsterkteen dus een sterker signaal. Daarbij moet overigens opgemerkt worden dat de SRV van debiologische nanoporie MspA sterk verhoogd kan worden (>160×) door een DNA-motoreiwit aan de ingang van deze nanoporie te plaatsen. Ik sluit dit hoofdstuk af met eenoverzicht van de beste methoden om zowel hoog- als laagfrequente stroomruis te on-derdrukken in biologische- en vaste-stof nanoporiën.
Tot op de dag van vandaag is er één bron van stroomruis die nanoporie wetenschap-pers niet goed begrijpen: de zogenaamde 1/f ruis. In Hoofdstuk 3 karakteriseer ik hetlaagfrequente ruis-spectrum van vaste-stof nanoporiën, en zien we dat de grootte vande fluctuaties in 1/f ruis afneemt bij grotere nanoporiën. Hoewel deze interessante ob-servatie niet nieuw is, bestond er nog geen theoretisch model om dit fenomeen op eenanalytische manier te verklaren. In dit hoofdstuk laat ik zien dat de globale trends vandit fenomeen goed te verklaren zijn door ook rekening te houden met de bijdrage van denanoporie-ingang aan de 1/f ruis, hetgeen in eerdere modellen niet gedaan werd. Verderintroduceren we twee verschillende ‘Hooge parameters’ om twee lokale mechanismenvoor ionenfluctuaties te beschrijven, enerzijds aan het oppervlakte van de nanoporie,en anderzijds in de bulk en de ingang van de nanoporie. Ons uiteindelijke model werkthierdoor goed voor nanoporiën van verschillende diameters, en vormt daarmee een ver-algemenisering van het Hooge model voor vaste-stof nanoporiën.
Hoofdstuk 4 geeft een breed overzicht van het nanoporiën onderzoeksveld, met de na-druk op toepassing die verder gaan dan het traditionele sequencen van DNA of RNAmoleculen. Door belangrijke bijdragen van nanoporiën in andere onderzoeksvelden tebenadrukken laten we zien hoe veelzijdig en hoe breed toepasbaar zowel biologische alsvaste-stof nanoporiën kunnen zijn, en hoe ze daardoor kunnen bijdragen aan een breedscala van wetenschappelijke uitdagingen. De veelzijdigheid van nanoporiën is te dan-ken aan tenminste drie parameters die gevarieerd kunnen worden, zoals de lengte ende diameter van de porie, en de ‘bekleding’ van het oppervlakte waardoor de interactiemet andere moleculen aangepast kan worden. In dit overzichtshoofdstuk komen on-der meer de volgende toepassingen aan de orde: proteomics met moleculaire resolutie,biopsie van biomarkers met moleculaire resolutie, het creëren van nanoreactoren voorpolymeerchemie en het nabootsen van biologische poriën (zoals de kernporie) om een

SAMENVATTING
8
237
betreffend biologische transport proces te bestuderen.
In Hoofdstuk 5 borduren we voort op eerder biomimetisch werk waarin de kernporiewerd nagebootst door vaste-stof nanoporiën te bekleden met gezuiverde FG-Nup eiwit-ten. Hier maken we echter geen gebruik meer van een uit de natuur afkomstige FG-Nup,maar van een synthetisch FG-Nup eiwit dat we zelf ontworpen hebben en ‘NupX’ noe-men. Onze hypothese is dat we de het gedrag van de kernporie zouden moeten kunnennabootsen door kunstmatige ‘designer FG-Nup’ eiwitten te ontwerpen die voldoen aandezelfde bouwkundige principes als hun natuurlijke tegenhangers. Drie bouwkundigeprincipes hebben we weten te achterhalen door de aminozuursequentie van de belang-rijkste GLFG-Nups uit bakkersgist te analyseren: (i) een bi-modale verdeling van zowelgeladen als plakkerige aminozuren, om precies te zijn: een plakkerig N-terminaal do-mein met weinig lading, en een niet-plakkerig C-terminaal domein met relatief veel la-ding; (ii) een herhaling van het ‘FG’ of het ‘GLFG’ motief met een onderliggende afstandvan 5-20 aminozuren in het plakkerige gedeelte; en (iii) eiwitten die intrinsieke ongeor-dend zijn, dat wil zeggen dat ze geen vaste drie-dimensionale structuur hebben. Om deselectiviteit van ons designer eiwit NupX te onderzoeken hebben we een QCM-D chip(waarmee eiwit-eiwit interacties gemeten kunnen worden) ermee bekleed, en kondenwe aantonen dat de kernporie-transporter Kap95 op een vergelijkbare manier bindt aanNupX als aan een natuurlijke FG-Nup. Het controle eiwit BSA daarentegen (dat niet be-trokken is bij kernporietransport) bindt noch aan NupX noch aan zijn natuurlijke te-genhanger. En toen we biomimetische nanoporiën bekleedden met NupX zagen we datKap95 (in tegenstelling tot BSA) de stroom van ionen onderbreekt, hetgeen aantoontdat het inderdaad middels NupX getransporteerd kan worden. Door deze experimenteleresultaten te combineren met computersimulaties van de conformatie en de domeinlokalisatie van NupX hebben we een gedetailleerd microscopisch beeld kunnen krijgenvan deze biomimetische nanoporie. Samengevat toont dit hoofdstuk dus aan dat kern-porietransport in het laboratorium ook goed nagebootst kan worden met een rationeelontworpen synthetisch eiwit.
In Hoofdstuk 6 bestuderen we met biomimetische nanoporiën de interactie tussen dekernporie-transporter Kap95 en een natuurlijk FG-Nup eiwit, namelijk Nsp1. In eer-dere studies is weliswaar de selectiviteit van Nsp1 voor Kap95 aangetoond, maar in dithoofdstuk wordt er pas voor het eerst gekeken naar de concentratieafhankelijkheid vandit transport, teneinde onderscheid te kunnen maken tussen twee conflicterende theo-retische modellen: het Kap-centrische- en het FG- centrische model. Wanneer we eenoplossing met Kap95 over een met Nsp1 beklede vaste-stof nanoporie spoelden namenwe een gestage afname in de ionenstroom waar, hetgeen erop duidt dat een gedeeltevan de Kap95 populatie aan Nsp1 bindt met een hoge affiniteit. Daarnaast observeer-den we bovenop die gestage afname in de ionenstroom vele korte blokkades (van mil-lisecondes) die duiden op een tweede populatie van Kap95 moleculen die snel getrans-porteerd worden. Een analyse van de laagfrequente ruis, die bij biomimetische nanopo-riën vooral gekenmerkt wordt door FG-Nup fluctuaties in de nanoporie, toonde aan datde 1/f ruis afnam bij toenemende Kap95 concentraties. Dit is in overeenstemming meteen verwachte versteviging van het FG-Nup netwerk in de nanoporie, die veroorzaakt

8
238 SAMENVATTING
wordt door de eerstgenoemde populatie van hoog-affiniteit gebonden Kap95 molecu-len. We bevestigen onze nanoporie-metingen met QCM-D metingen, waar we ook eenconcentratie-afhankelijke toename van Kap95 in het Nsp1 netwerk waarnemen. Met an-dere woorden, uit verschillende metingen blijkt dat er zowel een langzame als een snelleKap95 populatie is in het FG-Nup netwerk van de nanoporie, wat in overeenstemming ismet voorspellingen van het zogeheten Kap-centrische model.
De zoektocht naar betere biomimetische kernporiën heeft wetenschappers naar DNAorigami geleid, omdat dat ingezet kan worden als een drie-dimensionale ringvormigemal waaraan FG-Nup eiwitten op een gecontroleerde manier vastgemaakt kunnen wor-den. Tot nu toe was het echter niet mogelijk om de transporteigenschappen van FG-Nups binnenin zo’n origami mal te bestuderen. In Hoofdstuk 7 beschrijven we eennieuw methode om relatief grote (30 nm) DNA origami-poriën in te bouwen in het mem-braan van een liposoom, oftewel een vetblaasje. Teneinde de hoge energiebarrière (omeen dusdanig groot object in een membraan te krijgen) te omzeilen hebben we gebruikgemaakt van de methode ‘cDICE’. Hiermee werden de DNA-origami poriën al in hetmembraan ingebouwd op het moment dat dit gevormd wordt vanuit een omgekeerdeemulsie. We hebben vervolgens geverifieerd dat de DNA-origamis inderdaad de ver-wachte poriën vormen door de influx van verschillende moleculen erdoorheen te me-ten. Hieruit bleek dat kleine (GFP van ∼30 kDa) tot middelgrote moleculen (dextran van∼250 kDa) de DNA-origami porie gemakkelijk konden passeren, maar grotere dextranmoleculen niet, precies zoals verwacht op basis van de porie diameter. Daarnaast heb-ben we het aantal DNA-origami poriën per liposoom gekwantificeerd door middel vanFRAP experimenten, waaruit blijkt dat er honderden in één enkel liposoom ingebouwdkunnen worden. Samengevat tonen deze experimenten aan dat DNA-origami poriënzeer geschikt zijn als biomimetische kernporie om het transport van biologische mole-culen over de kernmembraan te bestuderen.
In Hoofdstuk 8 blik ik terug op de resultaten die in dit proefschrift beschreven zijn, enstel ik nieuwe projecten en ontwikkelingen voor die gevolgd zouden kunnen worden omonopgeloste problemen te benaderen. Zo stel ik voor om FG-Nup eiwitten in meer de-tail te bestuderen door de aminozuur samenstelling van synthetische designer FG-Nupssystematisch te variëren, en het effect daarvan te bepalen op selectiviteit en transport.Ook stel ik nieuwe experimenten voor waarmee we de interacties tussen Kap-eiwittenen FG-Nups beter zouden kunnen karakteriseren, en hoe we op basis van DNA-origamibiomimetische kernporiën zouden kunnen maken die dichter in de buurt komen vande natuurlijke kernporie. Als allerlaatste zoom ik uit op het gehele onderzoeksveld dattransport door de kernporie bestudeert, en geet ik mijn visie op openstaande thema’szoals (i) de fase-scheiding van FG-Nup eiwitten; (ii) het samenspel tussen FG-Nups enKap- eiwitten; en (iii) de drie-dimensionale structuur van de kernporie. Ik ben ervanovertuigd dat we een bevredigend mechanistisch inzicht in dit transport proces kunnenkrijgen wanneer we deze verschillende thema’s gelijktijdig aanpakken.

ACKNOWLEDGEMENTS
These last 4-5 years have been truly transformative and I feel extremely grateful for howmuch I could learn, grow, and have real fun. For this, I would like to thank a number ofpeople who I was lucky to meet along the way.
First of all I would like to thank my promotor, Cees. Thank you for giving me the oppor-tunity to join the cool CD lab. I feel extremely lucky I could learn from you the way todo science. You tremendously shaped the way I do research: from conceiving a project,to carry out experiments and write a story about it (including making nice figures). Ilearned that to do meaningful science, technique(s) should serve the scientific question,and not the other way around. In fact, to find answers to my questions I was able toexplore freely and master a wide array of techniques, from making electrical measure-ments on biomimetic nanopores, up to looking at giant liposomes through a confocalmicroscope. Conceiving original ideas is key to any great innovation and discovery, andyou showed me that boldness and a pinch of naivety are very important in such process,as we would have never made our beloved ‘designer FG-Nups’ otherwise. I am gratefulfor the numerous supportive, exciting, and confidence boosting meetings, which mademe even more motivated and ambitious to achieve always higher goals. Finally, I reallyenjoyed our casual, fun chats, competing against each other on the football court, aswell as jamming together on multiple occasions – still impressed, and a bit jealous, ofhow many different instruments you can play.
I would like to thank the committee members for taking the time to read and assessmy thesis: Prof. Anton Zilman, Prof. Roderick Lim, Prof. Marileen Dogterom, Prof.Patrick Onck, Prof. Liesbeth Veenhoff, Dr. Sabina Caneva. I hope you found it interest-ing and I look forward to the discussion.
One of the best aspects of academia is discussing your research with peers who share thesame curiosity and enthusiasm. Throughout the years, I had the fortune to engage in anumber of successful collaborations and team efforts. Henry, I still remember our firstvirtual meetings when we were both starting our PhD. Conceiving the idea of designingnew FG-Nups from scratch with you has been really exciting. It was the first time in myPhD where I felt like ‘we had it’, a true eureka moment, while dreaming about all pos-sible applications and future impact. I learned a lot from you. You are accurate, calm,and reflective, which by the way helped a lot while preparing the rebuttals for Rev.#4. I’mso happy that, in the end, we made it! John and Andreas, I really enjoyed collaboratingwith you and I really appreciated your positive energy and swift reaction to our proposalof collaboration. Your contribution has been (and still is) extremely valuable. Pierre andHendrik, the best DNA-origami architects I know. I had so much fun working with yournanostructures and I am very proud of our shared work.
239

8
240 ACKNOWLEDGEMENTS
In the CD lab I found many people who inspired me on a both scientific and personallevel. Notable mentions go to the nanopore/NPC team. Sergii, thank you for all the noisydiscussions, it has been so much fun. You have been truly inspirational and I always ad-mired your sharpness and creativity. Sonja, I still remember the myriads of nanoporesketches I drew on the wall in your office. Many great discussions, sometimes extremelylong and tiring, but thanks to that nanopores have now much less secrets. I was alwaysimpressed by the quality of your work (and your slides!), your innate stubbornness andgenuine curiosity, as well as your ultrabroad skillset. Adi, thanks for handing me thelegacy of biomimetic NPCs, your lessons and ground work helped me a lot in gettingthrough the rough world of nanopores. Wayne, thanks for being such a cool nanoporebuddy. Your jokes and dark humour made my life in the lab much more enjoyable. Also,thanks for your precious help in making this thesis! Daniel V, it was really fun to have youaround, I still wonder where you get all that energy. I was always struck by your naturalcharisma, and I was a big fan of your Christmas presentations, simply brilliant. DanielShi, I admire how you get so much work done all by yourself. I really enjoyed our beerdrinking sessions and fun conversations. Laura, I will only say one number: 549! I knowyou will understand. Stephanie, thanks for the nice chats in the office and for sharingyour noisy data. Your graphene pores definitely won the battle for the highest 1/f noise.Paola, it was great to have a NPC biologist in the team who is aware of how good foodshould taste like. Nils, you are unique in so many aspects and I truly admire how youpursue your ideals regardless of what all the others think or do. Social pressure clearlyhas no effect on your decisions. Anders, I only wish you had joined the lab much earlieron, I really love working as well as rocking together.
The work presented in this thesis would have not been nearly possible without the helpof some really skilled people. Eli, your contribution to this thesis is just enormous. Thankyou for all the proteins you made and purified (the list is very long) and for helping mein the design and making of our designer Nups. I am sorry that those were such a painto express, but your stubbornness won eventually! I am grateful for all the lab skills andtricks I could learn from you, and thanks a lot for translating my summary. Ash, thankyou so much for all the proteins (sorry for the NupYs!), still impressed how organizedand efficient you are at doing what you are doing. Most importantly, I love your voice,our crazy singing sessions, and our duets, such emotional moments! Jaco, you helpedme out and gave really useful advice in so many circumstances. It was always fun to chatin the lab and discuss my latest data with you. Meng-Yue, thank you for supplying topquality nanopores to all of us and for accommodating our demands on many occasions.Wiel, thanks for assisting me in operating the TEM and for all the sarcastic jokes. Allard,thank you for taking the coolest images ever of our Nup-coated DNA-origami pores, yourAFM skills are just superior. I still keep that dataset for when I need to show off. Jacob,we managed to finally collaborate on a shared project during my last year and I can’tthank you enough for the coding tricks and ideas you taught me, as well as all the laughsand jokes we had while debugging. Jeremie, thank you for assisting me in operating theconfocal microscope. Dimitri and Jelle, the best craftsmen at TU Delft, thank you forrealizing many awesome flow cells and chip holders, your work made my life in the lab

ACKNOWLEDGEMENTS
8
241
so much easier. Amanda and Jan, thank you so much for helping me out with all thepaperwork. ICT people, thank you for keeping my Mac alive throughout all these years.
Optimizing protocols can be very challenging and time consuming. Luckily for me, Ihad the opportunity to guide and mentor many talented bachelor and master studentswho contributed greatly to the making of this thesis. Allison, you were my first studentwho courageously embarked in one of my projects. I am so happy of how it went, yourQCM-D ground work was essential to many of our follow up projects, including the NupXpaper. Most importantly, we had such a great time! I think I never laughed so hard in thelab, I still feel a bit sorry for Andrea’s TEM grids. Andrea, wei Bomber! I was (and still am)so proud of my italian student prodigy. I admired your exceptional creativity, instinct,motivation, and independence. You literally nailed every single project I gave you, hatsoff to you. Madusha, working with you has been a privilege and I feel extremely luckyI had you as one of my students. You are incredibly fast learning, skillful, and diligent,and you managed to explore so many uncharted territories with our DNA-origami poresin such a short period of time. Tong, I won’t deny you had one of the most challengingprojects for a student, but you managed to produce cool results nonetheless. I reallyappreciated our discussions, I could see how you really enjoyed contemplating aboutthe physics underlying our nanopore experiments. Bloem, I am still dazzled by yourimpeccable work and total independence. You learned the technique in one go, almosteffortlessly, and you never screwed up an experiment. Thank you for all the great work.Last but not least, Johanna! I am really fond of your enthusiasm for science and con-tagious smile. I value greatly your sharp, inquisitive, and critical mind, and thanks forreporting the mistakes in our paper, which none of the reviewers could find instead.
Aside for the great science, I had the pleasure to share numerous nice moments withmany people around the lab. Sandro, you have been great colleague, an incrediblychilled though prolific scientist, and a great friend (don’t get too emotional now). I havefond memories of the several band practices, BN concerts, fussball games, and somecrazy nights. Albertone, the sexiest (e)spanish I know. You have been the best buddy Icould wish for, and we shared such beautiful moments together. Besides preparing allthose litres of sangria in portugal, I loved to engage in philosophical discussions withyou. Grande Fede #1! I have many fond memories of our numerous concerts and funmoments in the office. You were hands down the toughest competitor at fussball. JK,a.k.a. Dr. Love, you are so cool. I loved playing with you and thank you for being so sup-portive and enthusiastic about my research and ideas. Eugene, I really enjoyed sharingso many beers together (you are a tough competitor (also) in that area!) and some reallyfun moments in San Diego. Bis, I admire your calm, always positive, relaxed temper. Os-kar, your viking, ferocious spirit managed to take me down once, but one day I will getmy revenge! Kuba, you are so Ridiculo! I loved your fine sense of humour and thanks forbeing my fussball mentor. Nicola, it was great to discuss DNA origami in dialetto venetoand I’m proud of the awesome paper we had together. Ganji, you will be rememberedas the first nano-looper, I enjoyed many fun conversations and extremely brutal fussballgames. Anthony, thank you for the after work whiskey. Richard, I really enjoyed ourchats and complaining about academia. Pinyao, Alejandro, Greg, Jorine, Michel, Mi-

8
242 ACKNOWLEDGEMENTS
tasha, thanks for the nice moments and fun chats. The next generation: Martin, Milos,Roman, Sabrina, despite the start of your PhD coincided with the start of a global pan-demic your motivation and drive has not been nearly affected – I’m confident that thefuture of the CD lab is in good hands!
Moments of frustration and stress were relieved at the fussball table, where many fiercegames took place. There, I had the pleasure to fight against some really good playersfrom BN: Luuk, Tijs, David, Elisa, Duko, Benjamin, thank you for sharing the field withme. From the rest of BN, I would like to thank Mike for the nice chats in the lab corri-dors about science and Netflix gangster series, Helena, Becca, and Viktorija for the greatparties and dancing, Jochem, for sharing the passion for SRV, Tanja for the fun conver-sations and imaging our grids, Sam and Misha for the great times playing together. Ithank professors Marie-Eve for being extremely supportive and Arjen for the scientificdiscussions. I would also like to thank Erik for making such a cool cover for my thesis!
Despite living abroad for so many years, where the sunlight is as scarce as the taste ofa raw zucchini, I managed to feel less nostalgic thanks to some good Southern Euro-pean friends: Luca, thanks preparing Carbonara with real Guanciale. Omar, Sasi, Beppe,thank you for the parties all’italiana and off-beat jam sessions. Fede and Giulia, thanksfor inviting me to your place for dinner and play gypsy jazz. Giulio, the best barber Iknow, I’m so honoured I could contribute to the creation of the Schiedam crop. Fil-ipe, my awesome vocal coach, thank you for bringing so much passion into every class.Maria and Dimitri, thank you for providing the best homemade, heartwarming food onecan find on campus.
Voglio ringraziare la mia famiglia. Mamma e Papà, grazie per avermi supportato du-rante i miei lunghi anni di studi, sia economicamente (ricorderò per sempre i sacrificiper mandarmi a Boston!), ma sopratutto spiritualmente. La mia motivazione, determi-nazione e ambizione la devo a voi e ai vostri stimoli. Ma soprattutto vi ringrazio peravermi sempre amato, donandomi un’infanzia e adolescenza felici, senza traumi, nonavrei potuto chiedere di meglio! Inoltre, sono grato di avere dei genitori così fighi e vivi,mi avete fatto scoprire e apprezzare tante gioie della vita. Alby, ciao fra! Sappiamo tuttiche il tuo contributo è stato fondamentale per farmi studiare all’estero, quindi questatesi la dedico anche a te. In più occasioni mi hai dimostrato che ho un fratello che micopre le spalle quando ne ho bisogno, grazie per esserci stato.Infine, Gaia, il mio cucciolone preferito. Scrivo mentre stai per prendere l’ennesimo voloCopenhagen-Amsterdam, che mostra quanto nonostante il mondo cerchi di separarci inmille modi, l’amore che ci tiene uniti vince su tutto. Grazie per avermi supportato, sop-portato, spronato, consolato, e incoraggiato costantemente durante questo lungo PhD,sei stata il sostegno che mi ha fatto rialzare nei momenti più difficili, e il premio piùgrande quando c’era da festeggiare per le nostre (tante) vittorie. Insieme siamo invin-cibili, un team perfetto, affiatati e affamati di conquista. Sono fortunato di avere unapersona così speciale al mio fianco e, come dico sempre, sei la cosa più bella che esista!
Alessio Fragasso

CURRICULUM VITÆ
Alessio FRAGASSO
13-05-1992 Born in Camposampiero (PD), Italy.
2011–2014 Bachelor in Information Engineering (full marks)Università degli Studi di PadovaThesis: An algorithmic approach based on non-cooperative game theoryaimed to address the routing problem in optical networks
2014–2016 Master in Nanotechnologies for ICTs (cum Laude)jointly held by Politecnico di Torino, Grenoble INP Phelma, and ÉcolePolytechnique Fédérale de LausanneThesis: Multimaterial 3D bioprinting of freeform complex structures
2015 Research InternBurg Lab – Max Planck Institute for Biophysical ChemistryDevelopment of a nanofluidic device for Alzheimer’s biomarkers detection
2016 Research InternKhademhosseini Lab – Harvard-MIT Health Sciences and Technology3D bioprinting of multimaterial freeform structures
2016-2021 PhD in BionanoscienceDelft University of Technology, Delft, The NetherlandsThesis: Towards a bottom-up reconstitution of the nuclear pore complexPromotor: Prof. dr. C. Dekker
243


LIST OF PUBLICATIONS
8. A. Fragasso, C. Dekker. Studying Karyopherins occupancy in the nuclear pore complex usingbiomimetic nanopores, manuscript in preparation.
7. Y. Ying*, Z. Hu*, S. Zhang*, Y. Qing*, A. Fragasso*, X. Zhang*, G. Maglia, A. Meller, H. Bayley,C. Dekker, L. Jiang, Y. Long. Nanopores: Beyond DNA Sequencing, manuscript in preparationfor Nature Nanotechnology, (commissioned).
6. A. Fragasso*, N. De Franceschi*, P. Stoemmer*, E. O. Van der Sluis, H. Dietz, C. Dekker. Re-constitution of ultrawide DNA origami pores in liposomes for transmembrane transport ofmacromolecules, ACS Nano, 15(8), 12768-12779 (2021).
5. A. Fragasso*, H. W. De Vries*, J. Andersson, E. O. Van Der Sluis, E. Van Der Giessen, A. Dahlin,P. R. Onck, C. Dekker. A designer FG-Nup that reconstitutes the selective transport barrier ofthe nuclear pore complex, Nature Communications, 12(1), 1–15 (2021).
4. A. Fragasso, S. Schmid, C. Dekker. Comparing current noise in biological and solid-statenanopores, ACS nano, 14(2), 1338-1349 (2020).
3. A. Fragasso, S. Pud, C. Dekker. 1/f noise in solid-state nanopores is governed by access andsurface regions, Nanotechnology 30(39), 395202 (2019).
2. M. Rocca*, A.Fragasso*, W. Liu, M. A Heinrich, Y. S. Zhang. Embedded multimaterial extru-sion bioprinting, SLAS Technology, 23(2), 154-163 (2018).
1. W. Liu, Z. Zhong, N. Hu, Y. Zhou, L. Maggio, A. K. Miri, A. Fragasso, X. Jin, A.Khademhosseini,
and Y. S. Zhang. Coaxial extrusion bioprinting of 3D microfibrous constructs with cell-favorable
gelatin methacryloyl microenvironments, Biofabrication, 10, 024102 (2018).
* denotes equal contribution
245