
Toward lithium-air batteries for aircraft application
242
HAL Id: tel-03634360 https://tel.archives-ouvertes.fr/tel-03634360 Submitted on 7 Apr 2022 HAL is a multi-disciplinary open access archive for the deposit and dissemination of sci- entific research documents, whether they are pub- lished or not. The documents may come from teaching and research institutions in France or abroad, or from public or private research centers. L’archive ouverte pluridisciplinaire HAL, est destinée au dépôt et à la diffusion de documents scientifiques de niveau recherche, publiés ou non, émanant des établissements d’enseignement et de recherche français ou étrangers, des laboratoires publics ou privés. Toward lithium-air batteries for aircraft application: a combined experimental/modeling study Caroline Gaya To cite this version: Caroline Gaya. Toward lithium-air batteries for aircraft application: a combined experimen- tal/modeling study. Other. Université de Picardie Jules Verne, 2019. English. NNT : 2019AMIE0053. tel-03634360
-
Upload
khangminh22 -
Category
Documents
-
view
0 -
download
0
Transcript of Toward lithium-air batteries for aircraft application

HAL Id: tel-03634360https://tel.archives-ouvertes.fr/tel-03634360
Submitted on 7 Apr 2022
HAL is a multi-disciplinary open accessarchive for the deposit and dissemination of sci-entific research documents, whether they are pub-lished or not. The documents may come fromteaching and research institutions in France orabroad, or from public or private research centers.
L’archive ouverte pluridisciplinaire HAL, estdestinée au dépôt et à la diffusion de documentsscientifiques de niveau recherche, publiés ou non,émanant des établissements d’enseignement et derecherche français ou étrangers, des laboratoirespublics ou privés.
Toward lithium-air batteries for aircraft application : acombined experimental/modeling study
Caroline Gaya
To cite this version:Caroline Gaya. Toward lithium-air batteries for aircraft application : a combined experimen-tal/modeling study. Other. Université de Picardie Jules Verne, 2019. English. �NNT :2019AMIE0053�. �tel-03634360�
Thèse de Doctorat
Mention Chimie
Spécialité Génie Electrochimique
présentée à l'Ecole Doctorale en Sciences Technologie et Santé (ED 585)
de l’Université de Picardie Jules Verne
par
Caroline Gaya
pour obtenir le grade de Docteur de l’Université de Picardie Jules Verne
Toward lithium-air batteries for aircraft application:
a combined experimental/modeling study
Soutenue le 22/01/19 après avis des rapporteurs, devant le jury d’examen :
M. Y. Bultel, Professeur, INP Grenoble Président
M. P. Notten, Professeur, Université d’Eindhoven Rapporteur
M. F. Favier, CNRS Researcher, Univ. de Montpellier II Rapporteur
Mme N. Krins, MCF, Univ. Pierre et Marie Curie Examinateur
M. A. A. Franco, Professeur, UPJV Amiens Directeur de thèse
M. D. Larcher, Professeur, UPJV Amiens Invité
M. N. Chadourne, Ingénieur, IRT Saint-Exupéry Invité


« Dans la vie il n'y a pas de solutions ; il y a des forces en marche : il faut les
créer et les solutions suivent. »
- Antoine de Saint-Exupéry -
“Much to learn, you still have”
- Master Yoda -
“An expert is a man who has made all the mistakes which can be made, in a
narrow field.”
- Niels Bohr -


Acknowledgments
Dear reader, the document you are about to read is the fulfilment of three years of thesis
work. Along the winding pathways taken, this journey was enriching on both professional and
personal aspects and empowered by all the people I had the chance to meet.
As all trip, an end is needed and I would like to deeply acknowledge the jury members
F. Favier, P. Notten, N. Krins and Y. Bultel for giving me the chance to defend my thesis, and
this way, they allowed me to close the Ph.D. student chapter to move toward new adventures.
Still, prior to say goodbye, I want first to thank all the people who helped me along the
expedition.
First of all, I would like to thank my supervisor A. A. Franco for giving me the chance to
join the LRCS, to undertake this thesis work and to develop my skills in an enriching
international team. Also, I thank him for triggering my scientific curiosity with hot topics such
as virtual reality and for encouraging me to attend events to learn how to popularize science
(Fête des science, Pint of Science, MT180).
In parallel, I would like to express my sincere gratitude to all my IRT supervisors.
Initially, G. Gager taught me the rigorous attitude to adopt to commit the imposed project
deadlines. Later, N. Chadourne was a strong pillar to achieve this thesis work. He strongly and
enthusiastically supported me along the thesis journey and joined to R. Sustra-Orus they offered
me the possibility to stay onboard the more electrical aircraft. For that, I would like to deeply
acknowledge them.
Moreover, it is very important to me to express my sincere gratefulness to D. Larcher.
Not officially involved in my thesis, he still guided me through it without asking any recognition
even though he won mine fully (and an apple pie thanks to a winning bet). Dominique is for me
the personification of the researcher, passionate by science and always incline to share his broad
knowledge. He always enticed me to merge disciplines and to take inspiration from the
surrounded nature. For all these reasons, I want to say “Merci Domi, milles fois!”.
My sincere thanks also goes to the industrial members of Safran, Zodiac Aerospace and
Airbus who were involved and strongly supported the CELIA project and especially to
A. Boisard, G. Cherouvrier, J. Labbé, C. Wolff, and M. Freire.
I would like also to thank B. Girard and F. Coccetti for following my work at IRT. In
addition, I would like also to address special thanks to I. Calvez and N. Chadourne for helping

me to solve the several setbacks I encountered during my many (jinxed) commutations in
between IRT Saint Exupéry and LRCS. In add, I would like to thank Julien Escobar for his wise
manuscript corrections.
Along this three years, I had the chance to work, exchange, debate, get help from several
of my colleagues and so I want to give many thanks especially to Y. Yin and A. Torayev (my
Li-O2 teammates), V. Thangavel, A. Jameli, C. Surcin, M. Morcrette, M. Courty, S. Laruelle,
S. Grugeon, D. Hubert, N. Recham, C. Delacourt, R. Janot, C. Lenfant and V. Viallet from
LRCS; M. Mammeri from LAMFA; E. Legrand from LG2A; V. Bequet from UPJV and
C. Pivot, A. Durier, P. Frey, F. Lakermi, C. David, M. Morin, P. Martinez, L. Hermette,
P. Zaffalon and F. Mir from IRT Saint-Exupéry (hopping to not forget anyone). More largely I
would like to thank all my colleagues from both IRT Saint-Exupéry and LRCS for enlighting
my days.
These three years at LRCS and IRT Saint-Exupéry would remain as a wonderful memory.
Special thanks to A. Pessot who introduced me to IRT and to V. Novelli who took me under
her wing since I arrived and made me discover “the dolce vita” in Roma. Also, many thanks to
all the serious guys (and also all the folks, I let you find to which category you belong) that
cross my path; M. Bazant, Y. Shao-Horn and B. Gallant for letting me discover MIT;
P. Johansson and all his Chalmers team so kind with me during my stay there; M. Pouget for
introducing me to acting; F. Luge who helped me to improve my MT180 speech; G. Besson for
her support and for always finding the right way to captivate an audience; M. Maiza for the
daily support and crazy USA trip; O. Beaujot for the energizing tea and shopping breaks; the
guys from the prototyping: T. Lombard, F. Rabuel, J.-B. Chabert and special thought for R.
David (for all the Justin Bieber songs I was enabled to not sing in the lab because of you); the
CELIA and FUSHIA teams that always welcomed me so nicely Y. Zhang, A. Pessot,
K. Mrozewksi, S. Rigal and S. El Aabid; the IRT MT180 team for the funny moments shared
for the sake of theatricality: B. Pawels, R. Dupuis, O. Chihani and C. Pecoste; my amazing
officemates: V. Nehru Bandla, A. Thiam, L. C. Loiza Rodrigues, A. Torayev and Z. Su.
Finally, many thanks to D. Leroy for helping me during the tough third year and for being a
really enthusiastic intern.
I thank also all my friends from the lab and outside that I did not acknowledge yet for all
the fun we had and the happy moments we shared in particular: Vianney, Simon, Charles-
Antoine, Boris, Diane, Blanche, Marine, Agnes, Clément, Marlene, Ines, Clémence, Lucie,

Iryna, Damien, Ronan, Abbos, Garima, Thibault C., Thibault V., Chloé, Lucas, Nautile,
Alexandre, Victor, Alice, the Delirium, the Network and the Glou Café.
As the list is too long it was hard to quote everybody one by one so please forgive for
that. I want to stress that I was really pleased to meet all of you guys (PhDs, post-docs, Masters
students, ice-skating fellows and Krav-maga ones).
Besides, I would like to thank my beloved family thanks to who I was able to follow my
studies. I deeply acknowledge my parents for letting me do and for helping me to do whatever
I felt necessary to broaden my mind (even though it implies a 6-month trip on my on without
preparation at the opposite side of the earth). I also thank my sister with who I share so much,
always happy to travel and to party together. Also, I acknowledge my grand-mother always
joyful to tell us how much our grandfather would be proud of his grandchildren.
Last but not least, I would like to thanks this guy (as Laura says) or more accurately THE
guy thanks to who I have spent three delighted years. Gaspard, thanks you so much for being
so supportive and for all the cheerful moments you created for us. I am so excited to discover
what the future holds for us in our next adventures together!

Preface
The work presented in this manuscript is the witness of the strong collaboration between
IRT Saint-Exupéry and LRCS (Unité Mixte de Recherche CNRS 7314, Université de Picardie
Jules Verne) and was developed within to the frame of the CELIA project. This project, led by
IRT Saint Exupéry, gathered another academic member, IMS, as well as three of the world
leading aeronautical suppliers which are Safran, Zodiac Aerospace and Airbus. The project was
funded by IRT Saint-Exupéry based on the financial participations from the industrial members
in parallel to an ANR funding. The thesis work was supervised by Pr. Alejandro A. Franco at
LRCS. The thesis work was pioneered as it focused on lithium-air batteries development with
as a target aeronautical applications. The project was initially followed at IRT Saint-Exupéry
by Guillaume Gager as the Project Manager and then later by Nicolas Chadourne as the Project
Manager and Aircraft Technical Referent. The gathering in this manuscript of the results
obtained during these three years was proposed as the completion for the PhD degree from
Université de Picardie Jules Verne.
The Chapters III and IV were presented in two different international conferences. In 2017,
the modeling results were unveiled at the 68th Annual Meeting of the International Society of
Electrochemistry (ISE) in Providence. Later in 2018, combination of the experimental and
modeling discoveries was disclosed during the European Material Research Society (EMRS)
Fall Meeting in Warsaw. Chapter III and Chapter IV were the subject of two papers. The first
one, entitled “Investigation of bi-porous electrodes for lithium oxygen batteries” (C. Gaya,
Y. Yin, A. Torayev, Y. Mammeri, A. A. Franco, Electrochim. Acta, 279, 118-127, 2018) is
already published. The second one which focused on “Characterization of the porosity in highly
porous carbon-loaded plastic flexible film electrodes” (C. Gaya, A. A. Franco, C. Surcin,
M. Courty, D. Larcher) was at the time of the PhD defence still under submission. Further
publications based on the last results are under consideration. Participation to two others
publications as co-author enabled to broaden the approach developed in this work (“Impact of
Li2O2 Particle Size on Li−O2 Battery Charge Process: Insights from a Multiscale Modeling
Perspective”, Y. Yin, C. Gaya, A. Torayev, V. Thangavel, A. A. Franco, J. Phys. Chem. Lett., 7,
3897−3902, 2016; “Linking the Performances of Li−O2 Batteries to Discharge Rate and
Electrode and Electrolyte Properties through the Nucleation Mechanism of Li2O2”, Y. Yin,
A. Torayev, C. Gaya, Y. Mammeri, A. A. Franco, J. Phys. Chem. C, 121, 19577−19585, 2017).


Acronyms
NASA: National Aeronautics and Space Administration
ACARE: Advisory Council for Aeronautics Research in Europe
MEA: More Electrical Aircraft
LIBs: Lithium-ion batteries
LiPo: Lithium Polymer
APU: Auxiliary Power Unit
NTSB: National Transport Safety Board
LEAPTech: Leading Edge Asynchronous Propeller Technology
LISs: Lithium-sulfur batteries
CIRA: Italian Aerospace Research center
PEMFC: Proton Exchange Membrane Fuel Cell
DLR: Deutsches Zentrum für Luft-und Raumfahrt
DoD: Depth of Discharge
HEV: Hybrid Electric Vehicle
EV: Electric Vehicle
LABs: Lithium-air batteries
LOBs: Lithium-oxygen batteries
BMS: Battery Management System
RTIL: Room Temperature Ionic Liquids
ORR: Oxygen Reduction Reaction
OER: Oxygen Evolution Reaction
RH: Relative Humidity
PVdF: Polyvinylidene diFluoride
DMSO: Dimethyl Sulfoxide
PTFE: Polytetrafluoroethylene
NMP: N-Methyl-2-pyrrolidone
DBP: Dibutyl Phthalate
DMSO: Dimethyl sulfoxide
DME: Dimethoxyethane
TriGDME: Triethylene glycol dimethyl ether

TetraGDME: Tetraethylene glycol dimethyl ether
DMA: N,N-Dimethylacetamide
SSA: Specific Surface Area
DSC: Differential scanning calorimetry
SEM: Scanning Electron Microscopy
EDX: Energy Dispersive X-Ray
IR: Infrared
SEI: Solid Electrolyte Interphase
LiClO4: Lithium perchlorate
LiTFSI: Bis(trifluoromethane)sulfonimide lithium salt
LiNO3: Lithium Nitrate
LiI: Lithium Iodide
CNT: Classical Nucleation Theory
GDL: Gas Diffusion Layer
OCV: Open Circuit Voltage

Nomenclature
𝜺𝒊: Porosity of domain 𝑖
𝑫𝟎: Oxygen diffusion coefficient in the electrolyte
𝑫: Effective oxygen diffusion coefficient in the electrolyte
𝝉𝒊: Tortuosity of the domain 𝑖
𝒄𝑿: Concentration of the X specie
𝑱𝑿𝑫𝒊𝒇𝒇
: Diffusion flux of the X specie
𝑺𝑿𝒊→𝒋
: Intraflux between domain 𝑖 and 𝑗
𝑹𝒙: Source term due to reactions producing or consuming the X specie
𝑺𝑿𝒊→𝒋
: Intraflux between domain 𝑖 and 𝑗
𝑨𝒄𝒐𝒏𝒕𝒂𝒄𝒕: Contact surface between meso and macro domains
𝑽𝑳𝒊𝟐𝑶𝟐: Volume of Li2O2 produced
𝑴𝑳𝒊𝟐𝑶𝟐: Li2O2 molar mass
𝝆𝑳𝒊𝟐𝑶𝟐: Li2O2 density
𝐕𝒎: Molar volume
𝑰: Current
𝒋𝑭𝒂𝒓: Overall Faradaic current
𝜼: Overpotential
𝒏: Number of electrons
𝒌: Prefactor
𝜻𝒕𝒖𝒏𝒏𝒆𝒍𝒊𝒏𝒈 : Tunneling function
𝑼: Cell potential
𝑼𝟎: Thermodynamic standard cell potential
𝒂𝒊,𝒋: Active surface available in domain 𝑖 and bin 𝑗
𝜹𝒊,𝒋: Li2O2 thickness in domain 𝑖 and bin 𝑗
𝜶: Symmetric factor in Butler-Volmer equation
𝜷: Symmetric factor in Tafel equation
𝜽: Contact surface ratio
𝒅𝒕: Time step
𝒅𝒙: Bin unit
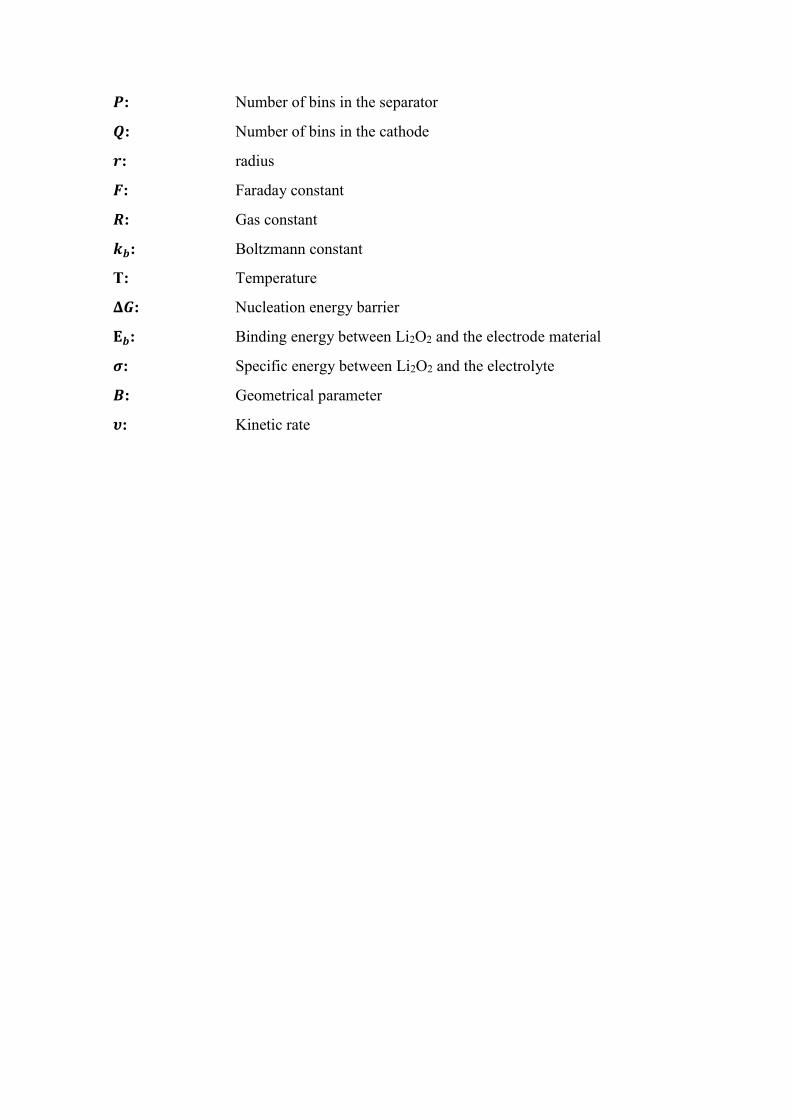
𝑷: Number of bins in the separator
𝑸: Number of bins in the cathode
𝒓: radius
𝑭: Faraday constant
𝑹: Gas constant
𝒌𝒃: Boltzmann constant
T: Temperature
𝚫𝑮: Nucleation energy barrier
𝐄𝒃: Binding energy between Li2O2 and the electrode material
𝝈: Specific energy between Li2O2 and the electrolyte
𝑩: Geometrical parameter
𝝊: Kinetic rate
Figures List
Figure I. 1: Schematic of the MEA concept based on fuel cells power supply compared
to conventional aircraft.5 ............................................................................................................ 1
Figure I. 2: Taurus G4 conception schematic with battery packs locations spotted with
numbers 1, 2 and 3.7 ................................................................................................................... 2
Figure I. 3: LEAPTech aircraft first conceptualization.9 .................................................. 2
Figure I. 4: Picture of Zephyr 7, the Airbus drone powered by photovoltaic cells and Li-
sulfur cells (source: https://www.droneuniversities.com). ......................................................... 3
Figure I. 5: Picture of Antares DLR-H2 the first aircraft powered by fuel cells (source:
https://www.dlr.de). .................................................................................................................... 4
Figure I. 6: Drawing of the car “La jamais contente”.29 ................................................... 8
Figure I. 7: Worldwide battery market from 1990 to 2015.49 ......................................... 10
Figure I. 8: LIBs worldwide market in volume (a) and in market share (b). (Values from
2015).48 ..................................................................................................................................... 11
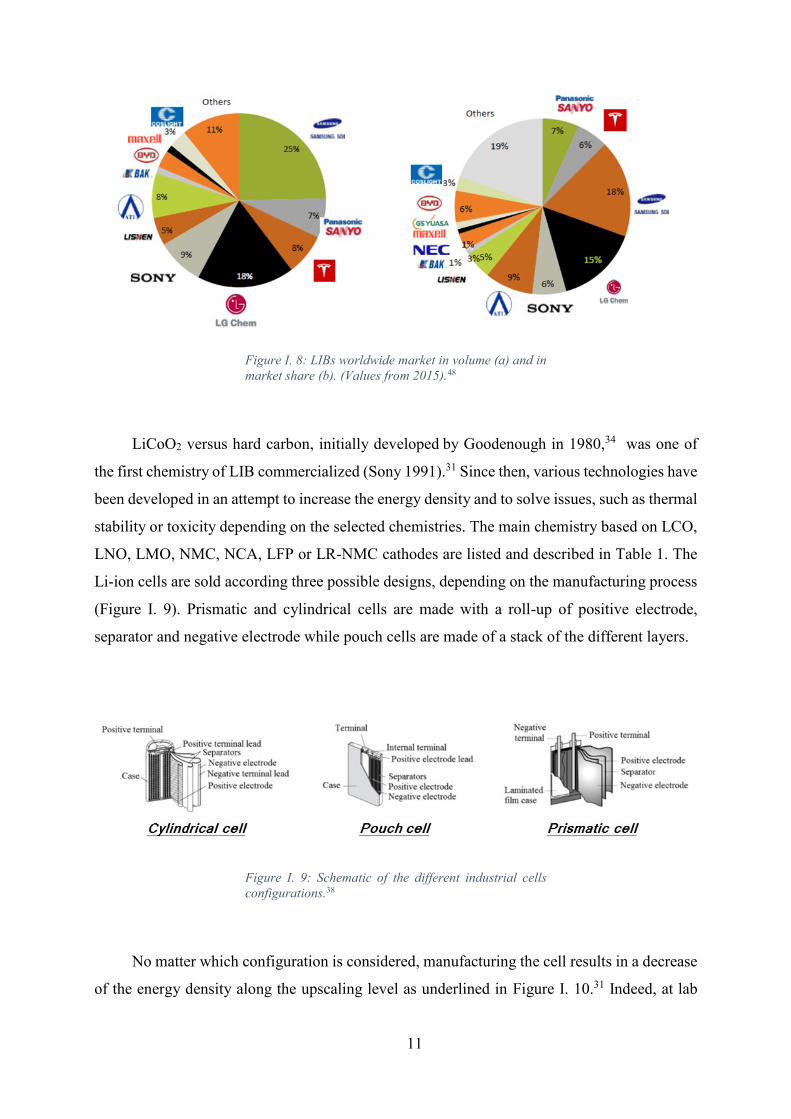
Figure I. 9: Schematic of the different industrial cells configurations.38 ........................ 11
Figure I. 10: Decrease of practical energy density over the battery value chain.31 ........ 12
Figure I. 11: The battery technology landscape as proposed by Tarascon in 2010.47 .... 13
Figure I. 12: Evolution of the number of publications related to the terms “Li-air batteries”
or “lithium-air batteries” or “Li-O2 batteries” or “lithium-oxygen batteries” on Web of Science
(data from 27/06/18). ................................................................................................................ 14
Figure I. 13: The 10 top countries releasing the most publication on “Li-air batteries” or
“lithium-air batteries” or “Li-O2 batteries” or “lithium-oxygen batteries” according to Web of
Science (data from 03/07/18). .................................................................................................. 15
Figure I. 14: Schematics of LABs discharge. ................................................................ 16
Figure I. 15: Schematics of the several kind of LABs.26 ................................................ 16
Figure I. 16: Schematic of lithium dissolution and deposition on top of lithium metal
electrode.69 ................................................................................................................................ 18
Figure I. 17: Schematics of oxygen transport during discharge depending on its solubility
in the electrolyte.70 ................................................................................................................... 18
Figure I. 18: Description of the solution mechanism and surface mechanism occurring in
Li-O2 batteries. In first case, Li2O2 is soluble (due to the use of high donor number) while in
the second one Li2O2 is insoluble (low donor number).81 ........................................................ 20
Figure I. 19: Discharge and charge voltage evolution of a non-aqueous cell at
∼ 0.1 mA/cm² express in function of the charge capacity per gram of Carbon SP in the
cathode.26 .................................................................................................................................. 24
Figure I. 20: Schematic of LABs limitations from lab scale to aeronautical application.
(Based on references53,117,118). .................................................................................................. 25
Figure I. 21: Impact of the carbon used as cathode for LABs. ....................................... 26
Figure I. 22: Variation with geologic time of Earth’s atmosphere composition.154 ....... 29
Figure I. 23: Schematic of Earth’s atmosphere structure and evolution of pressure and
temperature with altitude.157 ..................................................................................................... 30
Figure I. 24: The mixing ratio of some atmospheric gases in Earth’s Atmosphere as a
function of altitude.11 ................................................................................................................ 30
Figure I. 25: Records of temperature, pressure, RH and ozone concentration during a
commercial flight (Paris-Washington, on July 9, 1995).149 ..................................................... 31
Figure I. 26: Discharge curves for an aprotic Li-O2 cell (based on a Ketjen Black positive
electrode) The curves give the cell output potential as a function of discharge capacity per gram
of carbon in the positive electrode (mAh.g-1). U0 is the thermodynamic standard cell potential.26
.................................................................................................................................................. 33
Figure I. 27: Discharge curves at different current densities (capacities per electrode
geometric area).The vertical lines defined the mean values observed for each condition and
dash lines the standard deviation. (The black curves correspond to cells used in their
publication).171 .......................................................................................................................... 34
Figure I. 28: Electron microscopy (FESEM) images at a magnification of 20000x of a
pristine positive electrode (a) and after full discharge at (b) 5 µA/cm2, (c) 10 µA/cm2, (d) 25
µA/cm2, (e) 50 µA/cm2, and (f) 100 µA/cm2, with the corresponding discharge curves. Scale
bar 400nm.172 ............................................................................................................................ 35
Figure I. 29: (a) First discharge curves of cells wetted by electrolyte composed of 0.1 M
LiClO4 in DME. The flow is rather water-free or water-saturated oxygen. “Leaker cell”
corresponds to small leak of ambient air inside the cell and “water vapor cell” corresponds to
water saturated oxygen (b) First discharge curves of cell with non-contaminated or water-
contaminated electrolyte.175 ..................................................................................................... 36
Figure I. 30: LABs cycling curves obtained with different gas composition (1) dry oxygen
(0 %RH), (2) oxygen with 15 %RH and (3) ambient air (50 %RH) (a) Cycling conditions: 50
mA.g-1 applied between 2 V and 4.5 V (b) Cycling conditions: 200 mA.g-1 with a fixed capacity
of 1000 mA.g-1 (c) Cycling at several current densities.177 ...................................................... 37
Figure I. 31: SEM images of KB electrodes at different states for the Li2O2 batteries in
pure/dry O2 atmosphere (a, b, c), in O2 atmosphere with an 15 % RH (d, e, f), and in ambient
air with 50 %RH (g, h, i): before discharge (a, d, g), after discharge (b, e, h) and after recharge
(c, f, i), respectively.177 ............................................................................................................. 38
Figure I. 32: Li2O2 yield versus discharge capacity of carbon paper cathodes discharged
at 1 µA and 30 µA with different water contents in the electrolyte. The yield consists of the
determined mass of Li2O2 found in the cathode related to the mass expected from the charges
passed during discharge.179 ...................................................................................................... 39
Figure I. 33: Discharge curves of Li–O2/CO2 batteries with various O2/CO2 ratios at 25°C
(0.2 mA.cm-2).181 ...................................................................................................................... 39
Figure I. 34: Gas production according to charge potential applied.178 .......................... 40
Figure I. 35: Picture of a negative electrode before cycling (a) and after 51th cycles
(cutoffs at 500 mAh g-1) (b).160 ................................................................................................ 40
Figure I. 36: Picture of a Li-air pouch cell with gas diffusion membrane (PTFE) after
discharge in ambient air.186 ...................................................................................................... 41
Figure I. 37: Impact of temperature on cycling for TEGDME-based electrolyte
lithium−oxygen cells Capacity limited to 1000 mAh.g−1carbon. Current: 100 mA.g−1 carbon.
189 . 42
Figure I. 38: Proposed mechanism to explain Li2O2 crystallites growth. 169 .................. 43
Figure I. 39: Discharge curves at high and low discharge rate at several pressure (a) 1 atm
(b) 3 atm (c) 5 atm (d) 10 atm.170 ............................................................................................ 44
Figure I. 40: Discharge curves for diglyme-based Li-air cells discharged at 0.1 mA.cm-²
(a) and 1 or 2 mA.cm-² (b) for several pressures (1 atm, 5 atm and 25 atm). 192 ..................... 45
Figure I. 41: LABs capacities and cycling abilities according to applied oxygen partial
pressure (a) 1st discharge, (b) Cycling with cutoff at 300 mAh/gelectrode, (c) Cycling with cutoff
at 100 mAh/gelectrode, (d) Cycling properties versus oxygen partial pressure while applying a
cutoff at 300 mAh/gelectrode.195 ................................................................................................... 46
Figure I. 42: Highlighting of the capacity limitation impact on cyclability
overestimation.196,197 ................................................................................................................ 47
Figure I. 43: Non-exhaustive list of the several expressions of LABs capacity in the
literature.26,51,55,56,198–201 ............................................................................................................ 48
Figure II. 1: Modeling of Ketjen Black based LABs discharge capacities compared to
Carbon SP based ones.128 ......................................................................................................... 52
Figure II. 2: Mixing device for NMP slurries (Ultraturax). ............................................ 55

Figure II. 3: Multi-steps solvent addition process for Dip-coating electrode fabrication
process. ..................................................................................................................................... 55
Figure II. 4: Schematics of Dip-coated electrode fabrication process and related porosity
creation. .................................................................................................................................... 56
Figure II. 5: Observation of the dip-coating process issues to overcome a) aggregates and
inhomogeneous coating on top of the stainless steel grid b) cracks in the coating. ................. 57
Figure II. 6: Experimental plan design to test the several parameters impacting the grid
coating efficiency. The reference parameters are highlighted in dark blue. ............................ 57
Figure II. 7: SEM picture of a dip-coated electrode formulated with 15 wt% of binder.58
Figure II. 8: SEM picture of a dip-coated electrode formulated with 15 wt% of binder and
a slow drying process. .............................................................................................................. 58
Figure II. 9: SEM pictures of a dip-coated electrode at different scale for a formulation
with a dry mass of 0.28 %. ....................................................................................................... 59
Figure II. 10: Schematics of the flexible electrodes fabrication process and related
porosity creation. ...................................................................................................................... 60
Figure II. 11: Comparison of Dip-coating and Porous Flexible electrode fabrication
processes pros and cons. ........................................................................................................... 61
Figure II. 12: Pictures of disassembled and assembled Swagelok. ................................ 64
Figure II. 13: Pictures of (a) a dip-coated cathode (b) a porous flexible cathode (c) a GDL
cathode and (d) a lithium anode. .............................................................................................. 64
Figure II. 14: Schematic of the several layers superposed during Swagelok assembling.
In the case of dip-coated cathode, no grid is added as the cathode is already supported by a
stainless steel grid. .................................................................................................................... 65
Figure II. 15: Evolution of the atmosphere controller container for LABs called “Le
Parfait” container. (a) First design at LRCS, (b) New design made for the study. .................. 66
Figure II. 16: Schematic of the oxygen flow system. ..................................................... 67
Figure II. 17: Gas mixing system. ................................................................................... 68
Figure II. 18: Picture of the pycnometer (AccuPyc 1330, Micromeritics). .................... 69
Figure II. 19: Picture of the N2 adsorption and desorption measurement device at 77 K
using N2 (ASAP 2020, Micromeritics). ................................................................................... 70
Figure II. 20: DSC curve of PVdF-HFP carried on at 5 K/min from 25 °C to 250 °C. .. 71
Figure II. 21: Picture of VSP (Bio-Logic). ..................................................................... 71
Figure II. 22: Polarization tests for DMSO + 1 M LiCLO4 as the electrolyte. Succession
of current steps at 25 µA and -25 µA, each for 2 hours. .......................................................... 72

Figure II. 23: Pristine GDL SEM picture. ...................................................................... 73
Figure II. 24: EDX mapping of the carbon element (b) in the corresponding SEM picture
(a). ............................................................................................................................................ 74
Figure II. 25: Pictures of the ASAP tubes after degassing containing the electrode DBP60
without DBP removal (a) DBP60 with DBP extracted (3 times 15 minutes in ether) (b). ....... 74
Figure II. 26: IR spectra of the liquid recovered after ASAP degassing, compared to pure
DBP spectra. ............................................................................................................................. 75
Figure II. 27: Water content results for electrolytes based on TriGDME and TetraGDME
with several LiTFSI concentrations. ........................................................................................ 76
Figure III. 1: Structure of the bronchial tree.218 .............................................................. 80
Figure III. 2: LABs electrode concept development. ...................................................... 81
Figure III. 3: Schematics of the system described in the model considering coexistence of
two domains in the cathode: macro-porous and meso-porous domains. .................................. 83
Figure III. 4: Illustration of the tortuosity concept as proposed by Tjaden et al..220 ...... 85
Figure III. 5: Description of the simulated system. ........................................................ 87
Figure III. 6: Calculated evolution of macro-pores active surface (b) and meso-pores one
(c), of oxygen concentration in macro-pores (d) and meso-pores (e) and of porosity in macro-
pores (f) and meso-pores (g) linked to the discharge curve (a) done at I = 0.625 A/m²geometric for
an electrode with 50 wt% of carbon and 20 % of volume macro porosity volume ratio (initial
stage was estimated after 10 s and final one corresponded to end of discharge). .................... 91
Figure III. 7: a) Calculated impact of cathode thickness (µm) on electrode discharge
capacity (mAh/gelectrode) for a current density of 62.5 µA/cm²geometric and corresponding
evolution of mesoporous domain porosity for electrodes with a thickness of 75 and 200 µm (
b) and c) respectively). ............................................................................................................. 93
Figure III. 8: Calculated impact of the current density (a) 62.5 µA/cm²geometric , b)
125 µA/cm²geometric, c) 250 µA/cm²geometric) on the discharge capacity (mAh/gcarbon) for
different formulations based on Ketjen Back electrodes. ........................................................ 95
Figure III. 9: Calculated impact of the macro-porous volume ratio (from 20 to 50 %, for
electrodes with different Ketjen Black ratios 50 wt%, 60 wt% and 70 wt%. Current density was
estimated for each case depending on the available surface carbon and corresponded to
0.1 µA/m²carbon. ......................................................................................................................... 96
Figure III. 10: Simulation of the discharge over-potential evolution with available carbon
surface decrease for an electrode with 50 wt% of carbon and 20 % of volume macro porosity
volume ratio. Current density applied: 0.625 A/m²geometric. ...................................................... 98
Figure III. 11: Evolution of macro-pores active surface (b) and meso-pores one (c), of
oxygen concentration in macro-pores (d) and meso-pores (e) and of porosity in macro-pores (f)
and meso-pores (g) linked to the discharge curve (a) done at I = 62.5 µA/cm²geometric for an
electrode with 60 wt% of Ketjen Black and 30 % of volume macro porosity volume ratio (initial
stage was estimated after 10 s and final one corresponds to end of discharge). ...................... 99
Figure III. 12: Evolution of macro-pores active surface (b) and mesopores one (c), of
oxygen concentration in macro-pores (d) and meso-pores (e) and of porosity in macro-pores (f)
and meso-pores (g) linked to the discharge curve (a) done at I = 62.5 µA/cm²geometric for an
electrode with 60 wt% of carbon Super P and 30 % of volume macro porosity volume ratio
(initial stage was estimated after 10 s and final one corresponds to end of discharge). ......... 100
Figure IV. 1: Discharge curves of several electrodes along the improvement of dip-
coating process (I = 25 µA, electrolyte: dried DME + 0.1 M LiClO4). ................................. 105
Figure IV. 2: SEM pictures of the electrodes from B15D2.8F and B15D2.8S formulations.
................................................................................................................................................ 106
Figure IV. 3: Discharge curves of several dip-coated electrodes made with different dry
mass ratio (I = 25 µA, electrolyte: dried DME + 0.1 M LiClO4). .......................................... 106
Figure IV. 4: SEM pictures of an electrode made with the formulation B15D0.28S at a
magnificence of a) 40x and b) 150x. ..................................................................................... 107
Figure IV. 5: SEM pictures of an electrode made with the formulation B15D0.28SM at a
magnificence of a) 40x and b) 130x. ...................................................................................... 107
Figure IV. 6: Chemical formulas of a) DMSO, b) DME, c) TriGDME and d) TetraGDME.
................................................................................................................................................ 109
Figure IV. 7: Polarization tests (+/- 25 µA for 2h) a) Comparison between DME and
DMSO and b) and between TriGDME with LiClO4 or LiTFSI as a salt. .............................. 110
Figure IV. 8: Discharge/Charge of an electrode from batch B10D2.8F at -/+ 25 µA. .... 111
Figure IV. 9: Evolution of the electrolytes tested along the study. .............................. 112
Figure IV. 10: Statistical analysis of the efficiency of the DBP extraction (50 disks from
DBP65). ................................................................................................................................... 113
Figure IV. 11: Efficiency of DBP removal along the soaking process in ether depending
on the ether cleaning steps applied to DBP60 electrodes. ....................................................... 114
Figure IV. 12: Theoretical porosities compared to estimated porosities, calculations based
on DBP mass loss. The mean values of the estimated porosities were reported in blue, while the
maximum and minimum ones were shown in grey. The number of values considered for the
mean values calculations were provided in the table in grey. ................................................ 115
Figure IV. 13: Films thickness before and after DBP removal..................................... 117
Figure IV. 14: a) Evolution of the disks diameter (initially Ø= 11 mm) for electrodes from
DBP60 and DBP80 and b) comparison of the shrinkage observed for the several formulations
after DBP extraction. For b) electrodes were dried at the last cleaning step under a glass side to
remain flat. ............................................................................................................................. 117
Figure IV. 15: Total porosity (v%) for three disks cut from DBP40, DBP60 and DBP80
films, measured before (blue bars) and after (gray bars) DBP extraction. The orange bars
represent the volume of DBP extracted during the ether leaching step. The green bars represent
the mesoporous contribution to the total volume of extracted films. ..................................... 119
Figure IV. 16: SEM pictures of (a) DBP40, (b) DBP60 and (c) DBP80 films before (left
column) and after (right column) DBP extraction. (Magnification a) 2500x b) 2400x and c)
2500x). .................................................................................................................................... 121
Figure IV. 17: Diameter evolution for disks (initially Ø= 9 mm) cut from extracted films
DBP40 and DBP80 a) initially, b) immersed in ether and c) dried. ......................................... 124
Figure IV. 18: DSC curves of DBP80 before and after DBP extraction carried on under
Argon at 5 K/min from 25 °C to 250 °C. ............................................................................... 125
Figure IV. 19: Discharge curves of the Swagelok cells made using electrodes cut from a)
DBP60 and b) DBP80 films at 50 µA while in TriGDME + 0.5 M LiTFSI, reported in mAh.g-
1electrode and mAh.cm - ²electrode. Each color corresponds to the results obtained for the same cell.
................................................................................................................................................ 126
Figure IV. 20: Discharge curves of the Swagelok cells made using electrodes cut from
films DBP40 at 200 µA while using TriGDME + 0.5 M LiTFSI as the electrolyte reported in a)
mAh.g-1electrode and b) mAh.cm-²electrode. .................................................................................. 127
Figure IV. 21: SEM pictures taken from electrode DBP60 previously discharged until 2 V
at 50 µA in TriGDME + 0.5 M LiTFSI. The corresponding capacities values are
2372 mAh/gelectrode and 12 mAh/cm²electrode. ........................................................................... 128
Figure IV. 22: a) XRD diagram of a DBP60 electrode not discharge (bleu) and XRD
diagram of a DBP60 discharge electrode compared to b) XRD diagram of crystalline Li2O2.
................................................................................................................................................ 129
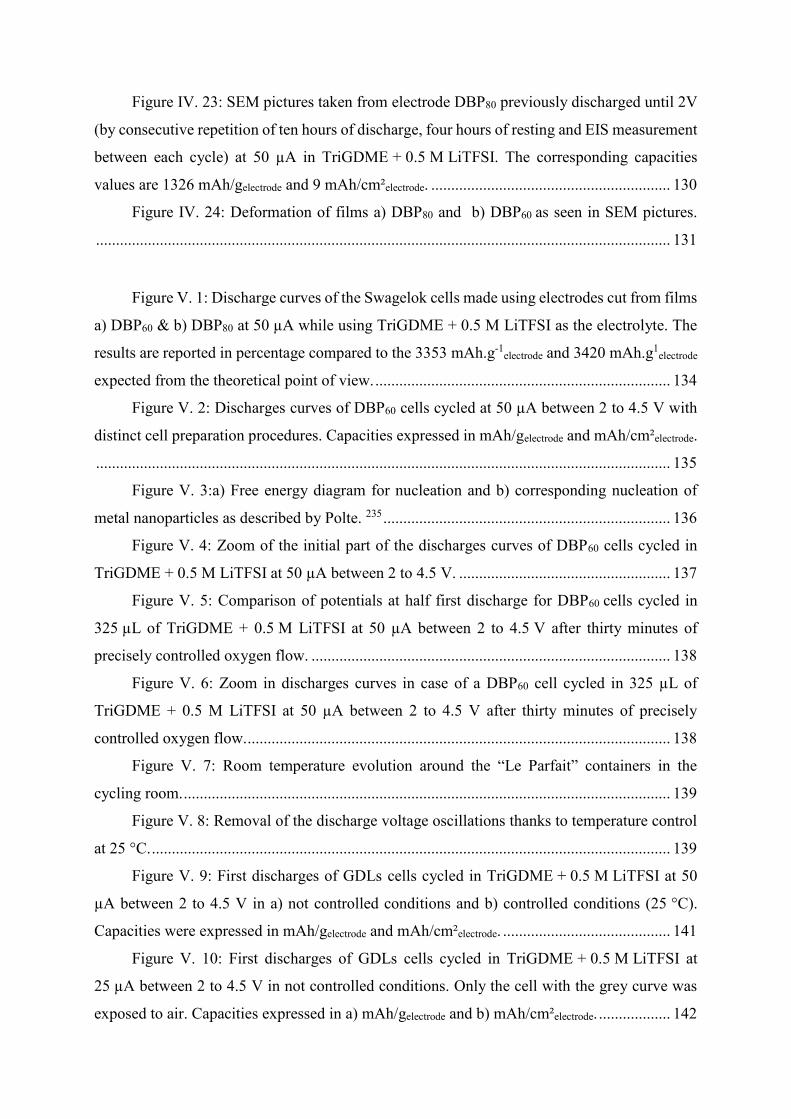
Figure IV. 23: SEM pictures taken from electrode DBP80 previously discharged until 2V
(by consecutive repetition of ten hours of discharge, four hours of resting and EIS measurement
between each cycle) at 50 µA in TriGDME + 0.5 M LiTFSI. The corresponding capacities
values are 1326 mAh/gelectrode and 9 mAh/cm²electrode. ............................................................ 130
Figure IV. 24: Deformation of films a) DBP80 and b) DBP60 as seen in SEM pictures.
................................................................................................................................................ 131
Figure V. 1: Discharge curves of the Swagelok cells made using electrodes cut from films
a) DBP60 & b) DBP80 at 50 µA while using TriGDME + 0.5 M LiTFSI as the electrolyte. The
results are reported in percentage compared to the 3353 mAh.g-1electrode and 3420 mAh.g1
electrode
expected from the theoretical point of view. .......................................................................... 134
Figure V. 2: Discharges curves of DBP60 cells cycled at 50 µA between 2 to 4.5 V with
distinct cell preparation procedures. Capacities expressed in mAh/gelectrode and mAh/cm²electrode.
................................................................................................................................................ 135
Figure V. 3:a) Free energy diagram for nucleation and b) corresponding nucleation of
metal nanoparticles as described by Polte. 235 ........................................................................ 136
Figure V. 4: Zoom of the initial part of the discharges curves of DBP60 cells cycled in
TriGDME + 0.5 M LiTFSI at 50 µA between 2 to 4.5 V. ..................................................... 137
Figure V. 5: Comparison of potentials at half first discharge for DBP60 cells cycled in
325 µL of TriGDME + 0.5 M LiTFSI at 50 µA between 2 to 4.5 V after thirty minutes of
precisely controlled oxygen flow. .......................................................................................... 138
Figure V. 6: Zoom in discharges curves in case of a DBP60 cell cycled in 325 µL of
TriGDME + 0.5 M LiTFSI at 50 µA between 2 to 4.5 V after thirty minutes of precisely
controlled oxygen flow. .......................................................................................................... 138
Figure V. 7: Room temperature evolution around the “Le Parfait” containers in the
cycling room. .......................................................................................................................... 139
Figure V. 8: Removal of the discharge voltage oscillations thanks to temperature control
at 25 °C. .................................................................................................................................. 139
Figure V. 9: First discharges of GDLs cells cycled in TriGDME + 0.5 M LiTFSI at 50
µA between 2 to 4.5 V in a) not controlled conditions and b) controlled conditions (25 °C).
Capacities were expressed in mAh/gelectrode and mAh/cm²electrode. .......................................... 141
Figure V. 10: First discharges of GDLs cells cycled in TriGDME + 0.5 M LiTFSI at
25 µA between 2 to 4.5 V in not controlled conditions. Only the cell with the grey curve was
exposed to air. Capacities expressed in a) mAh/gelectrode and b) mAh/cm²electrode. .................. 142

Figure V. 11: Discharge curves of the GDLs cells at 50 µA in controlled conditions while
using TriGDME + 0.5 M LiTFSI as the electrolyte. The results are reported in percentage
compared to the 3402 mAh.g-1electrode expected from the theoretical point of view. .............. 142
Figure V. 12: SEM pictures of a) GDL electrode and TEM picture of b) Ketjen black
powder. (Ketjen Black TEM results courtesy of Pr. D. Larcher). .......................................... 143
Figure V. 13: First discharges of GDLs cells cycled at 25 °C in
TriGDME + 0.5 M LiTFSI at 50 µA between 2 to 4.5 V Capacities expressed in a) mAh/gelectrode
and b) mAh/cm²electrode. ........................................................................................................... 144
Figure V. 14: First discharges of GDLs cells cycled between 2 to 4.5 V at different
temperatures and currents. Only for 25 µA and 25 °C the electrolyte was not dried, elsewise all
the cells contained dried TriGDME + 0.5 M LiTFSI. ............................................................ 147
Figure V. 15: Evolution of the discharges capacities mean value with temperature and
discharge currents. .................................................................................................................. 148
Figure V. 16: Evolution of the standard deviation over mean capacity ratio with
temperature and discharge currents. ....................................................................................... 148
Figure V. 17: SEM picture of a toroidal particle formed on top of GDL discharge in cell
containing TriGDME+ 1M LiNO3. ........................................................................................ 150
Figure V. 18: SEM picture of red blood cell with clear toroidal shape. Image taken from
Tamara et al. work.246 ............................................................................................................. 150
Figure V. 19: Schematic figured proposed by Aurbach et al. to highlight the several
electrolyte properties impacting the surface and solution growth mechanisms in LABs and thus
the film or toroid formation. 81 ............................................................................................... 151
Figure V. 20: Sum up of the several morphologies of LABs discharge products
encountered across the literature.77,171,174,179,243,247 ................................................................. 152
Figure V. 21: SEM picture of a glass fiber from separator deposited on top of a GDL
fiber. ....................................................................................................................................... 153
Figure V. 22: Schematic of the test implemented to define which part of the cell was
responsible for capacity fading cathode versus separator/electrolyte/lithium. ...................... 154
Figure V. 23: Sum up of the several morphologies of LABs final discharge product
observed after cycling in TriGDME + 0.5 M LiTFSI at different temperatures and currents.
................................................................................................................................................ 154
Figure V. 24: SEM pictures of different discharge product morphologies deposited on the
air side of cathodes operated at 27.5 °C and 25 µA (a,b) and at 30 °C and 50 µA (c,d). ...... 155
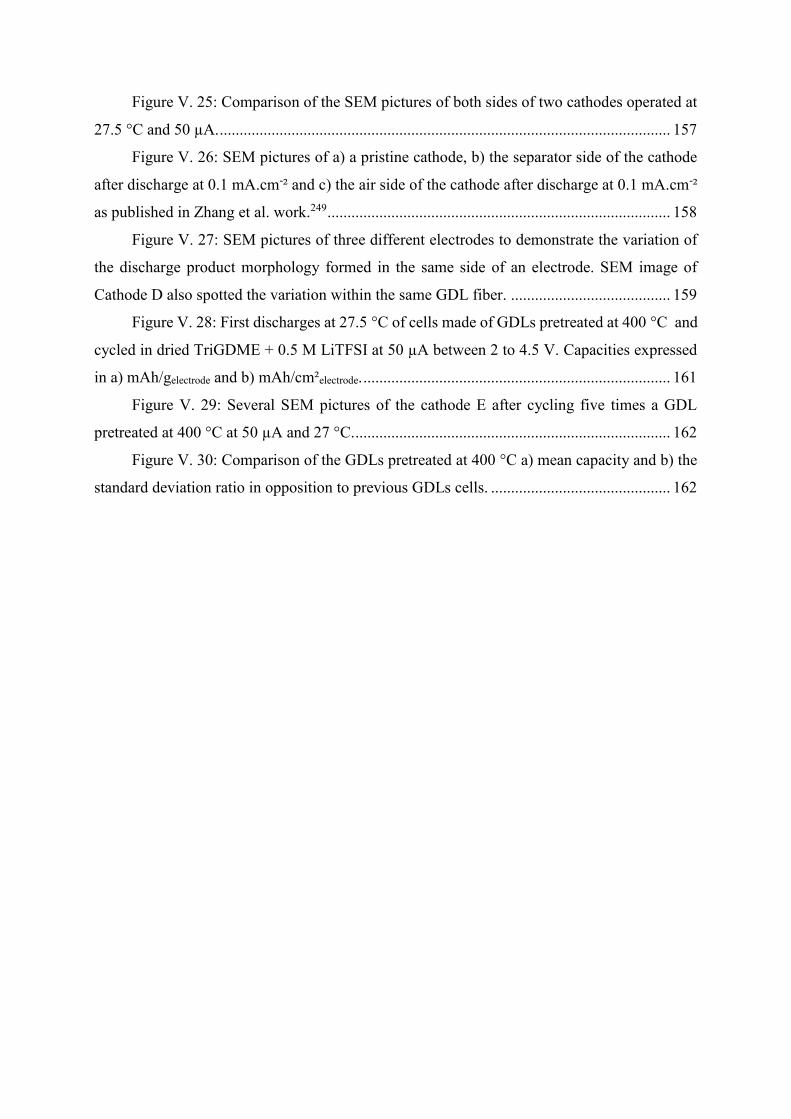
Figure V. 25: Comparison of the SEM pictures of both sides of two cathodes operated at
27.5 °C and 50 µA. ................................................................................................................. 157
Figure V. 26: SEM pictures of a) a pristine cathode, b) the separator side of the cathode
after discharge at 0.1 mA.cm-² and c) the air side of the cathode after discharge at 0.1 mA.cm-²
as published in Zhang et al. work.249 ...................................................................................... 158
Figure V. 27: SEM pictures of three different electrodes to demonstrate the variation of
the discharge product morphology formed in the same side of an electrode. SEM image of
Cathode D also spotted the variation within the same GDL fiber. ........................................ 159
Figure V. 28: First discharges at 27.5 °C of cells made of GDLs pretreated at 400 °C and
cycled in dried TriGDME + 0.5 M LiTFSI at 50 µA between 2 to 4.5 V. Capacities expressed
in a) mAh/gelectrode and b) mAh/cm²electrode. ............................................................................. 161
Figure V. 29: Several SEM pictures of the cathode E after cycling five times a GDL
pretreated at 400 °C at 50 µA and 27 °C. ............................................................................... 162
Figure V. 30: Comparison of the GDLs pretreated at 400 °C a) mean capacity and b) the
standard deviation ratio in opposition to previous GDLs cells. ............................................. 162

Table List
Table I. 1: Sum up of the most common battery technologies with detailed properties and
pros and cons. ............................................................................................................................. 9
Table I. 2: List of the different redox-mediators and linked observations found by Park et
al in literature. 110 ..................................................................................................................... 22
Table I. 3: Parameters selected for experiments simulating aircraft application of LABs.
.................................................................................................................................................. 31
Table II. 1: Formulations used to study porosity created along Bellcore process. ......... 61
Table II. 2: Density estimations by pycnometry of the powders used for flexible electrode
formulation. .............................................................................................................................. 69
Table II. 3: SSA estimations of the powders used for flexible electrode fabication. ..... 70
Table III. 1: List of the parameters used in the model. ................................................... 90
Table IV. 1: Sum up of the formulations produced at lab scale. .................................. 104
Table IV. 2: Textural characterization of DBP40, DBP60 and DBP80 films before and after
DBP leaching. ......................................................................................................................... 118
Table IV. 3: Evolutions in weight loss, porous volume and BET specific surface area
(SSA) for DBP60 along DBP extraction steps. ....................................................................... 121


Table of Contents
General Introduction ...................................................................................................... 1
Chapter I: State-of-the-art ............................................................................................. 7
I.1. Evolution of the battery technologies ..................................................................... 8
I.2. Definition of the case study: LABs ...................................................................... 14
I.2.a. LABs: worldwide research status ...................................................................... 14
I.2.b. LABs: working principle ................................................................................... 16
I.2.c. The cathode: a key component for LABs .......................................................... 26
I.2.d. Gap between flight conditions and lab conditions............................................. 29
Aircraft conditions .................................................................................................. 29
Lab testing conditions ............................................................................................. 32
Current density ............................................................................................................... 32
Relative humidity and air composition .......................................................................... 35
Temperature ................................................................................................................... 41
Pressure ......................................................................................................................... 43
I.2.e. How to define LABs capacity? .......................................................................... 48
I.3. Thesis objectives .................................................................................................. 50
Chapter II: Experimental Procedures ........................................................................ 51
II.1. Electrode fabrication process .............................................................................. 52
II.1.a. Electrode materials ........................................................................................... 52
Carbons ................................................................................................................... 52
Binders .................................................................................................................... 53
Solvent for slurry preparation ................................................................................. 53
Porogen agent ......................................................................................................... 54
II.1.b. Dip-coated electrodes fabrication process........................................................ 54
II.1.c. Porous flexible electrodes fabrication process ................................................. 59
II.1.d. Comparison of the two electrodes fabrication processes ................................. 61
II.2. Battery assembling .............................................................................................. 63
II.2.a. Electrolyte preparation ..................................................................................... 63
II.2.b. Swagelok cell assembling ................................................................................ 63
II.3. Experimental set-up for controlled LABs atmosphere ........................................ 66
II.3.a. “Le Parfait” container ....................................................................................... 66
II.3.b. Gas flow system ............................................................................................... 67
II.4. Characterization techniques ................................................................................ 69
II.4.a. Electrode characterization ................................................................................ 69
Pycnometry measurements ..................................................................................... 69
Nitrogen adsorption measurements ........................................................................ 69
DSC ......................................................................................................................... 70
II.4.b. Electrochemical characterization ..................................................................... 71
Galvanostatic cycling .............................................................................................. 71
Polarization measurements ..................................................................................... 72
II.4.c. System characterization .................................................................................... 73
SEM imaging & EDX Spectrometry ...................................................................... 73
IR spectroscopy ....................................................................................................... 74
XRD ........................................................................................................................ 75
Karl Fisher (HF) ...................................................................................................... 75
II.4.d. Continuum modeling ........................................................................................ 76
Chapter III: Theoretical study of bi-porous electrodes ............................................ 79
III.1. Concept of porous electrodes with enhanced diffusion ..................................... 80
III.2. Theoretical study ................................................................................................ 83
III.2.a. Model description ........................................................................................... 83
III.2.b. Discretization and boundary conditions.......................................................... 87
III.2.c. Parametrization ............................................................................................... 89
III.2.d. The reference case........................................................................................... 90

III.2.e. Electrode formulation and design impacts ...................................................... 92
Effect of the electrode thickness ............................................................................. 92
Macro-porous domain and carbon ratios combined effects .................................... 94
Effect of carbon surface .......................................................................................... 97
Chapter IV: Experimental study of bi-porous electrodes ....................................... 103
IV.1. Dip-coated electrode: a first attempt toward bi-porous electrodes .................. 104
IV.1.a. Formulations tested ....................................................................................... 104
IV.1.b. Preliminary tests ........................................................................................... 104
IV.2. Electrolyte modification .................................................................................. 109
IV.3. Development of highly porous and flexible electrodes for LABs ................... 113
IV.3.a. Efficiency of DBP removal ........................................................................... 113
IV.3.b. Impact of DBP removal on porosity creation ............................................... 115
First evaluation of the films porosity based on DBP mass loss ............................ 115
Volume modification along DBP extraction......................................................... 116
Assessment of the films porosities ........................................................................ 118
IV.3.c. Behavior of the films in the electrolyte solvent ............................................ 123
IV.3.d. Thermal behavior of the films at high temperature ...................................... 124
IV.3.e. Performances of the flexible porous carbon electrodes ................................ 125
IV.3.f. Discharge product formation ......................................................................... 127
IV.3.g. Merging of theory with experiments ............................................................ 131
Chapter V: Reproducibility issues and sensitivity to operating conditions .......... 133
V.1. Lab reproducibility issues ................................................................................. 134
V.1.a Description of the reproducibility issues ......................................................... 134
V.1.b. Attempts to reduce the uncertainty ................................................................ 134
Enhanced control of the electrolyte addition step and oxygen supply ................. 134
Observations of the discharge curves characteristics............................................ 136
Enhanced control of the operating temperature and electrode mechanical stability
........................................................................................................................................ 140
Enhanced control of water contamination ............................................................ 143
V.2. LABs sensitivity toward operating conditions .................................................. 146
V.2.a. Temperature and current effects on discharge capacity ................................. 146
V.2.b. Temperature and current effects on discharge product morphology ............. 149
Discharge product morphologies reported in literature ........................................ 149
Discharge product morphologies observed in several operation conditions ........ 152
V.3. LABs high sensitivity toward electrode surface ............................................... 161
V.4. Conclusions on LABs reproducibility issues .................................................... 164
Chapter VI: General conclusions and perspectives ................................................. 165
Annex: Model contamination .................................................................................... 193
Annex: Air Flushing ................................................................................................... 201
Annex: French Description ........................................................................................ 203

1
GENERAL INTRODUCTION
General Introduction
Worldwide connectivity is required to sustain the globalization of our societies. To
promote the mobility of people all around the world, with a reduced commuting time, a strong
aeronautical network has been settled. Still, the air traffic is always under improvement as it is
a key parameter of societies global development, as recognized by the NASA and ACARE.1,2
Notwithstanding a positive impact on society reinforcement, air transport growth comes
along with stressed environmental issues such as pollution and noise emissions. ACARE report
defines two targets for 2050 in order to solve such drawbacks. The first given directive is to
reduce noise and pollution thanks to new technological and design solutions. The second one,
with the aim to reach long term sustainability, implies to move from current kerosene
consumption toward the use of sustainable alternative fuels.2
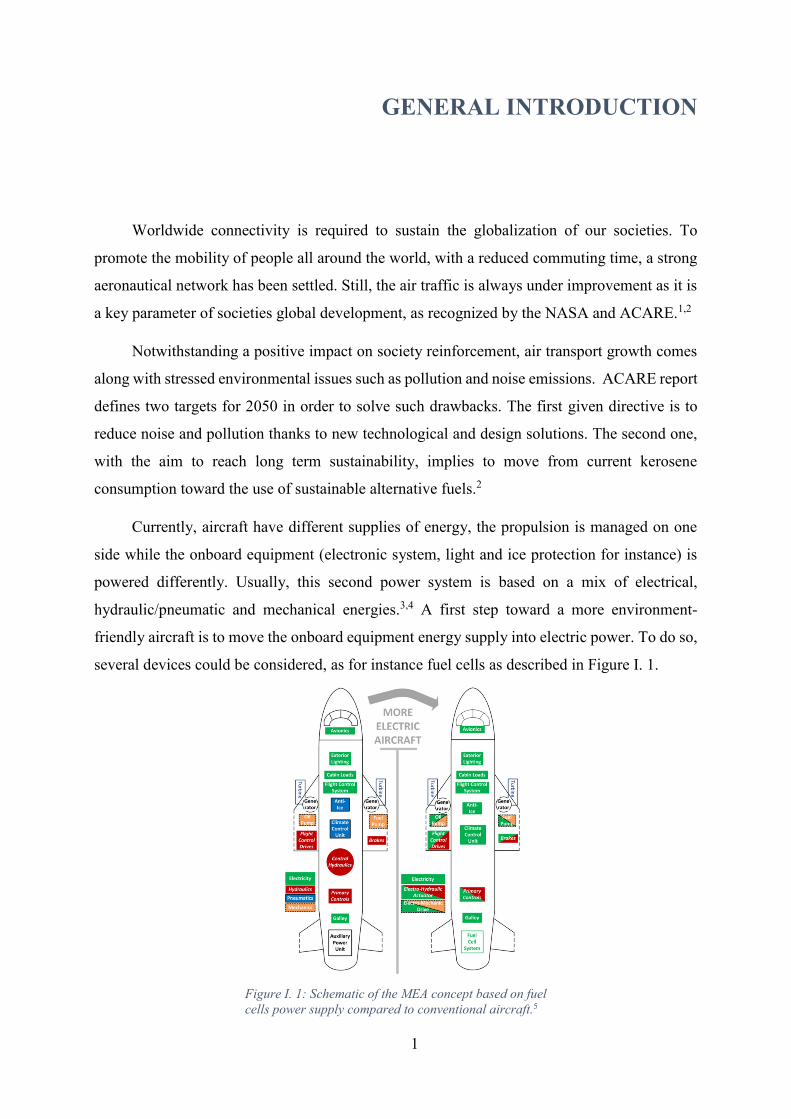
Currently, aircraft have different supplies of energy, the propulsion is managed on one
side while the onboard equipment (electronic system, light and ice protection for instance) is
powered differently. Usually, this second power system is based on a mix of electrical,
hydraulic/pneumatic and mechanical energies.3,4 A first step toward a more environment-
friendly aircraft is to move the onboard equipment energy supply into electric power. To do so,
several devices could be considered, as for instance fuel cells as described in Figure I. 1.
Figure I. 1: Schematic of the MEA concept based on fuel
cells power supply compared to conventional aircraft.5

2
This aircraft development concept is known as More Electric Aircraft (MEA) and has
been already studied since the 1980s.3 In addition to reduced environmental impact, such hybrid
systems could lead to a reduction up to 80 % of the ticket price according to Zunum Aero.6
To achieve long term sustainability, aircraft manufacturers examine development of
aircrafts with electric propulsion, leading to the creation of fully electrical aircrafts. The
Slovenian company Pipistrel, was pioneer as it succeeded to build the first four-seat electric
aircraft and won the “Nasa Green Flight Challenge” in 2011 with their Taurus G4. To achieve
an energy efficiency of 200 Passengers-Miles-per-Gallon, the aircraft was designed with a twin-
fuselage and one propeller concept. Thereby, the Taurus G4 was able to host the three battery
packs (88 LiPo cells in each pack) necessary to reach the energy target, as underlined in Figure
I. 2.7
Figure I. 2: Taurus G4 conception schematic with battery
packs locations spotted with numbers 1, 2 and 3.7
Moving from traditional aircraft powered by kerosene consumption to fully electric
airplanes is tricky. Indeed, the energy storage devices taken onboard should be able to compete
with the high gravimetric energy of kerosene (13000 Wh.kg-1)8. To welcome the new power
system, complete new aircraft concepts need to be implemented, as the twin-fuselage of the
Taurus G47 or the multi-propeller design of the Nasa aircraft LEAPTech, which is still under
development (Figure I. 3).9,10
Figure I. 3: LEAPTech aircraft first conceptualization.9
3
The company Roland Berger made an inventory of the programs focusing on electrically-
propelled airplanes and reached a number of seventy different projects11 which underlines the
diversity of the designs examined.
As previously mentioned, 100 % electrical aircraft concept is more demanding than MEA
as the airplanes designs need to be revised from the scratch9 while MEAs are less regarding on
aircraft structure modifications. The ease of implementation, which could lead to faster
validation and certification of the new MEA systems, explains the infatuation of aircraft
manufacturers for MEA.
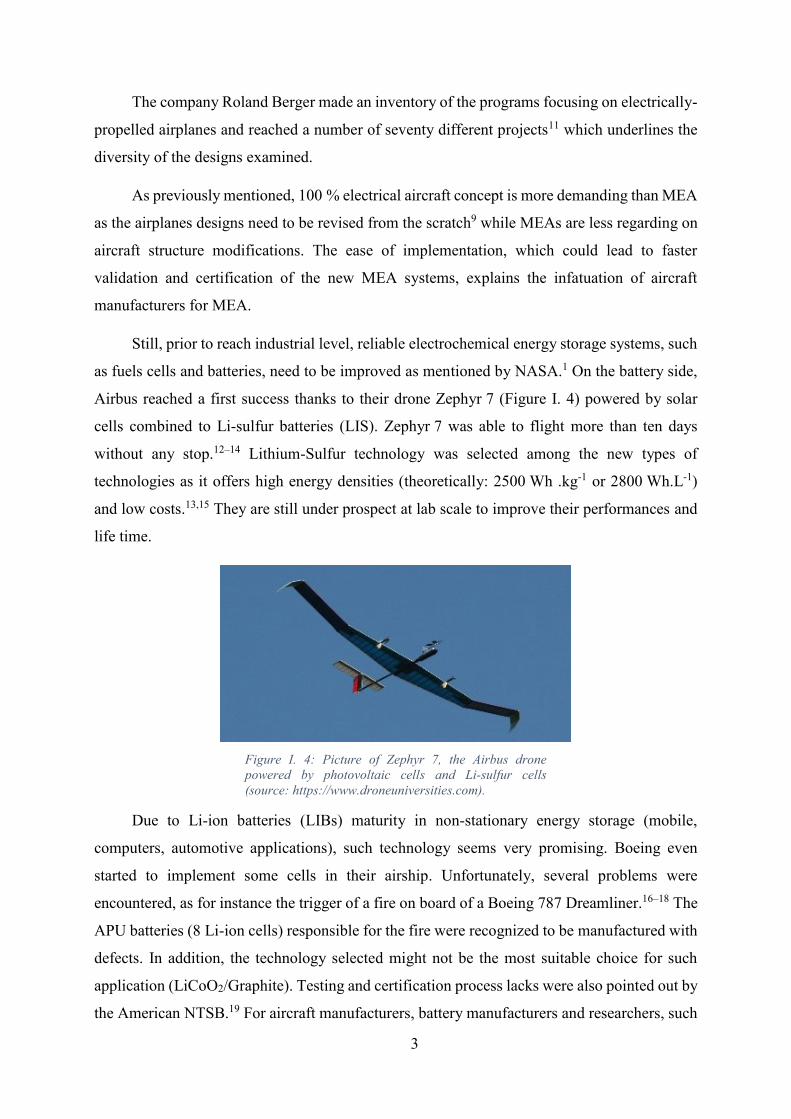
Still, prior to reach industrial level, reliable electrochemical energy storage systems, such
as fuels cells and batteries, need to be improved as mentioned by NASA.1 On the battery side,
Airbus reached a first success thanks to their drone Zephyr 7 (Figure I. 4) powered by solar
cells combined to Li-sulfur batteries (LIS). Zephyr 7 was able to flight more than ten days
without any stop.12–14 Lithium-Sulfur technology was selected among the new types of
technologies as it offers high energy densities (theoretically: 2500 Wh .kg-1 or 2800 Wh.L-1)
and low costs.13,15 They are still under prospect at lab scale to improve their performances and
life time.
Figure I. 4: Picture of Zephyr 7, the Airbus drone
powered by photovoltaic cells and Li-sulfur cells
(source: https://www.droneuniversities.com).
Due to Li-ion batteries (LIBs) maturity in non-stationary energy storage (mobile,
computers, automotive applications), such technology seems very promising. Boeing even
started to implement some cells in their airship. Unfortunately, several problems were
encountered, as for instance the trigger of a fire on board of a Boeing 787 Dreamliner.16–18 The
APU batteries (8 Li-ion cells) responsible for the fire were recognized to be manufactured with
defects. In addition, the technology selected might not be the most suitable choice for such
application (LiCoO2/Graphite). Testing and certification process lacks were also pointed out by
the American NTSB.19 For aircraft manufacturers, battery manufacturers and researchers, such
4
incidents underlined the necessity to develop rigorous batteries specifications and testing
procedures to be able to certify the well-functioning of the cells in such demanding conditions.
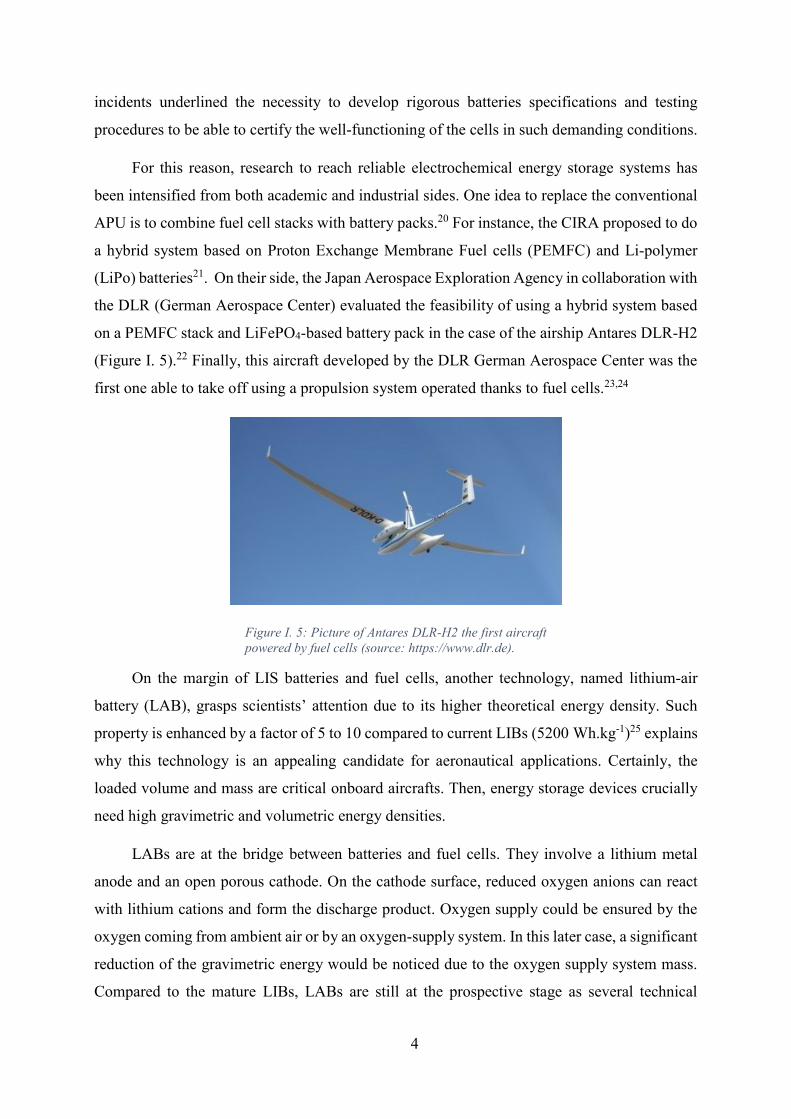
For this reason, research to reach reliable electrochemical energy storage systems has
been intensified from both academic and industrial sides. One idea to replace the conventional
APU is to combine fuel cell stacks with battery packs.20 For instance, the CIRA proposed to do
a hybrid system based on Proton Exchange Membrane Fuel cells (PEMFC) and Li-polymer
(LiPo) batteries21. On their side, the Japan Aerospace Exploration Agency in collaboration with
the DLR (German Aerospace Center) evaluated the feasibility of using a hybrid system based
on a PEMFC stack and LiFePO4-based battery pack in the case of the airship Antares DLR-H2
(Figure I. 5).22 Finally, this aircraft developed by the DLR German Aerospace Center was the
first one able to take off using a propulsion system operated thanks to fuel cells.23,24
Figure I. 5: Picture of Antares DLR-H2 the first aircraft
powered by fuel cells (source: https://www.dlr.de).
On the margin of LIS batteries and fuel cells, another technology, named lithium-air
battery (LAB), grasps scientists’ attention due to its higher theoretical energy density. Such
property is enhanced by a factor of 5 to 10 compared to current LIBs (5200 Wh.kg-1)25 explains
why this technology is an appealing candidate for aeronautical applications. Certainly, the
loaded volume and mass are critical onboard aircrafts. Then, energy storage devices crucially
need high gravimetric and volumetric energy densities.
LABs are at the bridge between batteries and fuel cells. They involve a lithium metal
anode and an open porous cathode. On the cathode surface, reduced oxygen anions can react
with lithium cations and form the discharge product. Oxygen supply could be ensured by the
oxygen coming from ambient air or by an oxygen-supply system. In this later case, a significant
reduction of the gravimetric energy would be noticed due to the oxygen supply system mass.
Compared to the mature LIBs, LABs are still at the prospective stage as several technical

5
limitations still need to be unlocked to achieve the expectations. First, optimization of the
cathode texture is required to increase practical energy while lowering the limiting phenomena
such as surface passivation and pore clogging. Pore clogging is due to the formation of products
inside the electrode porosity limiting further progress of the reactions as lithium and oxygen
diffusion is impeded.26 Secondly, most of the studies currently overlooks the impact of
atmospheric conditions as most of the studies are carried out at 25 °C and atmospheric pressure.
So, LABs behaviors in aeronautical atmospheric conditions should be scrutinized to evaluate
the feasibility of using LABs in aircrafts.
This study was then launched, by IRT Saint-Exupéry, to understand and estimate the gap
between theoretical promises of LABs and the requirements linked to their potential use in
MEA. IRT Saint-Exupéry is an Institute of Technology dedicated to ease and speed up the
transfer of state-of-the-art technologies from academia to industry. Thanks to a 50 - 50 public-
private funding, the Celia Project was launched by IRT Saint-Exupéry in 2015. As part of the
Celia Project, this study on LABs gathers both industrial partners, Zodiac Aerospace, Safran
Tech and Airbus, as well as an academic laboratory, the LRCS. The experimental and
theoretical studies of this thesis, entitled “Toward lithium-air batteries for aircraft application:
a combined experimental/modeling study”, were conducted at the LRCS under the supervision
of Prof. Alejandro A. Franco.

CHAPTER I: STATE-OF-THE-ART
Chapter I: State-of-the-art
Contents
xxxxxxxxxxxxxxxxxxxxxxxxxxxxxxxxxxxxxxxxxxxxxxxxxxxxxxxxxxxxxXxxxxxX
I.1. Evolution of the battery technologies………………………………………. 8
I.2. Definition of the case study: LABs…………………………………………... 14
I.2.a. LABs: worldwide research status…………………………………... 14
I.2.b. LABs: working principle…………………………………………… 16
I.2.c. The cathode: a key component for LABs…………………………. 26
I.2.d. Gap between flight conditions and lab conditions…………………. 29
I.2.e. How to define LABs capacity?........................................................... 48
I.3. Thesis objectives……………………………………………………………... 50
xxxxxxxxxxxxxxxxxxxxxxxxxxxxxxxxxxxxxxxxxxxxxxxxxxxxxxxxxxxxxXxxxxxX
8
I.1. Evolution of the battery technologies
The history of primary and secondary batteries development is made of successive
discoveries. It is generally recognized that Volta largely spread the concept of electrochemical
cell thanks to his pile. Later in 1866, another primary battery was then unveiled to the public
by Leclenché.27 A major historical breakthrough, was the invention by Planté in 1860 of the
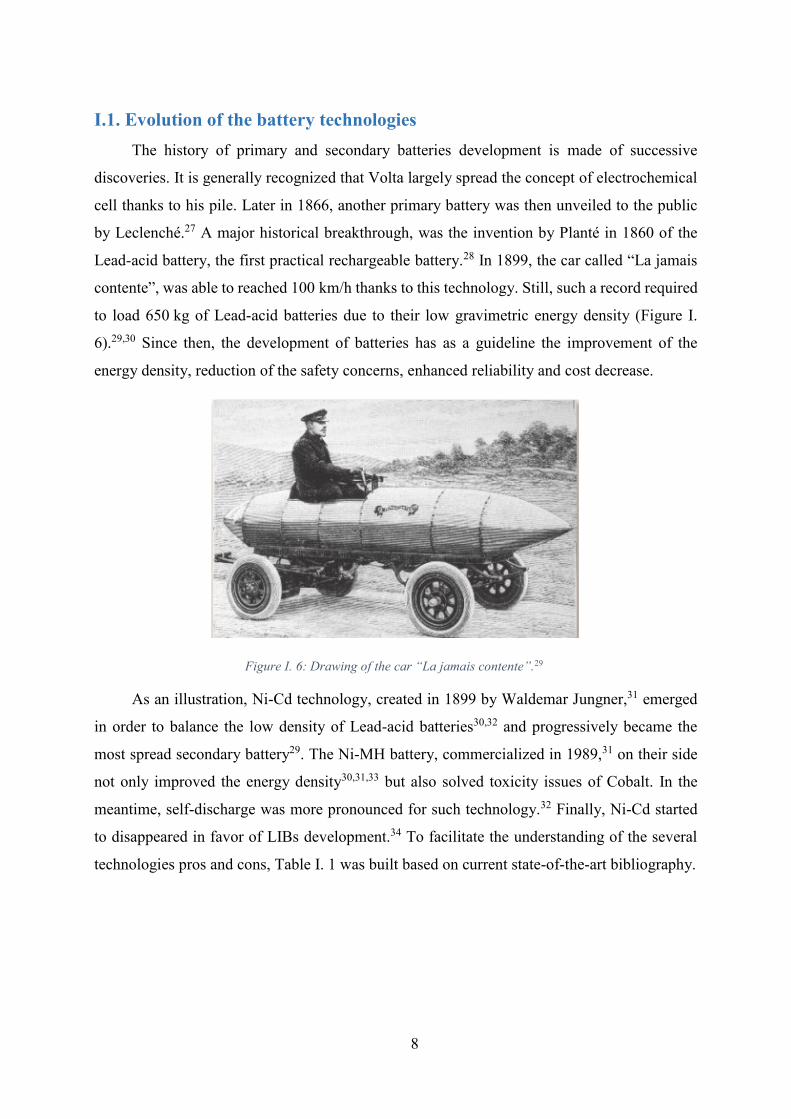
Lead-acid battery, the first practical rechargeable battery.28 In 1899, the car called “La jamais
contente”, was able to reached 100 km/h thanks to this technology. Still, such a record required
to load 650 kg of Lead-acid batteries due to their low gravimetric energy density (Figure I.
6).29,30 Since then, the development of batteries has as a guideline the improvement of the
energy density, reduction of the safety concerns, enhanced reliability and cost decrease.
Figure I. 6: Drawing of the car “La jamais contente”.29
As an illustration, Ni-Cd technology, created in 1899 by Waldemar Jungner,31 emerged
in order to balance the low density of Lead-acid batteries30,32 and progressively became the
most spread secondary battery29. The Ni-MH battery, commercialized in 1989,31 on their side
not only improved the energy density30,31,33 but also solved toxicity issues of Cobalt. In the
meantime, self-discharge was more pronounced for such technology.32 Finally, Ni-Cd started
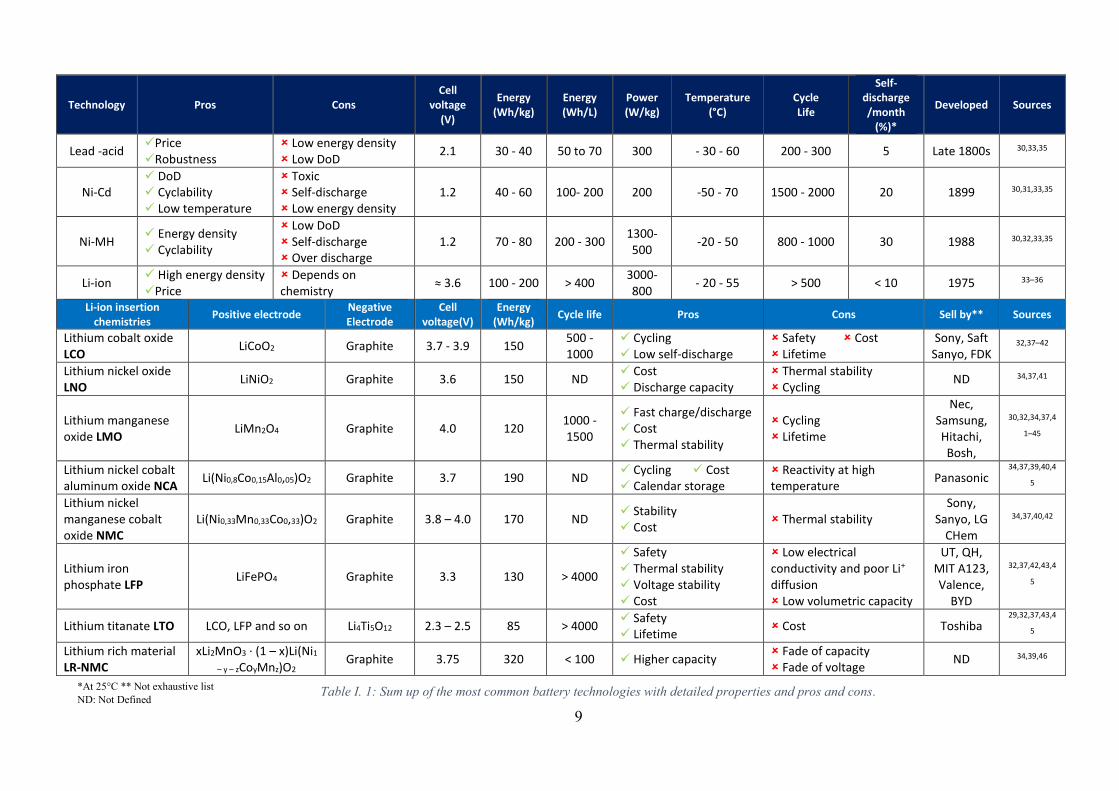
to disappeared in favor of LIBs development.34 To facilitate the understanding of the several
technologies pros and cons, Table I. 1 was built based on current state-of-the-art bibliography.
9
Technology Pros Cons Cell
voltage (V)
Energy (Wh/kg)
Energy (Wh/L)
Power (W/kg)
Temperature (°C)
Cycle Life
Self-discharge /month
(%)*
Developed Sources
Lead -acid Price Robustness
Low energy density Low DoD
2.1 30 - 40 50 to 70 300 - 30 - 60 200 - 300 5 Late 1800s 30,33,35
Ni-Cd DoD Cyclability Low temperature
Toxic Self-discharge Low energy density
1.2 40 - 60 100- 200 200 -50 - 70 1500 - 2000 20 1899 30,31,33,35
Ni-MH Energy density Cyclability
Low DoD Self-discharge Over discharge
1.2 70 - 80 200 - 300 1300-500
-20 - 50 800 - 1000 30 1988 30,32,33,35
Li-ion High energy density Price
Depends on chemistry
≈ 3.6 100 - 200 > 400 3000-800
- 20 - 55 > 500 < 10 1975 33–36
Li-ion insertion chemistries
Positive electrode Negative Electrode
Cell voltage(V)
Energy (Wh/kg)
Cycle life Pros Cons Sell by** Sources
Lithium cobalt oxide LCO
LiCoO2 Graphite 3.7 - 3.9 150 500 - 1000
Cycling Low self-discharge
Safety Cost Lifetime
Sony, Saft Sanyo, FDK
32,37–42
Lithium nickel oxide LNO
LiNiO2 Graphite 3.6 150 ND Cost Discharge capacity
Thermal stability Cycling
ND 34,37,41
Lithium manganese oxide LMO
LiMn2O4 Graphite 4.0 120 1000 - 1500
Fast charge/discharge Cost Thermal stability
Cycling Lifetime
Nec, Samsung, Hitachi, Bosh,
30,32,34,37,4
1–45
Lithium nickel cobalt aluminum oxide NCA
Li(Ni0,8Co0,15Al0,05)O2 Graphite 3.7 190 ND Cycling Cost Calendar storage
Reactivity at high temperature
Panasonic 34,37,39,40,4
5
Lithium nickel manganese cobalt oxide NMC
Li(Ni0,33Mn0,33Co0,33)O2 Graphite 3.8 – 4.0 170 ND Stability Cost
Thermal stability Sony,
Sanyo, LG CHem
34,37,40,42
Lithium iron phosphate LFP
LiFePO4 Graphite 3.3 130 > 4000
Safety Thermal stability Voltage stability Cost
Low electrical conductivity and poor Li+ diffusion Low volumetric capacity
UT, QH, MIT A123, Valence,
BYD
32,37,42,43,4
5
Lithium titanate LTO LCO, LFP and so on Li4Ti5O12 2.3 – 2.5 85 > 4000 Safety Lifetime
Cost Toshiba 29,32,37,43,4
5
Lithium rich material LR-NMC
xLi2MnO3 · (1 – x)Li(Ni1
– y – zCoyMnz)O2 Graphite 3.75 320 < 100 Higher capacity
Fade of capacity Fade of voltage
ND 34,39,46
Table I. 1: Sum up of the most common battery technologies with detailed properties and pros and cons.*At 25°C ** Not exhaustive list
ND: Not Defined

10
The advent of LIBs relies on lithium intrinsic properties. First of all, lithium is
characterized by a low molecular weight and a low standard potential.34 Using lithium permitted
to design batteries with high gravimetric and volumetric energy densities and higher voltage.
Moreover, it has been demonstrated by Whittingham in the 70s that lithium ion can be
intercalated into various layered transition metal dichalcogenides36 opening the road toward
LIB development. Progressively, LIBs took the lead on portable device energy supply,
previously powered by Ni-MH batteries.47 Then, LIBs entered also in the market of hybrid
electric vehicle (HEV) and electric vehicle (EV).31,48 The battery market evolution since 1990
to 2015, underlined the overwhelming growth of LIBs market at the cost of previous
technologies (Figure I. 7).49
Figure I. 7: Worldwide battery market from 1990 to
2015.49
In 2015, the LIB market reached 16,7 B$ which corresponds to 5600 M cells. Figure I. 8
highlights the major manufacturers volume production as well as their corresponding share
market.48 As shown, a large volume production does not imply a significant part of share values.
This can be explained by the variety of chemistries and applications gathered by LIBs market
(competition between some niche market and mass production).
11
Figure I. 8: LIBs worldwide market in volume (a) and in
market share (b). (Values from 2015).48
LiCoO2 versus hard carbon, initially developed by Goodenough in 1980,34 was one of
the first chemistry of LIB commercialized (Sony 1991).31 Since then, various technologies have
been developed in an attempt to increase the energy density and to solve issues, such as thermal
stability or toxicity depending on the selected chemistries. The main chemistry based on LCO,
LNO, LMO, NMC, NCA, LFP or LR-NMC cathodes are listed and described in Table 1. The
Li-ion cells are sold according three possible designs, depending on the manufacturing process
(Figure I. 9). Prismatic and cylindrical cells are made with a roll-up of positive electrode,
separator and negative electrode while pouch cells are made of a stack of the different layers.
Figure I. 9: Schematic of the different industrial cells
configurations.38
No matter which configuration is considered, manufacturing the cell results in a decrease
of the energy density along the upscaling level as underlined in Figure I. 10.31 Indeed, at lab
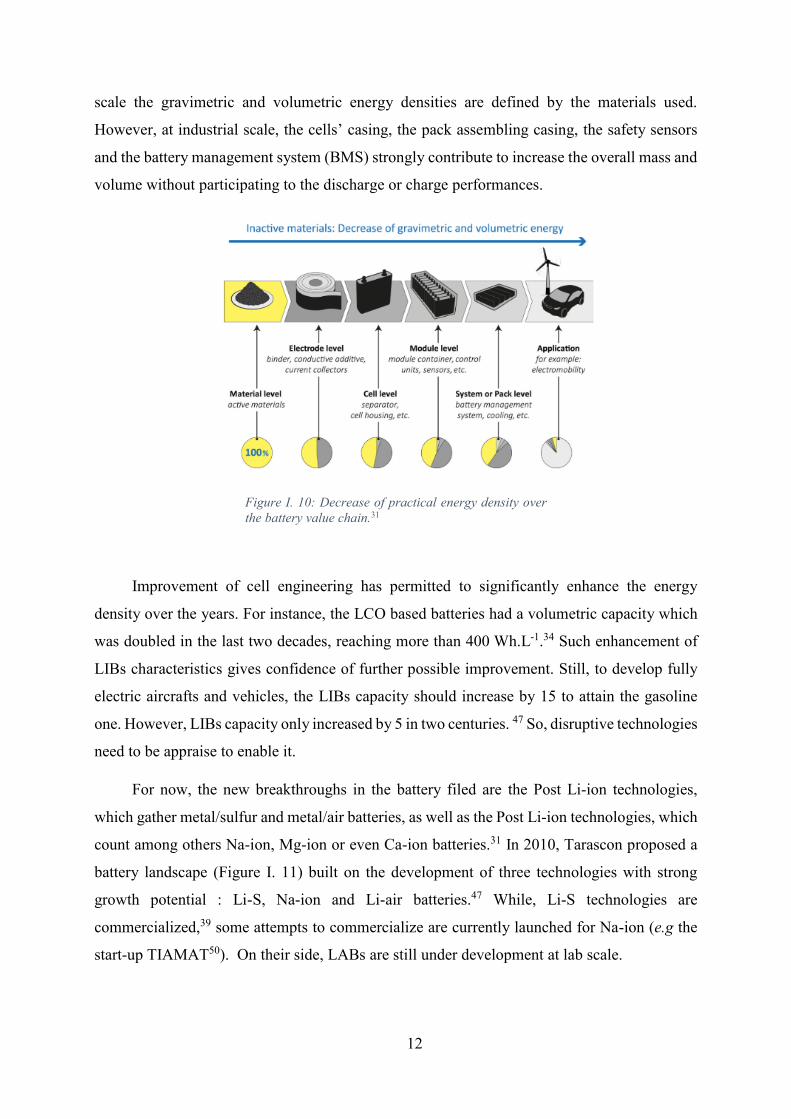
12
scale the gravimetric and volumetric energy densities are defined by the materials used.
However, at industrial scale, the cells’ casing, the pack assembling casing, the safety sensors
and the battery management system (BMS) strongly contribute to increase the overall mass and
volume without participating to the discharge or charge performances.
Figure I. 10: Decrease of practical energy density over
the battery value chain.31
Improvement of cell engineering has permitted to significantly enhance the energy
density over the years. For instance, the LCO based batteries had a volumetric capacity which
was doubled in the last two decades, reaching more than 400 Wh.L-1.34 Such enhancement of
LIBs characteristics gives confidence of further possible improvement. Still, to develop fully
electric aircrafts and vehicles, the LIBs capacity should increase by 15 to attain the gasoline
one. However, LIBs capacity only increased by 5 in two centuries. 47 So, disruptive technologies
need to be appraise to enable it.
For now, the new breakthroughs in the battery filed are the Post Li-ion technologies,
which gather metal/sulfur and metal/air batteries, as well as the Post Li-ion technologies, which
count among others Na-ion, Mg-ion or even Ca-ion batteries.31 In 2010, Tarascon proposed a
battery landscape (Figure I. 11) built on the development of three technologies with strong
growth potential : Li-S, Na-ion and Li-air batteries.47 While, Li-S technologies are
commercialized,39 some attempts to commercialize are currently launched for Na-ion (e.g the
start-up TIAMAT50). On their side, LABs are still under development at lab scale.

13
Figure I. 11: The battery technology landscape as
proposed by Tarascon in 2010.47
Among all the presented technologies, IRT Saint-Exupéry launched two projects on the
technologies which require more research effort but also which are the most promising in term
of energy density and application. Firstly, the project FUSHIA was created to study the
possibility to use fuel cells. Secondly, a more prospective project, CELIA, was elaborated to
study Li-air technology and will be described here.
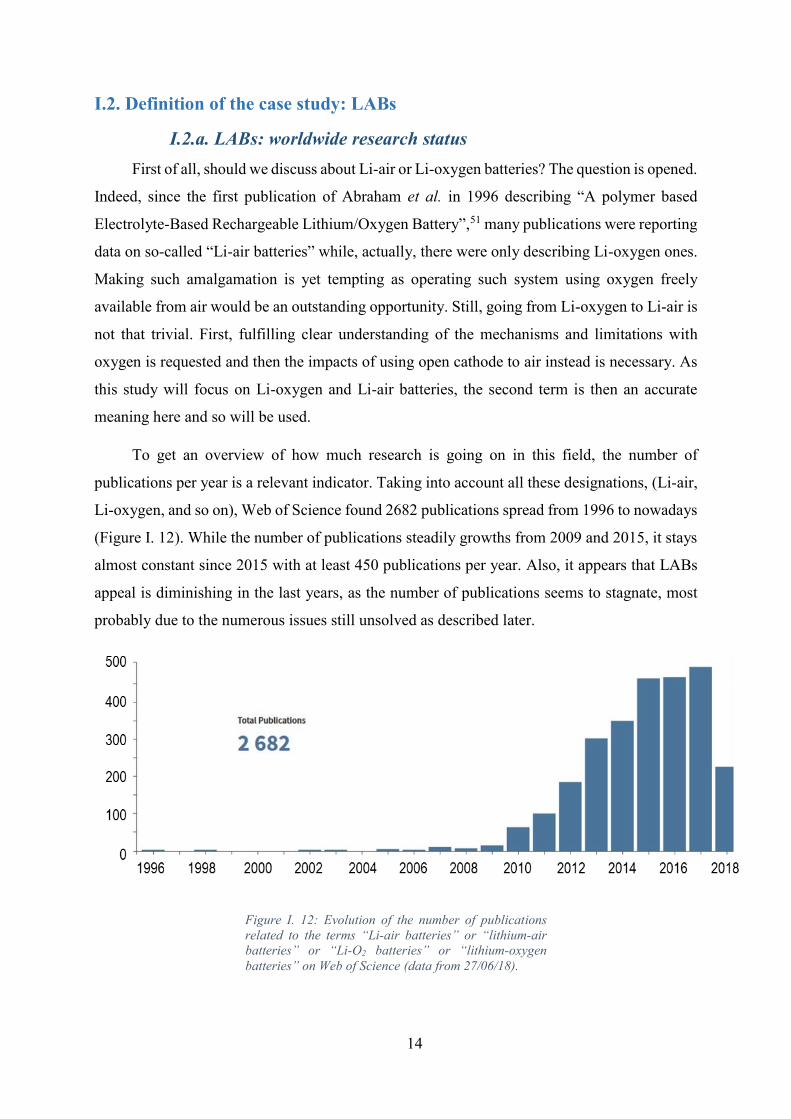
14
I.2. Definition of the case study: LABs
I.2.a. LABs: worldwide research status
First of all, should we discuss about Li-air or Li-oxygen batteries? The question is opened.
Indeed, since the first publication of Abraham et al. in 1996 describing “A polymer based
Electrolyte-Based Rechargeable Lithium/Oxygen Battery”,51 many publications were reporting
data on so-called “Li-air batteries” while, actually, there were only describing Li-oxygen ones.
Making such amalgamation is yet tempting as operating such system using oxygen freely
available from air would be an outstanding opportunity. Still, going from Li-oxygen to Li-air is
not that trivial. First, fulfilling clear understanding of the mechanisms and limitations with
oxygen is requested and then the impacts of using open cathode to air instead is necessary. As
this study will focus on Li-oxygen and Li-air batteries, the second term is then an accurate
meaning here and so will be used.
To get an overview of how much research is going on in this field, the number of
publications per year is a relevant indicator. Taking into account all these designations, (Li-air,
Li-oxygen, and so on), Web of Science found 2682 publications spread from 1996 to nowadays
(Figure I. 12). While the number of publications steadily growths from 2009 and 2015, it stays
almost constant since 2015 with at least 450 publications per year. Also, it appears that LABs
appeal is diminishing in the last years, as the number of publications seems to stagnate, most
probably due to the numerous issues still unsolved as described later.
Figure I. 12: Evolution of the number of publications
related to the terms “Li-air batteries” or “lithium-air
batteries” or “Li-O2 batteries” or “lithium-oxygen
batteries” on Web of Science (data from 27/06/18).
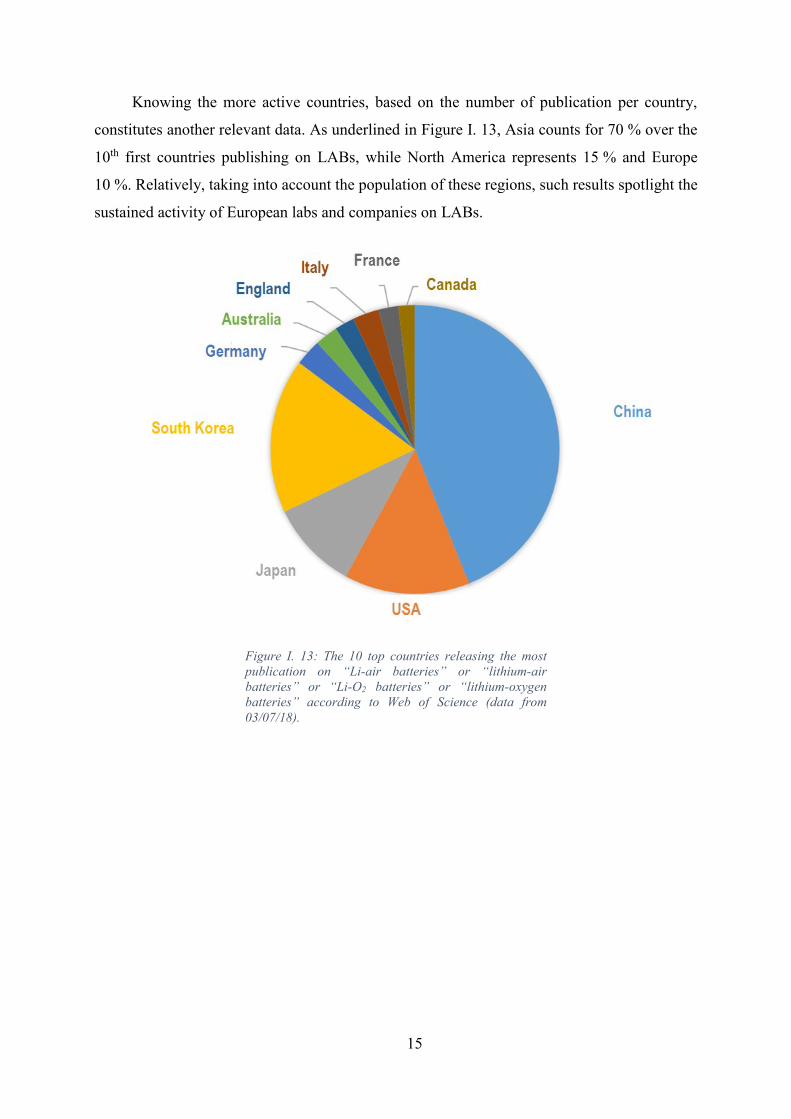
15
Knowing the more active countries, based on the number of publication per country,
constitutes another relevant data. As underlined in Figure I. 13, Asia counts for 70 % over the
10th first countries publishing on LABs, while North America represents 15 % and Europe
10 %. Relatively, taking into account the population of these regions, such results spotlight the
sustained activity of European labs and companies on LABs.
Figure I. 13: The 10 top countries releasing the most
publication on “Li-air batteries” or “lithium-air
batteries” or “Li-O2 batteries” or “lithium-oxygen
batteries” according to Web of Science (data from
03/07/18).
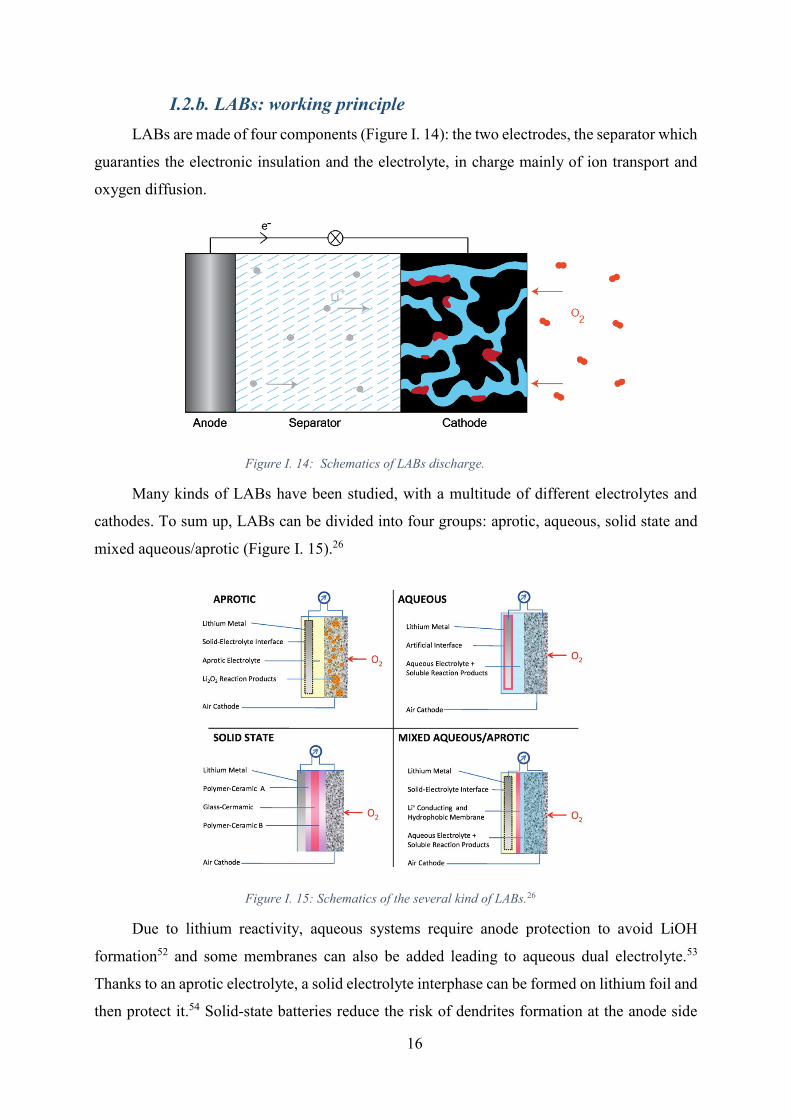
16
I.2.b. LABs: working principle
LABs are made of four components (Figure I. 14): the two electrodes, the separator which
guaranties the electronic insulation and the electrolyte, in charge mainly of ion transport and
oxygen diffusion.
Figure I. 14: Schematics of LABs discharge.
Many kinds of LABs have been studied, with a multitude of different electrolytes and
cathodes. To sum up, LABs can be divided into four groups: aprotic, aqueous, solid state and
mixed aqueous/aprotic (Figure I. 15).26
Figure I. 15: Schematics of the several kind of LABs.26
Due to lithium reactivity, aqueous systems require anode protection to avoid LiOH
formation52 and some membranes can also be added leading to aqueous dual electrolyte.53
Thanks to an aprotic electrolyte, a solid electrolyte interphase can be formed on lithium foil and
then protect it.54 Solid-state batteries reduce the risk of dendrites formation at the anode side
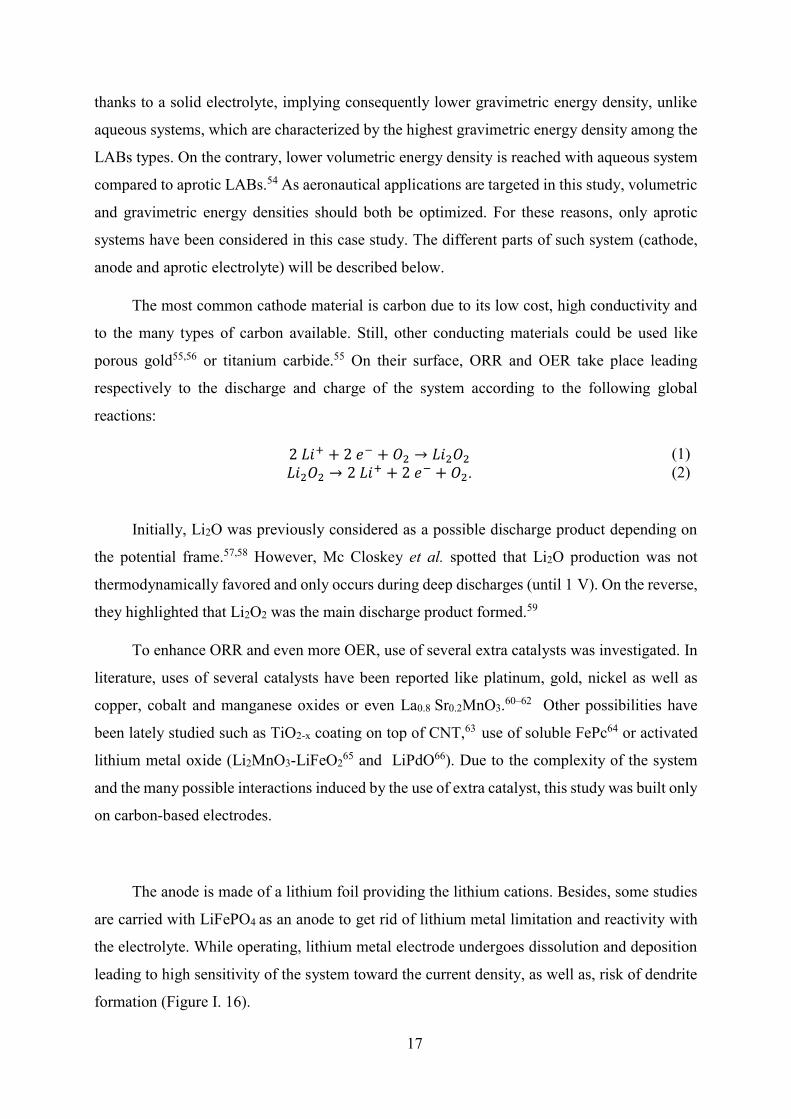
17
thanks to a solid electrolyte, implying consequently lower gravimetric energy density, unlike
aqueous systems, which are characterized by the highest gravimetric energy density among the
LABs types. On the contrary, lower volumetric energy density is reached with aqueous system
compared to aprotic LABs.54 As aeronautical applications are targeted in this study, volumetric
and gravimetric energy densities should both be optimized. For these reasons, only aprotic
systems have been considered in this case study. The different parts of such system (cathode,
anode and aprotic electrolyte) will be described below.
The most common cathode material is carbon due to its low cost, high conductivity and
to the many types of carbon available. Still, other conducting materials could be used like
porous gold55,56 or titanium carbide.55 On their surface, ORR and OER take place leading
respectively to the discharge and charge of the system according to the following global
reactions:
2 𝐿𝑖+ + 2 𝑒− + 𝑂2 → 𝐿𝑖2𝑂2 (1)
𝐿𝑖2𝑂2 → 2 𝐿𝑖+ + 2 𝑒− + 𝑂2. (2)
Initially, Li2O was previously considered as a possible discharge product depending on
the potential frame.57,58 However, Mc Closkey et al. spotted that Li2O production was not
thermodynamically favored and only occurs during deep discharges (until 1 V). On the reverse,
they highlighted that Li2O2 was the main discharge product formed.59
To enhance ORR and even more OER, use of several extra catalysts was investigated. In
literature, uses of several catalysts have been reported like platinum, gold, nickel as well as
copper, cobalt and manganese oxides or even La0.8 Sr0.2MnO3.60–62 Other possibilities have
been lately studied such as TiO2-x coating on top of CNT,63 use of soluble FePc64 or activated
lithium metal oxide (Li2MnO3-LiFeO265 and LiPdO66). Due to the complexity of the system
and the many possible interactions induced by the use of extra catalyst, this study was built only
on carbon-based electrodes.
The anode is made of a lithium foil providing the lithium cations. Besides, some studies
are carried with LiFePO4 as an anode to get rid of lithium metal limitation and reactivity with
the electrolyte. While operating, lithium metal electrode undergoes dissolution and deposition
leading to high sensitivity of the system toward the current density, as well as, risk of dendrite
formation (Figure I. 16).
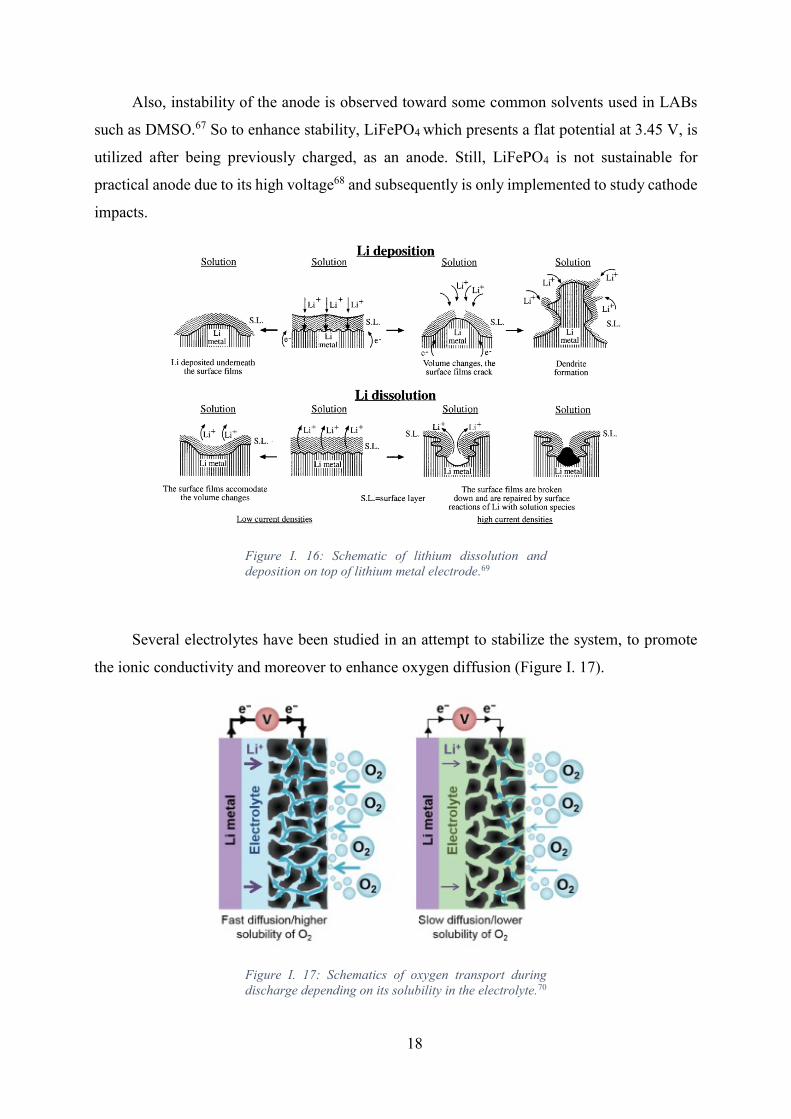
18
Also, instability of the anode is observed toward some common solvents used in LABs
such as DMSO.67 So to enhance stability, LiFePO4 which presents a flat potential at 3.45 V, is
utilized after being previously charged, as an anode. Still, LiFePO4 is not sustainable for
practical anode due to its high voltage68 and subsequently is only implemented to study cathode
impacts.
Figure I. 16: Schematic of lithium dissolution and
deposition on top of lithium metal electrode.69
Several electrolytes have been studied in an attempt to stabilize the system, to promote
the ionic conductivity and moreover to enhance oxygen diffusion (Figure I. 17).
Figure I. 17: Schematics of oxygen transport during
discharge depending on its solubility in the electrolyte.70

19
Initially, electrolytes coming from Li-ion field (e.g. PC) were largely used71 after the
demonstration of Abraham et al. of a Li-O2 cell based on a mixture of PAN, EC and PC.51 Still,
instability of such alkyl carbonate electrolytes have been observed by Freunberger et al. in
2011.72 McCloskey et al. also noticed carbonate electrolyte decomposition and preconized to
move toward ether based electrolytes.73
Such electrolytes have been selected compared to alkyl carbonate ones for their higher
stability toward O2 reduced species.74 Also, production of Li2O2 was observed during first
discharge for system using ether based electrolytes.75,76 Mitchell et al. recognized that fading is
still observed in the case of DME, even if cyclability is increased.77 A major drawback of DME
for LABs application is also its high vapor pressure, implying the use of ether solvents with
longer chain. Still, in 2011, Freunberger et al. draw attention to the degradation of ether
electrolytes (tetraglyme) enhanced with cycling.78
Despite previous studies, Grande et al. considered tetraglyme when they listed the five
currently stable electrolytes. Their list promotes DMSO, CAN, TEGDME, PEGDME and PEO
as safe electrolyte.53 Such step back point out the difficulty to develop an electrolyte which at
the same time is stable versus lithium, promotes oxygen diffusion, implies few parasitic
reactions and limits passivation mechanisms. In addition, a polarity issue still need to be
overcame as the electrolyte should dissolve polar species and in the meantime apolar O2 too.
Another great example of such challenging research is DMSO. Besides ether-based
electrolytes, Laoire et al. demonstrated in 2010 the reversible reduction of O2 using another
solvent: DMSO.79 For years, DMSO has been described as adequate choice due to its high donor
number properties80,81 facilitating solution mechanism81–84 as described in Figure I. 18 and so
leading to higher capacities.85,86
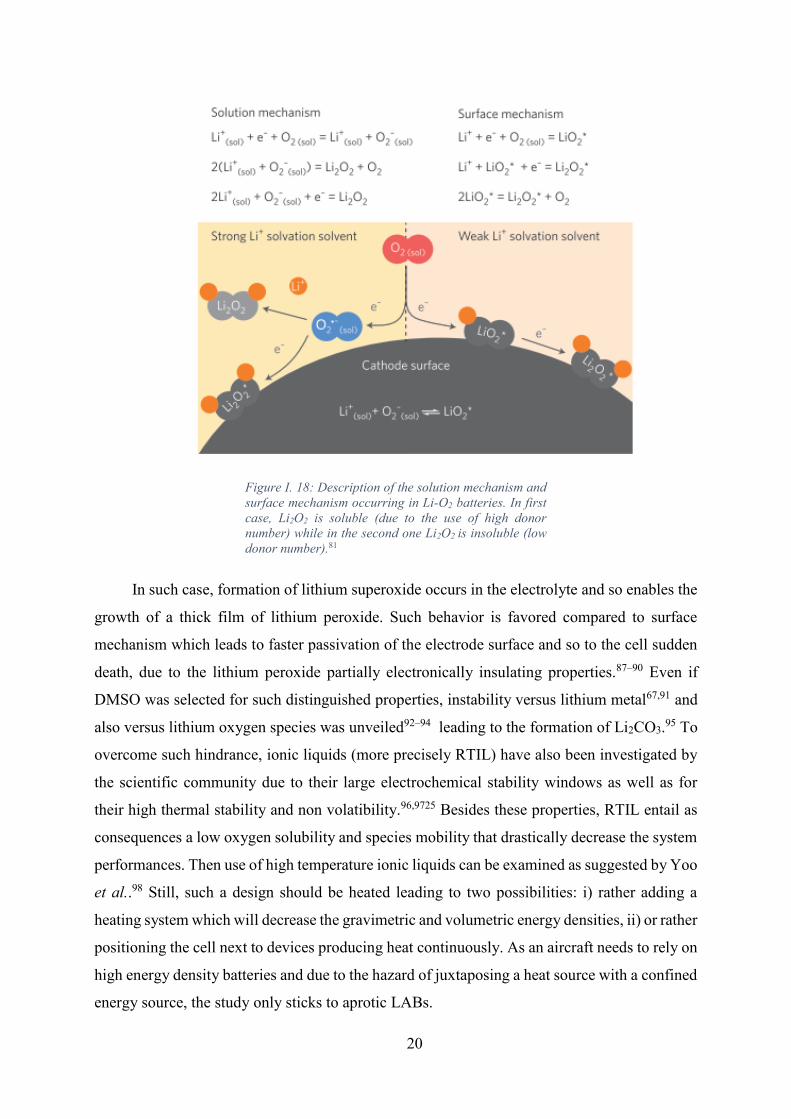
20
Figure I. 18: Description of the solution mechanism and
surface mechanism occurring in Li-O2 batteries. In first
case, Li2O2 is soluble (due to the use of high donor
number) while in the second one Li2O2 is insoluble (low
donor number).81
In such case, formation of lithium superoxide occurs in the electrolyte and so enables the
growth of a thick film of lithium peroxide. Such behavior is favored compared to surface
mechanism which leads to faster passivation of the electrode surface and so to the cell sudden
death, due to the lithium peroxide partially electronically insulating properties.87–90 Even if
DMSO was selected for such distinguished properties, instability versus lithium metal67,91 and
also versus lithium oxygen species was unveiled92–94 leading to the formation of Li2CO3.95 To
overcome such hindrance, ionic liquids (more precisely RTIL) have also been investigated by
the scientific community due to their large electrochemical stability windows as well as for
their high thermal stability and non volatibility.96,9725 Besides these properties, RTIL entail as
consequences a low oxygen solubility and species mobility that drastically decrease the system
performances. Then use of high temperature ionic liquids can be examined as suggested by Yoo
et al..98 Still, such a design should be heated leading to two possibilities: i) rather adding a
heating system which will decrease the gravimetric and volumetric energy densities, ii) or rather
positioning the cell next to devices producing heat continuously. As an aircraft needs to rely on
high energy density batteries and due to the hazard of juxtaposing a heat source with a confined
energy source, the study only sticks to aprotic LABs.

21
In addition to the solvent itself, salts and additives have also been scrutinized by
researchers. Even if the oxygen and intermediate species solubility depends obviously on the
solvent,85,99 oxygen diffusion coefficient also relies on the salt selected as demonstrated by
Gittleson et al. which used with TEGDME and DMSO several lithium salts (LiBF4, LiClO4,
LiCF3SO3, LiTFSI).70 Due to different ionic association strengths of the anions, which depends
on the negative charge properties (size, steric effect and delocalization), the solubility will be
different as the cations solvation will be changed81 (in a same way that high donor number
solvent impacts Li+ solvation)81,100. As a consequence, the cations reactivity can be drastically
modified.101 Moreover, the salt concentration also affects the oxygen diffusion coefficient and
so the system capabilities.70 Salt stability also should be analyzed in an attempt to develop safe
LABs. Thermal stability is then a crucial parameter. In this study, for instance, LiTFSI which
was reported as a stable salt for LIBs, was used. Moreover, selecting a stable salt not only
depends on the type of salt chosen but also on the salt purchased, as demonstrated by the several
thermal stabilities observed this time for three different commercialized LiFSI salts.102 To sum
up, selection of a good salt is tricky, even more for LABs than LIBs due to the multitude of
properties required for efficient operation.
In parallel, other additives, known as redox mediator, have been tested in an attempt to
overpass the passivation impacts at the cathode side (e.g. LiI103–105). Easier oxidation of lithium
peroxide emphasized by lower charge overpotential was claimed thanks to LiI
addition.103,104,106–108 Kawk et al. yet underlined the reactivity of LiI leading to side reactions
products such as LiOH and LiOI.104 Production of LiOH was confirmed and the decomposition
mechanism was proposed by Liu et al..109 Later, Park et al. pointed out the disparity of the
results observed (Table I. 2) and reported, as a drawback, side reactions at the anode with
lithium metal.110 Also, interest of such an additive can be questioned as the extra-long charge
plateau observed at 3 V could corresponds to degradation reactions between iodine and the
electrolyte.
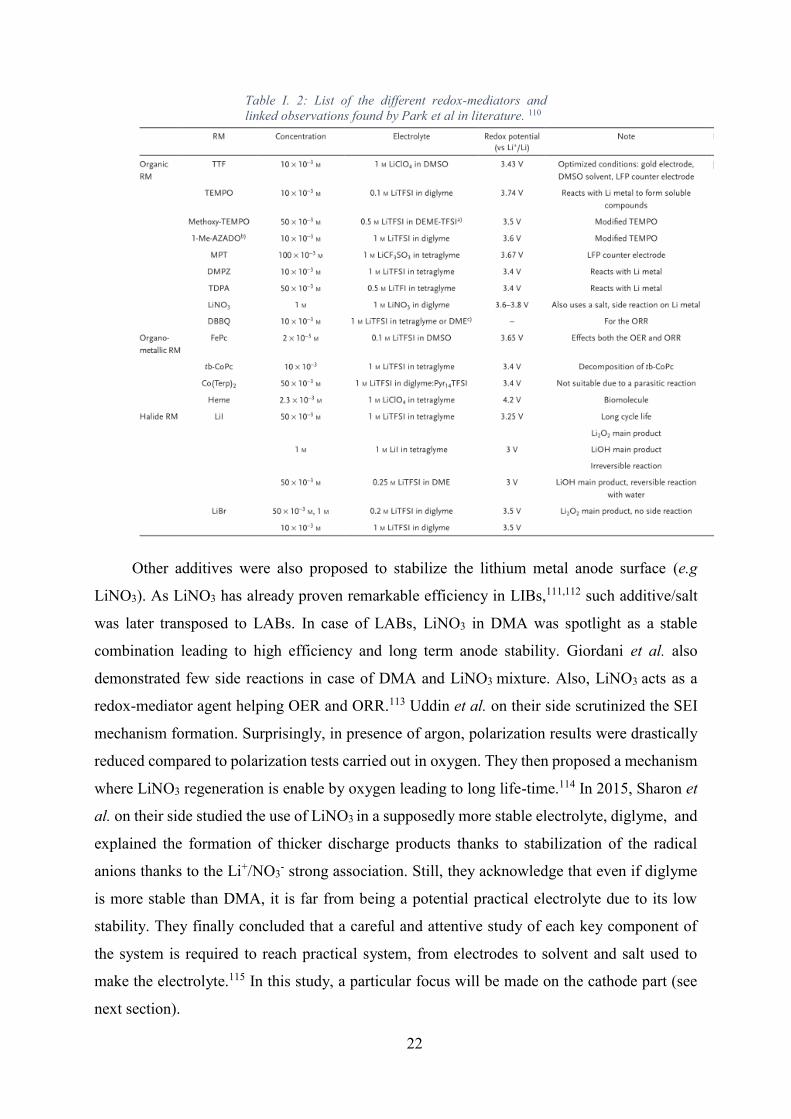
22
Table I. 2: List of the different redox-mediators and
linked observations found by Park et al in literature. 110
Other additives were also proposed to stabilize the lithium metal anode surface (e.g
LiNO3). As LiNO3 has already proven remarkable efficiency in LIBs,111,112 such additive/salt
was later transposed to LABs. In case of LABs, LiNO3 in DMA was spotlight as a stable
combination leading to high efficiency and long term anode stability. Giordani et al. also
demonstrated few side reactions in case of DMA and LiNO3 mixture. Also, LiNO3 acts as a
redox-mediator agent helping OER and ORR.113 Uddin et al. on their side scrutinized the SEI
mechanism formation. Surprisingly, in presence of argon, polarization results were drastically
reduced compared to polarization tests carried out in oxygen. They then proposed a mechanism
where LiNO3 regeneration is enable by oxygen leading to long life-time.114 In 2015, Sharon et
al. on their side studied the use of LiNO3 in a supposedly more stable electrolyte, diglyme, and
explained the formation of thicker discharge products thanks to stabilization of the radical
anions thanks to the Li+/NO3- strong association. Still, they acknowledge that even if diglyme
is more stable than DMA, it is far from being a potential practical electrolyte due to its low
stability. They finally concluded that a careful and attentive study of each key component of
the system is required to reach practical system, from electrodes to solvent and salt used to
make the electrolyte.115 In this study, a particular focus will be made on the cathode part (see
next section).

23
The several aforementioned electrolytes drawbacks spotlight the difficulty to determine
a suitable electrolyte for LABs. Even if electrolyte impact will be partially described in the
following research, developing a suitable electrolyte is still necessary to reach development of
practical LABs. Due to the complexity of the systems and implied limitations, such study should
be carried on its own in another project.
The tricky pathway toward performant and stable electrolyte development, as described
previously, is due to the many limitations of LABs system. Satisfying oxygen diffusion inside
the electrolyte through the overall electrode is not sufficient for high efficiency. Indeed, too
high diffusion of oxygen through the separator until the anode will constitute an internal short-
circuit. In addition to oxygen diffusion, promotion of reversible discharge product is necessary
and will be impede by the formation of a partially insulating film of discharge product Li2O2 as
well as by electrolyte degradation. Furthermore, limiting the parasitic reactions with the anode
and the cathode is required. Currently, due to the high system overpotential (Figure I. 19),26
high voltages are attained during the charge, promoting even more electrolyte degradation.
High overpotential is a major drawback impeding development of a practical cell. It
corresponds to the deviation from the standard equilibrium potential of the system (only
depending on the active materials involved). On the reverse, overpotential is linked to the extra
energy required in addition to thermodynamics and so take into account kinetics limitations
(depends on the current density)26,60 Also, the system intrinsic resistance contributes to
overpotential. With time, due to the formation of the passivating discharge product54 and side-
reaction products,60,116 overpotential rise leading to high charge plateau values. To reach
practical cell, decreasing the overpotential is necessary to enable the use of electrolyte with
lower voltage stability window.
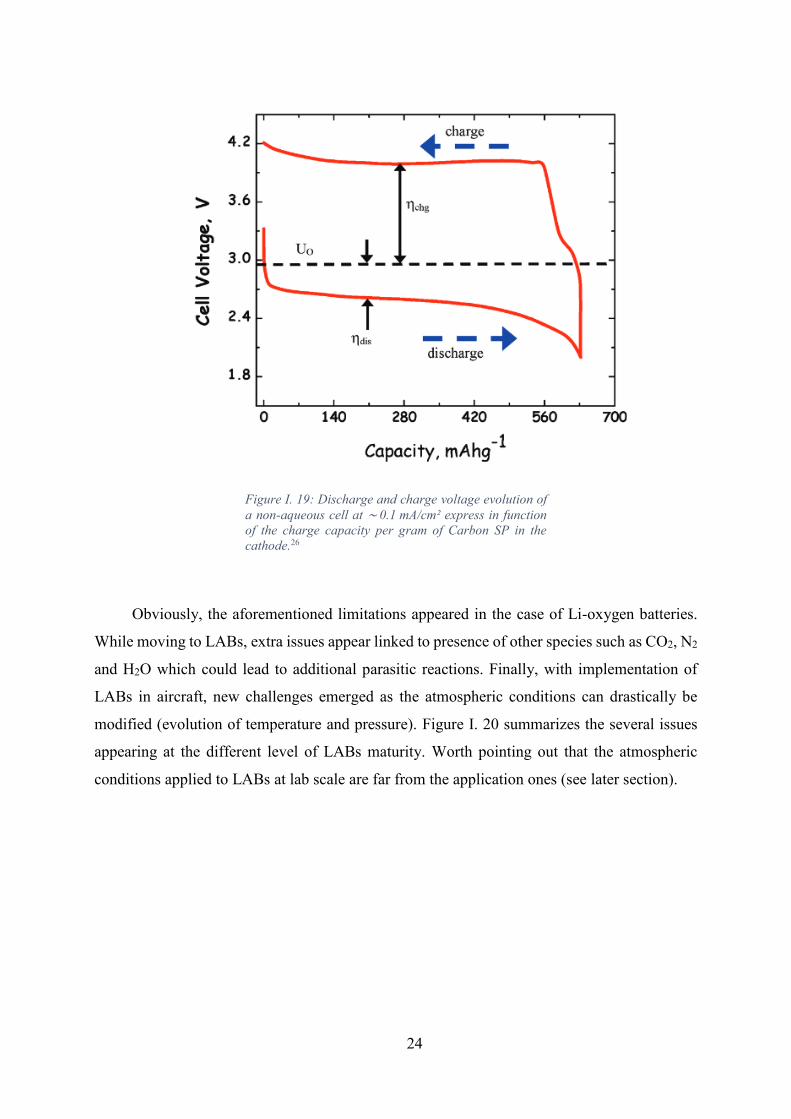
24
Figure I. 19: Discharge and charge voltage evolution of
a non-aqueous cell at ∼ 0.1 mA/cm² express in function
of the charge capacity per gram of Carbon SP in the
cathode.26
Obviously, the aforementioned limitations appeared in the case of Li-oxygen batteries.
While moving to LABs, extra issues appear linked to presence of other species such as CO2, N2
and H2O which could lead to additional parasitic reactions. Finally, with implementation of
LABs in aircraft, new challenges emerged as the atmospheric conditions can drastically be
modified (evolution of temperature and pressure). Figure I. 20 summarizes the several issues
appearing at the different level of LABs maturity. Worth pointing out that the atmospheric
conditions applied to LABs at lab scale are far from the application ones (see later section).

25
Figure I. 20: Schematic of LABs limitations from lab
scale to aeronautical application. (Based on
references53,117,118).
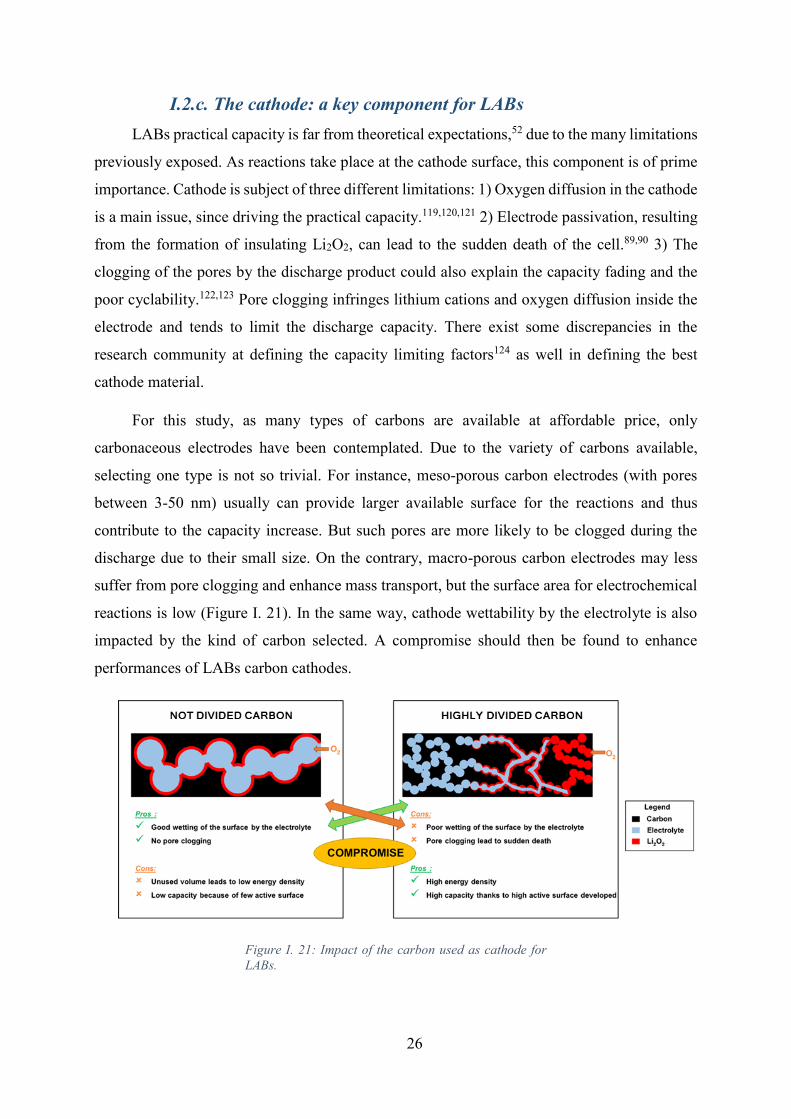
26
I.2.c. The cathode: a key component for LABs
LABs practical capacity is far from theoretical expectations,52 due to the many limitations
previously exposed. As reactions take place at the cathode surface, this component is of prime
importance. Cathode is subject of three different limitations: 1) Oxygen diffusion in the cathode
is a main issue, since driving the practical capacity.119,120,121 2) Electrode passivation, resulting
from the formation of insulating Li2O2, can lead to the sudden death of the cell.89,90 3) The
clogging of the pores by the discharge product could also explain the capacity fading and the
poor cyclability.122,123 Pore clogging infringes lithium cations and oxygen diffusion inside the
electrode and tends to limit the discharge capacity. There exist some discrepancies in the
research community at defining the capacity limiting factors124 as well in defining the best
cathode material.
For this study, as many types of carbons are available at affordable price, only
carbonaceous electrodes have been contemplated. Due to the variety of carbons available,
selecting one type is not so trivial. For instance, meso-porous carbon electrodes (with pores
between 3-50 nm) usually can provide larger available surface for the reactions and thus
contribute to the capacity increase. But such pores are more likely to be clogged during the
discharge due to their small size. On the contrary, macro-porous carbon electrodes may less
suffer from pore clogging and enhance mass transport, but the surface area for electrochemical
reactions is low (Figure I. 21). In the same way, cathode wettability by the electrolyte is also
impacted by the kind of carbon selected. A compromise should then be found to enhance
performances of LABs carbon cathodes.
Figure I. 21: Impact of the carbon used as cathode for
LABs.
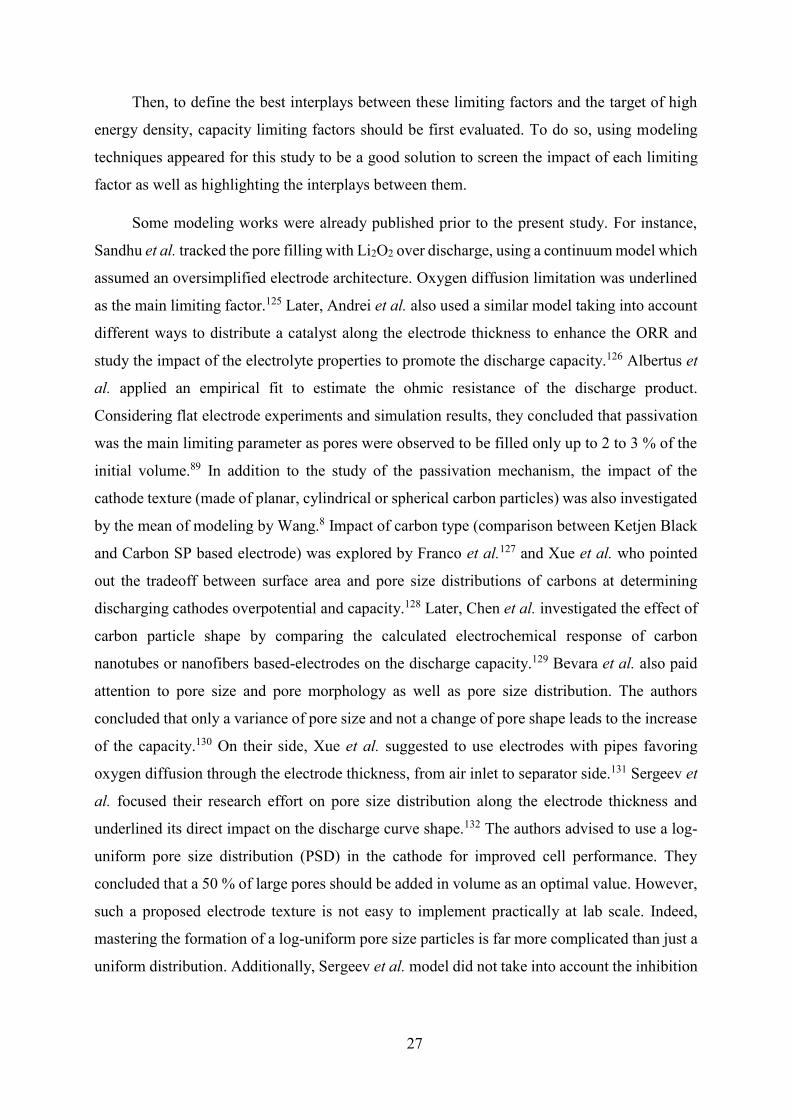
27
Then, to define the best interplays between these limiting factors and the target of high
energy density, capacity limiting factors should be first evaluated. To do so, using modeling
techniques appeared for this study to be a good solution to screen the impact of each limiting
factor as well as highlighting the interplays between them.
Some modeling works were already published prior to the present study. For instance,
Sandhu et al. tracked the pore filling with Li2O2 over discharge, using a continuum model which
assumed an oversimplified electrode architecture. Oxygen diffusion limitation was underlined
as the main limiting factor.125 Later, Andrei et al. also used a similar model taking into account
different ways to distribute a catalyst along the electrode thickness to enhance the ORR and
study the impact of the electrolyte properties to promote the discharge capacity.126 Albertus et
al. applied an empirical fit to estimate the ohmic resistance of the discharge product.
Considering flat electrode experiments and simulation results, they concluded that passivation
was the main limiting parameter as pores were observed to be filled only up to 2 to 3 % of the
initial volume.89 In addition to the study of the passivation mechanism, the impact of the
cathode texture (made of planar, cylindrical or spherical carbon particles) was also investigated
by the mean of modeling by Wang.8 Impact of carbon type (comparison between Ketjen Black
and Carbon SP based electrode) was explored by Franco et al.127 and Xue et al. who pointed
out the tradeoff between surface area and pore size distributions of carbons at determining
discharging cathodes overpotential and capacity.128 Later, Chen et al. investigated the effect of
carbon particle shape by comparing the calculated electrochemical response of carbon
nanotubes or nanofibers based-electrodes on the discharge capacity.129 Bevara et al. also paid
attention to pore size and pore morphology as well as pore size distribution. The authors
concluded that only a variance of pore size and not a change of pore shape leads to the increase
of the capacity.130 On their side, Xue et al. suggested to use electrodes with pipes favoring
oxygen diffusion through the electrode thickness, from air inlet to separator side.131 Sergeev et
al. focused their research effort on pore size distribution along the electrode thickness and
underlined its direct impact on the discharge curve shape.132 The authors advised to use a log-
uniform pore size distribution (PSD) in the cathode for improved cell performance. They
concluded that a 50 % of large pores should be added in volume as an optimal value. However,
such a proposed electrode texture is not easy to implement practically at lab scale. Indeed,
mastering the formation of a log-uniform pore size particles is far more complicated than just a
uniform distribution. Additionally, Sergeev et al. model did not take into account the inhibition
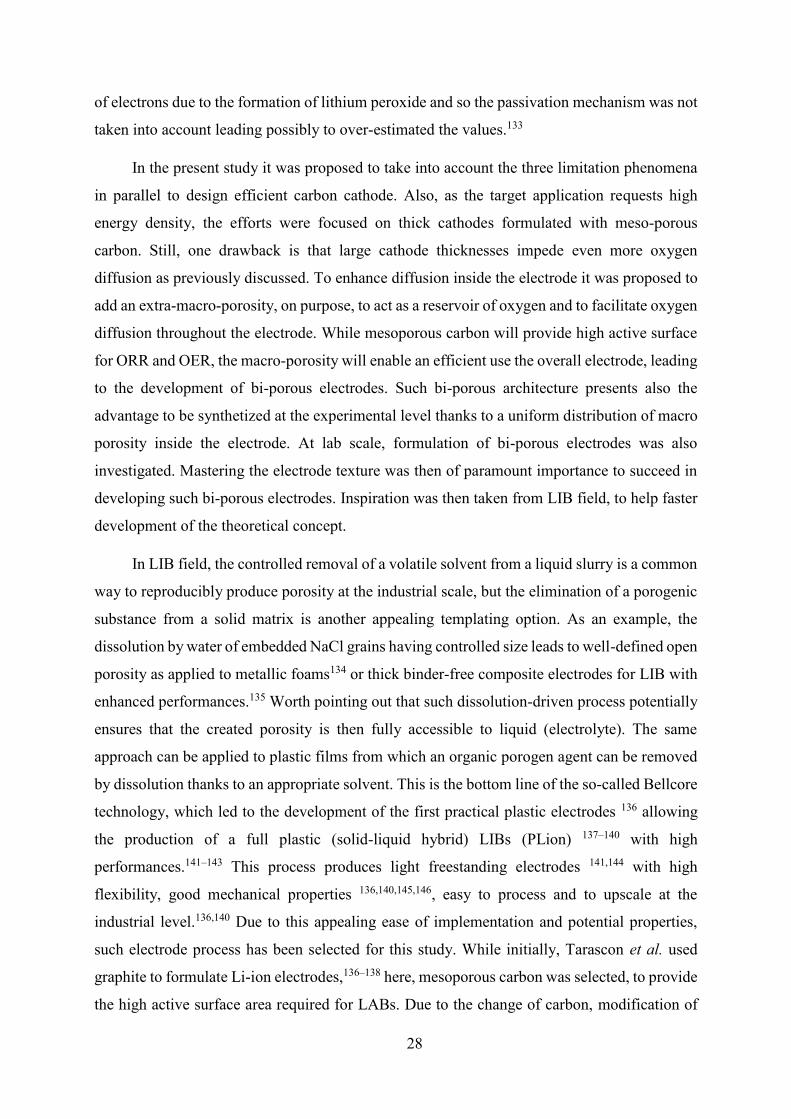
28
of electrons due to the formation of lithium peroxide and so the passivation mechanism was not
taken into account leading possibly to over-estimated the values.133
In the present study it was proposed to take into account the three limitation phenomena
in parallel to design efficient carbon cathode. Also, as the target application requests high
energy density, the efforts were focused on thick cathodes formulated with meso-porous
carbon. Still, one drawback is that large cathode thicknesses impede even more oxygen
diffusion as previously discussed. To enhance diffusion inside the electrode it was proposed to
add an extra-macro-porosity, on purpose, to act as a reservoir of oxygen and to facilitate oxygen
diffusion throughout the electrode. While mesoporous carbon will provide high active surface
for ORR and OER, the macro-porosity will enable an efficient use the overall electrode, leading
to the development of bi-porous electrodes. Such bi-porous architecture presents also the
advantage to be synthetized at the experimental level thanks to a uniform distribution of macro
porosity inside the electrode. At lab scale, formulation of bi-porous electrodes was also
investigated. Mastering the electrode texture was then of paramount importance to succeed in
developing such bi-porous electrodes. Inspiration was then taken from LIB field, to help faster
development of the theoretical concept.
In LIB field, the controlled removal of a volatile solvent from a liquid slurry is a common
way to reproducibly produce porosity at the industrial scale, but the elimination of a porogenic
substance from a solid matrix is another appealing templating option. As an example, the
dissolution by water of embedded NaCl grains having controlled size leads to well-defined open
porosity as applied to metallic foams134 or thick binder-free composite electrodes for LIB with
enhanced performances.135 Worth pointing out that such dissolution-driven process potentially
ensures that the created porosity is then fully accessible to liquid (electrolyte). The same
approach can be applied to plastic films from which an organic porogen agent can be removed
by dissolution thanks to an appropriate solvent. This is the bottom line of the so-called Bellcore
technology, which led to the development of the first practical plastic electrodes 136 allowing
the production of a full plastic (solid-liquid hybrid) LIBs (PLion) 137–140 with high
performances.141–143 This process produces light freestanding electrodes 141,144 with high
flexibility, good mechanical properties 136,140,145,146, easy to process and to upscale at the
industrial level.136,140 Due to this appealing ease of implementation and potential properties,
such electrode process has been selected for this study. While initially, Tarascon et al. used
graphite to formulate Li-ion electrodes,136–138 here, mesoporous carbon was selected, to provide
the high active surface area required for LABs. Due to the change of carbon, modification of
29
initial Li-ion electrodes fabrication process was necessary prior to electrode texture study.
Theoretical and experimental studies are described in Chapter III and Chapter IV.
I.2.d. Gap between flight conditions and lab conditions
Aircraft conditions
Aircrafts are exposed to many different atmospheric conditions along a flight as well as
during their storage in a tarmac. The environment evolution is really complex as parameters
like composition, pressure, hydrometric level and temperature change with altitude147–150,
according to spatial position over the globe151-152 and with time.153-154 Earth atmosphere where
aircrafts operate required then to be described.
Earth’s atmosphere has evolved since the creation of Earth 4.5 billion years ago, as
represented in Figure I. 23.154-155 Nowadays, it is well known that at sea level the atmosphere
is mainly composed of nitrogen, oxygen, water vapor and argon. 156 However, some traces of
other gases are found as carbon dioxide, methane,154 carbon monoxide,147 ozone,147,149,153 or
even N2O.148
Figure I. 22: Variation with geologic time of Earth’s
atmosphere composition.154
As commercial airplanes fly between 0 to 12 km from sea level and remain mainly around
9 to 12 km from sea level, only troposphere and lower stratosphere should then be analyzed
(Figure I. 23).150 In these domains, both temperature and pressure tend to decrease with height.
Temperature decreases almost by 80 °C from sea level to tropopause, then stays constant in
stratosphere. Meanwhile, pressure decreases from 1 bar to almost 0.1 bar. These significant

30
variations with altitude, necessitate to take into strong consideration the impact of these two
parameters onto LABs behavior.
Figure I. 23: Schematic of Earth’s atmosphere structure
and evolution of pressure and temperature with
altitude.157
Even if air composition is modified with altitude (Figure I. 24), its variations are
overlooked as the gas mixing ratios remain almost constant, except for water between
0 – 20 km. Then, the relative humidity, labelled RH, is the only parameter to be taken into
account in this study. RH can be defined, for a given temperature, as the percentage of the water
partial pressure over its saturation vapor pressure.158
Figure I. 24: The mixing ratio of some atmospheric gases
in Earth’s Atmosphere as a function of altitude.11
Even though, global changes are observed with altitude, local changes also exist. Several
studies provide information on parameters local evolution during flights (RH, pressure,
temperature) thanks to satellites and aircraft measurements.149,150,159. Significant variations of
RH, ozone content and temperature were then recorded (Figure I. 25).
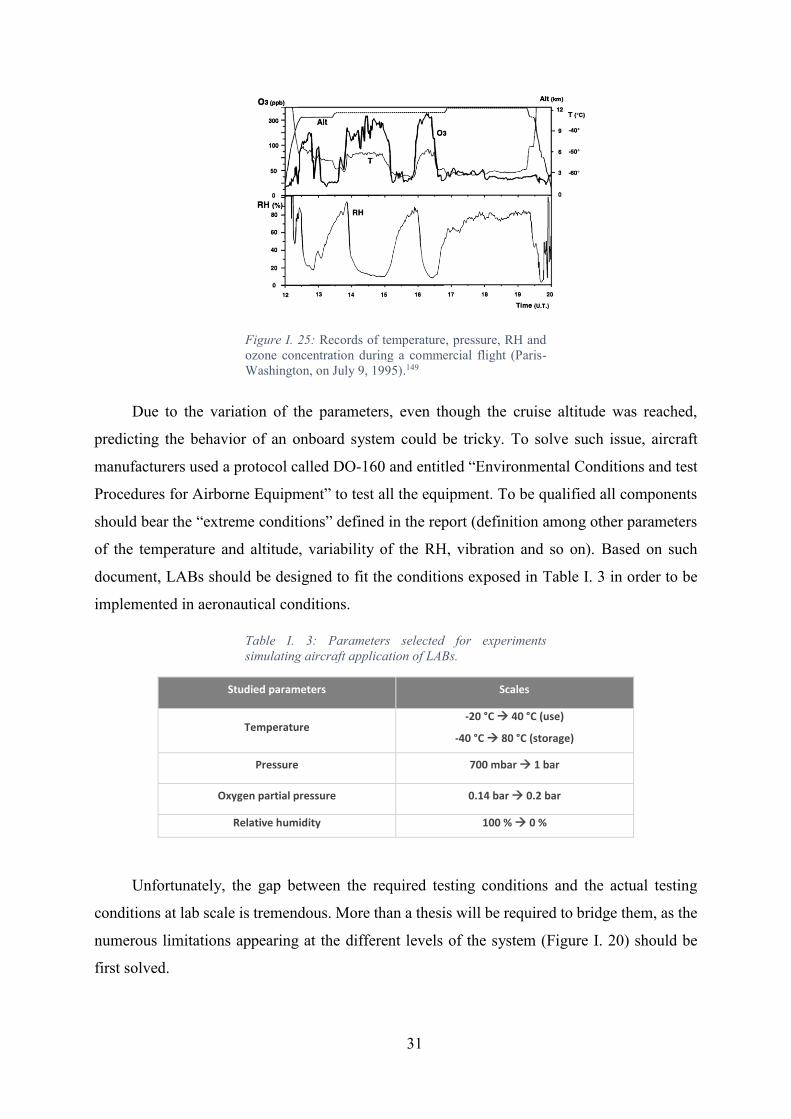
31
Figure I. 25: Records of temperature, pressure, RH and
ozone concentration during a commercial flight (Paris-
Washington, on July 9, 1995).149
Due to the variation of the parameters, even though the cruise altitude was reached,
predicting the behavior of an onboard system could be tricky. To solve such issue, aircraft
manufacturers used a protocol called DO-160 and entitled “Environmental Conditions and test
Procedures for Airborne Equipment” to test all the equipment. To be qualified all components
should bear the “extreme conditions” defined in the report (definition among other parameters
of the temperature and altitude, variability of the RH, vibration and so on). Based on such
document, LABs should be designed to fit the conditions exposed in Table I. 3 in order to be
implemented in aeronautical conditions.
Table I. 3: Parameters selected for experiments
simulating aircraft application of LABs.
Studied parameters Scales
Temperature -20 °C 40 °C (use)
-40 °C 80 °C (storage)
Pressure 700 mbar 1 bar
Oxygen partial pressure 0.14 bar 0.2 bar
Relative humidity 100 % 0 %
Unfortunately, the gap between the required testing conditions and the actual testing
conditions at lab scale is tremendous. More than a thesis will be required to bridge them, as the
numerous limitations appearing at the different levels of the system (Figure I. 20) should be
first solved.
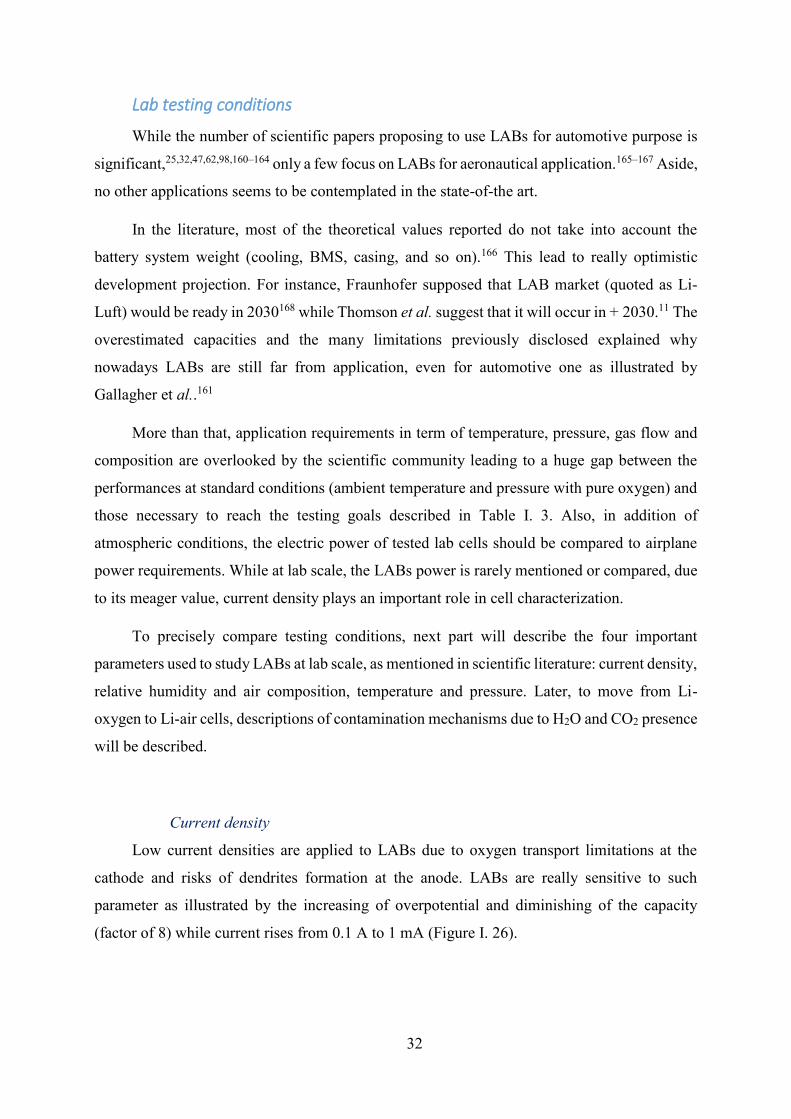
32
Lab testing conditions
While the number of scientific papers proposing to use LABs for automotive purpose is
significant,25,32,47,62,98,160–164 only a few focus on LABs for aeronautical application.165–167 Aside,
no other applications seems to be contemplated in the state-of-the art.
In the literature, most of the theoretical values reported do not take into account the
battery system weight (cooling, BMS, casing, and so on).166 This lead to really optimistic
development projection. For instance, Fraunhofer supposed that LAB market (quoted as Li-
Luft) would be ready in 2030168 while Thomson et al. suggest that it will occur in + 2030.11 The
overestimated capacities and the many limitations previously disclosed explained why
nowadays LABs are still far from application, even for automotive one as illustrated by
Gallagher et al..161
More than that, application requirements in term of temperature, pressure, gas flow and
composition are overlooked by the scientific community leading to a huge gap between the
performances at standard conditions (ambient temperature and pressure with pure oxygen) and
those necessary to reach the testing goals described in Table I. 3. Also, in addition of
atmospheric conditions, the electric power of tested lab cells should be compared to airplane
power requirements. While at lab scale, the LABs power is rarely mentioned or compared, due
to its meager value, current density plays an important role in cell characterization.
To precisely compare testing conditions, next part will describe the four important
parameters used to study LABs at lab scale, as mentioned in scientific literature: current density,
relative humidity and air composition, temperature and pressure. Later, to move from Li-
oxygen to Li-air cells, descriptions of contamination mechanisms due to H2O and CO2 presence
will be described.
Current density
Low current densities are applied to LABs due to oxygen transport limitations at the
cathode and risks of dendrites formation at the anode. LABs are really sensitive to such
parameter as illustrated by the increasing of overpotential and diminishing of the capacity
(factor of 8) while current rises from 0.1 A to 1 mA (Figure I. 26).
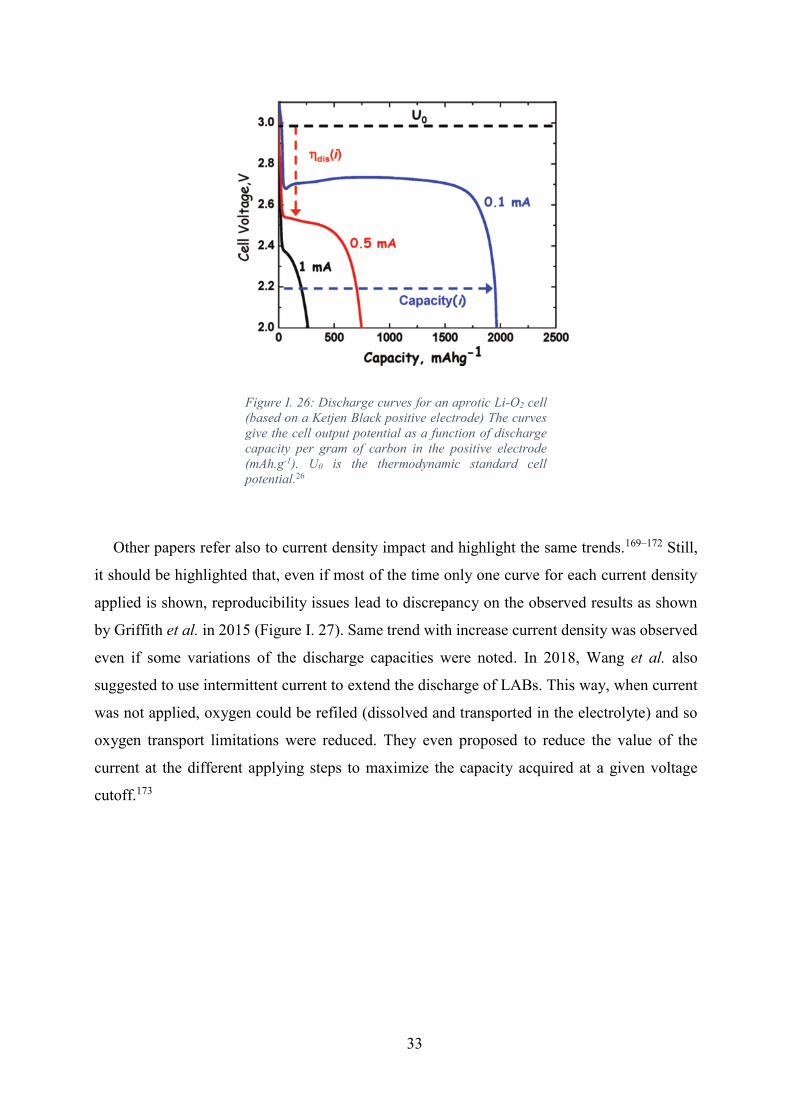
33
Figure I. 26: Discharge curves for an aprotic Li-O2 cell
(based on a Ketjen Black positive electrode) The curves
give the cell output potential as a function of discharge
capacity per gram of carbon in the positive electrode
(mAh.g-1). U0 is the thermodynamic standard cell
potential.26
Other papers refer also to current density impact and highlight the same trends.169–172 Still,
it should be highlighted that, even if most of the time only one curve for each current density
applied is shown, reproducibility issues lead to discrepancy on the observed results as shown
by Griffith et al. in 2015 (Figure I. 27). Same trend with increase current density was observed
even if some variations of the discharge capacities were noted. In 2018, Wang et al. also
suggested to use intermittent current to extend the discharge of LABs. This way, when current
was not applied, oxygen could be refiled (dissolved and transported in the electrolyte) and so
oxygen transport limitations were reduced. They even proposed to reduce the value of the
current at the different applying steps to maximize the capacity acquired at a given voltage
cutoff.173

34
Figure I. 27: Discharge curves at different current
densities (capacities per electrode geometric area).The
vertical lines defined the mean values observed for each
condition and dash lines the standard deviation. (The
black curves correspond to cells used in their
publication).171
Increase of overpotential and loss of discharge capacity were correlated by Nazar et al. to
the change of discharge product morphology (Figure I. 28). For very low current density (e.g.
µA.cm-²), Li2O2 toroids were observed on pristine positive electrode, while, for higher current
density the carbon surface was coated by Li2Ox small particles.172 Zhai et al., highlighted that
higher discharge capacities were linked to large toroidal particles formation. For this reason,
toroids formation should be sought.174

35
Figure I. 28: Electron microscopy (FESEM) images at a
magnification of 20000x of a pristine positive electrode
(a) and after full discharge at (b) 5 µA/cm2, (c) 10
µA/cm2, (d) 25 µA/cm2, (e) 50 µA/cm2, and (f) 100
µA/cm2, with the corresponding discharge curves. Scale
bar 400nm.172
Even if, attention of researchers was mainly focused on toroidal particle formation, some of
today’s publications show that various morphologies can be observed as illustrated by our
results (see Chapter V) even for same current density. Then, correlating morphologies such as
toroids with low current density seems a bit unfair and other parameters, such as electrolyte
nature, surface energy and so on, should be appraised.
Relative humidity and air composition
At first sight, it could have been easy to only target the water content of the air inlet, but
it appeared that even the electrolyte moisture (in ppm) can have dramatic impacts. Both water
sources will be described in the following part.
In 2011, Meini et al. evaluated the consequences of adding small water amount (by leak
from ambient air or by water-saturated oxygen) on electrochemical performances for cells
containing PC or DME electrolytes.

36
Figure I. 29: (a) First discharge curves of cells wetted
by electrolyte composed of 0.1 M LiClO4 in DME. The
flow is rather water-free or water-saturated oxygen.
“Leaker cell” corresponds to small leak of ambient air
inside the cell and “water vapor cell” corresponds to
water saturated oxygen (b) First discharge curves of cell
with non-contaminated or water-contaminated
electrolyte.175
As spotted in Figure I. 29, discharge capacity and system impedance significantly
increase with rise of the water content. Even if water addition seemed appealing to enhance the
capacity, the authors highlighted that its addition is not a solution as limiting reactions might
took place.175
In 2014, several papers on humidity effect were released. Cho et al. confirmed the
previous results. Cells assembled under ambient atmosphere, dry room and even glovebox and
flushed under oxygen (99.995%) were compared. In the same way, water level increases
discharge capacity but also system impedance and weight. The authors assumed that parasitic
reactions took place explaining the destruction of lithium metal, as seen after post-mortem
tests.176
Guo et al. decided to apply gas flows with different relative humidity: dry oxygen (0%
RH), oxygen with 15% RH and also ambient air (50 %RH) to cells wetted by TetraGDME.
Increase of discharge was also recorded. Nonetheless, cell cycling ability and rate were on the
reverse reduced (Figure I. 30). In case of oxygen with 15 %RH and even more for ambient air,

37
discharge capacity faded very quickly. However, use of oxygen with 15 %RH almost doubled
the first discharge capacity no matter which current density was applied. Also, the capacity fade
was less critical compared to ambient air case. This difference was explained thanks to ex-situ
XRD and ex-situ FTIR measurements. In each case, Li2O2 was the main discharge product even
if electrolyte decomposition occurred. Considering oxygen with 15 %RH, LiOH was also
formed at the end of the discharge, as well as Li2CO3. For ambient air, Li2CO3 appeared at the
beginning of the discharge and was attributed to CO2 – H2O parasite reactions.177 However, this
does not explain why Li2CO3 was observed in case of pure O2 with 15 %RH, suggesting that
electrolyte or cathode material decomposition could be involved.
Figure I. 30: LABs cycling curves obtained with different
gas composition (1) dry oxygen (0 %RH), (2) oxygen with
15 %RH and (3) ambient air (50 %RH) (a) Cycling
conditions: 50 mA.g-1 applied between 2 V and 4.5 V (b)
Cycling conditions: 200 mA.g-1 with a fixed capacity of
1000 mA.g-1 (c) Cycling at several current densities.177
Not only discharge products nature but also their morphologies were impacted. For dry
oxygen, a porous film was obtained (Figure I. 31). Under ambient air, small nanosheets were
noticed, irregularity of coating tends to prove partial recharge of the system. Meanwhile for
oxygen with 15 %RH, toroids were obtained. The dense packing of Li2O2 toroids might explain
the increase of discharge capacity.177
38
Figure I. 31: SEM images of KB electrodes at different
states for the Li2O2 batteries in pure/dry O2 atmosphere
(a, b, c), in O2 atmosphere with an 15 % RH (d, e, f), and
in ambient air with 50 %RH (g, h, i): before discharge (a,
d, g), after discharge (b, e, h) and after recharge (c, f, i),
respectively.177
Luntz et al. also noticed Li2O2 toroid formation when small water content was added to
anhydrous electrolyte. In addition, toroids size increased with water content which results in
higher discharge capacity.178
In 2015, Schwenke et al. recommended to add few amount of water in the electrolyte to
trigger Li2O2 formation and prevent electrode surface from passivation. Surprisingly, contrary
to previous works, no LiOH was formed on the cathode surface for electrolyte water content
< 1 %. They also highlighted that water content was beneficial, as Li2O2 yield was increased
(Figure I. 32) and so parasitic reactions were not that problematic. Still, they acknowledged that
avoiding compounds such as PVdF or DMSO is crucial in presence of water, as the resulting
protons production could deteriorate rapidly the electrolyte.179
Such contradictory results perfectly illustrate the versatility of the conclusion made in
state-of-the-art concerning the water content impact on LABs performances.

39
Figure I. 32: Li2O2 yield versus discharge capacity of
carbon paper cathodes discharged at 1 µA and 30 µA
with different water contents in the electrolyte. The yield
consists of the determined mass of Li2O2 found in the
cathode related to the mass expected from the charges
passed during discharge.179
Water is not the only contaminant that can affect battery performances. Nitrogen and
carbon dioxide from ambient air can also react in LABs. Even if it is well known that nitrogen
and lithium react at room temperature180 few studies were done on nitrogen impacts as they
seem to be negligible.
Figure I. 33: Discharge curves of Li–O2/CO2 batteries
with various O2/CO2 ratios at 25°C (0.2 mA.cm-2).181
Carbon dioxide impact was studied by Takechi et al. (Figure I. 33).181 A raise of CO2
content in O2/CO2 mixture leads to discharge capacity rise. Still, only O2/CO2 mixture, with
30 % to 70 % of CO2 at a discharge rate of 0.2 mA.cm-2, should be selected to really upgrade
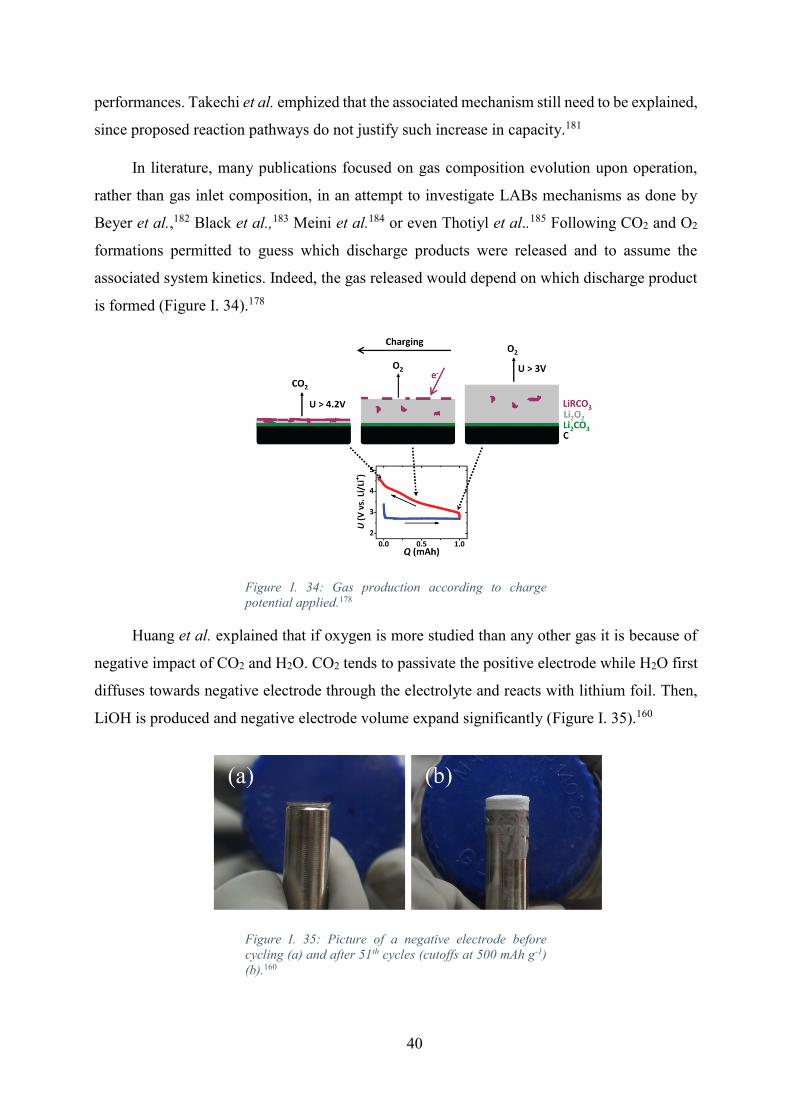
40
performances. Takechi et al. emphized that the associated mechanism still need to be explained,
since proposed reaction pathways do not justify such increase in capacity.181
In literature, many publications focused on gas composition evolution upon operation,
rather than gas inlet composition, in an attempt to investigate LABs mechanisms as done by
Beyer et al.,182 Black et al.,183 Meini et al.184 or even Thotiyl et al..185 Following CO2 and O2
formations permitted to guess which discharge products were released and to assume the
associated system kinetics. Indeed, the gas released would depend on which discharge product
is formed (Figure I. 34).178
Figure I. 34: Gas production according to charge
potential applied.178
Huang et al. explained that if oxygen is more studied than any other gas it is because of
negative impact of CO2 and H2O. CO2 tends to passivate the positive electrode while H2O first
diffuses towards negative electrode through the electrolyte and reacts with lithium foil. Then,
LiOH is produced and negative electrode volume expand significantly (Figure I. 35).160
Figure I. 35: Picture of a negative electrode before
cycling (a) and after 51th cycles (cutoffs at 500 mAh g-1)
(b).160
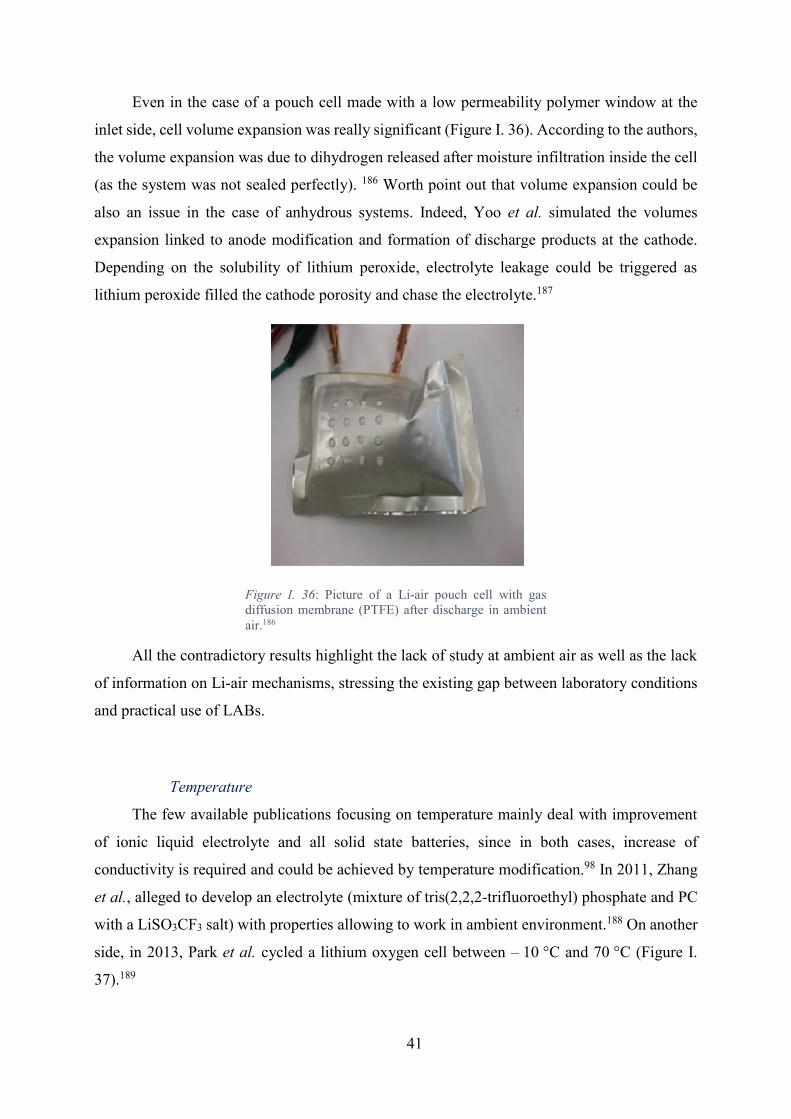
41
Even in the case of a pouch cell made with a low permeability polymer window at the
inlet side, cell volume expansion was really significant (Figure I. 36). According to the authors,
the volume expansion was due to dihydrogen released after moisture infiltration inside the cell
(as the system was not sealed perfectly). 186 Worth point out that volume expansion could be
also an issue in the case of anhydrous systems. Indeed, Yoo et al. simulated the volumes
expansion linked to anode modification and formation of discharge products at the cathode.
Depending on the solubility of lithium peroxide, electrolyte leakage could be triggered as
lithium peroxide filled the cathode porosity and chase the electrolyte.187
Figure I. 36: Picture of a Li-air pouch cell with gas
diffusion membrane (PTFE) after discharge in ambient
air.186
All the contradictory results highlight the lack of study at ambient air as well as the lack
of information on Li-air mechanisms, stressing the existing gap between laboratory conditions
and practical use of LABs.
Temperature
The few available publications focusing on temperature mainly deal with improvement
of ionic liquid electrolyte and all solid state batteries, since in both cases, increase of
conductivity is required and could be achieved by temperature modification.98 In 2011, Zhang
et al., alleged to develop an electrolyte (mixture of tris(2,2,2-trifluoroethyl) phosphate and PC
with a LiSO3CF3 salt) with properties allowing to work in ambient environment.188 On another
side, in 2013, Park et al. cycled a lithium oxygen cell between – 10 °C and 70 °C (Figure I.
37).189

42
Figure I. 37: Impact of temperature on cycling for
TEGDME-based electrolyte lithium−oxygen cells
Capacity limited to 1000 mAh.g−1carbon. Current: 100
mA.g−1 carbon.189
Less polarization is reported when temperature increases. Park et al. attributed thes
reductions of polarization and charge plateau voltage to a faster kinetics. This trend is also
enhanced by a diminution of electrolyte viscosity which promotes O2 and Li+ transport.
Increasing temperature also benefits to the formation of amorphous Li2O2189 which leads to
higher conductivity compared to crystal compounds.190 Conversely, thanks to a study made
between 30 °C and 70 °C on Super P electrode, Song et al. claimed that at high temperature
more Li2O2 crystal nuclei are formed and hence a thinner coating were deposited. Song et al.
proposed to use temperature as a tool to enhance discharge ability in the non-aqueous LABs.191
Tan et al. investigated in the same time temperature and current density and proposed a
mechanism for Li2O2 formation during discharge (Figure I. 38).169
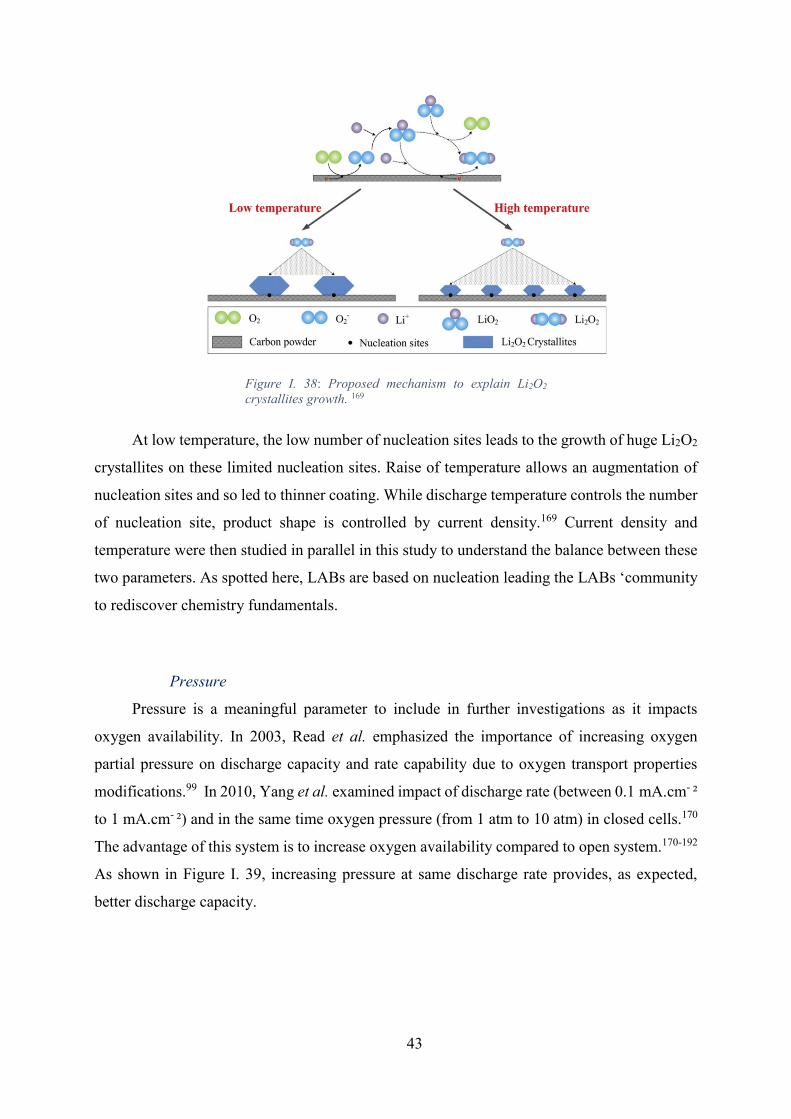
43
Figure I. 38: Proposed mechanism to explain Li2O2
crystallites growth. 169
At low temperature, the low number of nucleation sites leads to the growth of huge Li2O2
crystallites on these limited nucleation sites. Raise of temperature allows an augmentation of
nucleation sites and so led to thinner coating. While discharge temperature controls the number
of nucleation site, product shape is controlled by current density.169 Current density and
temperature were then studied in parallel in this study to understand the balance between these
two parameters. As spotted here, LABs are based on nucleation leading the LABs ‘community
to rediscover chemistry fundamentals.
Pressure
Pressure is a meaningful parameter to include in further investigations as it impacts
oxygen availability. In 2003, Read et al. emphasized the importance of increasing oxygen
partial pressure on discharge capacity and rate capability due to oxygen transport properties
modifications.99 In 2010, Yang et al. examined impact of discharge rate (between 0.1 mA.cm- ²
to 1 mA.cm- ²) and in the same time oxygen pressure (from 1 atm to 10 atm) in closed cells.170
The advantage of this system is to increase oxygen availability compared to open system.170-192
As shown in Figure I. 39, increasing pressure at same discharge rate provides, as expected,
better discharge capacity.
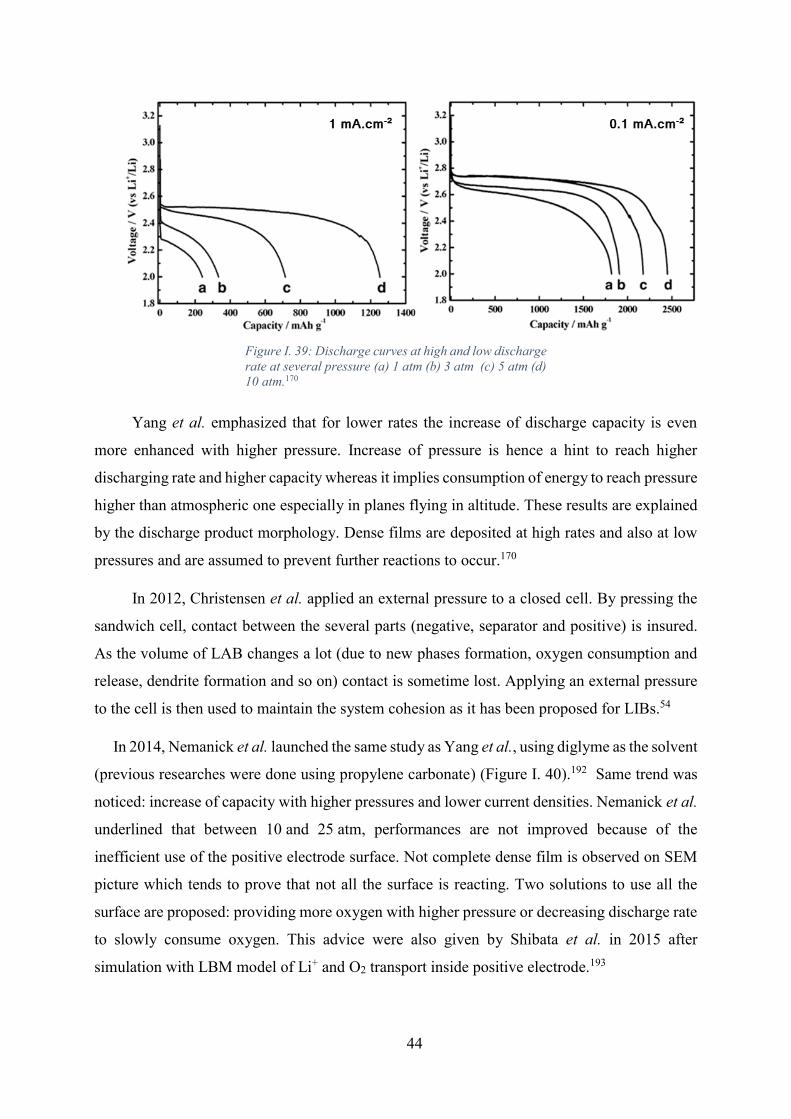
44
Figure I. 39: Discharge curves at high and low discharge
rate at several pressure (a) 1 atm (b) 3 atm (c) 5 atm (d)
10 atm.170
Yang et al. emphasized that for lower rates the increase of discharge capacity is even
more enhanced with higher pressure. Increase of pressure is hence a hint to reach higher
discharging rate and higher capacity whereas it implies consumption of energy to reach pressure
higher than atmospheric one especially in planes flying in altitude. These results are explained
by the discharge product morphology. Dense films are deposited at high rates and also at low
pressures and are assumed to prevent further reactions to occur.170
In 2012, Christensen et al. applied an external pressure to a closed cell. By pressing the
sandwich cell, contact between the several parts (negative, separator and positive) is insured.
As the volume of LAB changes a lot (due to new phases formation, oxygen consumption and
release, dendrite formation and so on) contact is sometime lost. Applying an external pressure
to the cell is then used to maintain the system cohesion as it has been proposed for LIBs.54
In 2014, Nemanick et al. launched the same study as Yang et al., using diglyme as the solvent
(previous researches were done using propylene carbonate) (Figure I. 40).192 Same trend was
noticed: increase of capacity with higher pressures and lower current densities. Nemanick et al.
underlined that between 10 and 25 atm, performances are not improved because of the
inefficient use of the positive electrode surface. Not complete dense film is observed on SEM
picture which tends to prove that not all the surface is reacting. Two solutions to use all the
surface are proposed: providing more oxygen with higher pressure or decreasing discharge rate
to slowly consume oxygen. This advice were also given by Shibata et al. in 2015 after
simulation with LBM model of Li+ and O2 transport inside positive electrode.193
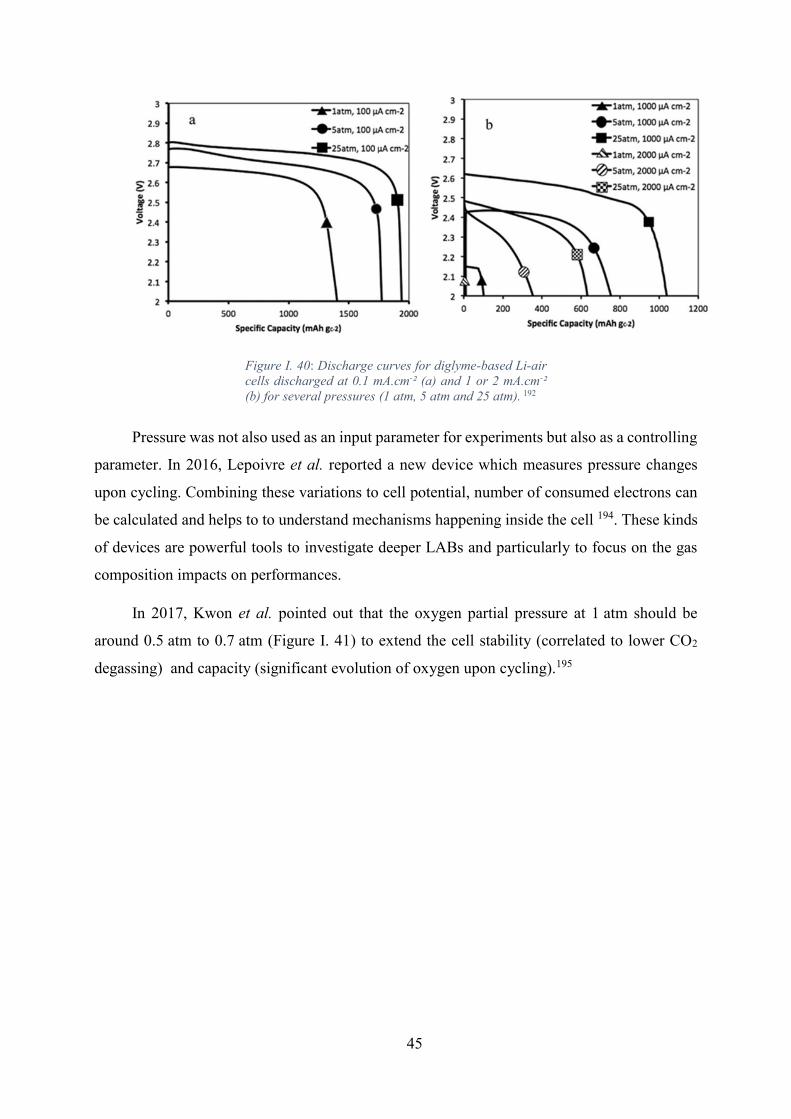
45
Figure I. 40: Discharge curves for diglyme-based Li-air
cells discharged at 0.1 mA.cm-² (a) and 1 or 2 mA.cm-²
(b) for several pressures (1 atm, 5 atm and 25 atm). 192
Pressure was not also used as an input parameter for experiments but also as a controlling
parameter. In 2016, Lepoivre et al. reported a new device which measures pressure changes
upon cycling. Combining these variations to cell potential, number of consumed electrons can
be calculated and helps to to understand mechanisms happening inside the cell 194. These kinds
of devices are powerful tools to investigate deeper LABs and particularly to focus on the gas
composition impacts on performances.
In 2017, Kwon et al. pointed out that the oxygen partial pressure at 1 atm should be
around 0.5 atm to 0.7 atm (Figure I. 41) to extend the cell stability (correlated to lower CO2
degassing) and capacity (significant evolution of oxygen upon cycling).195

46
Figure I. 41: LABs capacities and cycling abilities
according to applied oxygen partial pressure (a) 1st
discharge, (b) Cycling with cutoff at 300 mAh/gelectrode, (c)
Cycling with cutoff at 100 mAh/gelectrode, (d) Cycling
properties versus oxygen partial pressure while applying
a cutoff at 300 mAh/gelectrode.195
Notwithstanding the interesting information on pressure impact, Figure I. 41 reveals the
importance of the mass used to define the system capacity. Above all, comparison Figure I.
41.b and Figure I. 41.c shows how capacity retention of LABs can be easily twisted. Figure I.
41.c will tend to show that capacity retention is quite good over the cycling while Figure I. 41.b
proves the opposite, meaning that cycling cutoffs should be always provided. Unfortunately,
current state-of-the art, often lack of clear information on such parameter, making comparisons
difficult between the several systems described in literature.
More important than the comparison of the different published results, Kwak et al.
illustrated in their work how easily cells performances can be overestimated (Figure I. 42).196
While only paying attention to Figure I. 42.a or Figure I. 42.c, performances of the system
seemed pretty good. Still, while looking at Figure I. 42.b, it appeared that the cells are not at all
challenged, as they are cycled in a really short range of capacity. This way, as not all electrode
volume and surface is engaged, even if passivation and degradation mechanism occur, some
more surface and volume will be available for the other cycles. Thus, the cycle life is just
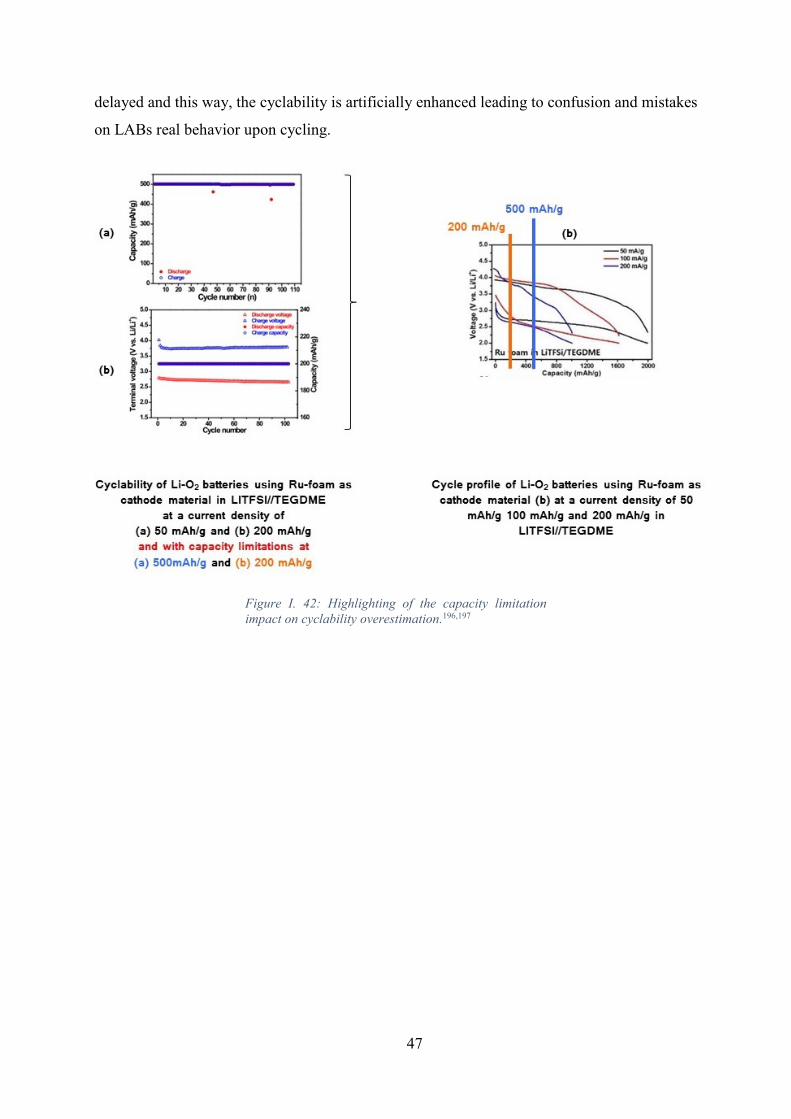
47
delayed and this way, the cyclability is artificially enhanced leading to confusion and mistakes
on LABs real behavior upon cycling.
Figure I. 42: Highlighting of the capacity limitation
impact on cyclability overestimation.196,197
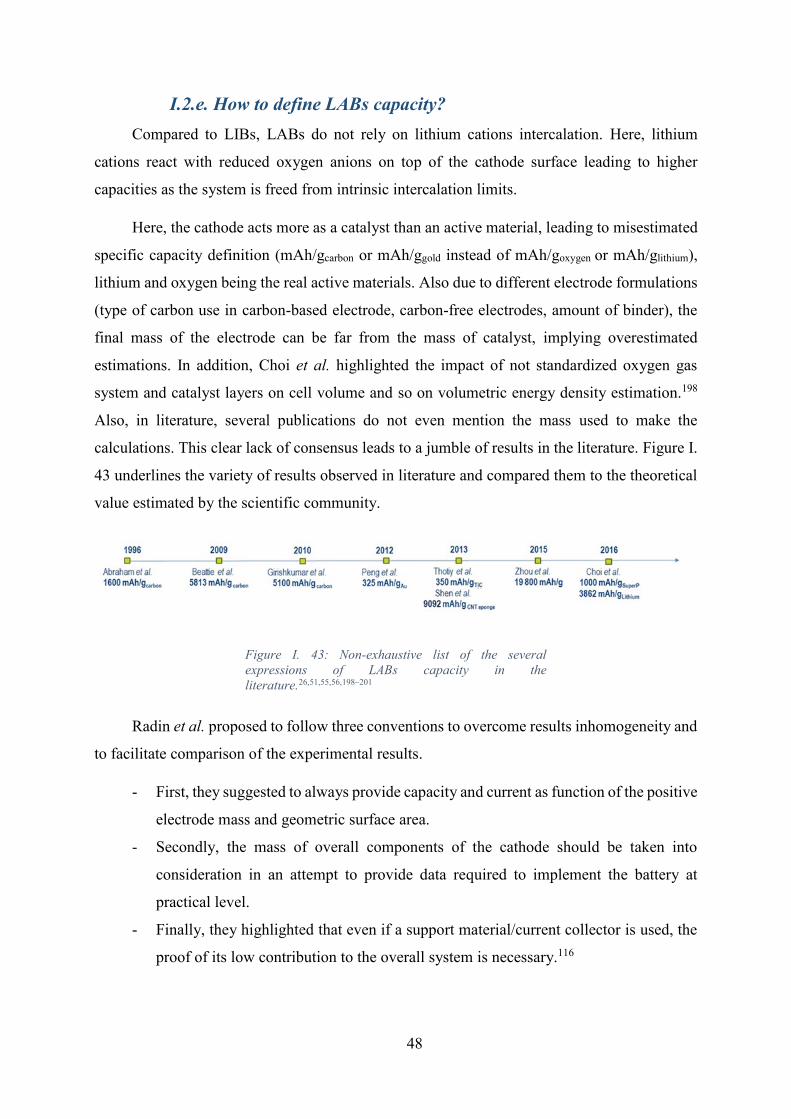
48
I.2.e. How to define LABs capacity?
Compared to LIBs, LABs do not rely on lithium cations intercalation. Here, lithium
cations react with reduced oxygen anions on top of the cathode surface leading to higher
capacities as the system is freed from intrinsic intercalation limits.
Here, the cathode acts more as a catalyst than an active material, leading to misestimated
specific capacity definition (mAh/gcarbon or mAh/ggold instead of mAh/goxygen or mAh/glithium),
lithium and oxygen being the real active materials. Also due to different electrode formulations
(type of carbon use in carbon-based electrode, carbon-free electrodes, amount of binder), the
final mass of the electrode can be far from the mass of catalyst, implying overestimated
estimations. In addition, Choi et al. highlighted the impact of not standardized oxygen gas
system and catalyst layers on cell volume and so on volumetric energy density estimation.198
Also, in literature, several publications do not even mention the mass used to make the
calculations. This clear lack of consensus leads to a jumble of results in the literature. Figure I.
43 underlines the variety of results observed in literature and compared them to the theoretical
value estimated by the scientific community.
Figure I. 43: Non-exhaustive list of the several
expressions of LABs capacity in the
literature.26,51,55,56,198–201
Radin et al. proposed to follow three conventions to overcome results inhomogeneity and
to facilitate comparison of the experimental results.
- First, they suggested to always provide capacity and current as function of the positive
electrode mass and geometric surface area.
- Secondly, the mass of overall components of the cathode should be taken into
consideration in an attempt to provide data required to implement the battery at
practical level.
- Finally, they highlighted that even if a support material/current collector is used, the
proof of its low contribution to the overall system is necessary.116

49
In this study to be conformed to this precious advices, capacities will be expressed in
mAh/gelectrode and mAh/cm²geometric with respect to the electrode overall mass and geometric area.
Despite the precautions taken, as oxygen is consumed and incorporated to the cell while
discharge product is formed, the final mass of the system will increase along discharge,52
misleading the capacity estimation in mAh/gelectrode. Once loaded in an aircraft, it worth points
out that the rise of weight will imply a change of the aircraft gravity center, impacting
significantly the aerodynamic properties.165

50
I.3. Thesis objectives
The initial thesis objectives were to optimize the cells developed at lab scale and to test
them after in the extreme conditions defined in Table I. 3. Besides, reality of LABs development
lead to a redefinition of the thesis objectives due to the many observed limitations (Figure I.
20).
As the initial requirement for LABs aeronautical application is high energy density, the
first attempt was to increase the energy density of the system. To do so, a first investigation on
one of the main components of the cell, the cathode, was launched. The first part of the study
focused then on the cathode development, taking into account the enlargement of high active
surface area, to promote ORR and OER reactions, while also taking into account the risks of
passivation and pore clogging. In addition, to maximize the gravimetric energy density, thick
cathodes were privileged even if it implies oxygen mass transport limitations. Then, taking into
account the limitations, as well as the target of high gravimetric energy density, cathode design
was studied from theoretical point of view, using multi-scale modeling, as well as from
experimental point of view. At first, the several techniques implemented along experimental
and theoretical investigations would be described in Chapter II. Later, the approach developed
as well as the results will be described in Chapter III and Chapter IV.
Later, to move from Li-oxygen to Li-air batteries, a particular focus was made on
experimental testing conditions. To study current density and temperature impacts, a
reproducibility study was implemented, based on the use of GDL electrodes as a reference
cathode. Variability of the results and the identified trends will be described in Chapter V. Also,
in an attempt to understand the observed results, a continuum model describing potential
contamination mechanisms would be also disclosed in Annex.
CHAPTER II: EXPERIMENTAL PROCEDURES
Chapter II: Experimental Procedures
Contents
xxxxxxxxxxxxxxxxxxxxxxxxxxxxxxxxxxxxxxxxxxxxxxxxxxxxxxxxxxxxxXxxxxxX
II.1. Electrode fabrication process…………………………………………………. 52
II.1.a. Electrode materials………………………………………………… 52
II.1.b. Dip-coated electrodes fabrication process…………………………. 54
II.1.c. Porous flexible electrodes fabrication process…………………….. 59
II.1.d. Comparison of the two electrodes fabrication processes………….. 61
II.2. Battery assembling……………………………………………………………. 63
II.2.a. Electrolyte preparation………………………………….…………..63
II.2.b. Swagelok cell assembling…………………………………………. 63
II.3. Experimental set-up for controlled LABs atmosphere………………………... 66
II.3.a. “Le Parfait” container……………………………………………… 66
II.3.b. Gas flow system…………………………………………………… 67
II.4. Characterization techniques…………………………………………………... 69
II.4.a. Electrode characterization…………………………………………. 69
II.4.b. Electrochemical characterization………………………………….. 71
II.4.c. System characterization……………………………………………. 73
II.4.d. Continuum modeling………………………………………………. 76
xxxxxxxxxxxxxxxxxxxxxxxxxxxxxxxxxxxxxxxxxxxxxxxxxxxxxxxxxxxxxXxxxxxX

52
II.1. Electrode fabrication process
Two electrode fabrication processes have been tested to design electrodes for LABs.
Initially, electrodes were produced using dip-coating process. Then, another process was
scrutinized to enhance the gravimetric energy density by moving from thin toward thick
electrodes fabrication. As oxygen diffusion limitation could get worse with the rise of the
electrode thickness, the studied process had been chiefly selected as it allows mastering the
electrode porosity. Such fabrication process is usually known in LIB field as the Bellcore
process.136
In the following part, the various components of the formulations prepared will be
described. Later, the aforementioned electrode fabrication processes will be reported. Once
electrode fabrication will be well defined, battery assembling will be uncovered. Finally, the
characterization techniques performed to evaluate the properties and performances of the
different electrodes and battery cells will be disclosed.
II.1.a. Electrode materials
Carbons
As previously argued, carbon-based electrodes had been selected for this study. Among the
several types of carbon, Ketjen Black (EC600-JD, Akzo Nobel) was considered due to its low
particle size. Also, previous continuum modeling at LRCS predicted that higher properties
would be reached compared to Carbon SP, usually picked over for such application (Figure II.
1).128 For comparison, Carbon SP (C.NERGY, Imerys) and Graphite (TIMCAL SLP50, Imerys)
were also chosen as electrode materials.
Figure II. 1: Modeling of Ketjen Black based LABs
discharge capacities compared to Carbon SP based
ones.128
53
As carbon substrate strongly influences the discharge product202 and due to the high
surface developed, likely to adsorb many unwanted species, Ketjen Black and Carbon SP were
dried at 300°C under vacuum overnight and then stored in an oven at 50 °C until use.
Binders
Different binders were used depending on the electrode fabrication process, as well as the
battery components compatibility. Initially, dip-coated electrode fabrication process was
implemented by previous LRCS studies for LABs electrodes fabrication. To guarantee cohesive
electrodes, PVdF (Kynar, Arkema) was then chosen as the binder. Unfortunately, while
electrodes were immerged in DMSO, which was at this time the electrolyte solvent,
disintegration of the electrode was observed. Such behavior can be explained by the solubility
of PVdF in polar solvents like DMSO or DMF,203 PVdF was then solubilized in the electrolyte
and the electrode cohesiveness was not ensured anymore. To overcome this issue, PVdF was
replaced in dip-coated electrode fabrication process by PTFE.
Later, flexible electrodes were again based on PVdF. More precisely a copolymer of
PVdF, named PVdF-HFP (Kynar Flex 2801, Arkema), was selected due to its lower
crystallinity ratio and melting temperature compared to PVdF itself.204 Thanks to its amorphous
domain a lot of electrolyte can be stored and its crystallinity parts help formation of self-
standing electrodes. According to literature, this binder is one the most stable and can be cycled
at high voltage (until 5 V).136,205 For all these reasons, its use was spread in LIB field to produce
flexible electrode films136–140 and thus was transposed in this study to LABs electrode
fabrication. Compatibility of electrode binder versus electrolyte solvent was insured in this part
of the study as DMSO was replaced by glymes.
Nonetheless, it worth points out that Black et al. highlighted the instability of PVdF
toward superoxide species.202 The binder could have then impacted the battery stability even if
such observation was not made here. Also, along the experiments, electrodes cohesiveness
seemed to be always maintained with the PVdF-HFP/glyme couple.
Solvent for slurry preparation
In order to prepare the different electrodes, the powders (carbons and binders) were stirred
in different solvents depending on the fabrication process taken into consideration.
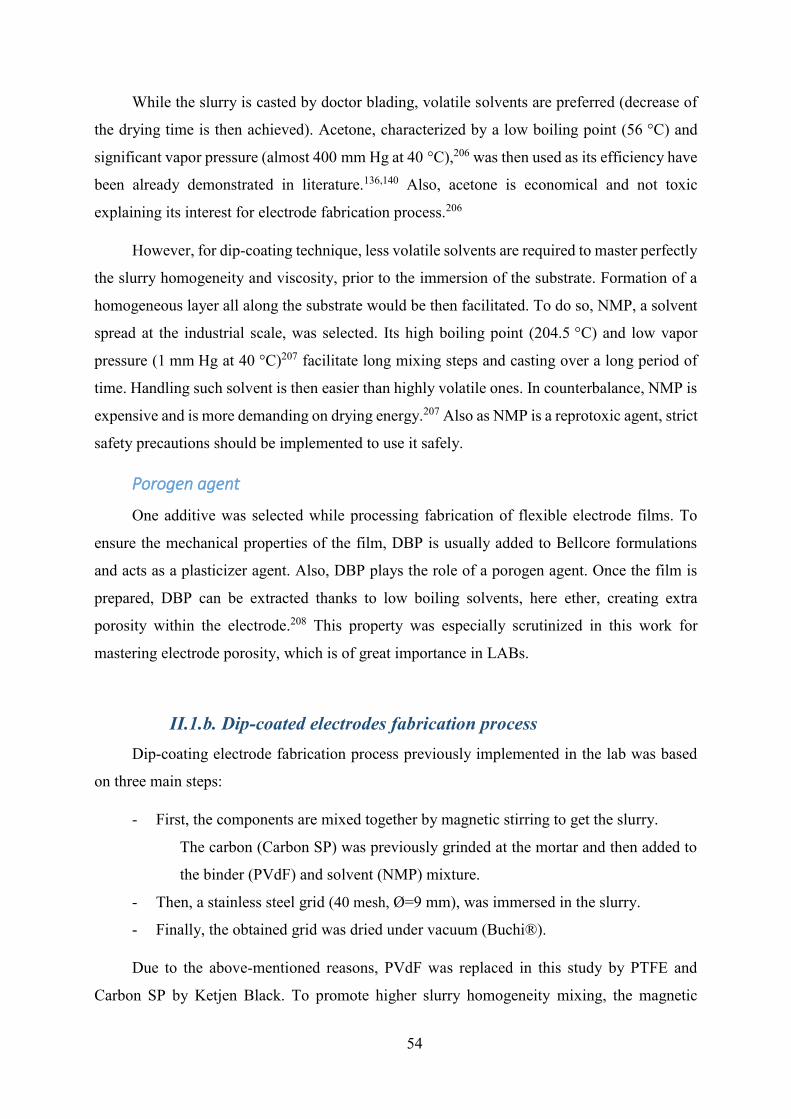
54
While the slurry is casted by doctor blading, volatile solvents are preferred (decrease of
the drying time is then achieved). Acetone, characterized by a low boiling point (56 °C) and
significant vapor pressure (almost 400 mm Hg at 40 °C),206 was then used as its efficiency have
been already demonstrated in literature.136,140 Also, acetone is economical and not toxic
explaining its interest for electrode fabrication process.206
However, for dip-coating technique, less volatile solvents are required to master perfectly
the slurry homogeneity and viscosity, prior to the immersion of the substrate. Formation of a
homogeneous layer all along the substrate would be then facilitated. To do so, NMP, a solvent
spread at the industrial scale, was selected. Its high boiling point (204.5 °C) and low vapor
pressure (1 mm Hg at 40 °C)207 facilitate long mixing steps and casting over a long period of
time. Handling such solvent is then easier than highly volatile ones. In counterbalance, NMP is
expensive and is more demanding on drying energy.207 Also as NMP is a reprotoxic agent, strict
safety precautions should be implemented to use it safely.
Porogen agent
One additive was selected while processing fabrication of flexible electrode films. To
ensure the mechanical properties of the film, DBP is usually added to Bellcore formulations
and acts as a plasticizer agent. Also, DBP plays the role of a porogen agent. Once the film is
prepared, DBP can be extracted thanks to low boiling solvents, here ether, creating extra
porosity within the electrode.208 This property was especially scrutinized in this work for
mastering electrode porosity, which is of great importance in LABs.
II.1.b. Dip-coated electrodes fabrication process
Dip-coating electrode fabrication process previously implemented in the lab was based
on three main steps:
- First, the components are mixed together by magnetic stirring to get the slurry.
The carbon (Carbon SP) was previously grinded at the mortar and then added to
the binder (PVdF) and solvent (NMP) mixture.
- Then, a stainless steel grid (40 mesh, Ø=9 mm), was immersed in the slurry.
- Finally, the obtained grid was dried under vacuum (Buchi®).
Due to the above-mentioned reasons, PVdF was replaced in this study by PTFE and
Carbon SP by Ketjen Black. To promote higher slurry homogeneity mixing, the magnetic
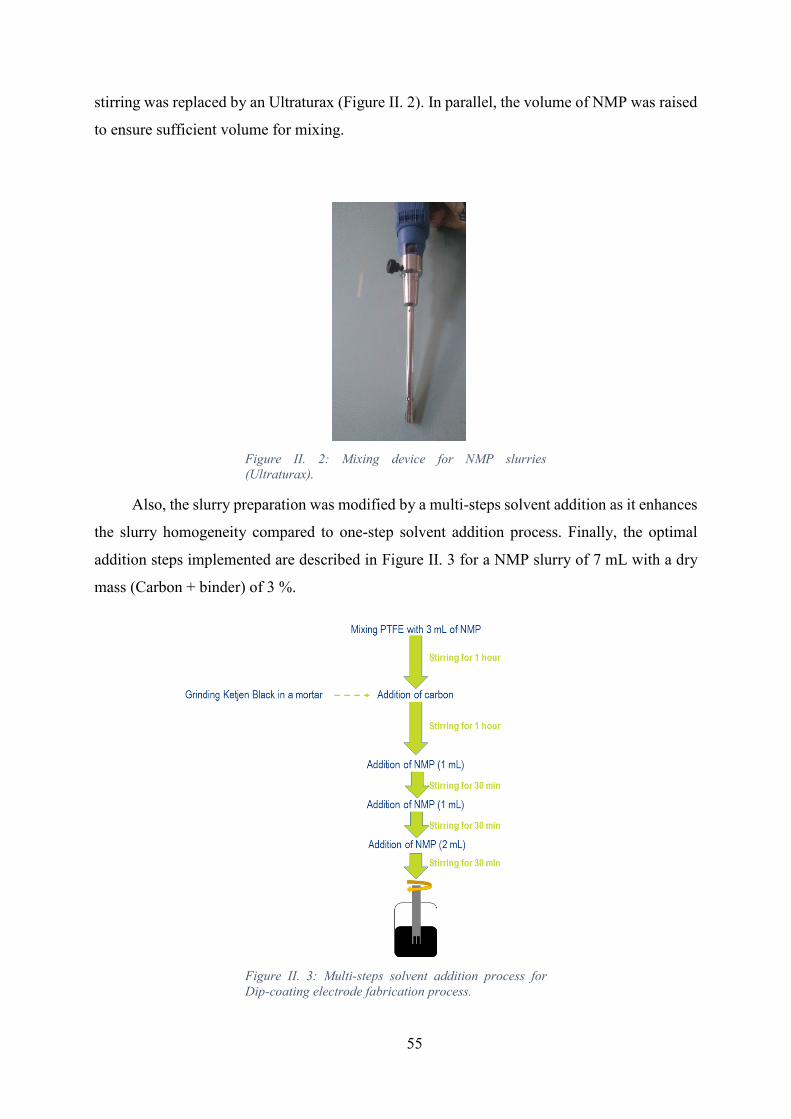
55
stirring was replaced by an Ultraturax (Figure II. 2). In parallel, the volume of NMP was raised
to ensure sufficient volume for mixing.
Figure II. 2: Mixing device for NMP slurries
(Ultraturax).
Also, the slurry preparation was modified by a multi-steps solvent addition as it enhances
the slurry homogeneity compared to one-step solvent addition process. Finally, the optimal
addition steps implemented are described in Figure II. 3 for a NMP slurry of 7 mL with a dry
mass (Carbon + binder) of 3 %.
Figure II. 3: Multi-steps solvent addition process for
Dip-coating electrode fabrication process.
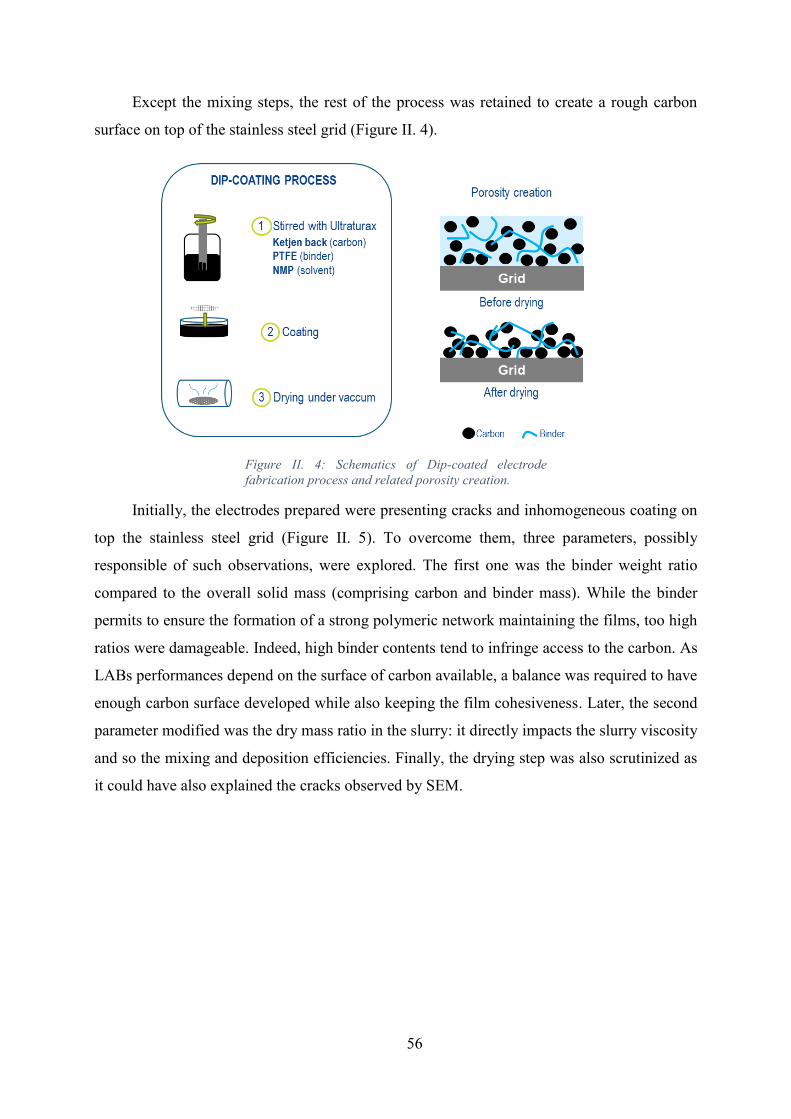
56
Except the mixing steps, the rest of the process was retained to create a rough carbon
surface on top of the stainless steel grid (Figure II. 4).
Figure II. 4: Schematics of Dip-coated electrode
fabrication process and related porosity creation.
Initially, the electrodes prepared were presenting cracks and inhomogeneous coating on
top the stainless steel grid (Figure II. 5). To overcome them, three parameters, possibly
responsible of such observations, were explored. The first one was the binder weight ratio
compared to the overall solid mass (comprising carbon and binder mass). While the binder
permits to ensure the formation of a strong polymeric network maintaining the films, too high
ratios were damageable. Indeed, high binder contents tend to infringe access to the carbon. As
LABs performances depend on the surface of carbon available, a balance was required to have
enough carbon surface developed while also keeping the film cohesiveness. Later, the second
parameter modified was the dry mass ratio in the slurry: it directly impacts the slurry viscosity
and so the mixing and deposition efficiencies. Finally, the drying step was also scrutinized as
it could have also explained the cracks observed by SEM.

57
Figure II. 5: Observation of the dip-coating process
issues to overcome a) aggregates and inhomogeneous
coating on top of the stainless steel grid b) cracks in the
coating.
To quickly test the effects of the various parameters impacting the grid coating efficiency,
a reduced experimental plan was implemented. As illustrated in Figure II. 6, the plan enables
to uncorrelate each parameter implication.
To create a film able to mold the grid shape and be maintained, the binder amount was
adjusted. Still, as formulation with low binder amount were preferred from gravimetric energy
density, lower and upper ratios were tested. In the case of 5 wt%, the coating was not improved.
In the contrary, 15 wt% of binder led to higher aggregation (Figure II. 7). Then only improving
the binder ratio was not sufficient.
Figure II. 6: Experimental plan design to test the several
parameters impacting the grid coating efficiency. The
reference parameters are highlighted in dark blue.
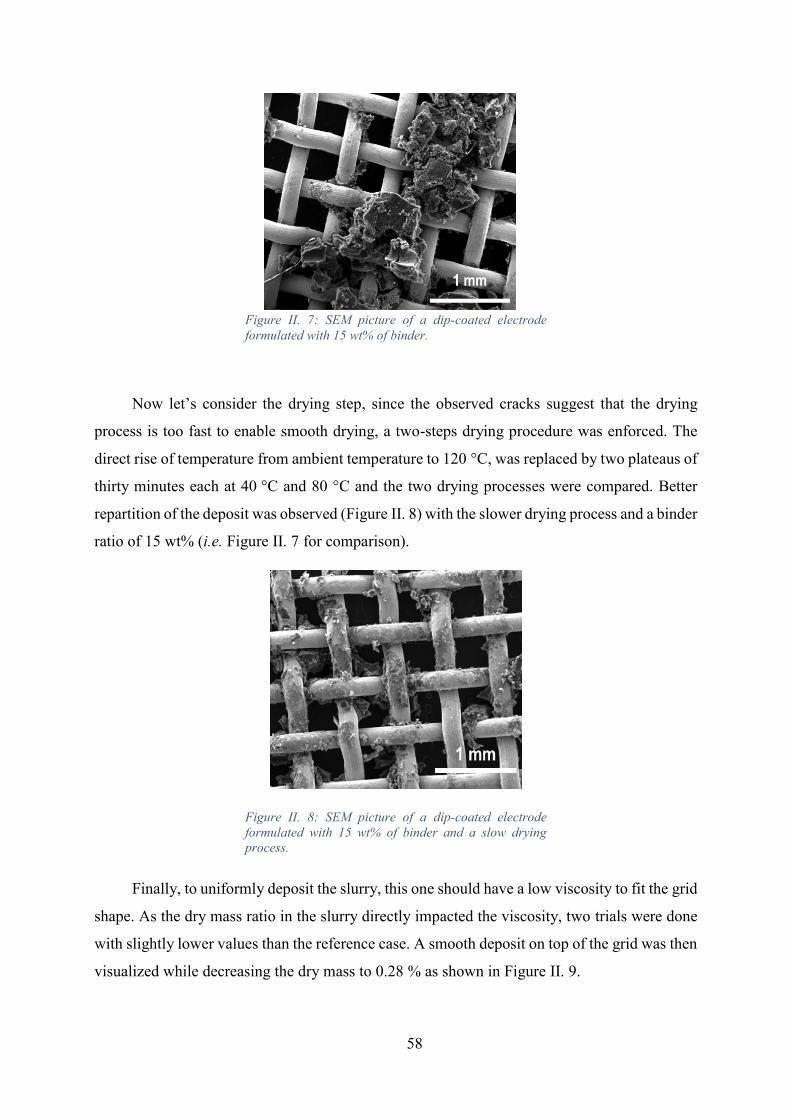
58
Figure II. 7: SEM picture of a dip-coated electrode
formulated with 15 wt% of binder.
Now let’s consider the drying step, since the observed cracks suggest that the drying
process is too fast to enable smooth drying, a two-steps drying procedure was enforced. The
direct rise of temperature from ambient temperature to 120 °C, was replaced by two plateaus of
thirty minutes each at 40 °C and 80 °C and the two drying processes were compared. Better
repartition of the deposit was observed (Figure II. 8) with the slower drying process and a binder
ratio of 15 wt% (i.e. Figure II. 7 for comparison).
Figure II. 8: SEM picture of a dip-coated electrode
formulated with 15 wt% of binder and a slow drying
process.
Finally, to uniformly deposit the slurry, this one should have a low viscosity to fit the grid
shape. As the dry mass ratio in the slurry directly impacted the viscosity, two trials were done
with slightly lower values than the reference case. A smooth deposit on top of the grid was then
visualized while decreasing the dry mass to 0.28 % as shown in Figure II. 9.

59
Figure II. 9: SEM pictures of a dip-coated electrode at
different scale for a formulation with a dry mass of
0.28 %.
Further results, presented in Chapter IV, were acquired with the optimal combination of
the formulation parameters, that is to say with the higher binder ratio (15 w%), the slow drying
process and the lower dry mass (2.8 %).
II.1.c. Porous flexible electrodes fabrication process
Porous flexible electrode fabrication process was largely used in battery field as it enables
to easily create thick and flexible porous electrodes. It is based on five main steps:
- First, the following components are mixed by magnetic stirring: active material,
binder, DBP and acetone. Before stirring the components together, the powders
(active material and binder) are ground in a mortar to break the aggregates.
- Later, the slurry is deposited on a Mylar foil by doctor blading.
- The film detached from the Mylar foil is then dried at ambient temperature
- The obtained film is laminated with a current collector, to ensure good contact.
- Finally, the film is soaked three times during fifteen minutes in ether, to remove the
porogen agent and this way to create the porosity. As porosity formation relies on a
dissolution-driven process it implies potentially the porosity created is fully
accessible.

60
In an attempt to design porous LABs electrode, based on Ketjen Black, the formulation
corresponding to negative graphite electrodes (with low BET value) was selected as a starting
point and then transposed to Ketjen Black. Due to the use of highly divided carbon, the electrode
formulation had to be accordingly adapted, in particular the binder content was adjusted
(increased > 20 %)..
For the same reasons, the amount of solvent had to be customized to fluidify the slurry
which became more viscous with Ketjen Black than with graphite. If the slurry is too viscous,
the magnetic stirring cannot mix properly. On the reverse, a too fluid slurry will easily spread
and a thick layer cannot be achieved.
Several trials were also carried on to fix the optimal mixing time (1h30), as well as the
blade gap to apply during doctor-blading casting (400 µm).
Once the modification operated, the films flued significantly during the laminating step
decrease the thickness of the films. As the aim was here to explore the porosity creation inside
thick self-standing films, the lamination step was not required and so not applied in the
following study. The final fabrication process applied is described in Figure II. 10.
Figure II. 10: Schematics of the flexible electrodes
fabrication process and related porosity creation.
Once the film was dried, the porosity creation was achieved by leaching DBP out of the
film by soaking it in ether. The Bellcore process advocates the use of three consecutive
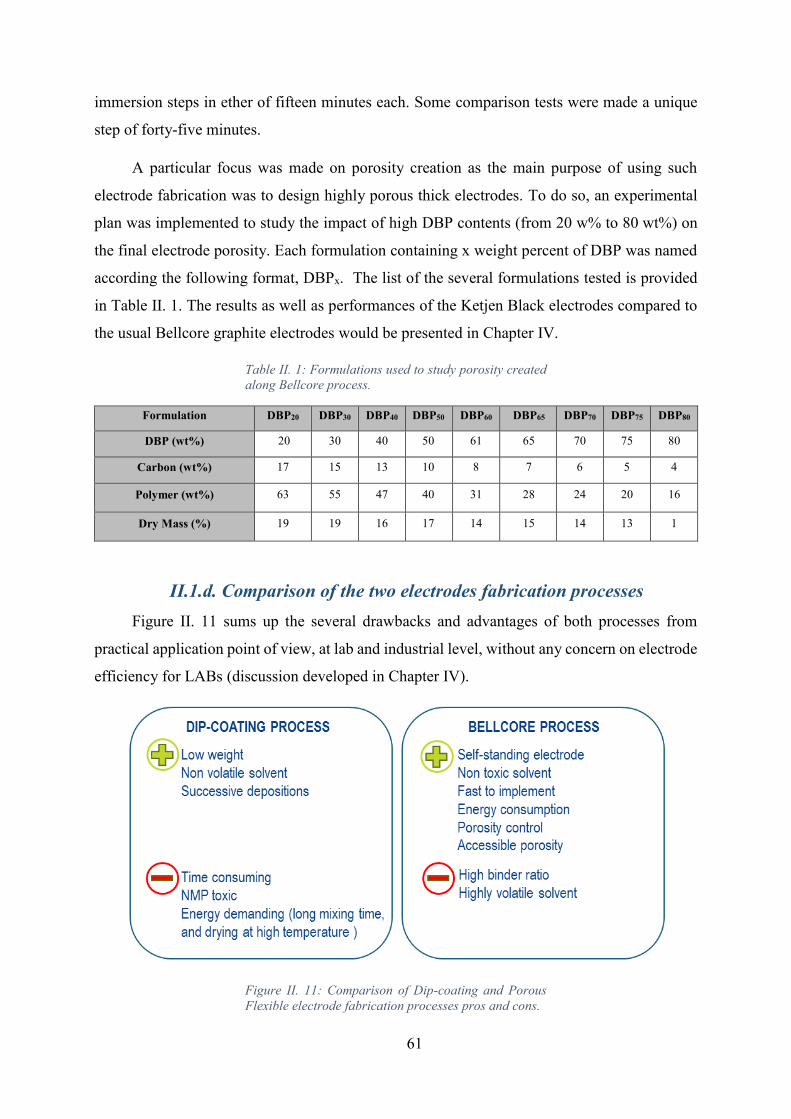
61
immersion steps in ether of fifteen minutes each. Some comparison tests were made a unique
step of forty-five minutes.
A particular focus was made on porosity creation as the main purpose of using such
electrode fabrication was to design highly porous thick electrodes. To do so, an experimental
plan was implemented to study the impact of high DBP contents (from 20 w% to 80 wt%) on
the final electrode porosity. Each formulation containing x weight percent of DBP was named
according the following format, DBPx. The list of the several formulations tested is provided
in Table II. 1. The results as well as performances of the Ketjen Black electrodes compared to
the usual Bellcore graphite electrodes would be presented in Chapter IV.
Table II. 1: Formulations used to study porosity created
along Bellcore process.
Formulation DBP20 DBP30 DBP40 DBP50 DBP60 DBP65 DBP70 DBP75 DBP80
DBP (wt%) 20 30 40 50 61 65 70 75 80
Carbon (wt%) 17 15 13 10 8 7 6 5 4
Polymer (wt%) 63 55 47 40 31 28 24 20 16
Dry Mass (%) 19 19 16 17 14 15 14 13 1
II.1.d. Comparison of the two electrodes fabrication processes
Figure II. 11 sums up the several drawbacks and advantages of both processes from
practical application point of view, at lab and industrial level, without any concern on electrode
efficiency for LABs (discussion developed in Chapter IV).
Figure II. 11: Comparison of Dip-coating and Porous
Flexible electrode fabrication processes pros and cons.

62
While the dip-coating process permits to produce light electrodes with a thin carbon
deposit on top of a stainless steel grid, the Bellcore process leads to thick self-standing
electrodes.
To create a textured electrode, multilayers depositions can be envisaged with both
processes. Still, practical application revealed difficulties to ensure that laminated films were
well superposed (films with distinct porogen agent ratios flowed differently during lamination).
Consequently, dip-coating process only enables multi-coatings. However, with dip-coating
only thin deposits are created. To design textured thick electrodes, porous flexible electrode
process was then the more suitable and easy to implement.
From industrial point of view, the difference between the two processes relies on the
solvent nature. Even though dip-coating facilitates the casting steps as it is not volatile, its use
is dangerous due to its chemical nature. On the reverse, porous flexible electrode process is
safer. Still, solvent evaporation is a concern all along the fabrication process.
Finally, the main drawback of the dip-coating technique, absent with the Bellcore process,
is the amount of energy required for mixing and drying. In parallel, in Bellcore process, higher
ratio of binder is required when the electrodes are based on highly divided carbon.
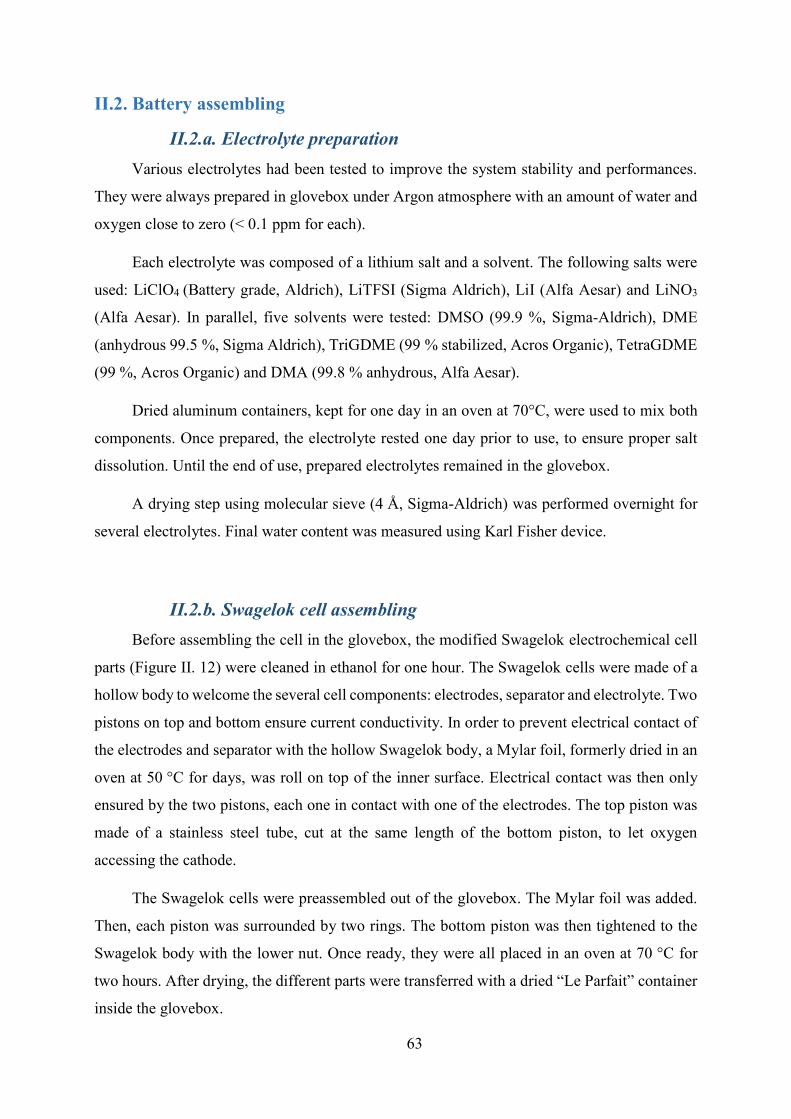
63
II.2. Battery assembling
II.2.a. Electrolyte preparation
Various electrolytes had been tested to improve the system stability and performances.
They were always prepared in glovebox under Argon atmosphere with an amount of water and
oxygen close to zero (< 0.1 ppm for each).
Each electrolyte was composed of a lithium salt and a solvent. The following salts were
used: LiClO4 (Battery grade, Aldrich), LiTFSI (Sigma Aldrich), LiI (Alfa Aesar) and LiNO3
(Alfa Aesar). In parallel, five solvents were tested: DMSO (99.9 %, Sigma-Aldrich), DME
(anhydrous 99.5 %, Sigma Aldrich), TriGDME (99 % stabilized, Acros Organic), TetraGDME
(99 %, Acros Organic) and DMA (99.8 % anhydrous, Alfa Aesar).
Dried aluminum containers, kept for one day in an oven at 70°C, were used to mix both
components. Once prepared, the electrolyte rested one day prior to use, to ensure proper salt
dissolution. Until the end of use, prepared electrolytes remained in the glovebox.
A drying step using molecular sieve (4 Å, Sigma-Aldrich) was performed overnight for
several electrolytes. Final water content was measured using Karl Fisher device.
II.2.b. Swagelok cell assembling
Before assembling the cell in the glovebox, the modified Swagelok electrochemical cell
parts (Figure II. 12) were cleaned in ethanol for one hour. The Swagelok cells were made of a
hollow body to welcome the several cell components: electrodes, separator and electrolyte. Two
pistons on top and bottom ensure current conductivity. In order to prevent electrical contact of
the electrodes and separator with the hollow Swagelok body, a Mylar foil, formerly dried in an
oven at 50 °C for days, was roll on top of the inner surface. Electrical contact was then only
ensured by the two pistons, each one in contact with one of the electrodes. The top piston was
made of a stainless steel tube, cut at the same length of the bottom piston, to let oxygen
accessing the cathode.
The Swagelok cells were preassembled out of the glovebox. The Mylar foil was added.
Then, each piston was surrounded by two rings. The bottom piston was then tightened to the
Swagelok body with the lower nut. Once ready, they were all placed in an oven at 70 °C for
two hours. After drying, the different parts were transferred with a dried “Le Parfait” container
inside the glovebox.
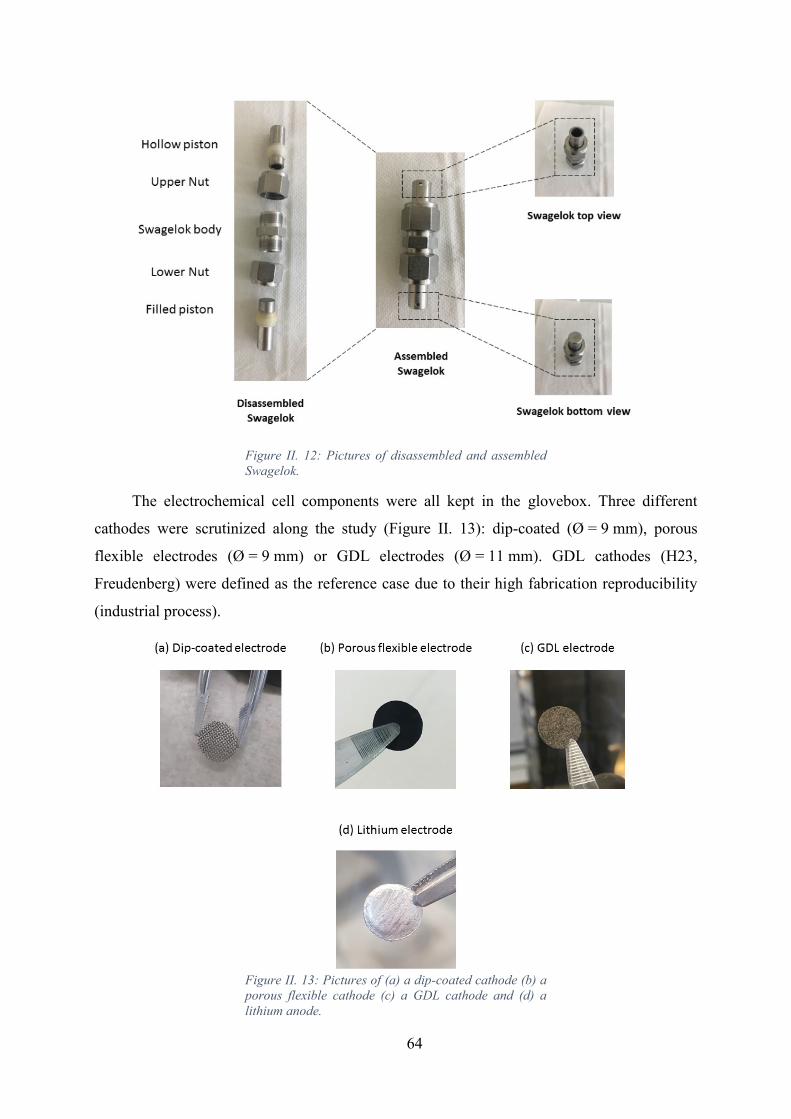
64
Figure II. 12: Pictures of disassembled and assembled
Swagelok.
The electrochemical cell components were all kept in the glovebox. Three different
cathodes were scrutinized along the study (Figure II. 13): dip-coated (Ø = 9 mm), porous
flexible electrodes (Ø = 9 mm) or GDL electrodes (Ø = 11 mm). GDL cathodes (H23,
Freudenberg) were defined as the reference case due to their high fabrication reproducibility
(industrial process).
Figure II. 13: Pictures of (a) a dip-coated cathode (b) a
porous flexible cathode (c) a GDL cathode and (d) a
lithium anode.
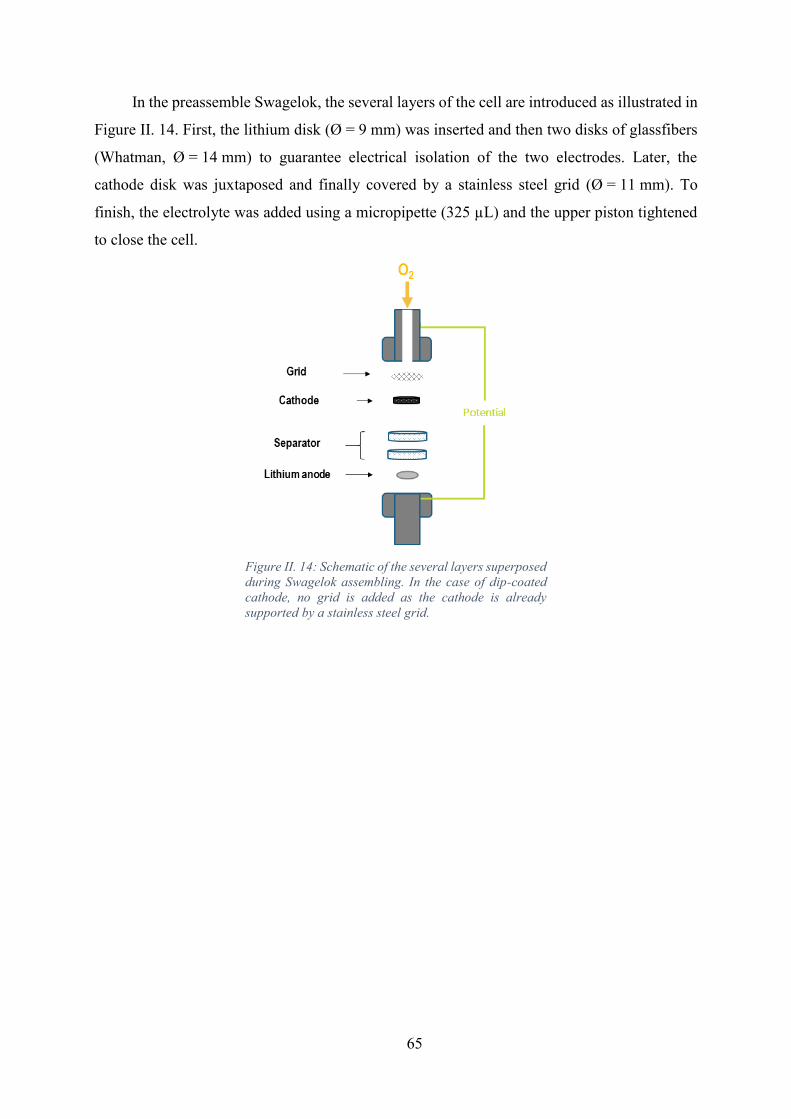
65
In the preassemble Swagelok, the several layers of the cell are introduced as illustrated in
Figure II. 14. First, the lithium disk (Ø = 9 mm) was inserted and then two disks of glassfibers
(Whatman, Ø = 14 mm) to guarantee electrical isolation of the two electrodes. Later, the
cathode disk was juxtaposed and finally covered by a stainless steel grid (Ø = 11 mm). To
finish, the electrolyte was added using a micropipette (325 µL) and the upper piston tightened
to close the cell.
Figure II. 14: Schematic of the several layers superposed
during Swagelok assembling. In the case of dip-coated
cathode, no grid is added as the cathode is already
supported by a stainless steel grid.
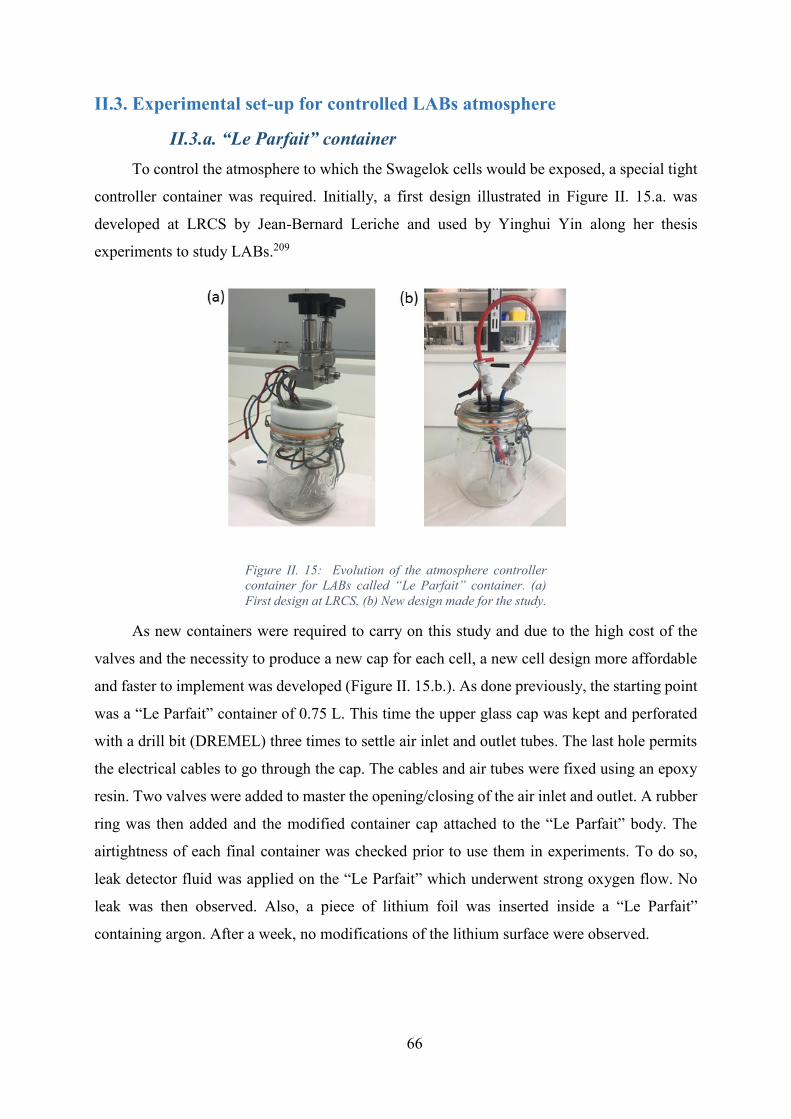
66
II.3. Experimental set-up for controlled LABs atmosphere
II.3.a. “Le Parfait” container
To control the atmosphere to which the Swagelok cells would be exposed, a special tight
controller container was required. Initially, a first design illustrated in Figure II. 15.a. was
developed at LRCS by Jean-Bernard Leriche and used by Yinghui Yin along her thesis
experiments to study LABs.209
Figure II. 15: Evolution of the atmosphere controller
container for LABs called “Le Parfait” container. (a)
First design at LRCS, (b) New design made for the study.
As new containers were required to carry on this study and due to the high cost of the
valves and the necessity to produce a new cap for each cell, a new cell design more affordable
and faster to implement was developed (Figure II. 15.b.). As done previously, the starting point
was a “Le Parfait” container of 0.75 L. This time the upper glass cap was kept and perforated
with a drill bit (DREMEL) three times to settle air inlet and outlet tubes. The last hole permits
the electrical cables to go through the cap. The cables and air tubes were fixed using an epoxy
resin. Two valves were added to master the opening/closing of the air inlet and outlet. A rubber
ring was then added and the modified container cap attached to the “Le Parfait” body. The
airtightness of each final container was checked prior to use them in experiments. To do so,
leak detector fluid was applied on the “Le Parfait” which underwent strong oxygen flow. No
leak was then observed. Also, a piece of lithium foil was inserted inside a “Le Parfait”
containing argon. After a week, no modifications of the lithium surface were observed.

67
Once the Swagelok were assembled in the glovebox, they were connected to the inner
cables of the “Le Parfait” container. The valve and cap of “Le Parfait” were then closed and the
system can be safely removed from the glovebox with a controlled inert atmosphere (argon).
II.3.b. Gas flow system
The last part missing for controlling the atmosphere to which the cells are exposed is the
gas flow system. A first simple system was then built to enable oxygen flow (Figure II. 16). A
flowmeter, added to settle the pressure gauge of the oxygen lab outlet, ensured the same flow
is applied. A blubber, at the end of the gas flow system, infringed gas reflux and so
contaminations from the lab atmosphere.
Figure II. 16: Schematic of the oxygen flow system.
To simulate real atmosphere and the presence of nitrogen, the gas system flow was
slightly modified to facilitate oxygen/azote mixing. As only one flowmeter was available, each
gas pressure gauges was fixed using the flowmeter to reach the required gas flow. Then, both
gas outlets were fixed to the gas mixing system as described in Figure II. 17 .
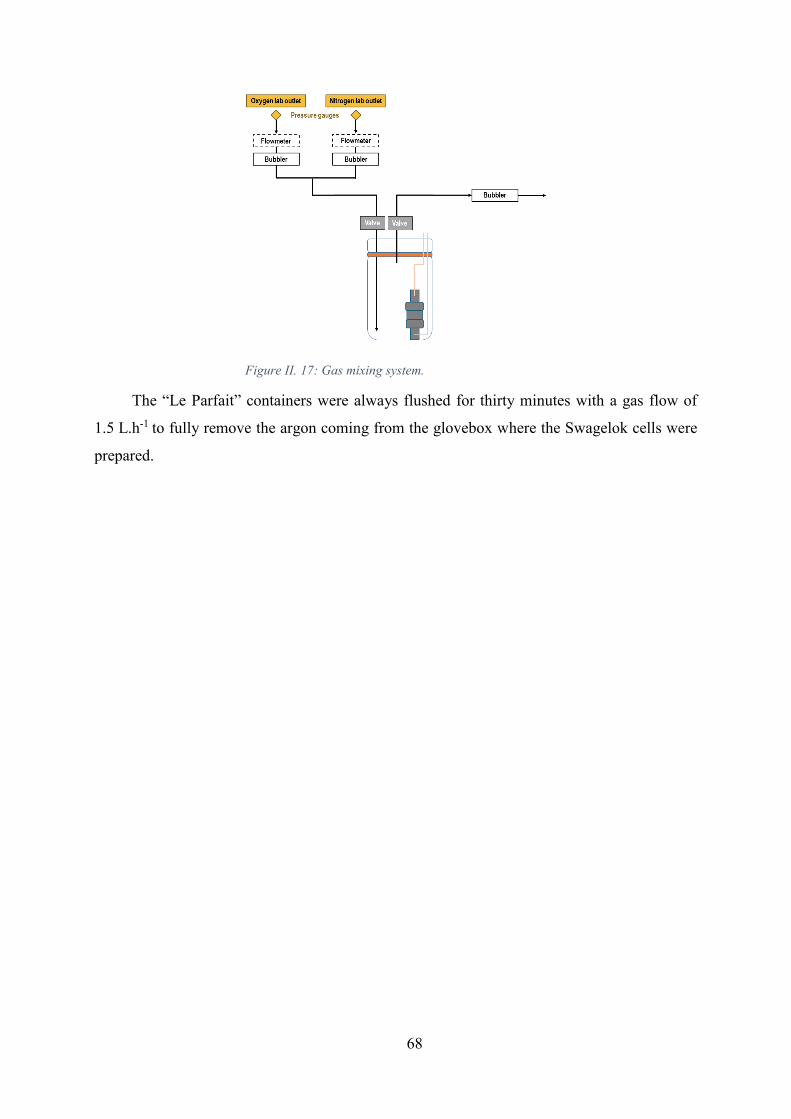
68
Figure II. 17: Gas mixing system.
The “Le Parfait” containers were always flushed for thirty minutes with a gas flow of
1.5 L.h-1 to fully remove the argon coming from the glovebox where the Swagelok cells were
prepared.
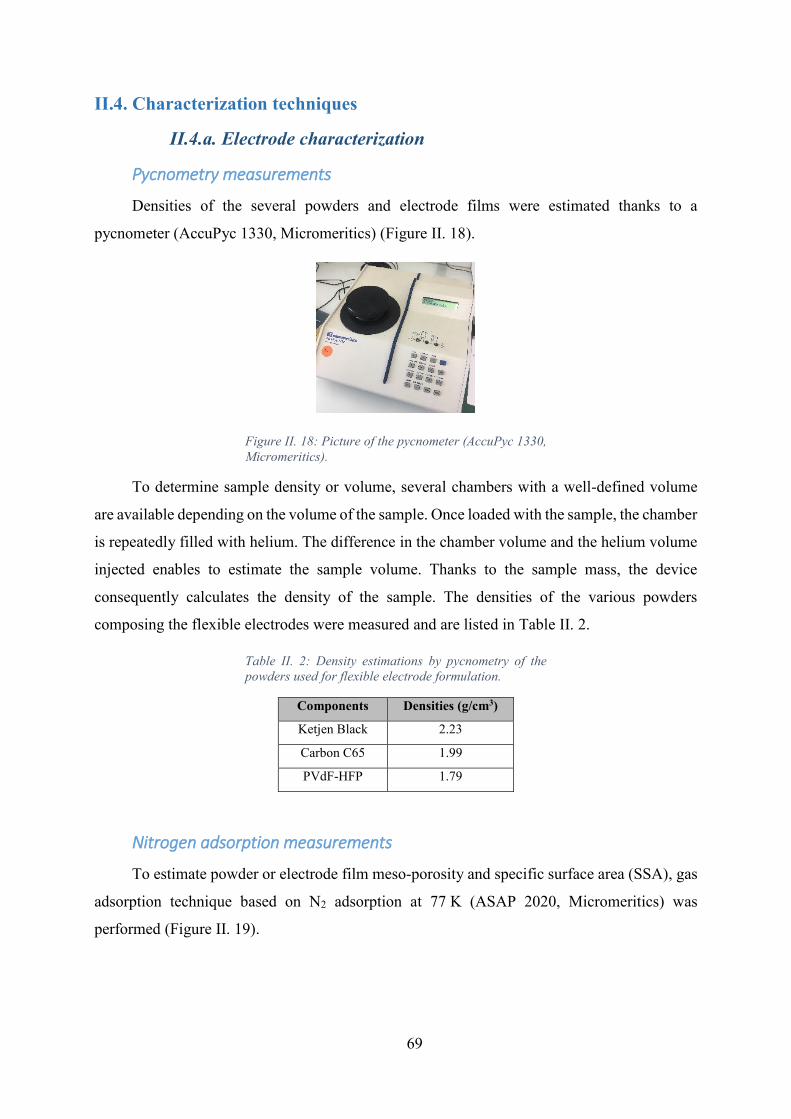
69
II.4. Characterization techniques
II.4.a. Electrode characterization
Pycnometry measurements
Densities of the several powders and electrode films were estimated thanks to a
pycnometer (AccuPyc 1330, Micromeritics) (Figure II. 18).
Figure II. 18: Picture of the pycnometer (AccuPyc 1330,
Micromeritics).
To determine sample density or volume, several chambers with a well-defined volume
are available depending on the volume of the sample. Once loaded with the sample, the chamber
is repeatedly filled with helium. The difference in the chamber volume and the helium volume
injected enables to estimate the sample volume. Thanks to the sample mass, the device
consequently calculates the density of the sample. The densities of the various powders
composing the flexible electrodes were measured and are listed in Table II. 2.
Table II. 2: Density estimations by pycnometry of the
powders used for flexible electrode formulation.
Components Densities (g/cm3)
Ketjen Black 2.23
Carbon C65 1.99
PVdF-HFP 1.79
Nitrogen adsorption measurements
To estimate powder or electrode film meso-porosity and specific surface area (SSA), gas
adsorption technique based on N2 adsorption at 77 K (ASAP 2020, Micromeritics) was
performed (Figure II. 19).
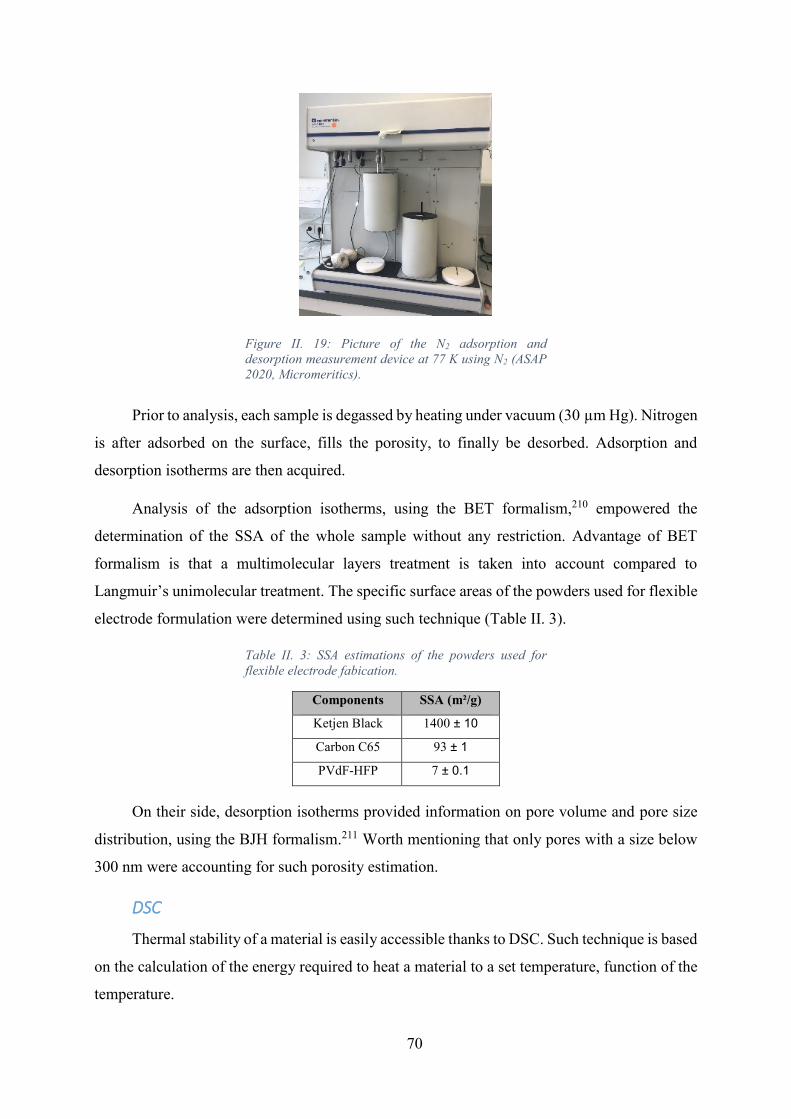
70
Figure II. 19: Picture of the N2 adsorption and
desorption measurement device at 77 K using N2 (ASAP
2020, Micromeritics).
Prior to analysis, each sample is degassed by heating under vacuum (30 µm Hg). Nitrogen
is after adsorbed on the surface, fills the porosity, to finally be desorbed. Adsorption and
desorption isotherms are then acquired.
Analysis of the adsorption isotherms, using the BET formalism,210 empowered the
determination of the SSA of the whole sample without any restriction. Advantage of BET
formalism is that a multimolecular layers treatment is taken into account compared to
Langmuir’s unimolecular treatment. The specific surface areas of the powders used for flexible
electrode formulation were determined using such technique (Table II. 3).
Table II. 3: SSA estimations of the powders used for
flexible electrode fabication.
Components SSA (m²/g)
Ketjen Black 1400 ± 10
Carbon C65 93 ± 1
PVdF-HFP 7 ± 0.1
On their side, desorption isotherms provided information on pore volume and pore size
distribution, using the BJH formalism.211 Worth mentioning that only pores with a size below
300 nm were accounting for such porosity estimation.
DSC
Thermal stability of a material is easily accessible thanks to DSC. Such technique is based
on the calculation of the energy required to heat a material to a set temperature, function of the
temperature.

71
To process accurate SSA measurements on flexible electrode films, the thermal stability
of the polymer during degassing step should be ensured. DSC measurements were then
implemented on PVdF-HFP to be sure that the films meso-porosity was not modified by the
polymer melting during the ASAP degassing step. The thermal analysis of the binder from
25 °C to 250 °C, revealed that the onset for PVdF-HFP melting is around 115 °C (Table II. 3).
So, the degassing was systematically performed at 95 °C.
Figure II. 20: DSC curve of PVdF-HFP carried on at 5
K/min from 25 °C to 250 °C.
II.4.b. Electrochemical characterization
Galvanostatic cycling
To estimate the electrochemical response of the LABs cells, galvanostatic cycling were
performed on a VSP (Bio-Logic) (Figure II. 21).
Figure II. 21: Picture of VSP (Bio-Logic).

72
The cycling parameters were settled using GCPL programs. Initially, cells voltages were
recorded for two hours while the cells were resting. Then, discharge and later charge protocols
were launched until their voltage cutoff were reached. For the first experiments, the voltage
cutoffs were set at 2 V and 4.5 V respectively. Later in the study, to access the effect of
temperature on performances, the VSP was coupled to an oven (Pol-Eko Aparatura Simple) to
set and maintained the cell temperature.
Polarization measurements
Electrolyte stability vs lithium was evaluated using polarization measurements (VSP,
Bio-Logic)). Polarization is a galvanostatic technique based on the successive application of
opposite current steps. Symmetric cells made of two lithium disks (Ø = 9 mm) separated by
two separators disks (Ø = 14 mm) soaked in electrolyte. In the current study, repetition of
current steps of 25 µA and – 25 µA was applied, each one lasting for two hours (e.g. Figure II.
22).
Figure II. 22: Polarization tests for
DMSO + 1 M LiCLO4 as the electrolyte. Succession of
current steps at 25 µA and -25 µA, each for 2 hours.
SEI formation can be tracked by polarization technique, as it results in an increase of the
cell resistance and so a rise of the gap between positive and negative plateaus. Once formed,
the gap should remain stable except if parasitic reactions are taking place.

73
The constant increase of the gap between the plateaus and the non-planar shape of
potential response, in the case of DMSO / 1 M LiClO4, highlighted the instability of the
electrolyte with lithium. Such instability was corroborated by the literature as DMSO is not
stable versus lithium, as formerly mentioned in Chapter I.
II.4.c. System characterization
SEM imaging & EDX Spectrometry
To get information on the surface of the electrodes studied and after galvanostatic cycling,
SEM was performed using the ETD (Everhart-Thornley Detector) in high vaccuum (FEI
Quanta 200F) at high voltage (20 kV for all samples). This microscopy technique is based on
the projection of an electron beam on a sample. Interaction of the electrons with the sample is
related to its topography and composition of the exposed sample. SEM images, as the one
illustrated in Figure II. 23, are then reconstructed and analyzed. Studied surface should be
conductive to get clear picture. On the opposite, nonconductive surface will lead to blurry and
white contrast.
Figure II. 23: Pristine GDL SEM picture.
Chemical microanalysis is possibly accomplished thanks to EDX (INCA Oxford
Instruments) combined to the INCA software. A mapping of the chemical components can be
disclosed as the one shown in Figure II. 24. Also, all the elements with an atomic number higher
than 11 can be quantified using this technique.
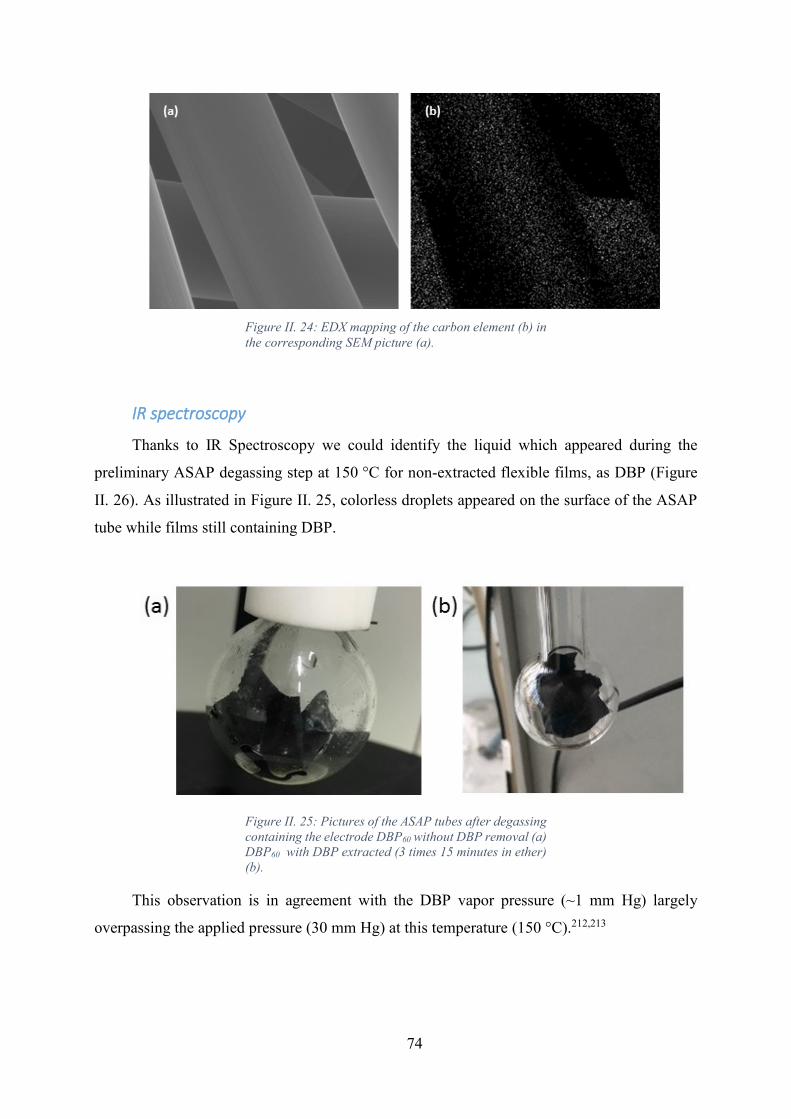
74
Figure II. 24: EDX mapping of the carbon element (b) in
the corresponding SEM picture (a).
IR spectroscopy
Thanks to IR Spectroscopy we could identify the liquid which appeared during the
preliminary ASAP degassing step at 150 °C for non-extracted flexible films, as DBP (Figure
II. 26). As illustrated in Figure II. 25, colorless droplets appeared on the surface of the ASAP
tube while films still containing DBP.
Figure II. 25: Pictures of the ASAP tubes after degassing
containing the electrode DBP60 without DBP removal (a)
DBP60 with DBP extracted (3 times 15 minutes in ether)
(b).
This observation is in agreement with the DBP vapor pressure (~1 mm Hg) largely
overpassing the applied pressure (30 mm Hg) at this temperature (150 °C).212,213
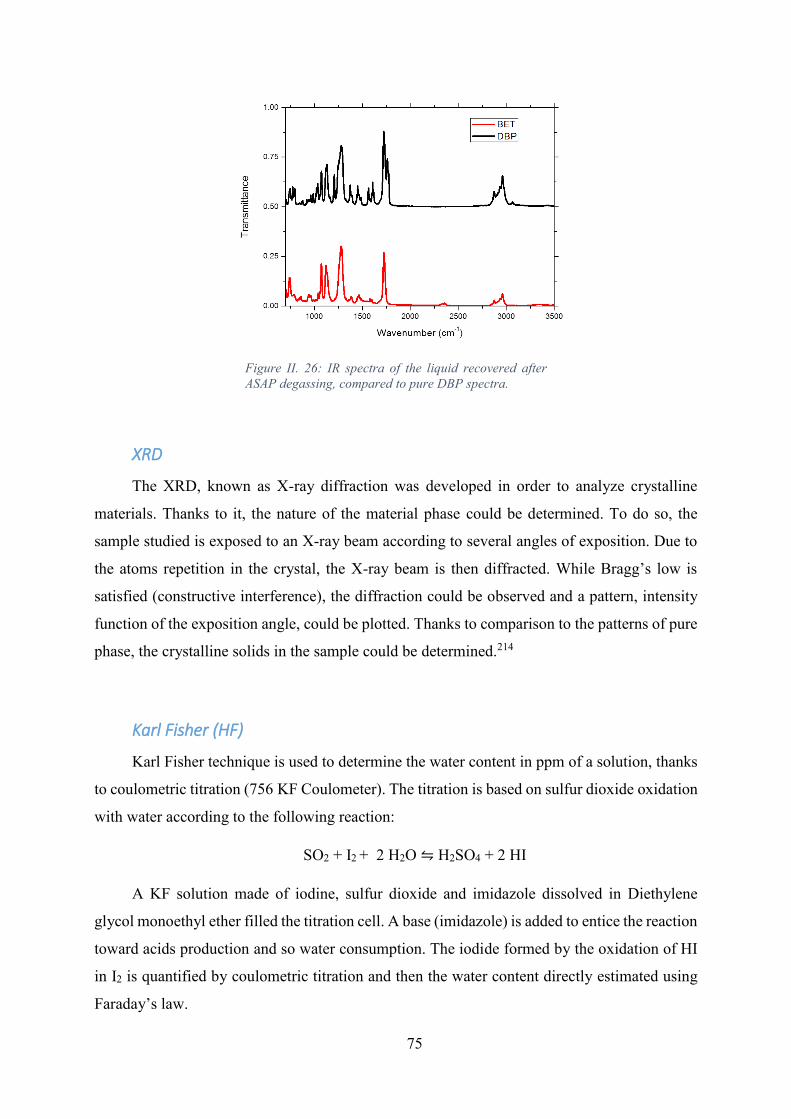
75
Figure II. 26: IR spectra of the liquid recovered after
ASAP degassing, compared to pure DBP spectra.
XRD
The XRD, known as X-ray diffraction was developed in order to analyze crystalline
materials. Thanks to it, the nature of the material phase could be determined. To do so, the
sample studied is exposed to an X-ray beam according to several angles of exposition. Due to
the atoms repetition in the crystal, the X-ray beam is then diffracted. While Bragg’s low is
satisfied (constructive interference), the diffraction could be observed and a pattern, intensity
function of the exposition angle, could be plotted. Thanks to comparison to the patterns of pure
phase, the crystalline solids in the sample could be determined.214
Karl Fisher (HF)
Karl Fisher technique is used to determine the water content in ppm of a solution, thanks
to coulometric titration (756 KF Coulometer). The titration is based on sulfur dioxide oxidation
with water according to the following reaction:
SO2 + I2 + 2 H2O ⇋ H2SO4 + 2 HI
A KF solution made of iodine, sulfur dioxide and imidazole dissolved in Diethylene
glycol monoethyl ether filled the titration cell. A base (imidazole) is added to entice the reaction
toward acids production and so water consumption. The iodide formed by the oxidation of HI
in I2 is quantified by coulometric titration and then the water content directly estimated using
Faraday’s law.
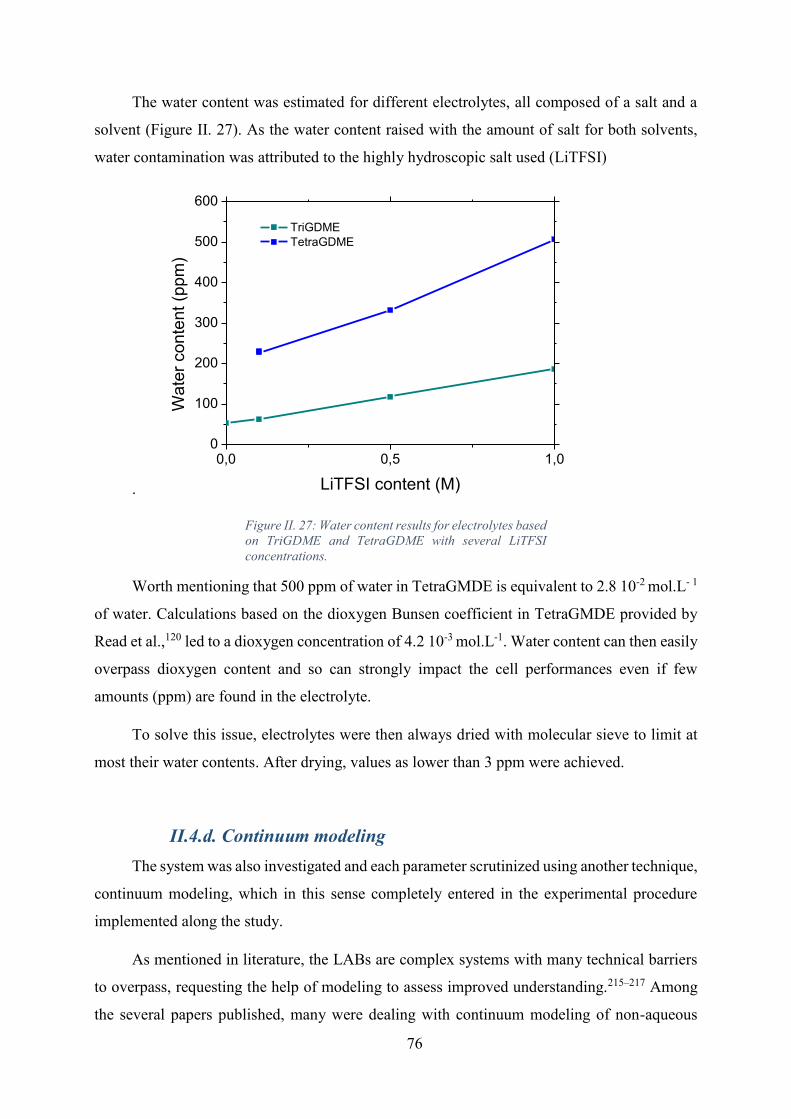
76
The water content was estimated for different electrolytes, all composed of a salt and a
solvent (Figure II. 27). As the water content raised with the amount of salt for both solvents,
water contamination was attributed to the highly hydroscopic salt used (LiTFSI)
.
Figure II. 27: Water content results for electrolytes based
on TriGDME and TetraGDME with several LiTFSI
concentrations.
Worth mentioning that 500 ppm of water in TetraGMDE is equivalent to 2.8 10-2 mol.L- 1
of water. Calculations based on the dioxygen Bunsen coefficient in TetraGMDE provided by
Read et al.,120 led to a dioxygen concentration of 4.2 10-3 mol.L-1. Water content can then easily
overpass dioxygen content and so can strongly impact the cell performances even if few
amounts (ppm) are found in the electrolyte.
To solve this issue, electrolytes were then always dried with molecular sieve to limit at
most their water contents. After drying, values as lower than 3 ppm were achieved.
II.4.d. Continuum modeling
The system was also investigated and each parameter scrutinized using another technique,
continuum modeling, which in this sense completely entered in the experimental procedure
implemented along the study.
As mentioned in literature, the LABs are complex systems with many technical barriers
to overpass, requesting the help of modeling to assess improved understanding.215–217 Among
the several papers published, many were dealing with continuum modeling of non-aqueous
0,0 0,5 1,00
100
200
300
400
500
600
TriGDME
TetraGDME
Wa
ter
co
nte
nt (p
pm
)
LiTFSI content (M)

77
LABs.216,217 Such trend finds its root in the efficiency and flexibility of such models, which are
powerful tools, privileged to access the mechanisms taking place in the system. As transport,
passivation and pore blocking, are well defined using continuum modeling technique, it had
been selected to study here the electrode texture impacts. Worth point out that atomistic models
are also presented in the literature to provide insight on the reaction mechanisms. Still, study of
the possible contamination mechanisms was also enabled here thanks to the use of multiscale
modeling (cf. Annex).
In the present study the multi-scale models were developed using the Finite Volume
Method. The several models built were coded using the software Matlab (R2014b).

CHAPTER III: THEORETICAL STUDY OF
BI-POROUS ELECTRODES
Chapter III: Theoretical study of bi-porous electrodes
Contents
xxxxxxxxxxxxxxxxxxxxxxxxxxxxxxxxxxxxxxxxxxxxxxxxxxxxxxxxxxxxxXxxxxxX
III.1. Concept of porous electrodes with enhanced diffusion……………………… 80
III.2. Theoretical study………………………………….………….……... 83
III.2.a. Model description……………………………………………..…...83
III.2.b. Discretization and boundary conditions……......…………………. 87
III.2.c. Parametrization………………….………………………………... 89
III.2.d. The reference case…………………………………………..…….. 90
III.2.e. Electrode formulation and design impacts……………………..…. 92
xxxxxxxxxxxxxxxxxxxxxxxxxxxxxxxxxxxxxxxxxxxxxxxxxxxxxxxxxxxxxxxxxxxXxx

80
III.1. Concept of porous electrodes with enhanced diffusion
In the context of carbonaceous porous electrode design, two parameters should be
balanced to reach efficient LABs electrodes. The tricky development of LABs is due to the
requirement of high surface available while also satisfying efficient oxygen diffusion inside the
electrode. While the first parameter favors utilization of highly divided carbon leading
supposedly to meso-porosity creation, it also tends to decrease oxygen diffusion. Pore clogging,
which is in this case more likely to occur, will then prevents further diffusion. On the reverse,
to enhance oxygen diffusion, larger pores creating macro-porosity are preferred. Still, in such
case lower surface is created, stressing even more surface passivation.
So, how to merge these two requirements to design optimal electrodes? A first look to the
nature can help to identify a solution. Dealing with oxygen diffusion and highly developed
surface, attention should be drawn to the lung (Figure III. 1). A clear ramification emerges.
While the initial bronchi only serve oxygen supply by slowing down the flow thanks the
sections subdivisions, the last ones also enable to multiply the exchange surface between the
gas flow and the blood while breathing.218 Even if in LABs case, oxygen is not provided directly
by a gas flow but thanks to the electrolyte in which the oxygen is dissolved, some inspiration
should be taken from this efficient structure.
Figure III. 1: Structure of the bronchial tree.218

81
While exactly reproducing such structure seems too complex and not needed, the idea of
successive domains with different porosities seemed relevant. As an analogy, macro-porosity
could be used to provide oxygen, acting like the first part of bronchi. Secondly, meso-porosity
could be added to promote higher developed surface as ensured by the acini directly connected
to the alveoli.
Two potential distributions of these domains were foresighted. Rather these domains
could be distributed in a way they form multilayers with the macro-porosity close to the oxygen
inlet. Rather these domains can be mixed along the depth of the electrode to form a lung-like
simplified structure, called “bi-porous electrode” to differentiate it from previous “multilayers
electrode”. Figure III. 2 highlights the approach implemented to develop LABs electrodes.
Figure III. 2: LABs electrode concept development.
At lab scale, to design such electrodes, two electrode fabrication processes, previously
described in Chapter II, were implemented. Initially the multilayers electrode was supposedly
achieved by the two processes: rather thanks to multiple coating on top of a grid, rather using
lamination of several flexible films. Still, due to the deformation of the flexible films while

82
laminating them together, such process was finally dedicated only to bi-porous electrode
fabrication. The results experimentally observed would be the subject of Chapter IV.
To evaluate the interest of the bi-porous electrodes and to facilitate the definition of the
macro-porosity ratio needed, prior to launched the experiments, a bi-porous electrode model
was implemented. The theoretical study was not implemented on the multilayer electrodes as
the experimental process was less tunable than the one of flexible porous electrode. Bi-porous
electrodes design seemed also more appealing, as well as, more interesting in terms of energy
density as thick electrodes can be produced.
Indeed, to enhance the gravimetric energy density of the cell, utilization of a thick
electrode is favored. Diffusion limitation is then triggered in such condition. Though, porosity
creation has to be well mastered to reduce its impacts. To do so, the Bellcore process (nowadays
Telcordia140) was considered as explained. Such fabrication procedure enables to form two
domains inside the electrode. The first one is made of carbon and binder. In the case of Ketjen
Black (highly divided carbon), this domain is then assumed to be meso-porous. The second one
is a macro-porous domain created by leaching out the porogen agent during the fabrication. The
electrodes were thereby complex bi-porous systems which needed to be initially studied from
theoretical point of view. As formerly demonstrated, identifying the failure mode of a battery
depending on the electrode texture is problematic. Fortunately, modeling is a powerful tool
helping to identify which limiting factor took the lead, as well as enabling to understanding the
correlations existing between the several parameters described. Along this study, three main
failure modes had been identified while focusing only on the electrode: the surface passivation,
the pore clogging and obviously the oxygen diffusion limitation. To clearly identify them and
thus examined which electrode bi-porosity should be selected, a modeling study taking into
account these three limiting phenomena was implemented.
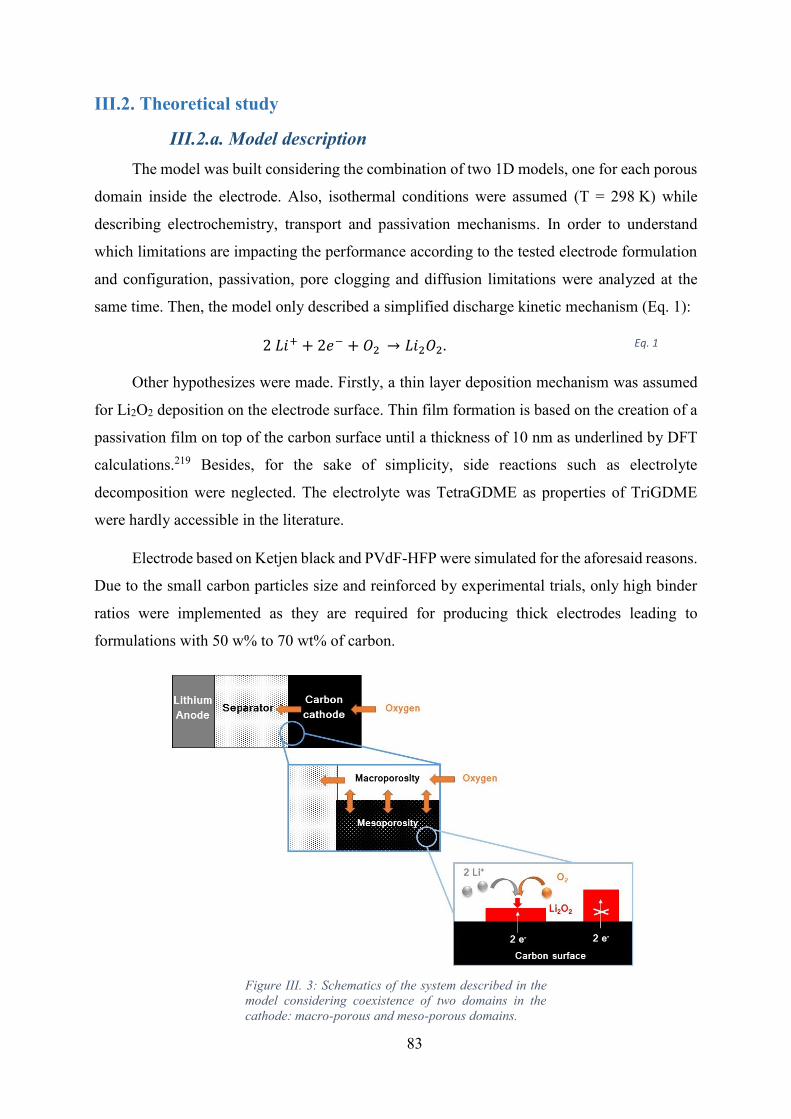
83
III.2. Theoretical study
III.2.a. Model description
The model was built considering the combination of two 1D models, one for each porous
domain inside the electrode. Also, isothermal conditions were assumed (T = 298 K) while
describing electrochemistry, transport and passivation mechanisms. In order to understand
which limitations are impacting the performance according to the tested electrode formulation
and configuration, passivation, pore clogging and diffusion limitations were analyzed at the
same time. Then, the model only described a simplified discharge kinetic mechanism (Eq. 1):
2 𝐿𝑖+ + 2𝑒− + 𝑂2 → 𝐿𝑖2𝑂2. Eq. 1
Other hypothesizes were made. Firstly, a thin layer deposition mechanism was assumed
for Li2O2 deposition on the electrode surface. Thin film formation is based on the creation of a
passivation film on top of the carbon surface until a thickness of 10 nm as underlined by DFT
calculations.219 Besides, for the sake of simplicity, side reactions such as electrolyte
decomposition were neglected. The electrolyte was TetraGDME as properties of TriGDME
were hardly accessible in the literature.
Electrode based on Ketjen black and PVdF-HFP were simulated for the aforesaid reasons.
Due to the small carbon particles size and reinforced by experimental trials, only high binder
ratios were implemented as they are required for producing thick electrodes leading to
formulations with 50 w% to 70 wt% of carbon.
Figure III. 3: Schematics of the system described in the
model considering coexistence of two domains in the
cathode: macro-porous and meso-porous domains.

84
As illustrated in Figure III. 3, the two previously described porous domains were assumed
to be coexisting in the cathode and were exchanging oxygen (mathematically described via an
intraflux). The volume ratio of the macro-porosity was set from 20 % to 50 % with respect to
the electrode volume.
To describe the meso-porous domain, carbon surface was calculated with respect to the
carbon weight volume in the formulation, its density and its active surface area. The active
surface value inserted in the model (7.68 109 m².m-3) was confirmed to be in the same range as
the experimental one (3.12 109 m².m-3) thanks to BET (1417 m².g-1) and pycnometry
(2.23 g.cm-3) measurements carried on Ketjen Black. The model then tended to overestimate
the carbon active surface. This trend could also be intensified by electrode surface wettability
as electrolyte do not perfectly wet the electrode surface. Still, as the range was respected, the
trend on discharges performances remained relevant while comparing the performances of
several formulations.
The macro-porous domain was initially fully filled by electrolyte, leading to a porosity
휀𝑚𝑎𝑐𝑟𝑜 of 1. As the macro-porous volume was significant, it was approximated that even though
Li2O2 was produced, the availability of the macro-porous domain will persist. Thus, porosity
evolution was not tracked over time for macro-porous domain but only for meso-porous one.
The diffusion coefficient of the macro-porous domain corresponded to the oxygen diffusion
coefficient 𝐷0. 𝐷0 was assumed to be equal to the oxygen diffusion coefficient in the electrolyte
solvent (value for TetraGDME taken from work of Laoire et al.)79.
Inside the meso-porous domain, the porosity decreased along the simulation in function
of the volume of Li2O2 produced. The porosity regression influenced the ease for diffusion to
take place. Its impact was thus inspected in the model using Bruggeman relation:220,221
𝐷𝑚𝑒𝑠𝑜 = 𝐷0. (휀𝑚𝑒𝑠𝑜
𝜏𝑚𝑒𝑠𝑜) = 𝐷0. 휀𝑚𝑒𝑠𝑜
1.5 Eq. 2
where 𝐷𝑚𝑒𝑠𝑜 corresponded to the effective diffusion coefficient of the meso-porous domain.
The tortuosity factor 𝜏𝑚𝑒𝑠𝑜 traduced the gap between ideal pathway (Lcv) from non-ideal one
(Lp) as represented in Figure III. 4. As carbon black particles are spherical, the Bruggeman
relation was valid in the meso-porous domain.127 Though, it should be kept in mind that such
relation described only simple diffusion220 and thus did not precisely traduced the transport
occurring inside experimental electrodes. Still, in an attempt to compare different electrode
compositions and structures, such approximation seemed appropriated. The initial value of the
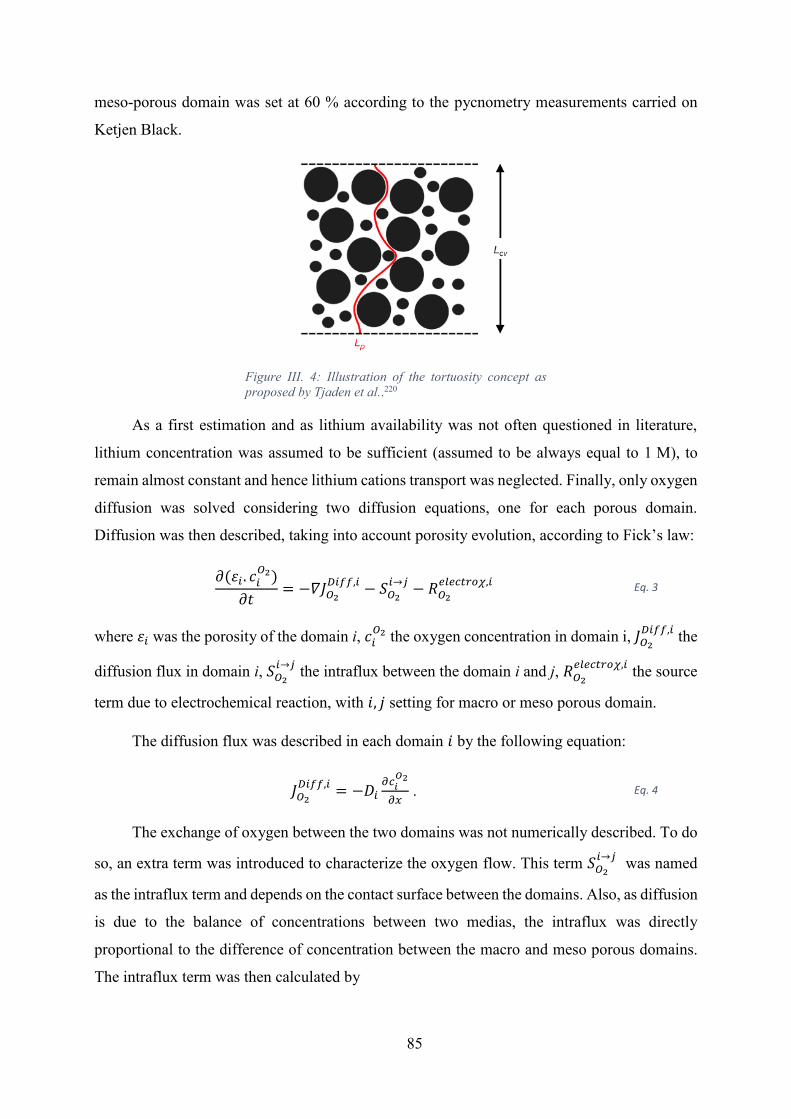
85
meso-porous domain was set at 60 % according to the pycnometry measurements carried on
Ketjen Black.
Figure III. 4: Illustration of the tortuosity concept as
proposed by Tjaden et al..220
As a first estimation and as lithium availability was not often questioned in literature,
lithium concentration was assumed to be sufficient (assumed to be always equal to 1 M), to
remain almost constant and hence lithium cations transport was neglected. Finally, only oxygen
diffusion was solved considering two diffusion equations, one for each porous domain.
Diffusion was then described, taking into account porosity evolution, according to Fick’s law:
𝜕(휀𝑖. 𝑐𝑖𝑂2)
𝜕𝑡= −𝛻𝐽𝑂2
𝐷𝑖𝑓𝑓,𝑖− 𝑆𝑂2
𝑖→𝑗− 𝑅𝑂2
𝑒𝑙𝑒𝑐𝑡𝑟𝑜𝜒,𝑖 Eq. 3
where 휀𝑖 was the porosity of the domain i, 𝑐𝑖𝑂2 the oxygen concentration in domain i, 𝐽𝑂2
𝐷𝑖𝑓𝑓,𝑖 the
diffusion flux in domain i, 𝑆𝑂2
𝑖→𝑗 the intraflux between the domain i and j, 𝑅𝑂2
𝑒𝑙𝑒𝑐𝑡𝑟𝑜𝜒,𝑖 the source
term due to electrochemical reaction, with 𝑖, 𝑗 setting for macro or meso porous domain.
The diffusion flux was described in each domain 𝑖 by the following equation:
𝐽𝑂2
𝐷𝑖𝑓𝑓,𝑖= −𝐷𝑖
𝜕𝑐𝑖𝑂2
𝜕𝑥 . Eq. 4
The exchange of oxygen between the two domains was not numerically described. To do
so, an extra term was introduced to characterize the oxygen flow. This term 𝑆𝑂2
𝑖→𝑗 was named
as the intraflux term and depends on the contact surface between the domains. Also, as diffusion
is due to the balance of concentrations between two medias, the intraflux was directly
proportional to the difference of concentration between the macro and meso porous domains.
The intraflux term was then calculated by
86
𝑆𝑂2
𝑖→𝑗= 𝑘′. 𝐴𝐶𝑜𝑛𝑡𝑎𝑐𝑡(𝑐𝑖
𝑂2 − 𝑐𝑗𝑂2) Eq. 5
where 𝐴𝐶𝑜𝑛𝑡𝑎𝑐𝑡 denoted the contact surface between the two domains estimated from
experimental electrode. Such surface was roughly estimated based on the number and diameter
of macro-pores observed on an electrode via SEM. Accessing the value of the exchange
coefficient 𝑘′ was on the reverse difficult to access, for this reason a parameter sensitivity
analysis was implemented to define its value.
At each time step, the volume of Li2O2 in bin 𝑗 and domain 𝑖 was calculated according to
Eq. 6:
𝜕𝑉𝐿𝑖2𝑂2
𝑖,𝑗
𝜕𝑡=
𝑗𝐹𝑎𝑟,𝑗𝑖 .𝐴 . 𝑀𝐿𝑖2𝑂2
𝑛 .𝐹.𝜌𝐿𝑖2𝑂2
. Eq. 6
Thanks to the volume of Li2O2 produced, the porosity was recalculated at each time step
to take into account the decrease of free space due to production of the discharge product.
From the volume of Li2O2, the growth of Li2O2 thickness 𝛿 was computed in each part of
the electrode and limited by the following 휁𝑡𝑢𝑛𝑛𝑒𝑙𝑖𝑛𝑔 function, capturing the phenomenon of
hole tunneling219 through the discharge product. Once the thickness 𝛿 reached the hole
tunneling distance, 𝑎𝑗,𝑛 the active surface of carbon in bin 𝑗 and domain went to zero due to Eq.
7:
𝑎𝑖,𝑗 = 휁𝑖,𝑗𝑡𝑢𝑛𝑛𝑛𝑒𝑙𝑖𝑛𝑔
. 𝑎0 with 휁𝑖,𝑗𝑡𝑢𝑛𝑛𝑛𝑒𝑙𝑖𝑛𝑔
=1−erf (𝛿𝑖,𝑗−7)
2. Eq. 7
The surface was then inactivated for further reactions and further Li2O2 growth was infringed.
The total faradic current 𝑗𝐹𝑎𝑟,𝑗 in bin 𝑗 depended on the current density applied to the
system 𝐼 (expressed in [A/m²geometric]). As two domains coexisted in each bin (𝑖 and 𝑖′), the total
current density applied to the system was linked to the faradic current 𝑗𝐹𝑎𝑟,𝑗𝑖 or 𝑗𝐹𝑎𝑟,𝑗
𝑖′ of each
domain 𝑛 and 𝑛′ in bin 𝑗 with respect to the total surface of carbon via Eq. 8:
𝐼 = ∑ [𝑗𝐹𝑎𝑟,𝑗𝑖 .
𝑎𝑖,𝑗
𝑎𝑖,𝑗 + 𝑎𝑖′,𝑗+ 𝑗𝐹𝑎𝑟,𝑗
𝑖′.
𝑎𝑖′,𝑗
𝑎𝑖,𝑗 + 𝑎𝑖′,𝑗]
𝑗
Eq. 8
where 𝑎𝑖,𝑗 refered to the carbon surface in bin 𝑗 and domain i.
By using the overall faradic current, access to the overpotential 휂 was given at each time
step using the Tafel equation

87
𝑗𝐹𝑎𝑟,𝑗𝑖 = 𝑛. 𝐹. 𝑘. 𝑐1−𝛽 . 𝑒
(−𝛽𝑛𝐹𝜂
𝑅𝑇)
Eq. 9
with 𝑛 the number of exchange electrons, 𝐹 the faradic constant, 𝑘 the kinetic rate, 𝛽 the charge
transfer, 𝑅 the gas constant and 𝑇 the temperature. The electrode potential was afterwards
defined by
𝑈 = 𝑈0 − 휂 . Eq. 10
Knowing 𝑗𝐹𝑎𝑟,𝑗𝑖 permitted to evaluate the number of oxygen consumed at each time step
and in each bin. So, the correct number of mole of oxygen, available inside the volume of
electrode still accessible, was assessed after removing the amount of oxygen involved in
electrochemistry via 𝑅𝑂2
𝑒𝑙𝑒𝑐𝑡𝑟𝑜𝜒,𝑖.
III.2.b. Discretization and boundary conditions
Once the mass transport equation and all its parts were mathematically defined, Eq. 3 was
discretized in order to be implemented inside a code. To do so, the system simulated was
divided in P+Q bins, respectively number of bin for the separator and for the cathode (Figure
III. 5).
Figure III. 5: Description of the simulated system.
As 𝑆𝑂2
𝑖→𝑗 and 𝑅𝑂2
𝑒𝑙𝑒𝑐𝑡𝑟𝑜𝜒,𝑖 were actually calculated in each bin of the electrode, only the
proper diffusion part was discretized, leading to the expression of 휀𝑗,𝑛𝑡 . 𝑐𝑗,𝑛
𝑡 approximation in bin
𝑗 and domain 𝑛 (meso-porous or macro-porous domain) at time 𝑡 according to following
equations:
88
휀𝑗,𝑛𝑡+1. 𝑐𝑗,𝑛
𝑡+1 = 휀𝑗,𝑛𝑡 . 𝑐𝑗,𝑛
𝑡 +𝑑𝑡
𝑑𝑥2(𝜅
𝑗−1
2,𝑛
𝑡 . 𝑐𝑗−1,𝑛𝑡 − (𝜅
𝑗−1
2,𝑛
𝑡 + 𝜅𝑗+
1
2,𝑛
𝑡 ) 𝑐𝑗,𝑛𝑡 +
𝜅𝑗+
1
2,𝑛
𝑡 . 𝑐𝑗+1,𝑛𝑡 ) − 𝑑𝑡. (𝑆𝑂2
𝑛→𝑚,𝑡 + 𝑅𝑂2
𝑒𝑙𝑒𝑐𝑡𝑟𝑜𝜒,𝑛,𝑡)
Eq. 11
with 𝜅𝑗+
12
,𝑛
𝑡 =𝜅𝑗,𝑛
𝑡 + 𝜅𝑗+1,𝑛𝑡
2 Eq. 12
And 𝜅𝑗,𝑛𝑡 = 𝐷0. (휀𝑗,𝑛
𝑡 )1.5
. Eq. 13
The discretization was valid only in the cases where the condition 𝐷.𝑑𝑥2
𝑑𝑡≤
1
2 was respected.222
Boundary conditions were required to solve Eq. 3 at the interfaces oxygen inlet/ cathode,
cathode/separator and separator/anode. As the cathode was assumed to be completely flooded
with electrolyte, the last cathode bin 𝑀 was assumed to be in contact with a bin 𝑀 + 1 fully
filled with an electrolyte saturated with oxygen. Then, at the oxygen inlet side, oxygen
concentration in bin 𝑃 + 𝑄 + 1 was then defined by:
𝑐𝑃+𝑄+1𝑂2 = 𝑐𝑠𝑎𝑡
𝑂2 . Eq. 14
At the interface cathode/separator, actually two interfaces should be considered as the
macro-porous and the meso-porous domains were both in contact with the separator. To solve
this, the oxygen flow was assumed to be separated between the two domains depending on the
contact surface between each domain and the separator, respectively named 휃𝑚𝑎𝑐𝑟𝑜 and 휃𝑚𝑒𝑠𝑜.
These surfaces were defined as following:
휃𝑚𝑎𝑐𝑟𝑜 =𝐴𝑚𝑎𝑐𝑟𝑜
𝐴 Eq. 15
휃𝑚𝑒𝑠𝑜 =𝐴 − 𝐴𝑚𝑎𝑐𝑟𝑜
𝐴 Eq. 16
with 𝐴𝑚𝑎𝑐𝑟𝑜 the surface of contact between the macro-porous domain and the oxygen inlet side.
𝐴𝑚𝑎𝑐𝑟𝑜 was estimated thanks to the radius of macropores 𝑟𝑚𝑎𝑐𝑟𝑜 and the volume of macro-
porous domain observed in experiments. 𝐴 corresponded here to the cathode geometric area.
Also, to ensure a smooth gap at the edge between cathode domain and separator, while
estimating the diffusion at last bin of the separator 𝑀, the mean value between of 𝜅𝑀𝑡 and

89
𝜅𝑀+1,𝑛𝑡 was implemented instead of 𝜅𝑀+1,𝑛
𝑡 only. Same way, the mean value of 𝜅𝑀+1,𝑛𝑡 and 𝜅𝑀
𝑡
was applied at bin 𝑀 + 1 as a substitute of 𝜅𝑀𝑡 due to porosity evolution.
At the anode side, oxygen flux was set to zero, to express that oxygen diffusion stopped
at the anode contact Then, while calculating the diffusion in the first cathode bin 𝑀, the
concentration of bin 𝑀 − 1 was fixed likewise:
𝑐𝑀−1𝑂2 = 𝑐𝑀
𝑂2. Eq. 17
III.2.c. Parametrization
One tricky step while developing a code is the definition of the parameters. The aim here
was to study which type of bi-porous electrodes should be developed at lab scale (volume of
macro-pore necessary and understanding impact of formulation on limiting parameters). Still,
in an attempt to simulate meaningful information, data from the parallel experimental study
were required to develop the code.
A batch of flexible porous electrode was examined and its mean thickness measured with
a digital Vernier caliper was implemented, as well as the radius and number of macro-pores
observed in SEM picture. Even though such approach could overlook the effect of some
parameters, like the modification of the number and diameter of macro-pores obtained with the
several formulations tested, it appeared that the system was already complex enough. Thus, all
codes were launched with the same macro-pore diameter. Depending on the volume of macro-
pores inserted, only the number of macro-pores and contact surface between the two domains
were recalculated assuming formation of cylindrical channels with a length equal to the cathode
thickness.
To clearly identify the impact of the several computed parameters, a sensitivity study was
implemented. Effects of intraflux prefactor, contact area between the porous domains, diffusion
coefficient (applying ± 10 % and ± 20 % to each parameter) and carbon surface availability
(50 %, 70 % or 90 % available compared to fully available) were studied. Finally, it ends up
that oxygen diffusion coefficient and carbon surface were the more impacting as expected, due
to their large impact on diffusion efficiency and electrochemistry. The code was then built using
the parameter values given in Table III. 1.

90
Table III. 1: List of the parameters used in the model.
Parameters Values Units Source
Faradic constant 𝑭 96 485 C.mol-1 Universal constant
Gas constant 𝑹 8.314 J.mol−1.K−1 Universal constant
Temperature 𝑻 298 K Assumed
Cathode length 100 µm From experimental
data
Cathode geometric
area 𝑨 1 m² Assumed
Pore radius in
macroporosity 𝒓𝒎𝒂𝒄𝒓𝒐 1.6 µm
From experimental
data
Number of bin 30 / Assumed
Time step 𝒅𝒕 0.01 s Assumed
Oxygen
concentration 𝒄𝒔𝒂𝒕𝑶𝟐
4.43 mol.m-3 Reference79
Diffusion coefficient
𝑫𝟎
2.17∙10-
10 m².s-1 Reference79
Intraflux prefactor 𝒌′ 1.10-
6∙D0 s-1.m-2 Assumed
Li2O2 Molar Mass 45.881 g.mol-1 Reference128
Li2O2 density 2.3 ∙106 g.m-3 Reference128
Ketjen Black specific
surface area 7.68∙109 m².m-3 Reference117
Super P specific
surface area 6.87∙107 m²/m3 Reference128
Equilibrium potential
ORR 𝑬𝟎 2.96 V Reference223
Symmetric coefficient
β 0.5 / Assumed
Tafel prefactor 𝒌 1.10-12 mol1/2.m.s-1 Assumed
III.2.d. The reference case
To carry a survey, an initial reference case need to be defined. In this study, in order to
match the experimental study, a Ketjen Black electrode with a carbon ratio of 50 wt%, a macro-
porous ratio of 20 % was simulated using the parameters defined in Table III. 1 and will
correspond to the reference case. Figure III. 6 revealed the relevance of the model which gave
new insights on the limiting parameters.
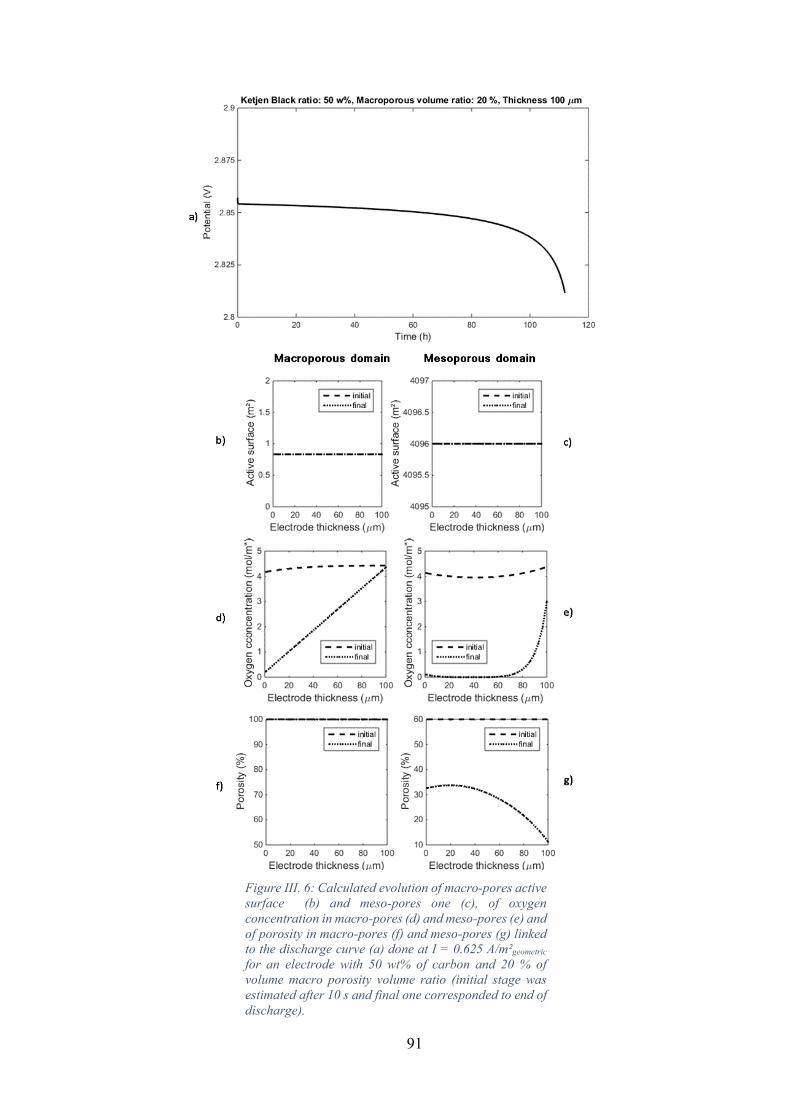
91
Figure III. 6: Calculated evolution of macro-pores active
surface (b) and meso-pores one (c), of oxygen
concentration in macro-pores (d) and meso-pores (e) and
of porosity in macro-pores (f) and meso-pores (g) linked
to the discharge curve (a) done at I = 0.625 A/m²geometric
for an electrode with 50 wt% of carbon and 20 % of
volume macro porosity volume ratio (initial stage was
estimated after 10 s and final one corresponded to end of
discharge).

92
The calculated evolution of the carbon active surface shown in Figure III. 6.b and Figure
III. 6.c emphasized that the electrode surface passivation was not the limiting factor of capacity
since active surface was still available in both domains at the end of the discharge. Figure III.
6.d and Figure III. 6.e, on the other side, described the evolution of the oxygen concentration
and underscored the impact of the oxygen diffusion limitation. At the end of discharge in the
macro-porous domain, some oxygen was still available, especially at the oxygen inlet. Still,
concentration decreased fast at the separator side. In addition, Figure III. 6.e and Figure III. 6.f
provided data on the porosity evolution as the filling of pores was tracked over time. Porosity
at the end of discharge presented a bending shape with lower porosity at the separator side
compared to the one at the middle of the electrode domain (Figure III. 6.f). This porosity
gradient could be explained by the oxygen diffusion process. On the oxygen inlet side, oxygen
was consumed and refueled quickly allowing further reactions. Thanks to the macro-porous
domain, diffusion was also fast enough from the oxygen inlet side to the separator side. On the
way, oxygen was also supplied to the meso-porous domain (Figure III. 5) leading to a higher
production of discharge product and then to a lower porosity. In the middle of the electrode,
diffusion was slowed down due to the meso-porous domain properties (tortuosity and porosity).
So, discharge products were produced slowly as oxygen needed to diffuse first. Finally,
evolutions of all these limiting parameters were correlated to the discharge capacity and
overpotential as illustrated in Figure III. 6.a.
In all the cases described, Ketjen Black electrodes were characterized with parameters
provided in Table III. 1,with a carbon ratio between 50 wt% to 70 wt% and a macro-porous
volume ratio ranging from 20 % to 50 %, the limiting impact of oxygen diffusion had not been
contested. All potential fades were linked to the decrease of oxygen diffusion in the meso-
porosity, even if free space was still available and Li2O2 thickness was inferior to the hole
tunneling distance.
III.2.e. Electrode formulation and design impacts
Effect of the electrode thickness
The most evident parameter to inspect while analyzing diffusion through thick electrodes
was the electrode thickness. Different thicknesses were then tested and the corresponding
discharge curves were reported in Figure III. 7.
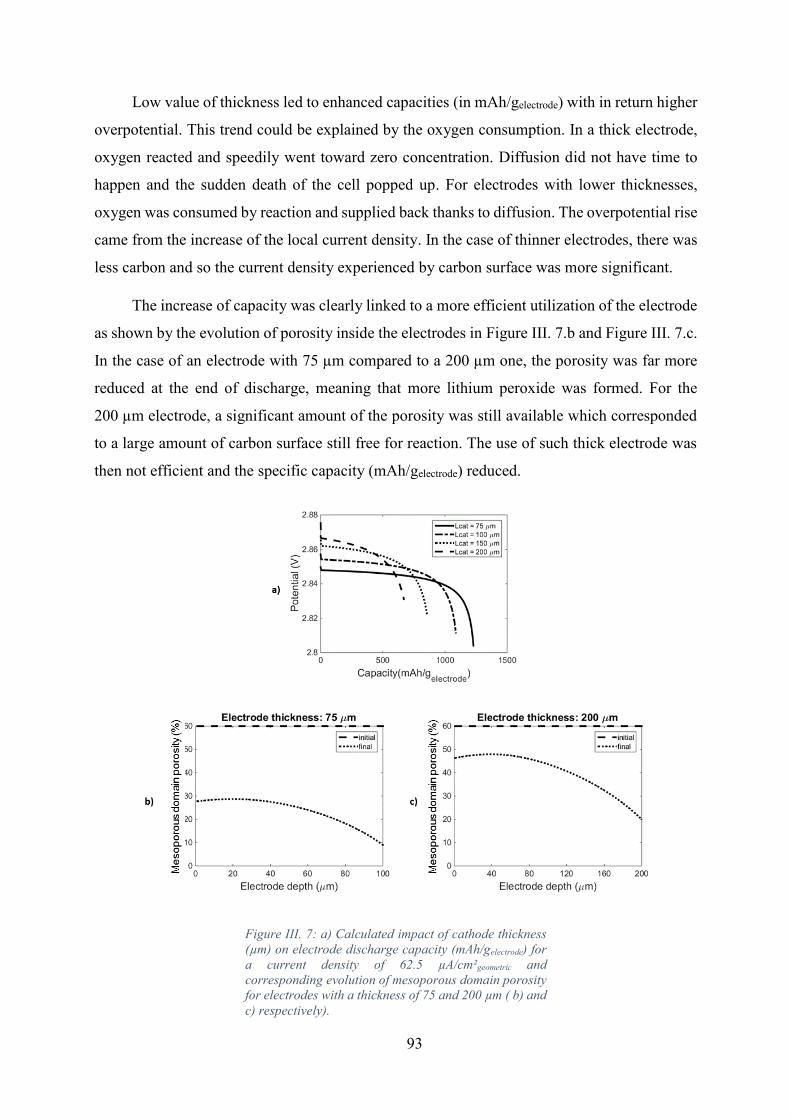
93
Low value of thickness led to enhanced capacities (in mAh/gelectrode) with in return higher
overpotential. This trend could be explained by the oxygen consumption. In a thick electrode,
oxygen reacted and speedily went toward zero concentration. Diffusion did not have time to
happen and the sudden death of the cell popped up. For electrodes with lower thicknesses,
oxygen was consumed by reaction and supplied back thanks to diffusion. The overpotential rise
came from the increase of the local current density. In the case of thinner electrodes, there was
less carbon and so the current density experienced by carbon surface was more significant.
The increase of capacity was clearly linked to a more efficient utilization of the electrode
as shown by the evolution of porosity inside the electrodes in Figure III. 7.b and Figure III. 7.c.
In the case of an electrode with 75 µm compared to a 200 µm one, the porosity was far more
reduced at the end of discharge, meaning that more lithium peroxide was formed. For the
200 µm electrode, a significant amount of the porosity was still available which corresponded
to a large amount of carbon surface still free for reaction. The use of such thick electrode was
then not efficient and the specific capacity (mAh/gelectrode) reduced.
Figure III. 7: a) Calculated impact of cathode thickness
(µm) on electrode discharge capacity (mAh/gelectrode) for
a current density of 62.5 µA/cm²geometric and
corresponding evolution of mesoporous domain porosity
for electrodes with a thickness of 75 and 200 µm ( b) and
c) respectively).
94
Macro-porous domain and carbon ratios combined effects
As here efficient formulation of electrodes for LABs was at stake, a comprehensive study
was launched to identify clearly the intrinsic links between the several involved parameters.
Initially, macro-porous volume ratio and carbon weight ratio were considered in parallel.
Two different ways of comparing the performances of electrodes with different
parameters were possible. Rather a constant current could be applied to each electrode
(µA/cm²geometric), rather a current density depending on the electrode developed surface
(µA/m²carbon) could be applied. While the initial case was close to the application target, the
second one facilitated the evaluation of the efficiency of the electrode. Indeed, with large carbon
amount variation, the final current densities applied to the electrodes could be drastically
different and thus the electrochemical responses completely different. Undeniably, such system
were really sensitive to the current density as illustrated in Figure III. 8 and expected from
literature.26 Then, to plainly understand what occurred at electrode level, both approaches were
implemented consecutively.
Sensitivity of such systems toward current density was due to the fast consumption of
oxygen while applying high current density. While concentration dropped quickly, oxygen
diffusion could not counterbalance the consumption and thus led to capacity fade.
Regardless of the current density, the simulation results shown that an increase of carbon
content always led to the decrease of capacity. As mentioned previously in case of Ketjen black
based electrode with a thickness of 100 nm, oxygen diffusion was always the limiting factor
while carbon surface was still available. Here, when the carbon content was increased, more
surface was available for the reaction, oxygen was consumed rapidly and its concentration drop
appeared sooner. Diffusion limitation was then emphasized and capacity fading occurred
earlier. At the end, the mass of carbon unused or still available was more significant leading to
a lower discharge capacity (mAh/gcarbon).
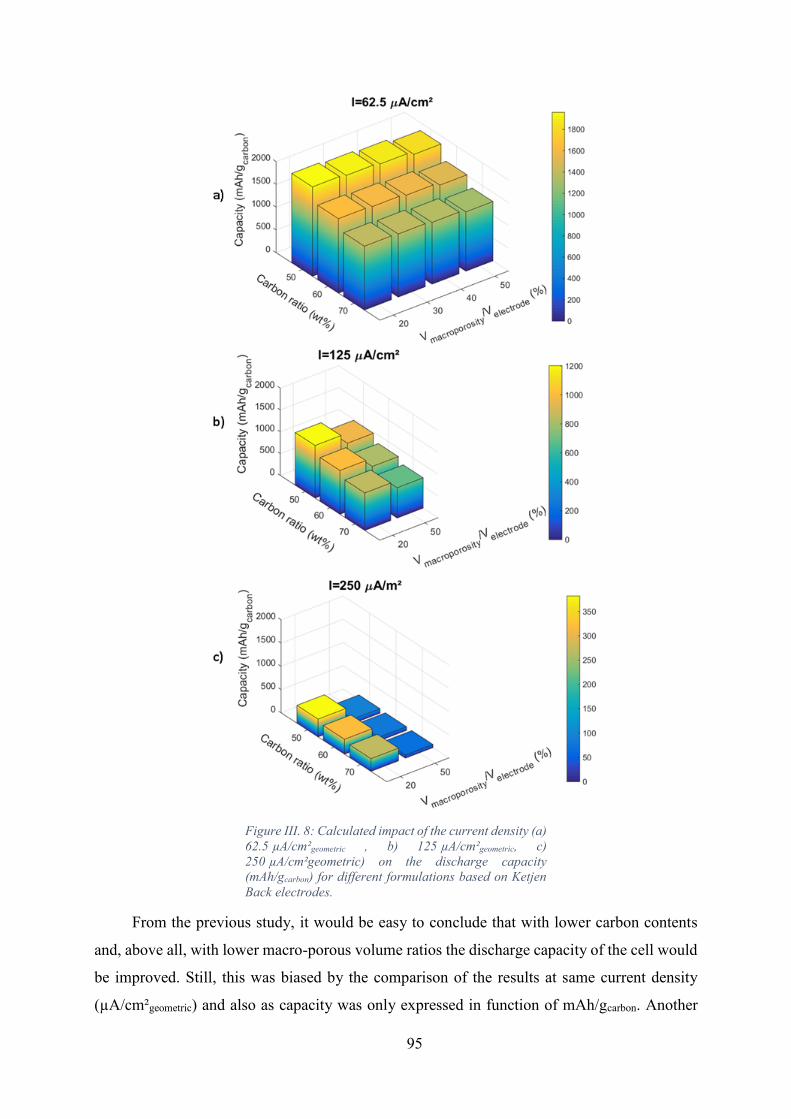
95
Figure III. 8: Calculated impact of the current density (a)
62.5 µA/cm²geometric , b) 125 µA/cm²geometric, c)
250 µA/cm²geometric) on the discharge capacity
(mAh/gcarbon) for different formulations based on Ketjen
Back electrodes.
From the previous study, it would be easy to conclude that with lower carbon contents
and, above all, with lower macro-porous volume ratios the discharge capacity of the cell would
be improved. Still, this was biased by the comparison of the results at same current density
(µA/cm²geometric) and also as capacity was only expressed in function of mAh/gcarbon. Another

96
batch of models were then run, this time at the same current density. The applied current was
calculated according to the carbon developed surface estimated for each formulation (calculated
based on 62.5 µA/cm²electrode applied in the case of electrode with 50 wt% of Ketjen Black and
20 % of macro-porous volume ratio which leads to a 0.1 µA/m²carbon). The results were reported
in Figure III. 9.
Figure III. 9: Calculated impact of the macro-porous
volume ratio (from 20 to 50 %, for electrodes with
different Ketjen Black ratios 50 wt%, 60 wt% and
70 wt%. Current density was estimated for each case
depending on the available surface carbon and
corresponded to 0.1 µA/m²carbon.
Contrary to the previous study,132 capacity was not multiplied by a factor of 5 while
introducing 50 % of porous volume, most probably due to the fact that in the current study,
electron-tunneling was taken into account and thus precipitate capacity fading. In fact, for all
carbon ratios from 50 wt% to 70 w%, the capacity increased with addition of macro-porous
volume. Still, depending on this amount added, capacity gain was not that significant. Indeed,
while for 50 wt% of carbon the capacity significantly evolved until adjunction of 40 % of
macro-porous volume, value stagnated after. For 60 wt% of carbon, a decline was even
observed for higher ratio than 40 % of macro-porous volume. Only in case of 70 wt% of carbon,
the capacity always raised in the range of macro-porous volume from 20 % to 50 %.
The increase of capacity with higher volume dedicated to macro-porous domain could be
easily explained. In case of high carbon loadings, oxygen reacted on top of the carbon and was
consumed fastly. As diffusion was not fast enough and oxygen available for reactions decreased
promptly inside the electrode. Also, not all the carbon surface was reacting as oxygen was not
able to properly diffuse inside the overall meso-porous media. Then, some carbon loaded in the
97
electrode only participated to the electrode weight and was not used for reactions. That is why
the highest capacities were acquired for 50 wt% of carbon.
Diffusion in meso-porous domain was slower compared to the macro-porous one, due to
the porosity and tortuosity of the media. Adding macro-porous domain allowed to the oxygen
to first diffuse quickly along the electrode thickness. Also, oxygen could in the same way
directly access to the meso-porous domain in each bin. So, the distance of diffusion across
macro and then meso-porous domains was smaller compared to a diffusion pathway using only
the meso-porous media (Figure III. 5). Thereby, more carbon could react, promoting higher
capacity as seen for the 50 wt% and 70 wt% of carbon cases. After a point, adding macro-
porous domain could not improve the performance anymore as diffusion inside the electrolyte
itself became the only limiting factor (carbon surface already accessible). Even more, with too
high volume of macro-pores compared to carbon loaded, capacity was significantly limited as
underlined with 60 wt% of carbon.
To conclude, definition of the optimal formulation from theoretical point of view was not
obvious as carbon and macro-porous domain volume ratios did not impact linearly the capacity.
From this theoretical study, it was observed that the best formulation to test experimentally
should be based on 50 wt% of carbon with 40 % of macro-porous volume. Worth point out that
for only 50 wt% of carbon, 50 wt% of binder should be used in parallel. Such high binder intake
would clearly impact the carbon surface accessibility and thus such results should be treated
carefully. So, the safer conclusion to extract from these results was that more than 40 % of
macro-porous volume was not required. This value should then be defined as the target of
macro-porous volume to introduce inside the electrode.
Effect of carbon surface
As an echo of the last consideration, carbon surface availability was then scrutinized
introducing a parameter 𝛼 to convey the coverage of carbon surface by the binder as well as the
inaccessibility of carbon surface due to the pore connectivity. Three values of coverage were
tested and compared to zero coverage case (Figure III. 10).
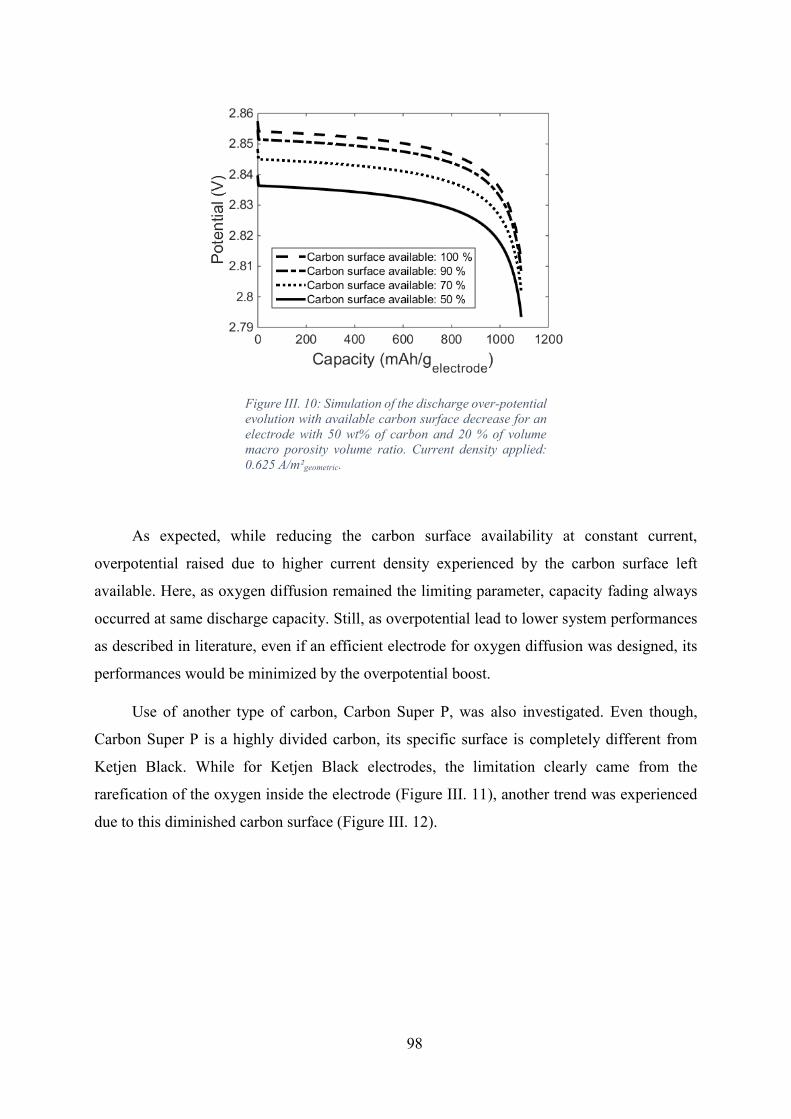
98
Figure III. 10: Simulation of the discharge over-potential
evolution with available carbon surface decrease for an
electrode with 50 wt% of carbon and 20 % of volume
macro porosity volume ratio. Current density applied:
0.625 A/m²geometric.
As expected, while reducing the carbon surface availability at constant current,
overpotential raised due to higher current density experienced by the carbon surface left
available. Here, as oxygen diffusion remained the limiting parameter, capacity fading always
occurred at same discharge capacity. Still, as overpotential lead to lower system performances
as described in literature, even if an efficient electrode for oxygen diffusion was designed, its
performances would be minimized by the overpotential boost.
Use of another type of carbon, Carbon Super P, was also investigated. Even though,
Carbon Super P is a highly divided carbon, its specific surface is completely different from
Ketjen Black. While for Ketjen Black electrodes, the limitation clearly came from the
rarefication of the oxygen inside the electrode (Figure III. 11), another trend was experienced
due to this diminished carbon surface (Figure III. 12).

99
Figure III. 11: Evolution of macro-pores active surface
(b) and meso-pores one (c), of oxygen concentration in
macro-pores (d) and meso-pores (e) and of porosity in
macro-pores (f) and meso-pores (g) linked to the
discharge curve (a) done at I = 62.5 µA/cm²geometric for an
electrode with 60 wt% of Ketjen Black and 30 % of
volume macro porosity volume ratio (initial stage was
estimated after 10 s and final one corresponds to end of
discharge).

100
Figure III. 12: Evolution of macro-pores active surface
(b) and mesopores one (c), of oxygen concentration in
macro-pores (d) and meso-pores (e) and of porosity in
macro-pores (f) and meso-pores (g) linked to the
discharge curve (a) done at I = 62.5 µA/cm²geometric for
an electrode with 60 wt% of carbon Super P and 30 % of
volume macro porosity volume ratio (initial stage was
estimated after 10 s and final one corresponds to end of
discharge).

101
For Carbon Super P, the limiting factor was the passivation of the active surface due to
the Li2O2 deposition until a thickness equal to the hole tunneling distance. Active surface in
each porous domain was then equivalent to zero (Figure III. 12.a. and Figure III. 12.b.). As
passivation phenomena occurred faster than oxygen concentration reduction, oxygen was still
available but no free carbon surface was remaining in the system. These considerations
highlighted the necessity to carefully select the carbon used to formulate LABs electrodes.
Moreover, it also spotlighted the high sensitivity of the system toward carbon surface.

CHAPTER IV: EXPERIMENTAL STUDY OF
BI-POROUS ELECTRODES
Chapter IV: Experimental study of bi-porous electrodes
Contents
xxxxxxxxxxxxxxxxxxxxxxxxxxxxxxxxxxxxxxxxxxxxxxxxxxxxxxxxxxxxxXxxxxxX
IV.1. Dip-coated electrode: a first attempt toward bi-porous electrodes………...… 104
IV.1.a. Formulations tested……………………………………………….. 104
IV.1.b. Preliminary tests………………………………………………….. 104
IV.2. Electrolyte modification…………………...………………………………… 109
IV.3. Development of highly porous and flexible electrodes for LABs…………… 113
IV.3.a. Efficiency of DBP removal……………………………………….. 113
IV.3.b. Impact of DBP removal on porosity creation…………………….. 115
IV.3.c. Behavior of the films in the electrolyte solvent…………………... 123
IV.3.d. Thermal behavior of the films at high temperature………………. 124
IV.3.e. Performances of the flexible porous carbon electrodes…………... 125
IV.3.f. Discharge product formation……………………………………… 127
IV.3.g. Merging of theory and experiments………………………………. 131
xxxxxxxxxxxxxxxxxxxxxxxxxxxxxxxxxxxxxxxxxxxxxxxxxxxxxxxxxxxxxXxxxxxX
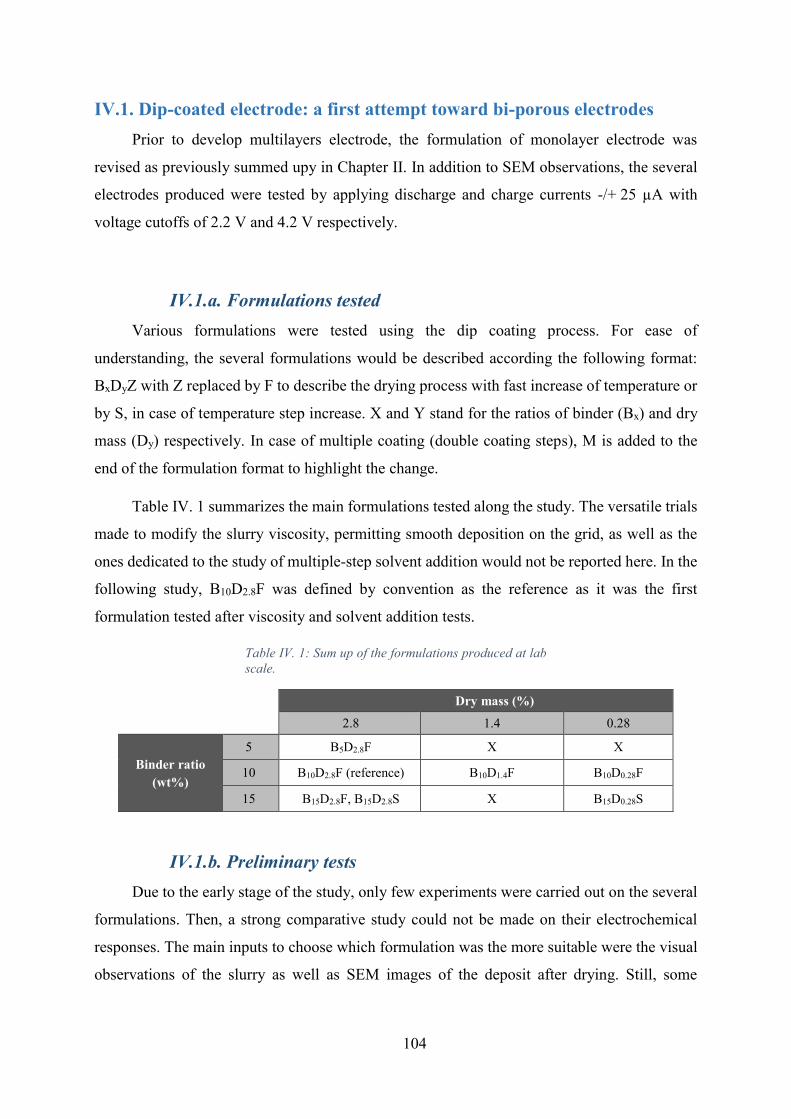
104
IV.1. Dip-coated electrode: a first attempt toward bi-porous electrodes
Prior to develop multilayers electrode, the formulation of monolayer electrode was
revised as previously summed upy in Chapter II. In addition to SEM observations, the several
electrodes produced were tested by applying discharge and charge currents -/+ 25 µA with
voltage cutoffs of 2.2 V and 4.2 V respectively.
IV.1.a. Formulations tested
Various formulations were tested using the dip coating process. For ease of
understanding, the several formulations would be described according the following format:
BxDyZ with Z replaced by F to describe the drying process with fast increase of temperature or
by S, in case of temperature step increase. X and Y stand for the ratios of binder (Bx) and dry
mass (Dy) respectively. In case of multiple coating (double coating steps), M is added to the
end of the formulation format to highlight the change.
Table IV. 1 summarizes the main formulations tested along the study. The versatile trials
made to modify the slurry viscosity, permitting smooth deposition on the grid, as well as the
ones dedicated to the study of multiple-step solvent addition would not be reported here. In the
following study, B10D2.8F was defined by convention as the reference as it was the first
formulation tested after viscosity and solvent addition tests.
Table IV. 1: Sum up of the formulations produced at lab
scale.
Dry mass (%)
2.8 1.4 0.28
Binder ratio
(wt%)
5 B5D2.8F X X
10 B10D2.8F (reference) B10D1.4F B10D0.28F
15 B15D2.8F, B15D2.8S X B15D0.28S
IV.1.b. Preliminary tests
Due to the early stage of the study, only few experiments were carried out on the several
formulations. Then, a strong comparative study could not be made on their electrochemical
responses. The main inputs to choose which formulation was the more suitable were the visual
observations of the slurry as well as SEM images of the deposit after drying. Still, some
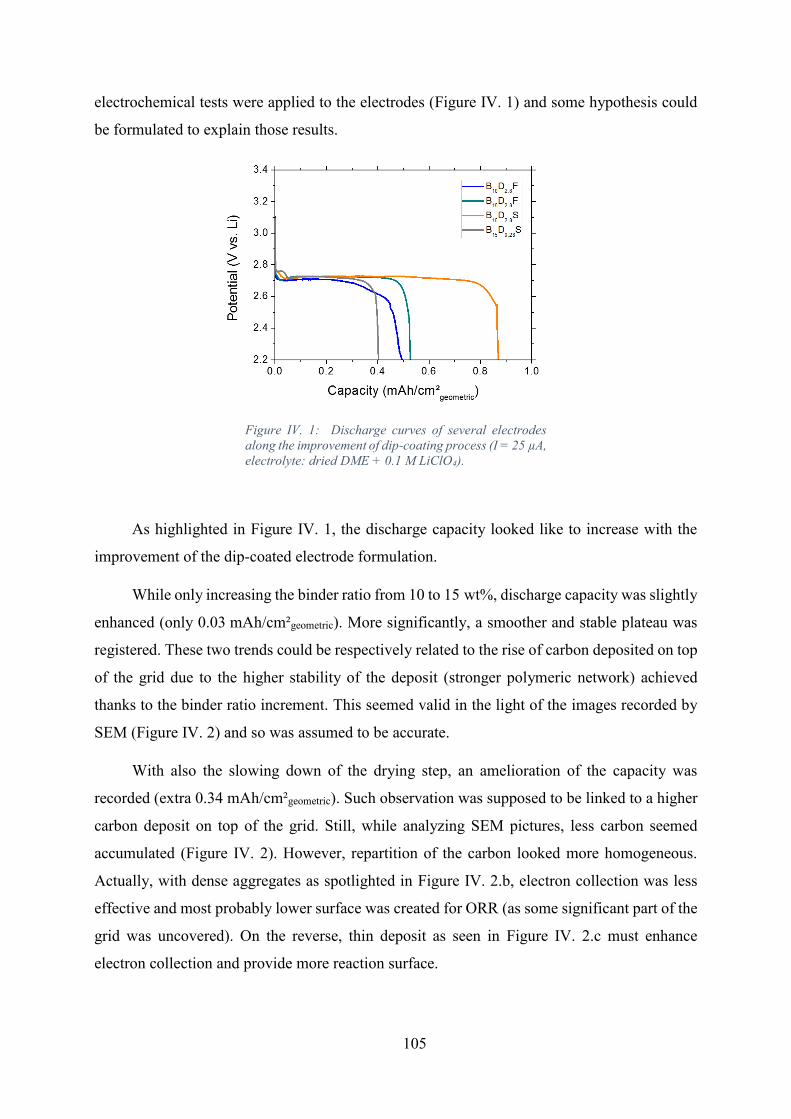
105
electrochemical tests were applied to the electrodes (Figure IV. 1) and some hypothesis could
be formulated to explain those results.
Figure IV. 1: Discharge curves of several electrodes
along the improvement of dip-coating process (I = 25 µA,
electrolyte: dried DME + 0.1 M LiClO4).
As highlighted in Figure IV. 1, the discharge capacity looked like to increase with the
improvement of the dip-coated electrode formulation.
While only increasing the binder ratio from 10 to 15 wt%, discharge capacity was slightly
enhanced (only 0.03 mAh/cm²geometric). More significantly, a smoother and stable plateau was
registered. These two trends could be respectively related to the rise of carbon deposited on top
of the grid due to the higher stability of the deposit (stronger polymeric network) achieved
thanks to the binder ratio increment. This seemed valid in the light of the images recorded by
SEM (Figure IV. 2) and so was assumed to be accurate.
With also the slowing down of the drying step, an amelioration of the capacity was
recorded (extra 0.34 mAh/cm²geometric). Such observation was supposed to be linked to a higher
carbon deposit on top of the grid. Still, while analyzing SEM pictures, less carbon seemed
accumulated (Figure IV. 2). However, repartition of the carbon looked more homogeneous.
Actually, with dense aggregates as spotlighted in Figure IV. 2.b, electron collection was less
effective and most probably lower surface was created for ORR (as some significant part of the
grid was uncovered). On the reverse, thin deposit as seen in Figure IV. 2.c must enhance
electron collection and provide more reaction surface.

106
Figure IV. 2: SEM pictures of the electrodes from
B15D2.8F and B15D2.8S formulations.
In parallel, effect of the dry mass ratio was examined and led to smoother deposit as
demonstrated in Chapter II. Despite coating visual aspect improvement, moving from 2.8 % to
1.4 % of dry mass in the slurry did not affect the discharge capacity even so a flatter plateau
was observed (Figure IV. 3).
Figure IV. 3: Discharge curves of several dip-coated
electrodes made with different dry mass ratio (I = 25 µA,
electrolyte: dried DME + 0.1 M LiClO4).
While transposing the dry mass ratio reduction to the previous improved formulation
(B15D2.8S), results also did not reach the expectations. Indeed, B15D0.28S capacity was divided
by a factor of 2 compared to B15D2.8S one (Figure IV. 1). As revealed by Figure IV. 4, only few
carbon was deposited which could explain the capacity drop.

107
Figure IV. 4: SEM pictures of an electrode made with the
formulation B15D0.28S at a magnificence of a) 40x and b)
150x.
Trying to enhance the capacity and to design multilayered electrode, a batch of electrodes
was dipped twice and entitled B15D0.28SM. Significant improvement of the carbon ratio coated
on top of the grid was then achieved (Figure IV. 5).
Figure IV. 5: SEM pictures of an electrode made with the
formulation B15D0.28SM at a magnificence of a) 40x and
b) 130x.
The appearance of the double coating, thin and almost translucent, called for a deeper
optimization study on such a fabrication process. Even though, a smooth coating was obtained,
it did not mold the grid shape and was then not homogeneous. It seemed that the slurry was not
viscous enough to stick to the grid and just flowed through it. One hint that could be followed
for further studies would be to test B15D1.4S and B15D0.56S to see if a dry mass in between 1.4 %
and 0.28 % would improve the film deposition. A slight increase of the viscosity could help the
slurry to be maintained on top of the grid prior to drying.
Due to the resulting low capacity (0.86 mAh/cm²geometric and 6.12 mAh/gelectrode) with this
electrode fabrication process, a different formulation procedure was later contemplated based

108
on the well-known Bellcore process. Still, across the development of dip-coated electrodes two
major improvements on cell operation and stability were performed.
First, as exhibited in Figure IV. 5, B10D0.28S had a stronger overpotential than other cases,
as well as, lower discharge capacity. Such behavior was correlated with the longer flushing time
applied for this only case (one hour against thirty minutes). Also, it was observed post-mortem
that after cycling all the electrodes and separator used were dry when DME + 0.1 M LiClO4
was used as the electrolyte. As DME is extremely volatile (48 mmHg @ 20 °C according to the
supplier datasheet) long flushing step or operation times aggravated the evaporation of the
solvent in the container (some µL of electrolyte for 0.75 L in the container). Then, electrolytes
and flushing time were revised to enhance the system stability and operation.
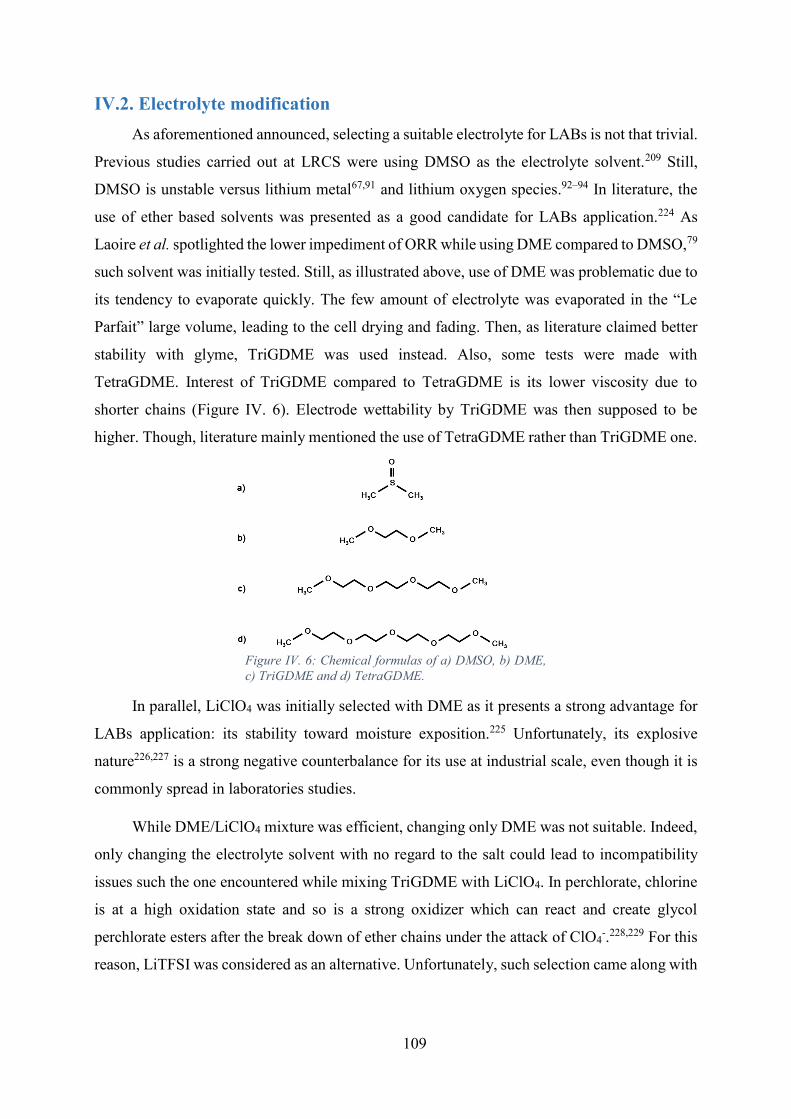
109
IV.2. Electrolyte modification
As aforementioned announced, selecting a suitable electrolyte for LABs is not that trivial.
Previous studies carried out at LRCS were using DMSO as the electrolyte solvent.209 Still,
DMSO is unstable versus lithium metal67,91 and lithium oxygen species.92–94 In literature, the
use of ether based solvents was presented as a good candidate for LABs application.224 As
Laoire et al. spotlighted the lower impediment of ORR while using DME compared to DMSO,79
such solvent was initially tested. Still, as illustrated above, use of DME was problematic due to
its tendency to evaporate quickly. The few amount of electrolyte was evaporated in the “Le
Parfait” large volume, leading to the cell drying and fading. Then, as literature claimed better
stability with glyme, TriGDME was used instead. Also, some tests were made with
TetraGDME. Interest of TriGDME compared to TetraGDME is its lower viscosity due to
shorter chains (Figure IV. 6). Electrode wettability by TriGDME was then supposed to be
higher. Though, literature mainly mentioned the use of TetraGDME rather than TriGDME one.
Figure IV. 6: Chemical formulas of a) DMSO, b) DME,
c) TriGDME and d) TetraGDME.
In parallel, LiClO4 was initially selected with DME as it presents a strong advantage for
LABs application: its stability toward moisture exposition.225 Unfortunately, its explosive
nature226,227 is a strong negative counterbalance for its use at industrial scale, even though it is
commonly spread in laboratories studies.
While DME/LiClO4 mixture was efficient, changing only DME was not suitable. Indeed,
only changing the electrolyte solvent with no regard to the salt could lead to incompatibility
issues such the one encountered while mixing TriGDME with LiClO4. In perchlorate, chlorine
is at a high oxidation state and so is a strong oxidizer which can react and create glycol
perchlorate esters after the break down of ether chains under the attack of ClO4-.228,229 For this
reason, LiTFSI was considered as an alternative. Unfortunately, such selection came along with

110
a significant cons, LiTFSI is highly hygroscopic230 and so the cell would be highly sensitive to
moisture.
Stability of the several electrolytes was evaluated using polarization tests (Figure IV. 7).
Figure IV. 7: Polarization tests (+/- 25 µA for 2h) a)
Comparison between DME and DMSO and b) and
between TriGDME with LiClO4 or LiTFSI as a salt.
Figure IV. 7 emphasizes several occurring phenomena. First of all, instability of DMSO
toward lithium metal can be observed thanks to the constant increase of the distance between
the two plateaus (Figure IV. 7.a). The gap between the two plateau can be correlated to the
system resistance. If the system is stable, the gap should be maintained. If a resistive SEI is
formed, an increment of the gap should be noticed. If a stable SEI is formed, the gap should
finally reach a constant value. Also, if the plateau does not remain flat, reaction occurring under
current application are spotlighted.
At the light of such behavior, it was clearly shown that DME is not stable overtime against
lithium. Indeed, after twenty-five hours of polarization test, the resistance was significantly
amplified and during application of current step no flat plateau was recorded (Figure IV. 7a).
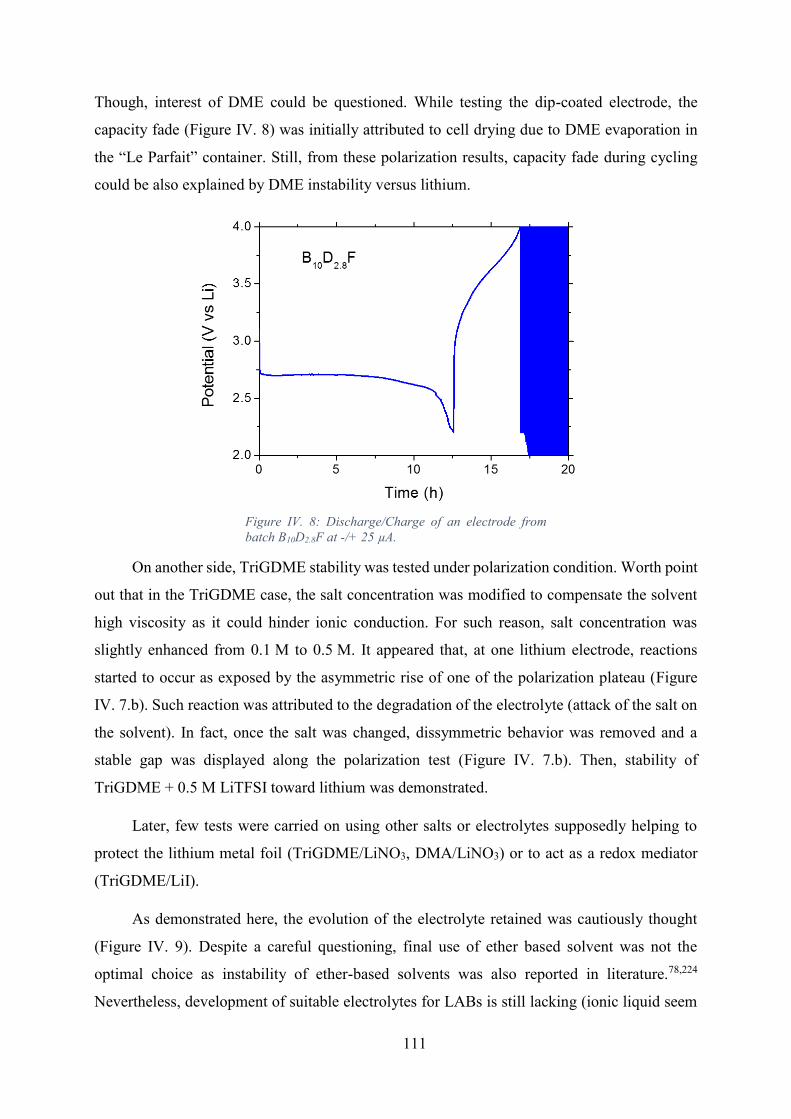
111
Though, interest of DME could be questioned. While testing the dip-coated electrode, the
capacity fade (Figure IV. 8) was initially attributed to cell drying due to DME evaporation in
the “Le Parfait” container. Still, from these polarization results, capacity fade during cycling
could be also explained by DME instability versus lithium.
Figure IV. 8: Discharge/Charge of an electrode from
batch B10D2.8F at -/+ 25 µA.
On another side, TriGDME stability was tested under polarization condition. Worth point
out that in the TriGDME case, the salt concentration was modified to compensate the solvent
high viscosity as it could hinder ionic conduction. For such reason, salt concentration was
slightly enhanced from 0.1 M to 0.5 M. It appeared that, at one lithium electrode, reactions
started to occur as exposed by the asymmetric rise of one of the polarization plateau (Figure
IV. 7.b). Such reaction was attributed to the degradation of the electrolyte (attack of the salt on
the solvent). In fact, once the salt was changed, dissymmetric behavior was removed and a
stable gap was displayed along the polarization test (Figure IV. 7.b). Then, stability of
TriGDME + 0.5 M LiTFSI toward lithium was demonstrated.
Later, few tests were carried on using other salts or electrolytes supposedly helping to
protect the lithium metal foil (TriGDME/LiNO3, DMA/LiNO3) or to act as a redox mediator
(TriGDME/LiI).
As demonstrated here, the evolution of the electrolyte retained was cautiously thought
(Figure IV. 9). Despite a careful questioning, final use of ether based solvent was not the
optimal choice as instability of ether-based solvents was also reported in literature.78,224
Nevertheless, development of suitable electrolytes for LABs is still lacking (ionic liquid seem
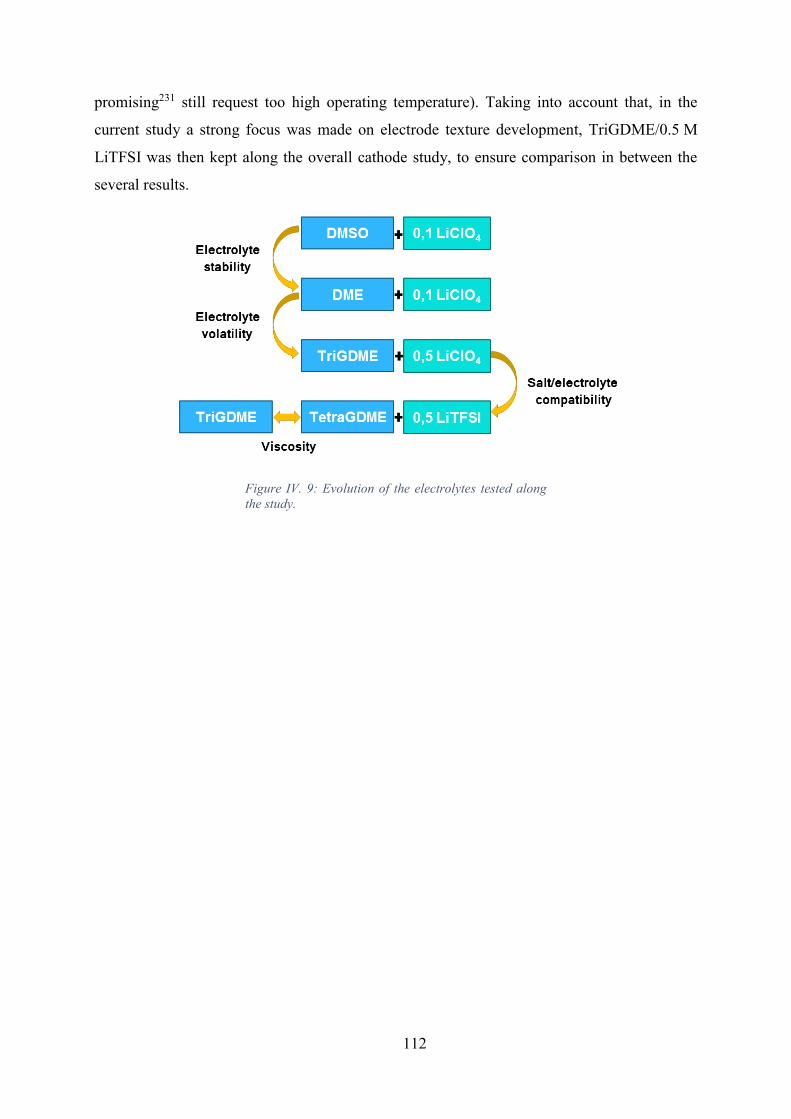
112
promising231 still request too high operating temperature). Taking into account that, in the
current study a strong focus was made on electrode texture development, TriGDME/0.5 M
LiTFSI was then kept along the overall cathode study, to ensure comparison in between the
several results.
Figure IV. 9: Evolution of the electrolytes tested along
the study.

113
IV.3. Development of highly porous and flexible electrodes for LABs
From theoretical point of view, it was defined that the addition until 40 % of macro-
porosity would enhance diffusion. In parallel, at experimental level, the creation of bi-porous
electrode was achieved thanks to flexible porous electrodes. To corroborate the theoretical
findings with experiments results, the electrode porosity should be precisely determined prior
to make further comparisons. Then, characterization of the self-standing flexible porous
electrodes was implemented.
Initially, as porosity was created by leaching out a porogen agent, here DBP, its removal
efficiency was firstly checked. Later, the nature and amount of created porosity (macro or meso
porosity) were probed all along the electrode fabrication process. Due to the multitude of
formulation tested, a particular focus was made from DBP40 to DBP80 (films respectively with
40 w% and 60 w% of DBP in their formulation) as they covered most of the experimental
framework. Finally, assessment of Li2O2 formation and electrochemical responses would be
described.
IV.3.a. Efficiency of DBP removal
The efficiency of the DBP removal was estimated by a statistical study carried out on 50
disks cut from DBP65. Each disk was weighted before and after full leaching process (3
consecutive soakings in pure ether) and the resulting weight loss was compared to the initial
mass of DBP in the disk, leading to the efficiency of the removal (%) (Figure IV. 10).
Figure IV. 10: Statistical analysis of the efficiency of the
DBP extraction (50 disks from DBP65).

114
The mean leaching efficiency was found equal to 94.4 %. DBP extraction was in the
90 – 100 % efficiency range for 94 % of the disks, and there was no disk with an extraction
efficiency lower than 75 %. Although these results could mean that the DBP removal was,
statistically, almost fully accomplished for electrode films with such high DBP contents, their
punctual slight deviation from full (100 % efficient) leaching could also enlighten some
inhomogeneity in the DBP content through the entire films from which the disks were cut. This
was of paramount importance since the initial chemical inhomogeneity straightly impacts the
texture of the DBP-extracted electrode films. Same slight deviation from 100 % efficiency was
observed for three electrodes from DBP40 (91, 92 and 95 %) and three from DBP80 (80, 93 and
94 %). More homogeneous results were achieved with DBP40.
To understand deeper the cleaning process, efficiency of DBP extraction in DBP60, at
each leaching step, was evaluated (each fifteen minutes in clean ether) and compared to a one-
leaching step (forty five minutes in same ether bath) (Figure IV. 11).
Figure IV. 11: Efficiency of DBP removal along the
soaking process in ether depending on the ether cleaning
steps applied to DBP60 electrodes.
In each case with three cleaning steps, the first step allowed to remove more than 65 %
of the initial DBP content. The second soaking in ether, then helped to pull out between 3 % to
26 % more. The impact of the last soaking was less significant but still led to extract a last extra
1 %. Only one step of 45 min, was clearly damageable as lower DBP amounts were withdraw.
The difference of results between three consecutives steps and the equivalent one could be
explained by some kinetics and/or saturation issues in DBP-containing ether. To sum up,

115
efficient DBP removal was fulfill using three consecutive cleaning steps in ether and was used
all along the study.
IV.3.b. Impact of DBP removal on porosity creation
First evaluation of the films porosity based on DBP mass loss
Each film porosity was quickly estimated based on the mass loss measured during the
leaching process. The mass loss was directly attributed to DBP extraction and so to porosity
creation. The results were compared to theoretical porosities, evaluated this time taking into
account that full initial DBP content was extracted (Figure IV. 12).
Figure IV. 12: Theoretical porosities compared to
estimated porosities, calculations based on DBP mass
loss. The mean values of the estimated porosities were
reported in blue, while the maximum and minimum ones
were shown in grey. The number of values considered for
the mean values calculations were provided in the table
in grey.
Surprisingly, not all the values were lower than the theoretical porosity (case of DBP20).
Indeed, as theoretical porosities were calculated estimating that all the DBP initially present in
the electrode was removed, experimental porosities were expected to be lower, due to the not
fully efficient DBP removal formerly demonstrated. Still, results for DBP20 could be explained
while observing the electrodes. Actually, the formulations were developed to created electrodes
with high DBP ratios (to reach 20 – 50 % of macro-porosity as deduced from the theoretical
study), lowering in these adjusted formulations the amount of DBP to 20 w% tended to lead to
high brittleness. Most probably, due to the electrode fragility, some electrode parts must have

116
fell apart leading to higher mass loss compared to the mass of DBP initially inserted in the
electrodes.
Another relevant information appeared also while analyzing the case of DBP60. Two
different batches had been prepared for such formulation leading to two values of mean porosity
separated by additional 7 %. The only difference between these two films was the grinding time
of the powders in the mortar. The first one was blended during five minutes while the second
one was mixed between ten to fifteen minutes. With less aggregation of solid particles, the film
was better blended and so DBP was certainly more homogeneously distributed along the
electrode, explaining an estimated porosity closer the theoretical value.
Such observation highlighted the strong impact of the grinding step, together with
chemical homogeneity effect, in developing homogeneous films. Actually, even in case of
DBP65 which has been demonstrated to be well extracted by a statistical study, chemical
inhomogeneity was revealed by the range of estimated porosities. Still, as spotlighted by the
high mean value, most of the electrodes were well extracted and homogeneous.
Even though some conclusions were drawn from previous calculations, they remained
based on theoretical calculations without taking into account the films volume. A clear
estimation of the porosities was then required using the films volume (thickness x surface).
Prior to any further investigations, the volume modifications of the films along DBP extraction
were analyzed in priority.
Volume modification along DBP extraction
Firstly, evolution of thicknesses for the several films was studied (Figure IV. 13). For
films with a DBP ratio ranging from 20 wt% to 40 wt%, thickness evolution was negligible.
However, for higher DBP ratios, a clear increase of the thicknesses was notified and seemed to
increase after DBP extraction.
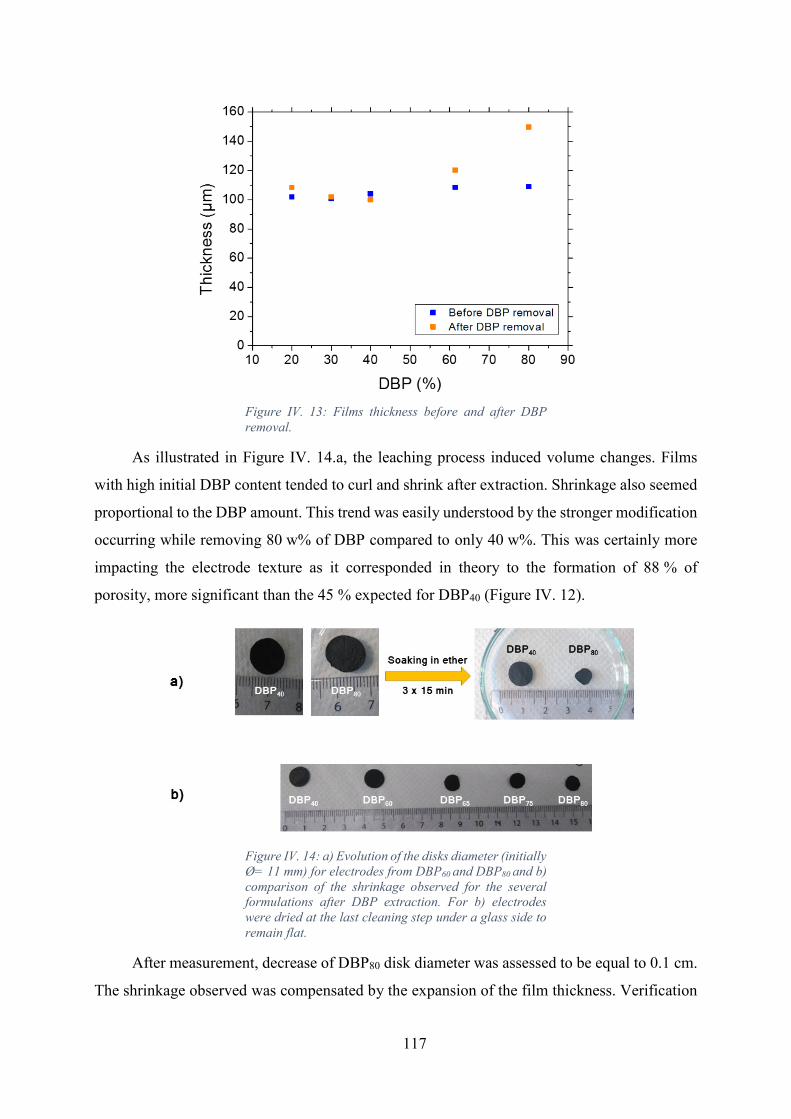
117
Figure IV. 13: Films thickness before and after DBP
removal.
As illustrated in Figure IV. 14.a, the leaching process induced volume changes. Films
with high initial DBP content tended to curl and shrink after extraction. Shrinkage also seemed
proportional to the DBP amount. This trend was easily understood by the stronger modification
occurring while removing 80 w% of DBP compared to only 40 w%. This was certainly more
impacting the electrode texture as it corresponded in theory to the formation of 88 % of
porosity, more significant than the 45 % expected for DBP40 (Figure IV. 12).
Figure IV. 14: a) Evolution of the disks diameter (initially
Ø= 11 mm) for electrodes from DBP60 and DBP80 and b)
comparison of the shrinkage observed for the several
formulations after DBP extraction. For b) electrodes
were dried at the last cleaning step under a glass side to
remain flat.
After measurement, decrease of DBP80 disk diameter was assessed to be equal to 0.1 cm.
The shrinkage observed was compensated by the expansion of the film thickness. Verification
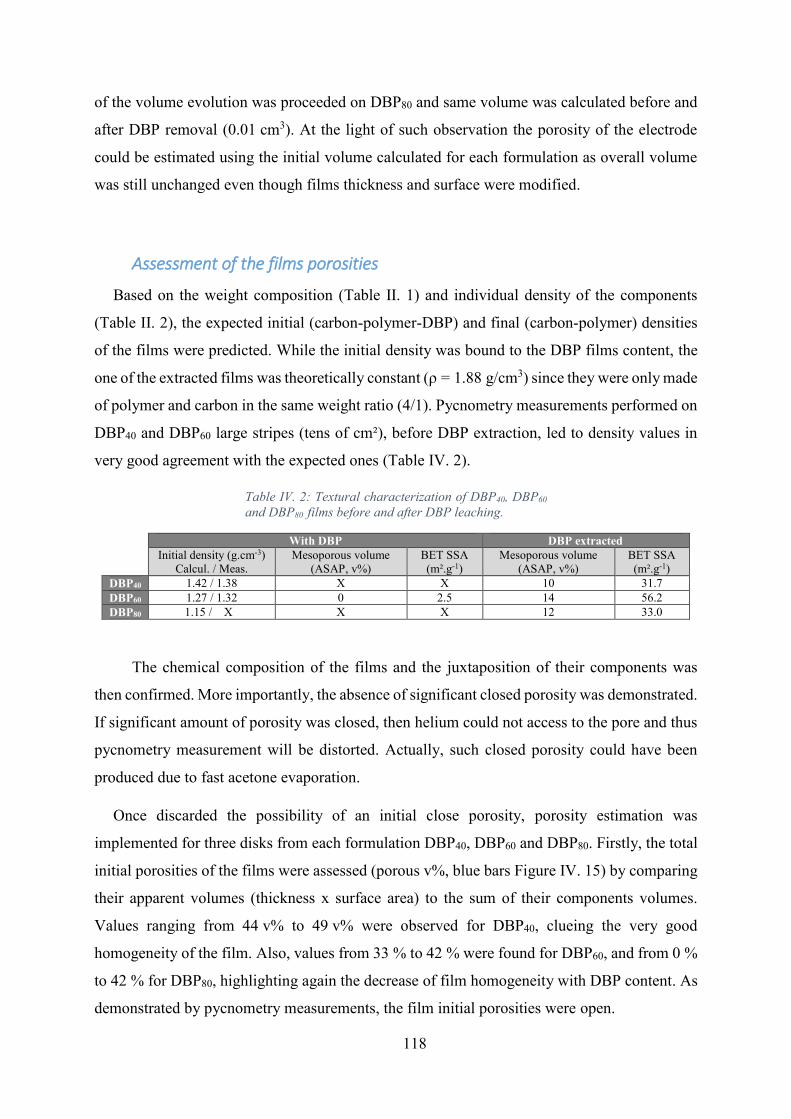
118
of the volume evolution was proceeded on DBP80 and same volume was calculated before and
after DBP removal (0.01 cm3). At the light of such observation the porosity of the electrode
could be estimated using the initial volume calculated for each formulation as overall volume
was still unchanged even though films thickness and surface were modified.
Assessment of the films porosities
Based on the weight composition (Table II. 1) and individual density of the components
(Table II. 2), the expected initial (carbon-polymer-DBP) and final (carbon-polymer) densities
of the films were predicted. While the initial density was bound to the DBP films content, the
one of the extracted films was theoretically constant (ρ = 1.88 g/cm3) since they were only made
of polymer and carbon in the same weight ratio (4/1). Pycnometry measurements performed on
DBP40 and DBP60 large stripes (tens of cm²), before DBP extraction, led to density values in
very good agreement with the expected ones (Table IV. 2).
Table IV. 2: Textural characterization of DBP40, DBP60
and DBP80 films before and after DBP leaching.
With DBP DBP extracted
Initial density (g.cm-3)
Calcul. / Meas.
Mesoporous volume
(ASAP, v%)
BET SSA
(m².g-1)
Mesoporous volume
(ASAP, v%)
BET SSA
(m².g-1)
DBP40 1.42 / 1.38 X X 10 31.7
DBP60 1.27 / 1.32 0 2.5 14 56.2
DBP80 1.15 / 0.X0 X X 12 33.0
The chemical composition of the films and the juxtaposition of their components was
then confirmed. More importantly, the absence of significant closed porosity was demonstrated.
If significant amount of porosity was closed, then helium could not access to the pore and thus
pycnometry measurement will be distorted. Actually, such closed porosity could have been
produced due to fast acetone evaporation.
Once discarded the possibility of an initial close porosity, porosity estimation was
implemented for three disks from each formulation DBP40, DBP60 and DBP80. Firstly, the total
initial porosities of the films were assessed (porous v%, blue bars Figure IV. 15) by comparing
their apparent volumes (thickness x surface area) to the sum of their components volumes.
Values ranging from 44 v% to 49 v% were observed for DBP40, clueing the very good
homogeneity of the film. Also, values from 33 % to 42 % were found for DBP60, and from 0 %
to 42 % for DBP80, highlighting again the decrease of film homogeneity with DBP content. As
demonstrated by pycnometry measurements, the film initial porosities were open.
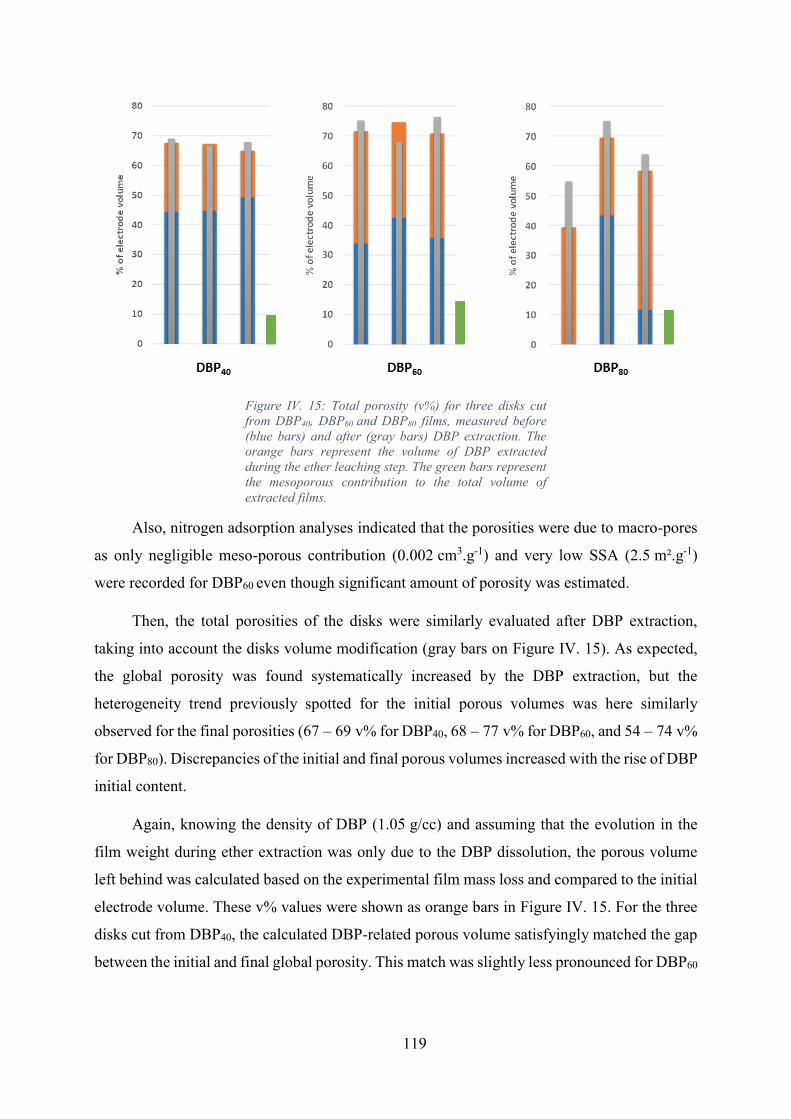
119
Figure IV. 15: Total porosity (v%) for three disks cut
from DBP40, DBP60 and DBP80 films, measured before
(blue bars) and after (gray bars) DBP extraction. The
orange bars represent the volume of DBP extracted
during the ether leaching step. The green bars represent
the mesoporous contribution to the total volume of
extracted films.
Also, nitrogen adsorption analyses indicated that the porosities were due to macro-pores
as only negligible meso-porous contribution (0.002 cm3.g-1) and very low SSA (2.5 m².g-1)
were recorded for DBP60 even though significant amount of porosity was estimated.
Then, the total porosities of the disks were similarly evaluated after DBP extraction,
taking into account the disks volume modification (gray bars on Figure IV. 15). As expected,
the global porosity was found systematically increased by the DBP extraction, but the
heterogeneity trend previously spotted for the initial porous volumes was here similarly
observed for the final porosities (67 – 69 v% for DBP40, 68 – 77 v% for DBP60, and 54 – 74 v%
for DBP80). Discrepancies of the initial and final porous volumes increased with the rise of DBP
initial content.
Again, knowing the density of DBP (1.05 g/cc) and assuming that the evolution in the
film weight during ether extraction was only due to the DBP dissolution, the porous volume
left behind was calculated based on the experimental film mass loss and compared to the initial
electrode volume. These v% values were shown as orange bars in Figure IV. 15. For the three
disks cut from DBP40, the calculated DBP-related porous volume satisfyingly matched the gap
between the initial and final global porosity. This match was slightly less pronounced for DBP60
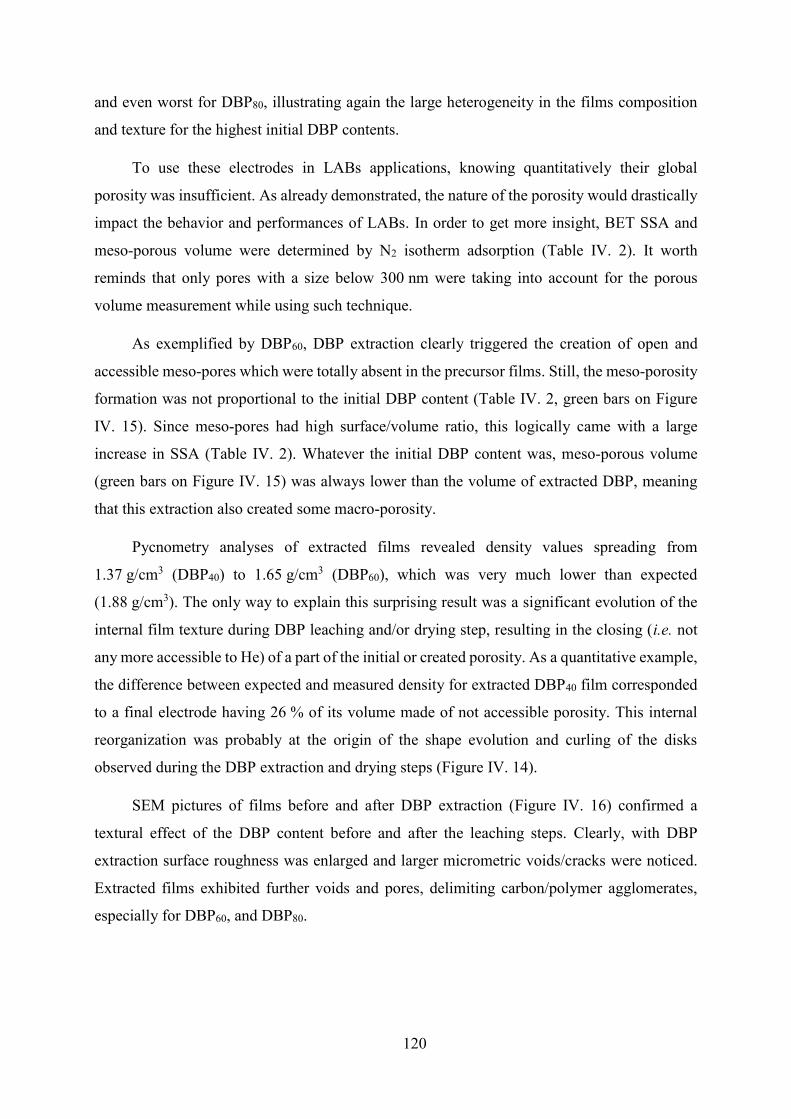
120
and even worst for DBP80, illustrating again the large heterogeneity in the films composition
and texture for the highest initial DBP contents.
To use these electrodes in LABs applications, knowing quantitatively their global
porosity was insufficient. As already demonstrated, the nature of the porosity would drastically
impact the behavior and performances of LABs. In order to get more insight, BET SSA and
meso-porous volume were determined by N2 isotherm adsorption (Table IV. 2). It worth
reminds that only pores with a size below 300 nm were taking into account for the porous
volume measurement while using such technique.
As exemplified by DBP60, DBP extraction clearly triggered the creation of open and
accessible meso-pores which were totally absent in the precursor films. Still, the meso-porosity
formation was not proportional to the initial DBP content (Table IV. 2, green bars on Figure
IV. 15). Since meso-pores had high surface/volume ratio, this logically came with a large
increase in SSA (Table IV. 2). Whatever the initial DBP content was, meso-porous volume
(green bars on Figure IV. 15) was always lower than the volume of extracted DBP, meaning
that this extraction also created some macro-porosity.
Pycnometry analyses of extracted films revealed density values spreading from
1.37 g/cm3 (DBP40) to 1.65 g/cm3 (DBP60), which was very much lower than expected
(1.88 g/cm3). The only way to explain this surprising result was a significant evolution of the
internal film texture during DBP leaching and/or drying step, resulting in the closing (i.e. not
any more accessible to He) of a part of the initial or created porosity. As a quantitative example,
the difference between expected and measured density for extracted DBP40 film corresponded
to a final electrode having 26 % of its volume made of not accessible porosity. This internal
reorganization was probably at the origin of the shape evolution and curling of the disks
observed during the DBP extraction and drying steps (Figure IV. 14).
SEM pictures of films before and after DBP extraction (Figure IV. 16) confirmed a
textural effect of the DBP content before and after the leaching steps. Clearly, with DBP
extraction surface roughness was enlarged and larger micrometric voids/cracks were noticed.
Extracted films exhibited further voids and pores, delimiting carbon/polymer agglomerates,
especially for DBP60, and DBP80.
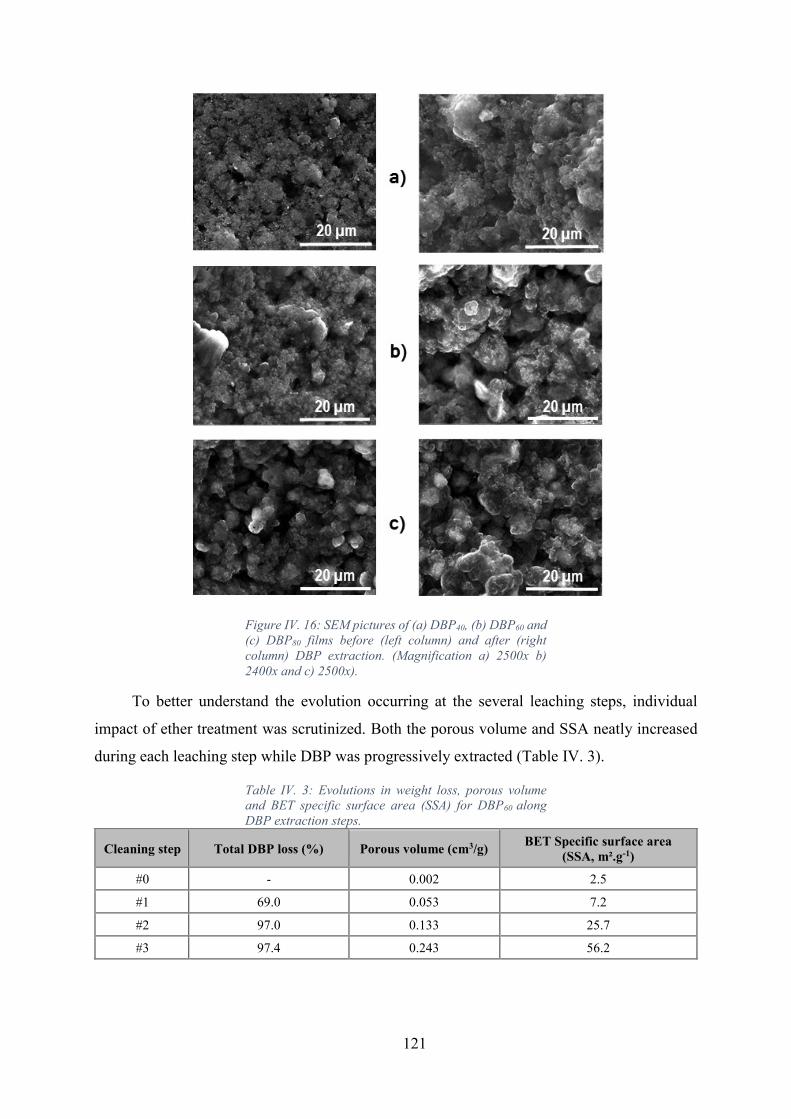
121
Figure IV. 16: SEM pictures of (a) DBP40, (b) DBP60 and
(c) DBP80 films before (left column) and after (right
column) DBP extraction. (Magnification a) 2500x b)
2400x and c) 2500x).
To better understand the evolution occurring at the several leaching steps, individual
impact of ether treatment was scrutinized. Both the porous volume and SSA neatly increased
during each leaching step while DBP was progressively extracted (Table IV. 3).
Table IV. 3: Evolutions in weight loss, porous volume
and BET specific surface area (SSA) for DBP60 along
DBP extraction steps.
Cleaning step Total DBP loss (%) Porous volume (cm3/g) BET Specific surface area
(SSA, m².g-1)
#0 - 0.002 2.5
#1 69.0 0.053 7.2
#2 97.0 0.133 25.7
#3 97.4 0.243 56.2
122
Even though resulting in a very slim DBP loss (0.4 %), step#3 was associated with the
largest porous volume and SSA increases, clearly confirming the need of the three steps. The
slight amount (< 3 %) of remaining non-dissolved DBP was likely located in isolated inner
parts of the film, non-accessible to ether percolation. Note that the maximum films SSA
remained lower (56 m².g-1) than the Ketjen Black expected contribution (280 m².g-1 for DBP60),
confirming that carbon particles were embedded in the polymeric film, hindering a part of its
surface. Still, a significant amount of the carbon surface was accessible and measured. As large
pores have small surface/volume ratio, the slight increase in SSA spotted during step #1 (2.5
7.2 m².g-1), while more than two third (69 %) of the DBP was gone, indicated the formation of
large pores from easily accessible large DBP-rich zones of the films, therefore firstly and
quickly extracted. Thereafter, smaller and less accessible DBP clusters were then progressively
accessed and leached out along the subsequent two steps (#2 and #3). This explained the much
larger gains in SSA, especially during step #3. It was assumed that such phenomenon was taking
place within the micrometric carbon/binder agglomerates clearly visible on the SEM images,
and between which, large micrometric macro-pores were also clearly observed (Figure IV. 16).
The ratio between the gain in porous volume and the gain in SSA gave a first evaluation of the
related pore size, and was founded to be lying below 10 nm during steps #2 and #3.
To sum up, the texture of the several porous-carbon loaded plastic film prepared for the
study was identify. Initially, the films already exhibited open and accessible macro-porosity, as
high as 40 v%, and no meso-porosity as demonstrated in Table IV. 2 and Table IV. 3. Still,
DBP extraction enabled to enhance the formation of macro-porosity as well as forming meso-
pores. Still, formation of extra-porosity came with a cost as electrodes suffered from internal
reorganization leading to close porosity (e.g. 26 v% for DBP40). Such close porosity was a
significant drawback for LABs application. Indeed, high amount of open porosity was required
for LABs. So, the closed pores will just decrease the energy density as they will not participate
to the discharge/charge mechanisms.
Another relevant information was the homogeneity of the films. Even though statistically
it was demonstrated that DBP extraction was really efficient (e.g. 94 % of the disks cut from
DBP65 films reached between 90 % to 100 % of extraction efficiency), it clearly appeared that
the chemical homogeneity of the film decreased with increment of the DBP ratio. This would
then also be a disadvantage as the local properties of the films would be radically different,
introducing uncertainty in the real value of porosity of the films. As the electrochemical
responses of the films will depend on the porosity created (volume of porosity = space to
123
produce Li2O2), inhomogeneity could lead to variations of the performances for the electrodes
coming from the same batch. For this raison, DBP40 would be preferred as it displayed an initial
homogeneous macro-porosity and composition, resulting in a similar homogeneity after
extraction.
So, due to films inhomogeneity and closed porosity, the use of high DBP initial contents
(> 60 w%) did not appear as a relevant choice to reach homogeneous high porosity in carbon-
based flexible electrodes. However, homogeneous films having high porosity (ca. 50 v%),
bimodal meso/macro porosity, and high accessible carbon surface area (ca. 50 m².gelectrode-1)
were fabricated while using moderate DBP content (e.g. DBP40).
Still, mastering the ratio between meso and macro porosities stroke as being difficult.
Surely, initially the electrodes were macro-porous highlighting that the carbon did not define
the carbon-polymer-DBP domain porosity. Also, as shown, the cleaning steps led to first
creation of macro-porosity and then of meso-porosity. Finally, bi-modal structure was
guaranteed, DBP removal giving access to the carbon surface. Still, the macro-pores/meso-
pores ratio was not easily tuned, as spotlighted by the similar volume of meso-pores founded
in the films though they had different initial DBP ratio (green bars in Figure IV. 15).
In the light of prior observations, it was then concluded that, as such electrode fabrication
process enabled to produce homogeneous bi-modal electrodes while cautiously preparing them
and when considering lower DBP ratios, their use could be transposed to LABs as well as other
metal-air batteries. Still, it worth underscores that the process would not permit to achieve
exactly the ratios predicted from the previous theoretical study. For that, another fabrication
should be then developed as for instance using templating.
IV.3.c. Behavior of the films in the electrolyte solvent
As formerly shown, films had a tendency to shrink after DBP extraction. Then, prior to
further test in electrochemical cell in presence of electrolyte (ether based solvent as TriGDME
and TetraGDME were used), evolution of the film while immersed in ether was inspected.
Expansion was noticed while soaking the films DBP40 and DBP60 in ether (Figure IV. 17).
An expansion of 0.1 cm was noticed for both formulations. Such swelling attested that the ether
filled the electrode porosity and so will the electrolyte do.

124
Figure IV. 17: Diameter evolution for disks (initially Ø=
9 mm) cut from extracted films DBP40 and DBP80 a)
initially, b) immersed in ether and c) dried.
Still, a concern on binder swelling appeared, as this spread could be irreversible. To check
it, the electrodes were dried. The final diameters (Figure IV. 17.c) of the disks were equal to
the one of extracted films (Figure IV. 17.a). This meant that binder swelling should not be a
concern. Indeed, same diameter expansion was demonstrated even though disk DBP60 contained
more binder. For these reasons, volume expansion was linked only to the penetration of the
ether inside the disk.
IV.3.d. Thermal behavior of the films at high temperature
Due to the targeted application, thermal stability of the electrode was a highly prized
characteristic. Actually, this property was emphasized by Du Pasquier et al. for this type
electrode.140 To certify it and to give idea of the range of stability, DSC measurements were
applied to DBP80 film, before and after DBP removal, as shown in Figure IV. 18.
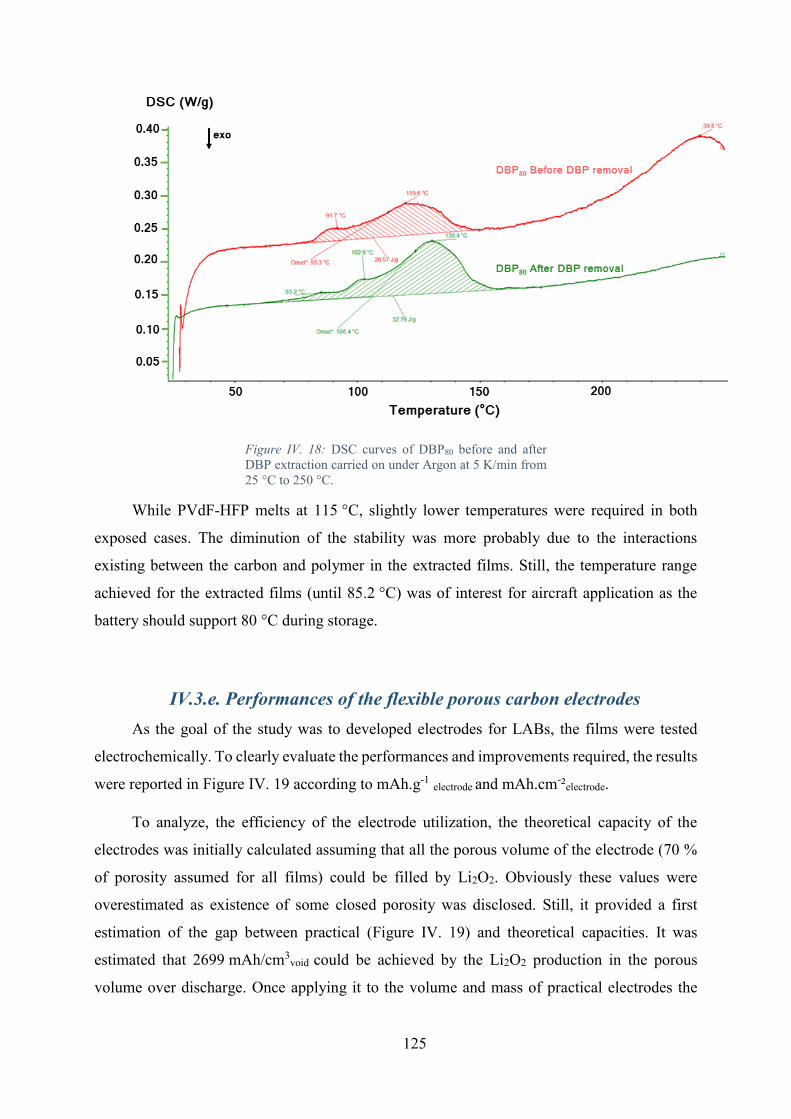
125
Figure IV. 18: DSC curves of DBP80 before and after
DBP extraction carried on under Argon at 5 K/min from
25 °C to 250 °C.
While PVdF-HFP melts at 115 °C, slightly lower temperatures were required in both
exposed cases. The diminution of the stability was more probably due to the interactions
existing between the carbon and polymer in the extracted films. Still, the temperature range
achieved for the extracted films (until 85.2 °C) was of interest for aircraft application as the
battery should support 80 °C during storage.
IV.3.e. Performances of the flexible porous carbon electrodes
As the goal of the study was to developed electrodes for LABs, the films were tested
electrochemically. To clearly evaluate the performances and improvements required, the results
were reported in Figure IV. 19 according to mAh.g-1 electrode and mAh.cm-²electrode.
To analyze, the efficiency of the electrode utilization, the theoretical capacity of the
electrodes was initially calculated assuming that all the porous volume of the electrode (70 %
of porosity assumed for all films) could be filled by Li2O2. Obviously these values were
overestimated as existence of some closed porosity was disclosed. Still, it provided a first
estimation of the gap between practical (Figure IV. 19) and theoretical capacities. It was
estimated that 2699 mAh/cm3void could be achieved by the Li2O2 production in the porous
volume over discharge. Once applying it to the volume and mass of practical electrodes the

126
theoretical capacities were 3265 mAh/electrode for DBP40, 3353 mAh/electrode for DBP60 and
3420 mAh/electrode for DBP80.
Figure IV. 19: Discharge curves of the Swagelok cells
made using electrodes cut from a) DBP60 and b) DBP80
films at 50 µA while in TriGDME + 0.5 M LiTFSI,
reported in mAh.g-1electrode and mAh.cm - ²electrode. Each
color corresponds to the results obtained for the same
cell.
Actually, the best performances of DBP60 and DBP80 electrodes finally corresponded to
80 % and 70 % of the respective theoretical capacities. This meant that the flexible electrodes
produced are efficient electrodes for LABs.
However, in parallel, 6 % and 16 % of the predicted capacities were reached in the worst
cases (cases corresponding to the lowest capacities in mAh/g and mAh/cm²electrode). At first
sight, the lack of reproducibility was overwhelming. Certainly, the capacities, initial curve
shapes and overpotentials of the several curves were strikingly different.
At higher current, DBP40 was tested and as expected it led to lower capacities (Figure IV.
20). Indeed, the gap between recorded and theoretical capacities was noteworthy. This
highlighted the strong sensitivity of LABs toward the current density and oxygen diffusion
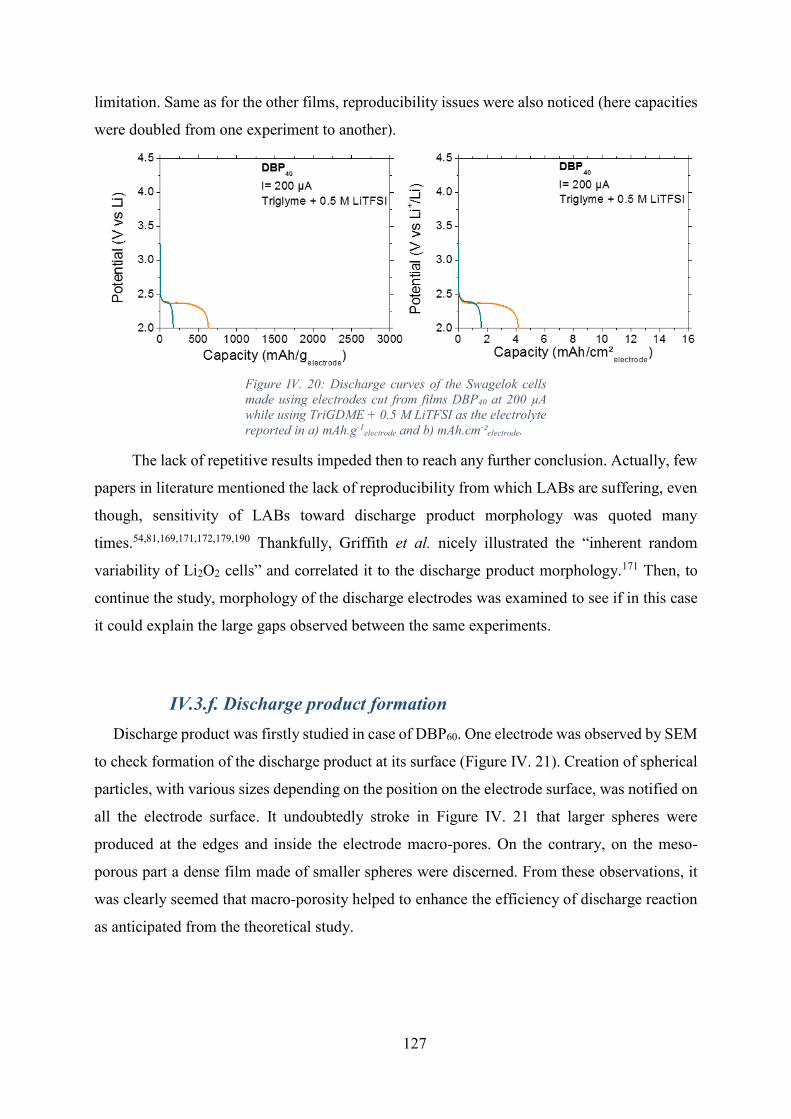
127
limitation. Same as for the other films, reproducibility issues were also noticed (here capacities
were doubled from one experiment to another).
Figure IV. 20: Discharge curves of the Swagelok cells
made using electrodes cut from films DBP40 at 200 µA
while using TriGDME + 0.5 M LiTFSI as the electrolyte
reported in a) mAh.g-1electrode and b) mAh.cm-²electrode.
The lack of repetitive results impeded then to reach any further conclusion. Actually, few
papers in literature mentioned the lack of reproducibility from which LABs are suffering, even
though, sensitivity of LABs toward discharge product morphology was quoted many
times.54,81,169,171,172,179,190 Thankfully, Griffith et al. nicely illustrated the “inherent random
variability of Li2O2 cells” and correlated it to the discharge product morphology.171 Then, to
continue the study, morphology of the discharge electrodes was examined to see if in this case
it could explain the large gaps observed between the same experiments.
IV.3.f. Discharge product formation
Discharge product was firstly studied in case of DBP60. One electrode was observed by SEM
to check formation of the discharge product at its surface (Figure IV. 21). Creation of spherical
particles, with various sizes depending on the position on the electrode surface, was notified on
all the electrode surface. It undoubtedly stroke in Figure IV. 21 that larger spheres were
produced at the edges and inside the electrode macro-pores. On the contrary, on the meso-
porous part a dense film made of smaller spheres were discerned. From these observations, it
was clearly seemed that macro-porosity helped to enhance the efficiency of discharge reaction
as anticipated from the theoretical study.

128
Figure IV. 21: SEM pictures taken from electrode DBP60
previously discharged until 2 V at 50 µA in TriGDME +
0.5 M LiTFSI. The corresponding capacities values are
2372 mAh/gelectrode and 12 mAh/cm²electrode.
Since, formation of a product was noticed on the electrode surface, determination of its
nature was required to clearly affirmed that it was the discharge product. Therefore, XRD tests
were launched to determine if crystalline Li2O2 was formed on the surface (Figure IV. 22).
XRD diagram of the DBP60 electrode after full discharge was compared to the diagram
of the hardware (XRD holder with a beryllium window containing a non-discharge electrode).
Two pics seemed to correspond to Li2O2 (around 32 and 35 °2θ) even if their intensity seemed
overwhelming by the other pics intensity. This difference of intensities could be explained by
the few amount of Li2O2 formed compared to the other components of the electrode and even
more compared to the beryllium sample holder.
Even though Li2O2 was detected in its crystalline form, it could also have been formed in
its amorphous phase too. Actually, literature report formation of both phases in LABs.190,232
Formation of both phases could give an explanation of the small intensity of the pics observed.
At least, production of Li2O2 was certified. Thus, the observed particles formed on the electrode
surface (Figure IV. 21) were attributed to discharge product formation.

129
Figure IV. 22: a) XRD diagram of a DBP60 electrode not
discharge (bleu) and XRD diagram of a DBP60 discharge
electrode compared to b) XRD diagram of crystalline
Li2O2.
An electrode from DBP80 was also analyzed by SEM trying to see if noticeable results
were found compared to the DBP60 case (Figure IV. 23) which was discharge at once until 2 V.
DBP80 on the reverse was discharged by repetitive sequences of ten hours of discharge and four
hours of resting to enable evaluation of the impedance spectra evolution over discharge. The
EIS results clearly shown an increase of charge transfer over discharge, which could corroborate
the deposition of a passivating product as Li2O2.

130
Figure IV. 23: SEM pictures taken from electrode DBP80
previously discharged until 2V (by consecutive repetition
of ten hours of discharge, four hours of resting and EIS
measurement between each cycle) at 50 µA in
TriGDME + 0.5 M LiTFSI. The corresponding
capacities values are 1326 mAh/gelectrode and
9 mAh/cm²electrode.
While SEM pictures for DBP60 demonstrated the formation of densely packed particles
with large spheres in particular at the macro-pores edges, more homogeneous repartition of the
particles sizes was noted for DBP80. Forsooth, this might come from the lower discharge
capacity achieved with this electrode and thus to the lower Li2O2 production and growth.
Also, this particular DBP80 electrode suffered significantly from deformations as
illustrated in Figure IV. 24. Even though the electrode thickness was preserved (while
comparing to the thickness in Figure IV. 24 to the one after DBP removal in Figure IV. 13), the
flexible electrodes clearly suffered from compression. The other electrode from DBP60 was also
distorted but to a lesser extent. As the DBP80 thickness was preserved, the compression
sensibility was not attributed to the electrode expansion and thus to the electrode formulation.
These alterations must occur during the celling of the Swagelok as the grid seemed to pierce
the electrodes with different intensity. As the celling was manually done in Swagelok, the
pressure applied to the cell were modified from one to another experiment.
Due to the large deformation of the films, the electrochemical results should be revised.
The distinct deformation of the films compressed by the grid could also explained the
discrepancy of the discharge curves as the surface developed at the oxygen inlet side, as well
as, the electron collection would be totally different depending on the compression applied.
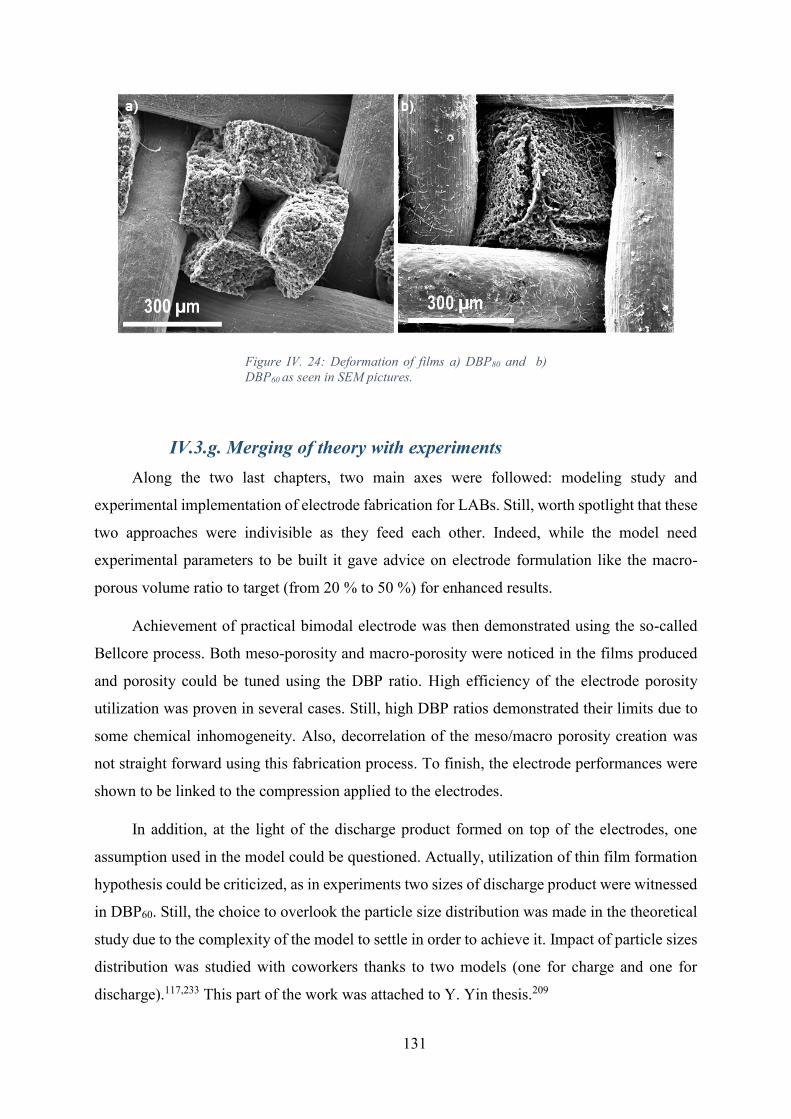
131
Figure IV. 24: Deformation of films a) DBP80 and b)
DBP60 as seen in SEM pictures.
IV.3.g. Merging of theory with experiments
Along the two last chapters, two main axes were followed: modeling study and
experimental implementation of electrode fabrication for LABs. Still, worth spotlight that these
two approaches were indivisible as they feed each other. Indeed, while the model need
experimental parameters to be built it gave advice on electrode formulation like the macro-
porous volume ratio to target (from 20 % to 50 %) for enhanced results.
Achievement of practical bimodal electrode was then demonstrated using the so-called
Bellcore process. Both meso-porosity and macro-porosity were noticed in the films produced
and porosity could be tuned using the DBP ratio. High efficiency of the electrode porosity
utilization was proven in several cases. Still, high DBP ratios demonstrated their limits due to
some chemical inhomogeneity. Also, decorrelation of the meso/macro porosity creation was
not straight forward using this fabrication process. To finish, the electrode performances were
shown to be linked to the compression applied to the electrodes.
In addition, at the light of the discharge product formed on top of the electrodes, one
assumption used in the model could be questioned. Actually, utilization of thin film formation
hypothesis could be criticized, as in experiments two sizes of discharge product were witnessed
in DBP60. Still, the choice to overlook the particle size distribution was made in the theoretical
study due to the complexity of the model to settle in order to achieve it. Impact of particle sizes
distribution was studied with coworkers thanks to two models (one for charge and one for
discharge).117,233 This part of the work was attached to Y. Yin thesis.209

132
Unfortunately, reproducibility issues did not permit to precisely determine the
electrochemical performances of the designed electrodes. In an attempt to improve the
repeatability of the experiments, several trials were implemented to have an enhanced control
of the operating conditions.

CHAPTER V: REPRODUCIBILITY ISSUES AND
SENSITIVITY TO OPERATING CONDITIONS
Chapter V: Reproducibility issues and sensitivity to operating conditions
Contents
xxxxxxxxxxxxxxxxxxxxxxxxxxxxxxxxxxxxxxxxxxxxxxxxxxxxxxxxxxxxxXxxxxxX
V.1. Lab reproducibility issues …………………………………………….………..134
V.1.a Description of the reproducibility issues………………………..….. 134
V.1.b. Attempts to reduce the uncertainty………………………………... 134
V.2. LABs sensitivity toward operating conditions……………………………...…146
V.2.a. Temperature and current effects on discharge capacity………….... 146
V.2.b. Temperature and current effects on discharge product morphology.149
V.3. LABs high sensitivity toward electrode surface……………………………… 161
V.4. Conclusions on LABs reproducibility issues…………………………………. 164
xxxxxxxxxxxxxxxxxxxxxxxxxxxxxxxxxxxxxxxxxxxxxxxxxxxxxxxxxxxxxXxxxxxX
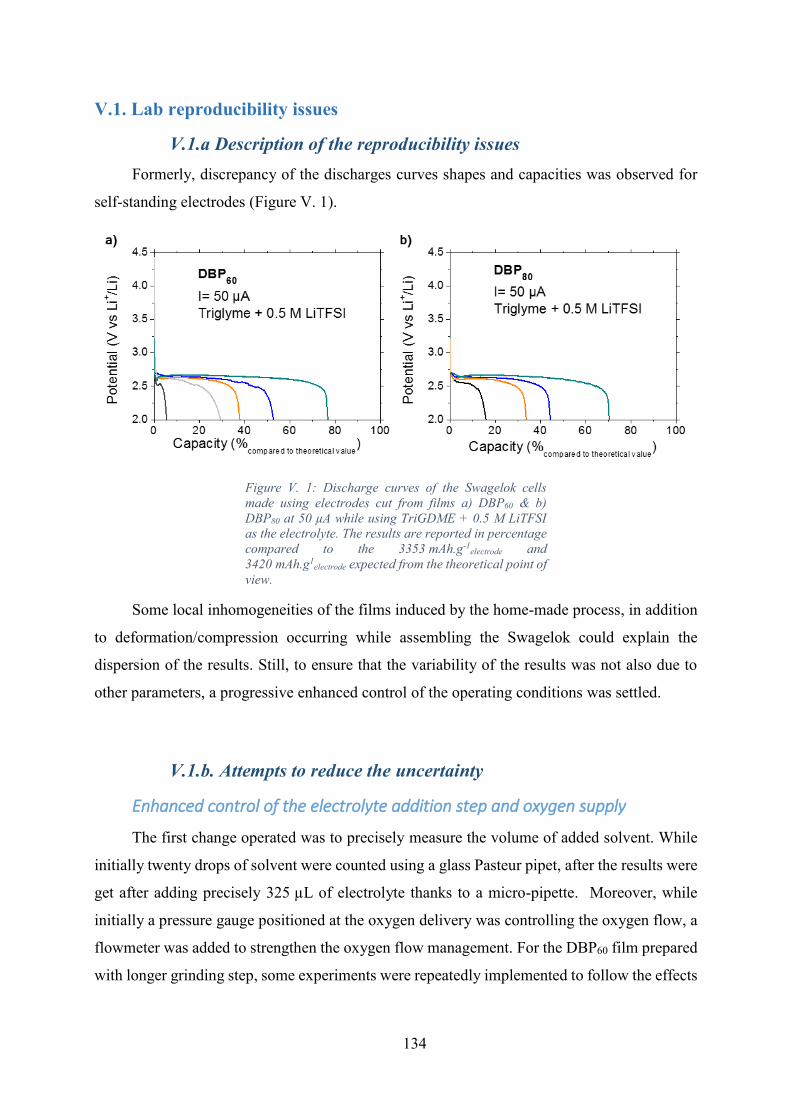
134
V.1. Lab reproducibility issues
V.1.a Description of the reproducibility issues
Formerly, discrepancy of the discharges curves shapes and capacities was observed for
self-standing electrodes (Figure V. 1).
Figure V. 1: Discharge curves of the Swagelok cells
made using electrodes cut from films a) DBP60 & b)
DBP80 at 50 µA while using TriGDME + 0.5 M LiTFSI
as the electrolyte. The results are reported in percentage
compared to the 3353 mAh.g-1electrode and
3420 mAh.g1electrode expected from the theoretical point of
view.
Some local inhomogeneities of the films induced by the home-made process, in addition
to deformation/compression occurring while assembling the Swagelok could explain the
dispersion of the results. Still, to ensure that the variability of the results was not also due to
other parameters, a progressive enhanced control of the operating conditions was settled.
V.1.b. Attempts to reduce the uncertainty
Enhanced control of the electrolyte addition step and oxygen supply
The first change operated was to precisely measure the volume of added solvent. While
initially twenty drops of solvent were counted using a glass Pasteur pipet, after the results were
get after adding precisely 325 µL of electrolyte thanks to a micro-pipette. Moreover, while
initially a pressure gauge positioned at the oxygen delivery was controlling the oxygen flow, a
flowmeter was added to strengthen the oxygen flow management. For the DBP60 film prepared
with longer grinding step, some experiments were repeatedly implemented to follow the effects
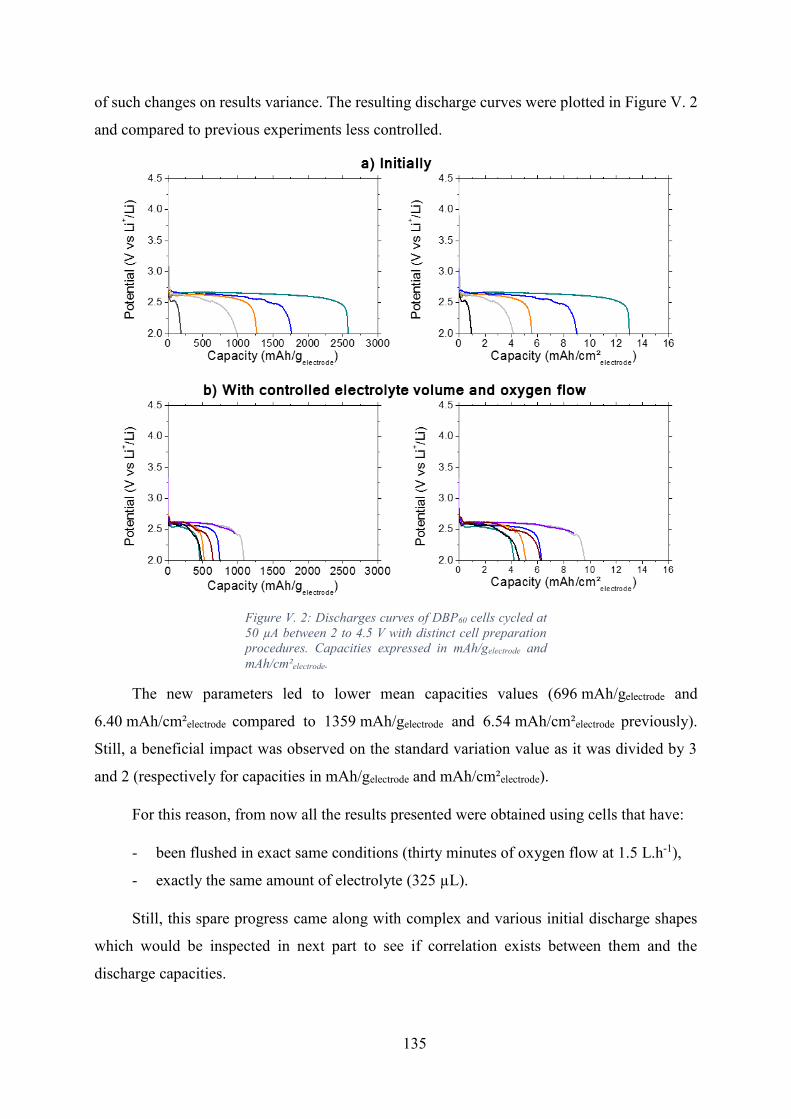
135
of such changes on results variance. The resulting discharge curves were plotted in Figure V. 2
and compared to previous experiments less controlled.
Figure V. 2: Discharges curves of DBP60 cells cycled at
50 µA between 2 to 4.5 V with distinct cell preparation
procedures. Capacities expressed in mAh/gelectrode and
mAh/cm²electrode.
The new parameters led to lower mean capacities values (696 mAh/gelectrode and
6.40 mAh/cm²electrode compared to 1359 mAh/gelectrode and 6.54 mAh/cm²electrode previously).
Still, a beneficial impact was observed on the standard variation value as it was divided by 3
and 2 (respectively for capacities in mAh/gelectrode and mAh/cm²electrode).
For this reason, from now all the results presented were obtained using cells that have:
- been flushed in exact same conditions (thirty minutes of oxygen flow at 1.5 L.h-1),
- exactly the same amount of electrolyte (325 µL).
Still, this spare progress came along with complex and various initial discharge shapes
which would be inspected in next part to see if correlation exists between them and the
discharge capacities.

136
Observations of the discharge curves characteristics
Prior to modify the experimental conditions, the already obtained discharge plots were
compared to determine if the curves characteristics could point out possible trends. While
scrutinizing more specifically the initial part, some clear dips were observed. In a previous
study implemented at the LRCS, the dips noticed were clearly linked to the Li2O2 nucleation.233
As initially highlighted by Köhler’s theory,234 the nucleation step requires a certain quantity of
energy to accumulate enough reactant to trigger the precipitation and thus the nuclei formation.
Once nuclei are formed, particles growth could start as predicted by the classical nucleation
theory (CNT) (Figure V. 3).235
Figure V. 3:a) Free energy diagram for nucleation and
b) corresponding nucleation of metal nanoparticles as
described by Polte. 235
To see if nucleation mechanisms could explain the discrepancy, the dips were compared
(Figure V. 4). Two different patterns were identified while analyzing the plots before the main
discharge plateau. In some cases, two consecutive plateaus were observed (Figure V. 4.a.). In
others, apparition of a first plateau tailed by a dip was noticed (Figure V. 4.b.). Unfortunately,
no obvious correlations between the discharge efficiency and the plot shape was evidently
identified. At least, it was noticed that nucleation likely took place.
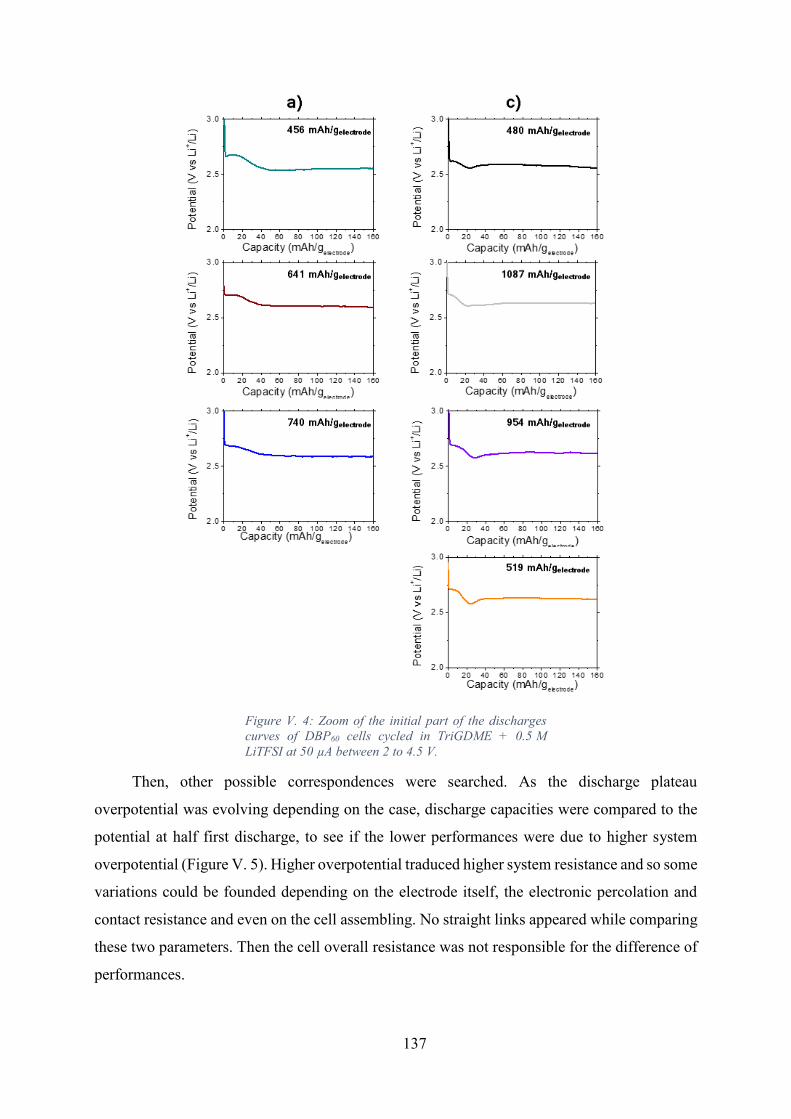
137
Figure V. 4: Zoom of the initial part of the discharges
curves of DBP60 cells cycled in TriGDME + 0.5 M
LiTFSI at 50 µA between 2 to 4.5 V.
Then, other possible correspondences were searched. As the discharge plateau
overpotential was evolving depending on the case, discharge capacities were compared to the
potential at half first discharge, to see if the lower performances were due to higher system
overpotential (Figure V. 5). Higher overpotential traduced higher system resistance and so some
variations could be founded depending on the electrode itself, the electronic percolation and
contact resistance and even on the cell assembling. No straight links appeared while comparing
these two parameters. Then the cell overall resistance was not responsible for the difference of
performances.

138
Figure V. 5: Comparison of potentials at half first
discharge for DBP60 cells cycled in 325 µL of TriGDME
+ 0.5 M LiTFSI at 50 µA between 2 to 4.5 V after thirty
minutes of precisely controlled oxygen flow.
Finally, no clear pattern linked the discharge capacity to the overpotential. This infringed
to make more advanced conclusions. Still, while scrutinizing the curve at smaller scale, two-
hour period oscillations were perceived as highlighted in Figure V. 6.
Figure V. 6: Zoom in discharges curves in case of a
DBP60 cell cycled in 325 µL of TriGDME + 0.5 M LiTFSI
at 50 µA between 2 to 4.5 V after thirty minutes of
precisely controlled oxygen flow.
After recording the temperature evolution in the cycling room, similar oscillations (same
period) in temperature were recorded and attributed to the air cooling system (Figure V. 7) as
oscillations variations were spread from 18.4 to 20.2 °C.

139
Figure V. 7: Room temperature evolution around the “Le
Parfait” containers in the cycling room.
The control of the operating temperature at 25 °C enabled to suppress the oscillations as
pointed out in Figure V. 8.
Figure V. 8: Removal of the discharge voltage
oscillations thanks to temperature control at 25 °C.
For these reason, mastering the temperature to which the cells were exposed was of
paramount importance as significant oscillations in voltage were induced with only 2 °C of
difference. This spotted the strong sensitivity of LABs toward temperature and suggested strong
kinetics limitations.

140
Enhanced control of the operating temperature and electrode mechanical
stability
In an attempt to reduce the uncertainty of the cells operation, the first measure was then
to control the temperature. The operation temperature control was managed using a stove in
which the VSP cables were inserted. As the stove did not possess cooling system, the
temperature set should be higher than the cycling room one, explaining why 25 °C was selected
at first as the operating temperature. Later, only higher temperatures were applied to the cell
for the same reason. Prior to launch the electrochemical tests, two hours of resting time in the
stove were always assigned to the cells for the sake of temperature homogenization. Along this
step, the OCV was stabilized, implying that enough resting time was applied.
In parallel, the second measure taken was the modification of the electrodes. As
previously spotted, bi-porous electrodes suffered from compression. During post-mortem
analysis, the deformed electrodes stuck to the grid due to strong deformations. Then, Bellcore-
like electrodes were replaced by electrodes, named GDLs, that could undergo the compression
step. Made of carbon fibers interlaced, GDLs promote good electronic conductivity and were
homogeneously produced thanks to an industrial process. Even though GDL could be
compressed as spotted in the fuel-cell field,236–238 GDL electrodes were reversibly deformed
which facilitated their observation at SEM once pulling them out from the stainless steel grid.
A significant advantage of GDLs was also their porosity (66 %) comparable to bi-porous
electrodes overall porosity. Thanks to their properties GDLs were then good candidate to make
comparisons with previous electrodes.
In opposition to what was supposed, using GDLs (more homogenous and bearing
compression) in the more controlled conditions did not solved the reproducibility issues (Figure
V. 9).
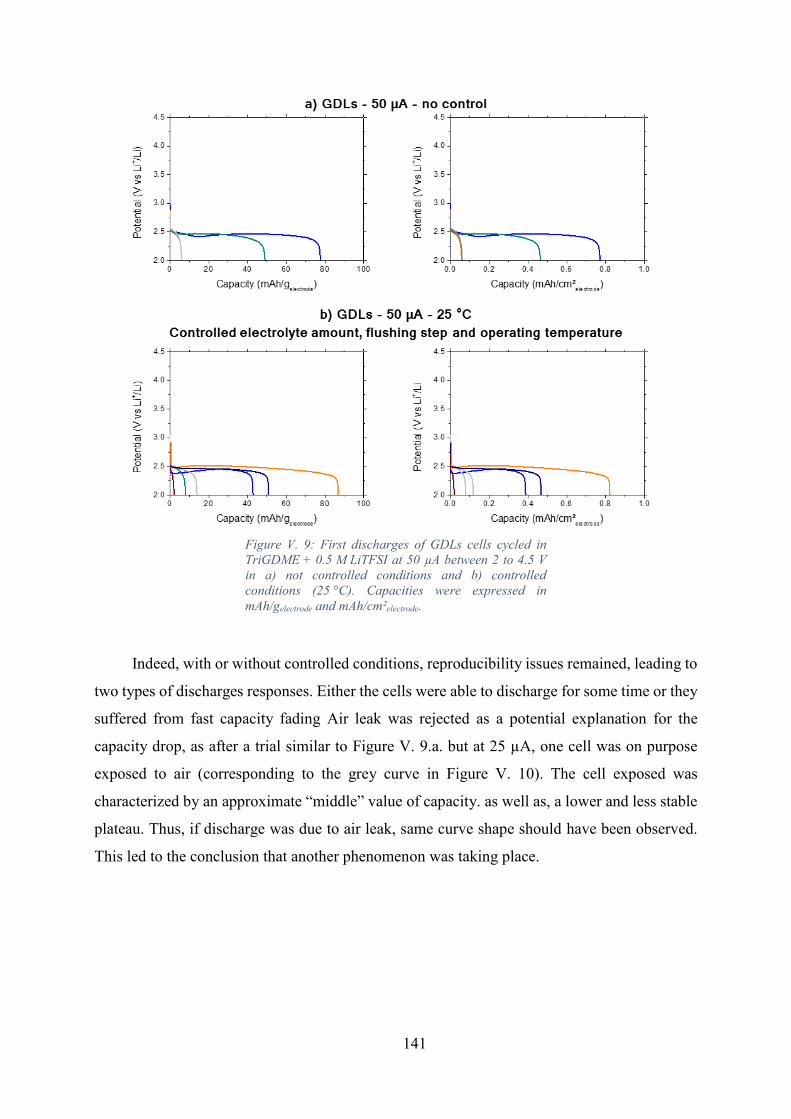
141
Figure V. 9: First discharges of GDLs cells cycled in
TriGDME + 0.5 M LiTFSI at 50 µA between 2 to 4.5 V
in a) not controlled conditions and b) controlled
conditions (25 °C). Capacities were expressed in
mAh/gelectrode and mAh/cm²electrode.
Indeed, with or without controlled conditions, reproducibility issues remained, leading to
two types of discharges responses. Either the cells were able to discharge for some time or they
suffered from fast capacity fading Air leak was rejected as a potential explanation for the
capacity drop, as after a trial similar to Figure V. 9.a. but at 25 µA, one cell was on purpose
exposed to air (corresponding to the grey curve in Figure V. 10). The cell exposed was
characterized by an approximate “middle” value of capacity. as well as, a lower and less stable
plateau. Thus, if discharge was due to air leak, same curve shape should have been observed.
This led to the conclusion that another phenomenon was taking place.

142
Figure V. 10: First discharges of GDLs cells cycled in
TriGDME + 0.5 M LiTFSI at 25 µA between 2 to 4.5 V
in not controlled conditions. Only the cell with the grey
curve was exposed to air. Capacities expressed in a)
mAh/gelectrode and b) mAh/cm²electrode.
Results with GDLs appeared to be even worse than home-made electrodes (mean value
of 34.8 mAh/gelectrode for a standard deviation of 28.6 mAh/gelectrode). Indeed, this time, while
comparing the achieved gravimetric capacities to theoretical value, less than 5 % was attained
(Figure V. 11). Besides, GDLs had approximately the same porosity than the flexible bi-porous
electrodes and thus similar theoretical capacity based on the volume available for Li2O2
production. Still, this value should be nuanced for GDL as low carbon surface was developed
and thus lower discharge capacity could be attained compared to electrode design with
enhanced porous volume utilization. This comforted the idea that special texture of the electrode
such as the described bi-porous electrodes is required to develop efficient LABs electrodes.
Figure V. 11: Discharge curves of the GDLs cells at
50 µA in controlled conditions while using TriGDME +
0.5 M LiTFSI as the electrolyte. The results are reported
in percentage compared to the 3402 mAh.g-1electrode
expected from the theoretical point of view.
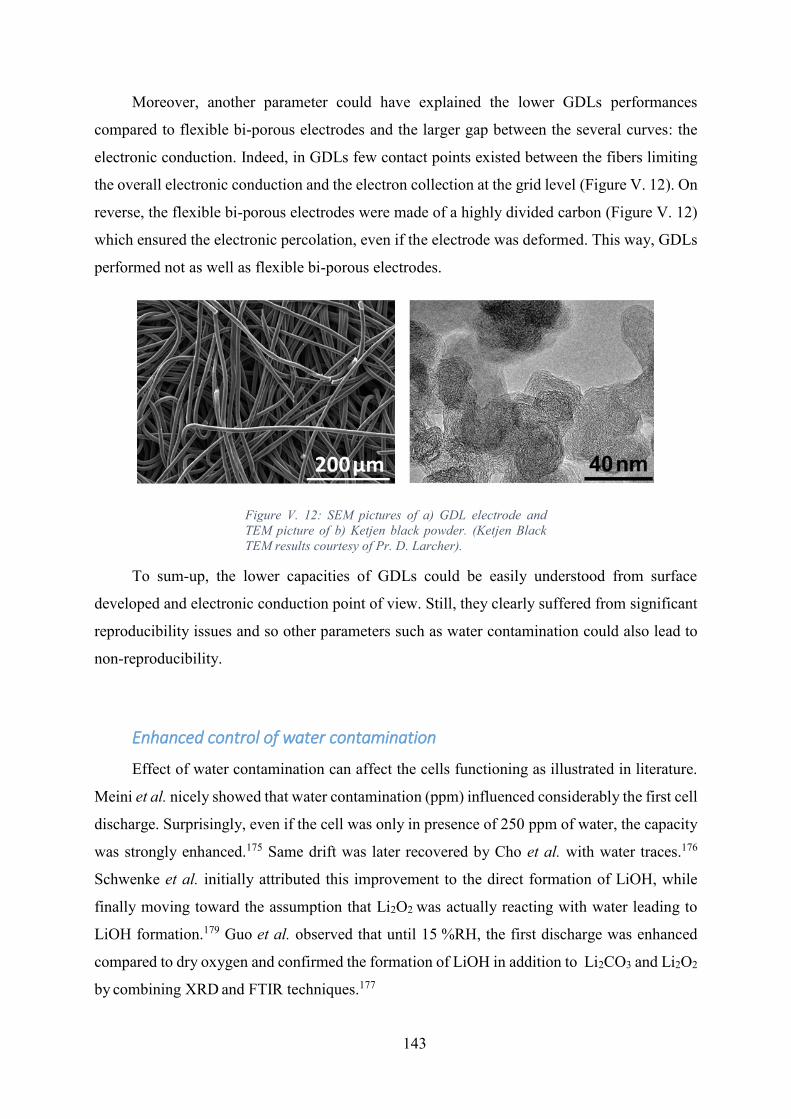
143
Moreover, another parameter could have explained the lower GDLs performances
compared to flexible bi-porous electrodes and the larger gap between the several curves: the
electronic conduction. Indeed, in GDLs few contact points existed between the fibers limiting
the overall electronic conduction and the electron collection at the grid level (Figure V. 12). On
reverse, the flexible bi-porous electrodes were made of a highly divided carbon (Figure V. 12)
which ensured the electronic percolation, even if the electrode was deformed. This way, GDLs
performed not as well as flexible bi-porous electrodes.
Figure V. 12: SEM pictures of a) GDL electrode and
TEM picture of b) Ketjen black powder. (Ketjen Black
TEM results courtesy of Pr. D. Larcher).
To sum-up, the lower capacities of GDLs could be easily understood from surface
developed and electronic conduction point of view. Still, they clearly suffered from significant
reproducibility issues and so other parameters such as water contamination could also lead to
non-reproducibility.
Enhanced control of water contamination
Effect of water contamination can affect the cells functioning as illustrated in literature.
Meini et al. nicely showed that water contamination (ppm) influenced considerably the first cell
discharge. Surprisingly, even if the cell was only in presence of 250 ppm of water, the capacity
was strongly enhanced.175 Same drift was later recovered by Cho et al. with water traces.176
Schwenke et al. initially attributed this improvement to the direct formation of LiOH, while
finally moving toward the assumption that Li2O2 was actually reacting with water leading to
LiOH formation.179 Guo et al. observed that until 15 %RH, the first discharge was enhanced
compared to dry oxygen and confirmed the formation of LiOH in addition to Li2CO3 and Li2O2
by combining XRD and FTIR techniques.177

144
Based on such findings, the results captured earlier (Figure V. 9) could be revised. Indeed,
the separation of the discharge in two types: either long or short first discharges could be
attributed to water contamination. Still, as shown previously, the water contamination was not
coming from air leak. Then, the most probable source of water was the electrolyte. In reality,
even if all the salt and solvent were only opened in glovebox with controlled atmosphere, they
could have been contaminated by exposure to scarce water traces in the glovebox.
Then, to identify if water was responsible of such results, the electrolyte
(TriGDME + 0.5 M LiTFSI) was dried overnight using molecular sieve. Its water content
evolved from 118 ppm to less than 3 ppm. Significant decrease of the discharge capacity was
then reached, confirming the water impact as described in literature (Figure V. 13).
Figure V. 13: First discharges of GDLs cells cycled at
25 °C in TriGDME + 0.5 M LiTFSI at 50 µA between 2
to 4.5 V Capacities expressed in a) mAh/gelectrode and b)
mAh/cm²electrode.
The mean discharge value was reduced to 9.4 mAh/gelectrode and standard deviation was
estimated at 2.9. As standard deviation expressed the disparity of the results, it was concluded
that reproducibility of the experiments was improved by removing the water traces. Starting

145
from there, and due to the LABs sensitivity toward the described parameters, all further
experiments were always executing with:
- Perfectly controlled electrolyte addition,
- Precisely fixed oxygen flushing step,
- Controlled operating temperature,
- Strict water removal.
Behaviors of the cells and discharge product morphology get at several temperatures and
currents values were accurately studied. GDLs electrodes were used for the rest of the study
due to their mechanical resistance and reproducibility from one sample to another. Also, GDLs
enabled to clearly see the formation of discharge product depending on the conditions applied.
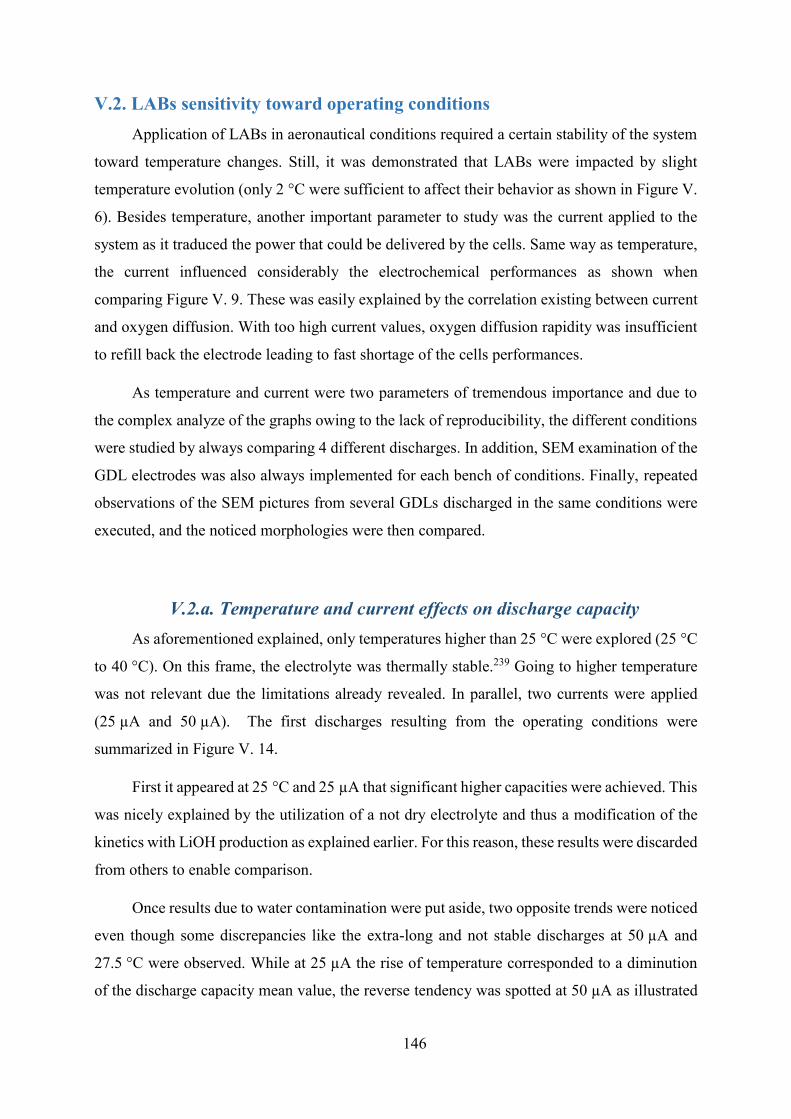
146
V.2. LABs sensitivity toward operating conditions
Application of LABs in aeronautical conditions required a certain stability of the system
toward temperature changes. Still, it was demonstrated that LABs were impacted by slight
temperature evolution (only 2 °C were sufficient to affect their behavior as shown in Figure V.
6). Besides temperature, another important parameter to study was the current applied to the
system as it traduced the power that could be delivered by the cells. Same way as temperature,
the current influenced considerably the electrochemical performances as shown when
comparing Figure V. 9. These was easily explained by the correlation existing between current
and oxygen diffusion. With too high current values, oxygen diffusion rapidity was insufficient
to refill back the electrode leading to fast shortage of the cells performances.
As temperature and current were two parameters of tremendous importance and due to
the complex analyze of the graphs owing to the lack of reproducibility, the different conditions
were studied by always comparing 4 different discharges. In addition, SEM examination of the
GDL electrodes was also always implemented for each bench of conditions. Finally, repeated
observations of the SEM pictures from several GDLs discharged in the same conditions were
executed, and the noticed morphologies were then compared.
V.2.a. Temperature and current effects on discharge capacity
As aforementioned explained, only temperatures higher than 25 °C were explored (25 °C
to 40 °C). On this frame, the electrolyte was thermally stable.239 Going to higher temperature
was not relevant due the limitations already revealed. In parallel, two currents were applied
(25 µA and 50 µA). The first discharges resulting from the operating conditions were
summarized in Figure V. 14.
First it appeared at 25 °C and 25 µA that significant higher capacities were achieved. This
was nicely explained by the utilization of a not dry electrolyte and thus a modification of the
kinetics with LiOH production as explained earlier. For this reason, these results were discarded
from others to enable comparison.
Once results due to water contamination were put aside, two opposite trends were noticed
even though some discrepancies like the extra-long and not stable discharges at 50 µA and
27.5 °C were observed. While at 25 µA the rise of temperature corresponded to a diminution
of the discharge capacity mean value, the reverse tendency was spotted at 50 µA as illustrated
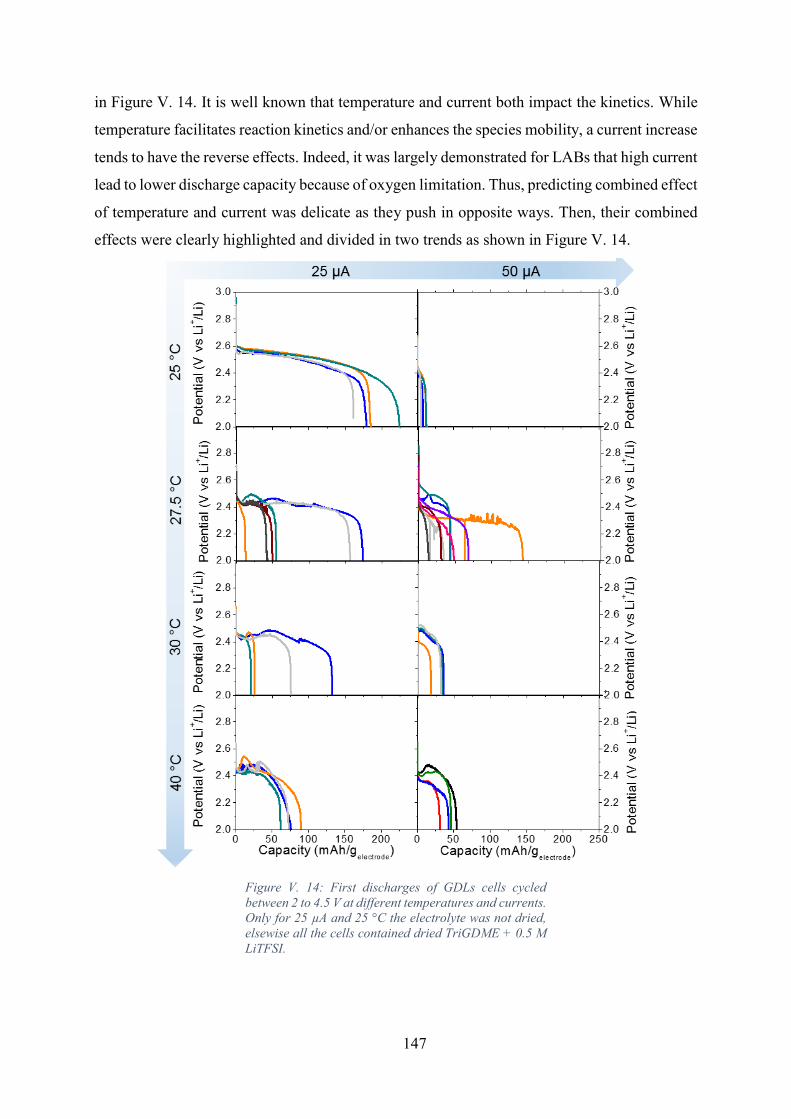
147
in Figure V. 14. It is well known that temperature and current both impact the kinetics. While
temperature facilitates reaction kinetics and/or enhances the species mobility, a current increase
tends to have the reverse effects. Indeed, it was largely demonstrated for LABs that high current
lead to lower discharge capacity because of oxygen limitation. Thus, predicting combined effect
of temperature and current was delicate as they push in opposite ways. Then, their combined
effects were clearly highlighted and divided in two trends as shown in Figure V. 14.
Figure V. 14: First discharges of GDLs cells cycled
between 2 to 4.5 V at different temperatures and currents.
Only for 25 µA and 25 °C the electrolyte was not dried,
elsewise all the cells contained dried TriGDME + 0.5 M
LiTFSI.

148
Figure V. 15: Evolution of the discharges capacities
mean value with temperature and discharge currents.
Also, it was remarked that reproducibility issues were partially reduced thanks to
temperature increase, as spotlighted by the variation of the standard deviation ratio for both
currents applied. To quantify the evolution of reproducibility, standard deviations noted in each
conditions were calculated. As actually the mean capacity significantly changed from one case
to another one, the results of the percentages represented by the standard deviations compared
to the respective mean capacity were plotted in Figure V. 16.
Figure V. 16: Evolution of the standard deviation over
mean capacity ratio with temperature and discharge
currents.
As illustrated, reproducibility clearly improved while temperature was increased even if
for 50 µA and 27.5 °C an unexpected rise was observed compared to other results get at 50 µA.
Such astonishing results were correlated to the mean discharge capacity value. Indeed, while

149
for duo of conditions, twin measurements were always noticed for high values (as for instance
at 25 °C and 50 µA: 12.1 - 12.7 mAh/gelectrode and 5.29 - 7.74 mAh/gelectrode) here more tests
were done but only one value was significantly higher than the other ones (unstable orange
curve in Figure V. 14). This led to higher standard deviation and mean value calculations.
Actually after removing this unforeseen value, mean value dropped until 40.3 mAh/gelectrode and
the ratio of standard deviation over mean capacity until 29.7 mAh/gelectrode leading to smooth
evolution of the values with temperature. Other relevant observation was that at 40 °C a higher
reproducibility was recorded for the highest current value, underlining the beneficial impact of
rise temperature in LABs. Even if it was already demonstrated in literature that higher current
density could be damageable, its impact was not clearly correlated to the temperature.
To sum up, it was clearly identified that temperature impacted the kinetics and thus the
discharge capacity. Temperature also helped to enhance the experiments reproducibility.
Impact of current density on discharge capacity was nuanced as such parameter should studied
aside from temperature. Still, at such point, understanding the improvements was not allowed
from previous results. Necessity to go deeper into the study was still required to understand the
origin of reproducibility issues. As LABs are based on reaction surface, analyze by SEM of the
electrode after discharge seemed relevant to observed qualitatively the efficiency of the
discharge, as well as, the repetitively of the discharge product morphologies observed.
V.2.b. Temperature and current effects on discharge product
morphology
Discharge product morphologies reported in literature
A clear trend popped up while analyzing the LABs discharge product morphologies as
many papers published by the scientific community reported formation of “toroids”. Actually,
while selecting the key-words “lithium-air batteries” OR “lithium-oxygen batteries” AND
“toroids” in Web of Science browser 1083 papers were found over the 2682 counted for LABs
(c.f. Chapter 1). This significant number of papers mentioning such particle shape highlighted
the large tendency consisting in looking for toroids while occulting formation of other shapes.
Many serious work focused on “toroids”, “toroidal” or even “toroid-like” particles
formation,77,81,171,174,178,179,202,240–243 most probably due to their characteristic and easily
identified shape as illustrated in Figure V. 17.

150
Figure V. 17: SEM picture of a toroidal particle formed
on top of GDL discharge in cell containing TriGDME+
1M LiNO3.
Astonishingly, their shape reminds the red blood cell (Figure V. 18), in charge to transport
the oxygen to the several organs of the human body. Even if the red blood cell shape could be
supposedly linked to oxygen, some works, such as the ones of Canham or Deuling et al.,
attributed it to a minimum of membrane bending energy and to the membrane elasticity
properties respectively.244,245 Then, the toroidal form is more linked to the cell properties than
the optimal contact surface for oxygen adsorption as it could easily be initially supposed.
Perhaps the visual likeness of some LABs discharge particles to human red blood cell was
responsible for the undeserved fame of toroids among the several discharge product
morphologies witnessed at lab scale.
Figure V. 18: SEM picture of red blood cell with clear
toroidal shape. Image taken from Tamara et al. work.246
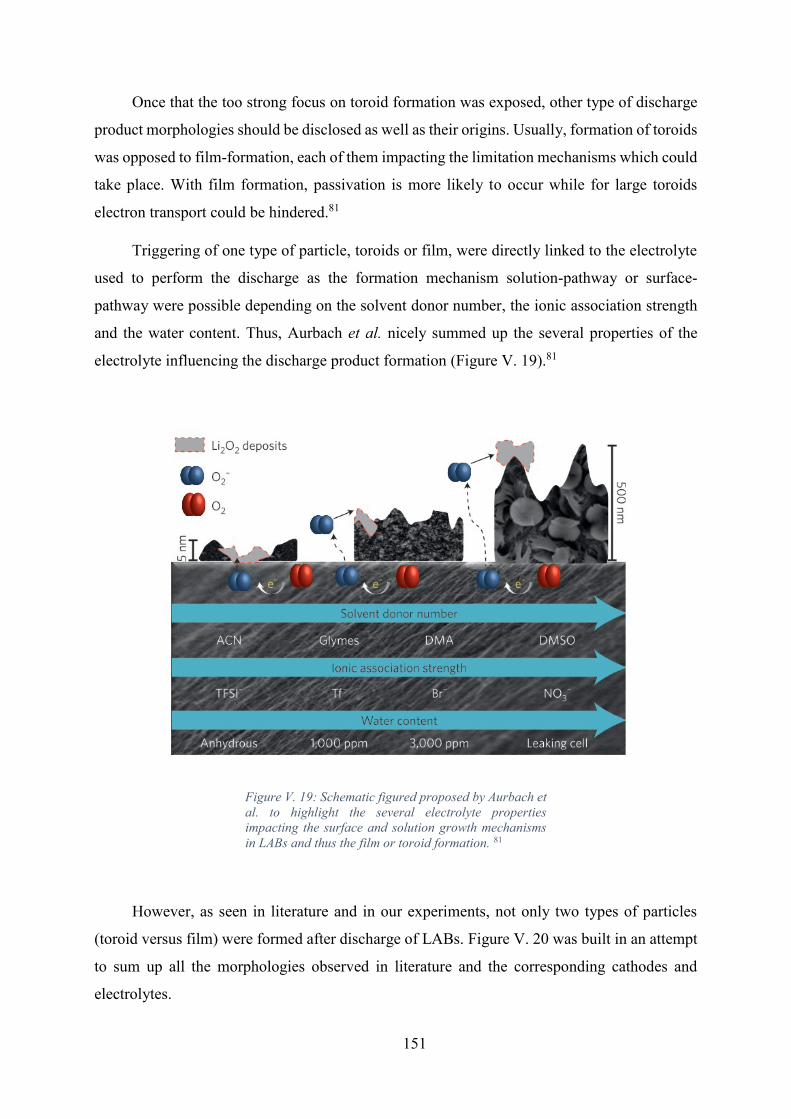
151
Once that the too strong focus on toroid formation was exposed, other type of discharge
product morphologies should be disclosed as well as their origins. Usually, formation of toroids
was opposed to film-formation, each of them impacting the limitation mechanisms which could
take place. With film formation, passivation is more likely to occur while for large toroids
electron transport could be hindered.81
Triggering of one type of particle, toroids or film, were directly linked to the electrolyte
used to perform the discharge as the formation mechanism solution-pathway or surface-
pathway were possible depending on the solvent donor number, the ionic association strength
and the water content. Thus, Aurbach et al. nicely summed up the several properties of the
electrolyte influencing the discharge product formation (Figure V. 19).81
Figure V. 19: Schematic figured proposed by Aurbach et
al. to highlight the several electrolyte properties
impacting the surface and solution growth mechanisms
in LABs and thus the film or toroid formation. 81
However, as seen in literature and in our experiments, not only two types of particles
(toroid versus film) were formed after discharge of LABs. Figure V. 20 was built in an attempt
to sum up all the morphologies observed in literature and the corresponding cathodes and
electrolytes.
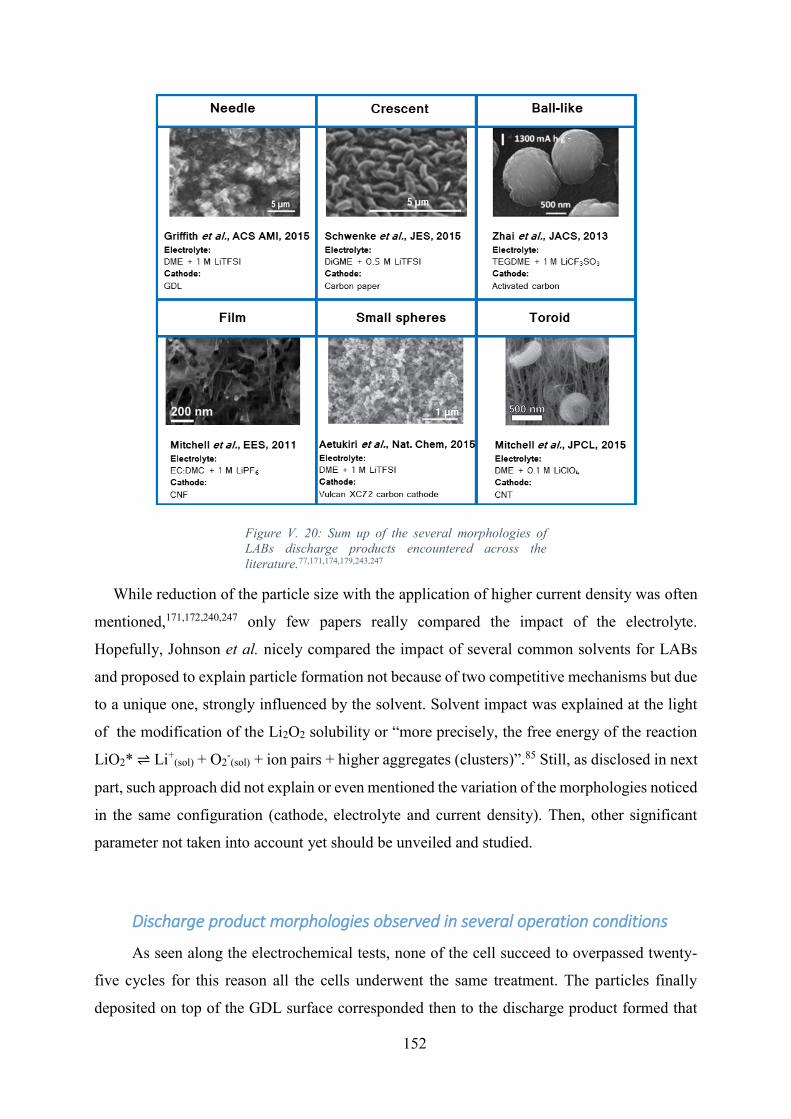
152
Figure V. 20: Sum up of the several morphologies of
LABs discharge products encountered across the
literature.77,171,174,179,243,247
While reduction of the particle size with the application of higher current density was often
mentioned,171,172,240,247 only few papers really compared the impact of the electrolyte.
Hopefully, Johnson et al. nicely compared the impact of several common solvents for LABs
and proposed to explain particle formation not because of two competitive mechanisms but due
to a unique one, strongly influenced by the solvent. Solvent impact was explained at the light
of the modification of the Li2O2 solubility or “more precisely, the free energy of the reaction
LiO2* ⇌ Li+(sol) + O2
-(sol) + ion pairs + higher aggregates (clusters)”.85 Still, as disclosed in next
part, such approach did not explain or even mentioned the variation of the morphologies noticed
in the same configuration (cathode, electrolyte and current density). Then, other significant
parameter not taken into account yet should be unveiled and studied.
Discharge product morphologies observed in several operation conditions
As seen along the electrochemical tests, none of the cell succeed to overpassed twenty-
five cycles for this reason all the cells underwent the same treatment. The particles finally
deposited on top of the GDL surface corresponded then to the discharge product formed that
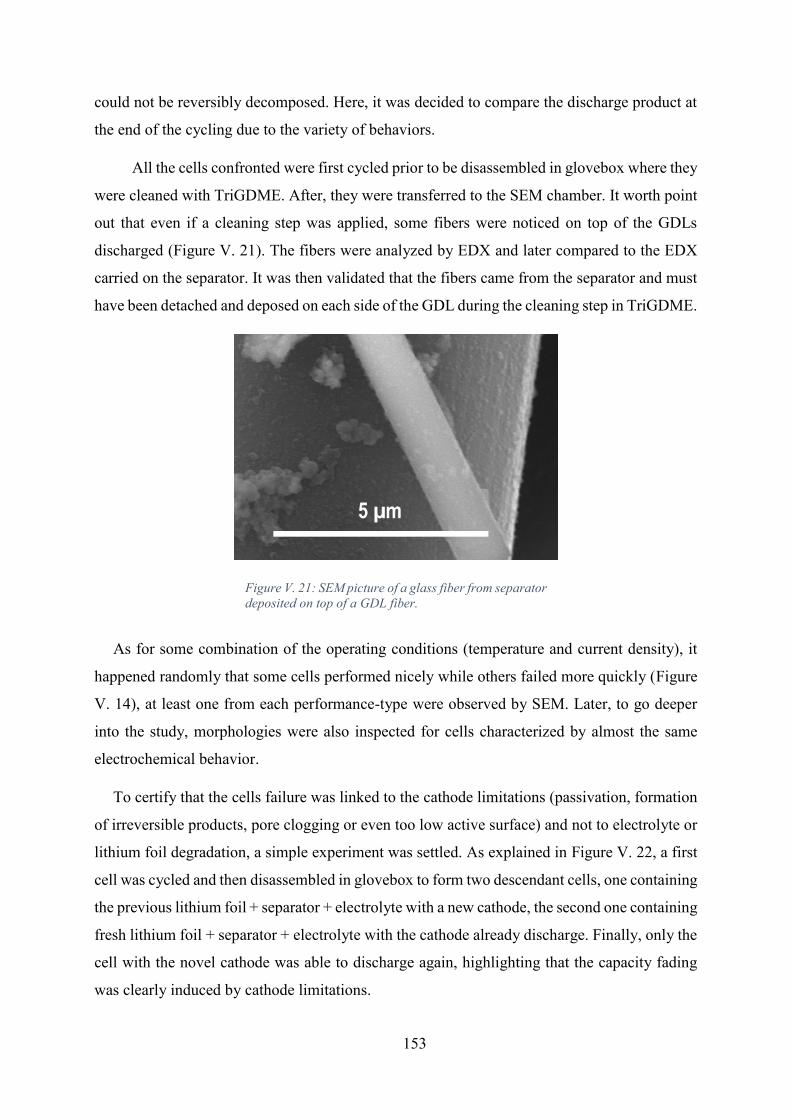
153
could not be reversibly decomposed. Here, it was decided to compare the discharge product at
the end of the cycling due to the variety of behaviors.
All the cells confronted were first cycled prior to be disassembled in glovebox where they
were cleaned with TriGDME. After, they were transferred to the SEM chamber. It worth point
out that even if a cleaning step was applied, some fibers were noticed on top of the GDLs
discharged (Figure V. 21). The fibers were analyzed by EDX and later compared to the EDX
carried on the separator. It was then validated that the fibers came from the separator and must
have been detached and deposed on each side of the GDL during the cleaning step in TriGDME.
Figure V. 21: SEM picture of a glass fiber from separator
deposited on top of a GDL fiber.
As for some combination of the operating conditions (temperature and current density), it
happened randomly that some cells performed nicely while others failed more quickly (Figure
V. 14), at least one from each performance-type were observed by SEM. Later, to go deeper
into the study, morphologies were also inspected for cells characterized by almost the same
electrochemical behavior.
To certify that the cells failure was linked to the cathode limitations (passivation, formation
of irreversible products, pore clogging or even too low active surface) and not to electrolyte or
lithium foil degradation, a simple experiment was settled. As explained in Figure V. 22, a first
cell was cycled and then disassembled in glovebox to form two descendant cells, one containing
the previous lithium foil + separator + electrolyte with a new cathode, the second one containing
fresh lithium foil + separator + electrolyte with the cathode already discharge. Finally, only the
cell with the novel cathode was able to discharge again, highlighting that the capacity fading
was clearly induced by cathode limitations.
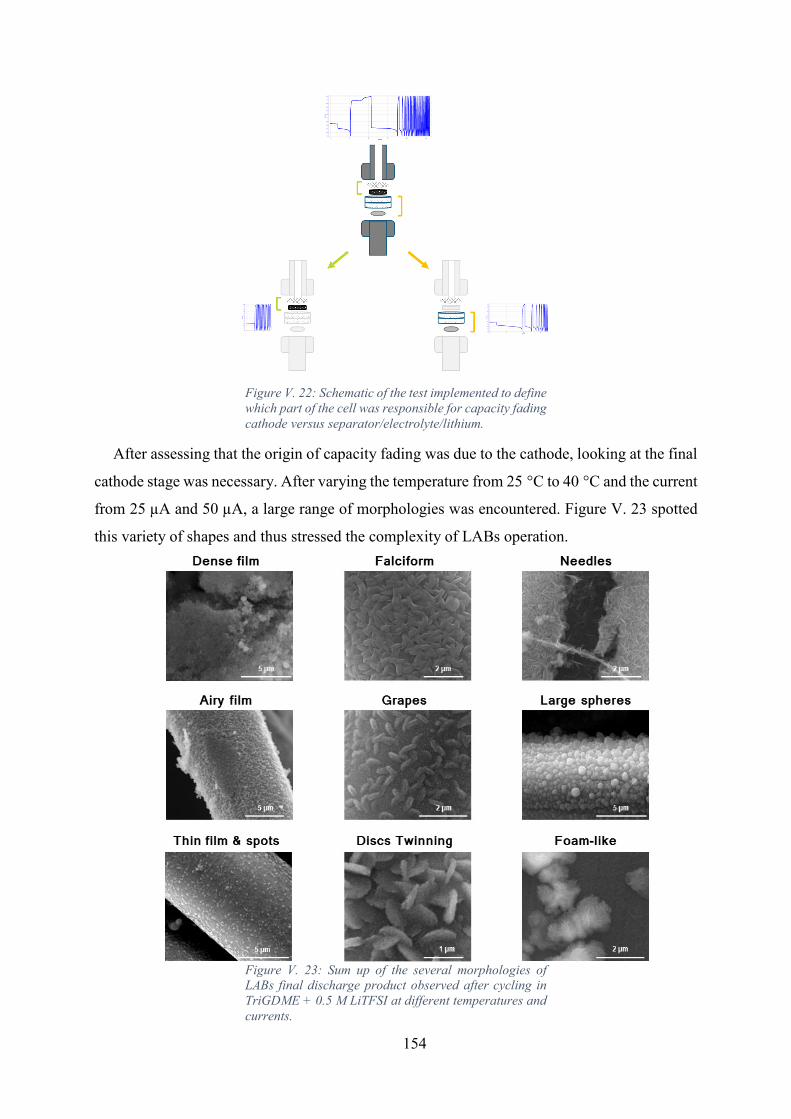
154
Figure V. 22: Schematic of the test implemented to define
which part of the cell was responsible for capacity fading
cathode versus separator/electrolyte/lithium.
After assessing that the origin of capacity fading was due to the cathode, looking at the final
cathode stage was necessary. After varying the temperature from 25 °C to 40 °C and the current
from 25 µA and 50 µA, a large range of morphologies was encountered. Figure V. 23 spotted
this variety of shapes and thus stressed the complexity of LABs operation.
Figure V. 23: Sum up of the several morphologies of
LABs final discharge product observed after cycling in
TriGDME + 0.5 M LiTFSI at different temperatures and
currents.

155
Even though all the morphologies presented in Figure V. 23 were not operated in the same
conditions, it was of major importance to underscore that the different morphologies were
produced for same cells (cathode-electrolyte-anode).
More precisely, comparisons of the final product morphologies were settled for two
different combinations of the operating conditions (Figure V. 24). At 27.5 °C and 25 µA, two
different films, a dense one (Figure V. 24.a) and an airy one (Figure V. 24.b), were produced
even if same conditions were applied. While comparing the electrochemical behavior of the
two cells it appeared that the first one discharged initially for long time and then starting from
the second discharge the discharge capacity decreased. In contrast, for the other cell the second
discharge was longer than the first one. Even though explaining the different formations of the
two films was difficult, it seemed from the results that density of the film formed strongly
depended on the discharge depth as well as on the charge step. Indeed, while the cell a) followed
a two-step charge, the cell b) was characterized only by one charge plateau.
Figure V. 24: SEM pictures of different discharge
product morphologies deposited on the air side of
cathodes operated at 27.5 °C and 25 µA (a,b) and at
30 °C and 50 µA (c,d).

156
These different performances of the cells during the charge pointed out that the
conclusions made in our previous work117 should be reassessed. Initially, we attributed the two
charge plateaus to the successive decomposition of, first, the Li2O2 film and then the Li2O2 large
particles. Still, here obviously two films were formed and only their respective densities were
different, invalidating then the first hypothesis made in the modeling study that only one dense
thin film can be produced. Obviously from the present experiments, charge process was not
only sensitive to the particle size. Ganapathy et al. took another approach to understand the
mechanism occurring over charge using X-ray diffraction.248 They demonstrated in their case
(using an activated carbon based cathode and TetraGDME + 0.1 M LiTFSI) that the first
plateau existing between 2.8 V and 3.4 V corresponded to transformation of amorphous Li2O2
as no modification of XRD patterns were noticed. Then, they attributed the second plateau
existing around 3.4 V to 3.9 V to a solid solution process leading to Li2-xO2 formation and then
decomposition back to lithium cations and oxygen. Unfortunately, here the overpotentials
observed were not corresponding to the one announced, making interpretations complicated.
Also, their study starting with the postulate that toroids were formed over discharge. Still, no
SEM proof was presented either in the paper or in the supporting information. Then, estimating
that the difference of the overpotential values was due to a more resistive system (GDL
electrode) and that actually not toroids but films were formed, conclusions made by Ganapathy
et al. could be transposed to the results of Figure V. 24.a and Figure V. 24.b. Then, while more
amorphous Li2O2 was produced over the first discharge, an airy film was formed. While
crystalline Li2O2 was formed, a denser film was formed. Still, the triggering of one or another
type of Li2O2 was not discerned.
While now comparing Figure V. 24.c and Figure V. 24.d, two dissimilar morphologies
were developed, even though the charge mechanisms were the same (two plateaus). This time,
except the initial discharge which evolved from one sample to another one, the same profile
with reduction of the discharge capacity over the cycles was recorded. Still, in the light of the
SEM pictures, the particles sizes were drastically distinct. These results just reaffirmed that
formation of dense film was more damageable to the cell performances than the formation of
large particles, must probably due to passivation limitation as previously described.
Finally making conclusive links between the morphologies and the operating conditions
appeared to be too deceitful and tricky. Diverse morphologies were perceived in same
conditions but, even more seriously, within the same electrode. Differences were noticed while

157
comparing the two sides of a same electrode (side exposed to air or side next to the separator)
as illustrated Figure V. 25.
Figure V. 25: Comparison of the SEM pictures of both
sides of two cathodes operated at 27.5 °C and 50 µA.
Surprisingly, in case of Cathode A, two distinct morphologies were formed: discs on air
side and foam-like on the separator side. Less significant changes between the two sides were
noticed for Cathode B. This time, same morphology was observed in both sides, yet, the
particles sizes were multiplied by at least three while opposing the ones on the separator side
to the ones at the air inlet. Actually, such results nicely fitted the observations from the
literature. Several papers, reported non-uniform distribution of the discharge products. In 2010,
Zhang et al. published SEM pictures of their LABs cathode with a substantial production of the
discharge product at the air side compared to separator one (Figure V. 26).249
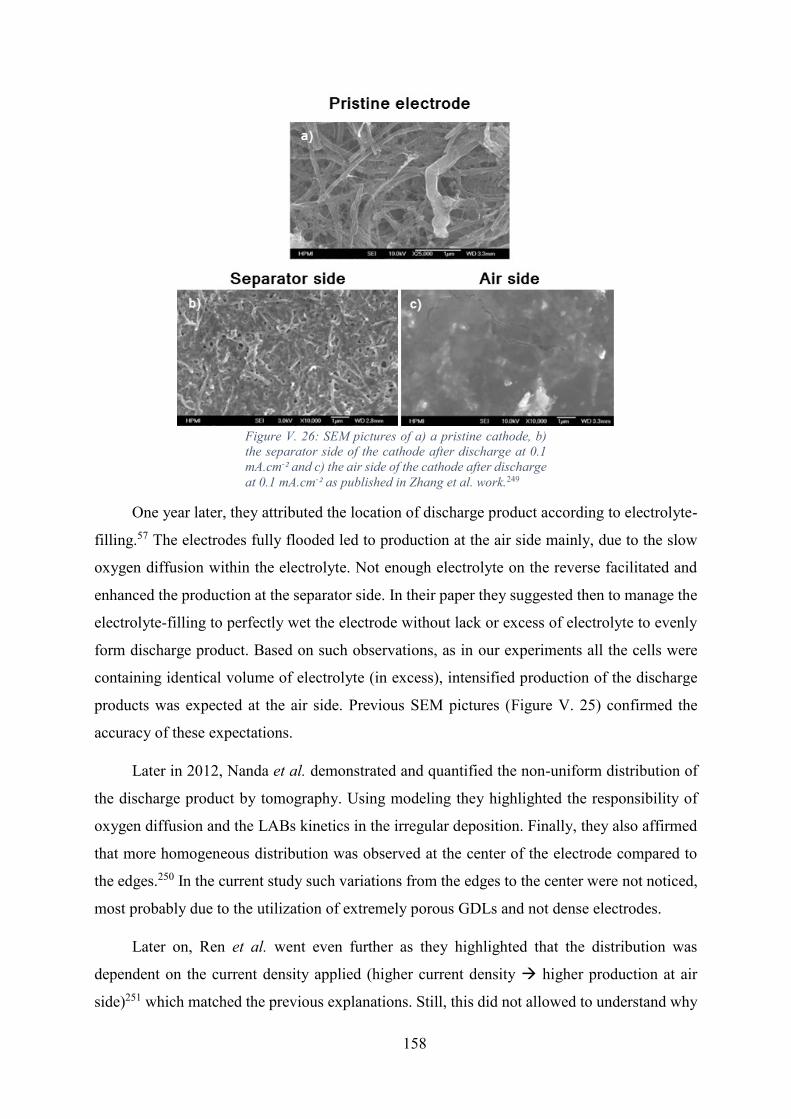
158
Figure V. 26: SEM pictures of a) a pristine cathode, b)
the separator side of the cathode after discharge at 0.1
mA.cm-² and c) the air side of the cathode after discharge
at 0.1 mA.cm-² as published in Zhang et al. work.249
One year later, they attributed the location of discharge product according to electrolyte-
filling.57 The electrodes fully flooded led to production at the air side mainly, due to the slow
oxygen diffusion within the electrolyte. Not enough electrolyte on the reverse facilitated and
enhanced the production at the separator side. In their paper they suggested then to manage the
electrolyte-filling to perfectly wet the electrode without lack or excess of electrolyte to evenly
form discharge product. Based on such observations, as in our experiments all the cells were
containing identical volume of electrolyte (in excess), intensified production of the discharge
products was expected at the air side. Previous SEM pictures (Figure V. 25) confirmed the
accuracy of these expectations.
Later in 2012, Nanda et al. demonstrated and quantified the non-uniform distribution of
the discharge product by tomography. Using modeling they highlighted the responsibility of
oxygen diffusion and the LABs kinetics in the irregular deposition. Finally, they also affirmed
that more homogeneous distribution was observed at the center of the electrode compared to
the edges.250 In the current study such variations from the edges to the center were not noticed,
most probably due to the utilization of extremely porous GDLs and not dense electrodes.
Later on, Ren et al. went even further as they highlighted that the distribution was
dependent on the current density applied (higher current density higher production at air
side)251 which matched the previous explanations. Still, this did not allowed to understand why
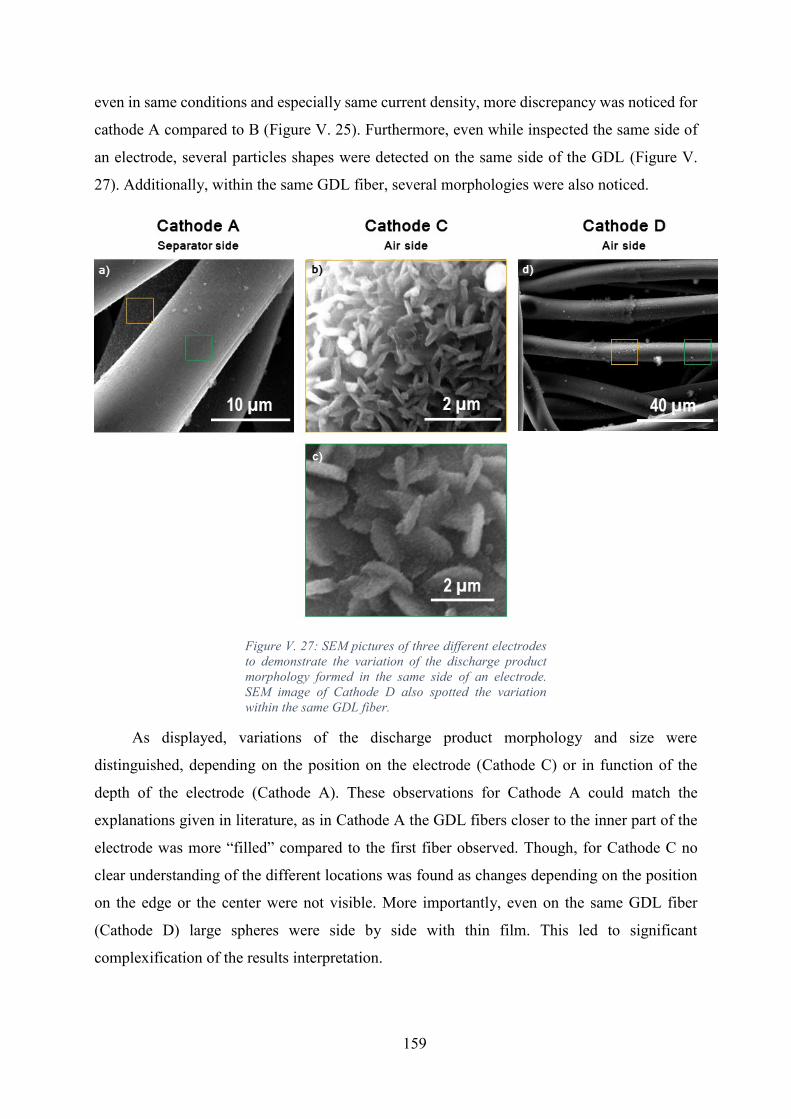
159
even in same conditions and especially same current density, more discrepancy was noticed for
cathode A compared to B (Figure V. 25). Furthermore, even while inspected the same side of
an electrode, several particles shapes were detected on the same side of the GDL (Figure V.
27). Additionally, within the same GDL fiber, several morphologies were also noticed.
Figure V. 27: SEM pictures of three different electrodes
to demonstrate the variation of the discharge product
morphology formed in the same side of an electrode.
SEM image of Cathode D also spotted the variation
within the same GDL fiber.
As displayed, variations of the discharge product morphology and size were
distinguished, depending on the position on the electrode (Cathode C) or in function of the
depth of the electrode (Cathode A). These observations for Cathode A could match the
explanations given in literature, as in Cathode A the GDL fibers closer to the inner part of the
electrode was more “filled” compared to the first fiber observed. Though, for Cathode C no
clear understanding of the different locations was found as changes depending on the position
on the edge or the center were not visible. More importantly, even on the same GDL fiber
(Cathode D) large spheres were side by side with thin film. This led to significant
complexification of the results interpretation.

160
Still, previous observations could in part explain the variation of the morphology. As
already mentioned, GDLs suffered from compression and thus their performances could be
largely impacted as the number of contact point and so the electronic conduction could change
significantly. This was validated by the lower capacities and large discrepancy of the results
noticed in the case of GDLs compared to the ones of flexible bi-porous electrodes. Variation of
the morphologies on same side of an electrode or within same fiber could be due to modification
of the local current density experienced by the GDL compressed. Still, morphology variations
could not be certainly attributed only to compression issues. One piece of the puzzle was still
lacking to be sure of it. As LABs are based on surface reactions, it was required to check that
local modification of the surface was not also responsible for various discharge product
morphologies. Then, pretreated GDLs were also tested to evaluate the impact of the GDL
surface.
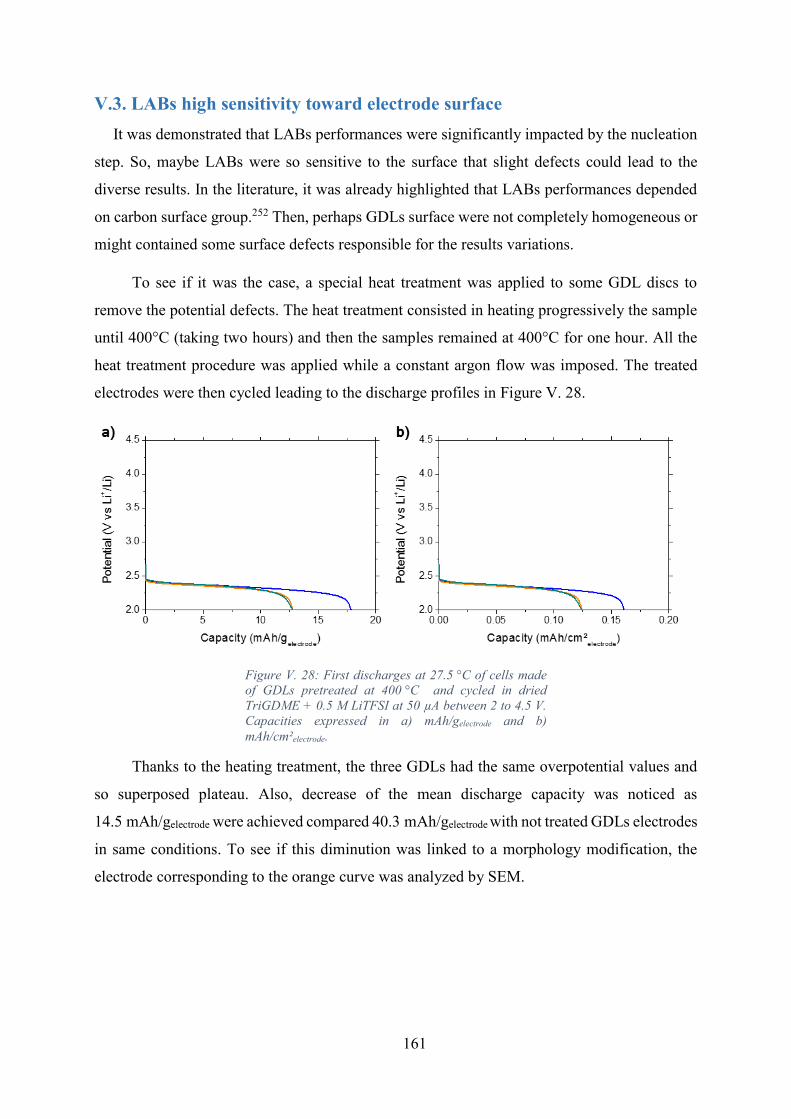
161
V.3. LABs high sensitivity toward electrode surface
It was demonstrated that LABs performances were significantly impacted by the nucleation
step. So, maybe LABs were so sensitive to the surface that slight defects could lead to the
diverse results. In the literature, it was already highlighted that LABs performances depended
on carbon surface group.252 Then, perhaps GDLs surface were not completely homogeneous or
might contained some surface defects responsible for the results variations.
To see if it was the case, a special heat treatment was applied to some GDL discs to
remove the potential defects. The heat treatment consisted in heating progressively the sample
until 400°C (taking two hours) and then the samples remained at 400°C for one hour. All the
heat treatment procedure was applied while a constant argon flow was imposed. The treated
electrodes were then cycled leading to the discharge profiles in Figure V. 28.
Figure V. 28: First discharges at 27.5 °C of cells made
of GDLs pretreated at 400 °C and cycled in dried
TriGDME + 0.5 M LiTFSI at 50 µA between 2 to 4.5 V.
Capacities expressed in a) mAh/gelectrode and b)
mAh/cm²electrode.
Thanks to the heating treatment, the three GDLs had the same overpotential values and
so superposed plateau. Also, decrease of the mean discharge capacity was noticed as
14.5 mAh/gelectrode were achieved compared 40.3 mAh/gelectrode with not treated GDLs electrodes
in same conditions. To see if this diminution was linked to a morphology modification, the
electrode corresponding to the orange curve was analyzed by SEM.
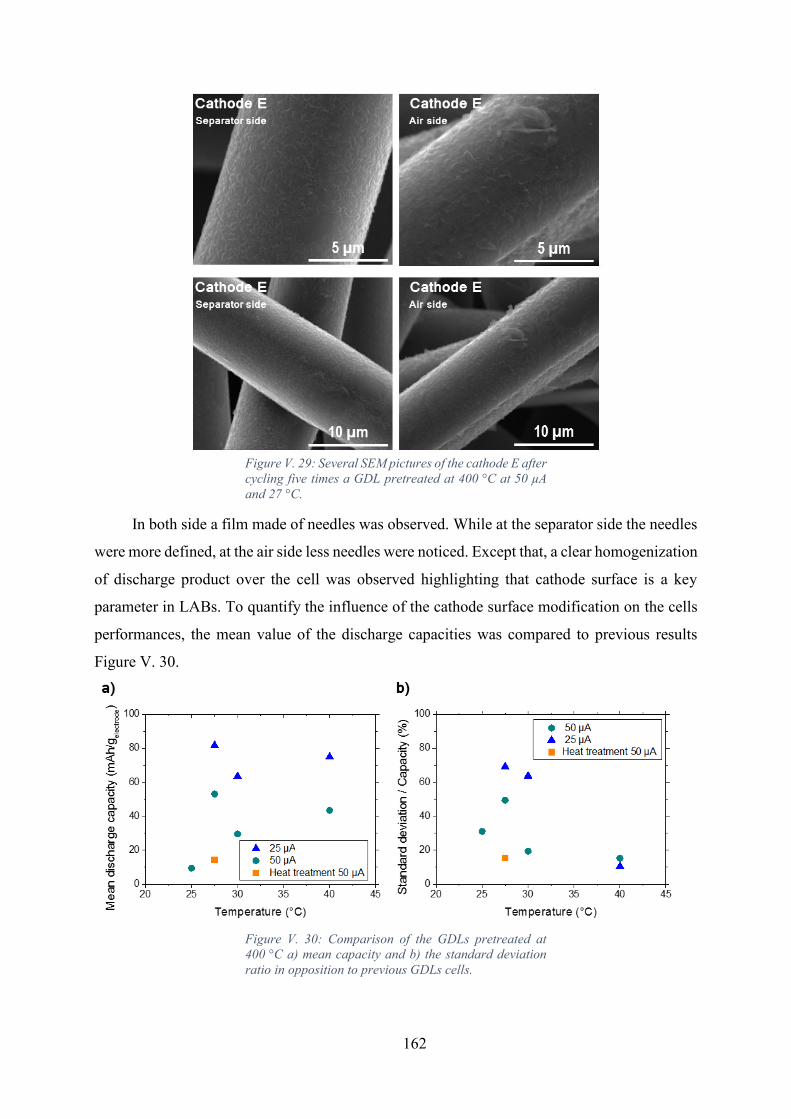
162
Figure V. 29: Several SEM pictures of the cathode E after
cycling five times a GDL pretreated at 400 °C at 50 µA
and 27 °C.
In both side a film made of needles was observed. While at the separator side the needles
were more defined, at the air side less needles were noticed. Except that, a clear homogenization
of discharge product over the cell was observed highlighting that cathode surface is a key
parameter in LABs. To quantify the influence of the cathode surface modification on the cells
performances, the mean value of the discharge capacities was compared to previous results
Figure V. 30.
Figure V. 30: Comparison of the GDLs pretreated at
400 °C a) mean capacity and b) the standard deviation
ratio in opposition to previous GDLs cells.
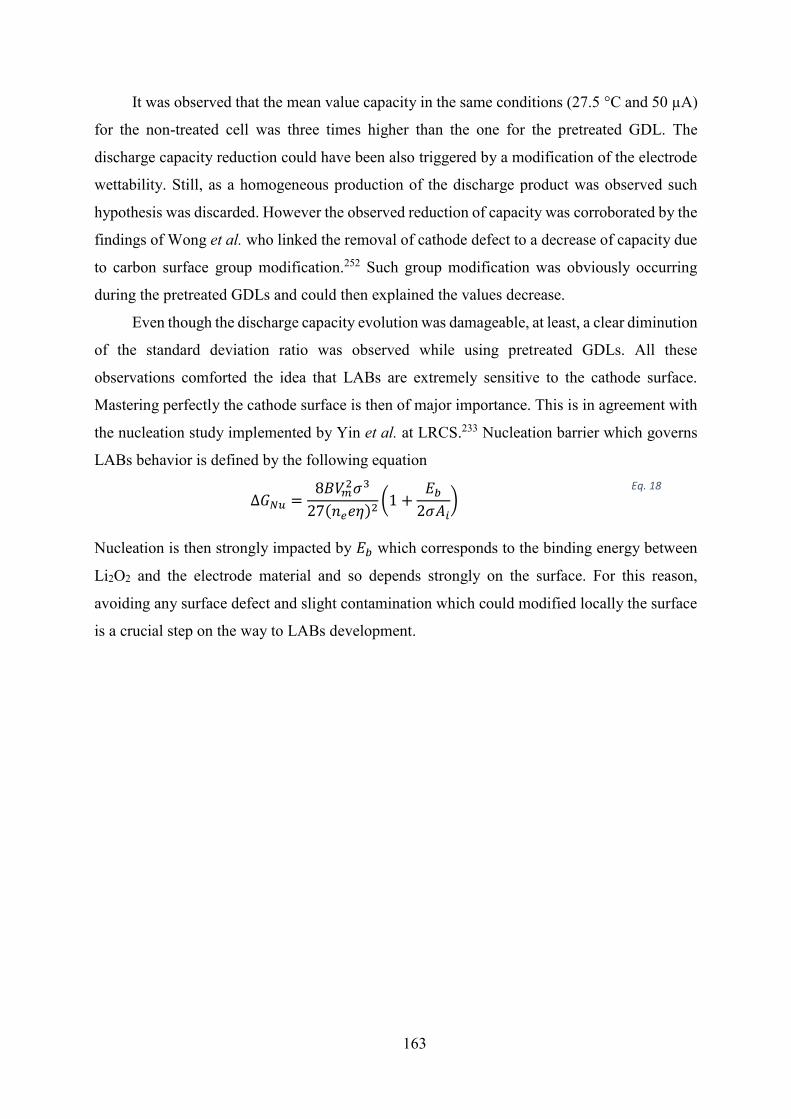
163
It was observed that the mean value capacity in the same conditions (27.5 °C and 50 µA)
for the non-treated cell was three times higher than the one for the pretreated GDL. The
discharge capacity reduction could have been also triggered by a modification of the electrode
wettability. Still, as a homogeneous production of the discharge product was observed such
hypothesis was discarded. However the observed reduction of capacity was corroborated by the
findings of Wong et al. who linked the removal of cathode defect to a decrease of capacity due
to carbon surface group modification.252 Such group modification was obviously occurring
during the pretreated GDLs and could then explained the values decrease.
Even though the discharge capacity evolution was damageable, at least, a clear diminution
of the standard deviation ratio was observed while using pretreated GDLs. All these
observations comforted the idea that LABs are extremely sensitive to the cathode surface.
Mastering perfectly the cathode surface is then of major importance. This is in agreement with
the nucleation study implemented by Yin et al. at LRCS.233 Nucleation barrier which governs
LABs behavior is defined by the following equation
∆𝐺𝑁𝑢 =8𝐵𝑉𝑚
2𝜎3
27(𝑛𝑒𝑒휂)2(1 +
𝐸𝑏
2𝜎𝐴𝑖)
Eq. 18
Nucleation is then strongly impacted by 𝐸𝑏 which corresponds to the binding energy between
Li2O2 and the electrode material and so depends strongly on the surface. For this reason,
avoiding any surface defect and slight contamination which could modified locally the surface
is a crucial step on the way to LABs development.
164
V.4. Conclusions on LABs reproducibility issues
LABs reproducibility issues have been clearly identified in case of flexible bi-porous
electrodes for DBP40, DBP60 and DBP80. Several leads have been followed to see if
reproducibility problematic could be solved. Controlled electrolyte-filling step, flushing time,
operating temperature and removal of water contamination were identified as relevant
parameters to reduce reproducibility. Among them, temperature appeared as a crucial one as
only 2 °C of difference implied voltage variation. Still, reproducibility issues remained and
were considered to be in part explained by the electrodes deformation. Diverse irreversible
deformations were noted while comparing several electrodes most probably due to the variation
of the pressure applied while closing the Swagelok.
To validate that deformations were responsible for it, other electrodes (GDLs) were used
as they can be reversible deformed. It ends up, that GDLs also suffer from reproducibility issues
and led to lower capacity values. This at least highlighted the importance of mastering the
electrode texture. Even though flexible bi-porous electrodes and GDLs had comparable
porosity overall value and so theoretical capacity values, GDLs performed far less than
texturized electrodes (due to lower electronic conductivity and developed surface in addition to
not improved texture). GDLs non-reproducibility were also triggered by the less efficient
electron conduction percolating network strongly impacted by compression.
Finally, combined effects of current and temperature were scrutinized. As both
parameters acted in opposite ways on the kinetics, their influences were not deccorelate. Above
all, it was recorded that temperature rise improved the repeatability of the experiments no matter
which current was applied. Also, another parameter impacting the kinetics and more precisely
the nucleation step was the electrode surface. Defect removal tends to reduce again the
performances but enhanced the reproducibility. For these reasons, not only electrode texture
and operating conditions but also surface state should be managed to design efficient and
reproducible LABs electrodes. Still, Torayev et al. demonstrated that part of the reproducibility
issues can be assigned to the inherent operation principles of LABs. Indeed, they pointed out
based on tomography data that even though some electrodes have same overall porosity,
depending on how the pores are connected, slight to significant variations of the simulated
discharge capacities are induced depending on the current applied to the system.253 If so,
removing completely the reproducibility issues would be tricky or at least will imply high
manufacturing cost (to master until exact pore connectivity).

CHAPTER VI: GENERAL CONCLUSIONS AND
PERSPECTIVES
Chapter VI: General conclusions and perspectives

166
Nowadays, one of the main challenge facing the aircraft manufacturers is to reach the
development of eco-friendlier airships. Even if feasibility of MEA or fully electrical aircraft
have already been demonstrated at the prototyping level, once it comes to commercial aircraft
a technological barrier needs to be overcame. To replace kerosene combustion by electrical
energy source, the latter should be first stored. To do so, efficient energy storage systems are
required. Going toward fully electric propulsion implies that the aircraft design should be
revisited from scratch to remove the kerosene tank and to welcome instead energy storage
devices and propulsion system (for instance multi-propeller or electric engine). For these
reasons, MEA appeared to be a more achievable target within the future years less significant
modifications need to be implemented. Still, to pretend to replace a part of the kerosene loaded
onboard, the energy storage systems selected for tomorrow MEA need to have high gravimetric
and volumetric energy densities.
Even though LIBs are mature, their characteristics in terms of energy densities are low
compared to new systems. Among the Post Li-ion technologies, LABs emerged as a potential
solution due to their high gravimetric and volumetric theoretical energy densities. Still, as
shown previously, LABs encountered many limitations from anode, electrolyte, to cathode. Due
to all these limitations, the practical energy densities of these systems are for now far from
theoretical ones. As LABs are based on surface reactions, their performances are defined by the
cathode properties, more precisely, by the cathode surface and porosity.
Then, as cathode is a key component of LABs, a strong focus was made in an attempt to
enhance the practical performances. To repel capacity fading due to the cathode limitations,
these ones should be first understood in order to be avoided later. LABs cathodes are subject to
three main limitations: oxygen diffusion through the electrode, surface passivation and pore
clogging. Occurrence of each phenomenon will be triggered differently by the electrode texture.
Indeed, depending on the material used, the surface developed and thus the passivation risk
would be modified. Also, the porosity will strongly impact the pathways available for oxygen
diffusion. It will also influence the facility for pore clogging to happen.
For these reasons, electrode texture was identified as a crucial step toward development
of performant LABs. Carbon-based electrodes were then examined as various textures could be
easily achieved using them. To load higher amount of energy per cell, thick electrodes have
been explored. This way, most part of the mass and volume of the battery would be due to the
electrode materials and not to the battery casing or current collector. However, limitations such
167
as diffusion are strengthened while using thick electrodes. To overcome the reinforcement of
the limitations with enlargement of the cathode thickness, a special electrode design was
proposed: bi-porous electrodes. Bi-porosity enabled to have two domains :1) a first meso-
porous domain which corresponded to the electrode material domain and acted as the reaction
surface provider and 2) a second macro-porous domain which was inserted on purpose to
facilitate oxygen diffusion through the electrode.
To develop these bi-porous electrodes, a first theoretical approach was implemented. As
the proportion of each domain impacted obviously the limitation phenomena, their respective
impacts were analyzed on the basis of multi-scale modeling. A continuum model describing the
three phenomena was then built. To be closed to the experimental electrodes developed in
parallel, the model also took into account the cathode properties like developed surface,
porosity, thickness and formulation (carbon versus binder amounts). Thanks to modeling, it was
identified that Carbon SP was more likely to fade due to surface passivation, while Ketjen Black
electrode sudden death was linked to oxygen diffusion limitation. Impacts of the formulation
and thickness were also scrutinized by comparing the first discharge capacities values and
overpotentials. The thickness strongly impacted the efficiency of the electrode utilization. The
beneficial impact of adding a macro-porous domain was highlighted thanks to the model and
depended on the electrode formulation selected. Indeed, at a certain point adding macro-
porosity did not help anymore to enhance the performances and thus no more than 40 % of
macro-porous volume should be targeted for all the carbon contents tested. In conclusion, the
model exhibited the interest of using bi-porous electrodes. Still, theoretical findings needed to
be confirmed by experimental results as several parameters, like the modification of the pore
size or the electrode real tortuosity, were not taken into account. Though, a strong experimental
study was implemented in parallel.
At experimental level, production of thick highly porous electrodes was accomplished
using an electrode fabrication process initially developed for LIBs and known as the Bellcore
process. It allowed to fabricate porous self-standing electrodes by dissolution of a porogen
agent. The facility to create a macro-porous domain via this process led to select it, this time
for LABs electrode fabrication. Still, due to the use of highly divided carbons (to promote high
surface for reaction) and the porosity requirement stronger than in LIB field, the formulation
had to be reviewed accordingly. In addition, to realize highly porous electrodes the amount of
the porogen agent (DBP) was significantly augmented. To make sure that the rise of DBP
content directly produced the expected macro-porosity, porosity creation was studied along the
168
fabrication process. While the efficiency of DBP removal was assessed, some variations
highlighted the chemical inhomogeneity of the film especially for higher DBP contents.
Demonstration of meso-porous and macro-porous domains creation was made. Although,
production of closed porosity was noticed in each case and was probably due to electrode
reorganization during DBP removal steps. Contrary to initial thoughts, high initial porogen
agent content (> 60 w%) was finally not relevant to obtain homogeneous and highly porous
electrodes. On the reverse, a middle range DBP content (40 w%) permitted to design bi-porous
electrodes for LABs with high porosity (50 v%) and significant carbon surface developed
(50 m².gelectrode). Once released from the porogen agent, electrolyte filling of the electrode was
proven. Also, the electrodes could bear until 80 °C. Moreover, the achieved electrode
efficiencies were interesting as more than 70 % of the theoretical capacity for both DBP60 and
DBP80 was reached while operating the cell at 50 µA.
Flexible bi-porous electrodes were also compared to GDLs electrode as they have
comparable overall porosity. Still, GDLs reached less than 5 % of the theoretical capacity while
discharged in the same conditions. This highlighted the necessity to texturize the electrode.
Also, it pointed out one drawback: electrode deformation due to compression. Even if GDLs
were reversibly deformed they might suffer more than home-made electrodes as they have a
less spread percolating network. Indeed, even deformed, flexible bi-porous electrodes
percolation is always ensured by the highly divided carbon particles (as many contact points as
carbon particles are in contact). On the contrary, depending on the compression the number of
contact points between the fibers of a GDL would be more impacted as they are less numerous.
These compression issues could explain in part the LABs reproducibility lack. In both cases, to
overcome deformation issues, the cell compression should be controlled to enable electrolyte
intake and good percolation, while also impeding the electrode deformation because of too tight
celling.
In an attempt to solve the reproducibility issues, the testing conditions have been more
and more controlled. Initially, various initial discharge curve shapes were observed. While the
initial dips observed highlighted the fact that nucleation step was taking place, understanding
the underpinning causes was difficult. It ends up that by progressively removing the parameters
impacting the nucleation step, reproducibility was improved even though it was not always the
case of the performances. For instance, water traces conducted to an extension of the discharge
capacity, as well as, higher results discrepancy. LABs high sensitivity toward temperature was
also spotted and its impact on performances correlated to the current applied. Temperature and

169
current influences had to be studied in parallel as they act in opposite ways on kinetics. It was
also concluded that temperature should be strictly controlled while operating the cell, to get rid
of potential oscillations with temperature variations. Once water traces removed and
temperature controlled, higher reproducibility was achieved while incrementing the operating
temperature. To check if the enhance reproducibility was linked to better controlled nucleation
step the cells were observed post-mortem. Finally, far more various morphologies than the
typical toroids described in literature were observed. The formation of distinct morphologies in
same conditions or even on same GDL fiber was difficult to apprehend. This spotlighted the
strong impact of nucleation mechanism as morphologies strongly changed depending on the
electrode location. This was confirmed by the more homogeneous results found while using
pyrolized GDLs which means GDLs with surface freed from defects.
Finally, extreme sensitivity of LABs was unveiled and the observed reproducibility
issues could find their roots in several parameters: reproducibility of the electrode texture,
compression of the electrode in the cell, temperature and current applied and obviously surface
state.
Unfortunately, perfect control of the operating condition is in opposition with the targeted
application which requires to handle significant temperature changes. Moreover, until then only
Li-oxygen and not Li-air batteries have been tested. Real LABs would involve atmosphere with
higher water contents. Some tests carried on in contact with wet-oxygen (using a bubbler filled
with water) or with a mix of oxygen and nitrogen (50/50) led to unstable electrochemical
responses. Fast electrolyte decomposition, surface modification, production of lithium
carbonates or two less oxygen available could explained the cells failure. To understand the
complexity of LABs versus LOBs, a model based on previous nucleation work233 is currently
under development to take into account more complex mechanisms due to air and not oxygen
supply. This involved reduction of the oxygen available, water and carbon dioxide
contamination and so Li2O2 transformation in LiOH and Li2CO3 (see Annex). As the model is
still under development, no clear conclusions are already available. Still, the number of
reactions taken into account to describe the several contaminations highlights the many
limitations that need to be overcome prior to performed LABs in contact of air.
More than anything, operation of LABs should be improved at lab scale and their cycling
performances improved thanks to the development of a stable electrolyte which should be
resistant toward oxygen like species, temperature and water degradation and in a meantime

170
should enable to solubilize high amount of oxygen. This is of paramount importance and yet is
still lacking, no matter the number of publications already released highlighting the complexity
of designing such an electrolyte. Still, once the electrolyte technical hindrance would be
overcame, utilization of bi-porous electrodes would enable to improve significantly the
practical performances of LABs and might permit their utilization, most probably only in
stationary applications. Contrary to aeronautical applications, stationary ones enable to easily
control the operating conditions, without paying attention to the temperature control device and
the oxygen providing systems masses, as there are less demanding on energy gravimetric and
volumetric density.
In the light of the current results and literature, LABs application in aeronautical field
may never happen due to their sensitivity to operating conditions even though electrolyte
stability issue would be solved. However, the study of this system enables to question the
electrochemical mechanisms taking place and the chemistry fundamentals. It also permitted
here to develop highly-porous and flexible electrodes with a mastered texture that can be
transposed to different technologies such as other types of metal-air batteries.
171
Bibliography
1. Ashcraft, S. W., Padron, A. S., Pascioni, K. A., Stout Jr., G. W. & Huff, D. L. Review
of Propulsion Technologies for N+3 Subsonic Vehicle Concepts. Nasa 217239, 1–38
(2011).
2. Darecki, M. et al. Flightpath 2050. Flightpath 2050 Europe’s Vision for Aviation (2011).
3. Jones, R. I. The more electric aircraft - assessing the benefits. J Aerosp. Eng. 216, 259–
269 (2002).
4. Zhao, W., Guerrero, J. M. & Xiaohua, W. Review of aircraft electric power systems and
architectures. in 2014 IEEE International Energy Conference (ENERGYCON) 949–953
(2014).
5. Dawoud, B., Amer, E. & Gross, D. Experimental investigation of an adsorptive thermal
energy storage. Int. J. energy Res. 31, 135–147 (2007).
6. Jay Carmel. The Quiet Revolution: Aviation Prepares to Go From Jet Age to Electric
Era of Flight. Avascent White Paper (2017).
7. Tomažič, T. et al. Pipistrel taurus G4: On creation and evolution of the winning
aeroplane of NASA green flight challenge 2011. J. Mech. Eng. 57, 869–878 (2011).
8. Wang, Y. Modeling discharge deposit formation and its effect on lithium-air battery
performance. Electrochim. Acta 75, 239–246 (2012).
9. Stoll, A. M., Bevirt, J., Moore, M. D., Fredericks, W. J. & Borer, N. K. Drag Reduction
Through Distributed Electric Propulsion. in 14th AIAA Aviation Technology, Integration,
and Operations Conference 16–20 (2014).
10. Clarke, S., Lin, W. Y., Papathakis, K. & Samuel, A. LEAPTech HEIST Power
Architecture and Testing Roadmap Power Level for Electrical Propulsion. in 2015 AIAA
Aviation Technology, Integration, and Operations Conference, (2015).
11. Thomson, R., Sachdeva, N., Nazukin, M. & Martinez, N. Aircraft Electrical Propulsion
– The Next Chapter of Aviation? Think: Act (2017).
12. Robert, F. Lithium-sulfur batteries poised for leap. Science 359, 1080–1081 (2018).
13. Nazar, L. F., Cuisinier, M. & Pang, Q. Lithium-sulfur batteries. MRS Bull. 39, 436–442
(2014).
172
14. Zhu, X., Guo, Z. & Hou, Z. Solar-powered airplanes: A historical perspective and future
challenges. Prog. Aerosp. Sci. 71, 36–53 (2014).
15. Peng, H. J., Huang, J. Q., Cheng, X. B. & Zhang, Q. Review on High-Loading and High-
Energy Lithium–Sulfur Batteries. Adv. Energy Mater. 7, 1–54 (2017).
16. Ross, P. E. Boeing ’ s Battery Blues become more dependent on electricity and batteries.
IEEE Spectrum - North American 11–12 (2013).
17. Williard, N., He, W., Hendricks, C. & Pecht, M. Lessons learned from the 787 dreamliner
issue on Lithium-Ion Battery reliability. Energies 6, 4682–4695 (2013).
18. Irfan, U. How Lithium Ion Batteries Grounded the Dreamliner. Scientific American 1–6
(2014). Available at: https://www.scientificamerican.com/article/how-lithium-ion-
batteries-grounded-the-dreamliner/.
19. NTBS - Office of Aviation Safety. Interim Factual Report- Boeing 787-8, JA829J, Japan
Airlines. (2013).
20. Dyantyi, N., Parsons, A., Sita, C. & Pasupathi, S. PEMFC for aeronautic applications: A
review on the durability aspects. Open Eng. 7, 287–302 (2017).
21. Guida, D. & Minutillo, M. Design methodology for a PEM fuel cell power system in a
more electrical aircraft. Appl. Energy 192, 446–456 (2017).
22. Nishizawa, A., Kallo, J., Garrot, O. & Weiss-Ungethüm, J. W. Fuel cell and Li-ion
battery direct hybridization system for aircraft applications. J. Power Sources 222, 294–
300 (2013).
23. Kallo, J. Fuel cells power first takeoff for DLR’s Antares aircraft. Fuel Cells Bulletin 3
(2009).
24. Kallo, J. Antares DLR-H2. Fuel Cells Bulletin 4 (2008).
25. Rahman, M. A., Wang, X. & Wen, C. A review of high energy density lithium-air battery
technology. J. Appl. Electrochem. 44, 5–22 (2014).
26. Girishkumar, G., McCloskey, B., Luntz, A. C., Swanson, S. & Wilcke, W. Lithium-air
battery: Promise and challenges. J. Phys. Chem. Lett. 1, 2193–2203 (2010).
27. Scrosati, B. History of lithium batteries. J. Solid State Electrochem. 15, 1623–1630
(2011).
173
28. Kurzweil, P. Gaston Planté and his invention of the lead-acid battery-The genesis of the
first practical rechargeable battery. J. Power Sources 195, 4424–4434 (2010).
29. Armand, M. & Tarascon, J. M. Building better batteries. Nature 451, 652–657 (2008).
30. Ngô, C. Stockage de l’énergie. Techniques de l’ingénieur (2016).
31. Placke, T., Kloepsch, R., Dühnen, S. & Winter, M. Lithium ion, lithium metal, and
alternative rechargeable battery technologies: the odyssey for high energy density. J.
Solid State Electrochem. 21, 1939–1964 (2017).
32. Opitz, A., Badami, P., Shen, L., Vignarooban, K. & Kannan, A. M. Can Li-Ion batteries
be the panacea for automotive applications? Renew. Sustain. Energy Rev. 68, 685–692
(2017).
33. Conte, F. V. Battery and battery management for hybrid electric vehicles: A review.
Elektrotechnik und Informationstechnik 123, 424–431 (2006).
34. Schipper, F. & Aurbach, D. A brief review: Past, present and future of lithium ion
batteries. Russ. J. Electrochem. 52, 1095–1121 (2016).
35. Diouf, B. & Pode, R. Potential of lithium-ion batteries in renewable energy. Renew.
Energy 76, 375–380 (2015).
36. Whittingham, M. S. & Gamble, F. R. The lithium intercalates of the transition metal
dichalcogenides. Mater. Res. Bull. 10, 363–371 (1975).
37. RECHARGE aisbl. Safety of lithium-ion batteries. (2013).
38. Wang, Q., Jiang, B., Li, B. & Yan, Y. A critical review of thermal management models
and solutions of lithium-ion batteries for the development of pure electric vehicles.
Renew. Sustain. Energy Rev. 64, 106–128 (2016).
39. Berg, E. J., Villevieille, C., Streich, D., Trabesinger, S. & Novák, P. Rechargeable
Batteries: Grasping for the Limits of Chemistry. J. Electrochem. Soc. 162, A2468–
A2475 (2015).
40. Nitta, N., Wu, F., Lee, J. T. & Yushin, G. Li-ion battery materials: Present and future.
Mater. Today 18, 252–264 (2015).
41. Nishi, Y. Lithium ion secondary batteries; past 10 years and the future. J. Power Sources
100, 101–106 (2001).

174
42. https://starkpower.com/understanding-lithium-ion-batteries. lithiumion-charts-01.
43. Hannan, M. A., Lipu, M. S. H., Hussain, A. & Mohamed, A. A review of lithium-ion
battery state of charge estimation and management system in electric vehicle
applications: Challenges and recommendations. Renew. Sustain. Energy Rev. 78, 834–
854 (2017).
44. Tao, H., Feng, Z., Liu, H., Kan, X. & Chen, P. Reality and Future of Rechargeable
Lithium Batteries. Open Mater. Sci. J. 5, 204–214 (2011).
45. Lewis, H. Lithium-ion battery consultation report. (2016).
46. Sathiya, M. et al. Origin of voltage decay in high-capacity layered oxide electrodes. Nat.
Mater. 14, 230–238 (2015).
47. Tarascon, J.-M. Key challenges in future Li-battery research. Philos. Trans. R. Soc. A
Math. Phys. Eng. Sci. 368, 3227–3241 (2010).
48. Lebedeva, N., Di Persio, F. & Boon-Brett, L. Lithium ion battery value chain and related
opportunities for Europe. European Commission, Petten, (2016).
49. Pillot, C. Battery Market Development for Consumer Electronics, Automotive, and
Industrial: Materials Requirements and Trends. Qinghai EV Rally 2015 (2015).
50. Tiamat. (2018). Available at: http://www.tiamat-energy.com/.
51. Abraham, K. M. & Jiang, Z. A Polymer Electrolyte-Based Rechargeable lithium /
Oxygen Battery. J. Electrochem. Sci. Technol. 143, 1–5 (1996).
52. Bruce, P. G., Freunberger, S. a., Hardwick, L. J. & Tarascon, J.-M. Li–O2 and Li–S
batteries with high energy storage. Nat. Mater. 11, 172–172 (2011).
53. Grande, L. et al. The Lithium/Air Battery: Still an Emerging System or a Practical
Reality? Adv. Mater 27, 784–800 (2015).
54. Christensen, J. et al. A Critical Review of Li/Air Batteries. J. Electrochem. Soc 159, 1–
30 (2012).
55. Ottakam Thotiyl, M. M. et al. A stable cathode for the aprotic Li-O2 battery. Nat. Mater.
12, 1050–6 (2013).
56. Peng, Z., Freunberger, S. A., Chen, Y. & Bruce, P. G. A reversible and higher-rate Li-

175
O2 battery. Science. 337, 563–566 (2012).
57. Zhang, S. S., Foster, D. & Read, J. The effect of quaternary ammonium on discharge
characteristic of a non-aqueous electrolyte Li/O2 battery. Electrochim. Acta 56, 1283–
1287 (2011).
58. Gasteiger, H. A. et al. Electrocatalytic Activity Studies of Select Metal Surfaces and
Implications in Li-Air Batteries. J. Electrochem. Soc. 157, A1016–A1025 (2016).
59. McCloskey, B. D., Scheffler, R., Speidel, A., Girishkumar, G. & Luntz, A. C. On the
mechanism of nonaqueous Li-O2 electrochemistry on C and its kinetic overpotentials:
Some implications for Li-air batteries. J. Phys. Chem. C 116, 23897–23905 (2012).
60. Padbury, R. & Zhang, X. Lithium–oxygen batteries—Limiting factors that affect
performance. J. Power Sources 196, 4436–4444 (2011).
61. Giordani, V., Freunberger, S. A., Bruce, P. G., Tarascon, J.-M. & Larcher, D. H2O2
Decomposition Reaction as Selecting Tool for Catalysts in Li–O2 Cells. Clin. Chem. 38,
A180–A183 (2010).
62. Lee, J. S. et al. Metal-air batteries with high energy density: Li-air versus Zn-air. Adv.
Energy Mater. 1, 34–50 (2011).
63. Yang, J. et al. Atomic layer deposition of amorphous oxygen-deficient TiO2-x on carbon
nanotubes as cathode materials for lithium-air batteries. J. Power Sources 360, 215–220
(2017).
64. Torres, W. R., Davia, F., del Pozo, M., Tesio, A. Y. & Calvo, E. J. EQCM and
RDE/RRDE Study of Soluble Iron Phthalocyanine Bifunctional Catalyst for the Lithium-
Oxygen Battery. J. Electrochem. Soc. 164, A3785–A3792 (2017).
65. Trahey, L. et al. Activated Lithium-Metal-Oxides as Catalytic Electrodes for Li–O2
Cells. Electrochem. Solid-State Lett. 14, A64–A66 (2011).
66. Akgül, F. S., Farsak, M., Kardaş, G. & Dehri, İ. Comparison of nonaqueous electrolytes
on oxygen reduction in Li-air batteries. J. Mol. Liq. 223, 343–349 (2016).
67. Roberts, M. et al. Increased Cycling Efficiency of Lithium Anodes in Dimethyl
Sulfoxide Electrolytes For Use in Li-O2 Batteries. ECS Electrochem. Lett. 3, A62–A65
(2014).
176
68. Chen, Y., Freunberger, S. A., Peng, Z., Fontaine, O. & Bruce, P. G. Charging a Li–O2
battery using a redox mediator. Nat. Chem. 5, 489–494 (2013).
69. Cohen, Y. S., Cohen, Y. & Aurbach, D. Micromorphological Studies of Lithium
Electrodes in Alkyl Carbonate Solutions Using in Situ Atomic Force Microscopy. J.
Phys. Chem. B 104, 12282–12291 (2000).
70. Gittleson, F. S., Jones, R. E., Ward, D. K. & Foster, M. E. Oxygen solubility and
transport in Li-air battery electrolytes: Establishing criteria and strategies for electrolyte
design. Energy Environ. Sci. 10, 1167–1179 (2017).
71. Lu, J. et al. Aprotic and aqueous Li-O2 batteries. Chem. Rev. 114, 5611–5640 (2014).
72. Freunberger, S. A. et al. Reactions in the Rechargeable Lithium-O2 Battery with Alkyl
Carbonate Electrolytes. J. Am. Chem. Soc. 2011, 133, 8040–8047 (2011).
73. McCloskey, B. D., Bethune, D. S., Shelby, R. M., Girishkumar, G. & Luntz, A. C.
Solvents’ Critical Role in Nonaqueous Lithium–Oxygen Battery Electrochemistry. J.
Phys. Chem. Lett. 2, 1161–1166 (2011).
74. Aurbach, D., Daroux, M., Faguy, P. & Yeager, E. The electrochemistry of noble metal
electrodes in aprotic organic solvents containing lithium salts. J. Electroanal. Chem. 297,
225–244 (1991).
75. Laoire, C. O., Mukerjee, S., Plichta, E. J., Hendrickson, M. A. & Abraham, K. M.
Rechargeable Lithium/TEGDME-LiPF6∕O2 Battery. J. Electrochem. Soc. 158, A302
(2011).
76. Freunberger, S. A. et al. The Lithium-Oxygen Battery with Ether-Based Electrolytes.
Angew. Chemie - Int. Ed. 50, 8609–8613 (2011).
77. Mitchell, R. R., Gallant, B. M., Thompson, C. V. & Shao-Horn, Y. All-carbon-nanofiber
electrodes for high-energy rechargeable Li–O2 batteries. Energy Environ. Sci. 4, 2952
(2011).
78. Freunberger, S. A. et al. The lithium-oxygen battery with ether-based electrolytes.
Angew. Chemie - Int. Ed. 50, 8609–8613 (2011).
79. Laoire, C. O., Mukerjee, S., Abraham, K. M., Plichta, E. J. & Hendrickson, M. A.
Influence of Nonaqueous Solvents on the Electrochemistry of Oxygen in the
177
Rechargeable Lithium-Air Battery. J. Phys. Chem. C 114, 9178–9186 (2010).
80. Abraham, K. M. Electrolyte-Directed Reactions of the Oxygen Electrode in Lithium-Air
Batteries. J. Electrochem. Soc. 162, A3021–A3031 (2015).
81. Aurbach, D., McCloskey, B. D., Nazar, L. F. & Bruce, P. G. Advances in understanding
mechanisms underpinning lithium-air batteries. Nat. Energy 1, 1–11 (2016).
82. Xue, K.-H., McTurk, E., Johnson, L., Bruce, P. G. & Franco, A. A. A Comprehensive
Model for Non-Aqueous Lithium Air Batteries Involving Different Reaction
Mechanisms. J. Electrochem. Soc. 162, A614–A621 (2015).
83. Gao, X., Chen, Y., Johnson, L. & Bruce, P. G. Promoting solution phase discharge in
Li–O2 batteries containing weakly solvating electrolyte solutions. Nat. Mater. 15, 882–
888 (2016).
84. Yang, S., He, P. & Zhou, H. Research progresses on materials and electrode design
towards key challenges of Li-air batteries. Energy Storage Mater. 13, 29–48 (2018).
85. Johnson, L. et al. The role of LiO2 solubility in O2 reduction in aprotic solvents and its
consequences for Li-O2 batteries. Nat. Chem. 6, 1091–1099 (2014).
86. Xue, K.-H., McTurk, E., Johnson, L., Bruce, P. G. & Franco, A. A. A Comprehensive
Model for Non-Aqueous Lithium Air Batteries Involving Different Reaction
Mechanisms. J. Electrochem. Soc. 162, A614–A621 (2015).
87. Meini, S., Solchenbach, S., Piana, M. & Gasteiger, H. A. The Role of Electrolyte Solvent
Stability and Electrolyte Impurities in the Electrooxidation of Li2O2 in Li-O2 Batteries.
J. Electrochem. Soc. 161, A1306–A1314 (2014).
88. Huang, J. & Faghri, A. Analysis of electrolyte level change in a lithium air battery. J.
Power Sources 307, 45–55 (2016).
89. Albertus, P. et al. Identifying Capacity Limitations in the Li/Oxygen Battery Using
Experiments and Modeling. J. Electrochem. Soc. 158, A343 (2011).
90. Wang, Y. & Cho, S. C. Analysis of Air Cathode Perfomance for Lithium-Air Batteries.
J. Electrochem. Soc 160, A1847–A1855 (2013).
91. Liu, B. et al. Stabilization of Li Metal Anode in DMSO-Based Electrolytes via
Optimization of Salt-Solvent Coordination for Li-O2 Batteries. Adv. Energy Mater. 7,
178
1602605 (2017).
92. Sharon, D. et al. Oxidation of dimethyl sulfoxide solutions by electrochemical reduction
of oxygen. J. Phys. Chem. Lett. 4, 3115–3119 (2013).
93. Kwabi, D. G. et al. Chemical instability of dimethyl sulfoxide in lithium-air batteries. J.
Phys. Chem. Lett. 5, 2850–2856 (2014).
94. Younesi, R., Norby, P. & Vegge, T. A New Look at the Stability of Dimethyl Sulfoxide
and Acetonitrile in Li-O2 Batteries. ECS Electrochem. Lett. 3, A15–A18 (2014).
95. Mozhzhukhina, N. et al. Insights into dimethyl sulfoxide decomposition in Li-O2 battery:
Understanding carbon dioxide evolution. Electrochem. commun. 80, 16–19 (2017).
96. Capsoni, D., Bini, M., Ferrari, S., Quartarone, E. & Mustarelli, P. Recent advances in the
development of Li-air batteries. J. Power Sources 220, 253–263 (2012).
97. Akbulut Uludağ, A. et al. Stability effect of some organic and inorganic additions in the
EMITFSI–LiTFSI nanocomposite electrolytes for lithium-air batteries. Microsyst.
Technol. 22, 953–963 (2016).
98. Yoo, K., Dive, A. M., Kazemiabnavi, S., Banerjee, S. & Dutta, P. Effects of Operating
Temperature on the Electrical Performance of a Li-air Battery operated with Ionic Liquid
Electrolyte. Electrochim. Acta 194, 317–329 (2016).
99. Read, J. et al. Oxygen Transport Properties of Organic Electrolytes and Performance of
Lithium/Oxygen Battery. J. Electrochem. Soc. 150, A1351 (2003).
100. Yang, S., He, P. & Zhou, H. Research progresses on materials and electrode design
towards key challenges of Li-air batteries. Energy Storage Mater. 13, 29–48 (2018).
101. Henderson, W. A. Glyme-lithium salt phase behavior. J. Phys. Chem. B 110, 13177–
13183 (2006).
102. Kerner, M., Plylahan, N., Scheers, J. & Johansson, P. Thermal stability and
decomposition of lithium bis(fluorosulfonyl)imide (LiFSI) salts. RSC Adv. 6, 23327–
23334 (2016).
103. Lim, H. D. et al. Superior rechargeability and efficiency of lithium-oxygen batteries:
Hierarchical air electrode architecture combined with a soluble catalyst. Angew. Chemie
- Int. Ed. 53, 3926–3931 (2014).

179
104. Kwak, W. J. et al. Understanding the behavior of Li-oxygen cells containing LiI. J.
Mater. Chem. A 3, 8855–8864 (2015).
105. Nakanishi, A. et al. Electrolyte Composition in Li/O2 Batteries with LiI Redox
Mediators: Solvation Effects on Redox Potentials and Implications for Redox Shuttling.
J. Phys. Chem. C 122, 1522–1534 (2018).
106. Kim, D. S. & Park, Y. J. Effect of multi-catalysts on rechargeable Li-air batteries. J.
Alloys Compd. 591, 164–169 (2014).
107. Yoon, T. H. & Park, Y. J. New strategy toward enhanced air electrode for Li-air batteries:
Apply a polydopamine coating and dissolved catalyst. RSC Adv. 4, 17434–17442 (2014).
108. Yu, M., Ren, X., Ma, L. & Wu, Y. Integrating a redox-coupled dye-sensitized
photoelectrode into a lithium–oxygen battery for photoassisted charging. Nat. Commun.
5, 5111 (2014).
109. Liu, T. et al. Cycling Li-O2 batteries via LiOH formation and decomposition. Encycl.
Soils Environ. 350, 170–175 (2005).
110. Park, J.-B., Lee, S. H., Jung, H.-G., Aurbach, D. & Sun, Y.-K. Redox Mediators for Li-
O2 Batteries: Status and Perspectives. Adv. Mater. 30, 1704162 (2018).
111. Blake, A. J. Synthesis and Characterization of Graphene Oxide/Sulfur Nanocomposite
for Lithium-Ion Batteries. 135 (2013).
112. Lepoivre, F. Study and improvement via the development of a silicon-based anode.
(2017).
113. Giordani, V. et al. Synergistic Effect of Oxygen and LiNO3 on the Interfacial Stability
of Lithium Metal in a Li/O2 Battery. J. Electrochem. Soc. 160, A1544–A1550 (2013).
114. Uddin, J. et al. Lithium nitrate as regenerable SEI stabilizing agent for rechargeable
Li/O2 batteries. J. Phys. Chem. Lett. 4, 3760–3765 (2013).
115. Sharon, D. et al. Catalytic Behavior of Lithium Nitrate in Li-O2 Cells. ACS Appl. Mater.
Interfaces 7, 16590–16600 (2015).
116. Radin, M. D. & Siegel, D. J. Rechargeable Batteries. (Springer International Publishing,
2015).
117. Yin, Y., Gaya, C., Torayev, A., Thangavel, V. & Franco, A. A. Impact of Li2O2 Particle

180
Size on Li–O2 Battery Charge Process: Insights from a Multiscale Modeling Perspective.
J. Phys. Chem. Lett. 7, 3897–3902 (2016).
118. Choi, J. W. & Aurbach, D. Promise and reality of post-lithium-ion batteries with high
energy densities. Nat. Rev. Mater. 1, 16013 (2016).
119. Andrei, P., Zheng, J. P., Hendrickson, M. & Plichta, E. J. Some Possible Approaches for
Improving the Energy Density of Li-Air Batteries. J. Electrochem. Soc. 157, A1287–
A1295 (2010).
120. Read, J. et al. Oxygen Transport Properties of Organic Electrolytes and Performance of
Lithium/Oxygen Battery. J. Electrochem. Soc. 150, A1351–A1356 (2003).
121. Ye, L. et al. A new insight into the oxygen diffusion in porous cathodes of lithium-air
batteries. Energy 83, 669–673 (2015).
122. Bardenhagen, I. et al. In situ investigation of pore clogging during discharge of a Li/O2
battery by electrochemical impedance spectroscopy. J. Power Sources 278, 255–264
(2015).
123. Bardenhagen, I., Fenske, M., Fenske, D., Wittstock, A. & Bäumer, M. Distribution of
discharge products inside of the lithium/oxygen battery cathode. J. Power Sources 299,
162–169 (2015).
124. Song, M., Park, S., Alamgir, F. M., Cho, J. & Liu, M. Nanostructured electrodes for
lithium-ion and lithium-air batteries: the latest developments, challenges, and
perspectives. Mater. Sci. Eng. R 72, 203–252 (2011).
125. Sandhu, S. S., Fellner, J. P. & Brutchen, G. W. Diffusion-limited model for a lithium/air
battery with an organic electrolyte. J. Power Sources 164, 365–371 (2007).
126. Andrei, P., Zheng, J. P., Hendrickson, M. & Plichta, E. J. Some Possible Approaches for
Improving the Energy Density of Li-Air Batteries. J. Electrochem. Soc. 157, A1287–
A1295 (2010).
127. Franco, A. A. & Xue, K.-H. Carbon-Based Electrodes for Lithium Air Batteries:
Scientific and Technological Challenges from a Modeling Perspective. ECS J. Solid
State Sci. Technol. 2, M3084–M3100 (2013).
128. Xue, K.-H. H., Nguyen, T.-K. K. & Franco, A. A. Impact of the Cathode Microstructure

181
on the Discharge Performance of Lithium Air Batteries: A Multiscale Model. J.
Electrochem. Soc. 161, E3028–E3035 (2014).
129. Chen, X. J. et al. Combined Effects of Oxygen Diffusion and Electronic Resistance in
Li-Air Batteries with Carbon Nanofiber Cathodes. J. Electrochem. Soc. 161, 1877–1883
(2014).
130. Bevara, V. & Andrei, P. Changing the Cathode Microstructure to Improve the Capacity
of Li-Air Batteries : Theoretical Predictions. J. Electrochem. Soc. 161, 2068–2079
(2014).
131. Xue, K.-H. & Franco, A. A. Optimization of the cathode microstructure in lithium air
batteries through multiscale physical modeling. in 225th ECS Meeting, Orlando, FL,
USA (2014).
132. Sergeev, A. V, Chertovich, A. V & Itkis, D. M. Modeling of the lithium-air battery
cathodes with broad pore size distribution. Chem. Phys. Lett. 660, 149–154 (2016).
133. Sergeev, A. V., Chertovich, A. V., Itkis, D. M., Goodilin, E. A. & Khokhlov, A. R.
Effects of cathode and electrolyte properties on lithium–air battery performance:
Computational study. J. Power Sources 279, 707–712 (2015).
134. Gaillard, C., Despois, J. F. & Mortensen, A. Processing of NaCI powders of controlled
size and shape for the microstructural tailoring of aluminium foams. Mater. Sci. Eng. A
374, 250–262 (2004).
135. Elango, R., Demortière, A., De Andrade, V., Morcrette, M. & Seznec, V. Thick Binder-
Free Electrodes for Li-Ion Battery Fabricated Using Templating Approach and Spark
Plasma Sintering Reveals High Areal Capacity. Adv. Energy Mater. 8, 1703031 (2018).
136. Tarascon, J. M., Gozdz, A. S., Schmutz, C., Shokoohi, F. & Warren, P. C. Performance
of Bellcore’s plastic rechargeable Li-ion batteries. Solid State Ionics 86–88, 49–54
(1996).
137. Gozdz, A. S., Tarascon, J. M. & Schmutz, C. N. Rechargeable lithium intercalation
battery hybrid polymeric electrolyte. (1994).
138. Gozdz, A. S., Schumtz, C. N., Tarascon, J. M. & Warren, P. C. Method of Making an
Electrolyte activatable Lithium-ion Rechargeable Battery Cell. (1995).

182
139. Gozdz, A. S., Schumtz, C. N., Tarascon, J. M. & Warren, P. C. Lithium Secondary
Battery Extraction Method. (1996).
140. Du Pasquier, A. et al. Plastic PVDF-HFP electrolyte laminates prepared by a phase-
inversion process. Solid State Ionics 135, 249–257 (2000).
141. Prosini, P. P., Villano, P. & Carewska, M. A novel intrinsically porous separator for self-
standing lithium-ion batteries. Electrochim. Acta 48, 227–233 (2002).
142. Richard, M. N., Koetschau, I. & Dahn, J. R. A Cell for In Situ X-Ray Diffraction Based
on Coin Cell Hardware and Bellcore Plastic Electrode Technology. J. Electrochem. Soc
144, 554–557 (1997).
143. Scrosati, B. & Garche, J. Lithium batteries: Status, prospects and future. J. Power
Sources 195, 2419–2430 (2010).
144. Tarascon, J. M. & Armand, M. Issues and challenges facing rechargeable lithium
batteries. Nature 414, 359–67 (2001).
145. Blyr, A., Sigala, C., Amatucci, G. & Tarascon, J. M. Self-Discharge of LMO/C Li-ion
cells in their discharge state. J. Electrochem. Soc. 145, (1998).
146. Morcrette, M. et al. In situ X-ray diffraction techniques as a powerful tool to study
battery electrode materials. Electrochim. Acta 47, 3137–3149 (2002).
147. Allen, G. et al. Atmospheric composition and thermodynamic retrievals from the ARIES
airborne TIR-FTS system - Part 2: Validation and results from aircraft campaigns.
Atmos. Meas. Tech. 7, 4401–4416 (2014).
148. Salmon, S. R., De Lange, K. M. & Lane, J. R. Structure and Abundance of Nitrous Oxide
Complexes in Earth’s Atmosphere. J. Phys. Chem. A 120, 2096–2105 (2016).
149. Marenco, A. et al. Measurement of ozone and water vapor by Airbus in-service aircraft:
The MOZAIC airborne program, an overview. J. Geophys. Res. 103, 25631 (1998).
150. Nédélec, P. P. et al. Instrumentation on commercial aircraft for monitoring the
atmospheric composition on a global scale : The IAGOS system, technical overview of
ozone and carbon monoxide measurements. Tellus B 67, 27791 (2015).
151. Allen, G. et al. South East Pacific atmospheric composition and variability sampled
along 20° S during VOCALS-REx. Atmos. Chem. Phys. 11, 5237–5262 (2011).

183
152. Dessler, A. E., Hintsa, E. J., Weinstock, E. M., Anderson, J. G. & Chan, K. R.
Mechanisms controlling water vapor in the lower stratosphere: ‘A tale of two
stratospheres’. J. Geophys. Res. 100, 167–172 (1995).
153. Froidevaux, L. et al. Global OZone Chemistry and Related trace gas Data records for the
Stratosphere (GOZCARDS): Methodology and sample results with a focus on HCl, H2O,
and O3. Atmos. Chem. Phys. 15, 10471–10507 (2015).
154. Hart, M. H. The evolution of the atmosphere of the earth. Icarus 33, 23–39 (1978).
155. Fegley, B. & Schaefer, L. K. in Treatise on Geochemistry 6, 71–90 (Elsevier, 2014).
156. Peacock, A. J. ABC of oxygen: Oxygen at high altitude. BMJ 317, 1063–1066 (1998).
157. Schlatter, T. W. Atmospheric Composition and Vertical Structure. Natl. Ocean. Atmos.
Adm. 6, 1–54 (2009).
158. Lawrence, M. G. The Relationship between Relative Humidity and the Dewpoint
Temperature in Moist Air: A Simple Conversion and Applications. Bull. Am. Meteorol.
Soc. 86, 225–234 (2005).
159. Newton, R. et al. Ozonesonde profiles from the West Pacific Warm Pool. Atmos. Chem.
Phys. 16, 619–634 (2016).
160. Huang, S., Cui, Z., Zhao, N., Sun, J. & Guo, X. Influence of Ambient Air on Cell
Reactions of Li-air Batteries. Electrochim. Acta 191, 473–478 (2016).
161. Gallagher, K. G. et al. Quantifying the promise of lithium–air batteries for electric
vehicles. Energy Environ. Sci. 7, 1555 (2014).
162. Wen, Z., Shen, C. & Lu, Y. Air Electrode for the Lithium-Air Batteries: Materials and
Structure Designs. Chempluschem 80, 270–287 (2015).
163. Park, M., Sun, H., Lee, H., Lee, J. & Cho, J. Lithium-air batteries: Survey on the current
status and perspectives towards automotive applications from a Battery Industry
Standpoint. Adv. Energy Mater. 2, 780–800 (2012).
164. Tan, P. et al. Advances and challenges in lithium-air batteries. Appl. Energy 204, 780–
806 (2017).
165. Vegh, J. M., Alonso, J. J., Orra, T. H. & Ilario da Silva, C. Flight Path and Wing
Optimization of Lithium-Air Battery Powered Passenger Aircraft. in 53rd AIAA

184
Aerospace Sciences Meeting 1–13 (2015).
166. Stückl, S., van Toor, J. & Lobentanzer, H. VOLTAIR - The All Electric Propulsion
Concept Platform – A Vision For Atmospheric Friendly Flight. in 28th Congress of the
International Council of the Aeronautical Sciences 1–11 (2012).
167. Reid, C. M., Dobley, A. & Seymour, F. W. Lithium - Air Cell Development. American
Institute of Aeronautics and Astronautics (2018).
168. Thielmann, A., Isenmann, R. & Wietschel, M. Technologie-Roadmap Vorwort.
Fraunhofer ISI (2010).
169. Tan, P., Shyy, W., Zhao, T. S., Wei, Z. H. & An, L. Discharge product morphology
versus operating temperature in non-aqueous lithium-air batteries. J. Power Sources 278,
133–140 (2015).
170. Yang, X. H. & Xia, Y. Y. The effect of oxygen pressures on the electrochemical profile
of lithium/oxygen battery. J. Solid State Electrochem. 14, 109–114 (2010).
171. Griffith, L. D., Sleightholme, A. E. S., Mansfield, J. F., Siegel, D. J. & Monroe, C. W.
Correlating Li/O2 cell capacity and product morphology with discharge current. ACS
Appl. Mater. Interfaces 7, 7670–7678 (2015).
172. Adams, B. D., Radtke, C., Black, R., Trudeau, M. & Zaghib, K. Current Density
Dependence of Peroxide Formation in the Li-O2 Battery and its Effect on Charge. Energy
Environ. Sci. 6, 1772 (2010).
173. Wang, F. & Li, X. Discharge Li-O2 batteries with intermittent current. J. Power Sources
394, 50–56 (2018).
174. Zhai, D. et al. Disproportionation in Li–O2 Batteries Based on a Large Surface Area
Carbon Cathode. J. Am. Chem. Soc. 135, 15364–15372 (2013).
175. Meini, S., Piana, M., Tsiouvaras, N., Garsuch, A. & Gasteiger, H. A. The Effect of Water
on the Discharge Capacity of a Non-Catalyzed Carbon Cathode for Li-O2 Batteries.
Electrochem. Solid-State Lett. 15, A45 (2012).
176. Cho, M. H. et al. The effects of moisture contamination in the Li-O2 battery. J. Power
Sources 268, 565–574 (2014).
177. Guo, Z., Dong, X., Yuan, S., Wang, Y. & Xia, Y. Humidity effect on electrochemical

185
performance of Li–O2 batteries. J. Power Sources 264, 1–7 (2014).
178. Luntz, A. C. & McCloskey, B. D. Nonaqueous Li–Air Batteries: A Status Report. Chem.
Rev. 114, 11721–11750 (2014).
179. Schwenke, K. U., Metzger, M., Restle, T., Piana, M. & Gasteiger, H. A. The Influence
of Water and Protons on Li2O2 Crystal Growth in Aprotic Li-O2 Cells. J. Electrochem.
Soc. 162, A573–A584 (2015).
180. Adams, J., Karulkar, M. & Anandan, V. Evaluation and electrochemical analyses of
cathodes for lithium-air batteries. J. Power Sources 239, 132–143 (2013).
181. Takechi, K., Shiga, T. & Asaoka, T. A Li–O2/CO2 battery. Chem. Commun. 47, 3463
(2011).
182. Beyer, H., Meini, S., Tsiouvaras, N., Piana, M. & Gasteiger, H. A. Thermal and
electrochemical decomposition of lithium peroxide in non-catalyzed carbon cathodes for
Li–air batteries. Phys. Chem. Chem. Phys. 15, 11025 (2013).
183. Black, R. et al. The Nature and Impact of Side Reactions in Glyme-based Sodium –
Oxygen Batteries. ChemSusChem. 9, 1–10 (2016).
184. Meini, S. et al. Rechargeability of Li-air cathodes pre-filled with discharge products
using an ether-based electrolyte solution: implications for cycle-life of Li-air cells. Phys.
Chem. Chem. Phys. 15, 11478–93 (2013).
185. Thotiyl, M. M. O., Freunberger, S. A., Peng, Z. & Bruce, P. G. The Carbon Electrode in
Nonaqueous Li−O2 Cells. J. Am. Chem. Soc. 135, 494–500 (2013).
186. Zhang, J. G., Wang, D., Xu, W., Xiao, J. & Williford, R. E. Ambient operation of Li/Air
batteries. J. Power Sources 195, 4332–4337 (2010).
187. Yoo, K., Banerjee, S. & Dutta, P. Modeling of volume change phenomena in a Li-air
battery. J. Power Sources 258, 340–350 (2014).
188. Zhang, S. S., Xu, K. & Read, J. A non-aqueous electrolyte for the operation of Li/air
battery in ambient environment. J. Power Sources 196, 3906–3910 (2011).
189. Park, J. et al. Influence of Temperature on Lithium−Oxygen Battery Behavior. Nano
Lett. 13, 2971–2975 (2013).
190. Zhang, Y. et al. Amorphous Li2O2: Chemical Synthesis and Electrochemical Properties.

186
Angew. Chemie Int. Ed. 55, 10717–10721 (2016).
191. Song, M. et al. Discharging temperature dependence of Li2O2 formation and its effect on
charging polarization for Li-O2 battery. Mater. Res. Bull. 68, 75–79 (2015).
192. Joseph Nemanick, E. & Hickey, R. P. The effects of O2 pressure on Li-O2 secondary
battery discharge capacity and rate capability. J. Power Sources 252, 248–251 (2014).
193. Shibata, K., Uemura, S., Tsushima, S. & Hirai, S. Reaction and Mass Transport
Simulations by LBM in Electrolyte of Aqueous Lithium-Air Battery. ECS Trans. 64, 39–
46 (2015).
194. Lepoivre, F., Grimaud, A., Larcher, D. & Tarascon, J.-M. Long-Time and Reliable Gas
Monitoring in Li-O2 Batteries via a Swagelok Derived Electrochemical Cell. J.
Electrochem. Soc. 163, A923–A929 (2016).
195. Kwon, H. J. et al. Effects of oxygen partial pressure on Li-air battery performance. J.
Power Sources 364, 280–287 (2017).
196. Kwak, K.-H., Kim, D. W., Kang, Y. & Suk, J. Hierarchical Ru- and RuO 2 -foams as
high performance electrocatalysts for rechargeable lithium–oxygen batteries. J. Mater.
Chem. A 4, 16356–16367 (2016).
197. Kwak, K. H., Kim, D. W., Kang, Y., Suk, J. & Division, A. M. Supporting Information:
Hierarchical Ru- and RuO2-foams as high performance cathodes for rechargeable
lithium-oxygen batteries. ournal Mater. Chem. A 4, 16356–16367 (2016).
198. Choi, J. W. & Aurbach, D. Promise and reality of post-lithium-ion batteries with high
energy densities. Nat. Rev. Mater. 1, (2016).
199. Beattie, S. D., Manolescu, D. M. & Blair, S. L. High-Capacity Lithium–Air Cathodes. J.
Electrochem. Soc. 156, A44 (2009).
200. Shen, Y. et al. A high-capacity lithium–air battery with Pd modified carbon nanotube
sponge cathode working in regular air. Carbon. 62, 288–295 (2013).
201. Zhou, W. et al. Hierarchical Micron-Sized Mesoporous/Macroporous Graphene with
Well-Tuned Surface Oxygen Chemistry for High Capacity and Cycling Stability Li–O2
Battery. ACS Appl. Mater. Interfaces 7, 3389–3397 (2015).
202. Black, R. et al. Screening for Superoxide Reactivity in Li-O2 Batteries : Effect on
187
Li2O2/LiOH crystallization. J. Am. Chem. Soc. 134, 2902–2905 (2012).
203. Li, M. et al. Controlling the microstructure of poly(vinylidene-fluoride) (PVDF) thin
films for microelectronics. J. Mater. Chem. C 1, 7695–7702 (2013).
204. Karabelli, D. Séparateurs Macroporeux Innovants à base de Poly(Fluorure de vinildène)
(PVdF) pour Supercondensateurs. (2012).
205. Du Pasquier, A. et al. Differential Scanning Calorimetry Study of the Reactivity of
Carbon Anodes in Plastic Li-Ion Batteries. J. Electrochem. Soc. 145, 472–477 (1998).
206. Lozano, A., Yip, B. & Hanson, R. K. Acetone: a tracer for concentration measurements
in gaseous flows by planar laser-induced fluorescence. Exp. Fluids 13, 369–376 (1992).
207. Wood, D. L. et al. Technical and economic analysis of solvent-based lithium-ion
electrode drying with water and NMP. Dry. Technol. 36, 234–244 (2018).
208. M., Doyle, J., Newman., A.S., Gozdz, C.N., Schumtz, J.M, T. Comparison of Modeling
Predictions with Experimental Data from Plastic Lithium Ion Cells. J. Electrochem. Soc.
143, 1890 (1996).
209. Yin, Y. A coupled Modeling/Experimental Study of Li-air Batteries. (2018).
210. Brunauer, S., Emmett, P. H. & Teller, E. Adsorption of Gases in Multimolecular Layers.
J. Am. Chem. Soc. 60, 309–319 (1938).
211. Barrett, E. P., Joyner, L. G. & Halenda, P. P. The Determination of Pore Volume and
Area Distributions in Porous Substances. I. Computations from Nitrogen Isotherms. J.
Am. Chem. Soc. 73, 373–380 (1951).
212. Ishak, H. et al. Aqueous solubility, vapor pressure and octanol-water partition coefficient
of two phthalate isomers dibutyl phthalate and di-isobutyl phthalate contaminants of
recycled food packages. Fluid Phase Equilib. 427, 362–370 (2016).
213. David Linden & Thomas Reddy. in Handbook of Batteries (ed. Mc Graw Hill
Professional) 74 (R. R. Donelley & Sons Coompany, 2001).
214. Day, Z. Preliminary studies in using X-ray diffraction for analyzing the atomic structure
of Central Plains tradition constituents. (2016).
215. Yoo, K., Banerjee, S., Kim, J. & Dutta, P. A Review of Lithium-Air Battery Modeling
Studies. Energies 10, 1748 (2017).

188
216. Tan, P., Kong, W., Shao, Z., Liu, M. & Ni, M. Advances in modeling and simulation of
Li–air batteries. Prog. Energy Combust. Sci. 62, 155–189 (2017).
217. Yuan, J., Yu, J.-S. & Sundén, B. Review on mechanisms and continuum models of multi-
phase transport phenomena in porous structures of non-aqueous Li-Air batteries. J.
Power Sources 278, 352–369 (2015).
218. Cazeaux, P. Autour de la modélisation du poumon. (2012).
219. Luntz, A. C. et al. Tunneling and polaron charge transport through Li2O2 in Li-O2
batteries. J. Phys. Chem. Lett. 4, 3494–3499 (2013).
220. Tjaden, B., Cooper, S. J., Brett, D. J., Kramer, D. & Shearing, P. R. On the origin and
application of the Bruggeman correlation for analysing transport phenomena in
electrochemical systems. Curr. Opin. Chem. Eng. 12, 44–51 (2016).
221. Bruggeman, D. A. G. Berechnung verschiedener physikalischer Konstanten von
heterogenen Substanzen. Ann. Phys. 421, 160–178 (1937).
222. Langtangen, H. P. Finite difference methods for diffusion processes. (2016).
223. Lu, J. & Amine, K. Recent research progress on non-aqueous lithium-air batteries from
Argonne National Laboratory. Energies 6, 6016–6044 (2013).
224. Balaish, M., Kraytsberg, A. & Ein-Eli, Y. A critical review on lithium-air battery
electrolytes. Phys. Chem. Chem. Phys. 16, 2801–2822 (2014).
225. Xu, K. Nonaqueous Liquid Electrolytes for Lithium-Based Rechargeable Batteries
Nonaqueous Liquid Electrolytes for Lithium-Based Rechargeable Batteries. Chem. Rev.
104, 4303–4417 (2004).
226. Aurbach, D. et al. Design of electrolyte solutions for Li and Li-ion batteries: a review.
Electrochim. Acta 50, 247–254 (2004).
227. Younesi, R., Veith, G. M., Johansson, P., Edström, K. & Vegge, T. Lithium salts for
advanced lithium batteries: Li-metal, Li-O2, and Li-S. Energy Environ. Sci. 8, 1905–
1922 (2015).
228. Biotechnology, S. C. Triglyme Material Safety Data Sheet. (2009).
229. Biotechnology, S. C. Diglyme Material Data Sheet. (2011).
189
230. Hawash, Z., Ono, L. K. & Qi, Y. Photovoltaics: Moisture and Oxygen Enhance
Conductivity of LiTFSI-Doped Spiro-MeOTAD Hole Transport Layer in Perovskite
Solar Cells. Adv. Mater. Interfaces 3, 1600117 (2016).
231. Xia, C., Kwok, C. Y. & Nazar, L. F. A High Energy Density Lithium-Oxygen Battery
Based on a Reversible Four Electron Conversion to Lithium Oxide. 781, 777–781
(2018).
232. Tian, F., Radin, M. D. & Siegel, D. J. Enhanced charge transport in amorphous Li2O2.
Chem. Mater. 26, 2952–2959 (2014).
233. Yin, Y., Torayev, A., Gaya, C., Mammeri, Y. & Franco, A. A. Linking the Performances
of Li-O2 Batteries to Discharge Rate and Electrode and Electrolyte Properties through
the Nucleation Mechanism of Li2O2. J. Phys. Chem. C 121, 19577–19585 (2017).
234. Köhler, H. The Nucleus in and the Growth Of Hygroscopic Droplets. Trans. Faraday
Soc. 1152–1161 (1936).
235. Polte, J. Fundamental growth principles of colloidal metal nanoparticles - a new
perspective. CrystEngComm 17, 6809–6830 (2015).
236. Molaeimanesh, G. R. & Nazemian, M. Investigation of GDL compression effects on the
performance of a PEM fuel cell cathode by lattice Boltzmann method. J. Power Sources
359, 494–506 (2017).
237. Radhakrishnan, V. & Haridoss, P. Effect of GDL compression on pressure drop and
pressure distribution in PEMFC flow field. Int. J. Hydrogen Energy 36, 14823–14828
(2011).
238. Ge, J., Higier, A. & Liu, H. Effect of gas diffusion layer compression on PEM fuel cell
performance. J. Power Sources 159, 922–927 (2006).
239. Kartal, M., Alp, A. & Akbulut, H. Electrical Conductivity, Viscosity and Thermal
Properties of TEGDME-Based Composite Electrolytes for Lithium-Air Batteries. Acta
Phys. Pol. A 129, 816–818 (2016).
240. Lau, S. & Archer, L. A. Nucleation and Growth of Lithium Peroxide in the Li-O2 Battery.
Nano Lett. 15, 5995–6002 (2015).
241. Lee, J.-H. et al. The role of vacancies and defects in Na0.44MnO2 nanowire catalysts for
190
lithium–oxygen batteries. Energy Environ. Sci. 5, 9558 (2012).
242. Lu, Y.-C. et al. Lithium-oxygen batteries: bridging mechanistic understanding and
battery performance. Energy Environ. Sci. 6, 750–768 (2013).
243. Aetukuri, N. B. et al. Solvating additives drive solution-mediated electrochemistry and
enhance toroid growth in non-aqueous Li-O2batteries. Nat. Chem. 7, 50–56 (2015).
244. Canham, P. B. The minimum energy of bending as a possible explanation of the
biconcave shape of the human red blood cell. J. Theor. Biol. 26, 61–81 (1970).
245. Deuling, H. J. & Helfrich, W. Red blood cell shapes as explained on the basis of
curvature elasticity. Biophys. J. 16, 861–868 (1976).
246. Berezina, T. L. et al. Influence of storage on red blood cell rheological properties. J.
Surg. Res. 102, 6–12 (2002).
247. Mitchell, R. R., Gallant, B. M., Shao-Horn, Y. & Thompson, C. V. Mechanisms of
Morphological Evolution of Li2O2 Particles during Electrochemical Growth. J. Phys.
Chem. Lett. 4, 1060–1064 (2013).
248. Ganapathy, S. et al. Nature of Li2O2 Oxidation in a Li–O2 Battery Revealed by Operando
X-ray Diffraction. J. Am. Chem. Soc. 136, 16335–16344 (2014).
249. Zhang, G. Q. et al. Lithium–Air Batteries Using SWNT/CNF Buckypapers as Air
Electrodes. J. Electrochem. Soc. 157, A953–A956 (2010).
250. Nanda, J. et al. Anomalous discharge product distribution in lithium-air cathodes. J.
Phys. Chem. C 116, 8401–8408 (2012).
251. Ren, X., Zhang, S. S., Tran, D. T. & Read, J. Oxygen reduction reaction catalyst on
lithium/air battery discharge performance. J. Mater. Chem. 21, 10118–10125 (2011).
252. Wong, R. A. et al. Structurally Tuning Li2O2 by Controlling the Surface Properties of
Carbon Electrodes: Implications for Li-O2 Batteries. Chem. Mater. 28, 8006–8015
(2016).
253. Torayev, A. et al. Stochasticity of Pores Interconnectivity in Li–O2 Batteries and its
Impact on the Variations in Electrochemical Performance. J. Phys. Chem. Lett. 9, 791–
797 (2018).
254. Sahapatsombut, U., Cheng, H. & Scott, K. Modelling of operation of a lithium-air battery

191
with ambient air and oxygen-selective membrane. J. Power Sources 249, 418–430
(2014).

192
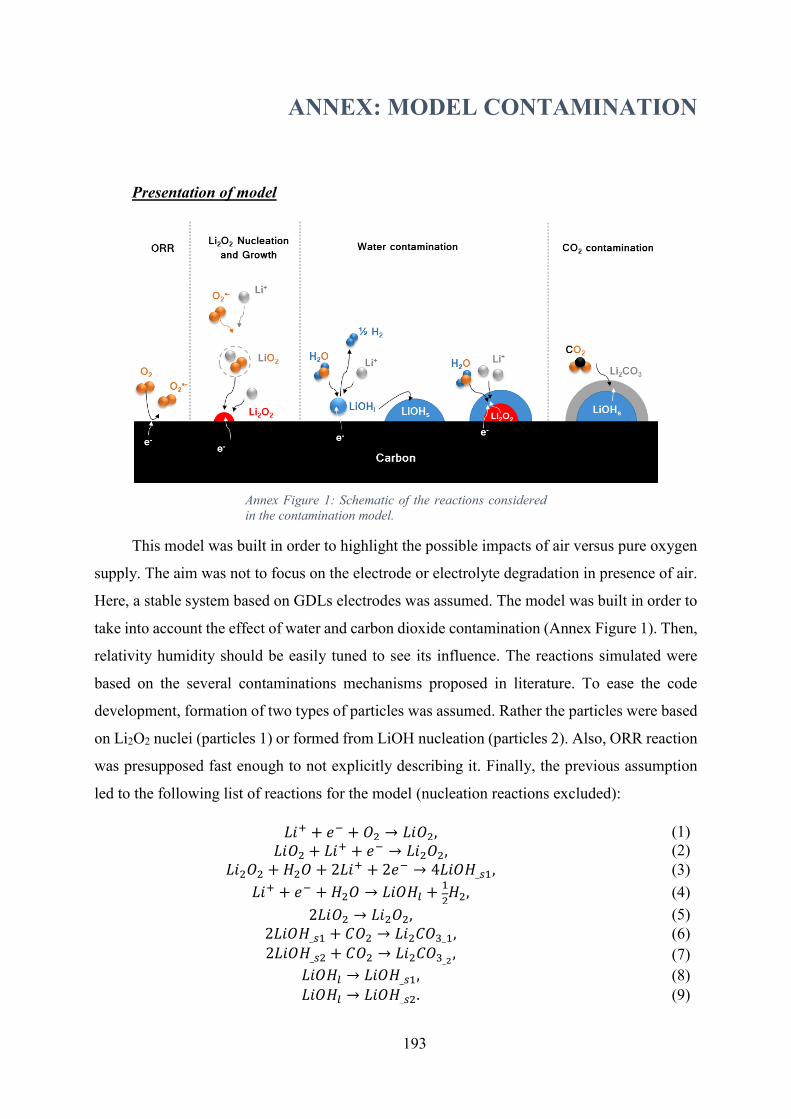
193
ANNEX: MODEL CONTAMINATION
Annex: Model contamination
Presentation of model
Annex Figure 1: Schematic of the reactions considered
in the contamination model.
This model was built in order to highlight the possible impacts of air versus pure oxygen
supply. The aim was not to focus on the electrode or electrolyte degradation in presence of air.
Here, a stable system based on GDLs electrodes was assumed. The model was built in order to
take into account the effect of water and carbon dioxide contamination (Annex Figure 1). Then,
relativity humidity should be easily tuned to see its influence. The reactions simulated were
based on the several contaminations mechanisms proposed in literature. To ease the code
development, formation of two types of particles was assumed. Rather the particles were based
on Li2O2 nuclei (particles 1) or formed from LiOH nucleation (particles 2). Also, ORR reaction
was presupposed fast enough to not explicitly describing it. Finally, the previous assumption
led to the following list of reactions for the model (nucleation reactions excluded):
𝐿𝑖+ + 𝑒− + 𝑂2 → 𝐿𝑖𝑂2, (1)
𝐿𝑖𝑂2 + 𝐿𝑖+ + 𝑒− → 𝐿𝑖2𝑂2, (2)
𝐿𝑖2𝑂2 + 𝐻2𝑂 + 2𝐿𝑖+ + 2𝑒− → 4𝐿𝑖𝑂𝐻_𝑠1, (3)
𝐿𝑖+ + 𝑒− + 𝐻2𝑂 → 𝐿𝑖𝑂𝐻𝑙 +1
2𝐻2, (4)
2𝐿𝑖𝑂2 → 𝐿𝑖2𝑂2, (5)
2𝐿𝑖𝑂𝐻_𝑠1 + 𝐶𝑂2 → 𝐿𝑖2𝐶𝑂3_1, (6)
2𝐿𝑖𝑂𝐻_𝑠2 + 𝐶𝑂2 → 𝐿𝑖2𝐶𝑂3_2, (7)
𝐿𝑖𝑂𝐻𝑙 → 𝐿𝑖𝑂𝐻_𝑠1, (8)
𝐿𝑖𝑂𝐻𝑙 → 𝐿𝑖𝑂𝐻_𝑠2. (9)

194
The model was then describing the system presented in Annex Figure 2.
Annex Figure 2: Schematic of the model described.
Similarly, as in the previous code, species diffusion was determined along the system
(separator + cathode) by the Fick’s law:
𝜕(휀. 𝑐𝑋)
𝜕𝑡= −𝛻𝐽𝑋
𝐷𝑖𝑓𝑓− 𝑅𝑋 I.1.
with 휀 the cathode porosity, 𝑐𝑋 the concentration of specie X, 𝐽𝑋𝐷𝑖𝑓𝑓
the diffusion flux of specie
X and 𝑅𝑋 the source term for X due to the reactions (consumption or production). Lithium
cations, water, carbon dioxide and oxygen diffusion were solved along the electrode thickness
as well as the produced species such as LiOH and LiO2. The diffusion flux was defined by the
following equation:
𝐽𝑋𝐷𝑖𝑓𝑓
= −𝐷𝑋𝜕𝑐𝑋
𝜕𝑥 I.2.
where 𝐷𝑋 is the effective diffusion coefficient of species X calculated from Bruggeman relation
based on :
𝐷𝑋 = 𝐷0. 휀1.5 I.3.
with 𝐷0 the oxygen diffusion coefficient of the electrolyte solvent (TetraGDME as TriGDME
value was not available)79 and the Bruggeman coefficient equal to 1.5. For the sake of simplicity
and as the values were not available in literature, water and carbon dioxide effective diffusion
coefficient were assumed to be equal to the oxygen one.
The equation was then discretized using the volume finite method as presented in
discretization part.

195
Discretization of the Fick’s law
Combination of equation I.1., I.2 and I.3. led for specie X to:
𝜕( .𝑐)
𝜕𝑡=
𝜕
𝜕𝑥(𝐷0휀𝛽 𝜕𝑐
𝜕𝑥) − 𝑅𝑋. I.4.
As 𝐷0 is a constant, the equation could be rewrite as:
𝜕( .𝑐)
𝜕𝑡= 𝐷0
𝜕
𝜕𝑥(휀𝛽 𝜕𝑐
𝜕𝑥) − 𝑅𝑋. I.5.
Once discretized by the finite volume method, the diffusion in the bin 𝑖 at time 𝑡 was
obtained according to:
( 𝑖𝑡+1𝑐𝑖
𝑡+1− 𝑖𝑡𝑐𝑖
𝑡
∆𝑡) = 𝐷0
[( 𝛽)𝑖+
12
𝑡 (𝜕𝑐
𝜕𝑥)
𝑖+12
−( 𝛽)𝑖−
12
𝑡 (𝜕𝑐
𝜕𝑥)
𝑖−12
]
∆𝑥− 𝑅𝑋. I.6.
Then several adjustments were implemented:
( 𝑖𝑡+1𝑐𝑖
𝑡+1− 𝑖𝑡𝑐𝑖
𝑡
∆𝑡) = 𝐷0
[( 𝛽)𝑖+
12
𝑡 (𝑐𝑖+1
𝑡 −𝑐𝑖𝑡
∆𝑥)−( 𝛽)
𝑖−12
𝑡 (𝑐𝑖
𝑡−𝑐𝑖−1𝑡
∆𝑥)]
∆𝑥− 𝑅𝑥
𝑖,
I.7.
( 𝑖𝑡+1𝑐𝑖
𝑡+1− 𝑖𝑡𝑐𝑖
𝑡
∆𝑡) = 𝐷0
[
(𝜀𝛽)𝑖+
12
𝑡 𝑐𝑖+1𝑡
∆𝑥−
(𝜀𝛽)𝑖+
12
𝑡 𝑐𝑖𝑡
∆𝑥−
(𝜀𝛽)𝑖−
12
𝑡 𝑐𝑖𝑡
∆𝑥+
(𝜀𝛽)𝑖−
12
𝑡 𝑐𝑖−1𝑡
∆𝑥]
∆𝑥− 𝑅𝑥
𝑖,
I.8.
( 𝑖𝑡+1𝑐𝑖
𝑡+1− 𝑖𝑡𝑐𝑖
𝑡
∆𝑡) = 𝐷0
[( 𝛽)𝑖+
12
𝑡 𝑐𝑖+1𝑡 −(( 𝛽)
𝑖+12
𝑡 +( 𝛽)𝑖−
12
𝑡 )𝑐𝑖𝑡+( 𝛽)
𝑖−12
𝑡 𝑐𝑖−1𝑡 )]
∆𝑥2 − 𝑅𝑥𝑖,
I.9.
Introducing that (휀𝛽)𝑖+
1
2
𝑡 =( 𝛽)𝑖+1
𝑡 +( 𝛽)𝑖𝑡
2 and (휀𝛽)
𝑖−1
2
𝑡 =( 𝛽)𝑖
𝑡+( 𝛽)𝑖−1𝑡
2, a new equation was
reached:
( 𝑖𝑡+1𝑐𝑖
𝑡+1− 𝑖𝑡𝑐𝑖
𝑡
∆𝑡) = 𝐷0
[((𝜀𝛽)𝑖+1
𝑡 +(𝜀𝛽)𝑖𝑡
2)𝑐𝑖+1
𝑡 −((𝜀𝛽)𝑖+1
𝑡 +(𝜀𝛽)𝑖𝑡
2+
(𝜀𝛽)𝑖𝑡+(𝜀𝛽)𝑖−1
𝑡
2 )𝑐𝑖
𝑡+((𝜀𝛽)𝑖
𝑡+(𝜀𝛽)𝑖−1𝑡
2)𝑐𝑖−1
𝑡 )]
∆𝑥2 − 𝑅𝑥𝑖, I.10.
( 𝑖𝑡+1𝑐𝑖
𝑡+1− 𝑖𝑡𝑐𝑖
𝑡
∆𝑡) = 𝐷0
[((𝜀𝛽)𝑖+1
𝑡 +(𝜀𝛽)𝑖𝑡
2)𝑐𝑖+1
𝑡 −((𝜀𝛽)𝑖+1
𝑡 +2(𝜀𝛽)𝑖𝑡+(𝜀𝛽)𝑖−1
𝑡
2)𝑐𝑖
𝑡+((𝜀𝛽)𝑖
𝑡+(𝜀𝛽)𝑖−1𝑡
2)𝑐𝑖−1
𝑡 ]
∆𝑥2 − 𝑅𝑥𝑖, I.11.
this leading to:

196
휀𝑖𝑡+1𝑐𝑖
𝑡+1 = 휀𝑖𝑡𝑐𝑖
𝑡 +𝐷0∆𝑡
∆𝑥2 [(( 𝛽)𝑖+1
𝑡 +( 𝛽)𝑖𝑡
2) 𝑐𝑖+1
𝑡 − (( 𝛽)𝑖+1
𝑡 +2( 𝛽)𝑖𝑡+( 𝛽)𝑖−1
𝑡
2) 𝑐𝑖
𝑡 +
(( 𝛽)𝑖
𝑡+( 𝛽)𝑖−1𝑡
2) 𝑐𝑖−1
𝑡 )] − 𝑅𝑥𝑖 . ∆𝑡.
I.12.
To simplify, a new annotation was taken, 𝑧 = 휀𝑐, permitting to write :
𝑧𝑖𝑡+1 = 𝑧𝑖
𝑡 +𝐷0∆𝑡
∆𝑥2 [(( 𝛽)𝑖+1
𝑡 +( 𝛽)𝑖𝑡
2) 𝑐𝑖+1
𝑡 − (( 𝛽)𝑖+1
𝑡 +2( 𝛽)𝑖𝑡+( 𝛽)𝑖−1
𝑡
2) 𝑐𝑖
𝑡 +
(( 𝛽)𝑖
𝑡+( 𝛽)𝑖−1𝑡
2) 𝑐𝑖−1
𝑡 ] − 𝑅𝑥𝑖 . ∆𝑡,
I.13.
giving finally:
𝑧𝑖𝑡+1 = 𝑧𝑖
𝑡 +𝐷0∆𝑡
2∆𝑥2 [((휀𝛽)𝑖+1𝑡 + (휀𝛽)𝑖
𝑡)𝑐𝑖+1𝑡 − ((휀𝛽)𝑖+1
𝑡 + 2(휀𝛽)𝑖𝑡 +
(휀𝛽)𝑖−1𝑡 )𝑐𝑖
𝑡 + ((휀𝛽)𝑖𝑡 + (휀𝛽)𝑖−1
𝑡 )𝑐𝑖−1𝑡 ]−𝑅𝑥
𝑖 . ∆𝑡.
I.14.
Boundary conditions
Air inlet
The model was created to easily recreate the air supply and to tune the relative humidity
applied. At the air inlet, the diffusive species concentrations in this bin P+Q depends on the
ones in P+Q+1. Concentrations in P+Q+1 were linked to the species dissolution in the
electrolyte and so were determined using Henry’s law254:
𝑐𝑃+𝑄+1𝑋 = 𝐻𝑋 . 𝑝𝑋 I.15.
with 𝑐𝑋 concentration of the gas X, 𝐻𝑋 Henry’s law constant for the gas X depending on
temperature and electrolyte selected and 𝑝𝑋 the partial pressure of the gas X in the atmosphere.
Knowing 𝑐𝑃+𝑄+1𝑋 for all the gas permitted in combination to equation I.14 to calculate their
concentrations in the last bin P+Q.
For the other diffusive species not gaseous, diffusion was impeded at P+Q and so a flux
equal to zero was considered
(𝜕𝑐𝑋
𝜕𝑥)
𝑎𝑖𝑟 𝑖𝑛𝑙𝑒𝑡=
𝑐𝑃+𝑄+1𝑋 −𝑐𝑃+𝑄
𝑋
∆𝑥= 0, I.16.
leading to
𝑐𝑃+𝑄+1𝑋 = 𝑐𝑃+𝑄
𝑋 . I.17.

197
Anode inlet
At the anode side except for lithium, all the boundary conditions were solved using the
same way a flux equal to zero. Application of a zero flux equal to zero enabled to implement in
the equation I.14. that
𝑐𝑃+𝑄−1𝑋 = 𝑐𝑃+𝑄
𝑋 . I.18.
For the lithium, an extra bin at the maximal concentration was assumed as done in
previous model (𝑐𝑃+𝑄−1𝐿𝑖+
= 1 𝑀).
Nucleation
As in Yin et al. paper, heterogeneous nucleation of hemispherical particles was
considered.233 Still, here two competing nucleation mechanism were imagined and described:
one for Li2O2 nucleation and one for LiOH (n and m correspond to the numbers of units included
in one nuclei of Li2O2 or LiOH respectively).
𝑛𝐿𝑖𝑂2 + 𝑛𝐿𝑖+ + 𝑛𝑒− ⇌ (𝐿𝑖2𝑂2)𝑛, (10)
𝑚𝐻2𝑂 + 𝑚𝐿𝑖+ + 𝑚𝑒− ⇌ (𝐿𝑖𝑂𝐻)𝑚 + 𝑚 1
2𝐻2. (11)
For each nucleation reaction, a Gibbs formation energy was calculated based on:
∆𝐺𝑐𝑟𝑖𝑡𝑖𝑐 =4𝐵𝜎3𝑉𝑚
2
27(𝑧𝑒∥𝜂∥)2 I.19.
with B the geometrical parameter (equal to 18 in case of hemisphere), 𝜎 the specific surface
energy of Li2O2 or LiOH in contact to the electrolyte, 𝑉𝑚 the volume molar of Li2O2 or LiOH,
z the number of electrons transferred, and 휂 the overpotential associated to the nucleation
reaction.
Thanks to the Gibbs formation energy, the nucleation reaction kinetics was calculated
using:
𝜐𝑛𝑢𝑐𝑙𝑒𝑎𝑡𝑖𝑜𝑛 = 𝑘𝑛𝑢. 𝐴𝑐 . 𝑒(−
∆𝐺𝑐𝑟𝑖𝑡𝑖𝑐𝑘𝑏.𝑇
) I.19.
with 𝑘𝑛𝑢 the kinetic constant (adjusted) and 𝐴𝑐 the active carbon surface (surface of carbon
uncovered from particles).
After the nucleation step, growth was able started. To save the evolution of the particle
size distribution, the following equation was implemented:
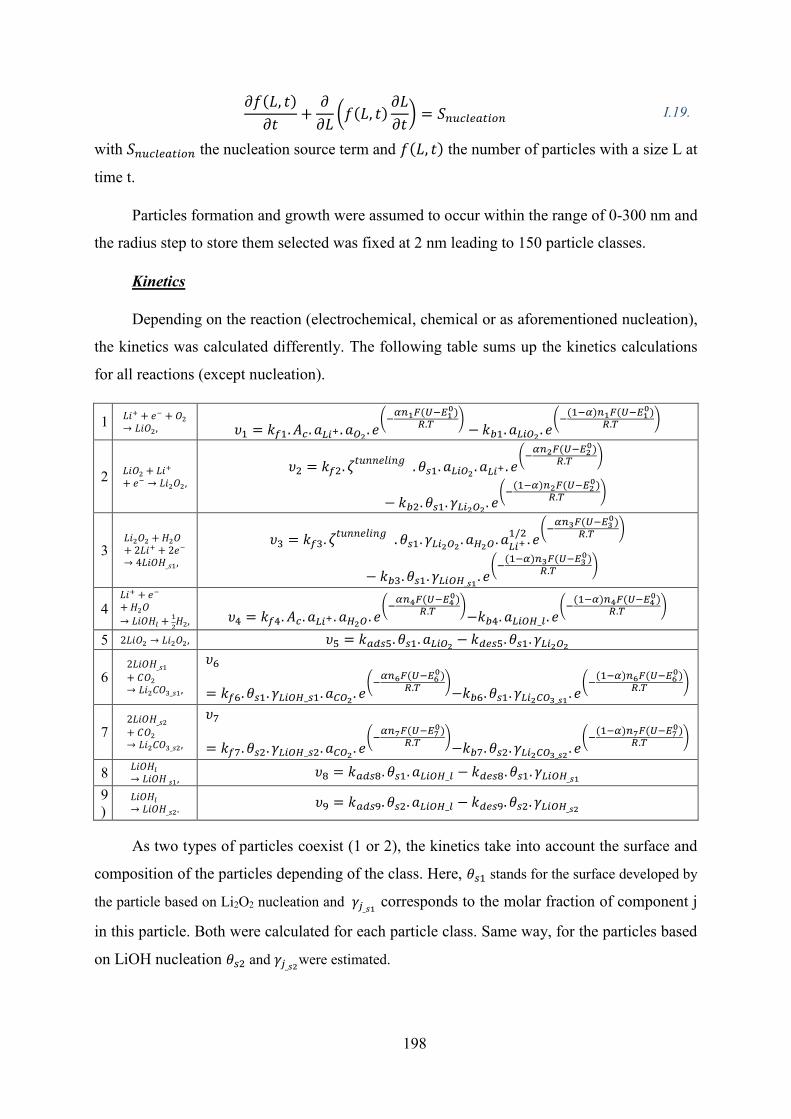
198
𝜕𝑓(𝐿, 𝑡)
𝜕𝑡+
𝜕
𝜕𝐿(𝑓(𝐿, 𝑡)
𝜕𝐿
𝜕𝑡) = 𝑆𝑛𝑢𝑐𝑙𝑒𝑎𝑡𝑖𝑜𝑛 I.19.
with 𝑆𝑛𝑢𝑐𝑙𝑒𝑎𝑡𝑖𝑜𝑛 the nucleation source term and 𝑓(𝐿, 𝑡) the number of particles with a size L at
time t.
Particles formation and growth were assumed to occur within the range of 0-300 nm and
the radius step to store them selected was fixed at 2 nm leading to 150 particle classes.
Kinetics
Depending on the reaction (electrochemical, chemical or as aforementioned nucleation),
the kinetics was calculated differently. The following table sums up the kinetics calculations
for all reactions (except nucleation).
1 𝐿𝑖+ + 𝑒− + 𝑂2
→ 𝐿𝑖𝑂2, 𝜐1 = 𝑘𝑓1. 𝐴𝑐 . 𝑎𝐿𝑖+ . 𝑎𝑂2. 𝑒
(−𝛼𝑛1𝐹(𝑈−𝐸1
0)𝑅.𝑇 )
− 𝑘𝑏1. 𝑎𝐿𝑖𝑂2. 𝑒
(−(1−𝛼)𝑛1𝐹(𝑈−𝐸1
0)𝑅.𝑇 )
2 𝐿𝑖𝑂2 + 𝐿𝑖+
+ 𝑒− → 𝐿𝑖2𝑂2,
𝜐2 = 𝑘𝑓2. 휁𝑡𝑢𝑛𝑛𝑒𝑙𝑖𝑛𝑔 . 휃𝑠1. 𝑎𝐿𝑖𝑂2. 𝑎𝐿𝑖+ . 𝑒
(−𝛼𝑛2𝐹(𝑈−𝐸2
0)𝑅.𝑇 )
− 𝑘𝑏2. 휃𝑠1. 𝛾𝐿𝑖2𝑂2. 𝑒
(−(1−𝛼)𝑛2𝐹(𝑈−𝐸2
0)𝑅.𝑇 )
3 𝐿𝑖2𝑂2 + 𝐻2𝑂+ 2𝐿𝑖+ + 2𝑒−
→ 4𝐿𝑖𝑂𝐻_𝑠1,
𝜐3 = 𝑘𝑓3. 휁𝑡𝑢𝑛𝑛𝑒𝑙𝑖𝑛𝑔 . 휃𝑠1. 𝛾𝐿𝑖2𝑂2. 𝑎𝐻2𝑂 . 𝑎
𝐿𝑖+1/2
. 𝑒(−
𝛼𝑛3𝐹(𝑈−𝐸30)
𝑅.𝑇 )
− 𝑘𝑏3. 휃𝑠1. 𝛾𝐿𝑖𝑂𝐻_𝑠1. 𝑒
(−(1−𝛼)𝑛3𝐹(𝑈−𝐸3
0)𝑅.𝑇 )
4 𝐿𝑖+ + 𝑒−
+ 𝐻2𝑂
→ 𝐿𝑖𝑂𝐻𝑙 +1
2𝐻2, 𝜐4 = 𝑘𝑓4. 𝐴𝑐 . 𝑎𝐿𝑖+ . 𝑎𝐻2𝑂 . 𝑒
(−𝛼𝑛4𝐹(𝑈−𝐸4
0)𝑅.𝑇 )
−𝑘𝑏4. 𝑎𝐿𝑖𝑂𝐻_𝑙 . 𝑒(−
(1−𝛼)𝑛4𝐹(𝑈−𝐸40)
𝑅.𝑇 )
5 2𝐿𝑖𝑂2 → 𝐿𝑖2𝑂2, 𝜐5 = 𝑘𝑎𝑑𝑠5. 휃𝑠1. 𝑎𝐿𝑖𝑂2− 𝑘𝑑𝑒𝑠5. 휃𝑠1. 𝛾𝐿𝑖2𝑂2
6 2𝐿𝑖𝑂𝐻_𝑠1
+ 𝐶𝑂2
→ 𝐿𝑖2𝐶𝑂3_𝑠1,
𝜐6
= 𝑘𝑓6. 휃𝑠1. 𝛾𝐿𝑖𝑂𝐻_𝑠1. 𝑎𝐶𝑂2. 𝑒
(−𝛼𝑛6𝐹(𝑈−𝐸6
0)𝑅.𝑇 )
−𝑘𝑏6. 휃𝑠1. 𝛾𝐿𝑖2𝐶𝑂3_𝑠1. 𝑒
(−(1−𝛼)𝑛6𝐹(𝑈−𝐸6
0)𝑅.𝑇 )
7 2𝐿𝑖𝑂𝐻_𝑠2
+ 𝐶𝑂2
→ 𝐿𝑖2𝐶𝑂3_𝑠2,
𝜐7
= 𝑘𝑓7. 휃𝑠2. 𝛾𝐿𝑖𝑂𝐻_𝑠2. 𝑎𝐶𝑂2. 𝑒
(−𝛼𝑛7𝐹(𝑈−𝐸7
0)𝑅.𝑇 )
−𝑘𝑏7. 휃𝑠2. 𝛾𝐿𝑖2𝐶𝑂3_𝑠2. 𝑒
(−(1−𝛼)𝑛7𝐹(𝑈−𝐸7
0)𝑅.𝑇 )
8 𝐿𝑖𝑂𝐻𝑙
→ 𝐿𝑖𝑂𝐻_𝑠1, 𝜐8 = 𝑘𝑎𝑑𝑠8. 휃𝑠1. 𝑎𝐿𝑖𝑂𝐻_𝑙 − 𝑘𝑑𝑒𝑠8. 휃𝑠1. 𝛾𝐿𝑖𝑂𝐻_𝑠1
9
) 𝐿𝑖𝑂𝐻𝑙
→ 𝐿𝑖𝑂𝐻_𝑠2. 𝜐9 = 𝑘𝑎𝑑𝑠9. 휃𝑠2. 𝑎𝐿𝑖𝑂𝐻_𝑙 − 𝑘𝑑𝑒𝑠9. 휃𝑠2. 𝛾𝐿𝑖𝑂𝐻_𝑠2
As two types of particles coexist (1 or 2), the kinetics take into account the surface and
composition of the particles depending of the class. Here, 휃𝑠1 stands for the surface developed by
the particle based on Li2O2 nucleation and 𝛾𝑗_𝑠1 corresponds to the molar fraction of component j
in this particle. Both were calculated for each particle class. Same way, for the particles based
on LiOH nucleation 휃𝑠2 and 𝛾𝑗_𝑠2were estimated.

199
Storing composition for all the particles existing within the same class is too heavy. For this
reason, in each class, an overall molar fraction is estimated for each particle class (1 or 2).
For simplicity, and due to the significant unknown parameters (all the kinetics constant
𝑘), it was assumed that for all electrochemical reactions, 𝛼 was the same and equal to 0.5.
Electrochemistry
Each local faradic current associated to one of the electrochemical reactions described
above (𝑗 = 1,2,3,4) is then estimated according to:
𝑖𝑗𝐹𝑎𝑟𝑎𝑑𝑖𝑐 = 𝑛𝑗𝐹𝜐𝑗. I.20.
The sum of all the local faradic current should then correspond to the overall current
applied to the system 𝐼𝑖𝑛𝑝𝑢𝑡.
Code chart flow

200

201
ANNEX: AIR FLUSHING TEST
Annex: Air Flushing
The following set-up was used to enrich the pure dry oxygen flow with water.
Annex Figure 3: Schematic of the set-up to let oxygen
flow bubble in water.
Finally, the cells voltage was oscillating a lot and the cells were unable to bear the charge
step most probably due to degradation mechanisms (cathode and electrolyte).
Annex Figure 4: GDLs flushed with wet oxygen then
cycled at ±50 µA after two hours of OCV.
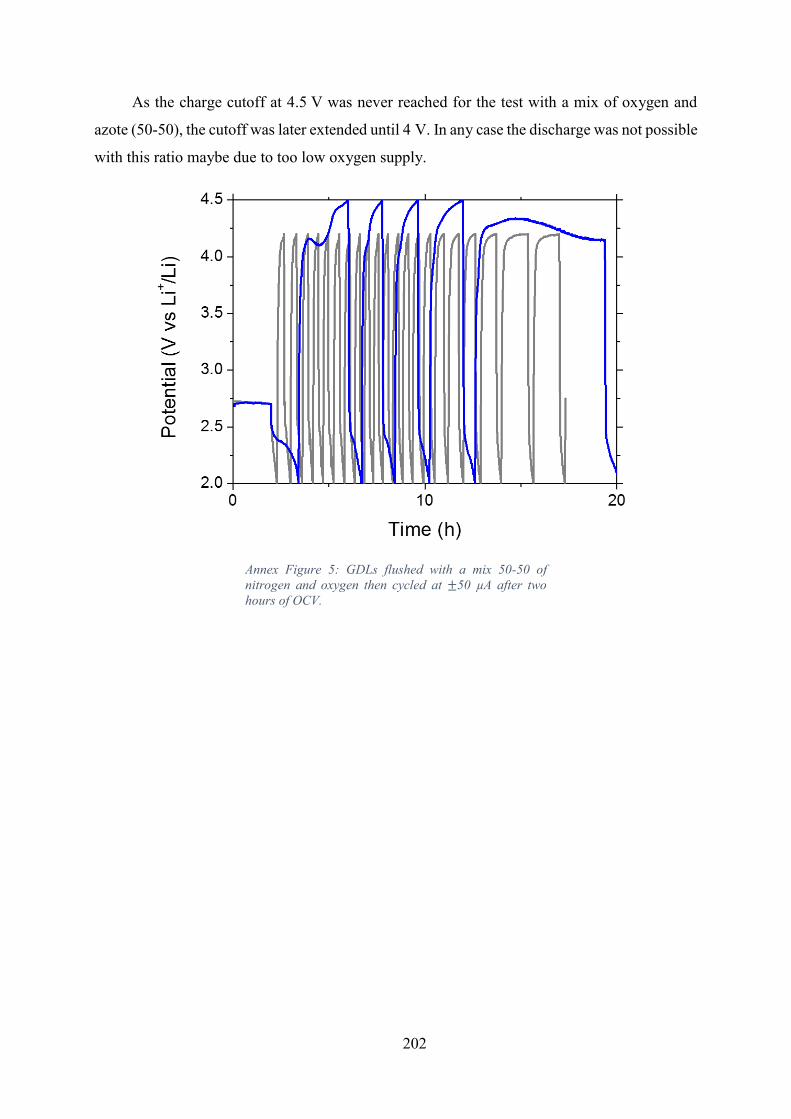
202
As the charge cutoff at 4.5 V was never reached for the test with a mix of oxygen and
azote (50-50), the cutoff was later extended until 4 V. In any case the discharge was not possible
with this ratio maybe due to too low oxygen supply.
Annex Figure 5: GDLs flushed with a mix 50-50 of
nitrogen and oxygen then cycled at ±50 µA after two
hours of OCV.

203
ANNEX: FRENCH DESCRIPTION
Annex: French Description
Un des plus grands défis que rencontrent les avionneurs de nos jours est le développement
d’appareils plus respectueux de l’environnement. Pour ce faire, il est essentiel de diminuer les
nuisances sonores et surtout la consommation de kérosène. Le passage au tout électrique
apparaît donc comme une solution de choix. Bien que sa faisabilité a déjà été démontrée avec
des prototypes pouvant embarquer jusqu’à quatre passagers, sa mise en place sur des avions
commerciaux est bien plus délicate. En effet, les avions tout électrique nécessitent de revoir
complètement le design de l’avion (suppression des turboréacteurs, modification du fuselage,
etc.). Pour cette raison, les avionneurs se focalisent sur le développement d’avions plus
électriques (A+E) dont la mise en application est envisagée à plus court terme. Dans un avion,
deux systèmes d’alimentation coexistent, le système de propulsion et le système secondaire qui
alimente les équipements de bord (ex : lumière, dégivrage, système électronique). Le principe
des avions A+E est de remplacer les sources d’énergies du système secondaire, habituellement
électriques et hydrauliques/pneumatiques, par une source uniquement électrique. Seulement
afin de fournir cette énergie électrique, des systèmes de stockage électrochimique présentant de
fortes densités d’énergie gravimétrique et volumétrique doivent être utilisés.
Actuellement, les batteries Li-ion sont les plus matures et envahissent d’ores et déjà le
marché des dispositifs portables. Leur utilisation se répand jusqu’à la production de voitures
tout électrique. Cependant, d’un point de vue de la densité d’énergie gravimétrique ou
volumétrique, les batteries Li-ion ont des performances inférieures à celles annoncées pour
certaines nouvelles technologies comme les batteries Li-souffre ou Li -air.
L’étude décrite ici a été dédiée à l’étude des batteries Li-air pour des applications à visée
aéronautique. Même si d’un point de vue théorique cette technologie est très prometteuse, de
nombreux verrous technologiques demeurent, limitant drastiquement les performances réelles
par rapport aux théoriques. Les phénomènes limitant rencontrés existent à tous les niveaux de
la batterie : la cathode, l’anode, l’électrolyte et l’approvisionnement en oxygène. Parmi ces
éléments, comme le principe de fonctionnement de ces batteries repose sur la production de
produit de décharge en surface de la cathode après diffusion de l’oxygène, la cathode a été
identifiée comme un élément clef pour améliorer les performances et a donc été dûment étudiée.
204
Cette étude s’est initialement focalisée sur le développement de cathodes poreuses
réalisées à partir de carbone, matériau conducteur, abordable et existant sous de nombreuses
formes. Afin de promouvoir les réactions de surface, l’utilisation de carbone très divisé a été
sélectionnée. Pour pouvoir améliorer la densité d’énergie, l’étude a été orientée vers le design
et la production d’électrodes épaisses. De cette façon, la plupart de la masse de la batterie est
attribuée à la cathode et non au collecteur de courant ou encore au boîtier. Cependant, utiliser
des électrodes épaisses induit une plus grande sensibilité du système face au problème de
diffusion de l’oxygène à travers la cathode. Outre la diffusion de l’oxygène, deux autres
phénomènes impactent les performances de la cathode : la passivation de la surface par la
formation d’un produit de décharge isolant et la fermeture de la porosité par la formation même
de ce produit, empêchant d’autant plus la diffusion des espèces.
Pour outrepasser ou tout du moins limiter l’occurrence de ces phénomènes, les électrodes
doivent être texturées. Dans cette étude, le développement d’électrodes bi-poreuses a été
proposé pour palier à ces problèmes. Le concept proposé a été de considérer des électrodes avec
un domaine mesoporeux correspondant au domaine carbone/liant et un domaine macroporeux
remplie d’électrolyte. Ce dernier domaine est ajouté sciemment afin de faciliter la diffusion de
l’oxygène à travers l’électrode.
Afin d’étudier théoriquement le bénéfice de la texturisation des électrodes, un modèle
continuum a été créé. Pour ce faire, le modèle crée prend en compte deux modèles de diffusion
1D (un pour chaque domaine de porosité) et un flux nommé « intraflux » permettant de traduire
la diffusion de l’oxygène existant entre ces deux domaines. Comme l’approche développée ici
repose sur une intrication de la modélisation et de l’expérience, afin de déterminer l’intérêt
d’une telle architecture et de permettre la réalisation pratique des textures simulées, le modèle
a été nourri de nombreuses valeurs expérimentales. Pour comprendre quel phénomène limitant
été impliqué dans la chute de capacité selon les cas simulés, les trois phénomènes prépondérants
à savoir la passivation de l’électrode, le remplissage des pores et les problèmes de diffusion de
l’oxygène ont été modélisés. De plus, il a été supposé que le mécanisme de formation du produit
de décharge correspondait à la formation d’une fine couche de produits de décharge. Grâce à la
modélisation, il a été alors montré que dans le cas d’électrodes à base de Ketjen Black le
phénomène majoritairement limitant était la diffusion de l’oxygène ce qui implique donc
d’autant plus la nécessité de texturer les électrodes pour la limiter. Le modèle a aussi souligné
qu’il n’est pas nécessaire d’ajouter plus 40 % de macroporosité pour améliorer la capacité de
décharge.
205
En parallèle, la réalisation pratique de ces électrodes a été démontrée grâce à l’utilisation
d’un procédé usuellement répandu pour les batteries Li-ion : le procédé Bellcore. Il permet la
mise en forme d’électrodes flexibles dont la porosité est créée grâce à l’extraction de l’agent
porogène, le DBP, par lavages successifs à l’éther. Habituellement réalisés à partir de graphite,
l’utilisation de carbone très divisé a nécessité de revoir les ratios utilisés dans la formulation
afin de créer des films cohésifs. Une fois le ratio carbone/liant déterminé, il a été conservé pour
pouvoir étudier l’impact du taux DBP sur la création de la porosité. L’objectif étant de créer
des électrodes très poreuses, une attention particulière a été apportée aux films contenant 40 à
80 m% de DBP. La porosité crée selon les formulations a alors été évaluée. Premièrement,
l’efficacité de l’extraction du DBP a été confirmée lorsque trois étapes successives de lavage
dans l’éther étaient appliquées (chacune durant 15 min). Cependant quelques inhomogénéités
de répartition des composés chimiques au sein du film ont été observées, et ce d’autant plus
pour les films avec des taux élevés de DBP. Une fois extraite les électrodes présentaient une
porosité à la fois macro et meso. De plus, surement du fait de la réorganisation du film lors de
l’étape d’extraction, une partie de la porosité demeure inaccessible. Contrairement à ce qui avait
été supposé initialement, des taux de DBP supérieurs à 60 m% ne sont pas nécessaires pour
obtenir des films très poreux et de surcroit homogènes. En revanche, un taux de DBP moyen
(40 m%) permet d’obtenir des électrodes très poreuses (50 v%) avec une importante surface
développée (50 m².gelectrode-1). Une fois libérées de l’agent poreux, les électrodes peuvent
aisément accueillir l’électrolyte qui remplit alors la porosité accessible. De surcroit, les
électrodes supportent des températures jusqu’à 80 °C (gamme requise pour des applications
aéronautiques). Pour finir, l’utilisation de telles électrodes comme cathode de batteries Li-air
semble tout à fait intéressant puisque 70 % de la capacité théorique ont été atteint avec les films
DBP60 et DBP80 déchargés à 50µA.
Les performances des électrodes flexibles bi-poreuses ont été comparées à celles
d’électrodes GDL (enchevêtrement de fibres de carbone) ayant une porosité globale comparable
(mais uniquement macro). Pourtant à même valeur de courant, seuls 5 % de la capacité
théorique ont été obtenus soulignant la nécessité de texturiser les électrodes. De plus,
l’importance de la percolation au sein de l’électrode et l’influence de la compression ont pu être
mis en avant. Les électrodes GDL bien que réversiblement déformées par rapport aux électrodes
flexibles, sont plus impactées par la compression imposée dans la Swagelok car leur réseau de
percolation électronique est moins bien étendu que celui des électrodes flexibles. Selon la
compression, le nombre de points de contact entre les fibres de carbone peut être modifié et la
206
percolation plus ou moins modifiée. Au contraire les électrodes flexibles créées avec du carbone
très divisé sont capables de maintenir leur réseau de percolation même après déformation. Dans
tous les cas, les légères variations de compression appliquées aux électrodes peuvent expliquer
une partie des problèmes de reproductibilité observés. Ces problèmes reposaient sur une
variation des capacités de décharge obtenues pourtant dans des conditions similaires. De plus,
les courbes de décharges présentaient des profils initiaux différents avec présence ou non d’un
rapide décrochage du potentiel (chute puis remontée brusques) associé au phénomène de
nucléation lié à la formation du peroxyde de lithium.
Afin de limiter la non-reproductibilité des expériences, une étude a été mise en place pour
contrôler au fur et à mesure tous les paramètres pouvant jouer un rôle comme le flux d’oxygène
appliqué avant la décharge ou encore le taux d’électrolyte précisément ajouté dans la cellule.
Aussi, il a été noté que le contrôle des paramètres influençant ou modifiant la nucléation
permettait de réduire les fluctuations de capacité, même si en parallèle une diminution des
performances pouvait aussi être observée. Par exemple, lorsque les traces d’eau présentes dans
l’électrolyte ont été retirées, une nette diminution de la capacité s’est dessinée bien que la
gamme de valeurs des capacités était moins étendue. La sensibilité des batteries Li-air face aux
traces d’eau était déjà connue cependant, son impact sur la reproductibilité des expériences
n’avait à notre connaissance pas encore était démontrée.
Un autre paramètre influençant fortement la décharge est la température puisqu’une
variation de deux degrés entraine des oscillations significatives du potentiel. Un contrôle de la
température a donc été mis en place et l’influence de la température a été observée en parallèle
avec celle du courant, en plus des mesures préalablement mises en place (GDL, contrôle volume
électrolyte, flux d’oxygène, électrolyte séché). Température et courant ont été étudiés
simultanément puisqu’ils influencent de manières opposées la cinétique de réaction du système.
Pour les deux courant étudiés, l’augmentation de la température a permis une diminution de la
variance des capacités et donc une meilleure reproductibilité.
Afin de savoir si la reproductibilité était due à une nucléation mieux contrôlée, les
particules formées à la surface des électrodes ont été analysées post-mortem par Microscopie
Electronique à Balayage (MEB). Diverses morphologies été déposées à la surface des
électrodes observées et, fait singulier, pour la plupart étaient bien loin des particules toroïdales
généralement décrites dans la littérature. De plus, dans les mêmes conditions de température et
courant, diverses morphologies recouvraient les électrodes. Fait encore plus marquant, sur la

207
même électrode et même parfois sur la même fibre de GDL, les particules formées pouvaient
varier. L’origine de la formation de particules si variées sur une seule fibre est complexe à
appréhender. Tout de même, la formation des particules semblait clairement dépendre de la
location précise sur la surface de l’électrode. La première hypothèse découlant d’une telle
observation est que la surface de l’électrode joue un rôle prépondérant dans les performances
des cellules, ce qui se comprend puisque la surface joue un rôle dans la nucléation (la barrière
énergétique associée à la nucléation dépend des interactions Li2O2/surface). Des tests réalisés
sur des GDLs prétraitées à 400 °C sous argon, et donc avec une surface modifiée et
supposément plus homogène, ont montrés une meilleure reproductibilité des capacités de
décharge. De plus, l’électrode analysée a montré la formation homogène de particules en
surface.
Au final, grâce à cette étude, l’extrême sensibilité des batteries Li-air face à la
température, la présence d’eau et l’état de surface a été soulignée. De même, les problèmes de
reproductibilité ont été en partie attribués à une combinaison des paramètres suivant :
reproductibilité de l’électrode, réseau de pores formé, compression de l’électrode, traces d’eau,
variation de la température, surface de l’électrode non homogène.
La sensibilité des batteries Li-air pose alors problème puisque l’application envisagée ici
est extrêmement demandeuse vis-à-vis des conditions de fonctionnement, notamment par
rapport à la température. De surcroit, pour l’instant on parle plus de batterie Li-oxygène que Li-
air, or un approvisionnement en air plutôt qu’en oxygène pure implique que d’autres gaz comme
de la vapeur d’eau soient en présence de la cellule. Quelques tests menaient avec de l’oxygène
humide ont abouti à des courbes de décharges instables (parfois pas de plateau clairement
dessiné). Lorsqu’un mélange 50-50 azote-oxygène était utilisé, la capacité de décharge fut
drastiquement diminuée probablement à cause du réactif en quantité réduite. Pour pouvoir
étudier les batteries Li-air cette fois un modèle de nucléation a commencé à être créé pour
appréhender et mettre en avant les divers mécanismes de contamination pouvant prendre place
lors de la décharge de la cellule. Ces derniers tests ainsi que le modèle sont brièvement présenté
en Annexe et soulignent la complexité de tels systèmes.
Ainsi, la priorité dans la course au développement des batteries Li-air est d’abord
d’améliorer leurs performances en laboratoire avec de l’oxygène pur comme source principale
avant de s’intéresser aux batteries utilisant l’oxygène de l’air. Par ailleurs, un électrolyte stable
face aux espèces oxygénés et aux changement de température ainsi que résistant à de hauts
208
potentiels manque toujours. Des efforts de recherche doivent donc être mis en place dans ce
sens. Une fois cet électrolyte défini les électrodes bi-poreuses développées ici pourront
permettre d’atteindre de meilleures performances. Cependant, leur application est plus probable
pour du stockage stationnaire car il permet aisément de contrôler les conditions de
fonctionnement et aussi d’utiliser de l’oxygène pur sans se soucier du poids et volumes du
système d’approvisionnement en gaz.
Pour conclure, la transposition des batteries Li-air au domaine aéronautique semble très
peu probable du fait de leur sensibilité vis-à-vis des conditions de fonctionnement, même si
l’on suppose le problème de stabilité de l’électrolyte résolu. Pour autant, étudier de tels système
permet de se questionner sur les processus électrochimiques et les fondamentaux des batteries.
De plus, ici le développement d’électrodes bi-poreuses a été permis et pourra être transposé à
d’autres applications par la suite, comme par exemple dans le domaine plus général des batteries
métal-air.

209
210
Toward lithium-air batteries for aircraft application:
a combined experimental/modeling study
Résumé :
Le développement des avions plus électriques nécessite des systèmes de stockage
électrochimique à fortes densité d’énergie, à la fois gravimétrique et volumétrique. Parmi les
diverses solutions envisagées, les batteries lithium-air air sont apparues comme une solution
envisageable du fait de leur densité d’énergie théorique élevée. Cependant, les performances
obtenues en pratique sont bien éloignées des théoriques à cause des nombreux verrous
technologiques dont souffrent ces batteries.
Afin d’augmenter les performances des batteries une grande partie des travaux a eu pour
objectif de créer des électrodes texturées prenant en compte les phénomènes limitant tels que
la diffusion de l’oxygène, le remplissage des pores ou encore la passivation de l’électrode
afin d’améliorer la capacité de décharge. D’abord étudiées grâce à la modélisation, le
développement en laboratoire a ensuite permit de créer des électrodes bi-poreuses pouvant
atteindre jusqu’à 70 % de la capacité théorique. Par la suite, en vue d’un manque de
reproductibilité certain, l’étude des paramètres pouvant induire une variation des capacités
de décharge a été mise en place. Il est alors apparu que les batteries lithium-air sont
extrêmement sensibles aux paramètres modifiant sa cinétique et l’étape de nucléation : la
température, la densité de courant et l’état de surface de l’électrode.
Mots-clefs : batteries Li-air, électrodes poreuses, reproductibilité, modélisation,
aéronautique
Abstract:
To develop more electrical aircrafts, energy storage systems with high gravimetric and
volumetric energy densities are required. Among the potential solutions, lithium-air batteries
appeared as a promising choice due to their high theoretical energy densities. However, such
systems suffer from many limitations which induces low practical energy densities.
To enhance the batteries performances, a study on the electrode texture was implemented
taking into account the limiting phenomena of passivation, pore clogging and oxygen
diffusion. First studied by the help of modeling, development of these electrodes was later
achieved at lab scale. The bi-porous electrodes obtained could reached the 70 % of the
expected capacity. Later, due to the reproducibility issues observed a second study was
settled to limit variation of the discharge capacities. It was noticed that lithium-air batteries
were extremely sensitive to the parameters impacting kinetics and more especially the
nucleation step. So temperature, current density and electrode surface should be perfectly
mastered.
Keywords: Li-air batteries, porous electrodes, reproducibility, modeling, aeronautic sector