Toward a Materials Genome Approach for Ionic Liquids: Synthesis Guided by Ab Initio Property Maps
21
Subscriber access provided by CARNEGIE MELLON UNIV The Journal of Physical Chemistry B is published by the American Chemical Society. 1155 Sixteenth Street N.W., Washington, DC 20036 Published by American Chemical Society. Copyright © American Chemical Society. However, no copyright claim is made to original U.S. Government works, or works produced by employees of any Commonwealth realm Crown government in the course of their duties. Article Towards a Materials Genome Approach for Ionic Liquids: Synthesis Guided by Ab Initio Property Maps Fangyong Yan, Michael Lartey, Kuldeep Harshad Jariwala, Sage R Bowser, Krishnan Damodaran, Erik Albenze, David Richard Luebke, Hunaid B. Nulwala, Berend Smit, and Maciej Haranczyk J. Phys. Chem. B, Just Accepted Manuscript • DOI: 10.1021/jp506972w • Publication Date (Web): 30 Oct 2014 Downloaded from http://pubs.acs.org on November 1, 2014 Just Accepted “Just Accepted” manuscripts have been peer-reviewed and accepted for publication. They are posted online prior to technical editing, formatting for publication and author proofing. The American Chemical Society provides “Just Accepted” as a free service to the research community to expedite the dissemination of scientific material as soon as possible after acceptance. “Just Accepted” manuscripts appear in full in PDF format accompanied by an HTML abstract. “Just Accepted” manuscripts have been fully peer reviewed, but should not be considered the official version of record. They are accessible to all readers and citable by the Digital Object Identifier (DOI®). “Just Accepted” is an optional service offered to authors. Therefore, the “Just Accepted” Web site may not include all articles that will be published in the journal. After a manuscript is technically edited and formatted, it will be removed from the “Just Accepted” Web site and published as an ASAP article. Note that technical editing may introduce minor changes to the manuscript text and/or graphics which could affect content, and all legal disclaimers and ethical guidelines that apply to the journal pertain. ACS cannot be held responsible for errors or consequences arising from the use of information contained in these “Just Accepted” manuscripts.
-
Upload
independent -
Category
Documents
-
view
1 -
download
0
Transcript of Toward a Materials Genome Approach for Ionic Liquids: Synthesis Guided by Ab Initio Property Maps

Subscriber access provided by CARNEGIE MELLON UNIV
The Journal of Physical Chemistry B is published by the American Chemical Society.1155 Sixteenth Street N.W., Washington, DC 20036Published by American Chemical Society. Copyright © American Chemical Society.However, no copyright claim is made to original U.S. Government works, or worksproduced by employees of any Commonwealth realm Crown government in the courseof their duties.
Article
Towards a Materials Genome Approach for IonicLiquids: Synthesis Guided by Ab Initio Property Maps
Fangyong Yan, Michael Lartey, Kuldeep Harshad Jariwala, Sage R Bowser, Krishnan Damodaran,Erik Albenze, David Richard Luebke, Hunaid B. Nulwala, Berend Smit, and Maciej HaranczykJ. Phys. Chem. B, Just Accepted Manuscript • DOI: 10.1021/jp506972w • Publication Date (Web): 30 Oct 2014
Downloaded from http://pubs.acs.org on November 1, 2014
Just Accepted
“Just Accepted” manuscripts have been peer-reviewed and accepted for publication. They are postedonline prior to technical editing, formatting for publication and author proofing. The American ChemicalSociety provides “Just Accepted” as a free service to the research community to expedite thedissemination of scientific material as soon as possible after acceptance. “Just Accepted” manuscriptsappear in full in PDF format accompanied by an HTML abstract. “Just Accepted” manuscripts have beenfully peer reviewed, but should not be considered the official version of record. They are accessible to allreaders and citable by the Digital Object Identifier (DOI®). “Just Accepted” is an optional service offeredto authors. Therefore, the “Just Accepted” Web site may not include all articles that will be publishedin the journal. After a manuscript is technically edited and formatted, it will be removed from the “JustAccepted” Web site and published as an ASAP article. Note that technical editing may introduce minorchanges to the manuscript text and/or graphics which could affect content, and all legal disclaimersand ethical guidelines that apply to the journal pertain. ACS cannot be held responsible for errorsor consequences arising from the use of information contained in these “Just Accepted” manuscripts.

1
Towards a Materials Genome Approach for Ionic Liquids:
Synthesis Guided by Ab Initio Property Maps
Fangyong Yan,a Michael Lartey,b Kuldeep Jariwala,a Sage Bowser,c Krishnan Damodaran,c Erik Albenze,b,d David R. Luebke,b* Hunaid B. Nulwala,b,e* Berend Smita,f* and Maciej Haranczyka*
a Lawrence Berkeley National Laboratory, Berkeley, CA 94720, USA. b National Energy Technology Laboratory, P.O. Box 10940, Pittsburgh, PA 15236, USA. c Department of Chemistry, University of Pittsburgh, 219 Parkman Ave, Pittsburgh, PA 15260, USA d URS Corporation, P.O. Box 618, South Park, USA. e Department of Chemistry, Carnegie Mellon University, Pittsburgh, PA, USA. f Department of Chemical and Biomolecular Engineering, University of California, Berkeley, CA 94720, USA.
*Corresponding authors’ emails: [email protected]; [email protected]; [email protected]; [email protected]
ABSTRACT: Materials Genome Approach (MGA) aims to accelerate development of new materials by incorporating computational and data-driven approaches to reduce the cost of identification of optimal structures for a given application. Here, we use the MGA to guide the synthesis of triazolium-based Ionic Liquids (ILs). Our approach involves an IL property-mapping tool, which merges combinatorial structure enumeration, descriptor-based structure representation and sampling, and property-prediction using molecular simulations. The simulated properties such as density, diffusivity and gas solubility obtained for a selected set of representative ILs were used to build neural network models and map properties for all enumerated species. Herein, a family of ILs based on ca. 200,000 triazolium-based cations paired with bis(trifluoromethanesulfonyl)amide anion was investigated using our MGA. Fourteen representative ILs spreading the entire range of predicted properties were subsequently synthesized and then characterized confirming the predicted density, diffusivity, and CO2 Henry’s Law coefficient. Moreover, the property (CO2, CH4 and N2 solubility) trends associated with exchange of the bis(trifluoromethanesulfonyl)amide anion with one of 32 other anions were explored and quantified.
KEYWORDS: Ionic liquids, Structure property relationships, Gas separation, Chemical space analysis
Page 1 of 20
ACS Paragon Plus Environment
The Journal of Physical Chemistry
123456789101112131415161718192021222324252627282930313233343536373839404142434445464748495051525354555657585960

2
1. INTRODUCTION
Ionic liquids (ILs) are fascinating materials with tunable solubility, thermal, and conductive properties. This tunability has led to their utilization in many industrial applications1–3 such as solvents4–6 and electrolytes.7,8 They have also been investigated in the context of gas separations, in particular CO2 capture.5,9–11 In principle, tuning of ILs properties for a given application is possible by modification and/or exchange of both the cation and anion. The number of possible ILs is estimated at over 1018; however, the number of IL that could be constructed taking into account only ions published-to-date is about 150000 while only about 1500 are commercially available.12,13 In practice, however, identification of the optimal IL with a specific set of properties for a given application is a major challenge 14–16 due to high costs of material synthesis and characterization to investigate many candidate structures during the design process. The same challenge is shared across many other material types and applications, e.g., structural, electronic, or battery materials.17 In fact, traditional materials development approaches relying on trial-and-error and/or systematic (brute-force) searches to identify optimal designs can take decades to introduce new materials into industrial applications.18 Shortening of this material development process and lowering its cost is the aim of the recent Materials Genome Initiative.19 The latter urges for development of new computational and data-driven methodologies that would allow by replacing traditional experiments with virtual design and testing.
Significant speed-up in materials development can be achieved by performing virtual experiments using molecular simulations. Indeed, classical molecular simulation employing ab initio derived force-fields can accurately predict IL properties such as density, ion conductivity, melting point, gas solubility, and others20–25 for yet-to-be-synthetized materials. However, the number of ILs that can be computationally characterized is limited. In practice, the available supercomputer resources typically allow characterization of about 100 ILs. The high computational cost of such studies is dictated by extensive sampling of configurations of molecules composing the liquid phase. An alternative approach is based either group contribution methods26–29 or on
quantitative structure-property relationships (QSPR).16,30–41 In the latter case, statistical models are constructed correlating numerical structure representations with experimentally obtained properties. Although fast and powerful in concept, these approaches depend on a sufficient number of reliable experimental data points. If the data are sparse and/or have heterogeneous distribution, the resulting QSPR models will suffer limited applicability, i.e. predictions may extrapolate beyond the training set resulting in low quality of predictions.
Our Materials Genome Approach goes beyond the limitations of the current techniques by introducing ab initio property maps for ionic liquids. This effectively combines QSPR and molecular simulations to screen large databases of materials and aid selection of structures that undergo experimental investigation. In our approach, we first enumerate structures within the chemical space of the considered ionic liquid family, and then create a map of this space using a structure similarity measure. The second step involves molecular simulations to generate accurate predicted data for a set of ionic liquids that optimally span this chemical space, and hence become the desired training set for a QSPR model. As some of the training-set structures lie on the boundary of the chemical space being considered, the following property predictions using the developed QSPR model are interpolations, and as such can reliably estimate the properties of the to-be-synthesized materials.
Our MGA allows identification of property ranges available in the enumerated set of ILs as well as identification of structures with the desired properties. To illustrate this approach, we have chosen a family of ILs based on a triazolium-based cation and bis(trifluoromethanesulfonyl)amide (Tf2N
-
)-based anion (Fig. 1),
Figure 1. Triazolium cation and Tf2N- anion.
Page 2 of 20
ACS Paragon Plus Environment
The Journal of Physical Chemistry
123456789101112131415161718192021222324252627282930313233343536373839404142434445464748495051525354555657585960
3
and focused on properties relevant to CO2 separations. Triazolium-based cations were chosen because synthetic routes are available which result in regio-specific structures allowing easy validation. Also, triazolium-based ionic liquids represent a newer class of ionic liquids and add new insight on materials development for this class of materials.42 A family of ca. 200,000 ILs was investigated in terms of properties such as density, ion conductivity and gas solubility. A set of fourteen representative ILs covering the whole range of available properties were synthetized and characterized to provide a confirmation of our predictions and a validation of our approach. Furthermore, we investigated and quantified the effects of exchange of the Tf2N
- anion with one of 32 alternatives on the IL properties relevant for carbon capture.
2. METHODS
2.1 Chemical space exploration and sampling
An important consideration is to determine the database size and the most relevant properties which can efficiently sample a large chemical space. The first step is to construct a library of all feasible structures within certain confines; subsequently we assign a set of descriptors to each IL, which allows us to quantify the similarity of the entries in our library. The most structurally diverse ILs are then identified to obtain an optimal sampling of the chemical search space.
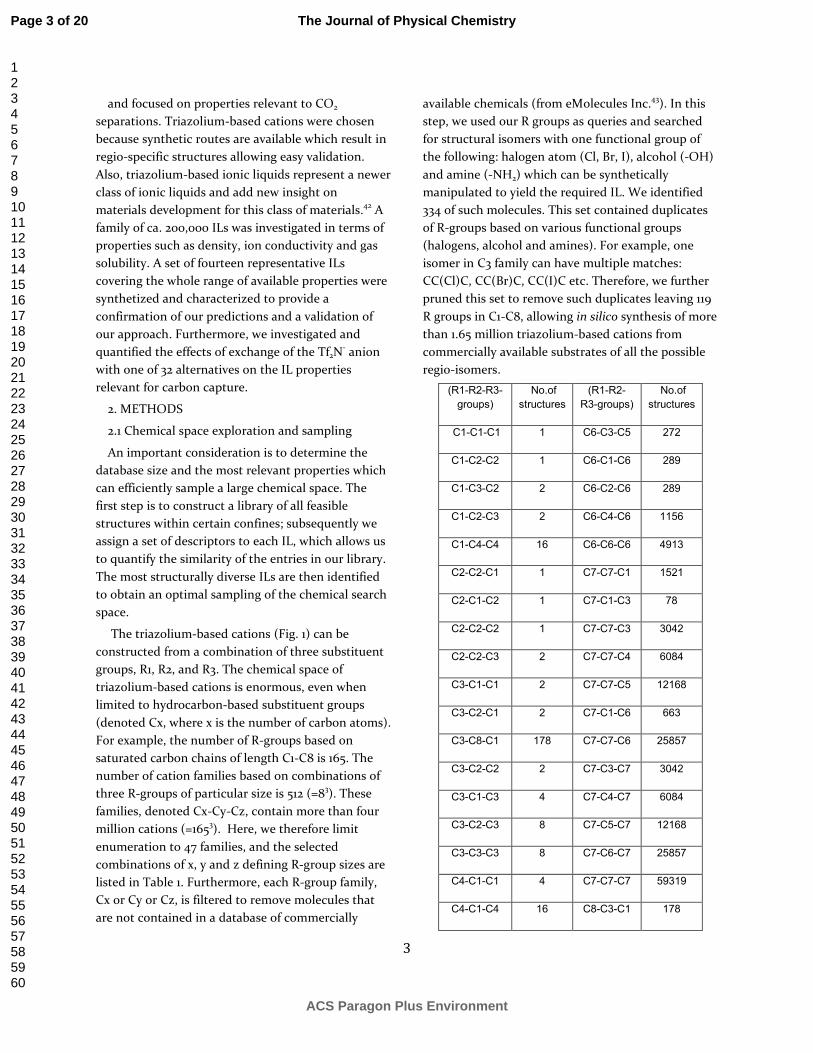
The triazolium-based cations (Fig. 1) can be constructed from a combination of three substituent groups, R1, R2, and R3. The chemical space of triazolium-based cations is enormous, even when limited to hydrocarbon-based substituent groups (denoted Cx, where x is the number of carbon atoms). For example, the number of R-groups based on saturated carbon chains of length C1-C8 is 165. The number of cation families based on combinations of three R-groups of particular size is 512 (=83). These families, denoted Cx-Cy-Cz, contain more than four million cations (=1653). Here, we therefore limit enumeration to 47 families, and the selected combinations of x, y and z defining R-group sizes are listed in Table 1. Furthermore, each R-group family, Cx or Cy or Cz, is filtered to remove molecules that are not contained in a database of commercially
available chemicals (from eMolecules Inc.43). In this step, we used our R groups as queries and searched for structural isomers with one functional group of the following: halogen atom (Cl, Br, I), alcohol (-OH) and amine (-NH2) which can be synthetically manipulated to yield the required IL. We identified 334 of such molecules. This set contained duplicates of R-groups based on various functional groups (halogens, alcohol and amines). For example, one isomer in C3 family can have multiple matches: CC(Cl)C, CC(Br)C, CC(I)C etc. Therefore, we further pruned this set to remove such duplicates leaving 119 R groups in C1-C8, allowing in silico synthesis of more than 1.65 million triazolium-based cations from commercially available substrates of all the possible regio-isomers.
(R1-R2-R3-
groups)
No.of
structures
(R1-R2-
R3-groups)
No.of
structures
C1-C1-C1 1 C6-C3-C5 272
C1-C2-C2 1 C6-C1-C6 289
C1-C3-C2 2 C6-C2-C6 289
C1-C2-C3 2 C6-C4-C6 1156
C1-C4-C4 16 C6-C6-C6 4913
C2-C2-C1 1 C7-C7-C1 1521
C2-C1-C2 1 C7-C1-C3 78
C2-C2-C2 1 C7-C7-C3 3042
C2-C2-C3 2 C7-C7-C4 6084
C3-C1-C1 2 C7-C7-C5 12168
C3-C2-C1 2 C7-C1-C6 663
C3-C8-C1 178 C7-C7-C6 25857
C3-C2-C2 2 C7-C3-C7 3042
C3-C1-C3 4 C7-C4-C7 6084
C3-C2-C3 8 C7-C5-C7 12168
C3-C3-C3 8 C7-C6-C7 25857
C4-C1-C1 4 C7-C7-C7 59319
C4-C1-C4 16 C8-C3-C1 178
Page 3 of 20
ACS Paragon Plus Environment
The Journal of Physical Chemistry
123456789101112131415161718192021222324252627282930313233343536373839404142434445464748495051525354555657585960

4
C4-C1-C4 16 C8-C8-C1 7921
C4-C4-C4 64 C8-C1-C3 186
C5-C5-C1 64 C8-C1-C8 8649
C5-C1-C5 64 C8-C4-C8 34596
C5-C5-C5 512 C8-C6-C8 147033
C6-C1-C3 34 Total 362370
Table 1. The considered combinations of R-groups, and the corresponding number of cations within each Cx-Cy-Cz group.
We used a combinatorial approach to enumerate structures for the triazolium-cations within the groups outlined in Table 1. These groups represent size-diverse subset of all possible groups. The enumeration involved ChemAxon’s Markush enumeration tool and resulted in 362,370 structures.44,45 Other steps during the library generation involved KNIME workflow engine46 and CDK tools.47 The cation structures were paired with Tf2N
- anions to form the corresponding ILs. For each generated cation, the lowest-energy conformation was identified in the gas phase using UFF force field implemented in the ChemAxon’s conformer tool, and numerical descriptors were calculated for the obtained conformation. As the chemistry of the set of cations is not diverse (all involve hydrocarbon side groups), the differences between the investigated structures can be efficiently captured by geometrical descriptors. We investigated the possibility of characterization of shape and geometry of the cations using seven descriptors: 1) Minimal projection area, 2) Maximal projection area, 3) Minimal projection radius, 4) Maximal projection radius, 5) Length perpendicular to the min area, 6) Length perpendicular to the max area, 7) van der Waals volume. From all investigated descriptors calculated for the lowest energy conformers, only maximum projection area, maximum projection radius, and Van der Waal’s volume were found to correlate with the corresponding descriptors obtained for the corresponding cations in the simulation of the liquid phase at temperatures of 296K and 500K. To further simplify analysis and visualization of the set of structures, we investigated correlations between the
three selected descriptors using principal component analysis. We found that only two principal components are required to explain 94% of variation. PC1 has loadings of 0.39, 0.33 and 0.28 for maximal projection area, maximal projection radius and Van der Waals volume respectively. PC2 has loadings of 0.03, 0.43 and 0.54 respectively whereas PC3 0.44, 0.32 and 0.24, respectively. The resulting PC1 and PC2 components were used as structural descriptors. They also allow projecting the database of structures into 2-dimentional map of the chemical space of triazolium-based cations (Fig. 2 and S-1). The map is not uniformly distributed as structures with more carbon atoms allow for more isomers with little variation to the overall molecular shape (e.g. methyl group moved by one carbon position of a side chain) leading to larger and denser clouds of points in the map.
Having each of the 362,370 cation structures represented by molecular descriptors and projected onto the 2D map, we selected a diverse set of structures representing all regions of the map. These structures are denoted D1-D25, and their positions are highlighted in Fig. S-1. The analysis of the diverse set as well as other structures from the map showed that small cations are located in the left part of the map, while larger cations are on the right side of the map. Moreover, branching of the cations increases with the increasing value of PC2 (the upper part of the map). As our previous studies indicated that ionic liquids based on branched cations have very high viscosity, reducing their practical applicability, we decided to further prune our database. We focused our investigation on ionic liquids positioned on the map below the line connecting D1 and D20, therefore neglecting D4, D9, D13, D16, D19 (Fig. S-1). The resulting set contained 183,090 structures (about 10% of all possible cations), out of which 20 structures formed our diverse set (Fig. 2). This diverse set will be characterized using molecular simulations, results of which will be used to construct and test structure-property relation models. The set was further divided into two sets: training and validation sets discussed in section 2.2. The first set contained all but D17, D18, D22 and D24, which formed the validation set. Moreover, we selected an additional set of random 14 structures, denoted E1-E14, which will be used for the
Page 4 of 20
ACS Paragon Plus Environment
The Journal of Physical Chemistry
123456789101112131415161718192021222324252627282930313233343536373839404142434445464748495051525354555657585960
5
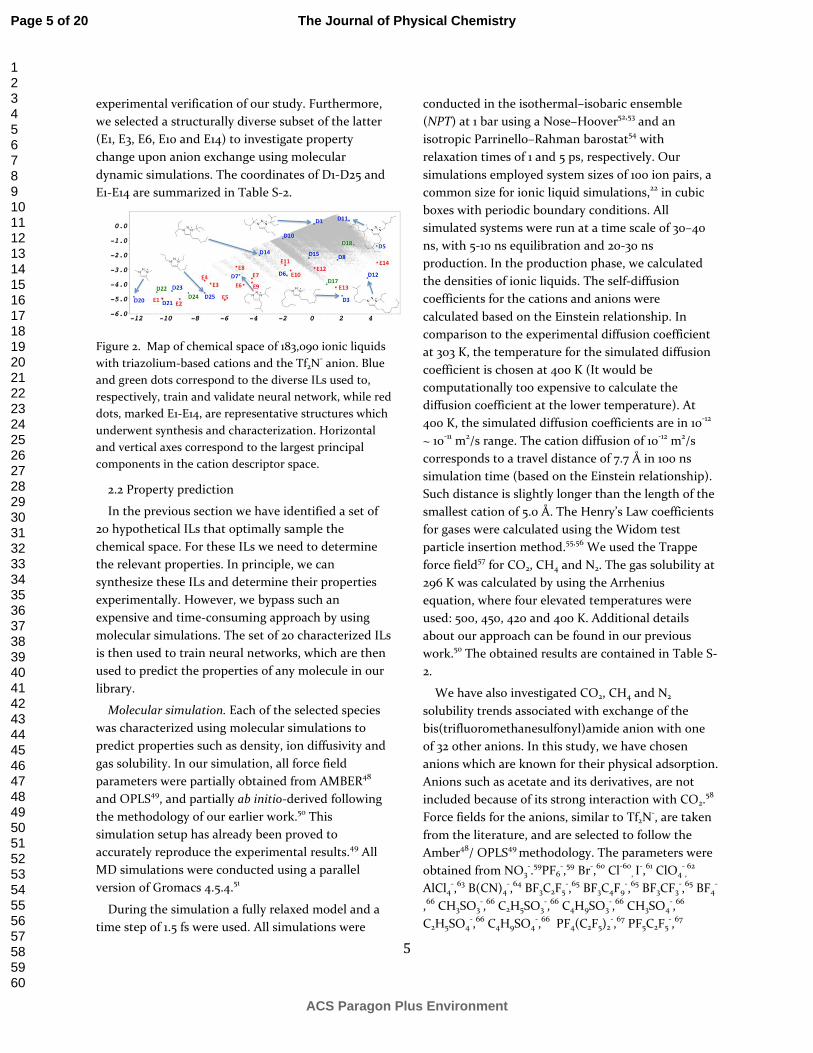
experimental verification of our study. Furthermore, we selected a structurally diverse subset of the latter (E1, E3, E6, E10 and E14) to investigate property change upon anion exchange using molecular dynamic simulations. The coordinates of D1-D25 and E1-E14 are summarized in Table S-2.
Figure 2. Map of chemical space of 183,090 ionic liquids with triazolium-based cations and the Tf2N
- anion. Blue and green dots correspond to the diverse ILs used to, respectively, train and validate neural network, while red dots, marked E1-E14, are representative structures which underwent synthesis and characterization. Horizontal and vertical axes correspond to the largest principal components in the cation descriptor space.
2.2 Property prediction
In the previous section we have identified a set of 20 hypothetical ILs that optimally sample the chemical space. For these ILs we need to determine the relevant properties. In principle, we can synthesize these ILs and determine their properties experimentally. However, we bypass such an expensive and time-consuming approach by using molecular simulations. The set of 20 characterized ILs is then used to train neural networks, which are then used to predict the properties of any molecule in our library.
Molecular simulation. Each of the selected species was characterized using molecular simulations to predict properties such as density, ion diffusivity and gas solubility. In our simulation, all force field parameters were partially obtained from AMBER48 and OPLS49, and partially ab initio-derived following the methodology of our earlier work.50 This simulation setup has already been proved to accurately reproduce the experimental results.49 All MD simulations were conducted using a parallel version of Gromacs 4.5.4.51
During the simulation a fully relaxed model and a time step of 1.5 fs were used. All simulations were
conducted in the isothermal–isobaric ensemble (NPT) at 1 bar using a Nose–Hoover52,53 and an isotropic Parrinello–Rahman barostat54 with relaxation times of 1 and 5 ps, respectively. Our simulations employed system sizes of 100 ion pairs, a common size for ionic liquid simulations,22 in cubic boxes with periodic boundary conditions. All simulated systems were run at a time scale of 30–40 ns, with 5-10 ns equilibration and 20-30 ns production. In the production phase, we calculated the densities of ionic liquids. The self-diffusion coefficients for the cations and anions were calculated based on the Einstein relationship. In comparison to the experimental diffusion coefficient at 303 K, the temperature for the simulated diffusion coefficient is chosen at 400 K (It would be computationally too expensive to calculate the diffusion coefficient at the lower temperature). At 400 K, the simulated diffusion coefficients are in 10-12 ~ 10-11 m2/s range. The cation diffusion of 10-12 m2/s corresponds to a travel distance of 7.7 Å in 100 ns simulation time (based on the Einstein relationship). Such distance is slightly longer than the length of the smallest cation of 5.0 Å. The Henry’s Law coefficients for gases were calculated using the Widom test particle insertion method.55,56 We used the Trappe force field57 for CO2, CH4 and N2. The gas solubility at 296 K was calculated by using the Arrhenius equation, where four elevated temperatures were used: 500, 450, 420 and 400 K. Additional details about our approach can be found in our previous work.50 The obtained results are contained in Table S-2.
We have also investigated CO2, CH4 and N2 solubility trends associated with exchange of the bis(trifluoromethanesulfonyl)amide anion with one of 32 other anions. In this study, we have chosen anions which are known for their physical adsorption. Anions such as acetate and its derivatives, are not included because of its strong interaction with CO2.
58 Force fields for the anions, similar to Tf2N
-, are taken from the literature, and are selected to follow the Amber48/ OPLS49 methodology. The parameters were obtained from NO3
-.59PF6-,59 Br-,60 Cl-60
, I-,61 ClO4
-,62
AlCl4-,63 B(CN)4
-,64 BF3C2F5-,65 BF3C4F9
-,65 BF3CF3-,65 BF4
-
,66 CH3SO3-,66 C2H5SO3
-,66 C4H9SO3-,66 CH3SO4
-,66 C2H5SO4
-,66 C4H9SO4-,66 PF4(C2F5)2
-,67 PF5C2F5-,67
Page 5 of 20
ACS Paragon Plus Environment
The Journal of Physical Chemistry
123456789101112131415161718192021222324252627282930313233343536373839404142434445464748495051525354555657585960

6
PF3(C2F5)3-, FEP-,67 N(SO2C2F5)2
-,67 N(SO2C3F7)2-,67
N(SO2C4F9)2-,67 N(SO2F)2
-,67 SCN-.68 Since no force field is available for CF3SO3,
C2F5SO3-, CF3SO4
-, C2F5SO4
-,C4F9SO4-, we calculated the partial charges
using CHelpG method69 at the level of MP2/cc-pVTZ(-f)//RHF/6-31G(d) for obtaining the electron densities, and the charges are shown in Fig. S-2. For other force field terms, the bond and bond angle, dihedral angles are taken from reference 66, except for the terms involving fluorine atom, which were taken from OPLS force field. N3
- is taken from reference 70, where charges are re-calculated using CHelpG method69 at the level of MP2/cc-pVTZ(-f)//RHF/6-31G(d) for obtaining the electron densities, the charges are shown in Fig. S-2, and Van der Waals parameters are taken from reference.61 All charge calculations used Gaussian 09 package1.71
Molecular dynamics simulations for ILs based on these 32 anions were performed in the isothermal-isobaric ensemble at 500 K and 1 bar, and as outlined before, were only limited to ILs based on one of five representative cations (E1, E3, E6, E10 and E14). All calculated properties, such as ionic liquid densities, self-diffusion coefficients of cations (D+), and CO2, CH4, N2 solubility, are shown in Table S-3.
Statistical models. Using the simulated properties of the selected ILs based on Tf2N
- anion, neural network (NN) models72 were built that correlate the position of an IL on the map with its predicted properties. The set of 20 ILs was divided into a training set (16) and a validation set (4). For each property (density, diffusion coefficient of cation, Henry coefficients), we built statistical models using the training set, and validated prediction errors of those models using the validation set.
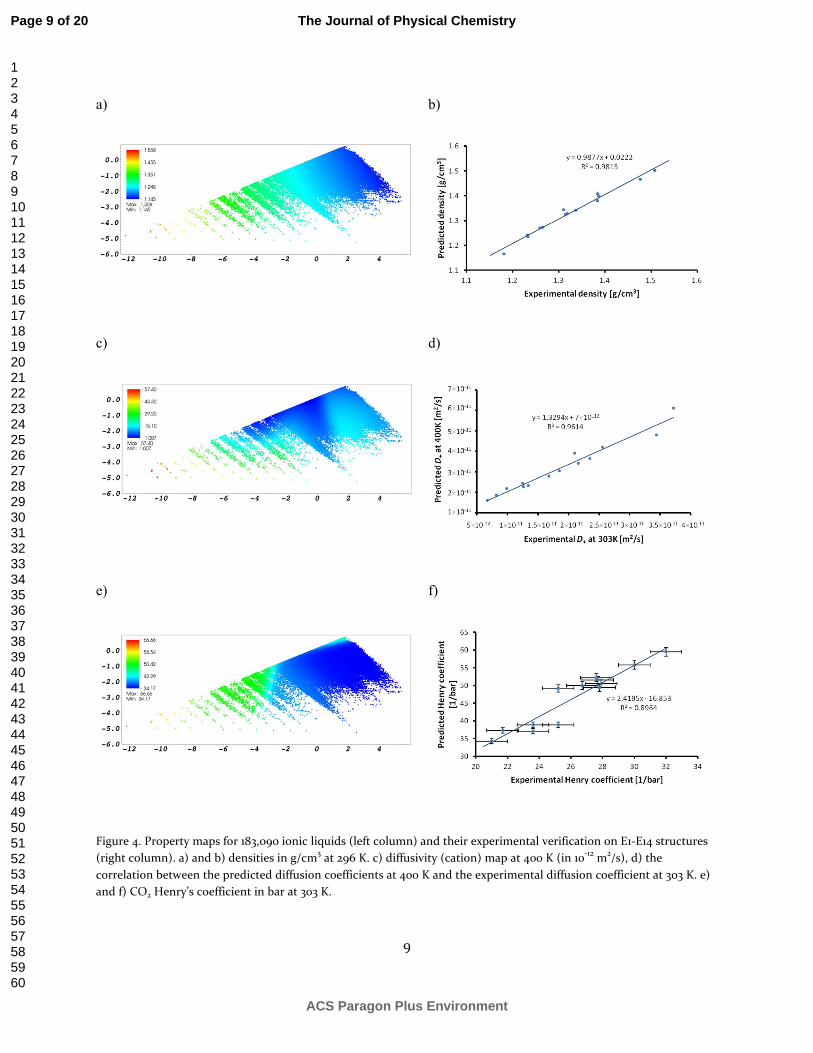
Our statistical models were based on 3-layered neutral networks (NN) and were executed using the AMORE library73 of the R statistical package.74 We generated a number of NN-models with different number of neurons in the middle layer (4-20) as well as different functions (sigmoid and tansig as defined in the AMORE R library). The selected models and their errors on validation set are summarized in Table 2. Then, we selected the model with the smallest maximum prediction error for the validation set, and used it to predict properties of all investigated (183,090) ionic liquids. Fig. 4a, c, e present the
predicted densities, cation diffusivities (D+’s) and CO2 Henry’s Law coefficients, KH(CO2) with the possible ranges indicated on the corresponding scale bars.
Property Number
of
neurons
Functio
n
Av.
Error
[%]
Max.
error
[%]
Density 14 sigmoid 0.58 0.83
CO2 Henry
coefficient
6 sigmoid 1.63 2.18
N2 Henry
coefficient
14 sigmoid 6.73 9.23
CH4 Henry
coefficient
8 tansig 3.28 4.38
Cation
diffusion
coefficient.
20 tansig 11.92 26.20
Table 2. Details of the selected neural network models.
2.3 Synthesis details
Chemical structures of the synthesized compounds are illustrated in Fig. 5. Synthesis details are provided for the compounds used in this study. Characterization details for chemical structural and physical characterization such as FTIR, NMR, Mass Spec. gas solubility, density, and self-diffusion details can be found in SI. All ionic liquids were dried under high vacuum and at elevated temperature (60-70°C) and stored in a desicator prior to any physical measurement to minimize the influence of water.
Materials: Sodium azide, copper on charcoal, (Cu/C, 3 %w/w Cu), copper (II) sulfate pentahydrate (CuSO4.5H2O), triethylamine, 3-methyl-1-hexanol and iodoalkanes were purchased from Sigma Aldrich. Bromoalkanes, acetonitrile, N, N-dimethylformamide (DMF), dichloromethane (DCM), hexanes, ethyl acetate, and tetrahydrofuran (THF) were purchased from Fisher Scientific. Alkynes were purchased from GFS Chemicals and lithium bis(trifluoromethylsulfonyl)imide, LiTf2N, was purchased from TCI, America. Decolorizing activated charcoal (4-12 mesh) was purchased from Acros. All
Page 6 of 20
ACS Paragon Plus Environment
The Journal of Physical Chemistry
123456789101112131415161718192021222324252627282930313233343536373839404142434445464748495051525354555657585960

7
chemicals were used as received unless otherwise specified.
General Procedure for the synthesis of alkyl
azides from alkyl bromides: Sodium azide (0.3 mol) was added to a solution of the appropriate alkyl bromide (0.1 mol) in 100 mL DMF. The mixture was stirred overnight at 65 °C. Afterwards, distilled water (300 ml x 3) was added to dissolve excess sodium azide and DMF. The product, which is insoluble in water, was separated from the lower aqueous layer and further washed with water and dried over sodium sulfate. 1-Azidopropane and 1-azidobutane were synthesized according to reported procedure.75 Briefly, sodium azide (0.3 mol, 19.8 g) was dissolved in 100 mL H2O-THF solution (95:5 v/v) and 1-bromopropane or 1-bromobutane was added. The mixture was stirred at 65 °C overnight. The water-insoluble 1-azidoalkane was separated from the mixture. The product was further washed with water to remove unreacted sodium azide and dried over Na2SO4. The azide products were characterized by FTIR. All azides were used immediately (further details can be found in SI).
General procedure for two-step synthesis of
1,4-dialkyl-1H-1,2,3-triazoles (Figure 3a):
Precursors for the ILs E5 (Tz4n14n), E7 (Tz4n4n4n), E10 (Tz5n5n5n), E12 (Tz7n7n3n) and E14 (Tz7n7n7n) were synthesized via the two-step approach as reported in the literature.50,76 In a typical example, a 250 mL round bottom flask equipped with a magnetic stir bar was charged with the appropriate 1-azidoalkane (58 mmol), triethylamine (58 mmol, 5.87 g), 1,4-dioxane (50 mL), appropriate alkyne (58 mmol) and Cu/C (2.4 g, 1.2 mmol Cu). The mixture was tightly sealed and stirred at 70 °C overnight. The product was filtered and Cu/C was washed with ethyl acetate (300 mL) The filtrate was concentrated under low vacuo and further purified by flash column chromatography using hexane:ethyl acetate (1:1 v/v) and concentrated under vacuum.
General procedure for two step synthesis of 1-
alkyl-4-methyl-1,2,3-triazoles (Figure 3a): The precursor triazoles for the ILs E1 (Tz3n11), E2 (Tz4n11), E6 (Tz5n5n1), E9 (Tz8i3n1), E11 (Tz7i7n1) and E13 (Tz8i8n1) were synthesized by this method. The synthesis involves propyne as the alkyne so care must be exercised during synthesis to avoid possible
explosion or excessive loss of volatile propyne. Cu/C (1.6 g, 0.7 mmol) and azidoalkane (39 mmol) were mixed in 30 mL of 1,4-dioxane and stirred for 10 minutes. The mixture was cooled in liquid nitrogen and vacuum was applied to remove any dissolved oxygen. To the frozen mixture was added propyne (39 mmol, 1.6 g) followed by triethylamine (39 mmol, 3.9 g). The mixture was warmed to room temperature and then heated at 70 °C overnight. The product was filtered from Cu/C, concentrated under low vacuo and further purified by flash column chromatography using hexane:ethyl acetate (1:1)
(a)
(b)
Figure 3. Generalized synthesis of ionic liquids via a) two-step synthesis of14,77and b) One-pot, one-step synthesis of triazoles.78
General procedure for one-pot, one-step
synthesis of 1,4-disubstituted-1,2,3-triazoles
(Figure 3b): The precursor triazoles for the following
ILs were synthesized via the one-pot route: E3 (Tz3n3n3n), E4 (Tz3n3n3i) and E8 (Tz4s4i4s). The synthesis was carried out using a reported procedure.79 Briefly, to a 500 mL round-bottom flask containing 50 mL distilled water, was added sodium azide (11.87 g, 183 mmol), sodium ascorbate (2.41 g, 12 mmol) and copper (II) sulfate pentahydrate (0.65 g, 4 mmol). After stirring to dissolve completely, 50 mL dimethyl formamide was added and stirred followed by the appropriate propyl bromide (41 mmol) and finally the alkyne (61 mmol). The mixture was stirred at 70 °C for 12 h. After 12 h, the reaction mixture was cooled to ambient temperature and water was added. The aqueous solution was extracted with dichloromethane and the organic layer was dried over MgSO4, filtered and concentrated under low vacuo. The crude product was further purified by flash column chromatography (hexane:ethyl acetate, 1:1)
Page 7 of 20
ACS Paragon Plus Environment
The Journal of Physical Chemistry
123456789101112131415161718192021222324252627282930313233343536373839404142434445464748495051525354555657585960

8
General synthesis of 1,3,4-trisubstituted-1H-
triazol-1,2,3-ium halide: Precursor triazoles, E1a-
E14a, (3 mmol) were dissolved in 50 mL degassed acetonitrile and the appropriate alkyl halide (5 mmol) was added and stirred in a sealed tube overnight at 75 °C. At the end of the reaction, acetonitrile was removed under vacuum and hexane was added to the crude product to dissolve unreacted triazole and alkyl halide. (Note: the triazolium halide does not dissolve in hexane but the precursor triazole and alkyl iodide are soluble in hexanes) The process is repeated 5 times and the product is dried under vacuum.
General synthesis of 1,3,4-trisubstituted-1H-
triazol-1,2,3-ium bis(trifluoromethanesulfonyl)
amide: The triazolium halide (2 mmol) and LiTf2N (3 mmol) were dissolved in 50 mL degassed acetonitrile and stirred at 80 °C overnight. Acetonitrile was removed under low vacuo and the crude product was washed with water and the product extracted with DCM. The product was further dissolved in methanol and purified to remove UV-active and fluorescent impurities by refluxing over activated charcoal as reported in literature.80
3. RESULTS
We have built statistical structure-property models based on simulated properties for the representative set of 20 ILs. These models were then used to predict properties for the remaining 183,070 of the enumerated ILs, including E1-E14, which serve as experimental validation set. As demonstrated in Fig 4b, d, f, the experimentally measured properties (density, cation diffusion coefficient, and CO2 Henry coefficient) match the predicted values, and as expected, span the whole range of values. The predicted densities are 3% higher than the experimental densities. A strong linear correlation is observed between the predicted diffusion coefficient for cations at 400 K and the corresponding experimental diffusion coefficient at 303 K (Fig. 4d). Similarly, Fig. 4f shows a significant positive correlation between the predicted and experimental CO2 Henry coefficient. This linear correlation verifies the property map and suggests that the latter can be used to predict the CO2 Henry coefficient quantitatively.
Page 8 of 20
ACS Paragon Plus Environment
The Journal of Physical Chemistry
123456789101112131415161718192021222324252627282930313233343536373839404142434445464748495051525354555657585960
9
a)
b)
c)
d)
e)
f)
Figure 4. Property maps for 183,090 ionic liquids (left column) and their experimental verification on E1-E14 structures (right column). a) and b) densities in g/cm3 at 296 K. c) diffusivity (cation) map at 400 K (in 10-12 m2/s), d) the correlation between the predicted diffusion coefficients at 400 K and the experimental diffusion coefficient at 303 K. e) and f) CO2 Henry’s coefficient in bar at 303 K.
Page 9 of 20
ACS Paragon Plus Environment
The Journal of Physical Chemistry
123456789101112131415161718192021222324252627282930313233343536373839404142434445464748495051525354555657585960
10
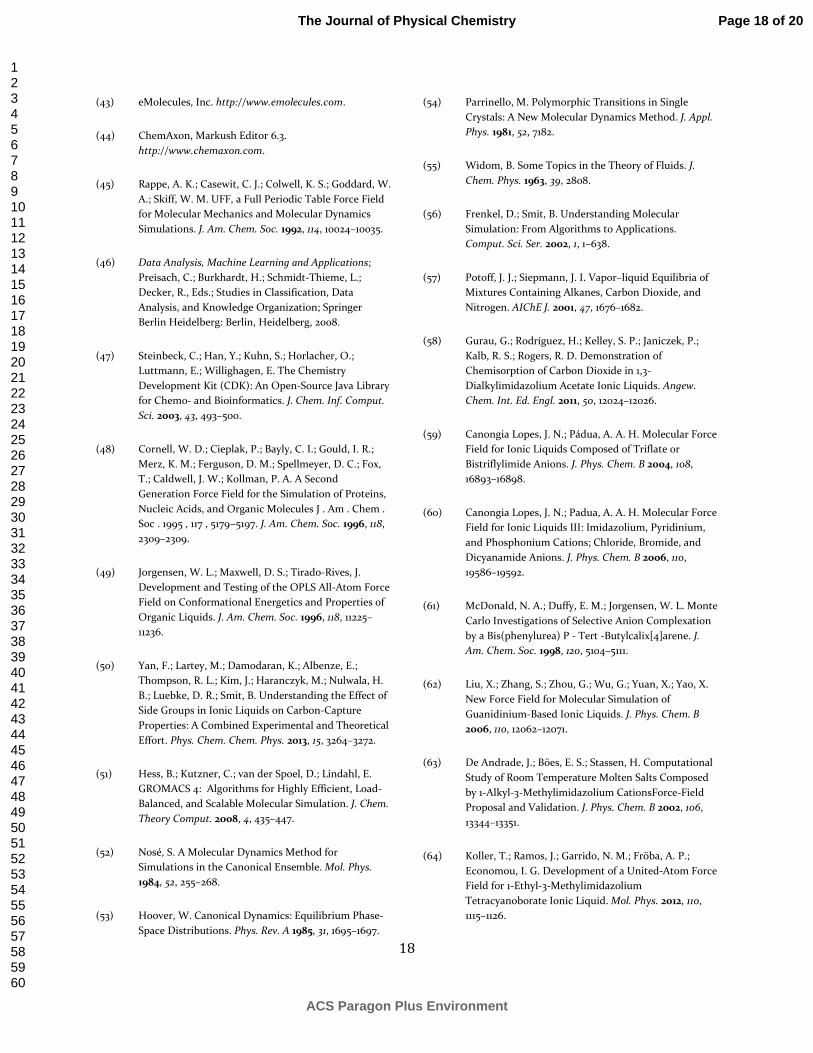
Figure 5. Structures of the fourteen synthesized and characterized cations composing the ionic liquids denoted E1-E14 in Fig. 2.
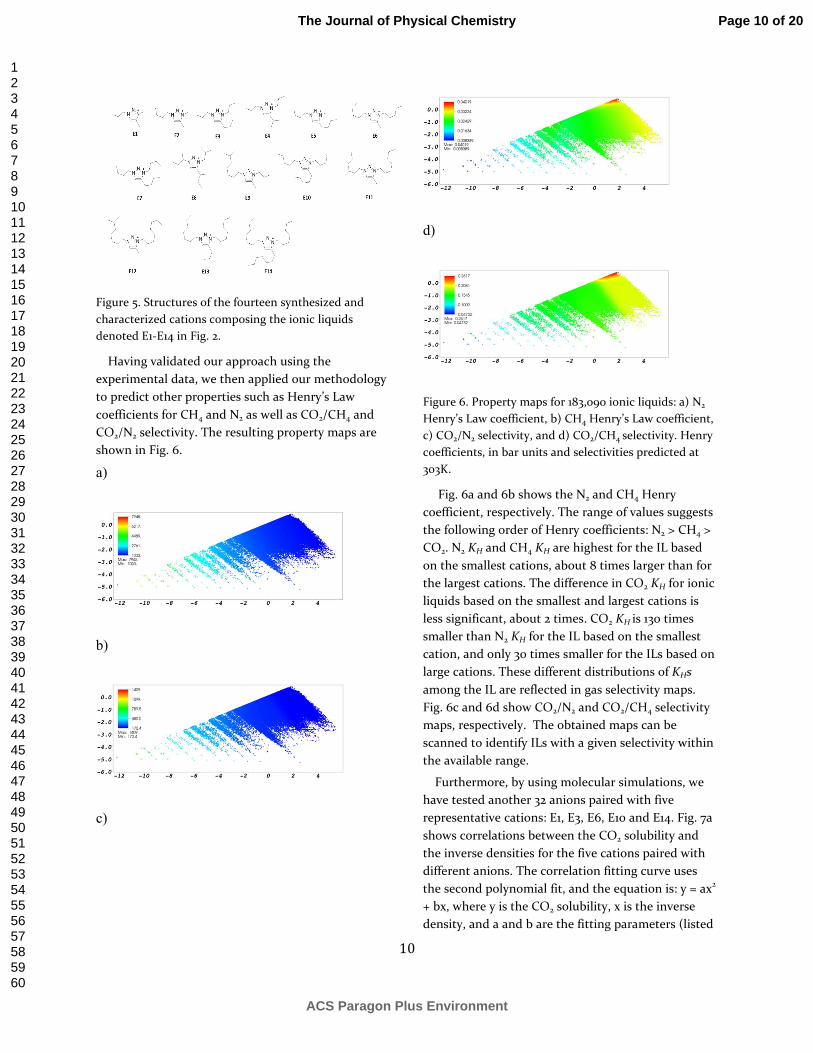
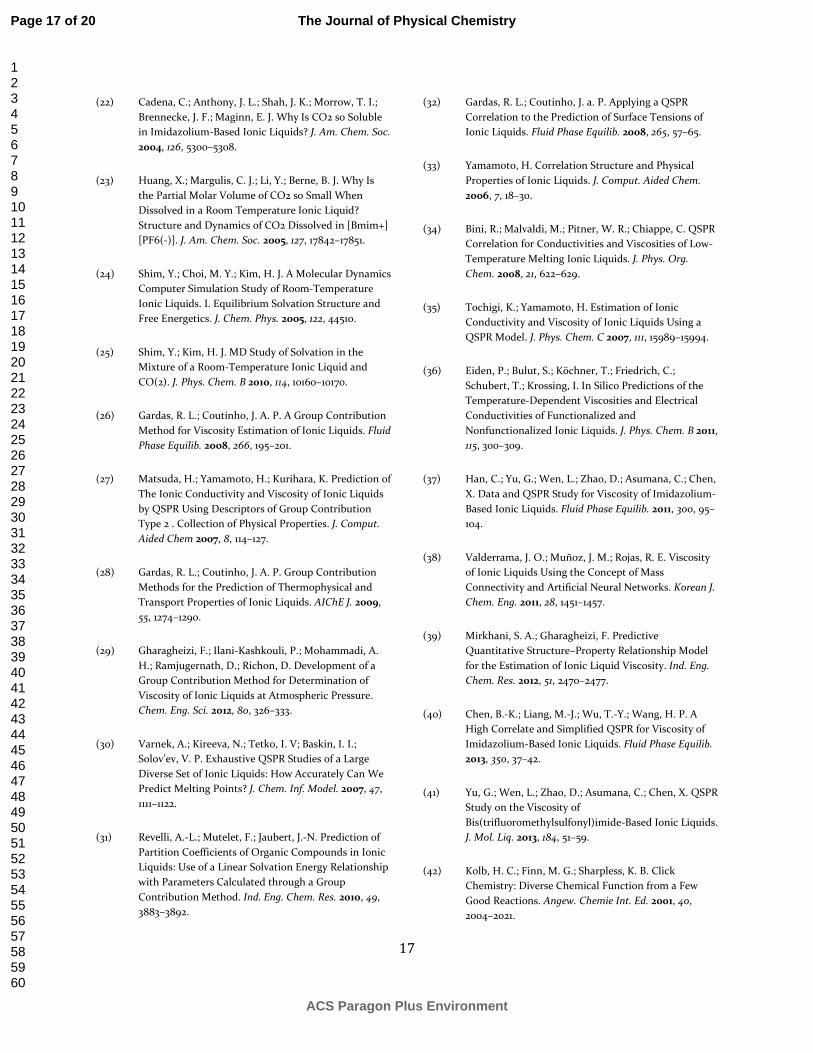
Having validated our approach using the experimental data, we then applied our methodology to predict other properties such as Henry’s Law coefficients for CH4 and N2 as well as CO2/CH4 and CO2/N2 selectivity. The resulting property maps are shown in Fig. 6.
a)
b)
c)
d)
Figure 6. Property maps for 183,090 ionic liquids: a) N2 Henry’s Law coefficient, b) CH4 Henry’s Law coefficient, c) CO2/N2 selectivity, and d) CO2/CH4 selectivity. Henry coefficients, in bar units and selectivities predicted at 303K.
Fig. 6a and 6b shows the N2 and CH4 Henry coefficient, respectively. The range of values suggests the following order of Henry coefficients: N2 > CH4 > CO2. N2 KH and CH4 KH are highest for the IL based on the smallest cations, about 8 times larger than for the largest cations. The difference in CO2 KH for ionic liquids based on the smallest and largest cations is less significant, about 2 times. CO2 KH is 130 times smaller than N2 KH for the IL based on the smallest cation, and only 30 times smaller for the ILs based on large cations. These different distributions of KHs among the IL are reflected in gas selectivity maps. Fig. 6c and 6d show CO2/N2 and CO2/CH4 selectivity maps, respectively. The obtained maps can be scanned to identify ILs with a given selectivity within the available range.
Furthermore, by using molecular simulations, we have tested another 32 anions paired with five representative cations: E1, E3, E6, E10 and E14. Fig. 7a shows correlations between the CO2 solubility and the inverse densities for the five cations paired with different anions. The correlation fitting curve uses the second polynomial fit, and the equation is: y = ax2 + bx, where y is the CO2 solubility, x is the inverse density, and a and b are the fitting parameters (listed
Page 10 of 20
ACS Paragon Plus Environment
The Journal of Physical Chemistry
123456789101112131415161718192021222324252627282930313233343536373839404142434445464748495051525354555657585960

11
in Table S-5). Of the five cations, E1 always gives the lowest inverse density and lowest CO2 solubility, and E14 gives the highest inverse density and highest CO2 solubility, following the same trend as the properties map of chemical space in Fig. 4a and 4e. Of all the 33 anions, N(SO2C4F9)2
- with the largest size, has the highest CO2 solubility, and Cl- and N3
- with the smallest size, have the lowest CO2 solubility. The anion plays an important role in the density and CO2
solubility. By averaging the fitting parameters a and b for all 33 anions, a “general” trend line is found for CO2 solubility in ionic liquids. The values of the inverse density for 33 anions are shown in Fig. 7b and 7c. It was found that inverse density trends well with high CO2 solubility. An exception is B(CN)4
-, anion which exhibits both low inverse density and high CO2 solubility. This finding is consistent with the
a) b)
c) d)
Figure 7. Properties for ionic liquids with 33 different anions. a) Trend line for CO2 solubility for ionic liquids with different anions. CO2 solubility = 104 / Henry coefficient, b) negative inverse density shift relative to the trend line, c) positive inverse density shift relative to the trend line, d) correlation between the densities and cation diffusion coefficients of ionic liquids.
0.7 0.8 0.9 1.0 1.1 1.20
20
40
60
80
100 E14
E10
E6
E3
E1
N(SO2C
4F9)2
-
FEP-
PF4(C
2F5)2
-
Tf2N
-
C2F5SO
4
-
BF3C
2F5
-
PF6
-
I-
BF4
-
SCN-
Trend line
CO
2 solubility (bar-1)
Inverse density (cm3/g)
-0.35 -0.30 -0.25 -0.20 -0.15 -0.10 -0.05 0.00
CF3SO
4
-
N(SO2F)
2
-
BF3C
2F5
-
C2F5SO
3
-
C2F5SO
4
-
PF5C
2F5
-
BF3C
4F9
-
Tf2N
-
C4F9SO
4
-
PF4(C
2F5)2
-
N(SO2C
2F5)2
-
FEP-
N(SO2C
3F7)2
-
N(SO2C
4F9)2
-
Shift inverse density (cm3/g)
0.00 0.05 0.10 0.15 0.20 0.25
N3
-
Cl-
SCN-
BCN4
-
C2H5SO
3
-
C4H
9SO
3
-
CH3SO
3
-
NO3
-
BF4
-
C2H
5SO
4
-
CH3SO
4
-
C4H9SO
4
-
Br-
ClO4
-
I-
BF3CF
3
-
PF6
-
TF-
AlCl4
-
Shift inverse density (cm3/g)
Page 11 of 20
ACS Paragon Plus Environment
The Journal of Physical Chemistry
123456789101112131415161718192021222324252627282930313233343536373839404142434445464748495051525354555657585960

12
literature81, where high CO2 solubility has been found for ionic liquids with B(CN)4
- anion.
Fig. 7d shows the relationship between cation diffusion coefficients of ILs with selected anions and the density of these ILs. The values for remaining anions, and the polynomial fitting parameters are listed in table S-8. Linear correlation is found for each individual anion, with E1 the fastest, and E14 the slowest. Of different anions, B(CN)4
- has the highest diffusion coefficient, and N(SO2C4F9)2
- the lowest diffusion coefficient.
Similar trend lines have also been found for CH4 and N2 solubility in the ILs with these anions (the obtained fitting parameters are collected in Tables S6 and S-7). As shown in Fig. 8a,
a)
b)
c)
Figure 8 | CO2, CH4 and N2 solubility trends for 33 anions. a) Trend lines for solubility of CO2, CH4, and N2, b) correlation between the inverse density shift relative to the CO2 trend line and to the CH4 trend line, c) correlation between the inverse density shift relative to the CO2 trend line and to the N2 trend line.
trend line for CO2 shows the highest solubility, whereas N2 the smallest. Despite the difference between the trend lines for CO2, CH4, and N2, the inverse density shift relative to individual trend line for different anions, are almost the same, as shown from the linear correlations with slope close to 1 between the inverse density shift relative to the CO2 trend line and to the CH4 trend line in Fig. 8b, and to the N2 trend line in Fig. 8c. This indicates that the inverse density shift for different anions relative to the gas solubility trend lines is dependent on the anion species, not on the type of adsorption gas.
Combining the gas solubility trends, in particular, the specific inverse density shifts for each anion, and the predicted densities for all ILs based on the reference anion, e.g. Tf2N
- in Fig. 4a-b, one can maximize the pace of discovery in finding optimal solutions for a given application. Here, we demonstrate an ability to predict CO2, CH4, and N2 solubility for ILs based on E1-E14 cation and FEP-, and PF6
- anions (we also include Tf2N- for reference). The
calculation procedure is as follows. The trend line for CO2 solubility is y = 164.83 * x2 + 121.04 * x, where x is the inverse density of a generic system corresponding to a non-specific anion matching with the trend line and y is the CO2 solubility. In the case of Tf2N
-, the
0.85 0.90 0.95 1.00 1.05 1.10 1.15 1.20 1.250
20
40
60
80
100
N2 trend line
CH4 trend line
CO2 trend line
Solubility (bar-1)
Inverse density (cm3/g)
-0.4 -0.3 -0.2 -0.1 0.0 0.1 0.2 0.3-0.4
-0.3
-0.2
-0.1
0.0
0.1
0.2
0.3
trend line (cm
3/g)
trend line (cm3/g)
Shift inverse density for CO2
y = 1.0089x + 0.0134
R2 = 0.9927
Shift inverse density for CH4
-0.4 -0.3 -0.2 -0.1 0.0 0.1 0.2 0.3-0.4
-0.3
-0.2
-0.1
0.0
0.1
0.2
0.3
trend line (cm
3/g)
trend line (cm3/g)
Shift inverse density for CO2
y = 1.0285x + 0.015
R2 = 0.9923
Shift inverse density for N2
Page 12 of 20
ACS Paragon Plus Environment
The Journal of Physical Chemistry
123456789101112131415161718192021222324252627282930313233343536373839404142434445464748495051525354555657585960

13
inverse density shift is -0.149 cm3/g relative to the trend line. The inverse density x for a specific system can be either calculated directly from molecular simulation, or, in general case, predicted using the presented property map approach. Hence, the predicted CO2 solubility for ILs based on Tf2N
- is calculated by the equation: y = 164.83 * (x + 0.149)2 + 121.04 * (x + 0.149). The prediction for CH4 and N2 follows the same procedure as CO2. We have compared the predicted values to the solubility obtained from molecular dynamics simulations, and the results are shown in Fig. 9 and tables S-9, S-10 and S-11.
(a)
b)
c)
Figure 9. The correlation between the predicted CO2, CH4, N2 solubility from the trend lines and the solubility calculated from molecular simulations at 500 K for the experimental cations E1-E14 paired with three anions: a) Tf2N-, b) FEP-, and c) PF6-.
Fig. 9a shows that in Tf2N-, the predicted gas
solubility is 8% - 19% higher than the solubility directly obtained from molecular simulations, and a strong correlation is observed between the predicted solubility and simulated solubility. Fig. 9b shows that in the case of FEP-, the predicted gas solubility is 7% lower or 9% higher than the solubility obtained from molecular simulation, and a nearly perfect correlation is observed between these two sets of solubility. Fig. 9c shows that in PF6
-, the predicted solubility is 7% - 14 % higher, and a strong correlation is also observed. Thus, the strong correlations between the predicted gas solubility from the trend lines and from the molecular simulations, shows the trend line approach can be used for prediction of gas solubility in different anions, and it can save the computation time and effort by using molecular simulations.
Finally, having predicted the properties for the considered ILs, we investigate which species may be good candidates for CO2 capture application. Here, three properties need to be considered: high CO2 solubility, high CO2/CH4 (CO2/N2) selectivity, and high ionic liquid diffusivity. In order to search for such candidate ILs, we introduce a combined factor for both CO2/CH4 (CO2/N2) selectivity and the cation diffusion coefficient D+, where the combined factor = selectivity × D+; and the higher combined factor, the
0 10 20 30 40 50 60 70 800
10
20
30
40
50
60
70
80
y = 1.0792x - 0.5518
R2 = 0.9768 (N
2)
y = 1.0804x - 1.1636
R2 = 0.982 (CH
4)
y = 1.1866x - 8.4904
R2 = 0.9843 (CO
2)
CO2
CH4
N2
Predicted solublity from trend line
for Tf 2N- (bar-1)
Solubility from molecular simulation
for Tf2N- (bar
-1)
0 10 20 30 40 50 60 70 80 90 1000
10
20
30
40
50
60
70
80
90
100
y = 0.9329x + 1.4384
R2 = 0.9947 (N
2)
y = 0.9452x + 1.6456
R2 = 0.9965 (CH
4)
y = 1.0859x - 6.3061
R2 = 0.9922 (CO
2)
CO2
CH4
N2
Predicted solublity from trend line
for FEP- (bar-1)
Solubility from molecular simulation
for FEP- (bar
-1)
0 10 20 30 40 50 60 700
10
20
30
40
50
60
70
y = 1.1444x - 0.6222
R2 = 0.9592 (N
2)
y = 1.1164x - 1.8135
R2 = 0.9628 (CH
4)
y = 1.0742x - 2.2014
R2 = 0.9745 (CO
2)
CO2
CH4
N2
Predicted solublity from trend line
for PF6
- (bar-1)
Solubility from molecular simulation
for PF6
- (bar
-1)
Page 13 of 20
ACS Paragon Plus Environment
The Journal of Physical Chemistry
123456789101112131415161718192021222324252627282930313233343536373839404142434445464748495051525354555657585960

14
better the material. Fig. 10 shows the correlation between the
Figure 10. The correlation between the combined factor for CO2/N2 selectivity and cation diffusion, and the CO2 solubility. A fitting curve for anion [Tf2N
-] is set as a reference and used to determine the performance of the anion, where the fitting equation is y = 5.011E-9*exp(-0.0290836*x), x is the CO2 solubility and y is the combined factor.
combined factor for CO2/N2 selectivity and CO2 solubility. The results for ILs based on the anion Tf2N
- are used as reference. Among all the 33 anions, only B(CN)4
-, FEP- and PF4(C2F5)2- shows better
performance than Tf2N-, and among these three
anions, B(CN)4- shows the best performance, then
FEP-, then PF4(C2F5)2-. Some anions, such AlCl4
-, BF3C2F5
-, and C2F5SO3-, only have better performance
when paired with E1. The correlation between the combined factor for CO2/CH4 selectivity and CO2 solubility gives the same trend for the performance, see Fig. 11.
Fig. 11 shows the correlation between the combined factor for CO2/CH4 selectivity and the cation diffusion, and the CO2 solubility. The equation for the fitting curve corresponds to anion Tf2N
- is, y = 1.904424E-9*exp(-0.02822994*x), x is the CO2 solubility and y is the combined factor. Among all 33 anions, B(CN)4
-, FEP- and PF4(C2F5)2- shows better
performance than Tf2N-, and among these three anions, B(CN)4
- shows the best performance, then FEP-, then PF4(C2F5)2
-. Some anions, such AlCl4-,
BF3C2F5-, and C2F5SO3
-, have only better performance when paired with E1.
Figure 11. Correlation between the combined factor for CO2/CH4 selectivity and cation diffusion, and the CO2 solubility.
4. CONCLUDING REMARKS
Our Materials Genome Approach based on using a combination of the property maps for exploring cation space, and property (inverse density) shifts for anions provides an efficient way to design ILs with any of the required properties. The applicability of our MGA goes beyond the presented case of hydrocarbon-substituted triazolium-based ionic liquids, and can be transferred to other families of ILs based on different cations and anions. When adopting this approach to ILs based on other chemistries, a number of issues need to be considered: (1) when mapping the chemical space of ILs, the structural descriptors need to be selected to both capture the differences between the investigated species and correlate with the investigated properties of ILs; (2) the sampled ILs of the chemical space need to cover the region of interest; (3) characterization of the selected species with molecular simulations needs to be done with care and ensuring full convergence of the property values, which will be used to build subsequent structure-property models. If all conditions (1)-(3) are fulfilled; the approach can be used to design ILs of various chemistries and in the context of diverse application. In practice, fulfilling (1) may be the most challenging step as identification
0 20 40 60 80 100
0.0
2.0E-10
4.0E-10
6.0E-10
8.0E-10
1.0E-9
1.2E-9
1.4E-9
1.6E-9
1.8E-9
2.0E-9
2.2E-9
[E1+][C
2F5SO
3
-]
[E1+][AlCl
4
-]
[E1+][BF
3C
2F5
-]
E14
E10
E6
E3
E1
Different anions paired with
cation E1, E3, E6, E10, E14
Fitting curve for Tf2N
-
B(CN)4
-
FEP-
PF4(C
2F5)2
-
Tf2N
-
Combined factor for CO
2/CH
4 selectivity
and diffusion (m
2/s)
CO2 solubility (bar
-1)
Page 14 of 20
ACS Paragon Plus Environment
The Journal of Physical Chemistry
123456789101112131415161718192021222324252627282930313233343536373839404142434445464748495051525354555657585960

15
of appropriate descriptors often requires some knowledge about structure-property trends, which may be not always available.
In conclusion, we have applied an integrated Materials Genome Approach to build property maps for 183,090 ionic liquids involving triazolium-based cations and the Tf2N
- anion, and revealed the available ranges of properties achievable in this set of ILs. We experimentally validated our approach by synthesizing and characterizing a representative set of 14 ionic liquids. The results show good agreement between prediction and experiment (Tables S-11 to S-14), suggesting that our tool is a useful technique to explore structure-property relationships in ILs. It was observed that shifts of inverse density and CO2, CH4 and N2 solubility are specific to the anion. It may therefore be possible to quantitatively predict the corresponding properties of any IL based on the property map for the reference system (e.g. Tf2N
-) and the inverse density shift table for anions (e.g. Fig. 7 b-c). The presented methodology is not limited to the considered type of ionic liquids. Other types of anions and cations can be investigated provided appropriate structure descriptors are used to represent the chemical space of these species.
ACKNOWLEDGMENTS
M.L., S.B., K.D., E.A., D.R.L. and H.B.N. gratefully acknowledge the financial support by the United States Department of Energy’s Office of Fossil Energy under the National Energy Technology Laboratory Field Work Proposal Car Cap-FY131415. F.Y. and K.J. were supported by the Assistant Secretary for Fossil Energy of the U.S. Department of Energy under Contract No. DE-AC02-05CH11231. M.H. and B.S. were supported as part of the Center for Gas Separations Relevant to Clean Energy Technologies, an Energy Frontier Research Center funded by the U.S. Department of Energy, Office of Science, Office of Basic Energy Sciences under Award Number DE-SC0001015. Berkeley Lab is supported by the Office of Science of the U.S. Department of Energy under Contract No. DE-AC02-05CH11231. This research used resources of the National Energy Research Scientific Computing Center, which is supported by the Office of Science of the U.S. Department of Energy under Contract No. DE-AC02-05CH11231.
Author Contributions
F.Y. performed molecular simulations. K.J. enumerated structures. M.L. synthesized materials. S.B., K.D. and E.A. characterized. D.R.L., H.B.N. B.S. and M.H. conceived, designed the study and wrote the paper.
SUPPORTING INFORMATION
Supporting Information Available: It includes additional information on (1) Chemical space sampling using cheminformatics techniques. In particular, Figure S-1 presents a chemical space map of 362,370 triazolium cations, and Table S-2 contains the map coordinates of D1-D25 and E1-E14 structures. (2) Molecular simulations.
Figure S-2 presents the structures of investigated anions with
the corresponding partial atomic charges. Table S-2 contains
tabulated simulated properties for IL based on D1-D25 and
Tf2N- anion obtained at 296K. Table S-3 contains tabulated
simulated properties for IL based on E1, E3, E6, E10, E14 cations paired with 33 anions, and obtained at 500K. Tables S-4 through S-7 present tabulated trend line fitting
parameters while Table S-8 through S-10 contain tabulated
simulation and statistical model-predicted properties for ILs
based on E1-E14 cation and paired with Tf2N-, FEP- and PF6
-
anions, respectively. (3) Experimental work with details on material synthesis and characterization. (4) Comparison between the experimental and simulation results presented as tabulated properties of ionic liquids based on E1-E14 cation and Tf2N- anion. Tables S-11 through S14 contain density, Henry’s coefficient of CO2, cation self-diffusion coefficient and anion self-diffusion coefficient, respectively. This material is available free of charge via the Internet at http://pubs.acs.org
Page 15 of 20
ACS Paragon Plus Environment
The Journal of Physical Chemistry
123456789101112131415161718192021222324252627282930313233343536373839404142434445464748495051525354555657585960

16
References
(1) Smiglak, M.; Metlen, A.; Rogers, R. D. The Second Evolution of Ionic Liquids: From Solvents and Separations to Advanced Materials-Energetic Examples from the Ionic Liquid Cookbook. Acc. Chem.
Res. 2007, 40, 1182–1192.
(2) Rogers, R. D.; Seddon, K. R. Ionic Liquids - Solvents of the Future? Science (80-. ). 2003, 302, 792–793.
(3) Plechkova, N. V; Seddon, K. R. Applications of Ionic Liquids in the Chemical Industry. Chem. Soc. Rev. 2008, 37, 123–150.
(4) Hallett, J. P.; Welton, T. Room-Temperature Ionic Liquids: Solvents for Synthesis and Catalysis. 2. Chem.
Rev. 2011, 111, 3508–3576.
(5) Shi, W.; Myers, C. R.; Luebke, D. R.; Steckel, J. A.; Sorescu, D. C. Theoretical and Experimental Studies of CO2 and H2 Separation Using the 1-Ethyl-3-Methylimidazolium Acetate ([emim][CH3COO]) Ionic Liquid. J. Phys. Chem. B 2012, 116, 283–295.
(6) Wang, H.; Gurau, G.; Rogers, R. D. Ionic Liquid Processing of Cellulose. Chem. Soc. Rev. 2012, 41, 1519–1537.
(7) Noda, A.; Susan, A. B.; Kudo, K.; Mitsushima, S.; Hayamizu, K.; Watanabe, M. Bronsted Acid-Base Ionic Liquids as Proton-Conducting Nonaqueous Electrolytes. J. Phys. Chem. B 2003, 107, 4024–4033.
(8) Xiang, H. F.; Yin, B.; Wang, H.; Lin, H. W.; Ge, X. W.; Xie, S.; Chen, C. H. Improving Electrochemical Properties of Room Temperature Ionic Liquid (RTIL) Based Electrolyte for Li-Ion Batteries. Electrochim.
Acta 2010, 55, 5204–5209.
(9) Shi, W.; Sorescu, D. C.; Luebke, D. R.; Keller, M. J.; Wickramanayake, S. Molecular Simulations and Experimental Studies of Solubility and Diffusivity for Pure and Mixed Gases of H-2, CO2, and Ar Absorbed in the Ionic Liquid 1-N-Hexyl-3-Methylimidazolium Bis(Trifluoromethylsulfonyl)amide ( Hmim Tf2N ). J. Phys. Chem. B 2010, 114, 6531–6541.
(10) Mikkelsen, M.; Jorgensen, M.; Krebs, F. C. The Teraton Challenge. A Review of Fixation and Transformation of Carbon Dioxide. Energy Environ. Sci. 2010, 3, 43–81.
(11) Wang, C. M.; Luo, X. Y.; Luo, H. M.; Jiang, D. E.; Li, H. R.; Dai, S. Tuning the Basicity of Ionic Liquids for Equimolar CO2 Capture. Angew. Chemie-International
Ed. 2011, 50, 4918–4922.
(12) Holbrey, J. D.; Seddon, K. R. Ionic Liquids. Clean
Technol. Environ. Policy 1999, 1, 223–236.
(13) Paduszyński, K.; Domańska, U. Viscosity of Ionic Liquids: An Extensive Database and a New Group Contribution Model Based on a Feed-Forward Artificial Neural Network. J. Chem. Inf. Model. 2014, 54, 1311–1324.
(14) Nulwala, H. B.; Tang, C. N.; Kail, B. W.; Damodaran, K.; Kaur, P.; Wickramanayake, S.; Shi, W.; Luebke, D. R. Probing the Structure-Property Relationship of Regioisomeric Ionic Liquids with Click Chemistry. Green Chem. 2011, 13, 3345.
(15) Li, H.; Ibrahim, M.; Agberemi, I.; Kobrak, M. N. The Relationship between Ionic Structure and Viscosity in Room-Temperature Ionic Liquids. J. Chem. Phys. 2008, 129, 124507.
(16) Yu, G.; Zhao, D.; Wen, L.; Yang, S.; Chen, X. Viscosity of Ionic Liquids: Database, Observation, and Quantitative Structure-Property Relationship Analysis. AIChE J. 2012, 58, 2885–2899.
(17) Jain, A.; Ong, S. P.; Hautier, G.; Chen, W.; Richards, W. D.; Dacek, S.; Cholia, S.; Gunter, D.; Skinner, D.; Ceder, G.; et al. Commentary: The Materials Project: A Materials Genome Approach to Accelerating Materials Innovation. APL Mater. 2013, 1, 011002.
(18) Eagar, T. W.; King, M. Bringing New Materials to Market. Technol. Rev. 1995, 98, 42.
(19) Kalil, T.; Wadia, C. Materials Genome Initiative: A Renaissance of American Manufacturing | The White House http://www.whitehouse.gov/blog/2011/06/24/materials-genome-initiative-renaissance-american-manufacturing (accessed Apr 4, 2014).
(20) Brennecke, J. E.; Gurkan, B. E. Ionic Liquids for CO2 Capture and Emission Reduction. J. Phys. Chem. Lett. 2010, 1, 3459–3464.
(21) Anthony, J. L.; Anderson, J. L.; Maginn, E. J.; Brennecke, J. F. Anion Effects on Gas Solubility in Ionic Liquids. J. Phys. Chem. B 2005, 109, 6366–6374.
Page 16 of 20
ACS Paragon Plus Environment
The Journal of Physical Chemistry
123456789101112131415161718192021222324252627282930313233343536373839404142434445464748495051525354555657585960
17
(22) Cadena, C.; Anthony, J. L.; Shah, J. K.; Morrow, T. I.; Brennecke, J. F.; Maginn, E. J. Why Is CO2 so Soluble in Imidazolium-Based Ionic Liquids? J. Am. Chem. Soc. 2004, 126, 5300–5308.
(23) Huang, X.; Margulis, C. J.; Li, Y.; Berne, B. J. Why Is the Partial Molar Volume of CO2 so Small When Dissolved in a Room Temperature Ionic Liquid? Structure and Dynamics of CO2 Dissolved in [Bmim+] [PF6(-)]. J. Am. Chem. Soc. 2005, 127, 17842–17851.
(24) Shim, Y.; Choi, M. Y.; Kim, H. J. A Molecular Dynamics Computer Simulation Study of Room-Temperature Ionic Liquids. I. Equilibrium Solvation Structure and Free Energetics. J. Chem. Phys. 2005, 122, 44510.
(25) Shim, Y.; Kim, H. J. MD Study of Solvation in the Mixture of a Room-Temperature Ionic Liquid and CO(2). J. Phys. Chem. B 2010, 114, 10160–10170.
(26) Gardas, R. L.; Coutinho, J. A. P. A Group Contribution Method for Viscosity Estimation of Ionic Liquids. Fluid
Phase Equilib. 2008, 266, 195–201.
(27) Matsuda, H.; Yamamoto, H.; Kurihara, K. Prediction of The Ionic Conductivity and Viscosity of Ionic Liquids by QSPR Using Descriptors of Group Contribution Type 2 . Collection of Physical Properties. J. Comput.
Aided Chem 2007, 8, 114–127.
(28) Gardas, R. L.; Coutinho, J. A. P. Group Contribution Methods for the Prediction of Thermophysical and Transport Properties of Ionic Liquids. AIChE J. 2009, 55, 1274–1290.
(29) Gharagheizi, F.; Ilani-Kashkouli, P.; Mohammadi, A. H.; Ramjugernath, D.; Richon, D. Development of a Group Contribution Method for Determination of Viscosity of Ionic Liquids at Atmospheric Pressure. Chem. Eng. Sci. 2012, 80, 326–333.
(30) Varnek, A.; Kireeva, N.; Tetko, I. V; Baskin, I. I.; Solov’ev, V. P. Exhaustive QSPR Studies of a Large Diverse Set of Ionic Liquids: How Accurately Can We Predict Melting Points? J. Chem. Inf. Model. 2007, 47, 1111–1122.
(31) Revelli, A.-L.; Mutelet, F.; Jaubert, J.-N. Prediction of Partition Coefficients of Organic Compounds in Ionic Liquids: Use of a Linear Solvation Energy Relationship with Parameters Calculated through a Group Contribution Method. Ind. Eng. Chem. Res. 2010, 49, 3883–3892.
(32) Gardas, R. L.; Coutinho, J. a. P. Applying a QSPR Correlation to the Prediction of Surface Tensions of Ionic Liquids. Fluid Phase Equilib. 2008, 265, 57–65.
(33) Yamamoto, H. Correlation Structure and Physical Properties of Ionic Liquids. J. Comput. Aided Chem. 2006, 7, 18–30.
(34) Bini, R.; Malvaldi, M.; Pitner, W. R.; Chiappe, C. QSPR Correlation for Conductivities and Viscosities of Low-Temperature Melting Ionic Liquids. J. Phys. Org.
Chem. 2008, 21, 622–629.
(35) Tochigi, K.; Yamamoto, H. Estimation of Ionic Conductivity and Viscosity of Ionic Liquids Using a QSPR Model. J. Phys. Chem. C 2007, 111, 15989–15994.
(36) Eiden, P.; Bulut, S.; Köchner, T.; Friedrich, C.; Schubert, T.; Krossing, I. In Silico Predictions of the Temperature-Dependent Viscosities and Electrical Conductivities of Functionalized and Nonfunctionalized Ionic Liquids. J. Phys. Chem. B 2011, 115, 300–309.
(37) Han, C.; Yu, G.; Wen, L.; Zhao, D.; Asumana, C.; Chen, X. Data and QSPR Study for Viscosity of Imidazolium-Based Ionic Liquids. Fluid Phase Equilib. 2011, 300, 95–104.
(38) Valderrama, J. O.; Muñoz, J. M.; Rojas, R. E. Viscosity of Ionic Liquids Using the Concept of Mass Connectivity and Artificial Neural Networks. Korean J.
Chem. Eng. 2011, 28, 1451–1457.
(39) Mirkhani, S. A.; Gharagheizi, F. Predictive Quantitative Structure–Property Relationship Model for the Estimation of Ionic Liquid Viscosity. Ind. Eng.
Chem. Res. 2012, 51, 2470–2477.
(40) Chen, B.-K.; Liang, M.-J.; Wu, T.-Y.; Wang, H. P. A High Correlate and Simplified QSPR for Viscosity of Imidazolium-Based Ionic Liquids. Fluid Phase Equilib. 2013, 350, 37–42.
(41) Yu, G.; Wen, L.; Zhao, D.; Asumana, C.; Chen, X. QSPR Study on the Viscosity of Bis(trifluoromethylsulfonyl)imide-Based Ionic Liquids. J. Mol. Liq. 2013, 184, 51–59.
(42) Kolb, H. C.; Finn, M. G.; Sharpless, K. B. Click Chemistry: Diverse Chemical Function from a Few Good Reactions. Angew. Chemie Int. Ed. 2001, 40, 2004–2021.
Page 17 of 20
ACS Paragon Plus Environment
The Journal of Physical Chemistry
123456789101112131415161718192021222324252627282930313233343536373839404142434445464748495051525354555657585960
18
(43) eMolecules, Inc. http://www.emolecules.com.
(44) ChemAxon, Markush Editor 6.3. http://www.chemaxon.com.
(45) Rappe, A. K.; Casewit, C. J.; Colwell, K. S.; Goddard, W. A.; Skiff, W. M. UFF, a Full Periodic Table Force Field for Molecular Mechanics and Molecular Dynamics Simulations. J. Am. Chem. Soc. 1992, 114, 10024–10035.
(46) Data Analysis, Machine Learning and Applications; Preisach, C.; Burkhardt, H.; Schmidt-Thieme, L.; Decker, R., Eds.; Studies in Classification, Data Analysis, and Knowledge Organization; Springer Berlin Heidelberg: Berlin, Heidelberg, 2008.
(47) Steinbeck, C.; Han, Y.; Kuhn, S.; Horlacher, O.; Luttmann, E.; Willighagen, E. The Chemistry Development Kit (CDK): An Open-Source Java Library for Chemo- and Bioinformatics. J. Chem. Inf. Comput.
Sci. 2003, 43, 493–500.
(48) Cornell, W. D.; Cieplak, P.; Bayly, C. I.; Gould, I. R.; Merz, K. M.; Ferguson, D. M.; Spellmeyer, D. C.; Fox, T.; Caldwell, J. W.; Kollman, P. A. A Second Generation Force Field for the Simulation of Proteins, Nucleic Acids, and Organic Molecules J . Am . Chem . Soc . 1995 , 117 , 5179−5197. J. Am. Chem. Soc. 1996, 118, 2309–2309.
(49) Jorgensen, W. L.; Maxwell, D. S.; Tirado-Rives, J. Development and Testing of the OPLS All-Atom Force Field on Conformational Energetics and Properties of Organic Liquids. J. Am. Chem. Soc. 1996, 118, 11225–11236.
(50) Yan, F.; Lartey, M.; Damodaran, K.; Albenze, E.; Thompson, R. L.; Kim, J.; Haranczyk, M.; Nulwala, H. B.; Luebke, D. R.; Smit, B. Understanding the Effect of Side Groups in Ionic Liquids on Carbon-Capture Properties: A Combined Experimental and Theoretical Effort. Phys. Chem. Chem. Phys. 2013, 15, 3264–3272.
(51) Hess, B.; Kutzner, C.; van der Spoel, D.; Lindahl, E. GROMACS 4: Algorithms for Highly Efficient, Load-Balanced, and Scalable Molecular Simulation. J. Chem.
Theory Comput. 2008, 4, 435–447.
(52) Nosé, S. A Molecular Dynamics Method for Simulations in the Canonical Ensemble. Mol. Phys. 1984, 52, 255–268.
(53) Hoover, W. Canonical Dynamics: Equilibrium Phase-Space Distributions. Phys. Rev. A 1985, 31, 1695–1697.
(54) Parrinello, M. Polymorphic Transitions in Single Crystals: A New Molecular Dynamics Method. J. Appl.
Phys. 1981, 52, 7182.
(55) Widom, B. Some Topics in the Theory of Fluids. J. Chem. Phys. 1963, 39, 2808.
(56) Frenkel, D.; Smit, B. Understanding Molecular Simulation: From Algorithms to Applications. Comput. Sci. Ser. 2002, 1, 1–638.
(57) Potoff, J. J.; Siepmann, J. I. Vapor–liquid Equilibria of Mixtures Containing Alkanes, Carbon Dioxide, and Nitrogen. AIChE J. 2001, 47, 1676–1682.
(58) Gurau, G.; Rodríguez, H.; Kelley, S. P.; Janiczek, P.; Kalb, R. S.; Rogers, R. D. Demonstration of Chemisorption of Carbon Dioxide in 1,3-Dialkylimidazolium Acetate Ionic Liquids. Angew.
Chem. Int. Ed. Engl. 2011, 50, 12024–12026.
(59) Canongia Lopes, J. N.; Pádua, A. A. H. Molecular Force Field for Ionic Liquids Composed of Triflate or Bistriflylimide Anions. J. Phys. Chem. B 2004, 108, 16893–16898.
(60) Canongia Lopes, J. N.; Padua, A. A. H. Molecular Force Field for Ionic Liquids III: Imidazolium, Pyridinium, and Phosphonium Cations; Chloride, Bromide, and Dicyanamide Anions. J. Phys. Chem. B 2006, 110, 19586–19592.
(61) McDonald, N. A.; Duffy, E. M.; Jorgensen, W. L. Monte Carlo Investigations of Selective Anion Complexation by a Bis(phenylurea) P - Tert -Butylcalix[4]arene. J. Am. Chem. Soc. 1998, 120, 5104–5111.
(62) Liu, X.; Zhang, S.; Zhou, G.; Wu, G.; Yuan, X.; Yao, X. New Force Field for Molecular Simulation of Guanidinium-Based Ionic Liquids. J. Phys. Chem. B 2006, 110, 12062–12071.
(63) De Andrade, J.; Böes, E. S.; Stassen, H. Computational Study of Room Temperature Molten Salts Composed by 1-Alkyl-3-Methylimidazolium CationsForce-Field Proposal and Validation. J. Phys. Chem. B 2002, 106, 13344–13351.
(64) Koller, T.; Ramos, J.; Garrido, N. M.; Fröba, A. P.; Economou, I. G. Development of a United-Atom Force Field for 1-Ethyl-3-Methylimidazolium Tetracyanoborate Ionic Liquid. Mol. Phys. 2012, 110, 1115–1126.
Page 18 of 20
ACS Paragon Plus Environment
The Journal of Physical Chemistry
123456789101112131415161718192021222324252627282930313233343536373839404142434445464748495051525354555657585960

19
(65) Tsuzuki, S.; Umecky, T.; Matsumoto, H.; Shinoda, W.; Mikami, M. Interactions of Perfluoroalkyltrifluoroborate Anions with Li Ion and Imidazolium Cation: Effects of Perfluoroalkyl Chain on Motion of Ions in Ionic Liquids. J. Phys. Chem. B 2010, 114, 11390–11396.
(66) Lopes, J. N. C.; Padua, A. A. H.; Shimizu, K. Molecular Force Field for Ionic Liquids IV: Trialkylimidazolium and Alkoxycarbonyl-Imidazolium Cations; Alkylsulfonate and Alkylsulfate Anions. J. Phys. Chem.
B 2008, 112, 5039–5046.
(67) Shimizu, K.; Almantariotis, D.; Costa Gomes, M. F.; Pádua, A. A. H.; Canongia Lopes, J. N. Molecular Force Field for Ionic Liquids v: Hydroxyethylimidazolium, Dimethoxy-2- Methylimidazolium, and Fluoroalkylimidazolium Cations and Bis(fluorosulfonyl)amide, Perfluoroalkanesulfonylamide, and Fluoroalkylfluorophosphate Anions. J. Phys. Chem. B 2010, 114, 3592–3600.
(68) Pereiro, A. B.; Araújo, J. M. M.; Oliveira, F. S.; Bernardes, C. E. S.; Esperança, J. M. S. S.; Lopes, J. N. C.; Marrucho, I. M.; Rebelo, L. P. N. Inorganic Salts in Purely Ionic Liquid Media: The Development of High Ionicity Ionic Liquids (HIILs). Chem. Commun.
(Camb). 2012, 48, 3656–3658.
(69) Breneman, C. M.; Wiberg, K. B. DETERMINING ATOM-CENTERED MONOPOLES FROM MOLECULAR ELECTROSTATIC POTENTIALS - THE NEED FOR HIGH SAMPLING DENSITY IN FORMAMIDE CONFORMATIONAL-ANALYSIS. J. Comput. Chem. 1990, 11, 361–373.
(70) Morita, A.; Kato, S. Vibrational Relaxation of Azide Ion in Water: The Role of Intramolecular Charge Fluctuation and Solvent-Induced Vibrational Coupling. J. Chem. Phys. 1998, 109, 5511.
(71) Frisch, M. J.; Schlegel, H. B.; Scuseria, G. E.; Robb, M. A.; Cheeseman, J. R.; Scalmani, G.; Barone, V.; Mennucci, B.; Petersson, G. A.; Nakatsuji, H.; et.al. Gaussian 09, Revision A.1, 2009.
(72) Haykin, S. Neural Networks – a Comprehensive
Foundation.; 2nd ed.; Prentice Hall, New Jersey, 1999.
(73) CRAN - Package AMORE http://cran.r-project.org/web/packages/AMORE/ (accessed Oct 12, 2014).
(74) The R Project for Statistical Computing http://www.r-project.org/.
(75) Swetha, M.; Ramana, P. V.; Shirodkar, S. G. Simple and Efficient Method for the Synthesis of Azides in Water-THF Solvent System. Org. Prep. Proced. Int. 2011, 43, 348–353.
(76) Nulwala, H.; Takizawa, K.; Odukale, A.; Khan, A.; Thibault, R. J.; Taft, B. R.; Lipshutz, B. H.; Hawker, C. J. Synthesis and Characterization of Isomeric Vinyl-1,2,3-Triazole Materials by Azide−Alkyne Click Chemistry. Macromolecules 2009, 42, 6068–6074.
(77) Khan, S. S.; Hanelt, S.; Liebscher, J. Versatile Synthesis of 1 , 2 , 3-Triazolium-Based Ionic Liquids. ARKVOC 2009, 2009, 193–208.
(78) Thibault, R. J.; Takizawa, K.; Lowenheilm, P.; Helms, B.; Mynar, J. L.; Fréchet, J. M. J.; Hawker, C. J. A Versatile New Monomer Family: Functionalized 4-Vinyl-1,2,3-Triazoles via Click Chemistry. J. Am. Chem.
Soc. 2006, 128, 12084–12085.
(79) Adzima, B. J.; Taylor, S. C.; He, H.; Luebke, D. R.; Matyjaszewski, K.; Nulwala, H. B. Vinyl-Triazolium Monomers: Versatile and New Class of Radically Polymerizable Ionic Monomers. J. Polym. Sci. Part A
Polym. Chem. 2014, 52, 417–423.
(80) Burrell, A. K.; Sesto, R. E. Del; Baker, S. N.; McCleskey, T. M.; Baker, G. a. The Large Scale Synthesis of Pure Imidazolium and Pyrrolidinium Ionic Liquids. Green
Chem. 2007, 9, 449.
(81) Babarao, R.; Dai, S.; Jiang, D. Understanding the High Solubility of CO2 in an Ionic Liquid with the Tetracyanoborate Anion. J. Phys. Chem. B 2011, 115, 9789–9794.
Page 19 of 20
ACS Paragon Plus Environment
The Journal of Physical Chemistry
123456789101112131415161718192021222324252627282930313233343536373839404142434445464748495051525354555657585960
20
Table of Content Figure:
Page 20 of 20
ACS Paragon Plus Environment
The Journal of Physical Chemistry
123456789101112131415161718192021222324252627282930313233343536373839404142434445464748495051525354555657585960