Probing the effect of electron donation on CO2 absorbing 1,2,3-triazolide ionic liquids
Upload
khangminh22Category
view
2download
0
J. Chem. Phys. 152, 024502 (2020); https://doi.org/10.1063/1.5138130 152, 024502
© 2020 Author(s).
An analysis of radical diffusion in ionicliquids in terms of free volume theory
Cite as: J. Chem. Phys. 152, 024502 (2020); https://doi.org/10.1063/1.5138130Submitted: 13 November 2019 . Accepted: 19 December 2019 . Published Online: 08 January 2020
Dalibor Merunka , and Miroslav Peric
COLLECTIONS
This paper was selected as an Editor’s Pick

The Journalof Chemical Physics ARTICLE scitation.org/journal/jcp
An analysis of radical diffusion in ionic liquidsin terms of free volume theory
Cite as: J. Chem. Phys. 152, 024502 (2020); doi: 10.1063/1.5138130Submitted: 13 November 2019 • Accepted: 19 December 2019 •Published Online: 8 January 2020
Dalibor Merunka1 and Miroslav Peric2,a)
AFFILIATIONS1 Division of Physical Chemistry, Ruder Boškovic Institute, Bijenicka cesta 54, HR-10000 Zagreb, Croatia2Department of Physics and Astronomy, The Center for Biological Physics, California State University at Northridge,Northridge, California 91330, USA
a)Author to whom correspondence should be addressed:[email protected]
ABSTRACTThe Heisenberg spin exchange–dipole-dipole separation method was used to measure the translational diffusion coefficients of the14N-labeled perdeuterated 2,2,6,6-tetramethyl-4-oxopiperidine-1-oxyl (14N-pDTEMPONE) nitroxide spin probe as a function of tem-perature in two methylimidazolium ionic liquid series, one based on the tetrafluoroborate (BF4) anion and another one on thebis(trifluoromethane)sulfonimide (TFSI, Tf2N) anion. The obtained translational diffusion coefficients of 14N-pDTEMPONE were analyzedin terms of the Cohen–Turnbull free volume theory. It was found that the Cohen-Turnbull theory describes, exceptionally well, the transla-tional diffusion of 14N-pDTEMPONE in all the ionic liquids in the measured temperature range. In addition, the Cohen-Turnbull theory wasapplied to the viscosity and self-diffusion coefficients of the cation and anion—taken from literature—in the same ionic liquids. The criticalfree volume for the self-diffusion of the cation and anion in a given ionic liquid is the same, which suggests that the diffusion of each ionicpair is coordinated. The critical free volumes for the 14N-pDTEMPONE diffusion, self-diffusion, and viscosity for a given cation were about20% greater in the TFSI based ionic liquids than in the BF4 based ionic liquids. It appears that the ratio of the critical free volumes for a givencation between the two series correlates with the ratio of their densities.Published under license by AIP Publishing. https://doi.org/10.1063/1.5138130., s
I. INTRODUCTION
Compared to volatile organic compounds, room temperatureionic liquids (RTILs) have a number of preferred properties, includ-ing high electric conductivity, variable polarity, variable hydrophilic-ity and hydrophobicity,1–3 low vapor pressure, high viscosity (from50 to 1110 cP at room temperature), high thermal stability, andnegligible flammability.4 Most of these properties foster their indus-trial use and application. Additionally, the cation and anion com-ponents of the ionic liquids may be varied, which means that theionic liquid properties may be changed according to one’s needsand wishes.5,6 Therefore, it is not surprising that they are becom-ing the solvents of choice in many applications, such as organicsynthesis,7 adsorption, catalysis,8,9 electrochemistry,10 and analyti-cal chemistry.11 For that reason, it is essential to understand thetransport properties of RTILs, such as tracer and host (self-) dif-fusion, so that one can utilize and maximize the benefits of thoseproperties.12
Self-diffusion of the cations and anions in RTILs has beenexplored by pulsed-field gradient nuclear magnetic resonance (PFG-NMR).13–17 In addition, the tracer diffusion data of a variety of neu-tral and charged molecules in RTILs measured by PFG-1H-NMR,together with available literature data, have been used to uncoverwhat characteristics of the solute and solvent are most impor-tant in determining tracer diffusion rates.18 The diffusion coeffi-cients in all these Refs. 13–18 were analyzed in terms of either theStokes-Einstein (SE) relationship or the fractional Stokes-Einstein(SE) relationship.16,18 In the case of self-diffusion, the significantobservation was that regardless of the size difference between theion components, the diffusion coefficients of the anion and cationof a given RTIL are not much different. In the follow-up arti-cle19 to Ref. 18, Maroncelli and Margulis’s groups have performedthe computational analysis of the tracer diffusion of small neutraland charged solutes in RTILs. They found out that small neutralmolecules diffuse much faster than predicted by the SE relation-ship, while charged ones diffuse much slower due to the existence
J. Chem. Phys. 152, 024502 (2020); doi: 10.1063/1.5138130 152, 024502-1
Published under license by AIP Publishing

The Journalof Chemical Physics ARTICLE scitation.org/journal/jcp
of locally mostly polar—“stiff ”—regions and locally mostly apolar—“soft”—regions.19
When the EPR line broadening method,20 which is based onthe concentration-induced broadening of the EPR lines, was intro-duced, it was thought that it would be beneficial for studying thetranslational diffusion of radicals in viscous biological systems, suchas membranes and lipid bilayers.21 After thoroughly evaluating themethod, Berner and Kivelson22 concluded that, after all, the EPRline broadening method was not promising for exploring the fluidityproperties of these systems due to an interplay of dipole-dipole (DD)and Heisenberg spin exchange (HSE) interactions whose contribu-tions to the EPR line of a radical in the highly viscous environmentcould not be separated. In 1997, our group revisited the EPR linebroadening method,23 and by using nonlinear EPR spectral fittingof the EPR spectrum, we have shown that the spin exchange fre-quency, which is related to the translational tracer diffusion, canbe obtained not just from the broadening of the EPR line but alsofrom the ratio of the amplitudes of the absorption and dispersionline components and the shift of the EPR lines. In this case, thedispersion line component is not the conventional experimental dis-persion signal, but it is the dispersion EPR line shape induced byHSE and DD interactions and is opposite for the low- and high-fieldEPR lines as described in Ref. 24. In a series of articles,25–30 our groupand Salikhov’s group have continued to work on the separation ofthe HSE and DD interactions so that the concentration inducedbroadening of the EPR spectrum can be used to measure the transla-tional diffusion of radicals in highly viscous liquids. Finally, we haverecently been able to successfully apply the HSE-DD separation EPRmethod to measure the diffusion coefficients of the 14N- and 15N-labeled perdeuterated 2,2,6,6-tetramethyl-4-oxopiperidine-1-Oxyl(14N-pDTEMPONE and 15N-pDTEMPONE) radicals in 1-ethyl-3-methylimidazolium bis(trifluoromethylsulfonyl)imide (Emim TFSI)ionic liquid, glass-forming liquid propylene carbonate, andhydrogen-bonding liquid ethylene glycol.31 The translational dif-fusion of 14N-pDTEMPONE in those liquids was satisfactorilyexplained by the fractional Stokes-Einstein relation. The diffusioncoefficient values of the radicals were also found to approach thevalues of the self-diffusion coefficients of the liquids at lower tem-peratures, while at the higher temperatures, the values of the diffu-sion coefficient of the radicals were smaller than the values of theself-diffusion coefficients in all three liquids.
Apart from the Stokes-Einstein hydrodynamic approach, self-diffusion and tracer diffusion in liquids can be explained in termsof free volume models.32–36 The volume of a fluid is not homoge-neous at the molecular level since there is an empty space betweenthe liquid molecules. This empty space, whose geometry is contin-uously changing due to thermal fluctuations, is commonly calledthe free volume. One can assume that once a void (hole) largerthan some critical size appears in the neighborhood of a molecule,the molecule moves into the hole without any expense of energy.Then, it remains in that hole—“cage”—until its next chance tomove on. Although there are several ways to determine the freevolume in a liquid, according to Beichel et al.,37 the most effec-tive experimental method for quantifying the local free volume(holes) is PALS (Positron Annihilation Lifetime Spectroscopy). Thefree volumes in a number of RTILs have been characterized byPALS.37–40 The obtained free volume data are then used to suc-cessfully explain the transport properties (self-diffusion, viscosity,
and conductivity) of RTILs by the Cohen–Turnbull free volumetheory.
In this work, we applied the HSE-DD separation methodto measure the translational diffusion coefficients of the 14N-pDTEMPONE nitroxide spin probe as a function of temper-ature in two methylimidazolium ionic liquid series, one basedon the tetrafluoroborate (BF4) anion and another one on thebis(trifluoromethane)sulfonimide (TFSI, Tf2N) anion. The obtaineddiffusion coefficients of 14N-pDTEMPONE were then analyzedin terms of the Cohen–Turnbull free volume theory. Finally, theCohen–Turnbull free volume analysis of the translational diffusionof the nitroxides was compared to the Cohen–Turnbull free volumetheory explanation of the self-diffusion of the cations and anions,and the viscosity of both RTIL series.
II. EXPERIMENTAL METHODSA. Materials
The spin probe 14N-pDTEMPONE (99 at. % D) was purchasedfrom CDN Isotopes and used as received. The ionic liquids 1-ethyl-3-methylimidazolium tetrafluoroborate (Emim BF4), 1-butyl-3-methylimidazolium tetrafluoroborate (Bmim BF4), 1-hexyl-3-methylimidazolium tetrafluoroborate (Hmim BF4), 1-octyl-3-methylimidazolium tetrafluoroborate (Omim BF4), 1-decyl-3-methylimidazolium tetrafluoroborate (Dmim BF4), 1-ethyl-3-methylimidazolium bis(trifluoromethylsulfonyl)imide (Emim TFSI),1-butyl-3-methylimidazolium bis(trifluoromethylsulfonyl)imide(Bmim TFSI), 1-hexyl-3-methylimidazolium bis(trifluoromethyl-sulfonyl)imide (Hmim TFSI), 1-octyl-3-methylimidazolium bis(trifluoromethylsulfonyl)imide (Omim TFSI), 1-decyl-3-methy-limidazolium bis(trifluoromethylsulfonyl)imide (Dmim TFSI) and1-dodecyl-3-methylimidazolium bis(trifluoromethylsulfonyl)imide(Ddmim TFSI) were purchased from IOLITEC.
Stock solutions of 36 mM of 14N-pDTEMPONE were preparedby weight in each IL. Then, 12 concentrations of 14N-pDTEMPONE(from 3 mM to 36 mM) were prepared from the stock solution.Before EPR measurements, the samples were drawn into 5 μl cap-illaries. The bottom end of each capillary was sealed by Heamatocritsealing compound, while the top end was left open. EPR spectrawere measured with a Varian E-109 X-band spectrometer upgradedwith a Bruker microwave bridge and a Bruker high-Q cavity. Spec-tra were acquired using a sweep time of 20 s; sweep width, 50 G;time constant, 16 ms; microwave power, 0.5 mW; and modulationamplitude, 0.1 G. A thermocouple connected to an Omega tem-perature indicator was placed above but very close to the activeregion of the EPR cavity to avoid reducing the cavity Q-factor.The sample temperature, controlled by a Bruker variable tempera-ture unit, was held stable within ±0.2 K. The temperature increaseinterval, 5 K, was the same for all samples, while the temperaturerange was chosen based on the thermal properties of the ionic liq-uid. The concentrations of 14N-pDTEMPONE were corrected foreach temperature using the literature temperature density values foreach IL.
B. The HSE-DD separation EPR methodThe HSE-DD separation EPR method has been described in
detail previously in Refs. 28 and 31; here, we give a brief overview
J. Chem. Phys. 152, 024502 (2020); doi: 10.1063/1.5138130 152, 024502-2
Published under license by AIP Publishing

The Journalof Chemical Physics ARTICLE scitation.org/journal/jcp
of the method. Due to the use of field modulation and lock-indetection, the experimental EPR spectrum of a nitroxide radicalS(B) = dR(B)/dB is the first derivative of the absorption EPR signalR(B) with respect to the applied magnetic field B. The EPR spec-trum of 14N-pDTEMPONE has three EPR lines because the nitrogennucleus 14N has the spin I = 1. The original spectral function forthe absorption EPR spectra of 14N-labeled radicals interacting byHSE and DD interactions can be calculated from the modified Blochequations,28,29,31 and it is given by
R(B) = J0 Re[ G(B)1 −ΛG(B)];G(B) =
3
∑k=1
1zk + Λ + i(B − B0)
, (1a)
where J0 is a constant, Λ is the coherence transfer rate, B0 is the cen-tral field line position of the spectrum, and zk is the kth hyperfineline parameter. The line parameters have the forms
z1 = Γ1 − i(A + S/3), z2 = Γ2 + 2iS/3, z3 = Γ3 + i(A − S/3), (1b)
where Γk is the spin dephasing rate of the kth line, A is the nitrogenhyperfine splitting, and S is a small relative second-order hyperfineshift.
Experimental EPR spectra are fitted to the first derivativeof R(B) from Eqs. (1a) and (1b), using the nonlinear regres-sion command in Mathematica [see Figs. SI 1(a)–SI 1(d) of thesupplementary material]. From the fits, we obtain the values of Γ,Λ, and A as a function of concentration [see Figs. SI 2(a) and SI 2(b)of the supplementary material and Fig. 2 in Ref. 28]; here, Γ is theaverage linewidth of the hyperfine lines equal to (Γ1 + Γ2 + Γ3)/3.Then, for each temperature, from the plots of Γ, Λ, and A vs concen-tration, we obtain the linear concentration coefficients of the averagelinewidth W2, coherence transfer rate V2, and hyperfine splitting B2,respectively. The coefficient B2 is not considered further since it hasa much smaller value than the coefficients W2 and V2. Using theexperimental values of W2 and V2 together with their numericallycalculated theoretical values for different diffusion coefficients [seeFigs. SI 2(c) and SI 2(d) of the supplementary material and Fig. 3 inRef. 28], we find the values of diffusion coefficients DW and DV ,respectively. Figures SI 2(c) and SI 2(d) of the supplementary mate-rial and Fig. 3 in Ref. 28 were obtained by solving the kinematicequations for the spin evolution of a nitroxide pair, considering thenitroxide spin probes as continuously diffusing spherical objects inthe hard-core pair potential. Finally, the diffusion coefficient value
D was calculated as the average value (DW + DV )/2 in the rangeD > 4 Å2/ns, where DW and DV do not differ much.
III. RESULTSA. 14N-pDTEMPONE translational diffusion in RTILs
The diffusion coefficient values D of 14N-pDTEMPONE as afunction of temperature are shown in Fig. 1(a) (BF4 based RTILseries) and Fig. 1(b) (TFSI based RTIL series). The lines are fits tothe Vogel-Fulcher-Tammann equation,
D = D0 exp( BT − T0
). (2)
The fits are excellent, with the correlation coefficients higher than0.9997. The values of the Vogel-Fulcher-Tammann fit parametersare presented in Table I. For the same cation, the translational diffu-sion is faster in TFSI RTILs [Fig. 1(b)] than in BF4 RTILs [Fig. 1(a)].This can be even better observed in Fig. SI 3 of the supplemen-tary material, where all the data are plotted together. In addition,as the chain length of the cation increases, the step decrease indiffusion decreases, becoming almost negligible, especially in thecase of TFSI [Fig. 1(b)]. This diffusion saturation implies that thediffusion of 14N-pDTEMPONE in longer chain RTILs is not thatmuch affected by the increasing apolar areas composed of alkylchains.
According to Cohen and Turnbull,35,36 the translational diffu-sion of a tracer molecule can be described by the Cohen-Turnbullequation,
D = AD√T exp(−γV
∗
Vf), (3)
where γV∗ is the minimum (critical) free volume for the diffusionof a tracer or solvent molecule to occur, V f is the free volume persolvent molecule, and γ is a constant of order unity. Usually, it is noteasy to obtain a reasonable estimate of V f for a solvent, especiallyfor an ionic liquid. Recently, a series of articles37–40 in which the freevolumes in several imidazolium ionic liquids were characterized andanalyzed by PALS spectroscopy has been published. In Ref. 37, theauthors presented an excellent discussion of the relations betweendifferent types of volumes that can be defined in solid and liquid
FIG. 1. Diffusion coefficient D of 14N-pDTEMPONE as a function of T in (a)Emim BF4 (blue circle), Bmim BF4 (redsquare), Hmim BF4 (green diamond),Omim BF4 (brown triangle) and DmimBF4 (purple inverted triangle), and (b)Emim TFSI (blue circle), Bmim TFSI (redsquare), Hmim TFSI (green diamond),Omim TFSI (brown triangle), Dmim TFSI(purple inverted triangle), and Ddmim(black lower right triangle). The lines arefits to the Vogel-Fulcher-Tammann equa-tion [Eq. (2)].
J. Chem. Phys. 152, 024502 (2020); doi: 10.1063/1.5138130 152, 024502-3
Published under license by AIP Publishing

The Journalof Chemical Physics ARTICLE scitation.org/journal/jcp
TABLE I. Fit parameters for the diffusion coefficients of 14N-pDTEMPONE in RTILsaccording to the Vogel-Fulcher-Tammann equation [Eq. (2)].
RTIL D0 (Å2 ns−1) B (K) T0 (K) R
Emim BF4 323 ± 55 513 ± 56 174 ± 8 0.9998Bmim BF4 329 ± 60 473 ± 54 199 ± 8 0.9999Hmim BF4 154 ± 24 270 ± 33 241 ± 6 0.9998Omim BF4 180 ± 40 303 ± 49 237 ± 9 09 999Dmim BF4 112 ± 29 209 ± 47 258 ± 10 0.9998Emim TFSI 461 ± 60 616 ± 49 148 ± 7 0.9999Bmim TFSI 301 ± 49 438 ± 48 192 ± 8 0.9999Hmim TFSI 236 ± 56 372 ± 64 209 ± 11 0.9998Omim TFSI 206 ± 47 331 ± 56 219 ± 10 0.9997Dmim TFSI 264 ± 58 394 ± 60 208 ± 10 0.9998Ddmim TFSI 254 ± 39 393 ± 40 209 ± 7 0.9999
phases. By using volumes obtained by X-ray diffraction (XRD), theauthors created a link between the molecular structure and free vol-ume in RTILs and successfully described the transport properties,such as viscosity and conductivity, of ILs in terms of free volumetheory.37
The free (hole) volume per molecule V f can be found accordingto the following equation:37,40
Vf =MA
ρNA− Vm,sc, (4)
where MA is the molar weight, ρ is the density, NA is the Avogadroconstant, and Vm,sc is the scaled molecular volume. The values ofVm,sc for BF4
− (79 Å3), TFSI− (233 Å3), and Bmim+ (197 Å3) arefrom Ref. 37, while the values of Vm,sc for Emim+ (141 Å3), Hmim+
(253 Å3), Omim+ (309 Å3), Dmim+ (365 Å3), and Ddmim+ (421 Å3)are calculated from Vm,sc of Bmim+ assuming that the value of Vm,scfor CH2 is 28 Å3.41 It is assumed that the total ionic molecule vol-ume is the sum of the ionic volumes of the constituent ions. For thevalues of Vm,sc and MA for each RTIL, see Table SI 1. The values ofρ are taken from the literature, and the equations used for the cal-culation of ρ for each RTIL and source references are given in thesupplementary material section.
TABLE II. Fit parameters for the diffusion coefficients of 14N-pDTEMPONE in RTILsaccording to the Cohen-Turnbull equation [Eq. (3)].
RTIL AD (Å2 ns−1) γV∗ (Å3) R
Emim BF4 92.5 ± 3.1 204.2 ± 1.5 0.998Bmim BF4 83.2 ± 2.9 217.3 ± 1.3 0.998Hmim BF4 63.6 ± 3.0 220.1 ± 2.4 0.996Omim BF4 40.3 ± 2.2 210.0 ± 2.8 0.997Dmim BF4 25.1 ± 1.6 196.4 ± 3.5 0.997Emim TFSI 33.1 ± 0.7 231.0 ± 1.4 0.999Bmim TFSI 37.9 ± 1.3 262.0 ± 2.4 0.998Hmim TFSI 30.9 ± 1.4 265.0 ± 3.4 0.998Omim TFSI 26.0 ± 1.2 261.4 ± 3.6 0.998Dmim TFSI 20.7 ± 0.7 249.8 ± 2.9 0.999Ddmim TFSI 16.6 ± 0.4 242.1 ± 2.0 0.999
The diffusion coefficient values D divided by the square rootof the temperature of 14N-pDTEMPONE as a function of thefree volume are shown in Fig. 2(a) (BF4 based RTIL series) andFig. 2(b) (TFSI based RTIL series). For a given cation, the avail-able free volume is about 50% larger in the TFSI RTILs than thatin the BF4 RTILs [Fig. SI 4]. The lines in the figures are fitsto the Cohen-Turnbull equation. The fit parameters for the dif-fusion coefficients of 14N-pDTEMPONE in RTILs and the cor-relation coefficients, which are greater than 0.996, are given inTable II. Figure 3(a) shows the values of γV∗ for the diffusion of14N-pDTEMPONE in both RTIL series (closed and open blue cir-cles) as a function of the number of carbons in the cation alkylchain. The values of γV∗ in the TFSI RTIL series are greater thanthose in the BF4 RTIL series by about 20%, as shown in Fig. 3(b).This observation is in accordance with the conclusion of Beichelet al.37 that the critical free volume increases with the molecularsize.
B. Cation and anion translational self-diffusionin RTILs
The self-diffusion coefficients of cations D+ and anions D−in BF4
15,17 and TFSI13,14,16 RTILs measured by a pulsed-gradient
FIG. 2. Diffusion coefficient D overthe square root of temperature of 14N-pDTEMPONE as a function of V f in (a)Emim BF4 (blue circle), Bmim BF4 (redsquare), Hmim BF4 (green diamond),Omim BF4 (brown triangle), and DmimBF4 (purple inverted triangle), and (b)Emim TFSI (blue circle), Bmim TFSI (redsquare), Hmim TFSI (green diamond),Omim TFSI (brown triangle), Dmim TFSI(purple inverted triangle), and Ddmim(black lower right triangle). The linesare fits to the Cohen-Turnbull equation[Eq. (3)].
J. Chem. Phys. 152, 024502 (2020); doi: 10.1063/1.5138130 152, 024502-4
Published under license by AIP Publishing

The Journalof Chemical Physics ARTICLE scitation.org/journal/jcp
FIG. 3. (a) Critical free volume γV∗ as a function of the number of carbons in the cation alkyl chain for D of 14N-pDTEMPONE in the BF4 series (blue filled circle), D of14N-pDTEMPONE in the TFSI series (blue unfilled circle), D+ in the BF4 series(red filled square), D+ in the TFSI series (red unfilled square), D− in the BF4 series (green filleddiamond), D− in the TFSI series (green unfilled diamond), η in the BF4 series (brown filled triangle), and η in the TFSI series (brown unfilled triangle). (b) The ratio of γV∗
from D of 14N-pDTEMPONE in TFSI and BF4 RTILs (blue filled circle), D+/D− in BF4 RTILs (red filled square), D+/D− in TFSI RTILs (green filled diamond), D+ in TFSI andBF4 RTILs (brown filled triangle), D− in TFSI and BF4 RTILs (purple filled inverted triangle), and η (eta) in TFSI and BF4 RTILs (black lower right triangle) as a function of thenumber of carbons in the cation. The lines are to guide the eye.
spin-echo NMR method are taken from the literature. Figure 4(a)shows the self-diffusion coefficients of cations D+ and anions D−divided by the square root of temperature for the BF4 based RTILseries (C2 to C8) as a function of free volume, while Fig. 4(b)shows the same thing for the TFSI series. The lines are fits tothe Cohen-Turnbull equation (3). The obtained parameters forthe fits are also given in Table III. From the correlation coeffi-cients in Table III and Figs. 4(a) and 4(b), it can be observedthat the fits are excellent. The largest difference in the coefficientsof diffusions of the cations and anions occurs in Emim TFSI,then, in decreasing order, in Bmim TFSI, Emim BF4, Omim BF4,and Hmim TFSI, while in the remaining liquids, the difference isnegligible.
The minimum critical free volumes for the diffusion of cationsand anions γV∗ have been presented in Fig. 3(a) and Table III. Sim-ilarly, as in the case of the values of γV∗ for 14N-pDTEMPONE
[Fig. 3(a) and Table II], the values of γV∗ for the self-diffusion ofthe cations and anions for the same cation are again greater in theTFSI RTIL series than those in the BF4 RTIL series by about 20%as shown in Fig. 3(b). Interestingly, the critical free volumes for thediffusion of the cations and anions are about the same in all RTILs[Fig. 3(b)]. The ratio of the critical free volumes for the diffusion ofcations and anions is close to unity, within five percent.
C. Viscosity of BF4 and TFSI RTILs in terms of freevolume
It has already been shown that empirical two-parameterCohen-Turnbull equations are very good descriptions of the viscos-ity of certain ILs.37–39 Since according to the Stokes-Einstein equa-tion η ∝ kBT
D , the Cohen-Turnbull equation for viscosity [Eq. (3)]becomes
FIG. 4. (a) Self-diffusion coefficients ofcations D+ (closed symbols) and anionsD− (open symbols) over the squareroot of temperature as a function ofV f in Emim BF4 (circles), Bmim BF4(squares), Hmim BF4 (diamonds), andOmim BF4 (triangles); (b) self-diffusioncoefficients of cations D+ (closed sym-bols) and anions D− (open symbols)as a function of V f in Emim TFSI (cir-cles), Omim TFSI (squares), Hmim TFSI(diamonds), and Dmim TFSI(triangles).The lines are fits to the Cohen-Turnbullequation [Eq. (3)].
J. Chem. Phys. 152, 024502 (2020); doi: 10.1063/1.5138130 152, 024502-5
Published under license by AIP Publishing
The Journalof Chemical Physics ARTICLE scitation.org/journal/jcp
TABLE III. Fit parameters for the diffusion coefficients of cations, D+, and anions, D−, in RTILs according to the Cohen-Turnbull equation [Eq. (3)].
RTIL AD+ (Å2 ns−1) γV∗ (Å3) R AD− (Å2 ns−1) γV∗ (Å3) R
Emim BF4 264 ± 20 245.9 ± 3.4 0.999 272 ± 21 253.3 ± 3.5 0.999Bmim BF4 371 ± 35 302.4 ± 4.2 0.999 579 ± 47 321.1 ± 3.6 0.999Hmim BF4 214 ± 14 313.2 ± 3.2 0.999 153.1 ± 7.2 295.4 ± 2.2 0.999Omim BF4 68.9 ± 0.9 294.4 ± 0.6 0.999 85.4 ± 1.6 296.1 ± 0.9 0.999Emim TFSI 94.6 ± 3.6 296.6 ± 2.6 0.999 74.9 ± 2.4 315.4 ± 2.2 0.999Bmim TFSI 103.5 ± 4.8 352.3 ± 3.2 0.999 97.6 ± 4.1 364.3 ± 3.0 0.999Hmim TFSI 83.3 ± 2.1 370.4 ± 1.8 0.999 75.8 ± 2.1 373.3 ± 2.0 0.999Omim TFSI 57.2 ± 0.5 370.6 ± 0.7 0.999 57.1 ± 0.5 373.3 ± 0.6 0.999
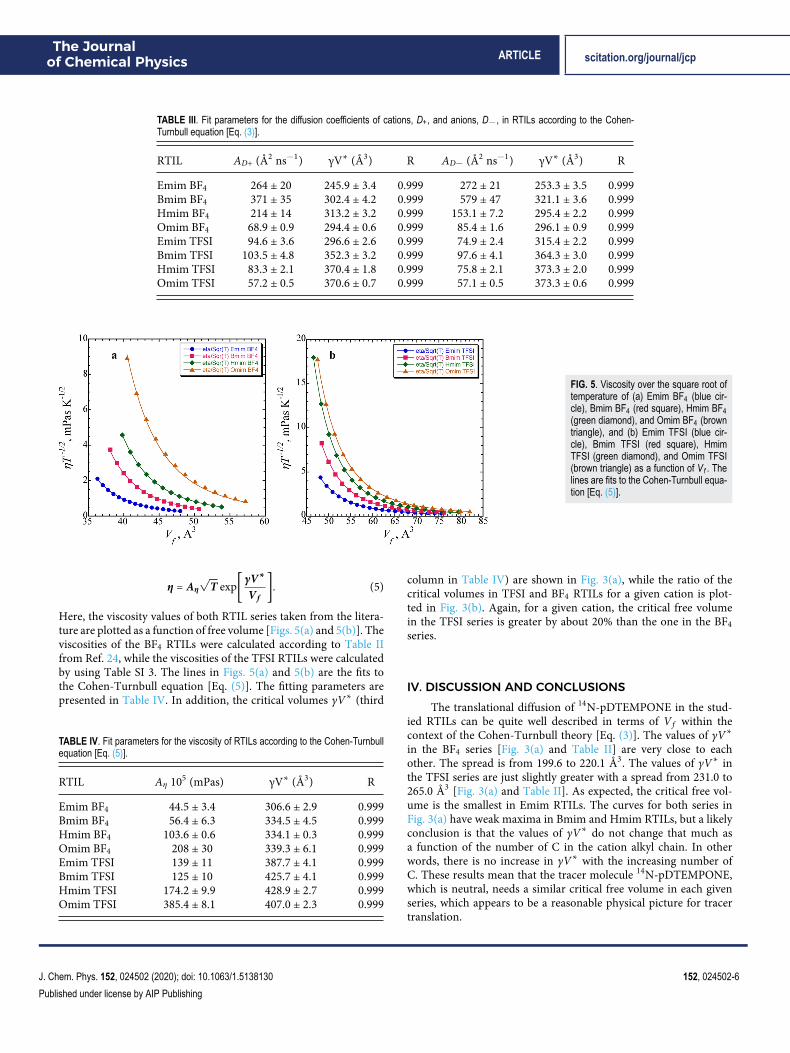
FIG. 5. Viscosity over the square root oftemperature of (a) Emim BF4 (blue cir-cle), Bmim BF4 (red square), Hmim BF4(green diamond), and Omim BF4 (browntriangle), and (b) Emim TFSI (blue cir-cle), Bmim TFSI (red square), HmimTFSI (green diamond), and Omim TFSI(brown triangle) as a function of V f . Thelines are fits to the Cohen-Turnbull equa-tion [Eq. (5)].
η = Aη√T exp[γV
∗
V f]. (5)
Here, the viscosity values of both RTIL series taken from the litera-ture are plotted as a function of free volume [Figs. 5(a) and 5(b)]. Theviscosities of the BF4 RTILs were calculated according to Table IIfrom Ref. 24, while the viscosities of the TFSI RTILs were calculatedby using Table SI 3. The lines in Figs. 5(a) and 5(b) are the fits tothe Cohen-Turnbull equation [Eq. (5)]. The fitting parameters arepresented in Table IV. In addition, the critical volumes γV∗ (third
TABLE IV. Fit parameters for the viscosity of RTILs according to the Cohen-Turnbullequation [Eq. (5)].
RTIL Aη 105 (mPas) γV∗ (Å3) R
Emim BF4 44.5 ± 3.4 306.6 ± 2.9 0.999Bmim BF4 56.4 ± 6.3 334.5 ± 4.5 0.999Hmim BF4 103.6 ± 0.6 334.1 ± 0.3 0.999Omim BF4 208 ± 30 339.3 ± 6.1 0.999Emim TFSI 139 ± 11 387.7 ± 4.1 0.999Bmim TFSI 125 ± 10 425.7 ± 4.1 0.999Hmim TFSI 174.2 ± 9.9 428.9 ± 2.7 0.999Omim TFSI 385.4 ± 8.1 407.0 ± 2.3 0.999
column in Table IV) are shown in Fig. 3(a), while the ratio of thecritical volumes in TFSI and BF4 RTILs for a given cation is plot-ted in Fig. 3(b). Again, for a given cation, the critical free volumein the TFSI series is greater by about 20% than the one in the BF4series.
IV. DISCUSSION AND CONCLUSIONSThe translational diffusion of 14N-pDTEMPONE in the stud-
ied RTILs can be quite well described in terms of V f within thecontext of the Cohen-Turnbull theory [Eq. (3)]. The values of γV∗in the BF4 series [Fig. 3(a) and Table II] are very close to eachother. The spread is from 199.6 to 220.1 Å3. The values of γV∗ inthe TFSI series are just slightly greater with a spread from 231.0 to265.0 Å3 [Fig. 3(a) and Table II]. As expected, the critical free vol-ume is the smallest in Emim RTILs. The curves for both series inFig. 3(a) have weak maxima in Bmim and Hmim RTILs, but a likelyconclusion is that the values of γV∗ do not change that much asa function of the number of C in the cation alkyl chain. In otherwords, there is no increase in γV∗ with the increasing number ofC. These results mean that the tracer molecule 14N-pDTEMPONE,which is neutral, needs a similar critical free volume in each givenseries, which appears to be a reasonable physical picture for tracertranslation.
J. Chem. Phys. 152, 024502 (2020); doi: 10.1063/1.5138130 152, 024502-6
Published under license by AIP Publishing

The Journalof Chemical Physics ARTICLE scitation.org/journal/jcp
For more than a decade, it has been known that RTILs formnanostructures.42–44 In the case of RTILs with the alkyl chainsshorter than C4, due to their electrostatic interactions, anions andcations are homogeneously distributed, and alkyl chain aggregationis minimal.44 Starting with the butyl chain length (C4), the alkylchain length enables the chains to form bicontinuous spongelikenanostructures44 (see Fig. 11 in Ref. 44). The size of nanostruc-tured soft apolar regions increases with the length of the cationalkyl chain.24,42,43 PALS gives only the hole radius distribution inthe bulk ionic liquid;38 as far as we know, there are no such dis-tributions for each domain. Therefore, if one assumes both homo-geneous hole radius distribution and diffusion throughout the bulkionic liquid, the growth of bicontinuous apolar nanodomains maynot change much the overall diffusion of the spin probe. Conse-quently, the saturation of the diffusion of 14N-pDTEMPONE inlonger chain RTILs [Figs. 1(a) and 1(b)] and the slight cation alkylchain dependence of γV∗ for RTILs with C4 and above (Fig. 3)are then expected due to the growth of the apolar soft domainsand the faster diffusion through them. The presented view of thediffusion of 14N-pDTEMPONE is in agreement with the findingson the diffusion of small neutral molecules in RTILs.19 Using MDsimulations, Araque et al.19 found out that small neutral moleculessample both polar and apolar RTIL domains. According to Araqueet al., the neutral probe is caged in the polar stiff regions, andthereby it diffuses slowly, while in the less polar soft regions, theneutral probe experiences fast diffusive jumps. In other words,the translational diffusion of 14N-pDTEMPONE speeds up in apo-lar nanodomains so that the overall diffusion does not changenoticeably.
The self-diffusion of the cations and anions of both series canalso be described as a function of V f using the Cohen-Turnbullequation. Again, the fitted values of the critical free volume arenoticeably lower in the case of Emim RTILs [Fig. 3(a) and Table III]compared to the remaining RTILs. After four carbons in the alkylchain, the values of the critical free volume appear almost constant.It has been observed that the self-diffusion coefficients of the cationand anion of a given RTIL are, in many cases, similar, even in thecase of substantial size differences.18 Here, we observe the similarityin the case of three (Bmim BF4, Hmim BF4, and Omim TFSI) outof eight RTILs [Figs. 4(a) and 4(b)]. From the ratio of γV∗ for D+and D− in a given RTIL, which is close to unity (ranges from 0.94 to1.06), it can be concluded that the values of γV∗ for the cation andanion of a given RTIL appear to be almost the same [Table III andFig. 3(b)] even in the case of Emim TFSI, in which the self-diffusionof D− is about 70% faster than the self-diffusion of D+ [Fig. 4(b)]. Inaddition, if the self-diffusion coefficients D+ and D− are added andthen fitted to the Cohen-Turnbull equation [Eq. (3), Figure SI 5], thevalues of γV∗are the average of the values of γV∗ for the cations andanions (Table SI 4).
The Cohen-Turnbull equation describes well the viscositybehavior of the studied RTILs in terms of free volume [Figs. 5(a) and5(b) and Table IV]. Although the values of the critical free volumefor viscosity are larger compared to the other two transport proper-ties for both series [Fig. 3(a)], the overall behavior is the same as inthe other two cases. The values of γV∗ do not change noticeably withthe length of the cation alkyl chain, and the ratio of the critical vol-umes in TFSI and BF4 RTILs is still close to 1.2 [Fig. 3(b)]. The ratioseems not to be related to the ratio of the free volumes between the
two series (Fig. SI 4) since the free volumes in the TSFI based RTILsare about 50% greater than those in the BF4 series. It appears thatthe ratio of the critical free volumes in the two series is related to theratio of the corresponding densities (Fig. SI 4), which is also closeto 1.2. There is no such relation among the members of each seriesas the critical volumes have almost the same values for the membersof each RTIL series (Fig. 3), while their densities are quite different(see Table SI 4 of the supplementary material). At the moment, therelation of the ratio of the critical volumes and the correspondingdensities for the studied RTIL series is empirical. It would be inter-esting to find out whether there is a similar relation between otherRTIL series. Since the only difference between the two series is theanion, there is no doubt that the nature of the anion is responsiblefor this relation. Possibly, the anion size affects the hole radius dis-tribution, which then affects the translation diffusion. Since the sizeof the TFSI anion is greater than the size of the BF4 anion, the highercritical volume values for the TFSI series than for the BF4 series agreewith the observation of Beichel et al.,37 who also observed a system-atic increase in the critical volumes for viscosity with the molecularsize of the anion in the case of the [C4MIM] series with differentanions. Based on the values from Ref. 37, the ratio of critical freevolumes for the viscosity of Bmim TFSI and Bmim BF4 is 1.23.
The three transport properties of ILs studied, the translationaldiffusion of 14N-pDTEMPONE cation and anion diffusion, and vis-cosity in TFSI and BF4 RTILs, can be described well in terms of freevolume concepts. The fits of the experimental data to the Cohen-Turnbull equations [Eqs. (3) and (5)] are excellent. The goodness offits validates the empirical procedure for finding the free volume inILs proposed by Beichel et al.37
Even in the cases when the self-diffusion coefficients of thecation and anion, e.g., Emim TFSI and Bmim TFSI [Fig. 4(b)], arenoticeably different, the critical free volumes for the diffusion of thecation and anion are the same. The similarity of the critical free vol-umes for the cation and anion suggests that the diffusion of eachionic pair is coordinated. The ratio of critical free volumes betweenthe two RTIL series for a given cation is similar for all three transportproperties, and it appears close to the ratio of their densities.
SUPPLEMENTARY MATERIAL
See the supplementary material for EPR spectra and fits of14N-pDTEMPONE in Emim BF4, average spin dephasing rate Γ andcoherence transfer rate Λ of 14N-pDTEMPONE in Emim BF4, con-centration coefficients W2 and V2 of 14N-pDTEMPONE in EmimBF4, diffusion coefficient D of 14N-pDTEMPONE as a function of T,ratio of the density and free volume of TFSI and BF4 RTIL as a func-tion of T, summation of the self-diffusion coefficients D+ and D− asa function of T, molecular weights and scaled molecular volumes ofRTILs, and densities of RTILs.
ACKNOWLEDGMENTSThis work was supported by the Croatian Science Foundation
under Project Nos. 1108 and 3168, as well as by the Foundation ofthe Croatian Academy of Sciences and Arts. D.M. wishes to thankDejana Caric for her assistance in sample preparation. M.P. grate-fully acknowledges support from NSF MRI (Grant No. 1626632) andNSF RUI (Grant No. 1856746).
J. Chem. Phys. 152, 024502 (2020); doi: 10.1063/1.5138130 152, 024502-7
Published under license by AIP Publishing

The Journalof Chemical Physics ARTICLE scitation.org/journal/jcp
REFERENCES1J. G. Huddleston, H. D. Willauer, R. P. Swatloski, A. E. Visser, and R. D. Rogers,Chem. Commun. 1998, 1765.2S. N. Baker, G. A. Baker, and F. V. Bright, Green Chem. 4, 165 (2002).3N. Ito and R. Richert, J. Phys. Chem. B 111, 5016 (2007).4D. Bankmann and R. Giernoth, Prog. Nucl. Mag. Reson. Spectr. 51, 63 (2007).5M. J. Earle and K. R. Seddon, Pure Appl. Chem. 72, 1391 (2000).6N. V. Plechkova and K. R. Seddon, Chem. Soc. Rev. 37, 123 (2008).7M. Freemantle, Chem. Eng. News 82, 44 (2004).8C. M. Gordon, Appl. Catal., A 222, 101 (2001).9P. Wasserscheid and W. Keim, Angew.Chem., Int. Ed. 39, 3772 (2000).10M. Armand, F. Endres, D. R. MacFarlane, H. Ohno, and B. Scrosati, Nat. Mater.8, 621 (2009).11S. Carda–Broch, A. Berthod, and D. W. Armstrong, Anal. Bioanal. Chem. 375,191 (2003).12B. Kirchner, Topics in Current Chemistry (Springer, Heidelberg, 2009), Vol. 290.13A. Noda, K. Hayamizu, and M. Watanabe, J. Phys. Chem. B 105, 4603 (2001).14H. Tokuda, S. Tsuzuki, M. A. B. H. Susan, K. Hayamizu, and M. Watanabe,J. Phys. Chem. B 110, 19593 (2006).15H. Tokuda, K. Hayamizu, K. Ishii, M. A. B. H. Susan, and M. Watanabe, J. Phys.Chem. B 108, 16593 (2004).16K. R. Harris and M. Kanakubo, Phys. Chem. Chem. Phys. 17, 23977 (2015).17K. R. Harris and M. Kanakubo, J. Phys. Chem. B 120, 12937 (2016).18A. Kaintz, G. Baker, A. Benesi, and M. Maroncelli, J. Phys. Chem. B 117, 11697(2013).19J. C. Araque, S. K. Yadav, M. Shadeck, M. Maroncelli, and C. J. Margulis, J. Phys.Chem. B 119, 7015 (2015).20G. E. Pake and T. R. Tuttle, Phys. Rev. Lett. 3, 423 (1959).21Y. N. Molin, K. M. Salikhov, and K. I. Zamaraev, Spin Exchange Principles andApplications in Chemistry and Biology (Springer, Berlin, 1980).
22B. Berner and D. Kivelson, J. Phys. Chem. 83, 1406 (1979).23B. L. Bales and M. Peric, J. Phys. Chem. B 101, 8707 (1997).24D. Merunka, M. Peric, and M. Peric, J. Phys. Chem. B 119, 3185 (2015).25B. L. Bales and M. Peric, J. Phys. Chem. A 106, 4846 (2002).26I. Peric, D. Merunka, B. L. Bales, and M. Peric, J. Phys. Chem. B 118, 7128(2014).27M. Peric, B. L. Bales, and M. Peric, J. Phys. Chem. A 116, 2855 (2012).28D. Merunka and M. Peric, J. Phys. Chem. B 121, 5259 (2017).29K. M. Salikhov, Appl. Magn. Reson. 38, 237 (2010).30K. M. Salikhov, Appl. Magn. Reson. 47, 1207 (2016).31D. Merunka and M. Peric, J. Mol. Liq. 277, 886 (2019).32J. M. Zielinski and J. L. Duda, AIChE J. 38, 405 (1992).33F. Faupel, W. Frank, M.-P. Macht, H. Mehrer, V. Naundorf, K. Rätzke, H. R.Schober, S. K. Sharma, and H. Teichler, Rev. Mod. Phys. 75, 237 (2003).34A. K. Doolittle, J. Appl. Phys. 22, 1471 (1951).35M. H. Cohen and D. Turnbull, J. Chem. Phys. 31, 1164 (1959).36D. Turnbull and M. H. Cohen, J. Chem. Phys. 34, 120 (1961).37W. Beichel, Y. Yu, G. Dlubek, R. Krause-Rehberg, J. Pionteck, D. Pfefferkorn,S. Bulut, D. Bejan, C. Friedrich, and I. Krossing, Phys. Chem. Chem. Phys. 15,8821 (2013).38G. Dlubek, Y. Yu, R. Krause-Rehberg, W. Beichel, S. Bulut, N. Pogodina,I. Krossing, and C. Friedrich, J. Chem. Phys. 133, 124502 (2010).39Y. Yu, W. Beichel, G. Dlubek, R. Krause-Rehberg, M. Paluch, J. Pionteck,D. Pfefferkorn, S. Bulut, C. Friedrich, N. Pogodina, and I. Krossing, Phys. Chem.Chem. Phys. 14, 6856 (2012).40Y. Yu, D. Bejan, and R. Krause-Rehberg, Fluid Phase Equilib. 363, 48 (2014).41H. Petrache, S. E. Feller, and J. F. Nagle, Biophys. J. 70, 2237 (1997).42Y. Wang and G. A. Voth, J. Am. Chem. Soc. 127, 12192 (2005).43C. Lopes, N. A. José, and A. A. H. Pádua, J. Phys. Chem. B 110, 3330 (2006).44R. Hayes, G. G. Warr, and R. Atkin, Chem. Rev. 115, 6357 (2015).
J. Chem. Phys. 152, 024502 (2020); doi: 10.1063/1.5138130 152, 024502-8
Published under license by AIP Publishing
Copyright © 2022 FDOKUMEN