TONGUE RIVER WATERSHED ASSESSMENT ... - State of Wyoming
366
TONGUE RIVER WATERSHED ASSESSMENT FINAL REPORT 1996 - 1999 September, 2000 Prepared by: Sheridan County Conservation District 1949 Sugarland Drive, Suite 102 Sheridan, WY 82801 (307) 672-5820
-
Upload
khangminh22 -
Category
Documents
-
view
0 -
download
0
Transcript of TONGUE RIVER WATERSHED ASSESSMENT ... - State of Wyoming

TONGUE RIVER WATERSHED
ASSESSMENT FINAL REPORT 1996 - 1999
September, 2000
Prepared by:
Sheridan County Conservation District
1949 Sugarland Drive, Suite 102
Sheridan, WY 82801
(307) 672-5820

Sheridan County Conservation District
Tongue River Watershed Assessment 205j Final Report 1996-1999 i
FORWARD The Tongue River watershed is the lifeblood for northwest Sheridan County, Wyoming because it
provides the water resource that drives the recreational, agricultural, urban and wildlife
opportunities in this region of Wyoming. Protection of this water resource is critical to maintain
the quality of life enjoyed by not only residents in the watershed, but by all Wyoming residents and
citizens from throughout the United States that visit this region for the recreational, esthetic,
spiritual and economic offerings provided by the watershed.
Water quality concerns have emerged over the years in that segment of the Tongue River from the
Bighorn National Forest (BHNF) boundary to the Town of Ranchester. Concerns were related to
suspect water quality deterioration manifest by sediment, nutrient, and bacterial inputs to the
Tongue River and its tributaries. Public health and safety concerns surfaced because the Town of
Dayton and the Town of Ranchester rely on the Tongue River for their domestic water supply.
The Town of Ranchester received complaints from residents regarding turbidity and odor. The
Ranchester Water Treatment Plant has shut down operation on occasion when the facility was
unable to meet treatment standards. Moreover, the Tongue River is a Class 1 coldwater trout
fishery near the BHNF boundary. This classification indicates a premium trout fishery of
national importance. The quality of the fishery declines to the Town of Ranchester suggesting a
declining water resource within this reach of the Tongue River.
SCCD in partnership with the Natural Resources Conservation Service (NRCS) initiated an
assessment of the Tongue River watershed between the Bighorn National Forest boundary and the
Town of Ranchester. SCCD and NRCS implemented the Project not only for water quality
concerns, but because of the high value for resources in the watershed and to continue to address
voluntary conservation and resource issues as part of an integrated conservation program. A
proposal was submitted to WDEQ in 1995 and funding was received in 1996. Additional 205(j)
funding was secured in 1998 to extend the watershed assessment through 1999.
In 1996, the Wyoming Department of Environmental Quality 305(b) report indicated this segment
of the Tongue River was not achieving full attainment of its beneficial uses. The 1996 Wyoming
Water Quality Assessment (305(b)) report listed this segment as Threatened due to fishery
concerns (WDEQ, 1996). The causes responsible for this finding were listed as siltation and
nutrients based on information provided by the Wyoming Game and Fish Department and the
United States Geological Survey monitoring station number 06298000. The sources for these
pollutants were reported as range land and pasture land.
The Little Tongue River and Smith Creek, tributaries to the Tongue River, were also listed by
WDEQ in 1996 for not achieving full attainment of their beneficial uses. The Little Tongue River
was listed as partially supporting aquatic life use while Smith Creek was listed as not supporting

Sheridan County Conservation District
Tongue River Watershed Assessment 205j Final Report 1996-1999 ii
drinking water standards due to pathogens indicated by high fecal coliform bacteria levels.
SCCD conducted chemical, physical, biological and stream habitat monitoring at stations on the
main stem Tongue River and major tributaries from 1996 through 1999. The Wyoming
Department of Environmental Quality Water Quality Division (WDEQ), Wyoming Game and
Fish Department (WGFD), United States Geological Survey (USGS), Ranchester Public Works
Department (RPWD), Wyoming State Board of Control (WSBC) and Natural Resources
Conservation Service (NRCS) conducted monitoring concurrent with SCCD monitoring during
the same time frame. This Final Report presents historic and current monitoring data, analysis of
the data from each monitoring group and provides recommendations for future monitoring
direction and assessment techniques. The Watershed Plan prepared under auspices of SCCD,
Tongue River Watershed Steering Committee and watershed landowners is provided as a separate
document (SCCD, 2000) and may be secured by contacting SCCD.
Sheridan County Conservation District
Tongue River Watershed Assessment 205j Final Report 1996-1999 iii
ACKNOWLEDGEMENTS
SCCD would like to thank many individuals and agencies for their time and effort offered during
this Project. Successful completion of this Project could not have occurred without their
assistance and dedication.
The SCCD supervisors and associate members provided encouragement and volunteered many
hours in the field. Sincere appreciation is due to Mr. Jerry Forster, Natural Resources
Conservation Service (NRCS) District Conservationist and fellow NRCS personnel in the
Sheridan, Wyoming office for assistance in the field. The NRCS Casper Wyoming Office
provided valuable precipitation and air temperature data and expertise for hydrologic aspects
including construction of discharge rating curves for discharge measurements. The Town of
Dayton and Town of Ranchester, especially Mr. Harold Herman, Director of the Ranchester Public
Works Department, provided valuable analytical technical assistance and extensive long term
water quality data files. Special thanks go to Kurt King, WDEQ, Sheridan, for providing
monitoring and assessment training to SCCD staff, technical advice, Quality Assurance and
Quality Control insight and field assistance. The Wyoming Game and Fish Department in
Sheridan provided fisheries data and a historical natural resource perspective for the Tongue River
watershed. George Cleek, NRCS liaison with the Wyoming Department of Agriculture was a
pivotal link in the watershed planning process. Sincere appreciation goes to the Tongue River
watershed landowners and users, especially those that allowed access for sampling.
The Wyoming Department of Environmental Quality is acknowledged for providing the
mechanism to conduct the watershed assessment and to the United States Environmental
Protection Agency for providing funding through Section 205(j) of the Clean Water Act.

Sheridan County Conservation District
Tongue River Watershed Assessment 205j Final Report 1996-1999 iv
EXECUTIVE SUMMARY Sheridan County Conservation District (SCCD) completed a four (4) year Tongue River
Watershed Assessment Project on the Tongue River and five (5) major tributaries. The Project
area located in North-Central Wyoming comprised approximately 80,000 surface acres and
extended from near the Bighorn National Forest boundary to the Town of Ranchester.
The Tongue River watershed is the lifeblood for northwest Sheridan County, Wyoming because it
provides the water resource that drives the recreational, agricultural, urban and wildlife
opportunities in this region of Wyoming. Protection of this water resource is critical to maintain
the quality of life enjoyed by not only residents in the watershed, but by all Wyoming residents and
citizens from throughout the United States that visit this region for the recreational, esthetic,
spiritual and economic offerings provided by the watershed.
Water quality concerns emerged over the years for the segment of the Tongue River from the
Bighorn National Forest boundary to the Town of Ranchester. Concerns were related to suspect
water quality deterioration manifest by sediment, nutrient, and bacterial inputs to the Tongue River
and its tributaries. Public health and safety concerns surfaced because the Town of Dayton and
the Town of Ranchester rely on the Tongue River for their domestic water supply. The Tongue
River fishery declines from a Class 1 wild trout fishery of national importance near the Bighorn
National Forest boundary to a marginal fishery at the Town of Ranchester indicating a declining
water resource.
SCCD in partnership with the Natural Resources Conservation Service (NRCS) initiated an
assessment of the Tongue River watershed between the Bighorn National Forest boundary and the
Town of Ranchester. SCCD and NRCS implemented the Project not only for water quality
concerns, but because of the high value for resources in the watershed and to continue to address
voluntary conservation and resource issues as part of an integrated conservation program. In
1995, funding was requested from the United States Environmental Protection Agency through
Section 205(j) funding administered by the Wyoming Department of Environmental Quality.
Funding was received in 1996 and 1998 for monitoring through 1999.
This segment of the Tongue River was identified by Wyoming Department of Environmental
Quality in 1996 as water quality limited and placed on the 303d list. The Little Tongue River and
Smith Creek, tributaries to the Tongue River, were also identified as water quality limited.
SCCD conducted integrated chemical, physical, biological and stream habitat monitoring at
multiple stations on the Tongue River and five major tributaries from 1996 through 1999. Some
of the tributaries had never been sampled prior to the Project. Other tributaries had not been
sampled at this scale or intensity. The Wyoming Department of Environmental Quality Water

Sheridan County Conservation District
Tongue River Watershed Assessment 205j Final Report 1996-1999 v
Quality Division (WDEQ), Wyoming Game and Fish Department (WGFD), United States
Geological Survey (USGS), Ranchester Public Works Department (RPWD), Natural Resources
Conservation Service (NRCS) and Wyoming State Board of Control (WSBC) conducted
monitoring in the watershed during the same time frame. Data collected by WDEQ after 1997
was considered PROVISIONAL for this Final Report and subject to change because data had not
been subjected to internal Quality Assurance review. Macroinvertebrate data collected by USGS
in 1999 was also considered PROVISIONAL and subject to change because data was not
subjected to the usual USGS Quality Assurance and peer review process.
This Final Report presents historic data from as early as 1938, current monitoring data, analysis of
the data from each monitoring group and provided recommendations for potential future
monitoring and assessment. The Tongue River Watershed Management Plan was prepared under
auspices of SCCD, Tongue River Watershed Steering Committee and watershed landowners.
The Plan was provided as a separate document from this Final Report and may be secured by
contacting SCCD. The Tongue River Watershed Management Plan charted the future direction
for land treatments, priorities, funding mechanisms and Information and Education. The role that
SCCD may play in future monitoring efforts is uncertain due to staffing limitations, limited
operating budget dependent upon “soft money”, unknown future funding and public support for
voluntary BMP implementations and land treatments. SCCD must stretch limited resources to
fulfill it’s commitment not only the Tongue River watershed, but to all Sheridan County residents
to promote and implement wise conservation practices.
Water pollutants affecting the Tongue River and primary tributaries were identified. Potential
sources for pollutants were discussed in relation to primary land uses. However, specific sources
for pollutants such as individual septic tanks, storm drains, animal feeding operation were not
identified because the Project scope was geared to a watershed scale assessment. The Tongue
River watershed within the Project area was a complex system due to multiple land uses and water
uses. Land ownership was about 92 percent private and 8 percent State of Wyoming land. Land
use in the upper watershed bordering the Bighorn National Forest was primarily wildlife habitat,
recreation and seasonal livestock grazing. Land use diversifies in the middle and lower portions
of the watershed. Agricultural land use predominated although wildlife habitat,
tourism/recreation, urban (areas within or immediately adjacent to a town) and emerging rural
subdivision development were locally significant. There are approximately 12,000 acres of
irrigated hay and crop land in the Project area with approximately one-third to one-half operating
at low efficiencies. Agricultural operations center around cattle and hay production enhanced by
irrigation water from the Tongue River and tributaries primarily during the summer growing
season. Livestock tend to be fed and wintered along the creek bottoms since these areas provide
the necessary shelter and water.
Quality Assurance and Quality Control (QA/QC) evaluation of data collected during the four year
Project indicated adequate data quality was provided to meet Project goals and objectives.

Sheridan County Conservation District
Tongue River Watershed Assessment 205j Final Report 1996-1999 vi
Recommendations were made when QA discrepancies were identified. Each water quality
monitoring project reveals numerous unanswered questions. This Project was no exception.
Recommendations found in this Final Report were provided to improve future water quality
monitoring and assessment within the Tongue River Project area. Some recommendations,
especially for water temperature and fecal coliform monitoring, may have implications to
statewide water quality monitoring by Conservation Districts, WDEQ and other groups.
The Tongue River Watershed Assessment Project was initiated before Credible Data legislation
was enacted in 1999 as per W.S. §35-11-103 of the Wyoming Environmental Quality Act. The
SCCD monitoring program met the criteria and intent of the legislation. This was important
because data collected during this Project may be used to determine attainment of designated uses
for the Tongue River and tributaries and to propose stream classifications or change in stream
classification when appropriate.
Water quality in the Tongue River from the Bighorn National Forest boundary to the Town of
Ranchester was good to excellent with few exceptions. Land use in the Bighorn National Forest
produced no significant effects for water quality and stream biological condition in the Tongue
River and its primary tributaries. Nutrient concentrations (nitrate, phosphorus and ammonia)
were either low or not detected, herbicides and pesticides were not detected. Turbidity, pH and
dissolved oxygen were within Wyoming water quality standards. Conductivity, alkalinity, total
sulfate and total chloride concentrations were relatively low for a water body of this stream order
and drainage area. Total hardness concentration indicated water in the Tongue River was
moderately hard to hard and reflected the predominant limestone geology in the upper watershed.
USGS sampling found non-detectable or low stream bed sediment metal concentrations; brown
trout fish tissue and liver samples indicated no accumulation of organic compounds. Water
column metals sampling found non-detectable or low concentrations. The metals and organic
sampling suggested low potential for contamination of the aquatic food chain and no fish
consumption advisory. Monthly water quality sampling by USGS at the Tongue River Upper
station confirmed findings from SCCD and WDEQ water quality sampling. Intensive monitoring
by WDEQ at the Dayton Wastewater Treatment Plant (WWTP) found no significant amount of
pollutants were entering the Tongue River from the WWTP.
Biological condition based on sampling and analysis of benthic macroinvertebrate communities
was rated good at each Tongue River station indicating full support for aquatic life use and
attainment of Wyoming water quality narrative biological criteria. Limited benthic
macroinvertebrate sampling conducted by USGS compared favorably with SCCD and WDEQ
benthic macroinvertebrate sampling despite differences in sampling method, sampling date and
sampling location. The transition from a cool water benthic community at the Upper station to a
warmer water benthic macroinvertebrate community at the Lower station reflected the increase in
water temperature along the longitudinal gradient from the upper to lower reaches. Dewatering
during the summer accelerated water temperature increase in the lower reach. Periphyton and

Sheridan County Conservation District
Tongue River Watershed Assessment 205j Final Report 1996-1999 vii
algae samples were collected by USGS and WDEQ, but analytical results were not available for
this Final Report.
In-stream and riparian habitat quality was reduced from the Tongue River Upper to Lower reaches
based on qualitative habitat scoring criteria. Because habitat assessments were subjective, SCCD
took a conservative approach for the interpretation of habitat data. The reduction in habitat scores
between stations was due to lower scores for embeddedness (silt cover on cobble and gravel stream
substrate), channel flow status, channel shape, channelization, width depth ratio and bank stability.
Reduced scores for some of the habitat parameters were related not only to current land use
practices and water management, but to lingering effects from the period of extensive
channelization that apparently occurred in the late 1950's to early 1960's. The semi-quantitative
stream substrate particle size distribution varied little between stations. The general decrease in
substrate particle size observed from the Upper station to the Lower station was normal because
particle size generally decreases as stream size, drainage area and stream order increase. Stream
substrate composition at Tongue River stations in order of importance was cobble, coarse gravel
and fine gravel. Sand and silt deposition was minimal. Sand comprised from 1 percent to 5
percent of stream substrate at Tongue River stations. Only the Upper and Lower stations had
detectable silt deposition. Silt comprised about one (1) percent of total substrate at those stations.
Stream substrate embeddedness increased from the Tongue River Upper to Lower stations.
Increase in embeddedness from the Upper to Lower stations was considered normal for the size
(drainage area was 347 square miles at Tongue River Lower station) and stream order of the
Tongue River. The increase in embeddedness and minor increase in sediment deposition
observed from Tongue River upper to lower reaches was expected due to normal hydrologic
processes. Increased water temperature, embeddedness and minor sediment deposition had no
apparent detrimental effect on the benthic macroinvertebrate population because biological
condition was rated very good and full support of aquatic life use was indicated. Despite the
reduction in habitat scores and increase in embeddedness values from Tongue River Upper to
Lower stations, these stations ranked high when compared to habitat scores and embeddedness
values observed at other plains streams in the Northwestern Great Plains ecoregion of Wyoming.
The small percent of sand and silt comprising the Tongue River stream substrate further indicated
no large scale disruption in the Tongue River watershed.
Review of historic and current WGFD fishery data found game fish populations were dominated
by trout species in the Tongue River upper canyon reach. Whitefish replaced trout species
downstream of the canyon into the middle reach. Extensive historic channelization appeared to
reduce trout habitat and trout populations downstream to the Town of Ranchester. Non-game
fish populations increased in abundance in this reach. Loss of habitat due to channelization,
channel modification, and elevated summer water temperature accelerated by dewatering
appeared to be the primary reasons for the decline in game fish populations observed in the Tongue
River over the years. Effects of channelization and channel modification continue to this day
Sheridan County Conservation District
Tongue River Watershed Assessment 205j Final Report 1996-1999 viii
requiring stream bank stabilization projects.
Long term monitoring data sets provided by RPWD indicated a gradual, but significant decline in
turbidity, water temperature and pH in the Tongue River over the years. Decline in alkalinity was
also indicated in a short term two (2) year data set. Decline in pH and alkalinity could be related
to anthropogenic (man caused) effects affecting other water bodies nationwide (i.e. acid rain),
change in water management in Tongue River tributaries or to other unknown factors. Reduction
in turbidity and water temperature were positive trends. Continued monitoring by RPWD was
recommended to track the trends in pH and alkalinity because further decline may affect the
aquatic biological community, fishery and the ability of the Tongue River to meet Wyoming water
quality standards.
All Wyoming water quality numeric and narrative criteria were met in the Tongue River with the
exception of frequent water temperature and infrequent fecal coliform bacteria exceedences in the
lower reach near the Town of Ranchester. Dewatering appeared to accelerate the increase in
summer water temperature. There was one fecal coliform sample that exceeded the Wyoming
water quality standard during the four (4) year Project representing four (4) percent of total fecal
coliform bacteria samples collected. Significant, but infrequent fecal coliform bacteria
contamination may exist. Because the fecal coliform excursion occurred near the Ranchester
Water Treatment Plant intake, remedial action should be pursued to ensure that all fecal coliform
bacteria samples are in compliance with the Wyoming water quality standard.
Historic fecal coliform data were compared to fecal coliform data collected during this Project.
There was no large difference in fecal coliform bacteria between periods in the upper reach of the
Tongue River. Generally consistent and low fecal coliform bacteria levels were observed since
1976 to present. Potential wildlife and recreational sources for fecal coliform bacteria potentially
affecting the upstream reach were not contributing significant levels of bacterial contamination.
Livestock do not access this area because the steep-walled canyon does not provide suitable
grazing pasture. Significant reductions in fecal coliform bacteria level occurred from 1985 to
present in the middle reach of the Tongue River. The reduction in fecal coliform bacteria was
probably due to the significant upgrade of the Dayton WWTP in the mid-1980's, continued
effective operation and maintenance of the facility. Fecal coliform bacteria level in the lower
Tongue River reach appeared to decline slightly over time, but large differences in the number of
samples collected between periods prevented a firm conclusion.
The Tongue River will remain on the Wyoming 303d list identifying water quality limited stream
segments due to exceedence of the water temperature and fecal coliform bacteria standards.
However, the size of the current water quality limited segment should be reduced. The current
water quality limited segment was from near the Tongue River Upper station and Bighorn
National Forest boundary to the Tongue River Lower station at Ranchester. The revised water
quality limited segment should be listed as from the Halfway Lane County Road near the Tongue

Sheridan County Conservation District
Tongue River Watershed Assessment 205j Final Report 1996-1999 ix
River Middle station located about midway between the Town of Dayton and the Town of
Ranchester, to the Town of Ranchester. Reduction in size of the water quality limited segment
was justified because no water quality problems were identified at or upstream of the Tongue
River Middle station. Impairments will be listed as water temperature and fecal coliform
bacteria. Being retained on the 303d list will require remedial action probably in the form of
BMP implementation and voluntary conservation land treatments in concert with water
management modification to restore water quality. SCCD prepared the Tongue River Watershed
Management Plan (SCCD, 2000) under the auspices of the Tongue River Watershed Steering
Committee (TRWSC) and Tongue River watershed landowners with assistance from NRCS. The
management plan and TRWSC will guide future prioritization and implementation of voluntary
land treatments, land management changes and monitoring activity within the Project area to bring
affected water bodies back into compliance with Wyoming water quality standards. The
Watershed Plan will delay implementation of Total Maximum Daily Loads (TMDL’s) for both
water temperature and fecal coliform.
Water temperature naturally increases along the longitudinal gradient in the Tongue River during
the warmer summer months. Dewatering accelerated the increase in water temperature and
resulted in loss of habitat by restricting trout to reaches further upstream. However, after
accounting for these factors and evaluation of credible historic and current chemical, physical and
biological data, it was evident that the Tongue River Lower station was sited in the transition zone
between a cold water system (WDEQ Class 2 cold water) and a warm water system (WDEQ Class
2 warm water). The entire length of the Tongue River to the Montana border is currently a Class
2 cold water, water body. SCCD proposed that reclassification of the Tongue River from Class 2
cold water to Class 2 warm water was warranted. The Interstate 90 Bridge was proposed as a
possible point of division between cold water and warm water stream classes. SCCD may
consider submittal of a formal petition to WDEQ to initiate the reclassification process at a later
date. Data and findings contained in this Final Report should provide adequate justification for
initiation of the proposed reclassification. The proposed reclassification will not change the
current status for placement of the Tongue River Lower segment on the Wyoming 303d list, but
will provide more appropriate water quality goals for the downstream segments.
Water quality in tributaries was poorer than water quality in the Tongue River. Each tributary
exceeded one or more Wyoming water quality standards and will be placed on the Wyoming 303d
list. Smith Creek and Little Tongue River were previously on the 303d list and will remain.
Columbus Creek, Wolf Creek and Five Mile Creek will be new additions to the 303d list.
Smith Creek will be listed for exceedence of the fecal coliform bacteria standard, the turbidity
standard and water temperature standard. The water quality limited length of stream was
identified as the segment from the Smith Creek Upper station to the Smith Creek Lower station
because the impairments were occurring somewhere between the two stations.
Little Tongue River will be listed for exceedence of the fecal coliform bacteria standard, the water

Sheridan County Conservation District
Tongue River Watershed Assessment 205j Final Report 1996-1999 x
temperature standard and narrative biological criteria standard. The water quality limited length
of stream was identified as the segment from the Little Tongue River Upper station to the Little
Tongue River Lower station because the impairments were occurring somewhere between the two
stations. The Little Tongue River Upper station exceeded the narrative biological criteria
standard based on WDEQ benthic macroinvertebrate sampling in 1993. SCCD analysis
confirmed the WDEQ finding.
Columbus Creek will be listed for exceedence of the fecal coliform bacteria standard, water
temperature standard, turbidity standard and narrative biological criteria standard. The water
quality limited length of stream was identified as the segment from the Columbus Creek Upper
station to the Columbus Creek Lower station because the impairments were occurring somewhere
between the two stations. Water quality upstream of the Upper station was good with the
exception of a single high fecal coliform bacteria sample representing four (4) percent of total
samples. SCCD proposed that the Columbus Creek segment upstream of this station not be
placed on the 303d list due to the single sample exceedence. Rather, SCCD proposed to continue
fecal coliform bacteria monitoring to determine if significant bacterial contamination persisted.
Wolf Creek will be listed for exceedence of the fecal coliform bacteria standard, water temperature
standard and turbidity standard. The water quality limited stream segment was identified as from
the Wolf Creek Upper station to the Wolf Creek Lower station because the impairments were
occurring somewhere between the two stations. The EPA secondary drinking water standard for
total sulfate was exceeded based on a single WDEQ sample collected in 1995 at the Wolf Creek -
Berry station. However, the EPA secondary drinking water standard was not enforceable and as
such, will not require a potential TMDL.
Five Mile Creek exhibited the poorest water quality of any stream assessed during this Project.
Five Mile Creek will be placed on the 303d list for exceedence of the fecal coliform bacteria
standard, water temperature standard, turbidity standard and narrative standard for biological
criteria. The EPA secondary drinking water standard for sulfate was exceeded, but this standard
was not enforceable and will not require a potential TMDL. The sulfate concentration may pose a
seasonal health risk to young livestock and animals especially if they are not acclimated to higher
sulfate water. The water quality limited length of stream was identified as the entire Five Mile
Creek drainage including the Five Mile Ditch and both irrigation storage reservoirs because the
impairments were occurring somewhere upstream of the Five Mile Creek Lower station.
Five Mile Creek was currently not classified by WDEQ, but assumed the classification of the
Tongue River (Class 2 cold water) due to the “tributary rule”. Five Mile Creek functions as an
irrigation water supply conduit. SCCD proposed that Five Mile Creek be classified as a Class 3
water body. Because Five Mile Creek was currently not classified, SCCD believes notification
and reference to this Final Report should provide sufficient documentation to justify the proposed
classification. The Class 3 determination will not change the status for placement of Five Mile

Sheridan County Conservation District
Tongue River Watershed Assessment 205j Final Report 1996-1999 xi
Creek on the Wyoming 303d list.
Chemical, physical, biological and habitat attributes were ranked by station to assist prioritization
of voluntary land treatments and management activity to improve water quality. Five Mile Creek
had the poorest water quality followed by Columbus Creek, Smith Creek, Little Tongue River and
Wolf Creek. The Tongue River stations rated highest for water quality. Site ranking for
biological condition based on benthic macroinvertebrates closely agreed with the site ranking for
water quality. Close agreement between water quality and benthic macroinvertebrate rankings
suggested that macroinvertebrate sampling alone could provide a good estimate for water quality
at a fraction of the cost. The percent contribution of benthic oligochaetes (worms) to the total
benthic macroinvertebrate community was a statistically significant and reliable predictor for
identification of significant fecal coliform bacteria contamination. Certain worm taxa including
Ophidonais serpentina, Eiseniella tetraedra, Nais variabilis and Lumbricina may present
additional predictive power because these organisms occurred most frequently at stations
exceeding the Wyoming water quality standard for fecal coliform bacteria. No Tubifex tubifex
worms were identified from samples. T. tubifex is significantly involved in the whirling disease
life cycle caused by a parasite (Myxobolus cerebralis) that penetrates the head and spinal cartilage
of fingerling trout. Whirling disease may eventually cause death in trout and the absence of this
worm indicated low probability for the occurrence of whirling disease in the Tongue River
watershed within the Project area.. These associations further indicated the importance of benthic
macroinvertebrates as cost-effective water quality indicators.
Comparability between the habitat assessment ranking and both water quality and benthic
macroinvertebrate rankings was not good. The subjective nature of the habitat assessment and
annual variability in flow dependent habitat parameters appeared to be important factors related to
the lack of comparability between the habitat assessment and the water quality and biological
condition rankings.
Water quantity reduction and water temperature increase observed at tributaries affected mainstem
Tongue River water resources. However, cumulative total discharge from tributaries comprised a
relatively small proportion of total discharge in the Tongue River. With the exception of Smith
Creek and Five Mile Creek, each tributary exhibited a reduction in stream discharge from Upper to
Lower stations. Reduction in discharge was most apparent during the summer irrigation months.
Reduction in tributary discharge reduced the quantity of pollutants entering the Tongue River.
The Little Tongue River contributed an estimated 6.2 percent of the Tongue River discharge.
Smith Creek comprised an estimated 1.3 percent, Columbus Creek 1.3 percent, Wolf Creek 8.9
percent and Five Mile Creek an estimated 1.6 percent of the total Tongue River discharge. The
proportionally small percentage attributed to Five Mile Creek was due to diversion of Columbus
Creek water into the Five Mile Creek watershed. Accordingly, diversion from Columbus Creek
into Five Mile Creek reduced the amount of discharge from Columbus Creek to the Tongue River.
It was noted that discharge data measured during this Project was usually from April through

Sheridan County Conservation District
Tongue River Watershed Assessment 205j Final Report 1996-1999 xii
September and may not reflect total annual discharge characteristics for the tributaries.
Water management and irrigation practices appeared to greatly influence water quality, aquatic
benthic communities and fish populations more in tributaries than in the Tongue River. The
proportion of irrigation return comprising total tributary discharge appeared high especially for
Smith Creek, Columbus Creek and Wolf Creek. Dewatering, admixture of ambient water with
irrigation return water and variable stream discharge related to irrigation demand appeared to
result in the lack of consistent and expected associations between discharge and certain water
quality parameters. The apparent repeated use and reuse of water was a complicating factor in
determining the fate of pollutants in the tributaries. These factors may be responsible for the lack
of consistent associations between fecal coliform bacteria and temperature, discharge and turbidity
at the regulated Lower tributary stations. Irrigation return entering the Tongue River did not
appear to have a significant impact on Tongue River water quality and water quantity because
primary points for return water were located downstream of the Project area.
The majority of pollutants affecting tributaries were from apparent non-point sources. Water
quality and fecal coliform bacteria levels changed significantly from the Upper tributary stations to
the Lower tributary stations. Accordingly, primary land use and water management changed
significantly from the Upper tributary to Lower tributary stations.
Fecal coliform bacteria levels were generally low at the Tongue River Upper station and at each of
the Upper tributary stations. With the exception of the Columbus Creek Upper station (one daily
exceedence), there were no exceedences of the Wyoming water quality standard for fecal coliform
bacteria during the four year Project. Primary land use in the watershed at and upstream of these
stations included wildlife, recreation and seasonal livestock grazing. This observation indicted
that wildlife, recreation and limited seasonal livestock grazing land use had no significant effect on
fecal coliform bacteria levels.
Fecal coliform bacteria levels increased significantly at the Tongue River Lower station and each
tributary station. Each station exceeded the Wyoming water quality standard for fecal coliform
bacteria. Agricultural land uses including irrigated hayland, dryland pasture and livestock
grazing (more intensive, some year around grazing) predominated areas between the Upper and
Lower tributary stations although wildlife habitat, recreation, rural residential and urban land use
were locally important. It was not possible to separate the potential influence of agricultural land
uses from the potential influence by wildlife, recreation, and other land uses on fecal coliform
bacteria levels at the Lower stations. Ancillary effects related to irrigation water delivery and
return may promote fecal coliform bacteria contamination by transporting bacteria, contributing
sediment and creating variable discharges resulting in the instability of stream bottom sediment
suspected of harboring bacteria and resuspension of fecal coliform bacteria. Although wildlife
land use was not an important source of fecal coliform bacteria at the Upper tributary stations,
change in the stream channel morphology from the higher gradient Upper stations in the foothills

Sheridan County Conservation District
Tongue River Watershed Assessment 205j Final Report 1996-1999 xiii
to the lower gradient and meandering Lower stations in the plains provided better habitat for
increased utilization by waterfowl and small mammals. Thus, the role that waterfowl may exert
on fecal coliform bacteria levels further complicated the search for fecal bacteria sources.
Although livestock grazing was suspected as a potential source for significant bacterial
contamination at some of the Lower tributary stations, certain best management practices may be
implemented to ensure livestock grazing has no significant effect on bacteria levels. Likewise,
suspect urban, recreational, rural residential and agricultural land use practices should be
re-evaluated throughout the Tongue River watershed within the Project area.
Identification of fecal coliform bacteria sources is elusive because of the usual interaction of
wildlife, livestock and occasionally humans through urban, rural residential and normally limited
high use recreation concentration. Because wildlife and livestock have more widespread
distribution throughout the Tongue River watershed, they represent the primary potential sources
for fecal coliform bacteria. Identification of potential sources is even more difficult in urban
areas affected by storm drain effluent. Recent advances in biotechnology have allowed water
quality investigators to more readily discern sources of fecal contamination through DNA testing.
DNA testing is relatively expensive and time consuming and results may be inconclusive about 20
percent to 60 percent of the time. Reliability for identification of fecal bacteria sources increases
as the reference source material database increases for the watershed under study. Although
expensive in the short term, DNA testing may realize long term benefits and cost savings by more
effectively directing water quality improvement funds to areas suspect of fecal contamination.
SCCD and other monitoring groups may explore use of DNA testing for future monitoring in the
Project area or for statewide monitoring.
Considerable analysis of fecal coliform bacteria data was conducted because each tributary and the
Tongue River Lower station exceeded the Wyoming water quality standard. Regression analyses
were conducted to determine the relationship between fecal coliform bacteria level, certain water
quality parameters and select benthic macroinvertebrate community metrics.
With few exceptions, there were no consistent statistically significant associations between fecal
coliform bacteria level and discharge, temperature and turbidity at the Tongue River Upper station
and at the Upper tributary stations. These stations normally exhibited lower fecal coliform levels
and with the exception of a single high fecal coliform bacteria sample at Columbus Creek Upper,
none exceeded Wyoming water quality standards. There was an infrequent statistically
significant relationship between fecal coliform and discharge, water temperature and turbidity.
Turbidity appeared to be the primary physical factor that was routinely significantly associated
with high fecal coliform bacteria levels at Lower tributary stations and the Tongue River Lower
station. However, the association was not consistent at all stations indicating that merely
reducing turbidity would not always result in reduction in fecal coliform levels. Discharge, and

Sheridan County Conservation District
Tongue River Watershed Assessment 205j Final Report 1996-1999 xiv
then temperature, occasionally exhibited statistical significance with fecal coliform bacteria levels
usually at the Lower tributary stations where discharge was highly regulated by irrigation demand.
There appeared to be more interaction between turbidity, discharge and temperature with fecal
coliform bacteria levels at the more highly regulated Lower tributary stations than at the Upper
tributary stations that were not regulated by irrigation demand. Some of the conflicting “noise”
present in the fecal coliform bacteria - water quality chemical and physical relationships at the
Lower tributary stations sited in urban settings may be due to potential fecal coliform
contamination from urban sources during low stream discharge in addition to suspected fecal
coliform contamination from upstream wildlife and agricultural related land use.
The association between turbidity and fecal coliform bacteria level may be related in part to
sediment deposition. Sediment may harbor bacteria for a considerable length of time.
The usual significant relationship between fecal coliform bacteria and turbidity suggested a strong
link to deposition of stream bed sediment. The statistically significant association between
increase in percent of Oligochaeta (worms associated with sediment and organic pollution) in the
benthic community and increase in fecal coliform bacteria contamination added more evidence to
suggest a link between fecal bacteria in sediment with fecal coliform bacteria detected in the water
column.
Sampling frequency influenced the ability to reliably detect significant fecal coliform bacteria
contamination. SCCD found that a single instantaneous monthly grab sample for fecal coliform
would miss significant fecal coliform bacteria contamination on average, about forty-eight (48)
percent of the time. However, the greater the level of fecal coliform contamination, the fewer
number of daily samples were generally needed to detect significant fecal coliform contamination
with confidence. At stations with high geometric mean fecal coliform bacteria levels greater than
500 per 100ml, samples collected on one to two different days would generally be sufficient to
detect significant fecal coliform bacteria levels (when using the WDEQ standard of 400 per 100ml
based on a single daily sample). When fecal coliform bacteria levels were lower (geometric mean
from 200 per 100ml to 300 per 100ml), the minimum number of separate daily samples collected
must be increased from three (3) to five (5) per 30 day period to reliably detect significant fecal
coliform contamination. The single daily sample for fecal coliform collected monthly by SCCD
had a probability of about 50 percent of missing significant fecal coliform levels when in fact
significant bacteria probably existed.
Sampling season had a significant effect on fecal coliform bacteria level. SCCD evaluation of
WDEQ fecal coliform bacteria data collected from the adjacent Goose Creek watershed found a
significant difference (P<0.01) in fecal coliform bacteria level between the Recreation Season
(May 1 to September 30) and Non-Recreation Season. Fecal coliform bacteria levels were
significantly higher at each station during the Recreation Season than during the Non-Recreation
season. The greatest difference observed at a single station was a 31-fold decrease in fecal
coliform bacteria during the Non-Recreation Season when compared to fecal coliform bacteria

Sheridan County Conservation District
Tongue River Watershed Assessment 205j Final Report 1996-1999 xv
levels during the Recreation Season. Several stations exhibited >15-fold decreases in fecal
coliform bacteria during the Non-Recreation Season.
Based on these findings, SCCD will modify fecal coliform bacteria sampling frequency for future
watershed scale and routine water quality sampling. Sampling will occur during the Recreation
Season and at a minimum frequency of five (5) samples each on separate days during a 30 day
period within the Recreation Season (May 1 through September 30). Sampling for fecal coliform
bacteria outside the Recreation Season may be required to identify sources for fecal coliform, but
the data should be relegated to an secondary role for public health and safety concerns. Other
Conservation Districts and monitoring groups in Wyoming may consider adopting this sampling
frequency to standardize fecal coliform bacteria monitoring results statewide.
Analysis of historic and current water temperature data found that routine instantaneous water
temperature measurements were insufficient to detect maximum daily water temperature.
Maximum daily summer water temperature in the Tongue River was generally recorded between
1700 hours (5:00 pm) and 2000 hours (8:00 pm) and minimum daily water temperature generally
occurred from 0800 hours (8:00 am) to 1000 hours (10:00 am). The difference between
maximum and minimum daily summer water temperatures routinely ranged from 5oC to 7
oC.
The SCCD sampling design and routine water temperature measurements by other monitoring
groups in the watershed missed the maximum daily water temperature. SCCD sampling
generally occurred during the morning through early afternoon hours when lower water
temperatures persisted. Instantaneous daily water temperature measured by SCCD and others
during this Project usually more closely approximated the lower minimum daily water temperature
instead of maximum daily water temperatures needed to evaluate potential effects on cold water
fish species and determine compliance with the Wyoming temperature standard. This finding
indicated that water temperatures recorded in the Tongue River and tributaries could be
conservatively adjusted upward by from 5oC to 7
oC to provide a better estimate of maximum daily
water temperature. Continuous water temperature recorders or thermistors should be purchased
and installed at stations suspected of approaching the Wyoming water temperature standard.
The TRWSC will prioritize voluntary water quality improvement activity after consultation with
SCCD, landowners, WDEQ and EPA. Water bodies with confirmed fecal coliform bacteria
standard violations may receive the highest priority because they represent immediate public
health and safety concerns. Water bodies with turbidity, water temperature, sulfate and narrative
biological criteria exceedences may receive secondary priority. Other local important watershed
resource concerns (i.e. roads) and willingness of landowners to apply voluntary land treatments
should be closely factored into the prioritization process. Improvement in water quality will play
a major role in improvement of aquatic resources and fisheries.
Successful planning must include the entire watershed and the majority of landowners and land
users within the Project area. Water management in the upper watershed affects water users in

Sheridan County Conservation District
Tongue River Watershed Assessment 205j Final Report 1996-1999 xvi
the lower watershed. Land use and water management practices appeared to be indirectly
responsible for some water temperature, turbidity and narrative biological criteria standard
violations at the Tongue River lower reach and lower tributary stations. The role that water
management practice had on fecal coliform bacteria standard violations was less clear. The
Tongue River Watershed Management Plan listed this topic as a watershed concern.
Numerous recommendations were proposed throughout this Final Report. Additional water
quality and benthic macroinvertebrate monitoring will be required at some time because the
Tongue River Lower station and each tributary within the Project area will be placed on the
Wyoming 303d list identifying water quality limited stream segments. Monitoring will be
required to determine when water quality in these water bodies is improved to meet Wyoming
water quality standards. Future monitoring may be directed toward the identification of those
specific segments within each impaired tributary to better identify potential sources of significant
pollution and effectively target resources to improve water quality. Monitoring to identify
segments with significant pollutants and the potential sources of pollutants will require a more
complex and intensive sampling design than the basic upstream and downstream design used
during this Project. A project of this scope would require significant additional resources
currently beyond those available to SCCD. Local support from Sheridan County and its residents
will be instrumental in order for the District to accept future significant monitoring responsibilities
in the Tongue River watershed in addition to fulfilling it’s prior commitment to land and water
conservation for all Sheridan County residents.
It is possible that future monitoring will be funded primarily through Section 319 of the Clean
Water Act administered by WDEQ through EPA funding. Section 319 projects include a
combination of voluntary BMP implementations, land treatments and appropriate land
management changes in concert with an emphasis on intensive “implementation monitoring” to
determine if BMP’s and on the ground changes are effective by reducing water pollutants.
Intensive implementation monitoring will require more resources, QA/QC oversight, time and
coordination between the Project Sponsors, land owners and funding agencies.
Sheridan County Conservation District
Tongue River Watershed Assessment 205j Final Report 1996-1999 xvii
TABLE OF CONTENTS
FORWARD.......................................................................................................................... i
ACKNOWLEDGEMENTS ............................................................................................... iii
EXECUTIVE SUMMARY ............................................................................................... iv
TABLE OF CONTENTS ................................................................................................ xvii
LIST OF FIGURES ...................................................................................................... xxvii
LIST OF TABLES ....................................................................................................... xxxiii
1. INTRODUCTION..............................................................................................................1 1.1 STATEMENT OF NEED ........................................................................................1
2. GOALS, OBJECTIVES AND TASKS ............................................................................3 2.1 GOAL 1 - PROJECT ADMINISTRATION............................................................3
2.1.1 Objective 1 - Oversite as lead agency ..........................................................3
2.1.1.1 Task 1- Day to day management tasks ............................................3
2.2 GOAL 2 - DETERMINE NONPOINT SOURCE IMPAIRMENTS ......................3
2.2.1 Objective 1 - Sampling and analysis plan and parameter list ......................4
2.2.1.1 Task 2 - Compile and evaluate existing data ...................................4
2.2.1.2 Task 3 - Public education and input .................................................4
2.2.2 Objective 2 - Sample analyses and data interpretation ................................5
2.2.2.1 Task 4 - Monitor water quality ........................................................5
2.2.2.2 Task 5 - Assess health of riparian areas ...........................................5
2.3 GOAL 3 - DEVELOP WATERSHED PLAN .........................................................6
2.3.1 Objective 3 - Develop management and structural practices ....................6
2.3.1.1 Task 6 - Identify concerns and opportunities ...................................6
2.3.1.2 Task 7 - Identify high priority areas of concern ..............................6
3. DESCRIPTION OF PROJECT AREA ...........................................................................8
3.1 TONGUE RIVER AND MAJOR TRIBUTARIES .................................................8 3.1.1 Tongue River ......................................................................................................... 8
3.1.2 Little Tongue River .............................................................................................. 10
3.1.3 Smith Creek ......................................................................................................... 11
3.1.4 Columbus Creek .................................................................................................. 12
3.1.5 Wolf Creek ........................................................................................................... 14
3.1.6. Five Mile Creek ................................................................................................... 15

Sheridan County Conservation District
Tongue River Watershed Assessment 205j Final Report 1996-1999 xviii
3.2 LAND USES ..........................................................................................................16
3.3 POINT SOURCE DISCHARGES .........................................................................16
4. STREAM CLASSIFICATION AND STANDARDS ....................................................18
4.1 STREAM CLASSIFICATIONS ............................................................................18
4.2 BENEFICIAL USES .............................................................................................18
4.3 WATER QUALITY STANDARDS......................................................................18
5. HISTORIC AND CURRENT DATA SOURCES .........................................................23
5.1 HISTORICAL DATA AND DATA SOURCES ...................................................23
5.2 EVALUATION OF HISTORICAL DATA...........................................................24
5.3 CURRENT DATA COLLECTION BY OTHER INVESTIGATORS .................24
5.3.1 USGS data ..................................................................................................25
5.3.2 WDEQ data ................................................................................................25
5.3.3 WGFD data ................................................................................................26
5.3.4 NRCS data .................................................................................................26
5.2.5 WSBC data.................................................................................................26
5.2.6 RPWD data ................................................................................................27
6. MONITORING AND ASSESSMENT PLAN ...............................................................45
6.1 MONITORING DESIGN ......................................................................................45
6.1.1 Pre-Survey..................................................................................................45
6.1.2 Types of monitoring designs employed .....................................................46
6.2 SAMPLING STATIONS .......................................................................................47 6.2.1 Tongue River ....................................................................................................... 48
6.2.1.1 Tongue River Upper ............................................................................... 48
6.2.1.2 Tongue River Middle .............................................................................. 48
6.2.1.3 Tongue River Lower ............................................................................... 49
6.2.2 Little Tongue River .............................................................................................. 49
6.2.2.1 Little Tongue River Upper ...................................................................... 49
6.2.2.2 Little Tongue River Lower ..................................................................... 50
6.2.3 Smith Creek ......................................................................................................... 50
6.2.3.1 Smith Creek Upper ................................................................................. 50
6.2.3.2 Smith Creek Lower ................................................................................. 51
6.2.4 Columbus Creek .................................................................................................. 51
6.2.4.1 Columbus Creek Upper .......................................................................... 51
6.2.4.2 Columbus Creek Lower .......................................................................... 52
6.2.5 Wolf Creek ........................................................................................................... 52
6.2.5.1 Wolf Creek Upper ................................................................................... 52
6.2.5.2 Wolf Creek Lower .................................................................................. 53
6.2.6 Five Mile Creek Lower ........................................................................................ 53

Sheridan County Conservation District
Tongue River Watershed Assessment 205j Final Report 1996-1999 xix
6.3 SAMPLING PARAMETERS ................................................................................54
6.3.1 Field water chemistry and physical parameters .........................................54
6.3.1.1 Temperature ...................................................................................54
6.3.1.2 pH ...................................................................................................57
6.3.1.3 Conductivity ...................................................................................58
6.3.1.4 Dissolved Oxygen ..........................................................................58
6.3.1.5 Discharge .......................................................................................59
6.3.1.6 Precipitation and Air Temperature .................................................59
6.3.1.7 Habitat Assessment ........................................................................60
6.3.2 Laboratory Analyzed Water Chemistry Parameters ..................................60
6.3.2.1 Turbidity ........................................................................................60
6.3.2.2 Total Suspended Solids ..................................................................61
6.3.2.3 Alkalinity .......................................................................................62
6.3.2.4 Total Sulfate ...................................................................................62
6.3.2.5 Total Chloride ................................................................................63
6.3.2.6 Total Nitrate Nitrogen ....................................................................63
6.3.2.7 Total Phosphorus ...........................................................................64
6.3.2.8 Ammonia........................................................................................65
6.3.2.9 Total Hardness ...............................................................................66
6.3.2.10 Pesticides and Herbicides ..........................................................67
6.3.3 Laboratory Analyzed Biological Parameters .............................................67
6.3.3.1 Fecal Coliform Bacteria .................................................................67
6.3.3.2 Biochemical Oxygen Demand .......................................................68
6.3.3.3 Benthic Macroinvertebrates ...........................................................69
6.3.3.4 Periphyton ......................................................................................70
6.4 SAMPLING FREQUENCY ..................................................................................70
6.5 SAMPLING AND ANALYSIS METHODS ........................................................72
6.5.1 Water Quality .............................................................................................72
6.5.2 Discharge ...................................................................................................73
6.5.3 Precipitation and Air Temperature .............................................................73
6.5.4 Benthic Macroinvertebrates .......................................................................74
6.5.4.1 Macroinvertebrate Data Analysis, Determination of
Biological Condition and Aquatic Life Use...................................75
6.5.5 Habitat Assessment ....................................................................................77
6.5.5.1 Substrate Composition ...................................................................77
6.5.5.2 Embeddedness (silt cover) .............................................................78
6.5.5.3 Qualitative Habitat Assessment .....................................................79
6.5.5.4 Photopoints ....................................................................................82
7. QUALITY ASSURANCE AND QUALITY CONTROL ...........................................104
7.1 FUNCTION OF QUALITY ASSURANCE AND QUALITY CONTROL .......104

Sheridan County Conservation District
Tongue River Watershed Assessment 205j Final Report 1996-1999 xx
7.2 TRAINING ..........................................................................................................104
7.3 COLLECTION, PRESERVATION, ANALYSIS AND CUSTODY
OF SAMPLES FOLLOWING APPROVED METHODS ..................................105
7.3.1 Collection, Preservation and Analysis .....................................................105
7.3.2 Sample Custody .......................................................................................105
7.4 CALIBRATION AND PROPER OPERATION OF FIELD AND
LABORATORY EQUIPMENT ACCORDING TO MANUFACTURER’S
INSTRUCTIONS .................................................................................................105
7.5 COLLECTION OF REPRESENTATIVE SAMPLES ........................................105
7.6 DATA QUALITY OBJECTIVES, PRECISION, ACCURACY,
COMPLETENESS, AND COMPARABILITY ..................................................106
7.6.1 Data Quality Objectives ...........................................................................106
7.6.2 Precision ...................................................................................................106
7.6.3 Accuracy ..................................................................................................106
7.6.4 Completeness ...........................................................................................107
7.6.5 Comparability ..........................................................................................107
7.7 DATA VALIDATION.........................................................................................108
7.8 DOCUMENTATION AND RECORDS .............................................................108
7.9 DATA BASE AND DATA REDUCTION .........................................................108
7.9.1 Data Base Construction............................................................................108
7.9.2 Data Reduction.........................................................................................109
7.10 DATA REPORTING ...........................................................................................110
7.11 DATA RECONCILIATION ................................................................................110
8. RESULTS AND DISCUSSION ....................................................................................113
8.1 QUALITY ASSURANCE AND QUALITY CONTROL ...................................113
8.1.1 Summary of QA/QC Evaluation ..............................................................113
8.2 NRCS PRECIPITATION AND AIR TEMPERATURE AT STATION
WY07E33S ..........................................................................................................118
8.2.1 Precipitation .............................................................................................118
8.2.2 Air Temperature .......................................................................................119
8.3 USGS DISCHARGE AT TONGUE RIVER STATION 06298000....................119
8.4 USGS DISCHARGE AT WOLF CREEK STATION 06299500 ........................121
8.5. TONGUE RIVER UPPER, MIDDLE AND LOWER STATIONS ....................121
8.5.1. Tongue River SCCD and WDEQ Discharge ...........................................121
8.5.2 WGFD Continuous Tongue River Water Temperature
Monitoring in 1988 and 1994 ..................................................................122
8.5.3 RPWD Water Temperature Monitoring at Tongue River Lower
Station ......................................................................................................124
8.5.4 SCCD and WDEQ Tongue River Temperature Monitoring....................126
8.5.5 SCCD and WDEQ Tongue River pH Monitoring ...................................126

Sheridan County Conservation District
Tongue River Watershed Assessment 205j Final Report 1996-1999 xxi
8.5.6 RPWD pH Monitoring at Tongue River Lower Station ..........................127
8.5.7 SCCD and WDEQ Tongue River Specific Conductivity
Monitoring ...............................................................................................128
8.5.8 SCCD and WDEQ Tongue River Dissolved Oxygen
Monitoring ...............................................................................................128
8.5.9 SCCD and WDEQ Tongue River Turbidity Monitoring .........................129
8.5.10 RPWD Turbidity Monitoring at Tongue River Lower Station ................130
8.5.11 SCCD and WDEQ Tongue River Fecal Coliform Bacteria
Monitoring ...............................................................................................131
8.5.12 SCCD Tongue River Pesticide and Herbicide Monitoring ......................133
8.5.13 USGS NAWQA Organics Monitoring Including Pesticides
and Herbicides at Tongue River Upper Station .......................................133
8.5.14 SCCD and WDEQ Tongue River Nitrate Nitrogen Monitoring ..............134
8.5.15 SCCD and WDEQ Tongue River Total Phosphorus Monitoring ............134
8.5.16 WDEQ Tongue River Monitoring for Additional Water Chemistry
Parameters ................................................................................................135
8.5.17 RPWD Alkalinity Monitoring at Tongue River Lower Station ...............137
8.5.18 USGS NAWQA Water Quality, Brown Trout Liver Trace Metals
and Bed Sediment Metals Monitoring at Tongue River Station
06298000..................................................................................................138
8.5.19 SCCD, WDEQ and USGS Tongue River Benthic
Macroinvertebrate Monitoring .................................................................139
8.5.20 SCCD and WDEQ Tongue River Habitat Assessment............................145
8.5.21 WGFD Tongue River Fish Population Monitoring .................................147
8.6. LITTLE TONGUE RIVER STATIONS .............................................................150
8.6.1 Little Tongue River Discharge.................................................................150
8.6.2 SCCD and WDEQ Little Tongue River Temperature Monitoring ..........151
8.6.3 SCCD and WDEQ Little Tongue River pH Monitoring .........................152
8.6.4 SCCD and WDEQ Little Tongue River Specific Conductivity
Monitoring ...............................................................................................152
8.6.5 SCCD and WDEQ Little Tongue River Dissolved Oxygen
Monitoring ...............................................................................................152
8.6.6 SCCD and WDEQ Little Tongue River Turbidity Monitoring ...............153
8.6.7 SCCD and WDEQ Little Tongue River Fecal Coliform Bacteria
Monitoring ...............................................................................................153
8.6.8 SCCD and WDEQ Little Tongue River Nitrate Nitrogen
Monitoring ...............................................................................................154
8.6.9 SCCD and WDEQ Little Tongue River Total Phosphorus
Monitoring ...............................................................................................155
8.6.10 WDEQ Little Tongue River Monitoring for Additional Water
Chemistry Parameters ..............................................................................156

Sheridan County Conservation District
Tongue River Watershed Assessment 205j Final Report 1996-1999 xxii
8.6.11 SCCD and WDEQ Little Tongue River Benthic Macroinvertebrate
Monitoring ...............................................................................................157
8.6.12 SCCD and WDEQ Little Tongue River Habitat Assessment ..................159
8.6.13 WGFD Little Tongue River Fish Population Monitoring........................161
8.7 SMITH CREEK STATIONS ...............................................................................161
8.7.1 Smith Creek Discharge ............................................................................161
8.7.2 SCCD and WDEQ Smith Creek Temperature Monitoring .....................162
8.7.3 SCCD and WDEQ Smith Creek pH Monitoring .....................................163
8.7.4 SCCD and WDEQ Smith Creek Specific Conductivity Monitoring .......163
8.7.5 SCCD and WDEQ Smith Creek Dissolved Oxygen Monitoring ............164
8.7.6 SCCD and WDEQ Smith Creek Turbidity Monitoring ...........................164
8.7.7 SCCD and WDEQ Smith Creek Fecal Coliform Bacteria
Monitoring ...............................................................................................165
8.7.8 SCCD and WDEQ Smith Creek Nitrate Nitrogen Monitoring ................166
8.7.9 SCCD and WDEQ Smith Creek Total Phosphorus Monitoring ..............167
8.7.10 WDEQ Smith Creek Monitoring for Additional Water Chemistry
Parameters ................................................................................................167
8.7.11 SCCD and WDEQ Smith Creek Benthic Macroinvertebrate
Monitoring ...............................................................................................169
8.7.12 SCCD and WDEQ Smith Creek Habitat Assessment .............................170
8.7.13 WGFD Smith Creek Fish Population Monitoring ...................................171
8.8 COLUMBUS CREEK STATIONS .....................................................................171
8.8.1 Columbus Creek Discharge .....................................................................171
8.8.2 SCCD and WDEQ Columbus Creek Temperature Monitoring ...............172
8.8.3 SCCD and WDEQ Columbus Creek pH Monitoring ..............................173
8.8.4 SCCD and WDEQ Columbus Creek Specific Conductivity
Monitoring ...............................................................................................173
8.8.5 SCCD and WDEQ Columbus Creek Dissolved Oxygen
Monitoring ...............................................................................................174
8.8.6 SCCD and WDEQ Columbus Creek Turbidity Monitoring ....................174
8.8.7 SCCD and WDEQ Columbus Creek Fecal Coliform Bacteria
Monitoring ...............................................................................................175
8.8.8 SCCD and WDEQ Columbus Creek Nitrate Nitrogen
Monitoring ...............................................................................................176
8.8.9 SCCD and WDEQ Columbus Creek Total Phosphorus
Monitoring ...............................................................................................177
8.8.10 WDEQ Columbus Creek Monitoring for Additional Water
Chemistry Parameters ..............................................................................178
8.8.11 SCCD and WDEQ Columbus Creek Benthic Macroinvertebrate
Monitoring ...............................................................................................180
8.8.12 SCCD and WDEQ Columbus Creek Habitat Assessment .......................182

Sheridan County Conservation District
Tongue River Watershed Assessment 205j Final Report 1996-1999 xxiii
8.8.13 WGFD Columbus Creek Fish Population Monitoring ............................183
8.9 WOLF CREEK STATIONS ................................................................................184
8.9.1 Wolf Creek Discharge..............................................................................184
8.9.2 SCCD and WDEQ Wolf Creek Temperature Monitoring .......................185
8.9.3 SCCD and WDEQ Wolf Creek pH Monitoring ......................................185
8.9.4 SCCD and WDEQ Wolf Creek Specific Conductivity Monitoring ........185
8.9.5 SCCD and WDEQ Wolf Creek Dissolved Oxygen Monitoring ..............186
8.9.6 SCCD and WDEQ Wolf Creek Turbidity Monitoring ............................186
8.9.7 SCCD and WDEQ Wolf Creek Fecal Coliform Bacteria
Monitoring ...............................................................................................187
8.9.8 SCCD Tongue River Pesticide and Herbicide Monitoring ......................188
8.9.9 SCCD and WDEQ Wolf Creek Nitrate Nitrogen Monitoring .................188
8.9.10 SCCD and WDEQ Wolf Creek Total Phosphorus Monitoring ...............189
8.9.11 WDEQ Wolf Creek Monitoring for Additional Water Chemistry
Parameters ................................................................................................190
8.9.12 SCCD and WDEQ Wolf Creek Benthic Macroinvertebrate
Monitoring ...............................................................................................191
8.9.13 SCCD and WDEQ Wolf Creek Habitat Assessment ...............................193
8.9.14 WGFD Wolf Creek Fish Population Monitoring.....................................194
8.10 FIVE MILE CREEK LOWER STATION ..........................................................196
8.10.1 Five Mile Creek Discharge ....................................................................196
8.10.2 SCCD and WDEQ Five Mile Creek Temperature Monitoring ..............197
8.10.3 SCCD and WDEQ Five Mile Creek pH Monitoring .............................198
8.10.4 SCCD and WDEQ Five Mile Creek Specific Conductivity
Monitoring ..............................................................................................198
8.10.5 SCCD and WDEQ Five Mile Creek Dissolved Oxygen Monitoring .....199
8.10.6 SCCD and WDEQ Five Mile Creek Turbidity Monitoring ...................199
8.10.7 SCCD and WDEQ Five Mile Creek Fecal Coliform Bacteria
Monitoring ..............................................................................................200
8.10.8 SCCD Five Mile Creek Pesticide and Herbicide Monitoring ................201
8.10.9 SCCD and WDEQ Five Mile Creek Nitrate Nitrogen Monitoring ........201
8.10.10 SCCD and WDEQ Five Mile Creek Total Phosphorus
Monitoring ..............................................................................................202
8.10.11 WDEQ Five Mile Creek Monitoring for Additional Water Chemistry
Parameters .............................................................................................203
8.10.12 SCCD and WDEQ Five Mile Creek Benthic Macroinvertebrate
Monitoring ............................................................................................204
8.10.13 SCCD and WDEQ Five Mile Creek Habitat Assessment ....................207
8.10.14 WGFD Five Mile Creek Fish Population Monitoring ..........................208
8.11 FACTORS AFFECTING FECAL COLIFORM BACTERIA
CONCENTRATION IN THE TONGUE RIVER AND TRIBUTARIES ..........208

Sheridan County Conservation District
Tongue River Watershed Assessment 205j Final Report 1996-1999 xxiv
8.11.1 Effect of Sampling Frequency ................................................................209
8.11.2 Effect of Seasonal Variability ................................................................211
8.11.3 Factors Related to Fecal Coliform Bacteria Levels................................212
8.11.4 Fecal Coliform Bacteria and Land Use Relationships ...........................215
9. CUMULATIVE EFFECTS AND PRIORITIZATION ..............................................301 9.1 TONGUE RIVER ................................................................................................301
9.2 TRIBUTARIES TO THE TONGUE RIVER ......................................................304
9.3 EFFECT OF TRIBUTARY WATER QUALITY ON TONGUE RIVER ..........305
9.4 WATER BODY RANKING AND PRIORITIZATION FOR
RESTORATION ..................................................................................................306
10. RECOMMENDATIONS ...............................................................................................313
11. LITERATURE CITED .................................................................................................316
APPENDIX A: HISTORIC WATER QUALITY DATA COLLECTED
AT STREAM STATIONS WITHIN THE SHERIDAN
COUNTY CONSERVATION DISTRICT TONGUE
RIVER WATERSHED 205j PROJECT AREA ......................... A-1
APPENDIX B: CURRENT WATER QUALITY DATA COLLECTED
BY THE SHERIDAN COUNTY CONSERVATION
DISTRICT AND WYOMING DEPARTMENT OF
ENVIRONMENTAL QUALITY AT STREAM
STATIONS WITHIN THE TONGUE RIVER
WATERSHED 205j PROJECT AREA .......................................B-1
APPENDIX C: HISTORIC AND CURRENT FISHERY AND
PERIPHYTON DATA COLLECTED BY WYOMING
GAME AND FISH DEPARTMENT AND USGS AT
STREAM STATIONS WITHIN THE TONGUE
RIVER 205j PROJECT AREA ....................................................C-1
APPENDIX D: CURRENT WHOLE BODY FISH TISSUE ORGANICS
ANALYSIS FOR BROWN TROUT, LIVER TRACE
METAL ANALYSIS FOR BROWN TROUT, BED
SEDIMENT TRACE METAL ANALYSIS AND BED
SEDIMENT ORGANICS ANALYSIS FOR SAMPLES
COLLECTED BY USGS AT STATION NUMBER
06298000 ................................................................................... D-1

Sheridan County Conservation District
Tongue River Watershed Assessment 205j Final Report 1996-1999 xxv
APPENDIX E: CONTINUOUS SURFACE WATER TEMPERATURE DATA
COLLECTED BY WYOMING GAME AND FISH
DEPARTMENT AT STREAM STATIONS WITHIN THE
SHERIDAN COUNTY CONSERVATION DISTRICT
TONGUE RIVER 205j PROJECT AREA .................................. E-1
APPENDIX F: BENTHIC MACROINVERTEBRATE TAXA LISTS
FOR SAMPLES COLLECTED BY SHERIDAN COUNTY
CONSERVATION DISTRICT, WYOMING DEPARTMENT
OF ENVIRONMENTAL QUALITY AND USGS AT
STREAM STATIONS WITHIN THE TONGUE RIVER
205j PROJECT AREA ................................................................. F-1
APPENDIX G: BENTHIC MACROINVERTEBRATE METRICS FOR
SAMPLES COLLECTED BY SHERIDAN COUNTY
CONSERVATION DISTRICT, WYOMING DEPARTMENT
OF ENVIRONMENTAL QUALITY AND USGS AT
STREAM STATIONS WITHIN THE TONGUE RIVER
205j PROJECT AREA ................................................................ G-1
APPENDIX H: ORGANOCHLORINE PESTICIDE AND CHLORINATED
HERBICIDE DATA COLLECTED BY SHERIDAN
COUNTY CONSERVATION DISTRICT AT STREAM
STATIONS WITHIN THE TONGUE RIVER 205j
PROJECT AREA ........................................................................ H-1
APPENDIX I: HABITAT ASSESSMENT DATA COLLECTED BY SHERIDAN
COUNTY CONSERVATION DISTRICT
AND WYOMING DEPARTMENT OF ENVIRONMENTAL
QUALITY AT STREAM STATIONS WITHIN THE
TONGUE RIVER 205j PROJECT AREA ................................... I-1
APPENDIX J: TEMPERATURE AND PRECIPITATION DATA
COLLECTED BY NATURAL RESOURCES
CONSERVATION SERVICE AT BURGESS
JUNCTION METEOROLOGICAL STATION
WY07E33S; 1982 - 2000 .............................................................. J-1

Sheridan County Conservation District
Tongue River Watershed Assessment 205j Final Report 1996-1999 xxvi
APPENDIX K: DISCHARGE DATA COLLECTED BY UNITED STATES
GEOLOGICAL SERVICE AT TONGUE RIVER NEAR
DAYTON STATION 06298000 AND WOLF CREEK
AT WOLF, WYO STATION 06299500; 1982-1999 ................. K-1
APPENDIX L: STATISTICAL CORRELATION AND R-SQUARED
VALUES FOR ASSOCIATION OF FECAL COLIFORM
BACTERIA LEVELS TO DISCHARGE, TEMPERATURE
AND TURBIDITY AND FOR CONDUCTIVITY VERSUS
DISCHARGE AT ALL TONGUE RIVER 205j PROJECT
SAMPLING STATIONS, 1996-1999 ......................................... L-1
APPENDIX M: DISCHARGE COMPARISONS BETWEEN TONGUE
RIVER TRIBUTARY STATIONS AND MAINSTEM
TONGUE RIVER STATIONS DURING TONGUE
RIVER 205j PROJECT, 1996-1999 ........................................... M-1
Sheridan County Conservation District
Tongue River Watershed Assessment 205j Final Report 1996-1999 xxvii
LIST OF FIGURES
FIGURE 5-1. Historic sampling stations in the Tongue River 205j Project area,
1938-1990 ..............................................................................................................35
FIGURE 5-2. Current sampling stations in the Tongue River 205j Project area,
1991-1999 ..............................................................................................................36
FIGURE 6-1. WDEQ Tongue River long term trend monitoring station in canyon
(Station ID # MRC 24) looking upstream from base of sampling reach;
October 13, 1998; (Photo courtesy of WDEQ) ......................................................89
FIGURE 6-2. SCCD and WDEQ Tongue River Middle monitoring station looking
upstream from base of sampling reach; October 28, 1999 ....................................89
FIGURE 6-3. SCCD and WDEQ Tongue River Middle monitoring station looking
downstream from base of sampling reach; note extensive riprap on bend
related to historic channelization; October 28, 1999 .............................................90
FIGURE 6-4. SCCD and WDEQ Tongue River Lower station for benthic macroinvertebrate
monitoring and habitat assessment looking upstream from base of sampling
reach; October 28, 1999 .......................................................................................90
FIGURE 6-5. SCCD Little Tongue River Upper station looking upstream from base of
sampling reach; October 12, 1999 .........................................................................91
FIGURE 6-6. SCCD and WDEQ Little Tongue River Lower station looking upstream from
base of sampling reach; October 14, 1999 .............................................................91
FIGURE 6-7. SCCD Smith Creek Upper station looking upstream from base of sampling
reach; October 13, 1999 .........................................................................................92
FIGURE 6-8. SCCD and WDEQ Smith Creek Lower station looking upstream from
base of sampling reach; October 28, 1999 .............................................................92
FIGURE 6-9. SCCD and WDEQ Columbus Creek Upper station looking upstream from
near base of sampling reach; October 12, 1999 .....................................................93
FIGURE 6-10. SCCD and WDEQ Columbus Creek Lower station looking downstream
from base of sampling reach; October 21, 1999 .................................................93

Sheridan County Conservation District
Tongue River Watershed Assessment 205j Final Report 1996-1999 xxviii
FIGURE 6-11. SCCD Wolf Creek Upper station looking upstream from near base of
sampling reach; October 13, 1999 ......................................................................94
FIGURE 6-12. SCCD and WDEQ Wolf Creek Lower station looking upstream from base
of sampling reach; October 10, 1997 (Photo courtesy of WDEQ) .....................94
FIGURE 6-13. Wolf Creek below Soldier Creek bridge crossing upstream of WGFD
sampling station in 1997 and WDEQ sampling in 1995 at Wolf Creek -
Berry’s station; Photo taken 1993 .....................................................................95
FIGURE 6-14. Same site shown in Figure 6-13 two years after grazing and riparian
management changes were implemented; Photo taken 1995 .............................95
FIGURE 6-15. SCCD and WDEQ Five Mile Creek Lower station relocated in 1999 to
site upstream of Highway 14 bridge crossing; looking upstream from base
of sampling reach; October 21, 1999 ..................................................................96
FIGURE 6-16. Collection of water samples at representative well mixed riffle/run at
Columbus Creek Upper station, 1997 .................................................................96
FIGURE 6-17. Field water chemistry measurements at Smith Creek Lower station, 1997 .......97
FIGURE 6-18. Recording field water chemistry measurements in field notebook .....................97
FIGURE 6-19. Placement of water sample containers in cooler containing ice for hand
delivery to the contract analytical laboratory, 1997 ...........................................98
FIGURE 6-20. SCCD analysis of turbidity sample at Ranchester Water Treatment Plant
Laboratory using Hach 2100A turbidimeter instrumentation, 1997 ...................98
FIGURE 6-21. Collection of benthic macroinvertebrate sample with 500 micron modified
Surber Sampler at random quadrate at Tongue River Lower station;
October 10, 1996 ................................................................................................99
FIGURE 6-22. Transfer of benthic macroinvertebrate sample from 500 micron sieve to
sample container; October 9, 1997 .....................................................................99
FIGURE 6-23. Laboratory technician using binocular dissecting microscope to sort
(remove) benthic organisms from random subsamples selected from the
total benthic macroinvertebrate sample ..........................................................100

Sheridan County Conservation District
Tongue River Watershed Assessment 205j Final Report 1996-1999 xxix
FIGURE 6-24. Pteronarcys , a genus of stonefly and indicator of excellent water
quality found in well oxygenated and cool Wyoming mountain and
foothill streams. Present at Tongue River Upper station during this Project .100
FIGURE 6-25. Atherix, snipe fly larva in the order Diptera, is a predator that consumes
other invertebrates and is an indicator of good to excellent water quality.
Present at Tongue River Upper and Middle stations during this Project .........101
FIGURE 6-26. Head capsule of the larva Chironomus, a genus of pollution tolerant
midge fly and indicator of poor water quality and habitat conditions often
found in water with lower dissolved oxygen, high sediment and organic
deposition. Present at Five Mile Creek Lower station during this Project ......101
FIGURE 6-27. Plexiglass used by SCCD to allow better resolution of stream bottom
substrate for particle size determination and embeddedness measurements ....102
FIGURE 6-28. Example of stream bottom substrate with low embeddedness (low degree
of silt covering or surrounding cobble and gravel). Weighted embeddedness
value at this sample quadrate is approximately 99.0 ........................................102
FIGURE 6-29. Example of stream bottom substrate with high embeddedness (high degree
of silt covering or surrounding cobble and gravel). Weighted embeddedness
value at this sample quadrate is approximately 20.0 ........................................103
FIGURE 8-1. Cumulative monthly precipitation at Burgess Junction Meteorological
Station WY07E33S operated by NRCS, Sheridan County, Wyoming ................219
FIGURE 8-2. Monthly air temperature at Burgess Junction Meteorological Station
WY07E33S operated by NRCS, Sheridan County, Wyoming ............................220
FIGURE 8-3. Monthly discharge at USGS Tongue River Station 06298000, Sheridan
County, Wyoming ................................................................................................221
FIGURE 8-4. Monthly discharge from April through September at USGS Wolf Creek
Station 06299500, Sheridan County, Wyoming ..................................................222
FIGURE 8-5. Comparison of discharge measurements recorded same day at Tongue River
Upper, Middle and Lower stations collected by SCCD and WDEQ,
1996-1999, Sheridan County, Wyoming .............................................................223

Sheridan County Conservation District
Tongue River Watershed Assessment 205j Final Report 1996-1999 xxx
FIGURE 8-6. Maximum daily water temperature recorded at Tongue River Upper and
Tongue River Lower (Ranchester) by Wyoming Game and Fish Department
during 1988 (Upper Station) and Lower Station (1994) in comparison to
the Wyoming water quality standard (25.6 degrees centigrade), Sheridan
County, Wyoming ................................................................................................224
FIGURE 8-7. Average monthly water temperature (based on daily temperature
measurements) at the Town of Ranchester Water Treatment Plant raw
water intake at Tongue River Lower station, 1993 - 1999, Sheridan
County, Wyoming ................................................................................................225
FIGURE 8-8. Time series analysis for average annual water temperature (based on daily
temperature measurements) at the Town of Ranchester Water Treatment Plant
raw water intake at Tongue River Lower station, 1993 - 1999, Sheridan
County, Wyoming ................................................................................................226
FIGURE 8-9. Comparison of water temperature at Tongue River Upper, Middle and Lower
stations on comparable days, 1997-1999, Sheridan County, Wyoming ..............227
FIGURE 8-10. Comparison of water temperature at Tongue River Middle and Lower
stations on comparable days, 1996-1999, Sheridan County, Wyoming ...........228
FIGURE 8-11. Average monthly pH (based on daily pH measurements) at the Town of
Ranchester Water Treatment Plant raw water intake at Tongue River
Lower station, 1993 - 1999, Sheridan County, Wyoming ................................229
FIGURE 8-12. Time series analysis for average annual pH (based on daily pH readings)
at the Town of Ranchester Water Treatment Plant raw water intake at
Tongue River Lower station, 1993 - 1999, Sheridan County, Wyoming .........230
FIGURE 8-13. Scatterplot showing association between conductivity and discharge at
Tongue River Middle station, 1996 - 1999, Sheridan County, Wyoming ........231
FIGURE 8-14. Scatterplot showing association between turbidity and discharge at Tongue
River Middle Station, 1996-1999, Sheridan County, Wyoming ......................232
FIGURE 8-15. Average monthly turbidity (based on daily turbidity measurements) at the
Town of Ranchester Water Treatment Plant raw water intake at Tongue
River Lower station, 1983 - 1999, Sheridan County, Wyoming ......................233

Sheridan County Conservation District
Tongue River Watershed Assessment 205j Final Report 1996-1999 xxxi
FIGURE 8-16. Time series analysis for mean annual turbidity (based on daily turbidity
measurements) at the Town of Ranchester Water Treatment Plant raw
water intake at Tongue River Lower station, 1983 - 1999, Sheridan
County, Wyoming.............................................................................................234
FIGURE 8-17. Mean monthly alkalinity (based on daily alkalinity measurements) analyses
at the Town of Ranchester Water Treatment Plant raw water intake at
Tongue River Lower station, 1983 - 1999, Sheridan County, Wyoming .........235
FIGURE 8-18. Scatterplot showing relationship between percent scrapers and Weighted
Embeddedness (substrate silt cover) at Tongue River biomonitoring
stations, 1993 through 1999, Sheridan County, Wyoming ...............................236
FIGURE 8-19. Comparison of discharge measurements recorded same day at Little Tongue
River Upper and Lower stations collected by SCCD and WDEQ, 1996-1999,
Sheridan County, Wyoming ..............................................................................237
FIGURE 8-20. Comparison of discharge measurements recorded same day at Smith Creek
Upper and Lower stations collected by SCCD and WDEQ, 1996-1999,
Sheridan County, Wyoming .............................................................................238
FIGURE 8-21. Comparison of discharge measurements recorded same day at Columbus Creek
Upper and Lower stations collected by SCCD and WDEQ, 1996-1999,
Sheridan County, Wyoming .............................................................................239
FIGURE 8-22. Comparison of discharge measurements recorded same day at Wolf Creek
Upper and Lower stations collected by SCCD and WDEQ, 1996-1999,
Sheridan County, Wyoming .............................................................................240
FIGURE 8-23. Discharge measurements at Five Mile Creek Lower station collected by
SCCD and WDEQ, 1996-1999, Sheridan County, Wyoming ..........................241
FIGURE 8-24. Scatterplot showing the relationship between the average fecal coliform
bacteria level and percent Oligochaeta at mainstem Tongue River stations
and Lower Tributary stations, 1996-1999, Sheridan County, Wyoming .........242
FIGURE 8-25. Scatterplot showing the relationship between the geometric mean and
the number of five daily samples collected per 30 day period with fecal
coliform bacteria levels <400 per 100 ml at stations exceeding the
Wyoming fecal coliform standard in the Tongue River and Goose Creek
watersheds, 1998 and 1999, Sheridan County, Wyoming ................................243

Sheridan County Conservation District
Tongue River Watershed Assessment 205j Final Report 1996-1999 xxxii
FIGURE 8-26. Comparison of fecal coliform bacteria levels at Little Goose Creek and
Big Goose Creek stations during the Recreation (May 1 to September 30)
and Non-Recreation seasons, 1998, Sheridan County, Wyoming ....................244
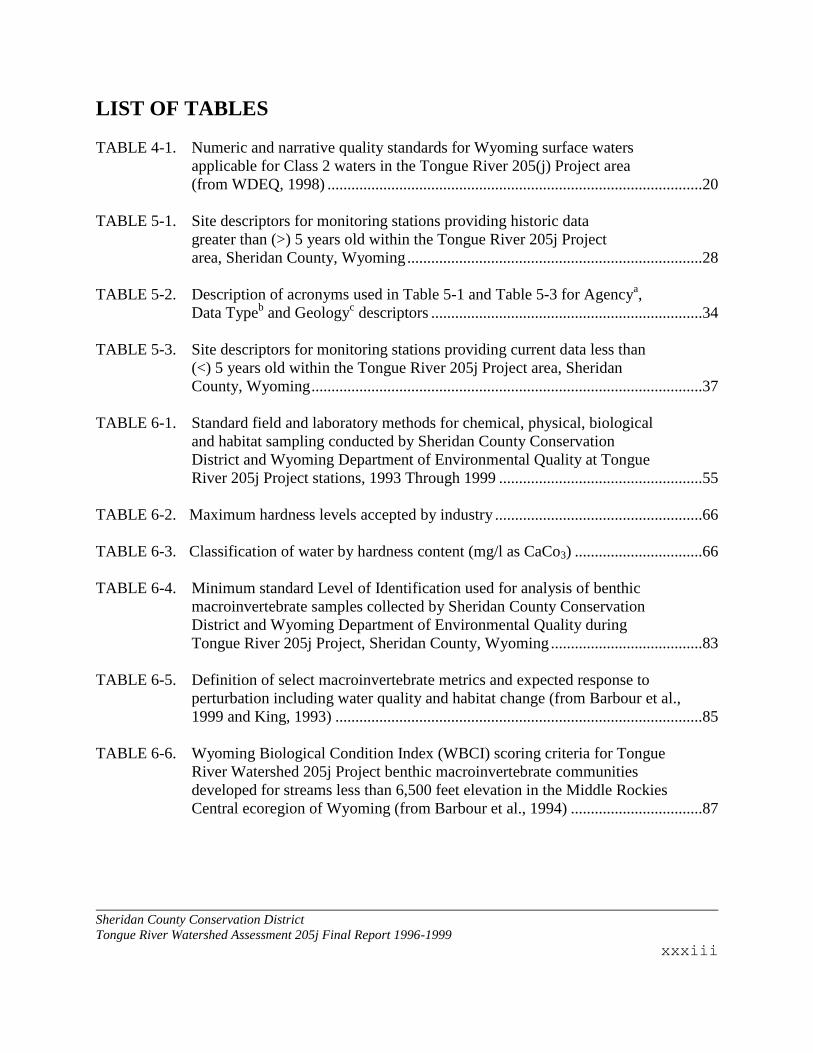
Sheridan County Conservation District
Tongue River Watershed Assessment 205j Final Report 1996-1999 xxxiii
LIST OF TABLES
TABLE 4-1. Numeric and narrative quality standards for Wyoming surface waters
applicable for Class 2 waters in the Tongue River 205(j) Project area
(from WDEQ, 1998) ..............................................................................................20
TABLE 5-1. Site descriptors for monitoring stations providing historic data
greater than (>) 5 years old within the Tongue River 205j Project
area, Sheridan County, Wyoming ..........................................................................28
TABLE 5-2. Description of acronyms used in Table 5-1 and Table 5-3 for Agencya,
Data Typeb and Geology
c descriptors ....................................................................34
TABLE 5-3. Site descriptors for monitoring stations providing current data less than
(<) 5 years old within the Tongue River 205j Project area, Sheridan
County, Wyoming ..................................................................................................37
TABLE 6-1. Standard field and laboratory methods for chemical, physical, biological
and habitat sampling conducted by Sheridan County Conservation
District and Wyoming Department of Environmental Quality at Tongue
River 205j Project stations, 1993 Through 1999 ...................................................55
TABLE 6-2. Maximum hardness levels accepted by industry ....................................................66
TABLE 6-3. Classification of water by hardness content (mg/l as CaCo3) ................................66
TABLE 6-4. Minimum standard Level of Identification used for analysis of benthic
macroinvertebrate samples collected by Sheridan County Conservation
District and Wyoming Department of Environmental Quality during
Tongue River 205j Project, Sheridan County, Wyoming ......................................83
TABLE 6-5. Definition of select macroinvertebrate metrics and expected response to
perturbation including water quality and habitat change (from Barbour et al.,
1999 and King, 1993) ............................................................................................85
TABLE 6-6. Wyoming Biological Condition Index (WBCI) scoring criteria for Tongue
River Watershed 205j Project benthic macroinvertebrate communities
developed for streams less than 6,500 feet elevation in the Middle Rockies
Central ecoregion of Wyoming (from Barbour et al., 1994) .................................87
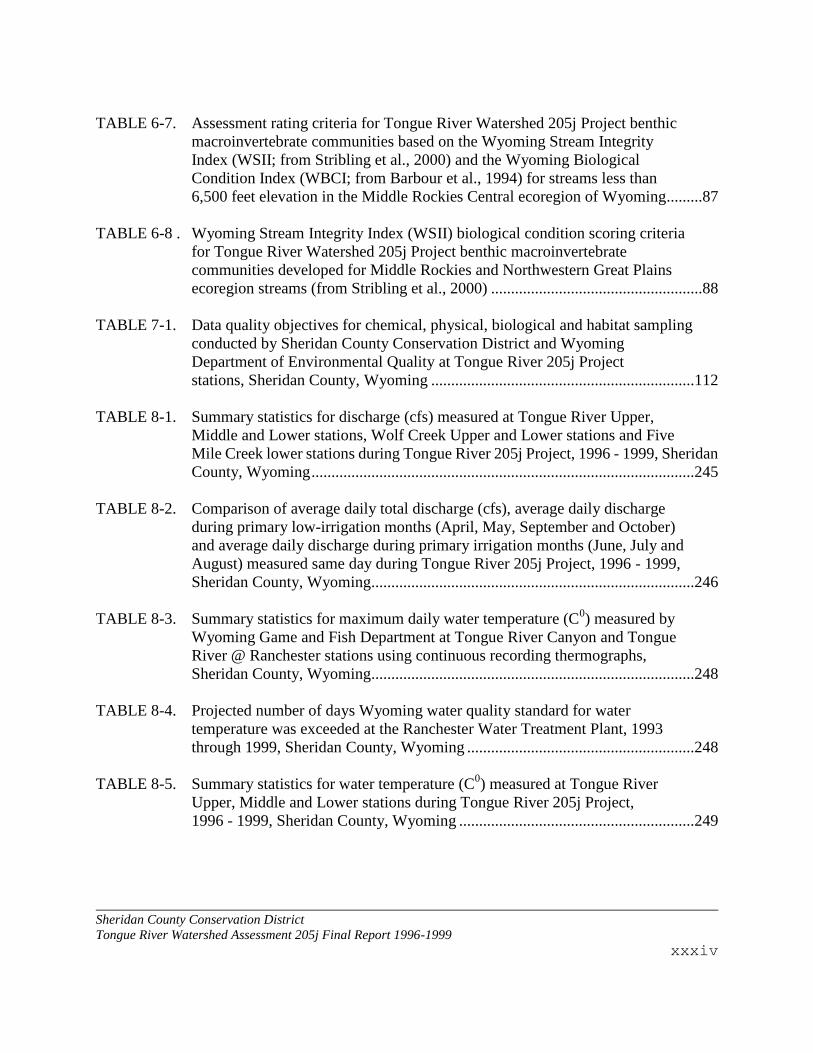
Sheridan County Conservation District
Tongue River Watershed Assessment 205j Final Report 1996-1999 xxxiv
TABLE 6-7. Assessment rating criteria for Tongue River Watershed 205j Project benthic
macroinvertebrate communities based on the Wyoming Stream Integrity
Index (WSII; from Stribling et al., 2000) and the Wyoming Biological
Condition Index (WBCI; from Barbour et al., 1994) for streams less than
6,500 feet elevation in the Middle Rockies Central ecoregion of Wyoming .........87
TABLE 6-8 . Wyoming Stream Integrity Index (WSII) biological condition scoring criteria
for Tongue River Watershed 205j Project benthic macroinvertebrate
communities developed for Middle Rockies and Northwestern Great Plains
ecoregion streams (from Stribling et al., 2000) .....................................................88
TABLE 7-1. Data quality objectives for chemical, physical, biological and habitat sampling
conducted by Sheridan County Conservation District and Wyoming
Department of Environmental Quality at Tongue River 205j Project
stations, Sheridan County, Wyoming ..................................................................112
TABLE 8-1. Summary statistics for discharge (cfs) measured at Tongue River Upper,
Middle and Lower stations, Wolf Creek Upper and Lower stations and Five
Mile Creek lower stations during Tongue River 205j Project, 1996 - 1999, Sheridan
County, Wyoming ................................................................................................245
TABLE 8-2. Comparison of average daily total discharge (cfs), average daily discharge
during primary low-irrigation months (April, May, September and October)
and average daily discharge during primary irrigation months (June, July and
August) measured same day during Tongue River 205j Project, 1996 - 1999,
Sheridan County, Wyoming.................................................................................246
TABLE 8-3. Summary statistics for maximum daily water temperature (C0) measured by
Wyoming Game and Fish Department at Tongue River Canyon and Tongue
River @ Ranchester stations using continuous recording thermographs,
Sheridan County, Wyoming.................................................................................248
TABLE 8-4. Projected number of days Wyoming water quality standard for water
temperature was exceeded at the Ranchester Water Treatment Plant, 1993
through 1999, Sheridan County, Wyoming .........................................................248
TABLE 8-5. Summary statistics for water temperature (C0) measured at Tongue River
Upper, Middle and Lower stations during Tongue River 205j Project,
1996 - 1999, Sheridan County, Wyoming ...........................................................249

Sheridan County Conservation District
Tongue River Watershed Assessment 205j Final Report 1996-1999 xxxv
TABLE 8-6. Summary statistics for pH (Standard Units) measured at Tongue River Upper,
Middle and Lower stations during Tongue River 205j Project, 1996 - 1999,
Sheridan County, Wyoming.................................................................................250
TABLE 8-7. Summary statistics for conductivity (Micromhos per Centimeter) measured at
Tongue River Upper, Middle and Lower stations during Tongue River 205j Project,
1996 - 1999, Sheridan County, Wyoming ...........................................................251
TABLE 8-8. Summary statistics for dissolved oxygen (mg/l) measured at Tongue River
Upper, Middle and Lower stations during Tongue River 205j Project,
1996 - 1999, Sheridan County, Wyoming ...........................................................252
TABLE 8-9. Summary statistics for turbidity (NTU) analyses for samples collected at
Tongue River Upper, Middle and Lower stations, Wolf Creek Upper and
Lower Stations and Five Mile Creek Lower station during Tongue River
205j Project, 1996 - 1999, Sheridan County, Wyoming ......................................253
TABLE 8-10. Summary statistics for fecal coliform bacteria (Number per 100 Milliliters)
analyses for samples collected at Tongue River Upper, Middle and Lower
Stations during Tongue River 205j Project, 1996 - 1999, Sheridan County,
Wyoming..............................................................................................................254
TABLE 8-11. Comparison of summary statistics for fecal coliform bacteria (Number per
100 Milliliters) analyses for historical samples and samples collected during
current study at Tongue River Upper, Middle, and Lower stations,
Sheridan County, Wyoming.................................................................................255
TABLE 8-12. Summary statistics for total nitrate nitrogen (mg/l) measured at Tongue River
Upper, Middle and Lower stations during Tongue River 205j Project,
1996 - 1999, Sheridan County, Wyoming ...........................................................256
TABLE 8-13. Summary statistics for total phosphorus (mg/l) measured at Tongue River
Upper, Middle and Lower stations during Tongue River 205j Project,
1996 - 1999, Sheridan County, Wyoming ...........................................................257
TABLE 8-14. Summary statistics for alkalinity, total chloride, total hardness, total sulfate,
and total suspended solids analyses for samples collected by WDEQ at
Tongue River Upper (1993-1999), Middle and Lower stations (1996-1999)
during Tongue River 205j Project, Sheridan County, Wyoming.........................258

Sheridan County Conservation District
Tongue River Watershed Assessment 205j Final Report 1996-1999 xxxvi
TABLE 8-15. Scoring and assessment of biological condition for Tongue River Watershed
205j Project benthic macroinvertebrate communities based on the Wyoming
Stream Integrity Index (WSII; from Stribling et al., 2000) and the Wyoming
Biological Condition Index (WBCI; from Barbour et al., 1994) developed
for streams less than 6,500 feet elevation in the Middle Rockies Central
ecoregion of Wyoming ........................................................................................259
TABLE 8-16. Five most dominant macroinvertebrate taxa based on mean abundance,
Tolerance Value (TV) and Functional Feeding Group (FFG) designation
by station within the Tongue River Watershed Project Area, 1996 through
1999......................................................................................................................261
TABLE 8-17. Habitat assessment scores for Tongue River 205j Project stations, 1993
through 1999 ......................................................................................................263
TABLE 8-18. Habitat assessment scores for Tongue River 205j Project stations, 1996
through 1999 ........................................................................................................264
TABLE 8-19. Mean percent stream substrate composition, percent embeddedness and
current velocity for Tongue River 205j Project stations,1993 through 1999 ......265
TABLE 8-20. Mean percent stream substrate composition, percent embeddedness and
stream Velocity for Tongue River 205j Project Stations,1996 Through 1999 ....266
TABLE 8-21. Summary statistics for discharge (cfs) measured at Little Tongue River Upper,
and Lower stations, Smith Creek Upper and Lower stations and Columbus
Creek Upper and Lower stations during Tongue River 205j Project,
1996 - 1999, Sheridan County, Wyoming ...........................................................267
TABLE 8-22. Summary statistics for water temperature (C0) measured at Little Tongue
River Upper and Lower and Smith Creek Upper and Lower stations during
Tongue River 205j Project, 1996 - 1999, Sheridan County, Wyoming ...............268
TABLE 8-23. Summary statistics for pH (Standard Units) measured at Little Tongue River
Upper and Lower and Smith Creek Upper and Lower stations during Tongue
River 205j Project, 1996 - 1999, Sheridan County, Wyoming ............................269
TABLE 8-24. Summary statistics for conductivity (Micromhos per Centimeter) measured
at Little Tongue River Upper and Lower and Smith Creek Upper and
Lower stations during Tongue River 205j Project, 1996 - 1999, Sheridan
County, Wyoming ................................................................................................270

Sheridan County Conservation District
Tongue River Watershed Assessment 205j Final Report 1996-1999 xxxvii
TABLE 8-25. Summary statistics for dissolved oxygen (mg/l) measured at Little Tongue
River Upper and Lower and Smith Creek Upper and Lower stations during
Tongue River 205j Project, 1996 - 1999, Sheridan County, Wyoming ...............271
TABLE 8-26. Summary statistics for turbidity (NTU) analyses for samples collected at
Little Tongue River Upper and Lower and Smith Creek Upper and Lower
stations during Tongue River 205j Project, 1996 - 1999, Sheridan County,
Wyoming..............................................................................................................272
TABLE 8-27. Summary statistics for fecal coliform bacteria (Number per 100 Milliliters)
analyses for samples collected at Little Tongue River Upper and Lower
stations during Tongue River 205j Project, 1996 - 1999, Sheridan County,
Wyoming..............................................................................................................273
TABLE 8-28. Summary statistics for total nitrate nitrogen (mg/l) analyses for samples
collected at Little Tongue River Upper and Lower and Smith Creek Upper
and Lower stations during Tongue River 205j Project, 1996 - 1999, Sheridan
County, Wyoming ................................................................................................274
TABLE 8-29. Summary statistics for total phosphorus (mg/l) analyses for samples collected
at Little Tongue River Upper and Lower and Smith Creek Upper and Lower
stations during Tongue River 205j Project, 1996 - 1999, Sheridan County,
Wyoming..............................................................................................................275
TABLE 8-30. Summary statistics for alkalinity, total chloride, total hardness, total sulfate,
and total suspended solids analyses for samples collected by WDEQ at
Little Tongue River Upper (1993) and Lower (1996-1999) and Smith Creek
Upper and Lower stations (1996-1999) during Tongue River 205j Project,
Sheridan County, Wyoming.................................................................................276
TABLE 8-31. Habitat assessment scores for Columbus Creek and Little Tongue River 205j
Project stations, 1993 Through1999 ....................................................................277
TABLE 8-32. Mean percent stream substrate composition, percent embeddedness and
current velocity for Columbus Creek and Little Tongue River 205j Project
stations,1996 through 1999 ..................................................................................278
TABLE 8-33. Summary statistics for fecal coliform bacteria (Number per 100 Milliliters)
analyses for samples collected at Smith Creek Upper and Lower stations
during Tongue River 205j Project, 1996 - 1999, Sheridan County, Wyoming ...279

Sheridan County Conservation District
Tongue River Watershed Assessment 205j Final Report 1996-1999 xxxviii
TABLE 8-34. Summary statistics for discharge (CFS) measured at Columbus Creek Upper
and Lower stations during Tongue River 205j Project, 1996 - 1999, Sheridan
County, Wyoming ................................................................................................280
TABLE 8-35. Summary statistics for water temperature (C0) measured at Columbus Creek
Upper and Lower stations during Tongue River 205j Project, 1996 - 1999,
Sheridan County, Wyoming.................................................................................280
TABLE 8-36. Summary statistics for pH (Standard Units) measured at Columbus Creek
Upper and Lower stations during Tongue River 205j Project, 1996 - 1999,
Sheridan County, Wyoming.................................................................................281
TABLE 8-37. Summary statistics for conductivity (Micromhos per Centimeter) measured
at Columbus Creek Upper and Lower stations during Tongue River 205j
Project, 1996 – 1999, Sheridan County, Wyoming .............................................282
TABLE 8-38. Summary statistics for dissolved Oxygen (mg/l) analyses for samples
collected at Columbus Creek Upper and Lower stations during Tongue
River 205j Project, 1996 – 1999, Sheridan County, Wyoming ...........................282
TABLE 8-39. Summary statistics for turbidity (NTU) analyses for samples collected at
Columbus Creek Upper and Lower stations during Tongue River 205j
Project, 1996 – 1999, Sheridan County, Wyoming .............................................283
TABLE 8-40. Summary statistics for fecal coliform bacteria (Number per 100 Milliliters)
analyses for samples collected at Columbus Creek Upper and Lower stations
during Tongue River 205j Project, 1996 – 1999, Sheridan County, Wyoming...284
TABLE 8-41. Summary statistics for total nitrate nitrogen (mg/l) analyses for samples
collected at Columbus Creek Upper and Lower stations during Tongue
River 205j Project, 1996 – 1999, Sheridan County, Wyoming ...........................285
TABLE 8-42. Summary statistics for total phosphorus (mg/l) analyses for samples collected
at Columbus Creek Upper and Lower stations during Tongue River 205j
Project, 1996 – 1999, Sheridan County, Wyoming .............................................285
TABLE 8-43. Summary statistics for alkalinity, total chloride, total hardness, total sulfate,
and total suspended solids analyses for samples collected by WDEQ at
Columbus Creek River Upper (1993) and Lower (1996-1999) during
Tongue River 205j Project, Sheridan County, Wyoming ....................................286

Sheridan County Conservation District
Tongue River Watershed Assessment 205j Final Report 1996-1999 xxxix
TABLE 8-44. Summary statistics for water temperature (C0) measured at Wolf Creek Upper
and Lower and Five Mile Creek Lower stations during Tongue River 205j
Project, 1996 – 1999, Sheridan County, Wyoming .............................................287
TABLE 8-45. Summary statistics for pH (Standard Units) measured at Wolf Creek Upper
and Lower and Five Mile Lower stations during Tongue River 205j Project,
1996 – 1999, Sheridan County, Wyoming...........................................................288
TABLE 8-46. Summary statistics for conductivity (Micromhos per Centimeter) measured
at Wolf Creek Upper and Lower and Five Mile Creek Lower stations during
Tongue River 205j Project, 1996 – 1999, Sheridan County, Wyoming ..............289
TABLE 8-47. Summary statistics for dissolved Oxygen (mg/l) analyses for samples
collected at Wolf Creek Upper and Lower and Five Mile Creek Lower
stations during Tongue River 205j Project, 1996 – 1999, Sheridan County,
Wyoming..............................................................................................................290
TABLE 8-48. Summary statistics for turbidity (NTU) analyses for samples collected at
Wolf Creek Upper and Lower and Five Mile Creek Lower stations during
Tongue River 205j Project, 1996 – 1999, Sheridan County, Wyoming ..............291
TABLE 8-49. Summary statistics for fecal coliform bacteria (Number per 100 Milliliters)
analyses for samples collected at Wolf Creek Upper and Lower and Five
Mile Creek Lower stations during Tongue River 205j Project, 1996 – 1999,
Sheridan County, Wyoming.................................................................................292
TABLE 8-50. Summary statistics for total nitrate nitrogen (mg/l) analyses for samples
collected at Wolf Creek Upper and Lower and Five Mile Creek Lower
stations during Tongue River 205j Project, 1996 – 1999, Sheridan County,
Wyoming..............................................................................................................293
TABLE 8-51. Summary statistics for total phosphorus (mg/l) analyses for samples collected
at Wolf Creek Upper and Lower and Five Mile Creek Lower stations during
Tongue River 205j Project, 1996 – 1999, Sheridan County, Wyoming ..............294
TABLE 8-52. Summary statistics for alkalinity, total chloride, total hardness, total sulfate,
and total suspended solids analyses for samples collected by WDEQ at
Wolf Creek – Berry’s (1995) and Lower (1996-1999) and Five Mile
Creek Lower stations (1996-1999) during Tongue River 205j Project,
Sheridan County, Wyoming.................................................................................295

Sheridan County Conservation District
Tongue River Watershed Assessment 205j Final Report 1996-1999 xl
TABLE 8-53. Habitat assessment scores for Five Mile Creek, Wolf Creek and Smith Creek
205j Project stations, 1995 Through1999 ............................................................296
TABLE 8-54. Mean percent stream substrate composition, percent embeddedness and
current velocity for Five Mile Creek, Wolf Creek and Smith Creek 205j
Project stations,1995 Through 1999 ....................................................................297
TABLE 8-55. Summary statistics from fecal coliform sample stations in the Goose Creek
and Tongue River watersheds exceeding Wyoming fecal coliform bacteria
standards during the Recreation Season and Non-Recreation Season based
on five (5) samples collected within a 30 day period, 1998-1999, Sheridan
County, Wyoming ................................................................................................298
TABLE 9-1 . Summary of Wyoming water quality standard numeric, narrative and drinking
drinking water standard violations during Tongue River watershed assessment
205j Project, Sheridan County, Wyoming ...........................................................308
TABLE 9-2. Final Project average water quality values and ranking (1 equals highest rank
decreasing to 8 for lowest rank) by station within the Tongue River
watershed Project area, 1996 through 1999 .........................................................309
TABLE 9-3. Final Project average macroinvertebrate metric values and ranking
(1 equals highest rank decreasing to 8 for lowest rank) by station within
the Tongue River watershed Project area, 1996 through 1999 ............................310
TABLE 9-4. Final Project average habitat assessment parameter values and ranking
(1 equals highest rank decreasing to 8 for lowest rank) by station within
the Tongue River watershed Project area, 1996 through 1999 ............................311
TABLE 9-5 Comparison of final Project water quality, macroinvertebrate, and habitat
assessment ranking (1 equals highest rank decreasing to 8 for lowest rank)
by station within the Tongue River watershed Project area, 1996 Through
1999......................................................................................................................312

Sheridan County Conservation District
Tongue River Watershed Assessment 205j Final Report 1996-1999 1
INTRODUCTION
1
1.1 STATEMENT OF NEED
There are water quality concerns for that portion of the Tongue River from the Bighorn National
Forest (BHNF) boundary to the Town of Ranchester (Figure 5-1). Concerns were related to
suspect water quality deterioration manifest by sediment, nutrient, and bacterial inputs to the
Tongue River and its tributaries. Public health and safety concerns emerged because the Town of
Dayton and the Town of Ranchester rely on the Tongue River for their domestic water supply. As
of 1998, the Town of Dayton and Town of Ranchester served total populations of 650 and 675
individuals, respectively (Wyoming Water Development Commission, 2000). The Town of
Ranchester has received complaints from residents regarding turbidity and odor. Seasonal water
quality changes in the Tongue River have caused the Ranchester Water Treatment Plant to modify
operations when the facility was unable to meet treatment standards.
Because of these concerns, in 1995, SCCD in partnership with the Natural Resources Conservation
Service (NRCS) explored the need for an assessment of the Tongue River watershed between the
Bighorn National Forest boundary and the Town of Ranchester. SCCD and NRCS felt an
assessment was important not only for water quality concerns, but because of the high value for
resources in the watershed and to continue to address voluntary conservation and resource issues
as part of an integrated conservation program.
The Tongue River is classified by the Wyoming Department of Environmental Quality (WDEQ)
as a Class 2 coldwater water body (WDEQ, 1998). This classification designates the beneficial
uses applicable for the Tongue River including:
· Agriculture;
· Protection and propagation of fish and wildlife;
· Industry;
· Human Consumption;
· Recreation; and
· Scenic Value
In addition, EPA requires states to report on beneficial use attainment for Aquatic Life.
In 1996, the WDEQ Wyoming Water Quality Assessment 305(b) report indicated this segment of
the Tongue River was not achieving full attainment of it’s beneficial uses (WDEQ, 1996). The

Sheridan County Conservation District
Tongue River Watershed Assessment 205j Final Report 1996-1999 2
1996 report listed this segment as Threatened due to fishery concerns. The causes responsible for
this finding were listed as siltation and nutrients based on information provided by the Wyoming
Game and Fish Department (WGFD) and the United States Geological Survey (USGS) monitoring
station number 06298000. The sources for these pollutants were reported as range land and
pasture land. This reach was identified by WDEQ as WYTR10090101-007-3 and assigned a
medium priority for future statewide assessment.
The Tongue River is classified by WGFD as a Class 1 cold water trout fishery upstream from the
BHNF boundary (WGFD, 1991). This classification indicated a trout fishery of national
importance. WGFD currently manages this reach as a wild trout fishery and it receives no
supplemental stocking. The quality of the fishery appears to decline from the BHNF boundary to
the Town of Ranchester indicating a declining water resource within this segment.
The 1996 305(b) report listed the Little Tongue River segment from near the BHNF boundary to
it’s confluence with the Tongue River in Dayton as water quality impaired. This segment was
identified by WDEQ as WYTR10090101-022-2 and assigned a low priority for future statewide
assessment.
The entire length of Smith Creek from its headwaters in the BHNF to confluence with the Tongue
River in Dayton was listed in the 1996 305(b) report as water quality limited. This segment was
identified as WYTR10090101-100-1. WDEQ assigned a medium priority to Smith Creek for
future statewide assessment.
There was sufficient information to indicate the Tongue River, Little Tongue River and Smith
Creek were water quality limited. This observation suggested that the other primary Tongue
River tributaries (Columbus Creek, Wolf Creek, Five Mile Creek) may have water quality
problems. However, potential sources and magnitude of water quality pollutants were unknown
due to limited historic sampling throughout the watershed.
SCCD submitted a proposal in 1995 for funding from the United States Environmental Protection
Agency (EPA) through Section 205(j) funding administered by the WDEQ. Funding was
received in 1996. Additional 205(j) funding was secured in 1998 to extend the watershed
assessment through 1999. Important elements of the assessment included water quality sampling,
data analysis and evaluation, information and education outreach and formation of the Tongue
River Watershed Steering Committee (TRWSC). The TRWSC is an oversight committee
consisting of a representative from the Town of Ranchester, Town of Dayton, a SCCD board
member, the SCCD District Manager and the NRCS District Conservationist. Attempts were
made to include a representative from each sub-drainage within the Project area. The role of the
steering committee was to provide information and education, explain the assessment project to
the public, review project results, and develop a Watershed Plan. Landowner involvement was a
critical component in TRWSC planning.

Sheridan County Conservation District
Tongue River Watershed Assessment 205j Final Report 1996-1999 3
GOALS, OBJECTIVES AND TASKS
2
The Project goals were the same for the 1996 205(j) assessment project and the 1998 205(j)
assessment project. The 1998 project was a continuation of monitoring and assessment initiated
in 1996. Minor changes were made to certain objectives and tasks in 1998 to fine tune monitoring
and assessment based on evaluation of data collected in 1996 and 1997. For example, fecal
coliform bacteria sampling frequency increased in 1999 to more accurately estimate fecal coliform
bacteria concentrations during the Recreation Season (defined by WDEQ as the period from May
1 through September 30) to allow comparison with the Wyoming water quality standard for fecal
coliform bacteria. Dissolved oxygen measurements were initiated in 1999 to determine
attainment with the Wyoming water quality standard for this physical parameter (WDEQ, 1998).
The goals and objectives for the Tongue River watershed project included: 2.1 GOAL 1
Was to provide project administration consistent with approved project management. This Goal
was completed as planned.
2.1.1 OBJECTIVE 1
Was to provide oversite and administration as the lead agency. This Objective was completed as
planned.
2.1.1.1 TASK 1
Was to conduct project administration including ordering supplies, making payments, preparation
of reports, submitting reimbursement applications and day-to-day management responsibilities to
ensure completion of the project. This Task was completed as planned.
2.2 GOAL 2
Was to determine the major types of nonpoint source impairments occurring in the Tongue River
watershed Project area. This Goal was completed as planned and results may be found in Section
8 and Section 9 of this Final Report.

Sheridan County Conservation District
Tongue River Watershed Assessment 205j Final Report 1996-1999 4
2.2.1 OBJECTIVE 1
Was to develop the list of sampling parameters to be analyzed in the watershed and a sampling and
analysis plan by which sampling for analyses would proceed. This Objective was completed as
planned. See Section 6 for the list of sampling parameters and sampling methods employed
during this Project. See Section 7 for the Quality Assurance and Quality Control program.
2.2.1.1 TASK 2
Was to compile and evaluate available data in the Tongue River watershed Project area. This task
comprised three primary efforts
A. Evaluation of water quality data obtained from the Wyoming Water Resource
Center, the Bighorn National Forest and a historical water quality data review;
B. Utilize local contacts to ensure awareness of potentially useful data. Contacts may
include the Wyoming Game and Fish Department, United States Forest Service,
United States Geological Survey, Wyoming Department of Environmental Quality,
Ranchester Water Treatment Plant, and Tongue River High School students; and
C. Review all available data and information to determine which water quality
parameters were likely to cause concerns.
This Task was completed as planned. See Section 5.1 for a description of historic chemical,
physical and biological data compiled within the Project area, Figure 5-1 for the approximate
locations of historic monitoring stations and Appendices A, C, E, J and K for the historical data.
2.2.1.2 TASK 3
Was to provide public education and obtain public input in the target watershed from agricultural
producers, recreational land users, and urban community members. This task had two primary
efforts:
A. Education through tours, newsletters, and personal contact of landowners within
the watershed and
B. Obtain additional input through Conservation District Board meetings and TRWSC
meetings.
This Task was completed as planned. SCCD personnel have conducted numerous information
and education activities for public groups, schools and local radio talk shows. The TRWSC was

Sheridan County Conservation District
Tongue River Watershed Assessment 205j Final Report 1996-1999 5
formed and has met numerous times for preparation of the Tongue River Watershed Plan (SCCD,
2000). TRWSC has held several public meetings to obtain public input and landowner
participation has been encouraging.
2.2.2 OBJECTIVE 2
Was to perform sample analyses and interpret data collected.
This Objective was completed as planned. See Section 8 for results of sample analyses and
Section 8 and Section 9 for interpretation of the data.
2.2.2.1 TASK 4
Was to monitor water quality and perform analyses.
This Task was completed as planned. See Section 8 for results of water quality monitoring and
analysis of samples.
2.2.2.2 TASK 5
Was to assess the relative health of the riparian areas to determine effects on the water quality
within the Project area. WGFD conducted a concurrent inventory of landscape and habitat factors
on the entire Tongue River Drainage using multi-layer remote sensing Geographic Information
System (GIS) computer models. The University of Wyoming also conducted a Master of Science
(M.S.) graduate level water quality project on the North Tongue River watershed and a Doctor of
Philosophy (Ph.D) graduate level project to develop an ecosystem-based assessment of the North
Tongue River fishery on the BHNF. Both these projects could provide information related to
assessment of nonpoint source impairments within the Project area.
This task was completed as planned. See Section 8 for habitat assessment results and
determination of relative riparian health at main stem Tongue River and tributary stations.
WGFD completed the GIS project for vegetation types and relative composition for each
vegetation type. The GIS layer has been presented to SCCD.
The University of Wyoming M.S. thesis was completed by Felbeck (1999). The thesis evaluated
potential sediment sources and estimated the percent sediment contribution from each source to
the North Tongue River. The study was valuable in that it provided information to assist land
managers and users to chart future management of the North Tongue River in the BHNF. SCCD
analysis of the water quality data presented by Felbeck, although important at the scale of the
North Tongue River watershed, was not directly applicable to the Tongue River within the SCCD

Sheridan County Conservation District
Tongue River Watershed Assessment 205j Final Report 1996-1999 6
Project area located several miles downstream of Felbeck’s study area. It appeared that water
quality observed in the North Tongue River was greatly transformed as it flowed downstream to
the SCCD Project area (starting at the BHNF boundary in the Tongue River canyon). The
transformation in water quality appeared to be due to the influence of South Tongue River and
other tributary water entering the Tongue River within the BHNF. Once the Tongue River
entered the upper Tongue River canyon and flowed approximately eight (8) stream miles through
the isolated canyon, water quality appeared to improve since natural stream cleansing processes
were allowed to function because anthropogenic, potential negative land use influence and
significant pollutant sources were absent. Water quality in the Tongue River as it exited the lower
canyon may be characterized as good to excellent (See Section 9.1). Thus, the Felbeck (1999)
data set was not included in this Final Report because of the observed transformation in water
quality to the SCCD Project area. The Ph.D level thesis has not been completed to date of this
Final Report.
2.3 GOAL 3
Was to develop a Watershed Plan to address identified nonpoint source pollution concerns within
the Tongue River project area.
The Tongue River Watershed Management Plan was completed as planned (see SCCD, 2000).
2.3.1 OBJECTIVE 3
Was to develop a prioritized list of cost-effective management and structural practices.
This objective was completed in the Tongue River Watershed Management Plan (see SCCD,
2000).
2.3.1.1 TASK 6
Was to interpret data and identify concerns/opportunities to improve the watershed.
This task was completed as planned. See Section 8 and Section 9 in this Final Report and the
Tongue River Watershed Management Plan (SCCD, 2000).
2.3.1.2 TASK 7
Was to develop a Watershed Plan to address high priority areas of concern that may require
additional efforts to remediate identified water quality problems. The Watershed Plan would
provide discussion for the implementation of future projects requiring additional technical and
financial assistance to address concerns identified through this 205(j) watershed assessment.

Sheridan County Conservation District
Tongue River Watershed Assessment 205j Final Report 1996-1999 7
Typical improvements may include irrigation improvements, relocation of livestock facilities,
filter strips, improved grazing management in riparian areas, streambank stabilization, and
nutrient/pesticide management. Other Best Management Practices (BMP’s) would be identified to
address resource concerns.
This task was completed and is addressed in the Tongue River Watershed Management Plan (see
SCCD, 2000).

Sheridan County Conservation District
Tongue River Watershed Assessment 205j Final Report 1996-1999 8
DESCRIPTION OF PROJECT AREA
3
3.1 TONGUE RIVER AND MAJOR TRIBUTARIES
3.1.1 TONGUE RIVER
The Tongue River forms at the junction of the North Tongue River and the South Tongue River in
the Big Horn Mountains. The North Tongue River and the South Tongue River are WDEQ Class
1 water bodies (WDEQ, 1998). This classification indicated that these streams were among the
highest quality water bodies in Wyoming and no further water quality degradation by point source
discharges other than from dams would be allowed (WDEQ, 1998). The WDEQ stream
classification changes to Class 2 after the confluence of the North and South Tongue Rivers. The
river flows east where it enters the steep walled Tongue River Canyon. Access to the river in the
canyon segment is limited to a pack trail and recreation is the primary land use. It is in this reach
downstream to near the lower canyon mouth that was classified by WGFD as a Class 1 trout
fishery (WGFD, 1991). It is near the mouth of the canyon where the SCCD Project begins; the
Project area extends from near the BHNF boundary in the canyon downstream to the Town of
Ranchester.
An instream flow water right was issued for this reach by the State of Wyoming Engineers office
in 1990. This was only the third stream in Wyoming at that time approved for an instream flow
water right. The instream flow right is for 60 cubic feet per second (cfs) from July through
March, 80 cfs in April and 180 cfs during May and June. There are no dams on the mainstem
Tongue River from its headwaters to the Wyoming state line where it enters the state of Montana.
The Tongue River Reservoir is sited in Montana near the Wyoming state line and provides
excellent recreational opportunities and a warm water fishery of regional importance.
The Hydrologic Unit Code (HUC) for the Tongue River and each major tributary in the Project
area is 10090100. Predominant geology in the canyon section is plutonic rocks, quartz diorite to
quartz monzonite (USGS, 1985) indicating low erosive potential. The river has been classified as
a Reference Stream reach by WDEQ indicating that this reach has been minimally affected by
human activity (Hughes, 1995). As such, the upper reach in the canyon serves as a suitable
reference or control site for comparison to downstream Tongue River sites because the Reference
classification exhibits water quality and biological conditions most natural and attainable for
streams in this foothills region of Wyoming (EPA, 1996).
After the river exits the canyon, it enters a transition zone from the Big Horn Mountain foothills to
the Great Plains. The river transforms from a higher gradient and confined “B” type channel in

Sheridan County Conservation District
Tongue River Watershed Assessment 205j Final Report 1996-1999 9
the canyon to a lower gradient, meandering “C” type channel in the plains (Rosgen 1996).
Moreover, the river exits the Middle Rockies Ecoregion and enters the Great Plains Ecoregion
(Omernik and Gallant, 1987). Because ecoregions are regions of relative homogeneity (similar to
one another) with respect to ecological systems (Hughes, 1995), the change from one ecoregion to
another indicated that normal changes in environmental, ecological and water quality
characteristics were expected along the longitudinal gradient of the Tongue River.
The predominant geology in the plains is alluvium and colluvium comprised of clay, silt, sand and
gravel present in flood plains, fans, terraces and slopes (USGS, 1985). The meandering character
of the river combined with these geological characteristics provide naturally greater potential for
clay and silt introduction and deposition in the river. Because of the greater natural potential of
siltation in the river, it is even more important for land users to practice wise soil and irrigation
conservation practices and employ Best Management Practices (BMP’S) where appropriate.
Disruption of the river channel by channelization and stream bank modification may drastically
alter hydrologic, physical and biological (e.g. fishery) processes.
Soils in the Tongue River canyon area are dominated by the Tolman-Cloud Peak-Stanley
association indicating shallow, moderately deep and very deep soils and areas of rock outcrop
present in mountainous areas (NRCS, 1998). Soil type from the canyon to near the Town of
Dayton is dominated by the Trimad-Trivar-Abac association characterized by shallow and very
deep soils on hills, terraces and alluvial fans adjacent to mountainous areas. The soil type
changes to the Worfka-Samday-Parmleed association from near Dayton to the Town of
Ranchester. This association is also characterized by shallow and very deep soils on hills,
terraces and alluvial fans adjacent to mountainous areas.
There are no impoundments on the main stem Tongue River. There are no diversions from the
Tongue River prior to the lower canyon mouth. Water is first diverted from the Tongue River at
the Highline Ditch just upstream of USGS gage station 06298000. Other significant diversions
downstream include the South Side located near the XL Ranch and the Tongue River No. 1 located
about ½ mile upstream of the Town of Dayton. The Hanover Ditch is another large diversion
located near the Highway 14/16 bridge in Dayton. The Hanover Ditch later splits into the OZ
Ditch and Mikado Ditch. The York Ditch is present downstream of Dayton in the vicinity of the
Dayton Wastewater Treatment Facility. Water in the main stem Tongue River is not over
appropriated whereas some of the primary tributaries within the Project area are over appropriated.
The dominant use for Tongue River water is for agricultural use. Municipalities use a
proportionately small amount of water when compared to agricultural diversions. The Town of
Dayton normally uses an average of about 152,000 gallons per day (gpd) or 0.235 cubic feet per
second (cfs) per day with peak usage of about 470,000 gpd or 0.727 cfs per day during summer
months (WWDC, 2000). The Town of Ranchester uses an average of about 203,000 gpd or 0.314
cfs per day with peak usage of about 684,000 gpd or 1.058 cfs per day during summer months
(WWDC, 2000).

Sheridan County Conservation District
Tongue River Watershed Assessment 205j Final Report 1996-1999 10
Significant irrigation return enters the Tongue River downstream of the Town of Ranchester
outside the Project area. Certain tributaries entering the Tongue River within the Project area
were believed to contain flow consisting primarily of irrigation return water during the irrigation
season from about May into September.
Primary land use in the lower canyon area is wildlife habitat and recreation with private summer
and year around residences located intermittently along it’s length. After exiting the canyon,
primary land use changes to irrigated hayland, dryland pasture, wildlife habitat, livestock grazing,
recreation and limited gravel and sand mining. A change to urban land use occurs as the river
enters the Town of Dayton, then reverts back to agricultural related land use and wildlife habitat as
the Tongue River flows downstream. The Dayton Wastewater Treatment Facility discharges
treated effluent directly to the Tongue River about one to two miles downstream of Dayton.
Agricultural land use and wildlife habitat dominates the mainstem Tongue River until it enters the
Town of Ranchester which marks the lower end of the Project area. Land use in Ranchester is
urban, recreation and wildlife habitat.
3.1.2 LITTLE TONGUE RIVER
The headwaters for the Little Tongue River are in the BHNF near Black Mountain at an elevation
of about 8,200 feet. The stream disappears underground as it traverses the face of the mountain in
the vicinity of a rock slide called the Fallen City. The stream surfaces in the lower foothills on the
Horseshoe Ranch which is located within the Project area. Dye studies suggest a portion of
underground stream flow discharges in the Tongue River Canyon to the north.
The WDEQ 1996 Wyoming Water Quality Assessment listed the Little Tongue River as partially
supporting aquatic life use (WDEQ, 1996). The causes believed to be responsible for this finding
were listed as siltation and flow alteration based on information provided by WDEQ. The source
for siltation was reported as pasture land and flow alteration was due to low stream discharge
possibly related to water diversion for irrigation.
The stream is a 4th
order water body (Strahler, 1957) and drains an area of about 26.2 square miles
up to its confluence with the Tongue River in the Town of Dayton. The predominant geology of
the watershed within the Project area is Bearpaw shale comprised of dark greenish-gray shale
containing thin gray sandstone partings (USGS, 1985). The entire stream is placed in the Middle
Rockies Ecoregion although the lower reaches near the Town of Dayton approach the
Northwestern Great Plains (Omernik and Gallant, 1987). WGFD has classified the Little Tongue
River within the project area as a Class 4 trout fishery. This indicated the stream was a low
production trout water, a fishery frequently of local importance, but generally incapable of
sustaining substantial fishing pressure (WGFD, 1991).
Soils in the upper Little Tongue River watershed are dominated by the Tolman-Cloud

Sheridan County Conservation District
Tongue River Watershed Assessment 205j Final Report 1996-1999 11
Peak-Stanley association indicating shallow, moderately deep and very deep soils and areas of
rock outcrop present in mountainous areas (NRCS, 1998). The remainder of the watershed
downstream to the Town of Dayton is dominated by the Trimad-Trivar-Abac association
characterized by shallow and very deep soils on hills, terraces and alluvial fans adjacent to
mountainous areas.
There are no dams on the main stem of the Little Tongue River although flows are diverted for use
primarily by a golf course and for agricultural use. The Frisbee Ditch may divert up to 12 cubic
feet per second during periods of spring runoff. Primary landuse in the upper drainage within the
project area is recreational (golf course), irrigated hayland, wildlife habitat and limited livestock
grazing. Landuse in the middle portion of the drainage include irrigated hayland, pasture land,
wildlife habitat, recreation and livestock grazing. Landuse in the lower drainage in Dayton is
primarily urban. Considerable channelization (straightening) of the stream bank has occurred in
Dayton.
3.1.3 SMITH CREEK
The headwaters for Smith Creek are found in the BHNF at about 7,600 feet. This is the smallest
tributary to the Tongue River within the Project area with a drainage area of about 11.6 square
miles at the confluence with the Tongue River in the Town of Dayton.
The WDEQ 1996 Wyoming Water Quality Assessment listed Smith Creek as non supporting for
drinking water use due to pathogens (based on fecal coliform bacteria sampling), siltation,
nutrients and habitat alteration. The sources for these impairments were reported as pasture land,
streambank alteration and removal of riparian vegetation. The source of information leading to
this finding was WDEQ. WDEQ apparently identified water quality impairments at a confined
animal feeding operation in response to a citizen complaint.
The stream is a 3rd
order water body (Strahler, 1957) and is a Class 2 coldwater stream (WDEQ,
1998). The predominant geology in the upper Portion of the watershed within the Project area is
Madison limestone comprised of blue-gray, massive limestone and dolomite underlain by gray
cherty limestone and dolomite (USGS, 1985). The preponderance of limestone in the drainage
should naturally result in higher stream pH and Total Dissolved Solids (TDS). The lower portion
of the drainage near the confluence with the Tongue River is Bearpaw shale comprised of dark
greenish-gray shale containing thin gray sandstone partings (USGS, 1985). The upper segment of
the stream is placed in the Middle Rockies ecoregion while the lower reach near the Town of
Dayton approaches the Northwestern Great Plains ecoregion (Omernik and Gallant, 1987).
WGFD classified Smith Creek as a Class 5 trout fishery within the Project area. This indicated
the stream was very low production trout water, often incapable of sustaining a trout fishery
(WGFD, 1991).
Sheridan County Conservation District
Tongue River Watershed Assessment 205j Final Report 1996-1999 12
Soils in the upper Smith Creek watershed downstream to near County Road 116 are dominated by
the Tolman-Cloud Peak-Stanley association indicating shallow, moderately deep and very deep
soils and areas of rock outcrop present in mountainous areas (NRCS, 1998). Soil type
downstream to about two miles upstream from the Town of Dayton is dominated by the
Trimad-Trivar-Abac association characterized by shallow and very deep soils on hills, terraces and
alluvial fans adjacent to mountainous areas. The soil type then changes to the
Norbert-Savage-Savar association downstream to Dayton. This association is also characterized
by shallow and very deep soils on hills, terraces and alluvial fans adjacent to mountainous areas.
There are no major impoundments on the main stem of Smith Creek although stream discharge is
highly regulated by diversions for primarily agricultural use. The Powers Pipeline, Mock No. 2,
Scott Pipeline-Huntington & Smith, Owens No. 1 and the Davis Supply Ditch are primary Smith
Creek irrigation water conduits serving irrigators (WSBC, 1998). Stream surveys published by
the WGFD in 1958 stated that the lower portion of Smith Creek was unsuitable for game fish due
to low flows caused by irrigations diversions (WGFD, 1958). The report added that trout habitat
and trout spawning facilities were good on the Glenn Mock Ranch (in the upper watershed) while
fish food production was poor.
Primary landuse in the upper Smith Creek drainage within the Project area are wildlife habitat,
recreation, limited seasonal livestock grazing, limited irrigated hayland, and pasture land. A
Confined Animal Feeding Operation (CAFO) was relocated off Smith Creek in the mid to latter
1990's to the White Tail drainage south of Smith Creek. Rural subdivision development is
present in the middle portion of the watershed. Other land use in the middle portion of the
drainage include irrigated hayland, wildlife habitat, dry land pasture and livestock grazing.
Landuse in the lower drainage is agricultural, wildlife habitat, recreation and urban in the Town of
Dayton. Considerable channelization (straightening) of the stream bank has occurred in Dayton.
3.1.4 COLUMBUS CREEK
Columbus Creek heads in the BHNF at an elevation of about 7,900 feet. It is the second largest
tributary to the Tongue River within the Project area with a drainage area of about 17.9 square
miles near it’s confluence with the Tongue River near Halfway Lane (located about halfway
between the Town of Dayton and the Town of Ranchester).
Columbus Creek was not listed by WDEQ as water quality impaired although citizen complaints
have been reported in the vicinity of a CAFO located upstream of Highway 14.
The stream is a 3rd
order water body (Strahler, 1957) and is a Class 2 cold water stream (WDEQ,
1998). The predominant geology in the upper portion of the watershed within the Project area is
Madison limestone comprised of blue-gray, massive limestone and dolomite underlain by gray
cherty limestone and dolomite (USGS, 1985). The lower portion of the drainage near the

Sheridan County Conservation District
Tongue River Watershed Assessment 205j Final Report 1996-1999 13
confluence with the Tongue River is the Fort Union Formation, Tullock Member comprised of soft
gray sandstone, gray and brown carbonaceous shale and thin coal beds. The upper segment of the
stream is placed in the Middle Rockies Ecoregion foothills while the lower reach is in the
Northwestern Great Plains Ecoregion (Omernik and Gallant, 1987). WGFD classified Columbus
Creek as a Class 3 trout fishery within the Project area. This indicated the stream was an
important trout water and fishery of regional importance (WGFD, 1991).
Soils in the upper Columbus Creek watershed within the Project area downstream to near the
County Road 140 crossing are dominated by the Tolman-Cloud Peak-Stanley association
indicating shallow, moderately deep and very deep soils and areas of rock outcrop present in
mountainous areas (NRCS, 1998). Soil type then changes a short distance downstream to the
Trimad-Trivar-Abac association characterized by shallow and very deep soils on hills, terraces and
alluvial fans adjacent to mountainous areas. The soil type again changes to the
Norbert-Savage-Savar association, similar in characterization to the Trimad-Trivar-Abac
association. Soil type then shifts to the Worfka-Samday-Parmleed association and then again to
the Haverdad-Zigweid-Nuncho association near the Highway 14 crossing. The
Haverdad-Zigweid-Nuncho association was also identified in the lower Wolf Creek flood plain
and was characterized by very deep soils on flood plains, low terraces, and alluvial fans (NRCS,
1998). This soil type indicated the presence of increased amounts of soil available for transport
to the water column during high discharge periods or riparian and channel disturbance.
There are no major impoundments on the mainstem of Columbus Creek although the stream is
highly regulated because nearly all stream discharge flow may be diverted during the irrigation
season for agricultural use. Water is diverted from Columbus Creek into the Five Mile Ditch.
An average 3,260 acre feet of water are diverted to Five Mile Ditch annually based on records
maintained by the Wyoming State Board of Control from 1989 to 1998. Consequently, discharge
in lower Columbus Creek during the latter portion of the irrigation season is greatly reduced and
believed to be comprised primarily by irrigation return or groundwater recharge from upstream
irrigated hayfields. Stream surveys conducted by WGFD in 1958 stated that the lower portion of
Columbus Creek from Mock’s Ranch to the mouth was not suitable for trout as a large irrigation
reservoir on the Bear Claw Ranch and irrigation diversions deplete the stream flow (WGFD,
1958). The report added that the upper section of the stream (probably in the foothills) had
adequate fish shelter and fish food production was good. Trout spawning facilities were very
good.
Primary landuse in the upper drainage within the Project area is livestock grazing, wildlife habitat,
limited seasonal livestock grazing and recreation. Landuse in the middle and lower portions of
the drainage include livestock grazing, irrigated hayland, confined feeding operation, pasture land,
limited irrigated crop land, wildlife habitat and recreation.

Sheridan County Conservation District
Tongue River Watershed Assessment 205j Final Report 1996-1999 14
3.1.5 WOLF CREEK
The headwaters for Wolf Creek are in the BHNF at an elevation of about 8,800 feet. This is the
largest tributary to the Tongue River within the Project area with a drainage area of about 72.4
square miles near its confluence with the Tongue River near the Town of Ranchester.
Wolf Creek was not listed as water quality impaired by WDEQ although complaints related to
livestock feeding operations have been received. The stream is a 4th
order water body (Strahler,
1957) and is a Class 2 coldwater stream throughout its length (WDEQ, 1998). The predominant
geology in the upper portion of the watershed within the Project area is a mixture of the Fort Union
Formation and Tullock Member comprised of soft gray sandstone, gray and brown carbonaceous
shale and thin coal beds and alluvium and colluvium comprised of clay, silt, sand and gravel in
flood plains, fans and terraces and slopes. Geology in the lower portion of the drainage near the
confluence with the Tongue River is undivided surficial deposits of mostly alluvium, colluvium,
and glacial landslide deposits (USGS, 1985). The upper portions of the stream are placed in the
Middle Rockies Ecoregion while the lower reaches near the Town of Ranchester are in the
Northwestern Great Plains Ecoregion (Omernik and Gallant 1987). WGFD classified Wolf
Creek as a Class 3 trout fishery within the Project area. This indicated the stream was an
important trout water and fisheries of regional importance (WGFD, 1991).
Soils in the upper watershed near the Project boundary downstream to just below the Soldier Creek
Road are dominated by the Tolman-Cloud Peak-Stanley association indicating shallow,
moderately deep and very deep soils and areas of rock outcrop present in mountainous areas
(NRCS, 1998). Soil type downstream to the Town of Ranchester is dominated by the
Bidman-Parmleed-Shingle association characterized by shallow and very deep soils on hills,
terraces and alluvial fans adjacent to mountainous areas. Within the lower half of Wolf Creek is a
relatively narrow band soil type within the immediate flood plain identified as the
Haverdad-Zigweid-Nuncho association. This soil type is characterized by very deep soils on
flood plains, low terraces, and alluvial fans (NRCS, 1998).
There are no major impoundments on the mainstem of Wolf Creek although stream flows are
highly regulated by diversion primarily for agricultural use. Several irrigation supply ditches are
routinely monitored by WSBC because Wolf Creek is over appropriated (water rights exceed the
total amount of water in Wolf Creek). Major ditches monitored by WSBC include Hardin &
Campbell, West Wolf, East Wolf, Nichols & Oberich, Shields, Dye & Shields, Gibbons, Old
Reliable, Garrard, Decker and Grinnell (WSBC, 2000). One landowner has apparently elected to
leave a portion of appropriated water in Wolf Creek to enhance fisheries.
Stream surveys published by the WGFD in 1958 stated that Wolf Creek had fair spawning
facilities toward the mouth (near the confluence with the Tongue River) and excellent spawning
areas near the canyon section (near the upper boundary of Wolf Creek within the Project area).
Sheridan County Conservation District
Tongue River Watershed Assessment 205j Final Report 1996-1999 15
Primary landuse in the upper Wolf Creek drainage within the Project area include wildlife habitat,
recreation and limited livestock grazing. Primary landuse in the middle and lower portions of the
watershed include irrigated hayland, pasture land, some year around livestock grazing, wildlife
habitat and recreation. Urban landuse is evident near the Town of Ranchester.
3.1.6. FIVE MILE CREEK
Five Mile Creek although termed a Creek, is primarily a conduit to deliver irrigation water for
agricultural landuse. The Creek receives the majority of flow from diversion of Columbus Creek
via the Five Mile Ditch. A few springs exist in the drainage, but they would not provide sufficient
discharge to allow maximum agricultural development without diversion from Columbus Creek.
The first water rights appropriated for the Five Mile Ditch date back to August 16, 1882 when
several individuals and a company were granted rights. Water diverted from Columbus Creek is
stored in irrigation reservoirs for release during the irrigation season.
The headwaters for Five Mile Creek are difficult to identify, but appear to consist of a single spring
or series of springs. The entire drainage is contained within the Project area and consists of about
15.2 square miles up at the confluence with the Tongue River in the Town of Ranchester.
Five Mile Creek was not listed as water quality impaired by WDEQ. The stream is a 4th
order
water body (Strahler, 1957) and was not classified by WDEQ (WDEQ, 1998). Although not
classified, Five Mile Creek assumes the classification of the Tongue River (Class 2 cold water) due
to the “tributary rule”. The tributary rule states that “...any unlisted water shall have the same
classification as the first listed water to which it is a tributary” (i.e. Tongue River) (WDEQ, 1998).
The predominant geology in the drainage is the Fort Union Formation, Lebo Member comprised of
dark-gray clay shale and concretionary sandstone (USGS 1985). The entire watershed is placed
in the Northwestern Great Plains Ecoregion (Omernik and Gallant, 1987). WGFD classified Five
Mile Creek as a Class 5 trout fishery. This indicated the stream was very low production trout
water, often incapable of sustaining a trout fishery (WGFD, 1991).
Soils in the upper Five Mile Creek watershed are dominated by the Norbert-Savage-Savar
association characterized by shallow and very deep soils on hills, terraces and alluvial fans
adjacent to mountains. Soil type then shifts to the Worfka-Samday-Parmleed association and
then again to the Haverdad-Zigweid-Nuncho association near the Town of Ranchester. The
Haverdad-Zigweid-Nuncho association was also identified in the lower Wolf Creek area and
lower Columbus Creek drainage. This soil type is characterized by very deep soils on flood
plains, low terraces, and alluvial fans (NRCS, 1998) and indicated the presence of increased
amounts of soil available for transport to the water column during high discharge periods and
riparian and channel disturbance.
There were two impoundments significantly influencing Five Mile Creek. One impoundment in

Sheridan County Conservation District
Tongue River Watershed Assessment 205j Final Report 1996-1999 16
Wagner Draw receives and stores water diverted from Columbus Creek for use during the
irrigation season. Located downstream is Five Mile Creek Reservoir, the largest impoundment
on Five Mile Creek. It also functions to store water for irrigation use. The irrigation season may
begin as early as May and continue through August and into mid-September. Primary landuse in
the Five Mile Creek drainage is irrigated hayland, cropland, pasture land, livestock grazing and
wildlife habitat although urban and recreational land use occur in the lower reach in the Town of
Ranchester.
3.2 LAND USES
The land surface within the Project area is approximately 80,000 acres with about 8 percent in state
ownership, including the Amsden Creek Big Game Winter range administered by WGFD. The
remaining 92 percent is privately owned.
The land use in the BHNF in which the Tongue River and all tributaries originate, with the
exception of Five Mile Creek, include recreation, wildlife habitat, logging and seasonal livestock
grazing. Land use within the Project area as indicated in Section 3.1 is diverse and dominated by
irrigated cropland, irrigated hayland, dryland pasture, livestock grazing, recreation and wildlife
habitat. Urbanization occurs in the Towns of Dayton and Ranchester. A golf course, emerging
rural subdivisions, significant tourist/recreation industry and limited sand and gravel mining
operations are additional land uses. The area provides outstanding year-round habitat for small
and big game, furbearers, waterfowl, game birds and songbirds. Prime wildlife habitat is
concentrated along stream bottoms and brushy draws where riparian zones were intact.
The mainstem Tongue River and major tributaries contain numerous small to very large ranches.
Status for domestic wastewater treatment at ranches and rural subdivisions was unknown.
Agriculture related land use dominates. Agricultural operations center around cattle and hay
production enhanced by irrigation water from the Tongue River and tributaries during the summer
growing season. There are approximately 12,000 acres of irrigated hay and crop land in the
Project area with approximately one-third to one-half operating at low efficiencies. Livestock
tend to be fed and wintered along the creek bottoms since these areas provide the necessary shelter
and water.
3.3 POINT SOURCE DISCHARGES
There are three permitted facilities with point source discharges in the Project area. Each has a
National Pollutant Discharge Elimination System (NPDES) permit issued through WDEQ. Two
of the permits are issued to feedlots which have historically generated water quality complaints.
A. The Padlock Ranch feedlot (Permit Number WY-0022462) is located adjacent to

Sheridan County Conservation District
Tongue River Watershed Assessment 205j Final Report 1996-1999 17
Columbus Creek in the lower watershed about 1 to 2 miles upstream of Highway
14. It has a capacity of around 9,000 animals and has been in operation for several
years. The NPDES permit for the feedlot allows no discharge except during
chronic or catastrophic storm events which may cause an overflow of wastewater
storage lagoons or in the event of precipitation or snowmelt runoff events which
exceed the 25 year, 24 hour event. The permit allows the operator to remove
wastewater from storage treatment lagoons for use by spray irrigation onto adjacent
fields. Should the facility discharge, the operator is required to immediately notify
WDEQ.
B. The Bear Claw Cattle Company feedlot (NPDES Permit Number WY-0035831)
was relocated in 1995 and 1996 from Smith Creek south to the Whitetail Creek
drainage. A complaint to WDEQ in the mid 1990's led to the relocation of the
feedlot to the White Tail Creek watershed. The feedlot site on Smith Creek was
remediated. The permit indicated that the feedlot has a capacity of about 400
head per year. The NPDES permit allows no discharge except during chronic or
catastrophic storm events cause an overflow from facilities designed, constructed
and operated to contain all process generated waste waters plus the runoff from a
25 year - 24 hour precipitation event (3.3 inches). The facility is required to
immediately notify WDEQ in the event of a discharge.
C. The last NPDES permitted facility in the project area is the Town of Dayton
Wastewater Treatment Facility (WWTF) (Permit Number WY-0020435). The
WWTF treats wastewater from the Town of Dayton. The system consists of a two
cell aerated lagoon with ultraviolet light disinfection before discharging directly to
the mainstem Tongue River. There is also a second discharge point consisting of
groundwater from the WWTF french drain system. The WWTF received funding
to significantly upgrade the treatment system around 1986 and 1987. Further
WWTF upgrade and repair of lagoon liners occurred in 1998.

Sheridan County Conservation District
Tongue River Watershed Assessment 205j Final Report 1996-1999 18
STREAM CLASSIFICATION AND STANDARDS
4
4.1 STREAM CLASSIFICATIONS
The Tongue River, Little Tongue River, Smith Creek, Columbus Creek, and Wolf Creek within
the Project area are Class 2 cold water streams (WDEQ,1998; Chapter 1, Water Quality Rules and
Regulations). Five Mile Creek was not classified. However, it is a Class 2 coldwater stream as
indicated in Section 3.1.6. The Class 2 designation indicated these water bodies were:
1. Presently supporting game fish; or
2. Have the hydrologic and natural water quality potential to support game fish; or
3. Include nursery areas or food sources for game fish.
4.2 BENEFICIAL USES
The Tongue River and tributaries are Class 2 water bodies. As Class 2 water bodies, all Wyoming
beneficial uses apply to each including:
1. Agriculture;
2. Protection and propagation of fish and wildlife;
3. Industry;
4. Human Consumption;
5. Recreation; and
6. Scenic Value
In addition, EPA requires states to report on beneficial use attainment for Aquatic
Life.
4.3 WATER QUALITY STANDARDS
Wyoming surface waters designated as Class 2 water bodies are protected through application of
narrative (descriptive) and numeric water quality standards described in WDEQ Water Quality
Rules and Regulations, Chapter 1 (WDEQ, 1998). All Aquatic Life use and Human Health water
quality criteria found in Appendix B of Chapter 1 apply. WDEQ (2000) proposed revisions to
water quality rules and regulation as part of the required triennial review after initiation of this
Project in 1996. It was uncertain how the revised rules and regulations may affect findings

Sheridan County Conservation District
Tongue River Watershed Assessment 205j Final Report 1996-1999 19
contained in this Final Report because they have not been finalized.
Table 4-1 lists water quality parameters, reference for the water quality standard and a brief
description of the narrative or numeric water quality standard applicable to the parameter.
Standards for eighty-seven (87) organic priority pollutants and fifteen (15) organic non-priority
pollutants are referenced as a group in Table 4-1, but are not listed individually. These organic
pollutants include numerous pesticides, herbicides, solvents and other compounds. Please see
Appendix B in WDEQ Water Quality Rules and Regulations, Chapter 1 (WDEQ, 1998) for the
specific organic pollutant and associated standard.
Included in Table 4-1 are lists of additional chemical, biological and habitat parameters for which
there are no established Wyoming surface water quality numeric standards. These parameters
were included since they provided additional information for use in determining attainment of
beneficial uses applicable to the water bodies within the Project area. Recommended referenced
standards are provided for each. These parameters and rationale for their use in the Project
monitoring plan are discussed in detail in Section 6.0.

Sheridan County Conservation District
Tongue River Watershed Assessment 205j Final Report 1996-1999 20
TABLE 4-1. Numeric and Narrative Quality Standards for Wyoming Surface Waters Applicable
for Class 2 Waters in the Tongue River 205(j) Project Area (From WDEQ, 1998)
NUMERIC STANDARDS Parameter
Reference
Standard / Description
Antimony
Section 18; Appendix B
Human Health: 14 ug/l
Arsenic
Section 18; Appendix B
Human Health: .018 ug/l; Acute Aquatic Life: 360 ug/l
Asbestos
Section 18; Appendix B
Human Health: 30000 fibers/L
Beryllium
Section 18; Appendix B
Human Health: .0077 ug/l
Cadmium
Section 18; Appendix B
Human Health: 10 ug/l; Acute Aquatic Life: 3.9 ug/l (calculated)
Chromium (III)
Section 18; Appendix B
Human Health: 50 ug/l; Acute Aquatic Life: 1700 ug/l (calculated)
Chromium (VI)
Section 18; Appendix B
Human Health: 50 ug/l; Acute Aquatic Life: 16 ug/l
Copper
Section 18; Appendix B
Human Health: 1000 ug/l; Acute Aquatic Life: 18 ug/l (calculated)
Total Cyanide
Section 18; Appendix B
Human Health: 200 ug/l; Acute Aquatic Life: 22 ug/l
Lead
Section 18; Appendix B
Human Health: 50 ug/l; Acute Aquatic Life: 82 ug/l (calculated)
Mercury
Section 18; Appendix B
Human Health: .144 ug/l; Acute Aquatic Life: 2.4 ug/l
Nickel
Section 18; Appendix B
Human Health: 610 ug/l; Acute Aquatic Life: 1400 ug/l
(calculated) Selenium
Section 18; Appendix B
Human Health: 10 ug/l; Acute Aquatic Life: 20 ug/l
Silver
Section 18; Appendix B
Human Health: 50 ug/l; Acute Aquatic Life: 4.1 ug/l (calculated)
Thallium
Section 18; Appendix B
Human Health: 13 ug/l
Zinc
Section 18; Appendix B
Human Health: 5000 ug/l; Acute Aquatic Life: 120 ug/l
(calculated) Aluminum (pH
6.5-9.0)
Section 18; Appendix B
Acute Aquatic Life: 750 ug/l
Ammonia
Sections 18 and 21
See Appendix C (WDEQ, 1998)

Sheridan County Conservation District
Tongue River Watershed Assessment 205j Final Report 1996-1999 21
TABLE 4-1. (Con’t)
Barium
Section 18; Appendix B
Human Health: 1000 ug/l
Chloride
Section 18; Appendix B
Acute Aquatic Life: 860000 ug/l
Chlorine
Section 18; Appendix B
Acute Aquatic Life: 19 ug/l
Dissolved
Gases
Sections 18 and 30;
Appendix B
Chronic Aquatic Life: 100%; Section 30: 110% saturation below
man-made dams Dissolved
Oxygen
Sections 18 and 30
Appendix D: 5.0 mg/l for fish early life; 4.0 mg/l other life stages
Fecal Coliform
Section 27
200 groups / 100ml (Recreation Season, 5 samples w/in 30 days);
400 groups / 100ml in 10 percent of samples Iron
Section 18; Appendix B
Acute Aquatic Life: 19 ug/l
Manganese
Section 18; Appendix B
Human Health: 50 ug/l
Nitrates (as N)
Section 18; Appendix B
Human Health: 1000 ug/l
Oil and Grease
Section 29
10 mg/l; no sheen or visible deposits allowed
pH
Sections 18 and 26;
Appendix B
Chronic Aquatic Life: 6.5-9.0 standard units
Sulfide (S
2-,
HS-)
Section 18; Appendix B
Chronic Aquatic Life: 2 ug/l
Radium 226
Section 22
60 pCi/l
Temperature
Section 25
No change greater than 2 degrees F (1.1 degrees C); Maximum
temperature considered to be 78 degrees F (25.6 degrees C) Turbidity
Section 23
No increase greater than 10 NTU due to discharge of substances
Organics,
priority
Section 18
Human Health and Aquatic Life, Appendix B: Standards for 87
organic priority pollutants are listed Organics,
non-priority
Section 18
Human Health and Aquatic Life, Appendix B: Standards for 15
organic non-priority pollutants are listed

Sheridan County Conservation District
Tongue River Watershed Assessment 205j Final Report 1996-1999 22
TABLE 4-1. (Con’t)
NARRATIVE STANDARDS
Parameter Reference
Standard / Description
Settleable
Solids
Section 15
Shall not be present to degrade aquatic life habitat or adversely
affect other water uses Floating and
Suspended
Solids
Section 16
Shall not be present to degrade aquatic life habitat or adversely
affect other water uses
Taste, Odor,
Color
Section 17
Shall not contain substances that produce taste, odor and color in
fish, skin, clothing vessels, structures, water supplies Macroinver-
tebrates
Barbour et al. (1994);
Stribling et al. (2000);
Section 32 (proposed,
WDEQ (2000)
Barbour et al. (1994): WBCI total score >35 Middle Rockies;
Stribling et al. (2000): WSII Middle Rockies: Score <70 based on
25th
percentile of reference; WSII NW Great Plains: Score <57
based on 25th
percentile of reference; WDEQ (2000) proposed
narrative biological criteria ADDITIONAL PARAMETERS AND RECOMMENDED STANDARDS Total
Phosphorus
EPA (1977); USGS
(1999)
EPA: Should not exceed 0.05 mg/L for a stream entering a lake or
reservoir (i.e. Tongue River Reservoir); USGS: National
background level in undisturbed watersheds is 0.10 mg/l Sulfate
WDEQ (1993)
Groundwater: 200 mg/L agriculture; 250 mg/L drinking water;
3000 mg/L livestock; 250 mg/L EPA secondary drinking water Alkalinity
EPA (1986)
Minimum 20 mg/L
Total
Suspended
Solids (TSS)
None
No recommended standard for use attainability.
Hardness
Sawyer (1960) in EPA
(1986)
Concentrations greater than 300 mg/L may be considered
unsuitable for industrial use Habitat
King (1993); Stribling et
al. (2000)
Habitat condition no less than 50 percent of reference; total habitat
score >100 to qualify as reference

Sheridan County Conservation District
Tongue River Watershed Assessment 205j Final Report 1996-1999 23
HISTORIC AND CURRENT DATA SOURCES
5
5.1 HISTORICAL DATA AND DATA SOURCES
Collection, compilation and evaluation of historical data provided a historical perspective for
water quality within the Project area. Historical data played an important role in the development
of an effective monitoring and assessment plan. Historical data was used to develop a
cost-effective monitoring plan by providing information to:
1. Identify gaps in previous monitoring, sampling parameters, sampling frequency
and sampling locations;
2. Select representative sampling stations;
3. Select proper sampling parameters;
4. Allow comparison of current data collected during the Project to historic data; and
5. Assist development of post-project monitoring recommendations.
Historical data for purposes of this project were defined as data that were greater than five years
old from the start of this Project. Because the Tongue River Watershed Assessment Project was
initiated in 1996, data collected before 1991 was considered historic data.
The following sources were contacted for historical data within the Project area:
1. Wyoming Department of Environmental Quality (WDEQ)
2. United States Geological Survey (USGS)
3. Wyoming Game and Fish Department (WGFD)
4. City of Dayton Public Works Department (DPWD)
5. City of Ranchester Public Works Department (RPWD)
6. United States Environmental Protection Agency (STORET) database
7. Natural Resources Conservation Service (NRCS)
8. Wyoming State Engineers Office, Wyoming State Board of Control (WSBC)
9. Wyoming Water Resources Database (WWR)
10. United States Forest Service (USFS)
Table 5-1 lists historic sampling stations, the name of the sample station, agency conducting data

Sheridan County Conservation District
Tongue River Watershed Assessment 205j Final Report 1996-1999 24
collection, data type and other descriptive information. Table 5-2 described the acronyms used in
Table 5-1 and Table 5-3. Figure 5-1 shows the general location of the historical sampling stations
within the Project area. Appendices A, C, E, J and K contain the historical data.
5.2 EVALUATION OF HISTORICAL DATA
Historic environmental data was obtained from several sources. When possible, files and
publications were obtained directly from the agency responsible for data collection to secure
original or first-hand data sets. Some data files obtained by SCCD were found to be corrupt and
could not be used with confidence. For example, some data presented in the University of
Wyoming Water Resources Database (WWR) were problematic. One consistent problem
included mis-labeling of reporting units for WDEQ data collected after 1982 (i.e. Chloride and
sulfate values were reported as dissolved instead of total as actually collected). The reported
location of several sampling stations appeared inaccurate both in the latitude-longitude and
section, township, range. Data qualifiers were absent which could have improved the quality of
the data base. The disclaimer at the beginning of the WWR data base should be closely read before
using data. Because of these findings, SCCD used data from the WWR data base after data
could be confirmed by comparison to original or first-hand data sets.
The USGS and EPA STORET data bases were determined to contain high quality data with minor
(<.001 percent of all data evaluated) exceptions. The minor exceptions included omission of less
than (<) or greater than (>) data qualifiers (in older data sets) when a value was greater than or less
than the detection limit reported for the specific parameter. When identified, SCCD attached
these qualifiers to the data after the analytical method was researched. Additionally, data
reported as 0.00 were rejected for some reported USGS metal parameters when no qualifier was
attached. Historic water quality data sets are presented in Appendix A of this Final Report.
Long-term monitoring stations within the Project area provided both historic and current data.
USGS Station Number 06298000 recorded discharge data since about 1918. The NRCS Burgess
Junction meteorological station Number WY07E33S collected precipitation and temperature data
since at least 1982. The Town of Ranchester Water Treatment Plant has collected daily turbidity
measurements at the Tongue River raw water intake since 1983, daily temperature and pH
measurements since 1993 and daily alkalinity measurements since 1998.
5.3 CURRENT DATA COLLECTION BY OTHER INVESTIGATORS
USGS, WDEQ, WGFD, NRCS, RBPU and WSBC collected monitoring data within the Project
area concurrent with SCCD (see Appendices A, B, C, D, F, I and J). This data provided a
valuable source of information for use by SCCD to meet Project goals and objectives.
Consequently, much of the data collected by these agencies will be referred to in upcoming
Sections of this Final Report. The monitoring stations used for collection of current chemical,

Sheridan County Conservation District
Tongue River Watershed Assessment 205j Final Report 1996-1999 25
physical, biological and habitat data are presented in Table 5.3 and cross referenced to Figure 5-2.
A brief description of current monitoring efforts by other agencies within the Project area is
described herein.
5.3.1 USGS Data
USGS initiated the Upper Yellowstone Basin National Water Quality Assessment (NAWQA)
study in 1998. The NAWQA study design placed one monitoring station at the Tongue River
gage Station No. 06298000. This was the same station used by SCCD for monitoring during the
Project. The station was identified by SCCD as Tongue River Upper. USGS collected whole
body brown trout fish tissue organic samples (Appendix Table D-2), liver trace metals from brown
trout (Appendix Table D-1), bed sediment trace metals (Appendix Table D-3) and bed sediment
organics (Appendix Table D-4). Benthic macroinvertebrate samples were collected in 1999
(Appendix Table F-40 and Appendix Table G-3). Benthic macroinvertebrate sample results were
considered PROVISIONAL at the time of this Final Report because data had not been finalized.
SCCD adjusted the USGS macroinvertebrate data to the same taxonomic Level of Identification
used by SCCD and WDEQ (see Section 6.5.4.1, Table 6-4). The taxonomic Level of
Identification must be standardized to allow reliable comparison between data sets. For example,
USGS reported the larvae, pupae and adults for Optioservus separately whereas SCCD and
WDEQ combined larvae, pupae and adults into a single taxon. USGS water quality sampling was
initiated in January, 1999 (Appendix Table B-26).
5.3.2 WDEQ Data
WDEQ established a long-term Reference station in the Tongue River canyon in 1993 (Site ID
MRC 24). Water quality, benthic macroinvertebrates and habitat quality were sampled annually
usually in late September or early October. Annual periphyton sampling was initiated in 1998,
but results of sample analyses were not available for this Final Report. Because the Tongue
River, Little Tongue River and Smith Creek were listed by WDEQ in 1996 as impaired water
bodies, monitoring stations were established by WDEQ in 1996 at these and other water bodies
within the Project area for annual assessment. Additional intensive sampling occurred in 1998 at
Tongue River stations upstream and downstream of the Dayton WWTF. Five sample events
occurred within a 30-day period in October and November, 1998.
SCCD and WDEQ coordinated placement of monitoring stations, sampling parameters, field and
analytical methods, and sampling frequency to avoid duplication and ensure data would be
comparable and usable by each. It should be noted that some duplication in effort was desired to
establish comparability between results obtained by one monitoring group with results obtained by
another monitoring group (see Section 7.6.5). Close coordination between SCCD and WDEQ
allowed each to draw upon the expertise offered by one another. Data collected by WDEQ was
presented in Appendices B, F, G and I. It should be noted that data collected by WDEQ in 1998

Sheridan County Conservation District
Tongue River Watershed Assessment 205j Final Report 1996-1999 26
and 1999 were considered PROVISIONAL because it had not undergone Quality Assurance
evaluation nor released prior to completion of this Final Report.
5.3.3 WGFD Data
WGFD collected current fish population data at stations on the Tongue River at the IXL Ranch in
1991, in Ranchester during 1993 and 1994, the Little Tongue River at the Little Tongue River
Ranch in 1997 and Wolf Creek at Berry’s in 1997. Results of current and historic fish sampling
since 1959 comprised 34 individual data sets. Fishery data are presented in Appendix C.
WGFD conducted historic continuous water temperature monitoring at the Tongue River canyon
in 1988 and current continuous water temperature monitoring on the Tongue River at Ranchester
in 1994. These data sets presented in Appendix E provided valuable insight into the thermal
dynamics of the lower Tongue River reach during summer, low flow periods.
5.3.4 NRCS Data
NRCS collected daily precipitation and air temperature data at the Burgess Junction
meteorological station WY07E33S since at least 1982. Although this station was located outside
the Project area in the BHNF and upper Tongue River watershed, it provided excellent information
for daily precipitation and temperature which together, could track the timing and magnitude for
water yield within the Project area. The timing and magnitude of water yield may affect
chemical, physical, biological and habitat characteristics of water bodies within the watershed.
NRCS data is presented in Appendix J.
5.3.5 WSBC
WSBC, District II is responsible for tracking water quantity and water use information within the
Tongue River drainage. WSBC records quantity of water at several irrigation diversions and
ditches using a combination of calibrated recorders and flumes. The data collected by WSBC was
not included in this Final Report, but may be accessed by reference to the Annual Hydrographers
Report published by WSBC (see WSBC, 1998).
Water quantity diverted from the Tongue River was not regularly recorded by WSBC. Other than
USGS gage station 06298000, the nearest continuous discharge recorder was operated by the Big
Horn Coal Mine located about ½ to 3/4 mile downstream of the Interstate 90 bridge crossing.
Water quantity was closely tracked by WSBC during the irrigation season (May through
September) at Little Tongue River, Smith Creek, Wolf Creek and Five Mile Creek because these
waters are near or above maximum appropriation.

Sheridan County Conservation District
Tongue River Watershed Assessment 205j Final Report 1996-1999 27
5.2.6 RPWD
RPWD collected daily samples for temperature, pH, turbidity and alkalinity to provide
information for the Town of Ranchester Water Treatment Plant operations. Samples were drawn
directly from the raw water intake line prior to treatment generally between the hours of 0730 AM
and 0900 AM. Daily turbidity samples have been measured since 1982 (Appendix Table A-19),
daily water temperature (Appendix Table A-20) and pH (Appendix Table A-21) have been
measured since 1993 and daily alkalinity has been measured since 1998 (Appendix Table A-22).
It was rare to find a continuous quality long-term and well maintained water quality record such as
this during the historic data search. The Town of Ranchester should be commended for their
commitment to provide quality service to the residents of Ranchester.
SCCD contacted the Town of Dayton Water Treatment Plant to procure their daily operational
water quality data record. The data could not be used for this Project because samples were
drawn from a large submerged stilling basin and results were not representative of ambient Tongue
River water.

Sheridan County Conservation District
Tongue River Watershed Assessment 205j Final Report 1996-1999 28
TABLE 5-1. Site Descriptors for Monitoring Stations Providing Historic Data Greater Than (>)
5 Years Old Within the Tongue River 205j Project Area, Sheridan County,
Wyoming (Note: See Table 5-2 for Description of Agencya, Data Type
b and
Geologyc Acronyms)
Descriptor
Tongue River
Tongue River
Tongue River
Tongue River
Station Name
5 Miles West of
Dayton
Canyon Mouth
Campground @
USGS 6-2974.80
West of Dayton
Agency a
WGFD
WGFD
USFS
WWRC
Year(s)
1938
1959;69;79;89
1968-70;73;76
1976
Data Type Collected b
P
F
C;P;B
C;P
Figure 5-1 Station No.
1
1
1
2
Appendix Table
A-1
C-1,2,3,4
A-2
A-3
Hydrologic Unit Code
10090100
10090100
10090100
10090100
NRCS Small
Watershed Code
000
000
000
000
USGS Quad Map
Dayton South
Dayton South
Dayton South
Dayton South
Ecoregion
Middle Rockies
Middle Rockies
Middle Rockies
Middle Rockies
Landform
Foothill
Foothill
Foothill
Foothill
DEQ Classification
2
2
2
2
Strahler Order
5
5
5
5
Drainage Area (mi2)
Unknown
Unknown
Unknown
Unknown
Elevation (ft)
Unknown
Unknown
4210
Unknown
Section
10
10
10
11
Township
56
56
56
56
Range
87
87
87
87
Latitude
Unknown
Unknown
Unknown
Unknown
Longitude
Unknown
Unknown
Unknown
Unknown
Geology c
WVG
WVG
WVG
WVG
Dam Present?
No
No
No
No

Sheridan County Conservation District
Tongue River Watershed Assessment 205j Final Report 1996-1999 29
TABLE 5-1. Con’t
Descriptor
Tongue River
Tongue River
Tongue River
Tongue River
Station Name
USGS #0629800
USGS #0629800
Dayton WTP Intake
Adamsons - Stations 4,
5, 5A
Agency a
USGS
USGS
WDEQ
WGFD
Year(s)
1975,76,77
1966 through 81;87,88
1983-90
1969;81
Data Type Collected b
PER
C;P
C;P;B
F
Figure 5-1 Station No.
2
2
3
4
Appendix Table
C-5
A-4
A-5
C-6 through 10
Hydrologic Unit Code
10090100
10090100
10090100
10090100
NRCS Small
Watershed Code
000
000
000
000
USGS Quad Map
Dayton South
Dayton South
Dayton South
Dayton South
Ecoregion
Middle Rockies
Middle Rockies
Middle Rockies
Middle Rockies
Landform
Foothill
Foothill
Foothill
Foothill
DEQ Classification
2
2
2
2
Strahler Order
5
5
5
5
Drainage Area (mi2)
204
204
Unknown
Unknown
Elevation (ft)
4060
4060
Unknown
Unknown
Section
11
11
1
Unknown
Township
56
56
56
Unknown
Range
87
87
87
87
Latitude
44050'58"
44050'58"
Unknown
Unknown
Longitude
107018'14"
107018'14"
Unknown
Unknown
Geology c
WVG
WVG
MD
Unknown
Dam Present?
No
No
No
No

Sheridan County Conservation District
Tongue River Watershed Assessment 205j Final Report 1996-1999 30
TABLE 5-1. Con’t
Descriptor
Tongue River
Tongue River
Tongue River
Tongue River
Station Name
IXL Ranch
Dayton WWTF
At Dayton
Dayton WWTF
Agency a
WGFD
WDEQ
WWRC
WWRC
Year(s)
1979
1985,89
1976,77
1977
Data Type Collected b
F
B
C;P
C;P
Figure 5-1 Station No.
4
6
5
6
Appendix Table
C-12
A-6
A-7
A-8,9,10
Hydrologic Unit Code
10090100
10090100
10090100
10090100
NRCS Small
Watershed Code
000
000
000
000
USGS Quad Map
Dayton South
Dayton South
Dayton South
Dayton South
Ecoregion
Middle Rockies
Middle Rockies
Middle Rockies
Middle Rockies
Landform
Foothill
Foothill
Foothill
Foothill
DEQ Classification
2
2
2
2
Strahler Order
5
5
5
5
Drainage Area (mi2)
Unknown
241
Unknown
241
Elevation (ft)
Unknown
3870
Unknown
3870
Section
1
28
Unknown
28
Township
56
57
57
57
Range
87
87
87
87
Latitude
Unknown
44053'02"
Unknown
44053'02"
Longitude
Unknown
107014'21"
Unknown
107014'21"
Geology c
MD
QA
QA
QA
Dam Present?
No
No
No
No

Sheridan County Conservation District
Tongue River Watershed Assessment 205j Final Report 1996-1999 31
TABLE 5-1. Con’t
Descriptor
Tongue River
Tongue River
Tongue River
Tongue River
Station Name
County Road 71
Halfway Bridge
Bearclaw Ranch
Ranchester WTP
Intake
Ranchester City Park
Agency a
WDEQ
WGFD
WDEQ
WWRC
Year(s)
1985
1962
1967-71;73;85;83-90
1976
Data Type Collected b
B
F
C;P;B
C:P
Figure 5-1 Station No.
7
7
8
8
Appendix Table
A-11
C-13
A-12,13,14
A-15
Hydrologic Unit Code
10090100
10090100
10090100
10090100
NRCS Small
Watershed Code
000
000
000
000
USGS Quad Map
Ranchester
Ranchester
Ranchester
Ranchester
Ecoregion
Northwestern Great
Plains
Northwestern Great
Plains
Northwestern Great
Plains
Northwestern Great
Plains
Landform
Plains
Plains
Plains
Plains
DEQ Classification
2
2
2
2
Strahler Order
5
5
5
5
Drainage Area (mi2)
264
Unknown
347
347
Elevation (ft)
3810
Unknown
3750
3750
Section
26
Unknown
19
19
Township
57
Unknown
57
57
Range
86
86
85
85
Latitude
44053'26"
Unknown
44054'25"
44054'25"
Longitude
107012'38"
Unknown
107009'55"
107009'55"
Geology c
QA
QA
QA
QA
Dam Present?
No
No
No
No

Sheridan County Conservation District
Tongue River Watershed Assessment 205j Final Report 1996-1999 32
TABLE 5-1. Con’t
Descriptor Little Tongue River
Little Tongue River
Smith Creek
Wolf Creek
Station Name
Station 06298500
Leonard Grahams
Stations 1, 2, 3
Glen Mock Ranch
Near Eaton’s
Stations 1, 2, 2A, 3
Agency a
USGS
WGFD
WGFD
WGFD
Year(s)
1971;85
1972,73,81,82,84
1959
1959
Data Type Collected b
C;P
F
F
F
Figure 5-1 Station No.
9
10
11
13
Appendix Table
A-16
C-17 through C-21
C-22
C-23 through 26
Hydrologic Unit Code
10090100
10090100
10090100
10090100
NRCS Small
Watershed Code
030
030
040
040
USGS Quad Map
Dayton South
Dayton South
Dayton North
Wolf
Ecoregion
Middle Rockies
Middle Rockies
Middle Rockies
Middle Rockies
Landform
Foothills
Foothills
Foothills
Foothills
DEQ Classification
2
2
2
2
Strahler Order
4
4
4
4
Drainage Area (mi2)
25.1
Unknown
Unknown
Unknown
Elevation (ft)
4420
Unknown
Unknown
Unknown
Section
24
28
21
27? & 33?
Township
56
56
57
56
Range
87
87
87
86
Latitude
44048'38"
Unknown
Unknown
Unknown
Longitude
107017'02"
Unknown
Unknown
Unknown
Geology c
MD
QU
Unknown
MD
Dam Present?
No
No
No
No

Sheridan County Conservation District
Tongue River Watershed Assessment 205j Final Report 1996-1999 33
TABLE 5-1. Con’t
Descriptor
Wolf Creek
Wolf Creek
Wolf Creek
Wolf Creek
Station Name
Joe Patterson Ranch
Wolf Ranch
Stations 2,2A
Near Bighorn N.F.
Boundary
Station #06299500
Agency a
WGFD
WGFD
USFS
USGS
Year(s)
1967,68,69
1972,82
1972,73,74
1985
Data Type Collected b
F
F
C;P
C
Figure 5-1 Station No.
16
14
12
13
Appendix Table
C-27,28,29
C-30 through 33
A-17
A-18
Hydrologic Unit Code
10090100
10090100
10090100
10090100
NRCS Small
Watershed Code
040
040
040
040
USGS Quad Map
Wolf
Wolf
Wolf
Wolf
Ecoregion
Middle Rockies
Middle Rockies
Middle Rockies
Middle Rockies
Landform
Foothill
Foothill
Foothills
Foothills
DEQ Classification
2
2
2
2
Strahler Order
4
4
4
4
Drainage Area (mi2)
Unknown
Unknown
Unknown
37.8
Elevation (ft)
Unknown
Unknown
4750
4525
Section
Unknown
15 & 33
5
5
Township
Unknown
56
55
55
Range
Unknown
86
86
86
Latitude
Unknown
Unknown
Unknown
44046'21"
Longitude
Unknown
Unknown
Unknown
107014'01"
Geology c
Unknown
QU
MD
MD
Dam Present?
No
No
No
No

Sheridan County Conservation District
Tongue River Watershed Assessment 205j Final Report 1996-1999 34
TABLE 5-2. Description of Acronyms Used in Table 5-1 and Table 5-3 for Agencya, Data Type
b
and Geologyc Descriptors
Agency
WGFD = Wyoming Game and Fish Department USFS = United States Forest Service
WWRC = Wyoming Water Resources Center USGS = United States Geological Survey
WDEQ = Wyoming Department Environmental Quality SCCD = Sheridan County Conservation District
RPWD = Ranchester Public Works Department
Data Type Collected
C = Water Chemical
P = Water
Physical
B = Bacteria F = Fish
Population
PER = Periphyton PES =
Organochlorine Pesticides
HER = Chlorinated Herbicides H = Habitat
M = Benthic Macroinvertebrates BSO = Bed Sediment Organics
BSM = Bed Sediment Trace Metals FTM = Brown trout liver trace
metals
FTO = Brown trout fish tissue organics
Geology (after USGS, 1985) KFB = Bearpaw shale - dark greenish-gray shale containing thin gray sandstone partings.
MD = Madison limestone: blue-gray, massive limestone and dolomite underlain by gray cherty limestone and dolomite.
QA = Alluvium and colluvium: clay, silt, sand, and gravel in flood plains, fans, terraces and slopes.
QU = Undivided surficial deposits; mostly alluvium, colluvium, and glacial landslide deposits.
TFL = Fort Union Formation - Lebo Member; dark-gray clay shale and concretionary sandstone.
TFT = Fort Union Formation, Tullock Member: soft gray sandstone, gray and brown carbonaceous shale and thin coal beds.
WVG = Plutonic rocks; quartz diorite to quartz monzonite.

Sheridan County Conservation District
Tongue River Watershed Assessment 205j Final Report 1996-1999 35
FIGURE 5-1 PAGE HERE

Sheridan County Conservation District
Tongue River Watershed Assessment 205j Final Report 1996-1999 36
FIGURE 5-2 PAGE HERE

Sheridan County Conservation District
Tongue River Watershed Assessment 205j Final Report 1996-1999 37
TABLE 5-3. Site Descriptors for Monitoring Stations Providing Current Data Less Than (<) 5
Years Old Within the Tongue River 205j Project Area, Sheridan County, Wyoming
(Note: See Table 5-2 for Description of Agencya, Data Type
b and Geology
c
Acronyms)
Descriptor
Tongue River
Tongue River
Tongue River
Tongue River
Station Name
Upper @ Canyon
(ID #MRC 24)
Upper (@ USGS
#0629800)
USGS #0629800
IXL Ranch
Agency a
WDEQ
SCCD
USGS
WGFD
Year(s)
1993-99
1996-99
1998-99
1991
Data Type Collected b
C;P;B;M;H;PE
C;P;B;PES;HER
C;P;MFTO;FTM:
M;BSM;BSO
F
Figure 5-2 Station No.
1
2
2
3
Appendix Table
B-1;F
B-2
D-1-4;B-26;F-40
C-11
Hydrologic Unit Code
10090100
10090100
10090100
10090100
NRCS Small
Watershed Code
000
000
000
000
USGS Quad Map
Dayton South
Dayton South
Dayton South
Dayton South
Ecoregion
Middle Rockies
Middle Rockies
Middle Rockies
Middle Rockies
Landform
Foothill
Foothill
Foothill
Foothill
DEQ Class
2
2
2
2
Strahler Order
5
5
5
5
Drainage Area (mi2)
202
204
204
Unknown
Elevation (ft)
4120
4060
4060
Unknown
Section
10
11
11
1
Township
56
56
56
56
Range
87
87
87
87
Latitude
44050'44"
44050'58"
44050'58"
Unknown
Longitude
107019'48"
107018'14"
107018'14"
Unknown
Geology c
WVG
WVG
WVG
MD
Dam Present?
No
No
No
No

Sheridan County Conservation District
Tongue River Watershed Assessment 205j Final Report 1996-1999 38
TABLE 5-3. Con’t
Descriptor
Tongue River
Tongue River
Tongue River
Tongue River
Station Name
Above Dayton WWTF
(ID# NGP 37)
Below Dayton WWTF
(ID# NGP 39)
Middle
Middle (ID# NGPI 5)
Agency a
WDEQ
WDEQ
SCCD
WDEQ
Year(s)
1998
1998
1996-99
1996-99
Data Type Collected b
C;P;B;M;H
C;P;B;M;H
C;P;B;M;H;PES;
HER
C;P;B;M;H
Figure 5-2 Station No.
4
4
5
5
Appendix Table
B-3;F
B-4;F
B-5;F
B-6;F
Hydrologic Unit Code
10090100
10090100
10090100
10090100
NRCS Small
Watershed Code
000
000
000
000
USGS Quad Map
Dayton South
Dayton South
Ranchester
Ranchester
Ecoregion
Northwestern Great
Plains
Northwestern Great
Plains
Northwestern Great
Plains
Northwestern Great
Plains
Landform
Plains
Plains
Plains
Plains
DEQ Class
2
2
2
2
Strahler Order
5
5
5
5
Drainage Area (mi2)
241
245
264
264
Elevation (ft)
3870
3860
3810
3810
Section
28
27
26
26
Township
57
57
57
57
Range
87
87
86
86
Latitude
44053'02"
44052'59"
44053'26"
44053'26"
Longitude
107014'21"
107014'05"
107012'38"
107012'38"
Geology c
QA
QA
QA
QA
Dam Present?
No
No
No
No

Sheridan County Conservation District
Tongue River Watershed Assessment 205j Final Report 1996-1999 39
TABLE 5-3. Con’t
Descriptor
Tongue River
Tongue River
Tongue River
Tongue River
Station Name
Lower (at
Ranchester)
Lower (ID# NGPI 4)
Conner Battlefield
Ranchester
Ranchester WTP
Intake
Agency a
SCCD
WDEQ
WGFD
RPWD
Year(s)
1996-99
1996-99
1993-94
1982-99
Data Type Collected b
C;P;B;M;H;PES;
HER
C;P;B;M;H;PE
F
P
Figure 5-2 Station No.
6
6
6
6
Appendix Table
B-7;F
B-8;F
C-14;C-15
A-19;A-20
Hydrologic Unit Code
10090100
10090100
10090100
10090100
NRCS Small
Watershed Code
000
000
000
000
USGS Quad Map
Ranchester
Ranchester
Ranchester
Ranchester
Ecoregion
Northwestern Great
Plains
Northwestern Great
Plains
Northwestern Great
Plains
Northwestern Great
Plains
Landform
Plains
Plains
Plains
Plains
DEQ Class
2
2
2
2
Strahler Order
5
5
5
5
Drainage Area (mi2)
347
347
347
347
Elevation (ft)
3750
3750
3750
3750
Section
19
19
19
19
Township
57
57
57
57
Range
85
85
85
85
Latitude
44054'25"
44054'25"
44054'25"
44054'25"
Longitude
107009'55"
107009'55"
107009'55"
107009'55"
Geology c
QA
QA
QA
QA
Dam Present?
No
No
No
No

Sheridan County Conservation District
Tongue River Watershed Assessment 205j Final Report 1996-1999 40
TABLE 5-3. Con’t
Descriptor
Tongue River
Little Tongue
Little Tongue
Little Tongue
Station Name
Conner Battlefield
Ranchester
Upper
Upper
(ID# MRC 30)
Little Tongue River
Ranch
Agency a
WGFD
SCCD
WDEQ
WGFD
Year(s)
1993
1996-99
1993
1997
Data Type Collected b
P
C;P;B
C;P;M;H
F
Figure 5-2 Station No.
6
8
7
9
Appendix Table
E-2
B-9
B-11;F
C-16
Hydrologic Unit Code
10090100
10090100
10090100
10090100
NRCS Small
Watershed Code
000
030
030
030
USGS Quad Map
Ranchester
Dayton South
Dayton South
Dayton South
Ecoregion
Northwestern Great
Plains
Middle Rockies
Middle Rockies
Middle Rockies
Landform
Plains
Foothills
Foothills
Foothills
DEQ Class
2
2
2
2
Strahler Order
5
4
2
4
Drainage Area (mi2)
347
12.8
4.2
Unknown
Elevation (ft)
3750
4420
4480
4170
Section
19
24
24
7
Township
57
56
56
56
Range
85
87
87
88
Latitude
44054'25"
44048'38"
44048'33"
Unknown
Longitude
107009'55"
107017'02"
107017'21"
Unknown
Geology c
QA
MD
MD
KFB
Dam Present?
No
No
No
No

Sheridan County Conservation District
Tongue River Watershed Assessment 205j Final Report 1996-1999 41
TABLE 5-3. Con’t
Descriptor
Little Tongue
Little Tongue
Smith Creek
Smith Creek
Station Name
Lower
Lower (ID# MRCI 23)
Upper
Lower
Agency a
SCCD
WDEQ
SCCD
SCCD
Year(s)
1996-99
1996-99
1996-99
1996-99
Data Type Collected b
C;P;B;M;H
C;P;B;M;H
C;P;B
C;P;B;M;H
Figure 5-2 Station No.
10
10
11
12
Appendix Table
B-10;F
B-12;F
B-13
B-14
Hydrologic Unit Code
10090100
10090100
10090100
10090100
NRCS Small
Watershed Code
030
030
040
040
USGS Quad Map
Dayton North
Dayton North
Dayton North
Dayton North
Ecoregion
Middle Rockies
Middle Rockies
Middle Rockies
Northwestern Great
Plains
Landform
Foothills
Foothills
Foothills
Plains
DEQ Classification
2
2
2
2
Strahler Order
4
4
3
3
Drainage Area (mi2)
26.2
26.2
3.7
11.6
Elevation (ft)
3890
3890
4880
3885
Section
32
32
20
32
Township
57
57
57
57
Range
86
86
87
86
Latitude
44052'37"
44052'37"
44053'41"
44052'41"
Longitude
107015'54"
107015'54"
107022'26"
107016'03"
Geology c
KFB
KFB
MD
KFB
Dam Present?
No
No
No
No
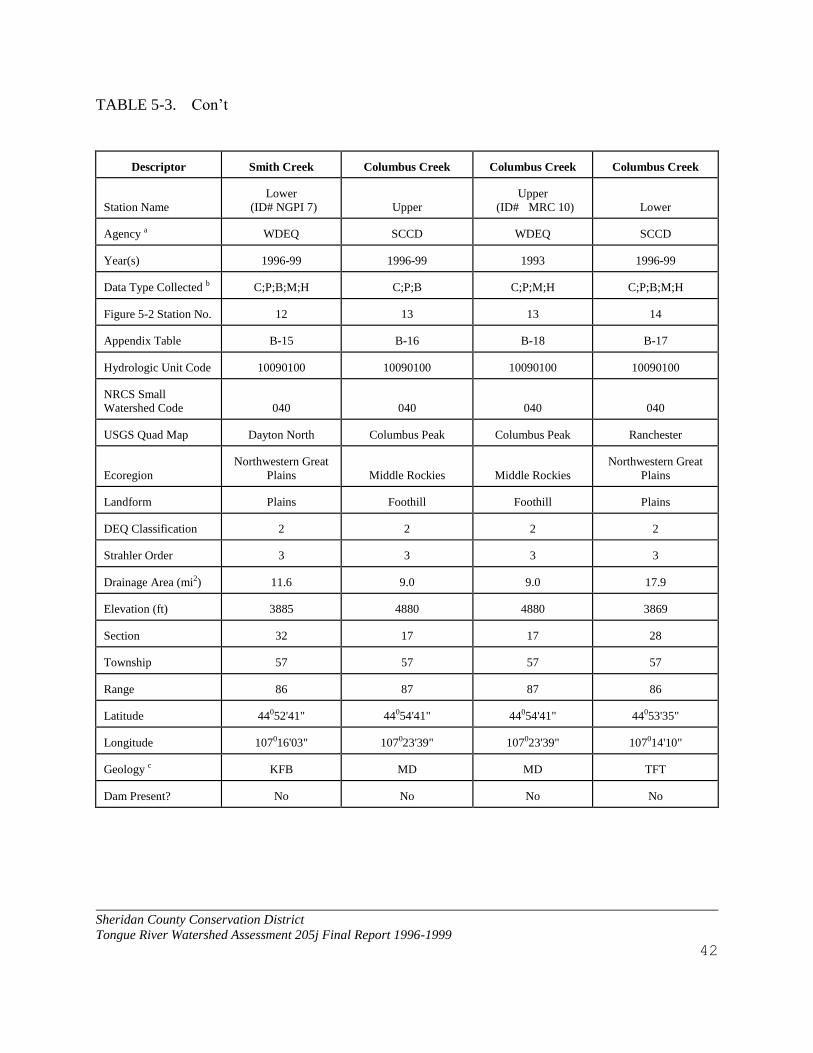
Sheridan County Conservation District
Tongue River Watershed Assessment 205j Final Report 1996-1999 42
TABLE 5-3. Con’t
Descriptor
Smith Creek
Columbus Creek
Columbus Creek
Columbus Creek
Station Name
Lower
(ID# NGPI 7)
Upper
Upper
(ID# MRC 10)
Lower
Agency a
WDEQ
SCCD
WDEQ
SCCD
Year(s)
1996-99
1996-99
1993
1996-99
Data Type Collected b
C;P;B;M;H
C;P;B
C;P;M;H
C;P;B;M;H
Figure 5-2 Station No.
12
13
13
14
Appendix Table
B-15
B-16
B-18
B-17
Hydrologic Unit Code
10090100
10090100
10090100
10090100
NRCS Small
Watershed Code
040
040
040
040
USGS Quad Map
Dayton North
Columbus Peak
Columbus Peak
Ranchester
Ecoregion
Northwestern Great
Plains
Middle Rockies
Middle Rockies
Northwestern Great
Plains
Landform
Plains
Foothill
Foothill
Plains
DEQ Classification
2
2
2
2
Strahler Order
3
3
3
3
Drainage Area (mi2)
11.6
9.0
9.0
17.9
Elevation (ft)
3885
4880
4880
3869
Section
32
17
17
28
Township
57
57
57
57
Range
86
87
87
86
Latitude
44052'41"
44054'41"
44054'41"
44053'35"
Longitude
107016'03"
107023'39"
107023'39"
107014'10"
Geology c
KFB
MD
MD
TFT
Dam Present?
No
No
No
No

Sheridan County Conservation District
Tongue River Watershed Assessment 205j Final Report 1996-1999 43
TABLE 5-3. Con’t
Descriptor
Columbus Creek
Wolf Creek
Wolf Creek
Wolf Creek
Station Name
Lower
(ID# NGPI 8)
Upper
Upper (Berry’s
ID# NGPI 25)
Berry’s nr.road
ID#4116971008
Agency a
WDEQ
SCCD
WDEQ
WGFD
Year(s)
1996-99
1996-99
1995
1997
Data Type Collected b
C;P;B;M;H
C;P;B
C;P;M;H
F
Figure 5-2 Station No.
14
15
17
16
Appendix Table
B-19
B-20
B-22
C-35
Hydrologic Unit Code
10090100
10090100
10090100
10090100
NRCS Small
Watershed Code
040
050
050
050
USGS Quad Map
Ranchester
Wolf
Wolf
Wolf
Ecoregion
Northwestern Great
Plains
Middle Rockies
Northwestern Great
Plains
Northwestern Great
Plains
Landform
Plains
Foothill
Plains
Plains
DEQ Classification
2
2
2
2
Strahler Order
3
4
4
4
Drainage Area (mi2)
17.9
37.8
54.9
Unknown
Elevation (ft)
3869
4525
4000
4116
Section
28
4
11
15
Township
57
55
56
56
Range
86
86
86
86
Latitude
44053'35"
44046'21"
44050'33"
Unknown
Longitude
107014'10"
107014'01"
107011'21"
Unknown
Geology c
TFT
MD
QA
QA
Dam Present?
No
No
No
No

Sheridan County Conservation District
Tongue River Watershed Assessment 205j Final Report 1996-1999 44
TABLE 5-3. Con’t
Descriptor
Wolf Creek
Wolf Creek
Five Mile Creek
Five Mile Creek
Station Name
Lower
Lower
(ID# NGPI 6)
Lower
Lower (ID# NGPI 9)
Agency a
SCCD
WDEQ
SCCD
WDEQ
Year(s)
1996-99
1996-99
1996-99
1996-99
Data Type Collected b
C;P;B;M;H;
PES;HER
C;P;B;M;H
C;P;B;M;H;
PES;HER
C;P;B;M;H
Figure 5-2 Station No.
18
18
19
19
Appendix Table
B-21;H-1
B-23
B-24;H-1
B-25
Hydrologic Unit Code
10090100
10090100
10090100
10090100
NRCS Small
Watershed Code
050
050
081
081
USGS Quad Map
Ranchester
Ranchester
Ranchester
Ranchester
Ecoregion
Northwestern Great
Plains
Northwestern Great
Plains
Northwestern Great
Plains
Northwestern Great
Plains
Landform
Plains
Plains
Plains
Plains
DEQ Classification
2
2
2
2
Strahler Order
4
4
4
4
Drainage Area (mi2)
72.4
72.4
15.2
15.2
Elevation (ft)
3775
3775
3773
3773
Section
19
19
19
19
Township
57
57
57
57
Range
85
85
85
85
Latitude
44053'54"
44053'54"
44054'23"
44054'23"
Longitude
107010'18"
107010'18"
107010'08"
107010'08"
Geology c
QA
QA
TFL
TFL
Dam Present?
No
No
No
No

Sheridan County Conservation District
Tongue River Watershed Assessment 205j Final Report 1996-1999 45
MONITORING AND ASSESSMENT PLAN
6
6.1 MONITORING DESIGN
A primary goal of the Project was to determine the major types of nonpoint source impairments
occurring in the Tongue River watershed. A monitoring design was developed by SCCD in close
consultation with WDEQ in order to meet this goal. The monitoring design described the
sampling stations, sampling parameters, frequency for sampling and the methods for analysis and
interpretation of data. The design was a component of the total monitoring program that
functioned to provide the information required to meet Project goals and objectives. The
monitoring program was designed to be cost effective, easy to implement, provide credible data,
and result in realization of Project goals through sound interpretation and analysis of data.
In 1999, the Wyoming Legislature enacted Credible Data legislation as per W.S. §35-11-103 of
the Wyoming Environmental Quality Act. The statute defines Credible Data as scientifically
valid chemical, physical and biological monitoring data collected under an accepted sampling and
analysis plan, including quality control, quality assurance procedures and available historical data.
Only credible data may be used to determine attainment of designated uses for a water body or
assign classification of water body segments. Designated uses for the Tongue River and
tributaries in the Project area were identified in Section 4.2.
Although the Tongue River Watershed Assessment Project was initiated before Credible Data
legislation was enacted, the SCCD monitoring program met the criteria and intent of the
legislation. This was important because data collected during this Project may be used to
determine attainment of designated uses for the Tongue River and tributaries and to propose
stream classifications or change in stream classification when appropriate.
6.1.1 Pre-Survey
A pre-survey or study was conducted prior to development of the Project monitoring design
(Mendenhall et al. 1971; Green 1979; Mason et al. 1989). The pre-survey provided information
to examine magnitude, spatial and temporal variability of target water quality parameters and to
determine where data gaps may exist. The SCCD historical data search served this purpose and
revealed significant data gaps. Considerable data existed for the Tongue River upper and lower
reaches within the Project area. Little data was available for the middle reach of the Tongue
River. No historical water quality data was located for Smith Creek, Columbus Creek and Five
Mile Creek. The Little Tongue River had limited historic water quality data. No significant
water quality sampling had been conducted on Wolf Creek since 1974 when USFS collected

Sheridan County Conservation District
Tongue River Watershed Assessment 205j Final Report 1996-1999 46
samples near the BHNF boundary. The paucity of historic bacteria data for Tongue River
tributaries was identified and considered by SCCD as a monitoring priority due to potential public
health and safety concerns.
6.1.2 Types of Monitoring Designs Employed
The monitoring design for the Project incorporated four types of monitoring into a
multi-disciplinary chemical, physical, biological and habitat monitoring program. Each
monitoring type provides certain types of information. The four types of monitoring include:
1. Baseline monitoring
2. Long term trend monitoring
3. Above and below monitoring with discharge
4. Below only monitoring
Baseline monitoring involved initial data collection at a specified frequency and fixed location.
This monitoring type occurred at Little Tongue River, Columbus Creek, Smith Creek, Wolf Creek
lower reaches and Five Mile Creek because these water bodies had no or little previous water
quality data. Baseline data described the current water quality and stream conditions.
Baseline monitoring over a period of years evolves into long term trend monitoring. Trend
monitoring continues over many years and is used to identify temporal (seasonal or annual) water
quality variability within the watershed and assist in determination of water quality change. This
type of monitoring occurred within the Project area at the upper Tongue River canyon USGS
station 06298000 where substantial, although intermittent historic data was collected. WDEQ
established a long term trend monitoring Reference Stream station upstream of the USGS station
that has been assessed annually since 1993. RPWD conducted long term trend monitoring for
turbidity, water temperature and pH at the Water Treatment Plant in Ranchester
Above and below monitoring with discharge measurement was used to identify general areas
of pollutant sources (MacDonald et al., 1991) and when used in conjunction with discharge
measurements was fairly specific for detection of water quality change related to change in land
use and water use (Spooner et al., 1985). An upper control station and at least one downstream
station was established on each primary tributary (with the exception of Five Mile Creek) to
evaluate water quality change. Three monitoring stations were established on the Tongue River.
Water quality data from the upstream control location was compared to water quality data from
downstream locations to detect water quality change.

Sheridan County Conservation District
Tongue River Watershed Assessment 205j Final Report 1996-1999 47
Accurate discharge measurements were critical to the above and below monitoring design since
many chemical and physical water quality parameters were directly affected by change in
discharge. This was evident during evaluation of historical USGS data collected at the Tongue
River gage station No. 06298000 where highest suspended sediment concentrations occurred
during periods of highest annual discharge. Moreover, Total Dissolved Solids (TDS) were
associated with discharge. TDS concentration decreased with increasing stream discharge.
Good discharge data were required to partition discharge dependent water quality parameters
according to discharge measured during the Project.
Below only monitoring consisted of monitoring at a single fixed site located at the lower end of a
water body. This was not the preferred monitoring method for this Project since comparisons
could not be made to a control location. Although long term monitoring will be required to detect
water quality change in absence of a control location, the single lower station may provide
adequate data to determine compliance with most numeric Wyoming water quality standards.
Despite this disadvantage, the lack of a well defined headwater, significant Columbus Creek
diversions and monitoring budget constraints necessitated below only monitoring at a single
station on lower Five Mile Creek.
6.2 Sampling Stations
Sampling stations were selected in consultation with WDEQ after evaluation of historical
sampling stations, historical data, anticipated monitoring within the Project area (e.g. USGS
NAWQA), monitoring budget and access. The monitoring budget allowed for sampling at
thirteen (13) stations within the Project area. Table 5-2 listed the sampling stations and Figure
5-2 illustrated the location of the sampling stations.
Three sampling stations were established on the mainstem Tongue River. Two stations were
established on primary tributaries to the Tongue River including the Little Tongue River, Smith
Creek, Columbus Creek, and Wolf Creek. A minimum of two sampling stations were needed to
detect cursory water quality change as the water bodies flowed through the Project area.
Increasing the number of sampling stations at each tributary would have increased the ability to
detect water quality change and identify potential sources of water pollutants, but the Project
monitoring budget limited the total number of sample stations. Only one sampling station was
established on Five Mile Creek because it’s headwaters were difficult to identify due to dominance
of Columbus Creek water diverted into the drainage.
Upper monitoring stations were sited in or near the foothills of the Bighorn Mountains in the
Middle Rockies Ecoregion and lower stations were sited either in the lower foothills of the Middle
Rockies ecoregion or in the Northwestern Great Plains ecoregion (Omernik and Gallant, 1987).

Sheridan County Conservation District
Tongue River Watershed Assessment 205j Final Report 1996-1999 48
6.2.1 Tongue River
Three (3) sampling stations were located on the mainstem Tongue River; the Upper (Figure 5-2,
Site Number 2), Middle (Figure 5-2, Site Number 5) and Lower (Figure 5-2, Site Number 6).
6.2.1.1 Tongue River Upper
The Tongue River Upper station was located at USGS station 06298000 at an elevation of 4,060
feet. The station was accessed by taking County Road 92 (also known as the Tongue Canyon
Road) west, southwest from the Town of Dayton to the gage station located on the north bank,
south of the County road. This station was located about one mile downstream from the WDEQ
long-term Reference Stream station identified as Tongue River - Upper (MRC 24). Figure 6-1
illustrates the character of the Tongue River at the WDEQ monitoring station.
Primary land use near this station was recreation, wildlife habitat and limited summer and year
around residences. County Road 92 ends near the WDEQ canyon monitoring station. Access
upstream is limited to a pack trail. This station served as the reference station for comparison to
water quality change identified at downstream Tongue River monitoring stations.
USGS conducted historic water quality sampling at this station from 1966 through 1981, 1987 and
1988. Discharge has been measured daily since 1940. USGS initiated bed sediment metals and
organics, fish tissue, fish liver and fish population sampling in 1998 as part of the Yellowstone
NAWQA project. Monthly water chemistry sampling was initiated January, 1999 and annual
macroinvertebrate and periphyton sampling occurred in 1999. The USGS water chemistry data
(Appendix Table B-26), macroinvertebrate data (Appendix Table F, Page F-40 and Appendix
Table G-3), brown trout liver trace metals data (Appendix Table D-1), brown trout whole body fish
tissue organics data (Appendix Table D-2), bed sediment trace metals data (Appendix Table D-3)
and stream bed sediment organics data (Appendix Table D-4) were available for this Final Report.
USGS periphyton and fish population data were not available.
6.2.1.2 Tongue River Middle
The Tongue River Middle station was located at the Halfway Lane County Road bridge at an
elevation of 3810 feet. WDEQ also established a monitoring station in 1996 identified as Tongue
River - Middle (station ID NGPI 5). WDEQ and SCCD sampled benthic macroinvertebrates at
the first riffle upstream of the Halfway Lane County Road bridge. Water samples were collected
just downstream of the bridge. Figures 6-2 and 6-3 show general characteristics for this stream
reach. Primary land uses in order of importance include irrigated hayland, livestock grazing,
wildlife habitat and recreation.
The majority of historical sampling occurred upstream of the SCCD station during the 1970's and

Sheridan County Conservation District
Tongue River Watershed Assessment 205j Final Report 1996-1999 49
1980's in the vicinity of the Town of Dayton Waste Water Treatment Facility (WWTF). Historic
sampling was conducted by WDEQ and WWRC. WDEQ conducted current additional water
quality, bacteriological, macroinvertebrate and stream habitat sampling in the fall, 1998 at stations
upstream and downstream of the Dayton WWTF. The WDEQ upstream station was identified
as Above Dayton WWTF (Figure 5-2, Site Number 4), and downstream station identified as
Below Dayton WWTF; (Figure 5-2, Site Number 4). The Dayton WWTF is located about 1 mile
upstream of the SCCD Tongue River - Middle station. Historic stream channelization was
apparent in this segment.
6.2.1.3 Tongue River Lower
The Tongue River Lower station was located near the Ranchester Water Treatment Plant (WTP)
immediately upstream of the raw water intake structure at the foot bridge at an elevation of about
3,750 feet. WDEQ established a sampling site in 1996 about 1/4 to 1/3 mile upstream. This
WDEQ site was identified as Tongue River - Lower (station ID NGPI 4) and was located
immediately upstream of the County Road 67 bridge. SCCD used the WDEQ station for
macroinvertebrate sampling and habitat assessment to allow comparison to data collected by
WDEQ. However, all water quality sampling occurred at the station near the Ranchester WTP
intake. Figure 6-4 illustrates stream reach characteristics at the joint SCCD/WDEQ monitoring
station.
WGFD conducted fish population sampling in 1993 and 1994 at a station identified as the Connor
Battlefield located adjacent to the Ranchester WTP intake. The fishery data is presented in
Appendix C, Tables C-14 and C-15. The RPWD collected daily raw water samples at the Tongue
River WTP intake from 1982 through 1999. Temperature, ph, turbidity and alkalinity samples
were collected and data are presented in Appendix A, Tables A-19 through A-22.
Urban, recreation and wildlife were the primary land uses at the station. Primary land use
upstream of the Lower sampling station in order of importance included irrigated hayland,
livestock grazing, wildlife habitat, rural residential and recreation.
6.2.2 Little Tongue River
Two monitoring stations were established on Little Tongue River. The stations were identified as
the Upper and Lower.
6.2.2.1 Little Tongue River Upper
The Little Tongue River Upper station was located at the USGS station 06298500 at an elevation
of 4,480 feet (Figure 5-2, Site Number 8). The station was located on the Horseshoe Ranch at the
Horseshoe Ranch Golf Course. It may be accessed off Highway 14 south, southwest of the Town

Sheridan County Conservation District
Tongue River Watershed Assessment 205j Final Report 1996-1999 50
of Dayton by entering the golf course entrance and proceeding to the USGS gage station. This
station was located about 1/4 to 1/3 mile downstream from the WDEQ reference stream station
established in 1993 identified as Little Tongue River - Upper (MRC 30) (Figure 5-2, Site Number
7). Figure 6-5 illustrates the stream reach near the SCCD monitoring station.
Primary land use near this station was recreation (golf course), wildlife habitat, limited horse
grazing and dryland pasture. This station served as the reference station for comparison to the
Little Tongue River Lower station.
USGS conducted limited historic one day water quality sampling on August 29, 1971 and October
18, 1985 (Appendix Table A-16). WGFD conducted historic fish population monitoring at
Leonard Graham’s. Sampling results are presented in Appendix C, Tables C-17 through C-21.
WGFD conducted current fish population monitoring at the Little Tongue River Ranch in 1997
(Figure 5-2, Site Number 9). Fishery data are presented in Appendix C, Table C-16.
6.2.2.2 Little Tongue River Lower
The Little Tongue River Lower station was located in the Town of Dayton about 300 to 400
yards upstream of the confluence with the Tongue River. Elevation was 3890 feet. Figure 5-2,
Site Number 10, identified the general location of this station and Figure 6-6 illustrated the stream
reach habitat, especially the extensive historic stream channelization (straightening). The
drainage area at this station was 26.2 square miles compared to the drainage area of 12.8 square
miles at the Upper station.
Primary land use at this station in order of importance was urban, recreation and wildlife habitat.
Irrigated hayland, dryland pasture, wildlife habitat, livestock grazing and recreation land use are
present upstream of the Dayton town limits.
WDEQ established a monitoring station in 1996 at the SCCD monitoring station. The WDEQ
station was identified as Little Tongue River - Lower (station ID MRCI 23).
6.2.3 Smith Creek
Two monitoring stations were established on Smith Creek. The stations were identified as the
Upper and Lower.
6.2.3.1 Smith Creek Upper
The Smith Creek Upper station was located upstream of the last bridge crossing on County Road
116 west, northwest of the Town of Dayton (Figure 5-2, Site Number 11). Figure 6-7 illustrates
the foothills character for the stream reach situated at an elevation of 4880 feet. Drainage area

Sheridan County Conservation District
Tongue River Watershed Assessment 205j Final Report 1996-1999 51
upstream was 3.7 square miles.
Primary land use near this station was wildlife habitat, recreation and seasonal livestock grazing.
This station served as the reference station for comparison to the Smith Creek - Lower station.
SCCD sampling represented the first known water quality collection in the Smith Creek
watershed. WDEQ may have conducted limited water quality sampling in the 1990's but data
could not be located for insertion into this Final Report. WGFD sampled fish populations in 1959
at a station identified as the Glen Mock Ranch. The fishery data is presented in Appendix C,
Table C-22.
6.2.3.2 Smith Creek Lower
The Smith Creek Lower station was located in the Town of Dayton about 150 to 200 yards above
the confluence with the Tongue River and about 30 yards downstream from County Road 92
(Tongue River Canyon Road) bridge crossing. The station was located downstream of the
bridge crossing due to access limitations. Elevation was 3885 feet and the primary land use was
urban. Rural subdivision development, irrigated hayland, dryland pasture, wildlife habitat and
livestock grazing were additional land uses in the watershed upstream of this station.
Figure 5-2, Site Number 12, identified the general location for this station and Figure 6-8
illustrated the stream reach habitat, especially the extensive historic stream channelization
(straightening). The drainage area at this station was 11.6 square miles making it the smallest
tributary monitored during this Project.
WDEQ established a monitoring station in 1996 at the SCCD monitoring station. The WDEQ
station was identified as Smith Creek - Lower (station ID NGPI 7).
6.2.4 Columbus Creek
Two monitoring stations were established on Columbus Creek. The stations were identified as
the Upper and Lower.
6.2.4.1 Columbus Creek Upper
The Columbus Creek Upper station was located upstream of the ford across Columbus Creek on
County Road 140. The route on County Road 116 south from the Parkman Road provided easiest
access. Figure 5-2, Site Number 13 shows the general location of the monitoring station and
Figure 6-9 illustrated the foothill character for the stream reach situated at an elevation of 4880
feet. Drainage area upstream was about 9.0 square miles.
Primary land use near this station included wildlife habitat, limited livestock grazing and

Sheridan County Conservation District
Tongue River Watershed Assessment 205j Final Report 1996-1999 52
recreation. A summer home is upstream of the station, but was not believed to impact the stream.
A large irrigation diversion (Five Mile Creek Ditch) downstream transfers water north into the
Five Mile Creek drainage. This station served as the reference station for comparison to the
Columbus Creek Lower station and as a general reference to the Five Mile Creek Lower station.
WDEQ established a monitoring station in 1993 at the SCCD monitoring station. The WDEQ
station was identified as Columbus Creek - Upper (station ID MRC 10). WDEQ has not
sampled the station since 1993.
6.2.4.2 Columbus Creek Lower
The Columbus Creek Lower station was located just downstream of the Highway 14 bridge
crossing. The station was sited downstream of the highway crossing due to access limitations.
Elevation was about 3869 feet and the primary land use upstream was a confined animal feeding
operation, irrigated hayland, livestock grazing and wildlife habitat.
Figure 5-2, Site Number 14, identified the general location for this station and Figure 6-10
illustrates the stream reach habitat characterized by an entrenched F Type channel and
channelization below the highway crossing. The drainage area at this station was about 17.9
square miles.
WDEQ established a monitoring station in 1996 at this monitoring station. The WDEQ station
was identified as Columbus Creek - Lower (station ID NGPI 8).
6.2.5 Wolf Creek
Two monitoring stations were established on Wolf Creek. The stations were identified as the
Upper and Lower.
6.2.5.1 Wolf Creek Upper
The Wolf Creek Upper station was located at the USGS gage station identified as Wolf Creek at
Wolf, station number 06299500. Discharge has been measured since 1945 usually on a seasonal
basis from April through September. Figure 5-2, Site Number 15 shows the general location of
the monitoring station and Figure 6-11 illustrated the foothills character of the stream reach and B
channel type situated at an elevation of 4525 feet. Drainage area was about 37.8 square miles.
Primary land use near this station included recreation, wildlife habitat and limited seasonal
livestock grazing. Access upstream of this station is limited to a pack trail and few anthropogenic
effects were apparent. This station served as the reference station for comparison to the Wolf
Creek Lower station.

Sheridan County Conservation District
Tongue River Watershed Assessment 205j Final Report 1996-1999 53
6.2.5.2 Wolf Creek Lower
The Wolf Creek Lower station was located just downstream of the County Road 67 (also known
as the Wolf Creek Road) bridge crossing. The station was sited downstream of the highway
crossing due to access limitations. Elevation was about 3775 feet and the primary land use
upstream was irrigated hayland, livestock grazing, wildlife habitat and recreation.
Figure 5-2, Site Number 18, identified the general location of this station and Figure 6-12
illustrates the stream reach habitat characterized by a C Type channel upstream and entrenched F
Type channel downstream of the station. The drainage area at this station was about 72.4 square
miles making it the largest tributary the Tongue River within the Project area.
WDEQ established a monitoring station in 1996 at this monitoring station. The WDEQ station
was identified as Wolf Creek - Lower (station ID NGPI 6). WGFD conducted fish population
sampling in 1997 at a station upstream near the Soldier Creek Road. Results of sampling are
presented in Appendix C, Table C-34. WDEQ established a monitoring station in 1995 about one
(1) mile downstream of the WGFD fish sampling station. This station was identified as Wolf
Creek - Upper (Berry’s) (Station ID NGPI 25). Figure 5-2, Site Number 17 identified the general
location of the monitoring station.
The stream channel at Wolf Creek Lower has evolved into a meandering C Type channel
commonly found in the Wyoming plains as compared to the B Type channel observed at the SCCD
Wolf Creek Upper foothill station. Other differences at the Lower station when compared to the
Wolf Creek - Upper station included increased water demand for irrigation, increased irrigated
hayland acreage, presence of irrigation returns and increased livestock grazing. Figures 6-13 and
6-14 illustrated results of stream habitat improvement in this vicinity related to changes in
livestock grazing management that occurred after 1993.
6.2.6 Five Mile Creek Lower
A single monitoring station identified as Five Mile Creek Lower was established downstream of
the Highway 14 crossing in the Town of Ranchester at a Park. This station was relocated about
100 yards upstream of Highway 14 in 1999 because the initial station was impounded by a beaver
pond and representative samples could not be collected. Descriptive data for this station
presented in Table 5-3 represented the station that was established in 1999. Figure 5-2, Site
Number 19 shows the general location of the monitoring station and Figure 6-15 shows
representative stream reach habitat. The reach was classified as an entrenched meandering F
Type channel due to historic down cutting and was situated at an elevation of 3773 feet. Drainage
area was about 15.2 square miles, but this value was inconsequential because the majority of water
in Five Mile Creek originated from diversion of Columbus Creek water via the Five Mile Ditch.

Sheridan County Conservation District
Tongue River Watershed Assessment 205j Final Report 1996-1999 54
Two reservoirs are present upstream for storage of irrigation water.
Primary land use upstream includes irrigated hayland, livestock grazing, wildlife habitat and
recreation. Land use in the immediate vicinity of the monitoring station was urban, wildlife
habitat, recreation and grazing by horses.
WDEQ established a monitoring station in 1996 at the SCCD station and subsequently relocated
the station in 1999 along with SCCD due to beaver activity. The WDEQ station was identified as
Five Mile Creek - Lower (station ID NGPI 9).
6.3 Sampling Parameters
Sampling parameters were selected after review of historical data and consultation with WDEQ to
coordinate concurrent monitoring efforts within the Project area. Table 6-1 lists chemical,
physical, bacteriological, biological, habitat and discharge sampling parameters, sampling agency,
reporting unit, minimum detection limit, sample container, preservation, holding time, analytical
method and analytical method reference.
6.3.1 Field Water Chemistry and Physical Parameters
6.3.1.1 Temperature
Water temperature affects growth, distribution and survival of aquatic organisms including trout.
These organisms are cold-blooded and thus assume the temperature of the water in which they
reside. Water temperature in the Project area is affected by seasonal changes in air temperature,
solar radiation, discharge and other factors. Physical factors may affect stream water temperature
through loss of vegetative cover caused by disruption of the riparian zone, reduction in stream
discharge due to water withdrawal by diversion and irrigation returns. Cold water is diverted
from the Tongue River and tributaries and routed through irrigation supply systems for delivery to
crop land. Water from Columbus Creek is diverted to irrigation reservoirs in the Five Mile Creek
watershed for later use in the summer. Both practices can increase stream water temperatures
during summer.
High summer water temperature is most critical to trout. Trout are mobile and may migrate to
cooler upstream reaches. However, low stream discharge and low head diversion structures may
prevent trout movement and result in death when lethal temperatures of 25.6 degrees C (78
degrees F) are attained (Garside and Tate, 1958). EPA (1986) stated that the upper tolerance limit
for a balanced benthic macroinvertebrate population structure was approximately 32 degrees C.

Sheridan County Conservation District
Tongue River Watershed Assessment 205j Final Report 1996-1999 55
TABLE 6-1. Standard Field and Laboratory Methods for Chemical, Physical, Biological and Habitat Sampling Conducted by Sheridan
County Conservation District, Wyoming Department of Environmental Quality and Ranchester Public Works
Department at Tongue River 205j Project Stations, 1993 Through 1999
Parameter
Sampling Agency
Reporting
Unit
Minimum
Detection Limit
Sample Container
Preservation
Holding Time
Method / Reference
Temperature
SCCD;WDEQ;
RPWD
C0
0.1
None
None
Analyze in Field
170.1 / EPA 1983
pH
SCCD;WDEQ;
RPWD
S.U.
0.1
None
None
Analyze In Field
150.1 / EPA 1983
Conductivity
SCCD;WDEQ
umhos/cm
5
None
None
Analyze In Field
120.1 / EPA 1983
Dissolved Oxygen
SCCD;WDEQ
Mg/L
0.1
None
None
Analyze In Field
360.1 / EPA 1983
Turbidity
SCCD;WDEQ
NTU
.05 To 100
Plastic or Glass
Ice
48 Hours
180.1 / EPA 1983
T. Suspended Solids
WDEQ
Mg/l
2
Plastic or Glass
Ice
7 Days
160.2 / EPA 1983
Alkalinity
WDEQ;RPWD
Mg/l
1
Plastic or Glass
Ice
14 Days
310.1 / EPA 1983
Total Sulfate
WDEQ
Mg/l
10
Plastic or Glass
Ice
28 Days
375.2 / EPA 1983
Total Chloride
WDEQ
Mg/l
5
Plastic or Glass
Ice
28 Days
325.2 / EPA 1983
Total Nitrate
SCCD;WDEQ
Mg/l
0.1
Plastic or Glass
Ice; 5 ml
1+1H2SO4
28 Days
353.2 / EPA 1983
Total Phosphorus
SCCD
Mg/l
0.02
Plastic or Glass
Ice; 5 ml
1+1H2SO4
28 Days
200.7 / EPA 1994
Total Phosphorus
WDEQ
Mg/l
0.1
Plastic or Glass
Ice; 5 ml
1+1H2SO4
28 Days
365.3 / EPA 1983
Total Ammonia
WDEQ
Mg/l
0.1
Plastic or Glass
Ice; 5 ml
1+1H2SO4
28 Days
350.3 / EPA 1983

Sheridan County Conservation District
Tongue River Watershed Assessment 205j Final Report 1996-1999 56
TABLE 6-1. Con’t
Parameter
Sampling
Agency
Reporting
Unit
Minimum
Detection Limit
Sample Container
Preservation
Holding Time
Method / Reference
Total Hardness
WDEQ
Mg/l
10
Plastic or Glass
Ice; 5 ml 1+1HNO3
6 Months
130.1 / EPA 1983
Fecal Coliform
SCCD;WDEQ
No./100ml
1 to 10
Sterile Plastic or Glass
Ice
6 Hours
Membrane Filter /EPA 1978
BOD
WDEQ
Mg/L
1
Sterile Plastic or Glass
Ice
48 Hours
405.1 / EPA 1983
Organochlorine
Pesticides (Various)
SCCD
Mg/l
.0004
Glass
Ice
7 Days
EPA Method 8081
Chlorinated Herbicides (Various)
SCCD
Mg/l
.0004
Glass
Ice
7 Days
EPA Method 8150
Benthic
Macroinvertebrates
SCCD;WDEQ
Metrics
Not Applicable
Plastic
Isopropyl Alcohol
and Formalin
None
King 1993
Habitat Assessment
SCCD;WDEQ
Parameters
Not Applicable
None Required
None Required
None
King 1993
Periphyton
WDEQ
Unknown
Not Applicable
Plastic
Formalin and
Lugol’s
None
Modified from Porter et al.
1993
Discharge
SCCD;WDEQ;
USGS
Cubic Feet per
Second (CFS)
1 CFS
None Required
None Required
None
Calibrated Staff Gage NRCS
and USGS Internal Methods
Ambient Air Temperature
NRCS
C0
0.1
None Required
None Required
None
NRCS Internal Methods
Precipitation
NRCS
Inches
0.1
None Required
None Required
None
NRCS Internal Methods

Sheridan County Conservation District
Tongue River Watershed Assessment 205j Final Report 1996-1999 57
Wyoming surface water quality standards for Class 2 waters prohibit temperature increases which
change natural water temperatures to levels which are deemed harmful to existing coldwater fish
life, which is considered to be 78 degrees F (25.6 degrees C) (WDEQ, 1998). Prohibited are
activities which cause temperature changes in excess of 4 degrees F (2.2 degrees C) from ambient
water temperatures (WDEQ, 1998).
Review of historical temperature data indicated that instantaneous grab samples for water
temperature normally collected during water quality monitoring were insufficient to detect
maximum daily stream temperature critical to trout. The review of historic continuous surface
water temperature data collected by WGFD at an upper Tongue River station in 1988 (Appendix
Table E-1) and at a Tongue River station in Ranchester (Appendix Table E-2) clearly illustrated
the need for continuous recording thermometers to detect thermal trends affecting trout. Detailed
discussion of this data set and implications for routine water temperature monitoring conducted by
SCCD and WDEQ is found in Section 8.5.2.
The WGFD data set was not discovered by SCCD until after the 1998 monitoring season began.
The monitoring budget did not allow for purchase of continuous recording thermometers or
thermisters. It was recommended that future monitoring at the mainstem Tongue River Middle
and Lower Stations and each major tributary Lower station include continuous temperature
recorders (Section 10).
Should Wyoming quality standards for water temperature be exceeded, management changes may
be implemented to mitigate the problem. Water conservation and improved irrigation
management combined with riparian management to promote cover and shading may result in
more consistent stream discharge and lower water temperature benefitting trout and aquatic
organism populations.
6.3.1.2 pH
The pH of water is a standard measurement conducted for water quality monitoring. Values for
pH range from 0 to 14 standard units (SU). The pH of pure water at 24 degrees C (75.2 degrees F)
is 7.0 SU which is neutral. Water greater than 7.0 SU is considered basic and water with a pH
below 7.0 SU is considered acidic. The pH for most mountain streams in northeast Wyoming
ranges from near neutral to slightly basic while plains streams are usually basic. Streams
coursing through limestone formations common within the upper Tongue River and tributary
watersheds should normally have pH values greater than 7.0 SU.
Daily fluctuations in stream pH are common and may be quite pronounced when considerable in
stream plant growth is present. The pH usually rises during daylight hours in response to plant
photosynthesis which reduces the buffering capacity of water. Reduction in pH normally occurs
during the night when plant photosynthesis is reduced. Some tributary streams in the Tongue

Sheridan County Conservation District
Tongue River Watershed Assessment 205j Final Report 1996-1999 58
River watershed Project area contain rooted aquatic plants thus, variable pH readings may be
expected dependent upon the time of day that pH is measured.
The pH of water contained in irrigation storage reservoirs present in the Five Mile Creek drainage
may produce significant amounts of algae (microscopic plants) during the warmer summer season.
Water released from these reservoirs may have high pH values and potentially affect the receiving
stream.
EPA has set a pH range from 6.5 SU to 9.0 SU to protect aquatic life (EPA, 1986). The Wyoming
water quality standard limits pH from 6.5 SU to 9.0 SU (WDEQ, 1998).
6.3.1.3 Conductivity
The primary purpose for measurement of conductivity is to provide an estimate for the relative
concentration of Total Dissolved Solids (TDS). TDS is a measure of the amount of total
substances that are dissolved in water and although not entirely correct, has also been referred to as
salinity. Conductivity is not directly proportional to the TDS concentration; however, the higher
the concentration of dissolved substances present in water, the higher the conductivity
measurement. Thus, conductivity is a reliable, inexpensive estimator of TDS. Conductivity is
measured in the field whereas determination of TDS concentration requires a more expensive
laboratory analysis.
TDS may pollute streams due to irrigation delivery system seepage (Riggle and Kysar, 1985) and
poor quality irrigation return flow (MacDonald et al., 1991). High conductivity can negatively
affect aquatic organisms. King (1990) reported that aquatic organisms in several northeast
Wyoming plains ponds were affected when conductivities were greater than 6,900 umhos/cm.
EPA (1988a) found that high conductivity and chloride concentrations resulted in lower diversity
of stream macroinvertebrate taxa. Lower diversity of stream macroinvertebrates used as a food
source for stream fish may negatively affect fish populations.
There were no Wyoming surface water standards for conductivity or TDS since these parameters
generally pose no significant threat to surface water supplies, beneficial use, fisheries and aquatic
organisms. However, quality standards are established for Wyoming groundwater such that
TDS concentrations for domestic, agriculture, or livestock use shall not exceed 500 mg/l, 2000
mg/l, or 5000 mg/l, respectively (WDEQ, 1993).
6.3.1.4 Dissolved Oxygen
Dissolved oxygen (DO) is the amount of free oxygen available to fish and aquatic organisms. A
minimum of 4 milligrams per liter (mg/l) is required for maintenance and survival of most aquatic
organisms. One mg/l is equivalent to one part per million (ppm). Trout and other coldwater fish
generally require a minimum of 5 mg/l DO.

Sheridan County Conservation District
Tongue River Watershed Assessment 205j Final Report 1996-1999 59
Temperature and DO are inversely related in that as the water temperature rises, the DO
concentration decreases. Moreover, elevation and DO are inversely related. As elevation
increases, DO decreases. DO depletion rarely occurs in shallow, well mixed, aerated streams
(Hynes, 1970) typified by water bodies in the Tongue River Project area. Low DO was not
expected to occur in the Tongue River Project area streams.
Wyoming surface water quality standards for DO in Class 2 water bodies were designed to protect
both the early life stages for coldwater fish (eggs, larvae and juveniles) and other life stages
(adults). A 1 day minimum DO concentration of 5.0 mg/l was set for early life stages and a
minimum 1 day minimum DO concentration of 4.0 mg/l was set to protect adult coldwater fish.
6.3.1.5 Discharge
Discharge is the measure of the amount of water flowing in a water body and is usually expressed
as Cubic Feet per Second (cfs). Discharge is an important physical parameter measured during
water quality monitoring because it may affect the concentration and quantity of pollutants. For
example, in most Wyoming streams TSS, turbidity, nitrate and phosphorus will normally increase
with increasing stream discharge while conductivity, chlorides, sulfates and other ions will
normally decrease with increasing stream discharge. Discharge may be used to estimate the load,
or amount, of a pollutant by combining measured stream discharge with the concentration of a
pollutant. Estimate of pollutant loads assist to evaluate pollutant response to variable temporal
and spatial stream discharge and provide information for sources of pollutants.
Adequate discharge must be present to fill the stream channel or critical habitat for fish and aquatic
organisms is lost. Water quality may be sufficient to support aquatic populations, but without
sufficient water, fish and organisms may be stressed or death may occur resulting in non support
for the Wyoming beneficial use for the protection and propagation of fish and wildlife (see Section
4.2). Corning (1969) found that productive trout streams were transformed into non productive
water bodies due to extreme water fluctuation. The primary causative factor was a 94% loss in
surface water area resulting from stream discharge reduction during the summer months.
There were no Wyoming or U.S. EPA standards established for discharge. However, in stream
flow rights may be granted through the State of Wyoming Engineer to establish minimum
discharge for a water body (see Section 3.1.1, Tongue River in stream flow).
6.3.1.6 Precipitation and Air Temperature
Precipitation and temperature are essential components in watershed scale monitoring projects.
Both may be used to estimate the timing and magnitude for water yield (discharge) within the
Project area. Hydrologic processes are controlled by precipitation and air temperature because

Sheridan County Conservation District
Tongue River Watershed Assessment 205j Final Report 1996-1999 60
accumulated snowpack and runoff are largely determined by this interaction. Water yield will
affect chemical, physical, biological and habitat characteristics for water bodies within the
watershed. Precipitation and temperature must be factored into water quality data analyses
because observed water quality change among years may be related to normal annual fluctuation
in meteorological conditions rather than anthropogenic (man caused) effects.
6.3.1.7 Habitat Assessment
Evaluation of stream habitat is a necessary component of the total water quality monitoring
program. Disruption of upland, riparian and in stream habitat can adversely affect stream water
quality and biological communities. Good habitat quality is key to good fish populations and
healthy aquatic biological communities. Soil compaction, loss of ground cover and eroding
stream banks can result in increased discharge, erosion, sedimentation and water temperature.
Trout spawning and rearing habitat may be lost and macroinvertebrate populations which serve as
food for trout may be reduced.
There were no numeric standards for habitat quality in Wyoming water quality standards.
However, Section 15 (Settleable Solids) and Section 16 (Floating and Suspended Solids) in
Chapter 1 of the Wyoming standards refer to narrative (non-numeric) standards for Settleable
Solids, Floating and Suspended Solids that shall not be present in quantities which could result in
significant aesthetic degradation, significant degradation of habitat for aquatic life, or adversely
affect other beneficial uses.
In addition for use to address narrative Wyoming water quality standards, the habitat assessment
may be used to determine if change in benthic macroinvertebrate populations was due to change in
water quality or to change in habitat quality. General habitat quality will also be compared
between the Upper and Lower stations for the Tongue River and tributaries.
Habitat Assessment data collected during the Project will be compared to habitat assessment data
collected from Reference Stream reaches identified during statewide WDEQ Reference Stream
Project monitoring at similar stream types in the Northwestern Great Plains ecoregion and Middle
Rockies ecoregion of Wyoming.
6.3.2 Laboratory Analyzed Water Chemistry Parameters
6.3.2.1 Turbidity
Turbidity is a common parameter measured in water quality monitoring studies since analysis of
samples is inexpensive and results may be used as an indicator of suspended sediment
concentration. Turbidity is based on a comparison of the intensity of light scattered by a water
sample with the intensity of light scattered by a standard reference solution under the same

Sheridan County Conservation District
Tongue River Watershed Assessment 205j Final Report 1996-1999 61
conditions (American Public Health Association, 1975).
A strong correlation may exist between turbidity and suspended sediment. The higher the
turbidity value, the higher the suspended sediment concentration. High turbidity may be caused
by substances other than sediment. Presence of natural water color due to high mineral content
(i.e. sulfates, chlorides), or to significant amounts of algae entrained in water may affect turbidity
values. However, no significant natural water color or high concentration of algae were expected
in the Project area with the possible exception of Five Mile Creek where summer water release
from Five Mile Reservoir may contain algae.
The Wyoming water quality standard for turbidity in Class 2 waters which are cold water fisheries
states that the discharge of substances attributable to or influenced by the activities of man shall
not be present in quantities which would result in a turbidity increase of more than 10
nephelometric turbidity units (NTU’s). Each water body in the Project area has been designated
as Class 2 cold water. In all Class 3 waters and Class 2 waters which are warm water fisheries, the
discharge of substances attributable to or influenced by the activities of man shall not be present in
quantities which would result in a turbidity increase of more than 15 NTU’s (WDEQ, 1998).
6.3.2.2 Total Suspended Solids
Total suspended solids (TSS) is the measure of suspended solid material in the water column.
The majority of TSS present in streams within the Project area will be comprised of sediment.
This is a valuable indicator parameter because it may be used to track and identify sources
contributing sediment to a water body. TSS is highly variable and is generally correlated to
stream discharge. Because of this variability, large numbers of samples may be required to
adequately estimate mean daily, monthly or annual TSS concentration. SCCD did not collect
TSS samples during this Project because the monitoring budget did not allow for collection of an
adequate number of samples. WDEQ collected TSS samples annually at their monitoring
stations.
There was no Wyoming water quality standard for TSS. However, narrative standards in Section
15 and Section 16 of the Wyoming water quality standards addressed effects due to sediment
deposition. Section 15 states that in all Wyoming surface waters, substances attributable to or
influenced by the activities of man that will settle to form sludge, bank or bottom deposits shall not
be present in quantities which could result in significant aesthetic degradation, significant
degradation of habitat for aquatic life or adversely affect public water supplies, agricultural or
industrial water use, plant life or wildlife (WDEQ, 1998). Section 16 stated that in all Wyoming
surface waters, floating and suspended solids attributable to or influenced by the activities of man
shall not be present in quantities which could result in significant aesthetic degradation, significant
degradation of habitat for aquatic life or adversely affect public water supplies, agricultural or
industrial water use, plant life or wildlife (WDEQ, 1998).

Sheridan County Conservation District
Tongue River Watershed Assessment 205j Final Report 1996-1999 62
6.3.2.3 Alkalinity
Alkalinity is the sum total of components in the water that tend to elevate the pH of the water
above a value of about 4.5 SU. It is a measure of the buffering capacity of water, and since pH has
a direct effect on organisms as well as an indirect effect on the toxicity of certain other pollutants in
the water, the buffering capacity is important to water quality (EPA, 1986). The pH is also used
in the evaluation and control of water and waste water treatment processes.
Dissolved substances such as carbonates, bicarbonates, phosphates, hydroxides (USEPA, 1986),
borates and silicates (APHA, 1975) can increase stream alkalinity. Stream water high in
alkalinity can maintain ambient pH when exposed to acidic water better than water low in
alkalinity. Alkalinity is important for primary production (bacteria and algae) in streams which
directly affect benthic macroinvertebrate populations that serve as food for fish. Generally, as
alkalinity increases, stream productivity and density (total number of organisms) increases.
SCCD did not collect TSS samples during this Project. WDEQ collected alkalinity samples
annually at their monitoring stations and RPWD collected daily alkalinity samples at the WTP
since 1998.
There was no Wyoming water quality standard for alkalinity. Naturally occurring maximum
alkalinity levels up to approximately 400 mg/l as calcium carbonate (CaCo3) are not considered a
problem to human health. Without adequate alkalinity levels, a water body may experience
dramatic shifts in pH which can disrupt fish and other aquatic life. EPA (1986) suggested a
minimum of 20 mg/l alkalinity was required for adequate productivity in streams.
6.3.2.4 Total Sulfate
Sulfate is a potential significant pollutant in Wyoming streams. It is naturally present in waters in
concentrations ranging from a few to several thousand mg/l (APHA, 1975). Higher sulfate
content is expected in groundwater close to sodium chloride and other chloride salt deposits in
sedimentary rocks. Drinking water high in sulfate (greater than 600 mg/l) may have laxative
effects on individuals. Water high in sulfate consumed by livestock may cause the “blind
staggers” and eventual death. Increased sulfate concentration in streams is a good indicator of
anthropogenic (caused by man) effects because irrigation return, industrial, oil field produced
water and other point source discharge effluents may artificially elevate ambient levels.
Increase in sulfate appears to negatively affect aquatic life and benthic macroinvertebrates.
Winget and Mangum (1979) studying streams in the Great Basin, found that as sulfate levels
increased, macroinvertebrate community diversity decreased. They indicated that a sulfate
concentration below 150 mg/l was optimal for macroinvertebrates.

Sheridan County Conservation District
Tongue River Watershed Assessment 205j Final Report 1996-1999 63
Wyoming has not established a surface water quality standard for sulfate. However, sulfate limits
for Wyoming groundwater are 250 mg/l, 200 mg/l and 3000 mg/l for domestic, agricultural, and
livestock use, respectively (WDEQ, 1993). EPA has recommended a secondary drinking water
standard at 250 mg/L. The secondary drinking water standard was not an enforceable standard,
but should be a goal for consideration of public health.
6.3.2.5 Total Chloride
Chloride naturally occurs in streams and is a principal component of salt (NaCl). Wyoming
mountain and foothill streams generally contain low chloride concentrations (generally <25 mg/l).
Streams draining from sedimentary deposits high in salts may result in higher chloride levels.
Stream chloride levels may increase due to oil and gas produced water, industrial and municipal
effluent and irrigation return. Water impounded by reservoirs may increase chloride and sulfate
concentration by a process termed evaporative concentration. Water held in reservoirs may
evaporate, but chloride and sulfate are left resulting in higher chloride and sulfate levels that may
be discharged to receiving waters.
Plants are more sensitive than humans to high chloride content. Thus, the Wyoming groundwater
standard sets chloride content at 250 mg/l for domestic use, 100 mg/l for agricultural/irrigation
water and 2000 mg/l for livestock use (WDEQ, 1993). The Wyoming surface water quality and
U.S. EPA standard for chloride is 860 mg/l for protection of aquatic life (WDEQ, 1998).
Aquatic life is sensitive to chlorides at higher concentrations. O’Neil et al. (1989) studying
effects of coalbed methane produced water, found that chloride concentrations at or below 565
mg/l produced no significant effects to the benthic macroinvertebrate community structure in
study streams. Chloride values above 565 mg/l showed defined impairment to the community.
Birge et al. (1985) found that benthic macroinvertebrate community structure was negatively
affected by increasing chloride concentration. They recommended that the average chloride
concentration should not exceed 600 mg/l over thirty consecutive days and a maximum
instantaneous (one time sample) should not exceed 1,200 mg/l.
6.3.2.6 Total Nitrate Nitrogen
Nitrate nitrogen (NO2 + NO3-N) in streams may originate from several possible sources including
the atmosphere, plant debris, animal waste and sewage, nitrogen based fertilizers and some
industrial wastes. Nitrate is considered to be one of the primary nutrients (along with
phosphorus) associated with Nonpoint Source (NPS) pollution. Nitrate is the end product of the
decomposition of decomposed organic material such as sewage and excrement. Bacteria acts on
organic material changing it to ammonia (NH3), then nitrite (NO2) and finally nitrate (NO3).
Sheridan County Conservation District
Tongue River Watershed Assessment 205j Final Report 1996-1999 64
Wyoming has adopted the EPA drinking water human health standard of 10 mg/l for Class 2
surface waters (WDEQ, 1998). The EPA standard of 10 mg/l for drinking water supplies was to
protect against toxic infant methemoglobinemia (blue baby syndrome) characterized by a bluish
color of the skin (EPA, 1986). EPA has not established surface water standards for nitrates since
concentrations required for toxicity to cold or warmwater fish rarely occur in natural waters (EPA,
1986). High concentrations of nitrate in livestock drinking water has resulted in abnormally
high mortality rates in baby pigs and calves and abortion in brood animals. USGS (1999)
reported that national background concentrations of nitrate from streams in undeveloped areas
(reference-like areas) was about 0.6 mg/L. However, they cautioned that the overall national
background levels were higher than those concentrations measured from relatively undeveloped
areas.
Nitrate generally has no direct effect on aquatic organisms. Indirect effects are manifest by
stimulation of bacteria, periphyton, algae and in stream macrophyte (submerged and rooted plants)
growth which in turn, may stimulate benthic macroinvertebrate and fish production. The benthic
macroinvertebrate community structure may shift due to increased abundance of periphyton and
algae used as food or refuge by different taxa. Thus, evaluation of the benthic macroinvertebrate
community change can indicate nitrate pollution.
6.3.2.7 Total Phosphorus
Phosphorus and nitrate are the two most common nutrients associated with NPS pollution.
Phosphorus is an essential element for plant growth. However, generally low levels of
phosphorus (>0.2 mg/l) can stimulate primary production (bacteria, periphyton, algae) and plant
growth when in the presence of sunlight. Strict control of phosphorus is required in watersheds
draining to lakes and reservoirs because aquatic organisms and plants rapidly assimilate
phosphorus resulting in potential nuisance algae and plant populations creating unfit conditions for
human recreation and problematic filter clogging algal forms in municipal water treatment plants.
Bacterial breakdown of dense growth of algae and plants consumes dissolved oxygen often
resulting in oxygen depletion in lakes and reservoirs stressing or killing fish and aquatic
organisms.
Naturally occurring phosphorus enters streams primarily by soil erosion and sediment transport.
Additional phosphorus may enter streams through municipal and industrial point discharges,
runoff containing animal wastes and phosphate fertilizes. Phosphorus creates less problems in
streams than in lakes and reservoirs since phosphorus is accumulated in bottom sediments.
Phosphorus is difficult to eliminate from standing water bodies because they serve as sediment
traps and generally cannot be flushed of bottom sediments.
Wyoming has not established surface water quality standards for phosphorus because problems
associated with this pollutant are generally site-specific due to localized sources of phosphorus

Sheridan County Conservation District
Tongue River Watershed Assessment 205j Final Report 1996-1999 65
affecting individual water bodies. U.S. EPA (1977) recommended that total phosphorus
concentration should not exceed 0.05 mg/l in a stream that enters a lake or reservoir (e.g. Tongue
River Reservoir) to prevent development of nuisance algal and plant populations. Mackenthun
(1973) suggested a target phosphorus level of less than 0.10 mg/l for streams that did not directly
enter lakes or reservoirs. Recent information provided by USGS (1999) from nationwide
NAWQA monitoring and assessment reported that national background concentrations for total
phosphorus from streams in undeveloped (reference - like ) areas was about 0.10 mg/L. USGS
indicated that waters with concentrations of total phosphorus greater than the national background
concentration were considered to have been affected by human activity. They found that
enrichment of streams with nutrients generally occurred in small watersheds and regions
dominated by agricultural or urban land use.
The natural background level in relatively undisturbed watersheds (0.10 mg/l) presented by USGS
(1999) conflicted with the EPA recommended standard (0.05 mg/l) because the national
background (reference) concentration found by USGS was two-fold greater than the EPA
recommended standard. This observation indicated that in order to meet the recommended EPA
standard for total phosphorus, a water body would have to reduce its total phosphorus
concentration by 50 percent below that of natural background. Because this goal was not
attainable, SCCD adopted the finding by USGS as the recommended standard for interpretation of
total phosphorus data collected during this Project. The recommended standard was not an
enforceable standard.
6.3.2.8 Ammonia
Ammonia is a byproduct of the decomposition of organic material and by the hydrolysis of urea
(found in urine). It is toxic to aquatic organisms in low concentration. U.S. EPA (1986) cited
chronic (long term) mortality in trout when ammonia concentration ranged from 0.083 to 1.090
mg/l and from 0.140 to 4.60 mg/l for non-trout species.
Ammonia is generally unstable in water and in most stream systems quickly converts to nitrite and
then to nitrate. Thus, it provides evidence of localized pollutant sources when identified in
streams. SCCD did not sample for ammonia during this Project. WDEQ sampled for ammonia
only in 1998 in conjunction with intensive sampling in the vicinity of the Dayton WWTF.
Seemingly harmless changes in pH and temperature can greatly affect the toxicity of ammonia to
aquatic organisms and fish. The toxicity of ammonia to aquatic organisms is increased by
increasing water pH. For example, a total ammonia concentration that would have virtually no
lethal effect on fish at a pH of 7 could become acutely toxic if the pH were raised to 8. Decreasing
water temperature generally increases the toxicity of ammonia to fish.
The Wyoming water quality standard for ammonia is variable because of the interaction between
pH and temperature. However, an upper limit of 0.26 mg/l for ammonia based on a single

Sheridan County Conservation District
Tongue River Watershed Assessment 205j Final Report 1996-1999 66
sample exposure should protect trout and coldwater aquatic life from mortality (WDEQ, 1998; in
Appendix C). The Wyoming groundwater standard for ammonia for domestic use is 0.50 mg/l
(WDEQ, 1993). USGS (1999) reported that national background concentration for total
ammonia from streams in undeveloped areas was about 0.10 mg/L.
6.3.2.9 Total Hardness
Hardness is related to the concentration of metals (metallic ions) and is usually equivalent to the
concentration of calcium carbonate (CaCo3). Hardness may be used as an indicator to determine
suitability of water for industrial use (i.e. Wyoming beneficial use for Industry). The maximum
acceptable hardness concentration for industrial use varies according the type of industry. Table
6.2 shows the maximum hardness levels accepted by industry as a raw water source (after EPA,
1986).
TABLE 6-2. Maximum Hardness Levels Accepted by Industry
Maximum Concentration (mg/l)
Industry as CaCo3
Electric utilities 5,000
Textile 120
Pulp and paper 475
Chemical 1,000
Petroleum 900
Primary metals 1,000
A commonly used classification for hardness is presented in Table 6.3 (in EPA, 1986; after
Sawyer, 1960).
TABLE 6.-3. Classification of Water by Hardness Content (mg/l as CaCo3).
Concentration Description
0 - 75 Soft
75 - 150 Moderately Hard
150 - 300 Hard
300 + Very Hard
Water that comes into contact with natural limestone formations is the primary source for hardness
Sheridan County Conservation District
Tongue River Watershed Assessment 205j Final Report 1996-1999 67
in streams. Municipal and industrial (especially subsurface mines) point source effluents, storm
drain discharge, and to a lessor extent, runoff from agricultural areas, may elevate hardness
concentration.
Wyoming and U.S. EPA have not established water quality standards for hardness. Because
hardness in water can be removed with treatment by such processes as softening or ion exchange
systems, a standard for industrial use or for public water supply is not practical. Moreover, the
effects of hardness on fish and aquatic life appear to be related to the specific ions causing the
hardness (i.e. calcium, magnesium, manganese) rather than the hardness itself (EPA, 1986).
6.3.2.10 Pesticides and Herbicides
Pesticides and herbicides may enter surface water bodies through surface runoff, ground water
discharge or direct application through accidental spillage or haphazard aerial and ground
application. Once in water, many of these man-made compounds may persist and pose human
health and safety risks. Pesticides and herbicides may work their way into the aquatic food chain
by benthic and terrestrial organism uptake, consumption of the organisms by fish, and
accumulation in fish tissue consumed by wildlife and humans. Contamination of drinking water
supplies is a major concern because many of these compounds may be carcinogenic at low
concentration. Because Tongue River is a popular recreational fishery and drinking water source
for the Town of Dayton and the Town of Ranchester, SCCD sampled for select herbicides and
pesticides once in 1996. USGS sampled for numerous pesticides and herbicides in fish tissue and
bed sediment at USGS station 06298000 (SCCD Tongue River Upper station) in 1998 as part of
the Yellowstone NAWQA.
WDEQ and EPA have established drinking water standards for numerous pesticides and
herbicides. The list of standards for individual pesticides and herbicides is extensive and is not
presented in this Final Report. However, the reader may refer to Appendix B in Wyoming
Surface Water Quality Standards (WDEQ, 1998) for standards applicable to many of these
compounds.
6.3.3 Laboratory Analyzed Biological Parameters
6.3.3.1 Fecal Coliform Bacteria
Fecal coliform bacteria are present in the digestive tract of humans and all mammals. Sampling
for fecal coliform bacteria may be considered as one of the most important tests conducted in water
quality monitoring programs because of public health and safety concern. Cholera, typhoid fever,
bacterial dysentery, infectious hepatitis and cryptosporidiosis are some of the well known diseases
that spread through contact with fecal contaminated water. Eye, ear, nose and throat infections
may also result from contact with contaminated water.

Sheridan County Conservation District
Tongue River Watershed Assessment 205j Final Report 1996-1999 68
Presence of fecal coliform bacteria in water indicates that the water is contaminated with fecal
material and the possible presence of pathogenic organisms harmful to humans. Animals may be
carriers of these pathogens as well as humans. Because of this, domestic sewage from wastewater
treatment systems and runoff from land may contaminate water with human pathogens.
Escherichia coli (E. coli) is a species of fecal coliform bacterium commonly identified as an
indicator of fecal contamination. This species comprises many different strains of which the vast
majority are not pathogenic to humans (Hinton, 1985). However, particular strains of E. coli (i.e.
E. coli 0157:H7) and other verotoxic strains may be responsible for haemorraghic colitis (severe
diahhrea) and haemolytic uraemic syndrome (kidney failure) in humans which may be fatal if left
untreated.
The fecal coliform bacteria standard for Wyoming Class 2 water bodies is comprised of two parts:
1. During the entire year, fecal coliform concentrations shall not exceed a geometric
mean of 200 fecal coliform groups per 100 milliliters (based on a minimum of not
less than 5 samples obtained during separate 24 hour periods for any 30 day
period), nor shall 10 percent of the samples exceed 400 groups per 100 milliliters
during any 30 day period in any Class 4 water and at all public water supply intakes
(e.g. Town of Dayton and Town of Ranchester Water Treatment Plant Intakes).
2. During the recreation season, (May 1, through September 30) fecal coliform
concentrations shall not exceed a geometric mean of 200 fecal coliform groups per
100 milliliters (based on a minimum of not less than 5 samples obtained during
separate 24 hour periods for any 30 day period), nor shall 10 percent of the samples
exceed 400 groups per 100 milliliters during any 30 day period in all Wyoming
surface waters.
6.3.3.2 Biochemical Oxygen Demand
Biochemical oxygen demand (BOD) is the measure of the amount of oxygen required to
breakdown organic matter through the action of bacteria. Large amounts of organic matter may
consume large amounts of oxygen during this process depriving aquatic organisms and fish of
oxygen. Fish kills have resulted from spillage of large quantities of waste manure from confined
animal feeding operations into streams. Sources of organic material in streams affecting BOD
may include municipal wastewater discharges, runoff from animal feeding operations, storm drain
discharge, septic tank leach field systems and agricultural runoff.
SCCD did not sample for BOD during this Project. WDEQ sampled for BOD only in 1998 in
conjunction with intensive sampling in the vicinity of the Dayton WWTF. Wyoming and EPA
have not established surface water quality standards for BOD. However, required monitoring for

Sheridan County Conservation District
Tongue River Watershed Assessment 205j Final Report 1996-1999 69
BOD is common for municipal wastewater treatment system discharge to determine effectiveness
of the specific treatment system and to evaluate potential impact to receiving water bodies.
6.3.3.3 Benthic Macroinvertebrates
Aquatic macroinvertebrates (bugs) reside in and on bottom substrate of streams. They are small
but visible to the naked eye and large enough to be retained in a U.S. Standard No. 30 sieve.
Benthic macroinvertebrate populations provide another valuable tool for assessment of water
quality. Some may argue that macroinvertebrates provide the most holistic assessment of stream
health or aquatic life use attainment because they are year around monitors and incorporate both
water quality and habitat quality change. Because macroinvertebrates are relatively immobile
and live in the stream for most of their lives, they are exposed to daily and seasonal water quality
changes often missed by conventional water quality monitoring. Water chemistry sampling
provides information for the quality of water at the time of sample collection. In contrast,
macroinvertebrates serve as continuous monitors of stream water quality and are exposed to
variable concentrations of pollutants over extended periods of time. This is an important concept
because water quality sampling may miss important changes in water quality due to normal
seasonal and spatial variability, accidental material spills, or facility wastewater treatment plant
malfunction that macroinvertebrates may detect.
Water quality monitoring evaluates a series of individual parameters (i.e. temperature, DO,
turbidity) to determine if they are within standards. If they are within standards, then it is
assumed that aquatic life use is fully supported. However, this assumption may not be true
because this approach fails to account for the usual synergistic interaction between water quality
parameters. For example, a stream with higher water temperature and turbidity and lower DO
and pH approaching water quality standards, but that are within standards, when combined may
produce negative synergistic stress on aquatic biological populations resulting in non-support of
aquatic life use.
Wyoming water quality standards established for chemical and physical water quality parameters
(in WDEQ, 1998, Appendixes B, C, and D, Chapter 1, Wyoming Water Quality Rules and
Regulations) are established to protect aquatic life and human health. Instead of using sampling
results from individual chemical and physical water quality parameters, evaluation of benthic
macroinvertebrate populations may serve as a direct measure to determine support for aquatic life
use in addition to validating the effectiveness of individual narrative and numeric water quality
chemical and physical standards. Benthic macroinvertebrates also serve to integrate water quality
and habitat quality interaction, and evaluate potential synergistic effects from multiple chemical
and physical water pollutants not measured during routine water quality monitoring.
Wyoming has developed preliminary Biological Criteria for streams statewide (Stribling et al.,
2000), but they have not been adopted as numeric, enforceable standards. As such, they may be

Sheridan County Conservation District
Tongue River Watershed Assessment 205j Final Report 1996-1999 70
interpreted as narrative standards to determine beneficial use attainment for protection and
propagation of fish and wildlife. WDEQ (2000) proposed narrative Biological Criteria in Chapter
1, Section 32 revised rules and regulations to protect indigenous or intentionally introduced
aquatic communities (i.e. brown, brook and rainbow trout species). In addition, Section 4 in the
current Wyoming water quality standards relate the presence of food sources (e.g. benthic
macroinvertebrates) for game and nongame fish as a criteria for Surface Water Classes and
(beneficial) Uses (WDEQ, 1998).
6.3.3.4 Periphyton
Periphyton are microscopic and macroscopic organisms attached to or living in proximity to
stream substrates. Periphyton communities are usually dominated by algae, but may include
bacteria and microinvertebrates. They are in direct contact with water and are directly affected by
water quality. Periphyton are useful for water quality assessments because they have rapid
reproduction rates and short life cycles, and thus they respond quickly to anthropogenic (man
caused) perturbation.
Wyoming and U.S. EPA have not established biological criteria for periphyton for surface waters.
Many of the same advantages offered by the assessment of macroinvertebrates are afforded by the
assessment of periphyton communities. They serve to integrate water quality and habitat quality
interaction, and evaluate potential synergistic effects from multiple chemical and physical water
pollutants not measured during routine water quality monitoring.
SCCD did not sample periphyton during this Project. WDEQ initiated annual periphyton
sampling in 1998 at the long term Tongue River Upper reference station and sampled periphyton at
the Tongue River Lower station in 1998. Analytical results were not available for this Final
Report. USGS sampled algae and periphyton at station 06298000 in 1999, but results were not
available for this report.
6.4 Sampling Frequency
SCCD monitoring was based on a random (unbiased) systematic sampling design. Monitoring
budget constraints limited the total number of sampling stations, the total number of sampling
events and sampling frequency.
With the exception of Five Mile Creek, each tributary to the Tongue River had two sampling
stations. One station was sited near the upper boundary and the second station was located near
the confluence with the Tongue River. Five Mile Creek had a single lower station established
near the confluence with the Tongue River. The Tongue River had three monitoring stations
identified as the Upper, Middle and Lower stations. Three monitoring stations allowed SCCD to
evaluate changes along the longitudinal gradient and determine potential water quality change

Sheridan County Conservation District
Tongue River Watershed Assessment 205j Final Report 1996-1999 71
from tributary input.
Year around sampling was not conducted due to monitoring budget constraints and historic
Tongue River water quality and discharge data indicating that the majority of potential water
pollutants were expected to occur between spring runoff (normally starting in April) and the end of
the irrigation season (in September).
Tongue River and Lower tributary stations were each sampled two times monthly during April,
May and June to coincide with periods of higher stream discharge associated with annual
snowmelt runoff. Monthly sampling occurred during the months of July, August and September.
Tongue River stations and Lower tributary stations were sampled once in October in association
with benthic macroinvertebrate sampling. Upper tributary stations were sampled once monthly
due to monitoring budget constraints. SCCD suggests that higher sampling frequency be directed
to the Lower tributary stations to better estimate potential pollutants entering the Tongue River.
Excluding Fridays, weekends and holidays, sampling dates were chosen randomly with use of the
a random number table or computer generated random numbers to prevent “fair day” sampling
bias.
Sampling was scheduled to occur at all stations the same day to provide data for upstream -
downstream comparisons. However, same day sampling did not regularly occur due to lack of
field monitoring personnel and the short holding time afforded by fecal coliform sampling (6 hour
holding time). Future sampling should ensure adequate field personnel to complete same day
monitoring. Lack of regular same day monitoring did not compromise the integrity of the data
set, but rather prevented maximum use of data for upstream - downstream comparisons.
Temperature, pH, conductivity, turbidity and discharge were collected during each sampling
event. Dissolved oxygen measurements were initiated in 1999 after purchase of an electronic
dissolved oxygen meter and measured during each sampling event. Fecal coliform bacteria
samples were collected monthly at each station. Fecal coliform sampling frequency was
increased in 1999 to collection of five (5) samples on separate days during a 30 day period within
the recreational season (May 1 through September 30) to better estimate fecal coliform levels and
determine attainment of the WDEQ water quality standard for fecal coliform bacteria (See Section
6.3.3.1 and WDEQ, 1998). Total nitrate samples were collected monthly at mainstem Tongue
River and Lower tributary stations, but not at Upper tributary stations (with the exception of
Columbus Creek) due to budget constraints. Total phosphorus samples were generally collected
twice at each station during the entire Project. WDEQ collected total phosphorus and other water
quality parameters annually in September or October at mainstem Tongue River and Lower
tributary stations. Pesticide and herbicide samples were collected once in 1996 at Tongue River
stations, Lower Wolf Creek and Five Mile Creek Lower.
Sampling for benthic macroinvertebrates and habitat assessment was conducted annually in

Sheridan County Conservation District
Tongue River Watershed Assessment 205j Final Report 1996-1999 72
September or October at Tongue River and Lower tributary stations. This was the same sampling
index period used by WDEQ for benthic macroinvertebrates and habitat assessment. The Tongue
River Upper station was sampled by WDEQ because it was a designated long term Reference
station monitored annually. No benthic macroinvertebrates or habitat assessments were
measured at the Upper tributary stations due to monitoring budget constraints.
6.5 Sampling and Analysis Methods
Field methods followed approved WDEQ sampling protocols (King, 1993). Each sampling
location was placed on a riffle marked by permanent fencepost placed above the high water line for
easy relocation. Fenceposts served as permanent location markers so that samples would be
collected at the same location during the course of the Project thus ensuring sampling consistency.
Photopoints were established to provide additional location identification and document general
condition of stream habitat.
Riffles were chosen to ensure a well mixed homogenous water mass for representative sample
collection (Figure 6-16). Sampling progressed from downstream to upstream locations.
6.5.1 Water Quality
Field water chemistry parameters were measured in-situ, or at the stream, with portable monitoring
instruments. Temperature and pH were measured with a Hanna Instruments meter Model No. HI
9025. A two-point calibration using commercially prepared 7 and 10 buffer solutions was
performed once prior to sampling or more frequently if the meter appeared to deviate from prior
calibration. Calibrations were recorded on field data sheets. Conductivity was measured with a
Hanna Instruments conductivity meter Model No. HI 8733. Dissolved oxygen (DO)
measurements were made with a YSI 600R multi-probe meter. The meter was calibrated
following manufacturers instructions. Other than the DO meter, field meters used by SCCD
were the same as those used by WDEQ.
Before sampling, a two gallon plastic bucket was rinsed at least twice with ambient water. Facing
upstream, the bucket was filled with stream water and field parameters immediately measured
(Figure 6-17). During high water when stream entry was considered hazardous, samples were
collected from shore. Buchanan and Somers (1968) and King (1990a) found that a single grab
sample adequately represented quality of the water column during high flow and at riffles where
water was well mixed. Analytical results were recorded on appropriate field data sheets (Figure
6-18).
Instantaneous grab samples for parameters requiring laboratory analysis were collected directly
from the stream in labeled 500 milliliter plastic containers. Fecal coliform bacteria samples were
collected in pre-sterilized glass bottles containing sodium thiosulfate to neutralize potential

Sheridan County Conservation District
Tongue River Watershed Assessment 205j Final Report 1996-1999 73
residual chlorine. Pesticide and herbicide samples were each collected in one (1) liter glass
containers.
Samples were collected at 0.6 the depth of the water mass when discharge or adequate depth
allowed (Ponce, 1980). Care was taken to prevent agitation of stream substrate during low
discharge to prevent accidental introduction of sediment into the sample container. With the
exception of pesticide and herbicide samples, at least ten percent of samples were collected in
duplicate for Quality Assurance and Quality Control (QA/QC) purposes. High analytical cost
prevented collection of duplicate pesticide and herbicide samples.
Samples requiring preservation were immediately preserved, placed on ice and hand delivered to
the laboratory for analysis (Figure 6-19). Turbidity samples were analyzed at the Ranchester
WTP laboratory under supervision of Mr. Harold Herman, Public Works Director. A Hach
Turbidimeter Model 2100A was used to analyze samples in accordance with EPA method 180.1
(Figure 6-20). Remaining samples were hand delivered to Intermountain Laboratories, Inc. in
Sheridan. Appropriate chain of custody forms and procedures were completed to ensure proper
sample tracking, analysis and disposition (EPA, 1988; WDEQ, 1989). Referenced sample
analysis methods are listed in Table 6-1.
6.5.2 Discharge
Discharge was measured daily by USGS at Tongue River gage station number 06298000 following
normal USGS operational guidelines. Wolf Creek discharge was measured daily by WSBC for
USGS from April through September at gage station number 06299500. These data were reported
annually in the USGS Water Resources Data Wyoming Water Year publication. Discharge was
measured by SCCD at each monitoring station during each sampling event. Staff gages were
installed, surveyed and calibrated by SCCD under direction of the NRCS State Hydrologist and
assistance from NRCS Sheridan office personnel. Staff gage discharge relationships were
developed by the NRCS hydrologist stationed in Casper. The staff gage at Little Tongue River
Lower was repositioned during the Project to adequately measure low discharge volume. The staff
gage at Five Mile Creek was relocated because it was inundated by a beaver dam.
6.5.3 Precipitation and Air Temperature
Daily precipitation and air temperature were recorded by NRCS at the Burgess Junction
Meteorological Station Number WY07E33S. Field data collection and reduction followed
established NRCS methods. Daily precipitation and air temperature data were submitted to SCCD
electronically from the NRCS Casper, Wyoming office.

Sheridan County Conservation District
Tongue River Watershed Assessment 205j Final Report 1996-1999 74
6.5.4 Benthic Macroinvertebrates
Benthic macroinvertebrate sample collection and analysis methods were the same as those used by
WDEQ described in King (1993). Samples were collected in the late September or October index
period. Eight benthic macroinvertebrate samples were collected from a representative maximum
100 foot riffle/run and composited into a single sample. Sampling began at the downstream
portion of the riffle and proceeded upstream to prevent substrate disturbance and incidental
sampling of drift. A one square foot modified Surber sampler (extended 3 foot net length) fitted
with 500 micron (um) netting was used. Computer generated random numbers were used to
select individual square foot quadrants. At least ten percent of all locations were sampled in
duplicate. Duplicate sampling consisted of two samplers each equipped with a Surber sampler
collecting simultaneously next to one other.
The Surber sampler was firmly seated on the stream bottom facing upstream into the stream flow
(Figure 6-21). Before disturbing substrate surrounded by the Surber sampler, substrate particle
size composition (see Section 6.5.5.1) and embeddedness (see Section 6.5.5.2) measurements
were taken. After completion of substrate and embeddedness measurements, larger cobble and
gravel within the Surber sampler were scraped by hand and soft brush, visually examined to ensure
removal of all organisms, then discarded outside the sampler. Remaining substrate within the
sampler was thoroughly agitated to a depth of 2 to 3 inches (5 to 8 centimeters). Net contents
were placed in a tub and rinsed into a U.S. Standard No. 35 (500um) sieve. Sieve contents were
placed into labeled plastic jars containing an isopropyl alcohol - formalin mixture for preservation
(Figure 6-22). A macroinvertebrate sample chain of custody form was completed and placed with
samples in a cooler to accompany samples from the field to the laboratory.
Stream current velocity was measured in feet per second (fps) at each Surber sample quadrant after
macroinvertebrate collection by placing a portable current meter at 0.6 times the water depth.
The meter was placed where the front of the Surber sampler was located. The purpose for
velocity measurement was to determine if differences in sediment deposition and embeddedness
among stations may be due to differences in current velocity.
Samples were sent to Aquatic Biology Associates (ABA) in Corvallis, OR for processing and
analysis. This was the same laboratory used by WDEQ and thus, the same analytical methods
were used. Lead taxonomist was Mr. Robert Wisseman, ABA Senior Scientist. Other
specialists that may perform specific identifications for rare or unusual specimens included Dr.
John Gelhaus of the Philadelphia Academy of Natural Sciences for Tipulidae (crane flies), Dr.
Don Klemm of the U.S. EPA, Cincinnati for Hirudinea (leeches), Mr. Douglas Spencer, private
consultant, Fowlerville, Michigan and Dr. Thomas L. Boullion of Sierra Consulting Services,
Cottonwood, CA for Oligochaeta (worms), Ms. Tracey Anderson, Oregon State University,
Corvallis, Dr. Len Ferrington, Jr., University of Kansas, Manhattan and Mr. Gary Lester of
Eco-Analysts, Moscow, ID, for Chironomidae (non-biting midges), Dr. Terrence Frest of Deixus

Sheridan County Conservation District
Tongue River Watershed Assessment 205j Final Report 1996-1999 75
Consulting, Seattle for Gastropoda (snails) and Pelecypoda (clams) and Dr. Cheryl Barr,
University of California, Berkeley, for Coleoptera (beetles) and Elmidae (riffle beetles).
In the laboratory, at least 500 organisms (usually 500 to 550) were removed from randomly
selected squares in a gridded tray described by Caton (1991). When organism density was high
(greater than 300 organisms per square), the next square or subsample was subdivided into
quarters by placing an X-shaped frame over the petri dish or sorting container. A random number
from 1 to 4 was selected and all organisms were removed from the corresponding quarter. The
entire sample was analyzed if less than 500 organisms were present. After subsampling was
completed and 500 to 550 organisms removed, the sorter re-distributed the remaining sample
within the gridded tray and spent about 5 minutes looking for Large and Rare organisms (Vinson
and Hawkins 1996). Organisms removed during the large and rare search were placed in a
separate vial and assigned an occurrence of one (1) for the correction factor, density and metric
calculations. Organisms were hand picked using illuminated 2X and 3X magnifiers or
stereozoom binocular microscope and no flotation methods were employed (Figure 6-23).
The majority of organisms were identified to genus or species with the exception of taxonomically
indistinct worms and certain difficult Dipteran taxa. Zooplankton, including Cladocera,
Copepoda and Rotifera, terrestrials, fish, amphibians, reptiles, Ostracoda, bryozoans, protozoans
and gastrotrichs were noted, but were not included in taxa lists and metric calculations. A
consistent Standard Level of Identification was used during the Project to provide comparable data
among years (Table 6-4). The same Level of Identification should be used in future benthic
macroinvertebrate monitoring for comparability. Density estimates were expressed as number
per square meter (No./m2). Examples of benthic organisms identified were illustrated in Figures
6-24 through 6-26. Figure 6-24 shows an example of a stonefly (Pteronarcys), Figure 6-25
shows an example of a snipe fly (Atherix) and Figure 6-26 shows an example of a midge fly
(Chironomus).
Electronic and hard copy analytical results were sent to SCCD from ABA. Included in the data
package was a Taxa List and a list of seventy-two (72) macroinvertebrate metrics for each station.
See Appendix G for the list of macroinvertebrate metrics.
6.5.4.1 Macroinvertebrate Data Analysis, Determination of Biological Condition and
Aquatic Life Use
A series of metrics were calculated for each benthic macroinvertebrate sample. A metric is a
descriptor of one facet of the benthic population that responds to water quality and habitat change
in a predictable manner (Barbour et al., 1999). Table 6-5 lists select macroinvertebrate metrics
and their response to water quality and habitat quality stressors. Appendix Tables G-1 through
G-4 lists seventy-four (74) total metrics calculated for each sample.

Sheridan County Conservation District
Tongue River Watershed Assessment 205j Final Report 1996-1999 76
Benthic macroinvertebrate data were evaluated by using three different methods:
1. Data comparison to biological criteria defined in the Wyoming Biological
Condition Index (WBCI) developed by Barbour et al. (1994) for Bighorn Mountain
foothill streams less than 6,500 feet elevation in the Middle Rockies Central
ecoregion of Wyoming. Tongue River Upper including the USGS sample station
06298000, Little Tongue River Upper (WDEQ station) and Lower, and Columbus
Creek Upper (WDEQ station) were sited in the Middle Rockies ecoregion.
Barbour et al. (1994) found nine (9) metrics that consistently responded to water
quality and habitat quality change (Table 6-6). Scoring criteria were developed to
determine if biological condition was Good, Fair or Poor. The metrics and scoring
criteria for the WBCI are presented in Table 6-6.
Metric values were assigned a score of 5, 3, or 1, then summed. The total score
was used to determine a biological condition rating of Good, Fair or Poor (Table
6-7). A biological condition rating of Good indicated full support for aquatic life
use and fair or poor ratings indicate non-support for aquatic life use. Non-support
indicates the aquatic community was stressed and water quality or habitat
improvement was required to restore biological condition to full support for aquatic
life use.
2. Stribling et al. (2000) expanded on previous work by Barbour et al. (1994) to
develop regionally calibrated biological criteria for Wyoming streams statewide.
Because Barbour developed biological criteria only for the Middle Rockies
ecoregion streams, SCCD stations sited in the Northwestern Great Plains ecoregion
(Smith Creek Lower, Columbus Creek Lower, Wolf Creek Lower and Five Mile
Creek) could not be assessed using these criteria. Biological communities in the
Middle Rockies ecoregion mountain and foothill streams naturally differed from
biological communities in the plains streams of the Northwestern Great Plains
ecoregion. Because benthic communities naturally differed between ecoregions,
expectations for benthic communities required a different set of biological criteria.
Biological criteria developed by Stribling et al. (2000) updated criteria for the
Middle Rockies ecoregion and presented new biological criteria for streams in the
Northwestern Great Plains ecoregion of Wyoming. The biological criteria were
based on analysis of monitoring data collected by WDEQ from 1993 through 1997
from multiple reference and non-reference quality streams statewide. Stribling
used a different approach to develop scoring and assessment criteria than Barbour
by using percent comparison of metrics to the reference benthic community. The
rationale for selection of metrics and development of scoring criteria is found in
Stribling et al. (2000). Interestingly, there was strong agreement in biological
condition determination for Middle Rockies streams assessed using both sets of

Sheridan County Conservation District
Tongue River Watershed Assessment 205j Final Report 1996-1999 77
biological criteria (See Section 8.5.19 and Table 8-15). The updated biological
criteria for the Wyoming Stream Integrity Index (WSII) are presented in Table 6-8.
Metric values for the monitoring station were compared to metric values from
combined reference (least impacted) stations (Table 6-8) and percentages were
calculated. Percentages were summed, then divided by the total number of
metrics to provide an Average Index Value. The Average Index Value was used to
rate the biological community as Very Good, Good, Fair, Poor or Very Poor (Table
6-7). Biological condition ratings of Very Good or Good indicated full support for
aquatic life use and ratings of fair, poor, or very poor indicated non-support for
aquatic life use. Non-support indicated the aquatic community was stressed and
water quality or habitat improvement required to restore the stream to full support
for aquatic life use.
3. Benthic macroinvertebrate communities were compared by station among years
(temporal comparison) and between stations (spatial or locational comparison; see
Table 9-3 and Table 9-5). Biological condition ratings and certain metric values
were compared to certain water quality and habitat variables (including discharge)
by linear regression to determine significant associations.
6.5.5 Habitat Assessment
Habitat assessments were conducted at the same stream reach where benthic macroinvertebrates
were collected after biological sampling was completed. The habitat assessment was conducted
following methods found in Platts et al. (1983), Plafkin et al. (1989) and Hayslip (1993)
compiled and modified by King (1993) for use in Wyoming.
The habitat assessment included three components:
1. Semiquantitative substrate particle size composition and embeddedness evaluation;
2. Qualitative habitat assessment for the stream reach; and
3. Photopoints
6.5.5.1 Substrate Composition
Evaluation of substrate was required because substrate particle size was an important factor
controlling the composition and density of benthic macroinvertebrate populations. Stream
reaches dominated by diverse cobble and gravel substrate will have a diverse benthic
macroinvertebrate population (in the absence of water pollution). Stream reaches dominated by

Sheridan County Conservation District
Tongue River Watershed Assessment 205j Final Report 1996-1999 78
sand and silt substrate will exhibit different benthic community composition when compared to
reaches dominated by cobble and gravel. Population density and diversity is usually reduced
because favorable habitat for colonization of organisms is reduced. Water quality monitoring
programs must include evaluation of substrate to determine whether observed change in benthic
macroinvertebrate population were due to water pollutants or merely to change in stream substrate.
Evaluation of differences in substrate particle size among stations may reveal disruptions in the
watershed often evidenced by increased sand and sediment deposition
Immediately after the Surber sampler was seated and before substrate was disturbed, , the percent
area occupied by cobble, gravel, fine gravel, sand and silt was estimated (DeBrey and Lockwood,
1990; Platts et al., 1983). A piece of plexiglass was used to reduce surface glare to aid in
observation of substrate (Figure 6-27). The following particle size classification was based on
Plafkin et al. (1989) and Burton (1991). Particle size composition was evaluated for each of the
eight Surber sample quadrats.
Stream Substrate Particle Size Classification
Type Size
Boulder Greater than 10 inches
Cobble 2.5 inches to 10 inches
Coarse Gravel 1 inch to 2.5 inches
Fine Gravel .3 inch to 1 inch
Silt .3 inch and below (texture soft, fine)
Sand .3 inch and below (texture gritty, coarse)
Hard Pack Clay .3 inch and below (solid, slick)
When silt was greater than approximately 1/4 inch (about 6 millimeters) in depth, it was classified
as silt. When silt was less than approximately 1/4 inch, the substrate underneath the silt was
classified.
6.5.5.2 Embeddedness (silt cover)
Embeddedness is a measure of the degree to which cobble and gravel were covered or surrounded
by fine silt. Silt which settles on, or penetrates into the streambed is detrimental to fish and
benthic macroinvertebrate populations compared to silt entrained in the water column (Campbell
and Doeg, 1989). Silt deposited on substrate can result in lowered inter-gravel oxygen
concentration reducing survival of trout eggs and negatively affect stream productivity and density
of aquatic organisms which are the main food source of cold water stream fish (Hynes, 1970;
Hawkins et al., 1983; Waters, 1995). Low levels of silt generally reduces the density of
organisms while high levels of silt reduces both density and diversity of organisms (Chutter, 1969;

Sheridan County Conservation District
Tongue River Watershed Assessment 205j Final Report 1996-1999 79
Lenat et al., 1981). Heavy silt deposition combined with nutrient enrichment (from nitrate and
phosphorus) may produce drastic effects by reducing diversity through elimination of
macroinvertebrate species (Lemly, 1982).
Embeddedness was classified at the same time as substrate particle size classification for each of
the 8 Surber sample quadrate.
The following embeddedness rating system used was described by Platts et al. (1983).
Embeddedness Rating Classification
Rating Description
5 Less than 5 percent of surface covered by silt
4 Between 5 to 25 percent of surface covered by silt
3 Between 25 to 50 percent of surface covered by silt
2 Between 50 to 75 percent of surface covered by silt
1 Greater than 75 percent of surface covered by silt
Embeddedness data from each quadrate were combined into the Weighted Embeddedness Value
(WEV) that described the degree that cobble and gravel were covered or surrounded by silt.
Because each quadrate was randomly selected, the WEV provided an unbiased estimate of silt
coverage at the study riffle/run.
The WEV may range from 20 (complete silt cover) to 100 (no silt cover). Figure 6-28 illustrated
stream substrate with a WEV value of 99 and Figure 6-29 shows stream substrate with a WEV
value of 20.
6.5.5.3 Qualitative Habitat Assessment
The habitat assessment is a qualitative assessment comprised of thirteen (13) parameters.
Because of the subjective nature of the assessment, results must be interpreted with caution.
SCCD attempted to reduce uncertainty by estimating precision for assessments through intra-crew
assessments at ten percent of total stations assessed. The intra-crew assessment consisted of two
or more individuals each performing the assessment independent of one another without
communication. Despite uncertainty for accuracy for the subjective assessment, with proper
training, general instream and riparian habitat condition may be adequately described to identify
significant habitat deficiencies needing improvement.
The majority of habitat assessment parameters were “discharge dependent”. This means many
habitat parameters rated higher during periods of higher discharge and some rated lower during

Sheridan County Conservation District
Tongue River Watershed Assessment 205j Final Report 1996-1999 80
periods of low discharge. This was an important consideration because discharge at the
unregulated Tongue River Upper station may vary 8-fold between spring high flow and the fall and
winter low base flow (Figure 8-3). SCCD attempted to conduct habitat assessments within + two
weeks of the preceding annual date of assessment to reduce bias introduced by variable seasonal
stream discharge.
The qualitative habitat assessment method used by SCCD was described in King (1993) and was
based on compilation of methods presented in Plafkin et al. (1989), EPA (1991) and Hayslip
(1993). The length of stream reach assessed was determined by multiplying the bankfull width
times 20, or a minimum of 360 feet (Burton, 1991). SCCD determination of stream reach length
assessed was the same as that used by WDEQ.
Habitat parameters were weighted according to their influence on aquatic organisms. Primary
parameters received the greatest weight and described microhabitat characteristics which have a
direct influence on macroinvertebrates. Secondary parameters described macrohabitat
characteristics through stream channel morphology which indirectly influenced
macroinvertebrates and fish. Tertiary parameters were weighted less than primary and
secondary parameters. These parameters described surrounding land use characteristics which
affected streambank and riparian zone stability. The higher the individual or cumulative score,
the better the habitat. The maximum habitat assessment score was 200 points.
Primary Parameters (each 20-0 points)
1. Bottom substrate / Percent fines (silt, sand): estimated the percent of combined
sand and silt only within the riffle/run sampled. See Section 6.5.5.1 for Substrate
Composition methods.
2. In stream cover (for fish): estimated the amount of in stream features serving as
habitat and cover for fish for the entire reach.
3. Embeddedness (silt cover): estimated the degree to which cobble and gravel were
covered or surrounded by silt only within the riffle/run sampled. See Section
6.5.5.2 for embeddedness evaluation methods.
4. Velocity / Depth: estimated the relative contribution for four different velocity and
depth regimes within the entire reach.
a. Fast and deep
b. Slow and deep
c. Fast and shallow
d. Slow and shallow

Sheridan County Conservation District
Tongue River Watershed Assessment 205j Final Report 1996-1999 81
A stream reach with equal mixtures of each is desirable and would score high. A
stream reach dominated by one velocity/depth regime (which may naturally occur
in some stream types) would score low.
5. Channel Flow Status: estimated how much of the stream channel and in stream
structures were covered by water within the entire reach. Complete inundation of
the channel and in stream structures would rate highest.
Secondary Parameters (each 15-0 points)
6. Channel shape (at bankfull stage): evaluates the approximate shape of the stream
channel at the bankfull stage for the entire reach. Four shapes may be selected and
a stream channel may normally be comprised of an admixture of two shapes.
a. Trapezoidal (undercut banks) will rate highest.
b. Rectangular will rate high.
c. Triangular will rate lower.
d. Inverse trapezoidal (obvious deposition and bars in channel) will rate
lowest.
7. Channel alteration (channelization): the amount of man-caused channelization
(straightening) and channel disruption (dredging) was estimated for the entire
reach. The length of time in years since channelization was an important element
for assessing this parameter.
8. Pool / Riffle Ratio: the approximate ratio for the distance between pools and riffles
was estimated. A consistent pool and riffle sequence within the entire reach was
desired. A variety of pool and riffle habitat would rate high. Lack of a pool and
riffle sequence and dominance by all pool or all riffle would rate low.
9. Width to Depth Ratio: the approximate average “wetted” channel width divided
by average water depth within the entire reach provided an estimate for the amount
of channel that may support fish and aquatic life. A low width to depth ratio less
than 7 was optimal and a high width to depth ratio greater than 25 would rate low.
Tertiary Parameters (each 10-0 points)
10. Bank Vegetation Protection: estimated the amount of stream bank (at the bankfull
stage) within the entire reach that was covered by vegetation, large cobble, boulder
and larger woody debris serving to provide bank stability. The rating would
increase as bank area covered by protective bank features increased.

Sheridan County Conservation District
Tongue River Watershed Assessment 205j Final Report 1996-1999 82
11. Bank Stability: estimated the amount of bank erosion (at the bankfull stage) within
the entire reach evidenced by raw, sloughing or unstable banks. A low proportion
of unstable bank areas would rate high. A stream reach dominated by unstable
banks would rate low.
12. Disruptive Pressures: estimated the degree that vegetation was cropped or
removed from the streambank immediately adjacent to stream along the entire
reach. Presence of all vegetation expected for the ecoregion, stream channel type
and seasonal development would rate high. Significant removal of vegetation
would rate lower.
13. Zone of Influence: estimated the width of the riparian zone within the entire reach.
Consideration was given to the degree of human impact within the riparian zone.
A wide riparian zone with negligible human impact provides an adequate buffer
zone to filter water pollutants and would rate high. A narrow riparian zone
impacted by man related activity would rate low.
Stribling et al. (2000) reported that reference (least impaired) streams in the Middle Rockies
ecoregion and Northwestern Great Plains ecoregion of Wyoming would have total habitat
assessment scores greater than 100.
6.5.5.4 Photopoints
Photopoints were established at the base of the stream reach. Upstream, downstream and
panorama photographs were taken of the stream reach to aid in station relocation, provide a visual
record and assist in interpretation of habitat assessment data.

Sheridan County Conservation District
Tongue River Watershed Assessment 205j Final Report 1996-1999 83
TABLE 6-4. Minimum Standard Level of Identification used for Analysis of Benthic
Macroinvertebrate Samples Collected by Sheridan County Conservation District
and Wyoming Department of Environmental Quality during Tongue River 205j
Project, Sheridan County, Wyoming
Ephemeroptera (mayflies) Genus for:
Acanthametropodidae, Ameletidae, Ametropodidae, Callibaetis, Heptageniidae,
Isonychiidae, Pseudironidae, Polymitarcyidae, Baetiscidae, Caenidae, Tricorythidae,
Ephemeridae, Leptophlebiidae, Oligoneuriidae, Siphlonuridae, Metretopodidae,
Ephemerellidae (see below for genera Drunella and Timpanoga). Species for:
Mature nymphs of the Genus Baetis; immatures to genus
Mature nymphs of the genera Drunella and Timpanoga; immatures to genus
Plecoptera (stoneflies) Genus for:
Perlodidae, Pteronarcyidae, Peltoperlidae, Perlodidae, Nemouridae
Species or Species
Groups for:
Perlidae, mature specimens for the genera Zapada, Kathroperla, Sweltsa and Doddsia;
immatures to genus Family for:
early instar Capniidae, Leuctridae, Chloroperlidae, Taeniopterygidae
Trichoptera (caddisflies)
Genus for:
All genera except for genera in the Family Rhyacophilidae
Species or Species
Groups for:
Rhyacophilidae
Coleoptera (beetles)
Genus for:
Elmidae (combine larvae and adults into one taxon)
Genus or Family for:
All other families (combine larvae and adults into one taxon)
Chironomidae (midge flies)
Genus for:
All genera except certain Cricotopus, Orthocladius
Species or species
groups for:
Cricotopus nostococladius, C. trifascia, C. bicinctus, C. isocladius, C. festivellus, C.
tremulus; Orthocladius Complex NOTE!
Combine all pupae into one taxon identified as Chironomidae pupae
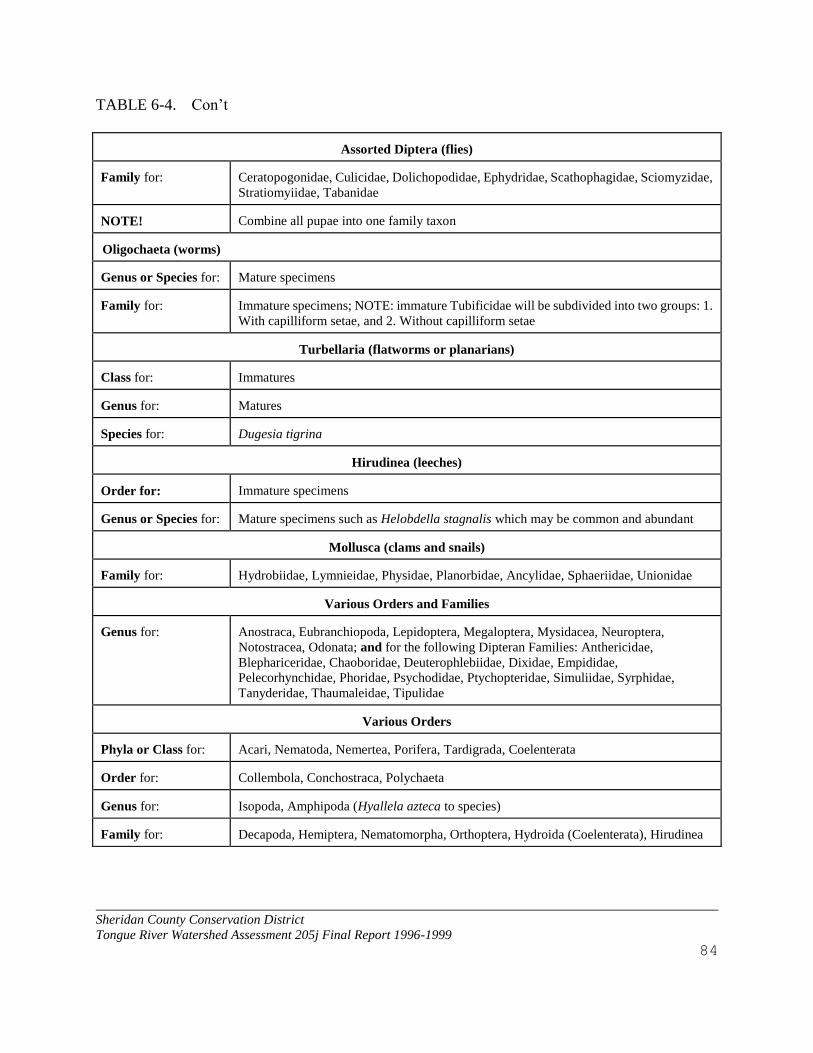
Sheridan County Conservation District
Tongue River Watershed Assessment 205j Final Report 1996-1999 84
TABLE 6-4. Con’t
Assorted Diptera (flies) Family for:
Ceratopogonidae, Culicidae, Dolichopodidae, Ephydridae, Scathophagidae, Sciomyzidae,
Stratiomyiidae, Tabanidae NOTE!
Combine all pupae into one family taxon
Oligochaeta (worms) Genus or Species for:
Mature specimens
Family for:
Immature specimens; NOTE: immature Tubificidae will be subdivided into two groups: 1.
With capilliform setae, and 2. Without capilliform setae
Turbellaria (flatworms or planarians) Class for:
Immatures
Genus for:
Matures
Species for:
Dugesia tigrina
Hirudinea (leeches)
Order for:
Immature specimens
Genus or Species for:
Mature specimens such as Helobdella stagnalis which may be common and abundant
Mollusca (clams and snails)
Family for:
Hydrobiidae, Lymnieidae, Physidae, Planorbidae, Ancylidae, Sphaeriidae, Unionidae
Various Orders and Families
Genus for:
Anostraca, Eubranchiopoda, Lepidoptera, Megaloptera, Mysidacea, Neuroptera,
Notostracea, Odonata; and for the following Dipteran Families: Anthericidae,
Blephariceridae, Chaoboridae, Deuterophlebiidae, Dixidae, Empididae,
Pelecorhynchidae, Phoridae, Psychodidae, Ptychopteridae, Simuliidae, Syrphidae,
Tanyderidae, Thaumaleidae, Tipulidae
Various Orders Phyla or Class for:
Acari, Nematoda, Nemertea, Porifera, Tardigrada, Coelenterata
Order for:
Collembola, Conchostraca, Polychaeta
Genus for:
Isopoda, Amphipoda (Hyallela azteca to species)
Family for:
Decapoda, Hemiptera, Nematomorpha, Orthoptera, Hydroida (Coelenterata), Hirudinea

Sheridan County Conservation District
Tongue River Watershed Assessment 205j Final Report 1996-1999 85
TABLE 6-5. Definition of Select Macroinvertebrate Metrics and Expected Response to
Perturbation Including Water Quality and Habitat Change (from King, 1993 and
Barbour et al., 1999)
METRIC
DEFINITION EXPECTED RESPONSE
Total Number Taxa
Measures the overall variety of the macroinvertebrate
assemblage
Decrease
Total Number EPT
Taxa
Number of taxa in the insect orders Ephemeroptera
(mayflies), Plecoptera (stoneflies, and Trichoptera
(caddisflies)
Decrease Total Number
Ephemeroptera Taxa
Total Number of mayfly taxa
Decrease
% Ephemeroptera
Percent of mayfly nymphs
Decrease
Total Number
Plecoptera Taxa
Total Number of stonefly taxa
Decrease
% Plecoptera
Percent of stonefly nymphs
Decrease
Total Number Insect
Taxa
Total Number taxa in the Class Insecta
Decrease
Total Number Non -
Insect Taxa
Total Number taxa not in the Class Insecta
Increase
% Non - Insects
Percent of Non - Insects
Increase
% Chironomidae
Percent of midge larvae
Increase
% Oligochaeta
Percent of worms
Increase
% 5 Dominant
Total Percent of the 5 most dominant taxa
Increase
% 10 Dominant
Total Percent of the 10 most dominant taxa
Increase
Number Predator
Taxa
Number of taxa that feed upon other organisms or
themselves in some instances
Variable, but appears to
decrease in most regions of
Wyoming Total Number
Scraper Taxa
Total Number of taxa that scrape periphyton for food
Decrease
% Scrapers
Percent organisms that scrape periphyton for food
Decrease
% Collector -
Filterers
Percent organisms that filter Fine Particulate Organic
Material from either the water column or sediment
Increase in most Wyoming
ecoregions

Sheridan County Conservation District
Tongue River Watershed Assessment 205j Final Report 1996-1999 86
TABLE 6-5. Con’t
% Collector -
Gatherers
Percent organisms that either collect or gather food
particles
Increase
Modified HBI
Uses tolerance values to weight abundance in an estimate
of overall pollution. Originally designed to evaluate
organic pollution.
Increase
BCI CTQa
Tolerance classification based on nonpoint source impact
of sedimentation and velocity alteration
Increase Shannon H (Log base
2)
Incorporates both richness and evenness in a measure of
general diversity and composition
Decrease
% Multivoltine
Percent of organisms having short (several per year) life
cycle
Increase
% Univoltine
Percent of organisms relatively long-lived (life cycles of 1
or more years)
Decrease

Sheridan County Conservation District
Tongue River Watershed Assessment 205j Final Report 1996-1999 87
TABLE 6-6. Wyoming Biological Condition Index (WBCI) scoring criteria for Tongue River
Watershed 205j Project benthic macroinvertebrate communities developed for
streams less than 6,500 feet elevation in the Middle Rockies Central ecoregion of
Wyoming (from Barbour et al., 1994)
Macroinvertebrate Metric
Scoring
5
3
1
EPT Taxa
>18
18 - 10
<9
% Ephemeroptera
>22
22 - 11
<11
% Plecoptera
>6
6 - 4
<4
% Chironomidae
<12
12 - 39
>39
Predator taxa
>7
7-4
<4
% Scrapers
>8
8 - 5
<5
HBI
<3.7
3.7 - 4.7
>4.7
BCI
>79
79 - 46
<46
% Collector filterers
<2.6
2.6 - 23.2
>23.2
TABLE 6-7. Assessment rating criteria for Tongue River Watershed 205j Project benthic
macroinvertebrate communities based on the Wyoming Stream Integrity Index
(WSII; from Stribling et al., 2000) and the Wyoming Biological Condition Index
(WBCI; from Barbour et al., 1994) for streams less than 6,500 feet elevation in the
Middle Rockies Central ecoregion of Wyoming
Rating of Biological
Condition (Aquatic Life
Use Support)
WSII (% of Reference)
WBCI (Total Score Middle
Rockies Streams)
Middle Rockies
Northwestern Great
Plains
Very Good (Full Support)
>85.1
>78.6
NA
Good (Full Support)
70.2 - 85.1
57.1 - 78.6
>35
Fair (Non - Support)
46.8 - 70.1
38.1 - 57.0
35 - 23
Poor (Non - Support)
23.4 - 46.7
19.0 - 38.0
21 - 9
Very Poor (Non - Support)
<23.4
<19.0
NA

Sheridan County Conservation District
Tongue River Watershed Assessment 205j Final Report 1996-1999 88
TABLE 6-8 . Wyoming Stream Integrity Index (WSII) biological condition scoring criteria for
Tongue River Watershed 205j Project benthic macroinvertebrate communities
developed for Middle Rockies and Northwestern Great Plains ecoregion streams
(from Stribling et al., 2000)
Macroinvertebrate Metric
Middle Rockies (5th
or 95th
%ile)
Northwestern Great Plains
(5th
or 95th
%ile) Total Taxa
NA
A
44
Ephemeroptera taxa
12
7
Plecoptera taxa
NA
3
Trichoptera taxa
NA
10
Insect taxa
45
NA
Non-insect taxa
1
NA
% Ephemeroptera
69.8
NA
% Plecoptera
NA
4.0
% non-insects
NA
0.10
% Oligochaeta
0.0
NA
% 5 dominant
49.8
NA
% 10 dominant
NA
74
HBI
1.40
NA
BCI CTQa
NA
73.8
Scraper taxa
NA
7
% scrapers
56.1
NA
% collector-gatherers
NA
13
NAA = Metric not applicable to ecoregional scoring criteria.

Sheridan County Conservation District
Tongue River Watershed Assessment 205j Final Report 1996-1999 89
Figures 6-1 and 6-2 on this page

Sheridan County Conservation District
Tongue River Watershed Assessment 205j Final Report 1996-1999 90
Figures 6-3 and 6-4 on this page

Sheridan County Conservation District
Tongue River Watershed Assessment 205j Final Report 1996-1999 91
Figures 6-5 and 6-6 on this page

Sheridan County Conservation District
Tongue River Watershed Assessment 205j Final Report 1996-1999 92
Figures 6-7 and 6-8 on this page

Sheridan County Conservation District
Tongue River Watershed Assessment 205j Final Report 1996-1999 93
Figures 6-9 and 6-10 on this page

Sheridan County Conservation District
Tongue River Watershed Assessment 205j Final Report 1996-1999 94
Figures 6-11 and 6-12 on this page

Sheridan County Conservation District
Tongue River Watershed Assessment 205j Final Report 1996-1999 95
Figures 6-13 and 6-14 on this page

Sheridan County Conservation District
Tongue River Watershed Assessment 205j Final Report 1996-1999 96
Figures 6-15 and 6-16 on this page

Sheridan County Conservation District
Tongue River Watershed Assessment 205j Final Report 1996-1999 97
Figures 6-17 and 6-18 on this page

Sheridan County Conservation District
Tongue River Watershed Assessment 205j Final Report 1996-1999 98
Figures 6-19 and 6-20 on this page

Sheridan County Conservation District
Tongue River Watershed Assessment 205j Final Report 1996-1999 99
Figures 6-21 and 22 on this page

Sheridan County Conservation District
Tongue River Watershed Assessment 205j Final Report 1996-1999 100
Figures 6-23 and 6-24 on this page

Sheridan County Conservation District
Tongue River Watershed Assessment 205j Final Report 1996-1999 101
Figures 6-25 and 6-26 on this page

Sheridan County Conservation District
Tongue River Watershed Assessment 205j Final Report 1996-1999 102
Figures 6-27 and 6-28 on this page

Sheridan County Conservation District
Tongue River Watershed Assessment 205j Final Report 1996-1999 103
Figure 6-29

Sheridan County Conservation District
Tongue River Watershed Assessment 205j Final Report 1996-1999 104
QUALITY ASSURANCE AND QUALITY
CONTROL
7
7.1 FUNCTION OF QUALITY ASSURANCE AND QUALITY CONTROL
Quality Assurance (QA) may be defined as an integrated system of management procedures
designed to evaluate the quality of data and to verify that the quality control system is operating
within acceptable limits (Friedman and Erdmann, 1982; USEPA, 1995). Quality control (QC)
may be defined as the system of technical procedures designed to ensure the integrity of data by
adhering to proper field sample collection methods, operation and maintenance of equipment and
instruments. Together, QAQC functions to ensure that all data generated is consistent, valid and
of known quality (USEPA 1980; 1993). QAQC should not be viewed as an obscure notion to be
tolerated by monitoring and assessment personnel, but as a critical, deeply ingrained concept
followed through each step of the monitoring process. Data quality must be assured before the
results can be accepted with any scientific study.
Project QAQC is described in a document called a Quality Assurance Project Plan (QAPP). A
draft QAPP was prepared for the Tongue River 205j watershed Project, but it was not reviewed nor
approved by WDEQ or EPA. Major elements of the draft QAPP were embedded throughout this
Final Report in Sections 1 through 7 to describe specific QAQC components for this Project.
This QAQC guidance provided a framework for groups interested in future Tongue River
watershed water quality monitoring or investigators using the Project data base. The following
specific QAQC components provide a synopsis of the Tongue River Project QAQC process.
7.2 TRAINING
Personnel involved in collection and analysis of samples should receive adequate training for
proper implementation of Project field and laboratory methods. SCCD personnel received
training from Mr. Kurt King with the WDEQ Sheridan Field Office. Mr. King was the WDEQ
QA Officer, authored WDEQ stream biomonitoring methods (King, 1993), initiated the statewide
Reference Stream Project and had over 18 years experience as aquatic biologist and water quality
specialist. Personnel received annual refresher training in addition to a water quality monitoring
course conducted by the Wyoming Association of Conservation Districts in 1998 and 1999. Mr.
King accompanied SCCD field personnel on the majority of macroinvertebrate and habitat
assessment sample events. Mr. Harold Herman, Director of RPWD, provided training to SCCD
personnel for operation of the Hach 2100A turbidimeter.

Sheridan County Conservation District
Tongue River Watershed Assessment 205j Final Report 1996-1999 105
7.3 COLLECTION, PRESERVATION, ANALYSIS AND CUSTODY OF SAMPLES
FOLLOWING APPROVED METHODS
7.3.1 Collection, Preservation and Analysis
Accepted referenced methods for collection, preservation, and analysis of samples were described
in Section 6.0 and listed in Table 6-1 in this Final report.
7.3.2 Sample Custody
Sample custody described the sampling and analysis record starting with sample collection and
ending with laboratory analysis and sample disposition. The purpose of sample custody was to
ensure that samples were not tampered with by outside entities and the integrity of samples was
maintained.
Project field measurements were recorded on field data sheets. Water samples requiring
laboratory analysis were immediately placed on ice, preserved (if required) and hand delivered to
the analytical laboratory (IML). The IML Chain of Custody (COC) form was prepared and
signed by the sampler before samples entered laboratory custody. After samples changed
custody, IML internal COC procedures were implemented.
Benthic macroinvertebrate samples were preserved in the field (Section 6.5.4), placed in a cooler
and transported to the NRCS/SCCD office in Sheridan. A Project specific macroinvertebrate
COC form was completed. After all macroinvertebrate samples were collected, samples and
COC forms were sealed inside a cooler and shipped by United Parcel Service to the contract
analytical laboratory. The analytical laboratory opened the cooler, performed a visual check for
the number and general condition of samples, then signed the COC form. The completed original
COC form was returned to SCCD by the analytical laboratory after completion of analyses.
7.4 CALIBRATION AND PROPER OPERATION OF FIELD AND LABORATORY
EQUIPMENT ACCORDING TO MANUFACTURER’S INSTRUCTIONS Frequency and calibration of field equipment were described in Section 6.0. Macroinvertebrate
sample collection and habitat assessments required no calibration of equipment. The QA Plan for
the contract water quality laboratory (IML) and the contract macroinvertebrate sample analysis
laboratory (Aquatic Biology Associates, Inc.) were available upon request.
7.5 COLLECTION OF REPRESENTATIVE SAMPLES
Collection of representative samples was ensured by sampling at well-mixed riffles during random
sampling dates. Of concern was the siting of some sampling locations downstream of road
crossings due to lack of access and landowner consent. Placement of sampling sites downstream

Sheridan County Conservation District
Tongue River Watershed Assessment 205j Final Report 1996-1999 106
of road crossings normally does not affect collection of representative water quality samples.
However, macroinvertebrate populations may be affected by the scouring action often observed
downstream of bridges. Habitat assessment may be affected due to channelization often observed
downstream of bridges and road crossings.
7.6 DETERMINATION OF DATA QUALITY OBJECTIVES, PRECISION,
ACCURACY, COMPLETENESS, AND COMPARABILITY
7.6.1 Data Quality Objectives
Data Quality Objectives (DQO’s) are qualitative and quantitative specifications used for water
quality monitoring programs. DQO’s function to limit data uncertainty to an acceptable level.
DQO’s were established for each monitoring parameter for precision, accuracy and completeness
at levels sufficient to allow SCCD to realize Project goals and objectives. Table 7-1 lists DQO’s
for this Project.
7.6.2 Precision
Precision was defined as the degree of agreement of a measured value as the result of repeated
application under the same condition. Because the determination of precision was affected by
changes in relative concentration for certain chemical parameters, the Relative Percent Difference
(RPD) statistic was used. RPD is defined as:
RPD = [(A - B)/(A + B)] X 200
For example, the field measurement for conductivity Duplicate 1 was 855 umhos/cm and the
conductivity Duplicate 2 measurement was 875 umhos/cm. The RPD = [(855 - 875)/(855 +
875)] X 200 = 2.3%. The DQO for precision for conductivity was 10% (Table 7-1) thus, the
agreement between duplicate measurements was within the precision DQO established for
conductivity.
Precision was determined for chemical, physical (excluding discharge), biological and habitat
measurements by conducting duplicate samples at 10 percent of sampling sites. Duplicate
intra-crew habitat assessments were conducted by each observer conducting the assessment at the
same time as one another without communication.
7.6.3 Accuracy
Accuracy was defined as the degree of agreement of a measured value with the true or actual value.
Accuracy for water quality parameters measured in the field was assured by calibration of
equipment to known standards. Accuracy for water quality parameters measured by the contract

Sheridan County Conservation District
Tongue River Watershed Assessment 205j Final Report 1996-1999 107
laboratory was determined by % Recovery. Accuracy for water samples requiring laboratory
analysis was determined by the contract analytical laboratory (Intermountain Laboratories (IML)).
No QA findings were reported by IML concerning accuracy or for other QA/QC components
during this Project.
Accuracy for macroinvertebrate sampling and habitat assessment could not be determined since
the true or actual value for macroinvertebrate populations or habitat parameters were unknown.
In this instance, precision served as the primary QA check for benthic macroinvertebrate sampling
and habitat assessment.
7.6.4 Completeness
Completeness refers to the percentage of measurements that are determined to be valid and
acceptable compared to the number of samples scheduled for collection. This DQO was achieved
by avoiding loss of samples due to accidents, inadequate preservation, holding time exceedences,
and proper access to sample sites for collection of samples as scheduled. Completeness was
calculated by the following formula:
Completeness = Amount of Valid Data Reported / Amount of Data Expected X 100
For example, 595 valid turbidity measurements were reported during a hypothetical water quality
monitoring project out of a total of 605 turbidity samples scheduled for collection. Completeness
was determined by the following calculation: 595/605 = .983 X 100 = 98.3%. Because the
Project DQO for completeness for turbidity was 95%, the DQO was met for completeness.
7.6.5 Comparability
Comparability refers to the degree that data collected during this Project was comparable to data
collected during other past or present studies. This was an important factor because future water
quality monitoring will occur in the Tongue River 205j Project area and current Project data must
be comparable to future data in order to detect water quality change with confidence. Several
steps were taken to assure data comparability including:
Collection of samples at the same monitoring stations;
Collection of samples during the same time of year;
Collection of samples using the same field sampling methods and sampling gear;
Analysis of samples using the same laboratory analytical methods and equipment;
Use of the same reporting units and significant figures
Use of the same data handling and reduction methods (i.e. data rounding and
censoring); and
Use of similar QAQC processes

Sheridan County Conservation District
Tongue River Watershed Assessment 205j Final Report 1996-1999 108
Frequent causes for lack of comparability among data sets is due to lack of documentation for
historic data sets, change in sensitivity of laboratory analytical equipment and differing monitoring
goals and objectives among sampling groups.
Chemical, physical, biological and habitat data collected by SCCD and WDEQ during this Project,
with the exception of total phosphorus data, were highly comparable because of close coordination
prior to initiation of sampling. Each step identified above was implemented to assure
comparability.
Total phosphorus data was not highly comparable because SCCD used an analytical method that
was more sensitive (lower Minimum Detection Limit (MDL)) than the analytical method used by
WDEQ. This prevented direct comparison of data when phosphorus was present in
concentrations between the detection limits provided by each analytical method. However, when
this situation occurred, data was compared after “censoring”. Censoring is a common statistical
treatment employed when numerous data points are reported as less than (<) or greater than (>) the
MDL or the maximum detection limit (Gilbert, 1987). Section 7.9.1 described censoring rules
employed during this Project.
7.7 DATA VALIDATION
Data generated by SCCD contract laboratories was subject to the internal contract laboratory
QAQC process before it was released. Data was assumed valid because the laboratory adhered to
it’s internal QAQC plan. Field data generated by SCCD was considered valid and usable only
after defined QAQC procedure and process were applied, evaluated and determined acceptable.
Data determined to be invalid was rejected and not used in preparation of this Final Report. A
discussion of the type and quantity of rejected data was presented in Section 8.1.1.
7.8 DOCUMENTATION AND RECORDS
Field data and other information were recorded on separate field data sheets prepared for each
monitoring station. Photographs and negatives were placed in station files. Results of water
sample results were received hard copy. Macroinvertebrate sample results were received hard
copy and electronically. All analytical results were placed in station files.
7.9 DATA BASE AND DATA REDUCTION
7.9.1 Data Base Construction
The Project data base consisted of a series of electronic computer files. Hard copy files were
prepared and maintained for each electronic file. Each data base file was constructed with

Sheridan County Conservation District
Tongue River Watershed Assessment 205j Final Report 1996-1999 109
reportable data (accepted after QC checks) by entering into Excel 7.0 spread sheets. Electronic
files for water quality, macroinvertebrate, and habitat data were prepared. A second individual
checked all computer data entries for mistakes. If a mistake was suspected, the original field or
laboratory data sheet was re-examined and data entry corrected. Suspect data not resolved were
either not entered into the data base or were deleted from the data base once detected.
Two (2) master data bases were prepared to house all historical and current water quality data:
1. Reportable data (not censored) data base and
2. Censored data base
The uncensored data base contained data reported from field measurements and data reported by
the analytical laboratory including all values less than MDL’s. All data presented in Appendices
in this Final Report represent uncensored data.
The censored data base contained data that was censored to allow various statistical procedures to
be performed. Values for the major sampling parameters (e.g. fecal coliform, total phosphorus,
total nitrate) reported as less than the MDL, were “censored to the left” following guidance found
in Gilbert (1987).
When a relatively small number of data were censored, the rule was to replace the less than (<)
value with a value one half the MDL. For example, the censored value for a fecal coliform
reportable value of <20 colonies per 100ml would be 20 divided in half or 10 colonies per 100ml.
When more than approximately 20 percent of reportable values for a parameter (such as for total
phosphorus and total nitrate samples) were less than (<) values, random numbers generated by
computer assisted in the assignment of censored values. For example, 24 total phosphorus values
out of a total of 50 reportable values were < the MDL of 0.1 mg/l. A random number ranging
from 0.01 mg/l to 0.09 mg/l was selected by computer for each of the 24 total phosphorus samples.
The random number value replaced the original reported value in the censored data base.
7.9.2 Data Reduction
After data validation and data base construction, data were imported to a statistics software
program, Statgraphics Plus®, for statistical analyses. Summary statistics, interpretive statistics
and graphs used were documented in the software manufacturer’s instruction manual. Statistics
calculated included:
Average
Geometric mean
Median
Maximum
Sheridan County Conservation District
Tongue River Watershed Assessment 205j Final Report 1996-1999 110
Minimum
Range
Transformation (for non-normal distributions)
Linear regression
Multiple regression
Time series trend analysis
The average and geometric mean were the primary statistics used to determine water quality
change between Upper and Lower stations. The use of the annual average or Project average
from multiple water quality measurements avoided concerns for potential pseudoreplication
should each data point have been treated as an independent observation (Hurlbert, 1994).
Graphics presented in this Final Report were generated in Excel 7.0 using censored data when
required.
7.10 DATA REPORTING
Data collected by SCCD were presented in tabular and graphic form in this Final Report. The
Final Report will be distributed to WDEQ, EPA and interested parties. Data collected by other
monitoring groups concurrent with this Project and historic data accumulated by SCCD have been
placed either in the main body of this report or in Appendices. Interested parties may contact
SCCD at the address listed on the Title Page of this Final Report to obtain an electronic copy of
data at a minimal fee to cover duplication time, compact disc cost and shipping cost. Smaller
electronic files may be transferred through Electronic Mail.
7.11 DATA RECONCILIATION
Data collected by SCCD were subjected to two levels of evaluation before accepted and entered
into the data base. Obvious outliers were flagged after consideration of “expected” values based
on evaluation of historical and current data. Field data sheets were re-checked and if no
calibration or field note anomalies or excursions were identified, data was accepted as presented.
Otherwise, data were rejected and not included in the data base.
An exception was presented by data collected by WDEQ during 1998 and 1999. This data set had
not undergone WDEQ internal QA/QC evaluation and should not be considered as approved.
Data was thus presented as PROVISIONAL. Provisional data is subject to change,
modification or rejection dependant upon the WDEQ QA/QC evaluation. The WDEQ 1996
and 1997 data set was previously approved and released to the public.
USGS data presented in this Final Report with the exception of the benthic macroinvertebrate data,
had undergone agency QA/QC evaluation and was released for public consumption. USGS

Sheridan County Conservation District
Tongue River Watershed Assessment 205j Final Report 1996-1999 111
benthic macroinvertebrate data was presented as PROVISIONAL and may be subject to
change, modification or rejection dependant upon the USGS QA/QC evaluation. RPWD, WGFD
and NRCS data received internal review before release to SCCD.

Sheridan County Conservation District
Tongue River Watershed Assessment 205j Final Report 1996-1999 112
TABLE 7-1. Data Quality Objectives for Chemical, Physical, Biological and Habitat Sampling
Conducted by Sheridan County Conservation District and Wyoming Department of
Environmental Quality at Tongue River 205j Project Stations, Sheridan County,
Wyoming
Parameter
Precision (%)
Accuracy (%)
Completeness (%)
Temperature
10
10
95
pH
5
5
95
Conductivity
10
10
95
Dissolved Oxygen
20
20
95
Turbidity
10
10
95
T. Suspended Solids
10
10
95
Alkalinity
10
10
95
Total Sulfate
20
20
95
Total Chloride
10
10
95
Total Nitrate
20
20
95
Total Phosphorus
20
20
95
Total Ammonia
20
20
95
Total Hardness
10
10
95
Fecal Coliform
10
10
95
BOD
20
20
95
Macroinvertebrates
Total Abundance
Total Taxa
NA
NA
95
50
NA
95
15
NA
95
Habitat Assessment
Intra-Crew
NA
NA
95
15
NA
10
Periphyton
NA
NA
95
Discharge
NA
NA
95

Sheridan County Conservation District
Tongue River Watershed Assessment 205j Final Report 1996-1999 113
RESULTS AND DISCUSSION
8
8.1 QUALITY ASSURANCE AND QUALITY CONTROL
The Quality Assurance and Quality Control (QAQC) summary was presented first in the Results
and Discussion Section because data must first be accepted as valid and of known quality before it
is evaluated and final conclusions and recommendations made.
8.1.1 Summary of QA/QC Evaluation
QA/QC evaluation of data collected during the four year Project indicated adequate data quality
was provided to meet Project goals and objectives. Although WDEQ data was PROVISIONAL
at the time of this report, SCCD conducted a QA/QC evaluation on the data set because both used
the same sample collection and analysis methods and implemented similar QA/QC procedures.
The following discussion combined SCCD and WDEQ sampling results since data collected by
each was included in this Final Report. In addition, the discussion follows the assumption that all
WDEQ data determined valid by SCCD QA/QC evaluation will be determined valid by WDEQ.
The SCCD QA/QC evaluation of WDEQ data found the data to be complete and approvable.
However, the data must be considered PROVISIONAL until final approval by WDEQ.
Recommendations were made when QA findings were identified. The recommendations were
compiled in Section 10 of this Final Report. Each water quality monitoring project reveals
numerous unanswered questions and identifies ways to improve the design and implementation of
the sampling program. This Project was no exception. The recommendations found in Section
10 are provided to improve future water quality monitoring and assessment within the Tongue
River Project area. Moreover, some recommendations, especially for water temperature and fecal
coliform monitoring, have implications to statewide water quality monitoring by Conservation
Districts, WDEQ and other groups.
The following is a QA/QC summary for the Tongue River watershed assessment.
1. Completeness for total number of samples measured was 101 percent (Appendix
Table B-28) which was greater than the DQO of 95 percent. There were a
combined total of over 3,200 individual water quality measurements made by
SCCD and WDEQ during the Project out of a scheduled 3,170 measurements.
Completeness for combined SCCD and WDEQ benthic macroinvertebrate sample
collection and habitat assessments was 100 percent which exceeded the DQO of 95
percent.

Sheridan County Conservation District
Tongue River Watershed Assessment 205j Final Report 1996-1999 114
2. Completeness DQO’s for individual water quality parameters was met except for
dissolved oxygen (DO) and pesticide and herbicide sampling. Only 65 percent
of DO sample data were accepted which was below the DQO of 95 percent
(Appendix Table B-28). A large number of DO measurements were rejected due
to apparent improper calibration of the YSI multi-probe purchased for use in 1999.
It should be noted that DO was not a scheduled monitoring parameter until 1999
because SCCD did not have a DO meter prior to that time. Once the DO meter
was purchased, DO measurements were integrated into the monitoring program.
Recommendation: All new equipment should be calibrated and maintained
according to manufacturer instructions. New equipment should undergo adequate
field testing and adequate training by SCCD before use.
The total number of pesticide and herbicide samples were not collected
according to schedule because sampling in 1996 included more costly analyses
for individual parameters instead of a basic screening to determine presence or
absence of parameters. The single sampling event exhausted the entire Project
budget for herbicide and pesticide monitoring precluding further sampling. The
initial sampling at five stations detected no pesticide and herbicides. This
observation, combined with knowledge that USGS NAWQA would conduct
herbicide and pesticide sampling in 1998 or 1999 did not jeopardize the overall
sampling objective.
Recommendation: The Pre-project planning phase should include better
communication with the contract analytical laboratory for specific analytical
method used and costs for sample analyses.
3. Four years of complete data were not collected as intended. Sampling was
scheduled to begin in April 1996, but was not initiated until August 1996. The
delay was due to the late purchase of equipment, training delays and other logistical
monitoring facets. This resulted in collection of water quality and discharge data
during two (2) months instead of six (6) months in 1996 and missing the spring
runoff period. This also prevented complete comparison of 1996 data to data
collected in 1997, 1998 and 1999.
Recommendation: The Tongue River 205j Project was the first major water
quality monitoring effort conducted by SCCD. Project personnel apparently
underestimated the amount of time required for planning a project of this scale.
Future monitoring efforts by SCCD should allow for adequate time (a minimum of
six (6) months) to conduct planning prior to collection of the first sample. This
will allow future Projects to begin on schedule.

Sheridan County Conservation District
Tongue River Watershed Assessment 205j Final Report 1996-1999 115
4. Same day sampling did not occur at each sampling station as planned. This did
not affect the integrity of data, but prevented complete utilization of the data set to
make comparisons between Upper and Lower stations as well as comparisons
between the Tongue River stations and tributary stations. Because Upper tributary
stations were not sampled at the same frequency as Lower tributary stations, this
further added to the reduction in same day comparable data. Failure to collect
same day samples appeared to be due primarily to lack of an adequate number of
sampling personnel and “runners” needed to deliver fecal coliform samples to the
laboratory within the 6 hour holding time. The Project relied heavily on volunteer
assistance for sampling and adequate personnel were lacking on several sampling
events.
Recommendations: For future sampling, an adequate number of full-time
sampling technicians should be employed and firm commitments from volunteers
for monitoring should be secured at least two weeks in advance of scheduled
sampling. Field logistics should be improved to account for the short holding time
for fecal coliform samples by increasing the number of vehicles for use to deliver
samples to the analytical laboratory.
5. The DQO for total number of duplicate water quality and macroinvertebrate
samples was not met. The total number of duplicate intra-crew habitat
assessments (N = 10) representing about twenty-one (21) percent of total
assessments was within DQO’s (Appendix Table I-6). Of 389 total SCCD water
quality sampling events, only six (6) duplicate samples were collected (Appendix
Table B-27). This represented only 1.5 percent of total water samples collected in
duplicate which was less than the DQO required 10 percent. WDEQ collected
duplicate water samples at 6.2 percent of total sites sampled within the Project area.
WDEQ Sheridan field office sampling conducted within the Project area was only
part of their total water sampling commitment in Northeast Wyoming. During
1996, 1997 and 1998 WDEQ met DQO’s for total number and percent of duplicate
water sampling, benthic macroinvertebrate sampling and intra-crew habitat
assessment. It was unknown whether WDEQ met DQO’s for sampling in 1999
because the internal QA/QC evaluation for Northeast District sampling was not
available at the time of this Final Report.
Lack of an adequate number of duplicate water and benthic macroinvertebrate
samples placed a degree of uncertainty for sampling precision for certain
parameters with normally high variability for precision (i.e. fecal coliform bacteria,
turbidity and TSS). Mean Relative Percent Difference (RPD) values (the
measure of precision based on comparison of duplicate samples) were within

Sheridan County Conservation District
Tongue River Watershed Assessment 205j Final Report 1996-1999 116
DQO’s for all sampling parameters except fecal coliform and TSS (Appendix
Table B-26). The Mean RPD for fecal coliform was 22.3 percent. The higher
RPD was due to high variability during 2 of the 6 duplicate sampling events. The
high variability occurred when fecal coliform bacteria numbers were highest
indicating the need to collect duplicate samples when bacteria numbers were
expected to be the highest normally during periods of high turbidity. Increased
frequency of duplicate samples would provide a more reliable estimate for fecal
coliform levels which was important when concentrations may approach the
Wyoming water quality standard for fecal coliform bacteria.
SCCD did not sample TSS during this Project. However, the high mean RPD for
TSS was important to note should SCCD sample this parameter during future
Tongue River watershed monitoring. An increased number of duplicate samples
will provide a better estimate for precision.
The low number of duplicate samples appeared to be due to several factors:
a. Employee turnover during the Project. There were three different Project
supervisors during the four year Project due to employee turnover.
Employee turnover can lead to QA/QC inconsistency and problems with
continuity. Training becomes a critical element because new employees
not previously experienced in the Project water quality monitoring program
require considerable up front training.
Recommendation: Adequate salaries, benefits, flexibility and support
should be provided to personnel involved in monitoring activities to reduce
employee turnover and ensure monitoring consistency.
b. Budget fears. Personnel may have tried to “pinch pennies” and reduce
monitoring and analytical costs by not collecting duplicates at the proper
frequency at the expense of QA. The major over run in analytical costs for
pesticide and herbicide sampling in 1996 may have been a significant factor
adding to cost concerns.
Recommendation: Ensure that duplicate samples are included in budget
planning at the start. Provide field samplers with a “tracking sheet” to
record the number of duplicate samples required and the total number of
duplicate samples collected. Training should stress the importance of
duplicate samples in the QA process.
6. With the exception of dissolved oxygen data collected in 1999 and lack of

Sheridan County Conservation District
Tongue River Watershed Assessment 205j Final Report 1996-1999 117
duplicate samples, there were no problems requiring data reconciliation for
collection, preservation, analysis and custody of samples during this Project.
7. With the exception of dissolved oxygen data collected in 1999, there were no
problems noted for calibration and proper operation of field and laboratory
equipment according to manufacturer’s instructions. Operation and calibration of
field equipment were described in Section 6 of this report. Further, SCCD
received no notification of QA problems for calibration and operation of equipment
used by contract laboratories for the analysis of water samples and
macroinvertebrate samples. It should be noted that benthic macroinvertebrate
sample collection and habitat assessments required no calibration of equipment.
8. Water sampling was determined to be unbiased and representative because
samples were collected at well-mixed riffles during random sampling dates.
Concern for placement of some sampling sites downstream of road crossings may
have had an unknown effect upon some benthic macroinvertebrate samples as well
as habitat assessments.
Recommendation: Establish all monitoring stations upstream of road crossings.
Better land owner familiarity and involvement with future monitoring projects may
enhance the ability to gain broader access for sampling.
9. Unequal sampling between upstream stations and downstream stations on the same
water body was planned due to budget constraints. However, this prevented the
maximum amount of information gained from water sampling by reducing
comparability of samples between stations as well as reducing the ability to detect
change in water quality along the longitudinal gradient of the stream. Unequal
sampling among stations was compensated for by using the average annual and
average Project values.
Recommendation: Ensure that enough funds are available for identical sampling
frequency between all monitoring stations on a water body if required.
10. With the exception of dissolved oxygen samples collected in 1999, accuracy for
water quality parameters measured in the field was determined to be adequate to
meet Project goals and objectives. The contract water quality laboratory reported
no problems for internal accuracy checks determined by Percent Recovery. In
addition, no QA findings were reported by the contract water quality laboratory
concerning accuracy or other QA/QC components during this Project. SCCD was
not aware of any written documentation provided by the WDEQ Water Quality
Laboratory for accuracy for analyses of WDEQ water samples.

Sheridan County Conservation District
Tongue River Watershed Assessment 205j Final Report 1996-1999 118
Accuracy for macroinvertebrate sampling or habitat assessment could not be
determined since the true or actual value of macroinvertebrate populations and
habitat parameters were unknown. In this instance, precision served as the
primary DQO to evaluate benthic macroinvertebrate sampling and habitat
assessment.
11. Chemical, physical, biological and habitat data collected by SCCD and
WDEQ during this Project, with the exception of total phosphorus data, were
highly comparable because of coordination prior to initiation of sampling.
Other than for total phosphorus, all water quality, benthic macroinvertebrate and
habitat assessment methods were the same between SCCD and WDEQ.
Comparability between RPWD, USGS, SCCD and WDEQ water sampling data
appeared to be good. Comparability between USGS PROVISIONAL benthic
macroinvertebrate data collected at the Tongue River 06298000 station and SCCD
and WDEQ benthic macroinvertebrate data appeared good (see Section 8.5.19).
Biological condition was rated the same by both groups despite the fact that USGS
did not sample macroinvertebrates at the same time (about 1 month earlier) nor at
the same station (USGS station was about one mile downstream of the SCCD and
WDEQ macroinvertebrate station).
Total phosphorus data was not highly comparable because SCCD used an
analytical method that was more sensitive (lower Minimum Detection Limit
(MDL)) than the analytical method used by WDEQ. This prevented direct
comparison of data when phosphorus was present in concentrations between the
MDL’s provided by each analytical method. However, when this situation
occurred, data was comparable after “censoring” to adjust all values to the same
scale. Censoring was a common statistical treatment employed when numerous
data points were reported as less than (<) the MDL (Gilbert, 1987).
12. There were no problems encountered for:
Data Base Construction
Data Reduction
Data Reporting
8.2 NRCS Precipitation and Air Temperature at Station WY07E33S
8.2.1 Precipitation
Precipitation was measured daily at the Burgess Junction Meteorological Station Number
WY07E33S. The meteorological station was located in the upper Tongue River watershed in the
Bighorn National Forest several miles from the Project area. However it provided daily

Sheridan County Conservation District
Tongue River Watershed Assessment 205j Final Report 1996-1999 119
precipitation and temperature data that could be used to evaluate general trends affecting the
watershed within the Project area.
Mean monthly cumulative precipitation values compiled since 1982 are presented in Appendix
Table J-1. Figure 8-1 illustrates cumulative monthly precipitation during the Project in
comparison to the mean annual precipitation from 1982 through 1999.
Precipitation was significantly higher than normal during 1997, near normal during 1999 and
below normal during 1996 and 1998. Total precipitation during the Project varied from a high of
29.6 inches in 1997 to a low of 23.6 inches in 1998. Precipitation in 1996 (24.1 total inches) was
4.4 percent lower than the mean annual precipitation from 1982 through 1999 (25.2 inches).
Years 1998 and 1999 were 6.3 percent and 4.0 percent lower, respectively while 1997 was 17.5
percent higher than the average annual precipitation recorded since 1982.
Precipitation records during the sampling period (from April through September) showed 1996
was 14.4 percent lower, 1998 was 8.9 percent lower and 1999 was 1.4 percent lower than the
average precipitation during this period since 1982. Year 1997 was 20.5 percent higher than the
seasonal mean when compared to mean precipitation from April through September.
8.2.2 Air Temperature
Air temperature was measured daily at the Burgess Junction Meteorological Station Number
WY07E33S. Mean monthly temperature values compiled since 1990 were presented in
Appendix Table J-2. Figure 8-2 illustrates mean monthly air temperature during the Project in
comparison to the mean monthly air temperature from 1990 through 1999.
Temperature in 1996 during the Project sampling period (from April through September) was
slightly cooler (about 1 degree centigrade (C)) during May and September and slightly warmer
(about 1 degree centigrade) from June through August. April, 1996 was equal to the April
10-year average temperature. Air temperature in 1997 during the sampling period, with the
exception of April, was near normal. April, 1996 was about 3 degrees C cooler when compared to
mean temperatures measured since 1990.
Air temperature in 1998 deviated from the 10-year norm more than the other sampling years.
April and June were 1 degree C and 3 degrees C cooler while May and July through September
were 1 degree C to 3 degrees C warmer than normal. Air temperature in 1999 was normal except
for July and August (2 degrees C warmer) and September (2 degrees C cooler).
8.3 USGS Discharge at Tongue River Station 06298000
Daily discharge was recorded at USGS station No. 06298000. SCCD monitoring station Tongue

Sheridan County Conservation District
Tongue River Watershed Assessment 205j Final Report 1996-1999 120
River Upper was sited at the USGS station. Mean monthly discharge values compiled since 1982
reported in cubic feet per second (cfs) are presented in Appendix Table K-1. Figure 8-3 illustrates
mean monthly discharge during each year of the Project in comparison to the average monthly
discharge data from 1982 through 1999.
Mean annual discharge was highest during 1999 (as measured from October, 1998 through
September, 1999) followed by 1997, 1996 and 1998. Discharge during the SCCD sampling
period (from April through September) was highest during 1997 followed in decreasing order by
1999, 1996 and 1998.
Discharge during the sampling period (April through September) in 1997 was 7.1 percent greater
than the average discharge since 1982 during the same sampling period. Year 1999 discharge
was 3.4 percent higher than the mean discharge since 1982 while year 1996 and year 1998
discharge were 4.7 percent and 22.5 percent less, respectively.
Discharge increased from April to May followed by peak discharge in June (Figure 8-3).
Discharge decreased significantly into July followed by steady decreases in August and
September. Lowest base flows generally occurred from December through March. The general
seasonal hydrologic pattern for annual discharge exhibited during this Project was similar to the
mean seasonal pattern for discharge observed since 1982.
Highest mean monthly discharge for each sampling year occurred in June. Mean June discharge
in 1996, 1997, 1998 and 1999 were 759 cfs, 858 cfs, 441 cfs and 775 cfs, respectively. The mean
monthly discharge from 1982 through 1999 for June was 621 cfs.
Discharge in the Tongue River was closely associated with total precipitation measured by NRCS
at the Burgess Junction meteorological station. Although statistical modeling to further examine
the association between discharge and precipitation was beyond the scope of this Project, general
relationships between total annual precipitation, precipitation occurring during the Project
sampling period (April through September) and discharge could be accurately described. For
example, total precipitation and discharge were greatest in 1997. Conversely, total precipitation
and discharge were lowest in 1998.
Of all parameters monitored during this Project, discharge in the Tongue River appeared to be the
most important factor affecting chemical, physical, biological and habitat components at Tongue
River Upper, Middle and Lower stations. Diversion of water from the Tongue River primarily for
agricultural use affected stations especially during the warmer summer months of July and August
when water demand was greatest. The general and statistical relationships between discharge in
the Tongue River and monitoring parameters are discussed later in Section 8 and Section 9.

Sheridan County Conservation District
Tongue River Watershed Assessment 205j Final Report 1996-1999 121
8.4 USGS Discharge at Wolf Creek Station 06299500
Daily discharge was measured by the Wyoming State Board of Control from April through
September at Wolf Creek USGS station 06299500, also known as SCCD monitoring station Wolf
Creek Upper. Period of station operation was the same as the SCCD sampling period.
Discharge measurements were limited to these months to monitor available water supply for
agricultural use.
Mean monthly discharge values reported in cubic feet per second (cfs) compiled since 1982 are
presented in Appendix Table K-2. Figure 8-4 illustrates mean monthly discharge during the
Project in comparison to the mean monthly discharge from 1982 through 1999.
Seasonal discharge patterns observed at the USGS Wolf Creek station were similar to the seasonal
discharge patterns observed at the USGS Tongue River station 06298000. Mean monthly
discharge was highest during 1977 (62.2 cfs), followed by 1999 (54.5 cfs), 1996 (50.0 cfs) and
1998 (40.9 cfs). The mean monthly discharge based on values from 1982 through 1999 was 47.1
cfs. Thus, discharge in Wolf Creek was higher than average during each sampling year with the
exception of 1998 which was 13.2 percent below normal.
Discharge during each year increased from April to May followed by peak discharge in June
(Figure 8-4). Discharge decreased significantly into July followed by steady decreases in August
and September. As observed in the Tongue River and suggested at other streams within the
Project area, base flows probably occur from December through March. The general pattern in
annual discharge exhibited during this Project was similar to the mean annual discharge pattern
observed since 1982.
Highest mean monthly discharge for each sampling year occurred in June. Mean June discharge
in 1996, 1997, 1998 and 1999 was 139.2 cfs, 171.7 cfs, 84.8 cfs, and 141.0 cfs, respectively. The
mean monthly discharge from 1982 through 1999 for June was 121.2 cfs.
8.5. Tongue River Upper, Middle and Lower Stations
8.5.1. Tongue River SCCD and WDEQ Discharge
Instantaneous discharge measurements were recorded by SCCD and WDEQ during sampling at
Tongue River Upper, Middle and Lower stations. Summary statistics for discharges are
presented in Table 8-1. Discharge measurements during the Project at the Upper station
averaged 236 cfs, 421 cfs at the Middle station and 517 cfs at the Lower station (Table 8-1). The
average values were difficult to compare among mainstem Tongue River stations due to differing
sampling frequency and lack of same day sampling on numerous occasions. Figure 8-5 illustrates
discharge measured at each station on the same day. Discharge data not measured at each station

Sheridan County Conservation District
Tongue River Watershed Assessment 205j Final Report 1996-1999 122
on the same day was excluded from Figure 8-5 because discharge may vary daily precluding valid
comparison among stations. There were no comparable discharge data collected in 1996 and
limited comparable data collected in 1997.
Discharge during the primary low-irrigation months (April, May and September) progressively
increased from the Upper station to the Middle Station and from the Middle station to the Lower
station. There was a 90 percent increase in discharge from the Upper to Middle stations during
this period (Table 8-2). However, this trend was often reversed during the primary irrigation
months (June, July and August) when discharge was often reduced from the Tongue River Middle
station to the Tongue River Lower station (Figure 8-5). There was a 7 percent reduction in
discharge from the Middle station to the Lower station during irrigation season months, but a 31
percent increase between stations during the low-irrigation season months. The effects on
chemical, physical, biological and habitat characteristics related to dewatering during the warmer
summer months are discussed later in various Sections including Section 8.5.4, Section 8.15.19,
Section 8.5.21 and Section 9.1.
8.5.2 WGFD Continuous Tongue River Water Temperature Monitoring in 1988
and 1994
Continuous surface water temperature data was collected by WGFD near the Tongue River Upper
station in summer 1988 (Appendix Table E-1) and near the Tongue River Lower station in
Ranchester in summer 1994 (Appendix Table E-2). SCCD felt that this data should be presented
first since findings affected the discussion of instantaneous water temperature data collected
during this Project. The temperature data collected in 1988 near the Tongue River Upper stations
were considered “historic” because it was collected five (5) years prior to initiation of this Project.
The temperature data collected in 1994 near Tongue River Lower was considered “current” and
usable for determination of beneficial use attainment since it was collected within five (5) years of
the initiation of this Project in 1996.
Monitoring by WGFD near the Tongue River Upper station indicated water temperatures were
well below the upper thermal limit established for Class 2 cold water fisheries (25.6oC). The
maximum water temperatures occurred during the last part of July and early August. The
maximum water temperature was 18.5oC recorded on July 30, 1988. The majority of maximum
daily water temperatures generally ranged from 12oC to 16
oC (Figure 8-6). The optimal
temperature range for salmonids (including trout) is approximately 12oC to 14
oC (MacDonald et
al., 1991). Bjornn and Reiser (1991) indicated the optimal upper temperature for most salmonids
was 13oC to 16
oC. Lethal water temperatures may vary according to the duration that fish are
exposed to high temperatures and their acclimation to high temperature, but is generally in the
range of 20oC to 25
oC. The WGFD water temperature monitoring indicated that water
temperature was adequate for trout populations near the Tongue River Upper station.

Sheridan County Conservation District
Tongue River Watershed Assessment 205j Final Report 1996-1999 123
Water temperatures recorded at the Tongue River Lower station between June 21, 1994 and
September 7, 1994 exceeded the Wyoming Water Quality temperature standard for Class 2 waters
for cold water fisheries on seventy-two (72) percent of sampling days (Table 8-3). The standard
was exceeded on nineteen straight days from July 26, 1994 through August 13, 1994 (Figure 8-6).
Maximum daily temperatures were generally recorded between 1700 hours (5:00 pm) and 2000
hours (8:00 pm). The difference between maximum and minimum daily summer water
temperatures routinely ranged from 5oC to 7
oC. This observation was similar to daily stream
temperature variability described by MacDonald et al. (1991) where typical maximum daily
temperatures occurred in the late afternoon and daily minimum temperatures occurred just before
dawn. King (1990a) found considerable fluctuation in daily temperature, pH and dissolved
oxygen at Sand Creek, a small spring-fed stream in northeast Wyoming. He found that in order to
obtain a sample characteristic of water quality conditions during daylight hours, sampling should
be performed in the late afternoon before sunset.
Diurnal (difference between day and night time) temperature ranges of around 6oC are fairly
common in streams during summer (Hynes, 1970) and changes as great as 14oC have been
reported for smaller plains streams (Mackichan, 1967). It is probable that daily temperature
ranges exceeded 5oC to 7
oC at tributaries to the Tongue River Lower since tributaries were smaller
in size and contained less discharge. Lower discharge combined with shallow stream depth and
reduction in riparian vegetation may increase daily temperature fluctuation.
The time of day that the maximum daily water temperature occurred and the normal range between
daily maximum and minimum water temperatures indicated that the SCCD sampling design
missed the maximum daily water temperatures needed to evaluate effects on cold water fish
species and to determine attainment of the Wyoming water quality standard for water temperature.
SCCD sampling generally occurred during the morning through early afternoon when lower water
temperatures persist (minimum daily water temperature usually occurs from 8:00 am to 10:00 am;
see Appendix Table E-2). This indicated that instantaneous daily water temperature measured by
SCCD and WDEQ during this Project usually approximated the lower minimum daily water
temperature instead of maximum daily water temperatures needed to determine compliance with
the Wyoming temperature standard. This finding suggested that maximum temperatures
recorded in the Tongue River and at tributaries during this Project could be conservatively
adjusted upward by from 5oC to 7
oC to provide a better estimate of maximum daily water
temperature.
Ambient air temperature recorded at the NRCS Burgess Junction meteorological station and
discharge measured at USGS station 06298000 (SCCD Tongue River Upper station) during 1994
were evaluated to examine potential factors related to the high daily summer water temperatures
recorded by WGFD. Air temperatures were generally about 1 C cooler than normal indicating
that air temperature was not the critical factor. However, discharge measured by USGS near the
Tongue River Upper station during this period was considerably lower than mean discharge

Sheridan County Conservation District
Tongue River Watershed Assessment 205j Final Report 1996-1999 124
recorded during the period from 1982 through 1999. June, July, August, and September, 1994
mean monthly discharges were 237 cfs, 115 cfs, 64 cfs and 60 cfs, respectively compared to the
June, July, August, and September mean (1982 through 1999) monthly discharges of 621 cfs, 213
cfs, 102 cfs and 80 cfs, respectively. This observation suggested that low discharge in 1994 may
have been a significant factor related to the high water temperature and temperature standard
exceedence. Ward and Stanford (1979) found that reduced stream flows resulted in more extreme
temperature differences. Lower discharge normally results in reduced stream velocity and
shallower water depth that may contribute to warmer stream water temperature. Dewatering at
the Tongue River Lower station was evident during the July and August months at the height of the
summer irrigation period (Figure 8-5) since demand for water was highest during these months.
Discharge from tributaries to the Tongue River was also reduced during these months because
these water bodies were also subject to dewatering due to irrigation demand.
Even after consideration of water temperature increase due to dewatering, the WGFD water
temperature data suggested that the Tongue River in the vicinity of the Lower station may be
located near the transition zone between a Class 2 cold water stream and a Class 2 warm water
stream. Evaluation of the benthic macroinvertebrate community data (Section 8.5.19) and fish
population data (Section 8.5.21 and Appendix Tables C-14 and C-15) suggested that this reach
may more closely approximate a Class 2 warm water reach than a Class 2 cold water reach. These
observations indicated that reclassification of the Tongue River from a Class 2 cold water stream
to a Class 2 warm water stream should be considered. Additional discussion related to re-
classification is presented in benthic macroinvertebrate Section 8.5.19 and fisheries Section
8.5.21.
Water temperature in most Wyoming streams will naturally increase during summer months from
upstream to downstream along the longitudinal gradient even without effects due to dewatering.
However, dewatering at the Tongue River Lower station appeared to accelerate the natural water
temperature increase creating unfavorable conditions for game fish populations. Increasing
summer flows at Tongue River Lower will subject the stream to fewer adverse temperature
changes, decreased water temperature and increase important aquatic habitat needed for fish
survival.
It is certain that higher water temperatures occurred than those recorded by SCCD and WDEQ, but
were not detected because samples were collected before maximum daily temperature occurred.
SCCD did not have adequate funding to purchase continuous water temperature recorders and
software for this Project. Additional water temperature monitoring using continuous
thermographs is warranted to determine if exceedence of the Wyoming water quality standard for
temperature occurs regularly. It is recommended that continuous water temperature recorders be
used for future monitoring in the Tongue River Watershed.
8.5.3 RPWD Water Temperature Monitoring at Tongue River Lower Station

Sheridan County Conservation District
Tongue River Watershed Assessment 205j Final Report 1996-1999 125
RPWD collected instantaneous daily water temperature data at the Tongue River raw water inlet
since 1993. Temperature data provided additional insight for observed water temperature
exceedences at Tongue River Lower station. Mean monthly, minimum and maximum water
temperature values are presented in Appendix Table A-20.
Average monthly, minimum and maximum water temperature values recorded from 1993 through
1999 are illustrated in Figure 8-7. Lowest average monthly water temperature occurred in
December and January and highest average monthly water temperature occurred in July and
August.
Analysis of the data set (1993 through 1999) revealed one temperature measurement in August,
1994 exceeded the Wyoming water quality standard for water temperature. However, daily
temperature readings were measured from 0700 hours to 0900 hours (1999 Personal
Communication, Harold Herman, Ranchester Director of Public Works) and did not reflect
maximum daily water temperature since maxima generally occurred between 1700 hours and 2000
hours. Conservative maximum daily water temperatures were projected by adding 70C to
reported water temperature values since the range between daily minimum and maximum water
temperature was generally from 50C to 7
0C (See Section 8.5.2). Projected maximum daily water
temperature revealed numerous exceedences of the water temperature standard each year (Table
8-4). The water quality standard for water temperature was exceeded on 12 days in 1993, 42 days
in 1994, 30 days in 1995, 55 days in 1996, 16 days in 1997, 6 days in 1998 and 4 days in 1999.
The majority of exceedences occurred during the warmest summer months of July and August
when discharge was reduced due to dewatering.
The reliability of the projected maximum daily water temperature was checked by comparison to
the WGFD data set collected in 1994. WGFD recorded 57 water temperature standard
exceedence days in 1994 and RPWD recorded 42 projected water temperature standard
exceedence days in 1994. The projected daily RPWD water temperature exceedences matched
the WGFD water temperature exceedence days 74 percent of the time. This indicated that the
maximum daily water temperature projected by RPWD was reliable, but generally underestimated
the maximum daily water temperature. This indicated that a probable higher number of water
temperature standard exceedences occurred from 1993 through 1999 than the number based on
projected RPWD data.
Further analysis of the RPWD water temperature data set revealed an interesting trend that
required further investigation and evaluation beyond the scope of this Final Report. Average
annual water temperature has declined during consecutive years since 1993 (Figure 8-8). A time
series regression analysis was conducted on average annual water temperature to determine if the
decline in water temperature over time was due to random chance or due to other factors. The
regression analysis revealed a correlation coefficient of -0.973422 (P<0.01) suggesting that the

Sheridan County Conservation District
Tongue River Watershed Assessment 205j Final Report 1996-1999 126
association between decline in water temperature and year (time) was strong. This indicated that
the decline in water temperature was not due to chance, but to other factors. Should the decline in
annual water temperature continue to decline or level off, suggested reclassification of this reach
of the Tongue River from Class 2 cold water to Class 2 warm water may need to be re-evaluated.
Continued monitoring in concert with daily discharge measurement is recommended to further
evaluate thermal conditions at the Tongue River Lower station.
8.5.4 SCCD and WDEQ Tongue River Temperature Monitoring
Summary statistics for instantaneous water temperature measurements by SCCD and WDEQ at
Tongue River Upper, Middle and Lower stations are presented in Table 8.5. Water quality data
for the Upper station is presented in Appendix Tables B-1 and B-2, data for the Middle station in
Appendix Tables B-5 and B-6 and data for the Lower station in Appendix Tables B-7 and B-8.
Data collected by WDEQ in 1998 at the Tongue River in the vicinity of the Dayton WWTF
upstream of the Middle station is presented in Appendix Tables B-3 and B-4.
Average water temperature was lowest at the Upper station (9.60C) with a slight increase at the
Middle station (9.80C) and highest at the Lower station (11.7
0C). Maximum water temperature
recorded at the Upper station was 18.00C, 21.2
0C at the Middle station and 21.8
0C at the Lower
station. Water temperature measurements conducted at each station on the same day indicated a
general range of from about 30C to 7
0C in temperature between Upper and Lower stations (Figure
8-9). The higher the discharge at Tongue River Upper especially during spring runoff in May and
June, the more similar water temperature was among stations indicating increased discharge
stabilized water temperature among stations. The greatest temperature differential among
stations generally occurred during periods of lower discharge in the summer months of July and
August. However, comparison of water temperature measured the same day at Middle and Lower
stations during this Project generally showed no large difference in water temperature between
stations (Figure 8-10).
There were no exceedences of the Wyoming water quality standard for temperature. However, as
indicated in Section 8.5.2, sampling conducted by SCCD and WDEQ did not occur during the time
of day to detect maximum daily water temperature. Maximum daily temperature was projected at
each station during the months of June, July, August and September as described in Section 8.5.3.
Projected maximum daily water temperature indicated no exceedence of Wyoming water quality
standard for water temperature at the Upper and Middle stations. Two temperature exceedences
occurred at the Lower station. This suggested that the reach of concern for water temperature was
downstream of the Middle station in the vicinity of the Lower station and confirmed findings in
Sections 8.5.2 and 8.5.3.
8.5.5 SCCD and WDEQ Tongue River pH Monitoring

Sheridan County Conservation District
Tongue River Watershed Assessment 205j Final Report 1996-1999 127
Summary statistics for instantaneous pH measurements by SCCD and WDEQ at Tongue River
Upper, Middle and Lower stations are presented in Table 8.6. The pH varied little among Tongue
River Upper, Middle and Lower stations. The average and geometric mean for pH during this
Project was 8.2 SU at the Upper station, 8.0 SU at the Middle station and 8.0 SU at the Lower
station. The maximum pH recorded at each Tongue River station during the Project was the same
(8.6 SU). The minimum pH was 6.9 SU at the Upper and Middle stations and 6.8 SU at the Lower
station. All pH measurements were within Wyoming water quality standards (acceptable range
from 6.5 SU to 9.0 SU).
Little annual variability in average pH was observed at each station and among sampling stations.
The minimum annual pH at Tongue River mainstem stations was 7.9 SU at the Lower station in
1998 and the maximum annual pH was 8.3 SU at the Upper station in 1996.
8.5.6 RPWD pH Monitoring at Tongue River Lower Station
Daily pH measurements recorded by RPWD since 1993 at the Town of Ranchester Water
Treatment Plant raw water intake at the Tongue River Lower station provided an excellent long
term data set for evaluation of pH dynamics. Mean monthly, minimum and maximum pH values
are presented in Appendix Table A-21.
There was little variability for average monthly pH as illustrated in Figure 8-11. The average
monthly pH generally varied by less than 0.3 SU. There were exceedences of the upper (9.0 SU)
and lower (6.5 SU) limits for the Wyoming water quality standard for pH in 1998 (pH = 9.6 SU in
May) and 1999 (pH = 6.3 SU in May and 6.4 SU in June). Although the pH values technically
represented a violation of the pH standard, they accounted for less than 0.2 percent of total pH
measurements suggesting that pH was suitable for attainment of aquatic life use.
The data set indicated generally lower pH values when compared to pH values measured by SCCD
and WDEQ during this Project. The generally lower pH recorded by RPWD appeared to be due
to differences in the time that samples were measured. RPWD measured pH around 0800 hours
(+ one hour) to provide data for daily WTP operations. SCCD and WDEQ sampling occurred
later in the day, normally from 0900 hours to 1500 hours. Diurnal variation (variation within a
day) for pH is common in streams and is similar in manner to diurnal changes previously described
for temperature although the mechanism causing the variability is different. Differences in solar
radiation due to sunlight is known to cause differences in pH because instream plant and algal
production during daylight hours may reduce the buffering capacity of streams and increase pH.
Thus, stream pH may be expected to be lowest in the early morning and highest in the late
afternoon, especially on sunny days (Hynes,1970; King, 1990a, King, 1993).
Of significant interest was the gradual decline in pH at the Lower station since 1993 as shown in
Figure 8-12. A time series regression analysis was conducted on the average annual pH to

Sheridan County Conservation District
Tongue River Watershed Assessment 205j Final Report 1996-1999 128
determine if the decline in pH over time was due to chance or due to other factors. The regression
analysis revealed a correlation coefficient of -0.949931 (P<0.01) suggesting that the association
between decline in pH and year (time) was strong. This indicated that the decline in pH was not
due to chance, but to other factors. The general decrease in pH was interesting because many
water bodies in the United States and worldwide have experienced decline in pH due to suspect
acid rain precipitation. Research to determine why the pH has declined at Tongue River Lower
was beyond the scope of this Project, but should be strongly considered for future monitoring.
One area to investigate may be the relationship between a change in water management in Wolf
Creek that occurred around 1995 whereby more water may have remained in the water body
throughout the year to provide enhanced maintenance of the fishery. Should the decline in pH
shown in Figure 8-12 continue in the coming years, implications may be great for the aquatic life,
fishery and the ability of the Tongue River to attain the Wyoming water quality standard for pH.
8.5.7 SCCD and WDEQ Tongue River Specific Conductivity Monitoring
Summary statistics for specific conductivity are presented in Table 8-7. Average conductivity
during the Project was 209 umhos/cm at the Upper station, 277 umhos/cm at the Middle station
and 300 umhos/cm at the Lower station. Conductivity values at the Upper station ranged from a
low of 119 umhos/cm to a high of 530 umhos/cm, from a low of 147 umhos/cm to a high of 410
umhos/cm at the Middle Station and from a low of 90 umhos/cm to a high of 495 umhos/cm at the
Lower station. The increase in conductivity from the Upper station to the Lower station was
normal since conductivity will naturally increase along the longitudinal gradient of most water
bodies. Although there was no Wyoming water quality standard for conductivity, values were
generally considered low for a water body of this size and drainage area and within the range
required for support of aquatic life.
Conductivity values were controlled primarily by stream discharge. The association between
conductivity and discharge was strong and inverse such that as discharge increased, conductivity
decreased (Figure 8-13). The correlation coefficient at the Upper station was -0.526, -0.736 at the
Middle station and -0.709 at the Lower station (Appendix Table L-3). Correlation coefficients
were significant (P<0.01) at each station indicating there was less than a 1 percent chance that the
association was due to random chance alone.
8.5.8 SCCD and WDEQ Tongue River Dissolved Oxygen Monitoring
SCCD initiated monitoring for dissolved oxygen (DO) in 1999. WDEQ conducted monitoring
for DO once annually usually in October. Summary statistics for DO are presented in Table 8-8.
Average DO was 10.2 mg/l at the Upper station, 11.0 mg/l at the Middle station and 9.9 mg/l at the
Lower station. DO values at the Upper station ranged from 8.1 mg/l to 12.0 mg/l, from 8.1 mg/l
to 13.6 mg/l at the Middle Station and from 7.9 mg/l to 12.2 mg/l at the Lower station. The
general slight decrease in DO from the Upper station to the Lower station was apparently due to
Sheridan County Conservation District
Tongue River Watershed Assessment 205j Final Report 1996-1999 129
the slight decrease in average water temperature from the Upper station to the Lower station. DO
will normally decrease as water temperature increases. DO values at each station were generally
higher during the spring and fall during periods of cooler water temperature and lower during the
summer months when water temperature was higher.
There were no exceedences of the Wyoming water quality standard for DO because no DO values
were less than 5 mg/l. The lowest DO value recorded during the Project was 7.9 mg/l measured
by SCCD at the Lower station on September 15, 1999. The DO concentration was sufficient to
support diverse populations of aquatic organisms and fish indicating full support for aquatic life
use for this physical parameter.
8.5.9 SCCD and WDEQ Tongue River Turbidity Monitoring
Summary statistics for turbidity are presented in Table 8-9. Average turbidity during the Project
was 7.3 NTU at the Upper station, 9.0 NTU at the Middle station and 13.5 NTU at the Lower
station. The geometric mean was 3.6 NTU at the Upper station, 3.7 NTU at the Middle station
and 7.1 NTU at the Lower station. The geometric mean is a logarithmic transformation of data
and generally provides a more reliable estimate of the mean by smoothing extreme values when
variability is high among measurements due to normal seasonal variability. Turbidity values at
the Upper station ranged from a low of 0.2 NTU to 26.0 NTU, from 0.4 NTU to 33.0 NTU at the
Middle Station and from 1.0 NTU to 61.0 NTU at the Lower station. The increase in turbidity
from the Upper station to the Lower station was considered normal since turbidity will naturally
increase along the longitudinal gradient of most flowing water bodies.
Turbidity values were closely associated with discharge. There was a relatively strong positive
relationship such that turbidity values increased as discharge increased (Figure 8-14). The
correlation coefficient between turbidity and discharge at the Upper station was +0.445 (P<0.01),
+0.595 (P<0.01) at the Middle station and +0.582 (P<0.01) at the Lower station (Appendix Table
L-5). R-squared values for the regression analyses were 19.8 percent at the Upper station, 35.4
percent at the Middle station and 33.9 percent at the Lower station (Appendix Table L-6). The
R-squared value is a statistic that shows what percentage of the variability in concentration for a
water quality parameter (i.e. turbidity) is explained by another parameter (i.e. discharge). The
R-squared value at the Lower station was 33.9 percent indicating that 33.9 percent of the
variability in turbidity values during the Project was due to discharge. The correlation
coefficients and R-squared values at each station indicated that stream discharge was an important
factor controlling turbidity even in the absence of potential anthropogenic (man-caused) effects.
Because of the association between turbidity and discharge, lower turbidity values were recorded
during periods of lower discharge (prior to and after spring runoff) in early April, September and
October and higher turbidity values were recorded during periods of higher discharge during
spring runoff in latter April, May and June. There were no exceedences of the Wyoming water
Sheridan County Conservation District
Tongue River Watershed Assessment 205j Final Report 1996-1999 130
quality standard for turbidity. The average increase in turbidity between the Upper and Middle
stations was 1.7 NTU and the average increase in turbidity between the Middle and Lower stations
was 4.5 NTU. The average increase in turbidity between the Upper and Lower stations was 6.2
NTU which was well below the increase of 10 NTU allowed by the Wyoming water quality
standard for Class 2 cold water, water bodies.
8.5.10 RPWD Turbidity Monitoring at Tongue River Lower Station
Daily turbidity measurements were taken by RPWD since 1983 at the raw water intake to the
Ranchester Water Treatment Plant near the Tongue River Lower station. This data set
represented the most comprehensive long term water quality record (17 years) evaluated during
this Project. It provided valuable information regarding turbidity dynamics and due to the close
relationship between turbidity and suspended sediment, may also provide estimates for long term
suspended sediment concentration in the Tongue River should the relationship between turbidity
and TSS be determined. Mean annual and monthly turbidity values are presented in Appendix
Table A-19.
The data set clearly shows the seasonal variability in turbidity values due to the close association
with the annual Tongue River discharge regime. Lowest turbidity values occur during the months
from October through January when annual base flows are present (Figure 8-15). Turbidity
begins to increase in March and April and peaks in May during the period of highest discharge.
Values remain relatively high in June and progressively decline into July, August and September
in response to the seasonal decline in discharge. The highest average monthly turbidity was 52.6
NTU in May and lowest in October (2.4 NTU) and November (2.3 NTU).
Analysis of the long term record for turbidity revealed that there has been a general, but
statistically significant, trend towards reduction in turbidity since 1983 (Figure 8-16). A time
series regression analysis was conducted using average annual turbidity to determine if the decline
in turbidity was due to chance or due to other factors. The regression analysis revealed a
correlation coefficient of -0.5956389 (P<0.05) indicating that the association between reduction in
turbidity and year (time) was present. This indicated that the decline in turbidity was not due to
chance, but to other factors. Further analysis indicated that the apparent decline was primarily
related to the large reduction in annual turbidity from 1983 (average = 29.6 NTU) to 1985 (average
= 9.2 NTU). Average annual turbidity increased about 5 NTU during 1986 and 1987 and then
declined in 1988. Average annual turbidity then fluctuated by less than 3 NTU during the years
from 1990 through 1996.
There was no statistically significant relationship (P>0.05) between average annual turbidity and
average annual discharge measured at USGS station 06298000 from 1983 through 1999. The
lack of a relationship between turbidity and discharge was due to the fact that discharge measured
at station 06298000 (located at the Tongue River Upper station) did not accurately reflect

Sheridan County Conservation District
Tongue River Watershed Assessment 205j Final Report 1996-1999 131
discharge at the Tongue River Lower station near the RPWD sampling station due to water
management that affected discharge between the two stations.
8.5.11 SCCD and WDEQ Tongue River Fecal Coliform Bacteria Monitoring
Summary statistics for fecal coliform bacteria are presented in Table 8-10. The geometric mean
for fecal coliform bacteria at the Upper station during the Project was 5 per 100ml, 15 per 100ml at
the Middle station and 25 per 100ml at the Lower station. The geometric mean is a logarithmic
transformation of data and provided a more reliable estimate of the mean by smoothing extreme
values when variability was high among fecal coliform measurements. Fecal coliform
concentration at the Upper station ranged from 1 per 100ml to 90 per 100ml, from 1 per 100ml to
200 per 100ml at the Middle Station and from 1 per 100ml to 1060 per 100 ml at the Lower station.
The increase in fecal coliform from the Upper station to the Lower station followed the trend
exhibited by other water quality parameters in the Tongue River where values increased along the
longitudinal gradient.
Direct comparison for fecal coliform bacteria concentration among years could not be made due to
differences in sampling frequency between years. SCCD increased the sampling frequency in
1999 from monthly to five (5) samples within a 30 day period during the Recreational Season to
provide a better estimate of bacteria contamination and allow direct comparison to the Wyoming
water quality standard for fecal coliform bacteria.
The was no exceedence of the Wyoming water quality standard for fecal coliform bacteria at the
Upper station. The geometric mean of five (5) samples collected during the Recreational Season
in 1999 was 7 per 100ml which was considered low. There was no single sample in excess of 400
per 100ml since the maximum concentration during the Project was 90 per 100ml (collected
August 26, 1997).
The was no exceedence of the Wyoming water quality standard for fecal coliform bacteria at the
Middle station. The geometric mean of five (5) samples collected during the Recreational Season
in 1999 was 90 per 100ml which was considered low. There was no single sample in excess of
400 per 100ml since the maximum concentration during the Project was 200 per 100ml (collected
April 21, 1999). Intensive fecal coliform bacteria sampling conducted by WDEQ in fall, 1998 at
the Dayton WWTF upstream of the Middle station indicated no significant bacterial contamination
was discharged from the treatment plant (Appendix Tables B-3 and B-4). The maximum
instantaneous fecal coliform concentration was 24 per 100ml. This indicated the WWTF was
performing properly during the sampling period.
There was one exceedence of the Wyoming water quality standard for fecal coliform bacteria at
the Lower station. The exceedence was due to a single sample collected April 21, 1999 (prior to
the Recreation Season) that had a concentration of 1060 per 100ml. Although the geometric
mean of five (5) samples collected during the Recreational Season in 1999 was 63 per 100ml, the

Sheridan County Conservation District
Tongue River Watershed Assessment 205j Final Report 1996-1999 132
standard was exceeded because 10 percent of samples collected in 1999 exceeded 400 ml.
However, only 4 percent of total fecal coliform bacteria samples collected during the Project
exceeded the standard (1 sample out of 27 total samples) suggesting that significant, but infrequent
fecal coliform bacteria contamination may exist. Consistent and significant bacterial
contamination probably does not exist, but because there was a technical exceedence of the fecal
coliform bacteria standard near the Ranchester Water Treatment Plant intake, remedial action
should be taken to ensure that all fecal coliform bacteria samples are less than 400 per 100ml to
bring the Lower station into compliance with the Wyoming water quality standard for fecal
coliform bacteria.
Results for fecal coliform sampling conducted during this Project were compared to results for
historic fecal coliform sampling conducted at comparable Tongue River Upper, Middle and Lower
sampling stations. Results of these comparisons are presented in Table 8-11. Historical fecal
coliform data collected at the Upper station from 1976 through 1988 were compared to current
Project fecal coliform data. There was no large difference in fecal coliform bacteria between
periods indicating that the generally low fecal coliform levels have been consistent since 1976 and
potential wildlife and recreational sources for fecal coliform bacteria were not contributing
significant levels of bacterial contamination. Livestock were not a significant potential source for
fecal coliform bacteria because the upstream Tongue River canyon limits access and suitable
grazing areas for livestock (see Section 3.1.1).
Historical fecal coliform data collected at the Middle station from 1985 through 1989 were
compared to current Project fecal coliform data. Caution was used during this comparison
because the number of samples used in the analysis was lower during the historic period (N = 9
samples) than during the current Project (N = 37 samples). Even with this consideration, the data
revealed a significant reduction in fecal coliform contamination from 1985 to this Project. All
statistical measures including average, median, minimum, maximum and geometric mean fecal
coliform levels were reduced from 1985 to this Project. The Wyoming water quality standard for
fecal coliform bacteria was exceeded twenty-two percent (22%) of the time during historic
sampling, but no exceedence of the Wyoming water quality standard for fecal coliform bacteria
occurred during the current Project. The reduction in fecal coliform contamination over time
was probably due to the significant upgrade of the Dayton WWTF in the mid-1980's, installation
of improved lined, aerated treatment cells, an ultraviolet disinfection system treating effluent
before discharge to the Tongue River and adequate operation and maintenance of the facility.
Upgrade and maintenance of the WWTF occurred again in 1998 with replacement of the cell
liners.
Historic fecal coliform data collected at the Lower station from 1968 through 1990 were compared
to current Project fecal coliform data. Caution was used during this comparison because the
number of samples used in the analysis was two-fold higher during the historic period (N =57
samples) than during the current Project (N = 27 samples). Despite the unequal sampling

Sheridan County Conservation District
Tongue River Watershed Assessment 205j Final Report 1996-1999 133
between historic and current Project periods, the data suggested that fecal coliform contamination
was dropping over time. However, the trend was not as strong than the trend showing reduction
in fecal coliform contamination at the Middle station. All statistical measures including average,
median, minimum, maximum and geometric mean fecal coliform levels were generally reduced
from 1968 to this Project, but the disparity in sampling frequency precluded a firm conclusion that
fecal coliform bacteria had been significantly reduced at the Lower station.
8.5.12 SCCD Tongue River Pesticide and Herbicide Monitoring
SCCD conducted pesticide and herbicide sampling at Tongue River Upper, Middle and Lower
stations on August 21, 1996. Analytical results are presented in Appendix Table H-1. Sampling
occurred once during the Project due to the high cost associated with sample analyses, results from
this sampling event and knowledge that USGS NAWQA would conduct more intensive pesticide
and herbicide sampling at USGS station 06298000 (the SCCD Tongue River Upper station).
A total of nineteen (19) organochlorine pesticides and ten (10) chlorinated herbicides were
sampled. Analytical results found no detectable (less than the minimum detection limit)
concentrations for herbicides or pesticides at each station. This observation indicated that no
evidence of herbicide and pesticide contamination was present in the Tongue River water column
during this sampling event.
8.5.13 USGS NAWQA Organics Monitoring Including Pesticides and Herbicides at
Tongue River Upper Station
USGS NAWQA conducted organics sampling for whole body tissue from brown trout and from
bed sediment at Tongue River station 06298000 (SCCD Tongue River Upper station) on
September 23, 1998. Results for whole body tissue analyses are presented in Appendix Table
D-2 and results for bed sediment analyses are presented in Appendix Table D-4. A total of
twenty-eight (28) different organic compounds including various pesticides and herbicides were
analysed in fish tissue samples. A total of about ninety-five (95) different organic compounds
including various pesticides and herbicides were analysed in bed sediment samples.
Analytical results found no detectable organic compounds in brown trout whole body fish tissue
samples. This observation indicated that the organic compounds monitored did not exist or
persisted in concentrations that were not measurable. There were no exceedences of applicable
EPA standards to indicate a fish consumption advisory. Because brown trout are mobile and may
migrate several miles during their lives, the results suggested that not only were these organic
compounds not detected at the Upper station, but probably were not present in the Tongue River
water column for several miles upstream or downstream of the Upper station.
Analysis of bed sediment organics samples detected no organics at the Upper station. Results for

Sheridan County Conservation District
Tongue River Watershed Assessment 205j Final Report 1996-1999 134
eight (8) compounds were not presented in this Final Report because of uncertainty with the
analytical results for these compounds presented by USGS. However, the results indicated that a
wide array of organic compounds including various pesticides and herbicides were not detected at
the Upper station. This observation indicated that potential use of these compounds within the
watershed upstream of the Upper station (including the BHNF) has resulted in no detectable levels
of these compounds within the bed sediment.
8.5.14 SCCD and WDEQ Tongue River Nitrate Nitrogen Monitoring
Summary statistics for nitrate nitrogen are presented in Table 8-12. Average nitrate nitrogen
concentrations were low at each station during the Project. The average nitrate concentration at
the Upper station was .028 mg/l, .030 mg/l at the Middle station and .019 mg/l at the Lower station.
Nitrate values at the Upper station ranged from .001 mg/1 to .130 mg/l, from .001 mg/l to .100
mg/l at the Middle Station and from .002 mg/l to .120 mg/l at the Lower station.
Average and maximum nitrate values at the Upper, Middle and Lower stations should be
considered low. The nitrate concentration was well below the Wyoming water quality standard
and drinking water human health standard of 10 mg/l for Class 2 surface waters (WDEQ, 1998).
Data for nitrate nitrogen indicated that nitrate concentration in the Tongue River was less than the
background concentration of nitrate (about 0.60 mg/L) found in streams in undeveloped areas (i.e.
least impacted reference type streams) throughout the United States (USGS, 1999). These
observations indicated that nitrate nitrogen was not present in the Tongue River in concentrations
that could pose a human health threat or an ancillary threat to aquatic populations by effects caused
by eutrophication. Full support for all Wyoming beneficial uses applicable to nitrate was
indicated.
8.5.15 SCCD and WDEQ Tongue River Total Phosphorus Monitoring
Summary statistics for total phosphorus are presented in Table 8-13. These statistics were based
on “censored” values because the majority of analyses (35 samples out of 36 total samples) were
less than the minimum detection limit (minimum detection limit was 0.10 mg/l for WDEQ
analytical method; 0.05 mg/l for SCCD analytical method). The minimum detection limit for the
WDEQ analytical method did not provide adequate data needed to address the recommended
water quality standard for total phosphorus in water bodies draining to a lake or reservoir (0.05
mg/l; EPA, 1977). Data were thus censored to provide an estimate that could be related to the
recommended EPA standard of 0.05 mg/l.
Average total phosphorus concentrations were low at each station during the Project. The
average total phosphorus concentration at the Upper station was .044 mg/l, .041 mg/l at the Middle
station and .028 mg/l at the Lower station. Total phosphorus concentration at the Upper station
ranged from .006 mg/1 to .080 mg/l, from .006 mg/l to .090 mg/l at the Middle Station and from

Sheridan County Conservation District
Tongue River Watershed Assessment 205j Final Report 1996-1999 135
.004 mg/l to .080 mg/l at the Lower station. The geometric mean concentration gradually
dropped from the Upper station (.035 mg/l) to the Middle station (.031 mg/l) and to the Lower
station (.016 mg/l). The observed reduction in total phosphorus from Upper to Lower stations
may be due to the removal of phosphorus by periphyton and submerged rooted aquatic plants since
phosphorus is rapidly assimilated by aquatic plants. Macroinvertebrate monitoring and habitat
assessment at the Lower station noted increased periphyton at the Lower station when compared to
periphyton at the Upper and Middle stations.
Average and maximum total phosphorus values at the Upper, Middle and Lower stations should be
considered low. Wyoming has not established surface water quality standards for phosphorus.
U.S. EPA (1977) recommended that total phosphorus concentration should not exceed 0.05 mg/l
in a stream that enters a lake or reservoir (e.g. Tongue River Reservoir) to prevent development of
nuisance algal and plant populations. Mackenthun (1973) suggested a target phosphorus level of
less than 0.10 mg/l for streams that did not directly enter lakes or reservoirs. USGS (1999)
provided recent information from nationwide NAWQA monitoring and reported national
background concentrations for total phosphorus from streams in undeveloped (reference - like )
areas was about 0.10 mg/L. This finding suggested that a realistic standard for total phosphorus
should be 0.10 mg/l because that value represented a best attainable value for streams in least
disturbed watersheds. The USGS report conflicted with the EPA recommended standard
because the national background (reference) concentration found by USGS was two-fold greater
than the EPA standard. This observation indicated that in order to meet the EPA standard for total
phosphorus, a water body would have to reduce its total phosphorus concentration by 50 percent
beyond that of natural background. Because this goal was not attainable, SCCD adopted findings
by USGS for its interpretation of total phosphorus data collected during this Project.
Using the value of <0.10 mg/l as a target for total phosphorus concentration, no significant amount
of total phosphorus was identified in a single sample collected during this Project. However,
sampling frequency was generally low at the Upper and Lower stations (N=10) and at the Middle
station (N=16) over a four year period and sampling generally occurred during the fall low base
flow period when total phosphorus concentration was normally lower. Additional sampling is
required to provide a reliable estimate of total phosphorus concentration in the Tongue River.
8.5.16 WDEQ Tongue River Monitoring for Additional Water Chemistry
Parameters
WDEQ collected samples for additional water chemistry parameters during annual monitoring at
the Upper station from 1993 through 1999 and at Middle and Lower stations from 1996 through
1999. Summary statistics are presented in Table 8-14. Data for WDEQ intensive monitoring in
1998 at stations upstream and downstream of the Dayton WWTF are presented in Appendix
Tables B-3 and B-4.

Sheridan County Conservation District
Tongue River Watershed Assessment 205j Final Report 1996-1999 136
Alkalinity at the Upper station was generally low ranging from 90 mg/l to 124 mg/l. Average
alkalinity was 122 mg/l and the geometric mean was 121 mg/l. Alkalinity increased slightly at
the Middle station. Average alkalinity was 145 mg/l and the range was from a low of 120 mg/l to
a high of 170 mg/l. Alkalinity continued to increase slightly from the Middle Station to the Lower
station. Average alkalinity was 174 mg/l and the range was from a low of 160 mg/l to a high of
180 mg/l. There was no Wyoming water quality or EPA standard to compare alkalinity values to,
but data indicated that water was generally productive for aquatic life and was generally capable of
withstanding sudden changes in pH due to inputs from point or NPS sources.
Total chloride concentration was low at each station. There were no samples that had total
chloride concentrations greater than 5 mg/l. Total chloride values were well within WDEQ and
EPA water quality standards indicating full support for Wyoming beneficial uses applicable to
chloride.
Total sulfate concentration was low at the Upper station. All samples were <10 mg/l. Average
total sulfate concentration increased at the Middle station (23 mg/l) and at the Lower station (33
mg/l). These values may be considered normal because all samples were collected in the fall
during lower base flow when ion concentrations were normally highest. The low number of
samples collected at the Lower station (N=4) did not provide enough data with which to provide an
in depth analysis. Total sulfate sampling is recommended for future monitoring at the Tongue
River to determine if the increase in sulfate concentration at the Lower station is a natural
occurrence or if the increase is due to potential irrigation return and urban land use influence.
Total sulfate values were well within WDEQ standards (for groundwater use) and the EPA
secondary drinking water standard (See Table 4-1). This observation indicated full support for
Wyoming beneficial uses applicable to sulfate.
Hardness concentration was relatively high at each station and was reflective of the natural
limestone geology that predominated much of the upper Tongue River watershed. Average
hardness at the Upper station was 209 mg/l, 176 mg/l at the Middle station and 202 mg/l at the
Lower station. Water at each station may be termed hard based on the classification found in
Table 6-2. There were no Wyoming or EPA water quality standards for hardness, but observed
values indicated full support of the Wyoming beneficial use for Industrial use since all values were
less than 300 mg/l.
Total Suspended Solids (TSS) concentrations were low at each station. Low values were related
to the fact that all samples were collected in the fall during lower base flow when TSS values were
normally lowest. Average TSS concentration at the Upper station was 3 mg/l, 2 mg/l at the
Middle station and 3 mg/l at the Lower station. Results of limited TSS sampling conducted by
WDEQ provided little information for potential sediment problems within the Tongue River
watershed. However, further sampling for TSS is not recommended at this time because turbidity
sampling did not indicate sediment problems in the Tongue River. Turbidity should continue to

Sheridan County Conservation District
Tongue River Watershed Assessment 205j Final Report 1996-1999 137
be used as a surrogate indicator for TSS unless specific sediment loading questions arise.
Biochemical Oxygen Demand (BOD) sampling was conducted by WDEQ on five (5) days in
October and November 1998 at stations upstream and downstream of the Dayton WWTF. All
BOD values were low and ranged from <1 mg/l to 2 mg/l. There was no difference in BOD
between the upstream and downstream stations indicating that the Dayton WWTF effluent had no
effect on BOD values in the Tongue River. Moreover, the low BOD value at the upstream station
indicated low ambient BOD concentration at this reach of the Tongue River.
Total Ammonia sampling was conducted by WDEQ on five (5) days in October and November
1998 at stations upstream and downstream of the Dayton WWTF. No ammonia was detected
indicating low ambient ammonia concentration at this reach of the Tongue River. Further, this
observation indicated effective removal of ammonia in wastewater treated by the Dayton WWTF.
8.5.17 RPWD Alkalinity Monitoring at Tongue River Lower Station
Daily alkalinity measurements have been recorded by RPWD since January 1998 at the
Ranchester WTP raw water intake near the Tongue River Lower station. Mean monthly,
minimum and maximum alkalinity values are presented in Appendix Table A-22.
Monthly variability for alkalinity was observed (Figure 8-17) and was related to the seasonal
discharge regime in the Tongue River. Alkalinity values were highest in the fall and winter
months during low discharge and lowest during the spring and early summer months when
discharge was highest. The inverse relationship between alkalinity and discharge was normal and
may be expected for most Wyoming streams affected by snowmelt runoff that serves to dilute
alkalinity during the spring runoff period.
Average monthly alkalinity was lowest in May (80 mg/l) and June (90 mg/l) and highest in
December (168 mg/l) and March (172 mg/l). The effect of snowmelt runoff on alkalinity caused
an approximate 50 percent reduction in alkalinity between the spring and winter months.
Although the alkalinity data set was relatively small (2 years) compared to the RPWD data set for
pH (7 years), the apparent reduction in pH observed by RPWD was reflected in the alkalinity
values. There appears to be a general reduction in alkalinity over time which may be an important
factor in the reduction observed for pH at the Tongue River Lower station (see Section 8.5.6).
Alkalinity serves to buffer the water mass from changes in pH and reduction in alkalinity may
result in a reduction in pH. The implications for lower pH include changes in the aquatic
community and fisheries and more frequent lower pH readings that may approach the Wyoming
water quality standard for pH. As previously indicated, these observations warrant more
investigation and in depth analysis to determine causes for the apparent decline in alkalinity and
pH.

Sheridan County Conservation District
Tongue River Watershed Assessment 205j Final Report 1996-1999 138
8.5.18 USGS NAWQA Water Quality, Brown Trout Liver Trace Metals and Bed Sediment
Metals Monitoring at Tongue River Station 06298000
USGS NAWQA initiated monthly water quality monitoring at station 06298000 in January 1999.
Data collected from January 1999 through August 1999 are presented in Appendix Table B-26.
Liver trace metals analysis from brown trout liver samples collected on September 23, 1998 are
presented in Appendix Table D-1. Results for trace metals collected from bed sediment are
presented in Appendix Table D-3.
Results from water sample analyses confirmed SCCD and WDEQ findings indicating water
quality at the Upper station was excellent. Dissolved nutrients (nitrate, nitrite, phosphorus and
ammonia) were either not detected or present in low concentration. Water temperature, DO and
pH were within Wyoming water quality standards. Dissolved organic carbon and total organic
carbon levels were low. Hardness, conductivity, alkalinity, sulfate and chloride concentrations
were comparable to those concentrations identified in WDEQ samples. However, USGS chloride
and sulfate measurements were reported for dissolved constituents versus total chloride and total
sulfate values reported by WDEQ.
Twenty-three dissolved metals were sampled by USGS. Antimony, arsenic, beryllium, cadmium,
chromium, cobalt, copper, lead, nickel, selenium, silver, manganese, mercury, molybdenum,
uranium and zinc were either not detected or present in low concentration. Dissolved aluminum
was present in concentrations up to 8 ug/l and 9 ug/l which was within the WDEQ standard of 750
ug/l for protection of aquatic life use. Mean barium concentration was 24 ug/l which was within
the WDEQ standard of 1000 ug/l for protection of human health. Dissolved calcium,
magnesium, potassium and sodium were regularly present, but in low concentration and when
applicable, were within WDEQ or EPA standards for human health or aquatic life use.
Dissolved iron exceeded the WDEQ water quality standard of 19 ug/l for protection of aquatic life
during twenty-seven percent (27%) of sampling events. Dissolved iron was not detected in the
water column during sixty-four percent (64%) of sampling events. WDEQ recently proposed a
change in the standard for iron to 1000 ug/l for protection of aquatic life use and 300 ug/l for
protection of human health, fish and drinking water (WDEQ, 2000). The proposed change has
not been formally approved, but the proposal appears appropriate based on dissolved iron values
identified at the Lower station which typifies water quality for a minimally disturbed reference
quality stream reach. With these considerations, dissolved iron concentrations identified by
USGS did not appear to represent a threat to human health, aquatic life or fish populations.
Sodium Absorption Ratio (SAR) values were either 0.0 or 0.1 which were very low. SAR has
recently received considerable attention due to development of coal bed methane (CBM) resources
in Northeastern Wyoming and the effect that application of CBM water may have on vegetation.
The emphasis on this water quality parameter may be misdirected because the SAR of soil

Sheridan County Conservation District
Tongue River Watershed Assessment 205j Final Report 1996-1999 139
receiving CBM water is the most important factor to consider for long term soil fertility for growth
and maintenance of vegetation. For example, even though the SAR of water at USGS station
06298000 was very low, it could not be applied to soil with existing high SAR values without
developing soil fertility problems developing in the future. However, because of public concern,
generally and without any previous knowledge of soil SAR values, water with SAR values below
10 are believed to be sufficient for irrigation, and SAR values of 18 or higher are not recommended
for irrigation use.
Twenty-two (22) trace metals were analysed by USGS for samples collected from brown trout
livers. Fish liver may accumulate metals present in food consumed by trout and provide an
estimate for trace metals present in the aquatic and terrestrial environment. Eight (8) out of
twenty-two (22) trace metals analysed were not detected. Trace metals detected in order from
highest to lowest concentration included iron (450 ug/g), copper (190 ug/g), zinc (99 ug/g),
selenium (22 ug/g), manganese (6.5 ug/g), aluminum (3.3 ug/g) and silver (2.3 mg/g). Remaining
trace metals detected were present at concentrations less than 1.0 ug/g. Trace metals present in
brown trout fish livers were considered low suggesting metal concentration in aquatic and
terrestrial Tongue River environs were generally low and posed no significant threat to aquatic
resources and human health.
A total of forty-seven (47) trace metals and other parameters were analysed from bed sediment
samples. Five (5) of the forty-seven (47) parameters were not detected. Concentrations of those
parameters that were detected were generally low and indicated no significant contamination of
bed sediment at the Tongue River Upper station.
8.5.19 SCCD, WDEQ and USGS Tongue River Benthic Macroinvertebrate
Monitoring
The Tongue River Upper station has been monitored by WDEQ annually since 1993 because it
was a long term reference site. USGS sampled benthic macroinvertebrates in August 1999 at
station 06298000 located about one mile downstream of the WDEQ station. SCCD and WDEQ
sampled benthic invertebrates at Middle and Lower stations annually from 1996 through 1999.
WDEQ conducted additional one time benthic macroinvertebrate sampling in 1998 at stations
upstream and downstream from the Dayton WWTF discharge outfall.
Metric values for WDEQ samples collected from the Upper station are presented in Appendix
Table G-3 under the column heading Tongue R. @ Canyon. Metric values for the USGS sample
are presented in Appendix Table G-3 under the column heading Tongue R. @ USGS 06298.
Metric values for samples collected at the Middle station and Lower station are presented in
Appendix Table G-4. Metric values for samples collected upstream and downstream of the
Dayton WWTF are presented in Appendix Table G-3.
Lists of benthic taxa identified, density (number per square meter) of taxa and percent contribution

Sheridan County Conservation District
Tongue River Watershed Assessment 205j Final Report 1996-1999 140
of each taxon to the total benthic population are presented in Appendix F. WDEQ Upper station
taxa lists are presented in Appendix Tables F-28 through F-34, the USGS sample taxa list in
Appendix Table F-40, Middle station taxa lists in Appendix Tables F-22 through F-25, stations
upstream and downstream of the Dayton WWTF in Appendix Tables F-26 and F-27 and taxa lists
for the Lower station in Appendix Tables F-18 through F-21.
Biological condition at the Tongue River Upper station using scoring criteria from both the
Wyoming Biological Condition Index (WBCI) from Barbour et al. (1994) and the Wyoming
Stream Integrity Index (WSII) from Stribling et al. (2000) was good during each year (Table 8-15).
This observation indicated full support of aquatic life use. There was little variability among
years for WSII scores and WBCI scores. Average WSII scores ranged from 71.5 in 1998 to 78.0
in 1996 and WBCI scores ranged from 39 in 1996 to 43 in 1993, 1994 and 1997.
The benthic community was generally dominated by cool water taxa indicative of good water
quality and good habitat. Baetis tricaudatus and Glossosoma were the two dominant taxa from
1996 through 1999 (Table 8-16). Other dominant taxa in order of decreasing abundance included
Hydropsyche, Ephemerella inermis/infrequens and Drunella doddsi. Hydropsyche is a common
genus of caddisfly in Wyoming and the United States and may be considered a generalist found
from high elevation mountain streams to plains streams. Ephemerella inermis/infrequens is a
mayfly widely distributed throughout western North America and is often present in Wyoming
streams with cool, clean water. The nymphs of E. inermis and E. infrequens are morphologically
similar and difficult to separate taxonomically (Walley, 1930; Johnson, 1978). Drunella doddsi
was reported to inhabit streams from 6,000 feet to 11,000 feet elevation and prefer cold, rapid
streams free of silt (Allen and Edmunds, 1962). Worms and other organisms suggesting degraded
water quality were collected only in 1993 and 1994 by WDEQ and in 1999 by USGS. Abundance
of these organisms was very low. No Tubifex tubifex (a worm) were collected indicating a low
probability for the occurrence of whirling disease, caused by a destructive parasite that may
decimate trout populations. T. tubifex is significantly involved in the whirling disease life cycle
caused by a parasite (Myxobolus cerebralis) that penetrates the head and spinal cartilage of
fingerling trout. Whirling disease may eventually cause death in trout.
The total number of EPT taxa was generally consistent among years and ranged from seventeen
(17) taxa in 1996 and 1999 to twenty-six (26) taxa in 1994. Percent contribution of scraper taxa
was high and ranged from seventeen (17) percent in 1995 to forty-seven (47) percent in 1999.
Abundance of scrapers in the benthic population was desirable because their presence indicated
low deposition of sediment. The relationship between the percent composition of scrapers in the
total benthic population and weighted embeddedness (degree of silt deposited on cobble and
gravel substrate) was strong (Figure 8-18). The correlation coefficient was +0.591944; P<0.05
for all Tongue River stations indicating that percent scrapers increased as the amount of silt on
stream bottom substrate decreased. The percent contribution of collector filterers was generally
low and ranged from eight (8) percent in 1995 to fifteen (15) percent of the total benthic population

Sheridan County Conservation District
Tongue River Watershed Assessment 205j Final Report 1996-1999 141
in 1997. Low abundance of collector filterers indicated that fine particulate organic matter
originating from sources such as sewage and animal manure was minimal.
There was good agreement between WDEQ and USGS macroinvertebrate sampling in 1999 since
each sampling group rated biological condition as good. There were differences between
numerous metric values and this variability may be due to differences in sample collection
methods, sampling location (locations were about one (1) mile apart) and date that samples were
collected (WDEQ sampled about 1 ½ months later than USGS).
The benthic macroinvertebrate data collected by WDEQ and USGS indicated that activity
occurring upstream in the BHNF had no measurable effect on biological communities at the Upper
station. Potential pollutants entering the Tongue River from BHNF were apparently removed by
natural stream processes resulting in good year around water quality and healthy biological
communities. The good rating for biological condition confirmed the overall good water quality
shown through water quality sampling and indicated full support for aquatic life use.
Biological condition at the Tongue River Middle station using scoring criteria from the WSII was
very good during each year (Table 8-15). The WBCI was not applicable to this station because
the Middle station was located in the Northwestern Great Plains ecoregion and the WBCI was
developed for Middle Rockies ecoregion mountain and foothill streams. The rating of very good
indicated full support of aquatic life use. There was more variability among years for WSII
scores at the Middle station when compared to variability among years for WSII scores at the
Upper station. Average WSII scores ranged from 79.7 in 1998 to 97.9 in 1999.
The benthic community at the Middle station was generally dominated by cooler water taxa
indicative of good water quality and good habitat. Dominant taxa in order of decreasing
abundance included Hydropsyche, Lepidostoma, Brachycentrus occidentalis, Drunella
grandis/spinifera and the riffle beetle, Optioservus (Table 8-16). Hydropsyche was also
abundant at the Upper station. Lepidostoma is a caddisfly most often found in cool streams and is
widespread throughout the United States, but is most common in the western United States
(Wiggins, 1996). The pollution tolerance value (TV) for this genus was 1 indicating that this group
was intolerant of pollution. Brachycentrus occidentalis is a common caddisfly in Wyoming and
throughout the western United States. It is found in clear cold waters throughout the state (Ruiter
and Lavigne, 1985) and has a TV value of 1 indicating this species was intolerant of pollution.
Drunella grandis/spinifera is a pollution intolerant group of mayfly that is widely distributed
throughout the western United States. Optioservus is a common riffle beetle genus that often
replaces the riffle beetle genus Heterlimnius (common in Wyoming mountain streams) in lower
elevation streams. Optioservus was a scraper and has a TV of 4 indicating that it was mildly
tolerant of pollution. Worms, including Pristina jenkinae and Nais variabilis, were collected in
1996 and 1998. No worms were collected in 1997 and 1999. Worms comprised 6.5 percent of
the benthic community in 1996 and 0.2 percent of the community in 1998. No Tubifex tubifex

Sheridan County Conservation District
Tongue River Watershed Assessment 205j Final Report 1996-1999 142
were collected indicating a low probability for the occurrence of whirling disease.
The total number of EPT taxa was generally consistent among years and ranged from sixteen (16)
taxa in 1996 and 1999 to twenty-four (24) taxa in 1999. Percent contribution of scraper
abundance was generally lower than at the Upper station and ranged from eight (8) percent in 1999
to twenty-five percent in (25) percent in 1997. Lower percent composition of scrapers at the
Middle station indicated increased silt deposition when compared to the Upper station.
Embeddedness was relatively low at the Middle Station, but higher than embeddedness at the
Upper station. The percent contribution of collector filterers increased at the Middle station when
compared to the Upper station. Collector filterers comprised seven (7) percent of the population
in 1996, but percentage contribution increased in 1997 to 17 percent and to 40 percent in 1998 and
1999. The increase in collector filterers indicated an increase in fine particulate organic matter
that may originate from sources such as sewage and animal manure.
The benthic macroinvertebrate data collected in 1998 at Tongue River stations upstream and
downstream of the Dayton WWTF using scoring criteria from the WSII was very good (Table
8-15). The average WSII score was 86.7 at the upstream station and 84.2 at the downstream
station. The slight reduction in WSII score from the upstream station to the station downstream
of the WWTF indicated that effluent discharged from the WWTF had little measurable effect on
the biological community.
The benthic macroinvertebrate data at the Middle station found biological condition was very good
indicating healthy biological communities. The very good rating for biological condition
confirmed the overall good water quality shown through water quality sampling and indicated full
support for aquatic life use. Changes in the benthic macroinvertebrate population from the Upper
to Middle stations appeared to reflect slightly higher water temperature, increased input of fine
particulate organic material, and increased (but relatively low) amounts of sediment.
The biological condition of the benthic macroinvertebrate community at the Tongue River Lower
station rated very good each year (Table 8-15). Average WSII values ranged from 80.4 in 1999
to 85.2 in 1998. Average index values were slightly lower when compared to average index
values at the Middle station indicating a slight reduction in biological condition at the Lower
station. However, the WSII values indicated water quality and habitat quality was among the
highest when compared to water quality and habitat quality at other Wyoming plains streams
located in the Northwestern Great Plains (including streams in the counties of Sheridan, Johnson,
Natrona, Converse, Crook and Niobrara). These observations indicated full support for aquatic
life use at the Lower station.
Average total macroinvertebrate population density each year, although often highly variable in
freshwater benthic communities, was over three-fold higher at the Lower station (average density
= 24, 968 m2) when compared to the Middle station (average density = 7,154 m
2). Higher density

Sheridan County Conservation District
Tongue River Watershed Assessment 205j Final Report 1996-1999 143
at the Lower station indicated higher production due to change in water quality and warmer water
temperature. Warmer water temperature appeared to be important because there was a shift from
primarily cool water taxa at the Middle station to more warm water taxa characteristic of warmer
water plains streams. The mayfly, Tricorythodes minutus and the riffle beetle, Microcylloepus
were two of the five most dominant macroinvertebrate taxa at the Lower station (Table 8-16).
Both taxa are common in warmer water Wyoming plains streams affected by increased siltation.
The presence of T. Minutus in streams in the western United States has been associated with
increased sediment deposition (Winget and Mangum, 1991). Microcylloepus appears to favor
Wyoming streams with higher sediment deposition when compared to the riffle beetle taxon
Heterlimnius, found in mountain and foothill streams and Optioservus, found in intermediate
elevation and lowland Wyoming streams. Optioservus was a dominant taxon at the Tongue
River Middle station. The regular occurrence of the caddisflies, Helicopsyche borealis and
Cheumatopsyche at the Lower station during each year indicated warmer water temperature and
increased sand and silt deposition.
The total number of taxa at the Lower station was relatively consistent among years ranging from
36 taxa in 1998 to 40 taxa in 1999. The number of EPT taxa was likewise consistent ranging from
19 taxa in 1996 to 21 taxa in 1999. Ephemeroptera (mayflies), Plecoptera (stoneflies), and
Trichoptera (caddisflies), or the EPT taxa, are probably the most intolerant macroinvertebrate
groups to agricultural runoff (McCafferty, 1978; Lenat, 1984). The total number of taxa and EPT
taxa ranked high when compared to other plains streams in the Northwestern Great Plains
ecoregion.
Percent scrapers decreased from the Middle station (average = 14.3 percent) to the Lower station
(average = 8.3 percent) indicating increased sediment deposition at the Lower station.
Embeddedness (silt deposition) increased from the Middle station (average weighted
embeddedness = 76.9) to the Lower station (average weighted embeddedness =32.0) (Table 8-20).
Weighted embeddedness values decrease with increased sediment deposition. The percent
contribution of collector gatherers increased at the Lower station (average = 38.3 percent) when
compared to the Middle station (average = 25.5 percent) indicating the presence of increased
coarse particulate organic matter (i.e. leaves, algae, vegetation) due to apparent increased
production at this reach.
The number of worm taxa and percent contribution of worms to the total benthic population
increased slightly from the Middle station to the Lower station. The number of worm taxa and
percent contribution (in parenthesis) at the Lower station in 1996 was 3 (3.6 percent), 4 (1.4
percent) in 1997 and 0 (0.0 percent) in 1998 and 1999. The number and percent of worms were
considered quite low for Wyoming plains streams. No Tubifex tubifex worms were identified
from samples T. tubifex is significantly involved in the whirling disease life cycle caused by a
parasite (Myxobolus cerebralis) that penetrates the head and spinal cartilage of fingerling trout.
Whirling disease may eventually cause death in trout and the absence of this worm indicated low

Sheridan County Conservation District
Tongue River Watershed Assessment 205j Final Report 1996-1999 144
probability for the occurrence of whirling disease.
The shift from a benthic community comprised primarily by cool water taxa at the Middle station
to a community comprised of more warm water and generalist taxa at the Lower station indicated
fundamental change in the thermal regime and slightly higher sediment deposition at the Lower
station. There were no large differences for stream substrate particle size between stations to
account for the shift in composition of taxa (Table 8-20). Evaluation of the benthic
macroinvertebrate data, water quality data, temperature data and fishery data (see Section 8.5.21)
indicated that the Tongue River Lower station was sited near the transition zone from a cold water
environment (WDEQ Class 2 cold water body) to a warm water environment (WDEQ Class 2
warm water body). Dewatering during the critical warmer summer months (June, July and
August) appeared to increase average and daily maximum water temperature. The thermal
effects at the Lower station were further compounded by the fact that each tributary within the
Project area (with the exception of Five Mile Creek and Smith Creek) were dewatered during the
summer irrigation period thus reducing discharge to the Tongue River. Water temperature will
naturally increase during summer months, but dewatering appeared to accelerate the increase in
water temperature. Other than for these critical summer months, thermal conditions appeared
suitable for maintenance of cold water aquatic populations including trout. Dewatering induced
water temperature increase provided more favorable conditions for inhabitation by warm water
benthic macroinvertebrate and fish species than to cold water macroinvertebrate and trout species.
Coldwater benthic and fish species may be present and survive in this transition zone, but warm
water benthic and fish species will increase in dominance within the transition zone.
The apparent effect of seasonal dewatering and increased water temperature was to allow warm
water species to expand their range further upstream in the Tongue River than normal; the range
for coldwater species was thus reduced to reaches further upstream where favorable year around
water temperature persisted. The reduction in habitat for cold water species represented a loss of
habitat for trout. The loss of trout habitat due to summer dewatering is a complex issue in
Wyoming due to competing interests for water resources. The issue becomes more complex
because the political climate has avoided linking Wyoming water quality standards to water
quantity that is under jurisdiction of the Wyoming State Engineer. However, the link between
water quality and water quantity becomes clear when dewatering contributes to exceedence of the
Wyoming water quality standard for temperature. The balance between water use for irrigation
and survival of the agricultural community and water use to maintain trout habitat and recreation
has, historically for years, proven to be a difficult issue to resolve.
Dewatering and water temperature increase at the Lower station may be successfully addressed
only at the watershed scale because water quantity reduction and water temperature increase
observed at tributaries to the Tongue River affect mainstem Tongue River water resources.
Riparian vegetation management should be further evaluated since shading affects water
temperature. The Tongue River Watershed Plan prepared by SCCD, the Tongue River

Sheridan County Conservation District
Tongue River Watershed Assessment 205j Final Report 1996-1999 145
Watershed Steering Committee and Tongue River watershed landowners addresses the need for
better water management within the Project area (SCCD, 2000). Implementation of water
management change may succeed only with full cooperation of all water users, suitable financial
incentives and a dedication to improve year around water resources in the Tongue River and
tributaries. This may prove a difficult task since future development within the Tongue River
Project area will require increased use of water. The landowners must take the lead in concert
with SCCD and the Tongue River Watershed Steering committee since the majority of water is
used to sustain the agricultural economy. Measures that may be implemented to conserve water
resources include upgrade of irrigation water transmission systems (i.e. piping versus unlined
ditches), use of managed sprinkler systems instead of flood irrigation and better monitoring of soil
moisture in fields and pastures.
However, regardless of the effect on water temperature caused by seasonal dewatering, natural
changes in water quality and water temperature indicated that the entire Tongue River in Wyoming
was not a Class 2 cold water, water body as currently classified by WDEQ (1998). Chemical,
physical and biological data collected during this Project in accordance with the intent of the
Wyoming Credible Data statute, provided suitable credible data to propose a change in stream
classification from Class 2 cold water to Class 2 warm water. Despite scientific data collection,
defining the division point between Class 2 cold water and Class 2 warm water segments remains
an arbitrary exercise because there is no sharp distinction within the transition zone. Water
temperature appeared to be the single most reliable indicator to determine the division point
between cold water and warm water classifications.
Other than for anthropogenic affects related to dewatering and water temperature increase
observed during the summer period from June through August, it appeared that natural favorable
conditions exist for cold water species downstream from the Lower station approximately 8 to 9
stream miles to the Interstate 90 bridge crossing. Communication with WGFD indicated that this
location may be the logical point to reclassify the Tongue River to reflect the natural change in
water temperature. SCCD may consider submittal of a formal petition to WDEQ to initiate the
reclassification process at a later date. Data and findings contained in this Final Report should
provide adequate justification for initiation of the proposed reclassification. The proposed
reclassification will not change the current status for placement of the Tongue River Lower
segment on the Wyoming 303d list, but will provide more appropriate water quality goals for the
downstream segments.
8.5.20 SCCD and WDEQ Tongue River Habitat Assessment
Qualitative habitat assessments were conducted annually at each Tongue River station. WDEQ
conducted annual habitat assessments in 1998 at a station upstream of the Dayton WWTF and a
station downstream of the Dayton WWTF. Because habitat assessments were subjective, SCCD
used caution by providing a conservative interpretation of data.

Sheridan County Conservation District
Tongue River Watershed Assessment 205j Final Report 1996-1999 146
The average habitat score at the Upper station was 174 (Table 8-17), 140 at the Middle station and
134 at the Lower station (Table 8-18). The habitat assessment score was 152 at the station above
Dayton WWTF and 144 at the station below Dayton WWTF, The range in annual habitat scores
at the Upper station from 1993 through 1999 was from 165 in 1993 to 181 in 1996. Scores at the
Middle station ranged from 116 in 1999 to 158 in 1997. Scores at the Lower station ranged from
127 in 1996 to 137 in 1997. Variation in habitat scores between years appeared to be related to
difference in annual stream discharge. Although assessments were generally conducted on
sampling dates within + two (2) weeks of one another each year, differences in annual discharge
affected scoring for some habitat parameters because they were flow dependent. Scores for
instream cover, velocity / depth, channel flow status and width depth ratio will normally score
higher when discharge is increased, but will score lower when discharge is decreased.
The reduction in habitat score from the Upper station to downstream stations was due to lower
scores for embeddedness, channel flow status, channel shape, channelization, width depth ratio
and bank stability. Reduced scores for some of these parameters were related not only to current
land use practices, but to lingering effects from the period of extensive channelization that
apparently occurred in the late 1950's to early 1960's. Effects of channelization from that period
continue to affect the Tongue River stream channel to this day requiring patch work repair and
bank stabilization projects. Despite the lower habitat scores at the Middle and Lower stations,
these stations ranked high when compared to habitat scores at other Wyoming plains streams.
This observation indicated that although Tongue River in-stream and riparian habitat have been
altered due to channelization, habitat was still in better condition when compared to most
Wyoming plains streams in the Northwestern Great Plains ecoregion.
The semi-quantitative stream substrate particle size distribution varied little between the Upper,
Middle and Lower stations including the stations located upstream and downstream of the Dayton
WWTF monitored by WDEQ in 1998. Average percent cobble was 73 percent at the Upper
station, 85 percent at the station above Dayton WWTF, 76 percent at the station below Dayton
WWTF, 67 percent at the Middle station and 62 percent at the Lower station (Tables 8-19 and
8-20). Average percent coarse gravel ranged from 12 percent at the Upper station and the station
upstream of the Dayton WWTF, to 28 percent at the Lower station. Silt deposition was minimal.
Only the Upper and Lower stations had detectable silt deposition and silt comprised about 1
percent of total substrate at each station. Sand comprised 5 percent, 3 percent, 1 percent, 2
percent and 1 percent of the average total substrate at the Upper station, stations above and below
Dayton WWTF, Middle and Lower stations, respectively. Silt and sand are detrimental to trout
egg survival and maintenance of healthy benthic macroinvertebrate populations that provide food
for trout. The dominance of cobble and gravel at each station allowed reliable comparison of
macroinvertebrate communities between stations because potential variability caused by
difference in substrate was minimal.
Embeddedness (silt covering cobble and gravel) was low at the Upper station and stations

Sheridan County Conservation District
Tongue River Watershed Assessment 205j Final Report 1996-1999 147
upstream and downstream of the Dayton WWTF. Average weighted embeddedness at the
Upper station from 1993 through 1999 was 95.9. Average weighted embeddedness at stations
upstream and downstream of the Dayton WWTF were 100 and 99, respectively (Table 8-19).
The higher the weighted embeddedness value, the lower the embeddedness or amount of silt
deposited on cobble and gravel. Average weighted embeddedness at the Middle station was 76.8,
and 32.0 at the Lower station. The decrease in weighted embeddedness at the Middle and Lower
stations indicated increased deposition of silt when compared to the Upper station. Deposition of
silt is controlled by the amount of silt contained in the water column and by the current velocity.
Silt deposition will normally increase as current velocity decreases.
Average current velocity measured at the Upper station was 2.1 feet per second (fps), 2.5 fps at the
stations upstream and downstream of the Dayton WWTF, 2.3 fps at the Middle station and 2.6 fps
at the Lower station. Because average water current velocity was slightly higher at Middle and
Lower stations when compared to the Upper station and stations near the Dayton WWTF,
increased silt deposition was not related to difference in current velocity among stations, but was
due to increased amount of silt contained in the water column. This observation was confirmed
by turbidity sampling conducted at Upper, Middle and Lower stations.
The general decrease in substrate particle size from the Upper station to the Lower station was
normal because particle size generally decreases as stream size and stream order increase (Rosgen,
1996). Observed increase in embeddedness (silt deposition) from the Upstream station to the
Lower station was likewise considered normal for stream size and stream order. Embeddedness
at the Lower station was low when compared to weighted embeddedness values at other plains
streams in the Northwestern Great Plains ecoregion. Low levels of sediment tends to decrease
organism density while producing only slight effects on species diversity (Lenat et al., 1979; Lenat
et al., 1981). Heavy levels of sedimentation will usually result in decreases in both density and
diversity of organisms (Lenat, et al., 1981; Lemly, 1982; Olive et al., 1988). The benthic
macroinvertebrate population density was highest at the Lower station when compared to
organism densities at Upper and Middle stations. Fine sediment which settles on, or penetrates
into, the streambed is more detrimental to fish and macroinvertebrate populations than is
suspended sediment entrained in flowing water (Campbell and Doeg, 1989). Deposited sediment
can result in lowered inter-gravel oxygen concentrations reducing survival of trout eggs and
negatively affect stream productivity and density of aquatic organisms which are the main food
source of cold water stream fish (Hynes, 1970; Hawkins et al., 1983; Waters, 1995).
Embeddedness at the Lower station had no apparent detrimental effect on the benthic
macroinvertebrate population because biological condition was rated very good and full support of
aquatic life use was indicated.
8.5.21 WGFD Tongue River Fish Population Monitoring
WGFD conducted historic and current monitoring of fish populations at various Tongue River

Sheridan County Conservation District
Tongue River Watershed Assessment 205j Final Report 1996-1999 148
locations within the Project area over the period from 1959 through 1994. Approximate location
of sampling stations are illustrated in Figure 5-1 and Figure 5-2. Results from fifteen (15)
sampling events are presented in Appendix Tables C-1 through C-15.
Sampling at stations located near the mouth of the Tongue River canyon (near SCCD station
Tongue River Upper) has occurred since 1959. Game fish populations were dominated by brown
trout, mountain whitefish and rainbow trout. No Yellowstone cutthroat trout or other cutthroat
trout sub-species have been collected in the Tongue River within the Project area. The
Yellowstone cutthroat trout is the only native trout species known to have inhabited the Tongue
River watershed. Non-game species were dominated by longnose dace. Longnose sucker and
mountain sucker were collected less frequently. Absolute presence/absence data and relative
contribution of non-game species presented in sampling results contained an unknown degree of
bias because many historic fish surveys concentrated on capture of game (trout) species. Further,
the small size and often high density of longnose dace prevented high capture efficiency for this
species. Although presence/absence data for game fish species appeared reliable, changes in trout
abundance that may have occurred through the years could not be made due to differing sampling
effort and variable capture efficiencies.
Fish populations changed dramatically as the Tongue River exited the canyon and flowed toward
the Town of Dayton. Mountain whitefish became the dominant game species, followed in order
of general abundance by brown trout and rainbow trout. Non-game species increased
significantly. Longnose dace was probably the primary non-game species, but reliable estimates
for abundance could not be made due to unknown capture efficiency. Non-game species
identified in this reach, but which were absent from the Canyon reach, included white sucker,
longnose sucker and mountain sucker. The change in fish population from one dominated by
trout species in the canyon to one dominated by whitefish appeared to be related not to water
quality change, but to extensive channelization, which had widened the stream and reduced habitat
required for trout to thrive (Mueller, 1966). Channelization effects reduced the diversity in
stream habitat by creating more riffle and run habitat favorable for whitefish, but reducing the
number of pools preferred by trout.
Mueller (1966) conducted an investigation of the Tongue River in the vicinity of Dayton at the
request of then Mayor, Mr. Herman Northrup, to determine if pollution from septic tanks and
houses with no septic tanks were seeping into the Tongue River. The Town of Dayton had
submitted an application for federal aid to construct a new sewage disposal plant. The pollution
investigation found no correlation between fish populations and domestic pollution (if any) from
the Town of Dayton. Mueller indicated that channel clearing and the resulting deterioration of
trout habitat had a greater effect on the trout population than potential effects due to pollution (no
pollution was identified).
Following a landowner complaint regarding an increase in non-game fish, WGFD conducted a

Sheridan County Conservation District
Tongue River Watershed Assessment 205j Final Report 1996-1999 149
study in 1969 of fish populations in the Tongue River within the approximate current Project area
from the canyon mouth downstream to the Town of Ranchester (Mueller et al., 1970). The report
found extensive channelization of the Tongue River consisting of channel clearing, reshaping of
the banks and changing the channel. The purpose of the channelization was to allow more rapid
passage of flood water and prevent erosion and flooding of adjacent crop or pasture land. The
United States Department of Agriculture Soil Conservation Service provided technical assistance
and landowners received cost share from the Agriculture Stabilization and Conservation
Committee. Prior to issuance of this report, a memorandum dated November 17, 1967 from John
Mueller to Mr. Fred Eiserman and Mr. Don Dexter indicated that dewatering and water
temperature were additional problems to be dealt with for establishing a good fishery in the
Tongue River. Mueller et al. (1970) found that the end result of channelization was the
elimination of fish habitat for game fish. The loss of essential habitat substantially reduced both
game and non-game fish. Flood conditions in 1967 and 1968 were believed to have affected fish
populations sampled in 1969. Prior to channelization, it was reported that reasonably good
habitat and fish populations existed in the Tongue River and natural reproduction provided a
fishery without supplemental stocking.
A subsequent investigation was conducted by Mueller (1979) in response to a complaint from a
Wyoming state senator regarding whitefish abundance on the IXL ranch upstream of Dayton.
The report stated that the Tongue River had been channelized to protect land adjacent to the river
from flood damage. Channelization occurred essentially from Ranchester upstream to the
state-owned public fishing area (Tongue River canyon area), an area which was once considered
excellent trout water. Most of the good trout habitat was destroyed by channelization leaving
long stretches of riffle area. The riffle areas were more conducive to maintenance of whitefish
populations. Whitefish populations had increased while trout populations declined due to lack of
cover and resting areas.
Subsequent sampling by WGFD at the IXL Ranch in 1991 found whitefish were still relatively
abundant, but brown trout was the most abundant game species (Appendix Table C-11).
A survey of the Tongue River from about five (5) miles above Dayton to the Wyoming state line
was reported by Bjorn (1938). He reported that the Tongue River canyon water was very suitable
for trout. Brown and rainbow trout were taken from the canyon reach in great numbers in the
spring of the year. No game fish were taken from the middle (downstream of Ranchester?) or
lower (near the state line) stations. Flathead chub, longnose dace, common white sucker, chub
minnow and mountain suckers were found either at the middle or lower stations. The report
indicated no game fish were taken below the Middle station which was believed to be located
downstream of Ranchester. Bjorn did not mention extensive stream channelization in the survey.
This historic record adds additional information to suggest that the proposed division between
Class 2 cold water and Class 2 warm water in the vicinity of the I-90 bridge was reasonable.

Sheridan County Conservation District
Tongue River Watershed Assessment 205j Final Report 1996-1999 150
Sampling in 1962 above the halfway bridge (near the current SCCD Tongue River Middle station)
found mountain whitefish and brown trout in similar number followed by rainbow trout and
stonecat, a game species. Only one (1) rainbow trout and stonecat were collected (Appendix
Table C-13).
Fish populations were monitored by WGFD near the SCCD Tongue River Lower station in 1993
and 1994. Twelve (12) fish species were captured in 1993 and sixteen fish species were captured
in 1994. Sampling indicated a diverse fishery comprised of both cold water species and warm
water fish species. High species diversity is often encountered in larger rivers where there is an
admixture of cold water and warm water fish species due to the transition from a cold water system
to a warm water system (Funk, 1970). This observation further indicated that the Tongue River
Lower station was sited near the transition zone between cold water and warm water reaches.
The apparent decline in the fishery from the Tongue River canyon downstream to the Town of
Ranchester was an important concern for this Project. Evaluation of the water quality,
macroinvertebrate, fishery and habitat data indicated that the decline in the Tongue River fishery
was primarily due to historic large scale channelization causing destruction of in stream fishery
habitat. Dewatering and water temperature increase due to irrigation demand in the critical
warmer summer months from June through August compound the lack of physical habitat by
stressing cold water fish species present in the limited habitat. Limited channelization still occurs
within the Project area and bank stabilization efforts continue. Water quality (other than high
summer water temperature) does not appear to produce deleterious effects on the fishery. Aquatic
life use was fully supported at Tongue River Upper, Middle and Lower stations. However,
habitat loss has apparently reduced the number of game fish and increased the number of
non-game fish.
8.6 Little Tongue River Stations
8.6.1 Little Tongue River Discharge
Instantaneous discharge measurements were recorded by SCCD and WDEQ during sampling at
Little Tongue River Upper and Lower stations. Summary statistics for discharges are presented
in Table 8-21. Discharge measurements during the Project at the Upper station averaged 11.7
cfs, and 15.3 cfs at the Lower station. The geometric mean at the Upper station was 7.1 cfs, and
3.7 cfs at the Lower station. The average values were difficult to compare among Upper and
Lower stations due to differing sampling frequency and lack of same day sampling on numerous
occasions. Figure 8-19 illustrates discharge measured at each station on the same day.
Discharge data not measured at each station on the same day was excluded from Figure 8-19
because discharge may vary daily precluding valid comparison among stations.
Discharge during the primary low-irrigation months (April, May and September) often increased

Sheridan County Conservation District
Tongue River Watershed Assessment 205j Final Report 1996-1999 151
from the Upper station downstream to the Lower station. However, overall discharge measured
on all comparable days was reduced by about six (6) percent (Table 8-2). Discharge was often
reduced from the Upper station to the Lower station during the primary irrigation months (June,
July and August) (Figure 8-19) although there was no overall difference in average discharge
between the Upper and Lower stations during this period.
The Little Tongue Lower station had a discharge less than 1 cfs on 42 percent of the irrigation
season days. The lowest discharge measurement at the Little Tongue River Upper station during
irrigation season days was 4.51 cfs on August 10, 1999. The reduction in discharge from the
Upper station to the Lower station was due to dewatering. Dewatering at the Lower station was
especially evident in 1999 when discharge was less than 1 cfs on sampling days from July 21, 1999
to September 15, 1999. The generally low discharge at the Lower station appeared to be a
primary factor responsible for impairment of biological condition during each year of the Project
(see Section 8.6.11).
The contribution of discharge from the Little Tongue River to the Tongue River was estimated by
comparing discharge at the Little Tongue River Lower station to discharge measured at the
Tongue River Upper station on the same day. This comparison revealed the Little Tongue River
contributed an estimated 6.2 percent of the Tongue River discharge (Appendix Table M-2). This
suggested that potential pollutants entering the Tongue River from the Little Tongue River would
be significantly diluted.
8.6.2 SCCD and WDEQ Little Tongue River Temperature Monitoring
Summary statistics for instantaneous water temperature measurements by SCCD and WDEQ at
Little Tongue River Upper and Lower stations are presented in Table 8.22. Water quality data for
the Upper station is presented in Appendix Tables B-9 and B-11 and data for the Lower station in
Appendix Tables B-10 and B-12.
Average water temperature was lowest at the Upper station (10.70C) and slightly higher at the
Lower station (11.70C). Maximum water temperature recorded at the Upper station was 15.9
0C,
and 20.80C at the Lower station. Based on instantaneous measurements there were no
exceedences of the Wyoming water quality standard for water temperature. However, as
indicated in Section 8.5.2, sampling conducted by SCCD and WDEQ did not occur during the time
of day required to detect maximum daily water temperature. Maximum daily temperature was
projected at each station during the months of June, July, August and September as described in
Section 8.5.3. Projected maximum daily water temperature indicated no exceedence of Wyoming
water quality standard for temperature at the Upper station. One temperature exceedence
probably occurred at the Lower station on August 3, 1999 and possibly a second exceedence on
July 21, 1999. This observation indicated the need for future continuous water temperature
monitoring during warmer summer month at the Lower station to determine frequency of

Sheridan County Conservation District
Tongue River Watershed Assessment 205j Final Report 1996-1999 152
occurrence for exceedence of the water temperature standard.
8.6.3 SCCD and WDEQ Little Tongue River pH Monitoring
Summary statistics for instantaneous pH measurements by SCCD and WDEQ at Little Tongue
River Upper and Lower stations are presented in Table 8.23. The pH varied little among the
Upper and Lower stations. The average and geometric mean for pH during this Project was 8.0
SU at the Upper station and 8.1 SU at the Lower station. The maximum pH recorded at the Upper
station during the Project was 8.6 SU, and 8.5 SU at the Lower station. The minimum pH was 7.1
SU at the Upper station and 7.4 SU at the Lower station. The generally high pH at both stations
reflected the predominant limestone geology in the Little Tongue River watershed. All pH
measurements were within Wyoming water quality standards.
8.6.4 SCCD and WDEQ Little Tongue River Specific Conductivity Monitoring
Summary statistics for specific conductivity are presented in Table 8-24. Average conductivity
during the Project was 234 umhos/cm at the Upper station and 436 umhos/cm at the Lower station.
The geometric mean was 212 umhos/cm at the Upper station and 395 umhos/cm at the Lower
station. Conductivity values at the Upper station ranged from a low of 124 umhos/cm to a high of
580 umhos/cm and from a low of 197 umhos/cm to a high of 829 umhos/cm at the Lower station.
The average increase in conductivity from the Upper station to the Lower station was 86 percent.
The increase in conductivity between stations using the geometric mean was also 86 percent. The
increase in conductivity was higher than expected and suggested that irrigation return or urban
storm water effluent may be affecting conductivity at the Lower station especially during periods
of low discharge. Although there was no Wyoming water quality standard for conductivity,
values were generally considered low and within the range required for support of aquatic life.
Conductivity values were controlled primarily by stream discharge. The association between
conductivity and discharge was strong and inverse such that as discharge increased, conductivity
decreased. The correlation coefficient between conductivity and discharge at the Upper station
was -0.742, and -0.652 at the Lower station (Appendix Table L-3). Correlation coefficients were
significant (P<0.01) at each station indicating there was less than a 1 percent chance that the
association was due to random chance alone. This observation indicated that conductivity at the
Lower station could be reduced by increasing discharge.
8.6.5 SCCD and WDEQ Little Tongue River Dissolved Oxygen Monitoring
SCCD initiated monitoring for dissolved oxygen (DO) in 1999. WDEQ conducted monitoring
for DO once annually usually in October. Summary statistics for DO are presented in Table 8-25.
DO was similar at each station. Average DO during the Project was 9.6 mg/l at the Upper station

Sheridan County Conservation District
Tongue River Watershed Assessment 205j Final Report 1996-1999 153
and 9.9 mg/l at the Lower station. DO values ranged from 7.8 mg/l to 10.7 mg/l at the Upper
station and from 7.2 mg/l to 10.4 mg/l at the Lower station.
There were no exceedences of the Wyoming water quality standard for DO because no DO values
were less than 5 mg/l. The lowest DO value recorded during the Project was 7.2 mg/l measured
by SCCD at the Lower station on September 15, 1999. The DO concentrations were sufficient to
support diverse aquatic populations and fish indicating full support for aquatic life use for this
physical parameter.
8.6.6 SCCD and WDEQ Little Tongue River Turbidity Monitoring
Summary statistics for turbidity are presented in Table 8-26. Average turbidity measurements
during the Project were similar between stations considering variability normally present in
turbidity sampling. Average turbidity was 5.8 NTU at the Upper station and 8.5 NTU at the
Lower station. The geometric mean was 3.2 NTU at the Upper station and 3.5 NTU at the Lower
station. Turbidity values at the Upper station ranged from a low of 0.1 NTU to 20.0 NTU and
from 0.3 NTU to 36.0 NTU at the Lower station. The increase in turbidity from the Upper station
to the Lower station was low even considering that turbidity naturally increases along the
longitudinal gradient of most flowing water bodies.
Turbidity values were strongly associated with discharge. There was a significant positive
relationship such that turbidity values increased as discharge increased. The correlation
coefficient between turbidity and discharge at the Upper station was +0.673 (P<0.01), and +0.716
(P<0.01) at the Lower station. R-squared values for the regression analyses were 41.0 percent at
the Upper station and 51.3 percent at the Lower station (Appendix Tables L-5 and L-6). Because
of the association between turbidity and discharge, lower turbidity values were recorded during
periods of lower discharge (prior to and after spring runoff) in early April, September and October
and higher turbidity values were generally recorded during periods of higher discharge during
spring runoff in latter April, May and June. There was no exceedence of the Wyoming water
quality standard for turbidity. The average increase in turbidity between the Upper and Lower
stations was 2.7 NTU which was well below the increase of 10 NTU allowed by the Wyoming
water quality standard for Class 2 water bodies.
8.6.7 SCCD and WDEQ Little Tongue River Fecal Coliform Bacteria Monitoring
Summary statistics for fecal coliform bacteria are presented in Table 8-27. The geometric mean
for fecal coliform bacteria at the Upper station during the Project was 4 per 100ml, and 32 per
100ml at the Lower station. The geometric mean is a logarithmic transformation of data and
provided a more reliable estimate of the mean by smoothing extreme values when variability was
high among fecal coliform measurements characteristic in fecal coliform sampling. Fecal
coliform bacteria concentration at the Upper station ranged from 1 per 100ml to 98 per 100ml.

Sheridan County Conservation District
Tongue River Watershed Assessment 205j Final Report 1996-1999 154
The number of bacteria was quite low indicating that the primary land uses (wildlife, recreation
and limited seasonal livestock grazing) in the vicinity of the Upper station were not significant
sources of fecal coliform bacteria. Fecal coliform bacteria concentration at the Lower station
ranged from 1 per 100ml to 770 per 100ml.
The was no exceedence of the Wyoming water quality standard for fecal coliform bacteria at the
Upper station. The geometric mean of five (5) samples collected during the Recreational Season
in 1999 at the Upper station was 11per 100ml which was considered low. There was no single
sample in excess of 400 per 100ml since the maximum level during the Project was 98 per 100ml
(collected August 3, 1999).
Fecal coliform bacteria levels at the Lower station exceeded the Wyoming water quality standard
for fecal coliform bacteria. The geometric mean of five (5) samples collected during the
Recreation Season in 1999 was 290 per 100ml which exceeded the standard of 200 per 100ml.
Two samples had fecal coliform levels in excess of 400 ml. A sample collected on July 21, 1999
contained 770 per 100ml and sampling on July 28, 1999 found 570 per 100 ml. The exceedence
of the standard indicated remedial measures were required to lower fecal coliform levels to bring
the Lower station into compliance with the Wyoming water quality standard for fecal coliform
bacteria.
There were no exceedences of the fecal coliform standard in 1996, 1997 and 1998. SCCD
increased the sampling frequency in 1999 from monthly to five (5) samples within a 30 day period
during the Recreation Season to provide a better estimate of bacteria contamination and allow
direct comparison to the Wyoming water quality standard for fecal coliform bacteria. Other
sampling sites within the Project area exceeded the Wyoming fecal coliform standard only in
1999. It appeared the increased sampling frequency in 1999 compared to previous years
increased the probability for detection of fecal coliform levels in excess of the Wyoming fecal
coliform standard. Extensive discussion related to the effects of sampling frequency for reliable
estimates of fecal coliform bacteria is presented in Section 8.11.1.
The increase in fecal coliform bacteria from Upper to Lower stations may be related to sources
from different land uses. Because the Lower station was sited in the Town of Dayton, urban land
use may contribute bacteria in addition to wildlife, domestic animals and agricultural influences
upstream. A sampling station upstream of the Town of Dayton is required to separate potential
effects from urban land use from the effects of other land uses. The relationship between fecal
coliform bacteria level and land use within the Project area is discussed in Section 8.11.4.
8.6.8 SCCD and WDEQ Little Tongue River Nitrate Nitrogen Monitoring
Total nitrate samples were collected infrequently (N = 3 total samples) at the Little Tongue River
Upper station due to Project monitoring budget constraints. Sampling for nitrate nitrogen was

Sheridan County Conservation District
Tongue River Watershed Assessment 205j Final Report 1996-1999 155
concentrated at the Lower station because potential nutrients entering the Tongue River could be
best estimated at this station. Summary statistics for nitrate nitrogen are presented in Table 8-28.
Average nitrate nitrogen concentrations was low at each station during the Project. The average
nitrate concentration at the Upper station was .001 mg/l, and .022 mg/l at the Lower station.
Nitrate values at the Upper station based on four (4) samples (including one sample collected by
WDEQ in 1993) ranged from .010 mg/1 to .170 mg/l, and from .001 mg/l to .130 mg/l at the
Lower station.
Average and maximum nitrate values at the Upper and Lower stations were considered low.
Nitrate concentration was well below the Wyoming water quality standard and drinking water
human health standard of 10 mg/l for Class 2 surface waters (WDEQ, 1998). Data for nitrate
nitrogen indicated that nitrate concentration in the Little Tongue River was less than the
background concentration of nitrate (about 0.60 mg/L) found in streams in undeveloped areas
throughout the United States (USGS, 1999). These observations indicated that nitrate nitrogen
was not present in the Little Tongue River in concentrations that could pose a human health threat
or an ancillary threat to aquatic life use manifest by effects due to eutrophication. Full support for
all Wyoming beneficial uses that may be affected by nitrate nitrogen was indicated.
8.6.9 SCCD and WDEQ Little Tongue River Total Phosphorus Monitoring
Total phosphorus samples were collected infrequently by SCCD (N = 2 total samples) at the Little
Tongue River Upper and Lower stations due to Project monitoring budget constraints. The
majority of total phosphorus data was provided by WDEQ sampling during annual
bioassessments. Summary statistics for total phosphorus are presented in Table 8-29. These
statistics were based on “censored” values because the majority of analyses (8 samples out of 9
total samples) were less than the minimum detection limit (minimum detection limit was 0.10 mg/l
for WDEQ analytical method; 0.05 mg/l for SCCD analytical method). The minimum detection
limit for the WDEQ analytical method did not provide adequate data needed to address the
recommended water quality standard for total phosphorus in water bodies draining to a lake or
reservoir (0.05 mg/l; EPA, 1977). Data were thus censored to provide an estimate that could be
compared to the recommended EPA standard of 0.05 mg/l.
Average total phosphorus concentrations were low at each station during the Project. The
average total phosphorus concentration at the Upper station based on three (3) total samples was
.037 mg/l, and .042 mg/l at the Lower station. Total phosphorus concentrations at the Upper
station ranged from .020 mg/1 to .050 mg/l, and from .020 mg/l to .090 mg/l at the Lower station.
Average and maximum total phosphorus values at the Upper and Lower stations were based on a
low total number of samples. However, total phosphorus values should be considered low.
Wyoming has not established surface water quality standards for phosphorus. U.S. EPA (1977)
recommended that total phosphorus concentration should not exceed 0.05 mg/l in a stream that

Sheridan County Conservation District
Tongue River Watershed Assessment 205j Final Report 1996-1999 156
enters a lake or reservoir (e.g. Tongue River Reservoir) and Mackenthun (1973) suggested a target
phosphorus level of less than 0.10 mg/l for streams that did not directly enter lakes or reservoirs.
USGS (1999) provided recent information from nationwide NAWQA monitoring and reported
that national background concentrations for total phosphorus from streams in undeveloped
(reference - like ) areas was about 0.10 mg/L. SCCD adopted findings by USGS for its
interpretation of total phosphorus data collected during this Project.
Using the value of <0.10 mg/l as a target for total phosphorus concentration, no significant amount of
total phosphorus was identified in a single sample collected at Little Tongue River stations during this
Project. However, sampling frequency was generally low at the Upper (N = 4 samples) and Lower
station (N = 6 samples) over a four year period and sampling generally occurred during the fall low
base flow period when total phosphorus concentration is normally lower. Additional sampling is
required to provide a reliable estimate of total phosphorus concentration in the Little Tongue River.
8.6.10 WDEQ Little Tongue River Monitoring for Additional Water Chemistry
Parameters
WDEQ collected samples for additional water chemistry parameters during annual monitoring at the
Little Tongue River Upper station in 1993 and the Little Tongue River Lower station from 1996
through 1999. Summary statistics are presented in Table 8-30.
Alkalinity at the Upper station based on a single sample was 180 mg/l. Average alkalinity at the
Lower station based on four (4) samples was 210 mg/l. The geometric mean was 198 mg/l. The
range was from 153mg/l to 238 mg/l. There was no Wyoming water quality or EPA standard to
compare alkalinity values to, but data indicated that water was generally productive for aquatic life and
was generally capable of withstanding sudden changes in pH due to inputs from point and NPS
sources.
Total chloride concentration was low at each station during the limited sampling. There were no
samples collected at either Upper or Lower stations that had total chloride concentrations greater than 5
mg/l. Total chloride values were well within WDEQ and EPA water quality standards indicating full
support for Wyoming beneficial uses for chloride.
Total sulfate concentration was low at the Upper station. No sulfate was detected in the single
sample collected in 1993. Average total sulfate concentration based on four (4) total samples at the
Lower station was 210 mg/l. The range in total sulfate was from 153 mg/l to 238 mg/l. These values
were higher than expected even considering samples were collected in the fall during lower base flow
when ion concentrations were normally highest. Possible sources for the higher total sulfate
concentrations may include irrigation return and urban land use (i.e. storm water drain discharge).
Conductivity, of which total sulfate is a component, was higher than expected at the Lower station

Sheridan County Conservation District
Tongue River Watershed Assessment 205j Final Report 1996-1999 157
and increased from Upper to Lower stations. Toal sulfate sampling is recommended for future
monitoring at the Little Tongue River to determine if the increase in sulfate concentration at the Lower
station was a natural occurrence or if the increase was due to potential irrigation return and urban land
use influence. Total sulfate values were within WDEQ standards (for groundwater use), but
approached the EPA secondary drinking water standard of 250 mg/l. This observation indicated full
support for Wyoming beneficial uses for sulfate at this time.
Hardness concentration was relatively high at each station and may be due to the natural limestone
geology that predominated much of the upstream Little Tongue River watershed. Hardness at the
Upper station based on a single sample was 205 mg/l. Average hardness at the Lower station was 380
mg/l. The range in hardness at the Lower station was from 346 mg/l to 392 mg/l. Water at each
station may be termed very hard based on the classification found in Table 6-2. There were no
Wyoming or EPA water quality standards for hardness, but observed values indicated partial support
of the Wyoming beneficial use for Industrial use since all values were greater than 300 mg/l and
treatment may be required before industrial use. More year around sampling was required to
determine if the relatively high hardness values were due to seasonal sampling artifact during low flow
periods, to natural limestone geology in the watershed, irrigation return or to potential urban land use
influence.
Total Suspended Solids (TSS) concentrations were low at each station. Low values appeared to be
related to the fact that all samples were collected in the fall during lower flow when TSS values were
normally lowest. The TSS concentration at the Upper station based on a single sample was <2 mg/l.
Average TSS at the Lower station was 2 mg/l with a range from 1 mg/l to 3 mg/l. Results of limited
TSS sampling conducted by WDEQ provided little information for potential sediment problems within
the Little Tongue River watershed. However, results of turbidity sampling (Section 8.6.6) indicated
no large amount of sediment was entering the Little Tongue River between Upper and Lower stations.
Further sampling for TSS is not recommended at this time because turbidity sampling did not indicate
sediment problems within the Little Tongue River watershed. Turbidity should continue to be used as
a surrogate indicator for TSS unless specific sediment loading questions arise.
8.6.11 SCCD and WDEQ Little Tongue River Benthic Macroinvertebrate
Monitoring
The Little Tongue River - Upper station (upstream of the SCCD Little Tongue River Upper
station) was monitored by WDEQ once in 1993. SCCD and WDEQ sampled benthic
macroinvertebrates at the Lower station annually from 1996 through 1999.
Metric values for the single WDEQ sample collected from the Upper station is presented in
Appendix Table G-1. Metric values for samples collected at the Lower station are presented in
Appendix Table G-1.

Sheridan County Conservation District
Tongue River Watershed Assessment 205j Final Report 1996-1999 158
Lists of benthic taxa identified, density (number per square meter) of taxa and percent contribution
of each taxon to the total benthic population are presented for each station in Appendix F. The
WDEQ Upper station taxa list is presented in Appendix Table F-9. Taxa lists for the Lower
station are presented in Appendix Tables F-10 through F-13.
Biological condition at the Little Tongue River Upper station using scoring criteria from both the
Wyoming Biological Condition Index (WBCI) from Barbour et al. (1994) and the Wyoming
Stream Integrity Index (WSII) from Stribling et al. (2000) was fair (Table 8-15). This
observation indicated partial support for aquatic life use indicating that this station needed
improvement to attain full support for aquatic life use.
The fair biological condition rating was primarily due to the relatively low number of
Ephemeroptera (mayfly) taxa (N = 7), low percent contribution of Ephemeroptera (5 percent), low
percent contribution of scrapers (7 percent) and higher percentage of the 5 most dominant taxa (82
percent).
Although biological condition was rated fair, at least one additional year of sampling for benthic
macroinvertebrates is recommended because only one sample was taken. Should additional
sampling indicate impairment of the biological community and confirm biological impairment,
remedial measures should be considered. The WDEQ sample station was located upstream of the
SCCD water sampling station. The WDEQ benthic macroinvertebrate sampling station should be
relocated to the SCCD water quality sampling station to allow better comparison of the
macroinvertebrate community with water quality data and USGS gage station Number 06298500.
Biological condition at the Little Tongue River Lower station using scoring criteria from both the
Wyoming Biological Condition Index (WBCI) from Barbour et al. (1994) and the Wyoming
Stream Integrity Index (WSII) from Stribling et al. (2000) was fair (Table 8-15). This
observation indicated partial support of aquatic life use indicating impairment of the biological
community and the need for improvement to attain full support for aquatic life use.
The benthic community was dominated by a mixture of cool and warm water taxa indicative of fair
water quality and fair habitat quality. Three (3) genera of riffle beetles were among the five most
dominant taxa including Cleptelmis, Optioservus and Zaitzevia (Table 8-16). Paraleptophlebia,
a mayfly genus and Hydropsyche, a genus of caddisfly were the other dominant benthic
macroinvertebrate taxa. Worms were present at the Lower station each year ranging in percent
contribution from two (2) percent in 1999 to six (6) percent in 1998. There were two (2) worm
taxa in 1996 and 1997, eight (8) worm taxa in 1998 and three (3) worm taxa in 1999. Increased
density of worms (Oligochaeta) may be associated organic pollution (Klemm, 1985), pollution
from feedlots (Prophet and Edwards, 1973), and pollutants contained in urban storm water runoff
(Lenat et al., 1979; Lenat and Eagleson, 1981). The number of worm taxa and percent

Sheridan County Conservation District
Tongue River Watershed Assessment 205j Final Report 1996-1999 159
contribution did not indicate a severe pollution problem, but rather a moderate amount of pollution
indicative of animal waste from agricultural, wildlife or urban sources. This observation was
supported by the violation of the Wyoming water quality standard for fecal coliform bacteria.
The total number of EPT taxa was generally low each year and ranged from twelve (12) and
thirteen (13) taxa in 1999 and 1998, respectively, to twenty-three (23) taxa in 1997. Percent
contribution of scraper taxa was relatively low and ranged from twelve (12) percent in 1999 to
twenty (20) percent in 1997. The lower abundance of scrapers in the benthic population
suggested moderate deposition of sediment. This observation was confirmed by the average
weighted embeddedness value of 62.9 at the Lower station (Table 8-32).
The apparent effect of seasonal dewatering and increased water temperature was to allow warm
water species to colonize this expected cool water environment. Channelization and widening the
stream channel (see Section 8.6.12) probably assisted in increasing water temperature. The
higher water temperature combined with fecal coliform contamination and probable organic
pollution from animal or human origin resulted in a fair biological condition rating and partial
attainment for aquatic life use. Dewatering may be addressed through water management
practices. The apparent input of animal and human waste from potential agricultural, wildlife and
urban land use requires resolution to bring the stream into compliance with Wyoming water
quality standards and to fully support aquatic life use.
8.6.12 SCCD and WDEQ Little Tongue River Habitat Assessment
Qualitative habitat assessments were conducted once by WDEQ in 1993 at the Upper station and
annually by SCCD and WDEQ from 1996 through 1999 at the Lower station. Because habitat
assessments were subjective, SCCD used caution by providing a conservative interpretation of
data.
The total habitat score based on the single 1993 assessment at the Upper station was 147 (Table
8-31). The score indicated moderate to high habitat quality. Percent fines (silt and sand)
comprising the stream substrate was low (sand = 0 percent, silt = 0 percent) (Table 8-32).
Riparian condition indicator parameters including bank vegetation stability, bank stability,
disruptive pressures and riparian zone width scored high.
Habitat assessment scores were lower at the Little Tongue River Lower station when compared to
the Upper station. Total habitat scores varied little during the Project ranging from 103 in 1999 to
117 in 1996 (Table 8-31). The reduction in habitat score from the Upper station to the Lower
station was due to lower scores for instream cover, velocity / depth, pool riffle ratio and width
depth ratio. The lower scores for these parameters was related to extensive habitat alteration by
channelization that occurred years ago in the Town of Dayton. Channelization has straightened
and widened the stream channel reducing instream habitat for aquatic organisms and fish. The
Sheridan County Conservation District
Tongue River Watershed Assessment 205j Final Report 1996-1999 160
reduction in habitat coupled with low discharge due to dewatering and probable higher water
temperature appeared to place stress on aquatic communities to result in non-support for aquatic
life use. The low width depth ratio coupled with low discharge appeared to be a critical element
because there was not enough water to adequately fill the stream channel.
The semi-quantitative stream substrate particle size distribution differed between the Upper and
Lower stations. Average percent cobble was 95 percent at the Upper station, and 60 percent at the
Lower station. Average percent coarse gravel ranged from 4 percent at the Upper station to 21
percent at the Lower station. Silt deposition was not detected at either station. Sand deposition
was not detected at the Upper station and was minimal at the Lower station. Only the Lower
station had detectable sand deposition and it comprised about 3 percent of total substrate. The
low degree of silt and sand deposition at each station indicated no large scale disruption within the
watershed that could contribute sand and silt to the stream channel.
Embeddedness (silt covering cobble and gravel) was high the Upper station and moderately high at
the Lower station. The weighted embeddedness value at the Upper station was 27. This low
value indicated that although there were no deposits of sediment in the channel, the majority of
cobble and gravel substrate was covered or surrounded by fine silt. The average weighted
embeddedness value at the Lower station for the period from 1996 through 1999 was 62.9. This
value indicated a moderate amount of silt was covering and surrounding cobble and gravel
substrate. Silt deposition is controlled by the amount of silt contained in the water mass and by
the current velocity. Silt deposition will normally increase as current velocity is decreased.
The current velocity measured at the Upper station was 0.8 feet per second (fps) and 1.0 fps at the
Lower station (Table 8-32). The lower current velocity and apparent lack of flushing flows at
each station may have been factors related to the higher embeddedness values because low current
velocity will allow entrained sediment to settle out of the water column.
The general decrease in substrate particle size from the Upper station to the Lower station was
normal because particle size generally decreases as stream size and stream order increase (Rosgen,
1996). High embeddedness at the Upper station may have affected the benthic macroinvertebrate
community by reducing the mayfly population and other benthic groups sensitive to sediment.
Biological condition at the Upper station was Fair indicating partial support for aquatic life use.
Moderate embeddedness at the Lower station apparently had some effect on the benthic
macroinvertebrate community. Effects due to channelization, low discharge and probable higher
water temperature were the apparent determinants that led to moderate impairment of the benthic
aquatic population and partial support for aquatic life use. Because sediment does not appear to
be a problem in the watershed, full support of aquatic life use could probably be attained by
increasing the amount of water in the stream channel, especially during the summer. Increased
stream discharge would correspondingly lower the water temperature during the critical warmer
summer months and aid in transport of sediment through the system.

Sheridan County Conservation District
Tongue River Watershed Assessment 205j Final Report 1996-1999 161
8.6.13 WGFD Little Tongue River Fish Population Monitoring
WGFD conducted historic and current monitoring of fish populations at various locations within
the Little Tongue River Project area over the period from 1972 through 1997. Approximate
location of sampling stations are illustrated in Figure 5-1 and Figure 5-2. Results from six (6)
sampling events are presented in Appendix Tables C-16 through C-21.
Most historic fish sampling occurred at three (3) different stations identified by WGFD as Leonard
Grahams property. Game species collected included brown trout, rainbow trout and brook trout.
No whitefish were collected. No non-game species were collected, but it was unknown whether
non-game species were absent or if they were present, but not netted during sampling. Brown
trout were generally most abundant, followed by rainbow trout and brook trout. Brook trout were
most abundant during sampling in 1981 and 1984.
Sampling conducted at the Little Tongue River Ranch in 1997 found brown trout most abundant
and identification of a single Snake River cutthroat trout. Longnose dace, apparently the most
abundant non-game species in the Tongue River, were collected. No rainbow trout or brook trout
were collected. The apparent change in fish populations from the historic record to the current
1997 sampling event appeared to be related to change in fish stocking practice implemented by
WGFD in the 1990's. The occurrence of the Snake River cutthroat trout in 1997 was perplexing
because its origin could not be identified. WGFD no longer routinely stocks trout species in the
watershed except for specific case by case requests where public fishing opportunity may exist.
The chemical, physical and biological data combined with fish population data indicated water
quality and habitat were sufficient to fully support a fishery from the near the Upper station to at
least as far downstream as the Little Tongue River Ranch. Habitat alteration and dewatering have
probably occurred within that stream segment, but have apparently not prevented trout from
maintaining themselves. No fish sampling was conducted downstream at the Little Tongue River
Lower station to determine how low discharge, apparent warmer water temperature and altered
habitat caused by channelization have affected the trout fishery.
8.7 Smith Creek Stations
8.7.1 Smith Creek Discharge
Instantaneous discharge measurements were recorded by SCCD and WDEQ during sampling at
Smith Creek Upper and Lower stations. Summary statistics for discharges are presented in Table
8-21. Average discharge during the Project at the Upper station averaged 2.1 cfs, and 3.9 cfs at
the Lower station. The geometric mean at the Upper station was 1.6 cfs and 3.1 cfs at the Lower
station. The average values were difficult to compare among Upper and Lower stations due to
differing sampling frequency and lack of same day sampling on numerous occasions. Figure

Sheridan County Conservation District
Tongue River Watershed Assessment 205j Final Report 1996-1999 162
8-20 illustrates discharge measured at each station on the same day. Discharge data not
measured at each station on the same day was excluded from Figure 8-20 because discharge may
vary daily precluding valid comparison among stations.
Discharge during the primary low-irrigation months (April, May and September) usually
increased from the Upper station downstream to the Lower station. Overall discharge measured
on all comparable days increased by about fifty-six (56) percent from the Upper to the Lower
station (Table 8-2). Discharge was seldom reduced from the Upper station to the Lower station
during the primary irrigation months (June, July and August) (Figure 8-20) and there was an
overall fifty-three percent (53) increase in discharge between the Upper and Lower stations
during that period.
Smith Creek, with the exception of Five Mile Creek that was dominated by irrigation source
water, was unique among primary tributaries to the Tongue River in that there was an increase in
discharge from Upper to Lower stations. The other primary tributaries exhibited a decrease in
discharge from Upper to Lower stations. The decrease in discharge at the other tributaries was
usually most pronounced during the irrigation season. The difference in discharge between
Smith Creek and the other tributaries was probably related to water management practices and
probable trans-watershed diversion of water into Smith Creek from other sources.
Discharge at the Upper station ranged from 0.3 cfs to 6.3 cfs and the range at the Lower station
was from 0.3 cfs to 11.0 cfs. The relatively low discharge at Smith Creek stations when
compared to other tributary stations was related to the smaller watershed drainage area (Upper
station = 3.7 square miles and Lower station = 11.7 square miles). Discharge at the Lower
station was less than 2.5 cfs on only 6 of 38 days sampled (16 percent of total days). The
generally high and consistent discharge appeared to be a primary factor for observed good
biological condition and full support for aquatic life use described in Section 8.7.11.
The contribution of discharge to the Tongue River from Smith Creek was estimated by comparing
discharge at the Smith Creek Lower station to discharge measured at the Tongue River Upper
station on the same day. This comparison revealed that Smith Creek contributed an estimated
1.3 percent of the Tongue River discharge (Appendix Table M-2). This suggested that potential
pollutants entering the Tongue River from Smith Creek would be highly diluted and have no
significant effect on Tongue River water quality.
8.7.2 SCCD and WDEQ Smith Creek Temperature Monitoring
Summary statistics for instantaneous water temperature measurements by SCCD and WDEQ at
the Smith Creek Upper and Lower stations is presented in Table 8.22. Water quality data
collected by SCCD at the Upper station is listed in Appendix Table B-13. Water quality data
collected by SCCD and WDEQ at the Lower station is presented in Appendix Tables B-14 and
B-15, respectively.

Sheridan County Conservation District
Tongue River Watershed Assessment 205j Final Report 1996-1999 163
Average water temperature during the Project was lowest at the Upper station (10.20C) and
slightly higher at the Lower station (12.60C). Maximum water temperature recorded at the
Upper station was 14.50C, and 21.1
0C at the Lower station. Based on instantaneous
measurements there were no exceedences of the Wyoming water quality standard for
temperature. However, as indicated in Section 8.5.2, sampling conducted by SCCD and WDEQ
did not occur during the time of day required to detect maximum daily water temperature.
Maximum daily water temperature was projected at each station during the months of June, July,
August and September as described in Section 8.5.3. Projected maximum daily water
temperature indicated no exceedence of Wyoming water quality standard for water temperature at
the Upper station. One temperature exceedence probably occurred at the Lower station on July
29, 1999 representing about three (3) percent of total instantaneous temperature measurements.
This observation indicated the need for future continuous water temperature monitoring during
warmer summer months at the Lower station to determine frequency of occurrence for
exceedence of the water temperature standard.
8.7.3 SCCD and WDEQ Smith Creek pH Monitoring
Summary statistics for instantaneous pH measurements by SCCD and WDEQ at Little Tongue
River Upper and Lower stations are presented in Table 8.23. The pH varied little among the
Upper and Lower stations. The average and geometric mean for pH during this Project was 8.1
SU at the Upper station and 8.2 SU at the Lower station. The maximum pH recorded at the
Upper station during the Project was 8.8 SU, and 8.7 SU at the Lower station. The minimum pH
was 7.1 SU at the Upper station and 7.8 SU at the Lower station. The generally high pH at both
stations reflected the predominant limestone geology in the Smith Creek watershed. All pH
measurements were within Wyoming water quality standards.
8.7.4 SCCD and WDEQ Smith Creek Specific Conductivity Monitoring
Summary statistics for specific conductivity are presented in Table 8-24. Average conductivity
during the Project was 371 umhos/cm at the Upper station and 574 umhos/cm at the Lower
station. The geometric mean was 366 umhos/cm at the Upper station and 557 umhos/cm at the
Lower station. Conductivity values at the Upper station ranged from a low of 295 umhos/cm to a
high of 690 umhos/cm, and from a low of 375 umhos/cm to a high of 943 umhos/cm at the Lower
station. The average increase in conductivity from the Upper station to the Lower station was 55
percent. The increase in conductivity between stations using the geometric mean was 52
percent. The increase in conductivity was higher than expected and suggested that irrigation
return or urban storm water effluent may be affecting conductivity at the Lower station especially
during periods of lower discharge. Although there was no Wyoming water quality standard for
conductivity, values were generally considered low and within the range required for support of
aquatic life.
The relationship between conductivity and discharge noted at Little Tongue River and Tongue
River stations was not as apparent at Smith Creek stations. The association between conductivity

Sheridan County Conservation District
Tongue River Watershed Assessment 205j Final Report 1996-1999 164
and discharge at Smith Creek Upper was weak and inverse such that as discharge increased,
conductivity decreased slightly. The correlation coefficient between conductivity and discharge
at the Upper station was -0.274 (P>0.05). The correlation coefficient between conductivity and
discharge at Smith Creek Lower was +0.339 (P<0.05) indicating that as discharge increased,
conductivity increased. The only other station where this positive relationship was observed was
at Wolf Creek Lower. This observation suggested that Smith Creek Lower and Wolf Creek
Lower discharge during the irrigation season was comprised primarily by irrigation return water
higher in conductivity and thus, dissolved solids. This observation provided another indication
that more constant and sustained discharge at Smith Creek Lower than at other Lower tributary
stations was due to irrigation return (see Section 8.7.1).
8.7.5 SCCD and WDEQ Smith Creek Dissolved Oxygen Monitoring
SCCD initiated monitoring for dissolved oxygen (DO) in 1999. WDEQ conducted monitoring
for DO once annually usually in October at Smith Creek Lower. Summary statistics for DO are
presented in Table 8-25. DO was similar at each station. Average DO during the Project was 9.3
mg/l at the Upper station, and 9.2 mg/l at the Lower station. DO values ranged from 7.9 mg/l to
10.4 mg/l at the Upper station and from 7.9 mg/l to 10.1 mg/l at the Lower station.
There were no exceedences of the Wyoming water quality standard for DO because no DO values
were less than 5 mg/l. The lowest DO value recorded during the Project was 7.9 mg/l measured
by SCCD at both the Upper and Lower stations on September 16, 1999. The DO concentrations
were sufficient to support a diverse population of aquatic organisms and fish indicating full
support for aquatic life use for this physical parameter.
8.7.6 SCCD and WDEQ Smith Creek Turbidity Monitoring
Summary statistics for turbidity are presented in Table 8-26. Average turbidity measurements
during the Project were higher at the Lower station when compared to turbidity at the Upper
station. Average turbidity was 4.2 NTU at the Upper station and 19.0 NTU at the Lower station
which represented an average increase of 14.8 NTU. The geometric mean was 2.4 NTU at the
Upper station and 12.8 NTU at the Lower station which represented an average increase of 10.4
NTU. Turbidity values at the Upper station ranged from a low of 0.3 NTU to 14.0 NTU and from
1.8 NTU to 79 NTU at the Lower station.
The increase in turbidity from the Upper station to the Lower station was high even considering the
expected natural increase in turbidity along the longitudinal gradient of most flowing water bodies.
The average and geometric mean increase in turbidity between stations represented an exceedence
of the Wyoming water quality standard for turbidity at the Lower station. The average increase of
14.8 NTU and geometric mean increase of 10.4 NTU was greater than the increase of 10 NTU
allowed by the Wyoming water quality standard for Class 2 water bodies.

Sheridan County Conservation District
Tongue River Watershed Assessment 205j Final Report 1996-1999 165
The normal association between discharge and turbidity observed at Tongue River stations and
Little Tongue stations was absent at the Smith Creek Lower station. Turbidity was associated
with discharge at the Upper station, but not at the Lower station. The correlation coefficient
between turbidity and discharge at the Upper station was +0.413 (P<0.05), and +0.196 (P>0.05) at
the Lower station. R-squared values for the regression analyses were 17.1 percent at the Upper
station and 3.8 percent at the Lower station (Appendix Tables L-5 and L-6). This indicated that
higher turbidity was more likely to occur during lower periods of discharge which strongly
suggested negative influence of irrigation return water on turbidity levels. Because irrigation
return water appeared to comprise a majority of discharge at the Lower station, the increase in
turbidity may be related to higher turbidity contained in returns entering Smith Creek. The effect
that irrigation return may have on turbidity levels in Smith Creek should receive further
investigation by establishing additional sampling sites on the Creek and at identified irrigation
returns entering the Creek. Land use activity connected to turbidity increase should be identified
and corrective action implemented.
8.7.7 SCCD and WDEQ Smith Creek Fecal Coliform Bacteria Monitoring
Summary statistics for fecal coliform bacteria are presented in Table 8-33. The geometric mean
for fecal coliform bacteria at the Upper station during the Project was 12 per 100ml, and 176 per
100ml at the Lower station. The geometric mean is a logarithmic transformation of data and
provided a more reliable estimate of the mean by smoothing extreme values when variability was
high among fecal coliform measurements. Fecal coliform bacteria concentration at the Upper
station ranged from 1 per 100ml to 180 per 100ml. The number of bacteria was relatively low
indicating that the primary land uses (wildlife, recreation and seasonal livestock grazing) in the
vicinity of the Upper station were not significant sources of fecal coliform bacteria. Fecal
coliform bacteria concentration at the Lower station ranged from 8 per 100ml to 2790 per 100ml.
The highest fecal coliform level occurred on August 26, 1997 and a level of 2150 per 100ml was
detected on July 29, 1999.
The was no exceedence of the Wyoming water quality standard for fecal coliform bacteria at the
Upper station. The geometric mean of five (5) samples collected during the Recreation Season in
1999 at the Upper station was 57 per 100ml which was considered relatively low. There was no
single sample in excess of 400 per 100ml since the maximum level during the Project was 180 per
100ml (collected August 26, 1997).
Fecal coliform bacteria levels at the Lower station exceeded the Wyoming water quality standard
for fecal coliform bacteria. The geometric mean of five (5) samples collected during the
Recreation Season in 1999 was 534 per 100ml which exceeded the standard of 200 per 100ml. Six
samples had fecal coliform levels in excess of 400 ml. The exceedence of the standard indicated
remedial measures were required to lower fecal coliform levels to bring the Lower station into
compliance with the Wyoming water quality standard.

Sheridan County Conservation District
Tongue River Watershed Assessment 205j Final Report 1996-1999 166
There were no exceedences of the fecal coliform standard at the Lower station in 1996 and 1998.
SCCD increased the sampling frequency in 1999 from monthly to five (5) samples within a 30 day
period during the Recreational Season to provide a better estimate of bacteria contamination and
allow direct comparison to the Wyoming water quality standard for fecal coliform bacteria. Other
sampling sites within the Project area exceeded Wyoming fecal coliform standards only in 1999.
The increased sampling frequency in 1999 provided a better estimate of fecal coliform bacteria
contamination and increased the probability for detection of fecal coliform levels that may pose a
risk to public health and safety. Extensive discussion related to this finding is presented in
Section 8.11.1.
The sources of fecal coliform at the Lower station may be difficult to define due to multiple land
uses affecting this station, apparent significant irrigation return and trans-watershed water
diversion. Urban land use may be considered the predominant land use since this station was
located within the Town of Dayton. Rural subdivision development, irrigated hayland, livestock
grazing and dryland pasture land use are present upstream. The role that irrigation return may
have on fecal coliform levels should be closely evaluated since this water body appears to receive
return water high in proportion to total discharge.
8.7.8 SCCD and WDEQ Smith Creek Nitrate Nitrogen Monitoring
Total nitrate samples were collected infrequently (N = 2 total samples) at the Smith Creek Upper
station due to Project monitoring budget constraints. Sampling for nitrate nitrogen was
concentrated at the Lower station because potential nutrients entering the Tongue River could be
best estimated at this station. Summary statistics for nitrate nitrogen are presented in Table 8-28.
Average nitrate nitrogen concentrations were low at each station during the Project. The average
nitrate concentration at the Upper station was .155 mg/l, and .036 mg/l at the Lower station.
Nitrate values at the Upper station based on two (2) samples ranged from .140 mg/1 to .170 mg/l,
and from .001 mg/l to .190 mg/l at the Lower station.
Average and maximum nitrate values at the Upper and Lower stations were considered low.
Nitrate concentration was well below the Wyoming water quality standard and drinking water
human health standard of 10 mg/l for Class 2 surface waters (WDEQ, 1998). Data for nitrate
nitrogen indicated that nitrate concentration in Smith Creek was less than the background
concentration of nitrate (about 0.60 mg/L) found in streams in undeveloped areas throughout the
United States (USGS, 1999). These observations indicated that nitrate nitrogen was not present
in Smith Creek in concentrations that could pose a human health threat or an ancillary threat to
aquatic life use that could be caused by indirect effects due to eutrophication. Full support for all
Wyoming beneficial uses applicable to nitrate was indicated.

Sheridan County Conservation District
Tongue River Watershed Assessment 205j Final Report 1996-1999 167
8.7.9 SCCD and WDEQ Smith Creek Total Phosphorus Monitoring
Total phosphorus samples were collected infrequently by SCCD (N = 2 total samples) at both the
Upper and Lower stations due to Project monitoring budget constraints. The majority of total
phosphorus data was provided by WDEQ during annual bioassessment sampling. Summary
statistics for total phosphorus are presented in Table 8-29. These statistics were based on
“censored” values because the majority of analyses (6 samples out of 8 total samples) were less
than the minimum detection limit (minimum detection limit was 0.10 mg/l for WDEQ analytical
method; 0.05 mg/l for SCCD analytical method). The minimum detection limit for the WDEQ
analytical method did not provide adequate data needed to address the recommended water quality
standard for total phosphorus in water bodies draining to a lake or reservoir (0.05 mg/l; EPA,
1977). Data were thus censored to provide an estimate that could be compared to the
recommended EPA standard of 0.05 mg/l.
Average total phosphorus concentrations were low at each station during the Project. The
average total phosphorus concentration based on two (2) total samples at the Upper station was
.013 mg/l, and .067 mg/l at the Lower station. Total phosphorus concentrations at the Upper
station ranged from .006 mg/1 to .020 mg/l, and from .050 mg/l to .080 mg/l at the Lower station.
Average and maximum total phosphorus values at the Upper and Lower stations were based on a
low total number of samples. However, total phosphorus values should be considered low.
Wyoming has not established surface water quality standards for phosphorus. U.S. EPA (1977)
recommended that total phosphorus concentration should not exceed 0.05 mg/l in a stream that
enters a lake or reservoir (e.g. Tongue River Reservoir) to prevent development of nuisance algal
and plant populations. Mackenthun (1973) suggested a target phosphorus level of less than 0.10
mg/l for streams that did not directly enter lakes or reservoirs. USGS (1999) provided recent
information from nationwide NAWQA monitoring and assessment and reported that national
background concentrations for total phosphorus from streams in undeveloped (reference - like )
areas was about 0.10 mg/L. Because the EPA goal was not attainable, SCCD adopted the finding
by USGS for its interpretation of total phosphorus data collected during this Project.
Using the value of <0.10 mg/l as a target for total phosphorus concentration, no significant amount
of total phosphorus was identified in a single sample collected at Smith Creek stations during this
Project. However, sampling frequency was generally low at the Upper (N = 2 samples) and
Lower station (N = 6 samples) over a four year period and sampling generally occurred during the
fall low flow period when total phosphorus concentration was normally lower. Additional
sampling was necessary to provide a reliable estimate of total phosphorus concentration in Smith
Creek.
8.7.10 WDEQ Smith Creek Monitoring for Additional Water Chemistry Parameters
WDEQ collected samples for additional monitoring parameters during annual monitoring at the

Sheridan County Conservation District
Tongue River Watershed Assessment 205j Final Report 1996-1999 168
Smith Creek Lower station from 1996 through 1999. WDEQ conducted no sampling at the Smith
Creek Upper station. Summary statistics are presented in Table 8-30.
Alkalinity averaged 271 mg/l at the Lower station based on four (4) samples. The geometric
mean was 269 mg/l. The range was from 235 mg/l to 320 mg/l. There was no Wyoming water
quality or EPA standard to compare alkalinity values to, but data indicated that water was
generally productive for aquatic life and was generally capable of withstanding sudden changes in
pH due to inputs from point and NPS pollutants.
Total chloride concentration was low at the Lower station. There were no samples collected that
had total chloride concentrations greater than 5 mg/l. Total chloride values were well within
WDEQ and EPA water quality standards indicating full support for Wyoming beneficial uses that
may be affected by chloride.
Total sulfate concentration at the Lower station was considered moderately high. Average total
sulfate concentration based on four (4) total samples at the Lower station was 151 mg/l. The
range in total sulfate was from 113 mg/l to 216 mg/l. These values were higher than expected even
considering samples were collected in the fall during lower flow when ion concentrations were
normally highest. Possible sources for the higher total sulfate concentrations may include
irrigation return and urban land use (i.e. storm water drain discharge). Conductivity, of which
total sulfate is a component, was higher than expected at the Lower station and was observed to
increase from Upper to Lower stations. Total sulfate sampling is recommended for future
monitoring at Smith Creek to determine if the increase in sulfate concentration at the Lower station
was a natural occurrence or if the increase was due to potential irrigation return or urban land use
influence. Total sulfate values were within WDEQ standards (for groundwater use), but
approached the EPA secondary drinking water standard of 250 mg/l. This observation indicated
full support for Wyoming beneficial uses that may be affected by sulfate.
Hardness concentration was relatively high at the Lower station and may be due to the natural
limestone geology that predominated much of the upstream Smith Creek watershed. Average
hardness at the Lower station was 361 mg/l. The range in hardness at the Lower station was from
281 mg/l to 456 mg/l. Water at the Lower station may be termed very hard based on the
classification found in Table 6-2. There were no Wyoming or EPA water quality standards for
hardness, but observed values indicated partial support of the Wyoming beneficial use for
Industrial use since the majority of values were greater than 300 mg/l and treatment may be
required before industrial use. More year around sampling at upstream and downstream stations
was required to determine if the relatively high hardness values were due to seasonal sampling
artifact during low flow, natural limestone geology in the watershed, irrigation return, or to
potential urban land use influence.
Total Suspended Solids (TSS) concentrations were moderately high at the Lower station despite

Sheridan County Conservation District
Tongue River Watershed Assessment 205j Final Report 1996-1999 169
the fact that all samples were collected in the fall during lower flow when TSS values should
normally be lowest. Average TSS concentration at the Lower station was 10 mg/l with a range
from 1 mg/l to 20 mg/l. Results of limited TSS sampling conducted by WDEQ provided little
information for potential sediment problems within the Tongue River watershed. However,
results of turbidity sampling (Section 8.7.6) found an exceedence of the Wyoming water quality
standard for turbidity. This observation suggested that a significant amount of sediment was
entering Smith Creek between the Upper and Lower stations. Further sampling for TSS may be
considered because turbidity sampling indicated potential sediment problems within the Smith
Creek watershed. However, turbidity monitoring should continue to be used as the primary
surrogate indicator for TSS unless specific sediment loading questions arise.
8.7.11 SCCD and WDEQ Smith Creek Benthic Macroinvertebrate Monitoring
SCCD and WDEQ sampled benthic macroinvertebrates at the Lower station annually from 1996
through 1999. No benthic macroinvertebrate sampling occurred at the Upper station due to
monitoring budget constraints.
Metric values for samples collected at the Lower station are presented in Appendix Table G-2.
Lists of benthic taxa identified, density (number per square meter) of taxa and percent
contribution of each taxon to the total benthic population are presented in Appendix Tables F-14
through F-17.
Biological condition at the Smith Creek Lower station using scoring criteria from the Wyoming
Stream Integrity Index (WSII) from Stribling et al. (2000) was good during each year (Table
8-15). The WBCI (Barbour et al., 1994) was not applicable to this station because the Lower
station was located in the Northwestern Great Plains ecoregion and the WBCI was developed for
Middle Rockies ecoregion mountain and foothill streams. The range in average WSII scores was
from 57.1 in 1996 to 74.0 in 1997. The range in scores was greater than the range observed at
most other tributary stations. This observation indicated full support for aquatic life use.
The benthic community at the Smith Creek Lower station was dominated by a mixture of warm
and cool water taxa indicative of moderate water quality and habitat. Dominant taxa in order of
decreasing abundance included the caddisflies, Hydropsyche, Helicopsyche borealis, the riffle
beetle, Optioservus, the mayfly, Paraleptophlebia and the mayfly, Baetis tricaudatus (Table
8-16). Worms were present at the Lower station each year and ranged in percent contribution
from one (1) percent in 1996 and 1998 to two (2) percent in 1997 and 1999. There was one (1)
worm taxa in 1996, four (4) taxa in 1997 and 1999 and two (2) worm taxa in 1998. The worms
Ophidonais serpentina and Eiseniella tetraedra occurred most frequently. The number of worm
taxa and percent contribution did not indicate a severe pollution problem, but rather a moderate
amount of pollution indicative of animal waste from agricultural, wildlife or urban sources. This
observation was supported by the violation of the Wyoming water quality standard for fecal
coliform bacteria. No Tubifex tubifex were collected indicating a low probability for the

Sheridan County Conservation District
Tongue River Watershed Assessment 205j Final Report 1996-1999 170
occurrence of whirling disease.
The total number of EPT taxa was generally consistent among years and ranged from seven (7)
taxa in 1996 to twelve (12) taxa in 1997 and 1999. Percent contribution of scraper abundance was
variable, but was generally good ranging from nine (9) percent in 1996 to forty-three (43) percent
in 1998. Collector filterers comprised seventy-three (73) percent of the population in 1996 and
sixty-one (61) percent of the population in 1999. The high percentage of collector filterers
indicated the significant presence of fine particulate organic matter originating from potential
sources as sewage and animal waste. This observation combined with the exceedence of the
Wyoming water quality standard for fecal coliform suggested sources for human sewage, animal
waste, or both were impacting the Smith Creek Lower station.
The good rating for biological condition indicated that with the exception of turbidity and fecal
coliform bacteria contamination, water quality and habitat were sufficient to provide for a healthy
benthic community when compared to other streams in the Northwestern Great Plains of
Wyoming. Full support for aquatic life use was indicated, but continued benthic
macroinvertebrate monitoring is recommended to track water quality change.
8.7.12 SCCD and WDEQ Smith Creek Habitat Assessment
Qualitative habitat assessments were conducted by SCCD and WDEQ annually from 1996
through 1999 at the Lower station. No benthic macroinvertebrate sampling or habitat
assessments were conducted at the Smith Creek Upper station. Because habitat assessments were
subjective and based on best professional judgement, SCCD used caution by providing a
conservative interpretation of data.
The average total habitat assessment score at the Lower station was 128 (Table 8-53). Total
scores varied 117 in 1997 to 136 in 1998. Scores were high for substrate / percent fines
(indicating little sediment deposition), channel flow status (due to consistent discharge that
sufficiently covered the stream channel), and riparian condition parameters, with the exception of
riparian zone width. The riparian zone was narrow due to historic channelization and down
cutting of the stream channel which elevated the riparian zone above surface and groundwater
influence. Habitat parameter scores were relatively low for instream cover (historic
channelization had altered fish habitat and cover), embeddedness (silt cover apparently related to
increased turbidity and silt; see Section 8.7.6) and pool riffle ratio (channelization had reduced the
number of pools compared the length of riffles).
The semi-quantitative stream substrate particle size distribution indicated that the Lower station
was dominated by cobble (average = 64%), coarse gravel (average = 16%) and fine gravel
(average = 14%). Deposition of sand varied little among years and ranged from three (3) percent
in 1998 and 1999 to four (4) percent in 1996 and 1997. Deposition of silt was not observed in

Sheridan County Conservation District
Tongue River Watershed Assessment 205j Final Report 1996-1999 171
1996, 1998 and 1999, but comprised seven (7) percent of total substrate in 1997. The low degree
of silt and sand deposition at each station indicated no large scale disruption within the watershed
upstream that may contribute sand and silt to the stream channel. The diversity in stream
substrate particle size afforded a variety of niches for colonization and maintenance by benthic
microinvertebrates.
Embeddedness (silt covering cobble and gravel) was moderately high at the Lower station. The
weighted embeddedness at the Lower station was 48.1 (Table 8-54). Annual weighted
embeddedness values ranged from 33.2 (high amount of silt deposition) to 64.0 (moderate amount
of silt deposition). These values indicated that although there were no deposits of sediment in the
channel, the majority of cobble and gravel substrate was partially covered or surrounded by fine
silt. Silt deposition is controlled by the amount of silt contained in the water mass and by the
current velocity. Silt deposition will normally increase as current velocity is decreased provided
adequate silt is contained in the water column.
The average current velocity measured at the Lower station was 1.5 feet per second (fps). The
current velocity at the Lower station combined with higher turbidity may have been a factor related
to the higher embeddedness values because lower current velocity apparently allowed entrained
sediment to settle out of the water. However, silt deposition was apparently not high enough to
significantly affect benthic macroinvertebrate populations because biological condition was rated
good.
8.7.13 WGFD Smith Creek Fish Population Monitoring
WGFD conducted fish sampling in 1959 at a single location at the old Glen Mock Ranch in the
upper Smith Creek watershed. Approximate location of the sampling station is illustrated in
Figure 5-1. Results from the single sampling event are presented in Appendix Table C-22.
Brook trout dominated the fish community followed by collection of only two (2) brown trout.
No other game and non-game fish species were collected. It was unknown whether non-game
species were present because fish surveys conducted during that period appeared to concentrate on
collection of game species. Lack of other historic or current fish data prevented further
evaluation for current water quality or habitat conditions. However, the historic data indicated
that sufficient water quality and habitat were present to support cold water fish species in 1959.
8.8 Columbus Creek Stations
8.8.1 Columbus Creek Discharge
Instantaneous discharge measurements were recorded by SCCD and WDEQ during sampling at
Columbus Creek Upper and Lower stations. Summary statistics for discharges are presented in

Sheridan County Conservation District
Tongue River Watershed Assessment 205j Final Report 1996-1999 172
Table 8-34. Discharge measurements during the Project at the Upper station averaged 7.6 cfs,
and 7.2 cfs at the Lower station. The geometric mean at the Upper station was 5.7 cfs, and 4.6 cfs
at the Lower station. Discharge at the Upper station during the Project ranged from 1.8 cfs to 26.8
cfs and from 0.0 cfs to 33.6 cfs at the Lower station. The average values were difficult to compare
among Upper and Lower stations due to differing sampling frequency and lack of same day
sampling on numerous occasions. Figure 8-21 illustrates discharge measured at each station on
the same day. Discharge data not measured at each station on the same day was excluded from
Figure 8-21 because discharge may vary daily precluding valid comparison among stations.
Discharge during the primary low-irrigation months (April, May and September) often increased
from the Upper station downstream to the Lower station. However, overall discharge measured
on all comparable days was reduced by about thirty-two (32) percent from the Upper station to the
Lower station (Table 8-2). Discharge was reduced by twenty-nine (29) percent from the Upper
station to the Lower station during the primary irrigation months (June, July and August) (Figure
8-19).
The Columbus Creek Lower station had a discharge less than 4 cfs during thirty-four (34) percent
of all sampling days. The reduction in discharge from the Upper station to the Lower station
during the Project was due to diversion of water into the Five Mile Ditch serving the Five Mile
Creek drainage. Dewatering at the Lower station was especially evident in October of each year
when discharge was less than 1.5 cfs (Appendix Table B-19). The generally lower discharge at
the Lower station appeared to be a primary factor responsible for impairment of biological
condition during each year of the Project (see Section 8.8.11).
The contribution of discharge to the Tongue River from Columbus Creek was estimated by
comparing discharge at the Columbus Creek Lower station to discharge measured at the Tongue
River Middle station on the same day. This comparison revealed that Columbus Creek
contributed an estimated 1.3 percent of the Tongue River discharge (Appendix Table M-2). This
observation indicated that potential pollutants entering the Tongue River from Columbus Creek
would be significantly diluted and have no significant effect on Tongue River water quality.
8.8.2 SCCD and WDEQ Columbus Creek Temperature Monitoring
Summary statistics for instantaneous water temperature measurements by SCCD and WDEQ at
Columbus Creek Upper and Lower stations are presented in Table 8-35. Water quality data for
the Upper station is presented in Appendix Tables B-16 and B-18 and data for the Lower station in
Appendix Tables B-17 and B-19.
Water temperature varied among Columbus Creek Upper and Lower stations. Average water
temperature during the Project was lowest at the Upper station (9.60C) and higher at the Lower
station (13.50C). Maximum water temperature recorded at the Upper station was 14.1
0C, and

Sheridan County Conservation District
Tongue River Watershed Assessment 205j Final Report 1996-1999 173
25.10C at the Lower station. The average increase in water temperature between Upper and
Lower stations was not specific because of the difference in sampling frequency and lack of same
day sampling. However, the data indicated a consistent increase in water temperature between
Upper and Lower stations on comparable sampling days. Maximum water temperature at each
station occurred during the summer months of July and August when ambient air temperature was
highest. Lowest water temperature generally occurred during April, May or October when
discharge was dominated by snowmelt runoff or cooler seasonal ambient air temperature persisted.
Based on instantaneous measurements there were no exceedences of the Wyoming water quality
standard for water temperature at the Upper and Lower stations. However, as indicated in Section
8.5.2, sampling conducted by SCCD and WDEQ did not occur during the time of day required to
detect maximum daily water temperature. Maximum daily temperature was projected at each
station during the months of June, July, August and September as described in Section 8.5.3.
Projected maximum daily water temperature indicated no exceedence of Wyoming water quality
standard at the Upper station. Six water temperature exceedences probably occurred at the Lower
station during the summer. In addition, water temperature appeared to approach the temperature
standard (was within 1.00C) on six (6) other sampling days. This observation indicated the need
for future continuous water temperature monitoring during warmer summer months at the Lower
station to determine frequency of occurrence for exceedence of the Wyoming water quality
standard for water temperature.
8.8.3 SCCD and WDEQ Columbus Creek pH Monitoring
Summary statistics for instantaneous pH measurements by SCCD and WDEQ at Columbus Creek
Upper and Lower stations are presented in Table 8-36. The pH varied little among the Upper and
Lower stations. The average and geometric mean for pH during this Project was 8.2 SU at the
Upper station and 7.9 SU at the Lower station. As indicated in previous sections, direct
comparisons between Upper and Lower stations could not be made due to different sampling
frequency among stations and lack of same day sampling. The maximum pH recorded at the
Upper station during the Project was 8.6 SU, and 8.5 SU at the Lower station. The minimum pH
was 7.1 SU at the Upper station and 6.8 SU at the Lower station. The pH at both stations
generally decreased in response to higher discharge and increased during periods of lower
discharge. The generally high pH at both stations reflected the predominant limestone geology in
the Columbus Creek watershed. There were no samples <6.5 SU or > 9.0 SU indicating pH was
within the Wyoming water quality standard for pH.
8.8.4 SCCD and WDEQ Columbus Creek Specific Conductivity Monitoring
Summary statistics for specific conductivity are presented in Table 8-37. Average conductivity
during the Project was 404 umhos/cm at the Upper station and 525 umhos/cm at the Lower station.
The geometric mean was 401 umhos/cm at the Upper station and 479 umhos/cm at the Lower

Sheridan County Conservation District
Tongue River Watershed Assessment 205j Final Report 1996-1999 174
station. Conductivity values at the Upper station ranged from a low of 319 umhos/cm to a high of
496 umhos/cm, and from a low of 260 umhos/cm to a high of 977 umhos/cm at the Lower station.
The average increase in conductivity from the Upper station to the Lower station was 30 percent.
The increase in conductivity between stations using the geometric mean was 19 percent. The
increase in conductivity was slightly higher than expected and suggested that irrigation return
higher in conductivity may be affecting conductivity at the Lower station especially during periods
of low discharge. Although there was no Wyoming water quality standard for conductivity,
values were generally considered moderate and within the range required to support aquatic life.
Conductivity values were controlled primarily by stream discharge at the Upper station. The
association between conductivity and discharge was relatively strong and inverse such that as
discharge increased, conductivity decreased. The correlation coefficient between conductivity
and discharge at the Upper station was -0.439 (Appendix Table L-3). The correlation coefficient
was significant (P<0.05) indicating there was less than a 5 percent chance that the association was
due to random chance alone. The association between conductivity and discharge was not as
apparent at the Lower station. The correlation coefficient was -0.132 (P>0.05) which indicated a
weak and insignificant inverse association. The lack of a strong relationship between
conductivity and discharge was also observed at Smith Creek Lower where discharge appeared to
be comprised primarily by irrigation return. This observation indicated that discharge at
Columbus Creek Lower was also comprised primarily by irrigation return.
8.8.5 SCCD and WDEQ Columbus Creek Dissolved Oxygen Monitoring
SCCD initiated monitoring for dissolved oxygen (DO) in 1999. WDEQ conducted monitoring
once in 1993 at the Upper station, then once annually usually in October at the Lower station.
Summary statistics for DO are presented in Table 8-38. DO was similar at each station. Average
DO during the Project was 10.1 mg/l at the Upper station and 9.0 mg/l at the Lower station. DO
values ranged from 8.1 mg/l to 11.0 mg/l at the Upper station and from 7.9 mg/l to 11.2 mg/l at the
Lower station.
There were no exceedences of the Wyoming water quality standard for DO because no DO values
were less than 5 mg/l. The lowest DO value recorded during the Project was 7.9 mg/l on July 21,
1999 at the Lower station. The DO concentrations were sufficient to support diverse populations
of aquatic organisms and fish indicating full support of aquatic life use for this physical parameter.
8.8.6 SCCD and WDEQ Columbus Creek Turbidity Monitoring
Summary statistics for turbidity are presented in Table 8-39. Average turbidity measurements
during the Project were much higher at the Lower station than at the Upper station. Average
turbidity was 4.8 NTU at the Upper station and 51.7 NTU at the Lower station. The geometric
mean was 2.3 NTU at the Upper station and 36.2 NTU at the Lower station. Turbidity values at

Sheridan County Conservation District
Tongue River Watershed Assessment 205j Final Report 1996-1999 175
the Upper station ranged from a low of 0.5 NTU to 15.0 NTU and from 3.4 NTU to 185 NTU at the
Lower station. Turbidity values greater than or equal to 15 NTU were recorded at the Lower
station on thirty-one (31) different sampling dates representing 84 percent of total sampling
events.
Turbidity values were strongly associated with discharge. There was a significant positive
relationship such that turbidity values increased as discharge increased. The correlation
coefficient between turbidity and discharge at the Upper station was +0.502 (P<0.01), and +0.721
(P<0.01) at the Lower station. R-squared values for the regression analyses were 25.2 percent at
the Upper station and 52.0 percent at the Lower station (Appendix Tables L-5 and L-6). Because
of the association between turbidity and discharge, lower turbidity values were generally recorded
during periods of lower discharge (prior to and after spring runoff) in early April, September and
October and higher turbidity values were generally recorded during periods of higher discharge
during spring runoff in latter April, May and June. However, turbidity values greater than 30
NTU were sometimes measured at the Lower station when discharge was relatively low during the
summer. A portion of the higher turbidity may be related to the natural geology and soil type
upstream of this station, but frequent high turbidity strongly suggested sediment input from
unknown upstream sources. This scenario suggested influence from irrigation return water, other
land uses that may affect stream bank stability, or water management practices that may produce
an irregular discharge pattern. The average increase in turbidity between the Upper and Lower
stations was 46.9 NTU. The increase in turbidity represented an exceedence of the Wyoming
water quality standard because an increase up to 10 NTU is allowed for Class 2 cold water, water
bodies. Additional sampling stations are required upstream from the Lower station for future
turbidity sampling to identify the source(s) for turbidity affecting the Lower station.
8.8.7 SCCD and WDEQ Columbus Creek Fecal Coliform Bacteria Monitoring
Summary statistics for fecal coliform bacteria are presented in Table 8-40. The geometric mean
for fecal coliform bacteria at the Upper station during the Project was 12 per 100ml, and 107 per
100ml at the Lower station. The geometric mean is a logarithmic transformation of data and
provided a more reliable estimate of the mean by smoothing extreme values when variability was
high among measurements.
Fecal coliform bacteria concentration at the Upper station ranged from 1 per 100ml to 3300 per
100ml. With the exception of the single high sample collected on May 4, 1998, the number of
bacteria was generally quite low indicating that the primary land uses (wildlife, recreation and
limited seasonal livestock grazing) in the vicinity of the Upper station were not significant sources
of fecal coliform bacteria. The median fecal coliform bacteria concentration was 19 per 100 ml.
The median statistic is the number at which 50 percent of the observed values are above and 50
percent of the observed values are below.
Fecal coliform bacteria concentration increased significantly at the Lower station and ranged from

Sheridan County Conservation District
Tongue River Watershed Assessment 205j Final Report 1996-1999 176
1 per 100ml to 1800 per 100ml. The median value during the Project was 190 per 100 ml and the
median during 1999 was 480 per 100 ml.
The was a technical exceedence of the Wyoming water quality standard for fecal coliform bacteria
at the Upper station because a single sample collected in 1998 exceeded the standard of 400 per
100 ml. However, only four (4) percent of fecal coliform samples collected during the Project
exceeded the standard of 400 per 100 ml. The geometric mean of five (5) samples collected
during the Recreational Season in 1999 at the Upper station was 49 per 100ml which was
considered low. The single high sample represented an exceedence of the standard, but this
observation should be tempered by the fact that only four (4) percent of total samples exceeded the
standard. SCCD proposes that the reach upstream of Columbus Creek Upper not be placed on the
WDEQ (303d) list for water quality limited segments based on the single high sample. Rather,
SCCD proposes that sampling for fecal coliform continue to determine if frequent, significant
bacteria levels are present to ensure that public health and safety are protected.
Fecal coliform bacteria levels at the Lower station exceeded the Wyoming water quality standard
for fecal coliform bacteria. The geometric mean of five (5) samples collected during the
Recreational Season in 1999 was 405 per 100ml which exceeded the standard of 200 per 100ml.
During the Project seven (7) samples had fecal coliform levels in excess of 400 ml representing
twenty-six (26) percent of total samples. The exceedence of the standard indicated remedial
measures were required to lower fecal coliform levels to bring the Lower station into compliance
with Wyoming water quality standards.
There were no exceedences of the fecal coliform standard in 1996 and 1998. SCCD increased the
sampling frequency in 1999 from monthly to five (5) samples within a 30 day period during the
Recreation Season to provide a better estimate of bacteria contamination and allow direct
comparison to the Wyoming water quality standard for fecal coliform bacteria. Other sampling
sites within the Project area exceeded Wyoming fecal coliform standards only in 1999. It
appeared that the increased sampling frequency in 1999 compared to previous years increased the
probability for detection of fecal coliform levels in excess of the Wyoming fecal coliform
standard. Extensive discussion related to the effects of sampling frequency for reliable estimates
of fecal coliform bacteria is presented in Section 8.11.1.
8.8.8 SCCD and WDEQ Columbus Creek Nitrate Nitrogen Monitoring
Summary statistics for nitrate nitrogen are presented in Table 8-41. The nitrate data was more
comparable between the Upper and Lower stations than for most other tributaries because
sampling frequency was similar at both stations. Twenty-five (25) samples were collected at the
Upper station and twenty-seven (27) samples were collected at the Lower station. However,
same day sampling did not occur on all sampling dates.

Sheridan County Conservation District
Tongue River Watershed Assessment 205j Final Report 1996-1999 177
Average nitrate nitrogen concentrations were relatively low at each station during the Project.
The average nitrate concentration at the Upper station was .161 mg/l, and .057 mg/l at the Lower
station. Nitrate values at the Upper station ranged from .004 mg/1 to .720 mg/l, and from .001
mg/l to .800 mg/l at the Lower station. The average nitrate values at each station were higher than
the average nitrate values at mainstem Tongue River stations, Little Tongue River and Smith
Creek.
Average and maximum nitrate values at the Upper and Lower stations were considered low to
moderate. Nitrate concentration was well below the Wyoming water quality standard and
drinking water human health standard of 10 mg/l for Class 2 surface waters (WDEQ, 1998). Data
for nitrate nitrogen indicated that nitrate concentration in Columbus Creek was generally less than
the background concentration of nitrate (about 0.60 mg/L) found in streams in undeveloped areas
throughout the United States (USGS, 1999). These observations indicated that average nitrate
nitrogen levels in Columbus Creek were lower than natural background levels found throughout
the United States, but an occasional value slightly higher than background was detected. This
suggested occasional influence by anthropogenic (man-caused) influence. However, nitrate was
not present in Columbus Creek in concentrations that could pose a human health threat or an
ancillary threat to aquatic life use by indirect effects caused by eutrophication. Full support for all
Wyoming beneficial uses applicable to nitrate was indicated.
8.8.9 SCCD and WDEQ Columbus Creek Total Phosphorus Monitoring
Total phosphorus samples were collected infrequently by SCCD (N = 2 total samples) at the
Columbus Creek Upper and Lower stations due to Project monitoring budget constraints. The
majority of total phosphorus data was provided by WDEQ during annual bioassessments usually
in October. Summary statistics for total phosphorus are presented in Table 8-42. These statistics
were based on “censored” values because the majority of analyses (6 samples out of 9 total
samples) were less than the minimum detection limit (minimum detection limit was 0.10 mg/l for
WDEQ analytical method; 0.05 mg/l for SCCD analytical method). The minimum detection limit
for the WDEQ analytical method did not provide adequate data needed to address the
recommended water quality standard for total phosphorus in water bodies draining to a lake or
reservoir (0.05 mg/l; EPA, 1977). Data were thus censored to provide an estimate that could be
related to the recommended EPA standard of 0.05 mg/l.
Average total phosphorus concentrations were low at each station during the Project. The
average total phosphorus concentration at the Upper station based on three (3) total samples was
.039 mg/l, and .065 mg/l at the Lower station. Total phosphorus concentrations at the Upper
station ranged from .006 mg/1 to .070 mg/l, and from .008 mg/l to .180 mg/l at the Lower station.
Average and maximum total phosphorus values at the Upper and Lower stations were based on a
low total number of samples. However, total phosphorus values should be considered low.

Sheridan County Conservation District
Tongue River Watershed Assessment 205j Final Report 1996-1999 178
Wyoming has not established surface water quality standards for phosphorus. U.S. EPA (1977)
recommended that total phosphorus concentration should not exceed 0.05 mg/l in a stream that
enters a lake or reservoir (e.g. Tongue River Reservoir) to prevent development of nuisance algal
and plant populations. Mackenthun (1973) suggested a target phosphorus level of less than 0.10
mg/l for streams that did not directly enter lakes or reservoirs. USGS (1999) provided recent
information from nationwide NAWQA monitoring and assessment and reported that national
background concentrations for total phosphorus from streams in undeveloped (reference - like )
areas was about 0.10 mg/L. Because the EPA goal of 0.05 mg/l was not attainable, SCCD
adopted findings by USGS for its interpretation of total phosphorus data collected during this
Project.
Using the value of <0.10 mg/l as a target for total phosphorus concentration, one sample
exceeded the target value (August 17, 1999 at the Lower station collected by SCCD). Because
one (1) out of nine (9) total samples (11 % of total samples) exceeded the target value, sampling
frequency was generally low at the Upper (N = 3 samples) and Lower station (N = 6 samples) over
a four year period and sampling generally occurred during the fall low flow period when total
phosphorus concentration is normally lower, additional sampling was necessary to provide a
reliable estimate of total phosphorus concentration in Columbus Creek.
8.8.10 WDEQ Columbus Creek Monitoring for Additional Water Chemistry
Parameters
WDEQ collected samples for additional monitoring parameters during annual monitoring at the
Columbus Creek Upper station in 1993 and the Columbus Creek Lower station from 1996 through
1999. Summary statistics are presented in Table 8-43.
Alkalinity at the Upper station based on a single sample was 170 mg/l. Average alkalinity at the
Lower station based on four (4) samples was 326 mg/l. The geometric mean was 317 mg/l. The
range was from 210 mg/l to 390 mg/l. There was no Wyoming water quality or EPA standard to
compare alkalinity values to, but data indicated that water was moderate to highly alkaline, highly
productive for aquatic life and was generally capable of withstanding sudden changes in pH due to
inputs from point and NPS sources.
Total chloride concentration was low at each station during the limited sampling. Chloride was
not detected in the single sample collected at the Upper station. Chloride was detected during
each sampling event at the Lower station, although at low concentration. Average chloride based
on four (4) samples was 10 mg/l with a range from 2.5 mg/l (censored value) to 17.3 mg/l. Total
chloride values were well within WDEQ and EPA water quality standards indicating full support
for Wyoming beneficial uses that may be applicable to total chloride. However, presence of
chloride, although at low levels suggested that irrigation return may have some effect on the Lower
station.
Sheridan County Conservation District
Tongue River Watershed Assessment 205j Final Report 1996-1999 179
Total sulfate concentration based on a single sample at the Upper station was relatively high (68
mg/l) when compared to the Upper Tongue River station and Upper tributary stations. The
average total sulfate concentration based on four (4) total samples at the Lower station was 162
mg/l. The range in total sulfate was from 65 mg/l to 223 mg/l. These values were higher than
expected even considering samples were collected in the fall during lower flow when ion
concentrations were normally highest. The primary source for the higher total sulfate
concentration at the Lower station appeared to be natural sources (based on the Upper station
concentration) and a secondary source was probably related to irrigation return.
Total sulfate values for both stations were within WDEQ standards (for groundwater use), but the
Lower station approached the EPA secondary drinking water standard of 250 mg/l. This
observation indicated full support for Wyoming beneficial uses for sulfate. Total sulfate
sampling is recommended for future monitoring at Columbus Creek due to its approach to the EPA
secondary drinking water standard and to determine if the increase in sulfate concentration at the
Lower station was a natural occurrence or if the increase was related to irrigation return.
Hardness concentration was high at each station and may be due to the natural limestone geology
that predominated much of the upstream Columbus Creek watershed. Hardness at the Upper
station based on a single sample was 320 mg/l. Average hardness at the Lower station was 392
mg/l. The range in hardness at the Lower station was from 239 mg/l to 510 mg/l. Water at each
station may be termed very hard based on the classification found in Table 6-2. There were no
Wyoming or EPA water quality standards for hardness, but observed values indicated partial
support of the Wyoming beneficial use for Industrial use since all values were greater than 300
mg/l and treatment may be required before industrial use. More year around sampling was
required to determine if the high hardness values were due to seasonal sampling artifact during low
flow periods or to natural limestone geology in the watershed.
Total Suspended Solids (TSS) concentration was low at the Upper station. The single TSS
sample was <2 mg/l. The low value appeared to be related to the fact that the sample was
collected in the fall during lower flow when TSS values were normally lowest. However,
average TSS at the Lower station was 18 mg/l with a range from 6 mg/l to 23 mg/l. These values
were considered seasonally high because most stations in the Project area displayed TSS values
near or slightly above minimum detection limits during the low flow season. Results of turbidity
sampling (Section 8.8.6) showed high turbidity levels in excess of the Wyoming water quality
standard. This suggested that significant amounts of sediment were entering Columbus Creek
between Upper and Lower stations. Further sampling for TSS is not recommended at this time
unless specific sediment loading questions arise. Turbidity should continue to be used as a
surrogate indicator for TSS. As recommended in Section 8.8.6, further turbidity sampling is
required at Columbus Creek.

Sheridan County Conservation District
Tongue River Watershed Assessment 205j Final Report 1996-1999 180
8.8.11 SCCD and WDEQ Columbus Creek Benthic Macroinvertebrate Monitoring
The Columbus Creek Upper station was monitored by WDEQ once in 1993. SCCD and WDEQ
sampled benthic macroinvertebrates at the Lower station annually from 1996 through 1999.
Metric values for the single WDEQ sample collected from the Upper station is presented in
Appendix Table G-1. Metric values for samples collected at the Lower station are presented in
Appendix Table G-1.
Lists of benthic taxa identified, density (number per square meter) of taxa and percent contribution
of each taxon to the total benthic population at each station are presented in Appendix F. The
WDEQ Upper station taxa list is presented in Appendix Table F-1. Taxa lists for the Lower
station are presented in Appendix Tables F-2 through F-5.
Biological condition at the Columbus Creek Upper station using scoring criteria from the
Wyoming Biological Condition Index (WBCI) from Barbour et al. (1994) was good. Biological
condition using scoring criteria from the Wyoming Stream Integrity Index (WSII) from Stribling
et al. (2000) was fair (Table 8-15). The good biological condition rating indicated full support of
aquatic life use whereas the fair biological condition rating indicated partial support of aquatic life
use. Partial support of aquatic life use requires improvement in the aquatic resource to restore
biological condition to full support for aquatic life use. Contradictory or “gray area”
determination of biological condition may be expected to occur in as much as fifteen (15) to
twenty (20) percent of bioassessments (1998 Personal Communication, Kurt King, WDEQ).
SCCD used the WBCI from Barbour et al. (1994) as the primary indicator of biological condition
because the WBCI was developed specifically for streams in the mountains and foothills of the Big
Horn Mountains in the Middle Rockies Ecoregion and appeared to provide the most reliable
assessment. In contrast, the WSII was developed for all mountain streams statewide and may,
perhaps be less sensitive than the WBCI for assessment of biological condition in the Big Horn
Mountain foothill streams.
Although biological condition was rated good using the WBCI, at least one additional year of
sampling for benthic macroinvertebrates is recommended because only one sample was taken and
confirmation was required. Biological condition ratings that border between two ratings (i.e. fair
and good) should always be re-sampled the next year to confirm findings from the previous year
especially when the determination may result in listing the stream segment for non-support for
aquatic life use. Should additional sampling indicate impairment of the biological community,
another sample should be collected and if impairment is reconfirmed, remedial measures should be
considered.
Biological condition at the Columbus Creek Lower station using scoring criteria from the
Wyoming Stream Integrity Index (WSII) from Stribling et al. (2000) was fair in 1996 and 1998

Sheridan County Conservation District
Tongue River Watershed Assessment 205j Final Report 1996-1999 181
and good in 1997 and 1999 (Table 8-15). The Wyoming Biological Condition Index (WBCI) from
Barbour et al. (1994) could not be used at this station since it was developed for mountain and
foothill streams and not for plains stream sites such as the Columbus Creek Lower station. The
ratings in 1997 and 1999 indicated full support for aquatic life use whereas the ratings in 1996 and
1998 indicated partial support for aquatic life use. The contradictory ratings may be clarified by
concurrent evaluation of water quality and habitat quality data. The Lower station was water
quality limited due to projected high water temperature and it exceeded the Wyoming water
quality standard for turbidity and fecal coliform bacteria. Habitat quality ranked second to last
among all tributary streams assessed (Table 9-4). Evaluation of specific metrics for the benthic
macroinvertebrate community indicated that the Lower station was being negatively impacted by
warmer water temperature, sediment and possible organic enrichment from animal waste. Based
on these factors, SCCD took the conservative approach to declare the Lower station as partially
supporting aquatic life use. This observation will require remedial measures to restore biological
condition. It is likely that reduction in turbidity and sediment deposition, reduction in water
temperature and improvement in summer discharge will result in restoration of biological
condition at the Lower station.
The benthic community was dominated by primarily warmer water taxa indicative of fair water
quality and fair habitat quality. Of note was the importance of worms in the benthic community.
Increased density of worms (Oligochaeta) may be associated organic pollution (Klemm, 1985),
pollution from feedlots (Prophet and Edwards, 1973), and pollutants contained in urban storm
water runoff (Lenat et al., 1979; Lenat and Eagleson, 1981). Ophidonais serpentina and Uncinais
uncinata were worm taxa that were among the five most dominant taxa in the benthic population
(Table 8-16). O. serpentina and U. uncinata are widespread throughout the United States
(Hiltunen and Klemm, 1980; Brinkhurst, 1986) and are often associated with sediment and organic
deposits (e.g. animal waste). Both have pollution tolerance values of 8 (Table 8-16) indicating
they are highly tolerant of pollution. The average number of Oligochaete (worm) taxa during the
Project was five (5) which was the highest average number of worm taxa among tributary stations.
Percent contribution of worms to the total benthic community was nineteen (19) percent in 1996,
eight (8) percent in 1997, four (4) percent in 1998 and twenty-six (26) percent in 1999 (Appendix
Table G-1). Cheumatopsyche, a pollution tolerant caddisfly, was one of the five most dominant
taxa. This caddisfly genera is widespread and often becomes more abundant as water quality
deteriorates.
The total number of EPT taxa was generally low each year and ranged from eight (8) taxa in 1996
to thirteen (13) taxa in 1999. Percent contribution of scraper taxa was low and ranged from one
(1) percent in 1997 to four (4) percent in 1999. The lower percentage of scrapers in the benthic
population suggested high deposition of sediment. This observation was confirmed by the
average weighted embeddedness value of 21.8 at the Lower station (Table 8-32). The low
percentage of shredders in the benthic population suggested riparian disturbance and vegetation
removal. Shredders feed on coarse particulate organic material such as leaves and vegetation that
enter smaller stream systems usually from the riparian zone. Shredders comprised 0.2 percent,

Sheridan County Conservation District
Tongue River Watershed Assessment 205j Final Report 1996-1999 182
0.0 percent, 0.3 percent and 0.3 percent of the total benthic community during 1996, 1997, 1998
and 1999, respectively. The high percentage of collector filterers in the benthic population
further indicated degraded water quality at the Lower station because this macroinvertebrate
functional feeding group consumes fine particulate organic material suspended in the water
column originating from sources contributing organic material such as animal waste. Collector
filterers comprised 15 percent, 47 percent, 53 percent and 21 percent of the total benthic
community during 1996, 1997, 1998 and 1999, respectively.
The apparent effect of seasonal dewatering and projected higher water temperature in excess of the
Wyoming water quality standard was to allow warm water species to colonize and dominate this
expected cool water environment. The higher water temperature, high turbidity and sediment
deposition, combined with fecal coliform contamination and probable organic pollution from
animal origin result in a fair biological condition rating and partial attainment aquatic life use.
Dewatering may be addressed through water conservation practice. The apparent input of animal
waste and sediment from suspect wildlife or agricultural land use requires resolution to bring the
stream into compliance with Wyoming water quality standards and to fully support aquatic life
use.
8.8.12 SCCD and WDEQ Columbus Creek Habitat Assessment
Qualitative habitat assessments were conducted once by WDEQ in 1993 at the Upper station and
annually by SCCD and WDEQ from 1996 through 1999 at the Lower station. Because habitat
assessments were subjective, SCCD used caution by providing a conservative interpretation of
data.
The total habitat score based on the single 1993 assessment at the Upper station was 147 (Table
8-31). The score indicated good habitat quality. Percent fines (silt and sand) comprising the
stream substrate was relatively high (sand = 16 percent, silt = 3 percent) (Table 8-32). Riparian
condition indicator parameters including bank vegetation stability and riparian zone width scored
high. However, bank stability and riparian disruptive pressures scored lower because unstable
banks were common and vegetation was cropped by animals.
Habitat assessment scores were lower at the Columbus Creek Lower station when compared to the
Upper station. Total habitat scores varied during the Project and ranged from 66 in 1996 and
1999 to 97 in 1998 (Table 8-31). The lower scores indicated moderate to poor habitat. The
reduction in habitat score from the Upper station to the Lower station was due to lower scores for
all habitat parameters with the exception of disruptive pressures. The lower scores may be
partially due to the location of the station downstream of the Highway 14 crossing.
Channelization effects commonly occur downstream of bridges in the form of scouring.
However, percent fines (sand and silt) comprising the stream bed substrate was relatively high and
embeddedness (silt covering or surrounding cobble and gravel) were high resulting in lower
habitat scores for these parameters. Instream cover was low due to low discharge and

Sheridan County Conservation District
Tongue River Watershed Assessment 205j Final Report 1996-1999 183
channelization effects. Banks were unstable and eroding and the riparian zone width was low
because the stream channel had down cut leaving the riparian zone without access to stream water
or ground water.
The reduction in habitat coupled with low discharge due to dewatering and probable higher water
temperature appeared to place stress on aquatic communities to result in non-support for aquatic
life use.
The semi-quantitative stream substrate particle size distribution differed between the Upper and
Lower stations. Average percent cobble was 64 percent at the Upper station and 36 percent at the
Lower station. Average percent coarse gravel at the Upper station was 10 percent, and 15 percent
at the Lower station. The largest change between Upper and Lower stations was in silt deposition
and related high embeddedness. Silt comprised 3 percent of the Upper station and 29 percent at
the Lower station. Embeddedness was generally low at the Upper station (weighted
embeddedness value = 81) and high at the Lower station (weighted embeddedness value = 22).
The higher the Weighted Embeddedness value, the lower the amount of silt covering cobble and
gravel substrate. Silt deposition was affected by the apparent amount of silt entrained in the water
column (i.e. turbidity exceedence of the water quality standard), low discharge due to dewatering
and low current velocity. Silt deposition will normally increase as current velocity is decreased
provided the water column contains significant fine sediment.
The current velocity measured at the Upper station was 2.6 feet per second (fps) and average
current velocity at the Lower station was 0.5 fps (Table 8-32). Current velocity in 1999 was 0.05
fps. The low average current velocity appeared to be related to low discharge during sampling.
The general decrease in substrate particle size from the Upper station to the Lower station was
expected, but the amount of silt deposition was greater than anticipated. High embeddedness at
the Lower station, combined with low discharge, warmer water temperature and higher turbidity
appeared to negatively affect the benthic macroinvertebrate community by reducing the cool water
and pollution intolerant organisms with more warmer water taxa and pollution tolerant organisms.
Increased stream discharge and reduced turbidity would benefit aquatic organisms and improve
biological condition.
8.8.13 WGFD Columbus Creek Fish Population Monitoring
SCCD located no historic fish sampling data in the Columbus Creek watershed. However, SCCD
was later notified by WGFD that one fish sampling event occurred in 1959 at a station near the
SCCD Columbus Creek Upper station. The data could not be incorporated into this Final Report
due to time constraints; however, the data has been received and will be retained in the Project file.

Sheridan County Conservation District
Tongue River Watershed Assessment 205j Final Report 1996-1999 184
8.9 Wolf Creek Stations
8.9.1 Wolf Creek Discharge
Instantaneous discharge measurements were recorded by SCCD and WDEQ during sampling at
Wolf Creek Upper and Lower stations. Summary statistics for discharges are presented in Table
8-1. Discharge measurements during the Project at the Upper station averaged 33.5 cfs, and 39.2
cfs at the Lower station. The geometric mean at the Upper station was 19.0 cfs, and 8.7 cfs at the
Lower station. The average values were difficult to compare among Upper and Lower stations
due to differing sampling frequency and lack of same day sampling on numerous occasions.
Daily discharge was also measured by WSBC from April through September at Wolf Creek USGS
station 06299500 also known as SCCD monitoring station Wolf Creek Upper. Figure 8-4
illustrated the mean monthly discharge during the Project in comparison to the mean monthly
discharge from 1982 through 1999. Discharge measurements were limited to these months to
monitor available water supply for agricultural use.
Figure 8-22 illustrates discharge measured by SCCD and WDEQ at each station on the same day.
Discharge data not measured at each station on the same day was excluded from Figure 8-22
because discharge may vary daily precluding valid comparison among stations.
Discharge during the primary low-irrigation months (April, May and September) seldom increased
from the Upper station to the Lower station. Increase in discharge from upstream to downstream
is normal in unregulated stream systems due to increased drainage area. Overall discharge
measured on all comparable days was reduced by about fifty (50) percent (Table 8-2). Discharge
was normally reduced from the Upper station to the Lower station during the primary irrigation
months (June, July and August) (Figure 8-22). Discharge was reduced by about sixty-eight (68)
percent during the irrigation season.
Wolf Creek Lower had a discharge less than 4 cfs on 24 percent of the sampling days, the majority
occurring during the irrigation season. The lowest discharge measurement at the Lower station
was less than 1 cfs on consecutive sampling days from July 20, 1999 to August 18, 1999.
The contribution of discharge from Wolf Creek to the Tongue River was estimated by comparing
discharge at the Wolf Creek Lower station to discharge measured at the Tongue River Lower
station on the same day. This comparison revealed that Wolf Creek contributed an estimated 8.9
percent of the Tongue River Lower discharge (Appendix Table M-2). This suggested that
potential pollutants entering the Tongue River from Wolf Creek may have little effect on the
Tongue River due to dilution effects. The percent contribution of discharge to the Tongue River
was higher for Wolf Creek than for any other tributary within the Project area.

Sheridan County Conservation District
Tongue River Watershed Assessment 205j Final Report 1996-1999 185
8.9.2 SCCD and WDEQ Wolf Creek Temperature Monitoring
Summary statistics for instantaneous water temperature measurements by SCCD and WDEQ at
Wolf Creek Upper and Lower stations are presented in Table 8-44. Water quality data for the
Upper station is presented in Appendix Table B-20 and data for the Lower station in Appendix
Tables B-21 and B-23. Water quality data collected by WDEQ in 1995 for a single sample event
at a station identified as Wolf Creek - Upper (Berry’s) is presented in Appendix Table B-22.
Average water temperature during the Project was lowest at the Upper station (10.30C) and slightly
higher at the Lower station (13.40C). Maximum water temperature recorded at the Upper station
was 16.30C and the maximum water temperature recorded at the Lower station was 22.0
0C.
Based on instantaneous measurements there were no exceedences of the Wyoming water quality
standard for temperature. However, as indicated in Section 8.5.2, sampling conducted by SCCD
and WDEQ did not occur during the time of day required to detect maximum daily water
temperature. Maximum daily temperature was projected at each station during the months of
June, July, August and September as described in Section 8.5.3. Projected maximum daily water
temperature indicated no exceedence of the Wyoming water quality standard for water
temperature at the Upper station. However, the standard for water temperature was probably
exceeded on nine (9) different days at the Lower station. This represented water temperature
exceedences on about twenty-four (24) percent of total sampling days. All projected water
temperature exceedences occurred during the months of July and August usually when stream
discharge was relatively low. This observation indicated the need for future continuous water
temperature monitoring during warmer summer month at the Lower station to determine
frequency of occurrence for exceedence of the water temperature standard.
8.9.3 SCCD and WDEQ Wolf Creek pH Monitoring
Summary statistics for instantaneous pH measurements by SCCD and WDEQ at Wolf Creek
Upper and Lower stations are presented in Table 8.45. The pH varied little among the Upper and
Lower stations. The average and geometric mean for pH during this Project was 7.8 SU at the
Upper station and 8.0 SU at the Lower station. The maximum pH recorded at the Upper station
during the Project was 8.4 SU, and 8.5 SU at the Lower station. The minimum pH was 6.9 SU at
the Upper station, and 7.3 SU at the Lower station. All pH measurements were within Wyoming
water quality standards because measurements were within the range from 6.5 SU to 9.0 SU.
8.9.4 SCCD and WDEQ Wolf Creek Specific Conductivity Monitoring
Summary statistics for specific conductivity are presented in Table 8-46. Average conductivity
during the Project was 198 umhos/cm at the Upper station, and 429 umhos/cm at the Lower
station. The geometric mean was 179 umhos/cm at the Upper station, and 388 umhos/cm at the
Lower station. Conductivity values at the Upper station ranged from a low of 78 umhos/cm to a

Sheridan County Conservation District
Tongue River Watershed Assessment 205j Final Report 1996-1999 186
high of 635 umhos/cm, and from a low of 144 umhos/cm to a high of 964 umhos/cm at the Lower
station. The average increase in conductivity from the Upper station to the Lower station was 117
percent. The increase in conductivity between stations using the geometric mean was 101
percent. The increase in conductivity was higher than expected and suggested that irrigation
return may be affecting conductivity at the Lower station especially during periods of low
discharge. Although there was no Wyoming water quality standard for conductivity, values were
generally considered low to moderate and within the range required for support of aquatic life.
The strong association between conductivity and stream discharge observed at other sampling
stations in the Project area was not present at either Wolf Creek station. The correlation
coefficient between conductivity and discharge at the Upper station was -0.190, and +0.054 at the
Lower station (Appendix Table L-3). Neither correlation coefficient was statistically significant
(P>0.05).
8.9.5 SCCD and WDEQ Wolf Creek Dissolved Oxygen Monitoring
SCCD initiated monitoring for dissolved oxygen (DO) in 1999. WDEQ conducted monitoring
for DO once annually usually in October. Summary statistics for DO are presented in Table 8-47.
DO was slightly lower at the Lower station when compared to DO at the Upper station. Average
DO during the Project was 10.0 mg/l at the Upper station and 9.5 mg/l at the Lower station. DO
values ranged from 8.4 mg/l to 11.6 mg/l at the Upper station, and from 8.1 mg/l to 11.3 mg/l at the
Lower station.
There were no exceedences of the Wyoming water quality standard for DO because no DO values
were less than 5 mg/l. The lowest DO value recorded during the Project was 8.1 mg/l measured
by SCCD at the Lower station on September 15, 1999. The DO concentrations were sufficient to
support diverse populations of aquatic organisms and fish indicating full support for aquatic life
use for this physical parameter.
8.9.6 SCCD and WDEQ Wolf Creek Turbidity Monitoring
Summary statistics for turbidity are presented in Table 8-48. The average difference in turbidity
between Upper and Lower stations during the Project was higher than expected even when
considering natural increases in turbidity normally observed along the longitudinal gradient in
streams. Average turbidity was 4.7 NTU at the Upper station and 21.0 NTU at the Lower station.
The geometric mean was 2.4 NTU at the Upper station and 13.2 NTU at the Lower station.
Turbidity values at the Upper station ranged from 0.5 NTU to 20.0 NTU, and from 1.9 NTU to 125
NTU at the Lower station. The increase in turbidity from the Upper station to the Lower station
was considered relatively high and in excess of the Wyoming water quality standard.
Turbidity values were positively associated with discharge at the Upper station and at the Lower

Sheridan County Conservation District
Tongue River Watershed Assessment 205j Final Report 1996-1999 187
station. There was a significant positive relationship such that turbidity values increased as
discharge increased. The correlation coefficient between turbidity and discharge at the Upper
station was +0.582 (P<0.01), and +0.454 (P<0.01) at the Lower station. R-squared values for the
regression analyses were 34.5 percent at the Upper station and 51.8 percent at the Lower station
(Appendix Tables L-5 and L-6). Because of the association between turbidity and discharge,
lower turbidity values were normally recorded during periods of lower discharge (prior to and after
spring runoff) in early April, September and October and higher turbidity values were generally
recorded during periods of higher discharge and spring runoff in latter April, May and early June.
The average and geometric mean increase in turbidity between Upper and Lower stations was 16.3
NTU and 10.8 NTU, respectively. This represented an exceedence of the Wyoming water quality
standard for turbidity because increase in turbidity was greater than 10 NTU allowed for Class 2
cold water, water bodies. Additional sampling stations are required for future turbidity sampling
to identify the source(s) for turbidity affecting the Lower station.
8.9.7 SCCD and WDEQ Wolf Creek Fecal Coliform Bacteria Monitoring
Summary statistics for fecal coliform bacteria are presented in Table 8-49. The average for fecal
coliform bacteria at the Upper station was 11 per 100ml, and 148 per 100ml at the Lower station.
The geometric mean for fecal coliform bacteria at the Upper station during the Project was 5 per
100ml, and 57 per 100ml at the Lower station. The geometric mean is a logarithmic
transformation of data and provided a more reliable estimate of the mean by smoothing extreme
values due to high variability among fecal coliform measurements. Fecal coliform bacteria
concentration at the Upper station ranged from 1 per 100ml to 41 per 100ml. The number of fecal
coliform bacteria was quite low indicating that the primary land uses (wildlife, recreation and
limited seasonal livestock grazing) in the vicinity of the Upper station were not significant sources
of fecal coliform bacteria. Fecal coliform bacteria concentration at the Lower station ranged from
1 per 100ml to 700 per 100ml.
The was no exceedence of the Wyoming water quality standard for fecal coliform bacteria at the
Upper station. The geometric mean of five (5) samples collected during the Recreation Season in
1999 at the Upper station was 17 per 100ml which was low. There was no single sample collected
in excess of 400 per 100ml since the maximum level recorded during the Project was 41 per 100ml
(collected July 28, 1999).
Fecal coliform bacteria levels at the Lower station exceeded the Wyoming water quality standard
for fecal coliform bacteria. The geometric mean of five (5) samples collected during the
Recreation Season in 1999 was 147 per 100ml which did not exceed the standard of 200 per
100ml. However, samples collected on June 16, 1997, June 19, 1998 and April 21, 1999 had fecal
coliform levels in excess of 400 per 100ml that exceeded the Wyoming water quality standard for
fecal coliform bacteria. The exceedence of the standard indicated remedial measures were

Sheridan County Conservation District
Tongue River Watershed Assessment 205j Final Report 1996-1999 188
required to lower fecal coliform levels to bring the Lower station into compliance with the
Wyoming water quality standard.
There was no exceedence of the fecal coliform standard in 1996 because of apparent low sampling
frequency (N = 3 total samples). Exceedences in 1997, 1998 and 1999 were due to single samples
that exceeded the standard of 400 per 100 ml. Fourteen percent of samples exceeded the standard
during combined sampling in 1997, 1998 and 1999. SCCD increased the sampling frequency in
1999 from monthly to five (5) samples within a 30 day period during the Recreation Season to
provide a better estimate of bacteria contamination and allow direct comparison to the Wyoming
water quality standard for fecal coliform bacteria. Some sampling sites within the Project area
exceeded Wyoming fecal coliform standards only in 1999. It appeared the increased sampling
frequency at some stations in 1999 increased the probability for detection of fecal coliform levels
in excess of the Wyoming fecal coliform standard. Extensive discussion related to the effects of
sampling frequency for reliable estimates of fecal coliform bacteria is presented in Section 8.11.1.
8.9.8 SCCD Tongue River Pesticide and Herbicide Monitoring
SCCD conducted pesticide and herbicide sampling at the Wolf Creek Lower station on August 21,
1996. Analytical results are presented in Appendix Table H-1. Sampling occurred once during
the Project due to the high cost associated with sample analyses and negative results from this
1996 sampling event.
A total of nineteen (19) organochlorine pesticides and ten (10) chlorinated herbicides were
sampled. Analytical results found no detectable (less than the minimum detection limit)
concentrations for herbicides or pesticides. This observation indicated that no evidence of
herbicide and pesticide contamination was present in the Wolf Creek water column during this
sampling event.
8.9.9 SCCD and WDEQ Wolf Creek Nitrate Nitrogen Monitoring
Total nitrate samples were collected infrequently (N = 3 total samples) at the Wolf Creek Upper
station due to Project monitoring budget constraints. Sampling for nitrate nitrogen was
concentrated at the Lower station because potential nutrients entering the Tongue River could be
best estimated at this station. Summary statistics for nitrate nitrogen are presented in Table 8-50.
Average nitrate nitrogen concentrations were low at each station during the Project. The average
nitrate concentration at the Upper station was .001 mg/l, and .022 mg/l at the Lower station.
Nitrate values at the Upper station based on four (4) samples (including one sample collected by
WDEQ in 1995) ranged from .010 mg/1 to .170 mg/l and the range at the Lower station was from
.001 mg/l to .130 mg/l.
Average and maximum nitrate values at the Upper and Lower stations were considered low.
Sheridan County Conservation District
Tongue River Watershed Assessment 205j Final Report 1996-1999 189
Eighteen (18) out of twenty-seven (27) total samples collected at the Upper station were below the
minimum detection limit of 0.01 mg/l. Nitrate concentration was well below the Wyoming water
quality standard and drinking water human health standard of 10 mg/l for Class 2 surface waters
(WDEQ, 1998). Data for nitrate nitrogen indicated that nitrate concentration in Wolf Creek was
less than the background concentration of nitrate (about 0.60 mg/L) found in streams in
undeveloped areas throughout the United States (USGS, 1999). These observations indicated
that nitrate nitrogen was not present in Wolf Creek in concentrations that could pose a human
health threat or negatively affect aquatic populations by indirect effects caused by eutrophication.
Full support for all Wyoming beneficial uses applicable to nitrate was indicated.
8.9.10 SCCD and WDEQ Wolf Creek Total Phosphorus Monitoring
Total phosphorus samples were collected infrequently by SCCD (N = 3 total samples) at the Wolf
Creek Upper station due to Project monitoring budget constraints. WDEQ collected the majority
of total phosphorus samples during annual bioassessments. Summary statistics for total
phosphorus are presented in Table 8-51. These statistics were based on “censored” values
because analytical results from all samples were less than the minimum detection limit (minimum
detection limit was 0.10 mg/l for WDEQ analytical method; 0.05 mg/l for SCCD analytical
method). The minimum detection limit for the WDEQ analytical method did not provide
adequate data needed to address the recommended water quality standard for total phosphorus in
water bodies draining to a lake or reservoir (0.05 mg/l; EPA, 1977). Data were thus censored to
provide an estimate that could be related to the recommended EPA standard of 0.05 mg/l.
Average total phosphorus concentrations were low at each station during the Project. The
average total phosphorus concentration at the Upper station based on three (3) total samples was
.018 mg/l, and .027 mg/l at the Lower station. Total phosphorus concentrations at the Upper
station ranged from .001 mg/1 to .050 mg/l and from .003 mg/l to .090 mg/l at the Lower station.
Average and maximum total phosphorus values at the Upper and Lower stations were based on a
low total number of samples. However, total phosphorus values should be considered low.
Wyoming has not established surface water quality standards for phosphorus. U.S. EPA (1977)
recommended that total phosphorus concentration should not exceed 0.05 mg/l in a stream that
enters a lake or reservoir (e.g. Tongue River Reservoir) to prevent development of nuisance algal
and plant populations. Mackenthun (1973) suggested a target phosphorus level of less than 0.10
mg/l for streams that did not directly enter lakes or reservoirs. USGS (1999) provided recent
information from nationwide NAWQA monitoring and assessment and reported that national
background concentrations for total phosphorus from streams in undeveloped (reference - like )
areas was about 0.10 mg/L. Because the EPA goal was not attainable, SCCD adopted the finding
by USGS for its interpretation of total phosphorus data collected during this Project.
Using the value of <0.10 mg/l as a target for total phosphorus concentration, no significant amount
of total phosphorus was identified in a single sample collected at Wolf Creek stations during this

Sheridan County Conservation District
Tongue River Watershed Assessment 205j Final Report 1996-1999 190
Project. However, sampling frequency was low at the Upper (N = 3 samples) and Lower station
(N = 6 samples) over a four year period and sampling generally occurred during the fall low base
flow period when total phosphorus concentration is normally lower. Additional sampling was
required to provide a reliable estimate of total phosphorus concentration in Wolf Creek.
8.9.11 WDEQ Wolf Creek Monitoring for Additional Water Chemistry Parameters
WDEQ collected samples for additional monitoring parameters during annual monitoring in 1995
at a station downstream from the SCCD Wolf Creek Upper station. This station was identified as
Wolf Creek - Berry’s and was located about 3/4 to 1 mile downstream of the Soldier Creek Road
bridge crossing. WDEQ also conducted annual monitoring at the Wolf Creek Lower station from
1996 through 1999 in conjunction with benthic macroinvertebrate sampling and habitat
assessment. Summary statistics are presented in Table 8-52.
Alkalinity at the Wolf Creek - Berry station based on a single sample was 190 mg/l. Average
alkalinity at the Lower station based on four (4) samples was 244 mg/l. The geometric mean was
243 mg/l. The range was from 230 mg/l to 275 mg/l. There was no Wyoming water quality or
EPA standard to compare alkalinity values to, but data indicated that water was generally
productive for aquatic life and was capable of withstanding sudden changes in pH due to inputs
from NPS sources.
Total chloride concentration was low at each station during the limited sampling. There were no
samples collected at either Berry’s station or the Lower station that had total chloride
concentrations greater than 5 mg/l. Total chloride values were well within WDEQ and EPA
water quality standards indicating full support for Wyoming beneficial uses applicable to chloride.
Total sulfate concentration was high at Berry’s station based on the single sample in 1995. Total
sulfate concentration was 779 mg/l which exceeded the WDEQ standard (for groundwater use)
and the EPA secondary drinking water standard of 250 mg/l. The EPA standard was not
enforceable. Sulfate concentrations were lower at the Lower station. Average total sulfate
concentration based on four (4) total samples at the Lower station was 83 mg/l. The range in total
sulfate was from 67 mg/l to 101 mg/l. These values were considered moderate and slightly higher
than expected even considering samples were collected in the fall during lower base flow when ion
concentrations were normally highest. Total sulfate values at the Lower station were within
WDEQ standards (for groundwater use) and the EPA secondary drinking water standard of 250
mg/l. This observation indicated full support at the Lower station for Wyoming beneficial uses
applicable to sulfate.
Although the high total sulfate concentration at the Berry station was based on a single sample
collected during the low flow period, it suggested there was a potential water quality concern that
required further investigation. This area may have irrigation return questions affecting sulfate

Sheridan County Conservation District
Tongue River Watershed Assessment 205j Final Report 1996-1999 191
concentration. Because no water quality problems were detected at the Wolf Creek Upper station
during this Project, a potential future monitoring station may be sited in the vicinity of the Soldier
Creek bridge crossing.
Hardness concentration was relatively high at each station and may be due to the natural
limestone geology that predominated much of the upstream Wolf Creek watershed. Hardness at
the Berry station based on a single sample was 264 mg/l. Average hardness at the Lower station
was 293 mg/l. The range in hardness at the Lower station was from 251 mg/l to 334 mg/l. Water
at each station may be termed hard based on the classification found in Table 6-2. There were no
Wyoming or EPA water quality standards for hardness, but observed values suggested partial
support of the Wyoming beneficial use for Industrial use at the Lower station since some values
were greater than 300 mg/l and treatment may be required before industrial use. More year
around sampling was required to determine if the relatively high hardness values were due to
seasonal sampling artifact during low flow periods, to natural limestone geology in the watershed,
or to potential land use influence.
Total Suspended Solids (TSS) concentrations were low at the Berry station and relatively higher
at the Lower station. Lower values appeared to be related to the fact that all samples were
collected in the fall during lower flow when TSS values were normally lowest. The TSS
concentration at the Upper station based on a single sample was <2 mg/l. Average TSS at the
Lower station was 7 mg/l with a range from 5 mg/l to 10 mg/l. Results of limited TSS sampling
conducted by WDEQ indicated that TSS values at the Lower station were generally higher than at
most other stations within the Project area. This observation, coupled with high turbidity values,
suggested sediment input from NPS sources was affecting the station. Turbidity should continue
to be used as the indicator for TSS unless specific sediment loading questions arise.
8.9.12 SCCD and WDEQ Wolf Creek Benthic Macroinvertebrate Monitoring
SCCD and WDEQ did not sample for benthic macroinvertebrates at the Wolf Creek Upper station
during the Project. WDEQ conducted a bioassessment in 1995 at a station identified as Wolf
Creek - Berry’s. This station was located about four (4) miles downstream from the Upper station
(See Figure 5-5, Station Number 17). SCCD and WDEQ sampled benthic invertebrates at the
Wolf Creek Lower station annually from 1996 through 1999.
Metric values for the single WDEQ sample collected from Wolf Creek - Berry’s are presented in
Appendix Table G-2. Metric values for samples collected at the Lower station are presented in
Appendix Table G-2.
Lists of benthic taxa identified, density (number per square meter) of taxa and percent contribution
of each taxon to the total benthic population are presented for each station in Appendix F. The
taxa list for the Wolf Creek - Berry’s station is presented in Appendix Table F-35. Taxa lists for

Sheridan County Conservation District
Tongue River Watershed Assessment 205j Final Report 1996-1999 192
the Lower station are presented in Appendix Tables F-36 through F-39.
Biological condition at the Wolf Creek - Berry’s station using scoring criteria from the Wyoming
Stream Integrity Index (WSII) from Stribling et al. (2000) was very good (Table 8-15). This
observation indicated full support of aquatic life use and that biological condition was very good
when compared to biological condition at other streams in the Northwestern Great Plains
ecoregion of Wyoming. The very good biological condition rating was primarily due to the high
number of total taxa (N = 41), number of Ephemeroptera (mayfly) taxa (N = 7), number of
Plecoptera (stonefly) taxa (N = 5), percent contribution of Plecoptera to the total community (7
percent), number of Trichoptera (caddisfly) taxa (N = 7) and high number of scraper taxa (N = 7).
Grazing management changes implemented in 1994 at Wolf Creek upstream of this station
appeared to have dramatic positive effects for habitat improvement (see Figure 6-13 and Figure
6-14). Habitat improvement is often noticeable in plains streams within one year after
management changes are implemented. Although the very good biological condition rating was
based on a single sampling event in 1995, the management changes continued through the end of
this Project suggesting possible further improvement in biological condition. Further, equal or
better management of water resources and habitat upstream of this station should result in
continued full support of aquatic life use. SCCD water quality sampling at the Wolf Creek Upper
station found good to excellent water quality capable of fully supporting aquatic life use. Fish
population data in Section 8.9.14 further supports this observation indicating full support for
aquatic life use.
Biological condition at the Wolf Creek Lower station using scoring criteria from the Wyoming
Stream Integrity Index (WSII) from Stribling et al. (2000) was good during each year (Table 8-15).
This observation indicated full support for aquatic life use each year. WSII total scores ranged
from 62.3 in 1998 to 74.6 in 1999. The lower WSII score in 1998 was primarily due to the lack of
Plecoptera (stoneflies) in the benthic community. Stoneflies were present in the benthic
community during other years. Good biological condition was indicated by the high number of
total taxa, Ephemeroptera taxa, Trichoptera taxa and number of scraper taxa. The high number of
scraper taxa was interesting because sediment deposition was high at this station. It appeared that
the high number of scraper taxa and percent contribution of scrapers to the total community
(ranging from 27% in 1999 to 48% in 1996) was due to the large amount of macroscopic
periphyton attached to the top and side of cobbles allowing scrapers adequate habitat and food
source.
The benthic community was dominated by the riffle beetle Microcylloepus, the caddisflies
Hydropsyche and Helicopsyche borealis and the mayflies Baetis tricaudatus and Tricorythodes
minutus (Table 8-16). The dominant taxa were each generally warm water taxa. T. minutus was
an indicator of sediment deposition (Winget and Mangum, 1991). Worms were relatively
abundant during each year. There were 3, 8, 3 and 5 worm taxa collected in 1996, 1997, 1998 and
1999, respectively. Percent contribution of worms to the total benthic community ranged from

Sheridan County Conservation District
Tongue River Watershed Assessment 205j Final Report 1996-1999 193
one (1) percent in 1996 to eleven (11) percent in 1997. The number and percent of worms were
considered low to moderate for Wyoming plains streams. No Tubifex tubifex worms were
identified from samples indicating low probability for the occurrence of whirling disease. The
increased density of worms (Oligochaeta) may be associated with organic pollution (Klemm,
1985), pollution from feedlots (Prophet and Edwards, 1973), and pollutants contained in urban
storm water runoff (Lenat et al., 1979; Lenat and Eagleson, 1981). The number of worm taxa and
percent contribution did not indicate a severe pollution problem, but rather a low to moderate
amount of pollution indicative of animal waste from possible agricultural and wildlife sources.
Urban and rural residential land use influence were generally absent at this station. This
observation was supported by the violation of the Wyoming water quality standard for fecal
coliform bacteria. Further benthic macroinvertebrate monitoring is recommended to track this
indicator assemblage as fecal coliform bacteria is reduced through management changes, land
treatments and BMP implementation.
8.9.13 SCCD and WDEQ Wolf Creek Habitat Assessment
Qualitative habitat assessments were conducted once by WDEQ in 1995 at the Wolf Creek -
Berry’s station and annually by SCCD and WDEQ from 1996 through 1999 at the Lower station.
Because habitat assessments were subjective, SCCD used caution by providing a conservative
interpretation of data.
The total habitat score based on the single 1995 assessment at the Wolf Creek - Berry station was
169 (Table 8-53). The score indicated good to excellent habitat quality. Percent fines (silt and
sand) comprising the stream substrate was low (sand = 3 percent, silt = 0 percent) (Table 8-54).
The weighted embeddedness (silt covering cobble and gravel substrate) value was 90. This value
indicated that a small percentage of cobble and gravel was covered by silt. Riparian condition
indicator parameters including bank vegetation stability, riparian zone width and disruptive
pressures scored high. However, bank stability scored lower because unstable banks were
relatively common. Grazing management changes implemented in 1994 appeared to benefit the
riparian condition indicator parameters.
Habitat assessment scores were lower at the Wolf Creek Lower station when compared to Berry’s
station. Total habitat scores varied from 110 in 1996 to 142 in 1998 (Table 8-53). The reduction
in habitat score from Berry’s station to the Lower station was due to lower scores for instream
cover, embeddedness, pool riffle ratio and width depth ratio. The lower scores for these
parameters was related to silt deposition on cobble and gravel, lower discharge and apparent
habitat alteration by historic channelization. The low riparian zone width was related to down
cutting of the channel and channelization that combined to reduce the size of the riparian zone.
Other riparian indicators including bank vegetation protection and disruptive pressures scored
high because this stream reach was fenced. Banks were generally stable and scored moderate to
high.

Sheridan County Conservation District
Tongue River Watershed Assessment 205j Final Report 1996-1999 194
The semi-quantitative stream substrate particle size distribution differed between Berry’s and the
Lower station. Percent cobble was 67 percent at Berry’s and the average composition of cobble at
the Lower station was 80 percent. Silt deposition was not detected at Berry’s and silt deposition
was low at the Lower station averaging only 1 percent of the total stream substrate. Sand
deposition was minimal at Berry’s (3 percent) and at the Lower station (2 percent). The low
degree of silt and sand deposition at each station indicated no large scale disruption within the
watershed that could contribute sand and silt to the stream channel.
Embeddedness (silt covering cobble and gravel) was low at Berry’s and high the Lower station.
The weighted embeddedness value at Berry’s was 90 and the average weighted embeddedness at
the Lower station was about 28. The low value at the Lower station indicated that although there
were no deposits of sediment in the channel, the majority of cobble and gravel substrate was
covered or surrounded by fine silt. Weighted embeddedness values at the Lower station ranged
from 21.2 (almost complete silt coverage) in 1996 to 39.0 in 1999. Silt deposition is controlled
by the amount of silt contained in the water mass and by the current velocity. Silt deposition will
normally increase as current velocity is decreased provided the water column contains significant
fine sediment.
The average current velocity measured at Berry’s was 2.3 feet per second (fps) and 1.4 fps at the
Lower station (Table 8-54). The lower average current velocity at the Lower station combined
with high turbidity appeared to be factors related to the higher embeddedness values because lower
current velocity apparently allowed entrained sediment to settle out of the water column.
High embeddedness at the Lower station did not appear to affect the benthic macroinvertebrate
community because macroscopic periphyton was abundant on cobble and gravel thus providing
adequate alternative habitat to cobble and gravel themselves. However, reduction in turbidity and
increase in average discharge should promote gains in biological condition beyond the current
good rating.
8.9.14 WGFD Wolf Creek Fish Population Monitoring
WGFD conducted historic and current monitoring of fish populations at various locations within
the Wolf Creek watershed over the period from 1959 through 1997. Approximate location of
sampling stations are illustrated in Figure 5-1 and Figure 5-2. Results from twelve (12) sampling
events are presented in Appendix Tables C-23 through C-34.
Most historic fish sampling occurred at upper stations near Eaton’s Ranch, middle stations near the
Wolf Creek Ranch and lower stations at Joe Pattersons. Brown trout was the most abundant game
fish collected in the watershed followed by rainbow trout. No brook trout and whitefish were
reported during fish population sampling within the watershed. Yellow perch and stonecat were
collected in 1959 at Wolf Creek Station 1, believed to be near or downstream from the current

Sheridan County Conservation District
Tongue River Watershed Assessment 205j Final Report 1996-1999 195
SCCD Wolf Creek Lower monitoring station. These two species have not been reported in Wolf
Creek since then, but the lower Wolf Creek reaches have been sampled infrequently. The
majority of historic sampling in the upper reaches of Wolf Creek identified only game fish and
seldom non-game fish. This observation may be due to sampling artifact since early WGFD
surveys appeared to concentrate on collection of game species with less effort directed toward
capture of non-game species.
Non-game fish species collected in the Wolf Creek watershed included longnose dace, mountain
sucker, longnose sucker, white sucker, northern redhorse and creek chub. Longnose Dace appear
to be the most abundant non-game fish species in the Tongue River watershed and are distributed
throughout the Project area. Longnose dace are widespread in North America and is a native
species in Wyoming and common in all but the Green and Little Snake River drainages (Baxter
and Simon, 1970). The remaining non-game species were collected in the middle to lower Wolf
Creek reaches where conditions were more favorable for their existence. Warmer water
temperature, higher turbidity, higher substrate embeddedness and lower summer discharge
presented unfavorable conditions for trout species, but more suitable conditions for non-game
species.
The only WGFD fish sampling that occurred during this Project was on October 6, 1997 at a
location identified as Wolf Creek - Bob Berry’s (Appendix Table C-34). This location was near
the WDEQ 1995 bioassessment station identified as Wolf Creek - Berry’s. The WDEQ
bioassessment indicated biological condition was very good based on evaluation of the benthic
macroinvertebrate community. WGFD sampling found large numbers of brown trout, one (1)
rainbow trout, longnose suckers and white suckers. Sampling indicated that water quality and
habitat quality were suitable to maintain a large population of brown trout and other game and
non-game fish. Full support for aquatic life use was indicated.
Instream flow studies conducted by WGFD in this vicinity indicated that the lowest summer flow
that would maintain habitat quality at its present level between July 1 and September 30 was 8.0
cfs (Annear and Dey, 1998). The flow recommendation to maintain existing physical habitat for
brown trout spawning was 7.0 cfs. They reported that the instream flow to maintain existing
physical habitat for rainbow trout spawning was 20.0 cfs.
Extrapolating results from the instream flow study to the discharge data collected by SCCD at the
Wolf Creek Lower station indicated that instream flow requirements for trout were not achieved
due to low summer discharge caused by dewatering. Discharge was less than 8.0 cfs during
eleven (11) out of fourteen (14) sampling days (79%) from July 1 through September 30. High
projected summer water temperature, high turbidity and substrate embeddedness (Section 8.9.13)
probably limited trout habitat, survival and recruitment in the Lower reach.

Sheridan County Conservation District
Tongue River Watershed Assessment 205j Final Report 1996-1999 196
8.10 Five Mile Creek Lower Station
8.10.1 Five Mile Creek Discharge
Instantaneous discharge measurements were recorded by SCCD and WDEQ during sampling at
the Five Mile Creek Lower station. Summary statistics for discharge are presented in Table 8-1.
The average and geometric mean discharge during the Project was 9.8 cfs and 4.7 cfs, respectively.
Discharge ranged from 0.1 cfs to 52.0 cfs. Figure 8-23 illustrates discharge measurements
recorded during the Project.
Discharge generally followed the normal seasonal discharge pattern observed in the Tongue River
with the exception of generally greater fluctuation in discharge after spring runoff. These
fluctuations were apparently related to diversion of water from Columbus Creek into the Five Mile
watershed and controlled release of water from the Five Mile Reservoir for irrigation use.
Five Mile Creek is highly regulated because the primary source of water in the channel originates
from Columbus Creek via the Five Mile Ditch. Springs exist in Five Mile Creek, but are believed
to not provide adequate flow to sustain game fish populations. The extent to which the springs
recharge due to irrigation water influence is unknown. The majority of the length of Five Mile
Creek was probably ephemeral prior to its use as an irrigation water conduit in the 1880's. As
such, its entire length should be classified by WDEQ as a Class 3 water body. Five Mile Creek is
currently not classified by WDEQ, but assumes the classification of the Tongue River (Class 2
cold water) due to the “tributary rule” (WDEQ, 1999). The following three (3) decision criteria
are used to determine whether a water body is Class 2 or Class 3:
1. Be presently supporting game fish; or
2. Have the hydrologic and natural water quality potential to support game fish; or
3. Include nursery areas or food sources for game fish.
Criteria number 1 could not be determined because there has been no fish sampling in Five Mile
Creek. It is possible that cold water and warm water fish species may seasonally migrate into
Five Mile Creek, but fish survival is suspect after irrigation releases are reduced. Criteria number
2 could not be met because Five Mile Creek does not appear to have the hydrologic potential to
support either cold water or warm water game fish. However, it is probable that Five Mile Creek
could support non-game fish in the isolated pools that were probably characteristic of the Creek
(and other ephemeral plains streams) prior to development of irrigation in the watershed. The
other element for Criteria number 2, natural water quality potential to support game fish, could not
be determined because springs were not sampled for water quality nor could it be determined if
existing springs were natural or if they formed due to irrigation water recharge. Criteria number 3

Sheridan County Conservation District
Tongue River Watershed Assessment 205j Final Report 1996-1999 197
could not be met because lack of perennial discharge would preclude adequate nursery areas for
either cold water or warm water game fish. The other element for Criteria 3, food sources for
game fish, is difficult to link to nursery areas because food sources for fish may develop in
stagnant pools (i.e. pollution tolerant midge larvae (Chironomidae), mosquito larvae (Culicidae)
and worms (Oligochaeta) that are unsuitable as nursery areas for game fish. Because of these
factors, SCCD proposes that Five Mile Creek be classified as a Class 3 water body for its entire
length. Because this proposal does not reclassify the stream, a Use Attainability Analysis would
not be required because Five Mile Creek at this time, is not classified nor listed in WDEQ (1998).
SCCD will contact WDEQ for guidance to designate Five Mile Creek as a Class 3 water body.
The Five Mile Creek Lower station had a discharge less than 1 cfs on three (3) days which
represented about 9 percent of all sampling days. This low discharge value probably represented
an estimate for base flow under the current water management system in the Five Mile Creek
watershed.
The contribution of discharge from Five Mile Creek to the Tongue River was estimated by
comparing discharge at the Five Mile Creek Lower station to discharge measured at the Tongue
River Lower station on the same day. This comparison revealed that Five Mile Creek contributed
an estimated 1.6 percent of the Tongue River discharge (Appendix Table M-2). This observation
indicated that potential pollutants entering the Tongue River from Five Mile Creek would have an
insignificant effect on Tongue River water quality.
8.10.2 SCCD and WDEQ Five Mile Creek Temperature Monitoring
Summary statistics for instantaneous water temperature measurements by SCCD and WDEQ at
the Five Mile Creek Lower station are presented in Table 8-44. Water quality data for the Lower
station is presented in Appendix Tables B-24 and B-25.
The average and geometric mean water temperature during the Project was 14.10C, and 12.6
0C,
respectively. The maximum water temperature was 22.60C and the minimum water temperature
was 0.70C. Highest water temperatures occurred during the summer months of June through
August when ambient air temperature was highest. Lowest water temperatures generally
occurred during April, May or October when discharge was dominated by snowmelt runoff or
seasonally cooler ambient air temperatures.
Based on instantaneous measurements there were no exceedences of the Wyoming water quality
standard for water temperature. However, as indicated in Section 8.5.2, sampling conducted by
SCCD and WDEQ did not occur during the time of day required to detect maximum daily water
temperature. Maximum daily water temperature was estimated during the months of June, July,
August and September as described in Section 8.5.3. Projected maximum daily water
temperature indicated that there were probably nine (9) exceedences of the Wyoming water quality

Sheridan County Conservation District
Tongue River Watershed Assessment 205j Final Report 1996-1999 198
standard for water temperature during this Project. The number of exceedences represented about
24 percent of total sampling days. Higher water temperatures were not necessarily associated
with lower discharge as was often observed at other Tongue River and tributary stations. Some of
the projected higher water temperatures were recorded when discharge ranged from about 8 cfs to
46 cfs. This observation suggested that warm water releases from the upstream Five Mile Creek
Reservoir may significantly affect water temperature in Five Mile Creek. These observations
indicated the need for future continuous water temperature monitoring during warmer summer
months at the Lower station to determine frequency of occurrence for exceedence of the Wyoming
water quality standard for water temperature. The SCCD proposed stream classification would
increase the water temperature standard to 32.20C for a Class 3 water body (WDEQ, 1998).
8.10.3 SCCD and WDEQ Five Mile Creek pH Monitoring
Summary statistics for instantaneous pH measurements by SCCD and WDEQ at the Five Mile
Creek Lower station are presented in Table 8-45. The average and geometric mean for pH
during this Project was 8.0 SU. The maximum pH recorded during the Project was 8.5 SU and
the minimum pH was 7.6 SU. There were no samples less than 6.5 SU or greater than 9.0 SU
indicating pH was within the Wyoming water quality standard for pH.
8.10.4 SCCD and WDEQ Five Mile Creek Specific Conductivity Monitoring
Summary statistics for specific conductivity are presented in Table 8-46. The average and
geometric mean for conductivity during the Project was 819 umhos/cm and 742 umhos/cm,
respectively. Conductivity values ranged from a low of 157 umhos/cm to a high of 1824
umhos/cm. Conductivity at Five Mile Lower was compared to conductivity at the Columbus
Creek Upper station because Columbus Creek was the source for the majority of water in Five
Mile Creek. The average increase in conductivity from Columbus Creek Upper to Five Mile
Creek Lower station was 103 percent. The increase in conductivity between stations using the
geometric mean was 85 percent. The increase in conductivity was higher than expected and
suggested that irrigation return and water released from the irrigation storage reservoirs may be
affecting conductivity at the Five Mile Creek Lower station especially during periods of low
discharge. Although there was no Wyoming water quality standard for conductivity, values were
generally considered low to moderate and within the range required for support of aquatic life.
Conductivity values were affected by stream discharge, but not to the extent that discharge
affected conductivity at most other stations in the Project area. The association between
conductivity and discharge was present and inverse such that as discharge increased, conductivity
decreased. The correlation coefficient between conductivity and discharge at the Five Mile Creek
Lower station was -0.370 (Appendix Table L-3). The correlation coefficient was significant
(P<0.05) indicating there was less than a five (5) percent chance that the association was due to
random chance alone. However, the R-Squared value for the correlation was low (13.7%)

Sheridan County Conservation District
Tongue River Watershed Assessment 205j Final Report 1996-1999 199
indicating that discharge accounted for about 14 percent of the variability observed in
conductivity. Weaker correlation coefficients between discharge and conductivity were observed
at Smith Creek Upper and Lower, Columbus Creek Lower and Wolf Creek Lower stations. Three
of the four stations with lower correlations between conductivity and discharge were highly
regulated and their flows appeared to consist of primarily irrigation return during at least a portion
of the sampling year.
8.10.5 SCCD and WDEQ Five Mile Creek Dissolved Oxygen Monitoring
SCCD initiated monitoring for dissolved oxygen (DO) in 1999. WDEQ conducted monitoring
annually usually in October. Summary statistics for DO are presented in Table 8-47. Average
DO during the Project was 9.4 mg/l. DO values ranged from 7.9 mg/l to 11.2 mg/l.
There were no exceedences of the Wyoming water quality standard for DO because no DO values
were less than 5 mg/l. The lowest DO value recorded during the Project was 7.9 mg/l measured
by WDEQ on October 14, 1998. DO concentrations were sufficient to support diverse
populations of aquatic organisms and fish indicating full support for aquatic life use for this
physical parameter.
8.10.6 SCCD and WDEQ Five Mile Creek Turbidity Monitoring
Summary statistics for turbidity are presented in Table 8-48. Average turbidity measurements
during the Project were high when compared to turbidity at the Columbus Creek Upper station that
represented the primary source for water in Five Mile Creek. Average turbidity was 39.4 NTU at
Five Mile Lower and 4.8 NTU at Columbus Creek Upper (Table 8-39). The geometric mean was
26.5 NTU at Five Mile Lower and 2.3 NTU at Columbus Creek Upper. Turbidity values at Five
Mile Creek Lower ranged from a low of 3.8 NTU to 155 NTU. Turbidity values greater than or
equal to 15 NTU (maximum Columbus Creek Upper station value; see Table 8-39) were recorded
on twenty-seven (27) different sampling dates representing 72 percent of total sampling events.
This observation indicated that there was a significant change in turbidity after Columbus Creek
water was diverted into Five Mile Creek.
Turbidity values were strongly associated with discharge. There was a significant positive
relationship such that turbidity values increased as discharge increased. The correlation
coefficient between turbidity and discharge at the Five Mile Creek Lower station was +0.673
(P<0.01). The R-squared value for the regression analysis was 45.3 percent (Appendix Table
L-6) indicating that about 45 percent of the variability in turbidity values during the Project was
attributed to discharge. Because of the association between turbidity and discharge, lower
turbidity values were generally recorded during periods of lower discharge (prior to and after
spring runoff) in early April, September and October and higher turbidity values were generally
recorded during periods of higher discharge during spring runoff in latter April, May and June.
However, turbidity values greater than 30 NTU were sometimes measured when discharge was

Sheridan County Conservation District
Tongue River Watershed Assessment 205j Final Report 1996-1999 200
low during the summer. A portion of the higher turbidity may be related to the natural geology
and soil type upstream of this station, but frequent higher turbidity strongly suggested sediment
input from unknown upstream sources. This scenario suggested influence from irrigation return
water and potential influence from variable fluctuating discharge in response to irrigation demand
may resuspend sediment deposited on the stream bed.
The average increase in turbidity between the Five Mile Creek Lower station and Columbus Creek
Upper station (the control station) was 34.6 NTU. The increase in turbidity represented an
exceedence of the Wyoming water quality standard because an increase up to 10 NTU is allowed
for Class 2 cold water, water bodies. An increase in turbidity up to 15 NTU is allowed for Class 3
water bodies, which SCCD proposed for classification. Additional sampling stations are required
upstream for future turbidity sampling to identify the source(s) for turbidity affecting the Five Mile
Creek Lower station.
8.10.7 SCCD and WDEQ Five Mile Creek Fecal Coliform Bacteria Monitoring
Summary statistics for fecal coliform bacteria are presented in Table 8-49. The geometric mean
for fecal coliform bacteria at the Five Mile Creek Lower station during the Project was 185 per
100ml. The geometric mean is a logarithmic transformation of the raw data and provided a more
reliable estimate of the mean by smoothing extreme values due to high variability commonly
observed for fecal coliform sampling.
Fecal coliform bacteria concentration ranged from 1 per 100ml to 9100 per 100ml. The median
fecal coliform bacteria concentration was 190 per 100 ml. The median statistic value is the
number at which 50 percent of the observed values are above and 50 percent of the observed
values are below.
Fecal coliform bacteria levels at the Five Mile Creek Lower station exceeded the Wyoming water
quality standard for fecal coliform bacteria. The geometric mean of five (5) samples collected
during the Recreation Season in 1999 was 565 per 100ml which exceeded the standard of 200 per
100ml. During the Project eight (8) samples had fecal coliform levels in excess of 400 ml
representing thirty (30) percent of total samples. The exceedence of the standard indicated
remedial measures were required to lower fecal coliform levels to bring the Lower station into
compliance with the Wyoming water quality standard. The fecal coliform standard is the same
for Class 2 and Class 3 water bodies, thus the proposed classification for Five Mile Creek (Class 3)
will have no effect upon the effective numeric fecal coliform standard.
There were exceedences of the fecal coliform standard in 1997, 1998 and 1999, but none in 1996.
Based on fecal coliform bacteria numbers in 1997 through 1999, it was probable that fecal
coliform bacteria levels also exceeded the Wyoming water quality standard in 1996. The lack of
an exceedence in 1996 was probably related to the low number of samples collected (N = 3).

Sheridan County Conservation District
Tongue River Watershed Assessment 205j Final Report 1996-1999 201
SCCD increased the sampling frequency in 1999 from monthly to five (5) samples within a 30 day
period during the Recreation Season to provide a better estimate of bacteria contamination and
allow direct comparison to the Wyoming water quality standard for fecal coliform bacteria. Some
sampling stations within the Project area exceeded Wyoming fecal coliform standards only in
1999. It appeared that the increased sampling frequency in 1999 compared to previous years
increased the probability for detection of fecal coliform levels in excess of the Wyoming fecal
coliform standard. Extensive discussion related to this finding is presented in Section 8.11.1.
8.10.8 SCCD Five Mile Creek Pesticide and Herbicide Monitoring
SCCD conducted pesticide and herbicide sampling at the Five Mile Creek Lower station on
August 21, 1999. Analytical results are presented in Appendix Table H-1. Sampling occurred
once during the Project due to the high cost associated with sample analyses and negative results
from the 1996 sampling event.
A total of nineteen (19) organochlorine pesticides and ten (10) chlorinated herbicides were
sampled. Analytical results found no detectable (less than the minimum detection limit)
concentrations for herbicides or pesticides. This observation indicated that no evidence of
herbicide and pesticide contamination was present in the Five Mile Creek water column during
this sampling event.
8.10.9 SCCD and WDEQ Five Mile Creek Nitrate Nitrogen Monitoring
Summary statistics for nitrate nitrogen are presented in Table 8-50. Average nitrate nitrogen
concentrations were high when compared to nitrate concentrations at other monitoring stations
within the Project area. The average nitrate concentration at the Five Mile Creek Lower station
was 0.526 mg/l. The geometric mean was 0.222 mg/l and the median was 0.260 mg/l. The range
in nitrate values was from .005 mg/1 to 5.32 mg/l. Nitrate values of 1.32 mg/l and 1.18 mg/l were
recorded on August 26, 1998 and April 29, 1998, respectively. The average, geometric mean and
maximum nitrate values were higher at the Five Mile Creek Lower station than at any other station
in the Project area.
Although the Five Mile Creek Lower station exhibited the highest nitrate concentrations, the
average nitrate value was considered low to moderate. The maximum nitrate concentration (5.32
mg/l) was concerning, but fifty-seven (57) percent of total nitrate samples were less than 0.40
mg/l. The nitrate concentrations were well below the Wyoming water quality standard and
drinking water human health standard of 10 mg/l for Class 2 (and Class 3) surface waters (WDEQ,
1998). Data for nitrate nitrogen indicated that the nitrate concentration in Five Mile Creek was
generally less than the background concentration of nitrate (about 0.60 mg/L) found in streams in
undeveloped areas throughout the United States (USGS, 1999). These observations indicated
that nitrate nitrogen levels in Five Mile Creek were similar to natural background levels found

Sheridan County Conservation District
Tongue River Watershed Assessment 205j Final Report 1996-1999 202
throughout the United States, but five (5) of twenty-eight (28) samples representing 18% of total
samples were greater than the background level. This suggested occasional influence by
anthropogenic (man-caused) influences possibly from urban and agricultural related land use.
However, nitrate was not present in Five Mile Creek in concentrations that could pose a human
health threat nor were consistently present in moderately high concentration to pose a threat to
aquatic populations caused by indirect effects due to eutrophication. Full support for all
Wyoming beneficial uses applicable to nitrate was indicated. Future monitoring for nitrate and
total phosphorus is recommended. Because the Lower station was sited in the Town of
Ranchester, at least one other station upstream of the town limits should be established to separate
the potential influence from urban nutrient sources from potential agricultural sources.
8.10.10 SCCD and WDEQ Five Mile Creek Total Phosphorus Monitoring
Total phosphorus samples were collected infrequently by SCCD (N = 3 total samples) at the Five
Mile Creek Lower station due to Project monitoring budget constraints. An additional four (4)
total phosphorus samples were collected by WDEQ during annual bioassessments. Summary
statistics for total phosphorus are presented in Table 8-51. These statistics were based on
“censored” values because the majority of analyses (4 samples out of 7 total samples) were less
than the minimum detection limit (minimum detection limit was 0.10 mg/l for WDEQ analytical
method; 0.05 mg/l for SCCD analytical method). The minimum detection limit for the WDEQ
analytical method did not provide data quality needed to address the recommended water quality
standard for total phosphorus in water bodies draining to a lake or reservoir (0.05 mg/l; EPA,
1977). Data were thus censored to provide an estimate that could be related to the recommended
EPA standard of 0.05 mg/l.
The average total phosphorus concentration based on seven (7) total samples was .055 mg/l.
Total phosphorus concentration ranged from .002 mg/1 to .090 mg/l. The median nitrate
concentration was .050 mg/l.
The average and maximum total phosphorus values were based on a low total number of samples.
However, total phosphorus concentration in Five Mile Creek should be considered low.
Wyoming has not established surface water quality standards for phosphorus. U.S. EPA (1977)
recommended that total phosphorus concentration should not exceed 0.05 mg/l in a stream that
enters a lake or reservoir (e.g. Tongue River Reservoir) to prevent development of nuisance algal
and plant populations. Mackenthun (1973) suggested a target phosphorus level of less than 0.10
mg/l for streams that did not directly enter lakes or reservoirs. USGS (1999) provided recent
information from nationwide NAWQA monitoring and reported that national background
concentrations for total phosphorus from streams in undeveloped (reference - like ) areas was
about 0.10 mg/L. Because the EPA goal was not attainable, SCCD adopted the finding by USGS
for its interpretation of total phosphorus data collected during this Project.

Sheridan County Conservation District
Tongue River Watershed Assessment 205j Final Report 1996-1999 203
Using the value of <0.10 mg/l as a target for total phosphorus concentration, no single sample
exceeded the target value. However, because the sampling frequency was low (N = 7 total
samples) over a four year period, sampling generally occurred during the fall low base flow period
when total phosphorus concentration is normally lower and occasional moderately high nitrate
concentrations were present, additional sampling is required to provide a reliable estimate of
nutrient concentration in Five Mile Creek.
8.10.11 WDEQ Five Mile Creek Monitoring for Additional Water Chemistry
Parameters
WDEQ collected samples for additional water chemistry parameters during annual monitoring at
the Five Mile Creek Lower station from 1996 through 1999. Summary statistics are presented in
Table 8-52.
Alkalinity averaged 420 mg/l based on four (4) samples. The geometric mean was 396 mg/l.
The range was from 210 mg/l to 390 mg/l. Average alkalinity values were highest when
compared to average alkalinity values at Tongue River and other tributary stations. There was no
Wyoming water quality or EPA standard to compare alkalinity values to, but data indicated that
water was moderate to highly alkaline, highly productive for aquatic life and was generally
capable of withstanding sudden changes in pH due to inputs from point and NPS sources.
Total chloride concentration at Five Mile Creek Lower was relatively high when compared to
other monitoring stations within the Project area. Average chloride based on four (4) samples
was 10 mg/l with a range from 2.5 mg/l (censored value) to 17.0 mg/l. Columbus Creek Lower
had the same average chloride concentration. Total chloride values were well within WDEQ and
EPA water quality standards indicating full support for Wyoming beneficial uses that may be
affected by total chloride. However, presence of chloride, although at low levels suggested that
irrigation return may have some effect on Five Mile Creek.
Total sulfate concentration at Five Mile Creek Lower was highest when compared to the other
monitoring stations within the Project area. The average total sulfate concentration based on
four (4) total samples was 392 mg/l. The range in total sulfate was from 131 mg/l to 495 mg/l.
These values were higher than expected even considering samples were collected in the fall during
lower flow when ion concentrations were normally highest. The primary sources for the higher
total sulfate concentration at Five Mile Creek Lower appeared to be natural sources (based on the
Columbus Creek Upper control station concentration), urban sources, irrigation return and
probable water released from upstream storage reservoirs containing increased sulfate due to
evaporative concentration.
Total sulfate values for Five Mile Creek exceeded WDEQ standards (for groundwater use) and the
EPA secondary drinking water standard of 250 mg/l. This observation suggested non-support for

Sheridan County Conservation District
Tongue River Watershed Assessment 205j Final Report 1996-1999 204
the Wyoming beneficial use for human consumption although the EPA secondary drinking water
standard was not enforceable. Higher sulfate levels may also affect livestock (“blind staggers”)
especially if animals are moved to Five Mile Creek from a “cleaner” water source without
adequate time to acclimate to Five Mile Creek water. Total sulfate sampling is recommended for
future monitoring at Five Mile Creek Lower and at other stations upstream not only to further
evaluate sulfate, but to evaluate turbidity and fecal coliform levels that exceeded Wyoming water
quality standards.
Hardness concentration at Five Mile Creek Lower was highest when compared to the other
monitoring stations within the Project area. Average hardness was 392 mg/l. The range in
hardness was from 296 mg/l to 663 mg/l. Water may be termed very hard based on the
classification found in Table 6-2. There were no Wyoming or EPA water quality standards for
hardness, but observed values indicated partial support of the Wyoming beneficial use for
Industrial use since the average concentration approached 300 mg/l and treatment may be required
before industrial use. More year around sampling was required to determine if the high hardness
values were due to seasonal sampling artifact during low flow periods, natural limestone geology
in the watershed, probable irrigation water containing hardness due to evaporative concentration
from upstream storage reservoirs, urban sources or irrigation return.
Total Suspended Solids (TSS) concentration was relatively high at Five Mile Creek Lower when
compared to other monitoring stations within the Project area. Only Columbus Creek Lower had
a higher average TSS concentration. Average TSS was 11 mg/l with a range from 5 mg/l to 17
mg/l. These values were considered seasonally high because most stations in the Project area
displayed TSS values near or slightly above minimum detection limits during the lower flow
season. Results of turbidity sampling (Section 8.10.6) showed high turbidity levels in excess of
the Wyoming water quality standard. This suggested that significant amounts of sediment were
entering Five Mile Creek. Further sampling for TSS is not recommended at this time unless
specific sediment loading questions arise. Turbidity should continue to be used as a surrogate
indicator for TSS. As indicated in Section 8.10.6, further turbidity sampling is required at Five
Mile Creek.
8.10.12 SCCD and WDEQ Five Mile Creek Benthic Macroinvertebrate Monitoring
The Five Mile Creek Lower station was monitored by SCCD and WDEQ in 1996, 1997 and 1999.
There were no benthic macroinvertebrate samples collected in 1998 because beaver activity
dammed and inundated the sampling reach. The Five Mile Creek Lower benthic
macroinvertebrate station was relocated in 1999 to a station about 100 to 150 yards upstream of the
Highway 14 crossing.
Metric values are presented in Appendix Table G-2. Lists of benthic taxa identified, density
(number per square meter) of taxa and percent contribution of each taxon to the total benthic

Sheridan County Conservation District
Tongue River Watershed Assessment 205j Final Report 1996-1999 205
population at each station are presented in Appendix Tables F-6 through F-8.
Biological condition at Five Mile Creek Lower using scoring criteria from the Wyoming Stream
Integrity Index (WSII) from Stribling et al. (2000) was poor in 1996 and 1999 and fair in 1997
(Table 8-15). The poor biological condition rating indicated non-support for aquatic life use and
the fair biological condition rating indicated partial support for aquatic life use. Both poor and
fair ratings for biological condition require improvement in the aquatic resource to restore
biological condition to full support for aquatic life use.
The lower biological condition ratings were due to the low number of Ephemeroptera (mayfly)
taxa, Plecoptera (stonefly) taxa, Trichoptera (caddisfly) taxa and high percentage of non-insects
comprising the total benthic population. The total number of EPT taxa was generally low each
year and ranged from four (4) taxa in 1999 to nine (9) taxa in 1997. The number of scraper taxa
was low (1 taxa in 1996, 2 taxa in 1997 and 2 taxa in 1999) and percent contribution of scrapers to
the total benthic population comprised 0.2% in 1996, 0.3% in 1997 and 1.6% in 1999. The low
percentage of scrapers in the benthic population suggested high deposition of sediment covering
stream bottom substrate. This observation was confirmed by the average weighted
embeddedness value of 21.4 at the Lower station (Table 8-54) that indicated virtually all cobble
and gravel were covered by fine silt. The low percentage of shredders in the benthic population
suggested upstream riparian disturbance and vegetation removal. Shredders feed on coarse
particulate organic material such as leaves and vegetation that enter small stream systems usually
from the riparian zone. Shredders comprised 0.4 percent, 0.0 percent and 0.0 percent of the total
benthic community during 1996, 1997 and 1999, respectively.
The benthic community was dominated by warm water and generally pollution tolerant taxa
indicative of higher water temperature, fair water quality and fair habitat quality. The generalist
caddisfly, Hydropsyche was the dominant taxon followed in order of decreasing abundance by the
mayfly, Baetis tricaudatus, the blackfly, Simulium and the worms Nais variabilis and Uncinais
uncinata (Table 8-16).
Worms were a significant component in the benthic community especially in 1996 and 1997 when
they comprised 36 percent and 32 percent, respectively, of the total population. Increased density
of worms (Oligochaeta) may be associated organic pollution (Klemm, 1985), pollution from
feedlots (Prophet and Edwards, 1973), and pollutants contained in urban storm water runoff (Lenat
et al., 1979; Lenat and Eagleson, 1981). Nais variabilis and Uncinais uncinata were worm taxa
that were among the five most dominant taxa in the benthic population. These taxa and
Ophidonais serpentina, another abundant worm in Five Mile Creek, are widespread throughout
the United States (Hiltunen and Klemm, 1980; Brinkhurst, 1986) and are often associated with
sediment and organic deposits (e.g. animal waste). Each have pollution tolerance values of 8
(Table 8-16) indicating they are highly tolerant of pollution.

Sheridan County Conservation District
Tongue River Watershed Assessment 205j Final Report 1996-1999 206
The percent contribution of Oligochaeta to the total benthic macroinvertebrate community was a
reliable predictor for identification of fecal coliform bacteria contamination at monitoring stations
within the Project area. Regression analyses using the average percent contribution of
Oligochaeta and the average fecal coliform bacteria concentration at each monitoring station were
conducted. The correlation coefficient (+0.886) was statistically significant (P<0.05) indicating
that increase in percent Oligochaeta was associated with increase in fecal coliform bacteria level
(Figure 8-24). Although the association was significant and strong, there was no apparent direct
cause and effect relationship indicating that increased oligochaetes caused increased fecal
coliform bacteria levels. Rather, the association was indirect because environmental conditions
required for oligochaete populations to flourish (i.e. organic material from human and animal
sources and increased sediment) were similar to conditions expected for the occurrence of higher
fecal coliform bacteria levels (i.e. human and animal sources of excrement and generally higher
turbidity). The application of this relationship for water quality monitoring should be explored
further because general use of oligochaete populations to identify sources of fecal contamination
to estimate fecal coliform bacteria levels would represent major savings in manpower and
monitoring costs.
The presence of certain worm taxa including Ophidonais serpentina, Eiseniella tetraedra and
Lumbricina may present additional predictive power because these organisms occurred most
frequently at stations exceeding the Wyoming water quality standard for fecal coliform bacteria.
The use of these worm species as possible fecal coliform bacteria indicators should be explored
further. No Tubifex tubifex worms were identified from samples. T. tubifex is very common in
polluted waters (Goodnight, 1959) and is significantly involved in the whirling disease life cycle
caused by a parasite (Myxobolus cerebralis) that penetrates the head and spinal cartilage of
fingerling trout. Whirling disease may eventually cause death in trout and the absence of this
worm indicated low probability for the occurrence of whirling disease in the Tongue River
watershed within the Project area. These associations further indicated the utility of benthic
macroinvertebrates as cost-effective water quality indicators.
The projected higher water temperature, high turbidity and fine sediment deposition, frequent low
and irregular discharge appeared to combine with fecal contamination indicative of organic
pollution from animal or human origin to result in impairment of biological condition and
non-support for aquatic life use. Although SCCD proposed that Five Mile Creek be designated as
a Class 3 water body, aquatic life use must still be fully supported for Class 1, Class 2 and Class 3
water bodies. The apparent input of animal or human waste and sediment from suspected
agricultural, wildlife and urban land use requires resolution to bring the stream into compliance
with Wyoming water quality standards and to fully support aquatic life use. Further, future
macroinvertebrate monitoring is recommended at stations upstream of the Town of Ranchester to
separate potential impacts from urban land use from potential impacts from agricultural land use.

Sheridan County Conservation District
Tongue River Watershed Assessment 205j Final Report 1996-1999 207
8.10.13 SCCD and WDEQ Five Mile Creek Habitat Assessment
Qualitative habitat assessments were conducted by SCCD and WDEQ in 1996, 1997 and 1999 in
conjunction with benthic macroinvertebrate sampling. As indicated in Section 8.10.12, no
sampling occurred in 1998 due to beaver activity that impounded the station. Because habitat
assessments were subjective, SCCD used caution by providing a conservative interpretation of
data.
Habitat assessment scores were low at the Five Mile Creek Lower station. The average total
habitat score was 102. Total habitat scores ranged from 83 in 1996 to 122 in 1997 (Table 8-53).
The lower scores indicated poor to moderate habitat. The low total habitat score was due to lack
of instream cover for fish, high embeddedness (silt covering cobble and gravel), low
velocity/depth and low pool and riffle ratio. Riparian indicators for bank vegetation protection,
bank stability and disruptive pressures (vegetation removal) were good. However, riparian zone
width was low because the stream channel had significantly down cut isolating the riparian zone
from the influence of stream and groundwater. The location of the station downstream of
Highway 14 assessed in 1996 and 1997 was highly channelized and had extensive urban
development on one bank. Many of the lower scores for individual habitat parameters was related
to extensive habitat alteration by channelization that occurred years ago in the Town of
Ranchester. Channelization straightened and deepened the stream channel reducing instream
habitat for aquatic organisms and fish. The generally unstable soil and apparent irregular, often
high discharges also promoted down cutting of the stream channel such that Five Mile Creek
resembled a deep ditch. The reduction in habitat coupled with low and irregular discharge due to
irrigation demand and probable higher water temperature appeared to place stress on aquatic
communities resulting in non-support for aquatic life use.
The semi-quantitative stream substrate particle size distribution indicated that the stream bottom
was comprised of silt (35%), cobble (23%), coarse gravel (16%), fine gravel (15%), hard pan clay
(6%) and sand (3%) (Table 8-54). This observation suggested that reduction in silt deposition
may result in a cobble and gravel dominated substrate that would afford better habitat for
macroinvertebrate and fish populations and enhance biological condition.
The high degree of silt deposition was further evidenced by the low average weighted
embeddedness value of 21.4 (Table 8-54). The lower the weighted embeddedness value, the
higher the percent coverage of cobble and gravel substrate by fine silt. The low weighted
embeddedness value indicated virtually all cobble and gravel were covered by silt. Silt
deposition was affected by the apparent amount of silt entrained in the water column (i.e. turbidity
exceedence of the water quality standard), low and irregular discharge due to irrigation demand,
and relatively low current velocity. Silt deposition will normally increase as current velocity is
decreased provided adequate sediment is present in the water column.
Sheridan County Conservation District
Tongue River Watershed Assessment 205j Final Report 1996-1999 208
The average current velocity was 1.4 feet per second (fps) and the range in velocities was from 0.7
fps in 1996 to 1.9 fps in 1999.
8.10.14 WGFD Five Mile Creek Fish Population Monitoring
SCCD could locate no historic or current record of fish sampling in the Five Mile Creek
watershed.
8.11 Factors Affecting Fecal Coliform Bacteria Concentration in the Tongue River
and Tributaries
Fecal coliform bacteria levels at Little Tongue River Lower, Smith Creek Lower, Columbus Creek
Lower, Wolf Creek Lower and Five Mile Creek Lower stations exceeded the Wyoming water
quality standard for fecal coliform bacteria. Corrective action will be required to reduce fecal
coliform bacteria levels. Technical exceedence of the fecal coliform bacteria standard occurred at
Columbus Creek Upper and Tongue River Lower stations based on single high fecal coliform
bacteria samples. A sample collected at Columbus Creek Upper in 1998 exceeded the standard,
but this sample represented only four (4) percent of total samples collected during the four year
Project. Because of the low frequency, SCCD proposed that this stream reach not be placed on
the Wyoming Water Quality Limited list (303d list), but rather be monitored to determine if
limited, but significant bacterial contamination persisted. The same situation was observed at the
Tongue River Lower station. A sample collected at the Tongue River Lower station in 1999
exceeded the standard and this sample represented only four (4) percent of total samples collected
during the four year Project. However, because this station was located near the Town of
Ranchester Water Treatment Plant, SCCD recommended remedial action due to immediate health
and safety concerns and non-support for the Wyoming beneficial use for human consumption.
Fecal coliform bacteria levels at Little Tongue River Upper, Smith Creek Upper, Wolf Creek
Upper, Tongue River Upper and Tongue River Middle stations were generally low and within the
Wyoming water quality standard for fecal coliform bacteria. This observation indicated that
sources for fecal coliform bacteria located between the Upper and Lower stations on the mainstem
Tongue River and tributaries were contributing bacteria in sufficient quantities to produce health
and safety concerns and non-support for human consumption beneficial use.
Locating sources for fecal coliform bacteria will be required to effectively target limited resources
in the most cost-effective manner to remediate and reduce bacterial contamination. SCCD
conducted further analysis of the fecal coliform data set by associating bacteria levels to turbidity
levels, temperature, discharge, temporal (seasonal) effect and land use data. These variables were
evaluated because the literature suggested that they were most frequently associated with
variability in fecal coliform bacteria concentration at other water bodies throughout the United
States and other countries. The effect that sampling frequency had on the ability to detect

Sheridan County Conservation District
Tongue River Watershed Assessment 205j Final Report 1996-1999 209
significant fecal coliform bacteria levels was also evaluated because inadequate sampling for fecal
coliform may not detect bacteria contamination when in fact, a threat to public health and safety
may exist.
8.11.1 Effect of Sampling Frequency
Sampling frequency must be sufficient to detect levels of fecal coliform bacteria that pose a risk to
public health and safety through direct consumption by primary contact (i.e. swimming) and
secondary contact (i.e. boating, fishing and incidental contact).
There were no exceedences of the Wyoming water quality standard for fecal coliform at any
station in 1996. This observation suggested that there was no significant bacterial contamination
within the Project area. However, it was likely that significant bacteria contamination existed,
but was not detected. Lack of detection of significant fecal coliform levels appeared to be directly
due to the low sampling frequency in 1996 when only three (3) total samples were collected at
each station. As sampling frequency increased to seven (7) total samples in 1997 and 1998,
sporadic, but significant contamination was detected at additional stations. When sampling
frequency was increased in 1999 to ten (10) samples to incorporate WDEQ water quality standard
sampling requirements during the Recreation Season, all tributary stations and the Tongue River
Lower station were found to exceed the fecal coliform bacteria standard. There were no large
differences in environmental conditions or change in land use in 1999 to account for this
observation (See Section 8.11.3).
SCCD conducted further evaluation to determine the effect that sampling frequency had on the
ability to detect fecal coliform contamination by combining the fecal coliform data set from this
Project collected during the 1999 Recreation Season with the WDEQ fecal coliform data set
collected during the Recreation season in 1998 and 1999 at streams in the adjacent Goose Creek
watershed (Rogaczewski and Smith, 1999). Sampling by SCCD and WDEQ consisted of
collection of 5 samples obtained during separate 24 hour periods for a 30 day period between May
1 and September 30. Only data from those stations with confirmed exceedences of the Wyoming
water quality standard for fecal coliform bacteria were evaluated.
Table 8-55 presents summary statistics for the evaluation including the mean (number of fecal
coliform colonies per 100 milliliters), geometric mean (number of fecal coliform colonies per 100
milliliters), number of individual daily samples greater than 400 colonies per 100ml, number of
individual daily samples with less than 400 colonies per 100ml and the percent of total samples
with less than 400 colonies per 100 milliliters (based on the total of 5 samples collected at each
station within a 30 day period). SCCD modified the WDEQ data set before analysis. When
duplicate (N=2) fecal coliform samples were collected by WDEQ, the mean value was used by
SCCD for statistical analysis. This was in contrast to WDEQ treatment of duplicate values where
the lower of the two duplicate values and not the mean, was used for calculation of the geometric

Sheridan County Conservation District
Tongue River Watershed Assessment 205j Final Report 1996-1999 210
mean (Rogaczewski and Smith, 1999). This resulted in lower geometric mean values reported by
Rogaczewski and Smith when compared to geometric mean values presented by SCCD in Table
8-55.
Results of statistical analyses found that exceedence of the Wyoming water quality standard for
fecal coliform bacteria at stations with confirmed violations would not have been detected on
average, approximately 48 percent of the time, when a single daily sample was collected during a
30 day (monthly) period. A single instantaneous grab sample for fecal coliform would miss
significant fecal coliform bacteria contamination about half the time. However, the greater the
level of fecal coliform contamination, the fewer number of daily samples were generally needed to
detect an exceedence of the fecal coliform standard with confidence. For example, at stations
with high geometric mean fecal coliform bacteria levels greater than 500 per 100ml, samples
collected on one to two different days would generally be sufficient to detect an exceedence of the
fecal coliform standard (when using the standard of 400 per 100ml based on a single daily sample).
Conversely, when fecal coliform bacteria levels were lower (i.e. geometric mean from 200 per
100ml to 300 per 100ml), the minimum number of separate daily samples collected must be
increased from three (3) to (5) separate daily samples per 30 day period to reliably detect an
exceedence of the fecal coliform standard (Figure 8-25).
Based on this evaluation, a single daily sample collected monthly by SCCD was insufficient to
detect significant fecal coliform bacteria contamination except at only the most highly
contaminated stations with geometric mean fecal coliform bacteria levels greater than 500 per
100ml. Thus, the single daily sample for fecal coliform collected monthly by SCCD had a
probability of about 50 percent of missing an exceedence of the fecal coliform bacteria standard
when in fact significant bacteria probably existed. This finding should be considered
unacceptable because of the risk to public health and safety.
EPA (1986) found that a statistically sufficient number of samples for fecal coliform sampling was
generally not less than 5 samples equally spaced over a 30-day period. MacDonald et al. (1991)
cautioned that results from any single fecal coliform sample was of questionable value due to the
high variability of fecal coliform bacteria in surface water. They recommended that because of
variability associated with fecal coliform bacteria sampling, monitoring should be more regular
and intensive than for most other water quality monitoring parameters.
It appeared that the single daily fecal coliform sample collected monthly by SCCD during 1996
through 1998 was inadequate to detect significant fecal coliform bacteria contamination. This
sampling frequency should be abandoned for future fecal coliform monitoring in the Tongue River
watershed and perhaps, for statewide fecal coliform monitoring by Wyoming Conservation
Districts and WDEQ. The fecal coliform sampling frequency based on a minimum of not less
than 5 samples obtained during separate 24 hour periods for any 30 day period appeared to provide
the most reliable measure to detect significant fecal coliform contamination. Single day sampling

Sheridan County Conservation District
Tongue River Watershed Assessment 205j Final Report 1996-1999 211
may possibly continue due to time and budget considerations, but only at the risk of not detecting
significant fecal coliform bacteria contamination on average, about 50 percent of the time which
may place undue health and safety risk on the public.
It is recommended that future sampling for fecal coliform bacteria in the Tongue River watershed
(and other water bodies) consist of a minimum five (5) samples each collected on separate days
during a 30 day period within the Recreation Season (May 1 through September 30) to ensure
detection of significant bacterial levels for protection of public health and safety. Single daily
sampling, although less time consuming and costly, runs the risk of missing significant fecal
coliform bacteria contamination about 50 percent of the time. Sampling for fecal coliform
bacteria may also be conducted outside the Recreation Season to identify pollution sources that
may be related to seasonal factors such as discharge, turbidity, wildlife use, livestock use and
irrigation demand. However, sampling during the Recreation Season must be targeted first since
this is the period is when public risk is highest due to primary and secondary contact.
8.11.2 Effect of Seasonal Variability
Fecal coliform bacteria concentrations may fluctuate wildly in wildland streams due to normal
fluctuations in discharge and other environmental factors (Bohn and Buckhouse, 1985). Seasonal
fluctuations were observed in fecal coliform bacteria levels during this Project and at streams in
the Goose Creek watershed (adjacent to the Tongue River watershed) during sampling by WDEQ
in 1998 and 1999. Seasonal variability was evaluated by comparing results for fecal coliform
samples collected by WDEQ at several stations in the Goose Creek watershed (Rogaczewski and
Smith, 1999) during the Recreation Season (May 1 through September 30) to fecal coliform
concentrations collected during the Non-Recreation Season in October and November. Both
Recreation Season and Non-Recreation Season data sets consisted of collection of 5 instantaneous
grab samples obtained during separate 24 hour periods within a 30 day period.
There was a significant difference (P<0.01) in fecal coliform bacteria concentration between the
Recreation and Non-Recreation seasons (Figure 8-26). Fecal coliform bacteria levels were
significantly higher at each station during the Recreation Season than during the Non-Recreation
season. The greatest difference observed at a single station was a 31-fold decrease in fecal
coliform bacteria during the Non-Recreation Season when compared to fecal coliform bacteria
levels during the Recreation Season. Several stations exhibited >15-fold decreases in fecal
coliform bacteria during the Non-Recreation Season.
The largest percentage in reduction of fecal coliform bacteria level between seasons was
observed at those stations with the highest fecal coliform levels during the Recreation Season.
Further evaluation indicated that the lower bacteria levels during the Non-Recreation season
appeared to be related to seasonally lower turbidity levels and lower consistent stream discharge
(that reduced turbidity levels). Tunnicliff and Brickler (1984) found a statistically significant

Sheridan County Conservation District
Tongue River Watershed Assessment 205j Final Report 1996-1999 212
correlation between turbidity and fecal coliform bacteria concentrations in samples collected
during higher discharge storm events, but not for samples collected during base flow. The
relationship between fecal coliform bacteria, environmental and land use variables during the
SCCD Tongue River Project is discussed further in Section 8.11.4.
The evaluation indicated that sampling for fecal coliform bacteria outside the Recreation Season
will provide vastly different results than when sampling during the Recreation Season. A
monitoring design that concentrates fecal coliform sampling during the Non-Recreational season
should be avoided because significant bacterial contamination of risk to public health and safety
would not be detected. Sampling during the Recreation Season must be targeted first because it is
the primary period for primary and secondary water body contact and highest public health and
safety risk. Sampling for fecal coliform bacteria outside the Recreation Season may be required
to identify potential fecal bacterial pollution sources, but the data should be relegated to an
secondary role for public health and safety concerns.
Based on this evaluation, the most effective sample design for collection of fecal coliform bacteria
samples to protect public health and safety was to collect a minimum of five (5) samples each on
separate days during a 30 day period within the Recreation Season (May 1 through September 30).
This sampling design is the basis for the current Wyoming water quality standard for fecal
coliform bacteria (WDEQ, 1998). Collection of a single instantaneous fecal coliform sample on a
monthly basis was insufficient to detect fecal contamination when in fact, significant fecal
contamination existed (Section 8.11.1). WDEQ (2000) proposed new fecal coliform standards
that remove reference to sampling during the Recreation Season. This change may jeopardize
public health and safety because analytical results for fecal coliform bacteria samples collected
outside of the Recreation Season may be used to report on the annual status of fecal coliform
bacteria levels in a particular water body. Expected lower fecal coliform bacteria levels from
samples collected outside the Recreation Season may indicate insignificant fecal coliform bacteria
contamination when significant bacteria levels may persist during the Recreation Season.
SCCD recommends future fecal coliform bacteria sampling in the Tongue River Project area and
perhaps, statewide by other Conservation Districts, occur during the Recreation Season and at a
frequency of a minimum of five (5) samples each collected on separate days during a 30 day period
within the Recreation Season (May 1 through September 30). As previously indicated, sampling
for fecal coliform bacteria outside the Recreation Season may be required to identify sources for
fecal coliform, but the data should be relegated to a secondary role for public health and safety
concerns.
8.11.3 Factors Related to Fecal Coliform Bacteria Levels
A series of regression analyses were conducted on the Tongue River Project data set to compare
fecal coliform bacteria levels to discharge, temperature and turbidity. Regressions were run for

Sheridan County Conservation District
Tongue River Watershed Assessment 205j Final Report 1996-1999 213
each monitoring station, by year and for total combined data for 1996 through 1999. Results for
the regression analyses are presented in Appendix L. Correlation coefficients are presented in
Appendix Table L-1 and associated R-squared values are presented in Appendix Table L-2.
With few exceptions, there were no consistent statistically significant associations between fecal
coliform bacteria level and discharge, temperature and turbidity at the Tongue River Upper station
and at the Upper tributary stations. These stations normally exhibited lower fecal coliform levels
during the Project and with the exception of a single high fecal coliform bacteria sample at
Columbus Creek Upper, none exceeded Wyoming water quality standards. There was a
significant relationship (P<0.05) between fecal coliform and discharge at the Tongue River Upper
station in 1999, but this association did not hold when all data (1996 through 1999) were
combined. There was a significant, but weak association between fecal coliform and temperature
at Smith Creek Upper using combined data from 1996 through 1999. Regression analyses
revealed no other significant relationships at this station. There was a significant, but weak
association between fecal coliform and turbidity at Columbus Creek Upper using combined data
from 1996 through 1999. Regression analyses revealed no other significant relationships at
Columbus Creek Upper. There was a strong significant association between fecal coliform
bacteria and turbidity at Wolf Creek Upper in 1997 and 1998, but the association was insignificant
in 1996 (only 1 data point), 1999 and when using combined data from 1996 through 1999.
More consistent and significant associations between fecal coliform bacteria and turbidity were
observed at the Tongue river Middle and Lower stations and at the Lower tributary stations where
fecal coliform bacteria levels were higher. The association between fecal coliform bacteria and
turbidity was significant at the Tongue River Middle Station during 1997, 1998, 1999 (P<0.05)
and when using combined data from 1996 through 1999 (P<0.01). R-squared values for these
correlations ranged from 29.4 percent to 68.8 percent indicating that turbidity level explained
much of the variability observed in fecal coliform bacteria levels. A significant association
between fecal coliform bacteria and turbidity levels was evident at the Tongue River Lower station
(P<0.01 for combined 1996-1999 data), Five Mile Creek Lower (P<0.05 for combined 1996-1999
data), Columbus Creek Lower (P<0.01 for combined 1996-1999 data) and Wolf Creek Lower
(P<0.01 for combined 1996-1999 data).
Discharge and temperature were also closely associated with fecal coliform bacteria level at
Columbus Creek Lower based on combined 1996-1999 data. This was the only station where
discharge, temperature and turbidity were each significantly associated with fecal coliform
indicating interaction between the three physical parameters. Discharge, in addition to turbidity,
was also significantly associated (P<0.01) with fecal coliform bacteria level at the Wolf Creek
Lower station based on combined 1996-1999 data. Temperature was the only variable
significantly associated with fecal coliform bacteria levels at Smith Creek Lower when using
combined 1996-1999 data.

Sheridan County Conservation District
Tongue River Watershed Assessment 205j Final Report 1996-1999 214
Significant associations between turbidity, conductivity and discharge observed at the unregulated
Tongue River Upstream station and Upper tributary stations were not consistently observed at the
Lower tributary stations. The Tongue River Lower station and Lower tributary stations were
regulated by irrigation withdrawal and return especially during the Project sampling period from
April through September. Dewatering, admixture of ambient water with irrigation return water
and variable stream discharge related to irrigation demand appeared to result in the lack of
consistent and expected associations between discharge and certain water quality parameters.
These factors may be responsible for the lack of consistent associations between fecal coliform
bacteria and temperature, discharge and turbidity at the regulated Lower tributary stations.
Turbidity appeared to be the primary physical factor measured during this Project that was
regularly and significantly associated with high fecal coliform bacteria levels. However, the
association was not consistent at all stations indicating that merely reducing turbidity would not
always result in reduction in fecal coliform levels. Discharge, and then temperature, occasionally
exhibited statistical significance with fecal coliform bacteria levels usually at the Lower tributary
stations where discharge was highly regulated by irrigation demand. There appeared to be more
interaction between turbidity, discharge and temperature with fecal coliform bacteria levels at the
more highly regulated Lower tributary stations than at the Upper tributary stations that were not
regulated by irrigation demand. Some of the conflicting “noise” present in the fecal coliform
bacteria - water quality chemical and physical relationships at the Lower tributary stations sited in
urban settings (Little Tongue, Smith Creek, Five Mile Creek and Tongue River Lower) may be due
to potential fecal coliform contamination from urban sources during low stream discharge in
addition to suspected fecal coliform contamination from upstream wildlife and agricultural land
use. Future monitoring should establish stations upstream of the Towns of Dayton and
Ranchester to separate urban fecal coliform bacteria sources levels from potential wildlife and
agricultural sources.
The association between turbidity and fecal coliform bacteria level may be related to the fact that
bacteria appear to survive longer in sediment than when in the water column. This poses
additional problems for tracking fecal coliform sources in the Tongue River Project area since
fecal coliform bacteria may survive up to sixty (60) days in stream sediment. Davies et al. (1995)
found survival of fecal coliform bacteria in freshwater sediment for up to 60 days. The number of
bacteria was reduced by from 2 to 3-fold after 29 days. Bacteria numbers then remained
relatively constant after that. Sherer et al. (1992) found in the laboratory that the half life of fecal
coliform bacteria ranged from 11 to 30 days in fine and coarse sediment and the half life of fecal
coliform bacteria in the water column above the sediment was about 3 days. Marino and Gannon
(1991) found that fecal bacteria could survive in sediment in storm drains up to 6 days during dry
weather conditions.
Marino and Gannon (1991) suggested that an important factor affecting bacterial levels was the
resuspension of bacteria accumulated in bottom sediment. Sherer et al. (1988) and Stephenson
and Rychert (1982) found that fecal coliform bacteria were resuspended into the water column

Sheridan County Conservation District
Tongue River Watershed Assessment 205j Final Report 1996-1999 215
after physical disturbance of stream bed sediment. Sherer et al. (1992) reported that once stream
sediment was disturbed, bacteria could be re-suspended causing increased, but short term bacteria
levels. They found that survival of fecal coliform bacteria was longer in fine sediments than in
coarse sediments. Fecal bacteria entrained in water survives longer when attached to sediment
because of protection from ultraviolet light and other environmental deterrents. Other
investigators have found a close association between turbidity and fecal coliform bacteria.
Grimes (1980) found a high correlation between turbidity and indicators of fecal contamination in
the Mississippi River below a dredging operation that stirred up river bottom sediment. Because
of the close association between turbidity and fecal bacteria, Kay and Wyer (1997) suggested that
turbidity may be considered as a general indicator for bacteria contamination because it provided
“real time” data compared to the normal 24 hour incubation period to acquire accurate bacteria
counts. Gerba and McLeod (1976) found that the longer survival of E. coli in sediment than in
water was related to the higher amount of organic material in the sediment.
The significant relationship between fecal coliform bacteria and turbidity observed at Tongue
River Project stations with the highest bacterial levels suggested a strong link to stream bed
sediment. The apparent association between increase in aquatic Oligochaeta (associated with
sediment and organic pollution) and increase in fecal coliform bacteria contamination (see Section
8.10.12) added more evidence to suggest the link between fecal bacteria in sediment with fecal
coliform bacteria detected in the water column.
Overland runoff, direct defecation and discharge containing fecal bacteria are believed to be the
primary avenues for fecal bacteria contamination in streams (Miner, et al., 1992). Upon entering
the water body, fecal bacteria may survive for several days in stream bed sediment only to be
released later by physical disturbance of stream substrate. Sources of fecal material must be
reduced or eliminated to restore water quality and meet the Wyoming water quality standard for
fecal coliform bacteria
.
8.11.4 Fecal Coliform Bacteria and Land Use Relationships
Each land use within the Tongue River Project area had the potential to contribute fecal coliform
bacteria to the Tongue River and major tributaries. However, evaluation of the data suggested
that certain land uses were related to high fecal coliform bacteria concentration more than other
land uses.
Fecal coliform bacteria concentration was generally low at the Tongue River Upper and Middle
stations and at each of the four Upper tributary stations. With the exception of the Columbus
Creek Upper station (one daily exceedence), there were no exceedences of the Wyoming water
quality standard for fecal coliform bacteria during the four year Project. Primary land use in the
watershed at and upstream of these stations included wildlife, recreation and seasonal livestock

Sheridan County Conservation District
Tongue River Watershed Assessment 205j Final Report 1996-1999 216
grazing. This observation indicated that wildlife, recreation and limited seasonal livestock
grazing land use had no significant effect on fecal coliform bacteria levels. The generally low
fecal coliform bacteria concentration at the Tongue River Middle station and data collected by
WDEQ in the vicinity of the Town of Dayton WWTF, indicated potential bacteria sources were
not affecting the Middle stream reach and the Dayton WWTF was not a significant contributor of
bacteria. Comparison of historic fecal coliform data with current fecal coliform data colleted
during this Project indicated a reduction in fecal coliform bacteria in this reach over the years (See
Section 8.5.11). Upgrade and effective operation and maintenance of the Dayton WWTF was
believed to be the reason for reduced fecal coliform bacteria levels over the years.
Water quality and fecal coliform bacteria concentration changed significantly from the Upper to
Lower tributary stations. Each Lower tributary station exceeded the Wyoming water quality
standard for fecal coliform bacteria. Accordingly, primary land use changed significantly from
the Upper to Lower stations. Primary land uses at and upstream of the Lower stations in relative
order of importance included irrigated hayland, livestock grazing (more intensive, some year
around), wildlife habitat, dryland pasture, recreation and urban. The Little Tongue River Lower
and Smith Creek Lower stations were sited in urban settings (i.e. Town of Dayton); Five Mile
Creek Lower and the mainstem Tongue River Lower stations were sited in the Town of
Ranchester. It was not possible to separate the potential influence of fecal coliform bacteria from
wildlife and agricultural land use from the potential influence of fecal coliform bacteria from
urban land use at these stations. Although wildlife land use was not an important source of fecal
coliform bacteria at the Upper stations, changes in the stream channel morphology from the higher
gradient Upper stations in the foothills to the lower gradient and meandering Lower stations in the
plains provided better habitat for increased utilization by waterfowl and small mammals. Thus,
the role that waterfowl may exert on fecal coliform bacteria levels further complicated the search
for fecal bacteria sources.
Wolf Creek Lower and Columbus Creek Lower stations were probably not affected by urban land
use because these stations were not sited near urban development. Agricultural land use
dominated the watersheds upstream of these stations especially in Columbus Creek where a
Confined Animal Feeding Operation was located. The number and duration of livestock grazing
significantly increased from the Upper to Lower stations. Potential fecal bacteria contamination
from the large feedlot upstream of the Columbus Creek Lower station should be further evaluated.
Ancillary effects for irrigation water delivery and return may promote fecal coliform bacteria
contamination by transporting bacteria, contributing sediment and creating variable discharges
resulting in the instability of stream bottom sediment and resuspension of fecal bacteria.
Watersheds with cattle grazing may show increased concentrations of bacterial indicator
organisms (e.g. fecal coliform bacteria) in streams although effects may be variable and detectable
only for short distances downstream (Milne, 1976). Deposition of fecal material along water
ways contributed a major share of bacteria from grazed watersheds. Howell et al. (1996) reported

Sheridan County Conservation District
Tongue River Watershed Assessment 205j Final Report 1996-1999 217
that fecal coliform bacteria levels increased in stream sediments when cattle had direct access to
streams. Stephenson and Street (1978) and Jawson (1982) found fecal bacteria levels increased
once cattle entered a pasture. Bacterial levels remained high after cattle were removed. Once
deposited, fecal bacteria may survive for periods up to one year in cow feces (Bohn and
Buckhouse, 1985). If exposed, bacteria from feces may wash into streams, enter stream bottom
sediment and survive only to be resuspended in the water column when bottom substrates are
disturbed. Maule (1997) in laboratory experiments found the verotoxic strain of Escherichia coli
0157:H7 to survive and remain infective for long periods of time in cattle feces and in soil.
Despite seemingly logical rationale linking livestock grazing to fecal coliform bacteria
concentration in streams, it is often difficult to show the relationship because of varying livestock
management practices and seasonal transient use by wildlife and waterfowl. Doran et al. (1981)
and Dixon (1983) found that effects from cattle were often indistinguishable from effects due to
wildlife.
Recent advances in biotechnology have allowed water quality investigators to more readily
discern sources of fecal contamination through DNA testing. DNA testing is relatively expensive
(about $5,000 per station) and time consuming (50 samples per station) and results may be
inconclusive about 20 percent to 60 percent of the time (1999 Personal Communication, Dr.
Somadpour, University of Washington, Seattle). Identification of fecal bacteria sources increases
as the reference source material (i.e. human, cattle, ducks, beaver fecal material) database
increases for the watershed under study. Although expensive in the short term, DNA testing may
realize long term benefits and cost savings by more effectively directing restoration funds to
suspect sources of fecal contamination. SCCD may explore use of DNA testing for future
monitoring in the Project area.
Although livestock grazing was suspected as a potential source for significant bacterial
contamination at some of the Lower tributary stations, certain best management practices may be
implemented to ensure livestock grazing has no significant effect on bacteria levels. Likewise,
suspect urban, recreational and agricultural land use practices should be re-evaluated throughout
the Tongue River watershed within the Project area.
BMP’s that may be implemented within the Tongue River watershed Project area to reduce
bacterial contamination to streams include:
1. Locating pollutant sources away from streams. Placement of small and large
livestock confinements in areas which reduce the potential for transport of fecal
material during flooding and heavy rain periods to reduce the probability that
contaminated runoff will reach surface water;
2. Reduction of direct animal contact with surface water by removing high
concentrations of animals, strategic fencing of streams, or use of stream bank
entrance ramps to allow watering while minimizing direct defecation into surface

Sheridan County Conservation District
Tongue River Watershed Assessment 205j Final Report 1996-1999 218
water;
3. Improved management of waste disposal techniques and design of disposal areas to
include use of riparian buffer strips between application sites and surface water and
minimize manure spreading under conditions conducive to runoff and overland
flow such as saturated soils, surface channeling and on frozen ground;
4. Improvement of animal waste storage facilities at larger operations to reduce
leakage and drainage directly into surface water;
5. Relocating poorly planned septic systems;
6. Proper waste disposal by recreational users;
7. Effective regulatory oversight by WDEQ to ensure effective municipal and large
feedlot wastewater treatment through the NPDES program; and
8. Consideration of wildlife and waterfowl population management should they cause
significant fecal coliform contamination.

Sheridan County Conservation District
Tongue River Watershed Assessment 205j Final Report 1996-1999 219
FIGURE 8-1. Cumulative monthly precipitation at Burgess Junction Meteorological Station WY07E33S operated by NRCS, Sheridan
County, Wyoming.
0.0
5.0
10.0
15.0
20.0
25.0
30.0
35.0
OCT NOV DEC JAN FEB MAR APR MAY JUN JUL AUG SEP
Pre
cip
ita
tio
n in
In
ch
es
Month
Cumulative Monthly Precipitation at Burgess Junction Station WY07E33S
1982-1999 1996 1997 1998 1999
1997

Sheridan County Conservation District
Tongue River Watershed Assessment 205j Final Report 1996-1999 220
FIGURE 8-2. Monthly air temperature at Burgess Junction Meteorological Station WY07E33S operated by NRCS, Sheridan County,
Wyoming.
-15
-10
-5
0
5
10
15
20
Air
Te
mp
era
ture
(D
eg
ree
s C
els
ius
)
Month
Mean Monthly Air Temperature at Burgess Junction Station WY07E33S
1990-1999 1996 1997 1998 1999
OCT NOV DEC JAN FEB MAR APR MAY JUN JUL AUG SEP

Sheridan County Conservation District
Tongue River Watershed Assessment 205j Final Report 1996-1999 221
FIGURE 8-3. Monthly discharge at USGS Tongue River Station 06298000, Sheridan County, Wyoming
0
100
200
300
400
500
600
700
800
900
1000
OCT NOV DEC JAN FEB MAR APR MAY JUN JUL AUG SEP
Dis
ch
arg
e (
Cu
bic
Fe
et
per
Se
co
nd
)
Month
Monthly Discharge at USGS Tongue River Station 06298000
Mean 1982-99 1995-96 1996-97 1997-98 1998-99

Sheridan County Conservation District
Tongue River Watershed Assessment 205j Final Report 1996-1999 222
FIGURE 8-4. Monthly discharge from April through September at USGS Wolf Creek Station 06299500, Sheridan County, Wyoming.
0.0
20.0
40.0
60.0
80.0
100.0
120.0
140.0
160.0
180.0
200.0
APR MAY JUN JUL AUG SEP
Dis
ch
arg
e (
Cu
bic
Fe
et
per
Se
co
nd
)
Month
Monthly Discharge at USGS Wolf Creek Station 062995000
Mean 1982-99 1996 1997 1998 1999

Sheridan County Conservation District
Tongue River Watershed Assessment 205j Final Report 1996-1999 223
FIGURE 8-5. Comparison of discharge measurements recorded same day at Tongue River Upper, Middle and Lower stations collected
by SCCD and WDEQ, 1996-1999, Sheridan County, Wyoming.
0.00
500.00
1000.00
1500.00
2000.00
2500.00
3000.00D
isc
harg
e (
CF
S)
Discharge at Tongue Upper, Middle and Lower Stations
Tongue Upper Tongue Middle Tongue Lower
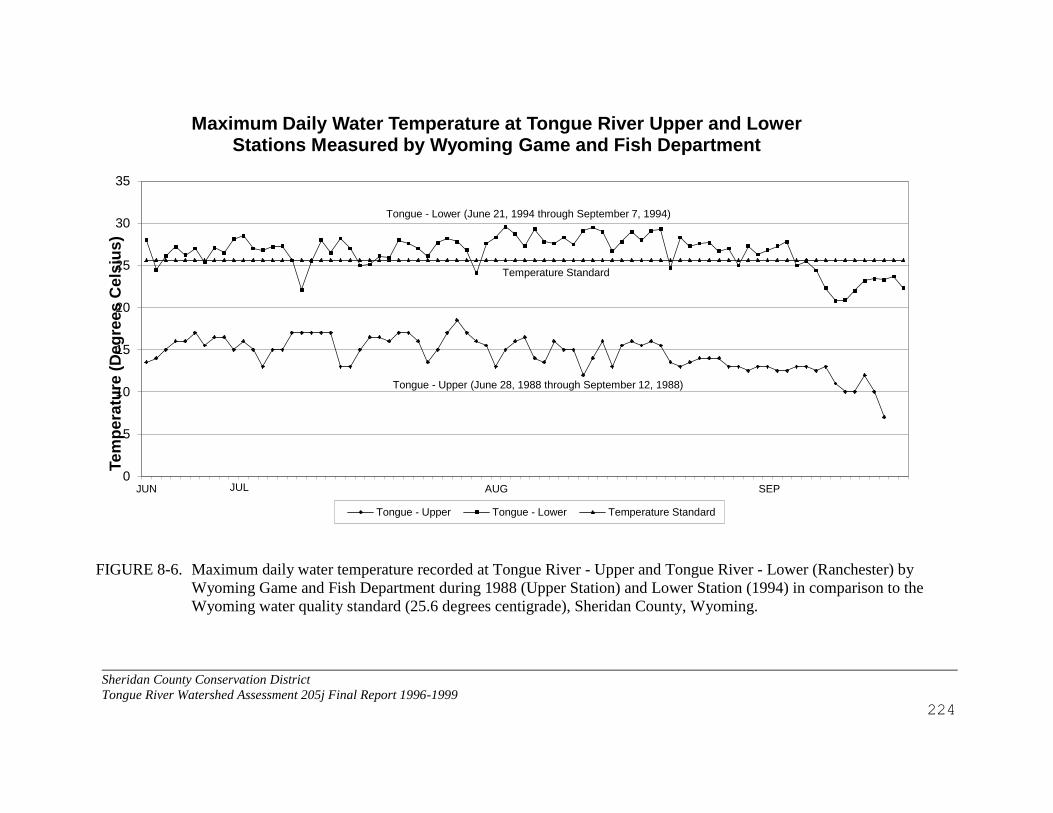
Sheridan County Conservation District
Tongue River Watershed Assessment 205j Final Report 1996-1999 224
FIGURE 8-6. Maximum daily water temperature recorded at Tongue River - Upper and Tongue River - Lower (Ranchester) by
Wyoming Game and Fish Department during 1988 (Upper Station) and Lower Station (1994) in comparison to the
Wyoming water quality standard (25.6 degrees centigrade), Sheridan County, Wyoming.
0
5
10
15
20
25
30
35
JUN
Te
mp
era
ture
(D
eg
ree
s C
els
ius
)
Maximum Daily Water Temperature at Tongue River Upper and Lower Stations Measured by Wyoming Game and Fish Department
Tongue - Upper Tongue - Lower Temperature Standard
Tongue - Lower (June 21, 1994 through September 7, 1994)
Temperature Standard
Tongue - Upper (June 28, 1988 through September 12, 1988)
JUL AUG SEP

Sheridan County Conservation District
Tongue River Watershed Assessment 205j Final Report 1996-1999 225
FIGURE 8-7. Average monthly water temperature (based on daily temperature measurements) at the City of Ranchester Water
Treatment Plant raw water intake at Tongue River Lower station, 1993 - 1999, Sheridan County, Wyoming.
0.0
5.0
10.0
15.0
20.0
25.0
Jan Feb Mar Apr May Jun Jul Aug Sep Oct Nov Dec
Te
mp
era
ture
(D
eg
ree
s C
els
ius
)
Month
Average Monthly Water Temperature at Ranchester WTP Intake at Tongue River Lower Station, 1993 - 1999
Average Minimum Maximum

Sheridan County Conservation District
Tongue River Watershed Assessment 205j Final Report 1996-1999 226
FIGURE 8-8. Time series analysis for average annual water temperature (based on daily temperature measurements) at the City of
Ranchester Water Treatment Plant raw water intake at Tongue River Lower station, 1993 - 1999, Sheridan County,
Wyoming.
0.0
2.0
4.0
6.0
8.0
10.0
12.0
14.0
16.0
18.0
20.0
1993 1994 1995 1996 1997 1998 1999
Te
mp
era
ture
(D
eg
ree
s C
els
ius
)
Year
Average Annual Water Temperature at Ranchester WTP at Tongue River Lower Station, 1993 - 1999
Average Minimum Maximum Linear (Average)
Regression Line
Correlation Coefficient = -0.973422; P<0.01
R-Squared = 94.7551%

Sheridan County Conservation District
Tongue River Watershed Assessment 205j Final Report 1996-1999 227
FIGURE 8-9. Comparison of water temperature at Tongue River Upper, Middle and Lower stations on comparable days, 1997-1999,
Sheridan County, Wyoming.
0
5
10
15
20
25
Te
mp
era
ture
(D
eg
ree
s C
els
ius
)
Date
Water Temperature at Tongue Upper, Middle, and Lower Stations, 1997-1999
Tongue - Upper Tongue - Middle Tongue - Lower

Sheridan County Conservation District
Tongue River Watershed Assessment 205j Final Report 1996-1999 228
FIGURE 8-10. Comparison of water temperature at Tongue River Middle and Lower stations on comparable days, 1996-1999,
Sheridan County, Wyoming.
0
5
10
15
20
25
Te
mp
era
ture
(D
eg
ree
s C
els
ius
)
Date
Water Temperature at Tongue Middle and Lower Stations, 1996-1999
Tongue - Middle Tongue - Lower

Sheridan County Conservation District
Tongue River Watershed Assessment 205j Final Report 1996-1999 229
FIGURE 8-11. Average monthly pH (based on daily pH measurements) at the City of Ranchester Water Treatment Plant raw
water intake at Tongue River Lower station, 1993 - 1999, Sheridan County, Wyoming.
0.0
2.0
4.0
6.0
8.0
10.0
12.0
Jan Feb Mar Apr May Jun Jul Aug Sep Oct Nov Dec
pH
(S
tan
da
rd U
nit
s)
Month
Average Monthly pH at Ranchester WTP Intake at Tongue River Lower Station, 1993 - 1999
Average Minimum Maximum

Sheridan County Conservation District
Tongue River Watershed Assessment 205j Final Report 1996-1999 230
FIGURE 8-12. Time series analysis for average annual pH (based on daily pH readings) at the Town of Ranchester Water
Treatment Plant raw water intake at Tongue River Lower station, 1993 - 1999, Sheridan County, Wyoming.
6.5
7.0
7.5
8.0
8.5
9.0
1993 1994 1995 1996 1997 1998 1999
pH
(S
tan
da
rd U
nit
s)
Year
Average Annual pH at Tongue River Lower Station at Ranchester WTP, 1993 - 1999
Average Minimum Maximum Linear (Average)
Regression Line
Correlation Coefficient = -0.949931; P<0.01
R-Squared = 90.2369%

Sheridan County Conservation District
Tongue River Watershed Assessment 205j Final Report 1996-1999 231
FIGURE 8-13. Scatterplot showing association between conductivity and discharge at Tongue River Middle station, 1996 - 1999,
Sheridan County, Wyoming.
0.00
500.00
1000.00
1500.00
2000.00
2500.00
3000.00
0 50 100 150 200 250 300 350 400 450
Dis
ch
arg
e (
cfs
)
Conductivity (umhos/cm)
Scatterplot Showing Relationship Between Conductivity and Discharge at Tongue River Middle Station, 1996-1999
Correlation Coefficient = -0.736; P<0.01 R-Squared = 54.2%

Sheridan County Conservation District
Tongue River Watershed Assessment 205j Final Report 1996-1999 232
FIGURE 8-14. Scatterplot showing association between turbidity and discharge at Tongue River Middle Station, 1996-1999,
Sheridan County, Wyoming.
0
500
1000
1500
2000
2500
0 5 10 15 20 25 30 35
Dis
ch
arg
e (
cfs
)
Turbidity (NTU)
Scatterplot Showing Relationship Between Turbidity and Discharge at Tongue River Middle Station, 1996-1999
Correlation Coefficient = +0.6001; P<0.01 R-Squared = 36.07%

Sheridan County Conservation District
Tongue River Watershed Assessment 205j Final Report 1996-1999 233
FIGURE 8-15. Average monthly turbidity (based on daily turbidity measurements) at the Town of Ranchester Water Treatment
Plant raw water intake at Tongue River Lower station, 1983 - 1999, Sheridan County, Wyoming.
0.0
5.0
10.0
15.0
20.0
25.0
30.0
35.0
Jan Feb Mar Apr May Jun Jul Aug Sep Oct Nov Dec
Tu
rbid
ity (
NT
U)
Month
Average Monthly Turbidity at Ranchester WTP Intake at Tongue River Lower Station, 1983 - 1999
Average Monthly Turbidity

Sheridan County Conservation District
Tongue River Watershed Assessment 205j Final Report 1996-1999 234
FIGURE 8-16. Time series analysis for mean annual turbidity (based on daily turbidity measurements) at the Town of Ranchester
Water Treatment Plant raw water intake at Tongue River Lower station, 1983 - 1999, Sheridan County,
Wyoming.
0.0
5.0
10.0
15.0
20.0
25.0
30.0
35.0
1982 1984 1986 1988 1990 1992 1994 1996 1998 2000
Tu
rbid
ity (
NT
U)
Year
Time Series Analysis for Mean Annual Turbidity at Tongue River Lower Station at Ranchester WTP 1983-1999
Correlation Coefficient = -0.595638; p <0.05

Sheridan County Conservation District
Tongue River Watershed Assessment 205j Final Report 1996-1999 235
FIGURE 8-17. Mean monthly alkalinity (based on daily alkalinity measurements) analyses at the Town of Ranchester Water
Treatment Plant raw water intake at Tongue River Lower station, 1983 - 1999, Sheridan County, Wyoming.
0
50
100
150
200
250
300
350
400
450
500
Jan-98
Feb-98
Mar-98
Apr-98
May-98
Jun-98
Jul-98
Aug-98
Sep-98
Oct-98
Nov-98
Dec-98
Jan-99
Feb-99
Mar-99
Apr-99
May-99
Jun-99
Jul-99
Aug-99
Sep-99
Oct-99
Nov-99
Dec-99
Alk
ali
nit
y (
Mg
/L)
Date
Average Monthly Alkalinity at Tongue River Lower Station at Ranchester WTP, 1998 - 1999
Average Minimum Maximum

Sheridan County Conservation District
Tongue River Watershed Assessment 205j Final Report 1996-1999 236
FIGURE 8-18. Scatterplot showing relationship between percent scrapers and Weighted Embeddedness (substrate silt cover) at
Tongue River biomonitoring stations, 1993 through 1999, Sheridan County, Wyoming.
0
5
10
15
20
25
30
35
40
45
50
0 10 20 30 40 50 60 70 80 90 100
Pe
rce
nt
Sc
rap
ers
Weighted Embeddedness
Relationship Between Percent Scrapers and Weighted Embeddedness, Tongue River Stations 1993 - 1999
Correlation Coefficient = +0.591944; P<0.05 R-Squared = +35.04%

Sheridan County Conservation District
Tongue River Watershed Assessment 205j Final Report 1996-1999 237
FIGURE 8-19. Comparison of discharge measurements recorded same day at Little Tongue River Upper and Lower stations
collected by SCCD and WDEQ, 1996-1999, Sheridan County, Wyoming.
0.00
10.00
20.00
30.00
40.00
50.00
60.00
70.00
Dis
ch
arg
e (
Cu
bic
Fe
et
per
Se
co
nd
)
Sampling Date
Comparison of Discharge at Little Tongue River Upper and Lower Stations
Little Tongue - Upper Little Tongue - Lower

Sheridan County Conservation District
Tongue River Watershed Assessment 205j Final Report 1996-1999 238
FIGURE 8-20. Comparison of discharge measurements recorded same day at Smith Creek Upper and Lower stations collected by
SCCD and WDEQ, 1996-1999, Sheridan County, Wyoming.
0.00
1.00
2.00
3.00
4.00
5.00
6.00
7.00
8.00
Dis
ch
arg
e (
Cu
bic
Fe
et
per
Se
co
nd
)
Sample Date
Comparison of Discharge at Smith Creek Upper and Lower Stations
Smith Creek - Upper Smith Creek - Lower
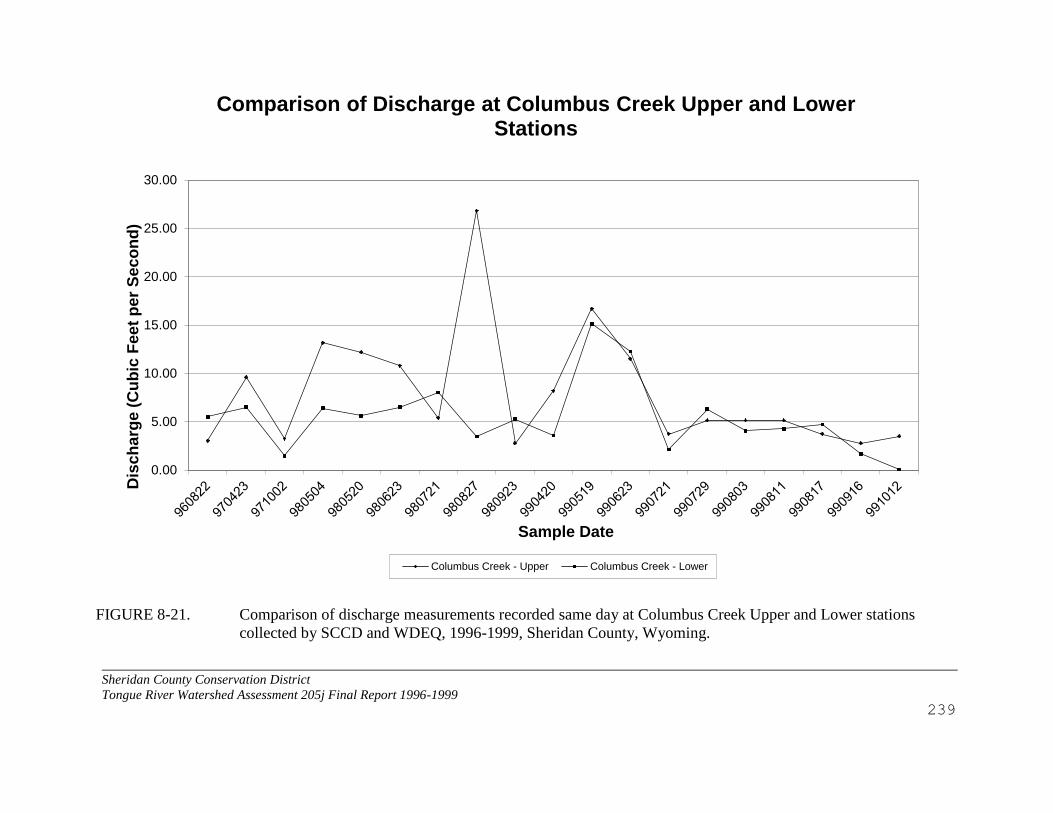
Sheridan County Conservation District
Tongue River Watershed Assessment 205j Final Report 1996-1999 239
FIGURE 8-21. Comparison of discharge measurements recorded same day at Columbus Creek Upper and Lower stations
collected by SCCD and WDEQ, 1996-1999, Sheridan County, Wyoming.
0.00
5.00
10.00
15.00
20.00
25.00
30.00
Dis
ch
arg
e (
Cu
bic
Fe
et
pe
r S
ec
on
d)
Sample Date
Comparison of Discharge at Columbus Creek Upper and Lower Stations
Columbus Creek - Upper Columbus Creek - Lower

Sheridan County Conservation District
Tongue River Watershed Assessment 205j Final Report 1996-1999 240
FIGURE 8-22. Comparison of discharge measurements recorded same day at Wolf Creek Upper and Lower stations collected by
SCCD and WDEQ, 1996-1999, Sheridan County, Wyoming.
0.00
50.00
100.00
150.00
200.00
250.00
Dis
ch
arg
e (
Cu
bic
Fe
et
per
Se
co
nd
)
Sample Date
Comparison of Discharge at Wolf Creek Upper and Lower Stations
Wolf Creek - Upper Wolf Creek - Lower

Sheridan County Conservation District
Tongue River Watershed Assessment 205j Final Report 1996-1999 241
FIGURE 8-23. Discharge measurements at Five Mile Creek Lower station collected by SCCD and WDEQ, 1996-1999, Sheridan
County, Wyoming.
0.00
10.00
20.00
30.00
40.00
50.00
60.0096
100
8
97
040
9
97
042
4
97
050
7
97
051
4
97
060
5
97
061
6
97
071
6
97
082
5
97
091
7
97
100
2
97
101
0
98
040
7
98
042
9
98
050
6
98
051
9
98
061
2
98
062
3
98
072
0
98
082
6
98
092
3
98
101
4
99
041
5
99
042
1
99
051
8
99
060
3
99
062
4
99
072
0
99
072
9
99
080
4
99
081
0
99
081
7
99
091
6
99
101
3
Dis
ch
arg
e (
cfs
)
Date
Discharge at Five Mile Creek Lower Station, 1996 - 1999
Five Mile Creek Lower

Sheridan County Conservation District
Tongue River Watershed Assessment 205j Final Report 1996-1999 242
FIGURE 8-24. Scatterplot showing the relationship between the average fecal coliform bacteria level and percent Oligochaeta at
mainstem Tongue River stations and Lower Tributary stations, 1996-1999, Sheridan County, Wyoming.
0
100
200
300
400
500
600
700
800
900
0 5 10 15 20 25 30
Ave
rag
e F
ec
al C
olifo
rm B
ac
teri
a L
eve
l (N
o. p
er
10
0 m
l.)
Percent Oligochaeta
Relationship Between Average Fecal Coliform Bacteria Level and Percent Oligochaeta
Correlation Coefficient = +0.833; p<0.05 R-Squared = 69.4 percent

Sheridan County Conservation District
Tongue River Watershed Assessment 205j Final Report 1996-1999 243
FIGURE 8-25. Scatterplot showing the relationship between the geometric mean and the number of five daily samples collected
per month with fecal coliform bacteria levels <400 per 100 ml at stations exceeding the Wyoming fecal coliform
standard in the Tongue River and Goose Creek watersheds, 1998 and 1999, Sheridan County, Wyoming.
0
200
400
600
800
1000
1200
0 10 20 30 40 50 60 70 80 90
Ge
om
etr
ic M
ea
n B
as
ed
on
5 D
ail
y S
am
ple
s p
er
Mo
nth
(N
o. p
er
10
0 m
l.)
Percent of 5 Daily Samples with Fecal Coliform levels <400 per 100 ml.
Relationship Between Fecal Coliform Geometric Mean and Percentage of Daily <400 Colonies per 100 ml
Correlation Coefficient = -0.776; p <0.01 R-Squared = 60.2 percent
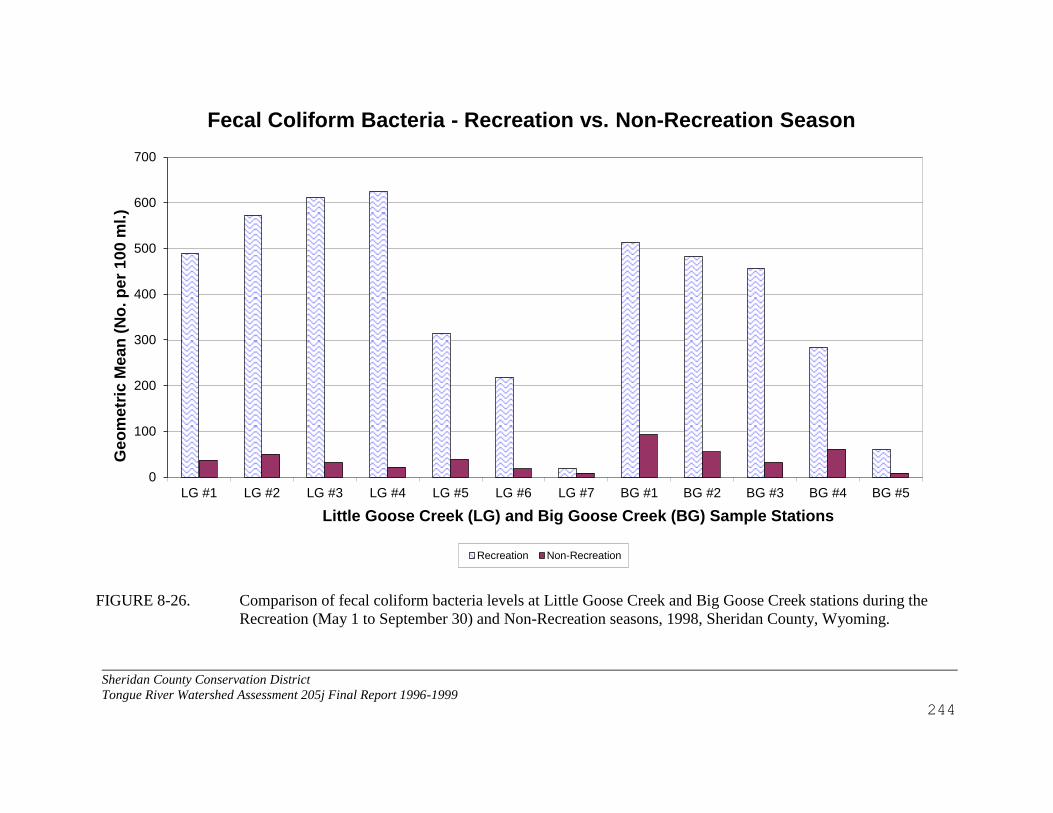
Sheridan County Conservation District
Tongue River Watershed Assessment 205j Final Report 1996-1999 244
FIGURE 8-26. Comparison of fecal coliform bacteria levels at Little Goose Creek and Big Goose Creek stations during the
Recreation (May 1 to September 30) and Non-Recreation seasons, 1998, Sheridan County, Wyoming.
0
100
200
300
400
500
600
700
LG #1 LG #2 LG #3 LG #4 LG #5 LG #6 LG #7 BG #1 BG #2 BG #3 BG #4 BG #5
Ge
om
etr
ic M
ea
n (
No
. p
er
10
0 m
l.)
Little Goose Creek (LG) and Big Goose Creek (BG) Sample Stations
Fecal Coliform Bacteria - Recreation vs. Non-Recreation Season
Recreation Non-Recreation

Sheridan County Conservation District
Tongue River Watershed Assessment 205j Final Report 1996-1999 245
TABLE 8-1. Summary Statistics for Discharge (cfs) Measured at Tongue River Upper, Middle and Lower Stations, Wolf Creek Upper
and Lower Stations and Five Mile Creek Lower Stations During Tongue River 205j Project, 1996 - 1999, Sheridan
County, Wyoming
Summary
Statistic
Tongue River - Upper
Tongue River - Middle
Tongue River - Lower
1996
1997
1998
1999
Total
1996
1997
1998
1999
Total
1996
1997
1998
1999
Total
Number Samples
7
11
10
13
41
4
11
20
12
47
4
11
10
15
40
Average
77
303
251
251
236
94
648
283
552
421
80
646
469
572
517
Median
86
113
156
137
114
94
171
121
184
129
85
204
437
358
226
Minimum
45
68
74
70
45
72
100
68
93
68
41
68
127
70
41
Maximum
88
1061
500
1108
1108
117
2484
992
2852
2852
110
2556
839
2629
2629
Geometric Mean
75
185
196
174
158
92
316
141
278
212
74
288
377
337
285
Summary
Statistic
Wolf Creek - Upper
Wolf Creek - Lower
Fivemile Creek - Lower
1996
1997
1998
1999
Total
1996
1997
1998
1999
Total
1996
1997
1998
1999
Total
Number Samples
3
6
7
10
26
4
11
10
13
38
1
11
10
12
34
Average
5.7
55.8
40.7
23.5
33.5
6.3
59.2
43.7
28.7
39.2
1.0
11.4
8.2
10.4
9.8
Median
5.5
27.7
23.7
14.0
17.8
5.1
19.7
48.2
5.4
16.5
1.0
3.4
6.9
9.2
5.2
Minimum
5.0
7.8
11.7
3.4
3.4
1.1
4.6
2.4
0.04
0.04
1.0
0.1
3.0
0.5
0.1
Maximum
6.6
182
93.2
82.3
182
14.0
221
83.3
203
221
1.0
52.0
23.8
23.5
52.0
Geometric Mean
5.6
32.5
29.6
14.6
19.0
4.4
27.7
28.0
1.7
8.7
1.0
2.9
6.8
5.9
4.7

Sheridan County Conservation District
Tongue River Watershed Assessment 205j Final Report 1996-1999 246
246
TABLE 8-2. Comparison of Average Daily Total Discharge (cfs), Average Daily Discharge
during Primary Low-Irrigation Months (April, May, September and October) and
Average Daily Discharge during Primary Irrigation Months (June, July and
August) Measured Same Day During Tongue River 205j Project, 1996 - 1999,
Sheridan County, Wyoming
Discharge Period
Tongue River Upper versus Tongue River Middle
Upper
Middle
Percent Difference
All Days (N = 29)
255
510
+100
Non-Irrigation Days (N = 17)
168
320
+90
Irrigation Days (N = 12)
380
780
+105
Tongue River Middle versus Tongue River Lower
Middle
Lower
Percent Difference
All Days (N = 36)
518
550
+6
Non-Irrigation Days (N = 20)
323
422
+31
Irrigation Days (N = 16)
761
710
-7
Little Tongue River Upper versus Little Tongue River Lower
Upper
Lower
Percent Difference
All Days (N = 24)
13.3
12.5
-6
Non-Irrigation Days (N = 12)
13.3
11.6
-13
Irrigation Days (N = 12)
13.4
13.4
0
Smith Creek Upper versus Smith Creek Lower
Upper
Lower
Percent Difference
All Days (N = 26)
2.1
3.3
+57
Non-Irrigation Days (N = 13)
2.5
4.0
+60
Irrigation Days (N = 13)
1.7
2.6
+53
Columbus Creek Upper versus Columbus Creek Lower
Upper
Lower
Percent Difference
All Days (N = 19)
8.0
5.4
-32
Non-Irrigation Days (N = 9)
8.0
5.1
-36
Irrigation Days (N = 10)
8.0
5.7
-29

Sheridan County Conservation District
Tongue River Watershed Assessment 205j Final Report 1996-1999 247
247
TABLE 8-2. Con’t
Discharge Period
Wolf Creek Upper versus Wolf Creek Lower
Upper
Lower
Percent Difference
All Days (N = 11)
24.1
12.1
-50
Non-Irrigation Days (N = 5)
23.1
16.8
-27
Irrigation Days (N = 6)
25.0
8.2
-68

Sheridan County Conservation District
Tongue River Watershed Assessment 205j Final Report 1996-1999 248
248
TABLE 8-3. Summary Statistics for Maximum Daily Water Temperature (C0) Measured by
Wyoming Game and Fish Department at Tongue River Canyon and Tongue River
@ Ranchester Stations Using Continuous Recording Thermographs, Sheridan
County, Wyoming
Summary
Statistic
Tongue River - Canyon
Tongue River - Ranchester
JUNE 28, 1988 - SEPT 12, 1988
JUNE 21, 1994 - SEPT 07, 1994
Number Samples
77
79
Average
14.5
26.5
Median
15.0
27.0
Minimum
7.0
20.8
Maximum
18.5
29.6
Geometric Mean
14.3
26.5
No. samples
> 25.6 C0
0
57 WQV
% of samples
> 25.6 C0
0
72.2 WQV
WQV = Violation of Wyoming Surface Water Quality Standards for Temperature
TABLE 8-4. Projected Number of Days Wyoming Water Quality Standard for Water
Temperature was Exceeded at the Ranchester Water Treatment Plant, 1993 through
1999, Sheridan County, Wyoming
Year
Month
1993
1994
1995
1996
1997
1998
1999
June
0
4
0
0
0
0
0
July
3
14
11
26
7
4
0
August
9
24
16
23
4
1
4
September
0
0
3
6
5
1
0
Total Days
12
42
30
55
16
6
4

Sheridan County Conservation District
Tongue River Watershed Assessment 205j Final Report 1996-1999 249
TABLE 8-5. Summary Statistics for Water Temperature (C0) Measured at Tongue River Upper, Middle and Lower Stations During
Tongue River 205j Project, 1996 - 1999, Sheridan County, Wyoming
Summary
Statistic
Tongue River - Upper
Tongue River - Middle
Tongue River - Lower 1996
1997
1998
1999
Total
1996
1997
1998
1999
Total
1996
1997
1998
1999
Total
Number Samples
7
11
11
13
42
4
11
20
13
48
6
11
10
15
42
Average
8.3
8.7
10.1
10.7
9.6
12.0
10.1
7.2
12.6
9.8
9.2
10.9
11.8
13.3
11.7
Median
7.5
10.2
9.2
10.4
9.2
10.6
9.6
4.2
12.7
9.7
9.4
11.2
11.3
13.7
11.4
Minimum
3.2
1.1
3.3
2.6
1.1
7.8
0.7
0.5
5.1
0.5
2.5
1.4
5.5
5.4
1.4
Maximum
15.0
16.3
18.0
18.0
18.0
19.1
17.2
21.2
20.1
21.2
17.1
17.3
21.8
20.1
21.8
Geometric Mean
7.3
6.8
9.0
9.2
8.1
11.4
8.2
4.6
11.5
7.3
7.7
9.4
11.0
12.4
10.5
No. samples
> 25.6 C0
0
0
0
0
0
0
0
0
0
0
0
0
0
0
0 % of samples
> 25.6 C0
0
0
0
0
0
0
0
0
0
0
0
0
0
0
0

Sheridan County Conservation District
Tongue River Watershed Assessment 205j Final Report 1996-1999 250
TABLE 8-6. Summary Statistics for pH (Standard Units) Measured at Tongue River Upper, Middle and Lower Stations During
Tongue River 205j Project, 1996 - 1999, Sheridan County, Wyoming
Summary
Statistic
Tongue River - Upper
Tongue River - Middle
Tongue River - Lower 1996
1997
1998
1999
Total
1996
1997
1998
1999
Total
1996
1997
1998
1999
Total
Number Samples
7
11
11
13
42
4
11
20
13
48
6
11
10
15
42
Average
8.3
8.2
8.0
8.2
8.2
8.2
8.1
8.0
8.1
8.0
8.0
8.1
7.9
8.0
8.0
Median
8.3
8.2
8.1
8.3
8.3
8.2
8.1
8.1
8.2
8.1
8.0
8.1
8.2
8.2
8.1
Minimum
7.9
7.9
6.9
7.6
6.9
7.9
7.7
6.9
7.5
6.9
7.4
7.8
6.8
7.1
6.8
Maximum
8.6
8.6
8.5
8.5
8.6
8.4
8.6
8.4
8.4
8.6
8.3
8.6
8.6
8.4
8.6
Geometric Mean
8.3
8.2
8.0
8.2
8.2
8.1
8.1
8.0
8.1
8.0
8.0
8.1
7.9
8.0
8.0
No. samples <6.5
or >9.0
0
0
0
0
0
0
0
0
0
0
0
0
0
0
0 % of samples <6.5
or >9.0
0
0
0
0
0
0
0
0
0
0
0
0
0
0
0

Sheridan County Conservation District
Tongue River Watershed Assessment 205j Final Report 1996-1999 251
TABLE 8-7. Summary Statistics for Conductivity (Micromhos per Centimeter) Measured at Tongue River Upper, Middle and Lower
Stations During Tongue River 205j Project, 1996 - 1999, Sheridan County, Wyoming
Summary
Statistic
Tongue River - Upper
Tongue River - Middle
Tongue River - Lower 1996
1997
1998
1999
Total
1996
1997
1998
1999
Total
1996
1997
1998
1999
Total
Number Samples
7
11
11
13
42
4
11
20
13
48
6
11
10
15
42
Average
283
195
193
193
209
358
281
269
260
277
293
324
271
304
300
Median
240
207
201
201
207
355
292
283
274
289
376
333
275
338
322
Minimum
223
137
139
119
119
330
170
150
147
147
90
171
161
155
90
Maximum
530
232
254
250
530
390
410
375
346
410
414
495
460
363
495
Geometric Mean
270
193
190
189
202
357
271
262
254
269
242
310
259
296
282
No. Samples
>7500
0
0
0
0
0
0
0
0
0
0
0
0
0
0
0 % Samples
>7500
0
0
0
0
0
0
0
0
0
0
0
0
0
0
0

Sheridan County Conservation District
Tongue River Watershed Assessment 205j Final Report 1996-1999 252
TABLE 8-8. Summary Statistics for Dissolved Oxygen (Mg/l) Measured at Tongue River Upper, Middle and Lower Stations During
Tongue River 205j Project, 1996 - 1999, Sheridan County, Wyoming
Summary
Statistic
Tongue River - Upper
Tongue River - Middle
Tongue River - Lower 1996
1997
1998
1999
Total
1996
1997
1998
1999
Total
1996
1997
1998
1999
Total
Number Samples
4
1
1
8
14
1
1
10
8
20
1
1
1
10
13
Average
10.4
12.0
11.1
9.6
10.2
10.0
12.1
12.1
9.6
11.0
9.0
12.2
11.5
9.6
9.9
Median
10.6
12.0
11.1
9.6
10.0
10.0
12.1
12.4
9.6
10.6
9.0
12.2
11.5
9.9
9.9
Minimum
9.1
12.0
11.1
8.1
8.1
10.0
12.1
10.6
8.1
8.1
9.0
12.2
11.5
7.9
7.9
Maximum
11.4
12.0
11.1
11.0
12.0
10.0
12.1
13.6
11.0
13.6
9.0
12.2
11.5
10.5
12.2
Geometric Mean
10.4
12.0
11.1
9.6
10.2
10.0
12.1
12.0
9.6
10.9
9.0
12.2
11.5
9.5
9.8
No. Samples
< 5 mg/l
0
0
0
0
0
0
0
0
0
0
0
0
0
0
0 No. Samples
< 4 mg/l
0
0
0
0
0
0
0
0
0
0
0
0
0
0
0

Sheridan County Conservation District
Tongue River Watershed Assessment 205j Final Report 1996-1999 253
TABLE 8-9. Summary Statistics for Turbidity (NTU) Analyses for Samples Collected at Tongue River Upper, Middle and Lower
Stations, Wolf Creek Upper and Lower Stations and Five Mile Creek Lower Station During Tongue River 205j Project,
1996 - 1999, Sheridan County, Wyoming
Summary
Statistic
Tongue River - Upper
Tongue River - Middle
Tongue River - Lower
1996
1997
1998
1999
Total
1996
1997
1998
1999
Total
1996
1997
1998
1999
Total
Number Samples
7
11
11
13
42
4
11
20
13
48
6
11
10
15
42
Average
1.1
10.2
13.0
3.3
7.3
1.3
12.8
8.3
9.4
9.0
2.4
15.7
18.0
13.3
13.5
Median
1.0
6.0
10.0
1.5
3.4
1.4
13.0
1.5
3.5
3.6
2.0
11.0
16.0
4.0
5.8
Minimum
0.2
1.1
0.6
0.8
0.2
0.4
1.0
0.4
0.5
0.4
1.3
1.2
1.7
1.1
1.0
Maximum
2.0
24.0
26.0
15.0
26.0
2.0
30.0
33.0
33.0
33.0
5.3
41.0
40.0
61.0
61.0
Geometric Mean
0.8
6.4
10.0
2.1
3.6
1.1
7.9
2.8
4.4
3.7
2.1
9.4
13.9
6.1
7.1
Summary
Statistic
Wolf Creek - Upper
Wolf Creek - Lower
Five Mile Creek - Lower 1996
1997
1998
1999
Total
1996
1997
1998
1999
Total
1996
1997
1998
1999
Total
Number Samples
4
6
7
10
27
4
11
10
13
38
5
11
10
11
37
Average
1.4
8.2
8.1
1.5
4.7
5.9
22.2
21.0
24.6
21.0
6.6
30.9
36.7
65.2
39.4
Median
1.2
8.0
7.0
0.6
2.1
7.0
19.0
17.5
6.5
15.5
6.5
27.0
36.0
50.0
34.0
Minimum
0.6
0.9
5.0
0.5
0.5
1.9
3.4
3.6
4.2
1.9
6.0
4.5
3.8
30.0
3.8
Maximum
2.6
17.0
15.0
7.5
17.0
7.9
48.0
41.0
125
125
7.6
100
90
155
155
Geometric Mean
1.2
5.0
7.6
0.9
2.4
5.2
15.1
17.6
12.6
13.2
6.6
21.5
28.1
58.0
26.5

Sheridan County Conservation District
Tongue River Watershed Assessment 205j Final Report 1996-1999 254
TABLE 8-10. Summary Statistics for Fecal Coliform Bacteria (Number per 100 Milliliters) Analyses for Samples Collected at Tongue
River Upper, Middle and Lower Stations During Tongue River 205j Project, 1996 - 1999, Sheridan County, Wyoming
Summary
Statistic
Tongue River - Upper
Tongue River - Middle
Tongue River - Lower 1996
1997
1998
1999
Total
1996
1997
1998
1999
Total
1996
1997
1998
1999
Total
Number Samples
3
7
7
10
27
3
7
17
10
37
3
7
7
10
27
Average
1
29
7
7
12
2
47
19
84
41
1
80
71
148
94
Median
1
20
4
4
5
1
43
9
84
16
1
64
14
60
25
Minimum
1
1
1
1
1
1
1
2
4
1
1
6
11
1
1
Maximum
1
90
21
20
90
5
100
126
200
200
2
270
260
1060
1060
Geometric Mean
1
15
4
5
5
2
28
10
44
15
1
41
29
38
25
Geometric Mean
(Recreation
Season)
NCA
NC
NC
7
NC
NC
NC
NC
90
NC
NC
NC
NC
63
NC
No. samples >
400/100ml
0
0
0
0
0
0
0
0
0
0
0
0
0
1
1 % of samples >
400/100ml
0
0
0
0
0
0
0
0
0
0
0
0
0
10WQV
4
NCA = Not calculated; less than 5 samples were collected during separate 24 periods within a 30 day period.
WQV = Violation of Wyoming Surface Water Quality Standard.

Sheridan County Conservation District
Tongue River Watershed Assessment 205j Final Report 1996-1999 255
255
TABLE 8-11. Comparison of Summary Statistics for Fecal Coliform Bacteria (Number per 100
Milliliters) Analyses for Historical Samples and Samples Collected During Current
Study at Tongue River Upper, Middle, and Lower Stations, Sheridan County,
Wyoming
Summary
Statistic
Tongue-Upper
Tongue- Middle
Tongue - Lower
Historical
(1976-88)
Current
Historical
(1985-89)
Current
Historical
(1968-90)
Current
Number Samples
21
27
9
37
57
27
Average
15
12
233
41
137
94
Median
9
5
80
16
70
25
Minimum
1
1
14
1
1
1
Maximum
65
90
1028
200
1600
1060
Variance
274
354
11611
2705
49925
42560
Std. Deviation
16.6
18.8
340.8
52.0
223.4
206
Geometric Mean
6
5
94
15
71
25
No. samples >
400/100ml
0
0
2
0
2
1 % of samples >
400/100ml
0
0
22WQV
0
4
4
WQV = Violation of Wyoming Surface Water Quality Standard.

Sheridan County Conservation District
Tongue River Watershed Assessment 205j Final Report 1996-1999 256
TABLE 8-12. Summary Statistics for Total Nitrate Nitrogen (Mg/l) Measured at Tongue River Upper, Middle and Lower Stations
During Tongue River 205j Project, 1996 - 1999, Sheridan County, Wyoming
Summary
Statistic
Tongue River - Upper
Tongue River - Middle
Tongue River - Lower 1996
1997
1998
1999
Total
1996
1997
1998
1999
Total
1996
1997
1998
1999
Total
Number Samples
6
8
8
9
31
4
8
17
8
37
6
8
7
10
31
Average
.041
.038
.015
.022
.028
.028
.021
.043
.012
.030
.012
.027
.013
.021
.019
Median
.035
.008
.010
.010
.010
.025
.007
.040
.004
.020
.006
.010
.004
.005
.006
Minimum
.006
.001
.006
.001
.001
.010
.003
.004
.001
.001
.002
.006
.002
.003
.002
Maximum
.080
.130
.060
.090
.130
.050
.070
.100
.070
.100
.050
.070
.050
.120
.120
Geometric Mean
.027
.013
.011
.011
.013
.023
.011
.029
.005
.015
.007
.016
.006
.008
.009
No. Samples
>10 mg/l)
0
0
0
0
0
0
0
0
0
0
0
0
0
0
0

Sheridan County Conservation District
Tongue River Watershed Assessment 205j Final Report 1996-1999 257
TABLE 8-13. Summary Statistics for Total Phosphorus (Mg/l) Measured at Tongue River Upper, Middle and Lower Stations During
Tongue River 205j Project, 1996 - 1999, Sheridan County, Wyoming
Summary
Statistic
Tongue River - Upper
Tongue River - Middle
Tongue River - Lower 1996
1997
1998
1999
Total
1996
1997
1998
1999
Total
1996
1997
1998
1999
Total
Number Samples
5
2
1
2
10
2
1
11
2
16
4
2
1
3
10
Average
.056
.028
.050
.028
.044
.029
.050
.050
.007
.041
.043
.029
.040
.005
.028
Median
.050
.028
.050
.028
.050
.029
.050
.050
.007
.045
.042
.029
.040
.004
.022
Minimum
.040
.006
.050
.007
.006
.008
.050
.020
.006
.006
.006
.008
.040
.004
.004
Maximum
.080
.050
.050
.050
.080
.050
.050
.090
.008
.090
.080
.050
.040
.006
.080
Geometric Mean
.054
.017
.050
.019
.035
.020
.050
.043
.007
.031
.030
.020
.040
.005
.016
No. Samples >0.10
mg/l
0
0
0
0
0
0
0
0
0
0
0
0
0
0
0 % Samples >0.10
mg/l
0
0
0
0
0
0
0
0
0
0
0
0
0
0
0

Sheridan County Conservation District
Tongue River Watershed Assessment 205j Final Report 1996-1999 258
TABLE 8-14. Summary Statistics for Alkalinity, Total Chloride, Total Hardness, Total Sulfate, and Total Suspended Solids Analyses
for Samples Collected by WDEQ at Tongue River Upper (1993-1999), Middle and Lower Stations (1996-1999) During
Tongue River 205j Project, Sheridan County, Wyoming
Summary
Statistic
Tongue River - Upper
Tongue River - Middle
Tongue River - Lower ALK
CL
HARD
SULF
TSS
ALK
CL
HAR
D
SULF
TSS
ALK
CL
HARD
SULF
TSS
Number Samples
7
7
7
7
7
14
14
14
14
14
4
4
4
4
4
Average
122
<5
209
<10
3
145
<5
176
23
2
174
<5
202
33
3
Median
125
<5
146
<10
2
140
<5
180
22
1
178
<5
201
32
3
Minimum
90
<5
124
<10
1
120
<5
149
17
1
160
<5
173
28
1
Maximum
140
<5
616
<10
6
170
<5
200
33
4
180
<5
235
40
6
Geometric Mean
121
<5
174
<10
2
144
<5
176
23
1
174
<5
201
32
2

Sheridan County Conservation District
Tongue River Watershed Assessment 205j Final Report 1996-1999
259
TABLE 8-15. Scoring and assessment of biological condition for Tongue River Watershed 205j
Project benthic macroinvertebrate communities based on the Wyoming Stream
Integrity Index (WSII; from Stribling et al., 2000) and the Wyoming Biological
Condition Index (WBCI; from Barbour et al., 1994) developed for streams less than
6,500 feet elevation in the Middle Rockies Central ecoregion of Wyoming
WSII
WBCI (Total
Score Middle
Rockies Streams)
Middle Rockies
Northwestern Great
Plains
Sampling Station and Year
Score
Rank
Score
Rank
Score
Rank
Tongue River Upper (1993)
75.2
Good
NA
A
NA
A
43
Good
Tongue River Upper (1994)
75.5
Good
NA
NA
43
Good
Tongue River Upper (1995)
74.9
Good
NA
NA
41
Good
Tongue River Upper (1996)
78.0
Good
NA
NA
39
Good
Tongue River Upper (1997)
72.2
Good
NA
NA
43
Good
Tongue River Upper (1998)
71.5
Good
NA
NA
41
Good
Tongue River Upper (1999)
73.8
Good
NA
NA
41
Good
Tongue River @ USGS 06298000 (1999)
77.5
Good
NA
NA
39
Good
Tongue River ab Dayton WWTF (1998)
NA
NA
86.7
Very Good
NA
NA
Tongue River be Dayton WWTF (1998)
NA
NA
84.2
Very Good
NA
NA
Tongue River Middle (1996)
NA
NA
86.7
Very Good
NA
NA
Tongue River Middle (1997)
NA
NA
92.2
Very Good
NA
NA
Tongue River Middle (1998)
NA
NA
79.7
Very Good
NA
NA
Tongue River Middle (1999)
NA
NA
97.9
Very Good
NA
NA
Tongue River Lower (1996)
NA
NA
83.3
Very Good
NA
NA
Tongue River Lower (1997)
NA
NA
82.4
Very Good
NA
NA
Tongue River Lower (1998)
NA
NA
85.2
Very Good
NA
NA
Tongue River Lower (1999)
NA
NA
80.4
Very Good
NA
NA
Little Tongue River Upper (1993)
59.1
Fair
NA
NA
33
Fair

Sheridan County Conservation District
Tongue River Watershed Assessment 205j Final Report 1996-1999
260
TABLE 8-15. Con’t
WSII
WBCI (Total Score Middle
Rockies Streams)
Middle
Rockies
North West
Great Plains
Sampling Station and Year Score
Rank
Score
Rank
Score
Rank
Little Tongue River Lower (1996)
51.0
Fair
NA
NA
35
Fair
Little Tongue River Lower (1997)
66.5
Fair
NA
NA
35
Fair
Little Tongue River Lower (1998)
40.6
Fair
NA
NA
27
Fair
Little Tongue River Lower (1999)
42.9
Fair
NA
NA
29
Fair
Smith Creek Lower (1996)
NA
NA
57.1
Good
NA
NA
Smith Creek Lower (1997)
NA
NA
74.0
Good
NA
NA
Smith Creek Lower (1998)
NA
NA
68.4
Good
NA
NA
Smith Creek Lower (1999)
NA
NA
64.0
Good
NA
NA
Columbus Creek Upper
61.5
Fair
NA
NA
39
Good
Columbus Creek Lower (1996)
NA
NA
42.5
Fair
NA
NA
Columbus Creek Lower (1997)
NA
NA
58.6
Good
NA
NA
Columbus Creek Lower (1998)
NA
NA
53.1
Fair
NA
NA
Columbus Creek Lower (1999)
NA
NA
57.9
Good
NA
NA
Wolf Creek Upper @ Berry’s
NA
NA
89.9
Very
Good
NA
NA
Wolf Creek Lower (1996)
NA
NA
68.3
Good
NA
NA
Wolf Creek Lower (1997)
NA
NA
69.8
Good
NA
NA
Wolf Creek Lower (1998)
NA
NA
62.3
Good
NA
NA
Wolf Creek Lower (1999)
NA
NA
74.6
Good
NA
NA
Five Mile Creek Lower (1996)
NA
NA
30.8
Poor
NA
NA
Five Mile Creek Lower (1997)
NA
NA
47.5
Fair
NA
NA
Five Mile Creek Lower (1999)
NA
NA
34.6
Poor
NA
NA
NAA = Scoring and ranking not applicable to this ecoregion.

Sheridan County Conservation District
Tongue River Watershed Assessment 205j Final Report 1996-1999
261
TABLE 8-16. Five Most Dominant Macroinvertebrate Taxa Based on Mean Abundance, Tolerance Value (TV) and Functional Feeding
Group (FFG) Designation by Station Within the Tongue River Watershed Project Area, 1996 Through 1999
Tongue River - Upper
Tongue River - Middle
Scientific Name
Group
TV
FFG*
Scientific Name
Group
TV
FFG Baetis tricaudatus
Mayfly
6
CG
Hydropsyche
Caddisfly
4
CF
Glossosoma
Caddisfly
1
SC
Lepidostoma - sand case
larvae
Caddisfly
1
SH
Hydropsyche
Caddisfly
4
CF
Brachycentrus occidentalis
Caddisfly
1
OM
Ephemerella inermis/infrequens
Mayfly
1
CG
Drunella grandis/spinifera
Mayfly
0
CG
Drunella doddsi
Mayfly
0
CG
Optioservus
Riffle Beetle
4
SC
Tongue River - Lower
Little Tongue River - Lower
Scientific Name
Group
TV
FFG
Scientific Name
Group
TV
FFG Hydropsyche
Caddisfly
4
CF
Cleptelmis
Riffle Beetle
4
CG
Ephemerella inermis/infrequens
Mayfly
1
CG
Paraleptophlebia
Mayfly
4
CG
Baetis tricaudatus
Mayfly
6
CG
Optioservus
Riffle Beetle
4
SC
Tricorythodes minutus
Mayfly
4
CG
Zaitzevia
Riffle Beetle
4
CG
Microcylloepus
Riffle Beetle
7
SC
Hydropsyche
Caddisfly
4
CF

Sheridan County Conservation District
Tongue River Watershed Assessment 205j Final Report 1996-1999
262
TABLE 8-16. Con’t
Smith Creek - Lower
Columbus Creek - Lower
Scientific Name
Group
TV
FFG
Scientific Name
Group
TV
FFG Hydropsyche
Caddisfly
4
CF
Hydropsyche
Caddisfly
4
CF
Helicopsyche borealis
Caddisfly
7
SC
Baetis tricaudatus
Mayfly
6
CG
Optioservus
Riffle Beetle
4
SC
Ophidonais serpentina
Worm
8
CG
Paraleptophlebia
Mayfly
4
CG
Uncinais uncinata
Worm
8
CG
Baetis tricaudatus
Mayfly
6
CG
Cheumatopsyche
Caddisfly
8
CF
Wolf Creek - Lower
Five Mile Creek - Lower
Scientific Name
Group
TV
FFG
Scientific Name
Group
TV
FFG Microcylloepus
Riffle Beetle
7
SC
Hydropsyche
Caddisfly
4
CF
Hydropsyche
Caddisfly
4
CF
Baetis tricaudatus
Mayfly
6
CG
Helicopsyche borealis
Caddisfly
7
SC
Simulium
Black Fly
6
CF
Baetis tricaudatus
Mayfly
6
CG
Nais variabilis
Worm
8
CG
Tricorythodes minutus
Mayfly
4
CG
Uncinais uncinata
Worm
8
CG
FFG* = CG = Collector Gatherer; SC = Scraper; CF = Collector Filterer; SH = Shredder; OM = Omnivore.

Sheridan County Conservation District
Tongue River Watershed Assessment 205j Final Report 1996-1999
263
TABLE 8-17.Habitat Assessment Scores for Tongue River 205j Project Stations, 1993 Through 1999
Habit Descriptor
Tongue River @ Canyon
Tongue above
Dayton WWTF
Tongue below
Dayton WWTF 1993
1994
1995
1996
1997
1998
1999
Mean
1998
1998
Substrate / Percent Fines
19
16
18
18
17
19
19
18
20
19
Instream Cover
16
18
18
19
18
19
19
18
17
14
Embeddedness
18
19
17
19
20
20
20
19
20
20
Velocity / Depth
18
18
18
18
18
19
16
18
16
15
Channel Flow Status
18
18
18
19
19
18
19
18
14
12
Channel Shape
9
11
11
11
11
9
9
10
8
8
Pool Riffle Ratio
11
14
14
13
12
13
14
13
10
9
Channelization
15
15
15
14
14
15
15
15
8
8
Width Depth Ratio
7
9
13
13
11
11
6
10
6
7
Bank Vegetation
Protection
8
9
9
9
9
9
10
9
8
8
Bank Stability
10
9
9
9
9
9
10
9
8
8
Disruptive Pressures
10
10
10
10
10
10
10
10
10
10
Riparian Zone Width
6
7
8
9
9
2
6
7
7
6
TOTAL SCORE
165
173
178
181
177
173
173
174
152
144

Sheridan County Conservation District
Tongue River Watershed Assessment 205j Final Report 1996-1999 264
TABLE 8-18. Habitat Assessment Scores for Tongue River 205j Project Stations, 1996 Through
1999
Habit Descriptor
Tongue River - Middle
Tongue River - Lower
(@ Ranchester) 1996
1997
1998
1999
Mean
1996
1997
1998
1999
Mean
Substrate / Percent Fines
19
20
19
17
19
20
19
20
20
20
Instream Cover
15
14
17
17
16
12
13
19
16
15
Embeddedness
11
19
16
13
15
1
7
4
2
4
Velocity / Depth
19
19
19
7
16
14
16
17
19
16
Channel Flow Status
14
15
14
10
13
15
16
15
15
15
Channel Shape
3
7
8
6
6
8
8
10
9
9
Pool Riffle Ratio
14
13
13
13
13
12
13
14
14
13
Channelization
10
10
9
11
10
11
9
9
11
10
Width Depth Ratio
8
8
8
4
7
5
2
2
3
3
Bank Vegetation
Protection
8
9
8
8
8
8
7
8
7
8 Bank Stability
4
7
6
3
5
6
8
6
8
7
Disruptive Pressures
7
9
6
6
7
6
10
9
8
8
Riparian Zone Width
8
8
4
1
5
9
9
2
2
6
TOTAL SCORE
140
158
147
116
140
127
137
135
134
134

Sheridan County Conservation District
Tongue River Watershed Assessment 205j Final Report 1996-1999 265
TABLE 8-19. Mean Percent Stream Substrate Composition, Percent Embeddedness and Current Velocity for Tongue River 205j
Project Stations,1993 Through 1999
SUBSTRATE TYPE
Tongue River - Upper @ Canyon
Tongue above
Dayton WWTF
Tongue below
Dayton WWTF 1993
1994
1995
1996
1997
1998
1999
Mean
1998
1998
Cobble
72
64
68
83
81
82
62
73
85
76
Coarse Gravel
15
18
11
7
9
10
16
12
12
16
Fine Gravel
7
10
7
4
3
4
19
8
3
6
Silt
0
1
0
0
0
0
0
1
0
0
Sand
6
8
4
5
7
3
3
5
1
2
Clay
0
0
0
0
0
0
0
0
0
0
EMBEDDEDNESS
RATING
Weighted Value
92.0
95.0
92.2
95.4
99.0
99.0
98.6
95.9
100
99 CURRENT VELOCITY
(Feet Per Second)
2.4
1.7
2.2
2.3
1.7
2.4
1.9
2.1
2.5
2.5

Sheridan County Conservation District
Tongue River Watershed Assessment 205j Final Report 1996-1999 266
TABLE 8-20. Mean Percent Stream Substrate Composition, Percent Embeddedness and Current
Velocity for Tongue River 205j Project Stations,1996 Through 1999
SUBSTRATE TYPE
Tongue River - Middle
Tongue River - Lower
(@ Ranchester) 1996
1997
1998
1999
Mean
1996
1997
1998
1999
Mean
Cobble
59
75
72
63
67
72
66
42
69
62
Coarse Gravel
23
14
17
7
15
18
24
51
18
28
Fine Gravel
15
11
8
24
14
9
7
7
14
9
Silt
0
0
0
0
0
0
1
0
0
1
Sand
3
0
3
6
3
1
2
0
0
1
Clay
0
0
0
0
0
0
0
0
0
0
EMBEDDEDNESS
RATING
Weighted Value
61.2
93.6
81.0
71.4
76.8
21.8
47.6
33.0
25.4
32.0 CURRENT VELOCITY
(Feet Per Second)
2.3
2.4
2.4
2.1
2.3
3.2
2.3
2.3
2.6
2.6

Sheridan County Conservation District
Tongue River Watershed Assessment 205j Final Report 1996-1999 267
TABLE 8-21. Summary Statistics for Discharge (cfs) Measured at Little Tongue River Upper,
and Lower Stations, Smith Creek Upper and Lower Stations and Columbus Creek
Upper and Lower Stations During Tongue River 205j Project, 1996 - 1999,
Sheridan County, Wyoming
Summary
Statistic
Little Tongue River - Upper
Little Tongue River - Lower
1996
1997
1998
1999
Total
1996
1997
1998
1999
Total
Number Samples
4
7
6
10
27
4
11
10
13
38
Average
2.0
14.8
17.2
10.2
11.7
8.0
23.9
18.9
7.5
15.3
Median
1.5
6.3
15.9
5.1
5.9
8.8
18.4
19.1
0.1
8.8
Minimum
1.4
3.5
5.4
1.9
1.4
4.0
4.8
0.5
<.1
<.1
Maximum
3.4
44.0
30.8
35.4
44.0
10.4
58.3
38.9
42.9
58.3
Geometric Mean
1.8
10.0
13.4
6.6
7.1
7.5
17.9
10.1
0.4
3.7
Summary
Statistic
Smith Creek - Upper
Smith Creek - Lower
1996
1997
1998
1999
Total
1996
1997
1998
1999
Total
Number Samples
3
7
6
10
26
4
11
10
13
38
Average
0.7
2.8
2.5
2.0
2.1
4.5
4.7
3.0
3.9
3.9
Median
0.5
1.6
2.3
1.1
1.1
4.0
5.8
3.2
3.5
3.8
Minimum
0.3
0.8
0.8
0.8
0.3
2.9
0.3
0.4
2.8
0.3
Maximum
1.3
6.3
4.4
5.7
6.3
7.0
11.0
5.4
7.2
11.0
Geometric Mean
0.6
2.0
1.9
1.6
1.6
4.2
3.3
2.1
3.7
3.1
Summary
Statistic
Columbus Creek - Upper
Columbus Creek - Lower
1996
1997
1998
1999
Total
1996
1997
1998
1999
Total
Number Samples
5
7
6
10
28
4
11
10
13
38
Average
2.6
9.0
11.9
6.6
7.6
2.2
8.4
5.4
9.2
7.2
Median
2.1
6.8
11.5
5.1
5.1
1.6
6.5
5.5
4.3
5.1
Minimum
1.8
3.2
2.8
2.8
1.8
0.0
1.0
1.5
0.05
0.0
Maximum
4.0
19.3
26.8
16.7
26.8
5.5
21.2
8.0
33.6
33.6
Geometric Mean
2.4
7.0
9.4
5.6
5.7
1.0
5.7
5.0
4.4
4.6

Sheridan County Conservation District
Tongue River Watershed Assessment 205j Final Report 1996-1999 268
TABLE 8-22. Summary Statistics for Water Temperature (C0) Measured at Little Tongue River
Upper and Lower and Smith Creek Upper and Lower Stations During Tongue
River 205j Project, 1996 - 1999, Sheridan County, Wyoming
Summary
Statistic
Little Tongue River - Upper
Little Tongue River - Lower
1996
1997
1998
1999
Total
1996
1997
1998
1999
Total
Number Samples
4
7
6
7
24
2
11
10
12
35
Average
9.2
10.3
11.3
11.1
10.7
15.4
11.0
10.9
12.4
11.7
Median
9.6
10.9
11.2
10.6
10.8
15.4
11.1
10.7
12.2
11.3
Minimum
4.6
5.1
7.7
7.1
4.6
13.4
1.2
5.3
4.7
1.2
Maximum
15.9
14.7
15.6
15.5
15.9
17.5
18.9
19.0
20.8
20.8
Geometric Mean
8.9
9.7
11.0
10.6
10.1
15.3
9.3
10.2
11.5
10.6
No. samples
> 25.6 C0
0
0
0
0
0
0
0
0
0
0 % of samples
> 25.6 C0
0
0
0
0
0
0
0
0
0
0
Summary
Statistic
Smith Creek - Upper
Smith Creek - Lower
1996
1997
1998
1999
Total
1996
1997
1998
1999
Total
Number Samples
3
7
6
10
26
4
11
10
13
38
Average
11.3
9.1
10.2
10.7
10.2
12.3
11.8
12.0
13.8
12.6
Median
10.9
9.3
9.3
11.2
9.5
12.2
11.4
11.8
13.8
12.8
Minimum
8.6
4.8
6.4
6.4
4.8
9.5
0.5
5.3
4.7
0.5
Maximum
14.5
12.6
14.4
13.9
14.5
15.3
19.5
17.8
21.1
21.1
Geometric Mean
11.1
8.7
9.9
10.4
9.8
12.1
9.2
11.3
12.7
11.2
No. samples
> 25.6 C0
0
0
0
0
0
0
0
0
0
0 % of samples
> 25.6 C0
0
0
0
0
0
0
0
0
0
0

Sheridan County Conservation District
Tongue River Watershed Assessment 205j Final Report 1996-1999 269
TABLE 8-23. Summary Statistics for pH (Standard Units) Measured at Little Tongue River
Upper and Lower and Smith Creek Upper and Lower Stations During Tongue
River 205j Project, 1996 - 1999, Sheridan County, Wyoming
Summary
Statistic
Little Tongue River - Upper
Little Tongue River - Lower
1996
1997
1998
1999
Total
1996
1997
1998
1999
Total
Number Samples
4
7
6
10
27
4
11
10
13
38
Average
8.2
7.9
7.9
8.1
8.0
8.3
8.2
8.0
8.0
8.1
Median
8.3
7.9
8.0
8.0
8.0
8.3
8.2
8.2
8.1
8.2
Minimum
7.8
7.6
7.1
7.9
7.1
8.0
7.8
7.4
7.6
7.4
Maximum
8.6
8.3
8.3
8.3
8.6
8.5
8.5
8.4
8.4
8.5
Geometric Mean
8.2
7.9
7.9
8.1
8.0
8.3
8.2
8.0
8.0
8.1
No. samples <6.5
or >9.0
0
0
0
0
0
0
0
0
0
0 % of samples <6.5
or >9.0
0
0
0
0
0
0
0
0
0
0
Summary
Statistic
Smith Creek - Upper
Smith Creek - Lower
1996
1997
1998
1999
Total
1996
1997
1998
1999
Total
Number Samples
3
7
6
10
26
4
11
10
13
38
Average
8.2
8.1
8.0
8.2
8.1
8.3
8.3
8.1
8.2
8.2
Median
8.2
8.1
8.1
8.2
8.1
8.2
8.3
8.2
8.2
8.2
Minimum
7.9
7.8
7.1
7.8
7.1
8.1
8.1
6.8
7.8
6.8
Maximum
8.4
8.4
8.3
8.8
8.8
8.5
8.6
8.6
8.7
8.7
Geometric Mean
8.2
8.1
8.0
8.2
8.1
8.3
8.3
8.1
8.2
8.2
No. samples <6.5
or >9.0
0
0
0
0
0
0
0
0
0
0 % of samples <6.5
or >9.0
0
0
0
0
0
0
0
0
0
0

Sheridan County Conservation District
Tongue River Watershed Assessment 205j Final Report 1996-1999 270
TABLE 8-24. Summary Statistics for Conductivity (Micromhos per Centimeter) Measured at
Little Tongue River Upper and Lower and Smith Creek Upper and Lower Stations
During Tongue River 205j Project, 1996 - 1999, Sheridan County, Wyoming
Summary
Statistic
Little Tongue River - Upper
Little Tongue River - Lower 1996
1997
1998
1999
Total
1996
1997
1998
1999
Total
Number Samples
4
7
6
10
27
4
11
10
13
48
Average
405
190
176
233
234
576
453
371
428
436
Median
358
195
158
244
227
573
383
314
471
408
Minimum
324
102
95
124
95
380
197
197
214
197
Maximum
580
293
277
327
580
780
706
829
745
829
Geometric Mean
394
175
163
222
212
552
410
330
396
395
No. Samples
>7500
0
0
0
0
0
0
0
0
0
0 % Samples
>7500
0
0
0
0
0
0
0
0
0
0
Summary
Statistic
Smith Creek - Upper
Smith Creek - Lower 1996
1997
1998
1999
Total
1996
1997
1998
1999
Total
Number Samples
3
7
6
10
26
4
11
10
13
38
Average
502
362
345
353
371
500
648
551
550
574
Median
435
360
352
362
360
497
608
476
515
546
Minimum
380
329
303
295
295
420
494
375
383
375
Maximum
690
414
363
387
690
585
910
943
703
943
Geometric Mean
485
361
345
351
366
494
636
524
542
557
No. Samples
>7500
0
0
0
0
0
0
0
0
0
0 % Samples
>7500
0
0
0
0
0
0
0
0
0
0

Sheridan County Conservation District
Tongue River Watershed Assessment 205j Final Report 1996-1999 271
TABLE 8-25. Summary Statistics for Dissolved Oxygen (Mg/l) Measured at Little Tongue River
Upper and Lower and Smith Creek Upper and Lower Stations During Tongue
River 205j Project, 1996 - 1999, Sheridan County, Wyoming
Summary
Statistic
Little Tongue River - Upper
Little Tongue River - Lower
1996
1997
1998
1999
Total
1996
1997
1998
1999
Total
Number Samples
1
NC*
NC
8
9
1
1
1
8
11
Average
9.7
NC
NC
9.6
9.6
8.9
10.0
9.8
9.6
9.5
Median
9.7
NC
NC
9.8
9.7
8.9
10.0
9.8
9.7
9.7
Minimum
9.7
NC
NC
7.8
7.8
8.9
10.0
9.8
7.2
7.2
Maximum
9.7
NC
NC
10.7
10.7
8.9
10.0
9.8
10.4
10.4
Geometric Mean
9.7
NC
NC
9.5
9.6
8.9
10.0
9.8
9.5
9.5
No. Samples
< 5 mg/l
0
NC
NC
0
0
0
0
0
0
0 No. Samples
< 4 mg/l
0
NC
NC
0
0
0
0
0
0
0
Summary
Statistic
Smith Creek - Upper
Smith Creek - Lower
1996
1997
1998
1999
Total
1996
1997
1998
1999
Total
Number Samples
NC*
NC
NC
8
8
1
1
1
8
11
Average
NC
NC
NC
9.3
9.3
9.1
9.7
10.1
9.0
9.2
Median
NC
NC
NC
9.2
9.2
9.1
9.7
10.1
9.0
9.1
Minimum
NC
NC
NC
7.9
7.9
9.1
9.7
10.1
7.9
7.9
Maximum
NC
NC
NC
10.4
10.4
9.1
9.7
10.1
10.1
10.1
Geometric Mean
NC
NC
NC
9.3
9.3
9.1
9.7
10.1
9.0
9.2
No. Samples
< 5 mg/l
NC
NC
NC
0
0
0
0
0
0
0 No. Samples
< 4 mg/l
NC
NC
NC
0
0
0
0
0
0
0
NC* = No samples collected.

Sheridan County Conservation District
Tongue River Watershed Assessment 205j Final Report 1996-1999 272
TABLE 8-26. Summary Statistics for Turbidity (NTU) Analyses for Samples Collected at Little
Tongue River Upper and Lower and Smith Creek Upper and Lower Stations
During Tongue River 205j Project, 1996 - 1999, Sheridan County, Wyoming
Summary
Statistic
Little Tongue River - Upper
Little Tongue River - Lower 1996
1997
1998
1999
Total
1996
1997
1998
1999
Total
Number Samples
4
7
6
10
27
4
11
10
13
38
Average
1.3
9.2
11.1
1.8
5.8
1.3
10.4
16.3
3.1
8.5
Median
1.4
8.0
9.5
1.5
2.5
1.2
6.0
13.5
1.0
4.6
Minimum
0.1
1.7
8.0
0.5
0.1
0.6
0.6
0.3
0.5
0.3
Maximum
2.4
19.0
20.0
3.5
20.0
2.3
25.0
36.0
16.0
36.0
Geometric Mean
0.8
6.8
10.6
1.5
3.2
1.2
5.7
10.4
1.4
3.5
Summary
Statistic
Smith Creek - Upper
Smith Creek - Lower 1996
1997
1998
1999
Total
1996
1997
1998
1999
Total
Number Samples
3
7
6
10
26
4
11
10
13
38
Average
0.9
5.7
9.3
1.0
4.2
4.3
18.2
26.0
19.0
19.0
Median
1.0
6.0
8.0
1.0
1.5
4.1
10.0
20.5
9.6
10.0
Minimum
0.3
1.2
7.0
0.5
0.3
2.5
1.8
6.1
5.2
1.8
Maximum
1.5
11.0
14.0
1.5
14.0
6.4
43.0
79.0
53
79
Geometric Mean
0.8
4.4
9.1
1.0
2.4
4.0
12.1
19.0
14.2
12.8

Sheridan County Conservation District
Tongue River Watershed Assessment 205j Final Report 1996-1999 273
TABLE 8-27. Summary Statistics for Fecal Coliform Bacteria (Number per 100 Milliliters)
Analyses for Samples Collected at Little Tongue River Upper and Lower Stations
During Tongue River 205j Project, 1996 - 1999, Sheridan County, Wyoming
Summary
Statistic
Little Tongue River - Upper
Little Tongue River - Lower
1996
1997
1998
1999
Total
1996
1997
1998
1999
Total
Number Samples
2
7
6
10
25
3
7
7
10
27
Average
2
1
6
33
15
1
72
40
214
108
Median
2
1
2
11
2
1
82
23
126
62
Minimum
1
1
1
1
1
1
6
1
11
1
Maximum
2
3
23
98
98
1
100
110
770
770
Geometric Mean
1
1
3
11
4
1
57
17
92
32
Geometric Mean
(Recreation
Season)
NCA
NC
NC
55
NC
NC
NC
NC
290WQV
NC
No. samples >
400/100ml
0
0
0
0
0
0
0
0
2
2 % of samples >
400/100ml
0
0
0
0
0
0
0
0
20WQV
7
NCA = Not calculated; less than 5 samples were collected during separate 24 periods within a 30 day period.
WQV = Violation of Wyoming Surface Water Quality Standard.

Sheridan County Conservation District
Tongue River Watershed Assessment 205j Final Report 1996-1999 274
TABLE 8-28. Summary Statistics for Total Nitrate Nitrogen (Mg/l) Analyses for Samples
Collected at Little Tongue River Upper and Lower and Smith Creek Upper and
Lower Stations During Tongue River 205j Project, 1996 - 1999, Sheridan County,
Wyoming
Summary
Statistic
Little Tongue River - Upper
Little Tongue River - Lower 1996
1997
1998
1999
Total
1996
1997
1998
1999
Total
Number Samples
3
NC*
NC
1
4
2
8
7
10
27
Average
.090
NC
NC
.020
0.01
.042
.027
.026
.011
.022
Median
.070
NC
NC
.020
0.01
.042
.009
.005
.008
.008
Minimum
.030
NC
NC
.020
0.03
.005
.005
.001
.002
.001
Maximum
.170
NC
NC
.020
0.17
.080
.130
.110
.050
.130
Geometric Mean
.071
NC
NC
.020
0.08
.020
.013
.009
.007
.010
No. Samples >10
mg/l
0
NC
NC
0
0
0
0
0
0
0
Summary
Statistic
Smith Creek - Upper
Smith Creek - Lower 1996
1997
1998
1999
Total
1996
1997
1998
1999
Total
Number Samples
1
NC*
NC
1
2
4
8
7
8
27
Average
.170
NC
NC
.140
.155
.068
.061
.020
.010
.036
Median
.170
NC
NC
.140
.155
.065
.030
.010
.006
.020
Minimum
.170
NC
NC
.140
.140
.004
.002
.004
.001
.001
Maximum
.170
NC
NC
.140
.170
.140
.190
.060
.030
.190
Geometric Mean
.170
NC
NC
.140
.154
.036
.030
.014
.006
.016
No. Samples >10
mg/l
0
NC
NC
0
0
0
0
0
0
0
NC* = No samples collected.

Sheridan County Conservation District
Tongue River Watershed Assessment 205j Final Report 1996-1999 275
TABLE 8-29. Summary Statistics for Total Phosphorus (Mg/l) Analyses for Samples Collected at
Little Tongue River Upper and Lower and Smith Creek Upper and Lower Stations
During Tongue River 205j Project, 1996 - 1999, Sheridan County, Wyoming
Summary
Statistic
Little Tongue River - Upper
Little Tongue River - Lower
1996
1997
1998
1999
Total
1996
1997
1998
1999
Total
Number Samples
2
NC*
NC
1
3
1
1
1
3
6
Average
.045
NC
NC
.020
.037
.020
.050
.090
.030
.042
Median
.045
NC
NC
.020
.040
.020
.050
.090
.020
.035
Minimum
.040
NC
NC
.020
.020
.020
.050
.090
.020
.020
Maximum
.050
NC
NC
.020
.050
.020
.050
.090
.050
.090
Geometric Mean
.045
NC
NC
.020
.034
.020
.050
.090
.027
.035
No. Samples >0.10
mg/l
0
NC
NC
0
0
0
0
0
0
0 % Samples >0.10
mg/l
0
NC
NC
0
0
0
0
0
0
0
Summary
Statistic
Smith Creek - Upper
Smith Creek - Lower
1996
1997
1998
1999
Total
1996
1997
1998
1999
Total
Number Samples
1
NC*
NC
1
2
2
1
1
2
6
Average
.020
NC
NC
.006
.013
.065
.080
.060
.065
.067
Median
.020
NC
NC
.006
.013
.065
.080
.060
.065
.065
Minimum
.020
NC
NC
.006
.006
.050
.080
.060
.060
.050
Maximum
.020
NC
NC
.006
.020
.080
.080
.060
.070
.080
Geometric Mean
.020
NC
NC
.006
.011
.063
.080
.060
.065
.066
No. Samples >0.05
mg/l
0
NC
NC
0
0
0
0
0
0
0 % Samples >0.05
mg/l
0
NC
NC
0
0
0
0
0
0
0
NC* = No samples collected.

Sheridan County Conservation District
Tongue River Watershed Assessment 205j Final Report 1996-1999 276
TABLE 8-30. Summary Statistics for Alkalinity, Total Chloride, Total Hardness, Total Sulfate,
and Total Suspended Solids Analyses for Samples Collected by WDEQ at Little
Tongue River Upper (1993) and Lower (1996-1999) and Smith Creek Upper and
Lower Stations (1996-1999) During Tongue River 205j Project, Sheridan County,
Wyoming
Summary
Statistic
Little Tongue River - Upper
Little Tongue River - Lower ALK
CL
HARD
SUL
F
TSS
ALK
CL
HARD
SULF
TSS
Number Samples
1
1
1
1
1
4
4
4
4
4
Average
180
<5
205
<10
<2
220
<5
380
201
2
Median
180
<5
205
<10
<2
220
<5
391
206
1
Minimum
180
<5
205
<10
<2
200
<5
346
153
1
Maximum
180
<5
205
<10
<2
240
<5
392
238
3
Geometric Mean
180
<5
205
<10
<2
220
<5
379
198
1
Summary
Statistic
Smith Creek - Upper
Smith Creek - Lower ALK
CL
HARD
SUL
F
TSS
ALK
CL
HARD
SULF
TSS
Number Samples
NC*
NC
NC
NC
NC
4
4
4
4
4
Average
NC
NC
NC
NC
NC
271
<5
361
151
10
Median
NC
NC
NC
NC
NC
265
<5
353
137
9
Minimum
NC
NC
NC
NC
NC
235
<5
281
113
1
Maximum
NC
NC
NC
NC
NC
320
<5
456
216
20
Geometric Mean
NC
NC
NC
NC
NC
269
<5
355
146
6
NC* = No samples collected at this station

Sheridan County Conservation District
Tongue River Watershed Assessment 205j Final Report 1996-1999 277
TABLE 8-31. Habitat Assessment Scores for Columbus Creek and Little Tongue River 205j Project Stations, 1993 Through1999
Habit Descriptor
Columbus Cr.
Upper
Columbus Cr.
Lower
Little Tongue
Upper
Little Tongue
Lower
1993 1996
1997
1998
1999
Mean
1993
1996
1997
1998
1999
Mean
Substrate / Percent Fines
11
8
5
11
6
8
19
20
19
19
16
18
Instream Cover
15
1
3
4
4
3
15
10
6
5
10
8
Embeddedness
12
1
0
1
1
1
2
13
13
12
7
11
Velocity / Depth
15
1
14
10
7
8
14
10
9
9
9
9
Channel Flow Status
17
16
17
17
8
14
9
14
16
15
8
13
Channel Shape
12
8
7
7
7
7
11
9
7
7
7
8
Pool Riffle Ratio
12
4
6
6
2
4
14
5
7
6
5
6
Channelization
14
9
9
9
10
9
15
9
10
10
6
9
Width Depth Ratio
10
9
8
10
9
9
11
1
1
3
9
4
Bank Vegetation
Protection
8
1
2
8
2
3
8
8
9
8
9
8
Bank Stability
6
0
4
6
2
3
9
7
9
8
8
8
Disruptive Pressures
6
4
6
8
8
6
10
8
6
8
8
8
Riparian Zone Width
9
4
4
0
0
2
10
3
1
2
1
2
TOTAL SCORE
147
66
85
97
66
77
147
117
113
112
103
112

Sheridan County Conservation District
Tongue River Watershed Assessment 205j Final Report 1996-1999 278
TABLE 8-32. Mean Percent Stream Substrate Composition, Percent Embeddedness and Current Velocity for Columbus Creek
and Little Tongue River 205j Project Stations,1993 Through 1999
SUBSTRATE TYPE
Columbus Cr.
Upper
Columbus Cr.
Lower
Little Tongue
Upper
Little Tongue
Lower
1993 1996
1997
1998
1999
Mean
1993
1996
1997
1998
1999
Mean
Cobble
64
33
38
29
42
36
95
59
58
69
56
60
Coarse Gravel
10
16
3
28
12
15
4
30
24
17
14
21
Fine Gravel
8
18
1
24
2
11
10
9
16
12
22
15
Silt
3
26
46
0
43
29
0
0
0
0
0
0
Sand
16
8
0
19
1
7
0
1
2
2
8
3
Clay
0
0
12
0
0
3
0
0
0
0
0
0
EMBEDDEDNESS
RATING
Weighted Value
81
23.2
20.0
22.4
21.8
21.8
27
71.8
68.6
66.0
45.2
62.9 CURRENT VELOCITY
(Feet Per Second)
2.6
0.6
0.6
0.6
0.05
0.5
0.8
1.3
0.7
1.2
0.7
1.0

Sheridan County Conservation District
Tongue River Watershed Assessment 205j Final Report 1996-1999 279
TABLE 8-33. Summary Statistics for Fecal Coliform Bacteria (Number per 100 Milliliters)
Analyses for Samples Collected at Smith Creek Upper and Lower Stations During
Tongue River 205j Project, 1996 - 1999, Sheridan County, Wyoming
Summary
Statistic
Smith Creek - Upper
Smith Creek - Lower
1996
1997
1998
1999
Total
1996
1997
1998
1999
Total
Number Samples
2
7
6
10
25
3
7
7
10
23
Average
1
38
22
62
41
8
603
87
459
407
Median
1
11
20
54
15
8
160
80
305
160
Minimum
1
3
1
1
1
1
50
8
65
8
Maximum
1
180
47
160
180
14
2790
184
2150
2790
Geometric Mean
1
14
8
23
12
5
222
61
278
176
Geometric Mean
(Recreation
Season)
NCA
NC
NC
57
NC
NC
NC
NC
534WQV
NC
No. samples >
400/100ml
0
0
0
0
0
0
2
0
3
5 % of samples >
400/100ml
0
0
0
0
0
0
29WQV
0
30WQV
11WQV
NCA
= Not calculated; less than 5 samples were collected during separate 24 periods within a 30 day period.
WQV = Violation of Wyoming Surface Water Quality Standard.

Sheridan County Conservation District
Tongue River Watershed Assessment 205j Final Report 1996-1999 280
TABLE 8-34. Summary Statistics for Discharge (CFS) Measured at Columbus Creek Upper and
Lower Stations During Tongue River 205j Project, 1996 - 1999, Sheridan County,
Wyoming
Summary
Statistic
Columbus Creek - Upper
Columbus Creek - Lower 1996
1997
1998
1999
Total
1996
1997
1998
1999
Total
Number Samples
5
7
6
10
28
4
11
10
13
38
Average
2.6
9.0
11.9
6.6
7.6
2.2
8.4
5.4
9.2
7.2
Median
2.1
6.8
11.5
5.1
5.1
1.6
6.5
5.5
4.3
5.1
Minimum
1.8
3.2
2.8
2.8
1.8
0.0
1.0
1.5
0.05
0.0
Maximum
4.0
19.3
26.8
16.7
26.8
5.5
21.2
8.0
33.6
33.6
Geometric Mean
2.4
7.0
9.4
5.6
5.7
1.0
5.7
5.0
4.4
4.6
TABLE 8-35. Summary Statistics for Water Temperature (C0) Measured at Columbus Creek
Upper and Lower Stations During Tongue River 205j Project, 1996 - 1999,
Sheridan County, Wyoming
Summary
Statistic
Columbus Creek - Upper
Columbus Creek - Lower 1996
1997
1998
1999
Total
1996
1997
1998
1999
Total
Number Samples
5
7
6
10
28
4
11
10
13
38
Average
8.6
8.9
9.6
10.5
9.6
13.0
12.2
13.2
14.9
13.5
Median
6.9
8.9
8.7
11.0
9.2
11.4
11.9
14.2
14.8
13.0
Minimum
6.6
5.2
6.3
6.5
5.2
10.5
0.5
6.0
4.1
0.5
Maximum
12.4
11.9
14.1
13.6
14.1
18.6
18.9
17.5
25.1
25.1
Geometric Mean
8.3
8.6
9.3
10.2
9.2
12.6
9.3
12.7
13.6
11.8
No. samples
> 25.6 C0
0
0
0
0
0
0
0
0
0
0 % of samples
> 25.6 C0
0
0
0
0
0
0
0
0
0
0

Sheridan County Conservation District
Tongue River Watershed Assessment 205j Final Report 1996-1999 281
TABLE 8-36. Summary Statistics for pH (Standard Units) Measured at Columbus Creek Upper
and Lower Stations During Tongue River 205j Project, 1996 - 1999, Sheridan
County, Wyoming
Summary
Statistic
Columbus Creek - Upper
Columbus Creek - Lower 1996
1997
1998
1999
Total
1996
1997
1998
1999
Total
Number Samples
5
7
6
10
28
4
11
10
13
38
Average
8.2
8.4
8.0
8.2
8.2
8.0
8.1
7.9
7.8
7.9
Median
8.3
8.5
8.1
8.2
8.3
7.9
8.1
8.0
8.0
8.0
Minimum
7.9
8.1
7.1
7.5
7.1
7.8
7.8
6.8
7.3
6.8
Maximum
8.5
8.6
8.4
8.5
8.6
8.3
8.5
8.4
8.1
8.5
Geometric Mean
8.2
8.4
8.0
8.1
8.2
8.0
8.1
7.9
7.8
7.9
No. samples <6.5
or >9.0
0
0
0
0
0
0
0
0
0
0 % of samples <6.5
or >9.0
0
0
0
0
0
0
0
0
0
0

Sheridan County Conservation District
Tongue River Watershed Assessment 205j Final Report 1996-1999 282
TABLE 8-37. Summary Statistics for Conductivity (Micromhos per Centimeter) Measured at
Columbus Creek Upper and Lower Stations During Tongue River 205j Project,
1996 - 1999, Sheridan County, Wyoming
Summary
Statistic
Columbus Creek - Upper
Columbus Creek - Lower
1996
1997
1998
1999
Total
1996
1997
1998
1999
Total
Number Samples
5
7
6
10
28
4
11
10
13
38
Average
442
401
374
404
404
546
639
428
498
525
Median
439
401
370
409
406
545
590
346
397
454
Minimum
370
319
330
323
319
300
386
274
260
260
Maximum
493
496
419
476
496
794
931
842
977
977
Geometric Mean
440
398
372
403
401
502
610
395
446
479
No. Samples
>7500
0
0
0
0
0
0
0
0
0
0 % Samples
>7500
0
0
0
0
0
0
0
0
0
0
TABLE 8-38. Summary Statistics for Dissolved Oxygen (Mg/l) Analyses for Samples Collected
at Columbus Creek Upper and Lower Stations During Tongue River 205j Project,
1996 - 1999, Sheridan County, Wyoming
Summary
Statistic
Columbus Creek - Upper
Columbus Creek - Lower
1996
1997
1998
1999
Total
1996
1997
1998
1999
Total
Number Samples
1
NC*
NC
8
9
1
1
1
9
12
Average
11.0
NC
NC
10.0
10.1
8.0
11.2
9.7
8.8
9.0
Median
11.0
NC
NC
10.0
10.1
8.0
11.2
9.7
8.4
8.8
Minimum
11.0
NC
NC
8.1
8.1
8.0
11.2
9.7
7.9
7.9
Maximum
11.0
NC
NC
10.9
11.0
8.0
11.2
9.7
9.9
11.2
Geometric Mean
11.0
NC
NC
10.0
10.1
8.0
11.2
9.7
8.8
9.0
No. Samples
< 5 mg/l
0
NC
NC
0
0
0
0
0
0
0 No. Samples
< 4 mg/l
0
NC
NC
0
0
0
0
0
0
0
NC* = No samples collected.

Sheridan County Conservation District
Tongue River Watershed Assessment 205j Final Report 1996-1999 283
TABLE 8-39. Summary Statistics for Turbidity (NTU) Analyses for Samples Collected at
Columbus Creek Upper and Lower Stations During Tongue River 205j Project,
1996 - 1999, Sheridan County, Wyoming
Summary
Statistic
Columbus Creek - Upper
Columbus Creek - Lower 1996
1997
1998
1999
Total
1996
1997
1998
1999
Total
Number Samples
5
7
6
10
28
4
11
10
12
37
Average
0.7
6.2
12.0
1.5
4.8
21.4
48.4
41.9
73.0
51.7
Median
1.0
6.0
11.5
1.4
1.6
17.2
36.0
30.5
80.0
36.0
Minimum
0.04
0.6
9.0
0.5
0.04
15.0
10.0
105
6.5
3.4
Maximum
1.2
14.0
15.0
3.5
15.0
36.0
120
105
185
185
Geometric Mean
0.4
4.3
11.8
1.3
2.3
20.0
38.1
30.0
49.2
36.2

Sheridan County Conservation District
Tongue River Watershed Assessment 205j Final Report 1996-1999 284
TABLE 8-40. Summary Statistics for Fecal Coliform Bacteria (Number per 100 Milliliters)
Analyses for Samples Collected at Columbus Creek Upper and Lower Stations
During Tongue River 205j Project, 1996 - 1999, Sheridan County, Wyoming
Summary
Statistic
Columbus Creek - Upper
Columbus Creek - Lower
1996
1997
1998
199
9
Total
1996
1997
199
8
1999
Total
Number Samples
3
7
6
11
27
3
7
7
9
27
Average
1
76
558
45
162
115
414
95
395
284
Median
1
19
12
47
19
13
200
64
480
190
Minimum
1
1
1
1
1
1
8
15
5
1
Maximum
1
390
3300
110
3300
330
1800
290
750
1800
Geometric Mean
1
11
15
23
12
16
153
59
227
107
Geometric Mean
(Recreation
Season)
NCA
NC
NC
49
NC
NC
NC
NC
405WQ
V
NC
No. samples >
400/100ml
0
0
1
0
1
0
2
0
5
7 % of samples >
400/100ml
0
0
17WQV
0
4
0
29WQV
0
56WQV
26WQV
NCA
= Not calculated; less than 5 samples were collected during separate 24 periods within a 30 day period.
WQV = Violation of Wyoming Surface Water Quality Standard.

Sheridan County Conservation District
Tongue River Watershed Assessment 205j Final Report 1996-1999 285
TABLE 8-41. Summary Statistics for Total Nitrate Nitrogen (Mg/l) Analyses for Samples
Collected at Columbus Creek Upper and Lower Stations During Tongue River 205j
Project, 1996 - 1999, Sheridan County, Wyoming
Summary
Statistic
Columbus Creek - Upper
Columbus Creek - Lower
1996
1997
1998
1999
Total
1996
1997
1998
1999
Total
Number Samples
4
7
6
8
25
4
8
7
8
27
Average
.380
.138
.064
.146
.161
.019
.133
.029
.024
.057
Median
.095
.140
.065
.055
.090
.008
.030
.020
.014
.010
Minimum
.008
.070
.004
.004
.004
.001
.002
.001
.001
.001
Maximum
1.32
.190
.120
.720
1.32
.060
.800
.080
.090
.800
Geometric Mean
.099
.130
.044
.064
.076
.007
.025
.015
.012
.015
No. Samples >10
mg/l
0
0
0
0
0
0
0
0
0
0
TABLE 8-42. Summary Statistics for Total Phosphorus (Mg/l) Analyses for Samples Collected at
Columbus Creek Upper and Lower Stations During Tongue River 205j Project,
1996 - 1999, Sheridan County, Wyoming
Summary
Statistic
Columbus Creek - Upper
Columbus Creek - Lower
1996
1997
1998
1999
Total
1996
1997
1998
1999
Total
Number Samples
2
NC*
NC
1
3
2
1
1
2
6
Average
.055
NC
NC
.006
.039
.060
.060
.020
.094
.065
Median
.055
NC
NC
.006
.040
.060
.060
.020
.094
.045
Minimum
.040
NC
NC
.006
.006
.030
.060
.020
.008
.008
Maximum
.070
NC
NC
.006
.070
.090
.060
.020
.180
.180
Geometric Mean
.053
NC
NC
.006
.026
.051
.060
.020
.038
.041
No. Samples >0.10
mg/l
0
NC
NC
0
0
0
0
0
1
1 % Samples >0.10
mg/l
0
NC
NC
0
0
0
0
0
50
17
NC* = No samples collected.

Sheridan County Conservation District
Tongue River Watershed Assessment 205j Final Report 1996-1999 286
TABLE 8-43. Summary Statistics for Alkalinity, Total Chloride, Total Hardness, Total Sulfate,
and Total Suspended Solids Analyses for Samples Collected by WDEQ at
Columbus Creek River Upper (1993) and Lower (1996-1999) During Tongue
River 205j Project, Sheridan County, Wyoming
Summary
Statistic
Columbus Creek - Upper
Columbus Creek - Lower ALK
CL
HARD
SUL
F
TSS
ALK
CL
HARD
SULF
TSS
Number Samples
1
1
1
1
1
4
4
4
4
4
Average
170
<5
320
68
<2
326
10
392
162
18
Median
170
<5
320
68
<2
352
10
410
180
20
Minimum
170
<5
320
68
<2
210
2.5
239
65
6
Maximum
170
<5
320
68
<2
390
17.3
510
223
23
Geometric Mean
170
<5
320
68
<2
317
8
378
147
15

Sheridan County Conservation District
Tongue River Watershed Assessment 205j Final Report 1996-1999 287
TABLE 8-44. Summary Statistics for Water Temperature (C0) Measured at Wolf Creek Upper and Lower and Five Mile Creek Lower
Stations During Tongue River 205j Project, 1996 - 1999, Sheridan County, Wyoming
Summary
Statistic
Wolf Creek - Upper
Wolf Creek - Lower
Five Mile Creek - Lower 1996
1997
1998
1999
Total
1996
1997
1998
1999
Total
1996
1997
1998
1999
Total
Number Samples
4
6
7
10
27
4
11
10
13
38
5
11
10
12
38
Average
9.3
9.1
10.5
11.3
10.3
12.8
12.2
13.5
14.4
13.4
12.6
13.5
13.8
15.4
14.1
Median
8.2
9.2
10.3
12.1
9.6
11.8
12.0
12.8
13.1
12.1
10.9
13.1
12.7
17.5
13.0
Minimum
5.6
4.4
5.1
4.1
4.1
9.6
0.9
6.7
6.3
0.9
10.0
0.7
6.6
5.5
0.7
Maximum
15.0
13.2
14.8
16.3
16.3
18.2
19.7
21.0
22.0
22.0
20.8
21.1
22.6
21.7
22.6
Geometric Mean
8.6
8.4
9.7
10.4
9.5
12.5
10.2
12.8
13.3
12.1
12.0
10.8
13.2
14.3
12.6
No. samples
> 25.6 C0
0
0
0
0
0
0
0
0
0
0
0
0
0
0
0 % of samples
> 25.6 C0
0
0
0
0
0
0
0
0
0
0
0
0
0
0
0

Sheridan County Conservation District
Tongue River Watershed Assessment 205j Final Report 1996-1999 288
TABLE 8-45. Summary Statistics for pH (Standard Units) Measured at Wolf Creek Upper and Lower and Five Mile Lower Stations
During Tongue River 205j Project, 1996 - 1999, Sheridan County, Wyoming
Summary
Statistic
Wolf Creek - Upper
Wolf Creek - Lower
Five Mile Creek - Lower 1996
1997
1998
1999
Total
1996
1997
1998
1999
Total
1996
1997
1998
1999
Total
Number Samples
4
6
7
10
27
4
11
10
13
38
5
11
10
12
38
Average
8.2
7.8
7.6
7.8
7.8
8.1
8.1
7.9
7.9
8.0
7.9
8.1
8.0
8.0
8.0
Median
8.2
7.8
7.5
7.8
7.8
8.1
8.0
8.0
8.0
8.0
7.8
8.1
8.0
8.0
8.0
Minimum
8.0
7.5
6.9
7.3
6.9
7.9
7.8
7.3
7.5
7.3
7.7
7.7
7.6
7.6
7.6
Maximum
8.4
8.3
8.1
8.4
8.4
8.2
8.5
8.4
8.3
8.5
8.3
8.5
8.2
8.4
8.5
Geometric Mean
8.2
7.8
7.6
7.8
7.8
8.0
8.1
7.9
7.9
8.0
7.9
8.1
7.9
8.0
8.0
No. samples <6.5
or >9.0
0
0
0
0
0
0
0
0
0
0
0
0
0
0
0 % of samples <6.5
or >9.0
0
0
0
0
0
0
0
0
0
0
0
0
0
0
0
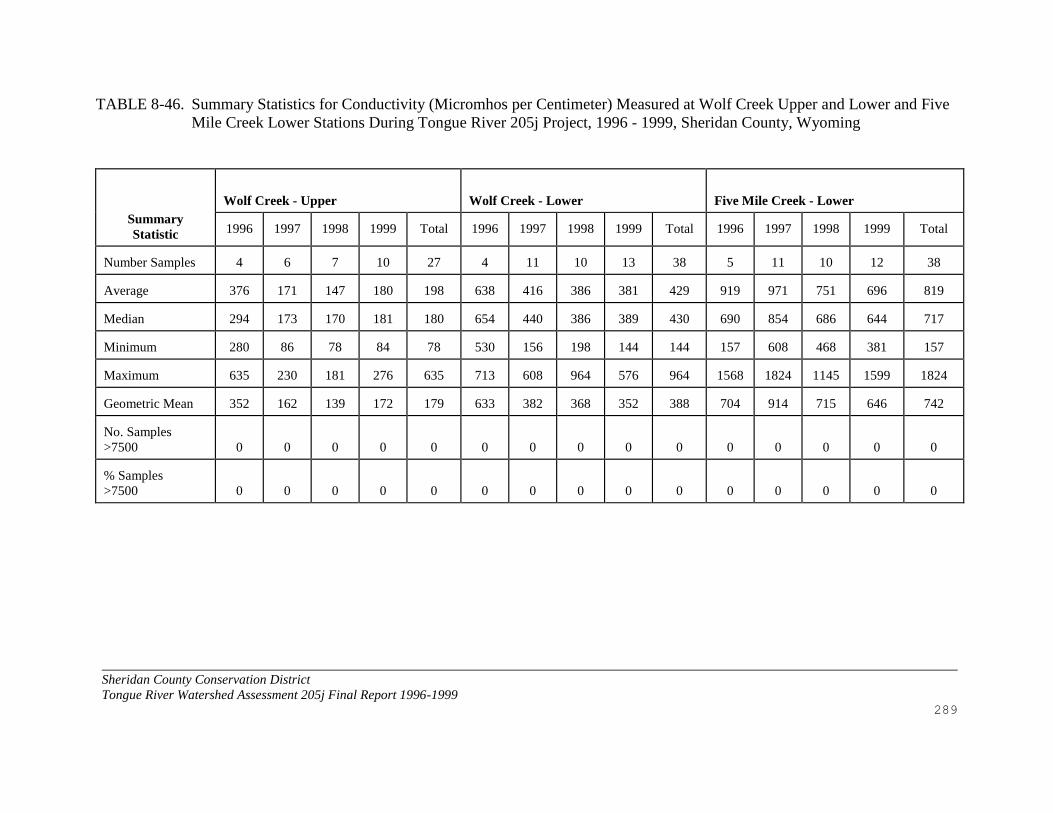
Sheridan County Conservation District
Tongue River Watershed Assessment 205j Final Report 1996-1999 289
TABLE 8-46. Summary Statistics for Conductivity (Micromhos per Centimeter) Measured at Wolf Creek Upper and Lower and Five
Mile Creek Lower Stations During Tongue River 205j Project, 1996 - 1999, Sheridan County, Wyoming
Summary
Statistic
Wolf Creek - Upper
Wolf Creek - Lower
Five Mile Creek - Lower 1996
1997
1998
1999
Total
1996
1997
1998
1999
Total
1996
1997
1998
1999
Total
Number Samples
4
6
7
10
27
4
11
10
13
38
5
11
10
12
38
Average
376
171
147
180
198
638
416
386
381
429
919
971
751
696
819
Median
294
173
170
181
180
654
440
386
389
430
690
854
686
644
717
Minimum
280
86
78
84
78
530
156
198
144
144
157
608
468
381
157
Maximum
635
230
181
276
635
713
608
964
576
964
1568
1824
1145
1599
1824
Geometric Mean
352
162
139
172
179
633
382
368
352
388
704
914
715
646
742
No. Samples
>7500
0
0
0
0
0
0
0
0
0
0
0
0
0
0
0 % Samples
>7500
0
0
0
0
0
0
0
0
0
0
0
0
0
0
0

Sheridan County Conservation District
Tongue River Watershed Assessment 205j Final Report 1996-1999 290
TABLE 8-47. Summary Statistics for Dissolved Oxygen (Mg/l) Analyses for Samples Collected at Wolf Creek Upper and Lower and
Five Mile Creek Lower Stations During Tongue River 205j Project, 1996 - 1999, Sheridan County, Wyoming
Summary
Statistic
Wolf Creek - Upper
Wolf Creek - Lower
Five Mile Creek - Lower 1996
1997
1998
1999
Total
1996
1997
1998
1999
Total
1996
1997
1998
1999
Total
Number Samples
1
NC*
NC
8
9
1
1
1
9
12
1
1
1
7
10
Average
11.2
NC
NC
9.8
10.0
8.4
9.8
10.1
9.5
9.5
8.5
10.8
7.9
9.5
9.4
Median
11.2
NC
NC
9.8
10.0
8.4
9.8
10.1
9.3
9.4
8.5
10.8
7.9
9.4
9.0
Minimum
11.2
NC
NC
8.4
8.4
8.4
9.8
10.1
8.1
8.1
8.5
10.8
7.9
8.3
7.9
Maximum
11.2
NC
NC
11.6
11.6
8.4
9.8
10.1
13.0
13.0
8.5
10.8
7.9
11.2
11.2
Geometric Mean
11.2
NC
NC
9.8
9.9
8.4
9.8
10.1
9.4
9.4
8.5
10.8
7.9
9.4
9.3
No. Samples
< 5 mg/l
0
NC
NC
0
0
0
0
0
0
0
0
0
0
0
0 No. Samples
< 4 mg/l
0
NC
NC
0
0
0
0
0
0
0
0
0
0
0
0
NC* = No samples collected.

Sheridan County Conservation District
Tongue River Watershed Assessment 205j Final Report 1996-1999 291
TABLE 8-48. Summary Statistics for Turbidity (NTU) Analyses for Samples Collected at Wolf Creek Upper and Lower and Five Mile
Creek Lower Stations During Tongue River 205j Project, 1996 - 1999, Sheridan County, Wyoming
Summary Statistic
Wolf Creek - Upper
Wolf Creek - Lower
Five Mile Creek - Lower
1996
1997
1998
1999
Total
1996
1997
1998
1999
Total
1996
1997
1998
1999
Total
Number Samples
4
6
7
10
27
4
11
10
13
38
5
11
10
11
37
Average
1.4
8.2
8.1
1.5
4.7
5.9
22.2
21.0
24.6
21.0
6.6
30.9
36.7
65.2
39.4
Median
1.2
8.0
7.0
0.6
2.1
7.0
19.0
17.5
6.5
15.5
6.5
27.0
36.0
50.0
34.0
Minimum
0.6
0.9
5.0
0.5
0.5
1.9
3.4
3.6
4.2
1.9
6.0
4.5
3.8
30.0
3.8
Maximum
2.6
17.0
15.0
7.5
17.0
7.9
48.0
41.0
125
125
7.6
100
90
155
155
Geometric Mean
1.2
5.0
7.6
0.9
2.4
5.2
15.1
17.6
12.6
13.2
6.6
21.5
28.1
58.0
26.5

Sheridan County Conservation District
Tongue River Watershed Assessment 205j Final Report 1996-1999 292
TABLE 8-49. Summary Statistics for Fecal Coliform Bacteria (Number per 100 Milliliters) Analyses for Samples Collected at Wolf
Creek Upper and Lower and Five Mile Creek Lower Stations During Tongue River 205j Project, 1996 - 1999, Sheridan
County, Wyoming
Summary
Statistic
Wolf Creek - Upper
Wolf Creek - Lower
Five Mile Creek - Lower
1996
1997
1998
1999
Total
1996
1997
1998
1999
Total
1996
1997
1998
1999
Total
Number Samples
2
6
9
10
25
3
7
7
10
27
3
7
7
10
27
Average
3
18
5
14
11
5
194
118
176
148
34
359
396
1620
799
Median
3
16
5
8
6
3
163
64
120
109
50
150
250
305
190
Minimum
1
1
1
1
1
1
4
3
16
1
1
45
27
9
1
Maximum
5
37
9
41
41
12
570
460
700
700
52
910
1170
9100
9100
Geometric Mean
2
11
3
7
5
3
102
42
111
57
14
207
196
359
185
Geometric Mean
(Recreation
Season)
NCA
NC
NC
17
NC
NC
NC
NC
147
NC
NC
NC
NC
565WQV
NC
No. samples >
400/100ml
0
0
0
0
0
0
1
1
1
3
0
3
2
3
8 % of samples >
400/100ml
0
0
0
0
0
0
14WQV
14WQV
10WQV
11WQV
0
26WQV
26WQV
30WQV
30WQV
NCA
= Not calculated; less than 5 samples were collected during separate 24 periods within a 30 day period.
WQV = Violation of Wyoming Surface Water Quality Standard.

Sheridan County Conservation District
Tongue River Watershed Assessment 205j Final Report 1996-1999 293
TABLE 8-50. Summary Statistics for Total Nitrate Nitrogen (Mg/l) Analyses for Samples Collected at Wolf Creek Upper and Lower
and Five Mile Creek Lower Stations During Tongue River 205j Project, 1996 - 1999, Sheridan County, Wyoming
Summary
Statistic
Wolf Creek - Upper
Wolf Creek - Lower
Five Mile Creek - Lower 1996
1997
1998
1999
Total
1996
1997
1998
1999
Total
1996
1997
1998
1999
Total
Number Samples
2
NC*
NC
1
3
4
8
7
8
27
5
8
7
8
28
Average
.065
NC
NC
.020
.050
.019
.018
.012
.006
.013
.266
.965
.498
.276
.526
Median
.065
NC
NC
.020
.050
.010
.018
.006
.006
.007
.150
.380
.190
.195
.260
Minimum
.050
NC
NC
.020
.020
.002
.002
.050
.002
.002
.100
.009
.100
.005
.005
Maximum
.080
NC
NC
.020
.080
.050
.050
.080
.010
.050
.600
5.32
1.32
.870
5.32
Geometric Mean
.063
NC
NC
.020
.043
.013
.007
.063
.006
.008
.214
.303
.312
.122
.222
No. Samples >10
mg/l
0
0
0
0
0
0
0
0
0
0
0
0
0
0
0
NC* = No samples collected.

Sheridan County Conservation District
Tongue River Watershed Assessment 205j Final Report 1996-1999 294
TABLE 8-51. Summary Statistics for Total Phosphorus (Mg/l) Analyses for Samples Collected at Wolf Creek Upper and Lower and
Five Mile Creek Lower Stations During Tongue River 205j Project, 1996 - 1999, Sheridan County, Wyoming
Summary
Statistic
Wolf Creek - Upper
Wolf Creek - Lower
Fivemile Creek - Lower 1996
1997
1998
1999
Total
1996
1997
1998
1999
Total
1996
1997
1998
1999
Total
Number Samples
2
NC*
NC
1
3
2
1
1
2
6
2
2
1
2
7
Average
.026
NC
NC
.004
.018
.008
.080
.060
.003
.027
.055
.070
.002
.065
.055
Median
.026
NC
NC
.004
.004
.008
.080
.060
.003
.008
.055
.070
.002
.065
.050
Minimum
.001
NC
NC
.004
.001
.006
.080
.060
.003
.003
.050
.050
.002
.050
.002
Maximum
.050
NC
NC
.004
.050
.010
.080
.060
.003
.080
.060
.090
.002
.080
.090
Geometric Mean
.007
NC
NC
.004
.006
.008
.080
.060
.003
.012
.054
.067
.002
.063
.038
No. Samples >0.10
mg/l
0
NC
NC
0
0
0
0
0
0
0
0
0
0
0
0 % Samples >0.10
mg/l
0
NC
NC
0
0
0
0
0
0
0
0
0
0
0
0
NC* = No samples collected.

Sheridan County Conservation District
Tongue River Watershed Assessment 205j Final Report 1996-1999 295
TABLE 8-52. Summary Statistics for Alkalinity, Total Chloride, Total Hardness, Total Sulfate, and Total Suspended Solids Analyses
for Samples Collected by WDEQ at Wolf Creek River - Berry’s (1995) and Lower (1996-1999) and Five Mile Creek
Lower Stations (1996-1999) During Tongue River 205j Project, Sheridan County, Wyoming
Summary Statistic
Wolf Creek - Upper (Berry’s)
Wolf Creek - Lower
Fivemile Creek - Lower ALK
CL
HARD
SULF
TSS
ALK
CL
HARD
SULF
TSS
ALK
CL
HARD
SULF
TSS
Number Samples
1
1
1
1
1
4
4
4
4
4
3
4
4
4
4
Average
190
<5
264
779
<2
244
<5
293
83
7
420
10
556
392
11
Median
190
<5
264
779
<2
235
<5
294
81
6
490
10
633
472
10
Minimum
190
<5
264
779
<2
230
<5
251
67
5
240
2.5
296
131
5
Maximum
190
<5
264
779
<2
275
<5
334
101
10
530
17
663
495
17
Geometric Mean
190
<5
264
779
<2
243
<5
291
81
7
396
8
529
346
10

Sheridan County Conservation District
Tongue River Watershed Assessment 205j Final Report 1996-1999 296
TABLE 8-53. Habitat Assessment Scores for Five Mile Creek, Wolf Creek and Smith Creek 205j Project Stations, 1995 Through1999
Habit Descriptor
Five Mile Cr.
Lower
Wolf Cr.
Upper
Wolf Creek
Lower
Smith Creek
Lower 1996
1997
1999
Mean
1995
1996
1997
1998
1999
Mean
1996
1997
1998
1999
Mean
Substrate / Percent Fines
1
12
11
8
19
19
17
19
20
19
18
15
19
19
18
Instream Cover
2
7
5
5
18
6
12
12
14
11
7
10
10
13
10
Embeddedness
1
1
0
1
18
1
2
2
5
2
10
11
5
4
8
Velocity / Depth
1
8
1
3
16
13
15
18
16
16
5
10
10
14
10
Channel Flow Status
19
18
19
19
15
15
17
19
17
17
19
19
18
16
18
Channel Shape
11
11
11
11
12
8
11
11
12
10
11
10
9
8
10
Pool Riffle Ratio
4
9
3
5
14
7
12
10
6
9
4
4
14
13
9
Channelization
9
10
13
11
11
10
11
11
11
11
10
9
10
6
9
Width Depth Ratio
4
12
11
9
10
1
8
9
9
7
9
6
14
13
10
Bank Vegetation
Protection
9
9
9
9
9
9
8
10
8
9
9
7
9
9
8
Bank Stability
9
9
9
9
7
7
8
10
8
8
8
7
9
9
8
Disruptive Pressures
9
9
8
9
10
9
9
9
9
9
9
7
9
8
8
Riparian Zone Width
4
7
1
4
10
5
8
2
2
4
4
2
0
0
2
TOTAL SCORE
83
122
101
102
169
110
138
142
137
132
123
117
136
132
128

Sheridan County Conservation District
Tongue River Watershed Assessment 205j Final Report 1996-1999 297
TABLE 8-54. Mean Percent Stream Substrate Composition, Percent Embeddedness and Current Velocity for Five Mile Creek, Wolf
Creek and Smith Creek 205j Project Stations,1995 Through 1999
SUBSTRATE TYPE
Five Mile Cr.
Lower
Wolf Cr.
Upper
Wolf Creek
Lower
Smith Creek
Lower 1996
1997
1999
Mean
1995
1996
1997
1998
1999
Mean
1996
1997
1998
1999
Mean
Cobble
6
26
38
23
67
79
82
76
85
80
51
62
77
68
64
Coarse Gravel
2
29
18
16
18
11
9
12
6
10
23
12
11
17
16
Fine Gravel
2
28
16
15
12
8
3
8
9
7
22
15
9
12
14
Silt
90
6
8
35
0
1
4
0
0
1
0
7
0
0
2
Sand
0
10
0
3
3
1
2
3
0
2
4
4
3
3
4
Clay
0
0
19
6
0
0
0
0
0
0
0
0
0
0
0
EMBEDDEDNESS
RATING
Weighted Value
21.6
22.6
20.0
21.4
90
21.2
26.8
24.6
39.0
27.9
58.6
64.0
36.6
33.2
48.1 CURRENT VELOCITY
(Feet Per Second)
0.7
1.5
1.9
1.4
2.3
1.7
1.6
1.2
1.1
1.4
2.2
0.9
1.2
1.6
1.5

Sheridan County Conservation District
Tongue River Watershed Assessment 205j Final Report 1996-1999 298
TABLE 8-55. Summary statistics from fecal coliform sample stations in the Goose Creek and Tongue River watersheds exceeding
Wyoming fecal coliform bacteria standards during the Recreation Season and Non-Recreation Season based on five (5)
samples collected within a 30 day period, 1998-1999, Sheridan County, Wyoming
Water body / Station
Year (Season)
No.
Samples
Mean
(#/100ml)
Geometric Mean
(#/100ml)
# Samples
>
400/100ml
# Samples
<
400/100ml
% Samples
< 400 /100ml
Little Goose Creek / #1
1998 (Rec.)
5
692
489
2
3
60
Little Goose Creek / #2
1998 (Rec.)
5
962
573
3
2
40
Little Goose Creek / #3
1998 (Rec.)
5
956
611
3
2
40
Little Goose Creek / #4
1998 (Rec.)
5
710
624
5
0
0
Little Goose Creek / #5
1998 (Rec.)
5
318
314
1
4
80
Little Goose Creek / #6
1998 (Rec.)
5
273
218
1
4
80
Little Goose Creek / #1
1999 (Rec.)
5
302
275
2
3
60
Little Goose Creek / #2
1999 (Rec.)
5
308
296
1
4
80
Little Goose Creek / #3
1999 (Rec.)
5
672
642
5
0
0
Little Goose Cr. / Woodland
1999 (Rec.)
5
466
457
4
1
20
Little Goose Creek / #4
1999 (Rec.)
5
306
294
1
4
80
Little Goose Creek / #5
1999 (Rec.)
5
321
279
2
3
60
Sacket Creek
1999 (Rec.)
5
710
587
3
2
40
Jackson Creek
1999 (Rec.)
5
506
469
2
3
60
Kruse Creek
1999 (Rec.)
5
528
514
4
1
20

Sheridan County Conservation District
Tongue River Watershed Assessment 205j Final Report 1996-1999 299
TABLE 8-55. Con’t
Water body / Station
Year (Season)
No.
Samples
Mean
(#/100ml)
Geometric Mean
(#/100ml)
# Samples
>
400/100ml
# Samples
<
400/100ml
% Samples
< 400 /100ml
Big Goose Creek / #1
1998 (Rec.)
5
529
513
4
1
20
Big Goose Creek / #2
1998 (Rec.)
5
514
482
3
2
40
Big Goose Creek / #2
1998 (Rec.)
5
592
457
2
3
60
Big Goose Creek / #4
1998 (Rec.)
5
356
283
1
4
80
Goose Creek / #2
1998 (Non-Rec.)
5
390
317
2
3
60
Goose Creek / #3
1998 (Non-Rec.)
5
501
330
2
3
60
Goose Creek / #4
1998 (Non-Rec.)
5
395
318
2
3
60
Big Goose Creek / #1
1999 (Rec.)
5
275
258
1
4
80
Big Goose Creek / #2
1999 (Rec.)
5
324
307
1
4
80
Big Goose Creek / #3
1999 (Rec.)
5
313
287
2
3
60
Big Goose Creek / #4
1999 (Rec.)
5
607
458
3
2
40
B. Goose Cr. bel. Beaver Cr.
1998 (Rec.)
5
66
619
4
1
20
Big Goose Cr. / High. 81
1998 (Rec.)
5
452
411
3
2
40
Beaver Creek
1998 (Rec.)
5
1012
1003
5
0
0

Sheridan County Conservation District
Tongue River Watershed Assessment 205j Final Report 1996-1999 300
TABLE 8-55. Con’t
Water body / Station
Year (Season)
No.
Samples
Mean
(#/100ml)
Geometric Mean
(#/100ml)
# Samples
>
400/100ml
# Samples
<
400/100ml
% Samples
< 400 /100ml
Rapid Creek
1998 (Rec.)
5
430
389
2
3
60
Fivemile Creek / Lower
1999 (Rec.)
5
2056
565
3
2
40
Little Tongue River / Lower
1999 (Rec.)
5
377
290
2
3
60
Columbus Creek / Lower
1999 (Rec.)
5
448
405
5
0
0
Smith Creek / Lower
1999 (Rec.)
5
740
534
3
2
40
GRAND TOTAL
-----
170
-----
-----
89
81
48
Sheridan County Conservation District
Tongue River Watershed Assessment 205j Final Report 1996-1999 301
CUMULATIVE EFFECTS AND PRIORITIZATION
9
The Tongue River watershed assessment 205j Project identified pollutants affecting the mainstem
Tongue River and primary tributaries. There were no significant pollutants identified from point
source discharge, thus the majority of pollutants affecting water bodies were from non-point
sources. The assessment provided potential sources for pollutants and discussed land use
associations with fecal coliform bacteria concentration and certain water quality parameters.
Sampling provided baseline chemical, physical, biological and habitat data for several of the
primary tributaries to the Tongue River, all of which had never been sampled at this intensity.
Section 8 presented results and discussion for each sampling station and each sampling parameter.
Section 9 provides a cumulative overview of monitoring and assessment results. Evaluation of
cumulative water quality effects at the Project watershed scale will assist planning future
watershed restoration activity described in the Tongue River Watershed Management Plan.
9.1 Tongue River
The water quality assessment conducted by SCCD using historic and current data from WDEQ,
USGS, RPWD and WGFD found water quality in the Tongue River from the BHNF boundary to
the Town of Ranchester good to excellent with few exceptions. Land use activities in the BHNF
produced no significant effects for water quality and stream biological condition in the Tongue
River and its primary tributaries. Nutrient concentrations (nitrate, phosphorus and ammonia)
were either low or not detected, herbicides and pesticides sampled by SCCD and USGS were not
detected. USGS sampling at the Upper station found non-detectable or low stream bed sediment
metal concentrations; brown trout fish tissue and liver samples indicated no accumulation of
organic compounds. Water column metals sampling found non-detectable or low concentrations.
The metals and organic sampling suggested low potential for contamination of the aquatic food
chain and no fish consumption advisory. Water quality sampling by USGS in 1999 at the Tongue
River Upper station confirmed findings from SCCD and WDEQ water quality sampling.
Comparison of historic fecal coliform bacteria data with current Project fecal coliform bacteria
data indicated a decline in bacteria level at the Middle station and Lower station since the 1970's
and 1980's. The decline in bacteria levels at the Middle station appeared to be related to upgrade
and effective operation and maintenance of the Dayton WTP. Intensive monitoring conducted by
WDEQ in 1998 in the vicinity of the Dayton WTP confirmed this finding. No significant amount
of pollutants were entering the Tongue River from the Dayton WTP discharge.
Water temperature at the Tongue River Lower station appeared to regularly exceed the Wyoming
water quality standard for Class 2 cold water streams during the summer when air temperatures
were highest and stream discharge was reduced for irrigation demand. Concurrent reduced
discharge from primary tributaries during the summer irrigation season compounded the effects of
high water temperature and low discharge at the Tongue River Lower station. Other than high

Sheridan County Conservation District
Tongue River Watershed Assessment 205j Final Report 1996-1999 302
water temperature and a single high fecal coliform sample at Tongue River Lower, there were no
exceedences of Wyoming water quality standards during the four year Project (Table 9-1). The
Tongue River will remain on the Wyoming 303d list identifying water quality limited stream
segments due to exceedence of the water temperature and fecal coliform bacteria standards.
However, the size of the current water quality limited segment should be reduced. The current
water quality limited segment was from near the Tongue River Upper station and BHNF boundary
to the Tongue River Lower station at Ranchester. The revised water quality limited segment
should be listed as from the Halfway Lane County Road near the Tongue River Middle station
located about midway between the Town of Dayton and the Town of Ranchester, to the Town of
Ranchester. Reduction in size of the water quality limited segment was justified because no water
quality problems were identified at or upstream of the Tongue River Middle station. Impairments
will be listed as water temperature and fecal coliform bacteria. Placement on the 303d list will
require remedial action probably in the form of BMP implementation and voluntary conservation
land treatments in concert with water management modification to restore water quality. SCCD
prepared the Tongue River Watershed Management Plan (SCCD, 2000) under the auspices of the
Tongue River Watershed Steering Committee (TRWSC) and Tongue River watershed landowners
with assistance from NRCS. The management plan and TRWSC will guide future prioritization
of voluntary land treatment, land management changes and monitoring activity within the Project
area to bring affected water bodies back into compliance with Wyoming water quality standards.
The Watershed Plan will delay implementation of Total Maximum Daily Loads (TMDL’s) for
both water temperature and fecal coliform.
Long term monitoring data sets provided by RPWD for daily turbidity, water temperature and pH
measurements at the Ranchester WTP raw water intake indicated a gradual, but significant decline
for these parameters over the years. Decline in alkalinity was also indicated. Decline in pH and
alkalinity could be related to anthropogenic (man caused) effects affecting other water bodies
nationwide (i.e. acid rain), change in water management in Wolf Creek or other unknown factors.
Continued monitoring by RPWD will be important to track trends because further decline in these
parameters will potentially affect the aquatic biological community, fishery and the ability of the
Tongue River to meet Wyoming water quality standards.
Biological condition based on sampling and analysis of benthic macroinvertebrate communities
was rated good at each Tongue River station. Benthic macroinvertebrate sampling conducted by
USGS in 1999 at the Upper station compared favorably with SCCD and WDEQ benthic
macroinvertebrate sampling despite differences in sampling method, sampling date and sampling
location. The transition from a cool water benthic community at the Upper station to a warmer
water benthic macroinvertebrate community at the Lower station reflected the natural increase in
water temperature along the longitudinal gradient from the Upper station to the Lower station.
Increase in summer water temperature appeared to be accelerated by dewatering for irrigation
demand.
Review of historic and current WGFD fish population data found game fish populations
dominated by trout species in the Upper canyon. Whitefish dominate and replace trout species

Sheridan County Conservation District
Tongue River Watershed Assessment 205j Final Report 1996-1999 303
downstream of the canyon. Extensive historic channelization appeared to further reduce trout
habitat and trout populations allowing non-game fish populations to increase in abundance
downstream to the Town of Ranchester. Loss of habitat due to channelization and elevated
summer water temperature accelerated by dewatering appeared to be the primary reasons for the
decline in game fish populations observed in the Tongue River over the years. Effects of
channelization continue to this day requiring stream bank stabilization projects.
In-stream and riparian habitat quality was reduced from the Tongue River Upper to Lower stations
based on qualitative habitat scoring criteria. The reduction in habitat scores was due to lower
scores for embeddedness (silt cover on cobble and gravel stream substrate), channel flow status,
channel shape, channelization, width depth ratio and bank stability. Reduced scores for some of
the habitat parameters were related not only to current land use practices and water management,
but to lingering effects from the period of extensive channelization that apparently occurred in the
late 1950's to early 1960's. The semi-quantitative stream substrate particle size distribution varied
little between stations. The general decrease in substrate particle size observed from the Upper
station to the Lower station was normal because particle size generally decreases as stream size
and stream order increase (Rosgen, 1996). Stream substrate composition at Tongue River
stations in order of importance was cobble, coarse gravel and fine gravel. Sand and silt deposition
was minimal. Sand comprised from 1 percent to 5 percent of stream substrate at Tongue River
stations. Only the Upper and Lower stations had detectable silt deposition. Silt comprised about
one (1) percent of total substrate at those stations.
Stream substrate embeddedness increased from the Tongue River Upper to Lower stations.
Increase in embeddedness from the Upper to Lower stations was considered normal for the size
(drainage area was 347 square miles at Tongue River Lower station) and stream order of the
Tongue River. Stream substrate and embeddedness had no apparent detrimental effect on the
benthic macroinvertebrate population because biological condition was rated very good and full
support of aquatic life use was indicated. Despite the reduction in habitat scores and increase in
embeddedness values from Tongue River Upper to Lower stations, these stations ranked high
when compared to habitat scores and embeddedness values observed at other plains streams in the
Northwestern Great Plains ecoregion of Wyoming. The small percent of sand and silt comprising
the Tongue River stream substrate further indicated no large scale disruption in the Tongue River
watershed.
Water temperature naturally increases along the longitudinal gradient in the Tongue River during
the warmer summer months. Dewatering accelerated the increase in water temperature and
resulted in loss of habitat by restricting trout to reaches further upstream. However, after
accounting for these factors and evaluation of credible historic and current chemical, physical and
biological data, SCCD determined that the Tongue Rive Lower station was sited in the transition
zone between a cold water system (WDEQ Class 2 cold water) and a warm water system (WDEQ
Class 2 warm water). The entire length of the Tongue River to the Montana border is currently a
Class 2 cold water, water body. SCCD proposed that reclassification of the Tongue River from

Sheridan County Conservation District
Tongue River Watershed Assessment 205j Final Report 1996-1999 304
Class 2 cold water to Class 2 warm water was warranted. The Interstate 90 Bridge was proposed
as a possible point of division between cold water and warm water stream classes. SCCD will
formally petition WDEQ to initiate the reclassification process. Data and findings contained in
this Final Report should provide adequate justification for initiation of the proposed
reclassification. The proposed reclassification will not change the current status for placement of
the Tongue River Lower segment on the Wyoming 303d list, but will provide more appropriate
water quality goals for the downstream segments.
9.2 Tributaries to the Tongue River
Each primary tributary to the Tongue River within the Project area exceeded one or more
Wyoming water quality standards. Each tributary will be placed on the Wyoming 303d list for
water quality limited stream segments. Smith Creek and Little Tongue River were previously on
the 303d list and will remain. Columbus Creek, Wolf Creek and Five Mile Creek will be new
additions to the 303d list.
Smith Creek will be listed for exceedence of the fecal coliform bacteria standard, the turbidity
standard and water temperature standard (Table 9-1). The water quality limited length of stream
was identified as the segment from the Smith Creek Upper station to the Smith Creek Lower
station because the impairments were occurring somewhere between the two stations.
Little Tongue River was listed for exceedence of the fecal coliform bacteria standard, the water
temperature standard and narrative biological criteria standard. The water quality limited length
of stream was identified as the segment from the Little Tongue River Upper station to the Little
Tongue River Lower station because the impairments were occurring somewhere between the two
stations. The Little Tongue River Upper station exceeded the narrative biological criteria
standard based on WDEQ benthic macroinvertebrate sampling in 1993. SCCD analysis
confirmed the WDEQ finding. SCCD recommended the WDEQ station be relocated downstream
to the current SCCD Little Tongue River Upper station and site of USGS gage station No.
06298500 for better comparison with the water quality sampling station.
Columbus Creek will be listed for exceedence of the fecal coliform bacteria standard, water
temperature standard, turbidity standard and narrative biological criteria standard (Table 9-1).
The water quality limited length of stream was identified as the segment from the Columbus Creek
Upper station to the Columbus Creek Lower station because the impairments were occurring
somewhere between the two stations. Water quality upstream of the Upper station was good with
the exception of a single high fecal coliform bacteria sample. SCCD proposed that the Columbus
Creek segment upstream of this station not be placed on the 303d list due to the single sample
exceedence. Rather, SCCD proposed to continue monitoring to determine if significant bacterial
contamination persisted.
Wolf Creek will be listed for exceedence of the fecal coliform bacteria standard, water temperature

Sheridan County Conservation District
Tongue River Watershed Assessment 205j Final Report 1996-1999 305
standard and turbidity standard (Table 9-1). The water quality limited length of stream was
identified as the segment from the Wolf Creek Upper station to the Wolf Creek Lower station
because the impairments were occurring somewhere between the two stations. The EPA
secondary drinking water standard for total sulfate was exceeded based on a single WDEQ sample
collected in 1995 at the Wolf Creek - Berry station. The EPA secondary drinking water standard
was not enforceable and as such, will not require a potential TMDL.
Five Mile Creek will be placed on the 303d list for exceedence of the fecal coliform bacteria
standard, water temperature standard, turbidity standard and narrative standard for biological
criteria (Table 9-1). The water quality limited length of stream was identified as the entire Five
Mile Creek drainage including the Five Mile Ditch and both irrigation storage reservoirs because
the impairments were occurring somewhere upstream of the Five Mile Creek Lower station. Five
Mile Creek exhibited the poorest water quality of any stream assessed during this Project.
Five Mile Creek was currently not classified by WDEQ, but assumed the classification of the
Tongue River (Class 2 cold water) due to the “tributary rule” (WDEQ, 1998). Five Mile Creek
functions as an irrigation water supply conduit. Because of it’s dependence upon Columbus
Creek for discharge, and the evaluation of chemical, physical and biological data collected during
this Project, SCCD proposed that Five Mile Creek be classified as a Class 3 water body. Data and
findings contained in this Final Report should provide adequate justification for the proposed
classification. Because Five Mile Creek was currently not classified, SCCD believes notification
and reference to this Final Report should provide sufficient documentation to justify the proposed
classification. The Class 3 determination will not change the status for placement of Five Mile
Creek on the Wyoming 303d list. However, the exceedence of the water temperature standard
when classified as a Class 2 cold water, water body (25.60C) would not be an exceedence of the
water temperature standard for a Class 3 water body (32.20C). The exceedences for fecal
coliform, turbidity and narrative biological criteria standards remain applicable.
9.3 Effect of Tributary Water Quality on Tongue River
Water quality in the Tongue River was good to excellent and water quality in tributary streams
draining to the Tongue River was of lessor quality. Each tributary stream had one or more
violations of Wyoming water quality standards. An important assumption made at the beginning
of this Project was that water quality in tributaries caused deterioration of water quality in the
Tongue River. This Project demonstrated that tributaries to the Tongue River had no significant
effect on water quality in the Tongue River. The primary reason was that each tributary was
significantly dewatered thereby reducing discharge and introduction of potential water pollutants
into the Tongue River. It should be noted that discharge measurements during this Project did not
reflect the annual discharge regime in the tributaries because measurements were taken primarily
from April through September.
During this Project, the Little Tongue River contributed an estimated 6.2 percent of the Tongue
River discharge. Smith Creek comprised an estimated 1.3 percent, Columbus Creek 1.3 percent,

Sheridan County Conservation District
Tongue River Watershed Assessment 205j Final Report 1996-1999 306
Wolf Creek 8.9 percent and Five Mile Creek an estimated 1.6 percent of the total Tongue River
discharge. The small, but proportionally high percentage attributed to Five Mile Creek was due
to diversion of Columbus Creek water into the Five Mile Creek watershed. Accordingly,
diversion reduced the amount of discharge from Columbus Creek to the Tongue River.
Although each tributary had specific water quality problems, cumulative total discharge from
tributaries comprised a relatively small proportion of total discharge in the Tongue River. With
the exception of Smith Creek and Five Mile Creek, each tributary exhibited a reduction in stream
discharge from Upper to Lower stations. Reductions in discharge were most apparent during the
summer irrigation months. The water chemistry data further suggested that discharge in each
tributary, especially Smith Creek, Columbus Creek and Wolf Creek was primarily comprised of
irrigation return water. This suggested that potential pollutants entering the Tongue River from
tributaries were significantly diluted and produced no significant water quality effect. Irrigation
return did not appear to have a significant impact on Tongue River water quality because primary
points for return water were located downstream of the Project area.
The change in many water quality parameters from most Upper to Lower tributary stations was
greater than the change in water quality parameters from the Tongue River Upper to Lower
stations. The larger change in water quality parameters in tributaries appeared to be related to
water management practices that affected discharge and the amount of irrigation return comprising
total tributary discharge.
9.4 Water Body Ranking and Prioritization for Restoration
Chemical, physical, biological and habitat attributes were ranked by station to assist prioritization
of voluntary land treatments and management activity to improve water quality. Mean values for
each water quality parameter were compared among Tongue River stations and Lower tributary
stations (Table 9-2). The same ranking process was conducted for benthic macroinvertebrate
communities by ranking select metrics (Table 9-3) and for habitat parameters (Table 9-4).
Parameters and metrics were ranked individually and then summed to provide a ranking value for
comparison among stations (Table 9-5).
Based on the ranking system, water quality was highest at the Tongue River Middle station
followed by the Tongue River Upper and Tongue River Lower stations. The Tongue River
Middle station ranked higher than the Upper station due to additional intensive sampling by
WDEQ at the Dayton WWTF near the Middle station during low flow in the fall, 1998. Wolf
Creek Lower ranked 4th
for water quality followed by Little Tongue River Lower and Smith Creek
Lower. The poorest water quality was at Columbus Creek Lower and Five Mile Creek Lower.
Columbus Creek Lower had a total of 4 Wyoming water quality numeric and narrative standard
exceedences and Five Mile Creek had a total of 5 standard exceedences. Wolf Creek Lower and
Little Tongue Lower had 3 exceedences of standards and Tongue River Lower had 2 exceedences.
Results for the water quality ranking agreed favorably with results for the benthic
macroinvertebrate community ranking (Table 9-5). Comparability between results for habitat

Sheridan County Conservation District
Tongue River Watershed Assessment 205j Final Report 1996-1999 307
assessment rankings and both water quality and benthic macroinvertebrate rankings was not good.
The subjective nature of the habitat assessment and variability in flow dependent habitat
parameters may be related to the lack of comparability to water quality and benthic
macroinvertebrate rankings. Close agreement between water quality and benthic
macroinvertebrate rankings suggested that macroinvertebrate sampling alone could provide a good
estimate for overall water quality at a fraction of the cost. The percent contribution of benthic
oligochaetes (worms) to the total benthic macroinvertebrate community was a statistically
significant and reliable predictor for identification of significant fecal coliform bacteria
contamination in the Tongue River watershed Project area. Certain worm taxa including
Ophidonais serpentina, Eiseniella tetraedra, Nais variabilis and Lumbricina may present
additional predictive power because these organisms occurred most frequently at stations
exceeding the Wyoming water quality standard for fecal coliform bacteria. No Tubifex tubifex
worms were identified from samples. T. tubifex is very common in polluted waters (Goodnight,
1959) and is significantly involved in the whirling disease life cycle caused by a parasite
(Myxobolus cerebralis) that penetrates the head and spinal cartilage of fingerling trout. Whirling
disease may eventually cause death in trout and the absence of this worm indicated low probability
for the occurrence of whirling disease in the Tongue River watershed within the Project area..
These associations further indicated the importance of benthic macroinvertebrates as
cost-effective water quality indicators.
The TRWSC will prioritize voluntary water quality improvement activity after consultation with
SCCD, landowners, WDEQ and EPA. Water bodies with confirmed fecal coliform bacteria
standard violations may receive the highest priority because they represent immediate public
health and safety concerns. Water bodies with turbidity, water temperature, sulfate and narrative
biological criteria exceedences may receive secondary priority. Other important watershed
resource concerns (i.e. roads) and willingness of landowners to apply voluntary land treatments
should be closely factored into the prioritization process. Potential stream habitat improvement
projects should be reviewed by WGFD before implementation. Improvement in water quality
will play a major role in improvement of aquatic resources and fisheries.
Restoration strategy must involve the entire watershed because water management practices
affecting each tributary and the Lower Tongue River station appeared to be indirectly responsible
for some water temperature, turbidity and narrative biological criteria standard exceedences. The
role that water management practice had on fecal coliform bacteria standard exceedences was less
clear. Water management in the upper watershed affects water users in the lower watershed.
The Tongue River Watershed Management Plan listed this topic as a watershed concern.

Sheridan County Conservation District
Tongue River Watershed Assessment 205j Final Report 1996-1999 308
TABLE 9-1. Summary of Wyoming Water Quality Standard Numeric, Narrative and Drinking
Water Standard Violations During Tongue River Watershed Assessment 205j
Project, Sheridan County, Wyoming
Sampling Station
Fecal
ColiformA
TemperatureA
TurbidityA
Total
SulfateB
Biological
CriteriaC
Tongue - Upper
Tongue - Middle
Tongue - Lower
X
Little Tongue - Upper
X
Little Tongue - Lower
X
X
A
X
Smith Creek - Upper
Smith Creek - Lower
X
X
A
X
Columbus Creek - Upper
Columbus Creek - Lower
X
X
A
X
X
Wolf Creek - Upper
X
B
Wolf Creek - Lower
X
X
A
X
Five Mile Creek - Lower
X
X
A
X
C
X
X
A = Wyoming surface water quality numeric standard.
B= EPA secondary drinking water standard (not enforceable); Wyoming groundwater standard.
C = Wyoming surface water quality narrative standard.
XA = Based on projected maximum water temperature.
XB = Based on single sample in 1995 collected downstream of SCCD Wolf Creek Upper station.
X C = Based on comparison to Columbus Creek - Upper which is the primary source of water for this station.

Sheridan County Conservation District
Tongue River Watershed Assessment 205j Final Report 1996-1999 309
TABLE 9-2. Final Project Average Water Quality Values and Ranking (1 equals highest rank decreasing to 8 for lowest rank) by
Station Within the Tongue River Watershed Project Area, 1996 Through 1999
Tongue
Upper
Tongue
Middle
Tongue
Lower
Little Tongue
Lower
Smith
Lower
Columbus
Lower
Wolf Creek
Lower
Five Mile
Lower
Chemical
Parameter
Mean
Rank
Mean
Rank
Mean
Rank
Mean
Rank
Mean
Rank
Mean
Rank
Mean
Rank
Mean
Rank
Temperature
9.6
1
9.8
2
11.7
3.5
11.7
3.5
12.6
5
13.5
7
13.4
6
14.1
8
pH
8.2
7.5
8.0
3.5
8.0
3.5
8.1
6
8.2
7.5
7.9
1
8.0
3.5
8.0
3.5
Conductivity
209
1
277
2
300
3
436
5
574
7
525
6
429
4
819
8
DO
10.2
2
11.0
1
9.9
3
9.5
4.5
9.2
7
9.0
8
9.5
4.5
9.4
6
Turbidity
7.3
1
9.0
3
13.5
4
8.5
2
19.0
5
51.7
8
21.0
6
39.4
7
TSS
3
3.5
2
1.5
3
3.5
2
1.5
10
6
18
8
7
5
11
7
Alkalinity
122
1
145
2
174
3
220
4
271
6
326
7
244
5
420
8
Sulfate
<10
1
23
2
33
3
201
7
151
5
162
6
83
4
392
8
Chloride
<5
3.5
<5
3.5
<5
3.5
<5
3.5
<5
3.5
10
7.5
<5
3.5
10
7.5
Nitrate
.028
4
.030
5
.019
2
.022
3
.036
6
.057
7
.013
1
.526
8
Phosphorus
.044
5
.041
3
.028
2
.042
4
.067
8
.065
7
.027
1
.055
6
Hardness
209
3
176
1
202
2
380
6
361
5
392
7
293
4
556
8
F. Coliform
5
1
15
2
25
3
32
4
176
7
107
6
57
5
185
8
SUM RANKINGS
34.5
31.5
39.0
54.0
78.0
85.5
52.5
93.0
WATER
CHEMISTRY RANK
2
1
3
5
6
7
4
8

Sheridan County Conservation District
Tongue River Watershed Assessment 205j Final Report 1996-1999 310
TABLE 9-3. Final Project Average Macroinvertebrate Metric Values and Ranking (1 equals highest rank decreasing to 8 for lowest
rank) by Station Within the Tongue River Watershed Project Area, 1996 Through 1999
Tongue
Upper
Tongue
Middle
Tongue
Lower
Little Tongue
Lower
Smith
Lower
Columbus
Lower
Wolf Creek
Lower
Five Mile
Lower
Macroinvertebrate Metric
Mean
Rank
Mean
Rank
Mean
Rank
Mean
Rank
Mean
Rank
Mean
Rank
Mean
Rank
Mean
Rank
Number Taxa
27.2
7
39.5
3
37.5
4
34.8
5
27.0
8
39.8
2
42.0
1
31.3
6
Number EPT Taxa
18.5
3
19.8
1.5
19.8
1.5
16.2
5
10.5
7
10.8
6
17.0
4
6.3
8
% Plecoptera
10.0
1
6.2
3
1.4
5
3.40
4
7.38
2
0.10
7
0.54
6
0.06
8
% Chironomidae
1.0
2
7.1
4.5
7.1
4.5
1.7
3
0.7
1
12.58
7
7.5
6
14.3
8
% Oligochaeta
0.0
1
1.7
4
1.3
2
3.3
5
1.6
3
14.2
7
6.3
6
22.9
8
No. Predator Taxa
6.5
1
6.0
2
5.0
4.5
2.5
7
2.0
8
4.8
6
5.0
4.5
5.3
3
% Scrapers
33.8
2
14.3
5
8.3
6
15.9
4
25.3
3
2.9
7
35.1
1
0.7
8
% Collect.Filterers
12.1
2
25.9
4
45.7
8
4.1
1
44.6
7
33.8
5
17.0
3
35.8
6
Modified HBI
2.31
1
2.93
2
3.81
3
3.85
4
4.55
5
5.65
6
5.66
7
6.12
8
BCI CTQa
48.0
1
69.4
2
73.8
4
70.8
3
79.5
5
91.9
7
85.2
6
98.2
8
Shannon H (Log 2)
3.50
4
3.82
1
3.24
7
3.34
5
2.78
8
3.65
3
3.81
2
3.29
6
% Multivoltine
16.9
3
13.9
2
23.2
6
8.4
1
19.1
4
39.4
8
22.7
5
27.6
7
% Univoltine
70.3
1
64.2
5
69.3
2
31.7
8
68.9
3
56.4
6
45.6
7
66.4
4
SUM RANKINGS
29
39
57.5
55
64
77
58.5
88
METRIC RANK
1
2
5
3
6
7
4
8

Sheridan County Conservation District
Tongue River Watershed Assessment 205j Final Report 1996-1999 311
TABLE 9-4. Final Project Average Habitat Assessment Parameter Values and Ranking (1 equals highest rank decreasing to 8 for
lowest rank) by Station Within the Tongue River Watershed Project Area, 1996 Through 1999
Tongue
Upper
Tongue
Middle
Tongue
Lower
Little Tongue
Lower
Smith
Lower
Columbus
Lower
Wolf Creek
Lower
Five Mile
Lower
Habitat Parameter
Mean
Rank
Mean
Rank
Mean
Rank
Mean
Rank
Mean
Rank
Mean
Rank
Mean
Rank
Mean
Rank
Substrate / Percent Fines
18
5.3
19
2.5
20
1
18
5.3
18
5.3
8
7.5
19
2.5
8
7.5
Instream Cover
18
1
16
2
15
3
8
6
10
5
3
8
11
4
5
7
Embeddedness
19
1
15
2
4
5
11
3
8
4
1
7.5
2
6
1
7.5
Velocity / Depth
18
1
16
3
16
3
9
6
10
5
8
7
16
3
3
8
Channel Flow Status
18
2.5
13
7.5
15
5
13
7.5
18
2.5
14
6
17
4
19
1
Channel Shape
10
3
6
8
9
5
8
6
10
3
7
7
10
3
11
1
Pool Riffle Ratio
13
2
13
2
13
2
6
6
9
4.5
4
8
9
4.5
5
7
Channelization
15
1
10
4.5
10
4.5
9
7
9
7
9
7
11
2.5
11
2.5
Width Depth Ratio
10
1.5
7
5.5
3
8
4
7
10
1.5
9
3.5
7
5.5
9
3.5
Bank Vegetation
Protection
9
2
8
5.5
8
5.5
8
5.5
8
5.5
3
8
9
2
9
2
Bank Stability
9
1.5
5
7
7
6
8
4
8
4
3
8
8
4
9
1.5
Disruptive Pressures
10
1
7
7
8
5
8
5
8
5
6
8
9
2.5
9
2.5
Riparian Zone Width
7
1
5
3
6
2
2
7
2
7
2
7
4
4.5
4
4.5
TOTAL SCORE
174
140
134
112
128
77
132
102
7
SUM RANKINGS
21.3
59.5
55.0
75.3
59.3
92.5
48.0
55.5
HABITAT RANK
1
6
3
7
5
8
2
4

Sheridan County Conservation District
Tongue River Watershed Assessment 205j Final Report 1996-1999 312
TABLE 9-5. Comparison of Final Project Water Quality, Macroinvertebrate, and Habitat
Assessment Ranking (1 equals highest rank decreasing to 8 for lowest rank) by
Station Within the Tongue River Watershed Project Area, 1996 Through 1999
Tongue
Upper
Tongu
e
Middl
e
Tongue
Lower
Little
Tongue
Lower
Smith
Lower
Columb
us
Lower
Wolf
Lower
Five
Mile
Lower
Water Quality
Rank
2
1
3
5
6
7
4
8
Macroinvertebrate
/ Biological
Condition Rank
1
2
5
3
6
7
4
8
Habitat
Assessment Rank
1
6
3
7
5
8
2
4

Sheridan County Conservation District
Tongue River Watershed Assessment 205j Final Report 1996-1999 313
RECOMMENDATIONS
10 Numerous recommendations were proposed throughout this Final Report. This Section
summarizes those recommendations. Additional water quality and benthic macroinvertebrate
monitoring will be required at some time because the Tongue River Lower station and each
tributary within the Project area will be placed on the Wyoming 303d list identifying water quality
limited stream segments. The role that SCCD may play in future monitoring efforts is uncertain
due to staffing limitations, limited operating budget dependent upon “soft money”, unknown
future funding and public support for voluntary BMP implementations and land treatments.
SCCD has a commitment not only the Tongue River watershed, but to all Sheridan County
residents to promote and implement wise conservation practices county-wide.
Monitoring will be required to determine when water quality in these water bodies is improved to
meet Wyoming water quality standards. This Project identified water quality pollutants of
concern and the water bodies in which they occurred. Because each tributary had only Upper and
Lower stations, with the exception of Five Mile Creek (single Lower station), the entire reach
between stations will be placed on the 303d list. However, it was unlikely that the entire reach
was water quality limited. Future monitoring may be directed toward the identification of those
specific segments within each impaired tributary to better identify potential sources of significant
pollution and effectively target resources to improve water quality. Monitoring to identify
segments with significant pollutants and the potential sources of pollutants will require a more
complex and intensive sampling design than the basic upstream and downstream design used
during this Project. A project of this scope would require significant additional resources
currently beyond those available to SCCD in order for the District to fulfill it’s other conservation
commitments to Sheridan County residents.
It is possible that future monitoring will be funded through Section 319 of the Clean Water Act
administered by WDEQ through EPA funding. Section 319 projects include a combination of
voluntary BMP implementations, land treatments and appropriate land management changes in
concert with an emphasis on intensive “implementation monitoring” to determine if BMP’s and on
the ground changes are effective by reducing water pollutants. Intensive implementation
monitoring will require more resources, QA/QC oversight, time and coordination between the
Project Sponsors, land owners and funding agencies. The following recommendations may be
considered during design of future monitoring projects within the Tongue River Project area.
1. The Project Manager and Field Coordinator must ensure that all new equipment is
calibrated and maintained according to manufacturer instructions. New
equipment should undergo adequate field testing and training by sampling
personnel before use.
2. The Pre-project planning phase should include better communication with the
contract analytical laboratory for specific analytical method and costs.

Sheridan County Conservation District
Tongue River Watershed Assessment 205j Final Report 1996-1999 314
3. Future monitoring efforts should allow for adequate time (a minimum of six (6)
months) to conduct planning prior to collection of the first sample. This will allow
sampling to begin as scheduled.
4. For future sampling, an adequate number of full-time sampling technicians should
be employed and firm commitments from volunteers for monitoring should be
secured at least two weeks in advance of scheduled sampling. Field logistics
should be improved to account for the short holding time for fecal coliform samples
by increasing the number of vehicles for use to deliver samples to the analytical
laboratory.
5. Adequate salaries, benefits, flexibility and support should be provided to personnel
involved in monitoring activities to reduce employee turnover and ensure
monitoring consistency.
6. Ensure that duplicate samples are included in budget planning at the start. Provide
field samplers with a “tracking sheet” to record the number of duplicate samples
required and the total number of duplicate samples collected. Training should
stress the importance of duplicate samples in the QA process.
7. Establish all monitoring stations upstream of road crossings. Better land owner
familiarity and involvement with projects should enhance the ability to gain
broader access for sampling.
8. Ensure that enough funds are available for identical sampling frequency between
all monitoring stations on a water body if required.
9. SCCD and WDEQ instantaneous water temperature sampling was not sufficient to
detect maximum daily temperature needed to evaluate attainment of the Wyoming
water quality standard for water temperature. Continuous water temperature
recorders or thermistors should be purchased for monitoring at stations suspected
of approaching the Wyoming water temperature standard.
10. The benthic macroinvertebrate sampling station established by WDEQ at the Little
Tongue River Upper station should be relocated to the SCCD Little Tongue River
Lower water quality sampling station to allow better comparison of the benthic
macroinvertebrate data with water quality data.
11. The stream reach upstream of the Columbus Creek Upper stations should not be
placed on the WDEQ (303d) list for Wyoming water quality limited segments
based on the single high fecal coliform bacteria sample. Sampling for fecal
coliform should continue to determine if frequent, significant bacteria levels are

Sheridan County Conservation District
Tongue River Watershed Assessment 205j Final Report 1996-1999 315
present to ensure that public health and safety are protected.
12. Biological condition ratings that border between two ratings (i.e. fair and good)
should always be re-sampled the next year to confirm findings from the previous
year especially when the determination may result in listing the stream segment for
non-support for aquatic life use. Should additional sampling indicate impairment
of the biological community, another sample should be collected and if impairment
is reconfirmed, restoration measures should be considered.
13. Future sampling for fecal coliform bacteria in the Tongue River watershed (and
other water bodies) should consist of five (5) samples each collected on separate
days during a 30 day period within the Recreation Season (May 1 through
September 30) to ensure detection of significant bacterial levels for protection of
public health and safety. Sampling may be conducted outside the Recreation
Season to identify pollution sources that may be related to seasonal factors such as
discharge, turbidity, wildlife use and irrigation demand. Monthly fecal coliform
sampling, although less time consuming and costly, should be abandoned because
sampling at this frequency runs the risk of missing significant fecal coliform
bacteria contamination about 50 percent of the time.
14. Future monitoring should include placement of continuous discharge recorders at
the lower end of each primary tributary and at the Tongue River near the
Ranchester Water Treatment Plant.
15. The Ranchester Public Works Department should be encouraged to continue daily
water temperature, pH, turbidity and alkalinity measurements at the Tongue River
raw water intake to track long term water quality change in the Tongue River.
16. Objectives and goals in the Tongue River Watershed Management Plan should be
implemented as scheduled. Date, location and type of voluntary BMP
implementations, land treatments or land management changes should be tracked
by SCCD and the Tongue River Watershed Steering Committee to relate to
potential water quality and water resource improvement possibly precluding the
need for future TMDL’s.

Sheridan County Conservation District
Tongue River Watershed Assessment 205j Final Report 1996-1999 316
LITERATURE CITED
11
Allen, R.K. and G.F. Edmunds, Jr. 1962. A revision of the Genus Ephemerella (Ephemeroptera,
Ephemerellidae) V. The Subgenus Drunella in North America. Entomological Society of
America Miscellaneous Publications 3:147-179.
American Public Health Association. 1975. Standard methods for the examination of water and
wastewater. 14th Edition., Washington, D.C. 1193pp.
Annear, T.C. and P.D. Dey. 1998. Instream flow studies on Wolf Creek, Sheridan County,
Wyoming. Project IF-SN-8CC-511. Wyoming game and Fish Department, Fish Division
Administrative Report. Cheyenne, WY.
Barbour, M.T., M.L. Bowman and J.S. White. 1994. Evaluation of the biological condition of
streams in the Middle Rockies Central - ecoregion, Wyoming. Report to Wyoming Department
of Environmental Quality, Cheyenne, WY prepared by Tetra Tech, Inc., Owings Mills, MD.
Baxter, G.T. and J.R. Simon. 1970. Wyoming fishes. Bulletin No. 4. Wyoming Game and
Fish Department, Cheyenne, WY.
Birge, W.J., J.A. Black, A.G. Westerman, T.M. Short, S.B. Taylor, D.M. Bruser and E.D.
Wallingford. 1985. Recommendations on numerical values for regulating iron and chloride
concentrations for the purpose of protecting warmwater species of aquatic life in the
Commonwealth of Kentucky. Memorandum of Agreement 5429. Kentucky Natural Resources
and Environmental Protection Cabinet, Lexington, KY.
Bjorn, E.E. 1938. Preliminary report on the Tongue River. Wyoming Game and Fish
Department, Cheyenne.
Bjornn, T.C. and D.W. Reiser. 1991. Habitat requirements of salmonids in streams: Influences
of forest and rangeland management on salmonid fishes and their habitat. William R. Meehan,
Ed. American Fisheries Society Special Publication 19:83-138.
Bohn, C.C. and J.C. Buckhouse. 1985. Coliforms as an indicator of water quality in wildland
streams. Journal of Soil and Water Conservation 40(1): 95-97.
Brinkhurst, R.O. 1986. Guide to the Freshwater Aquatic Microdrile Oligochaetes of North
America. Canadian Special Publication of Fisheries and Aquatic Sciences 84. Department of
Fisheries and Oceans. Ottawa.

Sheridan County Conservation District
Tongue River Watershed Assessment 205j Final Report 1996-1999 317
Buchanan, T.J. and W.P. Somers. 1968. Stage measurements at gaging stations: United States
Geological Survey Techniques of Water-Resources Investigations, Book 3, Chapter A7. 28p.
Burton, T.A. 1991. Protocols for evaluation and monitoring of stream/riparian habitats
associated with aquatic communities in rangeland streams. Water Quality Monitoring Protocols
Report No. 4. Idaho Department of Health and Welfare Water Quality Bureau. Boise, ID.
88pp.
Campbell, I.C. and T.J. Doeg. 1989. Impact of timber harvesting and production on streams: a
review. Australian Journal of Marine and Freshwater Research 40:519-539.
Caton, L.W. 1991. Improving subsampling methods for the EPA “Rapid Bioassessment”
benthic protocols. Bulletin of the North American Benthological Society 8(3): 317-319.
Chutter, F.M. 1969. The effects of sand and silt on the invertebrate fauna of streams and rivers.
Hydrobiologia 34: 57-76.
Corning, R.V. 1969. Water fluctuation, a detrimental influence on trout streams. In
Proceedings of the 23rd
Annual conference of the Southeastern Association of Game and Fish
Commissioners. pp. 431-454.
Davies, C.M., J.A.H. Long, M. Donald and N.J. Ashbolt. 1995. Survival of fecal
microorganisms in marine and freshwater sediments. Applied and Environmental Microbiology
61(5): 1888-1896.
DeBrey, L.D. and J.A. Lockwood. 1990. Effects of sediment and flow regime on the aquatic
insects of a high mountain stream. Regulated Rivers: Research and Management 5: 241-250.
Doran, J.W., J.S. Schepers and N.P. Swanson. 1981. Chemical and bacteriological quality of
pasture runoff. Journal of Soil and Water Conservation 36(3): 166-171.
Felbeck, E.A. 1999. Suspended sediment sources to the North Tongue River, Wyoming. M.S.
thesis. Department of Renewable Resources, Rangeland Ecology and Watershed Management /
Water Resources. University of Wyoming, Laramie.
Friedman, L.C. and D.E. Erdmann. 1982. Quality assurance practices for the chemical and
biological analyses of water and fluvial sediments. Techniques of water-resources investigations
of the United States Geological Survey. Book 5, Laboratory analysis; Chapter A6. Washington,
D.C.
Funk, J.L. 1970. Warm-water streams. In N.G. Benson, Editor. A century of fisheries in
North America. Special Publication No. 7. American Fisheries Society. Washington, D.C.
pp. 141-152.

Sheridan County Conservation District
Tongue River Watershed Assessment 205j Final Report 1996-1999 318
Garside, E.T., and J.S. Tait. 1958. Preferred temperature of rainbow trout (Salmo gairdneri
Richardson) and its unusual relationship to acclimation temperature. Canadian Journal of
Zoology. 36(3): 563-567.
Gerba, C.P. and J.S. McLeod. 1976. Effect of sediments on the survival of Escherichia coli in
marine waters. Applied and Environmental Microbiology 32(1):114-120.
Gilbert, R.O. 1987. Statistical methods for environmental pollution monitoring. Van Nostrand
Reinhold Press. New York, NY.
Goodnight, C.J. 1959. Oligochaeta. In W.T. Edmondson, Editor. Fresh-water biology. 2nd
Edition. John Wiley & Sons, Inc. pp. 522-537.
Green, R.H. 1979. Sampling design and statistical methods for environmental biologists. John
Wiley & Sons, New York, NY. 257pp.
Grimes, D.J. 1980. Bacteriological water quality effects of hydraulically dredging
contaminated upper Mississippi River bottom sediment. Applied and Environmental
Microbiology 39(4):782-789.
Hawkins, C.P., M.L. Murphy, and N.J. Anderson. 1983. Density of fish and salamanders in
relation to riparian canopy and physical habitat in streams of the north-western United
States. Canadian Journal of Fisheries and Aquatic Science 40(8):1173-1186.
Hayslip, G.A. 1993. EPA Region 10 in-stream biological monitoring handbook (for wadeable
streams in the Pacific Northwest). EPA-910-9-92-013. United States Environmental Protection
Agency Region 10, Environmental Services Division, Seattle, WA.
Hiltunen, J.K. and D.J. Klemm. 1980. A guide to the Naididae (Annelida: Clitellata:
Oligochaeta) of North America. EPA-600/4-80-031. United States Environmental Protection
Agency, Environmental Monitoring and Support Laboratory, Office of Research and
Development. Cincinnati, OH.
Hinton, M. 1985. The subspecific differentiation of Escherichia coli with particular reference
to ecological studies in young animals including man. Journal of Hygiene 95: 595-609.
Howell, J.M., Coyne, M.S. and P.L. Cornelius. 1996. Effect of sediment particle size and
temperature on fecal bacteria mortality rates and the fecal coliform / fecal streptococci ratio.
Journal of Environmental Quality 25: 1216-1220.

Sheridan County Conservation District
Tongue River Watershed Assessment 205j Final Report 1996-1999 319
Hughes, R.M. 1995. Defining acceptable biological status by comparing with reference
conditions. In W.S. Davis and T.P. Simon, Editors. Biological assessment and criteria: tools for
water resource planning and decision making. Lewis Publishers. Boca Raton, FL.
Hurlbert, S.H. 1994. Pseudoreplication and the design of ecological field experiments.
Ecological Monograph 54(2).
Hynes, H.B.N. 1970. The ecology of running waters. University of Toronto Press, Toronto.
555p.
Jawson, M.D., L.F. Elliot, K.E. Saxton and D.H. Fortier. 1982. The effect of cattle grazing on
indicator bacteria in runoff from a Pacific Northwest watershed. Journal of Environmental
Quality 11:621-627.
Johnson, S.C. 1978. Larvae of Ephemerella inermis and E. infrequens (Ephemeroptera:
Ephemerellidae). The Pan-Pacific Entomologist 54:19-25.
Kay, D. and M. Wyer. 1997. Microbiological indicators of recreational water. In D.Kay and
C. Fricker, Editors. Special Publication No. 191. The Royal Society of Chemistry.
Cambridge, United Kingdom. pp. 89-100.
King, K.W. 1990. Effects of oil field produced water discharges on pond zooplankton
populations. Wyoming Department Environmental Quality Water Quality Division. Cheyenne.
26pp.
King, K.W. 1990a. Final Sand Creek water quality monitoring report. Wyoming Department
of Environmental Quality, Water Quality Division. Cheyenne, WY.
King, K.W. 1993. A bioassessment method for use in Wyoming stream and river water quality
monitoring. Wyoming Department of Environmental Quality Water Quality Division.
Cheyenne, WY. 85pp.
Klemm, D.J. (Editor). 1985. A guide to the freshwater Annelida (Polychaeta, Naidid and
Tubificid Oligochaeta, and Hirudinea) of North America. Kendall/Hunt Publishing Company,
Dubuque, IA.
Lemly, A.D. 1982. Modification of benthic insect communities in polluted streams: combined
effects of sedimentation and nutrient enrichment. Hydrobiologia 87:229-245.
Lenat, D.R., D.L. Penrose and K.W. Eagleson. 1979. Biological evaluation of non-point source
pollutants in North Carolina streams and rivers. Biological Series #102. North Carolina
Department of Natural Resources Division of Environmental Management. 167pp.

Sheridan County Conservation District
Tongue River Watershed Assessment 205j Final Report 1996-1999 320
Lenat, D.R., D.L. Penrose and K.W. Eagleson. 1981. Variable effects of sediment addition on
stream benthos. Hydrobiologia 79:187-194.
Lenat, D.R. and K.W. Eagleson. 1981a. Biological effects of urban runoff on North Carolina
streams. Biological Series #102. North Carolina Department of Natural Resources and
Community Development, Division of Environmental Management, Water Quality Section,
Biological Monitoring Group. Raleigh, NC.
Lenat, D.R. 1984. Agriculture and stream water quality: a biological evaluation of erosion
control practices. Environmental Management 8(4):333-344.
MacDonald, L.H., A.W. Smart, and R.C. Wissmar. 1991. Monitoring guidelines to evaluate
effects of forestry activities on streams in the pacific northwest and Alaska. U.S. EPA, Region
10, NPS Section, EPA 910/9-91-001. Seattle, WA.
Mackenthun, K.M. 1973. Toward a cleaner environment. United States Environmental
Protection Agency. Washington, D.C.
Mackichan, K.A. 1967. Diurnal variations of three Nebraska streams. United States
Geological Survey Paper 575B: 233-234.
Marino, R.P. and J.J. Gannon. 1991. Survival of fecal coliforms and fecal streptococci in storm
drain sediment. Water Research 25(9):1089-1098.
Mason, R.L., R.F. Gunst, and J.L. Hess. 1989. Statistical design and analysis of experiments.
John Wiley & Sons, New York, NY. 692pp.
Maule, A. 1997. Survival of the verotoxigenic strain E. coli 0157:H7 in laboratory - scale
microcosms. In D.Kay and C. Fricker, editors, Special Publication No. 191. The Royal
Society of Chemistry. Cambridge, United Kingdom. pp. 61-65.
McCafferty, W.P. 1978. Premanagement assessment of aquatic macroinvertebrates in small,
sedimentary drainage area of Maumee and Lake Erie basin. Great Lakes Entomology 11:37-43.
Mendenhall, W., L. Ott, and R.L. Scheaffer. 1971. Elementary survey sampling. Duxbury
Press. Belmont, CA. 247pp.
Milne, C.M. 1976. Effect of a livestock watering operation on a western mountain stream.
Transactions of the American Society of Agricultural Engineering 19(4):749-752.

Sheridan County Conservation District
Tongue River Watershed Assessment 205j Final Report 1996-1999 321
Miner, J.R., Buckhouse, J.C. and J.A. Moore. 1992. Will a water trough reduce the amount of
time hay-fed livestock spend in the stream (and therefore improve water quality?). Rangelands
14(1): 35-38.
Mueller, J.W. 1966. The effect of channel changes and pollution on habitat and trout
populations in Tongue River, Sheridan County. Project 0366-07-6601. Wyoming Game and
Fish Administrative Report, Cheyenne.
Mueller, J.W., L.C. Rockett and S. Condit. 1970. Tongue River fish populations as related to
channel alterations. Project 0369-07-6801. Wyoming Game and Fish Administrative Report,
Cheyenne.
Mueller, J.W. 1979. Investigations of whitefish abundance in Tongue River, Sheridan County.
Project 3079-07-7905. Wyoming Game and Fish Administrative Report, Cheyenne.
Natural Resources Conservation Service. 1998. Soil Survey of Sheridan County Area,
Wyoming. United States Department of Agriculture, Natural Resources Conservation Service.
Washington, D.C.
Olive, J.H., J.L. Jackson, J. Bass, L. Holland and T. Savisky. 1988. Benthic macroinvertebrates
as indexes of water quality in the upper Cuyahoga River. Ohio Journal of Science 88(3):91-98.
Omernik, J.M. and A.L. Gallant. 1987. Ecoregions of the west central United States (Map).
U.S. Environmental Protection Agency, Environmental Research Laboratory. Corvallis, OR.
O’Neal, P.E., S.C. Harris, K.R. Drottar, D.R. Mount, J.P. Fillo and M.F. Mettee. 1989.
Biomonitoring of a produced water discharge from the Cedar Cive Degasification Field, Alabama.
Bulletin 135. Geological Survey of Alabama, Tuscaloosa, AL.
Plafkin, J.L., M.T. Barbour, K.D. Porter, S.K. Gross, and R.M. Hughes. 1989. Rapid
bioassessment protocols for use in streams and rivers. EPA/444/4-89-001. United States
Environmental Protection Agency Office of Water (Wh-553), Washington, D.C.
Platts, W.S., W.F. Megahan, and G.W. Minshall. 1983. Methods for evaluating stream,
riparian, and biotic conditions. General Technical Report INT-138. United States Department
of Agriculture Forest Service. Ogden, UT.
Ponce, S.L. 1980. Water quality monitoring programs. United States Department of
Agriculture Forest Service. Technical Paper WSDG-TP-00002. Fort Collins, CO. 66pp.

Sheridan County Conservation District
Tongue River Watershed Assessment 205j Final Report 1996-1999 322
Porter, S.D., T.F. Cuffney, M.E. Gurtz and M.R. Meador. 1993. Methods for collecting algal
samples as part of the National Water-Quality Assessment Program. United States Geological
Survey Open-File Report 93-409. Raleigh, NC.
Prophet, W.W. and N.L. Edwards. 1973. Benthic macroinvertebrate community structure in a
great plains stream receiving feedlot runoff. Water Resources Bulletin 9:583-589.
Riggle, F.R., and L.N. Kysar. 1985. Salinity control in the Grand Valley of Colorado. In:
Perspectives on nonpoint source pollution. United States Environmental Protection. Office of
Water, EPA 440/5-85-001. Washington, D.C. pp.359-361.
Rogaczewski, M. and J. Smith. 1999. Big Goose, Little Goose, and Goose Creeks - fecal
bacterial monitoring summary of the 1998 monitoring effort. Wyoming Department of
Environmental Quality Water Quality Division. Cheyenne, WY.
Rosgen, D.L. 1996. Applied river morphology. Wildland Hydrology. Pagosa Springs, CO.
Ruiter, D.E. and R.J. Lavigne. 1985. Distribution of Wyoming Trichoptera. SM 47,
University of Wyoming Agricultural Experiment Station, Laramie, WY.
Sawyer, C.N. 1960. Chemistry for sanitary engineers. McGraw-Hill, New York, NY.
Sherer, B.M., J.R. Miner, J.A. Moore and J.C. Buckhouse. 1988. Resuspending organisms from
a rangeland stream bottom. Transactions of the American Society of Agricultural Engineers
31(4):1217-1222.
Sherer, B.M., Miner, J.R., Moore, J.A. and J.C. Buckhouse. 1992. Indicator bacterial survival in
stream sediments. Journal of Environmental Quality 21:591-595.
Sheridan County Conservation District. 2000. Tongue River watershed management plan.
Sheridan, WY.
Spooner, J., R.P. Maas, S.A. Dressing, M.D. Smolen and F.J. Humernik. 1985. Appropriate
designs for documenting water quality improvements from agricultural NPS control programs.
In: Perspectives on nonpoint source pollution. EPA 440/5-85-001. United States Environmental
Protection Office of Water. Washington, D.C. pp.30-34.
Stephenson, G.R. and L.V. Street. 1978. Bacterial variations from a southwest Idaho rangeland
watershed. Journal of Environmental Quality 7(1):150-157.
Stephenson, G.R. and R.C. Rychert. 1982. Bottom sediment: A reservoir of Escherichia coli in
rangeland streams. Journal of Range Management 35(1):119-123.

Sheridan County Conservation District
Tongue River Watershed Assessment 205j Final Report 1996-1999 323
Strahler, A.N. 1957. Quantitative analysis of watershed geomorphology. Transactions of the
American Geophysical Union 38:913-920.
Stribling, J.B., B.K. Jessup and J. Gerritsen. 2000. Development of biological and physical
habitat criteria for Wyoming streams and their use in the TMDL process. Report to U.S. EPA
Region 8, Denver, CO prepared by Tetra Tech, Inc., Owings Mills, MD.
Tunnicliff, B. and S. Brickler. 1984. Recreational water quality analyses of the Colorado River
corridor in Grand Canyon. Applied and Environmental Microbiology 48(5):909-917.
U.S. Environmental Protection Agency. 1977. Basic water monitoring program.
EPA-440/9-76-025. Washington, DC.
U. S. Environmental Protection Agency. 1978. Microbiological methods for monitoring the
environment, water and wastes. 600/8-78-017. Environmental Monitoring and Support
Laboratory. Cincinnati, OH.
U. S. Environmental Protection Agency. 1980. Interim guidelines and specifications for
preparing quality assurance project plans. QAMS-005/80. Office of Monitoring Systems and
Quality Assurance, Office of Research and Development. Washington, D.C.
U.S. Environmental Protection Agency. 1983. Methods for chemical analysis of water and
wastes. 600/4-79-020. Environmental Monitoring and Support Lab., Cincinnati, OH.
U.S. Environmental Protection Agency. 1986. Quality criteria for water: 1986. Office of
Water Regulation and Standards. Washington, D.C.
U.S. Environmental Protection Agency. 1988. Standard operating procedures for field
samplers. Region VIII, Environmental Services Division. Denver, CO.
U.S. Environmental Protection Agency. 1988a. Martha oil field study, Martha, Kentucky.
Environmental Services Division Report. Athens, GA. 18pp.
U.S. Environmental Protection Agency. 1990. Biological criteria: national program guidance
for surface waters. Office of Water, EPA/440/5-90-004. Washington, D.C.
U.S. Environmental Protection Agency. 1991. Stream bioassessment technical issue papers:
Workshop Proceedings. (Draft). Office Wetlands, Oceans, Watersheds, Assessment,
Watershed Protection Division, Monitoring Section. Washington, D.C.

Sheridan County Conservation District
Tongue River Watershed Assessment 205j Final Report 1996-1999 324
U.S. Environmental Protection Agency. 1993. EPA requirements for quality assurance project
plans for environmental data operations. EPA QA/R5. Quality Assurance Management Staff,
Washington, D.C.
U.S. Environmental Protection Agency. 1994. Method 200.2, Revision 2.8. 600/R-94-111.
May, 1994. Environmental Monitoring Systems Laboratory. Cincinnati, OH.
U.S. Environmental Protection Agency. 1995. Generic quality assurance project plan guidance
for programs using community-level biological assessment in streams and wadeable rivers. EPA
841-B-95-004. Office of Water, Washington, D.C.
U.S. Environmental Protection Agency. 1996. Biological criteria technical guidance for
streams and small rivers. EPA 822-B-96-001, Office of Water 4304. Washington, D.C.
United States Geological Survey. 1985. Geologic map of Wyoming. Sheets 1, 2 and 3.
Reston, VA. G85136.
United States Geological Survey. 1999. The quality of our nation’s waters - nutrients and
pesticides. United States Geological Survey circular 1225. Reston, VA. 82p.
Vinson, M.R. and C.P. Hawkins. 1996. Effects of sampling area and subsampling procedure on
comparisons of taxa richness among streams. Journal of the North American Benthological
Society 15(3): 392-399.
Walley, G.S. 1930. Review of Ephemerella nymphs of western North America
(Ephemeroptera). The Canadian Entomologist. January: 12-20.
Ward, J.V. and J.A. Stanford. 1979. Ecological factors controlling stream zoobenthos with
emphasis on thermal modification of regulated streams. In J.V. Ward and J.A Stanford, Editors.
The ecology of regulated streams. Plenum Press, New York. pp. 35-55.
Waters, T.F. 1995. Sediment in streams: sources, biological effects, and control. American
Fisheries Society Monograph 7. Bethesda, MD.
Wiggins, G.B. 1996. Larvae of the North American caddisfly genera (Trichoptera). 2nd
Edition. University of Toronto Press, Toronto.
Winget, R.N. and F.A. Mangum. 1979. Biotic condition index: integrated biological, physical,
and chemical stream parameters for management. United States department of Agriculture,
Forest Service, Intermountain Region.

Sheridan County Conservation District
Tongue River Watershed Assessment 205j Final Report 1996-1999 325
Winget, R.N. and F.A. Mangum. 1991. Environmental profile of Tricorythodes minutus Traver
(Ephemeroptera: Tricorythidae) in the Western United States. Journal of Freshwater Ecology
6(3):335-344
Wyoming Board of Control. 1998. Hydrographers annual report. Water Division II.
Sheridan, WY.
Wyoming Department of Environmental Quality. 1989. Surface water quality assurance project
plan. Water Quality Division. Cheyenne. 40pp.
Wyoming Department of Environmental Quality. 1993. Water Quality Rules and Regulations
Chapter VIII, Quality standards for Wyoming groundwaters. Cheyenne, WY.
Wyoming Department of Environmental Quality. 1996. Wyoming water quality assessment.
Volumes 1 and 2. Wyoming Department of Environmental Quality Water Quality Division.
Cheyenne, WY.
Wyoming Department of Environmental Quality. 1998. Water Quality Rules and Regulations
Chapter 1, Quality standards for Wyoming surface waters. Cheyenne, WY.
Wyoming Department of Environmental Quality. 2000. Water quality rules and regulations
Chapter 1, Wyoming surface water quality standards. Proposed rules before the Environmental
Quality Council. Cheyenne, WY.
Wyoming Game and Fish Department. 1958. A fisheries survey of lakes and streams in the
Tongue River drainage. Fisheries Technical Report No. 12. Wyoming Game and Fish
Commission. Cheyenne, WY.
Wyoming Game and Fish Department. 1991. Wyoming trout stream classification map.
Wyoming Game and Fish Department. Cheyenne, WY.
Wyoming Water Development Commission. 2000. 1998 water system survey report.
Wyoming Water Development Commission. Cheyenne, WY.