commercial trucking fees - Wyoming Legislature
180
-
Upload
khangminh22 -
Category
Documents
-
view
2 -
download
0
Transcript of commercial trucking fees - Wyoming Legislature


COMMERCIAL TRUCKING FEES
COMMERCIAL VEHICLES OVERSIZE/OVERWEIGHT LIMITS
Page 1 of 3
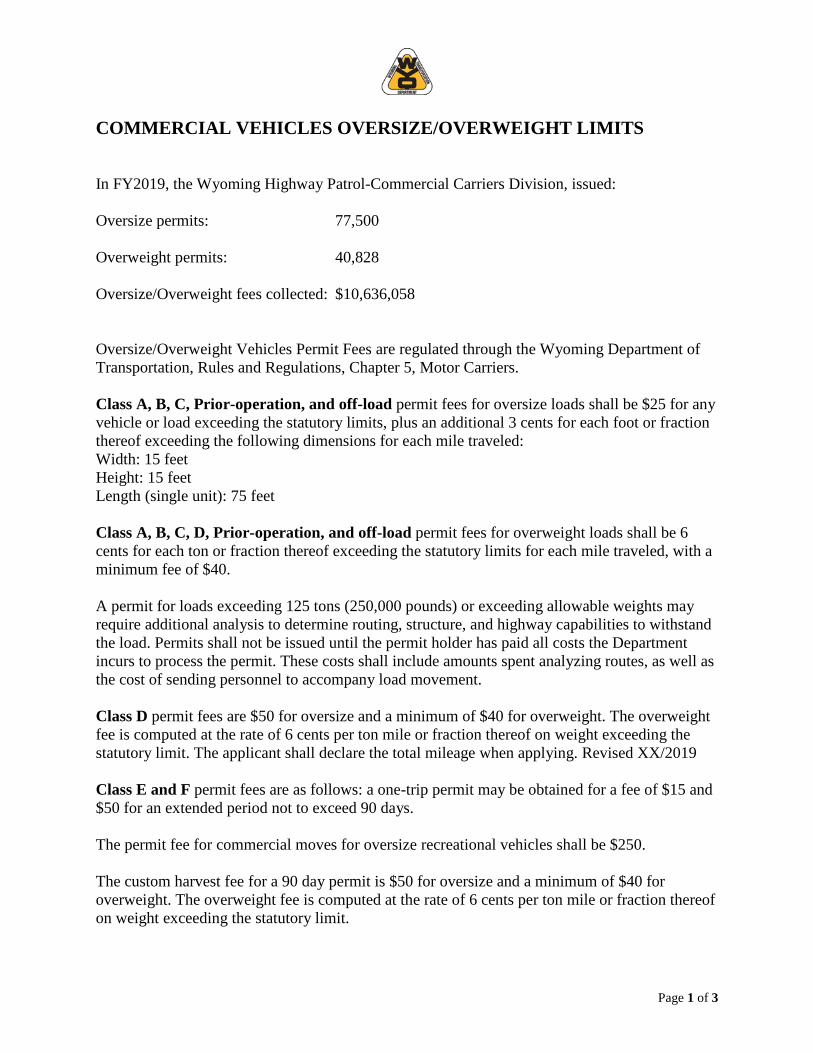
In FY2019, the Wyoming Highway Patrol-Commercial Carriers Division, issued: Oversize permits: 77,500 Overweight permits: 40,828 Oversize/Overweight fees collected: $10,636,058 Oversize/Overweight Vehicles Permit Fees are regulated through the Wyoming Department of Transportation, Rules and Regulations, Chapter 5, Motor Carriers. Class A, B, C, Prior-operation, and off-load permit fees for oversize loads shall be $25 for any vehicle or load exceeding the statutory limits, plus an additional 3 cents for each foot or fraction thereof exceeding the following dimensions for each mile traveled: Width: 15 feet Height: 15 feet Length (single unit): 75 feet Class A, B, C, D, Prior-operation, and off-load permit fees for overweight loads shall be 6 cents for each ton or fraction thereof exceeding the statutory limits for each mile traveled, with a minimum fee of $40. A permit for loads exceeding 125 tons (250,000 pounds) or exceeding allowable weights may require additional analysis to determine routing, structure, and highway capabilities to withstand the load. Permits shall not be issued until the permit holder has paid all costs the Department incurs to process the permit. These costs shall include amounts spent analyzing routes, as well as the cost of sending personnel to accompany load movement. Class D permit fees are $50 for oversize and a minimum of $40 for overweight. The overweight fee is computed at the rate of 6 cents per ton mile or fraction thereof on weight exceeding the statutory limit. The applicant shall declare the total mileage when applying. Revised XX/2019 Class E and F permit fees are as follows: a one-trip permit may be obtained for a fee of $15 and $50 for an extended period not to exceed 90 days. The permit fee for commercial moves for oversize recreational vehicles shall be $250. The custom harvest fee for a 90 day permit is $50 for oversize and a minimum of $40 for overweight. The overweight fee is computed at the rate of 6 cents per ton mile or fraction thereof on weight exceeding the statutory limit.

COMMERCIAL VEHICLES OVERSIZE/OVERWEIGHT LIMITS
Page 2 of 3
Permit Class Definition. Class A permits (Super Loads) authorize separate movements of non-divisible loads exceeding Class B or Class C limits. Class A permits shall be approved ONLY by the Overweight Loads Office, and are issued by permit-issuing authorities. Loads exceeding 18 feet wide or 18 feet high require a minimum of 24-hour prior notification by the carrier. Movements that are delayed shall notify the Overweight Loads Office. Class A permits are subject to any conditions or restrictions imposed. Class B permits authorize separate movements of non-divisible loads not exceeding Class B weight and length limits listed in Wyoming Statute 31-18-804. Class C permits are self-issuing permits that authorize separate movements of non-divisible loads not exceeding Class C limits. The Overweight Loads Office approves and issues Class C permits to qualified residents of Wyoming. The self-issuing permit holder shall complete a separate Class C permit before each separate move. Instructions for Class C permits are explained in Section 15. Class D permits are extended period permits authorizing multiple movements of vehicles without loads or with a non-divisible load or vehicle that does not exceed the Class D limits. Class D permits are approved for specified vehicles and loads, routes, and time periods. Class D permits shall be issued as explained in Section 17. Class E permits are oversize permits for separate movements or extended periods of movement. Class E permits are effective for one or more months (not to exceed 90 days) to permit hauling forest products, baled hay or corn stalks, or combine headers. Class E permits shall be issued as explained in Section 19. Class F permits are overweight permits for separate movements or extended periods of movement. Class F permits are effective for one or more months (not to exceed 90 days) to permit hauling of forest products, sugar beets, gravel, livestock, and agricultural products in trucks that cannot be weighed at the point of loading on primary and secondary highways ONLY. Class F permits will be issued as explained in Section 19. Class W permits are for multi-piece loads exceeding 117,000 pounds on primary and secondary highways ONLY. Class W permits will be issued as explained in Section 20. Off-load permits are for vehicles or loads exceeding statutory size and/or weight limits that cannot be safely reduced at the location where the violation was discovered. (Please see W.S. 31-18-805[b].) These permits shall not exceed Class B limits without the Overweight Loads Office authority. Off-load permits shall be issued as explained in Section 5, Statutory and Administrative Exemptions.

COMMERCIAL VEHICLES OVERSIZE/OVERWEIGHT LIMITS
Page 3 of 3
Secondary tow permits for weight shall be issued as explained in following Section 5, Statutory and Administrative Exemptions. Emergency relief permits are oversize and/or overweight permits for separate movements or extended periods of movement. Emergency relief permits are issued when the Governor or the director has determined that greater vehicle weight or size will relieve an economic hardship or benefit the general welfare of the state of Wyoming or another state. Emergency relief permits shall be issued as explained in Section 24. Prior-operation permits are issued for unauthorized, non-permitted, and/or size and weight violations for exceeding statutory or permit limits.

HIGHWAY SYSTEM

Executive Summary to compare the Reason Foundation 24th Annual Highway Report to
WYDOT’s performance measures
Background Civil Engineering Professor Dr. David T. Hartgen began issuing studies on the condition and cost-
effectiveness of state-owned highway systems periodically in 1984. It is important to note that
these reports are not necessarily issued annually even though they are called “annual studies.” The
data also runs behind, so, for instance, the data for the recent report dated August 2019 is from
2016. The information comes from reports that state departments of transportation (DOTs)
provide to the Federal Highway Administration (FHWA) through the Highway Performance
Monitoring System (HPMS) and to the National Highway Traffic Safety Administration (NHTSA)
through the Fatality Analysis Reporting System (FARS). These data elements are then analyzed
further to facilitate rankings. Some of the congestion information comes from INRIX, a private
firm that studies congestion for private and public sector customers including Google and some
state DOTs. The congestion calculation quantities found in the report are quite complex and
probably not meaningful outside large metropolitan areas with observable congestion issues.
For much of the time, Dr. Hartgen was a professor at the University of North Carolina at Charlotte.
Later, the studies moved to the Reason Foundation, a “think tank” that frequently makes
transportation policy recommendations. Dr. Hartgen no longer writes the reports.
Rankings Following are Wyoming’s overall recent rankings among the 50 states.
1998 2nd
2000 1st
2003 2nd
2004 10th
2005 7th
2006 4th
2007 6th
2008 7th
2009 3rd
2014 1st
2016 8th
2018 8th
2019 11th
In the latest study, Wyoming ranks 11th in the nation in overall state highway performance and
cost-effectiveness, falling three spots from the previous report. Wyoming’s ranking for the
specific categories in the 2019 report follow:

The Performance of State Highway Systems Studies
Page 2
*WYDOT values encompass all interstate pavements and are not broken out by rural and urban. 2016 Reason Foundation
Values are based only on ride quality while WYDOT values consider ride quality, rutting, and cracking.
**WYDOT’s comparable value is non-interstate National Highway System (NHS). WYDOT does not distinguish by arterial
classification, which includes non-NHS arterials, such as WY 789 from Creston Jct. to Baggs or WY 28 from Farson to US
287. Again, WYDOT does not separate by rural and urban pavements on the non-interstate NHS pavement conditions.
Discussion
Unlike the report’s snapshot approach, WYDOT typically uses a 5-year rolling average to measure
fatality categories. This technique helps avoid overemphasizing one-year outliers and focus on true
patterns and trends. As the report indicates, “[t]he . . . fatality rate has increased over the last several
years after a decades-long downward trend. While there is no one cause, distracted driving appears to
be the biggest contributor.” In Wyoming, the fatality rate plummeted in 2013, before rising in 2014 and
2015, dropping sharply in 2016, and rebounding in the years since. While looking at any individual year
might provide a sense of relief or caution, the overall trend is pointing upward, and WYDOT is working
Measures
Reason
Foundation
Ranking
Reason
Foundation
Results
WYDOT
Results
WYDOT
Targets
Pavement Condition (%rated poor)
Rural Interstate 24th 1.24% 0.4% - 2017* <5%
Urban Interstate 34th 5.66% 0.4% - 2017* <5%
Rural Arterial 8th 0.41% 1.1% - 2017** <10%
Urban Arterial 24th 10.38% 1.1% - 2017** <10%
Structurally Deficient Bridges (% rated poor)
Structurally Deficient
Bridges 33rd 9.91%
10.7 - 2016
8.1 - 2017 Poor<10%
Fatality Rate (per million vehicle miles traveled)
Overall 26th 1.20
1.55 - 2016
1.2 - 2017 1.4
Rural 30th 1.44 N/A N/A
Urban 39th 1.03 N/A N/A
Congestion (calculated at 7.25 hours) Reliability
(% person-miles traveled reliably)
Urbanized Area
Congestion 1st 0% 100% 96%>=
Disbursements (per mile)
Total Highway
Disbursements 8th $30,441
Capital and Bridge
Disbursements 9th $18,529
Administrative
Disbursement 17th $3,004
Maintenance
Disbursements 13th $6,413

The Performance of State Highway Systems Studies
Page 3
to address this situation by considering countermeasures to reduce distraction, speeding, impaired
driving, and lack of seatbelt use.
Over the last 20 years, WYDOT funding has been impacted by de-earmarking of state mineral severance
and royalty payments (an $874 million loss since 2002) and reduced, then eliminated, general funds to
the department (which in the mid-2000s represented about 25 percent of WYDOT’s transportation
improvement budget). Federal funding has also been stagnant since the mid-2000s when the highway
trust fund stopped experiencing an annual surplus. The 10-cent fuel tax increase in 2013 and increased
registration fees in 2017 have partially offset these losses, but certainly have not made the
department whole.
In the early 2000s, WYDOT inherited responsibility for WyoLink, the state’s interoperable emergency
communications system. A significant portion of the $125 million spent to date to construct and operate
this system has come from department funds, which has further reduced WYDOT’s ability to maintain
and improve physical highway assets.
Because of these funding impacts, WYDOT has shifted its focus from reconstruction and capital
improvements to pavement preservation and has used its asset management system to ease the effects of
insufficient funding. This preservation measure is a stopgap and cannot be maintained over the long-
term as an effective solution. Prolonged Preservation Strategy is listed as an identified risk in the 2018
Transportation Asset Management Plan.
As Wyoming’s rankings since 2014 (using 2012 data) indicate, the cumulative effects to the
transportation system of inadequate funding (currently estimated to be $135.6 million a year
department-wide) cannot be postponed indefinitely.
WYDOT is currently reviewing reduced revenue forecasts and refining its goals to better align and refine
its mission with available resources. Funding restraints have the potential to affect Wyoming’s ranking
adversely by lowering disbursements per mile and reducing pavement condition ratings, especially on
non-interstate routes.
Overall, surrounding states rank as follows in comparison to Wyoming’s 11th: Colorado, 36th; Nebraska,
15th; South Dakota, 14th; Montana, 8th; Idaho, 13th; and Utah, 9th.
Conclusions
The information and measurements used in the Reason study do not completely align with WYDOT’s
current performance measurement goals or measurement protocol. WYDOT Performance Measures
instead align with the FHWA-established performance measures and nationally established goals.
While the studies’ methodology and rankings have been questioned by some, the reports are frequently
cited to demonstrate state DOT performance and efficiency relative to funding. As an example, Alvarez
and Marshall cited the 2018 study in a 2019 report prepared for the Management Council of the

The Performance of State Highway Systems Studies
Page 4
Wyoming Legislature. The studies will remain a vital resource for those seeking a barometer for state
highway systems and state department of transportation performance.
The next report, which is expected to be issued in the next couple of years and use 2018 data, will likely
show a continued erosion in Wyoming’s ranking.
24TH ANNUAL HIGHWAY REPORT by Baruch Feigenbaum, M. Gregory Fields, Ph.D., and Spence Purnell August 2019

Reason Foundation’s mission is to advance a free society by developing, applying and promoting libertarian principles, including individual liberty, free markets and the rule of law. We use journalism and public policy research to influence the frameworks and actions of policymakers, journalists and opinion leaders.
Reason Foundation’s nonpartisan public policy research promotes choice, competition and a dynamic market economy as the foundation for human dignity and progress. Reason produces rigorous, peer-reviewed research and directly engages the policy process, seeking strategies that emphasize cooperation, flexibility, local knowledge and results. Through practical and innovative approaches to complex problems, Reason seeks to change the way people think about issues, and promote policies that allow and encourage individuals and voluntary institutions to flourish.
Reason Foundation is a tax-exempt research and education organization as defined under IRS code 501(c)(3). Reason Foundation is supported by voluntary contributions from individuals, foundations and corporations. The views are those of the author, not necessarily those of Reason Foundation or its trustees.

24th ANNUAL HIGHWAY REPORT
Feigenbaum, Fields and Purnell
i
EXECUTIVE SUMMARY Reason Foundation’s Annual Highway Report has tracked the performance of the 50 state-owned highway systems from 1984 to 2016. The 24th Annual Highway Report ranks the performance of state highway systems in 2016, with congestion and bridge condition data from 2017. Each state’s overall rating is determined by rankings in 13 categories, including highway expenditures per mile, Interstate and primary road pavement conditions, urbanized area congestion, bridge conditions and fatality rates. The study is based on spending and performance data state highway agencies submitted to the federal government. This study also reviews changes in highway performance over the past year. Although individual state highway sections (roads, bridges, pavements) steadily deteriorate over time due to age, traffic and weather, they are improved by maintenance and reconstruction. As a result, system performance can improve even as individual roads and bridges deteriorate. Table ES1 summarizes recent system trends for key indicators. Despite a decades-long trend of steady, incremental improvement, from 2013 to 2016, the overall condition of the total system has worsened. The four disbursement measures for the U.S. state-owned highway system improved between 2015 and 2016 (states expended fewer dollars on their highway systems in 2016 than in 2015). However, six of the eight performance measures worsened, including all of the pavement rankings and all three fatality rate rankings. The significant increase in the fatality rate is particularly troubling. The structurally deficient bridges ranking improved significantly (a smaller percentage of bridges is structurally deficient) and urbanized area congestion improved slightly. The Urban Other Principal Arterial ranking is new to this year’s report. States do not need to engage in a spending bonanza to improve their systems. But there is some evidence that a small increase in spending could yield a significantly better system.

24TH ANNUAL HIGHWAY REPORT
Feigenbaum, Fields and Purnell | 24th Annual Highway Report
ii
TABLE ES1: PERFORMANCE OF STATE-OWNED HIGHWAYS, 2012-2015 Statistic 2013 2015 2016 Percent Change
2013 –2016
2015–2016
Mileage Under State Control (Thousands) 815,024 814,154 836,775 2.67 2.78
Total Disbursements per Lane Mile, $ 160,997 178,116 171,025 6.22 -3.98
Disbursements per Mile, Capital/Bridges, $ 84,494 91,992 88,212 4.40 -4.10
Disbursements per Mile, Maintenance, $ 25,996 28,020 28,687 10.35 -2.38
Disbursements per Mile, Administration, $ 9,980 10,864 10,825 8.47 -0.36
Consumer Price Index (1983=1.00) 233.0 237.0 240.0 3.00 1.27
Rural Interstate, Percent Poor Condition 2.00 1.85 1.96 -2.00 5.95
Urban Interstate, Percent Poor Condition 5.37 5.02 5.18 -3.54 3.19
Rural Other Principal Arterial, Percent Poor Condition
1.27 1.35 1.36 7.09 0.74
Urban Other Principal Arterial, Percent Poor Condition*
N/A N/A 13.97 N/A N/A
Urbanized Area Congestion** N/A 34.95 34.77 N/A -0.52
Structurally Deficient Bridges, Poor Condition
9.60 9.10 8.86 -7.71 -2.64
Fatality Rate per 100 Million Vehicle-Miles All Roadways
1.10 1.13 1.18 7.27 4.42
Rural Fatality Rate per 100 Million Vehicle-Miles, All Arterials***
1.30 1.58 1.71 31.54 8.23
Urban Fatality Rate per 100 Million Vehicle-Miles, All Arterials***
0.67 0.70 0.77 14.93 10.00
* Urban Other Principal Arterial Condition was first measured in 2016.
** 2015 and 2016 used “peak hours spent in congestion” in 2015 and in 2016. 2013 used a different metric that is not listed because it is not comparable.
*** Rural Fatality Rate per 100 Million Vehicle-Miles, All Arterials and Urban Fatality Rate per 100 million Vehicle-Miles, All Arterials use 2014 data instead of 2013 data.

24th ANNUAL HIGHWAY REPORT
Feigenbaum, Fields and Purnell
iii
FIGURE ES1: TRENDS IN HIGHWAY SYSTEM PERFORMANCE, 2007–2017
0.50
0.70
0.90
1.10
1.30
1.50
1.70
1.90
2.10
2.30
2007 2008 2009 2010 2011 2012 2013 2014 2015 2016 2017
Ratio
Total Disbursements Percent Rural Interstate Poor Mileage*
Percent Urban Interstate Poor Mileage* Percent Rural Arterial Poor Mileage*
Percent Urban Arterial Poor Mileage*** Urban Congestion Annual Peak Hours ****
Structurally Deficient Bridges Overall Fatality Rate
Rural Fatality Rate** Urban Fatality Rate**
Capital/Bridge Disbursements Maintenance Disbursements
Administrative Disbursements
WORSE
↑
↓BETTER
* Data for Pavement Condition is not included for 2010 ** Data for Rural Fatality Rate and Urban Fatality Rate starts in 2014 *** Data for Percent Urban Arterial Miles starts in 2016 **** Data for Urban Congestion Annual Peak Hours starts in 2016. The previous measure of congestion is not comparable.
24TH ANNUAL HIGHWAY REPORT
Feigenbaum, Fields and Purnell | 24th Annual Highway Report
iv
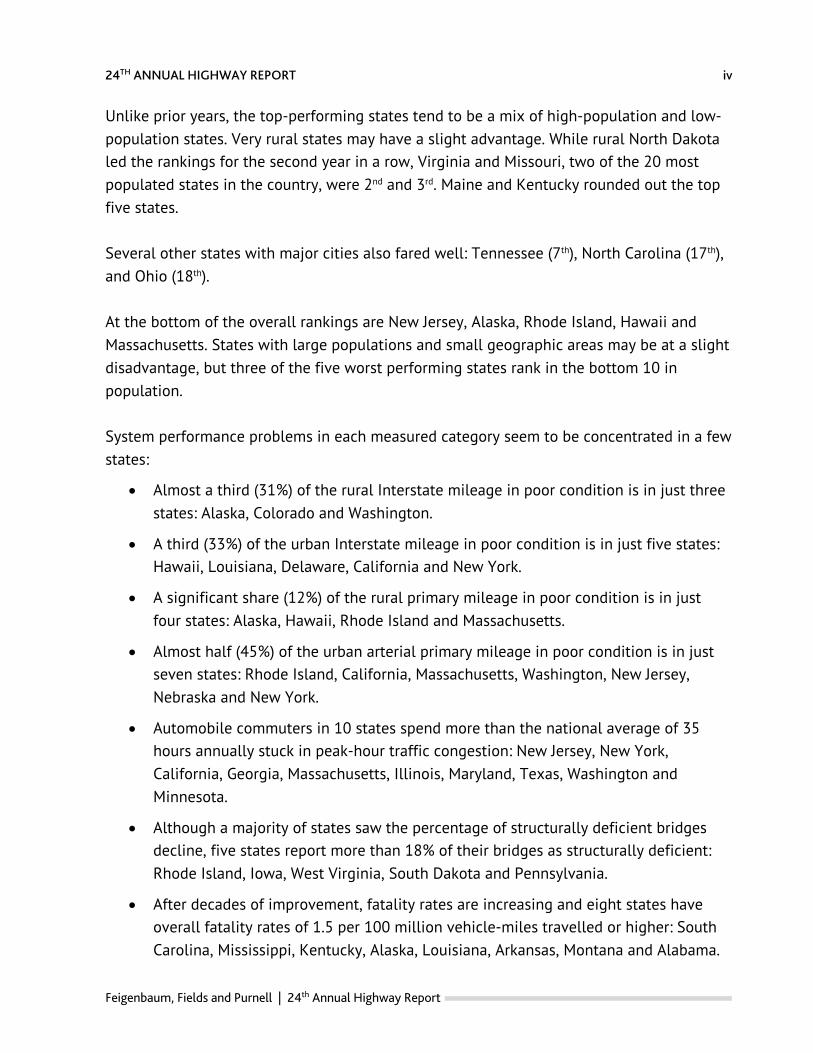
Unlike prior years, the top-performing states tend to be a mix of high-population and low-population states. Very rural states may have a slight advantage. While rural North Dakota led the rankings for the second year in a row, Virginia and Missouri, two of the 20 most populated states in the country, were 2nd and 3rd. Maine and Kentucky rounded out the top five states. Several other states with major cities also fared well: Tennessee (7th), North Carolina (17th), and Ohio (18th). At the bottom of the overall rankings are New Jersey, Alaska, Rhode Island, Hawaii and Massachusetts. States with large populations and small geographic areas may be at a slight disadvantage, but three of the five worst performing states rank in the bottom 10 in population. System performance problems in each measured category seem to be concentrated in a few states:
• Almost a third (31%) of the rural Interstate mileage in poor condition is in just three states: Alaska, Colorado and Washington.
• A third (33%) of the urban Interstate mileage in poor condition is in just five states: Hawaii, Louisiana, Delaware, California and New York.
• A significant share (12%) of the rural primary mileage in poor condition is in just four states: Alaska, Hawaii, Rhode Island and Massachusetts.
• Almost half (45%) of the urban arterial primary mileage in poor condition is in just seven states: Rhode Island, California, Massachusetts, Washington, New Jersey, Nebraska and New York.
• Automobile commuters in 10 states spend more than the national average of 35 hours annually stuck in peak-hour traffic congestion: New Jersey, New York, California, Georgia, Massachusetts, Illinois, Maryland, Texas, Washington and Minnesota.
• Although a majority of states saw the percentage of structurally deficient bridges decline, five states report more than 18% of their bridges as structurally deficient: Rhode Island, Iowa, West Virginia, South Dakota and Pennsylvania.
• After decades of improvement, fatality rates are increasing and eight states have overall fatality rates of 1.5 per 100 million vehicle-miles travelled or higher: South Carolina, Mississippi, Kentucky, Alaska, Louisiana, Arkansas, Montana and Alabama.

24th ANNUAL HIGHWAY REPORT
Feigenbaum, Fields and Purnell
v
• After decades of improvement, rural fatality rates are increasing and nine states have rural fatality rates of 2.0 per 100 million vehicle-miles traveled or higher: Hawaii, North Carolina, Florida, California, Mississippi, New York, Kansas, South Carolina and Oregon.
• After decades of improvement, urban fatality rates are increasing and 13 states have urban fatality rates of 1.0 per 100 million vehicle-miles traveled or higher: New Mexico, Arizona, Hawaii, Florida, Arkansas, Kentucky, South Carolina, Louisiana, Oklahoma, Alaska, Tennessee, Wyoming and Nevada.
While system performance is down overall this year, nearly half of the states (21 of 50) made progress in 2016 compared to 2015. However, a 10-year average of state overall performance data indicates that system performance problems are concentrated in the bottom 10 states. These states are finding it difficult to improve. There is also increasing evidence that higher-level road systems (Interstates, other freeways and principal arterials) are in better shape than lower-level road systems, particularly local roads.
24TH ANNUAL HIGHWAY REPORT
Feigenbaum, Fields and Purnell | 24th Annual Highway Report
vi
TABLE OF CONTENTS
PART 1: STATE HIGHWAY PERFORMANCE RANKINGS .................................................................. 1
PART 2: METHODOLOGICAL CHANGES .......................................................................................... 11
PART 3: BACKGROUND DATA ......................................................................................................... 14 STATE-CONTROLLED MILES .......................................................................................................... 15 STATE HIGHWAY AGENCY (SHA) MILES ..................................................................................... 16
PART 4: PERFORMANCE INDICATORS ........................................................................................... 17 CAPITAL AND BRIDGE DISBURSEMENTS .................................................................................. 18 MAINTENANCE DISBURSEMENTS ................................................................................................ 20 ADMINISTRATIVE DISBURSEMENTS ........................................................................................... 22 TOTAL DISBURSEMENTS ................................................................................................................. 25 RURAL INTERSTATE PAVEMENT CONDITION ......................................................................... 27 URBAN INTERSTATE PAVEMENT CONDITION ......................................................................... 29 RURAL OTHER PRINCIPAL ARTERIAL PAVEMENT CONDITION ........................................ 31 URBAN OTHER PRINCIPAL ARTERIAL PAVEMENT CONDITION ........................................ 33 URBANIZED AREA CONGESTION .................................................................................................. 35 STRUCTURALLY DEFICIENT BRIDGES ........................................................................................ 38 OVERALL FATALITY RATE ............................................................................................................... 40 RURAL FATALITY RATE .................................................................................................................... 42 URBAN FATALITY RATE ................................................................................................................... 44
ABOUT THE AUTHORS ................................................................................................................................. 46
APPENDIX: TECHNICAL NOTES .................................................................................................................. 48 MEASURES OF MILEAGE .................................................................................................................. 49 DISBURSEMENTS FOR STATE-OWNED HIGHWAYS ............................................................... 49 MEASURES OF SYSTEM CONDITION ........................................................................................... 51 OVERALL RATINGS ............................................................................................................................ 55
ENDNOTES .................................................................................................................................................... 56

24TH ANNUAL HIGHWAY REPORT
Feigenbaum, Fields and Purnell
1
STATE HIGHWAY PERFORMANCE RANKINGS The Reason 24th Annual Highway Report rates state highway systems on cost versus quality using a method developed in the early 1990s by David T. Hartgen, Ph.D., emeritus professor at the University of North Carolina at Charlotte. This method has since been refined by Hartgen, M. Gregory Fields, Ph.D., Baruch Feigenbaum, and Spence Purnell. Since states have different budgets, system sizes, and traffic and geographic circumstances, their comparative performance depends on both system performance and the resources available. To determine relative performance across the country, state highway system budgets (per mile of responsibility) are compared with system performance, state by state. States with high ratings typically have better-than-average system conditions (good for road users) along with relatively low per-mile expenditures (good for taxpayers). The following table shows the overall highway performance of the state highway systems using 2016 and 2017 data. This year’s leading states are North Dakota, Virginia, Missouri, Maine and Kentucky. At the other end of the rankings are Massachusetts, Hawaii, Rhode Island, Alaska and New Jersey.
PART 1

24TH ANNUAL HIGHWAY REPORT
Feigenbaum, Fields and Purnell | 24th Annual Highway Report
2
Unlike prior years, the top-performing states tend to be a mix of high-population and low-population states. Very rural states may have a slight advantage (Tables 1, 2, 3, 4, and Figure 1). But several states with large urban areas also rank highly: Virginia (2nd), Missouri (3rd), Tennessee (7th), North Carolina (17th), and Ohio (18th). Although it is tempting to ascribe these ratings solely to geographic circumstances, a more careful review suggests that numerous other factors—terrain, climate, truck volumes, urbanization, system age, budget priorities, unit cost differences, state budget circumstances and management/ maintenance philosophies, just to name a few—are all affecting overall performance. The remainder of this report reviews the statistics underlying these overall ratings in more detail.
TABLE 1: OVERALL HIGHWAY PERFORMANCE RANKINGS, 2016 Overall State 1 North Dakota 2 Virginia 3 Missouri 4 Maine 5 Kentucky 6 Kansas 7 Tennessee 8 Montana 9 Utah 10 Alabama 11 Wyoming 12 Oregon 13 Idaho 14 South Dakota 15 Nebraska 16 West Virginia 17 North Carolina 18 Ohio 19 Vermont 20 South Carolina 21 New Mexico 22 Minnesota 23 Texas 24 New Hampshire 25 Mississippi 26 Georgia 27 Nevada 28 Illinois 29 Arizona 30 Michigan 31 Iowa 32 Arkansas 33 Indiana 34 Louisiana 35 Pennsylvania 36 Colorado 37 Washington 38 Wisconsin 39 Maryland 40 Florida 41 Oklahoma 42 Delaware 43 California 44 Connecticut 45 New York 46 Massachusetts 47 Hawaii 48 Rhode Island 49 Alaska 50 New Jersey

24th ANNUAL HIGHWAY REPORT
Feigenbaum, Fields and Purnell
3
TABLE 2: OVERALL HIGHWAY PERFORMANCE RANKINGS IN ALPHABETICAL ORDER, 2016 State Overall Alabama 10 Alaska 49 Arizona 29 Arkansas 32 California 43 Colorado 36 Connecticut 44 Delaware 42 Florida 40 Georgia 26 Hawaii 47 Idaho 13 Illinois 28 Indiana 33 Iowa 31 Kansas 6 Kentucky 5 Louisiana 34 Maine 4 Maryland 39 Massachusetts 46 Michigan 30 Minnesota 22 Mississippi 25 Missouri 3 Montana 8 Nebraska 15 Nevada 27 New Hampshire 24 New Jersey 50 New Mexico 21 New York 45 North Carolina 17 North Dakota 1 Ohio 18 Oklahoma 41 Oregon 12 Pennsylvania 35 Rhode Island 48 South Carolina 20 South Dakota 14 Tennessee 7 Texas 23 Utah 9 Vermont 19 Virginia 2 Washington 37 West Virginia 16 Wisconsin 38 Wyoming 11

24TH ANNUAL HIGHWAY REPORT
Feigenbaum, Fields and Purnell | 24th Annual Highway Report
4
TABLE 3: HIGHWAY PERFORMANCE RANKINGS BY CATEGORY, 2016 State
Ove
rall
Tota
l Dis
burs
emen
ts
per M
ile
Capi
tal &
Brid
ge
Dis
burs
emen
ts p
er
Mile
Mai
nten
ance
D
isbu
rsem
ents
per
M
ile
Adm
in
Dis
burs
emen
ts
per M
ile
Rura
l Int
erst
ate
Pa
vem
ent C
ondi
tion
Urb
an In
ters
tate
Pa
vem
ent C
ondi
tion
Rura
l Art
eria
l Pa
vem
ent C
ondi
tion
Urb
an A
rter
ial
Pave
men
t Co
nditi
on
Urb
aniz
ed A
rea
Co
nges
tion
Stru
ctur
ally
D
efic
ien t
Brid
ges
Ove
rall
Fata
lity
Ra
te
Rura
l Fat
ality
Ra
te
Urb
an F
atal
ity
Rate
Alabama 10 16 16 2 35 16 30 12 2 18 22 43 40 36 Alaska 49 29 41 30 32 48 19 50 19 6 36 47 37 41 Arizona 29 32 35 14 42 29 6 17 17 36 4 40 36 49 Arkansas 32 10 12 11 3 40 44 44 38 13 17 45 39 46 California 43 40 30 44 44 45 47 35 49 48 19 18 47 21 Colorado 36 33 34 32 27 47 28 27 33 37 13 23 33 32 Connecticut 44 46 47 33 50 42 18 34 22 30 24 11 4 26 Delaware 42 43 28 49 49 NA 48 1 13 38 6 24 19 29 Florida 40 49 49 41 37 6 5 2 1 40 3 42 48 47 Georgia 26 22 30 15 41 30 21 14 4 47 7 31 28 35 Hawaii 47 41 42 39 34 NA 50 48 39 19 15 21 50 48 Idaho 13 23 11 17 13 26 14 20 25 11 28 41 41 24 Illinois 28 42 46 35 22 8 4 3 16 45 26 16 15 27 Indiana 33 30 36 42 21 43 43 32 21 27 21 14 29 18 Iowa 31 20 29 19 15 33 36 43 30 3 49 27 21 16 Kansas 6 19 24 10 16 7 9 4 7 16 25 33 44 37 Kentucky 5 18 18 16 1 12 16 10 8 25 23 48 23 45 Louisiana 34 17 21 24 6 39 49 38 37 29 44 46 16 43 Maine 4 15 10 28 5 1 26 7 27 7 41 20 11 10 Maryland 39 44 44 45 36 27 39 21 34 44 14 7 3 23 Massachusetts 46 48 45 43 48 37 31 47 48 46 30 1 1 12 Michigan 30 38 27 27 25 34 42 19 41 34 35 19 7 30 Minnesota 22 25 31 29 23 35 40 25 6 41 11 3 6 4 Mississippi 25 9 15 4 14 38 37 24 29 12 39 49 46 1 Missouri 3 3 2 12 4 17 17 5 14 24 40 32 24 33 Montana 8 7 8 8 12 19 13 31 32 5 31 44 35 11 Nebraska 15 13 14 23 2 18 24 29 45 8 45 17 25 8 Nevada 27 34 32 22 45 13 25 26 5 33 2 29 32 38 New Hampshire 24 24 22 37 26 1 7 36 23 26 38 15 18 25 New Jersey 50 50 50 50 46 1 45 46 46 50 29 4 10 22 New Mexico 21 6 4 1 39 25 3 22 20 14 20 39 34 50 New York 45 47 48 47 43 41 46 30 44 49 37 5 45 5 North Carolina 17 5 6 9 10 20 15 23 18 23 34 30 49 13 North Dakota 1 11 25 3 8 9 1 15 28 4 43 22 22 2 Ohio 18 28 39 21 19 31 29 18 35 28 18 13 5 15 Oklahoma 41 37 33 46 38 36 41 37 40 15 42 38 26 42 Oregon 12 21 13 25 31 15 23 9 15 17 12 34 42 19 Pennsylvania 35 39 38 34 28 32 32 41 31 35 46 25 20 28 Rhode Island 48 45 43 48 47 1 10 49 50 31 50 2 2 14 South Carolina 20 1 1 5 7 28 27 42 9 21 32 50 43 44 South Dakota 14 4 5 6 18 23 8 33 42 9 47 28 14 9 Tennessee 7 14 19 18 24 11 12 16 11 32 8 35 17 40 Texas 23 27 26 26 22 22 33 13 36 43 1 37 38 34 Utah 9 31 17 40 29 10 11 11 3 20 5 9 31 17 Vermont 19 26 23 38 40 1 1 39 26 10 10 6 8 3 Virginia 2 12 7 31 20 14 22 6 12 39 16 10 12 6 Washington 37 35 37 36 30 46 38 28 47 42 9 8 9 20 West Virginia 16 2 3 7 9 21 20 40 10 2 48 36 27 31 Wisconsin 38 36 40 20 33 44 35 45 43 22 27 12 13 7 Wyoming 11 8 9 13 17 24 34 8 24 1 33 26 30 39

24th ANNUAL HIGHWAY REPORT
Feigenbaum, Fields and Purnell
5
TABLE 4: OVERALL HIGHWAY PERFORMANCE RANKING TRENDS, 2013-2016 State Year Change in Rank
2013 2015 2016 2015-2016 2013-2016 Alabama 20 17 10 +7 +10 Alaska 50 48 49 -1 +1 Arizona 24 16 29 -13 -5 Arkansas 33 29 32 -3 +1 California 42 42 43 -1 -1 Colorado 35 31 36 -5 -1 Connecticut 44 46 44 +2 0 Delaware 37 19 42 -23 -5 Florida 32 35 40 -5 -8 Georgia 21 18 26 -8 -5 Hawaii 48 47 47 0 +1 Idaho 16 7 13 -6 +3 Illinois 29 28 28 0 +1 Indiana 36 34 33 +1 +3 Iowa 40 15 31 -16 +9 Kansas 3 2 6 -4 -3 Kentucky 14 13 5 +8 +9 Louisiana 34 37 34 +3 0 Maine 5 23 4 +19 +1 Maryland 38 40 39 +1 -1 Massachusetts 46 44 46 -2 0 Michigan 31 32 30 +2 +1 Minnesota 27 25 22 +3 +5 Mississippi 10 11 25 -14 -15 Missouri 12 9 3 +6 +9 Montana 6 6 8 -2 -2 Nebraska 4 4 15 -11 -11 Nevada 22 20 27 -7 -5 New Hampshire 26 30 24 +6 +2 New Jersey 49 50 50 0 -1 New Mexico 11 24 21 +3 -10 New York 45 45 45 0 0 North Carolina 15 14 17 -3 -2 North Dakota 7 1 1 0 +6 Ohio 9 26 18 +6 -9 Oklahoma 17 33 41 -8 -24 Oregon 23 21 12 +9 +11 Pennsylvania 39 41 35 +6 +4 Rhode Island 47 49 48 +1 -1 South Carolina 1 5 20 -15 -19 South Dakota 2 3 14 -11 -12 Tennessee 18 12 7 +5 +11 Texas 19 22 23 -1 -4 Utah 13 10 9 +1 +4 Vermont 41 39 19 +20 +22 Virginia 30 27 2 +25 +28 Washington 43 43 37 +6 +6 West Virginia 25 36 16 +20 +9 Wisconsin 28 38 38 0 -10 Wyoming 8 8 11 -3 -3

24TH ANNUAL HIGHWAY REPORT
Feigenbaum, Fields and Purnell | 24th Annual Highway Report
6
FIGURE 1: OVERALL HIGHWAY PERFORMANCE RANK, 2007–2017
0.50
0.70
0.90
1.10
1.30
1.50
1.70
1.90
2.10
2.30
2007 2008 2009 2010 2011 2012 2013 2014 2015 2016 2017
Ratio
Total Disbursements Percent Rural Interstate Poor Mileage*
Percent Urban Interstate Poor Mileage* Percent Rural Arterial Poor Mileage*
Percent Urban Arterial Poor Mileage*** Urban Congestion Annual Peak Hours ****
Structurally Deficient Bridges Overall Fatality Rate
Rural Fatality Rate** Urban Fatality Rate**
Capital/Bridge Disbursements Maintenance Disbursements
Administrative Disbursements
WORSE
↑
↓BETTER
* Data for Pavement Condition is not included for 2010 ** Data for Rural Fatality Rate and Urban Fatality Rate starts in 2014 *** Data for Percent Urban Arterial Miles starts in 2016 **** Data for Urban Congestion Annual Peak Hours starts in 2016. The previous measure of congestion is not comparable.

24th ANNUAL HIGHWAY REPORT
Feigenbaum, Fields and Purnell
7
Despite the methodological changes, the overall rankings were not dramatically different from the previous version of the Annual Highway Report. However, four states’ overall ranking improved by double digits, while seven states’ overall ranking declined by 10 or more spots:
• Virginia improved 25 positions, from 27th to 2nd in the overall rankings, as the number of structurally deficient bridges decreased and the state benefited from the report no longer measuring narrow rural arterial lanes (the state ranked 49th last year).
• Vermont improved 20 positions, from 39th to 19th in the overall rankings, as the state benefited from the report’s increased emphasis on fatality rates (Vermont ranked 6th, 8th and 3rd in Overall Fatality Rate, Rural Fatality Rate and Urban Fatality Rate respectively) and the elimination of the Narrow Rural Arterial Lane ranking (the state ranked 47th last year).
• West Virginia improved 20 positions, from 36th to 16th in the overall rankings, as the fatality rate decreased somewhat and the state benefited from the report no longer measuring narrow rural arterial lanes (the state ranked 50th last year).
• Maine improved 19 positions, from 23rd to 4th in the overall rankings, as the state benefited from the report no longer measuring narrow rural arterial lanes (the state ranked 42nd last year). Maine’s previous ranking (using 2015 data) may have been an aberration as several years ago it ranked 5th (using 2013 data).
• Delaware declined 23 positions, from 19th to 42nd in the overall rankings, as disbursements increased significantly and urban Interstate pavement condition deteriorated significantly. Delaware’s previous ranking (using 2015 data) may have been an aberration as several years ago it ranked 37th (using 2013 data).
• Iowa declined 16 positions, from 15th to 31st in the overall rankings, as rural arterial pavement condition declined and the percentage of structurally deficient bridges increased. Iowa’s previous ranking (using 2015 data) may have been an aberration as several years ago it ranked 40th (using 2013 data).
• South Carolina declined 15 positions, from 5th to 20th in the overall rankings, as rural Interstate pavement condition and rural arterial pavement condition both declined significantly. The percentage of deficient bridges also increased significantly. South Carolina also has the highest fatality rate in the country for the second year in a row.

24TH ANNUAL HIGHWAY REPORT
Feigenbaum, Fields and Purnell | 24th Annual Highway Report
8
• Mississippi declined 14 positions, from 11th to 25th in the overall rankings, as rural Interstate pavement condition declined and the number of structurally deficient bridges increased substantially.
• Arizona declined 13 positions, from 16th to 29th in the overall rankings, as the state was negatively affected by the report’s increased emphasis on fatality rate (Arizona ranked 40th, 36th and 39th in Overall Fatality Rate, Rural Fatality Rate and Urban Fatality Rate) and elimination of the Narrow Rural Arterial Lanes category (Arizona ranked 1st last year). Arizona’s previous rankings (using 2015 data) may have been an aberration as several years ago it ranked 24th (using 2013 data).
• Nebraska declined 11 positions, from 4th to 15th in the overall rankings, as the state rankings worsened in many categories, with a significant increase in the percentage of structurally deficient bridges.
• South Dakota declined 11 positions, from 3rd to 14th in the overall rankings, as rural Interstate pavement condition and rural arterial pavement condition declined significantly. The percentage of structurally deficient bridges also increased significantly.

24th ANNUAL HIGHWAY REPORT
Feigenbaum, Fields and Purnell
9
Sample State Rankings
Determining a state’s overall ranking includes using data from 13 different categories. States that perform poorly overall often excel in one or more categories, and states that perform well often struggle in one or more categories. Legislative actions can significantly affect a state’s ranking. Finally, there is a lag in the data. As a result, states with a high-quality system today may have a lower ranking because they struggled when the data were compiled and vice versa. This text box provides a little more context on six of the states.
Georgia: Georgia has historically ranked in the top 20 of the Annual Highway Report but this year it slipped to 26th. While this may sound troubling, it reaffirms Georgia’s 2015 decision to revamp its transportation funding system. Prior to 2015, Georgia had county gasoline sales taxes that went to the county general fund instead of to the Department of Transportation for roadway funding. As part of the 2015 change, including the imposition of an electric vehicle fee, Georgia dedicated substantially more money to transportation with a minimal gas tax increase. Due to the lag in the data, Georgia’s numbers are expected to start improving with 2017 and 2018 data. The worsening of Georgia’s pavement conditions between 2012 and 2016 shows the importance of dedicating gas tax revenue to highways.
Virginia: Virginia ranks 2nd in this year’s Annual Highway Report, a significant increase from last year. The state is able to maintain smooth pavement conditions with low overall disbursements. Most states that rank in the top 20 are able to maintain a good quality system at a low overall cost. The state has also worked to significantly decrease its percentage of structurally deficient bridges. Virginia also benefited this year due to two changes in the metrics. Both the increased focus on fatality rate (the state typically has one of the lowest fatality rates outside the Northeast) and the elimination of the narrow arterial lanes category (Virginia ranked 49th last year) helped the state’s rankings. However, the state still has room for improvement. It’s urbanized area congestion ranking is 39th (or 12th worst). Virginia may need to dedicate more of its resources to reducing congestion.
Florida: Florida ranks 40th in this year’s Annual Highway Report, a decline from last year’s ranking of 35th. The state excels in some parts of the rankings but still ranks poorly overall. And in other state DOT quality rankings, Florida places higher. Why is there a discrepancy? While Florida’s pavement condition is excellent (its worst ranking in the four pavement categories is 6th) and it has few structurally deficient

24TH ANNUAL HIGHWAY REPORT
Feigenbaum, Fields and Purnell | 24th Annual Highway Report
10
bridges (3rd overall), its average disbursements are high (ranging from 37th to 49th) and its fatality rate is very high (ranging from 42nd to 48th). Florida excels in some rankings but it trails in many others, leading to its overall ranking of 40th. If the state can reduce its average disbursements and fatality rate even slightly, its ranking will improve significantly.
New Jersey: For the second year in a row New Jersey ranks 50th. This is due to the state’s fifth quintile rankings (41st to 50th) in many categories. New Jersey spends the highest amount of revenue per roadway mile, ranking 50th in three of the disbursement categories and 46th in the fourth category. The state also ranks last in the country in congestion. It ranks 45th, 46th and 46th in the categories of Urban Interstate Pavement Condition, Rural Principal Arterial Pavement Condition and Urban Principal Arterial Pavement Condition. The state does rank well in several categories. It ties for 1st in Rural Interstate Pavement Condition and its Overall Fatality Rate is 4th. However, the state ranks poorly on far more categories than it ranks highly. Several years ago, New Jersey increased its gas tax by 23 cents. Unfortunately, due to system inefficiency including high costs, we remain skeptical that the increased revenue will improve the overall system.
Ohio: Overall, less populated states may have a slight edge in the rankings. However, many higher population states continue to rank highly. Ohio, 7th in population, is one of these states. While, Ohio has only one top 10 ranking (Rural Fatality Rate is 5th), its high overall ranking is a result of it not placing in the bottom 10 in any category. It ranks in the second quintile (11th to 20th) in five categories, the third quintile (21st to 30th) in four categories and the fourth quintile (31st to 40th) in three categories. Ohio illustrates two ranking realities. First, a state with large metro areas can rank highly, and second, a state with an absence of poor rankings has a better overall ranking than a state with several excellent rankings but several poor rankings as well.
Utah: Utah shows that efficient DOTs tend to have better rankings. The state has long been considered an innovative DOT, winning several national awards for administration and creativity. The state has been a thought leader in many groups, including the American Association of State Highway and Transportation Officials (AASHTO). Utah’s efficiency is the result of having an executive who is a transportation official rather than a politician, a metric-driven project selection process and a collaborative relationship among the federal, state and local governments.
24th ANNUAL HIGHWAY REPORT
Feigenbaum, Fields and Purnell
11
METHODOLOGICAL CHANGES The Annual Highway Report’s goal is to provide an accurate, current evaluation of state highway systems. In order to meet that goal, we made a number of changes to this year’s report based on two factors: data availability and nationwide population/demographic changes. In addition, certain states have expressed concerns about some of our metrics and we have tried to take those concerns into account as well. We explain the changes in the following paragraphs. The report’s technical and quantitative metrics are detailed in the appendix:
• Increase the category rankings from 11 to 13. Previous versions of the Annual Highway Report have included 11 categories, including four measuring disbursements, three measuring pavement quality, one measuring roadway congestion and three measuring safety. In order to give the roadway pavement and safety categories the same weight as the disbursements and to include a richer array of data, we have added a fourth pavement and a fourth safety category. (We discuss the fourth pavement category below and the fourth safety category in the third bullet below.)
The fourth pavement category is Urban Other Arterial Pavement Condition. In previous reports, we have measured both rural and urban Interstate condition but only rural arterial condition. Given the increasing urbanization of the country (particularly growth in exurbs and suburbs) we think it is important to weight rural
PART 2

24TH ANNUAL HIGHWAY REPORT
Feigenbaum, Fields and Purnell | 24th Annual Highway Report
12
and urban pavement conditions equally. This new weighting will provide a more accurate sampling of the country’s pavement quality.
• Calculate rankings using lane-miles, which is the length of the highway system multiplied by the number of lanes on a highway (a five-mile road with two lanes equals 10 lane-miles while a five-mile road with six lanes equals 30 lane-miles) instead of using centerline-miles, which is the length of the highway system (a five-mile road equals five centerline-miles regardless of number of lanes).
Using centerline-miles worked well for more than 20 years. We used centerline-miles because the cost of building the first mile of a highway from Point A to Point B (including right of way acquisition and pre-construction) is much more expensive than the cost to build an additional mile of that highway also from Point A to Point B. However, as more-populated states widen their roadways and less-populated states do not, the average width (number of lanes) of a state roadway differs significantly from 2.06 in West Virginia to 3.66 in New Jersey. As a result, we think lane-miles is a better metric for today’s state highway systems.
• Make substantial changes to the safety rankings. Given the availability of data, we
revised our safety metrics.
We continue to rank bridge quality. However, this year we measure only structurally deficient bridges (those with deteriorated conditions that need maintenance in the near future to ensure continued safety) and not functionally obsolete ones (those that have narrower lanes or shoulders but no structural concerns). While neither condition is ideal, structurally deficient bridges are a much bigger problem. Functionally obsolete bridges are older, are built to different design standards, and tend to be located in northeastern states with more mature infrastructure. Penalizing states with safe but old infrastructure negatively affects certain states and is poor policy.
We eliminated the ranking of narrow arterial lanes (those less than 12 feet wide) for two reasons. First, some states measure their roadways by eye while other use advanced laser measures. States that have switched to laser measures have found that many of their arterial lanes that they thought were 12 feet wide are actually 11 feet 10 inches wide. Given that states use both measures, comparing states measured with lasers to those measured by eye is not accurate. Second, states with narrower lanes tend to have older roadways not built to today’s design standards. Penalizing states with older roads is poor policy.

24th ANNUAL HIGHWAY REPORT
Feigenbaum, Fields and Purnell
13
As a result of eliminating the narrow arterial lane ranking and increasing the safety rankings to four, we needed two new categories. Our other safety ranking—fatalities—is considered the most important safety ranking. Given the troubling increase in fatalities and the differences between urban and rural fatality rates, we decided to split the fatality ratings into three categories and include each in the rankings. We continue to rank total fatalities but we have added new categories for rural fatality and urban fatality rates. State rankings vary substantially on this metric, with some states’ rural fatality rate being 30 or more slots different from their urban fatality rate.
We believe these rankings will improve the quality of the report. Next year, we will evaluate these changes and may make additional changes if needed.

24TH ANNUAL HIGHWAY REPORT
Feigenbaum, Fields and Purnell | 24th Annual Highway Report
14
BACKGROUND DATA State highway system sizes range from approximately 1,000 miles to more than 80,000 miles. States with larger geographic areas and larger populations tend to have larger systems. Some states, such as North Carolina, maintain all of their roads on the state level, except for subdivision and other local roads. Other states, such as Florida, have robust county road systems. State-controlled highway mileage and state highway agency miles are not included in the rankings. They are included in this report as background information and are used to weight the financial data.
PART 3

24th ANNUAL HIGHWAY REPORT
Feigenbaum, Fields and Purnell
15
STATE-CONTROLLED MILES State-controlled mileage encompasses the state highway systems, state-agency toll roads, some ferry services, and smaller systems serving universities and state-owned properties. It includes the Interstate System, the National Highway System, and most federal aid system roads. Nationwide in 2016, 813,417 miles were under state control (Table 5, State-Controlled Highway Mileage), 737 miles fewer than in 2015 (814,154), the last time this assessment was completed. Small annual changes in state-controlled miles are to be expected, as state systems are expanded to meet increasing needs. Often jurisdictions assume responsibility for mileage previously under state control. The smallest state-owned road systems are Hawaii (1,012 miles) and Rhode Island (1,192 miles); the largest are Texas (80,854 miles) and North Carolina (80,676 miles).
TABLE 5: STATE-CONTROLLED HIGHWAY MILEAGE 2016 Size State Mileage 1 Texas 80,854 2 North Carolina 80,676 3 Virginia 58,861 4 Pennsylvania 41,659 5 South Carolina 41,534 6 West Virginia 34,689 7 Missouri 33,981 8 Kentucky 28,220 9 Ohio 20,365 10 Georgia 18,029 11 Illinois 16,742 12 Louisiana 16,702 13 New York 16,442 14 Arkansas 16,432 15 California 16,112 16 Washington 15,497 17 Tennessee 14,286 18 Minnesota 13,516 19 Oklahoma 13,355 20 Florida 12,193 21 New Mexico 12,148 22 Wisconsin 11,740 23 Indiana 11,215 24 Alabama 11,078 25 Montana 10,995 26 Mississippi 10,981 27 Kansas 10,531 28 Nebraska 10,064 29 Colorado 9,899 30 Michigan 9,764 31 Iowa 9,503 32 South Dakota 9,431 33 Oregon 9,132 34 Maine 8,648 35 Alaska 7,965 36 Arizona 7,874 37 North Dakota 7,433 38 Wyoming 7,225 39 Utah 6,404 40 Delaware 5,490 41 Nevada 5,462 42 Maryland 5,444 43 Idaho 4,992 44 Connecticut 4,057 45 New Hampshire 4,005 46 Massachusetts 3,615 47 New Jersey 3,344 48 Vermont 2,629 49 Rhode Island 1,192 50 Hawaii 1,012 U.S. Total 813,417 Average 16,268

24TH ANNUAL HIGHWAY REPORT
Feigenbaum, Fields and Purnell | 24th Annual Highway Report
16
STATE HIGHWAY AGENCY (SHA) MILES State highways are generally the Interstates and other major US-numbered and state-numbered roads (major and minor arterials). A few states also manage major portions of the rural road system (collectors and local roads). In 2016, 779,457 miles were the responsibility of the 50 state highway agencies (Table 6, State Highway Agency Mileage), identical to 2015, the last time this assessment was completed. For calculating state rankings, we use lane-miles as discussed in Part 2. In 2016, the 50 state highway agencies were responsible for 1,874,470 lane-miles. The average number of lanes per mile is 2.52 lanes, but a few states (New Jersey, Florida, California and Massachusetts) manage significantly wider roads, averaging more than 3.0 lanes per mile.
TABLE 6: STATE HIGHWAY AGENCY MILEAGE, BY AVERAGE NUMBER OF LANES/MILE 2016 Size State SHA Miles SHA Lane-Miles Ratio 1 New Jersey 2,331 8,545 3.67 2 Florida 12,106 43,921 3.63 3 California 15,091 51,279 3.40 4 Massachusetts 2,990 9,466 3.17 5 Arizona 6,780 19,636 2.90 6 Maryland 5,151 14,766 2.87 7 Michigan 9,668 27,451 2.84 8 Utah 5,881 16,065 2.73 9 Georgia 17,912 48,675 2.72 10 Alabama 10,929 29,609 2.71 11 Tennessee 13,888 37,284 2.68 12 Illinois 15,917 42,187 2.65 13 Connecticut 3,719 9,829 2.64 14 Hawaii 943 2,489 2.64 15 Washington 7,071 18,522 2.62 16 Rhode Island 1,099 2,862 2.60 17 Indiana 10,616 27,432 2.58 18 Mississippi 10,888 28,050 2.58 19 Ohio 19,229 49,529 2.58 20 Iowa 8,884 22,722 2.56 21 New York 15,042 38,304 2.55 22 Colorado 9,046 22,896 2.53 23 Wisconsin 11,740 29,707 2.53 24 Nevada 5,403 13,652 2.53 25 Minnesota 11,753 29,259 2.49 26 Oklahoma 12,254 30,373 2.48 27 New Mexico 11,994 29,689 2.48 28 Idaho 4,992 12,335 2.47 29 Texas 80,483 195,952 2.43 30 Oregon 7,655 18,589 2.43 31 Louisiana 16,677 39,312 2.36 32 Wyoming 6,733 15,758 2.34 33 Kansas 10,293 24,009 2.33 34 North Dakota 7,414 17,229 2.32 35 South Dakota 7,756 17,875 2.30 36 Arkansas 16,432 37,765 2.30 37 Missouri 33,856 77,679 2.29 38 Vermont 2,629 6,001 2.28 39 Montana 11,016 25,132 2.28 40 Nebraska 9,944 22,544 2.27 41 Kentucky 27,650 62,066 2.24 42 Pennsylvania 39,737 88,242 2.22 43 Delaware 5,412 11,869 2.19 44 South Carolina 41,340 90,462 2.19 45 Virginia 58,821 127,889 2.17 46 North Carolina 79,637 171,959 2.16 47 New Hampshire 3,900 8,399 2.15 48 Maine 8,352 17,540 2.10 49 Alaska 5,629 11,689 2.08 50 West Virginia 34,407 71,003 2.06 U.S. Total 779,457 1,874,470 2.40 Weighted Average 15,589 37,489

24th ANNUAL HIGHWAY REPORT
Feigenbaum, Fields and Purnell
17
PERFORMANCE INDICATORS The Annual Highway Report ranks each state in 13 categories. Four of the categories measure spending: Capital and Bridge Disbursements, Maintenance Disbursements, Administrative Disbursements and Total Disbursements. The remaining nine categories measure performance. Four of the categories measure pavement quality: Rural Interstate Pavement Condition, Urban Interstate Pavement Condition, Rural Other Principal Arterial Pavement Condition and Urban Other Principal Arterial Pavement. One of the categories measures congestion: Urban Area Congestion. Four of the categories measure safety: Structurally Deficient Bridges, Overall Fatality Rate, Rural Fatality Rate and Urban Fatality Rate. The four spending categories are considered together, weighted equally and then averaged to get one overall spending score. The nine performance categories are also considered together, weighted equally and then averaged to get one overall performance score. Then the spending and performance composite scores are added together, weighted by the number of metrics, and averaged to create one total score for each state. Therefore, each measure, whether spending efficiency or system performance, is weighted equally. This part of the report includes detailed data and trends for each category. Rankings include a table showing the state, the ranking and a composite score. Each ranking also includes a color-coded map with the composite score for each state.
PART 4

24TH ANNUAL HIGHWAY REPORT
Feigenbaum, Fields and Purnell | 24th Annual Highway Report
18
CAPITAL AND BRIDGE DISBURSEMENTS Capital and bridge disbursements are the costs to build new, and widen existing, highways and bridges. Capital and bridge disbursements for state-owned roads equal 51.6% of total disbursements, totaling $71.75 billion in 2016, about 4.4% less than was spent in 2015 ($74.90 billion), the last time this assessment was completed. This year, we measure capital and bridge disbursements per lane-mile. In past years, we measured them in centerline-miles. The average 2016 per-mile disbursement is $36,681 (Table 7, Capital and Bridge Disbursements per State-Controlled Mile, 2016, Figure 2). We also calculated disbursements in centerline-miles to compare 2016 disbursements to previous years. Centerline-mile disbursements decreased about 4.1%, from $91,992 per mile in 2015 to $88,212 per mile in 2016. This significant decrease bucks a generally steady spending trend over the last decade. Since 2007, these per-mile disbursements have increased about 15%, while the Consumer Price Index (CPI) has increased about 18%.1 In 2016, South Carolina, Missouri, West Virginia, New Mexico and South Dakota reported the lowest per-mile capital and bridge expenditures. New Jersey, Florida, New York, Connecticut and Illinois reported the highest per-mile
TABLE 7: CAPITAL AND BRIDGE DISBURSEMENTS PER STATE-CONTROLLED LANE-MILE, 2016 2016 Rank State Disbursement 1 South Carolina $8,154 2 Missouri $9,736 3 West Virginia $11,595 4 New Mexico $13,051 5 South Dakota $15,018 6 North Carolina $15,367 7 Virginia $15,745 8 Montana $17,741 9 Wyoming $18,529 10 Maine $23,323 11 Idaho $24,310 12 Arkansas $24,555 13 Oregon $24,570 14 Nebraska $25,108 15 Mississippi $25,635 16 Alabama $25,903 17 Utah $26,119 18 Kentucky $26,163 19 Tennessee $26,495 20 Georgia $26,612 21 Louisiana $27,652 22 New Hampshire $27,822 23 Vermont $30,615 24 Kansas $31,761 25 North Dakota $31,838 26 Texas $36,450 27 Michigan $36,723 28 Delaware $37,332 29 Iowa $38,218 30 California $40,406 31 Minnesota $41,717 32 Nevada $43,535 33 Oklahoma $43,807 34 Colorado $45,137 35 Arizona $46,262 36 Indiana $46,769

24th ANNUAL HIGHWAY REPORT
Feigenbaum, Fields and Purnell
19
expenditures. The states with the largest percentage shifts from 2015 to 2016 were Delaware and Nevada (which increased per-mile expenditures by more than 35%) and Texas and Hawaii (which decreased per-mile expenditures by more than 39%). Some of the disbursements per state-controlled mile can vary widely from year to year—reflecting funding actions and project schedules. * Massachusetts’ latest disbursement data is from 2010.
37 Washington $47,548 38 Pennsylvania $50,354 39 Ohio $50,811 40 Wisconsin $52,280 41 Alaska $54,413 42 Hawaii $72,796 43 Rhode Island $87,136 44 Maryland $90,441 45 Massachusetts* $92,972 46 Illinois $95,116 47 Connecticut $96,956 48 New York $102,418 49 Florida $137,875 50 New Jersey $214,678 Weighted Average $36,681
FIGURE 2: CAPITAL AND BRIDGE DISBURSEMENTS PER STATE-CONTROLLED LANE-MILE
24TH ANNUAL HIGHWAY REPORT
Feigenbaum, Fields and Purnell | 24th Annual Highway Report
20
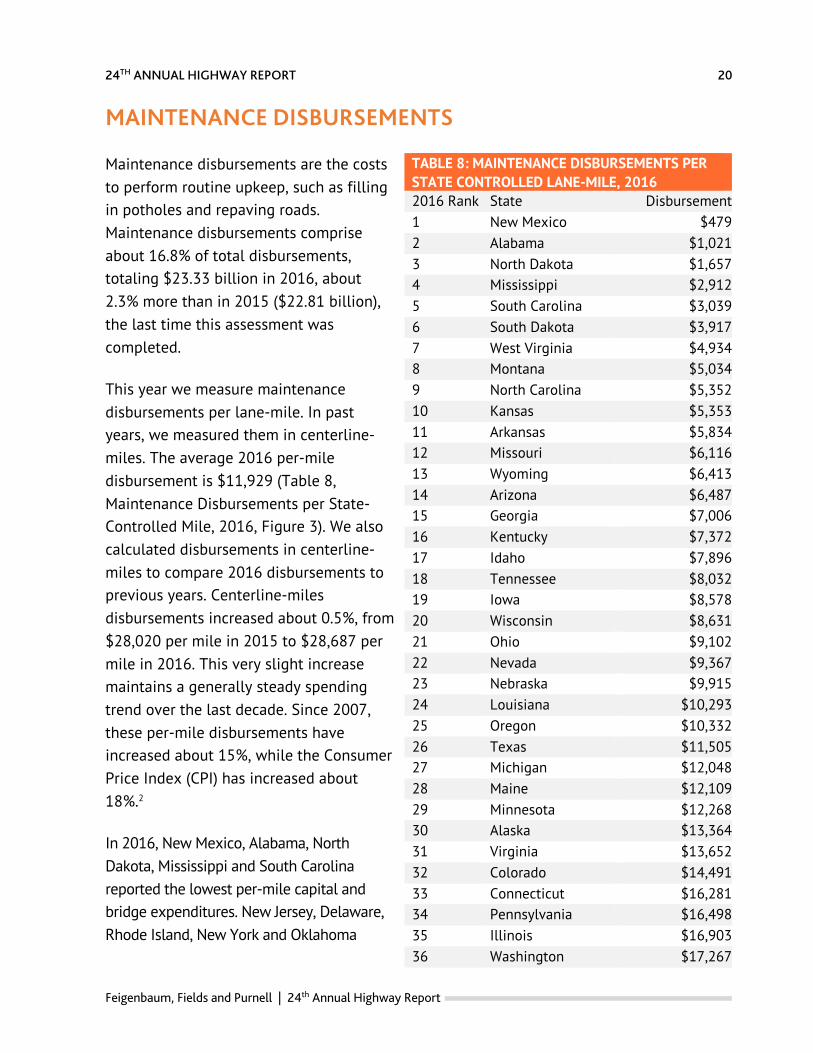
MAINTENANCE DISBURSEMENTS Maintenance disbursements are the costs to perform routine upkeep, such as filling in potholes and repaving roads. Maintenance disbursements comprise about 16.8% of total disbursements, totaling $23.33 billion in 2016, about 2.3% more than in 2015 ($22.81 billion), the last time this assessment was completed.
This year we measure maintenance disbursements per lane-mile. In past years, we measured them in centerline-miles. The average 2016 per-mile disbursement is $11,929 (Table 8, Maintenance Disbursements per State-Controlled Mile, 2016, Figure 3). We also calculated disbursements in centerline-miles to compare 2016 disbursements to previous years. Centerline-miles disbursements increased about 0.5%, from $28,020 per mile in 2015 to $28,687 per mile in 2016. This very slight increase maintains a generally steady spending trend over the last decade. Since 2007, these per-mile disbursements have increased about 15%, while the Consumer Price Index (CPI) has increased about 18%.2
In 2016, New Mexico, Alabama, North Dakota, Mississippi and South Carolina reported the lowest per-mile capital and bridge expenditures. New Jersey, Delaware, Rhode Island, New York and Oklahoma
TABLE 8: MAINTENANCE DISBURSEMENTS PER STATE CONTROLLED LANE-MILE, 2016 2016 Rank State Disbursement 1 New Mexico $479 2 Alabama $1,021 3 North Dakota $1,657 4 Mississippi $2,912 5 South Carolina $3,039 6 South Dakota $3,917 7 West Virginia $4,934 8 Montana $5,034 9 North Carolina $5,352 10 Kansas $5,353 11 Arkansas $5,834 12 Missouri $6,116 13 Wyoming $6,413 14 Arizona $6,487 15 Georgia $7,006 16 Kentucky $7,372 17 Idaho $7,896 18 Tennessee $8,032 19 Iowa $8,578 20 Wisconsin $8,631 21 Ohio $9,102 22 Nevada $9,367 23 Nebraska $9,915 24 Louisiana $10,293 25 Oregon $10,332 26 Texas $11,505 27 Michigan $12,048 28 Maine $12,109 29 Minnesota $12,268 30 Alaska $13,364 31 Virginia $13,652 32 Colorado $14,491 33 Connecticut $16,281 34 Pennsylvania $16,498 35 Illinois $16,903 36 Washington $17,267

24th ANNUAL HIGHWAY REPORT
Feigenbaum, Fields and Purnell
21
reported the highest per-mile expenditures. The states with the largest percentage shifts from 2015 to 2016 were Delaware and Oklahoma (which increased per-mile expenditures by 89% and 62% respectively) and New Mexico and Delaware (which decreased per-mile expenditures by 69% and 46% respectively). Some of the disbursements per state-controlled mile can vary widely from year to year, reflecting funding actions and project schedules. * Massachusetts’ latest disbursement data is from 2010.
37 New Hampshire $17,951 38 Vermont $18,445 39 Hawaii $22,248 40 Utah $22,717 41 Florida $23,123 42 Indiana $24,269 43 Massachusetts* $25,033 44 California $25,425 45 Maryland $30,561 46 Oklahoma $31,190 47 New York $36,247 48 Rhode Island $36,902 49 Delaware $37,040 50 New Jersey $60,646 Weighted Average $11,929
FIGURE 3: MAINTENANCE DISBURSEMENTS PER STATE CONTROLLED LANE-MILE

24TH ANNUAL HIGHWAY REPORT
Feigenbaum, Fields and Purnell | 24th Annual Highway Report
22
ADMINISTRATIVE DISBURSEMENTS Administrative disbursements typically include general and main-office expenditures in support of state-administered highways. They do not include project-related costs but occasionally include “parked” funds, which are funds from bond sales or asset sales awaiting later expenditure. Therefore, they vary widely from year to year. Administrative disbursements comprise about 6.3% of total disbursements, totaling $8.81 billion in 2016, nearly identical to 2015 ($8.85 billion), the last time this assessment was completed.
This year, we measure administrative disbursements per lane-mile. In past years, we measured them in centerline-miles. The average 2016 per-mile disbursement is $4,501 (Table 9, Administrative Disbursements per State-Controlled Mile, 2016, Figure 4). We also calculated disbursements in centerline-miles to compare 2016 disbursements to previous years. Centerline-mile disbursements decreased about 0.4%, from $10,864 per mile in 2015 to $10,825 per mile in 2016. This very slight decrease maintains a generally steady spending trend over the last decade. Since 2007, these per-mile disbursements have increased about 15%, while the Consumer Price Index (CPI) has increased about 18%.3 In 2016, Kentucky, Nebraska, Arkansas, Missouri and Maine reported the lowest administrative expenditures. Connecticut,
TABLE 9: ADMINISTRATIVE DISBURSEMENTS PER STATE-CONTROLLED LANE-MILE, 2016 2016 Rank State Disbursement 1 Kentucky $490 2 Nebraska $846 3 Arkansas $916 4 Missouri $928 5 Maine $1,142 6 Louisiana $1,228 7 South Carolina $1,310 8 North Dakota $1,343 9 West Virginia $1,362 10 North Carolina $1,524 11 Texas $1,873 12 Montana $2,175 13 Idaho $2,451 14 Mississippi $2,587 15 Iowa $2,650 16 Kansas $2,772 17 Wyoming $3,004 18 South Dakota $3,100 19 Ohio $3,119 20 Virginia $3,143 21 Indiana $3,544 22 Illinois $3,890 23 Minnesota $4,687 24 Tennessee $4,740 25 Michigan $5,107 26 New Hampshire $5,260 27 Colorado $5,337 28 Pennsylvania $5,408 29 Utah $5,414 30 Washington $5,451 31 Oregon $5,968 32 Alaska $6,078 33 Wisconsin $6,916 34 Hawaii $7,001 35 Alabama $7,151 36 Maryland $7,418

24th ANNUAL HIGHWAY REPORT
Feigenbaum, Fields and Purnell
23
FIGURE 4: ADMINISTRATIVE DISBURSEMENTS PER STATE CONTROLLED LANE-MILE
Delaware, Massachusetts, Rhode Island and New Jersey reported the highest per-mile expenditures. The states with the largest percentage shifts from 2015 to 2016 were Delaware (which increased per-mile expenditures by more than 214%) and Ohio and New Hampshire (which decreased per-mile expenditures by 60% and 48% respectively). Some of the disbursements per state-controlled mile can vary widely from year to year, reflecting funding actions and project schedules.
* Massachusetts’ latest disbursement data is from 2010.
37 Florida $7,780 38 Oklahoma $8,484 39 New Mexico $9,659 40 Vermont $9,928 41 Georgia $10,638 42 Arizona $10,954 43 New York $11,315 44 California $11,357 45 Nevada $12,468 46 New Jersey $14,035 47 Rhode Island $17,162 48 Massachusetts* $23,950 49 Delaware $25,120 50 Connecticut $35,028 Weighted Average $4,501
24TH ANNUAL HIGHWAY REPORT
Feigenbaum, Fields and Purnell | 24th Annual Highway Report
24
The Difference Between Maintenance and Administrative Disbursements Certain disbursement data can be counted in one of several categories. One example is benefits (vacation, health care, etc.) of state Department of Transportation maintenance workers. Certain states such as New Jersey count the benefits as a maintenance disbursement since the employees are conducting routine highway maintenance. Other states such as Connecticut count the benefits as an administrative disbursement since benefits are an administrative expense. Not surprisingly, of the two states New Jersey has the worse ranking in Maintenance Disbursements and Connecticut has the worse ranking in Administrative Disbursements. As a result, it is important to look at both the individual disbursement categories and disbursements as a whole, as states have some leeway in their classification of certain expenditures.

24th ANNUAL HIGHWAY REPORT
Feigenbaum, Fields and Purnell
25
TOTAL DISBURSEMENTS Since capital and bridge, maintenance, and administrative disbursements make up the majority of expenditures (74.7% in 2016), this report measures them individually and collectively. Total Disbursements include those three funding categories, plus three others: Highway Law Enforcement and Safety, Interest, and Bond Retirement. In total, the 50 states disbursed about $139.0 billion for state-owned roads in 2016, a 4.1% decrease from $145.0 billion in 2015, the last time this assessment was completed. This year, we measure average state disbursements per lane-mile. In past years, we measured them in centerline-miles. The average 2016 per-mile disbursement is $71,117 per lane-mile (Table 10, Total Disbursements per State-Controlled Mile, 2016, Figure 5). We also calculated disbursements in centerline-miles to compare 2016 disbursements to previous years. Centerline-mile disbursements decreased about 4.0% from $178,116 per mile in 2016 to $171,025 per mile in 2015. Over the last decade, highway spending has held steady. This small decrease maintains a generally steady spending trend over the last decade. Since 2007, these per-mile disbursements have increased about 15%, while the Consumer Price Index (CPI) has increased about 18%.4 In 2016, South Carolina, West Virginia, Missouri, South Dakota and North Carolina
TABLE 10: TOTAL DISBURSEMENTS PER STATE CONTROLLED LANE-MILE 2016 Rank
State Disbursement
1 South Carolina $13,255 2 West Virginia $19,625 3 Missouri $23,534 4 South Dakota $23,700 5 North Carolina $24,587 6 New Mexico $28,187 7 Montana $29,299 8 Wyoming $30,441 9 Mississippi $34,883 10 Arkansas $35,878 11 North Dakota $37,024 12 Virginia $37,875 13 Nebraska $39,228 14 Tennessee $40,138 15 Maine $41,847 16 Alabama $44,077 17 Louisiana $45,621 18 Kentucky $45,829 19 Kansas $53,157 20 Iowa $55,065 21 Oregon $57,173 22 Georgia $58,772 23 Idaho $59,373 24 New Hampshire $64,176 25 Minnesota $70,740 26 Vermont $72,032 27 Texas $72,622 28 Ohio $75,849 29 Alaska $77,165 30 Indiana $78,475 31 Utah $79,029 32 Arizona $84,551 33 Colorado $84,695 34 Nevada $88,236 35 Washington $90,702

24TH ANNUAL HIGHWAY REPORT
Feigenbaum, Fields and Purnell | 24th Annual Highway Report
26
reported the lowest expenditures. New Jersey, Florida, Massachusetts, New York and Connecticut reported the highest per-mile expenditures. The states with the largest percentage shifts from 2015 to 2016 were Delaware (which increased per-mile expenditures by more than 103%) and Oregon, Hawaii, Louisiana, Arizona, New Hampshire and Texas (which each decreased per-mile expenditures by more than 30%). Some of the disbursements per state-controlled mile can vary widely from year to year—reflecting funding actions and project schedules. * Massachusetts’ latest disbursement data is from 2010.
36 Wisconsin $93,376 37 Oklahoma $94,664 38 Michigan $99,626 39 Pennsylvania $101,129 40 California $125,397 41 Hawaii $126,932 42 Illinois $143,606 43 Delaware $164,801 44 Maryland $181,323 45 Rhode Island $194,769 46 Connecticut $209,157 47 New York $215,466 48 Massachusetts* $216,066 49 Florida $241,100 50 New Jersey $511,266 Weighted Average $71,117
FIGURE 5: TOTAL DISBURSEMENTS PER STATE CONTROLLED LANE-MILE

24th ANNUAL HIGHWAY REPORT
Feigenbaum, Fields and Purnell
27
RURAL INTERSTATE PAVEMENT CONDITION Rural Interstates are typically four- to six-lane roadways connecting urban areas. One measurement of roadway condition is pavement condition. In most states road pavement condition is measured using special machines that determine the roughness of road surfaces. A few states continue to use visual ratings, which are then converted to roughness. In 2016, about 1.96% of U.S. rural Interstates—566 miles out of 28,820—were reported to be in poor condition. (Table 11, Percent Rural Interstate Mileage in Poor Condition, 2016, Figure 6). This is a slight improvement from 2015, the last time this assessment was completed, when 529 miles out of 28,657 (about 1.85 %) of rural Interstate pavement was rated poor. Rural Interstate mileage in poor condition varies widely by state. In 2016, five states reported no poor mileage (Maine, New Hampshire, New Jersey, Rhode Island and Vermont) and 16 more reported less than 1% poor mileage. On the other hand, three states (Alaska, Colorado and Washington) reported more than 5% poor
TABLE 11: PERCENT RURAL INTERSTATE MILEAGE IN POOR CONDITION 2016 Rank
State Percent Rural Interstate Mileage in Poor
Condition 1 Maine 0.00 1 New Hampshire 0.00 1 New Jersey 0.00 1 Rhode Island 0.00 1 Vermont 0.00 6 Florida 0.14 7 Kansas 0.16 8 Illinois 0.16 9 North Dakota 0.20 10 Utah 0.29 11 Tennessee 0.32 12 Kentucky 0.32 13 Nevada 0.45 14 Virginia 0.50 15 Oregon 0.61 16 Alabama 0.71 17 Missouri 0.71 18 Nebraska 0.73 19 Montana 0.82 20 North Carolina 0.93 21 West Virginia 0.98 22 Texas 1.00 23 South Dakota 1.05 24 Wyoming 1.24 25 New Mexico 1.31 26 Idaho 1.35 27 Maryland 1.41 28 South Carolina 1.47 29 Arizona 1.53 30 Georgia 1.54 31 Ohio 1.56 32 Pennsylvania 1.58 33 Iowa 1.71 34 Michigan 2.14

24TH ANNUAL HIGHWAY REPORT
Feigenbaum, Fields and Purnell | 24th Annual Highway Report
28
mileage. The three states together have about 8% of U.S. rural Interstate mileage (2,150 miles of 28,220), but have 26% of the poor-condition mileage. Additionally, in 2016, California reported the largest change in rural pavement condition. The state has 2.5 times more rural pavement in poor condition than in 2015. Delaware and Hawaii are the only states with no rural mileage in their Interstate systems.
35 Minnesota 2.14 36 Oklahoma 2.50 37 Massachusetts 2.82 38 Mississippi 3.07 39 Louisiana 3.23 40 Arkansas 3.42 41 New York 3.44 42 Connecticut 3.45 43 Indiana 3.46 44 Wisconsin 4.15 45 California 4.90 46 Washington 5.83 47 Colorado 6.48 48 Alaska 10.64 49 Delaware N/A 50 Hawaii N/A Weighted Average 1.96
FIGURE 6: PERCENT OF RURAL INTERSTATES IN POOR CONDITION

24th ANNUAL HIGHWAY REPORT
Feigenbaum, Fields and Purnell
29
URBAN INTERSTATE PAVEMENT CONDITION The urban Interstates consist of major multi-lane Interstates in and near urbanized areas. The pavement condition of the urban Interstate system worsened from 2015 to 2016, increasing from 5.02% in poor condition to 5.18% (Table 12, Percent Urban Interstate Mileage in Poor Condition, 2016, Figure 7). In 2016, 958 of the 18,505 miles of urban Interstates were rated as poor, as compared to 940 poor-condition miles out of 18,730 miles in 2015, the last time this assessment was completed. Between 2015 and 2016, the percentage of poor urban Interstate mileage increased in 29 states, decreased in 20 states and remained about the same in the one remaining state. The percent of poor mileage changed less than one percentage point in 35 of the states. Hawaii and Rhode Island led the states in reducing poor-condition mileage (by 3.3 and 2.8 percentage points, respectively) while Delaware and California led the states in increasing poor-condition mileage (by 10.3 and 3.4 percentage points, respectively). The condition of urban Interstate miles also varies widely by state. In
TABLE 12: PERCENT URBAN INTERSTATE MILEAGE IN POOR CONDITION 2016 Rank
State Percent Urban Interstate Mileage in Poor Condition
1 North Dakota 0.00 1 Vermont 0.00 3 New Mexico 0.66 4 Illinois 0.74 5 Florida 1.05 6 Arizona 1.19 7 New Hampshire 1.20 8 South Dakota 1.33 9 Kansas 1.77 10 Rhode Island 1.92 11 Utah 1.98 12 Tennessee 2.01 13 Montana 2.04 14 Idaho 2.17 15 North Carolina 2.20 16 Kentucky 2.27 17 Missouri 2.42 18 Connecticut 2.52 19 Alaska 2.56 20 West Virginia 2.61 21 Georgia 2.64 22 Virginia 2.76 23 Oregon 2.99 24 Nebraska 3.13 25 Nevada 3.33 26 Maine 3.41 27 South Carolina 3.95 28 Colorado 4.28 29 Ohio 4.30 30 Alabama 4.48 31 Massachusetts 4.59 32 Pennsylvania 4.75 33 Texas 5.44 34 Wyoming 5.66 35 Wisconsin 5.88

24TH ANNUAL HIGHWAY REPORT
Feigenbaum, Fields and Purnell | 24th Annual Highway Report
30
2016, two states (North Dakota and Vermont) reported no poor mileage and two other states (New Mexico and Illinois) reported less than 1% in poor condition. The bottom five states (Hawaii, Louisiana, Delaware, California and New York) reported more than 10% poor mileage. These five states, collectively, only have about 14% of the urban Interstate mileage in the U.S. (3,004 of 18,730 miles) but have over 33% of the poor mileage (319 of 958 miles).
36 Iowa 5.92 37 Mississippi 5.93 38 Washington 6.27 39 Maryland 6.51 40 Minnesota 6.67 41 Oklahoma 7.37 42 Michigan 7.65 43 Indiana 7.81 44 Arkansas 9.68 45 New Jersey 9.84 46 New York 10.68 47 California 12.12 48 Delaware 12.20 49 Louisiana 12.90 50 Hawaii 21.82 Weighted Average 5.18
FIGURE 7: PERCENT OF URBAN INTERSTATES IN POOR CONDITION

24th ANNUAL HIGHWAY REPORT
Feigenbaum, Fields and Purnell
31
RURAL OTHER PRINCIPAL ARTERIAL PAVEMENT CONDITION Rural Other Principal Arterials (ROPA) are two- to four-lane roadways connecting different cities or regions. The condition of major rural arterials worsened slightly from 2015 to 2016, by about 0.01 percentage points. Overall, about 1.36% of the ROPA system—1,173 miles out of 86,113—was reported to be in poor condition (Table 13, Percent Rural Other Principal Arterial Mileage in Poor Condition, 2015, Figure 8). This compares with about 1.35% (1,192 of 88,155 miles) in 2015, the last time this assessment was completed. This is the highest amount of poor condition mileage since before 2000. (It should be noted that as cities grow, the urbanized area around them grows as well. As this occurs, roads near cities are often reclassified from rural to urban. If these roads were in good condition already, their reclassification has the effect of increasing the percentage of rural roads in poor condition.) Between 2015 and 2016 most states saw minor changes in ROPA pavement condition. Forty states saw decreases/increases of poor condition mileage of one percentage point or less, with 18 states seeing decreases, 21 states seeing increases, and one state seeing no change. Of the remaining 10 states, most had changes of less than 2%. However, the percentage of the ROPA system in poor condition in Connecticut and New Jersey decreased by 6.1 and 2.3 points, respectively,
TABLE 13: PERCENT RURAL OTHER PRINCIPAL ARTERIAL MILEAGE IN POOR CONDITION 2016 Rank
State Percent Rural Other Principal Arterial Mileage
in Poor Condition 1 Delaware 0.00 2 Florida 0.12 3 Illinois 0.21 4 Kansas 0.27 5 Missouri 0.36 6 Virginia 0.37 7 Maine 0.39 8 Wyoming 0.41 9 Oregon 0.41 10 Kentucky 0.42 11 Utah 0.43 12 Alabama 0.45 13 Texas 0.48 14 Georgia 0.51 15 North Dakota 0.65 16 Tennessee 0.73 17 Arizona 0.76 18 Ohio 0.79 19 Michigan 0.85 20 Idaho 0.85 21 Maryland 0.93 22 New Mexico 0.99 23 North Carolina 1.06 24 Mississippi 1.12 25 Minnesota 1.15 26 Nevada 1.20 27 Colorado 1.21 28 Washington 1.22 29 Nebraska 1.30 30 New York 1.36 31 Montana 1.41 32 Indiana 1.49 33 South Dakota 1.55

24TH ANNUAL HIGHWAY REPORT
Feigenbaum, Fields and Purnell | 24th Annual Highway Report
32
FIGURE 8: PERCENT OF RURAL OTHER PRINCIPAL ARTERIAL MILEAGE IN POOR CONDITION
while the poor mileage in Massachusetts increased by 2.3 points. One state, Delaware, reported zero poor condition ROPA mileage in 2016. Twenty-one additional states reported 1% or less ROPA mileage in poor condition. On the other hand, four states (Alaska, Rhode Island, Hawaii and Massachusetts) reported more than 5% of their ROPA mileage to be in poor condition. These four states have just over 1% of the U.S. ROPA mileage, but 12% of the mileage that is in poor condition. Alaska’s ROPA system has the most significant problem. By itself it has 10% of the poor ROPA mileage in the country.
34 Connecticut 1.68 35 California 2.07 36 New Hampshire 2.16 37 Oklahoma 2.17 38 Louisiana 2.22 39 Vermont 2.27 40 West Virginia 2.27 41 Pennsylvania 2.50 42 South Carolina 2.65 43 Iowa 2.96 44 Arkansas 3.27 45 Wisconsin 3.83 46 New Jersey 4.38 47 Massachusetts 5.08 48 Hawaii 6.41 49 Rhode Island 13.40 50 Alaska 21.36 Weighted Average 1.36

24th ANNUAL HIGHWAY REPORT
Feigenbaum, Fields and Purnell
33
URBAN OTHER PRINCIPAL ARTERIAL PAVEMENT CONDITION Urban Other Principal Arterials (UOPA) are four- to eight-lane roadways connecting different parts of an urban region. UOPA Condition is one of the new categories added to this year’s Highway Report. We have analyzed the past five years of data to provide an accurate depiction of these roadways. Overall, about 14% of the UOPA system—8,713 miles out of 62,643—was reported to be in poor condition (Table 14, Percent Urban Other Principal Arterial Mileage in Poor Condition, 2016, Figure 9). Overall urban arterial pavement condition is in much worse condition than rural arterials, rural Interstates or urban Interstates, with the percent in poor condition at 1.36%, 1.96% and 5.18% respectively. The percent UOPA mileage in poor condition varies drastically by state, from Florida with 1.96% to Rhode
TABLE 14: PERCENT URBAN OTHER PRINCIPAL ARTERIAL MILEAGE IN POOR CONDITION 2016 Rank
State Percent Urban Other Principal Arterial Mileage in Poor Condition
1 Florida 1.96 2 Alabama 2.58 3 Utah 2.62 4 Georgia 2.74 5 Nevada 3.69 6 Minnesota 3.86 7 Kansas 3.92 8 Kentucky 4.73 9 South Carolina 4.89 10 West Virginia 5.09 11 Tennessee 5.91 12 Virginia 6.35 13 Delaware 6.67 14 Missouri 7.01 15 Oregon 7.03 16 Illinois 8.17 17 Arizona 8.22 18 North Carolina 8.44 19 Alaska 8.70 20 New Mexico 9.15 21 Indiana 9.35 22 Connecticut 10.00 23 New Hampshire 10.36 24 Wyoming 10.38 25 Idaho 10.62 26 Vermont 11.01 27 Maine 11.41 28 North Dakota 11.76 29 Mississippi 13.08 30 Iowa 13.20 31 Pennsylvania 13.22 32 Montana 13.39 33 Colorado 13.48 34 Maryland 13.86

24TH ANNUAL HIGHWAY REPORT
Feigenbaum, Fields and Purnell | 24th Annual Highway Report
34
Island at 33.03%. Nine states reported less than 5% of UOPA miles in poor condition. On the other hand, seven states (Rhode Island, California, Massachusetts, Washington, New Jersey, Nebraska and New York) reported more than 20% of their UOPA mileage to be in poor condition. These seven states have 24% of the U.S. ROPA mileage, but 45% of the mileage that is in poor condition.
35 Ohio 14.34 36 Texas 14.45 37 Louisiana 15.20 38 Arkansas 16.23 39 Hawaii 16.54 40 Oklahoma 16.64 41 Michigan 16.92 42 South Dakota 19.01 43 Wisconsin 19.30 44 New York 21.04 45 Nebraska 22.52 46 New Jersey 22.78 47 Washington 23.00 48 Massachusetts 24.56 49 California 30.51 50 Rhode Island 33.03 Weighted Average 13.97
FIGURE 9: PERCENT OF URBAN OTHER PRINCIPAL ARTERIAL MILEAGE IN POOR CONDITION
1 to 10
11 to 20
21 to 30
31 to 40
41 to 50
Miles
0 200 400 600
Texas 36
New Mexico20
Arizona17
California49
Nevada 5
Oregon 15
Washington47
Idaho 25
Montana32
Wyoming24
Colorado33
Utah3
Kansas 7
Oklahoma40
Louisiana 37
Florida1
Georgia4
South Carolina9
North Carolina 18Tennessee
11
Kentucky 8
Alabama2
Virginia 12
W. Virginia 10
Maryland 34
Maine27
Vermont 26
New Hampshire 23Massachusetts 48
Rhode Island 50Connecticut 22
New Jersey 46
Alaska19
Hawaii39
New York 44
Pennsylvania 31
Delaware 13
Arkansas 38
Missouri 14
Iowa30Nebraska
45
South Dakota42
North Dakota 28
Minnesota6 Wisconsin
43
Illinois16
Michigan41
Indiana21
Ohio 35
Mississippi29

24th ANNUAL HIGHWAY REPORT
Feigenbaum, Fields and Purnell
35
URBANIZED AREA CONGESTION
There is no universally accepted definition of traffic congestion. In reporting to the federal government, the states have in the past used peak-hour traffic volume-to-capacity (V/C) ratios, as calculated in the Transportation Research Board’s Highway Capacity Manual, as a congestion measure. Through 2009, the Federal Highway Administration (FHWA) summed up these V/C calculations to determine the state mileage in various V/C categories. Since 2009, however, these tables have not been published by FHWA. Instead, FHWA has been reporting periodic statistics based on travel delays from mobile devices, but only for selected regions and roads, not for states. This change by FHWA has necessitated changes in this report’s state-level congestion metric. The 22nd Annual Highway Report used a congestion metric derived from the Urban Mobility Report, renamed the Urban Mobility Scorecard (UMS).5 The 2015 UMS was published jointly by the Texas A&M Transportation Institute and INRIX in August 2015, and reported data for 2014. The congestion measure selected, the average annual delay per auto commuter (in hours), captured delay in all three dimensions of congestion. It also had the advantages of being straightforward and relevant to the average citizen, was easily calculated, and was more current. Unfortunately, the UMS has not been updated and INRIX has
TABLE 15: ANNUAL PEAK HOURS SPENT IN CONGESTION PER AUTO COMMUTER 2016 Rank
State Peak Hours Spent in Congestion per
Auto Commuter 1 Wyoming 7.25 2 West Virginia 8.40 3 Iowa 8.49 4 North Dakota 8.52 5 Montana 9.05 6 Alaska 9.33 7 Maine 9.50 8 Nebraska 9.75 9 South Dakota 9.98 10 Vermont 10.17 11 Idaho 10.49 12 Mississippi 10.57 13 Arkansas 11.36 14 New Mexico 11.67 15 Oklahoma 12.00 16 Kansas 12.12 17 Oregon 12.12 18 Alabama 12.25 19 Hawaii 13.04 20 Utah 13.39 21 South Carolina 13.52 22 Wisconsin 13.68 23 North Carolina 14.80 24 Missouri 16.38 25 Kentucky 17.21 26 New Hampshire 18.28 27 Indiana 18.93 28 Ohio 19.19 29 Louisiana 19.59 30 Connecticut 19.77 31 Rhode Island 21.00 32 Tennessee 21.29 33 Nevada 21.78 34 Michigan 22.63 35 Pennsylvania 24.24 36 Arizona 27.32 37 Colorado 27.34 38 Delaware 28.06

24TH ANNUAL HIGHWAY REPORT
Feigenbaum, Fields and Purnell | 24th Annual Highway Report
36
For 2017, INRIX defines congestion as a speed below 65% of the free-flow speed, which is the typical uncongested speed on that road segment, and defines peak hours locally based on the actual driving habits in each city, as opposed to the more typical fixed peak periods of 6:00 AM–9:00 AM and 4:00 PM–7:00 PM. (The INRIX data, which are computed only for selected cities, are extended to all U.S. metropolitan areas and then rolled up by state. See the Appendix for details.) In 2017, the average annual peak hours spent in congestion in the urbanized areas across the United States was 34.77 hours (see Table 15, Peak Hours Spent in Congestion per Auto Commuter, Figure 10). Annual peak hours spent in congestion range from 7.25 in Wyoming to 70.15 in New Jersey. The congestion problem is primarily concentrated in the major cities of just a few states. Commuters in nine states spent fewer than 10 hours sitting in peak-hour congestion in 2016. Commuters in 31 additional states spent less than 35 hours sitting in peak-hour congestion. Only the bottom 10 states exceed the U.S. congestion delay average, but their totals skew the average peak hours spent in congestion upward. Commuters in the bottom four states (New Jersey, New York, California and Georgia) spent more than 50 hours per year in traffic congestion.
changed the methodology for some of its internal metrics. As a result, the past two Annual Highway Reports use data directly from the INRIX Global Traffic Scorecard. This report uses 2017 congestion data.6 The metric selected was the “peak hours spent in congestion per auto commuter annually.” This measure, straightforward and relevant to the average citizen, is taken directly from the INRIX Scorecard and uses real-time traffic data.
39 Virginia 32.56 40 Florida 33.87 41 Minnesota 35.07 42 Washington 37.40 43 Texas 38.73 44 Maryland 39.32 45 Illinois 44.11 46 Massachusetts 44.27 47 Georgia 51.55 48 California 60.91 49 New York 62.76 50 New Jersey 70.15 Weighted Average 34.77

24th ANNUAL HIGHWAY REPORT
Feigenbaum, Fields and Purnell
37
FIGURE 10: ANNUAL PEAK HOURS SPENT IN AUTO CONGESTION PER COMMUTER
1 to 10
11 to 20
21 to 30
31 to 40
41 to 50
Miles
0 200 400 600
Texas 43
New Mexico14
Arizona36
California48
Nevada 33
Oregon 17
Washington42
Idaho 11
Montana5
Wyoming 1
Colorado37
Utah20
Kansas 16
Oklahoma 15
Louisiana 29
Florida40
Georgia47
South Carolina21
North Carolina 23Tennessee
32
Kentucky 25
Alabama18
Virginia 39
W. Virginia 2
Maryland 44
Maine7
Vermont 10
New Hampshire 26Massachusetts 46
Rhode Island 31Connecticut 30
New Jersey 50
Alaska6
Hawaii19
New York 49
Pennsylvania 35
Delaware 38
Arkansas 13
Missouri 24
Iowa3Nebraska
8
South Dakota9
North Dakota 4
Minnesota41 Wisconsin
22
Illinois45
Michigan34
Indiana27
Ohio 28
Mississippi12

24TH ANNUAL HIGHWAY REPORT
Feigenbaum, Fields and Purnell | 24th Annual Highway Report
38
STRUCTURALLY DEFICIENT BRIDGES Federal law mandates the uniform inspection of all bridges for structural and functional adequacy at least every two years; bridges rated “deficient” are eligible for federal repair dollars. The National Bridge Inventory (NBI) is the source of the bridge data below, although we also use summaries provided in Better Roads (see Appendix). Since the NBI contains some recent inspections and some as old as two years, the age of the “average” inspection is about one year old. So, a “December 2017” summary from the NBI would represent, on average, bridge condition as of 2016. This year’s ranking measures structurally deficient bridges (those with deteriorated conditions that need maintenance in the near future to ensure continued safety) but not functionally obsolete ones (those that have narrower lanes or shoulders but no structural concerns). While neither condition is ideal, structurally deficient bridges are a much bigger problem. Functionally obsolete bridges are older and built to different design standards and tend to be located in states with more mature infrastructure. The condition of the nation’s highway bridges in 2017 improved slightly from 2015, the last time this assessment was completed. Of the 612,408 highway bridges reported, 54,254 (8.86%) were rated deficient for 2017 (Table 16, Percent of Structurally Deficient Bridges, 2017, Figure 11). This represents a 0.74% improvement over 2015 when 58,485 of 609,285 (9.60%) were rated as deficient. Two
TABLE 16: PERCENT STRUCTURALLY DEFICIENT BRIDGES, 2017 2017 Rank
State Percent Structurally Deficient Bridges
1 Texas 1.57 2 Nevada 1.59 3 Florida 2.14 4 Arizona 2.48 5 Utah 2.85 6 Delaware 4.44 7 Georgia 4.66 8 Tennessee 4.73 9 Washington 4.85 10 Vermont 5.23 11 Minnesota 5.32 12 Oregon 5.45 13 Colorado 5.60 14 Maryland 5.62 15 Hawaii 5.81 16 Virginia 5.92 17 Arkansas 5.95 18 Ohio 6.04 19 California 6.25 20 New Mexico 6.28 21 Indiana 7.44 22 Alabama 7.44 23 Kentucky 7.77 24 Connecticut 7.83 25 Kansas 8.46 26 Illinois 8.60 27 Wisconsin 8.74 28 Idaho 8.75 29 New Jersey 8.85 30 Massachusetts 9.28 31 Montana 9.71 32 South Carolina 9.91 33 Wyoming 9.91 34 North Carolina 10.20 35 Michigan 10.51

24th ANNUAL HIGHWAY REPORT
Feigenbaum, Fields and Purnell
39
FIGURE 11: PERCENT STRUCTURALLY DEFICIENT BRIDGES, 2017
states reported less than 2% of their bridges to be structurally deficient: Texas and Nevada at 1.57% and 1.59% respectively. Two states reported more than 20% of their bridges as structurally deficient: Rhode Island and Iowa, at 23.26% and 20.93% respectively. The majority of states (39) reported at least some improvement in the percentage of structurally deficient bridges between 2015 and 2017, with Pennsylvania, Oklahoma and Wyoming seeing the most improvement (2.7, 2.4 and 2.1 percentage points, respectively). Of the 11 states that reported a higher percentage of deficient bridges, two saw increases of more than one percentage point: West Virginia at 3.85% and Montana at 1.87%.
36 Alaska 10.52 37 New York 10.52 38 New Hampshire 10.89 39 Mississippi 11.76 40 Missouri 12.60 41 Maine 13.26 42 Oklahoma 14.02 43 North Dakota 14.03 44 Louisiana 14.11 45 Nebraska 14.73 46 Pennsylvania 18.32 47 South Dakota 18.58 48 West Virginia 18.98 49 Iowa 20.93 50 Rhode Island 23.26 Weighted Average 8.86

24TH ANNUAL HIGHWAY REPORT
Feigenbaum, Fields and Purnell | 24th Annual Highway Report
40
OVERALL FATALITY RATE The fatality rate is an important overall measure of each state’s road performance. The nation’s highway fatality rate worsened from 1.13 in 2015, the last time this assessment was completed, to 1.18 in 2016 (Table 17, Overall Fatality Rate per 100 Million Vehicle-Miles, 2016, Figure 12). The fatality rate has increased over the last several years after a decades-long downward trend. While there is no one cause, distracted driving appears to be the biggest contributor. In 2016, 37,434 fatalities were reported, more than the 35,069 fatalities reported in 2015, as VMT (vehicle-miles of travel) increased to 3.17 trillion from 3.09 trillion in 2015. There were more fatalities in 2016 than in any year since 2007. For 2016, Massachusetts reported the overall lowest fatality rate, 0.63, while South Carolina reported the highest, 1.86. Most states (31 of 50) reported an increase in their fatality rates compared to
TABLE 17: OVERALL FATALITY RATE PER 100 MILLION VEHICLE-MILES, 2016 2016 Rank State Fatality Rate per 100
Million Vehicle-Miles 1 Massachusetts 0.63 2 Rhode Island 0.64 3 Minnesota 0.66 4 New Jersey 0.78 5 New York 0.83 6 Vermont 0.84 7 Maryland 0.85 8 Washington 0.88 9 Utah 0.89 10 Virginia 0.90 11 Connecticut 0.93 12 Wisconsin 0.95 13 Ohio 0.95 14 Indiana 0.99 15 New Hampshire 1.01 16 Illinois 1.01 17 Nebraska 1.05 18 California 1.07 19 Michigan 1.07 20 Maine 1.09 21 Hawaii 1.13 22 North Dakota 1.16 23 Colorado 1.17 24 Delaware 1.17 25 Pennsylvania 1.17 26 Wyoming 1.20 27 Iowa 1.21 28 South Dakota 1.22 29 Nevada 1.22 30 North Carolina 1.24 31 Georgia 1.27 32 Missouri 1.28 33 Kansas 1.34 34 Oregon 1.35 35 Tennessee 1.35 36 West Virginia 1.38 37 Texas 1.39 38 Oklahoma 1.39 39 New Mexico 1.44

24th ANNUAL HIGHWAY REPORT
Feigenbaum, Fields and Purnell
41
2015, led by New Mexico, Alaska and Iowa, which worsened 0.36, 0.31 and 0.25 points, respectively. Two states’ rates were unchanged and 17 states saw their fatality rate decrease, with Montana and Wyoming reporting the largest rate decrease of 0.31 each.
40 Arizona 1.46 41 Idaho 1.47 42 Florida 1.47 43 Alabama 1.50 44 Montana 1.51 45 Arkansas 1.52 46 Louisiana 1.54 47 Alaska 1.60 48 Kentucky 1.69 49 Mississippi 1.69 50 South Carolina 1.86 Weighted Average 1.18
FIGURE 12: OVERALL FATALITY RATE PER 100 MILLION VEHICLE-MILES, 2016

24TH ANNUAL HIGHWAY REPORT
Feigenbaum, Fields and Purnell | 24th Annual Highway Report
42
RURAL FATALITY RATE Rural fatality rate is one of the new categories added to this year’s Highway Report. Given the troubling increase in highway fatalities and other changes we made to the safety metrics in the report, we have added a new category examining rural fatality rate. We have analyzed the past three years of data to place the ratings in context. The nation’s rural highway fatality rate worsened from 1.58 in 2015, to 1.71 in 2016, (Table 18, Rural Fatality Rate per 100 Million Vehicle-Miles, 2016, Figure 13). The rural fatality rate has increased over the last several years after a decades-long downward trend. While there is no one cause, distracted driving appears to be the biggest contributor. In 2016, 8,032 rural fatalities were reported, more than the 7,130 rural fatalities reported in 2015, as rural VMT (vehicle-miles of travel) increased to 0.47 trillion from 0.45 trillion in 2015. There were more rural fatalities in 2016 than in any year since 2007.
TABLE 18: FATALITY RATE PER 100 MILLION RURAL VEHICLE-MILES, 2016 2016 Rank
State Fatality Rate per 100 Million Rural Vehicle-Miles
1 Massachusetts 0.24 2 Rhode Island 0.50 3 Maryland 0.60 4 Connecticut 0.66 5 Ohio 0.69 6 Minnesota 0.70 7 Michigan 0.70 8 Vermont 0.71 9 Washington 0.79 10 New Jersey 0.99 11 Maine 1.01 12 Virginia 1.02 13 Wisconsin 1.03 14 South Dakota 1.03 15 Illinois 1.06 16 Louisiana 1.09 17 Tennessee 1.10 18 New Hampshire 1.14 19 Delaware 1.16 20 Pennsylvania 1.19 21 Iowa 1.20 22 North Dakota 1.26 23 Kentucky 1.27 24 Missouri 1.29 25 Nebraska 1.29 26 Oklahoma 1.31 27 West Virginia 1.34 28 Georgia 1.37 29 Indiana 1.38 30 Wyoming 1.44 31 Utah 1.45 32 Nevada 1.49 33 Colorado 1.51 34 New Mexico 1.56 35 Montana 1.60

24th ANNUAL HIGHWAY REPORT
Feigenbaum, Fields and Purnell
43
For 2016, Massachusetts reported the lowest rural fatality rate, 0.24, while Hawaii reported the highest, 6.99. Most states (30 of 50) reported an increase in their rural fatality rates compared to 2015, led by Hawaii and Florida, which worsened 3.28 and 2.25 points, respectively. Twenty states saw their fatality rates decrease, with Connecticut reporting the largest rate decrease of 1.00.
36 Arizona 1.61 37 Alaska 1.64 38 Texas 1.65 39 Arkansas 1.72 40 Alabama 1.81 41 Idaho 1.89 42 Oregon 2.06 43 South Carolina 2.08 44 Kansas 2.23 45 New York 2.27 46 Mississippi 2.47 47 California 3.18 48 Florida 3.87 49 North Carolina 4.90 50 Hawaii 6.99 Weighted Average 1.71
FIGURE 13: FATALITY RATE PER 100 MILLION RURAL VEHICLE MILES, 2016

24TH ANNUAL HIGHWAY REPORT
Feigenbaum, Fields and Purnell | 24th Annual Highway Report
44
URBAN FATALITY RATE Urban fatality rate is one of the new categories added to this year’s Highway Report. The troubling increase in highway fatalities, in addition to other changes we made to the safety metrics in the report, convinced us to add a new category to examine the urban fatality rate. We have analyzed the past three years of data to place the ratings in context. The nation’s urban highway fatality rate worsened from 0.70 in 2015 to 0.77 in 2016 (Table 19, Urban Fatality Rate per 100 Million Vehicle-Miles, 2016, Figure 14). The urban fatality rate has increased over the last several years after a decades-long downward trend. While there is no one cause, distracted driving appears to be the biggest contributor. In 2016, 9,917 urban fatalities were reported, more than the 8,704 urban fatalities reported in 2015, as urban VMT (vehicle-miles of travel) increased to 1.29 trillion from 1.25 trillion in 2015. There were more urban fatalities in 2016 than in any year since 2007.
TABLE 19: FATALITY RATE PER 100 MILLION URBAN VEHICLE-MILES 2016 Rank
State Fatality Rate per 100 Million Urban Vehicle-Miles
1 Mississippi 0.06 2 North Dakota 0.14 3 Vermont 0.27 4 Minnesota 0.33 5 New York 0.35 6 Virginia 0.39 7 Wisconsin 0.43 8 Nebraska 0.44 9 South Dakota 0.46 10 Maine 0.46 11 Montana 0.53 12 Massachusetts 0.55 13 North Carolina 0.58 14 Rhode Island 0.58 15 Ohio 0.59 16 Iowa 0.60 17 Utah 0.61 18 Indiana 0.61 19 Oregon 0.61 20 Washington 0.62 21 California 0.62 22 New Jersey 0.68 23 Maryland 0.68 24 Idaho 0.68 25 New Hampshire 0.70 26 Connecticut 0.72 27 Illinois 0.72 28 Pennsylvania 0.74 29 Delaware 0.78 30 Michigan 0.81 31 West Virginia 0.86 32 Colorado 0.90 33 Missouri 0.92 34 Texas 0.94 35 Georgia 0.95

24th ANNUAL HIGHWAY REPORT
Feigenbaum, Fields and Purnell
45
For 2016, Mississippi reported the lowest urban fatality rate, 0.06, while New Mexico reported the highest, 1.81. Most states (35 of 50) reported an increase in their urban fatality rates compared to 2015, led by New Mexico, Kansas and Maryland, which worsened 0.78, 0.47, and 0.42 points, respectively. Three states’ rates were unchanged and 12 states saw their fatality rate decrease, led by Mississippi, Vermont and North Dakota, which improved by 0.68, 0.47, and 0.39 points respectively.
36 Alabama 0.96 37 Kansas 0.98 38 Nevada 1.01 39 Wyoming 1.03 40 Tennessee 1.03 41 Alaska 1.04 42 Oklahoma 1.04 43 Louisiana 1.06 44 South Carolina 1.09 45 Kentucky 1.11 46 Arkansas 1.13 47 Florida 1.19 48 Hawaii 1.32 49 Arizona 1.52 50 New Mexico 1.81 Weighted Average 0.77
FIGURE 14: FATALITY RATE PER 100 MILLION URBAN VEHICLE–MILES
24TH ANNUAL HIGHWAY REPORT
Feigenbaum, Fields and Purnell | 24th Annual Highway Report
46
ABOUT THE AUTHORS Baruch Feigenbaum is assistant director of transportation policy at Reason Foundation, a non-profit think tank advancing free minds and free markets. Feigenbaum has a diverse background researching and implementing transportation issues, including revenue and finance, public-private partnerships, highways, transit, high-speed rail, ports, intelligent transportation systems, land use and local policymaking. Feigenbaum is involved with various transportation organizations. He is a member of the Transportation Research Board Bus Transit Systems and Intelligent Transportation Systems Committees. He is executive vice president for the Transportation Research Forum, Washington Chapter, a reviewer for the Journal of the American Planning Association (JAPA) and a contributor to Planetizen. He has appeared on NBC Nightly News and CNBC. His work has been featured in the Washington Post and The Wall Street Journal. Prior to joining Reason, Feigenbaum handled transportation issues on Capitol Hill for Representative Lynn Westmoreland. He earned his master’s degree in transportation planning from the Georgia Institute of Technology. M. Gregory Fields, Ph.D., is an independent transportation research consultant who has worked with the University of North Carolina at Charlotte and with The Hartgen Group, a consulting company specializing in transportation research. Over the last 14 years, he has contributed to a number of comparative transportation studies including the John Locke Foundation’s study of North Carolina highway cost effectiveness, the Fraser Institute’s study of Canadian provinces, and Reason Foundation’s studies of national congestion, city

24th ANNUAL HIGHWAY REPORT
Feigenbaum, Fields and Purnell
47
accessibility and productivity, and mid-size city congestion. He has been an author/co-author of Reason’s annual highway performance assessments for the last several years. He is a retired military officer with a bachelor’s degree from West Point, a master’s degree in human resources development from Webster University, master’s degrees in geography (transportation planning) and earth sciences (environmental monitoring) from UNC Charlotte, and a doctoral degree in geography and urban regional analysis from UNC Charlotte. Spence Purnell is a policy analyst at Reason Foundation, where he works on pension reform, transportation issues, Florida policy issues and economic development. Prior to joining Reason, Purnell worked as director of business development at Florida startup Dealers United and as an analyst for the state of Florida’s Executive Office of the Governor (Florida Gubernatorial Fellowship). Purnell graduated from Stetson University with a bachelor’s degree in political science and is working on an MPA at Florida State, where his research has focused on database infrastructure and analytics, economic development, and policy evaluation methods.

24TH ANNUAL HIGHWAY REPORT
Feigenbaum, Fields and Purnell | 24th Annual Highway Report
48
APPENDIX: TECHNICAL NOTES This brief technical appendix summarizes the definitions and sources of the data used in this assessment. The discussion is based on the assumption that comparative cost-effectiveness requires data on system condition or performance, information on the costs to operate and improve the system, and an understanding of the relationship between economic activity and tax revenues. This report relies heavily on the Highway Statistics series, which is compiled by the Federal Highway Administration (FHWA) from data reported by each state. We also use bridge condition data from the National Bridge Inventory and highway fatality rates reported by each state, and for congestion, we use data from INRIX Research and the American Community Survey. This assessment compares states with one another based on self-reported data. In general, we use the data as posted in the various data tables. We do not attempt to audit the data; instead, we assume the data to be correct. However, in cases where the data are clearly incorrect, we make appropriate adjustments to the data and footnote the changes made.

24th ANNUAL HIGHWAY REPORT
Feigenbaum, Fields and Purnell
49
MEASURES OF MILEAGE In general, larger highway systems require more resources to build and maintain than smaller systems. Accordingly, it is important to weight systems so that states can be compared accurately. In this study, mileage is the basic measure for bringing the states to a common baseline. Highway width is also important in differentiating system size (number of lanes), as more pavement generally requires more resources. This study does not rank states based on the size of their highway systems. However, it does use average highway width differences, as derived from state highway agency lane width measures, to measure overall financial performance. “State-Owned” Highway Mileage: In each state, the “state-owned” highway system consists of the State Highway System, and other systems such as toll roads, state parks, universities, prisons, medical facilities, etc. Each state’s responsibility for roads varies. In some, for instance North Carolina, the state is responsible for almost all roads outside of municipalities, while in others, such as New Jersey, the state is responsible for primarily the major multiple-lane roads. In addition, other features such as bridges also vary, with some states having many and others few. The source of data for the state-owned mileage is Table HM-10, Highway Statistics 2016 (https://www.fhwa.dot.gov/policyinformation/statistics/2016/) and includes both state highway agency mileage and other jurisdiction mileage controlled by the state. State Highway Agency (SHA) Mileage: The total numbers of miles and lane-miles for the SHA system are available for each state. From these data, the average lane-miles per centerline-mile is calculated and then used to weight overall financial performance. The source of data for SHA mileage is Table HM-81, Highway Statistics 2016 (https://www.fhwa.dot.gov/policyinformation/statistics/2016/).
DISBURSEMENTS FOR STATE-OWNED HIGHWAYS There are several types of disbursements for state-administered highways: capital and bridge work, maintenance and highway services, administration, research and planning, law enforcement and safety, interest (on bond payments) and bond retirement. Disbursement data are collected for the first three categories (Capital and Bridge Disbursements, Maintenance Disbursements, Administrative Disbursements) as well as for the total expenditures (Total Disbursements). Disbursements by state-administered agencies fund

24TH ANNUAL HIGHWAY REPORT
Feigenbaum, Fields and Purnell | 24th Annual Highway Report
50
the state highway agency, other toll and turnpike state agencies, and state universities, parks, prisons, etc. The source of all these data is Table SF-4, Highway Statistics 2016 (https://www.fhwa.dot.gov/policyinformation/statistics/2016/). These disbursements are divided by “lane-miles under state control” to arrive at a relative measure of expenditure per unit of responsibility. The national average is the weighted average, obtained by summing the financial numbers for all states, then dividing by the sum of all state-administered mileage. Since large per-mile expenditures are also a burden on taxpayers, the states are ranked inversely by this measure, with the highest per-mile expenditures rated the lowest. (In the case where a state has not reported current disbursement data (Massachusetts),7 the most recent available disbursement data are divided by the most recent available mileage data to derive the disbursements per mile.) Capital and Bridge Disbursements and Maintenance Disbursements: “Capital” actions are those intended to reconstruct or improve the system, whereas “maintenance” actions are those intended to preserve or repair the system, but not improve it. However, the definitions of these categories vary somewhat between the states. Most states use private sector contracts to build and reconstruct the system, although in some cases they may also use their own workforces for some projects. Most states also conduct maintenance largely with agency forces and the work is generally light in character, but many also conduct some major repairs, such as thick overlays, using contracted forces from the private sector. Administrative Disbursements: Administrative disbursements are intended to include all non-project-specific disbursements, and typically include most main-office and regional-office costs, research, planning and similar activities. Sometimes this category also includes bond restructurings and other non-project-specific financial actions. As a result, administrative disbursement can sometimes vary widely from year to year. Total Disbursements: Total disbursements represent total state outlays for state-administered roads, and include several categories not detailed above. Usually, states disburse about 2% to 3% less in funds than they collect, the difference resulting from timing differences and delays in project completion. However, states sometimes collect revenues that are not immediately expended, such as major bond sales, which show up as major increases in “receipts” without a similar increase in disbursements. And sometimes, later-year disbursements can be higher than receipts as states transfer money into projects without increasing revenues.
24th ANNUAL HIGHWAY REPORT
Feigenbaum, Fields and Purnell
51
MEASURES OF SYSTEM CONDITION There are nine measures of highway system condition: Rural Interstate Poor-Condition Mileage, Urban Interstate Poor-Condition Mileage, Rural Other Principal Arterial (ROPA) Poor-Condition Mileage, Urban Other Principal Arterial (UOPA) Poor-Condition Mileage, Urbanized Area Congestion, Structurally Deficient Bridges, Fatality Rate, Rural Fatality Rate and Urban Fatality Rate. Poor Condition Mileage: Perhaps no measure is more fundamental to road performance than road condition. There are numerous ways of defining road condition, but the one used for the U.S. higher-road system is the International Roughness Index (IRI), a measure of surface “bumpiness” in inches of vertical deviation per mile of length. The states use a variety of procedures in gathering these data, but most use mechanical or laser equipment driven over the road system. They often supplement these data with detailed information on road distress features, but this information is not generally used in federal reporting. A few states, however, still use visual ratings as the basis of their reports. Lower “roughness index” scores equate to a smoother road. Roads classified as poor typically have visible bumps and ruts leading to a rough ride. Long, smooth sections (greater than one mile in length) tend to dampen out short rough ones, so if a state has long, smooth sections in its database it can report very little “rough mileage” as a percent of the system. The source of road roughness data is Table HM-64, Highway Statistics 2016 (https://www.fhwa.dot.gov/policyinformation/statistics/2016/), which shows miles by roughness, for several functional classes, for each state. This mileage is then converted into a percent, to account for different sizes of systems (rural Interstate, urban Interstate and rural other principal arterials) in each state. The national average is the weighted average, obtained by dividing the sum of all poor-rated mileage by the sum of all state-administered mileage. Rural Interstate Poor-Condition Mileage: Rural Interstate mileage is all mileage outside of urban areas. By convention, Interstate sections with an IRI roughness of greater than 170 inches of roughness per mile (about three inches of vertical variation per 100 feet of road) are classified as “poor” in most reports. By comparison, sections with less than 60 inches of roughness per mile (about one inch of vertical deviation per 100 feet) would be classified as “excellent.” (Delaware and Hawaii have no rural Interstate mileage and are not rated on this measure.)
24TH ANNUAL HIGHWAY REPORT
Feigenbaum, Fields and Purnell | 24th Annual Highway Report
52
Urban Interstate Poor-Condition Mileage: Urban Interstate mileage is all mileage inside census-defined urban areas. It is calculated the same way as rural Interstate mileage is calculated. The IRI cutoff for urban Interstates is the same as for rural Interstates: 170 inches per mile or higher, for “poor” mileage. Rural Other Principal Arterial Poor-Condition Mileage: Rural other principal arterials (ROPAs) are the major inter-city or regional connectors, off the Interstate system. They can be US-numbered and state-numbered roads, and sometimes toll roads or parkways. This system is generally a top priority of most state highway agencies because of its importance to the economic competitiveness of the state. By convention, ROPA sections with an IRI greater than 220 inches per mile of roughness (about four inches of vertical deviation per 100 feet) are classified as “poor” in most reports. The cutoff is higher than for Interstates since speeds on these roads are typically lower, resulting in a smoother trip. Urban Other Principal Arterial Poor-Condition Mileage: Urban other principal arterials (UOPAs) are the major connectors within an urban area, off the Interstate system. They can be US-numbered and state-numbered roads, and sometimes toll roads or parkways. The IRI cutoff for urban other principal arterials is the same as for rural principal arterials: 220 inches per mile or higher for “poor” mileage. Urbanized Area Congestion: The Urbanized Area Congestion metric is measured as the average number of hours spent in congestion during peak hours annually per automobile commuter. For this measure, congestion is defined as a speed below 65% of the free-flow speed, which is the typical uncongested speed on that road segment, and peak hours are locally defined based on the actual driving habits in each city, as opposed to the more typical fixed peak periods of 6:00 AM–9:00 AM and 4:00 PM–7:00 PM. This metric captures the three dimensions of congestion (intensity, duration and extent), it uses real time traffic data, and it is straightforward in both calculation and interpretation. Additionally, updates for the previous measure are not available. This is the second report using the average number of hours spent in congestion metric. In the prior (22nd) Annual Highway Report, congestion was measured as the annual delay per auto commuter (in hours). It was that extra time vehicles spent traveling at congested speeds rather than free-flow speeds, delay that typically occurred during peak periods. This delay was calculated using data from the 2010 Census and the 2015 Urban Mobility Scorecard (UMS).
24th ANNUAL HIGHWAY REPORT
Feigenbaum, Fields and Purnell
53
There are three data sources required to calculate the current metric: the 2017 INRIX Global Traffic Scorecard and its supporting materials (http://inrix.com/scorecard/), the 2016 American Community Survey (https://www.census.gov/acs/www/data/data-tables-and-tools/index.php) and Table HM-74 from the FHWA Highway Statistics series (https://www.fhwa.dot.gov/policyinformation/statistics/2016/) The INRIX Global Traffic Scorecard provides 2017 empirical congestion data for 1,064 cities in 38 countries, including 240 cities here in the U.S. Data items include the Peak Hours Spent in Congestion metric for each city. The American Community Survey data used are the Means of Transportation data for workers 16 years and over (Table S0802). These data are used to calculate the number of auto commuters (the workers 16 years and older who drove alone or carpooled, with the carpoolers being divided by the average carpool occupancy rate of 2.2).8 Table HM-74 (Daily Vehicle-Miles of Travel (DVMT) by Measured Pavement Roughness / Present Serviceability Rating) includes data on all urbanized areas in the U.S. (i.e., those with populations above 50,000). The DVMT data for multi-state urbanized areas are apportioned by state and the percentages of the DVMT in each state are calculated based on total reported DVMT. Using American Community Survey data as the base table, the INRIX city data are linked to the ACS metro areas. Sixty-eight of the 240 INRIX cities are either micropolitan areas (populations below 50,000) or are included with one or more other INRIX cities in a single metropolitan area. (We use only the largest INRIX city available to represent each metro area and exclude the smaller cities in the metro areas, as well as the micropolitan areas.) The DVMT percentages for the multi-state cities are now linked to the base table. The Peak Hours Spent in Congestion metric is calculated for each non-INRIX metro based on national averages of groupings of the numbers of auto commuters. (We use national averages rather than state averages because the number of data points for the individual states is most often inadequate for a good average.) The metric is then weighted by the number of auto commuters. An MS Excel pivot table is used to sum the Weighted Peak Hours Spent in Congestion metric and the Auto Commuters totals by state. Finally, the former is divided by the latter to get the state’s Peak Hours Spent in Congestion figure. Structurally Deficient Bridges: As a result of several major bridge disasters in the 1960s and 1970s, states are required to inspect bridges biennially (every year if a bridge is rated structurally deficient) and maintain uniform records of inspections.

24TH ANNUAL HIGHWAY REPORT
Feigenbaum, Fields and Purnell | 24th Annual Highway Report
54
This year, we include structurally obsolete bridges only and not functionally deficient bridges. Structurally obsolete bridges have deteriorated structural conditions and need maintenance in the near future to ensure continued safety. Functionally obsolete bridges have narrower lanes or shoulders but no structural problems. While neither condition is ideal, structurally deficient bridges are a much bigger problem. Functionally obsolete bridges are older and built to different design standards and tend to be located in states with more mature infrastructure. This data source, titled the National Bridge Inventory (NBI), provides information on deficient bridges. Since the NBI contains a mixture of bridges inspected at different times, some as long as two years ago, the “average” inspection age is about one year. So, an October 2017 summary from the Inventory would represent, on average, bridge condition as of October 2016. While deficient bridge data are in the NBI, we use the annual summary of bridge deficiencies prepared by Better Roads, a trade publication, as our source. This summary, published since 1979, contains very recent information, gathered from each state shortly before the end of each calendar year, using a proprietary survey sent to state bridge engineers. The 2017 Better Roads Bridge Inventory (http://www.equipmentworld.com/2017-better-roads-bridge-inventory-2-year-decline-in-deficient-u-s-bridges-snapped/) contains data collected through October 2017. Overall Fatality Rate: Road safety is a very important measure of system performance, and fatality rates are a key measure of safety. The overall state fatality rate has long been seen as a measure of state performance in road safety. The fatality rate includes two components: a count of fatalities and a measure of travel, i.e., vehicle-miles. The sources of each are Tables FI-20 and VM-2, Highway Statistics 2016 (https://www.fhwa.dot.gov/policyinformation/statistics/2016/). Table FI-20 provides a count of fatalities by state and highway functional class and Table VM-2 provides an estimate of annual vehicle-miles of travel for each state by functional class. The national average fatality rates are the weighted averages across the states. Rural Fatality Rate: The Rural Fatality Rate applies to rural areas of the state. It is calculated in the same manner as the Overall Fatality Rate. Urban Fatality Rate: The Urban Fatality Rate applies to urban areas of the state. It is calculated in the same manner as the Overall Fatality Rate.

24th ANNUAL HIGHWAY REPORT
Feigenbaum, Fields and Purnell
55
OVERALL RATINGS The 2016 overall ratings for each state are developed in several steps:
• First, the relative performance of each state on each of 13 performance measures is determined by computing each state’s “performance ratio.” This is defined as the ratio of each state’s measure to the weighted U.S. mean for the measure. The mathematical structure is as follows:
Mis = Measure “i” for state “s” (e.g., percent of rural Interstates in poor condition, for North Carolina)
Ris = Performance Ratio for measure “i”, state “s” = Mis/M, where M is the weighted average of Mis across the 50 states.
• The four financial performance ratios are combined to calculate the average financial performance. The performance ratios are adjusted for the average lane-miles of each state’s system for an accurate comparison.
Financial Performance (FP) for state “s” = (( is)/4)* (L/Ls)
where Ls is the average SHA lanes-per-mile for measure “i” for state “s”, and L is the weighted average of the SHA lanes-per-mile, over 50 states.
• The nine system performance ratios (eight for Delaware and Hawaii, which have no rural Interstates) are combined to calculate the average system performance.
System Performance (SP) for state “s” = ( is)/9
• Then, financial performance and system performance are combined into an overall performance measure:
Overall Performance for state “s” = (FP*4 + SP*7)/13
In lieu of 9 and 13, Delaware and Hawaii use 8 and 12 since they have no rural Interstates. In final weighting, all metrics are weighted equally.
Since several state agencies are included in each state’s reports, this report should not be viewed as a cost-effectiveness comparison of the state highway departments. Instead, it should be viewed as an assessment of how the state, as a whole, is managing the state-owned roads.
å4
1R
å7
1R

24TH ANNUAL HIGHWAY REPORT
Feigenbaum, Fields and Purnell | 24th Annual Highway Report
56
ENDNOTES
1 “U.S. Consumer Price Index Data from 2013 to 2019.” https://www.usinflationcalculator.com, Inflation Calendar, April 10, 2019. https://www.usinflationcalculator.com/inflation/consumer-price-index-and-annual-percent-changes-from-1913-to-2008/, 9 May 2019.
2 “U.S. Consumer Price Index Data from 2013 to 2019.” https://www.usinflationcalculator.com.
3 Ibid.
4 Ibid.
5 Lomax, Tim, David Shrank and Bill Eisele. 2015 Urban Mobility Report. Texas A & M University. August 2015. http://mobility.tamu.edu/ums/, 4 February 2016.
6 Cookson, Graham and Bob Pishue. “2018 INRIX Global Traffic Scorecard.” INRIX. February 2019. http://inrix.com/scorecard/. 12 April 2019.
7 Per correspondence with Massachusetts, the state has not submitted data since 2010. However, the state is reorganizing its department and plans to submit data for the 2017 year.
8 Polzin, Steve and Alan Pisarski. “Commuting in America 2013.” American Association of State Highway and Transportation Officials. January 2014. 12 April 2019.


AERONAUTICS


0
Public Safety Communications
CommissionWyoLink Priorities
January 2020; Version 3

1
WyoLink Report UpdateSummary of ContentsThe following document includes additional information on the currentstatus and updates of the WyoLink system.
Governance for WyoLink is provided by the Public Safety Communications Commission(PSCC) with representation from state and local agencies.
Sections:
Equipment
Funding and budget
WyoLink Background
Training and Local Outreach
Statewide maps indicating the location of the 77 existing and 16 new WyoLink tower sites including site coverage maps, scaled down to regional coverage.
Definitions

2
WyoLink Equipment

3
WyoLink EquipmentQUANTAR™ – GTR
QUANTAR™ Radio: A Motorola radio intended for use as a base station, either as a radio or as a repeater. It is capable of conventional analog as well as transmission and reception. Its output power is 125 watts.
GTR Radio: Providing the same features of the QUANTAR™ but surpassing the bar previously set by QUANTAR™ offering software-based upgrades, no single point of failure, hot swap hardware, and front access serviceability. Its state of the art compact design enables everything from basic Analog Conventional to advanced P25 on the same hardware.
*Vendor support for the Quantar expires 12/31/2020; 346 units to be replaced at 70 WyoLink sites (5 to 7 units per site) at approx $12.18 Million equaling approx $35,200 per unit

4
WyoLink EquipmentQUANTAR™ – GTR
Quantar base station radios have been servicing WyoLink users for approximately 15 years and will no longer be supported by the vendor past 12/31/2020; meaning parts and service will no longer be available.
After 12/31/2020, Quantar based systems will be susceptible to cyber risks and threats (i.e., Windows operating systems no longer being supported).
Through software and configurations, GTR based systems may be upgraded to double-site capacity with no additional frequencies and limited hardware.
GTR base station radios provide a more robust, resilient WyoLink site; which also provide additional remote monitoring and repairable options – less site down time and fewer dispatching of technicians.
No “end of service & support “ has been announced for GTR based systems; the product will be in service for years to come.

5
WyoLink Towers
The addition of 2 new WyoLink towers over the biennium will provide extended radio coverage into regions and communities with limited to no existing coverage.
Location vetting includes: coverage gaps, lack of Mission Critical Communications, population, and areas of high travel/use.
Saratoga and Northern Sheridan County are target locations.
Expanded Coverage

6
WyoLink EquipmentDirect Current (DC) Power Systems
Base repeaters and microwave equipment operate on 48 volt DC power plants.
DC power plant converts 120 volt commercial power into 48 volt DC.
Replacement of existing power plants that have reached end-of-life/end of support.
• Vendor support expired 2/31/2019• 61 units to be replaced at 61 sites• Cost ~$1.44 million = $23,540 per site

7
WyoLink SMA
Limited resources in staffing (numbers and expertise) result in these services beingessential in order for WyoLink to deliver reliable mission critical communications.
The SMA provides the following services 24/7/365:• Remote System Monitoring: notification and dispatch services provided by the
vendor’s Network Operations Center.
• Remote System Performance Management: allowing remote network technicians to diagnose and repair issues before they affect the end users.
• Technical Assistance: provided to all WyoLink Technicians.
• On-Site Technician Services: for 2 WyoLink Master Sites (Cheyenne and Casper) as well as 2 Mission Critical locations (WHP and TMC dispatch centers)
• On-Site Technician Services: for 3 back-up dispatch centers (Laramie TMC, WyoLink Operations Center, and Wyoming Office of Homeland Security)
System Maintenance Agreement (SMA)

8
WyoLink SMA
SMA services (continued)
• Hardware Repairs with “Advance Replacement” for all WyoLink equipment &components.
• System Security Updates: providing up-to-date Cyber Security and testing for theentire system, including local dispatch centers (Windows-based platforms requiresecurity patches, allowing WyoLink to administer to local dispatch centers).
• System/Software Upgrade Agreement: is an annual system upgrade that isdesigned to maintain WyoLink at an “up-to-date” status. This includes software(i.e., moving to Windows 10 prior to the January 2020 expiration) as well upgradinghardware and components that are no longer capable of supporting an “up-to-date” status. The agreement covers, to an extent, upgrading local dispatch centers’equipment that would be incapable of supporting an “up-to-date” status.
*Services cover: Master Sites, Dispatch Centers, and WyoLink Radio Towers at ~$3.25 million per year (~$6.5 million per biennium)
System Maintenance Agreement (SMA)

9
WyoLink Funding and BudgetPriorities
Quantar to GTR replacement: $12,183,398
Two New WyoLink Towers: $1,971,844
DC Power Systems: $1,435,890
System Maintenance Agreement (SMA): $1,854,318
• A new contract for the 2021-22 biennium would be ~$6,521,511(Includes the addition of 16 new WyoLink Radio Towers)
*House Bill 20LSO-0047 would generate an estimated $3.7 million per year to be expended primarily towards the SMA

10
WyoLink BackgroundWyoming’s Critical, Statewide, Interoperable, Public Safety, Radio Communications System.
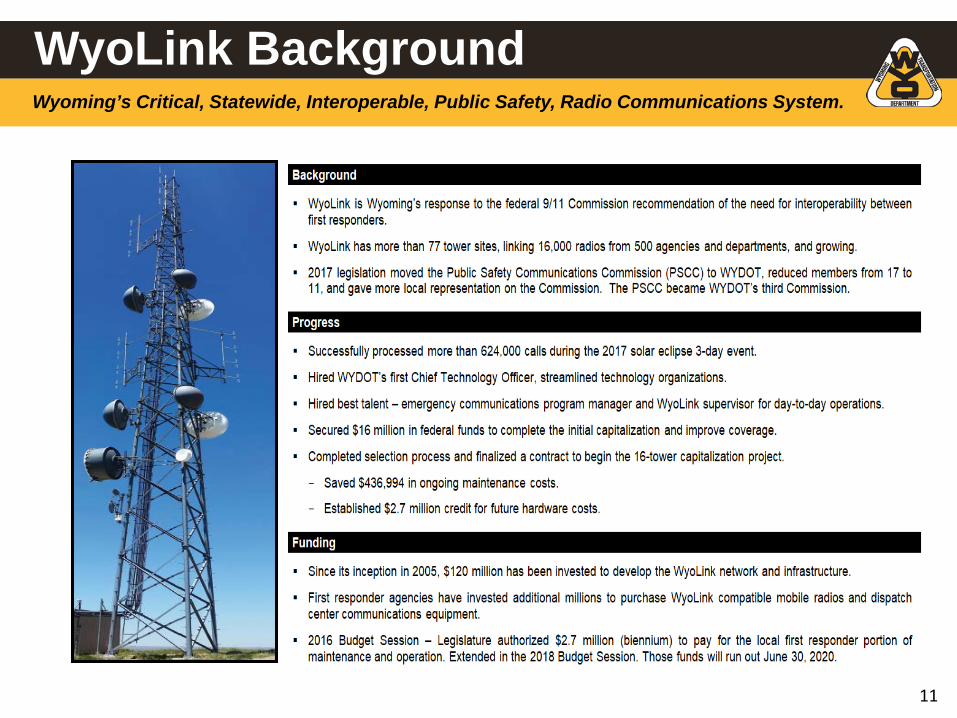
11
WyoLink BackgroundWyoming’s Critical, Statewide, Interoperable, Public Safety, Radio Communications System.
12
WyoLinkTraining & Local OutreachEnd users at the state and local level have stressed a need for additional and continued training. WYDOT - WyoLink are in the process of finalizing updated training materials and information to be distributed to all users.
Goals are to continue to improve:
Providing consistent and factual information to the agencies, allowing the agency to “attach” agency specific information to the common message;
Assist agencies in developing an agency specific WyoLink training program, while maintaining a common message for all users; and
Facilitate an improved procedure for customer feedback and requests

13
WyoLink Site Map
New Sites
Existing Sites

14
WyoLink Site MapWyoLink Site Names Abbreviation WyoLink Site Names Abbreviation Portable Coverage Sites @19 Abbreviation3 Mile 3Mil Mount Pisgah MoPi Buffalo Buff14 Mile (Rock Springs) 14Mi Narrows Hill HaHi Bluff Edge (Greybull) BlEd77 Hill 77Hi Nine Mile 9Mil Douglas Yellowstone DoYe85 South 85So North Albin NoAl Gillette Boxelder GiBoAlcova Reservoir (VHF) AlRe Northern Goshen NoGo Jackson JackAlva (Crook) Alva Orin Junction OrJu Laramie Cemetery LaCeAspen Mountain AsMo Oyster Ridge OyRi Lander Landfill LaLaAspen Ridge AsRi Pine Ridge PiRi Lusk LuskBaggs Hill BaHi Pinkham Mountain PiMo Mans Face MaFaBanner Ridge BaRi Pumpkin Buttes PuBu McCullough Peaks McPeBlack Mountain BlMo Rattlesnake Ridge RaRi Newcastle Newc
Casper Mountain CaMo Rendezvous Peak (MW Only) RePe Rawlins Hill RaHiCasper Port of Entry CaPo Rozet Hill RoHi Riverton Main RiMaCedar Mountain CeMo Sage Junction SaJu Sheridan Kroe ShKr
Cheyenne Water Tank ChWa Salt Pass SaPa Tank Hill (Rock Spring 800) TaHiChicken Creek ChCr Sherman Hill ShHi Thermopolis Owl ThOwChurch Buttes ChBu Shirley Mountain ShMo Torrington TorrCopper Mountain CoMo Signal Mountain SiMo Wheatland South WhSoDead Indian DeIn Snow King SnKi White Pine WhPi
Delaney Rim DeRi South Pass SoPaLocally Owned Sites 800MHZ
Divide Hill DiHi Strous Hill StHi Alcova Reservoir (800) Al80Duncan Lake DuLa Tisdale Divide TiDi Antelope AnteFirst Divide FiDi Tisdale Mountain TiMo Archer Ar80Halleck Ridge HaRi Torch Hill ToHi Burns BurnHell Hole HeHo Virgin Hill ViHi Casper Mountain (800) Ca80Hogsback Ridge HoRi Waltman Hill WaHi Cemetery Separation CeSeJade Mountain JaMo Warren Peak WaPe Fox Farm FoFaKissmett Ridge (Bondurant) KiRi Whitcomb Hill WhHi Southern Drive SoDrLittle Sheep (Big Horn) LiSh Windy Ridge WiRi Tall Grass TaGrLone Tree LoTr Winkleman Dome WiDo Locally Owned Sites 9Meadowlark (Washakie/Big Horn) MeLa Wright WrIg Existing WyoLink Sites 67
Medicine Mountain MeMoNew Sites Under Construction 16
Morton Hill MoHi Total WyoLink Sites 92
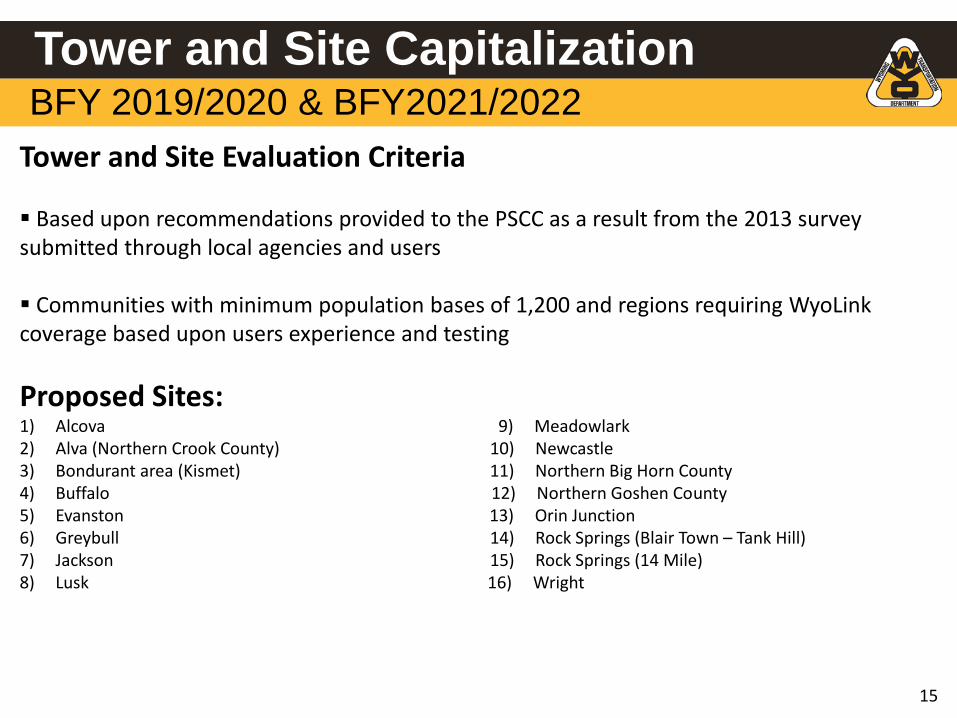
15
Tower and Site CapitalizationBFY 2019/2020 & BFY2021/2022
Tower and Site Evaluation Criteria
Based upon recommendations provided to the PSCC as a result from the 2013 survey submitted through local agencies and users
Communities with minimum population bases of 1,200 and regions requiring WyoLinkcoverage based upon users experience and testing
Proposed Sites:1) Alcova 9) Meadowlark2) Alva (Northern Crook County) 10) Newcastle3) Bondurant area (Kismet) 11) Northern Big Horn County4) Buffalo 12) Northern Goshen County5) Evanston 13) Orin Junction6) Greybull 14) Rock Springs (Blair Town – Tank Hill)7) Jackson 15) Rock Springs (14 Mile)8) Lusk 16) Wright

16
Alcova
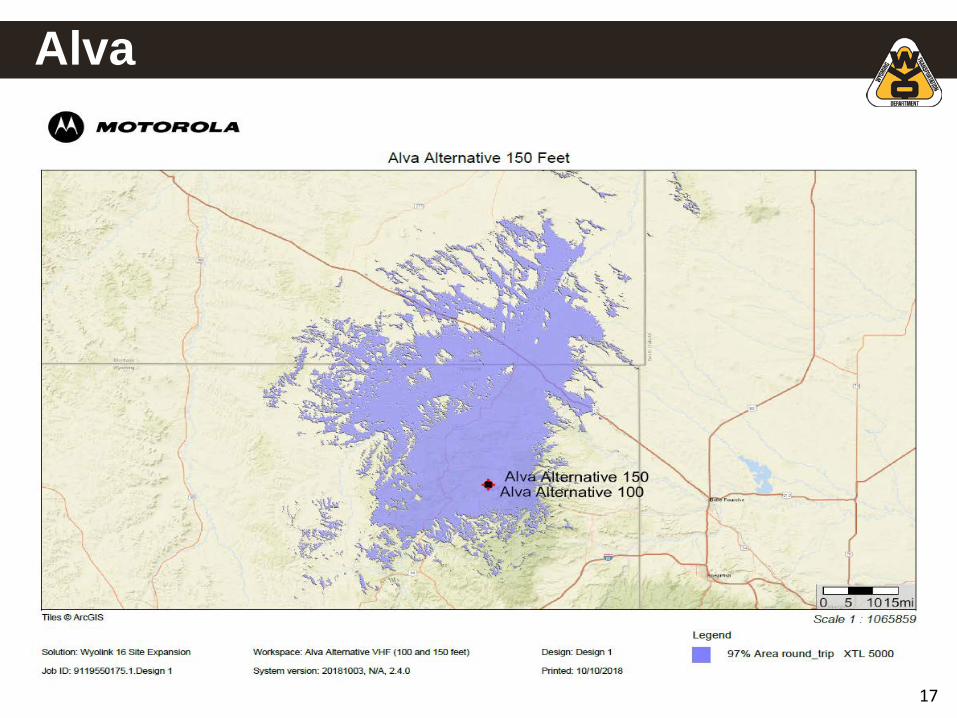
17
Alva

18
Bondurant area (Kismet)

19
Buffalo

20
Evanston

21
Greybull

22
Jackson

23
Lusk

24
Meadowlark

25
Newcastle

26
Northern Big Horn County

27
Northern Goshen County

28
Orin Junction

29
Rock Springs
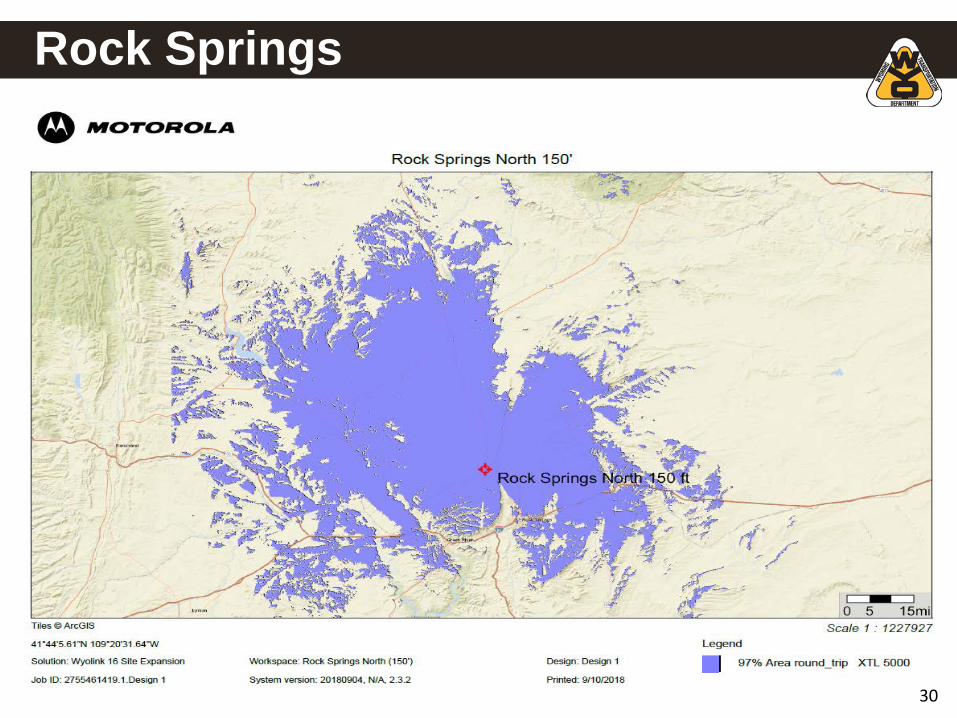
30
Rock Springs

31
Wright

32
WyoLink DefinitionsDispatch Console: Computer based system, connected to a network used to facilitate communicationswith first responders.
Base Repeater: A radio which combines a receiver and a transmitter that receives a signal and retransmitsit, so that two-way radio signals can cover longer distances; Base Repeaters are positioned at WyoLinkradio sites.
Subscriber Unit: A Base, Mobile and/or Portable radio belonging to an agency or individual user.
Base Radio or Control Station: A stationary desk top radio used in public safety offices and as backupradio in dispatch centers. Its output power may be 35 to 100 watts, depending on the radio and options.
Mobile Radio: A vehicle mounted radio that provides communications with dispatch centers and othermobile and portable radios on the system. Its output power may be 35 to 100 watts, depending on the radioand options.
Portable Radio: A Portable, two-way radio that provides field personnel with the ability to communicate witha dispatch center and other mobile radios and portable radios. Its output power is 5 or 7 watts, dependingon the radio.
Core Tower Site: Radio sites that provide for mobile/vehicle radio coverage for the system’s users. CoreTowers were strategically located to provide wide area coverage for the highway transportation system.100% Maintained by WYDOT.
Portable Coverage Enhancement (PCE) Tower Site: Radio sites which enhance portable radio coveragein a local area. PCE’s are located near cities and towns to provide first responders with radio coverage usingtheir handheld portable radios.
Local Tower Site: Radio sites which are funded, built, and maintained by a local agency; yet are connectedto the WyoLink system enabling access for all WyoLink users.
33
WyoLink DefinitionsAffiliate: The radio will request a talkgroup from the trunked system based on the selected talkgroup. Thesystem will then add that talkgroup to the site that the radio is currently attached to.
Subscriber Alias: A unique identifier that is displayed on dispatch’s screen when a radio is transmitting on a talkgroup that is being monitored. The alias corresponds with a specified subscriber ID.
Subscriber ID: A number that the system uses to identify individual radios on a trunked system. No two radios will use the same subscriber ID number.
Channel: Denotes a communications path or mode; often used interchangeably with "frequency," "mode," or "talkgroup" in trunked radio systems "channel" typically refers to the individual transceivers at radio site.
Talkgroup: Denotes the channels in a trunked radio system and is distinct from "frequency," as the radio user never actually changes the frequency. Think of talkgroup as a group of individuals on the same talkgroup.
Mode: On a radio, the selection of a Talkgroup or channel in a radio zone.
Zone: Grouping of talkgroups/channels for ease of use or radio configuration.
Control Channel: Dedicated channel on each radio tower site that passes information between the radio and the zone controller.
Out of Range: Indication of no service available to radio. You will hear a long tone at regular intervals.
Scan: Allows radios to search programmed channels/talkgroups for activity.
Site Busy (Busies): Indication that no repeater resources are available at the tower the radio is affiliated at, accompanied by short repeated tones, much like telephone busy signal.
Site Trunking: Indication that site connectivity to network master controller has been lost. Radio will be operational only in the coverage area of the tower on which it is affiliated.
Wide Area Trunking: Normal operation of a WyoLink site and is connected to the network.

1
2017 Budget SessionWyoLink Budget Narrative
January 2020; Version 3

2017- 2018 BIENNIUM UNIT NARRATIVE 89
DEPARTMENT DEPARTMENT OF TRANSPORTATION WyomIng On Uno Financial CodesDIVISION WyoLink DEPT DIVISION UNIT FUND APPR
UNIT WYOLINK PHASE 2 045 0600. 0603 108 lOB
Please note: WYDOT has made a commitment to build the Core Towers for WyoLink with Highway Funds. The P5CC has recommended building 3Core Towers in BEY 2017/2018. The cost of these 3 Core Towers is estimated to be $3,000,000.
GOVERNOR’S RECOMMENDATION
On-Going Costs
I recommend denial of $1,991,629 of general funds for Hardware and $1,134,985 of general funds for Software. I recommend approval of $1,991,629
of other funds for Hardware and $1,134,985 other funds for Software (Fund 108) collected by billing the users of the WYOLINK system based upon
seventy-five percent (75%) radio traffic by each user to the total radio traffic use of the system, and twenty-five percent (25%) based on the
number of radios to the total number of radios used on the system. I recommend approval of $1,530,000 existing software maintenance standard
general fund budget and the portion of this standard necessary to pay for the on-going state, school district and federal agencies costs, currently
estimated to be up to $139,705 state, $69,615 school district and $143,146 federal, shall be subtracted from the $1,530,000 standard budget prior tothe allocation of remaining expenditures to the local governments and WydoL Wydot shall be responsible for the administration and collection of
the invoiced amounts of On-Going costs. Wydot may select to bill yearly, quarterly or monthly. The invoices shall be based upon the time period
selected by Wydot, or if Wydot selects to bill quarterly, the invoices shall be based on the prior quarter’s activity. I further recommend $1,400,000
of unobligated Mineral Royalty Grant funding be used to pay for the local government’s share of the on-going costs represented as a credit on the
invoices delivered by Wydot to the office of State Lands until exhausted.
I recommend approval of the $593,005 general fund reduction to leased TI lines resulting from the conversion from leased TI lines to the Broadband
Unified Network. I further recommend the department allocate the TI line costs that are put in place for new participants accessing the WYOLINK
system for new leased TI lines to aforementioned $1,530,000 standard budget.
2. PRIORITY #3 PRIORITY LIST #2 DISPATCH CENTER CONSOLES
A. EXPLANATION OF REQUEST: The vendor has 5tated the wire line connected CentraCom Gold Elite Consoles will not be supported on WyoLink after the
7.16 update, schedules for the 1st Quarter of FY2017. The CentraCom Gold Elite Consoles are switch based: Internet Protocol (IP) based consoles will be
required. All dispatch center consoles, except WYDOT and Highway Patrol are locally owned: city, county or joint powers board.
There are 15 agencies with 64 seats currently meeting the IP based requirement and 7 agencies with 18 seats using the CentraCom Gold Elite consoles. The
following are the agencies with CentraCom Gold Elite Consoles: Teton County, Converse County, Crook County, Niobrara County, Glenrock Police
Department, Sheridan Police Departrnent, and Riverton Police Department. (Converse County is planning on consolidating the Douglas and Glenrock
consoles into one new console locatation.)
This is one-time funding.
%fr%

2
WyoLink Sample Invoices
January 2020; Version 3


3
WyoLink Informational Invoices to Users
January 2020; Version 3

WYOMING S‘—— “/ “Providing a safe, high quality, and efficient transportation system”
Mark Gordon 5300 Bishop Boulevard, Cheyenne, Wyoming 82009-3340Governor
MEMORANDUM
TO: WyoLink Subscribers
FROM: K. Luke Reiner, Director of WYDOT
DATE: January 2, 2020
SUBJECT: WyoLink “Informational Invoice”
Attached is the “informational invoice” for the period January 2020 through March 2020 (3rd
Quarter of FY20) for WyoLink maintenance and software. This invoice is an “informationalinvoice” only. DO NOT PAY!
The 2019-2020 biennium Budget bill passed by the Wyoming Legislature extended therequirement for the “informational invoice” for WyoLink maintenance and software throughJune 30, 2020. The methodology for billing is as follows.
The cost is based upon a percentage of the entire WyoLink usage using a 3 year weightedaverage. The 3 year average usage will be weighted 60%/25%/15%. As an example, fiscal year2020 will be billed with a weighted average of 60% from 2019, 25% from 201$, and 15% from2017. The weighted average determined for your entity will then be divided into the totalweighted average for WyoLink to calculate the total percentage of cost. That percentage will
the beginning of each quarter.
In order to provide you with a fixed bill for budgeting purposes, we will begin billing at thebeginning of the quarter (for example, the January 2020 through March 2020 quarter’s bill willbe sent by mid-January 2020). The amount of your quarterly bill will be the same each quarterof the fiscal year. As the next fiscal year’s billable amount for each entity is determined, thevariance between what you were billed and your actual usage for the fiscal year will becalculated. This variance will be included in the calculation to determine the next year’squarterly bill amount.
If you have any questions or need additional information, contact Nathan Smolinski, WyoLinkSupport Manager, at [email protected] or 307-777-4756.
K. Luke ReinerDirector
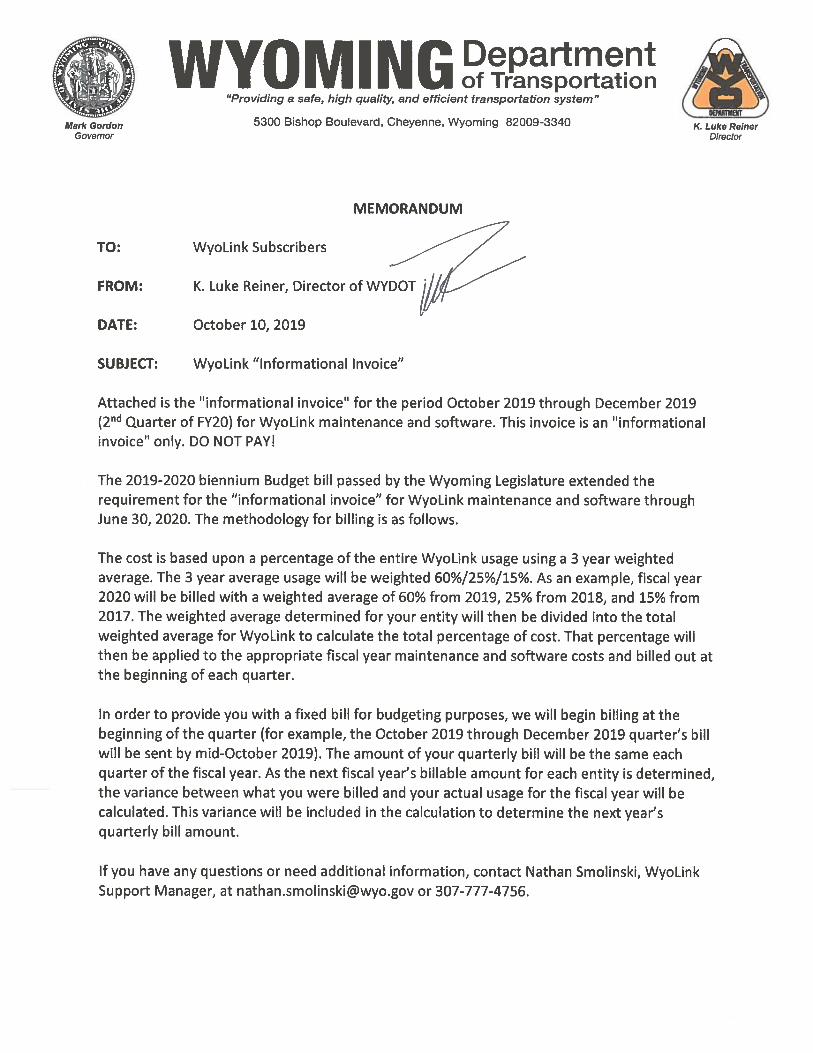
‘A’YOMING DepartmentNW of Transportation
“Providing a safe, high quality, and efficient transportation system”
5300 Bishop Boulevard, Cheyenne, Wyoming 82009-3340
MEMORANDUM
TO: WyoLink Subscribers
FROM: K. Luke Reiner, Director of WYDOT
DATE: October 10, 2019
SUBJECT: WyoLink “Informational Invoice”
Attached is the “informational invoice” for the period October 2019 through December 2019(2u7d Quarter of FY20) for WyoLink maintenance and software. This invoice is an “informationalinvoice” only. DO NOT PAY!
The 2019-2020 biennium Budget bill passed by the Wyoming Legislature extended therequirement for the “informational invoice” for WyoLink maintenance and software throughJune 30, 2020. The methodology for billing is as follows.
The cost is based upon a percentage of the entire WyoLink usage using a 3 year weightedaverage. The 3 year average usage will be weighted 60%/25%/15%. As an example, fiscal year2020 will be billed with a weighted average of 60% from 2019, 25% from 201$, and 15% from2017. The weighted average determined for your entity will then be divided into the totalweighted average for WyoLink to calculate the total percentage of cost. That percentage willthen be applied to the appropriate fiscal year maintenance and software costs and billed out atthe beginning of each quarter.
In order to provide you with a fixed bill for budgeting purposes, we will begin billing at thebeginning of the quarter (for example, the October 2019 through December 2019 quarter’s billwill be sent by mid-October 2019). The amount of your quarterly bill will be the same eachquarter of the fiscal year. As the next fiscal year’s billable amount for each entity is determined,the variance between what you were billed and your actual usage for the fiscal year will becalculated. This variance will be included in the calculation to determine the next year’squarterly bill amount.
If you have any questions or need additional information, contact Nathan Smolinski, WyoLinkSupport Manager, at [email protected] or 307-777-4756.
Mark GordonGovernor
K. Luke ReinerDirector
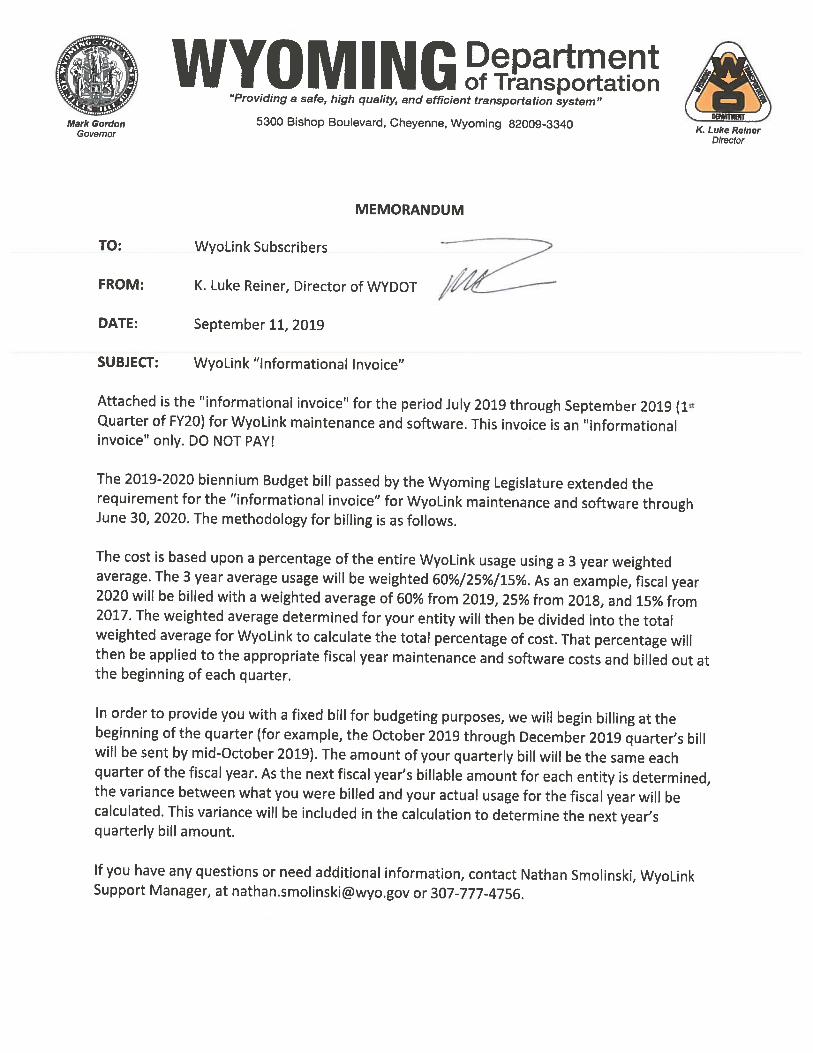
WYOMING“Providing
a safe, high qualiiy, and efficient transportation system”
Mark Gordon 5300 Bishop Boulevard, Cheyenne, Wyoming 82009-3340Governor
MEMORANDUM
TO: WyoLink Subscribers
FROM: K. Luke Reiner, Director of WYDOT
DATE: September 11, 2019
SUBJECT: WyoLink “Informational Invoice”
Attached is the “informational invoice” for the period July 2019 through September 2019 (1Quarter of FY20) for WyoLink maintenance and software. This invoice is an “informationalinvoice” only. DO NOT PAY!
The 2019-2020 biennium Budget bill passed by the Wyoming Legislature extended therequirement for the “informational invoice” for WyoLink maintenance and software throughJune 30, 2020. The methodology for billing is as follows.
The cost is based upon a percentage of the entire WyoLink usage using a 3 year weightedaverage. The 3 year average usage will be weighted 60%/25%/15%. As an example, fiscal year2020 will be billed with a weighted average of 60% from 2019, 25% from 2018, and 15% from2017. The weighted average determined for your entity will then be divided into the totalweighted average for WyoLink to calculate the total percentage of cost. That percentage willthen be applied to the appropriate fiscal year maintenance and software costs and billed out atthe beginning of each quarter.
In order to provide you with a fixed bill for budgeting purposes, we will begin billing at thebeginning of the quarter (for example, the October 2019 through December 2019 quarter’s billwill be sent by mid-October 2019). The amount of your quarterly bill will be the same eachquarter of the fiscal year. As the next fiscal year’s billable amount for each entity is determined,the variance between what you were billed and your actual usage for the fiscal year will becalculated. This variance will be included in the calculation to determine the next year’squarterly bill amount.
If you have any questions or need additional information, contact Nathan Smolinski, WyoLinkSupport Manager, at [email protected] or 307-777-4756.
K. Luke ReinerDirector

MEMORANDUM
TO: WyoLink Subscribers FROM: Rhonda S. Holt, CPA
Controller, WYDOT Financial Services DATE: March 12, 2019 SUBJECT: WyoLink “Informational Invoice” Attached is the "informational invoice" for the period October 2018 through December 2018 for WyoLink maintenance and software. This invoice is an "informational invoice" only. DO NOT PAY! The 2019‐2020 biennium Budget bill passed by the Wyoming Legislature extended the requirement for the “informational invoice” for WyoLink maintenance and software through June 30, 2020. The methodology for billing is as follows. The cost is based upon a percentage of the entire WyoLink usage using a 3 year weighted average. The 3 year average usage will be weighted 60%/25%/15%. As an example, fiscal year 2019 will be billed with a weighted average of 60% from 2018, 25% from 2017, and 15% from 2016. The weighted average determined for your entity will then be divided into the total weighted average for WyoLink to calculate the total percentage of cost. That percentage will then be applied to the appropriate fiscal year maintenance and software costs and billed out quarterly. If you have any questions or need additional information, contact Nathan Smolinski, WyoLink Support Manager, at [email protected] or 307‐777‐4756.

WYOMING?
_
“Providing a safe, high quality, and efficient transportation system” (ç’Matthew H. Mead 5300 Bishop Boulevard, Cheyenne, Wyoming 82009-3340 WllllamTPanos
Governor Director
MEMORANDUM
TO: W Link Subscribers
FROM: T. Panos, Director of WYDOT
DATE: October 22, 2012
SUBJECT: WyoLink “Informational Invoice”
Attached is the “informational invoice” for the period July 2018 through September 201$ forWyoLink maintenance and software. This invoice is an “informational invoice” only. DO NOTPAY!
The 20 19-2020 biennium Budget bill passed by the Wyoming Legislature extended therequirement for the “informational invoice” for WyoLink maintenance and software throughJune 30, 2020. The methodology for billing is as follows.
The cost is based upon a percentage of the entire WyoLink usage using a 3 year weightedaverage. The 3 year average usage will be weighted 60%/25%/1 5%. As an example, fiscal year2019 will be billed with a weighted average of 60% from 2018, 25% from 2017, and 15% from2016. The weighted average determined for your entity will then be divided into the totalweighted average for WyoLink to calculate the total percentage of cost. That percentage willthen be applied to the appropriate fiscal year maintenance and software costs and billed outquarterly.
If you have any questions or need additional information, contact Nathan Smolinski, WyoLinkSupport Manager, at nathan.smolinskiwyo.gov or 307-777-4756.

WYOMING?“Providing a safe, high quality, and efficient transportation system”
D.9TM1TMafthewH. Mead 5300 Bishop Boulevard, Cheyenne, Wyoming 82009-3340 William T. PanosGovernor Director
MEMORANDUM
TO: yjYoLink Subscribers
FROM: i am T. Panos, Director of WYDOT
DATE: August 7, 2018
SUBJECT: WyoLink “Informational Invoice”
Attached is the “informational invoice” for the period April 2018 through June 2018 forWyoLink maintenance and software. This invoice is an ‘informational invoice” only. DO NOTPAY!
The 2017-2018 biennium Budget bill passed by the Wyoming Legislature requires the WYDOTto send local govermnents an “informational invoice” for WyoLink maintenance and software.Seventy-five (75%) of the invoice will be from the previous quarter usage and the other twenty-five (25%) will be from the number of radios in inventory at the end of the quarter. This will bethe final “informational invoice” that is built upon this billing methodology.
The 2019-2020 biennium Budget bill passed by the Wyoming Legislature extended therequirement for the ‘informational invoice” for WyoLink maintenance and software throughJune 30, 2020. Based on conversations with our WYOLINK subscribers, a new methodology forthe 2019-2020 biennium has been developed based on usage only. Details regarding the newmethodology that will begin with the next quarter’s invoice for the period of July 2018 throughSeptember 2018 follows.
New methodology: The cost will be based upon a percentage of the entire WyoLink usage usinga 3 year weighted average. The 3 year average usage will be weighted 60%/25%/l 5%. As anexample, fiscal year 2019 will be billed with a weighted average of 60% from 2018, 25% from2017, and 15% from 2016. The weighted average determined for your entity will then be dividedinto the total weighted average for WyoLink to calculate the total percentage of cost. Thatpercentage will then be applied to the appropriate fiscal year maintenance and software costs andbilled out quarterly.
If you have any questions or need additional information, contact Nathan Smolinski, WyoLinkSupport Manager, at nathan.smolinskiwyo.gov or 307-777-4756.

WYOMING
_
“Providing a safe, high quality, and efficient transportation system” /Matthew H. Mead 5300 Bishop Boulevard, Cheyenne, Wyoming 82009-3340 WillIam T. Panos
Governor Director
MEMORANDUM
TO:
FROM:
DATE: April 30, 2018
SUBJECT: WyoLink “Informational Invoice”
Attached is the “informational invoice” for the period January 201$ through March 2018for WyoLink maintenance and software. This invoice is an “informational invoice” only.DO NOT PAY!
The 2017-2018 biennium Budget bill passed by the Wyoming Legislature requires theWyoming Department of Transportation (WYDOT) to send local governments an“informational invoice” for WyoLink maintenance and software. Seventy-five (75%) ofthe invoice will be from the previous quarter usage and the other twenty-five (25%) willbe from the number of radios in inventory at the end of the quarter. This billingmethodology will continue through June 30, 2018.
The 2019-2020 biennium Budget bill passed by the Wyoming Legislature extends the“informational invoice” requirement for WyoLink though June 30, 2020. Based on yourfeedback, we are currently reviewing other cost allocation models and will have furtherinformation regarding new methodology for the 20 19-2020 biennium next quarter.
Although this is only an “informational invoice”, it is important that you review it foraccuracy, including the number of radios in your inventory, since this will affect yourshare of costs in future billings.
Please update your information on the enclosed WyoLink Point of Contact (POC) formincluded with this invoice, if you did not do so with the POC form sent with the last“informational billing”. Be sure to include an email address if you want to receive theinvoice and detail information electronically.
If you have any questions or need additional information, contact Nathan Smolinski,WyoLink Support Manager, at nathan.sInolinski(wyo.gov or 307-777-4756.
‘illiarn T. Panos, Director of WYDOT

Ma
atthew H. Mead Governor
TO:
FROM:
DATE:
SUBJEC
Attached2017 foronly. DO The 201Wyomin“informathe invobe from feedbackinformed Althougaccuracyshare of Please uincluded“informainvoice a If you haWyoLin
WyoL
: Willia
Janua
CT: WyoL
d is the “infr WyoLink O NOT PAY
7-2018 bienng Departmational invoice will be the number
k, we are cud of any rec
gh this is ony, includingf costs in fut
update your d with this iational billiand detail in
ave any quenk Support M
Link Subscr
am T. Pano
ary 25, 2018
ink “Inform
formation inmaintenancY!
nnium Budment of Tranoice” for Wfrom the prr of radios iurrently revcommended
ly an “inforg the numbeture billings
informationinvoice, if ying”. Be surnformation
estions or nManager at
MEM
ribers
os, Director
8
mational Inv
nvoice” force and softw
dget bill pasnsportation
WyoLink marevious quain inventory
viewing othed changes.
rmational iner of radios s.
n on the enyou did not re to includ
n electronica
need additionathan.smo
MORANDU
of WYDO
voice”
r the period ware. This i
sed by the W(WYDOT)
aintenance aarter usage ay at the ender cost alloc
nvoice”, it iin your inv
closed Wyodo so with
de an email ally.
onal informaolinski@wy
UM
T
October 20invoice is a
Wyoming Lto send loc
and softwarand the othed of the quarcation mod
is importantventory, sin
oLink Pointthe POC foaddress if y
ation contacyo.gov or 3
017 throughan “informat
Legislature cal governmre. Seventy-er twenty-firter. Based els and will
t that you rece this will
t of Contactorm sent wiyou want to
ct Nathan S07-777-475
Will
h Decembertional invoi
requires thments an -five (75%)ive (25%) won your l keep you
eview it foraffect your
t (POC) forth the last
o receive the
Smolinski, 56.
liam T. Panos Director
r ice”
e
of will
r r
rm
e

Ma
atthew H. Mead
Governor
TO:
FROM:
DATE:
SUBJEC
Attachedfor Wy“informa
The 201Wyomin“informa(75%) o(25%) wyour feeinformed
Althougaccuracyshare of
Please uincluded“informainvoice a
If you hWyoLin
WyoL
: Willia
Nove
CT: WyoL
d is the “inoLink comational invo
17-2018 bieng Departmational invo
of the invoiwill be fromedback, we d of any rec
gh this is ony, includingf costs in fut
update yourd with this ational billiand detail in
have any qnk Support M
Link Subscr
am T. Pano
ember 17, 20
Link “Infor
nformation imputer hardoice” only.
ennium Budment of Troice” for Wce will be
m the numbeare currentlcommended
nly an “infg the numbture billings
r informatioinvoice, if
ing”. Be snformation
questions oManager at
MEM
ribers
os, Director
017
rmational In
invoice” fodware and DO NOT
dget bill paransportatio
WyoLink harfrom the p
er of radios ly reviewind changes.
formational ber of radios.
on on the ef you did nure to inclu
n electronica
or need addnathan.smo
MORANDU
of WYDO
nvoice”
or the periodd software PAY!
assed by thon (WYDOrdware and
previous quain inventor
ng other cos
invoice”, ios in your
nclosed Wynot do so wude an emaally.
ditional infolinski@wy
UM
T
d July 2017maintenan
he WyominOT) to send software marter usagery at the enst allocation
it is importinventory,
yoLink Poiwith the POail address
formation cyo.gov or 3
7 through Snce. This
ng Legislatund local gmaintenance and the ot
nd of the qun models an
tant that yosince this w
int of ContaOC form se
if you wan
contact Nat07-777-475
Will
September 2invoice i
ure requiregovernmente. Seventyther twentyarter. Base
nd will keep
ou review iwill affect
act (POC) nt with the
nt to receive
than Smoli56.
liam T. Panos Director
2017 s an
s the ts an y-five y-five ed on p you
it for your
form e last e the
inski,
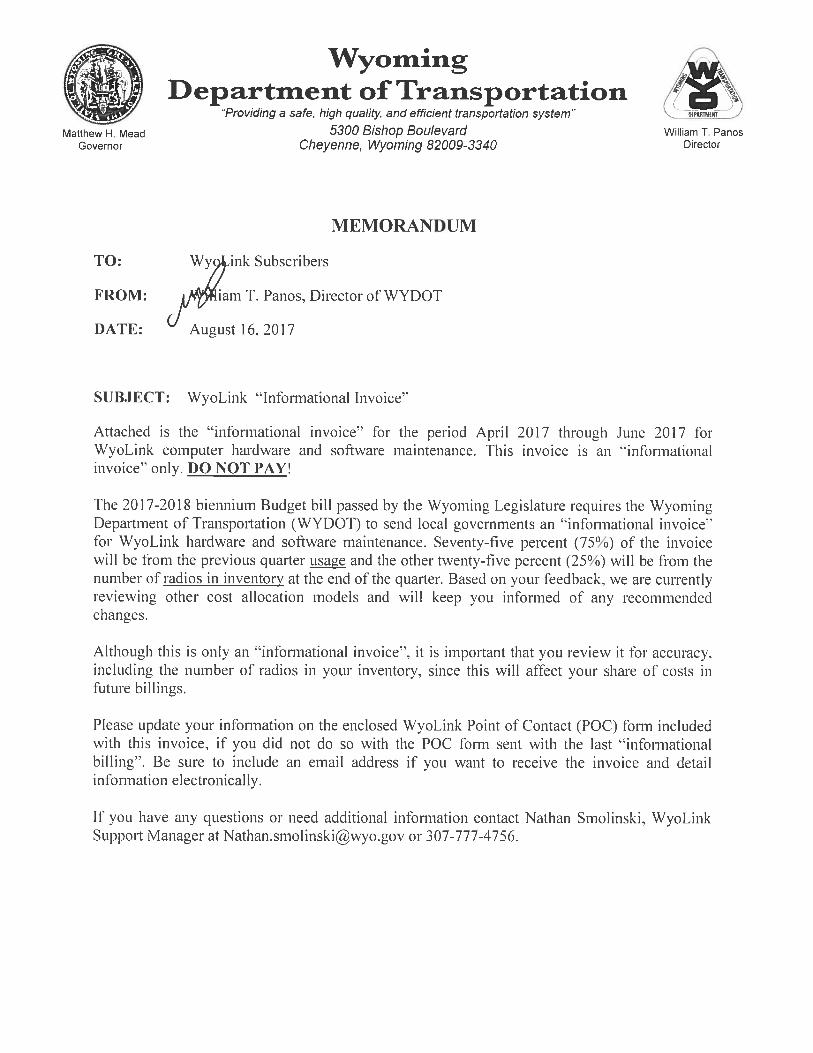
WyomingDepartment ofTransportation
‘Providing a safe, high quality, and efficient transportation system’ ‘ PARJMET JMatthew H. Mead 5300 Bishop Boulevard William T. Panos
Governor Cheyenne. Wyoming 82009-3340 Director
MEMORANDUM
TO: Wy,ink Subscribers
FROM: pam T. Panos, Director of WYDOT
DATE: U August 16, 2017
SUBJECT: WyoLink “Informational Invoice”
Attached is the “informational invoice” for the period April 2017 through June 2017 forWyoLink computer hardware and software maintenance. This invoice is an “informationalinvoice” only. DO NOT PAY!
The 2017-2018 biennium Budget bill passed by the Wyoming Legislature requires the WyomingDepartment of Transportation (WYDOT) to send local governments an “informational invoice”for WyoLink hardware and software maintenance. Seventy-five percent (75%) of the invoicewill be from the previous quarter usage and the other twenty-five percent (25%) will be from thenumber of radios in inventory at the end of the quarter. Based on your feedback, we are currentlyreviewing other cost allocation models and will keep you informed of any recommendedchanges.
Although this is only an “informational invoice”, it is important that you review it for accuracy.including the number of radios in your inventory, since this will affect your share of costs infuture billings.
Please update your information on the enclosed WyoLink Point of Contact (POC) form includedwith this invoice, if you did not do so with the POC form sent with the last “informationalbilling”. Be sure to include an email address if you want to receive the invoice and detailinformation electronically.
i you have any questions or need additional information contact Nathan Smolinski. Wy’oLinkSupport Manager at Nathan.smolinskiwyo.gov or 307-777-4756.

Matthew H. Mead
Governor
To:
From:
Subject:
Date:
Wyoming Department of Transportation
"Providing a safe, high quality, and efficient transportation system"
5300 Bishop Boulevard Cheyenne, Wyoming 82009-3340
MEMORANDUM
WyoLink Subscribers
William T. Panos, Director ofWYDOT
WyoLink Informational Invoice
October 31, 2016
- ,,..,,... .......... ==
William T. Panos
Director
o:u
Attached is an "informational invoice" for the period of July, 2016 through September, 2016 for
WyoLink computer hardware and software. This "informational invoice" is for information only.
PLEASE DO NOT PAY!
The 2017-2018 biennium Budget bill passed in the last legislative session requires the Wyoming
Department of Transportation (WYDOT) to send local governments an "informational invoice" for
WyoLink hardware and software maintenance. Seventy-five percent (75%) of the invoice will be
from the previous quarter usage, and the other twenty-five percent (25%) will be from the number
of radios in inventory at the end of the quarter.
The WyoLink hardware and software cost for the current biennium is $3,126,614. For this
biennium, highway funds will be used to pay $380,523 and the remaining local government
allocation of $2,746,091 will be paid by the State of Wyoming.
Although this is only an "informational invoice", it is important that you review it for accuracy,
including the number of radios in your inventory, since this will affect your share of costs in future
billings.
A WyoLink Point of Contact Form is also included. Please complete and mail it back to the
address listed on the form. Be sure to include an E-Mail Address if you wish to receive the invoice
and detailed information electronically.

REVENUE INFORMATION SYSTEM REPLACEMENT PLAN State of Wyoming | Wyoming Department of Transportation
1 MATHTECH | REVENUE INFORMATION SYSTEM REPLACEMENT PLAN
REVENUE INFORMATION SYSTEM REPLACEMENT PLAN State of Wyoming Department of Transportation October 8, 2018
Prepared by: Mathtech, Inc.
2465 Kuser Road, Suite 200 Hamilton, NJ 08690
www.mathtechinc.com

REVENUE INFORMATION SYSTEM REPLACEMENT PLAN State of Wyoming | Wyoming Department of Transportation
2 MATHTECH | REVENUE INFORMATION SYSTEM REPLACEMENT PLAN
Contents 1. Introduction & Executive Summary ---------------------------------------------------------------------------------------------------- 4
1.1 About This Report -------------------------------------------------------------------------------------------------------------------- 4
1.2 Executive Summary ----------------------------------------------------------------------------------------------------------------- 4
2. Background --------------------------------------------------------------------------------------------------------------------------------- 11
2.1 About Mathtech -------------------------------------------------------------------------------------------------------------------- 11
2.2 Project Approach ------------------------------------------------------------------------------------------------------------------- 12
3. Status of the Current WYDOT RIS System ------------------------------------------------------------------------------------------ 13
3.1 Technology & Status -------------------------------------------------------------------------------------------------------------- 13
3.2 System Deficiencies --------------------------------------------------------------------------------------------------------------- 13
3.3 Data Deficiencies ------------------------------------------------------------------------------------------------------------------- 15
3.4 RIS System Stability ---------------------------------------------------------------------------------------------------------------- 16
3.5 Risk of Not Addressing Modernization Needs ------------------------------------------------------------------------------ 17
3.6 WYDOT & ETS Support Capabilities ------------------------------------------------------------------------------------------- 18
3.7 ETS Mainframe Hosting Transition -------------------------------------------------------------------------------------------- 18
4. System Scope ------------------------------------------------------------------------------------------------------------------------------ 19
4.1 RIS Interactions with other Agencies and Stakeholders ----------------------------------------------------------------- 19
4.2 Driver Licensing --------------------------------------------------------------------------------------------------------------------- 19
4.3 Driver History ----------------------------------------------------------------------------------------------------------------------- 20
4.4 Vehicle Services --------------------------------------------------------------------------------------------------------------------- 20
4.5 Business Licensing ----------------------------------------------------------------------------------------------------------------- 20
4.6 Revenue Management ----------------------------------------------------------------------------------------------------------- 21
5. Vision for Moving Forward ------------------------------------------------------------------------------------------------------------- 21
5.1 New Functionality ------------------------------------------------------------------------------------------------------------------ 21
5.2 Improved Services & Capabilities ---------------------------------------------------------------------------------------------- 21
5.3 Better Technology ----------------------------------------------------------------------------------------------------------------- 22
6. Market Assessment ---------------------------------------------------------------------------------------------------------------------- 22
6.1 Market Background --------------------------------------------------------------------------------------------------------------- 22
6.2 Vendor Landscape ----------------------------------------------------------------------------------------------------------------- 23
7. Options for Moving Forward ----------------------------------------------------------------------------------------------------------- 24
7.1 Modernization Approaches ----------------------------------------------------------------------------------------------------- 24
7.2 Hosting & On-Site Considerations --------------------------------------------------------------------------------------------- 25
8. Challenges & Risks ------------------------------------------------------------------------------------------------------------------------ 27
8.1 Consideration of a Common System Across All Counties Operated By WYDOT ----------------------------------- 27
9. Potential Schedule ------------------------------------------------------------------------------------------------------------------------ 29
9.1 Modernization Subprojects and Activities ----------------------------------------------------------------------------------- 29
9.2 Potential Schedule ----------------------------------------------------------------------------------------------------------------- 31

REVENUE INFORMATION SYSTEM REPLACEMENT PLAN State of Wyoming | Wyoming Department of Transportation
3 MATHTECH | REVENUE INFORMATION SYSTEM REPLACEMENT PLAN
10. Staffing Requirements --------------------------------------------------------------------------------------------------------------- 31
10.1 Staffing Skill Sets ------------------------------------------------------------------------------------------------------------------- 31
10.2 Basic Staffing Expectations ------------------------------------------------------------------------------------------------------ 32
10.3 Staffing – Dual Burden ------------------------------------------------------------------------------------------------------------ 32
10.4 Staff Roles ---------------------------------------------------------------------------------------------------------------------------- 32
11. Estimate Project Costs & Funding ------------------------------------------------------------------------------------------------- 37
11.1 Estimated Budget ------------------------------------------------------------------------------------------------------------------ 38
11.2 Factors Impacting the Estimated Cost Range ------------------------------------------------------------------------------- 41
11.3 Pricing Model Considerations --------------------------------------------------------------------------------------------------- 43
11.4 Annual Cost Projection ----------------------------------------------------------------------------------------------------------- 45
11.5 Potential Savings from Mainframe Retirement & Current Consulting Staff ---------------------------------------- 46
11.6 Changes from Prior Cost Estimates -------------------------------------------------------------------------------------------- 46
11.7 Potential Funding Sources ------------------------------------------------------------------------------------------------------- 47
12. Next Steps ------------------------------------------------------------------------------------------------------------------------------- 49
For more information regarding this report please contact the author. Steven E. Young, PMP, Sr. Vice President [email protected] Mathtech, Inc. 2465 Kuser Road Suite 200 Hamilton, New Jersey, USA 08690 Phone: 609-689-8511

REVENUE INFORMATION SYSTEM REPLACEMENT PLAN State of Wyoming | Wyoming Department of Transportation
4 MATHTECH | REVENUE INFORMATION SYSTEM REPLACEMENT PLAN
1. Introduction & Executive Summary
1.1 About This Report Mathtech, Inc. was engaged by the Wyoming Department of Transportation (WYDOT) to assist in creating a plan for modernizing its primary computer systems known as the Revenue Information System (RIS). This included:
Review and Evaluation of Current and Future Business Needs
Assessment of Current Environment
Review of Similar Modernization Projects and Available Approaches
Development of a Strategic Plan for RIS Modernization
This document is the final Strategic Plan for RIS Modernization and it was developed in collaboration with senior leadership and user groups representing the following business functions:
Driver Services
Motor Vehicle Services
Driver History Management
Highway Patrol
County Clerks & Treasurers
Information Technology
Financial Services
Wyoming Enterprise Technology Services
Wyoming Attorney General's Office
1.2 Executive Summary
1.2.1 Project Background
Modernization Goal WYDOT operates with a substantially antiquated computer system, the Revenue Information System (RIS), and sought to begin the planning process to modernize this system. Modernization projects are complex and include enterprise technology planning, business process modernization, and large-scale system development and implementation. In short, large modernization projects are complex and an opportunity to transform the organization.
Mathtech – Planning Vendor WYDOT engaged Mathtech, Inc. to conduct a planning engagement. Mathtech has a 50-year history serving clients with complex projects. Mathtech is active in the AAMVA (American Association of Motor Vehicle Administrators) community and has experience planning and implementing motor vehicle system modernization projects working with jurisdictions including PA, NJ, NY, MN, WA, WI, MD, and others. Mathtech started work with WYDOT in April 2018 and delivered this final report in October 2018.
The project included working with the team on-site and off-site to complete this modernization plan deliverable including:
Limits of the current RIS system Desired New Functionality
Modernization Options Analysis Recommendations for Next Steps

REVENUE INFORMATION SYSTEM REPLACEMENT PLAN State of Wyoming | Wyoming Department of Transportation
5 MATHTECH | REVENUE INFORMATION SYSTEM REPLACEMENT PLAN
1.2.2 Status of the Current WYDOT RIS System The Revenue Information System (RIS) is a 40+ year old COBOL/CICS mainframe system that supports WYDOT’s key driver licensing and vehicle functions. The RIS system is completely outdated and difficult to maintain because of the technology, its design, and the limited number of staff who still understand and can support the system. Small changes and large ones require a substantial amount of time, resources, and risk to implement.
WYDOT finds itself “frozen in time” and unable to modernize operations or provide new services such as online transactions because the system cannot accommodate such enhancements and the burden of ongoing maintenance is a distraction.
System Deficiencies – Some of the RIS system deficiencies include:
Difficult to Support New Legislation or Customer Service Improvements – Because of the difficulty in changing or enhancing the system
Poor Support for County Motor Vehicle Operations – including insufficient access, poor data synchronization, and data quality problems
Poor Support for Law Enforcement – Including out-of-date vehicle information, missing driver photos, unclear driver history information, and no temporary vehicle registration data
Limited Data Analysis and Reporting Capabilities – Due to of outdated technology, limited analytical tools and limited data
No Support for Business Licensing – Transaction are performed manually and no business licensing data is provided to consumers
Forces WYDOT into Paper-Centric Operations – Due to the age of the systems and the inability to enhance them or interface them with newer technologies
Insufficient Data Management – The system does not collect or manage the wide range of information needed by WYDOT and its dependent stakeholders
Lack of Stability The RIS system is one of the most high-profile systems in the state. It is also an aging system with a complex combination of programming logic, software, data, and hardware – all of which are designed to work together. Changes to any part of any component must account for the dependencies on the other components and an improper change or enhancement can crash the entire system impacting Driver Licensing, Commercial Drivers, Law Enforcement, Voter Registration, Titling, and Registration services.
In the past year WYDOT has experienced multiple outages.
Very Limited Support As is typical with older mainframe systems, there are resource challenges that make supporting and enhancing the system difficult and risky. This is the case for WYDOT and ETS as well.
There are only two resources with the knowledge to support the system and respond to outages, one of which is a contractor resource with a planned retirement in about 2 years.
1.2.3 System Scope A modernized RIS system must support all of the WYDOT operational areas as they are all interconnected through common customer and vehicle information. This includes back-office operations, field office operations, and web based services made available to customers and partners. This scope includes the following:
Driver Licensing Services – driver and commercial license issuance, medical, vision, knowledge and road tests, learner permits, graduated driver licensing, identification cards, organ donor, and disabled parking placards

REVENUE INFORMATION SYSTEM REPLACEMENT PLAN State of Wyoming | Wyoming Department of Transportation
6 MATHTECH | REVENUE INFORMATION SYSTEM REPLACEMENT PLAN
Driver History Services – suspensions, restorations, driving record maintenance, and ignition interlock tracking
Vehicle Services – collection and consolidation of titling and registration, title searches, specialty plates, abandoned vehicles, lien filing, and compliance data from county processing
Business Licensing Services – full licensing tracking and management of businesses such as rental companies, dealers, and salvage yards
Revenue Management functions – collection, consolidation, and tracking of customer transaction financials and payments and integration with the Oracle Financial System
1.2.4 Vision for Moving Forward A modernized RIS system would not only address deficiencies but offer new capabilities to improve customer service and operational efficiencies and offer a stable, supportable technical platform. Important new capabilities should include:
Modern, Integrated, Flexible Systems – Provides current, supported technologies and tools that offer enhanced features that promote easier maintenance, reliability and security.
360 Degree View of Customer Information – Provides a consolidated view of all customer information allowing for better customer service as well as fraud detection. As allowed, consolidated information could include a photo, list of issued products with expiration dates, interactions, alerts etc.
On-line WYDOT and Full Featured Web Site - Provides new tools and capabilities for customers that will let them serve themselves, answer questions, and better understand DMV processes. As tools and processes improve, more functions can be offered online in a secure manner.
Improved Reporting and Financial Management – Provides improved tools to access clean, accurate data to support analysis and reporting supporting planning and improved management
Improved Customer Service and Convenience – Provides consistent guidance and information to staff to quickly provide customers answers ranging from automated assessments of driving records to comprehensive customer interaction logs.
Engage Partners and Customers for Self Service – Allows partners and customers to complete transactions and perform self service functions to meet their needs and improve their experience.
Full Support for Counties & Law Enforcement – Provides real time data for better decision making and accurate transaction processing across the entire state.
1.2.5 Market Assessment Modernization efforts are large and complex. DMVs around the country have had mixed results in modernizing these complex systems; meaning many failed and some successful projects. Many vendors are no longer providing DMV solutions due to their inability to successfully deliver.
Currently, there are approximately six active vendors in the DMV marketplace pursuing new projects. Of these active vendors, there are varying degrees of successful implementations. Some vendors are general system integrators and others focus on very specific solutions or approaches.
Some vendors have chosen to use a custom approach to developing software which effectively means “starting from scratch”. Other vendors such as Tech Mahindra and IDEMIA (formerly MorphoTrust) have leveraged a customer management system from Microsoft (Microsoft Dynamics) as the foundation for their system development. One vendor, FAST Enterprises, offers a COTS product that can be configured and customized.

REVENUE INFORMATION SYSTEM REPLACEMENT PLAN State of Wyoming | Wyoming Department of Transportation
7 MATHTECH | REVENUE INFORMATION SYSTEM REPLACEMENT PLAN
1.2.6 Options for Moving Forward
System Development Approach As WYDOT assesses how to approach a modernization effort, there are many options to consider. Each option has strengths, weaknesses, cost, risk, and time considerations. Approach options are summarized below:
Approach Success Rate
Ability to Meet Needs
Pro Con
Pre-Built Configurable System (COTS)
High
High
Ready to Use
Adaptable
Implements Best Practices
Ongoing Upgrades
Reliant on Vendor
Don’t “Own” System
Some Process Changes May Be Required
Refactor (Code Conversion)
Med
Low
May Require Less Staff Participation
Gets Off Aging Hardware
No Real Enhancements in Functionality
Doesn’t Solve Long Term Maintenance Challenge or Improve Staff knowledge of the system
Doesn’t fix poor code structures and expects existing documentation
Custom Built Med/ Low
High
Execute & Spend at Own Pace
Own All Software
Costs Not Always Manageable
Slow to Deliver
Very High Skill Sets Requirements
In-house Staffing Levels Not Typically Available
Transfer from Another DMV
Low?
Med
Possibly Own All Code
Possibly Less Expensive
Possibly Inheriting Another Mess
Do Nothing Low
Low
Easy Potential Software Failure and Inability to Support New Functions and Requirements

REVENUE INFORMATION SYSTEM REPLACEMENT PLAN State of Wyoming | Wyoming Department of Transportation
8 MATHTECH | REVENUE INFORMATION SYSTEM REPLACEMENT PLAN
Hosting vs Onsite Considerations In addition to the type of solution approach described above, WYDOT also needs to consider where the solution will reside and the support model. There are 2 options as described below:
Approach Pro Con
On-Site Systems Manage and Control Everything – Systems, Data, Infrastructure
Requires Hardware and Software Investment
Requires Maintenance Staff or Contract
Requires Disaster Recovery Planning
Cloud Based Systems
Vendor Procures and Manages System
Vendor May Have Cost Sharing Across Multiple Customers
Requires Robust Infrastructure
Systems and Data are off-site
1.2.7 Challenges & Risks As WYDOT moves forward with modernization it must consider a range of challenges and preparation tasks which should be addressed to reduce risk.
County Autonomy for Vehicle Operations – Variations in operations, data quality, and business processes complicate improvements as well as the time to receive and process county data into the statewide RIS system. A plan for consolidation or tighter integration must be developed.
Plate Numbering Scheme – Wyoming will incur additional costs to maintain the current plate numbering system. Clear, accurate data and plate numbers which can be easily distinguished supports reporting, law enforcement and analysis. Modern systems with standardized rules and tracking will force a consistent, unique plate numbering scheme. While it is possible to implement a system that allows duplicate plate numbers across different plate types (backgrounds) it is not a practical or typical of a modern solution.
Data Quality – Current data is accessible, but cleanup is required before implementing a new system. Some data quality problems are related to county operations and variations in standards. A data quality assessment should be planned, and a data management strategy should be developed with the counties so that moving forward with a new system does not bring along bad data or data management practices.
Available WYDOT Staff and Skills – Current technology teams are spread thin and there are no in-house IT skills to support the RIS system which presents a business continuity risks when problems occur and a shortage of staff to support modernization preparation and implementation. WYDOT must assess their in-house project management expertise and if outside skills are needed to supplement state teams.
1.2.8 Potential Schedule RIS modernization is not a single project. It should be broken down into subprojects that ultimately achieve the full modernization over a multi-year period. These subprojects include both preparation and procurement activities as well as the implementation. Preparation work is typically 6-12 months or more, procurement is typically 12-24 months and implementation is typically 36-48 months.
Key activities include:
Coordinating with County Operations – WYDOT needs to determine how Counties will use the new system including the plate numbering scheme and getting agreements on how separate systems will work together or a consolidated system will be created. In either case WYDOT will need to plan and

REVENUE INFORMATION SYSTEM REPLACEMENT PLAN State of Wyoming | Wyoming Department of Transportation
9 MATHTECH | REVENUE INFORMATION SYSTEM REPLACEMENT PLAN
implement a system that fully supports the full range of motor vehicle service offered to residents in the state.
Data, Process and Requirements Analysis – WYDOT needs to assess the current status, gaps, and improvements needed in these areas so they can be addressed with a new system. Data cleansing before conversion to a new system is a best practice that takes time. A poorly designed process should be implemented in a new system without improvements. A full understanding of requirements can help select the appropriate solution and support model.
Infrastructure Analysis and Preparation – WYDOT needs to assess the workstation configurations and network bandwidths to verify that these would support a new, more GUI/image-based transaction processing and start the process for upgrades if needed. Some of this work can begin now and some may need to wait until the needs of a selected solution are more clearly identified.
Procurement - A comprehensive RFP must be developed to procure a new system. This includes defining functional requirements, technical requirements, hosting requirements, delivery requirements, and support requirements.
Functional Implementation – Modernized systems are typically implemented in phases organized by functional areas. For example, Driver Licensing and Vehicles would be 2 phases, each implemented in 18-24 months.
1.2.9 Staffing Requirements All modernization projects require participation from a broad set of skills and stakeholders. The future WYDOT system modernization team could be a combination of in-house and contractor staff and would be typically be at least 10 members of IT, Business and Project Management type staff.
An additional burden on staffing is the need to focus on the planning and development of the new systems while also maintaining the existing systems and, in some cases, expand the existing systems to meet legislative and other functional needs. Every state deals with this challenge. Some states leverage vendors and staff supplementation, some hire new project staff, and some hire new staff to make existing staff available.
The following represents a core team that WYDOT should assemble and prepare as the modernization team. Assembling this team also requires planning to backfill their daily responsibilities or otherwise support operations.
IT Staff – 4 technical staff would provide the core support for a variety of technical responsibilities including:
Data analysis, interpretation, and conversion guidance
Interface management and planning integration with other systems such as the Driver License production system
Architecture planning and implementation
Infrastructure preparations and support planning
Business Staff – 5 business/operations staff would provide the core of a functional team responsible for defining the operations of the system including:
Defining business rules and calculations
Defining process flows and transaction requirements
Defining and designing new notices, products, and correspondence
Assessing changes to current operations to fit the new system
Approving all system functions
Guiding and conducting acceptance testing
Project Management Staff – 2 project managers would lead and oversee the project for WYDOT. Their responsibilities would include:
Coordinate WYDOT resources and ensure WYDOT commitments are met

REVENUE INFORMATION SYSTEM REPLACEMENT PLAN State of Wyoming | Wyoming Department of Transportation
10 MATHTECH | REVENUE INFORMATION SYSTEM REPLACEMENT PLAN
Oversee implementation vendor activities and approve deliverables and progress
Coordinate with all stakeholders
Coordinate and collaborate with supporting consultants such as a project management support vendor
Manage project risk, engage governance, and overall project management
1.2.10 Estimate Project Costs & Funding The related costs of a modernization project for WYDOT are significant and detailed planning is needed. An estimated 10 year overall total cost including approximately 5 years of implementation and 5 years of ongoing support is between $68 Million and $172 Million. This is a wide range and many factors impact the final costs. The costs and overall project expenses year to year will vary depending upon the approach and the report details some options. The chart below shows the factors that will impact the costs.
States use a variety of funding approaches for large projects including:
Capital & Operating Expenditure
State “general” funding is a typical approach and this is the most common strategy used by states, even when confronting an up-front purchase.
Fee Increase
Some states have used a technology fee which is added to customer transactions to fund the project.
A fee of $5 to $12 per transaction could cover the expected project costs.
Vendor Charge
Some jurisdictions may allow for a convenience or transaction fee to be charged by the vendor implementing the system. This fee would need to apply to all transactions, not just web transactions.
REVENUE INFORMATION SYSTEM REPLACEMENT PLAN State of Wyoming | Wyoming Department of Transportation
11 MATHTECH | REVENUE INFORMATION SYSTEM REPLACEMENT PLAN
1.2.11 Next Steps There are clear preparation steps that WYDOT can move forward with and they have direct benefit to WYDOT regardless of the timing of modernization. This preparation work includes: Data Analysis & Preparation
Interface Analysis & Preparation
Requirements Analysis & Preparation
Vendor Demonstrations and Investigations
Additionally, WYDOT needs to secure a support team for the RIS system that can understand and support the system both for maintenance and troubleshooting as well as enhancements as needed. The preparation projects will also support this objective.
2. Background
2.1 About Mathtech Mathtech is a strategy and consulting services firm with offices in New Jersey, Virginia, and Arizona. With over 50 years of experience serving federal, state, and local government agencies, nonprofits, and commercial organizations, Mathtech has built a solid reputation for successfully completing projects and working collaboratively with our clients. Mathtech Inc. evolved as the strategy and consulting arm of Mathematica, Inc., a professional services firm located in Princeton, NJ. The company has been employee-owned since 1986. Mathtech leverages industry leading methodologies, staff expertise, and a wealth of best practices and tools to deliver consistently clear approaches and solutions for our clients’ projects.
Mathtech has successfully serviced large and small projects across the country, from Washington State to Florida including large scale modernization efforts for Tax, Motor Vehicle, and Labor agencies.
Mathtech provides a full range of consulting services including:
Management Consulting – Mathtech provides a wide variety of services such as Business Process Reengineering, Strategic Planning, and Organizational Change Management.
System Modernization Support – Mathtech is a leader in modernization efforts and has helped agencies across the country transform systems and business processes.
IV&V/Project Management, PMOs, and Governance – Mathtech provides project management support to any size project. Mathtech has developed a governance model to properly guide a project, handle strategic decisions, and connect a project or operations to the organization.
Project Assessments and Turnarounds – Mathtech performs detailed analyses of projects, SDLCs, and project management operations as part of managing a project, establishing or improving a PMO, or turning around a struggling project.
Assessments and Planning – Mathtech provides all levels of assessments and consultation to Boards, Executive Management, and Project teams for diagnosing and improving the effectiveness of projects and daily operations.
IT Strategy and Architecture – Mathtech helps agencies develop a flexible strategy to meet technology objectives by leveraging existing technology and new technology as needed.
Requirements Analysis and RFPs – Mathtech can develop detailed requirements, write RFPs, and assist in the bidding and evaluation process. We design our RFPs to create manageable, well-defined projects.
System Development – Mathtech provides a full range of implementation services that allow agencies to provide more services quickly using industry standard methods and technologies.

REVENUE INFORMATION SYSTEM REPLACEMENT PLAN State of Wyoming | Wyoming Department of Transportation
12 MATHTECH | REVENUE INFORMATION SYSTEM REPLACEMENT PLAN
2.1.1 Mathtech Experience Mathtech leveraged a broad range of experience for this project.
Motor Vehicle Operations Mathtech is the national leader in motor vehicle and licensing operations. Mathtech has worked with many jurisdictions including FL, MD, NJ, WA, WI, OR, RI, PA, NY, MN, Jamaica, and Ontario, and AAMVA. Mathtech’s experience includes modernization planning and strategy, business process improvement, technology operations, and vendor management. Mathtech serves on AAMVA Committees and regularly present at regional and international conferences.
Motor Vehicle Vendor & Product Experience – Mathtech has managed vendors installing and maintaining Vehicle, Licensing, Card Production, Document Management, Inspections, and Queuing Systems. We understand the reality of vendor strengths and weaknesses, of support contracts, and procurement.
IT Operations The Mathtech team supports a wide range of technology operations. Conversion to new methodologies, Project Management, Cost Allocation to Departments, Reorganizations and Redesign, Quality Assurance, Enterprise Architecture – Our team has supported both federal and state agencies and CIOs as well as the private sector. We leverage best practice models for managing IT operations and assessing maturity.
System & Process Modernization The Mathtech team has worked on many modernization and transformation projects. These projects bring great improvements in both business processes and technology. But they are also very taxing on an agency in every area including business and IT. Outdated legacy systems are often accompanied by outdated legacy support and maintenance skills, processes, and tools. This makes any IT organization modernization more challenging.
Organizational Design The Mathtech team has completed many organizational design projects for both IT and other operations. This includes planning, design, and implementation.
2.2 Project Approach Mathtech worked with WYDOT over a five-month period from April to September 2018 to evaluate the current systems, processes, gaps and options for moving forward. The approach included the following:
Working Sessions – Mathtech met with WYDOT business and IT staff along with ETS and representatives from other agencies and the counties. The goal was to understand how each group uses the current systems and each group’s perspectives, concerns, and expectations for the future. Existing challenges and opportunities for the future were discussed as well as strengths and weaknesses of processes and systems.
Analysis and Planning – As a follow-on to the initial working sessions, the Mathtech team worked with WYDOT to clarify and verify observations, develop options, and prepare a strategy for moving forward which clarified cost, schedule, and preparations.
Final Plans and Report – Mathtech and WYDOT leadership worked together to finalize an approach and recommendations which were presented to the Legislative Joint Committee on Transportation, Highways & Military Affairs in June 2018 and resulted in this final report.

REVENUE INFORMATION SYSTEM REPLACEMENT PLAN State of Wyoming | Wyoming Department of Transportation
13 MATHTECH | REVENUE INFORMATION SYSTEM REPLACEMENT PLAN
3. Status of the Current WYDOT RIS System
3.1 Technology & Status The Revenue Information System (RIS) is a 40+ year old COBOL/CICS mainframe system that supports WYDOT’s key driver licensing and vehicle functions. The RIS system has limited design documentation which is generally considered not current making it difficult for new staff to understand the system logic and programming. The system is supported by a very small contractor team which presents risks in business continuity since only contractors are supporting the system. Small changes may be accomplished quickly but complex changes can take significant time to complete.
Functions supported by the system include violations, suspension, insurance compliance, driver licensing, various ID cards, permits, and title and registration records processing. Counties provide vehicle data that they process but not always in a timely or reliable manner and data is not standardized across Counties which can cause problems when consolidating the data into RIS. RIS also supports a large number of business-critical interfaces which are also not well documented. Users find the system cumbersome to access and navigate.
WYDOT finds itself in a situation common to many government agencies. It is dependent upon an outdated computer system (RIS System) which is very difficult to maintain or enhance. As it ages the number of individuals who understand and can maintain the system is quickly dwindling and institutional knowledge is declining.
WYDOT and agencies in similar situations find themselves “frozen in time” and unable to modernize operations or provide new services such as online transactions because the system cannot accommodate such enhancements and the burden of ongoing maintenance is a distraction. Furthermore, mandatory enhancements to the system to maintain legislative or federal compliance is slow, time consuming, and continually introduces the risk of breaking the system.
3.2 System Deficiencies The following is a summary of some of the most outstanding deficiencies of the RIS system.
Outdated and Inflexible Technology – The RIS system was built using the COBOL programming language. This language was a mainstay of large transaction processing computer systems in the 1970s and 1980s. It is still used today but it is not considered a modern programming language and support for it has significantly diminished, mostly in the availability of programmers who are trained in the language. Furthermore, the design and logic of the RIS system is insufficiently documented which makes it difficult for any new programmers to learn. Modifications to the system by anyone who does not understand the entire system risks damaging the system and causing unknown errors or system outages. The system lacks modern technical functions to manage data and interface with other systems. It is difficult to implement new features such as online transactions. Any required modifications require substantial effort – much more than would be required of a modern computer system.
Difficult to Support New Legislation or Customer Service Improvement – WYDOT faces continual challenges when it attempts to implement any changes to the RIS system. These changes, which are slow, costly, and risk system outages, include implementing new legislation, upgrades to support Federal programs, and improved customer service.
State Legislation – Legislation changes continually to address important public needs impacting driver licensing, vehicles, and businesses. This includes changing how young drivers are licensed as well as adding new license plate types.
Federal Programs – AAMVA, Congress, and the Department of Homeland Security are continually evolving programs and legislation to address homeland security, vehicle ownership fraud, and commercial driver safety. These programs are national requirements complied with by all U.S. jurisdictions. The RIS system causes WYDOT substantial challenges when trying to maintain compliance with these mandates.
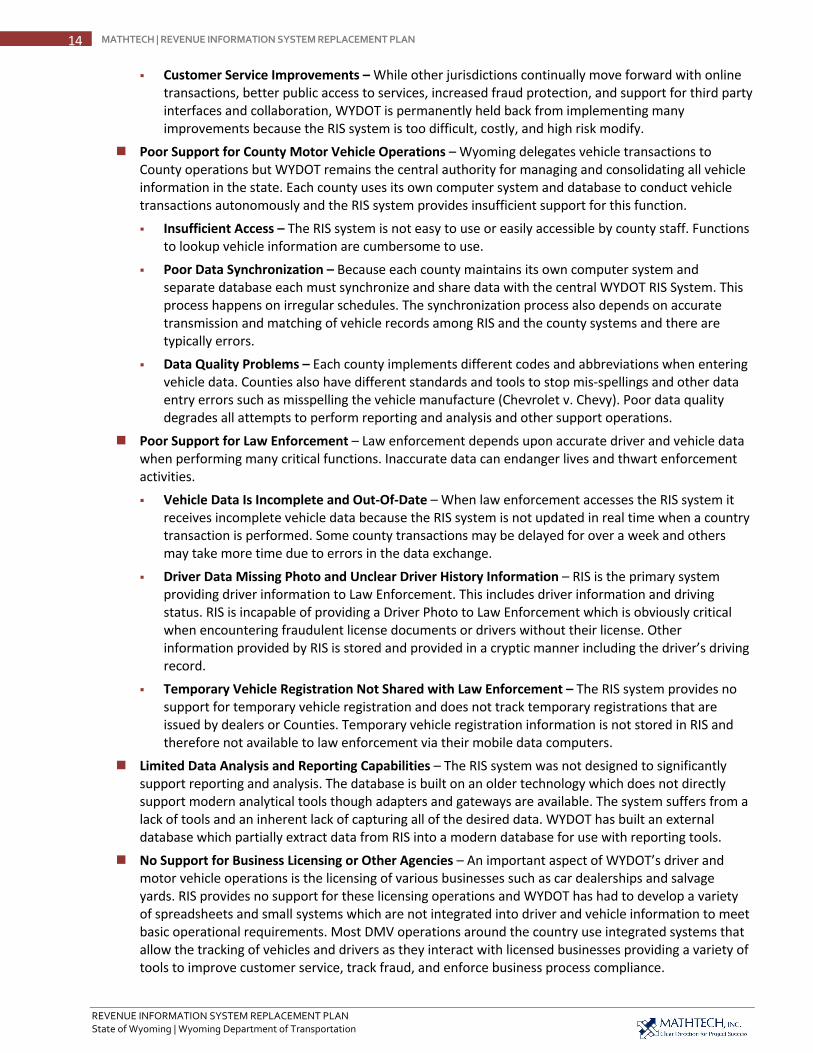
REVENUE INFORMATION SYSTEM REPLACEMENT PLAN State of Wyoming | Wyoming Department of Transportation
14 MATHTECH | REVENUE INFORMATION SYSTEM REPLACEMENT PLAN
Customer Service Improvements – While other jurisdictions continually move forward with online transactions, better public access to services, increased fraud protection, and support for third party interfaces and collaboration, WYDOT is permanently held back from implementing many improvements because the RIS system is too difficult, costly, and high risk modify.
Poor Support for County Motor Vehicle Operations – Wyoming delegates vehicle transactions to County operations but WYDOT remains the central authority for managing and consolidating all vehicle information in the state. Each county uses its own computer system and database to conduct vehicle transactions autonomously and the RIS system provides insufficient support for this function.
Insufficient Access – The RIS system is not easy to use or easily accessible by county staff. Functions to lookup vehicle information are cumbersome to use.
Poor Data Synchronization – Because each county maintains its own computer system and separate database each must synchronize and share data with the central WYDOT RIS System. This process happens on irregular schedules. The synchronization process also depends on accurate transmission and matching of vehicle records among RIS and the county systems and there are typically errors.
Data Quality Problems – Each county implements different codes and abbreviations when entering vehicle data. Counties also have different standards and tools to stop mis-spellings and other data entry errors such as misspelling the vehicle manufacture (Chevrolet v. Chevy). Poor data quality degrades all attempts to perform reporting and analysis and other support operations.
Poor Support for Law Enforcement – Law enforcement depends upon accurate driver and vehicle data when performing many critical functions. Inaccurate data can endanger lives and thwart enforcement activities.
Vehicle Data Is Incomplete and Out-Of-Date – When law enforcement accesses the RIS system it receives incomplete vehicle data because the RIS system is not updated in real time when a country transaction is performed. Some county transactions may be delayed for over a week and others may take more time due to errors in the data exchange.
Driver Data Missing Photo and Unclear Driver History Information – RIS is the primary system providing driver information to Law Enforcement. This includes driver information and driving status. RIS is incapable of providing a Driver Photo to Law Enforcement which is obviously critical when encountering fraudulent license documents or drivers without their license. Other information provided by RIS is stored and provided in a cryptic manner including the driver’s driving record.
Temporary Vehicle Registration Not Shared with Law Enforcement – The RIS system provides no support for temporary vehicle registration and does not track temporary registrations that are issued by dealers or Counties. Temporary vehicle registration information is not stored in RIS and therefore not available to law enforcement via their mobile data computers.
Limited Data Analysis and Reporting Capabilities – The RIS system was not designed to significantly support reporting and analysis. The database is built on an older technology which does not directly support modern analytical tools though adapters and gateways are available. The system suffers from a lack of tools and an inherent lack of capturing all of the desired data. WYDOT has built an external database which partially extract data from RIS into a modern database for use with reporting tools.
No Support for Business Licensing or Other Agencies – An important aspect of WYDOT’s driver and motor vehicle operations is the licensing of various businesses such as car dealerships and salvage yards. RIS provides no support for these licensing operations and WYDOT has had to develop a variety of spreadsheets and small systems which are not integrated into driver and vehicle information to meet basic operational requirements. Most DMV operations around the country use integrated systems that allow the tracking of vehicles and drivers as they interact with licensed businesses providing a variety of tools to improve customer service, track fraud, and enforce business process compliance.

REVENUE INFORMATION SYSTEM REPLACEMENT PLAN State of Wyoming | Wyoming Department of Transportation
15 MATHTECH | REVENUE INFORMATION SYSTEM REPLACEMENT PLAN
Manual Transactions – WYDOT has minimal support for licensing, renewals, reporting and oversight, and issuance of dealer plates.
No Consumer License Information – The RIS system provides no web-based capability for sharing business license information with consumers. This prevents consumers from easily checking the credentials and license of a business.
Paper-Centric Operations – The RIS system’s limited functionality and inability to expand to support modern operations results in WYDOT being constrained to outdated, paper-centric operations. While other jurisdictions and agencies can modernize to support electronic transactions and online services WYDOT remains paper-centric. Paper-centric operations are not only less efficient, but they also pose a security problem because electronic information is much easier to secure than paper forms which can be left on desktops or in unlocked file cabinets.
Inability to Match Drivers and Vehicle Owners – The RIS system does not have the capability to match drivers with vehicle owners. This results in a driver’s license being issued to “James M. Smith” while a vehicle is titled to “Jim Smith”, possibly with different addresses. The disconnection results in a variety of operational deficiencies which including poor customer service, poor enforcement of vehicle registration rules, greater opportunity for fraud, incorrect address information, and reduced enforcement capabilities.
Enforcement of Business Rules – The RIS system does not enforce many detailed business rules that are important to ensuring that transactions are conducted completely and accurately. The RIS system depends upon WYDOT staff to know and enforce rules and ensure that all transactions a valid. While WYDOT staff are very capable, most agencies depend upon modern systems to strictly enforce all applicable business rules for every transaction which improves reliability and data quality, fights fraud, and makes training and staff onboarding easier.
Weak Correspondence Management – The RIS system lacks modern capabilities to create, update, and manage customer correspondence and notices. The system generates over 300 different letters and notices for driver licensing and the system has minimal capabilities to update the text of these items to improve readability or clarity.
No Support for Specialty Plates – RIS does not provide support for Specialty Plate issuance or tacking resulting in the use of spreadsheets and other tools by WYDOT staff.
3.3 Data Deficiencies The current system includes a variety of data management deficiencies that a modernized system should address. Key data issues include lack of consistency in data, lack of standardization and validation, lack of access, untimely consolidation and availability of data.
Vehicles – Vehicle transactions are processed by 23 counties with no uniform set of rules or standardization. Examples include missing lien information at WYDOT level, difficulty linking drivers to vehicle (D. Lopez, Deb Lopez, Debbie Lopez) and inconsistent data (FRD vs FORD). This situation results in incomplete and untimely data aggregated by WYDOT. Non-uniform data does not support accurate reporting or transaction processing. The plate numbering scheme that allows the same plate number to be printed on different specialty plates should be addressed so that plates have unique numbers to support notifications and law enforcement activities.
Driver Licensing – The current system is not well integrated with other data such as photos and vehicle data. The system has limited capabilities to capture new information and data which would support new legislative mandates. Law enforcement would like to see more complete data with more detailed information such as medical information.
Driver History – This system does not retain extended historical data, perform real time data validation, or offer streamlined data correction functions which result in a lack of data integrity. The ability to make changes is also difficult due to lost institutional knowledge and the fact that individual data fields have been redefined over time for new purposes.

REVENUE INFORMATION SYSTEM REPLACEMENT PLAN State of Wyoming | Wyoming Department of Transportation
16 MATHTECH | REVENUE INFORMATION SYSTEM REPLACEMENT PLAN
Business Licensing – Most of this work is currently manual with no system support. As a result, data related to Business licensing is in many places and not easily viewed cohesively (ex: plates in RIS, license in Excel). Enforcement and tracking is also hampered by lack of easy access to full data by Law enforcement.
Law Enforcement – There are several key data gaps that if addressed would provide significantly improved function and effectiveness for law enforcement including: consistency of data, availability of photos, improved lookups for firearm license/permits, partial plate and name only searches, and improved plate numbering schemas.
Finance – Many functions today require manual entry and reconciliation. County fee data cannot be verified. The ability to balance and create reports and invoices are impacted by the timing and availability of complete data.
3.4 RIS System Stability
3.4.1 Potential for System Failure The RIS system is an aging system and like any large computer system it is a complex combination of programming logic, software, data, and hardware – all of which are designed to work together. Changes to any part of any component must account for the dependencies on the other components and an improper change or enhancement can crash the entire system.
Software Modifications – The RIS system contains many COBOL programs that interact with the database and depend upon each other. Changes to one programming module must understand the relationship to and impact on every other module. In other words, an enhancement to one module can break another.
Mainframe System Changes – All of the RIS software runs within the mainframe computer’s operating system and there are a number of dependencies between the system programming and the mainframe operating system. These include user security, database management, data interfaces, task scheduling, and system performance. Changes to any part of the mainframe system environment that are not planned and executed to be compatible with the RIS software can cause the system to crash or partially fail.
Hardware and Network Changes – Any changes to the mainframe hardware, network, or addressing schemes could impact the system. This continues to highlight the delicate nature of the system.
3.4.2 Impact of System Failure RIS is one of the most high-profile systems in the state and impacts a wide range of operations. Each of these systems and operations are supported by one or more specific interfaces. Changes to either system, the interface, or the supporting technologies could impact the support for these operations with an outage of operations or could simply result in incomplete or erroneous information being silently passed to the other operation. Operations which would be impacted by a RIS failure include:
Issuing and Renewing Driver Licenses
Verification of WY Driver Licenses and Identities
Licensing of Commercial Drivers
Operational Data for Law Enforcement
Support for Voter Registration
Data for Insurance Companies Issuing Vehicle Insurance
Data for Family Service Attempting to Serve Families
Support for Other States attempting to Title Wyoming Vehicles
Courts Adjudicate Traffic Violations

REVENUE INFORMATION SYSTEM REPLACEMENT PLAN State of Wyoming | Wyoming Department of Transportation
17 MATHTECH | REVENUE INFORMATION SYSTEM REPLACEMENT PLAN
3.4.3 Background on Recent System Failures The RIS system has recently experienced several outages, ranging from a few hours to almost a full day which impacted customer services and law enforcement queries. Driver licensing functions such as license issues, testing, ID card processing, and disability placards were unavailable during the outage.
3.5 Risk of Not Addressing Modernization Needs The RIS system is a key component of WYDOT motor vehicle and driver licensing operations. WYDOT’s operational needs grow every day to address legislative needs, Federal requirements, security challenges, customer service requirements and many others which cannot be ignored.
If the need to modernize the RIS system is unaddressed, WYDOT and other stakeholders will be “stuck in time” with a potential for software failure and an inability to support changes in any of the following areas:
Inability to Support Federal Requirements Changes – AAMVA makes continual improvements and offers new functions to improve security and features for licenses and titles for all states. States need to “keep up” with these changes to avoid being the weak link in these national systems and checks. Prolonged non-compliance could result in substantial remediation and planning oversight from the Federal perspective and the possibility of losing Federal funding.
Inability to State Legislation Changes – State DMV agencies are a favorite topic for legislative changes given their broad interactions with most citizens. WYDOT should expect to get new requirements each legislative session that must be addressed in a timely manner. These changes often come in addition to all other workloads and necessary changes.
Inability to Provide Better Customer Service – As private sector companies continue to offer improved customer services, these experiences become the expected level of business support by citizens. State agencies must be aware of and plan for these types of customer experiences as they become the expected standards. Furthermore, as legislators and executive branch leadership strive to demonstrate competency and effective management of public operations there will be a continued push for customer service improvements.
Inability to Address Surrounding Technology Changes – COBOL was the leading technology 40 years ago. Technology changes and the rate of change has only been increasing. As the work force ages, new workers are trained in new technologies. Software companies that offer new software solutions and tools leverage the new technologies and state agencies need to learn and leverage new technologies to best use these solutions and attract quality workers. WYDOT has certainly leveraged new technologies but the RIS system remains anchored in the past.
Inability to Better Detect and Prevent Fraud – Fraudulent titles and licenses impact individuals and businesses as well as state agencies. The impact of fraud includes time and money for all parties involved to identify and fix it. The better WYDOT can prevent the fraud up front, the less impact and cost it will have for all parties.
Inability to Implement Security Enhancements – Security enhancements support fraud prevention, data theft, and associated impacts. These enhancements include both improved processes and improved technologies and tools – all designed to help WYDOT detect and prevent fraud and data theft.
Limited Ability to Protect Personal Identity Information – Personally Identifiable Information (PII) is high value data and everyone wants it. The sophistication of hackers continues to improve. WYDOT must leverage better processes and tools to protect this highly sought-after data and maintain its citizen’s confidence in the agency.
Limited Ability to Support Law Enforcement – WYDOT and Law Enforcement are key partners who work together every day. Better access to accurate data allows Law Enforcement to support the State and WYDOT by promoting safe roads, insured vehicles, and properly licensed drivers. Modern systems that collect complete data, promote automatic data verifications, and are more easily accessed support this partnership.

REVENUE INFORMATION SYSTEM REPLACEMENT PLAN State of Wyoming | Wyoming Department of Transportation
18 MATHTECH | REVENUE INFORMATION SYSTEM REPLACEMENT PLAN
Inability to Improve Operational Efficiency – More with less. This is a common theme for state agencies with decreased revenues and pressures to hold costs in check. Leveraging better processes and technologies that support more automation allows agencies to be more efficient with the staff, operations, and system support.
3.6 WYDOT & ETS Support Capabilities As is typical with older mainframe systems, there are resource challenges that make supporting and enhancing the system difficult and risky. This is the case for WYDOT and ETS as well. Operational realities include:
Very Limited Resources – WYDOT and ETS are down to the smallest possible team with experience to support the system, oversee it, make modifications, and respond to outages. At this time, it appears to be a team of two resources.
One ETS resource
One contractor resource with a planned retirement in approximately two years.
Limited Documentation – The available documentation is significantly lacking making it difficult if not impossible for a new person to learn the new system.
This support capability is extremely limited and indicates the need to assess the system, catalog its data, and better document the current state in support of a thoughtful modernization and transition effort.
3.7 ETS Mainframe Hosting Transition RIS is a mainframe-based system and it runs on the mainframe computer system operated by the Department of Enterprise Technology Services (ETS). The mainframe system hosts a number of large state computer systems including RIS and systems from other departments including the Department of Family Services, Department of Workforce Services, and the Secretary of State.
Transition to a Vendor Hosted System – The mainframe system is an expensive, specialized, and capable platform that requires a range of technical skills to maintain. Mainframe systems are most cost effective when they are used at full capacity. ETS has begun a transition from an ETS owned and operated mainframe to a vendor owned and operated mainframe. This allows ETS to pay for needed capacity and avoid paying for hardware, software, and support resources that are not needed. Effectively, ETS is renting the mainframe service rather than owning it. This provides an option to scale down costs and commitment to the platform as systems are modernized and migrated off of the mainframe to newer systems.
Mainframe Migration is Not RIS Modernization – The migration of the RIS system from an ETS mainframe to a vendor supplied mainframe does not change any of the concerns or significant deficiencies of the RIS system including the following:
Supportability – The inner workings of the RIS system are still only known to a very small number of developers and the migration does not change that number.
Functionality – The RIS software does not provide the range of functionality needed to support motor vehicle and driver licensing operations and the migration does not change the RIS software’s functions.
Expandability – The RIS system is not positioned or really capable of incorporating new functionality using any modern approach and the transition to the same tools on a different mainframe does not change that.

REVENUE INFORMATION SYSTEM REPLACEMENT PLAN State of Wyoming | Wyoming Department of Transportation
19 MATHTECH | REVENUE INFORMATION SYSTEM REPLACEMENT PLAN
4. System Scope The RIS system currently supports driver licensing and vehicle services and supports the management of financial transactions. This section describes the scope of the RIS System.
4.1 RIS Interactions with other Agencies and Stakeholders The following diagram depicts the wide range of stakeholder that are dependent upon the RIS system. They include:
State Agencies
Federal Agencies
Local Government
Public
Private Sector
4.2 Driver Licensing WYDOT's Driver Services program administers and maintains Wyoming's driving records system, tests, and issues and processes all classes of driver licenses, commercial driver licenses, learner permits, graduated driver licensing, and identification cards. WYDOT functions include:
Personal and Commercial Driver Licensing
Driver License Renewal
Medical and Vision Screening
License Update
Identity Theft
RISDriver
Services
Supreme Court
Donor Alliance
WYDOTHighway Safety
Insurance Companies
Veterans Admin.
NLETS
RISMotor Vehicle
Services
Highway Patrol
Department of Criminal
Investigations
Real Time MVR
vendors
County Clerks
International Registration Plan (IRP)
Vehicle Owners
Game & Fish
Homeland Security
AAMVA
NHTSA
FMCSA
Federal and National Law Enforcement
Vital Records
Secretary of State
SSA
Other US Jurisdictions
Verisol
Dept. of Health
Family Services
Law Enforcement
County Treasurer
Toll Roads Agencies
National Motor Vehicle
Titling
CarFAX & Similar
Vendors
Vendors WYDOT
Compliance
Title & Abandoned
Vehicle Search
Parks & Recreation
Attorney General
Administrative Hearings
PDPS
Wyoming Citizens
PublicWyoming
State Gov’t
Private Sector
Local Gov’t
Federal Gov’t

REVENUE INFORMATION SYSTEM REPLACEMENT PLAN State of Wyoming | Wyoming Department of Transportation
20 MATHTECH | REVENUE INFORMATION SYSTEM REPLACEMENT PLAN
Organ Donor Information
Commercial
Insurance Verification
Disabled Parking Placards
ID Cards
Contact Driver Services
Motorcycle Safety Class
4.3 Driver History Driver Services maintains driver history records, including convictions for motor vehicle offenses and crashes, and administers the process of withdrawing and reinstating driving privileges. The RIS system supports the full range of driver history and enforcement activities including:
Driving Record Maintenance and Sharing
Suspensions & Restorations
Driver Education Tracking
Ignition Interlock Tracking
4.4 Vehicle Services WYDOT's Motor Vehicle Services handles title searches, specialty plates, abandoned vehicles and other services. The system can perform the full range of vehicle transactions, but a majority of the public transactions are conducted by county operations and county computer systems. The RIS system collects and consolidates all transaction data from the counties and creates a central database of all vehicle information that supports a variety of functions including law enforcement. Functions supported by WYDOT include:
Titles, Plates and Registrations
Specialty Plates
Title Search
State Assigned VIN
Government Exempt Plates
Vehicle Registrations
Titles and Lien Filings
Imported Vehicles
Multipurpose Vehicles
Abandoned Vehicles
Salvage Vehicles
Bonded Titles
Compliance
4.5 Business Licensing WYDOT has responsibility for licensing and overseeing a variety of businesses related to drivers and vehicles including:
Vehicle Rental Companies
Dealerships
Salvage Yards

REVENUE INFORMATION SYSTEM REPLACEMENT PLAN State of Wyoming | Wyoming Department of Transportation
21 MATHTECH | REVENUE INFORMATION SYSTEM REPLACEMENT PLAN
Licensing operations include:
Initial Licensing
Renewals
Inspections
Collection of Periodic Vendor Reports
Compliance Investigations
Issuance of Dealer Other Plates
The RIS system provides little to no support for any business licensing functions but a new system must include them.
4.6 Revenue Management The RIS system is responsible for consolidating and tracking the financial aspects of customer transactions as well as payment collection which is then transferred to the Oracle Financials System.
5. Vision for Moving Forward Plans to modernize the RIS system focus both on deficiencies that need to be corrected as well as new capabilities which will increase operational efficiencies and enhance customer service. The development of this plan has highlighted expectations for a new system that would greatly enhance WYDOT’s mission.
5.1 New Functionality The following is important new functionality that should be addressed by modernizing the RIS system. 360 Degree View of Customer Information – Provides a consolidated view of all customer information
allowing for better customer service as well as fraud detection. As allowed, consolidated information could include a photo, list of issued products with expiration dates, interactions, alerts etc.
On-line WYDOT and Full Featured Web Site - Provides new tools and capabilities for customers that will let them serve themselves, answer questions, and better understand DMV processes. As tools and processes improve, more functions can be offered online in a secure manner.
Better Financial Management & Reporting – Provides full Revenue Management with fully tracked transactions and payments for detailed level daily reconciliation and bank deposits.
Effective Enterprise Reporting & Analysis Capabilities – Provides staff with a suite of tools to access clean, accurate and well-defined data to create reports and perform analysis for the “what if” questions that support planning and improved management.
Smart Systems That Enforce Business Rules – Provides enforcement of business rules for consistent operations at each location, data verification upon entry, complete transaction verification and appropriate security enforced.
Easy to Understand – Provides consistent navigation and screen layouts that make it easy for users to learn and remember and guides users through the transaction steps and processes.
5.2 Improved Services & Capabilities Improved Customer Service and Convenience – Provides consistent guidance and information to staff
to quickly provide customers answers ranging from automated assessments of driving records to comprehensive customer interaction logs.

REVENUE INFORMATION SYSTEM REPLACEMENT PLAN State of Wyoming | Wyoming Department of Transportation
22 MATHTECH | REVENUE INFORMATION SYSTEM REPLACEMENT PLAN
Eliminate Paper – Provides reduced or eliminated reliance on paper documents for transactions and any negative impact on efficiency and security such as mobile licenses, e-titles and online insurance cards.
Engage Partners and Customers for Self Service – Allows partners and customers to complete transactions and perform self service functions to meet their needs and improve their experience.
Full Support for Counties & Law Enforcement – Provides real time data for better decision making and accurate transaction processing across the entire state.
5.3 Better Technology Better technology will allow WYDOT and ETS to better respond to changing needs in an efficient and effective manner. Newer, modern systems can be substantially easier to implement, maintain, and enhance.
Modern, Integrated, Flexible Systems – Provides current, supported technologies and tools that offer enhanced features that promote easier maintenance, reliability and security.
Real Time Data Updates – Provides a single system that collects and validates data real time, so all users and partners have access to the latest information.
Secure, Cloud Based – Provides a proven, protected environment that promotes business continuity and disaster recovery features.
6. Market Assessment Motor Vehicle and Driver Licensing Systems are extremely complex computer systems and often underestimate by those without large scale government system experience. DMVs around the country have had mixed results in modernizing these complex systems. This section describes the market and background of system modernization.
6.1 Market Background
6.1.1 History of Failed Projects Large modernization projects, especially for state DMV agencies, don’t have a great track record over the last 10 years. Many vendors have tried and exited the market. Examples of failed modernization projects include the following.
HP has 5 failed implementations including New Jersey, Vermont, Minnesota, Michigan and New Mexico. HP did complete the Rhode Island project. At this point, they have effectively exited the market.
3M has 4 failed implementations including Kansas, Kentucky, Idaho, and Delaware. 3M is still working to implement in Montana though they have effectively exited the market.
Deloitte, which has 1 failed implementation in Massachusetts did complete modernization work in Texas and is now working with Pennsylvania.
Tech Mahindra failed an implementation in Nevada but successfully completed a system for New Hampshire.
All of these projects were over budget and behind schedule. These projects invested years of time with little or no new functionality deployed before cancelling the projects. Both 3M and HP have stated they are no longer in the modernization market.
6.1.2 Current Vendors Currently, there are approximately 6 active vendors in the DMV marketplace pursuing new projects. Of these active vendors, there are varying degrees of successful implementations. Some vendors are system integrators and others are solution specific vendors. Recent wins include: Deloitte in Pennsylvania, FAST in MD, Minnesota, and Michigan, and Accenture in Florida.

REVENUE INFORMATION SYSTEM REPLACEMENT PLAN State of Wyoming | Wyoming Department of Transportation
23 MATHTECH | REVENUE INFORMATION SYSTEM REPLACEMENT PLAN
Some vendors have chosen to use a custom approach to developing software which effectively means “starting from scratch”. Other vendors such as Tech Mahindra and MorphoTrust have leveraged a customer management system from Microsoft (Microsoft Dynamics) as the foundation for their system development. Tech Mahindra was successful with this approach in New Hampshire.
FAST Enterprises has emerged as a unique player in the market. They have developed a Driver Licensing, Motor Vehicle, and Business Licensing system that was built on their previously successful Tax System. FAST has had a string of successful projects using this approach.
6.2 Vendor Landscape This table includes notable projects conducted by vendors and also includes some state-run modernization projects in the last line.
Vendor Approach Jurisdiction
Accenture Custom Software Florida (DL, MV) (ongoing)
Deloitte Custom Software
Refactoring of Old Software
Texas (MV) (completed in 2016)
Pennsylvania (MV, DL started in Jan 2018)
FAST Enterprises
Prebuilt Configurable System 10+ States including:
North Dakota (MV) (completed in 2016)
New Mexico (MV) (completed in 2016)
Washington (DL, MV)
Colorado (DL, MV) (completed in 2018)
Maryland (DL, MV)
Massachusetts (DL)
Minnesota (DL)
Infosys Custom Software Ontario (completed in 2016)
MorphoTrust Prebuilt + Custom Software Mississippi (DL)
North Carolina (DL)
Alabama (DL)
Tech Mahindra Prebuilt + Custom Software
Customer Software
New Hampshire (DL) (completed in 2017)
BIS Prebuilt + Custom Motor Vehicle Solution
Tennessee (MV)
State-Run Custom Software Florida
Kentucky
Florida is a combination of a State-run project with substantial vendor support.

REVENUE INFORMATION SYSTEM REPLACEMENT PLAN State of Wyoming | Wyoming Department of Transportation
24 MATHTECH | REVENUE INFORMATION SYSTEM REPLACEMENT PLAN
7. Options for Moving Forward This section discusses WYDOT’s options when planning modernization of the RIS system. There are both software modernization approaches and hosting options to consider.
7.1 Modernization Approaches Each modernization approach has strengths and weaknesses including cost, risk, complexity, and amount of time required to deliver.
Pre-Built Configurable System – This approach leverages a Commercial Off-The-Shelf (COTS) solution that is configured and minimally customized to deliver the required functions. This solution typically provides basic “out-of-the-box” functionality including AAMVA integration and a configurable design to allow each agency to add their specific business rules and requirements. A COTS system typically has annual updates which allow the agency to stay current with federal and AAMVA requirements and may provide new features based on advancements. This type of solution requires the agency to be flexible in setting up their business processes within the COTS structure and pay an annual license for the base system. The agency configured parts of the solution may be supported by the vendor for additional costs or by state staff. Some states want their own custom solution and do not want to be held constrained by a vendor or obligated to pay annual fees while other agencies see this path as an opportunity to leverage professionally developed functionality that simplifies maintenance and support, even if the approach has built-in support and licensing costs.
Refactor – This approach takes the existing system code and uses a tool to translate the programming language into a newer technology. It also creates documentation of the logic flow of the system and can better organize the old code. It typically does not deliver any real improvements to the programming logic or database, or provide new functions. Furthermore, the approach implements the same business rules. Users will often not notice much of a difference though the screen cosmetics may be updated. The state will still need to address underlying process, business rule, documentation, database, and operational consistency issues. In some cases, this approach can be combined with custom programming to start a series of enhancement projects using the new code as a start.
Custom – This approach builds a new system from scratch with newer technologies. Custom development best describes the software approach currently used at the WYDOT and many other jurisdictions around the country. All functionality is custom designed and coded. Custom development takes a long time to construct and test new functions. Custom software is historically designed “from scratch”, although some vendors now are using COTS Customer Relationship Management (CRM) packages as a foundation for custom development. These solutions don’t typically have a regular release or update schedule with functionality updates as would a commercial software product. In this approach, many standard functions such as inventory or financial management, reporting, and other functions can be better and more easily implemented by using commercial off the shelf (COTS) products
Transfer – This approach takes another state’s custom solution and uses it as a base to build a solution. The original system may be a “work of art” or a “sloppy workaround”. The original system built for the prior State may in fact work, but software standards may not have been structured to be flexible enough to accommodate the needs of other States. The process of “ripping apart” and reworking an existing system contains many risks that impact the quality of the project and the resulting system.

REVENUE INFORMATION SYSTEM REPLACEMENT PLAN State of Wyoming | Wyoming Department of Transportation
25 MATHTECH | REVENUE INFORMATION SYSTEM REPLACEMENT PLAN
Approach Success Rate
Ability to Meet Needs
Pro Con
Pre-Built Configurable System
High
High
Ready to Use
Adaptable
Implements Best Practices
Ongoing Upgrades
Reliant on Vendor
Don’t “Own” System
Some Process Changes May Be Required
Refactor (Code Conversion)
Med
Low
May Require Less Staff Participation
Gets Off Aging Hardware
No Real Enhancements in Functionality
Doesn’t Solve Long Term Maintenance Challenge or Improve Staff knowledge of the system
Doesn’t fix poor code structures and expects existing documentation
Custom Med/ Low
High
Execute & Spend at Own Pace
Own All Software
Costs Not Always Manageable
Slow to Deliver
Very High Skill Sets Requirements
In-house Staffing Levels Not Typically Available
Transfer Low?
Med
Possibly Own All Code
Possibly Less Expensive
Possibly Inheriting Another Mess
Do Nothing Low
Low
Easy Potential Software Failure and Inability to Support New Functions and Requirements
In the past few years, pre-built configurable systems have had the greatest success.
7.2 Hosting & On-Site Considerations The previous section described different approaches for building and implementing the system. This section describes two important approaches for hosting the system – or where and how to locate and maintain the system once it is operational.
7.2.1 Overview On-Site System (Buying a System) – On-Site Systems have been the standard for public sector and private sector systems for many decades. They consist of computer systems that are installed at local locations either in an office operation or the organization’s own data center. Even systems which are maintained in one building and used by staff in other buildings are still considered on-site solutions as they are still owned and maintained by the organization that uses the system.

REVENUE INFORMATION SYSTEM REPLACEMENT PLAN State of Wyoming | Wyoming Department of Transportation
26 MATHTECH | REVENUE INFORMATION SYSTEM REPLACEMENT PLAN
Cloud Based or Externally Hosted System (Buying a Service) – Externally Hosted Systems may be thought of as a “rented computer system”. Organizations in need of computer functionality use a computer system that is owned and maintained by a Hosting Company. Much like renting an apartment from a landlord, the renter is not required to perform maintenance on the property. Hosting Companies maintain the computer system at their own location and the organization using the system is freed from many typical computer maintenance and support tasks. Hosted systems are also referred to as Cloud Based Systems because they are available via the cloud of the Internet.
On-Site v. Cloud Based Comparison On-Site System (Buying a System)
Cloud Based System (Buying a Service)
Servers located in State’s data center
State owns the servers
State maintains servers
State upgrades all software
State owns all costs
Large upfront costs
Requires more internal staff
Servers located in vendor’s data center
Vendor owns the servers
Vendor maintains servers
Vendor upgrades all software
Vendor can share costs across many customers
Monthly, Annual, or Usage Based Payments
Vendor staff manage systems
Preferred Approach – Less Resource Intensive and More Cost Effective. The Cloud Based System is the preferred approach for WYDOT for RIS system modernization. WYDOT and ETS have limited capacity to maintain large complex computer systems and many agencies are finding that their IT resources add much more value when they are directly supporting the users and the operations rather than performing maintenance and analyzing the computer systems. Additionally, by not “owning” the computer system, the upfront costs are significantly less. Again, renting or buying a home is a very similar analogy and while each has pros and cons some approaches are much more desirable for some customers. The cost-effectiveness of the Cloud Based System is in part due to a Hosting Company’s ability to spread maintenance and support costs across many rented systems with a well-trained and dedicated team that individual customers may not be able to easily replicate. Cloud Based Systems typically will address other system requirements such as disaster recovery, data backups, and security.
Hybrid Approaches – Many Combinations Are Possible – In reality, every combination between On-Site Systems and Cloud-Based Systems are possible. For example, it is possible to purchase a computer system and have it placed in a remote hosted data center where a third party provides maintenance services. It is also possible to own an On-Site System and hire a maintenance operation to support the system. As WYDOT moves through the planning and procurement process these variations may appear as options.
Approach Pro Con
On-Site Systems Manage and Control Everything – Systems, Data, Infrastructure
Requires Hardware and Software Investment
Requires Maintenance Staff or Contract
Requires Disaster Recovery Planning
Cloud Based Systems
Vendor Procures and Manages System
Vendor May Have Cost Sharing Across Multiple Customers
Requires Robust Infrastructure
Systems and Data are off-site

REVENUE INFORMATION SYSTEM REPLACEMENT PLAN State of Wyoming | Wyoming Department of Transportation
27 MATHTECH | REVENUE INFORMATION SYSTEM REPLACEMENT PLAN
8. Challenges & Risks As WYDOT moves forward with modernization it must consider a range of challenges and preparation tasks which should be addressed to reduce risk.
Available WYDOT Staff – Current technology teams are spread thin and there are no in-house IT skills to support the RIS system which presents a business continuity risks when problems occur and a shortage of staff to support modernization preparation and implementation.
County Autonomy for Vehicle Operations – Variations in operations, data quality, and business processes complicate improvements as well as the time to receive and process county data into the statewide RIS system. A plan for consolidation or tighter integration must be developed.
Business Process Readiness – Any modernization effort will replace the current RIS system and replace the support for all current business processes. WYDOT must fully understand the current processes and business rules and how they will be improved in the future. Reviews and assessments of current process is a necessary planning step and outdated process should not be automated.
Data Quality – Current data is accessible, but cleanup is required before implementing a new system. Some data quality problems are related to county operations and variations in standards. A data quality assessment should be planned, and a data management strategy should be developed with the counties so that moving forward with a new system does not bring along bad data or data management practices.
Interface Management – If the RIS system is modernized then the impact to all parties exchanging data must be assessed. WYDOT must identify and understand all interfaces and collaborate with all partners to understand their needs as the modernization process moves forward. Any interfaces changes, additions, or improvements must be planned with adequate time to be implemented on both sides.
Available Project Management Expertise – WYDOT does not appear to have the skill sets for large scale project management and oversight and this is typical of most government agencies. Large projects are often a “once in a career” event for state staff (as evidenced by a 40-year-old RIS system) so outside skills must be considered to supplement state teams.
Plate Numbering Scheme – Wyoming will incur additional costs to maintain the current plate numbering system. Clear, accurate data and plate numbers which can be easily distinguished supports reporting, law enforcement and analysis. Modern systems with standardized rules and tracking will force a consistent, unique plate numbering scheme. While it is possible to implement a system that allows duplicate plate numbers across different plate types (backgrounds) it is not a practical or typical of a modern solution.
8.1 Consideration of a Common System Across All Counties Operated By WYDOT Wyoming faces two unique challenges which impact the planning and implementation of a modernized RIS system. These challenges create unique operational inefficiencies and will result in higher costs for the project. Additionally, they negatively impact law enforcement.
As WYDOT moves forward with planning, it must consider how to consolidate all county vehicle transactions on to one common computer system. This plan must address:
Current county investments in individual systems
County staff training
Data conversion for each county system
County system integration with county financial operations
Autonomous County Vehicle Operations and Computer Systems Wyoming, like some other states, dictates that vehicle transactions be conducted by county operations and this is not a significant operational challenge. However, unlike any jurisdiction which Mathtech has encountered,

REVENUE INFORMATION SYSTEM REPLACEMENT PLAN State of Wyoming | Wyoming Department of Transportation
28 MATHTECH | REVENUE INFORMATION SYSTEM REPLACEMENT PLAN
Wyoming has each county owning and operating its own vehicle registration and titling computer system and separate database. Each system and database are separate from the other counties and only loosely linked to WYDOT’s RIS system and database. This presents unique problems.
Data Quality – Each county collects data, performs transactions, and operates its systems differently. This results in data quality problems because there is inconsistent enforcement of rules and different approaches to entering data. In all other states data is managed more consistently because there is only one system (whether new or old) and one set of operational policies. Poor data quality impacts subsequent transactions, exchange of data, and analysis and planning.
Operational Consistency – The use of different computer systems dictates different procedures which could result in different levels of thoroughness in conducting transactions among county operations for vehicle transactions which should be consistent across the state.
Linkage to National Databases – National databases such as NMVTIS (National Motor Vehicle Title Information System) are designed to be accessed by each state’s central computer system, not by 23 systems in one state. These systems are becoming more critical as they become part of completing all vehicle transactions in real-time. Wyoming’s approach of using different county systems could be a significant problem in the future with respect to interfacing with national systems.
Timeliness of Data – County systems provide data to WYDOT’s RIS system on individual, periodic schedules ranging from days to weeks. This means that data from a county vehicle transaction may take days to weeks to be transmitted to the RIS system which feeds law enforcement, investigations, reporting, and planning. This approach is significantly deficient compared to other states which use one common system.
Customer Transaction Inefficiencies – A bulk of any registration or title transaction is data entry and document review. This is a time-consuming process, especially the first time a vehicle is entered into the vehicle management system. This burden is reduced when a vehicle is registered or retitled a second time because the vehicle is already entered into the computer system. However, in Wyoming, if a vehicle is titled in one county, but then moved to another county and titled to a new owner the new county must reenter all of the vehicle’s data because it was entered into the system from the first county, and now must be reentered into the system of the second county. The separate databases are inefficient but also allow for data entry errors or differences that likely make it difficult to track the life of the vehicle across multiple owners. Vehicle tracking supports many needs including fraud detection, law enforcement, and planning.
Non-Unique License Plate Numbering System Wyoming’s plate numbering scheme includes a 1 or 2-digit County Number followed by unique license plate sequence which together create unique plates across the state. Specialty plates (e.g. Pearl Harbor Survivor, Radio Amateur, Native American Tribes) use a numbering system without the County Number and the same number sequence can be used for different Specialty Plates. Because the same unique plate number can be issued on each of every different Specialty plate type offered in the State it is difficult to identify a vehicle. Law enforcement, toll collectors, and other service providers must identify the exact plate type or color and the sequence number.
Effectively, this results in non-unique license plate numbers in the system which is problematic both for technical data management reasons and for operational identification purposes. Some DMV computer systems may require customization at additional cost to support a system with non-unique plates. Of course, the numbering scheme in general requires an owner to get a new license plate when they move to another county.

REVENUE INFORMATION SYSTEM REPLACEMENT PLAN State of Wyoming | Wyoming Department of Transportation
29 MATHTECH | REVENUE INFORMATION SYSTEM REPLACEMENT PLAN
9. Potential Schedule This section describes a potential schedule and the subprojects required for a typical modernization project and one that would address WYDOT and the State’s needs.
9.1 Modernization Subprojects and Activities RIS modernization is not a single project. It should be broken down into subprojects that ultimately achieve the full modernization over a multi-year period. These subprojects include both preparation and procurement activities as well as the implementation.
9.1.1 Ongoing Planning & Coordination Coordinating with County Operations – WYDOT needs to determine how Counties will use the new system including the plate numbering scheme and getting agreements on how separate systems will work together or a consolidate system will be created. In either case WYDOT will need to plan and implement a system that fully supports the full range of motor vehicle service offered to residents in the state.
Infrastructure Analysis and Preparation – WYDOT needs to assess the workstation configurations and network bandwidths to verify that these would support a new, more GUI/image-based transaction processing and start the process for upgrades if needed. Some of this work can begin now and some may need to wait until the needs of a selected solution are more clearly identified.
9.1.2 Preparation Projects
Data Analysis & Preparation Poor data quality can derail a functioning system. Preparation activities start with cataloging the sources of data that will be replaced by the new system. The next focus is to collect the documentation about that data and create documentation that is missing and will be needed to support data conversion and migration. Tasks include creating and verifying the data models and dictionaries and finalize a staging database, which WYDOT has already partially created. Once data documentation is secured, data quality assessments can begin. Remediation plans and actual remediation can begin and continue through the implementation phase. This effort can begin immediately as the analysis of the data and staging it in a more accessible database provides immediate benefit and supports any future modernization approach.
Interface Analysis & Preparation Interface Management is one of the higher risk areas in a modernization project. Interfaces are an external dependency that is not under complete control of the project. Early communications with interfaces partners is a key to managing that risk and understanding approaches that will work for both sides and allow the project to move forward. Preparation includes identifying and cataloging interfaces with specifications and contact information, analyzing and documenting characteristics (ex: frequency, volumes and technologies), gathering specifications, and developing a management approach for moving forward.
Requirements Analysis & Preparation WYDOT needs to understand and define all requirements and expectations of the new system. It must know which processes will be supported and what features it expects from the new system. These expectations should link to WYDOT’s plans to enhance customer service and improve operational efficiency.
A process and requirements catalog is a tool for capturing such requirements and expectations. An analysis and planning effort will be needed to organize functional user groups, define transactions and expectations, and begin cleanup and preparations for evaluating and procuring a new system. As part of this effort, existing forms, correspondence, reports, and other artifacts can be documented and reviewed to understand how they will change, be consolidated, or improved in the new system.
Gaps in the current operations and RIS system must be identified so that can be addressed from both the technical

REVENUE INFORMATION SYSTEM REPLACEMENT PLAN State of Wyoming | Wyoming Department of Transportation
30 MATHTECH | REVENUE INFORMATION SYSTEM REPLACEMENT PLAN
and functional perspective.
Vendor Demonstrations and Investigations Before an RFP is issued, vendor demonstrations will help WYDOT understand the range of solution options available including: functional options (ex: is inventory or IRP included), support and pricing models, configurability, and hosting alternatives.
9.1.3 Procurement
RFP Development A comprehensive RFP must be developed to procure a new system. This includes defining functional requirements, technical requirements, hosting requirements, delivery requirements, and support requirements. The team will leverage the preparation activities to develop the RFP. RFPs are critical for successful project and critical to obtaining the desired pricing and pricing model.
More than anything, a well written RFP can protect the State and lay a foundation for a successful, realistic project that manages risk.
RFP Review and Approval Review and collaboration is time consuming and varies by State. Sufficient time should be planned to move from final draft to published procurement.
Vendor Bidding Period The vendor bidding period must provide sufficient time for vendors to prepare their bids, ask questions, and for the State to respond with answers, amendments, and strategy updates as necessary.
Evaluation and Award Evaluations must balance the needs of the project and procurement along with State procurement standards and processes. They can range across qualitative and quantitative assessments. Each proposal received will be large, complex, and contain many assumptions that must be assessed and understood. The analysis should include demonstrations and interviews with the bidders. The final effort may include negotiations and reworking of the scope to bring the procurement to conclusion.
9.1.4 Driver Services System Implementation The Driver Licensing System implementation would include both personal and commercial driver licensing functions as well as the Driver History function that track violations, suspensions, and restorations. This would naturally be the first phase of the implementation because driver management will be the foundation for customer management. Driver services are also the primary function used by WYDOT as most vehicle services are performed independently by the Counties.
9.1.5 Business Licensing System Implementation After assessment of transactions, this functionality may be partially implemented with the Driver and Vehicles implementations. Currently, WYDOT has very limited tools to support Business Licensing and the implementation of a new, comprehensive business licensing system would not require the retirement of current systems and the data conversion may be less complicated.
9.1.6 Vehicle Services System Implementation WYDOT maintains the State’s consolidated database of all titled and registered vehicles but it only performs a small number of vehicle transactions related to specialty plates and some other transactions. The majority of the State’s title and registration transactions are performed by the Counties using their own independent computer systems. In

REVENUE INFORMATION SYSTEM REPLACEMENT PLAN State of Wyoming | Wyoming Department of Transportation
31 MATHTECH | REVENUE INFORMATION SYSTEM REPLACEMENT PLAN
the end, WYDOT still needs a complete system that supports all available vehicle services.
The new system must either consolidate transactions from all Counties as is currently done or the new system must become the primary system for all vehicle transactions performed by WYDOT and all of the Counties. If a consolidated system is implemented, then the effort must include appropriate financial and operational interfaces for each county as well as data migration from each of the 23 databases.
9.2 Potential Schedule The following represent the best-case scenario for a multi-year modernization of the RIS system. This is a realistic schedule that is dependent upon a high level of dedicated resources and collaboration among agencies to focus and move through the project. Vendor approaches will also impact the duration of the implementation phases.
The schedule shown here depicts the implementation of a pre-built COTS (Commercial Off-The-Shelf) solution ideally procured as a hosted Cloud-Based System.
10. Staffing Requirements A technology team is required to support the modernization project. WYDOT’s staff is spread thin and the project will require moving staff from operational assignments.
WYDOT can engage consultants to supplement the team and bring specific modernization skills.
10.1 Staffing Skill Sets All modernization projects require participation from a broad set of skills and stakeholders. The future WYDOT system modernization team will need to include the following:
IT Staff – IT staff will require retraining and supplementation to participate on parts of the project using new technologies. Some aspects of the modernization will focus on interfacing new systems with existing systems. In these cases, the existing staff will have the required expertise.
Business Staff – Business staff generally have the expertise required to describe current and future business operations. An implementation vendor cannot substitute for this role though consulting staff can be brought in early in the project to assist with requirements analysis and planning and they can usually continue to support the project through implementation and support or supplement internal business staff.
Project Management Staff – State staff may not have the skills or experience necessary to manage such a large project or to oversee vendors. Training in project management, quality management and other skills may be

REVENUE INFORMATION SYSTEM REPLACEMENT PLAN State of Wyoming | Wyoming Department of Transportation
32 MATHTECH | REVENUE INFORMATION SYSTEM REPLACEMENT PLAN
necessary but may not substitute for large project experience.
10.2 Basic Staffing Expectations As WYDOT moves forward with modernization it will need a dedicated internal team to lead the project, make operational and technical decisions, and collaborate with the implementation vendor and other consultants or stakeholders.
The following represents a core team that WYDOT should assemble and prepare as the modernization team. Assembling this team also requires planning to backfill their daily responsibilities or otherwise support operations.
IT Staff – 4 technical staff would provide the core support for a variety of technical responsibilities including:
Data analysis, interpretation, and conversion guidance
Interface management and planning integration with other systems such as the Driver License production system
Architecture planning and implementation
Infrastructure preparations and support planning
Business Staff – 5 business/operations staff would provide the core of a functional team responsible for defining the operations of the system including:
Defining business rules and calculations
Defining process flows and transaction requirements
Defining and designing new notices, products, and correspondence
Assessing changes to current operations to fit the new system
Approving all system functions
Guiding and conducting acceptance testing
Project Management Staff – 2 project managers would lead and oversee the project for WYDOT. Their responsibilities would include:
Coordinate WYDOT resources and ensure WYDOT commitments are met
Oversee implementation vendor activities and approve deliverables and progress
Coordinate with all stakeholders
Coordinate and collaborate with supporting consultants such as a project management support vendor
Manage project risk, engage governance, and overall project management
10.3 Staffing – Dual Burden An additional burden on staffing is the need to focus on the planning and development of the new systems while also maintaining the existing systems and, in some cases, expand the existing systems to meet legislative and other functional needs.
This issue must always be a consideration when planning and funding the modernization effort and every state deals with this challenge. Some states leverage vendors and staff supplementation, some hire new project staff, and some hire new staff to make existing staff available. In all cases, staffing must be attended impact early in the project and it is critical to minimize or completely freeze changes to the existing system.
10.4 Staff Roles The project approach will impact the staffing needs and preliminary costs have been included in the cost model. The team will require:

REVENUE INFORMATION SYSTEM REPLACEMENT PLAN State of Wyoming | Wyoming Department of Transportation
33 MATHTECH | REVENUE INFORMATION SYSTEM REPLACEMENT PLAN
Role Description Minimum Skills
Project Director Serve as primary point of contact and Executive Liaison
Take accountability for delivery of the project and contract management
Resolve issues that are escalated
Act as the designated interface between the Contractor and WYDOT
Prior leadership involvement on a legacy modernization project of similar size and scope that completed on time and on budget
Project Managers
Provide day-to-day project co-ordination, planning, management and control responsibilities
Maintain communication with stakeholders
Liaise with senior executives when required
Maintain accountability for all project management Deliverables
Maintain responsibility for developing and maintaining the detailed project schedule (including specific project scope, time, quality and resources)
Maintain responsibility for the ongoing maintenance of the detailed, schedule
Manage and coordinate reviews of schedules, plans, estimates and deliverables
Proactively monitor and report on all project Deliverables against schedules, scope and resources
Manage critical analyses of deviations from schedules and facilitate resolutions to return the project to baseline schedule
Report on all agreed upon performance metrics according to the agreed upon schedule
At least 3 years of experience managing the implementation of systems:
for large, complex, multi-year, multi-tier, multi-stakeholder integrated business and IT projects including large-scale legacy modernization projects;
in the development of system modernization strategies, plans, and schedules;
3 years of prior experience with iterative projects
Superior communication (oral and written), presentation and interpersonal skills;
Superior leadership and consulting skills, with demonstrated ability to work independently; and in a team/multi-stakeholder enterprise environment;

REVENUE INFORMATION SYSTEM REPLACEMENT PLAN State of Wyoming | Wyoming Department of Transportation
34 MATHTECH | REVENUE INFORMATION SYSTEM REPLACEMENT PLAN
Role Description Minimum Skills
Technical Architects
Establish the technical direction Enterprise IT Standards and shall ensure that all technical designs align with industry standards and maintain technology decision accountability
Maintain accountability for the technology management of all phases the Project:
Provide leadership and direction to the technical team on a day to day basis, to completion of all their Deliverables within agreed upon timeframes and to the agreed upon quality
Strategically align technology policies and schedules for the project to plans and schedules
Resolve strategic and escalated technology issues
At least 5 years of experience fulfilling similar responsibilities
At least 3 years of experience:
Overseeing and monitoring the application of architecture & integration tools and methodologies, best practices and knowledge bases for large, complex, multi-year, multi-tier, multi-stakeholder integrated business and IT projects including large-scale legacy modernization projects
In the development of system modernization strategies, plans, and schedules;
Prior experience with iterative projects
Superior communication (oral and written), presentation and interpersonal skills;
Superior leadership and consulting skills, with demonstrated ability to work independently; and in a team/multi-stakeholder enterprise environment;

REVENUE INFORMATION SYSTEM REPLACEMENT PLAN State of Wyoming | Wyoming Department of Transportation
35 MATHTECH | REVENUE INFORMATION SYSTEM REPLACEMENT PLAN
Role Description Minimum Skills
Data Architects Maintain responsibility for the data architecture, design, development and management of all information, structured and unstructured data, database and content management components of the new Solution
Oversee all strategies of the information, data and content management processes
Ensure that all information, data, database and content management solution components promote the integrity, security and confidentiality of all Personally Identifying Information (PII) and other sensitive citizen and state data
Lead the design and development of data security, masking, encryption and other similar solution elements and components to ensure the security and confidentiality of citizen and state data
Lead the design and development of information lifecycle management strategies, processes and solution components
Lead the logical and physical data modeling and data model documentation
Lead the design, development, implementation, performance tuning and optimization of relational database solution components, including instances, databases, schemas, tables, views, procedures, data files, backup/recovery, etc.
Ensure that all information, data, database and content management solution components meet the needs of the transactional, operational and analytical needs of the solution
At least 5 years of experience fulfilling similar responsibilities
At least 3 years of experience:
for large, complex, multi-year, multi-tier, multi-stakeholder integrated business and IT projects including large-scale legacy modernization projects;
in the development and execution of information and data architecture strategies, plans, and schedules;
Prior experience with iterative projects
Superior communication (oral and written), presentation and interpersonal skills;
Superior leadership and consulting skills, with demonstrated ability to work independently; and in a team/multi-stakeholder enterprise environment

REVENUE INFORMATION SYSTEM REPLACEMENT PLAN State of Wyoming | Wyoming Department of Transportation
36 MATHTECH | REVENUE INFORMATION SYSTEM REPLACEMENT PLAN
Role Description Minimum Skills
Business Analysts
Coordinate the detailed business analysis
Identify and translate high level, conceptual user requirements and specifications
Facilitate completion of project Deliverables
Define business strategies for the application of the new technology
Participate in business process reengineering activities
Participate in requirements management and traceability
At least 3 years of experience in a similar role implementing systems:
For large, complex, multi-year, multi-tier, multi-stakeholder integrated business and IT projects including large-scale legacy modernization projects;
In the development and execution of business analysis strategies, plans, and schedules;
Prior experience with iterative projects
Superior communication (oral and written), presentation and interpersonal skills;
Superior leadership and consulting skills, with demonstrated ability to work independently; and in a team/multi-stakeholder enterprise environment
Subject Matter Leads
Provide DMV domain expertise
Provide strategic driver and vehicle advice to the team
Provide leadership and direction to the technical team on a day to day basis, on any industry/domain clarifications that might be needed for requirement clarification
Ensure that all business decisions align with the best industry practices and lessons learned from successful implementations
Develop and enforce methodologies and driver and vehicle best practices for the development, extraction and documentation of requirements from business subject matter experts, Policy & Directives, other available documentation and other sources
Facilitate and manage workshops with business subject matter experts (business & IT) to extract and develop system and detailed business requirements
At least 3 years of experience in a similar role:
For large, complex, multi-year, multi-tier, multi-stakeholder integrated business and IT projects including large-scale legacy modernization projects;
Demonstrated Motor Vehicle and Driver License domain experience;
Prior experience with iterative projects
Superior communication (oral and written), presentation and interpersonal skills;
Superior leadership and consulting skills, with demonstrated ability to work independently; and in a team/multi-stakeholder enterprise environment

REVENUE INFORMATION SYSTEM REPLACEMENT PLAN State of Wyoming | Wyoming Department of Transportation
37 MATHTECH | REVENUE INFORMATION SYSTEM REPLACEMENT PLAN
Role Description Minimum Skills
Subject Matter Experts
Provide DMV domain expertise
Provide clarifications to the technical team on for requirement clarification
Understand and explain driver and vehicle Policy & Directives, other available documentation and other sources
Support and participate in workshops to extract and develop system and detailed business requirements
At least 3 years of experience in a similar role:
For large, complex, multi-year, multi-tier, multi-stakeholder integrated business and IT projects including large-scale legacy modernization projects;
Demonstrated Motor Vehicle and Driver License domain experience;
Prior experience with iterative projects
Superior communication (oral and written), presentation and interpersonal skills;
Superior leadership and consulting skills, with demonstrated ability to work independently; and in a team/multi-stakeholder enterprise environment
Testers Support planning for the testing phases of the project
Support the creation and execution of test strategies and plans
Execute testing, assist in training according to the project schedule
Ensure full requirements / design / architecture traceability throughout the entire software development life cycle
Support and maintain the overall defect management process – triage, entry and resolution
Support and maintain test status reporting
At least 3 years of experience in a similar role:
or large, complex, multi-year, multi-tier, multi-stakeholder integrated business and IT projects including large-scale legacy modernization projects;
In the development and execution of testing strategies, plans, and schedules;
Experience testing for iterative projects
Superior communication (oral and written), presentation and interpersonal skills;
Superior leadership and consulting skills, with demonstrated ability to work independently; and in a team/multi-stakeholder enterprise environment
11. Estimate Project Costs & Funding This section describes the overall cost of the project including cost components, factors impacting the cost, and funding options.

REVENUE INFORMATION SYSTEM REPLACEMENT PLAN State of Wyoming | Wyoming Department of Transportation
38 MATHTECH | REVENUE INFORMATION SYSTEM REPLACEMENT PLAN
11.1 Estimated Budget The budget is divided into Implementation Costs and Annual Costs and developed to present a 10-year overall total cost including approximately 5 years of implementation and 5 years of ongoing support. This total cost includes a fairly wide range and the factors impacting the cost are described later in the discussion.
The total 10-year cost is especially important as WYDOT seeks to plan for the cost of a hosted Cloud-Based solution.
11.1.1 Summary Implementation Cost Summary
Category Description $ Low Range $ High Range
Preparation Costs First year costs to prepare project and conduct procurement
$910,000 $2,250,000
Hardware & Software* Component costs if purchased for on-site system $16,500,000 $42,000,000
Implementation Services* Professional services to implement the system and manage the project
$20,180,000 $53,700,000
Internal Staff Support Backfill or engage project staff $5,040,000 $7,920,000
$42,630,000 $105,870,000
Annual Costs
Category Description $ Low Range $ High Range
Annual Software License/Maintenance
Annual cost for software updates and support $2,325,000 $5,775,000
Annual Hardware Maintenance
Annual cost for hardware maintenance and support
$150,000 $525,000
$2,475,000 $6,300,000
10 Year Total Cost
Category Description $ Low Range $ High Range
Initial Implementation Costs Preparation, Hardware & Software, Implementation Services
$42,630,000 $105,870,000
Hardware Refresh After 5 years $1,000,000 $3,000,000
Annual Costs x 10 years $24,750,000 $63,000,000
$68,380,000 $171,870,000
Average Annualized Cost
$6,838,000 $17,187,000
Does not include workstation or network infrastructure costs. Does not include internal staff costs.
*Included in the 2013 Cost Estimate

REVENUE INFORMATION SYSTEM REPLACEMENT PLAN State of Wyoming | Wyoming Department of Transportation
39 MATHTECH | REVENUE INFORMATION SYSTEM REPLACEMENT PLAN
11.1.2 Detailed Cost Estimate Preparation Costs Category Description $ Low
Range $ High Range Considerations
Requirements Analysis and Process Improvement
Approximately 1 year to review current processes, collect documentation and prepare for process improvements
$240,000 $720,000
Interface Analysis Approximately 1 year to review current interfaces and plan for new ones
$180,000 $360,000
Data Quality Analysis
Approximately 1 year to review data, assess quality, prepare for migration
$240,000 $720,000
RFP Development Approximately 6 months to prepare RFP for release
$250,000 $450,000
$910,000 $2,250,000
Hardware & Software
Category Description $ Low Range
$ High Range Considerations
Hardware Servers, Storage, Workstations, Network Equipment
$1,000,000 $3,000,000
Peripherals New workstation peripherals as necessary including barcode readers, scanners, and signature pads
$0 $500,000 May have these already and can leverage with new applications
System Software Operating Systems, Support Tools, Database Management Software, Workflow, Rules Engine
$500,000 $5,000,000 Custom vs COTS will determine how much is bundled into the proposed costs
Application Software
DMV software $15,000,000 $25,000,000 Custom vs COTS will determine how much is bundled into the proposed costs
Point of Sale Software $0 $500,000 Could leverage existing?
Imaging and Document Management Software
$0 $1,000,000 Could be bundled in COTS or leverage the existing system which may require enhancements.
Inventory Software $0 $1,000,000 Could be bundled in COTS

REVENUE INFORMATION SYSTEM REPLACEMENT PLAN State of Wyoming | Wyoming Department of Transportation
40 MATHTECH | REVENUE INFORMATION SYSTEM REPLACEMENT PLAN
Financial Software $0 $5,000,000 Could be bundled in COTS. The existing Oracle Financials Suite would generally suffice.
Reporting, Business Intelligence and Data Warehousing Software
$0 $1,000,000 Could be bundled in COTS product
$16,500,000 $42,000,000 All Workstations and Network Infrastructure not included in estimate
Implementation Services Category Description $ Low
Range $ High Range Considerations
System Implementation
Development, Configuration, Installation of application software typically performed by the system integration vendor
$15,000,000 $35,000,000 Cost will depend upon how much WYDOT would change business process to match the software or require the software to be customized to WYDOT’s existing operations.
County Implementation
Costs for Integration with County Financial System ($100K to $500K/County)
$2,300,000 $11,500,000 Replace existing systems? Requires training and rollout effort.
Project Management & Oversight Services
Third Party support for managing and guiding project and overseeing the implementation vendor.
$2,880,000 $7,200,000
$20,180,000 $53,700,000
Internal Staff Support Category Description $ Low
Range $ High Range Considerations
Technical Staff Database, Interface, architecture activities
$1,440,000 $2,880,000
Functional Staff Process, operations, business rule, and testing activities
$2,160,000 $3,600,000
Managers Project management activities
$1,440,000 $1,440,000
$5,040,000 $7,920,000

REVENUE INFORMATION SYSTEM REPLACEMENT PLAN State of Wyoming | Wyoming Department of Transportation
41 MATHTECH | REVENUE INFORMATION SYSTEM REPLACEMENT PLAN
Implementation Cost Summary Category Description $ Low
Range $ High Range Considerations
Preparation Costs First year costs to prepare project and conduct procurement
$910,000 $2,250,000
Hardware & Software
Component costs if purchased for on-site usage
$16,500,000 $42,000,000
Implementation Services
Professional services to implement the system and manage the project
$20,180,000 $53,700,000
Internal Staff Support
Backfill or engage project staff
$5,040,000 $7,920,000
$42,630,000 $105,870,000
Annual Costs Category Description $ Low
Range $ High Range Considerations
Annual Software License/Maintenance
Annual cost for software updates and support
$2,325,000 $5,775,000 Level of support will impact annual cost - ranging from release updates to full support services.
Annual Hardware Maintenance
Annual cost for hardware maintenance and support
$150,000 $525,000
$2,475,000 $6,300,000
10 Year Total Cost Category Description $ Low
Range $ High Range Considerations
Initial Implementation Costs
Preparation, Hardware & Software, Implementation Services
$42,630,000 $105,870,000
Hardware Refresh After 5 years $1,000,000 $3,000,000 Annual Costs x 10 years $24,750,000 $63,000,000 $68,380,000 $171,870,000
Average Annual Cost
$6,838,000 $17,187,000
11.2 Factors Impacting the Estimated Cost Range The estimated project costs presented in this section have a significant range from approximately $70M to over $170M. This is obviously a wide range and many factors impact the outcome.
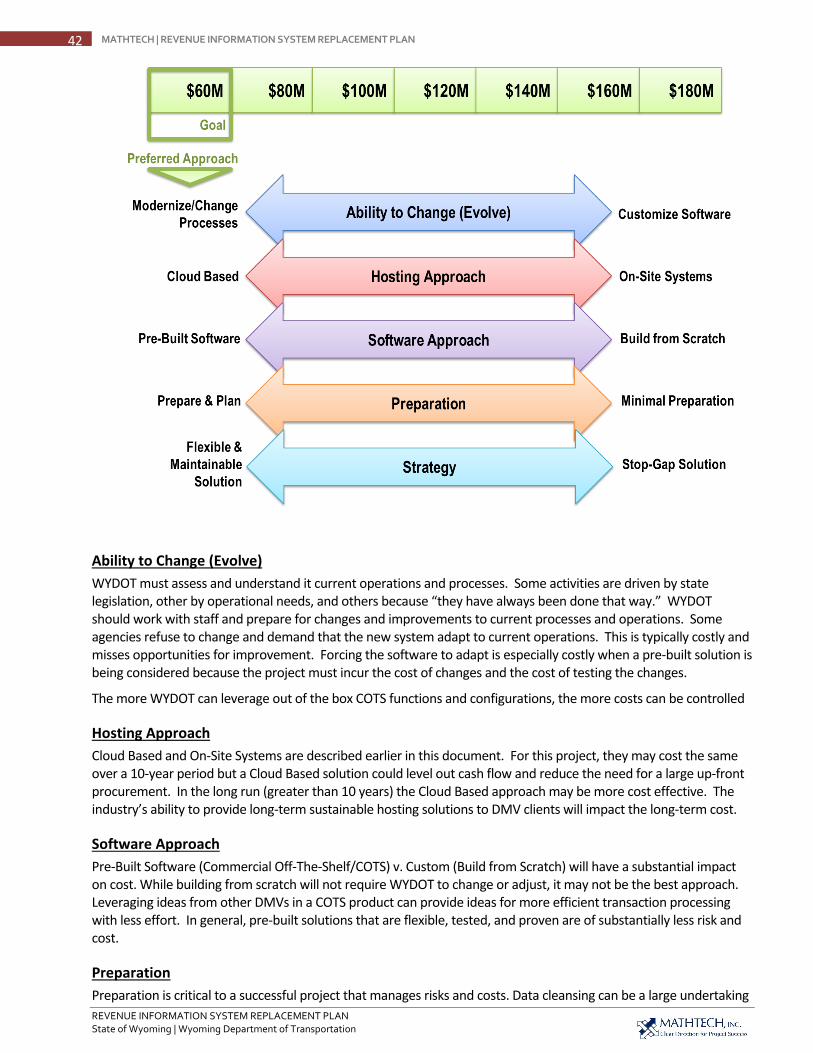
REVENUE INFORMATION SYSTEM REPLACEMENT PLAN State of Wyoming | Wyoming Department of Transportation
42 MATHTECH | REVENUE INFORMATION SYSTEM REPLACEMENT PLAN
Ability to Change (Evolve) WYDOT must assess and understand it current operations and processes. Some activities are driven by state legislation, other by operational needs, and others because “they have always been done that way.” WYDOT should work with staff and prepare for changes and improvements to current processes and operations. Some agencies refuse to change and demand that the new system adapt to current operations. This is typically costly and misses opportunities for improvement. Forcing the software to adapt is especially costly when a pre-built solution is being considered because the project must incur the cost of changes and the cost of testing the changes.
The more WYDOT can leverage out of the box COTS functions and configurations, the more costs can be controlled
Hosting Approach Cloud Based and On-Site Systems are described earlier in this document. For this project, they may cost the same over a 10-year period but a Cloud Based solution could level out cash flow and reduce the need for a large up-front procurement. In the long run (greater than 10 years) the Cloud Based approach may be more cost effective. The industry’s ability to provide long-term sustainable hosting solutions to DMV clients will impact the long-term cost.
Software Approach Pre-Built Software (Commercial Off-The-Shelf/COTS) v. Custom (Build from Scratch) will have a substantial impact on cost. While building from scratch will not require WYDOT to change or adjust, it may not be the best approach. Leveraging ideas from other DMVs in a COTS product can provide ideas for more efficient transaction processing with less effort. In general, pre-built solutions that are flexible, tested, and proven are of substantially less risk and cost.
Preparation Preparation is critical to a successful project that manages risks and costs. Data cleansing can be a large undertaking

REVENUE INFORMATION SYSTEM REPLACEMENT PLAN State of Wyoming | Wyoming Department of Transportation
43 MATHTECH | REVENUE INFORMATION SYSTEM REPLACEMENT PLAN
but doing the work upfront will limit impacts on transaction processing times and overall customer service. For example, if data is cleansed after go-live with each transaction, it could add several minutes to each transaction which could increase overall wait times and lower customer satisfaction.
Business Process Analysis is critical to understanding the range of WYDOT’s needs, critical expectations, and non-critical options. Analysis and planning will also allow the WYDOT team to move quickly and accurately with an implementation vendor to specify, implement, and testing all operational requirements without needed to unnecessarily uncover or be surprised by last minute requirements throughout the implementation and testing.
Strategy All project approaches must be understood as:
short term stop-gap solutions to an aging system that perpetuate the costly maintenance of the system compared to
long term solutions that address both current needs and future ongoing costs to maintain and enhance the system.
Staying with the current system as well as some of the solutions that may be proposed could be much costlier in the long run of owning and maintain the system. WYDOT should be prepared to understand these options and assess the short term and long-term costs, maintainability, and flexibility of each potential solution. The RFP and project strategy should address this as much as possible and as early as possible in the process.
11.3 Pricing Model Considerations This report has focused on the logistical and cost advantages of a Cloud Based solution. Cloud Based system services are typically rented or leased for a period of time and in this case would include the option to renew services. While it is easy to review the pricing and options for services such as cloud-based email, accounting systems, or customer management systems, there are currently no available, pre-priced DMV solutions. Any available option would come from a current vendor of on-site systems maturing to provide a cloud-based option. Given the availability of hosting services it would not be difficult for them to develop a cloud-based solution.
Cloud based solutions will spread out General Fund expenditures and allow the State to avoid the effort associated with infrastructure and data center setup along with ongoing maintenance and software upgrades. Other expectations for cloud based pricing include the following:
Cloud based costs will likely align with the total estimated system costs as Cloud Based Driver and Vehicle solutions are not yet common.
Savings should be realized as vendors will leverage established hosting infrastructures.
Wyoming’s size may result in decreased licensing costs for some vendors and may not impact the overall effort and costs for other vendors. For example, a vendor who proposes to build a new solution will incur a similar effort whether building the system for Wyoming or California. A vendor who has already built a system could reinstall and configure it with less effort and be positioned to charge less for the system given the reduced transaction, data, and financial volumes.

REVENUE INFORMATION SYSTEM REPLACEMENT PLAN State of Wyoming | Wyoming Department of Transportation
44 MATHTECH | REVENUE INFORMATION SYSTEM REPLACEMENT PLAN
The following diagram shows how the overall 10-year total cost of the system might be paid as a large initial up-front purchase with ongoing maintenance or a smaller annual cost that amortizes the total cost over 10 years, depending upon whether an On-Site or Cloud Based solution is used.
In the most extreme case, a $68.4M system developed as an on-site implementation would consist of a large up-front purchase such as $45M with an ongoing annual maintenance cost of $2.6M/year. This would compare to a cloud based solution which would evenly spread the costs to be approximately $6.84M/year.
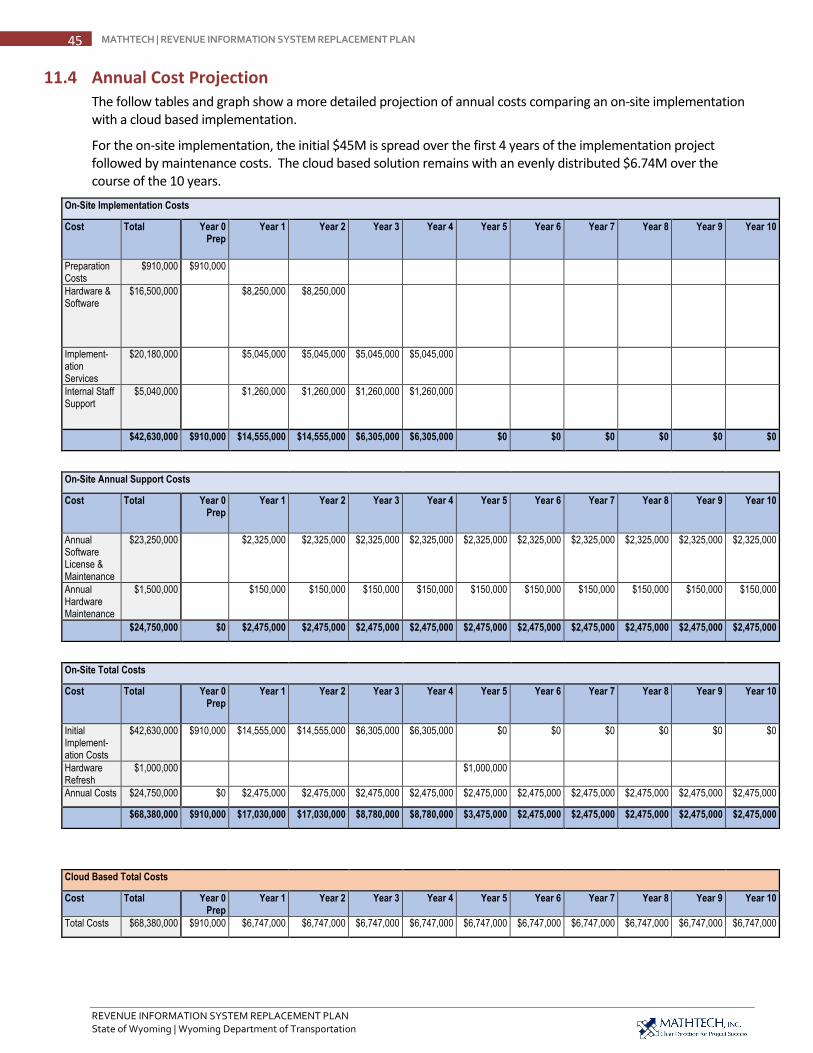
REVENUE INFORMATION SYSTEM REPLACEMENT PLAN State of Wyoming | Wyoming Department of Transportation
45 MATHTECH | REVENUE INFORMATION SYSTEM REPLACEMENT PLAN
11.4 Annual Cost Projection The follow tables and graph show a more detailed projection of annual costs comparing an on-site implementation with a cloud based implementation.
For the on-site implementation, the initial $45M is spread over the first 4 years of the implementation project followed by maintenance costs. The cloud based solution remains with an evenly distributed $6.74M over the course of the 10 years.
On-Site Implementation Costs
Cost Total Year 0 Prep
Year 1 Year 2 Year 3 Year 4 Year 5 Year 6 Year 7 Year 8 Year 9 Year 10
Preparation Costs
$910,000 $910,000
Hardware & Software
$16,500,000 $8,250,000 $8,250,000
Implement-ation Services
$20,180,000 $5,045,000 $5,045,000 $5,045,000 $5,045,000
Internal Staff Support
$5,040,000 $1,260,000 $1,260,000 $1,260,000 $1,260,000
$42,630,000 $910,000 $14,555,000 $14,555,000 $6,305,000 $6,305,000 $0 $0 $0 $0 $0 $0
On-Site Annual Support Costs
Cost Total Year 0 Prep
Year 1 Year 2 Year 3 Year 4 Year 5 Year 6 Year 7 Year 8 Year 9 Year 10
Annual Software License & Maintenance
$23,250,000 $2,325,000 $2,325,000 $2,325,000 $2,325,000 $2,325,000 $2,325,000 $2,325,000 $2,325,000 $2,325,000 $2,325,000
Annual Hardware Maintenance
$1,500,000 $150,000 $150,000 $150,000 $150,000 $150,000 $150,000 $150,000 $150,000 $150,000 $150,000
$24,750,000 $0 $2,475,000 $2,475,000 $2,475,000 $2,475,000 $2,475,000 $2,475,000 $2,475,000 $2,475,000 $2,475,000 $2,475,000
On-Site Total Costs
Cost Total Year 0 Prep
Year 1 Year 2 Year 3 Year 4 Year 5 Year 6 Year 7 Year 8 Year 9 Year 10
Initial Implement-ation Costs
$42,630,000 $910,000 $14,555,000 $14,555,000 $6,305,000 $6,305,000 $0 $0 $0 $0 $0 $0
Hardware Refresh
$1,000,000 $1,000,000
Annual Costs $24,750,000 $0 $2,475,000 $2,475,000 $2,475,000 $2,475,000 $2,475,000 $2,475,000 $2,475,000 $2,475,000 $2,475,000 $2,475,000
$68,380,000 $910,000 $17,030,000 $17,030,000 $8,780,000 $8,780,000 $3,475,000 $2,475,000 $2,475,000 $2,475,000 $2,475,000 $2,475,000
Cloud Based Total Costs
Cost Total Year 0 Prep
Year 1 Year 2 Year 3 Year 4 Year 5 Year 6 Year 7 Year 8 Year 9 Year 10
Total Costs $68,380,000 $910,000 $6,747,000 $6,747,000 $6,747,000 $6,747,000 $6,747,000 $6,747,000 $6,747,000 $6,747,000 $6,747,000 $6,747,000

REVENUE INFORMATION SYSTEM REPLACEMENT PLAN State of Wyoming | Wyoming Department of Transportation
46 MATHTECH | REVENUE INFORMATION SYSTEM REPLACEMENT PLAN
The following graph compares the annual cost projections for on-site and cloud-based.
Consistent with the schedule provided earlier, the large expenses are incurred in the first five years of an on-site implementation is selected.
11.5 Potential Savings from Mainframe Retirement & Current Consulting Staff As the RIS system is retired, its associated costs should be eliminated and replaced with costs in the proposed budget which should provide some offset to the modernization project costs.
To fully eliminate the mainframe, all functions must be retired and moved to a new system which is a reasonable goal when modernizing and replacing the RIS system. Secondly, all of the data must be migrated off of the mainframe. This goal can be achieved by creating a staging database for all mainframe data. The staging database will be used to:
Copy all data from the mainframe
Support data quality analysis and conversion
Support migration of a subset of data to the new system
Maintain a historical reference for data not migrated to the new system
Eliminate ETS Mainframe Costs – Once the mainframe is unnecessary, WYDOT should be able to save approximately $900,000 annually. Other ETS charges such as network costs that are incurred by WYDOT and the counties will likely be similar to infrastructure costs for the new system.
Eliminate HP Consultant Costs – Once the RIS system is retired, WYDOT can disengage the consultant currently supporting the RIS system saving WYDOT approximately $422,500 annually.
11.6 Changes from Prior Cost Estimates The proposed cost estimate is more comprehensive than the 2013 estimate prepared by WYDOT/ETS and now includes:
17,030,000
8,780,000
2,475,000
910,000
6,747,000
-
2,000,000
4,000,000
6,000,000
8,000,000
10,000,000
12,000,000
14,000,000
16,000,000
18,000,000
0 1 2 3 4 5 6 7 8 9 10
Estimated Annual Project CostsPreparation Year + 10 Year Project
On Site Implementation Cloud Implementation

REVENUE INFORMATION SYSTEM REPLACEMENT PLAN State of Wyoming | Wyoming Department of Transportation
47 MATHTECH | REVENUE INFORMATION SYSTEM REPLACEMENT PLAN
Preparation Costs
Contractor Staffing Costs
Hardware Update
Modern Software Components
10 Year Total Cost
The new model provides a more accurate estimate of General Fund needs.
11.7 Potential Funding Sources
11.7.1 Funding Models The State has three primary tools for funding the modernization effort. A blended approach may also be needed.
Capital & Operating Expenditure
State “general” funding is a typical approach and this is the most common strategy used by states, even when confronting an up-front purchase.
Fee Increase
Some states have used a technology fee which is added to customer transactions to fund the project.
A fee of $5 to $12 per transaction could cover the expected project costs.
Vendor Charge
Some jurisdictions may allow for a convenience or transaction fee to be charged by the vendor implementing the system. This fee would need to apply to all transactions, not just web transactions.
A fee of $5 to $12 per transaction could cover the expected project costs.
The above fee estimates are based on an annual volume of 1.5 M customer transactions.
11.7.2 Additional Revenue Generation Mathtech collaborated with WYDOT to identify and assess other revenue generation opportunities. These included the following:
Access Fees & Transaction Fees for Private Sector Companies Using the Modernized RIS System
Access Fees & Transaction Fees for State Agencies and Counties Using the Modernized RIS System
The following Private Sector companies were identified and analyzed for access and transaction options. This list was based on Wyoming and other state business transactions.
Banking Loan/Lien Processors
Commercial Driver Employers
Data Brokers
Dealer System Services
Dealers & Auction Houses
Driver Record Requestors
Driving Schools & Testing Centers
Ignition Interlock

REVENUE INFORMATION SYSTEM REPLACEMENT PLAN State of Wyoming | Wyoming Department of Transportation
48 MATHTECH | REVENUE INFORMATION SYSTEM REPLACEMENT PLAN
Insurance Companies
Organ Donor Agencies
Research/University
Tag & Title Agencies
Third Party – Full Service
Vehicle Inspection
While there may be some small options for new revenue generation these options were deemed not substantial for budgeting purposes for reasons such as:
Already charging fee, but fee could be increased (ex: from $5 to $10 per record lookup)
Transactions are conducted by the Counties, not WYDOT
Wyoming does not have such transactions (ex: vehicle inspections)
Not substantial or good appearance (ex: Organ Donor Agencies)
One small possibility was identified relating to Driving Schools as they do not currently access the RIS system to confirm or register students. In the future, if a new system supported access by driving schools, an access or transaction fee could be charged but this would not be a substantial amount.
Additionally, as Wyoming develops the ability to manage electronic liens and titling for vehicles, there may be a market for additional services to banks and lending institutions. Again, this overlaps with services currently offered by counties and may not be substantial enough to impact the project’s overall cost or budget.
The following is a list of public sector agencies and partners that could be considered when assessing an access or transaction fee. Through a range of discussions, it was deemed inappropriate or ineffective to attempt to push a substantial part of the new system’s cost to any of the following:
County Processors
Courts
Law Enforcement
Parking & Toll Authorities
State Agency
11.7.3 Approaches Used by Other States Other states have use a variety of options to support the funding of new computer systems, but in general they have used general funds.
New Jersey issued a $50M bond to support technology and facility upgrades for the Motor Vehicle Commission
Nevada, Texas, and Minnesota created a $1 transaction fee which was included on motor vehicle and driver licensing transactions.
Other states have considered a transaction fee but, in the end, for both political and other reasons, they have not pursued them.

REVENUE INFORMATION SYSTEM REPLACEMENT PLAN State of Wyoming | Wyoming Department of Transportation
49 MATHTECH | REVENUE INFORMATION SYSTEM REPLACEMENT PLAN
12. Next Steps Wyoming needs to develop commitment for moving forward with RIS modernization. The system is aging and presents many operational risks. Developing commitment may take one of many routes as would be typical for a state agency and state government. In the meantime, there are clear preparation steps that WYDOT can move forward with and they have direct benefit to WYDOT regardless of the timing of modernization. The preparation projects were outlined in Section 9.1.2 of this report and include: Data Analysis & Preparation
Interface Analysis & Preparation
Requirements Analysis & Preparation
Vendor Demonstrations and Investigations
Additionally, WYDOT needs to secure a support team for the RIS system that can understand and support the system both for maintenance and troubleshooting as well as enhancements as needed. The preparation projects will also support this objective.