TODAY'S CHALLENGES FOR GIRLS' EDUCATION
96
GLOBAL ECONOMY & DEVELOPMENT WORKING PAPER 90 | JUNE 2015 TODAY’S CHALLENGES FOR GIRLS’ EDUCATION Elizabeth M. King and Rebecca Winthrop
-
Upload
khangminh22 -
Category
Documents
-
view
2 -
download
0
Transcript of TODAY'S CHALLENGES FOR GIRLS' EDUCATION

GLOBAL ECONOMY & DEVELOPMENT
WORKING PAPER 90 | JUNE 2015
TODAY’S CHALLENGES FOR GIRLS’ EDUCATION
Elizabeth M. King and Rebecca Winthrop


Elizabeth King is a nonresident senior fellow in the
Center for Universal Education at the Brookings
Institution.
Rebecca Winthrop is a senior fellow and director of
the Center for Universal Education at the Brookings
Institution.
Acknowledgments:
Bridget A. McElroy was an integral part of preparing this paper. Her research assistance and project management
skills were crucial in helping us develop this paper in the short time frame available. We are deeply thankful for
her partnership and hard work. We are grateful for the many people who provided advice, guidance, feedback,
critique, and importantly shared reports and data with us. We are indebted to the numerous individuals in over
25 organizations that provided verbal and written feedback during the consultation process conducted during
the drafting of this paper. In addition there are several individuals with whom we worked especially closely on
the drafting of this paper and to whom we owe our deepest thanks. First and foremost is Nora Fyles and the col-
laboration with the U.N. Girls Education Initiative which was crucial in developing this paper. We also would like
to acknowledge the essential contributions of Judith-Ann Walker, Lucy Lake, Pauline Rose, and Urvashi Sahni.
Finally, we would like to thank the government of Norway and the U.N. Special Envoy for Global Education Gordon
Brown for their interest in these recommendations, especially regarding the Oslo Summit on Education for
Development.
This paper was supported by the William and Flora Hewlett Foundation. Brookings recognizes that the value it
provides is in its absolute commitment to quality, independence, and impact. Activities supported by its donors
reflect this commitment and the analysis and recommendations are not determined or influenced by any dona-
tion. The authors disclose that the government of Norway is a funder to the Brookings Institution.

iv GLOBAL ECONOMY AND DEVELOPMENT PROGRAM
CONTENTS
Executive Summary . . . . . . . . . . . . . . . . . . . . . . . . . . . . . . . . . . . . . . . . . . . . . . . . . . . . . . . . . . . . . . . . . . . . . . . vi
Why we care: Seven main benefits of girls’ education to society . . . . . . . . . . . . . . . . . . . . . . . . . . . .vii
Progress can we build on . . . . . . . . . . . . . . . . . . . . . . . . . . . . . . . . . . . . . . . . . . . . . . . . . . . . . . . . . . . . . . viii
What we face today: Girls’ education hotspots . . . . . . . . . . . . . . . . . . . . . . . . . . . . . . . . . . . . . . . . . . . . ix
Why girls are behind: What we know about gender equality in education. . . . . . . . . . . . . . . . . . . . . .x
What is working: Evidence on addressing girls’ education . . . . . . . . . . . . . . . . . . . . . . . . . . . . . . . . . . xi
What should we do: Taking action on girls’ education . . . . . . . . . . . . . . . . . . . . . . . . . . . . . . . . . . . . . .xv
I. Why we care: Seven main benefits of girls’ education to society . . . . . . . . . . . . . . . . . . . . . . . . . . . . . . . . 1
II. Progress we can build on . . . . . . . . . . . . . . . . . . . . . . . . . . . . . . . . . . . . . . . . . . . . . . . . . . . . . . . . . . . . . . . . . 5
Building on aggregate education expansion around the world . . . . . . . . . . . . . . . . . . . . . . . . . . . . . . 5
Building on civil society and political momentum . . . . . . . . . . . . . . . . . . . . . . . . . . . . . . . . . . . . . . . . . . 5
III. What we face today: Girls’ education hotspots . . . . . . . . . . . . . . . . . . . . . . . . . . . . . . . . . . . . . . . . . . . . . 9
Assessing gender equality: gender gaps in the quantity and quality of education . . . . . . . . . . . . . 9
The largest gender gaps in enrollment are in the poorest countries . . . . . . . . . . . . . . . . . . . . . 10
Countries in Africa, Middle East, and South Asia are home to the widest gender gaps in enrollment . . . . . . . . . . . . . . . . . . . . . . . . . . . . . . . . . . . . . . . . . . . . . . . . . . . 10
The girls who face multiple disadvantages are farthest behind . . . . . . . . . . . . . . . . . . . . . . . . . . 13
Overall learning levels are low, but girls do worse in math and boys in reading . . . . . . . . . . . . 16
“Soft” skills also key for girls . . . . . . . . . . . . . . . . . . . . . . . . . . . . . . . . . . . . . . . . . . . . . . . . . . . . . . . . 18
Emerging hotspots: Bogs, traps, and ceilings in girls’ education . . . . . . . . . . . . . . . . . . . . . . . . . . . . . 19
Stuck in an education bog . . . . . . . . . . . . . . . . . . . . . . . . . . . . . . . . . . . . . . . . . . . . . . . . . . . . . . . . . 20
Caught in an education quality trap . . . . . . . . . . . . . . . . . . . . . . . . . . . . . . . . . . . . . . . . . . . . . . . . . 22
Bumping against a gender “glass ceiling” . . . . . . . . . . . . . . . . . . . . . . . . . . . . . . . . . . . . . . . . . . . 23
Why girls are behind: What we know about gender equality in education . . . . . . . . . . . . . . . . . . . . . . . 24
Understanding the roots of education gender gaps . . . . . . . . . . . . . . . . . . . . . . . . . . . . . . . . . . . . . . . 24
Schooling is more costly for girls . . . . . . . . . . . . . . . . . . . . . . . . . . . . . . . . . . . . . . . . . . . . . . . . . . 24
Restricted space and expectations limit girls’ ability to reap the returns to education . . . . 26
Early marriage and teen pregnancy keep girls out of school . . . . . . . . . . . . . . . . . . . . . . . . . . . 28
Pervasive school-related violence harms millions of girls and young women . . . . . . . . . . . . 32
Lifting the obstacles to girls’ education . . . . . . . . . . . . . . . . . . . . . . . . . . . . . . . . . . . . . . . . . . . . . . . . . 34
What is working: Evidence on addressing girls’ education . . . . . . . . . . . . . . . . . . . . . . . . . . . . . . . . . . . . . 35
High-quality and gender-sensitive curricula and learning materials . . . . . . . . . . . . . . . . . . . . . . . . 35

TODAY’S CHALLENGES FOR GIRLS’ EDUCATION v
Girl-friendly infrastructure . . . . . . . . . . . . . . . . . . . . . . . . . . . . . . . . . . . . . . . . . . . . . . . . . . . . . . . . . . . . . 37
Great teachers . . . . . . . . . . . . . . . . . . . . . . . . . . . . . . . . . . . . . . . . . . . . . . . . . . . . . . . . . . . . . . . . . . . . . . . 38
Cost-reducing mechanisms . . . . . . . . . . . . . . . . . . . . . . . . . . . . . . . . . . . . . . . . . . . . . . . . . . . . . . . . . . . . 42
Safety in schools and freedom from violence . . . . . . . . . . . . . . . . . . . . . . . . . . . . . . . . . . . . . . . . . . . . 45
Girls’ and women’s capabilities for leadership and ability to make choices . . . . . . . . . . . . . . . . . . . 45
What should we do: Taking action on girls’ education . . . . . . . . . . . . . . . . . . . . . . . . . . . . . . . . . . . . . . . . . 50
Recommendation 1: Lean-in with girls and women’s leadership . . . . . . . . . . . . . . . . . . . . . . . . . . . . 50
Recommendation 1.1: Build strong girl leaders . . . . . . . . . . . . . . . . . . . . . . . . . . . . . . . . . . . . . . . . . 51
Recommendation 1.2: Girl-generated data . . . . . . . . . . . . . . . . . . . . . . . . . . . . . . . . . . . . . . . . . . . 52
Recommendation 2: Focus systemic reform with a gender lens . . . . . . . . . . . . . . . . . . . . . . . . . . . . 54
Recommendation 2.1: Design for education hotspots . . . . . . . . . . . . . . . . . . . . . . . . . . . . . . . . . . 55
Recommendation 2.2: Focus with a gender lens . . . . . . . . . . . . . . . . . . . . . . . . . . . . . . . . . . . . . 55
LIST OF TABLES
Table 1. Education and gender indicators: Bogs, traps and ceilings . . . . . . . . . . . . . . . . . . . . . . . . . .xii
Table 2. Gender gaps in net enrollment rates in primary and secondary education . . . . . . . . . . . . 11
Table 3. Gender gaps in net enrollment in primary and secondary education . . . . . . . . . . . . . . . . . 12
Table 4. Percentage of children aged 7-14 who are working . . . . . . . . . . . . . . . . . . . . . . . . . . . . . . . . 26
Table 5. Labor force participation rates, by sex and age group, by world region latest year . . . . . . . . . . . . . . . . . . . . . . . . . . . . . . . . . . . . . . . . . . . . . . . . . . . . . . . . . . . . . . . . . . . . . . . . . . . 29
Table 6. Percent share of female teachers in secondary education . . . . . . . . . . . . . . . . . . . . . . . . . .41
Appendix Table 1. Female-Male ratio of standardized achievement tests, by competency level; International and regional tests, latest years . . . . . . . . . . . . . . . . . . . . . . . . . 73
LIST OF FIGURES
Figure 1. Trend in average years of schooling, 1950-2010 . . . . . . . . . . . . . . . . . . . . . . . . . . . . . . . . . .6-7
Figure 2. Timeline of research, advocacy, and media milestones for girls’ education . . . . . . . . . . . .7
Figure 3. Average completion rates in primary education, by gender, income and rural-urban resdence. . . . . . . . . . . . . . . . . . . . . . . . . . . . . . . . . . . . . . . . . . . . . . . . . . . . . . . . 14
Figure 4. Gender gaps in Mozambique and Bolivia, by urban-urban residence and language group . . . . . . . . . . . . . . . . . . . . . . . . . . . . . . . . . . . . . . . . . . . . . . . . . . . . . . . . . . . . . . . . . . . . 15
Figure 5. Female-Male ratios in math and reading competency levels, various assessments, latest year. . . . . . . . . . . . . . . . . . . . . . . . . . . . . . . . . . . . . . . . . . . . . . . . . . . . . . . . . . . . . . . . 17
Figure 6. Girls’ Education Hotspots. . . . . . . . . . . . . . . . . . . . . . . . . . . . . . . . . . . . . . . . . . . . . . . . . . . . . . . 21
Figure 7. Female-Male ratio of completed years of schooling . . . . . . . . . . . . . . . . . . . . . . . . . . . . . . . 22
Figure 8. Percentage of women aged 20 to 24 years who were first married or in union before ages 15 and 18 . . . . . . . . . . . . . . . . . . . . . . . . . . . . . . . . . . . . . . . . . . . . . . . . . . . . . 30-31
Appendix Figure 1. Gender differences in primary and secondary net enrollment rates . . . . . . . 72

vi GLOBAL ECONOMY AND DEVELOPMENT PROGRAM
EXECUTIVE SUMMARY
“If only I can get educated,
I will surely be the president.”
—A teenage girl in rural Malawi
“There is no more valuable investment
than in a girls’ education.”
—Ban Ki Moon, secretary-general,
United Nations
Educating a girl is one of the best investments her
family, community, and country can make. We know
that a good quality education can be life-changing for
girls, boys, young women, and men, helping them de-
velop to their full potential and putting them on a path
for success in their life. We also know that educating
a girl in particular can kick-start a virtuous circle of
development. More educated girls, for example, marry
later, have healthier children, earn more money that
they invest back into their families and communities,
and play more active roles in leading their communi-
ties and countries.
Over the last 25 years, there have been large gains
in girls’ education, and we as a global community can
congratulate ourselves for the real progress that has
been made. This demonstrates that with shared goals
and collective action—among governments, interna-
tional organizations, civil society, media, and the pri-
vate sector—we can change the educational prospects
for girls around the world.
Despite this progress, our research shows that there
are hotspots in the world where girls are not getting
a quality education. While there certainly are places
where boys are behind, we have focused on under-
standing how and where across the world girls are be-
hind. The message is that many countries have work
to do to improve girls’ education, whether related to
the gender gap in primary or secondary enrollment
or learning.
There are about 80 countries where progress on girls’
education has stalled. These countries are not meet-
ing the education Millennium Development Goals.
They are stuck in an education bog—still struggling to
enroll all girls and boys in primary school and close
the gender gaps between boys and girls at both the
primary and secondary levels. There are an additional
30 countries that have successfully enrolled girls and
boys in primary and secondary education but are
trapped in low-quality learning. They are struggling to
ensure that girls and boys master foundational skills
such as basic literacy, numeracy, and science con-
cepts. Quality learning is important for the future lives
of girls and boys, but it is also an especially important
ingredient in the virtuous circle of development that
comes from girls’ education. Finally, there are another
30 countries where children are successfully enrolled
and learning. However, girls are behind boys in math.
In some ways, we can think of girls in these countries
bumping up against an educational glass ceiling.
In this report, we review in detail the progress in girls’
education, the work that remains to be done, and strat-
egies for success. Governments, international develop-
ment agencies, and civil society organizations have
supported a variety of programs that have made a
difference in both large and small ways. There are valu-
able lessons to learn from them—but more progress is
needed, especially in the poorest countries and among
the disadvantaged populations in most countries.
Ultimately we recommend renewed collective action
for advancing girls’ education in hotspots around the
world, especially in the 80 countries where progress on
girls’ education has stalled. We recognize the power-
ful contribution that girls and women themselves can
make to achieve this. Our first recommendation is to

TODAY’S CHALLENGES FOR GIRLS’ EDUCATION vii
lean in with girls’ and women’s leadership by invest-
ing in two initiatives that could go to scale in a short
time frame and rally support from a range of actors,
especially civil society and the private sector. The first
initiative aims to build strong girl and women leaders
by cultivating their skills and capacities to be agents
of their own lives. The second initiative aims to put
girls and women at the center of a data revolution
on gender, one that would fill the critical information
gaps about their status, what support they need to
succeed, and which interventions have been the most
and the least effective. Throughout the world today, it
is possible to put mobile technology to work catalyz-
ing a major girl-generated big data initiative.
Our second recommendation is for governments and
the partners supporting them to do the long-term
work needed to focus systemic reform with a gender
lens. This includes strengthening education systems
so that they work for girls (and boys). To do this,
governments and their international partners must
increase their investment in accelerating change in
girls’ education hotspots, especially to help countries
stuck in an education bog where progress on basic
education achievement and gender parity has stalled.
Governments and their partners also must ensure
that gender analysis is regularly used in developing
education policy, especially in national education
plans that underpin most of the systems in develop-
ing countries.
A detailed analysis underpins these recommenda-
tions. The report reviews data on six major questions:
• Why do we care about girls’ education?
• What progress can we build on?
• What do we face today in the effort to educate girls?
• Why are girls behind?
• What is working to address obstacles to girls’ edu-
cation?
• What should we do to accelerate progress on girls
education?
A summary of the key findings for each question are
presented below.
Why we care: Seven main benefits of girls’ education to society
We have identified seven main reasons why coun-
tries—from governments to civil society to the private
sector—should care about educating girls. Ultimately,
girls’ education is a powerful force for catalyzing a vir-
tuous circle of positive development outcomes.
1. More educated girls and women aspire to become
leaders and thus expand a country’s leadership
and entrepreneurial talent. One of the pernicious
features of gender inequality is that it feeds on itself;
parents may have lower aspirations for their daugh-
ters than for their sons, and so their daughters too
have lower aspirations for themselves. Yet, if given
the chance, girls and women can have the confidence
and skills to be change-makers. A recent review of
the literature on women’s leadership found that most
women leaders started early, engaging in educa-
tion and leadership activities as adolescents (O’Neil,
Plank and Domingo, 2015). A number of cases—from
India to Rwanda—have shown that having women
leading in their communities can make a difference,
driving policies and programs that improve family
and community well-being (Abbott, 2008).
2. It is the quality of schooling that really counts;
economic growth is faster when girls (and boys)
learn. Empirical research finds that more gender
equality in education is correlated with higher eco-
nomic growth. In addition, research concludes that
years of schooling is not an adequate measure of
educational progress. Instead, it is the quality of
schooling that matters. Hanushek and Woessmann

viii GLOBAL ECONOMY AND DEVELOPMENT PROGRAM
(2008) find that an increase of one standard-de-
viation in average reading and math scores is as-
sociated with a substantial two percentage-point
increase in annual GDP per capita growth, even
holding constant the average years of schooling. In
other words, a big portion of the benefits of girls’
education come from not just being in school but
learning well while there.
3. More equal education means greater economic
empowerment for women through more equal
work opportunities for women and men. Education
opens doors of opportunities for young women, es-
pecially when they cannot count on family wealth,
property, or business connections. Women with
more years of schooling are more likely to find
employment, own and operate productive farms or
firms, and earn higher wages. In Kenya, for example,
more education (and more inputs) for female farm-
ers relative to male farmers increases farm yields
by as much as 22 percent (Quisumbing, 1996).
4. More educated girls and young women are
healthier—and as adults they have healthier chil-
dren. A child whose mother can read is 50 percent
more likely to live past age five. Indeed, the global
decline in child mortality has been traced to in-
creases in mothers’ schooling, even after control-
ling for household income. Gakidou et al. (2010)
estimate that, of the 8.2 million fewer deaths of chil-
dren aged 5 years and below around the world be-
tween 1970 and 2009, one-half of the decrease can
be attributed to the global increase in the schooling
of women of reproductive age.
5. More educated mothers have more educated chil-
dren, especially daughters. Numerous empirical
studies have shown that mother’s education is criti-
cal for investments in the human capital of the next
generation. For example, in India, children of more
literate mothers study nearly two hours more a day
than children of illiterate mothers in similar house-
holds (Behrman et al., 1999).
6. More educated women are better able to protect
themselves and their families from the effects of
economic and environmental shocks. More edu-
cated mothers are able to protect their children’s
welfare during economic or environmental crises
through a higher quality of care and their greater
ability to mitigate adverse shocks, such as food
price changes, that might reduce food intake.
7. Education is valuable for girls in and of itself.
Finally, in the words of Urvashi Sahni, an Indian
girls’ education activist, “even without all of the ‘de-
velopmental and economic goodies’ that come from
girls’ education, we should care about educating
girls because it is inherently valuable to them and is
their right” (Sahni, 2015).
Progress we can build on
Globally, there are more girls getting educated than
ever before and the gender gap in education has nar-
rowed considerably. This progress reflects another
type of progress that is worthy of celebration and one
we can build on—the emergence and consolidation of
political and programmatic support for gender equal-
ity in education by civil society, national governments,
the media, private sector and international develop-
ment organizations. Any work today in accelerating
progress in girls’ education can build on very strong
foundations. In particular:
• Aggregate education expansion around the world.
Education levels have risen in most countries around
the world. In 1950, the (population-weighted) average
number of years of school completed by individuals
aged 25 and over was 6.1 in advanced countries and
only 1.4 in developing countries; 60 years later, aver-
age schooling levels had risen to 11.1 years in advanced
economies and 6.9 years in developing countries.
Current enrollment rates for children and years of
schooling completed for adults still show gender
gaps, but overall, women in developing countries have
gained relative to men with respect to education.
• Building on civil society and political momen-
tum. Girls themselves, their parents, teachers, and

TODAY’S CHALLENGES FOR GIRLS’ EDUCATION ix
communities have for decades worked to advance
their education. Researchers have long studied
girls’ and boys’ schooling and their different expe-
riences of education. However, in the last quarter
century, grassroots-level action has been promoted
and amplified into national policy debates, donor
strategies, media campaigns, multilateral action,
and initiatives of increasingly high-profile global
advocates.
What we face today: Girls’ education hotspots
The global convergence in average years of school-
ing between 1950 and 2010 described above, espe-
cially between men and women, marks a notable
shift toward greater gender equality in education.
Nonetheless, a closer and more disaggregated look at
several education indicators shows persistent gender
gaps in education in a number of countries.
Assessing gender equality: gender gaps in the quantity and quality of education
Examining a range of data—familiar quantitative in-
dicators to time series data on student learning—has
made it possible to highlight progress, or lack thereof
in girls’ education. Some key findings emerge:
• The largest gender gaps in enrollment are in
the poorest countries. In highly indebted poor
countries, the average net enrollment rate at the
primary level is 75.6 percent for girls compared
with 80.9 percent for boys. The average girls’ net
enrollment rate in these countries is more than 5
percentage points lower than the average for low-
income countries, more than 16 percentage points
lower than for middle-income countries, and more
than 20 percentage points lower than for in high-in-
come countries. At the secondary level, the deficits
for girls in the heavily indebted countries are much
larger, as table 2 indicates. To illustrate, the average
girls’ net enrollment rate is 25.9 percent, as com-
pared with 63.6 percent in middle-income countries
and 90.0 percent in high-income countries.
Countries in Africa, Middle East, and South Asia are home to the widest gen-der gaps in enrollment
In South Asia, the average net enrollment rate for girls
at the primary level is about the same as for boys, re-
flecting progress in primary education toward gender
equality, but in secondary education the average girls’
enrollment is 86.5 percent of boys’ net enrollment
rate. In the Africa region where the average girls’ en-
rollment rate is 74.8 percent at the primary level and
29.8 percent at the secondary level, far lower rates
than in other regions and also significantly lower than
those of boys.
• The girls who face multiple disadvantages are
farthest behind. While gender accounts for ob-
served disparities in education, poverty persists as
the most important and pervasive factor for educa-
tion inequality (UNESCO, 2010; Filmer, 2008b). Data
from 24 low-income countries show that poverty
alone accounts for 38 percentage points of the
gender difference between, but gender exacer-
bates that educational disadvantage, accounting
for about 10 percentage points of the difference
(King and Nguyen, 2013). Education lags most sig-
nificantly among people who face multiple sources
of disadvantage, not only income poverty, but also
place of residence, disability and/or ethno-linguistic
background.
• Overall learning levels are low, but girls do worse
in math and boys in reading. The gender distribu-
tion by competency levels in international and re-
gional assessments reveals that in general boys do
better than girls in math and girls perform better in
reading. Yet there is considerable variation in the
size of these gender differences across countries.
• Soft skills are also key for girls. There is a grow-
ing body of evidence from multiple disciplines

x GLOBAL ECONOMY AND DEVELOPMENT PROGRAM
(psychology, behavioral economics, and neurosci-
ence) that identifies certain sets of competencies, of-
ten referred to as soft skills or non-cognitive skills, as
important predictors of academic performance and
later success in life. Cultivating these types of com-
petencies or skills plays an important role in girls and
women’s empowerment and leadership. A common
definition of female empowerment looks both at cul-
tivating the “power within” (belief in self-work, self-
respect and self-acceptance), the “power to” (ability
to make choices and influence others), as well as the
“power over” and the “power with” Rowlands (1997).
Emerging hotspots: Bogs, traps, and ceilings in girls’ education
The education data points to relatively clear country
patterns with respect to gender equality. There are
clear girls’ education hotspots where progress must
continue to be made. For convenience, we use the
monikers of “bogs,” “traps,” and “ceilings” to refer to
three broad groups of countries; each group is a dif-
ferent type of hotspots. We defined these groups as:
• Bogs: Eighty countries where primary enrollment
rates may have increased but have not reached the
target levels of the MDGs, and gender gaps in enroll-
ment rates at the primary and secondary levels have
not narrowed sufficiently. In general, these countries
have stalled in reaching the MDGs for education.
• Traps: The countries where both primary and
secondary enrollment rates (and perhaps even
tertiary enrollment rates) have progressed well
and have generally reached the MDG targets, and
gender gaps in school enrollment have narrowed
sufficiently. However, these countries lag behind
in terms of learning outcomes, as measured by
their students’ average performance relative to the
average performance in international or regional
assessments. In varying degrees, these countries
have not made sufficient improvement in learning
outcomes and appear to be caught in a low-quality
education trap.
• Ceilings: Thirty countries that have reached the
highest levels of enrollment rates at all levels and
have achieved also relatively high levels of student
learning as measured by their average performance
on international assessments, but face gender in-
equality in the academic performance. We use a
simple measure of gender gap in performance: the
relative shares of girls to boys in the extreme com-
petency levels. The male dominance of adolescent
boys in math in international assessments means
that in many ways the glass ceiling begins in school.
Why girls are behind: What we know about gender equality in education
To examine why girls are behind in hotspots, we be-
gin with the girl and her family at the center, but also
trace gender differences to the norms, resources, and
constraints in the broader community and economy
that influence choices and outcomes. This framework
is well known and it ultimately allows us to see that
gender gaps in education reflect, in large part, gender
inequality in other aspects of society and the econ-
omy, and are also often instruments for perpetuating
that gender inequality. Some of the root causes of the
gender gap in education are:
• Schooling is more costly for girls. The direct costs
(e.g. school fees where they exist, uniforms, transpor-
tation) and opportunity costs (e.g. time could have
spent working or helping family) of school often im-
pact boys and girls differently. Many non-experimental
studies using household survey data find that girls’
schooling is more sensitive to cost, however defined,
than is boys’ schooling (see for example Glick and
Sahn, 2007). For example, in Kenya, higher school
fees increase dropout probabilities for girls but have
no effect on boys (Lloyd, Mensch, and Clark, 2000).
A study in Ethiopia finds that boys are less likely than
girls to combine work and schooling or to be engaged
in work only, and are more likely to be involved in lei-
sure activities only compared to girls, so the sum of
domestic and non-paid work for girls is higher for girls
(Woldehanna, Jones, and Tefera, 2008).

TODAY’S CHALLENGES FOR GIRLS’ EDUCATION xi
• Restricted space and expectations limit girls’
ability to reap the returns to education. Social
norms define the roles that women and men have
in the family and the community, the expectations
they have about their futures, their individual pref-
erences and the kind of relationships they form.
For example, in West Bengal, Beaman et al. (2011)
find that, in places where no woman had ever been
the local leader, 86 percent of parents wanted
their daughters to be either a housewife or what-
ever their in-laws would decide for her, compared
with less than 1 percent for their sons. Also, twice
as many parents reported that they wanted their
teenage sons to graduate from secondary school
or college as those who wished the same for their
daughters. In all, the degree of autonomy and em-
powerment that girls and women possess affects
how much they can expect to gain from schooling.
• Early marriage and teen pregnancy keep girls
out of school. Today, one in three girls in low- and
middle-income countries (excluding China) continue
to be married before the age of 18 and one in nine
girls are married before their 15th birthday. While
countries with the highest prevalence of child mar-
riage are concentrated in Western and sub-Saharan
Africa (e.g. in Niger 76 percent of girls marry before
age 18), due to population size, the largest number
of child brides reside in South Asia. Child marriage
imposes heavy costs for girls socially, physically, and
emotionally and undermines efforts to improve girls’
education. In rural Bangladesh, for example, each ad-
ditional year that marriage is delayed between ages
11 and 16 could add 0.22 year of schooling and 5.6
percent higher literacy (Field and Ambrus, 2008).
• Pervasive school-related violence harms millions
of girls and young women. The relationship of
school-related violence to educational participation
and academic performance is typically not exam-
ined in research on the determinants of schooling,
perhaps because of the absence of systematic infor-
mation on its prevalence. However, what data exist
paints a picture of extensive school-related violence
inflicted on girls. This violence ranges from extreme
acts such as kidnapping, bombing, maiming, and
killing—acts which often occur in contexts of armed
conflict, militancy, and political violence and in 15
countries around the world are directly targeted at
girls (e.g. Malala in Pakistan, Chibok girls in Nigeria).
But it also includes the often invisible but pervasive
practices of sexual abuse, exploitation, and bully-
ing. For example, one study finds that more than 30
percent of girls in southern Africa are raped in and
around school (Prinsloo, 2006).
What is working: Evidence on addressing girls’ education
Evidence from evaluations of programs and policies,
mostly in the developing world, that have been under-
taken to increase girls’ and women’s education point
to, among others, several important strategies.
• High-quality and gender-sensitive curricula and
learning materials. Textbook provision is almost
universally accepted as an important tool for teach-
ing and learning when the textbooks are used.
But thumbing through textbooks used in primary
schools in many countries around the world, one
gets an immediate sense of the traditional and ac-
cepted gender roles in those countries. Over the
past three decades, an increasing number of stud-
ies have been undertaken to examine the gender
content of textbooks: females tend to be greatly
underrepresented; males and females are associ-
ated with certain personal traits; they are depicted
in stereotyped ways in both occupational and do-
mestic spheres (Blumberg, 2007). The content of
textbooks has been slow to change, so they do not
reflect actual progress in women’s empowerment
and changing roles in society and the economy.
Ensuring gender equality is reflected in teaching
and learning materials and across the education
system “may represent the strongest source of
counter messages to traditional norms learned
in the family, community, and national media”
(Stromquist, 2007 as quoted in Blumberg 2007).
• Girl-friendly infrastructure. Programs that fo-
cus on improving infrastructure and school inputs

xii GLOBAL ECONOMY AND DEVELOPMENT PROGRAM
Table 1. Education and gender indicators: Bogs, traps and ceilings
EDUCATION INDICATORS
Gender indicators
Girls’ net primary and/or secondary enrollment rate are/
is below the global meansa
Girls’ net primary and/or secondary enrollment rates above the global meansa
Learning outcomes below average basic competency levelb
Learning outcomes at or above average basic competency
levelc Gender parity education not reachedd
BOGSAlbania, Antigua & Barbuda, Azerbaijan, Cameroon, Comoros, Dominican Republic, Ghana, Guatemala, India, Kenya, Malaysia, Morocco, Mozambique, Papua New Guinea, Palau, Timor-Leste, Zambia*
1SD below the enrollment mean: Afghanistan, Angola, Benin, Burkina Faso, Burundi, Cambodia, Central African Republic, Chad, Cote d’Ivoire, Democratic Republic of Congo*, Djibouti, Ethiopia, Guinea, Guinea-Bissau, Haiti*, Iraq, Lao PDR, Jamaica, Liberia, Malawi, Mali, Niger, Nigeria, Pakistan, Sierra Leone, Solomon Islands, South Sudan, Syrian Arab Republic, Togo, Uganda, Yemen
Gender parity in net enrollment ratese
Bermuda, Bhutan, Bolivia, Botswana, El Salvador, Honduras, Maldives, Marshall Is., Myanmar, Namibia, Nicaragua, Philippines, Paraguay, Sao Tome & Principe, Senegal, Suriname, Tanzania, Turks & Caicos, Tuvalu, Vanuatu, Venezuela*, Zimbabwe
1SD below the enrollment mean: Equatorial Guinea, Gambia, Guyana, Lesotho, Madagascar, Mauritania, Puerto Rico, Swaziland
Gender inequality in math achievementf
TRAPSAlgeria, Argentina, Bangladesh*, Brazil, Chile, Colombia, Costa Rica, Croatia, Ecuador, Greece, Grenada, Hungary, Iran, Italy, Kuwait, Lebanon, Luxembourg, Malta, Mexico, Mongolia, Peru, Rwanda*, Saudi Arabia, Serbia, Slovak Republic, South Africa, Spain, Sri Lanka*, Tunisia, Turkey, Uruguay,
[Boys’ deficitg: Bahrain, Egypt, Jordan, Oman, Palestinian NA, Qatar, Thailand]
CEILINGSAustralia, Austria, Belgium, Canada, Czech Republic, Denmark, Estonia, France, Germany, Hong Kong, Ireland, Japan, Korea, Liechtenstein, Netherlands, New Zealand, Portugal, Switzerland, United Kingdom, Vietnam
[Boys’ deficitg: Iceland]
No significant gender inequality in learning
Bulgaria, Cyprus, Georgia, Indonesia, Israel, Kazakhstan, Kyrgyz Republic, Lithuania, Macedonia, Mauritius, Moldova, Montenegro, Panama, Romania, Russian Federation, Sweden, Turkey, Trinidad & Tobago, United States, United Arab Emirates
China (Shanghai), Finland, Latvia, Macao (China), Norway, Poland, Singapore, Slovenia, Taipei (China), Ukraine

TODAY’S CHALLENGES FOR GIRLS’ EDUCATION xiii
Bogs: Includes countries (a) where girls’ primary and/or secondary net enrollment rates are below the global
means, whether or not their female/male ratio of enrollment rates is above or below the mean of that ratio; and
(b) where girls’ primary and secondary net enrollment rates are above the global mean but the female/male ratio
of enrollment rates falls below the mean of the ratio. The table also marks those countries that where the girls’
net enrollment rates are 1 SD below the mean.
Traps: Countries where (a) girls’ primary and secondary enrollment rates (and perhaps even tertiary enrollment
rates) are above the global means and the female-male ratio of enrollment rates is above the mean, but the av-
erage learning outcomes, as measured by the % of students performing at the low competency level is 40% or
more.
Ceilings: Countries where (a) girls’ primary and secondary enrollment rates (and even tertiary enrollment rates)
are above the global means, their female-male ratio of enrollment rates is above the mean, and they have
achieved relatively high levels of student learning as measured by their performance on international assess-
ments; however, the performance of girls relative to boys in math literacy is (statistically) significantly lower. For
countries that participated in the most recent PISA and TIMSS assessments, we used their analysis of gender
differences in math assessment (OECD, 2012; Mullis et al., 2012).
Missing data: Asterisks (*) indicate the countries that have missing gender-disaggregated net enrollment rates
or test scores for the period 2000-14. For countries that have data on net enrollment rates for both primary and
secondary levels, we used the data available to assign countries to their groups. For countries that have gender-
disaggregated data only for either primary or secondary education, we used the available data to assign the
countries to categories. Many countries do not have student assessment data, but those countries tend to have
low net enrollment rates that place them in the “bog” category.
Notes:
a Net enrollment rates of girls at the primary and/or secondary levels are below the global mean. UNESCO data for 2000-2014.
b Learning is below the average competency level in math as signified by PISA, TIMSS, PASEC, SACMEQ and LLECE assessments (latest years of data). When PISA or TIMSS data are available for a country, that country is used to benchmark the other countries in the same region that did not participate in either assessment.
c Learning is above the average competency level in math as signified by PISA, TIMSS, PASEC, SACMEQ and LLECE assessments (latest years of data). When PISA or TIMSS data are available for a country, that country is used to benchmark the other countries in the same region that did not participate in either assessment.
d Gender parity is not reached when the female-male ratio of enrollment rates is equal to or less than the global mean for the ratio.
e Gender parity is reached when the female-male ratio of enrollment rates is greater than the global mean for the ratio.
f Source: Organization for Economic Cooperation and Development (OECD), Program for International Student Assessment (PISA), 2012; Mullis, I., Martin, M.O., Foy, P. and Arora, A. 2012. TIMSS 2011 International Results in Mathematics. Chestnut Hill, MA: International Association for the Evaluation of Educational Achievement (IEA)
g In a few countries, the gender inequality in math achievement is significantly to the disadvantage of boys. The data sources are PISA and TIMSS.

xiv GLOBAL ECONOMY AND DEVELOPMENT PROGRAM
should be designed with incentives for girls in mind
to ensure that they improve girls’ education out-
comes. In Burkina Faso, a government program,
the Burkinabé Response to Improve Girls’ Chances
to Succeed (BRIGHT) program, which placed well-
resourced schools in 132 villages, is an example of
such a program. The package of interventions in-
cluded, among other things, school construction,
teaching and learning inputs, teacher support and
housing, gender sensitivity training for officials,
incentives to children to attend school, and a mech-
anism for mobilizing community support for educa-
tion in general and for girls’ education in particular.
The program results are promising. Enrollment of
all children rose by 19 percentage points and scores
improved by 0.41 standard deviations on a test that
covered math and French subjects (Kazianga et al.,
2012). The program increased girls’ enrollment by 5
percentage points more than boys’ enrollment, but
boys’ and girls’ test scores increased by the same
amount. “Girl friendly” amenities were found to be
especially impactful in doing this.
• Great teachers. A focus on the role of teachers
in addressing gender disparities is well-deserved.
There is strong evidence of the positive relation-
ship between teachers’ education, experience, and
cognitive skills and their students’ academic per-
formance. Six recent reviews of hundreds of impact
evaluations of education interventions find that
programs that train, support, and motivate teachers
are among the most effective. For example, in the
United States, having a good teacher is equivalent
to the average gain in learning of one school year;
having a great teacher means advancing 1.5 grade
levels or more. Great teachers are important for
girls and boys equally. While there are some argu-
ments for the importance of female teachers, this
is most salient in contexts where social norms pre-
clude girls learning in classrooms with male teach-
ers. Generally, what appears most important is for
male or female teachers to use gender-sensitive
pedagogy.
• Cost-reducing mechanisms. Demand side inter-
ventions, which reduce the costs of schooling, tend
to have the clearest gender-differentiated results
on enrollment (Glewwe, 2002). Conditional cash
transfer programs (CCTs) that offset a family’s op-
portunity cost of sending girls and boys to school
have been shown to increase enrollment, although
only half of available studies of the educational im-
pacts of CCTs actually report results by gender. Who
receives the transfer for the family, not just the size
of the transfer, also appears to make a difference
in CCT programs. One study of a CCT program in
Nicaragua shows that impacts of CCTs are higher
when the woman holds more power in the house-
hold (Gitter and Barham, 2008). Scholarship pro-
grams can reduce the direct costs of schooling but
the design of the program is essential to get right
if scholarships schemes are going to be effective.
Perhaps the best known scholarship scheme is the
Bangladesh Female Secondary Stipend Program,
which dates back to 1982 and to which researchers
attribute the country’s impressive increase in girls’
education. To continue to receive the stipend, each
girl must maintain a minimum 75 percent atten-
dance rate, at least a 45 percent score in the annual
school exams, and must remain unmarried until she
obtains the Secondary School Certificate (SSC) or
reaches age 18 (Raynor and Wesson, 2006).
• Safety in schools and freedom from violence.
On the factors that might explain school violence,
a study of 37 countries found that while national
rates of general crimes are not good predictors of
system-wide levels of school, factors inherent in the
education system—such as large variation in school
quality and in student achievement—are more pow-
erful predictors of school violence. Akiba et al. ar-
gue that equalizing the quality of education that
all students receive might be a national policy in-
tervention that can reduce school-related violence
(2002). Providing girls a safe means for getting to
school can also increase enrollment. For example,
an innovative program state of Bihar (and neighbor-
ing states) in India aimed to reduce the gender gap
in secondary school enrollment by providing girls
who continued to secondary school with a bicycle.
This bicycle program, launched in 2006, increased

TODAY’S CHALLENGES FOR GIRLS’ EDUCATION xv
girls’ age-appropriate enrollment in secondary
school by 30 percent and reduced the gender gap in
age-appropriate secondary school enrollment by 40
percent (Muralidharan and Prakash, 2013).
• Girls’ and women’s capabilities for leadership and
ability to make choices. A recent review of litera-
ture on girls’ and women’s leadership found several
elements to be especially useful. First, girls and
women need diverse skills to be leaders and culti-
vating the soft skills is important for their long-term
leadership capabilities. Mentorships, networks, ex-
periential learning opportunities, smart deployment
of technology, and support from boys and men are
all ways that can be helpful in building girls’ and
women’s leadership skills and capabilities (O’Neil,
Plank and Domingo, 2015). These capabilities and
leadership experiences contribute to an expanded
ability to make choices and an expanded vision for
their future. Engaging adolescent girls in leadership
activities is an important way of laying the founda-
tions for future leaderships. Studies have found that
one of the characteristics of women leaders today
is that they usually started early, with educational
and leadership activities as girls (O’Neil, Plank and
Domingo, 2015).
What should we do: Taking action on girls’ education
Taking action on girls’ education should not be con-
fined to the halls of government offices or multilateral
institutions. Civil society networks, business leaders,
media organizations, academia, social enterprises,
philanthropic communities, and individual global
champions all have a role to play. With this in mind,
we are recommending two focused streams of action.
• Recommendation 1: Lean in with girls and women’s
leadership. Our first recommendation proposes spe-
cific initiatives that are well positioned for engaging
diverse actors, including: women’s groups, tech-
nology companies, media partners, transparency
and education NGOs, and government education
planning departments. These initiatives are envi-
sioned as catalytic “quick wins” that, if given suffi-
cient financial and political support, could be scaled
up within a short time period. They also represent
an attempt to explore relatively new approaches to
tackling the decades-long girls’ education problem.
They are also recommended with the notion that
while not directly confronting violence and early
marriage, they will certainly help empower girls to
push back against these forces. It is our assessment
that all countries could benefit from leaning in on
girls and women’s leadership, as it is fundamental
to sustainable social change not only for girls’ edu-
cational opportunities but for gender equality more
broadly. The two initiatives we recommend are:
º Recommendation 1.1: Build strong girl leaders.
We propose a girls’ leadership initiative that si-
multaneously provides opportunities for girls to
develop the soft skills so crucial for their success
as well as provides roles models and networks
that help shift social perceptions and norms
around girls’ education and gender equality. We
propose a mentorship model be used with either
teachers or recent secondary school girl gradu-
ates and that the initiative be scaled up with di-
verse partners starting in countries where girls’
education is the most behind.
º Recommendation 1.2: Girl-generated data. We
propose a girl-generated big data initiative, which
would combine the power of “factivists and femi-
nists” (Drummond, 2015). Girl-generated data
has the potential to radically change the power
dynamics, with girls themselves generating
regular information about their circumstances,
needs, and achievements that is translated into
digestible and timely insight for policymakers,
civil society actors, community leaders, and edu-
cators. Transparency and accountability take on
whole new meanings in this light and ultimately
puts the girls at the center of the process. A girl-
generated big data initiative also can go a long
way in helping fill the data gap on girls’ educa-
tion, both on basic education data that we have
seen is often missing in many countries, but also
xvi GLOBAL ECONOMY AND DEVELOPMENT PROGRAM
more importantly on sensitive issues such as
school-related gender-based violence and child
marriage. We propose a model where technology
firms would partner with civil society and gov-
ernments to collect, analyze, and disseminate
this girl-generated data to those actors who can
make the changes needed to improve girls’ lives.
• Recommendation 2: Focus on systemic reform with
a gender lens. Ultimately, the best approach for
helping girls get educated is to ensure governments
have strong education systems, ones that enable all
children to access good schools and quality learn-
ing opportunities. Good schools must be in places
where girls and boys alike are given the opportu-
nity to thrive and grow. Developing an education
system where good schools are a reality, including
for marginalized girls, necessitates systemic reform
in many of the countries where girls are behind. In
support of systemic reform we propose:
º Recommendation 2.1: Design for education
hotspots. We recommend that international do-
nors and multilateral institutions focus increased
attention on hotspot countries, in particular in
countries stuck in an education bog where girls’
education progress has stalled. This includes
both ensuring aid dollars flow to those countries
and that the dollars go toward shoring up basic
education and gender equality, including in hu-
manitarian contexts. Governments must also do
their part and employ strategies for including
girls in education progress. This could include
defraying costs, supporting great teachers,
or improving teaching and learning materials.
Teacher organizations also have a role to play.
Global capacity can be deployed to help the pro-
fessional development of teachers across coun-
tries where girls are farthest behind.
º Recommendation 2.2: Focus with a gender
lens. Countries themselves, and their regional
and global partners, must ensure they under-
take systemic reforms with a gender lens. This
means all decisions around things such as policy,
budgets, hiring, and monitoring must be evalu-
ated with the understanding of their differential
impacts on girls versus boys. Gender analysis
tools should be systematically used in the de-
velopment of education sector plans. Applying a
gender lens to the process of sector plan devel-
opment—including sector analysis, plan prepara-
tion, and plan appraisal—can ensure that that the
key tools for national education system reform
and associated policies and strategies promote
effective actions that advance gender equality.
While made separately and with distinct purposes in
mind, these two recommendations are also mutually
reinforcing. Improved girls’ and women’s leadership,
and boosting the availability of relevant data gener-
ated, can provide an important feedback loop for gov-
ernments either for planning or monitoring purposes.
Likewise, government reforms can open up space
for girls’ and women’s leadership, serving to both
help such leadership flourish and reap its outcomes
in terms of improved girls’ education opportunities.
Ultimately, we hope that these two recommenda-
tions, and the specific initiatives made within each,
are translated into action and together with the wide
range of other strategies actors are pursuing can
make a difference to girls, their learning opportuni-
ties, and ultimately their ability to be successful in
their lives and livelihoods.

TODAY’S CHALLENGES FOR GIRLS’ EDUCATION 1
TODAY’S CHALLENGES FOR GIRLS’ EDUCATION
Elizabeth M. King and Rebecca Winthrop
Education for All (EFA) Dakar Goals (2000), Goal 5:
Eliminate gender disparities in primary and second-
ary education by 2005, and achieve gender equality in
education by 2015, with a focus on ensuring girls’ full
and equal access to and achievement in basic educa-
tion of good quality.
Millennium Development Goal (MDG) 3, Target 4:
Eliminate gender disparity in primary and secondary
education, preferably by 2005, and in all levels of edu-
cation no later than 2015.
I. WHY WE CARE: SEVEN MAIN BENEFITS OF GIRLS’ EDUCATION TO SOCIETY
Education is central to a person’s ability to respond
to opportunities and challenges that one encoun-
ters in life. By equipping young people with a set of
competencies and skills, behaviors and attitudes, and
a sense of cooperation and social responsibility that
enable them to participate in society as productive
workers and responsible citizens, education con-
tributes to economic development, lowers poverty
and inequity, and improves lives. Education yields its
greatest benefits in societies undergoing rapid tech-
nological, economic, and political changes. It also has
the potential to benefit most the people and commu-
nities who have the least in terms of other resources.
And it benefits society in other ways too—in terms
of better health, enhanced ability to cope with eco-
nomic and environmental shocks, and greater social
cohesion, among others. Given these benefits, it’s not
surprising that individuals, families, and governments
alike have been investing increasingly in education.
The central importance of education for human de-
velopment is one of the reasons why governments
around the world have committed to ensuring its
delivery to children. In 1948 with the Universal
Declaration of Human Rights and the subsequent
convention on economic, social, and cultural rights,
including the 1989 Convention on the Rights of the
Child, the world’s governments agreed that all chil-
dren, both boys and girls, should have access to free
education at the elementary levels that is devoted to
the full development of the human personality (United
Nations General Assembly, 1948). While this commit-
ment clearly acknowledges the value of education for
young people themselves first and foremost, in addi-
tion to the benefits their education brings to society,
there remains much work to fulfill this commitment.
2 GLOBAL ECONOMY AND DEVELOPMENT PROGRAM
Indeed, education systems around the world are still
facing the challenges of providing basic education to
hard-to-reach or disadvantaged groups, expanding
post-primary education to meet the demand for em-
ployable skills and global citizenship competence, and
ensuring learning at all levels. Too many young people
are leaving school and entering the workforce without
the relevant knowledge or competencies needed in
today’s economy. In a number of countries we identify
as education hotspots, where the education system
needs the greatest attention and support, the quan-
tity and quality of education have stagnated and girls’
schooling, in particular, lags far behind that of boys.
Because of their gender gaps, these countries do not
fully reap the benefits from investing in education.
1. More educated girls and women aspire to become
leaders and thus expand a country’s leadership
and entrepreneurial talent. One of the pernicious
features of gender inequality is that it feeds on it-
self: parents may have lower aspirations for their
daughters than for their sons, and so their daugh-
ters too have lower aspirations for themselves. Yet,
given the chance to be a policymaker or entrepre-
neur, with more education, women have the skills
and confidence to be able to influence their coun-
try’s legislative agenda and entrepreneurial suc-
cess. Gender quotas for the election of legislators
have been used since the late 1970s in a few coun-
tries such as Germany and Norway, but the list now
includes Argentina, India, Nepal, Rwanda, South
Africa, and many more. Indeed, the representation
of women in national parliaments has increased
to over 21 percent as of the end of 2013, and there
has also been an increase in the number of women
in other government levels (IPU, 2015). Political
action, legislation, and women’s greater visibility
in the labor market and higher education levels
have brought this progress about. But has women’s
greater political representation made a difference
for them and their constituencies? Many cases in-
dicate that it has. For example, in India where there
has been a political reservation policy for women in
rural councils, these councils are investing more in
the development priorities expressed by women.1 In
the state of West Bengal, where women complained
more often than men about water and roads, re-
served councils invested more in water and roads;
in Rajasthan, where women complained more often
about drinking water but less about roads, reserved
councils invested more in water and less in roads. In
Rwanda, women have the majority in parliament af-
ter the genocide. Although important gender gaps
remain, women in the Rwandan parliament have
influenced major reforms in banking and property
laws (Abbott, 2008). In entrepreneurial activities,
education also gives women easier access to credit
and business training opportunities, and greater
confidence in negotiating the bureaucracies of
government. In Nepal, women who have small busi-
nesses express frustration at not being adequately
prepared for the business world and not having ac-
cess to relevant business management and techni-
cal training (Bushell, 2008).
2. It is the quality of schooling that really counts;
economic growth is faster when girls (and boys)
learn. Empirical research finds that more gender
equality in education is correlated with higher
economic growth.2 In addition, research concludes
that years of schooling is not an adequate mea-
sure of educational progress, in part because an
additional year of schooling in one country does
not mean the same for another country in terms
of human capital formation.3 Instead, it is the qual-
ity of schooling across countries (albeit measured
simply by average student test scores) that is
more strongly associated with economic growth—
and also with sustained increase in demand for
schooling (Pritchett, 2013).4 Without learning and
without substantial improvements in the skills of
students, more years of schooling will not translate
into higher productivity or real advances in the
lives of young people. To illustrate, Hanushek and
Woessmann (2008) find that an increase of one
standard-deviation in average reading and math
scores (roughly equivalent to improving a country’s
ranking from the median to the top 15 percent in

TODAY’S CHALLENGES FOR GIRLS’ EDUCATION 3
international student assessments) is associated
with a substantial two percentage-point increase in
annual GDP per capita growth, even holding con-
stant the average years of schooling. In addition,
how well the performance of students in reading
and math translates into problem-solving skills later
in life is key to changing the skills profile in the pop-
ulation. Analyzing PIAAC data on 22 countries to
estimate earnings functions, Hanushek et al. (2013)
find that education quality, as measured by perfor-
mance on cognitive skills, also raises adult earnings:
“Across the 22 countries, a one-standard deviation
increase in numeracy skills is associated with an
average 18 percent wage increase among prime age
workers. Moreover, because of measurement errors
in skills, these estimates should be thought of as
lower bounds on the return to skill” (p. 15).
3. More equal education means greater economic
empowerment for women through more equal
work opportunities for women and men. Unequal
access to economic resources weakens women’s abil-
ities to participate fully in society and the economy
and to improve their life prospects. Education opens
doors of opportunities for young women, especially
when they cannot count on family wealth, property,
or business connections. Women with more years
of schooling are more likely to find employment,
own and operate productive farms or firms, and
earn higher wages. Across high- and lower-income
countries, gender differences in education explain
a significant fraction of the variation in productivity,
wages and incomes between men and women (World
Bank, 2011). Several reviews of the labor market re-
turns to schooling for men and women in developing
countries have found generally larger private returns
to schooling for women than for men.5 Despite the
lower average wages for women overall, controlling
for education and family background, those women
who have more education have higher earnings than
those with fewer years of schooling. Even in rural
economies, education makes a difference in produc-
tivity. In Kenya, for example, more education (and
more inputs) for female farmers, relative to male
farmers, increases farm yields by as much as 22 per-
cent (Quisumbing, 1996). There are several pathways
for these increases in productivity and earnings. The
simplest answer is that knowledge and experience
beget more learning, giving girls and women greater
confidence to learn new production technologies,
and to decipher and handle relationship challenges
in the workplace.
4. More educated girls and young women are
healthier—and as adults they have healthier chil-
dren. The global decline in child mortality has been
traced to increases in mothers’ schooling, even
after controlling for household income. Gakidou
et al. (2010) estimate that, of the 8.2 million fewer
deaths of children aged 5 years and below around
the world between 1970 and 2009, one-half can be
attributed to the global increase in the schooling of
women of reproductive age. A child whose mother
can read is 50 percent more likely to live past age
five. In part, this is because education increases
knowledge about the benefits of vaccination and ef-
fective strategies for coping with inadequate public
health services, and thus help reduce the spread
of infectious diseases (Desai and Alva, 1998). In all
regions, but especially in the low-income countries
of South Asia and sub-Saharan Africa, the percent-
age of children who are immunized is larger when
mothers have some secondary education than
when mothers have only some primary schooling,
and much larger when mothers have no schooling.
A mother’s presence is so important for children’s
welfare that, in Tanzania, losing one’s mother has a
permanent adverse impact on a child’s final height
and one year of completed schooling (Beegle, de
Weerdt, and Dercon, 2010). Among adults, educa-
tion facilitates better decision-making in many as-
pects of life—about where one lives and works; how
to access and process health-related information;
how to choose appropriate medical care; and how
generally to promote good health through nutri-
tion and avoidance of risky behaviors (Wolfe and
Zuvekas, 1995). Brunello et al. (2011) find that, in
12 European countries, one additional year of edu-
cation reduces self-reported poor health decades
later by 7.1 percent for adult women and 3.1 percent

4 GLOBAL ECONOMY AND DEVELOPMENT PROGRAM
for men, with improved health behaviors (regarding
smoking, drinking, and exercising) contributing 23-
45 percent of this total effect, depending on gender.
5. More educated mothers have more educated chil-
dren, especially daughters. Numerous empirical
studies have shown that mother’s education is criti-
cal for investments in the human capital of the next
generation. In Malaysia, for example, while both the
mother’s and the father’s education have signifi-
cant positive effects on their children’s school en-
rollment, the mother’s education has a far greater
effect than father’s education on daughters’ edu-
cation, while the mother’s and father’s education
have about equal, although lower, impact on sons’
education (Lillard and Willis, 1994; King, Anderson
and Wang, 2013). Similarly, in Guinea and Pakistan,
a mother’s education has a significant and larger
impact only on daughters’ schooling, suggesting
differences in maternal and paternal preferences
for schooling daughters relative to sons (Glick and
Sahn, 2000; Holmes, 2003).6 One of the ways that
mother’s education benefits their children’s school-
ing is by being able to help with their studies at
home. In India, children of more literate mothers
study nearly two hours more a day than children of
illiterate mothers in similar households (Behrman
et al., 1999).
6. More educated women are better able to protect
themselves and their families from the effects of
economic and environmental shocks. Economic
crises, environmental or natural shocks, and unex-
pected illness or death in the family can have cata-
strophic outcomes for individuals and their families.
Even when shocks do not have differential gender
impacts, the absolute welfare losses for both men
(and boys) and women (and girls) can be substantial.
More educated mothers are able to protect their
children’s welfare through a higher quality of care
and their greater ability to mitigate adverse shocks,
such as food price changes, that might reduce food
intake. Research also indicates that countries where
women have higher education are better able to
protect their economic productivity from the ad-
verse effects of environmental shocks (Blankespoor
et al., 2010).
7. Education is valuable for girls in and of itself.
Education has an intrinsic value that allows for per-
sonal growth, self-fulfillment, and empowerment. In
the words of Urvashi Sahni (2015), an Indian girls’
education activist, “even without all of the ‘develop-
mental and economic goodies’ that come from girls
education, we should care about educating girls be-
cause it is inherently valuable to them and is their
right.” When states uphold one’s right to education
through the provision of basic education, a symbolic
message is relayed: States deliver on basic human
rights and their citizens live in a context that values
what education has to offer to individuals and the
society as a whole. Where social norms and poverty
limit the opportunities a young girl may have to re-
alize her full potential, a quality education can help
inform and empower her to make good life choices
(UNESCO, 2014). With a better understanding of
their rights and greater awareness of their options,
girls’ daily lives have a greater chance of being im-
proved. The 2013/14 EFA Global Monitoring Report
finds that, in countries where arranged marriage is
common, girls with “at least a secondary education
are 30 percentage points more likely to have a say
over their choice of spouse than women with no
education in India and 15 percentage points more
likely in Pakistan” (182). Murphy-Graham (2010)
highlights how the non-cognitive skills acquired
through an education program for adolescents in
rural Honduras can equip women with the gender
consciousness, communication, and negotiation
skills to strengthen relationships in their domestic
household.

TODAY’S CHALLENGES FOR GIRLS’ EDUCATION 5
II. PROGRESS WE CAN BUILD ON
Globally, the overall trend in familiar indicators
about enrollment and completion rates over the
past 25 years point toward solid progress. These quan-
titative indicators reflect another type of progress
that is worthy of celebration and one we can build
on—the emergence and consolidation of political and
programmatic support for gender equality in educa-
tion by civil society, national governments, and inter-
national development organizations.
Building on aggregate education expansion around the world
Education levels have risen in most countries around
the world, responding to rising demand for more
skilled labor in the workplace in many countries and
to the greater availability of schools and classrooms
financed by successive generations of parents, com-
munities, and governments. The past two generations
have seen a narrowing of inequality across countries
and, within countries, between and within genders. In
1950, the (population-weighted) average completed
years of schooling of individuals aged 25 and over was
6.1 years in advanced countries and only 1.4 years in
developing countries; 60 years later, average school-
ing levels had risen to 11.1 years in advanced econo-
mies7 and 6.9
years in devel-
oping coun-
tries. During
the same pe-
riod, the ratio
of women’s to men’s schooling improved from 0.92
to 0.97 in advanced economies, and in developing
regions we see substantial convergence—among the
regions with the largest gender gaps in 1950, from
0.47 to 0.65 in South Asia, 0.58 to 0.78 in sub-Saha-
ran Africa, 0.48 to 0.89 in the Middle East, and 0.48
to 0.92 in East Asia. These improvements have been
the result of large advances in the enrollment rates
of girls at the primary and secondary levels. Current
enrollment rates for children and years of school-
ing completed for adults still show gender gaps, but
overall, women in developing countries have gained
relative to men with respect to education. Regional
and income-group averages still mask a large varia-
tion among countries, however, and we turn to avail-
able analyses of country evidence in the next section.
Moreover, we have to keep in mind that enrollment
rates and average years of schooling are measures
only of the quantity of education. In the next section
we also include a discussion of learning outcomes.
Building on civil society and political momentum
Increases in global education numbers have been
helped by a growing momentum around the globe
around the importance and social and economic ben-
efits of educating girls. In 1990, girls’ education was
clearly holding back educational progress in a broad
cross-section of countries, and most education minis-
ters in the developing world and international leaders
recognized its importance as a global priority when
they established the six Education for All goals. Since
then girls’ education as a development priority has
been identified by a broad set of actors (figure 2).
Girls themselves, their parents, teachers, and com-
munities have for decades worked to advance their
education. Researchers have long studied girls’ and
boys’ schooling and their different experiences of
education. However, in the last quarter century, grass-
roots-level action has been promoted and amplified
into national policy debates, donor strategies, media
campaigns, multilateral action, and initiatives of in-
creasingly high-profile global advocates.
Women in developing countries have gained relative to men with respect to education.

6 GLOBAL ECONOMY AND DEVELOPMENT PROGRAM
Average total years of schooling by global region:Female population, age 25+ overtime
Ave
rag
e t
ota
l yea
rs o
f sc
ho
olin
g12
10
8
6
4
2
0
Advanced Economies
East Asia andthe Pacific
Europe andCentral Asia
Latin America andthe Caribbean
Middle East andNorth Africa
South Asia
Sub-SaharanAfrica
1950 1955 1965 1970 1975 1980 1985 1990 1995 2000 2005 20101960
YEAR
Average total years of schooling by global region:Male population, age 25+ overtime
Ave
rag
e t
ota
l yea
rs o
f sc
ho
olin
g
12
10
8
6
4
2
0
Advanced Economies
East Asia andthe Pacific
Europe andCentral Asia
Latin America andthe Caribbean
Middle East andNorth Africa
South Asia
Sub-SaharanAfrica
1950 1955 1965 1970 1975 1980 1985 1990 1995 2000 2005 20101960
YEAR
Figure 1. Trend in average years of schooling, 1950-2010
Educational attainment for female population, 1950-2010Avg. years of total schoolingAge Group 25+Source: Barro R. & J.W. Lee – v. 2.0, 06/14
Educational attainment for male population, 1950-2010Avg. years of total schoolingAge Group 25+Source: Barro R. & J.W. Lee – v. 2.0, 06/14

TODAY’S CHALLENGES FOR GIRLS’ EDUCATION 7
Average total years of schooling by global region:Female to male ratio, age 25+ overtime
F/M
rat
io o
f ye
ars
of
sch
oo
ling
(1.
0 =
ge
nd
er
eq
ual
ity)
1.2
1
0.8
0.6
0.4
0.2
0
Advanced Economies
East Asia andthe Pacific
Europe andCentral Asia
Latin America andthe Caribbean
Middle East andNorth Africa
South Asia
Sub-SaharanAfrica
1950 1955 1965 1970 1975 1980 1985 1990 1995 2000 2005 20101960
YEAR
Figure 1. Trend in average years of schooling, 1950-2010 (continued)
Source: Barro R. & J.W. Lee – v. 2.0, 06/14
Source: Ackerman, X. 2015. Innovation and Action in Funding Girls’ Education. Global Economy & Development: Working Paper 84. Washington, D.C: Brookings Institution.
1990s 2000 2013201220112010200920082007200620052004200320022001 2014
Economic researchMicrofinance research
Gender mainstreaming
(Beijing Conference)(1995)
EFA & MDGsINCREASED CORPORATE ENGAGEMENT
MEDIA AND SOCIAL MEDIA
AED Center on Gender Equity
CUEGrowing Up
Global
Keeping the Promise
Grameen BankNobel Prize
RESEARCH AND ADVOCACY
Inexcusable Absence
BecauseI’m a Girl
EchidnaScholars
Girl Effect
Girls Count
New Lessons
UN Women
Girl Up
Women’sEmpowerment
Principles
Day ofthe Girl
GBC-Education
GPE 2012-2015Strategy, SO2
Malala atUNGA
Chimefor Change
Girl Rising
SPRINGAccelerator
UN Women-He for She
AAMGlobalGirls
Girls’CHARGEUNGEI
Figure 2. Timeline of research, advocacy, and media milestones for girls’ educationn

8 GLOBAL ECONOMY AND DEVELOPMENT PROGRAM
Commentators and scholars on girls’ education have
noted the emergence of girls’ education from a tech-
nical field within international development to a global
movement (Ackerman, 2015). Noted examples include
the establishment in 1992 by five female African min-
isters of education of the Forum of African Women
Educationalists (FAWE). Today, FAWE is a pan-African
organization working closely with the association
of African ministers of education to advance policy
and practice on girls’ education issues in Africa. In
2000, the United Nations increased its focus on girls’
education through the establishment of the U.N. Girls
Education Network (UNGEI), a network of organiza-
tions focused on actions to close the gender gap in
primary and secondary school. Today, UNGEI deploys
diverse strategies for advancing girls’ education, in-
cluding providing technical tools and advocacy for
national education plans to be developed using a gen-
der lens.
In the last 10 years, the girls’ education movement
has taken on new momentum with growing global
advocacy efforts. These include Plan International’s
Because I am a Girl campaign (2007), the Nike
Foundations’ Girl Effect (2008), and the Documentary
Group’s Girl Rising (2013) to name a few. The United
Kingdom’s David Cameron has identified girls’ edu-
cation as a top priority for its overseas development
assistance and in 2012 launched a significant program
of investment titled the Girls Education Challenge
fund, with the aim of investing 300 million pounds
and reaching 1 million girls. Global figures are also
increasingly speaking out, including Graca Machel
and Archbishop Desmond Tutu and other members
of the Elders who have taken up the issue of child
marriage, in partnership with the civil society move-
ment Girls Not Brides. Former U.S. Secretary of State
Hillary Clinton and former Australian Prime Minister
Julia Gillard jointly launched in 2014 Collaborative
for Harnessing Ambition and Resources for Girls’
Education (CHARGE), a girls’ education collaborative
of over 40 organizations focused on “second-genera-
tion” issues with a shared commitment of reaching 15
million girls. In 2015, U.S. First Lady Michelle Obama
launched Let Girls Learn, an initiative focused on sup-
porting developing country grass roots leadership in
girls’ education. Finally, the joint Nobel Peace Prize
award to Kailash Satyarthi and Malala Yousafzai for
their work on children’s rights, in particular girls’ right
to get an education, has put the global spotlight on
the issue in a way never yet seen.
The high-level attention and advocacy have helped
increase attention, resources, and ultimately on the
ground action around girls’ education. Indeed, today
girls’ education can celebrate its success by no longer
being a topic of concern across most countries but
rather being an issue for a subset of “hotspot” coun-
tries. Indeed, in many regions such as Latin America
and the Caribbean, it is now boys who are falling be-
hind. This attention and progress in girls’ education is
a useful platform to build on and provides an impor-
tant set of insights and tools with which the remaining
girls’ education challenges in hotspot countries can
be addressed.

TODAY’S CHALLENGES FOR GIRLS’ EDUCATION 9
III. WHAT WE FACE TODAY: GIRLS’ EDUCATION HOTSPOTS
The global convergence in average years of school-
ing between 1950 and 2010 described above,
especially between men and women, marks a notable
shift toward greater gender equality in education, an
observation made also with respect to changes in
Millennium Development Goal 3. Nonetheless, a closer
and more disaggregated look at several education
indicators shows some big challenges. Persistent gen-
der gaps in education in a number of countries and in
parts of several countries lead to several questions:
What are the sources of these gaps? Can they be re-
duced by economic growth, government policy, social
mobilization, or international pressure? If so, what
are the best ways to do so? Who should be involved in
making this progress? This section examines a broad
set of education indicators that reveal the fuller con-
tours of gender inequality in education, and identifies
where these are large and remarkably persistent. In
later sections, we present a framework for under-
standing the roots of gender inequality, together with
a brief survey of a rich body of evidence about this
framework. We review a variety of policy and program
interventions that have proved to be effective in ad-
dressing gender gaps, and then put forward a strategy
for pushing progress toward greater equality.
Assessing gender equality: gender gaps in the quantity and quality of education
To reveal fully the contours of gender gaps in educa-
tion, we examine a broad set of education indicators,
including the familiar indicators of net enrollment
rates and gender parity in enrollment rates as well as
gender differences in learning indicators. In this sec-
tion, we identify types of “education hotspots” that
affect different countries, including those that seem
veritably stuck in a low education level for girls. While
there has been significant progress in girls’ education
over the past two decades especially, in many cases
at a faster pace than boys’ education, progress has
stalled in a number of countries. In these countries,
girls are being left behind because of the persistent
dampening effect of barriers such as poverty, conflict,
and violence, poor service delivery, social and religious
norms, and limited opportunities for women to reap
the economic dividends of education. We also recog-
nize the continuing challenges in those countries that
have achieved much higher average levels of educa-
tion for girls (and boys), but where gender challenges
in education remain for minority or disadvantaged
groups, including low-quality education. While these
two concerns are not, in themselves, gender-specific,
research evidence suggests that they most affect girls’
education. We note too that even in countries that
seem to have done it all, girls and young women en-
counter “glass ceilings” in education that reflect “glass
ceilings” in the workplace and society as a whole.
In this section, we revisit the trends and gender differ-
ences in familiar quantitative indicators of educational
progress across world regions and countries—net en-
rollment rates at all education levels, persistence
rates at the primary level, and average completed
years of education—and in results from a number of
student assessments. More time-series country data
on student learning have made it possible to highlight
progress, or lack thereof. However, even to this day,
basic gender-disaggregated education data are not
available for all developing countries, especially some
of the poorest countries (e.g., Haiti, Sierra Leone,
Somalia), and in many countries that do have data, it
is not possible to examine trends from the past two
decades because data are either too old or not avail-
able for more than one year (e.g., Afghanistan, Gabon,
Libya). By delving into selected household survey data,

10 GLOBAL ECONOMY AND DEVELOPMENT PROGRAM
we are able to illustrate the layers of disadvantage that
girls from minority groups or in rural areas face. Finally,
we translate student test scores from international and
regional assessments into gender ratios to examine
gender patterns in math and reading comprehension
competencies without having to tackle the issue of
comparability across the different student assess-
ments. To our knowledge, this type of cross-country
comparison has not been previously undertaken.
The largest gender gaps in enrollment are in the poorest countries• Averaging across all countries for which gender-
specific enrollment data are available, the net en-
rollment rates of girls is only 1.1 percentage points
below that of boys at the primary level as well as at
the secondary level. However, when we group coun-
tries according to income levels, larger gender gaps
are revealed. Gender gaps narrow considerably at
higher income levels. Average net enrollment rates
over the period 2010-14 (or the latest year of data,
either 2005-09 or 2000-04)8 indicate that girls
face the greatest disadvantage in the lower-income
group of countries, especially in the least developed
economies and highly indebted countries. In highly
indebted poor countries, the average net enroll-
ment rate at the primary level is 75.6 percent for
girls compared with 80.9 percent for boys. The av-
erage girls’ net enrollment rate in these countries
is more than 5 percentage points lower than the
average for low-income countries, more than 16
percentage points lower than the average for mid-
dle-income countries, and more than 20 percent-
age points lower than the average for high-income
countries. At the secondary level, the deficits for
girls in the heavily indebted countries are much
larger, as table 3 indicates. To illustrate, the average
girls’ net enrollment rate is 25.9 percent, as com-
pared with 63.6 percent in middle-income countries
and 90.0 percent in high-income countries.
• Translating these enrollment rates as a proportion
of the net enrollment rates for boys in each country
income group, in the poorest countries the female-
male ratio is .93 at the primary level and .78 at the
secondary level. In middle-income countries, these
ratios are .99 and .96, respectively, and in high-
income countries, the ratios are equal to 1.
Countries in Africa, Middle East, and South Asia are home to the widest gender gaps in enrollment• By geographical region, girls face the largest educa-
tion gap in the developing countries in the Middle
East, South Asia, and Africa. In South Asia as a whole,
there is no gender gap at the primary level, reflecting
progress in basic education toward gender equality,
but in secondary education the average girls’ enroll-
ment is only 44.7 percent, equivalent to 86.5 percent
of boys’ net enrollment rate. In the Africa region, the
average girls’ enrollment rate is only 74.8 percent at
the primary level and only 29.8 percent at the sec-
ondary level, far lower rates than in other regions.
We note that in the Middle East, it is the Arab coun-
tries on average that have lower enrollment rates for
both boys and girls. In those countries, the average
girls’ net en-
rollment rates
are .95 and .92
of the boys’
rates at the
primary and
s e c o n d a r y
levels, respec-
tively.
• The income group and regional averages mask far
larger gender gaps in several countries. Net enroll-
ment rates vary widely across countries at both
primary and secondary levels. The primary net
enrollment rates in 171 countries for girls range
from a high of 99.7 percent (Germany, Spain, and
the United Kingdom, with several other advanced
economies coming very close) to a low of 39.5
percent (Liberia). The highest net enrollment rates
at the secondary level for girls in 156 countries range
from 99.2 percent (Greece, Ireland) to a low of just
By geographical region, girls face the largest education gap in the developing countries in the Middle East, South Asia, and Africa.

TODAY’S CHALLENGES FOR GIRLS’ EDUCATION 11
8.5 percent (Guinea Bissau, with Chad being a close
second at 9 percent). Focusing on deficits for girls,
several countries stand out. Table 3 lists those coun-
tries where the gender gaps in primary education
are more than one standard deviation below the cor-
responding global averages. Note that these lists are
incomplete because gender-specific data through
UNESCO are not available for many countries (e.g.,
Table 2. Gender gaps in net enrollment rates in primary and secondary education By income group and world region, using average value for 2010-14
PRIMARY EDUCATION SECONDARY EDUCATION
Income group/World region Total (%)Females
(%)Males
(%)Female/
Male Total (%)Females
(%)Males
(%)Female/
Male
World 91.17 90.33 91.95 0.982 63.94 62.53 65.28 0.958
High income 96.44 96.72 96.17 1.006 89.65 90.02 89.31 1.008
Upper middle income 95.67 95.24 96.06 0.992 76.65 77.28 76.06 1.016
Middle income 92.35 91.66 93.00 0.986 65.03 63.57 66.40 0.957
Lower middle income 90.26 89.41 91.06 0.982 56.31 53.41 59.02 0.905
Low income 83.05 81.14 84.92 0.956 36.35 34.23 38.44 0.891
Least developed countries* 81.11 78.66 83.51 0.942 33.46 31.14 35.76 0.871
Heavily indebted poor countries 78.26 75.55 80.92 0.934 29.62 25.88 33.34 0.776
*UN Classification
OECD members 96.72 96.99 96.46 1.005 86.98 87.31 86.67 1.007
Euro area 99.11 99.28 98.95 1.003 91.20 91.77 90.67 1.012
European Union 98.53 98.64 98.43 1.002 91.39 91.93 90.89 1.011
North America 93.52 93.94 93.12 1.009 87.23 87.79 86.69 1.013
Europe & Central Asia (all income levels)
97.32 97.34 97.30 1.000 88.54 88.45 88.64 0.998
East Asia & Pacific (all income levels)
95.81 95.94 95.69 1.003 74.70 75.42 74.05 1.019
Middle East & North Africa (all income levels)
95.77 93.94 97.51 0.963 72.09 69.37 74.71 0.929
Developing countries only:
Europe & Central Asia 94.79 94.40 95.16 0.992 85.73 84.80 86.65 0.979
East Asia & Pacific 95.53 95.68 95.40 1.003 73.10 73.84 72.43 1.019
Latin America & Caribbean 94.10 94.34 93.88 1.005 72.61 74.99 70.30 1.067
Middle East & North Africa 96.01 93.78 98.13 0.956 70.13 67.30 72.86 0.924
Arab World 85.69 83.27 88.00 0.946 63.48 61.24 66.79 0.917
South Asia* 94.23 93.97 94.46 0.995 48.39 44.74 51.78 0.864
Sub-Saharan Africa 77.53 74.75 80.25 0.931 32.13 29.80 34.44 0.865
Data source: UNESCO data through World Bank, EdStats website. We use the average for the years 2000-14 because the latest available data for all countries covered these years; for South Asia, the latest data for secondary education are for the years 2005-09.

12 GLOBAL ECONOMY AND DEVELOPMENT PROGRAM
Table 3. Gender gaps in net enrollment in primary and secondary education Countries with the lowest primary net enrollment rate and/or largest gender gap, using latest data available from 2000*
PRIMARY EDUCATION SECONDARY EDUCATION
Gender Gap Gender Gap
Country ordered by Primary Net Enrollment Rate: Lowest to highest
Latest year
Female Net
Enrollment Rate (%) F-M (%) F/M
Latest year
Female Net
Enrollment Rate (%) F-M (%) F/M
South Sudan 2010-14 34.33 -13.92 0.712 n/a
Liberia 2010-14 38.44 -2.11 0.948 2010-14 16.65 -2.99 0.835
Niger 2010-14 54.70 -12.05 0.819 2010-14 11.86 -4.55 0.678
Cote d’Ivoire 2005-09 56.29 -11.07 0.836 n/a
Djibouti 2010-14 56.97 -7.48 0.884 2005-09 22.86 -8.36 0.690
Equatorial Guinea 2010-14 59.14 -0.39 0.993 2005-09 22.02 -5.83 0.766
Nigeria 2010-14 60.03 -11.16 0.843 n/a
Central African Republic 2010-14 61.36 -19.00 0.764 2010-14 14.09 -8.48 0.538
Ethiopia 2005-09 61.78 -6.43 0.906 2000-04 13.52 -5.63 0.655
Chad 2010-14 62.58 -17.76 0.779 2000-04 8.96 -8.80 0.339
Burkina Faso 2010-14 63.17 -3.85 0.943 2010-14 19.08 -3.70 0.823
Syrian Arab Republic 2010-14 65.09 -1.13 0.983 2010-14 62.13 0.11 1.002
Pakistan 2010-14 67.06 -10.56 0.864 2010-14 36.18 -10.58 0.744
Guinea 2010-14 68.58 -11.85 0.853 2010-14 30.41 -13.73 0.631
Mali 2010-14 68.99 -10.26 0.871 2010-14 34.41 -10.58 0.733
Guinea-Bissau 2010-14 69.07 -3.44 0.953 2000-04 8.46 -4.75 0.562
Madagascar 2000-04 69.56 0.59 1.009 2010-14 30.37 0.14 1.004
Gambia, The 2010-14 73.47 3.85 1.055 n/a
Mauritania 2010-14 73.48 3.97 1.057 2010-14 21.80 -3.06 0.869
Angola 2010-14 76.32 -18.61 0.804 2010-14 13.46 -2.80 0.812
Solomon Islands 2005-09 77.60 -2.61 0.967 2005-09 32.63 -5.48 0.845
Additional selected countries:
Yemen, Rep. 2010-14 78.20 -15.24 0.837 2010-14 41.11 -17.52 0.647
India 2000-04 81.29 -10.83 0.882 n/a
Papua New Guinea 2010-14 83.26 -6.79 0.925 n/a
Palau 2005-09 83.62 -11.66 0.878 2005-09 44.50 -9.49 0.807
Togo 2005-09 85.49 -12.48 0.873 2000-04 23.53 -16.40 0.484
Cameroon 2010-14 85.87 -11.23 0.884 2010-14 42.03 -15.79 0.684
Iraq 2005-09 86.02 -11.15 0.885 2005-09 39.63 -9.49 0.807
Benin 2010-14 88.20 -11.67 0.883 2010-14 34.12 -15.79 0.684
Afghanistan n/a 2010-14 46.83 -26.71 0.554
Data source: UNESCO data, latest years Notes: *The net enrollment rates of these countries are at least one standard deviation below the average for all countries with available data.

TODAY’S CHALLENGES FOR GIRLS’ EDUCATION 13
gender-disaggregated data for primary education in
Afghanistan and Haiti and for secondary education in
Haiti, Nigeria, and South Sudan).
• As a result of increasing enrollment rates across
birth cohorts, the average years of schooling have
risen globally, especially for women’s schooling
relative to men’s. According to the Barro-Lee data
for the period 1970-2010 for 143 countries, the
mean years of schooling of women aged 25 years
and older has increased relative to men’s from
an average ratio of 66:100 to 89:100. In fact, in
eight countries, women’s gains are such that the
average schooling of women is one standard de-
viation greater than the average schooling of men.
However, in 21 countries, the average schooling of
women relative to men’s is one standard deviation
below the mean female-male ratio, even in 2010. We
will come back to these countries below. When the
years of schooling of younger birth cohorts (ages 15
to 24 years) are included to reflect the more recent
increases in girls’ education, there are 15 countries,
down from 21, where women’s average years of
schooling relative to men’s are one standard devia-
tion below the overall mean female-to-male ratio.
The girls who face multiple disadvantages are farthest behind • While gender accounts for observed disparities
in education, poverty persists as the most impor-
tant and pervasive factor for education inequality.
UNESCO’s EFA Global Monitoring Report in 2010
highlighted this point in its analysis of education
marginalization, finding that in numerous countries
gender exacerbates the existing educational disad-
vantages due to poverty and other factors (UNESCO,
2010). Multivariate analyses also support this con-
clusion; differences in educational attainment are
more highly associated with economic status than
with gender, orphanhood, or rural residence in poor
countries (Filmer, 2008b). Individual-level data from
Demographic and Health Surveys (DHS) in 24 low-
income countries show this even in the poorest coun-
tries (King and Nguyen, 2013). On average, only 34
percent of girls in the poorest-quintile households in
these countries complete primary school, compared
with 72 percent of girls in the richest-quintile house-
holds, a difference of 38 percentage points due to
income poverty alone (figure 3). In comparison, con-
trolling for income, the gap between the poorest girls
and the poorest boys is about 10 percentage points,
and that between the richest girls and the richest
boys is 12 percentage points.
• These simple statistics that show that disparities
due to income poverty greatly exceed the differ-
ences due to gender do not diminish the need to
pay attention to why gender makes any differ-
ence. Note that in the lowest-income countries for
which DHS data are available, gender inequality is
not wider among the poor than among the rich;
on the contrary, the education gender gap among
the poorest households where education levels are
lower for all may be narrower than among the rich-
est households.
• Distinguishing among groups further, we find
evidence that education lags most significantly
among people who face multiple sources of disad-
vantage, not only income poverty, but also place of
residence, disability and/or ethno-linguistic back-
ground. On average, urban children have higher
school enrollment and completion rates, compared
with children in rural areas (68 percent versus 50
percent). In fact, the primary completion rate of ur-
ban girls is 15 percentage points higher than that of
rural girls and 7 percentage points higher than that
of rural boys, indicating that gender is not the full
story behind observed disparities. However, urban
boys have the highest completion rate, exceeding
that of urban girls by nearly 15 percentage points
and that of rural girls by 30 percentage points.
• Adding ethnic and linguistic background to place
of residence, the case of two low-income countries
illustrates that gender inequality is indeed a more
complex story. In Bolivia, for example, the gender
gap in years of schooling among the non-indige-
nous population, even at the age groups that cor-
respond to secondary and tertiary education, has

14 GLOBAL ECONOMY AND DEVELOPMENT PROGRAM
disappeared, as shown by the overlapping curves
for the non-indigenous groups in figure 4. However,
among the indigenous population which makes up
about 40 percent of the total population, the gen-
der pattern varies by place of residence: urban men
have approximately two more years of schooling
than urban women at age 18, but urban women have
as many years of schooling as rural men. It is rural
indigenous women who have the least schooling, a
difference of about seven years at age 18. We note,
however, that the total gap between urban, non-
indigenous men and rural, indigenous women has
narrowed dramatically for younger age cohorts,
from nine years among the 40-year-olds to three
years among the 18-year-olds.
• In Mozambique, one of the poorest countries in
Africa, urban-rural differences are as large as in
Bolivia. Adding language to place of residence, in
urban areas lusophone (or Portuguese-speaking)
and non-lusophone women have closed the gap in
years of schooling with urban men, although this
is relatively recent progress. Moreover, urban lu-
sophone women appear to have overtaken urban
non-lusophone men. In rural areas, however, among
the non-lusophone groups, women have not gained
on men across the years and generations. Yet the
total gap in the population—between urban, luso-
phone men and rural, non-lusophone women—has
narrowed dramatically. Among the youngest co-
horts it has closed to three years among the
18-year-olds from 10 years among the 40-year-olds.
• Clearly, gender is not the only dimension of inequal-
ities in schooling, but among population groups that
already suffer from other sources of disadvantage,
90.00
80.00
70.00
60.00
50.00
40.00
30.00
20.00
10.00
0.00
Ave
rag
e p
rim
ary
co
mp
leti
on
rat
e (
%)
Richest quintile boys, 78.9%
Richest quintile average, 71.5%
Richest quintile girls, 66.7%
All average, 55.1%
Poorest quintile boys, 44%
Poorest quintile, 38.9%
Poorest quintile girls, 33.8%
Urban boys, 76%
Urban average, 67.7%
Urban girls, 61.7%All average, 55.1%
Rural boys, 53.9%
Rural average, 50.3%
Rural girls, 46.7%
Figure 3. Average completion rates in primary education, by gender, income and rural-urban residence
Source: Authors’ calculation using latest available data from Demographic and Health Surveys 2000-2011.Note: Aggregates for low-income countries are averages of 24 low-income countries for wealth disaggregates and for urban/rural disaggregates weighted by primary school age population.

TODAY’S CHALLENGES FOR GIRLS’ EDUCATION 15
Figure 4. Gender gaps in Mozambique and Bolivia, by urban-urban residence and language group
Mozambique (DHS data 2003-04)
Bolivia (DHS data 2008)
15
12
9
6
3
0
Ave
rag
e y
ears
of
sch
oo
ling
18 20 22 24 26 28 30 32 34 36 38 40Age
Urban Portugese-speaking boys
Urban Portugese-speaking girls
Urban non-Portugese-speaking boys
Urban non-Portugese-speaking girls
Rural non-Portugese-speaking girls
Rural non-Portugese-speaking boys
15
12
9
6
3
0
Ave
rag
e y
ears
of
sch
oo
ling
18 20 22 24 26 28 30 32 34 36 38 40Age
Urban non-indigenous boys
Urban non-indigenous girls
Urban indigenous boys
Urban indigenous girls
Rural indigenous girls
Rural indigenous boys
Source: King and Nguyen, 2012Notes: The curves for the lusophone (or Portugese-speaking) groups fluctuate more than the other curves, even after applying a STATA smoothing function to extract the age pattern, so we have omitted them; they represent a small population compared to the other groups.Non-indigenous population is defined as those people whose native language is Spanish; the indigenous population is defined those whose native language is Quechua, Aymara, Guarani, or other native languages. By this definition, the non-indigenous population in rural areas is small and we have omitted them here. A STATA smoothing function has been applied to extract the age pattern in the data.

16 GLOBAL ECONOMY AND DEVELOPMENT PROGRAM
gender widens that gap further. These two country
examples demonstrate that to understand the de-
gree of gender inequality, it is not enough to use
country-level averages. The very low level of edu-
cation and large deficit for groups facing multiple
sources of disadvantage—from poverty, to geogra-
phy, to ethnicity and language group, to disability—
suggest that the barriers they face are great even
at the most basic levels, and that extraordinary ef-
forts in policy and investments are needed to break
down those barriers (Lewis and Lockheed, 2006;
Chitrakar, 2009; UNESCO, 2010).9
Overall learning levels are low, but girls do worse in math and boys in reading • Only a limited number of countries have data on
student achievement, as measured by student
performance on international standardized as-
sessments (such as PISA, TIMSS, and PIRLS),
which would allow comparisons across countries.
However, there are countries that participate also
or only in regional standardized assessments (in-
cluding SACMEQ, PASEC, and LLECE) and these as-
sessments allow cross-country comparisons within
regions. These assessments test performance at
different ages or grades so comparing scores across
tests is not straightforward; however, cross-country
comparisons are possible within tests.10 To mini-
mize comparisons across these assessments, we
avoid working directly with test scores and instead
analyze the percentage distribution of students by
gender across the competency levels defined for
each assessment. By taking the ratio of percentage
shares of girls to boys in the extreme low- and high-
competency levels of each assessment, we are able
to compare gender ratios in performance across
countries. Unfortunately, many countries in East
Asia, South Asia, and the Middle East do not partici-
pate in international or regional assessments, thus
limiting our cross-country comparisons.
• The gender distribution by competency levels in
international and regional assessments reveals an
interesting pattern. In general, boys do better than
girls in math and girls perform better in reading.
Yet there is considerable variation in the size of
these gender differences across countries. Figure
5 presents a set of scatter plots based on gender
ratios from the different international and regional
student assessments. In these plots, gender equal-
ity at any competency level is signified by a gender
ratio (F/M) equal to one, so a gender ratio exceed-
ing one means over-representation of girls relative
to boys in a given competency level and a gender
ratio below one means under-representation rela-
tive to boys. We omit the middle competency level
from each graph; this means that if girls are under-
represented in the two extremes taken together,
then they are over-represented in the middle com-
petency level. On average, in math, girls are over-
represented in the low competency levels relative
to boys and under-represented in the high achieve-
ment levels. In reading comprehension, girls are
under-represented in the low achievement levels
and equally represented or over-represented in the
high achievement levels. The gender patterns in
math and reading competency levels are depicted
in figure 5 by the fact that the scatter plot for the
reading gender ratios tend to be above and to the
left of the plot for math gender ratios. This pat-
tern is most evident for the PISA tests which cover
15-year-olds; we overlap the TIMSS test for grade 8
students and find that the scatter plots for math for
both assessments are similarly placed. By compari-
son, figure 5 shows the plot of the gender ratios for
grade 4 TIMSS (math) and PIRLS (reading). This plot
shows that the math advantage of boys over girls
and the reading advantage of girls over boys are
not as marked as we see in the PISA comparison,
a pattern that we think reflects the more different
gender expectations about math and reading skills
in adolescence.
• Two cases illustrate extremes in the patterns we
see. In Argentina the gender ratio of girls to boys
in the high math competency level for PISA is only
0.3 while the gender ratio in the high reading com-
petency level is 2.2. In a few countries in Africa,
however, girls are over-represented in the low

TODAY’S CHALLENGES FOR GIRLS’ EDUCATION 17
Figure 5. Female-Male ratios in math and reading competency levels, various assessments, latest year
F/M ratio in math and reading competency levels in PISA & TIMSS, grade 8
6
5
4
3
2
1
0
F/M
rat
io in
hig
h c
om
pet
en
cy le
vel
PISA MathPISA ReadingTIMSS, Gr 8Linear (PISA Math)Linear (PISA Reading)Linear (TIMSS, Gr 8)
0 0.2 0.4 0.6 0.8 1.0 1.2 1.4 1.6 1.8
F/M ratio in low competency level
F/M ratio in math and reading competency levels, TIMSS and PIRLS, grade 4
1.4
1.2
1.0
0.8
0.6
0.4
0.2
0
F/M
rat
io in
hig
h c
om
pet
en
cy le
vel
MathReadingLinear (Math)Linear (Reading)
0 0.2 0.4 0.6 0.8 1.0 1.2 1.4 1.6 1.8
F/M ratio in low competency level
F/M ratio in math and reading competency levels, PASEC & SACMEQ assessments
1.4
1.2
1.0
0.8
0.6
0.4
0.2
0
F/M
rat
io in
hig
h c
om
pet
en
cy le
vel
MathReadingLinear (Math)Linear (Reading)
0 0.2 0.4 0.6 0.8 1.0 1.2 1.4 1.6 1.8
F/M ratio in low competency level
F/M ratio in math and reading competency levels, LLECE assessments
1.4
1.2
1.0
0.8
0.6
0.4
0.2
0
F/M
rat
io in
hig
h c
om
pet
en
cy le
vel
MathReadingLinear (Math)Linear (Reading)
0 0.2 0.4 0.6 0.8 1.0 1.2 1.4 1.6
F/M ratio in low competency level
competency levels in both math and reading, and
under-represented in the high competency levels
in both. In Burkina Faso, for example, girls are 31
percent more likely to be in the low-competency
level in math than boys and 21 percent more likely to
be in the low-competency level in reading.
Is the gender pattern by area of competency due to
intrinsically gender-related talents? An excellent re-
view of the research on the cognitive development
of infants, preschool children, and students does not
support the claim that this gender pattern has any
basis in genetic predisposition of boys to math (and
science) or the opposite for girls (Spelke, 2005).
Instead, this gender pattern may be reflecting widely
held cultural views about the appropriate roles for
women and men. Kazianga, Levy, and Linden (2013)

18 GLOBAL ECONOMY AND DEVELOPMENT PROGRAM
attribute the gender inequality in math competency
in Burkina Faso to a host of factors, including the
practice of teachers of directing more difficult, higher-
order questions to their male students and simpler
recall questions to their female students, confirming
in the minds of boys and girls the expected occupa-
tions and proper roles for men and women. Mutekwe
and Modiba (2013) point to the gender stereotypes
embodied in school textbooks and syllabi (the hid-
den curriculum), and that in Zimbabwe the general
perception communicated by teachers is that “math-
ematics and science subjects are a preserve for boys,
whereas languages and the humanities are a female
domain.” The gender pattern in unequal competen-
cies that emerges from PISA and TIMSS results has
certainly attracted the attention of researchers and
policymakers not only in developing countries but also
in more advanced countries.
Soft skills also key for girls
The addition of learning outcomes is a welcome
change in the research on the economic growth of
countries. This change is made possible by the greater
availability of international and regional standard-
ized tests for many more countries; as a result, more
growth studies are including measures of average
cognitive achievement in addition to years of school-
ing as a determinant of economic growth. We has-
ten to add that while learning outcomes have been
typically measured in terms of students’ reading and
math numeracy scores on tests, these are admittedly
a limited set of cognitive skills and of skills in general.
Moreover, as Heckman, Humphries, and Kautz (2014)
note, improving academic skills does not necessarily
translate into better labor market and life outcomes.
Specific technical or vocational skills related to an
occupation can expand opportunities in the labor
market, and the so-called soft skills such as communi-
cation, teamwork, critical thinking, and problem-solv-
ing are undeniably useful for people to function well
at home, in their communities, and at work.
In fact, there is a growing body of evidence from mul-
tiple disciplines (psychology, behavioral economics,
and neuroscience) that identifies certain personal
capabilities as also important predictors of academic
performance and later success in life. These capa-
bilities—such as self-esteem, generalized self-efficacy,
locus of control, and emotional stability—are receiv-
ing greater attention among researchers to explain
labor market success.11 Additionally, these soft skills
also have been documented to show improved life
outcomes. Evidence from longitudinal studies of nine
OECD countries found the development of compe-
tencies and character skills such as perseverance,
self-esteem, and sociability may have a bigger influ-
ence on addressing social challenges such as crime,
health decisions, and ensuring success in the labor
market (OECD, 2015; Mischel, 2014). Overall, these
findings suggests that the development of social and
emotional skills and other non-cognitive skills may
be just as important as the development of cognitive
skills (Heckman, Stixrud, and Urzua, 2006; Kautz et
al., 2014). Despite relatively equal levels of cognitive
ability, for example, boys generally get lower grades,
are less able to pay attention in class, are less orga-
nized in terms of their homework, have more disci-
plinary problems, and are more likely to be in special
education classes. These skills have received greater
attention in explaining gender differences in transi-
tion rates to college education—where the rates for
girls exceed those for boys. Research suggests that
in the United States the higher non-cognitive skills
and college premiums among women account for
nearly 80 percent of the gender gap in higher educa-
tion enrollment rates (Jacob, 2002). And as we have
noted above, measures of soft skills are growing, but

TODAY’S CHALLENGES FOR GIRLS’ EDUCATION 19
these are still rare in developing countries and define
a promising area for better understanding gender
differences in educational success but also in other
areas of life.
Soft skills, at times also referred to as non-cognitive or
transferable skills, are not usually cultivated through
pencil-and-paper tests and in general can be acquired
through a quality education that privileges experiential
learning activities and assists students in becoming
problem solvers, strong communicators, and leaders—
qualities that could be potentially lifesaving and cer-
tainly qualities well sought after in today’s economy
(UNESCO, 2012). A quality education and staying
in school longer has a positive effect on girls’ and
boys’ self-esteem, confidence, and aspirations overall
(UNESCO, 2012). In particular, marginalized girls and
women who face multiple disadvantages could benefit
from a quality education that allows for the develop-
ment of non-cognitive skills. Murphy-Graham (2010)
found that an innovative secondary education program
in rural Honduras that encouraged students to analyze
the context in which they lived helped build the female
students’ gender consciousness and strengthen their
relational resources (ie. communication and negotia-
tions skills). This research remarked on the “transfor-
mative potential of education” suggesting that when
education provides the opportunities for students to
develop relationships, learn how to express their ideas
and use their negotiation skills, it can transfer over
into the household sphere leading to potentially posi-
tive influence on household gender relations (Murphy-
Graham, 2010, 330).
Female empowerment has been well examined in lit-
erature on women’s leadership. This paper builds from
the empowerment/leadership framework presented
in Rowlands (1997) in which Rowlands presents four
dimensions of empowerment:
1. “Power within”: belief in self-worth, self- respect
and self-acceptance
2. “Power to”: ability to make choices and influence
others
3. “Power over”: ability to control others
4. “Power with”: acting with others to challenge dis-
criminatory structures
(O’Neil, Plank, and Domingo, 2015, 7; Rowlands, 1997)
This empowerment/leadership framework is useful in re-
flecting upon how the outcomes of developing soft skills
could benefit girls’ future and agency. Cultivating soft
skills that leads to greater confidence and improved self-
esteem provides girls with the ammunition—or the power
within—to transition into adulthood with more opportuni-
ties to succeed and in a better position to make choices
over their lives (also known as the power to). The notion
of leadership, applying soft skills, and developing female
leaders is addressed in a later section.
Emerging hotspots: Bogs, traps, and ceilings in girls’ education
The gender education indicators discussed above—
including the gender gaps in enrollment rates,
completed years of schooling and academic perfor-
mance—together point to relatively clear country
patterns with respect to gender equality. For conve-
nience, we use the moniker of “bogs,” “traps,” and
“ceilings” to refer to three broad groups of countries.
We defined these groups as:
• Bogs: the countries where girls’ net primary and
secondary enrollment rates may have increased but
have not reached the target levels of the MDGs, and
gender gaps in enrollment rates at the primary and
secondary levels have not narrowed sufficiently; in
general, these countries have stalled in reaching
the MDGs for education.

20 GLOBAL ECONOMY AND DEVELOPMENT PROGRAM
• Traps: the countries where both primary and
secondary enrollment rates (and perhaps even
tertiary enrollment rates) have progressed well
and have generally reached the MDG targets, and
gender gaps in school enrollment have narrowed
sufficiently. However, these countries lag behind
in terms of learning outcomes, as measured by
their students’ average performance relative to the
average performance in international or regional
assessments. In varying degrees, these countries
have not made sufficient improvement in learning
outcomes and appear to be caught in a low-quality
education trap.
• Ceilings: the countries that have reached the high-
est levels of enrollment rates at all levels and have
achieved relatively high levels of student learning
as measured by their average performance on in-
ternational or regional assessments, but face gen-
der inequality in academic performance. We use
a simple measure of gender gap in performance:
the relative shares of girls to boys in the extreme
competency levels. In particular, we use the “glass
ceiling” implied by the math dominance of adoles-
cent boys in international assessments as a gender
measure.
How we have categorized countries into these three
groups is summarized in table 1. A fourth group of
countries consists of those that have high enrollment
and completion rates at all education levels, have
performed relatively well (though not all at equally
spectacular levels) on international assessments, and
have attained relative gender parity with respect to
learning outcomes. Figure 6 presents a visual aid of
the four groups of countries. Finally, a missing group
of countries pertains to those that do not have gen-
der-disaggregated data on enrollment rates at either
primary or secondary levels or have not participated
in international or regional assessments that allow
cross-country comparisons.
Stuck in an education bog
Various education indicators repeatedly point to a
group of about 80 countries that have not made suf-
ficient progress to meet universal primary education,
including about 50 that have not met the MDG target
on gender equality in education. Returning to table
3, on average, low-income countries, especially the
least-developed countries (a U.N. classification) and
the highly indebted poor countries have not reached
the enrollment target for primary education. Among
these countries are South Sudan, Liberia, Niger, Cote
d’Ivoire, Djibouti, and Nigeria, a group of 21 countries
which have the lowest adjusted net enrollment rates
at the primary level. Several of these countries have
the widest gender gaps as measured by the female-
male ratio—for example, South Sudan, Central African
Republic, and Chad have gender gaps in excess of 20
percent. The net enrollment rates at the secondary
level in about two-thirds of these countries are only
about one-half of the global mean and their gender
gaps are substantial. In Afghanistan, Chad, Togo, and
the Central African Republic, girls’ net enrollment
rates are about 0.5 or less of boys’ rates.
These countries’ gender gaps in enrollment rates at the
primary and secondary levels eventually translate into
sizable disparities in the completed years of schooling
of the adult population. The Barro-Lee data on years
of schooling give us a long-run view of education in
these countries, and we do see some movement to-
ward greater equality from 1970, as measured by the
average years of schooling of the adult population
aged 25 years and above (figure 7). For example, both
Afghanistan and Pakistan are such countries. However,
the 30-year long view also reveals that the progress
has been generally modest and has not been a continu-
ously upward trend (in Mauritania, for example), and
there has not been an acceleration after 1990 when
the Education for All goals were established or after
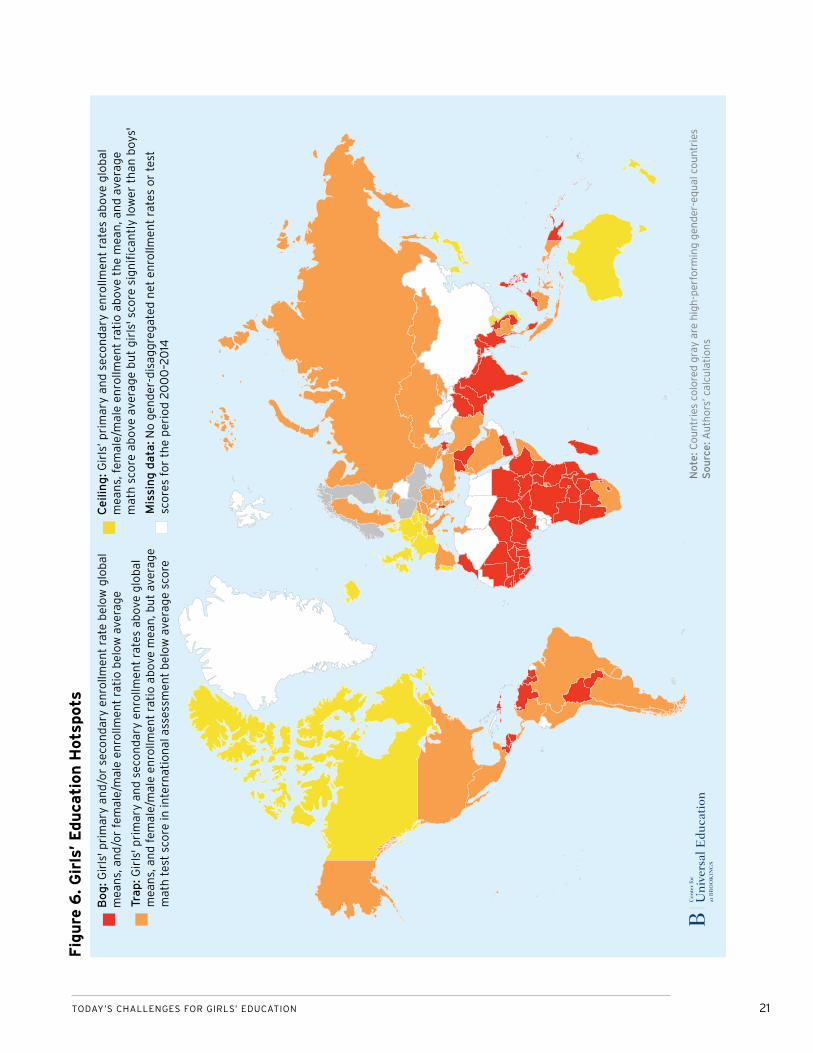
TODAY’S CHALLENGES FOR GIRLS’ EDUCATION 21
GIR
LS
’ E
DU
CA
TIO
N H
OT
SP
OT
SB
og
: Gir
ls' p
rim
ary
and
/or
seco
nd
ary
enro
llmen
t ra
te b
elow
glo
bal
mea
ns,
an
d/o
r fe
mal
e/m
ale
enro
llmen
t ra
tio
bel
ow a
vera
ge
Trap
: Gir
ls' p
rim
ary
and
sec
on
dar
y en
rollm
ent
rate
s ab
ove
glo
bal
mea
ns,
an
d f
emal
e/m
ale
enro
llmen
t ra
tio
ab
ove
mea
n, b
ut
aver
age
mat
h t
est
sco
re in
inte
rnat
ion
al a
sses
smen
t b
elow
ave
rag
e sc
ore
Ce
ilin
g: G
irls
’ pri
mar
y an
d s
eco
nd
ary
enro
llmen
t ra
tes
abo
ve g
lob
al
mea
ns,
fem
ale/
mal
e en
rollm
ent
rati
o a
bo
ve t
he
mea
n, a
nd
ave
rag
e m
ath
sco
re a
bo
ve a
vera
ge
bu
t g
irls
' sco
re s
ign
ific
antl
y lo
wer
th
an b
oys'
Mis
sin
g d
ata:
No
gen
der
-dis
agg
reg
ated
net
en
rollm
ent
rate
s o
r te
st
sco
res
for
the
per
iod
20
00
–20
14
No
te: C
ou
ntr
ies
colo
red
gra
y ar
e h
igh
-per
form
ing
gen
der
-eq
ual
co
un
trie
s S
ou
rce
: Au
tho
rs’ c
alcu
lati
on
s
Fig
ure
6. G
irls
’ E
du
cati
on
Hot
spot
s

22 GLOBAL ECONOMY AND DEVELOPMENT PROGRAM
the MDG targets were declared in 2000. As a group
these countries appear stuck with respect to gender
equality. Indeed, there is much to understand about
why this is so.
Caught in an education quality trap
Notable increases in enrollment rates for girls since
1990 have led to celebratory remarks about progress
in gender equality. On the basis of the rudimentary
indicators used to measure that goal and for the
countries that have time-series data on the indicator,
there has been progress. The education systems in
this large group of countries, perhaps reinforced by
economic forces, have succeeded in getting children—
boys and girls alike—to school, keeping them in school
until the end of the primary cycle, and raising transi-
tion levels to secondary education. Trends show that
once girls are enrolled, they are more likely to remain
in school and complete more years of schooling. The
current average net enrollment rates in primary edu-
cation and at the secondary level in most regions of
the world exceed 90 percent and 70 percent, respec-
tively (table 2). More reports are noting that gender
disparities show not only female disadvantage but
also male disadvantage with respect to enrollment
and completion rates, especially in Central and South
America and in parts of East Asia (Grant and Behrman,
2010; World Bank, 2011). However, robust successes in
entry and completion rates in primary education and
in transition rates to secondary education and even to
tertiary education have created perhaps a more dif-
ficult set of education challenges.
First among these challenges is that within these
countries there are segments of the population for
1.0
0.9
0.8
0.7
0.6
0.5
0.4
0.3
0.2
0.1
0F/M
rat
io o
f ye
ars
of
sch
oo
ling
(1.
0 =
ge
nd
er
eq
ual
ity)
1970 1975 1980 1985 1990 1995 2000 2005 2010
AFG
MRT
CAF
NPL
ZAR
NBR
CIV
PAK
GMB
PNG
HTI
SEN
IND
SLE
IRQ
SDN
LBR
TGO
MWIKHM
MOZ
BEN
MAR
MRT; 0.63
PAK; 0.23
AFG; 0.08
MRT; 0.56
PAK; 0.47
AFG; 0.22
Figure 7. Female-Male ratio of completed years of schooling 24 countries with largest gender inequality, Barro-Lee Data, 1970-2010 (Population 25 years and older)
Source: Barro R. & J.W. Lee – v. 2.0, 06/14

TODAY’S CHALLENGES FOR GIRLS’ EDUCATION 23
whom gender gaps have been persistent, suggesting
that system-wide policies or interventions do not work
well everywhere. Multiple sources of disadvantage
such as gender, rural residence, and minority affilia-
tion contribute to leaving groups of children behind.
We illustrated this above with the cases of Bolivia and
Mozambique (and the 2009 EFA Global Monitoring
Report gives the case of Nigeria), but it should be
possible to examine this inequality using household
survey data for other countries. We saw that this type
of analysis highlights the fact that average gender
equality in a country masks much larger gender dif-
ferences in some population groups, but individual
survey data are needed to undertake such an analy-
sis. Secondly, the inflow of large numbers of students
into the upper grades of basic education and then into
the secondary level has put a heavy strain on public
resources for education and on the capacity of the
education systems to deliver instructional services of
acceptable quality. Greater education equality comes
with additional financial and administrative require-
ments. Thirdly, these education systems have not
performed well on international and/or regional tests
relative to high-performing systems. Although these
student assessments are, by far, not a perfect mea-
sure of instructional quality and learning, they provide
a way of benchmarking the performance of education
systems and thus of reminding policymakers and civil
society that the ultimate goal of schooling is student
learning. We use data from the international and
regional assessments to examine whether countries
are caught in a low-quality trap. In particular, if a
country’s average math score is below the global
average for the test, then that country is included in
this category. An alternative measure would be to use
the percentage of students who fall in the low compe-
tency level. For example, using 40 percent as a thresh-
old value for this measure would shift a few countries
from the “trap” category to the “ceiling” group or bet-
ter (e.g., Israel, Italy, Greece, and the United States).
Bumping against a gender “glass ceiling”
These countries have demonstrated their capacity to
achieve not only high enrollment and completion rates
at the basic and secondary level but also relatively
high academic performance. Judging by how well their
students have performed in international or regional
assessments, these are some of the best education
systems in the world. However, there remain in these
countries gender gaps that need to be addressed;
there are significant differences in the level of com-
petencies of boys and girls and also a gender-specific
concentration in competency. One example we have
already presented is that of male dominance in math
performance and female dominance in reading com-
prehension. This gender pattern has been the subject
of numerous studies that examine a range of factors,
from biological or neurological abilities (see critical
review by Spelke, 2005), to gender discrimination
in the classroom (e.g. Dee, 2007), to social attitudes
pertaining to gender traits and roles.12 These gender
patterns in competencies are important because they
foreshadow the fields of study that young men and
women choose in post-secondary education and even
their choice of occupation as adults. Glass ceilings at
work and other places in society start with glass ceil-
ings in school. In the U.S., for instance, more young
women than young men are proceeding to college
but they tend to concentrate in certain areas of study,
with consequences for their future jobs. Jacob (2002)
notes that “[w]hile women have made considerable in-
roads into traditional white-collar male jobs, they have
had significantly less success moving into skilled blue-
collar occupations… For this reason, it is likely that a
young man with high school diploma will have a better
chance than a comparable young woman of finding a
relatively high-paying construction or manufacturing
job” (590). And while we highlight this challenge for
this set of countries, the male dominance in math is
present in the other country groups as well.

24 GLOBAL ECONOMY AND DEVELOPMENT PROGRAM
IV. WHY GIRLS ARE BEHIND: WHAT WE KNOW ABOUT GENDER EQUALITY IN EDUCATION
There is a rich literature that has explored the rela-
tionship between education indicators and sets of
economic, social, and political factors. In this section
we review familiar elements of a basic conceptual
framework for education outcomes and survey re-
search findings that help identify strategic and pro-
grammatic approaches to increasing and improving
girls’ and women’s education. The framework begins
with the girl and her family at the center, but also
traces gender differences to the norms, resources,
and constraints in the broader community and econ-
omy that influence choices and outcomes. With the
increasingly shared belief across the world that basic
education is a human right, the cost of schooling, the
policy environment (e.g., compulsory education laws,
education finance), the supply of and support for
teachers, and so on have changed, with consequences
for the educational level of populations and gender
differences in education.
Understanding the roots of education gender gaps
Basic education has been enshrined as a universal hu-
man right over the past six decades, and the benefits
from women’s education for development are fairly
well-recognized in global fora—so why do gender gaps
in education persist, and what are the best ways to
further reduce these disparities? Past studies have
included the following as factors affecting educa-
tion: household wealth or income, parents’ education,
presence of parents in the household, age of child,
household composition, the price or cost of schooling,
ethnicity or language spoken at home, urban/rural
residence, characteristics of teachers and the school,
and the perceived returns to schooling. This is a famil-
iar list of factors in the literature, but to understand
how these factors affect gender differences in educa-
tion, it is useful to begin with a model of demand for
education that explicitly recognizes that the demand
for girls’ education and boys’ education are distinct
and may be affected differently by a host of factors.13
The basic model of demand for education postulates
that an individual or the family makes education deci-
sions by comparing the discounted costs of schooling
against the discounted value of anticipated returns
in the future, and that a child remains in school until
the discounted (perceived) returns are equal to the
costs of schooling. Boys and girls grow up in the same
households, so the household income and parents’
discount rate that affect schooling decisions are thus
equal among siblings, and the availability of schools is
frequently the same, except where there is a strong
cultural preference for single-sex schools or class-
rooms. The framework must also acknowledge the
power of social and cultural forces that shape prefer-
ences, expectations, and attitudes about girls’ edu-
cation, as well as the legal and policy environments
that affect the space in which education decisions are
made.
Schooling is more costly for girls
Most countries do not charge tuition fees in primary
education, and some countries have eliminated such
fees even at the lower secondary level. Nonetheless,
there are other direct costs that can discourage
school attendance. When these other costs are gen-
der-specific (e.g. expenses for uniforms or transpor-
tation), when the supply of school differs by gender
(e.g., girls are allowed only in single-sex schools or
classrooms), or when the opportunity cost of school-
age children’s time varies by gender, the total cost of
school enrollment for girls may be large enough to
result in gender differences. In addition, when schools

TODAY’S CHALLENGES FOR GIRLS’ EDUCATION 25
fail to stimulate interest in learning adequately or
generally make it worthwhile, students may decide
to spend their time elsewhere, are not motivated to
attend classes daily, and may eventually drop out.
Many non-experimental studies using household
survey data find that girls’ schooling is more sensi-
tive to cost, however defined, than is boys’ schooling.
Greater distance to school or the absence of a nearby
school has stronger negative impacts on girls’ than
boys’ enrollments in many settings.14 This is because
cultural mores or concerns about the safety of teen-
age girls imply the need for girls to be chaperoned
to and from school by their older brothers or fathers
when in public, implying greater transportation costs.
In the case of settings where teenage girls cannot be
seen in public, distance to school may not even be rel-
evant. School fees, to the extent that they exist, also
may have differential effects on girls and boys. For
example, in Kenya, higher school fees increase drop-
out probabilities for girls but have no effect on boys
(Lloyd, Mensch, and Clark, 2000).
In addition to direct costs, the opportunity cost of
schooling may present a greater obstacle for girls.
Addressing these hidden costs pay off in completed
schooling and beyond. There is a fairly clear gender
pattern of time use that assigns care and housekeep-
ing work to women and market work to men, a gender
division of labor that applies to children and adoles-
cents in families where young household members
are expected to contribute. In lower-income countries,
the realities of poverty imply that work and school-
ing are competing activities for children’s time. There
may be pressure for adolescent boys to do farm or
market work instead of or in addition to attending
school, and girls are usually expected to help in pre-
paring food, collecting water and fuel, and housework
and care activities, which may or may not be flexible
enough to allow school attendance. In Nicaragua, a
large percentage of students combine schooling with
work, despite the fact that combining these activities
decreases the probability that they will complete pri-
mary school by over 20 percentage points and that
working over three hours a day eventually shortens
their completed schooling by 27 percent (Zabaleta,
2011). In rural Honduras, students drop out of school
for several months during the harvest season, only to
return the following year (Bedi and Marshall, 2002).
In sub-Saharan Africa, on average, one-third of boys
aged 7-14 work and one-fourth of them combine work
and schooling; the corresponding shares are only
slightly lower than for girls (table 4). The proportion
of children working is much higher than in other re-
gions, illustrating the importance of the opportunity
cost of schooling in African countries. In these set-
tings, abolishing tuition fees will be more effective
in raising enrollment rates if it is combined with a
mechanism to compensate families for the other costs
associated with schooling.
When domestic work for which comparable data across
developing countries are rare is also considered, girls’
work burden may actually be heavier than boys’.
Low household income and parental absence due to
employment push significant care and household work
onto children—particularly girls—as a family coping or
survival strategy. A study in Ethiopia finds that boys
are less likely than girls to combine work and schooling
or to be engaged in work only, and are more likely to
be involved in leisure activities only compared to girls,
so the sum of domestic and non-paid work for girls
is higher for girls (Woldehanna, Jones, and Tefera,
2008). As countries impose and enforce legislative
restrictions on child labor outside the home, boys
would likely reduce their farm or market work while
girls would likely continue with their responsibilities at
home, with the result of increasing the relative cost of
schooling for girls. Research evidence shows that the

26 GLOBAL ECONOMY AND DEVELOPMENT PROGRAM
absence of basic public services such as water supply
for household use and electricity imposes a heavy time
burden on girls and women in households, leaving them
even more “time poor,” and increases the opportunity
cost of schooling (Bardasi and Wodon, 2010).
In Pakistan and Peru, hours of child labor respond
positively and significantly to child wages (Ray, 2000).
Of particular interest are the estimated coefficients
of the adult wage variables, which indicate the nature
of the interaction between the child and adult labor
markets. In Peru increasing adult wages reduce boys’
and girls’ labor hours, suggesting that child and adult
labor hours are substitutes. In Pakistan, the estimated
coefficient of the woman’s employment status is
positive and statistically significant for both boys and
girls, so children from households in which the mother
is employed work longer hours than other children.
However, the size and significance of this relationship
is much higher for girls than for boys, suggesting a
stronger relationship between women’s and girls’ la-
bor markets. Without good schools and satisfactory
day care arrangements, mothers who work have to
put their children, especially daughters, to work as
well (Basu, 1999).
Restricted space and expectations limit girls’ ability to reap the returns to education
Social norms define the roles that women and men
have in the family and the community, the expecta-
tions they have about their futures, their individual
preferences and the kind of relationships they form.
Social norms create powerful incentives that guide
people’s attitudes and behaviors; behaviors outside
the accepted social boundaries can unleash formal
and informal systems of social sanction. There are so-
cial taboos, for example, against allowing unmarried
girls in public or traveling far from home, but there are
typically no such taboos for unmarried sons. These ta-
boos make the cost of school attendance greater for
girls than for boys. In Pakistan special transportation
or a chaperone must often be arranged for daughters
in middle and secondary schools, adding to the cost
of schooling for low-income families (Holmes, 2003).
Table 4. Percentage of children aged 7-14 who are working
Working Working and studying
Region Girls (%) Boys (%) F/M Girls (%) Boys (%) F/M
Central and Southeastern Europe (non-EU) and CIS
10.5 12.5 0.841 10.2 12.2 0.838
East Asia
Southeast Asia and the Pacific 11.2 12.5 0.901 8.4 9.3 0.907
South Asia 13.4 17.1 0.786 9.0 11.7 0.764
Latin America and the Caribbean 8.3 14.1 0.587 6.9 11.1 0.621
Middle East
North Africa 4.6 7.4 0.620 2.6 5.2 0.502
Sub-Saharan Africa 30.9 33.9 0.912 21.3 24.0 0.886Data sources: World Indicators Database, latest years Notes: *Percent of children working, whether working only or combining work and study.

TODAY’S CHALLENGES FOR GIRLS’ EDUCATION 27
Schooling itself may be considered a threat to a girl’s
honor and thus to her marriage prospects if contact
with boys cannot be avoided. Single-sex classrooms
with female teachers, boundary walls, and separate
latrines in schools may be the only way to bring more
girls to school in some communities. Indeed, because
of strong social taboos, simply imposing a compulsory
education law and eliminating fees may not be suf-
ficient to increase girls’ schooling in those settings.
In contrast to the strictures about the movement and
exposure of girls in parts of South Asia and the Middle
East, family systems in Latin America and Southeast
Asia are generally more egalitarian. Women are rarely
secluded and are typically expected to contribute to
household economy by working outside the home and
managing family finances. In African countries as well,
women are expected to help grow crops or sell farm
produce, even if their ability to own land or property
is constrained. In these settings social norms and cus-
toms also influence the roles that men and women take
in their personal relationships, the aspirations they
have about a future occupation and earnings, and their
ability to own and manage property. And while there
may not be strict limits on women’s movement outside
the home, there are negative consequences nonethe-
less for girls and women who cross the boundaries of
social norms, including domestic violence, bullying in
schools, and sexual harassment at work, the topic of
a later section. In all, the degree of autonomy and em-
powerment that girls and women possess affects how
much they can expect to gain from schooling.
Lack of self-confidence as well as low self-esteem
can also limit a girls’ education. In a 2015 Baseline
Report of 19 diverse and innovative education proj-
ects for marginalized girls supported by the U.K.’s
Department for International Development’s (DFID)
Girls’ Education Challenge Fund (GEC), six projects
being evaluated identified the lack of self-confidence
as a barrier to girls’ education (Coffey, 2015). The
same report identifies female aspirations, motivation,
and autonomy factors such as self-confidence as a
barrier “that has a direct influence on girls’ enroll-
ment, retention, attendance, and learning” (Coffey,
2015, 54). CAMFED’s SEM statistical model designed
to examine their education data from programming
in Zimbabwe also finds a strong relationship between
academic success and academic self-efficacy (“the
sense of being good at and enjoying academically-
related activities” (Johnson and Liht, 2015, 3). This
correlation suggests that a strong academic achiever
perceives his or herself as a strong student. In ad-
dition, children’s perceptions of their self-efficacy
in their academic performance are correlated with
choices and aspirations about their occupation
(Bandura et al, 2001; Rolleston and James, 2012).
Program findings about an overall lack of self-esteem,
confidence, and self-efficacy among adolescent girls
have led development actors such as CARE to develop
a Girls’ Leadership Model for their girls’ education
programming. This model identifies self-confidence
as a key component for girls to gain agency in their
decisions and in becoming leaders (CARE, 2012). A
good quality education can help boost the confidence
and motivation among girls who may have a low
self-esteem due to their socio-cultural environment
(UNESCO, 2012).
Gender differences in benefit streams help explain
why parents might invest less in girls’ education than
boys’ even within the same family.15 In the previous
section, we presented some of the benefits from
women’s education that also spell out the cost of not
investing in girls’ schooling—higher earnings in the
labor market, better health and education for the
next generation, greater ability to cope with external
shocks, among others. The belief is that parents—and
28 GLOBAL ECONOMY AND DEVELOPMENT PROGRAM
students themselves—try to see into the future and
form expectations about how education might im-
prove their lives. Where parents and students expect
that education will open up possibilities of a better life
for their children (and the family as a whole), they are
more likely to spend time and resources for educa-
tion, at a given level of costs, than where they do not
expect such benefits. Of course, what are regarded as
possibilities for a better life in the future are likely to
be as varied as people are different and are typically
influenced by social norms. For male adolescents, for
example, being able to find a well-paying job and a
good marriage might be paramount. For female ado-
lescents, the same may be true but not necessarily in
equal measure. Education may not be seen as equally
important for these life dimensions. We have already
mentioned that in traditional communities in South
Asia more education increases the price a girl has to
pay to marry since social norms require that husbands
have more education than wives; in these communi-
ties, the returns to an additional year of schooling for
daughters, as compared with that for sons, is low. In
West Bengal, Beaman et al. (2011) find that, in places
where no woman had ever been the local leader,
86 percent of parents wanted their daughters to be
either a housewife or whatever their in-laws would
decide for her, compared with less than 1 percent for
their sons. Also, twice as many parents reported that
they wanted their teenage sons to graduate from
secondary school or college as those who wished the
same for their daughters.
The large variation in the number and type of income-
earning opportunities that await girls and boys after
school matters to parents and students themselves
when they make education decisions, although this
consideration likely differs across families and com-
munities according to prevailing social norms and also
poverty levels (Jensen, 2010). In the Middle East, the
average labor force participation rate (LFPR) of adult
women in 2012 is 21 percent as compared with 85
percent for adult men. In Latin America, the average
LFPR of adult men is about the same as in the Middle
East at 85.5 percent, but the average LFPR of adult
women is 57 percent. In sub-Saharan Africa, although
average education levels are lower than in any other
region, the average LFPR of men is 87 percent and
that of women, 72 percent. These patterns suggest
that while labor market returns may be associated
with the demand for girls’ schooling, there are pow-
erful mediating factors such as norms regarding the
acceptable roles of women and men at home and in
the workplace. Indeed, a study of gender differences
in earnings in Pakistan illustrates the effect of social
norms and attitudes, including of employers, to male
and female workers (Aslam, 2009). Although the mar-
ginal returns to women’s education are substantially
and statistically significantly higher than men’s (7-11
percent for men as compared with 13-18 percent for
women), a decomposition of the gender wage gap
reveals a large “residual” component that is not ex-
plained by individual characteristics such as educa-
tion and work experience.
Early marriage and teen pregnancy keep girls out of school
Child marriage is a global problem affecting 15 million
girls every year (UNICEF, 2014a). The United Nations
Population Fund (UNFPA) reported that “[d]espite na-
tional laws and international agreements, child mar-
riage remains a real and present threat to the human
rights, lives, and health of children, especially girls, in
more than a hundred countries” (UNFPA, 2012, 10).
Moreover, according to UNFPA today, “one in three
girls in low and middle-income countries (excluding
China) will marry before the age of 18. One in nine
girls will marry before their 15th birthday” (UNFPA,

TODAY’S CHALLENGES FOR GIRLS’ EDUCATION 29
2012, 10). UNICEF predicts that if there is no reduction
in child marriage, 1.2 billion girls will marry as children
by 2050 (UNICEF, 2014a). While most countries have
laws in place to address this practice, inconsistencies
between customary law and state law as well as inad-
equate policies and systems in place to ensure imple-
mentation, mean child marriage remains a culturally
entrenched social norm in many countries.
Figure 8 shows that in Niger, as much as 76 percent
of girls marry or are in a union before age 18 and 28
percent by the age of 15 (UNICEF, 2014b). In eight
other countries with data on age of marriage dur-
ing the period 2000-1, at least one-half of girls marry
before age 18, and in three other countries, about 30
percent marry by age 15. While countries with the
highest prevalence of child marriage are concentrated
in Western and sub-Saharan Africa, due to population
size, the largest number of child brides reside in South
Asia UNICEF, 2014b).
Child marriage imposes heavy costs for girls socially,
physically, and emotionally. The practice of child mar-
riage undermines efforts to improve girls’ education
and must be addressed if real, lasting progress is to be
made in improving the lives of girls. Girls who have no
education are three times more likely that those with
a secondary or higher education to marry by the age
of 18 (UNFPA, 2012), illustrating how effective school-
ing can be in preventing girls from marrying before
they are ready (UNICEF, 2010). In rural Bangladesh,
for example, each additional year that marriage is
delayed between ages 11 and 16 could add 0.22 year
of schooling and 5.6 percent higher literacy (Field and
Ambrus, 2008).
Table 5. Labor force participation rates, by sex and age group, by world region, latest year
Youth, 15-24 Adult, 25+
RegionFemales
(%)Males
(%) F/MFemales
(%)Males
(%) F/M
WORLD 39.0 55.2 0.706 53.5 83.3 0.643
Developed Economies and European Union
45.1 48.9 0.921 54.2 70.8 0.765
Central and Southeastern Europe (non-EU) and CIS
32.9 47.4 0.695 54.0 76.6 0.705
East Asia 52.9 57.0 0.928 65.6 83.0 0.791
Southeast Asia and the Pacific 45.3 59.4 0.763 63.5 89.6 0.709
South Asia 22.6 55.4 0.407 33.3 90.4 0.368
Latin America and the Caribbean 42.5 62.3 0.681 56.9 85.5 0.666
Middle East 13.4 47.4 0.283 20.9 84.9 0.246
North Africa 19.4 47.4 0.409 25.5 84.9 0.300
Sub-Saharan Africa 51.9 56.4 0.921 71.7 87.4 0.820Data source: ILO - Estimates and Projections of the Economically Active Population (EAPEP), 2013 Edition

30 GLOBAL ECONOMY AND DEVELOPMENT PROGRAM
0
10
20
30
40
50
60
70
80
90
100Ni
ger
Chad CAR
Bang
lade
sh
Mal
i
Guin
ea
Burk
ina
Faso
Sout
h Su
dan
Mal
awi
Moz
ambi
que
Indi
a
Som
alia
Sier
ra L
eone
Nige
ria
Zam
bia
Mad
agas
car
Ethi
opia
Dom
inic
an R
epub
lic
Eritr
ea
Nepa
l
Nica
ragu
a
Afgh
anis
tan
Cuba
Ugan
da DRC
Cam
eroo
n
Libe
ria
Tanz
ania
Gam
bia
28
76
68 6865
5552 52 52 50 48 47 45 44 43 42 41 41 41 41 41 41 40 40 40 39 38 38 37 36
29 29 29
15
21
10 9 912
1418 18
8
1712 12
1613
10 10 1015
9 913
117 7
Perc
ent o
f wom
en fi
rst m
arre
d be
fore
15 o
r 18
year
s ol
d
Country
0
10
20
30
40
50
60
70
80
90
100
Braz
il
Laos
PDR
Sao
Tom
e &
Prin
cipe
Mau
ritan
ia
Hond
uras
Côte
d'Iv
oire
Sene
gal
Suda
n
Cong
o
Yem
en
Beni
n
Com
oros
Zim
babw
e
Guat
emal
a
Equa
toria
l Gui
nea
Naur
u
Keny
a
Mar
shal
l Isl
ands
Beliz
e
Bhut
an
El S
alva
dor
Togo Ira
q
Colo
mbi
a
Guya
na
Mex
ico
Solo
mon
Isla
nds
Ecua
dor
Thai
land
11 95
14
36 35 34 34 34 33 33 33 33 32 32 32 31 30 3027 26 26 26 25 25 24 23 23 23 22 22 22
26
8 10 127 6
12 11 104
7 9
26 6 3
6 5 6 5 6 6 5 3 4 4
Perc
ent o
f wom
en fi
rst m
arrie
d be
fore
15 o
r 18
year
s ol
d
Country
Married by 15
Married by 18
Figure 8. Percentage of women aged 20 to 24 years who were first married or in union before ages 15 and 18

TODAY’S CHALLENGES FOR GIRLS’ EDUCATION 31
0
10
20
30
40
50
60
70
80
90
100
Guin
ea-B
issa
u
Gabo
n
Boliv
ia
Vanu
atu
Papu
a Ne
w G
uine
a
Cost
a Ri
ca
Paki
stan
Ghan
a
Stat
e of
Pal
estin
e
Buru
ndi
Kirib
ati
Peru
Mol
dova
Tim
or-L
este
Leso
tho
Surin
ame
Cam
bodi
a
Cabo
Ver
de
Para
guay
Haiti
Indo
nesi
a
Iran
Egyp
t
Mor
occo
Phili
ppin
es
Geor
gia
Turk
ey
Syria
n Ar
ab R
epub
lic
Azer
baija
nPerc
ent o
f wom
en fi
rst m
arrie
d be
fore
15 o
r 18
year
s ol
d
Country
Married by 15
Married by 18
22 22 22 21 21 21 21 21 21 20 20 19 19 19 19 19 18 18 18 18 17 17 17 16 14 14 14 13 127 6 3 3 2
73 5
2 3 3 3 1 3 25
2 30
3 3 3 2 3 2 1 3 3 1
0
10
20
30
40
50
60
70
80
90
100
Sri L
anka
Tajik
ista
n
Tuva
lu
Alba
nia
Viet
Nam
Ukra
ine
Nam
ibia
Jord
an
Rwan
da
Trin
idad
& T
obag
o
Jam
aica
Kyrg
yzst
an
Sain
t Luc
ia
Arm
enia
Uzbe
kist
an
Mac
edon
ia
Swaz
iland
Kaza
khst
an
Leba
non
Sout
h Af
rica
Djib
outi
Serb
ia
Mon
tene
gro
Mon
golia
Mal
dive
s
Bosn
ia &
Her
zego
vina
Bela
rus
Alge
ria
Tuni
siaPe
rcen
t of w
omen
firs
t mar
ried
befo
re 15
or 1
8 ye
ars
old
Country
Married by 15
Married by 18
12 12 10 10 9 9 9 8 8 8 8 8 8 7 7 7 7 6 6 6 5 5 5 5 4 4 3 2 22 0 0 0 1 0 2 0 1 2 1 0 1 0 0 1 1 0 1 1 2 1 0 0 0 0 0 0 0
Figure 8. Percentage of women aged 20 to 24 years who were first married or in union before ages 15 and 18 (continued)

32 GLOBAL ECONOMY AND DEVELOPMENT PROGRAM
Child marriage can be both a cause and consequence
of poor educational attainment and often takes place
in the time before a girl is about to be married, or
shortly afterwards when her domestic burden has
significantly increased and she is no longer able or
allowed to continue her education. Child marriage is
not always the reason for school dropout—school fees,
safety concerns, and poor quality of teaching also
have a significant impact on whether girls remain in
school—but once a girl has left school, it is more likely
she will marry and start to have children before she is
physically and emotionally ready.
Child marriages, particularly those below the age of
12, are typically arranged marriages that involve very
young girls marrying much older men.16[1] Such a large
age gap between partners can make it difficult for
girls to assert their rights, especially when it comes
to their sexual reproductive health. Child marriage
is often closely followed by intense pressure on girls
to prove their fertility and start child bearing, often
before she is physically or emotionally ready. Early
pregnancy is consistently among the leading causes
of death of girls aged 15-19 worldwide. In sub-Saharan
Africa, a woman faces a 1 in 31 chance of dying from
complications due to pregnancy or childbirth, com-
pared with a risk of 1 in 4,300 in developed regions
(World Bank, 2011). Girls younger than 15 face worse
odds than this; they are five times more likely to die
in childbirth than women in their 20s (UNFPA, 2012).
Lack of agency to use contraceptives also means that
married girls are often at a higher risk of repeated un-
wanted pregnancy, sexually transmitted diseases, and
HIV/AIDS (UNFPA, 2012).
Domestic violence is also a serious risk, especially
for girls who marry before their 18th birthday (WHO,
2012). For example, research conducted in two states
in India found that girls who marry before 18 are
twice as likely to report being beaten or threatened
by their husbands than girls who marry later (ICRW,
2006). These girls can suffer psychologically, includ-
ing feelings of hopelessness, helplessness, and severe
depression (Khan and Lynch, 1997). Often when girls
marry, they are forced to live with their new in-laws
and many find this leads to social isolation, restricted
movement, and diminished support networks.
Pervasive school-related violence harms millions of girls and young women
School violence is not a new concern, although it has
been a topic of international concern in the past de-
cade as horrifying details of incidents have become
more public through social media. Its relationship
to educational participation and academic perfor-
mance is typically not examined in research on the
determinants of schooling, perhaps because of the
absence of systematic information on its prevalence.
However, what data exist paints a picture of extensive
school-related violence inflicted on girls. This violence
ranges from extreme acts such as kidnapping, bomb-
ing, maiming, and killing, acts which often occur in
contexts of armed conflict, militancy, and political
violence but also in the often invisible but pervasive
contexts of sexual abuse, exploitation, and bullying.
In her landmark 1996 report to the U.N. secretary-
general, Impact of Armed Conflict on Children, Graca
Machel put the issue of extreme violence suffered by
girls and boys on the global agenda. Sexual abuse and
exploitation of girls is exacerbated by armed conflict
as children are especially vulnerable during times of
upheaval (Greene et al., 2013).
Research and global advocacy groups have responded
by increasingly focusing on school-related violence.
Relatively recent attacks on schools have been
documented by human rights advocates in over 30

TODAY’S CHALLENGES FOR GIRLS’ EDUCATION 33
countries around the globe (GCPEA, 2014). In at least
15 countries, girls have been singled out for attack
(Winthrop and McGivney, 2014). In these cases, girls
are maimed and killed for trying to go to school, as the
world bore witness to in the high-profile case of Malala
Yousafzai in Pakistan. Girls’ schools are bombed, girls
are raped, girls are abducted and forced to work as
“wives” in fighting forces. In Pakistan, the outright
ban on female education by the Taliban forced 900
schools in the Swat Valley to close or stop enrolling
female students. Although schools have since re-
opened, a year later many girls were still too afraid to
return to school (Winthrop and McGivney, 2015).
In these contexts of armed conflict, schools in many
countries are partially or fully occupied by armed
forces or groups seeking places to shelter or to wage
battle. The Global Coalition to Protect Education from
Attack (GCPEA) estimates that “at least 26 conflict-
affected countries in Africa, Asia, Europe, the Middle
East, and South America” were used by armed groups
or armed forces over the 10-year period of January
2005 to March 2015 (GCPEA, 2015, 14). Children who
attend military-occupied schools experience a wide
range of physical violence from crossfire or explo-
sive devices, sometimes leading to serious injuries or
death (GCPEA, 2015). The psychological consequences
of children witnessing violence including torture, ha-
rassment, and sexual abuse can have long-term con-
sequences that derail a child’s educational trajectory
and harms overall well-being (GCPEA, 2015).
Although incidents of extreme violence have gar-
nered global attention (e.g. Malala and the Chibok
girls in Nigeria), much of the school-related violence
experienced by girls is invisible or unrecognized.17
For this reason, it is important to examine the evi-
dence presented by school- and individual-level data
from a number of countries on the different forms
of school violence: sexual harassment, bullying, use
of abusive language, fights, and so on.18 One study
of 19 countries around the world surveyed more
than 100,000 male and female students to estimate
and examine the prevalence of bullying in schools
(Fleming and Jacobsen, 2010). Of the respondents,
34 percent reported having been bullied in the month
previous to the survey. About one-half of those who
had been bullied had been victimized one or two
days in the month while 8 percent were victimized
every day of the month. The prevalence of bullying
within individual countries ranged from less than
20 percent in Tajikistan, to 20-40 percent in China,
Lebanon, Morocco, Oman, the Philippines, the United
Arab Emirates, Tanzania, and Venezuela, and to 41–61
percent in Botswana, Chile, Guyana, Jordan, Kenya,
Namibia, Swaziland, Uganda, Zambia, and Zimbabwe
(Fleming and Jacobsen, 2010). On average, boys are
more frequently bullied than girls but the difference is
small (36 percent compared with 33 percent).
A study using the 1998 Demographic & Health Survey
in South Africa found that 1.6 percent of the adult
female respondents reported being raped before the
age of 15 and that the most common perpetrators
(one-third of the cases) were male teachers (Jewkes
et al. 2002). Another study finds that more than 30
percent of girls in southern Africa are raped in and
around school (Prinsloo, 2006). Students suffer other
forms of violence in the hands of their teachers. In
middle schools in Ghana, Malawi, and Zimbabwe, a
study using survey data from schools finds that the
abuse of girls by male teachers is part of a wider
problem of school-based violence (which includes the
excessive use of corporal punishment and bullying),
much of it perpetrated by males (Leach et al., 2003).
Likewise, survey data from middle and secondary
public schools in Egypt show that, despite a ministe-
rial decree against the use of physical punishment as

34 GLOBAL ECONOMY AND DEVELOPMENT PROGRAM
a disciplinary action, both boys (80 percent) and girls
(62 percent) were subjected to corporal punishment,
usually for poor behavior or academic performance—
with boys usually suffering the worse injuries from
this type of punishment (Youssef, Attia, and Kamel,
1998). A study based on a representative sample of
more than 10,000 public school students in grades 7-11
in Israel find that 29 percent of students have been
victims of specific acts of sexual harassment in school
during the month before the survey (Zeira, Astor, and
Benbenishty, 2002).
School-based violence or threats of violence of dif-
ferent forms militate against learning for all students
and serve as a deterrent to both school continua-
tion rates and academic performance. The sexual
harassment or abuse of girls by teachers and peers
imposes huge physical and psychic costs on parents
and students that deter schooling. In addition, the
cross-national study by Fleming and Jacobsen (2010)
finds evidence of long-lasting effects on students. For
example, students who have been bullied are more
likely to suffer from some form of mental illness, such
as depression, insomnia, and suicidal ideation, and to
adopt risky health behaviors such as tobacco, alcohol
and drug use, but the size and statistical significance
of these relationships among victimization and health
impacts vary by age, gender, and culture. Indeed, seri-
ous violence experienced by children and young ado-
lescents could stunt their mental and psychological
development into adulthood.
Lifting the obstacles to girls’ education
In this section we consolidated a number of factors
that contribute to gender gaps in education into four
sets: (1) the direct and indirect costs of schooling that
are higher for girls than boys, (2) the restricted space
and expectations embodied in social norms and at-
titudes that limit girls’ ability to reap the returns to
education, (3) early marriage and teen pregnancies
that keep girls out of school, and finally (4) the school-
related violence that harms millions of girls and young
women. We find that these four sets of obstacles are
present in the countries that are most behind with
respect to their education indicators (the “bogs”).
Compulsory education laws, the abolition of tuition
fees, and support for other costs through scholarships
have had positive effects on girls’ enrollment and
completion rates, but these interventions have ad-
dressed mainly the first set of obstacles. To break the
barriers and achieve greater progress in this group of
countries, the other obstacles must be addressed too.
Improvements in the education system as a whole are
needed—ensuring that learning happens in order to
increase the social and economic returns to educa-
tion, addressing gender bias in the formal and hid-
den curricula, and making schools welcome and safe
places for girls (and boys). These different reforms will
lift obstacles across the three groups of countries. To
supplement system-wide reforms, there are specific
interventions that can be targeted to girls; we discuss
the evidence on some of those interventions in the
following section. Finally, reforms outside the school
system are needed too—enacting or enforcing exist-
ing laws about the minimum age of marriage and ad-
dressing gender bias in the workplace. Gender gaps
in education reflect, in large part, gender inequality
in other aspects of society and the economy, and are
also often instruments for perpetuating that gender
inequality.

TODAY’S CHALLENGES FOR GIRLS’ EDUCATION 35
V. WHAT IS WORKING: EVIDENCE ON ADDRESSING GIRLS’ EDUCATION
This section presents the evidence from evalua-
tions of programs and policies, mostly in the de-
veloping world, that have been undertaken to increase
girls’ and women’s education. In addition to individual
research publications, the discussion has been largely
informed by several recent excellent reviews of evalu-
ations of education interventions (Conn, 2014; Duflo,
2012; Glewwe et al., 2014; McEwan, 2014; Murnane
and Ganimian, 2014; Unterhalter et al., 2014, among
others) and by recent reports prepared by or for
development organizations (NGOs and bilateral and
multilateral organizations) (UNESCO, 2006; UNFPA,
2012; UNGEI, 2012; World Bank 2011). We give priority
to those findings that are based on empirical evalu-
ations with credible counterfactuals. As with previ-
ous reviews, our review is affected by a “publication
bias”—that is, the published and accessible literature
tend to feature primarily those interventions that
have succeeded or have merited an evaluation and
publication. Hence, we have less to say about what in-
terventions have not worked than about interventions
that are working. In fact, many more impact evalua-
tions are needed for gender-targeted education pro-
grams. In her review of programs for adolescent girls,
for example, Lloyd, and Young (2009, 78) found:
…very little evidence that the activities cur-
rently underway have been evaluated or that
evaluations are being planned…A little more
than a quarter of the programs (28 percent)
reported that an evaluation had been con-
ducted or planned. Fewer than 10 percent
of the evaluations reported have been or
will be carried out by external partners or
agencies that can bring more objectivity and
scientific rigor to the evaluation. The rest are
presumably internal. We found only three
comprehensive evaluation reports publicly
and readily available on organizations’ web
sites: two provided by the World Bank, and
one by BRAC.
And while education as a sector has many more rigor-
ous evaluations, evaluations do not often disaggre-
gate results by gender.
It is important to consider female-targeted programs—
those policies that alter the costs or benefits of girls’
schooling relative to boys’ schooling—as well as sup-
posedly gender-neutral interventions, which do not
specifically target female (or male) schooling returns
or costs. Supposedly gender-neutral interventions can
still have gender-differential effects, widening rather
than narrowing gender gaps, or vice versa. Policies
to improve girls’ education in developing countries
have generally focused on increasing the immediate
benefits of schooling as well as on reducing the costs
of attending school for girls. Policies not directly con-
cerned with education, labor market, and childcare
services (such as those providing cash transfers to
households), have also been shown to affect school-
ing incentives and may do so differently for girls and
boys. There have been some relatively recent reviews
of interventions on girls’ education,19 so we draw from
their findings in our discussion of strategies.
High-quality and gender-sensitive curricula and learning materials
Textbook provision is almost universally accepted as
an important tool for teaching and learning when they
are used. But thumbing through textbooks used in
primary schools in many countries around the world,
one gets an immediate sense of the traditional and ac-
cepted gender roles in those countries. Boys and men

36 GLOBAL ECONOMY AND DEVELOPMENT PROGRAM
are engaged in outside activities or leading meetings.
Girls and women are busy with house work or care
activities. Men are doctors or policemen. Women are
nurses or primary school teachers. These textbooks
and the curricular design underlying them reflect as
well as reinforce gender roles. By reflecting existing
gender roles, their depiction of family, community,
or professional relationships is not put into ques-
tion. However, that depiction also sends an implicit
message about the right order of things. Over the
past three decades, an increasing number of studies
have been undertaken to examine the gender content
of textbooks. Most of these studies survey the fre-
quency with which males and females are featured in
textbooks and the types of roles attributed to them.
Some present quantitative evidence based on content
analysis of all textbooks or a representative sample
of textbooks in a country. Others are more impres-
sionistic and polemical. Blumberg (2007) undertakes
a comprehensive review of a large number of studies
and arrives at a number of conclusions. He notes that
gender bias in textbooks is widespread geographically
and more so than is suggested by the gender parity
ratio (as defined by MDG 3). Blumberg also concludes
that gender bias in textbooks exhibits a strikingly
common pattern across developed and developing
countries: Females tend to be greatly underrepre-
sented; males and females are associated with certain
personal traits; they are depicted in stereotyped ways
in both occupational and domestic spheres. The con-
tent of textbooks has been slow to change, so they do
not reflect actual progress in women’s empowerment
and changing roles in society and the economy.20
Blumberg links the gender bias in textbooks to a hid-
den gender bias in formal curricula that leads girls
away from mathematics and science and into “female”
courses of study, while boys are unsupported in de-
veloping reading and language skills. The relatively
unrecognized bias in basic curricula explains, at least in
part, the gender disparities in academic performance
that we have seen in international and regional tests. In
addition to the gender bias in textbooks, there are gen-
der stereotypes perpetrated in school activities outside
the classroom, including in sports, cultural activities,
and non-academic responsibilities assigned to girls (or
even female teachers) in the school.
What will it take to see faster change in the content of
textbooks and other learning materials and in extra-
curricular activities in schools? Blumberg (2007) of-
fers a set of recommendations. From that set, we find
promising the recommendation to engage with NGOs,
textbook experts, and researchers familiar with this
issue in developing non-sexist learning materials and
curricula, crafting an implementation strategy, and
sensitizing teachers to explicit and hidden gender bias
in materials and curricula as early as their pre-service
training. We would pick out also the recommendations
to undertake adequate, gender-disaggregated moni-
toring and evaluation of any intervention in this con-
tent area, and to support impact research using varied
evaluation techniques—randomized trials, natural ex-
periments, and quasi-experimental designs—in order
to understand how specific measures affect a range of
outcomes at different points in the educational cycle.
The funding and expertise required to mount such a
systematic attack on the problem will be substantial,
so poorer countries are going to need financial and
technical support that would best be undertaken with
a coordinated donor effort.
This set of recommendations would be a major un-
dertaking that would require considerable funding
and expertise, as well as political will and support. The
need for political support is emphasized by Stromquist
(2007), who writes about Latin American countries but
whose caution applies to other countries as well:

TODAY’S CHALLENGES FOR GIRLS’ EDUCATION 37
The evidence suggests that insufficient work
is occurring in most national educational sys-
tems to modify curriculum content, textbooks,
and teachers’ skills and understanding of gen-
der issues. [Institutions such as governments
and conservative religious hierarchies] are
reluctant to alter curriculum and practices [to-
ward greater gender equity]. [But] despite the
weak attention to gender equity in schooling, it
may represent the strongest source of counter
messages to traditional norms learned in the
family, community, and national media. (as
quoted by Blumberg, 2007, 35).
In the United States, it took legislative action (Title IX)
to reduce or eliminate gender discrimination in educa-
tional institutions at all levels.21 The most well-known
application of Title IX is about equal athletic opportu-
nities for males and females, but the law also protects
students from discrimination on the basis of pregnant
status, marital status, or parenthood. Research on
the impact of the law reveals that, at least in the case
of athletics, there has been a huge increase in the
number of girls’ teams across different sports and
a large number of girls and young women compet-
ing in those sports (Brake, 2010). In turn, an impact
evaluation using pre- and post-law cohorts indicates
that a 10-percentage point rise in state-level female
sports participation generates a 1-percentage point
increase in female college attendance and a 1 to 2 per-
centage point rise in female labor force participation
(Stevenson, 2010). The law has also provided a legal
recourse for young women who have been sexually
harassed or discriminated against in their educational
institutions, although the implementation of the law in
this regard has been rife with controversies.
Taiwan has a similar national law, the Gender Equity
Education Act passed in 2004, that aims to “promote
substantive gender equality, eliminate gender dis-
crimination, uphold human dignity, and improve and
establish education resources and environment of
gender equality” (Taiwan, Republic of China, 2004).
The passing of the law was preceded by an assess-
ment of gender bias in Taiwan’s curriculum and
teaching practices. It prohibits schools from discrimi-
nating by gender orientation in its admissions policies
(except for schools that are historically single-sex
schools) and in its teaching practices, assessments,
and facilities. Similar to Title IX, it specifically protects
the right to education of pregnant students. It speci-
fies that teachers will be given gender equity courses
in their pre-service and in-service training. The U.S.
and Taiwan experience with amendments or additions
to the specifics of the law, implementation, enforce-
ment, and dispute resolution issues offer lessons for
countries that have yet to enact or enforce this type
of legislation.
Girl-friendly infrastructure
The most common government intervention in edu-
cation is the direct provision of public schools, which
includes the construction of school buildings and
classrooms, the allocation of teachers, and the distri-
bution of textbooks, school supplies, and classroom
equipment. Previous studies have examined the effect
of different aspects of this provision. In many stud-
ies, one or more measures of school quality, usually
defined as instructional materials, have been shown
to explain variation in attendance or enrollment, con-
trolling for other household, school, and community
factors. However, not all spending for infrastructure
and school inputs adds to learning; these inputs are
not effective when they are not accompanied by
complementary programs such as teacher training
or curriculum reform (McEwan and Marshall, 2004;
McEwan, 2012). Schools and classrooms must be

38 GLOBAL ECONOMY AND DEVELOPMENT PROGRAM
environments conducive to learning. Considering the
state of schools especially in rural or low-income ar-
eas, investments in the physical capacity of schools to
deliver services adequately are warranted.
Programs that focus on improving infrastructure and
school inputs should be designed with incentives
for girls in mind to ensure that they improve girls’
education outcomes. In Burkina Faso, a government
program, the Burkinabé Response to Improve Girls’
Chances to Succeed (BRIGHT) program, which placed
well-resourced schools in 132 villages, is an example
of such a program. The package of interventions in-
cluded school construction, incentives to children to
attend school and a mechanism for mobilizing com-
munity support for education in general and for girls’
education in particular. The prototype school included
three classrooms, classroom equipment, school
kits and textbooks, a playground, housing for three
teachers, separate latrines for boys and girls, and a
borehole equipped with a manual pump that served
as a source of clean water. All students were eligible
for school meals each day they attended school, but
girls were also eligible for take-home rations condi-
tional on 90 percent attendance each month. There
was an extensive information campaign for parents
on the potential benefits of education, particularly of
girls’ education; an adult literacy training program for
mothers; and capacity building among local officials.
The program sought to place more female teachers in
program schools, and teachers and ministry officials
received gender sensitivity training. Using a regres-
sion discontinuity evaluation design, a study finds that
the enrollment of all children rose by 19 percentage
points and scores improved by 0.41 standard devia-
tions on a test that covered math and French subjects
(Kazianga et al., 2012). The program increased girls’
enrollment by 5 percentage points more than boys’
enrollment, but boys’ and girls’ test scores increased
by the same amount. The evaluation also finds that
the “girl-friendly” amenities alone increased enroll-
ment by 13 percentage points above the 27 percent-
age point effect on girls of providing a regular school,
and raised test scores for all children in the village
by 0.35 standard deviations, in addition to the 0.32
standard deviation effect of providing a non-BRIGHT
school.
Great teachers
A focus on the role of teachers in addressing gen-
der disparities is well-deserved. There is strong evi-
dence of the positive relationship between teachers’
education, experience, and cognitive skills and their
students’ academic performance. Six recent reviews
of hundreds of impact evaluations of education inter-
ventions find that programs that train, support, and
motivate teachers are among the most effective. For
example, in the United States, having a good teacher
is equivalent to the average gain in learning of one
school year; having a great teacher means advancing
1.5 grade levels or more; but having a weak teacher
means mastering less than half of the expected sub-
ject content (Hanushek and Rivkin, 2010). What a
“great” teacher means and how to produce one are
the critical questions, of course. What is needed to
produce a great teacher is not always as expected. In
India, for instance, contrary to expectations, students
whose teachers have fewer than 10 years of experi-
ence do significantly better in language achievement
tests compared with those whose teachers have more
experience, but students whose teachers have had in-
service training in the previous 12 months tend to per-
form better than students whose teachers have had
no such training (Chudgar and Sankar, 2008).
The shift in teacher ability and pedagogy that is
needed is characterized by Darling-Hammond (2010)
TODAY’S CHALLENGES FOR GIRLS’ EDUCATION 39
as follows: “education can no longer be productively
focused on the transmission of pieces of information
that, once memorized, comprise a stable storehouse
of knowledge. Instead, schools must teach disciplinary
knowledge in ways that focus on central concepts and
help students learn how to think critically and learn
for themselves so that they can use knowledge in new
situations and manage the demands of changing in-
formation, technologies, jobs, and social conditions.”
Having great teachers may be even more important for
girls. In contexts where the benefits of sending girls to
a formal school are not recognized and formal school-
ing is regarded with suspicion, effective teaching and
learning right from the early grades ensure that girls
have acquired the basic competencies of reading and
math by the time they are pulled out of school—and
may even convince the girls and their parents of the
rewards of school attendance. However, a school and
classroom environment that is less conducive for girls
than for boys to learn would make schooling less at-
tractive to girls and could mean lower gains for them
with each year of enrollment. How teachers manage
the classroom and interact with students and their
mastery of subject content can make the school more
or less attractive to girls. In the Philippines, for ex-
ample, a program that improved the availability and
quality of schools through more teacher training, and
more textbooks especially at earlier grades, improved
education indicators, especially for girls. In terms of the
female–male gap, the program is estimated to have re-
sulted in 0.34 more school years, 0.14 lower repetition
rate in high school, 9 percent higher college entry rate,
and lower likelihood of girls working while they were
still enrolled in school, controlling for other factors. The
long-term impact of these relative gains for girls, as
seen for those beneficiaries who were tracked by a sur-
vey, was to reduce the salary gap between young men
and women (Yamauchi and Liu, 2011).
But are great teachers for girls necessarily female teach-
ers? Advocacy pieces have argued strongly for hiring
more female teachers as a means to increase girls’
schooling (Kirk, 2006; UNESCO, 2014). What is the ba-
sis for this advocacy, and does the evidence show that
indeed female teachers are more likely than male teach-
ers to increase girls’ enrollment and their learning? Are
female teachers better at teaching girls? Or is the need
for a larger presence of female teachers primarily about
alleviating parental concern about the moral or physical
safety and well-being of their daughters which may be of
paramount importance to girls’ schooling in traditional,
gender-segregated societies?
Some of the reasons for the advocacy for female
teachers are summarized by Kirk (2006):
• In some conservative communities, parents will
not allow their daughters to be taught by a male
teacher. In such settings, mothers feel more com-
fortable talking about their children with a woman
teacher. Parents may regard the presence of female
teachers as partial protection for girls from un-
wanted attention from boys or male teachers, and
even from sexual abuse and exploitation.
• In the school, female teachers may act as advocates
for girls, representing their perspectives and needs,
and promoting more girl-friendly learning. For ex-
ample, women teachers may be able to advocate for
better toilet and washing facilities, and for providing
female students with accurate information about
their own bodies and how to look after them.
• The presence of female teachers can support and
encourage girls by serving as role models. They rep-
resent possibilities that can open up when girls con-
tinue their studies. They demonstrate that women
can be active outside the home and be agents for
community development.
With respect to effective teaching, however, the
evidence for female teachers is decidedly mixed. For

40 GLOBAL ECONOMY AND DEVELOPMENT PROGRAM
example, a study of Indian classrooms in five states
that investigates the relationship between student
learning outcomes and the presence of female teach-
ers finds that, controlling for teacher’s education
and training background, male and female teachers
do differ in their classroom management practices,
but this difference is not directly related to learning
outcomes (Chudgar and Sankar, 2008). On the whole,
the widest differences between the classroom man-
agement styles of male and female teachers pertain
to their views on the need for strict discipline and
the importance of fear, with male teachers emphasiz-
ing the need to maintain control and authority in the
classroom. The study concludes that having a female
teacher is relatively advantageous for language learn-
ing but has no effect on math learning. However, girls
did not show a significant benefit when compared
with boys, and although girls did poorly in math over-
all compared with boys, that performance was not
further enhanced or worsened by the gender of the
teacher.
A careful study of a large sample of schools, teachers,
and students in Pakistan examines various hypotheses
that might explain the relationship between teacher
gender and any observed gender gap in math achieve-
ment (Warwick and Jatoi, 1994). When matched
against other possible influences on achievement,
teacher gender is the single most powerful predictor
on two mathematics tests, but the hierarchical linear
model results challenge the notion that male teachers
are inherently better than female teachers at teach-
ing math.22 The findings do not demonstrate a general
pattern of male superiority in teaching mathematics
and warn against making statements about male and
female ability in teaching and learning mathematics:
“The results on student achievement in urban areas,
and especially those showing a reversal of the gender
gap among teachers with university degrees, remove
the basis for any universal claims about male and fe-
male capability in teaching mathematics” (Warwick
and Jatoi, 1994). It is useful to list here the key find-
ings of the study because these identify possible ar-
eas for inquiry and policy change in other countries:
1. The female school supervisors visited girls’ schools
and met with rural female teachers significantly
less often than their male counterparts visited boys’
schools and met with rural male teachers. The prob-
lem was lack of adequate transportation for women
in rural areas. Whereas male supervisors could use
motorcycles and bicycles to reach schools, for cul-
tural reasons female supervisors had to be driven to
schools in appropriate transportation which proved
to be harder to secure.
2. The level of formal schooling attained by the
teacher is related to their students’ achievement,
and female teachers have, on average, much less
formal schooling than male teachers, especially in
rural areas. According to school supervisors, rural
schools find it difficult to attract and retain urban
women as teachers. These teachers must face the
“lack of transportation allowances for visits to their
homes, less contact with learning coordinators than
is the case in rural male schools, the risks of rob-
bery, rape, and kidnapping in certain areas, the ab-
sence or poor quality of school buildings, the need
to deal with a new language or culture in their com-
munities, and difficulties in making social contacts
with village residents.” In urban schools, whether
the student has a male or female teacher has no re-
lationship to the mathematics achievement of boys
in grade 4. Among girls in that grade, those taught
by women score much higher than those taught by
men. But one grade up, boys do significantly better
with male teachers while girls have about the same
achievement scores with male or female teachers.
3. According to officials, the students of male teachers
have higher scores in math because male teachers
use different teaching classroom practices. They
are more likely than female teachers to use class-
room practices associated with higher mathematics

TODAY’S CHALLENGES FOR GIRLS’ EDUCATION 41
achievement: greater coverage of the curriculum in
mathematics and science and having student trans-
lators explain what teachers are saying to students
who speak a different language. Again, these differ-
ences are present in rural schools but not in urban
schools where female teachers have received a uni-
versity degree.
In all, Warwick and Jatoi (1994) conclude that the
math gender gap arises mainly from the urban or ru-
ral location of schools, the formal education attained
by the teachers, and coverage of the math curriculum
by teachers. Hierarchical linear modeling shows that
teacher gender has a much stronger influence on the
mathematics achievement of students than student
gender.
The evidence for the recruitment of more female
teachers has been justified by the observation that in
“countries where there are more or less equal num-
bers of male and female primary teachers, there is
close to gender parity in student intake. In contrast,
in countries where women constitute only 20 percent
of teachers, there are far more boys than girls enter-
ing school.” The evidence presented is accurate but
the interpretation is a spurious one. While the aver-
age share of women in the teacher force across 127
countries with available data is 54 percent, among
the countries where the gender gap in net enrollment
rate in secondary education is one standard deviation
below the average gender gap, the average share of
female teachers is indeed only 20 percent (table 6).
However, this statistic does not imply causality. It is
not surprising that in countries with the lowest sec-
ondary enrollment rate for girls now the supply of
future female teachers is also likely to be the lowest.
Table 6. Percent share of female teachers in secondary education
Region/Country Name Latest year
% female teachers
World 2013 52.2%High income 2012 65.0%Upper middle income 2012 66.8%Middle income 2012 53.2%Lower middle income 2012 50.3%Low income 2012 30.5% Least developed countries: U.N. classification 2012 30.1% Heavily indebted poor countries (HIPC) 2010 27.2%OECD members 2012 61.9%Euro area 2012 65.4%European Union 2012 66.9%North America 2012 66.8%Europe & Central Asia (all income levels) n/aEast Asia & Pacific (all income levels) 2012 53.2%Middle East & North Africa (all income levels) 2009 48.7%Developing countries only: Europe & Central Asia n/a East Asia & Pacific 2012 53.5% Cambodia 2013 42.1% Timor-Leste 2011 30.4% Latin America & Caribbean 2012 63.2% Middle East & North Africa 2008 47.1% Arab World 2005 46.8% South Asia 2012 42.4% India 2011 44.5% Bhutan 2012 42.3% Afghanistan 2012 31.0% Nepal 2014 27.4% Bangladesh 2012 19.9% Sub-Saharan Africa 2010 29.5% Madagascar 2012 44.7% Zambia 2011 30.2% Rwanda 2009 28.5% Ethiopia 2012 27.1% Djibouti 2013 26.2% Ghana 2014 25.3% Niger 2012 22.2% Mozambique 2009 21.0% Burundi 2009 19.5% Gambia 2013 18.9% Senegal 2008 18.8% Mali 2013 16.8% Eritrea 2012 16.3% Burkina Faso 2009 15.8% Sierra Leone 2013 14.5% South Sudan 2011 14.0% Comoros 2013 13.9% Mauritania 2013 12.8% Benin 2013 11.1% Guinea 2011 5.7% Chad 2012 5.7% Liberia 2014 4.8%
Data source: UNESCO data through World Bank, EdStats website; we use the average for the years 2000-14 because the latest available data for all countries covered these years. Notes: Teachers refer to teaching staff in lower secondary (public and private, full and part-time, all programmes).

42 GLOBAL ECONOMY AND DEVELOPMENT PROGRAM
Cost-reducing mechanisms
Demand-side interventions which reduce the costs of
schooling tend to have the clearest gender-differen-
tiated results on enrollment (Glewwe, 2002). We re-
view here two broad types of mechanisms: those that
transfer cash to households in exchange for children
attending school (a means perhaps to compensate
households for the foregone work, domestic work,
or work for pay, of children; and those that eliminate
or reduce direct costs associated with school atten-
dance.
Cash transfers to households. The potential effect of
cash transfer programs on schooling has been dem-
onstrated by how much they have influenced school
enrollment and attendance, although the impacts of
these programs have been found to be larger when
specific conditions about schooling are imposed on
the households.
Existing conditional cash transfer (CCT) programs,
when they provide transfers for both boys and girls,
generally provide identical transfers. Only about half
of available studies of the educational impacts of CCTs
actually report results by gender. Of those reporting
results by gender, the PROGRESA/Oportunidades
program is the only program where impacts (for en-
rollment) are significantly higher for girls than boys.
Most studies show similar impacts of CCTs for girls
and boys, with a couple of contexts where CCTs ap-
pear to improve educational outcomes for boys more
than for girls. This evidence thus suggests that CCTs
do not act to reduce gender inequalities in education
favoring boys (Behrman, Parker and Todd, 2011). The
PROGRESA/Oportunidades program probably obtains
gender differences in impact because transfers for
girls are about 15 percent higher more at the second-
ary (grades 7–9) and high school levels (grades 10–12)
than for boys. This feature was originally motivated by
the higher dropout rates of girls than boys after pri-
mary school in rural areas of Mexico, although in fact
overall grades of completed schooling were similar for
boys and girls at the time of program implementation.
Experimental evidence clearly reveals the impor-
tance of conditionality attached to the transfer and
not just the size of the cash transfer.23 In Malawi,
school attendance and enrollment are significantly
higher in a program’s conditioned group, using data
from teacher-reported attendance and enrollment
rather than student/family reports (Baird, McIntosh,
and Ozler, 2011). Compared with a control group, the
conditioned group of girls aged 13 to 22 shows higher
scores on math and English achievement tests and a
cognitive (Raven’s) test, whereas the unconditioned
group shows no significant impact. Enrollment is not
sensitive to the size of benefits in the conditioned
groups, but is responsive in the unconditioned trans-
fer group; each additional dollar increases enrollment
by 0.08 percentage points. Who receives the transfer
for the family, not just the size of the transfer, also
appears to make a difference in CCT programs. Gitter
and Barham (2008) analyze the Nicaraguan CCT pro-
gram to test whether impacts on school enrollment
are higher in households where women hold more
power (measured as women’s level of education di-
vided by men’s level of education). Their results sug-
gest that impacts of CCTs are higher when the woman
holds more power in the household.
Can these programs actually sustain improvements
for girls beyond their initial impact on enrollment?
A stipend initiative for girls in Pakistan introduced
incentives for girls to spend more time in school and
less time at work (Alam, Baez and del Carpio, 2011).
An evaluation found that in the short term enroll-
ment rates went up by almost 9 percentage points;
five years hence, the program seems to have also

TODAY’S CHALLENGES FOR GIRLS’ EDUCATION 43
increased transition rates from middle to secondary
school and completion rates at grade 9.
Zero-fees and scholarships. Advocates for the aboli-
tion of school fees claim that school fees and other
policies that increase the direct costs to families are
a significant obstacle to enrollment, especially for the
poorest and most vulnerable children. Across-the-
board elimination of school fees, it is argued, has the
lowest overhead and yields the broadest impact, and
that it is less expensive and ultimately fairer to pay
fees for everyone than to divert funds into identifying,
verifying, and delivering financial assistance to a sub-
set of students. Abolishing fees can be done quickly
while setting up the infrastructure for delivering
targeted scholarships can significantly delay getting
benefits to needy families. Those less supportive of
abolishing school fees for all students argue that this
approach tends to subsidize the affluent as well as the
needy, unnecessarily increasing the fiscal cost of basic
education. Those families that can pay for their chil-
dren to attend school should and the resources used
to subsidize them could be used to augment subsidies
for the most disadvantaged students and/or invest in
better school quality.
On the one hand, some argue that the most appropri-
ate way to reduce school costs to families is for inter-
national organizations to directly subsidize the costs
of education in selected countries, thereby allowing
the government to abolish school fees; on the other
hand, some argue for a more targeted scholarship
program, in which only those most in need of financial
assistance receive it. Both approaches have strong
advocates but there are positive and negative ele-
ments of each approach. A central issue is whether it
is feasible and cost effective to identify eligible candi-
dates and deliver scholarships to targeted subsets of
students in countries characterized by weak economic
and social infrastructure and moderate to high levels
of corruption.
There are several examples of scholarships programs
targeted to girls. It is important to take note of the
design of these programs: the size of the scholarship
and what costs it covers, how recipients are selected,
whether conditions exist with respect to retaining the
scholarship, and how outcomes are monitored. We fo-
cus here on those programs that have been evaluated
in a rigorous fashion.
• The Bangladesh Female Secondary Stipend Program
dates back to 1982 when it was established—first in
a small number of rural districts, before it was ex-
panded to more rural districts and finally expanded
once more to become a national program in 1994.
Under the program, all rural girls who enter second-
ary school are eligible for a monthly sum amount-
ing to less than $1, with additional grants in Class
9 for new books and in Class 10 for exam fees. The
stipend is expected to cover 50 percent of the costs
of textbooks, uniforms, stationary, transportation,
exam fees, and miscellaneous direct educational
expenses. The stipend is paid directly to an account
in the girl’s name in the nearest Agrani Bank, a
state agricultural bank with branches throughout
the country. Once a school participates in the pro-
gram, all female students satisfying these criteria
receive the grants as prescribed for each grade and
the school is directly paid by the program for the
corresponding tuition. To continue to receive the
stipend, each awardee must maintain a minimum
of 75 percent attendance rate, at least a 45 percent
score in the annual school exams, and must remain
unmarried until she obtains the Secondary School
Certificate (SSC) or reach age 18 (Raynor and
Wesson 2006). In the past two decades, Bangladesh
has seen impressive increases in girls’ enrollment at
the primary and secondary levels. Researchers have
attributed these increases to the stipend program.
One evaluation estimates that, on average, one year
of the stipend program has increased girls’ second-
ary school enrollment by 12 percentage points, but

44 GLOBAL ECONOMY AND DEVELOPMENT PROGRAM
with this impact being larger for girls from families
who own more land (Khandker, Pitt and Fuwa, 2003).
• In Cambodia, the Japan Fund for Poverty Reduction
(JFPR) scholarship program, launched in the 2004
school year, awarded scholarships to poor girls who
were completing sixth grade, the last grade of pri-
mary school. The value of the scholarship is large—
in 2002, mean per capita gross domestic product
in Cambodia was approximately $300 (World Bank
2005). Another way of benchmarking the magni-
tude of the transfer is by comparing it with expendi-
tures by households on education. On average, the
$45 transfer is almost exactly equivalent to average
household spending per student in lower secondary
school, as reported in a recent household survey.
The program increased the enrollment and atten-
dance of recipients at program schools by about
30 percentage points (Filmer and Schady 2008).
Impact is larger among girls in the lowest socioeco-
nomic stratum at baseline. The results are robust
to a variety of controls for observable differences
between scholarship recipients and non-recipients,
to unobserved heterogeneity across girls, and to
selective transfers between program schools and
other schools.
• In Pakistan in the 1990s, the government of the
province of Balochistan initiated two pilot programs
that assisted communities in setting up private
schools and offered financial assistance to defray
the initial costs of operation as well as to assist
in setting up an endowment (Alderman, Kim and
Orazem, 2003). In both the urban girls’ fellowship
program and the rural program the government
support was based on the number of girls the new
schools could enroll. Despite the hurdles in finding a
qualified local woman who could serve as a teacher
in the rural school, more than 200 new schools
were established as a result of the program. Many
villages could not participate because they lacked
an educated woman who could serve as a teacher.
Villages that qualified for the rural girls’ fellowship
schools were among the least-educated villages in
the province. The estimated two-year enrollment
changes ranged from 25–45 percentage points in
Quetta, and by 25 and 29 percentage points in two
rural districts with initially very low enrollments.
• In Kenya, girls who scored well on academic exams
had school fees paid and received a grant as part of
a merit scholarship program (Kremer, Miguel and
Thornton, 2009). Girls showed substantial exam
score gains and teacher attendance improved in
program schools. There were positive externalities
for girls with low pretest scores, who were unlikely
to win a scholarship. There was no evidence for
weakened intrinsic motivation. There were hetero-
geneous program effects. In one of the two districts,
there were large exam gains and positive spillovers
to boys. In the other, attrition complicates estima-
tion, but one cannot reject the hypothesis of no
program effect.
• Another example of a targeted scholarship program
is the Ambassadors Girls’ Scholarship Program
(AGSP), which is funded by USAID. The AGSP in
Sierra Leone and Djibouti illustrate the weakness
of the latter approach which is partly due to the
lack of administrative capacity to implement a
targeted program (Chapman and Mushlin, 2008).
Scholarships are to be given to girls who are (a)
orphaned or in a single-parent/guardian home, (b)
handicapped or disabled, (c) economically disad-
vantaged, and (d) highly academically motivated as
evidenced by past school performance. The schol-
arship package was essentially the same across all
AGSP schools. It provided for payment of school
charges and the provision of textbooks, book bags,
uniforms, shoes and socks, school supplies, and a
school lunch. Local selection committees decide
which girls will receive an award. In Sierra Leone,
while recipients and parents were grateful for the
scholarships, the program fueled envy among
other equally needy and qualified non-recipients
who were not selected as beneficiaries. Community
members and parents recount stories of non-schol-
ars expressing their envy and sense of inferiority by
choosing not to go to school. In Djibouti girls who
did not receive the scholarships they thought they
deserved apparently dropped out of school from
frustration at being passed over.

TODAY’S CHALLENGES FOR GIRLS’ EDUCATION 45
• One scholarship program that managed the conflict
that could arise from non-beneficiaries who be-
lieve that they were qualified to be a beneficiary is
Colombia’s scholarship program in the 1990s, which
was targeted toward low-income students in urban
areas. As in Sierra Leone and Djibouti, the demand
for the scholarship exceeded the number of ben-
eficiaries that the program could support, so the
government agency that managed the program in-
stituted a lottery among those applicants who met
the selection criteria of the program (King, Orazem
and Wohlgemuth, 2001). Although the program did
not distinguish between male and female recipients,
an impact evaluation of the program (which used
the lottery mechanism to define an appropriate
control group) finds that the benefits differed by
gender. In particular, the school voucher programs
targeted to girls were found to increase enrollment
rates of both girls and boys (King, Orazem, and
Wohlgemuth 1999; Angrist et al., 2002).
Safety in schools and freedom from violence
On the factors that might explain school violence,
a study of 37 countries that participated in TIMSS
concludes that predictors of national rates of general
crimes are not good predictors of system-wide levels
of school violence (Akiba et al., 2002). Although basic
national conditions (e.g., GDP) and demographic con-
ditions (e.g., size of the youth population) associate
with levels of violence, the study finds that factors in-
herent in the education system such as large variation
in school quality and in student achievement are more
powerful predictors of school violence. The authors
argue that equalizing the quality of education that all
students receive might be a national policy interven-
tion that can reduce school-related violence.
The village-based schools program in rural Afghanistan
illustrates the benefit of shortening the distance to
school to girls’ education. While all children have
benefited from the program, the effects accrue dis-
proportionately to girls (Burde and Linden 2013).
Decreasing distance to school affects girls more than
boys—girls’ enrollment rises by 6 percentage points
more per mile reduced and, perhaps because of their
consistent attendance, their test scores rise by an
additional 0.09 standard deviations. Likewise, provid-
ing girls a safe means for getting to school increases
enrollment. An innovative program state of Bihar (and
neighboring states) in India aimed to reduce the gen-
der gap in secondary school enrollment by providing
girls who continued to secondary school with a bicy-
cle. This bicycle program, launched in 2006, increased
girls’ age-appropriate enrollment in secondary school
by 30 percent and reduced the gender gap in age-ap-
propriate secondary school enrollment by 40 percent
(Muralidharan and Prakash 2013). An impact evalu-
ation finds that increases in enrollment mostly took
place in villages where the nearest secondary school
was further away, suggesting that the mechanism for
program impact was the reduction in the time and
safety cost of school attendance made possible by
the bicycle. The coordinated provision of bicycles to
girls appears to have improved safety for girls cycling
to school in groups, and countered social norms that
proscribe female mobility outside the village.24
Girls’ and women’s capabilities for leadership and ability to make choices
Although the large variation in labor force participa-
tion data across countries and world regions indicates
that the relationship with demand for education is
not a simple one, within the limits of the cultural
context, it appears that young people do respond to
labor market incentives. Not many studies directly
test this responsiveness to expected future returns
to education on schooling decisions. For this reason,
the experimental study by Jensen (2010a) provides

46 GLOBAL ECONOMY AND DEVELOPMENT PROGRAM
very useful information. The pre-intervention survey
indicated that, on average, eighth-grade boys in the
Dominican Republic significantly underestimate the
returns to secondary education; 42 percent expected
that there would be no difference in their future earn-
ings if they completed only primary school, while
12 percent expected higher returns. The boys in the
treatment group were then provided information on
the actual increases in earnings for workers who com-
pleted more years of education. Better information
on returns to schooling increased the perceived re-
turns of the treatment group by 28 percent and these
boys completed, on average, 0.20–0.35 more years of
school over the next four years than those who did not
receive the information. Underestimating returns to
education perhaps explains why, in 2012, whereas the
persistence rate for boys in the Dominican Republic at
the primary level was 76 percent, their net enrollment
rate at the secondary level was 20 percentage points
lower. The study suggests that the dissemination of
information about returns is relatively inexpensive, so
this seems a cost-effective way of encouraging young
people to stay in school longer. Would this interven-
tion work for girls as well?
Instead of providing information about labor market
returns to education for young women, an experiment
in India provided three years of recruiting services to
help young unmarried women in randomly selected
rural villages get jobs in the business process out-
sourcing industry (Jensen, 2010b). This randomized
intervention examined whether an increase in employ-
ment prospects in India’s growing business process
outsourcing industry would lead to more schooling for
girls. The intervention connected young women to ex-
perienced recruiters. The evaluation found that girls
in the treatment villages were indeed more likely to be
in school; they also had greater body mass index (BMI)
measures, a reflection of nutritional status.
As examined in the prior discussion of soft skills, the lit-
erature on the benefits of developing soft or non-cogni-
tive skills in developing countries is limited; nonetheless,
a number of studies, particularly from OECD countries,
have suggested the positive benefits soft skill brings to
life outcomes. In addition to these longitudinal studies
that support the connection between soft skills and the
development of self-esteem, perseverance, and sociabil-
ity, there are projects and initiatives that are working
with girls to develop leadership programming that pro-
vides hands-on learning where the girls learn soft skills
through guided life experiences like leadership activities.
These projects have important takeaways and positive
outcomes worth noting:
• CARE’s Girls Leadership Programme focuses on
developing the leadership skills of girls through
extracurricular activities such as sports, the arts,
debate clubs, and school government (CARE, 2012).
The girls then apply the leadership skills acquired
to civic engagement activities in their schools and
communities. External evaluations of CARE’s two
girls’ leadership programs reveal demonstrated
development in girls’ agency as well as “robust
evidence of and potential to impact girls ‘leadership
development’” (CARE, 2012). CARE’s definition of a
“girl leader” is an “active learner who believes she
can make a difference in her world, and acts alone
and with others to bring about positive change”
(CARE, 2012, 2). Additionally, the girl leader must
demonstrate and develop the mastery of certain
soft skills such as voice/assertion, decision-making/
action, self-confidence, organization, and vision/
ability to motivate others—a competency-based ap-
proach that helps girls find their power within and
a similar empowerment/leadership framework
presented in Rowlands (2009) (Care, 2009; O’Neil,
Plank, and Domingo, 2015). CARE’s Girls Leadership
Programme assisted in building girls’ confidence
in Bangladesh leading to girls’ action in initiating a
community engagement about child marriage that
resulted in the abandonment of child marriage in
villages (CARE, 2012).

TODAY’S CHALLENGES FOR GIRLS’ EDUCATION 47
• Camfed’s Learner Guide Programme25 in sub-
Saharan Africa and Study Hall Foundation’s Girls’
Education program in India provide similar in-
sights.26 Girls in both programs have a chance to
talk with others, reflect on that engagement, and
most importantly use these opportunities to prac-
tice improving skills—an approach sometimes re-
ferred to as “hands-on, minds-on” learning, which
has been shown to be an effective pedagogical ap-
proach that assists in the development of soft skills.
Both programs have a core set of teaching and
learning materials that are designed to cultivate
leadership and life skills among marginalized girls,
have a networking component that links students
and mentors or teachers together, and anchors
their work in existing institutions like the school
and community. In Camfed’s Learner Guide pro-
gram, young women graduating secondary school
act as mentors for marginalized girls at lower lev-
els of education. The young women are trained on
leadership skills and how to help teach them, are
given a recognized position in the community and
in the schools, are networked with peers in other
communities, and run weekly sessions with girls
helping them problem-solve around the challenges
they are facing. In the Study Hall Foundation’s pro-
gram, teachers are trained on gender dynamics and
life skills, they are networked digitally with other
teachers in the same program, and once a week in
addition to the government curriculum the teachers
run a session for girls discussing their aspirations
for their lives and the problems they face. In both
cases, these strategies have provided a safe fo-
rum for marginalized girls to discuss and address a
range of issues from basic problems such as needed
school supplies to much more sensitive issues such
as abuse, exploitation, and early marriage.
What do project findings and the research suggest
for designing and implementing women’s and girls’
leadership training? The DfID-funded Learning and
Evidence Project on Women’s Voice and Leadership in
Decision Making provides a useful assessment of the
existing evidence around girls and women’s leader-
ship. A number of recent reports, all conducted by the
Overseas Development Institute, review in total hun-
dreds of studies on different dimensions of the topic,
including the role of technology. Overall, the evidence
base needs to be strengthened, but the data that does
exist points to some relevant findings, including:
• A range of capabilities are important, especially
soft skills. Girls and women need diverse skills to
be effective leaders. Studies drawing on evidence
from multiple countries indicate important capabili-
ties that include things such as creativity, flexibility,
patience, and the ability to take risks (O’Neil, Plank
and Domingo, 2015). Interestingly, some studies
show that mastering the use of new technology,
such as information and communications technolo-
gies, can help cultivate women’s confidence and
sense of self—both traits important for developing
the “power within” (Cummings and O’Neil, 2015).
• Adolescence is a great time to start cultivating
leadership skills. Various authors have found that
girls are open and interested in learning leadership
skills at this time in their lives. Also, studies on ef-
fective women leaders point to the importance of
leadership experiences during childhood and ado-
lescence (O’Neil, Plank and Domingo, 2015).
• Experiential learning approaches are important.
Experiential learning, sometimes called hands-on,
minds-on learning, can be an effective way to cul-
tivate leadership skills. This is especially true for
developing the “power within,” which is crucial
because “adolescent girls confront a ‘psychological
resistance’ in which, unable to ‘hear themselves’
in dominant cultural discourses, they experience a
conflict between what they feel themselves to know
and experience, on the one hand, and what socio-
cultural norms permit them to express outwardly,
on the other” (O’Neil, Plank and Domingo, 2015).
• Female role models can be effective. Girls’ obser-
vations of female role models can help provide an
alternative vision for their future compared to the
dominant cultural discourse. Studies from Uganda

48 GLOBAL ECONOMY AND DEVELOPMENT PROGRAM
and India found that role models can have a positive
influence on girls’ education and career aspirations
(O’Neil, Plank and Domingo, 2015).
• Support from men and boys. Several studies noted
the importance of men and boys in helping with
girls’ leadership trajectories. Some note the impor-
tance of fathers and brothers and their support in-
side the family as well as other areas of girls’ lives,
while others note the importance of engaging boys
in the extracurricular leadership activities girls’
engage in out in the community (O’Neil, Plank and
Domingo, 2015).
• Technology can effectively connect women.
Studies of rural women or isolated women, namely
women living in contexts where they are afforded
limited freedom of movement, have shown that in-
formation and communication technologies (ICT),
when deployed in a way that did not fuel anger or
a backlash from men in their lives, could provide
increased connection and information between
women and to the outside world. “Gaining both
skills and access to digital ICTs can provide women
and girls with alternative channels for self-expres-
sion and engagement in public affairs, regardless
of their physical location and if they experience
gender-based constraints on their voice locally (i.e.
increased power to)” (Cummings and O’Neil, 2015,
p. 6).
Interestingly, one area that studies have found wom-
en’s leadership activities has not fully leveraged is in
e-governance. E-governance is where the actors such
as the government and civil society employ digital
technology and data platforms to better understand
how services are delivered and what the end user is
experiencing, all in an effort to improve public service
delivery (Cummings and O’Neil, 2015). Anecdotal evi-
dence points to limited connection between these two
arenas. For example, in Northern Nigeria not a single
girls’ club was engaged in a government civil society
monitoring program (Walker, 2015).
Indeed, it is not only the monitoring of public services
that holds promise. Digital technology makes possible
a wide array of new possibilities for girls and women’s
participation in informing policy. What has been widely
called the “data revolution” describes the way in which
new forms of information are able to be collected, ana-
lyzed, and ultimately used. The 2014 United Nations
report, A World That Counts: Mobilizing the Data
Revolution for Sustainable Development, describes key
features of the data revolution. Some of these include
the ability for new voices to play a role making data
inform policy, new voices such as citizens and those
from marginalized groups. The advent of so called
crowdsourcing—getting large numbers of people to re-
spond to a particular issue—also opens up a new mech-
anism for getting accurate information as the average
response is surprisingly accurate. There are a number
of examples of digital technology enabling real time
data collection that is then used by relevant actors.
For example, in Uganda the Mtrac program collects
data via SMS (or text messaging) from health workers
on the outbreak of malaria, making response more
effective and rapid (U.N., 2014). Originally started as
an initiative by nongovernmental actors, the Ugandan
government quickly adopted the practice. Another
example from India and Egypt is the use of digital me-
dia to collect information from women on incidents
of violence and harassment. Currently a civil society
initiative, the data is tracked on maps allowing women
to make decisions about where they should and should
not go (Cummings and O’Neil, 2015).
Ultimately, a woman’s ability to choose and act at any
point in time partly reflects foundations laid earlier in
her life, often starting in childhood. These outcomes,
or expressions of agency, are:
• Ability to move freely. This is measured by wom-
en’s freedom to decide their movements and their
ability to move outside their homes.

TODAY’S CHALLENGES FOR GIRLS’ EDUCATION 49
• Control over resources. This is measured by wom-
en’s ability to earn and control income and to own,
use, and dispose of material assets.
• Decision-making over family formation. This is
measured by women’s and girls’ ability to decide
when and whom to marry, when and how many chil-
dren to have, and when to leave a marriage.
• Ability to have a voice in society and influence
policy. This is measured by participation and repre-
sentation in formal politics and engagement in col-
lective action and associations.

50 GLOBAL ECONOMY AND DEVELOPMENT PROGRAM
VI. WHAT SHOULD WE DO: TAKING ACTION ON GIRLS’ EDUCATION
Taking action on girls’ education should not be
confined to the halls of government offices or mul-
tilateral institutions. Civil society networks, business
leaders, media organizations, academia, social enter-
prises, philanthropic communities, and individual global
champions all have a role to play. With this in mind, we
are recommending two focused streams of action.
Our first recommendation, to lean in with girls’ and
women’s leadership, proposes specific initiatives that
are well positioned for engaging diverse actors, in-
cluding: women’s groups, technology companies, me-
dia partners, transparency and education NGOs, and
government education planning departments. These
initiatives are envisioned as catalytic “quick wins”
that, if given sufficient financial and political support,
could be scaled up within a short time period. They
also represent an attempt to explore relatively new
approaches to tackling the decades-long girls’ educa-
tion problem. It is our assessment that all countries
could benefit from leaning in on girls and women’s
leadership, as it is fundamental to sustainable social
change not only for girls’ educational opportunities
but for gender equality more broadly.
Our second recommendation, to pursue systemic re-
form with a gender lens, recognizes the central role of
governments in any effort to address the gender gap in
education. Governments are ultimately responsible for
delivering education for all of their country’s children,
girls and boys alike, and for brokering partnerships
that will help the state’s education system deliver on
this promise. We propose that governments, together
with their international partners, make a long-term
commitment to education system reform with a gender
lens. This approach has long been recognized as impor-
tant but still needs extra attention to be implemented
systematically in all countries. We acknowledge that
each country has a different experience with education
reform, including systemic reforms undertaken with a
gender lens, and therefore must decide for itself how
to best advance against this recommendation. We pro-
pose specific guidance that countries should take into
account when doing so.
While made separately and with distinct purposes in
mind, these two recommendations are also mutually
reinforcing. Improved girls’ and women’s leadership, in-
cluding new data generated, can provide an important
feedback loop for governments either for planning or
monitoring purposes. Likewise, government reforms can
open up space for girls’ and women’s leadership, serving
to both help it flourish and reap its outcomes in terms of
improved girls’ education opportunities. Ultimately, we
hope that these two recommendations, and the specific
initiatives made within each, are translated into action
and together with the wide range of other strategies
actors are pursuing can make a difference to girls, their
learning opportunities, and ultimately their ability to be
successful in their lives and livelihoods.
Recommendation 1: Lean in with girls and women’s leadership
Putting girls and women at the center of efforts to
close the gender gap in education is smart for sev-
eral reasons. While the evidence that exists for this
was reviewed in previous sections, it bears repeating.
Supporting girls’ and womens’ leadership capabilities
and promoting opportunities can:
• be a positive and potentially life-changing experi-
ence for the girls themselves.
• yield important information and insight for program
and policy designers.
• contribute to longer term changes in social norms.

TODAY’S CHALLENGES FOR GIRLS’ EDUCATION 51
We propose two specific initiatives that could help
countries lean in with girls’ and women’s leadership.
Both are informed by what evidence exists on this
topic but ultimately both are suggestions to explore
relatively new approaches. Hence, they can also serve
as important learning opportunities, learning about
what works and increasing the evidence base around
promising new strategies to support girls’ education.
Recommendation 1.1: Build strong girl leaders
The existing evidence, indicates that supporting girls’
and young women’s leadership capabilities and op-
portunities can help them increase their sense of self-
worth and sense of their own ability to affect change
(i.e. “power within”) as well as their ability to make
choices, and interact and influence others (i.e. “power
to”). Girls need strong foundational skills such as lit-
eracy and numeracy, but equally important for mar-
ginalized girls is the opportunity to build up a range
of capabilities. These soft skills are anything but soft.
They include, as previously discussed, the ability to
creatively solve problems, to communicate effectively,
and to have confidence in one’s abilities despite facing
resistance or failure. This full suite of competencies
is what we know girls need to be empowered. While
many children may develop these types of capabilities
from quality parenting, community interactions, and
learning opportunities, in the case of marginalized
girls, this is not a given. Thus, explicit attention should
be paid to ensuring marginalized girls have opportuni-
ties to build these valuable skills.
Evidence also points to the ways in which girls’ lead-
ership capabilities and opportunities can support
longer-term shifts in social norms. Engaging girls’ in
leadership activities during adolescence is a particu-
larly useful because they are especially open to learn-
ing new skills and it can pave the way for a lifetime
of activism. A common characteristic across women
leaders is their engagement in leadership activities
as girls. Girls and women leading in their schools or
communities provides visible role models, something
that has been seen to be important in shifting social
norms and perceptions around gender. Finally, from
girls’ clubs to women’s organizations to national net-
works, active attention to girls’ education issues by
local groups can provide sustained focus on gender
equality, especially in the face of shifting government
policy, donor priorities, or media attention.
Therefore, we propose a girls’ leadership initiative
that simultaneously provides opportunities for girls to
develop these soft skills as well as provides roles mod-
els and networks that help shift social perceptions and
norms around girls’ education and gender equality.
How could this work? Below are suggestions:
• Program components. Central to this initiative is
a mentorship model, where teachers or girls who
are finishing secondary school serve as mentors
for girls, providing opportunities for girls to learn,
reflect, and practice leadership skills in their daily
lives. Components of such a program include:
º Curriculum. Teaching and learning materials
that provide guidance to mentors on how to lead
discussions and help facilitate girls’ development
of soft skills and leadership capabilities.
º Safe space. A location, whether inside the
school or elsewhere in the community, where
girls are able to gather together and talk freely
with their mentor. In contexts where movement
is highly restricted, either for security or other
reasons, mentors may move from place to place.
º Learn by doing. Activities either within school
or within the community that give girls the op-
portunity to learn by doing, as many of these
soft skills are cultivated through experiences and
interaction with others.

52 GLOBAL ECONOMY AND DEVELOPMENT PROGRAM
º Network. Connecting the young women and the
girls involved in the initiative in one school or
community to others in different locations pro-
vides a sustaining community of practice.
º Engaging men and boys. Reaching out to boys
in school settings or the community, as well as fa-
thers and male community leaders, to find ways to
engage them in the process will be crucial.
• Focus. The focus of this initiative could start with
the countries farthest behind on girls’ education—
namely, those stuck in an education “bog.” A re-
gional focus within Africa, such as West Africa, and
within Asia, such as Southwest Asia, could leverage
synergies across borders.
• Scale. Given sufficient financial support, this ini-
tiative would have the possibility to be developed
and launched within three years. There are many
existing civil society organizations that are on the
ground and have the capacity to expand their activi-
ties to play a role in this initiative. It could first start
by building on existing NGO capacity and quickly
bring in governments and international organi-
zations, ultimately with the potential to scale up
widely and sustainably across regions.
• Partners. Organizations that are well placed to be
partners in this initiative include NGOs and net-
works with an expertise in girls’ and women’s edu-
cation and leadership, including: women’s groups;
U.N. agencies working on girls education within
the identified regions; funders from governments,
foundations, or corporate sectors; and ultimately,
governments with a ministry of education, ministry
of youth, or ministry of gender that are interested
in reaping immediate benefits to girls education and
also seeding long-term social change.
Recommendation 1.2: Girl-generated data
Gender-disaggregated or gender-related data that
can be used to monitor, evaluate, and advocate for
gender-sensitive programs and policies are needed
to promote further progress in gender equality. Girls
and women can help make this happen. To date, citi-
zen transparency and e-governance initiatives have
not typically leveraged girls’ and women’s leadership
or involvement. Yet there are some examples that
illustrate the promise this synergy holds, such as us-
ing information and communications technology and
crowdsourcing to identify and disseminate informa-
tion about effective occupational training or financial
programs for girls and women. Indeed, the data revo-
lution as a new movement can open up possibilities
for girls’ and women’s leadership. While the elements
of the data revolution that are particularly relevant
for girls’ and women’s leadership have been reviewed
in a prior section, it is worth summarizing them below:
• Democratizing data collection, with citizens having
new ways of sharing information and reporting on
problems, which in particular provides the potential
for increased voice from marginalized groups.
• Real time data, with information more rapidly col-
lected, aggregated, analyzed, and ready for use
than ever before.
• Easier to collect data on sensitive issues, with more
private mechanisms for sharing information and re-
porting problems, thus enabling data to be collected
on topics that face social taboos or other forms of
restrictions.
• Crowdsourcing, with large numbers of people pro-
viding information on a particular topic, which has
been shown to increase data accuracy.
• Promising policy linkages, with initial indications
showing that real time, citizen-generated data can
be effectively used by policymakers.
For these reasons, we propose a girl-generated data
initiative, which would combine the power of “factiv-
ists and feminists.” Girl-generated big data has the
potential to radically change the power dynamics
with girls themselves generating regular information
TODAY’S CHALLENGES FOR GIRLS’ EDUCATION 53
about their circumstances, needs, and achievements
that is translated into digestible and timely insight for
policymakers, civil society actors, community leaders,
and educators. Transparency and accountability take
on whole new meanings in this light and ultimately
puts the girls at the center of the process. A girl-
generated big data initiative also can go a long way in
helping fill the data gap on girls’ education, both on
basic education data that we have seen is often miss-
ing in many countries but also more importantly on
sensitive issues.
The importance of this potential to have better in-
formation on sensitive subjects in particular must be
underscored. We know that violence and child mar-
riage gravely impact girls and this appears to be par-
ticularly pervasive in countries where girls’ education
is not making progress, in other words, countries we
have classified here as “bogs.” Data on these phenom-
ena is particularly hard to come by. Mechanisms that
will allow for richer data on girls’ experiences with
violence and child marriage are crucial. For example,
we frequently hear the phrase that a girl has dropped
out of school “to get married.” But dig behind this
reason, and there is a complex interplay of causal fac-
tors. Often, it is not the case that a girl drops out of
school, but that she is “pushed out,” and at that point
her only option lies in marriage (Lake, 2015). In other
words, she did not drop out to get married; she was
pushed out and then got married. If we can get to
such hidden truths as to why girls are being pushed
out of the school system, then we can inform the right
action to tackle these challenges and deliver much
more effective solutions. In the end, it is ultimately
the girls themselves who are best able to explain and
share these stories and who with technology as a tool
can generate helpful and timely action on the part of
adults in their lives.
This approach is especially relevant today in an era
where citizen action is increasingly a force for social
change and where technology is helping bring to life
new forms of information and interpersonal connec-
tions that previously were unthinkable. How would
such an initiative work? Below are some suggestions:
• Program components. At the heart of this initiative
is an effort to put mobile technology into the hands of
girls (and boys) and to position them as drivers of real
time data on their lives and education. This includes:
º Girls and boys. Both girls and boys should be ac-
tively and equally engaged in this initiative, col-
lecting data on education and their experience
in their lives. Framing this as an initiative led by
young people of both genders will provide a mea-
sure of protection for girls who will need to be
supported (and not negatively targeted) because
they are engaging in citizen reporting. It will also
provide useful information about the different
(or similar) perspectives between girls and boys.
º Data on education and sensitive issues. A mix
of data should be collected, including informa-
tion on schooling experiences, family life, and
information that provides deep insight into some
of the issues that are sensitive or culturally diffi-
cult to discuss publicly, such as experiences with
violence and child marriage, both of which are
notoriously hard to collect data on with adult-
driven methods.
º ICT dep loyment , espec ia l ly mob i les .
Deployment of ICT, especially mobile technology,
which offers the opportunity for girls and boys
to conduct short surveys using for example ODK
Open Data Kit or SMS forms, even in areas with
low internet access.
º Training. Training activities will be provided for
the girls and boys engaged in the data collec-
tion, as well as for community leaders to ensure
they mobilize in support of the youth, and for
decision-makers so that they understand the
usefulness of the information.

54 GLOBAL ECONOMY AND DEVELOPMENT PROGRAM
º Collection and analysis. Data could be uploaded
and stored in the so-called cloud, and storage
and analysis could be done by an independent
entity that is able to ensure appropriate mea-
sures are taken to protect the privacy of data
collectors.
º Dissemination. Once analyzed, data could be
disseminated back to those engaged in the initia-
tive, and most importantly, to decision-makers at
different levels, such as teachers, education ad-
ministrators, community leaders, civil society ac-
tors engaged in girls’ empowerment, education
ministries, international agencies, and donors
and investors.
• Focus. Similar to the prior initiative on girls’ lead-
ership, the focus of this initiative could start with
countries the farthest behind on girls’ education,
namely those stuck in education “bogs.” A regional
focus within Africa, such as West Africa, and within
Asia, such as Southwest Asia, could leverage syner-
gies across borders.
• Scale. This initiative has the possibility to be trans-
formative for girls’ education, but it is ultimately
based on a relatively new idea around the power of
citizen reporting, and hence should be piloted be-
fore it is fully scaled up. However, once a successful
and scalable model is developed, the initiative has
the potential to scale rapidly across many countries,
assuming sufficient financial support.
• Partners. Organizations that are well placed to
be partners in this initiative include technology
and data analytics companies, transparency and
e-governance NGOs, teachers unions, civil society
organizations, networks focused on gender equal-
ity and issues like child marriage, researchers with
expertise on gender equality, planning departments
of education, gender ministries, and funders and
investors from governments, foundations, and cor-
porate sectors.
• Connection with the Build Strong Girl Leaders initiative. This initiative has obvious points of in-
tersection with the previously proposed initiative
on supporting girls and women’s leadership skills.
For example, one of the activities on which mentors
could work with girls is collecting data for the girl-
generated data initiative.
Recommendation 2: Focus systemic reform with a gender lens
Ultimately, the best approach for helping girls get
educated is to ensure that countries have strong edu-
cation systems, ones that enable all children to access
good schools and learning opportunities. Country
data presented earlier indicate that the countries with
the worst education indicators are those that are fail-
ing all students. Good schools must be places where
girls and boys alike must be given the opportunity to
thrive and grow. This means the school environment
is free of violence; school culture emphasizes respect
and equality; teachers are caring, motivated, and
trained to teach; infrastructure is adequate and ac-
cessible; textbooks and other materials are relevant,
present, and used and reflect messages of equality;
and students spend their time in school engaged in
learning activities.27 These are broad as well as pro-
found reforms that will demand the best effort from
a country’s political leaders, educators, students, and
communities. They will require robust financing and
administrative capacity, and staunch support from
civil society. The most effective path for reform would
depend on the specific challenges and opportunities
in the country, but they cannot be simply a collection
or series of effective but uncoordinated programs.
Our aim is to make the case that ministries of educa-
tion and their external partners (including education
sections in multilateral agencies, donor groups, and
civil society organizations) should consider the follow-
ing two actions.

TODAY’S CHALLENGES FOR GIRLS’ EDUCATION 55
Recommendation 2.1: Design for education hotspots
Around the world, girls face very different circum-
stances that constrain their educational opportuni-
ties. System-wide reforms must be implemented in
accordance with the preexisting contexts of those sys-
tems. In doing so, ministers of education, multilateral
and bilateral institutions, and civil society organiza-
tions engaged in reform processes should ensure they
pay particular attention to the key obstacles in the
education system that hold girls back. In particular we
urge the global community to focus on hotspots—es-
pecially on countries where progress on closing the
gender gaps has stalled, those countries stuck in an
education bog. This would include:
• Governments. Girls face numerous obstacles when
attempting to access learning opportunities in a
country stuck in an education bog; one of those
obstacles is cost, both out-of-pocket outlays for
direct costs and the time cost of attending school
regularly. By prioritizing national budgets and ex-
ternal aid dollars, governments can remove these
costs for children in struggling and disadvantaged
households. This is where the value for money is
potentially greatest, but it would pay to consider
the lessons from other countries and to continue to
learn from what works in the local context.
• Governments and teacher organizations. Once
in school, girls must be able to learn and thrive,
something particularly important during the early
grades when the foundation for school success is
being established. Great teachers can unleash the
potential in these girls. Governments and teachers
organizations must prioritize teacher training, gen-
der-sensitive pedagogy, and classroom support in
order to help as many teachers as possible in their
work. Teachers and teacher organizations can be
powerful agents for this reform.
• Donors. Overseas development assistance for basic
education has been decreasing in the last five years
and nowhere is this more dramatic than in sub-Sa-
haran Africa, home to more than half of the coun-
tries we have classified as stuck in an education bog
(UNESCO 2014; GPE, 2015). International donors
should prioritize more of their funding toward those
countries that need assistance the most, but this
support should be expected to make significant
improvements in the education and gender indica-
tors that are lagging behind. Continued support for
filling the gaps in gender-disaggregated data and
knowledge gaps about gender-focused reforms is
support for a powerful public good. Past support
for improving enrollment and completion rates and
expanding participation in international or regional
assessments has already paid off in terms of raising
awareness and building political momentum among
all education actors around gender equality.
• Humanitarian system. Despite extensive advocacy
by civil society, humanitarian aid for education re-
mains extremely low—on average less than 2 per-
cent of estimated needs are met (GPE, 2015; Nicolai,
2015). Emergencies and protracted crises devastate
the education systems of many countries. At least
15 of the countries classified as stuck in educa-
tion bogs are also facing humanitarian emergen-
cies, based on UNICEF’s recent categorization. The
U.N. special envoy for global education has urged
humanitarian and development actors to set up a
specialized funding stream for education in humani-
tarian contexts. If allocated with gender issues in
mind, this support would go a long way in helping to
close the gender gap in these countries.
Recommendation 2.2: Focus with a gender lens
Countries themselves, and their regional and global
partners, must design and implement systemic re-
forms with a gender lens. This means all decisions
around things such as policy, budgets, hiring, and
monitoring must be evaluated with the understanding
of their differential impacts on girls versus boys. To
do this, the issue of gender equality cannot be a top

56 GLOBAL ECONOMY AND DEVELOPMENT PROGRAM
concern for only those people in a specialized gender-
focused unit, as often is the case in government minis-
tries or donor agencies. Rather, gender equality must
be a core concern of personnel across all agencies
working on system reform.
It is key to move from the debate between gender
targeting and gender mainstreaming to a debate that
explicitly recognizes that eliminating gender inequality
requires both a focus on quantitative education indica-
tors and a wide-angle view of the key “proximate” in-
dicators of gender inequality that impact gender gaps.
These proximate indicators—including age of marriage,
labor force participation rates and occupational distri-
bution of women, and share of women in business, edu-
cation, and government leadership—are closely related
to education outcomes for young women because they
spell out the possible futures for them. Profound, sys-
temic education reform would require changes outside
the education system as well. Designing such reforms
explicitly aiming for equity and equality would mean
that, while improving the performance of the educa-
tion system as a whole holds the promise of improving
education for everyone (“a rising tide lifts all boats”),
the resulting system would be essentially blind to per-
sistent and specific obstacles that disadvantaged popu-
lations, including girls and young women, face. For this
reason, gender affirmative action policies that aim to
even the playing field for women have been enacted in
many countries. Such policies address unequal endow-
ments and attempt to give women a fighting chance in
what are supposed to be gender-neutral contests.
One approach that should be expanded and robustly
supported is to apply a gender lens to education
sector planning. In most developing countries, the
Education Sector Plan (ESP) is a key policy tool for
designing and planning implementation and moni-
toring in the education sector. It has the potential to
guide the setting of priority goals, the mobilization
of resources toward shared objectives, and enhanced
accountability for realizing a common vision of educa-
tion for all. Sound education sector planning is at the
heart of the Global Partnership for Education model—
and is the basis of support given by multilateral and
bilateral organizations—and thus can be linked to ma-
jor sources of external financing for education.
Applying a gender lens to the process of sector plan
development—including sector analysis, plan prepara-
tion, and plan appraisal—can ensure that that the key
tools for national education system reform and as-
sociated policies and strategies promote effective ac-
tions that advance gender equality. Applying a gender
lens helps to bring to the fore gender considerations
in national policy and program: Is there coherence be-
tween the compulsory education law and age of mar-
riage law? To what extent are these laws enforced?
What gender-disaggregated data are used to analyze
the sector challenges and to design the reform strat-
egy? Do the data cover both enrolment and learn-
ing outcomes? Are there teacher policies to support
women’s effective engagement in the sector, such as
maternity leave? Does the teacher training curricu-
lum reflect gender-related challenges that teachers
will encounter in the school and classroom? Is the
girls’ education strategy financed? Is the governance
of scholarship schemes putting girls at risk of sexual
exploitation? Are systems in place to monitor rates of
school-related gender-based violence (SRGBV)?
The UNGEI-GPE Guidance for developing gender-re-
sponsive education sector plans provides a framework
for understanding gender issues in education, includ-
ing the identification of key concepts and tools to help
in the analysis, design, and monitoring of education
sector plans (UNGEI-GPE, forthcoming). This high-
quality tool can be used across a range of contexts
and its guidance should be regularly part of plan de-
velopment processes.

TODAY’S CHALLENGES FOR GIRLS’ EDUCATION 57
REFERENCES
Abbott, P. Haerpfer, C., and Wallace, C. 2008. “Women
in Rwandan politics and society.” International
Journal of Sociology, 38 (4): 111–125.
Abu-Ghaida, D. and S. Klasen. 2004. “The costs of
missing the millennium development goal on gen-
der equity,” World Development 32 (7): 1075-1107.
Ackerman, X. 2015. Innovation and Action in Funding
Girls’ Education. Global Economy & Development:
Working Paper 84. Washington, D.C: Brookings
Institution.
Akiba, Motoko, LeTendre, G., Baker, D., and Goesling,
B. 2002. “Student victimization: National and
school system effects on school violence in 37
nations.” American Educational Research Journal
39 (4):829-853.
Alam, A., Baez, J. E. and Del Carpio, V. 2011. “Does
cash for school influence young women’s behav-
ior in the longer term? Evidence from Pakistan.”
Washington, DC: The World Bank, Policy Research
Working Papers.
Alderman, H., and King, E. M. 1998. “Gender differ-
ences in parental investment in education.”
Structural Change and Economic Dynamics 9(4):
453–468.
Alderman, H., Orazem, P. F., and Paterno, E. M. 2001.
“School quality, school cost, and the public/pri-
vate school choices of low-income households in
Pakistan.” The Journal of Human Resources 36
(2): 304-326.
Alderman, H., Kim, J., and Orazem, P. F. 2003. “Design,
evaluation, and sustainability of private schools
for the poor: The Pakistan urban and rural fel-
lowship school experiments,” Economics of
Education Review 22 (3): 265-274.
Anderson, K. H., King, E. M., and Wang, Y. 2003.
“Market Returns, Transfers, and Demand for
Schooling in Malaysia, 1976-89.” Journal of
Development Studies 39 (3): 1–28.
Angrist,J., Bettinger, E., Bloom, King, E.M., and Kremer,
M. 2002. “Vouchers for Private Schooling in
Colombia: Evidence from a Randomized Natural
Experiment,” American Economic Review 92 (5):
1535-59.
Aslam, M. 2009. “Education Gender Gaps in Pakistan:
Is the Labor Market to Blame?” Economic
Development and Cultural Change 57 (4): 747–
784.
Baird, S., McIntosh, C., and Ozler, B. 2010a. “Cash or
condition? Evidence from a randomized cash
transfer program.” Washington, DC: The World
Bank, Policy Research Working Papers.
Baird, S., McIntosh, C., and Ozler, B. 2010b. “The short-
term impacts of a schooling conditional cash
transfer program on the sexual behavior of young
women,” Health Economics 19 (S1): 55-68.
Baird, S., McIntosh, C., and Özler, B. 2011. “Cash or con-
dition? Evidence from a cash transfer experiment,”
The Quarterly Journal of Economics, 126 (4).
Bandura, A., Barbaranelli, C., Caprara, G., and
Pastorelli, C. 2001. “Self-Efficacy Beliefs as
Shapers of Children’s Aspirations and Career
Trajectories.” Child Development, 72 (1): 187-206.
Published by Wiley on behalf of the Society for
Research in Child Development. Accessed May
30, 2015, Stable URL: http://www.jstor.org/sta-
ble/1132479

58 GLOBAL ECONOMY AND DEVELOPMENT PROGRAM
Bardasi, E., and Wodon, Q. 2010. “Working long hours
and having no choice: Time poverty in Guinea.”
Feminist Economics, 16(3): 45-78.
Barro, R. J. and J-W. Lee. 1994. “Sources of economic
growth.” Carnegie-Rochester Conference Series
on Public Policy 40: 1-46.
Basu, K. 1999. “Child labor: cause, consequence, and
cure, with remarks on international labor stan-
dards.” Journal of Economic literature, 1083-1119.
Beaman, L., Duflo, E., Pande, R., and Topalova, P.
2011. “Female Leadership Raises Aspirations
and Educational Attainment for Girls: A Policy
Experiment in India.” Science 335(6068): 582-
586. doi:10.1126/science.1212382.
Beegle, K., De Weerdt, J., and Dercon, S. (2010).
“Orphanhood and human capital destruction: Is
there persistence into adulthood?” Demography,
47(1): 163-180.
Bedi, A., and Marshall, J. 2002. “Primary school at-
tendance in Honduras”. Journal of Development
Economics. 69 (1): 129-153.
Behrman, J. R., Foster, A. D., Rosenweig, M. R., and
Vashishtha, P. 1999. “Women’s schooling, home
teaching, and economic growth,” Journal of po-
litical Economy. 107(4): 682-714.
Behrman, J.R., Parker, S.W. and Todd, P.E. 2011. “Do
Conditional Cash Transfers for Schooling
Generate Lasting Benefits? A Five-Year Follow-Up of
Oportunidades Participants,” Journal of Human
Resources 46 (1): 93–122.
Blankespoor, B., S. Dasgupta, B. Laplante, and D.
Wheeler. 2010. “Adaptation to climate extremes
in developing countries: The role of education.”
Washington, DC: The World Bank, Policy Research
Working Papers.
Blankespoor, B., Dasgupta, S., Laplante, B., and
Wheeler, D. 2010. “The economics of adaptation
to extreme weather events in developing coun-
tries.” Center for Global Development Working
Paper No. 199. Washington, DC: Center for Global
Development
Blumberg, R. 2007. Gender bias in textbooks: a hidden
obstacle on the road to gender equality in educa-
tion. New York, New York: UNESCO
Behrman, J. R., Foster, A., Rosenzweig, M. R. and
Vashishtha, P. “Women’s Schooling, Home
Teaching, and Economic Growth.” Journal of
Political Economy, August 1999, 107(4): 682–714.
Bowles, S., Gintis, H., and Osborne, M. 2001. “The de-
terminants of earnings: A behavioral approach,”
Journal of Economic Literature 39 (4): 1137-1176.
Brake, Deborah L. 2010. Getting in the Game: Title IX
and the Women’s Sports Revolution. New York
University Press..
Brunello, G., Fort, M., Schneeweis, N., and Winter-
Ebmer, R. 2011. “The Causal Effect of Education
on Health: What is the Role of Health Behaviors,”
IZA Discussion Paper Series, No. 5944. Bonn,
Germany.
Buchmann, C., DiPrete, T., and McDaniel, A. 2008.
“Gender Inequalities in Education.” Annual
Review of Sociology, 34: 319-337 (Volume publi-
cation date August 2008) DOI: 10.1146/annurev.
soc.34.040507.134719

TODAY’S CHALLENGES FOR GIRLS’ EDUCATION 59
Burde, D., and Linden, L. L. 2013. “Bringing education
to Afghan girls: A randomized controlled trial
of village-based schools,” American Economic
Journal: Applied Economics 5(3): 27-40.
Bushell, B. 2008. “Women entrepreneurs in Nepal:
what prevents them from leading the sector?”
Gender & Development, 16(3): 549-564.
CARE. 2009. The Power to Lead: a Leadership Model
for Adolescent Girls. London: CARE.
CARE. 2012. Girls’ Leadership Development: Lessons
from the Field. London: CARE
Chapman, D.W., and Mushlin, S. 2008. “Do girls’
scholarship programs work? Evidence from two
countries,” International Journal of Educational
Development 28: 460–472.
Chattopadhyay, R, and Duflo, E. 2004. “Women as
Policy Makers: Evidence from a Randomized Policy
Experiment in India.” Econometrica 72 (5): 1409–43.
Chaudhury, N., and Parajuli, D. 2006. “Conditional
cash transfers and female schooling: The impact
of the female school stipend program on public
school enrollments in Punjab, Pakistan.” World
Bank Policy Research Working Paper No. 4102,
Washington, DC: World Bank.
Chin, A. 2005. “Can redistributing teachers across
schools raise educational attainment? Evidence
from operation blackboard in India,” Journal of
Development Economics 78: 384–405.
Chitrakar, R. 2009. Overcoming barriers to girls’ edu-
cation in South Asia: Deepening the Analysis.
Kathmandu: UNICEF Regional Office for South
Asia.
Chudgar, A., and Sankar, V. 2008. “The relationship
between teacher gender and student achieve-
ment: evidence from five Indian states.” Compare
38(5): 627-642.
Coffey. 2015. Baseline-Report: Final Version,
Evaluation Manger Girls’ Education Challenge
Fund . Berkshire, United Kingdom: Coffey
International Development Ltd.
Conn, K. 2014. “Identifying Effective Education
Interventions in Sub-Saharan Africa: A meta-anal-
ysis of rigorous impact evaluations.” Unpublished
manuscript, Columbia University, New York, NY.
Cummings, C., and O’Neil, T. 2015 Do digital informa-
tion and communications technologies increase
the voice and influence of women and girls? A
rapid review of the evidence. London: Overseas
Development Institute.
Darling-Hammond, L. 2010. The flat world and edu-
cation: How America’s commitment to equity
will determine our future. Columbia University:
Teachers College Press.
Dee, T. S. 2007. “Teachers and the Gender Gaps
in Student Achievement,” Journal of Human
Resources 42 (30): 528-554.
Deininger, K. 2003. “Does cost of schooling affect en-
rollment by the poor? Universal primary educa-
tion in Uganda,” Economics of Education Review
22 (3): 291-305.
Desai, S., and Alva, S. 1998. “Maternal education and
child health: Is there a strong causal relation-
ship?” Demography, 35(1), 71-81.
Dollar, D. and Gatti, R.. 1999. “Gender inequality,
income, and growth: Are good times good for

60 GLOBAL ECONOMY AND DEVELOPMENT PROGRAM
women?” Washington, DC: The World Bank, Policy
Research Report on Women in Development,
Policy Paper Series, No. 1.
Drummond, Jamie. Personal Communication, May,
2015.
Duflo, E. 2012. “Women’s empowerment and economic
development,” Journal of Economic Literature
50(4): 1051–1079.
Durasaimy, P. 2002. “Changes in returns to educa-
tion in India, 1983–94: by gender, age-cohort and
location,” Economics of Education Review 21(6):
609-622.
Field, E., and Ambrus, A. 2008. “Early marriage, age of
menarche and female schooling in Bangladesh,”
Journal of Political Economy 116(5): 881-930.
Field, E., Jayachandran, S. and Pande, R. 2010.
“Do Traditional Institutions Constrain Female
Entrepreneurship? A Field Experiment on
Business Training in India,” American Economic
Review 100 (2): 125–29.
Filmer, D. 2008a. “Disability, poverty and schooling in de-
veloping countries: Results from 14 household sur-
veys,” World Bank Economic Review 22(1): 141-163.
Filmer, D. 2008b “Inequalities in education: Effects
of gender, poverty, orphanhood, and disability,”
In Mercy Tembon and Lucia Fort (eds), Girls’
Education in the 21st Century, Washington, DC:
The World Bank, pp. 95-114.
Filmer, D., and Schady, N. 2008. “Getting girls into
school: Evidence from a scholarship program in
Cambodia,” Economic Development and Cultural
Change 56 (3): 581-617.
Fleming, L. and Jacobsen, K. 2010. “Bullying among
middle-school students in low and middle income
countries.” Health Promotion International 25(1):
73-84. doi:10.1093/heapro/dap046
Foster, A. and Rosenzweig, M.R. (2009). “Missing
Women, the Marriage Market, and Economic
Growth,” Brown University Working Paper.
Gakidou, E., Cowling, K., Lozano, R., and Murray, C. J.
L.. 2010. “Increased educational attainment and
its effect on child mortality in 175 countries be-
tween 1970 and 2009: A systematic analysis.” The
Lancet 376 (9745): 959–74.
GCPEA (Global Coalition to Protect Education from
Attack). 2014.Education Under Attack 2014.
New York, New York: Global Coalition to Protect
Education from Attack.
GCPEA. 2015. Lessons in War 2015: Military Use of
Schools and Universities during Armed Conflict.
New York, New York: Global Coalition to Protect
Education from Attack.
Glewwe, P. 2002. “Schools and Skills in Developing
Countries: Education Policies and Socioeconomic
Outcomes,” Journal of Economic Literature,
40(2): 436-482.
Glewwe, P., Hanushek, E. A., Humpage, S. and Ravina, R.
2014. “School resources and educational outcomes
in developing countries: a review of the literature
from 1990 to 2010.” In Education policy in devel-
oping countries, edited by P. Glewwe. Chicago, IL:
University of Chicago Press, 2014: 13-64.
Glick, P. 2008. “What Policies will Reduce Gender
Schooling Gaps in Developing Countries:
Evidence and Interpretation.” World Development
36 (9): 1623–1646.

TODAY’S CHALLENGES FOR GIRLS’ EDUCATION 61
Glick, P., and Sahn, D. 2000. “Schooling of girls and
boys in a West African country: The effects of
parental education, income, and household
structure.” Economics of Education Review 19(1):
63–87.
Glick, P., and Sahn, D. 2007. “Cognitive skills among chil-
dren in Senegal: Disentangling the roles of school-
ing and family background.” Cornell Food and
Nutrition Policy Program Working Paper No. 189.
GPE (Global Partnership for Education), 2015. Results
for Learning Report: Basic Education at Risk
2014/15. Washington, DC: GPE.
Gitter, S. R., and Barham, B. L. 2008. Women’s power,
conditional cash transfers, and schooling in
Nicaragua. The World Bank Economic Review,
22(2), 271-290.
Grant, M. J., and Behrman, J. R. 2010. “Gender gaps in
educational attainment in less developed coun-
tries.” Population and Development Review 36
(1): 71-89.
Greene, M., Robles, O., Stout, K. and Suvilaakso, T.
2013. A girls’ right to learn without fear: Working
to end gender-based violence at school. Working:
Plan International.
Hall, G. and H. A. Patrinos. 2010. Indigenous peoples,
poverty and development. Washington DC: The
World Bank.
Hallman, K., and Peracca, S. 2007. “Indigenous girls in
Guatemala: Poverty and location.” In M. Lewis, &
M. Lockheed. (Eds.), Exclusion, gender and school-
ing: Case studies from the developing world.
Washington, DC: Center for Global Development.
Hanushek, E. A., Schwerdt, G., Wiederhold, S., and
Woessmann, L. 2013. “Returns to Skills around the
World: Evidence from PIAAC.” OECD Education
Working Papers, No. 101, OECD Publishing. http://
dx.doi.org/10.1787/5k3tsjqmvtq2-en
H a n u s h e k , E . A . , a n d R i v k i n , S . G . 2 0 1 0 .
“Generalizations about using value-added mea-
sures of teacher quality,” The American Economic
Review 100 (2): 267-271.
Hanushek, E., and Woessmann, L. 2008. The role
of cognitive skills in economic development.
Stanford, Calif: Stanford Inst. for Economic Policy
Research. http://www-siepr.stanford.edu/papers/
pdf/07-34.pdf.
Hazarika, G. 2001. “The sensitivity of primary school en-
rollment to the costs of post-primary schooling in
rural Pakistan,” Education Economics 9(3): 237–244.
Heckman, J., Humphries, J.,and Kautz, T. 2014. The
myth of achievement tests: the GED and the role
of character in American life. (Chicago: University
of Chicago Press).
Heckman, J.J, J. Stixrud and S. Urzua. 2006. “The ef-
fects of cognitive and non-cognitive skills abilities
on labour market outcomes and social behavior.”
Journal of Labor Economics 24 (3): 411-482.
Herz, B. and Sperling, G. 2004. What Works in
Girls’ Education (Evidence and Policies in the
Developing World. Washington, DC: Council on
Foreign Relations Inc.
Holmes, J. 2003. Measuring the determinants of
school completion in Pakistan: analysis of censor-
ing and selection bias. Economics of Education
Review, 22(3), 249-264.

62 GLOBAL ECONOMY AND DEVELOPMENT PROGRAM
ICRW (International Center for Research on Women).
2006. Child Marriage and Domestic Violence.
Washington, DC: International Center for
Research on Women.
IPU (Inter-Parliamentary Union). 2015. “Women in
Parliaments.” Accessed June 22, 2015.http://
www.ipu.org/wmn-e/world.htm
Jacob, B. A. 2002. “Where the boys aren’t: Non-
cognitive skills, returns to school and the gender
gap in higher education.” Economics of Education
review 21(6): 589-598.
Jensen, R. 2010a. “The (perceived) returns to edu-
cation and the demand for schooling,” The
Quarterly Journal of Economics 125 (2): 515-548.
Jensen, R. 2010b. Economic opportunities and gen-
der differences in human capital: experimental
evidence for India. Working paper No. 16021.
Cambridge, MA: National Bureau of Economic
Research.
Jewkes, R., Levin, J., Mbananga, N., and Bradshaw, D.
2002. “Rape of girls in South Africa.” The Lancet
359: 319–320.
Johnson, S. and Liht, J. 2015. “Discussion paper: What
makes students think they might drop out of
school”. Camfed.
Judge, T. A, and Bono, J. E. 2001. “Relationship of core
self-evaluations traits—self-esteem, generalized
self-efficacy, locus of control, and emotional sta-
bility—with job satisfaction and job performance:
A meta-analysis.” Journal of Applied Psychology
86 (1): 80-92.
Kautz, T., Heckman, J., Diris, R., Weel, B., and Borghans,
L. 2014. “Fostering and Measuring Skills Improving
Cognitive and Non-cognitive Skills to Promote
Lifetime Success”.
Kazianga, H., de Walque, D., and Alderman, H. 2012.
“Educational and Child Labour Impacts of Two
Food-for-Education Schemes: Evidence from a
Randomised Trial in Rural Burkina Faso.” Journal
of African Economies :1-38.
Kazianga, H., Levy, D., Linden, L., and Sloan, M. 2013.
“The Effects of “Girl-Friendly” Schools: Evidence
from the BRIGHT School Construction Program
in Burkina Faso.” American Economic Journal:
Applied Economics no. 5 (3):41-62.
Khan, N. and M. Lynch. 1997. “Recognizing Child
Maltreatmentin Bangladesh.” Child Abuse and
Neglect 21(8):815-818.
Khandker, S., Pitt, M., and Fuwa, N. 2003. “Subsidy to
promote girls’ secondary education: The female
stipend program in Bangladesh.” MPRA Paper
23688. Munich, Germany: University Library of
Munich.
King, E. M. and Nguyen, V. 2013. “Gender and over-
lapping sources of education inequality,” in
Handbook of Research on Gender and Economic
Life (edited by D. Figart and T. Warnecke), Edward
Elgar.
King, E. M. and Mason A. D. 2001. Engendering
Development: Through Gender Equality in
Rights, Resources, and Voice. New York: Oxford
University Press.
King, E. M., Orazem, P., and Wohlgemuth, D. 1999.
“Central Mandates and Local Incentives:
Colombia’s Targeted Voucher Program.” World
Bank Economic Review 13 (3): 467-491.

TODAY’S CHALLENGES FOR GIRLS’ EDUCATION 63
Kingdon, G. G. 2005. “Where has all the bias gone?
Detecting bias in the intrahousehold allocation of
educational expenditure.” Economic Development
and Cultural Change 53 (2): 409-451.
Kirk, J. (2006). The Impact of Women Teachers on
Girls’ Education. UNESCO.
Klasen, S. and F. Lamanna. 2009. “The impact of gen-
der inequality in education and employment on
economic growth: New evidence for a panel of
countries.” Feminist Economics 15 (3): 91-132.
Kremer, M., Miguel, E. and Thornton, R. 2005
“Incentives to Learn.” Education Next: a Journal
of Opinion and Research 5(2): 57-64.
Kremer, M., Brannen, C., and Glennerster, R. 2013. “The
challenge of education and learning in the devel-
oping world.” Science 340 (6130): 297-300.
Krishnaratne, S., White, H. and Carpenter, E. 2013.
“Quality education for all children? What works in
education in developing countries?” International
Initiative for Impact Evaluation (3ie) Working
Paper 20, New Delhi.
Lake, L. 2015. “The Silver Bullet: Girls’ education as the
entry point for systemic change”. Forthcoming
place: Camfed.
Lavy, Victor. 1996. “School supply constraints and
children’s educational outcomes in rural Ghana”.
Journal of Development Economics. 51 (2): 291-
314.
Leach, F., Fiscian, V., Kadzamira, E., Lemani, E., and
Machakanja, P. 2003. An investigative study into
the abuse of girls in African schools. London:
Department for International Development (DFID).
Leach, F., Dunne, M., and Salvi, F. 2014. School-related
Gender-based Violence A global review of current
issues and approaches in policy, programming
and implementation responses to School-Related
Gender-Based Violence (SRGBV) for the
Education Sector.
Levine, R. and Rowe, M. 2009. “Maternal Literacy
and Child Health in Less-developed countries:
Evidence, Processes, and Limitations.” Journal
of Development & Behavorial Patterns. 30(4):
340-349.
Lewis, M. A. and Lockheed M. E. 2006a. Exclusion,
Gender and Education: Case Studies from the
Developing World. Washington DC: Center for
Global Development.
Lewis, M. A. and Lockheed, M. E. 2006b. Inexcusable
Absence: Why 60 Million Girls Still Aren’t in
School and What to do About It. Washington DC:
Center for Global Development.
Lillard, L. A., and Willis, R. J. 1994. Intergenerational
educational mobility: Effects of family and state
in Malaysia. Journal of Human Resources, 1126-
1166.
Lindqvist, E., and Vestman, R. 2011. “The labor mar-
ket returns to cognitive and noncognitive abil-
ity: Evidence from the Swedish enlistment.”
American Economic Journal: Applied Economics:
IFN Working Paper No. 794. Available at SSRN:
http://ssrn.com/abstract=1367603 or http://dx.doi.
org/10.2139/ssrn.1367603
Lloyd, C. B. and Young, J. 2009. New Lessons: The
Power of Educating Adolescent Girls – A Girls
Count Report on Adolescent Girls. New York, NY:
The Population Council.

64 GLOBAL ECONOMY AND DEVELOPMENT PROGRAM
Lloyd, C. B., El Tawila, S., Clark, W. H., and Mensch,
B. S. 2003. “The impact of educational quality
on school exit in Egypt” Comparative Education
Review 47(4): 444 - 467.
Lloyd, C. B., Mensch, B. S., and Clark, W. H. 2000. “The
effects of primary school quality on the educa-
tional participation and attainment of Kenyan
girls and boys.” Comparative Education Review
44(2): 113–147.
Lloyd, C. B., and Mensch, B. S. 2006. “Marriage and
childbirth as factors in school exit: An analysis
of DHS data from sub-Saharan Africa.” Working
Paper 219. New York, NY: Population Council.
Lloyd, C. B., Mete, C., and Sathar, Z. A. 2007. “The ef-
fect of gender differences in primary school ac-
cess, type, and quality on the decision to enroll
in rural Pakistan,” Economic Development and
Cultural Change 53(3): 685–710.
Machel, G. 1996. Impact of Armed Conflict on Children.
New York, NY: UNICEF. Accessed June 2, 2015.
Available at : http://www.unicef.org/graca/
Maccoby, E. and Jacklin, C. 1974. The Psychology of
Sex Differences. (California :Stanford University
Press)
Macy, S. 2011. Wheels of Change: How Women Rode the
Bicycle to Freedom (With a FewFlat Tires along
the Way): National Geographic Society.
Madsen, S. 2010. “The Experiences of UAE Women
Leaders in Developing Leadership Early in Life.”
Feminist Formations 22(3): 75-95.
McEwan, 2012
McEwan, P. J. 2014. “Improving Learning in Primary
Schools of Developing Countries: A
Meta-Analysis of Randomized Experiments,” Review
of Educational Research 20 (10): 1-42.
McEwan, P. J., and Marshall, J. H. 2004. “Why does
academic achievement vary across countries?
Evidence from Cuba and Mexico,” Education
Economics 12 (3): 205-217.
Mischel, W. 2014. The marshmallow test: master-
ing self-control. New York : Little, Brown and
Company.
Morrison, A., Raju, D., and Sinha, N. 2007. Gender
Equal i ty, Poverty and Economic Growth .
Washington DC: The World Bank.
Mullis, I., Martin, M.O., Foy, P. and Arora, A. 2012.
TIMSS 2011 International Results in Mathematics.
Chestnut Hill, MA: International Association for
the Evaluation of Educational Achievement (IEA).
Muralidharan, K. and Prakash, N. 2013. “Cycling to
School: Increasing Secondary School enrollment
for Girls in India.” National Bureau of Economic
Research Working Paper 19305. doi: 10.3386/
w19305
Murnane, R. J., and Ganimian, A.J. 2014. “Improving
Educational Outcomes in Developing Countries:
Lessons from Rigorous Evaluations.” National
Bureau of Economic Research, Working Paper No.
20284, Cambridge, MA.
Murnane, R. J., Willett, J. B., Duhaldeborde, Y., and
Tyler, J. H. 2000. “How important are the cogni-
tive skills of teenagers in predicting subsequent
earnings?” Journal o f Policy Analysis and
Management 19 (4): 547-568.

TODAY’S CHALLENGES FOR GIRLS’ EDUCATION 65
Murphy-Graham, E. 2010. “And when she comes
home? Education and women’s empowerment in
intimate relationships.” International Journal of
Educational Development 30(2010): 320-331.
Mutekwe, E and Modiba, M. 2013. “Perceived Gender-
Based Challenges Endured by Zimbabwean
Secondary School Girls in Their Academic
and Occupational Prospects,” Perspectives in
Education, 3(1): 20-29.
Narayan, D., Chambers, R., Shah, M. K., and Petesch, P.
2000. Voices of the Poor: Crying out for Change.
New York: Oxford University Press for the World
Bank.
Neugebauer, M., M. Helbig and Landmann, A. 2011.
“Unmasking the myth of the same-sex teacher
advantage.” European Sociological Review 27 (5):
669-689.
Nicolai, S., Hine, S., and Wales, J. “Education in
Emergencies and protected crises-toward a
strengthened response” (Background paper for
the Oslo Summit on Education for Development,
Oslo, Norway, July 6-7, 2015).
OECD. 2015. Skills for Social Progress: The Power of
Social and Emotional Skills, OECD Skills Studies,
OECD Publishing, Paris. DOI: http://dx.doi.
org/10.1787/9789264226159-en
O’Neil, T., Plank, G, and Domingo, P. 2015. Support to
women and girls’ leadership: A rapid review of the
evidence. London: Overseas Development Institute.
Prinsloo, S. 2006. “Sexual harassment and violence in
South African schools.” South African Journal of
Education 26 (2): 305–318.
Pritchett, L. 2013. The Rebirth of Education: Schooling
Ain’t Learning. Center for Global Development,
Washington DC, 2013
Orazem, P. F., and King, E. M. 2007. Schooling in devel-
oping countries: The roles of supply, demand and
government policy. Handbook of development
economics, 4, 3475-3559.
Qian, Nancy. 2008. “Missing Women and the Price
of Tea in China: The Effect of Sex-Specific
Earnings on Sex Imbalance,” Quarterly Journal of
Economics, 123(3), p. 1251-1285.
Quisumbing, A. R. 1996. Male-female differences in ag-
ricultural productivity: Methodological issues and
empirical evidence. World Development, 24(10),
1579-1595.
Ray, R. 2000. “Child labor, child schooling, and their
interaction with adult labor: Empirical evidence
for Peru and Pakistan,” The World Bank Economic
Review, 14(2): 347-367.
Raynor, J., and Wesson, K. 2006. “The girls’ stipend
program in Bangladesh,” Journal of Education for
International Development 2(2): 1-12.
Rolleston, C. and James, Z. 2012. The role of schooling
in skill development: evidence from Young Lives
in Ethiopia, India, Peru and Vietnam. Background
paper for EFA Global Monitoring Report 2012.
Rosenzweig, M and Shultz , P. 1982. “Market
Opportunities, Genetic Endowments and Intrafamily
Resource Distribution: Child Survival in India,”
American Economic Review, 72 (4): 803–815.
Rowlands, J. 1997. Questioning empowerment: work-
ing with women in Honduras. Oxford, England:
Oxfam.

66 GLOBAL ECONOMY AND DEVELOPMENT PROGRAM
Sahni, Urvashi. Personal Communication, December,
2014.
Sakellariou, C. 2004. “The Use of Quantile Regressions
in Estimating Gender Wage Differentials: A Case
Study of the Philippines.” Applied Economics 36
(9): 1001–1007.
Schultz, T. P. 1993. “Investments in the schooling
and health of women and men: Quantities and
returns.” Journal of Human Resources 28(4):
694–734.
Schultz, T. P. 2001.
Schultz, T. P. 2002. “Why governments should invest
more to educate girls.” World Development 30(2):
207–225.
Schultz, T. P. 2004. “School subsidies for the poor:
Evaluating the Mexican Progresa poverty pro-
gram.” Journal of Development Economics 74 (1):
199-250.
Sen, A. 1990. “More than 100 Million Women are
Missing,” New York Review of Books, December 20.
Sipahimalani, V. 1999. Education in the rural Indian
household: a gender based perspective. New
Delhi: National Council of Applied Economic
Research.
Spelke, E. S. 2005. Sex Differences in Intrinsic Aptitude
for Mathematics and Science?: A Critical Review.
American Psychological Association. Accessible
at: http://digitalcommons.usu.edu/advance/267.
Stash, S. and Hannum, E. 2001. “Who goes to school?
Educational stratification by gender, caste and
ethnicity in Nepal.” Comparative Education
Review 45(3): 354-378.
Stevenson, B. 2010. “Beyond the classroom: Using
Title IX to measure the return to high school
sports.” The Review of Economics and Statistics,
92(2): 284-301.
Stromquist, N. 2007. “Gender Equity Education
Globally.” Chap. 3 in Handbook for Achieving
Gender Equity through Education. 2nd edition.
Edited by Susan Klein et al. Mahwah, New Jersey:
Lawrence Erlbaum Associates.
Taiwan, Government of. 2004. Taiwan Gender
Equity Education Act. Promulgated by the
President on June 5, 2004. Accessed at:
https://www.wcwonline.org/pdf/lawcompilation/
TaiwanGenderEquityEducation%20Act.pdf.
UNESCO, 2006. The Impact of Women Teachers on
Girls’ Education. Bangkok: UNESCO.
UNESCO. 2010. EFA Global Monitoring Report –
Reaching the Marginalized , Paris, France:
UNESCO.
UNESCO. 2012. EFA Global Monitoring Report –Youth
and Skills Putting Educaiton to Work, Pari, France:
UNESCO.
UNESCO. 2014. EFA Global Monitoring Report -
Teaching and Learning: Achieveing quality for all,
Paris, France: UNESCO.
UNESCO Institute for Statistics. 2012. Data Centre.
Accessed July 2012: http://www.uis.unesco.org/
pages/default.aspx?&SPSLanguage=EN
UNFPA (United Nations Population Fund). 2012.
Marrying Too Young: End Child Marriage, New
York, New York: UNFPA

TODAY’S CHALLENGES FOR GIRLS’ EDUCATION 67
United Nations General Assembly. 1948. Universal
Declaration of Human Rights. Accessed 31 May,
31 2015. Available at: http://www.refworld.org/
docid/3ae6b3712c.html
UNGEI (United Nations Girls’ Education Initiative).
2012. Engendering Empowerment: Education
& Equality. New York, NY: United Nations Girls’
Education Initiative.
UNGEI and GPE. Forthcoming. Guidance for
Developing Gender-Responsive Education Sector
Plans. Washington, DC.
UNICEF. 2010. Progress for Children: Achieving the
MDGs with Equity. New York, New York: UNICEF.
UNICEFa. 2014. End Child Marriage: Progress and
Prospects. New York, New York: UNICEF
UNICEFb. 2014. State of the World’s Children 2015
Report. New York, New York: UNICEF
Unterhalter, E., North, A., Arnot, M., Lloyd, C.,
Moletsane, L., Murphy-Graham, E., Parkes, J., and
Saito, M., 2014. Interventions to enhance girls’
education and gender equality. Education rigor-
ous literature review. London, UK: Department for
International Development.
Judith-Ann Walker, e-mail message to author, June 5,
2015
Warwick, D. P., and Jatoi, H. 1994. Teacher gender and
student achievement in Pakistan. Comparative
Education Review, 377-399.
Winthrop, R. McGivney, and E. 2014. Raising the Global
Ambition for Girls’ Education. Global Economy and
Development at Brookings: Policy Paper 2014-05.
Washington, DC: The Bookings Institution.
Woldehanna, T., Jones, N., and Tefera, B. (2008). The
Invisibility of Children’s Paid and Unpaid Work
Implications for Ethiopia’s national poverty re-
duction policy. Childhood, 15(2), 177-201.
Wolfe, B. and Zuvekas, S. 1995. “Nonmarket Outcomes
of Schooling.” University of Wisconsin–Madison,
Institute for Research on Poverty Discussion
Paper No. 1065-95.
WHO (World Health Organization). 2012. Girls who
marry before 18 are also more likely to experience
domestic violence than girls who marry later.
Geneva, Switzerland: WHO.
World Bank. 2005
World Bank. 2008. Implementation Completion
and Results Report for the Republic of India
Elementary Education Project I (Sarva Shiksha
Abhiyan), Washington DC: The World Bank.
World Bank. 2010a. Equal Opportunities, Better Lives.
Gender in Africa: Using Knowledge to Reduce
Gender Inequality through World Bank Activities.
Washington DC: The World Bank.
World Bank. 2010b. India: Delivering on the Promise of
Education for All. Accessed August 4, 2011, http://
go.worldbank.org/ONG7G70SM0
World Bank. 2011. Learning for All: Investing in People’s
Knowledge and Skills to Promote Development.
Washington DC: The World Bank, World Bank
Group Education Strategy 2020.
World Bank. 2011. The 2012 World Development
Report on Gender Equality and Development.
Washington, DC: The World Bank.

68 GLOBAL ECONOMY AND DEVELOPMENT PROGRAM
Yamauchi, F., and Liu, Y. 2011. Girls take over: Long-
term impacts of an early stage education inter-
vention in the Philippines. (Working Paper No.
1144). Washington, DC: International Food Policy
Research Institute (IFPRI).
Youssef, R. M., Attia, M. S. and Kamel, M. I. 1998.
Children experiencing violence II: prevalence and
determinants of corporal punishment in schools,
Child Abuse and Neglect, 22(10), 975–985.
Zabaleta, M. B. 2011. ”The impact of child labor on
schooling outcomes in Nicaragua,” Economics of
Education Review 30 (6): 1527-1539.
Zeira, A., Astor, R. A. and Benbenishty, R. 2002. Sexual
harassment in Jewish and Arab public schools in
Israel, Child Abuse and Neglect, 26(2), 149–166
TODAY’S CHALLENGES FOR GIRLS’ EDUCATION 69
ENDNOTES1. A careful empirical evaluation of the impact of the
reservation policy in India was undertaken first by
Chattopadhyay and Duflo, 2004).
2. Among others, see Barro and Lee (1994), Dollar
and Gatti (1999); Abu-Ghaida and Klasen (2004);
Morrison et al. (2007), and Klasen and Lamanna
(2009). The gender inequality in education and
employment in the Middle East and North Africa
and in South Asia together explain 0.9-1.7 and 0.1-
1.6 percentage point slower growth in these re-
gions, respectively, compared to East Asia (Klasen
and Lamanna, 2009). In countries where boys
receive more education than girls at the ratio of
70:30, average human capital is 12 percent less,
growth is 0.3 percentage points lower and pov-
erty lower, compared with countries where there
is more gender equality (Morrision et al., 2007).
3. While data on the rate of enrollment are more
ubiquitous, the average years of schooling is a
better proxy for human capital in an empirical
growth model because it is the result of a series
of schooling decisions and is thus less likely to be
correlated with contemporaneous macroeconom-
ic shocks that also effect growth rates. In con-
trast, macroeconomic shocks that affect growth
rates could lead to an immediate change in enroll-
ment rates as the recent global macroeconomic
crisis has demonstrated.
4. Theories of endogenous economic growth stress
the role that education plays in increasing a coun-
try’s labor productivity and innovative capacity,
identifying education as a positive force for eco-
nomic growth, especially, in the long run. Econ-
omists have attempted to estimate the size of
education’s effect on economic growth, but many
have not found unequivocal evidence of a positive
impact of education, typically measured as aver-
age years of schooling.
5. In only 5 of 71 cases are the returns to school-
ing higher for men, and in 59 cases the estimated
returns are higher for women (Schultz 2001,
2002). These estimates may be subject to mea-
surement error and endogeneity biases; the high-
er average returns to schooling for women may
be due to larger estimation biases in samples of
women. Most of these studies use cross-section
rather than panel data for each woman which
would show the change in wages over time.
6. Glick and Sahn (2000) highlight the intergenera-
tional benefit of educating today’s girls: “Educa-
tion interventions targeted specifically at girls
would have immediate beneficial impacts on the
gender schooling gap and these impacts would
be compounded intergenerationally. This can be
inferred from the fact that improvements in ma-
ternal schooling so strongly favor girls’ educa-
tion: raising girls’ enrollments now is equivalent
to raising maternal schooling, hence girls’ school-
ing relative to boys’, in the next generation. Thus
there are intergenerational “increasing returns”
for education equity to improvements in female
schooling.”
7. Economies now classified as advanced include
also South Korea and Singapore which were
low-income countries in 1950. Barro-Lee time-
series data on gender-specific completed years of
schooling are available for 144 countries.
8. In all, 171 countries have gender-specific data on
the net enrollment rate at the primary level, as re-
ported by UNESCO and the World Bank’s EdStats
database.
9. Other examples are the ethnically and linguis-
tically diverse countries like India and Nepal
where “more than 100 ethnic/caste and language
groups, which are still the basis in many commu-
nities for determining the social class hierarchy,
reside in these countries. Social class divisions
based on caste, ethnicity and language further

70 GLOBAL ECONOMY AND DEVELOPMENT PROGRAM
complicate the issue of gender inequality in ed-
ucation. The degree of inequality in educational
access of a girl further increases if she belongs to
an under-privileged social group such as Dalits or
an ethnic minority. What is clear in all the coun-
tries of South Asia is that a typical child whose
right to an education is denied is most likely to
be a girl from a rural area coming from an under-
privileged social group.” (Chitrakar, 2009)
10. PISA tests students who are 15 years old, irrespec-
tive of grade. TIMSS tests students at grades 4
and 8. PIRLS tests students in reading at grade 4.
LLECE for Latin America tests students at grade
6. PASEC which covers francophone African
countries tests students at grade 5, and SACMEQ
which covers Anglophone African countries tests
students at grade 6. For the comparisons, we use
only the results from the latest assessments.
11. See, for example, Bowles et al. (2001), Judge and
Bono (2001), Lindqvist and Vestman (2011), and
Murnane et al. (2000).
12. Buchmann, Diprete and McDaniel (2008) observe
the following: Patterns in gender differences in
test scores have been the subject of much re-
search for decades. Maccoby and Jacklin’s (1974)
classic The Psychology of Sex Differences provid-
ed a comprehensive analysis of more than 1,600
studies in the areas of achievement, personality,
and social relations. Despite the large literature on
this topic, debate persists on when in the life cycle
gender differences in math performance emerge,
whether males are more variable than females on
measures of achievement, and whether sex differ-
ences in test scores are declining over time.
13. There is a large literature on this, but see, for ex-
ample, the framework and survey of the literature
by Glick (2008) and Orazem and King (2007).
14. Some of the studies that have estimated these
effects are: in India (Sipahimalani, 1999), Ghana
(Lavy, 1996), Pakistan (Holmes, 2003; Lloyd, Mete,
and Sathar, 2007), and Senegal (Glick and Sahn,
2007).
15. However, it is difficult to conclude firmly that it is
the increased future earnings potential that really
leads parents to invest more in their daughters. As
Jensen (2010) argues, most of the returns stud-
ies use cross-sectional data, and “concerns about
omitted variables bias (areas where women work
differ in many ways from areas where women
do not work) or reverse causality (higher human
capital women are more productive and there-
fore earn higher wages or are more likely to be in
the labor force) make it difficult to draw a causal
interpretation from the results, as noted by Sen
(1990) and Foster and Rosenzweig (2009).” Three
studies that attempt to address these concerns
are Rosenzweig and Schultz (1982), who use vari-
ation in rainfall as a determinant of women’s earn-
ings opportunities, Qian (2008), who exploits a
policy reform in China that differentially affected
the value of traditionally male and female crops,
and Foster and Rosenzweig (2009) who use land
prices and yields as measures of expected future
technical change and productivity. [1] The nations
with the highest rate of arranged child marriages
are: Niger, Chad, Mali, Bangladesh, Guinea, Cen-
tral African Republic, Afghanistan, Yemen, and
Pakistan.
16. There is a dedicated web page (www.id21.org/
education/gender_violence/index.html) entitled
‘Gender violence in Schools’, which featured sum-
maries of studies of school-based abuse of girls
and other related studies (for example, gender
violence in adolescent relationships; attitudes
toward HIV/AIDS among adolescents) as well as
accounts from different parts of the world of in-
novative and effective interventions to eliminate
gender violence (Leach et al., 2003).
17. A comprehensive definition of school violence is
given by Leach, Dunne and Salvi (2014): “It cov-
ers both explicit and symbolic forms of violence,

TODAY’S CHALLENGES FOR GIRLS’ EDUCATION 71
violence which takes place on school premises,
on the journey to and from school, and in school
dormitories and other school related facilities;
violence perpetrated by teachers and other edu-
cation personnel, students and community mem-
bers, both female and male, and both across and
within gender lines. Individuals may be victims or
perpetrators, or both. … An alternative approach
to the separation of sexual violence from other
forms of violence is one which accepts that all
manifestations of violence, including corporal
punishment and bullying, have their roots in ineq-
uitable gender relations. Indeed, it can be argued
that the three types of violence are inter‐related
and difficult to isolate both conceptually and prac-
tically. For example, a schoolgirl who grants sexu-
al favours to a male teacher will expect to avoid
being beaten, whereas one who turns the teacher
down might risk being singled out for beating or
other forms of victimisation; boys who are them-
selves beaten or observe male teachers behaving
inappropriately with certain girls may also use
physical violence to procure sexual favours and
other benefits for themselves. According to this
viewpoint, research that does not engage with
the gendered nature of school violence, and the
gender regime that encourages it, is unlikely to
advance understanding of the issues, and subse-
quent interventions are unlikely to be effective.”
18. Six recent reviews of evaluation research on ed-
ucation have not flagged gender differences in
impact (Conn, 2014; Glewwe et al., 2014; Kremer,
Brennan and Glennerster, 2013; Krishnaratne,
White and Carpenter, 2013; McEwan, 2012; Mur-
nane and Ganimian, 2014). According to our inter-
view with some of the authors of the reviews, they
did not note gender differences in the evaluation
literature, except when an intervention focused
specifically on either boys or girls.
19. Blumberg (2007) finds that textbooks largely ig-
nore all the changes in women’s position in recent
decades, such as shifts in any country’s female
labor force participation rate or its distribution
of occupations by gender, as well as advances in
women’s income, organization and activism, and
community involvement, despite the fact that
these things are happening worldwide.
20. Title IX, signed by the President in 1972, is a com-
prehensive federal law that prohibits discrimina-
tion on the basis of sex in any federally funded
education program or activity. It applies to tra-
ditional educational institutions such as colleg-
es, universities, and elementary and secondary
schools, as well as to any education or training
program operated by a recipient of federal finan-
cial assistance. It was renamed the Patsy Mink
Equal Opportunity in Education Act in 2002, after
its House co-author and sponsor.
21. Hierarchical Linear Models is a statistical model
that takes account of the unique features of
data organized into hierarchies such as students,
teachers and schools.
22. A different form of conditional subsidy to house-
holds is exemplified by two randomized school
feeding schemes on health and education out-
comes for children in rural Burkina Faso (Kazian-
ga, de Walque and Alderman, 2012). One program
provided lunch to children who attended school
that day and the other program provided take-
home rations to provide girl students each month,
conditional on a 90-percent attendance rate. Af-
ter for one school year, both programs increased
girls’ enrollment by 5 to 6 percentage points and
decreased absenteeism for children of house-
holds that had a relatively large child labor sup-
ply and so could spare children from agricultural
duties.
23. The authors of the evaluation cite Macy (2011)
for a detailed history of the role of the bicycle
in women’s empowerment in the United State
(Muralidharan and Prakash, 2013). The full quote
from Susan Anthony cited is: “Let me tell you

72 GLOBAL ECONOMY AND DEVELOPMENT PROGRAM
what I think of bicycling. I think it has done more
to emancipate women than anything else in the
world. I rejoice every time I see a woman ride by
on a wheel. It gives her a feeling of self-reliance
and independence the moment she takes her
seat; and away she goes – the picture of untram-
meled womanhood.”
24. Camfed’s Learner Guide Programme https://cam-
fed.org/what-we-do/leaders-of-change/
25. Study Hall Foundations Girls Education program
http://www.studyhallfoundation.org/index.php
26. There are many different frameworks that have
been developed to describe what makes a good
school that include these basic elements, see
for example: UNICEF’s Child Friendly Schools
framework, Right to Education Project’s 4 As
Framework, Inter-Agency Network for Education
in Emergencies Minimum Standards, the World
Bank’s SABER initiative, etc.

TODAY’S CHALLENGES FOR GIRLS’ EDUCATION 73
Appendix Figure 1. Gender differences in primary and secondary net enrollment rates
AGO
ATGAZE BEN
BFA
BMUBOLBWA
CAFCIV
CMRCOM
DJI
DOM
ETH
FSMGHA
GINGMB
GNBGNQ
GUY INDIRQJAM
KENKNA
LBR
LSO
MDG MLI
MOZ
MRT
NAM
NERNGA
PAK
PHLPLWPNG
PRIPRYSENSLB
SSD
SURSWZ
SYR
TCA
TCD
TGOTMPTUV
TZA
YEM
ABW
ALBARE
ARG
ARM
AUS
BDI
BEL
BGD BGR
BHS
BLR
BLZ
BRABRBBRN
BTN
CHE
CHLCOGCOL
CPVCRI
CUB
CYP
DEU
DMADNK
DZA
ECU
EGY
ESP
EST
FIN
FJI
FRAGBR
GEO
GRC
GRDGTMHKG
HND
HRVHUNIDN
IRL
IRN
ISL
ISR
ITA
JOR
KAZ
KGZKHM
KORKWT
LAO
LBNLCALKA
LTU
LUX
LVA
MAR
MDA
MDV
MEXMHL
MKDMLTMNEMNG
MUSMWI MYS
NIC
NLD
NOR
NPL
NZL
OMN
PANPER
POL
PRT
QAT
ROM
RUS
RWASAUSLVSMR
SRB
STPSVN
SWE
SYC THA
TJK
TTOTUN
TUR
UGA
UKRURY
USAUZB
VCTVEN
VUT
WBG
WSM
ZAFZMB
ZWE
40%
60%
80%
90%
95%
99%
99.9%
Median
Fem
ale P
rimar
y Enr
ollm
ent
40%
60%
80%
90%
95%
99%
99.9%
Median
Male Primary Enrollment
Primary BogsNot primary bogsLine of equal enrollment
99.9%
99.9%
99%
99%
95%
95%
90%
90%
80%
80%
60%
60%
40%
40%
MEDIAN
MEDIAN
Primary Bogs
Not primary bogs
Line of equal enrollment
Male Primary Enrollment
Fem
ale
Pri
mar
y E
nro
llme
nt
AFG
AGO
ALB
BDI
BEN
BFA
BGD
BMUBTNBWA
CAF
COM
DJI
DOM
ETH
GHA
GIN
GNB
GNQ
GTMHND
IRQ
KEN
KHMLAO
LBR
LSOMAR
MDG
MDV
MHL
MLI
MMR
MOZMRTMWI
MYSNAM
NER
NICNPL
PAK
PHLPRY
SEN
SLBSLE
SLV
STP
SUR
SWZ
SYR
TCD
TGO
TMP
UGA
VUT
YEMZWE
ABW
ARG
ARM
ATGAUSAZEBELBGRBHR
BHS
BLR
BLZBOL
BRB BRN
CHECHL
COLCPVCRI
CUBCYP
DMA
DNK
ECUEGY
ESP
ESTFIN
FJI
FRAGBR
GEO
GR
GRD
HKG
HRV
HUN
IDN IRN
ISL
ISR
ITA
JAM
JOR
JPN
KAZKGZ
KIR
KNA
KOR
KWT
LBN
LCALIELKA
LTU
LUXLVAMACMDA
MEXMKDMLT
MNG
MUS
NLD
NORNZL
OMN
PAN PERPLW
POL
PRI
PRT
SRBSVNSWE
SYCTHA
TJKTON
TTOTUR
TUV
UKR
URY
USAVCT
VENWBGWSM
ZAF
10%
20%30%40%
60%
80%
90%
95%
99%
Median
Fem
ale S
econ
dary
Enr
ollm
ent
10%
20%
30%
40%
60%
80%
90%
95%
99%
Median
Male Secondary Enrollment
Secondary BogsNot sec bogsLine of equal enrollment
Secondary Bogs
Not secondary bogs
Line of equal enrollment
Male Secondary Enrollment
Fem
ale
Pri
mar
y E
nro
llme
nt
MEDIAN
MEDIAN
10%
10%
20%
20%
30%
30%
40%
40%
60%
60%
80%
80%
90%
90%
95%
95%
99%
99%

74
F/M
Rat
io, P
ISA,
15-
year
s-ol
dF/
M R
atio
, TIM
SS
Grad
e 8
TIM
SS G
rade
4PI
RLS,
Gra
de 4
LLEC
E, G
rade
6F/
M R
atio
, PAS
EC, G
r 5F/
M R
atio
, SAC
MEQ
, Gr 6
, 200
7
Mat
h Re
adin
gM
ath
Mat
hRe
adin
gM
ath
Read
ing
Mat
hRe
adin
gM
ath
Read
ing
Coun
try
Year
Low
High
Low
High
Year
Low
High
Year
Low
High
Year
Low
High
Year
Low
High
Low
High
Year
Low
High
Low
High
Year
Low
High
Low
High
Alba
nia
2012
0.98
81.
089
0.89
31.
046
Alge
ria20
071.
065
0.86
920
070.
967
1.04
2
Arge
ntin
a20
121.
106
0.28
90.
744
2.23
320
110.
820
1.54
320
061.
046
0.80
70.
857
1.21
3
Arm
enia
2011
0.79
61.
030
2011
0.91
80.
971
Aust
ralia
2012
1.15
70.
730
0.47
71.
583
2011
1.08
00.
873
2011
0.99
30.
887
2011
0.57
91.
168
Aust
ria20
121.
316
0.58
90.
488
1.95
620
111.
179
0.81
920
110.
651
1.11
6
Azer
baija
n20
091.
155
1.10
820
110.
923
1.12
520
110.
791
1.42
7
Bahr
ain
2011
0.64
31.
240
2011
0.83
70.
795
Belg
ium
2012
1.04
00.
751
0.57
81.
577
Beliz
e20
110.
901
2.12
7
Beni
n20
051.
309
0.75
31.
181
0.90
3
Bosn
ia a
nd
Herz
egov
ina
2007
0.96
30.
974
Bots
wan
a20
070.
920
1.13
320
070.
804
1.06
20.
378
1.32
4
Braz
il20
121.
133
0.40
30.
732
1.57
020
061.
051
0.73
40.
652
1.17
1
Bulg
aria
2012
0.93
60.
810
0.53
02.
841
2007
0.72
61.
050
2011
0.71
01.
185
Burk
ina
Faso
2007
1.31
10.
853
1.21
40.
872
Buru
ndi
2009
0.99
70.
927
0.89
20.
970
Cam
eroo
n20
050.
913
1.01
90.
960
0.98
6
Cana
da20
121.
064
0.72
40.
435
1.64
220
110.
665
1.13
8
Chad
2010
1.17
30.
824
1.08
50.
940
Chile
2012
1.27
10.
387
0.69
21.
744
2011
1.22
50.
760
2011
1.06
10.
708
2006
0.92
20.
760
0.72
01.
040
Chin
a20
120.
922
0.95
60.
372
1.43
3
Colo
mbi
a20
121.
182
0.33
30.
822
1.10
320
071.
306
0.23
520
071.
103
0.20
520
111.
026
0.92
720
061.
322
0.51
61.
057
0.88
5
Com
oros
2009
1.17
30.
824
1.08
50.
940
Cong
o, D
em.
Rep.
2010
1.21
10.
960
1.16
90.
891
Cong
o, R
ep.
2009
1.04
21.
008
1.05
01.
004
Cost
a Ri
ca20
121.
274
0.19
70.
652
0.92
720
061.
393
0.69
90.
960
0.94
6
Cote
d’Iv
oire
2009
1.05
40.
860
1.00
01.
084
Croa
tia20
121.
075
0.59
60.
343
2.28
620
111.
039
0.70
620
110.
398
1.16
1
Cuba
2006
0.80
61.
051
0.66
11.
113
Cypr
us20
120.
964
0.42
00.
460
2.06
620
070.
679
1.23
320
031.
040
0.84
420
110.
601
1.47
7
Czec
h Re
publ
ic20
121.
179
0.78
70.
465
2.31
120
070.
915
0.98
720
111.
053
0.79
120
110.
699
1.09
3
Appen
dix
Table
1. Fe
male
-Male
rati
o o
f st
an
dard
ized
ach
ievem
ent
test
s, b
y c
om
pet
ency
lev
el; In
tern
ati
on
al an
d r
egio
nal te
sts,
late
st y
ears

F/M
Rat
io, P
ISA,
15-
year
s-ol
dF/
M R
atio
, TIM
SS
Grad
e 8
TIM
SS G
rade
4PI
RLS,
Gra
de 4
LLEC
E, G
rade
6F/
M R
atio
, PAS
EC, G
r 5F/
M R
atio
, SAC
MEQ
, Gr 6
, 200
7
Mat
h Re
adin
gM
ath
Mat
hRe
adin
gM
ath
Read
ing
Mat
hRe
adin
gM
ath
Read
ing
Coun
try
Year
Low
High
Low
High
Year
Low
High
Year
Low
High
Year
Low
High
Year
Low
High
Low
High
Year
Low
High
Low
High
Year
Low
High
Low
High
Denm
ark
2012
1.23
00.
728
0.52
51.
971
2011
1.01
70.
921
2011
0.71
31.
161
Dom
inic
an
Repu
blic
2006
0.95
80.
271
0.83
91.
381
Ecua
dor
2006
0.99
60.
892
0.94
50.
981
Egyp
t, Ar
ab
Rep.
2007
0.90
31.
140
El S
alva
dor
2007
1.09
90.
452
2007
1.06
00.
962
2006
1.15
10.
735
1.00
21.
027
Esto
nia
2012
0.98
10.
796
0.29
72.
463
2003
0.83
41.
031
Finl
and
2012
0.73
90.
866
0.26
02.
853
2011
0.76
01.
067
2011
0.72
90.
892
2011
0.46
11.
206
Fran
ce20
121.
001
0.69
30.
499
1.78
520
111.
039
1.07
1
Gabo
n20
061.
390
0.92
11.
179
0.98
0
Geor
gia
2009
0.98
90.
607
0.67
81.
954
2011
0.98
60.
784
2011
0.86
50.
889
2011
0.60
91.
484
Germ
any
2012
1.11
40.
749
0.43
02.
489
2011
1.28
50.
866
2011
0.70
51.
105
Ghan
a20
111.
103
0.56
1
Gree
ce20
121.
070
0.52
70.
413
1.87
920
110.
370
1.28
7
Guat
emal
a20
061.
120
0.64
60.
986
0.98
7
Hong
Kon
g SA
R, C
hina
2012
0.99
20.
760
0.44
31.
448
2011
0.73
91.
061
2011
0.54
50.
985
2011
0.36
71.
173
Hung
ary
2012
1.03
30.
664
0.48
41.
978
2011
1.07
60.
921
2011
0.86
80.
932
2011
0.65
21.
177
Icel
and
2012
0.84
80.
945
0.40
32.
524
2011
0.48
71.
284
Indo
nesi
a20
121.
031
0.64
40.
762
2.42
120
110.
896
1.10
220
110.
755
1.70
2
Iran,
Isla
mic
Re
p.20
111.
034
0.80
520
110.
967
0.86
020
110.
721
1.42
9
Irela
nd20
121.
229
0.67
20.
465
1.69
120
110.
734
0.91
920
110.
610
1.16
9
Isra
el20
120.
993
0.42
20.
469
1.21
220
110.
676
1.04
420
110.
679
1.01
5
Italy
2012
1.17
00.
513
0.48
51.
695
2011
1.24
60.
782
2011
1.16
80.
838
2011
0.72
91.
041
Japa
n20
121.
024
0.68
60.
463
1.26
320
110.
717
0.94
020
110.
554
0.97
0
Jord
an20
120.
894
0.21
90.
473
2.23
920
110.
794
1.15
9
Kaza
khst
an20
120.
988
0.71
70.
710
1.20
820
110.
930
0.89
320
110.
869
0.85
0
Keny
a20
071.
231
0.67
50.
880
1.00
2
Kore
a, R
ep.
2012
0.99
00.
732
0.43
31.
262
2011
0.63
20.
978
2011
0.69
80.
991
Kuw
ait
2007
0.93
50.
634
2011
0.86
21.
325
2011
0.77
02.
511
Kyrg
yz
Repu
blic
2009
1.00
40.
000
Latv
ia20
120.
851
0.83
90.
318
3.21
220
030.
708
1.00
020
070.
701
1.02
220
110.
254
1.44
1

F/M
Rat
io, P
ISA,
15-
year
s-ol
dF/
M R
atio
, TIM
SS
Grad
e 8
TIM
SS G
rade
4PI
RLS,
Gra
de 4
LLEC
E, G
rade
6F/
M R
atio
, PAS
EC, G
r 5F/
M R
atio
, SAC
MEQ
, Gr 6
, 200
7
Mat
h Re
adin
gM
ath
Mat
hRe
adin
gM
ath
Read
ing
Mat
hRe
adin
gM
ath
Read
ing
Coun
try
Year
Low
High
Low
High
Year
Low
High
Year
Low
High
Year
Low
High
Year
Low
High
Low
High
Year
Low
High
Low
High
Year
Low
High
Low
High
Leba
non
2011
1.15
70.
646
Leso
tho
2007
0.97
90.
894
0.79
01.
166
Liec
hten
stei
n20
121.
548
0.81
00.
654
1.67
5
Lith
uani
a20
120.
880
0.68
80.
325
3.16
720
110.
731
1.10
320
110.
911
1.00
120
110.
589
1.30
6
Luxe
mbo
urg
2012
1.43
00.
588
0.66
11.
508
2011
0.53
81.
025
Mac
ao S
AR,
Chin
a20
120.
861
0.86
10.
372
1.98
1
Mac
edon
ia,
FYR
2011
0.91
21.
074
2011
0.79
41.
427
Mad
agas
car
2005
0.95
40.
985
0.89
31.
154
Mal
awi
2007
1.16
00.
594
1.18
10.
586
Mal
aysi
a20
120.
917
0.89
70.
686
2.69
020
110.
718
0.98
9
Mal
ta20
090.
808
0.90
30.
503
3.63
820
070.
938
0.90
820
111.
061
0.80
320
110.
742
1.20
0
Mau
ritiu
s20
091.
023
0.49
60.
711
1.91
420
070.
654
1.10
20.
497
1.20
8
Moz
ambi
que
2007
1.23
00.
956
1.10
40.
912
Mex
ico
2012
1.15
30.
348
0.73
91.
451
2006
1.01
21.
107
0.80
41.
194
Mol
dova
2009
1.04
20.
573
0.71
05.
129
2003
0.80
51.
145
2003
0.83
71.
170
2011
0.66
91.
275
Mon
golia
2007
1.10
00.
739
2007
1.02
21.
019
Mon
tene
gro
2012
0.99
40.
611
0.51
83.
920
Mor
occo
2011
1.00
11.
119
2011
0.98
10.
977
2011
0.91
61.
151
Nam
ibia
2007
1.00
30.
821
0.66
61.
250
Neth
erla
nds
2012
1.13
90.
788
0.61
61.
653
2003
1.13
50.
943
2011
1.13
50.
864
2011
0.58
91.
079
New
Zea
land
2012
1.08
20.
671
0.54
01.
561
2011
1.22
10.
672
2011
0.91
80.
904
2011
0.63
71.
229
Nica
ragu
a20
061.
128
0.59
90.
969
0.71
1
Norw
ay20
120.
975
0.88
50.
426
2.09
720
110.
881
0.99
020
110.
959
0.74
820
110.
529
1.29
8
Oman
2011
0.70
91.
522
2011
0.83
21.
076
2011
0.72
11.
459
Pana
ma
2009
0.98
90.
401
0.82
42.
964
2006
0.95
70.
832
0.80
41.
364
Para
guay
2006
0.91
10.
985
0.85
21.
216
Peru
2012
1.08
40.
572
0.84
31.
801
2006
1.19
00.
637
1.00
40.
917
Phili
ppin
es20
030.
891
0.83
820
030.
924
1.15
6
Pola
nd20
120.
921
0.84
90.
320
1.77
420
111.
046
0.72
420
110.
601
1.16
8
Portu
gal
2012
1.08
00.
685
0.50
12.
068
2011
0.91
60.
872
2011
0.38
51.
184
Qata
r20
120.
964
0.83
00.
659
2.31
320
110.
898
1.00
420
110.
867
0.98
820
110.
740
1.33
8
Rom
ania
2012
1.01
90.
717
0.60
01.
627
2011
0.91
31.
243
2011
0.99
80.
949
2011
0.74
31.
197

F/M
Rat
io, P
ISA,
15-
year
s-ol
dF/
M R
atio
, TIM
SS
Grad
e 8
TIM
SS G
rade
4PI
RLS,
Gra
de 4
LLEC
E, G
rade
6F/
M R
atio
, PAS
EC, G
r 5F/
M R
atio
, SAC
MEQ
, Gr 6
, 200
7
Mat
h Re
adin
gM
ath
Mat
hRe
adin
gM
ath
Read
ing
Mat
hRe
adin
gM
ath
Read
ing
Coun
try
Year
Low
High
Low
High
Year
Low
High
Year
Low
High
Year
Low
High
Year
Low
High
Low
High
Year
Low
High
Low
High
Year
Low
High
Low
High
Russ
ian
Fede
ratio
n20
120.
945
1.00
90.
509
2.22
020
110.
788
0.97
420
110.
815
0.99
420
110.
398
1.16
8
Saud
i Ara
bia
2011
0.88
50.
575
2011
0.79
00.
560
2011
0.45
01.
455
Sene
gal
2007
1.25
90.
881
1.20
70.
852
Serb
ia20
121.
082
0.59
90.
548
2.20
320
070.
820
1.01
620
111.
033
0.90
1
Sing
apor
e20
120.
687
0.98
70.
459
1.49
020
110.
280
1.07
420
110.
689
1.03
620
110.
494
1.14
6
Slov
ak
Repu
blic
2012
0.98
70.
597
0.57
61.
781
2003
0.91
90.
955
2011
1.10
00.
841
2011
0.81
81.
149
Slov
enia
2012
0.97
20.
845
0.36
53.
557
2011
1.13
40.
915
2011
1.18
10.
806
2011
0.53
71.
194
Sout
h Af
rica
2003
1.00
90.
612
2011
0.92
21.
581
2007
0.89
41.
030
0.75
31.
279
Spai
n20
121.
134
0.50
40.
560
1.44
520
111.
151
0.71
220
110.
728
1.07
9
Swaz
iland
2007
1.37
20.
824
0.44
71.
073
Swed
en20
120.
921
0.81
50.
445
1.97
120
110.
899
1.11
520
111.
173
0.89
720
110.
699
1.23
1
Switz
erla
nd20
121.
115
0.78
80.
477
1.88
1
Syria
n Ar
ab
Repu
blic
2011
1.08
30.
576
Tanz
ania
2007
1.55
20.
610
1.16
30.
917
Thai
land
2012
0.85
71.
205
0.42
53.
804
2011
0.74
81.
083
2011
0.70
11.
032
Trin
idad
and
To
bago
2009
0.92
81.
095
0.62
24.
720
2011
0.58
91.
590
Tuni
sia
2012
1.12
00.
425
0.74
70.
918
2011
1.27
90.
647
2011
0.95
90.
755
Turk
ey20
121.
061
0.66
00.
394
2.39
120
110.
936
1.07
820
110.
926
0.98
920
110.
736
1.39
1
Ugan
da20
071.
121
0.74
41.
120
0.87
7
Ukra
ine
2011
0.89
20.
842
2007
0.93
80.
931
Unite
d Ar
ab
Emira
tes
2012
0.91
70.
619
0.47
32.
070
2011
0.67
91.
016
2011
0.86
20.
805
2011
0.70
81.
173
Unite
d Ki
ngdo
m20
121.
210
0.76
60.
682
1.76
4
Unite
d St
ates
2012
0.94
90.
816
0.48
81.
570
2011
1.01
30.
924
2011
1.08
30.
907
2011
0.60
71.
085
Urug
uay
2012
1.10
80.
399
0.73
11.
562
2006
0.89
40.
965
0.67
81.
275
Viet
nam
2012
1.00
40.
695
0.38
91.
708
Wes
t Ban
k an
d Ga
za20
110.
811
1.07
5
Yem
en, R
ep.
2011
0.99
10.
868
Zam
bia
2007
1.11
00.
361
1.11
50.
880
Zim
babw
e20
070.
894
0.88
00.
694
1.09
6


The views expressed in this working paper do not necessarily reflect the official position of Brookings, its board or the advisory council members.
© 2015 The Brookings Institution
ISSN 2158-7779
Selected photos courtesy of the World Bank: cover left to right: Simone D. McCourtie (#1, #6), Masaru Goto (#2), Curt Carnemark (#3, #4, #5, #7)

1775 Massachusetts Avenue, NW Washington, DC 20036 202-797-6000 www.brookings.edu/global