How Today's Graduates Continue to Learn Once They ...
112
S T A Y I N G S M A R T: How Today’s Graduates Continue to Learn Once They Complete College BY ALISON J. HEAD, PH.D. PROJECT INFORMATION LITERACY RESEARCH REPORT THE PASSAGE STUDIES JANUARY 5, 2016 PROJECT INFORMATION LITERACY http://projectinfolit.org THE UNIVERSITY OF WASHINGTON INFORMATION SCHOOL RESEARCH SPONSORED BY THE INSTITUTE OF MUSEUM AND LIBRARIES (IMLS) Abstract: This report presents findings about the information-seeking behavior of relatively recent college graduates used for lifelong learning in personal life, the workplace, and the local communities where they lived. Included are results from online surveys of 1,651 respondents and telephone interviews with 126 study participants who graduated from one of 10 US colleges and universities between 2007 and 2012. Findings indicated that most graduates needed to learn a combination of basic and complex life skills during the past year, such as money-management, how to make household repairs, and how to advance in their careers and communicate better on the job. They consulted friends, family, and coworkers almost as much as the Web. Graduates preferred information sources that had currency, utility, and interactivity. They also placed a high premium on curated information systems that were organized and kept up-to-date, such as libraries, museums, and bookstores. A model of shared utility is introduced for explaining graduates’ use of contemporary social media technologies as well as personal connections they had established with trusted allies. Graduates reported four barriers to their continued learning efforts: lack of time, finding affordable learning sources, staying on top of everything they needed to know, and staying motivated to keep learning after college. As a whole, graduates prided themselves on their ability to search, evaluate, and present information, skills they honed during college. Yet, far fewer said that their college experience had helped them develop the critical thinking skill of framing and asking questions of their own, which is a skill they inevitably needed in their post-college lives. Ten recommendations are presented for improving educational strategies, resources, and services that foster lifelong learning.
-
Upload
khangminh22 -
Category
Documents
-
view
3 -
download
0
Transcript of How Today's Graduates Continue to Learn Once They ...
S T A Y I N G S M A R T:
How Today’s Graduates Continue to Learn
Once They Complete College
BY ALISON J. HEAD, PH.D.
PROJECT INFORMATION LITERACY RESEARCH REPORT
THE PASSAGE STUDIES
JANUARY 5, 2016
PROJECT INFORMATION LITERACY http://projectinfolit.org
THE UNIVERSITY OF WASHINGTON INFORMATION SCHOOL
RESEARCH SPONSORED BY THE INSTITUTE OF MUSEUM AND LIBRARIES (IMLS)
Abstract: This report presents findings about the information-seeking behavior of relatively recent college graduates used for lifelong learning in personal life, the workplace, and the local communities where they lived. Included are results from online surveys of 1,651 respondents and telephone interviews with 126 study participants who graduated from one of 10 US colleges and universities between 2007 and 2012. Findings indicated that most graduates needed to learn a combination of basic and complex life skills during the past year, such as money-management, how to make household repairs, and how to advance in their careers and communicate better on the job. They consulted friends, family, and coworkers almost as much as the Web. Graduates preferred information sources that had currency, utility, and interactivity. They also placed a high premium on curated information systems that were organized and kept up-to-date, such as libraries, museums, and bookstores. A model of shared utility is introduced for explaining graduates’ use of contemporary social media technologies as well as personal connections they had established with trusted allies. Graduates reported four barriers to their continued learning efforts: lack of time, finding affordable learning sources, staying on top of everything they needed to know, and staying motivated to keep learning after college. As a whole, graduates prided themselves on their ability to search, evaluate, and present information, skills they honed during college. Yet, far fewer said that their college experience had helped them develop the critical thinking skill of framing and asking questions of their own, which is a skill they inevitably needed in their post-college lives. Ten recommendations are presented for improving educational strategies, resources, and services that foster lifelong learning.

Project Information Literacy Research Report: “Staying Smart” | January 5, 2016 | Alison J. Head
2
Introduction
Jessica received her baccalaureate degree in finance from one of the best schools in the US in 2010.1 The endless hours she spent studying had paid off. Unlike many of her classmates struggling to find entry-level career jobs in the worst job market for college hires in 20 years, she quickly landed a good job.2 She put the books away and focused her energy on doing rather than learning.
Like most of today’s young graduates, Jessica soon discovered that questions do not end with college assignments. Real life requires constant learning. Within months of leaving campus, she found herself needing to figure out how to schedule student loan payments, negotiate a salary increase, brush up on a couple of spreadsheet functions, plan a sightseeing trip to New York, and learn how to cook for herself.
Without a second thought, she grabbed her iPad, did a Google search, and visited the sites she usually frequented, like YouTube, Pinterest, and Hipmunk. She also turned to a trusted friend for advice. These are the tools for lifelong learning in the 21st century, a flood of Internet- and human-mediated sources that help recent graduates solve basic to complex information problems.
Even though Jessica, and others in the Google Generation, may have more information outlets than all previous generations combined, today's graduates are finding that staying informed, knowledgeable, and skilled may be more daunting than ever before.
Adding to this challenge, most graduates fight to carve out time to keep learning. Some cannot afford the expertise they want from professionals like contractors, attorneys, accountants, or career advisors. Others have trouble staying motivated to learn everything they think they should know to stay current, given the sheer volume of information they can access in physical and virtual domains. This “information transition” from college to real life may be one of the least understood challenges of the digital age.
Project Information Literacy (PIL) is a national series of ongoing research studies about how today’s college students and recent graduates find and use information for solving information problems they encounter.3 This PIL report is the last in a series of special reports called “The Passage Studies.”
The purpose of these unique studies has been to investigate the information transitions that early adults undergo at critical junctures in their lives. We sought to understand the information competencies and strategies they adopt and develop as they move from one complex information landscape to the next.
In this latest study, we turn our attention to lifelong learning. 4 We conducted a two-year study of the continued learning needs and information-seeking practices of today’s relatively recent college graduates in their personal and professional lives.5
1 “Jessica” is a composite character based on results from interviews with recent college graduates in our sample. 2 Hilary Wething, Natalie Sabadash, and Heidi Shierholz., “The Class of 2012: Labor Market for Young Graduates Remains Grim,” Economic Policy Review, Briefing Paper #340 (May 2012): 9, http://www.epi.org/publication/bp340-labor-market-young-graduates. 3 Project Information Literacy (PIL) is an educational nonprofit dedicated to conducting ongoing research about young adults and their research habits in the digital age. Alison J. Head, Ph.D., a Research Scientist in the University of Washington Information School and a Research Fellow at the metaLAB (at) Harvard, founded and directs PIL. Communication about this report should be sent to Dr. Alison J. Head at [email protected].
Project Information Literacy Research Report: “Staying Smart” | January 5, 2016 | Alison J. Head
3
In fall 2014, we administered an online survey to a sample of 1,651 respondents from 10 US colleges and universities, who had graduated between 2007 and 2012.6, 7 We also conducted 126 in-depth telephone interviews with study participants from the same institutions to collect qualitative data about graduates' views, experiences, and motivations as lifelong learners.
Each of the colleges and universities in our institutional sample was located in one of the top 25 fastest-growing areas in the US where today’s college-educated graduates in their mid-to-late 20s live. As part of our investigation, we examined whether these metropolitan areas may have graduates who are more avid information seekers than other locales.
The next section contains a summary of the study’s highlights. The remainder of the report features a discussion of findings, a model of the graduates’ lifelong learning process, and 10 recommendations for improving services and resources for continued learning.
Major Findings
Today’s college campuses are awash in data about their students. From campus servers piling up posts from online discussions to detailed assessments of information literacy learning for any given cohort, the learning needs—and wants—of students are documented more extensively than ever before.
When students graduate, however, this data stream slows to a trickle. Alumni associations track former students for promotional and fundraising purposes. Campus career centers monitor where graduates are employed to broaden their own collection of internship opportunities for current students. In other cases, ad-hoc committees have interviewed or surveyed former students about their undergraduate learning outcomes.8
While the data collected may be useful for evaluating post-college career progress, they only scratch the surface as far as assessing the learning needs today’s recent graduates may have after college. Subsequently, very little is known about the everyday information worlds of today’s graduates.
When asked about their information needs and challenges, the recent college graduates we studied said they spent a lot time learning career development tips and scrambling to improve their interpersonal communication and technical workplace skills. However, what kept them most busy during the past year was learning a mix of simple and complex life skills they needed outside the workplace. As they put their college days behind them, many graduates needed to learn how to manage their money or pick up an array of quick-fix solutions to everyday problems, like how to make household repairs, how to pay taxes, or shop for groceries on a budget.
4 This PIL study was generously supported with a two-year National Leadership Grant (LG-06-13-0186-13) from the Institute of Museum and Library Services (IMLS), http://www.imls.gov. 5 For a complete discussion of methods used for this study, see Appendix A of this report. 6 For all three phases of this study, the sample comprised the same 10 institutions of higher education in the US. Nine of these schools were four-year institutions, where graduates had received a baccalaureate degree, e.g., BA or BS. The remaining school in the sample was a community college, where graduates had received either an associate degree (AA) or a certificate. For a complete list of the institutions and details, see Appendix A: Participants. 7 We are grateful to the PIL Research Team members who conducted telephone interviews and contributed to this study’s findings: Sarah Evans (University of Washington), Kate Faoro (University of Washington), Michelle Fellows (University of Washington), Kirsten Hostetler (Central Oregon Community College), Ann Roselle (Phoenix College), and Michele Van Hoeck (California Maritime Academy). 8 For a recent example of a national study about graduates’ learning outcomes, see: Gallup, Inc., Great Jobs, Great Lives: The 2014 Gallup-Purdue Index Report, (2014), http://www.luminafoundation.org/files/resources/galluppurdueindex-report-2014.pdf.
…very little is known about the information worlds of today’s graduates.
Project Information Literacy Research Report: “Staying Smart” | January 5, 2016 | Alison J. Head
4
Others began building a learning network they could tap for guidance and advice they needed in their professional and personal lives, and to a lesser extent, in the communities where they lived. Most graduates said they were surprised by how little they knew about living on their own.
Predictably, recent graduates were heavy users of Google search. They also relied on an array of sources such as Facebook, YouTube, Pinterest, The New York Times, best-selling books, online forums, blogs, and to a lesser extent, public libraries and bookstores.
Graduates turned to friends, family, and coworkers almost as much as the Web. When weighing life’s most important decisions, such as deciding whether to buy a house, become a first-time parent, or change jobs, one-on-one discussions with a trusted confidant won out over sources they might be able to find on the Web.
As a whole, graduates preferred resources for lifelong learning that have three information qualities: currency, utility, and interactivity. They placed a high premium on lifelong learning systems that were organized, curated, up-to-date and where there was available assistance, as in the case of librarians and knowledgeable staff.
For young graduates, information utility meant sources that were useful, credible, relevant and directly and immediately applicable to the real problems in their lives. Interactivity entailed more than a Google search—it encompassed the validity and richness of solutions that come from multiple voices that can all join in, interact, or exchange ideas and information in a social space.
Most graduates prided themselves on being savvy information evaluators, competencies they honed during college. Yet, the large majority believed that formulating and asking their own questions was the one skill that they had not developed in college but found they needed in their post-college lives.
Summarizing the major findings from our interviews and survey:
1. Today’s young graduates have a diffuse set of needs after college that compels them to acquire additional competencies, strategies, knowledge, and skills. A breakdown of their learning needs indicated they had more needs in their personal lives (57%) than in the workplace (30%) and in their communities (13%).
2. More than anything else, graduates sought how-to information (75%): quick fixes to urgent problems in their personal lives. The graduates we interviewed said they needed to learn such things as how to cook, how to make household repairs, or how to read a legal agreement.
3. Over two-thirds of the survey respondents (69%) wanted to close gaps in their knowledge about managing money and their personal finances, often for the first time. Graduates said they needed to find out how to set up a personal budget. Others grappled with scheduling student loan payments. Still others had to plan a weekly food budget.
4. When it came to the workplace, more than anything else, young graduates wanted career and professional development guidance and information (69%). Most said they were steadfast in their search for information about new positions and opportunities in and beyond their current place of employment.
5. At the same time, more than half of the graduates (56%) needed to expand their interpersonal communication skills in their jobs, especially for engaging conversations with, and delegating tasks to, workers older than themselves.
6. One in four of the graduates wanted to learn how to become involved in their communities, especially how to and participate in civic life (25%); slightly fewer sought volunteering opportunities (24%).
Graduates turned to friends, family, and coworkers, almost as much as the Web.
Project Information Literacy Research Report: “Staying Smart” | January 5, 2016 | Alison J. Head
5
7. Search engines—especially the ubiquitous Google—were the go-to source for quickly connecting graduates to individual pages on social sources like Facebook, YouTube, or Pinterest, especially for information in their personal lives (88%), the workplace (83%), and to a lesser extent, their community (38%).
8. Almost three-fifths of the graduates (56%) relied on blogs for guidance and how-to specifics they could put to use in their personal lives. Blogs were a good source of low-cost information (71%), current and up-to-date information (69%), and provided good summaries of the topics (61%) of interest to many graduates, according to respondents who had used blogs in the past year.
9. Nearly half the graduates (45%) had used a public library in the past year when seeking information sources for use in their personal lives. In a follow-up analysis, we found that public library users were three times more likely to be bookstore visitors and museumgoers.
10. Finding sources for continued learning did not end with a Web search. A large majority (84%) of respondents had approached coworkers in the past year to informally learn the skills they needed to succeed on the job and to advance their careers.
11. Despite the widespread promise about online learning, few respondents reported using formal learning sites such as Coursera (14%), edX (5%), or Udacity (2%) in the past year. Instead, far more used informal learning sites that required less of a time commitment, such as YouTube (79%) and Pinterest (51%).
12. Graduates found it difficult to stay informed in the rapidly changing digital age. A majority said it was hard to find the time for continued learning (88%), locate affordable sources (73%), stay current, given the volume of information “out there,” (70%), and stay motivated to keep learning (62%).
13. Half of the sample (50%) reported being frustrated by no longer having access to their former instructors and lectures as well their campus library’s databases, such as ProQuest, JSTOR, or EBSCO. Far fewer had accessed open access government databases (13%), like ERIC or PubMed, in the workplace (27%) or in their personal lives (13%).
14. Most, though not all, of the critical thinking skills learned and developed during graduates’ college experiences were adapted in their post-college lives. A large majority of the graduates believed they had transferred information skills from college for interpreting and applying search results (76%) and reflecting on the ways they learned best (74%). Yet, far fewer—less than a third (27%)—agreed that college had helped them develop the ability to formulate and ask questions of their own.
Taken together, these findings suggest that colleges and universities are turning out graduates who are specialized, employable, and relatively proficient information seekers. Yet, our results also reveal a failure of higher education to prepare lifelong learners who leave college experienced at framing and asking their own questions rather than responding to questions that had been assigned to them. In the following pages, we present detailed findings and a lifelong learning model in four parts:
Part One: Lifelong Learning Needs. Findings are presented about the continued learning needs today’s recent graduates find they have after college in their personal lives, the workplace, and in the communities in which they live.
…public library users were three times more likely to be bookstore visitors and museumgoers.
Project Information Literacy Research Report: “Staying Smart” | January 5, 2016 | Alison J. Head
6
Part Two: Lifelong Learning Sources. Findings are featured about the information sources from bookstores and libraries to Web 2.0 sites and friends and family that recent graduates rely on for continued learning and to stay fulfilled and enriched in their personal and professional lives.
Part Three: College Takeaways. Findings are presented about the skills and competencies recent graduates have adapted from college for navigating the information universe of their post-college lives. Challenges graduates faced with continued learning are also provided.
Part Four: Modeling the Lifelong Learning Process. A model of shared utility is introduced for describing the lifelong learning process employed by recent graduates.
Throughout this report, the results of our research reveal consistent patterns from respondents that lend credibility to our findings. These results show how a sample of today’s recent college graduates find, use, and evaluate information to meet their continued learning needs once they receive their degrees and go on with their lives. Given the size of the sample and our research methodology, these findings should not be viewed as comprehensive and generalizable to all recent graduates in the US, but rather as exploratory and as another part of our ongoing research. !
Approach
Project Information Literacy studies are grounded in research on information-seeking behavior. As information scientists, we focus on the ways in which people of various ages find, evaluate, and select information and the processes they use to meet their information needs. These processes are investigated through participants’ accounts, reports, and experiences. We use social science research methods—interviews and surveys—to collect and analyze data.
The purpose of this study was to investigate continued learning after college. We focused on three arenas in which continued learning needs arise and occur in recent graduates’ lives: personal life, the workplace, and the communities where they lived.
We examined the information-seeking behavior recent college graduates used for continued learning in the 12 months preceding the survey; beginning with the learning needs they had and then turned our attention to the information sources on which they relied.
Five questions framed this study:
1. What information needs do today’s college graduates have for improving skills and adding to their knowledge or competencies after they leave campus and settle into their personal lives, the workplace, and their local communities?
2. What information sources do recent graduates use for finding information about personal fulfillment and cultural enrichment, career development and staying employable, and for becoming involved in civic affairs and their local community?
3. How do today’s graduates use the myriad of sources for continued learning available from traditional information systems, like public libraries, job training sessions, bookstores, and museums as well as Web 2.0 sources, such as blogs or MOOCs?
4. What critical thinking skills and information literacy competencies learned or developed in college are adapted and applied by young graduates in their personal and professional lives?

Project Information Literacy Research Report: “Staying Smart” | January 5, 2016 | Alison J. Head
7
5. How can the information-seeking process for lifelong learning be modeled? Given this model, what solutions for improving learning services and resources are feasible for meeting their needs?
These questions are posed at a critical juncture in the lives of the young college graduates living in the digital age. The global economy demands a constant retooling of skills and updating of expertise in order to stay adaptive and employable. Moreover, the sheer availability of online learning outlets has increased societal expectations to keep up to speed, relevant, and valued. For most young graduates, staying informed and current in today’s world can be more challenging than ever.
Defining Lifelong Learning
For the purposes of this study, we have used the phrases lifelong learning and continued learning interchangeably to define the activity of ongoing learning for improving skills and acquiring additional knowledge or information.9 This kind of continuous learning occurs online as well as in brick-and-mortar settings and it can and may occur in the in personal life, the workplace, and community and civic life.
Today, lifelong learning is an ongoing pursuit that can take place in formal, non-formal, and informal exchanges. A key distinction among these different modes is whether curricula are used and learners receive credits for participation. Two of the three modes of lifelong learning—formal and non-formal—are found in schools or in the workplace.
Formal learning consists of education and training in an institutional context. It is guided by a curriculum in which diplomas or certifications are awarded upon completion. Non-formal learning takes place in lessons, discussions, and trainings, such as in the workplace or through extension courses. A difference however, is that non-formal educational opportunities do not result in credits, degrees, digital badges, or certificates.
The third mode of learning—informal learning—is incidental, voluntary, and often experiential. It occurs when self-motivated individuals learn independently to advance their knowledge and skills. For instance, informal learning can occur in communities of practice, where interactions are highly contextualized.
The scholarly literature defines lifelong learners as curious, flexible, motivated, and reflective.10 Despite what these learners’ motivations may be, the pathways to learning venues are not always available, accessible, and affordable. Moreover, the level of skills and strategies that these learners bring to the process of finding and using information can be a critical barrier to their success in finding learning opportunities and to actually gaining skills and knowledge.
To better understand these competencies and what today’s graduates bring to their continued learning efforts, we used the lens of information literacy.11 Today, in the “information society,” numerous
9 As part of this two-year study, we conducted a recent literature review of lifelong learning and participation. See: Alison J. Head, Michele Van Hoeck, and Deborah S. Garson, “Lifelong Learning in the Digital Age: A Content Analysis of Recent Research on Participation,” First Monday, 20, no.2 (February 2015): http://dx.doi.org/10.5210/fm.v20i2.5857. 10 Christopher Knapper and Arthur J. Cropley, Lifelong Learning in Higher Education, (London: Kogan Page, 2000); Paul R. Pintrich and Barbara Schrauben, “Students’ Motivational Beliefs and Their Cognitive Engagement in Academic Classroom Tasks,” in Student Perceptions in the Classroom, eds. Dale H. Schunk and Judith L. Meece (New York: Routledge: 1992), 149–175. 11 For a current report that defines information literacy in the context of higher education, see Emma Coonen, A New Curriculum for Information Literacy, Theoretical Background: Teaching Learning: Perceptions of Information Literacy (Cambridge: Cambridge University Library, 2011), http://ccfil.pbworks.com/f/emma_report_final.pdf.
Project Information Literacy Research Report: “Staying Smart” | January 5, 2016 | Alison J. Head
8
situations arise daily, requiring competencies of exchanging, seeking, retrieving, applying, and evaluating information and a high degree of information literacy is required throughout life.
For instance, individuals need to continue to learn and grow to navigate daily life, to remain employable and to renew and update their professional skills and knowledge, and to be active in their communities and enriched in their personal lives. These information-seeking competencies and lifelong information literacy strategies determine whether or not these efforts will be successful.
We define competencies as the skills and knowledge needed for finding and using information, especially what action needs to be taken to execute a task and how to perform an action. These strategies are deliberate plans that are often highly individualized and focused on achieving an objective (within time constraints, resource availability, and cognitive abilities).
Ultimately, the purpose of this study was to investigate recent graduates' information-seeking behavior for lifelong learning, while making recommendations for improving services in higher education, public libraries, and K-12 settings to better meet their needs. We collected data for this inquiry by conducting in-depth qualitative interviews and administering a large-scale online survey to a sample of recent college graduates from between 2007 and 2012. !
Project Information Literacy Research Report: “Staying Smart” | January 5, 2016 | Alison J. Head
9
Detailed Findings
Part One: Lifelong Learning Needs
As information scientists, we began our study by asking the following question:
What situational learning needs do today’s recent graduates have for taking care of business in their personal lives, staying competitive in the workplace, or getting involved in local community activities and meeting people?
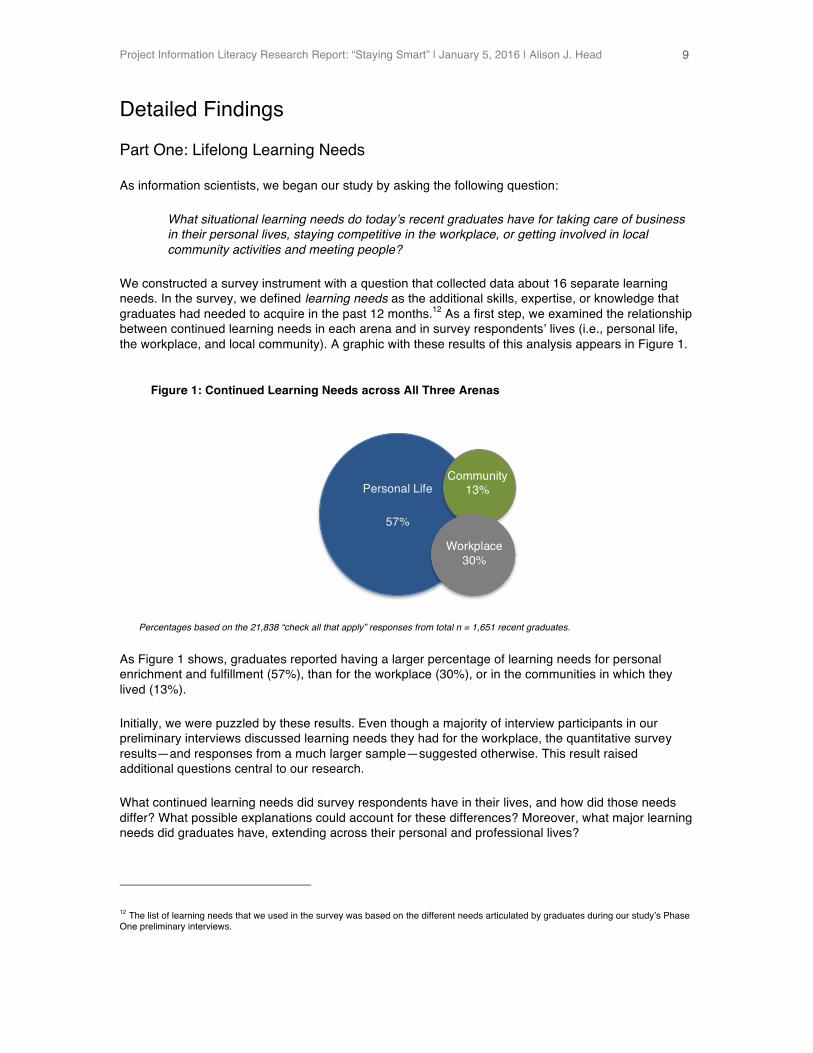
We constructed a survey instrument with a question that collected data about 16 separate learning needs. In the survey, we defined learning needs as the additional skills, expertise, or knowledge that graduates had needed to acquire in the past 12 months.12 As a first step, we examined the relationship between continued learning needs in each arena and in survey respondents’ lives (i.e., personal life, the workplace, and local community). A graphic with these results of this analysis appears in Figure 1.
Percentages based on the 21,838 “check all that apply” responses from total n = 1,651 recent graduates.
As Figure 1 shows, graduates reported having a larger percentage of learning needs for personal enrichment and fulfillment (57%), than for the workplace (30%), or in the communities in which they lived (13%).
Initially, we were puzzled by these results. Even though a majority of interview participants in our preliminary interviews discussed learning needs they had for the workplace, the quantitative survey results—and responses from a much larger sample—suggested otherwise. This result raised additional questions central to our research.
What continued learning needs did survey respondents have in their lives, and how did those needs differ? What possible explanations could account for these differences? Moreover, what major learning needs did graduates have, extending across their personal and professional lives?
12 The list of learning needs that we used in the survey was based on the different needs articulated by graduates during our study’s Phase One preliminary interviews.
Personal Life
57%
Community 13%
Workplace 30%
Figure 1: Continued Learning Needs across All Three Arenas
Project Information Literacy Research Report: “Staying Smart” | January 5, 2016 | Alison J. Head
10
To report on answers to these questions, we divided the first part of the report into four sections with findings about continued learning needs graduates had in their personal lives, workplaces, and communities of residence. We concluded with a fourth section that examines major learning needs across all three of these arenas.
1. Learning Needs: Personal Life
The concept of everyday life research was introduced 20 years ago in a study of adults living in a Finnish village.13 Researchers found that more participants spent time in their daily lives looking for practical information they could use for supporting the hobbies they enjoyed doing in their free time.
In 2010, PIL conducted its own study of everyday life research.14 Based on responses to a survey from 8,353 college students at 25 US campuses, we found that two-thirds of the respondents looked for information about making decisions directly related to their individual lives (i.e., purchasing something, health/wellness, finding a job, and trip planning).
Together, studies like these help to understand information seeking in daily life. To expand on this prior research, we began our study by investigating the continued learning needs today’s recent graduates had in their personal lives. To collect the data, we used a matrix question with 16 learning needs and a “check all that apply” response format in our survey.
In Figure 2, we present the data in a bar chart from most to fewest responses. (A complete data set of responses to this question appears as Figure 2A in Appendix E.)
13 Reijo Savolainen, “Everyday Life Information–Seeking: Approaching Information–Seeking in the Context of ‘Way of Life’,” Library & Information Science Research 17, no. 3 (Summer 1995): 259–294. 14 Alison J. Head and Michael B. Eisenberg, “How College Students Use the Web to Conduct Everyday Life Research,” First Monday 16, no. 4 (April 2011), http://dx.doi.org/10.5210/fm.v16i4.3484. The sample was 8,353 students.
Project Information Literacy Research Report: “Staying Smart” | January 5, 2016 | Alison J. Head
11
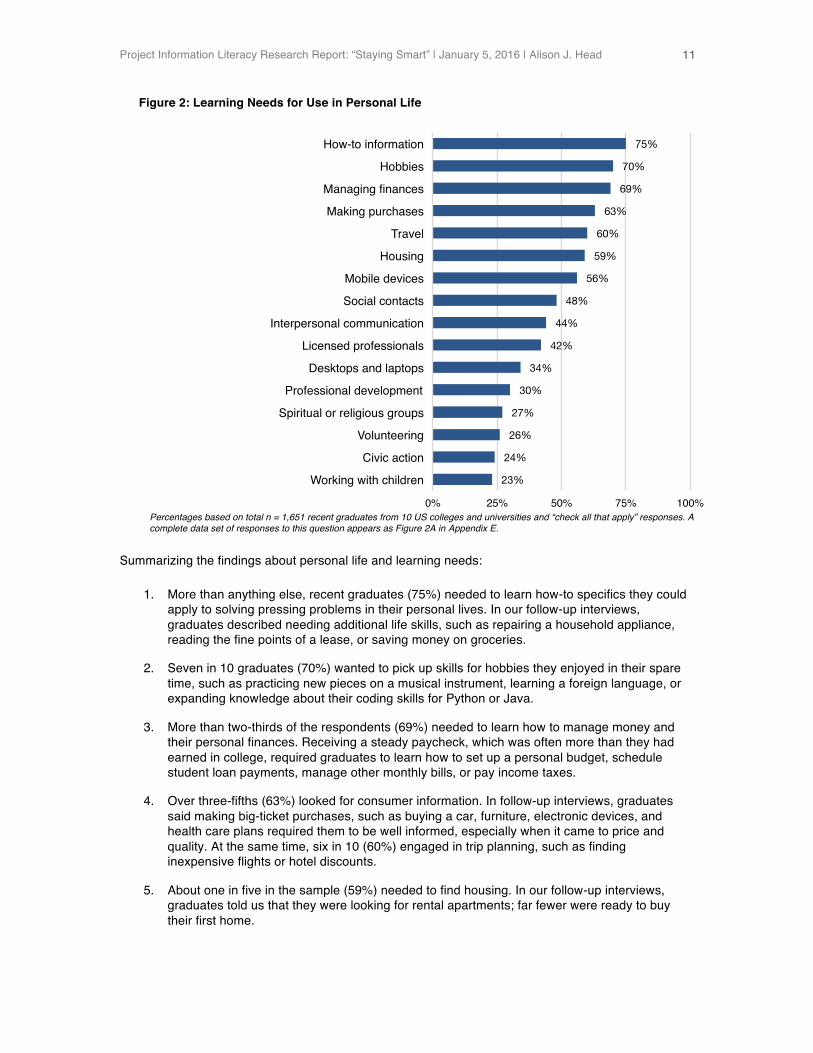
Figure 2: Learning Needs for Use in Personal Life
Percentages based on total n = 1,651 recent graduates from 10 US colleges and universities and “check all that apply” responses. A complete data set of responses to this question appears as Figure 2A in Appendix E.
Summarizing the findings about personal life and learning needs:
1. More than anything else, recent graduates (75%) needed to learn how-to specifics they could apply to solving pressing problems in their personal lives. In our follow-up interviews, graduates described needing additional life skills, such as repairing a household appliance, reading the fine points of a lease, or saving money on groceries.
2. Seven in 10 graduates (70%) wanted to pick up skills for hobbies they enjoyed in their spare time, such as practicing new pieces on a musical instrument, learning a foreign language, or expanding knowledge about their coding skills for Python or Java.
3. More than two-thirds of the respondents (69%) needed to learn how to manage money and their personal finances. Receiving a steady paycheck, which was often more than they had earned in college, required graduates to learn how to set up a personal budget, schedule student loan payments, manage other monthly bills, or pay income taxes.
4. Over three-fifths (63%) looked for consumer information. In follow-up interviews, graduates said making big-ticket purchases, such as buying a car, furniture, electronic devices, and health care plans required them to be well informed, especially when it came to price and quality. At the same time, six in 10 (60%) engaged in trip planning, such as finding inexpensive flights or hotel discounts.
5. About one in five in the sample (59%) needed to find housing. In our follow-up interviews, graduates told us that they were looking for rental apartments; far fewer were ready to buy their first home.
75%
70%
69%
63%
60%
59%
56%
48%
44%
42%
34%
30%
27%
26%
24%
23%
0%! 25%! 50%! 75%! 100%!
How-to information!
Hobbies!
Managing finances!
Making purchases!
Travel!
Housing!
Mobile devices!
Social contacts!
Interpersonal communication!
Licensed professionals!
Desktops and laptops!
Professional development!
Spiritual or religious groups!
Volunteering!
Civic action!
Working with children!
Project Information Literacy Research Report: “Staying Smart” | January 5, 2016 | Alison J. Head
12
6. The majority of graduates (56%) wanted to pick up new apps for smart phones and other mobile devices; far fewer (34%) needed information about using desktop computers and laptops for personal use.
7. Finding others who shared their interests through meetups or online dating was the kind of social contact that almost half the graduates (48%) in our sample had needed.
8. Two-fifths of the respondents (44%) wanted to brush up on interpersonal communication skills, like conflict resolution and being able to say no to friends. Some graduates said they needed quick fixes, while others wanted to learn about communication strategies in greater depth.
9. Many recent graduates (42%) reported that they looked for the availability and affordability of services from a licensed professional in the area where they lived, such as a physician, attorney, or accountant.
10. Finding out more about church or spiritual groups had been a need for slightly more than a quarter of the respondents (27%). Others needed to learn more about volunteering opportunities (26%) or participating in civic action (24%) to enrich their personal lives.
Two major trends about learning needs emerged from this analysis. Above all else, nearly all of the graduates needed to learn how to live on their own and separate from the familiar campus culture. Second, their most specific need involved compensating for their lack of financial knowledge.
Based on our interviews, we identified three types of how-to needs that graduates’ had: (1) domestic survival skills (including finance), (2) quick fixes, and (3) health and wellness information. For instance, some graduates described needing money-saving fixes like repairing a flat tire, installing a ceiling fan, or cleaning a clogged carburetor on a lawn mower. Others needed to master a combination of skills about managing their finances as their lives changed in significant ways:
I moved across the country to a major city two days after graduation! I got married a short time later and we ended up buying a house. I've gone through a lot of situations where I've said to myself, “I got to learn all of this!" Family is always a resource for learning. But I also have a financial advisor at my bank that is a free service with my account. For me, it comes down to those conversations where I can say, “Hey, how do you do this, can you teach and show me?" If I'm given the opportunity to go online or go meet with someone to talk about something, I would like to talk to someone about my specific case, especially when it comes to finances. I can ask questions, get immediate feedback, instead of searching online.
Other graduates said they had needed to acquire a great deal of knowledge about health disorders and learn how to help a loved one with a recently diagnosed illness. Still others said they needed domestic survival skills such as how to prepare meals and stretch their weekly grocery budget. As one graduate from a small university explained:
When I was in college, I just got into the habit of going to the grocery store and picking out whatever looked good and not formulating meals. Shopping in terms of thinking about meals, having a list, using websites like Food Network, Chef Ina Garten, and The Barefoot Contessa to generate recipes that could come in handy for a longer period of time, like a two-week period, so that I knew how much food to buy. I had to learn how to cook and this was difficult, because I had to learn how to shop effectively, too.
Taken together, we concluded that today’s college graduates have a diffuse set of learning needs—many of which involve building life skills, which they discovered they did not have in the first decade after they completed college.
Project Information Literacy Research Report: “Staying Smart” | January 5, 2016 | Alison J. Head
13
While much of their time was spent on finding domestic survival skills or quick-fix solutions, many of the graduates in our sample also had taken the time to dig into learning about something that had sparked their curiosity. Graduates tended to dig deep when making life decisions such as buying a house, making a career move, or starting a family.
In the next section, we turn our attention to graduates’ learning needs in the workplace. We investigated how the graduates we studied stayed adaptive and competitive in their current jobs and in the career they hoped to pursue.
2. Learning Needs: Workplace
The rising costs of college—tuition, books, and living expenses—gives the class of 2015 the unfortunate distinction of being “The Most Indebted Class Ever.”15 The average college student who took out student loans graduated with a debt of $35,000.16 Finding work after college and making money is not just the goal of going to college but by virtue of the cost of such an education, it is a stark necessity.
In this study, the graduates we surveyed fared fairly well as far as finding employment. More than three-quarters of the survey respondents (77%) reported having full-time employment. A smaller percentage of graduates were self-employed (3%), working part-time (10%), or were currently unemployed (8%).17
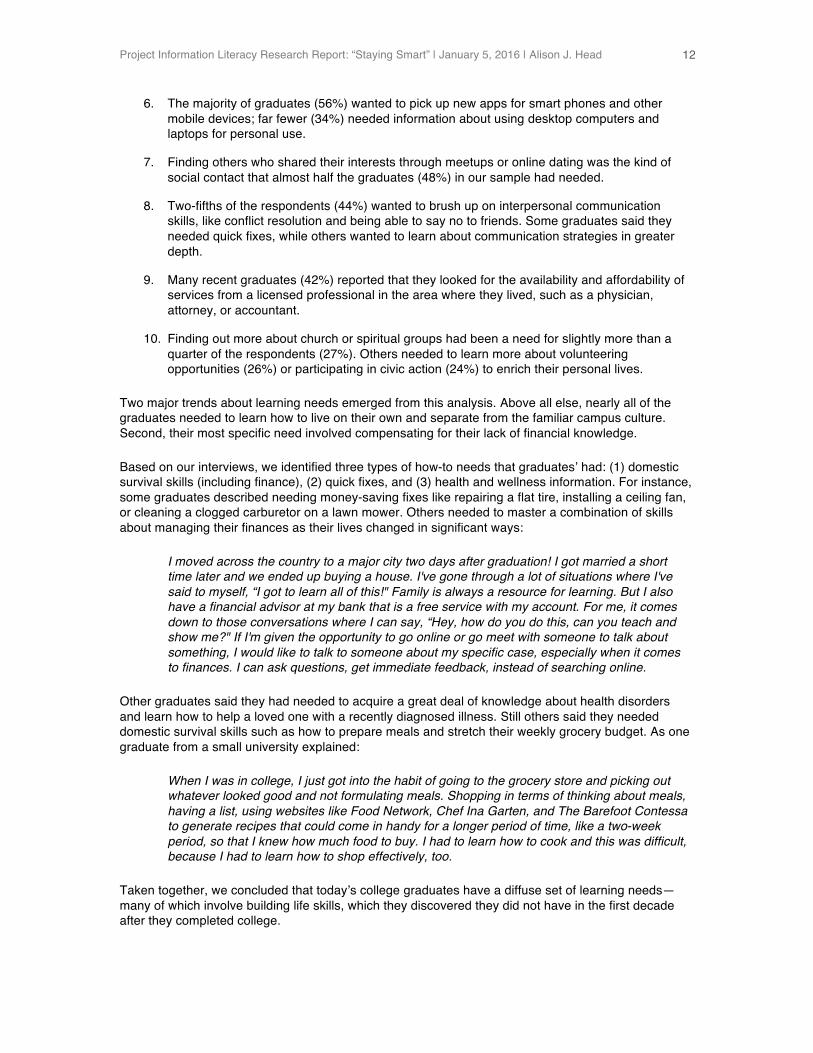
More than half of these respondents (55%) were working in the field they had majored in during college—slightly higher than the national average (Figure 3).18 Moreover, almost half the respondents were either currently enrolled in graduate school (20%) or had already received a graduate degree (28%).
Percentages based on total n = 1,651 recent graduates from 10 US colleges and universities. Percentages do not add to 100% due to rounding.
15 Jeffrey Sparshott, “Congratulations, Class of 2015. You’re the Most Indebted Ever (For Now),” The Wall Street Journal, May 8, 2015, http://blogs.wsj.com/economics/2015/05/08/congratulations-class-of-2015-youre-the-most-indebted-ever-for-now/. 16 Ibid. 17 The remaining participants (1%) declined to state their employment status. Percentages do not add to 100% due to rounding. 18 James Marshall Crotty, “60% of College Grads Can’t Find Work in their Field. Is a Management Degree the Answer?” Forbes, March 1, 2012, http://www.forbes.com/sites/jamesmarshallcrotty/2012/03/01/most-college-grads-cant-find-work-in-their-field-is-a-management-degree-the-answer/.
Working in field studied in college!
55%!
Working, but not in field from
college!37%!
Not currently working !
8%!
Declined to state 1%!
Figure 3: Working in the Field Studied during College?
Project Information Literacy Research Report: “Staying Smart” | January 5, 2016 | Alison J. Head
14
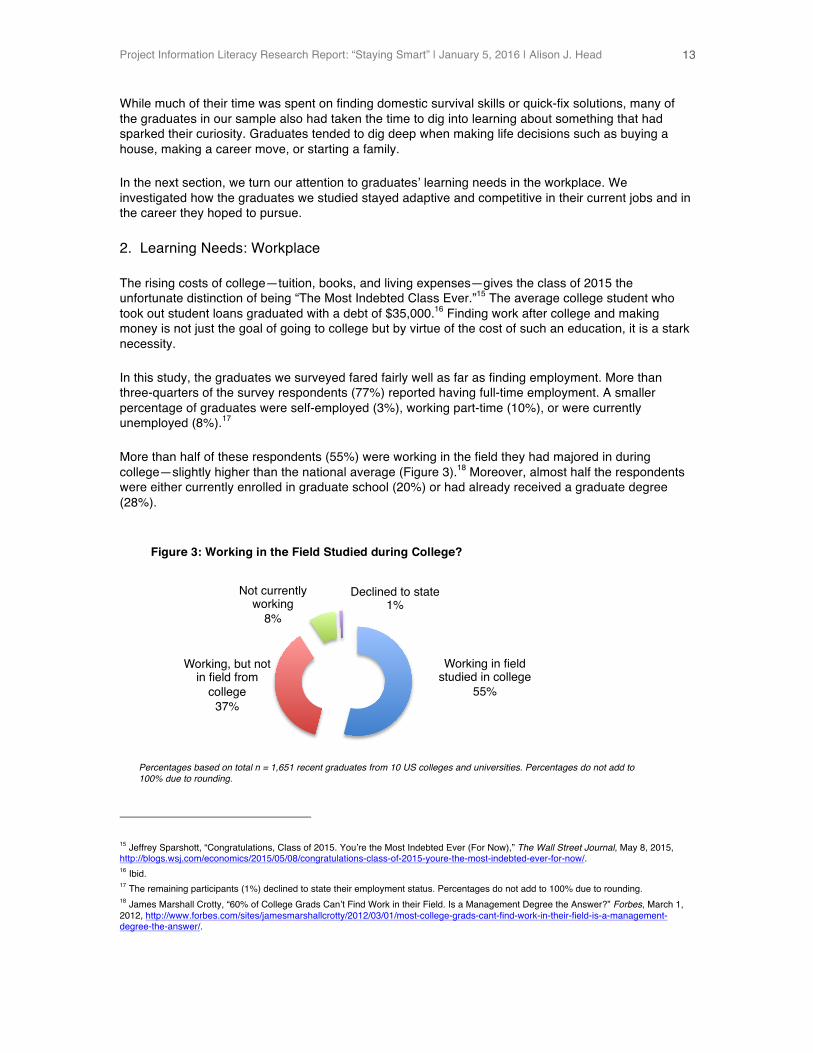
In light of these employment details, we focused on continued learning for the workplace and ask how have recent graduates stayed professionally nimble and remained employable during the past year. We used data from a survey question with 16 learning needs to answer this question. The results are presented in Figure 4.
Figure 4: Learning Needs for Use in the Workplace
Percentages based on total n = 1,651 recent graduates from 10 US colleges and universities and “check all that apply” responses. A complete data set of responses to this question appears as Figure 4A in Appendix E.
Summarizing the findings about the workplace and learning needs:
1. More than two-thirds of the respondents (69%) wanted to continue learning how to expand their career paths in the past 12 months. In our follow-up interviews, graduates discussed staying abreast of business statistics, changing industry standards, or new project management methods so they could remain valued, up-to-date, and ultimately, employable in what they considered to be their rapidly changing work settings.
2. A majority of the graduates (57%) wanted to gain more proficiency with desktop computers and laptops, especially in using spreadsheets or writing computer programs. Far fewer (32%) needed to learn about using mobile devices for supporting work tasks.
3. Over half of the respondents (56%) needed to improve their interpersonal communication skills for the workplace. Some graduates said they needed to learn negotiation and delegation techniques, especially for communicating with coworkers who were older than their college-age peers.
4. One in four graduates (25%) spent time in the past year looking for strategies to develop a professional network. In our follow-up interviews, some graduates said they used sites like LinkedIn and Facebook to keep track of current and former coworkers for recruiting or finding job leads of their own.
69%
57%
56%
32%
25%
23%
21%
20%
18%
18%
14%
14%
12%
9%
9%
2%
0%! 25%! 50%! 75%! 100%!
Professional development!
Desktops and laptops!
Interpersonal communication!
Mobile devices!
Social contacts!
Managing finances!
Travel!
How-to information!
Licensed professionals!
Working with children!
Making purchases!
Civic action!
Volunteering!
Housing!
Hobbies!
Spiritual or religious groups!
Project Information Literacy Research Report: “Staying Smart” | January 5, 2016 | Alison J. Head
15
5. More than one-fifth of the graduates (23%) had honed their financial skills over the last 12 months. In our interviews, graduates working in specialized fields discussed the importance of remaining abreast of accounting standards, while others discussed learning new approaches to preparing marketing plans.
6. Just over one-fifth of the sample (21%) looked for travel information in the past year. Graduates discussed looking for sites with flight or hotel deals for business trips. As a whole, though, far fewer needed information for making purchases beyond airline tickets and hotel bookings in the workplace (14%).
7. Almost one in five of the respondents (18%) wanted to learn about working with children since they were in educational fields, as either students enrolled in graduate programs or new hires employed in teaching jobs.
8. Some graduates looked for ways they could get involved in local civic groups (14%) or volunteering opportunities (12%) through their workplace, though it was less common. In our follow-up interviews, some graduates discussed getting involved with local schools or engaging in company volunteer efforts to read to young children in after-school programs.
The majority of the respondents identified three learning needs for the workplace during the past year: (1) professional and career development, (2) proficiency with desktop and laptop computer programs, and (3) expanded interpersonal communication skills.
Many said they were challenged keeping up with the fast pace and demands of their workplace. They described having learning needs that were specialized and that kept them up-to-date and employable in their field.
For instance, accountants and auditors said they needed more financial skills. New teachers needed to learn more about child development and working with children. Computer programmers had to brush up on technical skills for developing algorithms and writing code. As one interviewee, now working as a young research analyst, explained:
The pace of technology is something that makes me continue to learn, especially in the workplace. Even some of the statistical programs that I was taught when I was in college are not used anymore. I learned SPSS but at work they use SAS and I'm still just getting my feet wet learning that program. But now I'm learning a program called R on my own now through Code School, because I think that's where it's all going. What you need to know for the workplace is always changing and you have to be proactive—you have to keep learning if you want to have attractive skills.
At the same time, many recognized they needed a set of different interpersonal skills from those that had worked for them in college. No matter what field they were in, graduates we interviewed said that negotiation and delegation skills were essential to professional success. As one graduate, now working in the oil industry, explained:
I always knew that diversity was important, but it wasn't really applied in college. While my college was pretty diverse, my major was a bunch of white men. Now, I'm working for an international organization, and I'm learning how other cultures and personalities accept and hear information—how I need to communicate the best. If you want to succeed in this company and do well, you have to perform. In college, you can get a B or C, but after you get a degree, if you can't perform in this industry, you get laid off.
...many graduates recognized they needed a set of different interpersonal skills from those that had worked for them in college.
Project Information Literacy Research Report: “Staying Smart” | January 5, 2016 | Alison J. Head
16
Within months of graduating, many of the graduates found out that continued learning was an integral component of staying employable. They also began to discover that the skills learned in college for working on desktop and laptop computers and specialized software packages had a relatively short shelf life in the fast-paced workplace.19 In the next section, we focus on how graduates learned about becoming involved in their local communities, especially building community ties.
3. Learning Needs: Local Community
In past years, there has been evidence that today’s young adults do not engage in the public sphere beyond signing online e-petitions or “liking” a cause on Facebook. One study found that only a third of students enrolled in US higher education institutions believed that college had increased their commitment to civic involvement.20
Another report concluded the Google Generation voted less often than their older peers, paid less attention to politics, and was apathetic about their community.21 Still, a more recent report released in 2015 found almost half of US adults—at any age—are “interested bystanders.” 22 These are the individuals who stay on top of what is going on, but they do not express political opinions or take civic action, unless they have a personal or professional need at stake that aligns with their self-interest.23
Studies like these are a useful starting point for investigating the information-seeking behavior graduates used when learning about—and experiencing—their local communities. How much do these claims hold up? Specifically, what additional skills, expertise, or knowledge did recent graduates need to become involved in their local communities in the past year? Moreover, to what extent, do today’s graduates engage in community and civic life?
To answer these questions, we used the survey question with 16 learning needs and our follow-up interviews. The results from the survey question appear in Figure 5.
19 The shelf life of the skills learned in college degree will be less than five years by 2020. See: Jeff Cobb, “The Other Education Crisis,” Evolution Shift Blog, March 28, 2013, http://davidhoule.com/evolutionshift-blog/the-shift-age/general/2013/03/28/the-other-education-crisis. 20 National Task Force on Civic Learning and Democratic Engagement, A Crucible Moment: College Learning & Democracy's Future, (Washington, D.C.: Association of American Colleges and Universities, 2012), https://www.aacu.org/sites/default/files/files/crucible/Crucible_508F.pdf. 21 Krista Jenkins, Molly W. Andolina, Scott Keeter, and Cliff Zukin, “Is Civic Behavior Political? Exploring the Multidimensional Nature of Political Participation,” (paper presented at Midwest Political Science Association, Chicago, Illinois, April 3-6 2003), http://pollcats.net/downloads/JAKZMW2003.pdf. 22 Kate Krontiris, John Webb, Charlotte Krontiris, and Chris Chapman, “Understanding America’s ‘Interested Bystander;’ a Complicated Relationship with Civic Duty,” (Google Civic Innovation Team, June 2015), https://drive.google.com/file/d/0B4Nqm_QFLwnLNTZYLXp6azhqNTg/view. 23 The Google study concluded that almost half of their survey sample (48.9%), made up of all ages, qualified as “interested bystanders.”
Project Information Literacy Research Report: “Staying Smart” | January 5, 2016 | Alison J. Head
17
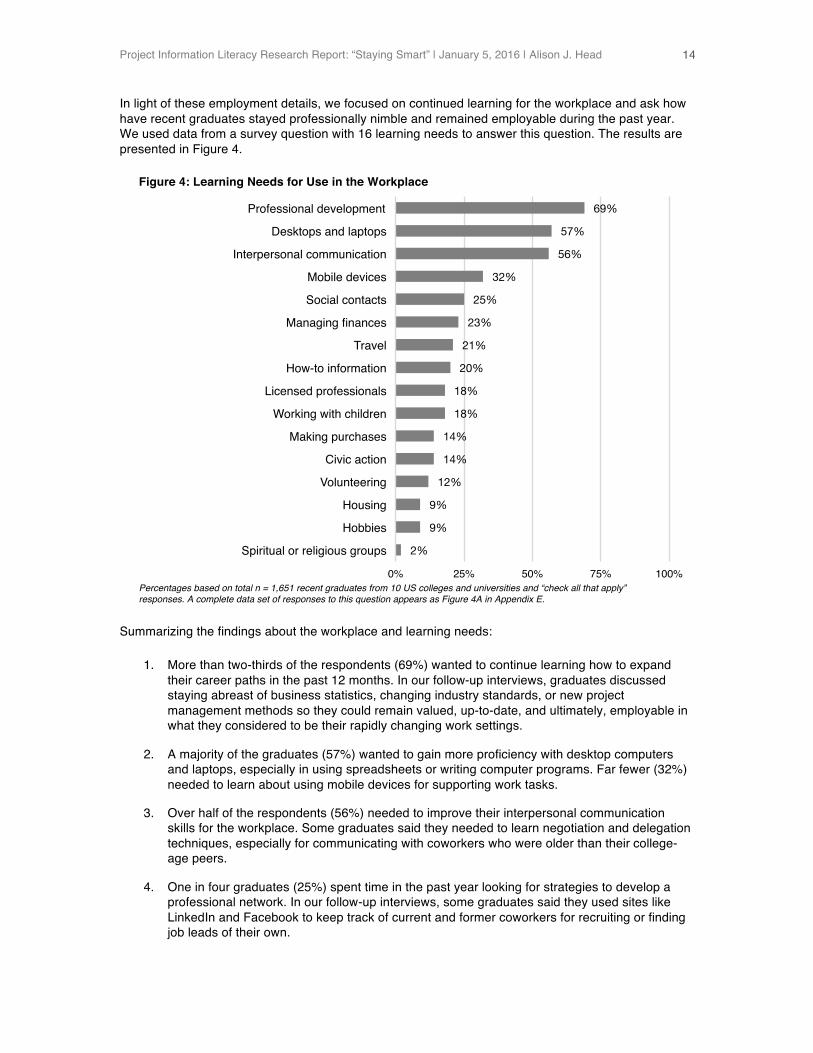
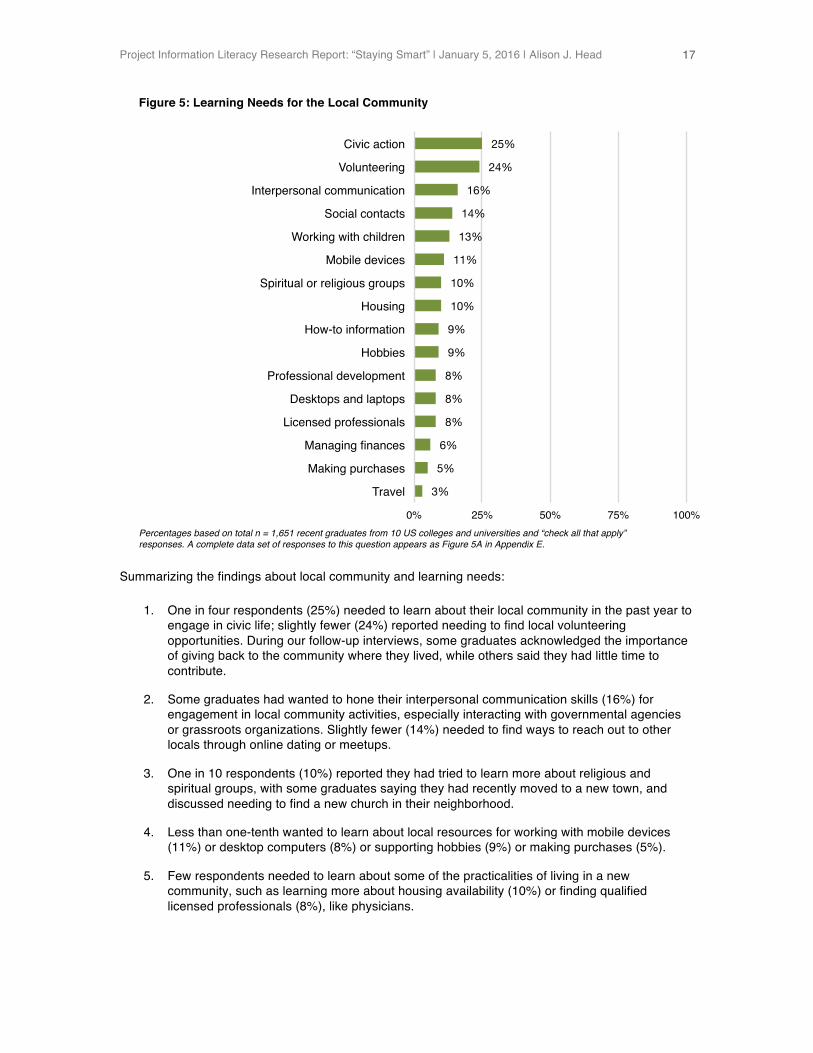
Figure 5: Learning Needs for the Local Community
Percentages based on total n = 1,651 recent graduates from 10 US colleges and universities and “check all that apply” responses. A complete data set of responses to this question appears as Figure 5A in Appendix E.
Summarizing the findings about local community and learning needs:
1. One in four respondents (25%) needed to learn about their local community in the past year to engage in civic life; slightly fewer (24%) reported needing to find local volunteering opportunities. During our follow-up interviews, some graduates acknowledged the importance of giving back to the community where they lived, while others said they had little time to contribute.
2. Some graduates had wanted to hone their interpersonal communication skills (16%) for engagement in local community activities, especially interacting with governmental agencies or grassroots organizations. Slightly fewer (14%) needed to find ways to reach out to other locals through online dating or meetups.
3. One in 10 respondents (10%) reported they had tried to learn more about religious and spiritual groups, with some graduates saying they had recently moved to a new town, and discussed needing to find a new church in their neighborhood.
4. Less than one-tenth wanted to learn about local resources for working with mobile devices (11%) or desktop computers (8%) or supporting hobbies (9%) or making purchases (5%).
5. Few respondents needed to learn about some of the practicalities of living in a new community, such as learning more about housing availability (10%) or finding qualified licensed professionals (8%), like physicians.
25%
24%
16%
14%
13%
11%
10%
10%
9%
9%
8%
8%
8%
6%
5%
3%
0%! 25%! 50%! 75%! 100%!
Civic action!
Volunteering!
Interpersonal communication!
Social contacts!
Working with children!
Mobile devices!
Spiritual or religious groups!
Housing!
How-to information!
Hobbies!
Professional development!
Desktops and laptops!
Licensed professionals!
Managing finances!
Making purchases!
Travel!
Project Information Literacy Research Report: “Staying Smart” | January 5, 2016 | Alison J. Head
18
Most graduates we interviewed were more involved in figuring out the daily necessities of living in a community—where to shop, dine, or see a movie—than they were with learning about civic causes or local volunteering opportunities during the past year.
Some said a new job or family obligations kept them from joining. Others said they were interested in becoming more locally involved, but were uncertain about where to look. Still others said their interest in becoming involved was piqued as the 2016 presidential election grew closer.
Among the small number of graduates that had become engaged in their communities during the past year, some had volunteered in homeless shelters. Others worked with children in after-school reading or athletic programs. Still others continued to learn about and be involved in a cause, such as legalizing marijuana or making their communities greener:
Heck, yes, I’d say graduates do volunteer! As soon as I graduated from college, I moved to a different community and sought out the nearest environmental group and started volunteering 20 hours a week there like I had done during college, too. I founded a "green drinks" group here where I live now. I've sat on numerous boards, numerous steering committees—civic duty is a really important thing for me.
Other graduates, like this one, wanted to engage in the public sphere in order to learn about the community and make new acquaintances. Still, others volunteered because the opportunity to give back aligned with a career-based interest. By volunteering, they could gain professional experience, which in the end could advance their careers. As one graduate, now working in retail management, explained:
My life revolves around work and how I can get where I want to go so when I'm not working I do a lot of volunteer work. I work with Goodwill and another group that helps disadvantaged and do things that are related to putting on fashion shows so it overlaps with my work life. It's not coincidental since fashion is my passion. So I fill my time up with things I truly love to do so I feel fulfilled and I'm giving back, I guess you could say.
As a whole, we concluded that most graduates were not necessarily apathetic or averse to participation in civic action and community engagement. Rather, many were consumed with trying to remain gainfully employed without neglecting their personal responsibilities. In most cases, if graduates they volunteered it often overlapped with their need to be more employable. We end this part of the report with an analysis of the three major learning needs today’s graduates had across the three arenas in their lives.
Project Information Literacy Research Report: “Staying Smart” | January 5, 2016 | Alison J. Head
19
4. Major Learning Needs: Personal Life, the Workplace, and Local Community
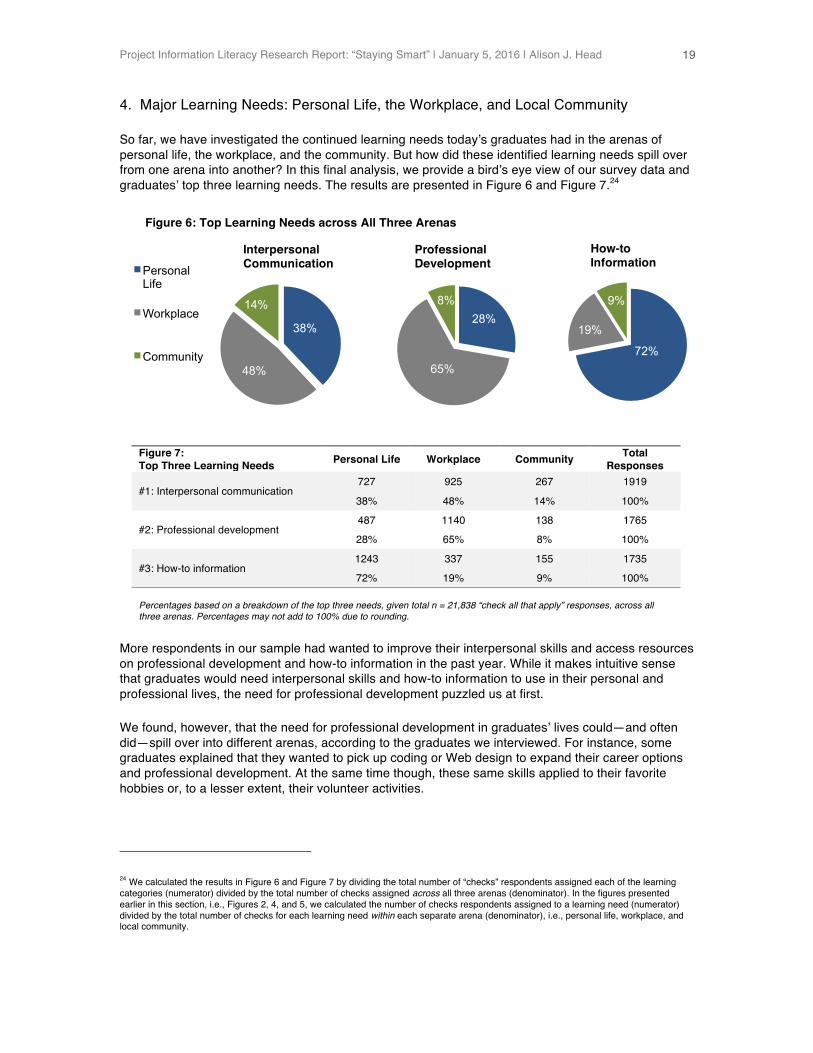
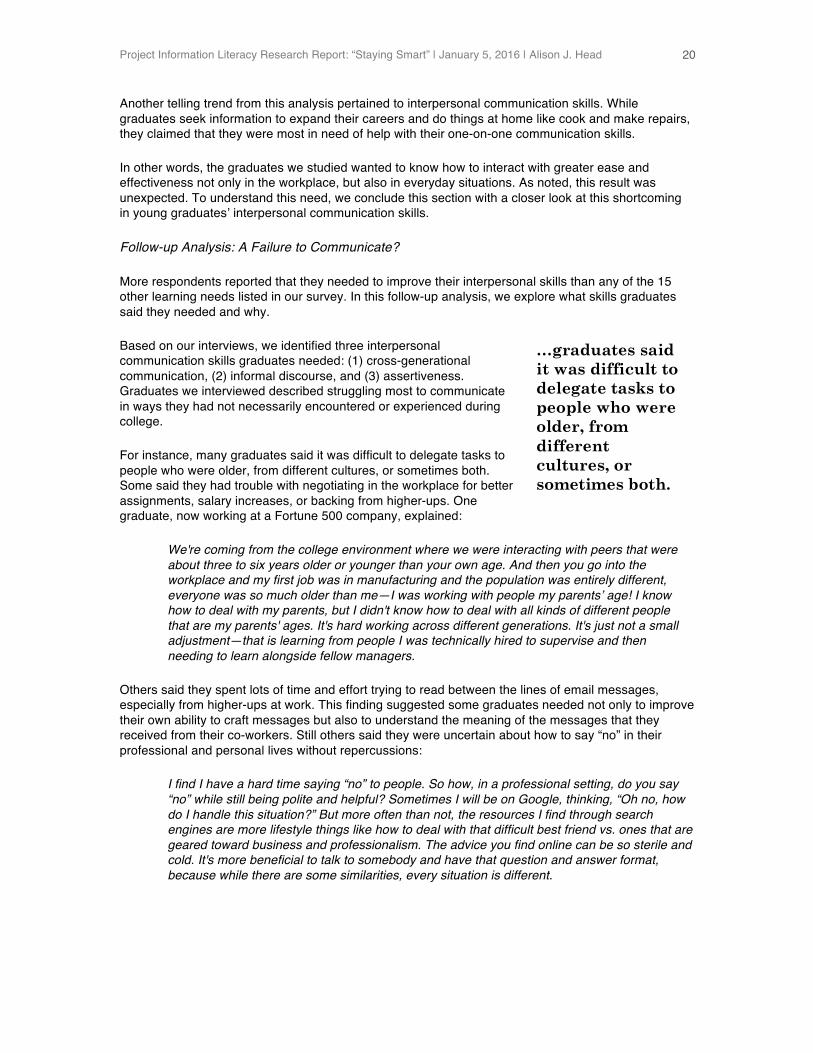
So far, we have investigated the continued learning needs today’s graduates had in the arenas of personal life, the workplace, and the community. But how did these identified learning needs spill over from one arena into another? In this final analysis, we provide a bird’s eye view of our survey data and graduates’ top three learning needs. The results are presented in Figure 6 and Figure 7.24
Percentages based on a breakdown of the top three needs, given total n = 21,838 “check all that apply” responses, across all three arenas. Percentages may not add to 100% due to rounding.
More respondents in our sample had wanted to improve their interpersonal skills and access resources on professional development and how-to information in the past year. While it makes intuitive sense that graduates would need interpersonal skills and how-to information to use in their personal and professional lives, the need for professional development puzzled us at first.
We found, however, that the need for professional development in graduates’ lives could—and often did—spill over into different arenas, according to the graduates we interviewed. For instance, some graduates explained that they wanted to pick up coding or Web design to expand their career options and professional development. At the same time though, these same skills applied to their favorite hobbies or, to a lesser extent, their volunteer activities.
24 We calculated the results in Figure 6 and Figure 7 by dividing the total number of “checks” respondents assigned each of the learning categories (numerator) divided by the total number of checks assigned across all three arenas (denominator). In the figures presented earlier in this section, i.e., Figures 2, 4, and 5, we calculated the number of checks respondents assigned to a learning need (numerator) divided by the total number of checks for each learning need within each separate arena (denominator), i.e., personal life, workplace, and local community.
Figure 7: Top Three Learning Needs Personal Life Workplace Community Total
Responses
#1: Interpersonal communication 727 925 267 1919
38% 48% 14% 100%
#2: Professional development 487 1140 138 1765
28% 65% 8% 100%
#3: How-to information 1243 337 155 1735
72% 19% 9% 100%
38%
48%
14%
Personal Life
Workplace
Community 72%
19%
9% 28%
65%
8%
Interpersonal Communication
Professional Development
How-to Information
Figure 6: Top Learning Needs across All Three Arenas
Project Information Literacy Research Report: “Staying Smart” | January 5, 2016 | Alison J. Head
20
Another telling trend from this analysis pertained to interpersonal communication skills. While graduates seek information to expand their careers and do things at home like cook and make repairs, they claimed that they were most in need of help with their one-on-one communication skills.
In other words, the graduates we studied wanted to know how to interact with greater ease and effectiveness not only in the workplace, but also in everyday situations. As noted, this result was unexpected. To understand this need, we conclude this section with a closer look at this shortcoming in young graduates’ interpersonal communication skills.
Follow-up Analysis: A Failure to Communicate?
More respondents reported that they needed to improve their interpersonal skills than any of the 15 other learning needs listed in our survey. In this follow-up analysis, we explore what skills graduates said they needed and why.
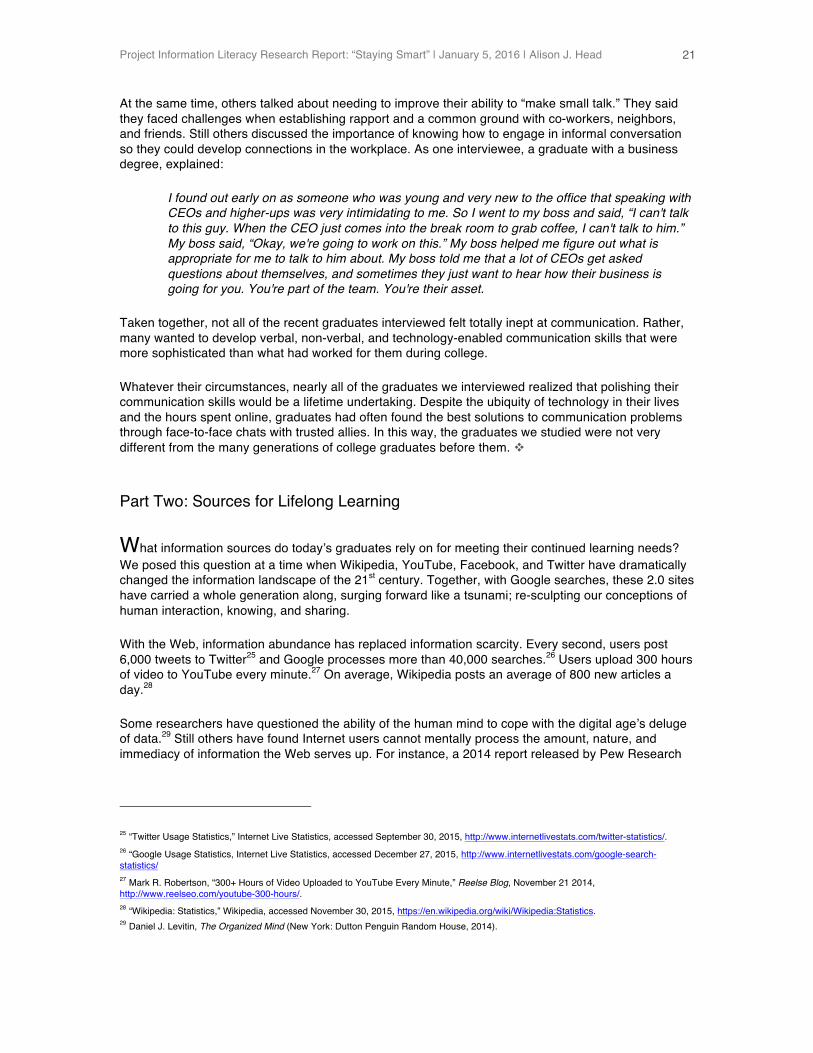
Based on our interviews, we identified three interpersonal communication skills graduates needed: (1) cross-generational communication, (2) informal discourse, and (3) assertiveness. Graduates we interviewed described struggling most to communicate in ways they had not necessarily encountered or experienced during college.
For instance, many graduates said it was difficult to delegate tasks to people who were older, from different cultures, or sometimes both. Some said they had trouble with negotiating in the workplace for better assignments, salary increases, or backing from higher-ups. One graduate, now working at a Fortune 500 company, explained:
We're coming from the college environment where we were interacting with peers that were about three to six years older or younger than your own age. And then you go into the workplace and my first job was in manufacturing and the population was entirely different, everyone was so much older than me—I was working with people my parents’ age! I know how to deal with my parents, but I didn't know how to deal with all kinds of different people that are my parents' ages. It's hard working across different generations. It's just not a small adjustment—that is learning from people I was technically hired to supervise and then needing to learn alongside fellow managers.
Others said they spent lots of time and effort trying to read between the lines of email messages, especially from higher-ups at work. This finding suggested some graduates needed not only to improve their own ability to craft messages but also to understand the meaning of the messages that they received from their co-workers. Still others said they were uncertain about how to say “no” in their professional and personal lives without repercussions:
I find I have a hard time saying “no” to people. So how, in a professional setting, do you say “no” while still being polite and helpful? Sometimes I will be on Google, thinking, “Oh no, how do I handle this situation?” But more often than not, the resources I find through search engines are more lifestyle things like how to deal with that difficult best friend vs. ones that are geared toward business and professionalism. The advice you find online can be so sterile and cold. It's more beneficial to talk to somebody and have that question and answer format, because while there are some similarities, every situation is different.
…graduates said it was difficult to delegate tasks to people who were older, from different cultures, or sometimes both.
Project Information Literacy Research Report: “Staying Smart” | January 5, 2016 | Alison J. Head
21
At the same time, others talked about needing to improve their ability to “make small talk.” They said they faced challenges when establishing rapport and a common ground with co-workers, neighbors, and friends. Still others discussed the importance of knowing how to engage in informal conversation so they could develop connections in the workplace. As one interviewee, a graduate with a business degree, explained:
I found out early on as someone who was young and very new to the office that speaking with CEOs and higher-ups was very intimidating to me. So I went to my boss and said, “I can't talk to this guy. When the CEO just comes into the break room to grab coffee, I can't talk to him.” My boss said, “Okay, we're going to work on this.” My boss helped me figure out what is appropriate for me to talk to him about. My boss told me that a lot of CEOs get asked questions about themselves, and sometimes they just want to hear how their business is going for you. You're part of the team. You're their asset.
Taken together, not all of the recent graduates interviewed felt totally inept at communication. Rather, many wanted to develop verbal, non-verbal, and technology-enabled communication skills that were more sophisticated than what had worked for them during college.
Whatever their circumstances, nearly all of the graduates we interviewed realized that polishing their communication skills would be a lifetime undertaking. Despite the ubiquity of technology in their lives and the hours spent online, graduates had often found the best solutions to communication problems through face-to-face chats with trusted allies. In this way, the graduates we studied were not very different from the many generations of college graduates before them. !
Part Two: Sources for Lifelong Learning
What information sources do today’s graduates rely on for meeting their continued learning needs? We posed this question at a time when Wikipedia, YouTube, Facebook, and Twitter have dramatically changed the information landscape of the 21st century. Together, with Google searches, these 2.0 sites have carried a whole generation along, surging forward like a tsunami; re-sculpting our conceptions of human interaction, knowing, and sharing.
With the Web, information abundance has replaced information scarcity. Every second, users post 6,000 tweets to Twitter25 and Google processes more than 40,000 searches.26 Users upload 300 hours of video to YouTube every minute.27 On average, Wikipedia posts an average of 800 new articles a day.28
Some researchers have questioned the ability of the human mind to cope with the digital age’s deluge of data.29 Still others have found Internet users cannot mentally process the amount, nature, and immediacy of information the Web serves up. For instance, a 2014 report released by Pew Research
25 “Twitter Usage Statistics,” Internet Live Statistics, accessed September 30, 2015, http://www.internetlivestats.com/twitter-statistics/. 26 “Google Usage Statistics, Internet Live Statistics, accessed December 27, 2015, http://www.internetlivestats.com/google-search-statistics/ 27 Mark R. Robertson, “300+ Hours of Video Uploaded to YouTube Every Minute,” Reelse Blog, November 21 2014, http://www.reelseo.com/youtube-300-hours/. 28 “Wikipedia: Statistics,” Wikipedia, accessed November 30, 2015, https://en.wikipedia.org/wiki/Wikipedia:Statistics. 29 Daniel J. Levitin, The Organized Mind (New York: Dutton Penguin Random House, 2014).
Project Information Literacy Research Report: “Staying Smart” | January 5, 2016 | Alison J. Head
22
found most respondents were grateful to have a way to share ideas with others (72%), believing the Web has improved their ability to learn new things (87%).30
Drawing on studies like these, we asked a sample of recent college graduates which information sources they used to fulfill basic to complex learning needs in their personal lives, workplaces, and the communities where they lived.
Our objective was to examine the relationship between information seeking sources graduates employed and the learning needs they hoped to satisfy. Such findings can assist educators, librarians, employers, and producers of online learning tools in preparing students to be lifelong learners.
We have divided this part of the report into three sections about the continued learning sources graduates used in their personal lives, workplace, and local communities. We conclude with a fourth section on the major learning sources across all three of these arenas.
1. Learning Sources: Personal Life
We began with an analysis of continued learning sources graduates turned to in everyday life during the past 12 months. We collected survey data about graduates’ use of 28 sources.
These sources fall into three categories: (1) traditional information systems such as libraries, museums, and bookstores that offer physical and virtual access to resources; (2) Web 2.0 forms and social networking sites (i.e., MOOCS and blogs); and (3) human-mediated channels (i.e., friends, family members, coworkers, and their bosses). In Figure 8, we present the findings from the survey.
30 Kristen Purcell and Lee Rainie, “Americans Feel Better Informed, Thanks to the Internet,” (Washington, D.C.: Pew Research Center, December 8, 2014), http://www.pewinternet.org/files/2014/12/PI_InformedWeb_120814_02.pdf.
Project Information Literacy Research Report: “Staying Smart” | January 5, 2016 | Alison J. Head
23
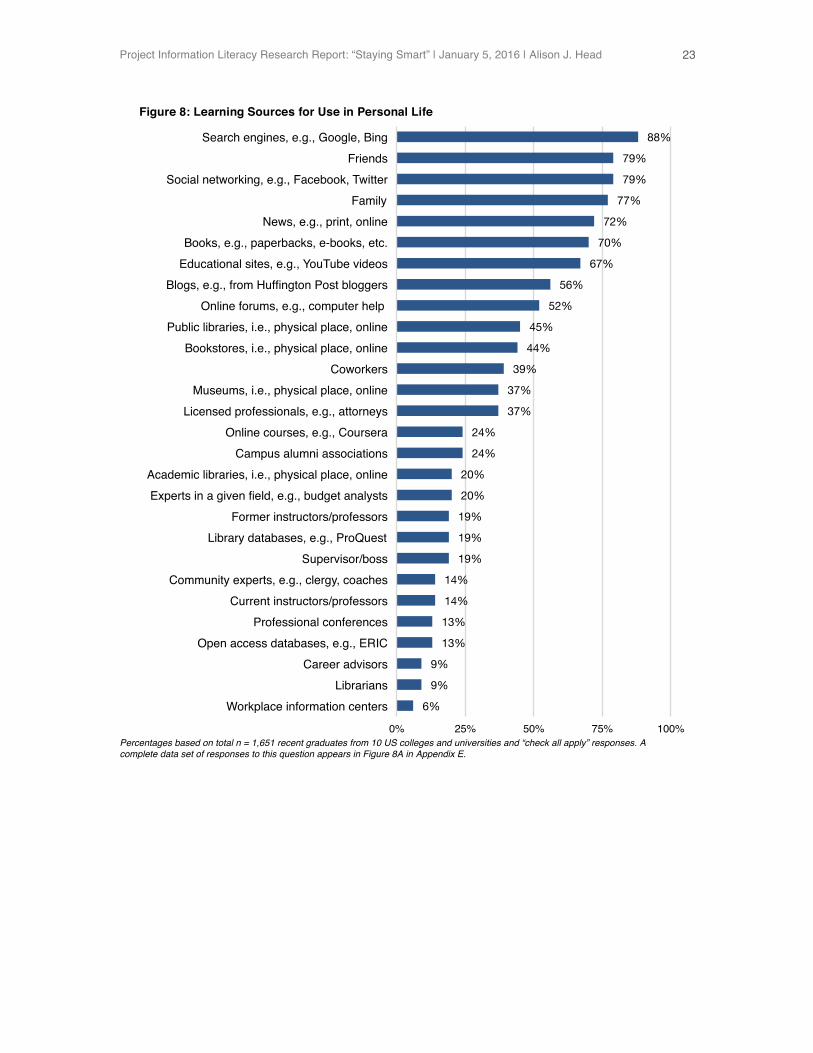
Percentages based on total n = 1,651 recent graduates from 10 US colleges and universities and “check all apply” responses. A complete data set of responses to this question appears in Figure 8A in Appendix E.
88%
79%
79%
77%
72%
70%
67%
56%
52%
45%
44%
39%
37%
37%
24%
24%
20%
20%
19%
19%
19%
14%
14%
13%
13%
9%
9%
6%
0%! 25%! 50%! 75%! 100%!
Search engines, e.g., Google, Bing!Friends!
Social networking, e.g., Facebook, Twitter!Family!
News, e.g., print, online!Books, e.g., paperbacks, e-books, etc.!
Educational sites, e.g., YouTube videos!Blogs, e.g., from Huffington Post bloggers!
Online forums, e.g., computer help !Public libraries, i.e., physical place, online!
Bookstores, i.e., physical place, online!Coworkers!
Museums, i.e., physical place, online!Licensed professionals, e.g., attorneys!
Online courses, e.g., Coursera!Campus alumni associations!
Academic libraries, i.e., physical place, online!Experts in a given field, e.g., budget analysts!
Former instructors/professors!Library databases, e.g., ProQuest!
Supervisor/boss!Community experts, e.g., clergy, coaches!
Current instructors/professors!Professional conferences!
Open access databases, e.g., ERIC!Career advisors!
Librarians!Workplace information centers!
Figure 8: Learning Sources for Use in Personal Life
Project Information Literacy Research Report: “Staying Smart” | January 5, 2016 | Alison J. Head
24
Summarizing the findings about the learning sources used in graduates’ personal lives:
1. Nearly all of the respondents (88%) had used search engines during the past year when they were specifically looking for learning materials they could apply to their daily lives.31 In our follow-up interviews, graduates called Google their “go-to starting point” or “best friend.” Many said they used Google for finding quick-fix solutions, creative hobby ideas, consumer information, or housing options.
2. Over three-fourths of the sample relied on friends (79%) or family (77%) for guidance during the past year, suggesting that most graduates still see human connections as being very important for learning. Many of the graduates we interviewed trusted allies when dealing with money matters, such as improving a credit score, setting up a personal budget, or making a decision about an expensive purchase.
3. Almost four-fifths (79%) had used social networking sites like Facebook or Twitter in their personal lives as a learning source. Some graduates said they used Facebook for fun and social reasons and to learn from friends’ posts. Others deployed the “like” feature as an aggregator tool, enabling them to receive new posts from traditional news magazines, such as Business Week or Newsweek. Still others tapped into social network sites to extend their social circle and arrange for local meetups.
4. Over two-thirds of the sample (72%) followed news sources as a way to stay up-to-date and current. Most said they read a mix of traditional media from national sources, such as The New York Times, Huffington Post, or Newsweek, through links found on blog postings, tweets, or Facebook feeds.
5. Seven out of 10 (70%) read books to fill their lifelong learning needs in the last year. Many said they had no preference for formats and used hardbound books, e-books, or paperbacks—whatever happened to be available, cost-effective, and close at hand.
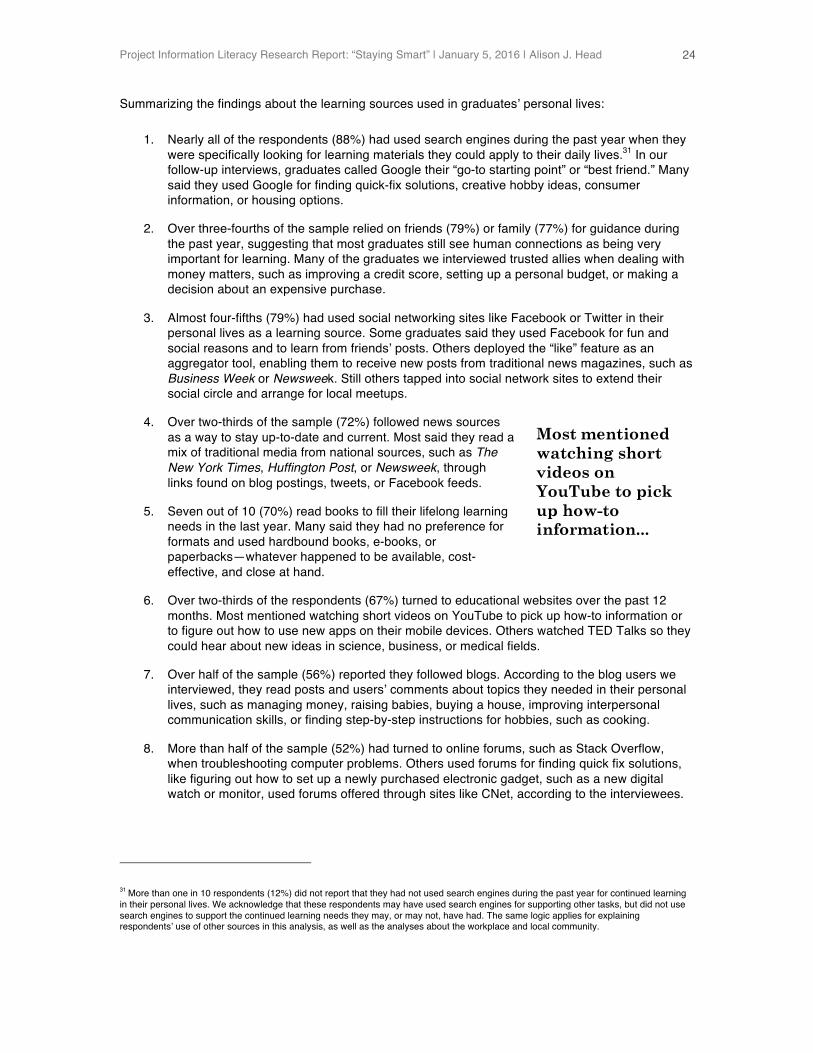
6. Over two-thirds of the respondents (67%) turned to educational websites over the past 12 months. Most mentioned watching short videos on YouTube to pick up how-to information or to figure out how to use new apps on their mobile devices. Others watched TED Talks so they could hear about new ideas in science, business, or medical fields.
7. Over half of the sample (56%) reported they followed blogs. According to the blog users we interviewed, they read posts and users’ comments about topics they needed in their personal lives, such as managing money, raising babies, buying a house, improving interpersonal communication skills, or finding step-by-step instructions for hobbies, such as cooking.
8. More than half of the sample (52%) had turned to online forums, such as Stack Overflow, when troubleshooting computer problems. Others used forums for finding quick fix solutions, like figuring out how to set up a newly purchased electronic gadget, such as a new digital watch or monitor, used forums offered through sites like CNet, according to the interviewees.
31 More than one in 10 respondents (12%) did not report that they had not used search engines during the past year for continued learning in their personal lives. We acknowledge that these respondents may have used search engines for supporting other tasks, but did not use search engines to support the continued learning needs they may, or may not, have had. The same logic applies for explaining respondents’ use of other sources in this analysis, as well as the analyses about the workplace and local community.
Most mentioned watching short videos on YouTube to pick up how-to information...
Project Information Literacy Research Report: “Staying Smart” | January 5, 2016 | Alison J. Head
25
9. During the past year, more than two-fifths (45%) reported using a public library—in-person and/or online. Graduates we interviewed said they had scanned shelves at their local library for books on home repair, hobbies, landscaping, cooking, or travel. Others said they went online to place best sellers on reserve that they could pick up at their local library later on. These findings suggest that many graduates preferred borrowing to buying. Slightly fewer had used bookstores (44%) and museums (37%) to browse titles or see exhibits.
10. Over one-third of the graduates trusted their coworkers (39%), and to a lesser extent their supervisors (19%), as sources of advice and guidance they could use in their personal lives. In follow-up interviews, graduates said small talk with coworkers kept them current about local events, books and movie recommendations, relationship issues, or housing options.
11. Some respondents sought expert advice from licensed professionals or experts during the past year, such as attorneys (37%), budget managers (20%), or career advisors (9%).
12. Almost one-quarter of the sample reported staying connected through their campus alumni association (24%). According to graduates we interviewed, many used alumni websites to find out about networking events, job leads, continuing education, or volunteering opportunities. Others said they checked the alumni website to keep up with old classmates or purchase tickets to campus events, like college football games.
13. Almost one-fourth (24%) had enrolled in an online course during the past year, with some saying they had enrolled in a MOOC, such as Coursera, so they could improve their computer skills with coding, programming, or Web design, according to interviewees.
14. One-fifth of the respondents (20%) consulted academic libraries and slightly fewer (19%) accessed online articles from library databases, if they had access, such as ProQuest or JSTOR, during the past 12 months. These visits were both physical and virtual, according to the graduates we interviewed. Some said they used scholarly sources through their campus library when they needed to conduct more intensive research on a topic, such as scientific breakthroughs for treating diseases like cancer.
15. Some respondents had contacted their former instructors (19%), or current instructors (14%) in graduate programs in which they were enrolled or had completed, for guidance.32 Others had consulted a community expert, such as clergy or a coach (14%) or a librarian (9%) during the past year.
Not surprisingly, most graduates said they used a mix of Google searches and popular sites like Facebook, Pinterest, or YouTube to locate quick-fix solutions or creative ideas. But their online searching did not end there.
Many graduates that we interviewed had consulted books, blogs, NPR, or BBC broadcasts to learn more deeply and authoritatively about new ideas. Others tuned into documentaries or TED Talks on YouTube since it felt like being back in school again—but with shorter lectures that were “impactful, concise, and applicable.” Still others said they took deep dives into the plethora of sources available on the Web, especially when a topic piqued their interest.
32 One in five (20%) of the survey respondents were currently enrolled in a graduate program and 28% had already completed a graduate program.
Project Information Literacy Research Report: “Staying Smart” | January 5, 2016 | Alison J. Head
26
Still others let their curiosity lead them from one source to the next over days and weeks in what one graduate called “serendipitous learning”:
It all started because I watched a documentary, The Business of Being Born—it’s what sparked my interest in midwives and exploring those options. So, after I saw that documentary, I looked at some other documentaries, and I went online to research statistics, what were options in my area, where to go, and what my options were with my insurance for having my own baby. There were books that were mentioned in the documentaries and that came up when I was searching online. I bought Ina May Gaskin's book on childbirth. I would also look at YouTube videos about natural childbirth.
Nearly all of the graduates we interviewed complemented their use of online sources with face-to-face discussions. Such conversations were useful for finding out about local events or restaurants, or when graduates were making risk-associated decisions, such as switching jobs, making a major purchase, starting a family, or figuring about money matters, according to interviewees.
All in all, most graduates we studied realized the Web could not satisfy their continued learning needs. Conversations with friends and family mattered. So did the traditional learning sources they had relied on in college—books and libraries.
To comprehend how recent graduates continue to learn in their personal lives, we conducted two follow-up analyses: 1) a discussion and findings about graduates’ use of blogs, and 2) their use of public libraries.
Follow-up Analysis: Why Do Blogs Still Matter?
Short-form content—as quickly created as it is consumed—has captured the attention of a nation of Internet users. In 2015, Instagram, Snapchat, and Twitter made the list of the top 25 most frequently downloaded mobile apps in the US.33 When we conducted interviews with recent college graduates in our study, we found that blogs, an older Web form, still mattered, too.
In this follow-up analysis, we discuss some of the reasons graduates rely on blogs for continued learning. According to our survey results, more than half (56%) had turned to blogs in the past year. More than two-fifths of the respondents (43%) had followed between one and four blogs to meet their continued learning needs. The majority of these blog followers were women (68%), slightly lower than the national average for social media usage.34
As content that once was the bedrock of the blogosphere has migrated to sites like Tumblr, Twitter, or Facebook, 35 we found the recent graduates we studied still turned to blogs for a variety of reasons (Figure 9).
33 Dan Frommer, “These Are the 25 Most Popular Mobile Apps in America,” Quartz, August 18, 2015, http://qz.com/481245/these-are-the-25-most-popular-2015-mobile-apps-in-america/. 34 Megan Garber, “The Digital (Gender) Divide: Women Are More Likely than Men to Have a Blog (and a Facebook Profile),” The Atlantic, April 27, 2012, http://www.theatlantic.com/technology/archive/2012/04/the-digital-gender-divide-women-are-more-likely-than-men-to-have-a-blog-and-a-facebook-profile/256466/. 35 Verne Kopytoff, “Blogs Wane as Youth Drift to Sites like Twitter,” The New York Times, February 20, 2011, http://www.nytimes.com/2011/02/21/technology/internet/21blog.html; Jason Kottke, “The Blog is Dead, Long Live the Blog,” Nieman Journalism Lab, December 19, 2013, http://www.niemanlab.org/2013/12/the-blog-is-dead/; Felix Gilette, “Department of Blogging Extinction: Technorati Rankings are Dead,” Bloomberg Business, June 24, 2014, http://www.bloomberg.com/bw/articles/2014-06-24/department-of-blogging-extinction-technorati-rankings-are-dead.

Project Information Literacy Research Report: “Staying Smart” | January 5, 2016 | Alison J. Head
27
Percentages based on total n = 1,651 recent graduates from 10 US colleges and universities. Responses of “strongly agree” and “somewhat agree” have been conflated into “agree.” Summarizing findings about the reasons for blog use:
Summarizing findings about blog use:
1. More than anything else, blogs were an affordable source (71%) of the know-how that recent graduates needed. According to the survey results, blogs offered up-to-date information (69%) and good summaries of topics (61%) from insiders, according to our survey results. Many blog users we interviewed said they would not have been able to afford to hire this quality of expertise so they relied on blogs for guidance, instruction, and advice.
2. Further, six in 10 (60%) reported that blogs were easy to locate using search engines. To a slightly lesser extent, there was an authenticity and candor to blog content (59%); writers rarely are compensated, unlike the writers from the mainstream media—publications that graduates we interviewed said they tended to mistrust. Notably, none of the interviewees mentioned sponsored reviews, which are a form of advertising on some blogs.
3. Over half the graduates said they prioritized their search for blogs by looking for utility as well as for ongoing discussions with multiple voices (55%) about the kinds of things today’s they need to know.
According to graduates we interviewed, blogs helped with learning more about things such as personal budgets, house-buying, parenting and newborn baby care, workplace communication, or starting a business from the ground up. In other cases, some said blogs helped them keep up on neighborhood news:
Blogs can get very specific about your neighborhood and they can cover just one neighborhood that newspapers really don't and can't. People who write for these blogs writers are on the ground and they're involved in the community. Blogs like this are very up to date. Several posts come out a day. If something happens, they're on it immediately.
71%
69%
61%
60%
59%
55%
0%! 25%! 50%! 75%! 100%!
Provides a good source of low-cost information!
Is a good source of current information!
Gives good summary of a topic!
Is easy to find with search engines!
Offers more candid viewpoints than mainstream press!
Allows for ongoing discussions with posts!
Figure 9: Why Graduates Read Blogs
Project Information Literacy Research Report: “Staying Smart” | January 5, 2016 | Alison J. Head
28
Utility, highlighted earlier in our report as being an important information quality to young graduates, was a main reason why graduates surveyed relied on blogs.36 Blog users we interviewed said they were looking for “specifics” and “how-to information” they could directly apply in their lives. They wanted practical and no-cost information that they could call up quickly and use.
We found most graduates said they were selective about the blogs that they consult, especially when they wanted to follow a certain topic closely. Many said they followed blogs after having carefully vetted them in a variety of ways.
For instance, one interviewee who had double-majored in business and music said he started reading a digital marketing guru’s blog after first learning about him in a New York Times business article. Another interviewee, who was setting up a graphic design business, said she is following a well-known entrepreneur’s blog for ideas and guidance.
Still another young graduate, who had majored in finance, said she had done a Google search and culled the results to find a credible blog about setting up first-time personal budgets after college. The comments posted on blogs, she said, helped her figure out which solutions worked over time and, ultimately, whether or not the budgeting methods were feasible for her.
Today, there are a myriad of online sources with this kind of shared utility for lifelong learning, such as online forums, social network sites, and video-sharing sites. However, our findings suggest these online venues may simply not be enough to provide lifelong learners with the quality of information graduates seek.
The quality and depth of blogs that have not migrated to social media platforms may be filling a gap with more information-rich content and less of the self-absorbed opinion and personal musings of the past. In the next section, we provide results from another follow-up analysis, this time, about public library usage.
Follow-up Analysis: Public Libraries, along with What Else?
Almost half of the graduates we surveyed (45%) had used a public library during the past year. In this follow-up analysis, we asked those respondents who reported using public libraries for continued learning, what other information sources were they likely to use for the same purpose.
A logistic regression analysis was used to determine the circumstances in which public libraries were more likely to be used—and not used—in graduates’ personal lives.37 The results of the analysis that are presented in Figure 10 provide the probability of whether respondents who used public libraries also used other sources for lifelong learning during the past 12 months. The full model containing all nine predictors of public library usage correctly classified 73% of the cases (n=1,571).38
36 Some of this discussion appears in Alison J. Head, “Why Blogs Still Matter to the Young,” (Cambridge, MA: Berkman Center for Internet and Society, Harvard University, December 2014), http://projectinfolit.org/images/pdfs/Why_Blogs_Matter.pdf. 37 The model contained nine independent variables: (1) consulting with a librarian(s), (2) visiting bookstores, (3) museums, (4) use of educational websites, (5) open access scholarly databases, e.g., ERIC, (6) gender, (7) having the ability to learn anything on their own, (8) use of online courses, and (9) age. The model’s dependent variable was the use of public libraries in their personal lives. We determined use by graduates’ responses to survey questions about the reported use of public libraries. 38 The value of the Nagelkerke R-squared was 0.3265, which means that 33% of all of the variance in the use of public libraries in personal life can be accounted for by these variables, using this model.

Project Information Literacy Research Report: “Staying Smart” | January 5, 2016 | Alison J. Head
29
As shown in Figure 10, although their effect was small, seven of the nine independent variables made a statistically significant contribution to the model about public library usage (0.05%) level. In the figure, these variables appear asterisked in the first column of the figure and shaded in gray. The associated p-values of the standardized partial regression coefficient and the odds ratio are bolded.
Figure 10: Logistic Regression Analysis Results on Public Library Usage
Estimate of B
S.E. of B
p-value of B
Odds ratio
95.0% C.I. for Odds ratio Probability
Lower Upper
Intercept -2.048 0.327 0 0.129
Librarians* 1.704 0.259 0 5.497* 3.31 9.13 84.609%
Bookstores* 1.051 0.125 0 2.859* 2.237 3.655 74.089%
Museums* 0.973 0.126 0 2.645* 2.066 3.387 72.567% Open access databases* 0.733 0.189 0 2.081* 1.438 3.012 74.089%
Educational websites* 0.697 0.137 0 2.007* 1.535 2.623 66.741%
Gender* 0.442 0.126 0 1.555* 1.216 1.99 60.868% Having the ability to learn anything on my own *
-0.33 0.162 0.042 0.719* 0.523 0.988 41.822%
Online courses 0.036 0.145 0.806 1.036 0.78 1.377 50.892%
Age 0.01 0.009 0.288 1.01 0.992 1,028 50.243% Percentages based on total n = 1,571 recent graduates from 10 US colleges and universities. Bolded values with asterisks (*) are statistically significant at p <0.05 level.
Summarizing findings about public library usage and other information systems:
1. The strongest predictor of using public libraries for continued learning in personal life was having also used librarians in the past 12 months. That is, graduates who used public libraries were five and a half times more likely to have consulted a librarian in the past year. This finding suggests that the use of public libraries was closely paired with the use of librarians for graduates surveyed.
2. Other strong predictors of public library use were using (1) bookstores (online or brick-and-mortar), with an odds ratio of 2.9; (2) visiting museums, with an odds ratio of 2.7; (3) using open access databases with research articles (e.g., ERIC or PubMed), with an odds ratio of 2.0, and (3) using educational websites such as YouTube, with an odds ratio of 2.0 (controlling for all other factors in the model).
3. The model indicated that public library users in our sample were also more likely to be female, with an odds ratio of 1.6. We found gender had an impact on public library use in our sample, which is consistent with other research studies.39
4. Those who thought they had the ability to learn independently on their own were less likely to use public libraries than those who did not believe they had the ability to learn anything on their own.40
39 Kathryn Zickuhr, Lee Rainie, Kristen Purcell, and Maeve Duggan, “How Americans Value Public Libraries in Their Communities, Section 1: An Overview of Americans’ Public Library Use” (Washington, D.C.: Pew Research Center, December 11, 2013), http://libraries.pewinternet.org/2013/12/11/section-1-an-overview-of-americans-public-library-use/. The Pew study found that more women (83%) than men (79%) had visited a public library or bookmobile in the past year and that more women (49%) than men (39%) had accessed a public library website. The sample size was 6,224 participants over 16 years of age.
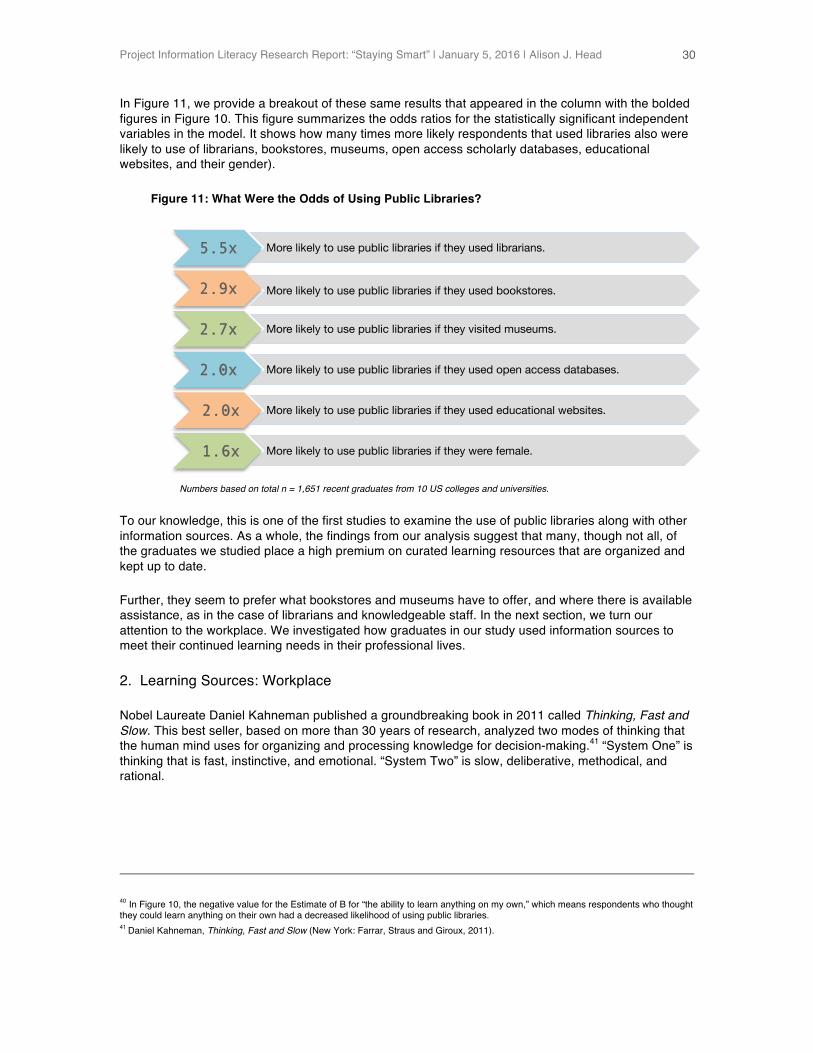
Project Information Literacy Research Report: “Staying Smart” | January 5, 2016 | Alison J. Head
30
In Figure 11, we provide a breakout of these same results that appeared in the column with the bolded figures in Figure 10. This figure summarizes the odds ratios for the statistically significant independent variables in the model. It shows how many times more likely respondents that used libraries also were likely to use of librarians, bookstores, museums, open access scholarly databases, educational websites, and their gender).
Numbers based on total n = 1,651 recent graduates from 10 US colleges and universities.
To our knowledge, this is one of the first studies to examine the use of public libraries along with other information sources. As a whole, the findings from our analysis suggest that many, though not all, of the graduates we studied place a high premium on curated learning resources that are organized and kept up to date.
Further, they seem to prefer what bookstores and museums have to offer, and where there is available assistance, as in the case of librarians and knowledgeable staff. In the next section, we turn our attention to the workplace. We investigated how graduates in our study used information sources to meet their continued learning needs in their professional lives.
2. Learning Sources: Workplace
Nobel Laureate Daniel Kahneman published a groundbreaking book in 2011 called Thinking, Fast and Slow. This best seller, based on more than 30 years of research, analyzed two modes of thinking that the human mind uses for organizing and processing knowledge for decision-making.41 “System One” is thinking that is fast, instinctive, and emotional. “System Two” is slow, deliberative, methodical, and rational.
40 In Figure 10, the negative value for the Estimate of B for “the ability to learn anything on my own,” which means respondents who thought they could learn anything on their own had a decreased likelihood of using public libraries. 41 Daniel Kahneman, Thinking, Fast and Slow (New York: Farrar, Straus and Giroux, 2011).
5.5x More likely to use public libraries if they used librarians.
2.9x More likely to use public libraries if they used bookstores.
2.7x More likely to use public libraries if they visited museums.
2.0x More likely to use public libraries if they used open access databases.
2.0x More likely to use public libraries if they used educational websites.
1.6x More likely to use public libraries if they were female.
Figure 11: What Were the Odds of Using Public Libraries?

Project Information Literacy Research Report: “Staying Smart” | January 5, 2016 | Alison J. Head
31
Kahneman’s book is a useful starting point when thinking about the information-seeking behavior of today’s college graduates in the workplace. In 2012, as a forerunner to this study on lifelong learning, PIL conducted its own qualitative study about how recent college graduates solved information problems once they joined the workforce.42
Our 2012 focus group samples of recent graduates said they used Google searches to solve information problems that landed on their desks in the course of a workday. For instance, a project manager in our discussions said he used Google to find directions to a hotel that was hosting a conference. A waiter did a quick Google search to learn how to describe a selection of artisan cheeses. A nurse needed to find out about new intervention methods and began with a Google search.
Comparing to Kahneman’s thesis, we found that recent graduates in the 2012 study used information strategy based on fast thinking when asked to solve urgent information problems in the workplace. These instincts for instant information, however, ended up having significant limitations for meeting employers’ needs, and, ultimately, for graduates’ professional success.43
While this earlier study provided insights into how today’s college hires make decisions for solving pressing information problems that workers were assigned, it only tells part of the story. Here, in this report, we have investigated both how graduates solve quick-fix information problems as well as how, and under what circumstances, they acquire a deeper and more conceptual understanding of a field, topic, or issue as lifelong learners.
Specifically, we have asked how recent graduates use different information sources to satisfy continued learning needs they have for the workplace. What role do coworkers, supervisors, and friends play in the Google Generation’s quest to learn additional skills and, ultimately, succeed at work?
To answer these questions, we collected data from a survey with 28 sources graduates may have used during the past year. The results appear in Figure 12 and are ordered from most to least frequently used.
42 Alison J. Head, “Learning Curve: How College Graduates Solve Information Problems Once They Join the Workplace,” (Seattle, WA: University of Washington, Project Information Literacy Research Report, October 16, 2012), http://projectinfolit.org/images/pdfs/pil_fall2012_workplacestudy_fullreport_revised.pdf. This research study was funded by IMLS Planning Grant IMLS LG-52-11-0269-11 (2011 - 2012). 43 In addition to focus groups with recent graduates, we conducted 23 interviews with employers who hired and trained new college graduates. These employers worked at companies that included Microsoft, Battelle, the Smithsonian Institution, Marriot International, and Nationwide Mutual Insurance Company.
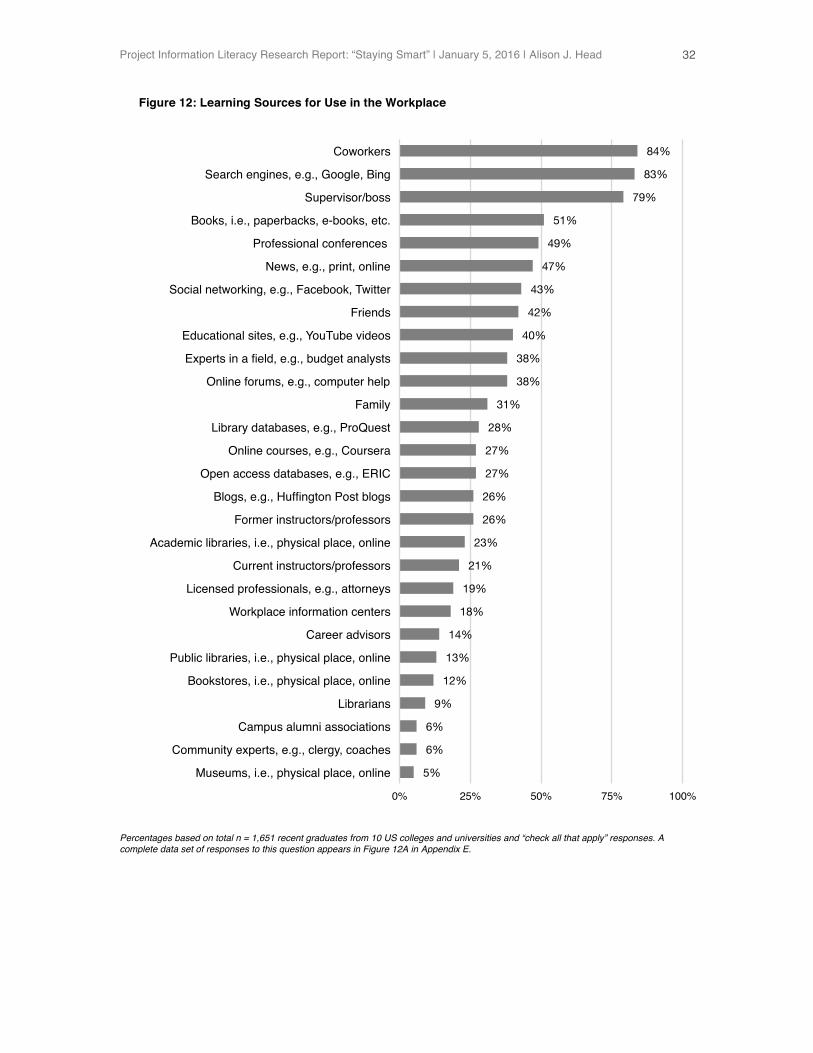
Project Information Literacy Research Report: “Staying Smart” | January 5, 2016 | Alison J. Head
32
Percentages based on total n = 1,651 recent graduates from 10 US colleges and universities and “check all that apply” responses. A complete data set of responses to this question appears in Figure 12A in Appendix E.
84%
83%
79%
51%
49%
47%
43%
42%
40%
38%
38%
31%
28%
27%
27%
26%
26%
23%
21%
19%
18%
14%
13%
12%
9%
6%
6%
5%
0%! 25%! 50%! 75%! 100%!
Coworkers!
Search engines, e.g., Google, Bing!
Supervisor/boss!
Books, i.e., paperbacks, e-books, etc.!
Professional conferences !
News, e.g., print, online!
Social networking, e.g., Facebook, Twitter!
Friends!
Educational sites, e.g., YouTube videos!
Experts in a field, e.g., budget analysts!
Online forums, e.g., computer help!
Family!
Library databases, e.g., ProQuest!
Online courses, e.g., Coursera!
Open access databases, e.g., ERIC!
Blogs, e.g., Huffington Post blogs!
Former instructors/professors!
Academic libraries, i.e., physical place, online!
Current instructors/professors!
Licensed professionals, e.g., attorneys!
Workplace information centers!
Career advisors!
Public libraries, i.e., physical place, online!
Bookstores, i.e., physical place, online!
Librarians!
Campus alumni associations!
Community experts, e.g., clergy, coaches!
Museums, i.e., physical place, online!
Figure 12: Learning Sources for Use in the Workplace
Project Information Literacy Research Report: “Staying Smart” | January 5, 2016 | Alison J. Head
33
Summarizing the findings about learning sources for the workplace:
1. A large majority of the respondents (84%) had turned to coworkers to meet their learning needs in the workplace during the past year. In follow-up interviews, many called coworkers their go-to source, especially for learning how to perform certain tasks they did not know how to do and how to avoid pitfalls.
2. More than four-fifths had relied on search engines (83%), such as Google, to obtain factual information they needed about other businesses, such as a phone number or email address while others relied on Google for finding data sheets of workplace products.
3. Over three-quarters of the sample (79%) approached their supervisors during the past year to clarify expectations of their job. According to our interviews with graduates, many expected their boss to assess whether they had certain computer skills, such as coding or running spreadsheet analyses. Others said they used their supervisors as mentors, who helped them sharpen their workplace skills.
4. More than half (51%) had relied on books for getting a deeper understanding of a concept or workplace procedure. In our follow-up interviews, some graduates said they reviewed chapters from their old college textbooks to brush up on techniques, especially marketing strategies or scientific or statistical procedures. Others said they read business bestsellers so they could contribute to discussions during the course of the workday.
5. About half (49%) attended professional conferences to keep up with changes in their specialized fields and to update their skills and knowledge. Some graduates said conferences with training sessions were preferable so they could learn from well-known experts and expand their professional network.
6. Almost half the sample (47%) had consulted online and print news sources during the last year. Some graduates mentioned looking for stories from The New York Times, Business Week, Harvard Business Review, or The Economist so they could stay on top of business news that was relevant to their field. To a far lesser extent, graduates used blogs (26%) for workplace learning.
7. Over two-fifths of the respondents (43%) had monitored social networking sites for news about skills and information they could use for career development. Some said they used popular sites like Facebook, Twitter, or LinkedIn to develop their professional network, that is, to recruit new employees or look for new employment opportunities of their own.
8. Two-fifths of the respondents had relied on friends (42%) when learning about managing their careers while a smaller percentage of respondents had turned to family members (31%). In the follow-up interviews, some graduates said they used their friends as sounding boards, especially when figuring our career moves or getting along with difficult coworkers.
9. Four in 10 graduates surveyed had used educational sites (40%) to help solve the daily problems they encountered at work. For example, some interviewees mentioned using YouTube videos to brush up on how to execute a spreadsheet formula, to improve skills for communicating during meetings, or set up devices, like a field pump or printer, that they needed at work. Still, over a third of the sample (38%) relied on experts for one-on-one exchanges and guidance in their field.
10. More than a third of the sample read online forums (38%), especially for finding quick solutions to computer problems. Fewer took online courses (27%) that offered complete training modules on topics they wanted to learn, such as coding or programming.
More than half (51%) relied on books for getting a deeper understanding of a concept or workplace procedure.
Project Information Literacy Research Report: “Staying Smart” | January 5, 2016 | Alison J. Head
34
11. Over a quarter of the sample (28%) had used specialized library databases during the past year. Interviewees mentioned using sites like LexisNexis and JSTOR for finding scholarly sources they needed for workplace research. Others used open-access databases (27%), such as ERIC, PubMed, ResearchGate, or Google Scholar, for finding research articles.
12. More than a quarter of the sample had contacted former instructors (26%) in the past 12 months while slightly fewer had turned to their current instructors in graduate programs (21%) as a source of workplace advice. Graduates, especially those that had graduated from smaller schools or were enrolled in graduate programs, said they relied on professors as mentors, especially for coaching them on career strategy and making professional decisions.
13. Over one-fifth (23%) had used academic libraries for conducting traditional work-related research while others (18%) had used workplace information centers during the past year. Comparatively, fewer had used public libraries (13%) or bookstores (12%).
14. For consulting on remedies to specific information problems they had encountered in the workplace, some graduates had consulted licensed professionals (19%), such as attorneys or CPAs, while fewer had sought guidance from career advisors (14%), librarians (9%), or community experts (6%).
Taken together, the graduates we interviewed had no shortage of sources they could use for continued learning in the workplace. Nor did most lack the competencies for evaluating the usefulness of relevant information. In many cases, what most graduates preferred and sought out were trustworthy and authoritative sources.
Some graduates, for instance, looked for guidance and advice from their peers in the workplace or from training sessions led by experts. Others went back to their textbooks from college courses, especially in the sciences or business. Still others pored through journal articles from library databases or Google Scholar for explanations of important concepts.
In this sense, these resources were similar to what many, as college students had relied on for learning while in college or a graduate program. The difference from college, however, was the goal—to succeed in the workplace and stay employed rather than simply to pass a course. To this end, graduates often sought out coworkers and authoritative sources in order to learn the tasks they needed to complete in their new position.
The graduates we surveyed relied on coworkers more than they did search engines, even though it was only by 1%. In the next section, we provide a follow-up analysis about how graduates used their coworkers as resources for the informal learning they needed for the workplace.
Follow-up Analysis: How Do Coworkers Help Graduates Learn?
A large majority of the survey respondents—84%—had consulted their coworkers during the past year to satisfy their continued learning needs. In this follow-up analysis we explored whether demographic factors helped to explain if anyone in our sample used coworkers more than anyone else. We used a cross-tabulation to see whether respondents majoring in certain fields were more likely to turn to coworkers than others.
From our analysis, we found that college major made little difference. That is, whether respondents had majored in arts and the humanities, education, engineering, or the sciences they had all approached coworkers to learn how to perform workplace tasks during the past year. Further, there
The difference from college, however, was the goal—to succeed in the workplace and stay employed rather than simply to pass a course.
Project Information Literacy Research Report: “Staying Smart” | January 5, 2016 | Alison J. Head
35
appeared to be no gender differences—as many female respondents as males in our sample reported having turned to coworkers as a learning source during the past year.
Additionally, we drew from our interviews to explore how graduates learn from their coworkers. Many interviewees said one-on-one conversations were helpful in sharpening their skills. Through these exchanges they were able to pick up “insider" knowledge that was unique to their workplace, especially regarding goals, mission, culture and “the ways of doing things around here.” This is where a Google search would not suffice.
In many cases, graduates said coworkers taught them the skills they did not have—but that their supervisors expected them to already know as part of their jobs. The informal training graduates received was often unknown to their supervisors and helped to ensure that they could do their job and remain employed.
For instance, one graduate we interviewed said she pulled a trusted coworker aside to teach her the basics of communicating with customers. She had been hired as a salesperson, but had little training from college. Another said that in college he had not learned to edit news footage even though it now was a part of his job at a news station. Still another graduate who had studied the sciences, explained:
This weekend I went into the lab, because that's my life now, and a post-doctoral fellow was there who helped me record from a different cell type than I usually do—a technique I did not know how to do. So for probably about three hours on Saturday this person did one-on-one practice with me. It wasn't something that was necessarily prearranged; we just both agreed that it needed to be done. And that's usually how it works. There's no real training, there's just a lot of roping my colleagues into teaching me something.
In situations like these, new college hires turned to a nearby coworker for a solution that would keep them in good stead in their boss’s eyes. Such learning exchanges helped graduates climb the steep learning curve that most soon discovered in their new workplace surroundings. These exchanges also helped with managing the pace and expectations of the workplace, which were very different from what they had experienced during college.
Learning from coworkers, however, did not end there. Some trusted their peers in the workplace to provide ongoing help to build their careers. They talked about these kinds of exchanges occurring face-to-face at work, rather than through social media, texts, or email.
For instance, a medical technician in our sample said she approached a more experienced technician for guidance. The seasoned coworker and the young graduate developed a month-to-month plan for learning how to use certain hospital machinery. Another graduate, who worked in human resources at a large company, asked a colleague how to be a better interviewer:
HR was not my background, so when I first started, I was completely overwhelmed. My interviews weren't going very well. They were really awkward. I said to a coworker “You're really great at interviewing, people love talking to you, people always leave with a smile whether it was a good interview or not. How do I make that part of my wheelhouse, one of my strengths?” She had her own stack of resources—different behavioral questions and guides—that she shared with me. She pulled a lot of online content and an old textbook for me. She helped me put together a game plan for every interview I had and then she would sit in on my interviews and give me feedback.
…graduates said coworkers taught them the skills they did not have—but that their supervisors expected them to already know as part of their jobs.
Project Information Literacy Research Report: “Staying Smart” | January 5, 2016 | Alison J. Head
36
Whatever their career goals, many of the graduates we interviewed could be characterized as continuous learners, especially when they had available time to learn in the often fast-paced workplace. In many situations, had come to depend on informal exchanges with people, over Google searches, to meet their professional learning needs.
Like apprentices, graduates adopted the age-old practice of learning from people who they considered to be masters of the trade. What many had come to learn once they graduated was that question asking was an essential skill they needed to develop and practice daily in their new jobs.
In some cases, graduates observed the step-by-step instruction to, as one graduate put it, “mimic” how to complete certain tasks correctly. This was a common practice for solving urgent information problems when the turnaround time and margin of error were both tight. In other cases, when graduates wanted to learn a field in-depth for career development, they identified experts in the workplace who took them under their wing and helped them expand their career options.
Our findings suggest that across a variety of situations, young graduates arranged for these mentorships on their own; very few had been assigned mentors from higher ups within the organization. These relationships were grounded in coaching—much like the professor to student relationship that they might have had during college.
Together, these findings may be an outcome of a changing emphasis in higher education away from authoritative and top-down relationships to more collaborative, open, and supportive interactions, and the carry-over of these approaches is seen in today’s workplace. A key distinction, however, between new hires and more seasoned workers was the size of the network each developed.
The young graduates we studied tended to use just one, or at most two coworkers, for informal learning with very few developing a larger community of practice, rich with expertise from workers across the organization or from throughout their professional field. In the next section, we examine the learning sources in the communities in where the graduates now lived.
3. Learning Sources: Local Community
Not long ago, getting a copy of the local phone book was as essential as hooking up to water and electricity for anyone settling into a new town. The telephone directory, with its Yellow Pages filled with local business and white pages of public services, was a veritable lifeline of reference material to everything from parks and schools to utilities and medical services.
Today, well before they even begin to pack for a move, people can consult sites like Yelp, Craigslist, LivingSocial, and Google Street View for a window into their new community. They may glean insights even longtime residents may still not know.
In our study, we wanted to understand how today’s college graduates used these and other sources to learn about their local communities. In our prior analysis about learning needs, far fewer graduates reported needing to learn about their local communities compared to the same graduates’ learning needs for their personal lives and workplaces. How could an analysis about what sources graduates used lend insights into why the graduates we studied did not seek to learn as much about their local communities?
In our analysis, we asked which of the 28 sources listed in our survey they had used most during the past year for staying involved in their local communities. In Figure 13, we present the survey results in descending order.
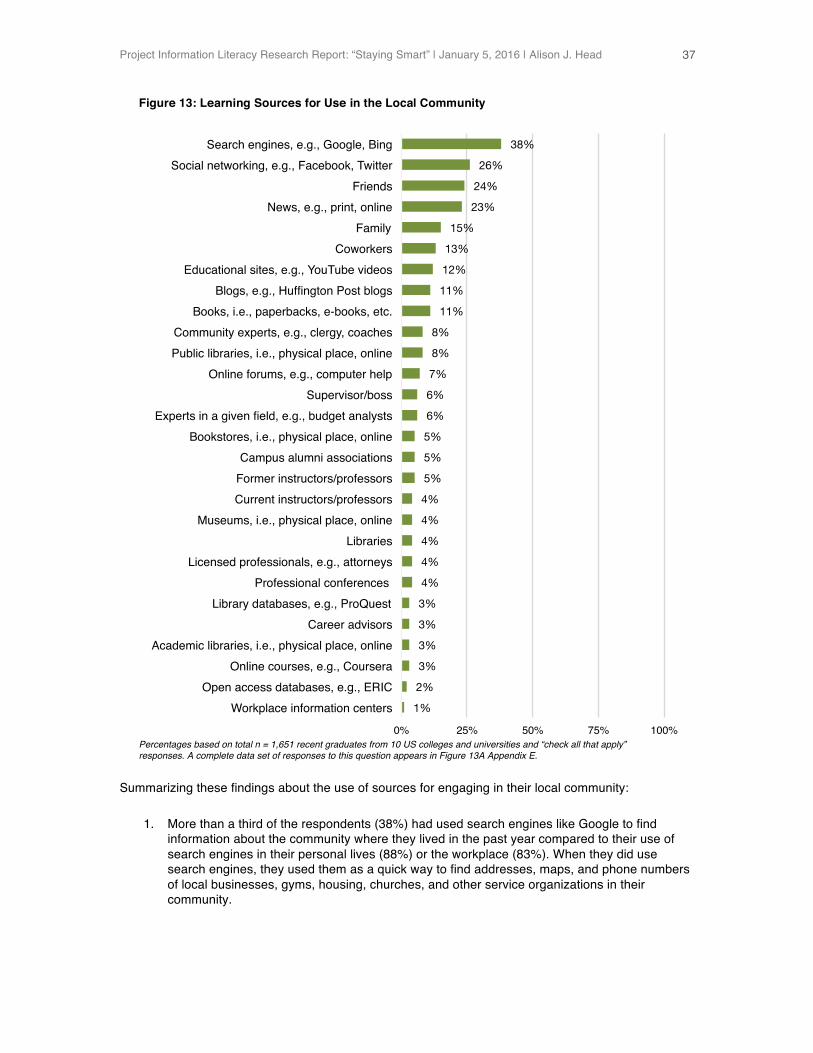
Project Information Literacy Research Report: “Staying Smart” | January 5, 2016 | Alison J. Head
37
Percentages based on total n = 1,651 recent graduates from 10 US colleges and universities and “check all that apply” responses. A complete data set of responses to this question appears in Figure 13A Appendix E.
Summarizing these findings about the use of sources for engaging in their local community:
1. More than a third of the respondents (38%) had used search engines like Google to find information about the community where they lived in the past year compared to their use of search engines in their personal lives (88%) or the workplace (83%). When they did use search engines, they used them as a quick way to find addresses, maps, and phone numbers of local businesses, gyms, housing, churches, and other service organizations in their community.
38%
26%
24%
23%
15%
13%
12%
11%
11%
8%
8%
7%
6%
6%
5%
5%
5%
4%
4%
4%
4%
4%
3%
3%
3%
3%
2%
1%
0%! 25%! 50%! 75%! 100%!
Search engines, e.g., Google, Bing!Social networking, e.g., Facebook, Twitter!
Friends!News, e.g., print, online!
Family!Coworkers!
Educational sites, e.g., YouTube videos!Blogs, e.g., Huffington Post blogs!
Books, i.e., paperbacks, e-books, etc.!Community experts, e.g., clergy, coaches!Public libraries, i.e., physical place, online!
Online forums, e.g., computer help!Supervisor/boss!
Experts in a given field, e.g., budget analysts!Bookstores, i.e., physical place, online!
Campus alumni associations!Former instructors/professors!Current instructors/professors!
Museums, i.e., physical place, online!Libraries!
Licensed professionals, e.g., attorneys!Professional conferences !
Library databases, e.g., ProQuest!Career advisors!
Academic libraries, i.e., physical place, online!Online courses, e.g., Coursera!
Open access databases, e.g., ERIC!Workplace information centers!
Figure 13: Learning Sources for Use in the Local Community
Project Information Literacy Research Report: “Staying Smart” | January 5, 2016 | Alison J. Head
38
2. Over one quarter of the sample (26%) had relied on social networking sites, such as Facebook during the past year for news in their communities. During the interviews, some said they had “liked” organizations on Facebook in order to receive updated information. Others said they relied on Yelp’s mobile app and the reviews for making decisions about where to dine or shop in their neighborhood.
3. Almost one in four turned to friends (24%) to learn about their local community; fewer had turned to family (15%) and coworkers (13%). Graduates said they talked to friends to find out about available housing, and to connect with people who had the same hobbies.
4. Over one-fifth of the sample (23%) had read a local newspaper or a free weekly shopper to stay current about local news, politics, housing, and events. Far fewer, about one in 10 (11%), had consulted blogs to learn what was going on within a few square blocks of their residence.
5. Though it was not very common, some respondents used educational sources like YouTube (12%), books (11%), online forums (7%), or online courses (3%) to learn skills for working with children or communicating with neighborhood groups.
6. Fewer than one in 10 had turned to community leaders or experts (8%), such as clergy, coaches, or neighborhood organizers; others sought out professionals (6%) to become involved in their local community.
7. Whether they visited the physical location or accessed materials online, fewer than one in 10 of the graduates who took the survey reported using public libraries (8%) and even fewer had consulted librarians (4%). At the same time, few respondents had used bookstores (5%) or museums (4%) as a community learning source during the past year.
8. Some respondents reported using their campus alumni associations (5%), academic libraries (3%), or workplace centers (1%) for learning about engaging in the community where they now lived. Similarly, few respondents used library databases like ProQuest (3%) or open access databases (2%) like ERIC or ResearchGate as part of engaging in community or civic life.
We found few respondents had looked beyond their usual go-to sources to learn how to become involved in their communities—mainly because they did not seem to have as many continued learning needs in this area. When they did look for community information, graduates turned to search engines first and then used social networking sites.
Some branched out and turned to friends and family for guidance, especially when they were trying to solve an information problem where there was a high degree of risk. As one graduate with a new baby explained about finding a pediatrician nearby to where he and his family lived:
I really trust the old Google Search, once I found a few places, I did more researching on pages, like Yelp to see what people have to say about the physician, what their staff was like, and how clean the clinic is. And then once I found a pediatrician that looked good, I looked up the name on the state medical boards to see if there were any sanctions against this physician—I did my homework before just arriving at the name of a physician.
Others learned about their new community by walking around their neighborhood. One graduate we interviewed, for instance, said she walked down a street in a new neighborhood while running the mobile apps of Google maps and Yelp. This was how she discovered new places to eat, shop, or, as in this situation, a new coffee shop where people her age congregated.
Still others relied on face-to-face conversations with friends, roommates, coworkers, so they could learn how to become involved in their new surroundings, especially when trying to find out about local events, businesses, services, or housing. The next section contains a follow-up analysis about the relationship between where graduates lived and their use of local information sources.
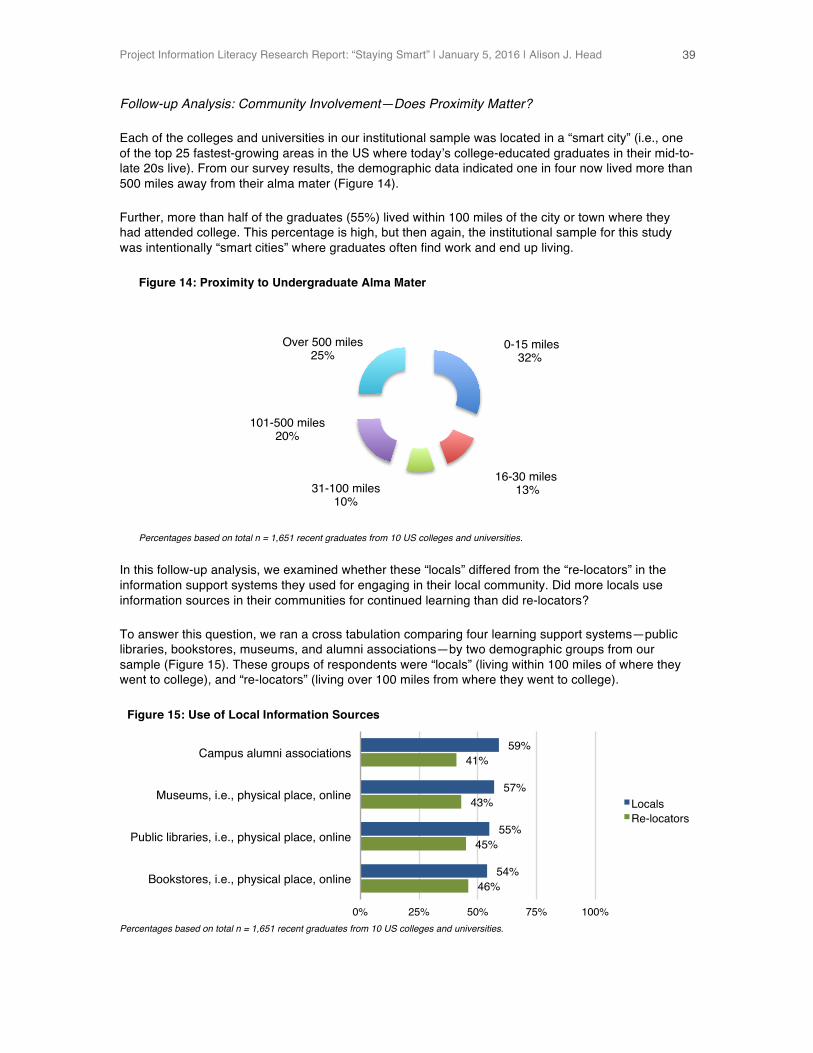
Project Information Literacy Research Report: “Staying Smart” | January 5, 2016 | Alison J. Head
39
Follow-up Analysis: Community Involvement—Does Proximity Matter?
Each of the colleges and universities in our institutional sample was located in a “smart city” (i.e., one of the top 25 fastest-growing areas in the US where today’s college-educated graduates in their mid-to-late 20s live). From our survey results, the demographic data indicated one in four now lived more than 500 miles away from their alma mater (Figure 14).
Further, more than half of the graduates (55%) lived within 100 miles of the city or town where they had attended college. This percentage is high, but then again, the institutional sample for this study was intentionally “smart cities” where graduates often find work and end up living.
Percentages based on total n = 1,651 recent graduates from 10 US colleges and universities.
In this follow-up analysis, we examined whether these “locals” differed from the “re-locators” in the information support systems they used for engaging in their local community. Did more locals use information sources in their communities for continued learning than did re-locators?
To answer this question, we ran a cross tabulation comparing four learning support systems—public libraries, bookstores, museums, and alumni associations—by two demographic groups from our sample (Figure 15). These groups of respondents were “locals” (living within 100 miles of where they went to college), and “re-locators” (living over 100 miles from where they went to college).
Percentages based on total n = 1,651 recent graduates from 10 US colleges and universities.
0-15 miles !32%!
16-30 miles! 13%!31-100 miles !
10%!
101-500 miles!20%!
Over 500 miles 25%!
Figure 14: Proximity to Undergraduate Alma Mater
59%!
57%!
55%!
54%!
41%!
43%!
45%!
46%!
0%! 25%! 50%! 75%! 100%!
Campus alumni associations!
Museums, i.e., physical place, online!
Public libraries, i.e., physical place, online!
Bookstores, i.e., physical place, online!
Locals!Re-locators!
Figure 15: Use of Local Information Sources
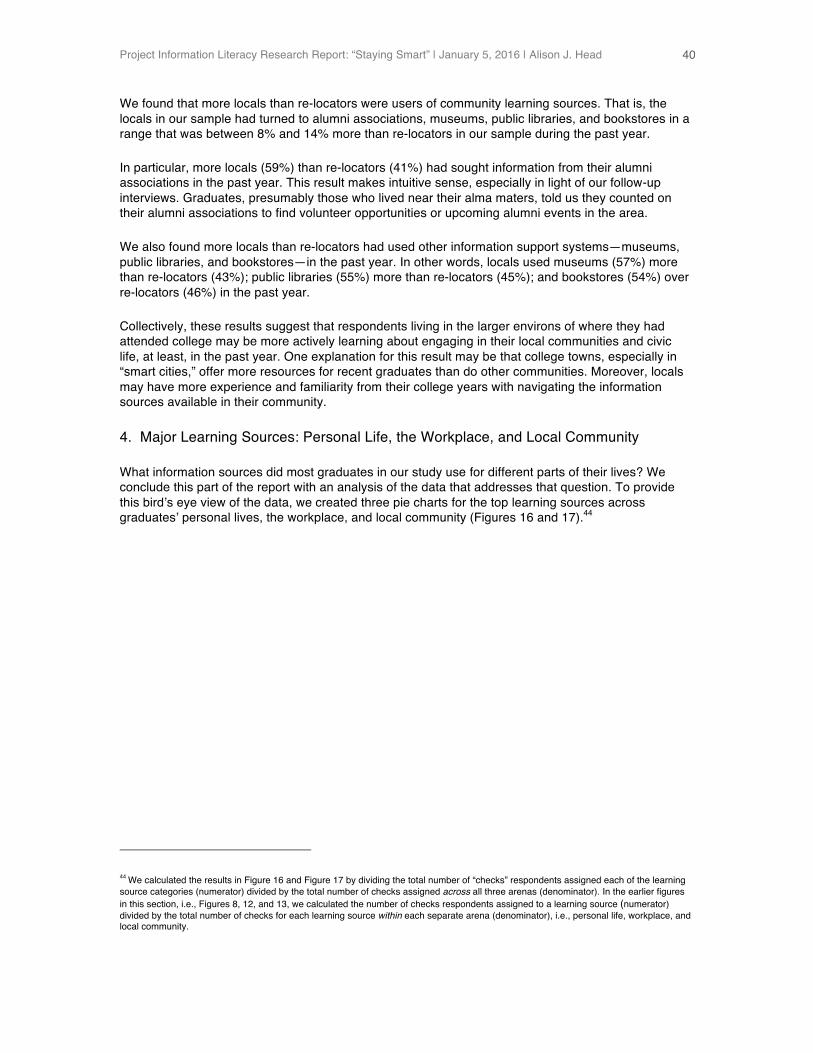
Project Information Literacy Research Report: “Staying Smart” | January 5, 2016 | Alison J. Head
40
We found that more locals than re-locators were users of community learning sources. That is, the locals in our sample had turned to alumni associations, museums, public libraries, and bookstores in a range that was between 8% and 14% more than re-locators in our sample during the past year.
In particular, more locals (59%) than re-locators (41%) had sought information from their alumni associations in the past year. This result makes intuitive sense, especially in light of our follow-up interviews. Graduates, presumably those who lived near their alma maters, told us they counted on their alumni associations to find volunteer opportunities or upcoming alumni events in the area.
We also found more locals than re-locators had used other information support systems—museums, public libraries, and bookstores—in the past year. In other words, locals used museums (57%) more than re-locators (43%); public libraries (55%) more than re-locators (45%); and bookstores (54%) over re-locators (46%) in the past year.
Collectively, these results suggest that respondents living in the larger environs of where they had attended college may be more actively learning about engaging in their local communities and civic life, at least, in the past year. One explanation for this result may be that college towns, especially in “smart cities,” offer more resources for recent graduates than do other communities. Moreover, locals may have more experience and familiarity from their college years with navigating the information sources available in their community.
4. Major Learning Sources: Personal Life, the Workplace, and Local Community
What information sources did most graduates in our study use for different parts of their lives? We conclude this part of the report with an analysis of the data that addresses that question. To provide this bird’s eye view of the data, we created three pie charts for the top learning sources across graduates’ personal lives, the workplace, and local community (Figures 16 and 17).44
44 We calculated the results in Figure 16 and Figure 17 by dividing the total number of “checks” respondents assigned each of the learning source categories (numerator) divided by the total number of checks assigned across all three arenas (denominator). In the earlier figures in this section, i.e., Figures 8, 12, and 13, we calculated the number of checks respondents assigned to a learning source (numerator) divided by the total number of checks for each learning source within each separate arena (denominator), i.e., personal life, workplace, and local community.
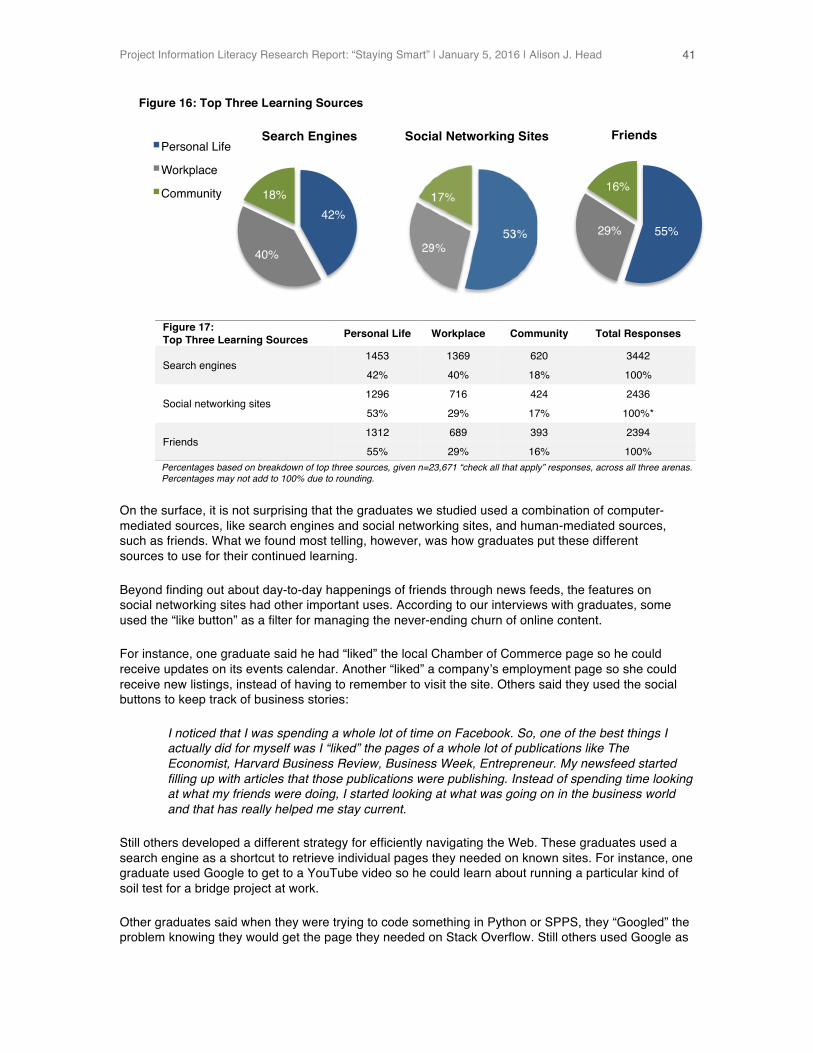
Project Information Literacy Research Report: “Staying Smart” | January 5, 2016 | Alison J. Head
41
Percentages based on breakdown of top three sources, given n=23,671 “check all that apply” responses, across all three arenas. Percentages may not add to 100% due to rounding.
On the surface, it is not surprising that the graduates we studied used a combination of computer-mediated sources, like search engines and social networking sites, and human-mediated sources, such as friends. What we found most telling, however, was how graduates put these different sources to use for their continued learning.
Beyond finding out about day-to-day happenings of friends through news feeds, the features on social networking sites had other important uses. According to our interviews with graduates, some used the “like button” as a filter for managing the never-ending churn of online content.
For instance, one graduate said he had “liked” the local Chamber of Commerce page so he could receive updates on its events calendar. Another “liked” a company’s employment page so she could receive new listings, instead of having to remember to visit the site. Others said they used the social buttons to keep track of business stories:
I noticed that I was spending a whole lot of time on Facebook. So, one of the best things I actually did for myself was I “liked” the pages of a whole lot of publications like The Economist, Harvard Business Review, Business Week, Entrepreneur. My newsfeed started filling up with articles that those publications were publishing. Instead of spending time looking at what my friends were doing, I started looking at what was going on in the business world and that has really helped me stay current.
Still others developed a different strategy for efficiently navigating the Web. These graduates used a search engine as a shortcut to retrieve individual pages they needed on known sites. For instance, one graduate used Google to get to a YouTube video so he could learn about running a particular kind of soil test for a bridge project at work.
Other graduates said when they were trying to code something in Python or SPPS, they “Googled” the problem knowing they would get the page they needed on Stack Overflow. Still others used Google as
Figure 17: Top Three Learning Sources Personal Life Workplace Community Total Responses
Search engines 1453 1369 620 3442
42% 40% 18% 100%
Social networking sites 1296 716 424 2436
53% 29% 17% 100%*
Friends 1312 689 393 2394
55% 29% 16% 100%
42%!
40%!
18%!
Personal Life!
Workplace!
Community!
55%!29%!
16%!
Search Engines Social Networking Sites Friends
Figure 16: Top Three Learning Sources
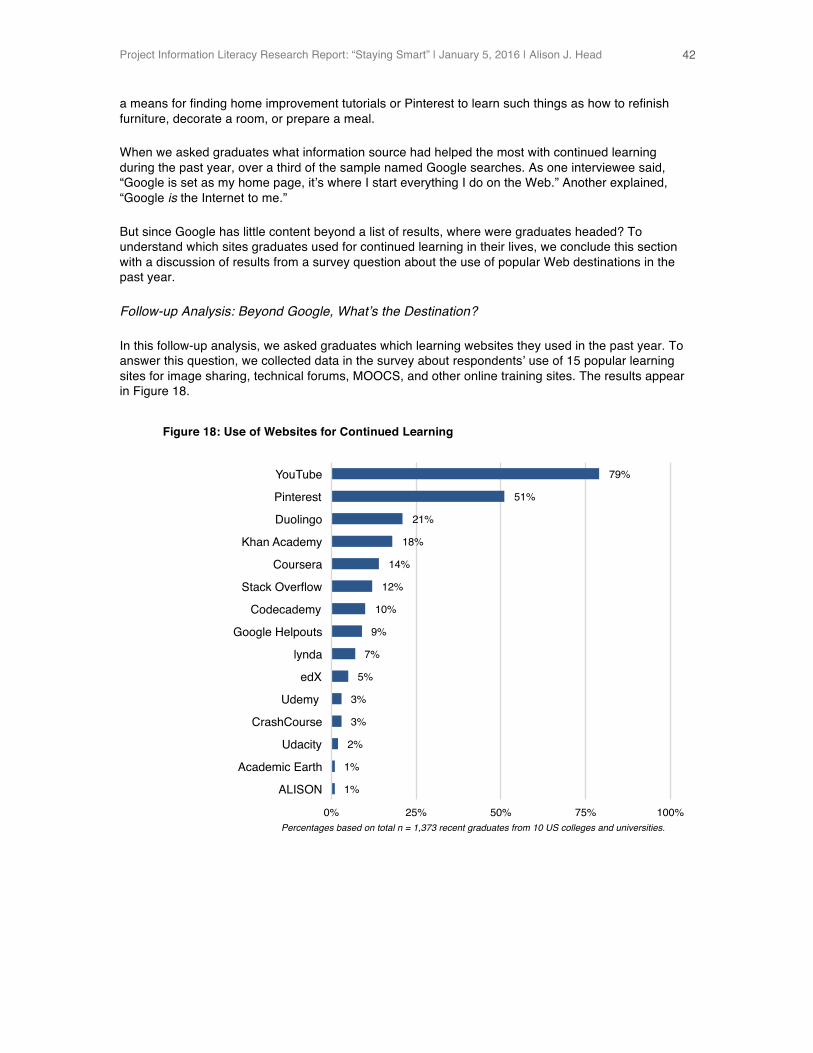
Project Information Literacy Research Report: “Staying Smart” | January 5, 2016 | Alison J. Head
42
a means for finding home improvement tutorials or Pinterest to learn such things as how to refinish furniture, decorate a room, or prepare a meal.
When we asked graduates what information source had helped the most with continued learning during the past year, over a third of the sample named Google searches. As one interviewee said, “Google is set as my home page, it’s where I start everything I do on the Web.” Another explained, “Google is the Internet to me.”
But since Google has little content beyond a list of results, where were graduates headed? To understand which sites graduates used for continued learning in their lives, we conclude this section with a discussion of results from a survey question about the use of popular Web destinations in the past year.
Follow-up Analysis: Beyond Google, What’s the Destination?
In this follow-up analysis, we asked graduates which learning websites they used in the past year. To answer this question, we collected data in the survey about respondents’ use of 15 popular learning sites for image sharing, technical forums, MOOCS, and other online training sites. The results appear in Figure 18.
Percentages based on total n = 1,373 recent graduates from 10 US colleges and universities.
79%!
51%!
21%!
18%!
14%!
12%!
10%!
9%!
7%!
5%!
3%!
3%!
2%!
1%!
1%!
0%! 25%! 50%! 75%! 100%!
YouTube!
Pinterest!
Duolingo!
Khan Academy!
Coursera!
Stack Overflow!
Codecademy!
Google Helpouts!
lynda!
edX!
Udemy !
CrashCourse!
Udacity!
Academic Earth!
ALISON!
Figure 18: Use of Websites for Continued Learning
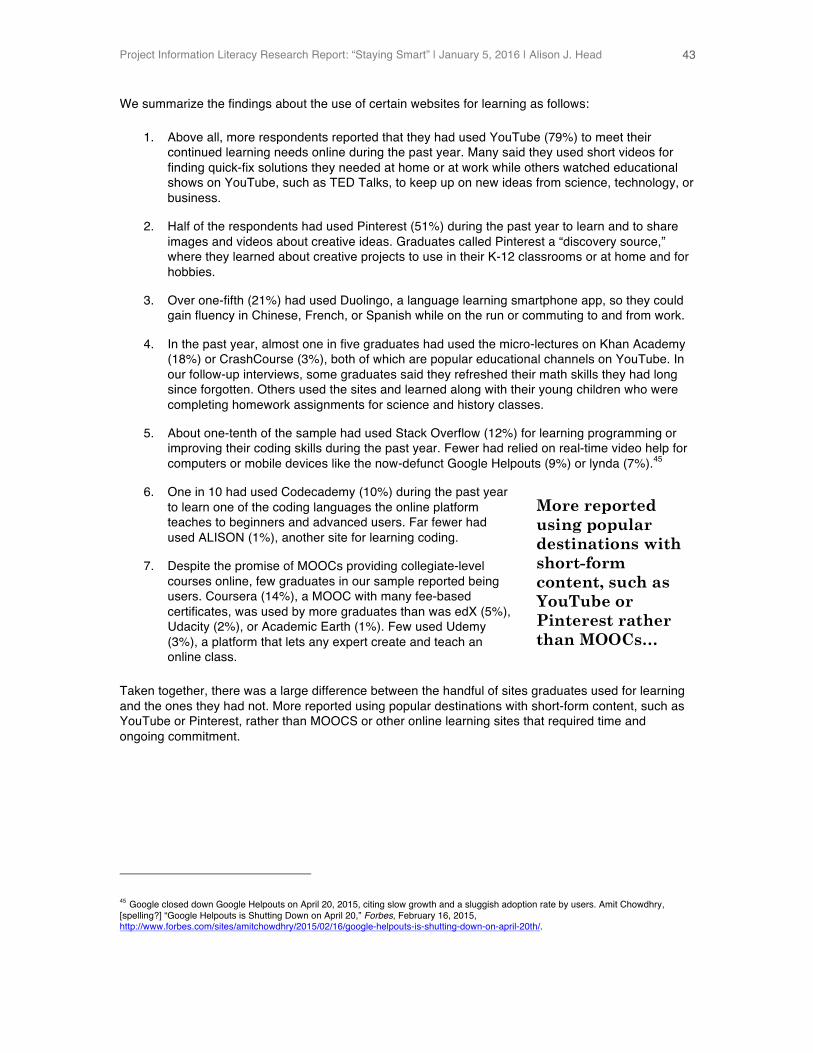
Project Information Literacy Research Report: “Staying Smart” | January 5, 2016 | Alison J. Head
43
We summarize the findings about the use of certain websites for learning as follows:
1. Above all, more respondents reported that they had used YouTube (79%) to meet their continued learning needs online during the past year. Many said they used short videos for finding quick-fix solutions they needed at home or at work while others watched educational shows on YouTube, such as TED Talks, to keep up on new ideas from science, technology, or business.
2. Half of the respondents had used Pinterest (51%) during the past year to learn and to share images and videos about creative ideas. Graduates called Pinterest a “discovery source,” where they learned about creative projects to use in their K-12 classrooms or at home and for hobbies.
3. Over one-fifth (21%) had used Duolingo, a language learning smartphone app, so they could gain fluency in Chinese, French, or Spanish while on the run or commuting to and from work.
4. In the past year, almost one in five graduates had used the micro-lectures on Khan Academy (18%) or CrashCourse (3%), both of which are popular educational channels on YouTube. In our follow-up interviews, some graduates said they refreshed their math skills they had long since forgotten. Others used the sites and learned along with their young children who were completing homework assignments for science and history classes.
5. About one-tenth of the sample had used Stack Overflow (12%) for learning programming or improving their coding skills during the past year. Fewer had relied on real-time video help for computers or mobile devices like the now-defunct Google Helpouts (9%) or lynda (7%).45
6. One in 10 had used Codecademy (10%) during the past year to learn one of the coding languages the online platform teaches to beginners and advanced users. Far fewer had used ALISON (1%), another site for learning coding.
7. Despite the promise of MOOCs providing collegiate-level courses online, few graduates in our sample reported being users. Coursera (14%), a MOOC with many fee-based certificates, was used by more graduates than was edX (5%), Udacity (2%), or Academic Earth (1%). Few used Udemy (3%), a platform that lets any expert create and teach an online class.
Taken together, there was a large difference between the handful of sites graduates used for learning and the ones they had not. More reported using popular destinations with short-form content, such as YouTube or Pinterest, rather than MOOCS or other online learning sites that required time and ongoing commitment.
45 Google closed down Google Helpouts on April 20, 2015, citing slow growth and a sluggish adoption rate by users. Amit Chowdhry, [spelling?] “Google Helpouts is Shutting Down on April 20,” Forbes, February 16, 2015, http://www.forbes.com/sites/amitchowdhry/2015/02/16/google-helpouts-is-shutting-down-on-april-20th/.
More reported using popular destinations with short-form content, such as YouTube or Pinterest rather than MOOCs…

Project Information Literacy Research Report: “Staying Smart” | January 5, 2016 | Alison J. Head
44
According to the follow-up interviews, sites like YouTube offered up an endless supply of user content with “how-to” information and step-by-step instructions, which they wanted to quickly learn:
I use YouTube all the time, especially when my sons are working on their science lab experiments. One of my sons has to build a catapult for a Roman Day and one of them has to build an aqueduct. So, we looked at some videos on YouTube—it’s better than other resources because videos demonstrating what you should actually do along with the instructions.
While graduates we interviewed had worked through the first couple of lessons on sites like Coursera or Codecademy, few had completed an entire module. We concluded from our interviews that there were three obstacles to learning online for graduates: time constraints, self-motivation, or lack of a formal classroom structure with face-to-face exchanges. As one graduate, who had an arts and humanities degree explained:
It’s been awhile since I've used Codecademy, I just haven't got back to it, I have my family, my kids, my job, so spare time is not in huge supply but it's also staying focused, too. If I don't use the skill the next day, what I’ve just learned does not stick.
In the next part of our report, we build on these findings. We provide data collected from graduates about the challenges they faced with continued learning, using online and offline modes as well as the critical thinking skills they took from college and applied in their everyday lives. ! Part Three: College Takeaways
What is the value of a college education? Some higher education stakeholders and will say college prepares students to be lifelong learners who are comfortable with diversity and change in an increasingly complex world.46 Others will take an economic stance, asserting that college graduates earn more over a lifetime than high school graduates. Still, others will insist that studying math, science, engineering, and technology (STEM) provide the best path to higher-paying jobs and “The American Dream.”47
But in 2013, there was a new twist to the argument. When executives in US companies and nonprofits were surveyed by the American Association of Colleges and Universities (AAC&U), nine out of 10 agreed that when assessing the value of new hires the ability to “think critically, communicate clearly, and solve complex problems” mattered more than their major.48
The AAC&U study underscores the high premium stakeholders from the workplace put on college students’ ability to be critical thinkers. Yet, the results do not include the opinions and thoughts of today’s graduates.
46 “What is a 21st Century Liberal Arts Education?” The American Association of Colleges and Universities, n.d., https://aacu.org/leap/what-is-a-liberal-education. 47 The following sources were consulted for developing the economic arguments about the value of a college education: D’Vera Cohn, “Lifetime Earnings of College Graduates,” (Washington, D.C.: Pew Research Center Social, May 16, 2011), http://www.pewsocialtrends.org/2011/05/16/lifetime-earnings-of-college-graduates/; “Educational Attainment in the United States: 2014,” Washington, D.C.: US Census Bureau, (2015), http://www.census.gov/newsroom/press-releases/2015/cb15-tps03.html; “The Rising Cost of Not Going to College,” (Washington, D.C.: Pew Research Center, February 2014), http://www.pewsocialtrends.org/2014/02/11/the-rising-cost-of-not-going-to-college/. 48 Hart Research Associates, “It Takes More than a Major: Employer Priorities for College Learning and Student Success,” (Washington, D.C.: Association of American Colleges and Universities, April 10, 2013), https://www.aacu.org/sites/default/files/files/LEAP/2013_EmployerSurvey.pdf.
Project Information Literacy Research Report: “Staying Smart” | January 5, 2016 | Alison J. Head
45
When we administered our survey to 1,651 graduates we investigated these otherwise limited assessments from the AAC&U. We asked survey respondents which critical thinking skills they believed they had developed during college and transferred and adapted to their post-college lives.
To more deeply understand these responses, in our follow-up interviews, we asked graduates how they have, or have not, directly applied these critical thinking competencies to their personal and professional lives. We also explored the related skills of collaboration, teamwork, and mentoring they found they needed in their post-college lives.
We have divided this part of the report into three sections with results from (1) the critical thinking indices we constructed for measuring respondents’ transferable competencies, (2) a survey question about the standards graduates use for evaluating Web content, and (3) a survey question about the challenges graduates have with continued learning.
1. Critical Thinking Indices
We began our analysis of critical thinking takeaways from college by constructing five indices. Indices are useful to social scientists as composite measures of ordinal variables that represent a larger construct, such as our investigation of critical thinking. They also provide indicators that are more valid than a single indicator of a variable, and they make finer distinctions among the values that a variable may take on.
In our analysis, we used indices to detect differences in critical thinking and information literacy competencies graduates thought they had acquired in college and transferred to their post-college lives. Two survey questions with a total of 15 different response categories were used to create these indices.49
These questions asked respondents how strongly they agreed or disagreed, with statements about individual skills, strategies, attitudes, or thinking processes. In turn, we used the results to examine how transferable this set of outcomes was for respondents once they graduated.
It is important to note the skills, attitudes, and competencies that we have used in our analysis were intentionally derived from an amalgamation of both information literacy and critical thinking concepts.50
As such, we incorporated, ACRL’s 2000 updated standards of information literacy as well as the newly revised 2015 framework for information literacy, which was released at the time we were conducting this research.51
These two defining ACRL documents encapsulate librarians’ mission to coach, train, and instruct students in both skills and competencies they will need for navigating the increasingly complex information systems as students and as lifelong learners. At the same time, we drew on our own research and other scholarly publications on lower- and higher-order thinking practices.
49 Fourteen out of 15 of the variables used to create the scale were derived from survey question 12. The variable in the analysis that measured challenges with staying motivated to keep learning was derived from survey question 13. We reverse-coded responses to question 13, so that respondents who agreed that they had no difficulty in staying motivated to keep learning ran in the same direction as responses to survey question 12. 50 John M. Weiner has concluded from his research that critical thinking and information literacy are both concerned with the ability to apply acute intelligence for solving information problems. However, information literacy is the bailiwick of academic librarians and focused on facilitating self-learning in any domain, while critical thinking is the domain of faculty discipline specialists and concerned with individual mastery. See: “Is There a Difference between Critical Thinking and Information Literacy?” Journal of Information Literacy 5, no. 2 (December 2011): 81-92, http://dx.doi.org/10.11645/5.2.1600. 51 “Information Literacy Competency Standards for Higher Education,” (Association of College and Research Libraries Board, January 18, 2000), http://www.ala.org/acrl/standards/informationliteracycompetency; “Framework for Information Literacy for Higher Education,” (Association of College and Research Libraries, February 2, 2015), http://www.ala.org/acrl/standards/ilframework.
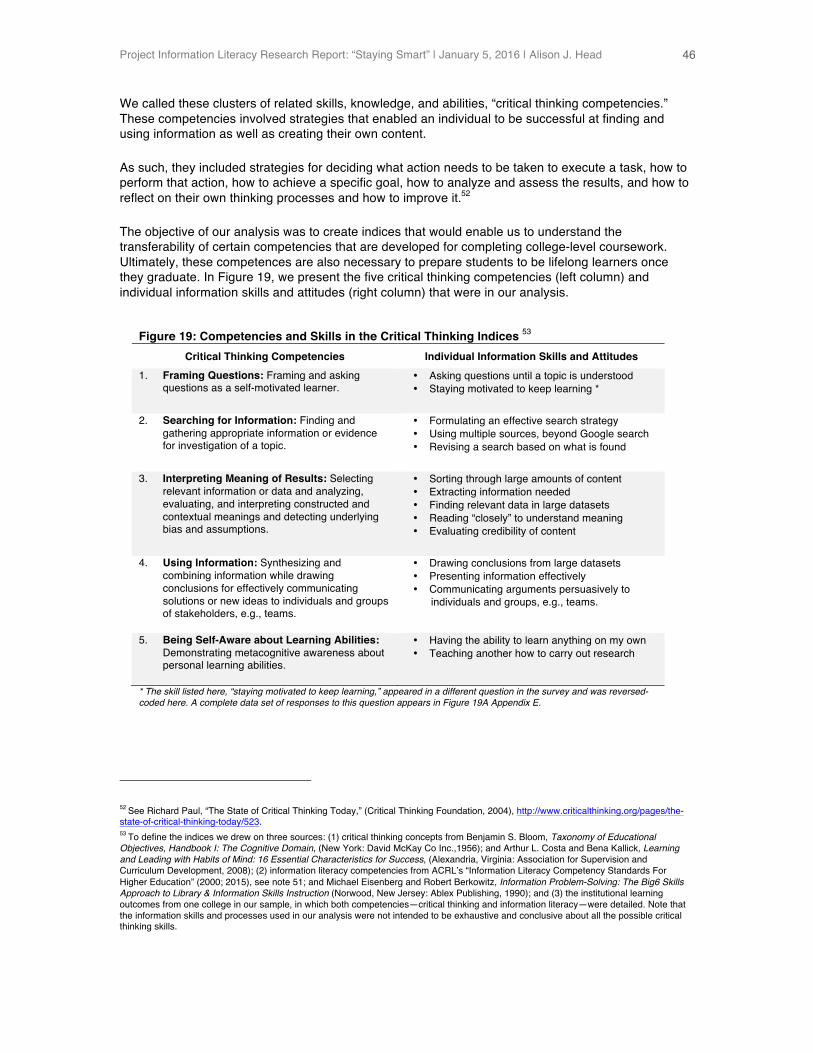
Project Information Literacy Research Report: “Staying Smart” | January 5, 2016 | Alison J. Head
46
We called these clusters of related skills, knowledge, and abilities, “critical thinking competencies.” These competencies involved strategies that enabled an individual to be successful at finding and using information as well as creating their own content.
As such, they included strategies for deciding what action needs to be taken to execute a task, how to perform that action, how to achieve a specific goal, how to analyze and assess the results, and how to reflect on their own thinking processes and how to improve it.52
The objective of our analysis was to create indices that would enable us to understand the transferability of certain competencies that are developed for completing college-level coursework. Ultimately, these competences are also necessary to prepare students to be lifelong learners once they graduate. In Figure 19, we present the five critical thinking competencies (left column) and individual information skills and attitudes (right column) that were in our analysis.
Figure 19: Competencies and Skills in the Critical Thinking Indices 53 Critical Thinking Competencies Individual Information Skills and Attitudes
1. Framing Questions: Framing and asking questions as a self-motivated learner.
• Asking questions until a topic is understood • Staying motivated to keep learning *
2. Searching for Information: Finding and gathering appropriate information or evidence for investigation of a topic.
• Formulating an effective search strategy • Using multiple sources, beyond Google search • Revising a search based on what is found
3. Interpreting Meaning of Results: Selecting relevant information or data and analyzing, evaluating, and interpreting constructed and contextual meanings and detecting underlying bias and assumptions.
• Sorting through large amounts of content • Extracting information needed • Finding relevant data in large datasets • Reading “closely” to understand meaning • Evaluating credibility of content
4. Using Information: Synthesizing and combining information while drawing conclusions for effectively communicating solutions or new ideas to individuals and groups of stakeholders, e.g., teams.
• Drawing conclusions from large datasets • Presenting information effectively • Communicating arguments persuasively to
individuals and groups, e.g., teams.
5. Being Self-Aware about Learning Abilities: Demonstrating metacognitive awareness about personal learning abilities.
• Having the ability to learn anything on my own • Teaching another how to carry out research
* The skill listed here, “staying motivated to keep learning,” appeared in a different question in the survey and was reversed-coded here. A complete data set of responses to this question appears in Figure 19A Appendix E.
52 See Richard Paul, “The State of Critical Thinking Today,” (Critical Thinking Foundation, 2004), http://www.criticalthinking.org/pages/the-state-of-critical-thinking-today/523. 53 To define the indices we drew on three sources: (1) critical thinking concepts from Benjamin S. Bloom, Taxonomy of Educational Objectives, Handbook I: The Cognitive Domain, (New York: David McKay Co Inc.,1956); and Arthur L. Costa and Bena Kallick, Learning and Leading with Habits of Mind: 16 Essential Characteristics for Success, (Alexandria, Virginia: Association for Supervision and Curriculum Development, 2008); (2) information literacy competencies from ACRL’s “Information Literacy Competency Standards For Higher Education” (2000; 2015), see note 51; and Michael Eisenberg and Robert Berkowitz, Information Problem-Solving: The Big6 Skills Approach to Library & Information Skills Instruction (Norwood, New Jersey: Ablex Publishing, 1990); and (3) the institutional learning outcomes from one college in our sample, in which both competencies—critical thinking and information literacy—were detailed. Note that the information skills and processes used in our analysis were not intended to be exhaustive and conclusive about all the possible critical thinking skills.
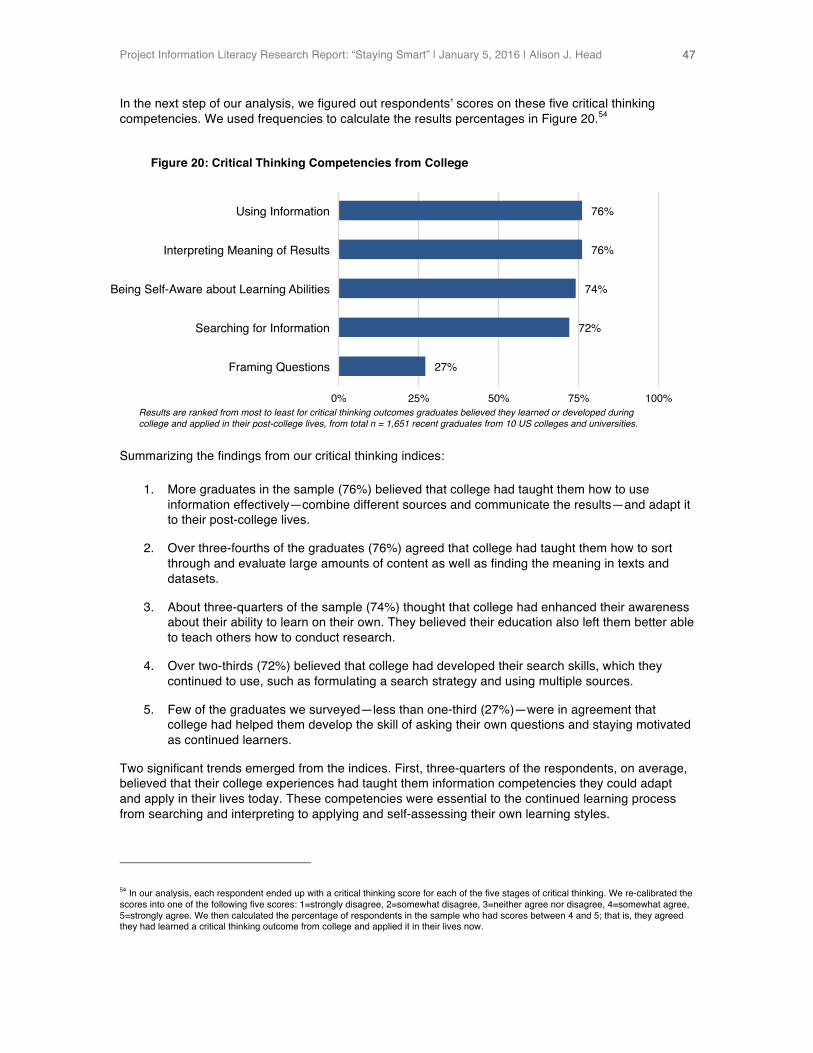
Project Information Literacy Research Report: “Staying Smart” | January 5, 2016 | Alison J. Head
47
In the next step of our analysis, we figured out respondents’ scores on these five critical thinking competencies. We used frequencies to calculate the results percentages in Figure 20.54
Results are ranked from most to least for critical thinking outcomes graduates believed they learned or developed during college and applied in their post-college lives, from total n = 1,651 recent graduates from 10 US colleges and universities.
Summarizing the findings from our critical thinking indices:
1. More graduates in the sample (76%) believed that college had taught them how to use information effectively—combine different sources and communicate the results—and adapt it to their post-college lives.
2. Over three-fourths of the graduates (76%) agreed that college had taught them how to sort through and evaluate large amounts of content as well as finding the meaning in texts and datasets.
3. About three-quarters of the sample (74%) thought that college had enhanced their awareness about their ability to learn on their own. They believed their education also left them better able to teach others how to conduct research.
4. Over two-thirds (72%) believed that college had developed their search skills, which they continued to use, such as formulating a search strategy and using multiple sources.
5. Few of the graduates we surveyed—less than one-third (27%)—were in agreement that college had helped them develop the skill of asking their own questions and staying motivated as continued learners.
Two significant trends emerged from the indices. First, three-quarters of the respondents, on average, believed that their college experiences had taught them information competencies they could adapt and apply in their lives today. These competencies were essential to the continued learning process from searching and interpreting to applying and self-assessing their own learning styles.
54 In our analysis, each respondent ended up with a critical thinking score for each of the five stages of critical thinking. We re-calibrated the scores into one of the following five scores: 1=strongly disagree, 2=somewhat disagree, 3=neither agree nor disagree, 4=somewhat agree, 5=strongly agree. We then calculated the percentage of respondents in the sample who had scores between 4 and 5; that is, they agreed they had learned a critical thinking outcome from college and applied it in their lives now.
76%!
76%!
74%!
72%!
27%!
0%! 25%! 50%! 75%! 100%!
Using Information!
Interpreting Meaning of Results!
Being Self-Aware about Learning Abilities!
Searching for Information!
Framing Questions!
Figure 20: Critical Thinking Competencies from College

Project Information Literacy Research Report: “Staying Smart” | January 5, 2016 | Alison J. Head
48
While these findings bode well for preparing students to be lifelong learners after graduation, the second major finding from this analysis does not. That is, very few graduates in our sample—slightly more than one in four respondents—believed that college had helped them develop the ability to frame and ask questions of their own.55 As such, these findings suggest that graduates in our sample left college fairly accomplished at answering other people’s questions—but were not very experienced with formulating their own questions.
Follow-up Analysis: In Their Words
Our follow-up interviews lend further insights into graduates’ experiences and beliefs about the critical thinking competencies they developed during college. Above all, graduates said they had learned how to search for and evaluate information during college, and they still used those strategies today.
For instance, an accountant said he had learned use Google to find Wikipedia articles with a citation trail to authoritative sites. An engineer said even though CNN was his favorite news show, he had been watching BBC News since college, too, to find different news coverage about worldwide topics. A social worker explained how college had taught her how to search for information:
I know what sources are more credible and reliable, like I know that .gov is more credible than a .com website and so are scholarly articles, peer-reviewed ones. When doing research, I find myself leaning to more of those types of articles than to just whatever is out there. I look at the credentials behind it, the source it is coming from. I always ask, “Okay, who wrote this?” or if there's a survey or study, “Okay, who conducted it?”
Others said college taught them to take what they had found in a search and extract what was important and share the reasons why with others. For instance, a budget analyst said he had first learned how to explain Excel spreadsheet results to inexperienced team members on projects during college and used the same skill in his new career.
A chemical engineer said college had taught him the basics of taking a systematic approach to analyzing a scientific problem. A statistician had learned the skill of reading a book quickly and pulling out its main arguments—a practice he still used today as a lifelong learner.
Yet, at the same time, comparatively few graduates said they had developed the ability to frame and ask their own questions during college. Based on our interviews, three factors kept graduates from learning and developing the critical thinking skill of how to ask questions in college: (1) student-to-professor ratio, (2) institutional culture, or (3) disciplinary curriculum.
For instance, some graduates from public universities said their lectures were so large that there was no time or place to ask a question. The student-to-professor ratio was a defining issue, but the way in which students perceived their school’s customs and rituals for communication also shaped their viewpoint about whether question asking was allowed.
55 For more about the importance of question asking and methods for teaching the skill, see: Alison J. Head, "Dan Rothstein: The Necessity of Asking Questions," Project Information Literacy, Smart Talk, no. 24 (April 21, 2015), http://projectinfolit.org/smart-talks/item/144-dan-rothstein-smart-talk; Dan Rothstein and Luz Santana, Make Just One Change: Teach Students to Ask Their Own Questions, (Cambridge, Massachusetts: Harvard Education Press, 2011).
Project Information Literacy Research Report: “Staying Smart” | January 5, 2016 | Alison J. Head
49
As one graduate from a large public university explained:
There just wasn't a lot of personal, one-on-one engagement at my college. At a school my size you get the feeling quickly that it's very much a business. My institution was in the business of getting people degrees, and churning out students. Maybe at a smaller liberal arts kind of college it would be an environment more conducive to creativity and personal growth. Where I think my institution was about “here's the path, here's how long it should take you, we do this every day, we know what we're doing here.”
Others said that it was the curriculum undergraduate institution that either did—or did not—foster questioning as an essential critical thinking competency. Some said engineering and computer science curriculum posed barriers to intellectual exploration:
The biggest difference is the engineering curriculum in college is the faculty and the textbook problem sets are defining what the issue is. It's well defined. The solution is known. The faculty, the textbook author, they can carve the question any way they want whereas in the real world it's not black and white, there's a lot of gray area and unknowns. You use the principles that you were taught in school once you get a job but it’s not necessarily a straight application in real life. In real life, you're the one defining the solution, not faculty or a textbook.
Notably, there was a difference in opinion from graduates we interviewed at liberal arts institutions and those at larger public schools. Those from smaller schools said their education had woven in the ability to frame questions into every class:
No one got through a class at my liberal arts college without speaking, having to ask questions, especially in my second, third, and fourth years. A lot of the courses were student-led and the professor was there as a moderator. Students were prompted with an issue and we had to ask questions, figure out solutions on our own, and if we got too far off base, the professor jumped in so no one had their time wasted. We were held accountable for figuring things out and solving problems.
To our knowledge, this is one of the first studies of the critical thinking competencies today’s recent graduates consider to be college takeaways. As a whole, the results have implications for those who believe that higher education prepares students to be lifelong learners. Rather, the majority of recent graduates appeared to come out of college more skilled at answering questions that instructors posed than framing questions of their own and finding answers. In the next section, our follow-up analysis examines the effect of undergraduate major and institutional affiliation on the scores for the critical thinking indices.
Follow-up Analysis: Does Major Matter?
In this analysis, we explore whether a respondent’s undergraduate major was a factor in the results of our questioning index. We used mean scores to calculate the results. A higher mean score meant that respondents with degrees in certain fields were in stronger agreement they had learned to develop their ability to ask their own questions in college more so than others that had lower mean scores and were in different disciplines. Figure 21 presents results for the questioning index.
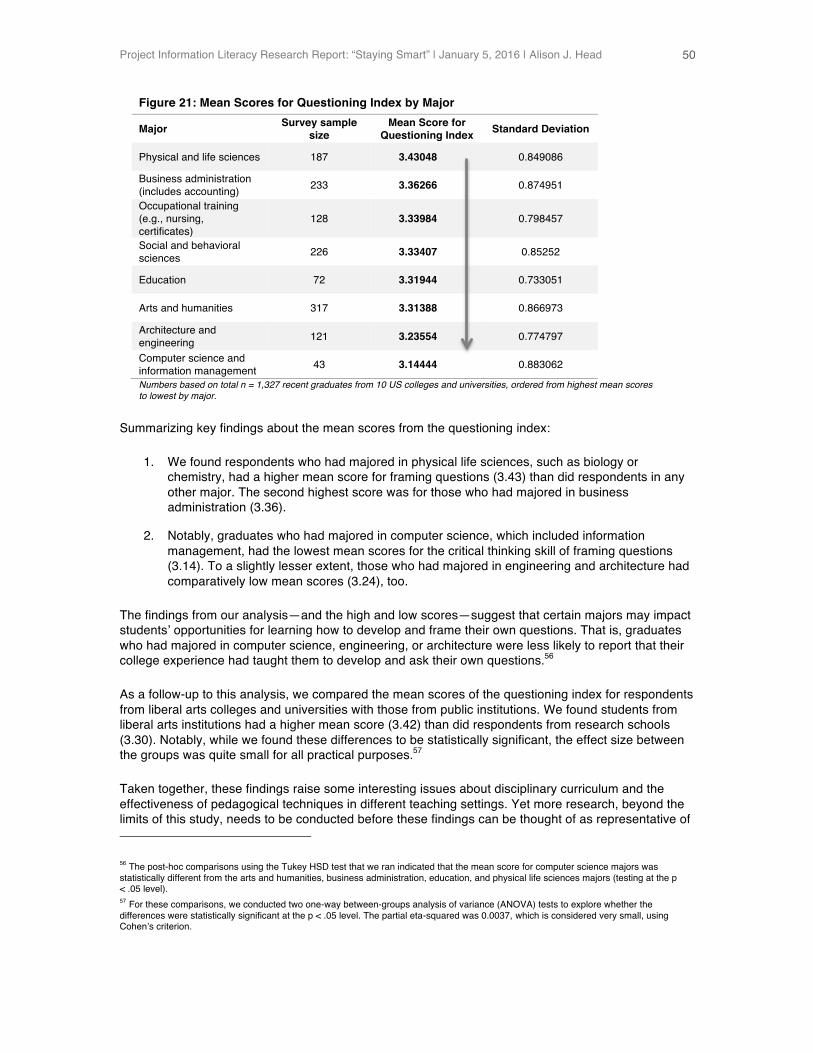
Project Information Literacy Research Report: “Staying Smart” | January 5, 2016 | Alison J. Head
50
Figure 21: Mean Scores for Questioning Index by Major
Major Survey sample size
Mean Score for Questioning Index Standard Deviation
Physical and life sciences 187 3.43048
0.849086
Business administration (includes accounting) 233 3.36266
0.874951
Occupational training (e.g., nursing, certificates)
128 3.33984
0.798457
Social and behavioral sciences 226 3.33407
0.85252
Education 72 3.31944
0.733051
Arts and humanities 317 3.31388
0.866973
Architecture and engineering 121 3.23554
0.774797
Computer science and information management 43 3.14444
0.883062
Numbers based on total n = 1,327 recent graduates from 10 US colleges and universities, ordered from highest mean scores to lowest by major.
Summarizing key findings about the mean scores from the questioning index:
1. We found respondents who had majored in physical life sciences, such as biology or chemistry, had a higher mean score for framing questions (3.43) than did respondents in any other major. The second highest score was for those who had majored in business administration (3.36).
2. Notably, graduates who had majored in computer science, which included information management, had the lowest mean scores for the critical thinking skill of framing questions (3.14). To a slightly lesser extent, those who had majored in engineering and architecture had comparatively low mean scores (3.24), too.
The findings from our analysis—and the high and low scores—suggest that certain majors may impact students’ opportunities for learning how to develop and frame their own questions. That is, graduates who had majored in computer science, engineering, or architecture were less likely to report that their college experience had taught them to develop and ask their own questions.56
As a follow-up to this analysis, we compared the mean scores of the questioning index for respondents from liberal arts colleges and universities with those from public institutions. We found students from liberal arts institutions had a higher mean score (3.42) than did respondents from research schools (3.30). Notably, while we found these differences to be statistically significant, the effect size between the groups was quite small for all practical purposes.57
Taken together, these findings raise some interesting issues about disciplinary curriculum and the effectiveness of pedagogical techniques in different teaching settings. Yet more research, beyond the limits of this study, needs to be conducted before these findings can be thought of as representative of
56 The post-hoc comparisons using the Tukey HSD test that we ran indicated that the mean score for computer science majors was statistically different from the arts and humanities, business administration, education, and physical life sciences majors (testing at the p < .05 level). 57 For these comparisons, we conducted two one-way between-groups analysis of variance (ANOVA) tests to explore whether the differences were statistically significant at the p < .05 level. The partial eta-squared was 0.0037, which is considered very small, using Cohen’s criterion.
Project Information Literacy Research Report: “Staying Smart” | January 5, 2016 | Alison J. Head
51
recent graduates from other institutions. For instance, why do graduates in the physical sciences and business majors think they are more adept at framing questions than graduates in other majors?
In the next section, we explore another critical thinking skill: evaluation. With over three-quarters of the sample believing that college taught them the competency of interpreting the meaning of results, we asked how graduates evaluated Web content for continued learning.
2. Evaluation: An Essential Takeaway
Evaluation of information has been called one of—if not the—most critical skills of the 21st century.58 Academic librarians and educators frequently cite the importance of teaching students how to navigate increasingly complex information systems in the digital age and how to be discriminating information seekers and consumers as well as ethical and legal producers of their own content.
In our study, we asked how recent graduates evaluate Web content they use for continued learning in their post-college lives. Do they apply and adapt the standards for judging the usefulness and validity of Web sources once taught to them as students?
To answer these questions, we used a survey question with a Likert scale to measure how often respondents considered 10 criteria about websites in the past year. We present the results in Figure 22.
58 “John Palfrey: Rethinking Plagiarism in the Digital Age,” Project Information Literacy Smart Talk, no. 3, (September 1, 2010), http://projectinfolit.org/smart-talks/item/117-john-palfrey.
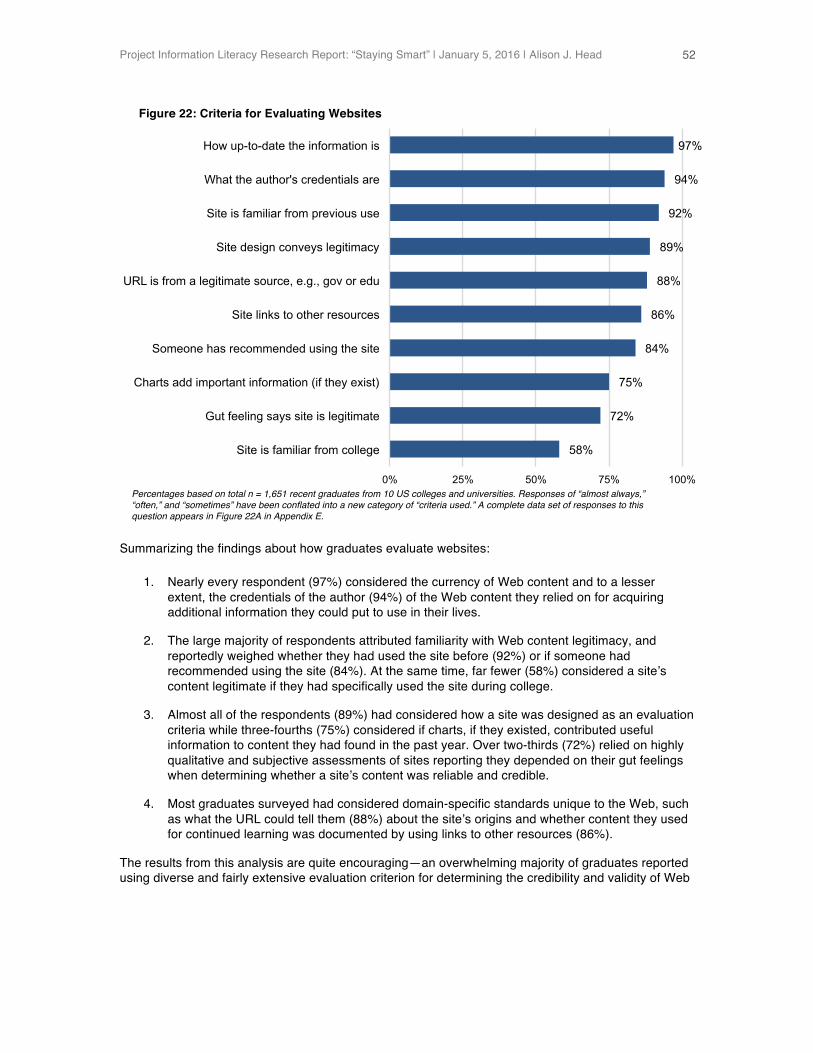
Project Information Literacy Research Report: “Staying Smart” | January 5, 2016 | Alison J. Head
52
Percentages based on total n = 1,651 recent graduates from 10 US colleges and universities. Responses of “almost always,” “often,” and “sometimes” have been conflated into a new category of “criteria used.” A complete data set of responses to this question appears in Figure 22A in Appendix E.
Summarizing the findings about how graduates evaluate websites:
1. Nearly every respondent (97%) considered the currency of Web content and to a lesser extent, the credentials of the author (94%) of the Web content they relied on for acquiring additional information they could put to use in their lives.
2. The large majority of respondents attributed familiarity with Web content legitimacy, and reportedly weighed whether they had used the site before (92%) or if someone had recommended using the site (84%). At the same time, far fewer (58%) considered a site’s content legitimate if they had specifically used the site during college.
3. Almost all of the respondents (89%) had considered how a site was designed as an evaluation criteria while three-fourths (75%) considered if charts, if they existed, contributed useful information to content they had found in the past year. Over two-thirds (72%) relied on highly qualitative and subjective assessments of sites reporting they depended on their gut feelings when determining whether a site’s content was reliable and credible.
4. Most graduates surveyed had considered domain-specific standards unique to the Web, such as what the URL could tell them (88%) about the site’s origins and whether content they used for continued learning was documented by using links to other resources (86%).
The results from this analysis are quite encouraging—an overwhelming majority of graduates reported using diverse and fairly extensive evaluation criterion for determining the credibility and validity of Web
Figure 22: Criteria for Evaluating Websites
97%
94%
92%
89%
88%
86%
84%
75%
72%
58%
0% 25% 50% 75% 100%
How up-to-date the information is
What the author's credentials are
Site is familiar from previous use
Site design conveys legitimacy
URL is from a legitimate source, e.g., gov or edu
Site links to other resources
Someone has recommended using the site
Charts add important information (if they exist)
Gut feeling says site is legitimate
Site is familiar from college
Project Information Literacy Research Report: “Staying Smart” | January 5, 2016 | Alison J. Head
53
content for continued learning in the past year. Consistent with our earlier studies, the young adults we have studied appear to be fairly avid evaluators of information obtained from the Web.59
According to the graduates we interviewed, most used multiple evaluation practices when making risk-associated decisions where Web content is used as an information source. Some said they had learned the importance of evaluating Web content at each stage of their educational training. As one interviewee working in the health profession explained:
I graduated with a biology degree, and one particular class of mine was very, very focused on critical thinking, specifically on evaluating scientific literature—looking at facts, what are they saying, is there usefulness in this. But I didn't really develop my critical thinking interpersonal communication skills until my graduate program, that is, evaluating what a patient is telling you, picking up on body language, written history and having to synthesize everything. It involves critical thinking in terms of people telling full truths, half-truths, or what they perceive to be the truth versus what I perceive. Written literature—undergraduate prepared me very well for that, but in terms of personal critical thinking, graduate school was really the crux.
Taken together, these findings suggest recent graduates are careful and deliberate evaluators of Web content. The results from this analysis further suggest evaluation may be one of information skills that today’s students learn early on and continue to apply throughout their lives. According to our interviews, today’s young adults assiduously applied and adapted a diverse method for evaluating Web content, especially when making risk-associated decisions for use in their lives after college.
3. Challenges with Continued Learning
The results from this study suggest that graduates believe they have learned essential critical thinking competencies for finding and applying information in their post-college lives. But do these results also mean that graduates were unchallenged by continued learning?
In this analysis, we investigate the challenges graduates have with continued learning. We used results from a survey question with a Likert scale to measure how strongly respondents agreed or disagreed with six statements about challenges with continued learning after college. The results from this analysis are presented in Figure 23.
59 Alison J. Head and Michael B. Eisenberg, “Truth Be Told: How College Students Evaluate and Use Information in the Digital Age,” Project Information Literacy Progress Report 9-12 (November 1, 2010), http://projectinfolit.org/images/pdfs/pil_fall2010_survey_fullreport1.pdf.
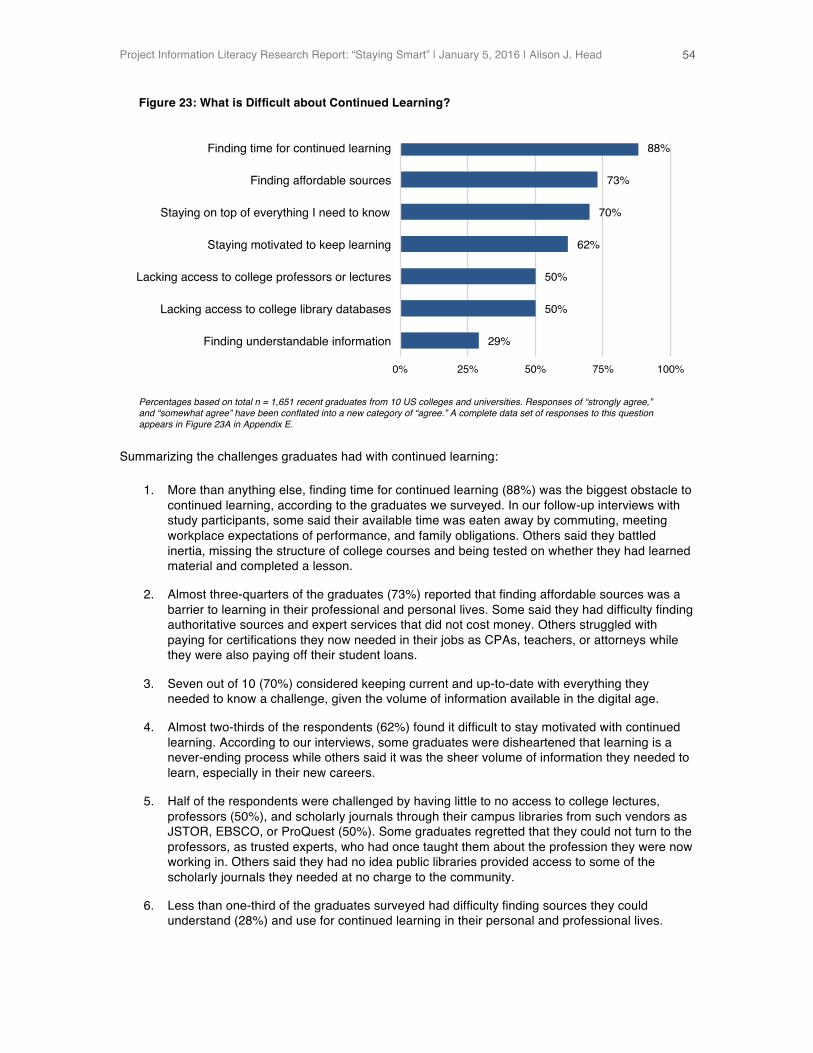
Project Information Literacy Research Report: “Staying Smart” | January 5, 2016 | Alison J. Head
54
Percentages based on total n = 1,651 recent graduates from 10 US colleges and universities. Responses of “strongly agree,” and “somewhat agree” have been conflated into a new category of “agree.” A complete data set of responses to this question appears in Figure 23A in Appendix E.
Summarizing the challenges graduates had with continued learning:
1. More than anything else, finding time for continued learning (88%) was the biggest obstacle to continued learning, according to the graduates we surveyed. In our follow-up interviews with study participants, some said their available time was eaten away by commuting, meeting workplace expectations of performance, and family obligations. Others said they battled inertia, missing the structure of college courses and being tested on whether they had learned material and completed a lesson.
2. Almost three-quarters of the graduates (73%) reported that finding affordable sources was a barrier to learning in their professional and personal lives. Some said they had difficulty finding authoritative sources and expert services that did not cost money. Others struggled with paying for certifications they now needed in their jobs as CPAs, teachers, or attorneys while they were also paying off their student loans.
3. Seven out of 10 (70%) considered keeping current and up-to-date with everything they needed to know a challenge, given the volume of information available in the digital age.
4. Almost two-thirds of the respondents (62%) found it difficult to stay motivated with continued learning. According to our interviews, some graduates were disheartened that learning is a never-ending process while others said it was the sheer volume of information they needed to learn, especially in their new careers.
5. Half of the respondents were challenged by having little to no access to college lectures, professors (50%), and scholarly journals through their campus libraries from such vendors as JSTOR, EBSCO, or ProQuest (50%). Some graduates regretted that they could not turn to the professors, as trusted experts, who had once taught them about the profession they were now working in. Others said they had no idea public libraries provided access to some of the scholarly journals they needed at no charge to the community.
6. Less than one-third of the graduates surveyed had difficulty finding sources they could understand (28%) and use for continued learning in their personal and professional lives.
88%!
73%!
70%!
62%!
50%!
50%!
29%!
0%! 25%! 50%! 75%! 100%!
Finding time for continued learning!
Finding affordable sources!
Staying on top of everything I need to know!
Staying motivated to keep learning!
Lacking access to college professors or lectures!
Lacking access to college library databases!
Finding understandable information!
Figure 23: What is Difficult about Continued Learning?
Project Information Literacy Research Report: “Staying Smart” | January 5, 2016 | Alison J. Head
55
The two greatest barriers to continued learning graduates had were time and money. Some graduates, as a result, had dramatically reduced their continued learning efforts. Others had devised workarounds for learning on a shoestring budget and with the little chunks of time that they had available. Many of these efforts were solo learning efforts; none mentioned learning through journal clubs or book clubs, where a group of individuals met regularly to discuss and critically evaluate articles or books.
For instance, some graduates used smart phone apps like Duolingo to brush up on their language skills while commuting to and from work, rather than taking a Spanish or French class at the local college. Others used online forums to learn from examples rather than taking an online course through Codecademy. Still others said they relied on their companies to buy textbooks or research articles they could skim at work when no one else was using them.
At the same time, many graduates felt overwhelmed by the need to stay current in their personal and professional lives. Some had lost confidence in their ability to stay informed on multiple fronts:
Self-doubt is my biggest obstacle to continued learning. I put a lot of pressure on myself, I have all these skills from college, which taught me the value of finishing my work, but often that can put an unnecessary amount of pressure and anxiety on the learning goals I pursue now. I know the direction I want to go to become an illustrator, but there aren’t any classes offered locally. The ones offered were too distant to drive to, and the offerings I found online were expensive. It’s hard to find exactly what you need, at the price and location you want.
All in all, the large majority of the graduates we studied fought to fit continued learning into their busy lives. Many had come to realize the resources that they had taken for granted in college—professors, lectures, and authoritative research sources—were difficult to come by now. If they wanted to keep learning, they needed to rely on their own motivation rather than homework, class time, grades, and meeting their professors’ expectations. ! Part Four: Modeling the Lifelong Learning Process
Whether they had graduated from community colleges, liberal arts colleges, or research universities, the majority of graduates in our study used similar information-seeking strategies to find the expertise and knowledge to continue learning and improve their skills. We have used these commonalities as the basis for developing a model that describes the research behavior today’s graduates use for lifelong learning.
Utility, as we first came to realize, was key to understanding how recent graduates operationalize and prioritize their search and select sources for learning to use as they make the transition from college to real life. In this context, utility means usefulness—not that a source is just relevant and credible, but that the information it contains can directly and immediately applicable to real problems.
For instance, the young graduates we studied were looking for “specifics,” “how-to solutions,” and “something really instructive” that that they could directly apply in their personal lives, the workplace, and to a lesser extent, the communities in which they lived. Whether they needed to find today’s stock price for a company, write the formula for an Excel function, or figure out how to trim a climbing rose bush, they sought useful information that was factual, reliable, and applicable.
The two greatest barriers to continued learning graduates had were time and money.
Project Information Literacy Research Report: “Staying Smart” | January 5, 2016 | Alison J. Head
56
Interestingly, graduates valued sources that met their utility requirement often related to personal connections they had established with coworkers, friends, supervisors, and family. Yet, they also used contemporary social media technologies such as YouTube videos, Pinterest, Wikipedia, Stack Overflow, Reddit, Khan Academy, and online forums.
Depending on what the situation required, graduates often took a deep dive into learning when they needed to acquire a conceptual understanding of a field or topic. For example, some told us they needed to master Python or Java so they could be an authority; others needed to learn how to develop a comprehensive social media marketing plan. Still others spent a lot of time learning about a topic that involved a certain amount of risk for them, such as making a career move or starting a family.
In some cases, many graduates told us they needed to improve their interpersonal communication skills. Here too, some were looking for quick fixes; others needed deeper learning to make sense of concepts around negotiation, conflict resolution, and cross-generational communication they could use in their personal and professional lives.
To fulfill these more complex learning needs, graduates said they took advantage of different sources and information systems. For example, they enrolled in job training courses, read books, or had ongoing conversations with supervisors or mentors about how to resolve communication issues. They also leveraged the deep learning potential of online learning through sources like blogs, webinars, TED Talks, or to a lesser extent, Coursera.
The information-seeking process for continued learning we have described so far is driven by graduates’ needs for utility and finding useful and applicable solutions. However, our model does not end there—it is where it starts. We came to understand that utility is a valued starting point, but that graduates recognize they have more extensive, lifelong learning needs.
The results of our study show that graduates also place a high premium on what we are now calling the socialness of the information. They prioritized their search for continued learning sources by looking for multiple voices with interactivity as well as utility. They wanted a variety of opinions, guidance, and an option to join in a discussion or exchange and interact. In time, these multiple voices added to the validity, reliability, and a richness of the solutions.
Taken together, we characterize continued learning sources that are both useful and interactive as having what we call shared utility. There are a variety of online sources with shared utility that graduates mentioned using, such as webinars, online forums, video-sharing sites, blogs, and social networking sites.
Shared utility is an attribute of some traditional sources as well as newer, social, and online ones. For instance, graduates mentioned using face-to-face training and professional conferences. They also tapped the expertise of co-workers they identified as mentors. In these situations, the multiple voices contributed to the richness of solutions through face-to-face exchanges. Figure 24 presents a graphical representation of the information attributes that contribute to our model of shared utility for lifelong learning.
They prioritized their search for continued learning sources by looking for multiple voices with interactivity as well as utility.
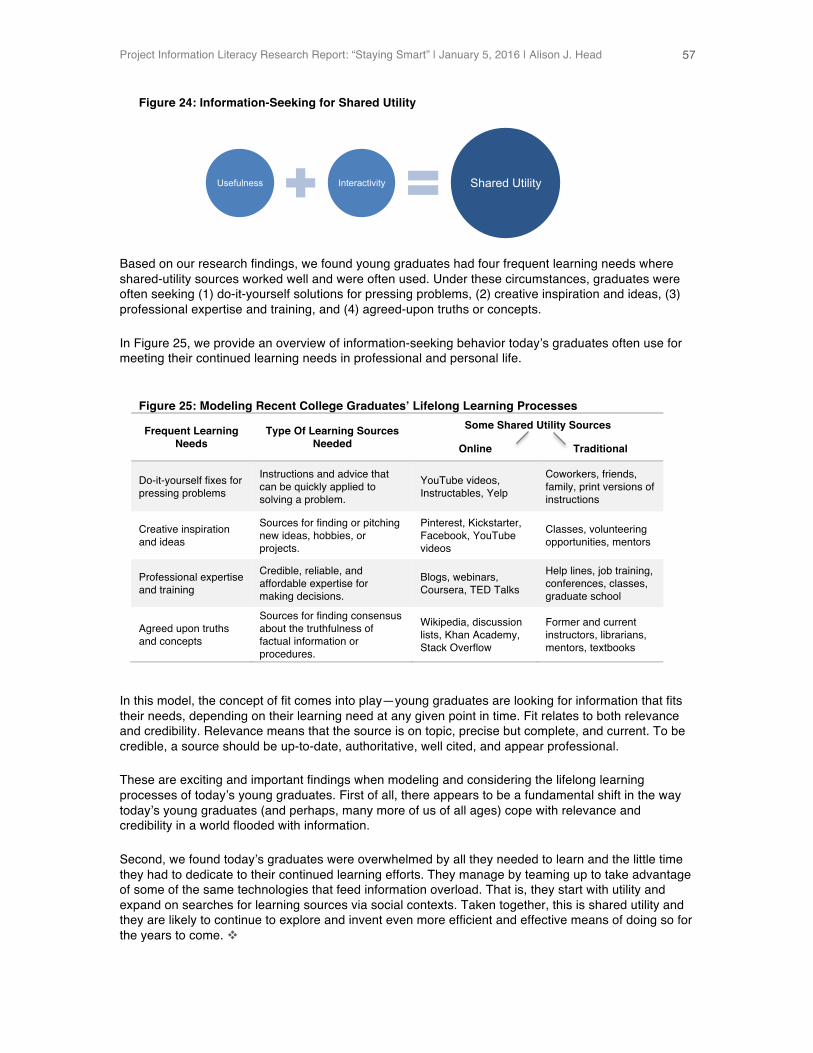
Project Information Literacy Research Report: “Staying Smart” | January 5, 2016 | Alison J. Head
57
Figure 24: Information-Seeking for Shared Utility
Based on our research findings, we found young graduates had four frequent learning needs where shared-utility sources worked well and were often used. Under these circumstances, graduates were often seeking (1) do-it-yourself solutions for pressing problems, (2) creative inspiration and ideas, (3) professional expertise and training, and (4) agreed-upon truths or concepts.
In Figure 25, we provide an overview of information-seeking behavior today’s graduates often use for meeting their continued learning needs in professional and personal life.
Figure 25: Modeling Recent College Graduates’ Lifelong Learning Processes
Frequent Learning Needs
Type Of Learning Sources Needed
Some Shared Utility Sources
Online Traditional
Do-it-yourself fixes for pressing problems
Instructions and advice that can be quickly applied to solving a problem.
YouTube videos, Instructables, Yelp
Coworkers, friends, family, print versions of instructions
Creative inspiration and ideas
Sources for finding or pitching new ideas, hobbies, or projects.
Pinterest, Kickstarter, Facebook, YouTube videos
Classes, volunteering opportunities, mentors
Professional expertise and training
Credible, reliable, and affordable expertise for making decisions.
Blogs, webinars, Coursera, TED Talks
Help lines, job training, conferences, classes, graduate school
Agreed upon truths and concepts
Sources for finding consensus about the truthfulness of factual information or procedures.
Wikipedia, discussion lists, Khan Academy, Stack Overflow
Former and current instructors, librarians, mentors, textbooks
In this model, the concept of fit comes into play—young graduates are looking for information that fits their needs, depending on their learning need at any given point in time. Fit relates to both relevance and credibility. Relevance means that the source is on topic, precise but complete, and current. To be credible, a source should be up-to-date, authoritative, well cited, and appear professional.
These are exciting and important findings when modeling and considering the lifelong learning processes of today’s young graduates. First of all, there appears to be a fundamental shift in the way today’s young graduates (and perhaps, many more of us of all ages) cope with relevance and credibility in a world flooded with information.
Second, we found today’s graduates were overwhelmed by all they needed to learn and the little time they had to dedicate to their continued learning efforts. They manage by teaming up to take advantage of some of the same technologies that feed information overload. That is, they start with utility and expand on searches for learning sources via social contexts. Taken together, this is shared utility and they are likely to continue to explore and invent even more efficient and effective means of doing so for the years to come. !
Usefulness Interactivity Shared Utility

Project Information Literacy Research Report: “Staying Smart” | January 5, 2016 | Alison J. Head
58
Conclusion
Project Information Literacy (PIL), in 2012, began a series of studies about the information transition from school to work that we called “The Passage Studies.” The purpose of this research series has been to better understand the information competencies and strategies that young adults say they adopt, develop, and apply as they move from one complex information landscape to the next.
Over the course of three studies that make up the series, we have surveyed and interviewed more than 3,500 college students and recent graduates from 14 higher education institutions in the US. In 2012, we used focus groups to explore how a sample of recent graduates solved information problems after joining the workplace. In 2013, we interviewed first-year college students to investigate the information challenges they faced as they made the transition from high school to college.
On the surface, these two study samples—fledgling college students and seasoned graduates—may appear to have little in common. But we have found otherwise. Whether they were conducting research for a first-semester composition course or preparing a report for a sales meeting, there were significant disparities between how today’s young adults find and use information and the expectations that instructors, librarians, or employers may have of these young adults’ information-seeking behaviors.
In this last (2015) study in the series, we have turned our attention to lifelong learning. Using a sample of 1,651 recent graduates from 10 US colleges and universities located in “smart cities,” our objective was to investigate the information-seeking strategies young adults employ once they complete college.
What makes this latest study a fitting bookend to the Passage series is its research focus. This study examines the critical passage from college to real life and the transition into three arenas in their lives: personal life, the workplace, and local community. Further, our inquiry explores how graduates respond to many of the information problems that they have identified themselves in their real life, rather than those that may have been assigned to them by instructors or employers.
The First Decade after College
We found the majority of the college graduates we studied were blindsided by all they needed to learn and know during their first decade out of college. Most scrambled to pick up quick-fix solutions in their personal lives, like how to make household repairs, schedule student loan payments, or shop for groceries on a budget.
Others spent much of their time trying to advance their early careers by improving their communication skills with coworkers. They also wanted to extend the shelf life of the technical work skills and deepening their understanding of fundamental concepts they had learned in college only a few years before.
Still others, though far fewer, needed to learn the ins and outs of a new neighborhood and how to respond to practical needs, from finding a local coffee shop where people their age congregated to lining up meaningful volunteering opportunities in their communities.
…the majority of the college graduates we studied were blindsided by all they needed to learn and know...
Project Information Literacy Research Report: “Staying Smart” | January 5, 2016 | Alison J. Head
59
One graduate interviewee from a large public university summed up his post-college life learning needs as follows:
When you graduate, you don't realize how much was provided when you were in college. I don't know how to manage my money even though I thought I did—I figured if I can pay my bills on time that's the same thing, but it’s not. I definitely have needed to learn about personal nutrition and how to eat healthy, too. It’s tough to engage in civic matters since I'm often in the minority opinion, so I don't seek out ways to get involved.
What makes this young graduate’s comments compelling, and this study’s related findings significant, is the preponderance of life skills that today’s graduates lack and need to learn. These skills, we found, ranged from learning how-to quick fixes to learning the conceptual underpinnings of an entirely new discipline or field, depending on a given situation.
Life Skills 101
The World Health Organization (WHO) has defined life skills as “abilities for adaptive and positive behavior that enable individuals to deal effectively with the demands and challenges of everyday life.”60 The United Nations Children’s Fund (UNICEF) has further divided life skills into three categories: “(1) cognitive skills for using and analyzing information, (2) personal skills for developing personal agency and managing oneself, and (3) interpersonal skills for communicating and interacting effectively with others.”61
Together, these two definitions are a useful lens for understanding our results about lifelong learning and today’s graduates and thinking about the broader implications of those findings. Borrowing on UNICEF’s categories, we found a wide gap between the life skills recent graduates had and the ones they did not. In particular, most graduates in our sample believed they had the cognitive skills for finding, evaluating, and using information; skills honed during college.
For instance, many graduates knew to go beyond the first page of Google search results and to look for credible sources. Most frequently, they considered the currency of the content and the credentials of the author. These graduates had leveraged evaluation skills from college to develop a hybrid strategy of using both computer-mediated and human-mediated sources for solving the information problems and acquiring conceptual knowledge they had needed in the last year.
Yet, at the same time, today’s graduates were reportedly missing some of the most important corresponding life skills that align with UNICEF’s other categories. That is, most lacked requisite skills needed for managing themselves in their personal and professional lives, and, to a lesser extent, in their local communities.
60 Carmen Aldinger and Cheryl Vince Whitman, “Skills for Health: Skills Based Health Education to Teach Life Skills,” in The Health Promoting School: International Advances In Theory, Evaluation And Practice, S. Clift and B.B. Jensen (eds) (Copenhagen, Denmark: Danish University of Education Press, 2005): 3. 61 “Life Skills: Definition of Terms,” United Nations International Children’s Education Fund (UNICEF), last modified June 13, 2003, http://www.unicef.org/lifeskills/index_7308.html.
… most lacked requisite skills needed for managing themselves in their personal lives and professional lives and, to a lesser extent, in their local communities.
Project Information Literacy Research Report: “Staying Smart” | January 5, 2016 | Alison J. Head
60
For instance, many graduates, even those who had been finance or math majors, needed to learn new skills for money management, such as figuring out how to pay taxes or setting up their first personal budget. Others had found they needed to improve and expand on their interpersonal communication skills in their jobs. They wanted to learn delegation and negotiation techniques for communicating with coworkers who were older than their college classmates had been. Still others looked for ways to build their professional network, and to a lesser degree, their social circle in the physical communities where they had relocated for a new job.
Even though our findings suggest that graduates were fairly proficient at finding information for meeting their continued learning needs and to meet life’s expectations once they graduated, the true irony was why graduates said their continued learning efforts were often diminished.
More than anything else, survey respondents reported that their lifelong learning efforts were hobbled by a lack of available time (88%) beyond the hours they put in at work.
Still, seven in 10 reported they had trouble staying on top of everything they needed to know, given the volume of information “out there.” Almost two-thirds (62%) were challenged by staying motivated to keep up with learning in their personal and professional lives. Half of the sample was frustrated by not having access to valued research articles from college library databases, like JSTOR.
Preparing Today’s Lifelong Learners
The findings from our study, as a whole, have broader implications about today’s recent graduates and what they are taking from their college years and able to apply as lifelong learners once they graduate. They raise essential questions for college administrators, educators, librarians, alumni associations, community groups, and commercial information publishers, like ProQuest or EBSCO.
How can college students be better prepared to acquire the life skills they will inevitably need once they continue with their lives? What lifelong learning educational strategies, resources, and services would best serve young adults once they graduate, given their limited time and money and the pressure of job and family obligations?
It is interesting but not surprising that questions like these had also occurred to some of the graduates we interviewed. When we asked graduates what could have helped better prepare for real life, they said there needed to be less of a separation between college life and life in the workaday world.
As one graduate explained: “We were sheltered in this idealistic undergraduate world where anything is possible, however, that’s not what the world is like. There needs to be some sort of real-world application with decision-making skills; if my college had required more internships or work-study programs that would have been great.”
In thinking more broadly about how to solve such far-reaching problems, it is important to conclude with this study’s two most revealing results. These results came from the critical thinking indices we developed and tested in our study. These indices were used to ascertain the information competencies recent graduates believed they had learned and developed in college and adapted and applied in their post-college lives.
We found, on average, three-quarters of the sample believed that their college experience had taught them information competencies, such as searching, evaluating, and presenting, and that they had adapted and applied in their post-college lives. Yet, what was most telling is that far fewer said they had developed the ability of framing and asking their own questions about topics as independent learners. Many acknowledged they had needed to develop the skill of asking their own questions once they entered the workplace after graduation and began their careers.
Notably, almost two-thirds (62%) were challenged by staying motivated to keep on learning...
Project Information Literacy Research Report: “Staying Smart” | January 5, 2016 | Alison J. Head
61
We cannot overestimate the importance of these two findings. They reveal the diminished potential of higher education to prepare a sizable number of lifelong learners who are prepared to keep learning throughout their lives. Moreover, the results raise serious questions about the critical thinking skills of today’s college graduates.
At a time when higher education is scrutinizing the efficacy of their pedagogical practices, are institutions graduating inquisitive question-askers who are prepared to be continuous and self-motivated learners in their personal and professional lives once they graduate?
Or, are they churning out an abundance of graduates that are “strategic learners" who can complete assignments in order to graduate and try to find work? Strategic learners chase the highest grade rather than concentrate on self-reflection, deep learning, and true knowing, according to Ken Bain, author of What the Best College Students Do.62
A third finding—the finding about tapping co-workers or supervisors— as learning sources highlights some of the changing relationships occurring in the workplace. It is certainly a finding worthy of more investigation for future researchers. How, for instance, do these lifelong learning relationships develop over time as far as recent graduates and continued learning? Are they short-lived, or do they tend to be nurtured over time and with what outcomes?
Taken together, the findings from our study have clearly shown an increased need to nurture individual discovery and curiosity in our classrooms, in our libraries, and in our communities. Furthermore, young adults need to learn how to adapt and develop an information-seeking behavior that fits into the information cultures and demands of their new settings. This way, graduates are more likely to become what Bain calls “adaptive experts.”
These are individuals who tackle unusual problems and generate new solutions, which few would disagree, are needed in an increasingly complex world. Graduates are also likely to be lifelong learners, an essential ingredient in a democratic society and for living a full, productive, and rich life. In the next section we conclude this report by presenting 10 recommendations for improving lifelong learning resources and services for today’s young adults.!
62 Ken Bain is the author of What the Best College Students Do (Cambridge, Massachusetts: Harvard University Press, 2012). Bain also served on the PIL Lifelong Learning Advisory Board for this report.
At a time when higher education is scrutinizing the efficacy of their pedagogical practices, are institutions graduating inquisitive question-askers who are prepared to be continuous and self-motivated learners…?
Project Information Literacy Research Report: “Staying Smart” | January 5, 2016 | Alison J. Head
62
Recommendations
In the final section of this report, we make 10 recommendations for improving educational strategies, resources, and services so that they foster lifelong learning. We hope these recommendations will resonate with librarians and library decision-makers in all settings (academic, public, school, and special) and stakeholders in higher education and K-12 settings, community groups, alumni associations, and producers and publishers of educational materials. Moreover, we hope these ideas will stimulate conversations that may lead to new strategies for helping recent graduates and other young adults fulfill their lifelong learning needs. These recommendations are based on the study’s research findings as well as ideas and solutions generated by our Lifelong Learning Advisory Board members.63
Higher Education
Recommendation 1: Reaffirm a broad-based purpose for higher education
To be sure, one of the goals of an undergraduate education is to help students gain the skills and knowledge to secure employment in a career of their choosing. However, in the past decade we have witnessed an overemphasis on the economic value of higher education. While the research studies cited in the pages of this report have shown a direct relationship between years of education and salaries, we contend that it is short sighted to overemphasize financial rewards. Our research suggests that an undue emphasis on the economic rewards of learning can have deleterious effects on students’ perceptions about the purpose of higher education. For instance, many of the graduates we interviewed viewed their institutions as being a big business rather than being a place for intellectual exploration and discovery. One young graduate said of the public university where he received his baccaulerate degree, "My institution was in the business of getting people degrees, and churning out students.” Students like this one were often the same ones that may rush to get through college and punch their ticket. Such students may come into college hedging their bets by bringing enough credits earned in high school so they can skip a year or more of college and graduate sooner. We understand the significant financial burden of higher education today. However on reflection, many of us also recognize that college years are valuable for personal and social growth and for learning ways of thinking and doing.
For these reasons, and others, we see a vital need for reaffirming the broad-based purpose of higher education. This is an approach that places the onus on institutions first, and libraries second. As a solution, we stress the importance of supporting lifelong learning across disciplines and across faculty, librarians, and administrative stakeholders, rather than assured employability after graduation. We believe these efforts must make it a clear priority to uphold—and improve—General Education curricula, especially a rigorous program general inquiry, problem solving, and critical thinking. This, however, is not always the case. For instance, in a recent article in the Chronicle of Higher Education, Michael W. Clune, a professor at Case Western Reserve University, warns against “the gutting of Gen Ed.”64 He points to examples of Gen Ed courses being slashed even though many parents, students, faculty, and administrators “believe that a college education should endow every graduate with a knowledge of the world beyond the terms and techniques of their chosen trade.”
63 Mike Eisenberg, the chair of the PIL Lifelong Learning Advisory Board, who contributed thoughts, opinions, and editing to many of these recommendations. PIL Lifelong Learning Advisory Board: Ken Bain (University of the District of Columbia); Ginnie Cooper (former Chief Librarian for the Washington, D.C. Public Library, now retired); Sari Feldman (President of the American Library Association and Executive Director of Cuyahoga County Public Library); Deborah S. Garson (Graduate School of Education at Harvard University); R. David Lankes (Syracuse University’s School of Information Studies); Peter Morville (Semantic Studios); Michael Stephens (San Jose State University Information School); and Bonnie Tijerina (Data & Society Research Institute). 64 Michael W. Clune, “Degrees of Ignorance,” Chronicle of Higher Education, December 6, 2015, http://chronicle.com/article/The-Gutting-of-Gen-Ed/234453.
Project Information Literacy Research Report: “Staying Smart” | January 5, 2016 | Alison J. Head
63
One library effort that is designed to reaffirm a broad-based view of education comes from Barbara Fister, a professor and academic librarian at Gustavus Adolphus College. For a small amount of credit, students at her institution in any major can enroll in a Reading Workshops where they would read and discuss books selected from a student database of fiction best picks. As Fister explained, “there is some interesting research on the psychology of reading for pleasure, suggesting that it correlates with empathy, that the brain is very active when ‘lost in a book,’ that it plays a role in identity formation, and that people learn a great deal about the world, even when they are reading fiction.”65 Whether library services or programs are big or small, what matters is integrating a broad-based approach into learning. Ultimately, we need to embrace the rewards that learning brings and a society that values knowledge over starting salaries. Recommendation 2: Integrate the social side of research into college curricula
More than anything else, graduates reported that they wanted to improve their interpersonal communication skills across the arenas in their lives during the past year. In our follow-up interviews, graduates, most of whom were between 20 and 29 (74%), explained their struggles to communicate with people who were older than their peers. For instance, some said they were uncomfortable and inexperienced with delegating tasks to fellow workers who were older than they were. Others said they had to learn how to negotiate with someone in a position of authority, since this was different than interacting with professors or their parents. Still others had trouble with making small talk with higher-ups at work or people with authority in their personal lives. We concluded that most graduates were not incapable communicators. Rather, they had little experience with some of the higher-order communication skills that are necessary to succeed in real life.
In this recommendation, we highlight the need for students to learn more advanced and essential social communication skills they will need once they graduate. To achieve this goal, we recommend a three-pronged effort where: (1) instructors engage students in formulating and asking questions via classroom lectures or related extra-curricular activities, (2) librarians work with faculty to develop assignments that require using human-mediated information sources in addition to textual sources, and (3) librarians expand information literacy instruction to include training and hands-on experience with conducting the social side of research. We define the social side of research as identifying, extracting, and integrating a mix of reliable and high quality human-mediated sources into the research discovery process. Today, these “social sources” may consist of face-to-face communication as well as discussions through social media platforms. We found graduates already engage, to a certain extent, in the social side of research in their professional and personal lives. More than eight in 10 (84%) turned to a coworker to learn in the past year. In their personal lives, others tapped social sources turned to social networking sites like Facebook (79%), blogs (56%), or online forums (52%), especially when they sought expert advice. Most students, however, tend to be more skilled at using textual sources, such as journal articles or books, than with employing social research skills when researching a topic. This is not surprising, since most research skills that faculty and librarians teach students are for fulfilling assignments rather than continuous learning throughout the rest of their lives.
Since library stakeholders recognize the importance of teaching students to retrieve quality information sources in a variety of formats, why hasn’t the social side of research been more discussed? Granted, we are heartened by ACRL’s framework and the concept of teaching “scholarship as conversation,”66
65 Michele Van Hoeck, “Barbara Fister: Playing for Keeps: Rethinking how Research is Taught to Today’s College Students," Project Information Literacy Smart Talk, no. 12, (July 26, 2012), http://projectinfolit.org/smart-talks/item/106-barbara-fister. 66 “Framework for Information Literacy for Higher Education,” Association of College and Research Libraries. See note 51.
Ultimately, we need to embrace the rewards that learning brings and a society that values knowledge over starting salaries.
Project Information Literacy Research Report: “Staying Smart” | January 5, 2016 | Alison J. Head
64
but what training and assignment ideas work for teaching students how to have fruitful exchanges that tap expertise with authorities? Are academic librarians across different library settings including instruction about social networks’ impact information-seeking behavior for solving information problems today?67 We contend that the social side of research needs to be recognized as a fundamental component of the research process. The graduates we interviewed said they discovered experiential and contextual factors gained through one-on-one exchanges with coworkers mattered just as much, if not more, than facts, figures, or theories from textual sources in the workplace. The question at hand for librarians is, how can young adults learn the social side of research while they are students so they are better prepared for joining the workplace and more experienced communicators? We think this starts by going beyond the reference interview or exchanges between students and librarians in research consultations for creating new opportunities for teaching the social side of research.
Recommendation 3: Ensure that students graduate knowing how to ask their own questions
We were surprised to find that less than a third of the graduates (27%) in our sample reported that college had helped them develop the critical thinking skill of framing and asking their own questions. As many recent graduates came to soon learn, this skill is critically important because in the workplace, problems and issues are mostly fuzzy, ambiguous, and ill defined. Knowing how—and when—to ask questions in the workplace is important, as some of the graduates we interviewed acknowledged. Yet, our study results suggested that certain majors, such as computer science and engineering, might preclude students from learning and getting much experience with how to formulate and ask their own questions. As the young engineer we interviewed put it, he learned about engineering through assigned problem sets where the facts were black and white and there was only one solution to a problem. But when he began his career, he was surprised to find that “you're the one defining the solution, not faculty or a textbook.”
Many of today's college students, like this engineer, specialize early on and take a narrow set of courses focused on their major and anticipated career. Even though General Education curricula are supposed to address general inquiry, problem solving, and critical thinking, we found this is not always the case. Such a discipline-intensive focus may help some students land their first job, but this kind of focus may be masking some deep and troubling shortcomings, especially the ability to ask meaningful questions and to stay motivated to keep learning. As PIL Lifelong Learning Advisory Board member Deborah Garson explained in our discussions, “We have to rethink and question how ‘questions’ influence and drive communication...just as librarians and faculty/teachers have developed and valued the ability to ask questions in order to teach and instruct effectively, so do students (at all levels) need to begin asking ‘What’s that?’ and ‘Why?’”
We agree that librarians are in the unique position of helping students be better at asking their own questions. As such, we recommend that librarians make a concerted effort in helping students develop their ability to formulate and ask their own questions in the assignments they co-produce with faculty, the reference exchanges they have with students, and the information literacy instruction they deliver to students throughout their education. In Garson’s words, “It is not an issue of the librarian instructing the user ‘how to be a librarian’ or even a ‘how to research’ but an educational opportunity to construct and ask questions. Libraries are places of inquiry. It is simply a matter of broadening and extending the role of questioning in the user/librarian interactions.”
67 One recent example of librarians coming together to discuss how social networks impact search behavior the Harvard Library Search and Discovery Initiative's Education Working Group at Harvard University Libraries on January 27, 2016, where Alison Head will be a panelist and discuss findings on the social side of research.
… librarians are in the unique position of helping students be better at asking their own questions.
Project Information Literacy Research Report: “Staying Smart” | January 5, 2016 | Alison J. Head
65
Recommendation 4: Make strategies for lifelong learning part of information literacy curriculum
Lifelong learning is a multifaceted, mutable, and often ambiguous concept. This is especially true in the digital age where the rapid expansion of communication technologies and the burgeoning availability of information have increased learning expectations. As researchers, we were confronted with defining lifelong learning for purposes of our inquiry. What exactly does lifelong learning mean to today’s recent college graduates? How could we explore what activities and dispositions it entails? We found what worked especially well for us was to ask graduates we interviewed, “How did they stay smart and up to date after college?” The phrase, “staying smart,” resonated with graduates. Most believed college had made them smarter. Upon graduating, most also came to realize that they were going to need to keep learning on their own in order to stay smart, or constantly update the shelf life of their knowledge, competencies, and skills. The phrase “staying smart” often led to candid discussions about graduates’ learning needs and the strategies they had used during the past year. In our discussions, we discovered many graduates equated lifelong learning with getting the advice or guidance they needed in their personal and professional lives. For instance, they wanted to know things like how to build their career, how they should spend as well as save money, or how they could make time to give back in their community.
We are not the first to recognize the shifting nature of lifelong learning needs. In a 2014 Atlantic Magazine article, the authors wrote that today’s lifetime learners are “looking for not just learning but guidance in navigating the changing world to find the best learning and career opportunities. The growth in life coaching and self-help books, now $2 billion and $11 billion industries respectively, is an early signal of this need.”68 This quote is consistent with our study’s major findings: Graduates have a tremendous need for guidance and advice during their first decade out of college. For instance, three-fourths of the graduates (75%) we surveyed had looked for “how-to information” in their personal lives during the past year. Over two-thirds (69%) wanted guidance with more complex questions about their own career development. At the same time though, many were frustrated by their lack of access and the affordability of expert advice they said might help.
In this recommendation, we see an opportunity—and a great need—to provide information literacy instruction that includes the competencies graduating seniors will need as they make the information passage from college to real life. How, for instance, can new college hires keep up with information in their field? What sources can help them extend the shelf life of skills they had learned in college only a few years before? How can they find credible but affordable expertise for continued learning? We applaud efforts by some librarians to integrate workplace information literacy into higher education curriculum. Most importantly, these librarians are using metacognitive frameworks to teach their students how to reflect on their own practices and engage in community and collective workplace practices. This approach is superlative over teaching students a set of functional information literacy skills that will soon be obsolete in the rapidly changing workplace today. 69 Further, such an approach can go a long way in preparing students to be successful lifelong learners.
68 John Hagel III, John Seely Brown, Roy Mathew, Maggie Wooll, and Wendy Tsu, “The Lifetime Learner,” The Atlantic, 2015, http://www.theatlantic.com/sponsored/deloitte-shifts/the-lifetime-learner/256/. This article was originally published by Deloitte University Press in 2015. We are grateful to PIL Lifelong Learning Advisory Board member Deborah Garson for providing sharing this article during our online discussions. 69 Alison Hicks, “Drinking on the Job: Integrating Workplace Information Literacy into the Curriculum,” LOEX Quarterly 41, no. 4 (2015), 9-15, http://scholar.colorado.edu/cgi/viewcontent.cgi?article=1060&context=libr_facpapers.
Graduates have a tremendous need for guidance and advice during their first decade out of college.
Project Information Literacy Research Report: “Staying Smart” | January 5, 2016 | Alison J. Head
66
Public Libraries
Recommendation 5: Design libraries as “gathering places” for informal and formal learning
More than half of the graduates in our sample had the greatest need for continued learning in their personal lives (57%) during the past year. For instance, graduates looked to improve their ability to live on there own—how to read a rental agreement, how to plan and prepare meals, and how to make household repairs. In order to meet such personal life needs, PIL Lifelong Learning Advisory Board Member Sari Feldman said it would be, “interesting to consider how libraries could be conceived of as ‘gathering places’ for recent college graduates. How could cohort groups be formed? Developing and programming financial literacy would be another attraction to recent graduates. How can programming be built into supporting maker space activities? Could libraries provide incubator spaces and support life skills programming?” Lifelong Learning Advisory Board Member Michael Stephens agreed and added to the discussion, “Public libraries should be promoting a culture of learning everywhere."
We think it is imperative for public libraries to connect information and technology skills programs with essential life skills that recent graduates (and others) say they increasingly need. This recommendation comes at a time when librarians are redesigning library space to increase informal and formal learning. It also comes when recent graduates are using public libraries in their personal lives. As Feldman said public libraries need, “More services that anticipate what people need, perhaps even before they know they need it, and services that are built on user experience and trust.” With access to current, relevant, and credible sources, libraries can find innovative ways to deliver life skill services and instruction to recent graduates. These services need not be restricted to the physical library; they could—and should—be offered virtually, where young people spend much of their time. Moreover, these services, if successful, could serve as a model for developing similar services for the general public. At least half of today’s recent graduates have a specific need that public libraries can meet. We recommend marketing these services and using them to promote libraries as physical and virtual gathering places.
Recommendation 6: Librarians have a mandate—and a responsibility—to intervene in their communities
Seven out of 10 (70%) of the graduates we surveyed were challenged by keeping abreast of everything they needed to know in their lives. Moreover, almost two-thirds (62%) found it difficult to stay motivated to keep up with learning after they were out of college. The sheer volume of information they needed to learn in a new career or their daily lives overwhelmed many of them. Some graduates were dismayed to discover that learning is a never-ending process. Still others longed for formal learning settings that provided curricula, sources, and structure. PIL Lifelong Learning Advisory Board Member Peter Morville defined three problems with staying informed today: “First, most people lack the necessary search skills and information literacy. Second, our information environment is increasingly fragmented (myriad formats, sources), hard to use, and dangerous to trust (e.g., research funded by Big Pharma). Third, technology is driving rapid change across all areas of life and work. These are wicked problems that we've failed to solve at scale… Students and faculty often fail to realize the value of the library and its collections. They simply don't know what they're missing. For me, this brings to mind the words of Lee Rainie during a 2015 Internet Librarian keynote: ‘Librarians have a mandate to intervene in their communities.’”
Some graduates were dismayed to discover that learning is a never-ending process.
Project Information Literacy Research Report: “Staying Smart” | January 5, 2016 | Alison J. Head
67
In this recommendation, we wholeheartedly support and expand upon Lee Rainie’s call to action: “Librarians not only have a mandate to intervene in their communities, it is their responsibility to do so!” One way for public librarians to have impact is to think of themselves as what Lee Rainie has called nodes.70 Nodes are actors in people’s social networks that are sources of authority, expertise, and trusted go-to advice. Nodes connect with people through the content they create in shared utility sources like Facebook, Twitter, blogs, or online forums. But we need to do more than simply “use” social media. Librarians have a unique role as nodes: they can leverage their highly valued expertise as trusted super searchers and help people stay on top of everything people need to know. Libraries need to fully embrace the online space and see this venue as a priority. For example, just as the media now has bloggers and journalists who spend all their time in virtual spaces, so too should librarians. Librarians should also involve younger people in nurturing these spaces. Librarians should be creative—such as engaging teens to develop and deliver social media spaces, services, and resources. They should offer “sandboxes”—cutting edge capabilities to test out and offer all the content resources related to their personal “how to” needs virtually. And again, these should not be seen as enhancing the physical. The online should stand on its own in the public library today—the online though, must be fully developed in order for librarians to intervene in their communities.
Recommendation 7: Develop localized lifelong learning with TED Talks
The large majority of survey respondents had used YouTube (79%) for continued learning over the past year. Many of these graduates said they watched TED Talks to keep up on new ideas from science, technology, or business. One graduate said she liked to watch TED Talks with her husband since it made them feel like they were back in school. One reason for the popularity of TED Talks is the myriad of short talks they offer on interesting topics, such as whether schools kill creativity or how body language shapes personality. Another reason TED Talks are used is they are easy to find; a Google search often turns up TED Talks in the first or second page of results.
Some public libraries have integrated some of these videos into their services through joint partnerships with other community organizations that promote lifelong learning. One example is the collaborative effort between Berkeley Public Library and the Osher Lifelong Learning Institute at nearby U.C. Berkeley. Their program is called “TED Talk Watchers” and the purpose is simple: to gather in the community room, watch, and discuss an 18-minute TED Talk video.71 These sessions are free of charge and open to the community. PIL Lifelong Learning Board Member Bonnie Tijerina took this programmatic idea one step further by asking, "What if public libraries embedded their collections and local services into certain TED Talks that were particularly relevant to locals?"
Along with PIL Lifelong Learning Board Member Dave Lankes, the two discussed what a public library lifelong learning campaign like this could entail. Dave suggested, “What if public libraries did something along the lines of ‘Like the talk, let us help you walk the walk!’ The library could pick a good TED Talk (or better still have a community board of new grads pick one), marshal a set of community experts and opportunity that match the talk and hold hyper-local [library] events, such as ‘Watched the video of Bill Gates and disease? Come by Thursday night and talk with folks from org X that is addressing the problem and share your thoughts and talents. Meet others in your community wrestling with topic X. Find out how to get involved. See the local perspective.’ By then coordinating these local events and activities, librarians can also begin incorporating learning and training activities, e.g., ‘Next week, we'll do a 3D printing and tour a local hospital. Curious what the need is for these kinds of services? We'll show you the databases and tools to find out.’ This is information literacy and tools in context.”
70 Michele Van Hoeck, “Lee Rainie: Why New Media Are Becoming Your New Neighborhood," Project Information Literacy Smart Talk, no. 7, (June 8, 2011), http://projectinfolit.org/smart-talks/item/113-lee-rainie. 71 “TED Talk Watchers,” University of California, Berkeley n.d., https://olli.berkeley.edu/interest-circles/ted-talk-watchers.
Project Information Literacy Research Report: “Staying Smart” | January 5, 2016 | Alison J. Head
68
The special value of a public library campaign like this is that it localizes continued learning and makes it community-based. It leverages popular—and relevant—TED Talk videos that already have a large following. Moreover, the library can present itself as a gathering place for “like minds." The library has an ample supply of curated and authoritative physical and virtual sources for viewers who want to dig more deeply into a topic.
Recommendation 8: Embed lifelong learning sources across settings, both physically and virtually
Almost half of the graduates we surveyed reported using a public library (45%)—physically and/or virtually when they wanted information sources or services they could use in their personal lives. Some said they turned to libraries for finding and checking out best-selling fiction. Others said they scanned the physical library’s shelves looking for books that would help them with their hobbies. Still others relied on libraries as a quiet place to read or search the Web on a library terminal. What was revealing from our analysis was the other information systems that public library users in our sample had also used during the past year. We found, for instance, that public library users were three times more likely also to visit bookstores and two and a half times more likely to go to museums.
Together, these findings tell us graduates who use libraries use a variety of other information systems in their communities—physically or virtually—to advance their learning. Further, our analyses suggested that graduates recognize the importance of curated, high quality learning resources that are organized, kept up to date, provided in a space where physical or virtual professional assistance is available if they need it. We cannot overestimate the importance of this finding—the graduates we studied wanted something, beyond Google searches, to order their ever-changing information worlds and help them understand how to find what they needed to know. For libraries, these findings are encouraging: Their needs can be met by library services, resources, and programs, and almost half of those in need already use public libraries. Of course, a majority (55%) of potential users are not taking advantage of their public libraries. Therefore, we recommend a three-pronged strategy: (1) market existing library offerings to students in their last year of college, including access to scholarly research databases that many graduates we studied had no idea were even available to the public, (2) collaborate with museums and other community institutions to offer seamless, integrated access tools and resources or even to embed (physically or virtually) library services and resources within other settings, and (3) evaluate the potential of cutting-edge, emerging technologies as ways to engage users, meet them where they are (i.e., online), and provide expanded forms of interaction and access.
Marketing is fairly straightforward, however, we recommend focusing marketing on online, social media forms of interaction. Collaboration requires overcoming concerns about turf and scope on both sides. Fortunately, while the audience for programs and services by libraries, museums, and community agencies overlap, the nature of those programs and services are quite different—but complementary. This is a case where the whole is truly greater than the sum of the parts. In addition, new technologies will expand the sense of community and the richness of offerings in virtual spaces. Libraries need to view their online spaces with as much care and pride as they do their physical ones. Virtual and augmented reality, ubiquitous mobile access, enhanced social media, and 3D graphics are just some of the emerging innovations that will expand the capabilities, effectiveness, and enjoyment of being and doing online.
Project Information Literacy Research Report: “Staying Smart” | January 5, 2016 | Alison J. Head
69
K-12 and Beyond
Recommendation 9: Teach financial literacy skills in a variety of venues
Eight out of 10 of today’s college students in the US have at least one credit card.72 The average college senior graduates owing a credit card balance of over $400073 along with $35,000 in student loan debt.74 Not surprisingly, student debt is mounting with every passing year. On this note, one of our study’s major findings is as worrisome as it is telling: more than two-thirds of the recent college graduates we surveyed admitted that they needed to learn more about managing money (69%) in their personal lives. The graduates we interviewed needed specifics for financial planning that are unique to early adults—not setting up an IRA and planning for their retirement, but meeting immediate money management needs such as setting up a first-time personal budget, scheduling student loan payments, or figuring out how to pay taxes. Most said they were surprised about how little they knew about money matters; as one young graduate said: “I don't know how to manage my money even though I thought I did—I figured if I can pay my bills on time that's the same thing, but it’s not.” We think these findings, and our conclusions, raise important questions: Where are young people supposed to learn these skills? Further, as there are information competencies for addressing financial literacy and other essential how-to needs, how are these best learned in K-12 and the first years of college? How might we rethink the possibilities for this in terms of K-12 and higher education curriculum, extracurricular programs, capstones, or just through school, or community culture? We recommend that librarians consider and plan for the financial literacy resources and services they might offer, both physically and virtually. Librarians should leverage their unique role for teaching financial literacy. Librarians are trusted sources of unbiased information, as we have found in our prior research.75 They are also highly valued collaborators. Some programmatic solutions across community and educational settings already exist. Since 2011, for instance, ALA has partnered with the Federal Reserve Bank of Chicago to hold a series of financial literacy educational activities in its annual Money Smart Week.76 In 2014, this partnership expanded to include the Consumer Financial Protection Bureau, so that Chicago libraries could host sessions on financial literacy for community members. Beyond successful programs like these, there are curricular solutions that librarians can tap for inspiration. For example, the Indiana Department of Financial Institutions have produced a set of online lesson plans that instructors can use helping high school students learn about the use of credit cards. In the higher education arena, there have been electives on personal money management designed for first-year students and at colleges and universities such as the University of Cincinnati, St. Olaf College, Texas State University, and Scripps College.
72 “How Undergraduate Students Use Credit Cards,” http://static.mgnetwork.com/rtd/pdfs/20090830_iris.pdf, (April 2009). Results in article are based on a national study published by Sallie Mae in 2009. 73 Ibid. 74 Sparshott, “Congratulations, Class of 2015.” 75 Alison J. Head, “Learning the Ropes: How Freshmen Conduct Course Research Once they Enter College,” (Seattle, WA: University of Washington Information School, Project Information Literacy Research Report, December 4, 2013), http://projectinfolit.org/images/pdfs/pil_2013_freshmenstudy_fullreport.pdf 76 “Money Smart Week,” American Library Association, n.d., http://www.ala.org/news/money-smart-week-your-library.
We recommend that librarians consider and plan for the financial literacy resources and services they might offer, both physically and virtually.
Project Information Literacy Research Report: “Staying Smart” | January 5, 2016 | Alison J. Head
70
Recommendation 10: Begin teaching information competencies early, and continue throughout students’ formal education
There is increasing recognition of the need for more formal and informal opportunities for students of all ages to learn essential life skills from kindergarten through their last year in college.77 Information problem-solving competencies such as search, determining relevance and credibility, analysis, synthesis, and evaluation are basic to all of these areas. Moreover, integrating information and technology literacy into life skills’ programs is clearly desirable, especially when we consider information skills as essential life skills as well (e.g., personal information management). Our findings have convinced us that early intervention that teaches requisite life skills in K-12 curriculum often has very positive outcomes. For instance, in this study, as well as others we have conducted with college students,78 we have found many young adults are careful and skilled at evaluation when accessing materials online. Further, many had learned to use and apply a diverse criterion for evaluating Web content.
In our study, almost all of the graduates used traditional evaluation standards they learned from librarians or teachers, such as considering the currency (97%) and an author’s credentials (94%). They also applied some of their own evaluation techniques they have learned along the way from their friends or teachers, such as sizing up whether a site’s design—the fonts, the colors, and images—conveys legitimacy (89%). Many of these are criteria that young adults first learned in elementary and middle school. One graduate we interviewed explained, “Evaluating information was actually something that I learned in high school because the Internet was becoming so popular for research and I had one teacher that really helped us differentiate the good from the bad. Then in college, these evaluation skills were enhanced and I learned the ability to look at a problem from all angles, that was important." As this young graduate’s comments suggest, early intervention efforts can help students succeed as they continue with their education and the expectations for course research evolve. We recommend building more bridges for teaching information competencies between K-20 curricula. Stakeholders—librarians, teachers, and faculty—need to discuss how students can be better prepared to succeed as they continue with their education from one setting to the next and ultimately, once they graduate, leave school settings, and continue as lifelong learners. !
77 See: Lauren Martin, “The Importance of Life-Based Education,” Learning Liftoff, May 13, 2014, http://www.learningliftoff.com/the-importance-of-life-skills-based-education/#.VnBuxHvLSy1. 78 Alison J. Head and Michael B. Eisenberg, “Truth Be Told: How College Students Evaluate and Use Information in the Digital Age.”
Project Information Literacy Research Report: “Staying Smart” | January 5, 2016 | Alison J. Head
71
Appendices
Project Information Literacy Research Report: “Staying Smart” | January 5, 2016 | Alison J. Head
72
Appendix A: Methods
Project Information Literacy’s two-year study investigated the lifelong learning information-seeking behavior of a sample of relatively recent college graduates and was conducted from September 2013 through December 2015. The survey sample consisted of 1,651 survey participants, who had graduated from one of 10 US colleges and universities between 2007 and 2012.
Preliminary telephone interviews were conducted with 63 participants. Follow-up interviews with an additional 63 study participants were conducted after the survey was administered. Interviewees attended the same institutions as survey respondents and graduated in the same years.
The purpose of this study was to investigate graduates’ continued learning habits after college in the digital age. We focused on the learning needs of relatively recent graduates as well as the sources they used in three arenas of their post-college lives (i.e., personal life, workplace, and the communities in which they lived). From a disciplinary standpoint, we investigated deeper issues about lifelong learning and the information literacy competencies adopted and used once college students graduated.
We defined the following five research questions for the study:
1. What information needs do today’s college graduates have for improving skills and adding to their knowledge or competencies after they leave campus and settle into their personal lives, the workplace, and their local communities?
2. What information sources do recent graduates use for finding information about personal fulfillment and cultural enrichment, career development and staying employable, and for becoming involved in civic affairs and their local community?
3. How do today’s graduates use the myriad of sources for continued learning available from traditional information systems, like public libraries, job training sessions, bookstores, and museums as well as Web 2.0 sources, such as blogs and MOOCs?
4. What critical thinking skills and information literacy competencies learned or developed in college are adapted and applied by young graduates in their personal and professional lives today?
5. How can the information-seeking process for lifelong learning be modeled? Given this model, what solutions for improving learning services and resources are feasible for meeting the needs of recent graduates?
This study’s primary contribution was to develop a deeper understanding about what it is like for recent graduates—in their words and through their experiences—to make the information transition from college to life beyond the academy. Findings are intended for an audience of librarians and educators so they may understand the readiness of today’s college graduates and the challenges that they face.
Participants
Institutional Sample
PIL partnered with 10 colleges and universities for the institutional sample used in our research (three private colleges and universities, six public universities, and one community college). To facilitate our efforts with each campus we utilized a research liaison at each location. This liaison was employed by the partnering institution as an instructor, a reference librarian, or a dean.
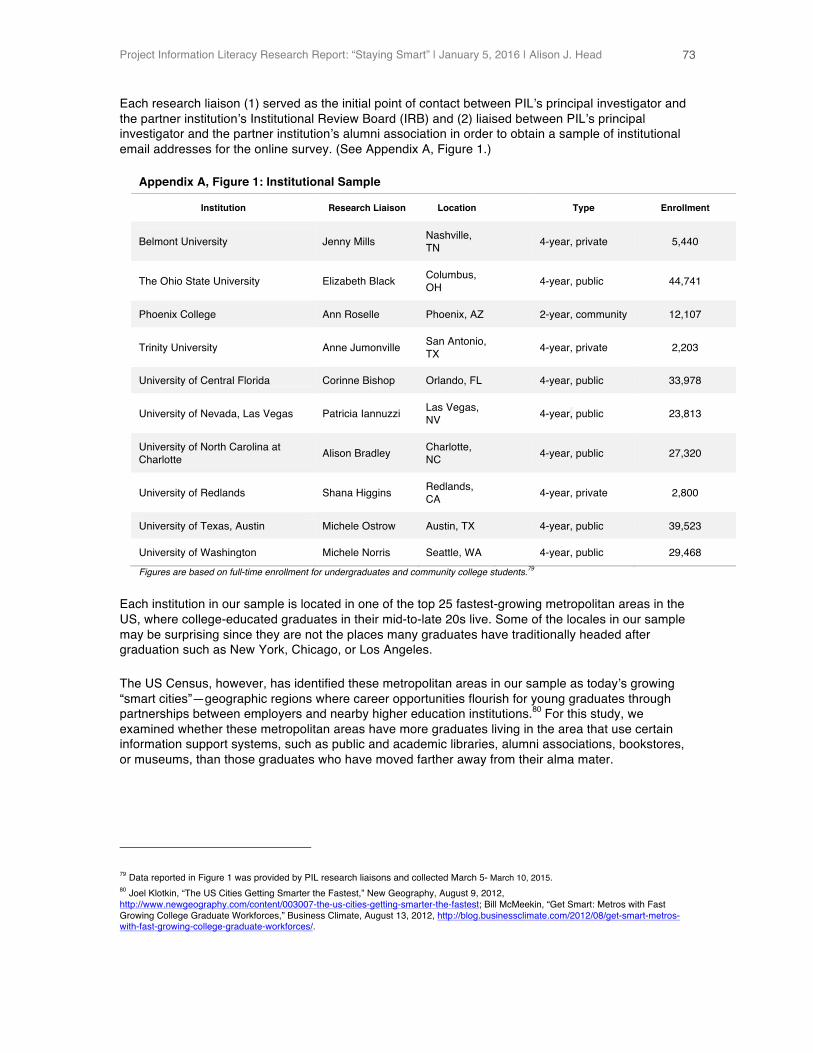
Project Information Literacy Research Report: “Staying Smart” | January 5, 2016 | Alison J. Head
73
Each research liaison (1) served as the initial point of contact between PIL’s principal investigator and the partner institution’s Institutional Review Board (IRB) and (2) liaised between PIL’s principal investigator and the partner institution’s alumni association in order to obtain a sample of institutional email addresses for the online survey. (See Appendix A, Figure 1.)
Appendix A, Figure 1: Institutional Sample
Institution Research Liaison Location Type Enrollment
Belmont University Jenny Mills Nashville, TN 4-year, private 5,440
The Ohio State University Elizabeth Black Columbus, OH 4-year, public 44,741
Phoenix College Ann Roselle Phoenix, AZ 2-year, community 12,107
Trinity University Anne Jumonville San Antonio, TX 4-year, private 2,203
University of Central Florida Corinne Bishop Orlando, FL 4-year, public 33,978
University of Nevada, Las Vegas Patricia Iannuzzi Las Vegas, NV 4-year, public 23,813
University of North Carolina at Charlotte Alison Bradley Charlotte,
NC 4-year, public 27,320
University of Redlands Shana Higgins Redlands, CA 4-year, private 2,800
University of Texas, Austin Michele Ostrow Austin, TX 4-year, public 39,523
University of Washington Michele Norris Seattle, WA 4-year, public 29,468
Figures are based on full-time enrollment for undergraduates and community college students.79
Each institution in our sample is located in one of the top 25 fastest-growing metropolitan areas in the US, where college-educated graduates in their mid-to-late 20s live. Some of the locales in our sample may be surprising since they are not the places many graduates have traditionally headed after graduation such as New York, Chicago, or Los Angeles.
The US Census, however, has identified these metropolitan areas in our sample as today’s growing “smart cities”—geographic regions where career opportunities flourish for young graduates through partnerships between employers and nearby higher education institutions.80 For this study, we examined whether these metropolitan areas have more graduates living in the area that use certain information support systems, such as public and academic libraries, alumni associations, bookstores, or museums, than those graduates who have moved farther away from their alma mater.
79 Data reported in Figure 1 was provided by PIL research liaisons and collected March 5- March 10, 2015. 80 Joel Klotkin, “The US Cities Getting Smarter the Fastest,” New Geography, August 9, 2012, http://www.newgeography.com/content/003007-the-us-cities-getting-smarter-the-fastest; Bill McMeekin, “Get Smart: Metros with Fast Growing College Graduate Workforces,” Business Climate, August 13, 2012, http://blog.businessclimate.com/2012/08/get-smart-metros-with-fast-growing-college-graduate-workforces/.
Project Information Literacy Research Report: “Staying Smart” | January 5, 2016 | Alison J. Head
74
Sample of Recent Graduates
Throughout all three phases of the study, the sample was made up of graduates who (1) had obtained their baccalaureate degree (or certificate or associate degree in the case of the one community college in our sample) between 2007 and 2012 from one of the 10 institutions in our sample, and (2) had email addresses available through the alumni association at each institutional setting for purposes of the study. We used a random sample for selecting participants for the Phase One interviews.
In Phase Two, the online survey, we sent the invitation for study participation to a random subset sample of eligible respondents at institutions with large enrollments (and thus a larger number of recent graduates). In Phase Three, a sample of interviewees was randomly selected from those participants who took the survey and also agreed to participate in a follow-up interview.
An incentive was offered to participants in each one of the three phases of the study. A $10 Amazon gift card was awarded to interviewees. Survey respondents had the option to enter a drawing for a $100 Amazon gift card that was awarded to one participant from each of the 10 institutions.
On average, most graduates in the study sample were between 20 and 29 years of age in all three phases of the study. A smaller subset of the sample was older than 30 years old and we used this difference in age to investigate whether or not age affects lifelong learning information needs and information-seeking strategies.
Graduates of all majors, including arts and humanities, business administration, engineering, social sciences, and the physical sciences, were included.
Phase One: Preliminary Interview Sample
We conducted 35-minute preliminary telephone interviews with 63 recent college graduates from 10 US colleges and universities from May 14, 2014 through June 25, 2014. The telephone interviews were used to collect qualitative data about the information-seeking lifelong learning practices of recent graduates. Appendix A, Figure 2 provides demographic data about the Phase One interview sample.
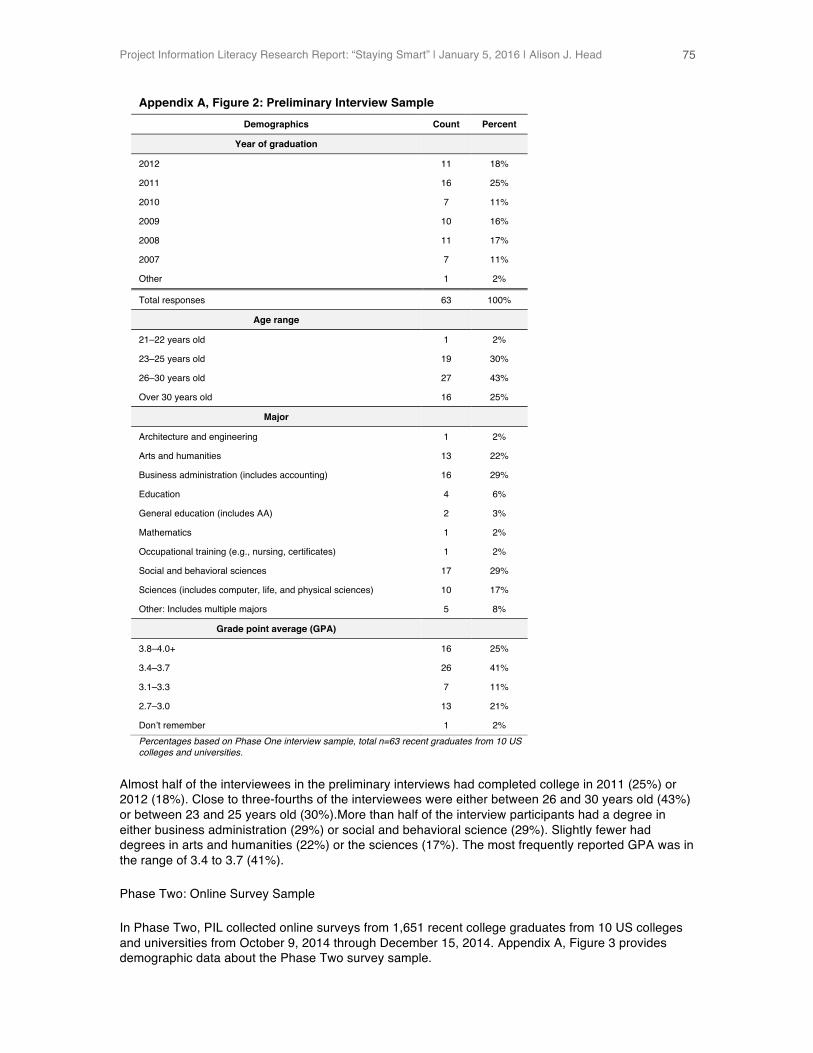
Project Information Literacy Research Report: “Staying Smart” | January 5, 2016 | Alison J. Head
75
Appendix A, Figure 2: Preliminary Interview Sample Demographics Count Percent
Year of graduation 2012 11 18%
2011 16 25%
2010 7 11%
2009 10 16%
2008 11 17%
2007 7 11%
Other 1 2%
Total responses 63 100%
Age range
21–22 years old 1 2%
23–25 years old 19 30%
26–30 years old 27 43%
Over 30 years old 16 25%
Major Architecture and engineering 1 2%
Arts and humanities 13 22%
Business administration (includes accounting) 16 29%
Education 4 6%
General education (includes AA) 2 3%
Mathematics 1 2%
Occupational training (e.g., nursing, certificates) 1 2%
Social and behavioral sciences 17 29%
Sciences (includes computer, life, and physical sciences) 10 17%
Other: Includes multiple majors 5 8%
Grade point average (GPA) 3.8–4.0+ 16 25%
3.4–3.7 26 41%
3.1–3.3 7 11%
2.7–3.0 13 21%
Don’t remember 1 2% Percentages based on Phase One interview sample, total n=63 recent graduates from 10 US colleges and universities.
Almost half of the interviewees in the preliminary interviews had completed college in 2011 (25%) or 2012 (18%). Close to three-fourths of the interviewees were either between 26 and 30 years old (43%) or between 23 and 25 years old (30%).More than half of the interview participants had a degree in either business administration (29%) or social and behavioral science (29%). Slightly fewer had degrees in arts and humanities (22%) or the sciences (17%). The most frequently reported GPA was in the range of 3.4 to 3.7 (41%).
Phase Two: Online Survey Sample
In Phase Two, PIL collected online surveys from 1,651 recent college graduates from 10 US colleges and universities from October 9, 2014 through December 15, 2014. Appendix A, Figure 3 provides demographic data about the Phase Two survey sample.
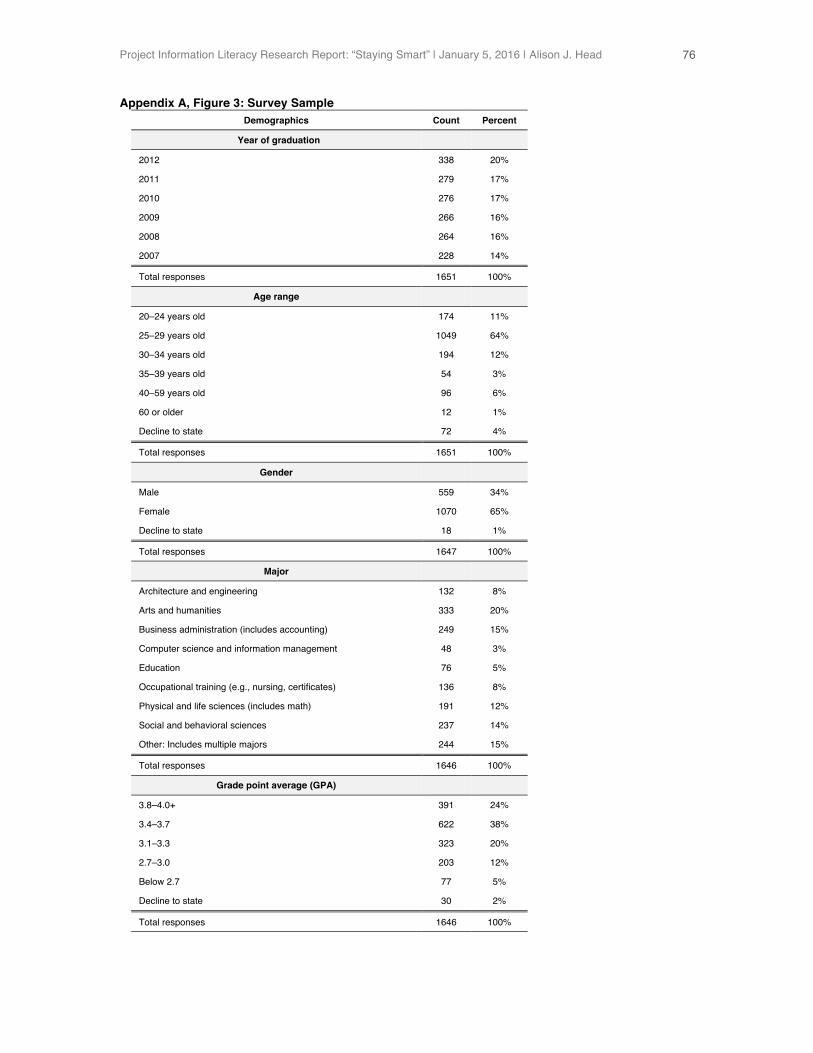
Project Information Literacy Research Report: “Staying Smart” | January 5, 2016 | Alison J. Head
76
Appendix A, Figure 3: Survey Sample Demographics Count Percent
Year of graduation 2012 338 20%
2011 279 17%
2010 276 17%
2009 266 16%
2008 264 16%
2007 228 14%
Total responses 1651 100%
Age range 20–24 years old 174 11%
25–29 years old 1049 64%
30–34 years old 194 12%
35–39 years old 54 3%
40–59 years old 96 6%
60 or older 12 1%
Decline to state 72 4%
Total responses 1651 100%
Gender
Male 559 34%
Female 1070 65%
Decline to state 18 1%
Total responses 1647 100%
Major Architecture and engineering 132 8%
Arts and humanities 333 20%
Business administration (includes accounting) 249 15%
Computer science and information management 48 3%
Education 76 5%
Occupational training (e.g., nursing, certificates) 136 8%
Physical and life sciences (includes math) 191 12%
Social and behavioral sciences 237 14%
Other: Includes multiple majors 244 15%
Total responses 1646 100%
Grade point average (GPA) 3.8–4.0+ 391 24%
3.4–3.7 622 38%
3.1–3.3 323 20%
2.7–3.0 203 12%
Below 2.7 77 5%
Decline to state 30 2%
Total responses 1646 100%
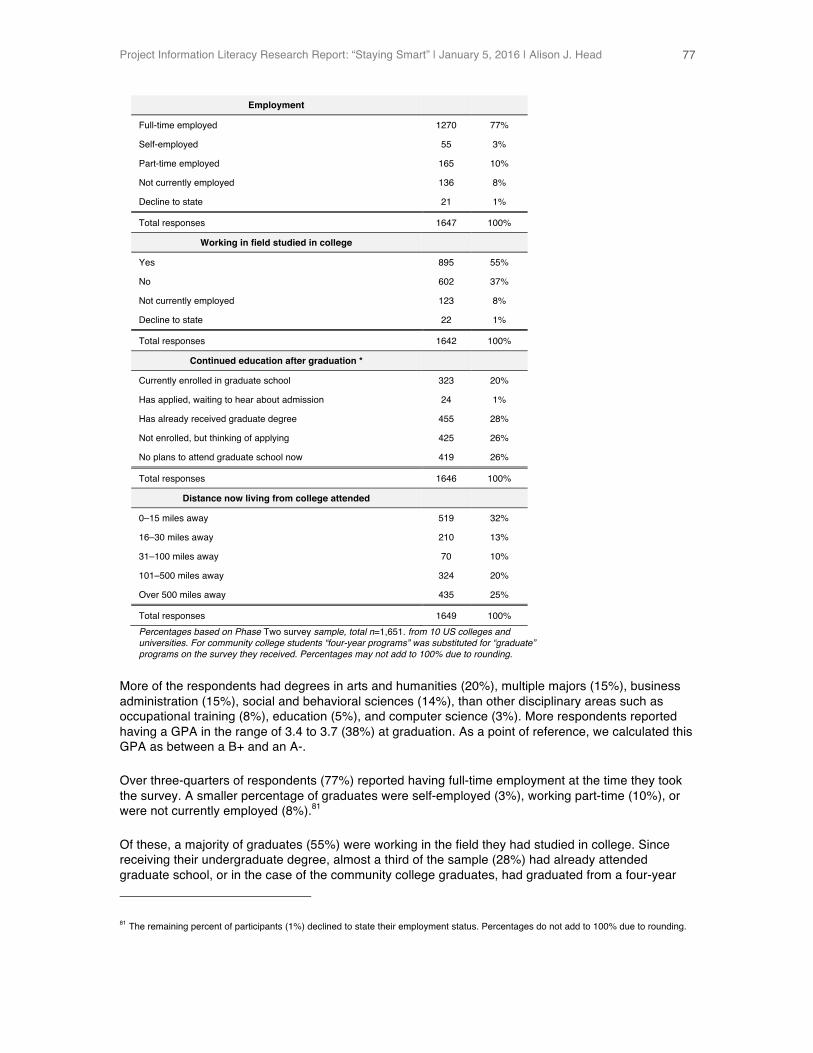
Project Information Literacy Research Report: “Staying Smart” | January 5, 2016 | Alison J. Head
77
Employment
Full-time employed 1270 77%
Self-employed 55 3%
Part-time employed 165 10%
Not currently employed 136 8%
Decline to state 21 1%
Total responses 1647 100%
Working in field studied in college
Yes 895 55%
No 602 37%
Not currently employed 123 8%
Decline to state 22 1%
Total responses 1642 100%
Continued education after graduation *
Currently enrolled in graduate school 323 20%
Has applied, waiting to hear about admission 24 1%
Has already received graduate degree 455 28%
Not enrolled, but thinking of applying 425 26%
No plans to attend graduate school now 419 26%
Total responses 1646 100%
Distance now living from college attended
0–15 miles away 519 32%
16–30 miles away 210 13%
31–100 miles away 70 10%
101–500 miles away 324 20%
Over 500 miles away 435 25%
Total responses 1649 100% Percentages based on Phase Two survey sample, total n=1,651. from 10 US colleges and universities. For community college students “four-year programs” was substituted for “graduate” programs on the survey they received. Percentages may not add to 100% due to rounding.
More of the respondents had degrees in arts and humanities (20%), multiple majors (15%), business administration (15%), social and behavioral sciences (14%), than other disciplinary areas such as occupational training (8%), education (5%), and computer science (3%). More respondents reported having a GPA in the range of 3.4 to 3.7 (38%) at graduation. As a point of reference, we calculated this GPA as between a B+ and an A-.
Over three-quarters of respondents (77%) reported having full-time employment at the time they took the survey. A smaller percentage of graduates were self-employed (3%), working part-time (10%), or were not currently employed (8%).81
Of these, a majority of graduates (55%) were working in the field they had studied in college. Since receiving their undergraduate degree, almost a third of the sample (28%) had already attended graduate school, or in the case of the community college graduates, had graduated from a four-year
81 The remaining percent of participants (1%) declined to state their employment status. Percentages do not add to 100% due to rounding.
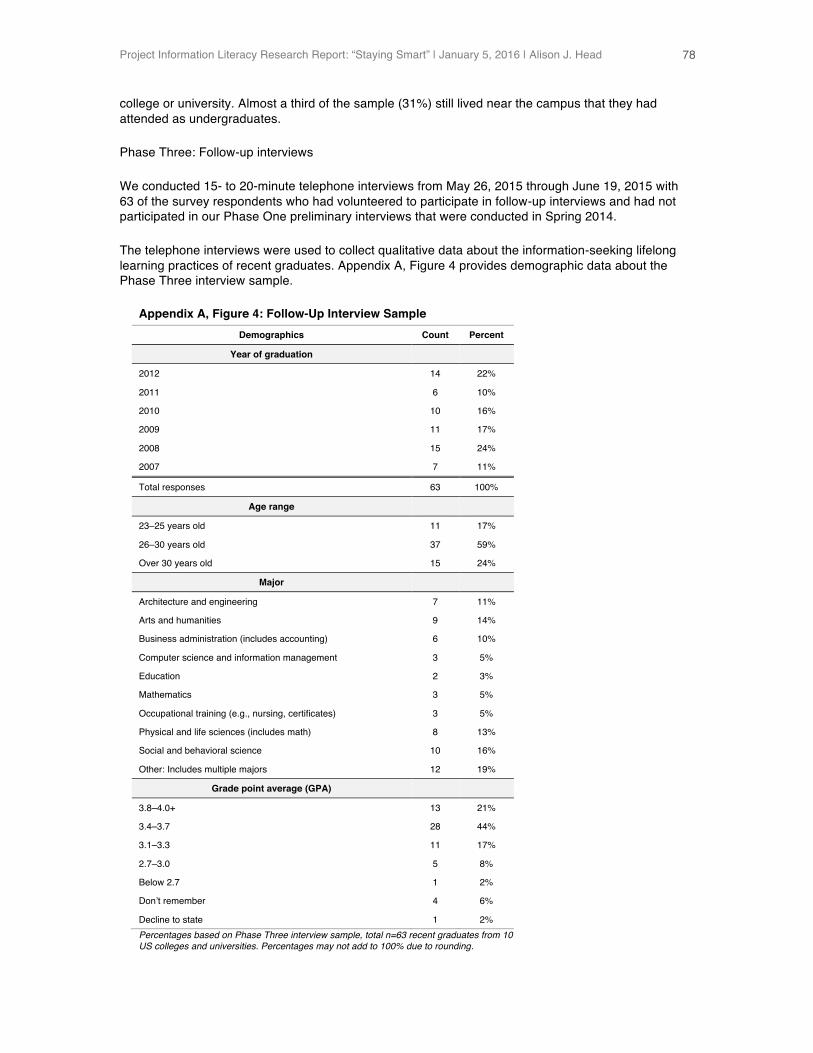
Project Information Literacy Research Report: “Staying Smart” | January 5, 2016 | Alison J. Head
78
college or university. Almost a third of the sample (31%) still lived near the campus that they had attended as undergraduates.
Phase Three: Follow-up interviews
We conducted 15- to 20-minute telephone interviews from May 26, 2015 through June 19, 2015 with 63 of the survey respondents who had volunteered to participate in follow-up interviews and had not participated in our Phase One preliminary interviews that were conducted in Spring 2014.
The telephone interviews were used to collect qualitative data about the information-seeking lifelong learning practices of recent graduates. Appendix A, Figure 4 provides demographic data about the Phase Three interview sample.
Appendix A, Figure 4: Follow-Up Interview Sample Demographics Count Percent
Year of graduation 2012 14 22%
2011 6 10%
2010 10 16%
2009 11 17%
2008 15 24%
2007 7 11%
Total responses 63 100%
Age range 23–25 years old 11 17%
26–30 years old 37 59%
Over 30 years old 15 24%
Major Architecture and engineering 7 11%
Arts and humanities 9 14%
Business administration (includes accounting) 6 10%
Computer science and information management 3 5%
Education 2 3%
Mathematics 3 5%
Occupational training (e.g., nursing, certificates) 3 5%
Physical and life sciences (includes math) 8 13%
Social and behavioral science 10 16%
Other: Includes multiple majors 12 19%
Grade point average (GPA) 3.8–4.0+ 13 21%
3.4–3.7 28 44%
3.1–3.3 11 17%
2.7–3.0 5 8%
Below 2.7 1 2%
Don’t remember 4 6%
Decline to state 1 2% Percentages based on Phase Three interview sample, total n=63 recent graduates from 10 US colleges and universities. Percentages may not add to 100% due to rounding.
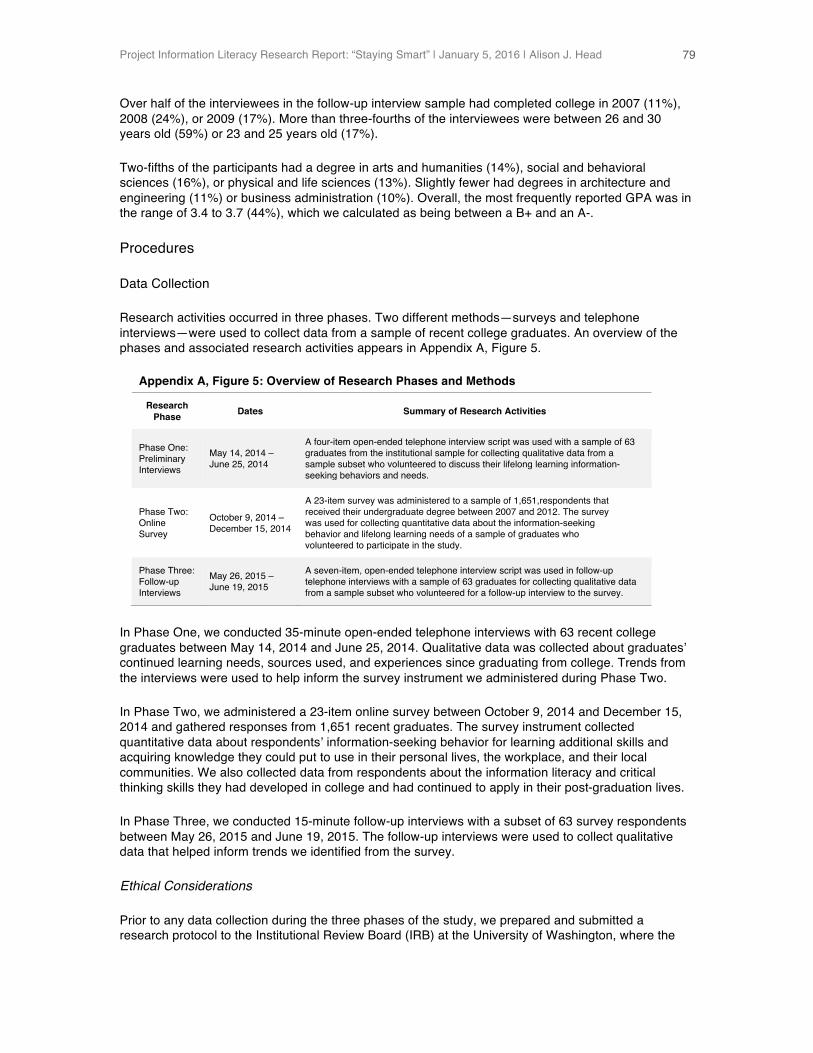
Project Information Literacy Research Report: “Staying Smart” | January 5, 2016 | Alison J. Head
79
Over half of the interviewees in the follow-up interview sample had completed college in 2007 (11%), 2008 (24%), or 2009 (17%). More than three-fourths of the interviewees were between 26 and 30 years old (59%) or 23 and 25 years old (17%).
Two-fifths of the participants had a degree in arts and humanities (14%), social and behavioral sciences (16%), or physical and life sciences (13%). Slightly fewer had degrees in architecture and engineering (11%) or business administration (10%). Overall, the most frequently reported GPA was in the range of 3.4 to 3.7 (44%), which we calculated as being between a B+ and an A-.
Procedures
Data Collection
Research activities occurred in three phases. Two different methods—surveys and telephone interviews—were used to collect data from a sample of recent college graduates. An overview of the phases and associated research activities appears in Appendix A, Figure 5.
Appendix A, Figure 5: Overview of Research Phases and Methods
Research Phase Dates Summary of Research Activities
Phase One: Preliminary Interviews
May 14, 2014 – June 25, 2014
A four-item open-ended telephone interview script was used with a sample of 63 graduates from the institutional sample for collecting qualitative data from a sample subset who volunteered to discuss their lifelong learning information-seeking behaviors and needs.
Phase Two: Online Survey
October 9, 2014 –December 15, 2014
A 23-item survey was administered to a sample of 1,651,respondents that received their undergraduate degree between 2007 and 2012. The survey was used for collecting quantitative data about the information-seeking behavior and lifelong learning needs of a sample of graduates who volunteered to participate in the study.
Phase Three: Follow-up Interviews
May 26, 2015 –June 19, 2015
A seven-item, open-ended telephone interview script was used in follow-up telephone interviews with a sample of 63 graduates for collecting qualitative data from a sample subset who volunteered for a follow-up interview to the survey.
In Phase One, we conducted 35-minute open-ended telephone interviews with 63 recent college graduates between May 14, 2014 and June 25, 2014. Qualitative data was collected about graduates’ continued learning needs, sources used, and experiences since graduating from college. Trends from the interviews were used to help inform the survey instrument we administered during Phase Two.
In Phase Two, we administered a 23-item online survey between October 9, 2014 and December 15, 2014 and gathered responses from 1,651 recent graduates. The survey instrument collected quantitative data about respondents’ information-seeking behavior for learning additional skills and acquiring knowledge they could put to use in their personal lives, the workplace, and their local communities. We also collected data from respondents about the information literacy and critical thinking skills they had developed in college and had continued to apply in their post-graduation lives.
In Phase Three, we conducted 15-minute follow-up interviews with a subset of 63 survey respondents between May 26, 2015 and June 19, 2015. The follow-up interviews were used to collect qualitative data that helped inform trends we identified from the survey.
Ethical Considerations
Prior to any data collection during the three phases of the study, we prepared and submitted a research protocol to the Institutional Review Board (IRB) at the University of Washington, where the
Project Information Literacy Research Report: “Staying Smart” | January 5, 2016 | Alison J. Head
80
study is based in the Information School. Once we had received approval, we underwent an IRB review at each of the 10 institutions in the sample.
Since 2008, PIL has received more than 60 IRB approvals from different institutions as part of our ongoing research project. This study was similar to all six of the preceding PIL studies, since we collected data from a voluntary sample for the purposes of educational assessment. Consistent with our prior research studies, the IRB for this study was considered “exempt” from a full board review.
Interview Procedures
Preliminary Interviews
The sample for telephone interviews in Phase One was drawn from post-college graduates who responded to an emailed invitation to participate. The alumni association at each of the 10 US colleges and universities that agreed to participate in our study sent the email invitation to a random sample of recent graduates from their institution that had made their addresses “publicly available.”
We also specified that the sample of potential participants needed to be 18 years old or older. At institutions with large enrollments (and thus a larger number of recent graduates), we sent the invitation for study participation to a random subset sample of eligible respondents.
The Phase One interviews were conducted by six PIL team members with CITI training certificates.82 Prior to conducting the interviews, each PIL interviewer reviewed and then pre-tested the script. Pre-tests were conducted with five recent graduates from institutions other than those in our study. After the pre-test phase, interviewers made minor suggestions to the wording in the script protocol.
We found, for instance, that the phrase lifelong learning was difficult to operationalize with study participants. Many pre-test interviewees had difficulty explaining how lifelong learning applied to their lives. Therefore, we ended up asking interviewees to discuss how they had continued to learn—their needs and the sources. Ultimately, when we asked participants how they “stayed smart,” this phrase resonated with and made sense to interviewees, so we used it throughout our study. A copy of the interview script used in the Phase One is included in Appendix B of this report.
On average, the voluntary interviews in Phase One lasted 35 minutes, with some lasting up to 45 minutes, if interviewees chose to continue the discussion during the interview debriefing. PIL interviewers began the interview by explaining the procedures and obtaining verbal consent from the interviewee. Next, interviewers asked interviewees four open-ended questions in audio-recorded sessions about the graduates and their continued learning.
During the interview, we asked participants about their learning needs and the sources and information systems used for acquiring additional skills and knowledge, best practices, and barriers to continued learning since graduating from college. At the end of the interview, we collected demographic data with four questions, i.e., year of graduation, major, undergraduate GPA, and age.
Each interview participant received a $10 thank you Amazon gift card for his or her participation, whether he or she had completed the entire interview or not. Following the interview, each participant was debriefed about the study’s purpose and thanked for his or her participation.
82 The Collaborative Institutional Training Initiative (CITI Program) is a leading provider of research education and certification. Modules cover the historical development of human subject protections, as well as current information on regulatory and ethical issues, https://www.citiprogram.org/.
Project Information Literacy Research Report: “Staying Smart” | January 5, 2016 | Alison J. Head
81
The data we collected from our preliminary and follow up interviews was audio-recorded with permission from each participant. We input, coded, and stored the data on the University of Washington’s secure file server used in past PIL studies. In team discussion sessions, we identified five early trends from the interviews and published an open-access, qualitative trends report on July 29, 2014.83
Follow-up Interviews
An interview script with seven open-ended questions was prepared, pilot-tested, and administered in the follow-up interviews. The interviews collected data about participants’ best practices and experiences as lifelong learners as well as their associated challenges and workarounds. The follow-up interviews were used to add “qualitative texture” to survey data, including direct quotes from participants about their lifelong learning experiences and behaviors.
The interviews were conducted by four PIL team members. Prior to conducting the interviews, each PIL interviewer reviewed and then pre-tested the script. Pre-tests were conducted with five recent graduates from institutions that were not included in our study. After the pre-test phase, interviewers made minor suggestions in the wording of the script protocol. For a copy of the interview script used in sessions, see Appendix D of this report.
PIL interviewers began the interview by explaining the procedures and obtaining verbal consent from the interviewee. Next, interviewers asked interviewees open-ended questions in audio-recorded sessions about the graduates and their continued learning. At the end of the short interviews, we collected demographic data with four questions: year of graduation, major, undergraduate GPA, and age.
Each interview participant received a $10 thank you Amazon gift card for his or her participation, whether he or she had completed the entire interview or not. Following the interview, each participant was debriefed about the study’s purpose and thanked for his or her participation.
The data we collected from our preliminary and follow-up interviews was audio-recorded with permission from each participant. We entered, coded, and stored the data on the University of Washington’s secure file server used in past PIL studies.
Survey Procedures
From October 9, 2014 through December 15, 2014, the alumni association of each institution sent a study invitation to a sample of recent graduates. Invitations were sent to all recent alumni who made their email addresses publicly available, except at institutions with large enrollments (and thus a larger number of recent graduates); we sent the survey to a random subset sample of eligible respondents.
The email invitation asked recent graduates to volunteer for a study by taking the online survey, with a link provided. The survey was described as being about people’s continued learning since receiving either a (1) BA or BS from a four-year college or university or (2) a certificate or AA from the community college in the institutional sample. Responses to the online survey were stored on a secure server at the University of Washington.
83 Alison J. Head, “Project Information Literacy’s Lifelong Learning Study, Phase One: Interviews with Recent Graduates Research Brief,” (Seattle, WA: Project information Literacy, University of Washington, July 29, 2014), http://projectinfolit.org/images/pdfs/pil_lll_phase1.pdf.
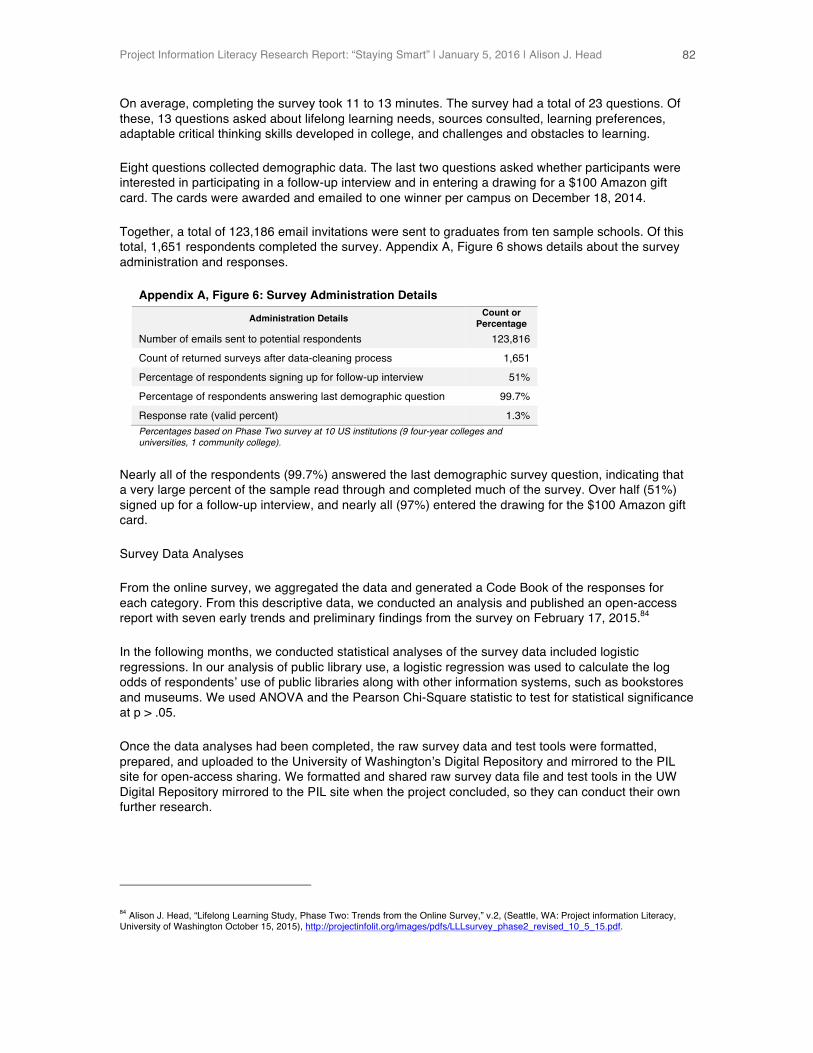
Project Information Literacy Research Report: “Staying Smart” | January 5, 2016 | Alison J. Head
82
On average, completing the survey took 11 to 13 minutes. The survey had a total of 23 questions. Of these, 13 questions asked about lifelong learning needs, sources consulted, learning preferences, adaptable critical thinking skills developed in college, and challenges and obstacles to learning.
Eight questions collected demographic data. The last two questions asked whether participants were interested in participating in a follow-up interview and in entering a drawing for a $100 Amazon gift card. The cards were awarded and emailed to one winner per campus on December 18, 2014.
Together, a total of 123,186 email invitations were sent to graduates from ten sample schools. Of this total, 1,651 respondents completed the survey. Appendix A, Figure 6 shows details about the survey administration and responses.
Appendix A, Figure 6: Survey Administration Details
Administration Details Count or Percentage
Number of emails sent to potential respondents 123,816
Count of returned surveys after data-cleaning process 1,651
Percentage of respondents signing up for follow-up interview 51%
Percentage of respondents answering last demographic question 99.7%
Response rate (valid percent) 1.3% Percentages based on Phase Two survey at 10 US institutions (9 four-year colleges and universities, 1 community college).
Nearly all of the respondents (99.7%) answered the last demographic survey question, indicating that a very large percent of the sample read through and completed much of the survey. Over half (51%) signed up for a follow-up interview, and nearly all (97%) entered the drawing for the $100 Amazon gift card.
Survey Data Analyses
From the online survey, we aggregated the data and generated a Code Book of the responses for each category. From this descriptive data, we conducted an analysis and published an open-access report with seven early trends and preliminary findings from the survey on February 17, 2015.84
In the following months, we conducted statistical analyses of the survey data included logistic regressions. In our analysis of public library use, a logistic regression was used to calculate the log odds of respondents’ use of public libraries along with other information systems, such as bookstores and museums. We used ANOVA and the Pearson Chi-Square statistic to test for statistical significance at p > .05.
Once the data analyses had been completed, the raw survey data and test tools were formatted, prepared, and uploaded to the University of Washington’s Digital Repository and mirrored to the PIL site for open-access sharing. We formatted and shared raw survey data file and test tools in the UW Digital Repository mirrored to the PIL site when the project concluded, so they can conduct their own further research.
84 Alison J. Head, “Lifelong Learning Study, Phase Two: Trends from the Online Survey,” v.2, (Seattle, WA: Project information Literacy, University of Washington October 15, 2015), http://projectinfolit.org/images/pdfs/LLLsurvey_phase2_revised_10_5_15.pdf.
Project Information Literacy Research Report: “Staying Smart” | January 5, 2016 | Alison J. Head
83
This public dataset was aggregated so that data from all 10 institutions appear as a single dataset. All personal identifiers were scrubbed to ensure the privacy of participants. The dataset was registered with Creative Commons for re-use.
Methodological Limitations
There are challenges associated with the use of interviews in research. For instance, interview methodologies depend on participants' provision of accurate and complete answers. Accordingly, the interviewer must endeavor to establish trust and rapport while keeping track of the responses. Bias on both sides of this kind of exchange is always a formidable issue. Bias can be readily introduced in the way the interviewer frames a certain question, or the way in which a respondent interprets and then answers a question.
Another issue is the generalizability of the data collected from qualitative interviews. When considering the limitation of the generalizability of interview data, we point to the main purpose of qualitative research: interviews are not necessarily used to produce generalizable findings about a sample. Rather, interviews are used to arrive at a deep understanding of a specific situation, such as continued learning in the years preceding college graduation, as respondents decide to report them.
To enhance the reliability of our interview technique and the consistency of the questions we asked, we used a scripted interview with study participants. The script was piloted and a few small changes were made to the wording before the interviews began.
At the same time, we acknowledge the challenges of using a survey methodology in any social science research study. Because our survey sample of graduates includes self-selected study participants, our sample is not fully randomized and is not representative of the demographic characteristics of the nationwide recent college graduate population.
Subsequently, the survey sample may be biased in unknown ways and we cannot draw conclusions about the larger population of recent graduates based on our study. However, our data is useful in that we can draw conclusions about the relationships between measurable characteristics in the sample and test the robustness of these relationships (e.g., major area of study in college and takeaway critical thinking skills that are still being used after graduation).
In our study, the survey data we collected shows consistent responses and fairly robust relationships for graduates across the sample of 10 institutions. As such, the data provide a snapshot of recent college graduates and their lifelong learning information-seeking behaviors. Because our study is designed to be an analytical study, we can argue that these relationships do exist in the larger population and could be seen in any sample used to describe them.85
Despite making every attempt to compensate for the limitations of our study methodologies, we fully acknowledge that future research is required to confirm our findings, especially as it may apply to others in the recent college graduate population and continuing and rapid changes occurring with technology and its use in the digital age. Our findings should not be viewed as comprehensive, but as part of our ongoing research.
85 An analytic study, such as this study, limits conclusions to the sample of respondents who actually participate in the study. There is no basis for making inferences to the population from the sample responses. By contrast, a descriptive study generalizes from those same responses to a larger population.
Project Information Literacy Research Report: “Staying Smart” | January 5, 2016 | Alison J. Head
84
Response Rate
In survey research, response rate is the actual percentage of questionnaires completed and returned. In the final tally of PIL survey results for each institution and response rate, the “undeliverable rate” has been subtracted from the sample of emails that was originally sent by the alumni association.
The response rate for the survey was 1.3%. While this response rate was far less than previous PIL studies,86 it was typical for alumni association survey requests. The alumni association on each campus was the only source of recent graduates’ email addresses. The alumni associations were unable to make the email lists available to PIL and offered to email the survey link directly from the alumni server.
The survey sample was randomly selected at larger schools where the number of graduating students deemed it possible. However, at smaller liberal arts institutions with lower enrollment rates, we chose to send the invitation for study participation to everyone who had graduated between 2007 and 2012.
When we cleaned and created the aggregated file of survey responses from all 10 institutions for this report, we removed all “dirty data” (respondents who attended but did not graduate from one of the schools in the institutional sample) and subtracted these responses from our total respondent sample.
Lifelong Learning Advisory Board
Michael Eisenberg (retired) is Dean Emeritus and Emeritus Professor at the University of Washington Information School, and, served as the chairperson of the eight-member Lifelong Learning Advisory Board. He managed the Advisory Board online discussion during June 25 through September 15, 2015. The purpose of this discussion was to share study findings with prominent leaders in libraries and education while thinking about possible solutions for improving lifelong learning services and programs to recent college graduates.
The following experts served on the board in a voluntary capacity:
Ken Bain is Provost and Vice President of Academic Affairs and Professor of History and Urban Education at the University of the District of Columbia, and an acclaimed educator, who has directed major teaching and learning centers at New York University, Northwestern University, Vanderbilt University, and Montclair University.
Ginnie Cooper (retired) last served as Chief Librarian of the DC Public Library (Washington, D.C.) and brought over 30 years of expertise to the Lifelong Learning Advisory Board as a public library director and a nationally recognized leader of urban library systems.
Sari Feldman is President of the American Library Association (ALA) and Executive Director of the Cuyahoga County (Ohio) Public Library. She brought over 35 years of expertise to the Lifelong Learning Advisory Board as the director of a large public library system and a leader of the largest group of librarians in the country.
Deborah S. Garson is Head of Research and Instruction Services and Lecturer on Education in the Graduate School of Education at Harvard University. She is a member of the US Department of Education’s Education Resources Information Center (ERIC) Library Committee and the Special Libraries Association’s Education Division.
86 Previous PIL studies, on the average, have had a response rate of between 7% and 11% when online surveys were administered directly to students by using email addresses provided by the Registrar’s Office at each campus.
Project Information Literacy Research Report: “Staying Smart” | January 5, 2016 | Alison J. Head
85
R. David Lankes is Professor and Dean’s Scholar for New Librarianship at Syracuse University’s School of Information Studies and Director of the Information Institute of Syracuse. He brought a keen understanding of public libraries and their purpose to our discussions.
Peter Morville is President of Semantic Studios and best known for helping to create the discipline of information architecture. He advises on search and user experience design to such clients as Harvard University, the Library of Congress, the National Cancer Institute, Vodafone, and the Weather Channel.
Michael Stephens is an Assistant Professor at San Jose State University and had previously worked in public libraries for more than 15 years. His research focuses on use of emerging technologies in libraries and technology learning programs. He has written ALA Library Technology Reports on Web 2.0 and is a columnist for Library Journal.
Bonnie Tijerina is a Fellow at the Data & Society Research Institute, is a Founder of the ER&L Conference, and is known for sparking change in electronic resource management to prepare for the library of the future. Her expertise includes digital collections, e-books and policy, and the future of libraries.!
Project Information Literacy Research Report: “Staying Smart” | January 5, 2016 | Alison J. Head
86
Appendix B: Phase One, Preliminary Interview Script
Introduction
Hello, I’m ____________ (PIL Team Member’s name). I am a researcher working on an academic research study. I will be conducting an interview with you today to hear your ideas, opinions, and beliefs for a new study we are conducting. We have obtained appropriate human subject approval at the institution where our study is based, the University of Washington’s Information School, so that we have the necessary approvals to conduct these interviews.
In our study, we are interested in how college students—and recent graduates—find and use information in the digital age and how these skills and strategies develop over time for use in the workplace, civic involvement, and social enrichment and personal fulfillment. Do you have 35 minutes available now for the interview we have scheduled? (If potential participant agrees to participate, continue with: “let me give you a few more details.”)
1. Inclusion Criteria: Are you 18 years old, or older? (If potential participants answer “no” to the question about age, and are younger than 18, thank them for their time and dismiss them from study involvement.)
2. Inclusion Criteria: Did you graduate with a BA and/or BS degree between the years of 2007 and 2012? Are you currently enrolled in a four-year institution this semester (e.g., a graduate program)? (If potential participants answer “yes” to the question about enrollment in graduate school, thank them for their time and dismiss them from study involvement.)
3. Study Procedures: I’m going to ask you a series of questions about how you have engaged in continued learning, for whatever reason, to acquire knowledge and skills you can use in the workplace, in your community, or for personal fulfillment.
4. Voluntary Participation and Withdrawal: Before we get started, I should tell you your participation is entirely voluntary. During this interview, you can choose to answer any of the questions asked of you, or not. If you decide to participate in this interview, you can withdraw any time you would like.
5. Anonymity: You should also know that any information that would identify you personally (e.g., your name or phone number) will be removed from the notes taken and the audio recording of this conversation. We will use a coding number to identify you in the notes that are taken today to maintain your anonymity.
6. Privacy: Once the study ends, your comments from today will be grouped with other participants’ comments and used in a summary of overall findings. Research notes will shredded and destroyed and the audiotape erased once this study concludes.
7. Incentive: A $10 Amazon thank you gift card will be sent to you via email later today, whether or not you complete the entire interview.
8. Contact Information: If you have any further questions about the research, you may contact the Lead Researcher, Dr. Alison Head, at [email protected]. Our final report will appear in a summary on the Project Information Literacy website (http://projectinfolit.org) in January 2016.
9. Risks and Benefits: There are no direct risks or benefits for you or other participants involved in this study; however, there is the possibility of a great benefit to improving the training students receive during college for finding information for continued learning.
Project Information Literacy Research Report: “Staying Smart” | January 5, 2016 | Alison J. Head
87
Interview Script (Phase One)
Before we begin – here are some things that will make our discussion more productive:
• No wrong answers • Don't hold back • Feel free to share your opinion and experiences • Interested in negative as well as positive experiences • As to timing – 35 minutes • Assured confidentiality (name will not appear in results) • Results will be brought together and analyzed for use in understanding continued
learning practices recent graduates may use.
My role:
• Ask questions • Listen • Will not insert my own opinions into the actual discussion
Let’s begin. We’re conducting a study about today's recent college students and their lifelong learning practices. Lifelong learning is purposeful learning that occurs on an ongoing basis with the aim of improving skills, knowledge, or competences.
Today, we’re going to be talking to you about how you have continued to learn in your life since you have graduated from college. You may have wanted to learn something that builds on your college skills so you remain employable or competitive in the workplace. Or you may have wanted to learn something just because you were curious about finding out more and found that it fulfilled your life somehow. Or you may have had something happen in your life that required you to learn about a topic or circumstance. For whatever reason, you have taken the initiative to continue to learn so that you may acquire knowledge and skills to, as we sometimes say, “stay smart” in your workplace, community, or personal life.
We know there are lots of ways and reasons to take part in continued learning—formally, by taking a class, and informally, too, by doing some research about something that interests you, such as learning a language for a trip, how to design an online game for fun, or how to find out about issues so you can vote in an election. To fulfill your continued learning needs you might use the Web, friends, and colleagues at work, books, search engines, forums, social media, Massive Open Online Courses (MOOCs), bookstores, learning fairs, extension courses, museums, or libraries.
Today, we want to hear about your learning needs for “staying smart.” We’re specifically interested in hearing more about three different kinds continued learning you may have been doing since you graduated from college: (1) learning to succeed and stay competitive in the workplace, (2) learning for getting involved in your community or civic life, and (3) learning for personal development or fulfillment.
Shall we begin? Any questions?
Project Information Literacy Research Report: “Staying Smart” | January 5, 2016 | Alison J. Head
88
When you think of learning have you have done since you have graduated from college, Q1.what purposeful learning activities for improving skills, knowledge, and competencies come to mind?
Prompt: Can you give me an example of what you needed to learn and why?
Prompt: Let's talk about three different kinds of learning that come up for individuals.
• Have you needed to do any continued learning to acquire knowledge or new skills to make you employable or competitive in the workplace?
• Have you needed to do any continued learning to acquire knowledge or new skills so that you could make something happen in your community or in civic life?
• Have you need to do any continued learning for enrichment or fulfillment in your personal life?
What kinds of resources have you used to help learn about a topic (e.g., websites, books, Q2.friends, colleagues, mentors, forums, social media, libraries)?
Prompt: Can you give me an example from your life where you needed to use learning resources for gaining knowledge or skills?
Prompt: Did these learning resources satisfy your learning needs? How?
What makes this kind of learning challenging for you? Is one of these kinds of continued Q3.learning more difficult to do than the others (i.e., continued learning for the workplace, in your community, or in your personal life)? Why?
Probe: Did any of the skills you learned in college help to prepare you for this kind of learning?
Probe: What new strategies have you developed for staying smart in the workplace, in your community, and in your personal life, since you graduated?
Demographic Data Collection
Would it be possible for you to provide us with a little bit of background about yourself? The information you provide will be used to describe our study sample, as a whole, and not you individually.
What year did you graduate from college with your undergraduate degree? Q1.
• 2012 • 2011 • 2010 • 2009 • 2008 • 2007 • Other:______
Project Information Literacy Research Report: “Staying Smart” | January 5, 2016 | Alison J. Head
89
What was your major (BA, BS, AA at community colleges)? Q2.
• Architecture and Engineering • Arts and Humanities • Business Administration • Multiple Majors (e.g., Arts and Humanities + Social Sciences) • General Education (includes AA, breadth requirements, undeclared majors) • Occupational Training (includes Nursing, 2 yr. and/or 4 yr. programs) • Social Sciences • Sciences (includes computer and physical sciences) • Other:_______
What was your GPA when you graduated from college? Q3.
• Below 1.7 • 1.7–2.0 • 2.1–2.3 • 2.4–2.6 • 2.7–3.0 • 3.1–3.3 • 3.4–3.7 • 3.8–4.0+ • Declined to state
What is your age today? Q4.
• 21–22 years old • 23–25 years old • 26–30 years old • Over 30 years old • Declined to state
Conclusion and Debriefing
Inform the interview participant of privacy and confidentiality measures. Inform the participant that findings will be reported in a synthesized format, descriptive of the sample, as a whole, and posted on the PIL website in summary form in early 2016. Thank the interviewees for their participation and confirm that a $10 Amazon gift card will be emailed to them at the end of the day of the interview.
After the Interview
Send an email thank-you to the interview participant and the Amazon $10 gift card thank you within two hours of each interview ending. Add in any missing data as notes are reviewed. Remove name and/or any personally identifying characteristics from notes and assign coding numbers to each participant. Destroy and shred research notes and erase the audio recording once the study concludes. !
Project Information Literacy Research Report: “Staying Smart” | January 5, 2016 | Alison J. Head
90
Appendix C: Phase Two, Survey Instrument
University and Graduation Year
What is the name of the college or university where you received your undergraduate Q1.degree?
• Belmont University • The Ohio State University • Phoenix College • Trinity University • University of Central Florida • University of Nevada, Las Vegas • University of North Carolina at Charlotte • University of Redlands • University of Texas at Austin • University of Washington
Note: To protect respondents’ identity, data from this question has not been included in the open access version of the survey.
In which year did you graduate? Q2.
• 2012 • 2011 • 2010 • 2009 • 2008 • 2007 • Other: ______
Project Information Literacy Research Report: “Staying Smart” | January 5, 2016 | Alison J. Head
91
Continued Learning after College
Once graduates finish college, many discover they still need to learn additional skills or gain Q3.knowledge so they can “stay smart.”
In the LAST YEAR, have you needed to learn any of these additional SKILLS or gain KNOWLEDGE to stay competitive in the workplace, involved in the local community where you live, or fulfilled in your personal life? (Check ALL that apply.)
• Working with desktop computers or laptops (e.g., applications, coding, graphics) • Working with smartphones, tablets, or mobile devices (e.g., apps, tools) • Managing money and finances (e.g., setting up budgets, paying taxes) • Working with children (e.g., parenting, teaching) • Career and professional development (e.g., job openings, courses, training) • “How to” specifics (e.g., making repairs, decorating, cooking, DIY) • Hobbies (e.g., crafts, making beer, cooking, learning a language) • Housing (e.g., finding housing, learning neighborhoods, maps) • Making purchases (e.g., buying furniture, computers, groceries) • Travel (e.g., trip planning, buying airline tickets) • Volunteering (e.g., hospitals, children’s reading programs) • Spiritual and religious groups (e.g., churches, Buddhist practice groups) • Interpersonal communication (e.g., resolving conflict, collaborating) • Getting involved, civic action (e.g., political causes, volunteering) • Making social contacts (e.g., finding others, online dating, meetups) • Availability of professionals (e.g., finding a doctor, lawyer, contractor)
Matrix grid with these categories at the top:
• Workplace • Community • Personal life
Project Information Literacy Research Report: “Staying Smart” | January 5, 2016 | Alison J. Head
92
Some recent college graduates use certain specific resources when they need to learn Q4.additional skills or gain knowledge for the workplace, their community, or personal lives.
In the LAST YEAR, have you consulted any of these RESOURCES to learn additional skills or gain knowledge to stay competitive in the workplace, involved in the local community where you live, or fulfilled in your personal life? (Check ALL that apply.)
• Search engines (e.g., Google, Bing) • Open access databases (e.g., ERIC) • Library databases (e.g., ProQuest) • Books (e.g., paperbacks, e-books, etc.) • News (e.g., print, online) • Social networking sites (e.g., Facebook, Twitter) • Blogs (e.g., Huffington Post blogs) • Online forums (e.g., computer help) • Educational sites (e.g., YouTube videos) • Online courses (e.g., MOOCs) • Campus alumni associations • Bookstores (i.e., physical place, online) • Public libraries (i.e., physical place, online) • Academic libraries • Workplace information centers • Museums (i.e., physical place, online) • Professional conferences
Matrix grid with these categories at the top:
• Workplace • Community • Personal life
Some recent college graduates turn to people as resources when they need to learn Q5.additional skills or acquire knowledge for the workplace, their community, or personal lives.
In the LAST YEAR, have you turned to any of the following PEOPLE to learn additional skills or gain knowledge to stay competitive in the workplace, involved in the local community where you live, or fulfilled in your personal life? (Check ALL that apply.)
• Coworkers • Supervisor/boss • Friends • Family • Librarians • Current instructors/professors • Former instructors/professors • Licensed professionals (e.g., attorneys) • Career advisors • Community experts (e.g., clergy, coaches) • Experts in a given field (e.g., budget analysts)
Matrix grid with these categories at the top:
• Workplace • Community
Project Information Literacy Research Report: “Staying Smart” | January 5, 2016 | Alison J. Head
93
• Personal life
If given the choice, how do you prefer to learn additional SKILLS or gain KNOWLEDGE for Q6.use in the workplace, the local community where you live, or your personal life? (Check ALL that apply.)
• Settings where learning is planned for me (i.e., extension classes, MOOCs) • Settings where I receive a diploma, certificate, or badge upon completion • Settings where there are no examinations, assignments, or grading involved • Job training offered through workplace opportunities • One-on-one help offered face-to-face • One-on-one help delivered online • Community education outlets (e.g., workshops at libraries, museums, organizations) • Learning from whatever sources might seem appropriate • Other:______
Now, let's focus on some of the specific sources you may have used them for continued Q7.learning.
In the last year, have you used any of the following WEBSITES to learn additional skills and gain knowledge? (Check ALL that you’ve used.)
• Coursera • Udacity • ALISON • Stack Overflow • lynda • Udemy • edX • Academic Earth • Codecademy • Duolingo • CrashCourse • Pinterest • Khan Academy • Google Helpouts • YouTube videos (beyond the sites listed here) • Other: ___________ • No experience with this situation
Some recent college graduates turn to blogs when they need to learn additional skills or gain Q8.knowledge for the workplace, their community, or personal lives.
How many BLOGS have you followed in the last year, whether you’ve subscribed or not?
• None • 1–2 blogs • 3–4 blogs • 5–6 blogs • 7–10 blogs • More than 10 blogs • Don't know
Project Information Literacy Research Report: “Staying Smart” | January 5, 2016 | Alison J. Head
94
How strongly do you agree or disagree with each of the following statements about reasons Q9.for reading (or not reading) BLOGS? (Check ALL that apply.)
• Blogs are easy to find using a search engine • Blogs can give a good summary about a topic • Blogs can be a good source of low-cost information • Blogs can be a source of current information • There’s an authenticity to content; blog writers are rarely paid • Blogs have candid viewpoints; more than mainstream media does • Blogs have ongoing discussion with posts • As an author of my own blog, I read other people’s blog content.
Matrix grid with these categories at the top:
• Strongly agree • Somewhat agree • Neither agree or disagree • Somewhat disagree • Strongly disagree • No experience with this situation • Don't know
Some recent college graduates turn to books when they need to learn skills or acquire Q10.knowledge for the workplace, their community, or personal lives.
How many BOOKS, if any, have you read within the last year (including e-books, books on tape, hardcovers, and paperbacks)? (If you have started but not finished a book that counts, too.)
• None • 1–2 books • 3–4 books • 5–6 books • 7–10 books • More than 10 books • Don't know
Project Information Literacy Research Report: “Staying Smart” | January 5, 2016 | Alison J. Head
95
When you are EVALUATING content from websites, in general, for continued learning, how Q11.often have you considered the following things in the last year?
• How up-to-date the information is • What they author’s credentials are • URL is from a legitimate source,(e.g., gov or edu) • Site links to other resources • Charts add important information (if they exist) • Someone has recommended using the site • Site is familiar from previous use • Site is familiar from college • Site design conveys legitimacy • Gut feeling says site is legitimate
Matrix grid with these categories at the top:
• Almost always • Often • Sometimes • Rarely • Never • Don’t know • No experience with this situation
Recent graduates sometimes find that they can use critical thinking skills learned in college Q12.for continued learning. What skills and competencies did YOU learn in college and now apply?
How strongly do you agree or disagree that you developed the following CRITICAL THINKING SKILLS in college and have continued to apply and use them after graduation?
• Formulating a search strategy • Using multiple sources • Sorting through large amounts of content • Evaluating credibility of content • Extracting the information needed • Revising a search based on findings • Reading text “closely” to find meaning • Finding relevant data within large datasets • Drawing conclusions from large datasets • Communicating an argument persuasively • Presenting information effectively • Asking questions until I understand • Having the ability to learn anything on my own
Matrix grid with these categories at the top:
• Strongly agree • Somewhat agree • Neither agree or disagree • Somewhat disagree • Strongly disagree • No experience with this situation • Don't know
Project Information Literacy Research Report: “Staying Smart” | January 5, 2016 | Alison J. Head
96
Now, let’s focus on the challenges of being a continuous learner and needing to learn Q13.additional skills and gain knowledge. What has been challenging for YOU? How much do you agree or disagree with each of the statements about what's CHALLENGING about continued learning after college?
• Finding time for continued learning • Finding affordable sources • Staying motivated to keep learning • Finding understandable information • Lacking access to college library databases • Lacking access to college professors or lectures • Staying on top of everything need to know
Matrix grid with these categories at the top:
• Strongly agree • Somewhat agree • Neither agree or disagree • Somewhat disagree • • Strongly disagree • No experience with this situation • Don't know
Demographic Data Collection
What was your undergraduate MAJOR? (Check all that apply.) Q14.
• Architecture or Engineering • Arts and Humanities • Business Administration (includes Accounting) • Computer Science • Education • Information Management and Systems • Mathematics • Occupational Training (includes Nursing, 2 yr. or 4 yr. certificate programs) • Physical and Life Sciences • Social and Behavioral Sciences • Other: ______
What was your GPA when you graduated from college with your undergraduate degree? Q15.
• Below 1.4 • 1.4–1.6 • 1.7–2.0 • 2.1–2.3 • 2.4–2.6 • 2.7–3.0 • 3.1–3.3 • 3.4–3.7 • 3.8–4.0+ • Decline to state
Project Information Literacy Research Report: “Staying Smart” | January 5, 2016 | Alison J. Head
97
Are you CURRENTLY EMPLOYED? Q16.
• Yes, I have full-time employment. • Yes, I am self-employed. • Yes, I have part-time employment. • No, I’m not currently employed. • Decline to state
If you are employed, are you working in the field that you STUDIED in college? Q17.
• Yes • No • No, I’m not currently employed • Decline to state
What is your AGE today? Q18.
• List age:_________ • Decline to state
What is your GENDER? Q19.
• Male • Female • Decline to state
How close do you CURRENTLY LIVE from the college where you received your Q20.undergraduate degree?
• 0–30 miles away • 31–50 miles away • 51–100 miles away • 101–500 miles away • Over 500 miles away • Other
Have you ENROLLED in a graduate program of any kind since college (e.g., graduate Q21.school, law school)?
• Yes, I am currently enrolled in a graduate program • Yes, I have applied and I’m waiting to hear about acceptance • Yes, I have received a graduate degree already • No, I'm not enrolled, but I am seriously considering going back to school in the near
future • No, I have no plans to attend graduate school right now
Project Information Literacy Research Report: “Staying Smart” | January 5, 2016 | Alison J. Head
98
Interested in participating in a follow-up interview? Q22.
If you would be willing to participate in a follow-up phone interview (10-15 mins.) to tell us about continued learning after college, please provide a telephone number and just your first (not your last) name. Note: To protect respondents’ identity, data from this question has not been included in the open access version of the survey.
How to Enter the Drawing for the $100.00 Gift Certificate
We would like to thank you for your involvement in our study by entering you in a drawing for a $100.00 Amazon.com gift certificate. If you win, you can use the certificate to buy anything you'd like from Amazon.
The drawing will be held within two weeks of the completion of administering the survey this fall. There will be ONE winner on each campus where the survey is administered.
If you would like to enter the drawing, please provide us with your email address so we can contact you if you win. You do not need to have answered all of the questions to enter the drawing.
Note: To protect respondents’ identity, data from this question has not been included in the open access version of the survey. !

Project Information Literacy Research Report: “Staying Smart” | January 5, 2016 | Alison J. Head
99
Appendix D: Phase Three, Follow-Up Interview Script
Introduction
Hello, I’m ____________ (PIL Team Member’s name). I am a researcher working on an academic research study. I will be conducting an interview with you today to hear your ideas, opinions, and beliefs for a new study we are conducting. We have obtained appropriate human subject approval at your institution as well as at the University of Washington’s Information School, where our study is based, so that we have the necessary approvals to conduct these interviews.
In our study, we are interested in how college graduates find and use information in the digital age and how these skills and strategies develop over time for use in the workplace, civic involvement, social enrichment, and personal fulfillment. Do you have 15 or 20 minutes available now for the interview we have scheduled?
Before we begin, let me ask you a few quick questions:
1. Inclusion Criteria: Are you 18 years old, or older? [If the potential participant answers “no” to the question about age, thank him or her for his or her time and dismiss him or her from study involvement.]
2. Inclusion Criteria: Did you graduate with a BA and/or BS degree between the years of 2007 and 2012? [If the potential participant answers “no, thank him or her for his or her time and dismiss him or her from study involvement.]
3. Inclusion Criteria: Are you currently enrolled in a four-year institution this semester (e.g., a graduate program)? [If the potential participant answers “yes” to the question about enrollment in graduate school, thank him or her for his or her time and dismiss him or her from study involvement.]
4. Recording: Do I have your permission to record this interview? We will use a coding number to identify you in the notes that are taken today to maintain your anonymity.
Now, let me provide you with a few more details about this study:
5. Study Procedures: During the interview, I will ask you a series of questions about how you have engaged in continued learning, for whatever reason, to acquire knowledge and skills you can use in the workplace, in your community, or for personal fulfillment.
6. Voluntary Participation and Withdrawal: Before we get started, I should tell you your participation is entirely voluntary. During this interview, you can choose to answer any of the questions asked of you, or not, and can withdraw from the interview at any time.
7. Privacy and Anonymity: Once the study ends, your comments from today will be grouped with other participants’ comments and used in a summary of overall findings. Research notes will be shredded and destroyed and the audiotape erased once this study concludes.
8. Incentive: A $10 Amazon thank you gift card will be sent to you via email within three working days, whether you complete the entire interview, or not, or withdraw from the study.
9. Contact Information: If you have any further questions about the research, you may contact the Lead Researcher, Dr. Alison Head, at [email protected]. Findings from the final report will appear in a summary on the Project Information Literacy website (http://projectinfolit.org) in January 2016.
Project Information Literacy Research Report: “Staying Smart” | January 5, 2016 | Alison J. Head
100
10. Risks and Benefits: There is minimal risk by being involved in this study. Yet, there is the benefit of receiving a $10 gift card for being part of our study, whether you complete the interview or not. There is also the possibility of the anonymous comments that you make during the interview having a benefit of improving the training that college students receive = for finding information for continued learning.
Interview Script (Phase Three)
Before we begin — here are some things that will make our discussion more productive:
• No wrong answers • Don't hold back • Feel free to share your opinion and experiences • Interested in negative as well as positive experiences • As to timing – 35 minutes • Assured confidentiality (name will not appear in results) • Results will be brought together and analyzed for use in understanding continued
learning practices recent graduates may use
My role:
• Ask questions • Listen • Won't interject my own opinions into the actual discussion
Let’s begin. We’re conducting a study about today's recent college students and their lifelong learning practices. Lifelong learning is purposeful learning that occurs on an ongoing basis with the aim of improving skills or knowledge.
Today we’re going to be talking to you about how you have continued to learn in your life since your college graduation. You may have wanted to learn something that builds on your college skills so that you will remain employable or competitive in the workplace. Or you may have wanted to learn something just because you were curious about finding it and found that it enriched your life somehow. Or you may have had something happen in your life that required you to learn about a topic or circumstance.
For whatever reason, you have taken the initiative to continue to learn so that you may acquire knowledge and skills to, as we sometimes say, “stay smart” in your workplace, community, or personal life. We know there are lots of ways and reasons to take part in continued learning—formally, by taking a class, and informally, too, by doing some research about something that interests you, such as learning a language for a trip, how to design an online game for fun, or how to find out about issues so you can vote in an election. To fulfill your continued learning needs you might use the Web, friends, and colleagues, books, search engines, forums, social media, Massive Open Online Courses (MOOCs), bookstores, learning fairs, extension courses, museums, or libraries.
Today, we want to hear about your learning needs for “staying smart.” We’re specifically interested in hearing more about three different kinds of continued learning you may have been doing since you graduated from college: (1) learning to succeed and stay competitive in the workplace, (2) learning for personal development or fulfillment, and (3) learning for involvement in your local community or civic life.
Shall we begin? Any questions?
Project Information Literacy Research Report: “Staying Smart” | January 5, 2016 | Alison J. Head
101
Let's start by talking about different kinds of continued learning that individuals do once they Q1.finish college. Sometimes graduates need to learn additional skills of all kinds. Or, sometimes it's learning to shore up certain knowledge gaps. What kinds of continued learning needs have related to the workplace? What need were you trying to fulfill, what sources did you use?
Now, can you give me an example from your life where you needed to gain some knowledge Q2.or improve your skills for use in your personal life? What was the need, what sources did you use?
Lastly, can you give me an example from your life where you needed to gain some Q3.knowledge or improve your skills for use in your local community? What was the need, what sources did you use?
What kinds of information sources have you used that have helped you learn the MOST Q4.about a topic (e.g., websites, books, friends, coworkers, mentors, forums, social media, libraries)?
Do you use many online sources for continued learning in your life, whether it's in the Q5.workplace, your personal life, or your local community? Do some sources work better than others? Why? What sources are they (by name)?
What is the ONE THING that makes learning after college the most challenging for you? Q6.
Which is more difficult? Learning and improving skills for staying competitive in the Q7.workplace, involved in your local community, or fulfilled and enriched in your personal life? Why?
Would you say that you learned certain critical thinking skills in college that helped you with Q8.continued learning today? What skills were they?
Demographic Data Collection
Would it be possible for you to provide us with a little bit of background about yourself? The information you provide will be used to describe our study sample, as a whole, and not you individually.
What year did you complete your undergraduate degree? Q1.
• 2012 • 2011 • 2010 • 2009 • 2008 • 2007 • Other:______
Project Information Literacy Research Report: “Staying Smart” | January 5, 2016 | Alison J. Head
102
What was your undergraduate major? (Check all that may apply) Q2.
• Architecture and Engineering • Arts and Humanities • Business Administration • Computer Science • Education • General Education (includes AA, breadth requirements, undeclared) • Mathematics • Occupational Training (includes Nursing, 2 yr. and/or 4 yr. programs) • Social and Behavioral Science • Life and physical sciences) • Other:_______
What was your GPA when you graduated from college? Q3.
• Below 1.7 • 1.7–2.0 • 2.1–2.3 • 2.4–2.6 • 2.7–3.0 • 3.1–3.3 • 3.4–3.7 • 3.8–4.0+ • Don't remember • Decline to state
What is your age today? Q4.
• 21–22 years old • 23–25 years old • 26–30 years old • Over 30 years old • Decline to state
Conclusion and Debriefing
Inform the interview participant of privacy and confidentiality measures. Inform the participant that findings will be reported in a synthesized format, descriptive of the sample, as a whole, and posted on the PIL website in summary form in early 2016. Thank the interviewee for his or her participation and confirm that a $10 Amazon gift card will be emailed to the interviewee at the end of the interview day.
After the Interview
Send an email thank you to the interview participant and the Amazon $10 gift card thank you within two hours of each interview ending. Add in any missing data as notes are reviewed. Remove name and/or any personally identifying characteristics from notes and assign coding numbers to each participant. Destroy and shred research notes and erase the audio recording once the study concludes. !
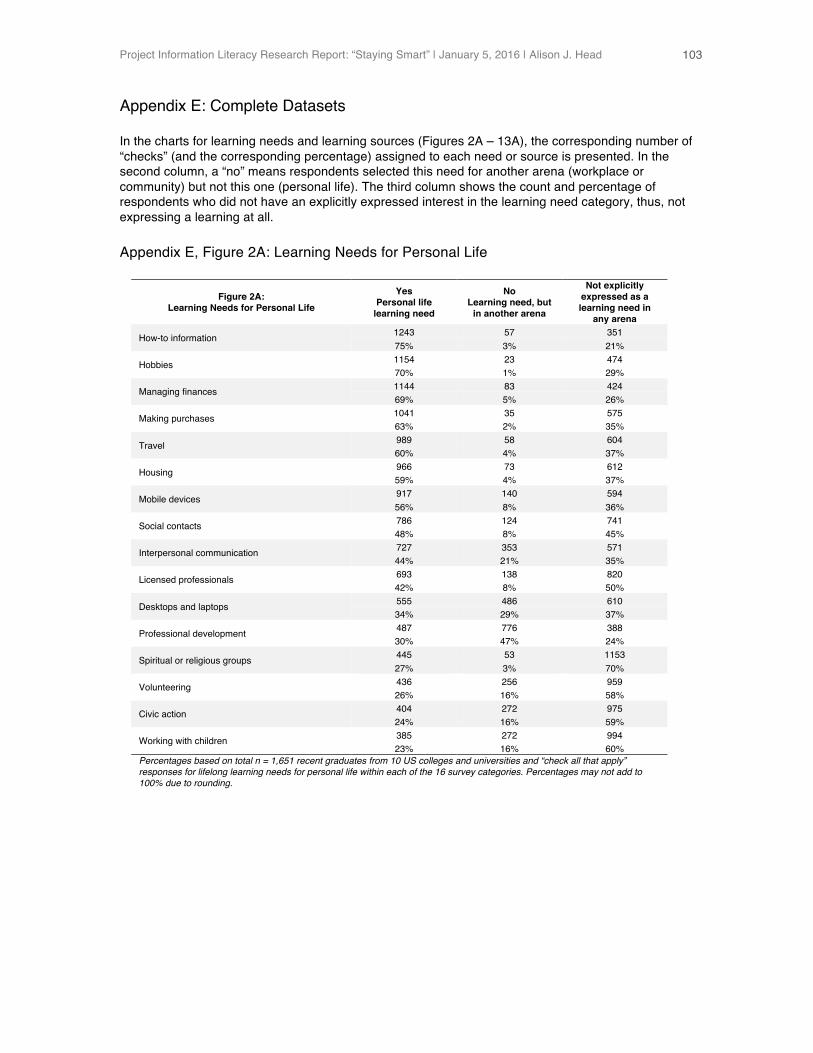
Project Information Literacy Research Report: “Staying Smart” | January 5, 2016 | Alison J. Head
103
Appendix E: Complete Datasets
In the charts for learning needs and learning sources (Figures 2A – 13A), the corresponding number of “checks” (and the corresponding percentage) assigned to each need or source is presented. In the second column, a “no” means respondents selected this need for another arena (workplace or community) but not this one (personal life). The third column shows the count and percentage of respondents who did not have an explicitly expressed interest in the learning need category, thus, not expressing a learning at all.
Appendix E, Figure 2A: Learning Needs for Personal Life
Figure 2A: Learning Needs for Personal Life
Yes Personal life
learning need
No Learning need, but
in another arena
Not explicitly expressed as a learning need in
any arena
How-to information 1243 57 351 75% 3% 21%
Hobbies 1154 23 474 70% 1% 29%
Managing finances 1144 83 424 69% 5% 26%
Making purchases 1041 35 575 63% 2% 35%
Travel 989 58 604 60% 4% 37%
Housing 966 73 612 59% 4% 37%
Mobile devices 917 140 594 56% 8% 36%
Social contacts 786 124 741 48% 8% 45%
Interpersonal communication 727 353 571 44% 21% 35%
Licensed professionals 693 138 820 42% 8% 50%
Desktops and laptops 555 486 610 34% 29% 37%
Professional development 487 776 388 30% 47% 24%
Spiritual or religious groups 445 53 1153 27% 3% 70%
Volunteering 436 256 959 26% 16% 58%
Civic action 404 272 975 24% 16% 59%
Working with children 385 272 994 23% 16% 60%
Percentages based on total n = 1,651 recent graduates from 10 US colleges and universities and “check all that apply” responses for lifelong learning needs for personal life within each of the 16 survey categories. Percentages may not add to 100% due to rounding.
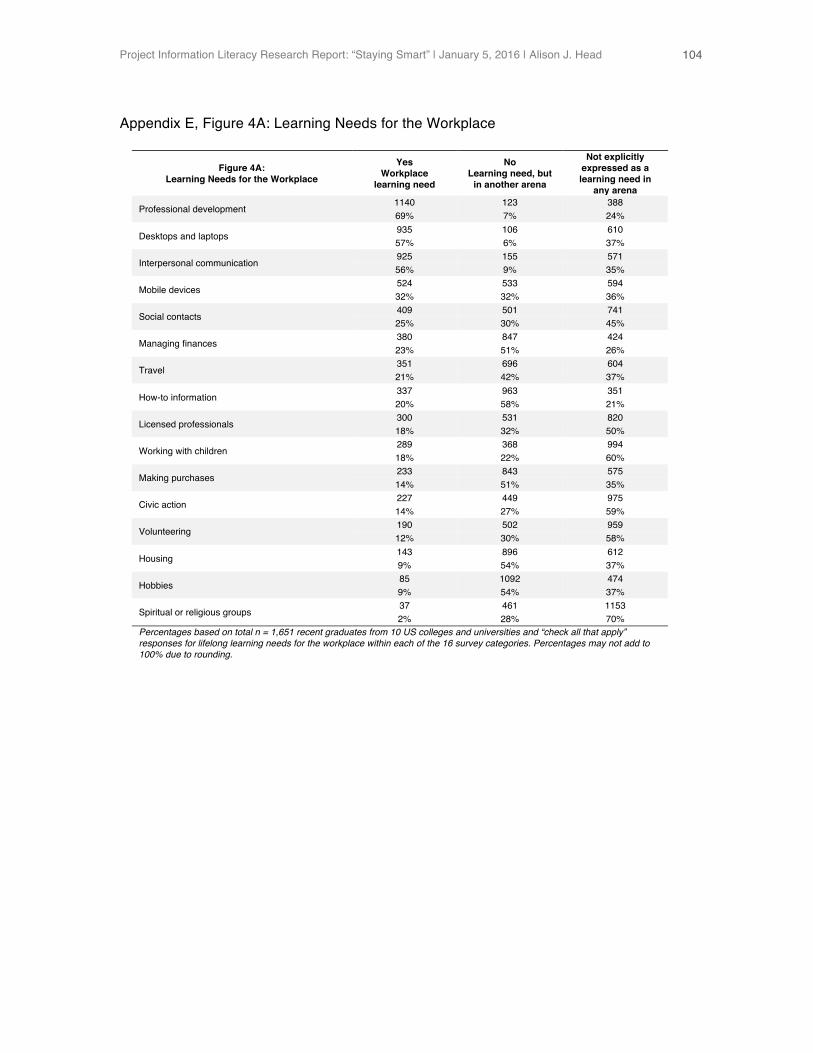
Project Information Literacy Research Report: “Staying Smart” | January 5, 2016 | Alison J. Head
104
Appendix E, Figure 4A: Learning Needs for the Workplace
Figure 4A: Learning Needs for the Workplace
Yes Workplace
learning need
No Learning need, but
in another arena
Not explicitly expressed as a learning need in
any arena
Professional development 1140 123 388 69% 7% 24%
Desktops and laptops 935 106 610 57% 6% 37%
Interpersonal communication 925 155 571 56% 9% 35%
Mobile devices 524 533 594 32% 32% 36%
Social contacts 409 501 741 25% 30% 45%
Managing finances 380 847 424 23% 51% 26%
Travel 351 696 604 21% 42% 37%
How-to information 337 963 351 20% 58% 21%
Licensed professionals 300 531 820 18% 32% 50%
Working with children 289 368 994 18% 22% 60%
Making purchases 233 843 575 14% 51% 35%
Civic action 227 449 975 14% 27% 59%
Volunteering 190 502 959 12% 30% 58%
Housing 143 896 612 9% 54% 37%
Hobbies 85 1092 474 9% 54% 37%
Spiritual or religious groups 37 461 1153 2% 28% 70%
Percentages based on total n = 1,651 recent graduates from 10 US colleges and universities and “check all that apply” responses for lifelong learning needs for the workplace within each of the 16 survey categories. Percentages may not add to 100% due to rounding.

Project Information Literacy Research Report: “Staying Smart” | January 5, 2016 | Alison J. Head
105
Appendix E, Figure 5A: Learning Needs About the Local Community
Figure 5A: Learning Needs About the Local Community
Yes Local community
learning need
No Learning need, but
in another arena
Not explicitly expressed as a
learning need in any arena
Civic action 407 269 975 25% 16% 59%
Volunteering 396 296 959 24% 18% 58%
Interpersonal communication 267 813 571 16% 49% 35%
Social contacts 235 675 741 14% 41% 45%
Working with children 216 441 994 13% 27% 60%
Mobile devices 173 884 594 11% 54% 36%
Spiritual or religious groups 169 329 1153 10% 20% 70%
Housing 167 872 612 10% 53% 37%
How-to information 155 1145 351 9% 69% 21%
Hobbies 146 1031 474 9% 62% 29%
Professional development 138 1125 388 8% 68% 24%
Desktops and laptops 134 907 610 8% 55% 37%
Licensed professionals 134 697 820 8% 42% 50%
Managing finances 92 1135 424 6% 69% 26%
Making purchases 87 989 575 5% 60% 35%
Travel 45 1002 604 3% 61% 37%
Percentages based on total n = 1,651 recent graduates from 10 US colleges and universities and “check all that apply” responses for lifelong learning needs about the local community within each of the 16 survey categories. Percentages may not add to 100% due to rounding.
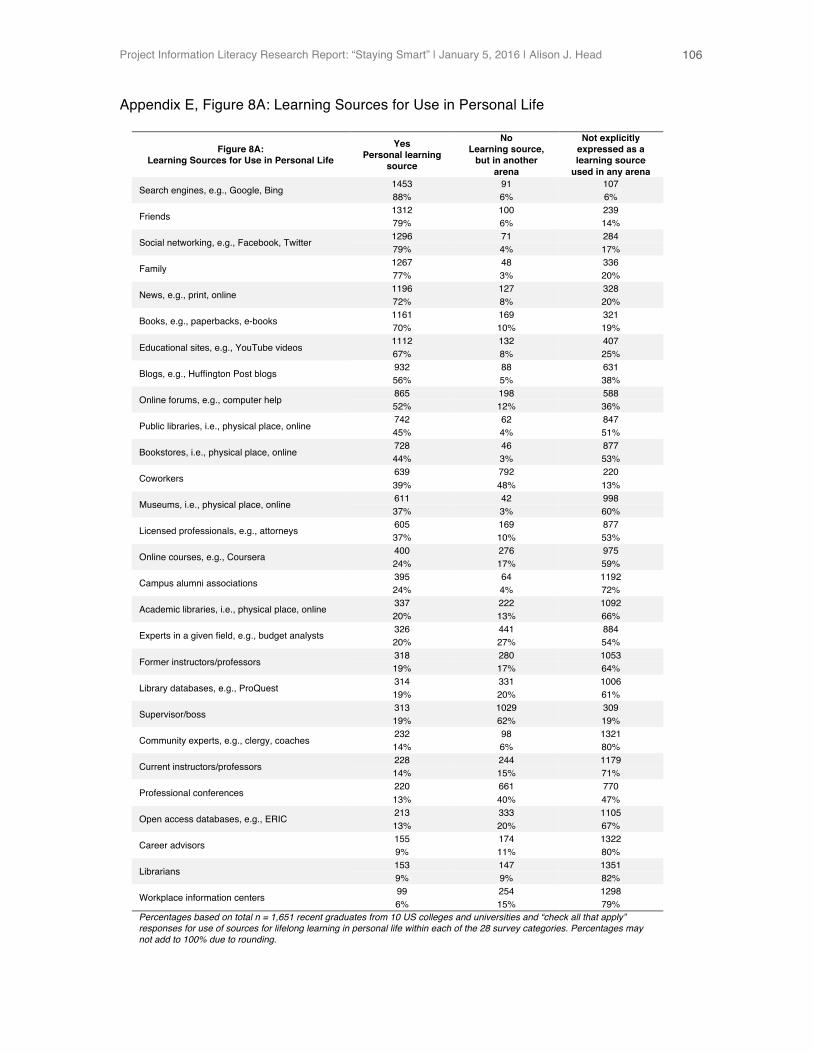
Project Information Literacy Research Report: “Staying Smart” | January 5, 2016 | Alison J. Head
106
Appendix E, Figure 8A: Learning Sources for Use in Personal Life
Figure 8A: Learning Sources for Use in Personal Life
Yes Personal learning
source
No Learning source,
but in another arena
Not explicitly expressed as a learning source
used in any arena
Search engines, e.g., Google, Bing 1453 91 107 88% 6% 6%
Friends 1312 100 239 79% 6% 14%
Social networking, e.g., Facebook, Twitter 1296 71 284 79% 4% 17%
Family 1267 48 336 77% 3% 20%
News, e.g., print, online 1196 127 328 72% 8% 20%
Books, e.g., paperbacks, e-books 1161 169 321 70% 10% 19%
Educational sites, e.g., YouTube videos 1112 132 407 67% 8% 25%
Blogs, e.g., Huffington Post blogs 932 88 631 56% 5% 38%
Online forums, e.g., computer help 865 198 588 52% 12% 36%
Public libraries, i.e., physical place, online 742 62 847 45% 4% 51%
Bookstores, i.e., physical place, online 728 46 877 44% 3% 53%
Coworkers 639 792 220 39% 48% 13%
Museums, i.e., physical place, online 611 42 998 37% 3% 60%
Licensed professionals, e.g., attorneys 605 169 877 37% 10% 53%
Online courses, e.g., Coursera 400 276 975 24% 17% 59%
Campus alumni associations 395 64 1192 24% 4% 72%
Academic libraries, i.e., physical place, online 337 222 1092 20% 13% 66%
Experts in a given field, e.g., budget analysts 326 441 884 20% 27% 54%
Former instructors/professors 318 280 1053 19% 17% 64%
Library databases, e.g., ProQuest 314 331 1006 19% 20% 61%
Supervisor/boss 313 1029 309 19% 62% 19%
Community experts, e.g., clergy, coaches 232 98 1321 14% 6% 80%
Current instructors/professors 228 244 1179 14% 15% 71%
Professional conferences 220 661 770 13% 40% 47%
Open access databases, e.g., ERIC 213 333 1105 13% 20% 67%
Career advisors 155 174 1322 9% 11% 80%
Librarians 153 147 1351 9% 9% 82%
Workplace information centers 99 254 1298 6% 15% 79%
Percentages based on total n = 1,651 recent graduates from 10 US colleges and universities and “check all that apply” responses for use of sources for lifelong learning in personal life within each of the 28 survey categories. Percentages may not add to 100% due to rounding.
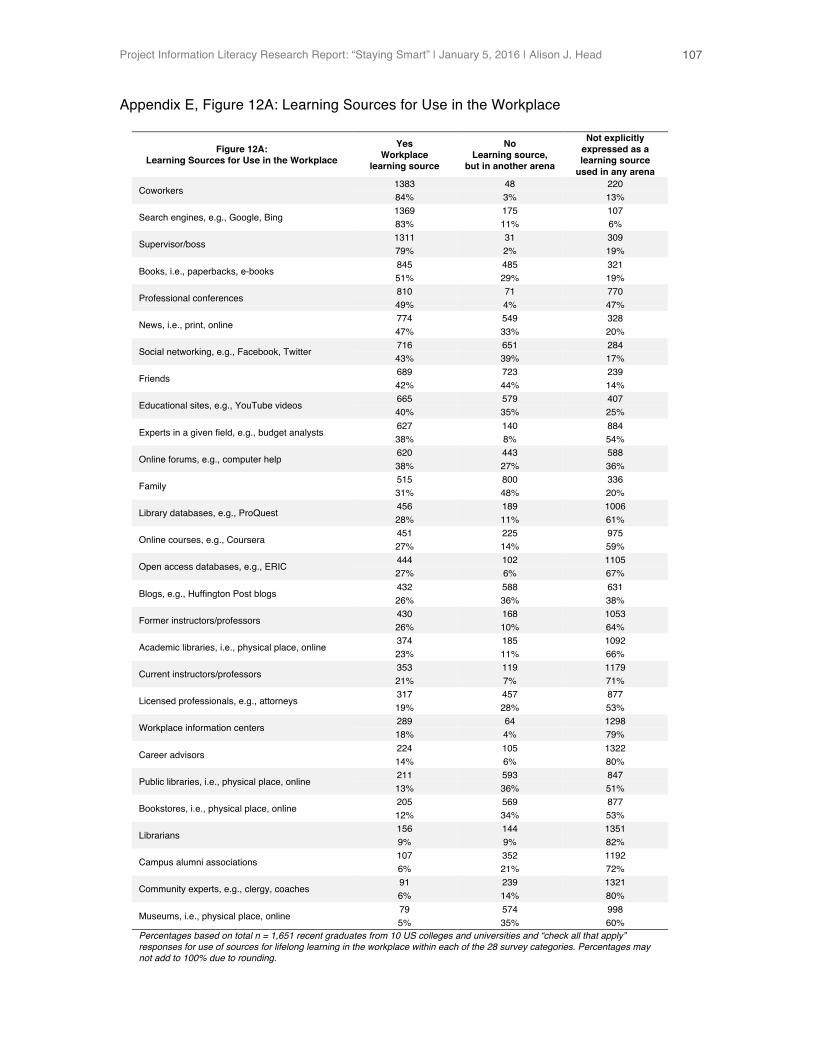
Project Information Literacy Research Report: “Staying Smart” | January 5, 2016 | Alison J. Head
107
Appendix E, Figure 12A: Learning Sources for Use in the Workplace
Figure 12A: Learning Sources for Use in the Workplace
Yes Workplace
learning source
No Learning source,
but in another arena
Not explicitly expressed as a learning source
used in any arena
Coworkers 1383 48 220 84% 3% 13%
Search engines, e.g., Google, Bing 1369 175 107 83% 11% 6%
Supervisor/boss 1311 31 309 79% 2% 19%
Books, i.e., paperbacks, e-books 845 485 321 51% 29% 19%
Professional conferences 810 71 770 49% 4% 47%
News, i.e., print, online 774 549 328 47% 33% 20%
Social networking, e.g., Facebook, Twitter 716 651 284 43% 39% 17%
Friends 689 723 239 42% 44% 14%
Educational sites, e.g., YouTube videos 665 579 407 40% 35% 25%
Experts in a given field, e.g., budget analysts 627 140 884 38% 8% 54%
Online forums, e.g., computer help 620 443 588 38% 27% 36%
Family 515 800 336 31% 48% 20%
Library databases, e.g., ProQuest 456 189 1006 28% 11% 61%
Online courses, e.g., Coursera 451 225 975 27% 14% 59%
Open access databases, e.g., ERIC 444 102 1105 27% 6% 67%
Blogs, e.g., Huffington Post blogs 432 588 631 26% 36% 38%
Former instructors/professors 430 168 1053 26% 10% 64%
Academic libraries, i.e., physical place, online 374 185 1092 23% 11% 66%
Current instructors/professors 353 119 1179 21% 7% 71%
Licensed professionals, e.g., attorneys 317 457 877 19% 28% 53%
Workplace information centers 289 64 1298 18% 4% 79%
Career advisors 224 105 1322 14% 6% 80%
Public libraries, i.e., physical place, online 211 593 847 13% 36% 51%
Bookstores, i.e., physical place, online 205 569 877 12% 34% 53%
Librarians 156 144 1351 9% 9% 82%
Campus alumni associations 107 352 1192 6% 21% 72%
Community experts, e.g., clergy, coaches 91 239 1321 6% 14% 80%
Museums, i.e., physical place, online 79 574 998 5% 35% 60%
Percentages based on total n = 1,651 recent graduates from 10 US colleges and universities and “check all that apply” responses for use of sources for lifelong learning in the workplace within each of the 28 survey categories. Percentages may not add to 100% due to rounding.
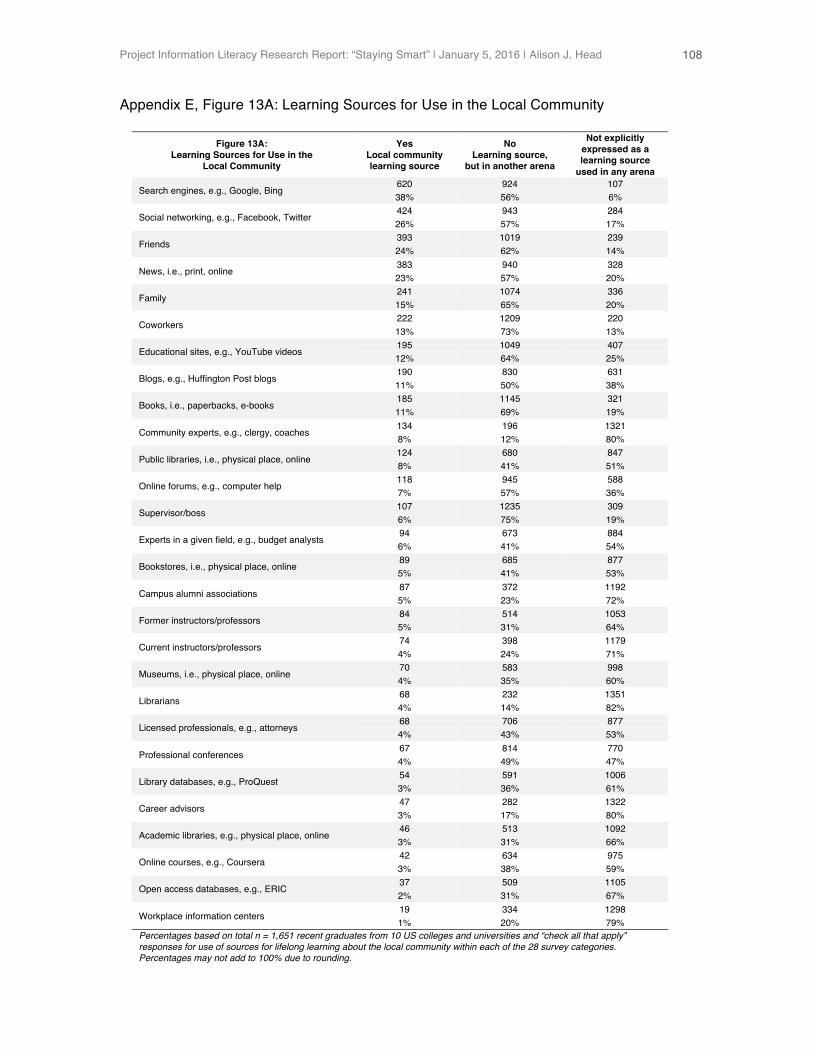
Project Information Literacy Research Report: “Staying Smart” | January 5, 2016 | Alison J. Head
108
Appendix E, Figure 13A: Learning Sources for Use in the Local Community
Figure 13A: Learning Sources for Use in the
Local Community
Yes Local community learning source
No Learning source,
but in another arena
Not explicitly expressed as a learning source
used in any arena
Search engines, e.g., Google, Bing 620 924 107 38% 56% 6%
Social networking, e.g., Facebook, Twitter 424 943 284 26% 57% 17%
Friends 393 1019 239 24% 62% 14%
News, i.e., print, online 383 940 328 23% 57% 20%
Family 241 1074 336 15% 65% 20%
Coworkers 222 1209 220 13% 73% 13%
Educational sites, e.g., YouTube videos 195 1049 407 12% 64% 25%
Blogs, e.g., Huffington Post blogs 190 830 631 11% 50% 38%
Books, i.e., paperbacks, e-books 185 1145 321 11% 69% 19%
Community experts, e.g., clergy, coaches 134 196 1321 8% 12% 80%
Public libraries, i.e., physical place, online 124 680 847 8% 41% 51%
Online forums, e.g., computer help 118 945 588 7% 57% 36%
Supervisor/boss 107 1235 309 6% 75% 19%
Experts in a given field, e.g., budget analysts 94 673 884 6% 41% 54%
Bookstores, i.e., physical place, online 89 685 877 5% 41% 53%
Campus alumni associations 87 372 1192 5% 23% 72%
Former instructors/professors 84 514 1053 5% 31% 64%
Current instructors/professors 74 398 1179 4% 24% 71%
Museums, i.e., physical place, online 70 583 998 4% 35% 60%
Librarians 68 232 1351 4% 14% 82%
Licensed professionals, e.g., attorneys 68 706 877 4% 43% 53%
Professional conferences 67 814 770 4% 49% 47%
Library databases, e.g., ProQuest 54 591 1006 3% 36% 61%
Career advisors 47 282 1322 3% 17% 80%
Academic libraries, e.g., physical place, online 46 513 1092 3% 31% 66%
Online courses, e.g., Coursera 42 634 975 3% 38% 59%
Open access databases, e.g., ERIC 37 509 1105 2% 31% 67%
Workplace information centers 19 334 1298 1% 20% 79%
Percentages based on total n = 1,651 recent graduates from 10 US colleges and universities and “check all that apply” responses for use of sources for lifelong learning about the local community within each of the 28 survey categories. Percentages may not add to 100% due to rounding.
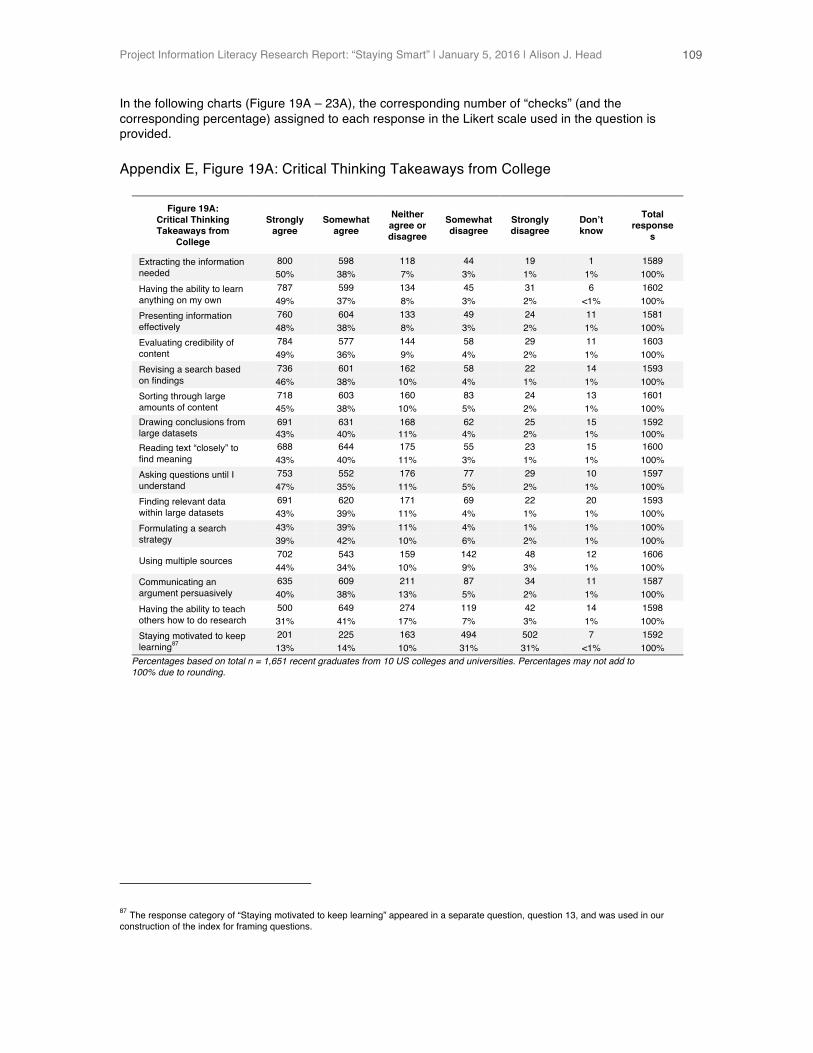
Project Information Literacy Research Report: “Staying Smart” | January 5, 2016 | Alison J. Head
109
In the following charts (Figure 19A – 23A), the corresponding number of “checks” (and the corresponding percentage) assigned to each response in the Likert scale used in the question is provided.
Appendix E, Figure 19A: Critical Thinking Takeaways from College
Figure 19A: Critical Thinking Takeaways from
College
Strongly agree
Somewhat agree
Neither agree or disagree
Somewhat disagree
Strongly disagree
Don’t know
Total response
s
Extracting the information needed
800 598 118 44 19 1 1589 50% 38% 7% 3% 1% 1% 100%
Having the ability to learn anything on my own
787 599 134 45 31 6 1602 49% 37% 8% 3% 2% <1% 100%
Presenting information effectively
760 604 133 49 24 11 1581 48% 38% 8% 3% 2% 1% 100%
Evaluating credibility of content
784 577 144 58 29 11 1603 49% 36% 9% 4% 2% 1% 100%
Revising a search based on findings
736 601 162 58 22 14 1593 46% 38% 10% 4% 1% 1% 100%
Sorting through large amounts of content
718 603 160 83 24 13 1601 45% 38% 10% 5% 2% 1% 100%
Drawing conclusions from large datasets
691 631 168 62 25 15 1592 43% 40% 11% 4% 2% 1% 100%
Reading text “closely” to find meaning
688 644 175 55 23 15 1600 43% 40% 11% 3% 1% 1% 100%
Asking questions until I understand
753 552 176 77 29 10 1597 47% 35% 11% 5% 2% 1% 100%
Finding relevant data within large datasets
691 620 171 69 22 20 1593 43% 39% 11% 4% 1% 1% 100%
Formulating a search strategy
43% 39% 11% 4% 1% 1% 100% 39% 42% 10% 6% 2% 1% 100%
Using multiple sources 702 543 159 142 48 12 1606 44% 34% 10% 9% 3% 1% 100%
Communicating an argument persuasively
635 609 211 87 34 11 1587 40% 38% 13% 5% 2% 1% 100%
Having the ability to teach others how to do research
500 649 274 119 42 14 1598 31% 41% 17% 7% 3% 1% 100%
Staying motivated to keep learning87
201 225 163 494 502 7 1592 13% 14% 10% 31% 31% <1% 100%
Percentages based on total n = 1,651 recent graduates from 10 US colleges and universities. Percentages may not add to 100% due to rounding.
87 The response category of “Staying motivated to keep learning” appeared in a separate question, question 13, and was used in our construction of the index for framing questions.
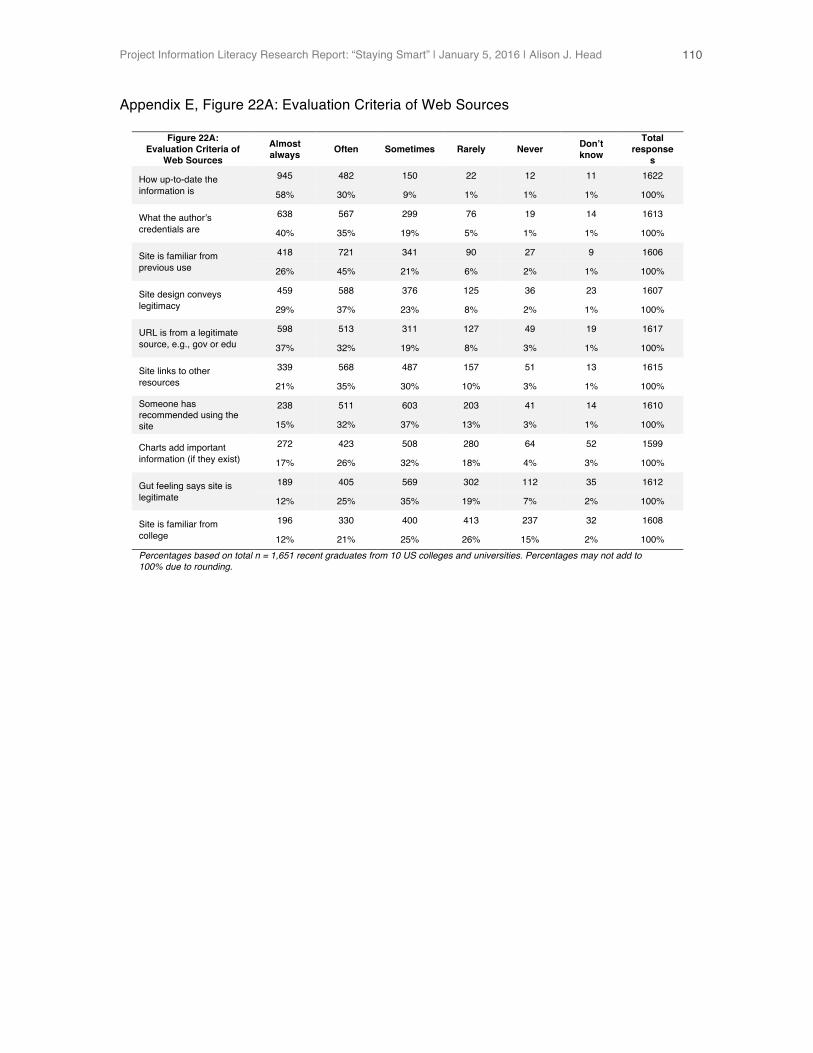
Project Information Literacy Research Report: “Staying Smart” | January 5, 2016 | Alison J. Head
110
Appendix E, Figure 22A: Evaluation Criteria of Web Sources
Figure 22A: Evaluation Criteria of
Web Sources Almost always Often Sometimes Rarely Never Don’t
know
Total response
s
How up-to-date the information is
945 482 150 22 12 11 1622
58% 30% 9% 1% 1% 1% 100%
What the author’s credentials are
638 567 299 76 19 14 1613
40% 35% 19% 5% 1% 1% 100%
Site is familiar from previous use
418 721 341 90 27 9 1606
26% 45% 21% 6% 2% 1% 100%
Site design conveys legitimacy
459 588 376 125 36 23 1607
29% 37% 23% 8% 2% 1% 100%
URL is from a legitimate source, e.g., gov or edu
598 513 311 127 49 19 1617
37% 32% 19% 8% 3% 1% 100%
Site links to other resources
339 568 487 157 51 13 1615
21% 35% 30% 10% 3% 1% 100%
Someone has recommended using the site
238 511 603 203 41 14 1610
15% 32% 37% 13% 3% 1% 100%
Charts add important information (if they exist)
272 423 508 280 64 52 1599
17% 26% 32% 18% 4% 3% 100%
Gut feeling says site is legitimate
189 405 569 302 112 35 1612
12% 25% 35% 19% 7% 2% 100%
Site is familiar from college
196 330 400 413 237 32 1608
12% 21% 25% 26% 15% 2% 100% Percentages based on total n = 1,651 recent graduates from 10 US colleges and universities. Percentages may not add to 100% due to rounding.
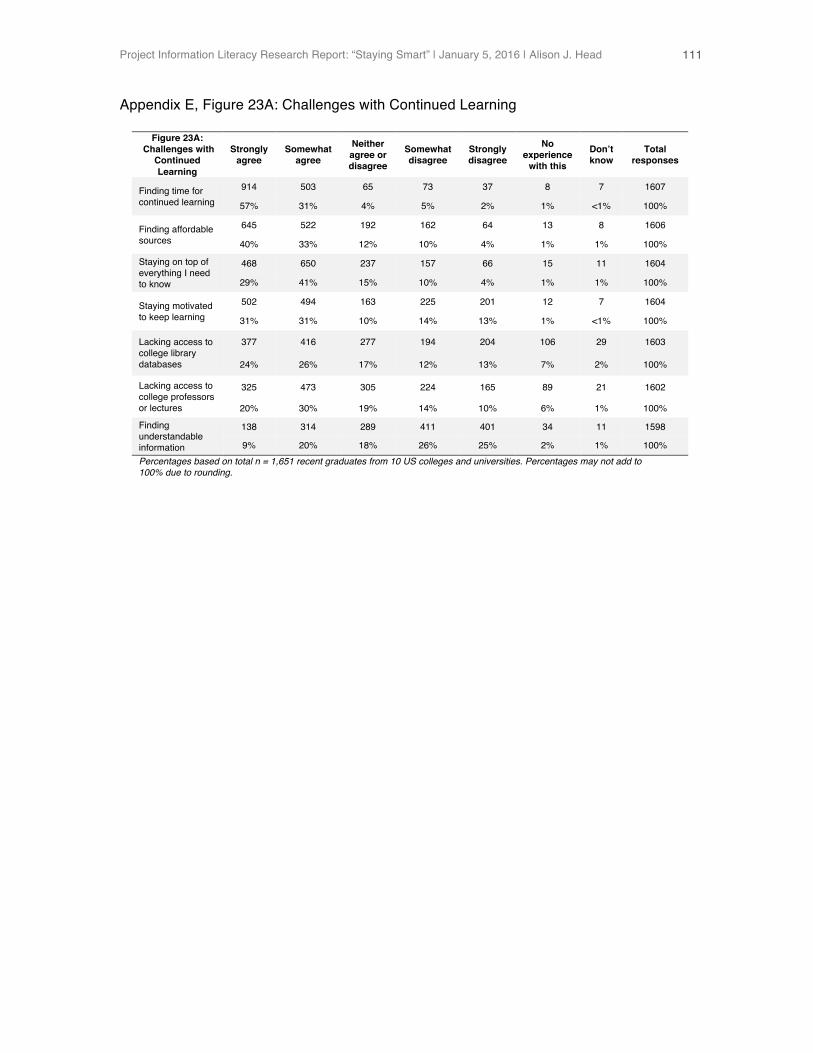
Project Information Literacy Research Report: “Staying Smart” | January 5, 2016 | Alison J. Head
111
Appendix E, Figure 23A: Challenges with Continued Learning
Figure 23A: Challenges with
Continued Learning
Strongly agree
Somewhat agree
Neither agree or disagree
Somewhat disagree
Strongly disagree
No experience
with this
Don’t know
Total responses
Finding time for continued learning
914 503 65 73 37 8 7 1607
57% 31% 4% 5% 2% 1% <1% 100%
Finding affordable sources
645 522 192 162 64 13 8 1606
40% 33% 12% 10% 4% 1% 1% 100%
Staying on top of everything I need to know
468 650 237 157 66 15 11 1604
29% 41% 15% 10% 4% 1% 1% 100%
Staying motivated to keep learning
502 494 163 225 201 12 7 1604
31% 31% 10% 14% 13% 1% <1% 100%
Lacking access to college library databases
377 416 277 194 204 106 29 1603
24% 26% 17% 12% 13% 7% 2% 100%
Lacking access to college professors or lectures
325 473 305 224 165 89 21 1602
20% 30% 19% 14% 10% 6% 1% 100%
Finding understandable information
138 314 289 411 401 34 11 1598
9% 20% 18% 26% 25% 2% 1% 100% Percentages based on total n = 1,651 recent graduates from 10 US colleges and universities. Percentages may not add to 100% due to rounding.
Project Information Literacy Research Report: “Staying Smart” | January 5, 2016 | Alison J. Head
112
Acknowledgements This study would never have been possible without the recent graduates who participated in this study’s samples and I thank them for generously giving their time and sharing their thoughts with us. At the same time, I am deeply grateful to coordinating efforts with the 10 research liaisons who participated in this study: Corinne Bishop (University of Central Florida), Elizabeth Black (The Ohio State University), Alison Bradley (University of North Carolina at Charlotte), Shana Higgins (University of Redlands), Patty Iannuzzi (University of Nevada, Las Vegas), Anne Jumonville (Trinity University), Jenny Mills (Belmont University), Michele Norris (University of Washington), Michele Ostrow (University of Texas at Austin), and Ann Roselle (Phoenix College).
I also owe many thanks to the Project information Literacy (PIL) Research Team who spent many hours of their time making valuable contributions to the data collection and discussion of significant trends: Sarah Evans (University of Washington School of Education), Kate Faoro (University of Washington), Michelle Fellows (University of Washington Information School), Kirsten Hostetler (Central Oregon Community College), Kristine Lu (Columbia University), Ann Roselle (Phoenix College), and Michele Van Hoeck (California Maritime Academy).
The collaborative discussion with the Lifelong Learning Advisory Board chairperson, Mike Eisenberg (University of Washington Information School) and the members led to invaluable insights about the findings about improving lifelong learning services and resources that are included in the Recommendations section of the report. I owe many thanks to these board members who were: Ken Bain (University of the District of Columbia), Ginnie Cooper (former Chief Librarian for the Washington, D.C. Public Library, now retired), Mike Eisenberg (University of Washington Information School), Sari Feldman (President of the American Library Association and Executive Director of Cuyahoga County Public Library), Deborah S. Garson (Graduate School of Education at Harvard University), R. David Lankes (Syracuse University’s School of Information Studies), Peter Morville (Semantic Studios), Michael Stephens (San Jose State University Information School), and Bonnie Tijerina (Data & Society Research Institute).
I am also very grateful to the PIL supporters-at-large who made invaluable suggestions for improving this report as it developed and was being written: Robin DeCook (University of Washington Information School), Mike Eisenberg (University of Washington Information School), Kirsten Hostetler (Central Oregon Community College), Lucas Koepke (University of Washington Information School), Ann Roselle (Phoenix College), Michele Van Hoeck (California Maritime Academy), and Sharon Weiner (Purdue University).
Our research study was supported with a National Leadership Grant from the Institute of Museum and Library Services and I thank them, especially Mary Alice Ball, Tim Carrigan, Maura Marx, and Sandy Toro, who all provided encouragement and support over the last two years.
Finally, the PIL Board is always a source of inspiration and support: R. David Lankes (Syracuse University), Peter Morville (Semantic Studios), David Nasatir (University of California, Berkeley, retired), Lee Rainie (Pew Research Center’s Internet & the American Life Project), and Karen Schneider (Sonoma State University). !
— Alison J. Head
January 5, 2016