Tobermolite effects on methane removal activity and microbial community of a lab‑scale soil...
11
1 3 J Ind Microbiol Biotechnol (2014) 41:1119–1129 DOI 10.1007/s10295-014-1448-x ENVIRONMENTAL MICROBIOLOGY Tobermolite effects on methane removal activity and microbial community of a lab‑scale soil biocover Kyung‑Eun Moon · Eun‑Hee Lee · Tae Gwan Kim · Kyung‑Suk Cho Received: 10 January 2014 / Accepted: 17 April 2014 / Published online: 14 May 2014 © Society for Industrial Microbiology and Biotechnology 2014 a stable methane oxidation level over wide temperature (20–40 °C, at least 38 μmol g-dry sample −1 h −1 ) and pH (5–8, at least 61 μmol g-dry sample −1 h −1 ) ranges. In con- clusion, the soil and tobermolite mixture is promising for methane mitigation. Keywords Methane mitigation · Biocover · Soil · Tobermolite · Methanotrophs Introduction Landfills are a significant anthropogenic source of meth- ane (CH 4 ) with global emission estimates of approximately 500–800 Mt CO 2 -eq year −1 [3]. Landfill-derived methane is primarily generated by the anaerobic decomposition of landfill solid waste via methanogenesis, which was histori- cally the largest source of global methane emissions from the waste sector [4, 8]. Landfill methane mitigation tech- nologies include gas collection, incineration, and biotic methane mitigation systems (e.g., landfill biocover and biofilters) [4]. Biocover systems have been used to mitigate methane mediated with biological oxidation by methano- trophs. Microbial methane oxidation is recognized as being globally important, accounting for approximately 80 % of global methane consumption [30]. Earlier field stud- ies have demonstrated that methane oxidation rates can be >200 g-CH 4 m −2 d −1 in engineered landfill biocover sys- tems [4, 5]. Recently, the approach of enhancing the metha- notrophic activity has been proposed for greater perfor- mance of the systems. The biocover performance is dependent on the pack- ing materials, temperature, pH, moisture content, methane and oxygen concentrations, and nutrients [31]. Methano- trophs must become well established and active in landfill Abstract Three identical lab-scale biocovers were packed with an engineered soil (BC 1), tobermolite only (BC 2), and a mixture of the soil and tobermolite (BC 3), and were operated at an inlet load of 338–400 g-CH 4 m −2 d −1 and a space velocity of 0.12 h −1 . The methane removal capac- ity was 293 ± 47 g-CH 4 m −2 d −1 in steady state in the BC 3, which was significantly higher than those in the BC 1 and BC 2 (106 ± 24 and 114 ± 48 g-CH 4 m −2 d −1 , respec- tively). Quantitative PCR indicated that bacterial and meth- anotrophic densities (6.62–6.78 × 10 7 16S rDNA gene copy number g-dry sample −1 and 1.37–2.23 × 10 7 pmoA gene copy number g-dry sample −1 in the BC 1 and BC 3, respectively) were significantly higher than those in the BC 2. Ribosomal tag pyrosequencing showed that metha- notrophs comprised approximately 60 % of the bacterial community in the BC 2 and BC 3, while they only com- prised 43 % in the BC 1. The engineered soil favored the growth of total bacteria including methanotrophs, while the presence of tobermolite enhanced the relative abundance of methanotrophs, resulting in an improved habitat for meth- anotrophs as well as greater methane mitigation perfor- mance in the mixture. Moreover, a batch experiment indi- cated that the soil and tobermolite mixture could display K.-E. Moon and E.-H. Lee contributed equally to this work (Co- first authors). Electronic supplementary material The online version of this article (doi:10.1007/s10295-014-1448-x) contains supplementary material, which is available to authorized users. K.-E. Moon · E.-H. Lee · T. G. Kim · K.-S. Cho (*) Global Top 5 Research Program, Department of Environmental Science and Engineering, Ewha Womans University, 52, Ewhayeodae-gil, Seodaemun-gu, Seoul, 120-750, Republic of Korea e-mail: [email protected]
Transcript of Tobermolite effects on methane removal activity and microbial community of a lab‑scale soil...
1 3
J Ind Microbiol Biotechnol (2014) 41:1119–1129DOI 10.1007/s10295-014-1448-x
EnvIrOnMEntal MIcrOBIOlOgy
Tobermolite effects on methane removal activity and microbial community of a lab‑scale soil biocover
Kyung‑Eun Moon · Eun‑Hee Lee · Tae Gwan Kim · Kyung‑Suk Cho
received: 10 January 2014 / accepted: 17 april 2014 / Published online: 14 May 2014 © Society for Industrial Microbiology and Biotechnology 2014
a stable methane oxidation level over wide temperature (20–40 °c, at least 38 μmol g-dry sample−1 h−1) and pH (5–8, at least 61 μmol g-dry sample−1 h−1) ranges. In con-clusion, the soil and tobermolite mixture is promising for methane mitigation.
Keywords Methane mitigation · Biocover · Soil · tobermolite · Methanotrophs
Introduction
landfills are a significant anthropogenic source of meth-ane (cH4) with global emission estimates of approximately 500–800 Mt cO2-eq year−1 [3]. landfill-derived methane is primarily generated by the anaerobic decomposition of landfill solid waste via methanogenesis, which was histori-cally the largest source of global methane emissions from the waste sector [4, 8]. landfill methane mitigation tech-nologies include gas collection, incineration, and biotic methane mitigation systems (e.g., landfill biocover and biofilters) [4]. Biocover systems have been used to mitigate methane mediated with biological oxidation by methano-trophs. Microbial methane oxidation is recognized as being globally important, accounting for approximately 80 % of global methane consumption [30]. Earlier field stud-ies have demonstrated that methane oxidation rates can be >200 g-cH4 m−2 d−1 in engineered landfill biocover sys-tems [4, 5]. recently, the approach of enhancing the metha-notrophic activity has been proposed for greater perfor-mance of the systems.
the biocover performance is dependent on the pack-ing materials, temperature, pH, moisture content, methane and oxygen concentrations, and nutrients [31]. Methano-trophs must become well established and active in landfill
Abstract three identical lab-scale biocovers were packed with an engineered soil (Bc 1), tobermolite only (Bc 2), and a mixture of the soil and tobermolite (Bc 3), and were operated at an inlet load of 338–400 g-cH4 m−2 d−1 and a space velocity of 0.12 h−1. the methane removal capac-ity was 293 ± 47 g-cH4 m
−2 d−1 in steady state in the Bc 3, which was significantly higher than those in the Bc 1 and Bc 2 (106 ± 24 and 114 ± 48 g-cH4 m
−2 d−1, respec-tively). Quantitative Pcr indicated that bacterial and meth-anotrophic densities (6.62–6.78 × 10⁷ 16S rDna gene copy number g-dry sample−1 and 1.37–2.23 × 10⁷ pmoA gene copy number g-dry sample−1 in the Bc 1 and Bc 3, respectively) were significantly higher than those in the Bc 2. ribosomal tag pyrosequencing showed that metha-notrophs comprised approximately 60 % of the bacterial community in the Bc 2 and Bc 3, while they only com-prised 43 % in the Bc 1. the engineered soil favored the growth of total bacteria including methanotrophs, while the presence of tobermolite enhanced the relative abundance of methanotrophs, resulting in an improved habitat for meth-anotrophs as well as greater methane mitigation perfor-mance in the mixture. Moreover, a batch experiment indi-cated that the soil and tobermolite mixture could display
K.-E. Moon and E.-H. lee contributed equally to this work (co-first authors).
Electronic supplementary material the online version of this article (doi:10.1007/s10295-014-1448-x) contains supplementary material, which is available to authorized users.
K.-E. Moon · E.-H. lee · t. g. Kim · K.-S. cho (*) global top 5 research Program, Department of Environmental Science and Engineering, Ewha Womans University, 52, Ewhayeodae-gil, Seodaemun-gu, Seoul, 120-750, republic of Koreae-mail: [email protected]
1120 J Ind Microbiol Biotechnol (2014) 41:1119–1129
1 3
biocover systems to establish successful methane miti-gation. It is generally accepted that the physico-chemical properties of the packing materials are identified as the key parameters of the packing materials for optimum methane consumption by methanotrophs [6, 16, 31]. conventional biocover systems have been operated using landfill cover soils manipulated with inorganic or organic materials such as mature compost, earthworm cast, powdered activated carbon, saprolite, and granular-activated carbon (gac) to improve the establishment and activity of methanotrophs [17, 27, 31]. although the previous studies reported that the methane oxidation and methanotrophic population levels were enhanced by introducing those materials into soils, biocover systems still face the problems of how to improve both the microbial establishment and the systematic perfor-mance that can determine their success. thus, an alterna-tive material is required to satisfy those factors for great methane mitigation in biocover systems.
In the present study, three lab-scale biocover systems were prepared using the soil mixture (Bc 1), tobermo-lite (Bc 2), and soil and tobermolite mixture (Bc 3) to develop an efficient biocover system for methane removal. tobermolite was used as a novel packing material and its quality was evaluated using the removal efficiency and the capacity of the methane by comparing these values with those of a conventional biocover system (Bc 1). to inves-tigate the bacterial and methanotrophic stability and estab-lishment, their populations were analyzed using quantita-tive real-time Pcr (qrt-Pcr) and the relative abundance and community structure were assessed using pyrose-quencing assay. In addition, batch-scale experiments were employed to evaluate the suitability of a packing material with regard to environmental changes such as temperature and pH, which should be considered when using biocover materials in the field.
Materials and methods
Packing material preparation for lab-scale biocover systems
Soil was collected from landfill cover soil at a depth of 10–30 cm from the surface in gapyeong-gun, gyeonggi-do, South Korea [20]. Earthworm cast was obtained from the nangi Municipal Sewage treatment Plant, goyang, gyeonggi-do, South Korea [25]. the landfill cover soil and earthworm cast were sieved with a 2-mm mesh prior to use. gac with a diameter of 4–8 mm was purchased from Jaeil carbon, co. ltd., yong-In, South Korea. commercial sapro-lite with a diameter of 3 mm was obtained from Kyungseo co. ltd., Seoul, South Korea. tobermolite with a diameter of 3–8 mm was purchased from JawooBio, Daejeon, South
Korea. the tobermolite was washed 4–5 times with tap water before use. all of the packing materials were stored at room temperature prior to use.
three mixtures of the packing materials were prepared to develop the efficient biocover systems. For Bc 1 and Bc 3, the earthworm cast was added to the biocovers as inoculums of methanotrophs. Bc 1 was filled with a soil mixture of landfill soil, gac, earthworm cast, and sapro-lite (4:2:1:1, w/w) to simulate a conventional biocover sys-tem, while Bc 3 was packed with a mixture of tobermo-lite, landfill soil, and earthworm cast (2:1:1, w/w). For Bc 2, the earthworm cast was mixed with distilled water (1:1, v/v) and its supernatant was used as an inoculum of the methanotrophs for Bc 2. the washed tobermolite was sus-pended with the supernatant to inoculate the methanotrophs into the Bc 2 for 1 day and the inoculated tobermolite was packed into Bc 2. all of the packing mixtures were com-pletely mixed before adding into the biocovers.
lab-scale biocover systems
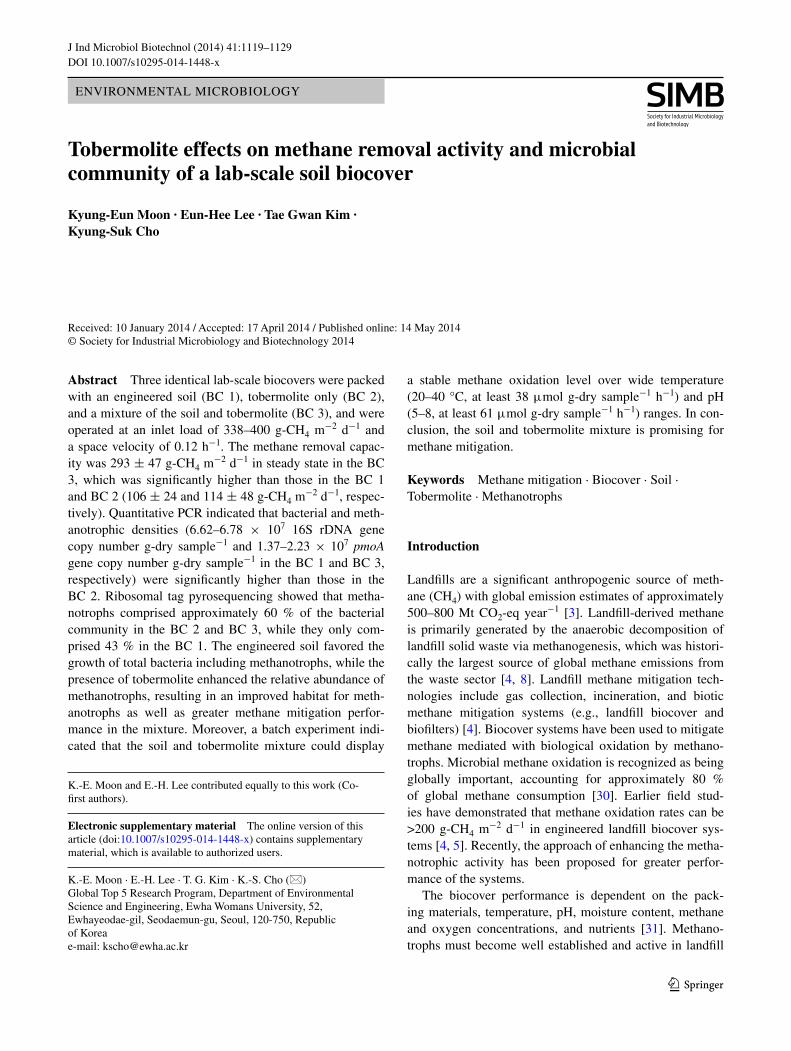
three identical biocover systems were set up with acryl columns to simulate landfill cover environments. Figure 1 shows a schematic diagram of the biocover systems. the lab-scale biocover systems consisted of two sections (the packing and ventilating sections) with an inner diameter of 8 cm. the packing height and volume of the packing section were 50 cm and 2.5 l, respectively. It had a per-forated plate at the bottom. a gas inlet port was located at the bottom of the biocover. the ventilating section (with
CH4 /CO2
cylinder
Humidifier
Gas flowmeter
Air
BC 1 BC 2 BC 3
Fig. 1 the schematic diagram of the methane-removing biocover systems
1121J Ind Microbiol Biotechnol (2014) 41:1119–1129
1 3
a height of 15 cm) was assembled on the packing section and it had air inlet and gas outlet ports. a synthetic gas of methane/carbon dioxide (2:3, v/v) was commercially pur-chased from Seoul Special gas Inc., Seoul, South Korea, and it was passed through a 50-cm long humidifier before introducing it into the biocover. the synthetic gas was con-trolled with a gas flow meter, but it could have fluctuated since the cylinder has high pressure of gas. thus, we meas-ured inlet and outlet gas concentrations to obtain correct results. the gas was continuously fed into the biocover sys-tems at a flow rate of 5 ml min−1 (with a space velocity of 0.12 h−1). compressed air entered into the top of the venti-lating section at a flow rate of 20 ml min−1. the biocovers were operated for 134 days at room temperature. the meth-ane oxidation efficiencies and capacities were calculated from the inlet and outlet methane fluxes of the biocover systems. the methane fluxes were calculated from the flow rates and the methane concentrations at the inlet and outlet. the operating and maintenance conditions were previously described by Kim et al. [18]. the moisture content of the biocovers was adjusted to 20 % with distilled water.
gas analysis
the methane concentration was monitored at the inlet and outlet for 39 days using gas chromatography (gc, 6850 n, agilent technologies Inc., Santa clara, USa) equipped with a flame ionization detector (FID) and a wax column (30 m × 0.32 mm × 0.25 μm, Supelco Inc., Bellefonte, Pa, USa), as previously described by lee et al. [20].
nucleic acid extraction and qrt-Pcr
after a 39-day operation period, the packing mixtures were collected in duplicate from the top (0–10 cm) layer of the surface of each biocover for analysis of the bacterial and methanotrophic community structures. the collected pack-ing mixtures were immediately stored at −70 °c prior to use. genomic Dna was extracted from 0.5 g of the pack-ing mixture from each biocover in duplicate. Dna was extracted using a nucleoSpin Soil kit (Macherey–nagel gmbH & co. Kg, Düren, germany) with a modification wherein the samples were disrupted using a BeadBeater-8 system (BioSpec Inc., Bartlesville, OK, USa) at 5,000 rpm for 30 s. the Dna was suspended in 100 μl of the elu-tion buffer and stored at −20 °c before use. the Dna was quantified using an aSP-2680 spectrophotometer (act-gene Inc., Piscataway, nJ, USa).
qrt-Pcr was used to quantify the total bacteria and methanotrophs using the primer sets of 304F & 805r and a189f & mb661r, respectively. the 304F and 805r primer set targets 16S rDna for total bacteria [18] and the a189f and mb661r primer set targets the α-subunit of
the particulate methane monooxygenase gene (pmoA) for methanotrophs [29].
Escherichia coli and Methylobacter luteus (ncIMB11914) were used to establish standard curves for the quantitative detection of the total bacteria and methano-trophs, respectively. the Pcr mixtures and reaction con-ditions were previously described by Kim et al. [19]. the 16S rDna and pmoA copy numbers were calculated by measuring the Dna concentrations. the Dna standards of the total bacteria and the methanotrophs were 104–108 and 103–107 copies, respectively. qrt-Pcr was performed in duplicate.
16S rRNA‑based analysis of bacterial communities using pyrosequencing
the pyrosequencing analysis was performed in duplicate using the samples collected from the top layer of each bio-cover after a 39-day operation period. For Pcr, the primer set of 340F and 805r was used to amplify the 340–805 region of the 16S rrna gene (positions based on Escheri-chia coli) containing the v3 and v4 regions. Six differ-ent composite primer sets were made based on the 340 F-805r set for multiplex pyrosequencing; the composite forward primer 340F 5’-ccatctcatccctgcgtgtct ccgac-TCAG-nnnnnnnnnn-tcctacgggagg cagcag-3’ and the composite reverse primer 805R 5’-cc tatcccctgtgtgccttggcagtc-TCAG-gactacHv gggtatctaatcc-3’. the first sequence of 26-bp is the genome Sequencer FlX titanium adaptors a and B. the sequence in italics is the four-base library key. nnnnnnn nnn is the 10-bp multiplex identifier tag (provided from Macrogen co. ltd, Seoul, Korea), and the last is the primer targeting the 16S rrna gene [18]. For each sample, four independent Pcr mixtures were prepared in parallel to avoid Pcr bias. the Pcr mixtures and conditions were previously described in detail by Kim et al. [18]. the purified Dna concentrations were measured using an aSP-2680 spectro-photometer (actgene Inc.). Equal amounts of the purified Dnas were combined in a single tube and sent to Macrogen Incorporation (Seoul, South Korea) to be run on a genome Sequencer 454 FlX titanium system (roche Diagnostics Inc., Mannheim, germany).
Pyrosequencing data analysis
For high-quality sequences, the primer sites of the sequences were trimmed and the low-quality and chimera sequences were excluded. the primer sites and low-quality sequences (length <400 nt, average quality score <25, and with an ambiguity) were removed using the rDP pyrose-quencing pipeline [7]. any possible chimeras were removed
1122 J Ind Microbiol Biotechnol (2014) 41:1119–1129
1 3
using Black Box chimera check software [11] with the default setting. In this study, the rDP pyrosequencing pipeline was used to analyze the pyrosequencing data. the most abundant sequence of each OtU (97 % similarity) was BlaSt searched against the rDP database (release 10) to determine the phylogeny of the OtU and then the chao1 richness estimates (chao1) and Shannon–Weaver diversity indices (H′) were calculated. Pyrosequencing reads were taxonomically assigned using the rDP classifier of the pipeline with bootstrap values more than 80 %. the rDP classifier provides rapid and independent taxonomic classifications from domain to genus [18]. the classifica-tion results were analyzed using MEgan software ver-sion 4.50 [13] for community analysis at the genus level. Bacterial communities were compared using the func-tion of “goodall-normalized” in the MEgan software. the sequences were identified at the species level when the similarity was greater than 99 %. the pyrosequencing reads obtained in this study were deposited into the Dna DataBank of Japan (DDBJ) Sequence read archive (http://trace.ddbj.nig.ac.jp/dra) under accession no. Dra001850.
Statistical analysis
relative abundances of OtUs were used for principal com-ponent analysis (Pca), and redundancy analysis (rDa) with UniFrac [21] and canOcO 4.5 software for Win-dows (ScIEntIa software, new york, ny, USa). a sta-tistical analysis of variance (anOva) was performed for validation of the qrt-Pcr abundance and methane oxida-tion rates of each group using the SPSS 20 for Windows (SPSS Inc., chicago, USa) program. the level of signifi-cance was p = 0.05 in all of the statistical analyses.
Effects of environmental changes on the methane oxidation of the biocovers
to evaluate the effects of environmental changes such as temperature and pH on the methane oxidation of Bc 3, the packing mixtures were collected at the end of the experi-mental period. the packing mixtures were completely mixed before sampling. to investigate the effects of the temperature on the methane oxidation of Bc 3, 20 g of the sample was added into 600-ml serum bottles containing 10 ml of a nitrate mineral salt (nMS) medium. the bottles were sealed with butyl rubbers and parafilm and then meth-ane was injected into each bottle at a final concentration of 5 % (v/v) from a methane cylinder (99 %, Seoul Special gases, Seoul, Korea). the bottles were incubated at 15, 20, 25, 30, 35, and 40 °c with an agitation of 150 rpm. the nMS medium consisted of MgSO4·7H2O 1 g, cacl2·2H2O 0.295 g, KnO3 1 g, KH2PO4 0.26 g, na2HPO4·2H2O 0.41 g, and cuSO4·5H2O 0.0025 g per 1-l; plus trace
elements of FeSO4·7H2O 500 μg, ZnSO4·7H2O 400 μg, Mncl2·4H2O 20 μg, H3BO4 15 μg, coc12·6H2O 50 μg, nicl2·6H2O 10 μg, and EDta 250 μg.
to evaluate the effects of the pH on the methane oxi-dation of Bc 3, the bottles were prepared as described above except that nMS media were adjusted with 0.2 M naH2PO4·2H2O and 0.2 M na2HPO4·12H2O solutions for the desired pH levels (pH 5, 6, 7, and 8). the serum bottles were incubated at 30 °c with an agitation of 150 rpm. the concentration of methane in the headspace was periodically monitored using a gas-tight syringe. all of the experiments were performed in triplicate.
Results
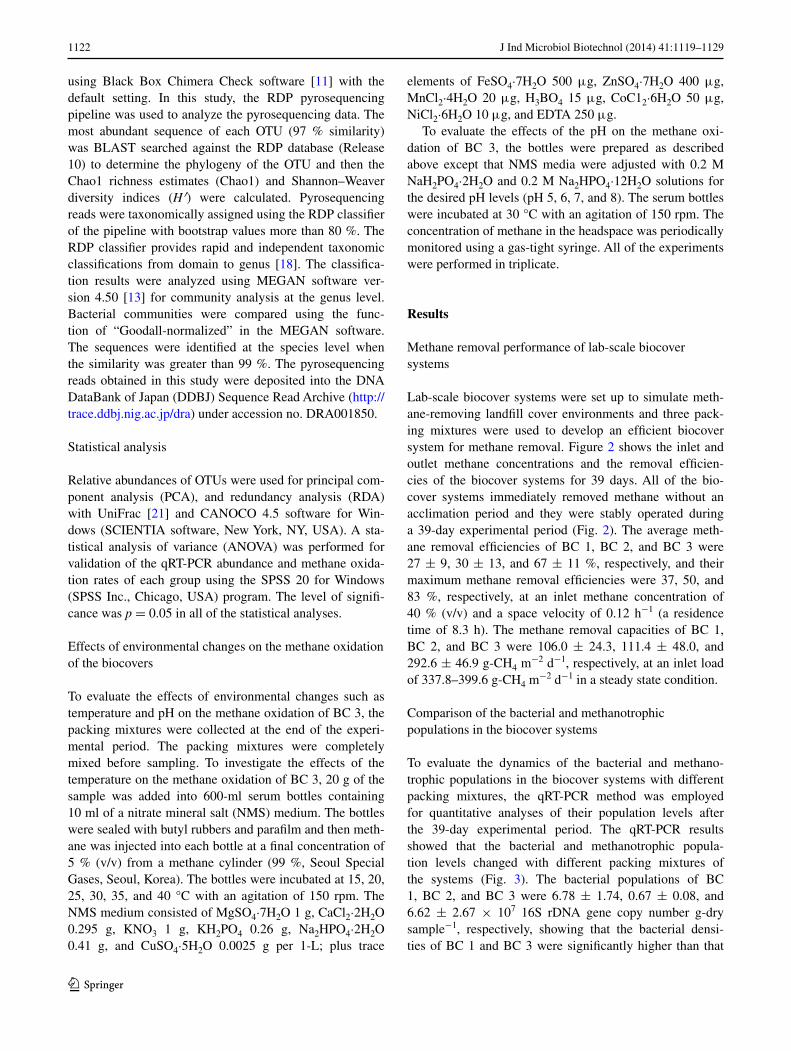
Methane removal performance of lab-scale biocover systems
lab-scale biocover systems were set up to simulate meth-ane-removing landfill cover environments and three pack-ing mixtures were used to develop an efficient biocover system for methane removal. Figure 2 shows the inlet and outlet methane concentrations and the removal efficien-cies of the biocover systems for 39 days. all of the bio-cover systems immediately removed methane without an acclimation period and they were stably operated during a 39-day experimental period (Fig. 2). the average meth-ane removal efficiencies of Bc 1, Bc 2, and Bc 3 were 27 ± 9, 30 ± 13, and 67 ± 11 %, respectively, and their maximum methane removal efficiencies were 37, 50, and 83 %, respectively, at an inlet methane concentration of 40 % (v/v) and a space velocity of 0.12 h−1 (a residence time of 8.3 h). the methane removal capacities of Bc 1, Bc 2, and Bc 3 were 106.0 ± 24.3, 111.4 ± 48.0, and 292.6 ± 46.9 g-cH4 m
−2 d−1, respectively, at an inlet load of 337.8–399.6 g-cH4 m
−2 d−1 in a steady state condition.
comparison of the bacterial and methanotrophic populations in the biocover systems
to evaluate the dynamics of the bacterial and methano-trophic populations in the biocover systems with different packing mixtures, the qrt-Pcr method was employed for quantitative analyses of their population levels after the 39-day experimental period. the qrt-Pcr results showed that the bacterial and methanotrophic popula-tion levels changed with different packing mixtures of the systems (Fig. 3). the bacterial populations of Bc 1, Bc 2, and Bc 3 were 6.78 ± 1.74, 0.67 ± 0.08, and 6.62 ± 2.67 × 10⁷ 16S rDna gene copy number g-dry sample−1, respectively, showing that the bacterial densi-ties of Bc 1 and Bc 3 were significantly higher than that
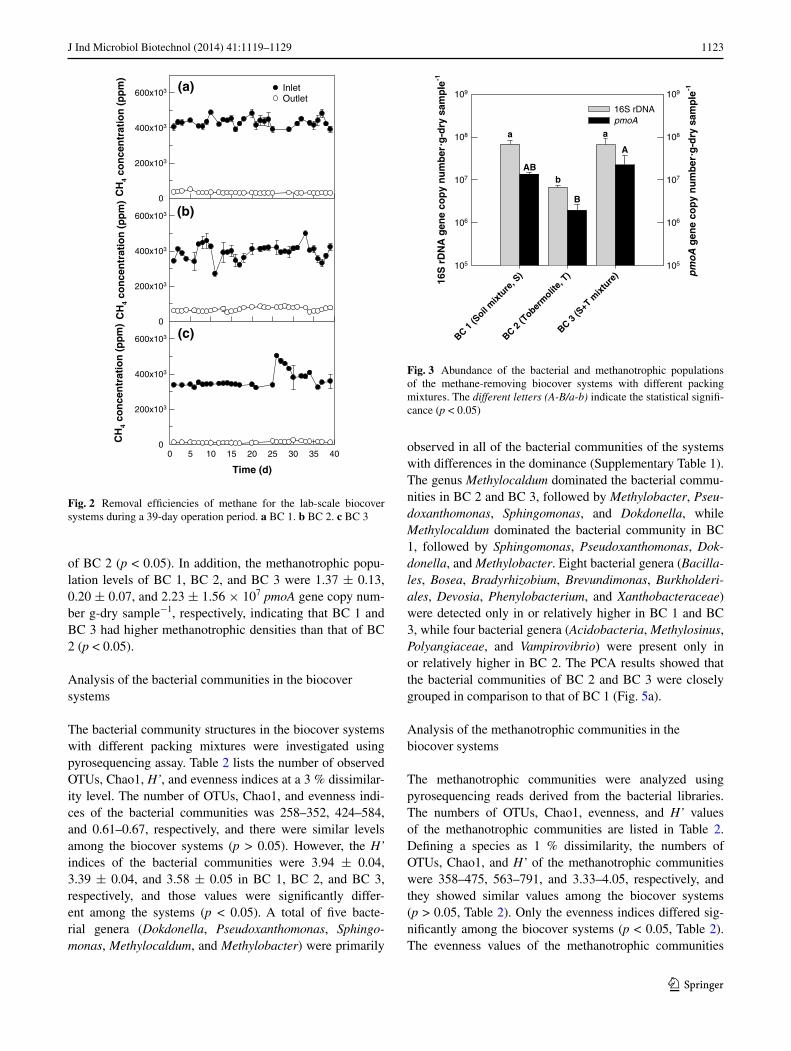
1123J Ind Microbiol Biotechnol (2014) 41:1119–1129
1 3
of Bc 2 (p < 0.05). In addition, the methanotrophic popu-lation levels of Bc 1, Bc 2, and Bc 3 were 1.37 ± 0.13, 0.20 ± 0.07, and 2.23 ± 1.56 × 10⁷ pmoA gene copy num-ber g-dry sample−1, respectively, indicating that Bc 1 and Bc 3 had higher methanotrophic densities than that of Bc 2 (p < 0.05).
analysis of the bacterial communities in the biocover systems
the bacterial community structures in the biocover systems with different packing mixtures were investigated using pyrosequencing assay. table 2 lists the number of observed OtUs, chao1, H’, and evenness indices at a 3 % dissimilar-ity level. the number of OtUs, chao1, and evenness indi-ces of the bacterial communities was 258–352, 424–584, and 0.61–0.67, respectively, and there were similar levels among the biocover systems (p > 0.05). However, the H’ indices of the bacterial communities were 3.94 ± 0.04, 3.39 ± 0.04, and 3.58 ± 0.05 in Bc 1, Bc 2, and Bc 3, respectively, and those values were significantly differ-ent among the systems (p < 0.05). a total of five bacte-rial genera (Dokdonella, Pseudoxanthomonas, Sphingo-monas, Methylocaldum, and Methylobacter) were primarily
observed in all of the bacterial communities of the systems with differences in the dominance (Supplementary table 1). the genus Methylocaldum dominated the bacterial commu-nities in Bc 2 and Bc 3, followed by Methylobacter, Pseu-doxanthomonas, Sphingomonas, and Dokdonella, while Methylocaldum dominated the bacterial community in Bc 1, followed by Sphingomonas, Pseudoxanthomonas, Dok-donella, and Methylobacter. Eight bacterial genera (Bacilla-les, Bosea, Bradyrhizobium, Brevundimonas, Burkholderi-ales, Devosia, Phenylobacterium, and Xanthobacteraceae) were detected only in or relatively higher in Bc 1 and Bc 3, while four bacterial genera (Acidobacteria, Methylosinus, Polyangiaceae, and Vampirovibrio) were present only in or relatively higher in Bc 2. the Pca results showed that the bacterial communities of Bc 2 and Bc 3 were closely grouped in comparison to that of Bc 1 (Fig. 5a).
analysis of the methanotrophic communities in the biocover systems
the methanotrophic communities were analyzed using pyrosequencing reads derived from the bacterial libraries. the numbers of OtUs, chao1, evenness, and H’ values of the methanotrophic communities are listed in table 2. Defining a species as 1 % dissimilarity, the numbers of OtUs, chao1, and H’ of the methanotrophic communities were 358–475, 563–791, and 3.33–4.05, respectively, and they showed similar values among the biocover systems (p > 0.05, table 2). Only the evenness indices differed sig-nificantly among the biocover systems (p < 0.05, table 2). the evenness values of the methanotrophic communities
(a)
CH
4 co
nce
ntr
atio
n (
pp
m)
0
200x103
400x103
600x103 InletOutlet
(b)
CH
4 co
nce
ntr
atio
n (
pp
m)
0
200x103
400x103
600x103
(c)
Time (d)
0 5 10 15 20 25 30 35 40
CH
4 co
nce
ntr
atio
n (
pp
m)
0
200x103
400x103
600x103
Fig. 2 removal efficiencies of methane for the lab-scale biocover systems during a 39-day operation period. a Bc 1. b Bc 2. c Bc 3
BC 1 (S
oil mixt
ure, S
)
BC 2 (T
oberm
olite,
T)
BC 3(S
+T m
ixture
)
16S
rD
NA
gen
e co
py
nu
mb
er. g
-dry
sam
ple
-1
105
106
107
108
109
pm
oA
gen
e co
py
nu
mb
er. g
-dry
sam
ple
-1
105
106
107
108
109
16S rDNApmoA
a a
b
A
AB
B
Fig. 3 abundance of the bacterial and methanotrophic populations of the methane-removing biocover systems with different packing mixtures. the different letters (A-B/a-b) indicate the statistical signifi-cance (p < 0.05)
1124 J Ind Microbiol Biotechnol (2014) 41:1119–1129
1 3
were 0.68 ± 0.03, 0.57 ± 0.03, and 0.55 ± 0.02 in Bc 1, Bc 2, and Bc 3, respectively, thus Bc 1 showed a higher evenness level than Bc 2 and Bc 3. the methanotrophs were more abundant in Bc 2 and Bc 3 than in Bc 1 (Fig. 4). Four methanotrophic genera in total (Methylobacter, Methy-localdum, Methylocystis, and Methylosinus) were observed in all of the systems, but Methylocaldum was the most abundant. the abundances of Methylobacter and Methylo-caldum in the bacterial communities were relatively higher in Bc 2 and Bc 3 than Bc 1. Methylocystis and Methyl-osinus were present in all of the methanotrophic communi-ties and their abundances in the bacterial communities were comparable among the biocover systems. the Pca results also indicated that the methanotrophic communities of Bc 2 and Bc 3 were more closely grouped than with that of Bc 1 (Fig. 5b). the methanotrophs comprised approximately 63 and 62 % of the bacterial communities in Bc 2 and Bc 3, respectively, while they comprised only 46 % of the bacte-rial community in Bc 1 (Fig. 4). the methanotrophs domi-nated the bacterial communities in Bc 2 and Bc 3.
Effects of environmental changes on the performance of Bc 3
to assess the effects of environmental conditions such as temperature and pH changes on the performance of the methane-removing biocover systems, the packing mix-ture that showed the greatest methane removal efficiency and capacity was collected from Bc 3. Batch-scale experi-ments were applied to estimate the effects of the environ-mental changes on the performance of Bc 3. qrt-Pcr was employed for the quantitative analysis of the bacterial and methanotrophic population changes with respect to the envi-ronmental conditions. Methane oxidation was observed over a temperature range of 15–40 °c, although it showed differ-ent methane oxidation rates (Fig. 6). Methane was immedi-ately oxidized without a lag period at all of the temperatures, but the methane oxidation declined rapidly at 15 and 20 °c, as indicated by the methane oxidation rates (Fig. 6a). the maximum methane oxidation rate was 88 ± 3.8 μmol g-dry sample−1 h−1 at 35 °c, followed by 85 ± 17 μmol g-dry sample−1 h−1 and 75 ± 3.2 μmol g-dry sample−1 h−1 at 40 and 30 °c, respectively (Fig. 6b). the methane oxida-tion rates declined to approximately 8, 38, and 65 % of the maximum oxidation rate at 15, 20, and 25 °c, respectively. However, the qrt-Pcr showed that the bacterial and meth-anotrophic populations were not significantly changed with changes in the temperature (Fig. 6c). Both the bacterial and methanotrophic population levels were slightly lower at 15 and 20 °c, but they remained at the levels of 1011 16S rDna gene copy number g-dry sample−1 and 107 pmoA gene copy number g-dry sample−1 over a range of 15–40 °c, respectively.
7.72%
BC 1 (S
oil mixt
ure, S
)
BC 2 (T
oberm
olite,
T)
BC 3 (S
+T m
ixture
)
Per
cen
tile
(%
)
0
20
40
60
80
100
MethylobacterMethylocaldumMethylocystisMethylosinusNon-methanotrophs
32.71%
3.74%1.57%
54.26%
37.27%
3.59%3.35%
43.92%
11.87%
38.28%
1.48%3.13%
40.94%
16.17%
Fig. 4 comparison of the methanotrophic and non-methanotrophic community compositions in the methane-oxidizing biocovers with different packing mixtures: relative abundance of the methanotrophs in the bacterial communities
2.0-2.0
1.5
-1.5
PC1 (78.4%)
PC
2 (1
7.4%
)
2.0-2.0
1.5
-1.5
PC
2 (8
.7%
)
PC1 (90.3%)
(b)
(a)
T
S
S+T
TS
S+T
Fig. 5 Principal component analysis (Pca) of relative abundances of OtUs from the 16S rrna pyrosequencing data for comparison of the bacterial (a) and methanotrophic communities (b) in the methane-oxidizing biocover systems with different packing mixtures. S (open square), soil mixture; t (open circle), tobermolite; S + t (open trian-gle), soil mixture + tobermolite

1125J Ind Microbiol Biotechnol (2014) 41:1119–1129
1 3
the effects of varied pH levels on the methane oxidation of the packing mixture from Bc 3 incubated at 30 °c were examined. Methane was oxidized with a 1 day lag period at pH levels of 5 and 8, whereas no lag period was observed for methane oxidation at pH levels of 6 and 7 (Fig. 7a). the methane oxidation rate was approximately 57 μmol g-dry sample−1 h−1 at pH levels between 6 and 8, while it declined to 75 % of the maximum methane oxidation rate at a pH level of 5 (Fig. 7b). Both the bacterial and methano-trophic population levels remained with the densities of 1012 16S rDna gene copy number g-dry sample−1 and 108 pmoA gene copy number g-dry sample−1 over a range of pH levels from 5 to 8, respectively (Fig. 7c). the optimum conditions for the methane oxidation of the packing mixture from Bc 3 were 30–40 °c and pH levels between 6 and 7.
Discussion
three biocover systems were operated with different packing mixtures and their performance and bacterial
communities were evaluated to develop the most efficient system for methane removal. the removal efficiencies and capacities of methane varied with the packing mix-tures of the biocover systems, although all of the systems were stably operated for 39 days without an acclimation period (Fig. 2). Bc 3 (soil mixture + tobermolite, S + t mixture) showed the greatest performance of the methane removal efficiency and capacity with values of 67 % and 292.6 g-cH4 m
−2 d−1, respectively, at a space velocity of 0.12 h−1, while Bc 1 (soil mixture, S) and Bc 2 (tobermo-lite, t) showed lower methane removal efficiencies and capacities of 27–30 % and 106–111.4 g cH4 m−2 d−1, respectively. these results indicate that the addition of tobermolite to the soil mixture improved the biocover system performance and this system is more efficient for methane oxidation than those of previous studies using mixed packing materials. Park et al. [27] reported that the methane removal capacity was 233.6 g-cH4 m−2 d−1 at a space velocity of 0.027 h−1 from a biocover with a soil and earthworm cast mixture (3:2, w/w) and this capacity level was greater than that from a biocover with a soil and
CH
4 co
nce
ntr
atio
n (
pp
m)
(a)
Time (d)
0 1 2 3 4 5 6 70
20x103
40x103
60x103
80x103
100x103
120x103
15 οC
20 οC
25 οC
30 οC
35 οC
40 οC
(b)
Temperature (οC)
15 20 25 30 35 40
CH
4 o
xid
atio
n r
ate
( µm
ol. g
-dry
sam
ple
-1. h
-1)
0
20
40
60
80
100
120
ab
a
b
e
d
c
Temperature (οC)
15 20 25 30 35 40
16S
rD
NA
gen
e co
py
nu
mb
er. g
-dry
sam
ple
-1
108
109
1010
1011
1012
1013
1014
pm
oA
gen
e co
py
nu
mb
er. g
-dry
sam
ple
-1
105
106
107
108
109
1010
1011
16S rDNApmoA
(c)A
AB BCBCC
C
cbc
bc
aabc ab
Fig. 6 Effects of temperature changes on the methane oxidation and bacterial and methanotrophic populations of the S + t mixture col-lected from Bc 3. time profiles of the methane oxidation (a), the
methane oxidation rates (b), and the abundance of the bacterial and methanotrophic populations (c) at different temperatures. the differ-ent letters (A-C/a-e) indicate the statistical significance (p < 0.05)
(a)
Time (d)0.0 0.5 1.0 1.5 2.0 2.5 3.0 3.5 4.0
CH
4 C
on
cen
trat
ion
(p
pm
)
0
20x103
40x103
60x103
80x103
100x103
pH 5pH 6pH 7pH 8
(b)
pH5 6 7 8
CH
4 o
xid
atio
n r
ate
( µm
ol. g
-dry
sam
ple
-1. h
-1)
0
10
20
30
40
50
60
70
a a
a
b
pH5 6 7 8
nu
mb
er. g
-dry
sam
ple
-1
108
109
1010
1011
1012
1013
1014
pm
oA
gen
eco
py
nu
mb
er. g
-dry
sam
ple
-1
105
106
107
108
109
1010
1011
16S rDNApmoA
(c)
aa
a a
A A A A
16S
rD
NA
gen
e co
py
Fig. 7 Effects of pH changes on the methane oxidation and the bac-terial and methanotrophic populations of the S + t mixture collected from Bc 3. time profiles of the methane oxidation (a), the methane
oxidation rates (b), and the abundance of the bacterial and methano-trophic populations (c) at different pH levels. the same letters (A or a) indicate statistical non-significance (p > 0.05)

1126 J Ind Microbiol Biotechnol (2014) 41:1119–1129
1 3
powdered activated carbon mixture (3:2, w/w). Kettunen et al. [15] found that the methane removal capacity was 31.4 g-cH4 m
−2 d−1 at a space velocity of 0.012–0.016 h−1 from a biocover using a mixture of mature sewage sludge compost, de-inking waste, and sand (4:2:4, w/w). Perdikea et al. [28] reported that a biocover with compost and saw-dust (9:1, w/w) showed a methane removal capacity of 11.3 g-cH4 m−2 d−1 at a space velocity of 0.001 h−1. In comparison with the results of the previous studies, Bc 3 showed a greater or comparable removal capacity of meth-ane at a space velocity of at least fourfold faster, indicat-ing greater system performance of methane removal by Bc 3. Physical gas adsorption was not observed in the systems containing the packing mixtures, indicating that methane was biologically consumed by methanotrophs (data not shown).
the methane removal capacity is associated with the properties of the packing materials. In general, the poros-ity, coarseness, water holding capacity, and organic matter content are considered as key factors of the packing mate-rials for the optimum methane consumption of methano-trophs [6, 16, 31]. tobermolite showed those properties with a high porosity and a water holding capacity of 72.1 % (v/v) and 83.5 % (w/w), respectively, but it had a low organic matter content of 4.79 ± 0.35 % (w/w) (table 1) [14]. In contrast, the soil mixture had a high organic mat-ter content of 21.14 ± 0.90 %, but it showed a low water holding capacity and a high bulk density of 38.66 % and 0.73 g ml−1, respectively. therefore, tobermolite com-bined with the soil mixture synergistically improved the physico-chemical properties with respect to the high poros-ity, water holding capacity, and low bulk density as well
as organic matter supply. Kightley et al. [16] reported that methane oxidation rate was higher of coarse sand (10.4 mol of cH4 m
−2 d−1) than that of fine sand or clay (7 mol of cH4 m−2 d−1). Bender and conrad [1] also showed that larger particles had greater specific activities of methane oxidation than smaller particles. Molecular ecological approaches were employed to examine how the packing mixtures influence the bacterial and methanotrophic com-munities in the biocover systems. the bacterial and meth-anotrophic population densities varied with the packing mixtures of the biocover systems, both of them were higher in Bc 1 and Bc 3 than Bc 2 (p < 0.05, Fig. 3). these sig-nificant increases in the populations were only observed in the biocover systems amended with the soil mixture (table 1). Bc 1 and Bc 3 containing the soil mixture had high organic matter contents of 18.30–21.14 %, presuma-bly derived from the earthworm cast (a c:n ratio of 40 and an organic matter content of 56.29 %), and this may have influenced the bacterial and methanotrophic populations [18]. Our results were in accordance with those of previous studies. Humer et al. [12] explained that the organic matter content is vitally important in methane oxidation, because organic matter primarily serves as a substrate for micro-organisms and improves the properties of soil. Martineau et al. [22] reported that the methanotrophic activity and populations were enhanced by nutrient amendment. Kight-ley et al. [16] found that the methane oxidation of soil was significantly stimulated by adding sewage sludge.
the bacterial and methanotrophic communities also dif-fered considerably with the packing mixtures of the bio-cover systems, but their changes were distinct from those in the populations. the addition of tobermolite induced a
Table 1 Physico-chemical properties of the packing mixtures
Biocover Bc 1 (Soil mixture, S) Bc 2 (tobermolite, t) Bc 3 (S + t mixture)
Materials landfill soil, gac, earthworm cast, saprolite
tobermolite tobermolite, landfill soil, earthworm cast
Mixing ratio (w/w) 4:2:1:1 1 2:1:1
Organic matter content (%, w/w) 21.14 ± 0.90 4.79 ± 0.35 18.30 ± 2.06
Water holding capacity (%, w/w) 46.94 ± 6.61 83.55 ± 4.44 54.00 ± 2.92
Bulk density (g/ml) 0.73 ± 0.01 0.26 ± 0.01 0.48 ± 0.01
Table 2 Operational taxonomic units (OtUs), species richness, evenness, and diversity estimates of the bacterial and methanotrophic libraries
a total numbers of reads were equalized with the lowest number of reads (1,382 reads)
communitya Sample Dissimilarity OtUs chao1 H’ Evenness
Bacteria Bc 1 3 % 352 ± 33 584 ± 126 3.94 ± 0.04 0.67 ± 0.00
Bc 2 258 ± 50 424 ± 24 3.39 ± 0.04 0.61 ± 0.01
Bc 3 295 ± 40 547 ± 179 3.58 ± 0.05 0.63 ± 0.02
Methanotrophs Bc 1 1 % 381 ± 74 791 ± 175 4.05 ± 0.33 0.68 ± 0.03
Bc 2 358 ± 148 563 ± 182 3.33 ± 0.09 0.57 ± 0.03
Bc 3 475 ± 71 638 ± 59 3.37 ± 0.05 0.55 ± 0.02
1127J Ind Microbiol Biotechnol (2014) 41:1119–1129
1 3
substantial change in the bacterial and methanotrophic community structures. Bc 2 and Bc 3 amended with tobermolite exhibited lower chao1, H’, and evenness index levels of the bacterial and methanotrophic communi-ties than those levels in Bc 1 (table 2). the Pca results demonstrated replicate homogeneity as well as differences among the biocover systems with different packing mix-tures. the Pca results also showed that both of the bac-terial and methanotrophic communities of Bc 2 and Bc 3 were more closely clustered than those of Bc 1 (Fig. 5).
the observed methanotrophs in this study were Methy-lobacter, Methylocaldum, Methylocystis, and Methylosinus. Methylocaldum was most abundant in all of the systems (Fig. 4). Interestingly, the abundances of Methylocaldum and Methylobacter in the bacterial communities increased in Bc 2 and Bc 3. this result is consistent with the fact that methanotrophs were shown to comprise approximately 60 % of the bacterial communities in Bc 2 and Bc 3, which is higher than that of Bc 1 (Fig. 4). these results indicate that the addition of tobermolite may enhance the methanotrophic abundance of the bacterial communities and influence their structures. Plessis et al. [10] reported that known methane-oxidizing bacteria were not retrieved from a biofilter with a mixture of compost pine bark and perlite, since the intrinsic complexity of the compost may be ascribed to low selectivity for the growth of methano-trophs. Kim et al. [18] also reported that methanotrophs comprised 29 % of the active community (Dna) in a lab-scale methane-degrading biocover.
compared to previous studies, tobermolite might pro-vide a good environment for the growth of methanotrophs. redundancy analysis (rDa) was performed to investigate the relationship between the bacterial community composi-tion and the packing mixtures. rDa revealed that all of the methanotrophs (Methylobacter, Methylocaldum, Methy-locystis, and Methylosinus) were positively correlated with tobermolite, while Dokdonella and Sphingomonas were negatively correlated with tobermolite (data not shown). those six bacterial genera (Methylobacter, Methylocaldum, Methylocystis, Methylosinus, Dokdonella, and Sphingo-monas) comprised at least 60 % of all of the bacterial com-munities, indicating that tobermolite primarily influenced the bacterial communities of Bc 2 and Bc 3. although eight bacterial genera (Bacillales, Bosea, Bradyrhizobium, Brevundimonas, Burkholderiales, Devosia, Phenylobacte-rium, and Xanthobacteraceae) were positively correlated with the soil mixture, their changes were insignificant due to the minor proportion of the bacterial communities that they comprised (data not shown). these results also support the fact that tobermolite significantly changed the bacterial communities and enhanced the methanotrophic proportion in particular. therefore, these changes possibly accounted for the greatest performance of Bc 3 for methane removal.
to evaluate the suitability of the S + t mixture as a packing material in the field conditions, we examined the effects of environmental variables such as temperature and pH changes on the methane oxidation of the S + t mixture collected from Bc 3. the methane oxidation of the S + t mixture varied significantly as a function of the incubation temperatures ranging from 15 to 40 °c (Fig. 6). Batch tests showed a significant response to tem-perature changes between 15 and 20 °c, whereas they showed a minimal response to pH changes, as indicated by the methane oxidation rates (Figs. 6, 7). the methane oxidation rates declined rapidly at 15 and 20 °c, perhaps due to the metabolic instability at low temperatures. this result suggests that the S + t mixture might be strongly dependent on the temperature rather than the pH changes. However, the methane oxidation remained at least 65 % of the maximum oxidation at mesophilic temperatures (25–40 °c) and at a range of pH levels between 5 and 8. Our findings are consistent with those of previous studies that showed most of the methanotrophs maintained their methane oxidation activity over a range of 20–37 °c and a pH range of 5.5–8.5 with a difference in the optimum conditions [2, 9, 12, 24, 26].
to the best of our knowledge, this is the first report to evaluate tobermolite as a packing material in landfill bio-cover systems for methane removal. Our findings indicate that the biocover performance for methane removal was greatly improved by adding tobermolite to the soil mix-ture. Due to its high porosity, tobermolite offers more sur-faces for methanotrophic colonization as compared to the soil mixture without tobermolite and it also improves the gas diffusion by increasing the contact area. In addition, its high porosity induces high gas permeability [23] and this greater gas penetration is advantageous for methane removal due to the fact that it allows oxidation to occur in the deeper soil.
Conclusions
Significant enhancement of the methane removal capacity could be achieved in the soil mixture biocover amended with tobermolite. the soil and tobermolite mixture syn-ergistically improved their physico-chemical properties with respect to the high porosity, water holding capacity, and low bulk density as well as organic matter supply. the soil mixture increased the bacterial biomass and tobermo-lite served as a suitable habitat for the selective growth of the methanotrophs as well as improving gas permeability. Since the mixture of soil and tobermolite showed greater methane removal capacity (293 g-cH4 m
−2 d−1), this mix-ture is a highly competitive packing bed material for meth-ane-removing biocover systems.

1128 J Ind Microbiol Biotechnol (2014) 41:1119–1129
1 3
Acknowledgments this research was supported by Basic Science research Program through the national research Foundation of Korea (nrF) funded by the Ministry of Science, Ict and future Plan-ning (nrF-2012r1a2a2a03046724). this research was also sup-ported by the Basic Science research Program through nrF funded by the Ministry of Education, Science, and technology (MESt) (r0a-2008-000-20044-0).
References
1. Bender M, conrad r (1994) Methane oxidation activity in vari-ous soils and freshwater sediments: occurrence, characteristics, vertical profiles, and distribution on grain size fractions. J geo-phys res atmos 99(D8):16531–16540. doi:10.1029/94JD00266
2. Bender M, conrad r (1995) Effect of cH4 concentra-tions and soil conditions on the induction of cH4 oxi-dation activity. Soil Biol Biochem 27(12):1517–1527. doi:10.1016/0038-0717(95)00104-M
3. Bogner J, Matthews E (2003) global methane emissions from landfills: new methodology and annual estimates 1980-1996. global Biogeochem cy 17 (2). doi:10.1029/2002gb001913
4. Bogner J, Pipatti r, Hashimoto S, Diaz c, Mareckova K, Diaz l, Kjeldsen P, Monni S, Faaij a, gao Q, Zhang t, ahmed Ma, Sutamihardja rt, gregory r, Intergovernmental Panel on cli-mate change Working g, III (2008) Mitigation of global green-house gas emissions from waste: conclusions and strategies from the Intergovernmental Panel on climate change (IPcc) Fourth assessment report. Working group III (Mitigation). Waste Manag res J Int Solid Wastes Public clean assoc ISWa 26(1): 11–32
5. Bogner J, Spokas K, chanton J, Powelson D (2005) Modeling landfill methane emissions from biocovers: a combined theoret-ical-empirical approach. In: 05, international solid and hazardous waste symposium, University of cagliari, Sardinia, cISa
6. Borjesson g, Sundh I, tunlid a, Frostegard a, Svensson BH (1998) Microbial oxidation of cH4 at high partial pressures in an organic landfill cover soil under different moisture regimes. FEMS Microbiol Ecol 26(3):207–217
7. cole Jr, Wang Q, cardenas E, Fish J, chai B, Farris rJ, Kulam-Syed-Mohideen aS, Mcgarrell DM, Marsh t, garrity gM, tiedje JM (2009) the ribosomal database project: improved alignments and new tools for rrna analysis. nucleic acids res 37((Database issue)):D141–D145. doi:10.1093/nar/gkn879
8. czepiel PM, Mosher B, crill PM, Harriss rc (1996) Quantifying the effect of oxidation on landfill methane emissions. J geophys res atmos 101(D11):16721–16729. doi:10.1029/96JD00222
9. De visscher a, Schippers M, van cleemput O (2001) Short-term kinetic response of enhanced methane oxidation in landfill cover soils to environmental factors. Biol Fertil Soils 33(3):231–237. doi:10.1007/s003740000313
10. du Plessis ca, Strauss JM, Sebapalo EMt, riedel KHJ (2003) Empirical model for methane oxidation using a composted pine bark biofilter. Fuel 82(11):1359–1365. doi:10.1016/S0016-2361(03) 00040-1
11. gontcharova v, youn E, Wolcott rD, Hollister EB, gentry tJ, Dowd SE (2010) Black box chimera check (B2c2): a win-dows-based software for batch depletion of chimeras from bac-terial 16S rrna gene datasets. Open Microbiol J 4:47–52. doi:10.2174/1874285801004010047
12. Humer M, lechner P (1999) alternative approach to the elimi-nation of greenhouse gases from old landfills. Waste Manag res J Int Solid Wastes Public clean assoc ISWa 17(6):443–452. doi:10.1034/j.1399-3070.1999.00064.x
13. Huson DH, auch aF, Qi J, Schuster Sc (2007) MEgan analysis of metagenomic data. genome res 17(3):377–386. doi:10.1101/gr.5969107
14. Jeong Sy, yoon Hy, Kim tg, cho KS (2013) Effect of tobermo-lite, perlite and polyurethane packing materials on methano-trophic activity. Korean J Microbiol Biotechnol 41(2):215–220
15. Kettunen rH, Einola JKM, rintala Ja (2006) landfill methane oxidation in engineered soil columns at low temperature. Water air Soil Poll 177(1–4):313–334. doi:10.1007/s11270-006-9176-0
16. Kightley D, nedwell DB, cooper M (1995) capacity for methane oxidation in landfill cover soils measured in laboratory-scale soil microcosms. appl Environ Microbiol 61(2):592–601
17. Kim tg, Moon KE, lee EH, choi Sa, cho KS (2011) assessing effects of earthworm cast on methanotrophic community in a soil biocover by concurrent use of microarray and quantitative real-time Pcr. appl Soil Ecol 50:52–55. doi:10.1016/j.apsoil.2011.07.011
18. Kim tg, Moon KE, yun J, cho KS (2013) comparison of rna- and Dna-based bacterial communities in a lab-scale methane-degrading biocover. appl Microbiol Biotechnol 97(7):3171–3181. doi:10.1007/s00253-012-4123-z
19. Kim tg, yi t, lee EH, ryu HW, cho KS (2012) characterization of a methane-oxidizing biofilm using microarray, and confocal microscopy with image and geostatic analyses. appl Microbiol Biotechnol 95(4):1051–1059. doi:10.1007/s00253-011-3728-y
20. lee EH, Park H, cho KS (2010) characterization of methane, benzene and toluene-oxidizing consortia enriched from landfill and riparian wetland soils. J Hazard Mater 184(1–3):313–320. doi:10.1016/j.jhazmat.2010.08.038
21. lozupone c, Hamady M, Knight r (2006) UniFrac-an online tool for comparing microbial community diversity in a phylogenetic context. BMc Bioinform 7:371. doi:10.1186/1471-2105-7-371
22. Martineau c, Whyte lg, greer cW (2010) Stable isotope prob-ing analysis of the diversity and activity of methanotrophic bac-teria in soils from the canadian high arctic. appl Environ Micro-biol 76(17):5773–5784. doi:10.1128/aEM.03094-09
23. Mccarthy KP, Brown KW (1992) Soil gas permeability as influ-enced by soil gas-filled porosity. Soil Sci Soc am J 56(4):997–1003. doi:10.2136/sssaj1992.03615995005600040001x
24. Mohanty Sr, Bodelier Pl, conrad r (2007) Effect of tem-perature on composition of the methanotrophic community in rice field and forest soil. FEMS Microbiol Ecol 62(1):24–31. doi:10.1111/j.1574-6941.2007.00370.x
25. Moon lE, lee Sy, lee SH, ryu HW, cho KS (2010) Earthworm cast as a promising filter bed material and its methanotrophic contribution to methane removal. J Hazard Mater 176(1–3):131–138. doi:10.1016/j.jhazmat.2009.11.007
26. Mor S, De visscher a, ravindra K, Dahiya rP, chandra a, van cleemput O (2006) Induction of enhanced methane oxidation in compost: temperature and moisture response. Waste Manag 26(4):381–388. doi:10.1016/j.wasman.2005.11.005
27. Park S, lee I, cho c, Sung K (2008) Effects of earthworm cast and powdered activated carbon on methane removal capacity of landfill cover soils. chemosphere 70(6):1117–1123
28. Perdikea K, Mehrotra aK, Hettiaratchi JP (2008) Study of thin biocovers (tBc) for oxidizing uncaptured methane emis-sions in bioreactor landfills. Waste Manag 28(8):1364–1374. doi:10.1016/j.wasman.2007.06.017
29. rahalkar M, Deutzmann J, Schink B, Bussmann I (2009) abun-dance and activity of methanotrophic bacteria in littoral and pro-fundal sediments of lake constance (germany). appl Environ Microbiol 75(1):119–126. doi:10.1128/aEM.01350-08
30. reeburgh WS, Whalen Sc, alperin MJ (1993) the role of methy-lotrophy in the global methane budget. In: Murrel Jc, Kelly DP (eds) Microbial growth in c1 compounds. Intercept limited, andover, Mass., pp 1–14
1129J Ind Microbiol Biotechnol (2014) 41:1119–1129
1 3
31. Scheutz c, Kjeldsen P, Bogner JE, De visscher a, gebert J, Hilger Ha, Huber-Humer M, Spokas K (2009) Microbial methane oxidation processes and technologies for mitigation
of landfill gas emissions. Waste Manag res J Int Solid Wastes Public clean assoc ISWa 27(5):409–455. doi:10.1177/0734242x09339325


![[Lab Report] PSpice](https://static.fdokumen.com/doc/165x107/631a338ebb40f9952b01e638/lab-report-pspice.jpg)