Timor-Leste MICS 2002 - Report - IHSN Survey Catalog
149
Timor-Leste MICS 2002 - Report
-
Upload
khangminh22 -
Category
Documents
-
view
1 -
download
0
Transcript of Timor-Leste MICS 2002 - Report - IHSN Survey Catalog
Timor-Leste MICS 2002 - Report
ii Timor-Leste MICS 2002 - Report
UNICEF, Dili, Timor-Leste
Multiple Indicator Cluster Survey (MICS – 2002)
Prepared for the Government of Republica Democratica De Timor-Leste
May 2003
Timor-Leste MICS 2002 – Report
iii
iv Timor-Leste MICS 2002 - Report
Acknowledgements
We wish to express sincere gratitude towards the Timorese people who responded to the numerous questions during the field work. We are also thankful to Dr. Mari Bim Amude Alkatiri, then the Chief Minister and Minister of Economic and Development of the East Timor Transitional Administration for endorsing the survey and Dr. Rui Maria de Araujo, Minister of Health, Mr. Luis Lobato, Vice minister of Health, Mrs. Aicha Bassarewan, Vice Minister of Planning and Finance, and Ms. Emilia Pires, Advisor of Planning and External Assistance Management Division, Ministry of Planning and Finance for their unstinted guidance and support in the preparation of the MICS Report.
The role of the Office of the Statistics in conducting the survey and collating the information has been very strategic and crucial. The office, under the overall direction of Mr. Manuel Mendonca and his deputy Mr. Elias Dos Santos Ferriera, deployed the necessary staff and played an active role in monitoring and management of the field operations. Mr. David Brackfield, advisor to the Statistics office provided constant and valuable technical support to the entire survey.
The report would not have been possible without the grant assistance provided by the Echo Humanitarian Aid Office and other donors for covering transport costs, equipment, recruitment and training for the field work in order to conduct the survey.
Special mention needs to be made of colleagues of UNICEF, Timor- Leste – Dr. Stemberg Vasconcelos, Dr. Rashed Mustafa and Mr. Joao da Costa who provided indispensable and timely administrative support in aspects of training and field monitoring and Ms.Vathinee Jitjaturunt who has given overall coordination in support of the survey. We are also grateful for the comments received from our colleagues at the East Asia & Pacific Regional Office, Dr. Stephen Atwood , Mr. Charles Schegel, Ms. Karen Coding, Mr. Cliff Meyers, Mr. Mark Hereward and Dr. Roger Shrimpton.
Credit is also due to the Cambodian Demographic and Health Survey report, sections of which were used to provide a more technically substantive introduction to some parts of the report, especially those related to maternal and child health.

Timor-Leste MICS 2002 – Report
v
Foreword
UNICEF, Timor-Leste with the joint collaboration of Office of statistics/Timor-Leste has conducted the country’s first Multiple Indicator Cluster Survey (MICS). This report was prepared by UNICEF and presents the most recent and comprehensive information on the children and women of Timor-Leste. The data presented in the report, however, poses a challenge to decision makers in meeting the needs of children, their future and the country’s future. It highlights the underlying poverty and deprivation among the population of Timor-Leste in particular among women and children.
The MICS report draws out the findings from a national sample of 4,000 households. In order to ensure a level of international comparability as well as to provide useful information for the Government of Timor-Leste, UNICEF and its people, the survey follows the fairly well tested design for MICS set out in the UNICEF MICS2 manual (UNICEF,1999). The MICS provides a relevant reference point for the UN Millennium Development Goals, the World Fit for Children and the Medium-Term Strategic Plan of UNICEF and sets a baseline and standards for measuring the priority indicators identified by the Government of Timor-Leste in the National Development Plan.
Mr. Peter Gardiner and Ms Mayling Oey-Gardiner of PT Insan Hitawasana Sejahtera (IHS) from Jakarta conducted the survey, served as the principal contractor, managed the survey and prepared the report. IHS was technically supported by experts from the Indonesian Central Statistics Board (Badan Pusat Statistik or BPS).
The office of Statistics of Timor-Leste played a very crucial role in providing relevant local technical support, organizing the field team and the timely completion of the 4,000 household data collection. Emphasis was also placed on capacity building, both through the intense involvement of the Office of Statistics in managing the field work and through provision for two of their staff in spending time in the IHS office in Jakarta during the data cleaning and processing stage.
The report does not necessarily represent the official view of UNICEF nor the Government of Republica Democratica Timor-Leste. Should there be any comments or queries on the findings of the report, I would like to encourage you to contact UNICEF, Timor-Leste (UN House, Caicoli Street, PO Box 212, Dili, Timor-Leste, TEL: +670 390 313 309, FAX: +670 390 313 322) Yoshiteru Uramoto Special Representative UNICEF, Timor-Leste 27 May 2003
vi Timor-Leste MICS 2002 - Report
Executive Summary Overview
UNICEF developed the Multiple Indicator Cluster Survey (MICS) to monitor goals established at the World Summit for Children (WSC) held in New York in 1990. But it is also consistent with many monitoring needs of the Millennium Development Goals (MDG), as well as those of the more recent World Fit for Children (WFFC) that many countries are now using for human development planning into the 21
st Century. MICS was created especially to meet the needs of developing countries lacking reliable routine sources of statistics and/or experience in carrying out reliable household surveys to measure performance relative to the WSC and, now, the Millennium Development and WFFC Goals.
The MICS is particularly important for Timor-Leste both because of the relevance of the these goals and the indicators that can be estimated from MICS data for policy formulation and planning and because the MICS can be used to establish more up-to-date baseline conditions in this newly independent country to help to more clearly define the challenges that lie ahead. The last comparable survey (Indonesian Demographic and Health Survey (DHS)) was carried out in 1997. The recently completed World Bank Poverty Assessment contains some relevant information, but not the depth of attention to child health, development and human rights provided by the MICS.
The Government has also established its own vision and agenda for the county’s future. Supporting that agenda through the provision of reliable base-line information is one of the main reasons for undertaking the MICS at this time. Results of the survey clearly show the extent of current problems, but they can also assist Government in planning the way forward. Strengthening basic health and education infrastructure, including the all-important human resource base of teachers and trained medical personnel, will necessarily be a major priority. But there is also considerable scope for institution building at the community level and working with the people themselves to build demand and strengthen knowledge and capabilities to ensure a sound and healthy environment for children to develop and prosper. There are significant levels of ignorance and lack of power on the part of families and communities to adequately safeguard the rights of children that, in fact, contribute to the current conditions along with deficiencies in the service networks. Building or renewing relevant community-based institutions, particularly through the effective empowerment of women who are the main caregivers, can be a critical vehicle to improve overall conditions for the development of Timor-Leste’s future generations. Survey Organization and Implementation
The MICS survey was carried out for the Government of Republica Democratica De Timor-Leste by UNICEF and was executed by Insan Hitawasana Sejahtera, an Indonesian social science research company under contract to UNICEF and with funding provided by UNICEF and the ECHO Humanitarian Aid Office. It also involved close collaboration with the Timor-Leste Statistics Office (Cabinete de Estatistica), which was responsible for management of all field operations as well as data entry. The role played by the staff of this

Timor-Leste MICS 2002 – Report
vii
office was critical and all efforts were made to involve them and to help develop their capabilities as part of the overall process.
For the Timor-Leste MICS, separate questionnaires for households, women aged 15-49 and children aged 0-4 were adapted directly from relevant modules in the MICS Manual. All of the modules were utilized with the exception of optional modules dealing with food fortification, child disability and maternal mortality. Additional questions were added on housing conditions and household assets to permit calculation of a household “wealth index.” Provision was also made for taking anthropometric measurements of female caregivers as well as children to allow estimation of nutritional status of mothers.
A multi-stage sample design was used to select a total of 4000 households in 200 “clusters” of 20 households each. The first stage involved listing of Suco in serpentine fashion and selection of 200 “clusters” at Suco level with probability proportional to size (pps sampling). The second stage involved assignment of “clusters” to Aldeia within the selected Suco, also using pps sampling. A new listing of households was made for each selected Aldeia by field supervisors during fieldwork. Outside Dili this was based on lists/information provided by Aldeia heads roughly verified by quick observation. In Dili there was a full door-to-door check to verify the listing. Immediately after listing, supervisors drew a fixed random sample of 20 households (separate random numbers tables were provided for each “cluster”), workloads were assigned to interviewers and interviewing was carried out.
Out of 4000 households in the sample, 3982 were successfully interviewed for a response rate of 99.6%. There were a total of 22,962 persons in the interviewed households of whom 4803 were women aged 15-49 and 4493 children under age 5. 4606 of the eligible women and 4454 of the children were covered in the women and child questionnaires giving response rates of 95.9% for women and 99.1% for children. These are all indicative of a high quality of field operations.
Major topics covered in the MICS report include: Population and Household Characteristics Infant and Child Mortality Education Water and Sanitation Child Malnutrition Child Health HIV/AIDS Reproductive Health Other Child Rights
Results are presented at the national level and also by region using breakdowns
similar to those used in the Suco Survey. These include:
Urban/Rural – Defined at the Suco level as in the Suco Survey. A special category of Major Urban was also used that included all urban Suco in the districts of Dili and Baucau,
Highland/Lowland – With highland including all Suco with most of their area above
500 meters elevation, and
viii Timor-Leste MICS 2002 - Report
East/Central/West – where: East = Districts of Baucau, Lautem and Viqueque; Central = Districts of Alieu, Ainaro, Dili, Ermera, Liquica, Manufahi and Manatuto; West = Distircts of Bobonaro, Covalima and Oecussi
Population and Household Characteristics
About 24 percent of the population resides in urban Suco, with nearly 14 percent of
these living in the major urban centers of Dili and Baucau. Over half of the population lives in the Central Region, and about two-thirds in lowland areas. Average household size is just under 6 persons. And it is larger in urban than in rural areas.
The most striking aspect of the Timor-Leste age and sex structure is its youthfulness. Overall, almost one-fifth of the population is under 5 years old, slightly over half are less than 15 years old and about two-thirds are less than 25 years old. The overall sex ratio (number of males per 100 females) is 102 indicating a dominance of males. Male dominance is particularly high in the major urban areas (111) and among those 50 years and over (118). About one-third of households consist of 1-4 persons, another third 5-6 persons and the last third of 7 persons or more. Very large households are more characteristic of the major urban areas (Dili/Baucau) where there is evidence of cases of more than one family living together. However, nuclear families are the norm. 78 percent of households consist only of mother and/or father and/or children. Non-nuclear households are most common in the major urban areas.
Ninety-seven percent of households are owned. Only in urban areas are other forms of non-ownership arrangements at all significant. The average household has between 3 and 4 rooms and about 50 m2 of floor area. There is only moderate variation among different strata.
The most common house has a zinc roof, wood or bamboo walls and a dirt floor. More permanent houses with brick walls and concrete floors are mainly an urban phenomenon.
Access to electricity is largely limited to urban areas. In Dili/Baucau, 92 percent of
households have electric lighting. In rural areas the figure is only 13 percent. Wood is the dominant fuel for cooking. Only in Dili/Baucau do more than 10 percent of households use non-wood sources (mainly kerosene).
Ownership of key durable goods is very low and is largely confined to the major urban centers. Even radio/tape ownership in rural areas is less than 30 percent and only about 10 percent of rural households have a TV. Infant and Child Mortality
Eight to nine out of every 100 children born die before reaching their first birthday. Another 3 to 4 die before reaching age 5. Risk of dying is markedly higher in rural than in urban areas and particularly in highland regions of the country. In highland areas almost 15 percent of children die before reaching age 5 compared with less than 7 percent in the major urban strata that includes Dili and Baucau.
Timor-Leste MICS 2002 – Report
ix
These figures are high, but not as high as some other estimates such as those by the UN Population Division. However, these estimates are also made using indirect techniques and refer to a point in time about 3-4 years before the survey. Education
Early childhood education (e.g. playschool or pre-school) is almost non-existent.
Only 2 percent of children aged 36-59 months attend any form of early childhood education program.
Access to basic education, particularly at primary level, is seen as a fundamental right of children. MICS included special questions on recent schooling for children between 5 and 17 years of age. The analysis focuses on these ages and on attendance patterns in the six years of primary school and 3 years of lower secondary school that are the official periods of schooling in Timor-Leste.
Gross, net and age-specific attendance rates have generally maintained or at least appear to have returned to levels close to pre-1999 standards at primary level. But there is evidence of some very slight deterioration in performance at lower secondary level.
Primary school attendance among 7-12 year-olds is around 90 percent in Dili/Baucau, but in rural and highland areas only about 70 percent of this age group is attending school. Part of the reason is late entrance. Only 55 percent of children age 7 and 72 percent of children age 8 were attending school in the academic year before the survey. There is also considerable age variation in children attending different grades in primary and lower secondary school and there are large numbers of “over-age” children, particularly at the higher grades. Also, while about 10 percent of children never attend school, once they do attend dropout rates are quite low, at least up to about age 14 or 15.
About 60 percent of adults claim to be able to read a newspaper. However, the figure varies from about 85 percent for 15-34 year-olds to less than 20 percent at ages 55 and over.
These literacy rates are mirrored in data on educational attainment of the adult population and have implications for labor policy and planning. For example, 67 percent of males and fully 87 percent of females age 35-44 (prime ages in terms of workforce participation) have less than a complete primary education. Water and Sanitation
Overall, about 55 percent of the population has access to safe water. It is over 70 percent in urban areas, but only around 50 percent in highland and rural areas of the country.
Access to safe means of excreta disposal, however, is very low. Almost 45 percent of the population has no toilet facility and of those with toilet facilities, probably less than half can be considered safe.

x Timor-Leste MICS 2002 - Report
Child Malnutrition
Children who are well nourished develop better physically and mentally and are less likely to contract various childhood diseases. Thus it should not be surprising the MICS pays particular attention to issues and indicators associated with child nutritional status. These include: Child malnutrition based on anthropometric measurements Breastfeeding Salt iodination Vitamin A supplementation (for both children and mothers) Low birth weight
Anthropometric measurements of height and weight can be used to assess child
nutritional status. Three basic measures are used: Weight for height (wasting) Height for age (stunting) Weight for age (underweight)
Malnutrition is measured in terms of Standard Deviations (SD) from an international
(World Health Organization) standard. Based on these measurements, about 12 percent of children under age 5 are
moderately or severely wasted, 47 percent moderately or severely stunted and 43 percent moderately or severely underweight according to WHO standards. Children around ages 1-2 who are shifting away from regular breastfeeding are particularly at risk.
Median duration of breastfeeding is just over 15 months. By 20-23 months of age only about 10 percent of children are still being breastfed. Introduction of food also comes early. By 6 months of age only a bit over 15 percent of children are still being exclusively breastfed and more than 60 percent of those being breastfed are already receiving some form of complimentary food.
About 72 percent of households have access to adequately iodized salt (> 15 ppm). Only in the Western Region does the figure fall below 60 percent.
Just over 50 percent of children aged 6 to 59 months had received a high dose Vitamin A supplement. And 35 percent of children in this age group had received a dose within the past 6 months. 39 percent of children receiving Vitamin A got the latest dose on a routine clinic visit, 19 percent on a clinic visit with a sick child and 25 percent during a national immunization day.
Children under 6 months are supposed to be protected by Vitamin A given to the
mother, and here, protection appears to be less. Only 28 percent of mothers giving birth during the year before the survey had received a Vitamin A dosage during the first two months after giving birth.
Only about 10 percent of babies born in the year before the survey were weighed at birth. Of these about 8 percent were reported as being underweight (< 2500 grams).
Timor-Leste MICS 2002 – Report
xi
However, about 25 percent of women whose babies were not weighed felt that their baby was “smaller than average”. Child Health
The focus here in the MICS is on two major topics: child immunization and childhood diseases. The former focuses on immunization for the 6 major diseases covered under the Extended Program on Immunization (EPI), the latter on three main childhood diseases, diarrhea, acute respiratory infection (ARI) and malaria. It should be noted that disease prevalence in the MICS is estimated by asking respondents about symptoms, not by any formal medical evaluation.
Thirty-seven percent of children aged 12-23 months had received BCG vaccine, 35 percent at least one DPT dosage, 37 percent at least one polio dosage and 28 percent a measles vaccination. However, only 5 percent of these children had been fully protected (one BCG, three DPT, three polio, and one measles inoculation) and fully 58 percent of children aged 12-23 months had never been vaccinated at all.
25 percent of children under age 5 experienced at least one episode of diarrhea during the two weeks preceding the survey. 96 percent of these children received some form of recommended treatment, mainly either water with feeding (58 percent), ORS packets (57 percent) or gruel (49 percent). However quantities were limited. Only 7 percent of children followed recommended procedures of drinking more and continuing eating. Only in the Eastern Region was the figure above 10 percent. Most children (91 percent) drank the same or less than normal.
Acute respiratory infection (ARI) is characterized by coughing accompanied by rapid breathing and often by constriction in the chest. These were the symptoms investigated by MICS. According to this classification, 14 percent of children under age 5 experienced at least one episode of ARI during the two weeks preceding the survey and 57 percent of these children received treatment from an appropriate medical provider (e.g. hospital, health center, dispensary, village health worker or private doctor).
Overall, 56 percent of children experienced some form of illness in the two weeks preceding the survey. However, as with diarrhea, very few (only 7 percent) followed recommended procedures of drinking more and continuing eating.
Knowledge of danger signals for seeking immediate medical attention is also fairly low. Except for “if the child becomes sicker” or “develops a fever” other danger signals are not widely recognized. Overall, 60 percent of caregivers could recognize at least two danger signals, the standard set out for this indicator in the MICS.
Prevalence of fever is used by MICS as an indicator of possible occurrence of malaria. In the MICS, 27 percent of under-5s experienced fever in the two weeks preceding the survey. And about half of these children received anti-malarial drugs.
Bed net use is fairly high, particularly in lowland areas where 60 percent of children use bed nets (the corresponding figure for highland areas is only 22 percent). However, only about 8 percent of children using bed nets had them treated with insecticide.
xii Timor-Leste MICS 2002 - Report
HIV/AIDS
Only 16 percent of women aged 15-49 in Timor-Leste have heard of HIV/AIDS and only a fraction of these can correctly identify all three major ways of preventing HIV/AIDS transmission or the three major misconceptions about the disease.
In fact, even among those who have heard of HIV/AIDS, only about 1% have “sufficient knowledge” defined by being able to correctly identify both ways of preventing transmission and misconceptions about the disease. Knowledge is also highly concentrated among younger women, those living in urban areas and among women with at least some secondary education.
However, 56 percent of women who have heard of HIV/AIDS are aware of the danger of transmittal from mother to child and most of these agree with ways that this can happen. But more disturbing is the finding of a high proportion of women who have heard of HIV/AIDS who still express discriminatory attitudes toward people with the disease. Reproductive Health
The health and well being of mothers is critical to that of their children. Reproductive health, which defines the ability of women to safely bear healthy children is a key factor in the mother and child health nexus. Three main areas are covered: Fertility and use of contraception, Maternal nutritional status, and The extent and nature of antenatal care and delivery care for women.
Current fertility can be estimated from reports of women on births in the year before
the survey. These suggest that fertility in Timor-Leste is currently among the highest in the world with a Total Fertility Rate (TFR) of about 7.4. This means that if current patterns of childbearing were sustained, on average a each woman would bear more than 7 children during her reproductive lifetime. Current patterns also mean that roughly a third of all women aged 20-34 are bearing a child each year.
High fertility is mirrored in very low use of contraception. Only 7 percent of non-pregnant women currently married or living with a male partner are currently using any form of contraception. Two methods, injections and contraceptive pills cover the great majority of use and use is highest among women 25-44 years of age.
Women’s height and the Body Mass Index (BMI) provide rough measures of adult women’s nutritional status. The BMI is computed from adult weight and height. MICS collected these data on women aged 15-49 who acted as caregivers of children under age 5. A BMI of less than 18.5 is suggestive of Chronic Energy Depletion (CED). Twenty-eight percent of women fell in this category; and 7 percent had a BMI below 17.0, which is indicative of moderate or severe CED.
Just over half (53 percent) of women who gave birth during the year preceding the survey had some form of antenatal care. About four-fifths of these or 43 percent of all women giving birth had at least one antenatal visit with skilled medical or paramedical personnel (e.g. doctor, nurse, midwife or auxiliary nurse).
Timor-Leste MICS 2002 – Report
xiii
Protection of women against neonatal tetanus by giving them tetanus toxoid injections during pregnancy guards against this major cause of neonatal mortality.
An estimated 41 percent of women giving birth during the past year were adequately protected against neonatal tetanus by receiving a relevant number of tetanus toxoid injections. Most of these women (84 percent of those receiving injections) had received them during their latest pregnancy.
However, access to skilled medical assistance at delivery is very low. A skilled practitioner (doctor, nurse, midwife or auxiliary midwife) assisted only 24 percent of women giving birth during the year preceding the survey. In highland areas the figure was only 12 percent. A family member, relative, friend or other person assisted nearly half (48 percent) of women giving birth and fully 18 percent of women had no assistance at all – giving birth completely alone. Other Child Rights
Finally, MICS looks at a few other non-health related aspects of child rights. These include the right to having births registered, the right to be able to live with one’s biological parents and the right not to be forced into excessive or dangerous work.
Birth registration is a recognized means for establishing identity within society. However, in Timor-Leste only 22 percent of children under age 5 claimed to have had their birth registered and certificates were available for less than half of these. Reasons for non-registration clearly show that lack of knowledge rather than avoidance is the major problem.
Three percent of children under age 15 are not living with a biological parent and just over 5 percent have one or both parent’s dead. Among 10-14 year olds, the figures are 5 percent and 9 percent respectively.
Child labor outside the household is relatively low. Only 4 percent of children aged 5-14 were reported as doing paid or unpaid work for non-household members during the week before the survey. Even among 10-14 year-olds it was only 7 percent.
Children, however, assist much more in household-based economic activity or in doing household chores. 15 percent of children (21 percent of 10-14 year-olds) worked in household enterprises and 69 percent (86 percent of 10-14 year-old) in household chores during the reference week.
Overall, about 19 percent of children aged 5-14 can be classified as working by MICS definition (working outside the household, in a household enterprise or doing more than 4 hours per day of household chores). Prevalence of child labor was low (4 percent) in Dili/Baucau, but was more than 20 percent overall in rural areas and nearly 30 percent among children aged 10-14.
xiv Timor-Leste MICS 2002 - Report
Table of Contents Page
Acknowledgements
Foreword Executive Summary Table of Contents
1. Background on MICS
2. Background on Timor-Leste
2.1 Political and Administrative Background 2.2 Demographic and Social Background
3. Survey Design and Methodology
3.1 Questionnaires 3.2 Sample Design 3.3 Interviewer Training and Fieldwork 3.4 Data Input 3.5 Data Processing and Tabulation 3.6 Sample Coverage and Response Rates
4. Population and Household Characteristics
4.1 Regional Distribution of Population and Households 4.2 Age and Sex Structure 4.3 Household Size and Composition 4.4 Housing Conditions and Household Assets Home Ownership and Housing Quality Access to Electrification Cooking Fuel Household Assets and Access to Land 4.5 Estimates of Household Economic or “Wealth Status.”
5. Infant and Child Mortality
6. Education
6.1 Early Childhood Education 6.2 Basic Education
General School Performance – Gross, Net and Age-Specific Enrollment Rates
iii
iv
v
xiii
1
3 3 4
7 7 7 8 9
10 10
13 13 14 17 18 18 19 20 21 22
25
29 29 30
31
Timor-Leste MICS 2002 – Report
xv
Page Regional and Age-Specific Variations in School Enrollment Never-Enrollment, Dropouts and Progression School Attendance Summary and Conclusions
6.3 Adult Literacy and Educational Attainment
7. Water and Sanitation 7.1 Access to Safe Water 7.2 Access to Sanitation
8. Child Malnutrition
8.1 Child Malnutrition – Height and Weight 8.2 Breastfeeding 8.3 Salt Iodization and Vitamin A Supplementation
Salt Iodization Vitamin A Supplementation
8.4 Low Birth Weight
9. Child Health 9.1 Immunization Coverage 9.2 IMCI Initiatives and Malaria
Diarrhea Acute Lower Respiratory Tract Infection (ALRI) Home-based Attention to Illness and Knowledge of When to Seek Medical Attention Malaria
10. HIV/AIDS
Knowledge of HIV/AIDS Knowledge of Means of Preventing HIV Transmission Knowledge of Common Misconceptions About HIV/AIDS Knowledge of HIV Transmission from Mother to Child Discriminatory Attitudes Toward People with HIV/AIDS Knowledge of AIDS Testing
11. Reproductive Health
11.1 Fertility and Contraception Fertility Contraception
11.2 Maternal Nutrition 11.3 Antenatal Care and Delivery Assistance
Antenatal Care
33 36 39 39 40
43 43 45
47 47 52 55 55 57 59
61 61 64 65 67
69 71
75 75 76 78 79 81 81
83 83 83 85 87 88 89
xvi Timor-Leste MICS 2002 - Report
Page
Tetanus Toxoid Delivery Care 12. Other Child Rights
12.1 Birth Registration 12.2 Orphans and Alternative Living Arrangements 12.3 Child Labor
Work Outside the Household Work Inside the Household
Annexes
I. Millennium Development Goals (MDG), World Fit for Children (WFFC) Goals, UNCIEF Priority Areas 2002-2005
II. Standard Tables
III. Sample Design and Sampling
IV. Questionnaires
V. Survey Personnel
VI. Wealth Index Calculation
VII. Sampling Errors
List of Tables and Figures Tables Table 4.1 – Distribution of Population and Households by Main Survey Sampling Strata Table 4.2 – Age Distribution, Median Age and Estimated Total Fertility Rates (TFR), Timor-Leste and Selected World Regions Table 4.3 – Sex Ratios (numbers of males per 100 females) by Age Group and Strata Table 4.4 – Percent Distribution of Households by Household Size and Strata Table 4.5 – Percent Distribution of Household Members by Relationship to Head of Household and Strata
90 92
95 95 96 97 97 98
13
15
16
17
18

Timor-Leste MICS 2002 – Report
xvii
Page Table 4.6 – Percent Distribution of Households by Ownership Status, Average and Per Capita Number of Rooms and Floor Area and Strata Table 4.7 – Percent Distribution of Households by Quality of Construction of Roofs, Walls and Floors for Housing, Main Source of Power for Lighting, Main Fuel for Cooking and Strata Table 4.8 – Percent Distribution of Households by Wealth Score Quintiles and Strata Table 5.1 – Estimates of Infant and Child Mortality Table 6.1 – Gross, Net and Age-Specific Enrollment Rates at Primary and Lower Secondary Level by Sex and Urban Rural Residence, Timor-Leste, 1999 Table 6.2 - Gross, Net and Age-Specific Enrollment Rates at Primary and Lower Secondary Level by Sex and Urban Rural Residence, Timor-Leste, 2002 Table 6.3 – Percent of Adults (Ages 15 and Over) by Level of Completed Education, Strata, Age Group and Sex Table 7.1 – Percent Distribution of Population by Main Source of Drinking Water and Selected Strata Table 7.2 – Percent Distribution of Population by Type of Toilet Facility and Final Means of Excreta Disposal and Selected Strata Table 8.1 – Percent of Under-Five Children who are Moderately or Severely Malnourished by Strata, Sex and Age of Child and Mother’s Education Table 9.1 – Percent of Children Under Age 5 with Diarrhea in the 2 Weeks Preceding the Survey and Percentage Who Took Increased Fluids and Continued Eating by Selected Strata and Age of Child Table 9.2 – Percent of Children Under Age 5 Reported Ill in the 2 Weeks Preceding the Survey and Percentage Who Took Increased Fluids and Continued Eating by Selected Strata and Age of Child Table 9.3 – Percent of Children Under Age 5 by Use and Treatment Status of Bed Nets and by Selected Strata and Mother’s Education Table 10.1 – Percent of All Women Aged 15-49 and Women Who Have Heard of HIV/AIDS Who Know the Main Ways of Preventing HIV Transmission Table 10.2 – Percent of All Women Aged 15-49 and Women Who Have Heard of HIV/AIDS Who Can Correctly Identify Misconceptions About the Disease Table 10.3 – Percent of All Women Aged 15-49 and Women Who Have Heard of HIV/AIDS Who Can Correctly Identify Means of HIV Transmission from Mother to Child by Strata, Age Group of Women and Woman’s Education
19
20
23 25
31
33
42
44
46
49
66
70
73
77
78
79
xviii Timor-Leste MICS 2002 - Report
Page
Table 11.1 – Estimated Age-Specific Fertility Rates and Total Fertility Rate (TFR) Based on Reported Births in the 12 Months Before the Survey Table 11.2 – Percent Distribution of Women Aged 15-49 That Are Caregivers of Children Aged 0-4 by Body Mass Index (BMI), Strata and Caregiver’s Education Table 11.3 – Percent of Women Giving Birth in the Past Year by Use of Antenatal Care (Total and by Skilled Personnel) and by Selected Strata Table 12.1 – Percent of Children Aged 5-14 Working as Paid or Unpaid Labor Outside Household During the Week Before the Survey Table 12.2 – Percent of Children Aged 5-14 Working in the Household and Assisting in Household Chores During the Week Before the Survey
Figures Figure 4.1 – Age and Sex Population Pyramid Figure 4.2 – Percent of Households Owning Durable Goods by Type of Good and Selected Strata Figure 4.3 – Distribution of Households by Wealth Scores (households ranked from lowest to highest score Figure 5.1 – Infant Mortality Rates by Strata, Sex of Child, Mother’s Education and Wealth Score Quintile Figure 5.2 – Under-Five Mortality Rates by Strata, Sex of Child, Mother’s Education and Wealth Score Quintile Figure 6.1 – Percent of Children Aged 7-12 Enrolled in Primary School by Strata Figure 6.2 – Age and Sex-Specific Enrollment Rates of Children Aged 5-17 Years Figure 6.3 – Single-Year Age Distribution of Grade 1 Primary School Students Figure 6.4 – Age Composition of Primary and Lower Secondary School Students by Grade Figure 6.5 – Percent of Population Aged 5-17 Years Who Had Not Yet or Never Enrolled in School by Single Years of Age and Sex Figure 6.6 – Percent of Population Aged 5-17 Years Who Had Dropped Out of School by Single Years of Age and Sex Figure 6.7 – Percent of Population Aged 15+ Who Are Literate by Sex and Strata Figure 6.8 – Percent of Population Aged 15+ Who are Literate by Age Group Figure 8.1 – Percent of Under-Five Children Who Are Moderately Stunted, Wasted or Underweight by Age of Child Figure 8.2 – Percent of Under-Five Children Who Are Severely Stunted, Wasted or Underweight by Age of Child
84
88
90
98
99
15
21
22
26
27
34
35
36
37
38
38
41 41
50
51
Timor-Leste MICS 2002 – Report
xix
Page
Figure 8.3 – Breastfeeding Status of Children Aged 0-35 Months by Single Month of Age Figure 8.4 – Percent of Households Using Adequately Iodized Salt (15 or more ppm) by Strata Figure 8.5 – Percent of Children Aged 6-59 Months Who Have Received a High Dose Vitamin A Supplement by Timing of Supplementation, Strata and Mother’s Education Figure 8.6 – Percent Distribution of Children Receiving Vitamin A Supplementation by Source of Supply Figure 8.7 – Percent Distribution of Births in the Past Year by Perceived Size of Birth (excludes don’t know) Figure 9.1 – Percent of Children Aged 12-23 Months Currently Vaccinated Against Childhood Diseases by Type of Immunization Figure 9.2 – Percent of Children Under Age Five with Diarrhea in the 2 Weeks Preceding the Survey by Type of Treatment Figure 9.3 – Percent of Children Under Age Five with Acute Respiratory Infection (ARI) in the 2 Weeks Preceding the Survey and Percentage of Children with ARI Seeking Appropriate Medical Treatment Figure 9.4 – Percent of Caretakers of Children Under Age Five by Knowledge of Signs for Seeking Immediate Medical Care for the Child Figure 9.5 – Percent of Children Who Were Ill With Fever in the 2 Weeks Preceding the Survey by Type of Treatment Received Figure 10.1 – Percent of Women Aged 15-49 Who Have Heard of HIV/AIDS by Strata and Age Group of Women and Woman’s Education Figure 10.2 – Percentages of Women Aged 15-49 Who Have Heard of HIV/AIDS by District Figure 10.3 – Percent of All Women Aged 15-49 and Women Who Have Heard of HIV/AIDS Who Have Sufficient Knowledge about HIV/AID Transmission Figure 10.4 – Percent of All Women Aged 15-49 and Women Who Have Heard of HIV/AIDS Who Express Discriminatory Attitudes Toward People With the Disease Figure 10.5 – Percent of All Women Aged 15-49 and Women Who Have Heard of HIV/AIDS Who Know Where to Get an AIDS Test and Who Have Been Tested Figure 11.1 – Percent of Women Aged 15-48 Using Contraception by Type of Contraction and Age Group of Women Figure 11.2 – Percent Distribution of Women Aged 15-49 That Are Caregivers of Children Aged 0-4 by Height (in cm.) Figure 11.3 – Percent of Women Aged 15-49 With a Birth in Last Year Protected Against Neonatal Tetanus by Strata and Women’s Education
53
56
57
78
60
63
67
68
71
72
76
77
80
81
82
86
87
91
xx Timor-Leste MICS 2002 - Report
Figure 11.4 – Percent of Women Aged 15-49 With a Birth in the Last Year by Type of Personnel Assisting at Delivery and Selected Strata Figure 12.1 – Percent of Children Under Age 5 by Reason for Non-registration of Birth Figure 12.2 – Percent of Children Aged 0-14 Not Living with Biological Parents and With One or Both Parents Dead by Strata and Age Group of Child Figure 12.3 – Percent of Children Aged 5-14 who are Currently Working by Strata and Sex and Age Group of Child
Page
92
95
96
99
Timor-Leste MICS 2002 – Report
xxi

Timor-Leste MICS 2002 – Report
1
1. Background on MICS The Multiple Indicator Cluster Survey (MICS) was created by UNICEF to provide a range of information relevant to monitoring the goals established at the World Summit for Children (WSC), held in New York in September 1990. The summit established a total of 7 major and 20 supporting goals related to the survival, health, nutrition, education and protection of children to be met over the period up to 2000 and, subsequently, key standard performance indicators to measure progress were also defined. The UN system was given the task of assisting countries to achieve these goals with UNICEF being asked to serve as lead agency in this process.
MICS was created especially to meet the needs of developing countries lacking reliable routine sources of statistics and/or experience in carrying out reliable household surveys to measure performance relative to the WSC goals. Here, UNICEF worked with a number of agencies including the UN Statistical Division, WHO, UNESCO, UNFPA, UNDP, the World Bank, the London School of Hygiene and Tropical Medicine and the Center for Disease Control, USA to develop an affordable, fast and reliable household survey instrument along with sound implementation procedures to measure these standard indicators. The original version of MICS was geared to provide mid-decade monitoring of several of these goals. Based on that experience some revisions were made for purposes of end-decade monitoring and these are reflected in the latest version of MICS (often referred to as MICS2). This is the version that is applied in this survey.
Although MICS was originally designed around the World Summit Goals (and it is
these goals that are referenced in the body of the report), it is equally relevant to the more recently established Millennium Development Goals (MDG) that have been set forward to guide human development policy and programs into the 21st Century. The UN Special Session for Children (UNGASS), where UNICEF served as the Secretariat, endorsed the MDG as a basis for promoting conditions and rights of children as 6 of the 8 goals are seen to relate closely to UNICEF’s core agenda.1
Besides the MDG, in 2002 the UN General Assembly adopted an updated document drawing on the WSC and both the progress as well as new challenges that had arisen during the 1990s. This document, entitled A World Fit for Children (WFFC) covered for key goals2 as well as a number of objectives and targets consistent with the internationally perceived needs of children at the start of the 21st
Century.
Finally, UNICEF’s own core agenda for the period 2002-2005 is outlined in a document “UNICEF’s Priorities for Children 2002-2005” that sets out five priority areas of greatest concern. These are (1) to ensure that every girl and every boy completes a quality
1 The Millennium Development Goals are: (1) to eradicate extreme hunger and poverty, (2) to achieve universal primary education, (3) to promote gender equality and empower women, (4) to reduce child mortality, (5) to improve maternal health, (6) to combat HIV/AIDS, malaria and other diseases, (7) to ensure environmental sustainability, and (8) to develop a global partnership for development. It can easily be seen that the first 6 of these goals are both relevant to UNICEF and to the spirit and purpose of the MICS in regard to child development and welfare in Timor-Leste. 2 These were; (1) promoting healthy lives, (2) providing quality education, (3) protecting against abuse, exploitation and violence, and (4) combating HIV/AIDS.
A I-2 Timor-Leste MICS 2002 – Annex I
primary school education, (2) to promote integrated early childhood development, ensuring that every child has the best possible start in live, (3) to safeguard every child against disease and disability, emphasizing immunization ‘plus’, (4) to stop the spread of HIV/AIDS and ensure that children and young people already affected by the disease are cared for, and (5) to protect every child s that all children can grow up free from violence, exploitation, abuse and discrimination.
All of these documents are important to countries such as Timor-Leste that are
seeking to develop and implement relevant policies and programs to the benefit of their children. To assist in interpretation, relevant goals and targets are summarized in Annex I and are, where possible, cross-referenced in the various substantive sections of the report text. A main advantages of MICS lie in its orientation toward internationally accepted objectives regarding child development and welfare and its use of a standard format that allows for international comparison. Questionnaire design and selection of relevant indicators are also based on a history of experience extending back over the past few decades and thus represent what can be considered to be state of the art in this area. Taking advantage of these benefits will be of major use to the Government of Timor-Leste by providing a set of benchmark indicators that can be not only used for internal planning, but also used to monitor the country’s position and progress relative to other countries in the region.
Timor-Leste MICS 2002 – Report
3
2. Background on Timor-Leste
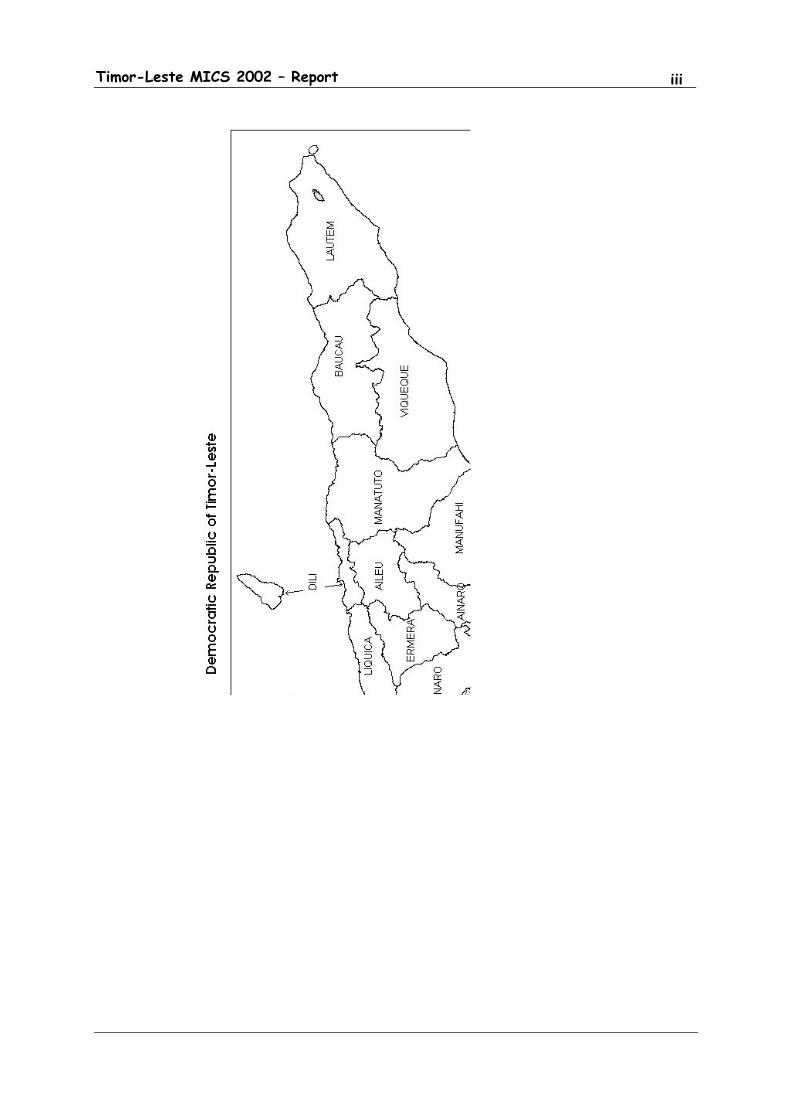
2.1 Political and Administrative Background The Republic of Timor-Leste is the world’s newest country, formally achieving Independence on 20 May 2002. The country is located in the Nusa Tenggara Archipelago that stretches eastward from Bali to the Moluccas. It shares the island of Timor with part of the Indonesian province of East Nusatenggara (see Map 1). The country is divided administratively into 13 distritos (districts), 67 postos (sub-districts), 498 sucos (villages) and 2336 aldeias (sub-villages). These correspond to administrative divisions under Indonesian rule when they were known as kabupaten, kecamatan, desa or kelurahan, and rukun warga (RW), respectively. From the 15th Century up to 1975, Timor-Leste was a colony of Portugal. In July 1975, however, under local and international pressure, Portugal agreed to relinquish control of Timor-Leste in 1978. This timed handover, however, was usurped, first by the Independence movement in Timor-Leste led by Fretelin who declared Independence on 28 November 1975 and then, on 5 December, by an invasion and occupation by Indonesian forces. In 1976, Timor-Leste was formally annexed by Indonesia and declared as the 27th province of that country. Although there is ample evidence that the Indonesian takeover was supported by a number of Western Countries, it was never formally recognized by the United Nations. There was continuing pressure from the Timorese and a number of sympathetic outside sources over the years to allow self-determination, and this finally became possible with the fall of the Suharto government in Indonesia in 1998 and moves toward greater democratization in that country. Starting in mid-1998, negotiations between Indonesia and Portugal, led to agreement to conduct a referendum in August 1999 allowing the citizens of Timor-Leste to choose between Independence and continued integration with Indonesia. Results of that referendum and the violence surrounding it are well known. It resulted in an overwhelming vote for Independence, but also a large amount of violence and destruction that left large numbers homeless and a massive flow of refugees across the border to the neighboring Indonesian Province of East Nusa Tenggara. Peace was restored with the arrival of international forces (under Interfet) in September 1999 and by the establishment of the United Nations Transitional Administration (UNTAET) in October. This administration effectively ran the country up to May 2002, attempting in the process to provide basic services and to reestablish basic functions of government in a civil service that had been dominated, at more senior levels, by Indonesian nationals, virtually all of who left the country following the Independence vote in 1999. On 20 May 2002 government authority was formally transferred to the new independent administration of the Republic of Timor Leste, with Xanana Gusmao as President and Mari Acaltiri as Prime Minister. This makes the timing of the MICS particularly fortuitous as it literally represents a snapshot of conditions around the time of birth of this, the 191st member of the UN family. In this regard it can hopefully help present a picture of
A I-4 Timor-Leste MICS 2002 – Annex I
both progress and problems that will serve the new government in addressing needs of women and children in the society.
2.2 Demographic and Social Background No MICS surveys have been carried out within the area of Timor-Leste. However, there have been a wide variety of household surveys covering social, demographic and health aspects of the population that were carried out before 1999 when Timor-Leste was still under Indonesian occupation. Of particular relevance are the Demographic and Health Surveys (DHS) conducted in 1991, 1994 and 1997; the annual National Socioeconomic Surveys (SUSENAS) – including special modules on health implemented once every three years from the mid 1980s, and the National Health Surveys (1993, 1995) jointly administered by the Indonesian Ministry of Health and the Central Bureau of Statistics (CBS) now officially called the Central Statistics Board (Badan Pusat Statistik). Some reference to these sources is made below. Further reference to these, however, is critical for those desiring greater detail on the historical background leading up this MICS.3
Given the recent upheavals and dislocations of population, there is a degree of uncertainty surrounding current demographic and social conditions in the country. The last census was under Indonesian administration in 1990 that recorded a total of 148,747 households and 747,750 people giving an average of 5.03 persons per household. The sex ratio was high, at 107.2 males per 100 females in the population. Equally important, the census recorded 18.0 percent of the population under age 5 and 3.2 percent under age 1, consistent with a high level of fertility and relatively rapid population growth. Population projections made by the Indonesian Central Statistics Board based on the Census suggested that by 2000 the population would exceed 900,000 with the annual growth rate declining gradually from about 2.6 percent per annum at the beginning of the decade to about 1.6 percent per annum at the end. The violence and dislocation clearly has had an impact. Refugee movements may have exceeded 250,000 persons (more than 30% of the population) and while many native Timorese have returned, there is still a residual refugee population in Western Timor and, of course, many migrants from other parts of Indonesia have left for good. A crude administrative survey conducted in 2001 (Suco Survey) estimated a population of around 840,000. However, this was widely seen to be an overestimate and “best” estimates for around mid-2001 were closer to 790,000 people.4
3 On the DHS, see Central Bureau of Statistics (CBS) [Indonesia] and National Family Planning Coordinating Board (NFPCB) and Ministry of Health (MOH) and Macro International Inc. (MI), Indonesia Demgraphic and Health Survey 1991, Calverton, Maryland, CBS and MI, 1992; Central Bureau of Statistics (CBS) [Indonesia] and State Ministry of Population/National Family Planning Coordinating Board (NFPCB) and Ministry of Health (MOH) and Macro International Inc. (MI), Indonesia Demgraphic and Health Survey 1994, Calverton, Maryland; CBS and MI, 1995; and Central Bureau of Statistics (CBS) [Indonesia] and State Ministry of Population/National Family Planning Coordinating Board (NFPCB) and Ministry of Health (MOH) and Macro International Inc. (MI), Indonesia Demgraphic and Health Survey 1997, Calverton, Maryland; CBS and MI, 1998. SUSENAS results are available from Indonesian Central Bureau of Statistics (CBS) publications, most notably volumes of Statistik Keesejahateran Rakyat (Welfare Statistics) that are published on an annual basis.
4 See East Timor Transitional Administration, The Asian Development Bank, The World Bank and The United Nations Development Programme, The 2001 Survey of Sucos: Initial Analysis and Implications for Poverty Reduction, Dili, October 2001.
Timor-Leste MICS 2002 – Report
5
Past fertility levels were high with the best recent estimates (pre-MICS) coming from the 1997 Indonesian Demographic and Health Survey (DHS).5
The estimated Total Fertility Rate (TFR) of 4.43 for the three years preceding the survey was the highest of any province of Indonesia in that survey and can be compared with the national average estimated for Indonesia of 2.78. The infant mortality rate estimated by the DHS for the ten-year period preceding the survey was relatively low, at only 33 per 1000 live births. This can be compared with levels closer to 60 both nationally for Indonesia and for the adjacent Indonesian province of East Nusa Tenggara.
Given the colonial background and literally centuries of neglect, it should not be surprising that Timor-Leste is one of the poorest countries in the world. The last socioeconomic survey conducted under Indonesian administration (the 1999 SUSENAS) estimated poverty incidence at more than 40 percent of the population, a figure that was roughly confirmed more recently by a 2001 Poverty Assessment conducted by a consortium led by the World Bank. The series of SUSENAS surveys from the 1980s through the 1990s also show that while there had been progress on a wide range of social indicators, it remained slow in many areas, and throughout the period, Timor-Leste continued to remain one of the least endowed regions in comparison with other parts of Indonesia. Up to 1999, development programs including those in key sectors affecting women and children such as education and health generally followed the national guidelines and patterns established by the Indonesian government. This included basic structures and administration of educational and health facilities as well as other public services and infrastructure. This was, of course, severely disrupted during the turmoil surrounding the 1999 Independence referendum, but the legacy still remains and it is still on the basis of these systems and structures that Timor-Leste has started to move in its own directions both during the transition period and following achievement of full Independence in 2002.
Here it is worth noting that Timor-Leste has also set forward its own agenda reflected in the visionary statement prepared by the Planning Commission and issued in April 2002.6
This statement evolved from an intensive program of public consultations across the entire country and included not only statements on sector priorities, but also on some of the indicators that could be used to monitor performance. Supporting this effort is also one of the reasons for undertaking this MICS at this time.
5 It should be noted that a new Demographic and Health Survey (DHS) is being executed in Timor-Leste in 2003. 6 Planning Commission, East Timor 2020: Our Nation, Our Future, Dili, April 2002.
A I-6 Timor-Leste MICS 2002 – Annex I
Timor-Leste MICS 2002 – Report
7
3. Survey Design and Methodology
3.1 Questionnaires7
Separate questionnaires for households, women and children were adapted directly from the relevant question modules contained in the MICS Manual. All of the modules were utilized with the exception of optional modules dealing with food fortification, child disability and maternal mortality. Following recommendations from UNICEF it was also decided to include additional questions on housing conditions and household assets that could be used to produce a “wealth index” using methods developed by Filmer and Pritchett that had been applied in previous Demographic and Health Surveys, as well as a few MICS, in other countries. Besides the anthropometrical measurement of children (under fives), the Timor-Leste MICS also provided for measurement and weighing of mothers/caregivers aged 15-49 with children under-five years of age in the sampled households. Draft questionnaires were assembled from the modules and then translated into Indonesian (Bahasa Indonesia), which was the language to be used in the field.8 They were then translated back into English to check for consistency. Pre-tests were also carried out; an initial pre-test in Jakarta, Indonesia (near to the consultant’s offices) to get a rough idea on timing and potential interviewing difficulties, and a larger pre-test in Manatuto, Timor-Leste that included not only tests of the instruments, but also of field procedures (listing, sampling) to be used during the final field operations. Both pre-tests resulted in minor modifications to the instruments.9
However, major benefits were in reaching decisions on the most appropriate approaches to general field procedures, including household listing and sampling operations. These are discussed in more detail below.
3.2 Sample Design10
A multi-stage sample design was used to select a total of 4000 households in 200 “clusters” of 20 households each. These choices are generally consistent with the guidelines in the MICS Manual, but were also predicated on practical considerations of time, budget and expected interviewer workloads. The sample was designed to produce national estimates of key MICS variables with acceptable levels of sampling error as well as more indicative estimates for various strata within the country. Strata of interest were those defined for the 2001 Suco Survey and included breakdowns by rural and urban residence, major region (East, Central and West) and highland or lowland location with the latter defined in terms of Suco with a majority of their area above or below a 500-meter elevation. Among urban areas, special attention was also given to the two major urban centers of Dili 7 Questionnaires in English and Bahasa Indonesia are reproduced in Annex IV. 8 Indonesian is still widely understood in Timor-Leste, particularly among persons (under about age 40 to 45) who went through schooling during the period following the takeover in 1975. Recruitment of interviewers, however, included provision for fluency in various local languages and this was used as criteria for their assignment to work in various parts of the country. 9 Modifications were mainly in response categories to some questions to better reflect realities in Timor-Leste. The basic structure and sequencing of questions in the MICS Manual proved to be well-designed and virtually entirely suitable to conditions found in the field. 10 A more detailed discussion of the sample frame and design can be found in Annex III.
A I-8 Timor-Leste MICS 2002 – Annex I
and Baucau where it was thought conditions would be likely to be different from those in smaller towns and rural areas in the country.
The first stage involved assignment of clusters to village level units (Suco) using systematic random sampling with probability proportional to population size and using populations from the 2001 Suco Survey. Suco were listed in serpentine fashion within Sub-districts (Posto), Sub-districts in serpentine fashion within Districts (Distrito), and Districts in serpentine fashion for the entire country in order to minimize any spatial bias in the selection process. Sampling was also stratified between Suco in the two major urban centers of Dili and Baucau (40 clusters) and those in the rest of the country (160 clusters).11
A total of 187 Suco were selected, with 13 Suco having more than one cluster due to their large population size.
The second stage involved selection of primary sampling units, which were defined in terms of sub-village units (known as Aldeia). Aldeia within the selected Suco were listed according to sequence numbers from the Suco Survey along with their populations and one or two aldeia (the latter for the Suco with multiple clusters) were chosen with probability proportional to population size, again using populations from the 2001 Suco Survey as the guide. In a few cases, very small Aldeia were grouped together before selection to ensure a sufficient base number of households for drawing the final sample of 20 households in the field. Sampling of households was carried out as part of the fieldwork just before interviewing took place.12 In most cases, this was based on a new listing of households prepared in the field based on any listings held by and/or discussions with Aldeia heads that were then confirmed by quick observation in the field. In the major urban centers, however, greater care was taken, and here a door-to-door listing operation was performed. Once listing had been completed, random samples of 20 households were selected in the field using random number tables.13
This resulted in a non-self weighting sample at this level. However, the preferred alternative (using fixed sampling intervals) was not feasible given the great uncertainty over the actual population sizes reported in the Suco Survey and the need to keep interviewer workloads as consistent as possible.
3.3 Interviewer Training and Fieldwork
The design provided for 10 field teams with each team made up of four interviewers, one supervisor, and one person to do anthrompometric measurement and 1 driver. This was based on considerations of vehicle capacity and timing. It was hoped that at an average of about 5 interviews per day per interviewer, a team could complete one cluster (20 households) in about one-day’s work and that with 10 teams and about 20 clusters per team, field operations could be completed over a period of between three and four weeks. In actual practice, this proved to be somewhat optimistic given difficulties with local terrain
11 Stratified sampling was not necessary for other strata as the systematic random PPS sampling procedure used was sufficient to give enough clusters in each of the other strata for basic analytical purposes. 12 Time and budget constraints prevented a separate household listing stage that would have allowed sampling of households to be carried out in the office as recommended in the MICS Manual. 13 To avoid potential bias, separate random number tables were generated for each cluster in the sample.

Timor-Leste MICS 2002 – Report
9
and needs to accommodate listing and anthropometric measurement as part of the process. However, delays were manageable and all fieldwork was completed within just over five weeks after the commencement of formal field operations. Female interviewers were recruited locally with about one-fifth having had previous experience on the Suco Survey. Supervisors were almost entirely male (9 of 10) and came from the Timor-Leste Statistics Office staff. Anthropometrists were local female health personnel. Training was carried out over a 4-day period (5-8 August 2002), with the interviewers, supervisors and anthopometrists divided into two groups with each one containing members of five of the field teams. Even through team members had different jobs, grouping teams for the training turned out to be useful. This was because the individual teams had to be able to work together in the field and to cover for each other if necessary. Training in this way allowed the teams to start building a sense of teamwork and cooperation before the actual fieldwork began. However, separate training was still organized for anthropometrsts (by UNICEF) and for supervisors (by IHS), with the latter focusing on household listing and field management procedures. Lack of sufficient time for practicing fieldwork procedures (due to time pressures on completing field work during the dry season) led to a decision to have all teams start work in one area (the District of Liquica) and to cover the first 10 clusters (200 households) under close supervision. This was followed up by a one-day classroom session to review problems encountered and to provide reinforcement of training where necessary. This worked well. The close supervision meant that quality could still be controlled, while interviewers, supervisors etc. were able to gain confidence in their abilities that could serve them well when they were then sent out to undertake further fieldwork on their own. Remaining fieldwork was done in two overlapping stages. The first stage included all remaining sample clusters outside Dili, with teams having varying workloads ranging from around 10 to 19 clusters depending on lines of communication (road networks) and the nature of terrain. The second stage was Dili, with workloads divided so that teams with fewer clusters outside Dili did more work in the capital. The first teams were able to return, and start fieldwork in Dili during the last week of August (slightly more than two weeks after leaving for the field) and all fieldwork was able to be completed by around 12 September (including Dili), roughly 5 weeks after the teams had initially left for the field.
3.4 Data Input Data entry was done using a package program, CSPro, which was set up for MICS by IHS staff with advice from BPS. Batches of questionnaires returned from the field were first manually reviewed for overall consistency by advisors and senior Statistics Office staff in Dili and then were subject to double entry (independent entry by two different data entry personnel). Input data sets were matched to uncover any inconsistencies and these were then resubmitted for correction (referring back to the questionnaires) by advisors and senior statistics staff. Once this was completed, the various data sets (household, women and children) were linked and merged (where relevant) for processing using SPSS. This was a relatively complex and time-consuming process, but was fundamental to ensuring maximum quality. Limitations on numbers of computers available in the Statistics

A I-10 Timor-Leste MICS 2002 – Annex I
Office in Dili and some limitations in the input program CSPro that had to be dealt with during data input also contributed to the pace of progress.14
Office editing operations were completed on 30 September, data entry (double entry) on 3 October, matching operations on 4 October, final editing of inconsistencies on 8 October, and final correction of files 16 October bringing to an official end this phase of survey operations.
3.5 Data Processing and Tabulation15
Final merging and processing of the raw data files was carried out in the offices of the principal consultants in Jakarta, Indonesia starting in the last week of October 2002. This included final data cleaning operations as well as preparation of tables and other output for the report. Involvement of local staff was accommodated by providing for two persons from the Timor-Leste Statistics Office to work with the consultants in Jakarta during this part of the operations.
The cleaning operation basically involved extensive evaluation of data consistency across questions and sections of the questionnaire (for example consistency in age reporting – particularly for women and children reporting dates of birth) that would not have been picked up during data entry and machine editing of inconsistent responses. This took about 3 weeks to complete. Once a clean data set had been produced, sample weights for each of the 200 clusters were assigned and creation of tables and other statistical outputs was done using SPSS.
3.6 Sample Coverage and Response Rates Summary results regarding coverage and response rates for households, women aged 15-49 and children under age 5 are given in Annex Table 1. Percentages of missing values on selected questions are also given in Annex Table 3.
Out of 4000 households in the sample, 3982 were located and successfully interviewed for the household questionnaire giving a response rate of 99.6 percent. Non-responses here included 5 outright refusals, 9 cases where no one was at home during the times that the interviewers could attempt an interview and 4 cases where the dwelling unit could not be found. 16
14 One difficulty was that CSPro was unable to handle households where there were more than 2 eligible women or children. This deficiency had to be corrected by doing a separate data inupt cycle for these additional women and children.
There were a total of 4802 women aged 15-49 in the interviewed households of which women’s questionnaires were able to be completed for a total of 4606
15 Standard tables for the survey following the general format in the MICS manual are given in Annex II. 16 It should be remembered that the cluster-level sample frame (listing of households in the sampled Aldeia) was carried out (either with the Aldeia head or by door-to-door canvassing) just before actual interviewing. Thus deterioration of the frame should not have been, and in fact was not, a significant problem. Numbers of cases where households could not be located were very few.
Timor-Leste MICS 2002 – Report
11
(95.9 percent). However, almost all eligible women who were caregivers of children under age 5 for whom data were obtained were included in the group successfully interviewed.17
Of 4493 children under age 5 in the interviewed households information was obtained for 4454 or 99.1 percent. There was little variation in response rates across strata. All of these are consistent with high rates of response for surveys of this type and thus add confidence to the credibility of the overall data collection process.
Response rates to the various questions were also high with numbers of missing values seldom exceeding a few percent of the total. Of particular interest was the ability of interviewers to obtain complete information on birth dates for nearly two-thirds of eligible women aged 15-49 and nearly 95 percent of eligible children under age 5. This greatly facilitated correction of reported ages in the household questionnaire, particularly for young children. Even though there may be some reporting errors remaining, this is extremely important due to the need for at least reasonable accuracy in age reporting for a number of the key child indicators in the MICS.
Annex I
Millennium Development Goals (MDG), World Fit for Children (WFFC) Goals, UNICEF Priority Areas 2002-2005
17 There were only 6 cases of women with under-five aged children who were not interviewed.

Timor-Leste MICS 2002 – Annex I A I-1
Annex I Millennium Development Goals (MDG), World Fit for Children (WFFC) Goals, UNICEF Priority Areas 2002-2005
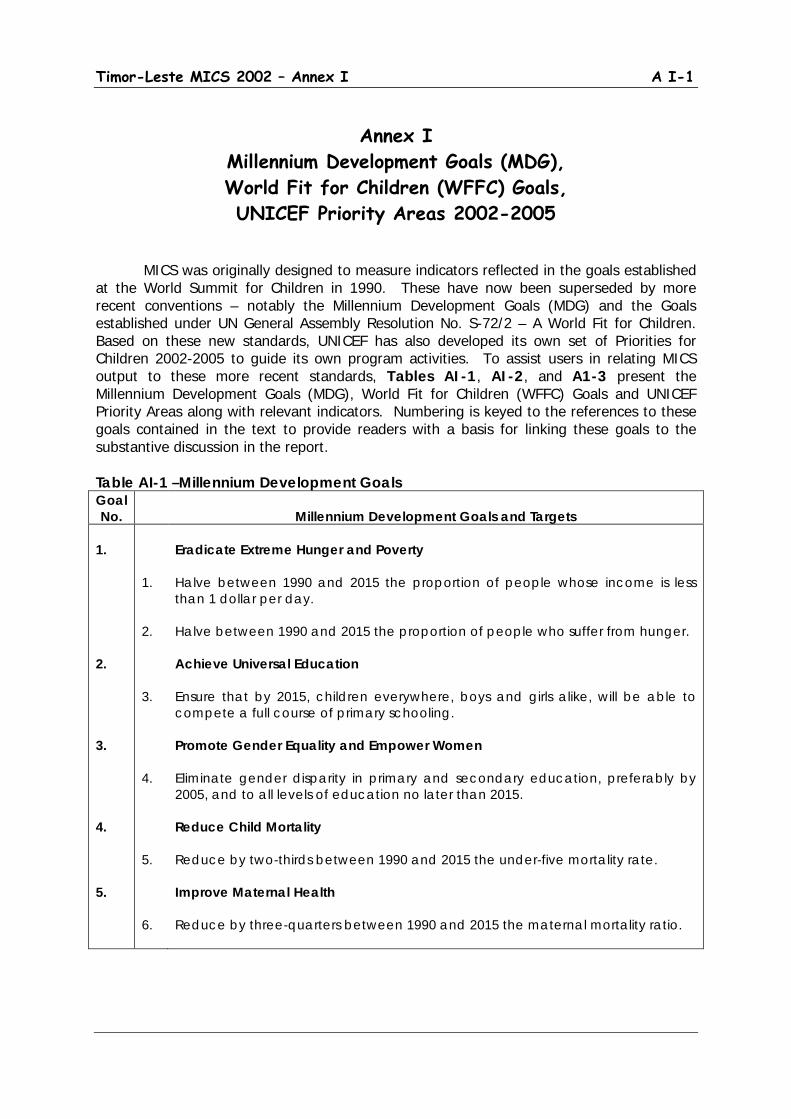
MICS was originally designed to measure indicators reflected in the goals established at the World Summit for Children in 1990. These have now been superseded by more recent conventions – notably the Millennium Development Goals (MDG) and the Goals established under UN General Assembly Resolution No. S-72/2 – A World Fit for Children. Based on these new standards, UNICEF has also developed its own set of Priorities for Children 2002-2005 to guide its own program activities. To assist users in relating MICS output to these more recent standards, Tables AI-1, AI-2, and A1-3 present the Millennium Development Goals (MDG), World Fit for Children (WFFC) Goals and UNICEF Priority Areas along with relevant indicators. Numbering is keyed to the references to these goals contained in the text to provide readers with a basis for linking these goals to the substantive discussion in the report. Table AI-1 –Millennium Development Goals Goal No.
Millennium Development Goals and Targets
1. 2. 3. 4. 5.
1. 2. 3. 4. 5. 6.
Eradicate Extreme Hunger and Poverty Halve between 1990 and 2015 the proportion of people whose income is less than 1 dollar per day. Halve between 1990 and 2015 the proportion of people who suffer from hunger. Achieve Universal Education Ensure that by 2015, children everywhere, boys and girls alike, will be able to compete a full course of primary schooling. Promote Gender Equality and Empower Women Eliminate gender disparity in primary and secondary education, preferably by 2005, and to all levels of education no later than 2015. Reduce Child Mortality Reduce by two-thirds between 1990 and 2015 the under-five mortality rate. Improve Maternal Health Reduce by three-quarters between 1990 and 2015 the maternal mortality ratio.
A I-2 Timor-Leste MICS 2002 – Annex I
Goal No.
Millennium Development Goals and Targets - continued
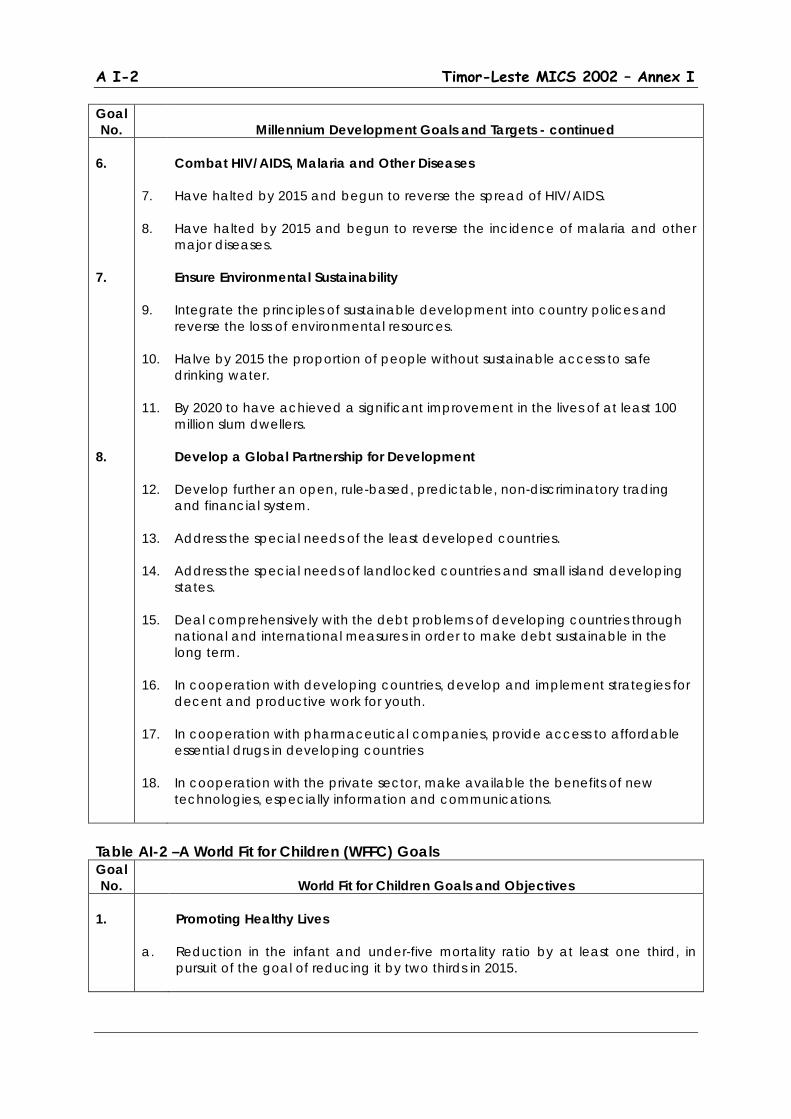
6. 7. 8.
7. 8. 9. 10. 11. 12. 13. 14. 15. 16. 17. 18.
Combat HIV/AIDS, Malaria and Other Diseases Have halted by 2015 and begun to reverse the spread of HIV/AIDS. Have halted by 2015 and begun to reverse the incidence of malaria and other major diseases. Ensure Environmental Sustainability Integrate the principles of sustainable development into country polices and reverse the loss of environmental resources. Halve by 2015 the proportion of people without sustainable access to safe drinking water. By 2020 to have achieved a significant improvement in the lives of at least 100 million slum dwellers. Develop a Global Partnership for Development Develop further an open, rule-based, predictable, non-discriminatory trading and financial system. Address the special needs of the least developed countries. Address the special needs of landlocked countries and small island developing states. Deal comprehensively with the debt problems of developing countries through national and international measures in order to make debt sustainable in the long term. In cooperation with developing countries, develop and implement strategies for decent and productive work for youth. In cooperation with pharmaceutical companies, provide access to affordable essential drugs in developing countries In cooperation with the private sector, make available the benefits of new technologies, especially information and communications.
Table AI-2 –A World Fit for Children (WFFC) Goals Goal No.
World Fit for Children Goals and Objectives
1.
a.
Promoting Healthy Lives Reduction in the infant and under-five mortality ratio by at least one third, in pursuit of the goal of reducing it by two thirds in 2015.

Timor-Leste MICS 2002 – Annex I A I-3
Goal No.
World Fit for Children Goals and Objectives - continued
2. 3.
b. c. d. e. f. g. a. b. c. d. e. f. a. b.
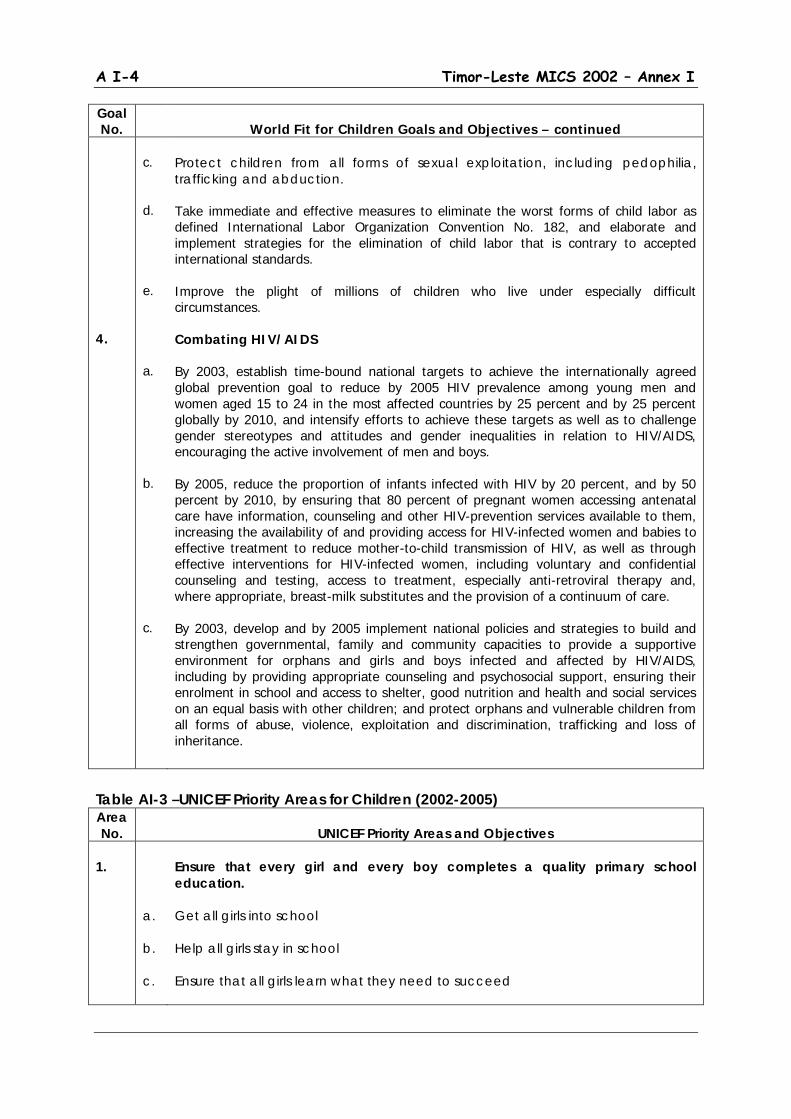
Reduction in the maternal mortality ratio by at lest one third, in pursuit of the goal of reducing it by three quarters in 2015. Reduction of child malnutrition among children under five years of age by at least one third, with special attention to children under two years of age, and reduction in the rate of low birth weight by at least one third of the current rate. Reduction in the proportion of households without access to hygienic sanitation facilities and affordable and safe drinking water by at least one third. Development and implementation of national dearly childhood development programs to ensure the enhancement of children’s physical, social, emotional, spiritual and cognitive development. Development and implementation of national health policies and programs for adolescents, including goals and indicators, to promote their physical and mental health. Access through the primary health-care system to reproductive health for all individuals of appropriate age as soon and possible, and no later than 2015. Providing Quality Education Expand and improve comprehensive early childhood care and education, for girls and boys, especially for the most vulnerable and disadvantaged children. Reduce the number of primary school-age children who are out of school by 50 percent and increase net primary school enrolment or participation in alternative, good quality primary education programs to at least 90 percent by 2010. Eliminate gender disparities in primary and secondary education by 2005; and achieve gender equality in education by 2015, with a focus on ensuring girls’ full and equal access to and achievement in basic education of good quality. Improve all aspects of the quality of education so that children and young people achieve recognized and measurable learning outcomes, especially in numeracy, literacy and essential life skills. Ensure that the learning needs of all young people are met through access to appropriate learning and life skills programs. Achieve a 50 percent improvement in levels of adult literacy by 2015, especially for women. Protection Against Abuse, Exploitation and Violence Protect children from al forms of abuse, neglect, exploitation and violence. Protect children from the impact of armed conflict and ensure compliance with international humanitarian law and human rights law.
A I-4 Timor-Leste MICS 2002 – Annex I
Goal No.
World Fit for Children Goals and Objectives – continued
4.
c. d. e. a. b. c.
Protect children from all forms of sexual exploitation, including pedophilia, trafficking and abduction. Take immediate and effective measures to eliminate the worst forms of child labor as defined International Labor Organization Convention No. 182, and elaborate and implement strategies for the elimination of child labor that is contrary to accepted international standards. Improve the plight of millions of children who live under especially difficult circumstances. Combating HIV/AIDS By 2003, establish time-bound national targets to achieve the internationally agreed global prevention goal to reduce by 2005 HIV prevalence among young men and women aged 15 to 24 in the most affected countries by 25 percent and by 25 percent globally by 2010, and intensify efforts to achieve these targets as well as to challenge gender stereotypes and attitudes and gender inequalities in relation to HIV/AIDS, encouraging the active involvement of men and boys. By 2005, reduce the proportion of infants infected with HIV by 20 percent, and by 50 percent by 2010, by ensuring that 80 percent of pregnant women accessing antenatal care have information, counseling and other HIV-prevention services available to them, increasing the availability of and providing access for HIV-infected women and babies to effective treatment to reduce mother-to-child transmission of HIV, as well as through effective interventions for HIV-infected women, including voluntary and confidential counseling and testing, access to treatment, especially anti-retroviral therapy and, where appropriate, breast-milk substitutes and the provision of a continuum of care. By 2003, develop and by 2005 implement national policies and strategies to build and strengthen governmental, family and community capacities to provide a supportive environment for orphans and girls and boys infected and affected by HIV/AIDS, including by providing appropriate counseling and psychosocial support, ensuring their enrolment in school and access to shelter, good nutrition and health and social services on an equal basis with other children; and protect orphans and vulnerable children from all forms of abuse, violence, exploitation and discrimination, trafficking and loss of inheritance.
Table AI-3 –UNICEF Priority Areas for Children (2002-2005) Area No.
UNICEF Priority Areas and Objectives
1.
a. b. c.
Ensure that every girl and every boy completes a quality primary school education. Get all girls into school Help all girls stay in school Ensure that all girls learn what they need to succeed

Timor-Leste MICS 2002 – Annex I A I-5
Area No.
UNICEF Priority Areas and Objectives – continued
2. 3. 4. 5.
a. b. c. d. e. f. a. b. c. d. a. b. c. d. a. b. c. d. e.
Promote integrated early childhood development, ensuring every child the best possible start in life. Develop and integrated approach to services that include: health, including women’s health, nutrition, water and environmental sanitation, psychosocial care and early learning, and child protection Focus most intensely on children under three years old Strengthen the capacities of families to care for children, especially those most vulnerable Increase the access of families and communities to good-quality basic services and adequate livelihoods Promote gender equality and ensure the rights and status of women Strengthen national IECD policies Safeguard every child against disease and disability, emphasizing immunization ‘plus’. Save all infants and all children under five from preventable deaths and disabilities Prevent the spread of childhood diseases Get all childhood vaccines to all children Use immunization ‘plus’ as and entry point for other health interventions Stop the spread of HIV/AIDS and ensure that children and young people already affected by the disease are cared for. Prevent HIV infections among young people Prevent parent-to-child transmission of HIV Expand care for children and parents living with HIV and AIDS Expand protection, care and support for orphans and children affected by HIV/AIDS Protect every child so that all children can grow up free from violence, exploitation, abuse and discrimination. Reduce violence against children Eliminate the worst forms of child labor Provide family and community-based care for all children without primary care givers Increase protection for children in armed conflict End discrimination in all its forms

A I-6 Timor-Leste MICS 2002 – Annex I
Annex II
Standard Tables

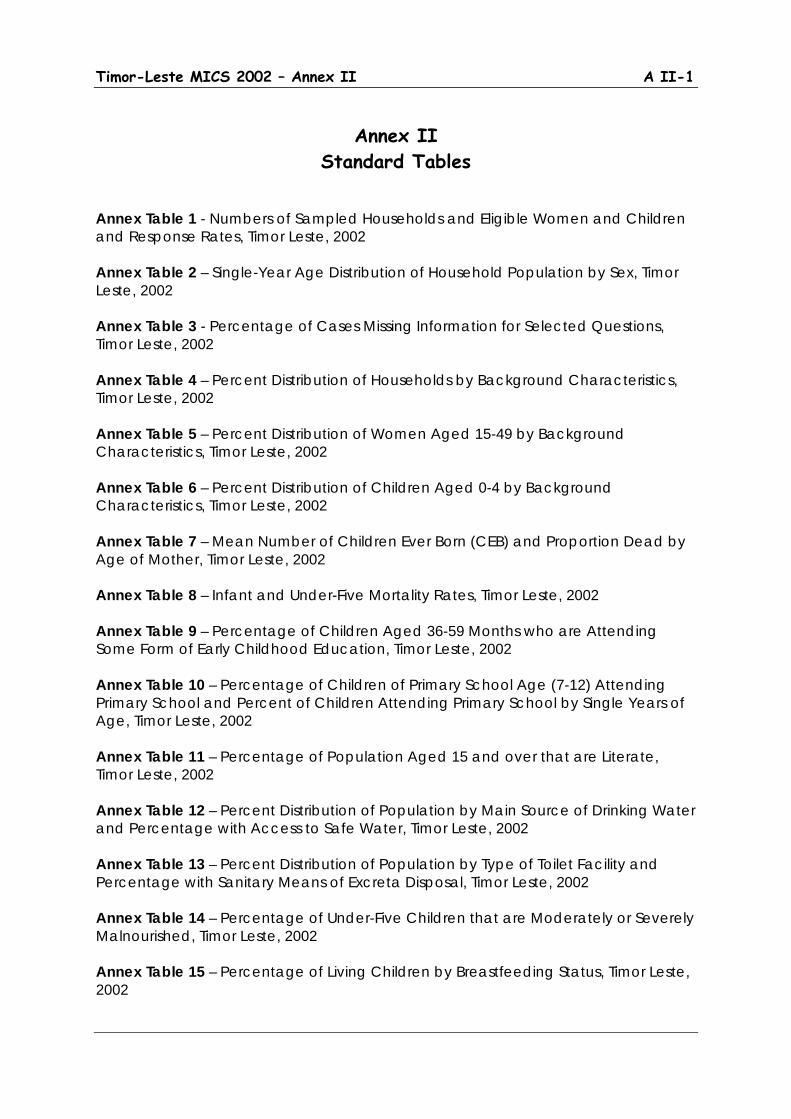
Timor-Leste MICS 2002 – Annex II A II-1
Annex II Standard Tables
Annex Table 1 - Numbers of Sampled Households and Eligible Women and Children and Response Rates, Timor Leste, 2002 Annex Table 2 – Single-Year Age Distribution of Household Population by Sex, Timor Leste, 2002 Annex Table 3 - Percentage of Cases Missing Information for Selected Questions, Timor Leste, 2002 Annex Table 4 – Percent Distribution of Households by Background Characteristics, Timor Leste, 2002 Annex Table 5 – Percent Distribution of Women Aged 15-49 by Background Characteristics, Timor Leste, 2002 Annex Table 6 – Percent Distribution of Children Aged 0-4 by Background Characteristics, Timor Leste, 2002 Annex Table 7 – Mean Number of Children Ever Born (CEB) and Proportion Dead by Age of Mother, Timor Leste, 2002 Annex Table 8 – Infant and Under-Five Mortality Rates, Timor Leste, 2002 Annex Table 9 – Percentage of Children Aged 36-59 Months who are Attending Some Form of Early Childhood Education, Timor Leste, 2002 Annex Table 10 – Percentage of Children of Primary School Age (7-12) Attending Primary School and Percent of Children Attending Primary School by Single Years of Age, Timor Leste, 2002 Annex Table 11 – Percentage of Population Aged 15 and over that are Literate, Timor Leste, 2002 Annex Table 12 – Percent Distribution of Population by Main Source of Drinking Water and Percentage with Access to Safe Water, Timor Leste, 2002 Annex Table 13 – Percent Distribution of Population by Type of Toilet Facility and Percentage with Sanitary Means of Excreta Disposal, Timor Leste, 2002 Annex Table 14 – Percentage of Under-Five Children that are Moderately or Severely Malnourished, Timor Leste, 2002 Annex Table 15 – Percentage of Living Children by Breastfeeding Status, Timor Leste, 2002
A II-2 Timor-Leste MICS 2002 – Annex II
Annex Table 16 – Percentage of Households by Iodine Content of Salt Used in the Household, Timor Leste, 2002 Annex Table 17 – Percent Distribution of Children Aged 6-59 Months by Whether They Have Received a High Dose Vitamin A Supplement in the Last 6 Months, Timor Leste, 2002 Annex Table 18 – Percent of Women with a Birth in the Last 12 Months by Whether They Have Received a High Dose Vitamin A Supplement Before the Infant was 8 Weeks Old, Timor Leste, 2002 Annex Table 19 – Percentage of Live Births in the Last 12 Months that Weighed Below 2500 Grams at Birth, Timor Leste, 2002 Annex Table 20 – Percentage of Children Aged 12-23 Months Immunized Against Childhood Diseases at Any Time Before the Survey and Before their First Birthday by Type of Immunization, Timor Leste, 2002 Annex Table 21 – Percentage of Children Aged 12-23 Months Currently Vaccinated Agains Childhood Diseases by Type of Immunization, Timor Leste, 2002 Annex Table 22 – Percentage of Children Under Age 5 with Diarrhea in the Last Two Weeks by Type of Treatment, Timor Leste, 2002 Annex Table 23 – Percentage of Children Under Age 5 with Diarrhea in the Last Two Weeks Who Took Increased Fluids and Continued to Eat During the Episode, Timor Leste, 2002 Annex Table 24 – Percentage of Children Under Age 5 with Acute Respiratory Infection (ARI) in the Last Two Weeks and Treatment by Health Providers, Timor Leste, 2002 Annex Table 25 – Percentage of Children Under Age 5 Reported Ill in the Last Two Weeks Who Took Increased Fluids and Continued to Eat During the Episode, Timor Leste, 2002 Annex Table 26 – Percentage of Caregivers of Children Under Age 5 Who Know of at Least Two Signs for Seeking Immediate Medical Care, Timor Leste, 2002 Annex Table 27 – Percentage of Children Under Age 5 Who Slept Under an Insecticide Impregnated Bed Net During the Previous Night, Timor Leste, 2002 Annex Table 28 – Percentage of Children Under Age 5 Who Were Ill with Fever in the Last Two Weeks and Who Received Anti-Malarial Drugs, Timor Leste, 2002 Annex Table 29 – Percentage of Women Aged 15-49 Who Know the Main Ways of Preventing HIV Transmission, Timor Leste, 2002 Annex Table 30 – Percentage of Women Aged 15-49 Who Can Correctly Identify Misconceptions About HIV/AIDS, Timor Leste, 2002

Timor-Leste MICS 2002 – Annex II A II-3
Annex Table 31 – Percentage of Women Aged 15-49 Who Can Correctly Identify Means of HIV Transmission from Mother to Child, Timor Leste, 2002 Annex Table 32 – Percentage of Women Aged 15-49 Who Express a Discriminatory Attitude Toward Persons With HIV/AIDS, Timor Leste, 2002 Annex Table 33 – Percentage of Women Aged 15-49 Who Have Sufficient Knowledge of HIV/AIDS Transmission, Timor Leste, 2002 Annex Table 34 – Percentage of Women Aged 15-49 Who Know Where to Get and AIDS Test and Who Have Been Tested, Timor Leste, 2002 Annex Table 35 – Percentage of Married or In-union Women Aged 15-49 Who Are Using (or Whose Partner is Using) a Contraceptive Method, Timor Leste, 2002 Annex Table 36 – Percentage of Mothers With a Birth in the Last 12 Months Protected Against Neonatal Tetanus, Timor Leste, 2002 Annex Table 37 – Percent Distribution of Women Aged 15-49 With a Birth in the Last 12 Months by Type of Personnel Delivering Antenatal Care, Timor Leste, 2002 Annex Table 38 – Percent Distribution of Women Aged 15-49 With a Birth in the Last 12 Months by Type of Personnel Assisting at Delivery, Timor Leste, 2002 Annex Table 39 – Percent Distribution of Children Under Age 5 by Whether Birth is Registered and Reasons for Non-Registration, Timor Leste, 2002 Annex Table 40 – Percent Distribution of Children Aged 0-14 Living in Households by Living and Residence Status of Biological Parents, Timor Leste, 2002 Annex Table 41 – Percent Distribution of Chidren Aged 5-14 by Work Status, Timor Leste, 2002

A II-4 Timor-Leste MICS 2002 – Annex II
Annex III
Sample Design


Timor-Leste MICS 2002 – Annex III A III-1
Annex III Sample Design
Overall Sample and Cluster Size In planning for the survey it was agreed that the sample would cover a total of 4000 households divided into 200 clusters of approximately 20 households each. The total sample size was based on considerations of likely sampling errors and the overall numbers of respondents required to produce reasonably reliable baseline estimates of MICS indicators for the country as a whole. It was also conditioned by budgetary constraints that precluded a larger sample, even though this would have given greater flexibility for producing estimates at sub-national level. Even so, the overall sample represents more than 2 percent of the roughly 180,000 households in the country. Cluster size was arbitrarily determined based on the expected daily workload of a survey team comprising 4 interviewers and 1 supervisor. This was based on an estimated average length of each interview of around 45-50 minutes (excluding anthropometrical measurements) and an ability of each interviewer to cover on average about 5 households per day – including travel time between households and supplementary activities associated with segment listing. However, this cluster size also fit in well with MICS (and other general survey design) recommendations to use clusters of between about 15 and 30 households. Sample Stratification Although there will be larger errors in estimation, it is important to consider possible regional or socioeconomic breakdowns of various estimates that may be desired. Here, the East Timor Suco Survey/Poverty Assessment suggested a number of regional breakdowns felt to be useful for analysis. These were as follows:
• Urban/Rural – with the urban segment broken down further into major urban areas (Dili and Baucau) and other urban areas covering the remaining district capital towns.
• Major Region – with a breakdown of East (Baucau, Lautem, Viquique), West
(Oecussi, Bobonaro, Cova Lima) and Central (covering the remaining seven districts in the country.
• Highland/Lowland – with highland areas defined at Suco level including all Suco with
a majority of their geographic area above the 500-meter contour line. These are also regarded as useful breakdowns for the MICS survey as they capture at least some major ecological variation, residential variations (town and country), and regional variations related both to ethnic/language differences and the impact of the disruptions surrounding the 1999 Independence Referendum and which was greater in some of the more western areas, particularly in those bordering on Indonesia. Locations of urban and rural Suco are plotted in Map AIII-1 and locations of highland and lowland Suco are plotted in Map AIII-2 to assist in interpretation.

A III-2 Timor-Leste MICS 2002 – Annex III
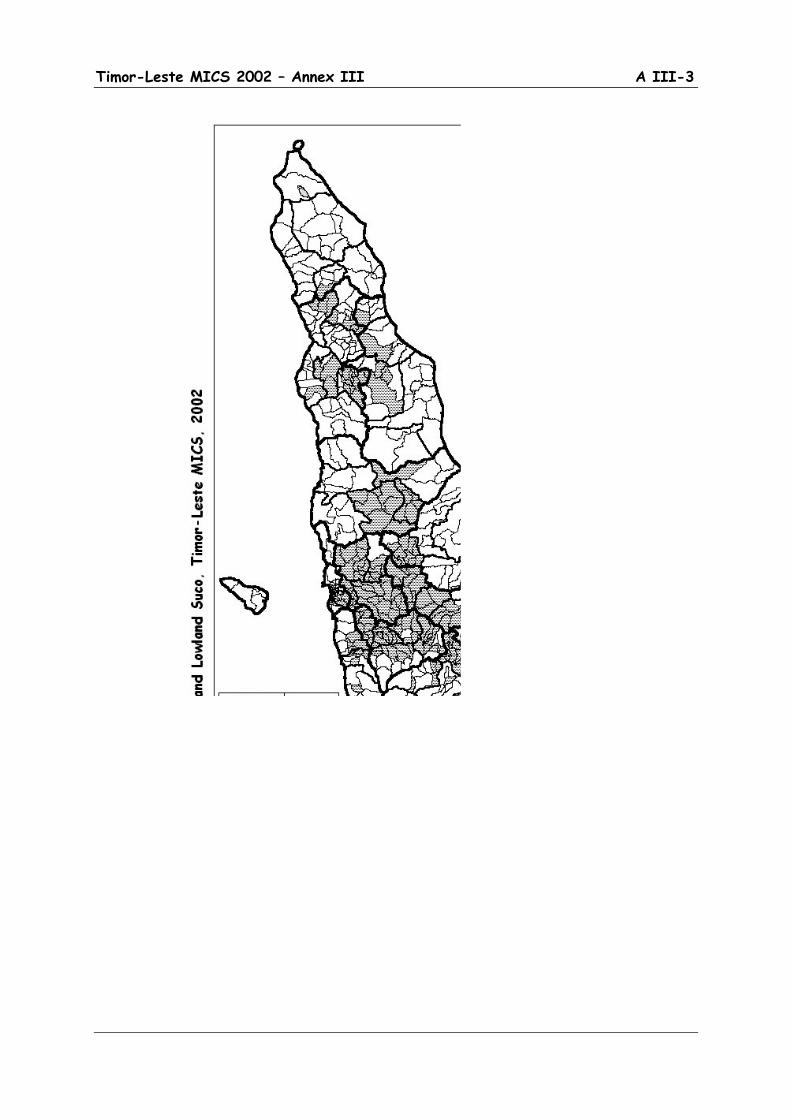
Timor-Leste MICS 2002 – Annex III A III-3
A III-4 Timor-Leste MICS 2002 – Annex III
Strata, however, do not need to be explicit as long as an overall probability sample is sufficient to generate enough cases for estimation. We cannot make an exact determination of this ahead of time, but we can make reasonable approximations based on the expected frequency of key characteristics in the sample and the approximate number of clusters required for reasonably sound estimation. There are a few rules of thumb we can follow here. Similar sample designs such as that used in the Indonesian SUSENAS are based on a minimum of around 40 clusters for each geographic unit where separate estimates are desired. In fact, as long as we are using average cluster sizes similar to those recommended by MICS, the expected sampling reliability is much more a function of the number of clusters than of the total population size in the stratum. Thus if an overall probability sample produces this number or more there is no need, at least on the basis of numbers of clusters, for explicit stratification. The other consideration is the expected numbers of eligible respondents for key MICS indicators – in effect the expected numbers in the denominators of key calculations. A rough rule of thumb is not to calculate indicators where the denominator is 25 or less (unweighted) and, preferably, to have denominators well in excess of 50 (if possible in excess of 100). For many characteristics this is not a problem. We would expect to find around 120 women, 90 ever-married women and 75-80 currently married women aged 15-49 for each 100 households. Presence of children under age 5 is likely to be about a 75-80 percent characteristic at the household level.1
Low frequency characteristics do represent a problem and these include such things as the numbers of children under 1 year old or births in the past year as well as numbers of under-fives experiencing various illnesses. Some of these could be as low a 15 to 20 per 100 households (e.g. roughly 3 percent characteristics for the population as a whole). Ability to make estimates for these sub-groups would require minimal samples of 400 to 500 households and, preferably 800 households or more in any relevant stratum.
Fortunately this is consistent with the minimum number of clusters discussed earlier when combined with our average cluster size of 20 households. In short, if we can keep to this basic criterion of strata with a minimum of 40 clusters (one-fifth of the total) then it should be possible to make strata–specific estimates for most if not all MICS indicators. Socioeconomic categories (as reflected, for example, by cross tabulations breaking down the sample by welfare category, mother’s education etc.) are subject to the same restrictions. Based on the previous observations, in general, with a total sample of 4000 households, we should be able to provide almost any indicator for any group representing around 20 percent or more of the sample population and some indicators for even smaller groups. Needs for explicit stratification can be seen in Table AIII-1 where we have used simple PPS sampling (using reported populations from the Suco Survey) to allocated clusters to Suco across the entire country. Numbers of expected clusters (based on population or family shares) and actual clusters (after sampling) are shown in the table. The numbers of clusters for the Western region are close to the minimum. Numbers are adequate for urban areas as a whole, but are too low if separate estimates for the major urban centers (Dili and Baucau) are desired.
1 These estimates are based on 1990 Census and on SUSENAS survey data for East Timor over the period 1996-1999.
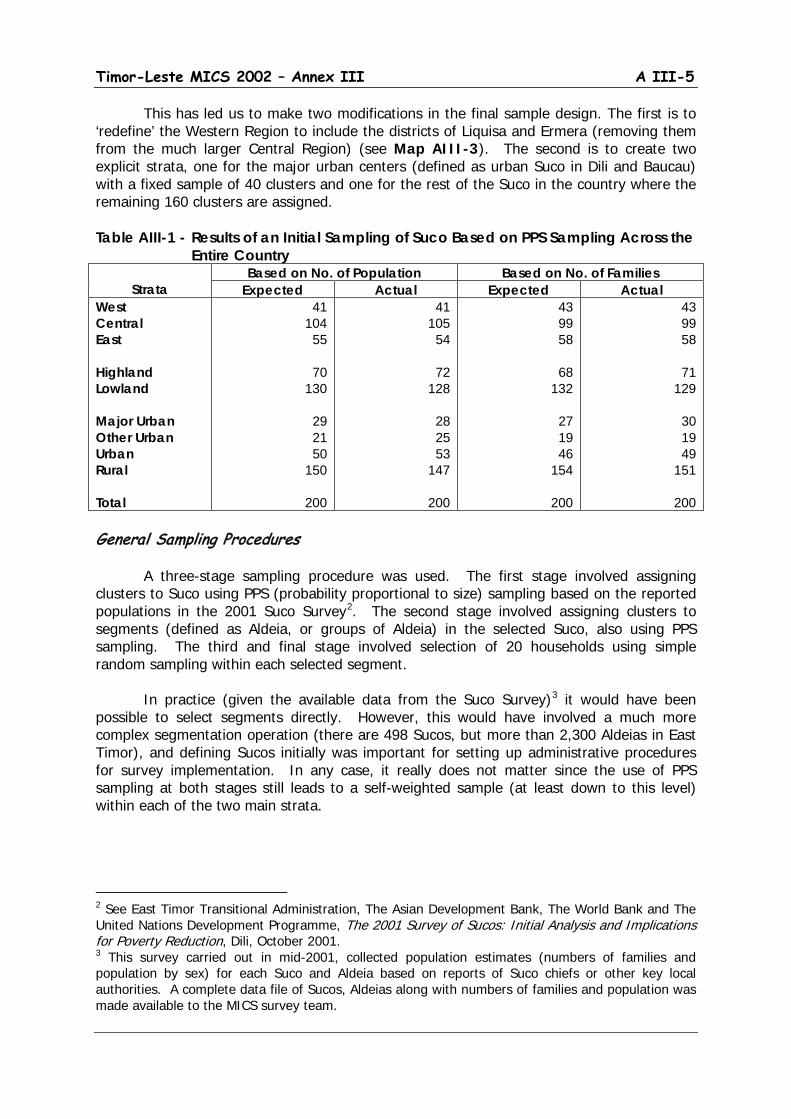
Timor-Leste MICS 2002 – Annex III A III-5
This has led us to make two modifications in the final sample design. The first is to ‘redefine’ the Western Region to include the districts of Liquisa and Ermera (removing them from the much larger Central Region) (see Map AIII-3). The second is to create two explicit strata, one for the major urban centers (defined as urban Suco in Dili and Baucau) with a fixed sample of 40 clusters and one for the rest of the Suco in the country where the remaining 160 clusters are assigned. Table AIII-1 - Results of an Initial Sampling of Suco Based on PPS Sampling Across the
Entire Country
Strata Based on No. of Population Based on No. of Families
Expected Actual Expected Actual West Central East Highland Lowland Major Urban Other Urban Urban Rural Total
41 104
55
70 130
29 21 50
150
200
41 105
54
72 128
28 25 53
147
200
43 99 58
68
132
27 19 46
154
200
43 99 58
71
129
30 19 49
151
200 General Sampling Procedures A three-stage sampling procedure was used. The first stage involved assigning clusters to Suco using PPS (probability proportional to size) sampling based on the reported populations in the 2001 Suco Survey2
. The second stage involved assigning clusters to segments (defined as Aldeia, or groups of Aldeia) in the selected Suco, also using PPS sampling. The third and final stage involved selection of 20 households using simple random sampling within each selected segment.
In practice (given the available data from the Suco Survey)3
it would have been possible to select segments directly. However, this would have involved a much more complex segmentation operation (there are 498 Sucos, but more than 2,300 Aldeias in East Timor), and defining Sucos initially was important for setting up administrative procedures for survey implementation. In any case, it really does not matter since the use of PPS sampling at both stages still leads to a self-weighted sample (at least down to this level) within each of the two main strata.
2 See East Timor Transitional Administration, The Asian Development Bank, The World Bank and The United Nations Development Programme, The 2001 Survey of Sucos: Initial Analysis and Implications for Poverty Reduction, Dili, October 2001. 3 This survey carried out in mid-2001, collected population estimates (numbers of families and population by sex) for each Suco and Aldeia based on reports of Suco chiefs or other key local authorities. A complete data file of Sucos, Aldeias along with numbers of families and population was made available to the MICS survey team.
A III-6 Timor-Leste MICS 2002 – Annex III
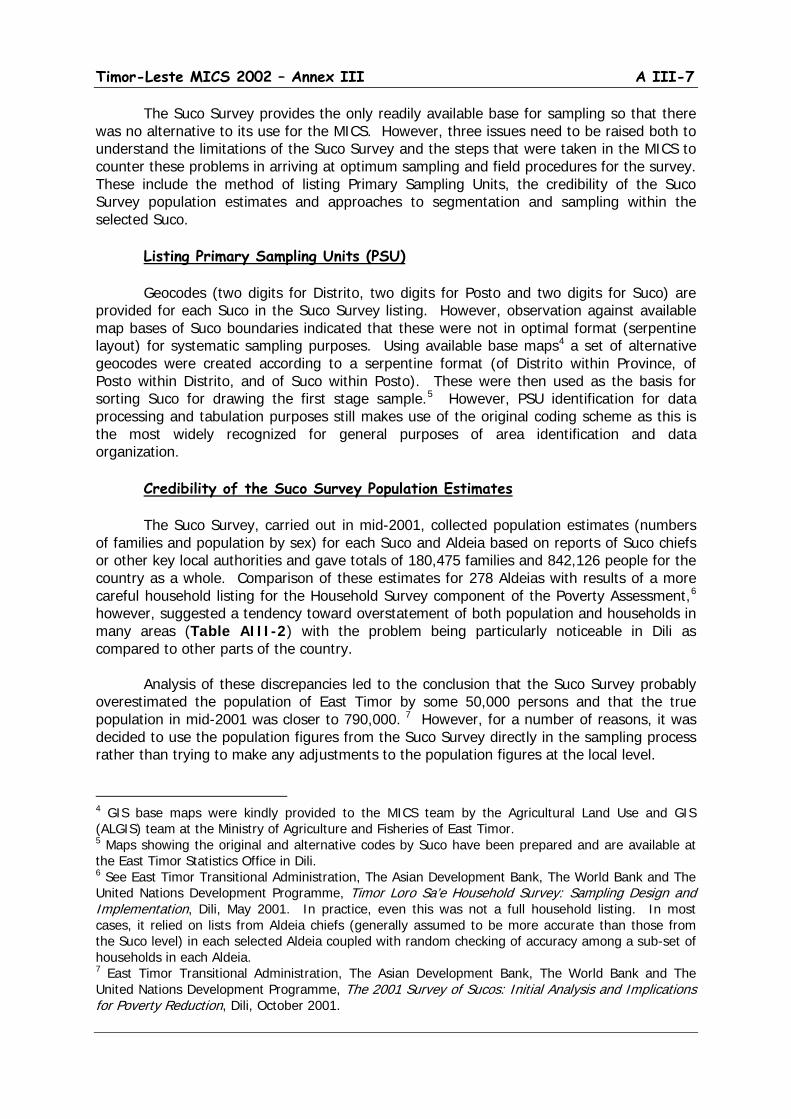
Timor-Leste MICS 2002 – Annex III A III-7
The Suco Survey provides the only readily available base for sampling so that there was no alternative to its use for the MICS. However, three issues need to be raised both to understand the limitations of the Suco Survey and the steps that were taken in the MICS to counter these problems in arriving at optimum sampling and field procedures for the survey. These include the method of listing Primary Sampling Units, the credibility of the Suco Survey population estimates and approaches to segmentation and sampling within the selected Suco.
Listing Primary Sampling Units (PSU)
Geocodes (two digits for Distrito, two digits for Posto and two digits for Suco) are provided for each Suco in the Suco Survey listing. However, observation against available map bases of Suco boundaries indicated that these were not in optimal format (serpentine layout) for systematic sampling purposes. Using available base maps4 a set of alternative geocodes were created according to a serpentine format (of Distrito within Province, of Posto within Distrito, and of Suco within Posto). These were then used as the basis for sorting Suco for drawing the first stage sample.5
However, PSU identification for data processing and tabulation purposes still makes use of the original coding scheme as this is the most widely recognized for general purposes of area identification and data organization.
Credibility of the Suco Survey Population Estimates
The Suco Survey, carried out in mid-2001, collected population estimates (numbers of families and population by sex) for each Suco and Aldeia based on reports of Suco chiefs or other key local authorities and gave totals of 180,475 families and 842,126 people for the country as a whole. Comparison of these estimates for 278 Aldeias with results of a more careful household listing for the Household Survey component of the Poverty Assessment,6
however, suggested a tendency toward overstatement of both population and households in many areas (Table AIII-2) with the problem being particularly noticeable in Dili as compared to other parts of the country.
Analysis of these discrepancies led to the conclusion that the Suco Survey probably overestimated the population of East Timor by some 50,000 persons and that the true population in mid-2001 was closer to 790,000. 7
However, for a number of reasons, it was decided to use the population figures from the Suco Survey directly in the sampling process rather than trying to make any adjustments to the population figures at the local level.
4 GIS base maps were kindly provided to the MICS team by the Agricultural Land Use and GIS (ALGIS) team at the Ministry of Agriculture and Fisheries of East Timor. 5 Maps showing the original and alternative codes by Suco have been prepared and are available at the East Timor Statistics Office in Dili. 6 See East Timor Transitional Administration, The Asian Development Bank, The World Bank and The United Nations Development Programme, Timor Loro Sa’e Household Survey: Sampling Design and Implementation, Dili, May 2001. In practice, even this was not a full household listing. In most cases, it relied on lists from Aldeia chiefs (generally assumed to be more accurate than those from the Suco level) in each selected Aldeia coupled with random checking of accuracy among a sub-set of households in each Aldeia. 7 East Timor Transitional Administration, The Asian Development Bank, The World Bank and The United Nations Development Programme, The 2001 Survey of Sucos: Initial Analysis and Implications for Poverty Reduction, Dili, October 2001.
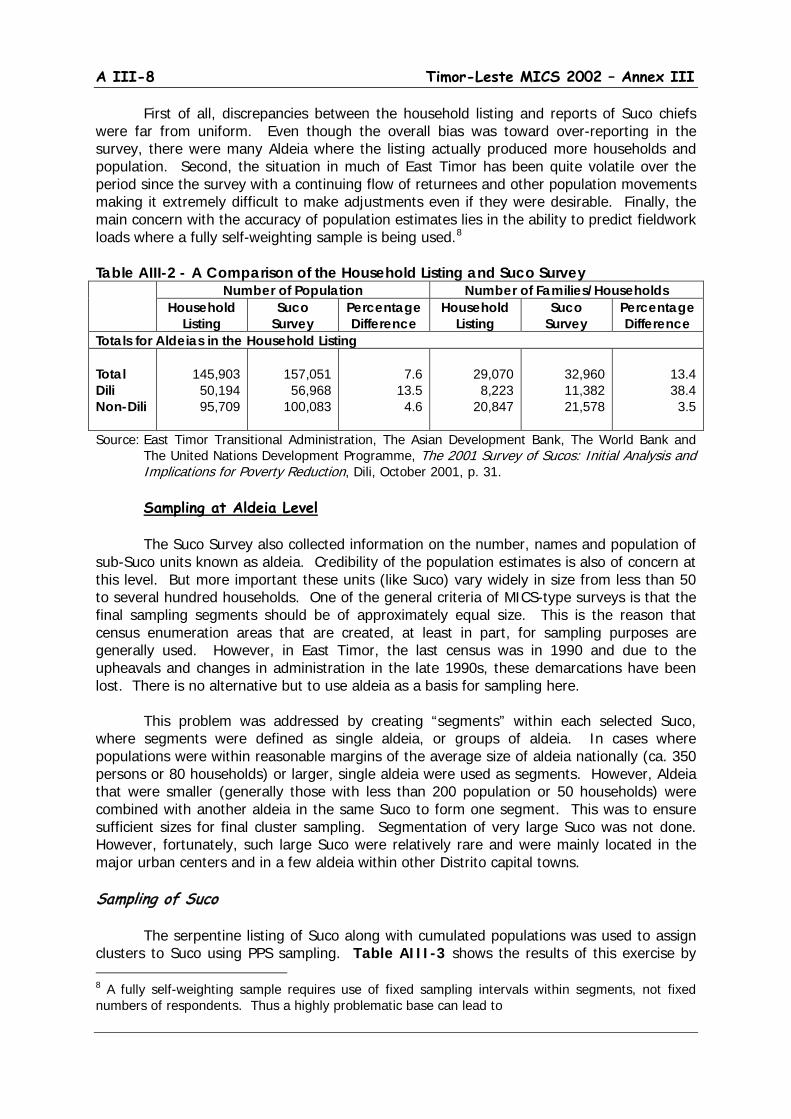
A III-8 Timor-Leste MICS 2002 – Annex III
First of all, discrepancies between the household listing and reports of Suco chiefs were far from uniform. Even though the overall bias was toward over-reporting in the survey, there were many Aldeia where the listing actually produced more households and population. Second, the situation in much of East Timor has been quite volatile over the period since the survey with a continuing flow of returnees and other population movements making it extremely difficult to make adjustments even if they were desirable. Finally, the main concern with the accuracy of population estimates lies in the ability to predict fieldwork loads where a fully self-weighting sample is being used.8
Table AIII-2 - A Comparison of the Household Listing and Suco Survey Number of Population Number of Families/Households
Household Listing
Suco Survey
Percentage Difference
Household Listing
Suco Survey
Percentage Difference
Totals for Aldeias in the Household Listing Total Dili Non-Dili
145,903 50,194 95,709
157,051 56,968
100,083
7.6
13.5 4.6
29,070 8,223
20,847
32,960 11,382 21,578
13.4 38.4
3.5
Source: East Timor Transitional Administration, The Asian Development Bank, The World Bank and The United Nations Development Programme, The 2001 Survey of Sucos: Initial Analysis and Implications for Poverty Reduction, Dili, October 2001, p. 31.
Sampling at Aldeia Level
The Suco Survey also collected information on the number, names and population of sub-Suco units known as aldeia. Credibility of the population estimates is also of concern at this level. But more important these units (like Suco) vary widely in size from less than 50 to several hundred households. One of the general criteria of MICS-type surveys is that the final sampling segments should be of approximately equal size. This is the reason that census enumeration areas that are created, at least in part, for sampling purposes are generally used. However, in East Timor, the last census was in 1990 and due to the upheavals and changes in administration in the late 1990s, these demarcations have been lost. There is no alternative but to use aldeia as a basis for sampling here. This problem was addressed by creating “segments” within each selected Suco, where segments were defined as single aldeia, or groups of aldeia. In cases where populations were within reasonable margins of the average size of aldeia nationally (ca. 350 persons or 80 households) or larger, single aldeia were used as segments. However, Aldeia that were smaller (generally those with less than 200 population or 50 households) were combined with another aldeia in the same Suco to form one segment. This was to ensure sufficient sizes for final cluster sampling. Segmentation of very large Suco was not done. However, fortunately, such large Suco were relatively rare and were mainly located in the major urban centers and in a few aldeia within other Distrito capital towns. Sampling of Suco The serpentine listing of Suco along with cumulated populations was used to assign clusters to Suco using PPS sampling. Table AIII-3 shows the results of this exercise by 8 A fully self-weighting sample requires use of fixed sampling intervals within segments, not fixed numbers of respondents. Thus a highly problematic base can lead to
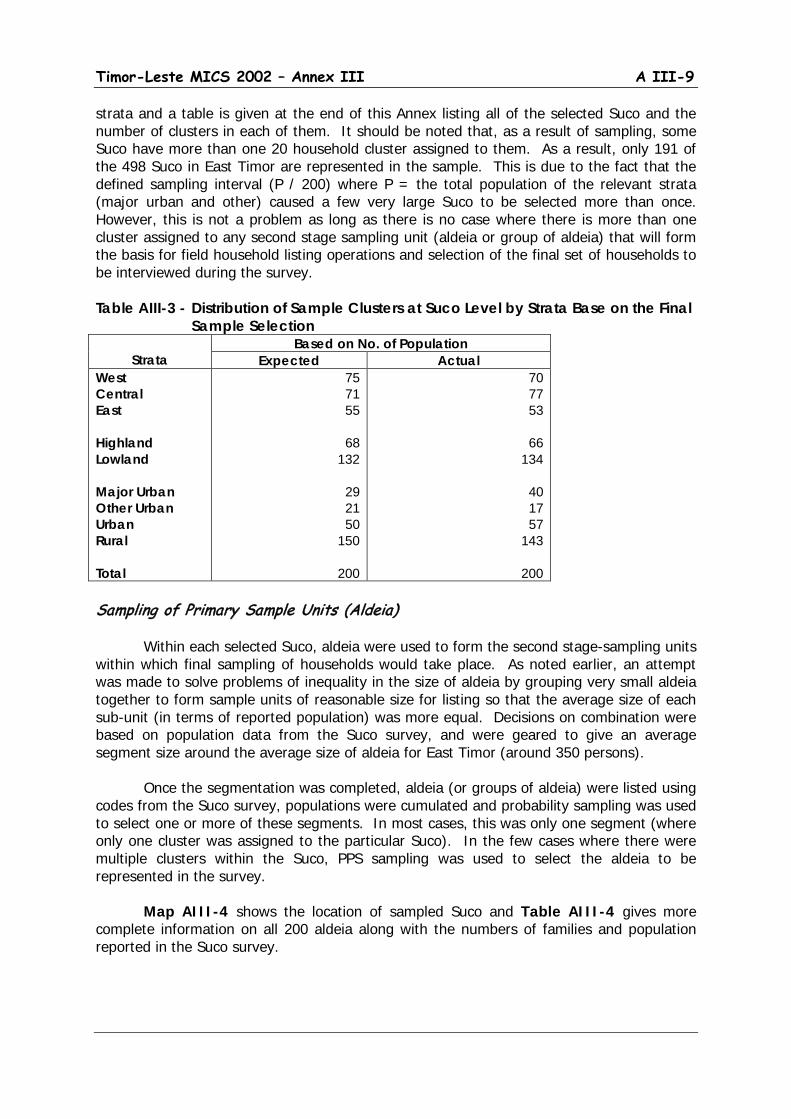
Timor-Leste MICS 2002 – Annex III A III-9
strata and a table is given at the end of this Annex listing all of the selected Suco and the number of clusters in each of them. It should be noted that, as a result of sampling, some Suco have more than one 20 household cluster assigned to them. As a result, only 191 of the 498 Suco in East Timor are represented in the sample. This is due to the fact that the defined sampling interval (P / 200) where P = the total population of the relevant strata (major urban and other) caused a few very large Suco to be selected more than once. However, this is not a problem as long as there is no case where there is more than one cluster assigned to any second stage sampling unit (aldeia or group of aldeia) that will form the basis for field household listing operations and selection of the final set of households to be interviewed during the survey. Table AIII-3 - Distribution of Sample Clusters at Suco Level by Strata Base on the Final
Sample Selection
Strata Based on No. of Population
Expected Actual West Central East Highland Lowland Major Urban Other Urban Urban Rural Total
75 71 55
68
132
29 21 50
150
200
70 77 53
66
134
40 17 57
143
200 Sampling of Primary Sample Units (Aldeia) Within each selected Suco, aldeia were used to form the second stage-sampling units within which final sampling of households would take place. As noted earlier, an attempt was made to solve problems of inequality in the size of aldeia by grouping very small aldeia together to form sample units of reasonable size for listing so that the average size of each sub-unit (in terms of reported population) was more equal. Decisions on combination were based on population data from the Suco survey, and were geared to give an average segment size around the average size of aldeia for East Timor (around 350 persons). Once the segmentation was completed, aldeia (or groups of aldeia) were listed using codes from the Suco survey, populations were cumulated and probability sampling was used to select one or more of these segments. In most cases, this was only one segment (where only one cluster was assigned to the particular Suco). In the few cases where there were multiple clusters within the Suco, PPS sampling was used to select the aldeia to be represented in the survey. Map AIII-4 shows the location of sampled Suco and Table AIII-4 gives more complete information on all 200 aldeia along with the numbers of families and population reported in the Suco survey.
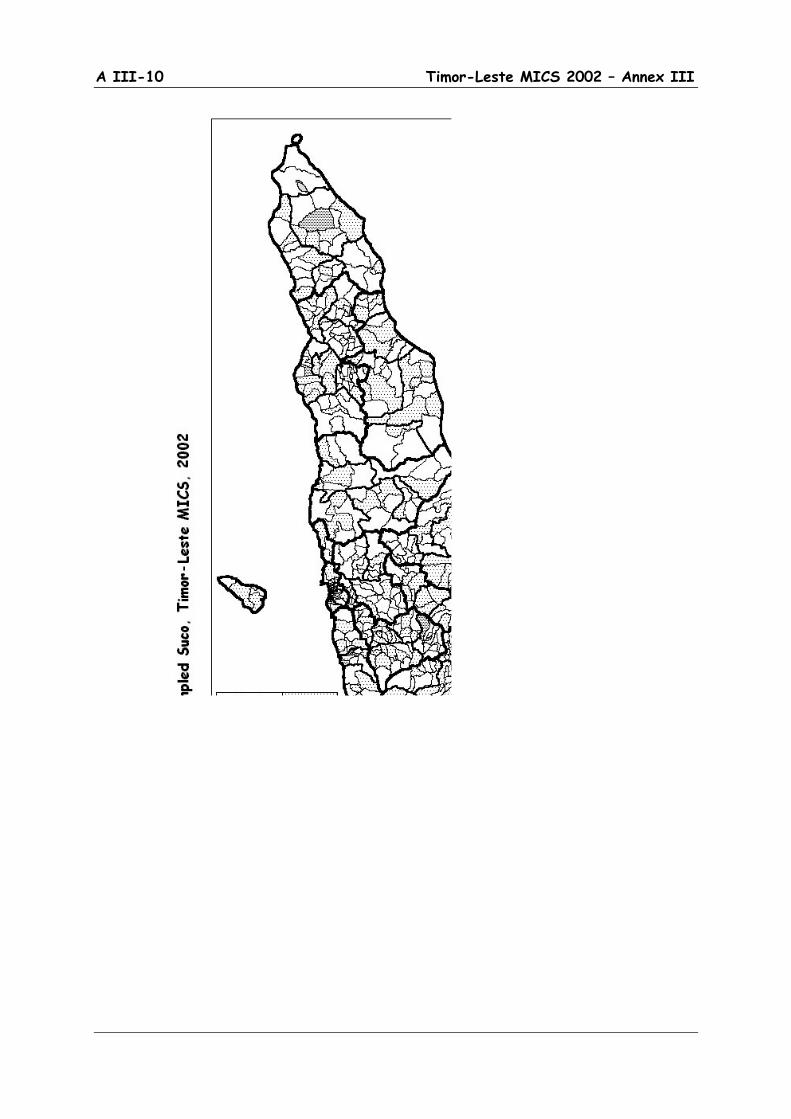
A III-10 Timor-Leste MICS 2002 – Annex III

Timor-Leste MICS 2002 – Annex III A III-11
Table AIII-4 - List of Sample Locations and Strata for the Timor-Leste MICS District/
Sub-District Suco Strata
Aldeia No. of
Reg. R/U Loc. HH Pop. Alieu Aileu Kota Band/Bandato C R H Railete-Dailor 64 420 Hurairaco C R H Raco-Taratehi-Hatuquei 95 432 Selaoi Craic C R H Colihoho 55 281 Laulara Tohumeta C R H Berleu Meta-Acadiru 70 342 Lequidoe Bere Leu C R H Lebumetan 64 290 Remexio Mau Meta C R L Tuqueu 51 224 Fatu Rasa C R H Rai Merahei 66 312 Ainaro Ainaro Manutasi C U H Raebitudo 155 751 Maulo C R H Maulpu-Hato Lau-Hato Lego 97 483 Soro Kraik C R L Ailau 160 315 Hato Builico Nuno Moge C R H Hatu Builiku 197 1002 Mulo C R H Manumera 62 282 Mauxiga C R H Mauxiga 138 731 Hataudu Leolima C R L Dau Sur 151 727 Maubisse Aituto C R H Maulefo-Hato Buti 73 357 Edi C R H Demutete-Hebau 95 415 Manelobas C R H Ernaro 66 273 Maubisse C R H Liquite 115 524 Bacau Baguia Defa Uassi E R L Lari Bere-Defa Uassi 80 473 Alawa Craic I E R L Neo Lodae 150 654 Baucau Tiri Lolo E MU L Beto Lale 296 1563 Bahu E MU L Ro Ulo 287 1410 E MU L Lame Gua 390 2405 Caibada Uaimua E MU L Anawaru 235 740 Buruma E R L Area B. 204 950 Bucoli E MU L Uai Semo 120 514 Caicido E R L Lia Lailisu 90 373 Triloca E MU H Aubaca 105 546 Fatu Maca Buibau E R H Bui Lai 145 608 Gariuai E R H Cairini 120 605 Waili E R H Uamana Boe 134 462 Laga Nunira E R L Bus Caulari 104 661 Sae Lari E R H Lari Ledana 59 293 Atelari E R H Loi Lari 79 370 Tekinomate E R L Sama Guia 82 393 Quelicai Lete Muno E R L Lau Mana 160 657 Abatala E R L Taleha 76 340 Abo E R L Abo 59 256 Namanei E R L Dai Cau 191 388
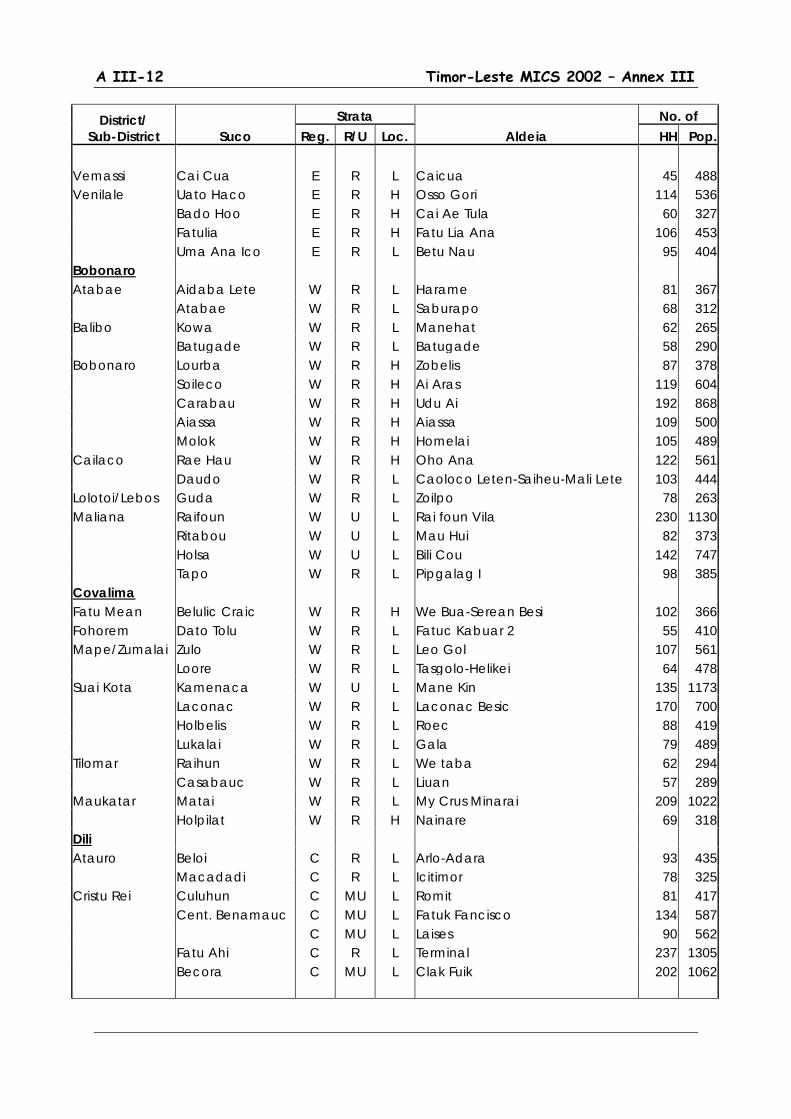
A III-12 Timor-Leste MICS 2002 – Annex III
District/ Sub-District Suco
Strata Aldeia
No. of Reg. R/U Loc. HH Pop.
Vemassi Cai Cua E R L Caicua 45 488 Venilale Uato Haco E R H Osso Gori 114 536 Bado Hoo E R H Cai Ae Tula 60 327 Fatulia E R H Fatu Lia Ana 106 453 Uma Ana Ico E R L Betu Nau 95 404 Bobonaro Atabae Aidaba Lete W R L Harame 81 367 Atabae W R L Saburapo 68 312 Balibo Kowa W R L Manehat 62 265 Batugade W R L Batugade 58 290 Bobonaro Lourba W R H Zobelis 87 378 Soileco W R H Ai Aras 119 604 Carabau W R H Udu Ai 192 868 Aiassa W R H Aiassa 109 500 Molok W R H Homelai 105 489 Cailaco Rae Hau W R H Oho Ana 122 561 Daudo W R L Caoloco Leten-Saiheu-Mali Lete 103 444 Lolotoi/Lebos Guda W R L Zoilpo 78 263 Maliana Raifoun W U L Rai foun Vila 230 1130 Ritabou W U L Mau Hui 82 373 Holsa W U L Bili Cou 142 747 Tapo W R L Pipgalag I 98 385 Covalima Fatu Mean Belulic Craic W R H We Bua-Serean Besi 102 366 Fohorem Dato Tolu W R L Fatuc Kabuar 2 55 410 Mape/Zumalai Zulo W R L Leo Gol 107 561 Loore W R L Tasgolo-Helikei 64 478 Suai Kota Kamenaca W U L Mane Kin 135 1173 Laconac W R L Laconac Besic 170 700 Holbelis W R L Roec 88 419 Lukalai W R L Gala 79 489 Tilomar Raihun W R L We taba 62 294 Casabauc W R L Liuan 57 289 Maukatar Matai W R L My Crus Minarai 209 1022 Holpilat W R H Nainare 69 318 Dili Atauro Beloi C R L Arlo-Adara 93 435 Macadadi C R L Icitimor 78 325 Cristu Rei Culuhun C MU L Romit 81 417 Cent. Benamauc C MU L Fatuk Fancisco 134 587 C MU L Laises 90 562 Fatu Ahi C R L Terminal 237 1305 Becora C MU L Clak Fuik 202 1062

Timor-Leste MICS 2002 – Annex III A III-13
District/ Sub-District Suco
Strata Aldeia
No. of Reg. R/U Loc. HH Pop.
C MU L Cakeularan 305 1299 C MU L 20 De Myo 252 1806 Hera C R L Sukaer Laran 123 546 Camea C MU L Ailok Laran 126 683 Bidau Santana C MU L Oriente 197 1199 C MU L Sagrada Familia 335 2020 Dom Aleixo Los Cabubu C R L Lemokari 212 1731 Beira Mar C MU L Zero Un 255 1370 C MU L Zero Tres 450 2236 Nazare C MU L Licarafouma 132 658 C MU L Tat 224 1030 Suleur C MU L Anin Fuic 139 637 28 Novembro C MU L Manu Fuic 143 809 Malinamoc C MU L 17 de Outubro 210 738 12 De Novembro C MU L Vitava 93 686 20 De Maio C MU L Lirio/ Farol 165 827 Rai Naca Doco C MU L Bebonuc Metin IV 165 507 C MU L Nitomea 196 936 Metinaro Benunuc C R L Haleu 102 384 Nain Feto Asucai Lor C MU L 4 De Setembro 143 686 Santa Cruz C MU L Moris Foun 220 1198 Inur Fuic C R L Sare 90 398 Talera Hun C MU L Bedic 157 836 Bemori C MU L Baba Liurai Leste 112 587 Lahane Oreintal C MU L Kmanec-Paz 85 405 Vera Cruz Alto Hospit C MU L Anitas Hun 51 298 Hanso Hatora C MU L Mate Resto 64 423 Bairo Alto C MU L Care Laran 87 400 Mascarinhas C MU L Alto P.M. 131 611 Rumbia C MU L Divino 12 84 409 Naroman C MU L Timor Kmanek 139 779 Haksolok C MU L Matua 205 1152 C MU L Virgo Loja 175 980 Isolado C MU L Fatu Metan 185 1042 Florestal C R H Fila Bebatua 58 300 Ermera Atsabe Baboe Leten C R H Liabe-Coilequi 89 364 Lacao C R H Ata Ubu 86 437 Malabe C R H Malabe 79 374 Ermera Kota Poetete C R H Taclela 138 755 Ponilala C R H Nunu Pu 112 652 Liquimea C R H Sinilelo 88 468 Talimoro C U H Talimoro / Bura 127 635
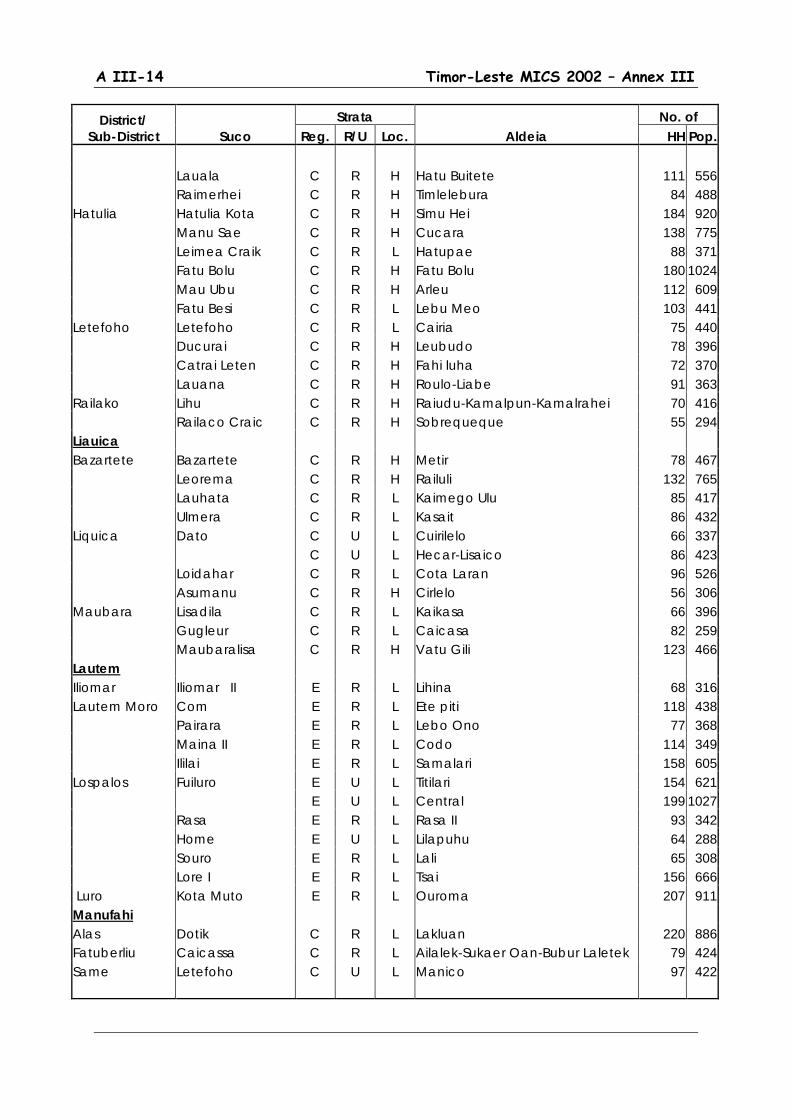
A III-14 Timor-Leste MICS 2002 – Annex III
District/ Sub-District Suco
Strata Aldeia
No. of Reg. R/U Loc. HH Pop.
Lauala C R H Hatu Buitete 111 556 Raimerhei C R H Timlelebura 84 488 Hatulia Hatulia Kota C R H Simu Hei 184 920 Manu Sae C R H Cucara 138 775 Leimea Craik C R L Hatupae 88 371 Fatu Bolu C R H Fatu Bolu 180 1024 Mau Ubu C R H Arleu 112 609 Fatu Besi C R L Lebu Meo 103 441 Letefoho Letefoho C R L Cairia 75 440 Ducurai C R H Leubudo 78 396 Catrai Leten C R H Fahi luha 72 370 Lauana C R H Roulo-Liabe 91 363 Railako Lihu C R H Raiudu-Kamalpun-Kamalrahei 70 416 Railaco Craic C R H Sobrequeque 55 294 Liauica Bazartete Bazartete C R H Metir 78 467 Leorema C R H Railuli 132 765 Lauhata C R L Kaimego Ulu 85 417 Ulmera C R L Kasait 86 432 Liquica Dato C U L Cuirilelo 66 337 C U L Hecar-Lisaico 86 423 Loidahar C R L Cota Laran 96 526 Asumanu C R H Cirlelo 56 306 Maubara Lisadila C R L Kaikasa 66 396 Gugleur C R L Caicasa 82 259 Maubaralisa C R H Vatu Gili 123 466 Lautem Iliomar Iliomar II E R L Lihina 68 316 Lautem Moro Com E R L Ete piti 118 438 Pairara E R L Lebo Ono 77 368 Maina II E R L Codo 114 349 Ililai E R L Samalari 158 605 Lospalos Fuiluro E U L Titilari 154 621 E U L Central 199 1027 Rasa E R L Rasa II 93 342 Home E U L Lilapuhu 64 288 Souro E R L Lali 65 308 Lore I E R L Tsai 156 666 Luro Kota Muto E R L Ouroma 207 911 Manufahi Alas Dotik C R L Lakluan 220 886 Fatuberliu Caicassa C R L Ailalek-Sukaer Oan-Bubur Laletek 79 424 Same Letefoho C U L Manico 97 422
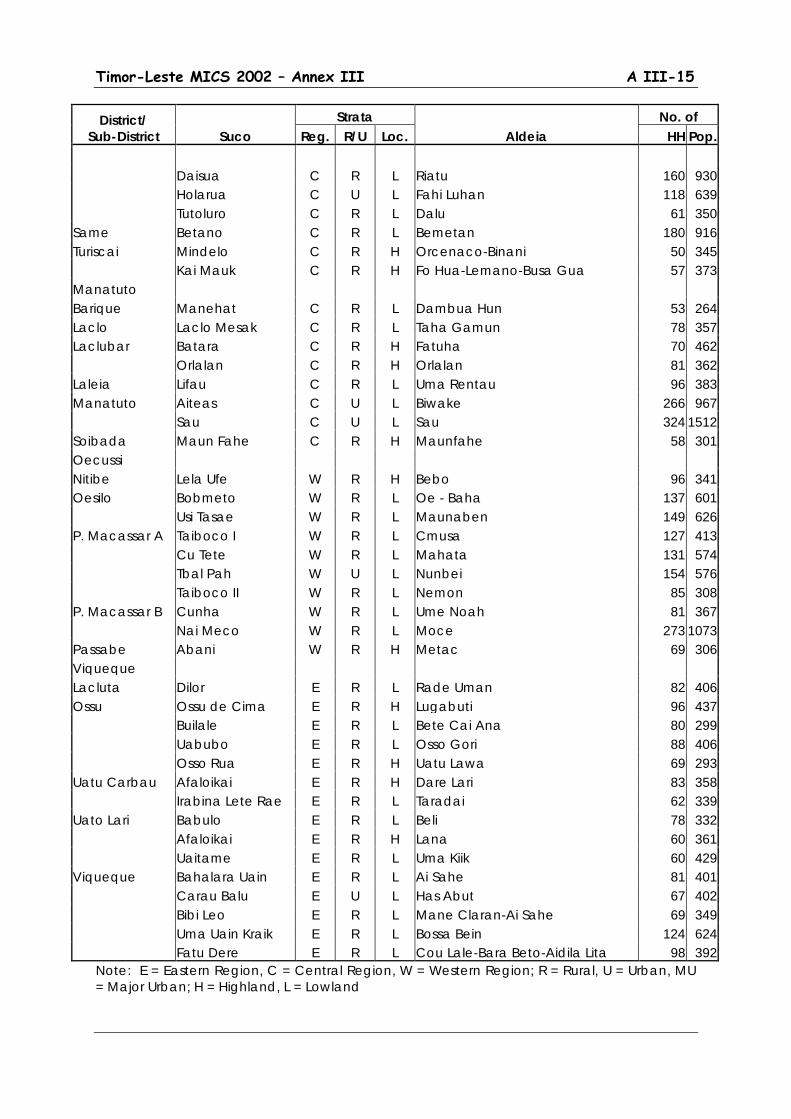
Timor-Leste MICS 2002 – Annex III A III-15
District/ Sub-District Suco
Strata Aldeia
No. of Reg. R/U Loc. HH Pop.
Daisua C R L Riatu 160 930 Holarua C U L Fahi Luhan 118 639 Tutoluro C R L Dalu 61 350 Same Betano C R L Bemetan 180 916 Turiscai Mindelo C R H Orcenaco-Binani 50 345 Kai Mauk C R H Fo Hua-Lemano-Busa Gua 57 373 Manatuto Barique Manehat C R L Dambua Hun 53 264 Laclo Laclo Mesak C R L Taha Gamun 78 357 Laclubar Batara C R H Fatuha 70 462 Orlalan C R H Orlalan 81 362 Laleia Lifau C R L Uma Rentau 96 383 Manatuto Aiteas C U L Biwake 266 967 Sau C U L Sau 324 1512 Soibada Maun Fahe C R H Maunfahe 58 301 Oecussi Nitibe Lela Ufe W R H Bebo 96 341 Oesilo Bobmeto W R L Oe - Baha 137 601 Usi Tasae W R L Maunaben 149 626 P. Macassar A Taiboco I W R L Cmusa 127 413 Cu Tete W R L Mahata 131 574 Tbal Pah W U L Nunbei 154 576 Taiboco II W R L Nemon 85 308 P. Macassar B Cunha W R L Ume Noah 81 367 Nai Meco W R L Moce 273 1073 Passabe Abani W R H Metac 69 306 Viqueque Lacluta Dilor E R L Rade Uman 82 406 Ossu Ossu de Cima E R H Lugabuti 96 437 Builale E R L Bete Cai Ana 80 299 Uabubo E R L Osso Gori 88 406 Osso Rua E R H Uatu Lawa 69 293 Uatu Carbau Afaloikai E R H Dare Lari 83 358 Irabina Lete Rae E R L Taradai 62 339 Uato Lari Babulo E R L Beli 78 332 Afaloikai E R H Lana 60 361 Uaitame E R L Uma Kiik 60 429 Viqueque Bahalara Uain E R L Ai Sahe 81 401 Carau Balu E U L Has Abut 67 402 Bibi Leo E R L Mane Claran-Ai Sahe 69 349 Uma Uain Kraik E R L Bossa Bein 124 624 Fatu Dere E R L Cou Lale-Bara Beto-Aidila Lita 98 392
Note: E = Eastern Region, C = Central Region, W = Western Region; R = Rural, U = Urban, MU = Major Urban; H = Highland, L = Lowland
A III-16 Timor-Leste MICS 2002 – Annex III
Household Listing and Sampling of Households for Interviewing
Household Listing
Normally, it is best to carry out listing as separate operation from the actual interviewing so that sample selection at the household level can be carried out in the more controlled environment of the central office. However, due to budget and logistical constraints this was not possible here and listing and sampling had to be carried out in the field immediately prior to the household interviewing. Thus a system had to be developed that would be as accurate as possible while still being manageable by the available field personnel. This was a particular problem in East Timor as experience from the Suco survey clearly showed that available household lists and even knowledge of local officials at Suco and aldeia level were not always accurate. Reasons included both the problems of population mobility surrounding the upheavals in 1999 and, more recently, repatriation of population as well as problems in local concepts of what actually constituted households or actual membership in a particular Suco or aldeia. Similar to the Suco survey, two methods were employed, one for the selected aldeia in the major urban centers (where quality of local knowledge is particularly deficient) and one for aldeia elsewhere in East Timor. Outside of the major urban centers, an initial listing was prepared by the team supervisor based on available lists and on direct consultation with the aldeia head and/or other knowledgeable persons at this level. This was done on a household listing form that included the sequence number, name of the household head, and the estimated number of household members. Supervisors were instructed to probe both for households that may have been considered as members of the aldeia but were not actually currently resident in the aldeia (to be excluded from the list) and for households that were not listed or mentioned (perhaps because they were not considered as members or were recent migrants) who should be included. At the same time the supervisor and informant(s) prepared a rough sketch map of the aldeia, outlining principal features (aldeia boundaries, roads, paths, streams, etc.) along with the approximate location of each dwelling unit and household on the listing form linked by the appropriate sequence number. This was designed both to help interviewers in locating sampled households as well as to provide a basis for field verification of the list (see below). The final stage of the listing operation was to do a quick field verification of the list and sketch map by a walk-through basically to verify that dwelling units identified on the initial listing and sketch map were actually occupied (if not, they would be eliminated form the list for sampling purposes) and that there were no occupied dwelling units that had been missed in the initial listing. This did not involve actual visits to households which would have been preferable from the point of view of ensuring maximum accuracy in listing and population estimation, but it was determined to be the most feasible given the cost, time and logistical constraints noted earlier. Pre-test experience suggested that for most aldeia the full listing and checking operation could be carried out in a few hours. As well, experience gained during the pre-test phase of work suggested that outside of the major urban centers, local knowledge with this level of verification was sufficient to identify eligible households with only a small, and acceptable, margin of error.

Timor-Leste MICS 2002 – Annex III A III-17
For some of the large aldeia in the major urban centers, however, it was determined that more comprehensive listing operations were required. Here field teams were instructed to conduct a full door-to-door listing of dwelling units and households; first by defining aldeia boundaries and features on the sketch maps and then undertaking a full listing operation, listing households and population on the listing form and plotting locations on the sketch map. Similar to the listing operation outlined above, listers were instructed to exclude clearly unoccupied dwelling units, but equally to include any occupied units, even if members of the household were temporarily absent. In the latter case, relevant information was obtained from neighbors. This was carried out for the entire aldeia before subsequent segmentation for sampling purposes. Fortunately, the majority of cases where this was necessary were in the capital city of Dili where extra time could be more easily allocated and more extensive supervision of this operation from the central office was more feasible.
Sampling of Households
Random number tables (one for each sample segment) were used to draw a fixed sample of 20 households from the final lists. This was also the responsibility of the supervisor and was carried out in the field immediately following completion of the listing operation. Here there were two options. For segments formed from a single aldeia sampling was direct. However, where two or more aldeia were combined to form a segment, listing was first done for all the aldeia and then the lists were combined sequentially with new cumulative sequence numbers for the additional aldeia before sampling was undertaken. The use of fixed sample sizes as opposed to fixed sampling intervals meant that the sample was not self-weighting at this level (e.g. there are separate sampling weights for each segment). However, this was seen as a necessity given the great uncertainty associated with the available population data from the Suco survey and the need to keep interviewer workloads to manageable levels. Sacrificing some convenience at the central level was seen to be a small payment for making sure that field workloads would remain reasonably equitable.
A III-18 Timor-Leste MICS 2002 – Annex III

Annex IV
Questionnaires

Annex V
Survey Personnel

Timor-Leste MICS 2002 – Annex V A V-1
Annex V Survey Personnel
Field Director, Statistics Office: Interviewers: Manuel Mendonca Felismina Odete P. S. Florentina Dos Santos Field Manager: Gizela M. Martins Elias Dos Santos Ferreira Graziela Exposto Soares Henriqueta Da Costa Braz Advisors: Herminia Ximenes Arizal Ahnaf Imaculada da Conceicao Aryago Mulia Inacia Vilena David Brackfield Jesuina de O. Sarmento Mayiling Oey-Gardiner Julia Baptista L. Araujo Peter Gardiner Juvencia Fernandes de L. S. Happy Hardjo Leovegilda Fatima Pereira Th. Suprono Luizinha Pereira Maria F. Tilman Santos Data Entry Manager Maria Lurdes de Jesus Lourenco Soares (M) Maria M. L. Ferreira Olandina M. Guterres Trainers/Monitors Palmira Carvalho Endang Sulastri Pascoela da Costa Indartik Rosaria Barros Amaral Sri Wardhani Bakri Silvia Verdial L. S. Swastika Andi Dwi Nugroho Zulmira M. Fernandes Th. Suprono Supervisors: Interviewers: Ananias E. Da Silva Adriana Gabriel de Jesus Pereira Antonio Soares Ana Brigida Freitas Fidencio de Araujo Anabela da Conceicao Gil F. V. Madeira Anastacia da C. Araujo Joaquim Gonzaga Angela Maria Fraga Manuel Soares Pereira Dircia Soares Babo Paulina Viegas Belinha Paula Ricardo Dos Santos Cesaltina M. S. Miranda Samuel Fatima Claudina Dos Santos Tomas Gusmao Clementina Rente F. Delia Nunes Anthropometrists: Dilva do R. F. B. da Costa Filomena de Carvalho Domingas Fernandes Rosa Soares Dorinha M. G. L. Remedios Ana Maria Guterres Dulce de Deus Rosa Doutel Gomes Vong Elisa Odilia F. B. Margarida de Araujo Elsa Camila Viegas Josefa Borges Ernestina dos Santos Belmira B. Barros
A V-2 Timor-Leste MICS 2002 – Annex V
Anthropometrists: Field Administrators/Drivers: Angela Maya Rafael Lobato Olinda Barros Vicente de Jesus Lusia Marcal de Jesus Mausilo Marques Yohanes W. Leyn Field Administrators/Drivers: Botavio Joaquim Alves Antonio Abilio Evaristo G. Alves Data Entry Specialists: Filomeno Pereira Juselina Corte Real Augusto Moniz Silvina Soares da Costa Mateus Potto Silvino Lopes Quintao de Deus Valdomar A. F. Belo Americo Soares
Timor-Leste MICS 2002 – Annex VI A VI-1
Annex VI
Wealth Index Calculation


Timor-Leste MICS 2002 – Annex VI A VI-1
Annex VI Wealth Index Calculation
The wealth index for the Timor-Leste MICS followed a methodology proposed by Filmer and Pritchett of the World Bank as outlined in a paper by Kiersten Johnson of MACRO International. It was based on a factor analysis using 21 variables as outlined below. These were selected based on review of the data and on the basis of judgment on their likely correlation with general wealth conditions at the household level. Variable Definitions FLOORA Total floor area of house (in square meters) FLRCAP Floor area per household member (in square meters) RM Number of rooms in the house RMCAP Number of rooms per household member WALL Wall made out of brick = 1, else = 0 WALL2 Wall made out of brick or wood = 1, else = 0 RF Roof made out of concrete, roof tile or zinc/asbestos = 1, else = 0 FLR Floor made out of marble/tile/ceramic, cement or wood = 1, else = 0 LIGHT Main source of lighting is electricity or pump lamp = 1, else = 0 RADIO2 Own radio or cassette player = 1, else = 0 TV2 Own TV = 1, else = 0 BYCLE2 Own bicycle = 1, else = 0 MOTOR2 Own motorcycle = 1, else = 0 TRC Own telephone, refrigerator or car = 1, else = 0 COOKF Main cooking fuel is electricity, gas, coal or kerosene = 1, else = 0 WATER Main source of drinking water is pipe to house or yard or pump well = 1, else =
0 WATER2 Main source of drinking water is pipe to house or yard, pump well or standpipe
= 1, else = 0 WATER 3 Main source of drinking water is pipe to house or yard, pump well, standpipe
or protected well or spring = 1, else = 0 SANIT Main source of sanitation is flush or pour flush toilet = 1, else = 0 SANIT2 Main source of sanitation is flush or pour flush toilet or improved pit latrine with
septic tank = 1, else = 0 SANIT3 Main source of sanitation is flush or pour flush toilet or improved pit latrine or pit
with septic tank The objective is to find a set of variables that can be assumed to be related to household wealth levels that together can create a factor (principal component) that explains as much as possible of the total variation among the variables. The factor analysis produces 21 principal components, but it is the first principal component that is ultimately evaluated and used to create the wealth index.
Results of the factor analysis are shown below. There were a total of 3982 cases on all variables (no missing values) and the first principal component explained 30.4 percent of the variance. This is relatively high and suggests that the Principle Components Analysis (PCA) has been reasonably successful in defining a relevant scale for differentiation of households along a wealth scale relevant to the specific conditions and assets included in
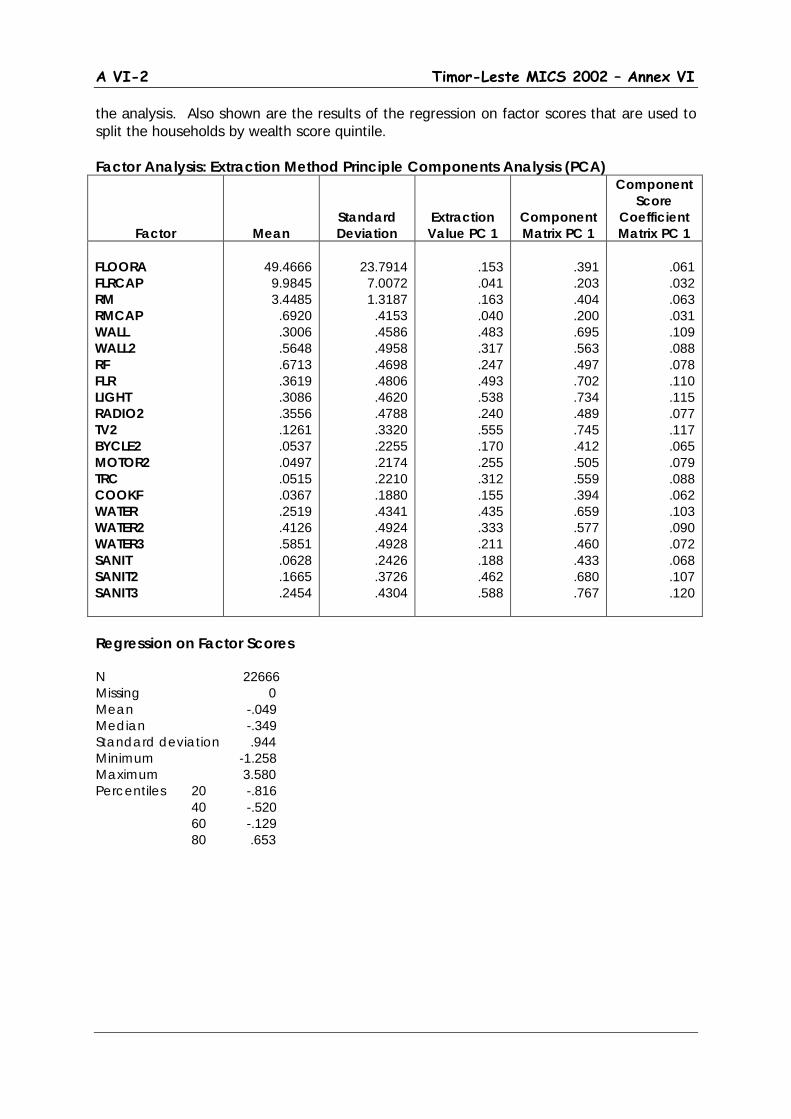
A VI-2 Timor-Leste MICS 2002 – Annex VI
the analysis. Also shown are the results of the regression on factor scores that are used to split the households by wealth score quintile. Factor Analysis: Extraction Method Principle Components Analysis (PCA)
Factor
Mean
Standard Deviation
Extraction Value PC 1
Component Matrix PC 1
Component Score
Coefficient Matrix PC 1
FLOORA FLRCAP RM RMCAP WALL WALL2 RF FLR LIGHT RADIO2 TV2 BYCLE2 MOTOR2 TRC COOKF WATER WATER2 WATER3 SANIT SANIT2 SANIT3
49.4666 9.9845 3.4485 .6920 .3006 .5648 .6713 .3619 .3086 .3556 .1261 .0537 .0497 .0515 .0367 .2519 .4126 .5851 .0628 .1665 .2454
23.7914 7.0072 1.3187 .4153 .4586 .4958 .4698 .4806 .4620 .4788 .3320 .2255 .2174 .2210 .1880 .4341 .4924 .4928 .2426 .3726 .4304
.153 .041 .163 .040 .483 .317 .247 .493 .538 .240 .555 .170 .255 .312 .155 .435 .333 .211 .188 .462 .588
.391 .203 .404 .200 .695 .563 .497 .702 .734 .489 .745 .412 .505 .559 .394 .659 .577 .460 .433 .680 .767
.061 .032 .063 .031 .109 .088 .078 .110 .115 .077 .117 .065 .079 .088 .062 .103 .090 .072 .068 .107 .120
Regression on Factor Scores N 22666 Missing 0 Mean -.049 Median -.349 Standard deviation .944 Minimum -1.258 Maximum 3.580 Percentiles 20 -.816 40 -.520 60 -.129 80 .653
Annex VII
Sampling Errors

A VII-1 Timor-Leste MICS 2002 – Annex VI
Annex VII Sampling Errors
Sampling errors are computed using the subroutine SYMEAN in the Stata 7 statistical processing package. These are relatively simple variance estimators,26 but are able to take account of basic features such as stratification and clustering in the sample design. One weakness of Stata 7 is that only linearization-based variance estimators are available. These are generally suitable for estimators based on means or proportions, but not for non-linear functions like rates or ratios where more complex replication methods such as jackknifing or repeated replication are commonly used.27
Fortunately, almost all of the important MICS indicators can be expressed as means or proportions. And in the few cases where rates are used, such as for infant or child mortality, confidence can be roughly assessed from the statistical accuracy of the input variables – in this case average numbers of children ever born and children surviving.
Table AVII-1 shows the list of selected variables for which sampling errors are estimated, including the type of estimate (mean or proportion) and the relevant base population. Table AVII-2 shows the sampling errors, including the value of the statistic (R), its standard error (SE), the number of weighted and un-weighted cases, the design effect (DEFT), the relative standard error (SE/R), and the 95 percent confidence intervals (R+2SE, R-2SE) for each variable. Separate tables are prepared for the total sample and for the principal domains used for calculations presented in the report.28
26 Details on the calculation methodology are available in the Stata 7 Reference Manual, Vol 4 (Su-Z), pp. 52-74. 27 The processing package (ISSA) used by DHS surveys provides for this. However, even there, linear estimators are still done for means and proportions. Only in a few cases, such as for fertility or mortality rates, are more complex replication methods applied. 28 These include breakdowns by major urban, total urban and rural; highland and lowland areas, and by region (Eastern, Central, Western). Where relevant errors are also computed for estimates by educational level of mother, age group of mother/child, and wealth quintile.
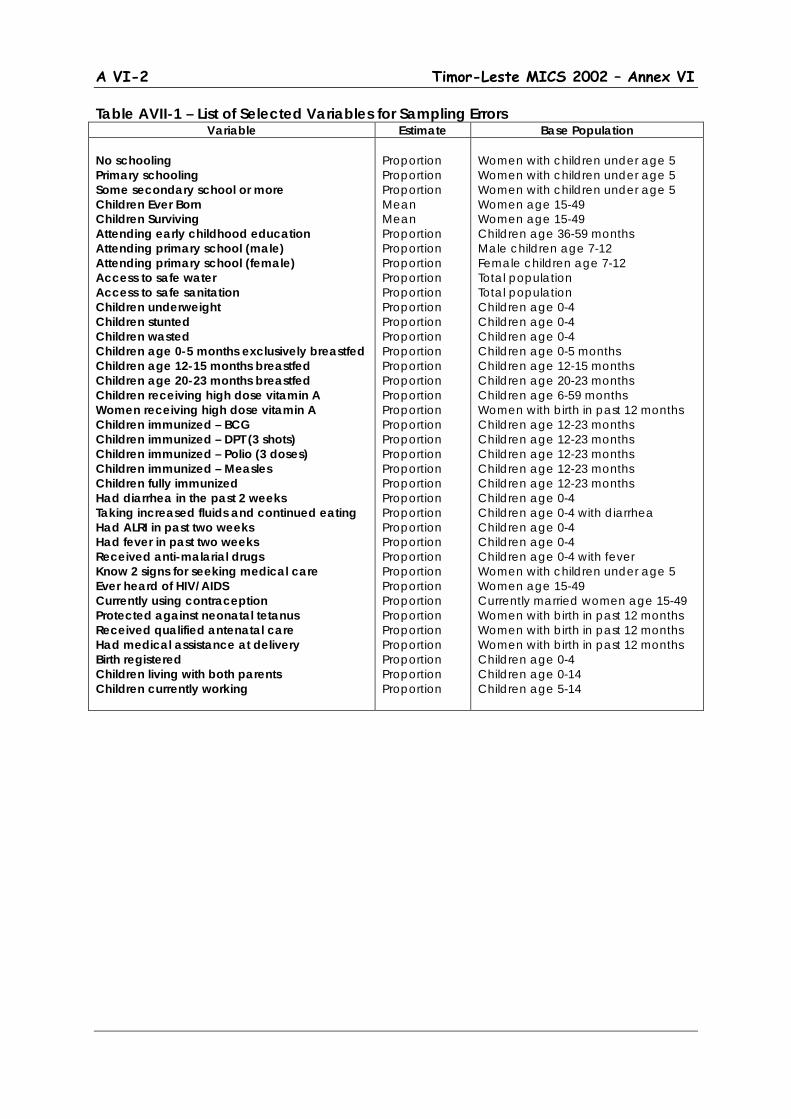
A VI-2 Timor-Leste MICS 2002 – Annex VI
Table AVII-1 – List of Selected Variables for Sampling Errors Variable Estimate Base Population
No schooling Primary schooling Some secondary school or more Children Ever Born Children Surviving Attending early childhood education Attending primary school (male) Attending primary school (female) Access to safe water Access to safe sanitation Children underweight Children stunted Children wasted Children age 0-5 months exclusively breastfed Children age 12-15 months breastfed Children age 20-23 months breastfed Children receiving high dose vitamin A Women receiving high dose vitamin A Children immunized – BCG Children immunized – DPT (3 shots) Children immunized – Polio (3 doses) Children immunized – Measles Children fully immunized Had diarrhea in the past 2 weeks Taking increased fluids and continued eating Had ALRI in past two weeks Had fever in past two weeks Received anti-malarial drugs Know 2 signs for seeking medical care Ever heard of HIV/AIDS Currently using contraception Protected against neonatal tetanus Received qualified antenatal care Had medical assistance at delivery Birth registered Children living with both parents Children currently working
Proportion Proportion Proportion Mean Mean Proportion Proportion Proportion Proportion Proportion Proportion Proportion Proportion Proportion Proportion Proportion Proportion Proportion Proportion Proportion Proportion Proportion Proportion Proportion Proportion Proportion Proportion Proportion Proportion Proportion Proportion Proportion Proportion Proportion Proportion Proportion Proportion
Women with children under age 5 Women with children under age 5 Women with children under age 5 Women age 15-49 Women age 15-49 Children age 36-59 months Male children age 7-12 Female children age 7-12 Total population Total population Children age 0-4 Children age 0-4 Children age 0-4 Children age 0-5 months Children age 12-15 months Children age 20-23 months Children age 6-59 months Women with birth in past 12 months Children age 12-23 months Children age 12-23 months Children age 12-23 months Children age 12-23 months Children age 12-23 months Children age 0-4 Children age 0-4 with diarrhea Children age 0-4 Children age 0-4 Children age 0-4 with fever Women with children under age 5 Women age 15-49 Currently married women age 15-49 Women with birth in past 12 months Women with birth in past 12 months Women with birth in past 12 months Children age 0-4 Children age 0-14 Children age 5-14

A VII-3 Timor-Leste MICS 2002 – Annex VI
Table AVII-2.a – Sampling Errors, National Sample
Number of Cases Confidence
Limits
Variable Value
(R)
Standard Error (SE)
Un-Weighted
(N) Weighted
(WN)
Design Effect (DEFT)
Relative Error (SER) R-2SE R+2SE
No schooling 0.517 0.019 2882 2963 2.048 0.037 0.479 0.555 Primary schooling 0.227 0.012 2882 2963 1.477 0.051 0.204 0.250 Some secondary school or more 0.256 0.016 2882 2963 1.920 0.061 0.225 0.287 Children Ever Born 3.285 0.054 4606 4631 1.251 0.016 3.177 3.393 Children Surviving 2.765 0.043 4606 4631 1.213 0.016 2.679 2.851 Attending early childhood education 0.015 0.004 1491 1504 1.240 0.259 0.007 0.023 Attending primary school (male) 0.760 0.015 2177 2175 1.653 0.020 0.729 0.790 Attending primary school (female) 0.746 0.017 2048 2042 1.792 0.023 0.711 0.780 Access to safe water 0.398 0.025 23016 23016 7.735 0.063 0.348 0.447 Access to safe sanitation 0.155 0.014 23016 23016 5.889 0.091 0.127 0.183 Children underweight 0.426 0.012 4174 4253 1.553 0.028 0.402 0.450 Children stunted 0.467 0.012 4084 4163 1.537 0.026 0.443 0.491 Children wasted 0.120 0.008 4061 4134 1.531 0.065 0.104 0.135 Children age 0-5 months excl. breastfed 0.440 0.027 619 654 1.374 0.061 0.386 0.493 Children age 12-15 months breastfed 0.558 0.030 432 448 1.248 0.053 0.499 0.617 Children age 20-23 months breastfed 0.100 0.024 236 245 1.212 0.234 0.053 0.147 Children receiving high dose vitamin A 0.519 0.019 3835 3893 2.361 0.037 0.480 0.557 Women receiving high dose vitamin A 0.275 0.019 1113 1157 1.469 0.070 0.237 0.314 Children immunized-BCG 0.372 0.021 988 1016 1.398 0.058 0.329 0.415 Children immunized-DPT (3 shots) 0.180 0.017 988 1016 1.416 0.096 0.146 0.215 Children immunized-Polio (3 doses) 0.175 0.016 988 1016 1.331 0.092 0.143 0.207 Children immunized-Measles 0.276 0.020 988 1016 1.415 0.073 0.236 0.316 Children fully immunized 0.048 0.011 988 1016 1.631 0.231 0.026 0.070 Had diarrhea in the past 2 weeks 0.254 0.012 4454 4547 1.778 0.046 0.231 0.277 Taking inc. fluids and continued eating 0.070 0.010 1117 1154 1.359 0.148 0.049 0.090 Had ALRI in past two weeks 0.141 0.011 4454 4547 2.016 0.075 0.120 0.162 Had fever in past two weeks 0.279 0.014 4454 4547 2.149 0.052 0.251 0.308 Received anti-malarial drugs 0.474 0.023 1223 1271 1.651 0.049 0.427 0.521 Know 2 signs for seeking medical care 0.599 0.022 2882 2963 2.383 0.036 0.555 0.642 Ever heard of HIV/AIDS 0.160 0.012 4606 4631 2.238 0.076 0.136 0.184 Currently using contraception 0.072 0.008 3313 3370 1.171 0.106 0.057 0.087 Protected against neonatal tetanus 0.410 0.024 1113 1157 1.633 0.058 0.363 0.457 Received qualified antenatal care 0.425 0.024 1113 1157 1.666 0.057 0.376 0.474 Had medical assistance at delivery 0.236 0.020 1113 1157 1.619 0.086 0.196 0.277 Birth registered 0.223 0.018 4454 4547 2.867 0.080 0.187 0.259 Children living with both parents 0.921 0.006 11478 11564 2.319 0.006 0.909 0.932 Children currently working 0.191 0.011 6985 6977 2.359 0.058 0.169 0.213
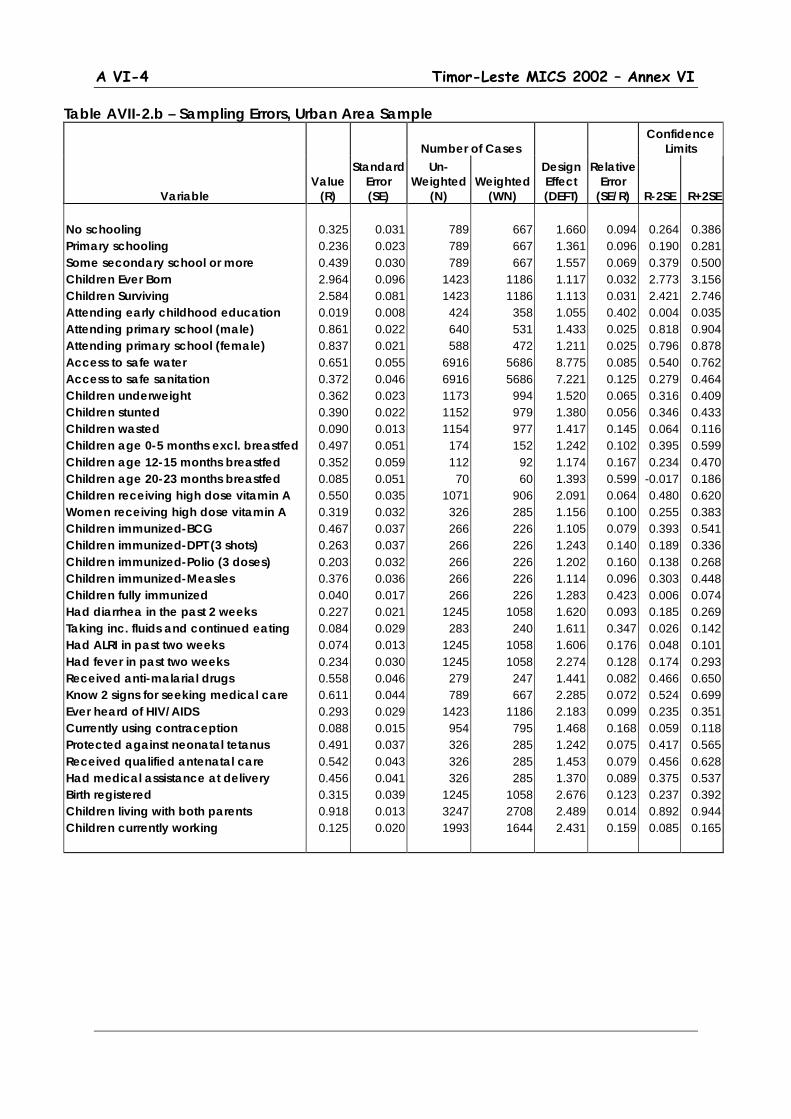
A VI-4 Timor-Leste MICS 2002 – Annex VI
Table AVII-2.b – Sampling Errors, Urban Area Sample
Number of Cases Confidence
Limits
Variable Value
(R)
Standard Error (SE)
Un-Weighted
(N) Weighted
(WN)
Design Effect (DEFT)
Relative Error
(SE/R) R-2SE R+2SE No schooling 0.325 0.031 789 667 1.660 0.094 0.264 0.386 Primary schooling 0.236 0.023 789 667 1.361 0.096 0.190 0.281 Some secondary school or more 0.439 0.030 789 667 1.557 0.069 0.379 0.500 Children Ever Born 2.964 0.096 1423 1186 1.117 0.032 2.773 3.156 Children Surviving 2.584 0.081 1423 1186 1.113 0.031 2.421 2.746 Attending early childhood education 0.019 0.008 424 358 1.055 0.402 0.004 0.035 Attending primary school (male) 0.861 0.022 640 531 1.433 0.025 0.818 0.904 Attending primary school (female) 0.837 0.021 588 472 1.211 0.025 0.796 0.878 Access to safe water 0.651 0.055 6916 5686 8.775 0.085 0.540 0.762 Access to safe sanitation 0.372 0.046 6916 5686 7.221 0.125 0.279 0.464 Children underweight 0.362 0.023 1173 994 1.520 0.065 0.316 0.409 Children stunted 0.390 0.022 1152 979 1.380 0.056 0.346 0.433 Children wasted 0.090 0.013 1154 977 1.417 0.145 0.064 0.116 Children age 0-5 months excl. breastfed 0.497 0.051 174 152 1.242 0.102 0.395 0.599 Children age 12-15 months breastfed 0.352 0.059 112 92 1.174 0.167 0.234 0.470 Children age 20-23 months breastfed 0.085 0.051 70 60 1.393 0.599 -0.017 0.186 Children receiving high dose vitamin A 0.550 0.035 1071 906 2.091 0.064 0.480 0.620 Women receiving high dose vitamin A 0.319 0.032 326 285 1.156 0.100 0.255 0.383 Children immunized-BCG 0.467 0.037 266 226 1.105 0.079 0.393 0.541 Children immunized-DPT (3 shots) 0.263 0.037 266 226 1.243 0.140 0.189 0.336 Children immunized-Polio (3 doses) 0.203 0.032 266 226 1.202 0.160 0.138 0.268 Children immunized-Measles 0.376 0.036 266 226 1.114 0.096 0.303 0.448 Children fully immunized 0.040 0.017 266 226 1.283 0.423 0.006 0.074 Had diarrhea in the past 2 weeks 0.227 0.021 1245 1058 1.620 0.093 0.185 0.269 Taking inc. fluids and continued eating 0.084 0.029 283 240 1.611 0.347 0.026 0.142 Had ALRI in past two weeks 0.074 0.013 1245 1058 1.606 0.176 0.048 0.101 Had fever in past two weeks 0.234 0.030 1245 1058 2.274 0.128 0.174 0.293 Received anti-malarial drugs 0.558 0.046 279 247 1.441 0.082 0.466 0.650 Know 2 signs for seeking medical care 0.611 0.044 789 667 2.285 0.072 0.524 0.699 Ever heard of HIV/AIDS 0.293 0.029 1423 1186 2.183 0.099 0.235 0.351 Currently using contraception 0.088 0.015 954 795 1.468 0.168 0.059 0.118 Protected against neonatal tetanus 0.491 0.037 326 285 1.242 0.075 0.417 0.565 Received qualified antenatal care 0.542 0.043 326 285 1.453 0.079 0.456 0.628 Had medical assistance at delivery 0.456 0.041 326 285 1.370 0.089 0.375 0.537 Birth registered 0.315 0.039 1245 1058 2.676 0.123 0.237 0.392 Children living with both parents 0.918 0.013 3247 2708 2.489 0.014 0.892 0.944 Children currently working 0.125 0.020 1993 1644 2.431 0.159 0.085 0.165

A VII-5 Timor-Leste MICS 2002 – Annex VI
Table AVII-2.c – Sampling Errors, Major Urban Area Sample
Number of Cases Confidence
Limits
Variable Value
(R)
Standard Error (SE)
Un-Weighted
(N) Weighted
(WN)
Design Effect (DEFT)
Relative Error
(SE/R) R-2SE R+2SE No schooling 0.270 0.027 570 394 1.170 0.098 0.217 0.324 Primary schooling 0.210 0.234 570 394 1.125 1.114 -0.258 0.679 Some secondary school or more 0.519 0.316 570 394 1.240 0.609 -0.114 1.152 Children Ever Born 2.989 0.129 1016 671 1.137 0.043 2.731 3.247 Children Surviving 2.647 0.093 1016 671 0.955 0.035 2.461 2.834 Attending early childhood education 0.017 0.007 313 216 0.838 0.435 0.002 0.032 Attending primary school (male) 0.904 0.022 462 317 1.306 0.024 0.861 0.947 Attending primary school (female) 0.877 0.024 430 284 1.211 0.027 0.830 0.924 Access to safe water 0.822 0.037 5009 3345 5.575 0.045 0.748 0.896 Access to safe sanitation 0.544 0.052 5009 3345 6.024 0.095 0.441 0.648 Children underweight 0.376 0.022 862 599 1.113 0.059 0.331 0.420 Children stunted 0.404 0.026 845 589 1.269 0.064 0.352 0.456 Children wasted 0.103 0.019 846 587 1.520 0.187 0.064 0.141 Children age 0-5 months excl. breastfed 0.519 0.054 129 90 1.021 0.105 0.411 0.628 Children age 12-15 months breastfed 0.288 0.065 74 50 1.014 0.227 0.157 0.419 Children age 20-23 months breastfed 0.057 0.036 52 36 0.915 0.626 -0.014 0.128 Children receiving high dose vitamin A 0.515 0.036 780 542 1.644 0.069 0.443 0.586 Women receiving high dose vitamin A 0.352 0.041 233 162 1.551 0.117 0.270 0.434 Children immunized-BCG 0.501 0.043 190 135 0.987 0.086 0.415 0.587 Children immunized-DPT (3 shots) 0.276 0.045 190 135 1.148 0.162 0.187 0.366 Children immunized-Polio (3 doses) 0.255 0.045 190 135 1.194 0.178 0.165 0.346 Children immunized-Measles 0.403 0.041 190 135 0.967 0.102 0.320 0.486 Children fully immunized 0.063 0.026 190 135 1.229 0.411 0.011 0.115 Had diarrhea in the past 2 weeks 0.211 0.018 909 632 1.112 0.086 0.175 0.248 Taking inc. fluids and continued eating 0.029 0.012 190 133 0.789 0.399 0.006 0.052 Had ALRI in past two weeks 0.043 0.010 909 632 1.234 0.234 0.023 0.063 Had fever in past two weeks 0.214 0.041 909 632 2.511 0.193 0.131 0.297 Received anti-malarial drugs 0.569 0.046 186 135 1.061 0.080 0.478 0.661 Know 2 signs for seeking medical care 0.698 0.045 570 394 1.191 0.064 0.608 0.787 Ever heard of HIV/AIDS 0.373 0.038 1016 671 2.054 0.103 0.296 0.450 Currently using contraception 0.060 0.013 694 472 1.204 0.219 0.034 0.087 Protected against neonatal tetanus 0.539 0.044 233 162 1.114 0.081 0.451 0.626 Received qualified antenatal care 0.629 0.036 233 162 0.948 0.057 0.556 0.701 Had medical assistance at delivery 0.554 0.050 233 162 1.272 0.090 0.454 0.653 Birth registered 0.352 0.056 909 632 2.901 0.158 0.240 0.463 Children living with both parents 0.933 0.010 2340 1596 1.549 0.010 0.914 0.952 Children currently working 0.057 0.017 1430 964 2.234 0.306 0.022 0.092

A VI-6 Timor-Leste MICS 2002 – Annex VI
Table AVII-2.d – Sampling Errors, Rural Area Sample
Number of Cases Confidence
Limits
Variable Value
(R)
Standard Error (SE)
Un-Weighted
(N) Weighted
(WN)
Design Effect (DEFT)
Relative Error
(SE/R) R-2SE R+2SE No schooling 0.573 0.022 2093 2296 2.062 0.038 0.530 0.616 Primary schooling 0.224 0.013 2093 2296 1.506 0.059 0.198 0.251 Some secondary school or more 0.203 0.017 2093 2296 2.019 0.085 0.169 0.237 Children Ever Born 3.396 0.063 3183 3445 1.258 0.018 3.271 3.521 Children Surviving 2.828 0.049 3183 3445 1.218 0.017 2.730 2.927 Attending early childhood education 0.014 0.005 1067 1146 1.311 0.328 0.005 0.023 Attending primary school (male) 0.727 0.018 1537 1644 1.637 0.025 0.691 0.763 Attending primary school (female) 0.718 0.021 1460 1570 1.864 0.029 0.676 0.761 Access to safe water 0.314 0.030 16100 17330 8.425 0.095 0.255 0.374 Access to safe sanitation 0.084 0.013 16100 17330 6.179 0.155 0.058 0.110 Children underweight 0.445 0.013 3001 3259 1.512 0.030 0.419 0.472 Children stunted 0.491 0.013 2932 3184 1.485 0.027 0.465 0.518 Children wasted 0.129 0.009 2907 3157 1.527 0.071 0.110 0.147 Children age 0-5 months excl. breastfed 0.422 0.031 445 502 1.380 0.073 0.361 0.484 Children age 12-15 months breastfed 0.612 0.032 320 356 1.219 0.052 0.548 0.675 Children age 20-23 months breastfed 0.105 0.026 166 185 1.162 0.251 0.052 0.158 Children receiving high dose vitamin A 0.509 0.022 2764 2987 2.418 0.044 0.464 0.554 Women receiving high dose vitamin A 0.261 0.024 787 872 1.588 0.091 0.214 0.309 Children immunized-BCG 0.345 0.025 722 789 1.445 0.072 0.295 0.394 Children immunized-DPT (3 shots) 0.156 0.019 722 789 1.444 0.121 0.119 0.194 Children immunized-Polio (3 doses) 0.167 0.018 722 789 1.375 0.110 0.130 0.204 Children immunized-Measles 0.248 0.023 722 789 1.470 0.092 0.202 0.293 Children fully immunized 0.050 0.013 722 789 1.698 0.266 0.023 0.077 Had diarrhea in the past 2 weeks 0.262 0.014 3209 3490 1.803 0.052 0.235 0.289 Taking inc. fluids and continued eating 0.066 0.010 834 914 1.262 0.159 0.045 0.087 Had ALRI in past two weeks 0.161 0.013 3209 3490 2.027 0.079 0.136 0.187 Had fever in past two weeks 0.293 0.016 3209 3490 2.110 0.056 0.261 0.326 Received anti-malarial drugs 0.453 0.027 944 1024 1.687 0.059 0.400 0.506 Know 2 signs for seeking medical care 0.595 0.025 2093 2296 2.422 0.042 0.545 0.646 Ever heard of HIV/AIDS 0.114 0.013 3183 3445 2.445 0.116 0.088 0.141 Currently using contraception 0.067 0.009 2359 2576 1.795 0.132 0.049 0.085 Protected against neonatal tetanus 0.384 0.029 787 872 1.781 0.077 0.325 0.442 Received qualified antenatal care 0.387 0.030 787 872 1.819 0.078 0.327 0.447 Had medical assistance at delivery 0.165 0.022 787 872 1.726 0.132 0.121 0.208 Birth registered 0.195 0.020 3209 3490 2.897 0.101 0.156 0.234 Children living with both parents 0.921 0.006 8231 8857 2.258 0.007 0.908 0.934 Children currently working 0.211 0.013 4992 5333 2.317 0.061 0.185 0.237

A VII-7 Timor-Leste MICS 2002 – Annex VI
Table AVII-2.e – Sampling Errors, Eastern Region Sample
Number of Cases Confidence
Limits
Variable Value
(R)
Standard Error (SE)
Un-Weighted
(N) Weighted
(WN)
Design Effect (DEFT)
Relative Error
(SE/R) R-2SE R+2SE No schooling 0.502 0.019 802 853 1.114 0.039 0.463 0.540 Primary schooling 0.237 0.016 802 853 1.095 0.068 0.205 0.270 Some secondary school or more 0.261 0.017 802 853 1.120 0.065 0.227 0.295 Children Ever Born 3.161 0.116 813 1021 1.389 0.037 2.930 3.392 Children Surviving 2.705 0.095 813 1021 1.398 0.035 2.515 2.895 Attending early childhood education 0.011 0.006 422 449 1.186 0.540 -0.001 0.023 Attending primary school (male) 0.738 0.027 547 586 1.461 0.036 0.685 0.791 Attending primary school (female) 0.756 0.024 505 519 1.285 0.032 0.707 0.804 Access to safe water 0.257 0.045 6031 6319 8.142 0.174 0.167 0.346 Access to safe sanitation 0.061 0.020 6031 6319 6.563 0.325 0.021 0.100 Children underweight 0.374 0.021 1183 1269 1.558 0.057 0.332 0.417 Children stunted 0.479 0.023 1157 1242 1.617 0.048 0.433 0.526 Children wasted 0.094 0.010 1150 1234 1.213 0.108 0.073 0.114 Children age 0-5 months excl. breastfed 0.498 0.046 164 182 1.240 0.093 0.405 0.591 Children age 12-15 months breastfed 0.502 0.048 121 129 1.086 0.096 0.406 0.599 Children age 20-23 months breastfed 0.096 0.044 59 63 1.160 0.456 0.008 0.183 Children receiving high dose vitamin A 0.486 0.036 1090 1168 2.421 0.074 0.414 0.557 Women receiving high dose vitamin A 0.366 0.044 200 268 1.500 0.121 0.278 0.455 Children immunized-BCG 0.303 0.041 271 289 1.484 0.134 0.222 0.385 Children immunized-DPT (3 shots) 0.170 0.028 271 289 1.233 0.162 0.115 0.225 Children immunized-Polio (3 doses) 0.149 0.026 271 289 1.212 0.172 0.098 0.201 Children immunized-Measles 0.233 0.034 271 289 1.354 0.146 0.165 0.301 Children fully immunized 0.018 0.011 271 289 1.344 0.591 -0.003 0.039 Had diarrhea in the past 2 weeks 0.188 0.021 1254 1350 1.928 0.110 0.147 0.230 Taking inc. fluids and continued eating 0.142 0.027 243 254 1.230 0.192 0.088 0.196 Had ALRI in past two weeks 0.158 0.023 1254 1350 2.289 0.145 0.112 0.204 Had fever in past two weeks 0.267 0.030 1254 1350 2.443 0.111 0.208 0.326 Received anti-malarial drugs 0.466 0.040 356 361 1.520 0.087 0.385 0.547 Know 2 signs for seeking medical care 0.607 0.019 802 853 1.137 0.032 0.569 0.646 Ever heard of HIV/AIDS 0.113 0.027 813 1021 2.753 0.242 0.058 0.168 Currently using contraception 0.164 0.021 613 791 1.554 0.125 0.123 0.205 Protected against neonatal tetanus 0.491 0.056 200 268 1.841 0.115 0.378 0.603 Received qualified antenatal care 0.512 0.054 200 268 1.769 0.106 0.403 0.620 Had medical assistance at delivery 0.254 0.050 200 268 1.872 0.196 0.154 0.354 Birth registered 0.357 0.022 1254 1350 1.665 0.062 0.313 0.400 Children living with both parents 0.926 0.009 3028 3207 1.900 0.009 0.908 0.944 Children currently working 0.245 0.024 1767 1847 2.394 0.098 0.197 0.293

A VI-8 Timor-Leste MICS 2002 – Annex VI
Table AVII-2.f – Sampling Errors, Central Region Sample
Number of Cases Confidence
Limits
Variable Value
(R)
Standard Error (SE)
Un-Weighted
(N) Weighted
(WN)
Design Effect (DEFT)
Relative Error
(SE/R) R-2SE R+2SE No schooling 0.502 0.014 1572 1444 1.050 0.028 0.474 0.530 Primary schooling 0.204 0.011 1572 1444 1.053 0.055 0.182 0.227 Some secondary school or more 0.293 0.013 1572 1444 1.060 0.044 0.267 0.319 Children Ever Born 3.403 0.079 2590 2329 1.242 0.023 3.245 3.560 Children Surviving 2.858 0.065 2590 2329 1.227 0.023 2.729 2.987 Attending early childhood education 0.015 0.005 843 768 1.068 0.319 0.005 0.024 Attending primary school (male) 0.769 0.022 1266 1126 1.721 0.028 0.726 0.812 Attending primary school (female) 0.737 0.028 1186 1088 2.067 0.037 0.682 0.792 Access to safe water 0.453 0.036 13120 11869 7.812 0.079 0.381 0.524 Access to safe sanitation 0.244 0.028 13120 11869 7.218 0.117 0.187 0.301 Children underweight 0.423 0.016 2313 2110 1.512 0.039 0.390 0.456 Children stunted 0.468 0.017 2270 2071 1.513 0.036 0.435 0.502 Children wasted 0.113 0.011 2260 2056 1.565 0.098 0.091 0.135 Children age 0-5 months excl. breastfed 0.484 0.036 342 316 1.266 0.074 0.412 0.556 Children age 12-15 months breastfed 0.529 0.045 232 209 1.297 0.086 0.438 0.620 Children age 20-23 months breastfed 0.106 0.032 143 142 1.242 0.307 0.041 0.171 Children receiving high dose vitamin A 0.513 0.024 2135 1951 2.126 0.047 0.464 0.561 Women receiving high dose vitamin A 0.279 0.025 614 550 1.292 0.089 0.230 0.329 Children immunized-BCG 0.419 0.030 557 523 1.365 0.071 0.360 0.479 Children immunized-DPT (3 shots) 0.199 0.026 557 523 1.453 0.129 0.148 0.250 Children immunized-Polio (3 doses) 0.195 0.024 557 523 1.344 0.121 0.148 0.242 Children immunized-Measles 0.315 0.029 557 523 1.408 0.092 0.257 0.373 Children fully immunized 0.058 0.016 557 523 1.585 0.282 0.025 0.091 Had diarrhea in the past 2 weeks 0.278 0.016 2477 2267 1.658 0.057 0.247 0.310 Taking inc. fluids and continued eating 0.054 0.014 660 631 1.493 0.251 0.027 0.082 Had ALRI in past two weeks 0.109 0.011 2477 2267 1.662 0.101 0.087 0.131 Had fever in past two weeks 0.296 0.021 2477 2267 2.187 0.072 0.253 0.338 Received anti-malarial drugs 0.494 0.031 671 670 1.574 0.062 0.432 0.555 Know 2 signs for seeking medical care 0.657 0.013 1572 1444 1.043 0.020 0.630 0.683 Ever heard of HIV/AIDS 0.196 0.020 2590 2329 2.461 0.103 0.156 0.237 Currently using contraception 0.042 0.006 1826 1649 1.230 0.145 0.030 0.054 Protected against neonatal tetanus 0.384 0.032 614 550 1.543 0.083 0.320 0.448 Received qualified antenatal care 0.437 0.033 614 550 1.567 0.076 0.371 0.504 Had medical assistance at delivery 0.272 0.030 614 550 1.583 0.111 0.212 0.332 Birth registered 0.226 0.027 2477 2267 3.039 0.119 0.172 0.280 Children living with both parents 0.923 0.008 6554 5952 2.197 0.008 0.907 0.938 Children currently working 0.148 0.015 4049 3659 2.575 0.102 0.118 0.179
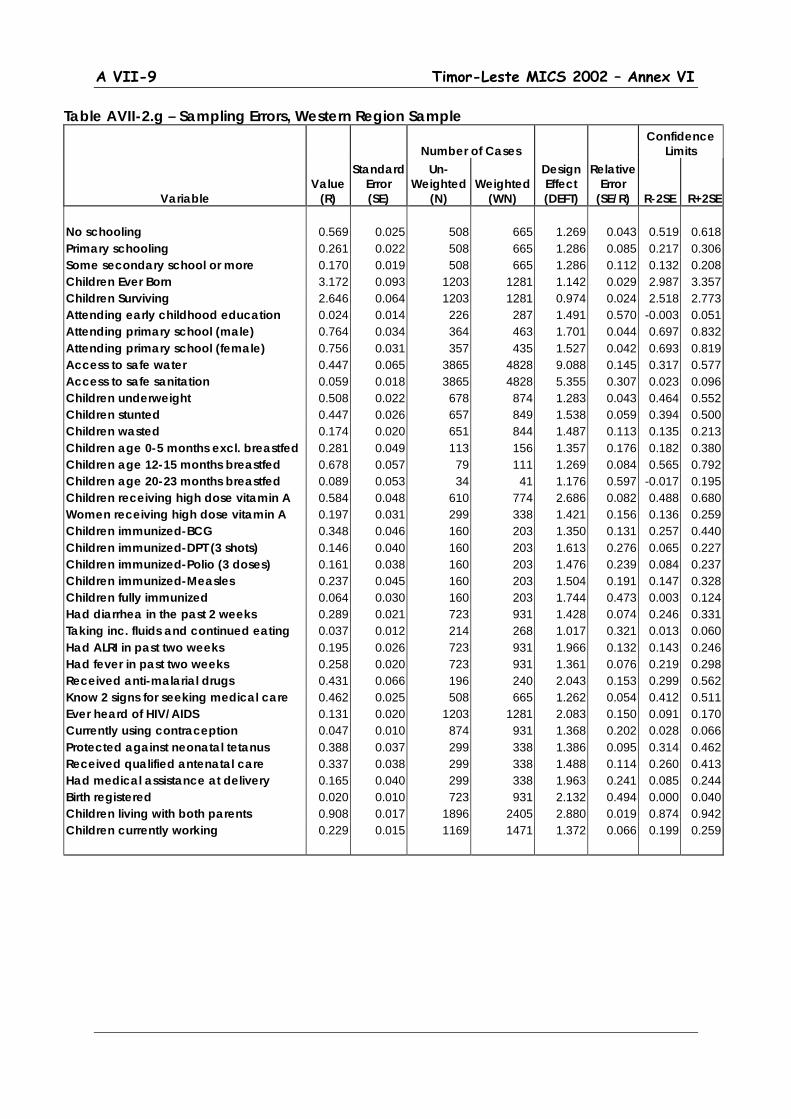
A VII-9 Timor-Leste MICS 2002 – Annex VI
Table AVII-2.g – Sampling Errors, Western Region Sample
Number of Cases Confidence
Limits
Variable Value
(R)
Standard Error (SE)
Un-Weighted
(N) Weighted
(WN)
Design Effect (DEFT)
Relative Error
(SE/R) R-2SE R+2SE No schooling 0.569 0.025 508 665 1.269 0.043 0.519 0.618 Primary schooling 0.261 0.022 508 665 1.286 0.085 0.217 0.306 Some secondary school or more 0.170 0.019 508 665 1.286 0.112 0.132 0.208 Children Ever Born 3.172 0.093 1203 1281 1.142 0.029 2.987 3.357 Children Surviving 2.646 0.064 1203 1281 0.974 0.024 2.518 2.773 Attending early childhood education 0.024 0.014 226 287 1.491 0.570 -0.003 0.051 Attending primary school (male) 0.764 0.034 364 463 1.701 0.044 0.697 0.832 Attending primary school (female) 0.756 0.031 357 435 1.527 0.042 0.693 0.819 Access to safe water 0.447 0.065 3865 4828 9.088 0.145 0.317 0.577 Access to safe sanitation 0.059 0.018 3865 4828 5.355 0.307 0.023 0.096 Children underweight 0.508 0.022 678 874 1.283 0.043 0.464 0.552 Children stunted 0.447 0.026 657 849 1.538 0.059 0.394 0.500 Children wasted 0.174 0.020 651 844 1.487 0.113 0.135 0.213 Children age 0-5 months excl. breastfed 0.281 0.049 113 156 1.357 0.176 0.182 0.380 Children age 12-15 months breastfed 0.678 0.057 79 111 1.269 0.084 0.565 0.792 Children age 20-23 months breastfed 0.089 0.053 34 41 1.176 0.597 -0.017 0.195 Children receiving high dose vitamin A 0.584 0.048 610 774 2.686 0.082 0.488 0.680 Women receiving high dose vitamin A 0.197 0.031 299 338 1.421 0.156 0.136 0.259 Children immunized-BCG 0.348 0.046 160 203 1.350 0.131 0.257 0.440 Children immunized-DPT (3 shots) 0.146 0.040 160 203 1.613 0.276 0.065 0.227 Children immunized-Polio (3 doses) 0.161 0.038 160 203 1.476 0.239 0.084 0.237 Children immunized-Measles 0.237 0.045 160 203 1.504 0.191 0.147 0.328 Children fully immunized 0.064 0.030 160 203 1.744 0.473 0.003 0.124 Had diarrhea in the past 2 weeks 0.289 0.021 723 931 1.428 0.074 0.246 0.331 Taking inc. fluids and continued eating 0.037 0.012 214 268 1.017 0.321 0.013 0.060 Had ALRI in past two weeks 0.195 0.026 723 931 1.966 0.132 0.143 0.246 Had fever in past two weeks 0.258 0.020 723 931 1.361 0.076 0.219 0.298 Received anti-malarial drugs 0.431 0.066 196 240 2.043 0.153 0.299 0.562 Know 2 signs for seeking medical care 0.462 0.025 508 665 1.262 0.054 0.412 0.511 Ever heard of HIV/AIDS 0.131 0.020 1203 1281 2.083 0.150 0.091 0.170 Currently using contraception 0.047 0.010 874 931 1.368 0.202 0.028 0.066 Protected against neonatal tetanus 0.388 0.037 299 338 1.386 0.095 0.314 0.462 Received qualified antenatal care 0.337 0.038 299 338 1.488 0.114 0.260 0.413 Had medical assistance at delivery 0.165 0.040 299 338 1.963 0.241 0.085 0.244 Birth registered 0.020 0.010 723 931 2.132 0.494 0.000 0.040 Children living with both parents 0.908 0.017 1896 2405 2.880 0.019 0.874 0.942 Children currently working 0.229 0.015 1169 1471 1.372 0.066 0.199 0.259

A VI-10 Timor-Leste MICS 2002 – Annex VI
Table AVII-2.h – Sampling Errors, Highland Area Sample
Number of Cases Confidence
Limits
Variable Value
(R)
Standard Error (SE)
Un-Weighted
(N) Weighted
(WN)
Design Effect (DEFT)
Relative Error
(SE/R) R-2SE R+2SE No schooling 0.647 0.016 966 939 1.019 0.025 0.615 0.679 Primary schooling 0.190 0.013 966 939 1.017 0.069 0.164 0.217 Some secondary school or more 0.163 0.012 966 939 1.012 0.076 0.138 0.187 Children Ever Born 3.530 0.097 1543 1490 1.181 0.027 3.337 3.724 Children Surviving 2.883 0.077 1543 1490 1.157 0.027 2.729 3.036 Attending early childhood education 0.014 0.007 533 518 1.350 0.509 0.000 0.028 Attending primary school (male) 0.701 0.027 792 757 1.599 0.038 0.648 0.754 Attending primary school (female) 0.644 0.031 719 691 1.710 0.048 0.581 0.706 Access to safe water 0.277 0.033 7891 7613 6.392 0.118 0.211 0.342 Access to safe sanitation 0.070 0.013 7891 7613 4.532 0.190 0.043 0.096 Children underweight 0.458 0.019 1425 1382 1.426 0.042 0.419 0.496 Children stunted 0.523 0.018 1389 1347 1.318 0.035 0.487 0.559 Children wasted 0.111 0.013 1379 1333 1.512 0.118 0.085 0.137 Children age 0-5 months excl. breastfed 0.461 0.039 221 215 1.127 0.084 0.384 0.539 Children age 12-15 months breastfed 0.654 0.054 147 146 1.367 0.083 0.546 0.763 Children age 20-23 months breastfed 0.138 0.043 85 86 1.149 0.313 0.052 0.224 Children receiving high dose vitamin A 0.470 0.032 1324 1294 2.307 0.069 0.405 0.535 Women receiving high dose vitamin A 0.177 0.025 379 367 1.273 0.144 0.126 0.228 Children immunized-BCG 0.310 0.036 339 341 1.413 0.116 0.238 0.381 Children immunized-DPT (3 shots) 0.122 0.027 339 341 1.495 0.219 0.069 0.176 Children immunized-Polio (3 doses) 0.135 0.025 339 341 1.340 0.186 0.085 0.185 Children immunized-Measles 0.202 0.030 339 341 1.346 0.146 0.143 0.261 Children fully immunized 0.038 0.020 339 341 1.887 0.521 -0.002 0.077 Had diarrhea in the past 2 weeks 0.263 0.017 1545 1509 1.486 0.065 0.229 0.297 Taking inc. fluids and continued eating 0.078 0.019 399 397 1.364 0.237 0.041 0.115 Had ALRI in past two weeks 0.153 0.014 1545 1509 1.502 0.092 0.125 0.181 Had fever in past two weeks 0.279 0.020 1545 1509 1.734 0.072 0.239 0.320 Received anti-malarial drugs 0.396 0.037 427 421 1.554 0.095 0.321 0.470 Know 2 signs for seeking medical care 0.589 0.017 966 939 1.034 0.029 0.556 0.623 Ever heard of HIV/AIDS 0.070 0.012 1543 1490 1.837 0.173 0.046 0.095 Currently using contraception 0.035 0.010 1098 1065 1.713 0.277 0.016 0.054 Protected against neonatal tetanus 0.274 0.034 379 367 1.459 0.124 0.206 0.342 Received qualified antenatal care 0.302 0.034 379 367 1.422 0.113 0.233 0.370 Had medical assistance at delivery 0.115 0.024 379 367 1.454 0.212 0.066 0.163 Birth registered 0.192 0.027 1545 1509 2.639 0.141 0.138 0.246 Children living with both parents 0.929 0.008 4096 3941 1.884 0.008 0.914 0.944 Children currently working 0.189 0.017 2530 2410 2.189 0.093 0.154 0.223

A VII-11 Timor-Leste MICS 2002 – Annex VI
Table AVII-2.i – Sampling Errors, Lowland Area Sample
Number of Cases Confidence
Limits
Variable Value
(R)
Standard Error (SE)
Un-Weighted
(N) Weighted
(WN)
Design Effect (DEFT)
Relative Error
(SE/R) R-2SE R+2SE No schooling 0.457 0.013 1916 2023 1.160 0.029 0.431 0.483 Primary schooling 0.244 0.011 1916 2023 1.168 0.046 0.221 0.266 Some secondary school or more 0.300 0.012 1916 2023 1.152 0.040 0.276 0.323 Children Ever Born 3.169 0.063 3063 3141 1.262 0.020 3.042 3.296 Children Surviving 2.710 0.051 3063 3141 1.229 0.019 2.607 2.813 Attending early childhood education 0.016 0.005 958 986 1.187 0.298 0.007 0.026 Attending primary school (male) 0.791 0.018 1385 1418 1.679 0.023 0.755 0.827 Attending primary school (female) 0.798 0.018 1329 1351 1.633 0.022 0.762 0.834 Access to safe water 0.457 0.036 15125 15403 9.039 0.079 0.385 0.530 Access to safe sanitation 0.197 0.024 15125 15403 7.531 0.122 0.149 0.246 Children underweight 0.411 0.015 2749 2871 1.598 0.036 0.381 0.440 Children stunted 0.441 0.015 2695 2816 1.591 0.034 0.411 0.471 Children wasted 0.124 0.010 2682 2801 1.537 0.078 0.104 0.143 Children age 0-5 months excl. breastfed 0.429 0.035 398 439 1.479 0.082 0.358 0.500 Children age 12-15 months breastfed 0.512 0.035 285 302 1.210 0.069 0.442 0.582 Children age 20-23 months breastfed 0.080 0.028 151 159 1.269 0.345 0.025 0.135 Children receiving high dose vitamin A 0.543 0.023 2511 2600 2.330 0.042 0.497 0.589 Women receiving high dose vitamin A 0.321 0.024 734 790 1.432 0.074 0.273 0.369 Children immunized-BCG 0.404 0.027 649 675 1.395 0.066 0.350 0.457 Children immunized-DPT (3 shots) 0.209 0.022 649 675 1.386 0.105 0.165 0.253 Children immunized-Polio (3 doses) 0.195 0.021 649 675 1.330 0.105 0.154 0.236 Children immunized-Measles 0.314 0.026 649 675 1.426 0.082 0.262 0.365 Children fully immunized 0.053 0.013 649 675 1.523 0.251 0.026 0.079 Had diarrhea in the past 2 weeks 0.249 0.015 2909 3039 1.913 0.061 0.219 0.279 Taking inc. fluids and continued eating 0.065 0.012 718 757 1.361 0.190 0.040 0.090 Had ALRI in past two weeks 0.135 0.015 2909 3039 2.321 0.108 0.106 0.164 Had fever in past two weeks 0.280 0.019 2909 3039 2.340 0.069 0.241 0.318 Received anti-malarial drugs 0.513 0.029 796 850 1.665 0.056 0.455 0.570 Know 2 signs for seeking medical care 0.603 0.013 1916 2023 1.169 0.021 0.577 0.629 Ever heard of HIV/AIDS 0.202 0.017 3063 3141 2.417 0.086 0.168 0.237 Currently using contraception 0.089 0.010 2215 2306 1.652 0.110 0.070 0.109 Protected against neonatal tetanus 0.473 0.028 734 790 1.571 0.059 0.417 0.529 Received qualified antenatal care 0.482 0.031 734 790 1.721 0.064 0.421 0.544 Had medical assistance at delivery 0.293 0.028 734 790 1.712 0.095 0.237 0.349 Birth registered 0.238 0.023 2909 3039 3.005 0.098 0.191 0.285 Children living with both parents 0.916 0.008 7382 7624 2.475 0.009 0.901 0.932 Children currently working 0.192 0.014 4455 4568 2.440 0.074 0.164 0.220
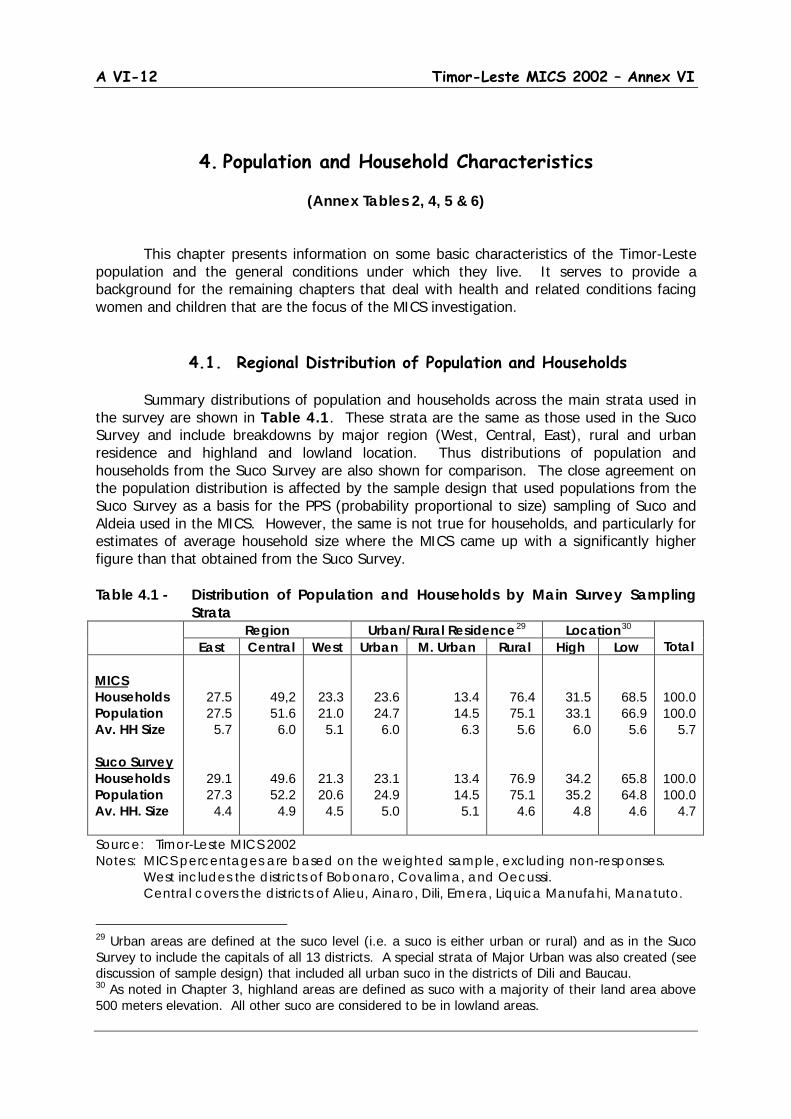
A VI-12 Timor-Leste MICS 2002 – Annex VI
4. Population and Household Characteristics
(Annex Tables 2, 4, 5 & 6)
This chapter presents information on some basic characteristics of the Timor-Leste population and the general conditions under which they live. It serves to provide a background for the remaining chapters that deal with health and related conditions facing women and children that are the focus of the MICS investigation.
4.1. Regional Distribution of Population and Households Summary distributions of population and households across the main strata used in the survey are shown in Table 4.1. These strata are the same as those used in the Suco Survey and include breakdowns by major region (West, Central, East), rural and urban residence and highland and lowland location. Thus distributions of population and households from the Suco Survey are also shown for comparison. The close agreement on the population distribution is affected by the sample design that used populations from the Suco Survey as a basis for the PPS (probability proportional to size) sampling of Suco and Aldeia used in the MICS. However, the same is not true for households, and particularly for estimates of average household size where the MICS came up with a significantly higher figure than that obtained from the Suco Survey. Table 4.1 - Distribution of Population and Households by Main Survey Sampling
Strata Region Urban/Rural Residence29 Location 30
Total East Central West Urban M. Urban Rural High Low MICS Households Population Av. HH Size Suco Survey Households Population Av. HH. Size
27.5 27.5
5.7
29.1 27.3
4.4
49,2 51.6
6.0
49.6 52.2
4.9
23.3 21.0
5.1
21.3 20.6
4.5
23.6 24.7
6.0
23.1 24.9
5.0
13.4 14.5
6.3
13.4 14.5
5.1
76.4 75.1
5.6
76.9 75.1
4.6
31.5 33.1
6.0
34.2 35.2
4.8
68.5 66.9
5.6
65.8 64.8
4.6
100.0 100.0
5.7
100.0 100.0
4.7
Source: Timor-Leste MICS 2002 Notes: MICS percentages are based on the weighted sample, excluding non-responses.
West includes the districts of Bobonaro, Covalima, and Oecussi. Central covers the districts of Alieu, Ainaro, Dili, Emera, Liquica Manufahi, Manatuto.
29 Urban areas are defined at the suco level (i.e. a suco is either urban or rural) and as in the Suco Survey to include the capitals of all 13 districts. A special strata of Major Urban was also created (see discussion of sample design) that included all urban suco in the districts of Dili and Baucau. 30 As noted in Chapter 3, highland areas are defined as suco with a majority of their land area above 500 meters elevation. All other suco are considered to be in lowland areas.
A VII-13 Timor-Leste MICS 2002 – Annex VI
East refers to the remaining districts of Bacau, Lautem and Viqueque According to the MICS about half the households in Timor-Leste are located in the 7 districts (distrito) in the Central Region (Alieu, Ainaro, Dili, Emera, Liquica Manufahi and Manatuto), slightly under one-fourth in the 3 districts in the Western Region (Bobonaro, Covalima, and Oecussi) and slightly more than one-fourth from the 3 districts in the Eastern Region (Bacau, Lautem and Viqueque). Urban households constitute about one-fourth of the total with the remaining households coming from rural areas. Finally, slightly more than two-thirds of households are located in lowland areas and slightly less than one-third are located in highland areas. Due to differences in average household size between areas, the regional population composition differs slightly from the distribution of households. While the share of the households is comparable to that of the population in the Eastern Region, smaller average household sizes result in a relatively lower share of population in the Western Region compared to the Central Region where average household sizes are somewhat larger. Larger households in urban compared to rural areas results in raising the urban population share by 1.3 percentage points over that for households, while the slightly larger household sizes in highland areas has the effect of a shift of about 1.5 percentage points in relative population share. In fact, as noted earlier, it is the larger average household sizes observed in the MICS that form the main difference in the results here from those in the Suco Survey. Reasons need to be investigated, although it can be suggested that part may lie in the fact that for the MICS these averages come from actual household enumeration, while the available numbers for the Suco Survey are from reports of local officials. The former would, presumably be more accurate.31
4.2. Age and Sex Structure
The most striking aspect of the Timor-Leste population age and sex structure is its youthfulness. This can be seen in the population pyramid shown in Figure 4.1. Overall, almost one-fifth of the population is under 5 years of age and slightly over half are less than 15 years old. About two-thirds are less than 25 years old. The extent of the domination by children and youth in Timor-Leste can be seen by making a comparison with age distributions from various world regions, including those where “young” populations are still the norm (Table 4.2). Thus, from United Nations data, the youngest populations are found in Middle Africa. But even there, under-fives and under-fifteens still constitute a slightly lower percentage of the total than is found in Timor-Leste. In short, Timor-Leste can currently lay claim to one of the youngest age structures anywhere in the world. This is reflected in a very low median age of population of 14.4 years (compared to 16.3 years in Middle Africa and 24.3 years for less developed regions as a whole). It is also consistent with the very high levels of current fertility (Total Fertility
31 Both surveys used a fairly standard definition of household to include persons generally living together in the same dwelling area and sharing basic household functions, e.g. ‘eating out of the same pot.’ Differences can also not be accounted for presence of extended family or other non-family members. In fact, prevalence of extended-family households was relatively low (see Section 4.3) and the main explanation of the large average household size found in the MICS results from the large number of children present in the households.
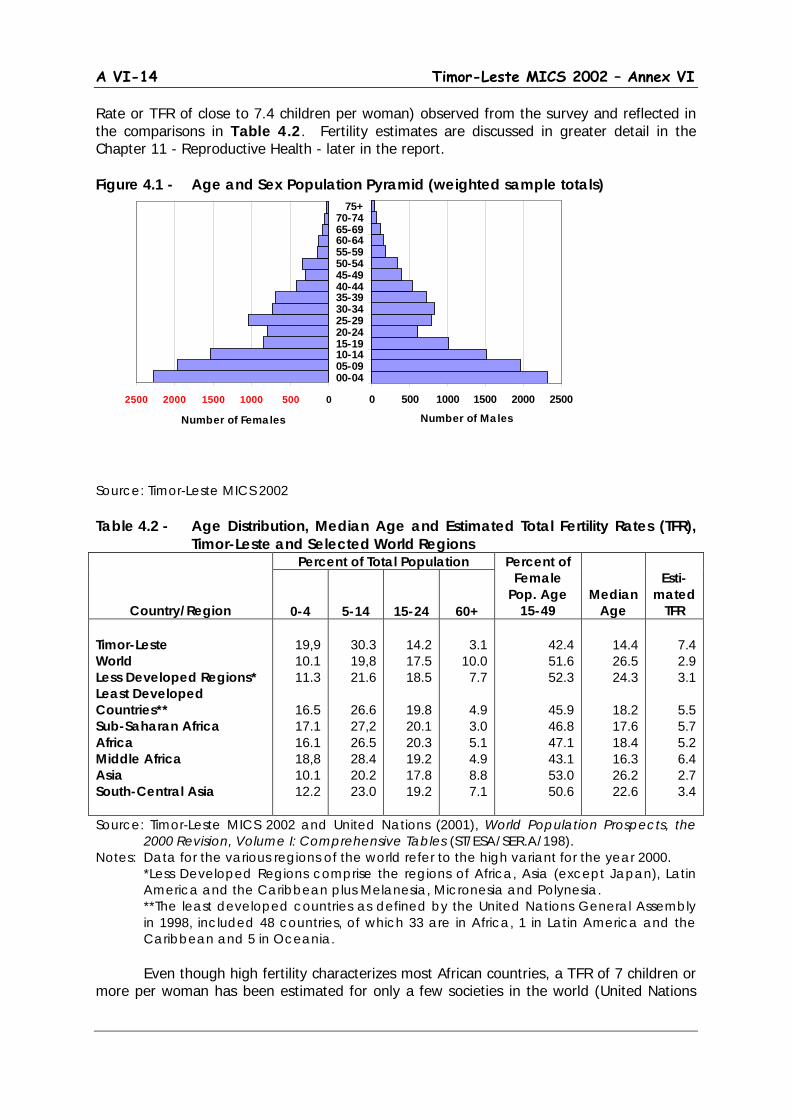
A VI-14 Timor-Leste MICS 2002 – Annex VI
Rate or TFR of close to 7.4 children per woman) observed from the survey and reflected in the comparisons in Table 4.2. Fertility estimates are discussed in greater detail in the Chapter 11 - Reproductive Health - later in the report. Figure 4.1 - Age and Sex Population Pyramid (weighted sample totals) Source: Timor-Leste MICS 2002 Table 4.2 - Age Distribution, Median Age and Estimated Total Fertility Rates (TFR),
Timor-Leste and Selected World Regions
Country/Region
Percent of Total Population Percent of Female
Pop. Age 15-49
Median Age
Esti-
mated TFR
0-4
5-14
15-24
60+ Timor-Leste World Less Developed Regions* Least Developed Countries** Sub-Saharan Africa Africa Middle Africa Asia South-Central Asia
19,9 10.1 11.3
16.5 17.1 16.1 18,8 10.1 12.2
30.3 19,8 21.6
26.6 27,2 26.5 28.4 20.2 23.0
14.2 17.5 18.5
19.8 20.1 20.3 19.2 17.8 19.2
3.1
10.0 7.7
4.9 3.0 5.1 4.9 8.8 7.1
42.4 51.6 52.3
45.9 46.8 47.1 43.1 53.0 50.6
14.4 26.5 24.3
18.2 17.6 18.4 16.3 26.2 22.6
7.4 2.9 3.1
5.5 5.7 5.2 6.4 2.7 3.4
Source: Timor-Leste MICS 2002 and United Nations (2001), World Population Prospects, the 2000 Revision, Volume I: Comprehensive Tables (ST/ESA/SER.A/198).
Notes: Data for the various regions of the world refer to the high variant for the year 2000. *Less Developed Regions comprise the regions of Africa, Asia (except Japan), Latin America and the Caribbean plus Melanesia, Micronesia and Polynesia. **The least developed countries as defined by the United Nations General Assembly in 1998, included 48 countries, of which 33 are in Africa, 1 in Latin America and the Caribbean and 5 in Oceania.
Even though high fertility characterizes most African countries, a TFR of 7 children or more per woman has been estimated for only a few societies in the world (United Nations
2500 2000 1500 1000 500 0
Number of Females
0 500 1000 1500 2000 2500
00-0405-0910-1415-1920-2425-2930-3435-3940-4445-4950-5455-5960-6465-6970-74
75+
Number of Males
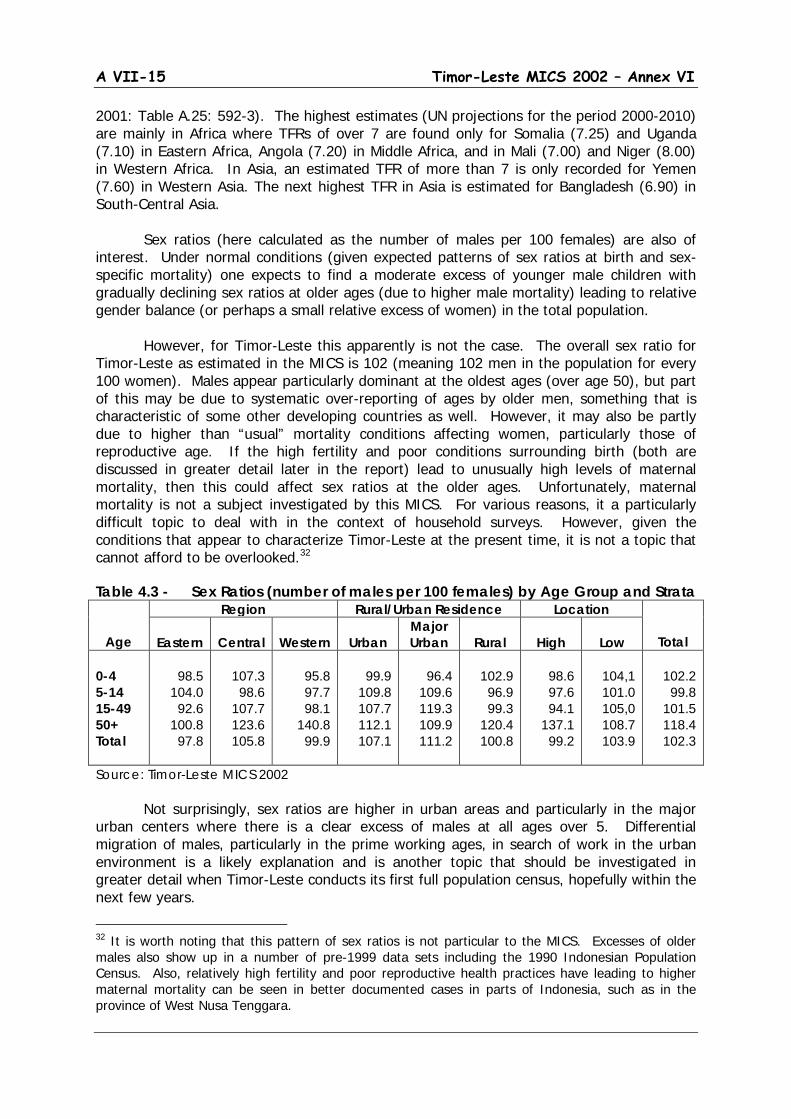
A VII-15 Timor-Leste MICS 2002 – Annex VI
2001: Table A.25: 592-3). The highest estimates (UN projections for the period 2000-2010) are mainly in Africa where TFRs of over 7 are found only for Somalia (7.25) and Uganda (7.10) in Eastern Africa, Angola (7.20) in Middle Africa, and in Mali (7.00) and Niger (8.00) in Western Africa. In Asia, an estimated TFR of more than 7 is only recorded for Yemen (7.60) in Western Asia. The next highest TFR in Asia is estimated for Bangladesh (6.90) in South-Central Asia. Sex ratios (here calculated as the number of males per 100 females) are also of interest. Under normal conditions (given expected patterns of sex ratios at birth and sex-specific mortality) one expects to find a moderate excess of younger male children with gradually declining sex ratios at older ages (due to higher male mortality) leading to relative gender balance (or perhaps a small relative excess of women) in the total population. However, for Timor-Leste this apparently is not the case. The overall sex ratio for Timor-Leste as estimated in the MICS is 102 (meaning 102 men in the population for every 100 women). Males appear particularly dominant at the oldest ages (over age 50), but part of this may be due to systematic over-reporting of ages by older men, something that is characteristic of some other developing countries as well. However, it may also be partly due to higher than “usual” mortality conditions affecting women, particularly those of reproductive age. If the high fertility and poor conditions surrounding birth (both are discussed in greater detail later in the report) lead to unusually high levels of maternal mortality, then this could affect sex ratios at the older ages. Unfortunately, maternal mortality is not a subject investigated by this MICS. For various reasons, it a particularly difficult topic to deal with in the context of household surveys. However, given the conditions that appear to characterize Timor-Leste at the present time, it is not a topic that cannot afford to be overlooked.32
Table 4.3 - Sex Ratios (number of males per 100 females) by Age Group and Strata
Age
Region Rural/Urban Residence Location
Total
Eastern
Central
Western
Urban Major Urban
Rural
High
Low
0-4 5-14 15-49 50+ Total
98.5
104.0 92.6
100.8 97.8
107.3 98.6
107.7 123.6 105.8
95.8 97.7 98.1
140.8 99.9
99.9
109.8 107.7 112.1 107.1
96.4
109.6 119.3 109.9 111.2
102.9 96.9 99.3
120.4 100.8
98.6 97.6 94.1
137.1 99.2
104,1 101.0 105,0 108.7 103.9
102.2 99.8
101.5 118.4 102.3
Source: Timor-Leste MICS 2002 Not surprisingly, sex ratios are higher in urban areas and particularly in the major urban centers where there is a clear excess of males at all ages over 5. Differential migration of males, particularly in the prime working ages, in search of work in the urban environment is a likely explanation and is another topic that should be investigated in greater detail when Timor-Leste conducts its first full population census, hopefully within the next few years.
32 It is worth noting that this pattern of sex ratios is not particular to the MICS. Excesses of older males also show up in a number of pre-1999 data sets including the 1990 Indonesian Population Census. Also, relatively high fertility and poor reproductive health practices have leading to higher maternal mortality can be seen in better documented cases in parts of Indonesia, such as in the province of West Nusa Tenggara.
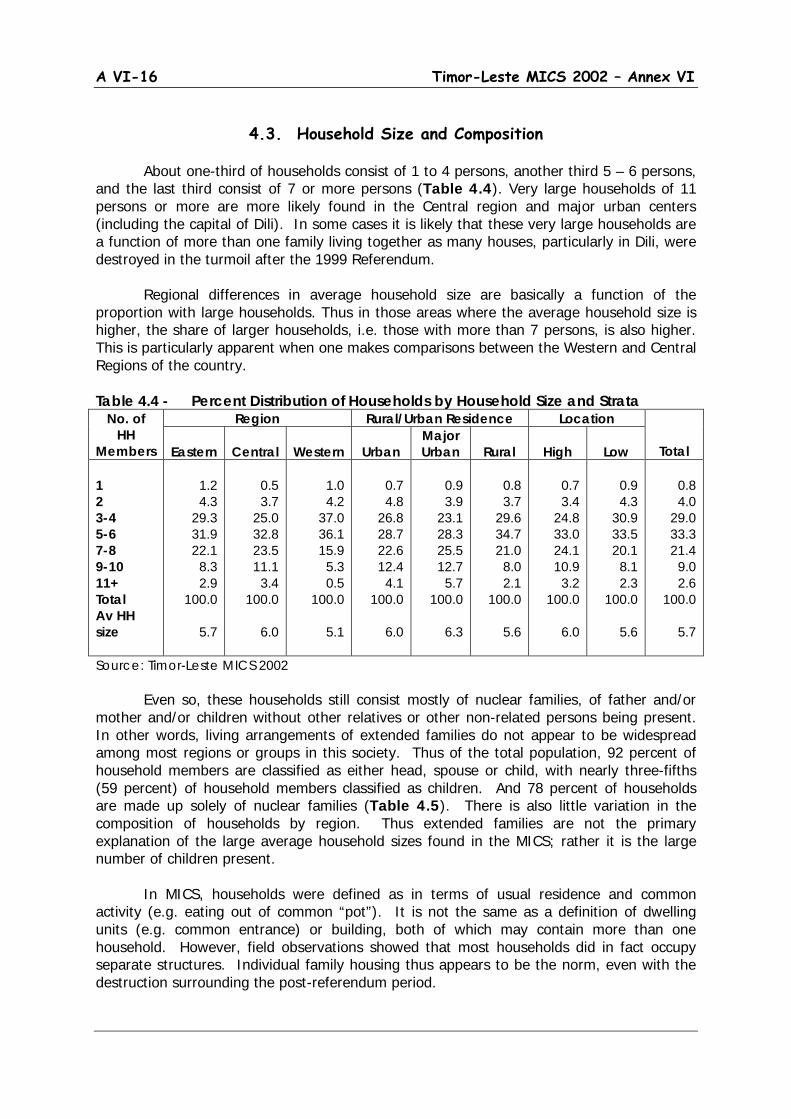
A VI-16 Timor-Leste MICS 2002 – Annex VI
4.3. Household Size and Composition
About one-third of households consist of 1 to 4 persons, another third 5 – 6 persons, and the last third consist of 7 or more persons (Table 4.4). Very large households of 11 persons or more are more likely found in the Central region and major urban centers (including the capital of Dili). In some cases it is likely that these very large households are a function of more than one family living together as many houses, particularly in Dili, were destroyed in the turmoil after the 1999 Referendum. Regional differences in average household size are basically a function of the proportion with large households. Thus in those areas where the average household size is higher, the share of larger households, i.e. those with more than 7 persons, is also higher. This is particularly apparent when one makes comparisons between the Western and Central Regions of the country. Table 4.4 - Percent Distribution of Households by Household Size and Strata
No. of HH
Members
Region Rural/Urban Residence Location
Total
Eastern
Central
Western
Urban Major Urban
Rural
High
Low
1 2 3-4 5-6 7-8 9-10 11+ Total Av HH size
1.2 4.3
29.3 31.9 22.1
8.3 2.9
100.0
5.7
0.5 3.7
25.0 32.8 23.5 11.1
3.4 100.0
6.0
1.0 4.2
37.0 36.1 15.9
5.3 0.5
100.0
5.1
0.7 4.8
26.8 28.7 22.6 12.4
4.1 100.0
6.0
0.9 3.9
23.1 28.3 25.5 12.7
5.7 100.0
6.3
0.8 3.7
29.6 34.7 21.0
8.0 2.1
100.0
5.6
0.7 3.4
24.8 33.0 24.1 10.9
3.2 100.0
6.0
0.9 4.3
30.9 33.5 20.1
8.1 2.3
100.0
5.6
0.8 4.0
29.0 33.3 21.4
9.0 2.6
100.0
5.7
Source: Timor-Leste MICS 2002 Even so, these households still consist mostly of nuclear families, of father and/or mother and/or children without other relatives or other non-related persons being present. In other words, living arrangements of extended families do not appear to be widespread among most regions or groups in this society. Thus of the total population, 92 percent of household members are classified as either head, spouse or child, with nearly three-fifths (59 percent) of household members classified as children. And 78 percent of households are made up solely of nuclear families (Table 4.5). There is also little variation in the composition of households by region. Thus extended families are not the primary explanation of the large average household sizes found in the MICS; rather it is the large number of children present. In MICS, households were defined as in terms of usual residence and common activity (e.g. eating out of common “pot”). It is not the same as a definition of dwelling units (e.g. common entrance) or building, both of which may contain more than one household. However, field observations showed that most households did in fact occupy separate structures. Individual family housing thus appears to be the norm, even with the destruction surrounding the post-referendum period.
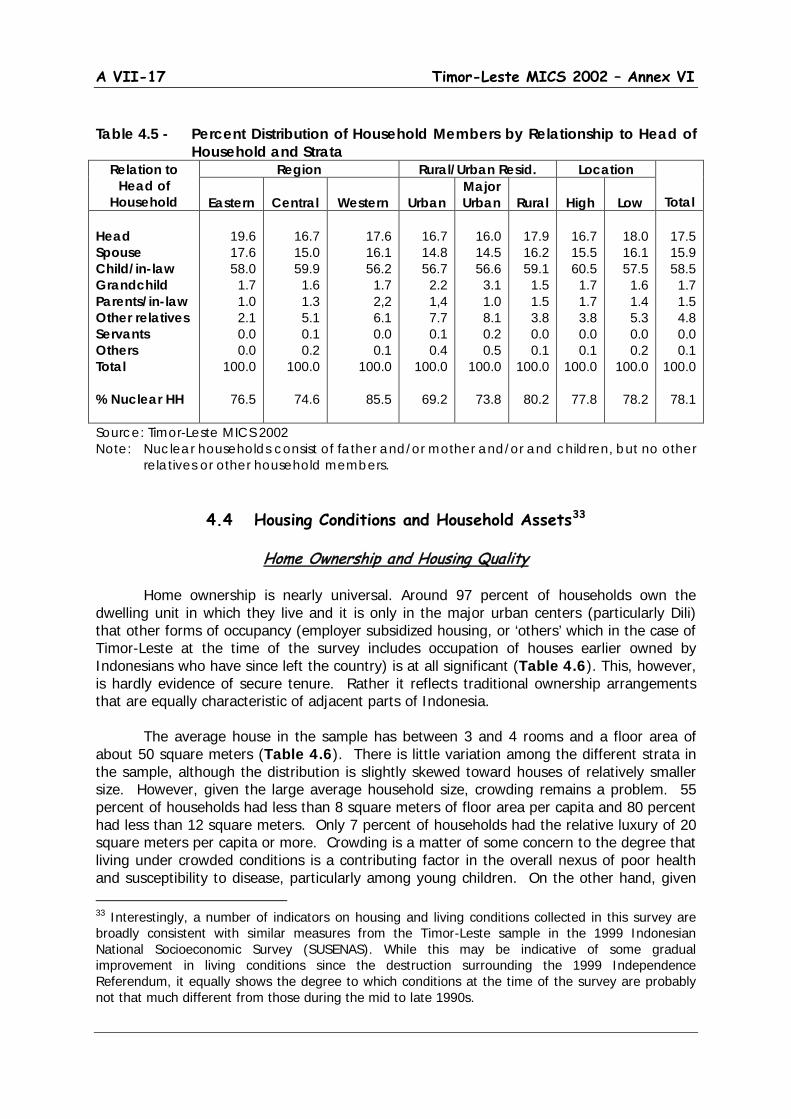
A VII-17 Timor-Leste MICS 2002 – Annex VI
Table 4.5 - Percent Distribution of Household Members by Relationship to Head of
Household and Strata Relation to
Head of Household
Region Rural/Urban Resid. Location
Total
Eastern
Central
Western
Urban Major Urban
Rural
High
Low
Head Spouse Child/in-law Grandchild Parents/in-law Other relatives Servants Others Total % Nuclear HH
19.6 17.6 58.0
1.7 1.0 2.1 0.0 0.0
100.0
76.5
16.7 15.0 59.9
1.6 1.3 5.1 0.1 0.2
100.0
74.6
17.6 16.1 56.2
1.7 2,2 6.1 0.0 0.1
100.0
85.5
16.7 14.8 56.7
2.2 1,4 7.7 0.1 0.4
100.0
69.2
16.0 14.5 56.6
3.1 1.0 8.1 0.2 0.5
100.0
73.8
17.9 16.2 59.1
1.5 1.5 3.8 0.0 0.1
100.0
80.2
16.7 15.5 60.5
1.7 1.7 3.8 0.0 0.1
100.0
77.8
18.0 16.1 57.5
1.6 1.4 5.3 0.0 0.2
100.0
78.2
17.5 15.9 58.5
1.7 1.5 4.8 0.0 0.1
100.0
78.1
Source: Timor-Leste MICS 2002 Note: Nuclear households consist of father and/or mother and/or and children, but no other
relatives or other household members.
4.4 Housing Conditions and Household Assets33
Home Ownership and Housing Quality Home ownership is nearly universal. Around 97 percent of households own the dwelling unit in which they live and it is only in the major urban centers (particularly Dili) that other forms of occupancy (employer subsidized housing, or ‘others’ which in the case of Timor-Leste at the time of the survey includes occupation of houses earlier owned by Indonesians who have since left the country) is at all significant (Table 4.6). This, however, is hardly evidence of secure tenure. Rather it reflects traditional ownership arrangements that are equally characteristic of adjacent parts of Indonesia. The average house in the sample has between 3 and 4 rooms and a floor area of about 50 square meters (Table 4.6). There is little variation among the different strata in the sample, although the distribution is slightly skewed toward houses of relatively smaller size. However, given the large average household size, crowding remains a problem. 55 percent of households had less than 8 square meters of floor area per capita and 80 percent had less than 12 square meters. Only 7 percent of households had the relative luxury of 20 square meters per capita or more. Crowding is a matter of some concern to the degree that living under crowded conditions is a contributing factor in the overall nexus of poor health and susceptibility to disease, particularly among young children. On the other hand, given 33 Interestingly, a number of indicators on housing and living conditions collected in this survey are broadly consistent with similar measures from the Timor-Leste sample in the 1999 Indonesian National Socioeconomic Survey (SUSENAS). While this may be indicative of some gradual improvement in living conditions since the destruction surrounding the 1999 Independence Referendum, it equally shows the degree to which conditions at the time of the survey are probably not that much different from those during the mid to late 1990s.
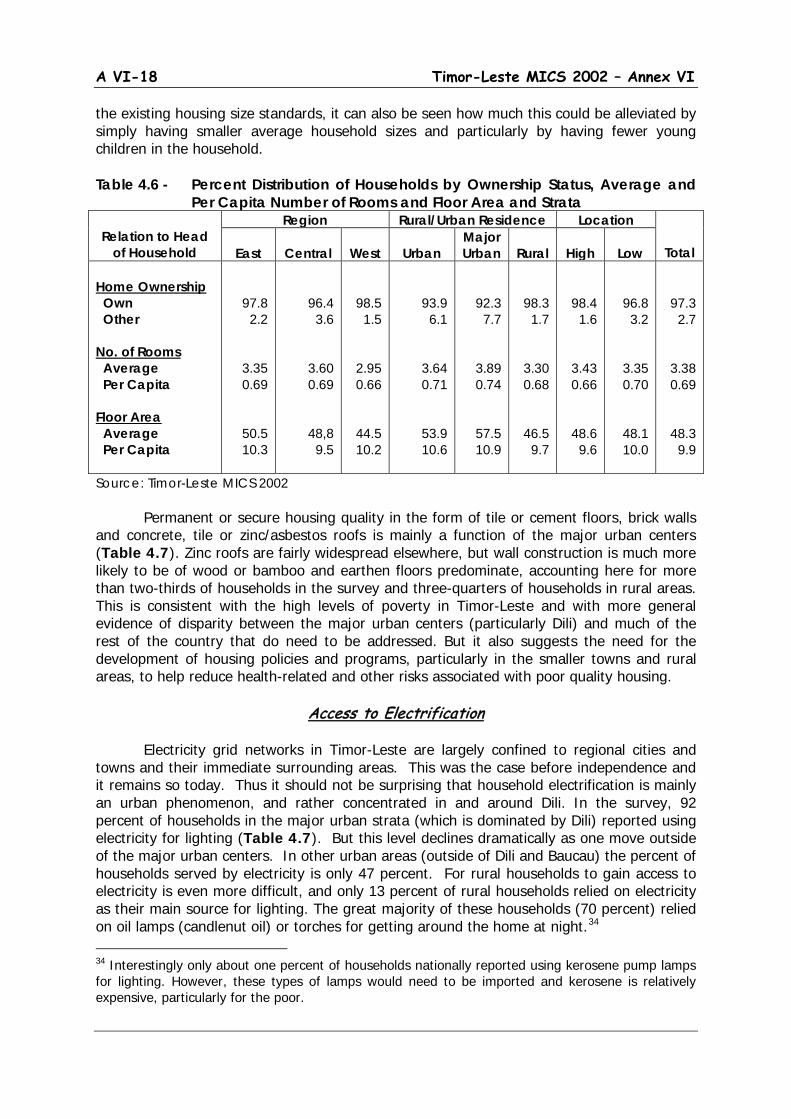
A VI-18 Timor-Leste MICS 2002 – Annex VI
the existing housing size standards, it can also be seen how much this could be alleviated by simply having smaller average household sizes and particularly by having fewer young children in the household. Table 4.6 - Percent Distribution of Households by Ownership Status, Average and
Per Capita Number of Rooms and Floor Area and Strata
Relation to Head of Household
Region Rural/Urban Residence Location
Total
East
Central
West
Urban Major Urban
Rural
High
Low
Home Ownership Own Other No. of Rooms Average Per Capita Floor Area Average Per Capita
97.8 2.2
3.35 0.69
50.5 10.3
96.4 3.6
3.60 0.69
48,8 9.5
98.5 1.5
2.95 0.66
44.5 10.2
93.9 6.1
3.64 0.71
53.9 10.6
92.3 7.7
3.89 0.74
57.5 10.9
98.3 1.7
3.30 0.68
46.5 9.7
98.4 1.6
3.43 0.66
48.6 9.6
96.8 3.2
3.35 0.70
48.1 10.0
97.3 2.7
3.38 0.69
48.3 9.9
Source: Timor-Leste MICS 2002 Permanent or secure housing quality in the form of tile or cement floors, brick walls and concrete, tile or zinc/asbestos roofs is mainly a function of the major urban centers (Table 4.7). Zinc roofs are fairly widespread elsewhere, but wall construction is much more likely to be of wood or bamboo and earthen floors predominate, accounting here for more than two-thirds of households in the survey and three-quarters of households in rural areas. This is consistent with the high levels of poverty in Timor-Leste and with more general evidence of disparity between the major urban centers (particularly Dili) and much of the rest of the country that do need to be addressed. But it also suggests the need for the development of housing policies and programs, particularly in the smaller towns and rural areas, to help reduce health-related and other risks associated with poor quality housing.
Access to Electrification Electricity grid networks in Timor-Leste are largely confined to regional cities and towns and their immediate surrounding areas. This was the case before independence and it remains so today. Thus it should not be surprising that household electrification is mainly an urban phenomenon, and rather concentrated in and around Dili. In the survey, 92 percent of households in the major urban strata (which is dominated by Dili) reported using electricity for lighting (Table 4.7). But this level declines dramatically as one move outside of the major urban centers. In other urban areas (outside of Dili and Baucau) the percent of households served by electricity is only 47 percent. For rural households to gain access to electricity is even more difficult, and only 13 percent of rural households relied on electricity as their main source for lighting. The great majority of these households (70 percent) relied on oil lamps (candlenut oil) or torches for getting around the home at night.34
34 Interestingly only about one percent of households nationally reported using kerosene pump lamps for lighting. However, these types of lamps would need to be imported and kerosene is relatively expensive, particularly for the poor.
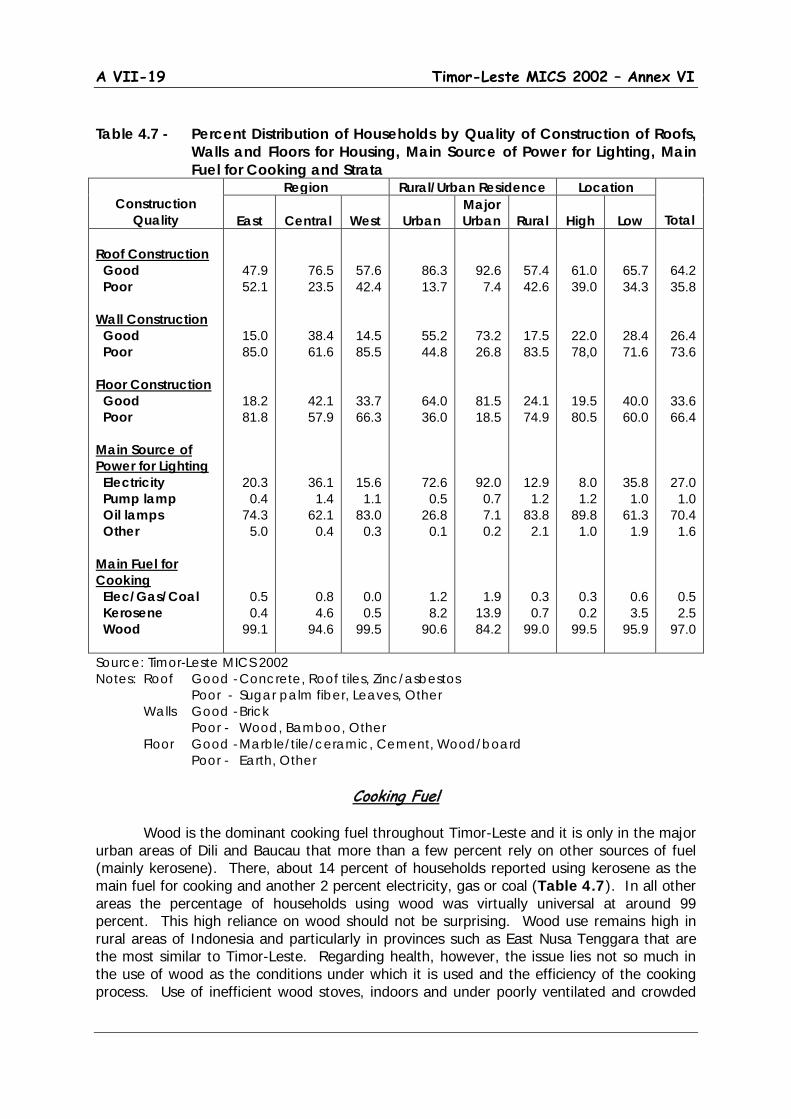
A VII-19 Timor-Leste MICS 2002 – Annex VI
Table 4.7 - Percent Distribution of Households by Quality of Construction of Roofs,
Walls and Floors for Housing, Main Source of Power for Lighting, Main Fuel for Cooking and Strata
Construction
Quality
Region Rural/Urban Residence Location
Total
East
Central
West
Urban Major Urban
Rural
High
Low
Roof Construction Good Poor Wall Construction Good Poor Floor Construction Good Poor Main Source of Power for Lighting Electricity Pump lamp Oil lamps Other Main Fuel for Cooking Elec/Gas/Coal Kerosene Wood
47.9 52.1
15.0 85.0
18.2 81.8
20.3 0.4
74.3 5.0
0.5 0.4
99.1
76.5 23.5
38.4 61.6
42.1 57.9
36.1 1.4
62.1 0.4
0.8 4.6
94.6
57.6 42.4
14.5 85.5
33.7 66.3
15.6 1.1
83.0 0.3
0.0 0.5
99.5
86.3 13.7
55.2 44.8
64.0 36.0
72.6 0.5
26.8 0.1
1.2 8.2
90.6
92.6 7.4
73.2 26.8
81.5 18.5
92.0 0.7 7.1 0.2
1.9 13.9 84.2
57.4 42.6
17.5 83.5
24.1 74.9
12.9 1.2
83.8 2.1
0.3 0.7
99.0
61.0 39.0
22.0 78,0
19.5 80.5
8.0 1.2
89.8 1.0
0.3 0.2
99.5
65.7 34.3
28.4 71.6
40.0 60.0
35.8 1.0
61.3 1.9
0.6 3.5
95.9
64.2 35.8
26.4 73.6
33.6 66.4
27.0 1.0
70.4 1.6
0.5 2.5
97.0
Source: Timor-Leste MICS 2002 Notes: Roof Good - Concrete, Roof tiles, Zinc/asbestos Poor - Sugar palm fiber, Leaves, Other Walls Good - Brick Poor - Wood, Bamboo, Other Floor Good - Marble/tile/ceramic, Cement, Wood/board Poor - Earth, Other
Cooking Fuel Wood is the dominant cooking fuel throughout Timor-Leste and it is only in the major urban areas of Dili and Baucau that more than a few percent rely on other sources of fuel (mainly kerosene). There, about 14 percent of households reported using kerosene as the main fuel for cooking and another 2 percent electricity, gas or coal (Table 4.7). In all other areas the percentage of households using wood was virtually universal at around 99 percent. This high reliance on wood should not be surprising. Wood use remains high in rural areas of Indonesia and particularly in provinces such as East Nusa Tenggara that are the most similar to Timor-Leste. Regarding health, however, the issue lies not so much in the use of wood as the conditions under which it is used and the efficiency of the cooking process. Use of inefficient wood stoves, indoors and under poorly ventilated and crowded
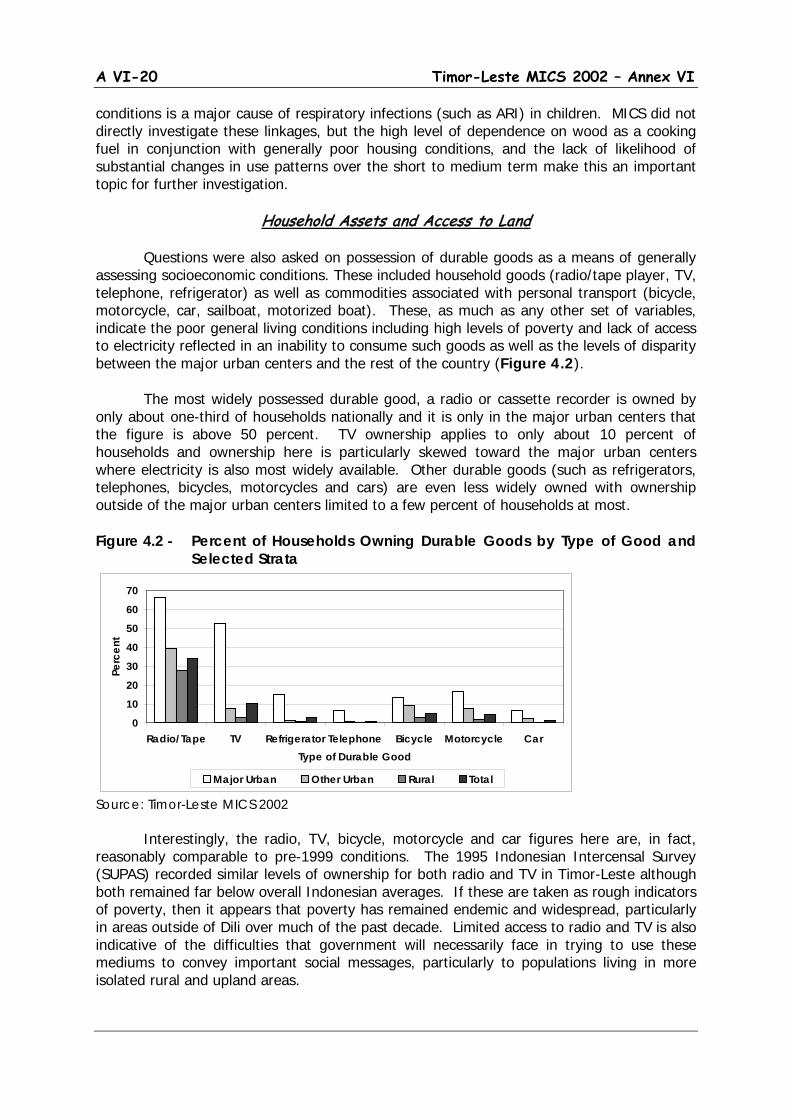
A VI-20 Timor-Leste MICS 2002 – Annex VI
conditions is a major cause of respiratory infections (such as ARI) in children. MICS did not directly investigate these linkages, but the high level of dependence on wood as a cooking fuel in conjunction with generally poor housing conditions, and the lack of likelihood of substantial changes in use patterns over the short to medium term make this an important topic for further investigation.
Household Assets and Access to Land Questions were also asked on possession of durable goods as a means of generally assessing socioeconomic conditions. These included household goods (radio/tape player, TV, telephone, refrigerator) as well as commodities associated with personal transport (bicycle, motorcycle, car, sailboat, motorized boat). These, as much as any other set of variables, indicate the poor general living conditions including high levels of poverty and lack of access to electricity reflected in an inability to consume such goods as well as the levels of disparity between the major urban centers and the rest of the country (Figure 4.2).
The most widely possessed durable good, a radio or cassette recorder is owned by only about one-third of households nationally and it is only in the major urban centers that the figure is above 50 percent. TV ownership applies to only about 10 percent of households and ownership here is particularly skewed toward the major urban centers where electricity is also most widely available. Other durable goods (such as refrigerators, telephones, bicycles, motorcycles and cars) are even less widely owned with ownership outside of the major urban centers limited to a few percent of households at most. Figure 4.2 - Percent of Households Owning Durable Goods by Type of Good and
Selected Strata
Source: Timor-Leste MICS 2002
Interestingly, the radio, TV, bicycle, motorcycle and car figures here are, in fact, reasonably comparable to pre-1999 conditions. The 1995 Indonesian Intercensal Survey (SUPAS) recorded similar levels of ownership for both radio and TV in Timor-Leste although both remained far below overall Indonesian averages. If these are taken as rough indicators of poverty, then it appears that poverty has remained endemic and widespread, particularly in areas outside of Dili over much of the past decade. Limited access to radio and TV is also indicative of the difficulties that government will necessarily face in trying to use these mediums to convey important social messages, particularly to populations living in more isolated rural and upland areas.
0
10
20
30
40
50
60
70
Radio/Tape TV Refrigerator Telephone Bicycle Motorcycle CarType of Durable Good
Perc
ent
Major Urban Other Urban Rural Total
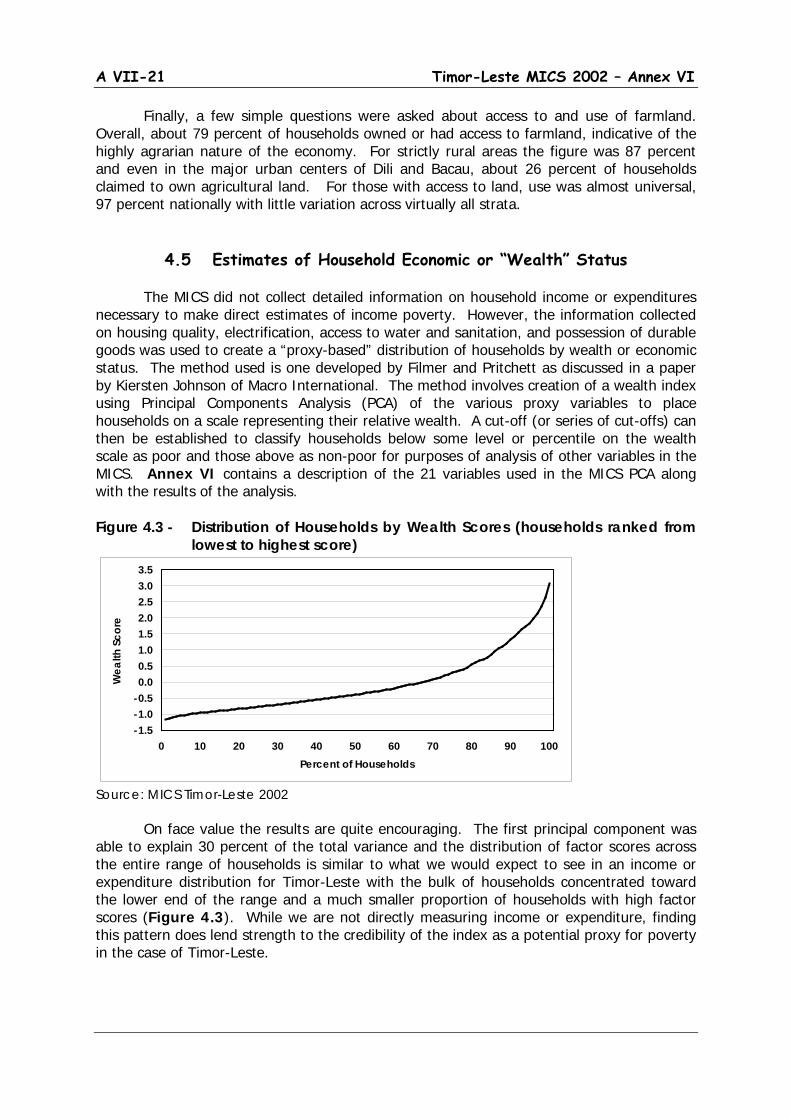
A VII-21 Timor-Leste MICS 2002 – Annex VI
Finally, a few simple questions were asked about access to and use of farmland. Overall, about 79 percent of households owned or had access to farmland, indicative of the highly agrarian nature of the economy. For strictly rural areas the figure was 87 percent and even in the major urban centers of Dili and Bacau, about 26 percent of households claimed to own agricultural land. For those with access to land, use was almost universal, 97 percent nationally with little variation across virtually all strata.
4.5 Estimates of Household Economic or “Wealth” Status
The MICS did not collect detailed information on household income or expenditures necessary to make direct estimates of income poverty. However, the information collected on housing quality, electrification, access to water and sanitation, and possession of durable goods was used to create a “proxy-based” distribution of households by wealth or economic status. The method used is one developed by Filmer and Pritchett as discussed in a paper by Kiersten Johnson of Macro International. The method involves creation of a wealth index using Principal Components Analysis (PCA) of the various proxy variables to place households on a scale representing their relative wealth. A cut-off (or series of cut-offs) can then be established to classify households below some level or percentile on the wealth scale as poor and those above as non-poor for purposes of analysis of other variables in the MICS. Annex VI contains a description of the 21 variables used in the MICS PCA along with the results of the analysis.
Figure 4.3 - Distribution of Households by Wealth Scores (households ranked from
lowest to highest score)
Source: MICS Timor-Leste 2002 On face value the results are quite encouraging. The first principal component was
able to explain 30 percent of the total variance and the distribution of factor scores across the entire range of households is similar to what we would expect to see in an income or expenditure distribution for Timor-Leste with the bulk of households concentrated toward the lower end of the range and a much smaller proportion of households with high factor scores (Figure 4.3). While we are not directly measuring income or expenditure, finding this pattern does lend strength to the credibility of the index as a potential proxy for poverty in the case of Timor-Leste.
-1.5-1.0-0.50.00.51.01.52.02.53.03.5
0 10 20 30 40 50 60 70 80 90 100Percent of Households
Wea
lth S
core
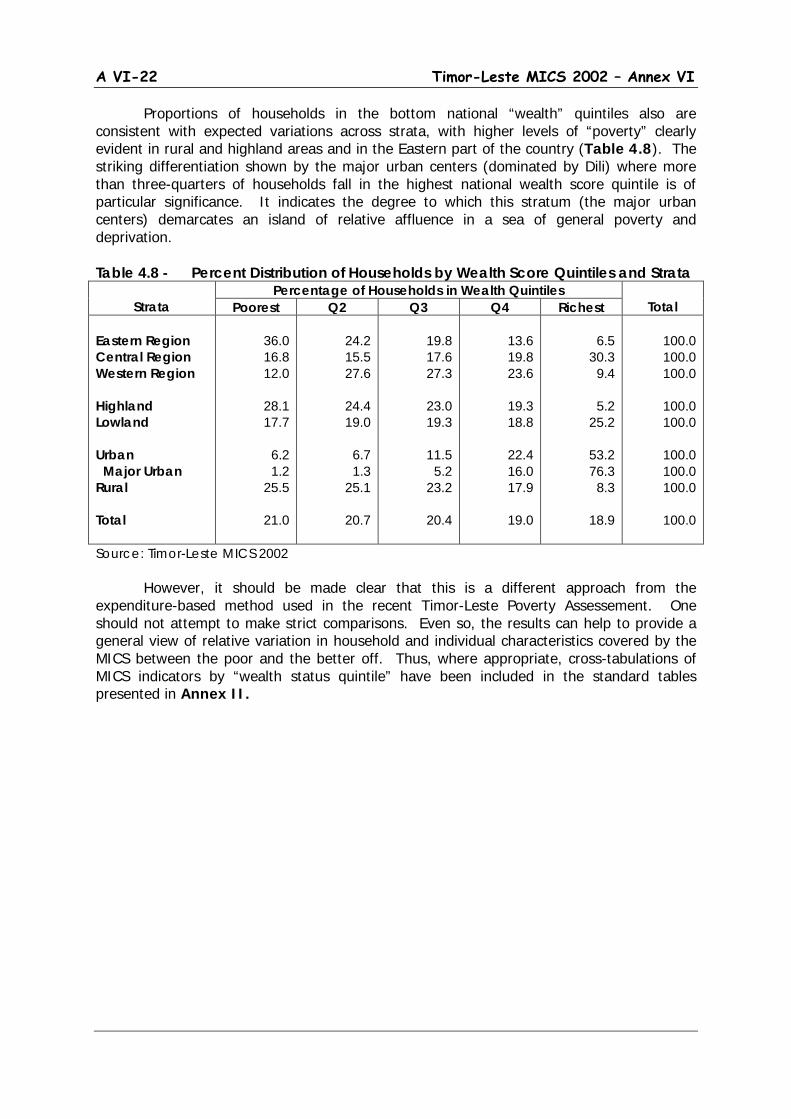
A VI-22 Timor-Leste MICS 2002 – Annex VI
Proportions of households in the bottom national “wealth” quintiles also are consistent with expected variations across strata, with higher levels of “poverty” clearly evident in rural and highland areas and in the Eastern part of the country (Table 4.8). The striking differentiation shown by the major urban centers (dominated by Dili) where more than three-quarters of households fall in the highest national wealth score quintile is of particular significance. It indicates the degree to which this stratum (the major urban centers) demarcates an island of relative affluence in a sea of general poverty and deprivation.
Table 4.8 - Percent Distribution of Households by Wealth Score Quintiles and Strata
Strata
Percentage of Households in Wealth Quintiles Total Poorest Q2 Q3 Q4 Richest
Eastern Region Central Region Western Region Highland Lowland Urban Major Urban Rural Total
36.0 16.8 12.0
28.1 17.7
6.2 1.2
25.5
21.0
24.2 15.5 27.6
24.4 19.0
6.7 1.3
25.1
20.7
19.8 17.6 27.3
23.0 19.3
11.5
5.2 23.2
20.4
13.6 19.8 23.6
19.3 18.8
22.4 16.0 17.9
19.0
6.5
30.3 9.4
5.2
25.2
53.2 76.3
8.3
18.9
100.0 100.0 100.0
100.0 100.0
100.0 100.0 100.0
100.0
Source: Timor-Leste MICS 2002 However, it should be made clear that this is a different approach from the
expenditure-based method used in the recent Timor-Leste Poverty Assessement. One should not attempt to make strict comparisons. Even so, the results can help to provide a general view of relative variation in household and individual characteristics covered by the MICS between the poor and the better off. Thus, where appropriate, cross-tabulations of MICS indicators by “wealth status quintile” have been included in the standard tables presented in Annex II.
A VII-23 Timor-Leste MICS 2002 – Annex VI
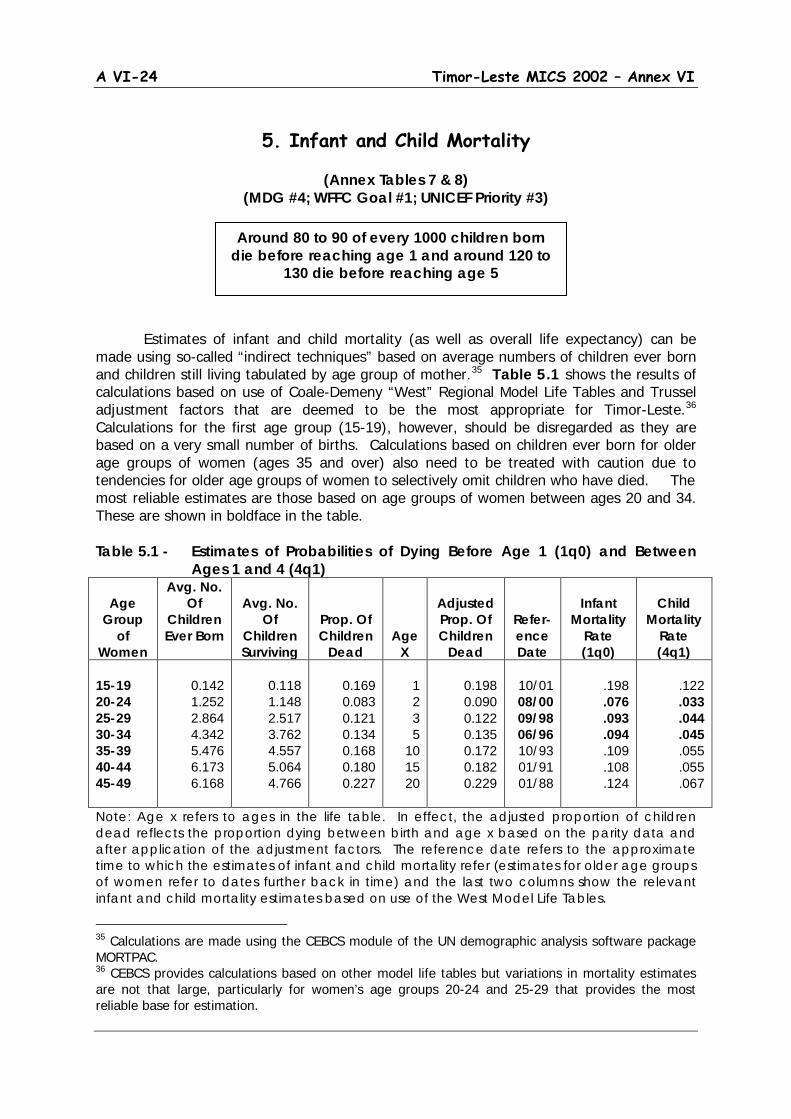
A VI-24 Timor-Leste MICS 2002 – Annex VI
5. Infant and Child Mortality
(Annex Tables 7 & 8)
(MDG #4; WFFC Goal #1; UNICEF Priority #3) Estimates of infant and child mortality (as well as overall life expectancy) can be made using so-called “indirect techniques” based on average numbers of children ever born and children still living tabulated by age group of mother.35 Table 5.1 shows the results of calculations based on use of Coale-Demeny “West” Regional Model Life Tables and Trussel adjustment factors that are deemed to be the most appropriate for Timor-Leste.36
Calculations for the first age group (15-19), however, should be disregarded as they are based on a very small number of births. Calculations based on children ever born for older age groups of women (ages 35 and over) also need to be treated with caution due to tendencies for older age groups of women to selectively omit children who have died. The most reliable estimates are those based on age groups of women between ages 20 and 34. These are shown in boldface in the table.
Table 5.1 - Estimates of Probabilities of Dying Before Age 1 (1q0) and Between Ages 1 and 4 (4q1)
Age
Group of
Women
Avg. No. Of
Children Ever Born
Avg. No.
Of Children Surviving
Prop. Of Children
Dead
Age X
Adjusted Prop. Of Children
Dead
Refer-ence Date
Infant
Mortality Rate (1q0)
Child
Mortality Rate (4q1)
15-19 20-24 25-29 30-34 35-39 40-44 45-49
0.142 1.252 2.864 4.342 5.476 6.173 6.168
0.118 1.148 2.517 3.762 4.557 5.064 4.766
0.169 0.083 0.121 0.134 0.168 0.180 0.227
1 2 3 5
10 15 20
0.198 0.090 0.122 0.135 0.172 0.182 0.229
10/01 08/00 09/98 06/96 10/93 01/91 01/88
.198 .076 .093 .094 .109 .108 .124
.122 .033 .044 .045 .055 .055 .067
Note: Age x refers to ages in the life table. In effect, the adjusted proportion of children dead reflects the proportion dying between birth and age x based on the parity data and after application of the adjustment factors. The reference date refers to the approximate time to which the estimates of infant and child mortality refer (estimates for older age groups of women refer to dates further back in time) and the last two columns show the relevant infant and child mortality estimates based on use of the West Model Life Tables.
35 Calculations are made using the CEBCS module of the UN demographic analysis software package MORTPAC. 36 CEBCS provides calculations based on other model life tables but variations in mortality estimates are not that large, particularly for women’s age groups 20-24 and 25-29 that provides the most reliable base for estimation.
Around 80 to 90 of every 1000 children born die before reaching age 1 and around 120 to
130 die before reaching age 5
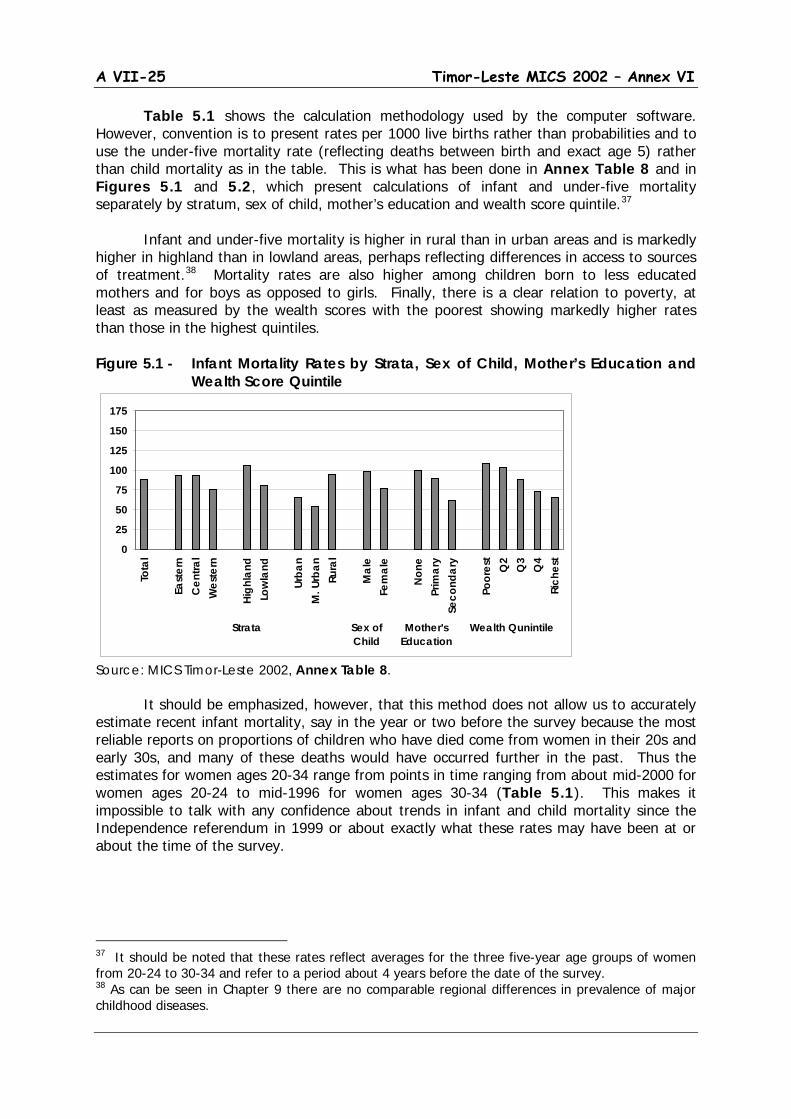
A VII-25 Timor-Leste MICS 2002 – Annex VI
Table 5.1 shows the calculation methodology used by the computer software. However, convention is to present rates per 1000 live births rather than probabilities and to use the under-five mortality rate (reflecting deaths between birth and exact age 5) rather than child mortality as in the table. This is what has been done in Annex Table 8 and in Figures 5.1 and 5.2, which present calculations of infant and under-five mortality separately by stratum, sex of child, mother’s education and wealth score quintile.37
Infant and under-five mortality is higher in rural than in urban areas and is markedly higher in highland than in lowland areas, perhaps reflecting differences in access to sources of treatment.38
Mortality rates are also higher among children born to less educated mothers and for boys as opposed to girls. Finally, there is a clear relation to poverty, at least as measured by the wealth scores with the poorest showing markedly higher rates than those in the highest quintiles.
Figure 5.1 - Infant Mortality Rates by Strata, Sex of Child, Mother’s Education and Wealth Score Quintile
Source: MICS Timor-Leste 2002, Annex Table 8.
It should be emphasized, however, that this method does not allow us to accurately estimate recent infant mortality, say in the year or two before the survey because the most reliable reports on proportions of children who have died come from women in their 20s and early 30s, and many of these deaths would have occurred further in the past. Thus the estimates for women ages 20-34 range from points in time ranging from about mid-2000 for women ages 20-24 to mid-1996 for women ages 30-34 (Table 5.1). This makes it impossible to talk with any confidence about trends in infant and child mortality since the Independence referendum in 1999 or about exactly what these rates may have been at or about the time of the survey.
37 It should be noted that these rates reflect averages for the three five-year age groups of women from 20-24 to 30-34 and refer to a period about 4 years before the date of the survey. 38 As can be seen in Chapter 9 there are no comparable regional differences in prevalence of major childhood diseases.
0
25
50
75
100
125
150
175
Tota
l
East
ern
Cen
tral
Wes
tern
High
land
Low
land
Urba
nM
. Urb
anRu
ral
Mal
eFe
mal
e
Non
ePr
imar
ySe
cond
ary
Poor
est
Q2
Q3
Q4
Rich
est
Strata Sex ofChild
Mother'sEducation
Wealth Qunintile
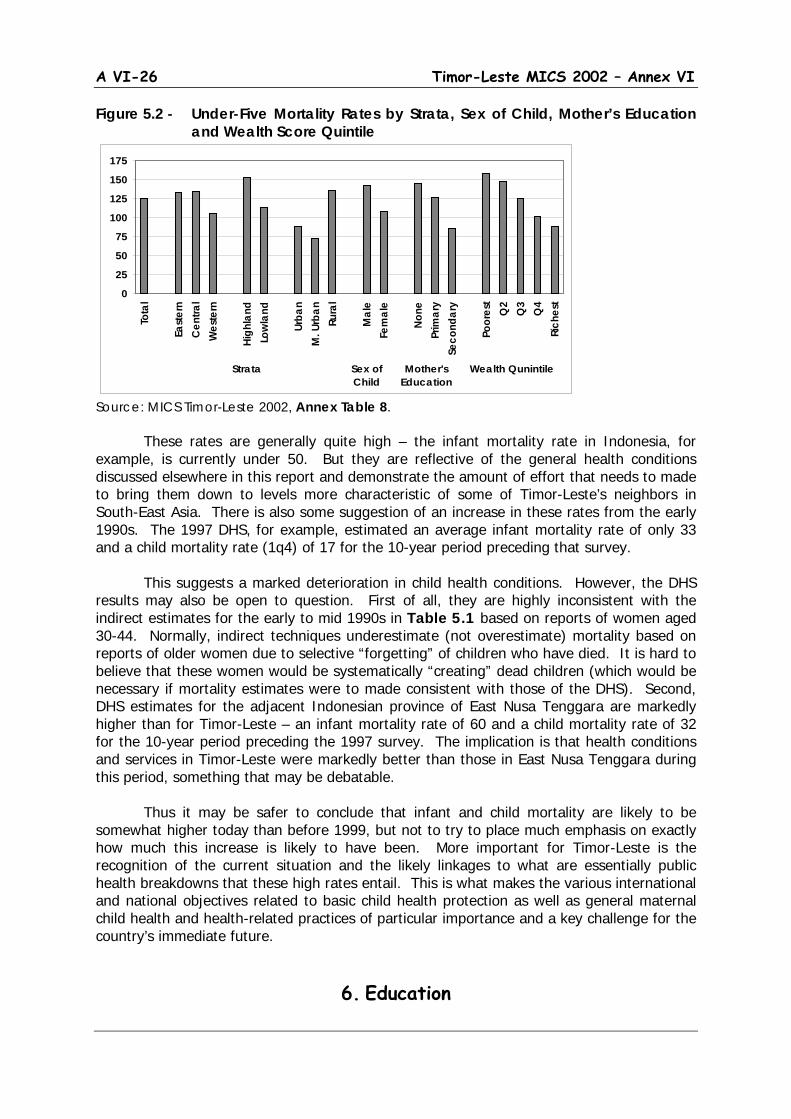
A VI-26 Timor-Leste MICS 2002 – Annex VI
Figure 5.2 - Under-Five Mortality Rates by Strata, Sex of Child, Mother’s Education and Wealth Score Quintile
Source: MICS Timor-Leste 2002, Annex Table 8. These rates are generally quite high – the infant mortality rate in Indonesia, for
example, is currently under 50. But they are reflective of the general health conditions discussed elsewhere in this report and demonstrate the amount of effort that needs to made to bring them down to levels more characteristic of some of Timor-Leste’s neighbors in South-East Asia. There is also some suggestion of an increase in these rates from the early 1990s. The 1997 DHS, for example, estimated an average infant mortality rate of only 33 and a child mortality rate (1q4) of 17 for the 10-year period preceding that survey. This suggests a marked deterioration in child health conditions. However, the DHS results may also be open to question. First of all, they are highly inconsistent with the indirect estimates for the early to mid 1990s in Table 5.1 based on reports of women aged 30-44. Normally, indirect techniques underestimate (not overestimate) mortality based on reports of older women due to selective “forgetting” of children who have died. It is hard to believe that these women would be systematically “creating” dead children (which would be necessary if mortality estimates were to made consistent with those of the DHS). Second, DHS estimates for the adjacent Indonesian province of East Nusa Tenggara are markedly higher than for Timor-Leste – an infant mortality rate of 60 and a child mortality rate of 32 for the 10-year period preceding the 1997 survey. The implication is that health conditions and services in Timor-Leste were markedly better than those in East Nusa Tenggara during this period, something that may be debatable. Thus it may be safer to conclude that infant and child mortality are likely to be somewhat higher today than before 1999, but not to try to place much emphasis on exactly how much this increase is likely to have been. More important for Timor-Leste is the recognition of the current situation and the likely linkages to what are essentially public health breakdowns that these high rates entail. This is what makes the various international and national objectives related to basic child health protection as well as general maternal child health and health-related practices of particular importance and a key challenge for the country’s immediate future.
6. Education
0
25
50
75
100
125
150
175To
tal
East
ern
Cen
tral
Wes
tern
High
land
Low
land
Urba
nM
. Urb
anRu
ral
Mal
eFe
mal
e
None
Prim
ary
Seco
ndar
y
Poor
est
Q2
Q3
Q4
Rich
est
Strata Sex ofChild
Mother'sEducation
Wealth Qunintile
A VII-27 Timor-Leste MICS 2002 – Annex VI
Low education is both a cause and an effect of poverty. Equally important from the point of view of MICS, there is a close relation between people’s education (particularly of women) and their behavior relative to a wide range of health and related issues affecting both themselves and their children. Thus it should not seem surprising that the Millennium Development Goals include objectives of dramatically reducing adult illiteracy and ensuring universal access to education, particularly primary education, for all children in the society – objectives that are reinforced for children in both the World Fit for Children and UNICEF Priorities. The Timor-Leste MICS survey included a separate module to assess levels of adult educational attainment as well as behavior in regard to school enrollment among all children aged 5 to 17 years in the survey households. A separate question was included in the Child Questionnaire on participation in any early childhood education program among children age 36-59 months at the time of the survey.
6.1. Early Childhood Education
(Annex Table 9) (WFFC Goal #2; UNICEF Priority #2)
Early childhood education here refers to programs such as playgroups for very young children aged 36-59 months (ages 3 and 4). It includes more structured pre-primary school programs through kindergartens or Taman Kanak-kanak (TK) that are aimed at 5 and 6 year-old children only to the degree that children actually aged 3 or 4 years old may have been attending them. As noted in the introduction, 5 and 6 year-old children were asked about current school enrollment in the MICS, but unfortunately they were recorded as currently being in school only if they had already started primary school. Thus we cannot get an accurate picture of pre-school enrollment at these ages, even if we wanted to include it as part of early childhood education here.39
This is something that should be rectified in future surveys.
In any case, Timor-Leste does not have much of a history of early childhood education as even in Indonesia, early childhood education, whether through playgroups or pre-school is still mostly provided through the private sector. 40
39 However, children in grade 1 were asked if they were in school the previous year and for this, TK was an allowable response. In the MICS data set no child in grade 1 said they were in kindergarten the previous school year, which suggests that enrollment in any form of pre-primary education is very low.
It tends to be a prerogative of urban children and among the better off. Results of the 2002 MICS in Timor-Leste clearly demonstrate the currently negligible levels of early childhood education with less than 2
40 Pre-school education, mostly private, accounts for about 12 percent of 3 to 4 year-olds and nearly a quarter of 5 to 6 year-olds in Indonesia. But rates for 5 and 6 year-olds are closer to 10 percent in Indonesian provinces closer to Timor-Leste that are probably more characteristic of pre-1999 conditions there.
Only 2% of children aged 36-59 months attend any form of early childhood
education program
A VI-28 Timor-Leste MICS 2002 – Annex VI
percent of children aged 36 to 59 months as attending any form of early learning program in their respective areas (see Annex Table 9). There are some minor differences across strata and population sub-groups (e.g. slightly higher participation in major urban areas, among older children and among children with more educated mothers), but literally nowhere are the differences large enough to be statistically meaningful. In short, early childhood education can be considered to be basically nonexistent at present in Timor-Leste and as an area for future development. It is an area worthy of some concern as there is increasing evidence that effective interventions in support of Early Childhood Development (ECD) can contribute to child development and performance in subsequent years. However, given historical experience both in Timor-Leste and Indonesia generally, it is likely to remain a luxury for at least some time as greater (and probably necessarily greater) attention is paid to basic education, particularly at the primary or elementary school level. This is discussed in greater detail in the section below.
6.2. Basic Education
(Annex Table 10) (MDG #2, 3; WFFC Goals #2; UNICF Priority #1)
At a minimum basic education must ensure that children gain a reasonable level of
literacy and numeracy so that they can function in society. Beyond this, education aims to provide children with life and technical skills that they can subsequently apply these skills as adults in order to expand their social and economic horizons. Even more broadly, education can be seen as one of the basic rights of children (perhaps one of the most important rights) as a child denied the right to an education is a child who will likely be denied the chance for a healthy and prosperous life. It is thus little wonder that the various international conventions place a high emphasis on universal child access to school and on completion of at least a full primary cycle of education by the great majority of these children.41
The state and private school system in Timor-Leste continues to follow patterns established during the period of Indonesian integration. Under this system, pre-school education (taman kanak-kanak or TK) covers 2 years with a normative age range of 5 to 6 years. This is followed by primary school (sekolah dasar or SD) consisting of 6 years with the normative age range being 7 to 12 years. This is followed by 3 years of lower secondary school (sekolah menengah pertama or SMP) with a normative age range of 13 to 15 years and three years of upper secondary school (sekolah menengah atas or SMA) with a normative age range of 16 to 18 years. The normative age ranges form the basis for standard calculations of enrollment rates, but it needs to be recognized that significant numbers of children enter school at either younger or older ages.
General School Performance – Gross, Net and Age- Specific Enrollment Rates
41 Completion of 5 years (rather than primary education per se) is reflected in the earlier World Summit Goals and in the general MICS methodology and reflects, in part, the minimal amount of schooling needed for permanent retention of what is learned (reading, writing, arithmetic). However, in Timor-Leste, as in Indonesia, primary school actually involves 6 years, followed by three years each of lower and upper secondary school. It is these breakdowns that are used in the discussion in the chapter.
Gross, net and age-specific enrollment rates have generally maintained pre-1999
standards at primary level. But there is evidence of some deterioration in
performance at lower secondary level.
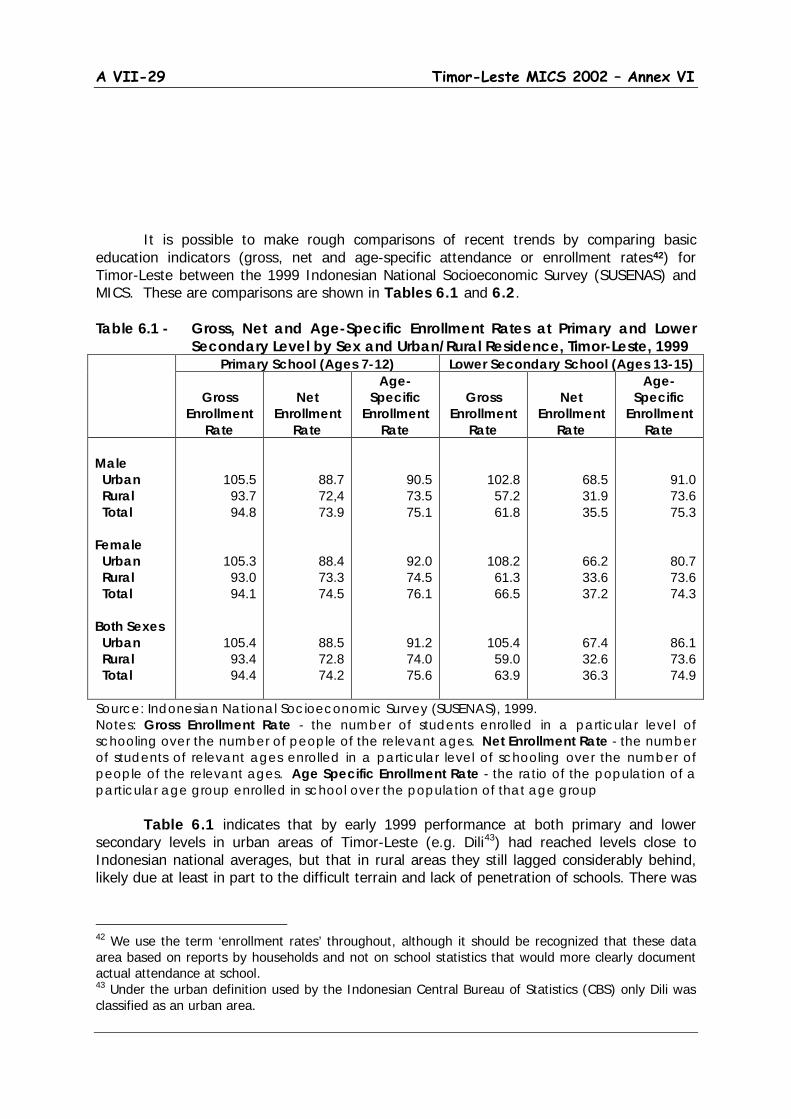
A VII-29 Timor-Leste MICS 2002 – Annex VI
It is possible to make rough comparisons of recent trends by comparing basic education indicators (gross, net and age-specific attendance or enrollment rates42
) for Timor-Leste between the 1999 Indonesian National Socioeconomic Survey (SUSENAS) and MICS. These are comparisons are shown in Tables 6.1 and 6.2.
Table 6.1 - Gross, Net and Age-Specific Enrollment Rates at Primary and Lower Secondary Level by Sex and Urban/Rural Residence, Timor-Leste, 1999
Primary School (Ages 7-12) Lower Secondary School (Ages 13-15)
Gross Enrollment
Rate
Net
Enrollment Rate
Age-Specific
Enrollment Rate
Gross
Enrollment Rate
Net
Enrollment Rate
Age-Specific
Enrollment Rate
Male Urban Rural Total Female Urban Rural Total Both Sexes Urban Rural Total
105.5 93.7 94.8
105.3 93.0 94.1
105.4 93.4 94.4
88.7 72,4 73.9
88.4 73.3 74.5
88.5 72.8 74.2
90.5 73.5 75.1
92.0 74.5 76.1
91.2 74.0 75.6
102.8 57.2 61.8
108.2 61.3 66.5
105.4 59.0 63.9
68.5 31.9 35.5
66.2 33.6 37.2
67.4 32.6 36.3
91.0 73.6 75.3
80.7 73.6 74.3
86.1 73.6 74.9
Source: Indonesian National Socioeconomic Survey (SUSENAS), 1999. Notes: Gross Enrollment Rate - the number of students enrolled in a particular level of schooling over the number of people of the relevant ages. Net Enrollment Rate - the number of students of relevant ages enrolled in a particular level of schooling over the number of people of the relevant ages. Age Specific Enrollment Rate - the ratio of the population of a particular age group enrolled in school over the population of that age group Table 6.1 indicates that by early 1999 performance at both primary and lower secondary levels in urban areas of Timor-Leste (e.g. Dili43
42 We use the term ‘enrollment rates’ throughout, although it should be recognized that these data area based on reports by households and not on school statistics that would more clearly document actual attendance at school.
) had reached levels close to Indonesian national averages, but that in rural areas they still lagged considerably behind, likely due at least in part to the difficult terrain and lack of penetration of schools. There was
43 Under the urban definition used by the Indonesian Central Bureau of Statistics (CBS) only Dili was classified as an urban area.
A VI-30 Timor-Leste MICS 2002 – Annex VI
little difference, however, by gender in access to school according to these data, a situation that is characteristic of most of the rest of Indonesia as well. Further important features reflected by these data suggest significant levels of over-age enrollment as indicated by substantial differences between gross and net enrollment rates. Gross enrollment measures all those enrolled in a particular level of schooling (of all ages) over the population of the relevant ages, while the net enrollment ratio limits the enrolled population to those of appropriate ages. The difference is mostly due to enrollment among those who are already beyond the appropriate ages, which at primary school level means 13 years and over, and at lower secondary level 16 years and over. Pre-Independence gaps between enrollment at primary and lower secondary level are also worth noting, indicating that, even then, continuation to even the lower secondary level was not high. Enrollment at the lower secondary level was substantially lower than at the primary level, particularly for rural youngsters. While gross enrollment rates declined by about one third between primary and lower secondary levels (from 94 to 64 percent), net enrollment declined by more than half (from 74 to 36 percent) (Table 6.1). Given the turmoil surrounding the 1999 Independence referendum, which resulted not only in widespread destruction but also in the departure of large numbers of Indonesian teachers who had been imported under the previous regime, one might have expected school enrollment to decline drastically. This, however, does not seem to be the case, at least when comparisons are made with the results of the 1999 SUSENAS and the focus is on primary school. In fact there is no apparent systematic decline in the performance figures at primary school level (Table 6.2). In fact, except for lower secondary school among urban youngsters, gross enrollment rates were all higher according to the MICS 2002 compared to the 1999 SUSENAS results, suggesting (when compared with the lack of change in net enrollment rates) an increase in over-aging or rising numbers of older children enrolled in primary school. This may well be partly a result of the turmoil in 1999 that caused disruptions in education and forced many children to miss a year or two of school. These children would have generally been older than they should have been when they finally tried to return to continue their studies. Nevertheless, it is a significant issue and the problem of over aging needs to be addressed urgently in order to improve efficiency and learning environment in the classroom. It will work itself out to some degree over time, but meeting needs of these children could also benefit from provision of additional non-formal accelerated learning programs aimed at older children and adolescents, who might otherwise, due to the past disruptions, not complete a full cycle of primary school. At lower secondary level, however, there is evidence of some deterioration in conditions, particularly in urban areas. Thus, while overall net enrollment and age-specific enrollment rates among urban primary school age children declined by around four percentage points between 1999 and 2002, at lower secondary level, for both sexes, urban gross enrollment rates declined by 17 percentage points and net enrollment rates by 23 percentage points. For rural areas the change at lower secondary level was much smaller - overall gross enrollment declined by only 2 percentage points and net enrollment by 8 percentage points (Table 6.2). These results clearly suggest that urban enrollment at this level (which was already much higher than that in rural areas before 1999) was affected more by the turmoil associated with the 1999 Independence Referendum. What actually happened is an issue requiring further investigation.
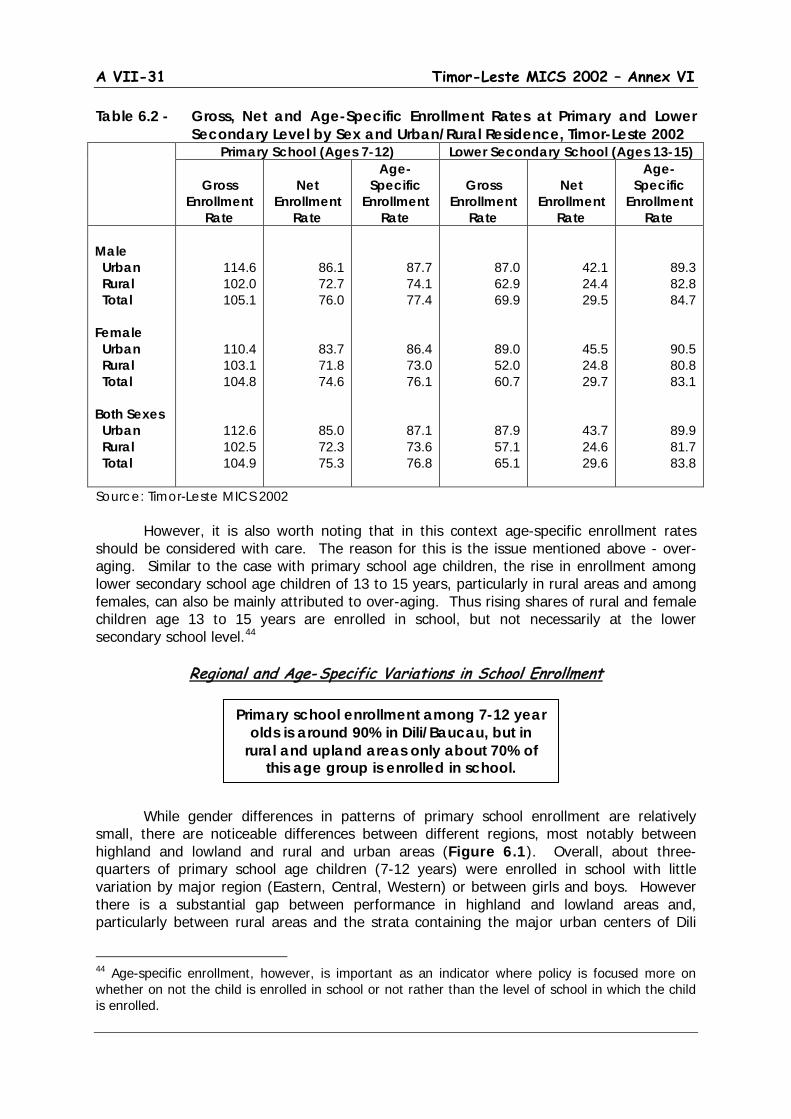
A VII-31 Timor-Leste MICS 2002 – Annex VI
Table 6.2 - Gross, Net and Age-Specific Enrollment Rates at Primary and Lower Secondary Level by Sex and Urban/Rural Residence, Timor-Leste 2002
Primary School (Ages 7-12) Lower Secondary School (Ages 13-15)
Gross Enrollment
Rate
Net
Enrollment Rate
Age-Specific
Enrollment Rate
Gross
Enrollment Rate
Net
Enrollment Rate
Age-Specific
Enrollment Rate
Male Urban Rural Total Female Urban Rural Total Both Sexes Urban Rural Total
114.6 102.0 105.1
110.4 103.1 104.8
112.6 102.5 104.9
86.1 72.7 76.0
83.7 71.8 74.6
85.0 72.3 75.3
87.7 74.1 77.4
86.4 73.0 76.1
87.1 73.6 76.8
87.0 62.9 69.9
89.0 52.0 60.7
87.9 57.1 65.1
42.1 24.4 29.5
45.5 24.8 29.7
43.7 24.6 29.6
89.3 82.8 84.7
90.5 80.8 83.1
89.9 81.7 83.8
Source: Timor-Leste MICS 2002 However, it is also worth noting that in this context age-specific enrollment rates should be considered with care. The reason for this is the issue mentioned above - over-aging. Similar to the case with primary school age children, the rise in enrollment among lower secondary school age children of 13 to 15 years, particularly in rural areas and among females, can also be mainly attributed to over-aging. Thus rising shares of rural and female children age 13 to 15 years are enrolled in school, but not necessarily at the lower secondary school level.44
Regional and Age- Specific Variations in School Enrollment While gender differences in patterns of primary school enrollment are relatively small, there are noticeable differences between different regions, most notably between highland and lowland and rural and urban areas (Figure 6.1). Overall, about three-quarters of primary school age children (7-12 years) were enrolled in school with little variation by major region (Eastern, Central, Western) or between girls and boys. However there is a substantial gap between performance in highland and lowland areas and, particularly between rural areas and the strata containing the major urban centers of Dili
44 Age-specific enrollment, however, is important as an indicator where policy is focused more on whether on not the child is enrolled in school or not rather than the level of school in which the child is enrolled.
Primary school enrollment among 7-12 year olds is around 90% in Dili/Baucau, but in
rural and upland areas only about 70% of this age group is enrolled in school.
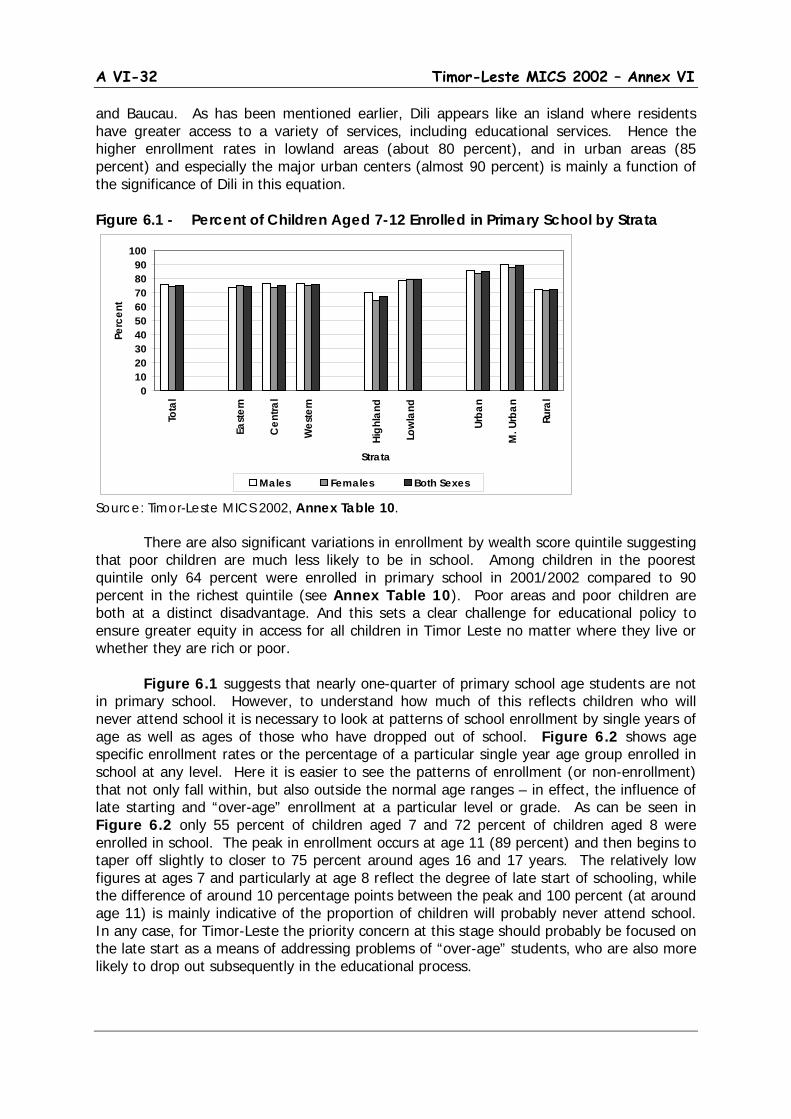
A VI-32 Timor-Leste MICS 2002 – Annex VI
and Baucau. As has been mentioned earlier, Dili appears like an island where residents have greater access to a variety of services, including educational services. Hence the higher enrollment rates in lowland areas (about 80 percent), and in urban areas (85 percent) and especially the major urban centers (almost 90 percent) is mainly a function of the significance of Dili in this equation. Figure 6.1 - Percent of Children Aged 7-12 Enrolled in Primary School by Strata
Source: Timor-Leste MICS 2002, Annex Table 10. There are also significant variations in enrollment by wealth score quintile suggesting that poor children are much less likely to be in school. Among children in the poorest quintile only 64 percent were enrolled in primary school in 2001/2002 compared to 90 percent in the richest quintile (see Annex Table 10). Poor areas and poor children are both at a distinct disadvantage. And this sets a clear challenge for educational policy to ensure greater equity in access for all children in Timor Leste no matter where they live or whether they are rich or poor. Figure 6.1 suggests that nearly one-quarter of primary school age students are not in primary school. However, to understand how much of this reflects children who will never attend school it is necessary to look at patterns of school enrollment by single years of age as well as ages of those who have dropped out of school. Figure 6.2 shows age specific enrollment rates or the percentage of a particular single year age group enrolled in school at any level. Here it is easier to see the patterns of enrollment (or non-enrollment) that not only fall within, but also outside the normal age ranges – in effect, the influence of late starting and “over-age” enrollment at a particular level or grade. As can be seen in Figure 6.2 only 55 percent of children aged 7 and 72 percent of children aged 8 were enrolled in school. The peak in enrollment occurs at age 11 (89 percent) and then begins to taper off slightly to closer to 75 percent around ages 16 and 17 years. The relatively low figures at ages 7 and particularly at age 8 reflect the degree of late start of schooling, while the difference of around 10 percentage points between the peak and 100 percent (at around age 11) is mainly indicative of the proportion of children will probably never attend school. In any case, for Timor-Leste the priority concern at this stage should probably be focused on the late start as a means of addressing problems of “over-age” students, who are also more likely to drop out subsequently in the educational process.
0102030405060708090
100
Tota
l
East
ern
Cen
tral
Wes
tern
High
land
Low
land
Urba
n
M. U
rban
Rura
l
Strata
Perc
ent
Males Females Both Sexes

A VII-33 Timor-Leste MICS 2002 – Annex VI
Figure 6.2 - Age and Sex-Specific Enrollment Rates of Children Aged 5 – 17 Years
Source: Timor-Leste MICS 2002, Annex Table 10. An even more striking picture of the late age issue can be seen by looking at the age distribution of children in grade 1 of primary school (Figure 6.3). MICS did not ask about ages at first entrance into school. However, it is arguable that evidence on the proportions of older-age children still in first grade can be used as a reasonable proxy for this phenomenon. The results shown in Figure 6.3 clearly point out the nature of the issue. 40 percent of children in grade 1 had reported ages of 8 or more and 17 percent of 9 or more in the MICS survey. There may be some age reporting errors here, but the picture is roughly the same as in parts of Eastern Indonesia where similar conditions prevail. Thus there are a few children who start school early, at least according to the “standard” ages of the Indonesian system (there is no information that this has changed for Timor-Leste since 1999). According to the MICS data there are even a few 5 year-olds already in first grade, but greater credence should probably be placed on the proportion of 5 and 6 year-olds (28 percent) as a rough measure of early entrance. Seven year-olds constitute another 32 percent of students in first grade indicating that about 60 percent of children are at the right, or at least a reasonable age for this grade level. Given that the MICS data collected age data on children at the end (rather than the start) of the school year, even some of the 8 year-olds may still not be over-age as they would still have been 7 years old at the start of the academic year. However, as noted above, beyond this point, most children are probably late starters and, in any case, are clearly over-aged for the particular grade. In most societies, an age range from 5 to 14 for grade 1 primary school is indeed very wide. During those ages children grow, not just physically, but also mentally, which could well create problems for the overall teaching and learning process.
0102030405060708090
100
5 6 7 8 9 10 11 12 13 14 15 16 17Age
Perc
ent
Males Females Both Sexes
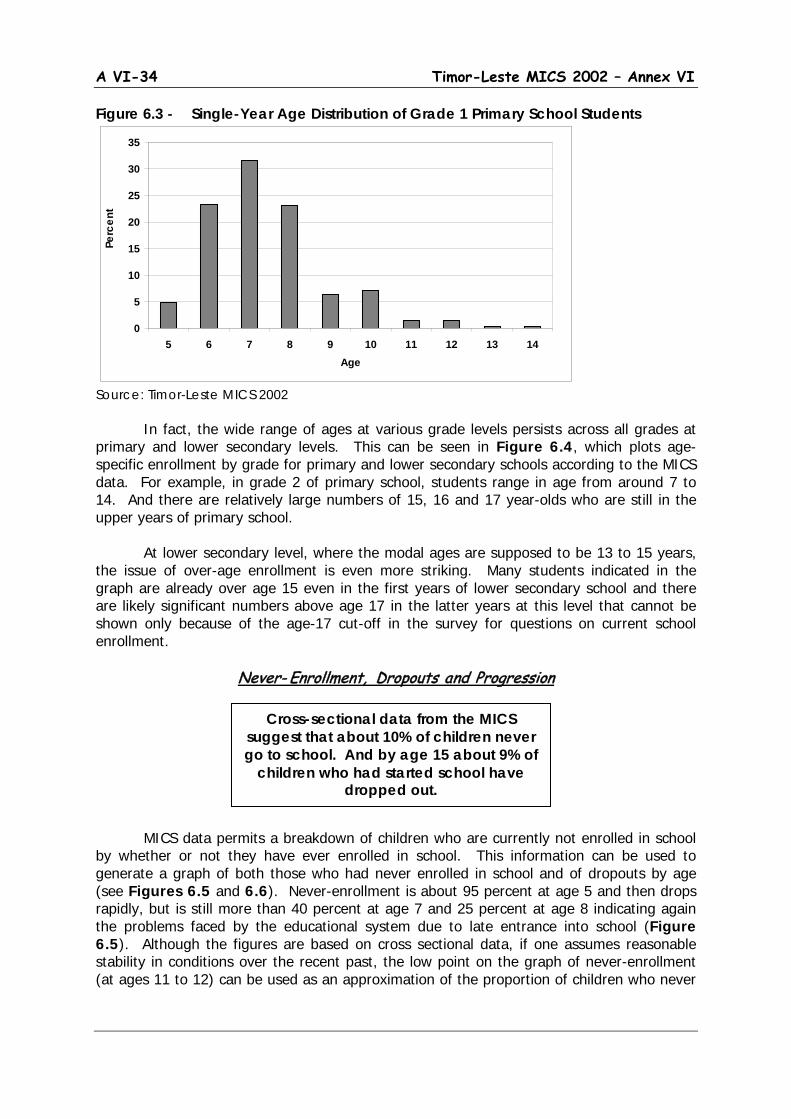
A VI-34 Timor-Leste MICS 2002 – Annex VI
Figure 6.3 - Single-Year Age Distribution of Grade 1 Primary School Students
Source: Timor-Leste MICS 2002 In fact, the wide range of ages at various grade levels persists across all grades at primary and lower secondary levels. This can be seen in Figure 6.4, which plots age-specific enrollment by grade for primary and lower secondary schools according to the MICS data. For example, in grade 2 of primary school, students range in age from around 7 to 14. And there are relatively large numbers of 15, 16 and 17 year-olds who are still in the upper years of primary school.
At lower secondary level, where the modal ages are supposed to be 13 to 15 years, the issue of over-age enrollment is even more striking. Many students indicated in the graph are already over age 15 even in the first years of lower secondary school and there are likely significant numbers above age 17 in the latter years at this level that cannot be shown only because of the age-17 cut-off in the survey for questions on current school enrollment.
Never- Enrollment, Dropouts and Progression MICS data permits a breakdown of children who are currently not enrolled in school by whether or not they have ever enrolled in school. This information can be used to generate a graph of both those who had never enrolled in school and of dropouts by age (see Figures 6.5 and 6.6). Never-enrollment is about 95 percent at age 5 and then drops rapidly, but is still more than 40 percent at age 7 and 25 percent at age 8 indicating again the problems faced by the educational system due to late entrance into school (Figure 6.5). Although the figures are based on cross sectional data, if one assumes reasonable stability in conditions over the recent past, the low point on the graph of never-enrollment (at ages 11 to 12) can be used as an approximation of the proportion of children who never
Cross-sectional data from the MICS suggest that about 10% of children never go to school. And by age 15 about 9% of
children who had started school have dropped out.
0
5
10
15
20
25
30
35
5 6 7 8 9 10 11 12 13 14Age
Perc
ent
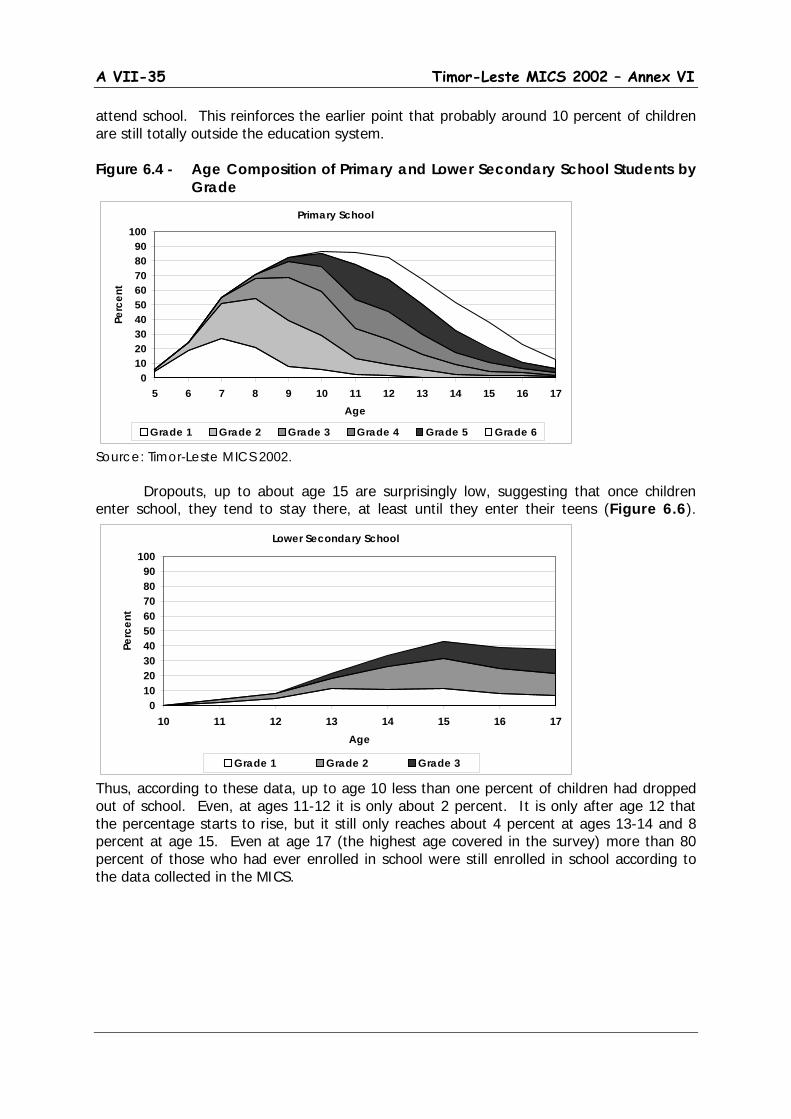
A VII-35 Timor-Leste MICS 2002 – Annex VI
attend school. This reinforces the earlier point that probably around 10 percent of children are still totally outside the education system. Figure 6.4 - Age Composition of Primary and Lower Secondary School Students by
Grade
Source: Timor-Leste MICS 2002. Dropouts, up to about age 15 are surprisingly low, suggesting that once children
enter school, they tend to stay there, at least until they enter their teens (Figure 6.6).
Thus, according to these data, up to age 10 less than one percent of children had dropped out of school. Even, at ages 11-12 it is only about 2 percent. It is only after age 12 that the percentage starts to rise, but it still only reaches about 4 percent at ages 13-14 and 8 percent at age 15. Even at age 17 (the highest age covered in the survey) more than 80 percent of those who had ever enrolled in school were still enrolled in school according to the data collected in the MICS.
Primary School
0102030405060708090
100
5 6 7 8 9 10 11 12 13 14 15 16 17Age
Perc
ent
Grade 1 Grade 2 Grade 3 Grade 4 Grade 5 Grade 6
Lower Secondary School
0102030405060708090
100
10 11 12 13 14 15 16 17Age
Perc
ent
Grade 1 Grade 2 Grade 3
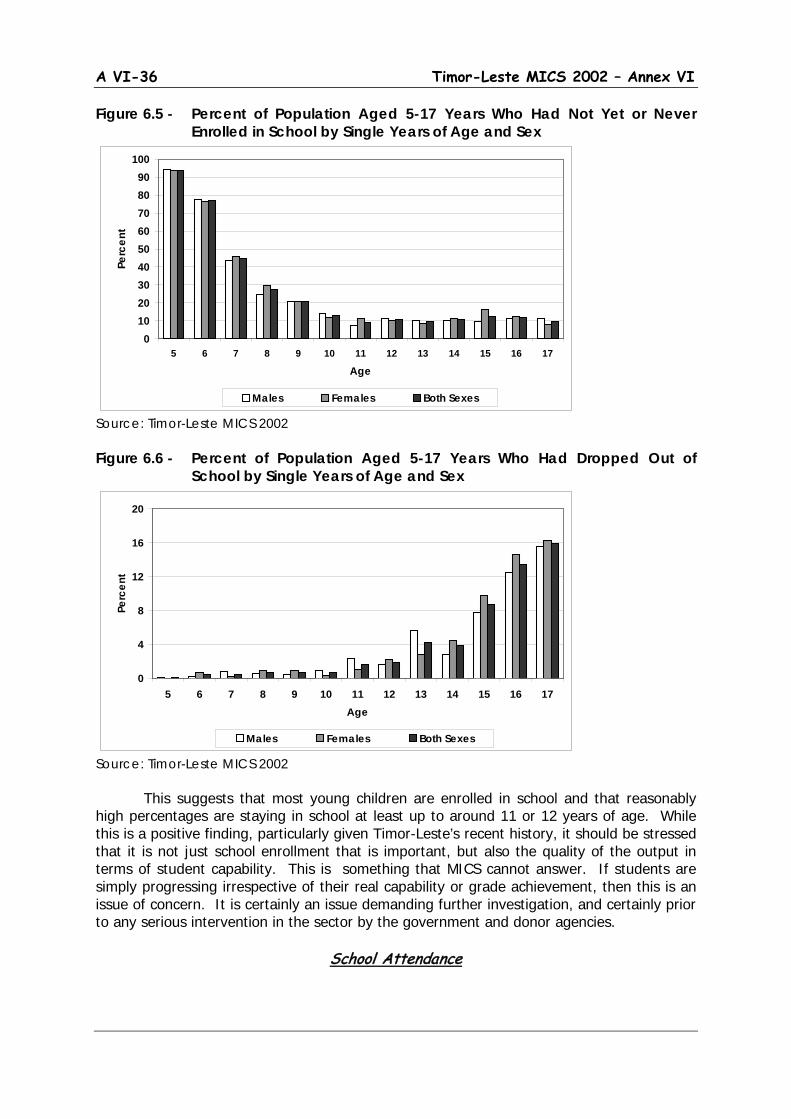
A VI-36 Timor-Leste MICS 2002 – Annex VI
Figure 6.5 - Percent of Population Aged 5-17 Years Who Had Not Yet or Never Enrolled in School by Single Years of Age and Sex
Source: Timor-Leste MICS 2002 Figure 6.6 - Percent of Population Aged 5-17 Years Who Had Dropped Out of
School by Single Years of Age and Sex
Source: Timor-Leste MICS 2002 This suggests that most young children are enrolled in school and that reasonably high percentages are staying in school at least up to around 11 or 12 years of age. While this is a positive finding, particularly given Timor-Leste’s recent history, it should be stressed that it is not just school enrollment that is important, but also the quality of the output in terms of student capability. This is something that MICS cannot answer. If students are simply progressing irrespective of their real capability or grade achievement, then this is an issue of concern. It is certainly an issue demanding further investigation, and certainly prior to any serious intervention in the sector by the government and donor agencies.
School Attendance
0102030405060708090
100
5 6 7 8 9 10 11 12 13 14 15 16 17
Age
Perc
ent
Males Females Both Sexes
0
4
8
12
16
20
5 6 7 8 9 10 11 12 13 14 15 16 17Age
Perc
ent
Males Females Both Sexes
A VII-37 Timor-Leste MICS 2002 – Annex VI
Finally, the MICS questionnaire included a question on the number of school missed during a particular month. Because of problems with school vacation, the MICS did not ask about the month before the survey, but referred to the last full calendar month of school in the previous year, June 2002. This provides a rough indicator of school attendance as opposed to school enrollment. Slightly over half (about 54 percent) of children aged 5-17 claimed to have missed no days of school during June 2002. Just over one-fifth (21 percent) said they missed one or two days and another fifth (22 percent) three to six days. Only 4 percent said they had missed more than a week of school during June 2002. There was no significant variation by age or gender By stratum, the only major difference lay in an apparent tendency for better attendance in the Eastern Region compared to the other regions. In the Eastern Region nearly three-quarters (74 percent) of children had no missed days of school compared to figures of 57 percent in the Western and only 42 percent in the Central Regions.
Summary and Conclusions In summary, the last few subsections have provided a fairly rich range of information on schooling of children focusing on those aged 5 to 17 years and those attending primary and lower secondary school. The results suggest that attention needs to be drawn to the following issues on which government may need to conduct further evaluation and to make needed policy decisions as part of a revitalization process of the educational system.
Late start - Timely entrance into the schooling system is important for child development. Policy decisions need to be made on the “proper ages” for schooling at a particular level.
Over-aging – This is, of course, closely related to late start and thus in the long
run, part of over-aging problem will be resolved when decisions are made on proper starting ages. However, it is also a function of how children progress through school and the avoidance of disruptions in their educational process. The degree of age variation at individual grade levels found in the MICS may be partly a result of recent societal disruptions, but it is an issue that needs to be addressed, both from the point of view of the children and of the educational process where combining a great age range in the same class may make the teaching and learning process more difficult.
Not yet/never enrolled in school - The proportion of children who still never even
get to school is still high and should be a priority area for intervention if the government intends to achieve a goal of education for all.
Dropouts – Dropouts appear to be remarkably low among younger children, but they rise rapidly as children enter their teens. This needs to be further evaluated and clear policies developed to ensure that as many children as possible stay in school through relevant educational cycles.
Continuation rates – The high continuation rates between classes indicated in the
MICS is encouraging. But, there is a need for a more detailed and thorough study on this topic and on what actually happens in the classroom, particularly in terms of just what the children are learning and just what is driving the continuation process.
A VI-38 Timor-Leste MICS 2002 – Annex VI
6.3 Adult Literacy and Educational Attainment
(Annex Table 11)
Adult literacy rates reflect a long history of educational achievement or disparity, and given the history of education in Timor-Leste, it should not be surprising that literacy among adults is not very high. Overall less than three-fifths of the adult population age 15 and over in Timor-Leste claimed to be literate (Figure 6.7). Gender differences are substantial with 65 percent of males but only 52 percent of females being literate. While there is little variation between the Eastern, Central and Western regions, literacy is much higher in the lowlands (65 percent) than the highlands (46 percent), and much higher in urban (73 percent) than in rural areas (53 percent), and higher still in major urban areas (80 percent) There is also fairly wide variation in literacy by wealth quintile ranging from 40 percent among females in the poorest quintile up to 90 percent among males in the richest quintile. The historical trends in improvement in literacy can also be demonstrated by tabulating literacy by age. This is shown in Figure 6.8. There is a marked downward slope indicating the degree to which education reached fewer and fewer of the population as one moves back into the past. Thus, 83 percent of those aged 15-24 claimed to be able to read a newspaper (the question used in the MICS questionnaire) while for the oldest age group (65 and over) the level of literacy had fallen to just 13 percent. The gender-gaps are also of interest, particularly the degree to which that appears to have narrowed over time. Thus, whereas among the youngest age group of 15-24 year-olds, female literacy is 80 percent as compared to 87 percent for males, the gender gap increases rapidly with age and among 45 to 54 years-olds the literacy rate for females is only 15 percent compared to fully 39 percent for males. This is in line in what has been observed earlier – that at least in more recent periods, there has been hardly any gender difference in school enrollment. Literacy rates are mirrored in data on educational attainment of the adult population. Although the Millennium Development Goals focus on literacy (particularly among young adults), educational attainment statistics can be even more revealing as they can be used to provide at least an initial indication of skill levels in the adult population Although this is not investigated further in the MICS, it is a topic of interest to those concerned with manpower policies and labor markets as well as those dealing with broader aspects of poverty reduction.
Fewer than 60% of adults claim to be able to read a newspaper. However, the figure
varies from about 85 percent for 15-34 year-olds to less than 20% at ages 55 and over.
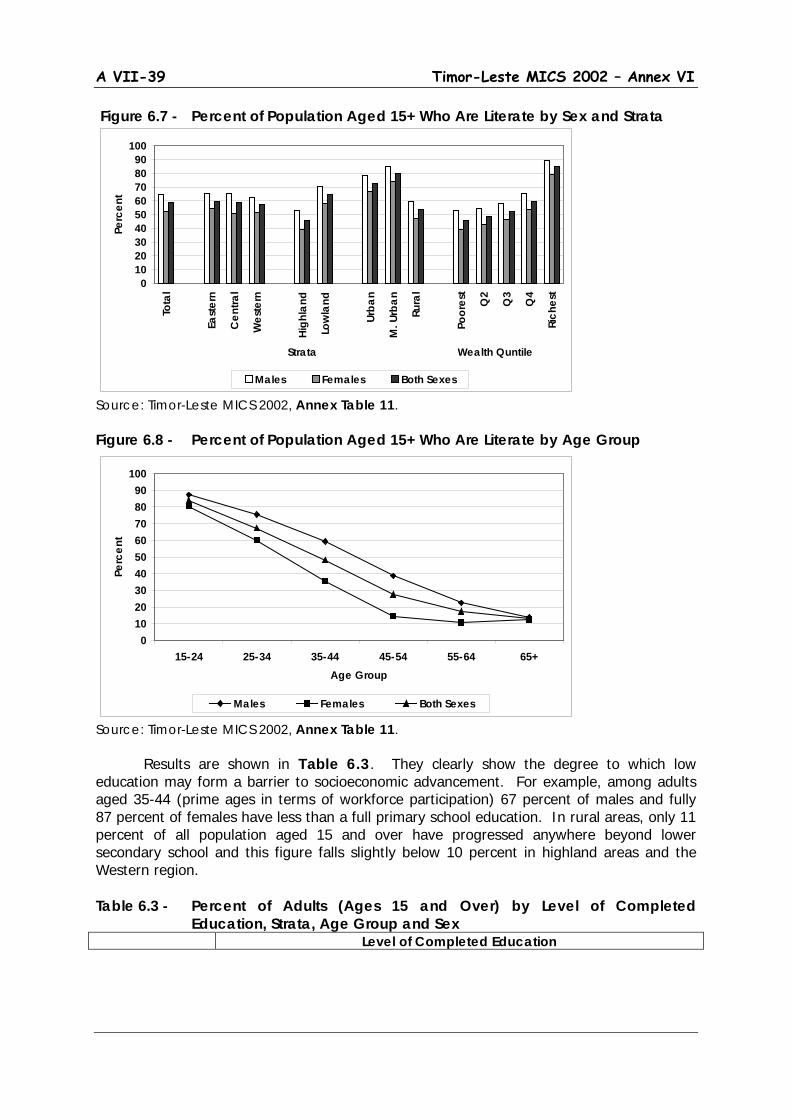
A VII-39 Timor-Leste MICS 2002 – Annex VI
Figure 6.7 - Percent of Population Aged 15+ Who Are Literate by Sex and Strata
Source: Timor-Leste MICS 2002, Annex Table 11. Figure 6.8 - Percent of Population Aged 15+ Who Are Literate by Age Group
Source: Timor-Leste MICS 2002, Annex Table 11. Results are shown in Table 6.3. They clearly show the degree to which low education may form a barrier to socioeconomic advancement. For example, among adults aged 35-44 (prime ages in terms of workforce participation) 67 percent of males and fully 87 percent of females have less than a full primary school education. In rural areas, only 11 percent of all population aged 15 and over have progressed anywhere beyond lower secondary school and this figure falls slightly below 10 percent in highland areas and the Western region. Table 6.3 - Percent of Adults (Ages 15 and Over) by Level of Completed
Education, Strata, Age Group and Sex Level of Completed Education
0102030405060708090
100
Tota
l
East
ern
Cen
tral
Wes
tern
High
land
Low
land
Urba
n
M. U
rban
Rura
l
Poor
est
Q2
Q3
Q4
Rich
est
Strata Wealth Quntile
Perc
ent
Males Females Both Sexes
0102030405060708090
100
15-24 25-34 35-44 45-54 55-64 65+Age Group
Perc
ent
Males Females Both Sexes

A VI-40 Timor-Leste MICS 2002 – Annex VI
Never
Enrolled in School
Some
Primary School
Completed
Primary School
Lower
Secondary School
Upper Secondary School or
More
Total Total Eastern Region Central Region Western Region Highland Lowland Urban Major Urban Rural Males 15-34 35-44 45-54 55+ Females 15-34 35-44 45-54 55+
54.3
54.3 51.5 61.0
64.3 49.3
38.6 28,5 59.4
30.9 50.8 71,1 89.9
41.7 76.3 93.1 97.2
14.4
15.7 14.1 13.4
14.7 14.2
15.4 16.1 14.1
17.7 16.6 15.5
6.9
16.8 11.5
3.5 1.8
6.2
5.6 5.8 8.0
3.8 7.4
6.7 8.0 6.1
8.6 7.0 5.0 1.8
8.1 3.0 1.7 0.6
10.4
11.2 11.0
7.8
8.1 11.5
12.6 14.7
9.6
16.5 9.0 3.8 0.7
15.1 4.8 0.6 0.3
14.7
13.2 17.6
9.7
8,8 17.5
26.7 32.7 10.8
26.2 16.5
4.6 0.7
18.3 4.3 1.2 0.1
100.0
100.0 100.0 100.0
100.0 100.0
100.0 100.0 100.0
100.0 100.0 100.0 100.0
100.0 100.0 100.0 100.0
Source: Timor-Leste MICS 2002. Note: Completed primary school includes those with a primary school diploma but no further education. Lower secondary school includes those with some lower secondary or a lower secondary school diploma. Upper secondary includes those with any upper secondary education or more. These results clearly highlight the challenge that will be faced by the new government in revitalizing the economy, particularly where it involves introduction of technologies and skills that are at least partly dependent on an educated workforce. It also highlights the degree of urban/rural disparity and particularly the relative dominance of the major urban centers (notably Dili) where a high proportion of more educated adults are concentrated. This latter finding should not be surprising given the previous discussion on “wealth” distribution, but it does serve to re-emphasize the problems that are likely to be faced in spreading development more equitably across all parts of the country.

A VII-41 Timor-Leste MICS 2002 – Annex VI
7. Water and Sanitation Universal access to safe drinking water and sanitation are two of the goals expressed at the World Summit for Children. They are also integral to the more recent Millennium Development Goals and objectives under A World Fit for Children. This should not be surprising. They are closely related to child health since use of unsafe water or unsanitary means of excreta disposal dramatically increase the risk of contracting various water-borne diseases. In order to assess the current situation in Timor-Leste, the 2002 MICS included specific questions on both of these topics that were addressed to all households covered in the survey.
7.1 Access to Safe Water
(Annex Table 12) (MDG # 7; WFFC Goal #1; UNICEF Priority #2)
Safe drinking water can be defined in several ways, but most often it refers to households obtaining their drinking water mainly from municipal piped sources (via either own connections or public standpipes) as well as those either drawing water from bore wells (with hand or electric pumps) or from protected shallow wells or springs or from rainwater. A more stringent view would eliminate protected shallow wells and springs and rainwater as protection is often hard to define and they can also be subject to contamination. Overall about 56 percent of the population has access to safe water with piped water (own connection or public tap) or water from bore wells with electric or hand pumps (the more stringent definition) accounting for about 39 percent of the total (Table 7.1). Not surprisingly there was a definite bias in this regard toward the major urban centers where nearly 85 percent of households already have access to reasonably safe drinking water sources. However in regard to rural areas there are two interesting findings. One is the relatively high percentages of households in rural areas (17 percent) obtaining water from “public taps.” This most likely is real and may reflect the impact of rural water supply programs to provide gravity feed systems (largely from spring sources) to rural villages and hamlets, a number of which have been implemented before and during the transition period. The other is the generally high reliance on spring sources, particularly in more mountainous areas where nearly 60 percent of the population rely on water from protected or unprotected springs. This clearly reflects the sheer impossibility of reliance on wells in this type of terrain and where seasonal variations in rainfall (and water table levels) can be extreme. Comparison with earlier data from SUSENAS is difficult due to a different structure in the questionnaires. However, there is a general indication of similarity in response patterns.
Overall, about 55% of the population has access to safe water. However access is
only around 50% in highland and rural areas

A VI-42 Timor-Leste MICS 2002 – Annex VI
For example, the 1999 SUSENAS for Timor-Leste indicated that 78 percent of urban households and 22 percent of rural households obtained their drinking water from pipe or pump sources. Adding in those with access to protected wells or springs raised the figures to 92 and 62 percent respectively. Given that Dili was the only area considered as urban in the SUSENAS, the results there can thus be seen to be reasonably consistent with those obtained in the MICS and indicating if anything, little change in patterns of access to drinking water over the transitional period. Table 7.1 - Percent Distribution of Population by Main Source of Drinking Water and
Selected Strata
Source of Water Strata
Urban
Major Urban
Rural
Highland
Lowland
Total
Piped Water Own Connect. Public Tap Pump Protected Well Protected Spring Rainwater Unprotected Well Unprotected Spring Pond/River/Stream Other Total
37.4 25.9 12.4 25.1
5.1 4.9 0.0 9.9
10.3 3.5 2.8
100.0
45.5 30.6 14.7 34.0
3.5 1.7 0.0 1.1 7.8 1.7 4.7
100.0
25.5
8.1 17.4
5.9 5.7
13.5 0.0 8.6
34.7 6.1 0.0
100.0
27.2 10.3 16.9
0.4 2.9
18.1 0.0 4.1
41.1 6.1 0.0
100.0
29.4 13.6 15.8 15.7
6.8 8.1 0.0
11.3 22.5
5.1 1.1
100.0
28.7 12.6 16.1 10.6
5.5 11.4
0.0 8.9
28.6 5.4 0.7
100.0
Source: Timor-Leste MICS, 2002, Annex Table 12. Note: Piped Water includes a few households in Dili and Baucau relying in bottled water or on water from tank trucks or water vendors as their main source of drinking water. Thus there appears to be a base of safe water access in Timor-Leste from which to work. However, the relatively simple questions asked in the MICS do not get at related issues associated with measurable water quality and on ease of access to sources of water supply. For example, in Indonesia, even municipal piped water is still generally not potable (it requires boiling to make it safe to drink). This is likely also true in Timor-Leste and it is likely that almost no source of water can be considered absolutely safe. Unfortunately, the extent to which households in Timor-Leste treat their drinking water by correct boiling cannot be determined from the MICS and is a question that should be investigated in future surveys. MICS did include a question on the average time needed to obtain water and this suggested that for most of the population, including those in rural areas, access was not a major problem. The average time required was just over 20 minutes (about 13-14 minutes in urban areas and closer to 23 minutes in rural areas). In rural areas, just under 15 percent of the population spend more than 30 minutes to get water and about 3 percent more than one hour. Finally, quantity of supply is likely an issue in many areas in this generally dry country with extreme seasonal variations in rainfall. This applies not only to drinking, but also to bathing or washing, which may not require fully clean or potable water, but is
A VII-43 Timor-Leste MICS 2002 – Annex VI
essential to a healthy lifestyle. Casual field observations during the survey suggested that this kind of auxiliary use of water (including for such things as washing hands after defecation) might well be limited. This is another topic that clearly deserves further investigation.
7.2 Access to Sanitation
(Annex Table 13) (MDG # 7; WFFC Goal #1; UNICEF Priority #2)
Two questions were asked regarding the nature of sanitation, one on the type of toilet facility and one on the method of final disposal of human waste. Households were also asked whether or not the toilet facility was located in the household or yard. Toilet facilities were divided into four categories – water seal pour flush latrines (leher angsa), pour flush latrines without water seal (plengsengan), squat hole or open pit latrines (Cemplung/Cubluk), and others. Final disposal had six categories – protected pit or septic tank (tangki septik), open channel or unprotected pit (lobang tanah), pond/rice field (kolam/sawah), river/lake/sea (sungai/danau/laut), beach/garden/yard (pantai/kebun/tanah lapangan), and others. Respondents (and likely interviewers) had some difficulty in distinguishing between some pour flush latrines and open pit systems as well as between protected pits or septic tanks and open pits as final disposal. To allow for better interpretation the annex table (Annex Table 13) classifies each type of toilet facility, including open pit systems by whether or not it was reported as connected to a protected pit or septic tank for final disposal. A minimum estimate of safe sanitation can then be obtained based on the number of households with access to water seal pour flush latrines (irrespective of final disposal) and those with pour flush latrines without water seal connected to protected pits or septic tanks. A maximum estimate can be obtained by further adding the rest of households with pour flush latrines without water seal and those with squat holes or open-pit latrines reported as connected to protected pits or septic tanks. In effect, this range brackets the definition used in the recommended MICS indicator, which includes any pour/pour flush toilet or improved pit latrine as a safe means of excreta disposal. Close to 45 percent of the population do not use any form of toilet facility, in effect relying on ponds, fields, etc. for meeting their sanitary needs (Table 7.2). However there is a marked variation across regions with toilet facilities as well as access to improved means of final disposal being much more characteristic of urban areas and, particularly, the major urban centers of Dili and Baucau where more than 90 percent of the population have some form of toilet facility. In rural areas more than half of the population have no facility and among those that do, the great majority use only a simple pit latrine with very little if any additional protection according the response patterns in the survey. Particular attention here can be paid to highland areas (and to the Western Region as shown in Annex Table 13) where close to 90 percent of the population either have no toilet facilities or essentially rely on simple squat holes or open pits for excreta disposal. This is an indication of an
Access to safe means of excreta disposal is low. Almost 45% of the population has no toilet facility
and of those with toilet facilities, probably less than half can be considered safe.
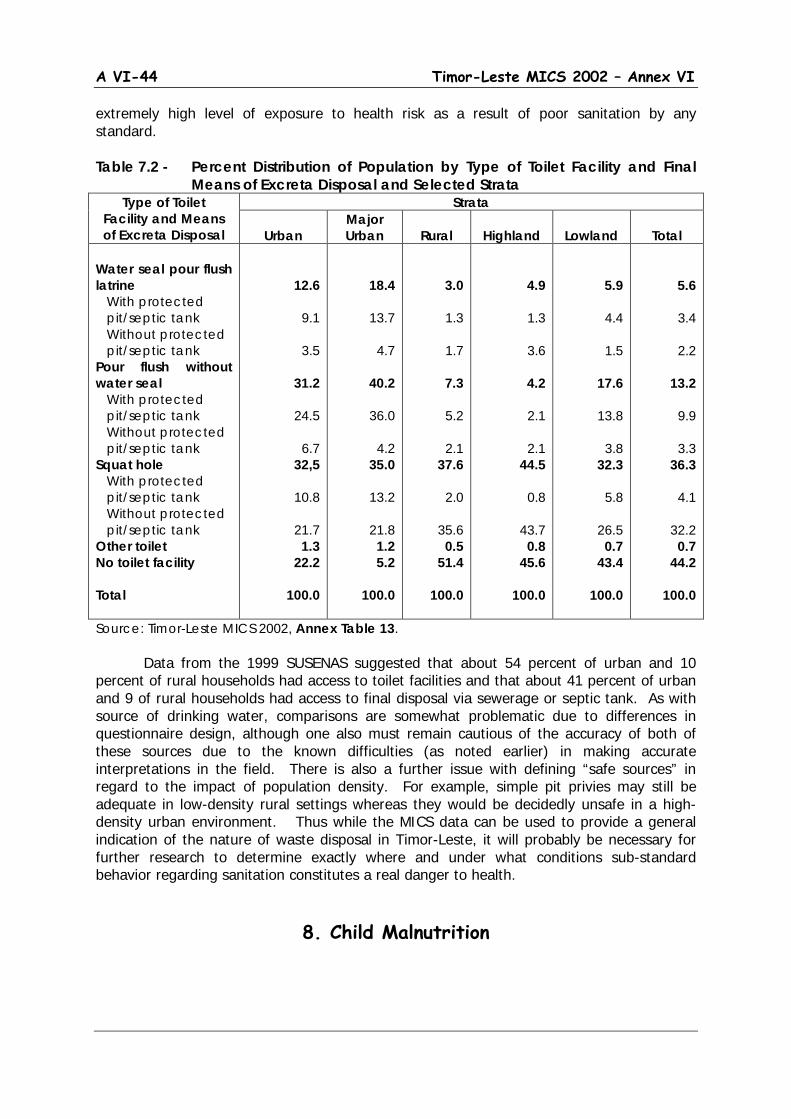
A VI-44 Timor-Leste MICS 2002 – Annex VI
extremely high level of exposure to health risk as a result of poor sanitation by any standard. Table 7.2 - Percent Distribution of Population by Type of Toilet Facility and Final
Means of Excreta Disposal and Selected Strata Type of Toilet
Facility and Means of Excreta Disposal
Strata
Urban Major Urban
Rural
Highland
Lowland
Total
Water seal pour flush latrine With protected pit/septic tank Without protected pit/septic tank Pour flush without water seal With protected pit/septic tank Without protected pit/septic tank Squat hole With protected pit/septic tank Without protected pit/septic tank Other toilet No toilet facility Total
12.6
9.1
3.5
31.2
24.5
6.7 32,5
10.8
21.7 1.3
22.2
100.0
18.4
13.7
4.7
40.2
36.0
4.2 35.0
13.2
21.8 1.2 5.2
100.0
3.0
1.3
1.7
7.3
5.2
2.1 37.6
2.0
35.6 0.5
51.4
100.0
4.9
1.3
3.6
4.2
2.1
2.1 44.5
0.8
43.7 0.8
45.6
100.0
5.9
4.4
1.5
17.6
13.8
3.8 32.3
5.8
26.5 0.7
43.4
100.0
5.6
3.4
2.2
13.2
9.9
3.3 36.3
4.1
32.2 0.7
44.2
100.0
Source: Timor-Leste MICS 2002, Annex Table 13. Data from the 1999 SUSENAS suggested that about 54 percent of urban and 10 percent of rural households had access to toilet facilities and that about 41 percent of urban and 9 of rural households had access to final disposal via sewerage or septic tank. As with source of drinking water, comparisons are somewhat problematic due to differences in questionnaire design, although one also must remain cautious of the accuracy of both of these sources due to the known difficulties (as noted earlier) in making accurate interpretations in the field. There is also a further issue with defining “safe sources” in regard to the impact of population density. For example, simple pit privies may still be adequate in low-density rural settings whereas they would be decidedly unsafe in a high-density urban environment. Thus while the MICS data can be used to provide a general indication of the nature of waste disposal in Timor-Leste, it will probably be necessary for further research to determine exactly where and under what conditions sub-standard behavior regarding sanitation constitutes a real danger to health.
8. Child Malnutrition
A VII-45 Timor-Leste MICS 2002 – Annex VI
Children who are well nourished develop better physically and mentally and are less likely to die from various childhood diseases. Thus it should not be surprising that the Millennium Development Goals as well as MICS pay particular attention to issues and indicators associated with child nutritional status. In fact, concerns with malnutrition start even before birth. Poor nutritional status of mothers can result in low birth weight. Babies with birth weights below 2500 grams are known to be at greater risk of disease and death in the first few weeks or months of life. The effects of poor fetal nutrition can also extend into adulthood. Infant and young child feeding is also a key component. Failure to provide exclusive breastfeeding during the first 6 months of life and lack of extended breastfeeding, preferably up to 20-23 months of age with appropriate complimentary feeding, means that children are not optimally nourished and cannot develop, physically and mentally, to their greatest capacity.
Quantity and quality of food intake is also of obvious and critical importance. MICS does not attempt direct measure of food intake, but does use anthropometric measurements (weight and length or height45) to make proxy estimates of malnutrition by comparison with standards drawn from a generally well-nourished population. Anthropometric measurements measure growth, which is affected not only by food intake but also by health and care.46
Finally, attention is paid to a few important kinds of interventions to improve micro nutrient intake - iodine (through the use of iodized salt) and vitamin A (through child as well as maternal use of special vitamin A capsules) – that are specifically dealt with among the World Fit for Children objectives. The WFFC also mentions the importance of iron intake in reducing anemia, although this is not specifically covered in the MICS methodology.
8.1 Child Malnutrition – Height and Weight
(Annex Table 14)
(MDG #1, 4; WFFC Goal #1; UNICEF Priority #2) Reduction of child malnutrition is a major priority of the Millennium Development Goals. This should not be surprising since malnutrition is a major proximate determinant not only of child illness and death, but also of the development of intellectual capacity and performance in school. Nutritional status is generally assessed via measurement of length or height and weight of children and comparing these with distributions for standard populations drawn from nutritionally adequate societies.47
Three measures are normally available.
Wasting (measured by weight for length or height)
45 The terms length and height refer to the way measurements are done. Length is used for children under age 2 who are measured lying down. Height is used for children ages 2-4 who are measured standing up. 46 See UNICEF, Conceptual Framework on the Causes of Malnutrition. 47 The most commonly used standard is that established by the US National Center for Health Statistics (NCHS), the World Health Organization (WHO) and UNICEF. That is the one used here.
12% of children under age 5 are moderately wasted, 47% stunted and 43%
underweight based on WHO standards
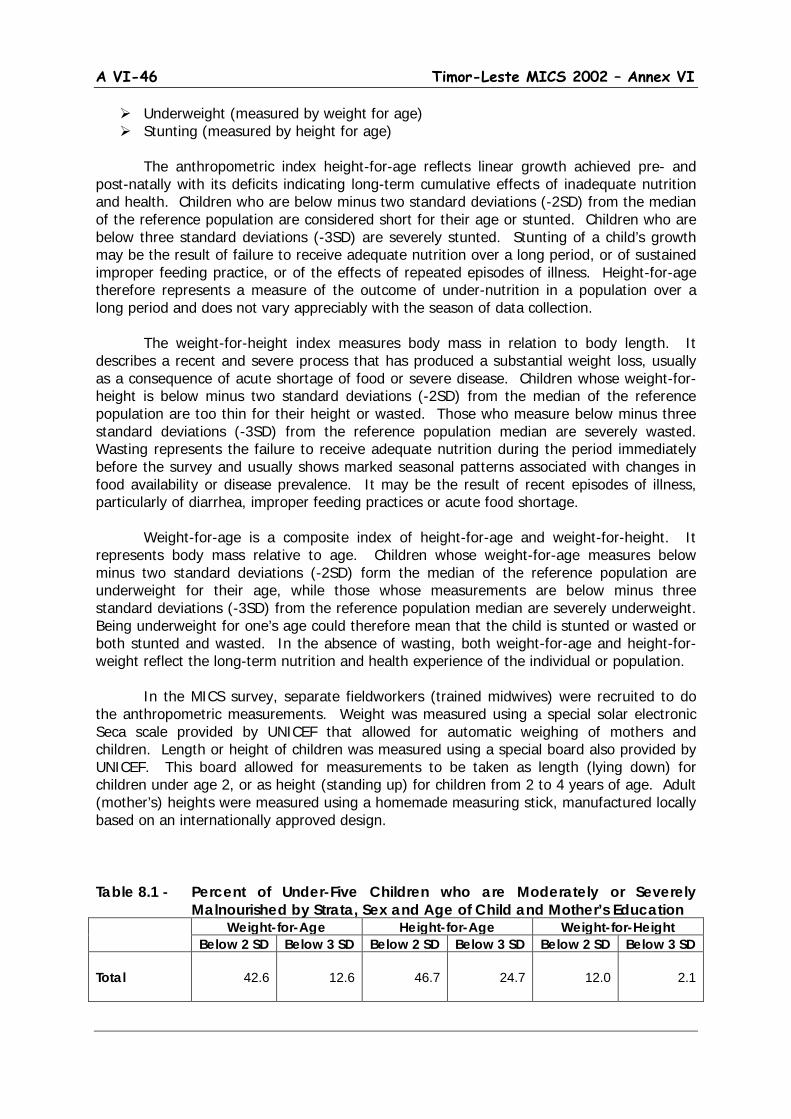
A VI-46 Timor-Leste MICS 2002 – Annex VI
Underweight (measured by weight for age) Stunting (measured by height for age)
The anthropometric index height-for-age reflects linear growth achieved pre- and
post-natally with its deficits indicating long-term cumulative effects of inadequate nutrition and health. Children who are below minus two standard deviations (-2SD) from the median of the reference population are considered short for their age or stunted. Children who are below three standard deviations (-3SD) are severely stunted. Stunting of a child’s growth may be the result of failure to receive adequate nutrition over a long period, or of sustained improper feeding practice, or of the effects of repeated episodes of illness. Height-for-age therefore represents a measure of the outcome of under-nutrition in a population over a long period and does not vary appreciably with the season of data collection.
The weight-for-height index measures body mass in relation to body length. It
describes a recent and severe process that has produced a substantial weight loss, usually as a consequence of acute shortage of food or severe disease. Children whose weight-for-height is below minus two standard deviations (-2SD) from the median of the reference population are too thin for their height or wasted. Those who measure below minus three standard deviations (-3SD) from the reference population median are severely wasted. Wasting represents the failure to receive adequate nutrition during the period immediately before the survey and usually shows marked seasonal patterns associated with changes in food availability or disease prevalence. It may be the result of recent episodes of illness, particularly of diarrhea, improper feeding practices or acute food shortage.
Weight-for-age is a composite index of height-for-age and weight-for-height. It
represents body mass relative to age. Children whose weight-for-age measures below minus two standard deviations (-2SD) form the median of the reference population are underweight for their age, while those whose measurements are below minus three standard deviations (-3SD) from the reference population median are severely underweight. Being underweight for one’s age could therefore mean that the child is stunted or wasted or both stunted and wasted. In the absence of wasting, both weight-for-age and height-for-weight reflect the long-term nutrition and health experience of the individual or population.
In the MICS survey, separate fieldworkers (trained midwives) were recruited to do the anthropometric measurements. Weight was measured using a special solar electronic Seca scale provided by UNICEF that allowed for automatic weighing of mothers and children. Length or height of children was measured using a special board also provided by UNICEF. This board allowed for measurements to be taken as length (lying down) for children under age 2, or as height (standing up) for children from 2 to 4 years of age. Adult (mother’s) heights were measured using a homemade measuring stick, manufactured locally based on an internationally approved design. Table 8.1 - Percent of Under-Five Children who are Moderately or Severely
Malnourished by Strata, Sex and Age of Child and Mother’s Education Weight-for-Age Height-for-Age Weight-for-Height
Below 2 SD Below 3 SD Below 2 SD Below 3 SD Below 2 SD Below 3 SD Total
42.6
12.6
46.7
24.7
12.0
2.1
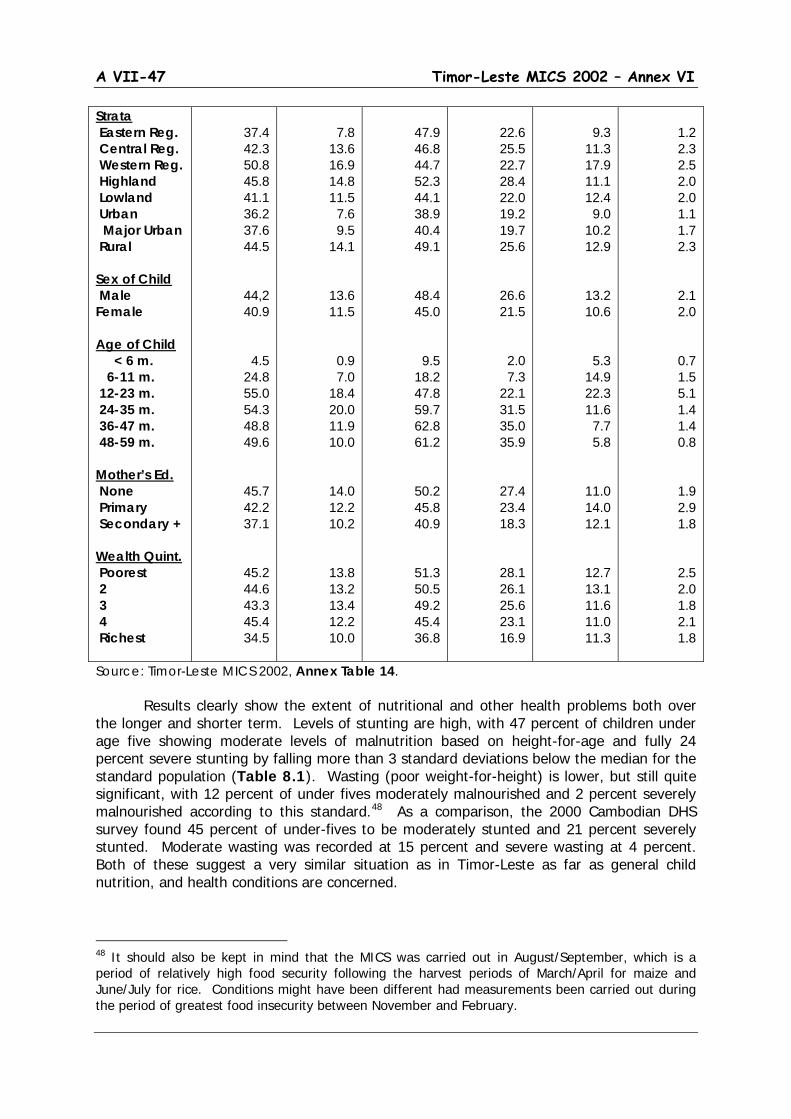
A VII-47 Timor-Leste MICS 2002 – Annex VI
Strata Eastern Reg. Central Reg. Western Reg. Highland Lowland Urban Major Urban Rural Sex of Child Male Female Age of Child < 6 m. 6-11 m. 12-23 m. 24-35 m. 36-47 m. 48-59 m. Mother’s Ed. None Primary Secondary + Wealth Quint. Poorest 2 3 4 Richest
37.4 42.3 50.8 45.8 41.1 36.2 37.6 44.5
44,2 40.9
4.5 24.8 55.0 54.3 48.8 49.6
45.7 42.2 37.1
45.2 44.6 43.3 45.4 34.5
7.8
13.6 16.9 14.8 11.5
7.6 9.5
14.1
13.6 11.5
0.9 7.0
18.4 20.0 11.9 10.0
14.0 12.2 10.2
13.8 13.2 13.4 12.2 10.0
47.9 46.8 44.7 52.3 44.1 38.9 40.4 49.1
48.4 45.0
9.5 18.2 47.8 59.7 62.8 61.2
50.2 45.8 40.9
51.3 50.5 49.2 45.4 36.8
22.6 25.5 22.7 28.4 22.0 19.2 19.7 25.6
26.6 21.5
2.0 7.3
22.1 31.5 35.0 35.9
27.4 23.4 18.3
28.1 26.1 25.6 23.1 16.9
9.3
11.3 17.9 11.1 12.4
9.0 10.2 12.9
13.2 10.6
5.3 14.9 22.3 11.6
7.7 5.8
11.0 14.0 12.1
12.7 13.1 11.6 11.0 11.3
1.2 2.3 2.5 2.0 2.0 1.1 1.7 2.3
2.1 2.0
0.7 1.5 5.1 1.4 1.4 0.8
1.9 2.9 1.8
2.5 2.0 1.8 2.1 1.8
Source: Timor-Leste MICS 2002, Annex Table 14.
Results clearly show the extent of nutritional and other health problems both over the longer and shorter term. Levels of stunting are high, with 47 percent of children under age five showing moderate levels of malnutrition based on height-for-age and fully 24 percent severe stunting by falling more than 3 standard deviations below the median for the standard population (Table 8.1). Wasting (poor weight-for-height) is lower, but still quite significant, with 12 percent of under fives moderately malnourished and 2 percent severely malnourished according to this standard.48
As a comparison, the 2000 Cambodian DHS survey found 45 percent of under-fives to be moderately stunted and 21 percent severely stunted. Moderate wasting was recorded at 15 percent and severe wasting at 4 percent. Both of these suggest a very similar situation as in Timor-Leste as far as general child nutrition, and health conditions are concerned.
48 It should also be kept in mind that the MICS was carried out in August/September, which is a period of relatively high food security following the harvest periods of March/April for maize and June/July for rice. Conditions might have been different had measurements been carried out during the period of greatest food insecurity between November and February.
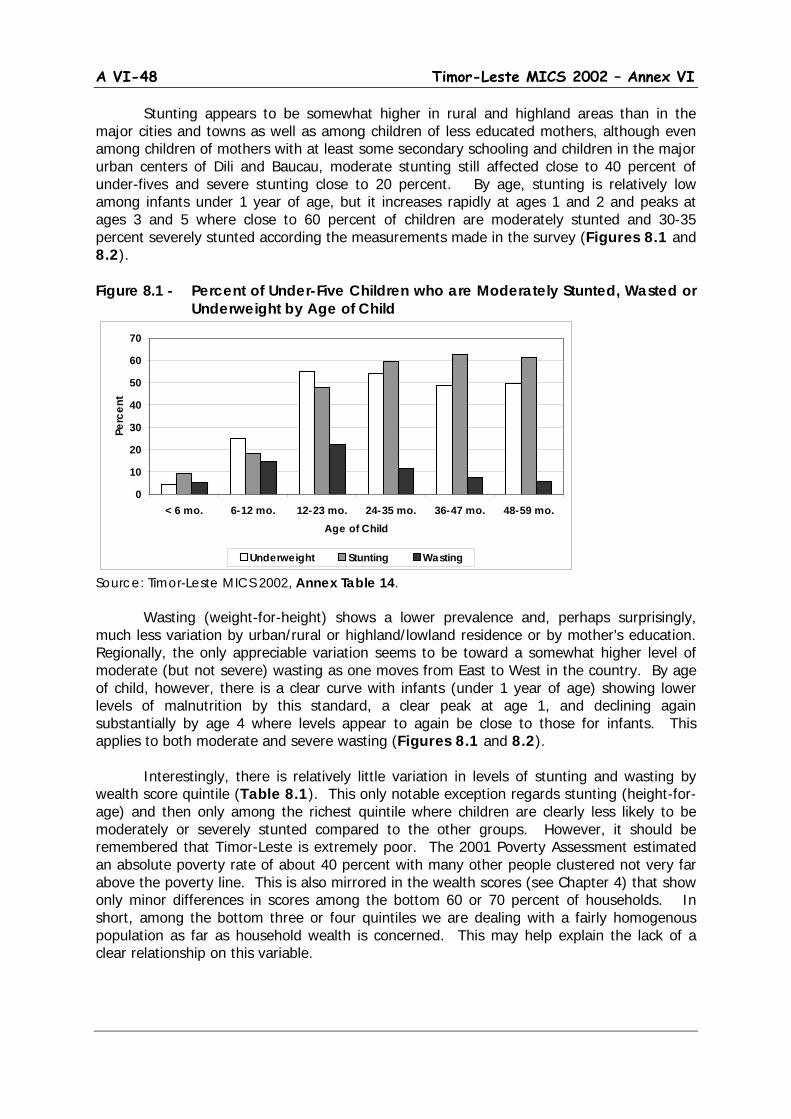
A VI-48 Timor-Leste MICS 2002 – Annex VI
Stunting appears to be somewhat higher in rural and highland areas than in the major cities and towns as well as among children of less educated mothers, although even among children of mothers with at least some secondary schooling and children in the major urban centers of Dili and Baucau, moderate stunting still affected close to 40 percent of under-fives and severe stunting close to 20 percent. By age, stunting is relatively low among infants under 1 year of age, but it increases rapidly at ages 1 and 2 and peaks at ages 3 and 5 where close to 60 percent of children are moderately stunted and 30-35 percent severely stunted according the measurements made in the survey (Figures 8.1 and 8.2). Figure 8.1 - Percent of Under-Five Children who are Moderately Stunted, Wasted or
Underweight by Age of Child
Source: Timor-Leste MICS 2002, Annex Table 14. Wasting (weight-for-height) shows a lower prevalence and, perhaps surprisingly, much less variation by urban/rural or highland/lowland residence or by mother’s education. Regionally, the only appreciable variation seems to be toward a somewhat higher level of moderate (but not severe) wasting as one moves from East to West in the country. By age of child, however, there is a clear curve with infants (under 1 year of age) showing lower levels of malnutrition by this standard, a clear peak at age 1, and declining again substantially by age 4 where levels appear to again be close to those for infants. This applies to both moderate and severe wasting (Figures 8.1 and 8.2). Interestingly, there is relatively little variation in levels of stunting and wasting by wealth score quintile (Table 8.1). This only notable exception regards stunting (height-for-age) and then only among the richest quintile where children are clearly less likely to be moderately or severely stunted compared to the other groups. However, it should be remembered that Timor-Leste is extremely poor. The 2001 Poverty Assessment estimated an absolute poverty rate of about 40 percent with many other people clustered not very far above the poverty line. This is also mirrored in the wealth scores (see Chapter 4) that show only minor differences in scores among the bottom 60 or 70 percent of households. In short, among the bottom three or four quintiles we are dealing with a fairly homogenous population as far as household wealth is concerned. This may help explain the lack of a clear relationship on this variable.
0
10
20
30
40
50
60
70
< 6 mo. 6-12 mo. 12-23 mo. 24-35 mo. 36-47 mo. 48-59 mo.Age of Child
Perc
ent
Underweight Stunting Wasting

A VII-49 Timor-Leste MICS 2002 – Annex VI
Figure 8.2 - Percent of Under-Five Children who are Severely Stunted, Wasted or Underweight by Age of Child
Source: Timor-Leste MICS 2002, Annex Table 14. The net result using the weight-for-age measure is a high level of child malnutrition across virtually all the country and among almost all sub-groups of the population. However, for policy, the dominance of stunting is important. It emphasizes both the poverty linkage and the need to generally increase access to nutritional quality as well as quantity of food to children, and particularly around the time and after they are weaned. Perhaps even more important, the high level of stunting is also indicative of poor maternal nutritional status and hence the consequences associated with long-term and inter-generational malnutrition. Finally, it should be noted that all forms of malnutrition affect the brain development of infants, which has far more serious implications on the future of the workforce and the nation as a whole. These measures also provide a background for the following discussion that deals more explicitly with children’s access to nutrition, through breast feeding, the appropriate introduction of complimentary foods and access to selected micro-nutrients, notably iodine and vitamin A.
8.2 Breastfeeding and Supplementation
(Annex Table 15) (MDG #4; WFFC Goal #1; UNICEF Priority #2)
Breastfeeding and complimentary feeding behaviors are important predictors of infant and child nutrition, health and survival. Poor nutritional status increases the risk of illness and death among children. Breastfeeding practices also have an effect on the
Median duration of breastfeeding is just over 15 months. By 20-23 months of age only about
10% of children are still being breastfed
0
10
20
30
40
50
60
70
< 6 mo. 6-12 mo. 12-23 mo. 24-35 mo. 36-47 mo. 48-59 mo.Age of Child
Perc
ent
Underweight Stunting Wasting
A VI-50 Timor-Leste MICS 2002 – Annex VI
mother’s fertility. A well-documented effect of frequent breastfeeding for long durations is delayed return to ovulation and therefore longer birth intervals and lower fertility, which is strongly related to infant and child survival.
MICS included questions on the duration of breastfeeding (exclusive and with
supplementation) for all children under age five. It also asked about the nature of supplementation during the day before the survey for children still being breastfed as well as the use of bottle feeding for all children whether they were being breastfed or not.
Breast milk is the most desirable source of nutrients for young infants. It provides a
complete source of nutrition for the first 6 months of life, half of all requirements in the second 6 months, and one third of all requirements in the second year of life.49
Thus exclusive breastfeeding, defined as consumption of human milk as the sole source of energy, is the preferred method of feeding for normal full-term infants from birth to six months. Breastfeeding, complimented by the appropriate introduction of other foods, is recommended for the remainder of the first year or longer, preferably up until the child is at least two years old.
Early supplementation is discouraged for several reasons. First, it exposes infants to pathogens and increases their risk of infection, especially diarrheal disease. Second, it decreases the infant’s intake of breast milk and therefore suckling, which reduces breast milk production. Third, in a harsh socioeconomic environment, supplementary food is often nutritionally inferior. For example, it is often difficult to meet zinc and iron requirements of children age 6-24 months even in the best conditions. Inadequate micronutrient and energy intake is often coupled with a high rate of both clinical and sub-clinical morbidity, which is often associated with anorexia.
Breastfeeding, but not exclusive breastfeeding, in Timor-Leste is nearly universal – of children born in the five years preceding the MICS survey 96 percent were breastfed for at least some period of time and more than 90 percent of mothers continued to breast-feed their children until at least 6 months (Figure 8.3).50
49 Early initiation of breastfeeding is also important due to the attributes of breast milk that offer the infant unsurpassed protection against infection. Colostrum, a pre-milk substance containing antibodies and white cells from the mother’s blood is produced during the first two or three days of lactation. Colostrum contains maternal immune factors that help protect the newborn infant from infections. It is also beneficial for the mother since it stimulates breast milk production and causes the uterus to retract, which can reduce postpartum blood loss. Unfortunately, MICS did not include specific questions on this topic.
This is comparable with levels reported for Indonesia as well as for Timor-Leste in the 1997 DHS so that there appears to be little or no change in behavior in this regard. Median duration of breastfeeding is just
50 Figure 8.3 shows cumulative percentages of children divided into five groups; those still being exclusively breastfed, those receiving breast milk plus water, those receiving breast milk plus other liquids (including other milk), those receiving breast milk plus complimentary solid or semi-solid food and those not being breastfed any longer. The residual distance between the top line and the horizontal line representing 100 percent of the children is used to represent the last category. Children receiving other liquid could also be receiving water, but not complimentary food. Those receiving food could be receiving other liquids as well. And those not being breastfed would clearly all be receiving at least some other liquid and/or food. For example, at 6 months of age, about 18 percent of children were still being exclusively breastfed and another 12 percent were receiving breast milk plus water or other liquids. About 63 percent were receiving breast milk plus complimentary food and the residual, 7 percent, had ceased breastfeeding.
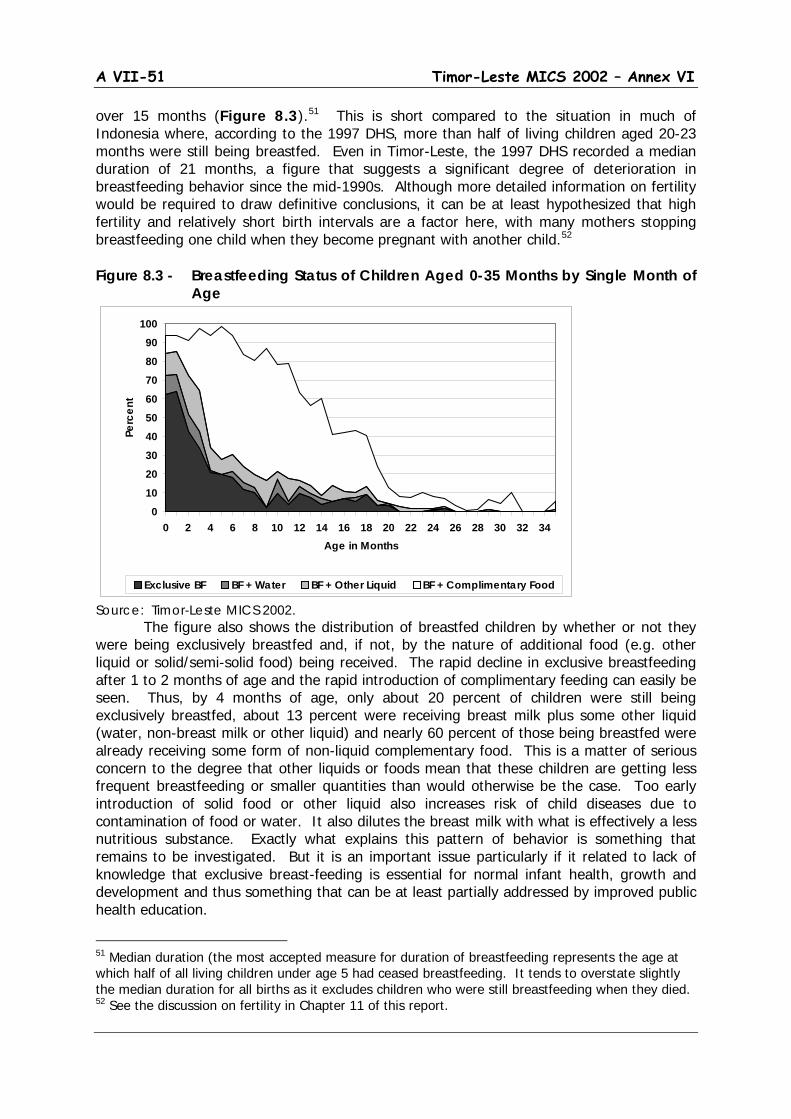
A VII-51 Timor-Leste MICS 2002 – Annex VI
over 15 months (Figure 8.3).51 This is short compared to the situation in much of Indonesia where, according to the 1997 DHS, more than half of living children aged 20-23 months were still being breastfed. Even in Timor-Leste, the 1997 DHS recorded a median duration of 21 months, a figure that suggests a significant degree of deterioration in breastfeeding behavior since the mid-1990s. Although more detailed information on fertility would be required to draw definitive conclusions, it can be at least hypothesized that high fertility and relatively short birth intervals are a factor here, with many mothers stopping breastfeeding one child when they become pregnant with another child.52
Figure 8.3 - Breastfeeding Status of Children Aged 0-35 Months by Single Month of Age
Source: Timor-Leste MICS 2002. The figure also shows the distribution of breastfed children by whether or not they
were being exclusively breastfed and, if not, by the nature of additional food (e.g. other liquid or solid/semi-solid food) being received. The rapid decline in exclusive breastfeeding after 1 to 2 months of age and the rapid introduction of complimentary feeding can easily be seen. Thus, by 4 months of age, only about 20 percent of children were still being exclusively breastfed, about 13 percent were receiving breast milk plus some other liquid (water, non-breast milk or other liquid) and nearly 60 percent of those being breastfed were already receiving some form of non-liquid complementary food. This is a matter of serious concern to the degree that other liquids or foods mean that these children are getting less frequent breastfeeding or smaller quantities than would otherwise be the case. Too early introduction of solid food or other liquid also increases risk of child diseases due to contamination of food or water. It also dilutes the breast milk with what is effectively a less nutritious substance. Exactly what explains this pattern of behavior is something that remains to be investigated. But it is an important issue particularly if it related to lack of knowledge that exclusive breast-feeding is essential for normal infant health, growth and development and thus something that can be at least partially addressed by improved public health education.
51 Median duration (the most accepted measure for duration of breastfeeding represents the age at which half of all living children under age 5 had ceased breastfeeding. It tends to overstate slightly the median duration for all births as it excludes children who were still breastfeeding when they died. 52 See the discussion on fertility in Chapter 11 of this report.
0102030405060708090
100
0 2 4 6 8 10 12 14 16 18 20 22 24 26 28 30 32 34Age in Months
Perc
ent
Exclusive BF BF + Water BF + Other Liquid BF + Complimentary Food
A VI-52 Timor-Leste MICS 2002 – Annex VI
Regarding use of bottles, MICS included a question on whether the child was bottle-
fed (DOT bottle) the day before the interview. Overall, about 16 percent of children aged 0-4 received bottle feeding, with the figure peaking at 28 percent for children age 12-23 months and at 16-17 percent for children under age 1 and children 24-35 months of age. However, bottle-feeding was also much more common in urban areas and among more educated women as well as among women from richer households. In rural areas, only about 13 percent of children age 0-4 was being bottle-fed according to the MICS data. The original MICS design included four indicators of breastfeeding performance, the percentage of children aged 0-3 months exclusively breastfed, the percentage of children aged 6-9 months receiving at least some complimentary food, and the percentages of children aged 12-15 months and 20-23 months who are still being breastfed (see Annex Table 15).53 To this we have added the percentage of children aged 0-5 months (under 6 completed months of age) being exclusively breastfed to accommodate the more recent standards advocating a full 6 months of exclusive breastfeeding. Overall 53 percent of children aged 0-3 months and 44 percent of children aged 0-5 months were being exclusively breastfed and 63 percent of children aged 6-9 months were receiving complimentary food in addition to breast milk.54
More important, perhaps, are differences in duration of breastfeeding as indicated by the percentages of children still being breastfed at ages 12-15 and 20-23 months. Fifty-six percent of children aged 12-15 months were still being breastfed compared with only 10 percent of children at ages 20-23 months. However, the percentages still being breastfed are much lower in urban than in rural areas (35 versus 61 percent), and among more educated mothers – 38 percent of children aged 12-15 months with mothers with at least some secondary education were still being breastfed compared to 66 percent of children whose mothers had never gone to school. There is also some indication that mothers from richer households are less likely to undertake extended breastfeeding, although the differences are less striking than those by education.
Variations by strata and by background characteristics of mother and child are hard to interpret although there is an indication that exclusive breastfeeding is higher among more educated and urban mothers – that is, lower educated and rural mothers tend to introduce complimentary feeding at an earlier age. This also shows up to some degree in the comparisons by wealth score quintile with the mothers from the richer quintiles being somewhat more likely to exclusively breast feed their children for longer periods than poorer mothers. The very low level of exclusive breastfeeding in the Western Region (34 percent) compared to the Central and Eastern parts of Timor-Leste is also worth noting although an explanation (if this is true) will need further investigation.
8.3 Salt Iodization and Vitamin A Supplementation
Salt Iodization
53 In the table, breastfeeding status is based on women’s reports of children’s consumption in the 24 hours prior to the interview. Exclusive breastfeeding referes to children who receive only breast milk and, possibly, vitamins, mineral supplements or medicine. Complementary feeding refers to children who receive breast milk and solid or semi-solid food. 54 In the MICS, complimentary food intake is calculated only for children who are still being breastfed. About 13 percent of children aged 6-9 months were not being breastfed and it is clear that these children would also have been consuming at least some solid or semi-solid food.
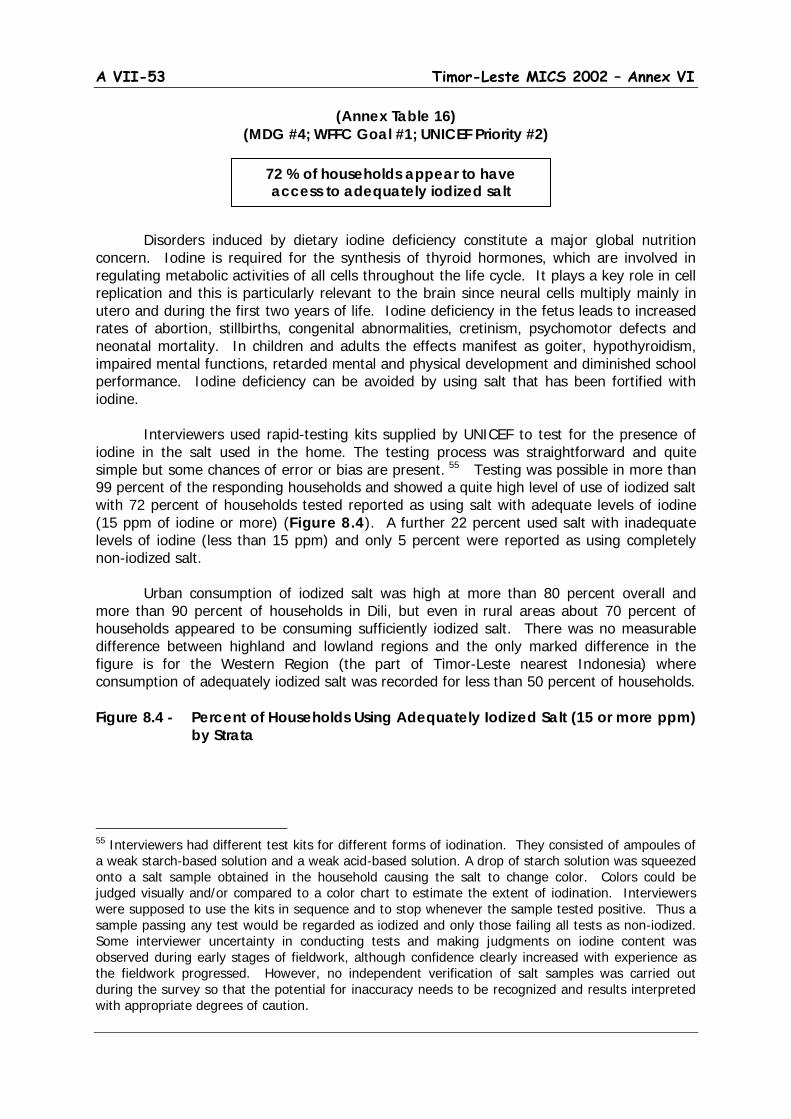
A VII-53 Timor-Leste MICS 2002 – Annex VI
(Annex Table 16) (MDG #4; WFFC Goal #1; UNICEF Priority #2)
Disorders induced by dietary iodine deficiency constitute a major global nutrition concern. Iodine is required for the synthesis of thyroid hormones, which are involved in regulating metabolic activities of all cells throughout the life cycle. It plays a key role in cell replication and this is particularly relevant to the brain since neural cells multiply mainly in utero and during the first two years of life. Iodine deficiency in the fetus leads to increased rates of abortion, stillbirths, congenital abnormalities, cretinism, psychomotor defects and neonatal mortality. In children and adults the effects manifest as goiter, hypothyroidism, impaired mental functions, retarded mental and physical development and diminished school performance. Iodine deficiency can be avoided by using salt that has been fortified with iodine. Interviewers used rapid-testing kits supplied by UNICEF to test for the presence of iodine in the salt used in the home. The testing process was straightforward and quite simple but some chances of error or bias are present. 55
Testing was possible in more than 99 percent of the responding households and showed a quite high level of use of iodized salt with 72 percent of households tested reported as using salt with adequate levels of iodine (15 ppm of iodine or more) (Figure 8.4). A further 22 percent used salt with inadequate levels of iodine (less than 15 ppm) and only 5 percent were reported as using completely non-iodized salt.
Urban consumption of iodized salt was high at more than 80 percent overall and more than 90 percent of households in Dili, but even in rural areas about 70 percent of households appeared to be consuming sufficiently iodized salt. There was no measurable difference between highland and lowland regions and the only marked difference in the figure is for the Western Region (the part of Timor-Leste nearest Indonesia) where consumption of adequately iodized salt was recorded for less than 50 percent of households. Figure 8.4 - Percent of Households Using Adequately Iodized Salt (15 or more ppm)
by Strata
55 Interviewers had different test kits for different forms of iodination. They consisted of ampoules of a weak starch-based solution and a weak acid-based solution. A drop of starch solution was squeezed onto a salt sample obtained in the household causing the salt to change color. Colors could be judged visually and/or compared to a color chart to estimate the extent of iodination. Interviewers were supposed to use the kits in sequence and to stop whenever the sample tested positive. Thus a sample passing any test would be regarded as iodized and only those failing all tests as non-iodized. Some interviewer uncertainty in conducting tests and making judgments on iodine content was observed during early stages of fieldwork, although confidence clearly increased with experience as the fieldwork progressed. However, no independent verification of salt samples was carried out during the survey so that the potential for inaccuracy needs to be recognized and results interpreted with appropriate degrees of caution.
72 % of households appear to have access to adequately iodized salt
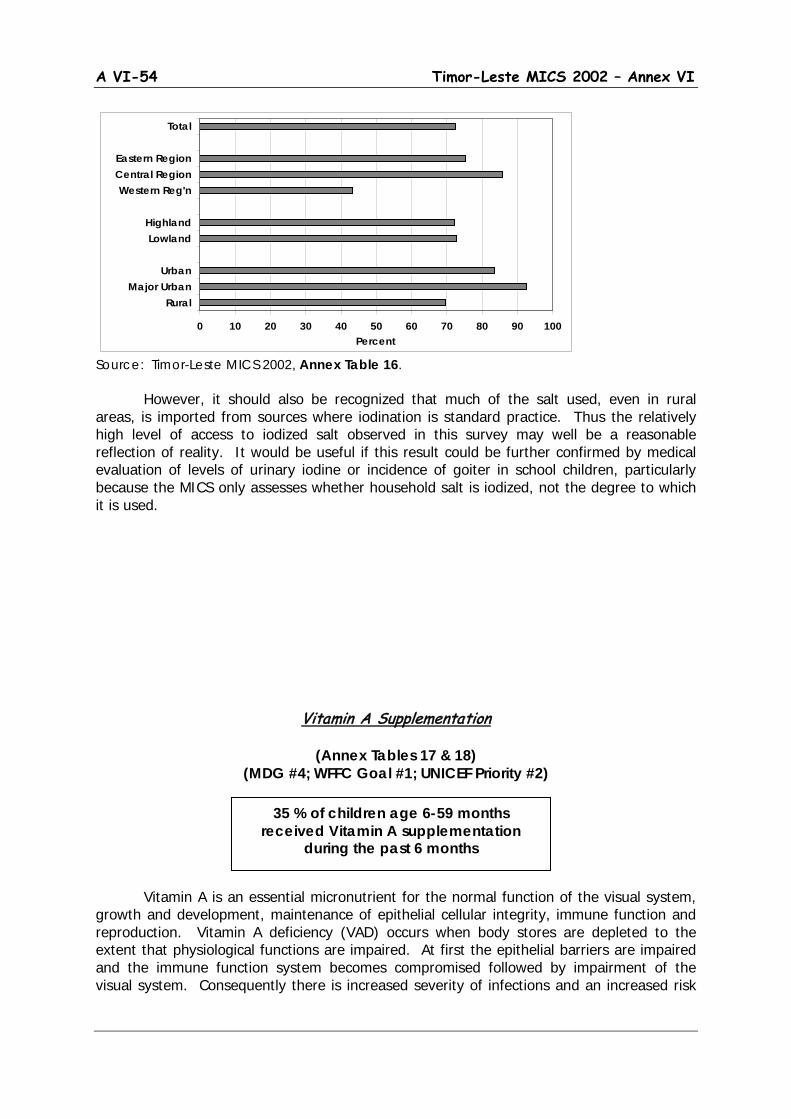
A VI-54 Timor-Leste MICS 2002 – Annex VI
Source: Timor-Leste MICS 2002, Annex Table 16. However, it should also be recognized that much of the salt used, even in rural areas, is imported from sources where iodination is standard practice. Thus the relatively high level of access to iodized salt observed in this survey may well be a reasonable reflection of reality. It would be useful if this result could be further confirmed by medical evaluation of levels of urinary iodine or incidence of goiter in school children, particularly because the MICS only assesses whether household salt is iodized, not the degree to which it is used.
Vitamin A Supplementation
(Annex Tables 17 & 18) (MDG #4; WFFC Goal #1; UNICEF Priority #2)
Vitamin A is an essential micronutrient for the normal function of the visual system, growth and development, maintenance of epithelial cellular integrity, immune function and reproduction. Vitamin A deficiency (VAD) occurs when body stores are depleted to the extent that physiological functions are impaired. At first the epithelial barriers are impaired and the immune function system becomes compromised followed by impairment of the visual system. Consequently there is increased severity of infections and an increased risk
35 % of children age 6-59 months received Vitamin A supplementation
during the past 6 months
0 10 20 30 40 50 60 70 80 90 100
Rural Major Urban
Urban
LowlandHighland
Western Reg'nCentral RegionEastern Region
Total
Percent

A VII-55 Timor-Leste MICS 2002 – Annex VI
of death, particularly among children. Improving the vitamin A status of young children reduces mortality rates. Vitamin A deficiency is associated with dietary practices and the degree to which children and adults consume foods naturally rich in vitamin A. Where concerns about consumption exist, a common solution is to provide high dose vitamin A supplementation with the target being children between 6 and 59 months of age and mothers of children under 6 months. MICS did not include questions regarding food consumption, but it did include questions on vitamin A supplementation. Figure 8.5 - Percent of Children Aged 6-59 Months Who Have Received A High
Dose Vitamin A Supplement by Timing of Supplementation, Strata and
Mother’s Education Source: Timor-Leste MICS 2002, Annex Table 17.
About 52 percent of children aged 6-59 months were reported to have received doses of Vitamin A with about 35 percent having received a dose within the past 6 months (Figure 8.5). Of those who had received Vitamin A, the most common source was from a regular visit to a health clinic (39 percent), although significant percentages of children were also given doses during clinic visits due to illness (19 percent) or during immunization drives (25 percent) (see Figure 8.6). Interestingly there was only moderate regional variation, with performance slightly better in lowland areas and in the Central and Western regions of the country. There was also little variation in performance by sex or age of child. However, there was a fairly clear tendency for a smaller proportion of children of less educated mothers as well as those from the poorest households to have received high dose vitamin A supplementation than of those with more educated mothers or mothers from richer households. Although it is hard to draw definitive conclusions, based on a crude comparison with apparent general levels of use of health facilities and participation in immunization drives (see Chapter 9) it does seem that many children making use of access to modern health facilities or personnel or participating in immunization drives are also getting access to Vitamin A supplementation. This suggests that extension of health links via such mechanisms as outreach services from clinics and intensification of future immunization or
0
10
20
30
40
50
60
70
Tota
l
East
ern
Cen
tral
Wes
tern
High
land
Low
land
Urba
n
M. U
rban
Rura
l
Non
e
Prim
ary
Seco
ndar
y
Poor
est
Q2
Q3
Q4
Rich
est
Strata Mother'sEducation
Wealth Quintile
Perc
ent
Last 6 months Prior to last 6 months
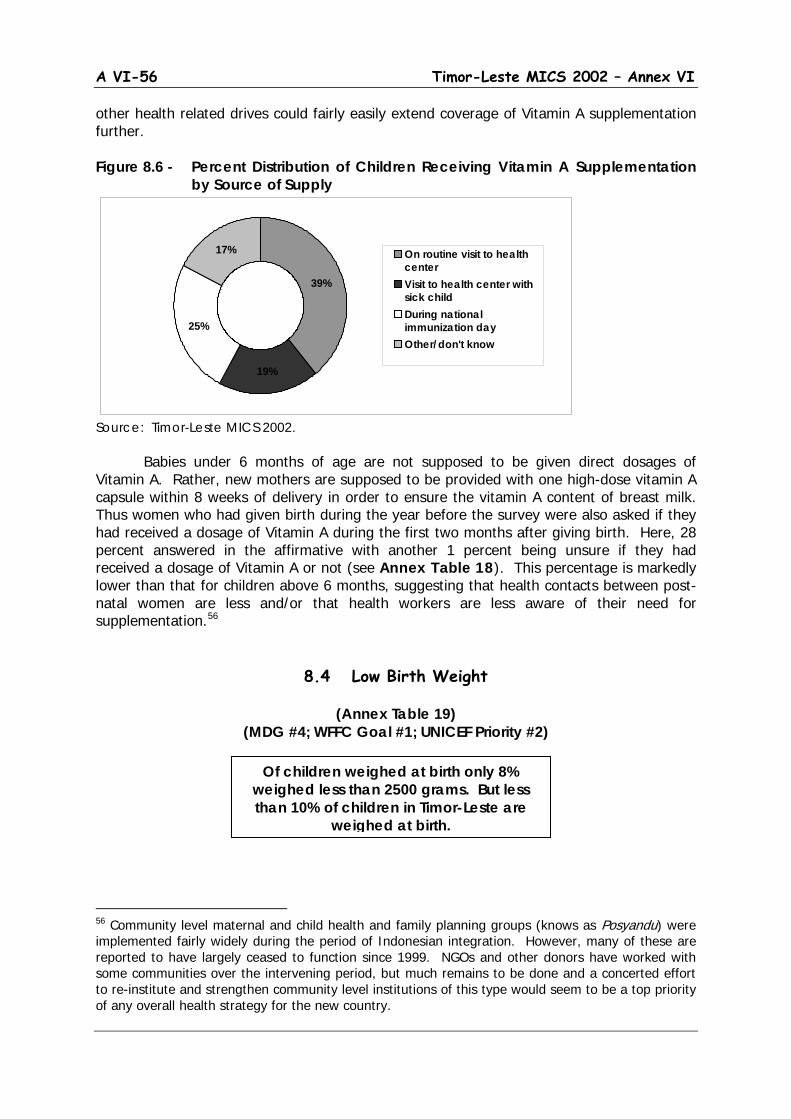
A VI-56 Timor-Leste MICS 2002 – Annex VI
other health related drives could fairly easily extend coverage of Vitamin A supplementation further. Figure 8.6 - Percent Distribution of Children Receiving Vitamin A Supplementation
by Source of Supply
Source: Timor-Leste MICS 2002. Babies under 6 months of age are not supposed to be given direct dosages of Vitamin A. Rather, new mothers are supposed to be provided with one high-dose vitamin A capsule within 8 weeks of delivery in order to ensure the vitamin A content of breast milk. Thus women who had given birth during the year before the survey were also asked if they had received a dosage of Vitamin A during the first two months after giving birth. Here, 28 percent answered in the affirmative with another 1 percent being unsure if they had received a dosage of Vitamin A or not (see Annex Table 18). This percentage is markedly lower than that for children above 6 months, suggesting that health contacts between post-natal women are less and/or that health workers are less aware of their need for supplementation.56
8.4 Low Birth Weight
(Annex Table 19)
(MDG #4; WFFC Goal #1; UNICEF Priority #2)
56 Community level maternal and child health and family planning groups (knows as Posyandu) were implemented fairly widely during the period of Indonesian integration. However, many of these are reported to have largely ceased to function since 1999. NGOs and other donors have worked with some communities over the intervening period, but much remains to be done and a concerted effort to re-institute and strengthen community level institutions of this type would seem to be a top priority of any overall health strategy for the new country.
Of children weighed at birth only 8% weighed less than 2500 grams. But less than 10% of children in Timor-Leste are
weighed at birth.
17%
39%
19%
25%
On routine visit to healthcenterVisit to health center withsick childDuring nationalimmunization dayOther/don't know
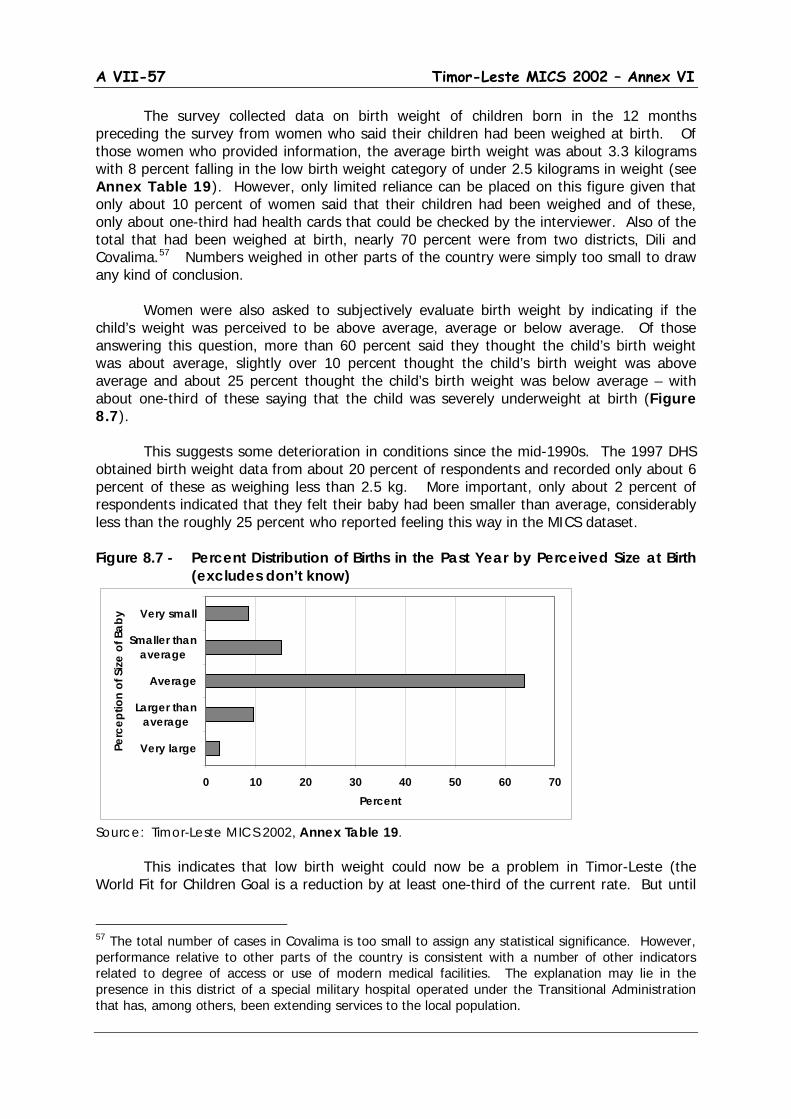
A VII-57 Timor-Leste MICS 2002 – Annex VI
The survey collected data on birth weight of children born in the 12 months preceding the survey from women who said their children had been weighed at birth. Of those women who provided information, the average birth weight was about 3.3 kilograms with 8 percent falling in the low birth weight category of under 2.5 kilograms in weight (see Annex Table 19). However, only limited reliance can be placed on this figure given that only about 10 percent of women said that their children had been weighed and of these, only about one-third had health cards that could be checked by the interviewer. Also of the total that had been weighed at birth, nearly 70 percent were from two districts, Dili and Covalima.57
Numbers weighed in other parts of the country were simply too small to draw any kind of conclusion.
Women were also asked to subjectively evaluate birth weight by indicating if the child’s weight was perceived to be above average, average or below average. Of those answering this question, more than 60 percent said they thought the child’s birth weight was about average, slightly over 10 percent thought the child’s birth weight was above average and about 25 percent thought the child’s birth weight was below average – with about one-third of these saying that the child was severely underweight at birth (Figure 8.7). This suggests some deterioration in conditions since the mid-1990s. The 1997 DHS obtained birth weight data from about 20 percent of respondents and recorded only about 6 percent of these as weighing less than 2.5 kg. More important, only about 2 percent of respondents indicated that they felt their baby had been smaller than average, considerably less than the roughly 25 percent who reported feeling this way in the MICS dataset. Figure 8.7 - Percent Distribution of Births in the Past Year by Perceived Size at Birth
(excludes don’t know)
Source: Timor-Leste MICS 2002, Annex Table 19.
This indicates that low birth weight could now be a problem in Timor-Leste (the World Fit for Children Goal is a reduction by at least one-third of the current rate. But until
57 The total number of cases in Covalima is too small to assign any statistical significance. However, performance relative to other parts of the country is consistent with a number of other indicators related to degree of access or use of modern medical facilities. The explanation may lie in the presence in this district of a special military hospital operated under the Transitional Administration that has, among others, been extending services to the local population.
0 10 20 30 40 50 60 70
Very large
Larger thanaverage
Average
Smaller thanaverage
Very small
Perc
eptio
n of
Size
of B
aby
Percent
A VI-58 Timor-Leste MICS 2002 – Annex VI
there is more concrete information from a much larger percentage of women giving birth, it will remain difficult to draw any hard conclusions.
A VII-59 Timor-Leste MICS 2002 – Annex VI
9. Child Health The chapter on child health covers two major topics, child immunization and childhood diseases. The former focuses on immunization for the 6 diseases covered under the Extended Program on Immunization (EPI); the latter focuses on three major childhood diseases, diarrhea, acute lower respiratory tract infection or ALRI, and malaria. MICS results suggest that both of these are areas of considerable concern. The proportion of fully immunized children is low, and, despite some immunization-drive activity since 1999, still appears to have decreased substantially since the pre-1999 period. Diarrhea, ALRI and malaria are endemic and prevalence is such that a majority of children under age five reported experiencing symptoms or conditions consistent with one or more of these illnesses during the 2-week period preceding the survey. Prevalence rates also appear to have increased significantly in recent years for all of these illnesses at least compared to available results from the series of Indonesian DHS surveys carried out in the 1990s.58
9.1 Immunization Coverage
(Annex Tables 20 & 21)
(MDG #4, 6; WFFC Goal #1; UNICEF Priority #3) Immunization is part of the “Immunization Plus” priority of UNICEF for the period 2002-2005 where it is stressed that immunization, along with appropriate micronutrient supplementation, can save millions of lives every year. However, it is stressed not just because it saves lives, but, because it is one of the easiest and most cost-effective ways to make significant inroads into infant and child mortality. Through the outreach activities under national immunization drives and other immunization activities, it can provide a base for launching a range of other interventions to help families and communities improve childcare practices, strengthen primary health care systems and control outbreaks of disease. Before 1999, Timor-Leste was part of the area covered under the EPI program of the Indonesian Ministry of Health that was launched in 1977. Under this program the objective was to immunize all children against 6 diseases: tuberculosis (BCG), diphtheria, pertussis, tetanus (DPT), polio and measles. This was supported through the issuance of health cards on which growth, immunization and child feeding data could be recorded. It also included National Mass Immunization Campaigns, the last of which was carried out in 1997. The 1997 DHS reported that about 79 percent of children (ages 1-4) in Timor-Leste had ever had a health card, although for only about 8 percent of children was the card
58 Reference here is to the DHS surveys carried out in 1991, 1994 and 1997.
Only 5% of children aged 12-23 months have received a full cycle of
immunization
A VI-60 Timor-Leste MICS 2002 – Annex VI
available to be seen by the interviewer. The DHS also reported that about 56 percent of children ages 12-23 months had received a full immunization cycle (BCG, measles and three doses each of DPT and polio) with individual coverage rates ranging from about 59 percent for polio 3+ to 78 percent for BCG. MICS included questions for all children under age five on immunization for the same diseases. Here respondents were first asked if the child had ever had a vaccination. If the answer was yes, then they were asked if they had a vaccination card and if it was available. Where cards were available information was copied onto the questionnaire and respondents were queried about any additional vaccinations not on the card. For those without a card, individual questions were asked about each type of vaccination and those who answered positively were considered to have received the relevant vaccine. Responses of ‘no’ or ‘don’t know’ were treated as not having been vaccinated.59
Results are reported for children aged 12-23 months in order to exclude those for whom immunizations either had not been completed (they are supposed to be carried out during the first year of life), or those whose immunization would have been further back in the past.
The bulk of the reports on vaccination are based on recall. In the MICS, 29 percent of children were reported to have vaccination records (cards), but for only 5 percent of children could the cards be made available to the interviewer (see Annex Table 20).
Principal results are reported in Figure 9.1. Here we can see that coverage rates
for children aged 12-23 months are reported to range from about 16 percent for the third cycle of polio vaccine (polio 3) to 37 percent for BCG.60
Only about 5 percent of these children were reported as having had received a full immunization cycle including 3 rounds of DPT and polio and single vaccinations for BCG and measles. These vaccination rates suggest a marked deterioration in immunization performance from the mid 1990s as reflected in the DHS data cited above.
Perhaps the most striking finding, however, can be found in the last column of the figure that suggests that nearly 60 percent of 1-year olds in Timor-Leste had never received any vaccination at all. This is matter of considerable concern, and at least some debate, given that the Transitional Administration had undertaken a national immunization drive (Pekan Imunizasi Nasional or PIN) in 2000 and the Timor-Leste Health Ministry has set immunization as one of its top priorities. On the other hand, there is a general level of comparability between the performance rates here and those estimated from similar questions asked in the Timor-Leste Poverty Assessment Survey that was conducted in 2001.
In fact, the results are even more interesting in that they suggest that a significant
proportion of children are “almost there” and have failed achieving full immunization largely due to failure to receive third doses of DPT and polio vaccine. The implication of the data is that somewhat more than one-third of children are receiving initial BCG, DPT and polio vaccinations (with a slightly lower percentage being vaccinated against measles) with the great majority of these following up with second rounds of DPT and polio, but with a
59 However, responses of ‘don’t know’ were negligible across all types of vaccination. Thus including these with the positive responses would have had virtually no effect on the results. 60 The percentage for polio 0 is slightly lower, but is not emphasized here as it is a special vaccination given just after birth and is affected, quite obviously, by the extremely low percentage of births in Timor-Leste that occur in medical facilities or that are attended by personnel who could provide the vaccination.

A VII-61 Timor-Leste MICS 2002 – Annex VI
substantial drop-off after that. This may well be function of timing – with many children only getting access to immunization during infrequent visits to clinics or occasional national immunization drives and meaning that they would not have had time to complete the full cycle by their first birthday.61
Figure 9.1 - Percent of Children Aged 12-23 Months Currently Vaccinated Against Childhood Diseases by Type of Immunization
Source: Timor-Leste MICS 2002, Annex Table 21
Immunization, as might be expected, is more prevalent in urban, lowland areas and among children of more educated mothers and among those from the higher wealth score quintiles. For example, children with mothers with some secondary education or from the richest wealth quintile are perform about twice as well across all immunization categories compared to children with uneducated mothers or from the poorest quintile. Among the poorest, more than 70 percent of children aged 12-23 months were reported as never having had any immunization and only 2 percent had received a full cycle (see Annex Table 21).
Timor-Leste was included in the Indonesian National Immunization Drive (NID) in
1997, but coverage is unknown and, in any case, this would barely be reflected in children under age 5 in mid-2002. Since then, there was a measles campaign in November 1999 covering children aged 9 months to 12 years old. A more complete national campaign (including polio) was conducted in November/December 2000 and another, with two rounds, in September/October of 2002.
Coverage rates are estimated to be quite high for all of these drives, ca. 79 percent for the 1999 measles drive, 84 percent for the 2000 NID and 81 percent and 97 percent respectively for the two rounds of the NID in September/October 2002.62
61 This casts doubt on the results shown in Annex Table 20where the percentage estimated as immunized by their first birthday is based on an assumption that the share for those without immunization cards is the same as for those able to produce these cards for the interviewer. The results here would suggest that the relatively small proportion of those with cards probably represent a biased sub-sample of the population with any immunization experience and that timely immunization is probably much less among those without cards in the population.
For polio 3,
62 Personal communication from UNICEF, Dili.
0
10
20
30
40
50
60
70
BCG
DPT1
DPT2
DPT3
Polio
0
Polio
1
Polio
2
Polio
3
Mea
sles
All
Non
e
Type of Immunization
Perc
ent
A VI-62 Timor-Leste MICS 2002 – Annex VI
coverage was estimated at 56 percent at the end of 2002. Unfortunately, the last drive started just as fieldwork for the MICS was being completed and thus would not be accounted for in this survey. And the NID conducted in late 2000 (the PIN drive cited above), would not have had much impact on children aged less than 24 months at the time of the survey. Running the same tabulations as in Annex Table 21 for children of 2, 3 and 4 years of age at the time of survey does suggest somewhat better performance among older children, but still quite far from the coverage rates suggested above, raising some questions about whether these are overestimated to at least some degree. Nevertheless, the results do speak for the need not only to undertake more general efforts to raise immunization levels, but also to reach children in more isolated areas and those from families where mothers have less education and, knowledge of basic child health issues.
9.2 IMCI Initiatives and Malaria
MICS includes a standard Care of Illness Module covering diarrhea, acute lower respiratory tract infection (ALRI) as well as information on treatment. A separate module is provided for Malaria to be administered in areas, such as Timor-Leste, where malaria is a significant problem.63
MICS does not attempt clinical or trained diagnosis. Rather it relies on interpretations of the caregiver (generally the mother) based on the questions asked. However some suitable probes are included and interviewers were instructed to be clear on definitions (for example, that of diarrhea as being three or more loose watery stools per day or evidence of blood in the stool), and to try to distinguish chronic conditions (such as longer standing coughing problems) from those of more recent origin in the identification of ALRI. On the other hand, it should also be recognized that training was limited and interviewers used in the survey generally had no background in health so that it is not always clear how well they were able to implement these concepts and definitions in the field. In general, it can be assumed that the results are at a minimum indicative of the extent of problems even if the exact measures need to be treated with a degree of caution.
All of the questions here used a two-week reference period and asked for information on occurrences during the period, even if they started earlier. This means that we can measure only prevalence and not incidence from these data. Prevalence refers to the proportion of the population at risk of experiencing an illness during a specific period of time, whether or not it started during that period. Incidence refers to the proportion of the population at risk experiencing an illness that actually commenced during the reference period. Thus MICS can only estimate prevalence. Data on duration of illness necessary to estimate incidence were not collected in the survey.
Diarrhea
(Annex Tables 22 & 23) (MDG #6; WFFC Goal #1; UNICEF Priority #3)
63 MICS suggests use of this module in countries or regions at high risk of malaria defined by the proportion of febrile children aged 2-59 months brought to a health facility. A high-risk setting is defined by WHO as one where more than 5 percent of febrile children have parasitaemia on a blood smear.

A VII-63 Timor-Leste MICS 2002 – Annex VI
In much of the developing world diarrhea is a major cause of death among young children. Even if it does not kill directly, severe and/or frequent bouts of diarrhea can weaken resistance of children to other diseases as well as lead to wasting in children. High incidence or prevalence of diarrhea is a direct result of poor sanitation practices and lack of access to safe water. It is also generally amenable to fairly simple home-based treatments that can at least diminish severity or intensity of episodes and thus reduce the threat of complications and possibly, death. As noted above, MICS used a definition for diarrhea of three or more loose watery stools per day or blood in the stool. Based on this definition, 25 percent of children ages 0-4 experienced at least one episode of diarrhea during the two weeks preceding the survey (Table 9.1). This figure is extremely high compared either to overall levels in neighboring Indonesia or pre-1999 levels reported for Timor-Leste – either of which appear to be close to or slightly under 10 percent. Reported prevalence appeared to be slightly lower in the major urban centers (Dili and Baucau) and in the Eastern Region generally, but even here figures were still close to 20 percent. The results may have been affected by the timing of the survey (it was conducted during the height of the dry season when incidence might be expected to be somewhat higher). But it is also likely a reflection of the generally unsanitary living conditions including poor access to safe water faced by much of the population. Variations by strata, age of child and wealth class can be observed, but none of them are extreme. For example, there is some suggestion of slightly lower prevalence in the Eastern Region, in the major urban centers and among children under one and over 3 years of age, as well as among children from richer households. Nevertheless, it clearly remains a problem irrespective of location, age or social class. MICS also included questions on the nature of treatment including kinds of liquids or liquids with food given to children and whether or not the child was given less, the same or more liquid or solid food during the episode. Virtually all children (98 percent) received some kind of liquid or liquid and food combination. Most important here, however, is the use of Oral Rehydration Therapy (solutions prepared from Oral Rehydration Solution packets commonly known as ‘Oralit’64
64 Oralit refers specifically to the government sponsored ORS that has been used for many years in Indonesia. However, it probably now has acquired a more generic designation so that it is not possible to distinguish in the MICS data exactly what type (or quality) of ORS packet was actually used.
), which is the recommended treatment for Diarrhea. 56 percent of children experiencing diarrhea were reported to have received ORS or ‘Oralit’ treatment (Figure 9.2), a figure that is only slightly less than the 60 percent reported in the 1997 DHS. Large percentages of children were also given water mixed with cereal (gruel) or water along with normal food. ORS use was fairly evenly spread across sample strata, although there was some indication of lower use in the Eastern part of Timor-Leste where treatment was supplemented by greater use of locally acceptable home fluids (see Annex Table 22).
25 % of children under age 5 experienced at least one episode of diarrhea during
the two weeks preceding the survey
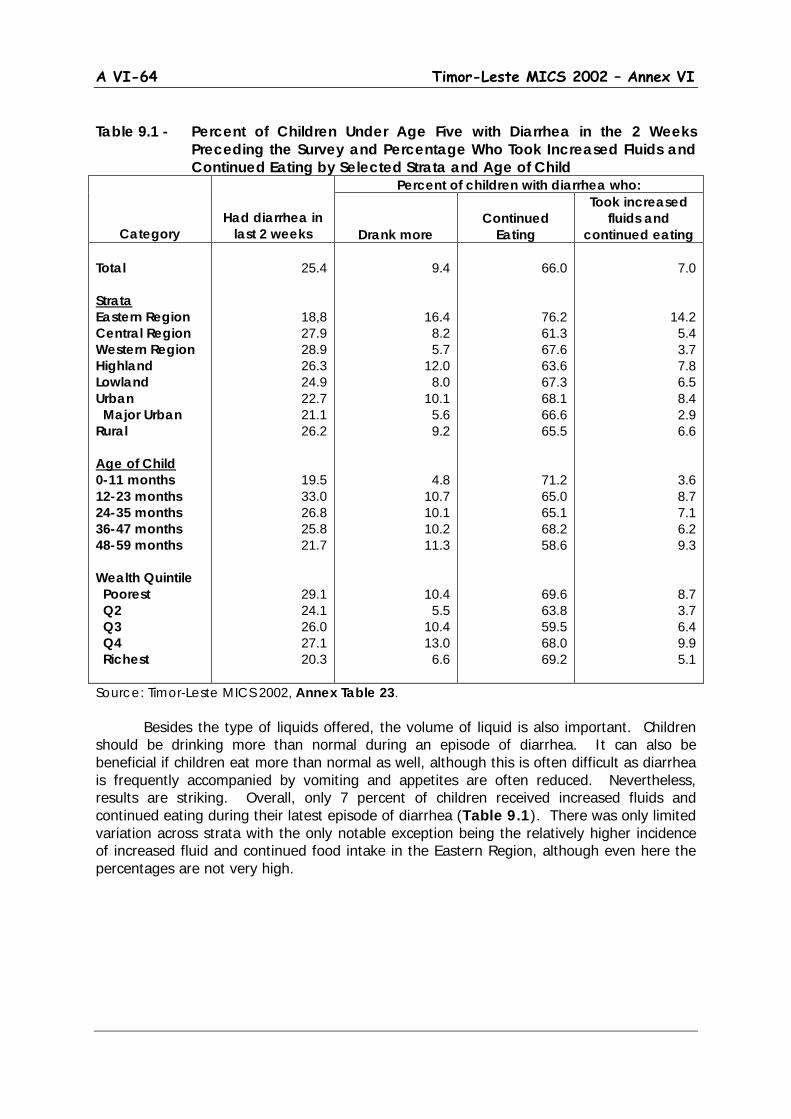
A VI-64 Timor-Leste MICS 2002 – Annex VI
Table 9.1 - Percent of Children Under Age Five with Diarrhea in the 2 Weeks
Preceding the Survey and Percentage Who Took Increased Fluids and Continued Eating by Selected Strata and Age of Child
Category
Had diarrhea in last 2 weeks
Percent of children with diarrhea who:
Drank more
Continued
Eating
Took increased fluids and
continued eating Total Strata Eastern Region Central Region Western Region Highland Lowland Urban Major Urban Rural Age of Child 0-11 months 12-23 months 24-35 months 36-47 months 48-59 months Wealth Quintile Poorest Q2 Q3 Q4 Richest
25.4
18,8 27.9 28.9 26.3 24.9 22.7 21.1 26.2
19.5 33.0 26.8 25.8 21.7
29.1 24.1 26.0 27.1 20.3
9.4
16.4 8.2 5.7
12.0 8.0
10.1 5.6 9.2
4.8 10.7 10.1 10.2 11.3
10.4 5.5
10.4 13.0
6.6
66.0
76.2 61.3 67.6 63.6 67.3 68.1 66.6 65.5
71.2 65.0 65.1 68.2 58.6
69.6 63.8 59.5 68.0 69.2
7.0
14.2 5.4 3.7 7.8 6.5 8.4 2.9 6.6
3.6 8.7 7.1 6.2 9.3
8.7 3.7 6.4 9.9 5.1
Source: Timor-Leste MICS 2002, Annex Table 23. Besides the type of liquids offered, the volume of liquid is also important. Children should be drinking more than normal during an episode of diarrhea. It can also be beneficial if children eat more than normal as well, although this is often difficult as diarrhea is frequently accompanied by vomiting and appetites are often reduced. Nevertheless, results are striking. Overall, only 7 percent of children received increased fluids and continued eating during their latest episode of diarrhea (Table 9.1). There was only limited variation across strata with the only notable exception being the relatively higher incidence of increased fluid and continued food intake in the Eastern Region, although even here the percentages are not very high.
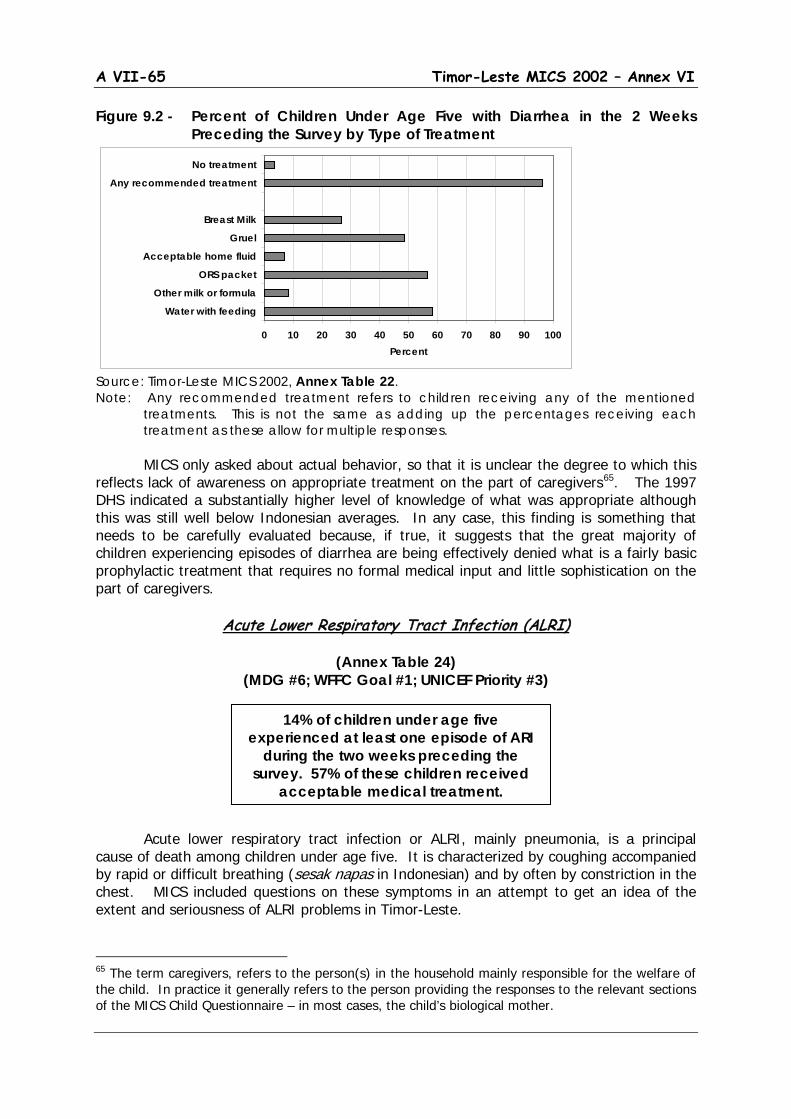
A VII-65 Timor-Leste MICS 2002 – Annex VI
Figure 9.2 - Percent of Children Under Age Five with Diarrhea in the 2 Weeks Preceding the Survey by Type of Treatment
Source: Timor-Leste MICS 2002, Annex Table 22. Note: Any recommended treatment refers to children receiving any of the mentioned
treatments. This is not the same as adding up the percentages receiving each treatment as these allow for multiple responses.
MICS only asked about actual behavior, so that it is unclear the degree to which this reflects lack of awareness on appropriate treatment on the part of caregivers65
. The 1997 DHS indicated a substantially higher level of knowledge of what was appropriate although this was still well below Indonesian averages. In any case, this finding is something that needs to be carefully evaluated because, if true, it suggests that the great majority of children experiencing episodes of diarrhea are being effectively denied what is a fairly basic prophylactic treatment that requires no formal medical input and little sophistication on the part of caregivers.
Acute Lower Respiratory Tract Infection (ALRI)
(Annex Table 24) (MDG #6; WFFC Goal #1; UNICEF Priority #3)
Acute lower respiratory tract infection or ALRI, mainly pneumonia, is a principal
cause of death among children under age five. It is characterized by coughing accompanied by rapid or difficult breathing (sesak napas in Indonesian) and by often by constriction in the chest. MICS included questions on these symptoms in an attempt to get an idea of the extent and seriousness of ALRI problems in Timor-Leste.
65 The term caregivers, refers to the person(s) in the household mainly responsible for the welfare of the child. In practice it generally refers to the person providing the responses to the relevant sections of the MICS Child Questionnaire – in most cases, the child’s biological mother.
14% of children under age five experienced at least one episode of ARI
during the two weeks preceding the survey. 57% of these children received
acceptable medical treatment.
0 10 20 30 40 50 60 70 80 90 100
Water with feeding
Other milk or formula
ORS packet
Acceptable home fluid
Gruel
Breast Milk
Any recommended treatment
No treatment
Percent

A VI-66 Timor-Leste MICS 2002 – Annex VI
More specifically caregivers were asked if the child had experienced an illness with a cough during the past two weeks and, if so, did the illness also include breathing that was faster than usual with short, quick breaths or more difficult breathing.66
And finally, if all this was the case, whether the symptoms were due to a problem in the chest and/or a blocked (as opposed to simply a runny) nose. Children deemed to have had ALRI were those who had an illness with a cough accompanied by rapid or difficult breathing and whose symptoms were due to a problem in the chest, or both a problem in the chest and a blocked nose, or among those whose mother/caregiver did not know the source of the problem.
Figure 9.3 - Percent of Children Under Age Five With Acute Lower Respiratory Tract Infection (ALRI) in the 2 Weeks Preceding the Survey and Percentage of Children With ARI Seeking Appropriate Medical Treatment
Source: Timor-Leste MICS 2002, Annex Table 24. Based on this definition a total of 14 percent of children under age five were reported as experiencing ALRI during the two weeks before the survey (Figure 9.3). Prevalence was lowest in the urban areas (and particularly in the major urban centers where the prevalence rate was under 5 percent) and was highest in the Western region at close to 20 percent. As might be expected, prevalence was somewhat lower among children with more educated mothers and, as indicated in Annex Table 24, among children from the richest wealth quintile. Poverty is related to housing conditions and housing conditions to the risk of ALRI - children living in crowded and/or poorly ventilated dwellings, particularly where wood fuel is used for cooking indoors are at an increased risk. One area for investigation would be to see the degree to which urban/rural or social class differences in these conditions may be a factor. The figure also shows the percentage of children with ALRI who sought medical treatment from qualified or appropriate sources. This included those seeking assistance from hospitals, health centers or dispensaries, village health workers and/or private medical
66 The intention was to find out if it was likely to be an illness meriting attention by a clinical professional. However, practical difficulties in making appropriate judgments by untrained respondents or interviewers with limited training and/or background need to be taken into account in interpreting the results.
01020304050607080
Tota
l
East
ern
Cen
tral
Wes
tern
High
land
Low
land
Urba
n
M. U
rban
Rura
l
Non
e
Prim
ary
Seco
ndar
y
Strata Mother's Education
Perc
ent
Percent with ARI Percent with ARI receiving medical treatment
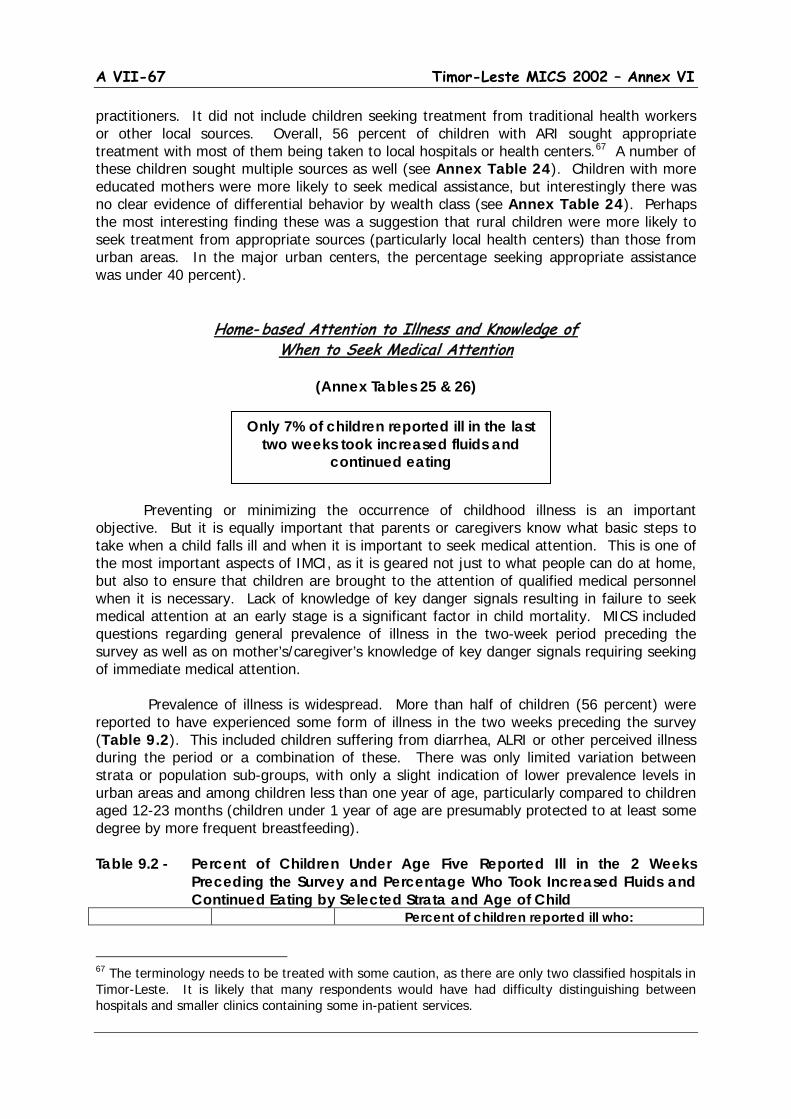
A VII-67 Timor-Leste MICS 2002 – Annex VI
practitioners. It did not include children seeking treatment from traditional health workers or other local sources. Overall, 56 percent of children with ARI sought appropriate treatment with most of them being taken to local hospitals or health centers.67
A number of these children sought multiple sources as well (see Annex Table 24). Children with more educated mothers were more likely to seek medical assistance, but interestingly there was no clear evidence of differential behavior by wealth class (see Annex Table 24). Perhaps the most interesting finding these was a suggestion that rural children were more likely to seek treatment from appropriate sources (particularly local health centers) than those from urban areas. In the major urban centers, the percentage seeking appropriate assistance was under 40 percent).
Home- based Attention to Illness and Knowledge of
When to Seek Medical Attention
(Annex Tables 25 & 26) Preventing or minimizing the occurrence of childhood illness is an important objective. But it is equally important that parents or caregivers know what basic steps to take when a child falls ill and when it is important to seek medical attention. This is one of the most important aspects of IMCI, as it is geared not just to what people can do at home, but also to ensure that children are brought to the attention of qualified medical personnel when it is necessary. Lack of knowledge of key danger signals resulting in failure to seek medical attention at an early stage is a significant factor in child mortality. MICS included questions regarding general prevalence of illness in the two-week period preceding the survey as well as on mother’s/caregiver’s knowledge of key danger signals requiring seeking of immediate medical attention. Prevalence of illness is widespread. More than half of children (56 percent) were reported to have experienced some form of illness in the two weeks preceding the survey (Table 9.2). This included children suffering from diarrhea, ALRI or other perceived illness during the period or a combination of these. There was only limited variation between strata or population sub-groups, with only a slight indication of lower prevalence levels in urban areas and among children less than one year of age, particularly compared to children aged 12-23 months (children under 1 year of age are presumably protected to at least some degree by more frequent breastfeeding). Table 9.2 - Percent of Children Under Age Five Reported Ill in the 2 Weeks
Preceding the Survey and Percentage Who Took Increased Fluids and Continued Eating by Selected Strata and Age of Child
Percent of children reported ill who:
67 The terminology needs to be treated with some caution, as there are only two classified hospitals in Timor-Leste. It is likely that many respondents would have had difficulty distinguishing between hospitals and smaller clinics containing some in-patient services.
Only 7% of children reported ill in the last two weeks took increased fluids and
continued eating
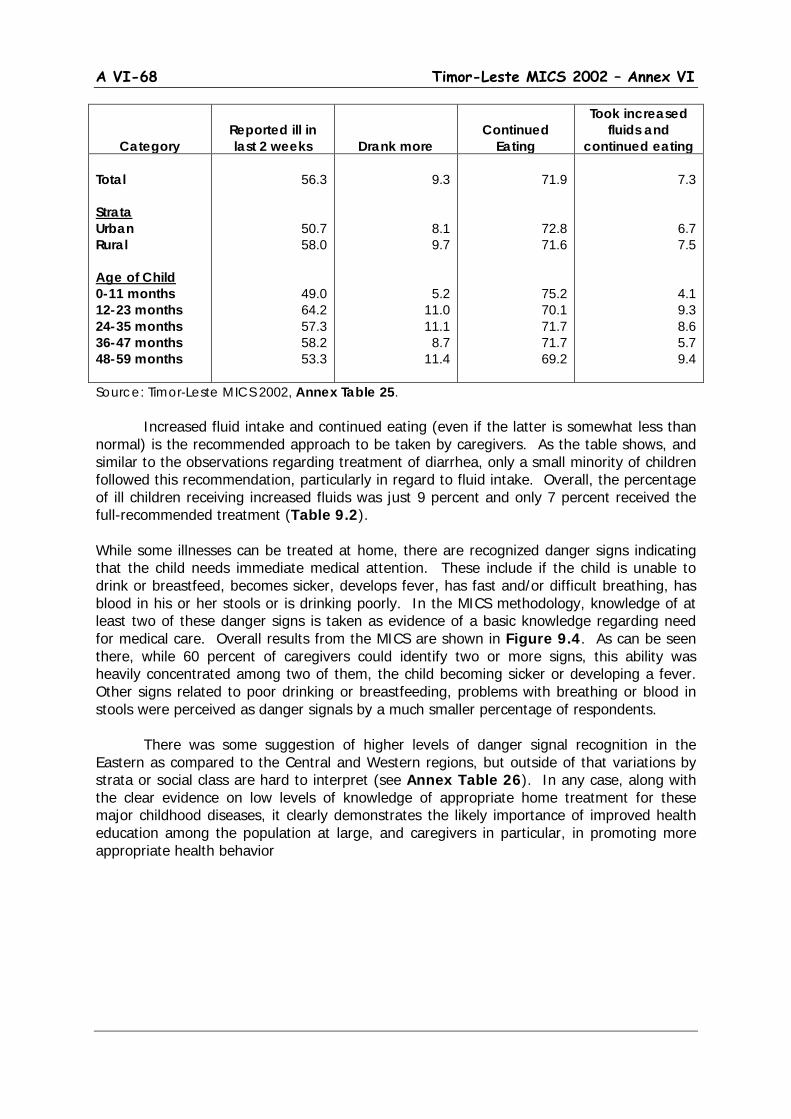
A VI-68 Timor-Leste MICS 2002 – Annex VI
Category
Reported ill in last 2 weeks
Drank more
Continued
Eating
Took increased fluids and
continued eating Total Strata Urban Rural Age of Child 0-11 months 12-23 months 24-35 months 36-47 months 48-59 months
56.3
50.7 58.0
49.0 64.2 57.3 58.2 53.3
9.3
8.1 9.7
5.2 11.0 11.1
8.7 11.4
71.9
72.8 71.6
75.2 70.1 71.7 71.7 69.2
7.3
6.7 7.5
4.1 9.3 8.6 5.7 9.4
Source: Timor-Leste MICS 2002, Annex Table 25. Increased fluid intake and continued eating (even if the latter is somewhat less than normal) is the recommended approach to be taken by caregivers. As the table shows, and similar to the observations regarding treatment of diarrhea, only a small minority of children followed this recommendation, particularly in regard to fluid intake. Overall, the percentage of ill children receiving increased fluids was just 9 percent and only 7 percent received the full-recommended treatment (Table 9.2). While some illnesses can be treated at home, there are recognized danger signs indicating that the child needs immediate medical attention. These include if the child is unable to drink or breastfeed, becomes sicker, develops fever, has fast and/or difficult breathing, has blood in his or her stools or is drinking poorly. In the MICS methodology, knowledge of at least two of these danger signs is taken as evidence of a basic knowledge regarding need for medical care. Overall results from the MICS are shown in Figure 9.4. As can be seen there, while 60 percent of caregivers could identify two or more signs, this ability was heavily concentrated among two of them, the child becoming sicker or developing a fever. Other signs related to poor drinking or breastfeeding, problems with breathing or blood in stools were perceived as danger signals by a much smaller percentage of respondents. There was some suggestion of higher levels of danger signal recognition in the Eastern as compared to the Central and Western regions, but outside of that variations by strata or social class are hard to interpret (see Annex Table 26). In any case, along with the clear evidence on low levels of knowledge of appropriate home treatment for these major childhood diseases, it clearly demonstrates the likely importance of improved health education among the population at large, and caregivers in particular, in promoting more appropriate health behavior
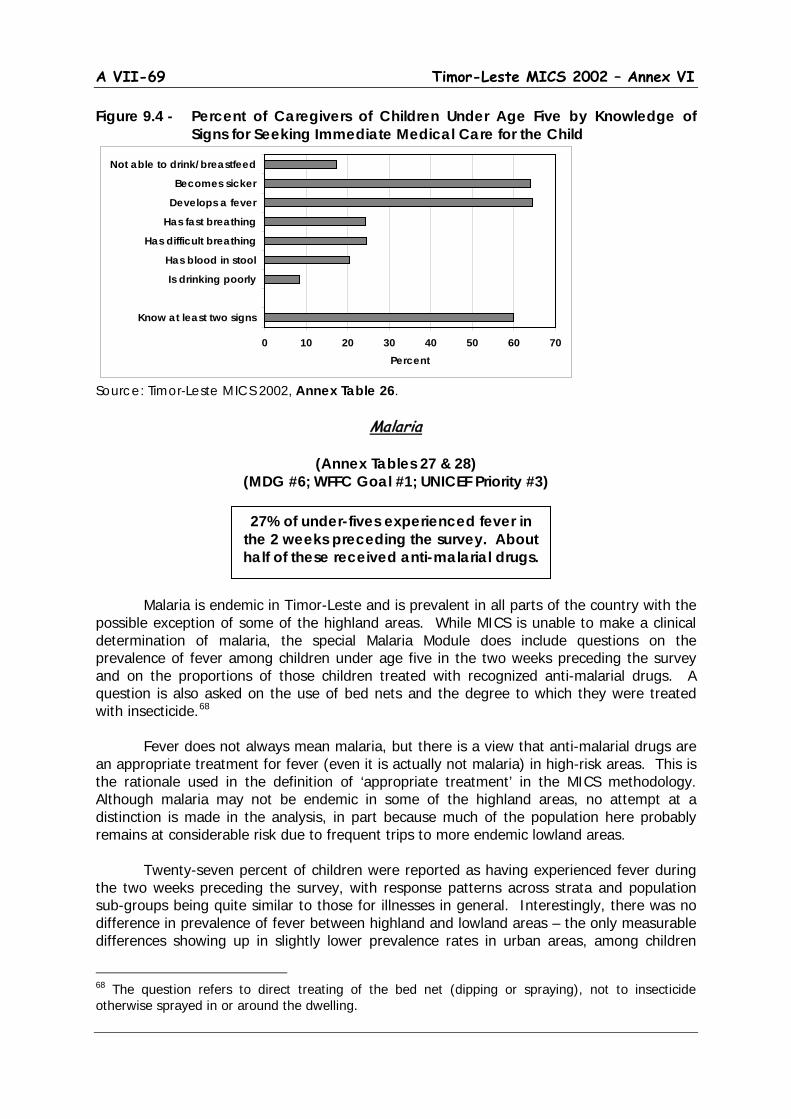
A VII-69 Timor-Leste MICS 2002 – Annex VI
Figure 9.4 - Percent of Caregivers of Children Under Age Five by Knowledge of Signs for Seeking Immediate Medical Care for the Child
Source: Timor-Leste MICS 2002, Annex Table 26.
Malaria
(Annex Tables 27 & 28) (MDG #6; WFFC Goal #1; UNICEF Priority #3)
Malaria is endemic in Timor-Leste and is prevalent in all parts of the country with the possible exception of some of the highland areas. While MICS is unable to make a clinical determination of malaria, the special Malaria Module does include questions on the prevalence of fever among children under age five in the two weeks preceding the survey and on the proportions of those children treated with recognized anti-malarial drugs. A question is also asked on the use of bed nets and the degree to which they were treated with insecticide.68
Fever does not always mean malaria, but there is a view that anti-malarial drugs are an appropriate treatment for fever (even it is actually not malaria) in high-risk areas. This is the rationale used in the definition of ‘appropriate treatment’ in the MICS methodology. Although malaria may not be endemic in some of the highland areas, no attempt at a distinction is made in the analysis, in part because much of the population here probably remains at considerable risk due to frequent trips to more endemic lowland areas. Twenty-seven percent of children were reported as having experienced fever during the two weeks preceding the survey, with response patterns across strata and population sub-groups being quite similar to those for illnesses in general. Interestingly, there was no difference in prevalence of fever between highland and lowland areas – the only measurable differences showing up in slightly lower prevalence rates in urban areas, among children
68 The question refers to direct treating of the bed net (dipping or spraying), not to insecticide otherwise sprayed in or around the dwelling.
27% of under-fives experienced fever in the 2 weeks preceding the survey. About half of these received anti-malarial drugs.
0 10 20 30 40 50 60 70
Know at least two signs
Is drinking poorly
Has blood in stool
Has difficult breathing
Has fast breathing
Develops a fever
Becomes sicker
Not able to drink/breastfeed
Percent
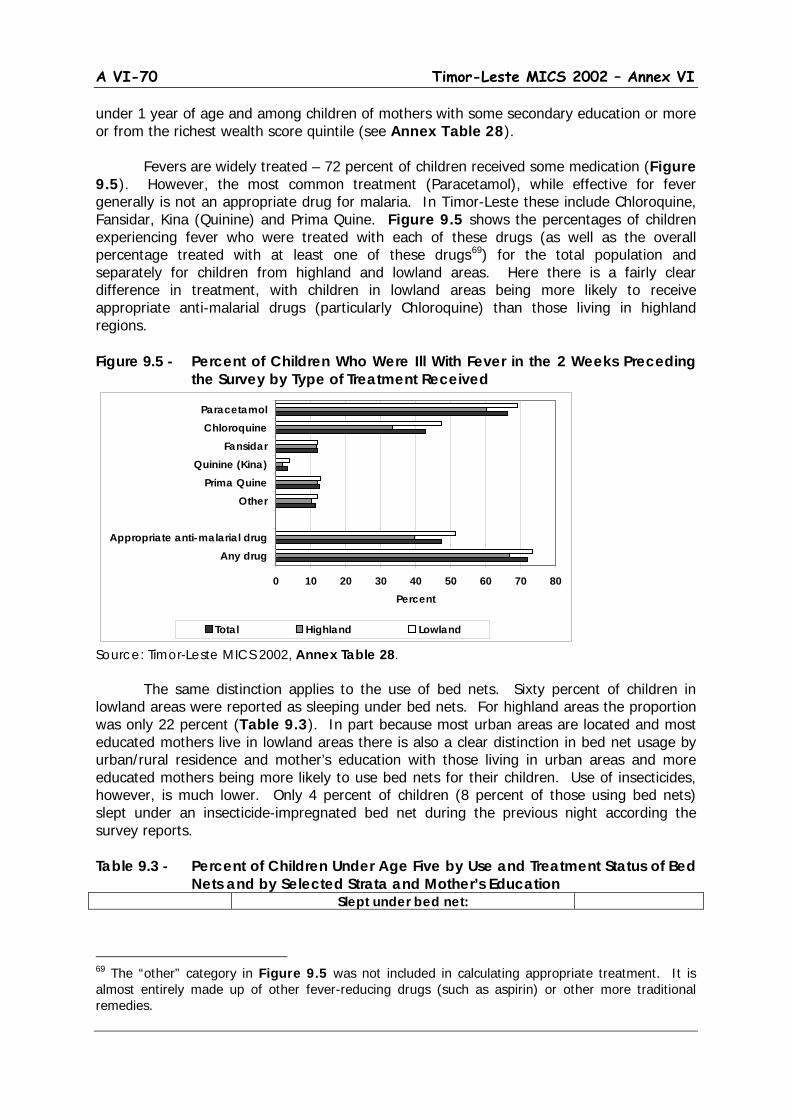
A VI-70 Timor-Leste MICS 2002 – Annex VI
under 1 year of age and among children of mothers with some secondary education or more or from the richest wealth score quintile (see Annex Table 28). Fevers are widely treated – 72 percent of children received some medication (Figure 9.5). However, the most common treatment (Paracetamol), while effective for fever generally is not an appropriate drug for malaria. In Timor-Leste these include Chloroquine, Fansidar, Kina (Quinine) and Prima Quine. Figure 9.5 shows the percentages of children experiencing fever who were treated with each of these drugs (as well as the overall percentage treated with at least one of these drugs69
) for the total population and separately for children from highland and lowland areas. Here there is a fairly clear difference in treatment, with children in lowland areas being more likely to receive appropriate anti-malarial drugs (particularly Chloroquine) than those living in highland regions.
Figure 9.5 - Percent of Children Who Were Ill With Fever in the 2 Weeks Preceding the Survey by Type of Treatment Received
Source: Timor-Leste MICS 2002, Annex Table 28. The same distinction applies to the use of bed nets. Sixty percent of children in lowland areas were reported as sleeping under bed nets. For highland areas the proportion was only 22 percent (Table 9.3). In part because most urban areas are located and most educated mothers live in lowland areas there is also a clear distinction in bed net usage by urban/rural residence and mother’s education with those living in urban areas and more educated mothers being more likely to use bed nets for their children. Use of insecticides, however, is much lower. Only 4 percent of children (8 percent of those using bed nets) slept under an insecticide-impregnated bed net during the previous night according the survey reports. Table 9.3 - Percent of Children Under Age Five by Use and Treatment Status of Bed
Nets and by Selected Strata and Mother’s Education Slept under bed net:
69 The “other” category in Figure 9.5 was not included in calculating appropriate treatment. It is almost entirely made up of other fever-reducing drugs (such as aspirin) or other more traditional remedies.
0 10 20 30 40 50 60 70 80
Any drugAppropriate anti-malarial drug
OtherPrima Quine
Quinine (Kina)Fansidar
ChloroquineParacetamol
Percent
Total Highland Lowland
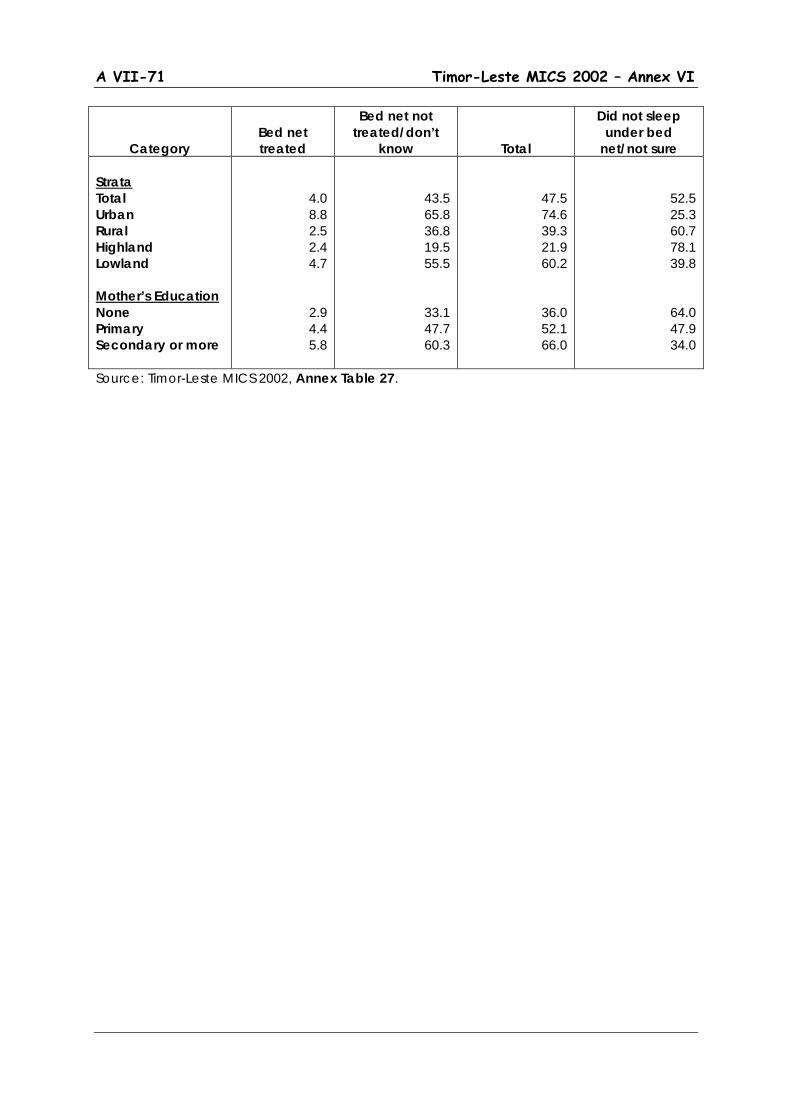
A VII-71 Timor-Leste MICS 2002 – Annex VI
Category
Bed net treated
Bed net not treated/don’t
know
Total
Did not sleep under bed
net/not sure Strata Total Urban Rural Highland Lowland Mother’s Education None Primary Secondary or more
4.0 8.8 2.5 2.4 4.7
2.9 4.4 5.8
43.5 65.8 36.8 19.5 55.5
33.1 47.7 60.3
47.5 74.6 39.3 21.9 60.2
36.0 52.1 66.0
52.5 25.3 60.7 78.1 39.8
64.0 47.9 34.0
Source: Timor-Leste MICS 2002, Annex Table 27.