Timing of Partial Melting and Cooling across the Greater ...
26
Timing of Partial Melting and Cooling across the Greater Himalayan Crystalline Complex (Nyalam, Central Himalaya): In-sequence Thrusting and its Implications Jia-Min Wang 1,2 , Daniela Rubatto 2 and Jin-Jiang Zhang 1, * 1 Key Laboratory of Orogenic Belts and Crustal Evolution, School of Earth and Space Sciences, Peking University, Beijing 100871, China and 2 Research School of Earth Sciences, Australian National University, Canberra, ACT 2601, Australia *Corresponding author. Telephone: þ86 10 62754368. E-mail: [email protected] Received November 26, 2014; Accepted August 4, 2015 ABSTRACT The timing of crustal melting and cooling has been investigated across the migmatites of the Greater Himalayan Crystalline Complex (GHC) in the Nyalam region, central Himalaya. Monazite U–Pb ages vary from 32 to 14 Ma and are linked to metamorphic conditions on the basis of mona- zite internal zoning, mineral inclusions, and changes in heavy rare earth element and Y compos- ition. Metamorphic temperatures were estimated by Zr-in-rutile thermometry and cooling rates were further constrained by rutile U–Pb ages. The results reveal two distinct blocks within the GHC of the Nyalam region. The upper GHC experienced higher peak metamorphic temperatures (730–750 C) and a higher degree of melting (15–25%). Partial melting was dominated by muscovite dehydration melting, which lasted from 32 to 25 Ma, possibly until 20 Ma. The lower GHC expe- rienced lower peak metamorphic temperatures (640–675 C) and a lower degree of melting (0–10%) mainly via H 2 O-saturated melting from 19 to 16 Ma. At different times, both upper and lower blocks experienced initial slow cooling (rates 35 6 8 and 10 6 5 C Ma –1 , respectively) followed by rapid cooling (100 6 20 C Ma –1 ). The documented diachronous metamorphism implies the presence of the ‘High Himalayan Thrust’ that was active at 25–16 Ma within the GHC of the central Himalaya. Different degrees and durations of partial melting in the investigated section suggest that a channel flow process dominated the exhumation of the upper GHC migmatites at 25–16 Ma, whereas a crit- ical taper process dominated the exhumation of the relatively lower-grade lower GHC rocks and cooled upper GHC migmatites at 16–10 Ma. We suggest that propagating thrusts along large tec- tonic boundaries together with low-viscosity lateral crustal flow could contribute to exhumation of high-grade metamorphic rocks in the Himalaya and other similar collisional orogens. Key words: monazite; partial melting; trace elements; tectonic discontinuity; U–Pb geochronology INTRODUCTION Burial and exhumation of high-grade metamorphic rocks in collisional settings has major implications for the thermal evolution of orogens and the crust in gen- eral (e.g. England & Thompson, 1984; Beaumont et al., 2001; Faccenda et al., 2008; Kohn, 2008). Despite numer- ous case studies and numerical simulations, our know- ledge of the factors that regulate the exhumation of high-grade metamorphic rocks is still limited. Traditional models focused on propagating thrusts, which form along failures in shortening orogens and are considered to be responsible for exhuming hang- ing-wall rocks and burying footwall rocks (England & Thompson, 1984; Royden, 1993; Henry et al., 1997). Recent thermal–mechanical models highlight the contri- bution of partial melting, suggesting that it has the V C The Author 2015. Published by Oxford University Press. All rights reserved. For Permissions, please e-mail: [email protected] 1677 J OURNAL OF P ETROLOGY Journal of Petrology, 2015, Vol. 56, No. 9, 1677–1702 doi: 10.1093/petrology/egv050 Advance Access Publication Date: 6 October 2015 Original Article Downloaded from https://academic.oup.com/petrology/article/56/9/1677/1460164 by guest on 06 July 2022
-
Upload
khangminh22 -
Category
Documents
-
view
0 -
download
0
Transcript of Timing of Partial Melting and Cooling across the Greater ...

Timing of Partial Melting and Cooling across
the Greater Himalayan Crystalline Complex
(Nyalam, Central Himalaya): In-sequence
Thrusting and its Implications
Jia-Min Wang1,2, Daniela Rubatto2 and Jin-Jiang Zhang1,*
1Key Laboratory of Orogenic Belts and Crustal Evolution, School of Earth and Space Sciences, Peking University,
Beijing 100871, China and 2Research School of Earth Sciences, Australian National University, Canberra, ACT 2601,
Australia
*Corresponding author. Telephone: þ86 10 62754368. E-mail: [email protected]
Received November 26, 2014; Accepted August 4, 2015
ABSTRACT
The timing of crustal melting and cooling has been investigated across the migmatites of the
Greater Himalayan Crystalline Complex (GHC) in the Nyalam region, central Himalaya. Monazite
U–Pb ages vary from 32 to 14 Ma and are linked to metamorphic conditions on the basis of mona-
zite internal zoning, mineral inclusions, and changes in heavy rare earth element and Y compos-
ition. Metamorphic temperatures were estimated by Zr-in-rutile thermometry and cooling rateswere further constrained by rutile U–Pb ages. The results reveal two distinct blocks within the GHC
of the Nyalam region. The upper GHC experienced higher peak metamorphic temperatures
(730–750�C) and a higher degree of melting (15–25%). Partial melting was dominated by muscovite
dehydration melting, which lasted from �32 to 25 Ma, possibly until �20 Ma. The lower GHC expe-
rienced lower peak metamorphic temperatures (640–675�C) and a lower degree of melting (0–10%)
mainly via H2O-saturated melting from 19 to 16 Ma. At different times, both upper and lower blocks
experienced initial slow cooling (rates 35 6 8 and 10 6 5�C Ma–1, respectively) followed by rapidcooling (100 6 20�C Ma–1). The documented diachronous metamorphism implies the presence of
the ‘High Himalayan Thrust’ that was active at �25–16 Ma within the GHC of the central Himalaya.
Different degrees and durations of partial melting in the investigated section suggest that a channel
flow process dominated the exhumation of the upper GHC migmatites at 25–16 Ma, whereas a crit-
ical taper process dominated the exhumation of the relatively lower-grade lower GHC rocks and
cooled upper GHC migmatites at 16–10 Ma. We suggest that propagating thrusts along large tec-tonic boundaries together with low-viscosity lateral crustal flow could contribute to exhumation of
high-grade metamorphic rocks in the Himalaya and other similar collisional orogens.
Key words: monazite; partial melting; trace elements; tectonic discontinuity; U–Pb geochronology
INTRODUCTION
Burial and exhumation of high-grade metamorphic
rocks in collisional settings has major implications for
the thermal evolution of orogens and the crust in gen-
eral (e.g. England & Thompson, 1984; Beaumont et al.,
2001; Faccenda et al., 2008; Kohn, 2008). Despite numer-
ous case studies and numerical simulations, our know-
ledge of the factors that regulate the exhumation of
high-grade metamorphic rocks is still limited.
Traditional models focused on propagating thrusts,
which form along failures in shortening orogens and
are considered to be responsible for exhuming hang-ing-wall rocks and burying footwall rocks (England &
Thompson, 1984; Royden, 1993; Henry et al., 1997).
Recent thermal–mechanical models highlight the contri-
bution of partial melting, suggesting that it has the
VC The Author 2015. Published by Oxford University Press. All rights reserved. For Permissions, please e-mail: [email protected] 1677
J O U R N A L O F
P E T R O L O G Y
Journal of Petrology, 2015, Vol. 56, No. 9, 1677–1702
doi: 10.1093/petrology/egv050
Advance Access Publication Date: 6 October 2015
Original Article
Dow
nloaded from https://academ
ic.oup.com/petrology/article/56/9/1677/1460164 by guest on 06 July 2022

capacity to lower the viscosity and density of
crustal rocks and can thus trigger exhumation
(Beaumont et al., 2001; Jamieson et al., 2004; Faccenda
et al., 2008).
As the youngest and one of the largest continent–continent collisional orogens on the planet, the
Himalaya are the best natural laboratory to investigate
burial and exhumation processes. The Himalaya are
being formed by the continuing collision of India and
Asia since 50–55 Ma (Rowley, 1996; Leech et al., 2005)
and have not been overprinted by a later orogenic
event. The orogen is relatively young so that moderngeochronology can accurately distinguish different
stages of evolution, which may not be resolvable for
older orogens. The issue discussed above lies between
two end-member models: (1) the critical taper model
(DeCelles et al., 2001; Kohn et al., 2004; Bollinger et al.,
2006; Robinson et al., 2006; Kohn, 2008; Corrie & Kohn,2011) assumes the orogen to be a Coulomb wedge and
supports propagating thrusting to dominate exhum-
ation of the Greater Himalayan Crystalline Complex
(GHC); (2) the channel flow model (Nelson et al., 1996;
Beaumont et al., 2001; Searle et al., 2003; Jamieson
et al., 2004; Searle & Szulc, 2005; Godin et al., 2006) pro-poses that low-viscosity crustal melts and focused sur-
face erosion triggered exhumation of the GHC, with
coeval movement along bounding structures of the
Main Central Thrust (MCT) and South Tibetan
Detachment (STD); (3) a third scenario suggests that the
channel flow and critical taper processes are not mutu-
ally exclusive, but that the dominant process changesthrough time as the orogen evolves (Beaumont &
Jamieson, 2010; Larson et al., 2010, 2011; Jamieson &
Beaumont, 2013).
Although a large number of studies have been made
of the GHC, the debate between the proponents of the
two main tectonic models continues (e.g. Kohn, 2008;Chambers et al., 2011; Montomoli et al., 2013). To better
evaluate the models, the following crucial questions
need to be answered.
1. Is metamorphism across the GHC diachronous or
synchronous and what is the duration of melting
and high-temperature metamorphism? Specifically,
the critical taper model supports diachronous meta-morphism and a short residence time (�5 Myr) at
high temperatures across the GHC (Kohn, 2008),
whereas the original channel flow model predicts
synchronous metamorphism and high temperatures
lasting for 10–15 Myr (Beaumont et al., 2001;
Jamieson et al., 2004).2. If channel flow and critical taper processes coexist
during the exhumation of the GHC, then how does
the dominant process evolve spatially and tempor-
ally? Some studies have proposed a transition from
channel flow to a critical taper process during the ex-
humation of the GHC (e.g. Larson et al., 2010, 2011),
but better spatial–temporal resolution of each pro-cess is still required.
Among the various approaches used to answer the
above questions, age determination using accessory
minerals provides crucial information. Successful stud-
ies in the Himalaya and other high-temperature ter-
ranes have used U–Th–Pb dating of accessory mineralsthat (re)crystallized at different points along P–T trajec-
tories to reconstruct the metamorphic process or time-
scale of partial melting (e.g. Foster et al., 2000; Rubatto
et al., 2001, 2013; Larson et al., 2011; Imayama et al.,
2012; From et al., 2014; Larson & Cottle, 2014).
Geochronology also plays an important role in identify-
ing hidden discontinuities that may be difficult to iden-tify using structures or metamorphic grade (Harrison
et al., 1997; Kohn et al., 2004; Imayama et al., 2012;
Rubatto et al., 2013). Among the various datable acces-
sory minerals, monazite is a preferred chronometer for
Himalayan metamorphic rocks because of (1) its abun-
dance in Himalayan metapelites, (2) its reactivity,particularly compared with zircon, during amphibolite-
facies metamorphism, (3) its complex growth mechan-
ism, which has the potential to record various stages
along the P–T trajectory (Foster et al., 2000; Hermann &
Rubatto, 2003; Williams et al., 2007), and (4) its robust-
ness to high-temperature resetting by diffusion(�900�C, Cherniak et al., 2004).
Despite the fact that monazite U–Th–Pb geochron-
ology has been used for decades (e.g. Scharer, 1984;
Parrish, 1990; Harrison et al., 1995), age interpretation
still represents a challenge, especially for metamorphic
rocks. Previous attempts to link monazite ages to meta-
morphic conditions have used different tools, asfollows.
1. In situ dating can provide clear temporal relation-
ships between monazite and garnet porphyroblastsor matrix minerals (Harrison et al., 1997; Foster
et al., 2000; Catlos et al., 2002; Kohn & Malloy, 2004).
2. Y and heavy rare earth element (HREE) signatures
can relate monazite formation to garnet growth or
breakdown. This includes monazite Y compositional
mapping by electron microprobe (EMP) (Foster
et al., 2002; Kohn et al., 2004; Kellett et al., 2010;Corrie & Kohn, 2011; Stearns et al., 2013) or monitor-
ing HREE signatures of dated growth zones
(Hermann & Rubatto, 2003; Buick et al., 2006;
Rubatto et al., 2006, 2013).
3. A third approach investigates monazite-forming re-
actions and conditions (Wing et al., 2003; Kohn &Malloy, 2004; Janots et al., 2007; Spear & Pyle,
2010).
4. In selected cases, the monazite–xenotime–garnet Y
equilibrium thermometer can directly provide meta-
morphic temperatures for monazite growth (Pyle
et al., 2001; Foster et al., 2004).
Interpretations that are not well constrained by some
of the above criteria could easily mix prograde, peak or
retrograde ages and thus prevent the resolution of the
detailed timescale of metamorphism, which is requiredto constrain tectonic models.
1678 Journal of Petrology, 2015, Vol. 56, No. 9
Dow
nloaded from https://academ
ic.oup.com/petrology/article/56/9/1677/1460164 by guest on 06 July 2022

We investigate the timing of metamorphism in the
Nyalam transect, for which crucial structural kinematics,
metamorphic conditions and P–T paths have already
been determined (Liu et al., 2012; Larson, 2012; Larson
et al., 2013; Wang et al., 2013, 2015), but geochronologyis still lacking. Ten samples of different metamorphic
grade were investigated for monazite U–Pb dating, in-
ternal zoning, mineral inclusions and trace element sig-
natures. The metamorphic conditions of monazite
formation were constrained by comparison with garnet
trace element zoning. Rutile U–Pb ages were obtained
for the first time in the GHC metapelites to constrain thetiming of cooling in a subset of samples, whereas Zr-in-
rutile temperatures were determined to retrieve peak
temperature conditions. The results give new insights
into the tectonic evolution of the GHC, particularly the
issue of whether propagating thrusting or partial melt-
ing dominates the exhumation of high-grade meta-morphic rocks in the Himalayan orogen.
GEOLOGICAL SETTING
The Himalayan orogen is commonly divided from north
to south into the Tethyan Himalayan Sequence (THS),
GHC, Lesser Himalayan Sequence (LHS) and SiwalikGroup (SG) by four first-order tectonic boundaries that
run �2500 km along the strike of the orogen (Fig. 1a;
Yin, 2006). These tectonic boundaries are the top-to-
north STD and the top-to-south MCT, Main Boundary
Thrust (MBT) and Main Frontier Thrust (MFT). The MCT
thrust the amphibolite- to granulite-facies GHC rocks ontop of the greenschist- to lower amphibolite-facies LHS
rocks (e.g. Le Fort, 1975; Arita, 1983; Schelling, 1992;
Pearson & DeCelles, 2005; Searle et al., 2008; Larson
et al., 2013). The STD separates the fossiliferous sedi-
ments of the THS from the underlying GHC (e.g.
Burchfiel & Royden, 1985; Burchfiel et al., 1992; Searle
et al., 2003; Cottle et al., 2007).The Nyalam region in the central Himalaya is located
�50 km to the east of the well-studied Langtang region
(Fig. 1a) and exposes similar metamorphic rocks
(Reddy et al., 1993; Fraser et al., 2000; Kohn et al., 2004).
Typical lithologies include graphite-rich pelitic schists
and Neoproterozoic granitic orthogneisses in the LHS,and migmatitic paragneisses, calc-silicate interlayers
and Early Paleozoic granitic orthogneisses in the GHC
(Schelling, 1992; Larson, 2012; Wang et al., 2013;
Larson et al., 2013). Foliations in the GHC rocks gener-
ally have moderate dips towards N5–30�W or N5–20�E
(Fig. 1b). Despite the debate on the position of the MCT
in other Himalayan transects [see review by Searle et al.(2008)], the MCT in this section was mapped at the top
of the Melung–Salleri orthogneiss and staurolite-bear-
ing schist, based on the presence of a metamorphic and
geochronological discontinuity (Larson et al., 2013). The
hanging-wall rocks (GHC) experienced a clockwise P–T
path with a kyanite-grade metamorphic peak at �19 Ma,whereas the footwall rocks (MCT zone and LHS) record
a hairpin-type P–T path with a staurolite–kyanite grade
metamorphic peak at �10–8 Ma (Larson et al., 2013).
The STD has been recognized �30 km north of Nyalam
town and is characterized by a 3 km wide ductile shear
zone and decreasing metamorphic grade from am-
phibolite to greenschist facies (Liu et al., 2012; Myrowet al., 2009; Wang et al., 2013). Timing of movement
along the STD was constrained to be �27–14 Ma by
cross-cutting leucogranite dykes (Liu et al., 2012; Wang
et al., 2013).
A typical Barrovian-type metamorphic zonation has
been recognized across the LHS and GHC.
Metamorphic grade gradually increases toward higherstructural levels (Fig. 1b) from chlorite, garnet and
staurolite–kyanite grade in the LHS, to sillimanite–mus-
covite, sillimanite–K-feldspar and cordierite grade in the
GHC (Larson, 2012; Wang et al., 2013). Results from gar-
net–biotite Fe–Mg exchange thermometers show that
minimum peak temperature conditions gradually in-crease from �580�C in the upper LHS to �750�C in the
upper GHC, whereas metamorphic pressures decrease
from 10–13 kbar to 4–7 kbar towards higher structural
levels (Wang et al., 2013). Melt is absent in the LHS
metapelitic rocks, but segregations of leucosome are
abundant across the GHC. Generally, the amount ofmelt production increases with increasing temperature
and decreasing pressure through a series of melting re-
actions: (1) H2O-saturated melting (MsþAbþQzþH2O¼melt; Imayama et al., 2010; Wang et al., 2015;
mineral abbreviations according to Whitney & Evans,
2010) dominated in the kyanite and sillimanite–musco-
vite zones; (2) dehydration melting of muscovite(MsþPlþQz¼KfsþAlsþmelt; Imayama et al., 2010;
Groppo et al., 2012) dominated in the sillimanite–K-feld-
spar zone; (3) dehydration melting of biotite producing
garnet (AlsþBtþPlþQz¼GrtþKfsþmelt, Groppo
et al., 2012) or cordierite (AlsþBtþPlþQz¼CrdþKfsþmelt, Groppo et al., 2013) also occurred in some ofthe higher grade rocks.
A few studies have investigated the discontinuities
within the GHC in this transect. Early work suggested
several thrusts (Ishida, 1969; Ishida & Ohta, 1973), but
later studies have shown that the entire GHC experi-
enced penetrative deformation and that the previously
proposed thrusts lack structural evidence (Larson,2012). The Nyalam Discontinuity was recognized within
the sillimanite–K-feldspar zone of the GHC based on an
inversion in P–T conditions of �40�C and �3 kbar to-
ward higher structural levels (Fig. 1b; Wang et al.,
2013). It is located at a similar structural level to the ad-
jacent ‘Langtang Thrust’, which is marked by a discon-tinuity in P–T conditions and monazite Th–Pb ages
(Kohn et al., 2004; Kohn, 2008). In this study, the GHC is
divided into the lower and upper blocks by the Nyalam
Discontinuity and Langtang Thrust.
SAMPLE DESCRIPTION
Nine samples of migmatitic metapelite or metapsam-
mite were collected along a north–south transect
Journal of Petrology, 2015, Vol. 56, No. 9 1679
Dow
nloaded from https://academ
ic.oup.com/petrology/article/56/9/1677/1460164 by guest on 06 July 2022

through the GHC in the Nyalam region (Fig. 1b). Of
these, four samples were located structurally below the
Nyalam Discontinuity and five samples were collected
structurally above it. An additional metapelitic sample
(L11) is from the Langtang region, and was collectedfrom structurally below the Langtang Thrust within the
kyanite zone defined by Kohn (2008) (Fig. 1a). Sample
global positioning system (GPS) locations, mineral as-
semblages and P–T estimates are given in Table 1. P–T
estimates for the same or adjacent samples from the
Nyalam transect were obtained by Wang et al. (2013)
using the garnet–biotite thermometer, garnet–Al2SiO5–
quartz–plagioclase barometer and garnet–biotite–
plagioclase–quartz barometer. Mineral compositionsand the P–T calculation method for sample L11 are
given in Supplementary Data (SD) Electronic Appendix
A (supplementary data are available for downloading at
http://www.petrology.oxfordjournals.org).
Fig. 1. (a) Geological map of the central Himalaya highlighting the lithostratigraphic units and main structures [modified after Yin(2006)]. The High Himalayan Thrust (HHT) is inferred from this study. Inset map shows the location. (b) Detailed geological map ofthe Nyalam region showing sample locations and metamorphic isograds [modified after Searle et al. (1997) and Wang et al.(2013)]. Abbreviations for local structures (see text for details): MSZ: Mangri shear zone; TSZ, Toijem shear zone; ST, Sinuwa thrust;LT, Langtang Thrust; ND, Nyalam Discontinuity; HHT, High Himalayan Thrust. Mineral abbreviations follow Whitney & Evans(2010). L&C 2014, Larson & Cottle (2014).
1680 Journal of Petrology, 2015, Vol. 56, No. 9
Dow
nloaded from https://academ
ic.oup.com/petrology/article/56/9/1677/1460164 by guest on 06 July 2022

Tab
le1
:L
oca
tio
ns,
min
era
la
sse
mb
lag
es
an
dP
–Tco
nd
itio
ns
of
stu
die
dsa
mp
les
Sa
mp
leL
oca
lity
GP
SR
ock
typ
eM
ain
min
era
lsA
cce
sso
ryR
etr
og
ress
ion
Me
ltin
gM
elt
ing
Pa
tp
ea
kP
ea
kT
Zr-
in-r
uti
leco
ord
ina
tes
min
era
lsd
eg
ree
(%)
rea
ctio
nT
(kb
ar)
(�C
)T
(�C
)
NL
01
Lo
we
rG
HC
,2
7� 5
80 8�3
900 N
,M
igm
ati
tic
Grt
(�3
%),
Bt,
Mn
z,A
p,Z
r,R
t5
62
H2O
-sa
tura
ted
9�9
60�8
65
26
25
64
06
35
Ny
ala
m8
5� 5
80 2�9
700 E
me
tap
elite
Ms,
Pl,
Ky
,Q
zL
11
Lo
we
rG
HC
,2
8� 1
30 3�0
000 N
,M
igm
ati
tic
Grt
(�3
%),
Bt,
Mn
z,A
p,Z
r,R
t5
62
H2O
-sa
tura
ted
12�4
60�8
67
36
25
65
96
35
La
ng
tan
g8
5� 2
10 2
3�6
000 E
me
tap
elite
Ms,
Pl,
Ky
,Q
zN
24
Lo
we
rG
HC
,2
8� 20 3
0�3
900 N
,M
igm
ati
tic
Grt
(�1
%),
Bt,
Mn
z,A
p,Z
r7
63
H2O
-sa
tura
ted
7�3
60�8
63
96
25
65
56
35
Ny
ala
m8
5� 5
90 1
8�2
800 E
me
tap
elite
Ms,
Pl,
Sil(f
),Q
z(N
L0
7)
(NL
07
)(N
L0
7)
N2
2L
ow
er
GH
C,
28� 30 6�9
000 N
,O
rth
og
ne
iss
Grt
(�1
%),
Bt,
Mn
z,A
p,Z
r�
0N
o6�1
60�8
65
16
25
67
56
36
Ny
ala
m8
5� 5
90 3
9�2
400 E
Ms,
Pl,
Qz
(NL
16
)(N
L1
6)
(NL
16
)N
18
Lo
we
rG
HC
,2
8� 70 2
0�6
400 N
,M
igm
ati
tic
Grt
(�3
%),
Bt,
Mn
z,A
p,Z
rC
hl
20
65
Ms
de
hy
dra
tio
n3�9
60�8
66
96
25
Ny
ala
m8
5� 5
90 2
9�9
000 E
me
tap
elite
Kfs
,P
l,S
il,Q
zN
L2
7U
pp
er
GH
C,
28� 80 0�4
300 N
,M
igm
ati
tic
Grt
(�5
%),
Bt,
Mn
z,A
p,Z
rM
s1
56
5M
sd
eh
yd
rati
on
6�7
60�8
71
36
25
Ny
ala
m8
5� 5
80 2
5�6
500 E
me
tap
elite
Kfs
,P
l,S
il,Q
zN
L2
9U
pp
er
GH
C,
28� 80 2
8�5
900 N
,M
igm
ati
tic
Bt,
Kfs
,P
l,S
il,
Mn
z,A
p,Z
r2
06
5M
sd
eh
yd
rati
on
Ny
ala
m8
5� 5
80 5
4�5
600 E
me
tap
elite
Qz
NY
11
Up
pe
rG
HC
,2
8� 1
20 3�3
100 N
,M
igm
ati
tic
Bt,
Kfs
,P
l,Q
zM
nz,
Ap
,Z
r,R
t2
56
5M
sd
eh
yd
rati
on
4�1
61�2
74
96
50
73
06
40
Ny
ala
m8
5� 5
90 2
1�7
100 E
me
tap
sam
mit
e(N
L3
3)
(NL
33
)N
12
Up
pe
rG
HC
,2
8� 1
30 2�6
200 N
,M
igm
ati
tic
Bt,
Kfs
,P
l,Q
zM
nz,
Ap
,Z
r,R
tM
s,P
lþB
t2
56
5M
sd
eh
yd
rati
on
4�1
61�2
74
96
50
74
76
41
Ny
ala
m8
6� 00 1�1
300 E
me
tap
sam
mit
esy
mp
lect
ite
(NL
33
)(N
L3
3)
N1
0U
pp
er
GH
C,
28� 2
00 7�8
600 N
,M
igm
ati
tic
Grt
(�7
%),
Bt,
Mn
z,A
p,Z
r2
06
5M
s/B
t6�9
61�2
72
66
50
Ny
ala
m8
6� 30 1
0�3
400 E
me
tap
sam
mit
eK
fs,P
l,Q
zd
eh
yd
rati
on
f,fi
bro
lite
sillim
an
ite
.D
eg
ree
of
pa
rtia
lm
elt
ing
wa
sd
efi
ne
db
yte
xtu
res
an
da
mo
un
to
fle
uco
som
ein
the
sam
ple
s.P
–Tco
nd
itio
ns
of
the
sam
esa
mp
les
fro
mth
eN
ya
lam
tra
nse
cth
av
eb
ee
np
ub
lish
ed
by
Wa
ng
et
al.
(20
13
)u
sin
gth
eg
arn
et–
bio
tite
the
rmo
me
ter,
ga
rne
t–A
l 2S
iO5–q
ua
rtz–
pla
gio
cla
seb
aro
me
ter
an
dg
arn
et–
bio
tite
–pla
gio
cla
se–q
ua
rtz
ba
rom
ete
r.P
–T
con
dit
ion
so
fsa
mp
les
N2
4,
N2
2,
NY
11
an
dN
12
are
fro
ma
dja
cen
tsa
mp
les
of
Wa
ng
et
al.
(20
13
)(s
am
ple
nu
mb
ers
giv
en
).M
ine
ral
com
po
siti
on
sa
nd
P–T
calc
ula
tio
nm
eth
od
sfo
rsa
mp
leL
11
are
list
ed
inS
up
ple
me
nta
ryD
ata
Ele
ctro
nic
Ap
pe
nd
ixA
.Z
r-in
-ru
tile
tem
pe
ratu
res
we
reca
lcu
late
du
sin
gth
eT
om
kin
se
ta
l.(2
00
7)
the
rmo
me
ter
an
dth
elist
ed
pre
ssu
res
we
reu
sed
for
corr
ect
ion
ine
ach
sam
ple
.
Journal of Petrology, 2015, Vol. 56, No. 9 1681
Dow
nloaded from https://academ
ic.oup.com/petrology/article/56/9/1677/1460164 by guest on 06 July 2022
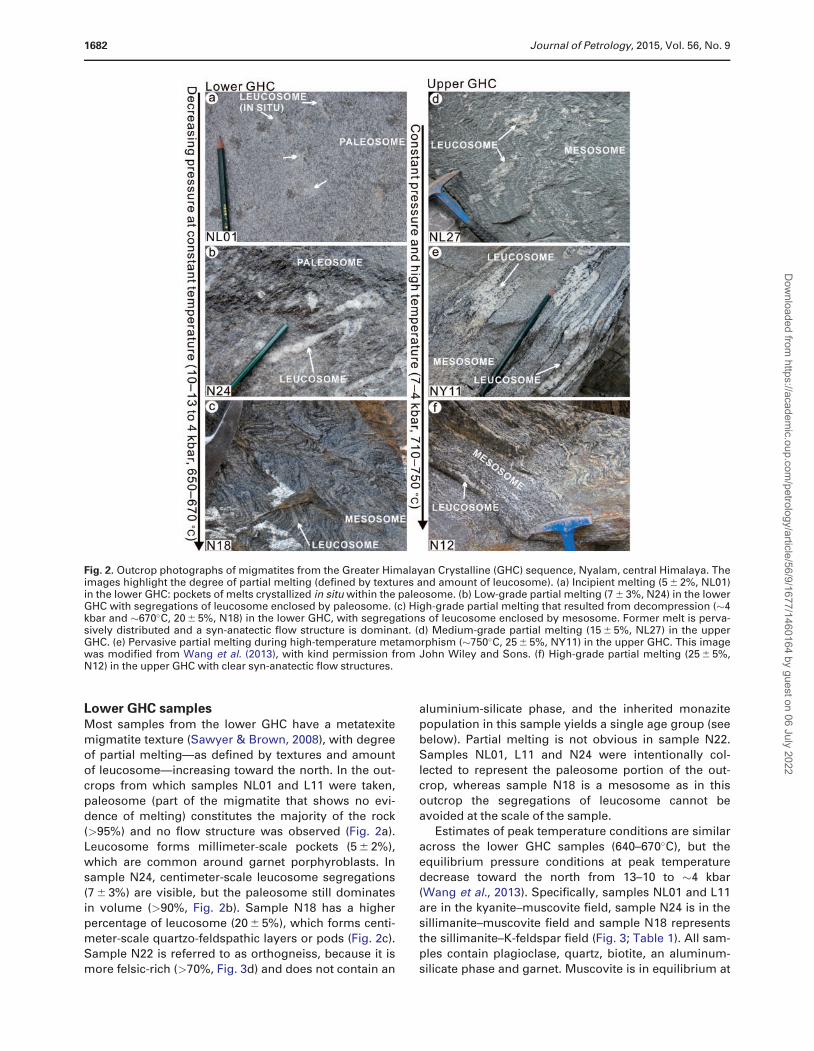
Lower GHC samplesMost samples from the lower GHC have a metatexite
migmatite texture (Sawyer & Brown, 2008), with degree
of partial melting—as defined by textures and amount
of leucosome—increasing toward the north. In the out-
crops from which samples NL01 and L11 were taken,
paleosome (part of the migmatite that shows no evi-
dence of melting) constitutes the majority of the rock(>95%) and no flow structure was observed (Fig. 2a).
Leucosome forms millimeter-scale pockets (5 6 2%),
which are common around garnet porphyroblasts. In
sample N24, centimeter-scale leucosome segregations
(7 6 3%) are visible, but the paleosome still dominates
in volume (>90%, Fig. 2b). Sample N18 has a higherpercentage of leucosome (20 6 5%), which forms centi-
meter-scale quartzo-feldspathic layers or pods (Fig. 2c).
Sample N22 is referred to as orthogneiss, because it is
more felsic-rich (>70%, Fig. 3d) and does not contain an
aluminium-silicate phase, and the inherited monazite
population in this sample yields a single age group (see
below). Partial melting is not obvious in sample N22.
Samples NL01, L11 and N24 were intentionally col-
lected to represent the paleosome portion of the out-crop, whereas sample N18 is a mesosome as in this
outcrop the segregations of leucosome cannot be
avoided at the scale of the sample.
Estimates of peak temperature conditions are similar
across the lower GHC samples (640–670�C), but the
equilibrium pressure conditions at peak temperature
decrease toward the north from 13–10 to �4 kbar(Wang et al., 2013). Specifically, samples NL01 and L11
are in the kyanite–muscovite field, sample N24 is in the
sillimanite–muscovite field and sample N18 represents
the sillimanite–K-feldspar field (Fig. 3; Table 1). All sam-
ples contain plagioclase, quartz, biotite, an aluminum-
silicate phase and garnet. Muscovite is in equilibrium at
Fig. 2. Outcrop photographs of migmatites from the Greater Himalayan Crystalline (GHC) sequence, Nyalam, central Himalaya. Theimages highlight the degree of partial melting (defined by textures and amount of leucosome). (a) Incipient melting (5 6 2%, NL01)in the lower GHC: pockets of melts crystallized in situ within the paleosome. (b) Low-grade partial melting (7 6 3%, N24) in the lowerGHC with segregations of leucosome enclosed by paleosome. (c) High-grade partial melting that resulted from decompression (�4kbar and �670�C, 20 6 5%, N18) in the lower GHC, with segregations of leucosome enclosed by mesosome. Former melt is perva-sively distributed and a syn-anatectic flow structure is dominant. (d) Medium-grade partial melting (15 6 5%, NL27) in the upperGHC. (e) Pervasive partial melting during high-temperature metamorphism (�750�C, 25 6 5%, NY11) in the upper GHC. This imagewas modified from Wang et al. (2013), with kind permission from John Wiley and Sons. (f) High-grade partial melting (25 6 5%,N12) in the upper GHC with clear syn-anatectic flow structures.
1682 Journal of Petrology, 2015, Vol. 56, No. 9
Dow
nloaded from https://academ
ic.oup.com/petrology/article/56/9/1677/1460164 by guest on 06 July 2022

peak stage in samples NL01, L11, N24 and N22, but is
absent in sample N18. The above mineral assemblages
indicate that partial melting was the result of H2O-satu-
rated melting in samples NL01, L11 and N24, but of
muscovite dehydration melting in sample N18. Garnet
is present in all the lower GHC samples, albeit in smallvolumes (1–3%). Polymineralic inclusions in garnet that
have negative crystal shapes (i.e. PlþQz inclusion in
Fig. 3c) increase in size from 5 to 100 lm with increasing
structural level. These inclusions are considered to
have crystallized from previous melt pores (nanogran-
ite; Ferrero et al., 2012; Groppo et al., 2012; Wang et al.,
2015). Most of the samples show no sign of retrogrademetamorphism other than occasional fractures filled
by retrograde chlorite or resorbed garnet rims in
sample N18. All the samples contain accessory mona-
zite, zircon and apatite, whereas rutile occurs only in
samples NL01 and L11, and is in textural equilibrium
with kyanite.
Upper GHC samplesMost samples from the upper GHC have a higher con-tent of leucosome than samples from the lower block,
resulting in a diatexite migmatite texture (Sawyer &
Brown, 2008). In all samples leucosome is widely dis-
tributed and the sample is a mix of leucosome and re-
siduum (mesosome). Leucosome segregations can
reach decimeter-scale and are usually enclosed by mes-
osome (Fig. 2d–f). The rocks are dominated by syn-ana-tectic flow structures. In samples NL27, NL29 and N10,
leucosome makes up about 15–20% of the rock,
whereas samples NY11 and N12 have a higher percent-
age of leucosome (25 6 5%). The samples used for geo-
chronology were collected from the mesosome portion
but still contain small segregations of leucosome.Estimated peak temperature conditions for the upper
GHC samples are similar at 710–750�C; equilibrium
pressures at the peak temperatures decrease toward
the north from 7 to 4 kbar (Wang et al., 2013). Most
Fig. 3. Photomicrographs of thin sections of investigated samples. (a) Typical kyanite-zone metapelitic assemblage with abundantkyanite coexisting with muscovite. (b) Fibrolite sillimanite aligned with biotite, formed by consumption of muscovite. (c)Replacement of garnet by biotite, sillimanite, quartz and plagioclase via decompression. Chlorite replaced garnet during retrogres-sion. (d) Orthogneiss sample that contains abundant quartzo-feldspathic domains and a few garnet grains. (e) Typical high-tem-perature metapelitic assemblage with prismatic sillimanite and K-feldspar, and lack of muscovite. (f) Folded prismatic sillimaniteand biotite. Crossed polars. (g) High-temperature metapsammite sample with a simple assemblage of K-feldspar, plagioclase, bio-tite and quartz. (h) High-temperature metapsammite sample with retrograde symplectite of plagioclase and biotite. (i) Peritectic gar-net formed through dehydration of biotite.
Journal of Petrology, 2015, Vol. 56, No. 9 1683
Dow
nloaded from https://academ
ic.oup.com/petrology/article/56/9/1677/1460164 by guest on 06 July 2022

samples represent the sillimanite–K-feldspar stability
field and contain K-feldspar, biotite, plagioclase, quartz
or sillimanite, which indicates that partial melting was
mainly produced by muscovite dehydration melting.
Sillimanite is present only in pelitic samples NL27 andNL29 (Fig. 3e and f), and garnet occurs only in samples
NL27 and N10 (Fig. 3e and i) as inclusion-free porphyro-
blasts. In sample N12, a retrograde symplectite of
plagioclase and biotite partly replaces the prograde
minerals (Fig. 3h). Corroded biotite crystals are partly
consumed to form K-feldspar and peritectic garnet in
sample N10 (Fig. 3i), which indicates that dehydrationmelting of biotite also occurred. All the samples contain
accessory monazite, zircon, and apatite; rutile is present
only in samples NY11 and N12, which record slightly
higher temperatures and lower pressures.
METHODS
Monazite and rutile crystals were separated using
standard heavy liquid and magnetic techniques, and
handpicked under a binocular microscope. The grains
were then mounted in epoxy resin and polished to ex-
pose the grain centers. Back-scattered electron (BSE)
images of monazite and rutile were produced with a
JEOL JSM-6610 A scanning electron microscope at theAustralian National University (ANU), with working con-
ditions of 15 kV, 60 lA and �10 mm working distance.
Inclusions in monazite were identified by a JED-2300
energy-dispersive X-ray system installed on the same
instrument. Transmitted and reflected light images of
monazite and rutile were also used to avoid inclusionsand fractures during analysis
SHRIMP U–Th–PbU, Th and Pb analyses of monazite were performed by
sensitive high-resolution ion microprobe (SHRIMP IIand SHRIMP RG) at ANU. Instrumental conditions and
data acquisition were generally as described by
Williams (1998). Energy filtering was applied (Rubatto
et al., 2001) to eliminate the interference on 204Pb, re-
duce the high counts on the ThO peak, and suppress
any matrix effect. A matrix effect for monazite reportedby Fletcher et al. (2010) was not observed in this study
(SD Electronic Appendix Fig. 1). The data were collected
in sets of six scans throughout the masses with a spot
size of 20–30 lm and reference material was analyzed at
each third analysis. The measured 206Pb/238U ratio was
corrected using reference monazite Delaware 44069
(425 Ma; Aleinikoff et al., 2006). In most of the analyticalsessions, calibration errors were <2�8% (2r, seven sam-
ples), but were slightly larger (3�5–3�7%, 2r) in some
sessions (three samples); in each case the calibration
error was propagated to the single analyses. For the
analyses yielding Cenozoic ages, the data were cor-
rected for common Pb based on the measured207Pb/206Pb (by assuming concordance), whereas the
pre-Cenozoic inherited ages were corrected using the
measured 204Pb (Williams, 1998). The analyses used for
average age calculations have a small percentage of
common Pb (mostly <1%, few 2–5%). The common Pb
compositions predicted by the Stacey & Kramers (1975)
model were used (207Pbc/206Pbc¼0�837 6 0�042, for
Himalayan ages). For the rim analyses of sample N22,
which are particularly rich in initial Pb, the initial Pb
composition was obtained from the Y-intercept of a free
regression in the uncorrected Tera–Wasserburg plot
(207Pbc/206Pbc¼ 0�511 6 0�026). This composition devi-
ates significantly from the model common Pb and recal-
culating the age with this input is a more accurateapproach. The software Squid 1 and Isoplot/Ex (Ludwig,
2008) were used for data reduction and age calculation,
and the 238U, 235U and 232Th decay constants of Steiger
& Jager (1977) were used. Average U–Pb ages are
quoted at the 95% confidence level. Analytical U–Th–Pb
data are listed in SD Electronic Appendix Table 1.For Th-rich minerals such as monazite, excess 206Pb
owing to decay of 230Th can lead to overestimation of
the real age. This problem has been reported for
Himalayan leucogranite (Scharer, 1984), where the melt
may be rich in 230Th. However, for Himalayan metape-
lites and metapsammites, the presence of excess 206Pbis less obvious and Th–Pb ages are usually in agree-
ment with U–Pb ages (Martin et al., 2007; Rubatto et al.,
2013; Stearns et al., 2013; Larson & Cottle, 2014). For
most analyses in this study, Th–Pb ages are in agree-
ment with U–Pb ages within 2r uncertainties and no
correlation was observed between U–Pb age and Th/U
ratios (SD Electronic Appendix Fig. 2a–d). The SHRIMPset-up is best suited for measuring the lower count
rates of Pb, and is less reliable when measuring very
high count rates, such as those for Th in monazite. For
these reasons, we consider U–Pb ages more accurate
and prefer them to Th–Pb ages. An exception is made
for samples N18 and N12, for which U–Pb ages are 1–3Myr older than Th–Pb ages and could be affected by ex-
cess 206Pb (SD Electronic Appendix Fig. 2e–h). For these
two samples, the ages were reported as a range con-
sidering the average U–Pb and Th–Pb ages.
LA-ICP-MS trace elementsTrace element analyses of monazite, rutile and garnet
were obtained by a laser ablation–inductively coupled
plasma–mass spectrometry (LA-ICP-MS) at ANU, using
a pulsed 193 nm ArF Excimer laser with 100 mJ energy
at a repetition rate of 5 Hz (Eggins et al., 1998) coupled
to an Agilent 7700 quadrupole ICP-MS system. Most
LA-ICP-MS analyses of monazite were performed onthe same site as the 2 lm deep SHRIMP pits. Garnet
was analyzed in polished thin sections, whereas mona-
zite and rutile were mounted in epoxy disks. Spot sizes
of 28 lm (monazite) and 47 lm (rutile and garnet) were
used and reference material was analyzed each tenth
analysis. External calibration was performed relative toNIST 610 glass (rutile) or NIST 612 glass (monazite and
garnet) and internal standardization was based on
1684 Journal of Petrology, 2015, Vol. 56, No. 9
Dow
nloaded from https://academ
ic.oup.com/petrology/article/56/9/1677/1460164 by guest on 06 July 2022
stoichiometry of Ce for monazite (23�6 wt %), Ti for rutile
(59�93 wt %) and Si for garnet (17�76 wt %). Accuracy
and precision of the analyses were evaluated with a
BCR-2G secondary glass standard and are always better
than 10% combined. Analyses that have apparent con-tamination from inclusions or those with insufficient
data collecting duration (<10 s) were discarded. Trace
element data reduction was performed using the soft-
ware Iolite v.2.5 (Paton et al., 2010). Analytical data are
listed in SD Electronic Appendix Tables 2, 3 and 4. Rare
earth element (REE) patterns of monazite and garnet
were normalized to chondrite (McDonough & Sun,1995).
Zr-in-rutile temperatures were calculated using the
calibration of Tomkins et al. (2007) for the b-quartz field.
The pressures used for correction for each sample were
from Wang et al. (2013) and are listed in Table 1. For
comparison, calculated results using the calibration ofWatson et al. (2006), which assumes a constant pres-
sure of 10 kbar, are also listed in SD Electronic
Appendix Table 4. Generally, differences in temperature
calculated using different calibrations are less than
630�C. Uncertainties are calculated by considering a
conservative analytical error of 615% in Zr measure-ments, 60�8 kbar (or 61�2 kbar) for pressure estimates
and a 63% (620�C) propagated uncertainty from the
calibration of the thermometer. The activities of Si and
Zr are fully buffered, as all the metasedimentary sam-
ples in this study are rich in quartz and zircon. The
47 lm laser pit was always located at the center of the
grains to avoid possible complications from Zr diffusionat the rim during cooling.
LA-ICP-MS U–PbU–Pb analyses of rutile were performed with the same
LA-ICP-MS system and working conditions as the trace
element analyses. A large spot size of 62 lm and a long
dwell time (70–90 ms) for 206Pb, 207Pb, 208Pb, 232Th and238U were used to improve precision. Each analysismeasures the background for �30 s before switching on
the laser for �40 s. Reference material was analyzed
each fifth analysis. The measured 206Pb/238U ratio was
corrected using reference rutile Wodgina-B (2846 Ma;
isotope dilution thermal ionization mass spectrometry
data; Ewing, 2011). Data reduction, including correc-tions for baseline, instrumental drift, mass bias and
downhole fractionation, was performed using the soft-
ware Iolite version 2.5 (Paton et al., 2010). The analyzed
rutile samples usually have a very low Th content (Th/U
generally< 0�001), which is an ideal case for common
Pb correction using the measured 206Pb/208Pb (Zack
et al., 2011). The fraction of common 206Pb (fc) is calcu-lated from a given common Pb composition
(206Pbc/208Pbc) by assuming Th/U� 0:
fcð206PbÞ ¼ ð206Pbm=208PbmÞ=ð206Pbc=
208PbcÞ:
For Himalayan samples, the present 206Pbc/208Pbc
ratio of 0�484 6 0�024 was used (Stacey & Kramers,
1975). To ensure accuracy, only those analyses with
common Pb fraction (fc) of less than 8% and U concen-
trations higher than 40 ppm were used for average age
calculation. Uncertainties of fc(206Pb) were calculated
using the formula suggested by Gregory et al. (2007) byconsidering the uncertainties in estimating the206Pbc/
208Pbc composition (65%) and uncertainties on
the measured 206Pbm/208Pbm ratios. Uncertainties on
the corrected 206Pb/238U ratio are quoted at the 2r level
and were calculated using the formula suggested by
Andersen (2002) by considering the analytical errors,
propagated calibration errors of the standard and errorsfrom common Pb correction. U–Th–Pb data are listed in
SD Electronic Appendix Table 5. Owing to the young
ages and little accumulation of radioactive 207Pb, the
obtained 207Pb/235U ages are less reliable than the206Pb/238U ages. Therefore, only the 206Pb/238U ages
were reported. Total 238U/ 206Pb–207Pb/ 206Pb Tera–Wasserburg plots are included in SD Electronic
Appendix Fig. 7.
MONAZITE U–PB GEOCHRONOLOGY ANDTRACE ELEMENTS
Most monazite grains are clear, light yellow or yellow in
color, and euhedral in shape. Monazite in lower grade
sample NL01 has a relatively small size (<60 lm in
diameter), whereas monazites in higher-grade samples
NY11 and N12 are usually larger than 300 lm in diam-eter. Internal zoning of monazite is described according
to the high-contrast BSE images (Figs 4 and 5); this is a
reflection of the total Z number. Average 206Pb/238U
ages are reported according to the statistically consist-
ent groups (n�5). Whenever the mean square of
weighted deviates (MSWD) is above the threshold oftwo, a range of dates is reported. U–Pb analyses uncor-
rected for common Pb are presented in Tera–
Wasserburg plots (Figs 4 and 5) and corrected ages are
shown in probability diagrams (SD Electronic Appendix
Fig. 3). Trace element compositions of dated monazite
are reported with particular emphasis on the featuresdistinguishing different domains or statistically consist-
ent age groups (Figs 6 and 7; SD Electronic Appendix
Fig. 5). Monazite inclusions, ages and relevant trace
element signatures are summarized in Table 2.
Lower GHC samplesIn metapelites NL01, N24 and N18, monazites have ir-
regular cores, which are exposed only in some grains,
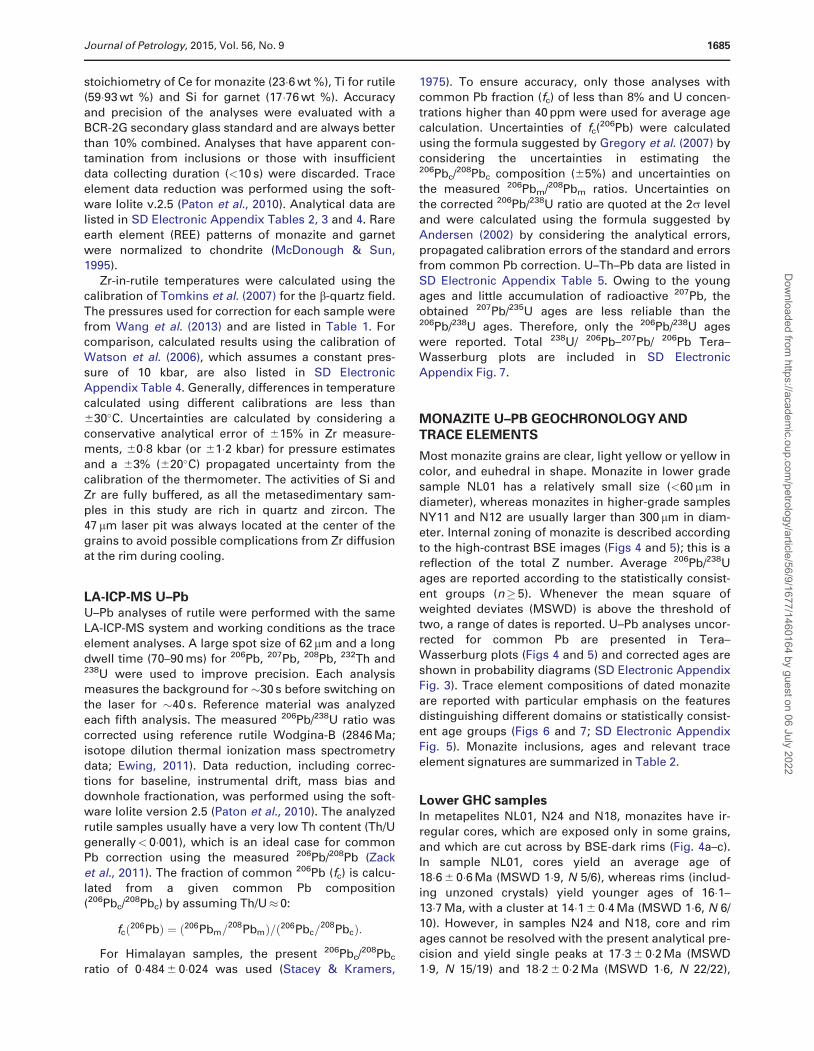
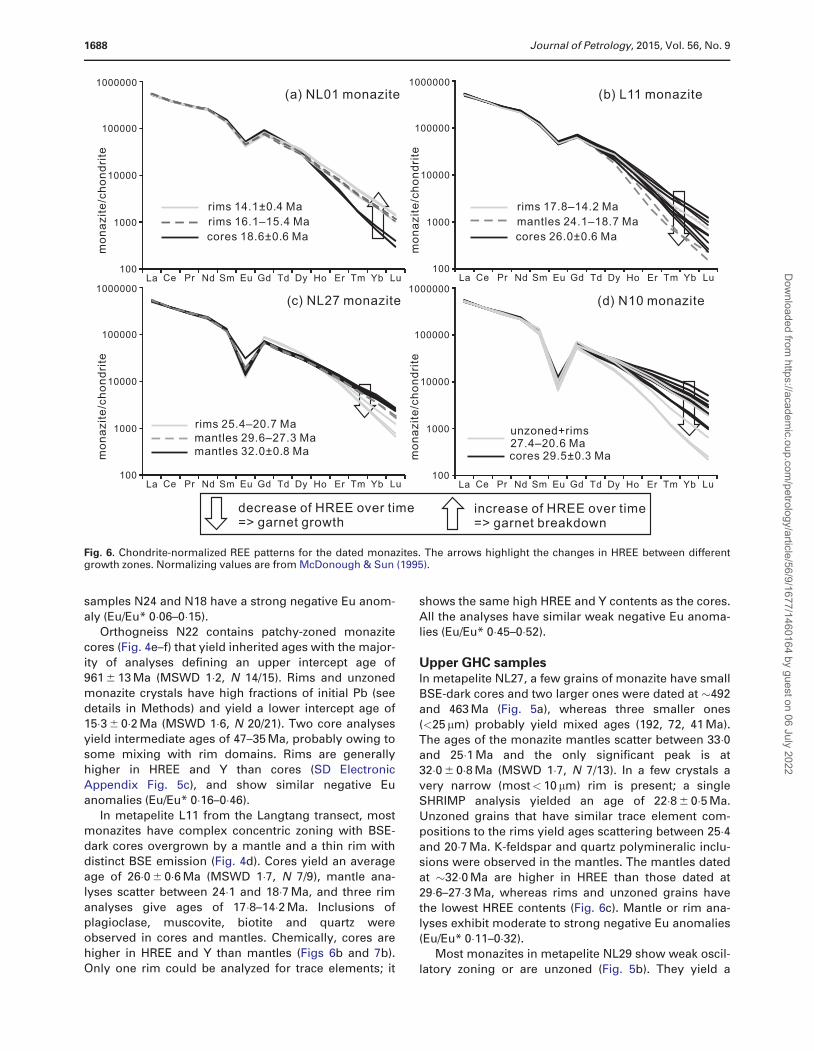
and which are cut across by BSE-dark rims (Fig. 4a–c).In sample NL01, cores yield an average age of
18�6 6 0�6 Ma (MSWD 1�9, N 5/6), whereas rims (includ-
ing unzoned crystals) yield younger ages of 16�1–
13�7 Ma, with a cluster at 14�1 6 0�4 Ma (MSWD 1�6, N 6/
10). However, in samples N24 and N18, core and rim
ages cannot be resolved with the present analytical pre-cision and yield single peaks at 17�3 6 0�2 Ma (MSWD
1�9, N 15/19) and 18�2 6 0�2 Ma (MSWD 1�6, N 22/22),
Journal of Petrology, 2015, Vol. 56, No. 9 1685
Dow
nloaded from https://academ
ic.oup.com/petrology/article/56/9/1677/1460164 by guest on 06 July 2022

respectively. Notably, sample N18 may contain excess206Pb and the U–Pb ages may be overestimated (see de-
tails in Methods section). Taking into account the
weighted average Th–Pb age (16�7 6 0�2 Ma, MSWD 1�6,
N 22/22), we report the age within the range 18�2–
16�7 Ma. Monazites in sample N24 contain index min-
eral inclusions of garnet and aggregates of albite and
orthoclase (Fig. 4b), and those in sample N18 contain
Fig. 4. Representative back-scattered electron images of selected monazite crystals and Tera–Wasserburg diagrams for monaziteU–Pb analyses of samples from the lower GHC. Ellipses represent 2r errors. Only filled gray ellipses were used for average age cal-culation. Ellipses in the BSE images indicate the location of the SHRIMP analyses and are �25mm in diameter; the numbers indicate206Pb/238U ages in Ma. Errors are given in SD Electronic Appendix Table 1.
1686 Journal of Petrology, 2015, Vol. 56, No. 9
Dow
nloaded from https://academ
ic.oup.com/petrology/article/56/9/1677/1460164 by guest on 06 July 2022
garnet, polymineralic inclusions of K-feldspar and
quartz and abundant sillimanite (SD ElectronicAppendix Fig. 4). Chemically, the rims of sample NL01
are distinctly higher in HREE and Y contents and have
lower GdN/LuN ratios than the cores (Figs 6a and 7a).
In sample N24, monazite has a relatively large variation
in HREE content, whereas monazite is homogeneous insample N18 (SD Electronic Appendix Fig. 5a and b).
Monazites in sample NL01 have a weak negative Eu
anomaly (Eu/Eu* of 0�40–0�44), whereas those of
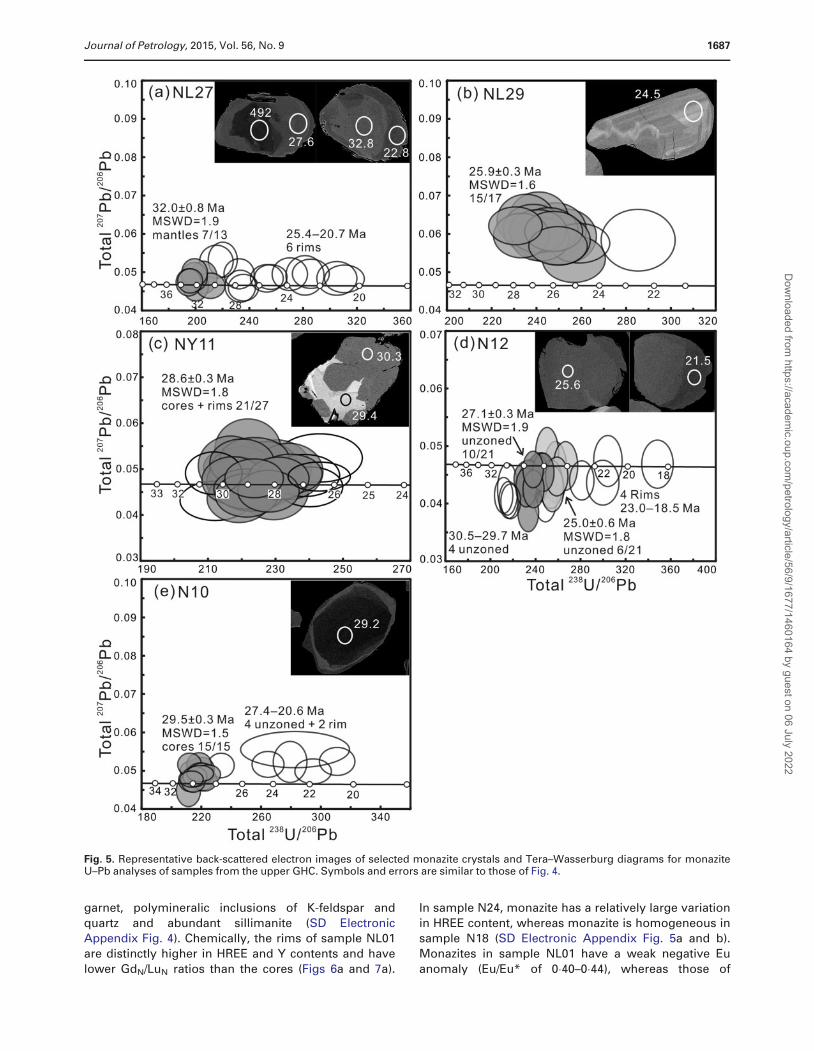
Fig. 5. Representative back-scattered electron images of selected monazite crystals and Tera–Wasserburg diagrams for monaziteU–Pb analyses of samples from the upper GHC. Symbols and errors are similar to those of Fig. 4.
Journal of Petrology, 2015, Vol. 56, No. 9 1687
Dow
nloaded from https://academ
ic.oup.com/petrology/article/56/9/1677/1460164 by guest on 06 July 2022
samples N24 and N18 have a strong negative Eu anom-
aly (Eu/Eu* 0�06–0�15).Orthogneiss N22 contains patchy-zoned monazite
cores (Fig. 4e–f) that yield inherited ages with the major-
ity of analyses defining an upper intercept age of
961 6 13 Ma (MSWD 1�2, N 14/15). Rims and unzoned
monazite crystals have high fractions of initial Pb (see
details in Methods) and yield a lower intercept age of
15�3 6 0�2 Ma (MSWD 1�6, N 20/21). Two core analysesyield intermediate ages of 47–35 Ma, probably owing to
some mixing with rim domains. Rims are generally
higher in HREE and Y than cores (SD Electronic
Appendix Fig. 5c), and show similar negative Eu
anomalies (Eu/Eu* 0�16–0�46).
In metapelite L11 from the Langtang transect, mostmonazites have complex concentric zoning with BSE-
dark cores overgrown by a mantle and a thin rim with
distinct BSE emission (Fig. 4d). Cores yield an average
age of 26�0 6 0�6 Ma (MSWD 1�7, N 7/9), mantle ana-
lyses scatter between 24�1 and 18�7 Ma, and three rim
analyses give ages of 17�8–14�2 Ma. Inclusions of
plagioclase, muscovite, biotite and quartz wereobserved in cores and mantles. Chemically, cores are
higher in HREE and Y than mantles (Figs 6b and 7b).
Only one rim could be analyzed for trace elements; it
shows the same high HREE and Y contents as the cores.
All the analyses have similar weak negative Eu anoma-lies (Eu/Eu* 0�45–0�52).
Upper GHC samplesIn metapelite NL27, a few grains of monazite have small
BSE-dark cores and two larger ones were dated at �492
and 463 Ma (Fig. 5a), whereas three smaller ones
(<25 lm) probably yield mixed ages (192, 72, 41 Ma).
The ages of the monazite mantles scatter between 33�0and 25�1 Ma and the only significant peak is at
32�0 6 0�8 Ma (MSWD 1�7, N 7/13). In a few crystals a
very narrow (most< 10 lm) rim is present; a single
SHRIMP analysis yielded an age of 22�8 6 0�5 Ma.
Unzoned grains that have similar trace element com-
positions to the rims yield ages scattering between 25�4and 20�7 Ma. K-feldspar and quartz polymineralic inclu-sions were observed in the mantles. The mantles dated
at �32�0 Ma are higher in HREE than those dated at
29�6–27�3 Ma, whereas rims and unzoned grains have
the lowest HREE contents (Fig. 6c). Mantle or rim ana-
lyses exhibit moderate to strong negative Eu anomalies
(Eu/Eu* 0�11–0�32).Most monazites in metapelite NL29 show weak oscil-
latory zoning or are unzoned (Fig. 5b). They yield a
La Ce Pr Nd Sm Eu Gd Td Dy Ho Er Tm Yb Lu100
1000
10000
100000
1000000
mo
na
zit
e/c
ho
nd
rite
cores 18.6±0.6 Ma
rims 16.1 15.4 Ma–
(a) NL01 monazite
rims 14.1±0.4 Ma
c) NL27 monazite
mantles 32.0±0.8 Ma
rims 25.4 20.7 Ma–
(
La Ce Pr Nd Sm Eu Gd Td Dy Ho Er Tm Yb Lu100
1000
10000
100000
1000000
mo
na
zit
e/c
ho
nd
rite
mantles 29.6 27.3 Ma–
(d) N10 monazite
cores 29.5±0.3 Ma
La Ce Pr Nd Sm Eu Gd Td Dy Ho Er Tm Yb Lu100
1000
10000
100000
1000000
mo
na
zit
e/c
ho
nd
rite
unzoned+rims27.4 20.6 Ma–
(b) L11 monazite
cores 26.0±0.6 Ma
mantles 24.1 18.7 Ma–
La Ce Pr Nd Sm Eu Gd Td Dy Ho Er Tm Yb Lu100
1000
10000
100000
1000000
mo
na
zit
e/c
ho
nd
rit e
rims 17.8 14.2 Ma–
decrease of HREE over time=> garnet growth
increase of HREE over time=> garnet breakdown
Fig. 6. Chondrite-normalized REE patterns for the dated monazites. The arrows highlight the changes in HREE between differentgrowth zones. Normalizing values are from McDonough & Sun (1995).
1688 Journal of Petrology, 2015, Vol. 56, No. 9
Dow
nloaded from https://academ
ic.oup.com/petrology/article/56/9/1677/1460164 by guest on 06 July 2022

single age peak at 25�9 6 0�3 Ma (MSWD 1�6, N 15/17).
Monazites in this sample have inclusions of minerals
that are stable at peak metamorphic conditions, includ-
ing sillimanite, biotite, plagioclase, K-feldspar, musco-
vite and quartz (SD Electronic Appendix Fig. 4). Allmonazites are homogeneous in HREE and Y contents
(SD Electronic Appendix Fig. 5d) and have similar mod-
erate Eu anomalies (Eu/Eu* 0�33–0�41).
In metapsammite NY11, monazite grains exhibit two
domains that are intergrown and are distinguished by
bright and dark BSE emission (Fig. 5c). The analyses of
bright domains have higher Th concentrations (most
>70 000 ppm) than the BSE-darker domains
(most< 55 000 ppm). Although the overall age is
28�6 6 0�3 Ma (MSWD 1�8, N 21/27, Fig. 6c), some of thebrighter domains have a tendency to older ages. The
Th-rich domains yield a tight average age of
29�2 6 0�4 Ma (MSWD 0�3, N 9/12), whereas the Th-poor
domains yield an average age of 28�4 6 0�3 Ma (MSWD
1�5, N 11/15), which is, however, barely resolvable from
the Th-rich domains. Polymineralic inclusions of K-
feldspar and quartz are abundant in the Th-poor mona-zites (SD Electronic Appendix Fig. 4). HREE and Y
contents and negative Eu anomalies are similar across
both domains (Eu/Eu* 0�12–0�20; SD Electronic
Appendix Fig. 5e).
Metapsammite N12 mainly contains unzoned mona-
zite, with a few grains showing a weak core–rim struc-ture (Fig. 5d). Ages of the unzoned grains scatter from
30�5 to 24�1 Ma, with two statistical peaks at
27�1 6 0�3 Ma (MSWD 1�9, N 10/21) and 25�0 6 0�6 Ma
(MSWD 1�8, N 6/21). Rim analyses are significantly
younger than unzoned grains and scatter from 23�0 to
18�5 Ma; however, there is no difference in trace elem-ent composition between the grains (SD Electronic
Appendix Fig. 5f). Sample N12 may contain excess206Pb and the weighted average Th–Pb age of unzoned
grains is reported (24�4 6 0�3 Ma, MSWD 1�3, N 16/21).
Polymineralic inclusions of K-feldspar and quartz were
observed in the unzoned grains.
Monazite grains in metapsammite N10 commonlyhave concentric zoning with large BSE-dark cores and
narrow BSE-grey rims (Fig. 5e). Cores yield older ages
with a tight average age of 29�5 6 0�3 Ma (MSWD 1�5, N
15/15). The unzoned or rim analyses scatter from 27�4 to
20�6 Ma. K-feldspar and quartz polymineralic inclusions
were observed in the monazite cores. Cores have rela-tively higher HREE and Y contents than the four rim
analyses (including unzoned) (Figs 6d and 7c). All of the
analyses show strong Eu anomalies (Eu/Eu* 0�09–0�15).
GARNET TRACE ELEMENT COMPOSITION
Garnet is present in several of the investigated samples
(Table 1) where it is a major phase rich in HREE and Y.
Its growth probably affected the trace element compos-
ition of monazite. Trace element traverses were ana-
lyzed for garnet porphyroblasts and small garnet grains
from samples NL01, NL27 and N10. Major element tra-
verses or maps of garnet in the same thin sections werepreviously published by Wang et al. (2013). The Fe, Mg,
Mn and Ca compositions of garnet porphyroblasts in all
three samples were homogenized by high-temperature
cation diffusion and exhibit similar flat zoning patterns.
At the outmost rims (<100 lm), Mn and Fe/(FeþMn) in-
crease and Mg decreases. This is attributed to back-dif-fusion of Mn and exchange of Fe and Mg with biotite
(Kohn et al., 2004).
10000
14000
18000
22000
26000
0 50 100 150 200 250 300 350
Gd /LuN N
Y(p
pm
)
Garnet breakdown
NL01 Monazite
rims 14.1±0.4 Ma
rims –16.1 15.4 Macores 18.6±0.6 Ma
(a)
5000
10000
15000
20000
25000
30000
35000
0 50 100 150 200 250 300
Y(p
pm
)
cores 29.5±0.3 Ma
N10 Monazitec)(
Garnetgrowth
5000
15000
25000
0 100 200 300 400
10000
20000
L11 Monazite(b)
Y(p
pm
)
rims 17.8 14.2 Ma–mantles 24 –.1 18.7 Macores 26.0±0.6 Ma
Garnet growth
rims 27.4 20.6 Ma–
Fig. 7. Y vs GdN/LuN for dated monazites. The arrows highlightchanges in Y and GdN/LuN values between different growthzones.
Journal of Petrology, 2015, Vol. 56, No. 9 1689
Dow
nloaded from https://academ
ic.oup.com/petrology/article/56/9/1677/1460164 by guest on 06 July 2022

Despite the lack of zoning in major elements, garnet
preserves significant variations in trace element com-
position, particularly in HREE and Y (SD Electronic
Appendix Fig. 6), owing to their much slower diffusion
rates than major elements (Lanzirotti, 1995; Hermann &Rubatto, 2003). Large garnet porphyroblasts commonly
have high HREE contents in the cores and show distinct
decreases toward the rims, with a transitional mantle
zone in some samples (NL01 and N10). Y contents in
garnet do not always correlate with HREE contents and
are less diagnostic in defining internal zoning. In the
mantle of the NL01 garnet, Y increases and has an op-posite trend to the HREE. The compositions of small
garnet grains vary in each sample. In sample NL01 the
HREE and Y contents of small garnets are higher than
those of the porphyroblast cores; in samples N10 and
NL27, they are similar to the compositions of the por-
phyroblast rims. Chondrite-normalized REE patterns ofgarnet in all the samples show light REE (LREE) deple-
tion below chondrite values, negative Eu anomalies and
relative HREE enrichment (Fig. 8). The negative Eu
anomalies and LREE depletion are similar across differ-
ent garnet domains, whereas the HREE enrichment is
always a maximum in the cores of large garnet por-phyroblasts. From cores to rims, HREE enrichment
gradually decreases and rims show relatively flat HREE
patterns or slight depletion compared with the middle
REE (MREE).
RUTILE U–Pb GEOCHRONOLOGY ANDTHERMOMETRY
Most rutile grains are clear, have euhedral crystal
shapes and vary in color from brown to dark yellow.
Grain sizes vary from �60 to >150 lm in radius (bra-
chyaxis) and are relatively larger in samples L11 and
N12. Most rutile grains are homogeneous and do not
show any internal zoning in BSE images (Fig. 9).Analyses that have unusually high concentrations of Si,
Zr, Hf, Y, Fe, Mn or Th were discarded owing to possible
contamination by inclusions such as zircon, monazite
and ilmenite.
Rutile crystals from samples L11, NY11 and N12
have relatively high concentrations of U (mostly>40 ppm; SD Electronic Appendix Table 5) and were ana-
lyzed for U–Pb dating. Rutile crystals in metapelite sam-
ple L11 yield ages that scatter between 8�7 and 4�4 Ma
(Fig. 9) with a significant peak at 6�9 6 0�3 Ma (MSWD
1�2, N 8/13). Rutile crystals in metapsammite sample
NY11 yield ages that define a peak at 16�4 6 0�5 Ma
(MSWD 1�5, N 12/15). Rutile crystals in metapsammitesample N12 have higher U concentrations of 300–
400 ppm and a low fraction of common Pb (most<
0�5%). Ages for this sample tightly cluster at
15�7 6 0�2 Ma (MSWD 1�1, N 31/31).
Rutile crystals from samples NL01, L11, NL07 (adja-
cent to N24), NL16 (adjacent to N22), NY11 and N12were analyzed for their Zr content; average tempera-
tures and uncertainties are reported in Table 1. SamplesTab
le2
:S
um
ma
ryo
fm
on
azi
tea
nd
ruti
leU
–Pb
ag
es,
an
dm
on
azi
tea
nd
ga
rne
ttr
ace
ele
me
nt
sig
na
ture
s
Sa
mp
leL
oca
lity
Mo
na
zite
incl
usi
on
sM
on
azi
tea
ge
(Ma
)M
on
azi
teR
EE
Ru
tile
ag
e(M
a)
NL
01
Lo
we
rG
HC
,N
on
eC
ore
s1
8�6
60�6
Ma
,ri
ms
16�1
–15�4
Ma
,C
ore
tori
m,in
cre
ase
inH
RE
Ea
nd
YN
ya
lam
rim
s1
4�1
60�4
Ma
L1
1L
ow
er
GH
C,
Plþ
Btþ
Msþ
Qz
Co
res
26�0
60�6
Ma
,m
an
tle
s2
4�1
–18�7
Ma
,C
ore
sto
ma
ntl
e,d
ecr
ea
sein
HR
EE
an
dY
6�9
60�3
La
ng
tan
g(c
oreþ
ma
ntl
e)
rim
s1
7�8
–14�2
Ma
Ma
ntl
eto
rim
,in
cre
ase
inH
RE
Ea
nd
YN
24
Lo
we
rG
HC
,A
bþ
Orþ
Qz
(rim
),C
ore
sþ
rim
s1
7�3
60�2
Ma
Co
reto
rim
,in
cre
ase
inH
RE
EN
ya
lam
Grtþ
Msþ
Bt
(co
re)
N2
2L
ow
er
GH
C,
Msþ
Qz
(rim
)In
he
rite
dco
res
96
16
13
Ma
,o
ve
rgro
wth
Co
reto
rim
,in
cre
ase
inH
RE
Ea
nd
YN
ya
lam
rim
s1
5�3
60�2
Ma
N1
8L
ow
er
GH
C,
Ab
un
da
nt
Sil,
Co
resþ
rim
s1
8�2
60�2
Ma
(ex
cess
20
6P
b,
No
dif
fere
nce
inH
RE
Ea
nd
YN
ya
lam
Kfsþ
Qzþ
Grtþ
Msþ
Btþ
Pl
Th
–Pb
ag
e�
16�7
Ma
)N
L2
7U
pp
er
GH
C,
(Kfsþ
Plþ
Qz)
po
lym
ine
ralic
Inh
eri
ted
core
s4
92
–46
3M
a,m
an
tle
sC
ore
tori
m,d
ecr
ea
sein
HR
EE
Ny
ala
min
clu
sio
n(m
an
tle
)3
2�0
60�8
Ma
,m
an
tle
s2
9�6
–27�3
Ma
,ri
ms
25�4
–20�7
Ma
NL
29
Up
pe
rG
HC
,K
fsþ
Msþ
Qzþ
Silþ
Btþ
Pl
25�9
60�3
Ma
No
dif
fere
nce
inH
RE
Ea
nd
YN
ya
lam
(Grt
-fre
esa
mp
le)
NY
11
Up
pe
rG
HC
,(K
fsþ
Msþ
Qz)
po
lym
ine
ralic
Co
res
29�2
60�4
Ma
,ri
ms
28�4
60�3
Ma
Ho
mo
ge
ne
ou
sin
HR
EE
an
dY
16�4
60�4
Ny
ala
min
clu
sio
nþ
Btþ
Pl(c
oreþ
rim
)(G
rt-f
ree
sam
ple
)N
12
Up
pe
rG
HC
,(K
fsþ
Qz)
po
lym
ine
ralic
Un
zon
ed
30�5
–29�7
Ma
,2
7�1
60�3
Ma
,N
od
iffe
ren
cein
HR
EE
an
dY
15�7
60�2
Ny
ala
min
clu
sio
n(u
nzo
ne
d)
25�0
60�6
Ma
,ri
ms
23�0
–18�5
Ma
(ex
cess
(Grt
-fre
esa
mp
le)
20
6P
b,T
h–P
ba
ge
24�4
60�3
Ma
)N
10
Up
pe
rG
HC
,(K
fsþ
Qz)
po
lym
ine
ralic
Co
res
29�5
60�3
Ma
,ri
ms
27�4
–20�6
Ma
Co
res
tori
ms,
de
cre
ase
inH
RE
Ea
nd
YN
ya
lam
incl
usi
onþ
Btþ
Pl(c
ore
)
1690 Journal of Petrology, 2015, Vol. 56, No. 9
Dow
nloaded from https://academ
ic.oup.com/petrology/article/56/9/1677/1460164 by guest on 06 July 2022

NL01 and L11 from the kyanite zone have the lowest Zr
contents of �200–380 ppm, which yield average tem-
peratures of 640 6 35�C and 660 6 35�C, respectively.Samples NL07 and NL16 from the sillimanite–muscovite
zone have slightly higher Zr contents of �250–500 ppm
and �350–700 ppm, respectively. Calculated average
temperatures are 655 6 35�C and 675 6 35�C, respect-
ively. Samples NY11 and N12 from the upper GHC have
significantly higher Zr contents (�1000–1400 ppm),which yield average temperatures of 730 6 40�C and
745 6 40�C, respectively. In summary, the upper GHC
samples have a tendency to record 50–100�C higher tem-
peratures than the lower GHC samples, although the
uncertainties are relatively large.
DISCUSSION
Linking monazite ages to metamorphicconditionsAccurate interpretation of the ages obtained from
accessory phases is challenging as they can grow at
different stages of the P–T path. In this study, the
following criteria are used to define the timing of mona-
zite formation with respect to other minerals and rockevolution.
La Ce Pr Nd Sm Eu Gd Td Dy Ho Er Tm Yb Lu
100
1000
10000
ga
rne
t/c
ho
nd
rite
(a) NL01 garnet 1
10
1
0.1
0.01
mantlecore
rim
La Ce Pr Nd Sm Eu Gd Td Dy Ho Er Tm Yb Lu
100
1000
10000
ga
rne
t/c
ho
nd
rite
b) NL27 garnet 1
10
1
0.1
0.01
rimcore
(
La Ce Pr Nd Sm Eu Gd Td Dy Ho Er Tm Yb Lu
100
1000
10000
ga
rne
t/c
ho
nd
rite
(c) N10 garnet 1 and 3
10
1
0.1
0.01
mantlecore
rim
Fig. 8. Chondrite-normalized REE patterns of garnet. Thearrows highlight changes in HREE between different growthzones.
0
2
4
6
8
10
12
14
16
18
13 14 15 16 17 18 19 20
re
bm
uN
tili
ba
bor
pe
vit
ale
Ry
N12 rutilec)
206 238Pb/ U Age (Ma)
(
15.7±0.2 MaMSWD=1.1
31N
0
1
2
3
4
5
3 4 5 6 7 8 9 10 11 12
re
bm
uN
L11 rutile(a)
6.9±0.3 MaMSWD=1.2
8/13N
vit
ale
Ryt
ili
ba
bor
pe
50um
18.1 1 2 Ma
1174ppm740 °C
0
1
2
3
4
5
re
bm
uN
9 11 13 15 17 19 21 23
ytil
ib
ab
orp
evi
tal
eR
16.4±0.5 MaMSWD=1.5
15N 12/
NY11 rutile(b)
100um
6.6 0 6 Ma
260ppm650 °C
100um15.8 0 9 Ma
1285ppm750 °C
±
±
±
Fig. 9. Representative back-scattered electron images of se-lected rutile crystals and probability diagrams with superim-posed histograms of rutile U–Pb ages. Circles indicate thelocation of the LA-ICP-MS analyses and are �62mm in diam-eter. Numbers indicate 206Pb/238U ages, Zr concentrations andcalculated temperatures using the Zr-in-rutile thermometer ofTomkins et al. (2007).
Journal of Petrology, 2015, Vol. 56, No. 9 1691
Dow
nloaded from https://academ
ic.oup.com/petrology/article/56/9/1677/1460164 by guest on 06 July 2022
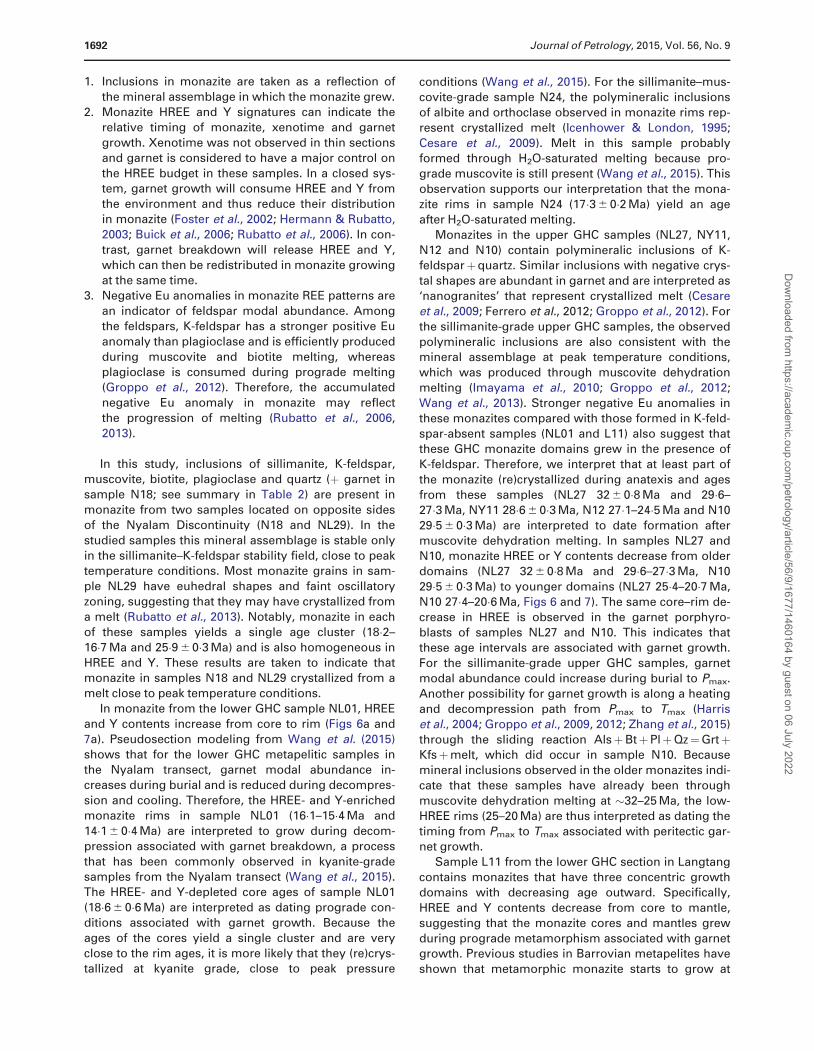
1. Inclusions in monazite are taken as a reflection of
the mineral assemblage in which the monazite grew.
2. Monazite HREE and Y signatures can indicate the
relative timing of monazite, xenotime and garnet
growth. Xenotime was not observed in thin sections
and garnet is considered to have a major control on
the HREE budget in these samples. In a closed sys-tem, garnet growth will consume HREE and Y from
the environment and thus reduce their distribution
in monazite (Foster et al., 2002; Hermann & Rubatto,
2003; Buick et al., 2006; Rubatto et al., 2006). In con-
trast, garnet breakdown will release HREE and Y,
which can then be redistributed in monazite growingat the same time.
3. Negative Eu anomalies in monazite REE patterns are
an indicator of feldspar modal abundance. Among
the feldspars, K-feldspar has a stronger positive Eu
anomaly than plagioclase and is efficiently produced
during muscovite and biotite melting, whereas
plagioclase is consumed during prograde melting(Groppo et al., 2012). Therefore, the accumulated
negative Eu anomaly in monazite may reflect
the progression of melting (Rubatto et al., 2006,
2013).
In this study, inclusions of sillimanite, K-feldspar,muscovite, biotite, plagioclase and quartz (þ garnet in
sample N18; see summary in Table 2) are present in
monazite from two samples located on opposite sides
of the Nyalam Discontinuity (N18 and NL29). In the
studied samples this mineral assemblage is stable only
in the sillimanite–K-feldspar stability field, close to peaktemperature conditions. Most monazite grains in sam-
ple NL29 have euhedral shapes and faint oscillatory
zoning, suggesting that they may have crystallized from
a melt (Rubatto et al., 2013). Notably, monazite in each
of these samples yields a single age cluster (18�2–
16�7 Ma and 25�9 6 0�3 Ma) and is also homogeneous in
HREE and Y. These results are taken to indicate thatmonazite in samples N18 and NL29 crystallized from a
melt close to peak temperature conditions.
In monazite from the lower GHC sample NL01, HREE
and Y contents increase from core to rim (Figs 6a and
7a). Pseudosection modeling from Wang et al. (2015)
shows that for the lower GHC metapelitic samples inthe Nyalam transect, garnet modal abundance in-
creases during burial and is reduced during decompres-
sion and cooling. Therefore, the HREE- and Y-enriched
monazite rims in sample NL01 (16�1–15�4 Ma and
14�1 6 0�4 Ma) are interpreted to grow during decom-
pression associated with garnet breakdown, a process
that has been commonly observed in kyanite-gradesamples from the Nyalam transect (Wang et al., 2015).
The HREE- and Y-depleted core ages of sample NL01
(18�6 6 0�6 Ma) are interpreted as dating prograde con-
ditions associated with garnet growth. Because the
ages of the cores yield a single cluster and are very
close to the rim ages, it is more likely that they (re)crys-tallized at kyanite grade, close to peak pressure
conditions (Wang et al., 2015). For the sillimanite–mus-
covite-grade sample N24, the polymineralic inclusions
of albite and orthoclase observed in monazite rims rep-
resent crystallized melt (Icenhower & London, 1995;
Cesare et al., 2009). Melt in this sample probablyformed through H2O-saturated melting because pro-
grade muscovite is still present (Wang et al., 2015). This
observation supports our interpretation that the mona-
zite rims in sample N24 (17�3 6 0�2 Ma) yield an age
after H2O-saturated melting.
Monazites in the upper GHC samples (NL27, NY11,
N12 and N10) contain polymineralic inclusions of K-feldsparþquartz. Similar inclusions with negative crys-
tal shapes are abundant in garnet and are interpreted as
‘nanogranites’ that represent crystallized melt (Cesare
et al., 2009; Ferrero et al., 2012; Groppo et al., 2012). For
the sillimanite-grade upper GHC samples, the observed
polymineralic inclusions are also consistent with themineral assemblage at peak temperature conditions,
which was produced through muscovite dehydration
melting (Imayama et al., 2010; Groppo et al., 2012;
Wang et al., 2013). Stronger negative Eu anomalies in
these monazites compared with those formed in K-feld-
spar-absent samples (NL01 and L11) also suggest thatthese GHC monazite domains grew in the presence of
K-feldspar. Therefore, we interpret that at least part of
the monazite (re)crystallized during anatexis and ages
from these samples (NL27 32 6 0�8 Ma and 29�6–
27�3 Ma, NY11 28�6 6 0�3 Ma, N12 27�1–24�5 Ma and N10
29�5 6 0�3 Ma) are interpreted to date formation after
muscovite dehydration melting. In samples NL27 andN10, monazite HREE or Y contents decrease from older
domains (NL27 32 6 0�8 Ma and 29�6–27�3 Ma, N10
29�5 6 0�3 Ma) to younger domains (NL27 25�4–20�7 Ma,
N10 27�4–20�6 Ma, Figs 6 and 7). The same core–rim de-
crease in HREE is observed in the garnet porphyro-
blasts of samples NL27 and N10. This indicates thatthese age intervals are associated with garnet growth.
For the sillimanite-grade upper GHC samples, garnet
modal abundance could increase during burial to Pmax.
Another possibility for garnet growth is along a heating
and decompression path from Pmax to Tmax (Harris
et al., 2004; Groppo et al., 2009, 2012; Zhang et al., 2015)
through the sliding reaction AlsþBtþPlþQz¼GrtþKfsþmelt, which did occur in sample N10. Because
mineral inclusions observed in the older monazites indi-
cate that these samples have already been through
muscovite dehydration melting at �32–25 Ma, the low-
HREE rims (25–20 Ma) are thus interpreted as dating the
timing from Pmax to Tmax associated with peritectic gar-net growth.
Sample L11 from the lower GHC section in Langtang
contains monazites that have three concentric growth
domains with decreasing age outward. Specifically,
HREE and Y contents decrease from core to mantle,
suggesting that the monazite cores and mantles grew
during prograde metamorphism associated with garnetgrowth. Previous studies in Barrovian metapelites have
shown that metamorphic monazite starts to grow at
1692 Journal of Petrology, 2015, Vol. 56, No. 9
Dow
nloaded from https://academ
ic.oup.com/petrology/article/56/9/1677/1460164 by guest on 06 July 2022
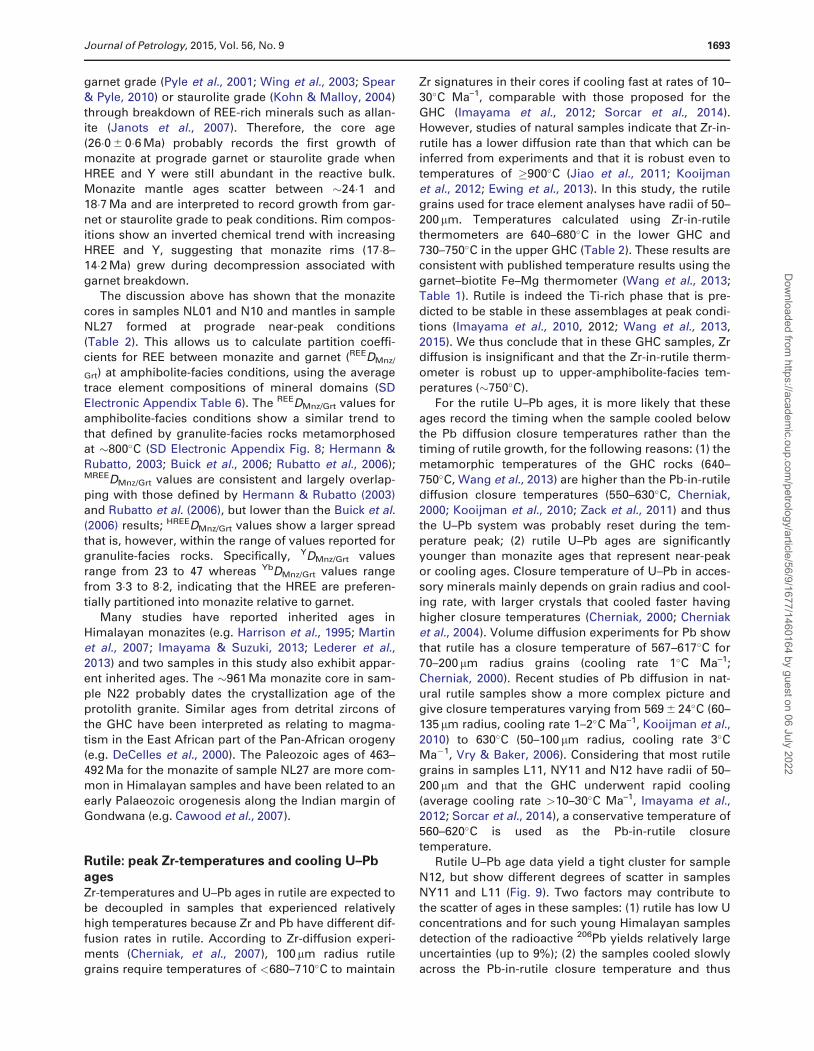
garnet grade (Pyle et al., 2001; Wing et al., 2003; Spear
& Pyle, 2010) or staurolite grade (Kohn & Malloy, 2004)
through breakdown of REE-rich minerals such as allan-
ite (Janots et al., 2007). Therefore, the core age
(26�0 6 0�6 Ma) probably records the first growth ofmonazite at prograde garnet or staurolite grade when
HREE and Y were still abundant in the reactive bulk.
Monazite mantle ages scatter between �24�1 and
18�7 Ma and are interpreted to record growth from gar-
net or staurolite grade to peak conditions. Rim compos-
itions show an inverted chemical trend with increasing
HREE and Y, suggesting that monazite rims (17�8–14�2 Ma) grew during decompression associated with
garnet breakdown.
The discussion above has shown that the monazite
cores in samples NL01 and N10 and mantles in sample
NL27 formed at prograde near-peak conditions
(Table 2). This allows us to calculate partition coeffi-cients for REE between monazite and garnet (REEDMnz/
Grt) at amphibolite-facies conditions, using the average
trace element compositions of mineral domains (SD
Electronic Appendix Table 6). The REEDMnz/Grt values for
amphibolite-facies conditions show a similar trend to
that defined by granulite-facies rocks metamorphosedat �800�C (SD Electronic Appendix Fig. 8; Hermann &
Rubatto, 2003; Buick et al., 2006; Rubatto et al., 2006);MREEDMnz/Grt values are consistent and largely overlap-
ping with those defined by Hermann & Rubatto (2003)
and Rubatto et al. (2006), but lower than the Buick et al.
(2006) results; HREEDMnz/Grt values show a larger spread
that is, however, within the range of values reported forgranulite-facies rocks. Specifically, YDMnz/Grt values
range from 23 to 47 whereas YbDMnz/Grt values range
from 3�3 to 8�2, indicating that the HREE are preferen-
tially partitioned into monazite relative to garnet.
Many studies have reported inherited ages in
Himalayan monazites (e.g. Harrison et al., 1995; Martinet al., 2007; Imayama & Suzuki, 2013; Lederer et al.,
2013) and two samples in this study also exhibit appar-
ent inherited ages. The �961 Ma monazite core in sam-
ple N22 probably dates the crystallization age of the
protolith granite. Similar ages from detrital zircons of
the GHC have been interpreted as relating to magma-
tism in the East African part of the Pan-African orogeny(e.g. DeCelles et al., 2000). The Paleozoic ages of 463–
492 Ma for the monazite of sample NL27 are more com-
mon in Himalayan samples and have been related to an
early Palaeozoic orogenesis along the Indian margin of
Gondwana (e.g. Cawood et al., 2007).
Rutile: peak Zr-temperatures and cooling U–PbagesZr-temperatures and U–Pb ages in rutile are expected to
be decoupled in samples that experienced relatively
high temperatures because Zr and Pb have different dif-
fusion rates in rutile. According to Zr-diffusion experi-ments (Cherniak, et al., 2007), 100 mm radius rutile
grains require temperatures of <680–710�C to maintain
Zr signatures in their cores if cooling fast at rates of 10–
30�C Ma–1, comparable with those proposed for the
GHC (Imayama et al., 2012; Sorcar et al., 2014).
However, studies of natural samples indicate that Zr-in-
rutile has a lower diffusion rate than that which can beinferred from experiments and that it is robust even to
temperatures of �900�C (Jiao et al., 2011; Kooijman
et al., 2012; Ewing et al., 2013). In this study, the rutile
grains used for trace element analyses have radii of 50–
200mm. Temperatures calculated using Zr-in-rutile
thermometers are 640–680�C in the lower GHC and
730–750�C in the upper GHC (Table 2). These results areconsistent with published temperature results using the
garnet–biotite Fe–Mg thermometer (Wang et al., 2013;
Table 1). Rutile is indeed the Ti-rich phase that is pre-
dicted to be stable in these assemblages at peak condi-
tions (Imayama et al., 2010, 2012; Wang et al., 2013,
2015). We thus conclude that in these GHC samples, Zrdiffusion is insignificant and that the Zr-in-rutile therm-
ometer is robust up to upper-amphibolite-facies tem-
peratures (�750�C).
For the rutile U–Pb ages, it is more likely that these
ages record the timing when the sample cooled below
the Pb diffusion closure temperatures rather than thetiming of rutile growth, for the following reasons: (1) the
metamorphic temperatures of the GHC rocks (640–
750�C, Wang et al., 2013) are higher than the Pb-in-rutile
diffusion closure temperatures (550–630�C, Cherniak,
2000; Kooijman et al., 2010; Zack et al., 2011) and thus
the U–Pb system was probably reset during the tem-
perature peak; (2) rutile U–Pb ages are significantlyyounger than monazite ages that represent near-peak
or cooling ages. Closure temperature of U–Pb in acces-
sory minerals mainly depends on grain radius and cool-
ing rate, with larger crystals that cooled faster having
higher closure temperatures (Cherniak, 2000; Cherniak
et al., 2004). Volume diffusion experiments for Pb showthat rutile has a closure temperature of 567–617�C for
70–200 lm radius grains (cooling rate 1�C Ma–1;
Cherniak, 2000). Recent studies of Pb diffusion in nat-
ural rutile samples show a more complex picture and
give closure temperatures varying from 569 6 24�C (60–
135 lm radius, cooling rate 1–2�C Ma–1, Kooijman et al.,
2010) to 630�C (50–100 lm radius, cooling rate 3�CMa�1, Vry & Baker, 2006). Considering that most rutile
grains in samples L11, NY11 and N12 have radii of 50–
200 lm and that the GHC underwent rapid cooling
(average cooling rate >10–30�C Ma–1, Imayama et al.,
2012; Sorcar et al., 2014), a conservative temperature of
560–620�C is used as the Pb-in-rutile closuretemperature.
Rutile U–Pb age data yield a tight cluster for sample
N12, but show different degrees of scatter in samples
NY11 and L11 (Fig. 9). Two factors may contribute to
the scatter of ages in these samples: (1) rutile has low U
concentrations and for such young Himalayan samples
detection of the radioactive 206Pb yields relatively largeuncertainties (up to 9%); (2) the samples cooled slowly
across the Pb-in-rutile closure temperature and thus
Journal of Petrology, 2015, Vol. 56, No. 9 1693
Dow
nloaded from https://academ
ic.oup.com/petrology/article/56/9/1677/1460164 by guest on 06 July 2022

recorded a range of ages. Therefore, only statistically
consistent age clusters were reported (N> 5). The ob-
tained rutile ages (L11 6�9 6 0�3 Ma, NY11 16�4 6 0�5 Ma,
N12 15�7 6 0�2 Ma) are 10–12 Myr younger than the
near-peak metamorphic ages revealed from monazite,and give information on the duration of cooling from
near-peak temperature conditions to 560–620�C.
Timing of partial melting and cooling historyIn the age summary of Fig. 10a there is a marked differ-
ence in monazite and rutile ages from lower GHC sam-
ples (monazite age populations between 26 and 14 Ma,
rutile ages �7 Ma) to upper GHC samples (monazite age
populations between 32 and 20 Ma, rutile ages �16–
17 Ma), indicating different times of metamorphism for
the two blocks. Together with the petrology and P–Tconditions of these samples (Wang et al., 2013), these
data are used to reconstruct the timing of partial melt-
ing in the two blocks (Fig. 10b). In addition, cooling his-
tories are defined using the monazite and rutile ages
from this study and published mineral cooling ages
from the Nyalam transect. The additional cooling agesused are muscovite 40Ar/39Ar ages (Wang et al., 2006)
with a closure temperature of 400 6 50�C (Hames &
Bowring, 1994), zircon fission-track ages (Wang et al.,
2010) with closure temperature of 280 6 20�C (Tagami
et al., 1998) and apatite fission-track ages (Zheng et al.,
2014) with a closure temperature of 100 6 10�C
(Gleadow & Duddy, 1981).
Lower GHC blockAt �26 Ma, monazite began to form at sub-solidus pro-
grade conditions (garnet or staurolite grade, 500–
600�C). Monazites that grew at this stage have relatively
high HREE and Y contents (cores of L11). From 26 to
19 Ma the lower GHC block underwent prograde meta-
morphism towards peak conditions. Monazite grew inequilibrium with garnet and recorded decreasing HREE
and Y contents (mantles of L11). At 19–16 Ma, most
samples reached peak metamorphic conditions (640–
675�C) and most monazites grew at this stage (cores of
NL01, N24 and N18). After the metamorphic peak, the
lower GHC samples underwent different degree of de-compression from the peak pressures (10–13 kbar) to
�4 kbar (Wang et al., 2013, 2015) and newly forming
monazite had higher HREE and Y contents owing to gar-
net breakdown (rims of NL01, L11, N22). The degree of
partial melting that the metapelitic rocks experienced
varies and largely depends on the pressures reached by
the samples. Partial melting in most metapelitic sam-ples (NL01, L11 and N24) was limited to a few per cent
(�5–7%) and was the result of an H2O-saturated melting
reaction (Table 1). During decompression, when the
sample entered the muscovite-dehydration field (4 kbar,
N18) a larger percentage of melt was produced
(�20 6 5%). Initial cooling probably began at �16 Ma.From �16 to 7 Ma, the lower GHC block cooled slowly
from peak temperatures to rutile U–Pb closure
temperatures (560–620�C) with an average cooling rate
of �10 6 5�C Ma–1. From �7 Ma, this block underwent
much faster cooling to zircon or apatite fission-trackclosure temperatures with an average cooling rate of
100 6 20�C Ma–1.
Upper GHC blockNo monazite that grew in sub-solidus prograde condi-
tions was preserved. The oldest preserved monazites
(mantles of NL27) grew at �32 Ma, during progradeanatexis after muscovite dehydration melting and incor-
porated relatively high HREE contents. For Himalayan
Channel f
low
Critic
al ta
perc.10°C/My
c.1
00
°C/M
y
c.1
20
°C/M
yc.
35°C/M
y
0
100
200
300
400
500
600
700
800
0 5 10 15 20 25 30 35
Te
mp
era
ture
(°C
)
Time (Ma)
Mnz U–Pb
Rt U Pb–
Ms40 39
Ar/ Ar
Zr FTAp FT
LGHC
UGHC
(b) Partial melting
0 5 10 15 20 25 30 35
Re
lati
ve p
rob
ab
ilit
y
Age (Ma)
Mnz subsolidusprogradeMnz melting
Mnz cooling
(a)
Lower GHC
Upper GHC
Rt cooling
Mnz N=97Rt N=18
Mnz N=110Rt N=46
Fig. 10. Summary of monazite and rutile age trends of theupper and lower GHC blocks; data from this study. (a)Probability diagrams of monazite and rutile ages that are linkedto different metamorphic stages. (b) Temperature–time histor-ies of the upper and lower GHC blocks and predictions fromchannel flow and critical taper models. Filled squares or circlesare statistically consistent average ages. Dashed red rectangleis the age interval defined by monazite rims from samplesNL27 and N10. Dashed blue rectangle is the age interval fromrutile sample L11. Black bars illustrate the uncertainties in cal-culated temperatures or ages. Monazite (re)crystallization tem-peratures are from Zr-in-rutile results in this study or thethermobarometric results of Wang et al. (2013). Temperaturesfor other minerals are diffusion closure temperatures (see textfor details). Muscovite 40Ar/39Ar ages and zircon and apatite fis-sion-track (FT) ages are from the literature (Wang et al., 2006;Wang et al., 2010; Zheng et al., 2014). LGHC, lower GHC;UGHC, upper GHC.
1694 Journal of Petrology, 2015, Vol. 56, No. 9
Dow
nloaded from https://academ
ic.oup.com/petrology/article/56/9/1677/1460164 by guest on 06 July 2022
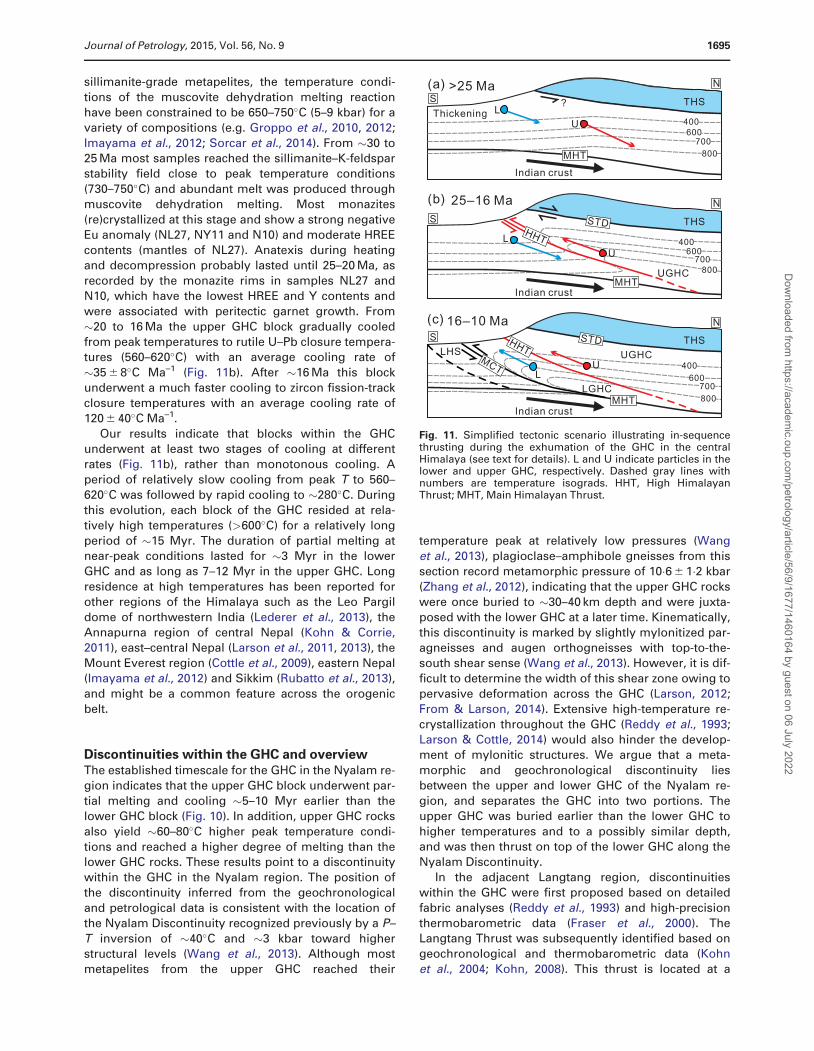
sillimanite-grade metapelites, the temperature condi-
tions of the muscovite dehydration melting reaction
have been constrained to be 650–750�C (5–9 kbar) for a
variety of compositions (e.g. Groppo et al., 2010, 2012;
Imayama et al., 2012; Sorcar et al., 2014). From �30 to25 Ma most samples reached the sillimanite–K-feldspar
stability field close to peak temperature conditions
(730–750�C) and abundant melt was produced through
muscovite dehydration melting. Most monazites
(re)crystallized at this stage and show a strong negative
Eu anomaly (NL27, NY11 and N10) and moderate HREE
contents (mantles of NL27). Anatexis during heatingand decompression probably lasted until 25–20 Ma, as
recorded by the monazite rims in samples NL27 and
N10, which have the lowest HREE and Y contents and
were associated with peritectic garnet growth. From
�20 to 16 Ma the upper GHC block gradually cooled
from peak temperatures to rutile U–Pb closure tempera-tures (560–620�C) with an average cooling rate of
�35 6 8�C Ma–1 (Fig. 11b). After �16 Ma this block
underwent a much faster cooling to zircon fission-track
closure temperatures with an average cooling rate of
120 6 40�C Ma–1.
Our results indicate that blocks within the GHCunderwent at least two stages of cooling at different
rates (Fig. 11b), rather than monotonous cooling. A
period of relatively slow cooling from peak T to 560–
620�C was followed by rapid cooling to �280�C. During
this evolution, each block of the GHC resided at rela-
tively high temperatures (>600�C) for a relatively long
period of �15 Myr. The duration of partial melting atnear-peak conditions lasted for �3 Myr in the lower
GHC and as long as 7–12 Myr in the upper GHC. Long
residence at high temperatures has been reported for
other regions of the Himalaya such as the Leo Pargil
dome of northwestern India (Lederer et al., 2013), the
Annapurna region of central Nepal (Kohn & Corrie,2011), east–central Nepal (Larson et al., 2011, 2013), the
Mount Everest region (Cottle et al., 2009), eastern Nepal
(Imayama et al., 2012) and Sikkim (Rubatto et al., 2013),
and might be a common feature across the orogenic
belt.
Discontinuities within the GHC and overviewThe established timescale for the GHC in the Nyalam re-
gion indicates that the upper GHC block underwent par-
tial melting and cooling �5–10 Myr earlier than the
lower GHC block (Fig. 10). In addition, upper GHC rocks
also yield �60–80�C higher peak temperature condi-
tions and reached a higher degree of melting than thelower GHC rocks. These results point to a discontinuity
within the GHC in the Nyalam region. The position of
the discontinuity inferred from the geochronological
and petrological data is consistent with the location of
the Nyalam Discontinuity recognized previously by a P–
T inversion of �40�C and �3 kbar toward higherstructural levels (Wang et al., 2013). Although most
metapelites from the upper GHC reached their
temperature peak at relatively low pressures (Wang
et al., 2013), plagioclase–amphibole gneisses from this
section record metamorphic pressure of 10�6 6 1�2 kbar
(Zhang et al., 2012), indicating that the upper GHC rocks
were once buried to �30–40 km depth and were juxta-
posed with the lower GHC at a later time. Kinematically,
this discontinuity is marked by slightly mylonitized par-agneisses and augen orthogneisses with top-to-the-
south shear sense (Wang et al., 2013). However, it is dif-
ficult to determine the width of this shear zone owing to
pervasive deformation across the GHC (Larson, 2012;
From & Larson, 2014). Extensive high-temperature re-
crystallization throughout the GHC (Reddy et al., 1993;Larson & Cottle, 2014) would also hinder the develop-
ment of mylonitic structures. We argue that a meta-
morphic and geochronological discontinuity lies
between the upper and lower GHC of the Nyalam re-
gion, and separates the GHC into two portions. The
upper GHC was buried earlier than the lower GHC to
higher temperatures and to a possibly similar depth,and was then thrust on top of the lower GHC along the
Nyalam Discontinuity.
In the adjacent Langtang region, discontinuities
within the GHC were first proposed based on detailed
fabric analyses (Reddy et al., 1993) and high-precision
thermobarometric data (Fraser et al., 2000). TheLangtang Thrust was subsequently identified based on
geochronological and thermobarometric data (Kohn
et al., 2004; Kohn, 2008). This thrust is located at a
THS
16 10 Ma–
Indian crust
800
700600
c)
U 400L
UGHC
MHT
(
MCT
LGHC
LHS
N
S
THS
25 16 Ma–
Indian crust
800
700600
(b)
U
STDHHT 400L
UGHCMHT
N
S
THS
>25 Ma
Indian crust
MHT 800
700600
?
(a)
Thickening400U
LS
N
HHTSTD
Fig. 11. Simplified tectonic scenario illustrating in-sequencethrusting during the exhumation of the GHC in the centralHimalaya (see text for details). L and U indicate particles in thelower and upper GHC, respectively. Dashed gray lines withnumbers are temperature isograds. HHT, High HimalayanThrust; MHT, Main Himalayan Thrust.
Journal of Petrology, 2015, Vol. 56, No. 9 1695
Dow
nloaded from https://academ
ic.oup.com/petrology/article/56/9/1677/1460164 by guest on 06 July 2022

similar position to the Nyalam Discontinuity and is
close to the K-feldspar-in isograd. Initial cooling of the
lower GHC in Langtang is constrained to be at �16 Ma
(Kohn et al., 2004), consistent with what we report for
the Nyalam region. Initial cooling of the upper GHC inLangtang is constrained at around 21 Ma. Metamorphic
conditions in both regions are similar, with rocks in the
hanging wall yielding �50–70�C higher temperatures
than the footwall rocks (Kohn, 2008). Because these two
adjacent regions are so close (<50 km) and have similar
metamorphic conditions and timing, we argue that the
Nyalam Discontinuity and Langtang Thrust are con-nected and that blocks in these two regions underwent
the same evolution.
Discontinuities within the GHC have also been re-
ported in other regions along the strike of the
Himalayan orogenic belt. In the Lower Dolpo region of
western Nepal a high-temperature top-to-the-SW shearzone has been recognized (Fig. 1a, Toijem shear zone;
Carosi et al., 2007). This shear zone was active between
�26 and 17 Ma, as constrained by U–Pb dating of mona-
zite in a mylonitic mica-schist and cross-cutting leucog-
ranite dyke (Carosi et al., 2010). Some 100 km to the
west, another 4 km thick shear zone (Mangri shearzone) has been recognized and its activity dated at �25–
18 Ma (Montomoli et al., 2013). In central–western
Nepal, two discontinuities have been identified (Martin
et al., 2010; Corrie & Kohn, 2011) and the initial activa-
tion of the structurally higher Sinuwa Thrust (<25 Ma,
Corrie & Kohn, 2011) is close in timing to the Nyalam
Discontinuity. In east–central Nepal a discontinuity inthe temperatures of deformation has been recognized
within the GHC (Larson & Cottle, 2014), but may lie
below the Nyalam Discontinuity because all the sam-
ples of Larson & Cottle (2014) were collected from lower
in the GHC compared with samples collected in this
study. The timing of metamorphism across this discon-tinuity is indistinguishable and dated to be from �24 to
16 Ma (Larson & Cottle, 2014; From et al., 2014), which
corresponds to the prograde metamorphism of the
lower GHC from this study. In eastern Nepal, the High
Himal Thrust (HHT) was recognized by Goscombe et al.
(2006), based on the finding of a 100–400 m thick shear
zone, but no jump in P–T conditions has been docu-mented (Imayama et al., 2012). The timing of initial cool-
ing was established to be 27–23 Ma in the hanging wall
and 18–16 Ma in the footwall (Imayama et al., 2012), and
is similar to that for the Nyalam region. Further to the
east in Sikkim, a discontinuity within the GHC was rec-
ognized on the basis of monazite and zircon U–Pb ages(Rubatto et al., 2013). However, this discontinuity differs
from those recognized in Nepal in that the timing of pro-
grade melting and peak conditions is older in the foot-
wall (�31–27 Ma) and younger in the hanging-wall
section (�26–23 Ma; Rubatto et al., 2013). Monazite U–
Th–Pb dating of the lowest GHC in this section con-
strains the timing of partial melting to be �23–19�5 Ma(Mottram et al., 2014), which allows for the identifica-
tion of a new discontinuity between the lowest GHC and
the �31–27 Ma sequence of Rubatto et al. (2013). In
Bhutan, the discontinuity within the GHC is termed the
Kakhtang Thrust, which separates a hanging wall that
records younger metamorphic ages (14–13 Ma) from a
footwall that exhibits older metamorphic ages (21–17 Ma) (Hollister & Grujic, 2006; Grujic et al., 2011;
Warren et al., 2011). This thrust is thus considered as an
out-of-sequence thrust.
This overview clarifies the presence of an in-se-
quence thrust within the GHC in the central Himalaya,
which extends from western Nepal to central and east-
ern Nepal and possibly to the Sikkim region, and is lo-cally named the Mangri Shear Zone, Toijem Shear
Zone, Sinuwa Thrust, Langtang Thrust, Nyalam
Discontinuity and the High Himal Thrust from west to
east. According to the present data, this thrust cannot
be extended to Bhutan, where an out-of-sequence
thrust has been identified. A conservative estimate oflength of the thrust is �800 km oriented parallel to the
strike of the Himalayan orogen. This thrust has been
named the ‘High Himalayan Discontinuity’ in west
Nepal (Montomoli et al., 2013) and the ‘High Himal
Thrust’ in east Nepal (Goscombe et al., 2006); here we
suggest the unifying name ‘High Himalayan Thrust’.Further work is needed to investigate whether this
thrust is connected to the Main Himalayan Thrust at
mid- to deep crustal levels (Fig. 11).
Implications for Himalayan tectonicsThe diachroneity of two distinct blocks within the GHC,as well as the different cooling rates within each block,
has important implications for tectonic models that
have been proposed for the Himalaya. The original
channel flow model (HT-1, Jamieson et al., 2004) and
other extrusion models such as wedge extrusion (Grujic
et al., 1996) and tectonic wedging (Webb et al., 2011)
consider the GHC as a coherent segment and assumethat the GHC was exhumed by coeval movement along
the top-to-south MCT and top-to-north STD. For these
models, synchronicity is a necessary factor. However,
our results and previous studies (Kohn et al., 2004;
Corrie & Kohn, 2011; Grujic et al., 2011; Warren et al.,
2011; Imayama et al., 2012; Rubatto et al., 2013) show adiachroneity in the age of peak metamorphism and ex-
humation across the different portions of the GHC. In
Nyalam, the upper GHC block was exhumed �5–10 Myr
earlier than the lower GHC block. This timing implies
that movements along the STD and MCT were not sim-
ultaneous and that the initial activity of the STD in the
Nyalam region (�27–25 Ma, Liu et al., 2012; Xu et al.,2013) was �10 Myr earlier than that of the MCT
(�16 Ma). Therefore, the earlier channel flow models
are not compatible with the timescales obtained from
this study or other studies of central Himalayan regions.
The evolved versions of the channel flow model (HT-
111 or HT-111E, Hollister & Grujic, 2006; Jamiesonet al., 2006; Jamieson & Beaumont, 2013) are able
to incorporate discontinuities and diachronous
1696 Journal of Petrology, 2015, Vol. 56, No. 9
Dow
nloaded from https://academ
ic.oup.com/petrology/article/56/9/1677/1460164 by guest on 06 July 2022

metamorphism, where a structurally higher and later
dome overlies a structurally lower and earlier GHC se-
quence. These channel flow models more successfully
explain the out-of-sequence pulsed channels observed
in Bhutan (Hollister & Grujic, 2006; Grujic et al., 2011;Warren et al., 2011), but are inconsistent with the in-se-
quence thrusting across the GHC observed in the Nepal
Himalaya regions. Another model that considers dia-
chroneity across the GHC is the critical taper model,
which suggests exhumation of the GHC by propagating
thrusts (Kohn, 2008). The distinct timing of peak meta-
morphism and cooling across the upper and lower GHCsupports the idea that these units were exhumed by in-
sequence thrusting along the High Himalayan Thrust
and MCT. Such an exhumation model is compatible
with the critical taper model.
Another important factor for comparing different tec-
tonic models is the duration of high-temperature meta-morphism. The channel flow models highlight the effect
of low-viscosity crustal melts, and assume a hot chan-
nel that sustained high-temperature conditions for >10–
15 Myr (Jamieson et al., 2004, 2006). In contrast, the
critical taper model suggests that the duration at high
temperatures was only �5 Myr (Kohn, 2008). In particu-lar, the degree of partial melting in the Nyalam upper
GHC was high (15–25%, 730–750�C, muscovite dehydra-
tion melting) and sustained for a relatively long
duration (7–12 Myr), which favors a low-viscosity mid-
dle–lower crust that may have contributed to the ex-
humation of the upper GHC. On the other hand, partial
melting in the lower GHC was not sufficiently high (0–10%, 640–680�C, H2O-saturated melting) and its dur-
ation was shorter (�3 Myr), indicating that melting in
the lower GHC rocks exposed at present may not be suf-
ficient to trigger lateral crustal flow. However, pro-
tracted high-temperature metamorphism (>600�C for
�15 Myr) in each block suggests that the unexposeddeeper rocks have the potential to sustain a longer dur-
ation of melting, which may be important for the trans-
port of heat and material in large hot orogens.
In conclusion, the in-sequence thrusting and rela-
tively long duration of high-temperature metamorph-
ism imply that channel flow and critical taper processes
are not mutually exclusive (Beaumont & Jamieson,2010; Larson et al., 2010, 2011; Jamieson & Beaumont,
2013; From et al., 2014; Larson & Cottle, 2014), but
evolved spatially and temporally. The channel flow
process is more likely to dominate the exhumation of
high-grade migmatitic rocks, whereas the critical taper
process seems more appropriate for the exhumation oflow-grade metamorphic or cooled migmatitic rocks. We
propose a simplified scenario to illustrate the tectonic
evolution of the GHC in the Nepal Himalaya (Fig. 11).
Before �25 Ma, the upper and lower GHC rocks were
progressively buried owing to thickening of the
Himalayan orogen. The upper GHC rocks were buried
to mid- to lower-crustal levels and reached melting tem-peratures as early as �32 Ma, whereas the lower GHC
rocks were still at a shallow crustal level. From �25 to
16 Ma, the upper GHC rocks were exhumed by coeval
movement along the STD and High Himalayan Thrust
in a setting that was dominated by lateral crustal flow,
whereas the lower GHC was continuously buried. From
�16 to �10 Ma the lower and upper GHC blocks werejuxtaposed and exhumed together along the MCT.
Because the upper GHC migmatites had already cooled,
and the degree and duration of partial melting in the
lower GHC was not sufficient to trigger crustal flow, the
juxtaposed GHC sequences were exhumed as a critical
thrusting wedge. Movements along the High Himalayan
Thrust and STD probably ceased at this time.Movement along the MCT ceased at around 10–8 Ma
(Harrison et al., 1997; Kohn et al., 2004; Larson et al.,
2013) and the thrusting wedge then shifted toward the
south to lower structural levels. After �16 Ma, tunneling
channel flow may have still existed, but retreated be-
neath the edge of the Tibetan plateau (Nelson et al.,1996; Jamieson & Beaumont, 2013) or was exhumed as
domes to the north as in the Bhutan region (Hollister &
Grujic, 2006; Grujic et al., 2011; Warren et al., 2011).
CONCLUSIONS
Determination of monazite ages in metapelites, meta-psammites and orthogneiss indicates that monazite in
amphibolite-facies (650–750�C) rocks can record either
inherited ages or metamorphic ages at various stages
along a Barrovian-type P–T path. Accurate interpret-
ation of these ages requires the combined study of
monazite zoning, mineral inclusions, age populations,trace element signatures, and bulk-rock P–T evolution.
Given the complexity and non-continuity of mineral re-
cords, dating migmatization requires investigation of
several samples from each block. Rutile in amphibolite-
facies rocks records cooling ages at its closure tempera-
ture. The Zr-in-rutile thermometer is robust at amphibo-
lite-facies conditions and can record peak temperatureconditions. Monazite and garnet partition coefficients
(DMnz/Grt) from amphibolite-facies samples are consist-
ent with those reported for granulite-facies samples.
The multidisciplinary approaches used in this study
allow us to link monazite and rutile U–Pb ages to meta-
morphic stages and to constrain the timing of partialmelting and cooling across the GHC in the Nyalam–
Langtang region. The GHC in this region consists of two
distinct blocks. The upper GHC block was the first to be
buried and reached higher peak temperatures (730–
750�C) and a higher degree of partial melting (15–25%),
dominated by muscovite dehydration melting.
Monazite records the earliest prograde melting at�32 Ma and large-scale partial melting lasted from 29 to
25 Ma, possibly to �20 Ma. From �20 to 16 Ma this
block slowly cooled from peak T to 560–620�C at an
average cooling rate of 35 6 8�C Ma–1, followed by rapid
cooling (120 6 40�C Ma–1). The lower GHC block experi-
enced lower peak temperatures (640–675�C) and alower amount of partial melting (0–10%) via H2O-satu-
rated or muscovite dehydration melting. Monazite
Journal of Petrology, 2015, Vol. 56, No. 9 1697
Dow
nloaded from https://academ
ic.oup.com/petrology/article/56/9/1677/1460164 by guest on 06 July 2022

records early sub-solidus prograde ages of �26 Ma and
partial melting lasted from �19 to 16 Ma, while the
upper section was already cooling. From �16 to 7 Ma,
the lower block slowly cooled from peak T to 560–620�C
at an average cooling rate of 10 6 5�C Ma–1, followed byrapid cooling (100 6 20�C Ma–1). The timescale of meta-
morphism suggests a long duration (�15 Myr) of high-
temperature metamorphism (>600�C). Partial melting
in the upper GHC lasted for 7–12 Myr, whereas partial
melting in the lower GHC was sustained for only �3
Myr.
The diachroneity of two distinct blocks within theGHC implies a discontinuity in the study area, which is
probably connected to other discontinuities in the cen-
tral Himalaya. These discontinuities together constitute
the High Himalayan Thrust, which was active during the
period 25–16 Ma. Diachronous metamorphism and in-
sequence thrusting across the GHC is compatible withthe critical taper model, whereas a long period at high
temperature in each block is more supportive of the
channel flow model. For the rocks exposed at present in
the Himalaya a channel flow process dominated the ex-
humation of the high-grade upper GHC during the
period 25–16 Ma, whereas a critical taper process domi-nated the exhumation of the lower GHC rocks and
cooled upper GHC migmatites from 16 to 10 Ma. This
study implies that both propagating thrusting along
large tectonic boundaries and low-viscosity lateral crus-
tal flow contribute to the exhumation of high-grade
metamorphic rocks in Himalaya-like large collisional
orogens.
ACKNOWLEDGEMENTS
The authors thank P. Holden and J.-W. Park for analyt-
ical help with the SHRIMP and LA-ICP-MS. S. M. Rai, M.
Wang and X. X. Wang are thanked for help during field-work in Himalaya. We greatly appreciate the construct-
ive reviews by T. Imayama and an anonymous
reviewer.
FUNDING
This work was supported by the National NaturalScience Foundation of China (grant numbers 41172176
and 41121062), China Geological Survey and China
Scholarship Council (grant number 201306010046).
SUPPLEMENTARY DATA
Supplementary data for this paper are available atJournal of Petrology online.
REFERENCES
Aleinikoff, J. N., Schenck, W. S., Plank, M. O., Srogi, L., Fanning,C. M., Kamo, S. L. & Howell, B. (2006). Deciphering igneousand metamorphic events in high-grade rocks of theWilmington Complex, Delaware: morphology,
cathodoluminescence and backscattered electron zoning,and SHRIMP U–Pb geochronology of zircon and monazite.Geological Society of America Bulletin 118, 39–64.
Andersen, T. (2002). Correction of common lead in U–Pbanalyses that do not report 204Pb. Chemical Geology 192,59–79.
Arita, K. (1983). Origin of the inverted metamorphism of theLower Himalayas, central Nepal. Tectonophysics 95, 43–60.
Beaumont, C. & Jamieson, R. A. (2010). Himalayan Tibetan or-ogeny: channel flow versus (critical) wedge models, a falsedichotomy. In: Leech, M. L., Klemperer, S. L. & Mooney, W.D. (eds) Proceedings for the 25th Himalaya–Karakoram–Tibet Workshop. US Geological Survey Open-File Report2010, 1099. [Available at http://pubs.usgs.gov/of/2010/1099/beaumont/.]
Beaumont, C., Jamieson, R. A., Nguyen, M. H. & Lee, B. (2001).Himalayan tectonics explained by extrusion of a low-viscos-ity crustal channel coupled to focused surface denudation.Nature 414, 738–742.
Bollinger, L., Henry, P. & Avouac, J. P. (2006). Mountain build-ing in the Nepal Himalaya: Thermal and kinematic model.Earth and Planetary Science Letters 244, 58–71.
Buick, I. S., Hermann, J., Williams, I. S., Gibson, R. L. & Rubatto,D. (2006). A SHRIMP U–Pb and LA-ICP-MS trace elementstudy of the petrogenesis of garnet–cordierite–orthoamphi-bole gneisses from the Central Zone of the Limpopo Belt,South Africa. Lithos 88, 150–172.
Burchfiel, B. C. & Royden, L. H. (1985). North–south extensionwithin the convergent Himalayan region. Geology 13,679–682.
Burchfiel, B. C., Chen, Z. L., Hodges, K. V., Liu, Y. P., Royden, L.H., Deng, C. & Xie, J. (1992). The South Tibetan detachmentsystem, Himalaya orogen: Extension contemporaneouswith and parallel to shortening in a collisional mountainbelt. Geological Society of America, Special Papers 269,1–41.
Carosi, R., Montomoli, C. & Visona, D. (2007). A structural tran-sect in the Lower Dolpo: Insights on the tectonic evolutionof Western Nepal. Journal of Asian Earth Sciences 29,407–423.
Carosi, R., Montomoli, C., Rubatto, D. & Visona, D. (2010). LateOligocene high-temperature shear zones in the core of theHigher Himalayan Crystallines (Lower Dolpo, westernNepal). Tectonics 29, TC4029.
Catlos, E. J., Gilley, L. D. & Harrison, T. M. (2002). Interpretationof monazite ages obtained via in situ analysis. ChemicalGeology 188, 193–215.
Cawood, P. A., Johnson, M. R. W. & Nemchin, A. A. (2007).Early Palaeozoic orogenesis along the Indian margin ofGondwana: Tectonic response to Gondwana assembly.Earth and Planetary Science Letters 255, 70–84.
Cesare, B., Ferrero, S., Salvioli-Mariani, E., Pedron, D. &Cavallo, A. (2009). ‘Nanogranite’ and glassy inclusions: theanatectic melt in migmatites and granulites. Geology 37,627–630.
Chambers, J., Parrish, R., Argles, T., Harris, N. & Horstwood, M.(2011). A short-duration pulse of ductile normal shear on theouter South Tibetan detachment in Bhutan: Alternatingchannel flow and critical taper mechanics of the easternHimalaya. Tectonics 30, TC2005.
Cherniak, D. J. (2000). Pb diffusion in rutile. Contributions toMineralogy and Petrology 139, 198–207.
Cherniak, D. J., Watson, E. B., Grove, M. & Harrison, T. M.(2004). Pb diffusion in monazite: a combined RBS/SIMSstudy. Geochimica et Cosmochimica Acta 68, 829–840.
Cherniak, D. J., Manchester, J. & Watson, E. B. (2007). Zr and Hfdiffusion in rutile. Earth and Planetary Science Letters 261,267–279.
1698 Journal of Petrology, 2015, Vol. 56, No. 9
Dow
nloaded from https://academ
ic.oup.com/petrology/article/56/9/1677/1460164 by guest on 06 July 2022

Corrie, S. L. & Kohn, M. J. (2011). Metamorphic history of thecentral Himalaya, Annapurna region, Nepal, and implica-tions for tectonic models. Geological Society of AmericaBulletin 123, 1863–1879.
Cottle, J. M., Jessup, M. J., Newell, D. L., Searle, M. P., Law, R.D. & Horstwood, M. S. A. (2007). Structural insights into theearly stages of exhumation along an orogen-scale detach-ment: the South Tibetan detachment system, Dzakaa Chusection, eastern Himalaya. Journal of Structural Geology 29,1781–1797.
Cottle, J. M., Searle, M. P., Horstwood, M. S. A. & Waters, D. J.(2009). Timing of midcrustal metamorphism, melting, anddeformation in the Mount Everest region of Southern Tibetrevealed by U-(Th)-Pb geochronology. Journal of Geology117, 643–664.
DeCelles, P. G., Gehrels, G. E., Quade, J., LaReau, B. & Spurlin,M. (2000). Tectonic implications of U–Pb zircon ages of theHimalayan orogenic belt in Nepal. Science 288, 497–499.
DeCelles, P. G., Robinson, D. M., Quade, J., Ojha, T. P.,Garzione, C. N., Copeland, P. & Upreti, B. N. (2001).Stratigraphy, structure, and tectonic evolution of theHimalayan fold–thrust belt in western Nepal. Tectonics 20,487–509.
Eggins, S. M., Rudnick, R. L., McDonough, W. F. (1998). Thecomposition of peridotites and their minerals: a laser abla-tion ICP-MS study. Earth and Planetary Science Letters 154,53–71.
England, P. C. & Thompson, A. B. (1984). Pressure–tempera-ture–time paths of regional metamorphism I. Heat transferduring the evolution of regions of thickened continentalcrust. Journal of Petrology 25, 894–928.
Ewing, T. A. (2011). Hf isotope analysis and U–Pb geochron-ology of rutile: Technique development and application to alower crustal section (Ivrea–Verbano Zone, Italy). PhDthesis, Australian National University, Canberra, ACT, 385pp.
Ewing, T. A., Hermann, J. & Rubatto, D. (2013). The robustnessof the Zr-in-rutile and Ti-in-zircon thermometers duringhigh-temperature metamorphism (Ivrea–Verbano Zone,northern Italy). Contributions to Mineralogy and Petrology165, 757–779.
Faccenda, M., Gerya, T. V. & Chakraborty, S. (2008). Styles ofpostsubduction collisional orogeny: influence of conver-gence velocity, crustal rheology and radiogenic heat pro-duction. Lithos 103(1–2), 257–287.
Ferrero, S., Bartoli, O., Cesare, B., Salvioli-Mariani, E., Acosta-Vigil, A., Cavallo, A., Groppo, C. & Battiston, S. (2012).Microstructures of melt inclusions in anatectic meta-sedimentary rocks. Journal of Metamorphic Geology 30,303–322.
Fletcher, I. R., McNaughton, N. J., Davis, W. J. & Rasmussen, B.(2010). Matrix effects and calibration limitations in ion probeU–Pb and Th–Pb dating of monazite. Chemical Geology 270,31–44.
Foster, G., Kinny, P., Vance, D., Prince, C. & Harris, N. (2000).The significance of monazite U–Th–Pb age data in meta-morphic assemblages; a combined study of monazite andgarnet chronometry. Earth and Planetary Science Letters181, 327–340.
Foster, G., Gibson, H. D., Parrish, R., Horstwood, M., Fraser, J. &Tindle, A. (2002). Textural, chemical and isotopic insightsinto the nature and behaviour of metamorphic monazite.Chemical Geology 191, 183–207.
Foster, G., Parrish, R. R., Horstwood, M. S. A., Chenery, S., Pyle,J. & Gibson, H. D. (2004). The generation of prograde P–T–tpoints and paths; a textural, compositional, and chronolo-gical study of metamorphic monazite. Earth and PlanetaryScience Letters 228, 125–142.
Fraser, G., Worley, B. & Sandiford, M. (2000). High-precisiongeothermobarometry across the High Himalayan meta-morphic sequence, Langtang Valley, Nepal. Journal ofMetamorphic Geology 18, 665–681.
From, R. & Larson, K. (2014). Tectonostratigraphy, deformation,and metamorphism of the Himalayan mid-crust exposed inthe Likhu Khola region, east–central Nepal. Geosphere 10,292–307.
From, R., Larson, K. & Cottle, J. M. (2014). Metamorphism andgeochronology of the exhumed Himalayan midcrust, LikhuKhola region, east–central Nepal: Recognition of a tectono-metamorphic discontinuity. Lithosphere 6, 361–376.
Gleadow, A. J. W. & Duddy, I. R. (1981). A natural long-termtrack annealing experiment for apatite. Nuclear Tracks 5,169–174.
Godin, L., Grujic, D., Law, R. D. & Searle, M. P. (2006). Channelflow, ductile extrusion and exhumation in continental colli-sion zones: an introduction. In: Law, R. D., Searle, M. P. &Godin, L. (eds) Channel Flow, Ductile Extrusion andExhumation in Continental Collision Zones. GeologicalSociety, London, Special Publications 268, 1–23.
Goscombe, B., Gray, D. & Hand, M. (2006). Crustal architectureof the Himalayan metamorphic front in eastern Nepal.Gondwana Research 10, 232–255.
Gregory, C. J., Rubatto, D., Allen, C. M., Williams, I. S.,Hermann, J. & Ireland, T. (2007). Allanite micro-geochron-ology: A LA-ICP-MS and SHRIMP U–Th–Pb study. ChemicalGeology 245, 162–182.
Groppo, C., Rolfo, F. & Lombardo, B. (2009). P–T evolutionacross the Main Central Thrust Zone (Eastern Nepal): hiddendiscontinuities revealed by petrology. Journal of Petrology50, 1149–1180.
Groppo, C., Rolfo, F. & Indares, A. (2012). Partial melting in theHigher Himalayan Crystallines of Eastern Nepal: the effect ofdecompression and implications for the ‘Channel Flow’model. Journal of Petrology 53, 1057–1088.
Groppo, C., Rolfo, F. & Mosca, P. (2013). The cordierite-bearinganatectic rocks of the Higher Himalayan Crystallines (east-ern Nepal): low-pressure anatexis, meltproductivity, meltloss and the preservation of cordierite. Journal ofMetamorphic Geology 31, 187–204.
Groppo, C., Rubatto, D., Rolfo, F. & Lombardo, B. (2010). EarlyOligocene partial melting in the Main Central Thrust Zone(Arun valley, eastern Nepal Himalaya). Lithos 118(3–4), 287–301.
Grujic, D., Casey, M., Davidson, C., Hollister, L. S., Kuendig, R.,Pavlis, T. L. & Schmid, S. M. (1996). Ductile extrusion of theHigher Himalayan Crystalline in Bhutan: Evidence fromquartz microfabrics. Tectonophysics 260, 21–43.
Grujic, D., Warren, C. J. & Wooden, J. L. (2011). Rapid syncon-vergent exhumation of Miocene-aged lower orogenic crustin the eastern Himalaya. Lithosphere 3, 346–366.
Hames, W. E. & Bowring, S. A. (1994). An empirical evaluationof the argon diffusion geometry in muscovite. Earth andPlanetary Science Letters 124, 161–169.
Harris, N. B. W., Caddick, M., Kosler, J., Goswami, S., Vance, D.& Tindle, A. G. (2004). The pressure -temperature -time pathof migmatites from the Sikkim Himalaya. Journal ofMetamorphic Geology 22, 249–264.
Harrison, T. M., McKeegan, K. D. & LeFort, P. (1995). Detectionof inherited monazite in the Manaslu leucogranite by208Pb/232Th ion microprobe dating: Crystallization age andtectonic implications. Earth and Planetary Science Letters133, 271–282.
Harrison, T. M., Ryerson, F. J., Le Fort, P., Yin, A., Lovera, O. M.& Catlos, E. J. (1997). A Late Miocene–Pliocene origin for theCentral Himalayan inverted metamorphism. Earth andPlanetary Science Letters 146, E1–E7.
Journal of Petrology, 2015, Vol. 56, No. 9 1699
Dow
nloaded from https://academ
ic.oup.com/petrology/article/56/9/1677/1460164 by guest on 06 July 2022

Henry, P., Le Pichon, X. & Goffe, B. (1997). Kinematic, thermaland petrological model of the Himalayas: constraints relatedto metamorphism within the underthrust Indian crust andtopographic elevation. Tectonophysics 273, 31–56.
Hermann, J. & Rubatto, D. (2003). Relating zircon and monazitedomains to garnet growth zones: age and duration of granu-lite facies metamorphism in the Val Malenco lower crust.Journal of Metamorphic Geology 21, 833–852.
Hollister, L. S. & Grujic, D. (2006). Pulsed channel flow inBhutan. In: Law, R. D., Searle, M. P. & Godin, L. (eds)Channel Flow, Ductile Extrusion and Exhumation inContinental Collision Zones. Geological Society, London,Special Publications 268, 415–423.
Icenhower, J. & London, D. (1995). An experimental study ofelement partitioning among biotite, muscovite, and coexist-ing peraluminous silicic melt at 200 MPa (H2O). AmericanMineralogist 80, 1229–1251.
Imayama, T. & Suzuki, K. (2013). Carboniferous inherited grainand age zoning of monazite and xenotime from leucogran-ites in far-eastern Nepal: Constraints from electron probemicroanalysis. American Mineralogist 98, 1393–1406.
Imayama, T., Takeshita, T. & Arita, K. (2010). Metamorphic P–Tprofile and P–T path discontinuity across the far-easternNepal Himalaya: investigation of channel flow models.Journal of Metamorphic Geology 28, 527–549.
Imayama, T., Takeshita, T., Yi, K., Cho, D.-L., Kitajima, K.,Tsutsumi, Y., Kayama, M., Nishido, H., Okumura, T., Yagi,K., Itaya, T. & Sano, Y. (2012). Two-stage partial melting andcontrasting cooling history within the Higher HimalayanCrystalline Sequence in the far-eastern Nepal Himalaya.Lithos 134–135, 1–22.
Ishida, T. (1969). Petrography and structure of the area betweenthe Dudh Kosi and Tamba Kosi, East Nepal. Journal of theGeological Society of Japan 75(3), 115–125.
Ishida, T. & Ohta, Y. (1973). Ramechhap–Okhaldhunga region.In: Hashimoto, S., Ohta, Y., Akiba, C. & Daigaku, H. (eds)Geology of the Nepal Himalayas. Saikon PublishingCompany, pp. 39–68.
Jamieson, R. A. & Beaumont, C. (2013). On the origin oforogens. Geological Society of America Bulletin 125,1671–1702.
Jamieson, R. A., Beaumont, C., Medvedev, S. & Nguyen, M. H.(2004). Crustal channel flows: 2. Numerical models withimplications for metamorphism in the Himalayan–Tibetanorogen. Journal of Geophysical Research B: Solid Earth 109,B06407.
Jamieson, R. A., Beaumont, C., Nguyen, M. H. & Grujic, D.(2006). Provenance of the Greater Himalayan sequence andassociated rocks: predictions of channel flow models. In:Channel Flow, Ductile Extrusion and Exhumation inContinental Collision Zones. Law, R. D., Searle, M. P. &Godin, L. (eds) Geological Society of London SpecialPublication 268, 165–182.
Janots, E., Brunet, F., Goffe, B., Poinssot, C., Burchard, M. &Cemic, L. (2007). Thermochemistry of monazite-(La) and dis-sakisite-(La): implications for monazite and allanite stabilityin metapelites. Contributions to Mineralogy and Petrology154, 1–14.
Jiao, S., Guo, J., Mao, Q. & Zhao, R. (2011). Application of Zr-in-rutile thermometry: a case study from ultrahigh-tempera-ture granulites of the Khondalite belt, North China Craton.Contributions to Mineralogy and Petrology 162, 379–393.
Kellett, A. D., Grujic, D., Warren, C., Cottle, J., Jamieson, R. &Tenzin, T. (2010). Metamorphic history of a syn-convergentorogen-parallel detachment: The South Tibetan detachmentsystem, Bhutan Himalaya. Journal of Metamorphic Geology28, 785–808.
Kohn, M. J. (2008). P–T–t data from central Nepal support crit-ical taper and repudiate large-scale channel flow of theGreater Himalayan Sequence. Geological Society ofAmerica Bulletin 120, 259–273.
Kohn, M. J. & Corrie, S. L. (2011). Preserved Zr-temperaturesand U–Pb ages in high-grade metamorphic titanite:Evidence for a static hot channel in the Himalayan orogen.Earth and Planetary Science Letters 311, 136–143.
Kohn, M. J. & Malloy, M. A. (2004). Formation of monazite viaprograde metamorphic reactions among common silicates:implications for age determinations. Geochimica etCosmochimica Acta 68, 101–113.
Kohn, M. J., Wieland, M. S., Parkinson, C. D. & Upreti, B. N.(2004). Miocene faulting at plate tectonic velocity in theHimalaya of central Nepal. Earth and Planetary ScienceLetters 228, 299–310.
Kooijman, E., Mezger, K. & Berndt, J. (2010). Constraints onthe U–Pb systematics of metamorphic rutile from in situ LA-ICP-MS analysis. Earth and Planetary Science Letters 293,321–330.
Kooijman, E., Smit, M. A., Mezger, K. & Berndt, J. (2012). Traceelement systematics in granulite facies rutile: implicationsfor Zr geothermometry and provenance studies. Journal ofMetamorphic Geology 30, 397–412.
Lanzirotti, A. (1995). Yttrium zoning in metamorphic garnets.Geochimica et Cosmochimica Acta 59, 4105–4110.
Larson, K., Godin, L. & Price, R. A. (2010). Relationships betweendisplacement and distortion in orogens: Linking theHimalayan foreland and hinterland in central Nepal.Geological Society of America Bulletin 122, 1116–1134.
Larson, K., Cottle, J. M. & Godin, L. (2011). Petrochronologic re-cord of metamorphism and melting in the upper GreaterHimalayan sequence, Manaslu–Himal Chuli Himalaya,west–central Nepal. Lithosphere 3(6), 379–392.
Larson, K. P. (2012). The geology of the Tama Kosi andRolwaling valley region, East–Central Nepal. Geosphere 8,507–517.
Larson, K. P. & Cottle, J. M. (2014). Mid-crustal discontinuitiesand the assembly of the Himalayan mid-crust. Tectonics33(5), 718–740.
Larson, K. P., Gervais, F. & Kellett, D. A. (2013). A P–T–t–Ddiscontinuity in east–central Nepal: Implications for the evo-lution of the Himalayan mid-crust. Lithos 179, 275–292.
Lederer, G. W., Cottle, J. M., Jessup, M. J., Langille, J. M. &Ahmad, T. (2013). Timescales of partial melting in theHimalayan middle crust: insight from the Leo Pargil dome,northwest India. Contributions to Mineralogy and Petrology166, 1415–1441.
Leech, M. L., Singh, S., Jain, A. K., Klemperer, S. L. &Manickavasagam, R. M. (2005). The onset of India–Asia con-tinental collision: Early, steep subduction required by thetiming of UHP metamorphism in the western Himalaya.Earth and Planetary Science Letters 234, 83–97.
Le Fort, P. (1975). Himalayas: the collided range. Present know-ledge of the continental arc. American Journal of Science275a, 1–44.
Liu, X., Liu, X., Leloup, P. H., Maheo, G., Paquette, J. L., Zhang,X. & Zhou, X. (2012). Ductile deformation within UpperHimalaya Crystalline Sequence and geological implications,in Nyalam area, Southern Tibet. Chinese Science Bulletin57, 3469–3481.
Ludwig, K. R. (2008). Isoplot/Ex version 3.7. A geochronologicaltoolkit for Microsoft Excel. Berkeley GeochronologicalCentre, Special Publication. [available at: http://www.bgc.org/isoplot_etc/isoplot.html].
Martin, A. J., Gehrels, G. E. & DeCelles, P. G. (2007). The tec-tonic significance of (U,Th)/Pb ages of monazite inclusions
1700 Journal of Petrology, 2015, Vol. 56, No. 9
Dow
nloaded from https://academ
ic.oup.com/petrology/article/56/9/1677/1460164 by guest on 06 July 2022

in garnet from the Himalaya of central Nepal. ChemicalGeology 244, 1–24.
Martin, A. J., Ganguly, J. & DeCelles, P. G. (2010).Metamorphism of Greater and Lesser Himalayan rocksexposed in the Modi Khola valley, central Nepal.Contributions to Mineralogy and Petrology 159, 203–223.
McDonough, W. F. & Sun, S. (1995). The composition of theEarth. Chemical Geology 120, 223–253.
Montomoli, C., Iaccarino, S., Carosi, R., Langone, A. &Visona, D. (2013). Tectonometamorphic discontinuitieswithin the Greater Himalayan Sequence in WesternNepal (Central Himalaya): Insights on the exhumation ofcrystalline rocks. Tectonophysics 608, 1349–1370.
Mottram, C. M., Warren, C. J., Regis, D., Roberts, N. M. W.,Harris, N. B. W., Argles, T. W. & Parrish, R. R. (2014).Developing an inverted Barrovian sequence; insights frommonazite petrochronology. Earth and Planetary ScienceLetters 403, 418–431.
Myrow, P. M., Hughes, N. C., Searle, M. P., Fanning, C. M.,Peng, S. C. & Parcha, S. K. (2009). Stratigraphic correlationof Cambrian–Ordovician deposits along the Himalaya:Implications for the age and nature of rocks in the MountEverest region. Geological Society of America Bulletin 121,323–332.
Nelson, K. D., Zhao, W., Brown, L. D., et al. (1996). Partially mol-ten middle crust beneath southern Tibet; synthesis ofProject INDEPTH results. Science 274, 1684–1688.
Parrish, R. R. (1990). U–Pb dating of monazite and its applicationto geological problems. Canadian Journal of Earth Sciences27, 1431–1450.
Paton, C., Woodhead, J. D., Hellstrom, J. C., Hergt, J. M., Greig,A. & Maas, R. (2010). Improved laser ablation U–Pb zircongeochronology through robust downhole fractionationcorrection. Geochemistry, Geophysics, Geosystems 11,Q0AA06.
Pearson, O. N. & DeCelles, P. G. (2005). Structural geology andregional tectonic significance of the Ramgarh Thrust,Himalayan fold–thrust belt of Nepal. Tectonics 24,doi:10.1029/2003TC001617.
Pyle, J. M., Spear, F. S., Rudnick, R. L. & McDonough, W. F.(2001). Monazite–xenotime–garnet equilibrium in metape-lites and a new monazite–garnet thermometer. Journal ofPetrology 42, 2083–2107.
Reddy, S. M., Searle, M. P. & Massey, J. A. (1993). Structuralevolution of the High Himalayan Gneiss sequence,Langtang valley, Nepal. In: Treloar, P. J. & Searle, M. P. (eds)Himalayan Tectonics. Geological Society, London, SpecialPublications 74, 375–389.
Robinson, D. M., DeCelles, P. G. & Copeland, P. (2006). Tectonicevolution of the Himalayan thrust belt in western Nepal:Implications for channel flow models. Geological Society ofAmerica Bulletin 118, 865–885.
Rowley, D. B. (1996). Age of initiation of collision between Indiaand Asia: A review of stratigraphic data. Earth and PlanetaryScience Letters 145, 1–13.
Royden, L. H. (1993). Evolution of retreating subduction boun-daries formed during continental collision. Tectonics 12,629–638.
Rubatto, D., Williams, I. S. & Buick, I. S. (2001). Zircon andmonazite response to prograde metamorphism in theReynolds Range, central Australia. Contributions toMineralogy and Petrology 140, 458–468.
Rubatto, D., Hermann, J. & Buick, I. S. (2006). Temperatureand bulk composition control on the growth of monaziteand zircon during low-pressure anatexis (MountStafford, central Australia). Journal of Petrology 47,1973–1996.
Rubatto, D., Chakraborty, S. & Dasgupta, S. (2013). Timescalesof crustal melting in the Higher Himalayan Crystallines(Sikkim, Eastern Himalaya) inferred from trace element-con-strained monazite and zircon chronology. Contributions toMineralogy and Petrology 165, 349–372.
Sawyer, E. W. & Brown, M. (2008). Working with Migmatites.Mineralogical Association of Canada, Short Course Series38, 12–13.
Scharer, U. (1984). The effect of initial 230Th disequilibrium onyoung U–Pb ages: the Makalu case, Himalaya. Earth andPlanetary Science Letters 67, 191–204.
Schelling, D. (1992). The tectonostratigraphy and structure ofthe eastern Nepal Himalaya. Tectonics 11, 925–943.
Searle, M. P. & Szulc, A. G. (2005). Channel flow and ductile ex-trusion of the high Himalayan slab—the Kangchenjunga–Darjeeling profile, Sikkim Himalaya. Journal of Asian EarthSciences 25, 173–185.
Searle, M. P., Parrish, R. R., Hodges, K. V., Hurford, A., Ayres, M.W. & Whitehouse, M. J. (1997). Shisha Pangma leucogran-ite, South Tibet: field relations, age, origin and emplace-ment. Journal of Geology 105, 295–315.
Searle, M. P., Simpson, R. L., Law, R. D., Parrish, R. R. & Waters,D. J. (2003). The structural geometry, metamorphic andmagmatic evolution of the Everest massif, High Himalaya ofNepal–South Tibet. Journal of Geological Society, London160, 345–366.
Searle, M. P., Law, R. D., Godin, L., Larson, K. P., Streule, M. J.,Cottle, J. M. & Jessup, M. J. (2008). Defining the HimalayanMain Central Thrust in Nepal. Journal of the GeologicalSociety, London 165, 523–534.
Sorcar, N., Hoppe, U., Dasgupta, S. & Chakraborty, S. (2014).High-temperature cooling histories of migmatites from theHigh Himalayan Crystallines in Sikkim, India: rapid coolingunrelated to exhumation?. Contributions to Mineralogy andPetrology 167, 1–34.
Spear, F. S. & Pyle, J. M. (2010). Theoretical modeling of mona-zite growth in a low-Ca metapelite. Chemical Geology 273,111–119.
Stacey, J. S. & Kramers, J. D. (1975). Approximation of terres-trial lead evolution by a two-stage model. Earth andPlanetary Science Letters 26, 207–221.
Stearns, M. A., Hacker, B. R., Ratschbacher, L., Lee, J., Cottle, J.M. & Kylander-Clark, A. (2013). Synchronous Oligocene–Miocene metamorphism of the Pamir and the northHimalaya driven by plate-scale dynamics. Geology 41,1071–1074.
Steiger, R. & Jager, E. (1977). Subcommission on geochron-ology: convention on the use of decay constants in geo- andcosmo-chronology. Earth and Planetary Science Letters 36,359–362.
Tagami, T., Galbraith, R. F., Yamada, R. & Laslett, G. M. (1998).Revised annealing kinetics of fission tracks in zircon andgeological implications. In: Van den Haute, P. & de Corte, F.(eds) Advances in Fission-Track Geochronology, 10. KluwerAcademic, pp. 99–112.
Tomkins, H. S., Powell, R. & Ellis, D. J. (2007). The pressure de-pendence of the zirconium-in-rutile thermometer. Journal ofMetamorphic Geology 25, 703–713.
Vry, J. K. & Baker, J. A. (2006). LA-MC-ICPMS Pb–Pb dating ofrutile from slowly cooled granulites: Confirmation of thehigh closure temperature for Pb diffusion in rutile.Geochimica et Cosmochimica Acta 70, 1807–1820.
Wang, A., Garver, J. I., Wang, G., Smith, J. A. & Zhang, K.(2010). Episodic exhumation of the Greater HimalayanSequence since the Miocene constrained by fission trackthermochronology in Nyalam, central Himalaya.Tectonophysics 495, 315–323.
Journal of Petrology, 2015, Vol. 56, No. 9 1701
Dow
nloaded from https://academ
ic.oup.com/petrology/article/56/9/1677/1460164 by guest on 06 July 2022

Wang, J. M., Zhang, J. J. & Wang, X. X. (2013). Structural kine-matics, metamorphic P–T profiles and zircon geochronologyacross the Greater Himalayan Crystalline Complex in south–central Tibet: implication for a revised channel flow. Journalof Metamorphic Geology 31, 607–628.
Wang, J. M., Zhang, J. J., Wei, C. J., Rai, S. M., Wang, M. & Qian,J. H. (2015). Characterising the metamorphic discontinuityacross the Main Central Thrust Zone of eastern–central Nepal.Journal of Asian Earth Sciences 101, 83–100.
Wang, Y., Li, Q. & Qu, G. (2006). 40Ar/39Ar thermochronologicalconstraints on the cooling and exhumation history of theSouth Tibetan Detachment System, Nyalam area, southernTibet. In: Law, R. D., Searle, M. P. & Godin, L. (eds) ChannelFlow, Ductile Extrusion and Exhumation in ContinentalCollision Zones. Geological Society, London, SpecialPublications 268, 327–354.
Warren, C. J., Grujic, D., Kellett, D. A., Cottle, J., Jamieson, R. A.& Ghalley, K. S. (2011). Probing the depths of the India–Asiacollision: U–Th–Pb monazite chronology of granulites fromNW Bhutan. Tectonics 30, TC2004.
Watson, E. B., Wark, D. A. & Thomas, J. B. (2006).Crystallization thermometers for zircon and rutile.Contributions to Mineralogy and Petrology 151, 413–433.
Webb, A. A. G., Schmitt, A. K., He, D. & Weigand, E. L. (2011).Structural and geochronological evidence for the leadingedge of the Greater Himalayan Crystalline complex in thecentral Nepal Himalaya. Earth and Planetary Science Letters304, 483–495.
Whitney, D. L. & Evans, B. W. (2010). Abbreviations for names ofrock-forming minerals. American mineralogist 95, 185–187.
Williams, I. S. (1998). U–Th–Pb geochronology by ion micro-probe. In: McKibben, M. A., Shanks, W. C. III , & Ridley, W. I.(eds) Application of Microanalytical Techniques toUnderstanding Mineralizing Processes. Society of EconomicGeologists, Reviews in Economic Geology 7, 1–35.
Williams, M. L., Jercinovic, M. J. & Hetherington, C. J. (2007).Microprobe monazite geochronology: understanding geologicprocesses by integrating composition and chronology. AnnualReview of Earth and Planetary Sciences 35, 137–175.
Wing, B. A., Ferry, J. M. & Harrison, T. M. (2003). Prograde de-struction and formation of monazite and allanite during con-tact and regional metamorphism of pelites: petrology andgeochronology. Contributions to Mineralogy and Petrology145, 228–250.
Xu, Z. Q., Wang, Q., Pecher, A., Liang, F. H., Qi, X. X., Cai, Z. H.,Li, H. Q., Zeng, L. S. & Cao, H. (2013). Orogen-parallel ductileextension and extrusion of the Greater Himalaya in the lateOligocene and Miocene. Tectonics 32, 191–215.
Yin, A. (2006). Cenozoic tectonic evolution of the Himalayanorogen as constrained by along-strike variation of structuralgeometry, exhumation history, and foreland sedimentation.Earth-Science Reviews 76, 1–131.
Zack, T., Stockli, D., Luvizotto, G., Barth, M., Belousova, E.,Wolfe, M. & Hinton, R. (2011). In situ U–Pb rutile dating byLA-ICP-MS: 208Pb correction and prospects for geologicalapplications. Contributions to Mineralogy and Petrology162, 515–530.
Zhang, X. G., Liu, X. H., Liu, X. B. & Zhou, X. J. (2012).Metamorphism of mafic enclaves in central greater Himalayasequence and its tectonic implication. Chinese Journal ofGeology 2, 278–289 (in Chinese with English abstract).
Zhang, Z. M., Xiang, H., Dong, X., Ding, H. X. & He, Z. Y. (2015).Long-lived high-temperature granulite-facies metamorph-ism in the Eastern Himalayan orogen, south Tibet. Lithos212–215, 1–15.
Zheng, Y., Zhang, J., Wang, J., Zhang, B., Wang, X. & Wang, M.(2014). Rapid denudation of the Himalayan orogen in theNyalam area, southern Tibet, since the Pliocene and implica-tions for tectonics–climate coupling. Chinese ScienceBulletin 59, 874–885.
1702 Journal of Petrology, 2015, Vol. 56, No. 9
Dow
nloaded from https://academ
ic.oup.com/petrology/article/56/9/1677/1460164 by guest on 06 July 2022