Time to revisit: upgrade to Buy - The page cannot be found
30
See important disclosures, including any required research certifications, beginning on page 28 ■ What's new Despite Bharat Heavy Electricals Ltd’s (BHEL) 20% share-price correction over the past month, we are encouraged by its 19% YoY order-backlog growth for 1Q FY16, the first double-digit growth for 4 years. We also see a good order pipeline (of at least 20GW annually) over FY16-18E, and now like its valuation. As a result, we upgrade our rating to Buy (1) from Sell (5). ■ What's the impact We see a V-shaped recovery for BHEL’s revenue, with FY16 marking the bottom for its order execution, as well as further earnings downgrades by the market. We forecast a strong pick-up in revenue from FY17E (+25% YoY) on a strong order backlog (up 19% YoY for 1Q FY16) with 9GW order wins. EBITDA margin recovery. For FY15-18E, we see a 6pp improvement on the end of its negative operating leverage, a pick- up in order execution, and favourable commodity prices. We lower FY16E earnings by 13%, but raise FY17-18E earnings by 4-8%, in line with the changes in our revenue and order-inflow forecasts. ■ What we recommend We now rate BHEL as a Buy (1), backed by a higher 12-month TP of INR243 (from INR225), based on an unchanged target PER of 18x on our revised FY17E EPS. We see near- term share-price catalysts in potential new-order wins, leading to order-inflow growth of over 40% YoY for FY16E and an FY16-18E earnings CAGR of 35%. The key risk: delays in the finalisation of power- sector orders, and the impact this would have on BHEL. It may seem ironic that the order outlook for the power sector (ie, BHEL) is recovering when India’s power deficit and utilisation levels are at historical lows (2% and 60%, respectively), but we believe that new-project orders being planned by the state and central utilities over FY16-18E are largely based on long- term demand expectations. ■ How we differ We believe the market is underestimating BHEL’s order- execution and EBITDA recovery. Industrials / India BHEL IN 15 September 2015 Bharat Heavy Electricals Time to revisit: upgrade to Buy • Recovery in order growth in FY15 (10% YoY) to continue over FY15-18E at a 17% CAGR, on annual order pipeline of 20GW • We expect 25% YoY revenue growth for FY17E, and EBITDA margin expansion of 6pp over FY15-18E • Upgrading to Buy (1); raising TP to INR243; we forecast a net profit CAGR of 35% over FY16-18E Source: Daiwa forecasts Source: FactSet, Daiwa forecasts Industrials / India Bharat Heavy Electricals BHEL IN Target (INR): 225.00 243.00 Upside: 14.8% 11 Sep price (INR): 211.75 Buy (from Sell) Outperform Hold Underperform Sell 1 2 3 4 5 Forecast revisions (%) Year to 31 Mar 16E 17E 18E Revenue change (6.2) 7.4 6.6 Net profit change (13.1) 8.0 4.8 Core EPS (FD) change (13.1) 8.0 4.8 90 100 110 120 130 180 210 240 270 300 Sep-14 Dec-14 Mar-15 Jun-15 Sep-15 Share price performance Brt Heavy (LHS) Relative to SENSEX Index (RHS) (INR) (%) 12-month range 197.80-297.00 Market cap (USDbn) 7.80 3m avg daily turnover (USDm) 15.75 Shares outstanding (m) 2,448 Major shareholder President of India (63.1%) Financial summary (INR) Year to 31 Mar 16E 17E 18E Revenue (m) 293,587 365,811 396,131 Operating profit (m) 17,844 34,716 39,563 Net profit (m) 20,657 33,043 37,926 Core EPS (fully-diluted) 8.440 13.500 15.495 EPS change (%) 45.5 60.0 14.8 Daiwa vs Cons. EPS (%) 0.0 10.2 n.a. PER (x) 25.1 15.7 13.7 Dividend yield (%) 0.9 1.4 1.9 DPS 2.000 3.000 4.000 PBR (x) 1.5 1.4 1.3 EV/EBITDA (x) 12.1 7.4 5.1 ROE (%) 5.9 9.0 9.6 Saurabh Mehta (91) 22 6622 1009 [email protected] Ajay Devnani (91) 22 6622 1015 [email protected] How do we justify our view? How do we justify our view?
-
Upload
khangminh22 -
Category
Documents
-
view
0 -
download
0
Transcript of Time to revisit: upgrade to Buy - The page cannot be found

See important disclosures, including any required research certifications, beginning on page 28
■ What's new Despite Bharat Heavy Electricals Ltd’s (BHEL) 20% share-price correction over the past month, we are encouraged by its 19% YoY order-backlog growth for 1Q FY16, the first double-digit growth for 4 years. We also see a good order pipeline (of at least 20GW annually) over FY16-18E, and now like its valuation. As a result, we upgrade our rating to Buy (1) from Sell (5). ■ What's the impact We see a V-shaped recovery for BHEL’s revenue, with FY16 marking the bottom for its order execution, as well as further earnings downgrades by the market. We forecast a strong pick-up in revenue from FY17E (+25% YoY) on a strong order backlog (up 19% YoY for 1Q FY16) with 9GW order wins.
EBITDA margin recovery. For FY15-18E, we see a 6pp improvement on the end of its negative operating leverage, a pick-up in order execution, and favourable commodity prices. We lower FY16E earnings by 13%, but raise FY17-18E earnings by 4-8%, in line with the changes in our revenue and order-inflow forecasts. ■ What we recommend We now rate BHEL as a Buy (1), backed by a higher 12-month TP of INR243 (from INR225), based on an unchanged target PER of 18x on our revised FY17E EPS. We see near-term share-price catalysts in potential new-order wins, leading to order-inflow growth of over 40% YoY for FY16E and an FY16-18E earnings CAGR of 35%. The key risk: delays in the finalisation of power-sector orders, and the impact this would have on BHEL. It may seem ironic that the order outlook for the power sector (ie, BHEL) is recovering when India’s power deficit and utilisation levels are at historical lows (2% and 60%, respectively), but we believe that new-project orders being planned by the state and central utilities over FY16-18E are largely based on long-term demand expectations.
■ How we differ We believe the market is underestimating BHEL’s order-execution and EBITDA recovery.
Industrials / IndiaBHEL IN
15 September 2015
Bharat Heavy Electricals
Time to revisit: upgrade to Buy
• Recovery in order growth in FY15 (10% YoY) to continue over FY15-18E at a 17% CAGR, on annual order pipeline of 20GW
• We expect 25% YoY revenue growth for FY17E, and EBITDA margin expansion of 6pp over FY15-18E
• Upgrading to Buy (1); raising TP to INR243; we forecast a net profit CAGR of 35% over FY16-18E
Source: Daiwa forecasts
Source: FactSet, Daiwa forecasts
Industrials / India
Bharat Heavy ElectricalsBHEL IN
Target (INR): 225.00 243.00
Upside: 14.8%
11 Sep price (INR): 211.75
Buy (from Sell)
OutperformHoldUnderperformSell
1
2
3
4
5
Forecast revisions (%)Year to 31 Mar 16E 17E 18ERevenue change (6.2) 7.4 6.6Net profit change (13.1) 8.0 4.8Core EPS (FD) change (13.1) 8.0 4.8
90
100
110
120
130
180
210
240
270
300
Sep-14 Dec-14 Mar-15 Jun-15 Sep-15
Share price performance
Brt Heavy (LHS)Relative to SENSEX Index (RHS)
(INR) (%)
12-month range 197.80-297.00Market cap (USDbn) 7.803m avg daily turnover (USDm) 15.75Shares outstanding (m) 2,448Major shareholder President of India (63.1%)
Financial summary (INR)Year to 31 Mar 16E 17E 18ERevenue (m) 293,587 365,811 396,131Operating profit (m) 17,844 34,716 39,563Net profit (m) 20,657 33,043 37,926Core EPS (fully-diluted) 8.440 13.500 15.495EPS change (%) 45.5 60.0 14.8Daiwa vs Cons. EPS (%) 0.0 10.2 n.a.PER (x) 25.1 15.7 13.7Dividend yield (%) 0.9 1.4 1.9DPS 2.000 3.000 4.000PBR (x) 1.5 1.4 1.3EV/EBITDA (x) 12.1 7.4 5.1ROE (%) 5.9 9.0 9.6
Saurabh Mehta(91) 22 6622 1009
Ajay Devnani(91) 22 6622 [email protected]
How do we justify our view?How do we justify our view?

Industrials / India BHEL IN
15 September 2015
- 2 -
Time to revisit: upgrading to Buy .................................................................................................. 6
Investment summary .................................................................................................................. 6
Recovery in order inflows ........................................................................................................... 9
Other initiatives to help order recovery ..................................................................................... 11
Other opportunities ................................................................................................................... 12
Improving fuel security .............................................................................................................. 13
Execution recovery and slow-moving orders ............................................................................ 14
EBITDA margin recovery ........................................................................................................... 16
Valuation and recommendation ................................................................................................ 17
Risks ........................................................................................................................................... 18
Appendix 1: India’s power situation .......................................................................................... 19
Appendix 2: India power sector order pipeline for FY16-17 ..................................................... 21
Appendix 3: power plants still in operation that are older than 25 years of age ..................... 22
Appendix 4: recent order pricing trends .................................................................................. 24
Appendix 5: glossary of terms ................................................................................................... 25
Contents

Industrials / India BHEL IN
15 September 2015
- 3 -
Growth outlook BHEL: revenue growth and net profit
We expect order-inflow recovery to continue over FY15-18E at a CAGR of 17% (began to pick up in FY15, at 10% YoY). We also see a pick-up in order execution from 2H FY16, and believe that FY16 is likely to be the bottom in terms of order execution and profitability, with the full impact of strong order execution only coming in from FY17. Over FY16-18, we forecast revenue and earnings to increase at CAGRs of 16% and 35%, respectively.
Source: Company, Daiwa forecasts
Valuation BHEL: 1-year-forward PER (x)
We are upgrading BHEL to Buy (1) from Sell (5). We also increase our 12-month target price to INR243 (from INR225), based on an unchanged target FY17E PER of 18x, to reflect the increase in our earnings forecasts. After the 20% share-price correction over the past month, we find BHEL’s current valuation, at FY17E PER of 15.7x, reasonable – it is trading at an over 20% discount to its historical average. Its EPS are also in the early part of the recovery cycle.
Source: Bloomberg, Company, Daiwa forecasts
Earnings revisions BHEL: EPS-forecast revisions
The Bloomberg consensus has been cutting its earnings forecast for BHEL for the past 3 years. And similarly, its FY16-17E earnings have been cut by 20-38% over past 12 months. However, with the recent order wins and improved visibility of orders, we expect this earnings-cut cycle to end and for these factors to become key stock-price catalysts.
Source: Bloomberg
How do we justify our view?
Growth outlook
Valuation
Earnings revisions
4 7 10 17
24 29 31
43
60
70 66
35
14 21
33 38
(30)
(20)
(10)
0
10
20
30
40
0
10
20
30
40
50
60
70
80
FY03
FY04
FY05
FY06
FY07
FY08
FY09
FY10
FY11
FY12
FY13
FY14
FY15
FY16
E
FY17
E
FY18
E
Net Profit (LHS) Revenue growth YoY (RHS)
(INRbn) (% )
05
101520253035404550
Mar
-06
Sep-
06
Mar
-07
Sep-
07
Mar
-08
Sep-
08
Mar
-09
Sep-
09
Mar
-10
Sep-
10
Mar
-11
Sep-
11
Mar
-12
Sep-
12
Mar
-13
Sep-
13
Mar
-14
Sep-
14
Mar
-15
Sep-
15
(PER)
28.4x Avg+1S.D.
20.5x Avg
12.6x Avg-1S.D.
8
9
10
11
12
13
14
15
16
Aug-
14
Sep-
14
Oct
-14
Nov
-14
Dec
-14
Jan-
15
Feb-
15
Mar
-15
Apr-1
5
May
-15
Jun-
15
Jul-1
5
Aug-
15
Sep-
15
FY16E FY17E
(INR)
12.9
8.8
12.6
10.1
15.8
11.7
13.112.5
14.2
Buy (from Sell)
OutperformHoldUnderperformSell
1
2
3
4
5

Industrials / India BHEL IN
15 September 2015
- 4 -
Key assumptions
Profit and loss (INRm)
Cash flow (INRm)
Source: FactSet, Daiwa forecasts
Year to 31 Mar 2011 2012 2013 2014 2015 2016E 2017E 2018EValue of new contracts added (%) 2.5 (63.5) 43.2 (11.5) 10.0 42.0 6.1 6.5Orderbook (INRbn) 1,556 1,282 1,097 973 972 1,108 1,195 1,280Book-to-Bill (x) 4.8 3.1 2.3 2.0 2.5 3.6 4.0 3.4
Year to 31 Mar 2011 2012 2013 2014 2015 2016E 2017E 2018EPower revenue 322,990 366,833 381,868 314,956 233,914 227,203 288,685 313,641Industry revenue 99,476 112,956 102,379 76,133 67,916 66,384 77,127 82,491Other Revenue 0 0 0 0 0 0 0 0Total Revenue 422,466 479,789 484,247 391,088 301,830 293,587 365,811 396,131Other income 0 0 0 0 0 0 0 0COGS (230,817) (280,845) (280,156) (231,565) (174,203) (169,459) (208,092) (223,814)SG&A (25,361) (32,228) (37,766) (33,085) (36,373) (29,359) (36,581) (35,652)Other op.expenses (85,874) (75,643) (81,961) (91,069) (81,041) (76,926) (86,422) (97,102)Operating profit 80,413 91,072 84,364 35,369 10,213 17,844 34,716 39,563Net-interest inc./(exp.) 5,721 7,626 4,797 4,984 7,195 8,999 10,834 12,975Assoc/forex/extraord./others 3,920 4,324 5,163 9,790 3,992 3,534 3,042 3,235Pre-tax profit 90,054 103,023 94,324 50,143 21,400 30,378 48,592 55,773Tax (29,942) (32,623) (28,177) (15,535) (7,207) (9,721) (15,550) (17,847)Min. int./pref. div./others 0 0 0 0 0 0 0 0Net profit (reported) 60,112 70,400 66,147 34,608 14,193 20,657 33,043 37,926Net profit (adjusted) 60,112 70,400 66,147 34,608 14,193 20,657 33,043 37,926EPS (reported)(INR) 122.798 28.763 27.025 14.139 5.799 8.440 13.500 15.495EPS (adjusted)(INR) 122.798 28.763 27.025 14.139 5.799 8.440 13.500 15.495EPS (adjusted fully-diluted)(INR) 24.560 28.763 27.025 14.139 5.799 8.440 13.500 15.495DPS (INR) 31.150 6.400 5.405 2.830 1.160 2.000 3.000 4.000EBIT 80,413 91,072 84,364 35,369 10,213 17,844 34,716 39,563EBITDA 85,854 99,072 93,898 45,198 20,986 28,945 46,252 51,597
Year to 31 Mar 2011 2012 2013 2014 2015 2016E 2017E 2018EProfit before tax 90,054 103,023 94,324 50,143 21,400 30,378 48,592 55,773Depreciation and amortisation 5,444 8,027 9,542 9,890 10,777 11,101 11,536 12,033Tax paid (29,328) (31,832) (32,375) (21,313) (10,299) (9,721) (15,550) (17,847)Change in working capital (40,247) (85,852) (55,523) (5,340) (18,457) 51,350 (20,805) 52,411Other operational CF items (5,606) (9,640) (3,369) 5,492 (3,777) (22,454) (25,632) (29,725)Cash flow from operations 20,318 (16,274) 12,598 38,871 (356) 60,653 (1,858) 72,644Capex (17,238) (12,979) (9,758) (6,697) (4,568) (7,000) (8,000) (8,000)Net (acquisitions)/disposals (3,585) (215) 650 100 35 10 10 10Other investing CF items 9 10 10 10 10 10 10 10Cash flow from investing (20,814) (13,184) (9,098) (6,587) (4,523) (6,980) (7,980) (7,980)Change in debt 351 286 13,044 12,330 (26,046) 0 0 (9)Net share issues/(repurchases) 0 0 0 0 0 0 0 0Dividends paid (14,563) (17,937) (16,486) (13,156) (5,940) (5,727) (8,591) (11,455)Other financing CF items 0 0 0 0 0 0 0 0Cash flow from financing (14,212) (17,651) (3,441) (825) (31,986) (5,727) (8,591) (11,464)Forex effect/others 0 0 0 0 0 0 0 0Change in cash (14,708) (47,110) 59 31,459 (36,866) 47,946 (18,429) 53,201Free cash flow 3,080 (29,254) 2,840 32,174 (4,924) 53,653 (9,858) 64,644
Financial summary

Industrials / India BHEL IN
15 September 2015
- 5 -
Balance sheet (INRm)
Key ratios (%)
Source: FactSet, Daiwa forecasts
Company profile
BHEL is India's largest engineering company in the power-equipment and industrial-systems segments. The company has a total installed capacity of 20GW. It also provides services to the process and hydro-carbon industries, as well as the defence sector and Indian Railways.
As at 31 Mar 2011 2012 2013 2014 2015 2016E 2017E 2018ECash & short-term investment 96,302 66,720 77,321 118,729 98,127 168,507 175,689 258,595Inventory 109,630 135,487 117,638 97,976 101,017 90,133 99,972 104,408Accounts receivable 273,546 357,406 398,882 399,530 376,373 321,740 360,800 325,587Other current assets 35,467 31,407 30,739 34,075 35,836 26,568 27,625 29,796Total current assets 514,945 591,019 624,580 650,309 611,353 606,949 664,086 718,387Fixed assets 51,631 56,662 56,908 53,711 46,934 42,834 39,298 35,264Goodwill & intangibles 0 0 0 0 0 0 0 0Other non-current assets 26,027 20,079 19,799 23,891 26,384 26,384 26,384 26,384Total assets 592,603 667,760 701,287 727,912 684,671 676,166 729,768 780,035Short-term debt 1,633 1,930 14,999 27,387 1,243 1,243 1,243 1,234Accounts payable 84,366 107,781 103,562 94,084 94,565 79,177 87,777 92,608Other current liabilities 305,065 304,317 278,285 275,970 248,017 239,970 260,521 279,495Total current liabilities 391,065 414,028 396,846 397,441 343,825 320,390 349,540 373,337Long-term debt 0 0 0 0 0 0 0 0Other non-current liabilities 0 0 0 0 0 0 0 0Total liabilities 391,065 414,028 396,846 397,441 343,825 320,390 349,540 373,337Share capital 4,895 4,895 4,895 4,895 4,895 4,895 4,895 4,895Reserves/R.E./others 196,643 248,837 299,546 325,575 335,951 350,880 375,332 401,803Shareholders' equity 201,538 253,732 304,441 330,471 340,846 355,776 380,227 406,698Minority interests 0 0 0 0 0 0 0 0Total equity & liabilities 592,603 667,760 701,287 727,912 684,671 676,166 729,768 780,035EV 423,611 453,490 455,958 426,937 421,396 351,015 343,833 260,918Net debt/(cash) (94,668) (64,790) (62,322) (91,343) (96,884) (167,264) (174,446) (257,361)BVPS (INR) 411.706 103.666 124.383 135.018 139.257 145.357 155.347 166.162
Year to 31 Mar 2011 2012 2013 2014 2015 2016E 2017E 2018ESales (YoY) 26.7 13.6 0.9 (19.2) (22.8) (2.7) 24.6 8.3EBITDA (YoY) 45.0 15.4 (5.2) (51.9) (53.6) 37.9 59.8 11.6Operating profit (YoY) 47.2 13.3 (7.4) (58.1) (71.1) 74.7 94.6 14.0Net profit (YoY) 39.5 17.1 (6.0) (47.7) (59.0) 45.5 60.0 14.8Core EPS (fully-diluted) (YoY) 39.5 17.1 (6.0) (47.7) (59.0) 45.5 60.0 14.8Gross-profit margin 45.4 41.5 42.1 40.8 42.3 42.3 43.1 43.5EBITDA margin 20.3 20.6 19.4 11.6 7.0 9.9 12.6 13.0Operating-profit margin 19.0 19.0 17.4 9.0 3.4 6.1 9.5 10.0Net profit margin 14.2 14.7 13.7 8.8 4.7 7.0 9.0 9.6ROAE 33.3 30.9 23.7 10.9 4.2 5.9 9.0 9.6ROAA 11.2 11.2 9.7 4.8 2.0 3.0 4.7 5.0ROCE 44.2 39.7 29.3 10.4 2.9 5.1 9.4 10.0ROIC 63.4 42.1 27.4 10.1 2.8 5.6 12.0 15.2Net debt to equity n.a. n.a. n.a. n.a. n.a. n.a. n.a. n.a.Effective tax rate 33.2 31.7 29.9 31.0 33.7 32.0 32.0 32.0Accounts receivable (days) 207.5 240.0 285.0 372.6 469.1 434.0 340.5 316.2Current ratio (x) 1.3 1.4 1.6 1.6 1.8 1.9 1.9 1.9Net interest cover (x) n.a. n.a. n.a. n.a. n.a. n.a. n.a. n.a.Net dividend payout 25.4 22.3 20.0 20.0 20.0 23.7 22.2 25.8Free cash flow yield 0.6 n.a. 0.5 6.2 n.a. 10.4 n.a. 12.5
Financial summary continued …

Industrials / India BHEL IN
15 September 2015
- 6 -
Time to revisit: upgrading to Buy
Given the recovery in the order inflow in FY15, which should continue over FY16-18E, we see a V-shaped recovery for revenue, with FY16 marking the bottom for order execution and consensus earnings downgrades. We expect a strong pick-up in revenue from FY17 (25% YoY). Upgrading to a Buy (1) due to: 35% net profit CAGR over FY16-18E, improving order-backlog visibility, and likely order execution pick-up from FY17E.
Investment summary
We upgrade our rating on BHEL to Buy (1) from Sell (5), as: 1) we believe the recovery seen in order growth in FY15 (10% YoY) will continue over FY15-18E, at a 17% CAGR, as we see orders of 20GW annually, largely from state and central utilities, 2) we expect a strong order-execution pick-up from FY17, on an improving order backlog (up by 19% YoY as at end-1Q FY16), with the company winning 9GW in orders over the past 12 months (including a few orders with shorter timelines), steps by the central government to improve coal availability and the rising pace of approvals by the Ministry of Environment and Forests (MoEF), and 3) we expect its EBITDA margin to recover over FY15-18E by 6pp, on the back of the end of negative operating leverage, driven by a pick-up in order execution and favourable commodity prices. We believe near-term share-price catalysts could come from potential new-order wins, leading to order-inflow growth of over 40% YoY for FY16E and a net profit CAGR of 35% over FY16-18E. Recovery in order inflow We expect BHEL to win power-sector orders worth 9.3GW in FY16E. The company received 4.1GW in orders for 1Q FY16 (including 4GW in orders from TSGENCO, a state utility) and is the lowest bidder for
about 5GW worth of projects (includes 3GW orders from NTPC and 1GW from NHPC). We believe the recovery in order growth for FY15 (10% YoY) will continue over FY15-18E, at a 17% CAGR, as we see orders of 20GW annually, largely from state and central utilities (see pages 9 and 10 for the order pipeline for FY16-17E and FY18-19E, respectively). Based on the status of each order (environment and forest approval, land acquisition and coal source finalisation), we see that the order pipeline for FY16-17E is already in the advanced stages and do not expect further delays in these orders getting placed (see appendix 2 on page 21 for the status of each project in the pipeline for FY16-17E). It may seem ironic that the order outlook for the power sector (ie, BHEL) is recovering when India’s power deficit and utilisation levels are at historical lows (2% and 60%, respectively; please see Appendix 1 for India’s power situation on page 19), but we believe that the new-project orders being planned by the state and central utilities over FY16-18E are largely based on long-term demand expectations. BHEL: order inflow
Source: Company, Daiwa forecasts
BHEL: order book and growth YoY
Source: Company, Daiwa forecasts
112165 182 189
356
512
597 590 605
221
317280 308
438 465495
0
100
200
300
400
500
600
700
FY03
FY04
FY05
FY06
FY07
FY08
FY09
FY10
FY11
FY12
FY13
FY14
FY15
FY16
E
FY17
E
FY18
E
(INRbn)
320 376 550
852
1,170
1,443 1,641
1,353 1,151
1,015 1,010
1,108 1,195
1,280
(20)
(10)
-
10
20
30
40
50
60
FY05
FY06
FY07
FY08
FY09
FY10
FY11
FY12
FY13
FY14
FY15
FY16
E
FY17
E
FY18
E
0
300
600
900
1,200
1,500
1,800
Order book (LHS) Growth YoY (RHS)
(INRbn) (% )

Industrials / India BHEL IN
15 September 2015
- 7 -
Strong execution pick-up only from FY17 We expect a strong pick-up in BHEL’s order execution from FY17E on an improving order backlog over the past 12 months, as it has won 9GW worth of orders, approval issues have been resolved by the MoEF, and coal availability has risen on Coal India’s (CIL) ramped-up production and the auctioning and allocation of coal blocks. BHEL has received 6GW of orders from TSGENCO, of which 2GW worth are to be executed on shorter timelines (24-36 months), helping the order execution pick-up that we see for BHEL, in our view. Currently, about 23% of BHEL’s current order backlog (INR250bn) comprises stranded projects, and the worst-case scenario in terms of customer default is only INR33.4bn (current receivables from these projects, as per management). BHEL: order book growth YoY and revenue growth YoY
Source: Company, Daiwa forecasts
EBITDA margin recovery We expect BHEL’s EBITDA margin to recover by 6pp over FY15-18E, on the back of the end of negative operating leverage, with a pick-up in order execution as well as favourable commodity prices. We also believe that an improving working-capital cycle, with higher advance payments from customers (on more orders if the aforementioned ordering scenario takes place) and the timely repayment to vendors will aid in lowering interest costs attached to outsourced parts of its order, and help to boost the EBITDA margin.
BHEL: revenue growth YoY and EBITDA margin
Source: Company, Daiwa forecasts
Accordingly, we forecast revenue CAGR of 16%, leading to a net profit CAGR of 35% for FY16-18E. BHEL: revenue growth and net profit
Source: Company, Daiwa forecasts
Valuation We value BHEL at 18x FY17E PER and increase our 12-month target price to INR243 (from INR225), reflecting an increase in our FY17E earnings. As the shares have corrected by 20% over the past month, we find BHEL’s valuation reasonable, at FY17E PER of 15.7x, particularly as the stock is trading at a more than a 20% discount to its historical average, and because its EPS is still in the early stages of the recovery cycle. BHEL: 1-year-forward PER (x)
Source: Bloomberg, Company, Daiwa forecasts
(30)
(20)
(10)
0
10
20
30
40
FY05
FY06
FY07
FY08
FY09
FY10
FY11
FY12
FY13
FY14
FY15
FY16
E
FY17
E
FY18
E
(20)
(10)
0
10
20
30
40
50
60
Order book growth Y oY (LHS ) Revenue growth YoY (RHS)
(% ) (% )
5
7
9
11
13
15
17
19
21
(30)
(20)
(10)
0
10
20
30
40
FY05
FY06
FY07
FY08
FY09
FY10
FY11
FY12
FY13
FY14
FY15
FY16
E
FY17
E
FY18
E
Revenue growth YoY (LHS) EBITDA margin (RHS)
(% ) (% )
4 7 10 17
24 29 31
43
60
70 66
35
14 21
33 38
(30)
(20)
(10)
0
10
20
30
40
0
10
20
30
40
50
60
70
80
FY03
FY04
FY05
FY06
FY07
FY08
FY09
FY10
FY11
FY12
FY13
FY14
FY15
FY16
E
FY17
E
FY18
E
Net Profit (LHS) Revenue growth YoY (RHS)
(INRbn) (% )
05
101520253035404550
Mar
-06
Sep-
06
Mar
-07
Sep-
07
Mar
-08
Sep-
08
Mar
-09
Sep-
09
Mar
-10
Sep-
10
Mar
-11
Sep-
11
Mar
-12
Sep-
12
Mar
-13
Sep-
13
Mar
-14
Sep-
14
Mar
-15
Sep-
15
PER
28.4x Avg+1S.D.
20.5x Avg
12.6x Avg-1S.D.
PERPER

Industrials / India BHEL IN
15 September 2015
- 8 -
BHEL: book-to-bill ratio and PER
Source: Company, Bloomberg
2.0
2.5
3.0
3.5
4.0
4.5
5.0
0
10
20
30
40
50
Mar
-04
Sep-
04M
ar-0
5Se
p-05
Mar
-06
Sep-
06M
ar-0
7Se
p-07
Mar
-08
Sep-
08M
ar-0
9Se
p-09
Mar
-10
Sep-
10M
ar-1
1Se
p-11
Mar
-12
Sep-
12M
ar-1
3Se
p-13
Mar
-14
Sep-
14M
ar-1
5Se
p-15
PER (LHS) Book to bill ratio (RHS)
(x) (x)

Industrials / India BHEL IN
15 September 2015
- 9 -
Recovery in order inflows
Order inflows We expect BHEL to win power-sector orders worth 9.3GW in FY16E. The company already received 4.1GW orders in 1Q FY16 and is L1 in about 5GW worth of projects. These projects include: Status of L1 orders Projects MW Status NTPC Barethi 2,640 Land is available. Awaiting EC. Captive coal is
available. Mahagenco Bhusawal 660 Land and EC are available. Coal linkage is
available. NTPC Rourkela 250 Both land and EC are not available. NHPC Pakal dul – hydro-electric project
1,000 Received EC. Land is not available.
SPIC Tuticorin 525 Land and EC are available. Fuel source is imported coal.
Pranahita 696 - 5,771
Source: MoEF, Media articles, Daiwa
In addition to these, BHEL expects order finalisation for another 15GW worth over the next year. BHEL received orders of INR308bn in the FY15, a jump of 10% YoY from INR280bn in FY14. Of the total orders, ~80% were from the power sector and the rest from the industry sector. Bottlenecks faced by the industry India’s power-generation equipment industry has been going through a dull phase since FY11 due to issues related to coal availability, fund constraints, land acquisition, clearances, competition from foreign players, etc. This has led to the continuous shrinking of order-inflow opportunities for BHEL. Its annual ordering opportunities decreased from ~20GW in FY11 to ~8GW in FY15. Current scenario With a new government at the centre (elected in May 2014), such issues have started to get resolved gradually. The new government has introduced an online platform for approvals for environmental and forest projects. Both these online systems are aimed at ensuring timely approvals for power projects and the coal blocks linked to them. To ease the coal shortage in India, the government has been pushing Coal India (COAL IN, INR333.8, Buy [1]) for ramped-up production growth (8.5% YoY since the new government has come to power; see Pump up the volume, 22 July 2015) and has engaged in the auction/allotment of coal blocks with 9.7bn tonnes of extractable reserves to the power sector. We expect this to reduce the uncertainty of coal and assure fuel supply
to power projects that are stuck due to the non-availability of coal. BHEL’s order inflow, which has been lacklustre over the past few years, is now showing signs of improvement. We expect the order recovery seen in FY15 to continue over FY16-17E, as we see orders worth 20GW annually over FY16-18E largely from state and central utilities (please refer to the tables on page 9-10 for a detailed breakup). This will likely be on the back of improved fuel security, faster environmental and forest approvals, the ‘plug and play model’ for UMPPs, the government’s initiatives such as ‘Make in India’ and ‘24x7 Power for all’, the replacement of some 25-year-old power plants, etc. Over the next couple of years, we expect orders to mainly come from central (NTPC [not rated]) and state utilities. Unless the problems relating to tariff disputes, coal-block de-allocation, the backing down by state utilities (they are not buying power due to unaffordability) and balance sheets can be solved, supply issues will not be resolved, and there will not be any capacity additions by private sector companies, in our view. BHEL: order inflow
Source: Company, Daiwa forecasts
BHEL: order book and growth YoY
Source: Company, Daiwa forecasts
112165 182 189
356
512
597 590 605
221
317280 308
438 465495
0
100
200
300
400
500
600
700
FY03
FY04
FY05
FY06
FY07
FY08
FY09
FY10
FY11
FY12
FY13
FY14
FY15
FY16
E
FY17
E
FY18
E
(INRbn)
320 376 550
852
1,170
1,443 1,641
1,353 1,151
1,015 1,010
1,108 1,195
1,280
(20)
(10)
-
10
20
30
40
50
60
FY05
FY06
FY07
FY08
FY09
FY10
FY11
FY12
FY13
FY14
FY15
FY16
E
FY17
E
FY18
E
0
300
600
900
1,200
1,500
1,800
Order book (LHS) Growth YoY (RHS)
(INRbn) (% )

Industrials / India BHEL IN
15 September 2015
- 10 -
Order pipeline for FY16 and FY17Project Client Configuration Size (MW) Coal source Cost (INRbn) Status Central Barethi NTPC 660x4 2,640 Captive coal 180 Bidding opened in July 2014. Awaiting environmental
clearance (EC). Katwa NTPC 660x2 1,320 - 100 Terms of reference (ToR) granted in December 2014 Pudimadaka NTPC 1000x4 4,000 Imported 240 Tenders invited in March 2015, Environmental Impact
Assessment (EIA) studies currently in progress Ramagundam (Telangana) NTPC 800x2 1,600 SCCL, MCL, SECL 110 Applied for ToR for revision of capacity in December 2014 Bilhaur NTPC 660x2 1,320 Existing coal blocks 66 Awaiting policy change requiring delinking EC/ FC (forest
clearance) Singareni 3rd unit NTPC 600x1 600 No coal linkage - Base data collection is in process for EC Rourkela NTPC-SAIL JV 250x1 250 - - Tender issued for EPC package in July 2014 Maitree Project (Bangladesh) BIFPCL (JV of NTPC and
BPDB) 660x2 1,320 - 90 Tender invited for EPC package in February 2015
Ghatampur TPP JV of NLC and UPRVUNL 660x3 1,980 Imported 144 Got EC based on imported coal Sundargarh MCL 800x2 1,600 - 90 800 acres of land was acquired in September 2014 Pakal dul hydro project NHPC 250x4 1,000 NA 106 Order almost finalised. Consortium with Patel Engineering State Nellore APGENCO 800x1 800 Imported 84 EC proposal submitted in April 2015 Kothagudem APGENCO 800x1 800 Imported 53 EC proposal submitted in July 2014 Panipat HPGENCO 800x1 800 Existing coal block 44 Got the existing coal linkage Patratu TPP JSEB 660x2 1,320 - 75 Banhardih coal block deallocated now, earlier allocated to it Bhusawal TPP unit 6 MSPGCL 660x1 660 Coal linkage 45 Land acquired for the project in July 2014 Nashik Expansion TPP MSPGCL 660x1 660 Coal linkage 38 EC proposal submitted in March 2015 Banswara TPP RRVUNL 660x2 1,320 - 79 REIA study could not start due to agitation by local people KaliSindh Phase-II RRVUNL 660x2 1,320 - 79 NOC for EC has been issued Udangudi TANGEDCO 660x2 1,320 Imported 87 Bids scrapped and new tenders will come up Harduaganj TPP Stage-2 UPRVUNL 660x1 660 Existing coal block 39 Bidding initiated in July 2014 Panki Expansion UPRVUNL 660x1 660 - 47 ToR granted in September 2014 Private Khandwa Dwarkesh Energy 660x2 1,320 Imported 74 Will use imported coal till coal linkage is made available Tuticorin SPIC Ltd 525x1 525 Imported 26 Waiting 6 months for approval from the regulatory
commission Others
Cheyyur UMPP Coastal Tamil Nadu Power 660x6 4,000 Imported 242 Awaiting the new bidding document to be finalised.
Bedabahal UMPP Odisha Integrated Power 800x5 4,000 Captive coal 252 Awaiting the new bidding document to be finalised.
Total 37,795
Source: Company, Daiwa
Note: For details of each project please see Appendix 2

Industrials / India BHEL IN
15 September 2015
- 11 -
Order pipeline for FY18 and FY19 Project Client MW Status Central Kajra TPP NTPC, BSPGCL and LBCPL 660x2 Feasibility report is in process Talcher TPS Expansion NTPC 660x2 Required land is available and all other statutory clearances are in place Singrauli TPP Stage 3 NTPC 500x1 Awaiting EC Trincomalee project (Sri Lanka) JV of NTPC and CEB 250x2 Feasibility report is in process State Vodarevu TPP stage-I APGENCO 800x2 Received approval from AP Government in July 2014. No clearance obtained yet. Srikakulam TPP JV of APGENCO and PTC 800x3 Not yet received any clearance Sattupally TPP APGENCO 600x1 Not yet received any clearance Vijayawada IGCC - BHEL JV of APGENCO and BHEL 182x1 Not yet received any clearance Pirpainti TPP Nalanda Power (CESC Ltd) 660x3 Awaiting FC and land acquisition Buxar TPP SJVNL 660x2 Awaiting EC and land acquisition Salka TPP ICPL 660x2 Awaiting fuel linkage and land acquisition Godhna TPP (KPCL) L&T and KPCL 800x2 Not yet received any clearance Wanakbori TPP Extension GSECL 800x1 No land acquisition yet Sinor TPP GSECL 800x2 Not yet received any clearance Jewargi TPP Power company of Karnataka Ltd 660x2 Awaiting FC Edlapur TPP KPCL (JV of KPCL and BHEL) 800x1 Awaiting final EC Gulbarga TPP Power Company of Karnataka Ltd 660x2 Land acquisition is in process Satpura TPP Extension MPPGCL 660x1 Awaiting fuel linkage Shahpura TPP NHDC(JV of NHPC & Govt of MP) 660x2 Not yet received any clearance Dondaicha TPP MSPGCL 550x6 Land acquisition is in process (516Ha land acquired) and awaiting final EC GHTP Lehra Mohabbat Ext Stage-III PSEB 250x2 Not yet received any clearance Sagardighi TPP Phase 3 WBPDCL 500x2 Not yet received any clearance Private Dahej TPP Adani power 660x4 Received only EC and could come up for bidding in 2 years UMPP Proposed UMPPs 12,000 Bihar, Jharkhand, Uttar Pradesh Total 41,902
Source: Company, Daiwa
Other initiatives to help order recovery
‘Plug and Play’ model for UMPPs In the Union budget 2015-16, the government proposed that 5 new Ultra Mega Power Projects (UMPPs) be set up in FY16 under the ‘Plug and Play model.’ To address the concerns investors and lenders had over the previous rules, the Ministry of Power (MoP) has come up with a new standard bidding document for case II bidding in August 2015 under which bidding for UMPPs will take place. This new bid document seems to have been positively received by stakeholders, and should kick-start the process of inviting tenders for the UMPPs. Under the ‘Plug and Play’ model, all regulatory clearances and fuel linkages must be in place before the projects go to auction. Under this model, implementation of the projects can be carried out more quickly, though implementation of the model will be challenging.
Replacement of 25-year-old power plants Power plants that have completed 25 years of operation start to face problems of frequent breakdowns, inefficiency and pollution, leading to lower utilisation. The government has therefore included in its guidelines requirements for all old and inefficient power plants to be gradually replaced with new generation energy-efficient super critical technology (sub critical is older, inefficient technology and the newer, more efficient one is known as super critical). The phasing in of newer-generation plants will enhance production capacity, as well as maximise power generation in India from lower usage of coal. Also, it will take less time to replace old technology with modern and environment-friendly technology as the fuel linkages, land are in place already, and other necessary approvals can be fast-tracked. About 25GW of the power plants in India, namely those of NTPC and other state utilities, are older than 25 years of age. The government plans to replace these inefficient units with new, bigger plants at the same locations with the assured coal supplies. The coal linkages granted to an old unit will be automatically

Industrials / India BHEL IN
15 September 2015
- 12 -
transferred to the new unit with similar super critical capacity. Most of India’s 25GW of capacity is sub critical, in the range of 110/220MW. Given the planned capacity of new super critical power plants is higher than that for the old plants, additional coal linkages may be provided by Coal India. The additional coal required by the new super critical plants will be provided on the basis of an annual MoU and not a long-term fuel supply agreement (FSA). Of the 25GW of capacity that has completed 25 years of operations (as shown in appendix 3), the government might decommission those plants first that had a plant load factor (PLF) of less than 40% during FY14. These projects totalling 6GW of capacity could present an order opportunity over the next couple of years. The government has already taken initiatives aimed at decommissioning plants with a PLF of 40%. In the first week of May 2015, the NTPC signed an MoU with Jharkhand State Electricity Board (JSEB) to build a 6400MW power plant in Patratu, in the Ramgarh district of Jharkhand. A power plant already exists in Patratu, totalling 840mw. The new plan includes scrapping this old plant and setting up 4 800MW units in the first phase, and another 4 units of 800mw in the second phase. The existing Patratu plant is operating at a PLF of 5%. New emission standards for coal-based thermal-power plants Based on the new norms, thermal power plants have to either invest in pollution control equipment, or older plants have to shut and plan replacements. To tighten the pollution norms, the Ministry of Environment, Forest and Climate Change (MoEF and CC) in May 2015 issued a draft notification for new emission limits and water consumption by the coal based thermal power plants. Now, power companies have to make investments in equipment like electrostatic precipitators (ESP) and fuel gas de-sulfurisation units, which help them keep their emissions in check and comply with the new proposed norms. Refurbishing and installing a new ESP, in order to comply with the proposed new norms, should present BHEL with order opportunities over the next few years, albeit not very meaningful in size since the value per MW is small.
Other opportunities
Nuclear In terms of nuclear power projects, BHEL is engaged in nuclear turbine generator sets, piping systems, surface condensers, feed water heaters, moisture separators and re-heaters, switchgears, automation and control systems, etc. Nuclear projects like Gorakhpur, Haryana (2x700MW), Kudankulam, Tamil Nadu (6x1050MW), Jaitapur, Maharashtra (6x1700MW), Mithi Virdi, Gujarat (6x1250MW) are some of the projects that are in the planning stage and could be put up for tender, and thus likely to create new order opportunities for BHEL over the next 4-5 years. Solar The new government has a strong focus on renewables with a target of 175GW capacity additions till 2022, comprising 100GW of solar, 60GW of wind, 10GW of biomass and 5GW of small hydro. These initiatives will also present order opportunities for BHEL. In the 1Q FY16 earnings call, the company highlighted the potential for scaling up its solar business (EPC target of 100MW for FY16, potentially doubling to 200MW in FY17). It has a presence in the entire chain, ie, solar photovoltaic (PV) systems, solar water heating systems, solar street light and grid interactive solar PV power plant. Its proposal for a solar PV manufacturing facility has been approved for solar PV facility (480MW) by the committee of secretaries and is waiting for the cabinet committee to take up at any time. The required capex for the facility is INR24bn and 40% of this requirement will be available from a National Clean Energy Fund (NCEF) as a capital subsidy. Defence and submarines BHEL is expecting an increase in naval orders from the Ministry of Defence Government of India (guns this year and submarines next year). It supplies super rapid gun mounts (SRGM), integrated platform management systems (IPMS) for naval ships, as well as thermos-pressed components and strategic equipment, etc. to the Indian defence forces. BHEL already manufactures 76mm naval guns and has been nominated by the Ministry of Defence to make 127mm and 30mm guns, which it is now bidding for.

Industrials / India BHEL IN
15 September 2015
- 13 -
The Ministry of Defence will announce the bid winners in FY16. The company has also formed a consortium with Mishra Dhatu Nigam Limited (Midhani) and Hindustan Shipyard Limited (HSL) to jointly bid to build P-75 (i) submarines for the Indian Navy. Railways The company provides alternating current (AC) and direct current (DC) traction motors, AC traction alternators, DC traction generators, traction systems, locomotives, coaches, etc, to Indian Railways (a state-owned enterprise. The company has submitted a tender to set up a diesel and electric locomotive factory in Bihar, which is currently being evaluated by Indian Railways. For the diesel factory, it has partnered with General Electric (GE), and for the electric factory, the selection of a partner is under way. It is also currently participating in a railway-locomotives tender for 15 high-speed trains in a partnership with Kawasaki and Toshiba, which is expected to be finalised by March 2016.
Improving fuel security
India has seen coal shortages for more than 5 years, which is a major concern for new projects as well as existing projects. The lack of coal availability has delayed the execution of existing orders as well as the finalisation of new orders for BHEL and the whole industry. Though, in the past 14 months, the new government has taken steps to improve coal availability in the short term, as well as medium and long term. The government has started with coal block auctions/ allotments, after the Supreme Court had cancelled all past allocations in August 2014; it has also pushed Coal India to ramp up production, resulting in an 8.5% YoY increase in coal production in the past 14 months. Coal block auctions/allocation The Supreme Court of India’s cancellation in August 2014 of 204 coal blocks, that had been allocated from 1993 to 2010, led to uncertainty relating to existing and new projects. However, since then the Ministry of Coal has put in place a framework to auction and allot 204 cancelled coal blocks. Until now, 46 mines have been auctioned/ allotted, with reserves of 9.7bn tonnes going to the power sector.
The NTPC has been allotted 5 coal mines in the allotment process with coal reserves of 2.3bn tonnes which had earlier belonged to the NTPC only. Under the new law, the NTPC can use the coal from any of its block for any of its power plants, given the prior approval of the central government. The NTPC has planned to come up with more than 13GW of thermal power capacity additions over FY16-17 and already issued Notices Inviting Tenders (NITs) for 8.5GW of projects. Given it has coal linkages/blocks in place for getting environmental and forest clearance, the NTPC should be able to come up with the above-mentioned order opportunity in the next 2 years without any delay. Increase in CIL production volume CIL’s volume production over the past 14 months (after new government came in to power) has been reasonably strong. In FY15, it produced 494m tonnes (up 6.9% YoY) and in first 5 months of FY16 it produced 192m tonnes (up 9.3% YoY). The growth is in line with the government’s ambitious target for CIL to meet 1bn tonnes of coal production by 2019-20. CIL meeting this target will lead to future coal supply certainty and will aid in converting BHEL and for the power-equipment industry’s order pipeline into an order inflow, which has been stuck due to the non-availability of coal. If CIL increases coal production and guarantees supply to future projects, these could be implemented. CIL: production and growth YoY
Source: Company
Environmental and forest approvals Many coal projects have gotten stuck over the past few years due to a delay in environmental and forest approvals. In order to speed up the process of approvals, the MoEF launched a system for online submission of applications for environmental and forest approvals in May and July 2014, respectively. This new system ensures that power projects which
33 35 35
40 44
47 47 48
57
42 41 39
35 36
11.5
9.0
5.2
14.8 13.3
5.7
(1.7)
12.7
7.2
10.7
12.9 12.4
5.5 4.8
(3)
0
3
6
9
12
15
20
25
30
35
40
45
50
55
60
Jul-1
4
Aug-
14
Sep-
14
Oct
-14
Nov
-14
Dec
-14
Jan-
15
Feb-
15
Mar
-15
Apr-1
5
May
-15
Jun-
15
Jul-1
5
Aug-
15
Coal production (LHS) % Change (RHS )
(m tonnes) (% )
Industrials / India BHEL IN
15 September 2015
- 14 -
have been stuck due to delays in environmental approvals and non-availability of coal on account of delays in EC and FC, get clearance in a timely manner.
Execution recovery and slow-moving orders
Strong execution pick-up only from FY17 We expect a strong pick-up in BHEL’s execution from FY17 onwards, as we have seen an improving order backlog over the past 12 months, as BHEL has won 9GW of orders, including ~2GW of orders with much shorter execution timelines (24-36 months vs. 48-60 months usually), resolution of issues of approvals by the MoEF, coal availability though increasing CIL’s production and coal blocks auction and allocation. Status of Telangana orders
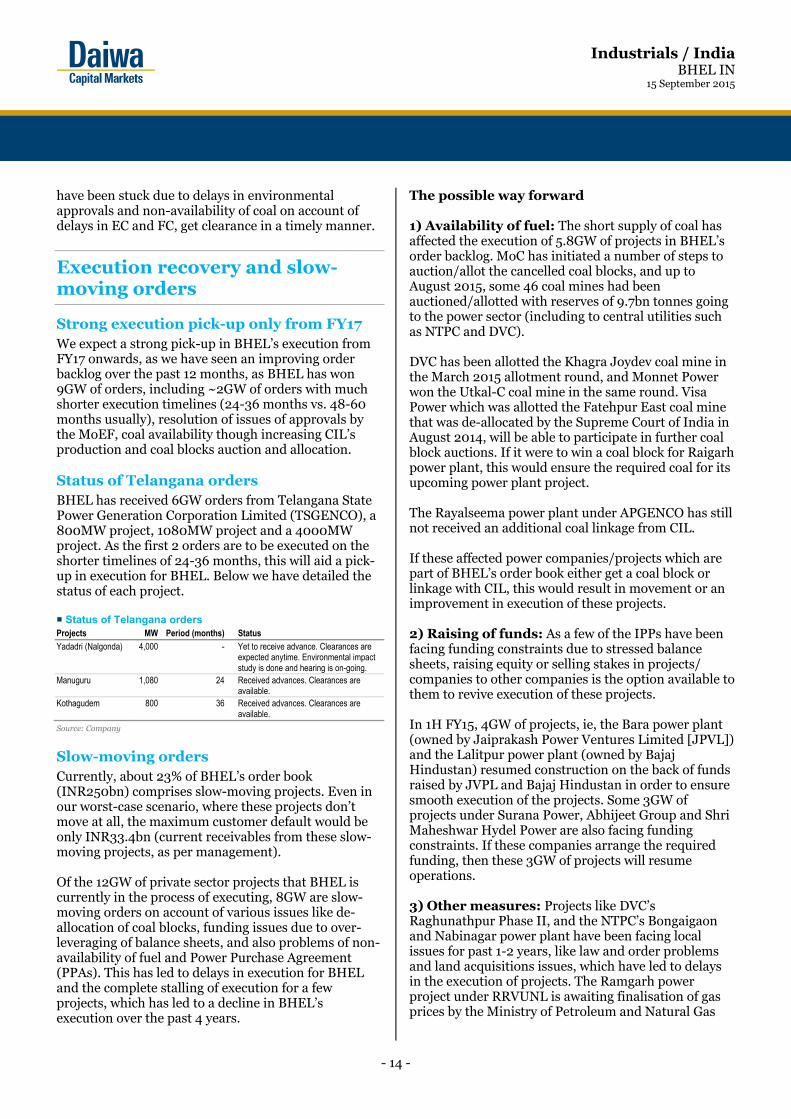
BHEL has received 6GW orders from Telangana State Power Generation Corporation Limited (TSGENCO), a 800MW project, 1080MW project and a 4000MW project. As the first 2 orders are to be executed on the shorter timelines of 24-36 months, this will aid a pick-up in execution for BHEL. Below we have detailed the status of each project. Status of Telangana orders Projects MW Period (months) Status Yadadri (Nalgonda) 4,000 - Yet to receive advance. Clearances are
expected anytime. Environmental impact study is done and hearing is on-going.
Manuguru 1,080 24 Received advances. Clearances are available.
Kothagudem 800 36 Received advances. Clearances are available.
Source: Company
Slow-moving orders Currently, about 23% of BHEL’s order book (INR250bn) comprises slow-moving projects. Even in our worst-case scenario, where these projects don’t move at all, the maximum customer default would be only INR33.4bn (current receivables from these slow-moving projects, as per management). Of the 12GW of private sector projects that BHEL is currently in the process of executing, 8GW are slow-moving orders on account of various issues like de-allocation of coal blocks, funding issues due to over-leveraging of balance sheets, and also problems of non-availability of fuel and Power Purchase Agreement (PPAs). This has led to delays in execution for BHEL and the complete stalling of execution for a few projects, which has led to a decline in BHEL’s execution over the past 4 years.
The possible way forward 1) Availability of fuel: The short supply of coal has affected the execution of 5.8GW of projects in BHEL’s order backlog. MoC has initiated a number of steps to auction/allot the cancelled coal blocks, and up to August 2015, some 46 coal mines had been auctioned/allotted with reserves of 9.7bn tonnes going to the power sector (including to central utilities such as NTPC and DVC). DVC has been allotted the Khagra Joydev coal mine in the March 2015 allotment round, and Monnet Power won the Utkal-C coal mine in the same round. Visa Power which was allotted the Fatehpur East coal mine that was de-allocated by the Supreme Court of India in August 2014, will be able to participate in further coal block auctions. If it were to win a coal block for Raigarh power plant, this would ensure the required coal for its upcoming power plant project. The Rayalseema power plant under APGENCO has still not received an additional coal linkage from CIL. If these affected power companies/projects which are part of BHEL’s order book either get a coal block or linkage with CIL, this would result in movement or an improvement in execution of these projects. 2) Raising of funds: As a few of the IPPs have been facing funding constraints due to stressed balance sheets, raising equity or selling stakes in projects/ companies to other companies is the option available to them to revive execution of these projects. In 1H FY15, 4GW of projects, ie, the Bara power plant (owned by Jaiprakash Power Ventures Limited [JPVL]) and the Lalitpur power plant (owned by Bajaj Hindustan) resumed construction on the back of funds raised by JVPL and Bajaj Hindustan in order to ensure smooth execution of the projects. Some 3GW of projects under Surana Power, Abhijeet Group and Shri Maheshwar Hydel Power are also facing funding constraints. If these companies arrange the required funding, then these 3GW of projects will resume operations. 3) Other measures: Projects like DVC’s Raghunathpur Phase II, and the NTPC’s Bongaigaon and Nabinagar power plant have been facing local issues for past 1-2 years, like law and order problems and land acquisitions issues, which have led to delays in the execution of projects. The Ramgarh power project under RRVUNL is awaiting finalisation of gas prices by the Ministry of Petroleum and Natural Gas

Industrials / India BHEL IN
15 September 2015
- 15 -
(MoPNG), and the Government of India (GoI). Meanwhile, Ideal Energy’s Bela power project has not yet received environmental approval. These are some
of issues that cannot be resolved within a stipulated time frame, and as such these 3.5GW of projects will remain mired in uncertainty.
BHEL’s slow moving projects Project name Developer Capacity (MW) Status Slow moving orders Raghunathpur Phase ll DVC 1,320 A 10km water corridor pipeline for a plant has not materialised due to social unrest Bongaigaon TPP NTPC 750 Frequent bands, slow progress in civil work by contractors, etc, has been affecting
the project Nabinagar TPP NTPC 1,000 Land acquisition and security-related issues have led to delays in the overall project Rayalseema TPP APGENCO 600 Additional coal linkage is pending Ramgarh RRVUNL 160 Finalisation of its gas price is being considered by MoPNG, GoI Amravati Phase II Indiabulls Power 1,350 No FSA or PPA Nashik Phase II Indiabulls Power 1,350 No FSA or PPA Raichur Surana Power 420 Fund constraints Raigarh Visa Power 1,200 The Fatehpur East coal block was cancelled by SC Malibrahmani Monnet Power 1,050 Late approvals and land acquisitions have led to delays, leading to cost overruns Chandwa Phase I and II Abhijeet Group 1,080 Abhijeet Group has not received the approval of existing lenders for restructuring the
loan given for Chandwa Phase I and II power plant Bela Ideal Energy 270 EC has yet to be received Gorgi (Sidhi, Singrauli) DB Power 1,320 Signed FSA with M/s Dynamic Concepts PTE as an interim measure and is request
for an FSA for the long-term linkage of domestic fuel is at the advanced stages of consideration
Maheshwar HEP SMHPCL 400 No funds to complete the project or for R&R activities Total 12,270 Slow moving orders as a % of the total order book 23% Projects starting to move Lalitpur Bajaj Hindusthan 1,980 Project has started moving driven by fund raising Bara TPP Jaypee 1,980 Raised INR15bn via a QIP in July 2014 Total 3,960 BHEL’s total order book 53,397 Source: Company, Media articles, Daiwa

Industrials / India BHEL IN
15 September 2015
- 16 -
EBITDA margin recovery
We forecast the EBITDA margin to recover by a combined 6pp over FY15-18E, as we see its negative operating leverage ending soon on a pick-up in orders, as well as more favourable commodity prices. Also its improving working capital cycle, with higher advances from customers (on higher orders if the above ordering scenario occurs) and the timely repayment of vendors would aid in lowering the interest costs attached to outsourced parts of an order will also help the company improve its margin. BHEL: revenue growth YoY and EBITDA margin
Source: Company, Daiwa forecasts
BHEL: EBITDA margin
Source: Company, Daiwa forecasts
BHEL: raw material and as % of sales
Source: Company, Daiwa forecasts
BHEL: gross margin and EBITDA margin
Source: Company, Daiwa forecasts
Employee costs Management expects around 8,000 employees to retire over the next 4 years (about 2,200 people every year), which will help the company control its employee-related costs. However, on the back of the implementation of the 7th Pay Commission (salaries are revised every 10 years) from 1 January 2017, this will result in higher employee costs, and as such we are factoring into our model per employee cost CAGR of over 20% over FY16-18E. BHEL: number of employees
Source: Company, Daiwa forecasts
5
7
9
11
13
15
17
19
21
(30)
(20)
(10)
0
10
20
30
40
FY05
FY06
FY07
FY08
FY09
FY10
FY11
FY12
FY13
FY14
FY15
FY16
E
FY17
E
FY18
E
Revenue growth YoY (LHS) EBITDA margin (RHS)
(% ) (% )
16.8
19.0 20.5
19.0
15.8
17.7
20.3 20.6 19.4
11.6
7.0
9.9
12.6 13.0
5
7
9
11
13
15
17
19
21
FY05
FY06
FY07
FY08
FY09
FY10
FY11
FY12
FY13
FY14
FY15
FY16
E
FY17
E
FY18
E
(% )
51 71
86 104
156 178
199
251 236
177
142 143 175 188
44
47
50
53
56
59
0
50
100
150
200
250
300
FY05
FY06
FY07
FY08
FY09
FY10
FY11
FY12
FY13
FY14
FY15
FY16
E
FY17
E
FY18
E
Raw materials (LHS) % of sales (RHS)
(INRbn) (%)
4
8
12
16
20
24
20
22
24
26
28
30
32
34FY
05
FY06
FY07
FY08
FY09
FY10
FY11
FY12
FY13
FY14
FY15
FY16
E
FY17
E
FY18
E
Gross margin (LHS) EBITDA margin (RHS)
(% ) (% )
48 47
44 43 43 42 44
46 46 47
49 48
48
45
43 41
39
30
35
40
45
50
FY02
FY03
FY04
FY05
FY06
FY07
FY08
FY09
FY10
FY11
FY12
FY13
FY14
FY15
FY16
E
FY17
E
FY18
E
('000)

Industrials / India BHEL IN
15 September 2015
- 17 -
BHEL: employee expenses and employee expenses as a % of revenue
Source: Company, Daiwa forecasts
Valuation and recommendation
We upgrade our rating on BHEL to Buy (1) from Sell (5) as we believe: 1) the recovery in order growth for FY15 (10% YoY) to continue over FY15-18E, at a CAGR of 17%, on the back of orders of 20GW p.a, largely from the state and central utilities, 2) we expect strong order execution from FY17, as we see its order backlog improving (up 19% YoY as at the end of 1Q FY16) on the back of 9GW in orders being won over the past 12 months, including orders with shorter timelines, and backed by government measures to improve the availability of coal and a quicker pace of MoEF approval, and 3) that the EBITDA margin will recover over FY15-18E by a combined 6pp on the end of its negative operating leverage, the pick-up in order execution and favourable commodity prices.
Near-term share price catalysts would come from potential new order wins (it is the lowest bidder for 5GW orders worth about INR150-200bn), leading to order growth of over 40% YoY for FY16 and an FY16-18 earnings CAGR of 35%.
We value BHEL at a target PER of FY17E of 18x and are raising our 12-month target price to INR243, from INR225, reflecting increase in earnings that we see for FY17E. Given the 20% share price correction over past month, we find BHEL’s current valuation at 15.7x FY17E PER reasonable, as this is still more than a 20% discount to its past average, and because its EPS is still in the early part of the recovery cycle.
BHEL: 1-year forward PER (x)
Source: Bloomberg, Company, Daiwa forecasts
BHEL: book to bill ratio and PER
Source: Company, Bloomberg
BHEL: one-year-forward PER bands
Source: Bloomberg, Company, Daiwa forecasts
14 15 16 17 19 24 26
30
64
54 55 58 59 55 53
59
70
8
10
12
14
16
18
20
22
0
10
20
30
40
50
60
70
80
FY02
FY03
FY04
FY05
FY06
FY07
FY08
FY09
FY10
FY11
FY12
FY13
FY14
FY15
FY16
E
FY17
E
FY18
E
Employee expenses (LHS) Employee costs as a % of revenue (RHS)
(INRbn) (%)
05
101520253035404550
Mar
-06
Sep-
06
Mar
-07
Sep-
07
Mar
-08
Sep-
08
Mar
-09
Sep-
09
Mar
-10
Sep-
10
Mar
-11
Sep-
11
Mar
-12
Sep-
12
Mar
-13
Sep-
13
Mar
-14
Sep-
14
Mar
-15
Sep-
15
(PER)
28.4x Avg+1S.D.
20.5x Avg
12.6x Avg-1S.D.
2.0
2.5
3.0
3.5
4.0
4.5
5.0
0
10
20
30
40
50
Mar
-04
Sep-
04M
ar-0
5Se
p-05
Mar
-06
Sep-
06M
ar-0
7Se
p-07
Mar
-08
Sep-
08M
ar-0
9Se
p-09
Mar
-10
Sep-
10M
ar-1
1Se
p-11
Mar
-12
Sep-
12M
ar-1
3Se
p-13
Mar
-14
Sep-
14M
ar-1
5Se
p-15
PER (LHS) Book to bill ratio (RHS)
(x) (x)
0100200300400500600700800900
Mar
-06
Sep-
06
Mar
-07
Sep-
07
Mar
-08
Sep-
08
Mar
-09
Sep-
09
Mar
-10
Sep-
10
Mar
-11
Sep-
11
Mar
-12
Sep-
12
Mar
-13
Sep-
13
Mar
-14
Sep-
14
Mar
-15
Sep-
15
16x22x 28x
10x
(INR)

Industrials / India BHEL IN
15 September 2015
- 18 -
BHEL: EV/EBITDA bands
Source: Bloomberg, Company, Daiwa forecasts
Risks
The main risk to our investment thesis would be any delays in finalising power orders in the sector. Secondary risks would be a greater-than-expected decline in revenue for FY16, due to unexpected delays in some orders from 2H FY16. Another risk would be if it has to be more aggressive in its pricing due to continued intense competition, and finally any plans by the government to sell stake in the company would also be a risk to our call.
0
200
400
600
800
1,000
1,200
1,400
1,600
1,800
Mar
-06
Sep-
06
Mar
-07
Sep-
07
Mar
-08
Sep-
08
Mar
-09
Sep-
09
Mar
-10
Sep-
10
Mar
-11
Sep-
11
Mar
-12
Sep-
12
Mar
-13
Sep-
13
Mar
-14
Sep-
14
Mar
-15
Sep-
15
16x 12x 8x 4x
(INRbn)

Industrials / India BHEL IN
15 September 2015
- 19 -
Appendix 1: India’s power situation
Bringing electricity to villages and rural households The power shortage situation in India seems to have improved over the past 6 years, from an 11% power deficit in FY09 to 2% YTD for FY16. But, in reality the number of power shortages experienced each year is very high, in contrast to the data published by CEA. This is visible from the percentage of rural households with electricity as compared to the percentage of villages that have electricity. As per India’s Rural Electrification Policy, a village will be classified as having electricity based on a certificate issued by the Gram Panchayat (local government), certifying that:
1) Basic infrastructure, such as distribution transformers and distribution lines, are provided in inhabited localities, as well as a minimum of one dalit basti (hamlet) where it the infrastructure exists.
2) Electricity is provided to public places like schools, panchayat offices, health centres, dispensaries, community centres, etc.
3) The number of households with electricity is at least 10% of the total number of households in a village.
The third condition appears out of sync to us. From the third chart on this page, 97% of villages had electricity in India as at May 2015. But only 55% of rural households had electricity as per the Census of India 2011. According to the Census 2011, states like Bihar, Uttar Pradesh, Jharkhand, Odisha and West Bengal has had a rural household electrification rate of less than the all-India average of 55%. Also, in these states, the difference between the percentage of villages with electricity and the percentage of rural households with electricity was very high as shown in the chart below. To counter this issue, the Forum of Regulators has set up a sub-group that has come up with a ‘Mission Mode’ approach to solving the issue quickly.
The all-India energy requirements and availability of electricity
Source: CEA
Note: YTD FY16 = as at 31 July 2015
All-India peak demand and demand for power met
Source: CEA
Note: YTD FY16= as at 31 July 2015
Percentage of villages and rural households with electricity and power deficit
Source: Planning commission, CEA
Note: Power deficits are as at 31 July 2015, Villages with electricity data is as at 31 May 2015, the rural household electrification data is as per the Census 2011
Main source of lighting As per the Census 2011, households are split into 6 groups depending on their main source of lighting ie, electricity, kerosene, solar, other oil, any other source, and no lighting. Of these, most households either have electricity or use kerosene for lighting.
778 831 862 938 996 999
1,068
367
692 746 788 859 910 957 1,030
359
-11%
-10%-9%
-8% -9% -4% -4%
-2%
(50%)
(40%)
(30%)
(20%)
(10%)
0%
0
200
400
600
800
1,000
1,200
1,400
FY09 FY10 FY11 FY12 FY13 FY14 FY15 YTDFY16
Energy Requ irement Energy Ava ilable
(BU)
106 113 118 125 130 133 143 143
92 99 105 112 118 126 137 139 -14%
-13% -11%-11% -9%
-5% -4% -3%
(50%)
(40%)
(30%)
(20%)
(10%)
0%
0
20
40
60
80
100
120
140
160
180
FY09 FY10 FY11 FY12 FY13 FY14 FY15 YTDFY16
Peak Demand Demand met
(GW)
96 99
93 92 100
97
97 90
1024
32 36 40
55 58 58
-2
-12
-1 -1 0-2
0 0
(14)
(12)
(10)
(8)
(6)
(4)
(2)
0
0
20
40
60
80
100
Biha
r
UP
Jhar
khan
d
Odi
sha
WB
Indi
a
MP
Raja
stha
n
% of villages with electricity % of rural households with electricityPower Deficit (RHS)
(% ) (% )

Industrials / India BHEL IN
15 September 2015
- 20 -
According to the Census 2011, at the all-India level, 67.2% of households used electricity for lighting, while for kerosene, the all-India dependence was 31.4%. In Bihar, UP, Jharkhand and Odisha, more than 50% of total households use kerosene as the source of lighting, which is worse than the average of 31% for the whole of India. % of total households that use kerosene as the main source of lighting in India (Census 2011)
Source: Census 2011
Note: Period is 2011
In rural areas, the situation is even worse in terms of Kerosene use in states like Bihar, UP, Jharkhand and Odisha. Some 55.3% of households use electricity for lighting in rural India and 43.2% rely on Kerosene. % of rural households use kerosene as a main source of lighting in India (Census 2011)
Source: Census 2011
Note: Period is 2011
The dependence on kerosene as a source of lighting proves that the electricity is still a distant dream in states like Bihar, UP, Jharkhand and Odisha.
Penetration levels of home appliances and electricity per capacity consumption In India, 31% of the households own a refrigerator, 10% own a washing machine, 6.8% have an air conditioner and 5.3% own a microwave. The growing Indian middle class and rising income levels will lead to long-term demand growth for these products, which will translate into higher demand for these for power and eventually higher demand for power equipment. Penetration rate in India (FY14)
Source: Statista
The per capita consumption of electricity in India was 884Kwh for 2011-12, versus 3,045 Kwh for the rest of the world in 2011-12, according to the World Bank. Even among Brazil, Russia, India, China and South Africa (BRICS) nations, India’s per capita consumption of electricity is the lowest. Per capita electric power consumption of countries (kWh)
Source: World Bank, CEA
The government announced programmes in 2014, such as ‘Make in India’ and ‘Digital India’, in a bid to turn India into a manufacturing hub and an electronically empowered country, ie, using more technology. Both these programmes will lead to greater demand for electricity in the coming years.
82
6255 53
32 31 3123
15 11 80
102030405060708090
Biha
r
UP
Odi
sha
Jhar
khan
d
MP
Indi
a
Raja
stha
n
Chh
attis
garh
Mah
aras
htra
Utta
rakh
and
Guj
arat
(% )
88
7566 63
43 41 39
28 2415 13
0102030405060708090
Biha
r
UP
Jhar
khan
d
Odi
sha
Indi
a
MP
Raja
stha
n
Chh
attis
garh
Mah
aras
htra
Utta
rakh
and
Guj
arat
(% )
31.0
10.0 6.8 5.3
0
5
10
15
20
25
30
35
Refrige rator Washing mach ine Air conditioner Microwaves
(% )
13.4
8.4
6.4 5.7
4.6
2.9 3.0 2.4 0.8
13.2
7.8 6.5
5.5 4.6
3.3 3.0 2.4 0.9 0.0
2.0
4.0
6.0
8.0
10 .0
12 .0
14 .0
USA Japan Russia UK SouthAfrica
China World Brazil Ind ia
2010-11 2011-12
(kwh in '000)

Industrials / India BHEL IN
15 September 2015
- 21 -
Appendix 2: India power sector order pipeline for FY16-17
Order pipeline for FY16 and FY17Project Client Size (MW) EC Land availability Status Central Barethi NTPC 2,640 N Y ToR granted in October 2014. NIT issued Katwa NTPC 1,320 N Y ToR granted in December 2014 Pudimadaka NTPC 4,000 N Y Tender opened in March 2015, EIA studies are in progress and MoEF expects it to
be completed by May Ramagundam (Telangana) NTPC 1,600 N Y Applied for a ToR for revision of capacity in December 2014. NIT issued in
February 2015 Bilhaur NTPC 1,320 N N EC proposal submitted in July 2014, awaiting policy change requiring delinking
EC/FC Singareni 3rd unit NTPC 600 N N Base data collection is in process for EC
Rourkela NTPC-SAIL JV 250 - - Tender issued for EPC package in July 2014. At advanced stage of the bidding process
Maitree Project (Bangladesh) BIFPCL (JV between NTPC and BPDB)
1,320 - - Tenders invited for the EPC package in February 2015
Ghatampur TPP JV between NLC and UPRVUNL
1,980 Y Y Received EC based on imported coal
Sundargarh MCL 1,600 N Partial 800 acres of land acquired in September 2014 Pakal dul hydro project NHPC 1,000 Y N Set up consortium with Patel Engineering State Nellore (Krishnapatnam) APGENCO 800 N Y EC proposal submitted in April 2015 Kothagudem (Vijayawada) APGENCO 800 N Y EC proposal submitted in July 2014 Panipat HPGENCO 800 N Y Received existing coal linkage Patratu TPP JSEB 1,320 N Y Banhardih coal block now de-allocated Bhusawal TPP unit 6 MSPGCL 660 Y Y Land acquired for the project in July 2014 Nashik Expansion TPP MSPGCL 660 N Y EC proposal submitted in March 2015 Banswara TPP RRVUNL 1,320 N N REIA study did not start due to social unrest KaliSindh Phase-II RRVUNL 1,320 N - Public hearing conducted by RSPCB in July 2014 and the NOC for EC was issued Udangudi TANGEDCO 1,320 Y Y Bids scrapped and new tenders will come up Harduaganj TPP Stage-2 UPRVUNL 660 Y Y Bidding initiated in July 2014 Panki Expansion UPRVUNL 660 N Y ToR granted in September 2014 Private Khandwa Dwarkesh Energy 1,320 Y N Received EC in August 2014 and will use imported coal until coal linkage if
available Tuticorin SPIC Ltd 525 Y Y Has been waiting 6 months to getting approval from the regulatory commission Others Cheyyur UMPP Coastal Tamil Nadu Power 4,000 Y Partial Bids cancelled and new tenders will come up with new terms and conditions Bedabahal UMPP Odisha Integrated Power 4,000 Y Partial Bids cancelled and new tenders will come up with new terms and conditions Total 37,795
Source: Company, Daiwa
Note: Y= Yes, N= No, Partial= some land is still available

Industrials / India BHEL IN
15 September 2015
- 22 -
Appendix 3: power plants still in operation that are older than 25 years of age
India: coal-based power projects older than 25 years of age still in operation Name of Project Name of Utility/Company State Years of Commissioning Operational Capacity (MW) Years it has been in operation Central Ramagundam STPS NTPC Andhra Pradesh 1983, 1984 600 31 Korba STPS NTPC Chhattisgarh 1983 to 1987 1,100 31 Badarpur NTPC Delhi 1973 to 1981 705 41 Vindhyachal NTPC Madhya Pradesh 1987 420 27 Talcher TPS NTPC Odisha 1969 to 1983 460 45 Singrauli NTPC Uttar Pradesh 1982 to 1987 2,000 32 Farakka NTPC West Bengal 1986, 1987 600 28
Total 5,885 States Dr. NT TPS (Vijaywada) APGENCO Andhra Pradesh 1979 to 1980 420 35 Ramagundam B APGENCO Andhra Pradesh 1971 63 43 Barauni BSEB Bihar 1983 to 1985 220 31 Muzaffarpur KBUNL Bihar 1985, 1986 220 29 Korba West Hasdeo CSEB Chhattisgarh 1983 to 1986 840 31 Korba - East Bank CSEB Chhattisgarh 1968 to 1981 440 46 Wanakbori GSECL Gujarat 1982 to 1987 1,260 32 Ukai GSECL Gujarat 1976 to 1985 850 38 Gandhinagar GSECL Gujarat 1977 240 37 Panipat HPGCL Haryana 1979 to 1987 440 35 Bokaro B DVC Jharkhand 1986 210 28 Chandrapura DVC Jharkhand 1964, 1965 390 50 Patratu JSEB Jharkhand 1984 to 1986 220 30 Raichur KPCL Karnataka 1985 to 1986 420 29 Satpura MPPGCL Madhya Pradesh 1967 to 1984 893 47 Amarkantak Extension MPPGCL Madhya Pradesh 1977 240 37 Koradi MAHAGENCO Maharashtra 1974 to 1983 1,080 40 Nashik MAHAGENCO Maharashtra 1970 to 1981 880 44 Chandrapur MAHAGENCO Maharashtra 1983 to 1986 840 31 Parli MAHAGENCO Maharashtra 1980 to 1987 630 34 Bhusawal MAHAGENCO Maharashtra 1979 to 1982 420 35 Guru Nanik Dev - Bathinda PSEB Punjab 1974 to 1979 440 40 Ropar PSEB Punjab 1984, 1985 420 30 Kota RRVUNL Rajasthan 1983 220 31 Neyveli M\C NLC Tamil Nadu 1986 to 1988 630 28 Tuticorin TNEB Tamil Nadu 1979 to 1982 630 35 Ennore TNEB Tamil Nadu 1970 to 1975 450 44 Kothagudem TSGENCO Telangana 1966 to 1978 720 48 Obra UPRVUNL Uttar Pradesh 1967 to 1982 1,374 47 Anpara UPRVUNL Uttar Pradesh 1986 to 1988 630 28 Parichha UPRVUNL Uttar Pradesh 1984, 1985 220 30 Panki UPRVUNL Uttar Pradesh 1976, 1977 210 38 Harduaganj UPRVUNL Uttar Pradesh 1977, 1978 170 37 Durgapur DPL West Bengal 1985 110 29 Durgapur DVC West Bengal 1966 to 1982 350 48 Kolaghat WBPDCL West Bengal 1984, 1985 420 30 Bandel WBPDCL West Bengal 1982 210 32 Santaldih WBPDCL West Bengal 1974 to 1981 480 40
Total 18,900 Grand Total 24,785
Source: CEA, state utilities
Note: Years of operation – from the year of commissioning of power plant to 2014

Industrials / India BHEL IN
15 September 2015
- 23 -
India: coal-based units older than 25 years of age with a PLF of less than 40% in FY14Station Name Name of utility/company State Unit No. Capacity as at 31.03.2014 (MW) Date of Commissioning Cumulative % PLF (FY14) Gandhinagar TPS GSECL Gujarat 1 120 13-Mar-77 2 Gandhinagar TPS GSECL Gujarat 2 120 23-Mar-77 2 Sikka Rep. TPS GSECL Gujarat 1 120 26-Mar-88 31 Ukai TPS GSECL Gujarat 1 120 19-Mar-76 21 Ukai TPS GSECL Gujarat 2 120 23-Jun-76 12 Wanakbori TPS GSECL Gujarat 3 210 15-Mar-84 30 Wanakbori TPS GSECL Gujarat 4 210 9-Mar-86 25 Wanakbori TPS GSECL Gujarat 5 210 23-Sep-86 29 Wanakbori TPS GSECL Gujarat 6 210 18-Nov-87 22 Panipat TPS HPGCL Haryana 1 110 30-Mar-79 11 Panipat TPS HPGCL Haryana 2 110 21-Feb-80 9 Panipat TPS HPGCL Haryana 3 110 1-Nov-85 10 Panipat TPS HPGCL Haryana 4 110 11-Jan-87 10 Bokaro ''B'' TPS DVC Jharkhand 1 210 24-Mar-86 40 Patratu TPS JSEB Jharkhand 1 40 1-Oct-66 - Patratu TPS JSEB Jharkhand 2 40 1-Jun-67 - Patratu TPS JSEB Jharkhand 3 40 1-Feb-69 - Patratu TPS JSEB Jharkhand 5 90 17-Dec-71 - Patratu TPS JSEB Jharkhand 6 90 17-Jan-77 5 Patratu TPS JSEB Jharkhand 7 105 13-Mar-72 - Patratu TPS JSEB Jharkhand 8 105 2-Mar-78 - Koradi TPS MAHAGENCO Maharashtra 1 105 4-Jun-74 - Koradi TPS MAHAGENCO Maharashtra 2 105 24-Mar-75 - Koradi TPS MAHAGENCO Maharashtra 3 105 3-Mar-76 - Koradi TPS MAHAGENCO Maharashtra 4 105 22-Jul-76 - Koradi TPS MAHAGENCO Maharashtra 5 200 31-Mar-78 32 Parli TPS MAHAGENCO Maharashtra 3 210 20-Sep-80 - Parli TPS MAHAGENCO Maharashtra 4 210 26-Mar-85 36 Parli TPS MAHAGENCO Maharashtra 5 210 31-Dec-87 32 Ennore TPS TNEB Tamil Nadu 4 110 30-Apr-73 38 Ennore TPS TNEB Tamil Nadu 5 110 10-Feb-75 - Harduaganj TPS UPRVUNL Uttar Pradesh 5 60 21-Mar-77 18 Obra TPS UPRVUNL Uttar Pradesh 8 94 15-Sep-75 - Panki TPS UPRVUNL Uttar Pradesh 3 105 10-Nov-76 25 Bandel TPS WBPDCL West Bengal 1 60 30-Nov-65 34 Bandel TPS WBPDCL West Bengal 3 60 30-Nov-65 30 Bandel TPS WBPDCL West Bengal 4 60 31-May-67 37 Bandel TPS WBPDCL West Bengal 5 210 8-Oct-82 32 D.P.L. TPS WBPDCL West Bengal 3 70 12-Jun-64 14 D.P.L. TPS WBPDCL West Bengal 4 75 1-Sep-64 14 D.P.L. TPS WBPDCL West Bengal 5 75 31-May-66 12 Santaldih TPS WBPDCL West Bengal 1 120 1-Jan-74 - Santaldih TPS WBPDCL West Bengal 2 120 16-Jul-75 - Santaldih TPS WBPDCL West Bengal 3 120 6-Dec-78 - Santaldih TPS WBPDCL West Bengal 4 120 30-Mar-81 - Total 5,729
Source: CEA, state utilities

Industrials / India BHEL IN
15 September 2015
- 24 -
Appendix 4: recent order pricing trends
The current average price of a supercritical turbine-generator is INR9m/MW, while that for a supercritical boiler is INR14m/MW.
Pricing of all supercritical orders won over the past 5 yearsProject Client Winner Year Unit size (MW) No of plants MW Price (INRm) Price/MW (INRm) BTG RPCL, Yeramarus KPCL-BHEL JV BHEL FY11 800 2 1,600 63,000 39 RPCL, Edlapur KPCL-BHEL JV BHEL FY11 800 1 800 31,500 39 Karchana JP Power Ventures LT FY11 660 3 1,980 65,000 33 Bellary TPS Unit-3 KPCL BHEL FY11 700 1 700 37,000 53 Lalitpur Bajaj Hindusthan BHEL FY11 660 3 1,980 54,500 28 Dainik Bhaskar DBPL BHEL FY12 660 2 1,320 37,829 29 IB Valley OPGCL BHEL FY13 660 2 1,320 40,510 31
EPC Rajpura L&T Power-Rajpura LT FY11 700 2 1,400 52,000 37 Rajpura Nabha Power, Rajpura LT FY11 700 1 700 30,060 43 Suratgarh RRVUNL BHEL FY13 660 2 1,320 56,000 42 Chhabra RRVUNL LT FY14 660 2 1,320 56,890 43 Ennore Expansion TANGEDCO Lanco Infratech FY14 660 1 660 39,600 60 North Karanpura NTPC BHEL FY14 660 3 1,980 79,000 40 Shree Singaji (Stage-II) MPPGCL LT FY15 660 2 1,320 51,000 39 Wanakbori GSECL BHEL FY15 800 1 800 35,360 44 Ennore SEZ TANGEDCO BHEL FY15 660 2 1,320 78,000 59 Kothagudem TSGENCO BHEL FY15 800 1 800 38,100 48 Khargone NTPC LT FY15 660 2 1,320 55,800 42 Yadadri (Nalgonda District) TSGENCO BHEL FY16 800 5 4,000 179,500 45
Turbine generators NTPC-Bulk Tender Turbine Generator NTPC BHEL FY11 660 2 1,320 16,500 13 Kudgi NTPC Toshiba-JSW FY12 800 3 2,400 23,000 10 Solapur NTPC Alstom Bharat Forge FY13 660 2 1,320 15,700 12 Meja NTPC Toshiba-JSW FY13 660 2 1,320 16,750 13 Raghunathpur DVC BHEL FY13 660 2 1,320 16,500 13 Nabinagar NTPC Alstom Bharat Forge FY13 660 3 1,980 22,510 11 Gadarwara NTPC BHEL FY13 800 2 1,600 15,500 10 Darlipali NTPC Toshiba-JSW FY14 800 2 1,600 10,800 7 Tanda (UP) NTPC Alstom Bharat Forge FY15 660 2 1,320 11,365 9
Boiler Kudgi NTPC Doosan FY12 800 3 2,400 60,000 25 Lara NTPC Doosan FY13 800 2 1,600 60,000 38 Nabinagar NTPC-BSEB BHEL FY13 660 3 1,980 28,540 14 Gadarwara NTPC BHEL FY13 800 2 1,600 29,000 18 Darlipali NTPC BHEL FY14 800 2 1,600 30,000 19 Tanda stage II NTPC LT FY15 660 2 1,320 18,850 14
Source: Company, Media articles

Industrials / India BHEL IN
15 September 2015
- 25 -
Appendix 5: glossary of terms
Glossary of terms TPS Thermal power station WBPDCL West Bengal Power Development Corporation Limited TPP Thermal power plant PSEB Punjab State Electricity Board EC Environmental clearance IGCC Integrated gasification combined cycle FC Forest clearance GHTP Guru Hargobind Thermal Plant EIA Environmental Impact Assessment BSPGCL Bihar State Power Generation Company Limited REIA Rapid Environmental Impact Assessment GIDC Gujarat Industrial Development Corporation TOR Terms of Reference NUPPL Neyveli Uttar Pradesh Power Limited MoEF Ministry of Environment & Forests SCL The Singareni Collieries Limited R&R Resettlement and Rehabilitation JUUNL Jharkhand Urja Utpadan Nigam Limited NOC No Objection Certificate TVNL Tenughat Vidyut Nigam Limited SPV Special Purpose Vehicle GIDC Goa Industrial Development Corporation PFC Power Finance Corporation TSPGCL Telangana State Power Generation Corporation Limited MCL Mahanadi Coalfields Limited SC Supreme Court of India NHPC National Hydroelectric Power Corporation FSA Fuel supply agreements MSPGCL Maharashtra State Power Generation Company Limited PPA Power Purchase Agreement SPIC Ltd Southern Petrochemical Industries Corporation Limited QIP Qualified Institutional Placement JSEB Jharkhand State Electricity Board MAHAGENCO Maharashtra State Power Generation Company Limited RSPCB Rajasthan State Pollution Control Board CSEB Chhattisgarh State Electricity Board TANGEDCO Tamil Nadu Generation and Distribution Corporation TNEB Tamil Nadu Electricity Board KPCL Karnataka Power Corporation Limited HPGCL Haryana Power Generation Corporation Limited GSECL Gujarat State Electricity Corporation Limited BSEB Bihar State Electricity Board MPPGCL Madhya Pradesh Power Generation Company Limited KBUNL Kanti Bijlee Utpadan Nigam Limited NTPC National Thermal Power Corporation Limited JSEB Jharkhand State Electricity Board TSGENCO Telangana State Power Generation Corporation Limited DPL Durgapur projects limited NLC Neyveli Lignite Corporation CEA Central Electricity Authority of India UPRVUNL Uttar Pradesh Rajya Vidyut Utpadan Nigam Limited BIFPCL Bangladesh-India Friendship Power Company (Private) Limited CESC Calcutta Electric Supply Corporation BPDB Bangladesh Power Development Board ICPL IFFCO Chhattisgarh Power Limited BSPGCL Bihar State Power Generation Company Limited SJVNL Sutlej Jal Vidyut Nigam Limited LBCPL Lakhisarai Bijlee Company Private Limited PTC Power trading corporation CEB Ceylon Electricity Board L&T Larsen and Toubro AP Andhra Pradesh NHDC Narmada Hydroelectric Development Corporation Limited HEP Hydro-electric power NHPC National Hydroelectric Power Corporation SMHPCL Shree Maheshwar Hydel Power Corporation Limited MP Madhya Pradesh NIT Notices Inviting Tenders RRVUNL Rajasthan Rajya Vidyut Utpadan Nigam Limited
Source: Daiwa

Industrials / India BHEL IN
15 September 2015
- 26 -
Daiwa’s Asia Pacific Research Directory
HONG KONG
Takashi FUJIKURA (852) 2848 4051 [email protected] Regional Research Head
Kosuke MIZUNO (852) 2848 4949 / (852) 2773 8273
Regional Research Co-head
John HETHERINGTON (852) 2773 8787 [email protected] Regional Deputy Head of Asia Pacific Research
Rohan DALZIELL (852) 2848 4938 [email protected] Regional Head of Product Management
Kevin LAI (852) 2848 4926 [email protected] Chief Economist for Asia ex-Japan; Macro Economics (Regional)
Christie CHIEN (852) 2848 4482 [email protected] Macro Economics (Regional); Banking; Insurance (Taiwan)
Junjie TANG (852) 2773 8736 [email protected] Macro Economics (China)
Jonas KAN (852) 2848 4439 [email protected] Head of Hong Kong and China Property
Cynthia CHAN (852) 2773 8243 [email protected]
Property (China)
Leon QI (852) 2532 4381 [email protected] Banking (Hong Kong/China); Broker (China); Insurance (China)
Anson CHAN (852) 2532 4350 [email protected] Consumer (Hong Kong/China)
Jamie SOO (852) 2773 8529 [email protected] Gaming and Leisure (Hong Kong/China)
Dennis IP (852) 2848 4068 [email protected] Power; Utilities; Renewables and Environment (Hong Kong/China)
John CHOI (852) 2773 8730 [email protected]
Head of Hong Kong and China Internet; Regional Head of Small/Mid Cap
Kelvin LAU (852) 2848 4467 [email protected] Head of Automobiles; Transportation and Industrial (Hong Kong/China)
Brian LAM (852) 2532 4341 [email protected] Transportation – Railway; Construction and Engineering (China)
Jibo MA (852) 2848 4489 [email protected] Head of Custom Products Group
Thomas HO (852) 2773 8716 [email protected] Custom Products Group
PHILIPPINES
Bianca SOLEMA (63) 2 737 3023 [email protected] Utilities and Energy
SOUTH KOREA
Sung Yop CHUNG (82) 2 787 9157 [email protected] Pan-Asia Co-head/Regional Head of Automobiles and Components; Automobiles; Shipbuilding; Steel
Mike OH (82) 2 787 9179 [email protected] Banking; Capital Goods (Construction and Machinery)
Iris PARK (82) 2 787 9165 [email protected] Consumer/Retail
SK KIM (82) 2 787 9173 [email protected]
IT/Electronics – Semiconductor/Display and Tech Hardware
Thomas Y KWON (82) 2 787 9181 [email protected] Pan-Asia Head of Internet & Telecommunications; Software – Internet/On-line Game
TAIWAN
Rick HSU (886) 2 8758 6261 [email protected] Head of Regional Technology; Head of Taiwan Research; Semiconductor/IC Design (Regional)
Steven TSENG (886) 2 8758 6252 [email protected] IT/Technology Hardware (PC Hardware)
Christine WANG (886) 2 8758 6249 [email protected] IT/Technology Hardware (Automation); Pharmaceuticals and Healthcare; Consumer
Kylie HUANG (886) 2 8758 6248 [email protected] IT/Technology Hardware (Handsets and Components)
Helen CHIEN (886) 2 8758 6254 [email protected] Small/Mid Cap
INDIA
Punit SRIVASTAVA (91) 22 6622 1013 [email protected] Head of India Research; Strategy; Banking/Finance
Saurabh MEHTA (91) 22 6622 1009 [email protected] Capital Goods; Utilities
SINGAPORE
Ramakrishna MARUVADA (65) 6499 6543 [email protected] Head of Singapore Research; Telecommunications (China/ASEAN/India)
Royston TAN (65) 6321 3086 [email protected] Oil and Gas; Capital Goods
David LUM (65) 6329 2102 [email protected] Property and REITs
Shane GOH (65) 64996546 [email protected] Small/Mid Cap (Singapore)
Jame OSMAN (65) 6321 3092 [email protected] Telecommunications (ASEAN/India); Pharmaceuticals and Healthcare; Consumer (Singapore)

Industrials / India BHEL IN
15 September 2015
- 27 -
Daiwa’s Offices
Office / Branch / Affiliate Address Tel Fax
DAIWA SECURITIES GROUP INC
HEAD OFFICE Gran Tokyo North Tower, 1-9-1, Marunouchi, Chiyoda-ku, Tokyo, 100-6753 (81) 3 5555 3111 (81) 3 5555 0661
Daiwa Securities Trust Company One Evertrust Plaza, Jersey City, NJ 07302, U.S.A. (1) 201 333 7300 (1) 201 333 7726
Daiwa Securities Trust and Banking (Europe) PLC (Head Office) 5 King William Street, London EC4N 7JB, United Kingdom (44) 207 320 8000 (44) 207 410 0129
Daiwa Europe Trustees (Ireland) Ltd Level 3, Block 5, Harcourt Centre, Harcourt Road, Dublin 2, Ireland (353) 1 603 9900 (353) 1 478 3469
Daiwa Capital Markets America Inc. New York Head Office Financial Square, 32 Old Slip, New York, NY10005, U.S.A. (1) 212 612 7000 (1) 212 612 7100
Daiwa Capital Markets America Inc. San Francisco Branch 555 California Street, Suite 3360, San Francisco, CA 94104, U.S.A. (1) 415 955 8100 (1) 415 956 1935
Daiwa Capital Markets Europe Limited, London Head Office 5 King William Street, London EC4N 7AX, United Kingdom (44) 20 7597 8000 (44) 20 7597 8600
Daiwa Capital Markets Europe Limited, Frankfurt Branch Neue Mainzer Str. 1, 60311 Frankfurt/Main, Germany (49) 69 717 080 (49) 69 723 340
Daiwa Capital Markets Europe Limited, Paris Representative Office 17, rue de Surène 75008 Paris, France (33) 1 56 262 200 (33) 1 47 550 808
Daiwa Capital Markets Europe Limited, Geneva Branch 50 rue du Rhône, P.O.Box 3198, 1211 Geneva 3, Switzerland (41) 22 818 7400 (41) 22 818 7441
Daiwa Capital Markets Europe Limited, Moscow Representative Office
Midland Plaza 7th Floor, 10 Arbat Street, Moscow 119002, Russian Federation
(7) 495 641 3416 (7) 495 775 6238
Daiwa Capital Markets Europe Limited, Bahrain Branch 7th Floor, The Tower, Bahrain Commercial Complex, P.O. Box 30069, Manama, Bahrain
(973) 17 534 452 (973) 17 535 113
Daiwa Capital Markets Hong Kong Limited Level 28, One Pacific Place, 88 Queensway, Hong Kong (852) 2525 0121 (852) 2845 1621
Daiwa Capital Markets Singapore Limited 6 Shenton Way #26-08, OUE Downtown 2, Singapore 068809, Republic of Singapore
(65) 6220 3666 (65) 6223 6198
Daiwa Capital Markets Australia Limited Level 34, Rialto North Tower, 525 Collins Street, Melbourne, Victoria 3000, Australia
(61) 3 9916 1300 (61) 3 9916 1330
DBP-Daiwa Capital Markets Philippines, Inc 18th Floor, Citibank Tower, 8741 Paseo de Roxas, Salcedo Village, Makati City, Republic of the Philippines
(632) 813 7344 (632) 848 0105
Daiwa-Cathay Capital Markets Co Ltd 14/F, 200, Keelung Road, Sec 1, Taipei, Taiwan, R.O.C. (886) 2 2723 9698 (886) 2 2345 3638
Daiwa Securities Capital Markets Korea Co., Ltd. 20 Fl.& 21Fl. One IFC, 10 Gukjegeumyung-Ro, Yeongdeungpo-gu, Seoul, Korea
(82) 2 787 9100 (82) 2 787 9191
Daiwa Securities Co. Ltd., Beijing Representative Office Room 301/302,Kerry Center,1 Guanghua Road,Chaoyang District, Beijing 100020, People’s Republic of China
(86) 10 6500 6688 (86) 10 6500 3594
Daiwa (Shanghai) Corporate Strategic Advisory Co. Ltd. 44/F, Hang Seng Bank Tower, 1000 Lujiazui Ring Road, Pudong, Shanghai China 200120 , People’s Republic of China
(86) 21 3858 2000 (86) 21 3858 2111
Daiwa Securities Co. Ltd., Bangkok Representative Office 18th Floor, M Thai Tower, All Seasons Place, 87 Wireless Road, Lumpini, Pathumwan, Bangkok 10330, Thailand
(66) 2 252 5650 (66) 2 252 5665
Daiwa Capital Markets India Private Ltd 10th Floor, 3 North Avenue, Maker Maxity, Bandra Kurla Complex, Bandra East, Mumbai – 400051, India
(91) 22 6622 1000 (91) 22 6622 1019
Daiwa Securities Co. Ltd., Hanoi Representative Office Suite 405, Pacific Palace Building, 83B, Ly Thuong Kiet Street, Hoan Kiem Dist. Hanoi, Vietnam
(84) 4 3946 0460 (84) 4 3946 0461
DAIWA INSTITUTE OF RESEARCH LTD
HEAD OFFICE 15-6, Fuyuki, Koto-ku, Tokyo, 135-8460, Japan (81) 3 5620 5100 (81) 3 5620 5603
MARUNOUCHI OFFICE Gran Tokyo North Tower, 1-9-1, Marunouchi, Chiyoda-ku, Tokyo, 100-6756 (81) 3 5555 7011 (81) 3 5202 2021
New York Research Center 11th Floor, Financial Square, 32 Old Slip, NY, NY 10005-3504, U.S.A. (1) 212 612 6100 (1) 212 612 8417
London Research Centre 3/F, 5 King William Street, London, EC4N 7AX, United Kingdom (44) 207 597 8000 (44) 207 597 8550

Industrials / India BHEL IN
15 September 2015
- 28 -
Important Disclosures and Disclaimer
This publication is produced by Daiwa Securities Group Inc. and/or its non-U.S. affiliates, and distributed by Daiwa Securities Group Inc. and/or its non-U.S. affiliates, except to the extent expressly provided herein. This publication and the contents hereof are intended for information purposes only, and may be subject to change without further notice. Any use, disclosure, distribution, dissemination, copying, printing or reliance on this publication for any other purpose without our prior consent or approval is strictly prohibited. Neither Daiwa Securities Group Inc. nor any of its respective parent, holding, subsidiaries or affiliates, nor any of its respective directors, officers, servants and employees, represent nor warrant the accuracy or completeness of the information contained herein or as to the existence of other facts which might be significant, and will not accept any responsibility or liability whatsoever for any use of or reliance upon this publication or any of the contents hereof. Neither this publication, nor any content hereof, constitute, or are to be construed as, an offer or solicitation of an offer to buy or sell any of the securities or investments mentioned herein in any country or jurisdiction nor, unless expressly provided, any recommendation or investment opinion or advice. Any view, recommendation, opinion or advice expressed in this publication may not necessarily reflect those of Daiwa Securities Group Inc., and/or its affiliates nor any of its respective directors, officers, servants and employees except where the publication states otherwise. This research report is not to be relied upon by any person in making any investment decision or otherwise advising with respect to, or dealing in, the securities mentioned, as it does not take into account the specific investment objectives, financial situation and particular needs of any person. Daiwa Securities Group Inc., its subsidiaries or affiliates, or its or their respective directors, officers and employees from time to time have trades as principals, or have positions in, or have other interests in the securities of the company under research including market making activities, derivatives in respect of such securities or may have also performed investment banking and other services for the issuer of such securities. The following are additional disclosures.
Ownership of Securities
For “Ownership of Securities” information, please visit BlueMatrix disclosure link at https://daiwa3.bluematrix.com/sellside/Disclosures.action.
Investment Banking Relationship
For “Investment Banking Relationship”, please visit BlueMatrix disclosure link at https://daiwa3.bluematrix.com/sellside/Disclosures.action. Japan
Daiwa Securities Co. Ltd. and Daiwa Securities Group Inc.
Daiwa Securities Co. Ltd. is a subsidiary of Daiwa Securities Group Inc.
Investment Banking Relationship
Within the preceding 12 months, the subsidiaries and/or affiliates of Daiwa Securities Group Inc. * has lead-managed public offerings and/or secondary offerings (excluding straight bonds) of the securities of the following companies: Modern Land (China) Co. Ltd (1107 HK); econtext Asia Ltd (1390 HK); Accordia Golf Trust (AGT SP); Hua Hong Semiconductor Ltd (1347 HK); GF Securities Co Ltd (1776 HK); Mirae Asset Life Insurance Co Ltd (085620 KS).
*Subsidiaries of Daiwa Securities Group Inc. for the purposes of this section shall mean any one or more of: Daiwa Capital Markets Hong Kong Limited (大和資本市場香港有限公司), Daiwa Capital Markets Singapore Limited, Daiwa Capital Markets Australia Limited, Daiwa Capital Markets India Private Limited, Daiwa-Cathay Capital Markets Co., Ltd., Daiwa Securities Capital Markets Korea Co., Ltd. Hong Kong This research is distributed in Hong Kong by Daiwa Capital Markets Hong Kong Limited (大和資本市場香港有限公司) (“DHK”) which is regulated by the Hong Kong Securities and Futures Commission. Recipients of this research in Hong Kong may contact DHK in respect of any matter arising from or in connection with this research. Relevant Relationship (DHK)
DHK may from time to time have an individual employed by or associated with it serves as an officer of any of the companies under its research coverage.
Singapore
This research is distributed in Singapore by Daiwa Capital Markets Singapore Limited and it may only be distributed in Singapore to accredited investors, expert investors and institutional investors as defined in the Financial Advisers Regulations and the Securities and Futures Act (Chapter 289), as amended from time to time. By virtue of distribution to these category of investors, Daiwa Capital Markets Singapore Limited and its representatives are not required to comply with Section 36 of the Financial Advisers Act (Chapter 110) (Section 36 relates to disclosure of Daiwa Capital Markets Singapore Limited’s interest and/or its representative’s interest in securities). Recipients of this research in Singapore may contact Daiwa Capital Markets Singapore Limited in respect of any matter arising from or in connection with the research. Australia
This research is distributed in Australia by Daiwa Capital Markets Australia Limited and it may only be distributed in Australia to wholesale investors within the meaning of the Corporations Act. Recipients of this research in Australia may contact Daiwa Capital Markets Stockbroking Limited in respect of any matter arising from or in connection with the research. India
This research is distributed in India to Institutional Clients only by Daiwa Capital Markets India Private Limited (Daiwa India) which is an intermediary registered with Securities & Exchange Board of India as a Stock Broker, Merchant Bank and Research Analyst. Daiwa India, its Research Analyst and their family members and its associates do not have any financial interest save as disclosed or other undisclosed material conflict of interest in the securities or derivatives of any companies under coverage. Daiwa India and its associates may have received compensation for any products other than Investment Banking (as disclosed) or brokerage services from the subject company in this report during the past 12 months. Unless otherwise stated in BlueMatrix disclosure link at https://daiwa3.bluematrix.com/sellside/Disclosures.action, Daiwa India and its associates do not hold more than 1% of any companies covered in this research report. There is no material disciplinary action against Daiwa India by any regulatory authority impacting equity research analysis activities as of the date of this report. Taiwan
This research is distributed in Taiwan by Daiwa-Cathay Capital Markets Co., Ltd and it may only be distributed in Taiwan to institutional investors or specific investors who have signed recommendation contracts with Daiwa-Cathay Capital Markets Co., Ltd in accordance with the Operational Regulations Governing Securities Firms Recommending Trades in Securities to Customers. Recipients of this research in Taiwan may contact Daiwa-Cathay Capital Markets Co., Ltd in respect of any matter arising from or in connection with the research. Philippines This research is distributed in the Philippines by DBP-Daiwa Capital Markets Philippines, Inc. which is regulated by the Philippines Securities and Exchange Commission and the Philippines Stock Exchange, Inc. Recipients of this research in the Philippines may contact DBP-Daiwa Capital Markets Philippines, Inc. in respect of any matter arising from or in connection with the research. DBP-Daiwa Capital Markets Philippines, Inc. recommends that investors independently assess, with a professional advisor, the specific financial risks as well as the legal, regulatory, tax, accounting, and other consequences of a proposed transaction. DBP-Daiwa Capital Markets Philippines, Inc. may have positions or may be materially interested in the securities in any of the markets mentioned in the publication or may have performed other services for the issuers of such securities.
For relevant securities and trading rules please visit SEC and PSE links at http://www.sec.gov.ph/irr/AmendedIRRfinalversion.pdf and http://www.pse.com.ph/ respectively. Thailand
This research is distributed to only institutional investors in Thailand primarily by Thanachart Securities Public Company Limited (“TNS”).
This report is prepared by analysts who are employed by Daiwa Securities Group Inc. and/or its non-U.S. affiliates. This report is provided to you for informational purposes only and it is not, and is not to be construed as, an offer or an invitation to make an offer to sell or buy any securities. Neither Thanachart Securities Public Company Limited, Daiwa Securities Group Inc. nor any of their respective parent, holding, subsidiaries or affiliates, nor any of their respective directors, officers, servants and employees accept any liability whatsoever for any direct or consequential loss arising from any use of this research or its contents.
The information and opinions contained herein have been compiled or arrived at from sources believed to be reliable. However, Thanachart Securities Public Company Limited, Daiwa SecuritiesGroup Inc. nor any of their respective parent, holding, subsidiaries or affiliates, nor any of their respective directors, officers, servants and employees make no representation or warranty, express or implied, as to their accuracy or completeness. Expressions of opinion herein are subject to change without notice. The use of any information, forecasts and opinions contained in thisreport shall be at the sole discretion and risk of the user.
Daiwa Securities Group Inc. and/or its non-U.S. affiliates perform and seek to perform business with companies covered in this research. Thanachart Securities Public Company Limited, Daiwa Securities Group Inc., their respective parent, holding, subsidiaries or affiliates, their respective directors, officers, servants and employees may have positions and financial interest in securities mentioned in this research. Thanachart Securities Public Company Limited, Daiwa Securities Group Inc., their respective parent, holding, subsidiaries or affiliates may from time to time perform investment banking or other services for, or solicit investment banking or other business from, any entity mentioned in this research. Therefore, investors should be aware of conflict of interest that may affect the objectivity of this research.

Industrials / India BHEL IN
15 September 2015
- 29 -
United Kingdom
This research report is produced by Daiwa Capital Markets Europe Limited and/or its affiliates and is distributed in the European Union, Iceland, Liechtenstein, Norway and Switzerland. Daiwa Capital Markets Europe Limited is authorised and regulated by The Financial Conduct Authority (“FCA”) and is a member of the London Stock Exchange, Eurex and NYSE Liffe. This publication is intended for investors who are not Retail Clients in the United Kingdom within the meaning of the Rules of the FCA and should not therefore be distributed to such Retail Clients in the United Kingdom. Should you enter into investment business with Daiwa Capital Markets Europe’s affiliates outside the United Kingdom, we are obliged to advise that the protection afforded by the United Kingdom regulatory system may not apply; in particular, the benefits of the Financial Services Compensation Scheme may not be available. Daiwa Capital Markets Europe Limited has in place organisational arrangements for the prevention and avoidance of conflicts of interest. Our conflict management policy is available at http://www.uk.daiwacm.com/about-us/corporate-governance-regulatory. Germany
This document is distributed in Germany by Daiwa Capital Markets Europe Limited, Niederlassung Frankfurt which is regulated by BaFin (Bundesanstalt fuer Finanzdienstleistungsaufsicht) for the conduct of business in Germany. Bahrain
This research material is distributed in Bahrain by Daiwa Capital Markets Europe Limited, Bahrain Branch, regulated by The Central Bank of Bahrain and holds Investment Business Firm – Category 2 license and having its official place of business at the Bahrain World Trade Centre, South Tower, 7th floor, P.O. Box 30069, Manama, Kingdom of Bahrain. Tel No. +973 17534452 Fax No. +973 535113
United States
This report is distributed in the U.S. by Daiwa Capital Markets America Inc. (DCMA). It may not be accurate or complete and should not be relied upon as such. It reflects the preparer’s views at the time of its preparation, but may not reflect events occurring after its preparation; nor does it reflect DCMA’s views at any time. Neither DCMA nor the preparer has any obligation to update this report or to continue to prepare research on this subject. This report is not an offer to sell or the solicitation of any offer to buy securities. Unless this report says otherwise, any recommendation it makes is risky and appropriate only for sophisticated speculative investors able to incur significant losses. Readers should consult their financial advisors to determine whether any such recommendation is consistent with their own investment objectives, financial situation and needs. This report does not recommend to U.S. recipients the use of any of DCMA’s non-U.S. affiliates to effect trades in any security and is not supplied with any understanding that U.S. recipients of this report will direct commission business to such non-U.S. entities. Unless applicable law permits otherwise, non-U.S. customers wishing to effect a transaction in any securities referenced in this material should contact a Daiwa entity in their local jurisdiction. Most countries throughout the world have their own laws regulating the types of securities and other investment products which may be offered to their residents, as well as a process for doing so. As a result, the securities discussed in this report may not be eligible for sales in some jurisdictions. Customers wishing to obtain further information about this report should contact DCMA: Daiwa Capital Markets America Inc., Financial Square, 32 Old Slip, New York, New York 10005 (Tel no. 212-612-7000). Ownership of Securities
For “Ownership of Securities” information please visit BlueMatrix disclosure link at https://daiwa3.bluematrix.com/sellside/Disclosures.action. Investment Banking Relationships
For “Investment Banking Relationships” please visit BlueMatrix disclosure link at https://daiwa3.bluematrix.com/sellside/Disclosures.action. DCMA Market Making
For “DCMA Market Making” please visit BlueMatrix disclosure link at https://daiwa3.bluematrix.com/sellside/Disclosures.action. Research Analyst Conflicts
For updates on “Research Analyst Conflicts” please visit BlueMatrix disclosure link at https://daiwa3.bluematrix.com/sellside/Disclosures.action. The principal research analysts who prepared this report have no financial interest in securities of the issuers covered in the report, are not (nor are any members of their household) an officer, director or advisory board member of the issuer(s) covered in the report, and are not aware of any material relevant conflict of interest involving the analyst or DCMA, and did not receive any compensation from the issuer during the past 12 months except as noted: no exceptions. Research Analyst Certification
For updates on “Research Analyst Certification” and “Rating System” please visit BlueMatrix disclosure link at https://daiwa3.bluematrix.com/sellside/Disclosures.action. The views about any and all of the subject securities and issuers expressed in this Research Report accurately reflect the personal views of the research analyst(s) primarily responsible for this report (or the views of the firm producing the report if no individual analysts[s] is named on the report); and no part of the compensation of such analyst(s) (or no part of the compensation of the firm if no individual analyst[s)] is named on the report) was, is, or will be directly or indirectly related to the specific recommendations or views contained in this Research Report.
The following explains the rating system in the report as compared to relevant local indices, unless otherwise stated, based on the beliefs of the author of the report.
"1": the security could outperform the local index by more than 15% over the next 12 months. "2": the security is expected to outperform the local index by 5-15% over the next 12 months. "3": the security is expected to perform within 5% of the local index (better or worse) over the next 12 months. "4": the security is expected to underperform the local index by 5-15% over the next 12 months. "5": the security could underperform the local index by more than 15% over the next 12 months. Disclosure of investment ratings
Rating Percentage of total
Buy* 60.4% Hold** 26.0% Sell*** 13.6%
Source: Daiwa
Notes: data is for single-branded Daiwa research in Asia (ex Japan) and correct as of 30 June 2015. * comprised of Daiwa’s Buy and Outperform ratings. ** comprised of Daiwa’s Hold ratings. *** comprised of Daiwa’s Underperform and Sell ratings. Additional information may be available upon request. Japan - additional notification items pursuant to Article 37 of the Financial Instruments and Exchange Law (This Notification is only applicable where report is distributed by Daiwa Securities Co. Ltd.) If you decide to enter into a business arrangement with us based on the information described in materials presented along with this document, we ask you to pay close attention to the following items. • In addition to the purchase price of a financial instrument, we will collect a trading commission* for each transaction as agreed beforehand with you. Since commissions may be included in
the purchase price or may not be charged for certain transactions, we recommend that you confirm the commission for each transaction. • In some cases, we may also charge a maximum of ¥ 2 million (including tax) per year as a standing proxy fee for our deposit of your securities, if you are a non-resident of Japan. • For derivative and margin transactions etc., we may require collateral or margin requirements in accordance with an agreement made beforehand with you. Ordinarily in such cases, the
amount of the transaction will be in excess of the required collateral or margin requirements. • There is a risk that you will incur losses on your transactions due to changes in the market price of financial instruments based on fluctuations in interest rates, exchange rates, stock prices,
real estate prices, commodity prices, and others. In addition, depending on the content of the transaction, the loss could exceed the amount of the collateral or margin requirements. • There may be a difference between bid price etc. and ask price etc. of OTC derivatives handled by us. • Before engaging in any trading, please thoroughly confirm accounting and tax treatments regarding your trading in financial instruments with such experts as certified public accountants.
*The amount of the trading commission cannot be stated here in advance because it will be determined between our company and you based on current market conditions and the content of each transaction etc.

Industrials / India BHEL IN
15 September 2015
- 30 -
When making an actual transaction, please be sure to carefully read the materials presented to you prior to the execution of agreement, and to take responsibility for your own decisions regarding the signing of the agreement with us. Corporate Name: Daiwa Securities Co. Ltd. Financial instruments firm: chief of Kanto Local Finance Bureau (Kin-sho) No.108 Memberships: Japan Securities Dealers Association, The Financial Futures Association of Japan Japan Securities Investment Advisers Association Type II Financial Instruments Firms Association