Common factors affecting psychotherapy outcomes: some implications for teaching psychotherapy

Running head: TIME SERIES PANEL ANALYSIS 1
Time-Series Panel Analysis (TSPA) – Multivariate modeling of temporal associations in
psychotherapy process.
Fabian Ramseyer1, Zeno Kupper1, Franz Caspar2, Hansjörg Znoj2, & Wolfgang Tschacher1
1Department of Psychotherapy, University Hospital of Psychiatry, University of Bern, Switzerland
2Department of Clinical Psychology and Psychotherapy, University of Bern, Switzerland
Journal of Consulting and Clinical Psychology 2014, Vol. X, No. Y, xx-xx
Supplemental materials: http://dx.doi.org/10.1037/a0037168.supp
Correspondence concerning this article should be addressed to:
Fabian Ramseyer, Ph.D.
University Hospital of Psychiatry
Department of Psychotherapy
Laupenstrasse 49
CH-3010 Bern, Switzerland
Email: [email protected]
Phone: +41 31 387-6163 Fax: +41 31 382-9020
© American Psychological Association
This article may not exactly replicate the final version published in the APA journal. It is not the copy of record.
See DOI: 10.1037/a0037168
http://psycnet.apa.org/journals/ccp/
Running head: TIME SERIES PANEL ANALYSIS 2
Abstract
Objective: Processes occurring in the course of psychotherapy are characterized by the simple
fact that they unfold in time and that the multiple factors engaged in change processes vary
highly between individuals (idiographic phenomena). Previous research, however, has neglected
the temporal perspective by its traditional focus on static phenomena, which were mainly
assessed at the group level (nomothetic phenomena). To support a temporal approach, the
authors introduce Time Series Panel Analysis (TSPA), a statistical methodology explicitly
focusing on the quantification of temporal, session-to-session, aspects of change in
psychotherapy. TSPA-models are initially built at the level of individuals, and are subsequently
aggregated at the group level, thus allowing the exploration of prototypical models. Method:
TSPA is based on vector autoregression (VAR), an extension of univariate autoregression
models to multivariate time-series data. The application of TSPA is demonstrated in a sample of
87 outpatient psychotherapy patients that were monitored by post-session questionnaires.
Prototypical mechanisms of change were derived from the aggregation of individual multivariate
models of psychotherapy process. In a second step, the associations between mechanisms of
change (TSPA) and pre-to-post symptom-change were explored. Results: TSPA allowed
identifying a prototypical process pattern, where patient‘s alliance and self-efficacy were linked
by a temporal feedback-loop. Furthermore, therapist's stability over time in both mastery- and
clarification interventions was positively associated with better outcome. Conclusions: TSPA is
a statistical tool that sheds new light on temporal mechanisms of change. Through this approach,
clinicians may gain insight into prototypical patterns of change in psychotherapy.
Keywords: time-series panel analysis (TSPA); vector autoregression (VAR); mechanisms of
change; psychotherapy process; self-efficacy

Running head: TIME SERIES PANEL ANALYSIS 3
Time-Series Panel Analysis (TSPA) – Multivariate modeling of temporal associations in
psychotherapy process.
When asked to describe the mechanisms of therapeutic change in a patient, a
psychotherapist will likely point to associations between certain factors of the therapist-patient
system. These associations occur temporally and in sequence: "When I did X, the patient
responded Y". A therapist relies on highly idiographic information, temporal evolution, and the
action of multiple factors when evaluating therapy effectiveness. Yet, comparing these properties
of therapists' reasoning to the strategies predominant in psychotherapy research (such as outcome
research, process research), a stark contrast exists between a therapist's real-life complexity and
research-dictated simplicity. This paper aims to show that the viewpoints and interests of the
practitioner and the scientist need not be mutually exclusive, and that time-series (i.e. repeated
measurements) may capture the dynamics of a psychotherapy process and vastly broaden the
analytic and inferential possibilities. We present statistical methodology that accounts for
temporal and individual-level information (idiographic perspective) and also generates
predictions at a general or group level (nomothetic perspective). In the following application of
Time Series Panel Analysis (TSPA) to psychotherapy data, we will introduce the reader to a
lesser-known methodology that is particularly well suited for the analysis of long time-series in
psychotherapy research. Main advantages of TSPA are the following characteristics:
• Focus on the temporal aspect of psychotherapy
• Inclusion of multivariate associations
• Individual models (idiographic information)
• Prototypical models (aggregation of individual models to nomothetic models)
• Indices of (potential) causal associations between variables

Running head: TIME SERIES PANEL ANALYSIS 4
Why do psychotherapy researchers profit from this methodology?
Outcome data have unquestionably demonstrated that psychotherapy works (e.g. Lambert
& Ogles, 2004). Hence, during the past decade, the focus of psychotherapy research has shifted
from efficacy studies to process studies. Consequently, effort is now being directed towards
questions of why and how psychotherapeutic change is effective, but “ ... research studies have
not equitably investigated all factors that either enhance or diminish psychotherapy
effectiveness.” (American Psychological Association, 2012). Correspondingly, the TSPA
approach to psychotherapy research is less concerned with the longstanding and ongoing
controversy of common versus specific factors of psychotherapeutic change (Castonguay &
Beutler, 2006; Chambless & Ollendick, 2001; DeRubeis, Brotman, & Gibbons, 2005;
Pfammatter & Tschacher, 2012; Wampold, 2001), but directed at the multivariate influences and
interdependencies between the active ingredients of psychotherapy. This view is in line with the
additional questions of why (mediators of change), for whom, and under what conditions
(moderators of change) change occurs (Laurenceau, Hayes, & Feldman, 2007). There is a
growing literature on process dynamics in psychotherapy, studying time-varying factors that
influence treatment progress and outcome (e.g. Hayes, Laurenceau, Feldman, Strauss, &
Cardaciotto, 2007; Mahoney, 1991; Smits, Julian, Rosenfield, & Powers, 2012). While this topic
is not new (Gottman & Rushe, 1993), it is gaining momentum with the availability of more
sophisticated data analyses, either for the reanalysis of existing data (e.g. Fisher, Newman, &
Molenaar, 2011), or for explorative studies on mechanisms of change (e.g. Tschacher, Zorn, &
Ramseyer, 2012). We advocate the approach of TSPA (Tschacher & Ramseyer, 2009), a
methodology focusing on the emergence of temporal dynamics between relevant factors of a
psychotherapy system.

Running head: TIME SERIES PANEL ANALYSIS 5
Background: Dynamic systems theory
The concepts of time and change are the fundaments of dynamic systems theory, which
addresses temporal dynamics and the formation and dissipation of patterns; both concepts are
most relevant for psychotherapy research. The importance of the time dimension is readily
evident in psychotherapy-process research, and the need or will for change is usually the reason
why psychotherapy is initiated and conducted. Dynamic systems theory provides a mathematical
background for the modeling of these phenomena, and self-organizational dynamics is a
conceptual frame for the process of pattern formation. A process is termed self-organized when
higher-order patterns spontaneously emerge from recursive interactions among simpler
components. In the patient-therapist dyad, for example, seemingly unrelated processes may
follow higher-order regularities which then give rise to new (emergent) qualities at the system
level (Newell & Molenaar, 1998; Salvatore & Tschacher, 2012; Vallacher & Nowak, 1997;
Vallacher, Coleman, Nowak, & Bui-Wrzosinska, 2010). A directly observable example for such
a self-organized process is the synchronization of nonverbal movement between patient and
therapist (Ramseyer & Tschacher, 2011). This kind of emergent processes was first described in
synergetics (Haken, 1977), an interdisciplinary approach that explains pattern-formation and
self-organization in open systems, i.e. systems that are open to external influences (= systems far
from thermodynamic equilibrium). Self-organization is a pervasive phenomenon found in many
domains such as motor behavior (Haken, Kelso, & Bunz, 1985), chemistry (Nicolis & Prigogine,
1977), biology (Kelso, 1995), and social interactions (Haken & Schiepek, 2006). Simply put,
dynamic systems theory explicitly seeks to understand and describe the complexity of highly
interdependent systems at a level of aggregation that usually goes beyond the abstraction found
in traditional analyses. Dynamic systems theory is a 'structural science' that serves the purpose to
provide the theoretical bases and concepts for more specific research endeavors, thus is

Running head: TIME SERIES PANEL ANALYSIS 6
applicable to diverse research questions and scientific fields, including psychotherapy research
(Fisher et al., 2011; Hayes & Strauss, 1998; Hayes et al., 2007; Laurenceau et al., 2007). For
example, multivariate associations between time-series in psychotherapy have been investigated
in post-session questionnaires (Tschacher & Ramseyer, 2009; Tschacher, Baur, & Grawe, 2000;
Tschacher et al., 2012), treatments for social anxiety (Smits, Rosenfield, McDonald, & Telch,
2006), treatments for panic disorder (Meuret, Rosenfield, Seidel, Bhaskara, & Hofmann, 2010),
in psychosocial crises (Tschacher & Jacobshagen, 2002), in symptom development in
schizophrenic patients (Tschacher & Kupper, 2002), and in functional magnetic resonance
imaging (Hamilton, Chen, Thomason, Schwartz, & Gotlib, 2011; Tschacher, Schildt, & Sander,
2010).
Ergodicity: Intraindividual models versus interindividual models
A further fundamental aspect that is explicitly addressed in TSPA is the concept of
ergodicity (Molenaar & Campbell, 2009) – the question whether phenomena detected at the
group level are related to the phenomena found at the level of the individual. Most
psychotherapeutic research acts on the tacit assumption that assessments at the group level are
representative for the individual level. Nomothetic evidence is treated as indicative of the
idiographic level. This global stance may be challenged and there is growing evidence that
ergodicity is the exception rather than the norm (Molenaar, 2004). For the current demonstration
of TSPA, we honored the problem of ergodicity by assessing and modeling temporal
relationships at the individual (idiographic) level (Collins, 2006; Curran & Bauer, 2011). In an
independent step, we aggregated the models to assess a general (nomothetic) level to characterize
the overall properties of the group (Hamaker, Dolan, & Molenaar, 2005).

Running head: TIME SERIES PANEL ANALYSIS 7
Repeated measures in psychotherapy data
As outlined above, the goal of this paper is to demonstrate an efficient way of modeling
temporal associations within and between repeatedly measured variables, so that the inherent
dynamics can be quantified. The literature on such time-series data analysis has dramatically
increased in the past decades (for reviews see e.g. Bollen & Curran, 2004; Collins, 2006;
Raudenbush, 2001) and numerous procedures have been presented. The continued evolution and
refinement of methods have also led to substantial overlaps: Previously distinct approaches – e.g.
multilevel models [MLM] and structural equation models [SEM] – are integrated (e.g. Boker et
al., 2011 [OpenMx]), thus differences have become less clearly distinguishable. In this paper, we
will focus on Time Series Panel Analysis (TSPA), an extension of vector autoregression (VAR),
which allows the multivariate modeling of relatively long series (N > 20) of repeated
measurements, such as post-session questionnaires collected after each therapy session. TSPA
uses VAR as the mathematical framework for the analysis of individual time series, and beyond
the VAR analysis, TSPA aggregates and statistically tests for prototypical patterns present at the
group level.
Key concepts of time-series analysis
Before detailing and comparing the various features of TSPA, we will first address the
relevant basic concepts associated with time-series analysis. In Figure 1, two graphical
representations of psychotherapy time-series (panels A & B) and their associated multivariate
systems (panels C & D) are depicted. Five post-session questionnaire factors 'alliance patient',
'self-efficacy patient', 'alliance therapist', 'clarification interventions' and 'mastery interventions'
are represented by different lines in the overlay plots (A & B) and by circles in the VAR models
(C & D). The examples consist of psychotherapy systems that cover two time steps referred to as

Running head: TIME SERIES PANEL ANALYSIS 8
t–1 (= previous session) and t (= today's session). The stepwise inclusion of temporal information
(termed 'lags' in time-series analysis) determines the number of time steps that a time-series
model 'looks back' in its analysis of associations between variables. The following central
aspects are illustrated with numbers (1) to (7) in Figure 1:
-- Insert Figure 1 around here --
(1) Trends. Systematic shifts of average levels of a variable across time are called trends. In the
case of psychotherapy data, most time series will show some kind of trend: Depending on the
variable assessed, a trend may be positive as in the quality of the alliance, or negative as in the
severity of symptoms. TSPA is focused on associations between variables over time irrespective
of their overall trajectories. Therefore trends are mathematically accounted for prior to the
analysis of such associations.
(2) Autoregression. A variable is said to have n autoregressive components [AR(n)] when the
output of the variable linearly depends on its own previous values. The strength is quantified by
𝜙 (phi), which ranges between -1 and 1. In psychotherapy data, positive autoregression is usually
found in variables that exhibit stability over time, such as e.g. the therapeutic alliance.
(3) Cross-regression. When multiple variables are simultaneously considered, their outputs may
linearly depend on other variable's previous values. As in the case of autoregression, the strength
of these cross-variable regressions is quantified by 𝜙 (phi). Positive values indicate positive
associations while negative values denote inverse relationships. In a psychotherapy system, a
patient’s self-efficacy may e.g. be positively associated with his/her previous session’s alliance.

Running head: TIME SERIES PANEL ANALYSIS 9
(4) Synchronous associations. Whereas both auto- and cross-regression explicitly account for
the temporal information in time series, synchronous associations designate the strength of the
associations between two variables at identical points in time. They are calculated by Pearson
correlations between the residuals of the VAR analysis. Using residuals has the effect of
controlling for serial dependency (autoregression) as well as for cross-variable dependency
(cross-regression). In psychotherapy systems, synchronous associations quantify how strongly
e.g. alliance and self-efficacy are associated at the level of the same session.
(5) Causal inferences. Cross-regressions contain information pertaining to the question which
change in a variable preceded change in another variable. The cross-regressions of VAR may be
interpreted in a so-called quasi-causal way, because significant sequential associations reflect
how a variable causally influences succeeding values of the other variable. In the time-series
literature, this property is called Granger causality, where causality is derived from systematic
time-lagged associations between two or more variables (Granger, 1969). In addition to Granger
causality, causal mechanisms may be inferred using mediation analyses (for an overview, see
Imai, Keele, Tingley, & Yamamoto, 2011). Such mediational causal inferences have been used
in cross-lag panel analyses (Smits et al., 2006) and in structural equation models (e.g. Gates,
Molenaar, Hillary, Ram, & Rovine, 2010). The discussion of different theoretical causality
models is beyond the scope of this paper, a discussion of contemporary models of causality may
be found elsewhere (Imai, Keele, & Tingley, 2010). To summarize, the question whether a
specific predictive relationship does or does not imply causality cannot be determined
statistically, but has to be decided based on current theoretical and empirical knowledge. In
VAR, statistical tests to assess the strength of (putative) causal relationships are available (see
supplementary online material, Tables W4 & W5).

Running head: TIME SERIES PANEL ANALYSIS 10
(6) Idiographic model. When assessing an individual's time-series, VAR first generates a
multivariate model of temporal associations, which is valid for this single case only. The
idiographic model represents the building block for succeeding prototypical models.
(7) Prototypical nomothetic model. After all individuals have been assessed by idiographic
models, TSPA then aims to derive overarching/prototypical models of general associations
between the system's variables. Prototypicality is achieved by various means of aggregation. The
most parsimonious way of aggregating individual models is by averaging the standardized
regression weights across individuals. Averaged regressions that significantly differ from an
expected mean of zero may then be taken as indices for generalized structure in the entirety of
the sample. More details on the parameters involved in this process may be found in the step-by-
step procedures provided below.
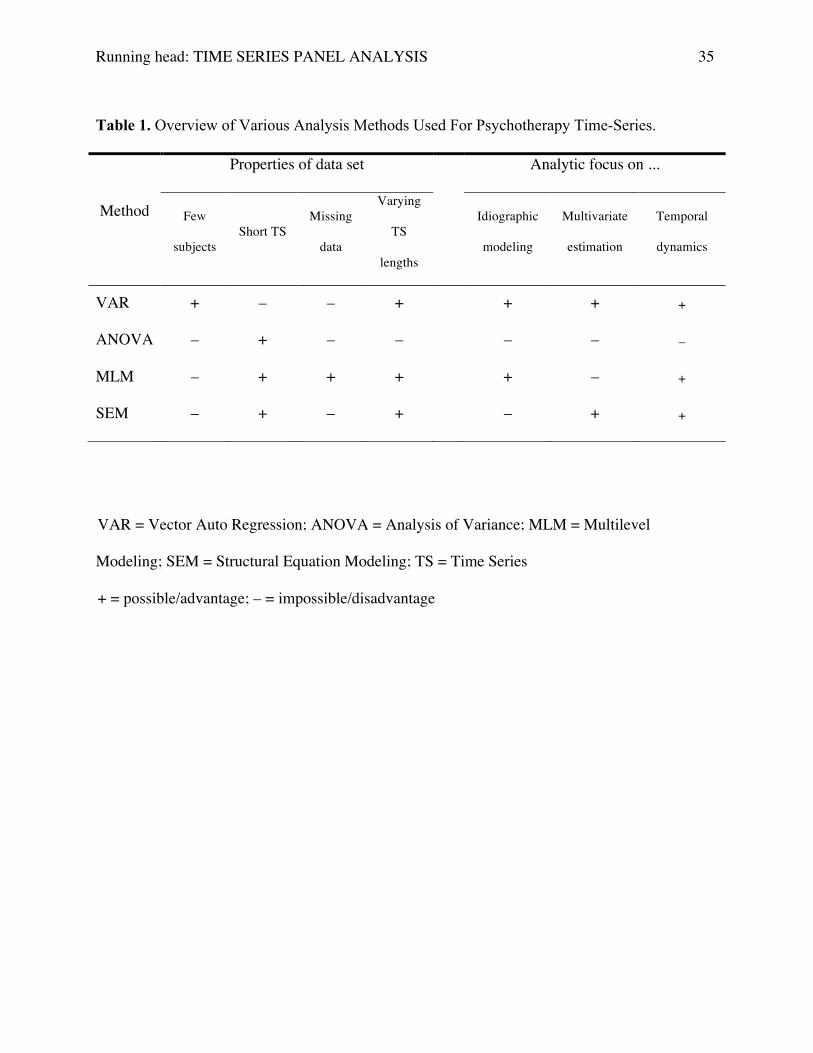
VAR versus traditional methods
For a general appreciation of VAR, the cornerstone of TSPA, in comparison to more
traditional methods, Table 1 outlines characteristics of four different approaches commonly used
for the analysis of time series. For reasons of simplicity, we will restrict our comparison of VAR
with other approaches to their common/standard usage and we will primarily comment the
peculiarities of VAR.
-- Insert Table 1 around here --
Let us first consider the data requirements in terms of properties of the data set to be analyzed:
Table 1 shows that VAR is particularly suited for situations where data of few or even single
cases is available. However, this flexibility in terms of patients needed in a sample comes at the

Running head: TIME SERIES PANEL ANALYSIS 11
price of a more demanding criterion regarding the number of data points: For every parameter
included in the model, at least 5 data points should be available. Missing data cannot be handled
by VAR (for more details see step-by-step instructions below), but the length of each patient's
time series may vary freely. Apart from these 'logistic' requirements, the methods also differ with
respect to their analytic focus: VAR focuses on individual models and trajectories, whereas other
approaches mostly emphasize group-level characteristics. A major advantage of VAR models is
the ability to easily include more than one dependent variable; a fact that is especially useful for
psychotherapy process data, where multiple factors of a psychotherapy system can be estimated
within one summary model. Recent extensions of multilevel models may also allow multivariate
estimation (see e.g. Baldwin, Imel, Braithwaite, & Atkins, 2014), but the specification of
multivariate associations gets rather complicated with increasing numbers of variables. The same
is true for the inclusion of lagged associations: Their consideration is an integral part in VAR,
whereas other approaches require the generation of lagged versions of variables. Apart from the
traditional methods shown in Table 1, there are some quite specialized methods that bear
similarities to VAR: One of them is dynamic factor analysis, a technique based on Cattell's
(1952) P-Technique, which factorizes an individual's responses in the time-domain (Fisher et al.,
2011; Molenaar, 1985). Recent combinations of structural equations models (SEM) with
autoregressive time-series analysis extend classical SEM by taking into account the temporal
associations of variables (Bollen & Curran, 2004; Hamaker et al., 2005; Oud & Jansen, 2000),
and cross-lag panel analysis – an elaboration of bivariate, two time-points analyses – likewise
allows quasi-causal inference (Meuret et al., 2010; Smits et al., 2012; Smits et al., 2006). Taken
together, traditional ANOVA, SEM and MLM provide integrated statistics at the price of
neglecting idiographic information, whereas VAR analysis provides a wealth of idiographically
suitable models at the price of some stricter requirements on data collection. Viewed from a

Running head: TIME SERIES PANEL ANALYSIS 12
clinical standpoint, VAR provides an intuitive summary of the way different factors in
psychotherapy process interact with one another over time (i.e. time-lagged associations) and
hence allows the quantitative reconstruction of the dynamics active in a therapeutic system.
Time Series Panel Analysis (TSPA)
TSPA is based on vector autoregression (VAR), which quantifies the linear dependency
of a set of variables at time (t) on values of the same set at n previous points in time (t–n, t–n+1,
..., t–1). This linear dependency includes both autoregressive components (i.e. components that
relate to themselves over time: Xt-1–>Xt) and multivariate associations (i.e. associations between
different variables over time: Yt-1–>Xt). VAR was initially developed as a tool in econometrics
(Sims, 1980; Stock & Watson, 2001), e.g. to predict the evolution of shares in economic markets.
VAR accounts for interdependencies and dynamic relationships in multivariate systems and
allows forecasting complex (multivariate) time series containing autoregressive elements. In the
area of economic series, VAR is used to model relationships among shares and associations
between external influences and the system. The application of VAR models in psychological
research has been described recently (e.g. Stroe-Kunold, Gruber, Stadnytska, Werner, & Brosig,
2012; Tschacher & Ramseyer, 2009; Wild et al., 2010), and in this article, we will focus on the
selection and interpretation of results, while leaving out mathematical and statistical details of
VAR models, as these are detailed in the publications mentioned above. The following
methodological steps may be viewed as general recommendations that apply to various statistical
packages implementing VAR analyses (e.g. SAS®, R, Stata®).

Running head: TIME SERIES PANEL ANALYSIS 13
Application of TSPA to ambulatory psychotherapy sessions
In this paper, our didactic goal was to provide an exemplary analysis of psychotherapy
process using TSPA, by which we also explored open issues of research in a dynamic systems
framework: First, we searched for temporal associations between factors of psychotherapy
(alliance, self-efficacy, clarification, and mastery) in a dataset of fully monitored ambulatory
psychotherapies. Second, we illuminated the relative significance of the therapists' versus the
patients' contributions to the process by exploring which associations derived from the patients'
or therapists' perspectives. Third, we explored associations between temporal dynamics and
psychotherapy outcome.
Dataset. This empirical dataset of ambulatory psychotherapies consisted of N = 87 dyadic
psychotherapy courses taken from a comprehensive database established at the outpatient
psychotherapy clinic of the University of Bern, Switzerland. Only completed therapies with a
minimum of 30 sessions were included in TSPA analyses. (Figure W1 in the supplementary
online material shows the flowchart of session selection criteria).
Measures of therapeutic process. To appropriately evaluate temporal processes in
psychotherapy variables, the relevant factors that contribute to change in psychotherapy have to
be specified. One way to monitor these processes is by using post-session questionnaires (see
supplementary online material S1 for further details). Owing to our empirically based
perspective, post-session questionnaires were used that a) capture patients' interpersonal
experiences in sessions (= alliance, ALP), and b) assess patients' subjective experience of
progress induced by sessions (= self-efficacy, SEP). In line with a dynamic systems perspective,
we viewed the therapy dyad as a system, which implies that we were also interested in the
therapist's perspective. We therefore assessed c) therapists' interpersonal experience (= alliance,
ALT) and their specific use of both d) clarification interventions (traditionally used in

Running head: TIME SERIES PANEL ANALYSIS 14
psychodynamic and humanistic therapies = clarification, CLT) and e) mastery interventions
(traditionally used in cognitive-behavioral therapies = mastery, MAT). Versions of the Bern Post-
Session Report (BPSR; Flückiger, Regli, Zwahlen, Hostettler & Caspar, 2010) were
independently administered to patients (BPSR-P, 22 items) and therapists (BPSR-T; 27 items)
after each therapy session (see supplementary online material S2 and Table W1 for details and
exemplary items).
Measures of therapeutic success. Therapy outcome was assessed using a pre-to-post change
measure that quantified constructive thinking (Constructive Thinking Inventory, CTI; Epstein &
Meier, 1989). The CTI (46 items) measures experiential intelligence, which reflects a person's
tendency to automatically think in ways relevant for solving everyday problems, by categorizing
thoughts as constructive or destructive (see supplementary online material S2 for details).
Step-by-Step Procedures for TSPA (see supplementary online material, Tables W4 & W5
for SAS and R-code)
General data requirements. All procedures described in Table 1 assume that time-series
have stable (time-invariant) means, variances, and autocovariances. This property is called
stationarity or – when the series show a linear trend, drift or slope – the series are 'trend
stationary'. The models described in this paper and most variables assessed in psychotherapy
process research (e.g. alliance, symptom distress, etc.) pertain to the category of trend
stationarity, because these variables are usually undergoing systematic change over the course of
therapy. The VARMAX procedure implemented in SAS® version 9.3 (SAS Institute Inc., 2011)
provides a simple option (trend=linear) for VAR-analyses of data that contain linear trends, and
the same applies to the package vars (Pfaff, 2008; Pfaff & Stigler, 2013) implemented in R
software (R Core Team, 2014). The code for procedures of the analyses presented here is

Running head: TIME SERIES PANEL ANALYSIS 15
provided in the supplementary online material (Tables W4 & W5). Besides the assumption of
stationarity, time-series analysis requires that data were assessed at fixed intervals (equally
spaced data). For session-report data, this requirement is met as long as sessions are assessed
regularly. The fact that the number of days between sessions may vary over the course of therapy
does not necessarily violate the assumption of equally spaced data because the calculated VAR-
model is based on session-to-session associations, not on exact temporal distances in terms of
days between sessions. Our own experience with post-session questionnaires tells us that non-
equally spaced data (e.g. due to missing or rescheduled sessions) usually lead to an
underestimation of temporal effects, which implies that this is a conservative strategy (see
paragraph on missing data).
Time-series length. VAR analyses require a minimal number of observations for the
computations. This lower limit depends on the number of parameters (variables in the model)
that a specific VAR model estimates. For illustrative purposes, we have included two different
models: One analysis with i) three parameters and another, more complex analysis, where ii) five
individual variables were entered into the model. At the minimal time-lag of 1, these conditions
resulted in i) 9 auto- and cross-regressions (3 X 3) and 3 trends, i.e. 12 estimated parameters (see
Figure W2, supplementary online material) and in ii) 30 estimated parameters (5 X 5 plus 5). The
minimal number of data-points needed for these cases imposed by e.g. the VARMAX procedure
in SAS would be i) 6 and ii) 13 observations; however, we recommend as a rule of thumb that
the number of observations should be higher than the number of estimated parameters. In the
application presented here, we chose a minimum of i) 20 and ii) 30 observations.
Missing data. The VAR computation in SAS and R will stop running when encountering
missing data: One can deal with missing time-series data in various ways. One possibility is to
use imputation procedures that substitute the missing data points (e.g. by the mean of the

Running head: TIME SERIES PANEL ANALYSIS 16
variable in question). Depending on the chosen imputation method and the number of missing
values, imputation may lead to over- or under-estimation of VAR parameters. We advocate the
simpler, radical method of treating the time series as though there were no missing values. By
ignoring missing values, we handle a time-series with e.g. a missing session #18 as if no gap
existed between sessions #17 and #19. This strategy has the effect of mixing associations with
lags higher than 1 with the lag-1 associations. Erroneously assuming lag-1 associations
(#17,#19,#20) when the time between measurements was actually longer (#17,missing,#19,#20)
leads to an underestimation of effects, because we empirically found that lag-2 models resulted
in poorer fit in the present data (see Results section). For TSPA models in psychotherapy data,
this radical method of dealing with missing data is better than the imputation method, because it
is conservative and less prone to entail inflated models of change.
Step 1: Idiographic modeling.
As described in the introduction, it was not assumed that each individual series would
reproduce on the group level; hence each patient’s individual time-series was analyzed
separately. Such a strategy provides the most appropriate model for each therapy course. The
procedures in SAS and R yield VAR parameters that quantify sequential associations by
ascription of positive, zero, or negative regression weights and T-values (the use of the symbol T
is SAS-convention). These T-values are defined as parameter weight (= estimate of association
between variables) divided by their standard error; they serve as indicators for statistical
significance at the individual level. To further illustrate the importance of the idiographic
modeling approach, consider the exemplary case of a single patient provided in Fig. 1, panel C.
The selection of an appropriate lag depends on theoretical considerations (e.g. session-to-
session change in psychotherapy; monthly changes in product sales, etc.), or may be chosen
empirically, based on information criteria (indicators of goodness of fit of a given model, such as

Running head: TIME SERIES PANEL ANALYSIS 17
Akaike's Information Criterion (AIC): Akaike, 1974). Lower AIC values indicate better fit; AIC
values of each model are provided by the software programs. For the aggregation of a
prototypical nomothetic model, the same lag should be chosen for all idiographic models. AIC
may be used to determine the most appropriate lag: One may count, for each lag, the number of
models with AIC minima, and decide on the appropriate lag on the basis of a chi-square test
(thus finding the lag with the highest percentage of models with lowest AIC values). Another
option is to decide between two different lags by calculation of a pairwise t-test for dependent
data on AIC values. Both chi-square and pairwise t-test are done outside the VAR procedures of
SAS or R.
In addition to the lagged VAR computations, synchronous associations (at time t)
between variables may be calculated. For these associations, we use the correlations between
residuals at lag-0. These residuals are what remains after all other effects, such as trends, auto-
and cross-correlations, have been accounted for. Correlations of residuals are superior to
conventional correlations because they take into account that in each patient we are dealing with
dependent measures. Correlation coefficients of residuals are transformed to Fisher‘s Z. The
resulting Z‘s can then be regarded as indicating the effect sizes of synchronous (lag-0)
associations.
Tests for the evaluation of causal associations may be performed at this stage: Both SAS
and R allow testing for Granger causality (see supplementary online material, Tables W4 & W5).
These tests are useful especially for the analysis of single cases; in TSPA they are not commonly
used in further steps.
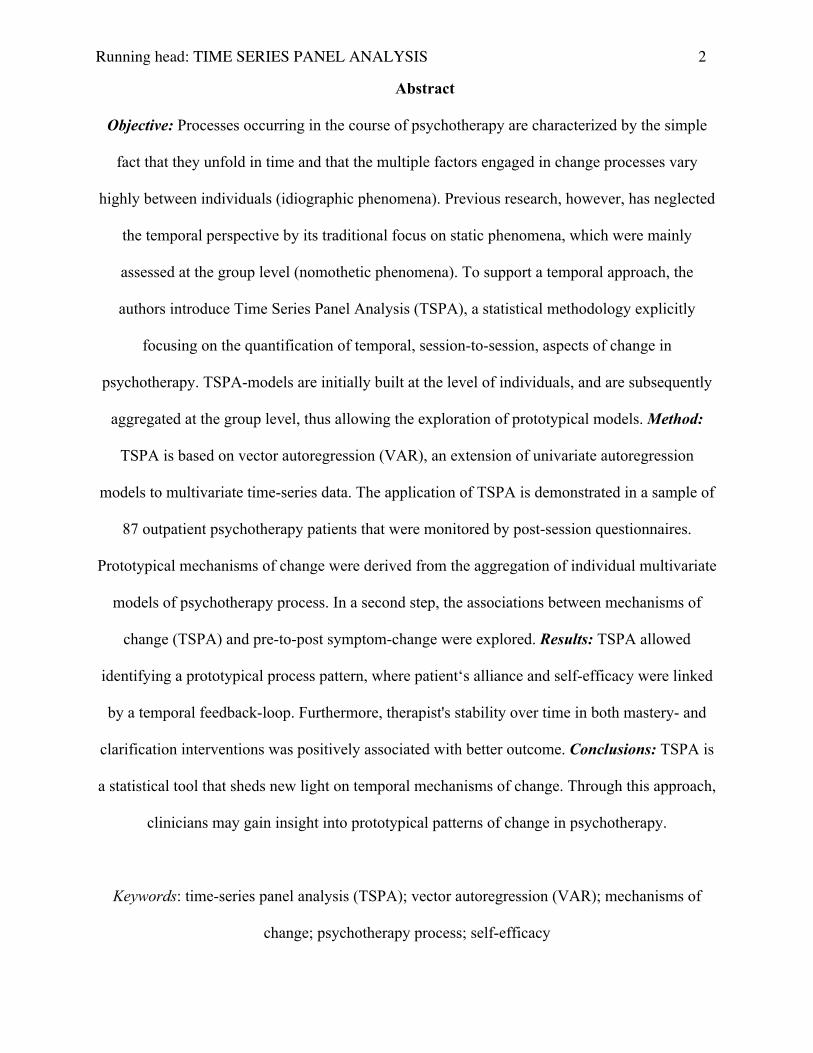
Step 2: Statistical evaluation of effects
To statistically test individual or group-level model parameters, different strategies are
available. One practical solution is to test the T-values of VAR parameters (i.e. the standardized
Running head: TIME SERIES PANEL ANALYSIS 18
VAR parameters) according to the standard p < .05 criterion, i.e. a T-value of ±1.96 and higher is
considered statistically significant. For aggregated models (derived from the assemblage of
individual parameters), a test against a hypothetical distribution around zero can be performed:
The T-values of VAR parameters are distributed around a mean of zero in 'time series' of random
numbers. Thus the null-model assumes that if no systematic associations exist in the data, the
averaged T-values of individual models of a group of patients would converge to zero;
additionally, positive and negative associations would cancel each other out (Tschacher &
Ramseyer, 2009). Testing the significance of T-values in the group dataset is thus accomplished
by comparing the group's distribution/average against the hypothesized average of zero (one-
sample t-test for the mean). This tests statistical significance of the aggregated (average) T-
values, which is different from the ±1.96 criterion used in the individual case, implying that
values inside the ±1.96 interval may be considered statistically significant. T-values at the
nomothetic level may also be converted into effect sizes: The sample's average T-value divided
by the sample's T-value standard deviation gives an approximation of Cohen's d. A positive
effect size thus denotes a (standardized) superiority of positive associations over no (zero)
association.
Step 3: Nomothetic aggregation.
Once each patient’s model has been estimated, aggregations are indicated when the
research goal is to find nomothetic associations. The respective grouping variables may be
chosen based on theory, experimental design, diagnosis, or – in the sense of a convenience
sample – by aggregating the entire sample or parts thereof (e.g. according to diagnostic groups,
see Tschacher et al., 2012). Aggregation is done outside of the VAR procedures in SAS or R;
these data-logistic steps may be performed in any statistical software. After the individual cases
have been aggregated, the group-averages of T-values can be assessed. Mean associations above

Running head: TIME SERIES PANEL ANALYSIS 19
a critical threshold – such as the null hypothesis described above – are then selected for further
testing, as we did in the present sample. At this point, the aggregated dataset may be
supplemented with additional individual-level data: In our present example, each patient's CTI
score – the measure of therapeutic success – was added for the implementation of the next step.
Step 4: Associations with outcome.
The process-outcome analyses may be based on those associations identified in Step 3, or
on all available associations (e.g. Tschacher & Kupper, 2002). Depending on the structure of the
dataset, multiple regression analyses or mixed model analyses may be performed. For the present
analysis, we calculated a multiple regression model to explain the outcome variable 'change in
constructive thinking'. The process-outcome sample was smaller than for the presented
prototypical model because CTI-scores were only available in n = 54 patients.
Results
The focus of the results section will be restricted to the temporal aspects found in the data
and to the application of TSPA. Additional background on sample data and a traditional pre-to-
post analysis of CTI scores and post-session questionnaires is provided in the supplementary
online material, S3 & Table W2.
Idiographic analyses. The individual VAR analyses showed that a lag-1 model provided
the best overall model fit. At the level of the whole sample, corrected Akaike information criteria
of lag-1 models were superior to lag-2 models [AIClag1 = -7.49, SDlag1 = 2.08; AIClag2 = -6.34;
SDlag2 = 2.34; t(86) = 15.45; p < .0001; d = 0.52]. AIC superiority of lag-1 over lag-2 was found
in 85 of 87 individual patients [χ2 (1) = 19.05, p < .001].
Comments. The patient-level models derived at this first step of the analysis are usually highly
heterogeneous. Depending on the research aim, they may be directly used for further

Running head: TIME SERIES PANEL ANALYSIS 20
explorations, e.g. in single-case designs. In TSPA, idiographic models are assembled into a new
dataset consisting of all VAR parameters and associated T-values from each patient.
Nomothetic analyses, prototypical model of change. Data of all 87 patients were
aggregated to provide a prototypical model capturing the overall dynamics found across
therapies (Figure 1/D). Statistical tests of T-values were based on the comparison with a
hypothetical average of zero, thus average T-values indicate whether the prototypical model
significantly deviated from the expected average of zero. The prototypical model was
characterized by the following attributes: Linear trends (TR), systematic change over the course
of therapy. Positive linear trends were present in all variables except therapist's clarification
intervention. Patient-assessed alliance and self-efficacy showed the strongest growth (T = 1.25
and 1.35; both p < .0001), while therapist-assessed alliance (T = 0.50; p < .01) and mastery
interventions (T = 0.58; p < .01) were characterized by weaker linear trends. Temporal stability,
predictability. The horizontal arrows in Figure 1/D (i.e. the autocorrelations of factors) of all five
factors were positive, and – with the exception of therapist’s rating of the alliance (T = 0.50; p <
.01) – autocorrelations had high T-values (T = 0.97 to 1.13; all p < .0001). All five
psychotherapy factors were thus characterized by significant temporal stability in the course of
therapy. In-session associations, lag-0 correlations. The correlations between residuals within
one session (lag-0) were limited to the alliance factors and self-efficacy. All three variables
showed positive correlations, indicating that within a single session, a good alliance rating by the
patient or the therapist was linked with high self-efficacy (Z = .40 and .36). Patient's and
therapist's perspective on the alliance were moderately correlated at lag-0 (Z = .26). Temporal
associations between factors, mechanisms of change. Of all possible lagged cross-regressions (n
= 20), only two reached statistical significance. Both of these cross-factor associations resided
within the patient's perspective: Patient‘s alliance at the previous session predicted subsequent

Running head: TIME SERIES PANEL ANALYSIS 21
self-efficacy (T = 0.39; p < .01) and patient's self-efficacy predicted subsequent alliance (T =
0.25; p < .05). Alliance and self-efficacy were thus connected in a positive feedback system.
Comments. The step of aggregating idiographic models and assessing statistical significance
and/or effect sizes of the prototypical model is the most important feature of TSPA: The
researcher has a wide range of choices regarding the way aggregation should proceed. When no
a-priori hypotheses were generated prospectively, we recommend the simple group-aggregation
demonstrated above. Depending on the dataset available, other criteria may be used. One option
is presented below, where we explored differences between phases of therapy.
Temporal evolution of VAR models. We computed additional VAR models in order to
compare initial and final phases, i.e. the first and last 20 sessions of therapies. Owing to the
smaller number of 20 time-points, only three variables were included in these VAR models
(ALP, SEP, ALT). The inclusion of 20 sessions entailed overlapping phases in those n = 37
therapies with less than 40 sessions. This partial overlap leads to a conservative (under-)
estimation of differences. The most striking difference between phases is the complete lack of
auto- and cross-correlations in the final phase (see Figure W2, supplementary online material). In
the initial phase of therapy (first 20 sessions of each patient), patient's alliance is autocorrelated
(T = 0.40; p < .01) and positively influences both subsequent self-efficacy (T = 0.47; p < .001)
and subsequent therapist's alliance (T = 0.32; p < .05). Self-efficacy and therapist's alliance are
not autocorrelated, and the lag-0 correlations among all three variables are moderate (Z = .26 to
.44). In the final phase of therapy (last 20 sessions), there are no significant auto- or cross-
correlations. Trends are slightly lower and lag-0 correlations are similar to those of the initial
phase.
Comments. The temporal distinction of initial versus final phases of therapy demonstrates that
the choice of the reference frame for VAR models has to be made with careful reflection.

Running head: TIME SERIES PANEL ANALYSIS 22
Theoretical and practical considerations should guide this decision.
Process-outcome analysis. The analysis of associations with outcome (multiple
regression analyses with CTI effect-size as dependent variable) was based on all available VAR
parameters and trends (in total, n = 30 parameters as predictors). Lag-0 associations were not
included in the regression model because the temporal aspects (captured by VAR parameters)
were the main focus of interest. The resulting multiple-regression model explained R2 = 37.3% of
the variance [F(30, 53) = 2.05; p = .040; η2 = 0.728]. Seven VAR parameters significantly
predicted change in CTI-scores (see Figure 2), and the majority of these associations originated
from the two intervention strategies reported by the therapists (see also Table W3, supplementary
online material).
-- Insert Figure 2 around here --
Linear trends (TR): The linear trend of patient's self-efficacy was positively associated
(standardized β = .42) with change in constructive thinking: Patients with pronounced linear
increase of self-efficacy over the course of therapy also had high change-scores in CTI.
Temporal stability: The autocorrelation of both therapist's clarification and mastery interventions
(β = .40 / .36) were associated with the CTI score: Therapies with higher predictability of
therapist's interventions had higher gains in constructive thinking. Temporal associations
between factors: CTI outcome was higher when the following associations were enhanced:
Therapist's alliance associated with subsequent alliance ratings of patients (β = .56); clarification
interventions associated with subsequent self-efficacy (β = .61); mastery associated with
subsequent patient's alliance (β = .80) and with therapist's clarification interventions (β = .46).
Comments. In terms of increase of knowledge, the process-outcome associations are probably the

Running head: TIME SERIES PANEL ANALYSIS 23
most interesting parts that may be achieved by TSPA. This combination of temporal dynamics
(gained through VAR, 'distilled' by TSPA to a prototypical model) with traditional outcome
measures enables researchers to fully combine the benefits of time-series analyses with pre-to-
post change assessments. In the present demonstration, the association of temporal stability in
therapist's intervention strategies with better outcome may be seen as a step towards an enriched
assessment of process-outcome relationships.
Discussion
This article provides an empirical demonstration of TSPA in a dataset of ambulatory
psychotherapy cases. Using five factors that describe a therapeutic system session by session
throughout therapy, TSPA allows identifying a prototypical model of change. This methodology
enables process research to address questions concerning a) the temporal dynamics of process
factors, b) the respective contributions of patients and therapists, and c) the associations between
mechanisms of change and therapy outcome. This was exemplified in 87 psychotherapies. In the
prototypical model of this dataset, all five factors showed temporal stability (autocorrelation) and
the two patient factors alliance and self-efficacy were connected in a positive feedback loop.
Furthermore, TSPA elucidated that those therapies were more successful in whom therapist's
interventions enhanced subsequent alliance and self-efficacy of patients. Most importantly, the
process-outcome analysis pointed to a previously overlooked facet of therapists’ intervention
strategies: Temporal stability. TSPA uncovered that the autocorrelation of therapists’
clarification and mastery interventions was associated with improvement in patients’
constructive thinking. This finding implies that patients evidenced higher changes in their
thinking style when they engaged with therapists who did not much change the intensity of their
interventions from one session to the next (t-1 to t). In line with this interpretation was the

Running head: TIME SERIES PANEL ANALYSIS 24
finding that low temporal stability (autocorrelation) was not confounded with low dosage: The
levels of clarification and mastery interventions were unrelated to change in constructive
thinking (r = -.04 / .05; see Table W1 / W2, supplementary online material). Taken together,
these results suggest that it is not the dosage of interventions, but rather the stability of therapist's
interventions on a session-to-session basis that turned out to be predictors of favorable outcome.
The discussed findings are relevant insofar as neither the averages of factors nor their
simultaneous associations were indicative of therapeutic improvement. Only through uncovering
temporal dynamics assessed by TSPA it was possible to clarify the linkage of process and
outcome in these therapeutic systems with differing success rates. In summary, the findings
support a specific methodological contribution of TSPA to psychotherapy research.
Clinical implications: Session-to-session response of patient's factors to therapist's
interventions was strongly associated with outcome: Specific short-scale effects (at the session-
to-session level) may be predictive of therapy outcome and may indicate the adequacy of current
therapeutic strategies. In the present dataset, lower stabilities of therapists’ intervention strategies
were associated with poorer outcome: This may either reflect a property pertaining to the patient
– e.g. a lack of responsiveness to interventions – or a property of the therapist, e.g. excessive
changing of therapeutic strategies and frequent switching of focus between mastery and
clarification interventions. While it may be an adequate strategy to be sensitive to patients’ early
change trajectories (Stulz, Lutz, Leach, Lucock, & Barkham, 2007), therapists may actually fare
better not varying their strategies too early or too often. Future studies should address these
(putative) causal mechanisms by experimental designs.
Limitations. Longer therapies were overrepresented in the present study, as the minimal
therapy duration was set to n = 30. Correspondingly, the sample contained slightly more severe
cases as evidenced by initial CTI scores and CTI-change. It should thus be borne in mind that our

Running head: TIME SERIES PANEL ANALYSIS 25
findings may not generalize to shorter therapies with higher proportions of less severe cases.
TSPA assumed that the VAR parameters of a single patient would not vary systematically during
the course of therapy. One may challenge this assumption because change mechanisms in the
initial stages of therapy may differ from those in the final stages of therapy (see Figure W2,
supplementary online material). This type of problem is inherent to time-series modeling in
general; the significance and stability of results may justify the chosen time frame.
General Conclusion
The purpose of this article was to explore time series panel analysis (TSPA) as a
complementary method to study change processes in psychotherapy time-series data.
In the exemplary sample presented here, temporal characteristics of therapy factors explained the
associations with constructive thinking better than average levels ('dosages') of factors. Being
able to model such associations and to statistically assess their effect can inform researchers and
clinicians alike of temporal processes in psychotherapy. This peculiarity is a core feature
distinguishing TSPA from more conventional procedures. TSPA's middle ground between
idiographic and nomothetic designs thus has specific merits for the psychotherapy research
agenda. The implementation of TSPA in software packages such as SAS and R is straightforward
and requires no additional programming. The broad range of applicability in time-series data,
and the availability of appropriate tools, may invite and encourage researchers to a) assess
psychotherapy process with a focus on temporal evolution, and b) investigate the temporal
mechanisms of change in psychotherapy.

Running head: TIME SERIES PANEL ANALYSIS 26
References
Akaike, H. (1974). A new look at the statistical model identification. IEEE Transactions on
Automatic Control, 19, 716-723. doi:10.1109/TAC.1974.1100705
American Psychiatric Association. (1994). DSM-IV: Diagnostic and statistical manual of mental
disorders. In Washington, DC: American Psychiatric Association.
American Psychological Association (2012). Resolution on the recognition of psychotherapy
effectiveness. Retrieved from http://www.apa.org/news/press/releases/2012/08/resolution-
psychotherapy.aspx#effectiveness
Baldwin, S. A., Imel, Z. E., Braithwaite, S. R., & Atkins, D. C. (2014, February 3). Analyzing
multiple outcomes in clinical research using multivariate multilevel models. Journal of
Consulting and Clinical Psychology. Advance online publication. doi:10.1037/a003562
Bandura, A. (1977). Self-efficacy: Toward a unifying theory of behavioral change.
Psychological Review, 84, 191-215. doi:10.1037/0033-295X.84.2.191
Boker, S., Neale, M., Maes, H., Wilde, M., Spiegel, M., Brick, T., . . . Fox, J. (2011). OpenMx:
An open source extended structural equation modeling framework. Psychometrika, 76, 306-
317. doi:10.1007/s11336-010-9200-6
Bollen, K. A., & Curran, P. J. (2004). Autoregressive latent trajectory (ALT) models a synthesis
of two traditions. Sociological Methods & Research, 32, 336-383.
doi:10.1177/0049124103260222
Caspar, F. (2007). Plan analysis. In T. Eells (Ed.), Handbook of psychotherapeutic case
formulations (2nd ed., pp. 251-289). New York, NY: Guilford
Castonguay, L. G., & Beutler, L. E. (2006). Principles of therapeutic change: A task force on
participants, relationships, and techniques factors. Journal of Clinical Psychology, 62, 631-
638. doi:10.1002/jclp.20256

Running head: TIME SERIES PANEL ANALYSIS 27
Cattell, R. B. (1952). The three basic factor-analytic research designs—their interrelations and
derivatives. Psychological Bulletin, 49, 499-520. doi:10.1037/h005424
Chambless, D. L., & Ollendick, T. H. (2001). Empirically supported psychological interventions:
Controversies and evidence. Annual Review of Psychology, 52, 685-716.
doi:10.1146/annurev.psych.52.1.685
Collins, L. M. (2006). Analysis of longitudinal data: The integration of theoretical model,
temporal design, and statistical model. Annual Review of Psychology, 57, 505-528.
doi:10.1146/annurev.psych.57.102904.19014
Curran, P. J., & Bauer, D. J. (2011). The disaggregation of within-person and between-person
effects in longitudinal models of change. Annual Review of Psychology, 62, 583-619.
doi:10.1146/annurev.psych.093008.10035
DeRubeis, R. J., Brotman, M. A., & Gibbons, C. J. (2005). A conceptual and methodological
analysis of the nonspecifics argument. Clinical Psychology: Science and Practice, 12, 174-
183. doi:10.1093/clipsy.bpi022
Epstein, S. (1991). Cognitive-experiential self-theory: An integrative theory of personality: In R.
Curtis (Ed.), The relational self: Convergences in psychoanalysis and social psychology
(pp. 111-137). New York, NY: Guilford Press.
Epstein, S. (2001). CTI. Constructive Thinking Inventory. Professional manual. Psychological
Assessment Resources (PAR), Inc. Lutz, FL: PAR.
Epstein, S., & Meier, P. (1989). Constructive thinking: A broad coping variable with specific
components. Journal of Personality and Social Psychology, 5, 332-350. doi:10.1037/0022-
3514.57.2.332
Fisher, A. J., Newman, M. G., & Molenaar, P. C. (2011). A quantitative method for the analysis
of nomothetic relationships between idiographic structures: Dynamic patterns create attractor

Running head: TIME SERIES PANEL ANALYSIS 28
states for sustained posttreatment change. Journal of Consulting and Clinical Psychology,
79, 552-563. doi:10.1037/a0024069
Flückiger, C., Regli, D., Zwahlen, D., Hostettler, S., & Caspar, F. (2010). Der Berner Patienten-
und Therapeutenstundenbogen 2000 [The Bern Post Session Report 2000, patient and
therapist versions]. Zeitschrift für Klinische Psychologie und Psychotherapie, 39, 71-79.
doi:10.1026/1616-3443/a000015
Gates, K. M., Molenaar, P. C., Hillary, F. G., Ram, N., & Rovine, M. J. (2010). Automatic
search for fMRI connectivity mapping: An alternative to Granger causality testing using
formal equivalences among SEM path modeling, VAR, and unified SEM. NeuroImage, 50,
1118-1125. doi:10.1016/j.neuroimage.2009.12.117
Goldin, P. R., Ziv, M., Jazaieri, H., Werner, K., Kraemer, H., Heimberg, R. G., & Gross, J. J.
(2012). Cognitive reappraisal self-efficacy mediates the effects of individual cognitive-
behavioral therapy for social anxiety disorder. Journal of Consulting and Clinical
Psychology, 80, 1034-1040. doi:10.1037/a0028555
Gottman, J. M., & Rushe, R. H. (1993). The analysis of change: Issues, fallacies, and new ideas.
Journal of Consulting and Clinical Psychology, 61, 907-910.
Granger, C. W. J. (1969). Investigating causal relations by econometric models and cross-
spectral methods. Econometrica, 37, 424-438.
Grawe, K. (1997). Research-informed psychotherapy. Psychotherapy Research, 7, 1-19.
Grawe, K. (2004). Psychological therapy. Seattle, Toronto: Hogrefe.
Haken, H. (1977). Synergetics - an introduction. Nonequilibrium phase-transitions and self-
organization in physics, chemistry and biology. Berlin, Germany: Springer.
Haken, H., & Schiepek, G. (2006). Synergetik in der Psychologie [Synergetics in psychology].
Göttingen, Germany: Hogrefe.

Running head: TIME SERIES PANEL ANALYSIS 29
Haken, H., Kelso, J. A. S., & Bunz, H. (1985). A theoretical model of phase transitions in human
hand movements. Biological Cybernetics, 51, 347-356. doi:10.1007/BF00336922
Hamaker, E. L., Dolan, C. V., & Molenaar, P. C. M. (2005). Statistical modeling of the
individual: Rationale and application of multivariate stationary time series analysis.
Multivariate Behavioral Research, 40, 207-233. doi:10.1207/s15327906mbr4002_3
Hamilton, J. P., Chen, G., Thomason, M. E., Schwartz, M. E., & Gotlib, I. H. (2011).
Investigating neural primacy in major depressive disorder: Multivariate Granger causality
analysis of resting-state fMRI time-series data. Molecular Psychiatry, 16, 763-772.
doi:10.1038/mp.2010.46
Hayes, A. M., & Strauss, J. L. (1998). Dynamic systems theory as a paradigm for the study of
change in psychotherapy: An application to cognitive therapy for depression. Journal of
Consulting and Clinical Psychology, 66, 939-947. doi:10.1037/0022-006X.66.6.939
Hayes, A. M., Laurenceau, J. P., Feldman, G., Strauss, J. L., & Cardaciotto, L. A. (2007).
Change is not always linear: The study of nonlinear and discontinuous patterns of change in
psychotherapy. Clinical Psychology Review, 27, 715-723. doi:10.1016/j.cpr.2007.01.008
Horvath, A. O., Del Re, A. C., Flückiger, C., & Symonds, D. (2011). Alliance in individual
psychotherapy. Psychotherapy, 48, 9-16. doi:10.1037/a0022186
Imai, K., Keele, L., & Tingley, D. (2010). A general approach to causal mediation analysis.
Psychological Methods, 15, 309-34. doi:10.1037/a0020761
Imai, K., Keele, L., Tingley, D., & Yamamoto, T. (2011). Unpacking the black box of causality:
Learning about causal mechanisms from experimental and observational studies. American
Political Science Review, 105, 765-789. doi:10.1017/S0003055411000414
King, M. W., & Resick, P. A. (2014, March 3). Data mining in psychological treatment research:
A primer on classification and regression trees. Journal of Consulting and Clinical

Running head: TIME SERIES PANEL ANALYSIS 30
Psychology. Advance online publication. doi:10.1037/a0035886
Kelso, J. (1995). Dynamic patterns: The self-organization of brain and behavior. Cambridge,
MA: MIT Press.
Lambert, M. J., & Ogles, B. J. (2004). The efficacy and effectiveness of psychotherapy. In M. J.
Lambert (Ed.), Bergin and Garfield's handbook of psychotherapy and behavior change (pp.
139-193). New York, NY: Wiley.
Laurenceau, J. P., Hayes, A. M., & Feldman, G. C. (2007). Some methodological and statistical
issues in the study of change processes in psychotherapy. Clinical Psychology Review, 27,
682-695. doi:10.1016/j.cpr.2007.01.007
Mahoney, M. J. (1991). Human change process: The scientific foundations of psychotherapy.
Chicago, IL: Basic Books.
Messer, S. B., & Wampold, B. E. (2002). Let's face facts: Common factors are more potent than
specific therapy ingredients. Clinical Psychology: Science and Practice, 9, 21-25.
doi:10.1093/clipsy.9.1.21
Meuret, A. E., Rosenfield, D., Seidel, A., Bhaskara, L., & Hofmann, S. G. (2010). Respiratory
and cognitive mediators of treatment change in panic disorder: Evidence for intervention
specificity. Journal of Consulting and Clinical Psychology, 78, 691-704.
doi:10.1037/a0019552
Molenaar, P. C. M. (1985). A dynamic factor model for the analysis of multivariate time series.
Psychometrika, 50, 181-202. doi:10.1007/bf02294246
Molenaar, P. C. M. (2004). A manifesto on psychology as idiographic science: Bringing the
person back into scientific psychology, this time forever. Measurement: Interdisciplinary
Research and Perspectives, 2, 201-218. doi:10.1207/s15366359mea0204_1
Molenaar, P. C. M., & Campbell, C. G. (2009). The new person-specific paradigm in

Running head: TIME SERIES PANEL ANALYSIS 31
psychology. Current Directions in Psychological Science, 18(2), 112-117.
doi:10.1111/j.1467-8721.2009.01619.
Newell, K. M., & Molenaar, P. C. M. (1998). Introduction: Modeling development as dynamical
systems. In K. M. Newell & P. C. M. Molenaar (Eds.), Applications of nonlinear dynamics
to developmental process modeling (pp. 201-240). Mahwah, NJ: Lawrence Erlbaum.
Nicolis, G., & Prigogine, I. (1977). Self-organization in nonequilibrium systems: From
dissipative structures to order through fluctuations. New York, NY: Wiley.
Norcross, J. C., & Wampold, B. E. (2011). Evidence-based therapy relationships: Research
conclusions and clinical practices. Psychotherapy, 48, 98-102. doi:10.1037/a0022161
Oud, J. H. L., & Jansen, R. A. R. G. (2000). Continuous time state space modeling of panel data
by means of sem. Psychometrika, 65, 199-215. doi:10.1007/BF02294374
Pfaff, B. (2008). VAR, SVAR and SVEC models: Implementation within R package vars.
Journal of Statistical Software, 27(4). Retrieved from http://www.jstatsoft.org/v27/i04/.
Pfaff, B., & Stigler, M. (2013). vars: VAR modeling (Version 1.5-2) [Software package]
Retrieved from http://CRAN.R-project.org/package=vars
Pfammatter, M., & Tschacher, W. (2012). Wirkfaktoren der Psychotherapie – eine Übersicht und
Standortbestimmung [Principles of therapeutic change – an overview]. Zeitschrift für
Psychiatrie, Psychologie und Psychotherapie, 60, 67-76. doi:10.1024/1661-4747/a000099
R Core Team. (2014). R: A language and environment for statistical computing (Version 3.0.3)
[Software package]. Vienna, Austria: R Foundation for Statistical Computing.
Ramseyer, F., & Tschacher, W. (2011). Nonverbal synchrony in psychotherapy: Coordinated
body-movement reflects relationship quality and outcome. Journal of Consulting and
Clinical Psychology, 79, 284-295. doi:10.1037/a0023419
Raudenbush, S. W. (2001). Comparing personal trajectories and drawing causal inferences from

Running head: TIME SERIES PANEL ANALYSIS 32
longitudinal data. Annual Review of Psychology, 52, 501-525.
doi:10.1146/annurev.psych.52.1.50
Salvatore, S., & Tschacher, W. (2012). Time dependency of psychotherapeutic exchanges: The
contribution of the theory of dynamic systems in analyzing process. Frontiers in Psychology,
3, 253. doi:10.3389/fpsyg.2012.00253
SAS Institute Inc. (2011). SAS/STAT® 9.3 User’s Guide. Cary, NC: SAS Institute Inc.
Sims, C. A. (1980). Macroeconomics and reality. Econometrica, 48, 1-48.
Smits, J. A., Julian, K., Rosenfield, D., & Powers, M. B. (2012). Threat reappraisal as a mediator
of symptom change in cognitive-behavioral treatment of anxiety disorders: A systematic
review. Journal of Consulting and Clinical Psychology, 80, 624-35. doi:10.1037/a0028957
Smits, J. A., Rosenfield, D., McDonald, R., & Telch, M. J. (2006). Cognitive mechanisms of
social anxiety reduction: An examination of specificity and temporality. Journal of
Consulting and Clinical Psychology, 74, 1203-12. doi:10.1037/0022-006X.74.6.1203
Stock, J. H., & Watson, M. W. (2001). Vector autoregressions. The Journal of Economic
Perspectives, 15, 101-115.
Stroe-Kunold, E., Gruber, A., Stadnytska, T., Werner, J., & Brosig, B. (2012). Cointegration
methodology for psychological researchers: An introduction to the analysis of dynamic
process systems. The British Journal of Mathematical and Statistical Psychology, 65, 511-
539. doi:10.1111/j.2044-8317.2011.02033.x
Stulz, N., Lutz, W., Leach, C., Lucock, M., & Barkham, M. (2007). Shapes of early change in
psychotherapy under routine outpatient conditions. Journal of Consulting and Clinical
Psychology, 75, 864-874. doi:10.1037/0022-006X.75.6.864
Tschacher, W., & Jacobshagen, N. (2002). Analysis of crisis intervention processes. Crisis, 23,
59-67. doi:10.1027//0227-5910.23.2.59
Running head: TIME SERIES PANEL ANALYSIS 33
Tschacher, W., & Kupper, Z. (2002). Time series models of symptoms in schizophrenia.
Psychiatry Research, 113, 127-137. doi:10.1016/S0165-1781(02)00247-0
Tschacher, W., & Ramseyer, F. (2009). Modeling psychotherapy process by time-series panel
analysis (TSPA). Psychotherapy Research, 19, 469-481. doi:10.1080/10503300802654496
Tschacher, W., Baur, N., & Grawe, K. (2000). Temporal interaction of process variables in
psychotherapy. Psychotherapy Research, 10, 296-308. doi:10.1093/ptr/10.3.296
Tschacher, W., Ramseyer, F., & Grawe, K. (2007). Der Ordnungseffekt im
Psychotherapieprozess [The order effect in the psychotherapy process]. Zeitschrift für
Klinische Psychologie und Psychotherapie, 36, 18-25. doi:10.1026/1616-3443.36.1.18
Tschacher, W., Schildt, M., & Sander, K. (2010). Brain connectivity in listening to affective
stimuli: A functional magnetic resonance imaging (fMRI) study and implications for
psychotherapy. Psychotherapy Research, 20, 576-588. doi:10.1080/10503307.2010.493538
Tschacher, W., Zorn, P., & Ramseyer, F. (2012). Change mechanisms of schema-centered group
psychotherapy with personality disorder patients. PLoS ONE, 7, e39687.
doi:10.1371/journal.pone.0039687
Vallacher, R. R., & Nowak, A. (1997). The emergence of dynamical social psychology.
Psychological Inquiry, 8, 73-99. doi:10.1207/s15327965pli0802_1
Vallacher, R. R., Coleman, P. T., Nowak, A., & Bui-Wrzosinska, L. (2010). Rethinking
intractable conflict: The perspective of dynamical systems. The American Psychologist, 65,
262-278. doi:10.1037/a0019290
Wampold, B. E. (2001). The great psychotherapy debate. Models, methods and findings.
Mahwah, NJ: Lawrence Erlbaum.
Wild, B., Eichler, M., Friederich, H. -C., Hartmann, M., Zipfel, S., & Herzog, W. (2010). A
graphical vector autoregressive modelling approach to the analysis of electronic diary data.

Running head: TIME SERIES PANEL ANALYSIS 34
BMC Medical Research Methodology, 10. doi:10.1186/1471-2288-10-28
Williams, D. M. (2010). Outcome expectancy and self-efficacy: Theoretical implications of an
unresolved contradiction. Personality and Social Psychology Review, 14, 417-425.
doi:10.1177/1088868310368802
Wittchen, H. U., Wunderlich, U., Gruschwitz, S., & Zaudig, M. (1997). SCID: Clinical interview
for DSM-IV (German Version). Göttingen, Germany: Hogrefe.
Running head: TIME SERIES PANEL ANALYSIS 35
Table 1. Overview of Various Analysis Methods Used For Psychotherapy Time-Series.
Method
Properties of data set Analytic focus on ...
Few
subjects Short TS
Missing
data
Varying
TS
lengths
Idiographic
modeling
Multivariate
estimation
Temporal
dynamics
VAR + – – + + + +
ANOVA – + – – – – –
MLM – + + + + – +
SEM – + – + – + +
VAR = Vector Auto Regression; ANOVA = Analysis of Variance; MLM = Multilevel
Modeling; SEM = Structural Equation Modeling; TS = Time Series
+ = possible/advantage; – = impossible/disadvantage

Running head: TIME SERIES PANEL ANALYSIS 36
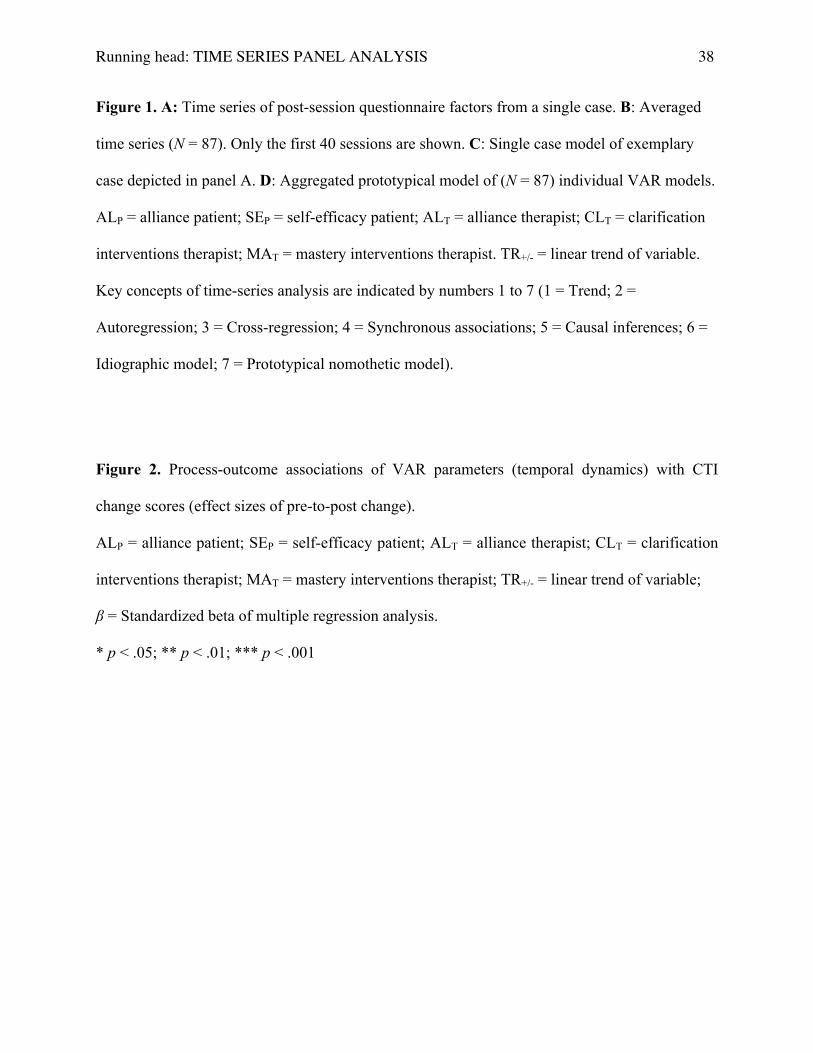
Figure 1

Running head: TIME SERIES PANEL ANALYSIS 37
Figure 2
Running head: TIME SERIES PANEL ANALYSIS 38
Figure 1. A: Time series of post-session questionnaire factors from a single case. B: Averaged
time series (N = 87). Only the first 40 sessions are shown. C: Single case model of exemplary
case depicted in panel A. D: Aggregated prototypical model of (N = 87) individual VAR models.
ALP = alliance patient; SEP = self-efficacy patient; ALT = alliance therapist; CLT = clarification
interventions therapist; MAT = mastery interventions therapist. TR+/- = linear trend of variable.
Key concepts of time-series analysis are indicated by numbers 1 to 7 (1 = Trend; 2 =
Autoregression; 3 = Cross-regression; 4 = Synchronous associations; 5 = Causal inferences; 6 =
Idiographic model; 7 = Prototypical nomothetic model).
Figure 2. Process-outcome associations of VAR parameters (temporal dynamics) with CTI
change scores (effect sizes of pre-to-post change).
ALP = alliance patient; SEP = self-efficacy patient; ALT = alliance therapist; CLT = clarification
interventions therapist; MAT = mastery interventions therapist; TR+/- = linear trend of variable;
β = Standardized beta of multiple regression analysis.
* p < .05; ** p < .01; *** p < .001
Copyright © 2022 FDOKUMEN