
WHAT IS 'FIRM HETEROGENEITY' IN TRADE MODELS? THE ROLE OF QUALITY, SCOPE, MARKUPS, AND COST
Upload
khangminh22Category
view
1download
0
Time, cost and quality trade-o� inproject management: a case study
Do Ba Khang* and Yin Mon MyintSchool of Management, Asian Institute of Technology, P.O. Box 2754, Bangkok 10501, Thailand
In 1996, Babu and Suresh proposed a framework to study the trade-o� among time, cost andquality using three inter-related linear programming models. This paper describes our attempt toapply the method to an actual cement factory construction project. The purpose is to evaluatethe practical applicability of the method by highlighting the managerial insights gained, as wellas pointing out key problems and di�culties faced. As consequence, the paper helps practicingproject engineers to have realistic expectations of the method. It also provides suggestions toovercome some practical problems if the method is to be applied in real industrial projects. #1999 Elsevier Science Ltd and IPMA. All rights reserved
Keywords: critical path method (CPM), time, cost, quality trade-o�, case study
Introduction
The critical path method (CPM) provides not only anexcellent way of calculating the shortest completiontime and the critical activities for a project, but also aframework to analyze the time/cost trade-o�. In prac-tice, however, one of the critical measures of projectsuccess is the quality of its performance that may bea�ected by attempt to crash the completion time withadditional budget1, 2. In this context, the traditionalCPM method is inadequate to help the project man-ager make informed decisions on project progress andperformance. Many attempts have been recorded inthe literature to improve the method since its inceptionin the late 1950s3. However, most of this researcheither focused on improving the e�ciency of the pro-ject-crashing algorithm4±8, or on relaxing on theassumption of the linear relationship between cost andtime factors9±11. In 1996, Babu and Suresh12 proposeda new method to study the tradeo� among time, costand quality using three inter-related linear program-ming models. Their approach is based on the linear re-lationship among the project cost, the quality measureand the project completion time. The method is illus-trated with a small textbook example taken fromHillier and Lieberman13.This paper describes an attempt to apply the Babu
and Suresh method to an actual cement factory con-struction project in Thailand. With the purpose ofevaluating the practical applicability of the method,the basic assumptions are investigated, major problemsin estimating input parameters are pointed out, and
the resulting managerial insights are highlighted. Asconsequence, the paper helps practicing project engin-eers to have realistic expectations of the method. Italso provides suggestions to overcome various practi-cal problems if the method is to be applied in realindustrial projects. This research also validates withreal data most of the conceptual ®ndings by Babu andSuresh in their original work.
Review of Babu and Suresh cost±time±qualitytrade-o� models
Babu and Suresh developed their method by assumingthat the project activities and their precedence relation-ships are determined. Each activity has a normal timeof completion and a crash time of completion.Associated with the normal time are normal cost andnormal performance quality, and with crash time arecrash cost and crash quality. It is assumed that thecost and quality of an activity vary as linear functionsof the completion time. Given individual activity com-pletion times, the total project completion time canthen be calculated using the traditional CPM method.The total cost is simply the sum of individual activitycosts, and the total project quality is measured by theaverage of the individual activity quality measures.Babu and Suresh suggest three optimization models
as a framework to analyze the trade-o� among thecost, time and quality factors of a project. In order toformulate these models in the familiar linear program-ming (LP) format, the activity-on-arc (AOC) networkconvention and the following notation will be used:
M: Number of eventsN: Number of activities
International Journal of Project Management Vol. 17, No. 4, pp. 249±256, 1999# 1999 Elsevier Science Ltd and IPMA. All rights reserved
Printed in Great Britain0263-7863/99 $ - see front matter
PII: S0263-7863(98)00043-X
*Corresponding author. Tel.: 00-662-524-5658; Fax: 00-662-524-5667.
249
Yi: Earliest time of event i (i= 1,2,...,M)Xij: Duration of activity (ij) (Xij and Yi are de-
cision variables)tij: Normal time for activity (i,j)t'ij: Crash time for activity (i,j) (tijrt'ijr0)cij: Normal cost for activity (i,j)c'ij: Crash cost for activity (i,j) (c'ijrcijr0)qij: Normal quality for activity (i,j)q'ij: Crash quality for activity (i,j) (qijrq'ijr0).
Notice that a dummy activity can be indicated byletting tij=t'ij=0. The constraints common to all theLP problems can then be summarized as follows:(a) The project is started at time zero.
Y1 � 0 �1�(b) Each activity completion time Xij is bounded
from above by the normal time, and from below bythe crash time:
tijrXijrt 0ij �2�(c) For each activity (i,j),
Yi � Xij ÿ YjR0 �3�The objective function for the ®rst LP model is the
project completion time that is simply the earliest timeof the last `®nish' event:
TF � YM
For the second model, the objective function is thetotal cost of the project. By assuming the linear re-lationship of the activity cost and completion time, thetotal project cost is estimated as a linear function ofthe individual activity times:
CF �X�i,j ��Aij � Bij � Xij �,
where Bij � �c 0ij ÿ cij �=�tij ÿ t 0ij � and Aij � c 0ij ÿ Bij � t 0ijare the slope and intercept of the cost curve for ac-tivity (i,j). For the third model, the objective functionis the project's overall quality that is calculated as theaverage of the individual activity qualities, that is
QF �X�i,j ��A 0ij � B 0ij � Xij �,
where B 0ij � �qij ÿ q 0ij �=�tij ÿ t 0ij � and A 0ij � q 0ij ÿ B 0ij � t 0ijare the slope and intercept of the quality curve for ac-tivity (i,j).Thus, assuming that T' and Q' are the lower bounds
for project completion time TF and average qualityQF, and C' is the upper bound for total cost CF, themodels can be simply written as:
Model 1: Minimize TF subject to (1±3) andCFRC' and QFrQ';
Model 2: Minimize CF subject to (1±3) andTFRT' and QFrQ';
Model 3: Maximize QF subject to (1±3) andCFRC' and TFRT'.
For di�erent budget levels and the quality toler-ances, the ®rst model yields the corresponding shortestcompletion times, and thus provides a framework forthe trade-o� analysis by considering project com-
pletion time as a function of budget and quality con-straints. In a similar way, the second model searchesfor the lowest cost to complete the project as a func-tion of completion due dates and quality toleranceallowed, while the third model yields maximum overallproject quality subject as a function of budget con-straints and completion due date.
Case study and parameter estimation
TPI Polene Public Company Limited (TPIPL) islocated about 134 km north of Bangkok, Thailand.The company currently operates three cement factorieswith an annual capacity of 9 million tons per annum.The fourth factory is now under construction and isexpected to be in operation by 1998, which will bringthe total cement capacity to 12.3 million tons perannum. The total cost for this new construction pro-ject is estimated to be baht 9.6 billion (or roughlyUS$375 million). The scope of work for the whole pro-ject is large and complex with 35 di�erent sub-projectsand more than 1000 separate activities. Partly becauseof this complexity, and partly due to the fact that thecompletion of the project is subject to a large numberof exogenous factors, both economical and political,beyond the control of the top management, it wasdecided to focus this research on only one of its sub-projects. The sub-project chosen is one of erecting theDopol pre-heater tower, which is the most time con-suming and problematic sub-project in the whole fac-tory construction project. In fact, the pre-heater towererection is so important that its schedule is used byproject engineers as the benchmark to adjust the sche-dule of all other sub-projects. It is believed that usingthis sub-project in evaluating the practical value of themethod will not a�ect the validity of the conclusions.The activities of the sub-project to erect the Dopol
pre-heater tower can be grouped into 52 workpackages under four main categories: civil work (level-ing, excavation, foundation and construction), mech-anical work (fabrication, erection, refractory and coldtest run), electrical work (power distribution, substa-tion and transformer, MCC control, cable rack instal-lation, power supply) and automation (Plc cabinet,safety and local control). Each work package consistsof numerous related speci®c activities that are nor-mally carried out under a single supervisor or subcon-tractor. The work packages are identi®ed so thatactivities of di�erent work packages do not use thesame resources at the same time, and therefore can bescheduled relatively independently. Care is taken thatcompletion time and cost of individual work packagescan be estimated relatively easily and accurately. Thelist of these work packages and their brief descriptionis given in Table 1.Estimating the relevant input parameters for work
packages was probably the most time consuming taskin applying the Babu and Suresh method to the sub-project under study. The work was done in close con-sultations with site managers. Below is described theway these parameters were estimated as well as the dif-®culties encountered.
Time, cost and quality trade-o� in project management: D B Khang and Y M Myint
250
Normal time cost and quality parameters
The time and cost parameters under assumed normalconditions were easiest to estimate. In fact, the normalcompletion time of activity was taken from the existingproject schedule that had been prepared by project en-gineers with care taken to all technical details. For thepurpose of studying the inter-relationship among thecost, time and quality dimensions of the project incrashing the activities, all ®xed costs of equipment andmaterials procurement, and the overhead wereexcluded from these cost parameters. In fact, all sitemanagers and engineers believed that these costs,although being a major part of the total cost, were nota�ected by decisions of crashing the project activities.Thus the cost data used in the calculations (see alsoTable 1) include only the variable costs of whichlabour cost is the major component. Since the relative
quality reduction due to crashing activities is the focusof interest in this research, the performance qualityexpected under the normal conditions is assumed to beat 100% level for each activity. This assumptionre¯ects the research objective of investigating only theimpact of the time/cost factor, and not any other in¯u-ence, on the project's overall quality.
Crashing time, cost and quality
Most of the work at the pre-heater tower is labourintensive with relatively clear de®nition. As it is typicalfor construction sites in Thailand, the number ofworkers working 6 days a week at the project isalready at the maximum due to the limited work area.Thus, according to the managers, the only way activi-ties can be accelerated is through using overtime. Sincethe maximum overtime allowed is 4 hours on top of
Table 1 Works on Dopol preheater tower and the estimates parameters
Work-package Brief description of work
tij(days)
t'ij(days)
cij(million baht)
c'ij(million baht) q'ij
A Procurement of Rebars 33 22 5.50 8.25 0.90B Procurement of steel section, plates, pipes, etc. 33 22 58.40 87.60 0.90C Excavation 33 22 0.50 0.75 0.90D Foundation 33 22 6.50 9.75 0.95E Concrete columns to ®rst ¯oor (188 m) 22 15 3.40 5.10 0.95F Concrete ¯oor and beams to ®rst ¯oor 22 15 3.50 5.25 0.95G Concrete columns to second ¯oor (200m) 22 15 2.50 3.75 0.95H Fabrication of beams, steel ¯oor and staircase (second ¯oor) 44 29 1.09 1.63 0.83I Fabrication of kiln inlet and transaction piece 75 50 1.84 2.76 0.83J Erection of kiln inlet and transaction piece 75 50 1.10 1.65 0.85K Installation of beams, steel ¯oor and staircase (second ¯oor) 44 29 1.95 2.93 0.85L Fabrication of beams, steel ¯oor and staircase (third ¯oor) 55 37 2.22 3.34 0.83M Installation of steel structure to 3rd ¯oor (217 m) 55 37 4.00 6.00 0.85N Erection of 1st stage cyclones and ducts between 3rd and 4th ¯oors 30 20 1.80 2.70 0.85O Fabrication of 1st stage cyclones and ducts (3rd ¯oor) 30 20 1.08 1.61 0.83P Refractory works (kiln inlet, transaction pieces, column ducts) 40 27 2.85 4.28 0.90Q Electrical works in 1st, 2nd and 3rd ¯oors 40 27 2.50 3.75 0.70R Fabrication of beams, steel ¯oor and staircase (4th and 5th ¯oors) 55 37 3.15 4.73 0.83S Erection of beams, steel ¯oor and staircase for 4th and 5th ¯oors (251 m) 55 37 5.68 8.51 0.85T Erection of 2nd stage cyclones and transfer ducts 40 27 1.65 2.48 0.85U Fabrication of 2nd stage cyclones and transfer ducts 40 27 2.75 4.12 0.83V Refractory works at 1st stage cyclones and ducts 44 29 2.54 3.81 0.90W Fabrication of beams, steel ¯oor and staircase (5th and 6th ¯oors) 55 37 1.99 2.99 0.83X Erection of beams, steel ¯oor and staircase (5th and 6th ¯oors) 55 37 3.59 5.38 0.85Y Erection of 3rd stage cyclones 30 20 0.80 1.20 0.85Z Fabrication of 3rd stage cyclones and ducts 30 20 1.34 2.01 0.83AA Refractory works at 2nd stage cyclones and ducts 44 29 2.54 3.81 0.90AB Electrical and instrument cabling 4th and 5th ¯oor 22 15 1.50 2.25 0.70AC Installation of 2 Poldos-feeding equipment in 1st ¯oor 30 20 1.20 1.80 0.85AD Installation of shock blowers (M.E) in ¯oors 1,2 and 3. 30 20 1.25 1.88 0.85AE Fabrication of beams, steel ¯oor and staircase (6th and 7th ¯oors) 55 37 1.59 2.39 0.83AF Erection of beams, steel ¯oor and staircase for 6th and 7th ¯oors (268 m) 55 37 2.87 4.30 0.85AG Erection of 4th stage cyclones on 6th ¯oor 30 20 0.69 1.04 0.85AH Fabrication of 4th stage cyclones etc. 30 20 1.16 1.73 0.83AI Refractory works at 3rd stage cyclones and ducts 44 29 3.25 4.88 0.90AJ Electrical and instrument cable racks etc. (6th ¯oor) 22 15 1.50 2.25 0.70AK Fabrication of beams, steel ¯oor and staircase (7th and 8th ¯oors) 72 48 1.54 2.31 0.83AL Erection of beams, steel ¯oor and staircase for 7th and 8th ¯oors (291 m) 72 48 2.77 4.16 0.85AM Erection of 5th stage cyclones on 7th ¯oor 40 27 0.62 0.93 0.85AN Fabrication of 5th stage cyclones and ducts 40 27 1.04 1.55 0.83AO Refractory works on 4th stage cyclones and ducts 44 29 3.25 4.88 0.90AP Fabrication of ladder, platform, stairs,beams for 8th ¯oor 55 37 1.23 1.85 0.83AQ Erection of steel structures for 8th ¯oor 55 37 2.22 3.33 0.85AR Erection of 6th stage cyclones on 8th ¯oor 40 27 1.19 1.79 0.85AS Fabrication of 6th stage cyclones on 8th ¯oor 40 27 1.98 2.97 0.83AT Refractory works on 5th stage cyclones and ducts 44 29 1.66 2.49 0.90AU Fabrication of second gas duct 165 111 3.55 5.32 0.83AV Refractory work on 6th stage cyclones completed 66 44 3.26 4.90 0.90AW Electrical and instrument cables on 7th ¯oor 30 20 1.50 2.25 0.70AX Installation of local instruments 88 59 5.23 7.85 0.85AY Insulation for gas ducts and 6th stage cyclones connection 66 44 2.28 3.62 0.85AZ Readying for test run 5 3 0.50 0.75 0.85
Time, cost and quality trade-o� in project management: D B Khang and Y M Myint
251
the regular 8-hour working day, activities may becrashed on average at a ratio of 2:3. These crash timeswere then adjusted for each of the 52 work-packagestaking into account the possibility that workers maysometimes be asked to work on Sunday also, and thatsome work would permit less hours of overtime due tolighting conditions and safety reasons. The results arethe maximum crash times t'ij used in the LP models.Site managers also believed that when activities needbe crashed, the cost increase is mostly due to thedouble rate for overtime. As consequence, they had noproblem in accepting the assumption of linear relation-ship between cost escalation and time crashed which isfundamental in the Babu and Suresh method.The estimation of the quality reduction due to crash-
ing was more di�cult and elaborate. There were twomajor obstacles in arriving at an acceptable measure-ment of quality reduction. First, and not surprisingly,it was found that the practicing managers and engin-eers were very sensitive to the idea that the quality ofthe project could be compromised at all by crashing.Second, the quality of an activity can be usuallymeasured only by subjectively using managers' judge-ment. In a few cases when quality can be determinedquantitatively and objectively using technical speci®ca-tions, these speci®cations were to be adhered to ratherstrictly, and the quality measure was not noticeablya�ected by the use of overtime. The common reactionwas that `quality reduction due to overtime is negli-gible and cannot exceed 2±3%, even if the maximumamount of overtime is used'. With the objective ofarriving at workable estimates of quality reductions inproject activities due to crashing, the following prin-ciples were agreed:
1. In interpreting the results of the models, it is notthe absolute value of the quality measure that is rel-evant, but the relative quality values of the individ-ual activities when crashing is performed.
2. These relative values should re¯ect two consider-ations:
± Some works (such as painting works) are moreprone to the measurable quality reduction whencrashed;
± Some works (such as welding or electrical works)are so important and critical that a minor re-duction in quality may seriously compromise thewhole project performance.
In both cases, crashing should induce a relativelylarge reduction in the quality measures of the ac-tivities.
3. If a work-package has more than one activity thenits quality is measured as the weighted average ofthe individual activities' quality where the weightsare proportional to the contractual values of the ac-tivities.
Based on this common framework, the researchersand the managers together compared the individual ac-tivities to estimate the relative quality reductions dueto crashing. The last column of Table 1 is the result ofthis time consuming process. The numbers in that col-umn indicate the relative, and at times subjective,assessment of the quality of the individual project ac-tivities when maximum crash is performed. It is pre-sumed then that the quality measure will decrease as alinear function of activity completion time from thenormal value of 1.00 to this lower bound.
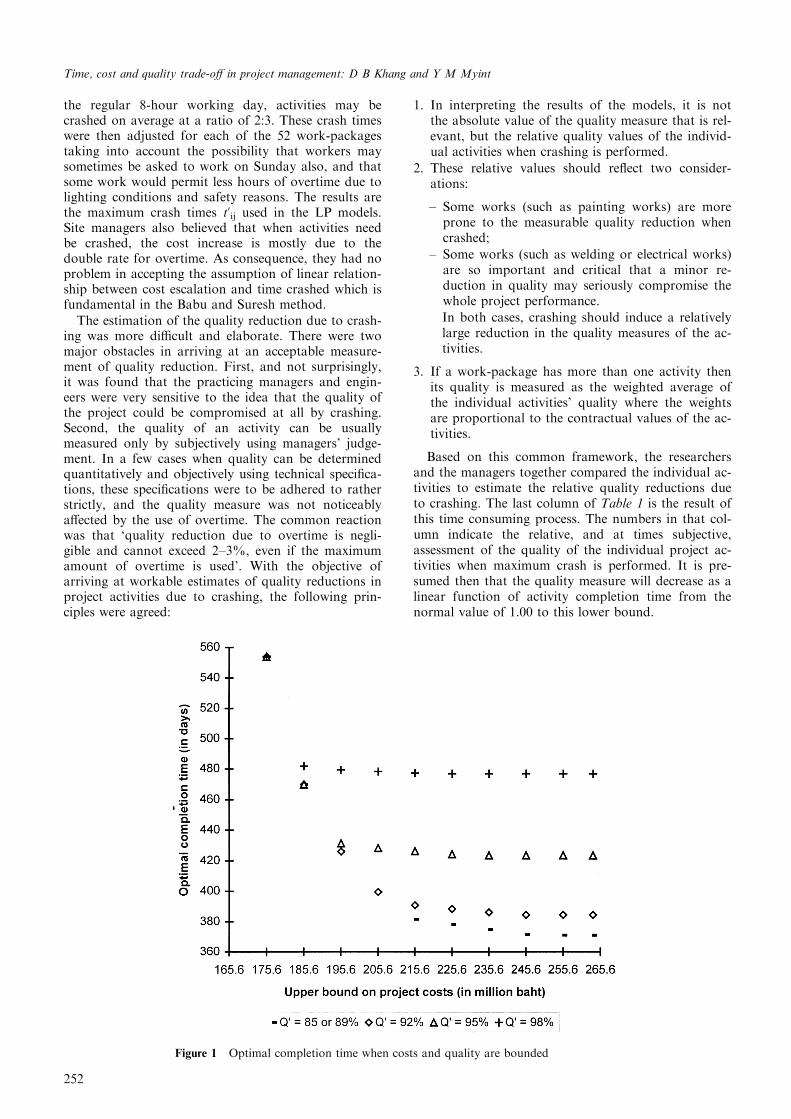
Figure 1 Optimal completion time when costs and quality are bounded
Time, cost and quality trade-o� in project management: D B Khang and Y M Myint
252
Analysis of computational results
Once the parameters are estimated, the computation ofthe three models, using software LINDO (version 5.1),is simple since the size of the LP problems is relativelysmall (104 variables and 231 constraints for eachmodel). All these problems were solved repeatedlyusing di�erent values for the goal constraints in cost,time and quality. The maximum budget varied withincrements of 10 million bahtÐexcept for the lastincrementÐfrom the normal cost of 175.60 millionbaht to the maximum crash cost of 263.60 millionbaht. The lower bound for completion time wasallowed to change in increments of 20 daysÐor 21days for the last three incrementsÐfrom the maximumcrash time of 371 days to the normal time of 554 days.
Five di�erent quality levels were considered in themodels: 85%, 89%, 92%, 95% and 98%.The computational results of the three models are
summarized in Figures 1±3 and Tables 2±4 which bearmuch similarity to the corresponding results obtainedby Babu and Suresh with their textbook example. Inparticular, the following major ®ndings can be noted:
. For each given quality level, there exists a budgetthreshold beyond which there would be of littlevalue to increase budget in the hope of expeditingfurther project completion. These thresholds aregiven in Figure 1 as 185.60 million baht at a 98%quality allowance, 195.60 million baht at a 95%quality allowance, and 215.60 million baht at a 92%quality allowance. The corresponding completiontimes are 482 days, 431 days and 391 days, respect-
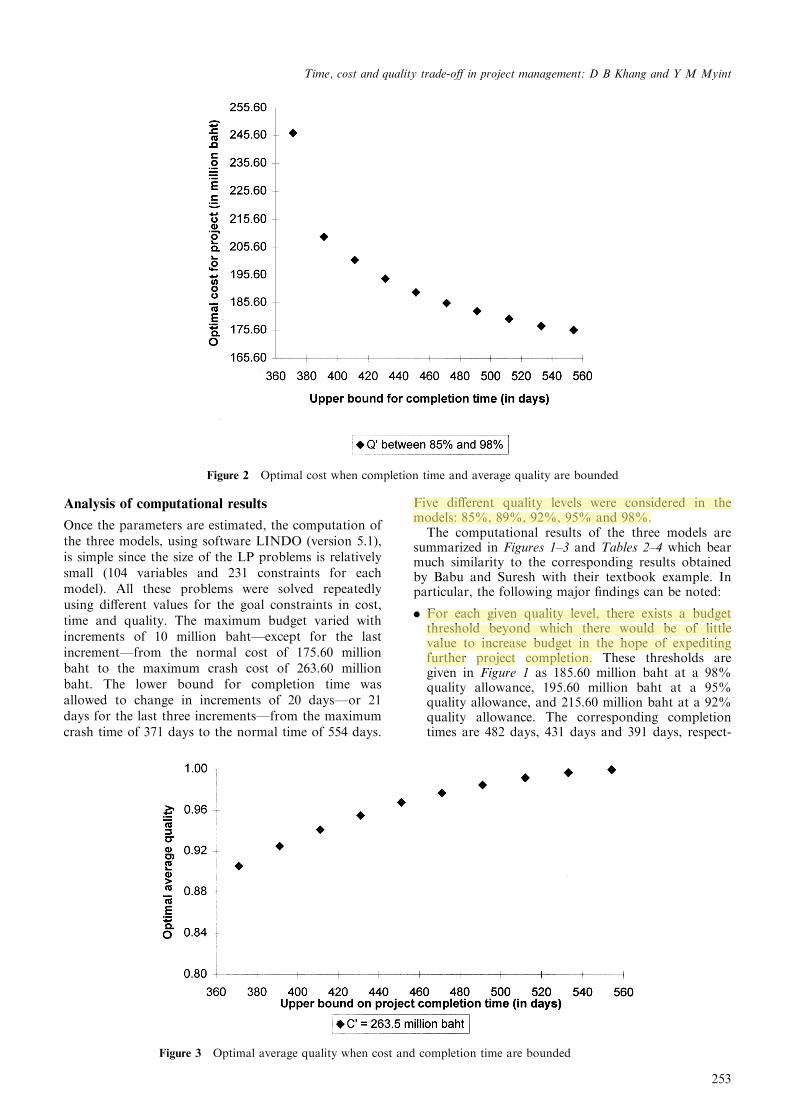
Figure 2 Optimal cost when completion time and average quality are bounded
Figure 3 Optimal average quality when cost and completion time are bounded
Time, cost and quality trade-o� in project management: D B Khang and Y M Myint
253

ively. At the lower quality levels of 89% and 85%,the thresholds are not as sharp as with the higherquality tolerances.
. If the average quality requirement is decreased, thesebudget thresholds, which can be interpreted as thepractical limiting costs for crashing, will increase,which in turn allows for a further reduction in pro-ject completion time.
. Project cost is almost independent of the qualityrequirement and therefore, the cost/time curves inFigure 3 coincide for all quality levels. This fact isnot surprising because the performance quality ateach activity was assumed to be a function of thetime factor only.
. There is a critical value for project completion time,beyond which it would be extremely expensive tocrash further. Figure 2 indicates that this criticalvalue is around 400 days.
In order to help managers to gain better insight ofthe trade-o� among time, cost and quality factors ofthe project, the output of Model 1 is re-organized byquality requirements. Wherever an increase in budgetis not accompanied by a reduction in completion time,only the minimum budget required for that time isrecorded. The results are summarized in Tables 5 andFigure 4. It is now clear that managers may not expectto crash the project completion time below 482 dayswithout compromising the high quality level of 98%
Table 2 Optimal completion time (in days) when costs and quality are bounded
Lower bound on project quality
Upper bound onproject costs(million baht) 0.85 0.89 0.92 0.95 0.98
175.6 554 554 554 554 554185.6 470 470 470 470 482195.6 426 426 426 431 479205.6 400 400 400 428 478215.6 381 381 391 426 477225.6 378 378 388 424 477235.6 375 375 386 424 477245.6 371 371 385 424 477255.6 371 371 385 424 477263.6 371 371 385 424 477
Table 3 Optimal project cost when completion time and average quality are bounded
Lower bound on project quality
Upper bound oncompletion time(in days) 0.85 0.89 0.92 0.95 0.98
371 246.48 246.48 INF INF INF391 209.42 209.42 214.50 INF INF411 200.97 200.97 200.97 INF INF431 194.21 194.21 194.21 196.26 INF451 189.32 189.32 189.32 189.32 INF471 185.41 185.41 185.41 185.41 INF491 182.48 182.48 182.48 182.48 182.49512 179.67 179.67 179.67 179.67 179.67533 177.08 177.08 177.08 177.08 177.08554 175.60 175.60 175.60 175.60 175.60
Table 4 Optimal average quality when cost and completion time are bounded
Upper bound on project costs (in million baht)
Lowerbound oncompletiontime (indays) 175.6 185.6 195.6 205.6 215.6 225.6 235.6 245.6 255.6 263.6
371 INF INF INF INF INF INF INF 0.91 0.91 0.91391 INF INF INF INF 0.92 0.92 0.92 0.93 0.93 0.93411 INF INF INF 0.94 0.94 0.94 0.94 0.94 0.94 0.94431 INF INF 0.95 0.95 0.95 0.96 0.96 0.96 0.96 0.96451 INF INF 0.97 0.97 0.97 0.97 0.97 0.97 0.97 0.97471 INF 0.97 0.98 0.98 0.98 0.98 0.98 0.98 0.98 0.98491 INF 0.99 0.99 0.99 0.99 0.99 0.99 0.99 0.99 0.99512 INF 0.99 0.99 0.99 0.99 0.99 0.99 0.99 0.99 0.99533 INF 1.00 1.00 1.00 1.00 1.00 1.00 1.00 1.00 1.00554 1.00 1.00 1.00 1.00 1.00 1.00 1.00 1.00 1.00 1.00
Time, cost and quality trade-o� in project management: D B Khang and Y M Myint
254
or running to an exceedingly high cost. Similarly, if95% average project quality is the performance thatcan be accepted, then trying to complete the project inless than 431 days may be very expensive.
Assessment of the method and conclusions
The linear programming models proposed by Babuand Suresh are conceptually easy to understand, andcomputationally easy to solve. All managers and en-gineers are interested in the possibility of incorporatingperformance quality in the time and cost scheduling.The results obtained, when presented using propergraphics, provide insightful information that can helpthe managers in making trade-o� decisions. At the
early stage of the cement factory construction projectwhen the research was conducted, the goal of complet-ing the construction in time was the most importantfor the managers. Thus, Model 1 was judged as themost relevant and interesting. However, it is possibleto foresee a situation where Model 2 becomes promi-nent, especially when some cost overrun has occurredin the project and the task of minimizing expendituresis of the top priority. In any case, the two models 1and 2 are dual in the linear programming sense, andcan always be considered together with quality levelsas parameters. Model 3, although playing a rathersymmetric role with the other two, is less appealing topractical managers and engineers. The main objectionto this model is that the quality measurements aresometimes too subjective and inaccurate to be con-sidered as an objective function in an LP formulation.At the same time, it can be observed that, while allmanagers, understandably, are sensitive to the issue ofquality reduction due to crashing work, they are alsoreluctant to consider improving an already acceptablequality level at extra expenses or by delaying the pro-ject completion.As already pointed out by Babu and Suresh, the sol-
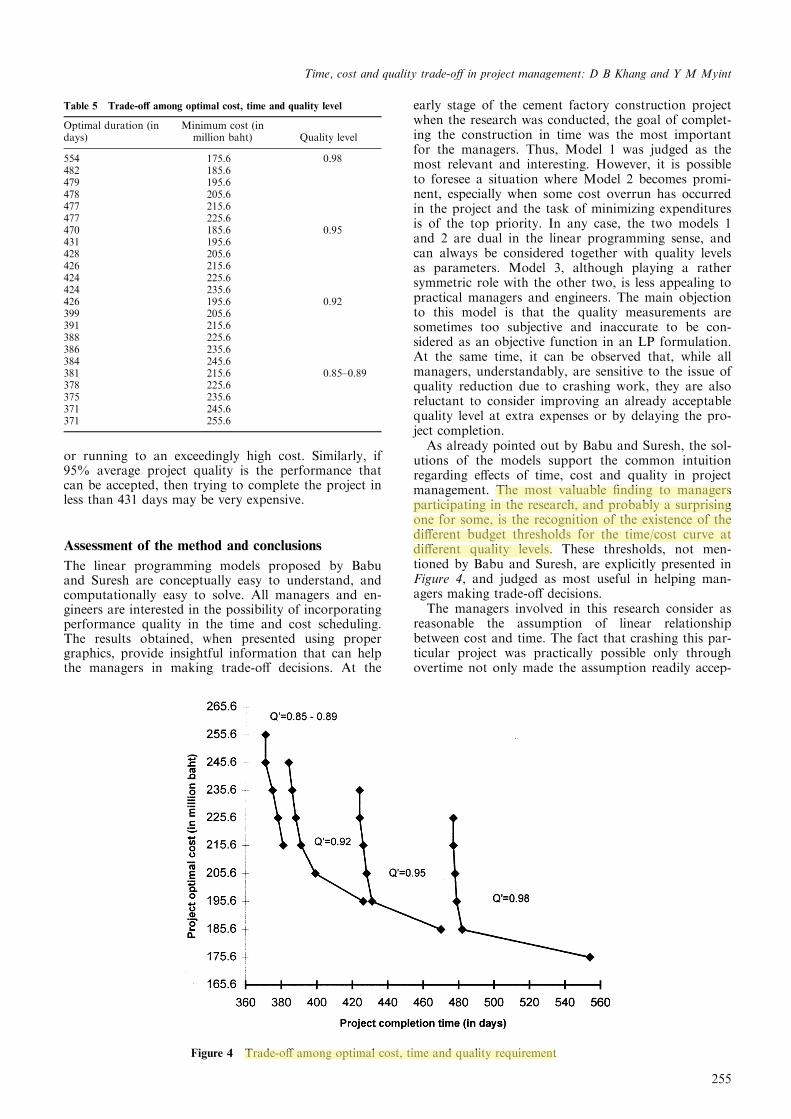
utions of the models support the common intuitionregarding e�ects of time, cost and quality in projectmanagement. The most valuable ®nding to managersparticipating in the research, and probably a surprisingone for some, is the recognition of the existence of thedi�erent budget thresholds for the time/cost curve atdi�erent quality levels. These thresholds, not men-tioned by Babu and Suresh, are explicitly presented inFigure 4, and judged as most useful in helping man-agers making trade-o� decisions.The managers involved in this research consider as
reasonable the assumption of linear relationshipbetween cost and time. The fact that crashing this par-ticular project was practically possible only throughovertime not only made the assumption readily accep-
Table 5 Trade-o� among optimal cost, time and quality level
Optimal duration (indays)
Minimum cost (inmillion baht) Quality level
554 175.6 0.98482 185.6479 195.6478 205.6477 215.6477 225.6470 185.6 0.95431 195.6428 205.6426 215.6424 225.6424 235.6426 195.6 0.92399 205.6391 215.6388 225.6386 235.6384 245.6381 215.6 0.85±0.89378 225.6375 235.6371 245.6371 255.6
Figure 4 Trade-o� among optimal cost, time and quality requirement
Time, cost and quality trade-o� in project management: D B Khang and Y M Myint
255
table, but also facilitated estimating the necessary par-ameters. The linearity assumption between quality andtime is more problematic. In fact, the most di�cult,and probably most controversial, task in applying themethod in the case project was to assess the quality re-duction associated with crashing. In the currentresearch, this is achieved, to a certain degree of satis-faction of both the researchers and practitioners,through the framework outlined in the chapter on par-ameter estimation. Even then, it is recognized that thequality measures at best re¯ect only relative perform-ance levels of di�erent activities with di�erent crashingdecisions. The di�culty also highlights a major limi-tation of the method: in all practically justi®ablemeasurements of quality, only a very small portionbears direct relation with crashing decisions. Thus, thequality factor considered in the models accounts foronly a small, and unfortunately usually not the mostrelevant, part of the performance of managerial inter-est. This leads to an interesting research question of®nding a more holistic measurement for performancequality, and a more realistic model to describe the re-lationship among quality of individual activities, andtherefore of the whole project, and the budget andtime allowed.
Acknowledgements
The authors gratefully acknowledge the support of MrMaung Maung Myint, Chief Erection Manager, andMr Zaw Win, Site Manager, from TPI Polene plc. incarrying out this research.
References1. Kerzner H. Project management: a systems approach to plan-
ning, scheduling and controlling. 5th ed. New York: VanNostrand Reinhold, 1995.
2. Badiru AB, Pulat PS. Comprehensive project management: inte-grating optimization models, management principles, and com-puters. New Jersey: Prentice Hall, 1995.
3. Kelly JE, Walker MR. Critical path planning and scheduling.Proceedings of the Easter Joint Computer Conference, NewYork, 1959:160±173.
4. Kelley, J.E., Critical-path planning and scheduling: mathemat-ical basis. Operations Research, 1961, 9(3), 296±320.
5. Siemens, N., A simple CPM time-cost trade-o� algorithm.Management Science, 1971, 17(6), B354±B363.
6. Goyal, S.K., A note on a simple CPM time-cost tradeo� algor-ithm. Management Science, 1975, 21(6), 718±722.
7. Wu, Y. and Li, C., Minimal cost project networks: the cut setparallel di�erence method. Omega, 1994, 22(4), 401±407.
8. Kamburowski, J., On the minimum cost project schedule.Omega, 1995, 23(4), 463±465.
9. Berman, E.B., Resource allocation in a PERT network undercontinuous activity time-cost function. Management Science,1964, 10(4), 734±745.
10. Deckro RF, Herbert JE, Verdini WA. Non-linear multiple cri-teria time/cost tradeo�. In: Lee JB, editor. Proceedings of the1987 Annual Western DSI, Palm Springs, CA, 1987:134±137.
11. Falk, J.E. and Horowitz, J.L., Critical path problems with con-cave cost-time functions. Management Science, 1974, 19(4),446±455.
12. Babu, A.J.G. and Suresh, N., Project management with time,cost, and quality considerations. European J. OperationsResearch, 1996, 88, 320±327.
13. Hillier FS, Lieberman GJ. Introduction to mathematical pro-gramming. New York: McGraw-Hill, 1990.
Do Ba Khang is Associate Professorat the School of Management, AsianInstitute of Technology (AIT),Bangkok, Thailand. Holding anM.Sc. in Mathematics fromUniversity of Budapest, Hungary,and an M.Sc. and Dr. Tech. Sc. inIndustrial Engineering from AIT, hecurrently teaches graduate courses inproject and operations management.He has previously published in IIETransactions, Networks, WaterResources Research, OperationsResearch Letters, Analysis andAnnuals of Numerical Mathematics.
Yin Mon Myint holds a B.A. inInternational Relations from theUniversity of Yangoon in Myanmarand M.B.A. from Asian Institute ofTechnology in Bangkok, Thailand.She is currently Financial andPublic Relations Manager of M.Chemical Company Ltd inMyanmar.
Time, cost and quality trade-o� in project management: D B Khang and Y M Myint
256
Available online at www.sciencedirect.com
2212-8271 © 2017 The Authors. Published by Elsevier B.V. This is an open access article under the CC BY-NC-ND license (http://creativecommons.org/licenses/by-nc-nd/4.0/).Peer-review under responsibility of the scientific committee of the 10th CIRP Conference on Intelligent Computation in Manufacturing Engineeringdoi: 10.1016/j.procir.2016.06.086
Procedia CIRP 62 ( 2017 ) 446 – 451
ScienceDirect
10th CIRP Conference on Intelligent Computation in Manufacturing Engineering - CIRP ICME '16
Quality- and Lifecycle-oriented Production Engineering in Automotive Industry
Jens Kiefer*, Sebastian Allegretti, Theresa Breckle
University of Applied Sciences Ulm, Prittwitzstraße 10, 89075 Ulm, Germany
* Corresponding author. Tel.: +49-731-50-28188; fax: +49-731-50-28458. E-mail address: [email protected]
Abstract
This paper presents a new quality- and lifecycle-oriented approach of integrated production engineering in automotive industry. In a first step, current production engineering projects are analyzed and present methodical, information-technical and organizational challenges regarding the project phase of concept planning are depicted. Based on this, existing industrial- and research-oriented solution approaches are illustrated and critically evaluated. Considering the weaknesses of these solutions, this paper introduces the new developed quality- and lifecycle-oriented pro-duction engineering approach. As one key issue of this new planning approach, the idea of using a model- and rule-based configuration system is presented. © 2016 The Authors. Published by Elsevier B.V. Selection and peer-review under responsibility of the International Scientific Committee of “10th CIRP ICME Conference".
Keywords: production engineering; quality management; lifecycle management; data integration
1. Introduction
In order to gain important market shares, car manufacturers (OEMs) are currently engaged in an innovation race characte-rized by the following market-driven key demands:
Soaring number of product variants with many product derivates
Increasing product complexity due to increasing quality demands and increasing mechatronic components (e.g. powerful and reliable driver assistance systems)
Increasing time pressure due to decreasing innovation and model cycles
Reduction of internal costs (e.g. development costs)
These global trends inevitably have an effect on all phases within the overall product creation process – especially on the project phase of production engineering. On the one hand, the processes within production engineering become increasingly more complex and, in consequence, more error-prone. On the other hand, the time for production engineering has to be cut to the bone. In addition, these trends cause extensive changes of the production systems: Production facilities become more
and more flexible (as base for producing several product types into one production line), their lifecycles extend and the number of worldwide production ramp-ups will be continually rising – especially after integration processes during running production.
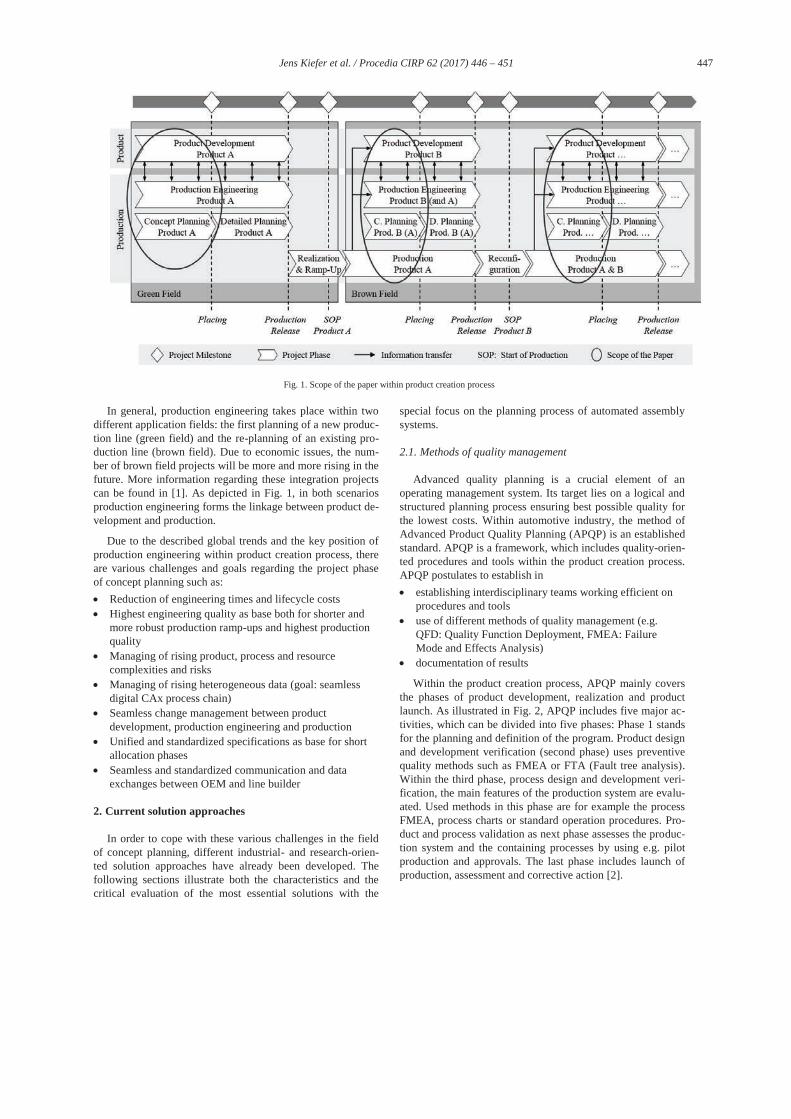
As portrayed in Fig. 1, this paper focuses on the project phase of concept planning in the field of automated assembly systems (e.g. car marriage). Dependent on the special car pro-ject, the concept planning phase starts about 1.5 years before SOP (start of production) and has a duration of about half a year. The tasks within concept planning are very different and can be divided into technical, economic and organizational tasks. Examples of these tasks are the development of the con-cept of the production line (e.g. the degree of flexibility), the process sequences, the layout of the production line including the line-specific bill of material as well as the accomplishment of economic calculations or the definition of the project plan for the phases of detailed planning, realization and ramp-up. All these results lead into specification documents. These spe-cifications forms the basis for the later placing of the respec-tive production facilities.
© 2017 The Authors. Published by Elsevier B.V. This is an open access article under the CC BY-NC-ND license (http://creativecommons.org/licenses/by-nc-nd/4.0/).Peer-review under responsibility of the scientifi c committee of the 10th CIRP Conference on Intelligent Computation in Manufacturing Engineering
447 Jens Kiefer et al. / Procedia CIRP 62 ( 2017 ) 446 – 451
Fig. 1. Scope of the paper within product creation process
In general, production engineering takes place within two different application fields: the first planning of a new produc-tion line (green field) and the re-planning of an existing pro-duction line (brown field). Due to economic issues, the num-ber of brown field projects will be more and more rising in the future. More information regarding these integration projects can be found in [1]. As depicted in Fig. 1, in both scenarios production engineering forms the linkage between product de-velopment and production.
Due to the described global trends and the key position of production engineering within product creation process, there are various challenges and goals regarding the project phase of concept planning such as:
Reduction of engineering times and lifecycle costs Highest engineering quality as base both for shorter and
more robust production ramp-ups and highest production quality
Managing of rising product, process and resource complexities and risks
Managing of rising heterogeneous data (goal: seamless digital CAx process chain)
Seamless change management between product development, production engineering and production
Unified and standardized specifications as base for short allocation phases
Seamless and standardized communication and data exchanges between OEM and line builder
2. Current solution approaches
In order to cope with these various challenges in the field of concept planning, different industrial- and research-orien-ted solution approaches have already been developed. The following sections illustrate both the characteristics and the critical evaluation of the most essential solutions with the
special focus on the planning process of automated assembly systems.
2.1. Methods of quality management
Advanced quality planning is a crucial element of an operating management system. Its target lies on a logical and structured planning process ensuring best possible quality for the lowest costs. Within automotive industry, the method of Advanced Product Quality Planning (APQP) is an established standard. APQP is a framework, which includes quality-orien-ted procedures and tools within the product creation process. APQP postulates to establish in
establishing interdisciplinary teams working efficient on procedures and tools
use of different methods of quality management (e.g. QFD: Quality Function Deployment, FMEA: Failure Mode and Effects Analysis)
documentation of results
Within the product creation process, APQP mainly covers the phases of product development, realization and product launch. As illustrated in Fig. 2, APQP includes five major ac-tivities, which can be divided into five phases: Phase 1 stands for the planning and definition of the program. Product design and development verification (second phase) uses preventive quality methods such as FMEA or FTA (Fault tree analysis). Within the third phase, process design and development veri-fication, the main features of the production system are evalu-ated. Used methods in this phase are for example the process FMEA, process charts or standard operation procedures. Pro-duct and process validation as next phase assesses the produc-tion system and the containing processes by using e.g. pilot production and approvals. The last phase includes launch of production, assessment and corrective action [2].

448 Jens Kiefer et al. / Procedia CIRP 62 ( 2017 ) 446 – 451
Fig. 2. 5-phase-model of APQP [2]
Concept planning of an assembly system covers the third
phase of APQP. Within this phase, the method of FMEA is used. In general, FMEA is described as highly structured and systematic method for failure analysis based on experiences e.g. with similar or former products and processes. As method for preventive system and risk analysis, FMEA already starts in an early state of the product creation process. By applying FMEA, weak points of the considered system are analyzed, measurements are initiated and risks are assessed. In this way, FMEA focuses on the prevention of potential product and process failures within product creation process [2].
APQP is mainly used for product development. For the project phase of production engineering it is not exhaustively applied due to following reasons:
Project time is limited Main focus lies on other priorities Sustainable FMEA needs resources and knowlegde
Big OEMs has detected the problem and qualify their engi-neers in advanced quality planning methods. At present, there is a large gap between theory and practical application.
2.2. Risk Management
Risk is not only described as negative effects facing a com-pany but also the conditions and environment within or out-side the company, which could cause negative effects [4]. In literature, the term of risk is defined in several ways [2, 5, 6]. Managing business risks in a systematic way is the main goal of risk management, including all activities of a company co-ordinating extensively and coherently their risks for managing and controlling [5]. The new approach regarding risk manage-ment is Enterprise Risk Management (ERM). ERM describes an integrated management of all risks an organization faces and conciliates risk management with corporate governance and strategy. Manifold definitions are listed in [7]. Risk ma-nagement is described as process [5]:
Identify risk aims to carve out potential threats [2] Analyze and rate risks based on identified risks; requires
comprehensive analyzing methods e. g. FMEA [3] Evaluate identified and analyzed risks; choose criteria
Full risk assessment with two dimensions: probability and severity; followed up by an illustration e.g. in a risk port-folio diagram [7]
Depict risks strategies execute for the risks’ treatment [2] Implement and follow up measurements for treatment
Different approaches for risk classification as context-ori-ented, cause- and effect-related or related to project-manage-ment. There are a non-exhaustive enumeration of risk classifi-cations [3]: Technical, organizational, contractual as well as financial, internal and external, political and sociocultural.
Early prevention of production planning failures and failures within product development is one of the most fre-quently mentioned reasons for risk analysis according to [8] in a manufacturing company. All classifications of risk occur in production engineering projects. Risk management is a vital method, but following aspects reduce its power:
Risk management as process is not installed as mandatory within the concept phase
Risk awareness according to multiplicity of decisions in the concept phase is often lacking
Systematic and structured risk prevention is not used
2.3. Changeable Manufacturing – (Re-)configuration
ElMaraghy defines changeability as “an umbrella frame-work that encompasses many paradigms, such as agility, adaptability, flexibility and re-configurability” [9]. Change-ability can be accomplished by a system and its components possess certain properties. According to Wiendahl only these certain system-properties or features allows the system to transform. Defined as change enablers there are universality, mobility, scalability, modularity and compatibility [10]. Due to modularity acts as a booster for all change enablers, it is re-cognized as an elementary key-demand of a changeable sys-tem [11]. Changeability represents the characteristic of a pro-duction, which allows an adaption of the production system. For this purpose both technical requirements and conditions like a consequent modulized, standardized and mobile pro-duction equipment and organizational requirements and con-ditions have to be defined. Existing approaches and concepts for a changeable production system are listed in [12].
Modularity represents the idea of “plug and produce”. This means standardized and pre-tested units and elements, which are separated of each other and regards technical facilities of the factory as well as structures of the organization [11]. A module embodies all resources needed to ensure its functiona-lity and autonomy and presents the smallest element of a system that can be multiplied, displaced or eliminated as a hole [13]. According to Pahl and Beitz, modularity effects more benefits as there are re-use and re-combination of mo-dules and upgradeability [14]. Modularity is the basic require-ment for reconfiguration. Mittal and Frayman define a confi-guration task as found in [15]. According to this definition, a configuration task requires components, which are specified, able to connect and with inherent properties.
449 Jens Kiefer et al. / Procedia CIRP 62 ( 2017 ) 446 – 451
Configuration includes two aspects: modularization and integration [12]. Only the connection of modularity and the change-enabler compatibility creates a valid functional unit [10]. Reconfiguration means the ability to adapt a manufactu-ring system on a fast, target-oriented and economic way in re-lation to functionality, capacity and technology. As an answer to changing specifications components, machines, cells etc. are able to adapt (adding, removing, interchanging or adjus-ting). Integrating modules rapidly and precisely will be provi-ded by standardized mechanical, informational and control interfaces for an automated assembly system [16].
The approach of integrated product and assembly configu-ration presented by Landherr premises a consequent function-oriented modularization. Within the concept-phase there are some limitations such as:
Configuration is not comprehensively used Reconfiguration-enablers require inherent properties Re-use of parts of existing assembly systems limited due
to missing connectivity Configuration-tool for concept planning is missing
2.4. Life Cycle Costing
Life cycle Costing (LCC) is a specific and holistic way of accounting used for terotechnology [17]. LCC summarizes all costs which are generated during planning, initial acquisition, implementation, operations, maintenance, reconfiguration, shutdown and recycling [10]. Derived from the factory life cycle and the reasons for planning there exists six planning types: re-planning, extension, re-newal of structure, reduction, transfer and outsourcing. Including a methodology of strategic planning of reconfiguration within the initial planning process requirements for reconfiguration could be integrated and de-picted within LCC. Hence, the planning methodology des-cribed by Karl, have to be executed during the purchasing or designing phase and the re-configuration have to be planned before implementation [18].
Methods of LCC are effectively for comparison all costs evokes during life cycle in case of evaluation of planning alternatives methods of a configured production object. Allowing an efficient comparison between different planning alternatives, LCC provides a holistic life cycle-oriented fun-dament for a decision.
Usually, in the planning process LCC is not applicable for following reasons:
Capital expenditure for production equipment etc. kept down due to low manufacturing costs and low project costs, including cost-cutting measurements.
Benefits of changeability due to modularity just estimated and uncertain [10, 18].
Requirements for flexibility, changeability and specifi-cations for re-use not mandatory and target within the project.
2.5. Data Management
Data management contains all organizational and technical tasks regarding the process by which the required data is acquired, validated, stored, protected, and processed, and by which its accessibility, reliability, and timeliness is ensured [19]. Managing product data (Product Data Management) and extended over the whole product life cycle (Product Lifecycle Management) the complexity and variety rise up. An ideal PLM system is able to manage diverse information: technical data, knowledge of constraints and requirements, capabilities as well as marketing specifications. Several approaches could be found in [20, 21]. Including all data and information of an organization for all business processes there are several data management systems such as PLM and ERP [22].
According to [23], used software tools within the phases of product development and production engineering are classi-fied into:
CAx- and office-tools PDM-, ERP and PLM-tools as integration platform or as
data backbone Visualization tools
In connection with production engineering and digital factory the requirements for data management could be found in [23]. Linking methods, models and tools for modelling product, process and resource data require a holistic and integrated data and IT management. The postulated comple-tely integrated and seamless data management is still not exis-ting. Furthermore, the controlling of increasing complexity of data management is rudimentary. An integrated data manage-ment is essential, but there are following restrictions:
Changes demand actualization in all models and affected uses; often no automatic updates
Data management overall business processes is not completely integrated
Interfaces between tools and models, standalone solutions hinder the collaboration and change management
2.6. Digital validation methods (as part of digital factory)
Within the development process of automated assembly systems, the use of digital validation methods is well estab-lished in automotive industry. As portrayed in [24], digital va-lidation methods are defined as methods to check and evaluate specific product-, process- or production-related quality cha-racteristics using digital data models. Examples of such used digital validations solutions are the powerful methods of vir-tual engineering and virtual commissioning. The development of further production-oriented digital validation methods such as physics-based analysis, tolerance analysis or mixed reality are currently in progress.
As a part of digital factory production-oriented digital vali-dation methods have apart from many powerful benefits some limitations such as:
Methods are not widespread used; application criteria are not described in a standardized way
450 Jens Kiefer et al. / Procedia CIRP 62 ( 2017 ) 446 – 451
Focus of application: Project phase of detailed planning; validation of pure technical quality characteristics (e.g. collision checks, cycle times)
Methods are not included in an integral planning process (stand-alone character); efforts for developing the needed data models are quite high
Methods are not part of a seamless CAx process chain; no seamless IT infrastructure
3. Quality- and lifecycle-oriented production engineering
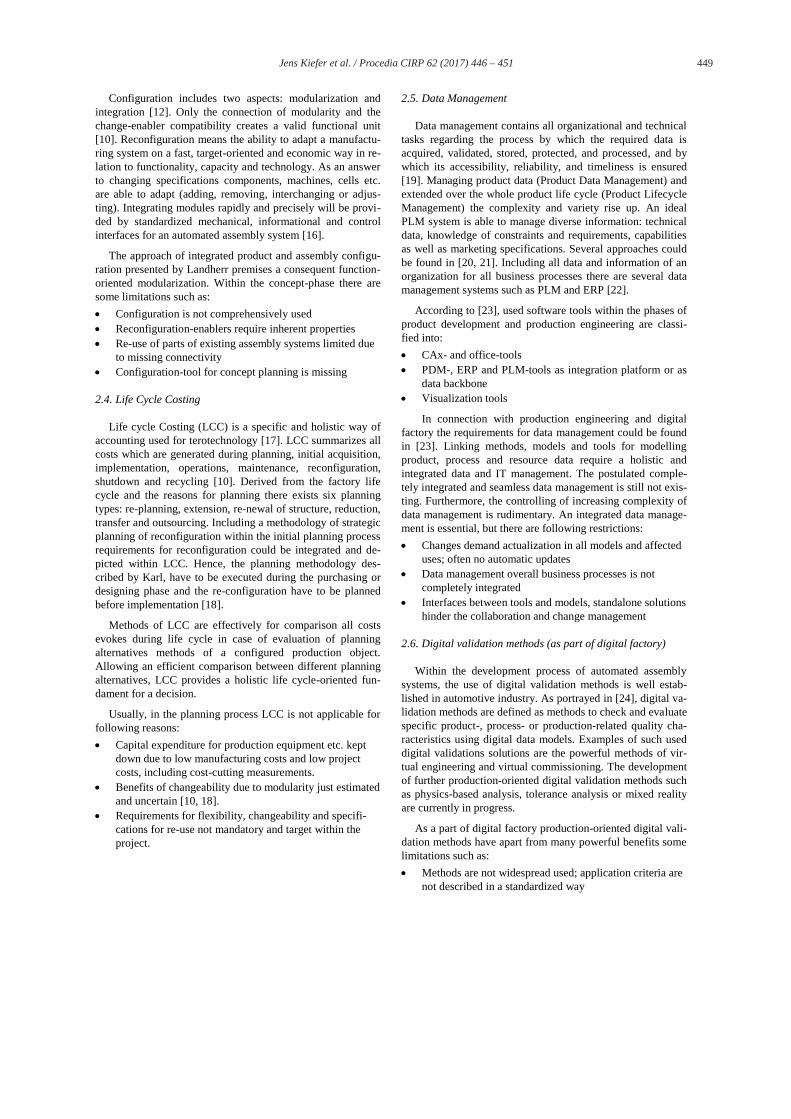
A holistic quality and lifecycle-oriented production engineering approach requires a concept containing technical, economic and organizational domains and tasks. Within pro-duction engineering, there are manifold aspects regarding quality, lifecycle, risk, digital factory and LCC. As discussed above, there are several approaches and methods in the context of production engineering. However, regarding the mentioned issues and goals within concept planning, the explained solution approaches don’t achieve a holistic and sustainable approach. Considering these quality- and lifecycle aspects, the new concept integrates and links the explained methods within the production engineering process as illustra-ted in Fig. 3.
Fig. 3. Quality- and lifecycle production engineering concept
Advance quality planning offers diverse quality methods
for an integrated planning. Implement FMEA by applying its continuous updated data within the product and production system lifecycle improve permanently outcome. By using the method FMEA the planner is supported in focusing on main risks and in capturing structural and preventive measurements for risks’ treatment. As described above, the method is sui-table to prevent risk in the early phase of the production engi-neering process.
Considering risk management as a process it has to be completely integrated into production engineering process. Output of risk management have to be deep-seated in the project milestones. Measurements out of risk analysis have followed up structurally and sustainably. Risk management should implemented in an early stage of planning ensuring a reduced risk in the entire production life cycle. Manufacturing knowledge and experience out of previous projects and daily
business should be integrated into new projects in a structural way to speed up time to production and efficient planning outputs. Postulating a seamless planning process an integrated communication system, a consistent knowledge and infor-mation data management is a cornerstone for high-quality planning results. A coherent, agile data management and a seamless digital CAx process chain is essentially for pro-cessing changes within the planning phase.
Questions regarding economic efficiency in a quality- and lifecycle-oriented production engineering concept requires an integrated approach, too. LCC offers a calculation formula. But guidelines and objectives for a financial project con-trolling over the life cycle needs a corporate-wide standar-dized target given by board of management. Integrating the economic and financial aspects LCC needs to be adjusted for production engineering for a quality- and lifecycle-oriented focus. Project-KPIs needs to be defined covering the new as-pects.
Specification documents are specified as a crucial result of the planning process. Using the idea of a changeable manu-facturing by planning an assembly line composed of modules with inherent properties (considering change enablers) offers the planner new possibilities for changes in the lifecycle of the automated assembly system.
Production engineering takes a key positon within the product creation process and within the lifecycle of an automated assembly system as well. Hence, requirements on the planning process and its influence on the output is highly rated in order to reach the goals regarding the project phase, e.g. to reduce engineering time. As evaluated, a holistic pro-duction engineering approach containing and processing ques-tions and requirements regarding quality, risk, LCC, change-ability and flexibility in an integrated data management is missing. But a fast and efficient way of concept planning is one of the most important goals. That requires an approach for processing these versatile and partially interdependent data and information within the process. A model- and rule-based configuration system could be a basic approach for the design of such a complex system like an assembly system in order to reach standardization and speed within the concept phase.
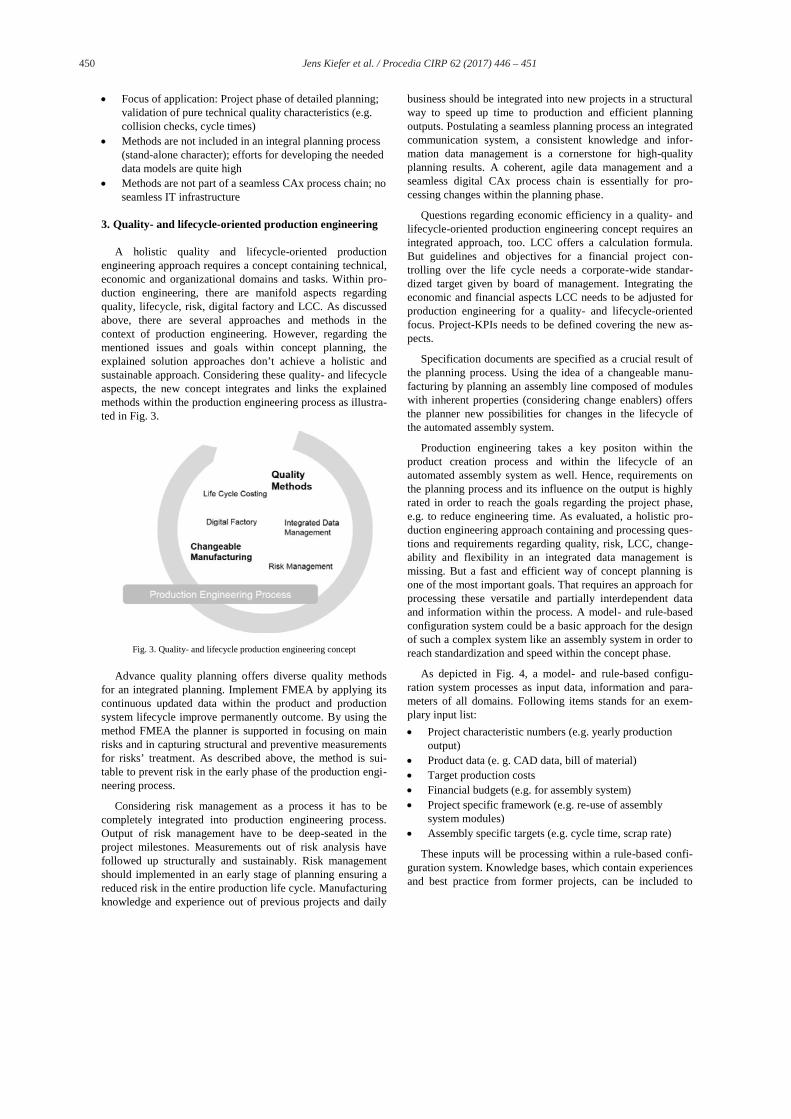
As depicted in Fig. 4, a model- and rule-based configu-ration system processes as input data, information and para-meters of all domains. Following items stands for an exem-plary input list:
Project characteristic numbers (e.g. yearly production output)
Product data (e. g. CAD data, bill of material) Target production costs Financial budgets (e.g. for assembly system) Project specific framework (e.g. re-use of assembly
system modules) Assembly specific targets (e.g. cycle time, scrap rate)
These inputs will be processing within a rule-based confi-guration system. Knowledge bases, which contain experiences and best practice from former projects, can be included to
451 Jens Kiefer et al. / Procedia CIRP 62 ( 2017 ) 446 – 451
profit from this knowledge. Rules for configuration process could be for example:
Structure of an assembly system Specifications for modules (e.g. preselection due to single
supplier for modules) Process specific rules (e.g. sequence planning) Calculation formula (e.g. for production costs,
amortization)
Fig. 4. Model- and rule-based configuration system
The configuration system needs to process models as well
as it configure models. After the configuration process, for all domains (e.g. process planning, material flow, quality, costs) an output should be available. Typical outputs of the model- and rule-based configuration system are for example:
Specification of assembly system (as base of allocation phase)
Lifecycle costs Quality aspects (e.g. risks) Layout and resources Manufacturing bill of material
4. Conclusion and Outlook
This contribution present a new sustainable and holistic de-veloped quality- and lifecycle-oriented production enginee-ring approach. Integrating the descripted methods like APQP and risk management into the planning process empowers to reach the above-mentioned goals within the concept planning. As an integrated configuration tool, the introduced model- and rule-based configuration system affords further research. This powerful system needs to be designed and evaluated. In order to integrate all domains within the planning process to speed up the process and receive higher quality, standardized and holistic outputs of the concept planning are necessary.
Acknowledgements
Parts of this contribution are developed within the ZAFH project "Digitaler Produktlebenszyklus (DiP)". More informa-tion about this project is available at: https://dip.reutlingen-university.de
References
[1] Walla W, Kiefer J. Life Cycle Engineering – Integration of New Products on Existing Production Systems in Automotive Industry. Proceedings of the 18th CIRP International Conference on Life Cycle Engineering. Braunschweig, Germany; 2011.
[2] Brückner C. Qualitätsmanagement – Das Praxisbuch für die Automobilindustrie. München: Carl Hanser Verlag; 2011.
[3] Pfeifer T, Schmitt R. Qualitätsmanagement – Strategien, Methoden, Techniken. München: Carl Hanser Verlag; 2015.
[4] Sawaguchi M. Research on the Efficacy of Creative Risk Management Procedia Engineering 131. 2015; 577 – 589.
[5] Norm EN ISO 31000:2009 – Risk Managemnt- Principles and Guidelines. Köln: Beuth-Verlag; 2010.
[6] Bromiley P, McShane M, Nair A, Rustambekov E. Enterprise Risk Management: Review, Critique, and Research Directions. Long Range Planning 48. 2015; 265-276.
[7] König R. Management betrieblicher Risiken bei produzierenden Unternehmen (Dissertation). Aachen: RWTH; 2008.
[8] Zentis T, Schmitt R. Nachholbedarf in Sachen Risikoprävention. Quality Engineering. 2011; 05: 12-13
[9] ElMaraghy H, Schuh G, ElMaraghy W, Piller F, Schönsleben P, Tseng M and Bernard A. Product variety management. CIRP Annals - Manufacturing Technology. 2013; 62(2): 629-652.
[10] Wiendahl HP, Reichardt J, Nyhuis P. Handbuch Fabrikplanung: Konzept, Gestaltung und Umsetzung wandlungsfähiger Produktionsstätten, 1 st ed. München: Carl Hanser Fachbuchverlag; 2010.
[11] Wiendahl HP, ElMaraghy HA, Nyhuis P, Zäh MF, Wiendahl HH, Duffie N, Brieke M. Changeable Manufacturing- Classification, Design and Operation. Annals of CIRP. 2007; Vol. 56/2: 783-809.
[12] Landherr M., Westkämper E. Integrated Product and Assembly Configuration Using Systematic Modularization and Flexible Integration. CIRP Procedia 2014; 17: 260-265.
[13] Baudzus B, Krebs M. Manuelle Montageprozesse im wandlungsfähigen Produktionssystem. Zeitschrift für wirtschaftlichen Fabrikbetrieb 2012; 107(5): 344-348.
[14] Pahl G, Beitz W, Feldhusen J, Grote KH. Konstruktionslehre. Berlin: Springer Vieweg; 2013.
[15] Mittal S, Frayman F. Towards a generic model of configuraton tasks. 11th IJCAI, San Francisco; 1989: 1395-1401. [16] Koren, Y, Shpitalni M. Design of reconfigurable manufacturing systems.
Journal of Manufacturing Systems. 2010; 29 (4): 130–141. [17] Spickova M, Myskova R. Costs Efficiency Evaluation using Life Cycle Costing as Strategic method. Procedia Economics and Finance 34.
2015: 337 – 343. [18] Karl F, Reinhart G, Zäh MF. Strategic Planning of Reconfigurations on
Manufacturing Resources. CIRP Procedia 3; 2012: 608-613. [19] Wenzel S, Meyer R. Kopplung der Simulation mit Methoden des
Datenmanagement. In: Kuhn, A.; Reinhardt, A.; Wiendahl, H.-P. (ed..): Handbuch Simulationsanwendungen in Produktion und Logistik. Band 7. Braunschweig: Vieweg; 1993: 347-368.
[20] Eversheim W, Schuh G. Integrierte Produkt- und Prozessgestaltung. Berlin: Springer; 2005.
[21] David M, Rowe F. What does Product lifecycle management manage: Data or documents?; Computers in Industry 75; 2016: 140 – 150.
[22] Eigner M, Stelzer R. Product Lifecycle Management. Dordrecht: Springer; 2013.
[23] Bracht U, Geckler D, Wenzel S. Digitale Fabrik. Berlin, New York: Springer; 2011.
[24] Kiefer J. Lean Digital Validation Methods within the Design Process of Automated Assembly Systems in Automotive Industry. Proceedings of the International Design Conference, Dubrovnik, Croatia; 2014.
.
Procedia - Social and Behavioral Sciences 197 ( 2015 ) 1399 – 1402
Available online at www.sciencedirect.com
ScienceDirect
1877-0428 © 2015 Published by Elsevier Ltd. This is an open access article under the CC BY-NC-ND license (http://creativecommons.org/licenses/by-nc-nd/4.0/).Peer-review under responsibility of Academic World Education and Research Center.doi: 10.1016/j.sbspro.2015.07.085
7th World Conference on Educational Sciences, (WCES-2015), 05-07 February 2015, Novotel Athens Convention Center, Athens, Greece
Conceptual model of management in automotive projects Laurentiu Margineanua*, Gabriela Prosteana, Serban Popaa
aPolytechnic University Timisoara, Faculty of Management in Production and Transportation, Str. Remus, No.14, 300191 Timisoara, Romania
Abstract
In automotive industry the development of new products, involve complex engineering processes subject to time pressures and fierce competition on the automotive market. An important role in the development of such projects it is the process planner. The position of process planner involves the interface between the department of design and development and production department, managing the projects in terms of technic side till implement them in series production. This paper develops in teach mode a conceptual model to scroll the successive phases of the project, designed to position the process planner ,in order to transfer the knowledge to the students, in the field of project management of new product development in the automotive industry. Through a case study it will be creates a conceptual model in methodological way, namely that exemplifies the main phases of automotive projects: the quote, concept, release of design, testing and qualification of product and final phase of preparing and launching in series production. Preliminary phase namely quotation phase includes defining the project team and submitting the offer. Process steps are established for each operation and the estimated cost for devices and equipment, project time planning, and can generate the first effective phase of the project, namely the concept phase, called the foundation project also. Next phase of concept phase is the release of design, thereupon the design is frozen, as well as the product bill of materials. PP sets: final steps of the process; production line (cell layout design); material flow; Process Failure Mode and Effects Analysis (P-FMEA ) and highlighting the top 5 risks assumed; In testing phase and product qualification, the PP manages and harmonizes in the smallest detail in order to achieve this target, to complete the preparation and launch in series production. © 2015 The Authors. Published by Elsevier Ltd. Peer-review under responsibility of Academic World Education and Research Center.
Keywords: - process planner, automotive, project management; product emergence process
* Laurentiu Margineanu. Tel.: +40-721788883.
E-mail address: [email protected]
© 2015 Published by Elsevier Ltd. This is an open access article under the CC BY-NC-ND license (http://creativecommons.org/licenses/by-nc-nd/4.0/).Peer-review under responsibility of Academic World Education and Research Center.
1400 Laurentiu Margineanu et al. / Procedia - Social and Behavioral Sciences 197 ( 2015 ) 1399 – 1402
1. Introduction Project management is in continuous development and a topical issue in recent years in the automotive industry,
one of the most severe competitions in the market, and where innovations are in continuous motion and succeed with rapidity and an amazing pace.
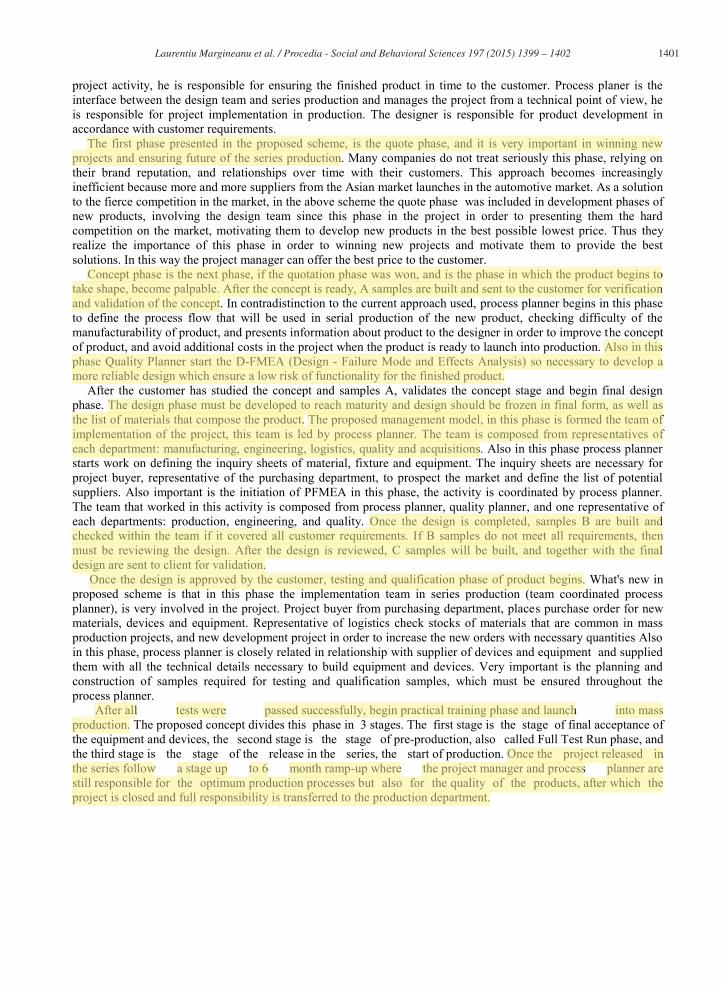
Most companies in the field of automotive project management using the same scheme that we meet in the paper of Gofer, Schulz "Supply chain during the product design emergence process-The example of the German car industry", published in the International Journal of Engineering Science and Technology, vol. 5, no. 2, 2013, pp. 110-118. The adapted scheme from this paper is presented in the figure1.
Figure 1. Product emergence process
The scheme is very good and also at present is successfully used by large companies with tradition, where
employees have extensive experience in project management. But younger companies on the market which try to use this scheme, do not always bring the desired result, because "not all projects are blessed with superstars." As Joan Knudson and Ira wrote in chapter Managing the team Bitz During the Project of Book Project Management published by AMACOM Books' ISBN: 0814450431 Pub Date: 01/01/91. Studying in detail the scheme can not be clearly observed phase sequence, and just grouping them in a certain period of time, and do not notice the interaction with the customer. Also in this scheme does not mention anything about the quotation phase, phase that helps to have a new project, and it is difficult to be interpreted by a person from outside the system, which means difficulty in understanding also for students.
Most automotive companies, wishing to initiate future employees since the time schools, but also because people who come from outside the company, can see the things from another angle and then offers a new and innovative idea, collaborate more and more with prestigious university worldwide, therefore the project management discipline has become a specialized study in college. In project management literature has been extensively studied, searching methods, tactics and tools to make it easier the project management activity, one of the reference book is Practical Project Management Tips, Tactics, and Tools, by Harvey Levine; Project Management A Systems Approach to Planning, Scheduling, and Controlling Seventh Edition, by Harold Kerzner, Ph.D. Division of Business Administration Baldwin-Wallace College Berea, Ohio).
This paper develops a conceptual model of the development phases of a new product in the automotive industry, a concept can be used as a model for introduction of students in project management of new product development in the automotive industry. The model is intended to be a summary of project management, that the paper treats them in the next pages using an original concept models.
2. The conceptual model of project management
In the paper that follows, it presents a new possible approach for new product development projects in the
automotive industry. In this paper, the project team consists of project manager, process planner, designer, quality planner and cost evaluator. Project manager is the interface between the client and design department and manage
1401 Laurentiu Margineanu et al. / Procedia - Social and Behavioral Sciences 197 ( 2015 ) 1399 – 1402
project activity, he is responsible for ensuring the finished product in time to the customer. Process planer is the interface between the design team and series production and manages the project from a technical point of view, he is responsible for project implementation in production. The designer is responsible for product development in accordance with customer requirements.
The first phase presented in the proposed scheme, is the quote phase, and it is very important in winning new projects and ensuring future of the series production. Many companies do not treat seriously this phase, relying on their brand reputation, and relationships over time with their customers. This approach becomes increasingly inefficient because more and more suppliers from the Asian market launches in the automotive market. As a solution to the fierce competition in the market, in the above scheme the quote phase was included in development phases of new products, involving the design team since this phase in the project in order to presenting them the hard competition on the market, motivating them to develop new products in the best possible lowest price. Thus they realize the importance of this phase in order to winning new projects and motivate them to provide the best solutions. In this way the project manager can offer the best price to the customer.
Concept phase is the next phase, if the quotation phase was won, and is the phase in which the product begins to take shape, become palpable. After the concept is ready, A samples are built and sent to the customer for verification and validation of the concept. In contradistinction to the current approach used, process planner begins in this phase to define the process flow that will be used in serial production of the new product, checking difficulty of the manufacturability of product, and presents information about product to the designer in order to improve the concept of product, and avoid additional costs in the project when the product is ready to launch into production. Also in this phase Quality Planner start the D-FMEA (Design - Failure Mode and Effects Analysis) so necessary to develop a more reliable design which ensure a low risk of functionality for the finished product.
After the customer has studied the concept and samples A, validates the concept stage and begin final design phase. The design phase must be developed to reach maturity and design should be frozen in final form, as well as the list of materials that compose the product. The proposed management model, in this phase is formed the team of implementation of the project, this team is led by process planner. The team is composed from representatives of each department: manufacturing, engineering, logistics, quality and acquisitions. Also in this phase process planner starts work on defining the inquiry sheets of material, fixture and equipment. The inquiry sheets are necessary for project buyer, representative of the purchasing department, to prospect the market and define the list of potential suppliers. Also important is the initiation of PFMEA in this phase, the activity is coordinated by process planner. The team that worked in this activity is composed from process planner, quality planner, and one representative of each departments: production, engineering, and quality. Once the design is completed, samples B are built and checked within the team if it covered all customer requirements. If B samples do not meet all requirements, then must be reviewing the design. After the design is reviewed, C samples will be built, and together with the final design are sent to client for validation.
Once the design is approved by the customer, testing and qualification phase of product begins. What's new in proposed scheme is that in this phase the implementation team in series production (team coordinated process planner), is very involved in the project. Project buyer from purchasing department, places purchase order for new materials, devices and equipment. Representative of logistics check stocks of materials that are common in mass production projects, and new development project in order to increase the new orders with necessary quantities Also in this phase, process planner is closely related in relationship with supplier of devices and equipment and supplied them with all the technical details necessary to build equipment and devices. Very important is the planning and construction of samples required for testing and qualification samples, which must be ensured throughout the process planner.
After all tests were passed successfully, begin practical training phase and launch into mass production. The proposed concept divides this phase in 3 stages. The first stage is the stage of final acceptance of the equipment and devices, the second stage is the stage of pre-production, also called Full Test Run phase, and the third stage is the stage of the release in the series, the start of production. Once the project released in the series follow a stage up to 6 month ramp-up where the project manager and process planner are still responsible for the optimum production processes but also for the quality of the products, after which the project is closed and full responsibility is transferred to the production department.
1402 Laurentiu Margineanu et al. / Procedia - Social and Behavioral Sciences 197 ( 2015 ) 1399 – 1402
3. Conclusions
As a conclusion, the above process is a simple description, exposed in a fluid layout, in order to be able to understand the continuity of projects phases of launching new products. As can be seen every phase diagram shows special items allocated "Lesson Learnt", elements that ensure continuous improvement of the activity of project management.
This scheme can be used successfully in ISO TS certification audits, or in the customer audits in order to present the work and phases of the project in a developed and elaborated way, always a diagram or picture being more explicit than a thousand words together.
The scheme is very useful in teaching environment in initiating students in project management, but also in facilitating understanding of each phase of new product development projects, the scheme proposed conceptual model representing the skeleton of conceptual model.
Reference
Gopfert, I., & Schulz, M. D. (2013). Supply chain design during the product emergence process–The example of the German car
industry. International Journal of Engineering, Science and Technology, 5(2), 110-118. Kerzner, H. R. (2013). Project management: a systems approach to planning, scheduling, and controlling. John Wiley & Sons. Levine, H. A. (2002). Practical project management: tips, tactics, and tools. John Wiley & Sons. Volberda, H. W., Van Den Bosch, F. A., & Mihalache, O. R. (2014). Advancing Management Innovation: Synthesizing Processes, Levels of
Analysis, and Change Agents. Organization Studies, 35(9), 1245-1264.
Copyright © 2022 FDOKUMEN