
THE TIGER AND THE DRAGON. DEVELOPMENT MODELS AND PERSPECTIVES OF INDIA AND CHINA
Upload
khangminh22Category
view
0download
0
STATUS OF TIGERS IN
INDIA-2018
SUMMARY REPORT

Citation: Jhala, Y. V, Qureshi, Q. & Nayak, A. K. (eds). 2019. Status of tigers, co-predators and prey in India 2018. Summary Report. National Tiger Conservation Authority, Government of India, New Delhi & Wildlife Institute of India, Dehradun.TR No./2019/05.
Cover Photo: Sanjay Shukla
STATUS OF TIGERS IN INDIA-2018


Thisisaptlyre�lectedinthefollowing
versefromtheMahabharata:
िनव�नो व�ते �ा�ो िन�ा��ं िछ�ते वनम् ।त�ा�ा�ो वनं र�े�नं �ा�ं च पालयेत् ।।
In the era of modern development, conserving the tiger is an
onerous task. Ensuring the conservation of this top carnivore
guarantees the well-being of our forested ecosystems, the
biodiversity they represent as well as the water and climate
security they provide. Monitoring the status of tigers, along
with associated biodiversity of the encompassing ecosystem,
is important to assess our success at meeting the commitment
of conserving our natural heritage.
(Tigerscannotsurvivewithoutforestsandsimilarlyforestsperishwithouttigers.Tigersprotecttheforeststhatnurture
them)(TheMahabharataUdyogaParva:5.29.48)
INTRODUCTION1
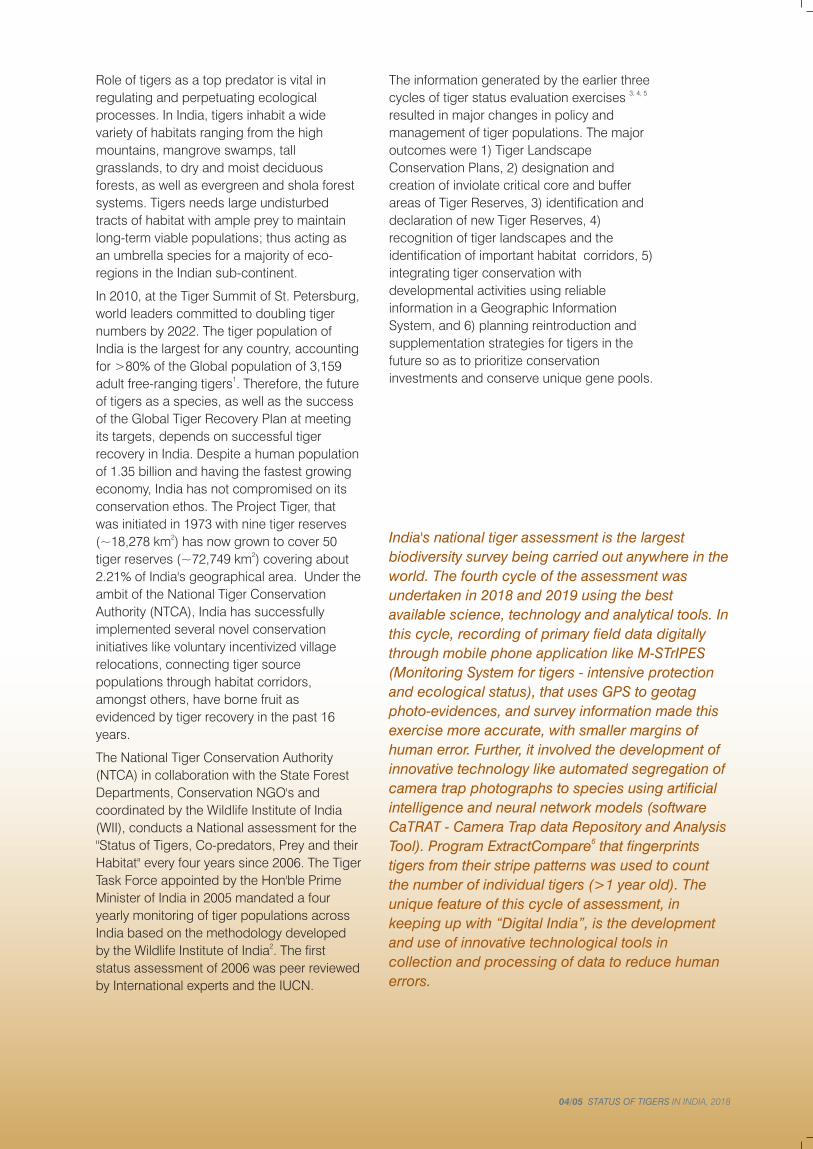
Role of tigers as a top predator is vital in
regulating and perpetuating ecological
processes. In India, tigers inhabit a wide
variety of habitats ranging from the high
mountains, mangrove swamps, tall
grasslands, to dry and moist deciduous
forests, as well as evergreen and shola forest
systems. Tigers needs large undisturbed
tracts of habitat with ample prey to maintain
long-term viable populations; thus acting as
an umbrella species for a majority of eco-
regions in the Indian sub-continent.
In 2010, at the Tiger Summit of St. Petersburg,
world leaders committed to doubling tiger
numbers by 2022. The tiger population of
India is the largest for any country, accounting
for >80% of the Global population of 3,159 1adult free-ranging tigers . Therefore, the future
of tigers as a species, as well as the success
of the Global Tiger Recovery Plan at meeting
its targets, depends on successful tiger
recovery in India. Despite a human population
of 1.35 billion and having the fastest growing
economy, India has not compromised on its
conservation ethos. The Project Tiger, that
was initiated in 1973 with nine tiger reserves 2(~18,278 km ) has now grown to cover 50
2tiger reserves (~72,749 km ) covering about
2.21% of India's geographical area. Under the
ambit of the National Tiger Conservation
Authority (NTCA), India has successfully
implemented several novel conservation
initiatives like voluntary incentivized village
relocations, connecting tiger source
populations through habitat corridors,
amongst others, have borne fruit as
evidenced by tiger recovery in the past 16
years.
The National Tiger Conservation Authority
(NTCA) in collaboration with the State Forest
Departments, Conservation NGO's and
coordinated by the Wildlife Institute of India
(WII), conducts a National assessment for the
"Status of Tigers, Co-predators, Prey and their
Habitat" every four years since 2006. The Tiger
Task Force appointed by the Hon'ble Prime
Minister of India in 2005 mandated a four
yearly monitoring of tiger populations across
India based on the methodology developed 2by the Wildlife Institute of India . The first
status assessment of 2006 was peer reviewed
by International experts and the IUCN.
The information generated by the earlier three 3, 4, 5cycles of tiger status evaluation exercises
resulted in major changes in policy and
management of tiger populations. The major
outcomes were 1) Tiger Landscape
Conservation Plans, 2) designation and
creation of inviolate critical core and buffer
areas of Tiger Reserves, 3) identification and
declaration of new Tiger Reserves, 4)
recognition of tiger landscapes and the
identification of important habitat corridors, 5)
integrating tiger conservation with
developmental activities using reliable
information in a Geographic Information
System, and 6) planning reintroduction and
supplementation strategies for tigers in the
future so as to prioritize conservation
investments and conserve unique gene pools.
India's national tiger assessment is the largest
biodiversity survey being carried out anywhere in the
world. The fourth cycle of the assessment was
undertaken in 2018 and 2019 using the best
available science, technology and analytical tools. In
this cycle, recording of primary field data digitally
through mobile phone application like M-STrIPES
(Monitoring System for tigers - intensive protection
and ecological status), that uses GPS to geotag
photo-evidences, and survey information made this
exercise more accurate, with smaller margins of
human error. Further, it involved the development of
innovative technology like automated segregation of
camera trap photographs to species using artificial
intelligence and neural network models (software
CaTRAT - Camera Trap data Repository and Analysis 6Tool). Program ExtractCompare that fingerprints
tigers from their stripe patterns was used to count
the number of individual tigers (>1 year old). The
unique feature of this cycle of assessment, in
keeping up with “Digital India”, is the development
and use of innovative technological tools in
collection and processing of data to reduce human
errors.
04/05 STATUS OF TIGERS IN INDIA, 2018
Thisisaptlyre�lectedinthefollowing
versefromtheMahabharata:
िनव�नो व�ते �ा�ो िन�ा��ं िछ�ते वनम् ।त�ा�ा�ो वनं र�े�नं �ा�ं च पालयेत् ।।
In the era of modern development, conserving the tiger is an
onerous task. Ensuring the conservation of this top carnivore
guarantees the well-being of our forested ecosystems, the
biodiversity they represent as well as the water and climate
security they provide. Monitoring the status of tigers, along
with associated biodiversity of the encompassing ecosystem,
is important to assess our success at meeting the commitment
of conserving our natural heritage.
(Tigerscannotsurvivewithoutforestsandsimilarlyforestsperishwithouttigers.Tigersprotecttheforeststhatnurture
them)(TheMahabharataUdyogaParva:5.29.48)
INTRODUCTION1
Role of tigers as a top predator is vital in
regulating and perpetuating ecological
processes. In India, tigers inhabit a wide
variety of habitats ranging from the high
mountains, mangrove swamps, tall
grasslands, to dry and moist deciduous
forests, as well as evergreen and shola forest
systems. Tigers needs large undisturbed
tracts of habitat with ample prey to maintain
long-term viable populations; thus acting as
an umbrella species for a majority of eco-
regions in the Indian sub-continent.
In 2010, at the Tiger Summit of St. Petersburg,
world leaders committed to doubling tiger
numbers by 2022. The tiger population of
India is the largest for any country, accounting
for >80% of the Global population of 3,159 1adult free-ranging tigers . Therefore, the future
of tigers as a species, as well as the success
of the Global Tiger Recovery Plan at meeting
its targets, depends on successful tiger
recovery in India. Despite a human population
of 1.35 billion and having the fastest growing
economy, India has not compromised on its
conservation ethos. The Project Tiger, that
was initiated in 1973 with nine tiger reserves 2(~18,278 km ) has now grown to cover 50
2tiger reserves (~72,749 km ) covering about
2.21% of India's geographical area. Under the
ambit of the National Tiger Conservation
Authority (NTCA), India has successfully
implemented several novel conservation
initiatives like voluntary incentivized village
relocations, connecting tiger source
populations through habitat corridors,
amongst others, have borne fruit as
evidenced by tiger recovery in the past 16
years.
The National Tiger Conservation Authority
(NTCA) in collaboration with the State Forest
Departments, Conservation NGO's and
coordinated by the Wildlife Institute of India
(WII), conducts a National assessment for the
"Status of Tigers, Co-predators, Prey and their
Habitat" every four years since 2006. The Tiger
Task Force appointed by the Hon'ble Prime
Minister of India in 2005 mandated a four
yearly monitoring of tiger populations across
India based on the methodology developed 2by the Wildlife Institute of India . The first
status assessment of 2006 was peer reviewed
by International experts and the IUCN.
The information generated by the earlier three 3, 4, 5cycles of tiger status evaluation exercises
resulted in major changes in policy and
management of tiger populations. The major
outcomes were 1) Tiger Landscape
Conservation Plans, 2) designation and
creation of inviolate critical core and buffer
areas of Tiger Reserves, 3) identification and
declaration of new Tiger Reserves, 4)
recognition of tiger landscapes and the
identification of important habitat corridors, 5)
integrating tiger conservation with
developmental activities using reliable
information in a Geographic Information
System, and 6) planning reintroduction and
supplementation strategies for tigers in the
future so as to prioritize conservation
investments and conserve unique gene pools.
India's national tiger assessment is the largest
biodiversity survey being carried out anywhere in the
world. The fourth cycle of the assessment was
undertaken in 2018 and 2019 using the best
available science, technology and analytical tools. In
this cycle, recording of primary field data digitally
through mobile phone application like M-STrIPES
(Monitoring System for tigers - intensive protection
and ecological status), that uses GPS to geotag
photo-evidences, and survey information made this
exercise more accurate, with smaller margins of
human error. Further, it involved the development of
innovative technology like automated segregation of
camera trap photographs to species using artificial
intelligence and neural network models (software
CaTRAT - Camera Trap data Repository and Analysis 6Tool). Program ExtractCompare that fingerprints
tigers from their stripe patterns was used to count
the number of individual tigers (>1 year old). The
unique feature of this cycle of assessment, in
keeping up with “Digital India”, is the development
and use of innovative technological tools in
collection and processing of data to reduce human
errors.
04/05 STATUS OF TIGERS IN INDIA, 2018

This method entails estimating spatial covariates of relative abundance of tigers, co-
predators, and ungulates, human impact indices, and habitat characteristics across all
potential tiger habitat in India, at a fine spatial resolution of a forest beat which is on 2
average about 15 km (Phase I and II). Subsequently an adequate area within each
landscape was sampled using camera traps at a high spatial density of one double 2camera location in 2 km (Phase III). The concept is similar to that of double sampling
wherein indices or raw counts of abundance obtained from the entire sample space are
calibrated against absolute density obtained from limited samples. The difference
between double sampling and SECR approach is that double sampling uses ratio or
regression to calibrate indices while tiger population estimation uses spatial information
on capture-mark-recapture (that accounts for detection correction) in a joint likelihood
with spatial covariates of tiger sign intensity, prey abundance, human disturbance and
habitat characteristics. This approach estimates tigers directly within camera trapped
areas and extrapolates it to areas with tigers but not camera trapped based on joint
distribution of covariates.
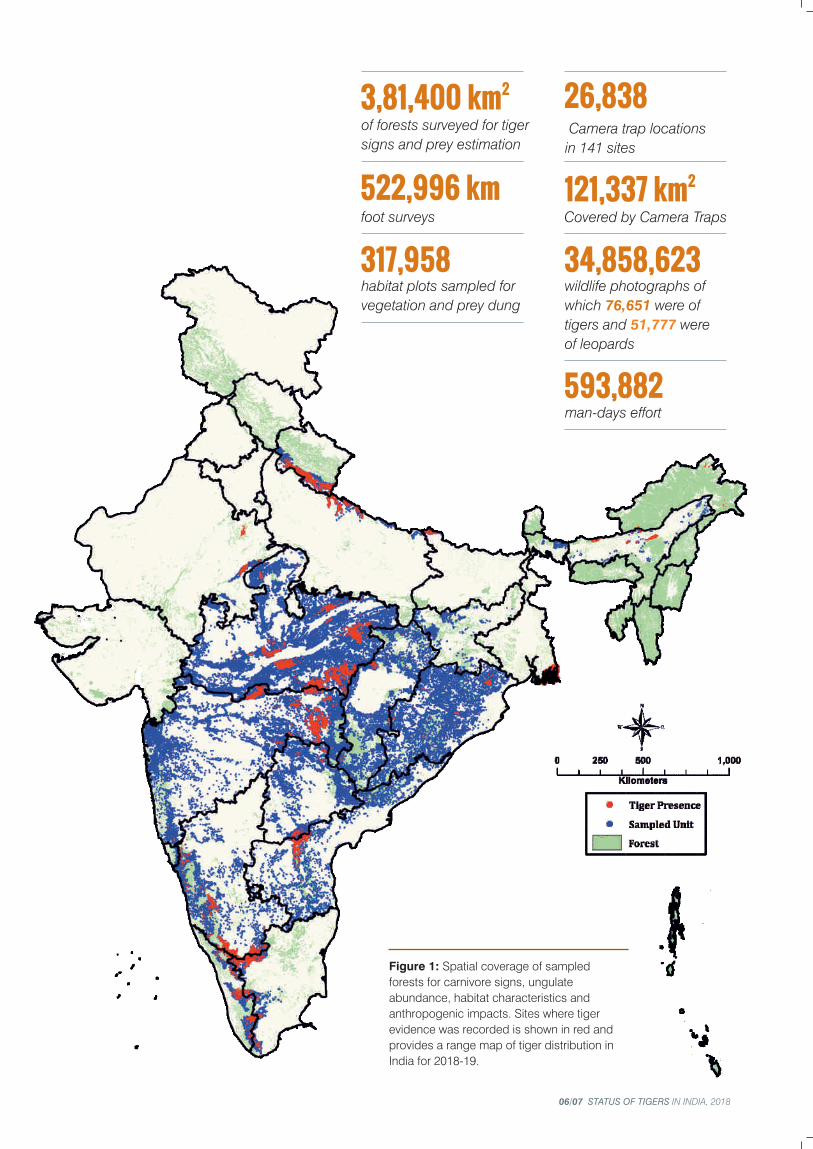
Figure 1: Spatial coverage of sampled
forests for carnivore signs, ungulate
abundance, habitat characteristics and
anthropogenic impacts. Sites where tiger
evidence was recorded is shown in red and
provides a range map of tiger distribution in
India for 2018-19.
METHODS
Since tigers occur across varied habitats and a
large geographical expanse of India, we divided
tiger bearing habitats into five major landscapes
Each landscape was analyzed separately since covariates were
likely to differ in their relationship with tiger abundance between
landscapes. In addition, landscapes formed logical and
biological units wherein tiger populations can share common
individuals, a common genepool and can potentially disperse
between populations. However, tiger movement between
landscapes were likely to be rare events in modern times.
Shivalik-
Gangetic
plains
Central
India and
Eastern
Ghats
Western
Ghats
North Eastern
Hills and
Brahmaputra
Flood Plains
Sundarbans
2Spatial data on individual tiger photo-captures is used in combination with
spatial data on prey, habitat, and anthropogenic factors as covariates in a
joint likelihood spatially explicit capture-mark-recapture (SECR) framework
to arrive at tiger population estimates for each tiger landscape.
2 3,81,400 km of forests surveyed for tiger
signs and prey estimation
522,996 km foot surveys
317,958 habitat plots sampled for
vegetation and prey dung
Camera trap locations
in 141 sites
Covered by Camera Traps
wildlife photographs of
which were of 76,651
tigers and were 51,777
of leopards
man-days effort
26,838
2121,337 km
34,858,623
593,882
06/07 STATUS OF TIGERS IN INDIA, 2018
This method entails estimating spatial covariates of relative abundance of tigers, co-
predators, and ungulates, human impact indices, and habitat characteristics across all
potential tiger habitat in India, at a fine spatial resolution of a forest beat which is on 2
average about 15 km (Phase I and II). Subsequently an adequate area within each
landscape was sampled using camera traps at a high spatial density of one double 2camera location in 2 km (Phase III). The concept is similar to that of double sampling
wherein indices or raw counts of abundance obtained from the entire sample space are
calibrated against absolute density obtained from limited samples. The difference
between double sampling and SECR approach is that double sampling uses ratio or
regression to calibrate indices while tiger population estimation uses spatial information
on capture-mark-recapture (that accounts for detection correction) in a joint likelihood
with spatial covariates of tiger sign intensity, prey abundance, human disturbance and
habitat characteristics. This approach estimates tigers directly within camera trapped
areas and extrapolates it to areas with tigers but not camera trapped based on joint
distribution of covariates.
Figure 1: Spatial coverage of sampled
forests for carnivore signs, ungulate
abundance, habitat characteristics and
anthropogenic impacts. Sites where tiger
evidence was recorded is shown in red and
provides a range map of tiger distribution in
India for 2018-19.
METHODS
Since tigers occur across varied habitats and a
large geographical expanse of India, we divided
tiger bearing habitats into five major landscapes
Each landscape was analyzed separately since covariates were
likely to differ in their relationship with tiger abundance between
landscapes. In addition, landscapes formed logical and
biological units wherein tiger populations can share common
individuals, a common genepool and can potentially disperse
between populations. However, tiger movement between
landscapes were likely to be rare events in modern times.
Shivalik-
Gangetic
plains
Central
India and
Eastern
Ghats
Western
Ghats
North Eastern
Hills and
Brahmaputra
Flood Plains
Sundarbans
2Spatial data on individual tiger photo-captures is used in combination with
spatial data on prey, habitat, and anthropogenic factors as covariates in a
joint likelihood spatially explicit capture-mark-recapture (SECR) framework
to arrive at tiger population estimates for each tiger landscape.
2 3,81,400 km of forests surveyed for tiger
signs and prey estimation
522,996 km foot surveys
317,958 habitat plots sampled for
vegetation and prey dung
Camera trap locations
in 141 sites
Covered by Camera Traps
wildlife photographs of
which were of 76,651
tigers and were 51,777
of leopards
man-days effort
26,838
2121,337 km
34,858,623
593,882
06/07 STATUS OF TIGERS IN INDIA, 2018

Camera trap based Capture-Mark-Recapture:
Camera trap surveys are a well-established
methodology for abundance/density estimation of
carnivores. Development of spatial capture-
recapture methods have led to greater clarity in
density estimation by integrating the spatial location
information of animal photo-captures.
Camera traps were placed at 26,880 locations
spread across 141 sites for mark recapture analysis
(Fig. 2). Camera traps were systematically
distributed within the sampling area by 2superimposing 2 km grid and deploying at least
one pair of cameras (Cuddeback, or Reconyx)
within each grid. The cameras are placed in the
best possible location to maximize photo-captures
of tigers and leopards, identified through extensive
search during sign surveys. Each grid was uniquely 2coded and was set within the 100 km country wide
grid that has been fixed since first cycle of National
Tiger Status Estimation in 2006 so that subsequent
inferences can be compared on the same spatial
scale and extent. Sampling was carried out 2simultaneously in a minimum block of 200 km . If
more number of camera traps were available to 2cover > 200 km , then sampling was done in larger
size blocks. Minimum camera trap location spacing
was maintained at around 1 km. Cameras were
usually operated between 25 to 35 days at each
site, with an average effort of over 500 trap-nights 2per ~100 km .
Remotely sensed spatial and attribute covariates:
Distribution and abundance of wildlife are likely to
be determined by habitat characteristics and
anthropogenic impacts. These covariates were
obtained from remotely sensed data and used to
model tiger occupancy and abundance. Habitat
characteristics were surrogated by forest area,
vegetation cover [Normalized Difference Vegetation
Index, (NDVI)], forest patch size, forest core areas,
elevation, distance from protected areas and
drainage density. Human impacts were surrogated
by human footprint, distance to night lights, night
light intensity, distance to roads and density of road
network.
Frontline staff of State Forest Departments of 21
potential tiger bearing States were trained to collect
the Phase I data (Fig. 1) in a digital format on the
M-STrIPES mobile application. A field guide in nine 7regional languages was published and provided to
each beat guard.
Data collection on each of the following
components was implemented in 2018:
a) Carnivore sign encounters (Form 1: multiple
occupancy surveys in a beat)
e) Dung counts (Form 4: count of all dung 2identified to species in multiple 40m plots on
transects)
For the Sundarbans, the above protocol was
modified so as to allow sampling using a boat
along river channels (khals). Phase I sampling on
the above aspects took a maximum of 10 days for
each forest beat with the effort of sampling by two
persons.
b) Tiger prey abundance (Form 2: Distance
sampling on line transect(s) in a beat)
c) Vegetation (Form 3A and 3C: Canopy cover,
tree, shrub and herb composition, weed
infestation on plots on a transect in a beat)
d) Human disturbance (Form 3B: Multiple plots of
30m diameter on line transects in a beat) and
Phase I Phase III Phase II
STATUS OF TIGERS IN INDIA, 2018
08/09 STATUS OF TIGERS IN INDIA, 2018
DATA ANALYSIS
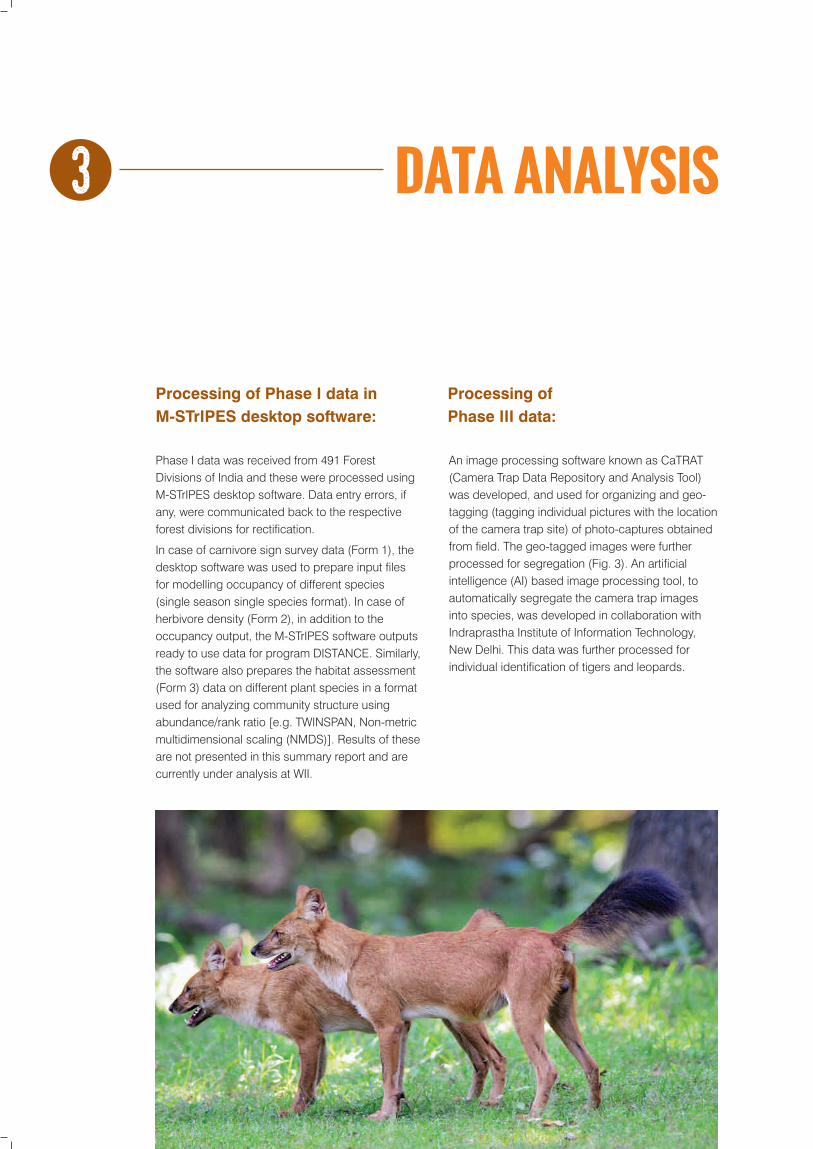
Phase I data was received from 491 Forest
Divisions of India and these were processed using
M-STrIPES desktop software. Data entry errors, if
any, were communicated back to the respective
forest divisions for rectification.
In case of carnivore sign survey data (Form 1), the
desktop software was used to prepare input files
for modelling occupancy of different species
(single season single species format). In case of
herbivore density (Form 2), in addition to the
occupancy output, the M-STrIPES software outputs
ready to use data for program DISTANCE. Similarly,
the software also prepares the habitat assessment
(Form 3) data on different plant species in a format
used for analyzing community structure using
abundance/rank ratio [e.g. TWINSPAN, Non-metric
multidimensional scaling (NMDS)]. Results of these
are not presented in this summary report and are
currently under analysis at WII.
Figure 2: Camera trap locations,
cameras with tiger captures and
tiger positive scat locations across
tiger bearing forests of India in
2018-19.
An image processing software known as CaTRAT
(Camera Trap Data Repository and Analysis Tool)
was developed, and used for organizing and geo-
tagging (tagging individual pictures with the location
of the camera trap site) of photo-captures obtained
from field. The geo-tagged images were further
processed for segregation (Fig. 3). An artificial
intelligence (AI) based image processing tool, to
automatically segregate the camera trap images
into species, was developed in collaboration with
Indraprastha Institute of Information Technology,
New Delhi. This data was further processed for
individual identification of tigers and leopards.
Processing of Phase I data in
M-STrIPES desktop software:
Processing of
Phase III data:
3
10/11 STATUS OF TIGERS IN INDIA, 2018

DATA ANALYSIS
Phase I data was received from 491 Forest
Divisions of India and these were processed using
M-STrIPES desktop software. Data entry errors, if
any, were communicated back to the respective
forest divisions for rectification.
In case of carnivore sign survey data (Form 1), the
desktop software was used to prepare input files
for modelling occupancy of different species
(single season single species format). In case of
herbivore density (Form 2), in addition to the
occupancy output, the M-STrIPES software outputs
ready to use data for program DISTANCE. Similarly,
the software also prepares the habitat assessment
(Form 3) data on different plant species in a format
used for analyzing community structure using
abundance/rank ratio [e.g. TWINSPAN, Non-metric
multidimensional scaling (NMDS)]. Results of these
are not presented in this summary report and are
currently under analysis at WII.
Figure 2: Camera trap locations,
cameras with tiger captures and
tiger positive scat locations across
tiger bearing forests of India in
2018-19.
An image processing software known as CaTRAT
(Camera Trap Data Repository and Analysis Tool)
was developed, and used for organizing and geo-
tagging (tagging individual pictures with the location
of the camera trap site) of photo-captures obtained
from field. The geo-tagged images were further
processed for segregation (Fig. 3). An artificial
intelligence (AI) based image processing tool, to
automatically segregate the camera trap images
into species, was developed in collaboration with
Indraprastha Institute of Information Technology,
New Delhi. This data was further processed for
individual identification of tigers and leopards.
Processing of Phase I data in
M-STrIPES desktop software:
Processing of
Phase III data:
3
10/11 STATUS OF TIGERS IN INDIA, 2018
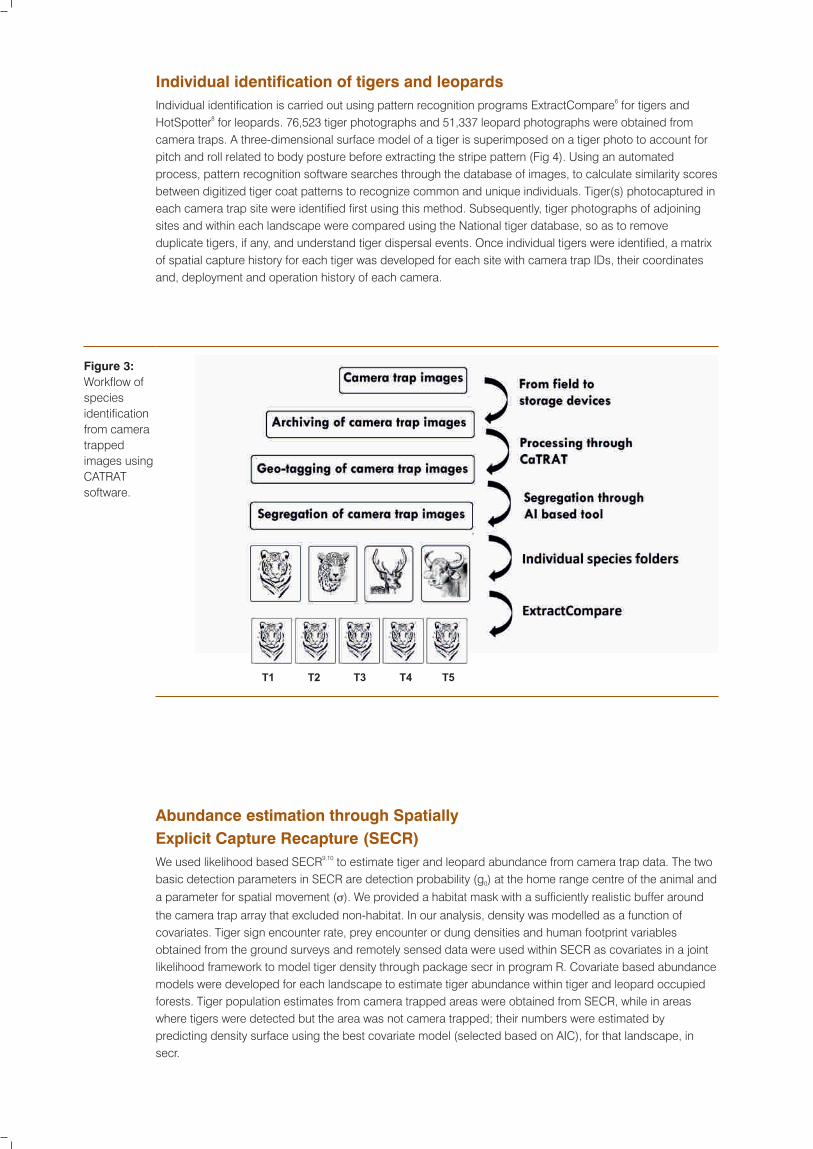
Individual identification of tigers and leopards6Individual identification is carried out using pattern recognition programs ExtractCompare for tigers and
8HotSpotter for leopards. 76,523 tiger photographs and 51,337 leopard photographs were obtained from
camera traps. A three-dimensional surface model of a tiger is superimposed on a tiger photo to account for
pitch and roll related to body posture before extracting the stripe pattern (Fig 4). Using an automated
process, pattern recognition software searches through the database of images, to calculate similarity scores
between digitized tiger coat patterns to recognize common and unique individuals. Tiger(s) photocaptured in
each camera trap site were identified first using this method. Subsequently, tiger photographs of adjoining
sites and within each landscape were compared using the National tiger database, so as to remove
duplicate tigers, if any, and understand tiger dispersal events. Once individual tigers were identified, a matrix
of spatial capture history for each tiger was developed for each site with camera trap IDs, their coordinates
and, deployment and operation history of each camera.
Figure 3:
Workflow of
species
identification
from camera
trapped
images using
CATRAT
software.
Abundance estimation through Spatially
Explicit Capture Recapture (SECR)
9,10We used likelihood based SECR to estimate tiger and leopard abundance from camera trap data. The two
basic detection parameters in SECR are detection probability (g ) at the home range centre of the animal and 0
a parameter for spatial movement (σ). We provided a habitat mask with a sufficiently realistic buffer around
the camera trap array that excluded non-habitat. In our analysis, density was modelled as a function of
covariates. Tiger sign encounter rate, prey encounter or dung densities and human footprint variables
obtained from the ground surveys and remotely sensed data were used within SECR as covariates in a joint
likelihood framework to model tiger density through package secr in program R. Covariate based abundance
models were developed for each landscape to estimate tiger abundance within tiger and leopard occupied
forests. Tiger population estimates from camera trapped areas were obtained from SECR, while in areas
where tigers were detected but the area was not camera trapped; their numbers were estimated by
predicting density surface using the best covariate model (selected based on AIC), for that landscape, in
secr.
Figure 4: Process of individual identification
of tigers using Extract Compare software.
a) Placing seeds on prominent body parts
(mid shoulder, tail, hip)
a) 3-D model fitting which takes into account the angle
at which the photo is taken
c) Pattern extracted
d) Visual compare to match tiger images after the computer program has
provided a few options from several thousand images
Genetic sampling
At sites where it was not possible to undertake
camera trapping due to very low tiger numbers or
unfavorable law and order conditions, scat
samples of carnivores were collected to estimate
minimum number of tigers through genetic
analysis. Genomic DNA was extracted from
samples using the guanidinium thiocyanate 11method . Following extraction, DNA samples were
first screened for species identification using a tiger 12specific cytochrome-b marker . Tiger positive
samples were confirmed after samples were run
along with a positive and negative control. A panel
of 11 highly polymorphic microsatellites were used
to identify individuals.
Maximum Entropy Models
(MaxEnt)
In the north eastern states of Arunachal Pradesh,
Mizoram and Nagaland, sampling could not be
done with appropriate mark recapture method due
to logistic constraints. In these states we used
confirmed tiger presence locations from tiger scats
(confirmed by DNA profile), and opportunistic camera
trap photos to model suitable tiger habitat using 13program MaxEnt . Minimal tiger density obtained from
individually identified tigers within small intensively
searched areas was used to provide a crude estimate
of tiger numbers in these states.
Peer Participation
The NTCA invited international experts in carnivore
ecology and shared with them the advancements
done for the 2018-19 tiger status assessment. These
experts were shown field data collection protocols and
procedures, data generated through M-STrIPES from
the field in GIS, camera trap photo repositories, and
analytical procedures used. They visited field sites
and interacted with Tiger Reserve managers to
understand issues related to tiger status assessment,
management, and conservation. Their perceptions are
appended as Annexure 2 to this summary report.
12/13 STATUS OF TIGERS IN INDIA, 2018

The fourth cycle of National tiger status assessment of 2018-19 is the most accurate survey 2 conducted. The survey covered 381,400 km of forested habitats in 20 tiger occupied states of
India. A foot survey of 522,996 km was done for carnivore signs and prey abundance estimation.
In these forests, 317,958 habitat plots were sampled for vegetation, human impacts and prey
dung. Camera traps were deployed at 26,838 locations. These cameras resulted in 34,858,623
photographs of wildlife of which 76,651 were of tigers and 51,777 were of leopards. The total area 2sampled by camera traps was 121,337 km . The total effort invested in the survey was 593,882
man-days. We believe that this is the world's largest effort invested in any wildlife survey till date,
on all of the above criteria.
A total of 2,461 individual tigers (>1 year of age) were photo-captured. The overall tiger
population in India was estimated at 2,967 (SE range 2,603 to 3,346) (Table 1, Fig. 7-11). Out of
this, 83% were actually camera trapped individual tigers and 87% were accounted for by camera-
trap based capture-mark-recapture and remaining 13% estimated through covariate based
models (Fig. 5). Tigers were observed to be increasing at a rate of 6% per annum in India when
consistently sampled areas were compared from 2006 to 2018 (Fig. 6). Tiger occupancy was 2 2found to be stable at 88,985 km the country scale since 2014 (88,558 km ). Though there were
losses and gains at individual landscapes and state scales. The occupancy reported in this report
is based on latest forest cover by Forest Survey of India (2017) and therefore cannot be compared
with earlier occupied areas which were computed from earlier forest cover data. To make the
comparison on the same scale we have recomputed tiger occupied forests for the 2014 cycle on
the forest cover of 2017 (Table 2). Reduction in occupied areas was due to a) not finding evidence
of tiger presence in sampled forests (20% actual loss), and b) not sampling forests that had tiger
presence in 2014 (8 %). New areas that were colonized by tigers in 2018 constituted 25,709 2(28%) km . This analysis suggests that loss and gain of tiger occupancy was mostly from habitat
pockets that support low density populations. Such habitats with low density tigers, though
contributing minimally to overall tiger numbers, are crucial links for gene flow and maintaining
connectivity between source populations. The loss and gain of tiger occupancy in these marginal
areas is a dynamic process and depends on several factors like proximity of a tiger source
population, anthropogenic pressures operating in the landscape, associated change in habitat
conditions and protection regime. Tiger occupancy has increased in the state of Madhya Pradesh,
and Andhra Pradesh. Loss in North East is due to poor sampling. Madhya Pradesh has also
registered a substantial increase in their tiger population and along with Karnataka ranks highest
in tiger numbers. The poor and continuing decline in tiger status in the states of Chhattisgarh and
Odisha is a matter of concern.
Table 1: Estimated tiger numbers (>1 year of age) in 2018 for landscapes
and States compared with estimates for 2006, 2010 and 2014. Numbers in
parenthesis are standard error limits.
*: Estimated through Scat DNA
#: For comparison with previous estimates of Andhra Pradesh, combine Andhra Pradesh and Telangana population estimate of current year
Tigers were not recorded in Buxa, Dampa and Palamau tiger reserves. Reserves had poor
tiger status in earlier assessments as well.
RESULTS4
Total tiger population estimated:
2,967
(2,603 - 3,346)
Total number of individual tigers camera trapped
2,461Tiger population estimated through Capture-mark-recapture
2,591
Shivalik Hills and Gangetic Plains Landscape
Bihar 10 (7-13) 8 28(25-31) 31 (26 - 37)
Uttarakhand 178 (161-195) 227 (199-256) 340 (299-381) 442 (393 - 491)
Uttar Pradesh 109 (91-127) 118 (113-124) 117 (103-131) 173 (148 - 198)
Goa - - 5* 3
Karnataka 290 (241-339) 300 (280-320) 406 (360-452) 524 (475 - 573)
Kerala 46 (39-53) 71 (67-75) 136 (119-150) 190 (166 - 215)
Tamil Nadu 76 (56-95) 163 053-173) 229 (201-253) 264 (227 - 302)
Shivalik-Gangetic 297 (259-335) 353(320-388) 485 (427-543} 646 (567 - 726)
Central Indian Landscape and Eastern Ghats
Andhra Pradesh 95 (84-107) 72 (65-79) 68 (58-78) 48 (40 - 56)#
Telangana - - - 26 (23 - 30)#
Western Ghats 402 (336-487) 534 (500-568) 776 (685-861) 981 (871 - 1,093)
North East Hills and Brahmaputra Plains Landscape
Arunachal Pradesh 14 (12-18) 28* 29*
Assam 70 (60-80) 143 (113-173) 167 (150-184) 190 (165 - 215)
Mizoram 6 (4-8) 5 3* 0
Nagaland - - - 0
Northern 10 (8-12) - 3* 0
West Bengal
North East Hills, 100 (84-118) 148 (118-178) 201 (174-212) 219 (194 - 244)
and Brahmaputra
Sundarbans 70 (62-96) 76 (62-96) 88 (86-90)
TOTAL 1,411 1,706 2,226 2,967
(1,165-1,657) (1,507-1,896) (1,945-2,491) (2,603 - 3,346)
Odisha 45 (37-53) 32 (20-44) 28 (24-32)* 28 (26 - 30)
Rajasthan 32 (30-35) 36 (35-37) 45 (39-51) 69 (62 - 76)
Central India & 601 (486-718) 601 (518-685) 688 (596-780) 1,033 (885- 1,193)
Eastern Ghats
Western Ghats Landscape
Chhattisgarh 26 (23-28} 26 (24-27) 46 (39-53}* 19 (18 - 21)
Jharkhand 10 (6-14) 3* 5
Madhya Pradesh 300 (236-364) 257 {213-301) 308 (264-352)* 526 (441 - 621)
Maharashtra 103 (76-131) 168 (155-183) 190 (163-217)* 312 (270 - 354)
State Tiger Population
2006 2010 2014 2018
14/15 STATUS OF TIGERS IN INDIA, 2018

2006 2010 2014 20182008 2012 20167
7.2
7.4
7.6
7.8
8
Ln
(Po
pu
latio
n)
8.2
Years
Ln (Pop)= 0.061 (years)- 114.672R = 0.98; P<0.01
Landscape Tiger occupancy Occupancy 2018 Difference Gain 2018 Tiger present Actual Loss
2014 in 2014 but not
sampled in 2018
Shivalik 8,815 8,346 -469 688 279 904
Central India 40,185 47,717 7,532 18,089 276 10,216
Western Ghats 27,824 27,297 -527 5,778 769 5,524
North East 9,901 3,312 -6,589 675 6,040 1,237
Sundarbans 1,834 2,313 479 479 0 0
India 88,558 88,985 427 25,709 7,364 17,881
Figure 6: Growth rate of tigers
in India estimated by regressing
natural log transformed
population against years. The
slope of the regression gives
the instantaneous growth rate
(r=0.06). Growth rate was
computed only from areas that
were sampled consistently from
2006 to 2018.
2Table 2: Tiger occupied forests (km ) for 2018 and 2014 for each landscape. Forest
Survey of India (2017) forest cover is used for computation of forest occupancy.
Figure 5:
Proportion of the
total tiger
population
camera trapped
and estimated by
capture-mark-
recapture (CMR).
%CMR %Camera Trapped
0
20
30
40
50
60
70
80
90
100
Shivalik North East Central India Western Ghat Sunderbans India
% P
opula
tion E
stim
ate
d
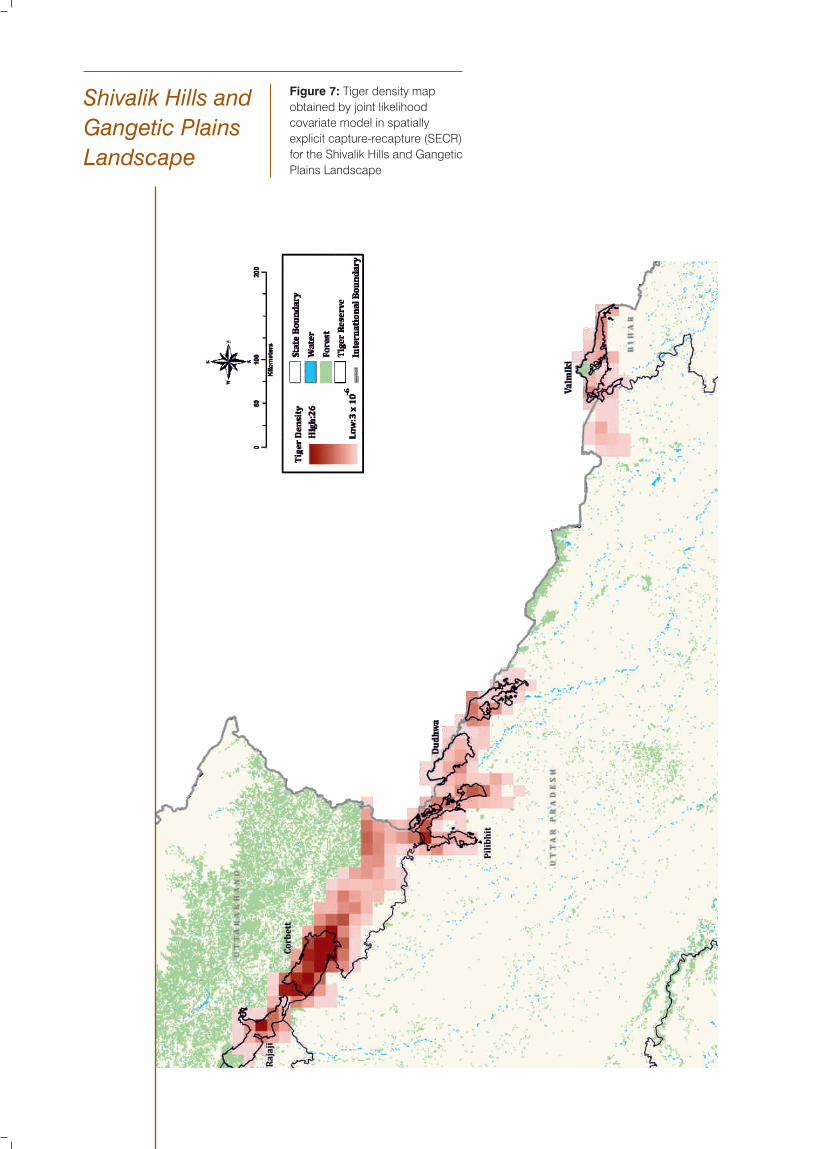
Figure 8: Tiger density map
obtained by joint likelihood
covariate model in spatially
explicit capture-recapture
(SECR) for the Central India and
Eastern Ghats Landscape
Figure 7: Tiger density map
obtained by joint likelihood
covariate model in spatially
explicit capture-recapture (SECR)
for the Shivalik Hills and Gangetic
Plains Landscape
Shivalik Hills and
Gangetic Plains
Landscape
Central India and
Eastern Ghats
Landscape
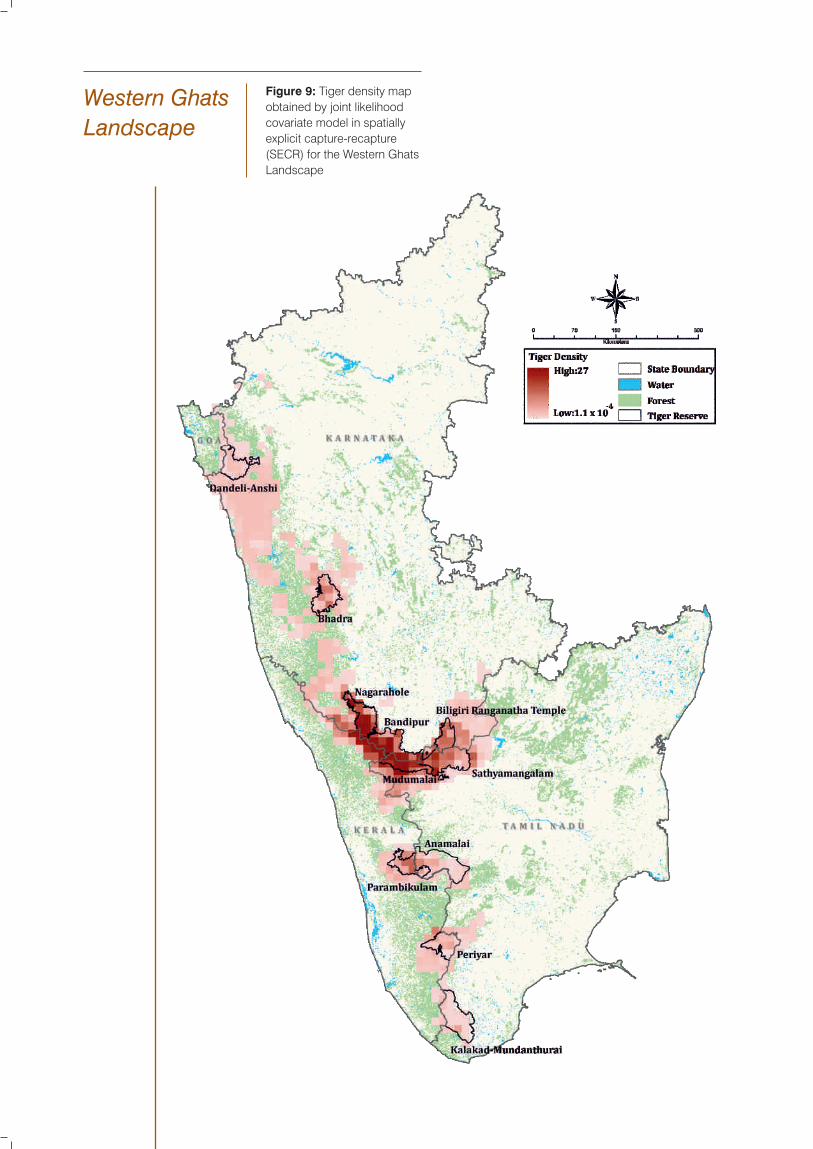
Figure 10: Tiger density map obtained
by spatially explicit capture-recapture
(SECR) and Maximum Entropy model
for the North Eastern Hills and
Brahmaputra Flood Plains Landscape
Figure 9: Tiger density map
obtained by joint likelihood
covariate model in spatially
explicit capture-recapture
(SECR) for the Western Ghats
Landscape
Western Ghats
Landscape
North Eastern Hills and
Brahmaputra Flood
Plains Landscape
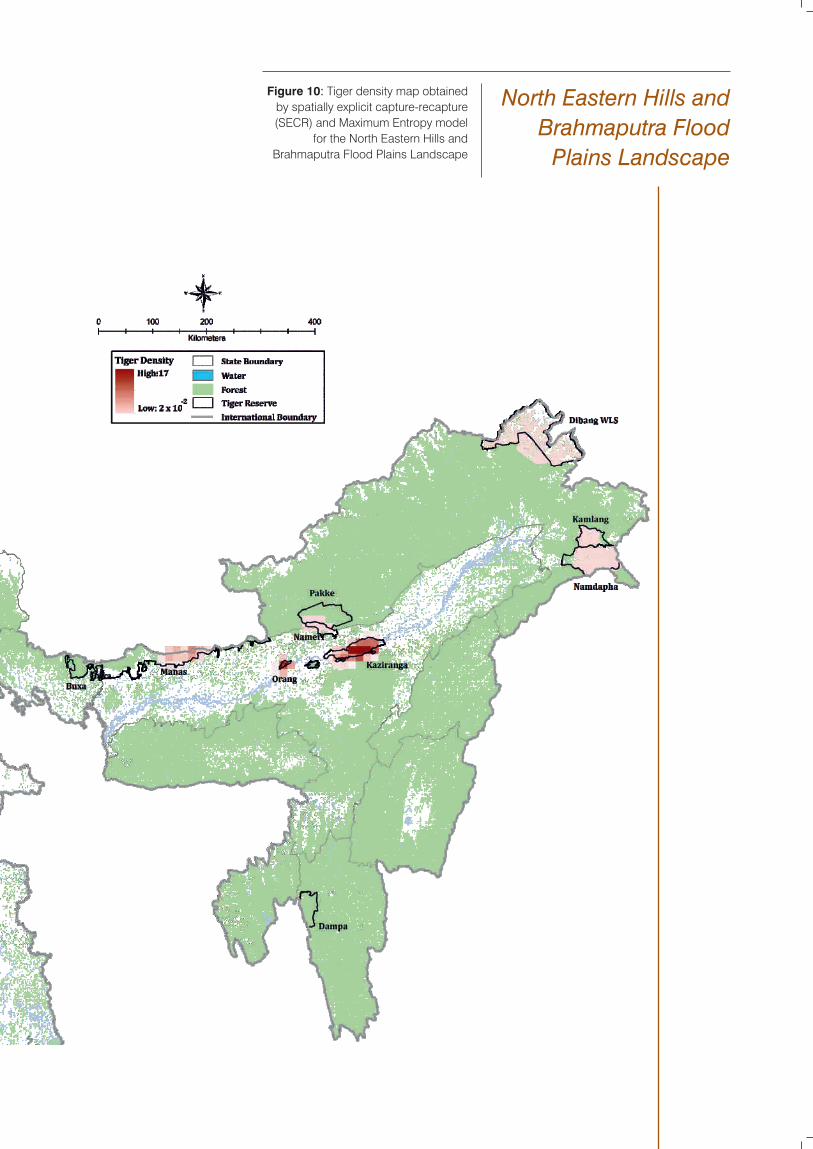

Figure 11: Spatially
explicit capture-mark-
recapture tiger density
map for the Sundarban
Landscape
Sundarban
Landscape
CONSERVATION
IMPLICATIONS
5
In this assessment cycle, a large area was camera trapped (121,337 km ), where 83% of 2
the tigers were photo-captured hence the major contribution to population estimate
(87%) was obtained directly from capture-mark-recapture, and only a small part of the
estimate was derived from the SECR covariate-based model. The covariate model has
been calibrated from areas having no tigers, to tiger densities exceeding 0.15 tigers km , -2
thus covering the full range of tiger densities.
Tiger population in India continues to increase, this rise is observed in areas with
substantial and good management inputs, complementing India's conservation efforts.
The populations of conservation priority based on genetic distinctiveness, diversity and
vulnerability were identified as those of North East Hills, Southern Western Ghats, and
tigers of Odisha and Valmiki . Of these, Southern Western Ghats and Valmiki populations 14
have shown improvement, while those of North East Hills and Odisha remain critically
vulnerable and need immediate conservation attention. The tiger reserves of Nameri and
Pakke have registered declines, while tigers have not been recorded in Buxa, Palamau,
and Dampa in this assessment. The poor tiger status in Indravati was related to law and
order situation in these areas. In areas where tigers have not been recorded or the
population has declined, restoration needs to proceed by improving protection,
augmentation of prey, and reintroduction of tigers from appropriate source. For
reintroduction of tigers into Palamau, prey augmentation needs to be coupled with
restoration of law and order. For tiger reintroduction or supplementation in Palamau and
Similipal, tigers need to be sourced from the closest source in the same genetic cluster . 14
Buxa and Dampa can be repopulated through reintroductions from Kaziranga, after prey
restoration in Buxa and strengthening protection in Dampa which has a good prey base.
Maintaining the source values of tiger reserve populations through good management,
protection and making the core areas inviolate through incentivized voluntary relocation
of human habitation has been the most important reason for continued improvement in
the status of tigers in India. Ensuring the functionality of habitat corridor connectivity
between source populations in India as well as with Nepal, Bhutan, Bangladesh and
Myanmar tiger populations is essential for the long-term viability of tiger populations
within India and the region. These habitat corridors are often threatened by development
of linear infrastructure. Careful spatial planning to avoid traversing critical habitats and
their linkages, along with appropriate mitigation through wildlife passage ways will ensure
that tigers and biodiversity conservation is not compromised by modern development.
22/23 STATUS OF TIGERS IN INDIA, 2018

Sustained conservation efforts through
continued "political will" have resulted in an
increase in tiger numbers. While there is
sufficient habitat to accommodate increasing
tigers in India, much of this habitat needs
conservation investment so as to recover prey
populations. Tiger habitat outside Protected
Areas are vital for linking source populations
but are extensively used by communities; a
conservation model that promotes tiger
permeability of such habitats while
simultaneously securing the livelihoods of
local communities is the answer. Managing
conflict promptly and providing economic
incentives from tigers will foster coexistence in
these multiple use forests and ensure the
long-term future of tigers in India. India has
once again lived up to its' expectations and
contributed significantly to the common goal
of the Global Tiger Recovery targets.
Wildlife Institute of India team:
Dr. V.B. Mathur,
Director;
Dr. G.S. Rawat,
Dean;
Dr. Bitapi Sinha,
Research Coordinator;
Dr. V.P. Uniyal,
Nodal Officer
Externally Aided Projects
Shri P.K. Agarwal,
Deputy Registrar
are acknowledged for their support
and facilitation.
Dr. Gopi G.V.
is acknowledged for providing data.
Shri Ashok Kumar
Ms. Kainat Latafat
Shri Ashish Prasad
Ms. Krishna Mishra
Shri Anup Kumar Pradhan
Ms. Anchal Bhasin
Shri Ninad Mungi
Shri Akshay Jain
Shri Deb Ranjan Laha
Ms. Papori Khatonier
Extract Compare Team
Dr. Lex Hiby
(program developer)
Ms. Ahana Dutt,
Sh. Muthu Veerappan
Senior Research Biologists
Ms. Manjari Roy,
Shri Sudip Banerjee,
Ms. Neha Awasthi,
Ms. Shweta Singh,
Shri Ritesh Vishwakarma
Research Biologists:
Research Assistants and Interns:
Volunteers
APPENDIX
Principal Investigators
Dr. Y.V. Jhala and
Prof. Qamar Qureshi
Faculties involved
all India tiger estimation:
Dr. Y.V. Jhala,
Prof. Qamar Qureshi &
Dr. Vishnupriya Kolipakam
NTCA-WII Tiger Cell Team:
Dr. Kausik Banerjee,
Shri Ujjwal Kumar,
Ms. Swati Saini,
Ms. Shikha Bisht and
Shri Ayan Sadhu
M-STrIPES Team:
Dr. Rajan Amin &
Kevin Dave for conceptualization.
Abhilasha Harendra Shrivastava
Adarsh Martandrao Kulkarni
Aishwarya Bhandari
Ajay Chauhan
Anish Kumar
Anjali Mehra
Ankita Sharma
Ashish Kumar Panda
Azam Khan
Bhawana Pant
Chiranjivi Sinha
Devesh Kumar Mishra
Farha Usmani
Gaurav P.J.
Genie Murao
Haritha V Mohanan
Indranil Bhowmick
Indranil Paul
Jyoti Sheoran
Kamakshi Singh Tanwar
Kesha Patel
Maitry Mayurkumar Jani
Manish Ashok Singanjude
Mohammad Mairaj
Monika Saraswat
Mouli Bose
Moulik Sarkar
Nanka Lakra
Nilanjan Basu
Nishant Nandkumar Zajam
Nupur Rautela
Parul Sen
Pooja Choudhary
Prashant Mahajan
Pratik Pramod Pansare
Pritam Kumar Dey
Priyadarshini Mitra
Rameshwar Pandurang Ghade
Ravi Kumar Sharma
Riddhi Sondagar
Sagarika Das
Samuel George
Satemmenla Longchar
Shalu Mesaria
Soufil Sharifmiya Malek
Sourabh Pundir
Sourabh Verma
Suhas S.N.
Suman Koley
Susmita Khan
Swaroop Rajendra Patankar
Tehlu Singh
Thilagavathi M
Tishya Dasgupta
Upamanyu Chakraborty
Vikas Verma
Vishwapriya, H.M
Vivekanand Kumar
Vyshakh A
Office Assistants: Shri Gyanseh Chhibber, Shri Vijay Prakash Baloni
SCIENCE (GIS Firm) team:
Shri Prabir De (Consultant),
Sh. Arun Kumar (M-STrIPES
app developer)
Indraprastha Institute of
Information Technology,
New Delhi team:
Dr. Saket Anand,
Sh. Gullal Singh Cheema
University of Petroleum and
Energy Studies, Dehradun
team:
Sh. Saurabh Shanu
Sh. Rahul Khot,
Bombay Natural History
Society is acknowledged for
providing data.
Name Designation
Headquarter
Dr. Anup Kumar Nayak ADG (PT) & MS (NTCA)
Dr. Debabrata Swain ADG (PT) & MS (NTCA)- Retd.
Dr. Amit Mallick IG
Dr. H.S. Negi ex-IG
Shri Surender Mehra DIG
Shri Nishant Verma DIG
Shri Sanjay Pathak ex-DIG
Dr. Vaibhav Mathur AIG
Dr. Rajaram Singh AIG
Regional Office Eastern Zone
Shri W. Longvah IG
Shri D.P. Bankhwal IG - Retd.
Ms. Agatha Momin Biologist
Regional Office Central Zone
Shri Hemant Kamdi AIG
Shri Anil Dashare Biologist
Regional Office Southern Zone
Shri N.S. Murali IG
Shri P.S. Somasekhar IG - Retd.
Shri Rajendra Garawad AIG
National Tiger Conservation Authority (NTCA) team
Abhijeet Gurung
Abhimanyu Bhardwaj
Abhishek Verma
Anjali Mishra
Anuroop Singh
Aparna Bhagat
Avinash Yadav
Ayushi Khanduri
Deepak Suyal
Himangshu Borah
Meera Makwana
Mukul Rawat
Naveen Negi
Neha Yadav
Patrick Bell
Pratikshya Mishra
Samridhi Dixit
Santanu Sharma
Siddharth Singh
Sugandha Gupta
Sumit Saha
Swati Singh
Vaishnavi Gusain
Vishant Saini
Yash Dabholkar
Yuyutshu Bhattacharya
Arpit Aggarwal
Garima Bhatt
Luxmi Hina
Mohammad Shaan
Priyanka Kaushik
Sakshi Tomar
Salmaan Khan
Santoshi Negi
Siddharth Rajmohan
Sunil Patel
Supragya Dimri
Tetseo Vetavolu
Tiazula Imchen
William Zanthansanga
Yash Sharma
Yukta Singh
I
26/27 STATUS OF TIGERS IN INDIA, 2018

Chief Wildlife
Wardens in the
States involved in
tiger status
estimation 2017-19
S. No. States Name
1 Shri. N. Prateep Kumar, Andhra Pradesh
Shri P. Mallikarjuna Rao,
Dr. Mohd Ilyas Rizvi,
Shri D. Nalini Mohan
2 Dr. R. Kemp, Arunachal Pradesh
Dr. Rabindra Kumar,
Dr. Bipin Behari
3 Shri Niranjan Vasu, Assam
Shri D.P. Bankhwal,
Dr. Ranjana Gupta
4 Shri Bharat Jyoti, Bihar
Shri A.K. Pandey
5 Dr. R.K Singh, Chhattisgarh
Shri Kaushlendra Singh,
Shri S.C. Agarwal,
Shri Rakesh Chaturvedi
6 Shri Ajay Saxena, Goa
Shri Santosh Kumar
7 Shri Lal Ratnakar Singh, Jharkhand
Shri P.K. Verma
8 Shri C. Jayaram, Shri Sanjay MohanKarnataka
9 Shri A.K. Bhardwaj, Kerala
Shri P.K. Keshavan,
Shri Surendra Kumar
10 Shri Jitendra Agrawal, Madhya Pradesh
Shri Shahbaz Ahmed,
Dr. U. Prakasham
11 Shri A. K. Mishra, Maharashtra
Shri N.H. Kakodkar
12 Dr. C.H. Muralidhar RaoMizoram
13 Shri Satya Prakash TripathiNagaland
14 Shri Siddhanta Das, Odisha
Dr. Sandeep Tripathi,
Dr. Ajay Kumar Mahapatra
15 Dr. G.V. Reddy, Rajasthan
Shri Arindam Tomar
16 Shri P.C. Tyagi, Tamil Nadu
Shri T.P. Raghunath
17 Dr. Manoranjan Bhanja, Telangana
Shri P.K. Jha
18 Shri S.K. Upadhyay, Uttar Pradesh
Shri Pawan Kumar,
Shri Sunil Pandey
19 Shri D.V.S. Khati, Uttarakhand
Shri Rajiv Bhartari,
Shri Jai Raj,
Shri Monish Mullick,
Ms. Ranjana Kala
20 Shri Ravi Kant SinhaWest Bengal
S. No. States Name
1 Shri S. Sarvanan, Andhra Pradesh
Shri Anand Kumar Jha,
Shri K. Gopinatha
2 Shri Tana Tapi, Arunachal Pradesh
Shri C. Loma,
Shri T. Riba,
Shri Koj Tassar
3 Dr. Satyendra Singh, Assam
Shri Utpal Bora
4 Shri S. Chandrasekhar, Bihar
Shri Hem Kant Roy
5 Dr. S.K. Singh, Chhattisgarh
Shri J.A.C.S Rao
6 Dr. A. Anil KumarGoa
7 Dr. M.P. Singh, Jharkhand
Shri Mohan Lal
8 Shri Manoj Kumar, Karnataka
Shri Subhash K. Malkhede
9 Shri George P Mathachen, Kerala
Shri K. Vijayanath,
Shri B.N. Anjankumar,
Ms. Silpa V Kumar,
Shri C.K. Haby,
Shri P.K. Vipin Das,
Shri M. Unnikrishnan
10 Shri Alok KumarMadhya Pradesh
11 Dr. Rambabu, Maharashtra
Shri Sunil Limaye,
Shri M.B. Naikwadi,
Shri Sachin M. Thakare,
Shri G.K. Washishth
12 Sh. Lalthlamuana PachuauMizoram
13 Shri Suman Shivashankar Sivachar W MNagaland
14 Dr. Jagyandatt Pati, Odisha
Shri Bhakta Padarbinda Rath,
Dr. Nimain Charan Palei
15 Dr. Sekhar Kumar Niraj, Tamil Nadu
Shri A. Venkatesh
16 Shri Munindra, Telangana
Shri A. Shankaran
17 Dr. S.P. Yadav, Uttar Pradesh
Shri A.K. Dwivedi,
Shri Pawan Kumar Sharma
18 Dr. Dhananjai Mohan, Uttarakhand
Shri Surendra Mehra,
Shri Ranajan Mishra
19 Shri N.S. Murali, West Bengal
Shri Nilanjan Mallick,
Shri Subhankar Sengupta,
Shri Kalyan Rai
All India tiger
estimation Nodal
Officials in the
States
28/29 STATUS OF TIGERS IN INDIA, 2018

State Name
Andhra Pradesh Shri S. Sarvanan, Dr. K. Suryanarayana, Shri P. Ramohan Rao
Shri N. Nageswara Rao, HYTICOS, Hyderabad
Arunachal Pradesh Shri Umesh Kumar
Assam Shri Sudip Banerjee (WII), Shri Deb Ranjan Laha (WII)
Bihar Shri Gaurav Ojha, Shri Ambarish Kumar Mall,
Dr. Kamlesh Maurya (WWF India), Shri Shariq Shafi (WWF India)
Chhattisgarh Dr. S.K Singh, Shri A.K Sonwani, Shri M.K Chaudhary,
Shri Loknath Patel, Shri S.K Sinha, Shri R.K Rayast, Shri K.L Nirmalkar,
Shri T.R Jaiswal, Shri Shyam Singh Dev, Shri Vivek Shukla
Jharkhand Dr. M.P. Singh, Shri Mohan Lal
Karnataka Information and Communications Technology (ICT) cell and Tiger cell, Aranya
Bhavan, Bengaluru
Kerala Dr. M. Balasubramanian, Shri M. Ramesh Babu, Dr. Patrick David,
Shri R. Rahul, Shri C. Sivakumar, Shri B. Karthik, Shri Vishnu Vijayan, Shri Shiju,
Shri Aneesh C.R.
Madhya Pradesh Dr. Dharmendra Varma - SFRI, Shri Vivek Jain, Shri Subharanjan Sen,
Shri Sanjay Shukla, Shri B.S. Annigeri, Shri L. Krishnamoorthy,
Shri H.S. Mohanta, Shri M. Pathak, Shri Ravikant Mishra,
Shri Rajnish Kumar Singh, Dr. Anjana Rajput - SFRI,
Dr. Aniruddha Majumdar - SFRI, Shri Gyan Prakash Shukla
Maharashtra Shri R.S. Govekar, Shri M.S. Reddy, Shri Mukul Trivedi, Dr. Ben V Clement,
Dr. Vinita Vyas, Shri Rishikesh Ranjan, Shri, N.R. Praveen,
Shri Amlendu Pathak, Shri Vishal Mali, Shri G.V. Sanap, Shri Kolhankar,
Shri Kavitkar, Shri L.N. Patil, Shri P.B. Panchbhai, Shri M. Toro, Shri Y. Bahale,
Shri S. Pardikar, Shri M. Khairnar, Shri Tushar Pawar, Shri Kishore Mankar,
Shri Manohar Gokhale, Shri M. Motghare, Shri Bobde, Ms. Morkute,
Shri V. Khedkar, Shri Azim Mujawar, Ms. Neenu Somarji, Shri R.K. Chavan,
Shri B.P. Rathod, Ms. G.S. Nannware, Shri S.S. Bhagawat, Shri G.P. Bobade,
Shri G.H. Luche, Shri D.V. Raut, Shri R.H. Kotrange, Shri P.R. Rathod,
Shri S.S. Pande, Shri A.H. Gore, Shri G.D. Thombare, Shri K.Y. Talwekar,
Shri Amaz Sidam, Shri Mohan Chati, Shri P. Humane, Shri, R. Bhongade,
Shri P.N. Naik, Shri P. Sathwane, Shri N.R. Gawande, Shri D.T. Dude,
Shri A.R. Deokar, Shri R.R. Sagir, Shri P.E. Patil, Shri C.R. Tambe,
Shri S.L. Bilolikar, Shri V.B. Kamble, Shri R.K. Bhawar, Shri K.M. Abharna,
Shri S.R. Dumare, Shri R.M. Wakde, Shri P.V. More, Shri S. Thipe,
Shri A.K. Mishra, Shri V.K. Bhorade, Shri S.G. Badhekar, Ms. Priyanka Bajaj
Tahaliyani, Ms. Pallavi Ghaskadbi (WII), Ms. Lynette Gomes, Shri Rahul Kale,
Shri Nilanjan Chatterjee (WII), Shri Zehidul Hussain (WII)
Nagaland Shri Y M Jami, Ms. K Caroline Angami, Shri Suman Shivashankar Sivachar W M,
Shri Jongpong Walling, Shri Kenlumtatei, Shri R. Aaron Yimchunger
Odisha Shri P. K. Sahoo, Dr. Jagyandatt Pati, Shri Bhakta Padarbinda Rath,
Dr. Nimain Charan Palei
Rajasthan Shri Y.K. Sahu, Dr. G.S. Bhardwaj, Shri Ghanshyam Prasad Sharma,
Shri Mukesh Saini, Shri Hemant Shekhawat, Dr. T. Mohan Raj
Tamil Nadu Dr. Sekhar Kumar Neeraj, Shri A. Venkatesh, Shri Srinivas R Reddy,
Shri V Ganeshan
Telangana Shri C.P. Vinod Kumar, Shri C. Sarvanan
Uttar Pradesh Shri V.K. Singh, Dr. Semmaran, Shri Manish Singh, Shri Adarsh Kumar,
Shri Kailash Prasad, Shri Samir Kumar, Shri Devendra Chaturvedi,
Shri R.K.P. Singh, Shri S.N. Yadav, Shri D.P. Shrivastava, Shri Ashok Kashyap,
Shri Ram Baran Yadav, Shri Ashok Chandra, Shri Dilip Shrivastava, Shri Asish
Bista ( WWF India)
Uttarakhand Shri Surendra Mehra, Shri Sanatan, Dr. Parag Dakate,
Shri Amit Verma, Shri G.S. Karki, Shri Ajay Sharma
West Bengal Shri Kalyan Rai, Shri Manish Yadav, Shri Durga Kant Jha, Shri Mayukh Ghosh,
Shri Ajoy Kumar Das, Shri Deepak M., Shri Kanu Chakraborty,
Shri Anindya Guhathakurta
Wildlife Institute Dr. Sutirtha Dutta, Dr. Amit Kumar
of India
Officials who
coordinated
training in the
states

Comments by Peers
Dr. Joseph BumpDeriving a population estimate for any rare and elusive species is a challenging task, but to do so
for dozens of tiger populations across the entire sub-continent of India is immense. The numbers
alone are phenomenal – 44,000 field staff, 600,000 person-days, 523,000 km of walked transects, 2318,000 habitat surveys, 26,800 camera trap locations across an area of 381,000 km yielding 35
million photographs of India's wildlife including 76,523 photos of tigers. Yet these efforts would
be redundant without using robust methods to analyse them. There has been criticism historically
about the methods used in previous tiger censuses, however I believe this is the most robust
estimate of tigers possible with detectability and observer error clearly accounted for as well as
possible, and I can think of no improvements based on the logistical constraints of our current
technological and analytic capabilities. Hence, I am confident that the latest estimate of tigers
across India is valid and robust, and represents a clear and impressive increase in population
size since the previous estimate.
India in general, and the project team in particular, should be lauded for their efforts and
investment in determining and securing the status of such a globally important and iconic
species. This project warrants expansion and should be implemented on a suite of iconic species
around the world. I wholeheartedly commend you for your wonderful efforts.
Yours sincerely
th thDuring my June 25 – July 4 visit to India, the Wildlife Institute of India provided an in depth and comprehensive showcase of the
methods and process to determine 'Status of Tigers, Co-predators, & Prey in India 2019.' India's effort to estimate its tiger
population is unprecedented globally and commendable in scale and scientific sophistication. The methods and process to
determine the status of tigers in India in 2018 is scientifically defensible; surveys are aligned with advancements in animal
abundance methods and use defensible statistical tools available within the constraints of national-scale assessment and
resources. Inclusion of both indices and camera-trap approaches makes pragmatic sense and such joint analyses strengthens
the overall assessment. Those responsible for leading tiger estimation in India wholly embrace that the scientific process of peer
review and publication in high-quality journals should guide the choice of appropriate methods for monitoring tigers and their
prey. Sensitivity analyses would add to the robustness of the process and help address warranted and unwarranted critiques,
thereby building confidence in the assessment. The voluntary village relocation program is a major step towards providing tigers
needed space, but care should be taken to ensure that villages are truly returned to wildlife habitat and not used for
administrative expansion. Investment in the well-being and working conditions of forest guards is an investment in the front line of
tiger conservation in India. To the extent that impacts to tiger corridors are minimized the healthy future of tigers is maximized.
Matt
Associate Professor, University of MinnesotaDirector of Graduate StudiesGullion Endowed Chair in Forest Wildlife Research & Education
Department of Fisheries, Wildlife and Conservation Biology
College of Food, Agricultural andNatural Resource Sciences
School of Environmental and Life SciencesUniversity of Newcastle, Callaghan, NSW 2308 Australia Facebook: Conservation Biology @ UoN
Dr. Matt Hayward
Associate Professor of Conservation
Twitter: @ConservResearch
Dr. Chris Carbone
th thDuring a recent visit to India between June 25 and July 4 , 2019, I was able to take part in discussions and meetings at the
Wildlife Institute of India (WII), the National Tiger Conservation Authority (NTCA), and Pench and Kanha National Parks. I was
given the opportunity to witness the processes involved in India’s effort to assess its tiger populations, which complimented an
earlier visit in 2006. I took part in a number of in-depth discussions with a range of people from senior officials to forest beat
guards. I commend WII and the Government of India for conducting the all-India tiger surveys. These represent a programme
which is unprecedented in scale, rigour and intensity. As far as I am aware, this is the largest centrally coordinated survey of its
kind in the world and represents an immense achievement providing invaluable information on the status of not only tigers, but a
wide range of coexisting mammals in tiger habitats. The methodology used balances the need to vary survey effort from core
tiger habitat to wider marginal areas. This programme combines, GIS analyses and the latest spatially-explicit methodologies in
cameratrapping along with wider-scale but lower intensity secondary sign surveys outside of tiger core areas making such a
large-scale survey achievable. There have also been impressive improvements since the original survey in 2006 due, in part, to
general technological advances (e.g. camera-traps, mobile phones and GPS etc.), but also due to the efforts of WII and partners
to develop software tools to automate the data recording and processing, including the use of M-STrIPES (phone app for all
types of in field data entry) and data analysis (Extract Compare (tiger ID) and CATRAT (species ID)). These advances are critical
to the process as they increase the speed and accuracy of data processing. The current report is immense in scale and intensity 2covering over 380,000 km and actually recording ~80% of the total tiger population directly in the photo record of ~ 75,000 tiger
photos. I don’t doubt that this represents an extremely robust and reliable estimate of the tiger population across the survey area.
Tigers are a vital part of India’s national heritage and recent reported increases are welcome news! It is essential therefore that
tiger core areas and key habitat corridors continue to be maintained and protected against threats of development. In addition, it
is important that working conditions of forest guards and other staff, which represent the front-line of India’s tiger protection
strategy, are reviewed to maintain motivation and effectiveness and to insure the future protection of tigers in the wild.
Senior Research Fellow, Doctoral Programmes CoordinatorInstitute of Zoology
Dr. Chris Carbone
APPENDIX2
32/33 STATUS OF TIGERS IN INDIA, 2018
Dr. Joseph K. Bump
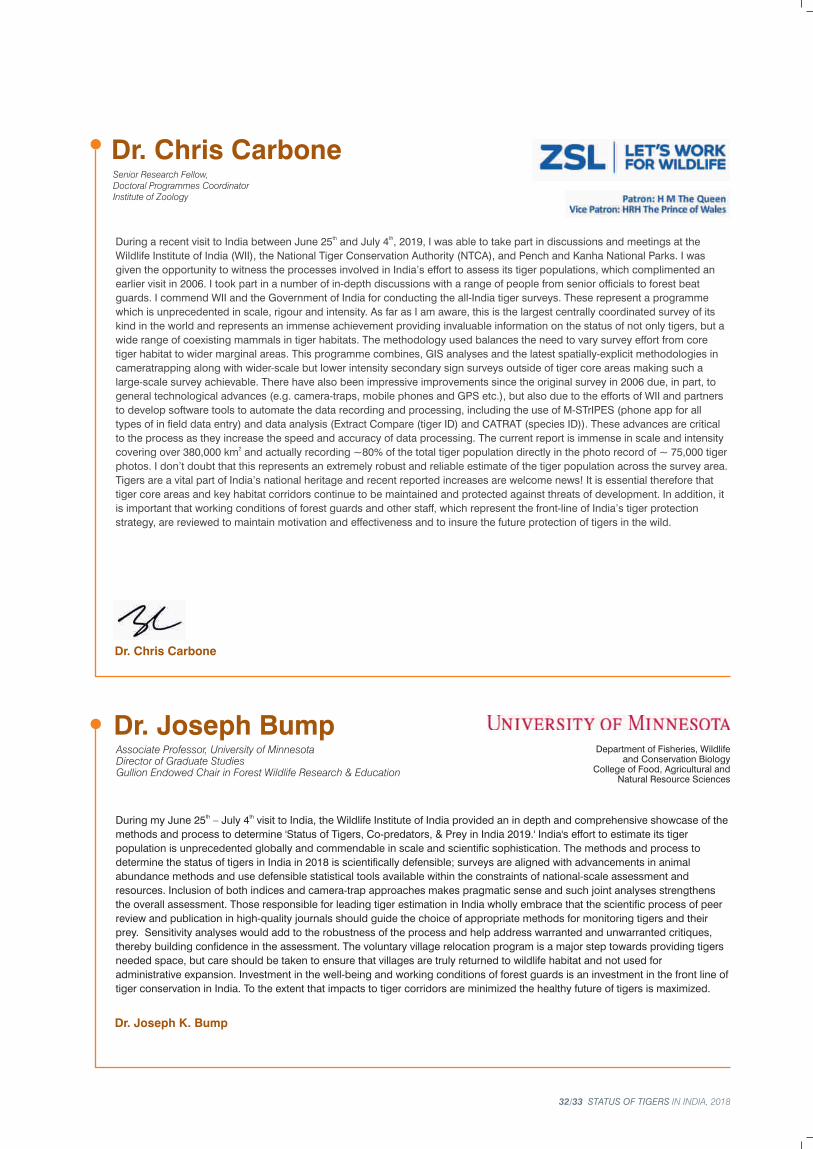

1. Goodrich, J., Lynam, A., Miquelle, D., Wibisono, H., Kawanishi, K., Pattanavibool,
A., Htun, S., Tempa, T., Karki, J., Jhala, Y. and Karanth, U. 2015. Panthera tigris.
The IUCN Red List of Threatened Species 2015: e.T15955A50659951.
http://dx.doi.org/10.2305/IUCN.UK.2015-2.RLTS.T15955A50659951.en.
2. Narain S., Panwar, H.S., Gadgil, M., Thapar, V. and Singh, S. (eds.) 2005. Joining
the dots: The report of the tiger task force. Project Tiger, Ministry of Environment
and Forests, New Delhi.
3. Jhala, Y.V., Gopal, R. and Qureshi, Q. (eds.) 2008. Status of tigers, co-predators
and prey in India. National Tiger Conservation Authority of India and Wildlife
Institute of India. TR08/001, Dehradun. Pp 164.
4. Jhala, Y.V., Qureshi, Q., Gopal, R. and Sinha P.R. (eds.) 2011b. Status of tigers, co-
predators and prey in India, 2010. National Tiger Conservation Authority, Govt., of
India, New Delhi and Wildlife Institute of India, Dehradun. TR 2011/003. Pp 302.
5. Jhala, Y.V., Qureshi, Q. and Gopal, R. (eds.) 2015. Status of tigers, co-predators
and prey in India, 2014. National Tiger Conservation Authority, Govt., of India, New
Delhi and Wildlife Institute of India, Dehradun. TR 2015/021. Pp 456.
6. Hiby, L., Lovell, P., Patil, N., Kumar, N.S., Gopalaswamy, A.G. and Karanth, K.U.
2009. A tiger cannot change its stripes: using a three-dimensional model to match
images of living tigers and tiger skins. Biology Letters 5: 383 - 386.
7. Jhala, Y.V., Qureshi, Q. and Gopal, R. 2017. Field Guide: Monitoring tigers, co-
predators, prey and their habitats. Fourth ed. Technical Publication of National
Tiger Conservation Authority, New Delhi and the Wildlife Institute of India,
Dehradun. TR-2017/012.
8. Crall, J.P., Stewart, C.V., Berger-Wolf, T.Y., Rubenstein, D.I., and Sundaresan, S.R.
2013. Hotspotter-pattern species instance recognition. In: 2013 IEEE workshop on
Applications of Computer vision, pp 230-237, Curran Associates, Red Hook, NY.
9. Borchers, D.L. and Efford, M.G. 2008. Spatially explicit maximum likelihood
methods for capture-recapture studies. Biometrics 64: 377-385.
10. Efford, M. 2011. Estimation of population density by spatially explicit capture-
recapture analysis of data from area searches. Ecology 92: 2202-2207.
11. Boom, R., Sol, C.J.A., Salimans, M.M., Jansen, C.L., Wertheim-Van Dillen, P.M.E.
and Noordaa, J.V.D. 1990. Rapid and simple method for purification of nucleic
acids. Journal of Clinical Microbiology 28: 495-503.
12. Bhagavatula J. and Singh L. 2006. Genotyping faecal samples of Bengal tiger
(Panthera tigris tigris) for population estimation: a pilot study. BMC Genetics 7(1):
48.
13. Phillips, S.J., Anderson, R.P. and Schapire, R.E. 2006. Maximum entropy modeling
of species geographic distributions. Ecological Modelling 190: 231-259.
14. Kolipakam, V., Singh, S., Pant, B., Qureshi, Q, and Jhala, Y.V. 2019. Genetic
structure of tigers (Panthera tigris tigris) in India and its implications for
conservation. Global Ecology and Conservation 20: e00710.
Literature cited

Photo Credits: Sanjay ShuklaSudhir MishraMoulik SarkarShantanu SharmaSamrat Godambe
Photo Credits: Sanjay ShuklaSudhir MishraMoulik SarkarShantanu SharmaSamrat Godambe
XP
RE
SS
ION
S:
92
19
55
25
63
|
D
oc
. N
o.
XP
S2
20
71
90
32
Wildlife Institute of IndiaChandrabani, Dehradun - 248001Uttarakhand, Indiawww.wii.gov.in
National Tiger Conservation AuthorityB-1 Wing, 7th Floor,Pt Deendayal Antyodaya BhawanCGO Complex, Lodhi Road,New Delhi 110 003, India
Copyright © 2022 FDOKUMEN