TIARA Annual Report 2000
327
JAERI-Review 2001-039 JPO150822 mm TIARA Annual Report 2000 November 2 0 0 1 Advanced Radiation Technology Center Japan Atomic Energy Research Institute
-
Upload
khangminh22 -
Category
Documents
-
view
0 -
download
0
Transcript of TIARA Annual Report 2000
JAERI-Review2001-039
JPO150822
mm
TIARA Annual Report 2000
November 2001
Advanced Radiation Technology Center
Japan Atomic Energy Research Institute

(T319-1195
^ - (=f319-1195
This report is issued irregularly.
Inquiries about availability of the reports should be addressed to Research Information Division,
Department of Intellectual Resources, Japan Atomic Energy Research Institute, Tokai-mura, Naka-
gun, Ibarakiken 319-1195, Japan.
©Japan Atomic Energy Research Institute, 2001
m
JAERI-Review 2001-039
TIARA Annual Report 2000
Advanced Radiation Technology Center
Takasaki Radiation Chemistry Research Establishment
Japan Atomic Energy Research Institute
Watanuki-cho, Takasaki-shi, Gunma-ken
(Received October 4, 2001)
This annual report describes research and development activities which have been performed with
the JAERI TIARA (Takasaki Ion Accelerators for Advanced Radiation Application) facilities from
April 1, 2000 to March 31, 2001. Summary reports of 103 papers and brief descriptions on the
status of TIARA in the period are contained. A list of publications, the type of research
collaborations and organization of TIARA are also given as appendices.
Keywords: JAERI TIARA, Ion Accelerators, Solid State Physics, Radiation Effects in Materials,
Materials for Space, Semiconductors, Organic Materials, Inorganic Materials, Nuclear
Fusion Reactor, Functional Materials, Radiation Chemistry, Radiation Biology, Nuclear
Medicine, Biotechnology, Radioisotope Production, Nuclear Chemistry, Radiation
Shielding, Materials Analysis, Microbeam Technology, Accelerator Technology, Safety
Control
(Eds.) Masahiro SAIDOH, Akio TORAISHI, Hideki NAMBA, Hisayoshi ITOH, Shigeru
TANAKA, Hiroshi NARAMOTO, Toshiakt SEKINE ,Atsushi TANAKA, Yasuhiko
KOBAYASHI, Kazuo ARAKAWA, Michiaki OTSUBO, Satoshi TAJIMA and
Susumu TANAKA
JAERI-Review 2001-039
(T I ARA)
(2001 ¥ 10 J!
2 0 0 0 ^ 4 ^ 1
N 3) 4) il^l»^^ 5)
9) 0
31 0, 2)^ 6)
= T370-1292 1233
Pk
JAERI-Review 2001-039
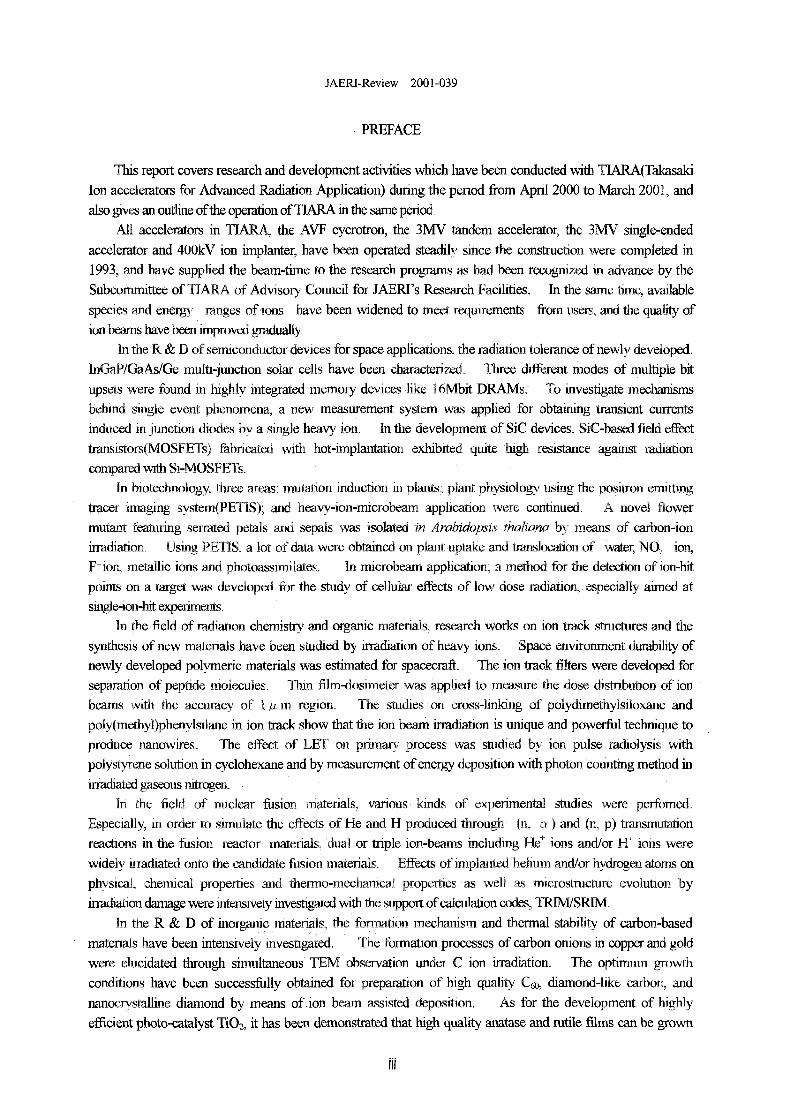
PREFACE
This report covers research and development activities which have been conducted with TTARA(Takasaki
Ion accelerators for Advanced Radiation Application) during the period from April 2000 to March 2001, and
also gives an outline of the operation of TIARA in the same period.
All accelerators in TIARA, the AVF cycrotron, the 3MV tandem accelerator, the 3MV single-ended
accelerator and 400kV ion implanter, have been operated steadily since the construction were completed in
1993, and have supplied the beam-time to the research programs as had been recognized in advance by the
Subcommittee of TIARA of Advisory Council for JAERI's Research Facilities. In the same time, available
species and energy ranges of ions have been widened to meet requirements from users, and the quality of
ion beams have been improved gradually.
In the R & D of semiconductor devices for space applications, the radiation tolerance of newly developed.
InGaP/GaAs/Ge multi-junction solar cells have been characterized. Three different modes of multiple bit
upsets were found in highly integrated memory devices like 16Mbit DRAMs. To investigate mechanisms
behind single event phenomena, a new measurement system was applied for obtaining transient currents
induced in junction diodes by a single heavy ion. In the development of SiC devices, SiC-based field effect
transistors(MOSFETs) fabricated with hot-implantation exhibited quite high resistance against radiation
compared with Si-MOSFETs.
In biotechnology, three areas: mutation induction in plants; plant physiology using the positron emitting
tracer imaging system(PETIS); and heavy-ion-microbeam application were continued. A novel flower
mutant featuring serrated petals and sepals was isolated in Arabidopsis thaliana by means of carbon-ion
irradiation. Using PETIS. a lot of data were obtained on plant uptake and translocation of water, NQ.,~ ion,
F"ion, metallic ions and photoassimilates. In rrucrobeam application, a method for the detection of ion-hit
points on a target was developed for the study of cellular effects of low dose radiation, especially aimed at
single-ion-hit experiments.
In the field of radiation chemistry and organic materials, research works on ion track structures and the
synthesis of new materials have been studied by irradiation of heavy ions. Space environment durability of
newly developed polymeric materials was estimated for spacecraft. The ion track filters were developed for
separation of peptide molecules. Thin film-dosimeter was applied to measure the dose distribution of ion
beams with the accuracy of 1 /z m region. The studies on cross-linking of polydimethylsiloxane and
poly(methyl)phenylsi]ane in ion track show that the ion beam irradiation is unique and powerful technique to
produce nanowires. The effect of LET on primary process was studied by ion pulse radiolysis with
polystyrene solution in cyclohexane and by measurement of energy deposition with photon counting method in
irradiated gaseous nitrogen.
In the field of nuclear fusion materials, various kinds of experimental studies were perfomed,
Especially, in order to simulate the effects of He and H produced through (n, a ) and (n, p) transrnuiafion
reactions in the fusion reactor materials, dual or triple ion-beams including He+ ions and/or Yt ions were
widely irradiated onto the candidate fusion materials. Effects of implanted helium and/or hydrogen atoms on
physical, chemical properties and thermo-mechanical properties as well as microstructure evolution by
irradiation damage were intensively investigated with the support of calculation codes, TRIM/SRUV1.
In the R & D of inorganic materials, the formation mechanism and thermal stability of carbon-based
materials have been intensively investigated. The formation processes of carbon onions in copper and gold
were elucidated through simultaneous TEM observation under C ion irradiation. The optimum growth
conditions have been successfully obtained for preparation of high quality C ^ diamond-like carbon, and
nanocrystalline diamond by means of ion beam assisted deposition. As for the development of highly
efficient photo-catalyst TiCK, it has been demonstrated that high quality anatase and rutile films can be grown
JAERI-Review 2001-039
epitaxially by pulsed laser deposition. Ion implantation of F into l iO 2 has also been performed to improve its
photo-reactivity.
In the ion beam analysis studies have been performed based on various different moyivations. The
secondary electrons spectroscopy combined with ion shadowing was developed further by confirming
non-diffraction effect. The in-situ analysis of solid-liquid interface was successfully employed to
determine the reaction kinetics in leaching process of nuclear waste materials. The interactions of cluster
ions with solids have been made in polymeric materials and crystalline solids, and the non-linear effect seems
to be influential in the radiation damage and also in the beam counting.
In nuclear science and radioisotope production, development of biomedica! radioisotopes has been
continued. Excitation functions for no-carrier added production of 186Re that is expected to be used in
radioimmunotherapy have been measured for deuteron-induced reactions on a tungsten target. Using an
isotope separator on-line, a search was made to find a proposed 12f'La isomer in measurement of internal
conversion electrons. A candidate transition for the isomer has been obtained. A laser ion source for an
isotope separator on-line has been developed; ionization of a short-lived aluminum isotope was enhanced by
photoionization. An isotope separator has 'been used for the first time to produce endohedral bjXe-fiilierene.
In the field of ion beam engineering, the fluoride concentration and distribution in the teeth were measured
by using proton induced gamma-ray emission in the micro beam system.. In the m-air micro-PIXE analysis
system, success of elemental distribution mapping in a human leukemia cells and of single fog droplets with
spatial resolution of 1 // m are worthy of note.
In the field of radiation shielding for accelerator facilities, 'three experiments have been performed aiming
to contribute to the radiation safety of the accelerators facilities. The first one is on the formation of
radioactive aerosols under high-energy radiation fields and the results were discussed in terms of the
attachment model. The second is on the measurements of dose distribution and microdosimetric spectra on
and inside a plastic phantom behind iron shield with a tissue equivalent detector. The third one is on the
comparison of the liquid scintillators responses with and without boron loading in order to improve a neutron
detector.
The sources of instability of cycrotron beam intensities were analyzed as the function of elapse time after
switching-on the AVF cycrotron. It is conformed that the cause of beam instability is correlated closely to the
change of magnetic field through the temperature change of the magnet yokes and pole tips. Constructing
the temperature control system for the cycrotron magnet successfully stabilized the magnetic field strength.
The reception of users, general management of the facilities, safety management of the radiation controlled
areas, support on utilization of facilities, and other duties have been also practiced smoothly.
The tenth TIARA Research Review Meeting was held on June 18 -19, 2001 in Takasaki, of which
subjects were reported in this issue, 8 keynote and one invited lectures as well as one memorial lecture were
presented. Three hundred twenty seven persons participated in the meeting. In contrast with the earlier
meetings, numerous results of TIARA utilization were presented, suggesting 'the TIARA is now becoming a
fruitful facility.
We owe the progress mentioned above to advices of the Consultative Committee for the
JAERI-Universities Joint Research Project Advisory Council JAERTs Research Facilities and their
subcommittees.
qMasahiro Saidok Director
Advanced Radiation Technology Center
Takasaki Radiation Chemistry Research Establishment
IV
JAERI-Review 2001-039
Contents
1. Semiconductors for Space • 1
1.1 Radiation Tolerance of Multi- junction Space Solar Cells 3
1.2 Analysis of Single-ion Multiple-bit Upset in Commercia l High-density D R A M s 6
1.3 Angular Dependence of Ion-induced Current Measured by TIBIC System —— • 9
1.4 Development of Coll imated Swift Heavy-ion Micro-beams for Investigation ofSingle Event Phenomena 12
1.5 Analysis of Failure Caused by Cosmic Rays in High-voltage High-power
Semiconductor Devices • • 14
1.6 Radiation Tolerance of Silicon Carbide Metal-oxide-semiconductor Transistor
with Annealed Gate Oxide 17
1.7 Study of Proton- and Electron-irradiation Effects on CuInSe 2 Thin Films 20
1.8 Pulsed-ESR Characterization of Diamond implanted with High Energy
Phosphorus Ions at High Temperature —- • 23
2. B i o t e c h n o l o g y - - - • —• - - —•• 27
2.1 Differential G-value of Oxidation of Phenylalanine in Aqueous Solution
Irradiated with Energetic Heavy Ions • • 31
2.2 The Influence of C Ion B e a m Irradiation on Nuclear D N A Content in Plants
Regenerated from Irradiated Leaf Expiants in Chrysan themum 34
2.3 Effects of 12C5+ Ion Beams on Germination and Leafing of Seed in
Chrysanthemum. {Dendranthema Grandiflora Tzvelev.) 36
2.4 Development of Cell Surgery Technique by Ion Microbeam 38
2.5 Effects of Ion Beam Irradiation on the Growth of Netted Melon (Cucumis Melo L.) —• 40
2.6 Carbon and Helium Ion Beam Irradiation Effects on Seedling and Plant
Characters of Tomato cv. First- • 42
2.7 Induction of Mutation in Spiraea by Ion Beam Irradiation —Effects of Ion Beams on
Germination of Spiraea Seed^ —•• • • 45
2.8 Isolation and Characterization of the lon-beam-induced New Arabidopsis Floral
Mutant,Fn7/1 •• -•• • - • • 47
2.9 Mutation Breeding using Ion-beam Irradiation in Aster 59
2.10 Mutation Generation in Carnation Plants Regenerated from in Vitro Leaf Cultures
Irradiated with Ion Beams - —• 52
2.11 Mutation Induced by Ion Beam Irradiation to Hinoki Cypress Shoot Primordia 55
2.12 Mutation Induction with Ion Beam Irradiation in Garlic(AUium Sativum. L.) 57
2.13 Mutation Breeding of RiceJBggplant and Gioriosa by Ion Beam Irradiation 59
2.14 Production of Mutants that have High Ability to Assimilate Nitrogen Dioxide by
the Irradiation of Ion Beams in Ficus Stipulata. - • 62
JAERI-Review 2001-039
2.15 Induction of Somatic Mutation by Ion Beam Irradiation in Lethal Chlorophyl
Mutant of Rice • 64
2.16 Genetic Screening of Antiauxin Mutants in Arabidopsis Thaliana 67
2.17 Isolation of Response Deficient Mutants to Environments from Plant Seeds
Irradiated with Ion-beam • • • • •——•• 70
2.18 System of Cell Irradiation with a Precise Number of Heavy.Ions-— 73
2.19 Effects of Locally Targeted Heavy Ions to the Zygotic Nuclei During Early
Development of the S\\V.\Norm,Bomhyx Mori • • 76
2.20 Ion Beam Mutagenesis in a Model Legume Lotus Japonicus ••••••• • 79
2.21 Effects of ion Beam Irradiation on Sweetpotato Callus and Chrysanthemum
Leaf Discs--- •••••• 8 2
2.22 Effects of Helium Ions and Gamma Rays Irradiation of Sexual Plant Reproductive
Stages on Seed Production and Postembryonic Leaf Development in
BrassicaNapus L. • •••• 35
2.23 Development of the Pollen Transformation System and Analysis of Apoptosis
Induction by Local Damage, using Penetration Controlled Irradiation with Ion
Beams ••• •• 87
2.24 Utilization of Ion Beam-irradiated Pollen in Plant Breeding ••••• 88
2.25 Dynamical Study on Influence of CO2 Enrichment to the Transportation of
Photoassimilates using Positron Imaging ••• 90
2.26 Analysis of Nitrogen Absorption and Translocation by Soybean Grown inDifferent Conditions for Phosphorus Supply 93
2.27 Zinc Translocation Oscillates in a Leaf of Zinc-deficient Rice • 96
2.28 Effects of Environmental Stress on "C Distribution in Rice Plants Detected by
PETIS Detector ••••• ••• 99
2.29 Water and Trace Element Behavior in a Plant-————•—••••••— ••• • ••• 102
2.30 Uptake of I8F-water 15O-H2O and l3N(Xin Tomato P l a n t s - - • ——- 105
2.31 Single-hit Effects and By-stander Effect on Cells by Heavy-ion Microbeams 107
2.32 Fundamental Study on Radiotherapy of Tumors to Beneficial Companion
Animals using Heavy Ion Beam 110
3. Radiation Chemistry/Organic Materials \ 13
3.1 Study on Space Environment Durability of Newly Developed Polymeric
Materials for Spacecraft (II) — • • 115
3.2 Preparation of Ion Track Membranes and Their Separation Characteristics of
Peptide Molecules •• • 118
3.3 Application of Thin Film Dosimeters to Measurement of Ion Beam Dose
Distribution II 120
3.4 Cross-linking of Polydimethylsiloxane in Heavy Ion Tracks • 122
3.5 Nano-wire Formation along Ion Projectiles in Polysilane Thin Films 125
VI
JAERI-Review 2001-039
3.6 Primary Process of Radiation Chemistry Studied by Ion Pulse Radiolysis 129
3.7 Measurement of Energy Deposition Around the Heavy Ion Trajectory by Photon
Counting Method 131
4. Inorganic Materials 133
4.1 He Ions Implantation Effect on the Thermal Diffusivity of CVD-SiC 135
4.2 Effects of Helium Embrittlement on Fatigue Properties of Reduced Activation
Ferritic/Martensitic Steel • 138
4.3 Effects of Triple Beams on Microstructural Evolution in Ferritic/Martensitic Steels 141
4.4 Investigation of the Resonant Vibration Modes of Self Interstitial Atoms in
Metals by Low Temperature Specific Heat Measurement 144
4.5 Study of Ion-induced Structural Changes in Li2Ti03 Ceramics-- 146
4.6 Damage Evolution in High Energy Multi Ion-irradiated BCC Metals and the
Interaction between Gas Atoms(H and He) and Damage Defects 149
4.7 Dose Rate Effects on Microstructural Evolution in Austenitic Stainless Steels
under Ion Irradiation- ••••••• • • 152
4.8 Effect of Simultaneous Ion Irradiation on Microstructural Change of SiC/SiC
Composites at High Temperature ••• • •—•• 155
4.9 Radiation Induced Cavity Formation in F82H with Various Heat and Mechanical
Treatments • • 158
4.10 Comparison of Cavity Formation Behavior in RAF/M Steels Irradiated with
Dual Beams of Fe +He Ions as Observed in the Depth Dependent Damage
Structure • • ••••• ••• •••*•• • • 161
4.11 Investigation of Hardness Changes on Helium-ion Implanted Iron by
Ultra-micro-hardness Testing— — 164
4.12 Effect of Ion Irradiation on Corrosion Behavior of Austenitic Stainless Steel—— 167
4.13 Effect of Radiation on Microstructures and Corrosion Resistance of Austenitic
Stainless Steels • 170
4.14 Nucleation and Growth of Carbon Onions in Cu and Au under Ion Implantation ••••--••• 173
4.15 Thermal Response of the Metal/Fullerite Hybrid Assembly 176
4.16 Deposition and Characterization of Carbon Films Prepared by
Ion-bombardment-assisted Method ••••• 179
4.17 Evolution of C0+C60 Structures during Co-deposition and SubsequentAnnealing • 181
4.18 Modification of Carbon Related Films with Ion Beams • 183
4.19 Formation Process and Stability of Radiation-induced Non-equilibrium Phase in
Silicon ; — • 186
4.20 Improvement in Surface Roughness of Nitrogen-implanted Glassy Carbon by
Hydrogen Doping • • • 188
4.21 Temperature Dependence of Growth Process of C6o Thin Films on a KBr(OOl)
JAERI-Review 2001-039
Surface • 190
4.22 Thermal Relaxation of Hydrogen Disordering in Palladium-hydrogen System
Irradiated with Energetic Electrons 193
4.23 Anomalous Change in Electrical Resistivity in EuBa2Cu3Oy Superconductor
Irradiated with Energetic Electrons ' 195
4.24 Defect Accumulation in Nanocrystalline Gold Irradiated with Electrons at LowTemperature • • 197
4.25 Epitaxial Anatase and Rutile TiO2 Films Prepared by Pulsed Laser Deposition 199
4.26 Effect of Fluorine-ion Implantation in TiO2 Rutile Single Crystals 201
5. Material Analysis • —• • ••••— - - 205
5.1 In-situ Observation of Growth Processes of Transition Metal Compound Thin
Films by Carbon-implantation • • • 207
5.2 Development of In-situ Ion Beam Analysis of Adsorbate Atoms at the Solid-
liquid Interface •••— • • ••• ••• • 210
5.3 Carbon KVV Auger Electron Emission from HOPG Bombarded by Fast Protons 212
5.4 Characterization of Defects and Hydrogen Absorption in Pd Irradiated with Protons 215
5.5 Chemical Modifications of Polycarbonate by Cn+ Cluster Irradiation 218
6. Nuclear Science and RI Production*—— • • •••—• 221
6.1 Development of a Laser Ion Source with an Ohmic-heating Ionizer for the
TIARA-ISOL •• • • ••- 223
6.2 Internal Conversion Electron Measurements in the Decay of the Proton-rich Isotope!26Ce using an On-line Mass Separator- • - • • 226
6.3 Synthesis of Endohedral 133Xe-fuIlerene by Ion Implantation 228
6.4 Excitation Functions of Rhenium Isotopes on the natW(d,xn) Reactions and Production
of No-carrier-added !86Re- • • 230
7. Microbeam Application • • 233
7.1 Evaluation of Three Dimensional Microstructures on Silica Glass Fabricated by
Ion Microbeam • •• • • - 235
7.2 Development of High Performance Buffer Materials — Sorption Mechanism of
Europium by Apatite and Smectite Mixture using RBS and Micro-PIXE— 238
7.3 Development of In-air Micro-PIXE System for High-efficiency Elemental Analyses 241
7.4 Fluoride Uptake Measurement using Microbeam PIGE 244
7.5 Application of In-air Micro-PIXE Camera to Bovine Aortic Endothelial Cells and
Human Leukemia Cells 247
7.6 Application of Micro-PIXE to the Analysis of Single Fog Droplets 250
7.7 In-air Micro-PIXE Analysis of Ascitic Hepatoma Tissue Slices- • 253
7.8 Redistribution of Elements between Minerals in Rocks —Analysis of Uranium
JAERI-Review 2001-039
Distribution in Rocks by n -PIXE— 256
7.9 Radiation Damage in Si PIN Diodes Induced by Heavy Ion Microbeam Single Hits 259
7.10 Development of a High-energy Microbeam Single Ion Hit Technique for
Bio-medical Applications 262
8. Radiation Shielding for Accelerator Facilities 265
8.1 Study of Particle Size Distribution of Radioactive Aerosols Formed by Irradiation
of 65 MeV Quasi-monoenergetic Neutrons • • • 267
8.2 Measurement of Neutron Dose behind Iron Shield with Tissue Equivalent
Proportional Counter 270
8.3 Development of Neutron Monitor using a Liquid Scintillator 273
9. Accelerator Technology/TIARA General 277
9.1 Beam Energy Measurement by the Time-of-flight Technique 279
9.2 Study of Beam Energy Spreads for the Single-ended Accelerator using Nuclear
Resonance Reactions ( n ) 281
9.3 Measurement of MeV Energy Cluster Ion Beam Current •••• •••• 283
9.4 Development of Transparent-type Beam Current Monitor-- • 285
9.5 Development of the Sub-micron Ion Beam System at keV Range • • 287
9.6 Temperature Control of Cyclotron Magnet for Stabilization of Magnetic Field
Strength • • 290
9.7 Present Status of JAERIAVF Cyclotron System • • 293
9.8 Renewal of Computer Control System of the 3MV Tandem Accelerator ••• 296
10. Status of TIARA 2000 299
10.1 Utilization of TIARA Facilities — • • •••• 301
10.2 Operation of the Electrostatic Accelerators- • • 303
10.3 Operation of JAERIAVF Cyclotron System 304
10.4 Radiation Control & Radioactive Waste Management in TIARA 305
Appendix : 309
Appendix 1. List of Publication • 311
Appendix 2. Type of Research Collaboration 325
Appendix 3. Organization and Personnel of TIARA- 327
IX

PLEASE BE AWARE THATALL OF THE MISSING PAGES IN THIS DOCUMENT
WERE ORIGINALLY BLANK
JAERI-Review 2001-039
1. Semiconductors for Space
1.1 Radiation Tolerance of Multi-junction Space Solar Cells 3Q.Anzawa, S.Kawakita, K.Aoyama, M.Imaizumi, S.Matsuda, T.Ohshima,T.Hirao, H.Itoh, M.Saito, and Y.Matsumoto,
1.2 Analysis of Single-ion Multiple-bit Upset in Commercial High-density DRAMs 6
H.Shindou, A.Makihara, T.Aburaya, S.Kuboyama, S.Matsuda, T.Hirao,T.Ohshima, M.Yoshikawa , and H.Itoh
1.3 Angular Dependence of Ion-induced Current Measured by TIBIC System 9H.Mori, T.Hirao, J.S.Laird, S.Onoda, and H.Itoh
1.4 Development of Collimated Swift Heavy-ion Micro-beams for Investigation ofSingle Event Phenomena 12
S.Onoda, T.Hirao, H.Mori, and H.Itoh1.5 Analysis of Failure Caused by Cosmic Rays in High-voltage High-power
Semiconductor Devices 14H.Matsuda, I.Omura, Y.Sakiyama, K.Shibata, H.Ohashi, T.Hirao, T.Ohshima,J.S.Laird, H.Itoh, H.Mori, and S.Onoda
1.6 Radiation Tolerance of Silicon Carbide Metal-oxide-semiconductor Transistorwith Annealed Gate Oxide •••• • • • 1 7
T.Ohshima, H.Itoh, and M.Yoshikawa1.7 Study of Proton- and Electron-irradiation Effects on CuInSe2 Thin Films 20
A.Yoshida, H.S.Lee, H.Okada, A.Wakahara, T.Ohshima, HJtoh, S.Kawakita,M.Imaizumi, and S.Matsuda
1.8 Pulsed-ESR Characterization of Diamond implanted with High Energy PhosphorusIons at High Temperature • • 23
J.Isoya, T.Ohshima, Y.Morita, and H.Itoh
- 1 -
JAERI-Review 2001-039
1.1 Radiation Tolerance of Multi-j unction Space Solar Cells
Osamu Anzawa, Shiro Kawakita, Kazuhiro Aoyama, Mitsuru Imaizumi,Sumio Matsuda, Takeshi Ohshima*, Toshio Hirao*, Hisayoshi Itoh*, MasashiSaito, Yusuke Matsumoto**National Space Development Agency of Japan (NASDA), Department of MaterialDevelopment, JAERI*, Advanced Engineering Service(AES) corporation**
1. Introduction
It is important to improve radiation tolerance
of space solar cells, which play a role of power
source of satellites, in order to extend the
mission life time of satellites. Therefore,
evaluation of radiation degradation of space
solar cells is necessary in developing new type
cells like multi-junction cells.
An InGaP/GaAs/Ge triple-junction solar cell
is formed by stacking three different sub cells
(InGaP top cell, GaAs middle cell, and Ge
bottom cell) on a Ge substrate. The
triple-junction solar cell shows extremely high
conversion efficiency, because the InGaP top
cell, the GaAs middle cell and the Ge bottom
cell effectively convert short, middle and long
wavelength light into electricity, respectively.
The output current of the multi-junction solar
cell is limited by the lowest photocurrent
generated at among the three sub cells. In order
to improve radiation tolerance of the
n-electrode
- anti reflection coatingwindow layer
n-GalnP
p-GalnP
BSF lavar
n layerwindow layer
n-GaAs
p-GaAs
BSF layer
layer i J
buffer layer
n-Ge layer
p-Ge substrate
top eel)
• tunnel junction
middle cell
tunnel junction
• bottom cell
• p-electrode
multi-junction solar cell, it is necessary to obtain
degradation characteristics of each sub cell by
irradiation. In this study, proton irradiation
experiments with various energy have been
carried out for the triple-junction solar cell and
its degradation characteristics have been
evaluated.
2. Experiments
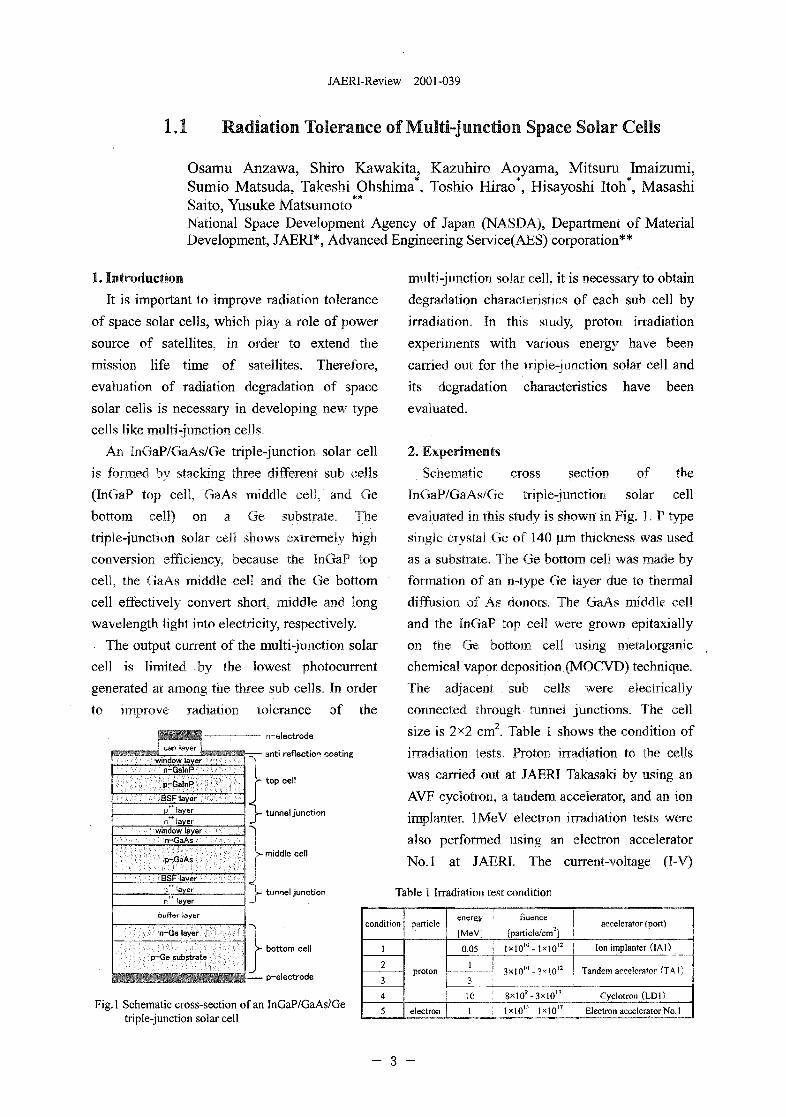
Schematic cross section of the
InGaP/GaAs/Ge triple-junction solar cell
evaluated in this study is shown in Fig. 1. P type
single crystal Ge of 140 urn thickness was used
as a substrate. The Ge bottom cell was made by
formation of an n-type Ge layer due to thermal
diffusion of As donors. The GaAs middle cell
and the InGaP top cell were grown epitaxially
on the Ge bottom cell using metalorganic
chemical vapor deposition (MOCVD) technique.
The adjacent sub cells were electrically
connected through tunnel junctions. The cell
size is 2x2 cm2. Table 1 shows the condition of
irradiation tests. Proton irradiation to the cells
was carried out at JAERI Takasaki by using an
AVF cyclotron, a tandem accelerator, and an ion
implanter. lMeV electron irradiation tests were
also performed using an electron accelerator
No.l at JAERI. The current-voltage (I-V)
Table 1 Irradiation test condition
Fig.l Schematic cross-section of an InGaP/GaAs/Getriple-junction solar cell
condition
1
2
3
4
5
particle
proton
electron
energy i fiuence
[MeVJ : (particle/cm2]
0.05 | l x l0 1 0 - l x l0 1 2
1 i , . . , n 1 0 - > . . I n l 2
10 g x l 0 9 - 3 x l 0 "
1 i l x l O 1 5 - i x i o "
accelerator (port)
Ion implanter (IA1)
Tandem accelerator (TA1)
Cyclotron (LD1)
Electron accelerator No.l
- 3 -
JAERI-Review 2001-039
characteristics of the cells were measured under
light illumination from an AMO solar simulator at
NASD A. The temperature of the cells was kept at
28 °C during the I-V measurements. The quantum
efficiency (QE) of each sub cell was individually
measured at 28 °C. During the measurement of
QE of a sub cell, the sample cell was illuminated
by color bias light in order to activate the other
sub cells. An appropriate electric bias was
applied between the electrodes of the sample cell
in order to measure QE for each sub cell under
zero bias (short circuit) condition.
3. Results and Discussion
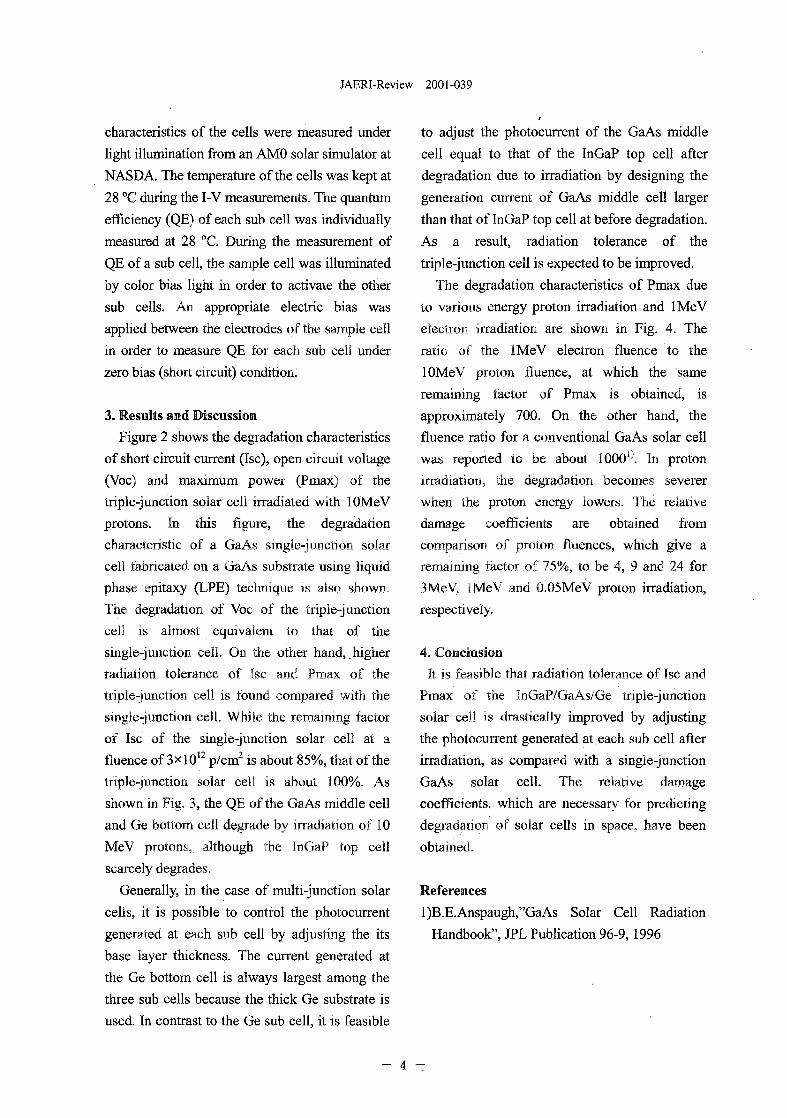
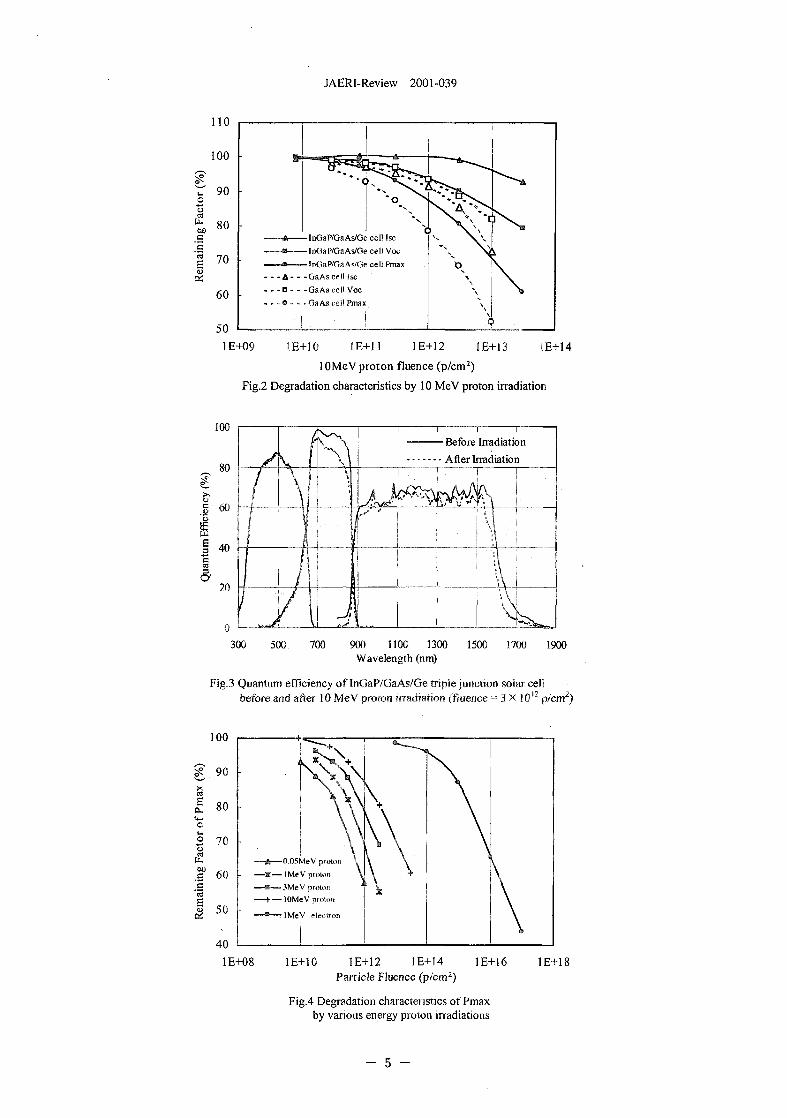
Figure 2 shows the degradation characteristics
of short circuit current (Isc), open circuit voltage
(Voc) and maximum power (Pmax) of the
triple-junction solar cell irradiated with lOMeV
protons. In this figure, the degradation
characteristic of a GaAs single-junction solar
cell fabricated on a GaAs substrate using liquid
phase epitaxy (LPE) technique is also shown.
The degradation of Voc of the triple-junction
cell is almost equivalent to that of the
single-junction cell. On the other hand, .higher
radiation tolerance of Isc and Pmax of the
triple-junction cell is found compared with the
single-junction cell. While the remaining factor
of Isc of the single-junction solar cell at a
fluence of 3xlO12 p/cm2 is about 85%, that of the
triple-junction solar cell is about 100%. As
shown in Fig. 3, the QE of the GaAs middle cell
and Ge bottom cell degrade by irradiation of 10
MeV protons, although the InGaP top cell
scarcely degrades.
Generally, in the case of multi-junction solar
cells, it is possible to control the photocurrent
generated at each sub cell by adjusting the its
base layer thickness. The current generated at
the Ge bottom cell is always largest among the
three sub cells because the thick Ge substrate is
used. In contrast to the Ge sub cell, it is feasible
to adjust the photocurrent of the GaAs middle
cell equal to that of the InGaP top cell after
degradation due to irradiation by designing the
generation current of GaAs middle cell larger
than that of InGaP top cell at before degradation.
As a result, radiation tolerance of the
triple-junction cell is expected to be improved.
The degradation characteristics of Pmax due
to various energy proton irradiation and lMeV
electron irradiation are shown in Fig. 4. The
ratio of the IMeV electron fluence to the
lOMeV proton fluence, at which the same
remaining factor of Pmax is obtained, is
approximately 700. On the other hand, the
fluence ratio for a conventional GaAs solar cell
was reported to be about lOOO'l In proton
irradiation, the degradation becomes severer
when the proton energy lowers. The relative
damage coefficients are obtained from
comparison of proton fiuences, which give a
remaining factor of 75%, to be 4, 9 and 24 for
3MeV, IMeV and 0.05MeV proton irradiation,
respectively.
4. Conclusion
It is feasible that radiation tolerance of Isc and
Pmax of the InGaP/GaAs/Ge triple-junction
solar cell is drastically improved by adjusting
the photocurrent generated at each sub cell after
irradiation, as compared with a single-junction
GaAs solar cell. The relative damage
coefficients, which are necessary for predicting
degradation of solar cells in space, have been
obtained.
References
l)B.E.Anspaugh,"GaAs Solar Cell Radiation
Handbook", JPL Publication 96-9,1996
- 4 -
JAERI-Review 2001-039
InGaP/GaAs/Ge eel! IscInGaP/GaAsK3e cell VocInGaP/GaAs/Ge cell Pmax
A- - -GaAscell isca . . -GaAs cell Voco . . -GaAs cell Pmax
1E-HJ9 1E+10 1E+11 1E+12 1E+13 1E+14
1 OMeV proton fluence (p/cm2)
Fig.2 Degradation characteristics by 10 MeV proton irradiation
Before Irradiation
After Irradiation
&
300 500 700 900 1100 1300 1500 1700 1900Wavelength (nm)
Fig.3 Quantum efficiency of InGaP/GaAs/Ge triple junction solar cellbefore and after 10 MeV proton irradiation (fiuence = 3 X !012 p/cm2)
100
90
80E<*-o5 703u.Oil_g'5'3
I60
50
40
1E+08
0.05MeV proton
I MeV proton3MeV protonlOMeV proton
^IMeV election
1E+10 1E+12 1E+14 1E+16Particle Fluence (p/crn2)
Fig.4 Degradation characteristics of Pmaxby various energy proton irradiations
1E+18
- 5 -
JAERI-Review 2001-039
1.2 Analysis of Single-Ion Multiple-Bit Upset in CommercialHigh-Density DRAMs
H.Shindou0, A.Makiharan, XAburaya'5, S.Kuboyama0, S.Matsuda1^
T.Hirao2), T.Ohshima2), M.Yoshikawa2) and H.Itoh2)
'^National Space Development Agency of Japan (NASD A)2' Depertment of Materials Development, JAERI
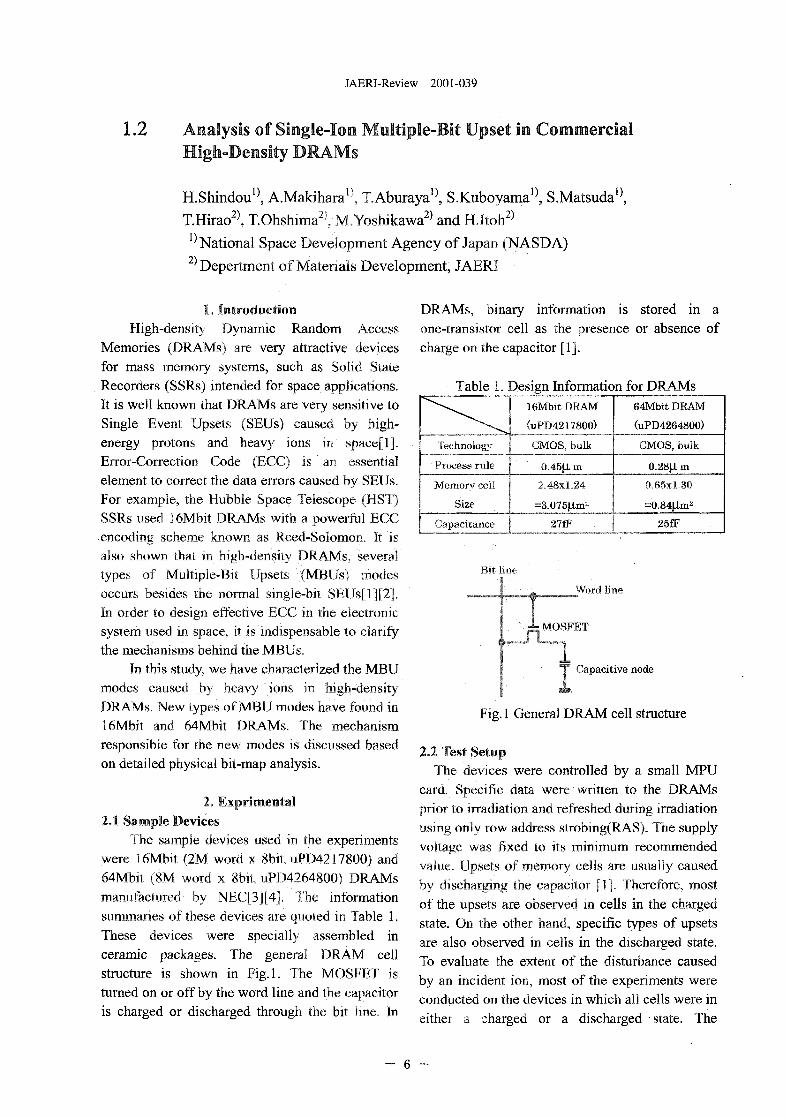
1, IntroductionHigh-density Dynamic Random Access
Memories (DRAMs) are very attractive devicesfor mass memory systems, such as Solid StateRecorders (SSRs) intended for space applications.It is well known that DRAMs are very sensitive toSingle Event Upsets (SEUs) caused by high-energy protons and heavy ions in spacefl].Error-Correction Code (ECC) is an essentialelement to correct the data errors caused by SEUs.For example, the Hubble Space Telescope (HST)SSRs used 16Mbit DRAMs with a powerful ECC.encoding scheme known as Reed-Solomon, It isalso shown that in high-density DRAMs, severaltypes of Multiple-Bit Upsets (MBUs) modesoccurs besides the normal single-bit SEUs[l][2].In order to design effective ECC in the electronicsystem used in space, it is indispensable to clarifythe mechanisms behind the MBUs.
In this study, we have characterized the MBUmodes caused by heavy ions in high-densityDRAMs. New types of MBU modes have found in16Mbit and 64Mbit DRAMs. The mechanismresponsible for the new modes is discussed basedon detailed physical bit-map analysis.
2. Exprimental2.1 Sample Devices
The sample devices used in the experimentswere 16Mbit (2M word x 8bit,uPD4217800) and64Mbit (8M word x 8bit, uPD4264800) DRAMsmanufactured by NEC[3][4]. The informationsummaries of these devices are quoted in Table 1.These devices were specially assembled inceramic packages. The general DRAM cellstructure is shown in Fig.l. The MOSFET isturned on or off by the word line and the capacitoris charged or discharged through the bit line. In
DRAMs, binary information is stored in aone-transistor cell as the presence or absence ofcharge on the capacitor [1].
Table 1. Design Information for DRAMs
Technology
Process rule
Memory cell
Size
Capacitance
16Mbit DRAM
(uPD4217800)
CMOS, butt
0.45U. m
2.48x1.24
=3.075jl.m2
27fF
64Mbit DRAM
(uPD4264800)
CMOS, bulk
0.28U. m
0.65x1.30
=0.84(Im2
25£F
Bit line
MOSFET
Word line
Capacitive node
Fig. 1 General DRAM cell structure
2.2 Test SetupThe devices were controlled by a small MPU
card. Specific data were written to the DRAMsprior to irradiation and refreshed during irradiationusing only row address strobing(RAS). The supplyvoltage was fixed to its minimum recommendedvalue. Upsets of memory cells are usually causedby discharging the capacitor [1]. Therefore, mostof the upsets are observed in cells in the chargedstate. On the other hand, specific types of upsetsare also observed in cells in the discharged state.To evaluate the extent of the disturbance causedby an incident ion, most of the experiments wereconducted on the devices in which all cells were ineither a charged or a discharged state. The
6 -
JAERI-Review 2001-039
experiments were performed with mono-energeticions obtained from accelerators at Japan AtomicEnergy Research Institute (JAERI) andBrookhaven National Laboratory (BNL).
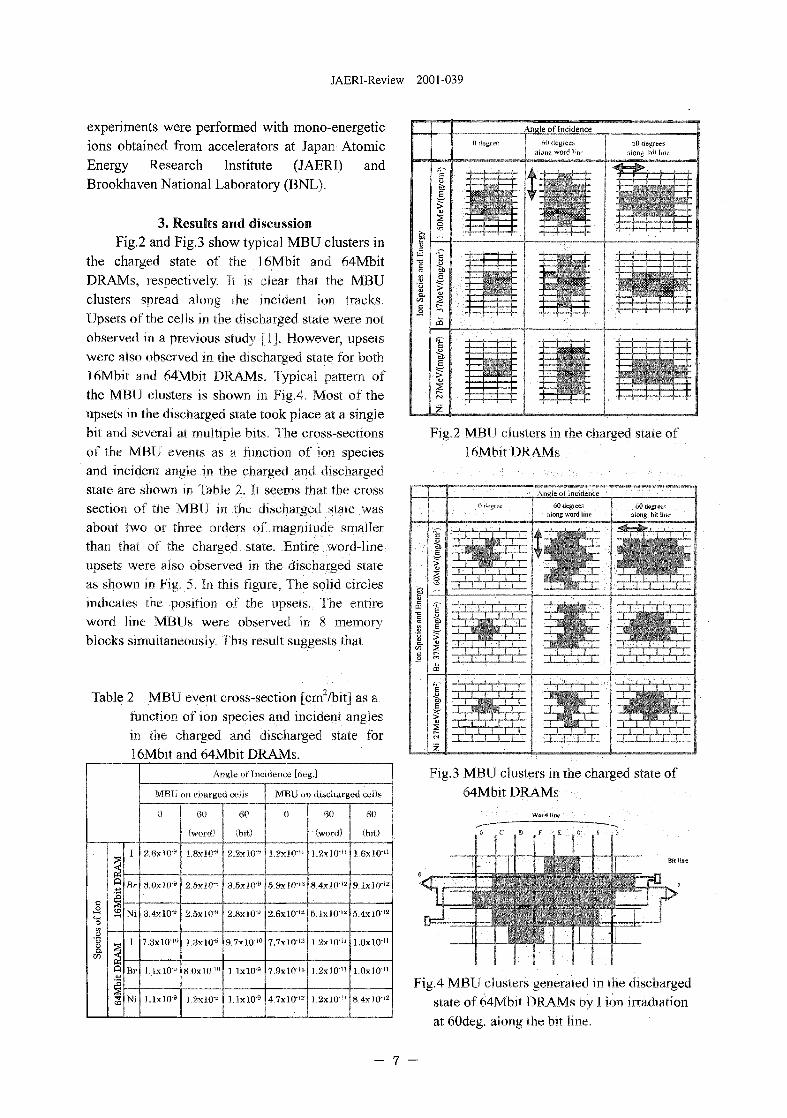
3. Results and discussionFig.2 and Fig.3 show typical MBU clusters in
the charged state of the 16Mbit and 64MbitDRAMs, respectively. It is clear that the MBUclusters spread along the incident ion tracks.Upsets of the cells in the discharged state were notobserved in a previous study [1]. However, upsetswere also observed in the discharged state for both16Mbit and 64Mbit DRAMs. Typical pattern ofthe MBU clusters is shown in Fig.4. Most of theupsets in the discharged state took place at a singlebit and several at multiple bits. The cross-sectionsof the MBU events as a function of ion speciesand incident angle in the charged and dischargedstate are shown in Table 2, It seems that the crosssection of the MBU in the discharged state wasabout two or three orders of magnitude smallerthan that of the charged state. Entire word-lineupsets were also observed in the discharged stateas shown in Fig. 5. In this figure, The solid circlesindicates the position of the upsets. The entireword line MBUs were observed in 8 memoryblocks simultaneously. This result suggests that
Table 2 MBU event cross-section [crrr/bit] as afunction of ion species and incident anglesin the charged and discharged state for16Mbit and 64Mbit DRAMs.
Br
Ni
Angle of Incidence [deg.]
M.BIJ on charged cells
0
2.6x10*
3.4xlO"9
7.3x10"'"
l.lxlO'a
l.lxlO"9
80
(word)
1.8xlO"9
2.5x10"*
2,5xlO-9
L3xlO"a
8.0x10"'"
1.2xlO"a
80
(bit)
2.2x10+
3.5x10""
2.8xlO"s
9.7x10"'
l.lxlO"9
UxlO" 9
MBU on discharged cells
0
1.2x10"'
5.9x10"'*
2.6x10"12
7.7xlO"12
7.9xlO"12
4.7xlO"i!
80
(word)
1.2x10""
8.4x10"'
5.1xI0"'2
1.2x10""
1.2x10""
1.2x10"'
80
(hit)
1,6x10""
9.1xlO"la
5.4xlO"12
1.0x10"
1.0x10"'
8.4X10"12
Fig.2 MBU clusters in the charged state of16Mbir DRAMs
Fig.3 MBU clusters in the charged state of64Mbit DRAMs
T"Fig.4 MBU clusters generated in the discharged
state of 64Mbit DRAMs by I ion irradiationat 60deg. along the bit line.
- 7 -
JAERI-Review 2001-039
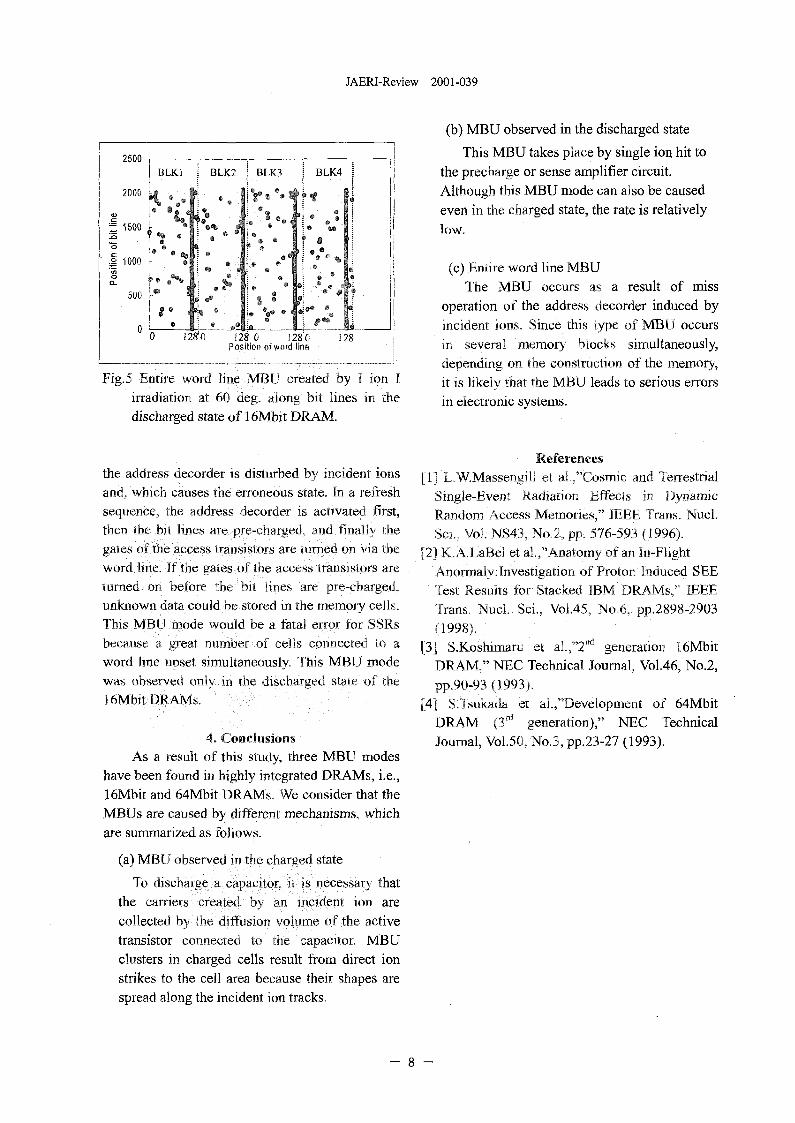
2500
Fig.5 Entire word line MBU created by I ion Iirradiation at 60 deg. along bit lines in thedischarged state of 16Mbit DRAM.
(b) MBU observed in the discharged state
This MBU takes place by single ion hit tothe precharge or sense amplifier circuit.Although this MBU mode can also be causedeven in the charged state, the rate is relativelylow.
(c) Entire word line MBUThe MBU occurs as a result of miss
operation of the address decorder induced byincident ions. Since this type of MBU occursin several memory blocks simultaneously,depending on the construction of the memory,it is likely that the MBU leads to serious errorsin electronic systems.
the address decorder is disturbed by incident ionsand, which causes the erroneous state. In a refreshsequence, the address decorder is activated first,then ine hii lines are pre-charged, and finally thegates or the access transistors are turned on via theword hnc It the gates of the access transistors areturned on before the bit lines are pre-charged,unknown data could be stored in the memory cells.This MBU mode would be a fatal error for SSRsbecause a great number of cells connected to aword line upset simultaneously. This MBU modewas observed onK in the discharged stare of the16MbitDRAMs
4. ConclusionsAs a result of this study, three MBU modes
have been found in highly integrated DRAMs, i.e.,16Mbit and 64Mbit DRAMs. We consider that theMBUs are caused by different mechanisms, whichare summarized as follows.
(a) MBTT observed in tli<» charged state
To •hxrnsiiat- " oarwcnm i is 'wessary that
the CHinfiv -jtiHiff i\ .ir iTinneni ion are
Collected IT* nt- diffusion vnmrnt- <>r the active
transistor connec.ie<. •< nt japnc-.uoi, M B U
clusters in charged cells result from direct ionstrikes to the cell area because their shapes arespread along the incident ion tracks.
References[1] L.W.Massengill et al.,"Cosmic and Terrestrial
Single-Event Radiation Effects in DynamicRandom Access Memories," IEEE Trans. Nucl.Sci, Vol. NS43, No.2, pp. 576-593 (1996).
[2] K. A.LaBel et a!.,"Anatomy of an In-FlightAnormalyrlnvestigation of Proton Induced SEETest Results for Stacked IBM DRAMs," IEEETrans. Nucl. Sci., Vol.45, No.6, pp.2898-2903(1998).
[3] S.Koshimaru et al.,"2"d generation 16MbitDRAM," NEC Technical Journal, Vol.46, No.2,pp.90-93 (1993).
[4] S.Tsukada et aI.,"Development of 64MbitDRAM (3rd generation)," NEC TechnicalJournal, Vol.50, No.3, pp.23-27 (1993).
JAERI-Review 2001-039
1.3 Angular Dependence of Ion-Induced CurrentMeasured by TIBIC System
H. Mori*, T. Hirao, J. S. Laird, S. Onoda* and H. Itoh
*Graduate School of Engineering, Tokai UniversityDepartment of Materials Development, JAERI
1. IntroductionSingle-event phenomena (SEP) are
known to be malfunctions of electronic
devices caused by the impact of high-energy
particles in space environments. Among
SEP, single event upset (SEU) is
accompanied with data errors in memory
devices. SEUs occur when the amount of
electric charge induced by an energetic ion
exceeds the critical charge required to
maintain the memory state of a cell.
Ion-induced carriers migrate promptly in a
picosecond time scale via the drift and
funneling processes. Migration of carriers
also takes place through the diffusion
process in a time range longer than 1
nanosecond.
Recent progress in large-scale integration
of memory devices has made them more
susceptible to SEUs because the critical
charge is reduced by such integration. In
highly integrated memory devices, a
number of memory cells upset
simultaneously due to impingement of a
single ion., which is called multiple bit upset
(MBU). When an angled ion strikes on such
devices, the MBU clusters were reported to
spread along the incident ion track [1,2].
The results can be ascribed to a spread of
carrier distribution formed by the incident
ion. However, the fundamental processes
behind MBU have not yet been fully
clarified. In this paper, we evaluate the
amount of the collected charge in diodes as
a function of incident ion angle to
investigate the influence of angled ion hit
on the generation of MBU clusters.
2. Experimental
The heavy ions used in this study were 15
MeV silicon (Si) of which linear energy
transfer (LET) and the projected range in Si
are 14.3 MeV/(mg/cm2) and 6.46 \im,
respectively. For ion irradiation, a
microbeam of about l|im in diameter was
formed using a heavy ion microbeam
system connected to a 3 MV tandem
accelerator at JAERI Takasaki TIARA
facility. The test devices were
low-capacitance Si p+n junction diodes with
a substrate doping level of 4 x 10 cm" or
5 x 10 cm"J (phosphorus donors) and a
junction area of 50 |im in diameter. The p+
region was formed by boron implantation at
30 keV at a dose 1 x 1015 cm"2. At an
applied bias of - 20 V the depth of the
depletion region for the two diodes are 8.3
|im and 2.3 am, respectively. The test
devices were mounted on a chip carrier with
50 £2 double-ended micro-striplines. They
were fixed at an angle of 0°, 15°, 30° and
45° to the incident ion. The experimental
setup is schematically shown in figure 1.
The transient current waveforms were
observed with a 3 GHz bandwidth
oscilloscope (Tektronix model TDS 694C).
- 9 -
JAERI-Review 2001-039
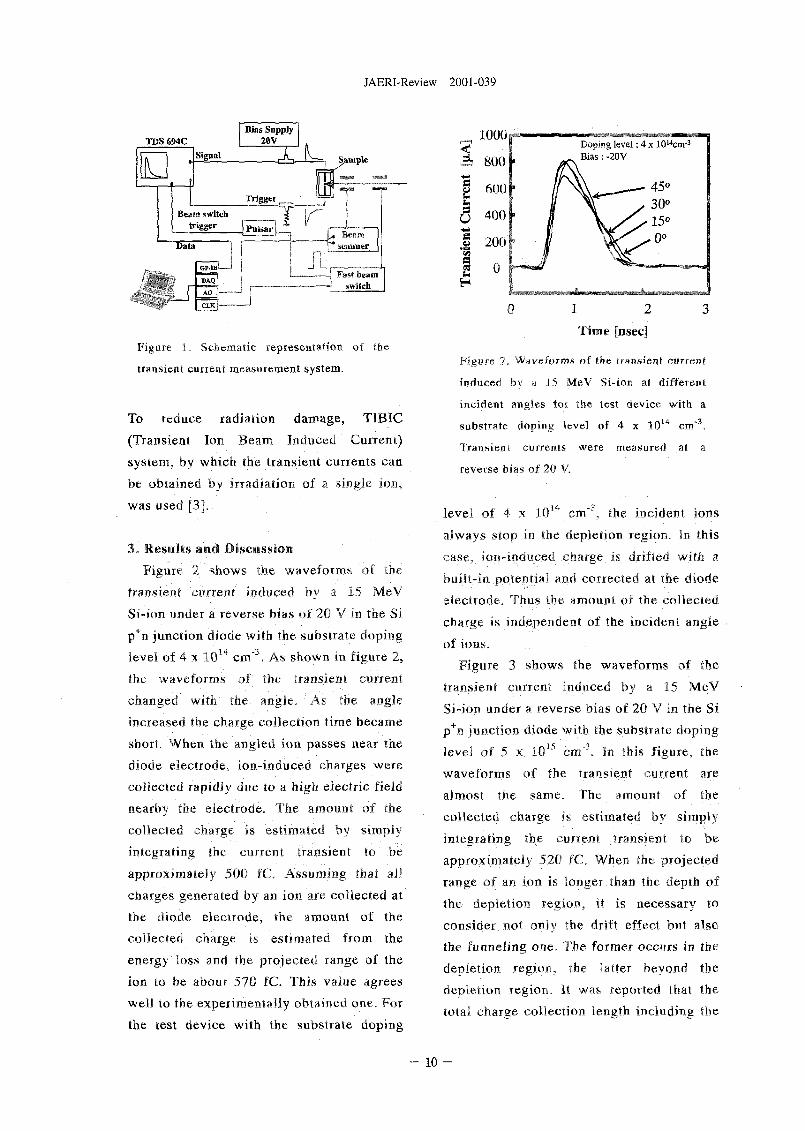
TBS 694C
Figure 1. Schematic representation of the
transient current measurement system.
To reduce radiation damage, T1BIC
(Transient Ion Beam Induced Current)
system, by which the transient currents can
be obtained by irradiation of a single ion,
was used [3].
3. Results and Discussion
Figure 2 shows the waveforms of the
transient current induced by a 15 MeV
Si-ion under a reverse bias of 20 V in the Si
p+n junction diode with the substrate doping
level of 4 x 1014 cm"3. As shown in. figure 2,
the waveforms of the transient current
changed with the angle. As the angle
increased the charge collection time became
short. When the angled ion passes near the
diode electrode, ion-induced charges were
collected rapidly due to a high electric field
nearby the electrode. The amount of the
collected charge is estimated by simply
integrating the current transient to be
approximately 500 fC. Assuming that all
charges generated by an ion are collected at
the diode electrode, the amount of the
collected charge is estimated from the
energy loss and the projected range of the
ion to be about 570 fC. This value agrees
well to the experimentally obtained one. For
the test device with the substrate doping
uping level: 4 x 10¹⁴cnr3
Bias: -20V
Figure 2. Waveforms of the transient current
induced by a 15 MeV Si-ion at different
incident angles for the test device with a
substrate doping level of 4 x 10 u cm"3.
Transient currents were measured at a
reverse bias of 20 V.
level of 4 x 10'* cm"'3, the incident ions
always stop in the depletion region. In this
case, ion-induced charge is drifted with a
built-in potential and corrected at the diode
electrode. Thus the amount of the collected
charge is independent of the incident angle
of ions.
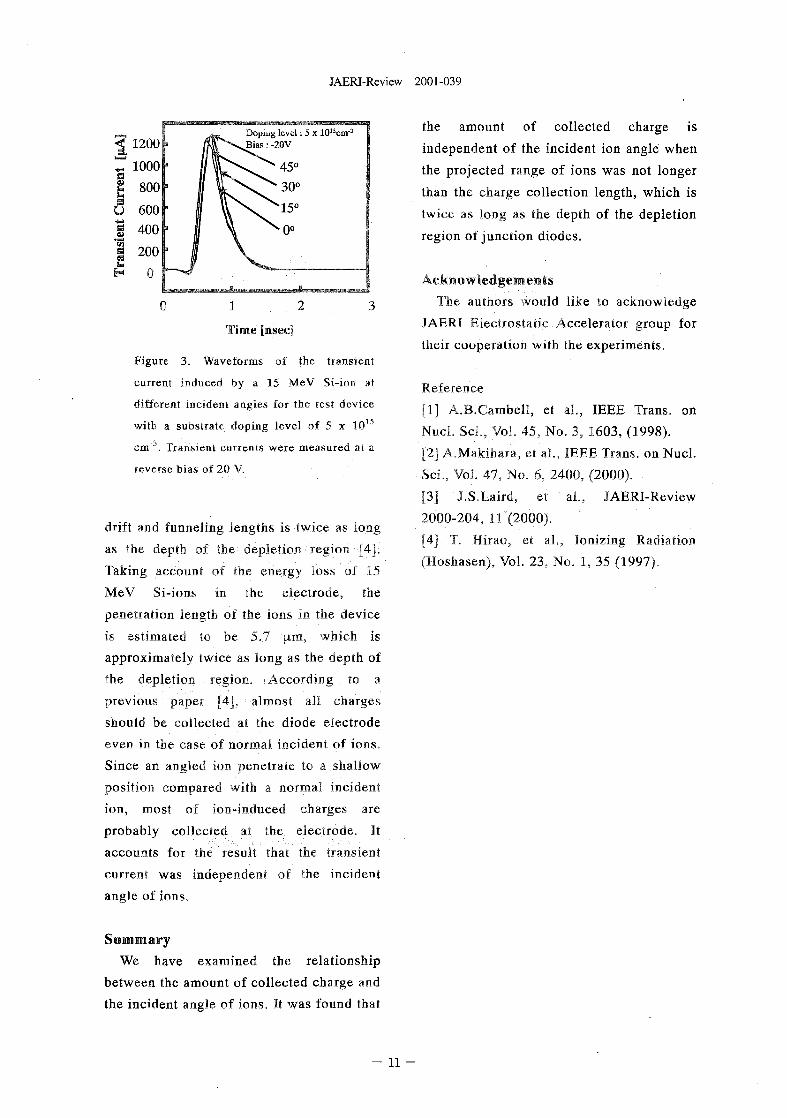
Figure 3 shows the waveforms of the
transient current induced by a 15 MeV
Si-ion under a reverse bias of 20 V in the Si
p+n junction diode with the substrate doping
level of 5 x 1O1S cm'3. In this figure, the
waveforms of the transient current are
almost the same. The amount of the
collected charge is estimated by simply
integrating the current transient to be
approximately 520 fC. When the projected
range of an ion is longer than the depth of
the depletion region, it is necessary to
consider not only the drift effect but also
the- funneling one. The former occurs in the
depletion region, the latter beyond the
depletion region. It was reported that the
total charge collection length including the
- 1 0 -
JAERI-Review 2001-039
Duping level. 5 x 10¹⁵cnr2
Bias: -2OV
Figure 3. Waveforms of the transient
current induced by a 15 MeV Si-ion at
different incident angles for the test device
with a substrate doping level of 5 x 10¹⁵
cm''. Transient currents were measured at a
reverse bias of 20 V.
drift and funneling lengths is twice as long
as the depth of the depletion region [4].
Taking account of the energy loss of 15
MeV Si-ions in the electrode, the
penetration length of the ions in the device
is estimated to be 5.7 jim, which is
approximately twice as long as the depth of
the depletion region. According to a
previous paper [4], almost all charges
should be collected at the diode electrode
even in the case of normal incident of ions.
Since an angled ion penetrate to a shallow
position compared with a normal incident
ion, most of ion-induced charges are
probably collected si ihi- eieciroiie. It
accounts for rhe result :hai tne transient
current was independent of the incident
angle of ions.
the amount of collected charge is
independent of the incident ion angle when
the projected range of ions was not longer
than the charge collection length, which is
twice as long as the depth of the depletion
region of junction diodes.
Acknowledgements
The authors would like to acknowledge
JAERI Electrostatic Accelerator group for
their cooperation with the experiments.
Reference
[1] A.B.Cambell, et al., IEEE Trans, on
Nucl. Sci., Vol. 45, No. 3, 1603, (1998).
[2] A.Makihara, et al., IEEE Trans, on Nucl,
Sci., Vol. 47, No. 6, 2400, (2000).
[3] J.S.Laird, et al., JAERI-Review
2000-204, 11 (2000).
[4] T. Hirao, et al., Ionizing Radiation
(Hoshasen), Vol. 23, No. 1, 35 (1997).
SummaryWe have examined the relationship
between the amount of collected charge and
the incident angle of ions. It was found that
- 11 -
JAERI-Review 2001-039
1.4 Development of Colimated Swift Heavy-iom Micro-beamsfor Investigation of Single Event Phenomena
S. Onoda*, T. Hirao, H. Mori* and H. Itoh* Graduate School of Engineering, Tokai UniversityDepartment of Materials Development, JAERI
lJntroductionSemiconductor devices used in artificial
satellites are exposed to high-energy particles.When these particles penetrate into devices,dense electron-hole pairs are created and induceSingle-Event Phenomena (SEP). Because SEPlead to system failures, it is necessary to raiseSEP tolerance to increase the reliability ofelectronic systems in artificial satellites. Tosimulate SEP of device used in space, it isimportant to use ion beams, having high LinerEnergy Transfer (LET), Focus such an ion beamon a SEP sensitive region in semiconductordevice, the size of the beam has to be smallerthan the sensitive area. Therefore, we have beendeveloping the technique of micro-beamformation using micro-colrimators, and applyingit to measure single event transient currents as afunction of LET.
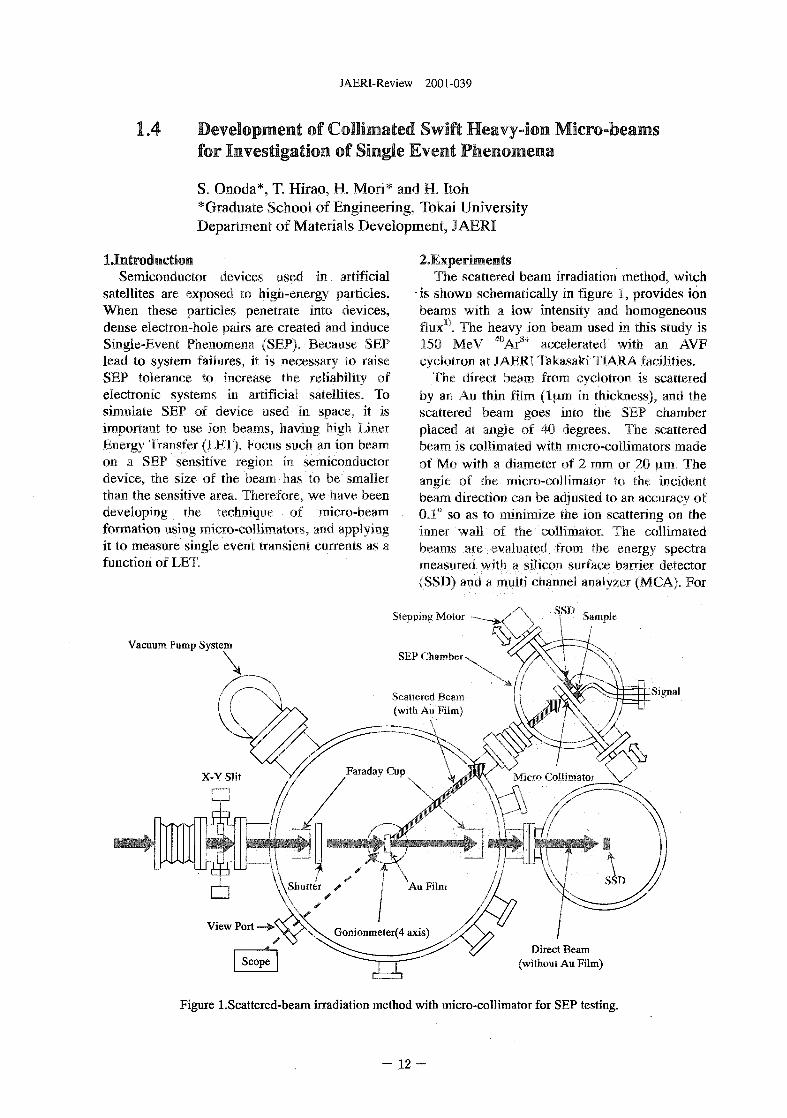
2.ExpeiimentsThe scattered beam irradiation method, witch
is shown schematically in figure 1, provides ionbeams with a low intensity and homogeneousflux1 . The heavy ion beam used in this study is150 MeV "°Ar8+ accelerated with an AVFcyclotron at JAERI Takasaki TIARA facilities.
The direct beam from cyclotron is scatteredby an Au thin film (ljim in thickness), and thescattered beam goes into the SEP chamberplaced at angle of 40 degrees. The scatteredbeam, is collimated with micro-collimators madeof Mo with a diameter of 2 mm or 20 am. Theangle of the micro-collimator to the incidentbeam direction can be adjusted to an accuracy of0,1° so as to minimize the ion scattering on theinner wall of the collimator. The collimatedbeams are evaluated from the energy spectrameasured with a silicon surface barrier detector(SSD) and a multi channel analyzer (MCA). For
Stepping Motor SSD Sample
Vacuum Pump System
\
Scattered Beam(with Au Film)
Signal
Direct Beam(without An Film)
Figure l.Scattered-beam irradiation method with micro-collimator for SEP testing.
.12 -
JAERI-Review 2001 -039
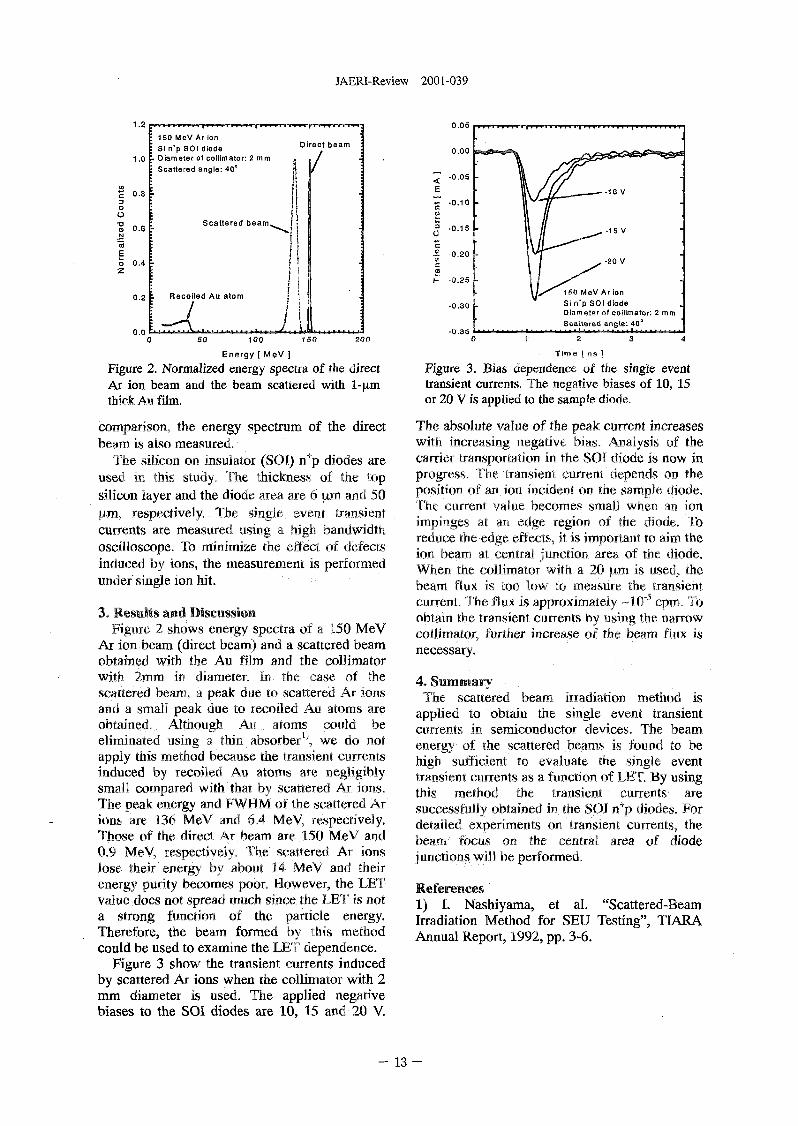
150 MeV Ar ionS in 'p SOI diodeDiameter of collimator: 2mmScattered angle: 40°
0.00 50 100 1S0 200
Energy [ MeV ]Figure 2. Normalized energy spectra of trie directAr ion beam and the beam scattered with l-|xmthick Au film.
comparison, the energy spectrum of the directbeam is also measured.
The silicon on insulator (SOI) n+p diodes areused in this study. The thickness of the topsilicon layer and the diode area are 6 \un and 50|xm, respectively. The single event transientcurrents are measured using a high bandwidthoscilloscope. To minimize the effect of defectsinduced by ions, the measurement is performedunder single ion hit.
3. Results and DiscussionFigure 2 shows energy spectra of a 150 MeV
Ar ion beam (direct beam) and a scattered beamobtained with the Au film and the collimatorwith 2mm in diameter. In the case of thescattered beam, a peak due to scattered Ar ionsand a small peak due to recoiled Au atoms areobtained. Although Au atoms could beeliminated using a thin absorber1^ we do notapply this method because the transient currentsinduced by recoiled Au atoms are negligiblysmall compared with that by scattered Ar ions.The peak energy and FWHM of the scattered Arions are 136 MeV and 6.4 MeV, respectively.Those of the direct Ar beam are 150 MeV and0.9 MeV, respectively. The scattered Ar Ionslose their energy by about 14 MeV and theirenergy purity becomes poor. However, the LETvalue does not spread much since the LET is nota strong function of the particle energy.Therefore, the beam formed by this methodcould be used to examine the LET dependence.
Figure 3 show the transient currents inducedby scattered Ar ions when the collimator with 2mm diameter is used. The applied negativebiases to the SOI diodes are 10, 15 and 20 V.
0.05
0.00
< -°-0 5
E^ -0.10(a
c
s
£ -0.25
-0.30
-0.3S
I MeV Ar ionSi n p SOI diodeDiameter of collimator: 2 mmScattered angle: 40°
1 2
Time i ns ]
Figure 3. Bias dependence of the single eventtransient currents. The negative biases of 10, 15or 20 V is applied to the sample diode.
The absolute value of the peak current increaseswith increasing negative bias. Analysis of thecarrier transportation in the SOI diode Is now inprogress. The transient current depends on theposition of an ion Incident on the sample diode.The current value becomes small when an ionimpinges at an edge region of the diode. Toreduce the edge effects, it is Important to aim theIon beam at central junction area of the diode.When the collimator with a 20 iim is used, thebeam flux is too low to measure the transientcurrent. The flux is approximately -10° cpm. Toobtain the transient currents by using the narrowcollimator, further increase of the beam, flux isnecessary.
4. SummaryThe scattered beam Irradiation method is
applied to obtain the single event transientcurrents in semiconductor devices. The beamenergy of the scattered beams is found to behigh sufficient to evaluate the single eventtransient currents as a function of LET. By usingthis method the transient currents aresuccessfully obtained in the SOI n+p diodes. Fordetailed experiments on transient currents, thebeam focus on. the central area of diodejunctions will be performed.
References1) I. Nashiyama, et al. "Scattered-BeamIrradiation Method for SEU Testing", TIARAAnnual Report, 1992, pp. 3-6.
- 1 3 -
JAERI-Review 2001-039
1.5 Analysis of Failure Caused by Cosmic Rays inHigh-Voltage High-Power Semiconductor Devices
Hideo Matsuda1^ Ichiro Omura^, Yoko Sakiyama1^Kunihiko Shibata15, Hiromichi Ohashi2\Toshio Hirao3^ Takeshi Ohshima3\Jamie S.Laird3-1, Hisayoshi Itoh3-1,Hidekl Mori4^ Shinobu Onoda4-1
lj Toshiba Corporation. Semiconductor Company2) Toshiba Corporation, R&D Center3) Department of Material Development, JAERI41 Graduate School of Engineering.. Tokai University
1. Introduction
High power semiconductor devices
have been widely used in key industries,
for instance, traction, transmission, etc. A
failure of such power devices induced by
cosmic rays at the sea level has been
recently observed(l). At the present stage
it is considered that high power devices
fail or breakdown by reaction between Si
and cosmic rays, e.g., high energy
neutrons and protons. Since the
experimental technique to measure
radiation induced failures in high power
devices is not established, the
mechanisms behind the failures have not
yet been clarified. As for the tests of high
power semiconductor devices by
irradiation of neutrons and protons using
accelerators, it has been reported that the
failure rate depended on the device
structure and that the rate at nominal
voltage was lower than that extrapolated
from the data obtained at higher voltage
The aims of this work is (l):to verify
the equivalence between the failure rates
obtained by proton irradiation and those
by actual cosmic rays and (2):to examine
the failure rates for various devices at
their nominal voltage, which are quite
useful for designing high power devices
having high performance as well as high
reliability. In order to clarify the failure
mechanisms, we have investigated the
failure points generated in power devices
by heavy ion irradiation.
2. Experiments
2.1 Proton irradiation
An AVF-cyclotron at TIARA has been
used for proton irradiation. Parameters
are proton energy and fluence. The failure
rate of high power devices was derived
from the number of failures divided by
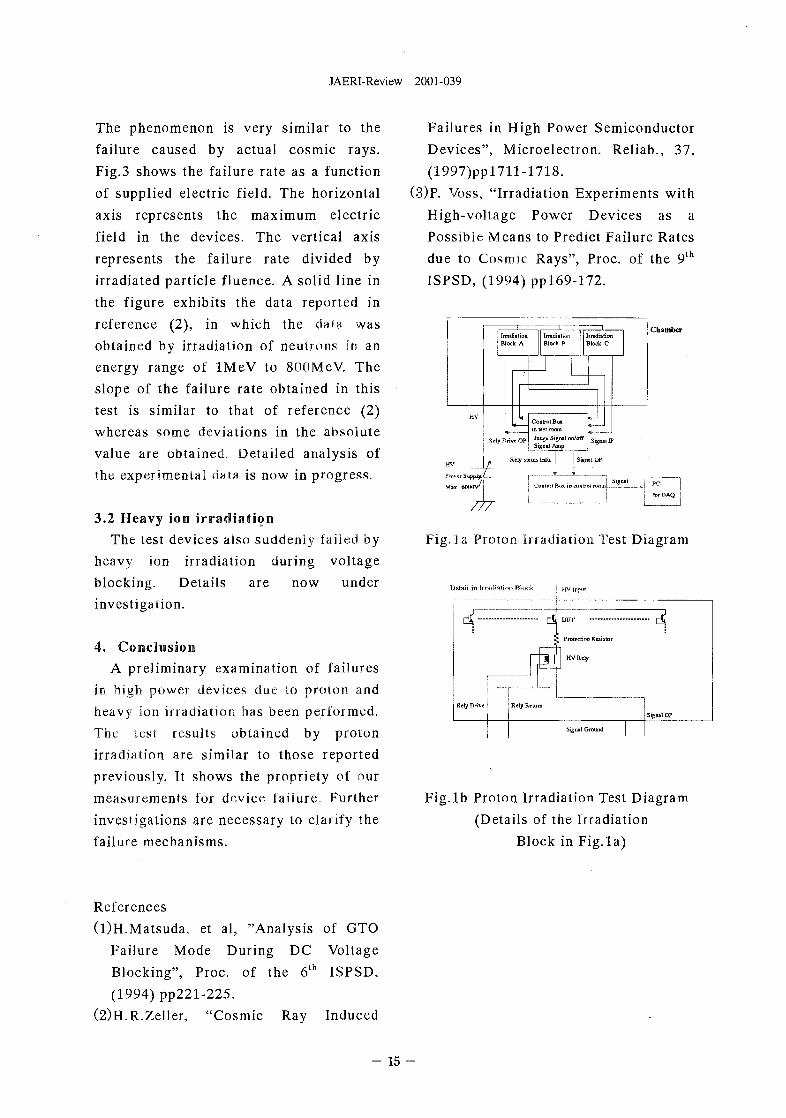
proton fluence. The test block diagram is
schematically shown in Fig.l.
2.2 Heavy ion irradiation
An 3MV-tandem-accelerator has been
used for heavy ion irradiation. A
micro-beam of i5MeV-C was scanned on
the test devices at 2 microns per pitch.
The test block diagram is shown in Fig.2.
3. Results and discussion
3.1 Proton irradiation
The test devices suddenly failed by
proton irradiation during voltage blocking.
- 14
JAERI-Review 2001-039
The phenomenon is very similar to thefailure caused by actual cosmic rays.Fig.3 shows the failure rate as a functionof supplied electric field. The horizontalaxis represents the maximum electricfield in the devices. The vertical axisrepresents the failure rate divided byirradiated particle fluence. A solid line inthe figure exhibits the data reported inreference (2), in which the data wasobtained by irradiation of neutrons in anenergy range of lMeV to 800MeV. Theslope of the failure rate obtained in thistest is similar to that of reference (2)whereas some deviations in the absolutevalue are obtained. Detailed analysis ofthe experimental data is now in progress.
3.2 Heavy ion irradiationThe test devices also suddenly failed by
heavy ion irradiation during voltageblocking. Details are now underinvestigation.
4. ConclusionA preliminary examination of failures
in high power devices due to proton andheavy ion irradiation has been performed.The lest results obtained by protonirradiation are similar to those reportedpreviously. It shows the propriety of ourmeasurements for device failure. Furtherinvestigations are necessary to clarify thefailure mechanisms.
Failures in High Power SemiconductorDevices", Microelectron. Reliab., 37,(1997)ppl711-1718.
(3)P. Voss, "Irradiation Experiments withHigh-voltage Power Devices as aPossible Means to Predict Failure Ratesdue to Cosmic Rays", Proc. of the 9th
ISPSD, (1994) pp!69-172.
Fig.la Proton Irradiation Test Diagram
Detail in lrr
:
Rely Drive
adiatk
_ . .
n Block
Rely Retun
IIl
a
HV input
Protection Resistor
HVRely
Sign*! Ground
Signal OP
Fig.lb Proton Irradiation Test Diagram(Details of the Irradiation
Block in Fig.la)
References(l)H.Matsuda, et al, "Analysis of GTO
Failure Mode During DC VoltageBlocking", Proc. of the 6th ISPSD,(1994)pp221-225.
(2)H.R.Zeller, "Cosmic Ray Induced
- 15 -
JAERI-Review 2001-039
DOT
Biss
mucSOOOV
r-f
f- UV Power Supply
Max 3OOOV
X - Y BeamScan Switch
Micro B«ControUei
Oscillo Scope
Buffer Amp.
7 ^ 7 " ftatgc^eff Diode P C f w D A Q
For protection
/7T
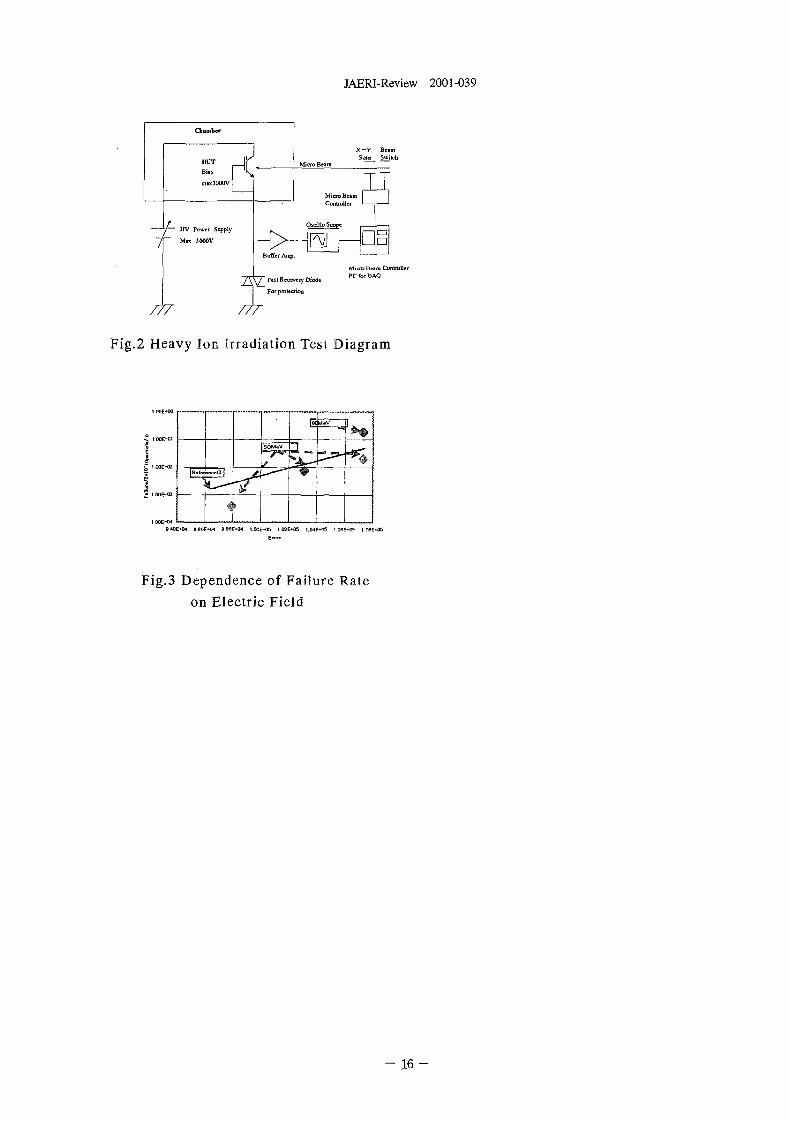
Fig.2 Heavy Ion Irradiation Test Diagram
5 , o
[5 I 00E-O3
Fig.3 Dependence of Failure Rateon Electric Field
- . 1 6 -
JAERI-Review 2001-039
1.6 Radiation Tolerance of Silicon Carbide Metal-Oxlde-Semlconductor Transistor with annealed gate oxide
Takeshi Ohshima, Hisayoshi Itoh, and Masahito YoshikawaDepartment of Material Development, JAERI
1. IntroductionSilicon carbide (SiC) is regarded as a
promising candidate for electronic devicesused in harsh radiation environments (Rad-hard devices) as well as high-power andhigh-frequency electronic devices. For thedevelopment of rad-hard devices, it isimportant to understand the effect ofvarious types of irradiation on the electricalcharacteristics of SiC devices. Recently, wehave demonstrated that the electricalcharacteristics of SiC metal-oxide-semiconductor field effect transistor(MOSFET) before irradiation can beimproved by hydrogen (H2) annealing of thegate oxide during the fabrication process.x)
In this study, we investigate the gamma-ray(y-ray) irradiation effects on SiC MOSFETswith }i>~anneaied gate oxides (SiC(H2)MOSFETs).
2. ExperimentsThe MOSFETs used in this study were
fabricated on p-type epitaxial 6H-SiC films(4fum thick) grown on 6H-SiC substrates(3.5° off, Si-face). The net acceptorconcentration of the epitaxial films rangesfrom 5xlO15 to ixlO16 /cm3. The source anddrain of the MOSFETs were formed usingphosphorous implantation at 800 °C andsubsequent annealing at 1500 °C for 20 minin an Ar atmosphere. The gate oxide wasfabricated by pyrogenic oxidation (H2:O2 =1:1) at 1100 °C for 60 min. Hydrogenannealing was performed at 700 °C for 30min at a pressure of 20 Torr. The gate length,and width of the MOSFETs are 10 am and200 p,m, respectively. Gamma-rayirradiation was performed up to 530 kGy(SiO2) at a rate of 8.8 kGy/h. at roomtemperature (RT). No electrical bias wasapplied to the gate , the drain and the sourceduring the irradiation. The electricalcharacteristics were measured at RT underdark conditions. The channel mobility ([A) ofthe MOSFETs was derived from the linearregion of the drain current (/D) versus drainvoltage (FD) curves. The value of jM before
irradiation was obtained to be 52 cm2/Vs.The threshold voltage (Vth) is determinedfrom the curve of the square root of Ioversus VG in the saturation region. Beforeirradiation, Vth was measured to be 1.37 V.
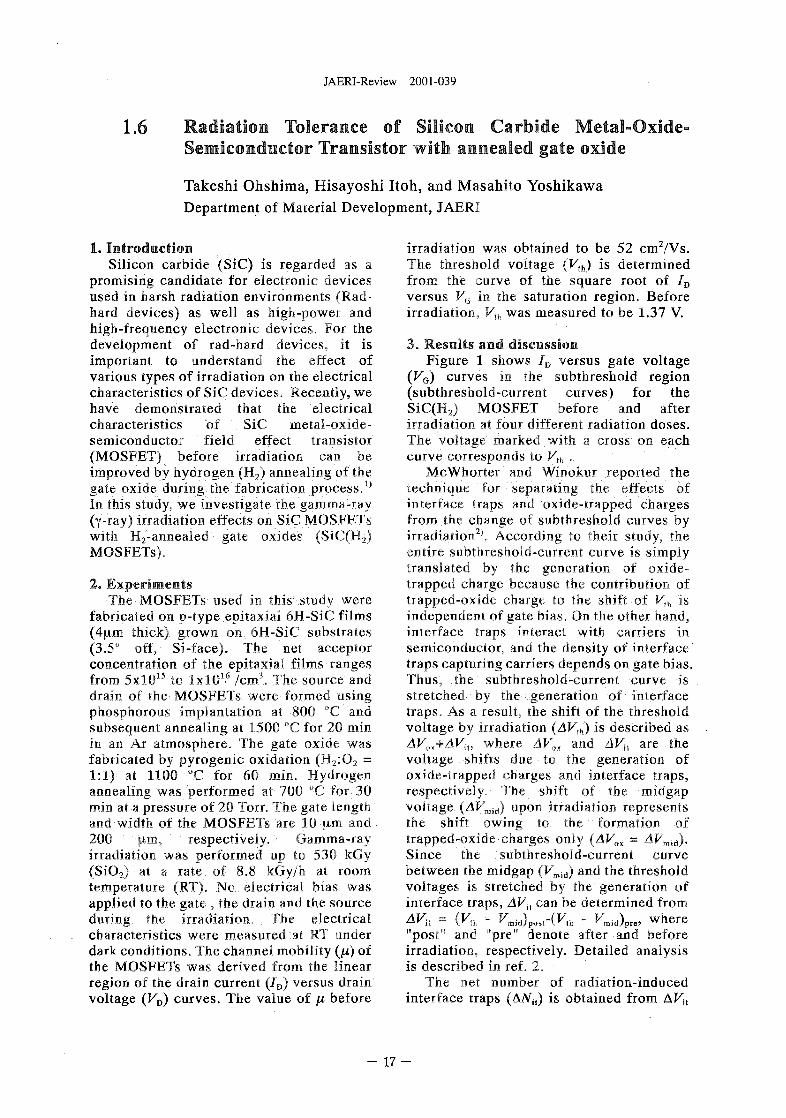
3. Results and discussionFigure 1 shows /D versus gate voltage
(FG) curves in the subthreshold region(subthreshold-current curves) for theSiC(H2) MOSFET before and afterirradiation at four different radiation doses.The voltage marked with, a cross on eachcurve corresponds to Vth .
McWhorter and Winokur reported thetechnique for separating the effects ofinterface traps and oxide-trapped chargesfrom the change of subthreshold curves byirradiation2^ According to their study, theentire subthreshold-current curve is simplytranslated by the generation of oxide-trapped charge because the contribution oftrapped-oxide charge to the shift of Flh isindependent of gate bias. On the other hand,interface traps interact with carriers insemiconductor, and the density of interfacetraps capturing carriers depends on gate bias.Thus, the subthreshold-current curve isstretched by the generation of interfacetraps. As a result, the shift of the thresholdvoltage by irradiation (AVth) is described asAV0X+AVH, where AV0X and AVh are thevoltage shifts due to the generation ofoxide-trapped charges and interface traps,respectively. The shift of the midgapvoltage (AVmii) upon irradiation representsthe shift owing to the formation oftrapped-oxide charges only (AVOX = AVmia).Since the subthreshold-current curvebetween the midgap (Fmjd) and the thresholdvoltages is stretched by the generation ofinterface traps, AVit can be determined fromAVh = (Fth - Fmjd)posr{Fth - Fmid)pre, where"post" and "pre" denote after and beforeirradiation, respectively. Detailed analysisis described in ref, 2.
The net number of radiation-inducedinterface traps (AiVit) is obtained from AFit
- 17 -
JAERI-Review 2001-039
1x10
0 2 4
Gate voltage (V)
Fig. 1 Subthreshold-current curves forSiC(H2) MOSFETs irradiated with frays.The bias of 12 V was applied betweensource and drain during the measurement.The values of absorbed dose are shown, inthe figure. The result before irradiation isalso shown for comparison.
10'
10'
10" r
R
- O
""•..Si
.O '
.•rt6 0
n-'
SiC
9'RiO
.-6
0.1 10 100
1.0
0.8
0.6
0.4
0.2
0.01000
Absorbed dose (kGy(SiO2))
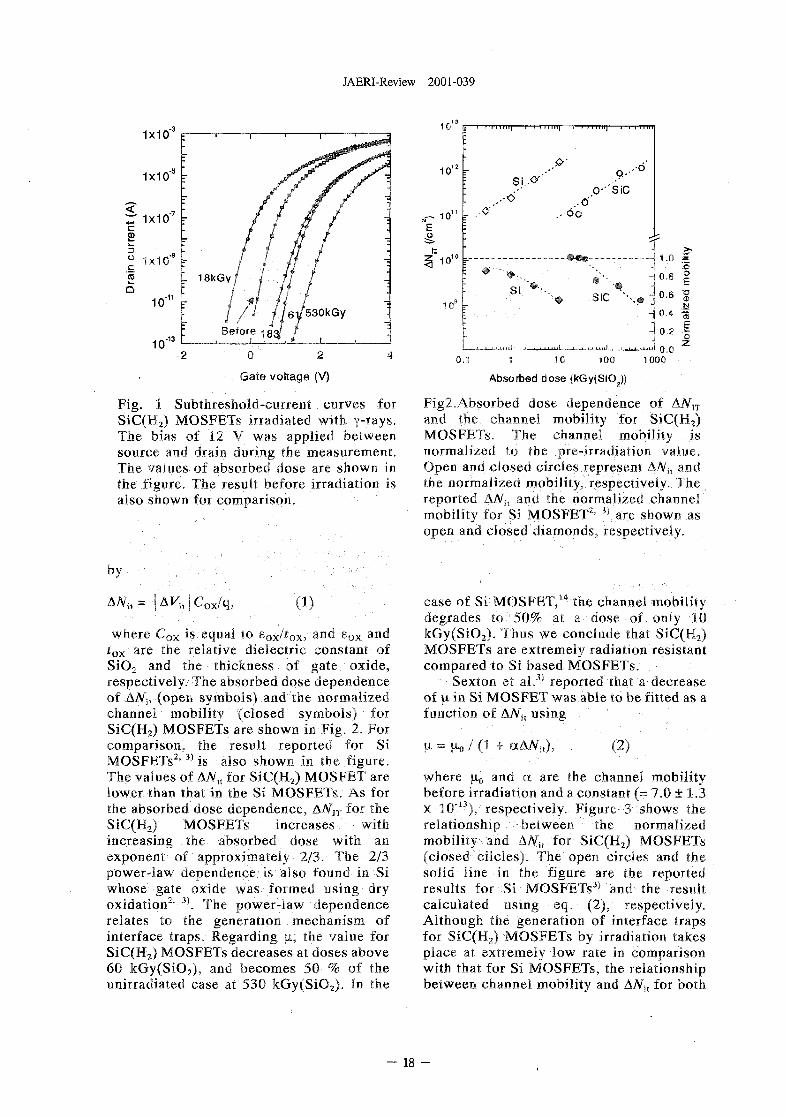
Fig2.Absorbed dose dependence of AiVITand the channel mobility for SiC(H2)MOSFETs. The channel mobility isnormalized to the pre-irradiation value.Open and closed circles represent ANit andthe normalized mobility, respectively. Thereported ANit and the normalized channelmobility for Si MOSFET2' 3) are shown asopen and closed diamonds, respectively.
by
h = |AKit|C0X/q, (1)
where Cox is equal to Box/tox, and sOxtox are the relative dielectric constant ofSiO2 and the thickness of gate oxide,respectively. The absorbed dose dependenceof AiVj, -(open symbols) and the normalizedchannel mobility (closed symbols) forSiC(H2) MOSFETs are shown in Fig. 2. Forcomparison, the result reported for SiMOSFETs2'3) is also shown in the figure.The values of ANh for SiC(H2) MOSFET arelower than that in the Si MOSFETs. As forthe absorbed dose dependence, AN1T for theSiC(H2) MOSFETs increases withincreasing the absorbed dose with anexponent of approximately 2/3. The 2/3power-law dependence is also found in Siwhose gate oxide was formed using dryoxidation2' 3). The power-law dependencerelates to the generation mechanism, ofinterface traps. Regarding \i, the value forSiC(H2) MOSFETs decreases at doses above60 kGy(SiO2), and becomes 50 % of theunirradiated case at 530 kGy(SiO2). In the
case of Si MOSFET,14 the channel mobilitydegrades to 50% at a dose of only 10kGy(SiO2). Thus we conclude that SiC(H2)MOSFETs are extremely radiation resistantcompared to Si based MOSFETs.
Sexton et al.3) reported that a decreaseof |A in Si MOSFET was able to be fitted as afunction of A/Vit using
jx = ii0 / (1 + aANit), (2)
where \i0 and a are the channel mobilitybefore irradiation and a constant (= 7.0 ± 1.3x 10"°), respectively. Figure 3 shows therelationship between the normalizedmobility and ANU for SiC(H2) MOSFETs(closed cilcles). The open circles and thesolid line in the figure are the reportedresults for Si MOSFETs3) and the resultcalculated using eq. (2), respectively.Although the generation of interface trapsfor SiC(H2) MOSFETs by irradiation takesplace at extremely low rate in comparisonwith that for Si MOSFETs, the relationshipbetween channel mobility and AiVit for both
- 18 -
JAERI-Review 2001-039
8 10 12 14AN (1011/cm2)
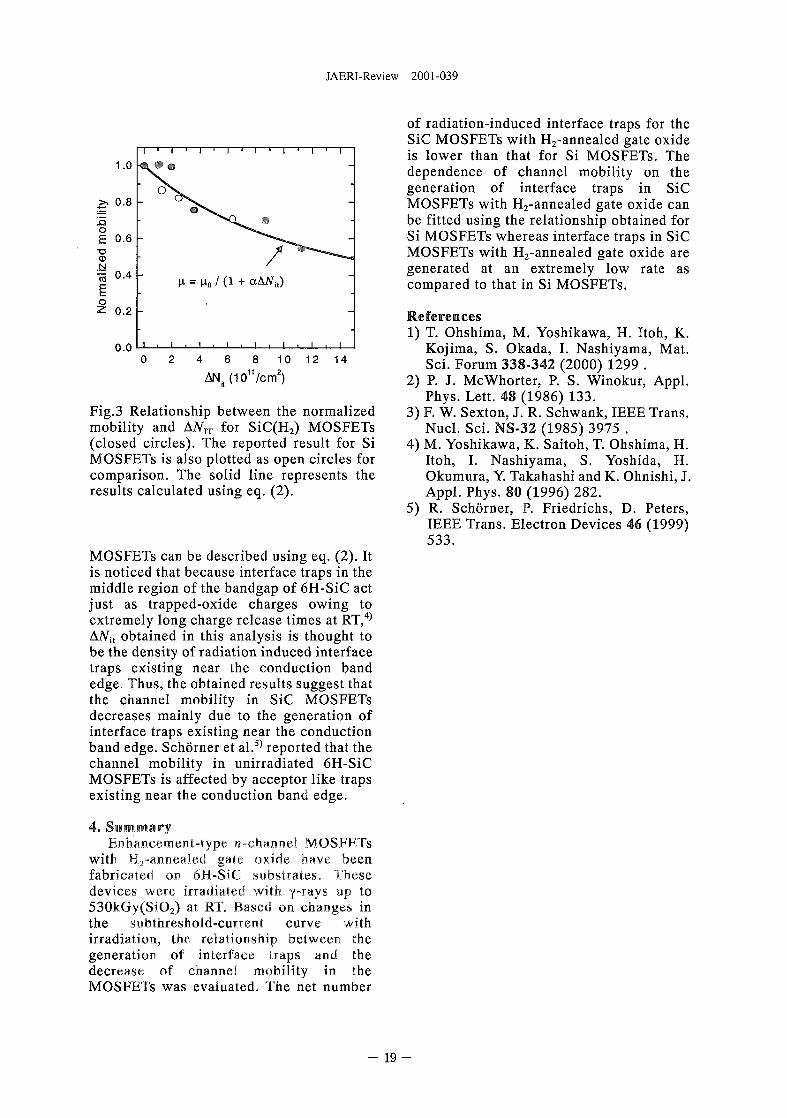
Fig.3 Relationship between the normalizedmobility and AiVIT for SiC(H2) MOSFETs(closed circles). The reported result for SiMOSFETs is also plotted as open circles forcomparison. The solid line represents theresults calculated using eq. (2).
MOSFETs can be described using eq. (2). Itis noticed that because interface traps in themiddle region of the bandgap of 6H-SiC actjust as trapped-oxide charges owing toextremely long charge release times at RT,4)
AAfjt obtained in this analysis is thought tobe the density of radiation induced interfacetraps existing near the conduction bandedge. Thus, the obtained results suggest thatthe channel mobility in SiC MOSFETsdecreases mainly due to the generation ofinterface traps existing near the conductionband edge. Schorner et al.5) reported that thechannel mobility in unirradiated 6H-SiCMOSFETs is affected by acceptor like trapsexisting near the conduction band edge.
4. SummaryEnhancement-type n-channel MOSFETs
with H,-anneaIed gate oxide have beenfabricated on 6H-SiC substrates. Thesedevices were irradiated with y-rays up to530kGy(SiO2) at RT. Based on changes inthe subthreshold-current curve withirradiation, the relationship between thegeneration of interface traps and thedecrease of channel mobility in theMOSFETs was evaluated. The net number
of radiation-induced interface traps for theSiC MOSFETs with H2-annealed gate oxideis lower than that for Si MOSFETs. Thedependence of channel mobility on thegeneration of interface traps in SiCMOSFETs with H2-annealed gate oxide canbe fitted using the relationship obtained forSi MOSFETs whereas interface traps in SiCMOSFETs with H2-annealed gate oxide aregenerated at an extremely low rate ascompared to that in Si MOSFETs.
References1) T. Ohshima, M. Yoshikawa, H. Itoh, K.
Kojima, S. Okada, I. Nashiyama, Mat.Sci. Forum 338-342 (2000) 1299 .
2) P. J. McWhorter, P. S. Winokur, Appl.Phys. Lett. 48 (1986) 133.
3) F. W. Sexton, J. R. Schwank, IEEE Trans.Nucl. Sci. NS-32 (1985) 3975 .
4) M. Yoshikawa, K. Saitoh, T. Ohshima, H.Itoh, I. Nashiyama, S. Yoshida, H.Okumura, Y. Takahashi and K. Ohnishi, J.Appl. Phys. 80 (1996) 282.
5) R. Schorner, P. Friedrichs, D. Peters,IEEE Trans. Electron Devices 46 (1999)533.
- 1 9 -
JAERI-Review 2001-039
1.7 Study of proton- and electron-Irradiation effects on CuInSe2thin films
A. Yoshida" H.S. Leen, H. Okada", A. Wakahara", T. Ohshima2', H. Itoh2),S. Kawakita3', M. Imaizumi3) and S. Matsuda3)
"Department of Electrical and Electronic Engineering, Toyohashi University ofTechnology,2) Department of Material Development, JAERI
3) National Space Development Agency of Japan
1. IntroductionCuInSe2 (ClS)-related chalcopyrite materials
have received considerable attention because oftheir potentials for solar cell application1'. Inaddition, CIS-related thin film solar cells havealso been expected to use in space area becauseof their superior irradiation hardness2', low costand low mass3'. In order to use in space areaunder high-energy electrons, protons and otherparticles, it is important to evaluate the propertyof damages generated by irradiation in solar cellsand cell materials. A few reports have beenpublished for irradiation effect on CIS-based thinfilm solar cells. Recently, NASDA4' performedthe irradiation of lMeV electrons and lOMeVprotons to CIS solar cells. The electricalcharacteristics were not decreased afterirradiation of electrons up to a fluence of 5x 10¹⁵
cm"2 and remained at 80% of the initial efficiencyafter irradiation of protons up to a fluence of1 x 10l3cm~2. CIS-based thin film solar cells havemore superior irradiation hardness, comparedwith other solar cells, such as Si and GaAs solarcells4'5'. However, the property of damagegenerated by irradiation in CIS thin film itself isnot yet clear.
In this work, in order to clarify the mechanismof damages generated by irradiation in CIS solarcells, and to improve their performance, we havestudied for the proton- and electron-irradiationeffects on the electrical properties of CIS thinfilms.
2. Experimental procedureThe CIS thin films were fabricated by radio
frequency sputtering on semi-insulating GaAs(001) substrates at 400~450°C. The thickness ofCIS thin films was 6000A. The process ofmaking a target material for sputtering wasdescribed in another report in more detail '. Thesubstrate was cleaned ultrasonically by organicsolvents, and etched in H2SO4 solution for lmin.In addition, the substrate was cleaned by Arplasma for lOmin to remove the native oxide onthe surface of the GaAs substrate before growth.
The proton irradiation was performed at theion-injector for 380keV proton and Tandemaccelerator for lMeV proton of the Japan
Atomic Energy Research Institute (JAERI). Theelectron irradiation was also performed at theCockcraft-Walton type accelerator for 2MeVelectron and dynamitron accelerator for 3MeVelectron. The fluences of proton and electronwere in the range of lx lO l 3 ~ 5xl0l4cm"2and1X 10 l5~ 6x 10 cm"2, respectively. The electronconcentration and mobility of CIS thin filmswere determined between 80 and 300K by vander Pauw method before and after irradiation.
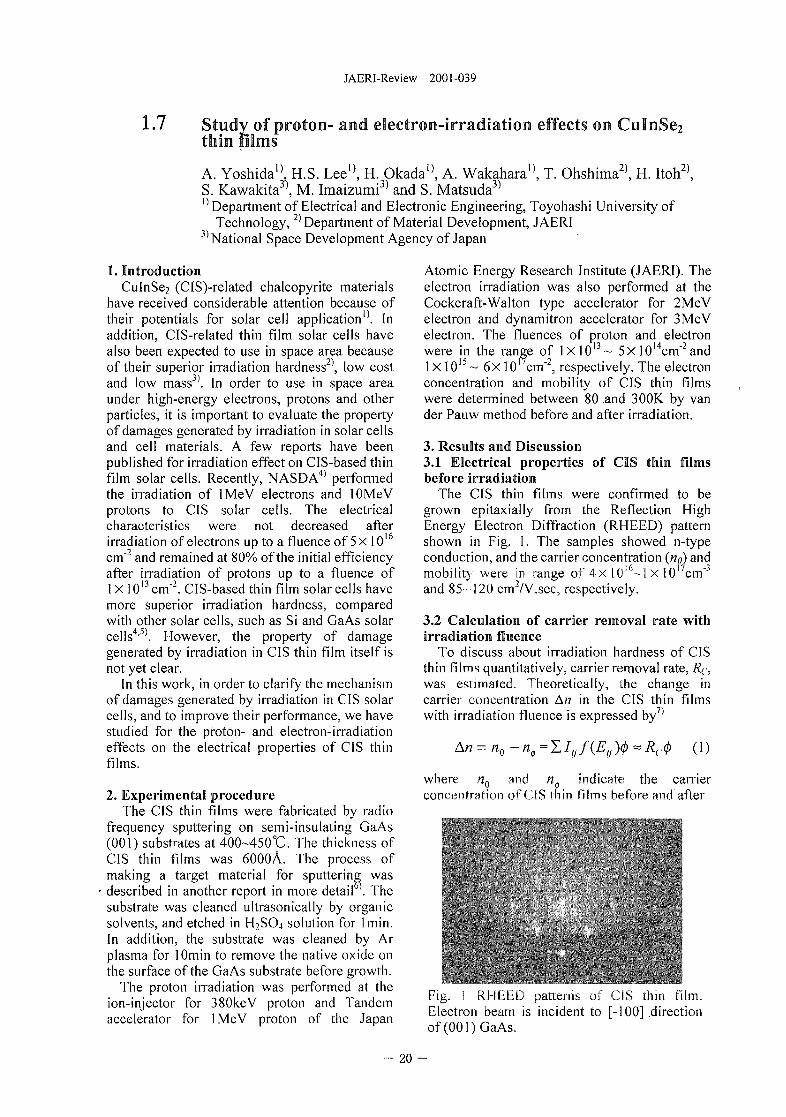
3. Results and Discussion3.1 Electrical properties of CIS thin filmsbefore irradiation
The CIS thin films were confirmed to begrown epitaxially from the Reflection HighEnergy Electron Diffraction (RHEED) patternshown in Fig. 1. The samples showed n-typeconduction, and the carrier concentration (no) andmobility were in range of 4X 10lfM X 10 cm"3
and 85-120 cm"/V.sec, respectively.
3.2 Calculation of carrier removal rate withirradiation fluence
To discuss about irradiation hardness of CISthin films quantitatively, carrier removal rate, Re,was estimated. Theoretically, the change incarrier concentration An in the CIS thin filmswith irradiation fluence is expressed by7'
Arc = n0 - n , = X / , / ( £ , ^ - (1)
where n0 and n6 indicate the carrierconcentration of CIS thin films before and after
Fig. 1 RHEED patterns of CIS thin film.Electron beam is incident to [-100] .directionof (001) GaAs.
20 -
JAERI-Review 2001-039
irradiation, respectively, Itj is the introductionrate of y-th majority carrier trap center byirradiation,/^,^ is the capture rate of majoritycarriers by the /-th trap center, Rc is the carrierremoval rate, and (b is the irradiation fluence.Carrier concentration n± after irradiation isapproximated, under the condition of small 0 ,from eq. (1) as follows:
n0) (2)
14
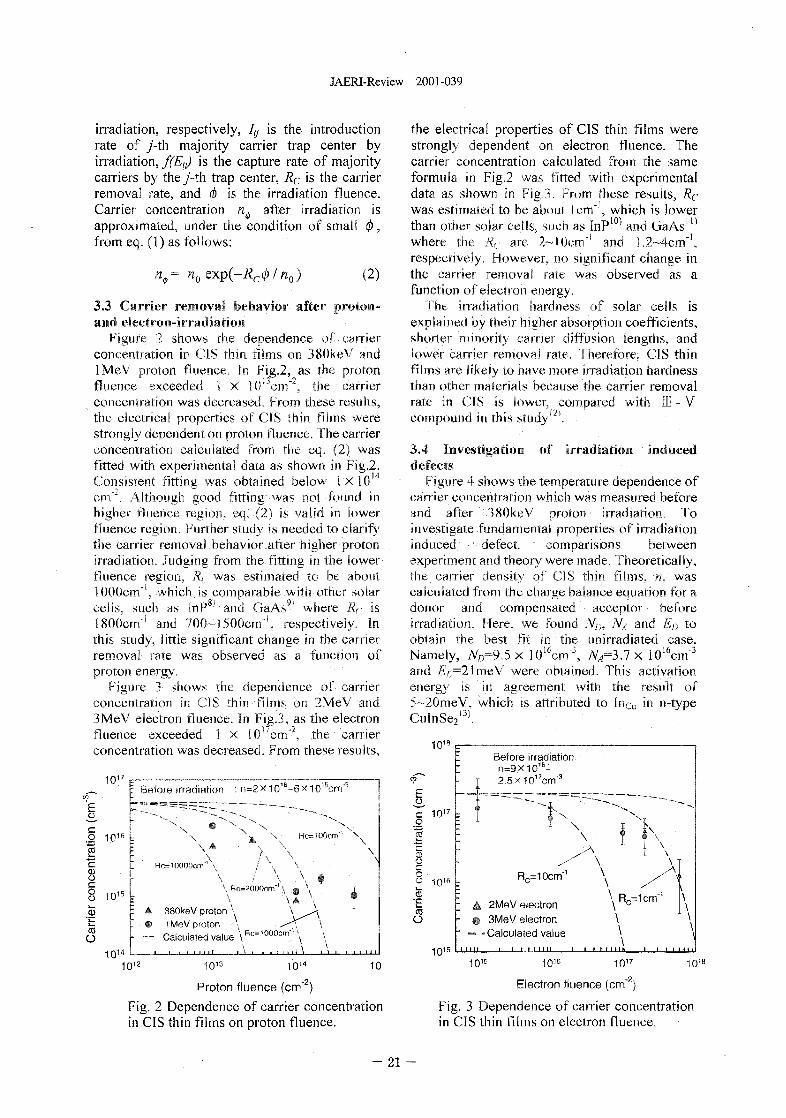
3.3 Carrier removal behavior after proton-and electron-irradiation
Figure 2 shows the dependence of carrierconcentration in CIS thin films on 380keV andlMeV proton fluence. In Fig.2, as the protonfluence exceeded 1 X lGL'cm"2, the carrierconcentration was decreased. From these results,the electrical properties of CIS thin films werestrongly dependent on proton fluence. The carrierconcentration calculated from the eq. (2) wasfitted with experimental data as shown in Fig.2.Consistent fitting was obtained below 1x10cm"'. Although good fitting was not found inhigher fluence region, eq. (2) is valid in lowerfluence region. Further study is needed to clarifythe carrier removal behavior after higher protonirradiation. Judging from the fitting in the lowerfluence region, R(- was estimated to be about1000cm"1, which is comparable with other solarcells, such as InP8j and GaAs9) where Rr is1800cm"1 and 700-1500cm"', respectively. Inthis study, little significant change in the carrierremoval rate was observed as a function ofproton energy.
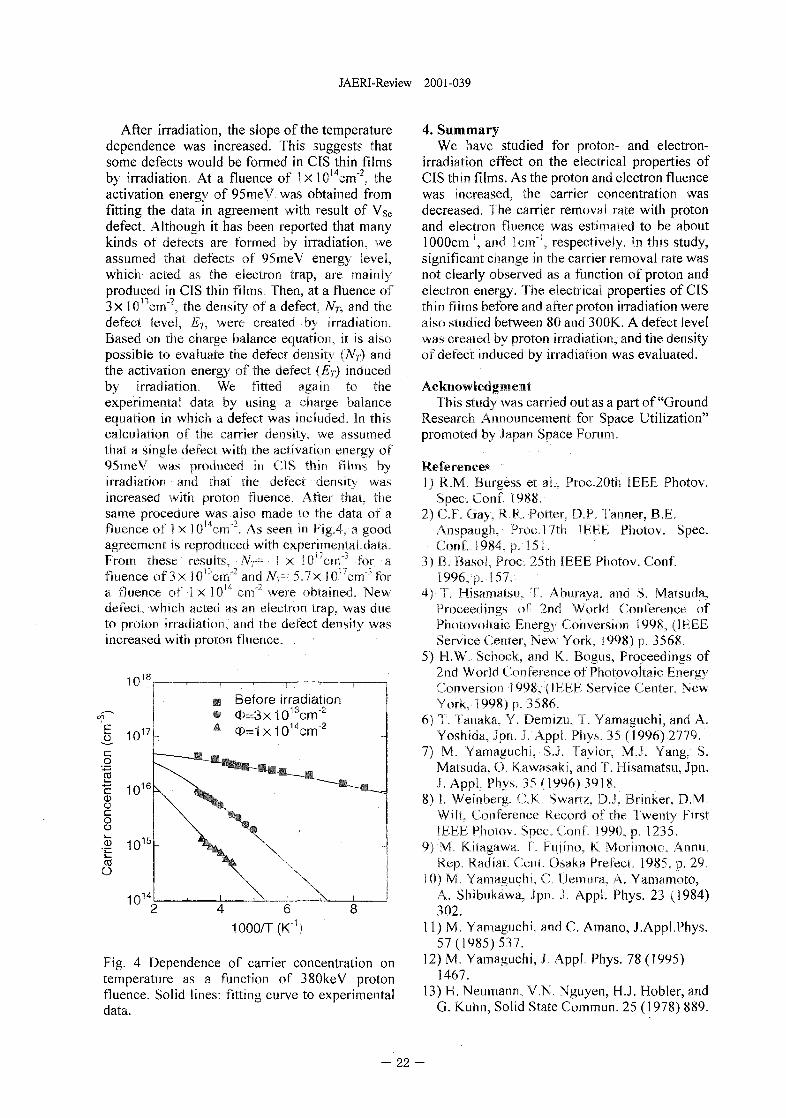
Figure 3 shows the dependence of carrierconcentration in CIS thin films on 2MeV and3MeV electron fluence. In Fiig,3, as the electron•fluence exceeded 1 x 10''cm", the carrierconcentration was decreased. From these results,
•JO17 _ . .: Before irradiation : n=2 x 101 6-6 x 1 0 1 W 3
. 1 1016 t
coo
8 101S jr
CD
10 u
\
Rc=10000cm'
\ / \ \\ Rc=2000cm \ m \X \A X
Rc=100cm"'
: A 380keV protonI • 1 MeV proton
O - — Calculated value \ R c = 1 O O O c m " \• \ \ , \
10 1 2 10 1 3 10 1 4 10
Proton fluence (cm"2)
Fig. 2 Dependence of carrier concentrationin CIS thin films on proton fluence.
the electrical properties of CIS thin films werestrongly dependent on electron fluence. Thecarrier concentration calculated from the sameformula in Fig.2 was fitted with experimentaldata as shown in Fig.3. from these results, Rcwas estimated to be about I cm"', which is lowerthan other solar cells, such as InP10) and GaAsn)
where the Rc are 2~l0errf' and I.2-4cm"1,respectively. However, no significant change inthe carrier removal rate was observed as afunction of electron energy.
The irradiation hardness of solar cells isexplained by their higher absorption coefficients,shorter minority carrier diffusion lengths, andlower carrier removal rate. Therefore, CIS thinfilms are likely to have more irradiation hardnessthan other materials because the carrier removalrate in CIS is lower, compared with III - Vcompound in this studyl2).
3.4 Investigation of Irradiation induceddefects
Figure 4 shows the temperature dependence ofcarrier concentration which was measured beforeand after 380keV proton irradiation. Toinvestigate fundamental properties of irradiationinduced defect, comparisons betweenexperiment and theory were made. Theoretically,the carrier density of CIS thin films, n, wascalculated from the charge balance equation for adonor and compensated acceptor beforeirradiation. Here, we found N!h NA and E!} toobtain the best fit in the unirradiated case.Namely, Nn=9,5 x 10¹⁶cnf3, NA=3.7x 1016cm"3
and Ep—2\meV were obtained. This activationenergy is in agreement with the result of5~20meV, which is attributed to InCu in n-typeCuInSe? 13)
1 018
CO
Oc
10 1 7 :
10"
toO
1015
: Before irradiationI n=9xio 1 6 -- T 2.5x io"cm' 3
: " l \
RG=10cm"1
; A 2MeV electron- # 3MeV electron" — - Calculated valuei l m , i , i i
\
\
\
\
\\\
1 1 1 1 1 1 1 h
1 \\
0=1cm'1
i i i i
\\\\i\
\
I I i
101 6 101 6 10 1 7
Electron fluence (cm"2}
10"
Fig. 3 Dependence of carrier concentrationin CIS thin films on electron fluence.
- 21
JAERI-Review 2001-039
After irradiation, the slope of the temperaturedependence was increased. This suggests thatsome defects would be formed in CIS thin filmsby irradiation. At a fluence of Ix 10l4cm"2. theactivation energy of 95meV was obtained fromfitting the data in agreement with result of Vse
defect. Although it has been reported that manykinds of defects are formed by irradiation, weassumed that defects of 95meV energy level,which acted as the electron trap, are mainlyproduced in CIS thin films. Then, at a fluence of3x 10ljcm"2, the density of a defect, NT, and thedefect level, £7, were created by irradiation.Based on the charge balance equation, it is alsopossible to evaluate the defect density (Nj) andthe activation energy of the defect (Ej) inducedby irradiation. We fitted again to theexperimental data by using a charge balanceequation in which a defect was included. In thiscalculation of the carrier density, we assumedthat a single defect with the activation energy of95meV was produced in CIS thin films byirradiation and that the defect density wasincreased with proton fluence. After that, thesame procedure was also made to the data of afluence of 1 x 10l4cm"2. As seen in Fig.4, a goodagreement is reproduced with experimental data.From, these results, N-j— 1 x 1 0 'cm'1' for afluence of 3x 10'"'cm"2 and N-i= 5.7x 10''cnV°fora fluence of 1 x 1014 cm"2 were obtained. Newdefect, which acted as an electron trap, was dueto proton irradiation, and the defect density wasincreased with proton fluence.
1018
O 10 17
Before irradiationcD=3x10¹³crrf2
<D=1x10ucm'2
1000/T(K~
Fig. 4 Dependence of carrier concentration ontemperature as a function of 380keV protonfluence. Solid lines: fitting curve to experimentaldata.
4. SummaryWe have studied for proton- and electron-
irradiation effect on the electrical properties ofCIS thin films. As the proton and electron fluencewas increased, the carrier concentration wasdecreased. The carrier removal rate with protonand electron fluence was estimated to be about1000cm"', and lcm'1, respectively. In this study,significant change in the carrier removal rate wasnot clearly observed as a function of proton andelectron energy. The electrical properties of CISthin films before and after proton irradiation werealso studied between 80 and 300K. A defect levelwas created by proton irradiation, and the densityof defect induced by irradiation was evaluated.
Acknowledgm entThis study was carried out as a part of "Ground
Research Announcement for Space Utilization"promoted by Japan Space Forum.
References1) R.M. Burgess et al , Proc.20th IEEE Photov.
Spec. Conf. 1988.2) C.F. Gay, R.R. Potter, D.P. Tanner, B.E.
Anspaugh, Prod7th IEEE Photov. Spec.Conf. 1984, p. 151.
3) B. Basol, Proc. 25th IEEE Photov. Conf.1996, p. 157.
4) T. Hisamatsu, T. Aburaya. and S. Matsuda,Proceedings of 2nd World Conference ofPhotovoltaic Energy Conversion 1998, (IEEEService Center, New York, 1998) p. 3568.
5) H.W. Schock, and K. Bogus, Proceedings of2nd World Conference of Photovoltaic EnergyConversion 1998, (IEEE Service Center, NewYork, 1998) p. 3586.
6) T. Tanaka, Y. Demizu, T. Yamaguchi, and A.Yoshida, Jpn. j . Appl. Phys. 35 (1996) 2779.
7) M. Yamaguchi, S i . Taylor, M.J. Yang. S.Matsuda, O. Kawasaki, and T. Hisamatsu, Jpn.j . Appt. Phys. 35 (1996) 3918.
8) I. Weinberg, C.K. Swartz, DJ. Brinker, D.M.Wilt, Conference Record of the Twenty FirstIEEE Photov. Spec. Conf. 1990, p. 1235.
9) M. Kitagawa, T. Fujino, K Morimoto, Annu.Rep. Radiat. Cent. Osaka Prefect. 1985, p. 29.
10) M. Yamaguchi, C. Uemura, A. Yamamoto,A. Shibukawa, Jpn. J. Appl. Phys. 23 (1984)302.
11) M. Yamaguchi, and C. Amano, J.Appl.Phys.57(1985)537.
12) M. Yamaguchi, J. Appl. Phys. 78 (1995)1467.
13) H. Neumann, V.N. Nguyen, H.J. Hobler, andG. Kuhn, Solid State Commun. 25 (1978) 889.
- 2 2 -
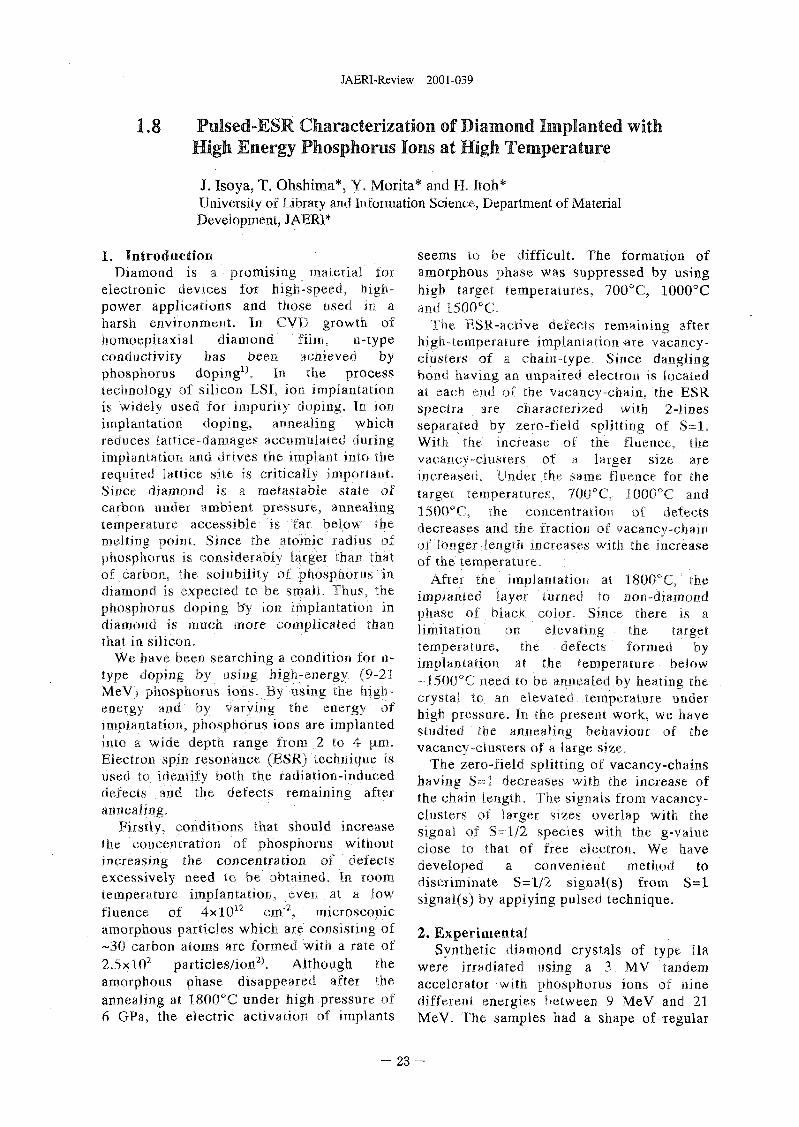
JAERI-Review 2001-039
1.8 Pulsed-ESR Characterization of Diamond Implanted withHigh Energy Phosphorus Ions at High Temperature
J. Isoya, T. Ohshima*, Y, Morita* and H. Itoh*University of Library and Information Science, Department of MaterialDevelopment, JAERI*
1. IntroductionDiamond is a promising material for
electronic devices for high-speed, high-power applications and those used in aharsh environment. In CVD growth ofhoraoepitaxial diamond film, n-typeconductivity has been achieved byphosphorus doping1*. In the processtechnology of silicon LSI, ion implantationis widely used for impurity doping. In ionimplantation doping, annealing whichreduces lattice-damages accumulated duringimplantation and drives the implant into therequired lattice site is critically important.Since diamond is a metastable state ofcarbon under ambient pressure, annealingtemperature accessible is far below themelting point. Since the atomic radius ofphosphorus is considerably larger than thatof carbon, the solubility of phosphorus indiamond is expected to'be small. Thus, thephosphorus doping b'y ion implantation indiamond is much more complicated thanthat in silicon.
We have been searching a condition for n-type doping by using high-energy (9-21MeV) phosphorus ions. By using the high-energy and by varying the energy ofimplantation, phosphorus ions are implantedinto a wide depth range from 2 to 4 itm.Electron spin resonance (ESR) technique isused to identify both the radiation-induceddefects and the defects remaining afterannealing.
Firstly, conditions that should increasethe concentration of phosphorus withoutincreasing the concentration of defectsexcessively need to be obtained. In room,temperature implantation, even at a lowfluence of 4xl012 cm"2, microscopicamorphous particles which are consisting of-30 carbon atoms are formed with a rate of2.5xlO2 particles/ion2). Although theamorphous phase disappeared after theannealing at 1800°C under high pressure of6 GPa, the electric activation of implants
seems to be difficult. The formation ofamorphous phase was suppressed by usinghigh target temperatures, 700°C, 1000°Cand 1500°C.
The ESR-active defects remaining afterhigh-temperature implantation-are vacancy-clusters of a chain-type. Since danglingbond having an unpaired electron is locatedat each end of the vacancy-chain, the ESRspectra are characterized with 2-linesseparated by zero-field splitting of S=l.With the increase of the fluence, thevacancy-dusters of a larger size areincreased. Under the same fluence for thetarget temperatures, 700°C, 1000°C and1500° C, the concentration of defectsdecreases and the fraction of vacancy-chainof longer length increases with the increaseof the temperature.
After the implantation at 1800°C3 theimplanted layer turned to non-diamondphase of black color. Since there is alimitation on elevating the targettemperature, the defects formed byimplantation at the temperature below~15OO°C need to be annealed by heating thecrystal to an elevated temperature underhigh pressure. In the present work, we havestudied the annealing behaviour of thevacancy-clusters of a large size.
The zero-field splitting of vacancy-chainshaving S=l decreases with the increase ofthe chain length. The signals from vacancy-clusters of larger sizes overlap with thesignal of S=l/2 species with the g-valueclose to that of free electron. We havedeveloped a convenient method todiscriminate S=l/2 signal(s) from S=lsignal(s) by applying pulsed technique.
2. ExperimentalSynthetic diamond crystals of type Ha
were irradiated using a 3 MV tandemaccelerator with phosphorus ions of ninedifferent energies between 9 MeV and 21MeV. The samples had a shape of regular
- 23
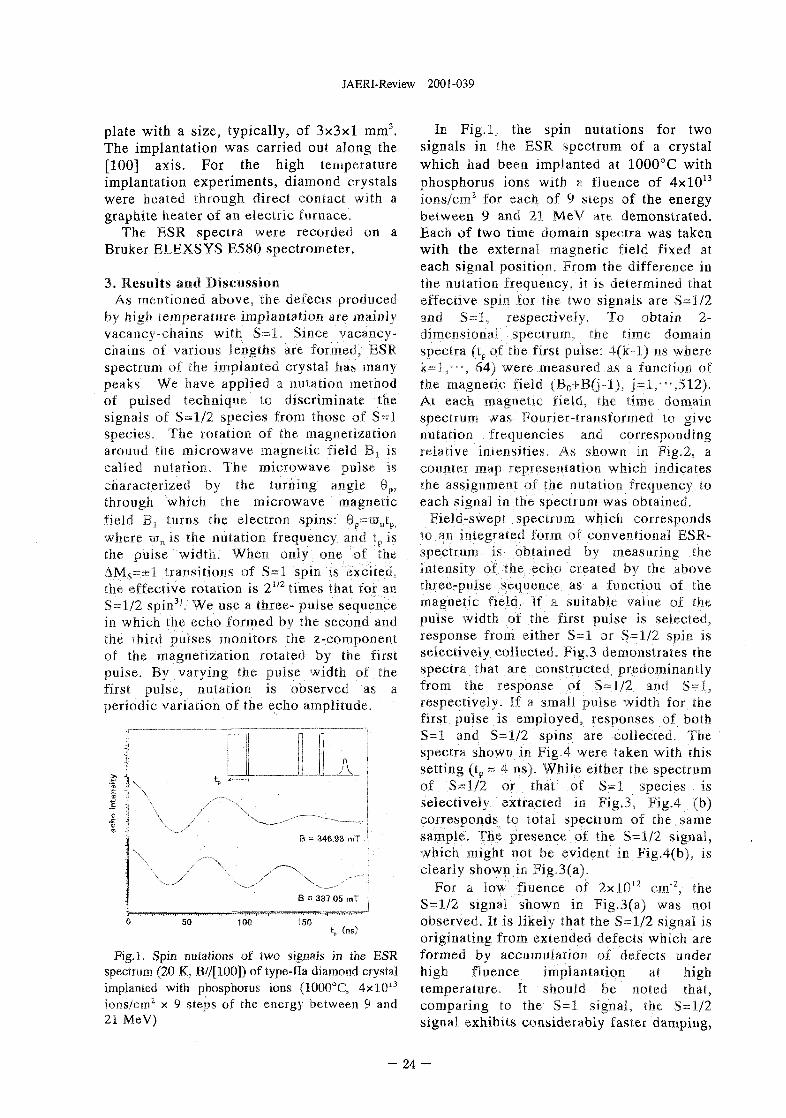
JAERI-Review 2001-039
plate with a size, typically, of 3x3x1 mmJ.The implantation was carried out along the[100] axis. For the high temperatureimplantation experiments, diamond crystalswere heated through direct contact with agraphite heater of an electric furnace.
The ESR spectra were recorded on aBruker ELEXSYS E580 spectrometer.
3. Results and DiscussionAs mentioned above, the defects produced
by high temperature implantation are mainlyvacancy-chains with S=l. Since vacancy-chains of various lengths are formed, ESRspectrum of the implanted crystal has manypeaks. We have applied a nutation methodof pulsed technique to discriminate thesignals of S=l/2 species from those of S=lspecies. The rotation of the magnetizationaround 'the microwave magnetic field Bj iscalled nutation. The microwave pulse ischaracterized by the turning angle 8P,through which the microwave magneticfield Bj turns the electron spins: 6p=
>raI1tPiwhere wa is the nutation frequency and tp isthe pulse width. When only one of theAMS=±1 transitions of S=l spin is excited,the effective rotation is 21/2 times that for aaS=l/2 spin35. We use a three- pulse sequencein which the echo formed by the second andthe third pulses monitors the z-componentof the magnetization rotated by the firstpulse. By varying the pulse width of thefirst pulse, nutation is observed as aperiodic variation of the echo amplitude.
50 100 150t, (ns)
Fig.l. Spin nutations of two signals in the ESRspectrum (20 K, B//[100]) of type-Ila diamond crystalimplanted with phosphorus ions (1000°C, 4xlO13
ions/cm2 x 9 steps of the energy between 9 and21 MeV)
In Fig.l, the spin nutations for twosignals in the ESR spectrum of a crystalwhich had been implanted at 1000°C withphosphorus ions with a fluence of 4xlO13
ions/cm2 for each of 9 steps of the energybetween 9 and 21 MeV are demonstrated.Each of two time domain spectra was takenwith the external magnetic field fixed ateach signal position. From the difference inthe nutation frequency, it is determined thateffective spin for the two signals are- S=I/2and 5=1, respectively. To obtain 2-dimensional spectrum, the time domainspectra (tpof the first pulse: 4(k-l) ns wherek=l,"", 64) were measured as a function ofthe magnetic field (B0+B(j-l), j=l,"-,512).At. each magnetic field, the time domainspectrum was Fourier-transformed to givenutation frequencies and correspondingrelative intensities. As shown in Fig.2, acounter map representation which indicatesthe assignment of the nutation frequency to
in tIII- <>pf,riTinr> was obtained.
i jvhich corresponds>r conventional ESR-
i\ measuring theTf.aind by the above
riret--oijisi- •immune- JS i function of the• nagnenc "icir 1 sujiahie value of thepulse width of the first pulse is selected,response from either S=l or 8=1/2 spin isselectively collected. Fig.3 demonstrates thespectra that are constructed predominantlyfrom the response of S=l/2 and S=l,respectively. If a small pulse width for thefirst pulse is employed, responses of bothS=l and S=l/2 spins are collected. Thespectra shown in Fig.4 were taken with thissetting (tp = 4 ns). While either the spectrumof S=l/2 or that of S=l species isselectively extracted in Fig.3, Fig.4 (b)corresponds to total spectrum of the samesample. The presence of the S=l/2 signal,which might not be evident in Fig.4(b), isclearly shown in Fig.3(a).
For a low fluence of 2xl0)Z cm"2, theS=l/2 signal shown in Fig.3(a) was notobserved. It is likely that the S=l/2 signal isoriginating from extended defects which areformed by accumulation of defects underhigh fiuence implantation at hightemperature. It should be noted that,comparing to the S=l signal, the S=l/2signal exhibits considerably faster damping,
- 2 4 -
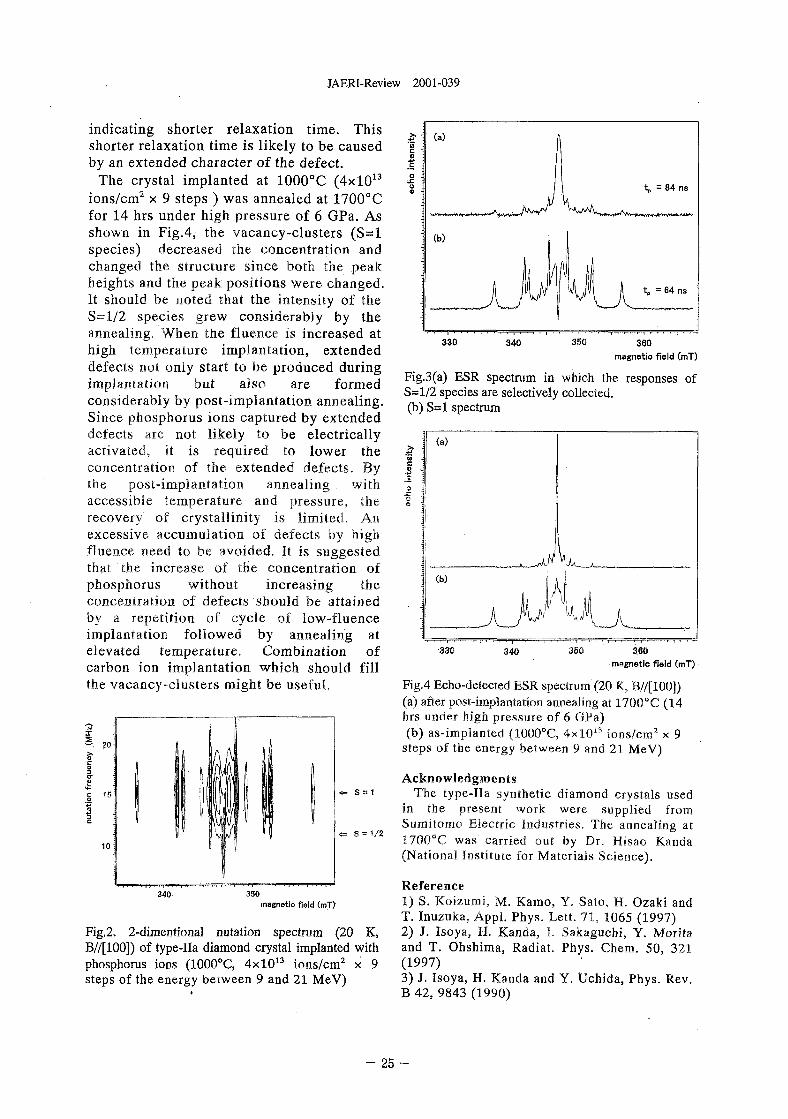
JAERI-Review 2001-039
indicating shorter relaxation time. Thisshorter relaxation time is likely to be causedby an extended character of the defect.
The crystal implanted at 1000°C (4xlO13
ions/cm2 x 9 steps ) was annealed at 1700°Cfor 14 hrs under high pressure of 6 GPa. Asshown in Fig.4, the vacancy-clusters (S=lspecies) decreased the concentration andchanged the structure since both the peakheights and the peak positions were changed.It should be noted that the intensity of theS=l/2 species grew considerably by theannealing. When the fluence is increased athigh temperature implantation, extendeddefects not only start to be produced duringimplantation but also are formedconsiderably by post-implantation annealing.Since phosphorus ions captured by extendeddefects are not likely to be electricallyactivated, it is required to lower theconcentration of the extended defects. Bythe post-implantation annealing withaccessible temperature and pressure, therecovery of crystallinity is limited. Anexcessive accumulation of defects by highfluence need to be avoided. It is suggestedthat the increase of the concentration ofphosphorus without increasing theconcentration of defects should be attainedby a repetition of cycle of iow-fluenceimplantation followed by annealing atelevated temperature. Combination ofcarbon ion implantation which should fillthe vacancy-dusters might be useful.
1 20-
10
A
<= S = 1
S= 1/2
340 350magnetic field (mT>
Fig.2. 2-dimentional nutation spectrum (20 K,B//[100]) of type-lla diamond crystal implanted withphosphorus ions (1000°C, 4xlO13 ions/cm2 x 9steps of the energy between 9 and 21 MeV)
330 350 360magnetic field (mT)
Fig.3(a) ESR spectrum in which the responses ofS=l/2 species are selectively collected,(b) S=l spectrum
£ 1(a)
!
(b)
i'I
1 \, /
L.% \ 1
330 340 350 360magnetic field (mT)
Fig.4 Echo-detected ESR spectrum (20 K, B//[100])(a) after post-implantation annealing at 1700°C (14hrs under high pressure of 6 GPa)(b) as-implanted (1000°C, 4x10° ions/cm2 x 9
steps of the energy between 9 and 21 MeV)
AcknowledgmentsThe type-lla synthetic diamond crystals used
in the present work were supplied fromSumitomo Electric Industries. The annealing at17O0°C was carried out by Dr. Hisao Kanda(National Institute for Materials Science).
Reference1) S. Koizumi, M. Kamo, Y. Sato, H. Ozaki andT. Inuzuka, Appl. Phys. Lett. 71, 1065 (1997)2) J. Isoya, H. Kanda, I. Sakaguchi, Y. Moritaand T. Ohshima, Radial. Phys. Chem. 50, 321(1997)3) J. Isoya, H. Kanda and Y. Uchida, Phys. Rev.B 42, 9843 (1990)
- 2 5 -
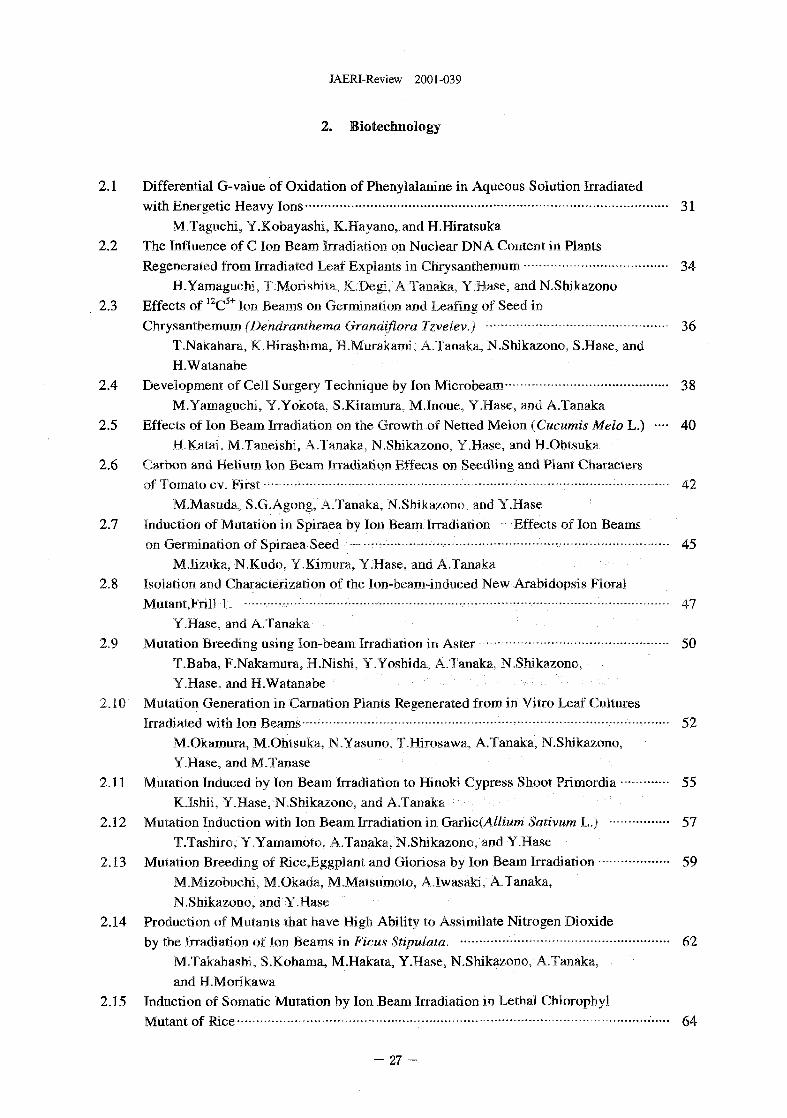
JAERI-Review 2001-039
2. Biotechnology
2.1 Differential G-value of Oxidation of Phenylalanine in Aqueous Solution Irradiatedwith Energetic Heavy Ions • 31
M.Taguchi, Y.Kobayashi, K.Hayano, and H.Hiratsuka2.2 The Influence of C Ion Beam Irradiation on Nuclear DNA Content in Plants
Regenerated from Irradiated Leaf Explants in Chrysanthemum ••••-•• 34H.Yamaguchl, T.Morishita, JLDegi, A.Tanaka, Y.Hase, and N.Shikazono
2.3 Effects of I2C5+Ion Beams on Germination and Leafing of Seed inChrysanthemum, (Dendranthema Grandiflora Tzvelev.) •• • • • 36
T.Nakahara, K.Hirashima, H.Murakami, A.Tanaka, N.Shikazono, S.Hase, andH.Watanabe
2.4 Development of Cell Surgery Technique by Ion Microbeam • 38M.Yamaguchi, Y.Yokota, S.Kitamura, M.Inoue, Y.Hase, and A.Tanaka
2.5 Effects of Ion Beam Irradiation on the: Growth of Netted Melon (Cucumis Melo L.) •••• 40H.Katai, M.Taneishi, A.Tanaka, N.Shikazono, Y.Hase, and H.Ohtsuka
2.6 Carbon and Helium Ion Beam Irradiation Effects on Seedling and Plant Charactersof Tomato cv. First • —• • •— 42
M.Masuda, S.G.Agong, A.Tanaka, N.Shikazono, and Y.Hase2.7 Induction of Mutation in Spiraea by Ion Beam Irradiation —Effects of Ion Beams
on Germination of Spiraea Seed — • ——— • - - 45M.Ezuka, N.Kudo, Y.Kimura, Y.Hase, and A.Tanaka
2.8 Isolation and Characterization of the lon-beam-induced New Arabidopsis FloralMutantJFrill 1. • • •• 47
Y.Hase, and A.Tanaka2.9 Mutation Breeding using Ion-beam Irradiation in Aster •••• 50
T.Baba, F.Nakamura, H.Nishi, Y.Yoshida, A.Tanaka, N.SMkazono,Y.Hase, and H.Watanabe
2.10 Mutation Generation in Carnation Plants Regenerated from in Vitro Leaf CulturesIrradiated with Ion Beams •••• •• • •••••• • • 52
M.Okamura, M.Ohtsuka, N.Yasuno, T.Hirosawa, A.Tanaka, N.Shikazono,Y.Hase, and M.Tanase
2.11 Mutation Induced by Ion Beam Irradiation to Hinoki Cypress Shoot Primordia 55K.Ishii, Y.Hase, N.Shikazono, and A.Tanaka
2.12 Mutation Induction with Ion Beam Irradiation in Garlic(A//iM/w Sativum L.) • 57T.Tashiro, Y.Yamamoto, A.Tanaka,'N.Shikazono,'and Y.Hase
2.13 Mutation Breeding of Rice,Eggplant and Gloriosa by Ion Beam Irradiation •—- 59M.Mizobuchi, M.Okada, M.Matsumoto, A.Iwasaki, A.Tanaka,N.Shikazono, and Y.Hase
2.14 Production of Mutants that have High Ability to Assimilate Nitrogen Dioxide
by the Irradiation of Ion Beams in Ficus Stipulata. 62M.Takahashi, S.Kohama, M.Hakata, Y.Hase, N.Shikazono, A.Tanaka,and H.Morikawa
2.15 Induction of Somatic Mutation by Ion Beam Irradiation in Lethal ChlorophylMutant of Rice • • - • ••• • •' 64
- 27 -
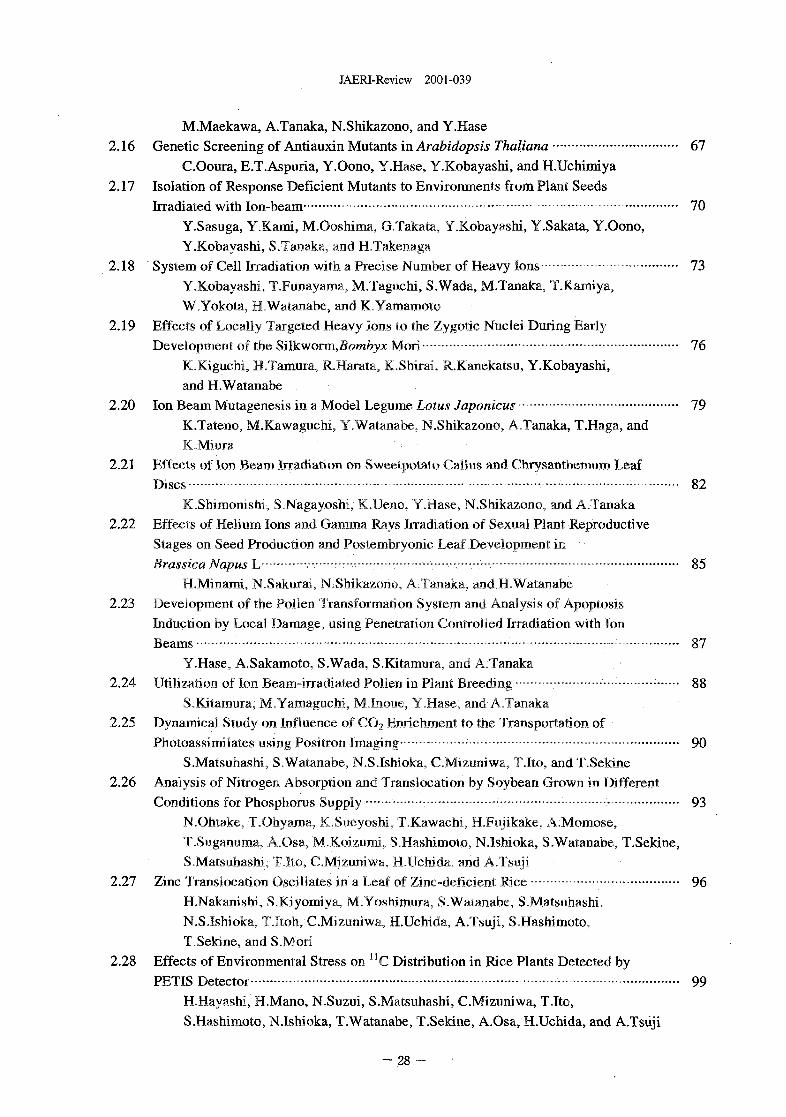
JAERI-Review 2001-039
M.Maekawa, A.Tanaka, N.Shikazono, and Y.Hase2.16 Genetic Screening of Antiauxin Mutants in Arabidopsis Thaliana 67
C.Ooura, E.T.Aspuria, Y.Oono, Y.Hase, Y.Kobayashi, and H.Uchimiya2.17 Isolation of Response Deficient Mutants to Environments from Plant Seeds
Irradiated with Ion-beam JQ
Y.Sasuga, Y.Kami, M.Ooshima, G.Takata, Y.Kobayashi, Y.Sakata, Y.Oono,Y.Kobayashi, S.Tanaka, and H.Takenaga
2.18 System of Cell Irradiation with a Precise Number of Heavy Ions • 73Y.Kobayashi, TT.Funayama, M.Taguchi, S.Wada, M.Tanaka, T.Kamiya,W.Yokota, H.Watanabe, and K.Yamamoto
2.19 Effects of Locally Targeted Heavy Ions to the Zygotic Nuclei During EarlyDevelopment of the Silkworm,BombyxMon—••••-•••••• — • • 76
K.Kiguchi, H.Tamura, R.Harata, K.Shirai, R.Kanekatsu, Y.Kobayashi,and H.Watanabe
2.20 Ion Beam Mutagenesis in a Model Legume Lotus Japonicus—-- 79K.Tateno, M.Kawaguchi, Y.Watanabe, N.Shikazono, A.Tanaka, T.Haga, andK.Miura
2.21 Effects of Ion Beam Irradiation on Sweetpotato Callus and Chrysanthemum LeafDiscs - - - - - • - - 82
K.Shimonishi, S.Nagayoshi, K.Ueno, Y.Hase, N.Shikazono, and A.Tanaka2.22 Effects of Helium Ions and Gamma Rays Irradiation of Sexual Plant Reproductive
Stages on Seed Production and Postembryonic Leaf Development inBrassica Napus h— 35
H.M'inami, N.Sakurai, N.Shikazono, A.Tanaka, and H.Watanabe2.23 Development of the Pollen Transformation System and Analysis of Apoptosis
Induction by Local Damage, using Penetration Controlled Irradiation with IonBeams • • 87
Y.Hase, A.Sakamoto, S.Wada, S.Kitamura, and A.Tanaka2.24 Utilization of Ion Beam-irradiated Pollen in Plant Breeding ; 88
S.Kitamura, M.Yamaguchi, M.Inoue, Y.Hase, and A.Tanaka2.25 Dynamical Study on Influence of CO2 Enrichment to the Transportation of
Photoassimilates using Positron Imaging • 90S.Matsuhashi, S.Watanabe, N.S.Ishioka, C.Mizuniwa, Tito, and T.Sekine
2.26 Analysis of Nitrogen Absorption and Translocation by Soybean Grown in DifferentConditions for Phosphorus Supply - •• — • • •— 93
N.Ohtake, T.Ohyama, K.Sueyoshi, T.Kawachi, H.Fujikake, A.Momose,T.Suganuma, A.Osa, M.Koizumi, S.Hashimoto, N.Ishioka, S.Watanabe, T.Sekine,S.Matsuhashi, T.Ito, C.Mizuniwa, H.Uchida, and A.Tsuji
2.27 Zinc Transiocation Oscillates in a Leaf of Zinc-deficient Rice •-••- ••—• • 96H.Nakanishi, S.Kiyomiya, M.Yoshimura, S.Watanabe, S.Matsuhashi,N.S.Ishioka, T.Itoh, C.Mizuniwa, H.Uchida, A.Tsuji, S.Hashimoto,T.Sekine, and S.Mori
2.28 Effects of Environmental Stress on ' !C Distribution in Rice Plants Detected byPETIS Detector 99
H.Hayashi, H.Mano, N.Suzui, S.Matsuhashi, C.Mizuniwa, T.Ito,S.Hashimoto, N.Ishioka, T.Watanabe, T.Sekine, A.Osa, H.Uchida, and A.Tsuji
- 28 -
JAERI-Review 2001-039
2.29 Water and Trace Element Behavior in a Plant 102T.M.Nakanishi, J.Furukawa, K.Tanoi, H.Yokota, N.Bceue, S.Hashimoto,S.Matsuhashi, T.Sekine, T.Itoh, T.Mizuniwa, N.S.Ishioka, S.Watanabe,A.Osa, H.Uchida, and A.Tsuji
2.30 Uptake of 18F-water 15O-H2O and 13NO3'in Tomato Plants 105A.Tsuji, H.Uchida, T.Yamashita, S.Matsuhashi, T.Ito, CMizuniwa,N.S.Ishioka, S.Watanabe, S.Hashimoto, and T.Sekine
2.31 Single-hit Effects and By-stander Effect on Cells by Heavy-ion Microbeams 107Y.Furusawa, N.Yasuda, CL.Shao, M.AokL K.Sato, K.Takakura,T.Funayama, and Y.Kobayashi
2.32 Fundamental Study on Radiotherapy of Tumors to Beneficial Companion Animalsusing Heavy Ion Beam 110
S.Wada, M.Natsuhori, NJto, Y.Kobayashi, T.Funayama, and K.Yamamoto
- 2 9 -
JAERI-Review 2001-039
2.1 Differential G-value of oxidation of phenylalaninein aqueous solution irradiated with energetic heavy ions.
Mitsumasa Taguchi1^ Yasuhiko Kobayashi1}, Kazuki Hayano2), and
Hiroshi Hiratsuka2)
'Department of Radiation Research for Environment and Resources, JAERI,
department of Chemistry, Gunma University.
l.Introduction
It is well known that the yields of transient
species, e.g., OH radical and hydrated electron,
depend on the kind of ionizing radiations used.
The differential G-values (the yield at a particular
energy or LET of an ion in the sample solution) of
OH radical decreased with the LET value of heavy
ions having a few hundred MeV/n energy1'.
Though low LET radiations form spurs sparsely,
heavy ions form spurs densely along their
trajectories. The transient species are so near as to
interact easily with each other in the track.
Therefore, the decrease of the G-value will be due to
the increase of reactions of OH radical with other
transient species.
The productions of/?-, m-, and o-tyrosine, which
are the adducts of one hydroxyl group on phenyl
ring of phenylalanine, were reported after y-ray
irradiation of aqueous phenylalanine solution2). In
the present report, we investigated the differential G-
value of production yields of tyrosine isomers by the
irradiations of He- or O2-saturated aqueous
phenylalanine solution with several hundreds MeV
C, Ne, and Ar ions.
2.ExperimemtaI
Aqueous phenylalanine solutions (13 mM) were
saturated with He or O2 gas, and put into an
aluminum cell, which has an aluminum window of
15-um thickness for the irradiation. The volume of
the sample solution was 4.7 ml and its depth was
about 4 mm.
Irradiations were performed with 220-MeV 12C5+,
350-MeV 20Ne8+, and 460-MeV 40Ar13+ ions using
Irradiation Apparatus for Seed3>4) in TIARA facility.
Energy of the ion was attenuated by a set of
aluminum foils (10- to 500-fxrn thickness) installed
on the cell. The incident energies (E0), the energies
of the ion at the surface of the sample solution after
penetrating the aluminum foils and the windows,
were calculated by the TRM code5*'. Penetration
depth of the ion was less than 1.1 mm in water.
Therefore, the sample solution was stirred during the
irradiation by a magnetically coupled stirrer chip to
keep the homogeneity. The sample solution was also
irradiated with y-ray as a low LET radiation.
The irradiated solutions were analyzed by High
Performance Liquid Chromatography (HPLC) 'with
a reversed phase column at 40 °C. Water with 3-%
acetonitrile was used as an eluent and its flow rate
was 0.8 ml/minute.
3.ResuIts and discussion
The productions of />-, /»-, and o-tyrosine were
confirmed on the HPLC chromatogram after the y-
ray and heavy ion irradiations. Yields of the
productions of these tyrosine isomers (Tyrs)
increased linearly with an increase of dose. G-value
of the production of total tyrosine isomers by y-ray
irradiation was estimated to be 0.30 (He-saturated)
and 1.35 (O2-saturated). G-values obtained by
heavy ion irradiations were not constant for the
different incident energies of the ions, for
example, G-values varied from 0.32 at 207
MeV to 0.19 at 67.6 MeV of the incident energy
of the C ion. This means that the yield of total
Tyrs along the trajectory decreases with
decreasing energy of the ions.
We estimated the number of total molecules of
Tyrs (NT) produced by the single ion irradiation from
31 -
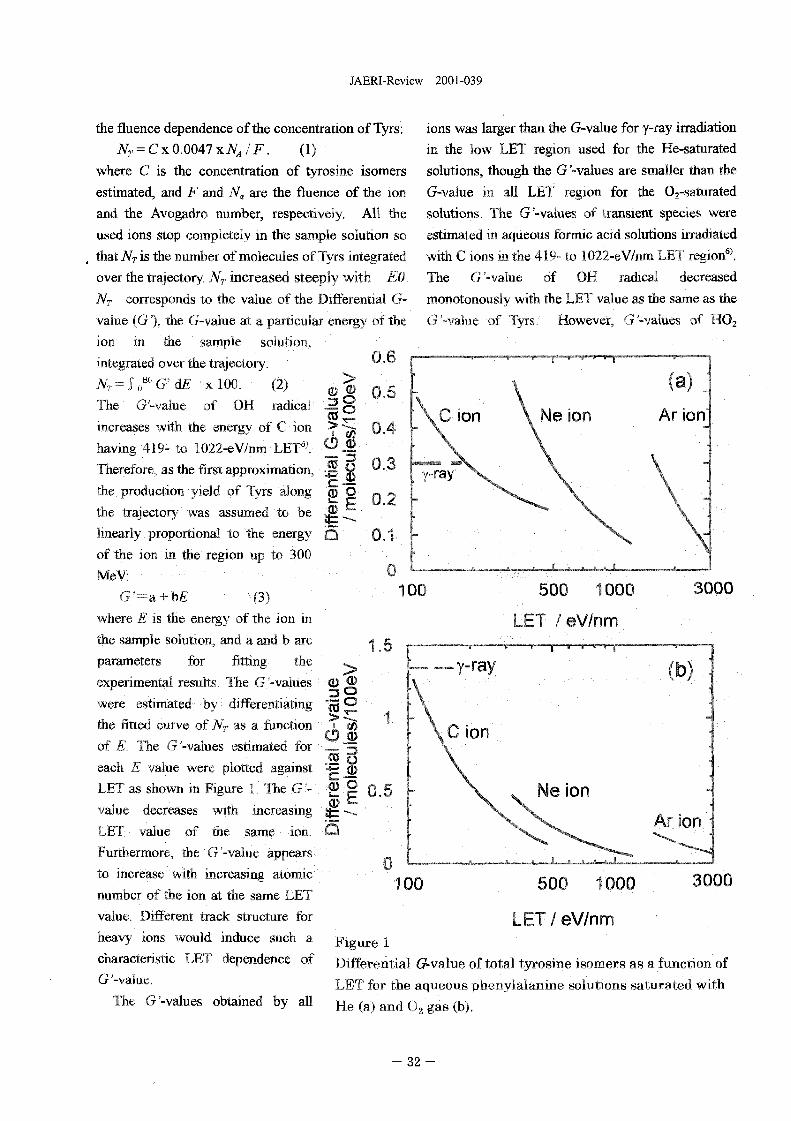
JAERI-Review 2001-039
the fluence dependence of the concentration of Tyrs:
NT = Cx0.0041xNA/F. (1)where C is the concentration of tyrosine isomers
estimated, and F and Na are the fluence of the ion
and the Avogadro number, respectively. All the
used ions stop completely in the sample solution so
that NT is the number of molecules of Tyrs integrated
over the trajectory. NT increased steeply with EO.
NT corresponds to the value of the Differential G-
value (G'), the G-value at a particular energy of the
ion in the sample solution,
integrated over the trajectory:
NT=jomG3dE xlOO. (2)
The G-value of OH radical
increases with the energy of C ion
having 419- to 1022-eV/nm LET6).
Therefore, as the first approximation,
the production yield of Tyrs along
the trajectory was assumed to be
linearly proportional to the energy
of the ion in the region up to 300
MeV:
- a + b£ (3)
where E is the energy of the ion in
the sample solution, and a and b are
parameters for fitting the
experimental results. The G'-values
were estimated by differentiating
the fitted curve of NT as a function
of E. The G'-values estimated for
each E value were plotted 3gainsf
LET as shown in Figure I. Tne > - -
value decreases with inci easing
LET value of the same
Furthermore, the G "'-value
to increase with increasing jtomic
number of the ion at the same LET
value. Different track structure for
heavy ions would induce such a
characteristic LET dependence of
G '-value.
The G '-values obtained by all
ions was larger than the G-value for y-ray irradiation
in the low LET region used for the He-saturated
solutions, though the G'-values are smaller than the
G-value in all LET region for the 0,-saturated
solutions. The G '-values of transient species were
estimated in aqueous formic acid solutions irradiated
with C ions in the 419- to 1022-eV/nm LET region6).
The G '-value of OH radical decreased
monotonously with the LET value as the same as the
G '-value of Tyrs. However. G '-values of HO2
alue
iSc£
Q
©oo%
o
mol
e0.6
0.5
0.4
0.3
0.2
0.1
0
Ne ion
( a ) ;
Ar ion"
Y-ray
100 500 1000
LET / eV/nm
3000
CD3CQ
6"c&a;
©oo*coMo
o
1.5
1
<or r
-y-ray
NC ion\\\
\ >He ion
(b) :
-
Ar ion •
00 500 1000
LET/eV/nm
3000
Figure 1Differential G-value of total tyrosine isomers as a function ofLET for the aqueous phenylalanine solutions saturated withHe (a) and O2 gas (b).
- 3 2 -
JAERI-Review 2001-039
radical and H2O2 increased monotonously with the
LET value in water, because these species would be
produced by the recombination of transient species
in the track6). The production of Tyrs will be
principally induced by OH radical. Assuming that
the G '-value of OH radical for all the ions used here
decreases similarly to the G '-value of OH radical in
formic acid solution, the G '-values of Tyrs will
decrease with the LET value from. 0.3 for He-
saturated and 1.35 for O2-saturated solutions
obtained by the y-ray irradiation. However, partly
greater G ""-values than that expected are observed
for only He-saturated solutions. The oxidizing
agents such as O2 and Fe(CN)/" increase the
oxidation of Phe. The G-value of total Tyrs in the
O2-saturated aqueous Phe solution was estimated to
be about four times of that in the absence of oxygen
after the irradiation with y-ray. The ions produce the
oxidizing species, e.g., O2 molecule and HO2
radical, which are rarely produced by the y-ray
irradiation and increase with the LET value. The
partly greater G-value would be caused by the
oxidizing species produced in the track for the He-
saturated aqueous Phe solution.
References
1) A. Appleby. E.A. Christman, and M. Jayko,
Radial Res., 1M, 263 (1985).
2) O.H. Weeler and R. Montalvo, Radial Res., 40, 1
(1989).
3) M. Kikuchi etal, TIARA Annual Report I, 159
(1992).
4) M.Taguchi et al., Radial Phys. Chem., 60, 263
(2001).
5) J.F. Ziegler, et al., The Stopping Power and
Range of Ions In Solid, vol. 1, Pergamon Press, New
York, 1985.
6) J.A. LaVerne, Radial Phys. Chem., 34, 135
(1989).
- 33 -
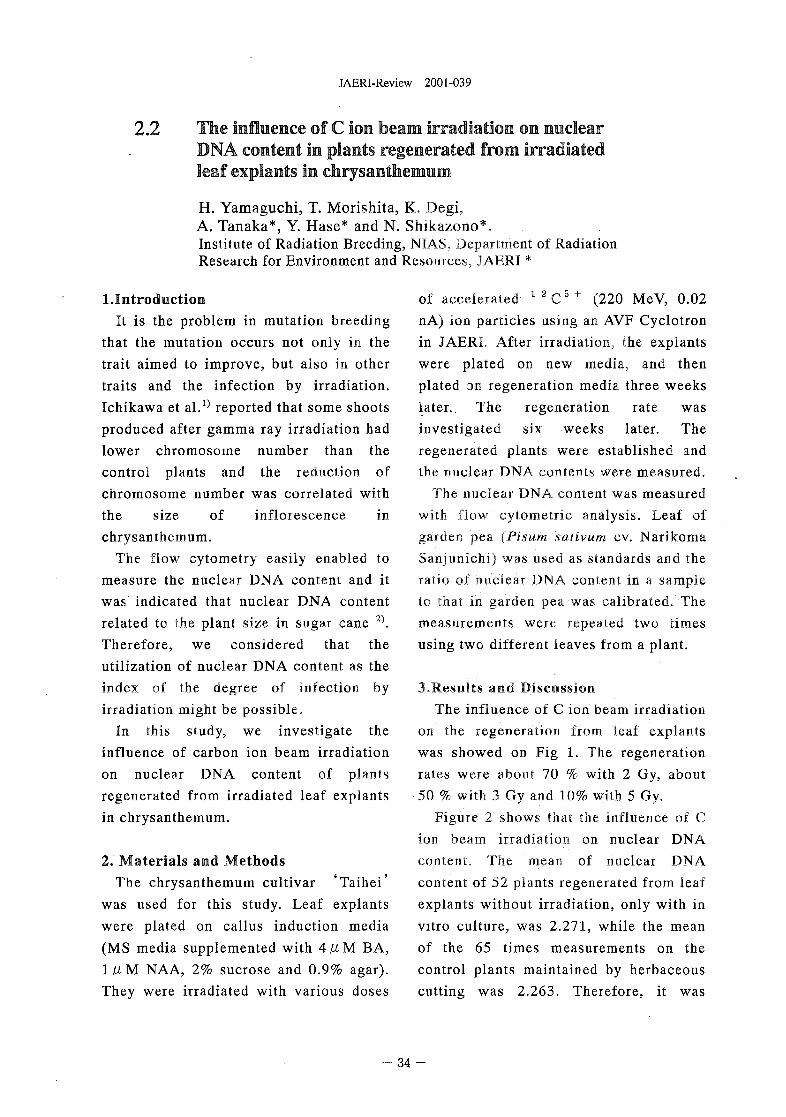
JAERI-Review 2001-039
2.2 The influence of C ion beam irradiation on nuclearDNA content in plants regenerated from irradiatedleaf explants in chrysanthemum
H. Yamaguchi, T. Morishita, K. Degi,A. Tanaka*, Y. Hase* and N. Shikazono*.Institute of Radiation Breeding, NIAS, Department of RadiationResearch for Environment and Resources, JAERI *
1.IntroductionIt is the problem in mutation breeding
that the mutation occurs not only in thetrait aimed to improve, but also in othertraits and the infection by irradiation.Ichikawa et al.J) reported that some shootsproduced after gamma ray irradiation hadlower chromosome number than thecontrol plants and the reduction ofchromosome number was correlated withthe size of inflorescence inchrysanthemum.
The flow cytometry easily enabled tomeasure the nuclear DNA content and itwas indicated that nuclear DNA contentrelated to the plant size in sugar cane 2).Therefore, we considered that theutilization of nuclear DNA content as theindex of the degree of infection byirradiation might be possible.
In this study, we investigate theinfluence of carbon ion beam irradiationon nuclear DNA content of plantsregenerated from irradiated leaf explantsin chrysanthemum.
2. Materials and MethodsThe chrysanthemum cultivar 'Taihei'
was used for this study. Leaf explantswere plated on callus induction media(MS media supplemented with 4/zM BA,1/iM NAA, 2% sucrose and 0.9% agar).They were irradiated with various doses
of accelerated 1 2 C 5 + (220 MeV, 0.02nA) ion particles using an AVF Cyclotronin JAERI. After irradiation, the explantswere plated on new media, and thenplated on regeneration media three weekslater.. The regeneration rate wasinvestigated six weeks later. Theregenerated plants were established andthe nuclear DNA contents were measured.
The nuclear DNA content was measuredwith flow cytometric analysis. Leaf ofgarden pea (Pisum sativum cv. NarikomaSanjunichi) was used as standards and theratio of nuclear DNA content in a sampleto that in garden pea was calibrated. Themeasurements were repeated two timesusing two different leaves from a plant.
3.Results and DiscussionThe influence of C ion beam irradiation
on the regeneration from leaf explantswas showed on Fig 1. The regenerationrates were about 70 % with 2 Gy, about50 % with 3 Gy and 10% with 5 Gy.
Figure 2 shows that the influence of Cion beam irradiation on nuclear DNAcontent. The mean of nuclear DNAcontent of 52 plants regenerated from leafexplants without irradiation, only with invitro culture, was 2.271, while the meanof the 65 times measurements on thecontrol plants maintained by herbaceouscutting was 2.263. Therefore, it was
- 34 -
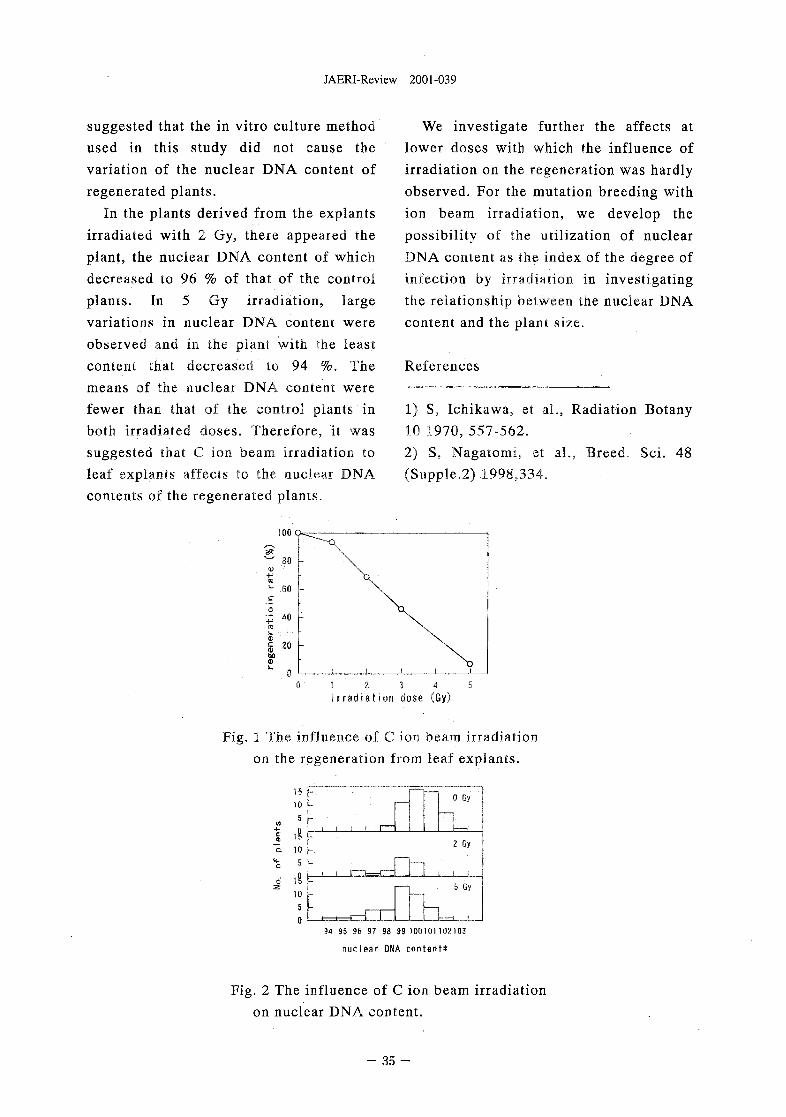
JAERI-Review 2001-039
suggested that the in vitro culture methodused in this study did not cause thevariation of the nuclear DNA content ofregenerated plants.
In the plants derived from the explantsirradiated with 2 Gy, there appeared theplant, the nuclear DNA content of whichdecreased to 96 % of that of the controlplants. In 5 Gy irradiation, largevariations in nuclear DNA content wereobserved and in the plant with the leastcontent that decreased to 94 %. Themeans of the nuclear DNA content werefewer than that of the control plants inboth irradiated doses. Therefore, it wassuggested that C ion beam irradiation toleaf explants affects to the nuclear DNAcontents of the regenerated plants.
We investigate further the affects atlower doses with which the influence ofirradiation on the regeneration was hardlyobserved. For the mutation breeding withion beam irradiation, we develop thepossibility of the utilization of nuclearDNA content as the index of the degree ofinfection by irradiation in investigatingthe relationship between the nuclear DNAcontent and the plant size.
References
1) S, Ichikawa, et al., Radiation Botany10 1970, 557-562.2) S, Nagatomi, et al., Breed. Sci. 48(Supple.2) 1998,334.
1 2 3 4 5I r rad ia t ion dose (Gy)
Fig. 1 The influence of C ion beam irradiationon the regeneration from leaf expiants.
o
4
I 1 i i 1 1 1
0 G>
"L2 Gy
i i
94 95 96 97 98 99 100101 102103
nuclear DNA content*
Fig. 2 The influence of C ion beam irradiationon nuclear DNA content.
- 35 -
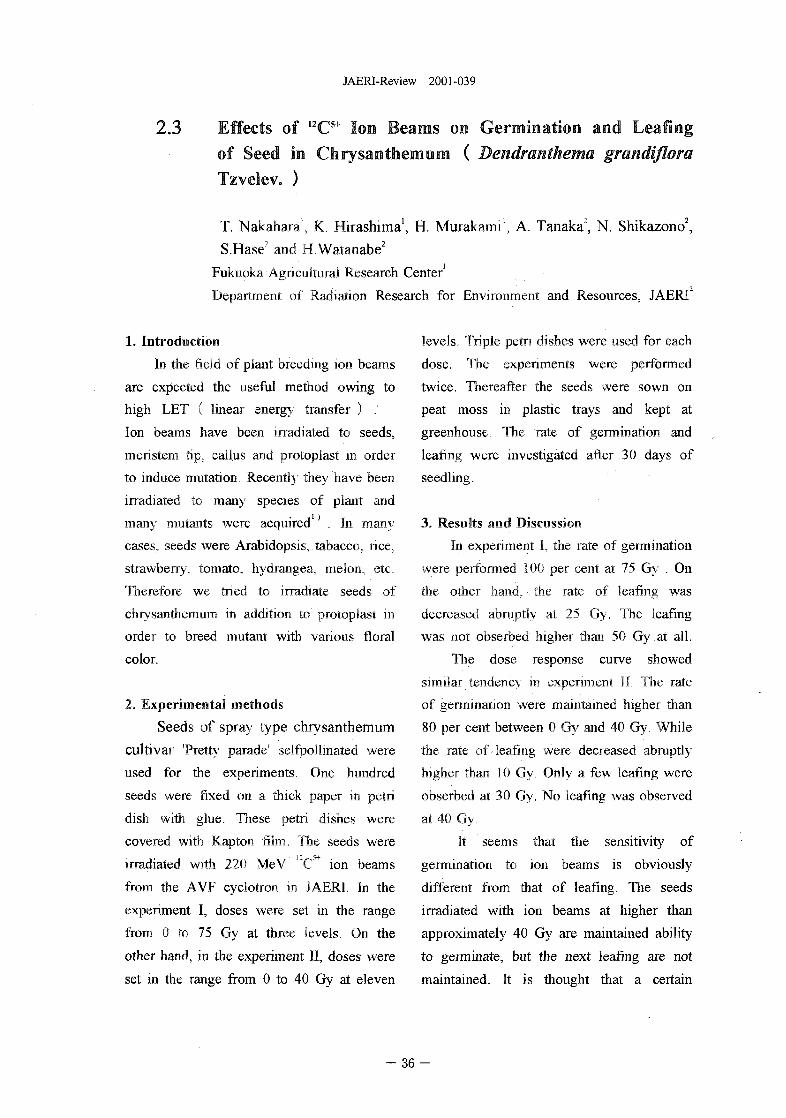
JAERI-Review 2001-039
2.3 Effects of 12C5+ Ion Beams on Germination and Leafingof Seed in Chrysanthemum ( Dendranthema grandifloraTzvelev. )
T. Nakahara1, K. Hirashima1, H. Murakami', A. Tanaka2, N. Shikazono2,
S.Hase2 and H.Watanabe2
Fukuoka Agricultural Research Center
Department of Radiation Research for Environment and Resources, JAER1"
1. Introduction
In the field of plant breeding ion beams
are expected the useful method owing to
high LET ( linear energy transfer ) .
Ion beams have been irradiated to seeds,
meristem tip, callus and protoplast in order
to induce mutation. Recently they have been
irradiated to many species of plant and
many mutants were acquired . In many
cases, seeds were Arabidopsis, tabacco. rice,
strawberry, tomato, hydrangea, melon, etc.
Therefore we tried to irradiate seeds of
chrysanthemum in addition to protoplast in
order to breed mutant with various floral
color.
2. Experimental methods
Seeds of spray type chrysanthemum
cultivar 'Pretty parade' selfpollinated were
used for the experiments. One hundred
seeds were fixed on a thick paper in petri
dish with glue. These petn dishes were
covered with Kapton film. The seeds were
irradiated with 220 MeV *C' ion beams
from the AVF cyclotron in JAER1. In the
experiment I, doses were set in the range
from 0 to 75 Gy at three levels. On the
other hand, in the experiment II, doses were
set in the range from 0 to 40 Gy at eleven
levels. Triple petn dishes were used for each
dose. The experiments were performed
twice. Thereafter the seeds were sown on
peat moss in plastic trays and kept at
greenhouse. The rate of germination and
leafing were investigated after 30 days of
seedling.
3. Results and Discussion
In experiment I. the rate of germination
were performed 100 per cent at 75 Gy . On
the other hand, the rate of leafing was
decreased abruptly at 25 Gy. The leafing
was not obserbed higher than 50 Gy at all.
The dose response curve showed
similar tendency in experiment II. The rate
of germination were maintained higher than
80 per cent between 0 Gy and 40 Gy. While
the rate of leafing were decreased abruptly
higher than 10 Gy. Only a few leafing were
obserbed at 30 Gy. No leafing was observed
at 40 Gy.
It seems that the sensitivity of
germination to ion beams is obviously
different from that of leafing. The seeds
irradiated with ion beams at higher than
approximately 40 Gy are maintained ability
to germinate, but the next leafing are not
maintained. It is thought that a certain
- 36 -
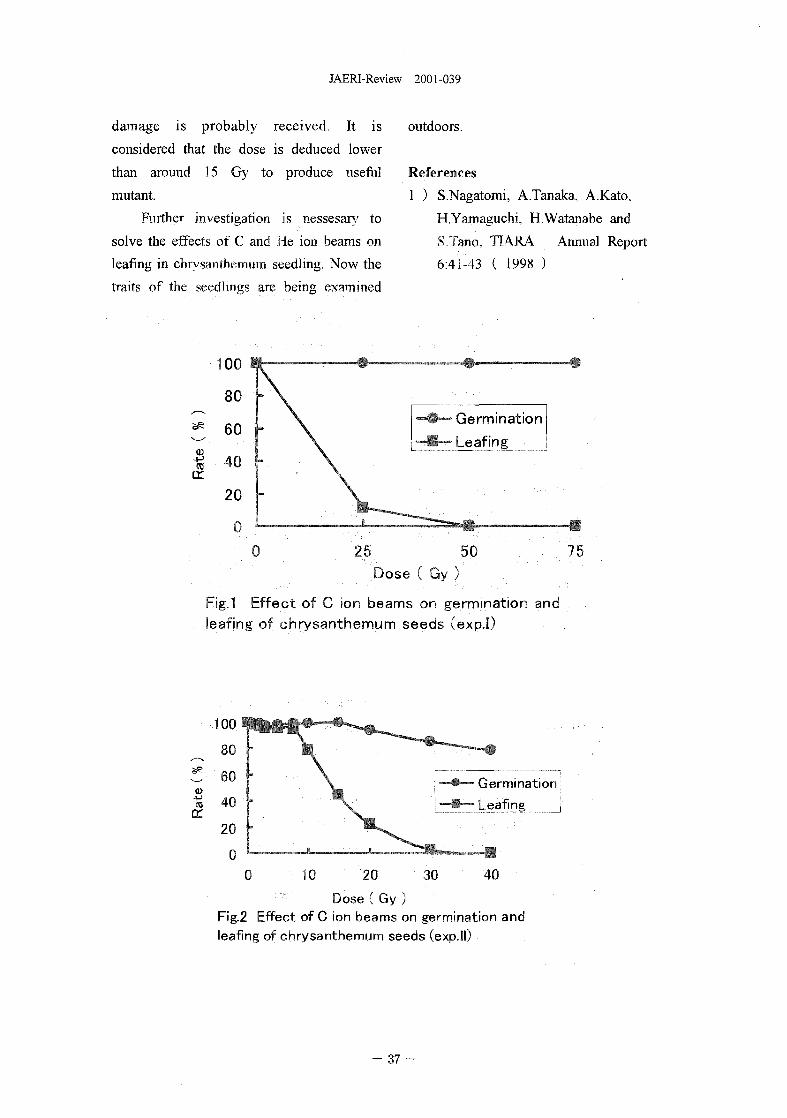
JAERI-Review 2001-039
damage is probably received. It is
considered that the dose is deduced lower
than around 15 Gy to produce useful
mutant.
Further investigation is nessesary to
solve the effects of C and He ion beams on
leafing in chrysanthemum seedling. Now the
traits of the seedlings are being examined
outdoors.
References
1 ) S.Nagatomi, A.Tanaka, A.Kato,
H.Yamaguchi. H Watanabe and
S.Tano. TIARA Annual Report
6:41-43 ( 1998 )
+TO
tx.
0
— Germination
•_eafing
25 50Dose ( Gy )
75
Fig. 1 Effect of C ton beams on germination andleafing of chrysanthemum seeds (exp.I)
CO
0 10 30
Germination!Leafing _|
4020
Dose ( Gy )Fig.2 Effect of C ion beams on germination andleafing of chrysanthemum seeds (exp.II)
- 37 -
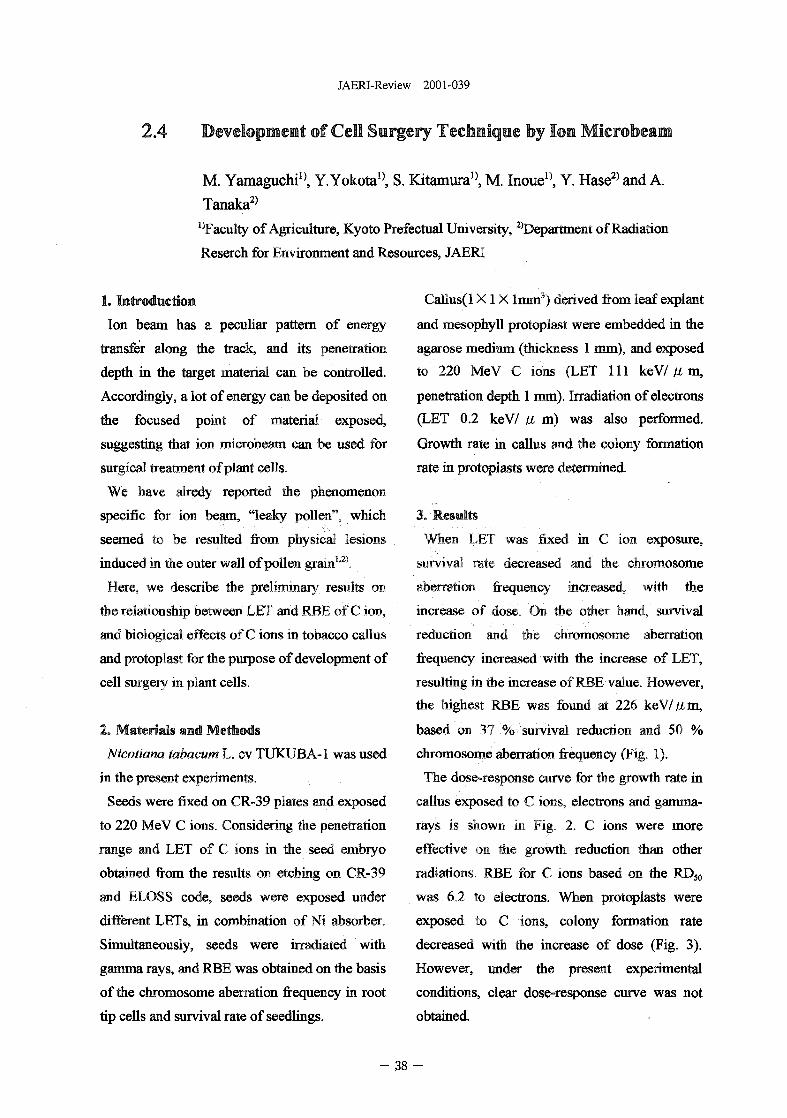
JAERI-Review 2001-039
2.4 Development of Cell Surgery Technique by Ion Microbeam
M. Yamaguchi1^ Y. Yokota", S. Kitamura15, M. Inoue1^ Y. Hase2) and A.
Tanaka2)
^Faculty of Agriculture, Kyoto Prefectual University, 2)Department of Radiation
Reserch for Environment and Resources, JAERI
1. Introduction
Ion beam has a peculiar pattern of energy
transfer along the track, and its penetration
depth in the target material can be controlled.
Accordingly, a lot of energy can be deposited on
the focused point of material exposed,
suggesting that ion microbeam can be used for
surgical treatment of plant cells.
We have alredy reported the phenomenon
specific for ion beam, "leaky pollen", which
seemed to be resulted from physical lesions
induced in the outer wall of pollen grain1'2'.
Here, we describe the preliminary results on
the relationship between LET and RBE of C ion,
and biological effects of C ions in tobacco callus
and protoplast for the purpose of development of
cell surgery in plant cells.
2. Materials and Methods
Nicotiam tabacum L. cv TUKUBA-1 was used
in the present experiments.
Seeds were fixed on CR-39 plates and exposed
to 220 MeV C ions. Considering the penetration
range and LET of C ions in the seed embryo
obtained from the results on etching on CR-39
and ELOSS code, seeds were exposed under
different LETs, in combination of Ni absorber.
Simultaneously, seeds were irradiated with
gamma rays, and RBE was obtained on the basis
of the chromosome aberration frequency in root
tip cells and survival rate of seedlings.
Callus(l X I X lmm3) derived from leaf explant
and mesophyll protoplast were embedded in the
agarose medium (thickness 1 mm), and exposed
to 220 MeV C ions (LET 111 keV/ fi m,
penetration depth 1 mm). Irradiation of electrons
(LET 0.2 keV/ u m) was also performed.
Growth rate in callus and the colony formation
rate in protoplasts were determined.
3. Results
When LET was fixed in C ion exposure,
survival rate decreased and the chromosome
aberration frequency increased, with the
increase of dose. On the other hand, survival
reduction and the chromosome aberration
frequency increased with the increase of LET,
resulting in the increase of RBE-value. However,
the highest RBE was found at 226 keV/Mm,
based on 3? % survival reduction and 50 %
chromosome aberration frequency (Fig. 1).
The dose-response curve for the growth rate in
callus exposed to C ions, electrons and gamma-
rays is shown in Fig. 2. C ions were more
effective on the growth reduction than other
radiations. RBE for C ions based on the RDJ0
was 6.2 to electrons. When protoplasts were
exposed to C ions, colony formation rate
decreased with the increase of dose (Fig. 3).
However, under the present experimental
conditions, clear dose-response curve was not
obtained.
- .38
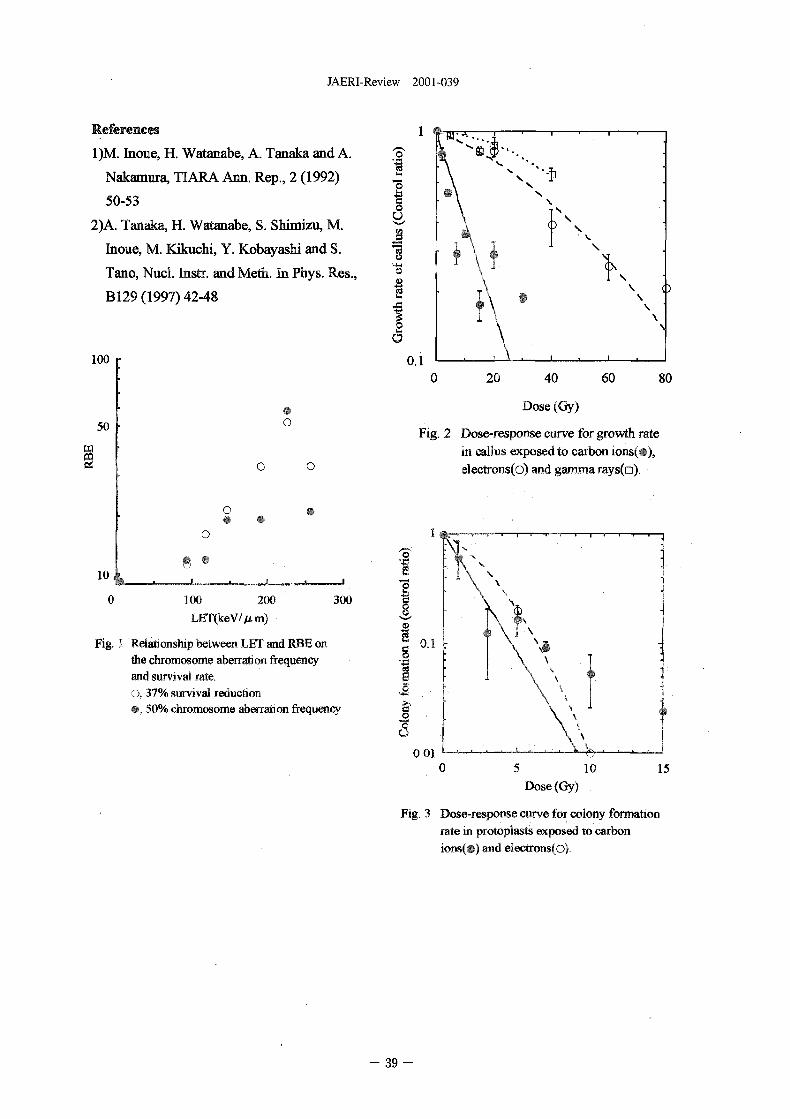
JAERI-Review 2001-039
References
1)M. Inoue, H. Watanabe, A. Tanaka and A.
Nakamura, TIARA Ann. Rep., 2 (1992)
50-53
2)A. Tanaka, H. Watanabe, S. Shunizu, M.
Inoue, M. Kikuchi, Y. Kobayashi and S.
Tano, Nucl. Instr. and Meth. In Phys. Res.,
B129 (1997) 42-48
100
50
Io
o o
o
o
io
100 200LET(keV/Mm)
300
Fig. 1 Relationship between LET and RBE onthe chromosome aberration frequencyand survival rate.0,37% survival reduction• , 50% chromosome aberration frequency
20 40 60 80
Dose (Gy)
Fig. 2 Dose-response curve for growth ratein callus exposed to carbon ions(n),electrons(o) and gamma rays(n).
o
1
1
0.015 10
Dose (Gy)15
Fig. 3 Dose-response curve for colony formationrate in protoplasts exposed to carbonions(#) and electrons(o).
- 3 9 -
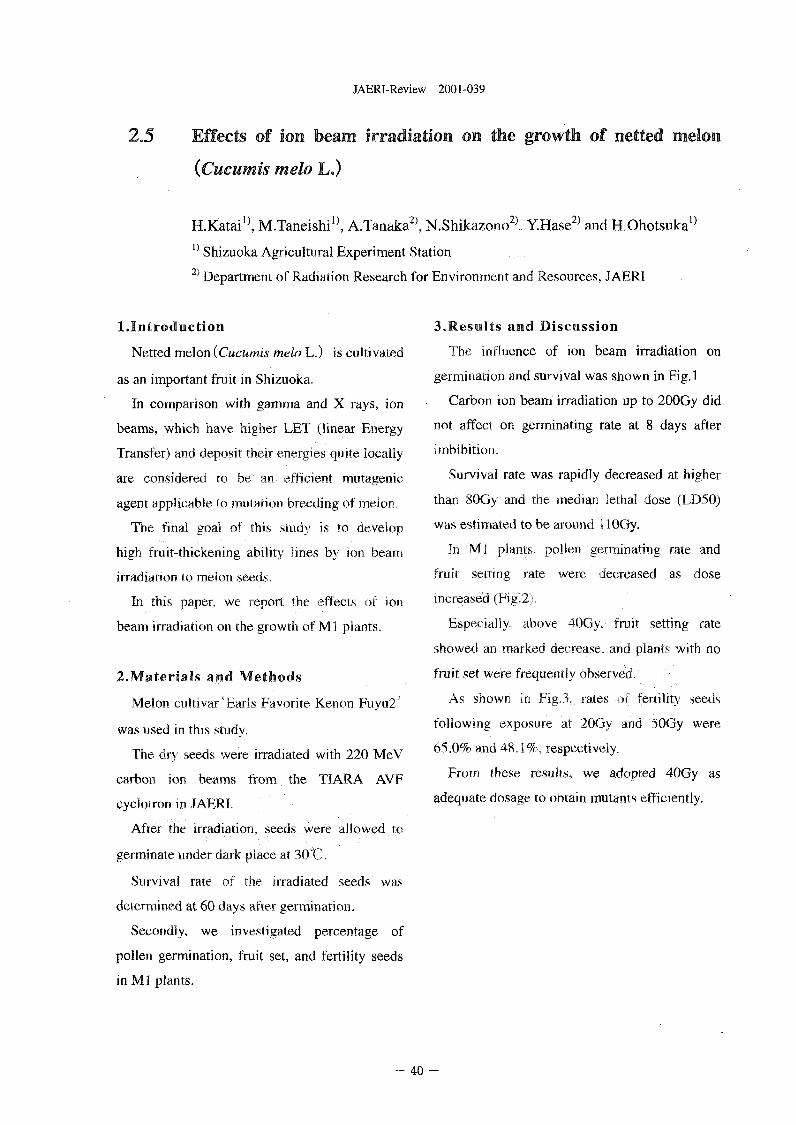
JAERI-Review 2001-039
2.5 Effects of ion beam irradiation on the growth of netted melon
{Cucumis melo L j
H.Katai0, M.Taneishi0, A.Tanaka2', N.Shikazono2), Y.Hase2) and H.Ohotsuka0
X) Shizuoka Agricultural Experiment Station2) Department of Radiation Research for Environment and Resources, J AERI
1.Introduction
Netted melon {Cucumis melo L.) is cultivated
as an important fruit in Shizuoka.
In comparison with gamma and X rays, ion
beams, which have higher LET (linear Energy
Transfer) and deposit their energies quite locally
are considered to be an efficient mutagenic
agent applicable to mutation breeding of melon.
The final goal of this study is to develop
high fruit-thickening ability lines by ion beam
irradiation to melon seeds.
In this paper, we report the effects of ion
beam irradiation on the growth of Ml plants.
2 .Mater ia ls and Methods
Melon cultivar'Earls Favorite Kenon Fuyu2'
was used in this study.
The dry seeds were irradiated with 220 MeV
carbon ion beams from the TIARA AVF
cyclotron in JAERI.
After the irradiation, seeds were allowed to
germinate under dark place at 30°C.
Survival rate of the irradiated seeds was
determined at 60 days after germination.
Secondly, we investigated percentage of
pollen germination, fruit set, and fertility seeds
in Ml plants.
3.Results and Discussion
The influence of ion beam irradiation on
germination and survival was shown in Fig. 1
Carbon ion beam irradiation up to 200Gy did
not affect on germinating rate at 8 days after
imbibition.
Survival rate was rapidly decreased at higher
than 80Gy and the median lethal dose (LD50)
was estimated to be around 1 lOGy.
In Ml plants, pollen germinating rate and
fruit setting rate were decreased as dose
increased (Fig.2).
Especially, above 40Gy, fruit setting rate
showed an marked decrease, and plants with no
fruit set were frequently observed.
As shown in Fig.3, rates of fertility seeds
following exposure at 20Gy and 50Gy were
65.0% and 48.1%, respectively.
From these results, we adopted 40Gy as
adequate dosage to obtain mutants efficiently.
- 40 -
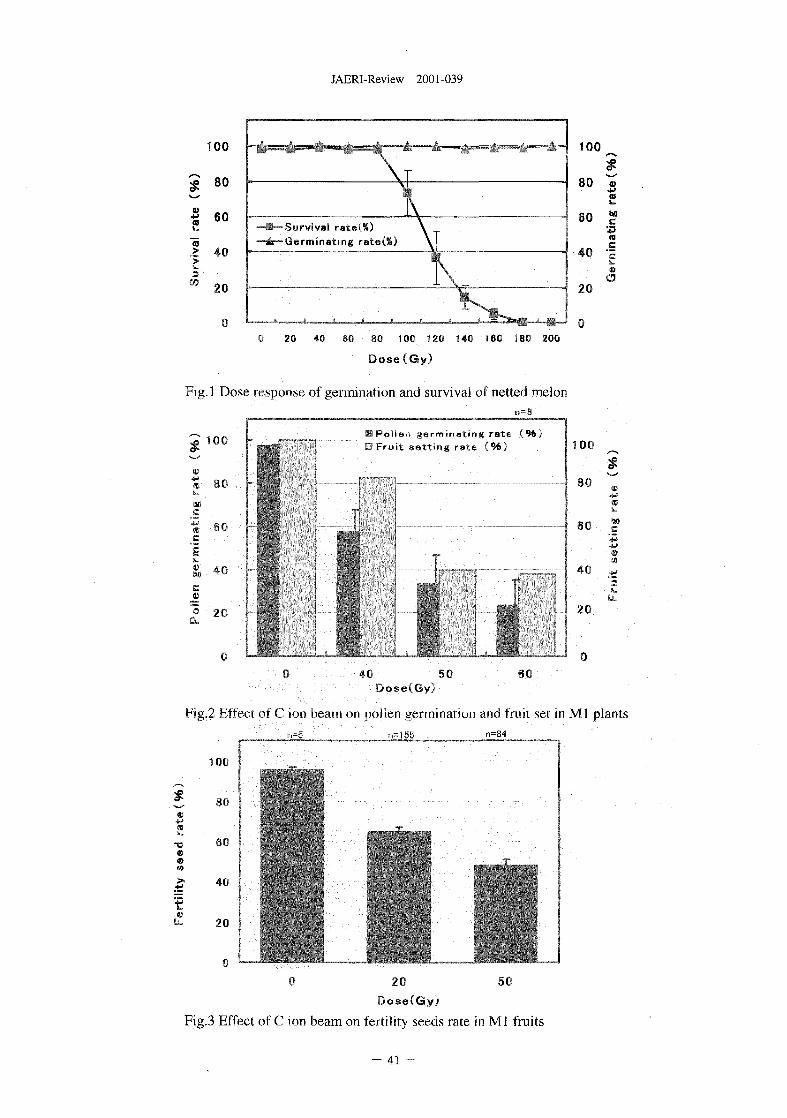
JAERI-Review 2001-039
100
80
I 60
<9
.> 40>« 20
0
too
—S—Survival rate{%)Germinating rate(X)
80
60
40
20
0
«(9
tatiri
K
to.
a
0 20 40 80 80 100 120 140 160 180 200
Dose(Gy)
Fig.l Dose response of germination and survival of netted melonn=8
100
rate
M
.£mc
ituc
Pol
!
80
80
40
20
germinating rate C%)100
•' 30
i so g
40
20
3
t f
F i g . 2 Efft-i"i i » ' " " " I i i c i i n i m
£
100
800!IB
»
srti
l
u.
60
40
20
L0
>jfiiiiiii:iiKio and fruit set in M l plants
ist n=84
J5020
Dose(Gy)
Fig.3 Effect of C ion beam on fertility seeds rate in Ml fruits
- 41 -
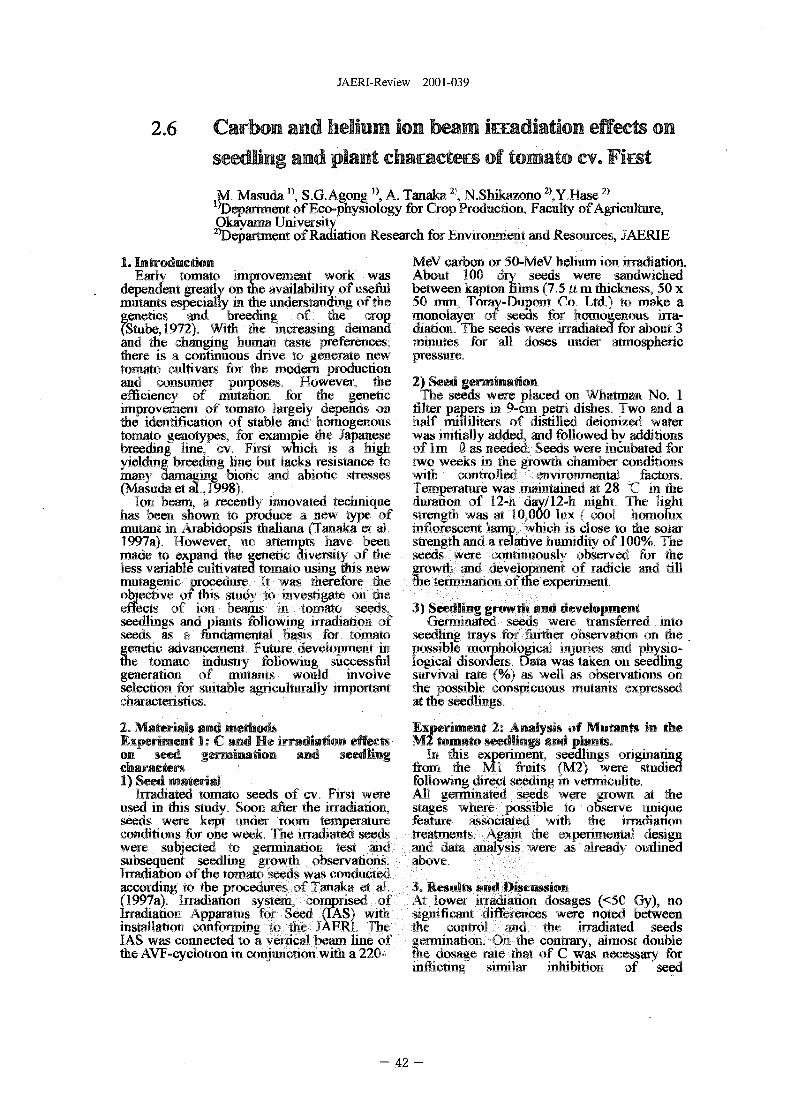
JAERI-Review 2001-039
2.6 Carbon and helium ion beam iccadiation effects onseedling and plant characters of tomato cv* Fkst
M. MasudaJ), S.G.Agong !), A. Tanaka2>, N.Shikazono 2),Y,Hase2)
'Department of Eeo-physiology for Crop Production, Faculty of Agriculture,Okayama University2)Department of Radiation Research for Environment and Resources, JAERIE
MeV carbon or 50-MeV helium ion irradiation.About 100 dry seeds were sandwichedbetween kapton films (7.5 a m thickness, 50 x50 mm, Toray-Dupont Co. Ltd) to make amonolayer of seeds for homogenous irra-diation. The seeds were irradiated for about 3minutes for all doses under atmosphericpressure.
2)Seei genminatioiiThe seeds were placed on Whatman No. 1
filter papers in 9-cm petri dishes. Two and ahalf miliiliters of distilled deionized watervas initially adrtec dtnd followed by additions"' " seeos were incubated for
•owrh chamber conditions^>vironmental fa_ctors.
"emperanurc wa" n-iainianied at 28 °C in the•inranoi! >f 12~», aay/17-h night. The light•iHTenyrti vas ai 0 000 iox ( cool homoliixinrinrest;enr lanili *hu;n is close to the solarsnengrh ano a lelative numidity of 100%. Theseeds *ert ^mnnuously observed for thejrciwcl me aeveiopment of radicle and till.%t-. «eii»"Tian««i iif the experiment.* »
1. IntroductionEarly tomato improvement work was
dependent greatly on the availability of usefulmutants especially in the understanding of thegenetics and breeding, of the crop(Stube,1972). With the increasing demandand the changing human taste preferences,there is a continuous drive to generate newtomato cultivars for the modem productionand consumer purposes. However, theefficiency of mutation for the geneticimprovement of tomato largely depends onthe identification of stable ana homogenoustomato genotypes, for example the fopanestbreeding line, cv. First which h * 'iiyielding breeding line but lacks resistancemany damaging biotic and abiotic(Masuda etaX, 1998).
Ion beam, a recently innovated ^has been shown to produce a new type >fmutant in Arabidopsis thaliana (Tanaka e« m1997a). However, no attempts havt- jeenmade to expand ihe generic diversn) .»f tht-less variable cultivated tomato using thismutagenic procenurt fi hfobjective oi this sinn> rceffects of ion wanit m 'iwnarc >
seedlings and plains following irrjnnsin«-«i n"seeds as a ftntiamenja ««isi> «« «»»HU.genetic advancement "uiuif •leveiofiineni uithe tomato industry following successfulgeneration of mutants would involveselection for suitable agriculturally importantcharacteristics.2. Materials and inethoisExperiment 1: C and Heirradiatloii effectson seed gemination and seedingcharacters1) Seed material
Irradiated tomato seeds of cv. First wereused in this study. Soon, after the irradiation,seeds were kept tinner mom-, -emperanm-conditions for one wen* The irradiated seeuswere subjected to tjenminanoii test mwsubsequent seedling "SKWITI tbservarmnsIrradiation of the toman «BD» wa-s conduuttsiaccording to the proceaurf ~>~Tanaka i» a(1997a). Irradiation <ys»e«x: :omprise(i jjIrradiation Apparatoi fi;« 1t**i JAS) witr.kstallation conforminu -« Sit 'AERl ~ni-IAS was connected t«> vcrrics*' beam hue <"the AVF-cyclotron in cunjunuoon with
i f 1 TT, >. as neeoer>TI the
;i)nrrolle(
development<ceo<- A/ere transferred into
r*v "urrimer observation on ther injuries and physio-»vas taken on seedling
.survival ract v'%) a& Aell as observations onthe possible conspicuous mutants expressedat the seedlings.
Experiment 2; Analysis of Mutants in theMz tomato seedlings and plants.
In -hi* -5xper»Tiieni seedlings originatingfrom rht Vr fruit* 'M2) were studiedfollowing direoi >»eedinji m vermiculite.All genmiTiaTer -seeds vere grown at thestages vrint- jdssihk to observe uniqueft nciait:!, vith the irradiation
-\gair -hs- ixperimental designwin mi?- -mnlvKis mart as already outlined-lliiivtr
\: jowa irraaiaiKm losages (<50 Gy), nosignificant HflR-ence). vere noted betweenhe uunirr. .of rh»- irradiated seedssjemninantu « ihe. contrary, almost double<b aosayt- mir. (hm iif C was necessary for
similar 'inhibition of seed
- 42 -
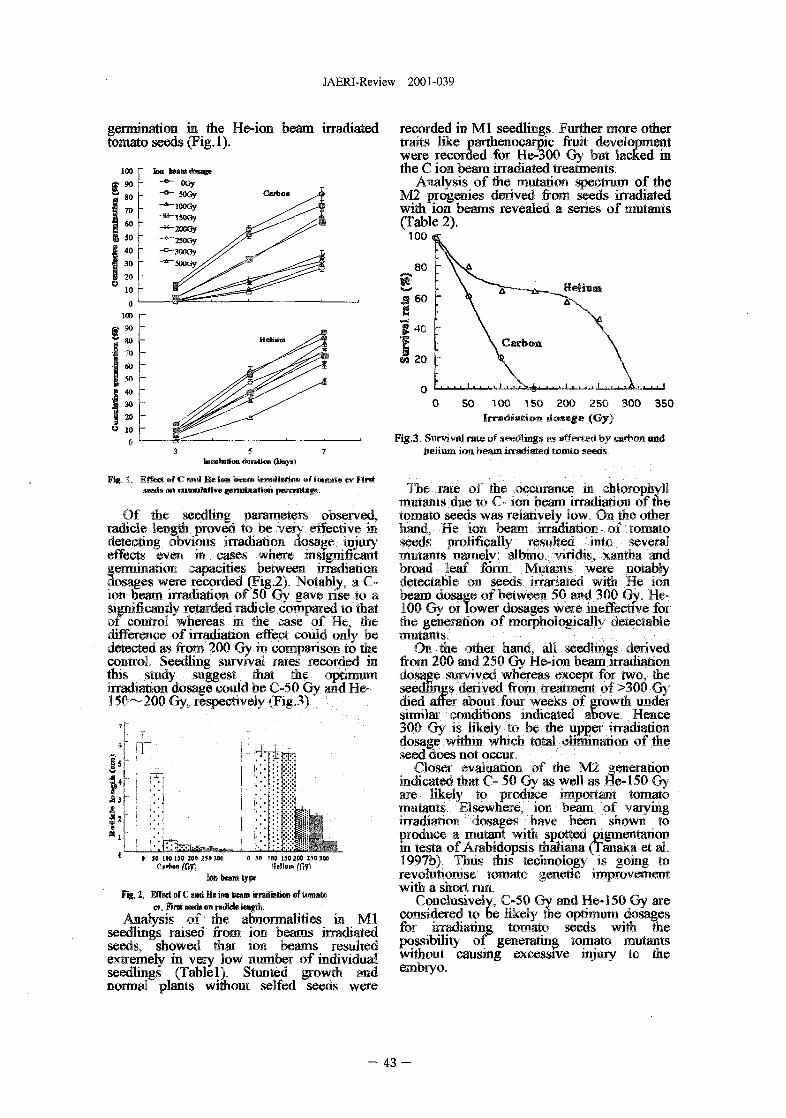
JAERI-Review 2001-039
germination in the He-ion beam irradiatedtomato seeds (Fig.l).
100
Fig. 1.. Effect of C and He ion beam tmtditrtlMi of tomato ev F Mseeds •»• etiiBHtoth>e genmtitttiaii peretntafc
Of the seedling parameters observed,radicle length proved to be very effective indetecting obvious irradiation dosage injuryeffects even in cases where insignificant
termination capacities between irradiationosages were recorded (Fig.2). Notably, a C-
ion beam irradiation of 50 Gy gave rise to asignificantly retarded radicle compared to thatof control whereas in the case of He, medifference of irradiation effect could only bedetected as from 200 Gy in comparison to thecontrol. Seedling survival rates recorded inthis study suggest that the optimumirradiation dosage could be C-50 Gy and. He-!50~200 Gy, respectively (Fig.3)
fA)
!•
1 0 IP 100 ISO 200 250 JOB » 50 190 150 200 2 « lor
Curb™ IfiJ) Minn (Cif,Ion b o a type
Fig. 2. Effect of C and Ht ini bow imdHtim of tomatoev. Fint weds an n d k k ieagtt,
.Analysis of the abnormalities in Mlseedlings raised from ion beams irradiatedseeds, showed that ion beams resultedextremely in very low number of individualseedlings (Table 1). Stunted growth andnormal plants without selfed seeds were
recorded in Ml seedlings. Further more othertraits like parthenocarpic fruit developmentwere recorded for He-300 Gy but lacked inthe C ion beam irradiated treatments.
Analysis of the mutation spectrum of theM2 progenies derived from, seeds irradiatedwith ion beams revealed a series of mutants(Table 2).
100
SeHram.
0 50 TOO 150 200 250 300 350Irradiation dosage (Gy)
Fig.3. Survival rate of seedlings as affected by carbon and.belium ion beam itraMated tojnto seeds.
The rate of the occurance in chlorophyllmutants due to C- ion beam irradiation of thetomato seeds was relatively low. On the otherhand, He ion beam -117801811011 of tomatoseeds prolifically resulted into severalmutants namely: albino, viridis, xantha andbroad leaf form. Mutants were notablydetectable on seeds irrariated with He ionbeam dosage of between 50 and 300 Qy, He-100 Gy or lower dosages were ineffective forthe generation of morphologically detectablemutants.
On the other hand, all seedlings derivedfrom 200 and 250 Gy He-ion beam irradiationdosage survived whereas except for two, theseedlings derived from treatment of >300 Gydied after about four weeks of growth undersimilar conditions indicated above. Hence300 Gy is likely to be the upper irradiationdosage within which total elimination of theseed does not occur.
Closer evaluation of the M2 generationindicated mat C- 50 Gy as well as He-150 Gyare likely to produce important tomatomutants. Elsewhere, ion. beam of varyingirradiation dosages have been shown toproduce a mutant with spotted pigmentationin testa of Arabidopsis thaliana (Tanaka et al.1997b). Thus this technology is going torevolutionise tomato genetic improvementwith a short run.
Conclusively, C-50 Gy and He-150 Gy areconsidered to be likely the optimum, dosagesfor irradiating tomato seeds with thepossibility of generating tomato mutantswithout causing excessive injury to theembryo.
- 43
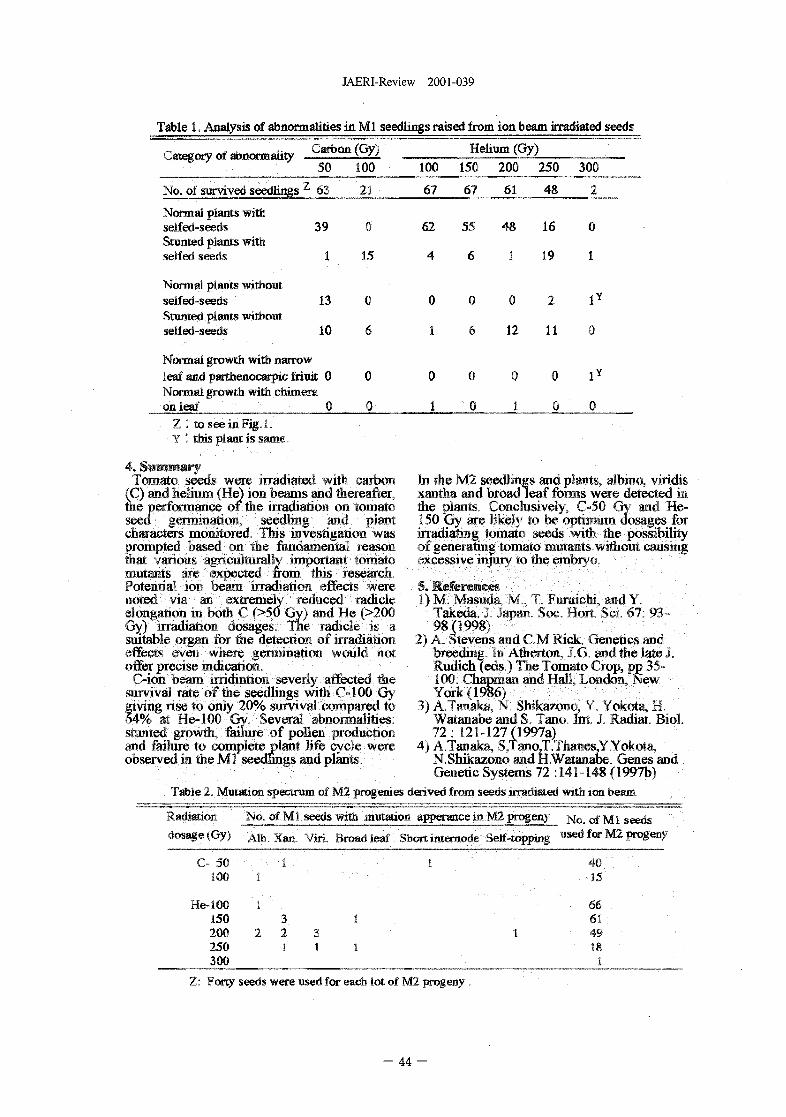
JAERI-Review 2001-039
Table 1. Analysis of abnormalities in Ml seedlings raised from ion beam irradiated seeds
Category of abnormality
No. of survived seedlings
Carbon (Gy)
50 100z 63 21
100
67
Helmm (Gy)150 200 250
67 61 48
300
2
16
19
Normal plants withselfed-seeds 39 0 62 55 48Stunted plants withselfed seeds 1 15 4 6 i
Normal plants withoutselfed-seeds 13 0 0 0 0 2Stunted plants withoutselfed-seeds 10 6 1 6 12 11
0
1
1Y
0
Normal growth with narrowleaf and parthenocarpic Mint 0 0 0 0 0 0 1 Y
Normal growth with chimeraon leaf 0 Q- 1 ' 0 1 0 0
Z ". to see in. Fig. t.Y '. this plant is same.
4. SiBBinaryTomato seeds were irradiated with carbon
(f!) and helium fHe) ioti beams and thereafter.the performance of the irradiation on i-omarrseea germ"iaaoi<, seedling .-mo piamcnaracters moniioren "Hiis (investigation M/«>prompieo based jn the muoameinai reasor,than various *gncuiiu«alh •mponanj <"omftiimuunus are ?xpecreo from this* researcr,^otenrial <or. oegm srradiamw sffeccs <y«r«-noted m AT> £xtremei\ <ed«iceci '•adiciesiongarion HI borh C ">50 Gy > ami He i>?.0CGy) irradiatirwt josages Tne radiyie <i ^snitabfe orgar« kn the de>ecrior« of irraiiianoieffects '?vei> vt/nere ierrifHTiafior, *«)uid n«>ioffer precise mcbcanon
C-ion neani «rndiimri<jr, severi> aflecteti Vat-,survival rate of the seedlings wifii C- OO <&\giving rise to oniy 20% survival uonnpared ti64% 3» He-100 Gv Severat dibnomiHlities.srumeo growch. faihjre of poliet prodncrior;ana failure io complete plant life cycie wereobserved in the Ml seedlings and plants.
In the M2 seedlings and plants, albino, Yiridisxantha and broad leaf forms were detected indie pjanis Conclusively C-5f- "r* ano He-150 Gy are likeiy \o be opnnTiuiiri dosages forirradiafi'tg (ornatt seen.? imtii me-- possibiJiiyjf generatiTig tornato imitanTs withoMl causingexcessive iniiirv u> die
1)M.Takeufc. -
I
VIS«K
,-indisci 57
Sievens and C IVJ KICK, iieneocs, nnObreedn% "HI Athenon. '.fi and the iaie i*.udich (ens. \ The Tomato Crop, pp ?5-100 Chapman and Hal*. Liwidxw.'NevYork (1086)
Vaianaoe and S Tan<. Tin j Radiar. 8iol.n. MX 127 (1997a)
4) A.TanaKa, S,Tano,T.Tnanes,Y.Yokoia,N.Shikazono and H.Watanabe. Genes andGenetic Systems 72 ; 141-148 (1997b)
Table 2, Mutation spectrum of M2 progenies derived from seeds irradiated with ion beam
Radiation No. of Ml seeds with mutation apperance in M2 progeny No. of Ml seedsdosage (Gy) Alb. Xan. Yiri, Broad leaf Short internode Self-topping used for M2 progeny
C- 50100
He-100150200250300
1
!
2
i
321
31
i 4015
86614918I
Z: Forty seeds were used for each lot of M2 progeny.
- 4 4 -
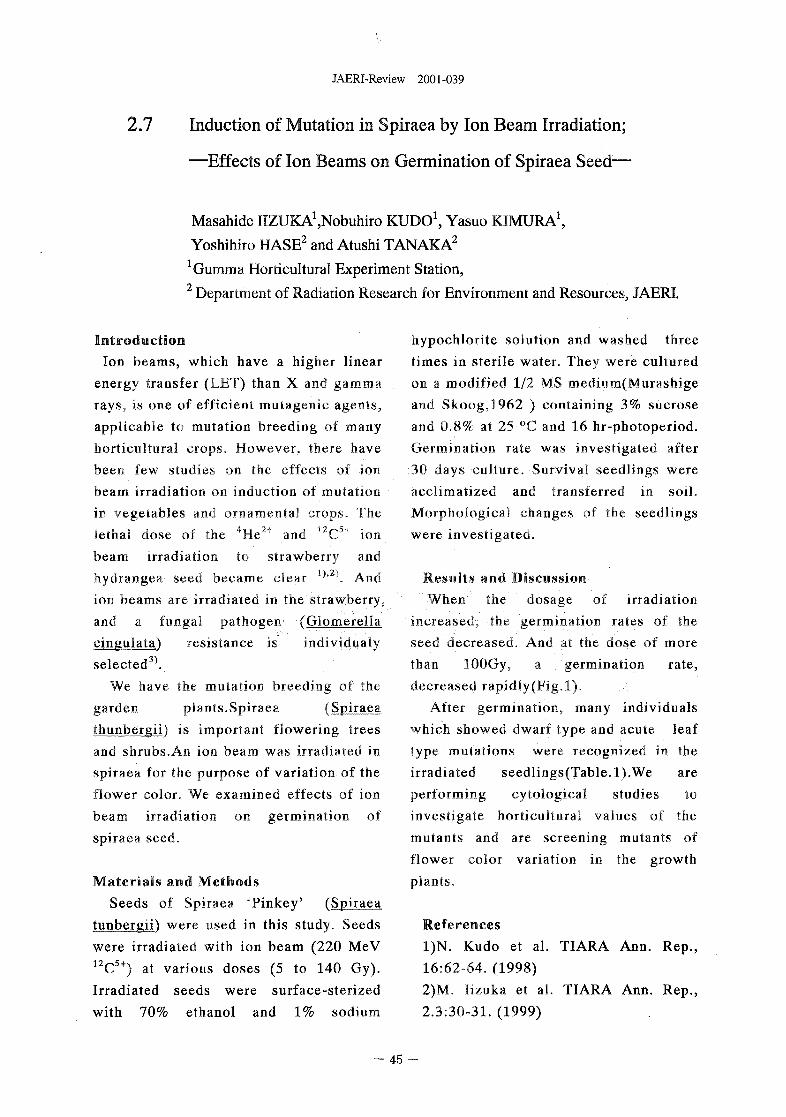
JAERI-Review 2001-039
2.7 Induction of Mutation in Spiraea by Ion Beam Irradiation;
—Effects of Ion Beams on Germination of Spiraea Seed—
Masahide IIZUKA^obuhiro KUDO1, Yasuo KIMURA1,
Yoshihiro HASE2 and Atushi TANAKA2
'Gumma Horticultural Experiment Station,2 Department of Radiation Research for Environment and Resources, JAERI.
IntroductionIon beams, which have a higher linear
energy transfer (LET) than X and gammarays, is one of efficient mutagenic agents,applicable to mutation breeding of manyhorticultural crops. However, there havebeen few studies on the effects of ionbeam irradiation on induction of mutationin vegetables and ornamental crops. Thelethal dose of the 4He2+ and 12C5+ ionbeam irradiation to strawberry andhydrangea seed became clear i)>2). Andion beams are irradiated in the strawberry,and a fungal pathogen (Glomerellacingulata) resistance is individualyselected3^.
We have the mutation breeding of thegarden plants.Spiraea (Spiraeathunbergii) is important flowering treesand shrubs.An ion beam was irradiated inspiraea for the purpose of variation of theflower color. We examined effects of ionbeam irradiation on germination ofspiraea seed.
Materials and MethodsSeeds of Spiraea 'Pinkey' (Spiraea
tunbergii) were used in this study. Seedswere irradiated with ion beam (220 MeV12C5+) at various doses (5 to 140 Gy).Irradiated seeds were surface-sterizedwith 70% ethanol and 1% sodium
hypochlorite solution and washed threetimes in sterile water. They were culturedon a modified 1/2 MS medium(Murashigeand Skoog,1962 ) containing 3% sucroseand 0,8% at 25 °C and 16 hr-photoperiod.Germination rate was investigated after
30 days culture. Survival seedlings wereacclimatized and transferred in soil.Morphological changes of the seedlingswere investigated.
Results and DiscussionWhen the dosage of irradiation
increased, the germination rates of theseed decreased. And at the dose of morethan lOOGy, a germination rate,decreased rapidly(Fig.l).
After germination, many individualswhich showed dwarf type and acute leaftype mutations were recognized in theirradiated seedlings(Table.l).We areperforming cytological studies toinvestigate horticultural values of themutants and are screening mutants offlower color variation in the growthplants.
References1)N. Kudo et al. TIARA Ann. Rep.,16:62-64. (1998)2)M. lizuka et al. TIARA Ann. Rep.,2.3:30-31. (1999)
- 45
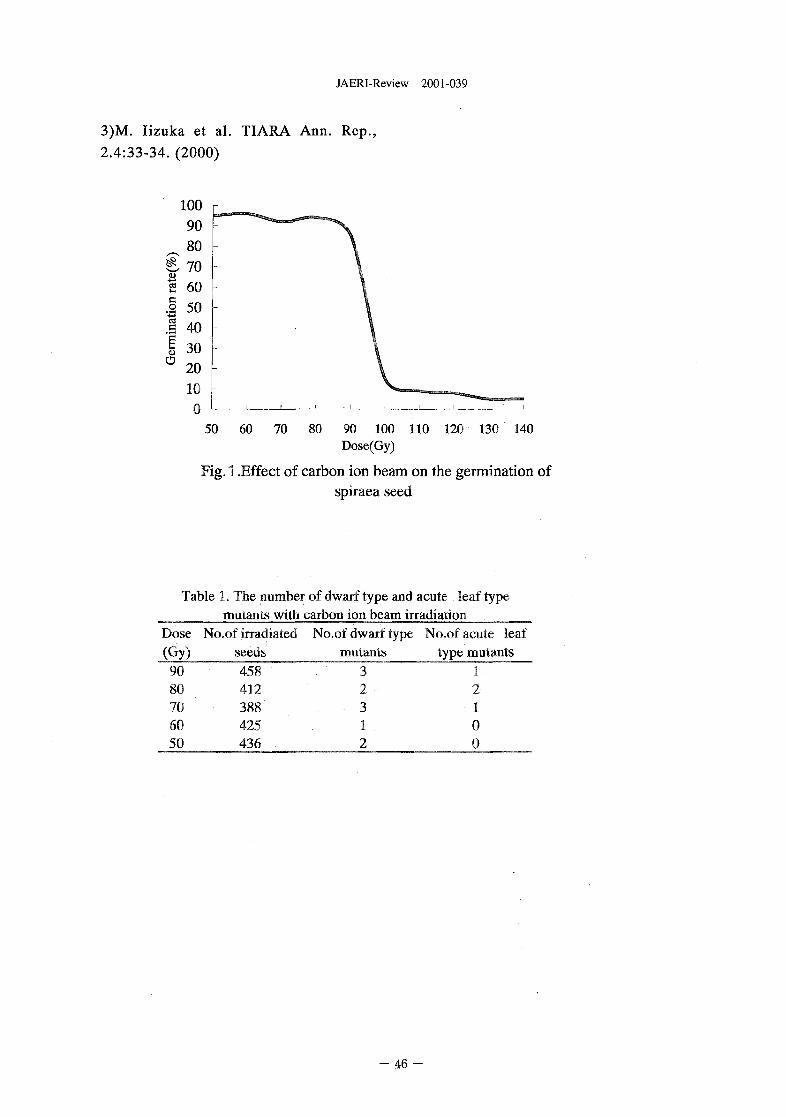
JAERI-Review 2001-039
3)M. Iizuka et al. TIARA Ann. Rep.,
2.4:33-34. (2000)
50 60 70 80 90 100 110 120 130 140Dose(Gy)
Fig.1 .Effect of carbon ion beam on the germination ofspiraea seed
Table 1. The number of dwarf type and acute leaf typemutants with carbon ion beam irradiation
Dose(Gy)9080706050
No.of irradiatedseeds458412388425436
No.of dwarf typemutants
32312
No.of acute leaftype mutants
12100
JAERI-Review 2001-039
2.8 Isolation and characterization of the ion-beam-induced newArabidopsis floral mutant, frilll
Yoshihiro Hase and Atsushi TanakaDepartment of Radiation Research for Environment and Resources, JAERI
1. IntroductionNew plant mutants such as UV-
resistant Arabidopsis and Chrysanthemumwith novel flower colors and shapes havebeen obtained using ion beams as amutagen1'2). These results strongly suggestthat ion beams provide the possibilities offinding a lot of new mutants valuable notonly for the plant breeding but also for theprimary botanical research.
Now that the Arabidopsis genomeproject has finished, mutant isolation isbecoming more important because widevarieties of mutants are indispensable forfunctional analysis of respective genes. Wehave been trying to isolate newArabidopsis mutants defect in organdevelopment in order to analyse how andby which genes plant organ formation isregulated. In this report, we describe a newArabidopsis floral mutant, frill 1 (fill), andits phenotypical analyses3).
2. Materials and Methods2.1 Isolation of mutant
Dry seeds of Arabidopsis ecotypeColumbia were exposed to 220 MeVcarbon ion beams with a dose of 150 Gy.Irradiated Ml seeds were sown and selfedto obtain M2 seeds. About 12,000 M.2plants derived from 1,500 Ml plants weregrown and visible mutants were selected.One of them, named the frll mutant, wasbackcrossed twice with wild-typeColumbia and has been maintained by self-pollination.
2.2 Mapping analysisThe frll mutant was crossed with
wild-type Lansberg erecta. Approximately400 plants of selfed F2 progeny were usedfor gene mapping as described byKonieczny and Ausubel4).
2.3 Phenotypical observationEpidermal cells of mature petals
were observed under an optical microscopeafter soaking in 70% ethanol for 2 days forclarification. For observation of nuclei, thepetals cleared were dyed in 1 [xg/ml DAPIsolution. Sections of the petals were madeusing Technovit 7100 resin and dyed bytoluidine blue.
3. Results and DiscussionFrom the screening of 12,000 M2
plants derived from the ion-beam-irradiatedMl seeds, more than 50 visible mutantswere selected (data not shown). Amongthem, the frilll (frll) mutant has serratedpetals and sepals but the other floral andvegetative organs are not affected (Fig. 1).Mutants like frll have not been reportedbefore and this mutant is thought to beimportant to understand plant morpho-genesis because it has a highly organ-specific phenotype.
In the wild-type petal, we can see awell-ordered radial cell lineage from thebase toward the tip (Fig. 2). However, thecell lineage in the frll petals was disordered,especially in the distal region of the petal(Fig. 2). Furthermore, the number of petalepidermal cells in the distal region was
- 4 7 -
JAERI-Review 2001-039
decreased and their size was variable andrelatively larger in the frll petal, ascompared with those in the wild-type petal(Fig. 2). Nuclear size was also larger andvariable in the frll petal but not in thewild-type petal. These observationssuggest that abnormal endo-reduplicationoccurred in the distal region of frll petal(Fig. 2). In contrast no significantphenotypical defect was observed in thebasal region of frll petal.
Morphological observations through-out the petal development revealed thatfrll petals were normal before stage 9 ofArabidopsis floral development and thefrll phenotype became apparent at stage 10(stage 10 corresponds to the middle stageof petal development) (data not shown).From these results, it is thought that FRIJacts in the latter half of petal development,and that FRL1 is an important factor toattain normal cell division and expansionespecially in the distal region ofArabidopsis petals.
Now we are isolating PRL1 geneusing a map-based approach (Fig. 3). FRL1is mapped in the I05-kb region at themiddle of the upper arm of chromosome 1.Complementation analysis is in progress.
References1) A.Tanaka et al., TIARA Ann.Rep.1995
(1996)32-34.2) S.Nagatomi et al., TIARA Ann. Rep.
1997, JAERI-Review 98-016 (1998) 41-43,
3) Y.Hase et al., Plant Journal, 24 (2000)21-32.
4) A.Konieczny and F.M.AusubeL, PlantJournal, 4 (1993) 403-410.
- 48 -
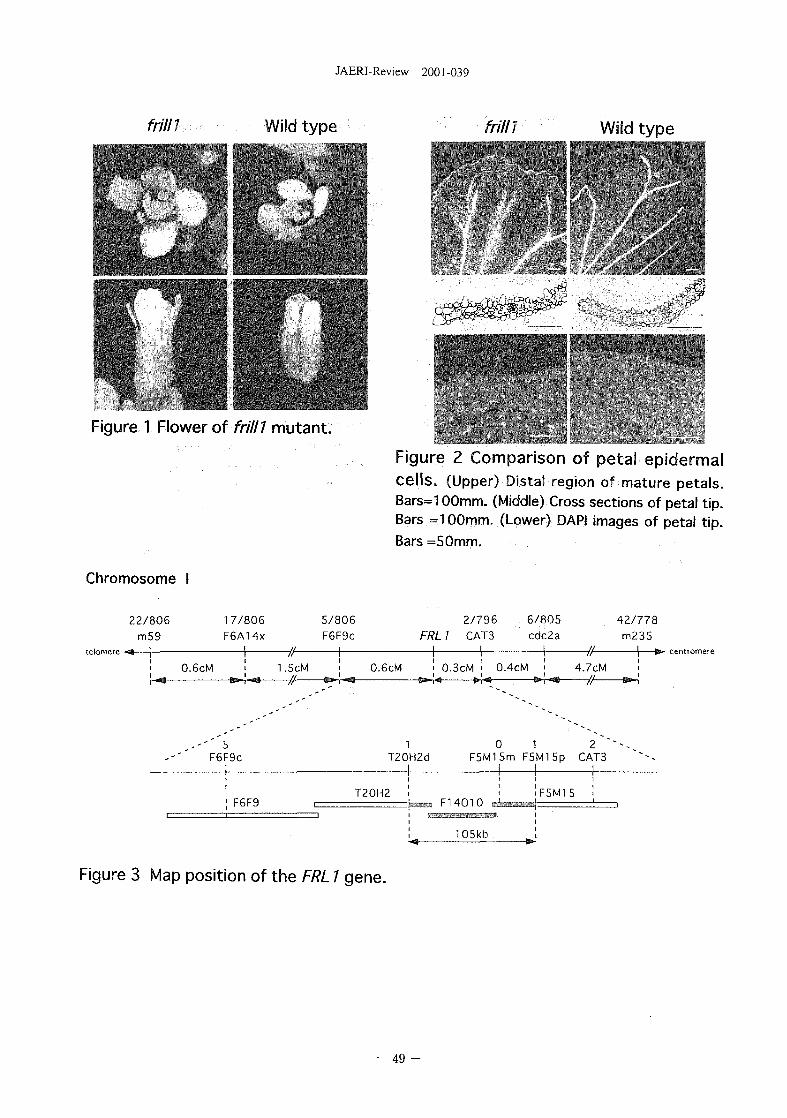
JAERI-Review 2001-039
frill 1 Wild type frilll Wild type
Figure 1 Flower of frill7 mutant.
Figure 2 Comparison of petal epidermalce l ls . (Upper) Distal region of mature petals.Bars=100mm. (Middle) Cross sections of petal tip.Bars = 100mm. (Lower) DAPI images of petal tip.Bars =5 0mm.
Chromosome I
22/806m59
17/806F6A14x
5/806F6F9c FRL 1 CAT3
6/805cdc2a
42/778m235
lelomereo 1
1 0.6cM 1o
////
.5cM//
1i 0.6cM 0
1
.3cM ' 0.4cM ! 4
//
.7cM
fa. cerrtromeie
i
- - ' 5F6F9c
1
| F6F9
1T20H2d
T20H2 |
—i i —
-<3
0F5M15m
i
F14010 r^~
105kb
1F5M15p
1
iF5M1
—»-
2 ' - .CAT3 " ~ ^
1
5 11
Figure 3 Map position of the FRL 7 gene.
- 49 -
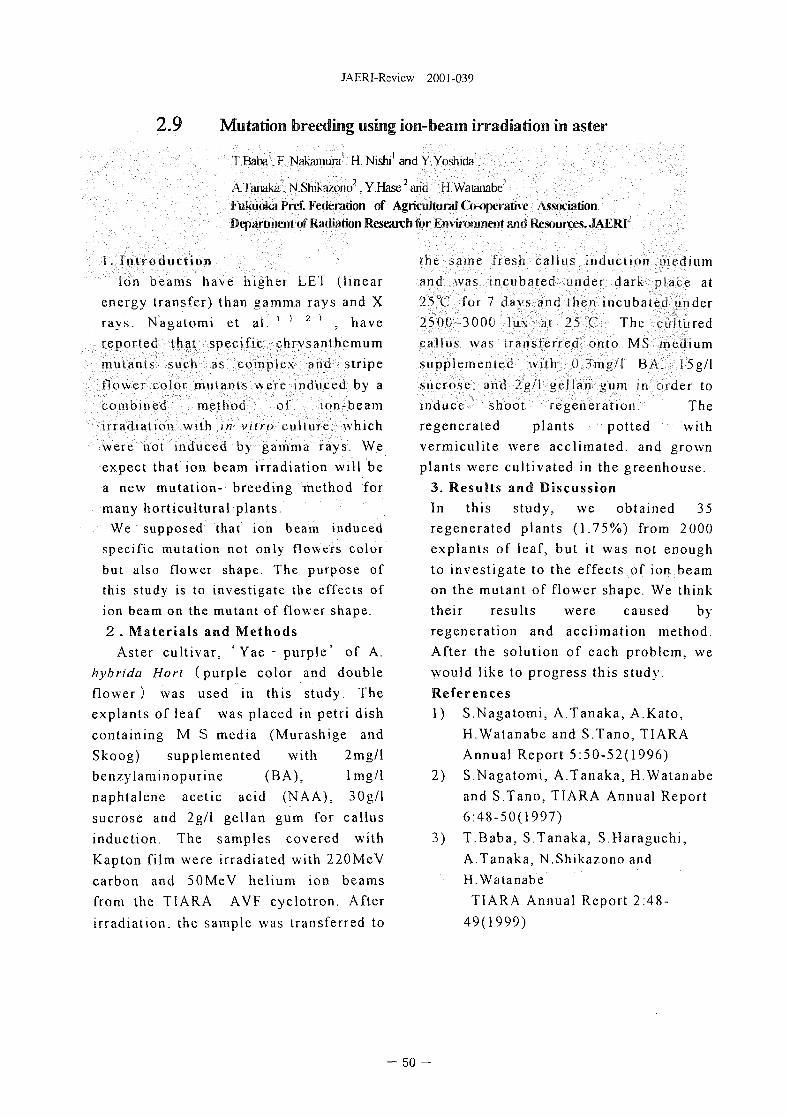
JAERI-Review 2001 -039
2.9 Mutation breeding using ion-beam irradiation in aster
T BaoH'. F Nakaimmr. H. Nishi1 and Y Yushicte'.
A'Kanaka . N Shika/ono2, Y.Hase2ami H Watanabe
Fuktioka PIT!'. FeiRTJition of Agricultural Ct»-i»pi-ran"vc Association
nf Radiation Research for tCmiPHimnit and Rt'NHirwi. JA&RT
1 . i n t r o u ii c t i o n
Ion beams have higher LEIenergy transfer) than gamma rays and Xrays. Nagaiomi et al. ' ' 2 ' , havereported thai specific chrvsanthemummutants such as complex ami stripeflower color mutants were induced by acombined method of :on-beamirradiation with in viim culture, whichwere not induced by gamma says. Weexpect that ion beam irradiation will bea new mutation- breeding method formany horticultural plants.We supposed that ion beam induced
specific mutation not only flowers colorbut also flower shape. The purpose ofthis study is to investigate the effects ofion beam on the mutant of flower shape.2 . Materials and Methods
Aster cultivar, ' Yae - purple' of A.hybrida Hort (purple color and doubleflower) was used in this study. Theexplants of leaf was placed in petri dishcontaining M S media (Murashige andSkoog) supplemented with 2mg/lbenzylaminopurine (BA), lmg/1naphtalene acetic acid (NAA), 30g/lsucrose and 2g/l gellan gum for callusinduction. The samples covered withKapton film were irradiated with 220MeVcarbon and 50MeV helium ion beamsfrom the TIARA AVF cyclotron. Afterirradiation, the sample was transferred to
the same fresh calius induction mediumand was incubated under darK place at2SV for 7 days and Chen incubaied under2500 3000 lux at 25 T . The culturedcallus was transferred onto MS mediumsupplemented with 0.3ina/l BA. !5g/lsucrose, and 2ui\ yelian gum in order toinduce shoo! regeneration Theregenerated plants potted withvermiculite were acclimated, and grownplants were cultivated in the greenhouse.
3. Results and DiscussionIn this study, we obtained 35regenerated plants (1.75%) from 2000explants of leaf, but it was not enoughto investigate to the effects of ion beamon the mutant of flower shape. We thinktheir results were caused byregeneration and acclimation method.After the solution of each problem, wewould like to progress this study.References1) S.Nagatomi, A.Tanaka, A.Kato,
H.Watanabe and S.Tano, TIARAAnnual Report 5:50-52(1996)
2) S.Nagatomi, A.Tanaka, H.Watanabeand S.Tano, TIARA Annual Report6:48-50(1997)
3) T.Baba, S.Tanaka, S.Haraguchi,A.Tanaka, N.Shikazono andH.WatanabeTIARA Annual Report 2:48-
49(1999)
- 50 -
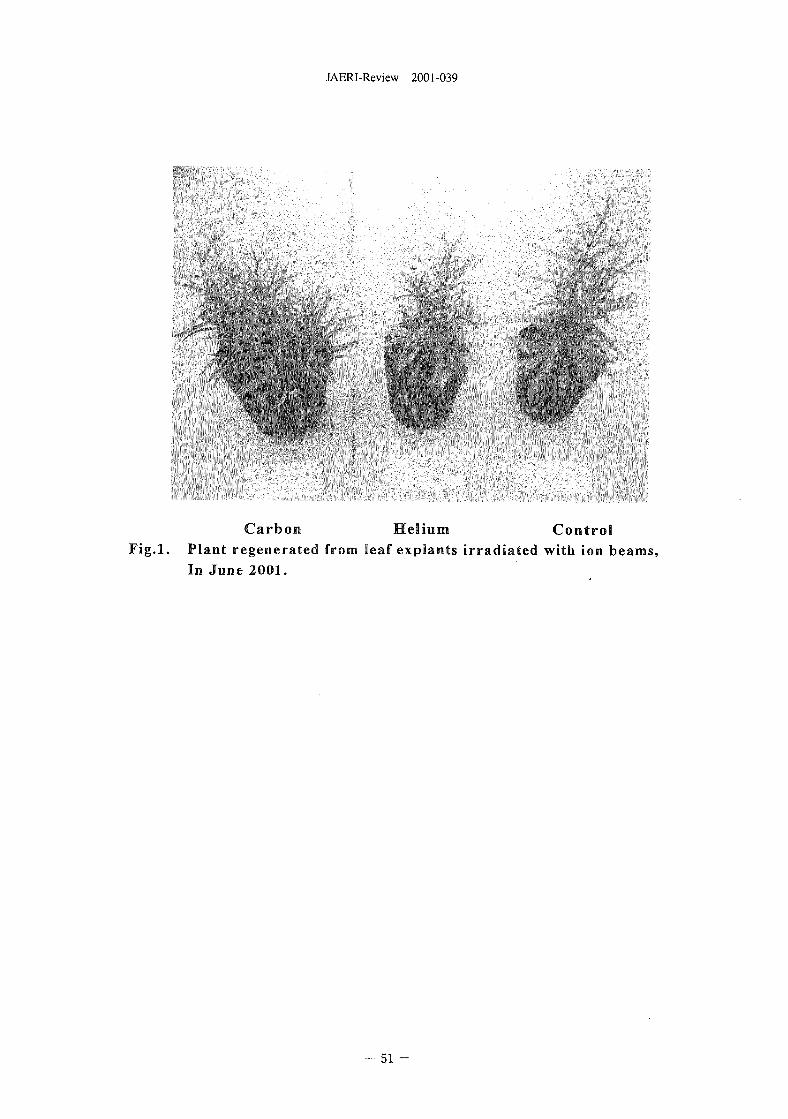
JAERI-Review 2001-039
Carbon Helium ControlFig.l. Plant regenerated from leaf explants irradiated with ion beams,
In June 2001.
- 51 -
JAERI-Review 2001-039
2.10 Mutation Generation in Carnation Plants Regenerated fromin vitro Leaf Cultures Irradiated with Ion Beams
M. Okamura0, M. Ohtsuka1', N. YasunoI}, T. Hirosawa1'.
A.Tanaka2), N. Shikazono2), Y. Hase2) and M. Tanase2)
Plant Laboratory', Agribio business company, Kirin Brewery Co., Ltd.2)Department of Radiation Research for Environment and Resources, JAERI
1. IntroductionMost of mutagens used for mutation
breeding of crops in the world are gamma raysand X-rays. Ion beams have higher linearenergy transfer (LET) and bring on plant cellsintensive relative biological effectiveness(RBE) as compared with gamma rays andX-rays'I Therefore ion beams could beutilized widely as a new mutagen. By theirradiation with heavy ion beams, specificflower color mutants were induced inchrysanthemum25 and new flower shapemutant was induced and analyzed inArabidopsis3).
A combined method of irradiation withplant cell and tissue culture is useful toenhance mutation frequency24-1, and to obtaincommercial varieties in a short period oftime5).
In this study, we investigate the efficiencyof mutation generation by means of acombined method of ion beam irradiation withtissue cultures, and characterize the feature ofmutation breeding using ion beam irradiationin carnation.
2. Materials and MethodsCarnation cultivar, "Vital" (spray type,
cherry pink flowers with frilly petals), wasused for the experiment. The leaf segmentswere placed in petri dish containingMurashige and Skoog medium supplementedwith 2mg/l Zeatin, 30g/l sucrose and 7g/l agar(MSZ medium). The samples covered withKapton film were irradiated with 220 MeVcarbon (12C5~) and 50 MeV helium (4He2+) ionbeams from the TIARA AVF cyclotron(JAERI, Takasaki). After irradiation, the leafsegments were transferred onto fresh MSZ
medium and cultured in the growth chamber.The frequency of adventitious shootregener-ation was examined two months afterirradiation. The regenerated plants wereacclimatized in the greenhouse and theirflower color and shape were investigated. Theregeneration frequency of adventitious shootsfrom the leaf cultures irradiated with gammarays was examined in order to compare theRBE of ion beams with that of gamma rays.
On the other hand, the regenerated plantsfrom the leaf cultures irradiated with X-raysby soft X-ray unit, and the plants derived from0.3% EMS (ethyl methanesulfonate)-treatedbuds for 5 hours were also established andexamined as comparison.
3. Results and DiscussionThe dose response curves of adventitious
shoot regeneration by ion beam irradiationwere shown in Figure 1, and that by gammaray irradiation in Figure 2. In 4He2+ ion beams,regeneration frequency decreased graduallywith increasing dose and the medianre-generation dose (RD50) was estimated at40 Gy. In 12C54 ion beams, regenerationfrequency also decreased with increasing doseand RD50 was estimated at 15 Gy. In gammarays, RD50 was around 60Gy. the RBE ofI2C54 ion beams relative to gamma rays wasestimated to be 3-4.
The mutants in flower color and/or shape inthe plants regenerated from leaf culturesirradiated with 12C5+ion beams were shown inTable 1. and those with X-rays in Table 2. Themutation rates of flower color are 2.3% and1.3% in 12C5+ ion beams and X-rays,respectively. Flower color mutants such aspink, light pink and red were obtained by
- 52 -
JAERI-Review 2001-039
X-ray irradiation, whereas the color spectrumof the mutants obtained by I2C5' ion beamirradiation was wide such as pink, dark pink,light pink, salmon, red. complex and stripedtypes (Figure 3). In EMS-treated plants,flower color mutants such as pink, red andstriped type were observed. However thestriped color of EMS mutants was vague ascompared with that of | :C5+ ion-inducedmutants. The examination of the plantsderived from gamma ray irradiation isongoing.
In carnation variety tested, new mutants inflower color such as salmon, clear striped type,complex type and in flower shape such as wildDicmthus type petals have been obtained fromthe plants regenerated from 12C5'' ionbeam-irradiated leaf cultures. The resultscorrespond with the report in chrysanthemum25
in that the color spectrum of the ionbeam-induced mutants was wider than that ofthe mutants induced by low LET radiationsand the specific mutants such as complex andstriped color types were obtained. High
frequency rearrangements of the DNA such asinversion, insertion and translocation werereported in carbon ion-induced mutants65.These results suggest that ion beams havedifferent effect from low LET radiations onmutation generation of crops.
References1) A. Tanaka, N. Shikazono. Y. Yokota, H.
Watanabe and S. Tano, Int. J. Radiat.Biol72(1997), 121-127
2) S. Nagatomi, A. Tanaka, H. Watanabe andS. Tano, JAERJ-Review 97-015 (1997).48-50
3) Y. Hase, A. Tanaka, T. Baba and H.Watanabe, The Plant 124 (2000). 21-32
4) H. Yamaguchi, S. Nagatomi, A. Tanaka. N.Shikazono, T. Morishita and K. Degi.JAERI-Review 2000-024 (2000), 41-42
5) M. Okamura, In: Bajai YPS ed.Biotechnology in Agriculture and Forestry,vol 27: Springer-Verlag (1994), pp209-223
6) N. Shikazono, A.Tanaka, H. Watanabe andS. Tano. Genetics 157 (2001), 379-387
Table 1. No. of mutants in plants regenerated from leaf cultures irradiated by C" ion beamsDose(Gy)
No. linestested230 ~~
Mutants in flower color and/or shape (No.) Mutation (%)in flower color
!0 254 Pink (1). Dark Pink H), Light Pink (2). Salmon (2;. 3.5Red < I). Slriped type: pink and white (2;.Diunihus type petals (2;
15 185 Pink t! i. Pink ' Round petals i l ) . 3.2Red (1 j . Red Round petals ( i ) ._Compjex type: pink and while (2)
30 36 Striped type; pink and white (1_) 2.8Total 705 Color mutants (16) 23
Table 2 No of muiarns in plants regenerated from leaf cultures irradiated by soft X-ray^
(Son X-ra\ •.inn. Ohimcion'R OM6OR: 6()kVp. 5mA)
[><>sc No- 'ines Mutants in iluwer coior and/or sliapc (No !ijeslec'A5 Pink^l)7^ Pink (2;^ '"'""' _' '_
•Gy;4080
Mutation (%')in flower color9-9
9(130Total
:72191556
Pink (2), Light pink (1)Red(l)Color mutants (7)
0.51.3
- 53 -
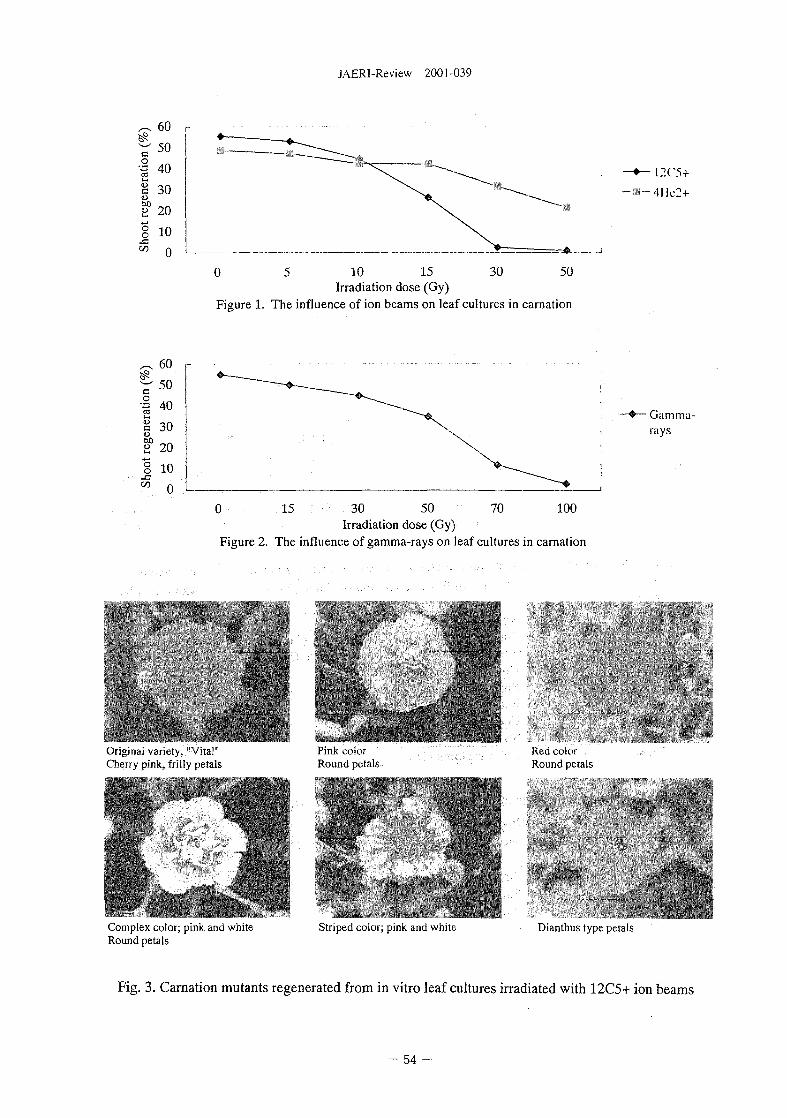
JAERI-Review 2001-039
c
60
50
40
30
20
10
0
0 30
12C5+
4Mc2+
505 10 15Irradiation dose (Gy)
Figure 1. The influence of ion beams on leaf cultures in carnation
60
50
1 401 30
8 10
£ 00 15 70 10030 50
Irradiation dose (Gy)Figure 2. The influence of gamma-rays on leaf cultures in carnation
Gamma-rays
Orij'PM.n v.im-iv • Ma '( h r ' i n [ i l l l k . t l l l | \ i v l a l . s Riuniu i Round pculs
Complex color; pink and whiteRound petals
Striped color; pink and white Dianthus type petals
Fig. 3. Carnation mutants regenerated from in vitro leaf cultures irradiated with 12C5+ ion beams
- 54 -
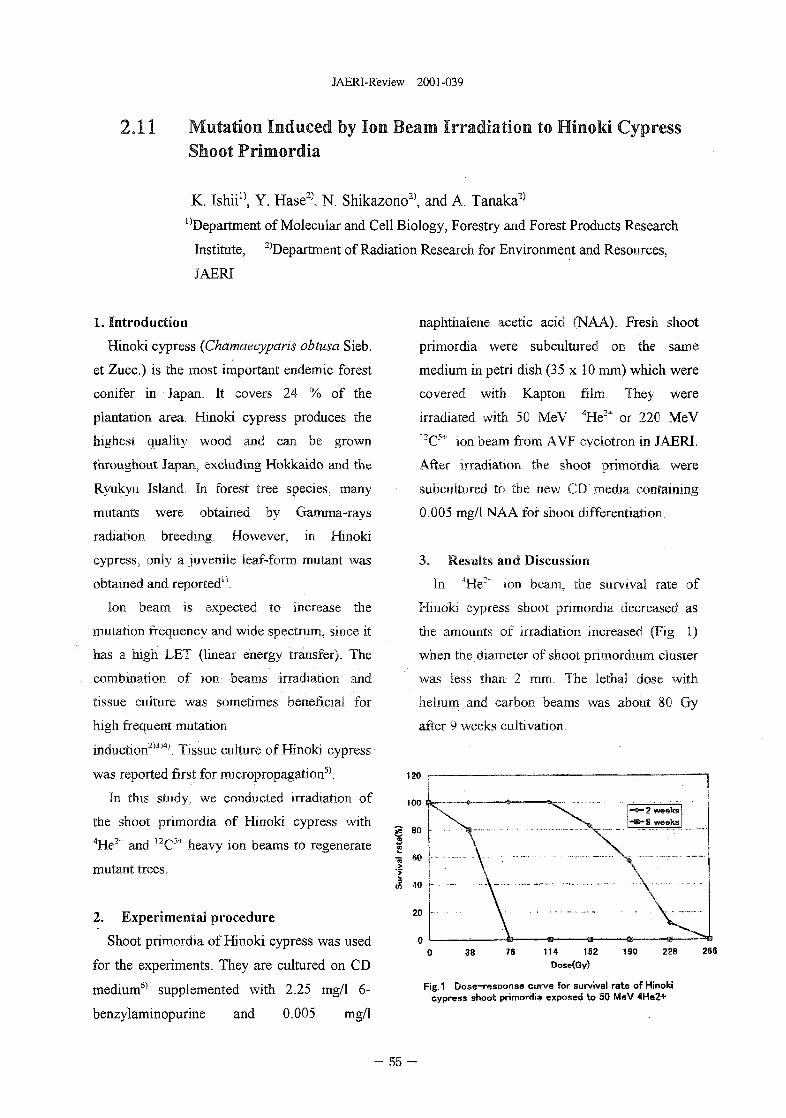
JAERI-Review 2001-039
2.11 Mutation Induced by Ion Beam Irradiation to HinoM CypressShoot Primordia
K. Ishii0, Y. Hase2), N. Shikazono2), and A. Tanaka2)
^Department of Molecular and Cell Biology, Forestry and Forest Products Research
Institute, 2)Departrnent of Radiation Research for Environment and Resources.
JAERI
1. Introduction
Hinoki cypress (Chamaecyparis obtusa Sieb.
et Zucc.) is the most important endemic forest
conifer in Japan. It covers 24 % of the
plantation area. Hinoki cypress produces the
highest quality wood and can be grown
throughout Japan, excluding Hokkaido and the
Ryukyu Island. In forest tree species, many
mutants were obtained by Gamma-rays
radiation breeding. However, in Hinoki
cypress, only a juvenile leaf-form mutant was
obtained and reported11.
Ion beam is expected to increase the
mutation frequency and wide spectrum, since it
has a high LET (linear energy transfer). The
combination of ion beams irradiation and
tissue culture was sometimes beneficial for
high frequent mutation
induction2'3'^. Tissue culture of Hinoki cypress
was reported first for micropropagation5'.
In this study, we conducted irradiation of
the shoot primordia of Hinoki cypress with4He2+ and UC:>~ heavy ion beams to regenerate
mutant trees.
2. Experimental procedure
Shoot primordia of Hinoki cypress was used
for the experiments. They are cultured on CD
medium6) supplemented with 2.25 mg/1 6-
benzylaminopurine and 0.005 mg/1
naphthalene acetic acid (NAA). Fresh shoot
primordia were subcultured on the same
medium in petri dish (35 x 10 mm) which were
covered with Kapton film. They were
irradiated with 50 MeV 4He2+ or 220 MeV!2C>+ ion beam from AVF cyclotron in JAERI.
After irradiation the shoot primordia were
subcultured to the new CD media containing
0.005 mg/1 NAA for shoot differentiation.
3. Results and Discussion
In "'He2'' ion beam, the survival rate of
Hinoki cypress shoot primordia decreased as
the amounts of irradiation increased (Fig. 1)
when the diameter of shoot primordium cluster
was less than 2 mm. The lethal dose with
helium and carbon beams was about 80 Gy
after 9 weeks cultivation.
120
100~2 weeks-9 weeks
114 152Dose(Gy)
190 228 266
Fig.1 Dose-response curve for survival rate of Hinokicypress shoot primordia exposed to 50 MeV 4He2+
55 -
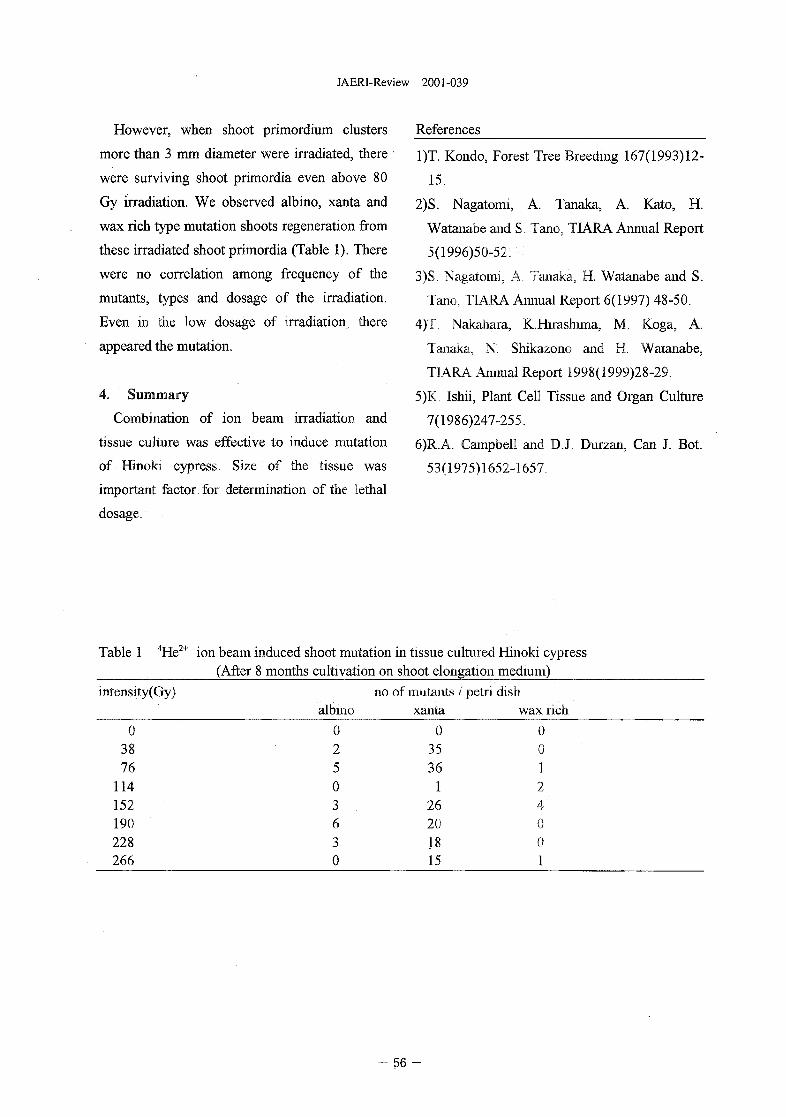
JAERI-Review 2001-039
However, when shoot primordium clusters
more than 3 mm diameter were irradiated, there
were surviving shoot primordia even above 80
Gy irradiation. We observed albino, xanta and
wax rich type mutation shoots regeneration from
these irradiated shoot primordia (Table 1). There
were no correlation among frequency of the
mutants, types and dosage of the irradiation.
Even in the low dosage of irradiation, there
appeared the mutation.
4. Summary
Combination of ion beam irradiation and
tissue culture was effective to induce mutation
of Hinoki cypress. Size of the tissue was
important factor, for determination of the lethal
dosage.
References
1)T. Kondo, Forest Tree Breeding 167(1993)12-
15.
2)S. Nagatomi, A. Tanaka, A. Kato, H.
Watanabe and S. Tano. TIARA Annual Report
5(1996)50-52.
3)S. Nagatomi, A. Tanaka, H. Watanabe and S.
Tano, TIARA Annual Report 6(1997) 48-50.
4)T, Nakahara, K.Hirashima, M. Koga, A.
Tanaka. N. Shikazono and H. Watanabe,
TIARA Annual Report 1998(1999)28-29.
5)K. Ishii, Plant Cell Tissue and Organ Culture
7(1986)247-255.
6)R.A. Campbell and D.J. Durzan, Can J. Bot.
53(1975)1652-1657.
Table 1 He ion beam induced shoot mutation in tissue cultured Hinoki cypress(After 8 months cultivation on shoot elongation medium)
intensity(Gy) no of mutants / petri dishalbino xanta wax rich
03876
114152190228266
02503630
03536
126201815
00124001
- 56 -
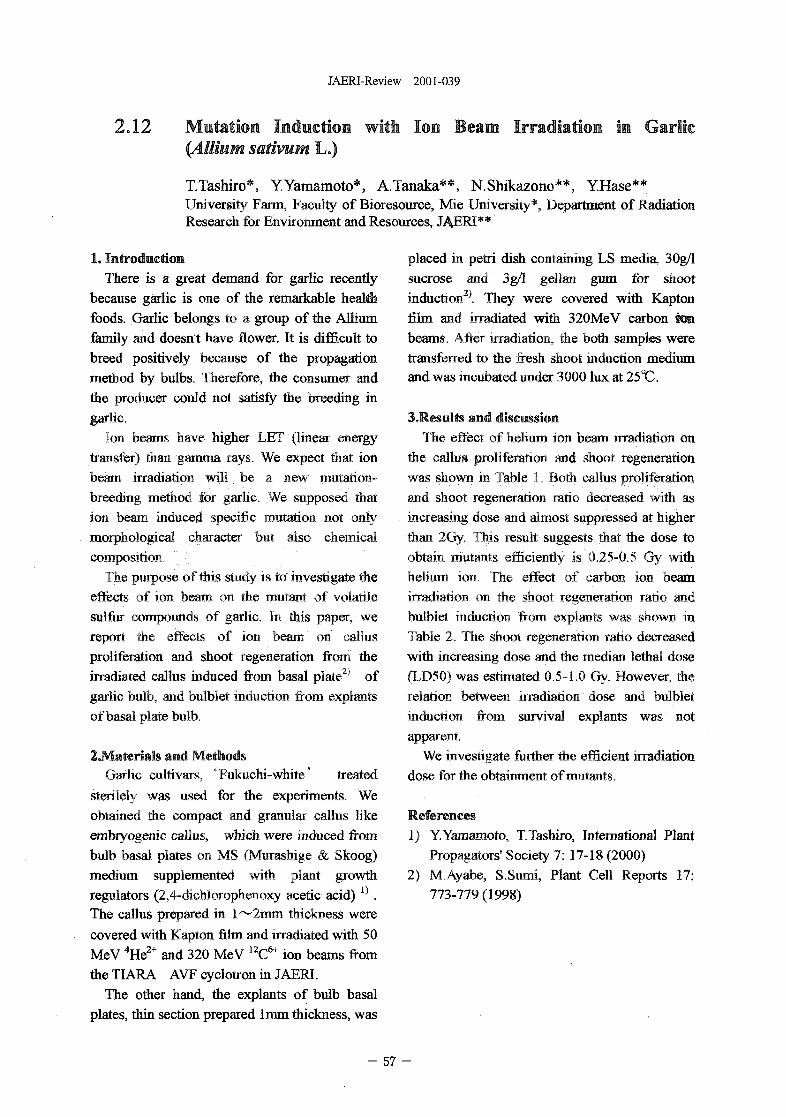
JAERI-Review 2001-039
2.12 Mutation Induction with Ion Beam Irradiation in Garlic(Aliium sativum L.)
T.Tashiro*, YYamamoto*, A.Tanaka**, N.Shikazono**, YHase**University Farm, Faculty of Bioresource, Mie University*, Department of RadiationResearch for Environment and Resources, JAERI**
1. IntroductionThere is a great demand for garlic recently
because garlic is one of the remarkable healthfoods. Garlic belongs to a group of the Aliiumfamily and doesn't have flower. It is difficult tobreed positively because of the propagationmethod by bulbs. Therefore, the consumer andthe producer could not satisfy the breeding ingarlic.
Ion beams have higher LET (linear energytransfer) than gamma rays. We expect that ionbeam irradiation will be a new mutation-breeding method for garlic. We supposed thation beam induced specific mutation not onlymorphological character but also chemicalcomposition.
The purpose of this study is to investigate theeffects of ion beam on the mutant of volatilesulfur compounds of garlic. In this paper, wereport the effects of ion beam on callusproliferation and shoot regeneration from theirradiated callus induced from basal plate2) ofgarlic bulb, and bulblet induction from explantsof basal plate bulb.
2.Materials and MethodsGarlic cultivars, ' Fukuchi-white' treated
sterilely was used for the experiments. Weobtained the compact and granular callus likeembryogenic callus, which were induced frombulb basal plates on MS (Murashige & Skoog)medium supplemented with plant growthregulators (2,4-dichlorophenoxy acetic acid) 1} .The callus prepared in l~2mm thickness werecovered with Kapton film and irradiated with 50MeV 4He2+ and 320 MeV 12C6r ion beams fromthe TIARA AVF cyclotron in JAERI.
The other hand, the explants of bulb basalplates, thin section prepared lmm thickness, was
placed in petri dish containing LS media, 30g/lsucrose and 3g/l gellan gum for shootinduction2l They were covered with Kaptonfilm and irradiated with 320MeV carbon ionbeams. After irradiation, the both samples weretransferred to the fresh shoot induction mediumand was incubated under 3000 lux at 25°C.
3.Results and discussionThe effect of helium ion beam irradiation on
the callus proliferation and shoot regenerationwas shown in Table 1. Both callus proliferationand shoot regeneration ratio decreased with asincreasing dose and almost suppressed at higherthan 2Gy. This result suggests that the dose toobtain mutants efficiently is 0.25-0.5 Gy withhelium ion. The effect of carbon ion beamirradiation on the shoot regeneration ratio andbulblet induction from explants was shown inTable 2. The shoot regeneration ratio decreasedwith increasing dose and the median lethal dose(LD50) was estimated 0.5-1.0 Gy. However, therelation between irradiation dose and bulbletinduction from survival explants was notapparent.
We investigate further the efficient irradiationdose for the obtainment of mutants.
References1) Y.Yamamoto, T.Tashiro, International Plant
Propagators' Society 7: 17-18 (2000)2) M.Ayabe, S.Suini, Plant Cell Reports 17:
773-779 (1998)
- 57 -
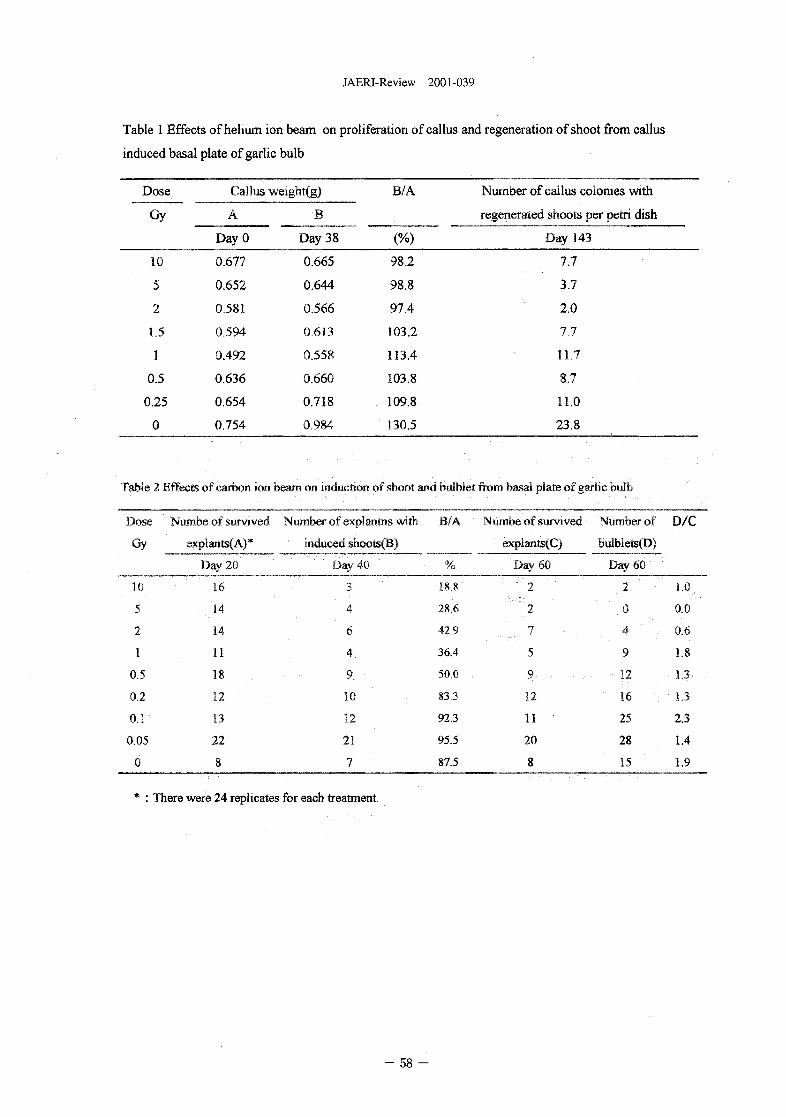
JAERI-Review 2001-039
Table 1 Effects of helium ion beam on proliferation of callus and regeneration of shoot from callus
induced basal plate of garlic bulb
Number of callus colonies with
regenerated shoots per petri dish
Dose
Gy
10
5
2
1.5
1
0.5
0.25
0
Callus
A
DayO
0.677
0.652
0.581
0.594
0.492
0.636
0.654
0.754
weight(g)
B
Day 38
0.665
0.644
0.566
0.613
0.558
0.660
0.718
0.984
B/A
(%)
98.2
98.8
97.4
103.2
113.4
103.8
. 109.8
130.5
Day 143
7.7
3.7
2.0
7.7
11.7
8.7
11.0
23.8
Table 2 Effects of carbon ion beam on induction of shoot and bulblet from basal plate of garlic bulb
Dose Numbe of survived Number of explantas with B/A Numbe of survived Number of D/C
Gy expIants(A)* induced shoots(B) explaots(C) bulblets(D)
Day 20 Day 40 % Day 60 Day 60
3 18.8 2
4 28.6 2
6 • 42.9 7
4 36.4 5
9 50.0 9
10 83.3 12
12 92.3 11 '
21 95.5 20
7 87.5 8
: There were 24 replicates for each treatment.
10
5
2
1
0.5
0.2
0.1
0.05
0
16
14
14
11
18
12
13
22
8
2
0
4
9
12
16
25
28
15
1.0
0.0
0.6
1.8
1.3
1.3
2.3
1.4
1.9
58 -
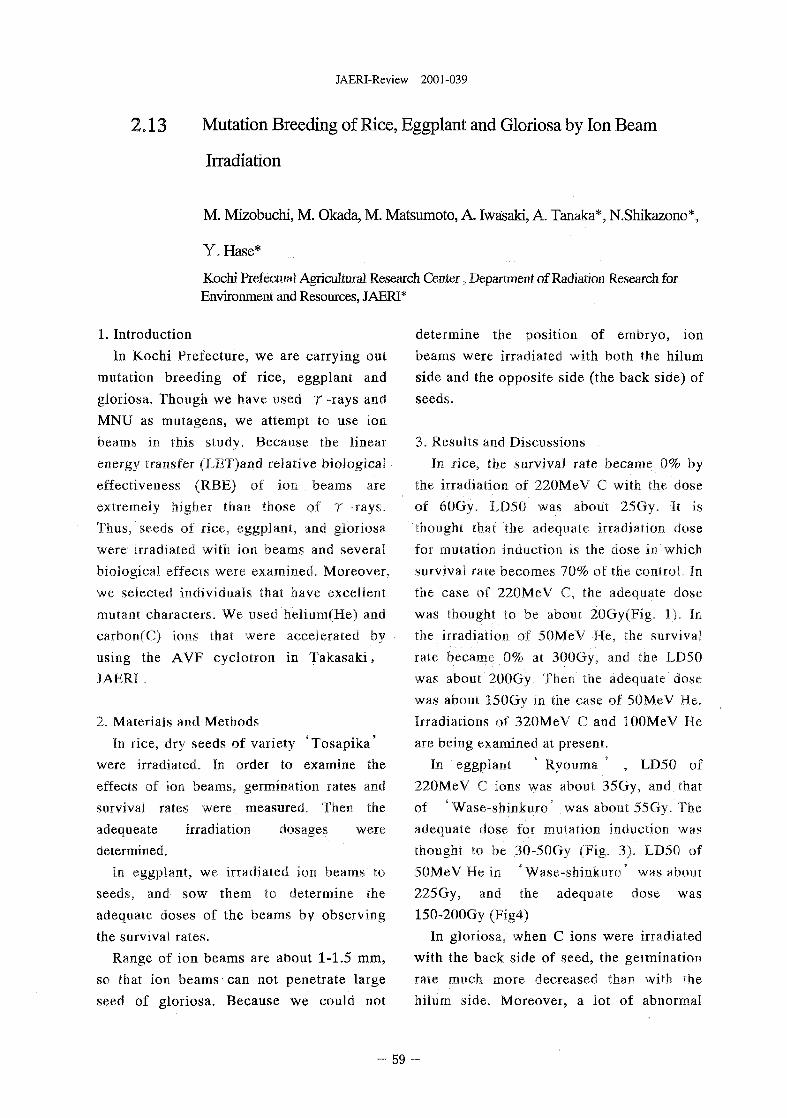
JAERI-Review 2001-039
2.13 Mutation Breeding of Rice, Eggplant and Gloriosa by Ion Beam
Irradiation
M. Mizobuchi, M. Okada, M. Matsumoto, A. Iwasaki, A. Tanaka*, N.Shikazono*,
Y. Hase*
Kochi Prefectual Agricultural Research Center, Department of Radiation Research forEnvironment and Resources, JAERI*
1. IntroductionIn Kochi Prefecture, we are carrying out
mutation breeding of rice, eggplant andgloriosa. Though we have used 7 -rays andMNU as mutagens, we attempt to use ionbeams in this study. Because the linearenergy transfer (LET)and relative biological •effectiveness (RBE) of ion beams areextremely higher than those of T -rays.Thus, seeds of rice, eggplant, and gloriosawere irradiated with ion beams and severalbiological effects were examined. Moreover,we selected individuals that have excellentmutant characters. We used nelium(He) andcarbon(C) ions that were accelerated byusing the AVF cyclotron in Takasaki,JAERI .
2. Materials and MethodsIn rice, dry seeds of variety 'Tosapika'
were irradiated. In order to examine theeffects of ion beams, germination rates andsurvival rates were measured. Then theadequeate irradiation dosages weredetermined.
In eggplant, we irradiated ion beams toseeds, and sow them to determine theadequate doses of the beams by observingthe survival rates.
Range of ion beams are about 1-1.5 mm,so that ion beams can not penetrate largeseed of gloriosa. Because we could not
determine the position of embryo, ionbeams were irradiated with both the hilumside and the opposite side (the back side) ofseeds.
3, Results and DiscussionsIn rice, the survival rate became 0% by
the irradiation of 220MeV C with the doseof 60Gy. LD50 was about 25Gy. It isthought that the adequate irradiation dosefor mutation induction is the dose in whichsurvival rate becomes 70% of the control. Inthe case of 220MeV C, the adequate dosewas thought to be about 20Gy(Fig, 1). Inthe irradiation of 50MeV He, the survivalrate became 0% at 300Gy, and the LD50was about 200Gy. Then the adequate dosewas about 150Gy in the case of 50MeV He.Irradiations of 320MeV C and lOOMeV Heare being examined at present.
In eggplant * Ryouma * , LD50 of220MeV C ions was about 35Gy, and thatof ' Wase-shinkuro* was about 55Gy. Theadequate dose for mutation induction wasthought to be 30-50Gy (Fig. 3). LD50 of50MeV He in * Wase-shinkuro* was about225 Gy, and the adequate dose was150-200Gy (Fig4)
In gloriosa, when C ions were irradiatedwith the back side of seed, the geiminationrate much more decreased than with thehilum side. Moreover, a lot of abnormal
59
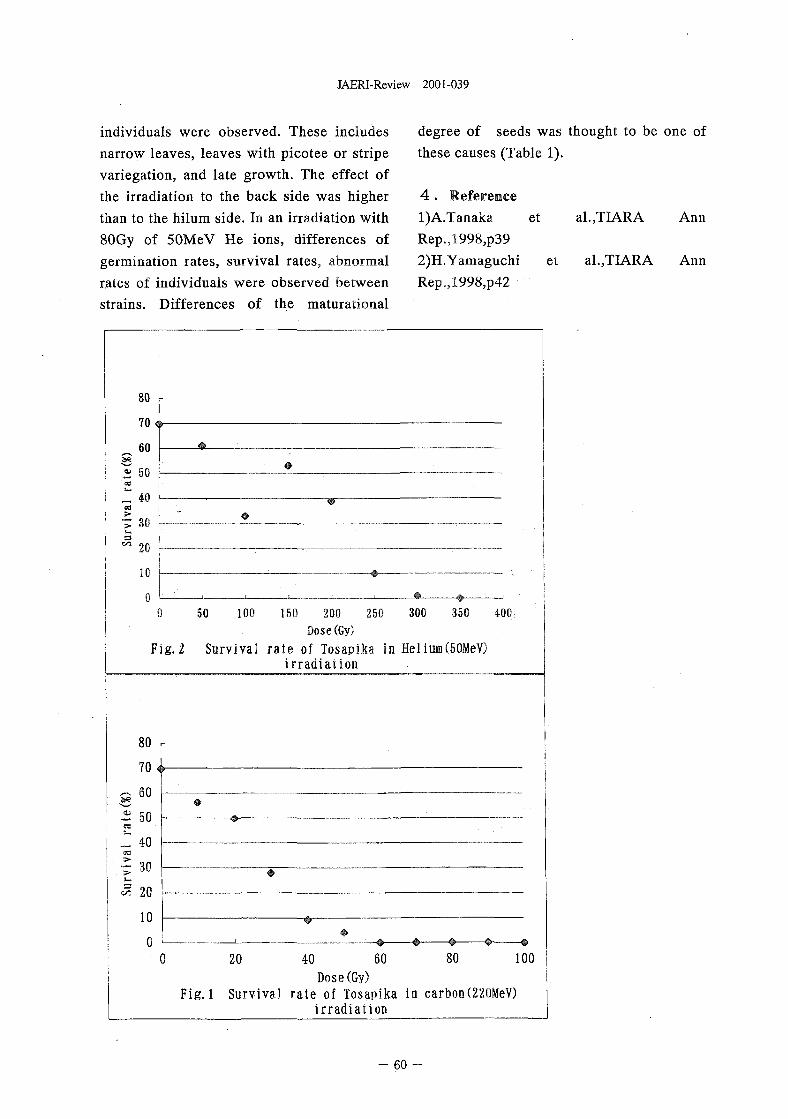
JAERI-Review 2001-039
individuals were observed. These includesnarrow leaves, leaves with picotee or stripevariegation, and late growth. The effect ofthe irradiation to the back side was higherthan to the hilum side. In an irradiation with80Gy of 50MeV He ions, differences ofgermination rates, survival rates, abnormalrates of individuals were observed betweenstrains. Differences of the maturational
degree of seeds was thought to be one ofthese causes (Table 1).
4 . Referencel)A.Tanaka etRep.,1998,p392)H.Yamaguchi etRep.,1998,p42
al.,TIARA
al.,TIARA
Ann
Ann
80
70 4
60
a. 50 h
_ 40
» 30 U
20
10
00 50 100 150 200 250 300 350 400
Dose(Gy)
Fig. 2 Survival rate of Tosapika in Helium(50MeV)irradiation
20 8040 60Dose(Gy)
Fig. 1 Survival rate of Tosapika in carbon(220MeV)irradiation
100
- 60
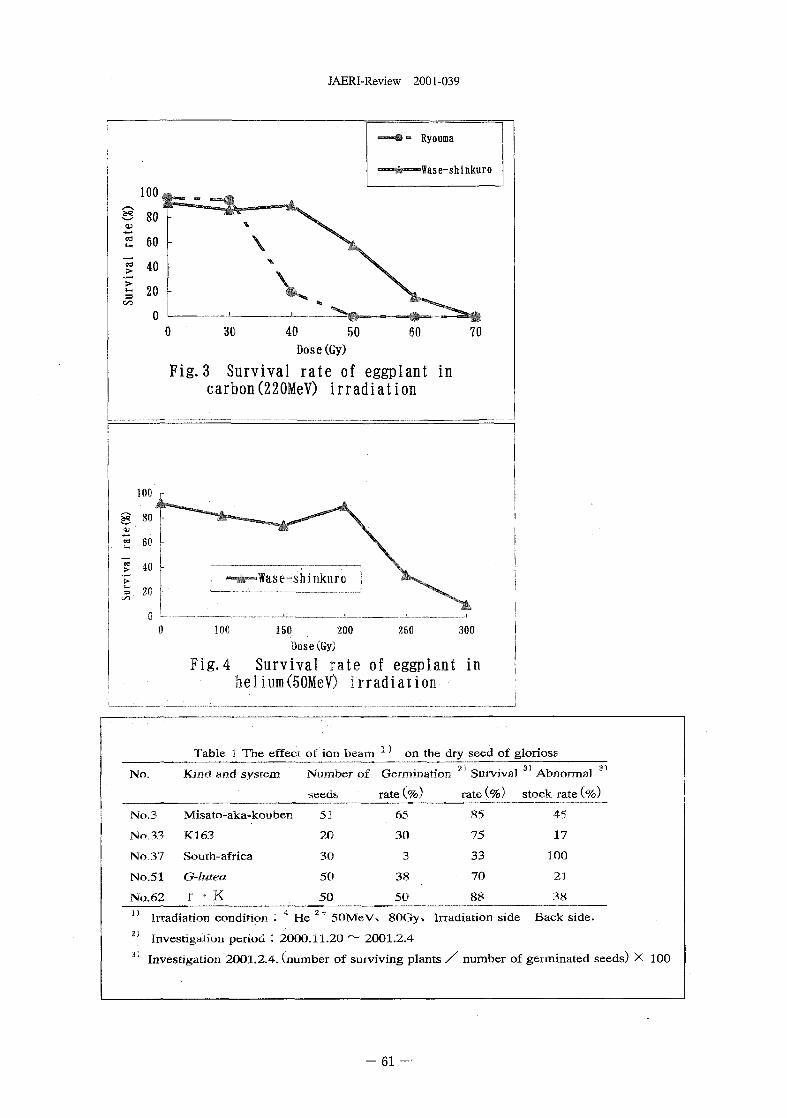
JAERI-Review 2001-039
40 50Dose(Gy)
Fig.3 Survival rate of eggplant incarbon(220MeV) irradiation
100 250 300150 200Dose(Gy)
Fig.4 Survival rate of eggplant infaelium(50MeV) irradiation
No.
Table 1 The effect of ion beam *' on the dry seed of gloriosa
Kind and system Number of Germination 2l Survival 3 Abnormal
seeds rate (%) rate (%) stock rate (%
No.3 Misato-aka-kouben 51
No.33 K163 20
No.37 South-africa 30
No.51 G-lutea 50
No.62 r • K 50
65
30
3
38
50
85
15
33
70
88
45
17
100
21
38i )
2)
Irradiation condition : 4 He 2+ 50MeW 80Gy% Irradiation side Back side.
Investigation period : 2000.11.20 ~ 2001.2.431 Investigation 2001.2.4. (number of surviving plants / number of germinated seeds) X 100
- 61 —
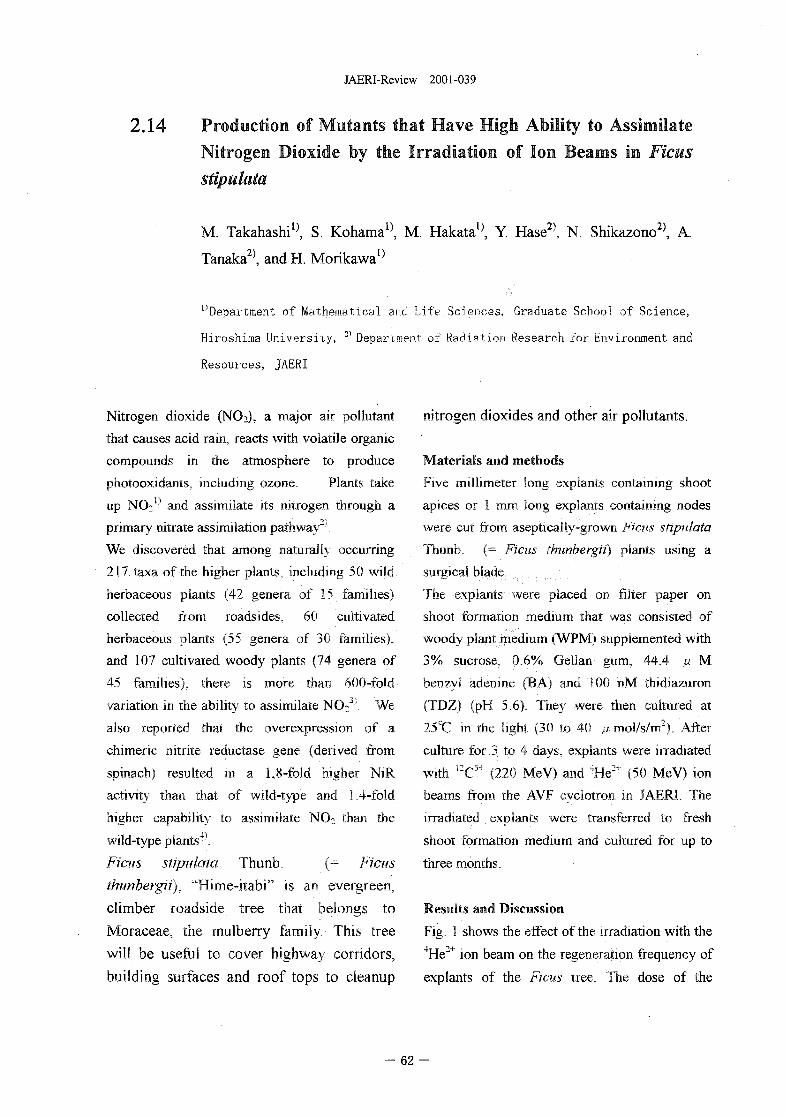
JAERI-Review 2001-039
2.14 Production of Mutants that Have High Ability to AssimilateNitrogen Dioxide by the Irradiation of Ion Beams in Ficusstipulata
M. Takahashi1}, S. Kohama1^ M. Hakata1}, Y. Hase2), N. Shikazono2), A.
Tanaka2), and H. MorikawaI}
'•Department of Mathematical and Life Sciences, Graduate School of Science,
Hiroshima University, 2) Department of Radiation Research for Environment and
Resources, JAERI
Nitrogen dioxide (NO2), a major air pollutant
that causes acid rain, reacts with volatile organic
compounds in the atmosphere to produce
photooxidants, including ozone. Plants take
up NO21} and assimilate its nitrogen through a
primary nitrate assimilation pathway-*1.
We discovered that among naturally occurring
217 taxa of the higher plants, including 50 wild
herbaceous plants (42 genera of 15 families)
collected from roadsides, 60 cultivated
herbaceous plants (55 genera of 30 families),
and 107 cultivated woody plants (74 genera of
45 families), there is more than 600-fold
variation in the ability to assimilate N C ^ . We
also reported that the overexpression of a
chimeric nitrite reductase gene (denved from
spinach) resulted in a 1,8-fold higher NiR
activity than that of wild-type and 1.4-fold
higher capability to assimilate NO2 than the
wild-type plants4).
Ficus stipulata Thunb. (= Ficus
thunbergii), "Hime-itabi" is an evergreen,
climber roadside tree that belongs to
Moraceae, the mulberry family. This tree
will be useful to cover highway corridors,
building surfaces and roof tops to cleanup
nitrogen dioxides and other air pollutants.
Materials and methods
Five millimeter long explants containing shoot
apices or I mm long explants containing nodes
were cut from asepticaliy-grown Ficus stipulata
Thunb. (= Ficus thunbergii) plants using a
surgical blade.
The explants were placed on filter paper on
shoot formation medium that was consisted of
woody plant medium (WPM) supplemented with
3% sucrose, 0.6% Gellan gum, 44.4 fi M
benzyi adenine (BA) and 100 nM thidiazuron
(TDZ) (pH 5.6). They were then cultured at
25°C in the light (30 to 40 n mol/s/m2). After
culture for 3 to 4 days, explants were irradiated
with 12C5+ (220 MeV) and ''He2* (50 MeV) ion
beams from the AVF cyclotron in JAERI. The
irradiated explants were transferred to fresh
shoot formation medium and cultured for up to
three months.
Results and Discussion
Fig. i shows the effect of the irradiation with the4He2+ ion beam on the regeneration frequency of
explants of the Ficus tree. The dose of the
- 62 -
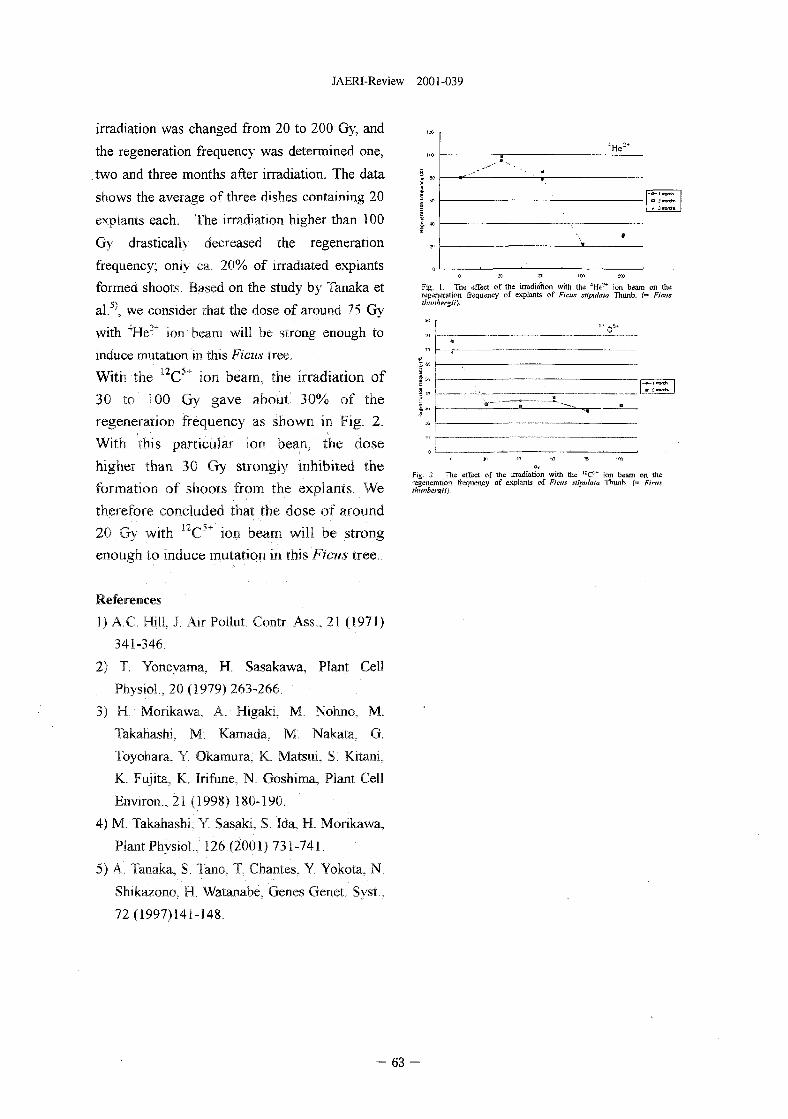
JAERI-Review 2001-039
irradiation was changed from 20 to 200 Gy, and
the regeneration frequency was determined one,
. two and three months after irradiation. The data
shows the average of three dishes containing 20
expiants each. The irradiation higher than 100
Gy drastically decreased the regeneration
frequency; only ca. 20% of irradiated expiants
formed shoots. Based on the study by Tanaka et
al.5), we consider that the dose of around 75 Gy
with 4He2T ion beam will be strong enough to
induce mutation in this Ficus tree.
With the l2C*~ ion beam, the irradiation of
30 to 100 Gy gave about 30% of the
regeneration frequency as shown in Fig. 2.
With this particular ion bean, the dose
higher than 30 Gy strongly inhibited the
formation of shoots from the expiants. We
therefore concluded that the dose of around
20 Gy with 12C>r Ion beam will be strong
enough to induce mutation in this Ficiis tree.
. - •• •
\
4He=*
8
• 3 rrortlB
Fig. 1. The effect of the irradiation with the 4Ht'* ion beam on theregeneration frequency of expiants of Ficus slipulaia Thunb. (= Fiatstlitmbergii).
Fig. 2. The ettect of the irradiation with the '-C-* ion beam on theregeneration frequency of expiants of Fiars stipr/lma Thunb. (= Firmthimbergii)
References
1) A.C. Hill J. Air Pollut. Contr. Ass., 21 (1971)
341-346.
2) T. Yoneyama, H. Sasakawa, Plant Cell
Physio!., 20 (1979) 263-266.
3) H. Morikawa, A. Higaki, M. Nohno, M.
Takahashi, M. Kamada, M. Nakata, G.
Toyohara. Y. Okamura. K. Matsui, S. Kitani,
K. Fujita. K. Irifune. N. Goshima, Plant Cell
Environ., 21 (1998) 180-190.
4) M. Takahashi, Y. Sasaki, S. Ida. H. Morikavva,
Plant Physiol, 126 (2001) 731-741.
5) A. Tanaka, S. Tano, T. Chantes, Y. Yokota. N.
Shikazono, H. Watanabe, Genes Genet. Syst,
72(1997)141-148.
- 63 -
JAERI-Review 2001-039
2.15 Induction of Somatic Mutation by Ion Beam Irradiation inLethal Chlorophyl Mutant of Rice
M. Maekawa1^ A. Tanaka2), N. Shikazono2) and Y. Hase2)
^Research Institute for Bioresources, Okayama University2)Department of Radiation Research for Environment and Resources, JAERI
1. Introduction
Transposon (mobile element) is very useful
for gene isolation in several plant species.
Since so far, any class IT type transposons have
not been discovered in rice, AclDs system in
maize was introduced into rice and was tried to
be applied for gene-tagging^. If an
endogenous transposon was discovered in rice,
it could be used easily as a powerful tool for
gene-tagging in open environments. As Mn
in maize2), transposons may be found in
mutagenized rice. As ion beams are a type of
high linear energy transfer (LET) radiation and
can deposit high energy on a target compared
to low LET radiations, the novel mutants or
large DNA rearrangements are expected to be
induced by ion beam irradiation35. So, it is
expected that transposon may be induced by
ion beam irradiation. Visualization of
transposon activity is made by variegation in
chlorophyl mutant or anthocyanin
accumulation. Maekawa4) found a variegated
chlorophyl mutant in F2 of the cross between
distantly related rice varieties. Although a
near isogenic line (NIL) for this mutant gene
with T-65 genetic background was bred, this
line did not show any variegations through
generations. So, if variegation could be
induced by mutation in this NIL, it is highly
expected that this mutant line carries
transposon. Thus, this study aims to induce
somatic mutation at Ml in this stable
chlorophyl mutant line by ion beams.
2. Experimental procedure
Seeds of a chlorophyl mutant (referred yl)
were derived from a yl-stble (stable yl) plant in
T-65 yl-stb BC3F2. Ion beams used were
helium and carbon. Irradiated seeds were
sterilized with 70% EtOH and sown in planters
containing commercial substrate. After three
weeks, presence/absence of variegations were
examined because yl mutants start withering
from this time.
3, Results and Discussion
Carbon ion beam irradiation drastically
reduces germination rates of T-65 yl-stb plants
irradiated with increasing dose and the median
lethal dose with carbon ion was estimated to be
30 Gy (Tab. 1). In Mi plants irradiated with
50 Gy of 220 MeV C ions, a variegated yl plant
generated as shown in Fig. 1 -b. This plant
showed small or large sectors in leaves
expanded laterly (Fig. 1-c and d). As a result,
out of 992 Ml plants germinated one
variegated plant was obtained. On the other
hand, helium ion beam irradiation slightly
reduces germination rate of yl-stb plants with
increasing dose of 50 Gy to 150 Gy and the
median lethal dose was estimated to be over
150 Gy. In Ml plants irradiated with 100
MeV 4He2', any yl plants showing clear
variegation were not observed though 9 vague-
typed yi plants were generated totally (Tab. 1).
These vague-typed yl plants were also obtained
with the frequencies of 0.1 % in control. The
frequency of vague-typed yl plants generated
with helium ion beam irradiation was 0.3 %.
This frequency was slightly higher than that in
- 64
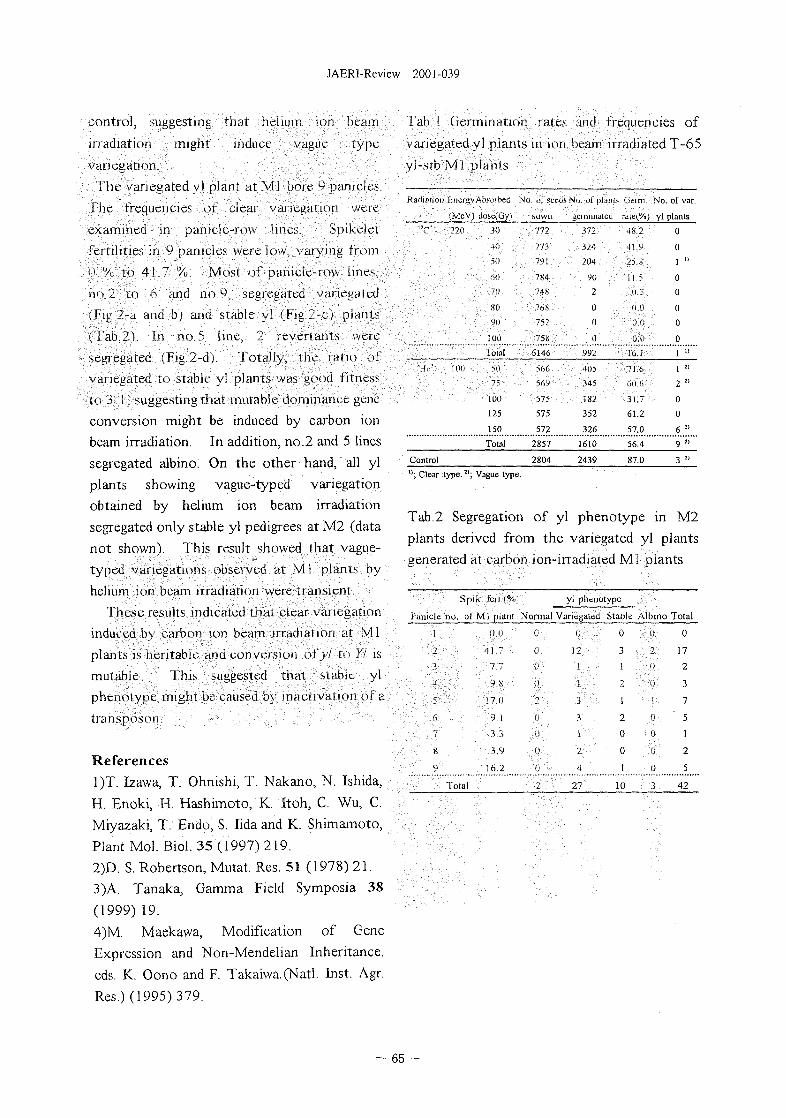
JAERl-Review 2001-039
control, suggesting thar helium ion beam
irradiation might induce vague type
variegation.
The variegated yl plant at MI bore 9 panicles.
The frequencies of clear variegation were
examined in panicie-row lines. Spikelet
fertilities in 9 panicles were low. varying from
ii % lo 41.7 %. Most of panicle-row lines,
no.2 to 6 and no.^, segregated variegated
(Fig.2-a and b) and stable yl (Fig.2~e) plants
(Tab.2). In no.5 line, 2 revcrtants were
segregated (Fig.2-d). Totally, the ratio of
variegated to stable yl plants was good fitness
to 3:1. suggesting that mutable dominance gene
conversion might be induced by carbon ion
beam irradiation. In addition, no.2 and 5 lines
segregated albino. On the other hand, all yl
plants showing vague-typed variegation
obtained by helium ion beam irradiation
segregated only stable yl pedigrees at M2 (data
not shown). This result showed that vague-
typed variegations observed at Ml plants by
helium ion beam irradiation were transient.
These results indicated that clear variegation
induced by carbon ion beam irradiation at Ml
plants is heritable and conversion ot'yl to Yl is
mutable. This suggested that stable yl
phenotype might be caused by inaetivation of a
transposon.
References
1)T. Izawa, T. Ohnishi, T. Nakano, N. Ishida,
H. Enoki, H. Hashimoto, K. Itoh, C. Wu, C.
Miyazaki, T. Endo, S. lida and K. Shimamoto,
Plant Mol. Biol. 35 (1997) 219.
2)D. S. Robertson, Mutat. Res. 51 (1978) 21.
3)A. Tanaka, Gamma Field Symposia 38
(1999) 19.
4)M. Maekawa, Modification of Gene
Expression and Non-Mendelian Inheritance.
eds. K. Oono and F. Takaiwa.(Natl. Inst. Agr.
Res.) (1995) 379.
Tab. 1 Germination rates and frequencies of
variegated yl plants in ion beam irradiated T-65
yl-sfb Ml plants
Kadiation hncrgv Ai »M xbecl
<MeV, doset.Gy.i
"C' 220 V)
•HI
5f
7 "
XI)
100
Total
' H e ' ' HID 50
7s
1011
125
150
Total
Control
No i>\ .seeds
suwn
772
773
791
7K4
74X
76X
752
758
6146
566
569
575
575
572
2857
2804
N... ..! pbnt,
^emanated
372
324
204
vu2
0
0
0
992
41)5
345
182
352
326
1610
2439
Cfcrm.
iae(%;
•18.2
•4i.y
25.K
11.5
ti.3
0.1)
0 0
0.0
16.1
71.6
611.6
31.7
61.2
57.0
56.4
87.0
No. of var.
yl plants
0
0
1 "
0
0
0
0
0
1 "
1 "
2 2>
0
0
6 "
9 "
3 "
"; Clear type.2>; Vague type.
Tab.2 Segregation of yl phenotype in M2
plants derived from the variegated yl plants
generated at carbon ion-irradiated Ml plants
Panicle
1
2
3
4
5
. .6.
7
8
9
Spik. feri.1%
no. of M l plan!
0 I)
4 1 . "
7 7
9,8
.17.0
9.1
• 3.3
3.9
16.2
Total
yl phenotype
Normal Varicgalct
0
0
0
2
u
!)
0
1
(j
12
1
I
3
3
i
2
4
27
i Stable
0
3
i
2
1
2
0
0
1
10
Albino
0
2
0
(1
1
o0
0
IJ
3
Total
0
17
2
3
7
5
1
2
5
42
- 65 -
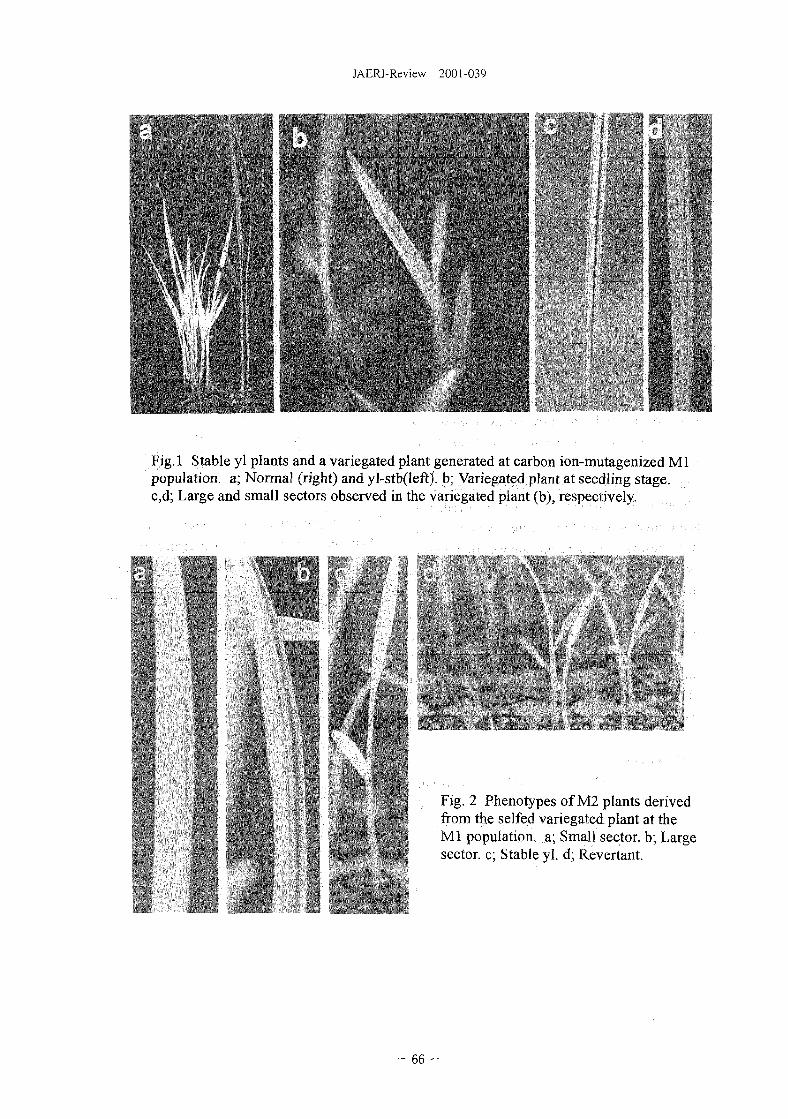
JAERI-Review 2001-039
Fig.l Stable yl plants and a variegated plant generated at carbon ion-mutagenized Mlpopulation, a; Normal (right) and yl-stb(left). b; Variegated plant at seedling stage.c,d; Large and small sectors observed in the variegated plant (b), respectively.
Fig. 2 Phenotypes of M2 plants derivedfrom the selfed variegated plant at theMl population, a; Small sector, b; Largesector, c; Stable yl. d; Revertant.
- 66
JAERI-Review 2001-039
2.16 Genetic screening of antiauxin mutants in Arabidopsis thaliana
C. Ooura1*, E.T. Aspuria1^, Y. Oono1^, Y. Hase2), Y. Kobayashi1^, H.
Uchimiya1^
''Advanced Science Research Center, JAERJ2) Depar tment of Radiation Research for Environment and Resources, JAERJ3) Institute of Molecular and Cellular Biosciences, The University of Tokyo
Dept. of Horticulture, University of the Philippines at Los Banos
1. Introduction
Auxins, typified by indole-3-acetic acid,
are plant hormones that regulate many
physiological and developmental
phenomena by controlling cell division, cell
elongation and cell differentiation in plants.
Genetic screening followed by
characterization of auxin-related mutants has
contributed to the elucidation of the
molecular mechanism of auxin biosynthesis,
transport and response to stimuli [1-3].
However, no mutant defective in an auxin
receptor gene has yet been isolated to date.
Recently. Shikazono et al. [4] reported that
the ion beams, characterized by high linear
energy transfer (LET), as compared to X-
rays or y-rays, induced point mutations as
well as large deletions at higher frequency.
These significant findings prompted us to
use ion beams for screening novel auxin-
related mutants as it may generate new type
of mutants that have never been obtained
through other mutagens. In addition, the use
of chemicals such as antiauxins was also
adapted for screening novel auxin-related
mutants. Antiauxins have similar structure to
auxins but do not exhibit auxin activity [5].
They are believed to inhibit the auxin action
by competing with auxin in the binding site
of the auxin receptor, although the detailed
mechanism of inhibition is unknown.
Antiauxins could be powerful tools to
elucidate molecular mechanism of auxin
perception, assuming that the hypothesis for
the inhibitory mechanism of antiauxins is
legitimate. This report demonstrates the
characterization of the effects of antiauxin
on root growth of Arabidopsis thaliana, and
the isolation of antiauxin resistant mutants
from ion beam-irradiated Arabidopsis seed
population.
2. Experiments
Arabidopsis thaliana (L.) Colombia
ecotype was used throughout the
experiments. The ion beam-irradiated
Arabidopsis thaliana lines were generated
with 12CS+ beams (220 MeV, 150 Gy)
accelerated by the AVF cyclotron at the
TIARA facility in JAERI TAKASAKI. The
EMS-treated lines were purchased from
LEHLE SEEDS (Round Rock TX5 USA), I-
DNA insertional lines were obtained from
Nottingham Arabidopsis Stock Center
(Nottingham, UK). BA3 line, a transgenic
line harboring AuxRD (auxin responsive
domain)-GUS, is described in Oono et al.,
[6], Surface-sterilized seeds were plated
- 67 -
JAERI-Review 2001-039
onto germination medium (GM, 0.5x
Murashige and Skoog salts [Giboco BRL,
Gaithersburg, MD, USA], 10% sucrose,
lxB5 vitamins, and 500 jxg ml"1 MES, pH
5.8 solidified with 0.8% Bacto agar [Difco,
Detroit, MI, USA]) containing various
concentration of auxin and/or anti-auxin, p-
chlorophenoxyisobutyric acid (PCIB).
Seedlings were grown vertically tinder
continuous light at 23 °C. For screening of
mutants, seeds were germinated and grown
on GM containing 20 JAM PCIB, Putative
mutants whose root growth was not
inhibited by PCTB were isolated, grown on
pots containing a mixture of Metro-Mix®
350 (Scotts, Marysville, OH, USA),
vermiculite and perlite at a ratio of 1:1:1 and
maintained in the greenhouse.
3. Result and discussion
Physiological experiments with
Arabidopsis roots showed that PCIB had
antagonistic effects on auxin-induced lateral
root formation and GUS expression in the
root tip of BA-3. PCIB inhibited root
eiongation by itself and did not restore root
elongation from auxin-induced inhibition.
The distinct root morphology caused by
PCIB and auxin suggested each compound
acts independently on root elongation (data
not shown).
PCIB resistant mutants that showed
relatively longer roots compared to wild'
type in the presence of 20 fxM PCIB were
screened from a total of 59,000 ion beam-,
EMS-, and T-DNA-mutagenized M2 seeds.
As shown in Table 1, seventy-six putative
mutants were isolated in the primary
screening. Twenty of 76 lines showed the
reproducible PCIB resistant phenotype in
M3 population, although the phenotype in
M3 is segregated in all the lines except one
(#183). The mutant line #183, which was
isolated from the ion beam-irradiated seed
population, exhibited slightly longer
hypocotyls and shorter roots than the wild
type line in the medium containing neither
auxin nor PCIB (Figure 1). The length of
mam roots of seven-day-old wild type and
#183 seedlings grown on the medium
containing 20 uM PCIB were 51% and 71 %
shorter than those of the untreated seedlings,
suggesting that #183 was PCIB resistant
with respect to root elongation (Figure 1).
The auxin dose response curve in root
elongation of the #183 line was similar to
that of the wild type. However, the #1-83 line
required higher auxin concentration than
wild type to form lateral roots (data not
shown). The root gravitropism of the #183
line seemed to be weaker than that of the
wild type. PCIB caused loss of gravitropism
in the #183 as in the wild type line (data not
shown). These results suggest that the #183
line is an auxin-related mutant that has
pleiotropic morphological phenotypes
characteristic of several other auxin-related
mutants.
4. Summary
The effects of PCIB, an antiauxin, on
Arabidopsis root system were investigated.
PCIB acted as auxin antagonist on auxin-
induced gene expression and lateral root
formation; it inhibited root elongation
independently to auxin. Furthermore, an
- 6 8 -
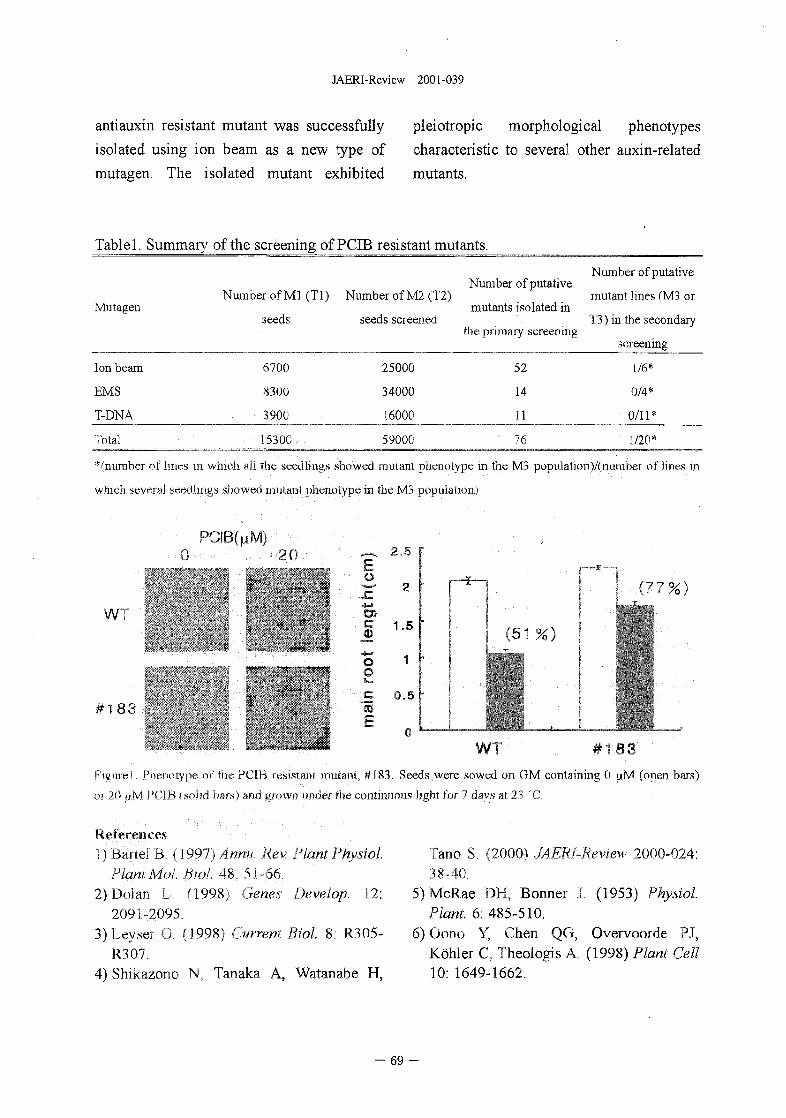
JAERI-Review 2001-039
antiauxin resistant mutant was successfully
isolated using ion beam as a new type of
mutagen. The isolated mutant exhibited
pleiotropic morphological phenotypes
characteristic to several other auxin-related
mutants.
Tablel. Summary of the screening of PCIB resistant mutants.
Number of putativeNumber of putative
Number of Ml (Tl) Number of M2 (T2) mutant lines (M3 orMutagen mutants isolated in
seeds seeds screened T3) in the secondarythe primary screening
screening
Ion beam
EMS
T-DNA
6700
8300
3900
25000
34000
16000
52
14
11
1/6*
0/4*
0/11*
Total 15300 59000 76 1/20*
* (number of lines iu which all the sccdhnu.s showed mutant phenotype in the M3 population)/(number of lines in
which several seedlings showed mutant pnenoiype in the M3 population)
0PCIB(LIM)
WT
#183
Eo
5
o©E"mE
2.5 -
2 t"i
%)
(77%)
0.5 t"
WT #183
Figurei Phrmuypr m tne PCIB resisiani mutant, #183. Seeds were sowed on GM containing 0 idvl (open bars)
or 20 uM PCIB (solid bars) and grown under the continuous light for 7 days at 23 'C.
References1) Bartel B. (1991) Annu. Rev. Plant Physiol.
Plant Mol.Biol 48: 51-66.2)DoIan L. (1998) Genes Develop, 12:
2091-2095.3)Leyser O. (1998) Current Biol. 8: R305-
R307.4) Shikazono N, Tanaka A, Watanabe H,
Tano S. (2000) JAERI-Review 2000=024:38-40,
5)McRae DH, Bonner J. (1953) Physiol.Plant. 6:485-510.
6)Oono Y, Chen QG, Overvoorde PJ,Kohler C5 Theologis A. (1998) Plant Cell10: 1649-1662.
- 69 -
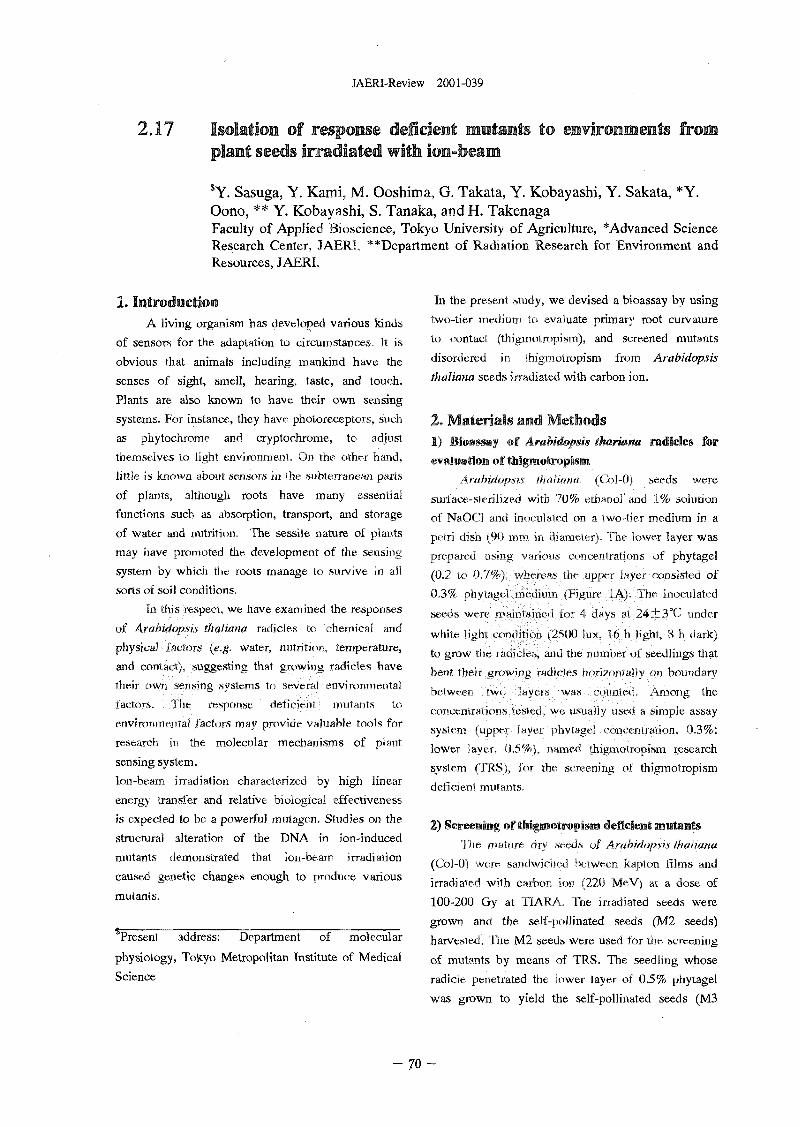
JAERI-Review 2001 -039
2.17 Isolation of response deficient mutants to environments fromplant seeds irradiated with ion-beam
SY. Sasuga, Y. Kami, M. Ooshima, G. Takata, Y. Kobayashi, Y. Sakata, *Y.Oono, ** Y. Kobayashi, S. Tanaka, and H. TakenagaFaculty of Applied Bioscience, Tokyo University of Agriculture, *Advanced ScienceResearch Center, JAER1, **Department of Radiation Research for Environment andResources, JAERI.
1. IntroductionA living organism has developed various kinds
of sensors for the adaptation to circumstances. It is
obvious that animals including mankind have the
senses of sight, smell, hearing, taste, and touch.
Plants are also known to have their own sensing
systems. For instance, they have photoreceptors, such
as phytochrome and cryptochrome, to adjust
themselves to light environment. On the other hand,
little is known about sensors in the- subterranean parts
of plants, although roots have many essential
functions such as absorption, transport, and storage
of water and nutrition. The sessile nature of plants
may have promoted the development of the sensing
system by which the roots manage to survive in all
sorts of soil conditions.
In ihi> it—pert, we have examined the responses
of Amni(iintsi\ thaliana radicles to chemical and
physic? ijM-mr; Ke.g. water, ruitntmi temperature,
and conirfi-i, suggesting that gmwum radicles have
their ow f-nsme systems tr -.rvr-rn environmental
factors "t it-sponse detn-it-in mutants to
enviroTuiK-mai factors may prnvio> valuable tools for
research in the molecular mechanisms of plant
sensing system.
Ion-beam irradiation characterized by high linear
energy transfer and relative biological effectiveness
is expected to be a powerful mutagen. Studies on the
structural alteration of the DNA in ion-induced
mutants demonstrated that ion-beam irradiation
caused genetic changes enough to produce various
mutants.
Present address: Department of molecular
physiology, Tokyo Metropolitan Institute of Medical
Science
In the present study, we devised a bioassay by using
two-tier medium to evaluate primary root curvature
to contact (tbigmotropism), and screened mutants
disordered in thigmotropism from Arabidopsis
thaliana seeds irradiated with carbon ion.
2, Materials and Methods1) Bloassay of Arabidopsis thariamm radicles for
evaluation of tMgmotropism
Arabidopsis thaliana (Col-0) seeds were
surface-sterilized with 70% ethanol and 1% solution
of NaOCI and inoculated on a two-tier medium in a
petri dish (90 mm in diameter). The lower layer was
preparei wnt ^irnni- •inuvitraiirm^ jt phytagel
(0.2 to •M"/t, »nit-tr;i<. nit- iiuiin Hvt- -mibisted of
0 . 3 % pnviiiyt-i mt-ilumi • hiunrr A nr 'iioculated
seeds writ- mHniiHinni n>r ^ IMV* -n ^4 r }v(y under
white liiiHi i-nniiir 'im • 2r><)•) mx h n iiuhi •< h dark)
to grow me jHuu.ir-,, anu tnc liiirnnf-i 01 seedlings that
bent the i ' ^mwin t i rwhpips riiMi/iininjiv <>n boundary
betweer w. n u n - M - -nnim-i ->"i(ing the
concentiHiii)n> irsn-i w»- USUHIP1 MM-U •„ ^impie assay
system 'Up"<- avri )nviHyr -nm-i-iiiiMMnn 0 . 3 % ;
lower l a v n I S % ( turner 'hmiMMininiMii i.esearch
system (TRS), for the screening of thigmotropism
deficient mutants.
2) Screening of thigmotroplsm deficient mutants
The mature dry seeds of Arabidopsis thaliana
(Col-0) were sandwiched between kapton films and
irradiated with carbon ion (220 MeV) at a dose of
100-200 Gy at TIARA. The irradiated seeds were
grown and the self-pollinated seeds (M2 seeds)
harvested. The M2 seeds were used for the screening
of mutants by means of TRS. The seedling whose
radicle penetrated the lower layer of 0.5% phytagel
was grown to yield the self-pollinated seeds (M3
- 7 0 -
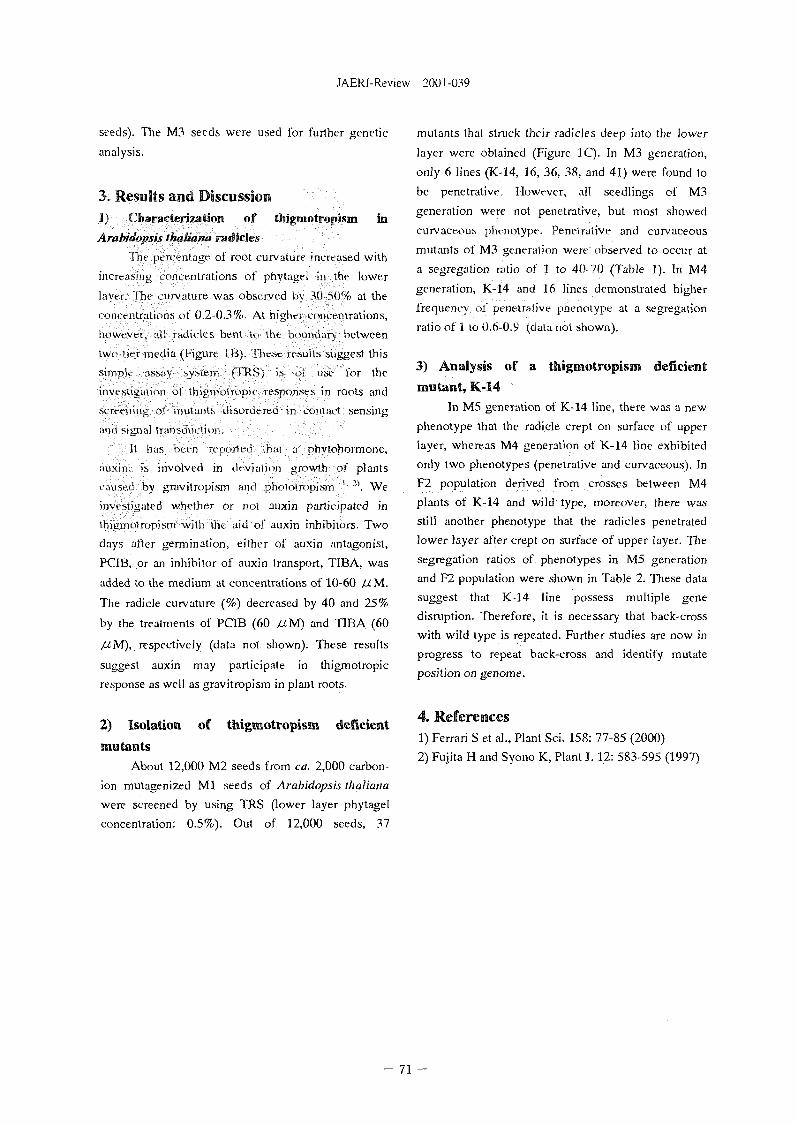
JAERI-Review 2001 -039
seeds). The M3 seeds were used for further genetic-
analysis.
3. Results and Discussion1) Characterization of tfaigmotroplsm in
Ambidopsis thaliana radiclesThe pcrcenl;ige of root curvature increased with
increasing concentrations of phytagel in the lower
layer. JTit- curvature was observed by 30-50% at the
concentrations of 0.2-0.3%. At higher concentrations,
however, all radicles bent So the boundary between
two tier media ^Figure IB). These results suggest this
simple assay system (TRS) i.s of use for the
investigation of thigmotropic responses in roots and
screening of mutants disordered in contact sensing
arn.1 signal transihuiion.
It has ix-en reported that a phytohormone,
auxin, is involved in deviation growth of plants
caused by gravitropism and phofotropism '" 2). We
investigated whether or not auxin participated in
thigrootropism with the aid of auxin inhibitors. Two
days after germination, either of auxin antagonist,
PCIB, or an inhibitor of auxin transport, TIBA, was
added to the medium at concentrations of 10-60 JUM.
The radicle curvature (%) decreased by 40 and 25%
by the treatments of PCIB (60 UM) and TIBA (60
UM), respectively (data not shown). These results
suggest auxin may participate in thigmotropic
response as well as gravitropism in plant roots.
2) Isolation of thigmotropism deficient
ma CantsAbout 12,000 M2 seeds from ca. 2,000 carbon-
ion mutagenized Ml seeds of Arabulopsis thaliana
were screened by using TRS (lower layer phytagel
concentration: 0.5%). Out of 12,000 seeds, 37
mutants that struck their radicles deep into the lower
layer were obtained (Figure 1C). In M3 generation,
only 6 lines (K-14, 16, 36, 38, and 41) were found to
be penetrative. However, all seedlings of M3
generation were not penetrative, but most showed
curvaceous phenotype. Penetrative and curvaceous
mutants of M3 generation were observed to occur at
a segregation ratio of 1 to 40-70 (Table 1). In M4
generation, K-14 and 16 lines demonstrated higher
frequency of penetrative phenotype at a segregation
ratio of 1 to 0.6-0.9 (data not shown).
3) Analysis of a thigmotropism deficient
mutant, K-14In M5 generation of K-14 line, there was a new
phenotype that the radicle, crept on surface of upper
layer, whereas M4 generation of K-14 line exhibited
only two phenotypes (penetrative and curvaceous). In
F2 population derived from crosses between M4
plants of K-14 and wild type, moreover, there was
still another phenotype that the radicles penetrated
lower layer after crept on surface of upper layer. The
segregation ratios of phenotypes in M5 generation
and F2 population were shown in Table 2. These data
suggest that K-14 line possess multiple gene
disruption. Therefore, it is necessary that back-cross
with wild type is repeated. Further studies are now in
progress to repeat back-cross and identify mutate
position on genome.
4. References1) Ferrari S et a]., Plant So". 158: 77-85 (2000)
2) Fujita H and Syono K, Plant J. 12: 583-595 (1997)
- 71 -
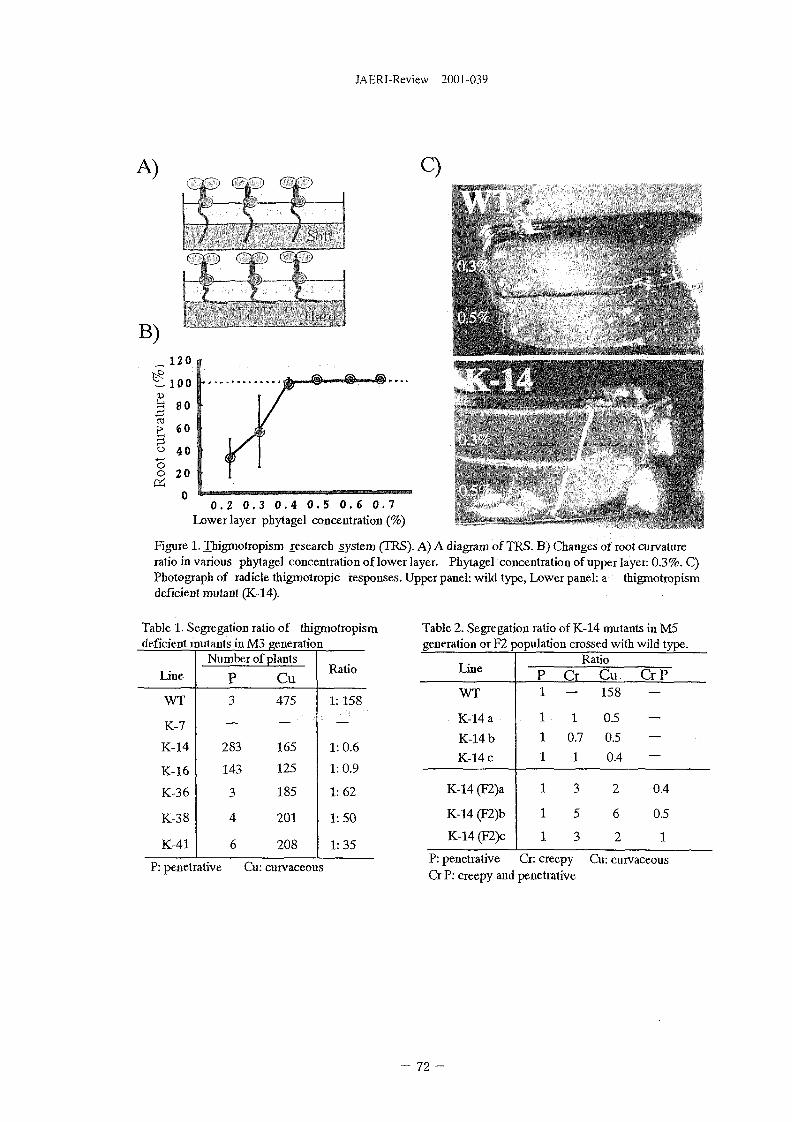
JAERI-Review 2001-039
i
C)
CLJ Q.1
_!
B)„ 120
B 80
GJ
B<-> 40
o 20
0.2 0 .3 0 .4 0 .5 0 . 6 0 .7Lower layer phytagel concentration (%)
Figure 1. Thigmotropism research system (TRS). A) A diagram of TRS. B) Changes of root curvatureratio in various phytagel concentration of lower layer. Phytagel concentration of upper layer: 0.3%. C)Photograph of radicle thigmotropic responses. Upper panel: wild type, Lower panel: a thigmotropismdeficient mutant (K-14).
Table 1. Segregation ratio of thigmotropismdeficient mutants in M3 generation
Line
WT
K-7
K-14
K-16
K-36
K-38
K-41
Number of plants
P3
—
283
143
3
4
6
Cu475
—
165
125
185
201
208
Ratio
1:158
—
1:0.6
1:0.9
1:62
1:50
1:35
P: penetrative Cu: curvaceous
Table 2. Segregation ratio of K-14 mutants in M5generation or F2 population crossed with wild type.
Line
WT
K-14 a
K-14b
K-14c
K-14 (F2)a
K-14 (F2)b
K-14 (F2)c
P1
1
1
1
1
1
1
RatioCr—
1
0.7
1
3
5
3
Cu158
0.5
0.5
0.4
2
6
2
CrP—
—
0.4
0.5
1
P: penetrative Cr: creepy Cu: curvaceousCr P: creepy and penetrative
- 72 -
JAERI-Review 2001-039
2.18 System of Cel Irradiation with a Precise Number of Heavy IonsY. Kobayashi1}, T. Funayama1), M. Taguchi1}, S. WadaU), M. TanakaU),
T. Kamiya4), W. Yokota4), H. Watanabe1} and K. YamamotoU)
^Department of Radiation Research for Environment and Resources, JAERI,2)Department of Veterinary Medicine. Kitasato University, 3)Department of
Biomolecular Sciences, Graduate School of Life Sciences. Tohoku University,4)Advanced Radiation Technology Center, JAERI
1. Introduction
A microbeam is a source of focused or
collimated radiation localized to micron-sized
area of the specimen. The use of heavy ion
microbeams provides a unique way to control
precisely, the number of ions traversing
individual cells and the localization of dose
within the irradiated cell. In recent years there
has been, an increasing interest in the use of
microbeams to study a number of important
radiobiological processes in ways that cannot
be achieved using conventional "broad-field"
irradiation1 "3).
Heavy ions transfer their energy to
biological organisms through high-density
ionization and excitation of molecules and
atoms along the particle trajectories.
Populations of cells exposed to very low doses
of high-LET heavy ions contains a few cells
which have been hit by a particle, while the
majority of the cells receive no radiation
damage. At somewhat higher doses, a few cells
receive two or more events according to the
Poisson distribution of ion injections. Using
microbeams, we will be able to overcome this
limitation by delivering an exactly counted
number of ions to each cell.
A microbeam can be used for selective
irradiation of individual cells, which can be
subsequently observed to ascertain what
changes have occurred to that cell and to
neighboring un-irradiated cells. The use of
microbeam allows direct investigation of cell-
to-cell communications such as "bystander
effects", that is, radiation effects of heavy ions
transmitted from irradiated cells to neighboring
un-irradiated cells.
Furthermore, a microbeam with sufficient
resolution will be useful for analyzing cellular
spatial sensitivity, the interaction of damages
produced by separate events, the dynamics of
cellular repair, and the intra-cellular process
such as apoptosis; by means of highly
localized irradiation of a part, of a nucleus or
cytoplasm.
Therefore, we have developed a cell
irradiation system for targeting cells
individually with a precise number of high-
LET heavy ions to elucidate radiobiological
effects of exactly one particle and to
investigate the interaction of damages
produced by separate events.
2. Experimental setup
The cell irradiation system was
incorporated into the high-energy heavy ion
microbeam apparatus45 which has been
installed under a vertical beam line of the AVF
cyclotron at the TIARA of JAERI-Takasaki.
Figure 1 shows a schematic diagram of the
connections between the off-line microscope
control system for cell-finding, the on-line
microscope control system for cell-targeting,
and the beam shutter control system for
- 73 -
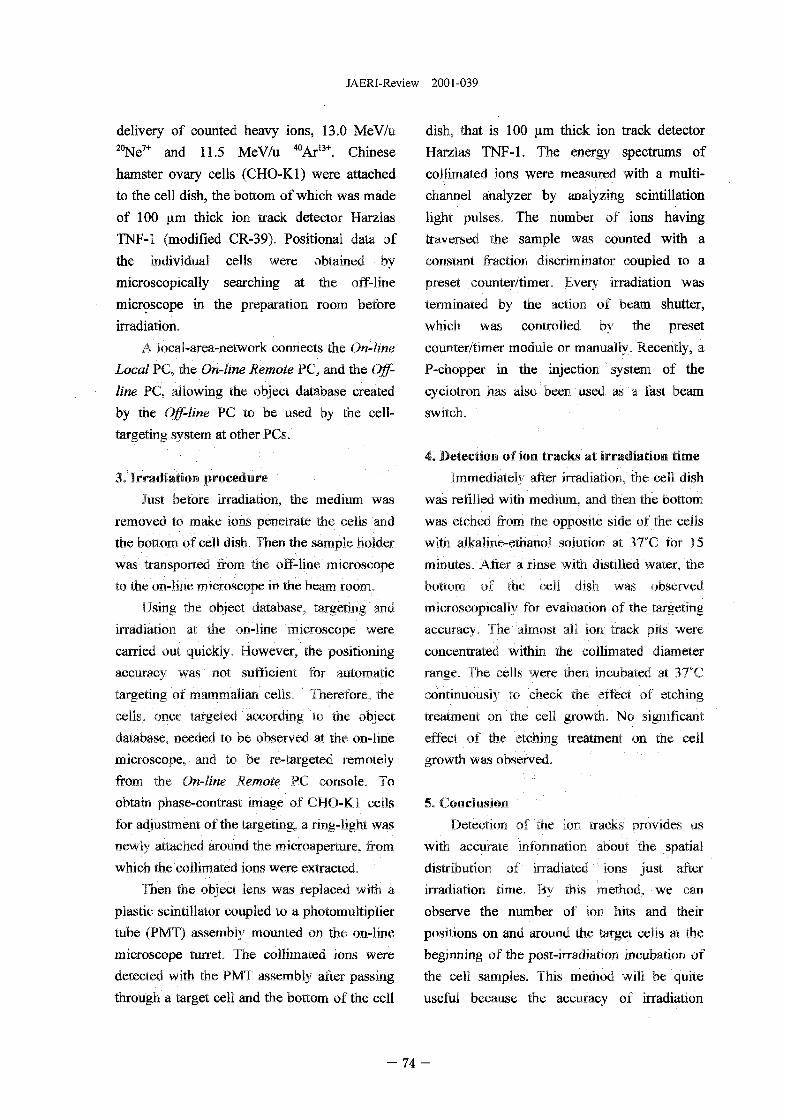
JAERI-Review 2001-039
delivery of counted heavy ions, 13.0 MeV/u20Ne7+ and 11.5 MeV/u 40ArI3+. Chinese
hamster ovary cells (CHO-K1) were attached
to the cell dish, the bottom of which was made
of 100 urn thick ion track detector Harzlas
TNF-1 (modified CR-39). Positional data of
the individual cells were obtained by
microscopically searching at the off-line
microscope in the preparation room before
irradiation.
A local-area-network connects the On-line
Local PC, the On-line Remote PC, and the Off-
line PC. allowing the object database created
by the Off-line PC to be used by the cell-
targeting system at other PCs.
3. Irradiation procedure
Just before irradiation, the medium was
removed to make ions penetrate the cells and
the bottom of cell dish. Then the sample holder
was transported from the off-line microscope
to the on-line microscope in the beam room.
Using the object database, targeting and
irradiation at the on-line microscope were
carried out quickly. However, the positioning
accuracy was not sufficient for automatic
targeting of mammalian cells. Therefore, the
cells, once targeted according to the object
database, needed to be observed at the on-line
microscope, and to be re-targeted remotely
from the On-line Remote PC console. To
obtain phase-contrast image of CHO-K1 cells
for adjustment of the targeting, a ring-light was
newly attached around the microaperture, from
which the collimated ions were extracted.
Then the object lens was replaced with a
plastic scintillator coupled to a photomultiplier
tube (PMT) assembly mounted on the on-line
microscope turret. The collimated ions were
detected with the PMT assembly after passing
through a target cell and the bottom of the cell
dish, that is 100 um thick ion track detector
Harzlas TNF-1. The energy spectrums of
collimated ions were measured with a multi-
channel analyzer by analyzing scintillation
light pulses. The number of ions having
traversed the sample was counted with a
constant fraction discriminator coupled to a
preset counter/timer. Every irradiation was
terminated by the action of beam shutter,
which was controlled by the preset
counter/timer module or manually. Recently, a
P-chopper in the injection system of the
cyclotron has also been used as a fast beam
switch.
4. Detection of ion tracks at irradiation time
Immediately after irradiation, the cell dish
was refilled with medium, and then the bottom
was etched from the opposite side of the cells
with, alkaline-ethanol solution at 37°C for 15
minutes. After a rinse with distilled water, the
bottom of the cell dish was observed
microscopically for evaluation of the targeting
accuracy. The almost all ion track pits were
concentrated within the collimated diameter
range. The cells were then incubated at 37°C
continuously to check the effect of etching
treatment on. the cell growth. No significant
effect of the etching treatment on the cell
growth was observed,
5. Conclusion
Detection of the ion tracks provides us
with, accurate information about the spatial
distribution of irradiated ions just after
irradiation time. By this method, we can
observe the number of ion hits and their
positions on and around the target cells at the
beginning of the post-irradiation incubation of
the cell samples. This method will be quite
useful because the accuracy of irradiation
- 7 4 -
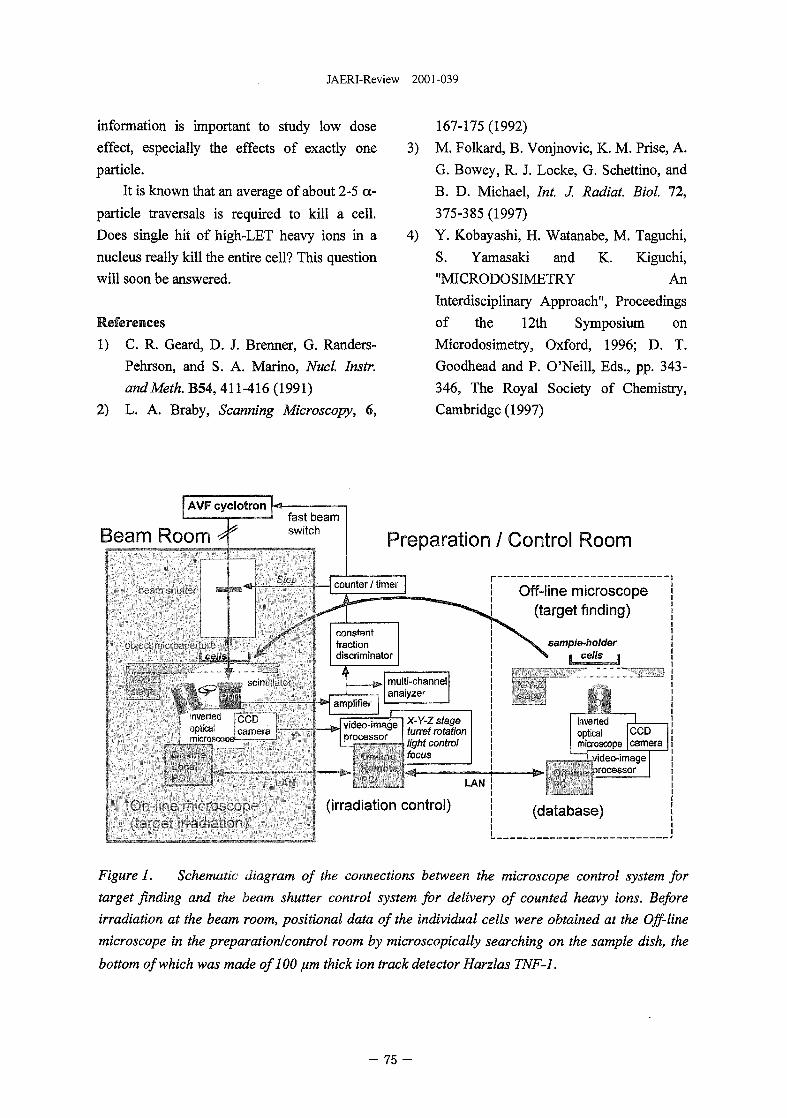
JAERI-Review 2001-039
information is important to study low dose
effect, especially the effects of exactly one
particle.
It is known that an average of about 2-5 o>
particle traversals is required to kill a cell.
Does single hit of high-LET heavy ions in a
nucleus really kill the entire cell? This question
will soon be answered.
References
1) C. R. Geard, D. J. Brenner, G. Randers-
Pehrson, and S. A. Marino, Nucl. Instr.
andMeth. B54, 411-416 (1991)
2) L. A. Braby, Scanning Microscopy, 6,
167-175 (1992)
3) M. Folkard, B. Vonjnovic, K. M. Prise, A.
G. Bowey, R. J. Locke, G. Schettino, and
B. D. Michael, Int. J. Radial Biol 72,
375-385 (1997)
4) Y. Kobayashi, H. Watanabe, M. Taguchi,
S. Yamasaki and K. Kiguchi,
"MICRODOSIMETRY An
Interdisciplinary Approach", Proceedings
of the 12th Symposium on
Microdosimetry, Oxford, 1996; D. T.
Goodhead and P. O'Neill, Eds., pp. 343-
346, The Royal Society of Chemistry,
Cambridge (1997)
AVF cyclotron •*j — fast beam
Beam Room * r switch
jptica earners,nirrnsroow
Preparation / Control Room
counter / timer Off-line microscope(target finding)
constantfractiondiscriminator
(irradiation control)
Figure 1. Schematic diagram of the connections between the microscope control system for
target finding and the beam shutter control system for delivery of counted heavy ions. Before
irradiation at the beam room, positional data of the individual cells were obtained at the Off-line
microscope in the preparation/control room by microscopically searching on the sample dish, the
bottom of which was made of 100 ftm thick ion track detector Harzlas TNF-1.
- 75 -
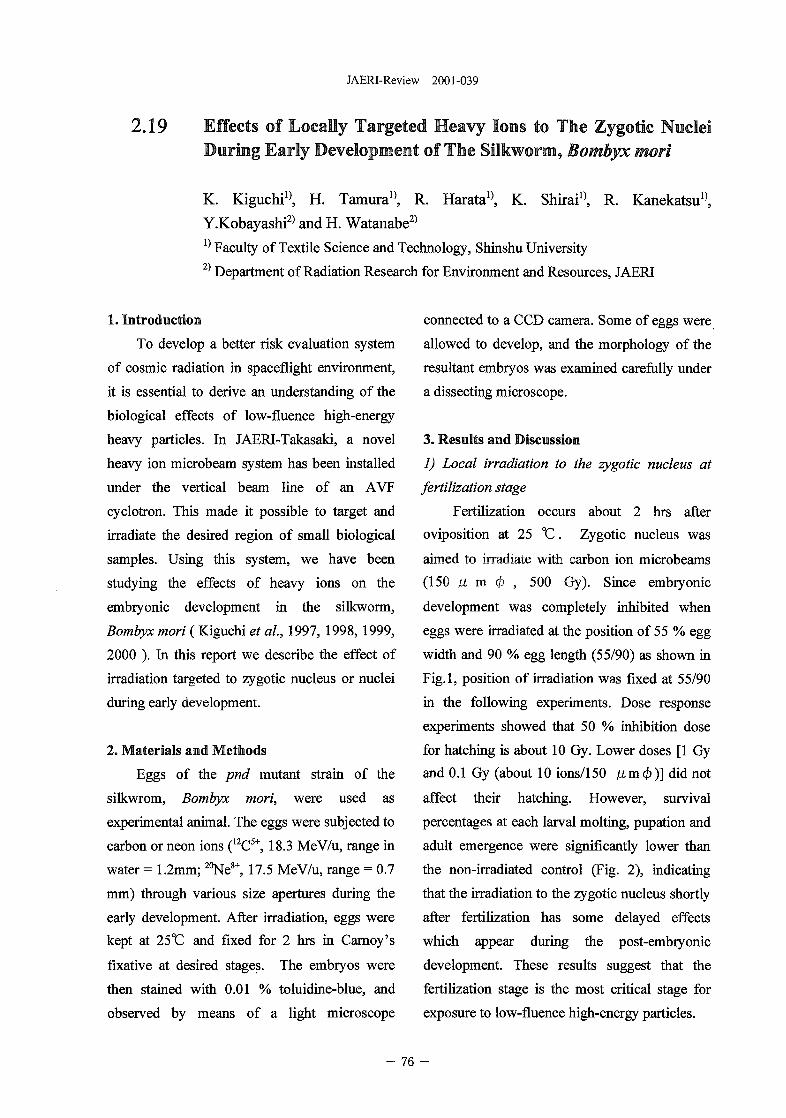
JAERI-Review 2001-039
2.19 Effects of Locally Targeted Heavy Ions to The Zygotic NucleiDuring Early Development of The Silkworm, Bombyx mori
K. Kiguchi1), H. Tamura1}, R. Harata!), K. Shirai", R. Kanekatsu",
Y.Kobayashi2) and H. Watanabe2)
1) Faculty of Textile Science and Technology, Shinshu University2) Depar tment of Radiat ion Research for Envi ronment and Resources, JAERI
1. Introduction
To develop a better risk evaluation system
of cosmic radiation in spaceflight environment,
it is essential to derive an understanding of the
biological effects of low-fluence high-energy
heavy particles. In JAERI-Takasaki, a novel
heavy ion microbeam system has been installed
under the vertical beam line of an A W
cyclotron. This made it possible to target and
irradiate the desired region of small biological
samples. Using this system, we have been
studying the effects of heavy ions on the
embryonic development in the silkworm,
Bombyx mori (Kiguchi et ah, 1997, 1998, 1999,
2000 ). In this report we describe the effect of
irradiation targeted to zygotic nucleus or nuclei
during early development.
2. Materials and Methods
Eggs of the pnd mutant strain of the
silkwrom, Bombyx mori, were used as
experimental animal. The eggs were subjected to
carbon or neon ions (12C5+, 18.3 MeV/u, range in
water = 1.2mm; 20Ne8+, 17.5 MeV/u, range = 0.7
mm) through various size apertures during the
early development. After irradiation, eggs were
kept at 25CC and fixed for 2 hrs in Carnoy's
fixative at desired stages. The embryos were
then stained with 0.01 % toluidine-blue, and
observed by means of a light microscope
connected to a CCD camera. Some of eggs were
allowed to develop, and the morphology of the
resultant embryos was examined carefully under
a dissecting microscope.
3. Results and Discussion
1) Local irradiation to the zygotic nucleus at
fertilization stage
Fertilization occurs about 2 hrs after
oviposition at 25 °C. Zygotic nucleus was
aimed to irradiate with carbon ion microbeams
(150 ii m (j) , 500 Gy). Since embryonic
development was completely inhibited when
eggs were irradiated at the position of 55 % egg
width and 90 % egg length (55/90) as shown in
Fig. 1, position of irradiation was fixed at 55/90
in the following experiments. Dose response
experiments showed that 50 % inhibition dose
for hatching is about 10 Gy. Lower doses [1 Gy
and 0.1 Gy (about 10 ions/150 /xmcf))] did not
affect their hatching. However, survival
percentages at each larval molting, pupation and
adult emergence were significantly lower than
the non-irradiated control (Fig. 2), indicating
that the irradiation to the zygotic nucleus shortly
after fertilization has some delayed effects
which appear during the post-embryonic
development. These results suggest that the
fertilization stage is the most critical stage for
exposure to low-fluence high-energy particles.
- 76 -
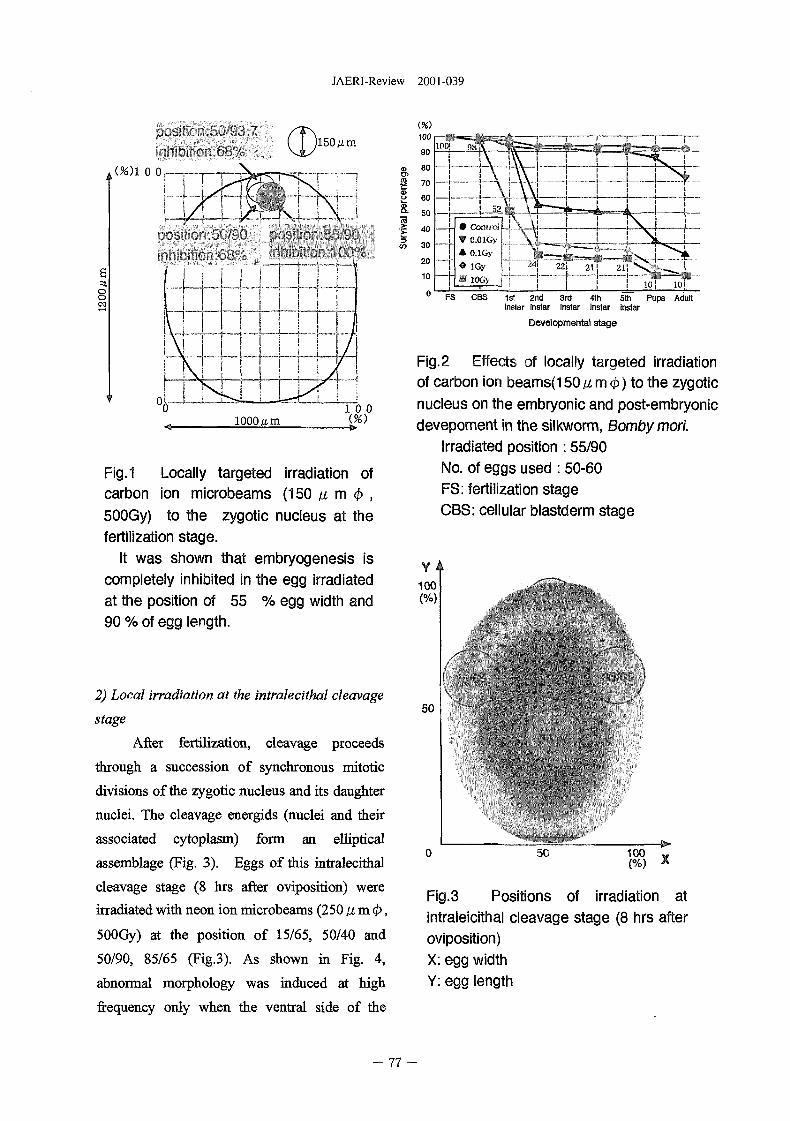
JAERI-Review 2001-039
position :5G/93.7inhibition :68%
)150jtim
-. • - ]
position: 50/90 po^v;
Fig.1 Locally targeted irradiation ofcarbon ion microbeams (150 At m 0 ,500Gy) to the zygotic nucleus at thefertilization stage.
It was shown that embryogenesis iscompletely inhibited in the egg irradiatedat the position of 55 % egg width and90 % of egg length.
2) Local irradiation at the intralecithal cleavage
stage
After fertilization, cleavage proceeds
through a succession of synchronous mitotic
divisions of the zygotic nucleus and its daughter
nuclei. The cleavage energids (nuclei and their
associated cytoplasm) form an elliptical
assemblage (Fig. 3). Eggs of this intralecithal
cleavage stage (8 hrs after oviposition) were
irradiated with neon ion microbeams (250 p. m <t>,
500Gy) at the position of 15/65, 50/40 and
50/90, 85/65 (Fig.3). As shown in Fig. 4,
abnormal morphology was induced at high
frequency only when the ventral side of the
CBS 1st 2nd 3rd 4th 5th Pupa Adultinslar Instar Instar Instar instar
Developmental stage
Fig.2 Effects of locally targeted irradiationof carbon ion beams(150 u m <t>) to the zygoticnucleus on the embryonic and post-embryonicdevepoment in the silkworm, Bombymori.
Irradiated position : 55/90
No. of eggs used : 50-60FS: fertilization stageCBS: cellular blastderm stage
y 4100
50
50 100
Fig.3 Positions of irradiation atintraleicithal cleavage stage (8 hrs afteroviposition)X: egg widthY: egg length
- 77 -
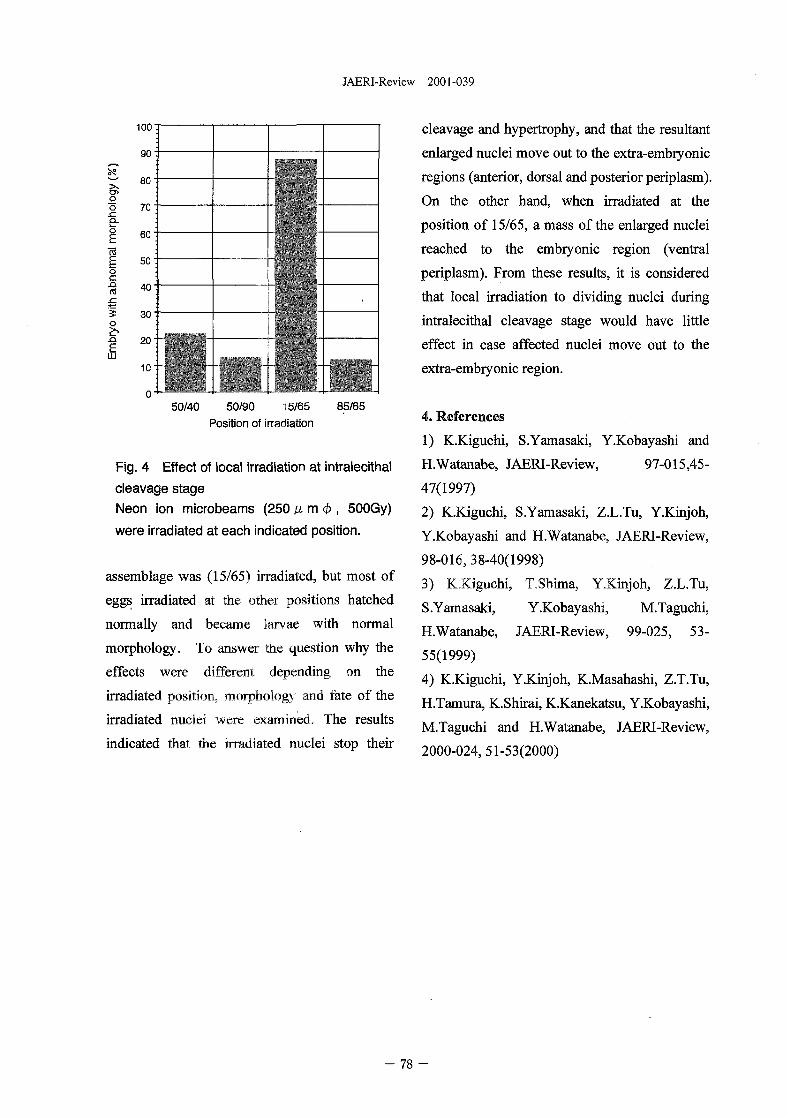
JAERI-Review 2001-039
oQ.
Oc.a
s
100
90
80
70
60
50
40
30
20
10
0 : :
-
50/40 50/90 15/65Position of irradiation
85/65
Fig. 4 Effect of local irradiation at intralecithal
cleavage stage
Neon ion microbeams (250 / i m i f ) , 500Gy)
were irradiated at each indicated position.
assemblage was (15/65) irradiated, but most of
eggs irradiated at the other positions hatched
normally and became larvae with normal
morphology. To answer the question why the
effects were different depending on the
irradiated position, morphology and fate of the
irradiated nuclei were examined. The results
indicated that the irradiated nuclei stop their
cleavage and hypertrophy, and that the resultant
enlarged nuclei move out to the extra-embryonic
regions (anterior, dorsal and posterior periplasm).
On the other hand, when irradiated at the
position of 15/65, a mass of the enlarged nuclei
reached to the embryonic region (ventral
periplasm). From these results, it is considered
that local irradiation to dividing nuclei during
intralecithal cleavage stage would have little
effect in case affected nuclei move out to the
extra-embryonic region.
4. References
1) K.Kiguchi, S.Yamasaki, Y.Kobayashi and
H.Watanabe, JAERI-Review, 97-015,45-
47(1997)
2) K.Kiguchi, S.Yamasaki, Z.L.Tu, Y.Kinjoh,
Y.Kobayashi and H.Watanabe, JAERI-Review,
98-016, 38-40(1998)
3) K.Kiguchi, T.Shima, Y.Kinjoh, Z.L.Tu,
S.Yamasaki, Y.Kobayashl, M.Taguchi,
H.Watanabe, JAERI-Review, 99-025, 53-
55(1999)
4) K.Kiguchi, Y.Kinjoh, KMasahashi, Z.T.Tu,
H.Tamura, K.Shirai, K.Kanekatsu, Y.Kobayashi,
M.Taguchi and H.Watanabe, JAERI-Review,
2000-024,51-53(2000)
- 78 -
JAERI-Review 2001-039
2.20 Ion beam mutagenesis in a model legume Lotus japonicus
Kumiko Tateno, Masayoshi Kawaguchi*, Yuichiro Watanabe*,
Naoya Shikazono**, Atsushi Tanaka**, Tatsuya Haga, Kinichiro Miura
Institute for Biomolecular Science, Gakushuin University. *Departtnent of Life
Sciences, Graduate School of Arts and Sciences, University of Tokyo. **Department
of Radiation Research for Environment and Resources, JAERI.
1. Introduction
Leguminosae is one of the largest families in
angiosperms. The family exhibits a remarkable
biodiversity which includes many of the
agronoically significant crop species.
Furthermore most of leguminous plants have an
ability of symbiotic nitrogen fixation in response
to rhizobia. In order to understand the
biodiversity and the biological interactions at a
molecular level. Lotus japonicus has been
selected as a model system [1]. In a couple of
years the infrastructure such as a large-scale
EST analysis [2], genome analysis [3] and
construction of high-linkage map has started in
L. japonicus. Paralell to the infrastructure.
generation of a large-scale mutant seed pool
would significantly facilitate molecular genetic
analysis in legumes. Prior to a large-scale
mutagenesis, it would be of imporance to
evaluate which kinds of mutagenesis work on L.
japonicus systemically. In this report we
compared the frequency in emergence of
symbiotic mutants isolated by ion beam
mutagenesis with that by EMS mutagenesis
which we have conducted (4, 5, Kawaguchi et al.
in submssion].
2. Materials and Methods2.1. Plant material
An early flowering accession of L. japonicus
'Miyaojima' MG-20 [6] was used for ion beam
mutagenesis. Ml seeds were sown on Power
Soil (Kanto Hiryo Kogyo, Japan) in a biotron
LH-300 (Nippon Medical & Chemical
Instruments. Japan). Plants were grown under
the 18 h/ 6 h day/night cycle, a light intensity of
150 (xEsec-'m-l at 25 °C, 70-90% humidity
condition. Fifty to 500 Ml plants were bulked to
obtain M2 seeds.
Dry seeds of 'Miyakojima1 MG-20 covered
with a Kapton film were irradiated with various
doses of C5" (50 to 300 Gy at the intervals of 50
Gy) and He2+ ions (100 to 600 Gy at intervals of
100 Gy). The energy of carbon and helium ions
was 220 MeV and 50 MeV, respectively.
Mutants with, stable phenotypes were crossed
with L. japonicus 'Miyakojima' MG-20 or a
different species L. hurttii B-303. F2 seedlings
were grown in a nitrogen-free B & D media
containing a true symbiont of L. japonicus,
Mesorhizobium loti 303099. The nodulating
phenotype was evaluated one month after
inoculation. Allelism tests were done between a
hypernodulating mutant isolated from F2
population mutagenized by irradiation of helium
ions and another hypernodulating mutant
Ljsym78 which had been isolated by EMS
mutagenesis.
- 79 -
JAERI-Review 2001-039
3. Results and Discussions
M2 seeds were bulked from 50 - 500 Ml
plants. No M2 seeds were obtained from Ml
plants mutagenized with 500 Gy and 600 Gy
helium ions. Unfortunately due to a careless
mistake, we failed to draw a survival curve
using seeds irradiated by a various doses of ion
beam. Therefore we evaluated the emergence of
symbiotic mutants in M2 population. Nodulation
phenotype was evaluated from 4,884 M2
seedlings (200 Gy of carbon ions), 3,505
seedlings (250 Gy) and 3,352 seedlings (300
Gy). and some of mutant candidates were
isolated. However no stable mutants were
obtained at M3 generation. In contrast the
emergence frequency of symbiotic mutants is
approximately one-to-thousand ratio with
respect with EMS mutagenesis (kawaguchi et al
in submission). The genome mutation derived
from this kind of carbon ion appeared to be very
weak in L. japonicus.
On the other hand, we succeeded to isolate
one hypernodulating mutant from 345 M2
seedlings irradiated by 300 Gy dose of helium
ions. The hypemodulating mutant (tentatively
named LjHe300-l) exhibited pleiotropic
phenotypes shown in Figure 1. In addition to
dramatically enhanced nodulation on the root
(Fig. 1C), an increased number of flowers were
observed at the top of peduncle (Fig. 1A).
Flowering time was much later than that of wild
type (data not shown). Noteworthy is the leaflet
of LjHe30Q-i plant (Fig. IB). In general leaf
veins develop near the bottom of leaflets.
However the veins of the mutant plant develop
near a leaflet surface, and consequently the back
of the leaflets appeared to emerge on the surface
in the LjHe300-l mutant. These pleiotropic traits
were cosegregated stably to M3 generation with
hypernodulating phenotype. Backcrosses with L.
japonicus 'Miyakojima ' MG-20 or L. burttii
allowed us to know that the mutant phenotypes
were inherited in a recessive manner. Then we
crossed LjHe300-l with a hyernodulating
mutantLjsym78 derived from EMS mutagenesis.
The hypernodulating phenotype was clearly
complemented in Fl seedling, indicating that
LjHe300-l defines a new locus.
As far as we examined, helium ion beam
mutagenesis seemed to be effective in L.
japonicus to some extent. However the effects
of ion beam irradiation and the genome structure
of the mutants including LjHe300-l remains
mysterious and unclear. For example it is rather
difficult to think that the highly pleiotropic traits
of LjHe300-l are regulated by only single gene.
Because there are few molecular data on the ion
beam mutagenesis, it would be of value to
accumulate the molecular information in L.
japonicus. A large-scale mutagenesis and
subsequent generation of a large mutant pool
should be avoided at present.
Reference
[1] K.Handberg and J. Stougaard, Plant J., 2,
487, 1992.
[2] E.Asamizu et al., DNA Res., 7,127, 2000.
[3] D. Cyranoski, Nature 4093 272, 2001.
[4J H.Imaizumi-Anraku et al., Plant Cell
Physiol.,38,871,1997.
[5] MZ. Solaiman et al., J. Plant Res. 113, 443,
2000.
[6] M. Kawaguchi, J. Plant Res., 113,497, 2000.
- 8 0 -
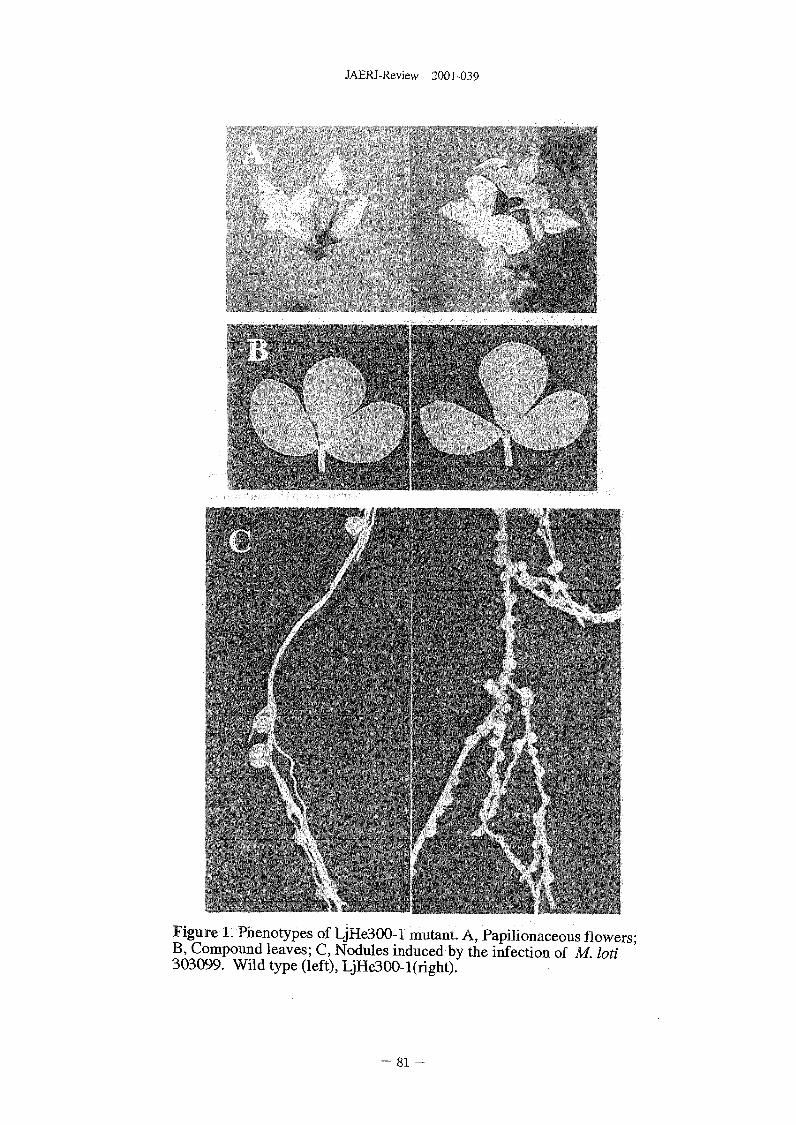
JAERI-Review 2001-039
Figure 1. Phenotypes of LjHe300-l mutant. A, Papilionaceous flowers;B, Compound leaves; C, Nodules induced by the infection of M loti303099. Wild type (left), LjHe300-l(right).
- 8 1 -
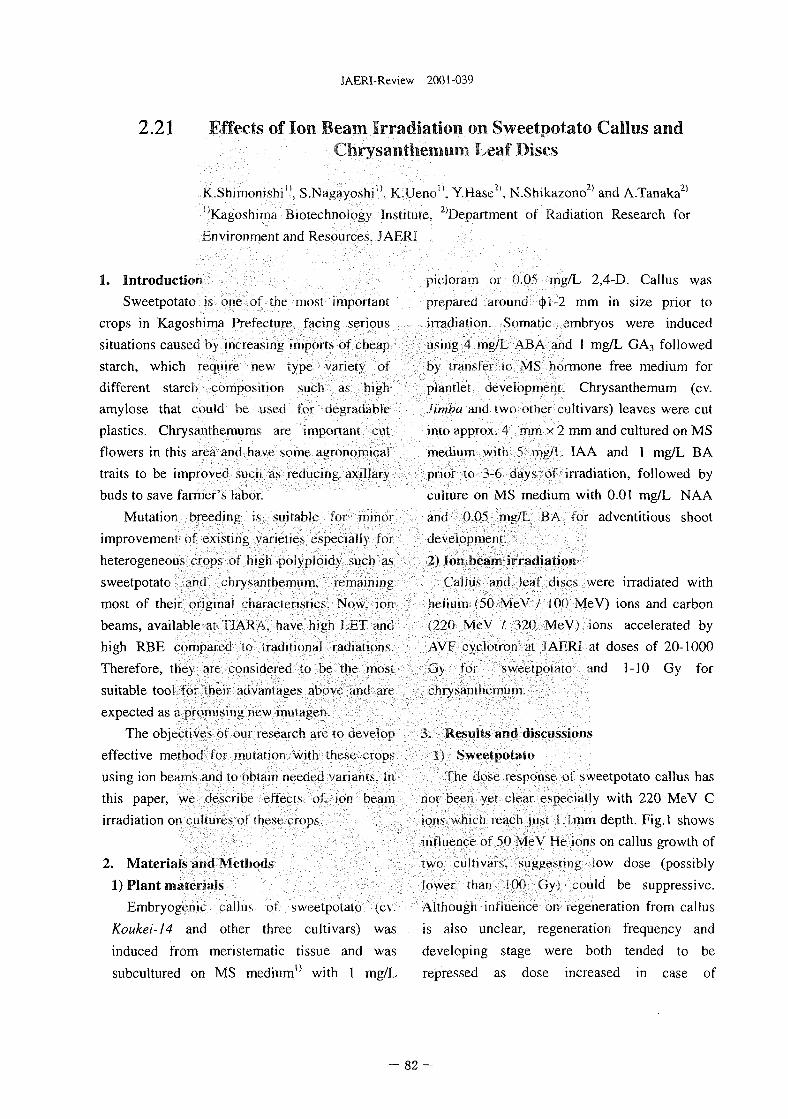
JAERI-Review 2001-039
2.21 Effects of Ion Beam Irradiation on Sweetpotato Callus andChrysanthemum Leaf Discs
K.Shimnnishi". S.Nagayoshi1 - K.Uenc '_ Y.Hase2), N.Shikazono2' and A.Tanaka2'
"Kagoshima Biotechnoiog\ Institute. ^Department of Radiation Research for
environment and Resources. JAHRI
1. Introduction
Sweetpotato is one of rhe most important
crops in Kagoshima Prefecture, facing serious
situations caused by increasing imports of cheap
starch, which require new type variety of
different starch composition such as high
amylose that could he. used for degradable
plastics. Chrysanthemums are important cut
flowers in this area and have sonic agronomical
traits to be improved such as reducing axillary
buds to save farmers labor.
Mutation breeding is suitable for minor-
improvement of existing varieties especially for
heterogeneous crops ol high noiypioidy such as
sweetpotato and chrysanthemum, remaining
most of their original characteristics. Now, ion
beams, available at TIARA, have high LKT and
high RBE compared u> traditional radiations.
Therefore, they are considered to be the most
suitable tool for their advantages above and are
expected as a promising new rmitagen.
The objectives of our research arc to develop
effective method for mutation with these crops
using ion beams ami to obtain needed variants. In
this paper, we describe effects of ion beam
irradiation on cultures of rhese crops.
2. Materials and Methods
1) Plant materials
Embryogenic callus of sweetpoiaio <cv.
Koukei-14 and other three cultivars) was
induced from meristematic tissue and was
subcultured on MS medium0 with 1 mg/L
picioram or o.<)5 mg/L 2,4-D. Callus was
prepared around (pi-2 mm in size prior to
irradiation. Somatic embryos were induced
using 4 mg/L ABA and 1 mg/L GA3 followed
by transfer to MS hormone free medium for
piantiet development. Chrysanthemum (cv.
Jimhu and two other cultivars) leaves were cut
into approx. 4 mm x 2 mm and cultured on MS
medium with 5 mg/L IAA and 1 mg/L BA
prior to 3-6 days of irradiation, followed by
culture on MS medium with 0.01 mg/L NAA
and 0.05 mg/L BA for adventitious shoot
development.
2) Son beam irradiation
Callus and leaf discs were irradiated with
helium (50 MeV / !()() MeV) ions and carbon
(220 MeV / 320 MeV; ions accelerated by
AVH cyclotron at JAHRI at doses of 20-1000
Gy for sweetpotatn and 1-10 Gy for
chrysanthemum.
3. Results and discussions
1 > Sweetpotato
The dose response of sweetpotato callus has
not been yet clear especially with 220 MeV C
ions which reach jusi !. i mm depth. Fig.l shows
influence of 50 ivjeV He ions on callus growth of
1 we, cultivars. suggesting iow dose (possibly
lower rhan iOO Gy; could be suppressive.
Although influence jr; regeneration from callus
is also unclear, regeneration frequency and
developing stage were both tended to be
repressed as dose increased in case of
82 -
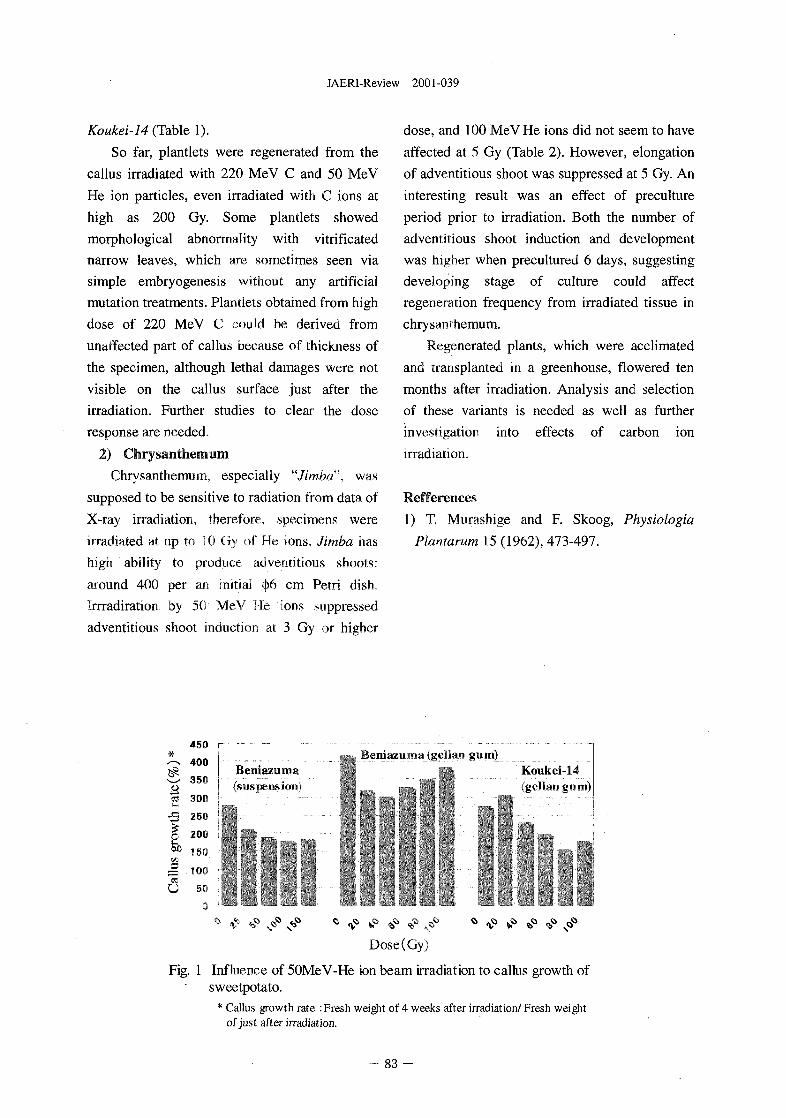
JAERI-Review 2001-039
Koukei-14 (Table 1).
So far, plantlets were regenerated from the
callus irradiated with 220 MeV C and 50 MeV
He ion particles, even irradiated with C ions at
high as 200 Gy. Some plantlets showed
morphological abnormality with vitrificated
narrow leaves, which are sometimes seen via
simple embryogenesis without any artificial
mutation treatments. Plantlets obtained from high
dose of 220 MeV C could be derived from
unaffected part of callus because of thickness of
the specimen, although lethal damages were not
visible on the callus surface just after the
irradiation. Further studies to clear the dose
response are needed.
2) Chrysanthemum
Chrysanthemum, especially "Jimba", was
supposed to be sensitive to radiation from data of
X-ray irradiation, therefore, specimens were
irradiated at up to 10 Gy of He ions. Jimba has
high ability to produce adventitious shoots:
around 400 per an initial <J)6 cm Petri dish.
Irrradiration by 50 MeV He ions suppressed
adventitious shoot induction at 3 Gy or higher
dose, and 100 MeV He ions did not seem to have
affected at 5 Gy (Table 2). However, elongation
of adventitious shoot was suppressed at 5 Gy. An
interesting result was an effect of preculture
period prior to irradiation. Both the number of
adventitious shoot induction and development
was higher when precultured 6 days, suggesting
developing stage of culture could affect
regeneration frequency from irradiated tissue in
chrysanthemum.
Regenerated plants, which were acclimated
and transplanted in a greenhouse, flowered ten
months after irradiation. Analysis and selection
of these variants is needed as well as further
investigation into effects of carbon ion
irradiation.
Refferences
1) T. Murashige and F. Skoog, Physiologia
Plantarum 15 (1962), 473-497.
450* 400
w 350
g 300
•3 250
| 200
1506b
*. ! ! • . ' I I S I I
-a(gellan gum)Knukci-1^
•= 10003
U 50
Dose(Gy)
Fig. 1 Influence of 50MeV-He ion beam irradiation to callus growth ofsweetpotato.
* Callus growth rate : Fresh weight of 4 weeks after irradiation/Fresh weightof just after irradiation.
83-
JAERI-Review 2001-039
Table 1. Regeneration from callus irradiatedby 50 MeV-He ions in sweetpotato.
Cultivar
Beni-azuma
Koukei-i/i
(Gy)
20406080100
2550100150200
Regeneration
Frequency y)
0.01.52.00.50.5
2.5L00.50.00.0
indicatorsDeveloping
stagez)
0.01.52.51.00.5
1.51.00.50.00.0
y) Classified to five levels by ratio of regenerating (pro-embryo or later) area: .0 (none) - 4 (all)
z) Classified to five levels of developing stage; 0 (stayingcalllus) - 4 (development of somatic embryos)
Table 2. Adventitious shoot (AS) formation from leaf discs irradiated by helium ion beamsin chrysanthemum cv. Jimba
(Gy)
123510
50 MeV-He ions
AS Formation
Frequency
84.331.751.815.0
• 7.1
# Shootsinduced
1.6.87.210.03.01.4
(Gy)
0125
X
Precultureperiod(day)
66663
100 MeV-He
AS
Frequency #
10010099959089
ions
Formation
Shoots #
2061461641688270
Shoots
30433919145
y) Number of visible shoot prinz) Number of shoots developed
Niinmcrs are per one Petri dish with 20 leaf discs.'\nmne.i* are per one Petri dish with 20 leaf discs.
- 84 -
JAERI-Review 2001-039
2.22 Effects of Helium Ions and Gamma Rays Irradiation ofSexual Plant Reproductive Stages on Seed Productionand Postembryonic Leaf Development i i Brassicanapus L.
H.Mmami,N,Sakurai*,N.Shikazono**JA.Tanaka**andH.Watanabe**Olisima Horticultural Research Center, Tokyo Metropolitan AgriculturalStation; *Radiation Laboratory, Tokyo Metropolitan Industrial TechnologyInstitute; **Department of Radiation Research for Environment andResources, JAERI
1.IntroductionThe effects of gamma rays on whole
plants in sexual reproductive stages havebeen intensively examined in plantmutation breeding. It is especiallyimportant in mutation breeding to increasemutation ratio. The ratio varies in lifestages in which plant was irradiated. It iswell known that reproductive organsranging from differentiation to developmentand immature embryo during
embryogenesis are more radiosensitive thanthe other organs1}.
Lardon et al2\ made the flower culturemethod for developing an isolated wholeflower (a flower with a pedicel) of Brassicanapus into a mature pod within 50 daysafter pollination. The embryogenesis insexual reproductive stages proceedssynchronously.
The purpose of this study is toinvestigate the effects of ion beams insexual reproductive stages onembryogenesis and postembryogenic plantdevelopment of B. napus through flowerculture method. In this paper, we report theeffects of helium ions and gamma rays ofthe flowers ranging from the stage justbefore pollination to in torpedo embryo on
seed production or postembryonic leafdevelopment of B. napus.
2.Materials and Methods2.1 Plant
B. napus cv. Lisandra were grown at15/10°C under natural daylight. Flowers ofthe terminal racemes were used andcultured through flower culture method.Whole flowers, which were unpollinated onthe morning of anthesis during middleflowering period, were collected to betransferred on 1.5 ml tube (eppendorf) inMurashige and Skoog's macro and microelements medium3 supplemented with 3 %sucrose pH 5.8 using a procedure modifiedfrom that of Lardon et al..
2.2 Stages and IrradiationThe fertilization and early embryo
stages were observed one day and four days,respectively; after pollination. The earlyglobular • and globular embryos wereobserved five days and six days,respectively, after pollination. The torpedoembryo was observed 10 days afterpollination.Seed production
Whole flowers were irradiated justbefore pollination at day of anthesis. one
- 8 5 -
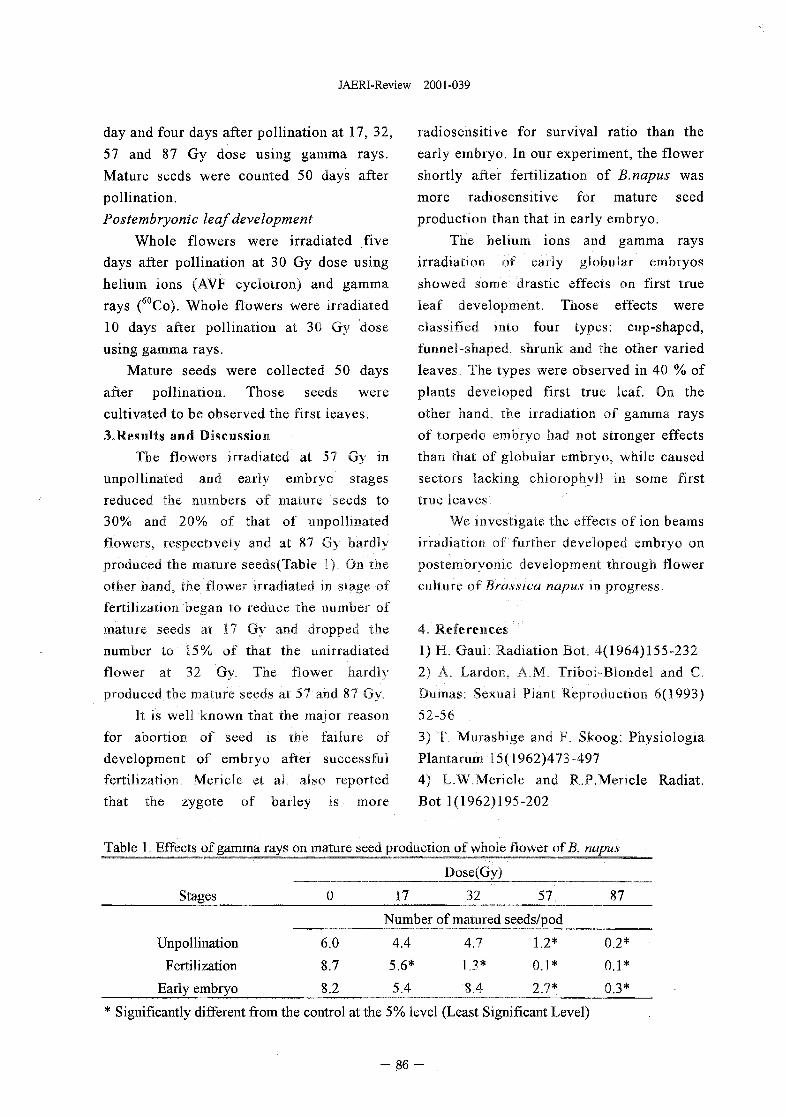
JAERI-Review 2001-039
day and four days after pollination at 17, 32,57 and 87 Gy dose using gamma rays.Mature seeds were counted 50 days afterpollination.Postembryonic leaf development
Whole flowers were irradiated fivedays after pollination at 30 Gy dose usinghelium ions (AVF cyclotron) and gammarays (60Co). Whole flowers were irradiated10 days after pollination at 30 Gy doseusing gamma rays.
Mature seeds were collected 50 daysafter pollination. Those seeds werecultivated to be observed the first leaves.3.Results and Discussion
The flowers irradiated at 57 Gy inunpollinated and early embryo stagesreduced the numbers of mature seeds to30% and 20% of that of unpollinatedflowers, respectively and at 87 Gy hardlyproduced the mature seeds(Tabie 1). On theother hand, the flower irradiated in stage offertilization began to reduce the number ofmature seeds at 17 Gy and dropped thenumber to 15% of that the unirradiatedflower at 32 Gy. The flower hardlyproduced the mature seeds at 57 and 87 Gy.
It is well known that the major reasonfor abortion of seed is the failure ofdevelopment of embryo after successfulfertilization. Mericle et al. also reportedthat the zygote of barley is more
radiosensitive for survival ratio than theearly embryo. In our experiment, the flowershortly after fertilization of B.napus wasmore radiosensitive for mature seedproduction than that in early embryo.
The helium ions and gamma raysirradiation of early globular embryosshowed some drastic effects on first trueleaf development. Those effects wereclassified into four types: cup-shaped,funnel-shaped, shrunk and the other variedleaves. The types were observed in 40 % ofplants developed first true leaf. On theother hand, the irradiation of gamma raysof torpedo embryo had not stronger effectsthan that of globular embryo, while causedsectors lacking chlorophyll in some firsttrue leaves.
We investigate the effects of ion beamsirradiation of further developed embryo onpostembryonic development through flowerculture of Brassica napus in progress.
4. References1) H. Gaul: Radiation Bot. 4(1964)155-2322) A. Lardon, A.M. Triboi-Blondel and C.Dumas: Sexual Plant Reproduction 6(1993)52-563) T. Murashige and F. Skoog: PhysiologiaPlantarum 15(1962)473-4974) L.W.Mericle and R.P.Mericle Radiat.Bot 1(1962)195-202
Table 1. Effects of gamma
Stages
rays on mature
0
seed production of wholeDose(Gy)
17 32
flower of B.
57
napus
87
Number of matured seeds/pod
Unpollination
Fertilization
Early embryo
6.0
8.7
8.2
4.45.6*
5,4
4.71.3*
8.4
1.2*0,1*
2.7*
0.2*0.1*
0.3*
Significantly different from the control at the 5% level (Least Significant Level)
- 8 6 -
JAERI-Review 2001-039
2.23 Development of the pollen transformation system andanalysis of apoptosis induction by local damage, usingpenetration controlled irradiation with ion beamsY. Hase, A. Sakamoto, S. Wada, S. Kitamura and A. TanakaDepartment of Radiation Research for Environment and Resources, JAERI
There are several gene transfertechniques in plants such asAgrobacterium-medi&ted transformationand direct gene introduction byelectroporation. However, the range ofapplicable plant species is restricted by thehost range in the Agrobacterium-transfection method, and also plant speciesthat are capable of regeneration fromprotoplast are limited in the electroporationmethod. If pollen can be used as a carrierof DNA vector, a large part of thesedisadvantages could be surmounted.However, no stable method in pollentransformation has been established before.
We have reported that thetransient GUS expression was observed ata high frequency (55.1%) when tobaccopollen was incubated in a DNA (pBI221)solution, following ion-beam irradiation ofpollen at the penetration depth of 4 ^m1<2).Although tobacco pollen has anendogenous GUS-like activity, the GUSexpression frequency increased as theconcentration of DNA solution increased15.Those results suggest that the foreign DNAcan be efficiently introduced into thepollen using penetration-controlledirradiation with ion beams. The amount ofseeds obtained by the pollination of theDNA-introduced pollen did not decreasesignificantly2). However, any apparenttransformant was not found in thescreening of more than 10,000 seeds. Wementioned three possible reasons whytransformants had not been obtained in oursystem3). One is nucleases released frompollen, the second is the bimembranestructure of the pollen and the last is DNAincorporation frequency into the generativenuclei3). In order to examine theseproblems, we subjected pollen to theAgrobacterium transfection. However, anytransformant has not been obtained yet.
Recently, it was reported that the target ofArabidopsis in planta transformationmethod is the ovule and is not the pollen4"6). In their reports, the GUS expression ratein pollen was zero or extremely low ascompared with that in ovules. Furthermore,a transformant was obtained only bygenetic crosses using Agrobacterium-treated pistils were used as a recipient ofthe untreated pollen, but was not obtainedin the reciprocal treatment. These resultssuggest that the pollen transformation cannot be achieved only by raising thetransient GUS expression frequency andthat the nature of pollen, such asbimembrane structure and DNAincorporation capability may befundamental problems in a pollentransformation system.
In another work, we aredeveloping a experimental system toanalyse the local irradiation effect on theapoptosis induction. Actually, apoptosis isinduced by the damage on DNA. However,some evidence suggests that damage in cellmembrane is also involved in the apoptosisinduction. Now we are investigating thefrequency of apoptosis induced cellsfollowing ion beam irradiation at differentpenetration depth.
References1) A. Tanaka et al., JAERI Rev. 97-
015:21-23(1997).2) Y. Hase et al., JAERI Rev, 98-016:81-
83(1998).3) Y. Hase et al., JAERI Rev. 99-025:82-
83(1999).4) Guan-Ning Ye et al., Plant Journal 19:
249-257 (1999).5) C. Desfeux et al., Plant Physiology
123: 895-904(2000),6) N. Bechtold et al., Genetics 155: 1875-
1887(2000).
- 8 7 -
JAERI-Review 2001-039
2.24 Utilization of Ion Beam-irradiated Pollen in Plant Breeding
Satoshi Kitamura1'2, Muratoshi Yamaguchi1, Masayoshi Inoue1,
Yoshihiro Hase2 and Atsushi Tanaka2
1. Faculty of Agriculture, Kyoto Prefecture! University. 2. Department of
Radiation Research for Environment and Resources, JAERI.
Introduction
Pollen is indispensable to sexual
reproduction in different plant species. We
have been analyzing biological effects of ion
beam on the pol]en(1- 2> 3l Previously, we
revealed that pollen exposed to ion beam was
available for overcoming cross-
incompatibility^. Furthermore, we found a
unique phenomenon, "leaky pollen", which
was specific for the ion beam exposure. This
ion beam-specific phenomenon seemed to be
resulted from physical lesions induced in
outer wall of pollen grain(1l In C ion exposure,
the most effective penetration depth for
inducing leaky pollen was around 4/*mw.
We are developing the gene transfer
system using the pollen exposed to ion beam.
Materials and Methods
Nicotiana tabacum L. cv. Bright Yellow 4
was used in this experiment. Dry mature
pollen was monolayered on a Kapton film or
plastic plate. The samples were set in a beam
line of 3MV tandem accelerator, where the
penetration depth of ion particles could be
controlled(4), and exposed to 18 MeV C ion
(LET, 800 keV/^m) with the penetration
depth oflAfim.
Pollen germination rate was determined on
a solid medium containing 20% sucrose, 100
/Mg/ml boric acid and 0.8% agar.
After exposure, pollen was suspended in a
liquid medium (20% sucrose and 100 /ig/ml
boric acid) and pollinated to the emasculated
flowers. Based on seed weight per capsule,
seed fertility was determined. Transient GUS
assay was performed in the pollen suspended
in the liquid medium with pBI221. Separately,
pollen was suspended in the liquid medium
with pCH (harboring hygromycin resistance
gene), and pollinated according to the
methods described above. The seeds obtained
were allowed to grow in MS medium with 6%
sucrose, 0.8%' agar and 5 ppm hygromycin.
Survival seedlings were subjected to PCR
amplification of the hygromycin resistance
gene.
Results and Discussion
Pollen germination rate was reduced with
the increase of dose, and resulted in about
60% of the control in the 1000 Gy regime.
However, up to the 1000 Gy exposure, a
significant reduction of seed fertility was not
observed.
Transient GUS expression was observed in
the pollen grain and pollen tube. GUS
expression rate in the exposed was 2-4 times
higher than that in the non-exposed. In the
1000 Gy regime, GUS expression rate was
about 30%. Considering pollen germination
rate and transient GUS expression rate, the
1000 Gy of C ion seemed to be mostly
available for the pollen mediation.
Pollen exposed to 1000 Gy of C ion was
suspended in the medium with pCH and used
- 8 8 -
JAERI-Review 2001-039
for pollination. Consequently, a number of
seeds were obtained. After screening on the
medium containing hygromycin, several
seedlings were survived. However, after PCR
amplification specific for the resistance gene,
a corresponding band was not detected in any
survival seedlings.
It is known that pollen releases nuclease
during the developmental stage®. It was
reported that the nuclease activity in pollen
was removed by replacement of the liquid
medium^ or treatment of chelating reagents
such as EDTA(7). We also found that nuclease
activity was strong in mature tobacco pollen,
resulting in the degradation of exogenous
piasmid DNA suspended in the medium. This
degradation was, to a limited extent,
weakened by washing with the medium
solution. Application of 50 mM EDTA into
the medium was mostly effective for
suppressing the nuclease activity, but,
simultaneously, pollen germination was
greatly reduced.
As mentioned above, it is conceivable that
exogenous gene can be incorporated into
pollen through the opening induced by ion
beam exposure. To establish the gene transfer
system using the pollen exposed to ion beam,
it is necessary to develop another procedure
reducing nuclease activity in pollen.
References
(1) Inoue, M., H. Watanabe, A. Tanaka and A.
Nakamura (1992) TIARA Annual Report
2: 50-52.
(2) Yamashita, T., M. Inoue, H. Watanabe, A.
Tanaka and S. Tano (1995) TIARA Annual
ReportS: 44-46.
(3) Nishimura, H., M. Inoue, A. Tanaka and
H. Watanabe (1997) Can. J. Bot. 75:
1261-1266.
(4) Tanaka, A., H. Watanabe, S. Shimizu, M.
Inoue, M. Kikuchi, Y. Kobayashi and S.
Tano (1997) Nuc. Instr. Meth. Phys. Res.
B129: 42-48.
(5) Vischi, M,, and S. Marchetti (1997) Theor.
Appl. Genet. 95: 185-190.
(6) Matousek, J., and J. Tupy (1983) Plant
Set Lett. 30: 83-89.
(7) Negrutiu, I , E. H. Bors and I. Potrykus
(1986) Biotechnology and Ecology of
pollen. Springer Verlag, pp 65-70.
- 8 9 -
JAERI-Review 2001-039
2.25 Dynamical study on influence of CO2 enrichment to thetransportation of photoassimilates using positron imaging
S. Matsuhashi, S. Watanabe, N. S. Ishioka, C. Mizuniwa, T. Ito and T. Sekine
Department of Radiation Research for Environment and Resources, JAERI
Introduction
Burning of a large amount of fossil fuel by
humans after the Industrial Revolution causes
markedly increasing of the carbon dioxide (CO2)
concentration in the air, and the present CO2
concentration is about 350 ppm'l In general, it
is known that plants increase their
photosynthesis rate for a while as a short period
response to CO2 enrichment2^ This conclusion
was deduced from yield measurement.
Detailed studies have not been done yet,
especially on dynamical aspects on the
translocation of photoassimilates from source to
sink.
The present paper reports the first positron-
imaging measurement using nC-]abeled carbon
dioxide ("CCta) on the influence of CO2
enrichment to behavior of photoassimilates in a
broad bean plant. This plant was chosen
because of its broad leaves absorbing muchUCO2.
Experiment
Seeds of broad bean (Vicia faha) were
immersed in a water flow until a radicle
(enbryonic root) broke through testa (seed
coat). The seeds were transplanted from
water to a vermiculite bed after germination.
After a shoot appeared on the soil, the plant
was transplanted to a plastic cultivation pot
filled with vermiculite. The beds and pots
were kept in an illuminated incubator. A
commercial nutrient solution (HYPONeX 8-
12-6, HYPONeX Japan Co.) was fed to the
plants every week. A broad bean with the 6th
under-growing foliage leaf on the plant was
selected for the present experiment. For
positron imaging measurement, the plant was
placed in a chamber conditioned at 350-ppm
CO2. The pair of the 4th foliage leaves were
inserted into a quvet for feeding 'CO2 which is
a clear acrylic box (with dimensions: 12 cm in
length x 8 cm in width x 1 cm in depth). The
quvet was sealed at the petiole of the 4th
foliage leaves with dental filling, and
connected to the |!CO2 gas circulating system.
The CO2 concentration in. the quvet was
controlled at 350- or 1000-ppm CO2 by
introducing fresh air or a CO2 standard gas (air
containing 1000-ppm CO2) at a flow rate of 60
ml/min. The nCO2 gas was supplied to the
quvet for 1-2 minutes3'. Immediately
measurments with the positron-emitting tracer
imaging system. (PETIS) and positron multi-
points measurement system (PMPS) were
started45. After the "CO2 gas was drained
from the quvet, fresh air was sent to the box.
Three hours later, the CO2 concentration in the
quvet was changed from 350-ppm to 1000-ppm,
and kept at the same CO2 concentration for
approximately 2 hours. The next PETIS and
PMPS measurements were done by labeling
the same leaves with nCO2 gas, followed by
supplying a 1000-ppm-CO2 standard gas until
the end of the measurements.
Results and discussion
Figure 1 shows the PETIS images of nC-
labeled photoassimilates from the 4th foliage
leaves to the stem through the petiole in a broad
bean plant. As seen from Fig.l (b), the first
90 -
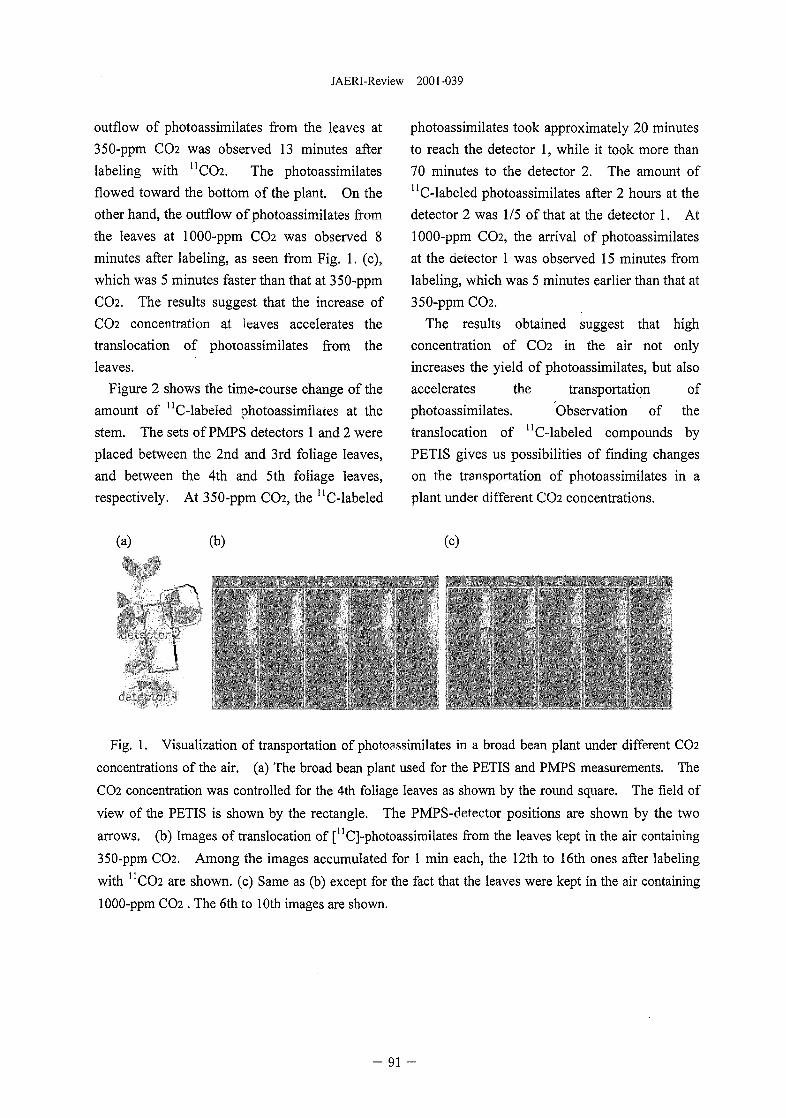
JAERI-Review 2001-039
outflow of photoassimilates from the leaves at
350-ppm CO2 was observed 13 minutes after
labeling with "CO2. The photoassimilates
flowed toward the bottom of the plant. On the
other hand, the outflow of photoassimilates from
the leaves at 1000-ppm CO2 was observed 8
minutes after labeling, as seen from Fig. 1. (c),
which was 5 minutes faster than that at 350-ppm
CO2. The results suggest that the increase of
CO2 concentration at leaves accelerates the
translocation of photoassimilates from the
leaves.
Figure 2 shows the time-course change of the
amount of "C-labeled photoassimilates at the
stem. The sets of PMPS detectors 1 and 2 were
placed between the 2nd and 3rd foliage leaves,
and between the 4th and 5th foliage leaves,
respectively. At 350-ppm CO2, the uC-labeled
(a) (b)
photoassimilates took approximately 20 minutes
to reach the detector 1, while it took more than
70 minutes to the detector 2. The amount of
"C-labeled photoassimilates after 2 hours at the
detector 2 was 1/5 of that at the detector 1. At
1000-ppm CO2, the arrival of photoassimilates
at the detector 1 was observed 15 minutes from
labeling, which was 5 minutes earlier than that at
350-ppm CO2.
The results obtained suggest that high
concentration of CO2 in the air not only
increases the yield of photoassimilates, but also
accelerates the transportation of
photoassimilates. Observation of the
translocation of " C-labeled compounds by
PETIS gives us possibilities of finding changes
on the transportation of photoassimilates in a
plant under different CO2 concentrations.
(c)
Fig. 1. Visualization of transportation of photoassimilates in a broad bean plant under different CO2
concentrations of the air. (a) The broad bean plant used for the PETIS and PMPS measurements. The
CO2 concentration was controlled for the 4th foliage leaves as shown by the round square. The field of
view of the PETIS is shown by the rectangle. The PMPS-detector positions are shown by the two
arrows, (b) Images of translocation of [nC]-photoassimilates from the leaves kept in the air containing
350-ppm CO2. Among the images accumulated for 1 min each, the 12th to 16th ones after labeling
with nCO2 are shown, (c) Same as (b) except for the fact that the leaves were kept in the air containing
1000-ppm CO2 . The 6th to 10th images are shown.
- 91
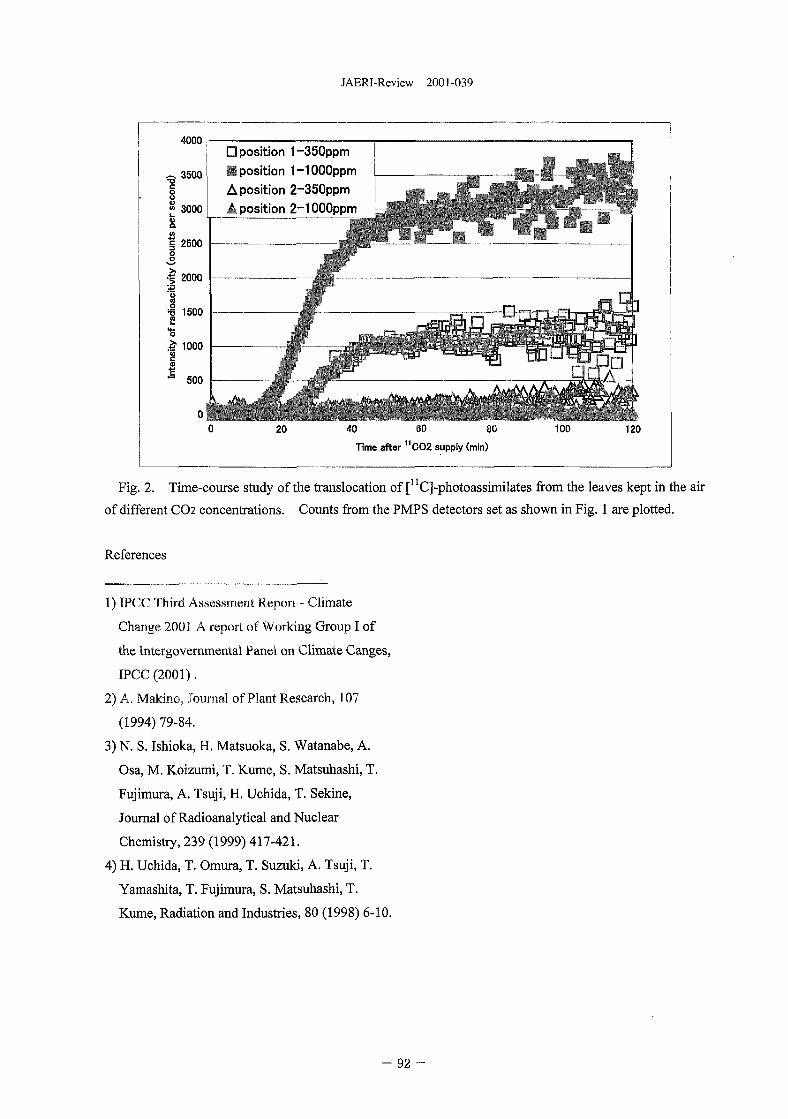
JAERI-Review 2001-039
4000
3500
3000
2500
•f 2000Bo
| 1 5 0 0
1000
500
• position 1-350ppm i• position 1-1000ppm LA position 2-350ppmA position 2-1000ppm
20 40 SO 80
Time after 1 1CO2 supply (min)
100
Fig. 2. Time-course study of the translocation of [' -photoassimilates from the leaves kept in the air
of different CO2 concentrations. Counts from the PMPS detectors set as shown in Fig. 1 are plotted.
References
1) IPCC Third Assessment Report - Climate
Change 2001 A report of Working Group I of
the Intergovernmental Panel on Climate Canges,
IPCC (2001).
2) A. Makino, Journal of Plant Research, 107
(1994) 79-84.
3) N. S. Ishioka, H. Matsuoka, S. Watanabe, A.
Osa, M. Koizumi, T. Kume, S. Matsuhashi, T.
Fujimura, A. Tsuji, H. Uchida, T. Sekine,
Journal of Radioanalytical and Nuclear
Chemistry, 239 (1999) 417-421.
4) H. Uchida, T. Omura, T. Suzuki, A. Tsuji, T.
Yamashita, T. Fujimura, S. Matsuhashi, T.
Kume, Radiation and Industries, 80 (1998) 6-10.
- 92 -
JAERI-Review 2001-039
2.26 Analysis of Nitrogen Absorption and Translocationby Soybean Grown in Different Conditions for
Phosphorus Supply
N. Ohtake, T.Ohyama, K. Sueyoshi. T. Kawachi, H. Fujikake, A. Momose,
T. Suganuma, A. Osa*, M. Koizumi *5 S. Hashimoto**, N.Ishioka*, S.
Watanabe*, T Sekine*, S. Matsuhashi**, T. Ito**, C. Mizuniwa**,
H.Uchida*** and A. Tsuji***
Faculty of Agriculture, Niigata University, * Department of Material
Science, JAERI, ** Department of Radiation Research for Enviroment and
Resources, JAERI ,*** Hamamatsu Photonics Co.
1. Introduction
Because the phosphate is easily absorbed by
in soil, especially volcanic ash soils, P
fertilizer is important for crop growth
together with N fertilizer. Generally, the
phosphate requirement of plants is in a
relatively narrow range. The phosphorus
requirement for optimal growth is in a range
of 0.3-0.5% of the plant dry matter during
the vegetative stage of growth1'. On the
other hand, the probability of phosphorus
toxicity increases at contents higher than 1%
in the dry matter1'. The purpose of this study
was to investigate the nitrate absorption,
translocation and accumulation by non-
nodulating soybean plants grown under
different P levels using 13NO3" or 15NO3' as
tracer.
2. Materials and methods
Non-nodulating soybean seeds (T201) were
sown in vermiculite. Ten days after sowing
(DAS), the plants were transplanted to
culture in a 800mL glass bottle with 600mL
of the hydroponics culture solution
containing 2mM NaNO3 and grown in a
growth chamber (LX-3000, Taitec Co.
Japan) which was kept in cycles of being 12
hours light (336 £imol m"V) at 28°C, and
12 hours dark at 18 °C . The chemical
composition of the culture solution except
for P was as follows (mg I"1): K2SO4 (109),
KC1 (7.854), CaCl2-5H2O (184), MgSCy
7H2O (123), H3BO4 (0.367), CuSO4-5H2O
(0.032), MnSO4 (0.189), ZnSO4 • 7H2O
(0.144), (NH4)6Mo7O24 (0.004), NiSO4 •
6H2O (0.0035), EDTANa, (14.6), FeSO4 •
7H2O (14.9). Four levels of phosphate
contents was applied as sodium hydrogen
phosphate (adjusted at pH 6.0) at 0 ^M (P-
free), 10 [iM (Low-P), 50 \xM (Control) or
250 [xM (High-P). ~~
The l3N-tracing experiment was
conducted 34 and 35 days after planting.
- 93 -
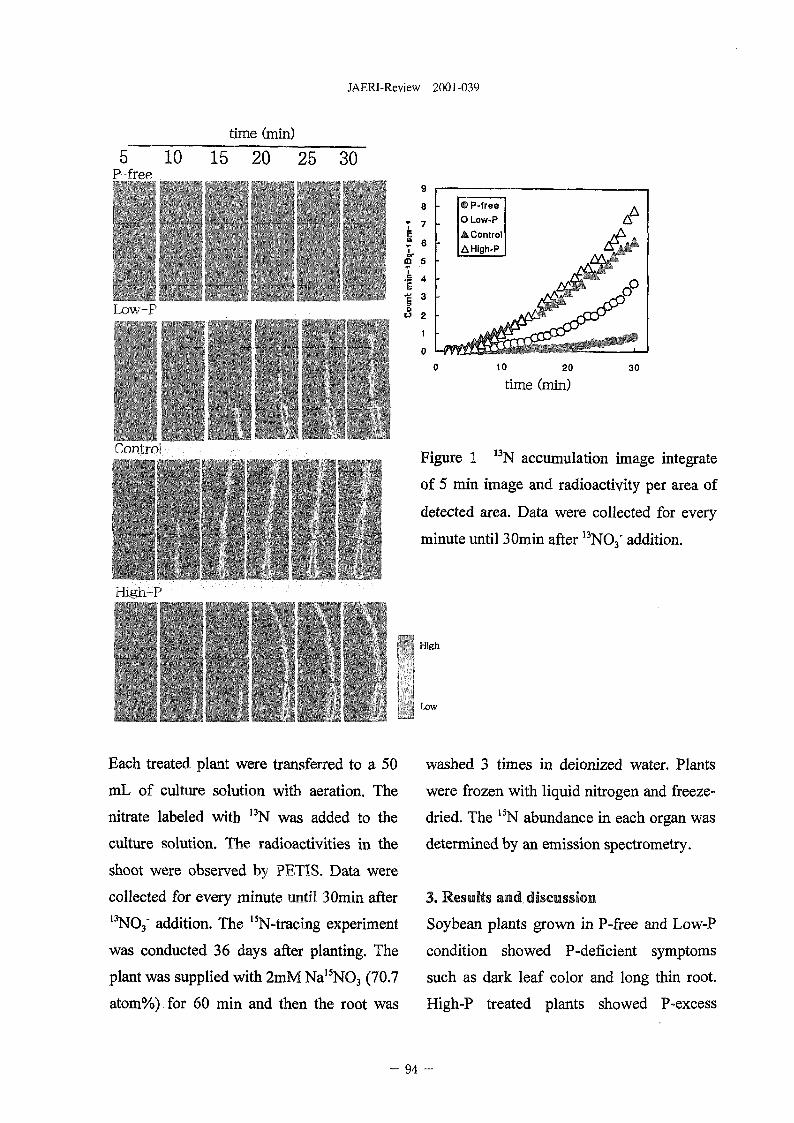
JAERI-Review 2001-039
time (min)
5 10P-free
15 20 25 30
<a
© P-free
O Low-P
• Control
AHigh-P
time (min)
nniioFigure 1 13N accumulation image integrate
of 5 min image and radioactivity per area of
detected area. Data were collected for every
minute until 30min after 13NO3' addition.
Jjlj Lowits.
Each treated plant were transferred to a 50
mL of culture solution with aeration. The
nitrate labeled with 13N was added to the
culture solution. The radioactivities in the
shoot were observed by PETIS. Data were
collected for every minute until 30min after13NO3' addition. The 15N-tracing experiment
was conducted 36 days after planting. The
plant was supplied with 2mM Na15NO3 (70.7
atom%) for 60 min and then the root was
washed 3 times in deionized water. Plants
were frozen with liquid nitrogen and freeze-
dried. The 15N abundance in each organ was
determined by an emission spectrometry.
3. Results and. discussion
Soybean plants grown in P-free and Low-P
condition showed P-deficient symptoms
such as dark leaf color and long thin root.
High-P treated plants showed P-excess
- 94
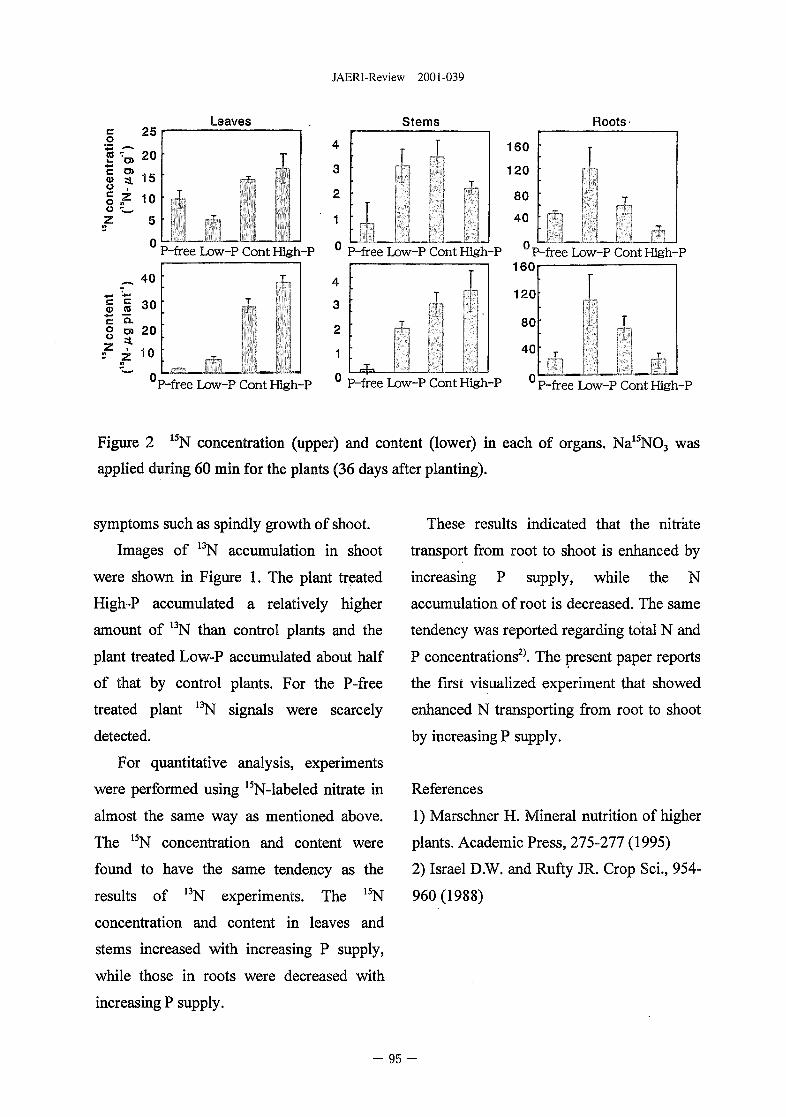
JAERI-Review 2001-039
co
trat
i
c
oooZ
c£coo
'C3>
O>
i
cCOa.
I
Z**-*
25
20
15
10
5
0
40
30
20
10
0
Leaves
P-iree Low-P ContHigh-P
4
3
2
1: f
Stems
I IT
Roots
P-free Low-P Cont High-P
4
3
2
1
0
160
120
80
40
P-free Low-P Cont High-P ° P-free Low-P Cont High-P
160
120
80
40
0P-free Low-P Cont High-P P-free Low-P Cont High-P
Figure 2 15N concentration (upper) and content (lower) in each of organs. Na15NO3 was
applied during 60 min for the plants (36 days after planting).
symptoms such as spindly growth of shoot.
Images of 13N accumulation in shoot
were shown in Figure 1. The plant treated
High-P accumulated a relatively higher
amount of 13N than control plants and the
plant treated Low-P accumulated about half
of that by control plants. For the P-free
treated plant 13N signals were scarcely
detected.
For quantitative analysis, experiments
were performed using 15N-labeled nitrate in
almost the same way as mentioned above.
The 15N concentration and content were
found to have the same tendency as the
results of 13N experiments. The 15N
concentration and content in leaves and
stems increased with increasing P supply,
while those in roots were decreased with
increasing P supply.
These results indicated that the nitrate
transport from root to shoot is enhanced by
increasing P supply, while the N
accumulation of root is decreased. The same
tendency was reported regarding total N and
P concentrations2^ The present paper reports
the first visualized experiment that showed
enhanced N transporting from root to shoot
by increasing P supply.
References
1) Marschner H. Mineral nutrition of higher
plants. Academic Press, 275-277 (1995)
2) Israel D.W. and Rufty JR. Crop Sci., 954-
960 (1988)
- 95 -
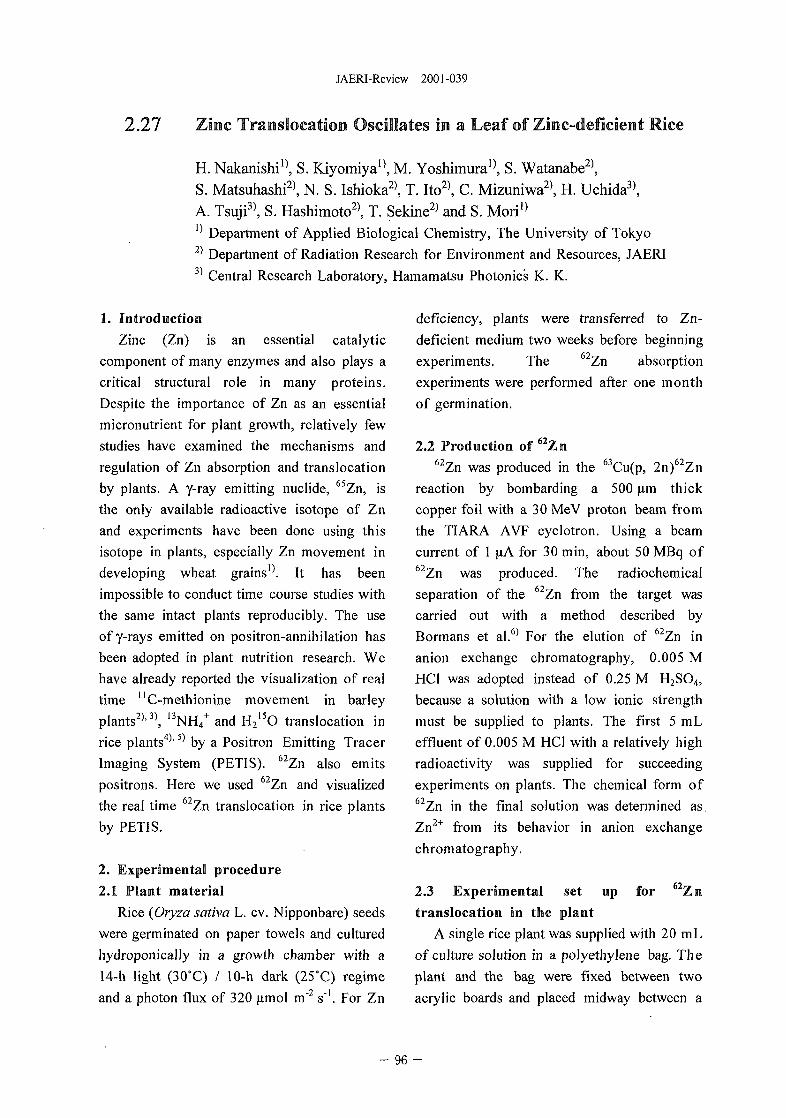
JAERI-Review 2001-039
2.27 Zinc Transloeation Oscillates in a Leaf of Zinc-deficient Rice
H. Nakanishi0, S. Kiyomiya0, M. Yoshimura0, S. Watanabe2),S. Matsuhashi2), N. S. Ishioka2), T. Ito2), C. Mizuniwa2), H. Uchida3),A. Tsuji3), S. Hashimoto2), T. Sekine2) and S. Mori1}
!) Department of Applied Biological Chemistry, The University of Tokyo2) Department of Radiation Research for Environment and Resources, JAERI3) Central Research Laboratory, Hamamatsu Photonics K. K.
1. Introduction
Zinc (Zn) is an essential catalytic
component of many enzymes and also plays a
critical structural role in many proteins.
Despite the importance of Zn as an essential
micronutrient for plant growth, relatively few
studies have examined the mechanisms and
regulation of Zn absorption and translocation
by plants. A y-ray emitting nuclide, 65Zn, is
the only available radioactive isotope of Zn
and experiments have been done using this
isotope in plants, especially Zn movement in
developing wheat grains'^. It has been
impossible to conduct time course studies with
the same intact plants reproducibly. The use
of y-rays emitted on positron-annihilation has
been adopted in plant nutrition research. We
have already reported the visualization of real
time "C-methionine movement in barley
plants2U), I3NH4+ and H2
15O translocation in
rice plants4'15) by a Positron Emitting Tracer
Imaging System (PETIS). 62Zn also emits
positrons. Here we used 62Zn and visualized
the real time 62Zn translocation in rice plants
by PETIS.
2. Experimental procedure
2.1 Plant material
Rice (Oryza saliva L. cv. Nipponbare) seeds
were germinated on paper towels and cultured
hydroponically in a growth chamber with a
14-h light (30°C) / 10-h dark (25°C) regime
and a photon flux of 320 (xmol m"2 s'1. For Zn
deficiency, plants were transferred to Zn-
deficient medium two weeks before beginning
experiments. The 62Zn absorption
experiments were performed after one month
of germination.
2.2 Production of 62Zn62Zn was produced in the 63Cu(p, 2n)62Zn
reaction by bombarding a 500 um thick
copper foil with a 30 MeV proton beam from
the TIARA AVF cyclotron. Using a beam
current of 1 uA for 30 min, about 50 MBq of62Zn was produced. The radiochemical
separation of the 62Zn from the target was
carried out with a method described by
Bormans et al.6) For the elution of 62Zn in
anion exchange chromatography, 0.005 M
HC1 was adopted instead of 0.25 M H2SO4,
because a solution with a low ionic strength
must be supplied to plants. The first 5 mL
effluent of 0.005 M HC1 with a relatively high
radioactivity was supplied for succeeding
experiments on plants. The chemical form of62Zn in the final solution was determined as
Zn2+ from its behavior in anion exchange
chromatography.
2.3 Experimental set up for 62Zn
translocation in the plant
A single rice plant was supplied with 20 mL
of culture solution in a polyethylene bag. The
plant and the bag were fixed between two
acrylic boards and placed midway between a
96 -
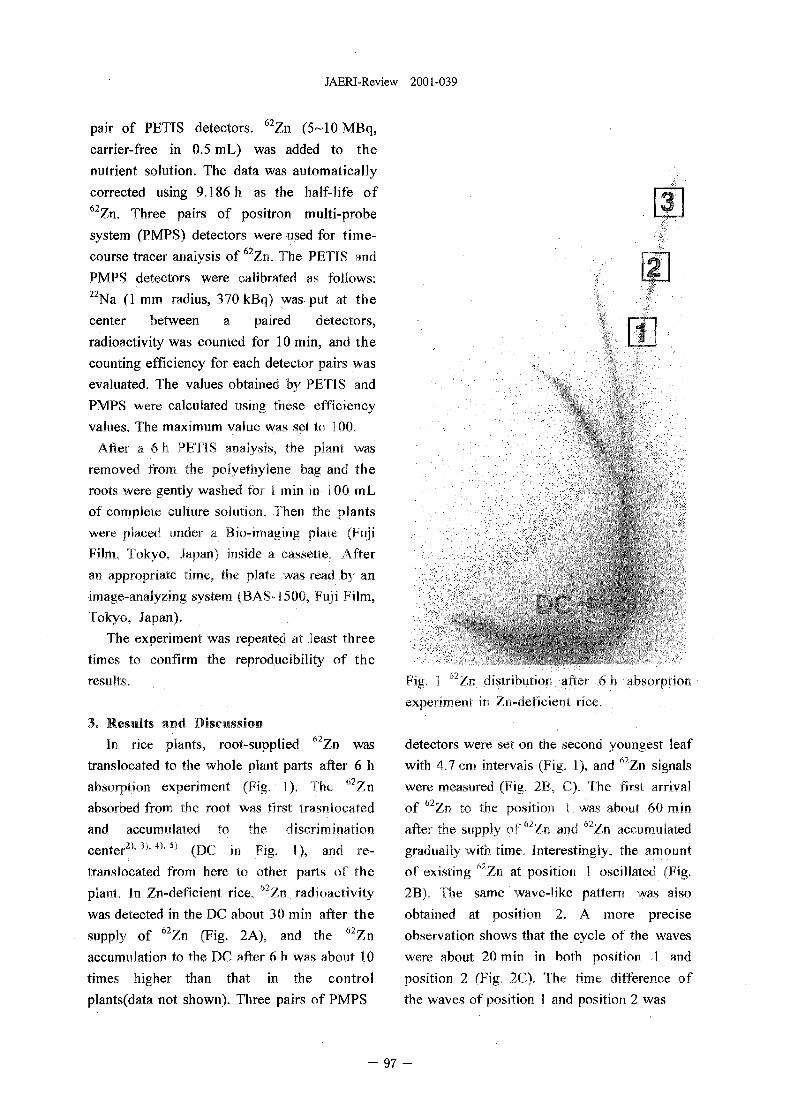
JAERI-Review 2001 -039
pair of PETIS detectors. 62Zn (5-10 MBq,
carrier-free in 0.5 mL) was added to the
nutrient solution. The data was automatically
corrected using 9.186h as the half-life of62Zn. Three pairs of positron multi-probe
system (PMPS) detectors were used for time-
course tracer analysis of 62Zn. The PETIS and
PMPS detectors were calibrated as follows:22Na (1 mm radius, 370 kBq) was put at the
center between a paired detectors,
radioactivity was counted for 10 min, and the
counting efficiency for each detector pairs was
evaluated. The values obtained by PETIS and
PMPS were calculated using these efficiency
values. The maximum value was set to 100.
After a 6 h PETIS analysis, the plant was
removed from the polyethylene bag and the
roots were gently washed for 1 min in 100 mL
of complete culture solution. Then the plants
were placed under a Bio-imaging plate (Fuji
Film, Tokyo, Japan) inside a cassette. After
an appropriate time, the plate was read by an
image-analyzing system (BAS-1500. Fuji Film,
Tokyo, Japan).
The experiment was repeated at least three
times to confirm the reproducibility of the
results,
3. Results and Discussion
In rice plants, root-supplied 62Zn was
translocated to the whole plant parts after 6 h
absorption experiment (Fig. 1). The 62Zn
absorbed from the root was first trasnlocated
and accumulated to the discrimination
center2^3) '4) '5) (DC in Fig. 1), and re-
translocated from here to other parts of the
plant. In Zn-deflcient rice, 62Zn radioactivity
was detected in the DC about 30 min after the
supply of 62Zn (Fig. 2A), and the 62Zn
accumulation to the DC after 6 h was about 10
times higher than that in the control
plants(data not shown). Three pairs of PMPS
62 rFig. 1 °'Zr .lisirinurioiexperiment it /ii-uerii;ieni rice.
msitr in ion
detectors were set on the second youngest leaf
with 4.7 cm intervals (Fig. 1), and 62Zn signals
were measured (Fig. 2B, C). The first arrival
of 62Zn to the position 1 was about 60 min
after the supply of 62Zn and 62Zn accumulated
gradually with time. Interestingly, the amount
of existing 62Zn at position 1 oscillated (Fig.
2B). The same wave-like pattern was also
obtained at position 2. A more precise
observation shows that the cycle of the waves
were about 20 min in both position 1 and
position 2 (Fig. 2C). The time difference of
the waves of position 1 and position 2 was
- 9 7 -
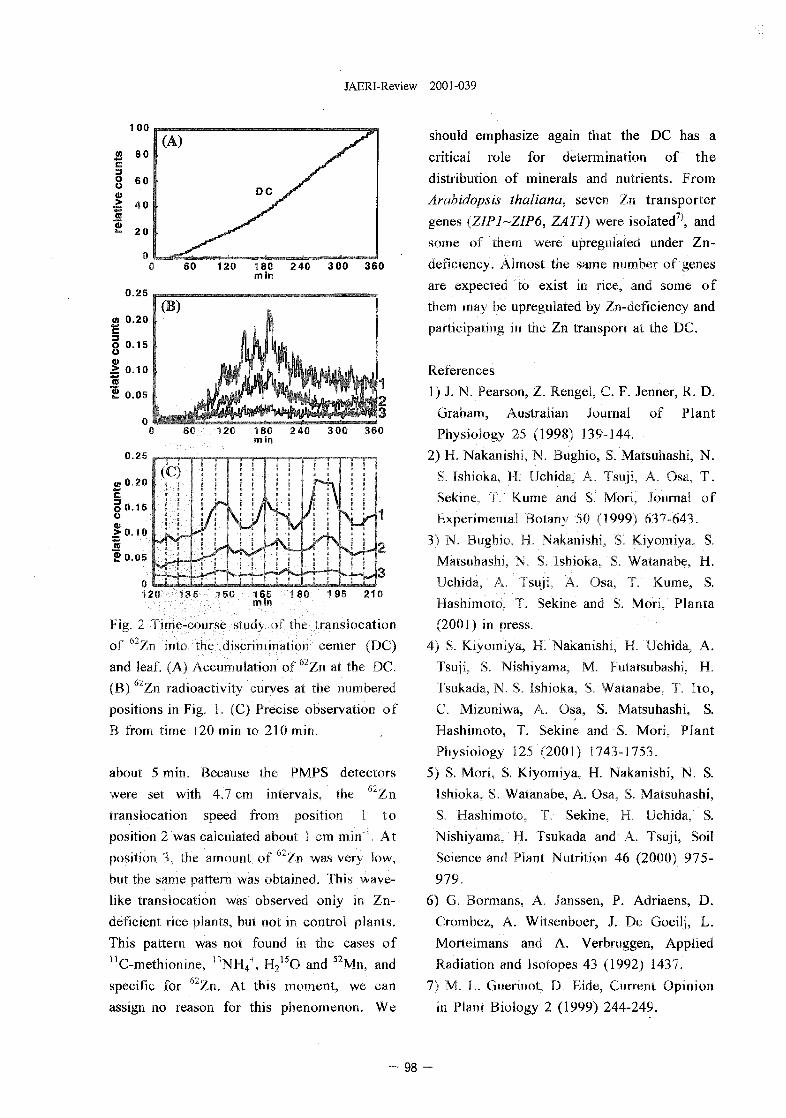
JAERI-Review 2001-039
1 0 0
SO 120 180 240 300 360mill
0.2S
' 2C
Fig I lme-conrst -aum i l i t rnnsiocation
o f ¥ fr nu n t i iscnminano! jetnei DC)
and lfHi . A , Accumulation n " ' / n HI the ~)C.
(B) Zn radioactivity curves at the numbered
positions in Fig. 1. (C) Precise observation of
B from time 120 min to 210 min.
about 5 min. Because the PMPS detectors
were set with 4.7 cm intervals, the "Zn
translocation speed from position 1 to
position 2 was calculated about 1 cm min"1. At
position 3, the amount of 62Zn was very low,
but the same pattern was obtained. This wave-
like translocation was observed only in Zn-
deficient rice plants, but not in control plants.
This pattern was not found in the cases ofnC-methionine, 13NH4
+, H215O and 52Mn, and
specific for 62Zn. At this moment, we can
assign no reason for this phenomenon. We
should emphasize again that the DC has a
critical role for determination of the
distribution of minerals and nutrients. From
Arabidopsis thaliana, seven Zn transporter
genes (ZIP 1-ZIP6, ZAT1) were isolated71, and
some of them were upregulated under Zn-
deficiency. Almost the same number of genes
are expected to exist in rice, and some of
them may be upregulated by Zn-deficiency and
participating in the Zn transport at the DC.
References
1) J. N. Pearson, Z. Rengel, C. F. Jenner, R. D.
Graham, Australian Journal of Plant
Physiology 25 (1998) 139-144.
2) H. Nakanishi, N. Bughio, S. Matsuhashi, N.
S. Ishioka, H. Uchida, A. Tsuji, A. Osa, T.
Sekine, T. Kume and S. Mori, Journal of
Experimental Botany 50 (1999) 637-643.
3) N. Bnerhir u Nakanishi, S. Kiyomiya, S.
Matsonash \ 5. Ishioka, S. Watanabe, H.
Uchidf- - suji, A. Osa, T. Kume, S.
HashimoM , Sekine and S. Mori, Planta
(2001) in press.
4) S. Kiyomiya, H. Nakanishi, H. Uchida, A.
Tsuji, S. Nishiyama, M. Futatsubashi, H.
Tsukada, N. S. Ishioka, S. Watanabe. T. Ito,
C. Mizuniwa, A. Osa, S. Matsuhashi, S.
Hashimoto, T. Sekine and S. Mori, Plant
Physiology 125 (2001) 1743-1753.
5) S, Mori, S. Kiyomiya, H. Nakanishi, N. S.
Ishioka, S. Watanabe, A. Osa, S. Matsuhashi,
S. Hashimoto, T. Sekine, H. Uchida, S.
Nishiyama, H. Tsukada and A. Tsuji, Soil
Science and Plant Nutrition 46 (2000) 975-
979.
6) G. Bormans, A. Janssen, P. Adriaens, D.
Crombez, A. Witsenboer, J. De Goeilj, L.
Mortelmans and A. Verbruggen, Applied
Radiation and Isotopes 43 (1992) 1437.
7) M. L, Guerinot, D. Eide, Current Opinion
in Plant Biology 2 (1999) 244-249.
- 98 -
JAERI-Review 2001-039
2.28 Effects of environmental stress on nC distribution in riceplants detected by PETIS detector
H. Hayashi1, H. Mano1, N. Suzui1, S. Matsuhashi2, C. Mizuniwa2,
T. Itcr, S. Hashimoto2, N. Ishioka2, T. Watanabe2, T. Sekine2, A. Osa3,
H. Uchida4, A. Tsuji4
'Department of Applied Biological Chemistry.
Univ. Tokyo, 2Department of Radiation Research for Environment and
Resources, JAERI, 'Department of Material Science, JAERI,4Central Research Laboratory, Hamamatsu Photonics Co.
1. Introduction
Sieve tubes are the main roots for long
distance transport of photoassimilates in plants.
This phloem transport process of
photoassimilates is highly affected by the
surrounding conditions, such as temperature and
light condition as this process is an energy
dependent process. Sucrose, most important
photoassimilate translocating in sieve tubes, is
loaded into sieve tubes through cell membrane
from apoplast by the energy dependent process,
so called phloem loading. Sucrose in the sieve
tubes at the site of photosynthesis is unloaded
and reloaded along sieve tubes repeatedly, and is
finally transported to the sink position.
To know this process deeply, we have
established the experiments for detailed analysis
of phloem transport, such as speed of
translocation by the positron-emitting tracer
imaging system (PETIS).
2. Experiments
Rice plants (Oryza sativa L. var. Nipponbare)
were grown in a complete nutrient solution. The
plants of the 9th-leaf stage were used for the
experiments.
Around 135 MBq of "CO, was applied to
the small absorption chamber containing the tip
of 7th leaf blade of rice plant for 10 min. Just
after the absorption started, the "C-compounds
distribution were detected by PETIS at the leaf
sheath position. To detect the effect of
temperature, several positions of the leaf sheath
which absorbed "CO2were cooled down to 5 °C
by cooling blocks.
3. Results and discussion
The results show that this PETIS provides a
convenient system for displaying "C-
compounds movements in plants even though
the spatial detection limit is 2 mm and
measurement lasting more than 60 minutes may
be difficult because of fast decay of "C.
- 99 -
JAERI-Review 2001-039
Figure 1 shows the BAS image of the
absorption and translocation of nC-compounds
at the end of experiment. The absorbed UC-
compounds at the leaf blade were transported
only to the leaf sheath direction, namely to the
leaf sheath, roots and another leaves, not to the
tip of the leaf blade. These results suggest that
phloem transport is one-way traffic at the leaf
blade level.
Detailed images of PETIS are presented in
figure 2. The absorbed nCO2were metabolized
at the leaf blade and translocated to the leaf
sheath within 17 min (Figure 2-1, Position B).
The distance between A and B in the leaf sheath
was 5.25 cm and the time delay of "C-
compound arrival was 5,0 minute. From these
data, the rate of phloem transport at the leaf
sheath of rice plants was calculated as 63
cm/hour, from the data of position B and C, the
rate was calculated
as 48 cm/hour. These figures of phloem
transport rate are consistent with another
examples of phloem transport of other plants,
which was evaluated by different methods.
The effects of low temperature on the phloem
transport rate were also analyzed by the same
PETIS. We tried several times to detect the
effects of low temperature. In some experiments,
the delay of "C-compounds arrival was detected
(data not shown). However, low temperature (5
°C) did not stop the phloem transport in our
experiments.
These data of phloem transport of "C-
compounds measured by PETIS are very useful
to discuss the effects of environmental stress on
the long distance phloem transports of
photoassimilates, specially the rate of transport.
In our experiments, the rate of phloem transport
was calculated directly based on the data by
PETIS.
- 100 -
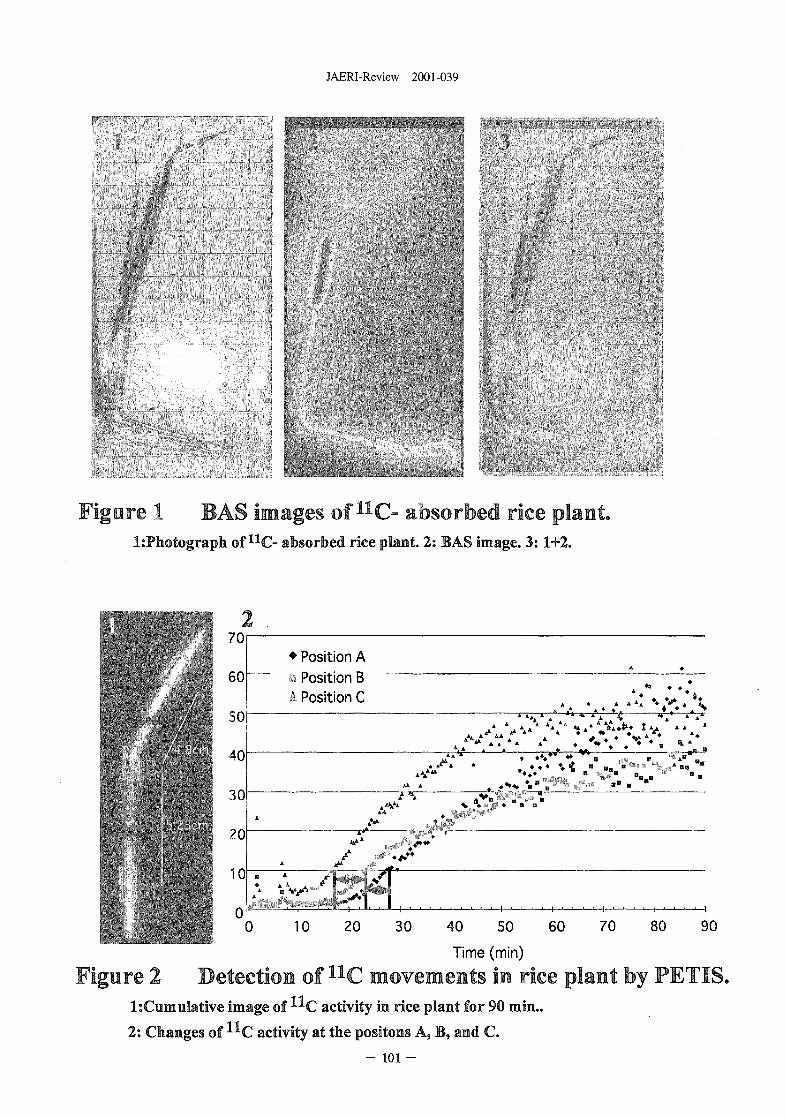
JAERI-Review 2001-039
Figure 1 BAS images of U C- absorbed rice plantl:Photograph of 11C- absorbed rice plant. 2; BAS image. 3:1+2.
70
60• Position A• Position B4 Position C
sor
40
30
20
10
0
* ** *
0 10 20 30 9040 50 60 70 80
Time (min)
re 2 Detection of UC movements in rice plant by PETIS,1 Cumulative image of ^ C activity in rice plant for 90 min..
2; Changes of ^ C activity at the positons A, B, and C.
- IOI -
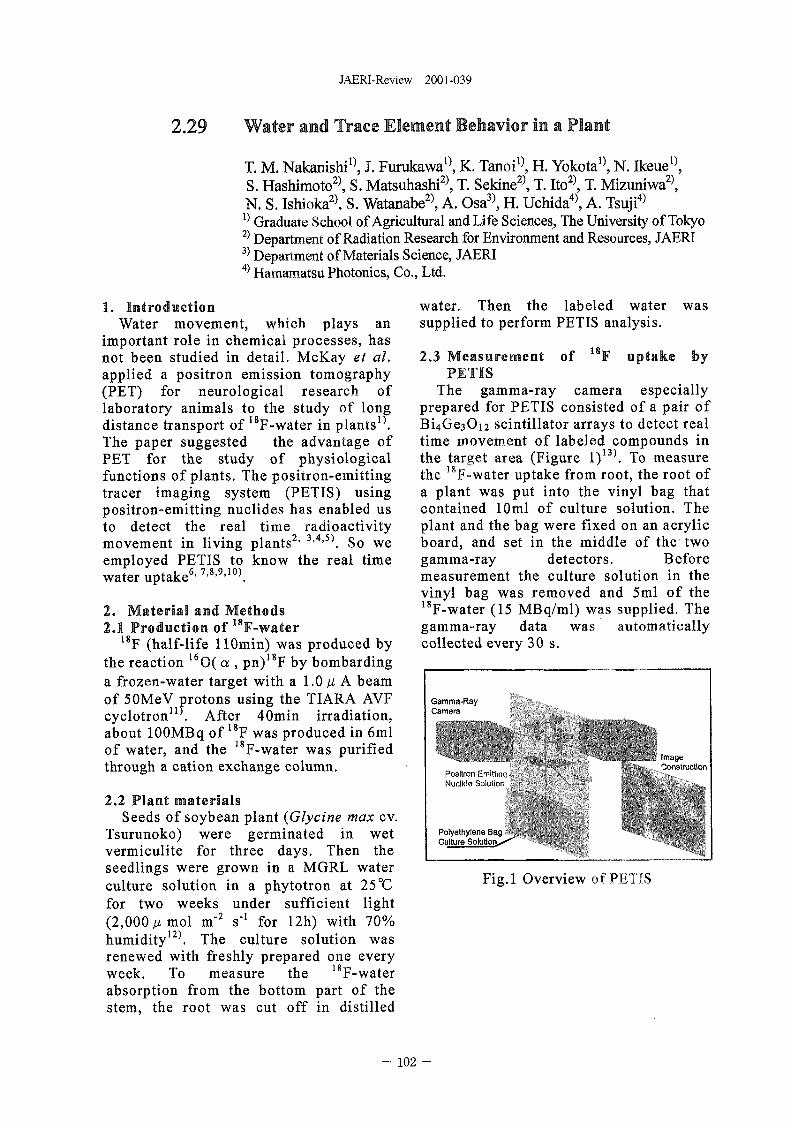
JAERI-Review 2001-039
2.29 Water and Trace Element Behavior In a Plant
T. M. Nakanishi1}, J. Furukawa0, K. Tanoi1}, H. Yokota1^ N. Ikeue1^S. Hashimoto2), S. Matsuhashi2), T. Sekine2), T. Ito2), T. Mizuniwa2),N. S. Ishioka2), S. Watanabe2), A. Osa3), H. Uchida4), A. Tsuji4)
!) Graduate School of Agricultural and Life Sciences, The University of Tokyo2) Depar tment o f Radia t ion Research for Envi ronment and Resources , J A E R I3) Department of Materials Science, JAERI4) Hamamatsu Photonics, Co., Ltd.
1. IntroductionWater movement, which plays an
important role in chemical processes, hasnot been studied in detail. McKay et al.applied a positron emission tomography(PET) for neurological research oflaboratory animals to the study of longdistance transport of I8F-water in plants^.The paper suggested the advantage ofPET for the study of physiologicalfunctions of plants. The positron-emittingtracer imaging system (PETIS) usingpositron-emitting nuclides has enabled usto detect the real time radioactivitymovement in living plants2' 3>4'5). So weemployed PETIS to know the real timewater uptake6'7'8'9'10).
2. Material and Methods2.1 Production of 18F-water
18F (half-life HOmin) was produced bythe reaction 16O( a , pn) lsF by bombardinga frozen-water target with a 1.0 p. A beamof 5 OMeV protons using the TIARA AVFcyclotron11 . After 40min irradiation,about lOOMBq of 18F was produced in 6mlof water, and the 18F-water was purifiedthrough a cation exchange column.
2.2 Plant materialsSeeds of soybean plant (Glycine max cv.
Tsurunoko) were germinated in wetvermiculite for three days. Then theseedlings were grown in a MGRL waterculture solution in a phytotron at 25°Cfor two weeks under sufficient light(2,000//mol m"2 s-1 for 12h) with 70%humidity125. The culture solution wasrenewed with freshly prepared one everyweek. To measure the 18F-waterabsorption from the bottom part of thestem, the root was cut off in distilled
water. Then the labeled water wassupplied to perform PETIS analysis.
2.3 Measurement of 18F uptake byPETIS
The gamma-ray camera especiallyprepared for PETIS consisted of a pair ofBi4Ge3Oi2 scintillator arrays to detect realtime movement of labeled compounds inthe target area (Figure 1)13). To measurethe 18F-water uptake from root, the root ofa plant was put into the vinyl bag thatcontained 10ml of culture solution. Theplant and the bag were fixed on an acrylicboard, and set in the middle of the twogamma-ray detectors. Beforemeasurement the culture solution in thevinyl bag was removed and 5ml of the18F-water (15 MBq/ml) was supplied. Thegamma-ray data was automaticallycollected every 30 s.
Gamma-RayCamera
Positron E-nitl.1 •Nucllde Soluli11
Polyethylene BagCulture Solutions
Fig.l Overview of PETIS
- 102 -
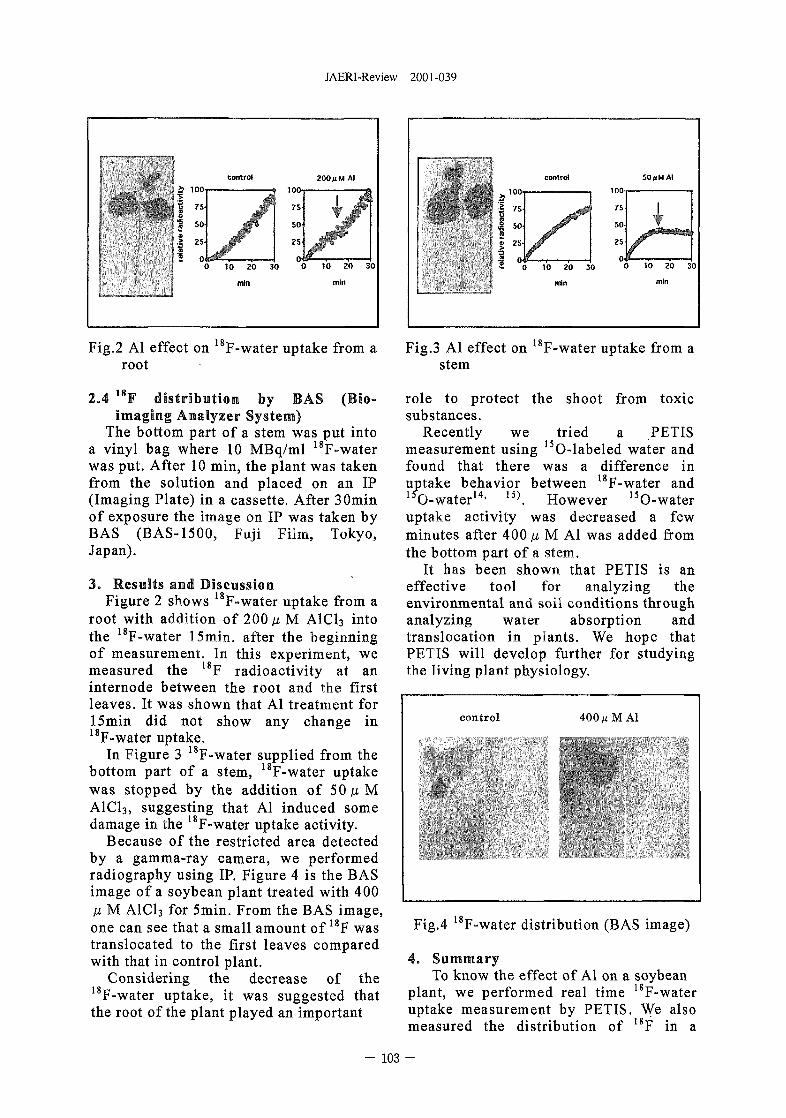
JAERI-Review 2001-039
200/iM Al
so.
I
100'
75-
50'
25
0'
V . "
fir10 20
mln
10 20 30
mln
Fig.2 Al effect onroot
18F-water uptake from a
(BSo-2.4 18F distribution by BASimaging Analyzer System)
The bottom part of a stem was put intoa vinyl bag where 10 MBq/ml 18F-waterwas put. After 10 min, the plant was takenfrom the solution and placed on an IP(Imaging Plate) in a cassette. After 30minof exposure the image on IP was taken byBAS (BAS-1500, Fuji Film, Tokyo,Japan).
3. Results and DiscussionFigure 2 shows 18F-water uptake from a
root with addition of 200 \x M A1C13 intothe 18F-water 15min. after the beginningof measurement. In this experiment, wemeasured the 18F radioactivity at aninternode between the root and the firstleaves. It was shown that Al treatment for15min did not show any change in18F-water uptake.
In Figure 3 18F-water supplied from thebottom part of a stem, 18F-water uptakewas stopped by the addition of 50 is MA1C13, suggesting that Al induced somedamage in the 18F-water uptake activity.
Because of the restricted area detectedby a gamma-ray camera, we performedradiography using IP. Figure 4 is the BASimage of a soybean plant treated with 400H M AICI3 for 5min. From the BAS image,one can see that a small amount of I8F wastranslocated to the first leaves comparedwith that in control plant.
Considering the decrease of the18F-water uptake, it was suggested thatthe root of the plant played an important
SOuMAI
g 75
•i o i10 20
min
100
75
50
25
10 20
min
Fig.3 Al effect on 18F-water uptake from astem
role to protect the shoot from toxicsubstances.
Recently we tried a .PETISmeasurement using 15O-labeled water andfound that there was a difference inuptake behavior between 18F-water and^O-water14' 15). However 15O-wateruptake activity was decreased a fewminutes after 400 fj. M Al was added fromthe bottom part of a stem.
It has been shown that PETIS is aneffective tool for analyzing theenvironmental and soil conditions throughanalyzing water absorption andtranslocation in plants. We hope thatPETIS will develop further for studyingthe living plant physiology.
control 400 ix MAI
Fig.4 F-water distribution (BAS image)
4. SummaryTo know the effect of Al on a soybean
plant, we performed real time 18F-wateruptake measurement by PETIS. We alsomeasured the distribution of 18F in a
- 103 -
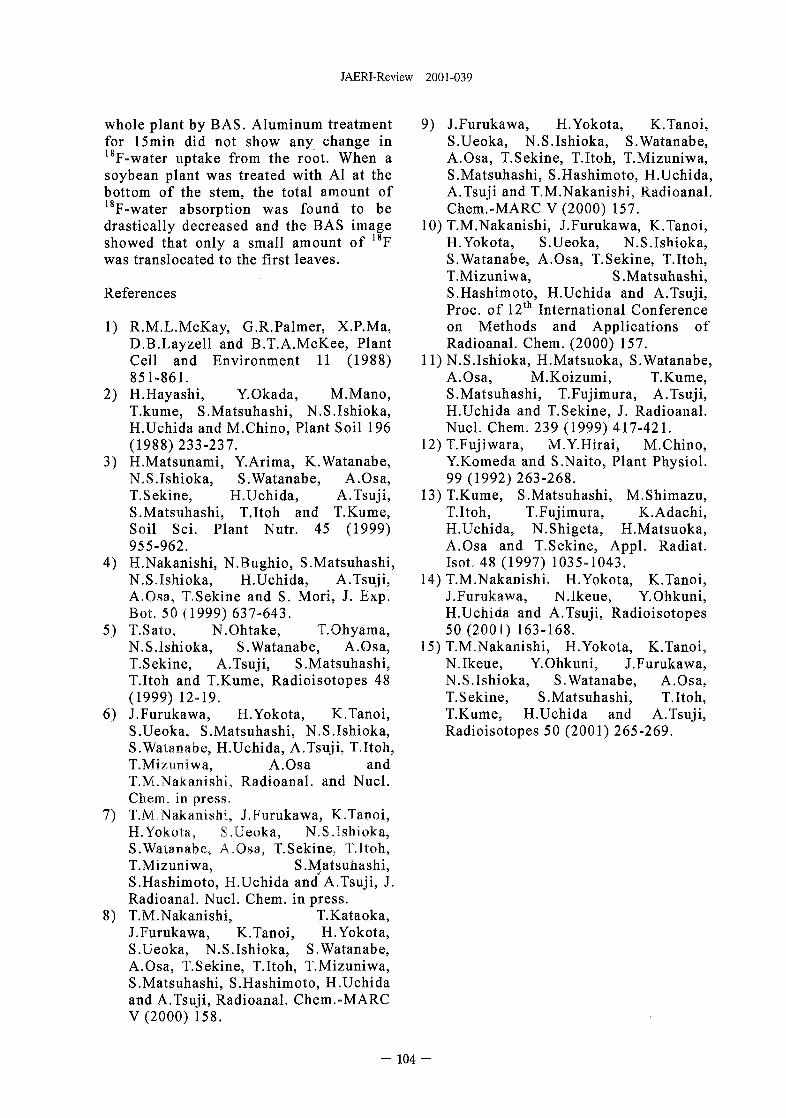
JAERI-Review 2001-039
whole plant by BAS. Aluminum treatmentfor 15min did not show any change in18F-water uptake from the root. When asoybean plant was treated with Al at thebottom of the stem, the total amount ofI8F-water absorption was found to bedrastically decreased and the BAS imageshowed that only a small amount of 18Fwas translocated to the first leaves.
References
1) R.M.L.McKay, G.R.Palmer, X.P.Ma,D.B.Layzell and B.T.A.McKee, PlantCell and Environment 11 (1988)851-861.
2) H.Hayashi, Y.Okada, M.Mano,T.kume, S.Matsuhashi, N.S.Ishioka,H.Uchida and M.Chino, Plant Soil 196(1988)233-237.
3) H.Matsunami, Y.Arima, K.Watanabe,N.S.Ishioka, S.Watanabe, A.Osa,T.Sekine, H.Uchida, A.Tsuji,S.Matsuhashi, T.Itoh and T.Kume,Soil Sci. Plant Nutr. 45 (1999)955-962.
4) H.Nakanishi, N.Bughio, S.Matsuhashi,N.S.Ishioka, H.Uchida, A.Tsuji,A.Osa, T.Sekine and S. Mori, J. Exp.Bot. 50(1999) 637-643.
5) T.Sato, N.Ohtake, T.Ohyama,N.S.Ishioka, S.Watanabe, A.Osa,T.Sekine, A.Tsuji, S.Matsuhashi,T.Itoh and T.Kume, Radioisotopes 48(1999) 12-19.
6) J.Furukawa, H.Yokota, K.Tanoi,S.Ueoka, S.Matsuhashi, N.S.Ishioka,S.Watanabe, H.Uchida, A.Tsuji, T.Itoh,T.Mizuniwa, A.Osa andT.M.Nakanishi, Radioanal. and Nucl.Chem. in press.
7) T.M.Nakanishi, J.Furukawa, K.Tanoi,H.Yokota, S.Ueoka, N.S.Ishioka,S.Watanabe, A.Osa, T.Sekine. T.Itoh,T.Mizuniwa, S.Matsuhashi,S.Hashimoto, H.Uchida and A.Tsuji, J.Radioanal. Nucl. Chem. in press.
8) T.M.Nakanishi, T.Kataoka,J.Furukawa, K.Tanoi, H.Yokota,S.Ueoka, N.S.Ishioka, S.Watanabe,A.Osa, T.Sekine, T.Itoh, T.Mizuniwa,S.Matsuhashi, S.Hashimoto, H.Uchidaand A.Tsuji, Radioanal. Chem.-MARCV(2000) 158.
9) J.Furukawa, H.Yokota, K.Tanoi,S.Ueoka, N.S.Ishioka, S.Watanabe,A.Osa, T.Sekine, T.Itoh, T.Mizuniwa,S.Matsuhashi, S.Hashimoto, H.Uchida,A.Tsuji and T.M.Nakanishi, Radioanal.Chem.-MARC V (2000) 157.
10) T.M.Nakanishi, J.Furukawa, K.Tanoi,H.Yokota, S.Ueoka, N.S.Ishioka,S.Watanabe, A.Osa, T.Sekine, T.Itoh,T.Mizuniwa, S.Matsuhashi,S.Hashimoto, H.Uchida and A.Tsuji,Proc. of 12th International Conferenceon Methods and Applications ofRadioanal. Chem. (2000) 157.
11) N.S.Ishioka, H.Matsuoka, S.Watanabe,A.Osa, M.Koizumi, T.Kume,S.Matsuhashi, T.Fujimura, A.Tsuji,H.Uchida and T.Sekine, J. Radioanal.Nucl. Chem. 239 (1999) 417-421.
12) T.Fujiwara, M.Y.Hirai, M.Chino,Y.Komeda and S.Naito, Plant Physiol.99 (1992) 263-268.
13) T.Kume, S.Matsuhashi, M.Shimazu,T.Itoh, T.Fujimura, K.Adachi,H.Uchida, N.Shigeta, H.Matsuoka,A.Osa and T.Sekine, Appl. Radiat.Isot. 48 (1997) 1035-1043.
14) T.M.Nakanishi, H.Yokota, K.Tanoi,J.Furukawa, N.Ikeue, Y.Ohkuni,H.Uchida and A.Tsuji, Radioisotopes50 (2001) 163-168.
15) T.M.Nakanishi, H.Yokota, K.Tanoi,N.Ikeue, Y.Ohkuni, J.Furukawa,N.S.Ishioka, S.Watanabe, A.Osa,T.Sekine, S.Matsuhashi, T.Itoh,T.Kume, H.Uchida and A.Tsuji,Radioisotopes 50 (2001) 265-269.
- 104 -
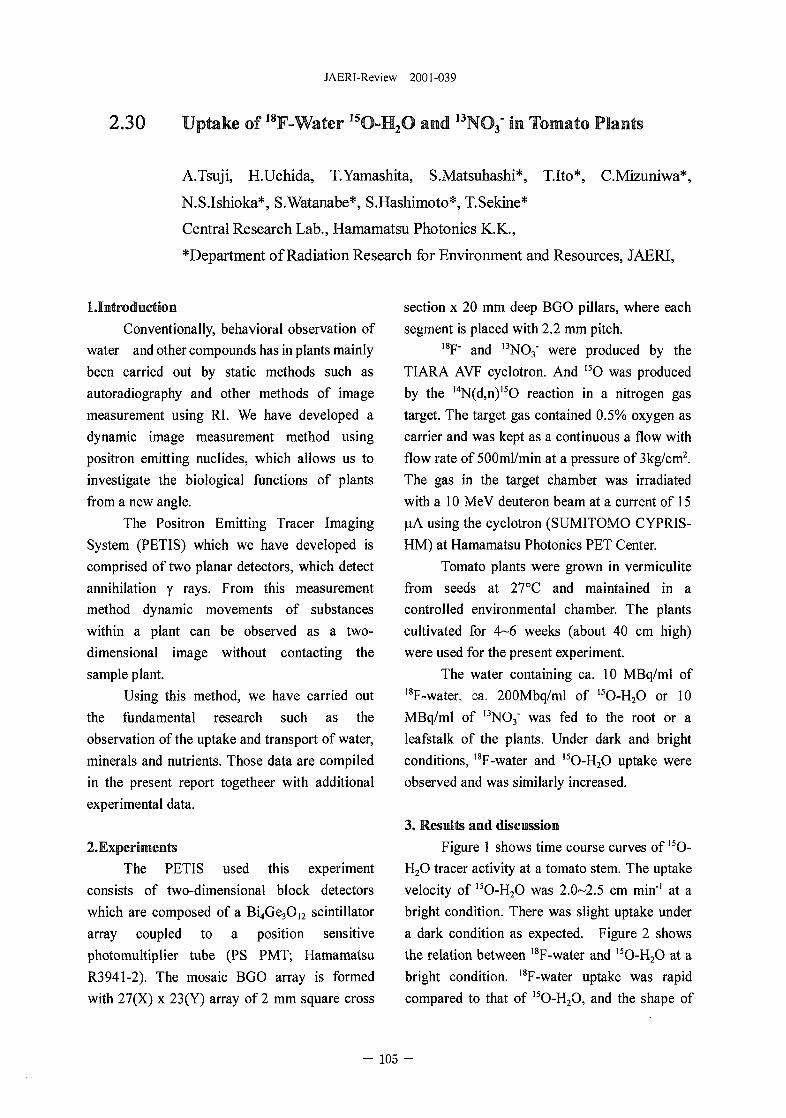
JAERI-Review 2001-039
2.30 Uptake of 18F-Water 15O-H2O and 13NO3" In Tomato Plants
A.Tsuji, H.Uchida, T.Yamashita, S.Matsuhashi*, Tito*, C.Mizuniwa*,
N.SJshioka*, S.Watanabe*, S.Hashimoto*, T.Sekine*
Central Research Lab., Hamamatsu Photonics K.K.,
*Department of Radiation Research for Environment and Resources, JAERI,
Untroduction
Conventionally, behavioral observation of
water and other compounds has in plants mainly
been carried out by static methods such as
autoradiography and other methods of image
measurement using RI. We have developed a
dynamic image measurement method using
positron emitting nuclides, which allows us to
investigate the biological functions of plants
from a new angle.
The Positron Emitting Tracer Imaging
System (PETIS) which we have developed is
comprised of two planar detectors, which detect
annihilation y rays. From this measurement
method dynamic movements of substances
within a plant can be observed as a two-
dimensional image without contacting the
sample plant.
Using this method, we have carried out
the fundamental research such as the
observation of the uptake and transport of water,
minerals and nutrients. Those data are compiled
in the present report togetheer with additional
experimental data.
2.Experiments
The PETIS used this experiment
consists of two-dimensional block detectors
which are composed of a Bi4Ge3012 scintillator
array coupled to a position sensitive
photomultiplier tube (PS PMT; Hamamatsu
R3941-2). The mosaic BGO array is formed
with 27(X) x 23(Y) array of 2 mm square cross
section x 20 mm deep BGO pillars, where each
segment is placed with 2.2 mm pitch.18F" and 13NO3' were produced by the
TIARA AVF cyclotron. And I5O was produced
by the 14N(d,n)'5O reaction in a nitrogen gas
target. The target gas contained 0.5% oxygen as
carrier and was kept as a continuous a flow with
flow rate of 500ml/min at a pressure of 3kg/cm2.
The gas in the target chamber was irradiated
with a 10 MeV deuteron beam at a current of 15
HA using the cyclotron (SUMITOMO CYPRIS-
HM) at Hamamatsu Photonics PET Center.
Tomato plants were grown in vermiculite
from seeds at 27°C and maintained in a
controlled environmental chamber. The plants
cultivated for 4-6 weeks (about 40 cm high)
were used for the present experiment.
The water containing ca. 10 MBq/ml of18F-water, ca. 200Mbq/ml of 15O-H2O or 10
MBq/ml of I3NO3" was fed to the root or a
leafstalk of the plants. Under dark and bright
conditions, l8F-water and 15O-H2O uptake were
observed and was similarly increased.
3. Results and discussion
Figure 1 shows time course curves of 15O-
H2O tracer activity at a tomato stem. The uptake
velocity of 15O-H2O was 2.0-2.5 cm min'1 at a
bright condition. There was slight uptake under
a dark condition as expected. Figure 2 shows
the relation between 18F-water and 15O-H2O at a
bright condition. 18F-water uptake was rapid
compared to that of 15O-H2O, and the shape of
- 105
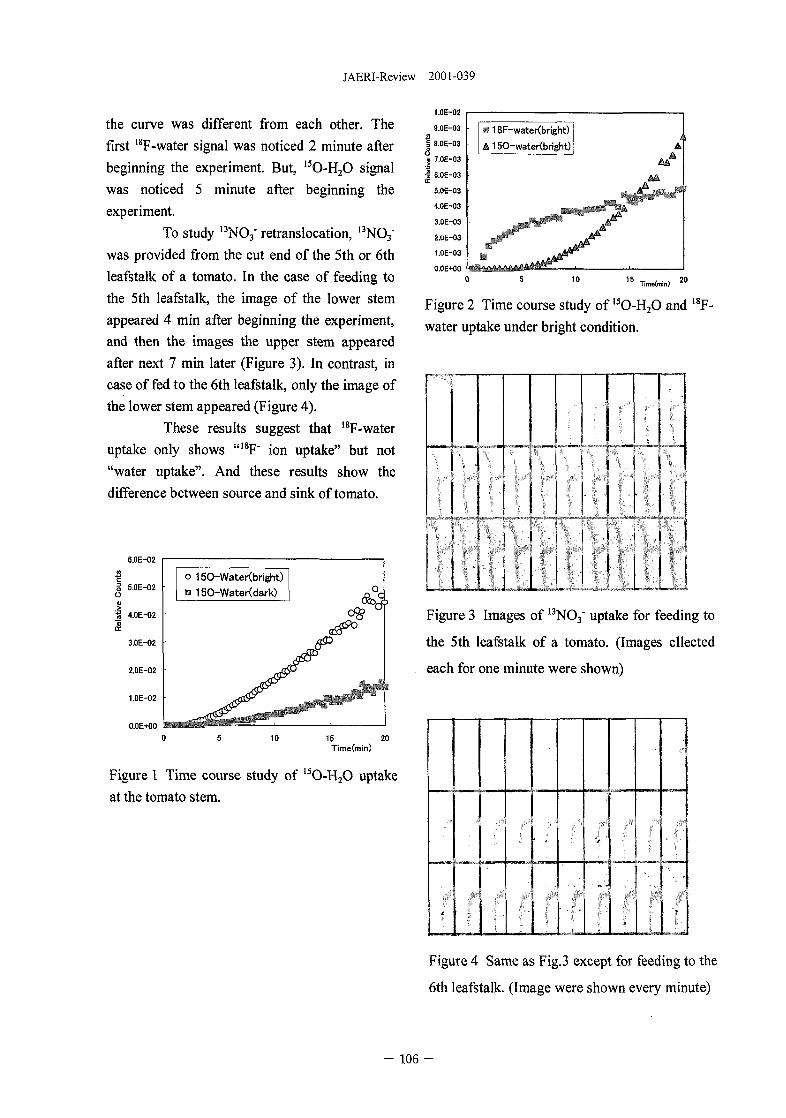
JAERI-Review 2001-039
the curve was different from each other. The
first 18F-water signal was noticed 2 minute after
beginning the experiment. But, 15O-H2O signal
was noticed 5 minute after beginning the
experiment.
To study 13NO3' retranslocation, I3NO3'
was provided from the cut end of the 5th or 6th
leafstalk of a tomato. In the case of feeding to
the 5th leafstalk, the image of the lower stem
appeared 4 min after beginning the experiment,
and then the images the upper stem appeared
after next 7 min later (Figure 3). In contrast, in
case of fed to the 6th leafstalk, only the image of
the lower stem appeared (Figure 4).
These results suggest that 18F-water
uptake only shows "18F" ion uptake" but not
"water uptake". And these results show the
difference between source and sink of tomato.
6.0E-02
15 20TimeCmin)
Figure 1 Time course study of 15O-H2O uptake
at the tomato stem.
1.0E-02
9.0E-03
i 8.0E-03
> 7.0E-03
! 6.0E-03
5.0E-03
4.0E-03
3.0E-03
2.OE-03
I.OE-03
0.0E+00
• 18F-wateKbright)
A 15O-water(bright)i
Figure 2 Time course study of 15O-H2O and 18F-
water uptake under bright condition.
I
1
1
, I . 1 .-I
LLLUUJXUFigure 3 Images of 13NO3" uptake for feeding to
the 5th leafstalk of a tomato. (Images cllected
each for one minute were shown)
t
tann
• 1
L".Figure 4 Same as Fig.3 except for feeding to the
6th leafstalk. (Image were shown every minute)
- 106 -
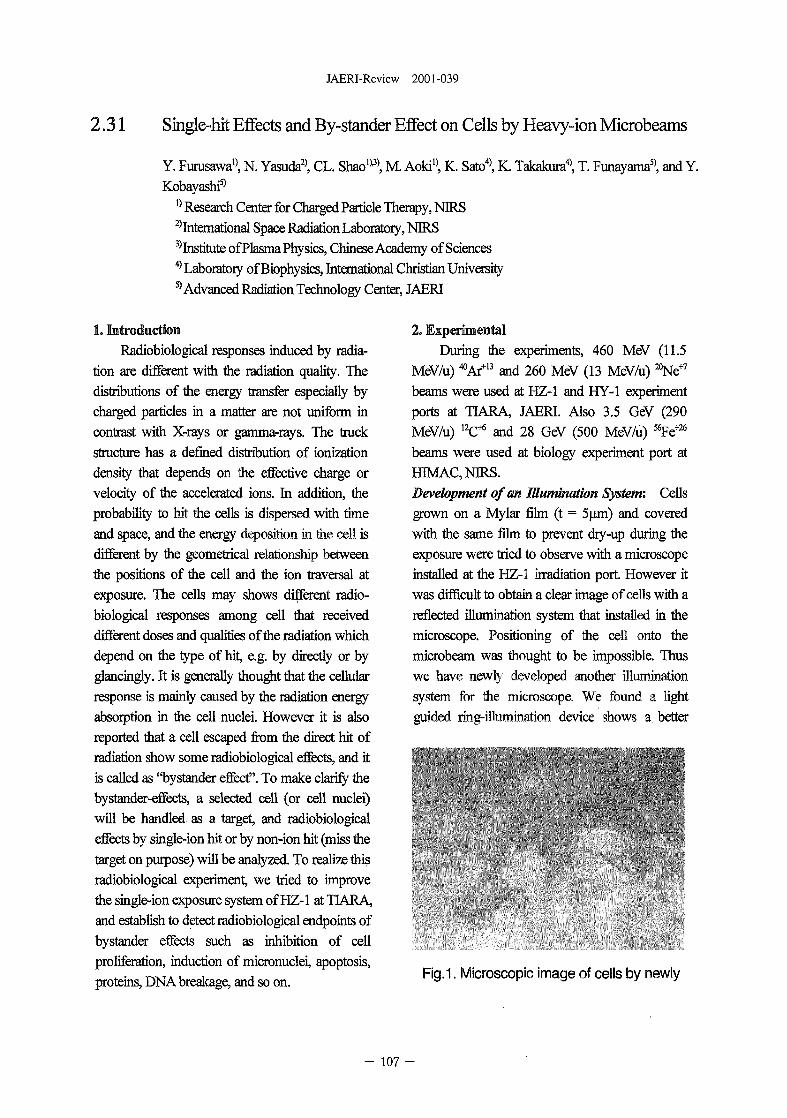
JAERI-Review 2001-039
2.31 Single-hit Effects and By-stander Effect on Cells by Heavy-ion Microbeams
Y. Furusawa0, N. Yasuda2), CL. ShaoV), M. Aoki0, K. Sato4), K. Takakura4), T. Funayama5), and Y.
Kobayash?0 Research Center for Charged Particle Therapy, MRS
^International Space Radiation Laboratory, MRS3)Institute of Plasma Physics, Chinese Academy of Sciences4) Laboratory of Biophysics, International Christian University55 Advanced Radiation Technology Center, JAERI
1. Introduction
Radiobiological responses induced by radia-tion are different with the radiation quality. Thedistributions of the energy transfer especially bycharged particles in a matter are not uniform incontrast with X-rays or gamma-rays. The truckstructure has a defined distribution of ionizationdensity that depends on the effective charge orvelocity of the accelerated ions. In addition, theprobability to hit the cells is dispersed with timeand space, and the energy deposition in the cell isdifferent by the geometrical relationship betweenthe positions of the cell and the ion traversal atexposure. The cells may shows different radio-biological responses among cell that receiveddifferent doses and qualities of the radiation whichdepend on the type of hit, e.g. by directly or byglancingly. It is generally thought that the cellularresponse is mainly caused by the radiation energyabsorption in the cell nuclei. However it is alsoreported that a cell escaped from the direct hit ofradiation show some radiobiological effects, and itis called as "bystander effect". To make clarify thebystander-effects, a selected cell (or cell nuclei)will be handled as a target, and radiobiologicaleffects by single-ion hit or by non-ion hit (miss tiietarget on purpose) will be analyzed. To realize thisradiobiological experiment, we tried to improvethe single-ion exposure system of HZ-1 at TIARA,and establish to detect radiobiological endpoints ofbystander effects such as inhibition of cellproliferation, induction of micronuclei, apoptosis,proteins, DNA breakage, and so on.
2. Experimental
During the experiments, 460 MeV (11.5MeV/u) *Ar+13 and 260 MeV (13 MeV/u) "Ne*7
beams were used at HZ-1 and HY-1 experimentports at TIARA, JAERI. Also 3.5 GeV (290MeV/u) 12C* and 28 GeV (500 MeV/u) *Fe+2S
beams were used at biology experiment port atHMAQMRS.
Development of an Illumination System: Cellsgrown on a Mylar film (t = 5|im) and coveredwith the same film to prevent dry-up during theexposure were tried to observe with a microscopeinstalled at the HZ-1 irradiation port. However itwas difficult to obtain a clear image of cells with areflected illumination system that installed in themicroscope. Positioning of the cell onto themicrobeam was thought to be impossible. Thuswe have newly developed another illuminationsystem for the microscope. We found a lightguided ring-illumination device shows a better
Fig.1. Microscopic image of cells by newly
- 107 -
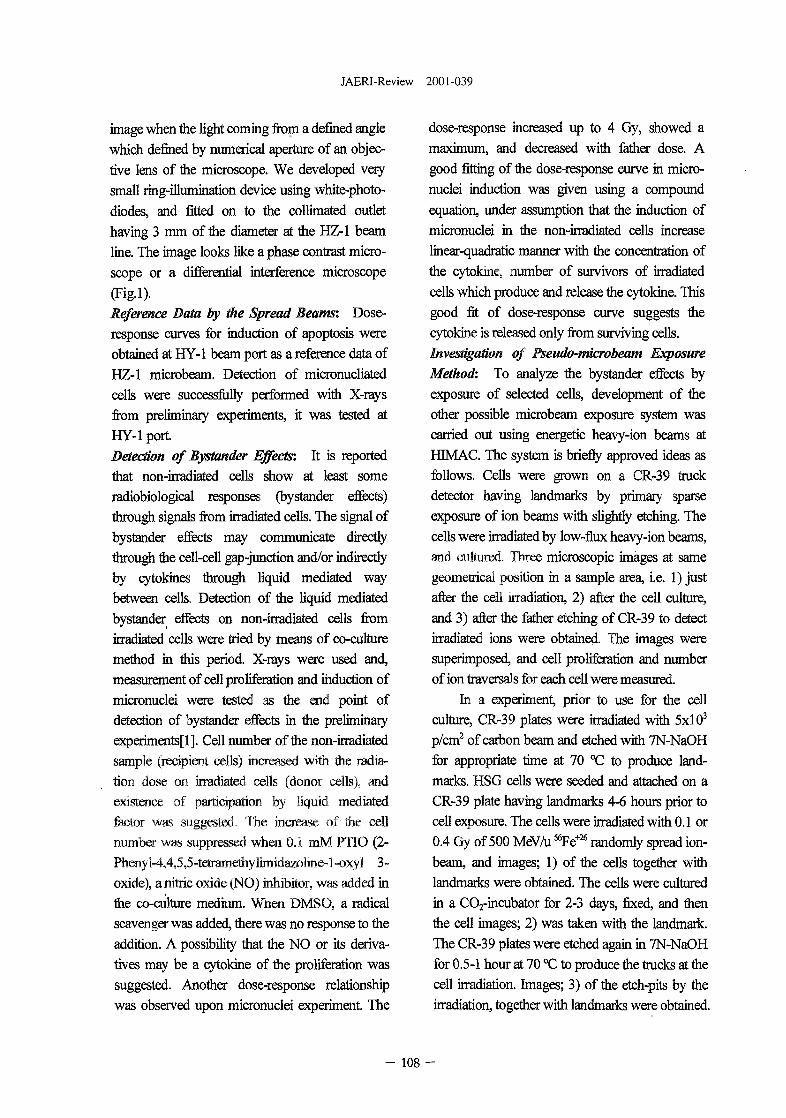
JAERI-Review 2001-039
image when Hie light coming from a defined angle
which defined by numerical aperture of an objec-
tive lens of the microscope. We developed very
small ring-illumination device using white-photo-
diodes, and fitted on to the collimated outlet
having 3 mm of the diameter at the HZ-1 beam
line. The image looks like a phase contrast micro-
scope or a differential interference microscope
(Fig.1).
Reference Data by the Spread Beams: Dose-response curves for induction of apoptosis were
obtained at HY-1 beam port as a reference data of
HZ-1 microbeam. Detection of micronucliated
cells were successfully performed with X-rays
from preliminary experiments, it was tested at
HY-1 port.
Detection of Bystander Effects'. It is reported
that non-irradiated cells show at least some
radiobiological responses (bystander effects)
through signals from irradiated cells. The signal of
bystander effects may communicate directly
through the cell-cell gap-junction and/or indirectly
by cytokines through liquid mediated way
between cells. Detection of the liquid mediated
bystander effects on non-irradiated cells from
irradiated cells were tried by means of co-culture
method in this period. X-rays were used and,
measurement of cell proliferation and induction of
micronuclel were tested as the end point of
detection of bystander effects in the preliminary
experiments[l]. Cell number of the non-irradiated
sample (recipient cells) increased with the radia-
tion dose on irradiated cells (donor cells), and
existence of participation by liquid mediated
factor was suggested. The increase of the cell
number was suppressed when 0.1 rnM FI1O (2-
Phenyl-4,4,5,5-tetiamethylimidazoline-l -oxyl 3-
oxide), a nitric oxide (NO) inhibitor, was added in
the co-culture medium. When DMSO, a radical
scavenger was added, there was no response to the
addition. A possibility that the NO or its deriva-
tives may be a cytokine of the proliferation was
suggested. Another dose-response relationship
was observed upon micronuclei experiment. The
dose-response increased up to 4 Gy, showed a
maximum, and decreased with father dose. A
good fitting of the dose-response curve in micro-
nuclei induction was given using a compound
equation, under assumption that the induction of
micronuclei in the non-irradiated cells increase
linear-quadratic manner with the concentration of
the cytokine, number of survivors of irradiated
cells which produce and release the cytokine. This
good fit of dose-response curve suggests the
cytokine is released only from surviving cells.
Investigation of Pseudo-microbeatn Exposure
Method: To analyze the bystander effects by
exposure of selected cells, development of the
other possible microbeam exposure system was
carried out using energetic heavy-ion beams at
HMAC. The system is briefly approved ideas as
follows. Cells were grown on a CR-39 truck
detector having landmarks by primary sparse
exposure of ion beams with slightly etching. The
cells were irradiated by low-flux heavy-ion beams,
and cultured. Three microscopic images at same
geometrical position in a sample area, i.e. 1) just
after the cell irradiation, 2) after the cell culture,
and 3) after the father etching of CR-39 to detect
irradiated ions were obtained. The images were
superimposed, and cell proliferation and number
of ion traversals for each cell were measured.
In a experiment, prior to use for the cell
culture, CR-39 plates were irradiated with 5x10³
p/cm2 of carbon beam and etched with 7N-NaOH
for appropriate time at 70 °C to produce land-
marks. HSG cells were seeded and attached on a
CR-39 plate having landmarks 4-6 hours prior to
cell exposure. The cells were irradiated with 0.1 or
0.4 Gy of 500 MeV/u *Fe+16 randomly spread ion-
beam, and images; 1) of the cells together with
landmarks were obtained. The cells were cultured
in a CO2-incubator for 2-3 days, fixed, and then
the cell images; 2) was taken with the landmark.
The CR-39 plates were etched again in 7N-NaOH
for 0.5-1 hour at 70 °C to produce the trucks at the
cell irradiation. Images; 3) of the etch-pits by the
irradiation, together with landmarks were obtained.
- 108 -
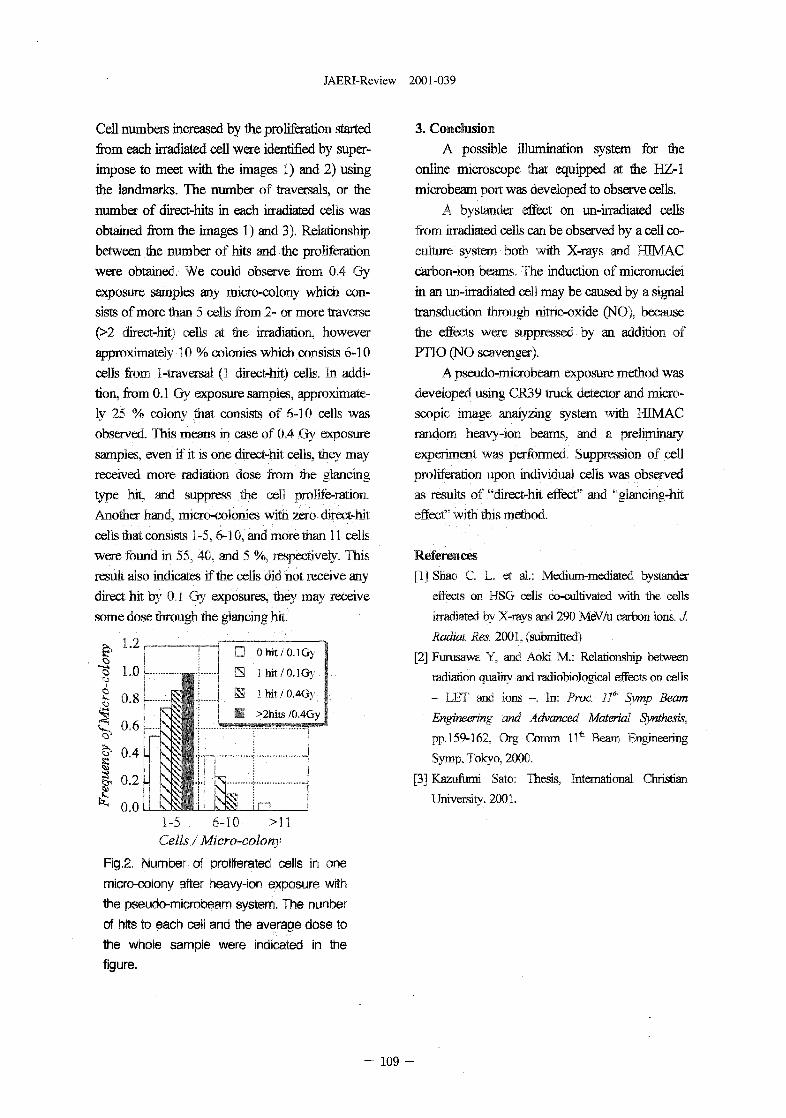
JAERI-Review 2001-039
Cell numbers increased by the proliferation started
from each irradiated cell were identified by super-
impose to meet with the images 1) and 2) using
the landmarks. The number of traversals, or the
number of direct-hits in each irradiated cells was
obtained from the images 1) and 3). Relationship
between the number of hits and the proliferation
were obtained. We could observe from 0.4 Gy
exposure samples any micro-colony which con-
sists of more than 5 cells from .2- or more traverse
(>2 direct-hit) cells at fee irradiation, however
approximately 10 % colonies which consists 6-10
cells from 1-traversal (1 direct-hit) cells. In addi-
tion, from 0.1 Gy exposure samples, approximate-
ly 25 % colony that consists of 6-10 cells was
observed. This means in case of 0.4 Gy exposure
samples, even if it is one direct-hit cells, they may
received more radiation dose from the glancing
type hit, and suppress me cell prolife-ration.
Anoiier hand, micro-colonies with zero direct-hit
cells mat consists 1-5,6-10, and more man 11 cells
were found in 55, 40, and 5 %. respectively. This
result also indicates if the cells did not receive any
direct hit by 0.1 Gy exposures, they may receive
some dose through the glancing hit.
D Ohit/O.IGy
H ihit/O.lGy
I hit/0.4Gy
>2hits /0.4Gy
1-5 6-10 >11Cells / Micro-colony
Fig.2. Number of proliferated cells in one
micro-colony after heavy-ion exposure with
the pseudo-microbeam system. The nunber
of hits to each cell and the average dose to
the whole sample were indicated in the
figure.
3. Conclusion
A possible illumination system for the
online microscope that equipped at the HZ-1
microbeam port was developed to observe cells.
A bystander effect on un-irradiated cells
from irradiated cells can be observed by a cell co-
culture system both with X-rays and HIMAC
carbon-ion beams. The induction of micronuclei
in an un-irradiated cell may be caused by a signal
transduction through nitric-oxide (NO), because
the effects were suppressed by an addition of
PTIO (NO scavenger).
A pseudo-microbeam exposure method was
developed using CR39 truck detector and micro-
scopic image analyzing system with HIMAC
random heavy-ion beams, and a preliminary
experiment was performed. Suppression of cell
proliferation upon individual cells was observed
as results of "direct-hit effect" and "glancing-hit
effect" with this method.
References
[1] Shao C. L. et al.: Medium-mediated bystander
effects on HSG cells co-cultivated with the cells
irradiated by X-rays and 290 MeV/u carbon ions. J.
Radktt. Res. 2001. (submitted)
[2] Furusawa Y. and Aoki M,: Relationship between
radiation quality and radiobiological effects on cells
- LET and ions —. In: Proc. 11" Symp Beam
Engineering and Advanced Material Synthesis,
pp. 159-162, Org Comm 11th Beam Engineering
Symp, Tokyo, 2000.
[3] Kazufumi Sato: Thesis, International Christian
University, 2001.
- 109 -
JAERI-Review 2001-039
2.32 Fundamental Study on Radiotherapy of Tumors to
Beneficial Companion Animals using Heavy Ion Beam
S,Wadaa, M.Natsuhori3, N.Ito3
Y.Kobayashf T.Funayama", K.Yamamotob
''Department of Veterinary Medicine,Kitasato UniversitybDepartment of Radiation Research for Environment and Resources,JAERI
1.IntroductionRecently, beneficial companion
animals that assist the people bothmentally and physically, and that highlycontribute to the people in manyoccasions have risen in their estimation.As companion animals can live muchlonger than before because ofimprovement of their breeding conditionand preventive medicine, the incidence ofaging-related disorders and neoplasmformation are increasing. So theapplication of radiotherapy in theveterinary medicine increases as one oftreatments against tumor. But differenttumor types have differentradiosensitivity1) respectively. It isimportant to determine the intrinsicradiosensitivity of its tumor to individualpatient in advance for curing of tumoreffectively, increasing local control andreducing morbidity. Especially there arenot biological fundamental data enoughon the radiotherapy against canine andfeline tumor by using ion beam. It isessential for effective radiotherapy withhigh LET radiation as well as low LET toestablish the predictive assay andbiological parameters that can rapidly
evaluate radiosensitivity of the tumors.To examine the correlation between thedouble-strand breaks (DSB) and the cellsurvival as radiation effect, we measuredDSB by using the single cell gelelectrophoresis (comet assay) that israpid and. easy method.
2.Materials and methodsCell lines used for this experiment
were squamous cell carcinomas,fibrosarcoma and hemangiopericytomathat originated from, spontaneouslygenerated canine tumor. Cell lines werekept and grown in MEM medium with10% serum supplemented. These wereincubated at 37 °C n mmidifiedatmosphere of 95% air im -5% carbondioxide mixture. Thest .-ells wereirradiated 12C ion beams HI 22<) MeV (108keV///m) or 7 ray radianm. (60Co- Jsource) at a dose rate of 2.f 'jry/min. Thesurvival rates were fitteu < the linear-quadratic model, and the-^mvival fractionat 2Gy (SF2) as the in a ex »f the cellkilling by radiation was calculated fromthe survival curves^'.
On the irradiation of J -rays, I x 10s
cell/ml cells suspended in medium wereirradiated. On the irradiation of carbon
110
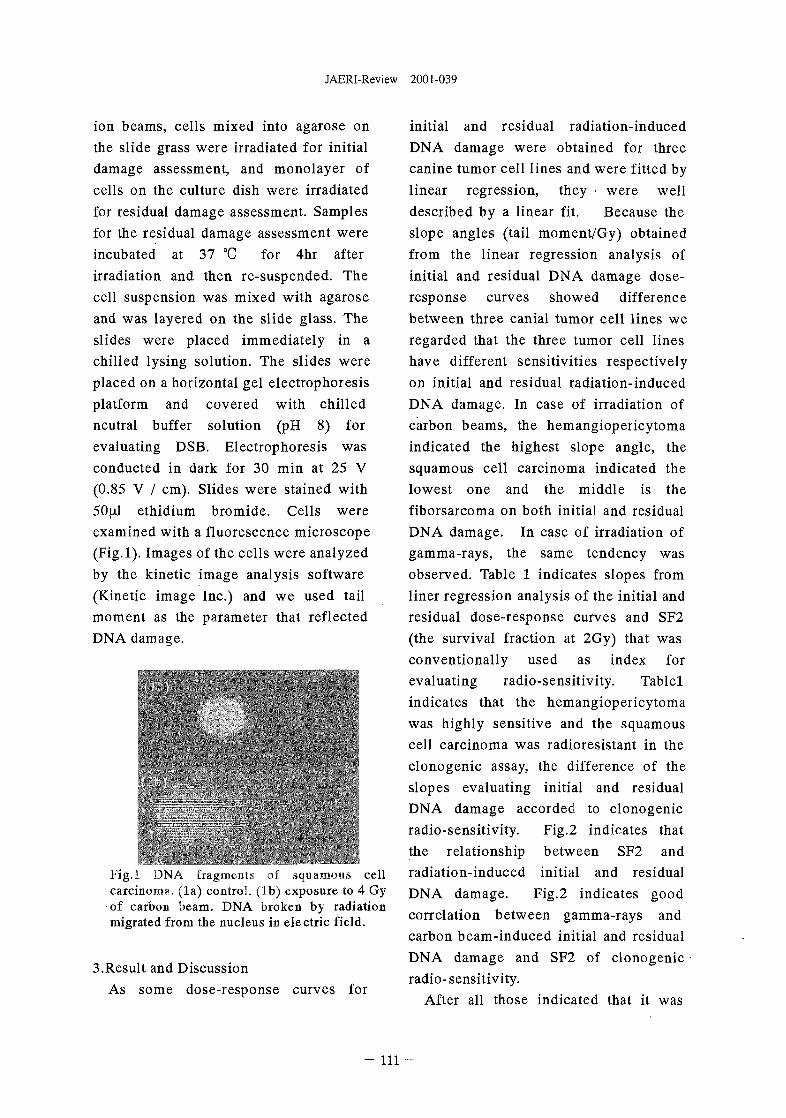
JAERI-Review 2001-039
ion beams, cells mixed into agarose onthe slide grass were irradiated for initialdamage assessment, and monolayer ofcells on the culture dish were irradiatedfor residual damage assessment. Samplesfor the residual damage assessment wereincubated at 37 °C for 4hr afterirradiation and then re-suspended. Thecell suspension was mixed with agaroseand was layered on the slide glass. Theslides were placed immediately in achilled lysing solution. The slides wereplaced on a horizontal gel electrophoresisplatform and covered with chilledneutral buffer solution (pH 8) forevaluating DSB. Electrophoresis wasconducted in dark for 30 min at 25 V(0.85 V / cm). Slides were stained with50^1 ethidium bromide. Cells wereexamined with a fluorescence microscope(Fig.l). Images of the cells were analyzedby the kinetic image analysis software(Kinetic image Inc.) and we used tailmoment as the parameter that reflectedDNA damage.
Fig.l DNA fragments of squamous cellcarcinoma, (la) control, (lb) exposure to 4 Gyof carbon beam. DNA broken by radiationmigrated from the nucleus in electric field.
3.Result and DiscussionAs some dose-response curves for
initial and residual radiation-inducedDNA damage were obtained for threecanine tumor cell lines and were fitted bylinear regression, they • were welldescribed by a linear fit. Because theslope angles (tail moment/Gy) obtainedfrom the linear regression analysis ofinitial and residual DNA damage dose-response curves showed differencebetween three canial tumor cell lines weregarded that the three tumor cell lineshave different sensitivities respectivelyon initial and residual radiation-inducedDNA damage. In case of irradiation ofcarbon beams, the hemangiopericytomaindicated the highest slope angle, thesquamous cell carcinoma indicated thelowest one and the middle is thefiborsarcoma on both initial and residualDNA damage. In case of irradiation ofgamma-rays, the same tendency wasobserved. Table 1 indicates slopes fromliner regression analysis of the initial andresidual dose-response curves and SF2(the survival fraction at 2Gy) that wasconventionally used as index forevaluating radio-sensitivity. Tablelindicates that the hemangiopericytomawas highly sensitive and the squamouscell carcinoma was radioresistant in theclonogenic assay, the difference of theslopes evaluating initial and residualDNA damage accorded to clonogenicradio-sensitivity. Fig.2 indicates thatthe relationship between SF2 andradiation-induced initial and residualDNA damage. Fig.2 indicates goodcorrelation between gamma-rays andcarbon beam-induced initial and residualDNA damage and SF2 of clonogenicradio-sensitivity.
After all those indicated that it was
- Ill -
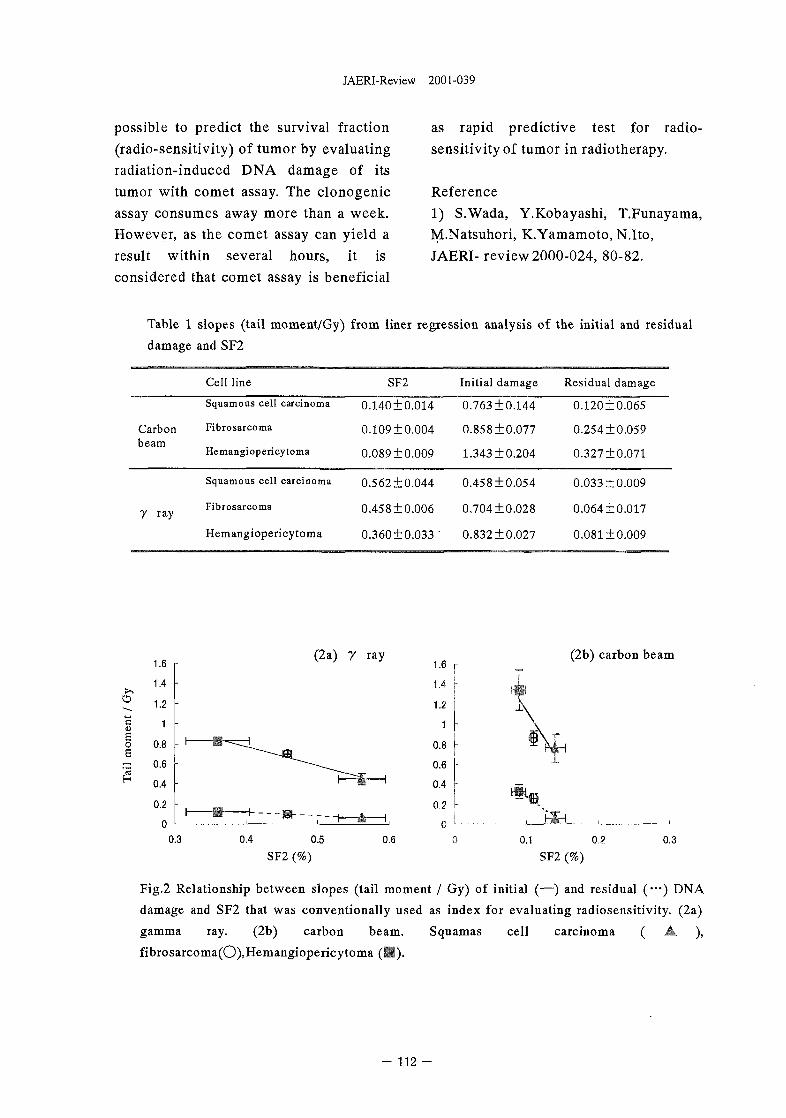
JAERI-Review 2001-039
possible to predict the survival fraction(radio-sensitivity) of tumor by evaluatingradiation-induced DNA damage of itstumor with comet assay. The clonogenicassay consumes away more than a week.However, as the comet assay can yield aresult within several hours, it isconsidered that comet assay is beneficial
as rapid predictive test for radio-sensitivity of tumor in radiotherapy.
Reference1) S.Wada, Y.Kobayashi, T.Funayama,M.Natsuhori, K.Yamamoto, N.Ito,JAERI- review 2000-024, 80-82.
Table 1 slopes (tail moment/Gy) from liner regression analysis of the initial and residual
damage and SF2
Carbonbeam
y ray
Cell line
Squamous cell carcinoma
Fibrosarcoma
Hemangiopericytoma
Squamous cell carcinoma
Fibrosarcoma
Hemangiopericytoma
SF2
0.140±0.014
0.109±0.004
0.089 ±0.009
0.562±0.044
0.458±0.006
0.360±0.033 •
Initial damage
0.763±0.144
0.858 + 0.077
1.343 ±0.204
0.458±0.054
0.704±0.028
0.832 ±0.027
Residual damage
0.120±0.065
0.254 ±0.059
0.327±0.071
0.033 ±0.009
0.064±0.017
0.081 ±0.009
©
o
£
1.6
1.4
1.2
0.8
0.6
0.4
0.2
0
0.3
(2a) 7 ray
1-=* 1
0.4 0.5 0.6
SF2 (%)
1.6 r
i
1.4 \
1.2
1
0.8
0.6
0.4 r
0.2 \
0 L-0
(2b) carbon beam
" \
0.1 0.2SF2 (%)
0.3
Fig.2 Relationship between slopes (tail moment / Gy) of initial (—) and residual (•••) DNA
damage and SF2 that was conventionally used as index for evaluating radiosensitivity. (2a)
gamma ray. (2b) carbon beam. Squamas cell carcinoma ( A ),
fibrosarcoma(0),Hemangiopericytoma (11).
- 112 -
JAERI-Review 2001-039
3. Radiation Chemistry/Organic Materials
3.1 Study on Space Environment Durability of Newly Developed Polymeric Materialsfor Spacecraft (II) 115
F.Imai, M.Iwata, Y.Nakayama, K.Imagawa, M.Sugimoto, N.Morishita, andS.Tanaka
3.2 Preparation of Ion Track Membranes and Their Separation Characteristics ofPeptide Molecules 118
M.Asano, H.Koshikawa, Y.Maekawa, M.Yoshida, T.Kume, and K.Ogura3.3 Application of Thin Film Dosimeters to Measurement of Ion Beam Dose
Distribution II 120T.Kojima, H.Sunaga, H.Takizawa, H.Hanaya, and H.Tachibana
3.4 Cross-linking of Polydimethylsiloxane in Heavy Ion Tracks 122H.Koizumi, M.Taguchi, Y.Kobayashi, and T.Ichikawa
3.5 Nano-wire Formation along Ion Projectiles in Polysilane Thin Films 125S.Seki, K.Maeda, Y.Yoshida, S.Tagawa, M.Sugimoto, and S.Tanaka
3.6 Primary Process of Radiation Chemistry Studied by Ion Pulse Radiolysis 129Y.Yoshida, S.Seki, A.Saeki, K.Okamoto, S.Tagawa, M.Taguchi, and H.Namba,
3.7 Measurement of Energy Deposition Around the Heavy Ion Trajectory by PhotonCounting Method 131
M.Taguchi, H.Namba, and S.Ohno
- 113 -
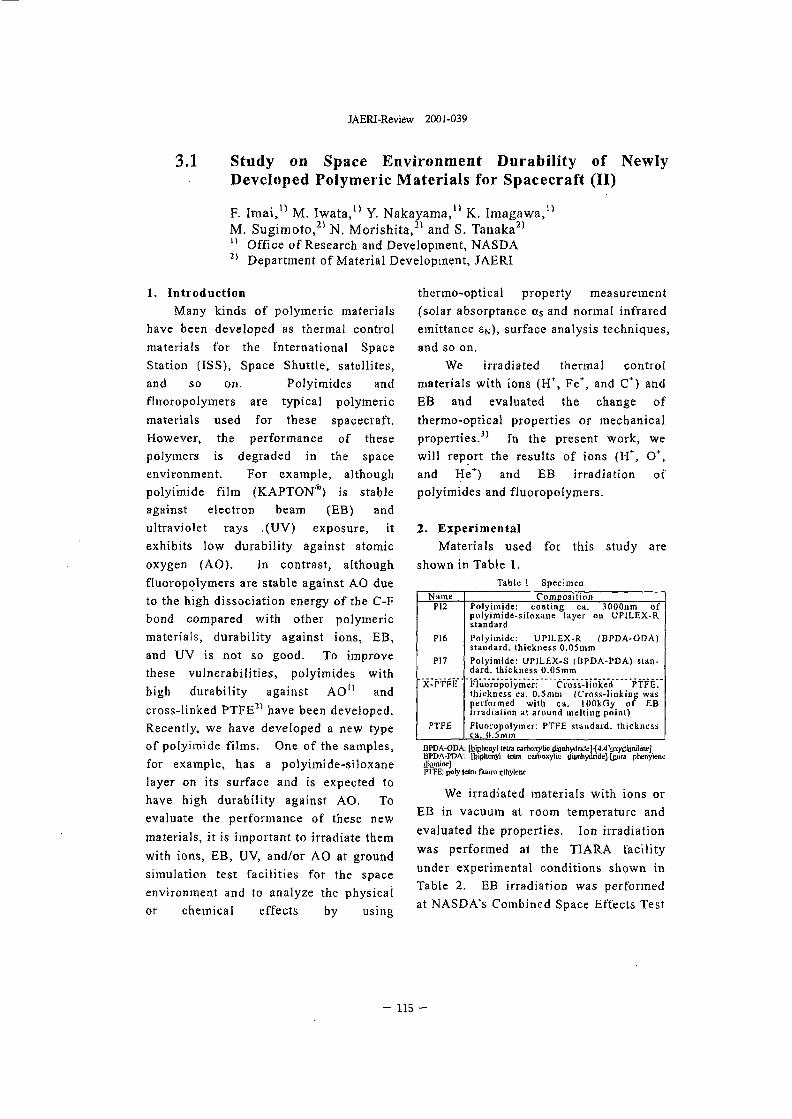
JAERI-Review 2001-039
3.1 Study on Space Environment Durability of NewlyDeveloped Polymeric Materials for Spacecraft (II)
nF. Imai, M. Iwata, Y. Nakayama, K. Imagawa,M. Sugimoto,21 N. Morishita,21 and S. Tanaka21
" Office of Research and Development, NASDADepartment of Material Development, JAERI
n
2)
1. IntroductionMany kinds of polymeric materials
have been developed as thermal controlmaterials for the International SpaceStation (ISS), Space Shuttle, satellites,and so on. Polyimides andfluoropolymers are typical polymericmaterials used for these spacecraft.However, the performance of thesepolymers is degraded in the spaceenvironment. For example, althoughpolyimide film (KAPTON1*) is stableagainst electron beam (EB) andultraviolet rays (UV) exposure, itexhibits low durability against atomicoxygen (AO). In contrast, althoughfluoropolymers are stable against AO dueto the high dissociation energy of the C-Fbond compared with other polymericmaterials, durability against ions, EB,and UV is not so good. To improvethese vulnerabilities, polyimides withhigh durability against AOn andcross-linked PTFE21 have been developed.Recently, we have developed a new typeof polyimide films. One of the samples,for example, has a polyimide-siloxanelayer on its surface and is expected tohave high durability against AO. Toevaluate the performance of these newmaterials, it is important to irradiate themwith ions, EB, UV, and/or AO at groundsimulation test facilities for the spaceenvironment and to analyze the physicalor chemical effects by using
thermo-optical property measurement(solar absorptance as and normal infraredemittance SN), surface analysis techniques,and so on.
We irradiated thermal controlmaterials with ions (H\ Fe+, and C*) andEB and evaluated the change ofthermo-optical properties or mechanicalproperties.3' In the present work, wewill report the results of ions (H+, O+,and He+) and EB irradiation ofpolyimides and fluoropolymers.
2. ExperimentalMaterials used for this study are
shown in Table 1.Table 1 Specimen
NamePI2
P16
PI7
X-PTFE
PTF£
CompositionPolyimide: coating c». 3OO0nm ofpolyimide-siloxane layer ou UPILEX-R.standard
Polyimide: UPILEX-R (BPDA-ODA)standard, thickness 0.05mm
Polyimide: UP1LEX-S (BPDA-PDA) stan-dard, thickness 0.05mm
FiuoVo'polymen Cross-linked" PTFE"'thickness ca. 0.5mm (Cross-linking wasperformed with ca. lOOkGy of EBirradiation at around melting point)
Fluoropolymer. PTFE standard, thicknessca. 0.5mm
BPDA-ODA: (Ijijihenyl leira c a r t a y l i c j J i n ^ H ^ u y s l a jBPDA-PDA: [biphenyl tetra carboxylic (Jignhydriifc]-[pura phenyleneiltamine)PTFE: poly lclra fluoro elhylene
We irradiated materials with ions orEB in vacuum at room temperature andevaluated the properties. Ion irradiationwas performed at the TIARA facilityunder experimental conditions shown inTable 2. EB irradiation was performedat NASDA's Combined Space Effects Test
- 1 1 5 -
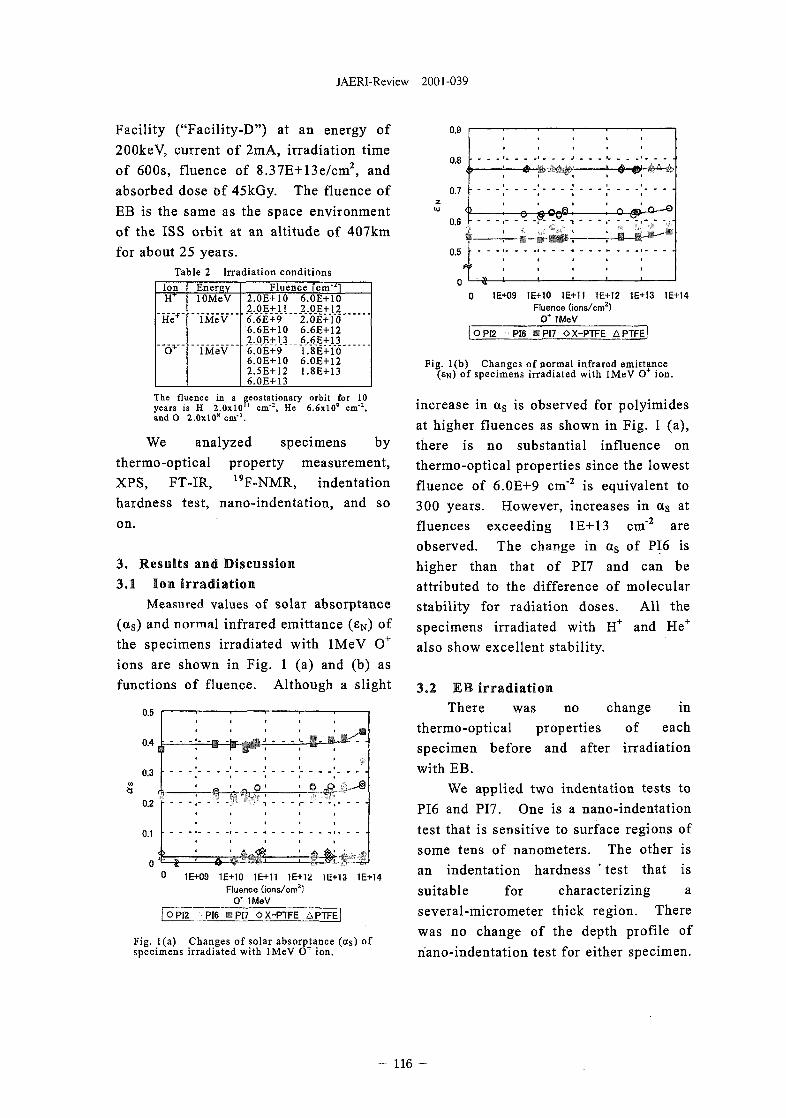
JAERI-Review 2001-039
Facility ("Facility-D") at an energy of200keV, current of 2mA, irradiation timeof 600s, fluence of 8.37E+13e/cm2, andabsorbed dose of 45kGy. The fluence ofEB is the same as the space environmentof the ISS orbit at an altitude of 407kmfor about 25 years.
Table 2 Irradiation conditionsIonIT
He+
O +
EnergylOMeV
lMeV
lMeV
Fluence [cm-i]2.0E+10 6.0E+102.0E+11 2.0E+126.6E+9 2.0E+106.6E+10 6.6E+122.0E+13 6.6E+136.0E+9 1.8E+106.0E+10 6.0E+122.5E+12 1.8E+136.0E+13
The fluence in a geostationary orbit for 10years is H 2.0x10" cnV2, He 6.6x10' cm'1,and O 2.0x10" cm"2.
We analyzed specimens bythermo-optical property measurement,XPS, FT-IR, 19F-NMR, indentationhardness test, nano-indentation, and soon.
3. Results and Discussion3.1 Ion irradiation
Measured values of solar absorptance(as) and normal infrared emittance (eN) ofthe specimens irradiated with lMeV O+
ions are shown in Fig. 1 (a) and (b) asfunctions of fluence. Although a slight
0.5
0.4
0.3
0.2
0.1
I I
A—
<»
- - •- - • » -, H
hr - • - ' " J -M ±-~- .
^ 0 '
. . L n,.. '. S?.
: :-M ~0 1E+09 1E+10 1E+11 1E+12 1E+13 1E+14
Fluence (ions/cm2)0* 1MeV
JOPI2 PI6 «PI7 OX-PTFE ]
0.9
0.8
0.7
0.6
0.5
4 3 -
0 1E+09 1E+10 1E+11 1E+12 1E+13 1E+14Fluenoe (ions/cm2)
0* IMeV
(OPI2 PI6 «P17 OX-PTFE APTFJI
Fig. l(b) Changes of normal infrared emittance(«N) of specimens irradiated with lMeV O+ ion.
increase in as is observed for polyimidesat higher fluences as shown in Fig. 1 (a),there is no substantial influence onthermo-optical properties since the lowestfluence of 6.0E+9 cm'2 is equivalent to300 years. However, increases in as atfluences exceeding 1E+13 cm"2 areobserved. The change in as of PI6 ishigher than that of PI7 and can beattributed to the difference of molecularstability for radiation doses. All thespecimens irradiated with H+ and He+
also show excellent stability.
Fig. l(a) Changes of solar absorptance (as) ofspecimens irradiated with lMeV O+ ion.
3.2 EB irradiationThere was no change in
thermo-optical properties of eachspecimen before and after irradiationwith EB.
We applied two indentation tests toPI6 and PI7. One is a nano-indentationtest that is sensitive to surface regions ofsome tens of nanometers. The other isan indentation hardness ' test that issuitable for characterizing aseveral-micrometer thick region. Therewas no change of the depth profile ofriano-indentation test for either specimen.
- 116
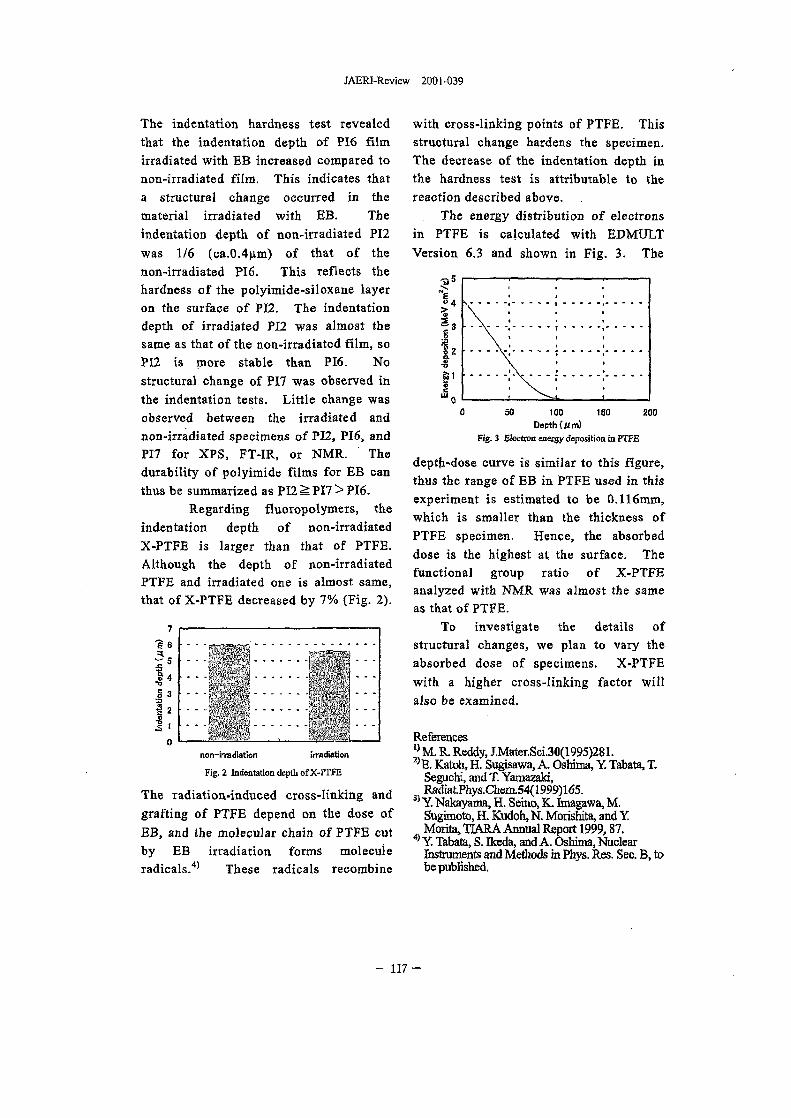
JAERI-Review 2001-039
The indentation hardness test revealedthat the indentation depth of PI6 filmirradiated with EB increased compared tonon-irradiated film. This indicates thata structural change occurred in thematerial irradiated with EB. Theindentation depth of non-irradiated PI2was 1/6 (ca.0.4um) of that of thenon-irradiated PI6. This reflects thehardness of the polyimide-siloxane layeron the surface of PI2. The indentationdepth of irradiated PI2 was almost thesame as that of the non-irradiated film, soPI2 is more stable than PI6. Nostructural change of PI7 was observed inthe indentation tests. Little change wasobserved between the irradiated andnon-irradiated specimens of PI2, PI6, andPI7 for XPS, FT-IR, or NMR. Thedurability of polyimide films for EB canthus be summarized as PI2 PI7 > PI6.
Regarding fluoropolymers, theindentation depth of non-irradiatedX-PTFE is larger than that of PTFE.Although the depth of non-irradiatedPTFE and irradiated one is almost same,that of X-PTFE decreased by 7% (Fig. 2).
7
t 6 • • - - - - —
F
j
§333
1:0
non-irradiation irradiation
Fig. 2 Indentation depth ofX-PTFE
The radiation-induced cross-linking andgrafting of PTFE depend on the dose ofEB, and the molecular chain of PTFE cutby EB irradiation forms moleculeradicals.4' These radicals recombine
with cross-linking points of PTFE. Thisstructural change hardens the specimen.The decrease of the indentation depth inthe hardness test is attributable to thereaction described above.
The energy distribution of electronsin PTFE is calculated with EDMULTVersion 6.3 and shown in Fig. 3. The
-a 5
°4
•8SSI
50 ISO100Depth (wm)
Fig. 3 Electron energy deposition in PTFE
200
depth-dose curve is similar to this figure,thus the range of EB in PTFE used in thisexperiment is estimated to be 0.116mm,which is smaller than the thickness ofPTFE specimen. Hence, the absorbeddose is the highest at the surface. Thefunctional group ratio of X-PTFEanalyzed with NMR was almost the sameas that of PTFE.
To investigate the details ofstructural changes, we plan to vary theabsorbed dose of specimens. X-PTFEwith a higher cross-linking factor willalso be examined.
Referencesl) M. R. Reddy, J.Mater.Sci J0(1995)281.^E. Katoh, H. Sugisawa, A. Oshima, Y. Tabata, T.
Segucbi, and T. Yamazaki,Radiat.Phys.Chem.54(1999)165.
3) Y. Nakayama, H. Seino, K. Imagawa, M.Sugimoto, H. Kudoh, N. Morishita, and Y.Morita, TIARA Annual Report 1999,87.
4> Y. Tabata, S. Bceda, and A. Oshima, NuclearInstruments and Me&ods in Phys. Res. Sec. B, tobe published.
- 1 1 7 -
JAERI-Review 2001-039
3.2 Preparation of Ion track membranes and their separationcharacteristics of peptide molecules
M. Asano!), H. Koshikawa0, Y. Maekawa]), M. Yoshida0, T. Kume°,
and K. Ogura2)
'department of Material Development, JAERI2)College of Industrial Technology, Nihon University
1. IntroductionHeavy ion-beam deposits energy locally
concentrated along the ion-path through thematerials. This induces nanoscopic damagesufficient for the ion-path to be susceptible todevelopment in an etchant, resulting in theformation of through-holes with uniform size.These membranes are used as the separationfilters for radioactive wastes of nuclear powerplants. Since their pore sizes are easilycontrolled by the kind of ion particles andetching conditions, these membranes arefurther expected to be applied to preciselycontrolled selective separation membranes. Wereported that polyethylene terephthalate (PET)membranes with different pore diameters areapplied to size-exclusion membranes; thepolyethylene glycols with the mol ecular weightof 106 to 70,000, are clearly separated to eachother by changing the pore diameter0. In thisreport, we describe the preparation of the PETand diethyleneglycol-bis-allylcarbonate(PEGAC) membranes with nanometer scalepore diameters using highly diluted alkalineetchant and their application to separate theproteins in blood, albumin (BSA) and y -globulin (IgG).
2. ExperimentalThe PEGAC film was prepared according
to a conventional cast polymerization with 3wt% of di-2-propylperoxydicarbonate (EPP) asa radical initiator at 70 °C for 24 hours. The
films are irradiated with Xe and Ar ions withthe energy of 450 and 520 MeV, respectively,using TIARA cyclotron of Japan AtomicEnergy Research Institute (Takasaki, Japan) andAu ions with the energy of 11.4MeV/n usingUNILAC of GSI (Darmstadt, Germany). Theirradiated films were etched in 0.1 - 0.3 NNaOH at 70 °C. The samples were etched in aconductometric cell made of Teflon. Theetching was monitored by simultaneousmeasurements of the electric conductivity usinga conductometer (712, Metrohm Ltd.,Switzerland) to determine the breakthroughtime of pore through membranes. The porediameters were determined using a scanningelectron microscope (SEM). The separationexperiments of the blood proteins wereperformed using a permeation measurementapparatus "Demonstrator" developed bycollaboration of GSI and JAERI; thepermeation of the proteins through themembranes was determined by a gelpermeation chromatography (GPC).
3. Results and Discussion3.1 Preparation of ion track membranes
Figure 1 shows the pore diameter of PET(38 urn thickness), as a function of etchingtime in 0.1, 0.2, and 0.3 N NaOH at 70 °C.The PET membranes were irradiated with Xeions (450 MeV, 1.0 x 10¹⁰ ions/cm2 fluence)before etching. The plots of the pore diameterto the etching time exhibited two linear relation
- 118 -
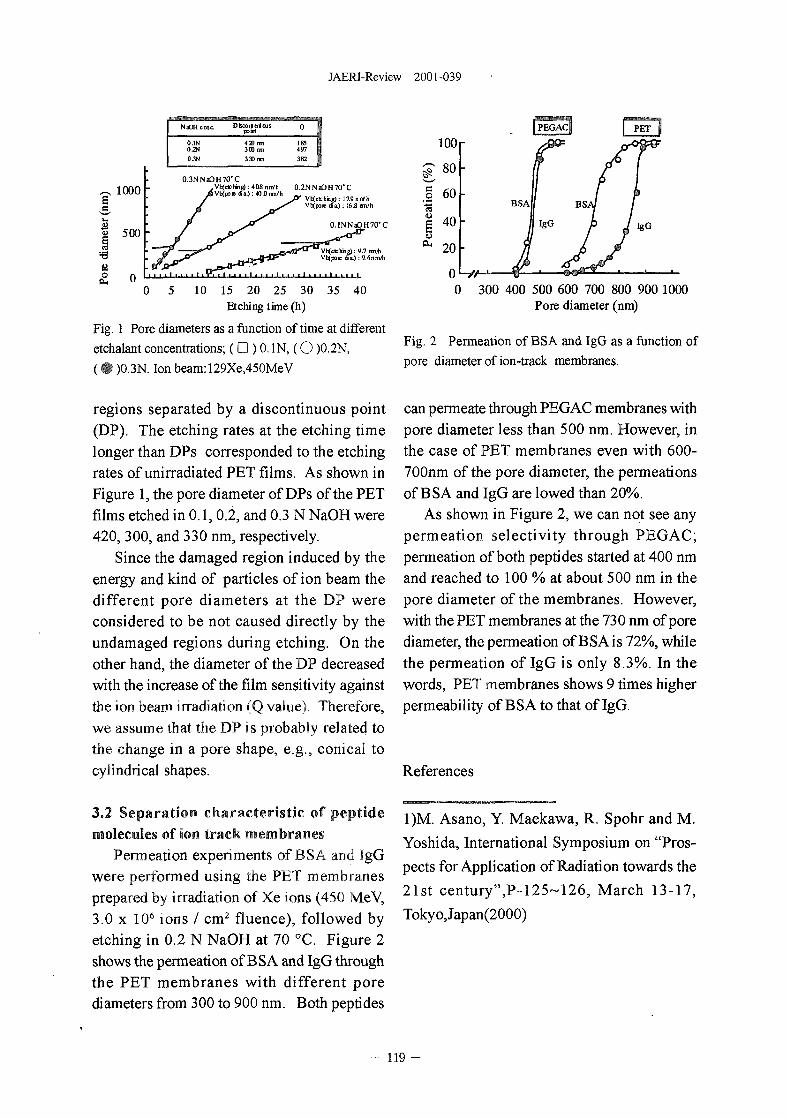
JAERI-Review 2001-039
l(X)0
oo
500
0
DscoijaiaitpOBIt
0.1N0.2N
420 nm300 mi
185497382
0.3NNaOH70*C.Vb(dcNng : 408 nnVhV b t & ) m O l l
0.2NNiOH7<rC(etching): 17.9nirfh(poicita.): 16.8 m/h
0.1NNaOH70"C
0 10 15 20 25 30 35 40Etching time (h)
Fig. 1 Pore diameters as a function of time at different
etchalant concentrations; ( • ) 0. IN, ( O )0.2N,
( O )0.3N. Ion beam:129Xe,450MeV
regions separated by a discontinuous point(DP). The etching rates at the etching timelonger than DPs corresponded to the etchingrates of unirradiated PET films. As shown inFigure 1, the pore diameter of DPs of the PETfilms etched in 0.1, 0.2, and 0.3 N NaOH were420, 300, and 330 nm, respectively.
Since the damaged region induced by theenergy and kind of particles of ion beam thedifferent pore diameters at the DP wereconsidered to be not caused directly by theundamaged regions during etching. On theother hand, the diameter of the DP decreasedwith the increase of the film sensitivity againstthe ion beam irradiation (Q value). Therefore,we assume that the DP is probably related tothe change in a pore shape, e.g., conical tocylindrical shapes.
3.2 Separation characteristic of peptidemolecules of ion track membranes
Permeation experiments of BSA and IgGwere performed using the PET membranesprepared by irradiation of Xe ions (450 MeV,3.0 x 106 ions / cm2 fluence), followed byetching in 0.2 N NaOH at 70 °C. Figure 2shows the permeation of BSA and IgG throughthe PET membranes with different porediameters from 300 to 900 nm. Both peptides
0 300 400 500 600 700 800 900 1000Pore diameter (nm)
Fig. 2 Permeation of BSA and IgG as a function of
pore diameter of ion-track membranes.
can permeate through PEGAC membranes withpore diameter less than 500 nm. However, inthe case of PET membranes even with 600-700nm of the pore diameter, the permeationsof BSA and IgG are lowed than 20%.
As shown in Figure 2, we can not see anypermeation selectivity through PEGAC;permeation of both peptides started at 400 nmand reached to 100 % at about 500 nm in thepore diameter of the membranes. However,with the PET membranes at the 730 nm of porediameter, the permeation of BSA is 72%, whilethe permeation of IgG is only 8.3%. In thewords, PET membranes shows 9 times higherpermeability of BSA to that of IgG.
References
1)M. Asano, Y. Maekawa, R. Spohr and M.
Yoshida, International Symposium on "Pros-
pects for Application of Radiation towards the
21st century",P-125~126, March 13-17,
Tokyo,Japan(2000)
- 1 1 9 -
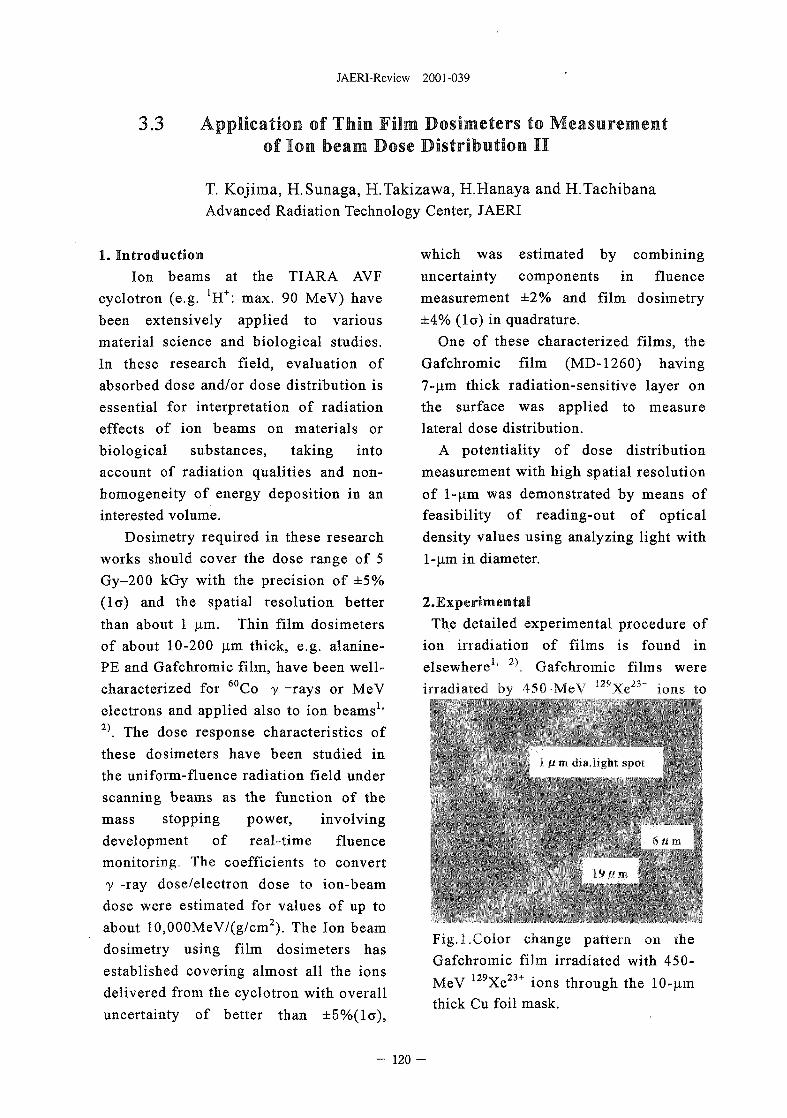
JAERI-Review 2001-039
3.3 Application of Thin Film Dosimeters to Measurementof Ion beam Dose Distribution II
T. Kojima, H.Sunaga, H.Takizawa, H.Hanaya and H.TachibanaAdvanced Radiation Technology Center, JAERI
1. IntroductionIon beams at the TIARA AVF
cyclotron (e.g. !H+: max. 90 MeV) havebeen extensively applied to variousmaterial science and biological studies.In these research field, evaluation ofabsorbed dose and/or dose distribution isessential for interpretation of radiationeffects of ion beams on materials orbiological substances, taking intoaccount of radiation qualities and non-homogeneity of energy deposition in aninterested volume.
Dosimetry required in these researchworks should cover the dose range of 5Gy-200 kGy with the precision of ±5%(lo) and the spatial resolution betterthan about 1 jim. Thin film dosimetersof about 10-200 nm thick, e.g. alanine-PE and Gafchromic film, have been well-characterized for 60Co y -rays or MeVelectrons and applied also to ion beams1'2). The dose response characteristics ofthese dosimeters have been studied inthe uniform-fluence radiation field underscanning beams as the function of themass stopping power, involvingdevelopment of real-time fluencemonitoring. The coefficients to converty -ray dose/electron dose to ion-beamdose were estimated for values of up toabout 10,000MeV/(g/cm2). The Ion beamdosimetry using film dosimeters hasestablished covering almost all the ionsdelivered from the cyclotron with overalluncertainty of better than ±5%(la),
which was estimated by combininguncertainty components in fluencemeasurement ±2% and film dosimetry±4% (la) in quadrature.
One of these characterized films, theGafchromic film (MD-1260) having7-|j,m thick radiation-sensitive layer onthe surface was applied to measurelateral dose distribution.
A potentiality of dose distributionmeasurement with high spatial resolutionof l-|i.m was demonstrated by means offeasibility of reading-out of opticaldensity values using analyzing light withl-|j.m in diameter.
2.ExperimentalThe detailed experimental procedure of
ion irradiation of films is found inelsewhere1' 2\ Gafchromic films wereirradiated by 450-MeV 129Xe23+ ions to
U TII inn hum smti
U II
Fig. 1.Color change pattern on theGafchromic film irradiated with 450-
MeV lzyXe2j+ ions through the 10-jimthick Cu foil mask.
120 -
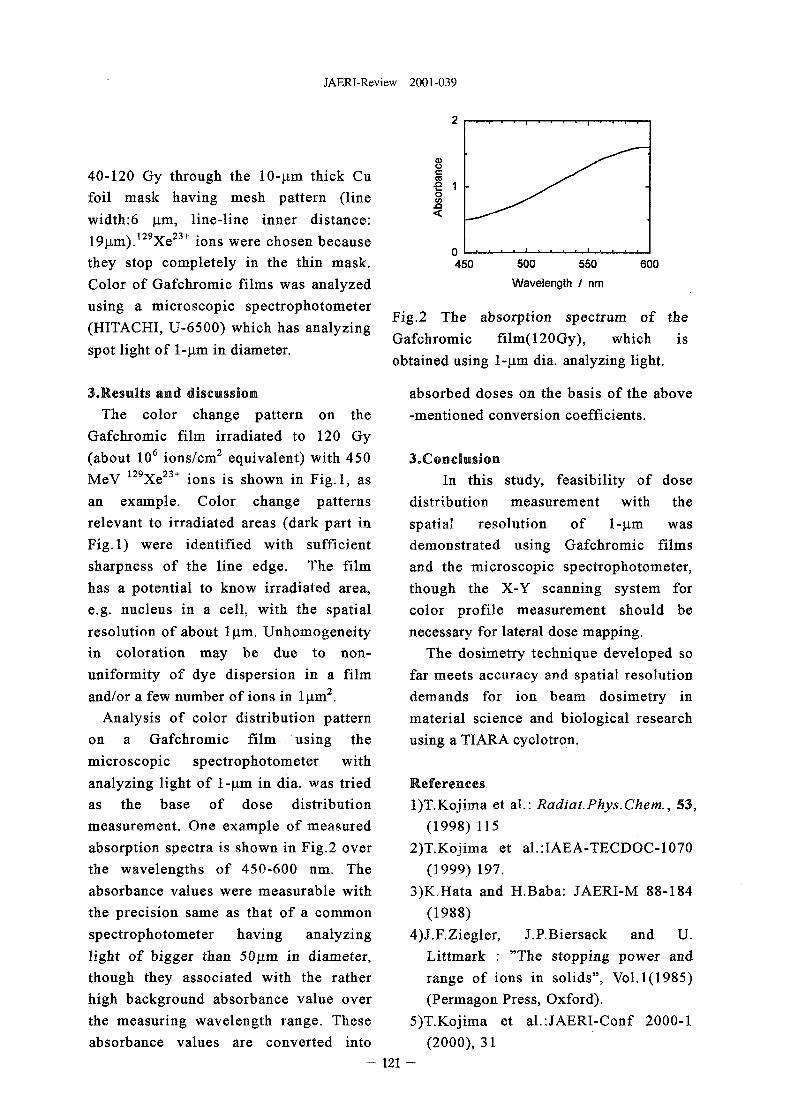
JAERI-Review 2001-039
40-120 Gy through the 10-|am thick Cufoil mask having mesh pattern (linewidth:6 jan, line-line inner distance:19(j.m).129Xe23+ ions were chosen becausethey stop completely in the thin mask.Color of Gafchromic films was analyzedusing a microscopic spectrophotometer(HITACHI, U-6500) which has analyzingspot light of 1-n.m in diameter.
3.Results and discussionThe color change pattern on the
Gafchromic film irradiated to 120 Gy(about 106 ions/cm2 equivalent) with 450MeV 129Xe23+ ions is shown in Fig.l, asan example. Color change patternsrelevant to irradiated areas (dark part inFig.l) were identified with sufficientsharpness of the line edge. The filmhas a potential to know irradiated area,e.g. nucleus in a cell, with the spatialresolution of about l|j.m. Unhomogeneityin coloration may be due to non-uniformity of dye dispersion in a filmand/or a few number of ions in ljim2.
Analysis of color distribution patternon a Gafchromic film using themicroscopic spectrophotometer withanalyzing light of 1-jj.m in dia. was triedas the base of dose distributionmeasurement. One example of measuredabsorption spectra is shown in Fig.2 overthe wavelengths of 450-600 nm. Theabsorbance values were measurable withthe precision same as that of a commonspectrophotometer having analyzinglight of bigger than 50|j.m in diameter,though they associated with the ratherhigh background absorbance value overthe measuring wavelength range. Theseabsorbance values are converted into
450 500 550
Wavelength / nm600
Fig.2 The absorption spectrum of theGafchromic film(120Gy), which isobtained using l-|j.m dia. analyzing light.
absorbed doses on the basis of the above-mentioned conversion coefficients.
3.ConclusionIn this study, feasibility of dose
distribution measurement with thespatial resolution of l-|im wasdemonstrated using Gafchromic filmsand the microscopic spectrophotometer,though the X-Y scanning system forcolor profile measurement should benecessary for lateral dose mapping.
The dosimetry technique developed sofar meets accuracy and spatial resolutiondemands for ion beam dosimetry inmaterial science and biological researchusing a TIARA cyclotron.
Referencesl)T.Kojima et al.: Radiat.Phys.Chem., S3,
(1998) 1152)T.Kojima et al.:IAEA-TECDOC-1070
(1999) 197.3)K.Hata and H.Baba: JAERI-M 88-184
(1988)4)J.F.Ziegler, J.P.Biersack and U.
Littmark : "The stopping power andrange of ions in solids", Vol. 1(1985)(Permagon Press, Oxford).
5)T.Kojima et al.:JAERI-Conf 2000-1(2000), 31
121 -
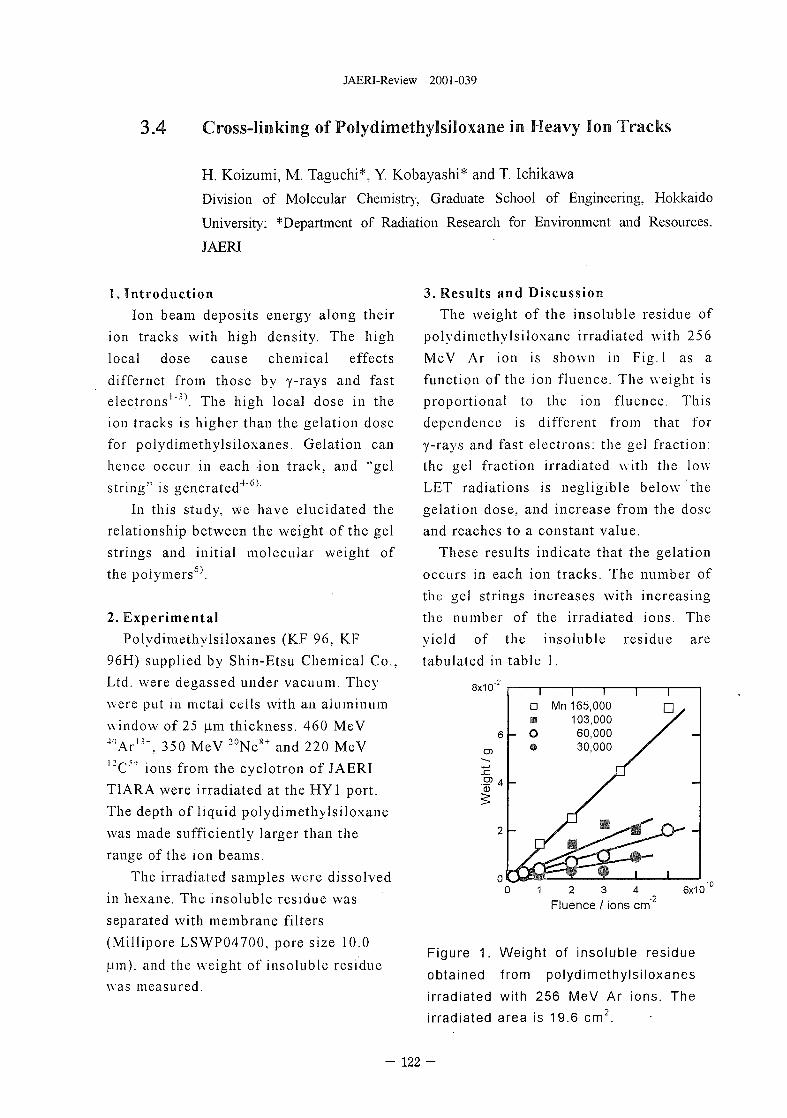
JAERI-Review 2001-039
3.4 Cross-linking of Polydimethylsiloxane in Heavy Ion Tracks
H. Koizumi, M. Taguchi*, Y. Kobayashi* and T. Ichikawa
Division of Molecular Chemistry. Graduate School of Engineering. Hokkaido
University: *Department of Radiation Research for Environment and Resources.
JAERI
1. IntroductionIon beam deposits energy along their
ion tracks with high density. The highlocal dose cause chemical effectsdiffernet from those by y-rays and fastelectrons'"0. The high local dose in theion tracks is higher than the gelation dosefor polydimethylsiloxanes. Gelation canhence occur in each ion track, and "gel"string" is generated4'*0'
In this study, we have elucidated therelationship between the weight of the gelstrings and initial molecular weight ofthe polymers'0.
2. ExperimentalPolydimethylsiloxanes (KF 96, KF
96H) supplied by Shin-Etsu Chemical Co..Ltd. were degassed under vacuum. Theywere put in metal cells with an aluminumwindow of 25 u,m thickness. 460 MeV4"Ar n \ 350 MeV 20Ne8+ and 220 MeV^C""" ions from the cyclotron of JAERITIARA were irradiated at the HY1 port.The depth of liquid polydimethylsiloxanewas made sufficiently larger than therange of the ion beams.
The irradiated samples were dissolvedin hexane. The insoluble residue wasseparated with membrane filters(Millipore LSWP04700. pore size 10.0p.m). and the weight of insoluble residuewas measured.
3. Results and DiscussionThe weight of the insoluble residue of
polydimcthylsiloxane irradiated with 256MeV Ar ion is shown in Fig.l as afunction of the ion fluence. The weight isproportional to the ion fluence. Thisdependence is different from that fory-rays and fast electrons: the gel fraction:the gel fraction irradiated with the lowLET radiations is negligible below thegelation dose, and increase from the doseand reaches to a constant value.
These results indicate that the gelationoccurs in each ion tracks. The number ofthe gel strings increases with increasingthe number of the irradiated ions. Theyield of the insoluble residue aretabulated in table I.
8x1 CT
6 -
CD
.yj 4 -
2 -
1
a•
- o
-
1 ! 1
Mn 165,000103,00060,00030,000 /y
i
r
i
Fluence / ions cm"-2
6x10
Figure 1. Weight of insoluble residue
obtained from polydimethylsiloxanes
irradiated with 256 MeV Ar ions. The
irradiated area is 19.6 cm2.
- 122 -
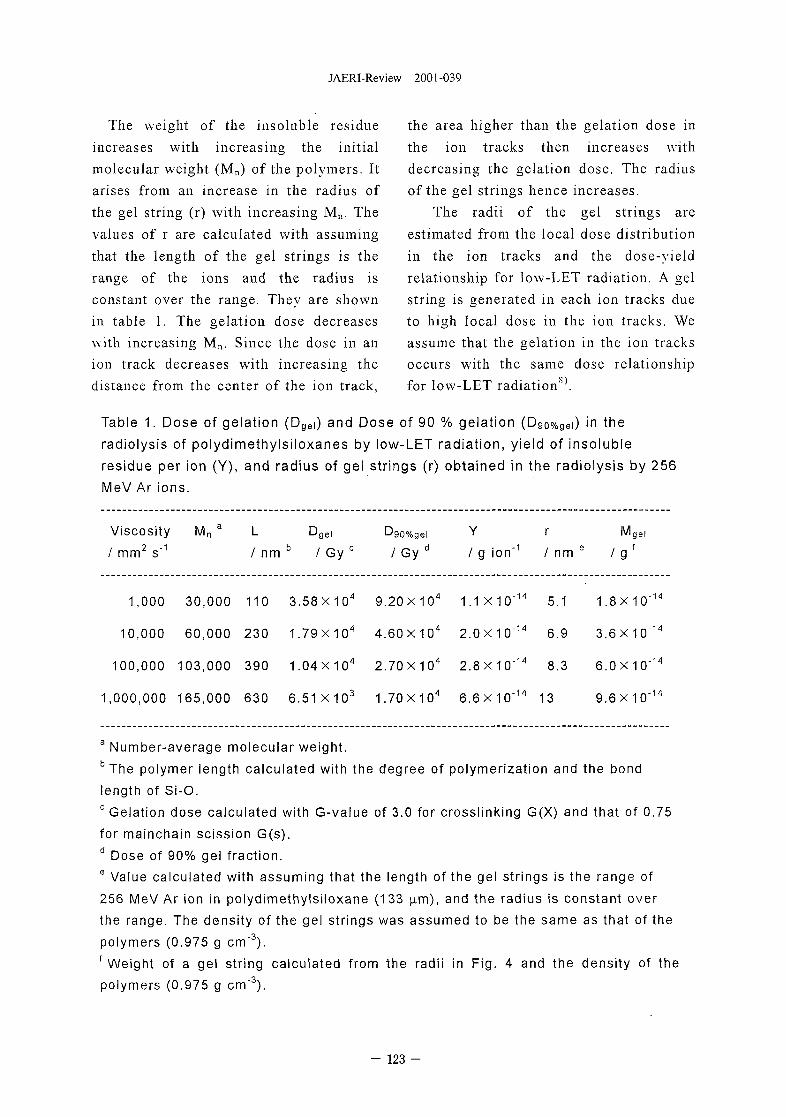
JAERI-Review 2001-039
The weight of the insoluble residueincreases with increasing the initialmolecular weight (Mn) of the polymers. Itarises from an increase in the radius ofthe gel string (r) with increasing Mn. Thevalues of r are calculated with assumingthat the length of the gel strings is therange of the ions and the radius isconstant over the range. They are shownin table 1. The gelation dose decreaseswith increasing Mn. Since the dose in anion track decreases with increasing thedistance from the center of the ion track.
the area higher than the gelation dose inthe ion tracks then increases withdecreasing the gelation dose. The radiusof the gel strings hence increases.
The radii of the gel strings areestimated from the local dose distributionin the ion tracks and the dose-yieldrelationship for low-LET radiation. A gelstring is generated in each ion tracks dueto high local dose in the ion tracks. Weassume that the gelation in the ion tracksoccurs with the same dose relationshipfor low-LET radiation10.
Table 1. Dose of gelation (Dgei) and Dose of 90 % gelation (DgO%gei) in the
radiolysis of polydimethylsiloxanes by low-LET radiation, yield of insoluble
residue per ion (Y), and radius of gel strings (r) obtained in the radiolysis by 256
MeV Ar ions.
DViscosity Mn a L Dgei
/ mm2 s"1 / n m b / Gy c / Gy90%gel
d
Y r M
/ g ion"1 / nm e / g
gel
1 , 0 0 0 3 0 , 0 0 0 1 1 0 3 . 5 8 X 1 0 4 9 . 2 0 X 1 0 4 1 . 1 X 1 0 " 1 4 5 . 1 1 . 8 X 1 0
1 0 , 0 0 0 6 0 , 0 0 0 2 3 0 1 . 7 9 X 1 0 4 4 . 6 0 X 1 0 4 2 . 0 X 1 0 " 1 4 6 . 9 3 , 6 X 1 0
1 , 0 0 0 , 0 0 0 1 6 5 , 0 0 0 6 3 0 6 . 5 1 X 1 0 3 1 . 7 0 X 1 0 4 6 . 6 X 1 0 " 1 4 1 3
-14
• 1 4
1 0 0 , 0 0 0 1 0 3 , 0 0 0 3 9 0 1 . 0 4 X 1 0 4 2 . 7 0 X 1 0 4 2 . 8 X 1 0 " 1 4 8 . 3 6 . 0 X 1 0 " 1 4
9 . 6 X 1 0 -14
3 Number-average molecular weight.bThe polymer length calculated with the degree of polymerization and the bond
length of Si-O.c Gelation dose calculated with G-value of 3.0 for crosslinking G(X) and that of 0.75
for mainchain scission G(s).d Dose of 90% gel fraction.e Value calculated with assuming that the length of the gel strings is the range of
256 MeV Ar ion in polydimethylsiloxane (133 p.m), and the radius is constant over
the range. The density of the gel strings was assumed to be the same as that of the
polymers (0.975 g cm'3).f Weight of a gel string calculated from the radii in Fig. 4 and the density of the
• 3 spolymers (0.975 g cm" ).
- 123 -
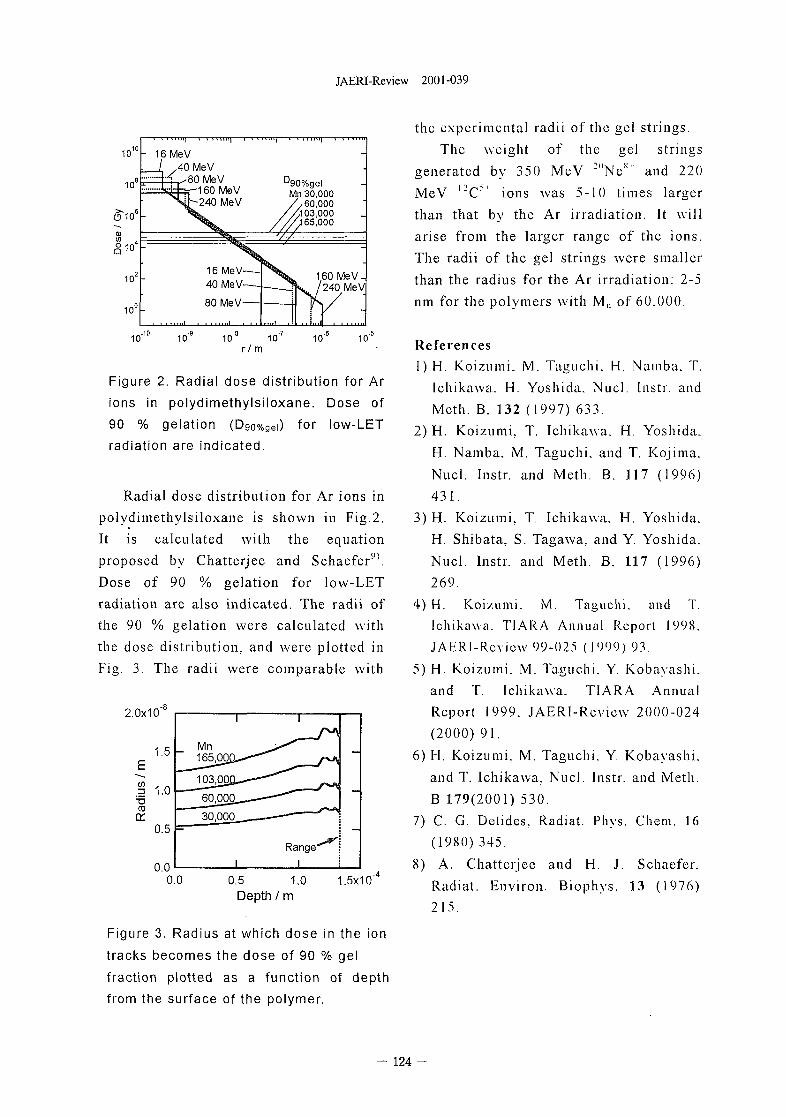
JAERI-Review 2001-039
10'
10
16 MeVJ . x40 MeV
-80 MeV-160 MeV-240 MeV
D90%gelMn 30,000
',60,000<103,000'165,000
Figure 2. Radial dose distribution for Ar
ions in polydimethylsiloxane. Dose of
90 % gelation (D90%gei) for low-LET
radiation are indicated.
Radial dose distribution for Ar ions inpolydimethylsiloxane is shown in Fig.2.It is calculated with the equationproposed by Chatterjee and Schaefer9'.Dose of 90 % gelation for low-LETradiation are also indicated. The radii ofthe 90 % gelation were calculated withthe dose distribution, and were plotted inFig. 3. The radii were comparable with
2.0x10
0.5 1.0 1.5x10Depth / m
Figure 3. Radius at which dose in the ion
tracks becomes the dose of 90 % gel
fraction plotted as a function of depth
from the surface of the polymer.
the experimental radii of the gel strings.The weight of the gel strings
generated by 350 MeV :"Ne^ and 220MeV l2C°' ions was 5-I0 times largerthan that by the Ar irradiation. It willarise from the larger range of the ions.The radii of the gel strings were smallerthan the radius for the Ar irradiation: 2-5nm for the polymers with Mn of 60.000.
References1) H. Koizumi. M. Taguchi. H. Namba. T.
Ichikawa. H. Yoshida. Nucl. Instr. andMcth. B. 132 (1997) 633.
2) H. Koizumi. T. Ichikawa. H. Yoshida.H. Namba. M. Taguchi. and T. Kojima.Nucl. Instr. and Meth. B. 117 (1996)431.
3) H. Koizumi, T. Ichikawa. H. Yoshida.H. Shibata, S. Tagawa. and Y. Yoshida.Nucl. Instr. and Meth. B. 117 (1996)269.
4) H. Koizumi. M. Taguchi. and T.Ichikawa. TIARA Annual Report 1998.JAERI-Rcvicw 99-025 (1999) 93.
5) H. Koizumi. M. Taguchi. Y. Kobayashi.and T. Ichikawa. TIARA AnnualReport 1999. JAERI-Rcvicw 2000-024(2000) 91.
6) H. Koizumi. M. Taguchi. Y. Kobayashi.and T. Ichikawa. Nucl. Instr. and Meth.B 179(2001) 530.
7) C. G. Delides: Radiat. Phys. Chem. 16(1980) 345.
8) A. Chattcrjee and H. J. Schaefer.Radiat. Environ. Biophys. 13 (1976)215.
- 1 2 4 -
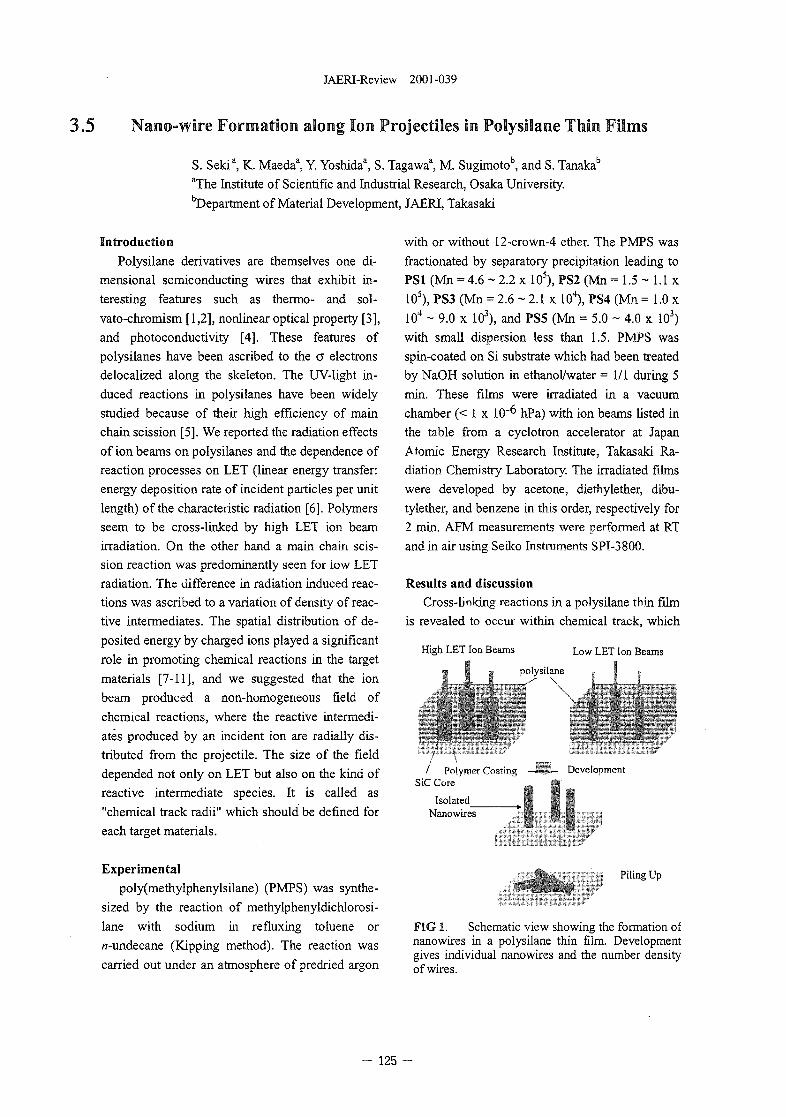
JAERI-Review 2001-039
3.5 Nano-wire Formation along Ion Projectiles in Polysilane Thin Films
S. Sekia, K. Maedaa, Y. Yoshidaa, S. Tagawa", M. Sugimotob, and S. Tanakab
"The Institute of Scientific and Industrial Research, Osaka University.bDepartment of Material Development, JAERI, Takasaki
Introduction
Polysilane derivatives are themselves one di-
mensional semiconducting wires that exhibit in-
teresting features such as thermo- and sol-
vato-chromism [1,2], nonlinear optical property [3],
and photoconductivity [4]. These features of
polysilanes have been ascribed to the o electrons
delocalized along the skeleton. The UV-light in-
duced reactions in polysilanes have been widely
studied because of their high efficiency of main
chain scission [5]. We reported the radiation effects
of ion beams on polysilanes and the dependence of
reaction processes on LET (linear energy transfer:
energy deposition rate of incident particles per unit
length) of the characteristic radiation [6]. Polymers
seem to be cross-linked by high LET ion beam
irradiation. On the other hand a main chain scis-
sion reaction was predominantly seen for low LET
radiation. The difference in radiation induced reac-
tions was ascribed to a variation of density of reac-
tive intermediates. The spatial distribution of de-
posited energy by charged ions played a significant
role in promoting chemical reactions in the target
materials [7-11], and we suggested that the ion
beam produced a non-homogeneous field of
chemical reactions, where the reactive intermedi-
ates produced by an incident ion are radially dis-
tributed from the projectile. The size of the field
depended not only on LET but also on the kind of
reactive intermediate species. It is called as
"chemical track radii" which should be defined for
each target materials.
with or without 12-crown-4 ether. The PMPS was
fractionated by separatory precipitation leading to
PS1 (Mn = 4.6 ~ 2.2 x 10⁵), PS2 (Mn = 1.5 ~ 1.1 x
10s), PS3 (Mn = 2.6 ~ 2.1 x 10⁴), PS4 (Mn = 1.0 x
104 - 9.0 x 10³), and PS5 (Mn = 5.0 ~ 4.0 x 10³)
with small dispersion less than 1.5. PMPS was
spin-coated on Si substrate which had been treated
by NaOH solution in ethanol/water = 1/1 during 5
min. These films were irradiated in a vacuum
chamber (< 1 x 10"^ hPa) with ion beams listed in
the table from a cyclotron accelerator at Japan
Atomic Energy Research Institute, Takasaki Ra-
diation Chemistry Laboratory. The irradiated films
were developed by acetone, diethylether, dibu-
tylether, and benzene in this order, respectively for
2 min. AFM measurements were performed at RT
and in air using Seiko Instruments SPI-3800.
Results and discussion
Cross-linking reactions in a polysilane thin film
is revealed to occur within chemical track, which
High LET Ion Beams - Low LET Ion Beams
p "olysilane
/ Polymer Coating —SiC Core
Isolated
_— Development
Nanowires
Experimental
poly(methylphenylsilane) (PMPS) was synthe-
sized by the reaction of methyiphenyldichlorosi-
lane with sodium in refluxing toluene or
«-undecane (Kipping method). The reaction was
carried out under an atmosphere of predried argon
Piling Up
FIG 1. Schematic view showing the formation ofnanowires in a polysilane thin film. Developmentgives individual nanowires and the number densityof wires.
- 125 -
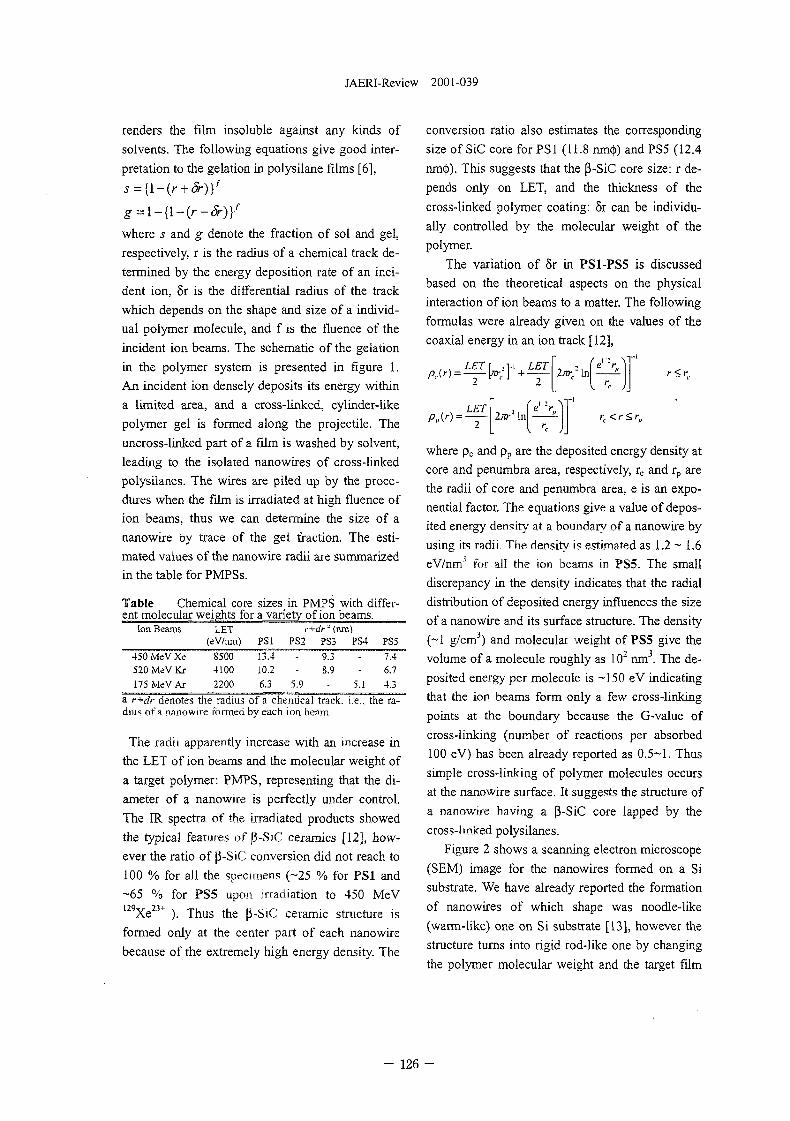
JAERI-Review 2001-039
renders the film insoluble against any kinds of
solvents. The following equations give good inter-
pretation to the gelation in polysilane films [6],
where 5 and g denote the fraction of sol and gel,
respectively, r is the radius of a chemical track de-
termined by the energy deposition rate of an inci-
dent ion, Sr is the differential radius of the track
which depends on the shape and size of a individ-
ual polymer molecule, and f is the fluence of the
incident ion beams. The schematic of the gelation
in the polymer system is presented in figure 1.
An incident ion densely deposits its energy within
a limited area, and a cross-linked, cylinder-like
polymer gel is formed along the projectile. The
uncross-linked part of a film is washed by solvent,
leading to the isolated nanowires of cross-linked
polysiianes. The wires are piled up by the proce-
dures when the film is irradiated at high fluence of
ion beams, thus we can determine the size of a
nanowire by trace of the gel fraction. The esti-
mated values of the nanowire radii are summarized
in the table for PMPSs.
Table Chemical core sizes in PMPS with differ-ent molecular weights for a variety of ion beams.
Ion Beams LET r+dr * (nm)(eV/iim) PS1 PS2 PS3 PS4 PS5
450 MeV Xe520 MeV Kr175 MeV Ax
S50041002200
13.410.26.3
9.38.9
5.9 5.1
7.46.74.3
a r+dr denotes the radius of a chemical track, i.e., the ra-dius of a nanowire formed by each ion beam.
The radii apparently increase with an increase in
the LET of ion beams and the molecular weight of
a target polymer: PMPS, representing that the di-
ameter of a nanowire is perfectly under control.
The IR spectra of the irradiated products showed
the typical features of (3-SiC ceramics [12]. how-
ever the ratio of p-SiC conversion did not reach to
100 % for all the specimens (-25 % for PS1 and
~65 % for PSS upon irradiation to 450 MeVU9Xe23+ ). Thus the p-SiC ceramic structure is
formed only at the center part of each nanowire
because of the extremely high energy density. The
conversion ratio also estimates the corresponding
size of SiC core for PS1 (11.8 nm(j>) and PS5 (12.4
nm(|)). This suggests that the (3-SiC core size: r de-
pends only on LET, and the thickness of the
cross-linked polymer coating: or can be individu-
ally controlled by the molecular weight of the
polymer.
The variation of 5r in PS1-PS5 is discussed
based on the theoretical aspects on the physical
interaction of ion beams to a matter. The following
formulas were already given on the values of the
coaxial energy in an ion track [12],
, , LET! ,T-i LET\ . -. (e'':rPM) = — k- f + — 2m-c- ln| —-2
P,,{r) = ~ 2^a
where pc and pp are the deposited energy density at
core and penumbra area, respectively, rc and rp are
the radii of core and penumbra area, e is an expo-
nential factor. The equations give a value of depos-
ited energy density at a boundary of a nanowire by
using its radii. The density is estimated as 1.2 - 1.6
eV/nmJ for all the ion beams in PS5. The small
discrepancy in the density indicates that the radial
distribution of deposited energy influences the size
of a nanowire and its surface structure. The density
(~1 g/cm3) and molecular weight of PS5 give the
volume of a molecule roughly as 102 nm . The de-
posited energy per molecule is -150 eV indicating
that the ion beams form only a few cross-linking
points at the boundary because the G-value of
cross-linking (number of reactions per absorbed
100 eV) has been already reported as 0.5-1. Thus
simple cross-linking of polymer molecules occurs
at the nanowire surface. It suggests the structure of
a nanowire having a [3-SiC core lapped by the
cross-linked polysilanes.
Figure 2 shows a scanning electron microscope
(SEM) image for the nanowires formed on a Si
substrate. We have already reported the formation
of nanowires of which shape was noodle-like
(warm-like) one on Si substrate [13], however the
structure turns into rigid rod-like one by changing
the polymer molecular weight and the target film
- 126 -
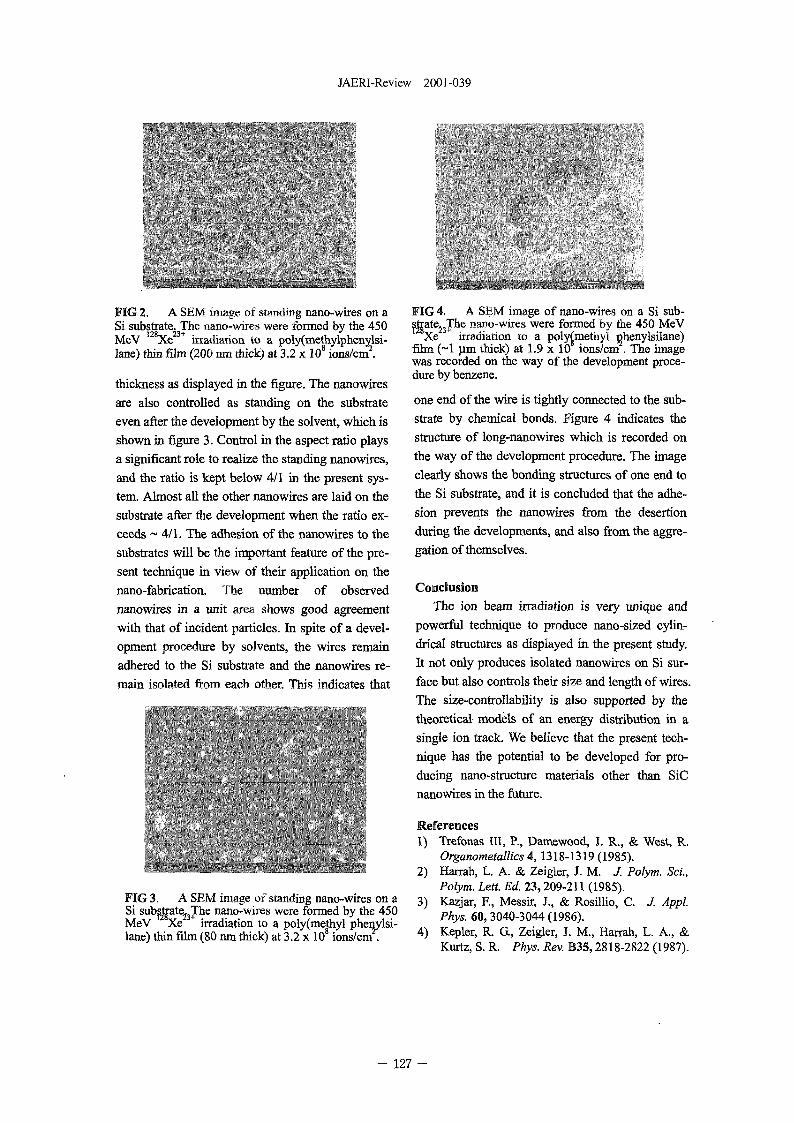
JAERI-Review 2001-039
FIG 2. A SEM image of standing nano-wires on aSi substrate. The nano-wires were formed by the 450
12R 23+
MeV Xe irradiation to a poly(methylphenylsi-lane) thin film (200 nm thick) at 3.2 x 10⁸ ions/cm2.
thickness as displayed in the figure. The nanowiresare also controlled as standing on the substrateeven after the development by the solvent, which isshown in figure 3. Control in the aspect ratio playsa significant role to realize the standing nanowires,and the ratio is kept below 4/1 in the present sys-tem. Almost all the other nanowires are laid on thesubstrate after the development when the ratio ex-ceeds ~ 4/1. The adhesion of the nanowires to thesubstrates will be the important feature of the pre-sent technique in view of their application on thenano-fabrication. The number of observednanowires in a unit area shows good agreementwith that of incident particles. In spite of a devel-opment procedure by solvents, the wires remainadhered to the Si substrate and the nanowires re-main isolated from each other. This indicates that
FIG 3. A SEM image of standing nano-wires on aSi subs2trate23The nano-wires were formed by the 450MeV Xe irradiation to a poly(methyl phenylsi-lane) thin film (80 nm thick) at 3.2 x 10⁸ ions/cm .
FIG 4. A SEM image of nano-wires on a Si sub-s|rateJ3The nano-wires were formed by the 450 MeV
Xe irradiation to a poly(methyl phenylsilane)film (~1 urn thick) at 1.9 x 10 ions/cm . The imagewas recorded on the way of the development proce-dure by benzene.
one end of the wire is tightly connected to the sub-strate by chemical bonds. Figure 4 indicates thestructure of long-nanowires which is recorded onthe way of the development procedure. The imageclearly shows the bonding structures of one end tothe Si substrate, and it is concluded that the adhe-sion prevents the nanowires from the desertionduring the developments, and also from the aggre-gation of themselves.
Conclusion
The ion beam irradiation is very unique andpowerful technique to produce nano-sized cylin-drical structures as displayed in the present study.It not only produces isolated nanowires on Si sur-face but also controls their size and length of wires.The size-controllability is also supported by thetheoretical models of an energy distribution in asingle ion track. We believe that the present tech-nique has the potential to be developed for pro-ducing nano-structure materials other than SiCnanowires in the future.
References1) Trefonas III, P., Damewood, J. R., & West, R.
Organometallics 4, 1318-1319 (1985).2) Harrah, L. A. & Zeigler, J. M. J. Polym. Sci.,
Polym. Lett. Ed. 23,209-211 (1985).3) Kazjar, R, Messir, J., & Rosillio, C. J. Appl.
Phys. 60, 3040-3044 (1986).4) Kepler, R. G, Zeigler, J. M., Harrah, L. A., &
Kurtz, S. R. Phys. Rev. B3S, 2818-2822 (1987).
- 127 -

JAERI-Review 2001-039
5) Trefonas 111, P., West, R., & Miller, R. D. J. Am. 9) Kobetich E. & Katz, R Phys. Rev. 170,Chem. Soc. 107,2737-2742 (1985). 391-396 (1968).
6) Seki, S., et al. J. Phys. Chem. B103, 3043-3048 10) Wilson, W. E. Radial Res. 140, 375-381(1999). (1994).
7) Magee, J. L. & Chattarjee, A. Kinetics of 11) Varma, M. N., Baum, J. W., & Kuehner, A. J.Nonhomogenious Processes, G. R. Freeman Ed., Radiat. Res. 62, 1-11 (1975).Chapter 4, p.171-214 (1987). 12) Seki, S., et al. Radiat. Phys. Chem. 48, 539-544
8) La Verne, J. A. & Schuler, R. H. J. Phys. Chem. (1996).98, 4043-4049 (1994). 13) Seki, S. et al. Adv. Mater, in press.
- 128 -
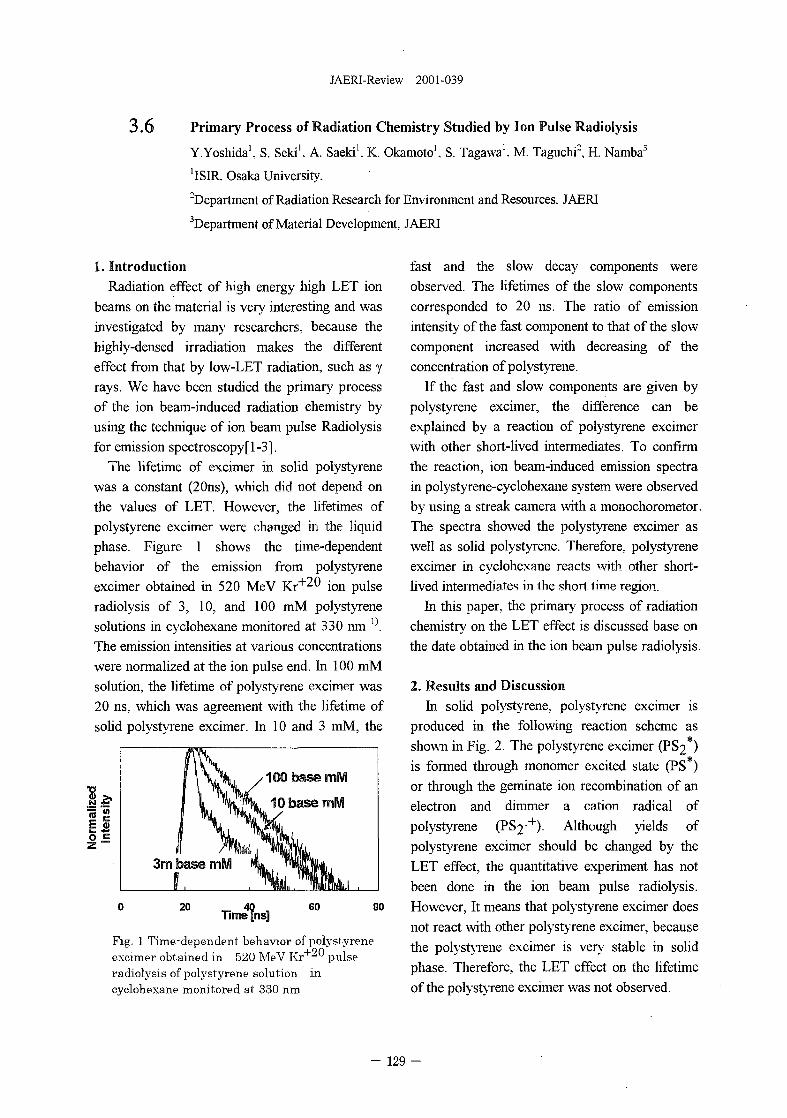
JAERI-Review 2001-039
3.6 Primary Process of Radiation Chemistry Studied by Ion Pulse Radiolysis
Y.Yoshida1, S. Seki1. A. Saeki1. K. Okamoto1. S. Tagawa1. M. Taguchi2, H. Namba3
'ISIR. Osaka University.
department of Radiation Research for Environment and Resources. JAERI
department of Material Development. JAERI
1. IntroductionRadiation effect of high energy high LET ion
beams on the material is very interesting and wasinvestigated by many researchers, because thehighly-densed irradiation makes the differenteffect from that by low-LET radiation, such as yrays. We have been studied the primary processof the ion beam-induced radiation chemistry byusing the technique of ion beam pulse Radiolysisfor emission spectroscopy[l-3].
The lifetime of excimer in solid polystyrenewas a constant (20ns), which did not depend onthe values of LET. However, the lifetimes ofpolystyrene excimer were changed in the liquidphase. Figure 1 shows the time-dependentbehavior of the emission from polystyreneexcimer obtained in 520 MeV Kr+20 ion pulseradiolysis of 3, 10, and 100 mM polystyrenesolutions in cyclohexane monitored at 330 ran ]).The emission intensities at various concentrationswere normalized at the ion pulse end. In 100 mMsolution, the lifetime of polystyrene excimer was20 ns, which was agreement with the lifetime ofsolid polystyrene excimer. In 10 and 3 mM, the
100 base mM
10 base mM
3m base mM
20ns]
60 80
Fig. 1 Time'dependent behavior of polystyreneexcimer obtained in 520 MeV Kr+-J" pulseradiolysis of polystyrene solution incyclohexane monitored at 330 nm
fast and the slow decay components wereobserved. The lifetimes of the slow componentscorresponded to 20 ns. The ratio of emissionintensity of the fast component to that of the slowcomponent increased with decreasing of theconcentration of polystyrene.
If the fast and slow components are given bypolystyrene excimer, the difference can beexplained by a reaction of polystyrene excimerwith other short-lived intermediates. To confirmthe reaction, ion beam-induced emission spectrain polystyrene-cyclohexane system were observedby using a streak camera with a monochorometor.The spectra showed the polystyrene excimer aswell as solid polystyrene. Therefore, polystyreneexcimer in cyclohexane reacts with other short-lived intermediates in the short time region.
In this paper, the primary process of radiationchemistry on the LET effect is discussed base onthe date obtained in the ion beam pulse radiolysis.
2. Results and DiscussionIn solid polystyrene, polystyrene excimer is
produced in the following reaction scheme asshown in Fig. 2. The polystyrene excimer (PS2 )is formed through monomer excited state (PS )or through the geminate ion recombination of anelectron and dimmer a cation radical ofpolystyrene (PS2"1"). Although yields ofpolystyrene excimer should be changed by theLET effect, the quantitative experiment has notbeen done in the ion beam pulse radiolysis.However, It means that polystyrene excimer doesnot react with other polystyrene excimer, becausethe polystyrene excimer is very stable in solidphase. Therefore, the LET effect on the lifetimeof the polystyrene excimer was not observed.
- 129 -
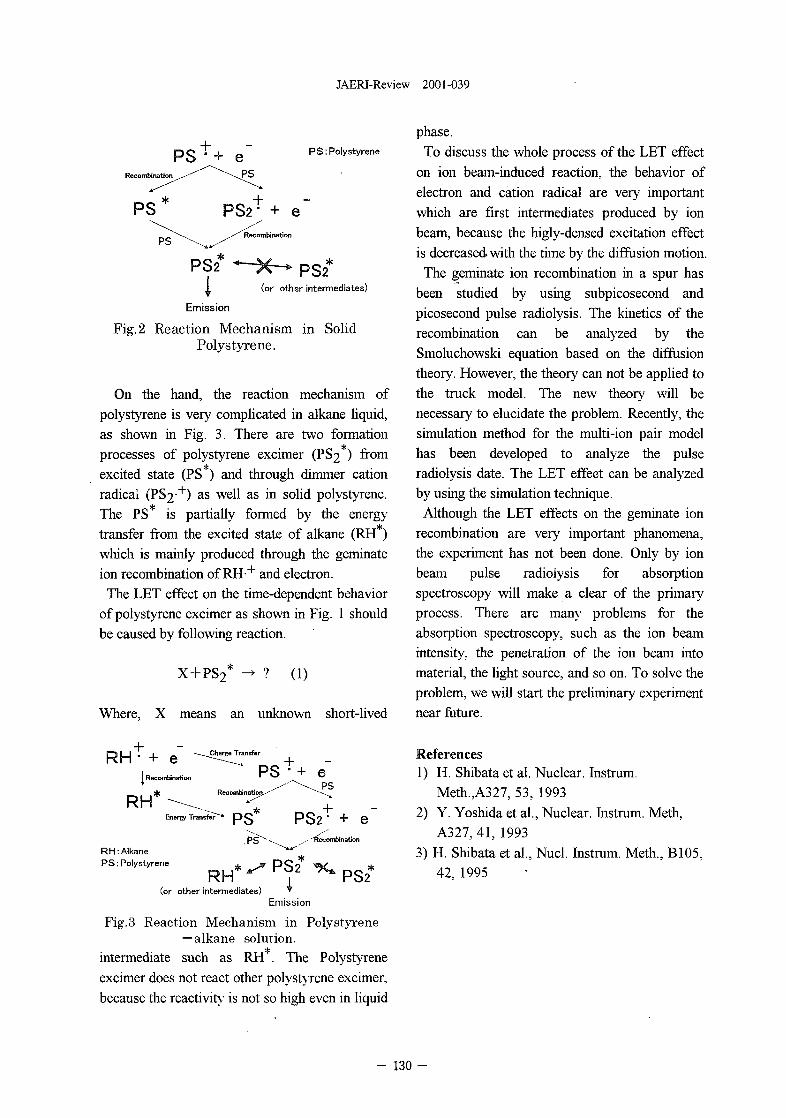
JAERI-Review 2001-039
PS: Polystyrene
PS2(or other intermediates)
Fig.2 Reaction Mechanism in SolidPolystyrene.
On the hand, the reaction mechanism ofpolystyrene is very complicated in alkane liquid,as shown in Fig. 3. There are two formationprocesses of polystyrene excimer (PS2 ) fromexcited state (PS ) and through dimmer cationradical (PS2"1") as well as in solid polystyrene.The PS is partially formed by the energytransfer from the excited state of alkane (RH )which is mainly produced through the geminateion recombination of RH + and electron.The LET effect on the time-dependent behavior
of polystyrene excimer as shown in Fig. 1 shouldbe caused by following reaction.
X+PS2 (1)
Where, X means an unknown short-lived
Charge Transfer
RH: AlkanePS: Polystyrene
RH"(or other intermediates)
PS2*
Emission
Fig.3 Reaction Mechanism in Polystyrene— alkane solution.
intermediate such as RH . The Polystyreneexcimer does not react other polystyrene excimer,because the reactivity is not so high even in liquid
phase.
To discuss the whole process of the LET effecton ion beam-induced reaction, the behavior ofelectron and cation radical are very importantwhich are first intermediates produced by ionbeam, because the higly-densed excitation effectis decreased with the time by the diffusion motion.
The geminate ion recombination in a spur hasbeen studied by using subpicosecond andpicosecond pulse radiolysis. The kinetics of therecombination can be analyzed by theSmoluchowski equation based on the diffusiontheory. However, the theory can not be applied tothe truck model. The new theory will benecessary to elucidate the problem. Recently, thesimulation method for the multi-ion pair modelhas been developed to analyze the pulseradiolysis date. The LET effect can be analyzedby using the simulation technique.
Although the LET effects on the geminate ionrecombination are very important phanomena,the experiment has not been done. Only by ionbeam pulse radiolysis for absorptionspectroscopy will make a clear of the primaryprocess. There are many problems for theabsorption spectroscopy, such as the ion beamintensity, the penetration of the ion beam intomaterial, the light source, and so on. To solve theproblem, we will start the preliminary experimentnear future.
References1) H. Shibata et al. Nuclear. Instrum.
Meth.,A327, 53, 19932) Y. Yoshida et al.. Nuclear. Instrum. Meth,
A327, 41, 1993
3) H. Shibata et al., Nucl. Instrum. Meth., B105,42, 1995
- 130 -
JAERI-Review 2001-039
3.7 Measurement of energy deposition around the heavy iontrajectory by photon counting method.
M.Taguchia, H.Nambab, and S.Ohno0
"Department of Radiation Research for Environment and Resources, JAERI,"Department of Material Development, JAERI,Theoretical Radiation Research Laboratory.
LlntroductionIt is well known that irradiation effects of
heavy ions on chemical substances and livingthings are more complicated than that of lowLET radiations. The characteristic irradiationeffects of heavy ions are considered to be causedby heterogeneous and high-dense energydistribution around heavy ion trajectory. Wehave been studying on spatial distribution ofenergy deposited by high energy heavy ionstraveling through matters1"2'. The distribution ofdeposit-energy for various ions can be estimatedby the theoretical equations in water, which isthe main component of living bodies.
In the present report, we measured numbersof photons from the gaseous nitrogen irradiatedwith 330-MeV Ar11+ ions by the photon countingsystem to estimate the contribution of total andlow energy electrons to energy deposition inorder to understand track structure in detail.
2.ExperimentaIIon irradiation and light emission
measurement were performed at the beam portof HX-1 in TIARA facility, which is called theExperimental Apparatus for Basic study ofRadiation Chemistry with Heavy Ions (EA-BRACHI)13'. Ar11+ ions with 330-MeV energywere induced through a tantalum collimatorswith 2 mm hole, which was sealed with Kaptonfilm (7.5 um thick) to keep the gas pressure inthe target chamber, set on the upper streams ofthe ion beam to the target chamber. Thepressure of nitrogen gas was controlled to 100-360 Torr at ambient temperature, using pressuresensors, a throttling valve, pressure controllerand mass flow controller that previously
described35. The fluence of the Ar ion wasmeasured by counting photons from plasticscintillators induced by one Ar ion irradiation,or counting Ar ions directory by channeltrondetector before and after the photon countingmeasurements, and was lxlO6 ions/sec. Opticalsystem was constructed with lens and three slitsto collect photons of the excited nitrogenmolecules from the restricted area. The spaceresolution of the area was 2 mm. The distance ofthe restricted area from the center of the ionbeam was changed with moving target chamberitself. The optical system was placed at theradial distance of from -2 mm to 50 mm. Thephotons were measured by a single photoncounting system with a photomultiplier tube(PMT).
3.Results and DiscussionFigure 1 shows light emission spectrum of
gaseous nitrogen at 760 Torr irradiated with 330MeV Aru+ ions. Several emission bands areclearly observed in the spectrum. Similar bandsof nitrogen have been observed in the electronirradiation experiment4'. All these light emissionbands measured here could be ascribed to eitherthe second positive transitions of nitrogenmolecules (C3riu-B
3ng) or the first negativetransitions of nitrogen molecular ions. The (0,0)transition of the first negative system of nitrogenmolecular ion observed at the wavelength of 429nm has an excitation cross section proportionalto the total ionization cross section5'. Therefore,the analysis of this transition will be importantto evaluate the yields of total ion pairs, whichcorresponds to the ionization measurementsperformed previously1'2'. On the other hand, the
- 1 3 1 -
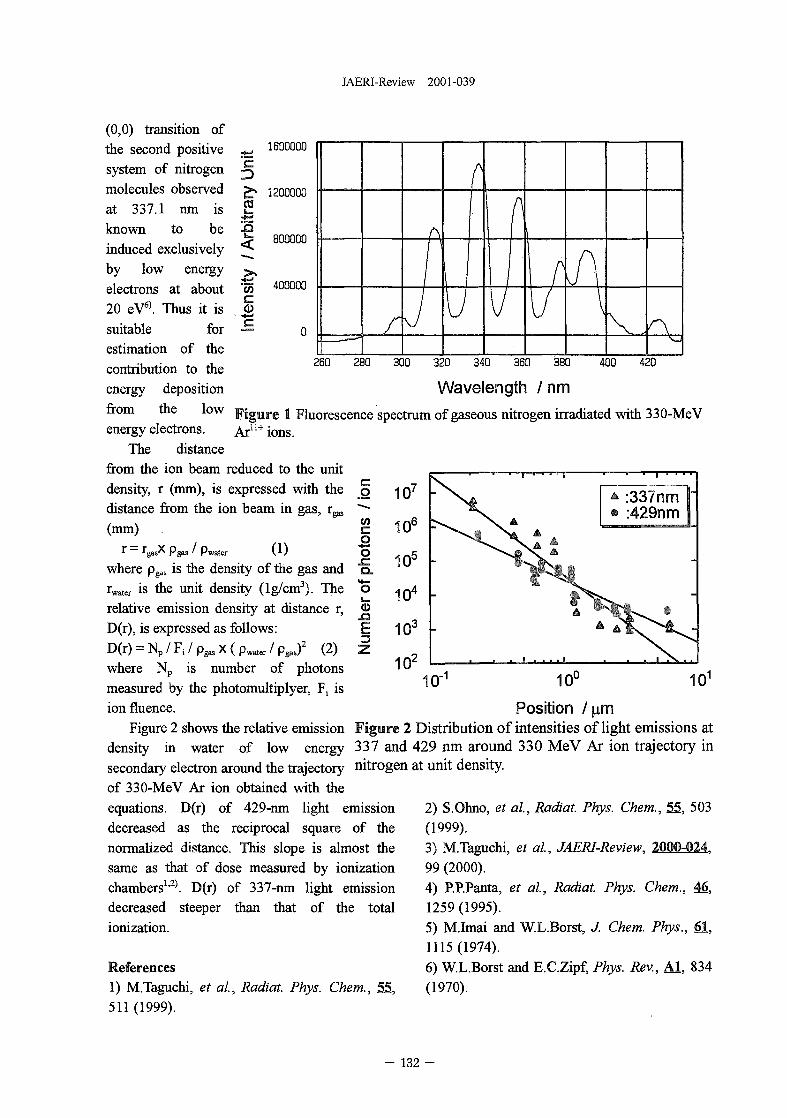
JAERI-Review 2001-039
(0,0) transition ofthe second positivesystem of nitrogenmolecules observedat 337.1 nm isknown to beinduced exclusivelyby low energyelectrons at about20 eV6). Thus it issuitable for
estimation of thecontribution to theenergy depositionfrom the lowenergy electrons.
^ 1600000
'E
E
I1200000
800000
•£5 400000
I . r J M
A
r1/ \260 280 300 320 340 360 380 400 420
co :337nm:429nm
Wavelength / nmFigure 1 Fluorescence spectrum of gaseous nitrogen irradiated with 330-MeVAr11+ ions.
The distancefrom the ion beam reduced to the unitdensity, r (mm), is expressed with thedistance from the ion beam in gas, r ^(mm)
r = r^X p ^ / pwater (1)where p ^ is the density of the gas andrmter is the unit density (lg/cm3). Therelative emission density at distance r,D(r), is expressed as follows:D(r) = N p /F i /P g a sx(pw a t e r /P g a s )
2 (2) _102
|Q.
15
CD
310°
10,-1 10°
Position /urn
101where Np is number of photonsmeasured by the photomultiplyer, F, ision fiuence.
Figure 2 shows the relative emission Figure 2 Distribution of intensities of light emissions atdensity in water of low energy 337 and 429 nm around 330 MeV Ar ion trajectory insecondary electron around the trajectory nitrogen at unit density,of 330-MeV Ar ion obtained with theequations. D(r) of 429-nm light emissiondecreased as the reciprocal square of thenormalized distance. This slope is almost the
same as that of dose measured by ionizationchambersu). D(r) of 337-nm light emissiondecreased steeper than that of the totalionization.
References1) M.Taguchi, et al, Radial Phys. Chem., 55,511 (1999).
2) S.Ohno, et al, Radial Phys. Chem., 55, 503(1999).3) M.Taguchi, et al, JAERI-Review, 2000-02499 (2000).4) P.P.Panta, et al, Radial Phys. Chem., 46,1259 (1995).5) M.Imai and W.L.Borst, J. Chem. Phys., 6±,1115(1974).6) W.L.Borst and E.C.Zipf, Phys. Rev., Al, 834(1970).
- 132 -
JAERI-Review 2001-039
4. Inorganic Materials
4.1 He Ions Implantation Effect on the Thermal Diffusivity of CVD-SiC 135T.Taguchi, N.Igawa, and S.Jitsukawa
4.2 Effects of Helium Embrittlement on Fatigue Properties of ReducedActivation Ferritic/Martensitic Steel ••••• ••••••• •••• • 138
T.Hirose, H.Tanigawa, M.Ando, E.Wakai, Y.Miwa, S.Jitsukawa, Y.Katoh,A.Kohyama, and M.Narui
4.3 Effects of Triple Beams on Microstructural Evolution in Ferritic/Martensitic Steels 141E.Wakai, T.Sawai, A.Naito, K.Kikuchi, S.Jitsukawa, S.Yamamoto,H.Naramoto, S.Yamashita, Y.Masumoto, K.Oka, and S.Ohnuki
4.4 Investigation of the Resonant Vibration Modes of Self Interstitial Atoms in Metalsby Low Temperature Specific Heat Measurement 144
M.Watanabe4.5 Study of Ion-induced Structural Changes in Li2TiC>3 Ceramics 146
T.Nakazawa, V.Grismanovs, D.Yamaki, Y.Katano, T.Aruga,A.Iwamoto, and S.Jitsukawa
4.6 Damage Evolution in High Energy Multi Ion-irradiated BCC Metals and theInteraction between Gas Atoms (H and He) and Damage Defects • • 149
Y.Shimomura, I.Mukouda. D.Yamaki, T.Nakazawa, T.Aruga, and S.Jitsukawa4.7 Dose Rate Effects on Microstructural Evolution in Austenitic Stainless Steels
under Ion Irradiation • ••••• 152N.Sekimura, T.Okita, A.Kurui, Y.Hashimoto, S.Jitsukawa, T.Sawai,Y.Miwa, S.Hamada. S.Saitoh, and K.Kikuchi
4.8 Effect of Simultaneous Ion Irradiation on Microstructural Change of SiC/SiCComposites at High Temperature • •••••• 155
T.Taguchi, E.Wakai, N.Igawa, S.Nogami, A.Hasegawa, L.L.Snead,and S.Jitsukawa
4.9 Radiation Induced Cavity Formation in F82H with Various Heat and MechanicalTreatments • 158
T.Sawai, E.Wakai, T.Tomita, A.Naito, and S.Jitsukawa4.10 Comparison of Cavity Formation Behavior in RAF/M Steels Irradiated with Dual
Beams of Fe +He Ions as Observed in the Depth Dependent Damage Structure 161A.Naito, S.Jitsukawa, E.Wakai, T.Sawai, I.Ioka, and H.Tanigawa
4.11 Investigation of Hardness Changes on Helium-ion Implanted Iron byUltra-micro-hardness Testing 164
H.Tanigawa, S.Jitsukawa, H.Abe, T.Iwai, and Y.Katoh4.12 Effect of Ion Irradiation on Corrosion Behavior of Austenitic Stainless Steel 167
I.Ioka, S.Hamada, M.Futakawa, A.Naito, K.Kiuchi, S.Kuroiwa,S.Miyamoto, and K.Ogura
4.13 Effect of Radiation on Microstructures and Corrosion Resistance of AusteniticStainless Steels 170
S.Hamada, A.Naito, C.Kato, and K.Kiuchi4.14 Nucleation and Growth of Carbon Onions in Cu and Au under Ion Implantation 173
H.Abe, S.Yamamoto, A.Miyashita, and H.Itoh4.15 Thermal Response of the Metal/Fullerite Hybrid Assembly •• 176
J.Vacik, H.Naramoto, K.Narumi, Y.H.Xu, S.Yamamoto, and H.Abe
- 133 -
JAERI-Review 2001-039
4.16 Deposition and Characterization of Carbon Films Prepared bylon-bombardment-assisted Method 179
X.D.Zhu, Y.H.Xu, H.Naramoto, K.Narumi, A.Miyashita, and K.Miyashita4.17 Evolution of Co+C60 Structures during Co-deposition and Subsequent Annealing 181
V.Lavrentiev, H.Abe, S.Yamamoto, H.Naramoto, K.Narumi, and K.Miyashita4.18 Modification of Carbon Related Films with Ion Beams 183
H.Naramoto, Y.Xu, K.Narumi, X.Zhu, J.Vacik, S.Yamamoto, and K.Miyashita4.19 Formation Process and Stability of Radiation-induced Non-equilibrium Phase in
Silicon • 186M.Takeda, T.Suda, S.Watanabe, S.Ohnuki, and H.Abe
4.20 Improvement in Surface Roughness of Nitrogen-implanted Glassy Carbon byHydrogen Doping 188
K.Takahiro, N.Takeshima, K.Kawatsura, S.Nagata, S.Yamamoto, K.Narumi,and H.Naramoto
4.21 Temperature Dependence of Growth Process of C60 Thin Films on a KBr(OOl)Surface 190
K.Narumi, and H.Naramoto4.22 Thermal Relaxation of Hydrogen Disordering in Palladium-hydrogen System
Irradiated with Energetic Electrons • 193K.Yamakawa, Y.Chimi, K.Adachi, NJshikawa, and A.Iwase
4.23 Anomalous Change in Electrical Resistivity in EuBa2Cu3Gy SuperconductorIrradiated with Energetic Electrons • 195
NJshikawa, Y.Chimi, A.Iwase, H.Wakana, T.Hashimoto, and O.Michikami4.24 Defect Accumulation in Nanocrystalline Gold Irradiated with Electrons at Low
Temperature 197Y.Chimi, A.Iwase, NJshikawa M.Kobiyama, T.Inami, and S.Okuda
4.25 Epitaxial Anatase and Rutile TiO2 Films Prepared by Pulsed Laser Deposition 199S.Yamamoto, T.Sumita, T.Yamaki, H.Abe, A.Miyashita, and H.Itoh
4.26 Effect of Fluorine-ion Implantation in TiO2 Rutile Single Crystals 201T.Yamaki, T.Sumita, S.Yamamoto, H.Abe, A.Miyashita, and HJtoh
- 1 3 4 -
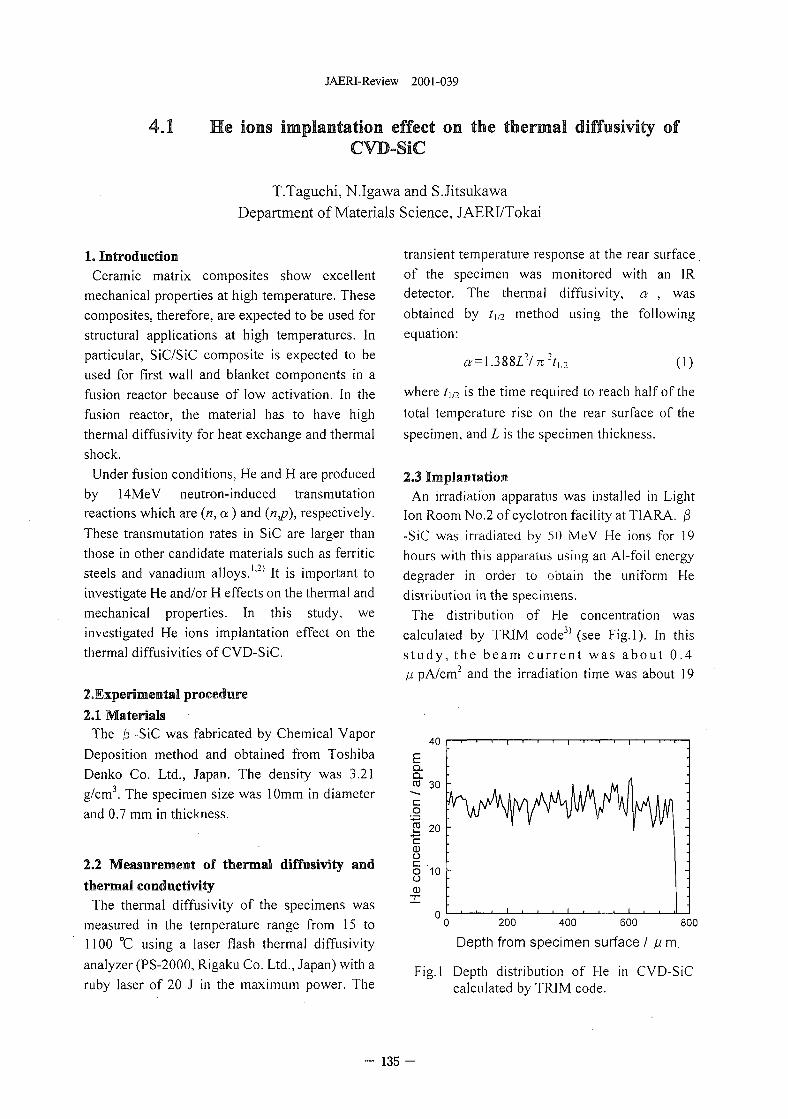
JAERI-Review 2001-039
4.1 He ions implantation effect on the thermal diffusivity ofCVD-SiC
T.Taguchi, N.Igawa and S.JitsukawaDepartment of Materials Science, JAERI/Tokai
1. IntroductionCeramic matrix composites show excellent
mechanical properties at high temperature. Thesecomposites, therefore, are expected to be used forstructural applications at high temperatures. Inparticular, SiC/SiC composite is expected to beused for first wall and blanket components in afusion reactor because of low activation. In thefusion reactor, the material has to have highthermal diffusivity for heat exchange and thermalshock.
Under fusion conditions, He and H are producedby 14MeV neutron-induced transmutationreactions which are {n, a) and (n,p), respectively.These transmutation rates in SiC are larger thanthose in other candidate materials such as ferriticsteels and vanadium alloys.L2) It is important toinvestigate He and/or H effects on the thermal andmechanical properties. In this study, weinvestigated He ions implantation effect on thethermal diffusivities of CVD-SiC.
^Experimental procedure
2.1 MaterialsThe jB -SiC was fabricated by Chemical Vapor
Deposition method and obtained from ToshibaDenko Co. Ltd., Japan. The density was 3.21g/cm3. The specimen size was 10mm in diameterand 0.7 mm in thickness.
2.2 Measurement of thermal diffusivity and
thermal conductivityThe thermal diffusivity of the specimens was
measured in the temperature range from 15 to1100 °C using a laser flash thermal diffusivityanalyzer (PS-2000, Rigaku Co. Ltd., Japan) with aruby laser of 20 J in the maximum power. The
transient temperature response at the rear surfaceof the specimen was monitored with an IRdetector. The thermal diffusivity, a , wasobtained by t\i2 method using the followingequation:
where t\i2 is the time required to reach half of the
total temperature rise on the rear surface of the
specimen, and L is the specimen thickness.
2.3 ImplantationAn irradiation apparatus was installed in Light
Ion Room No.2 of cyclotron facility at TIARA. j3-SiC was irradiated by 50 MeV He ions for 19hours with this apparatus using an Al-foil energydegrader in order to obtain the uniform Hedistribution in the specimens.
The distribution of He concentration wascalculated by TRIM codej) (see Fig. 1). In thiss tudy, the beam cur ren t was about 0.4ji pA/cm2 and the irradiation time was about 19
0 200 400 600 800
Depth from specimen surface / fi m.
Fig.l Depth distribution of He in CVD-SiCcalculated by TRIM code.
- 135 -
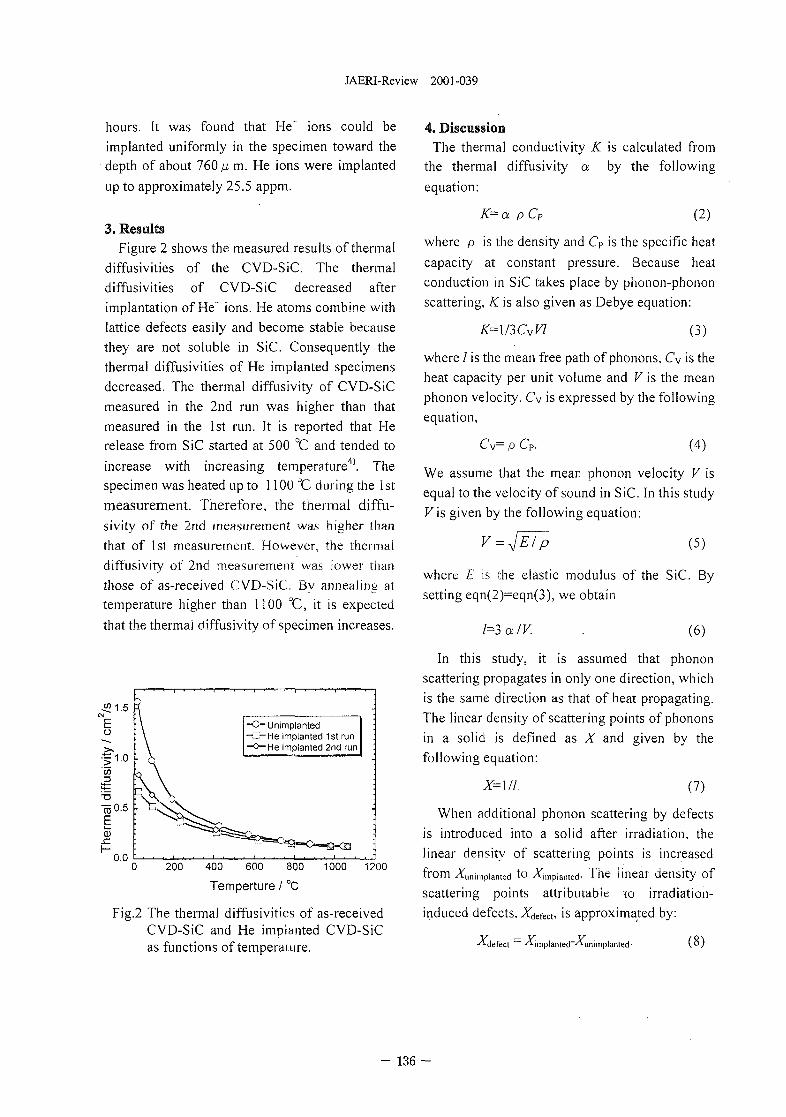
JAERI-Review 2001-039
hours. It was found that He" ions could beimplanted uniformly in the specimen toward thedepth of about 760 fi m. He ions were implantedup to approximately 25.5 appm.
3. ResultsFigure 2 shows the measured results of thermal
diffusivities of the CVD-SiC. The thermaldiffusivities of CVD-SiC decreased afterimplantation of He* ions. He atoms combine withlattice defects easily and become stable becausethey are not soluble in SiC. Consequently thethermal diffusivities of He implanted specimensdecreased. The thermal diffusivity of CVD-SiCmeasured in the 2nd run was higher than thatmeasured in the 1st run. It is reported that Herelease from SiC started at 500 °C and tended toincrease with increasing temperature41. Thespecimen was heated up to 1100 °C during the 1stmeasurement. Therefore, the thermal diffu-sivity of the 2nd measurement was higher thanthat of 1st measurement. However, the thermaldiffusivity of 2nd measurement was lower thanthose of as-received CVD-SiC. By annealing attemperature higher than 1100 "C, it is expectedthat the thermal diffusivity of specimen increases.
.52 1.5
-C-Unimplanted——-He implanted 1st run—O— He implanted 2nd run
200 400 600 800
Temperture / °C
1000 1200
Fig.2 The thermal diffusivities of as-receivedCVD-SiC and He implanted CVD-SiCas functions of temperature.
4. DiscussionThe thermal conductivity K is calculated from
the thermal diffusivity a by the followingequation:
K=a pCP (2)
where p is the density and C? is the specific heatcapacity at constant pressure. Because heatconduction in SiC takes place by phonon-phononscattering, K is also given as Debye equation:
K^MICyVl (3)
where / is the mean free path of phonons, Cv is theheat capacity per unit volume and V is the meanphonon velocity. Cv is expressed by the followingequation,
C v = p CP. (4)
We assume that the mean phonon velocity V isequal to the velocity of sound in SiC. In this studyV\s given by the following equation:
V = (5)
where E is the elastic modulus of the SiC. Bysetting eqn(2)=eqn(3), we obtain
1=3 a IV. (6)
In this study, it is assumed that phononscattering propagates in only one direction, whichis the same direction as that of heat propagating.The linear density of scattering points of phononsin a solid is defined as X and given by thefollowing equation:
X-Ml. (7)
When additional phonon scattering by defectsis introduced into a solid after irradiation, thelinear density of scattering points is increasedfrom -ATunimpiamed to impiamed- The linear density ofscattering points attributable to irradiation-induced defects, detect, is approximated by:
yHiTiplanted~yMinimplanted- (8)
- 136 -
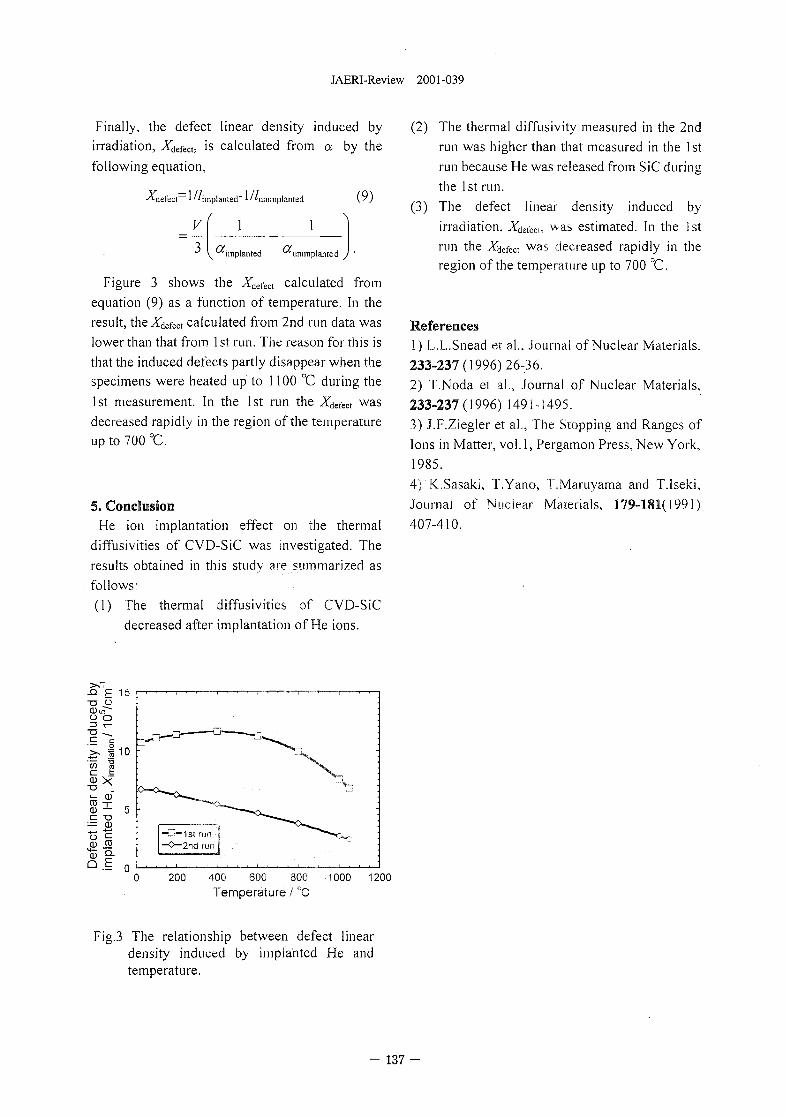
JAERI-Review 2001-039
Finally, the defect linear density induced byirradiation, .Affect, is calculated from a by thefollowing equation,
^•defect ^' 'implanted" ^' nimmplanted
v(9)
' implanted unimplanted J '
Figure 3 shows the Xfefea calculated fromequation (9) as a function of temperature. In theresult, the detec calculated from 2nd run data waslower than that from 1st run. The reason for this isthat the induced defects partly disappear when thespecimens were heated up to 1100 °C during the1st measurement. In the 1st run the Xdefect wasdecreased rapidly in the region of the temperatureup to 700 °C.
5. ConclusionHe ion implantation effect on the thermal
diffusivities of CVD-SiC was investigated. Theresults obtained in this study are summarized asfollows:(1) The thermal diffusivities of CVD-SiC
decreased after implantation of He ions.
(2) The thermal diffusivity measured in the 2ndrun was higher than that measured in the 1strun because He was released from SiC duringthe 1st run.
(3) The defect linear density induced byirradiation, Xdefea. was estimated. In the 1strun the Affect was decreased rapidly in theregion of the temperature up to 700 °C.
References1) L.L.Snead et al.. Journal of Nuclear Materials.233-237(1996)26-36.2) T.Noda et al., Journal of Nuclear Materials,233-237(1996)1491-1495.3) J.F.Ziegler et al., The Stopping and Ranges ofIons in Matter, vol.1, Pergamon Press, New York,1985.4) K.Sasaki, T.Yano, T.Maruyama and T.lseki,Journal of Nuclear Materials, 179-181(1991)407-410.
0 200 400 600 800 1000 1200Temperature / °C
Fig.3 The relationship between defect lineardensity induced by implanted He andtemperature.
- 137 -
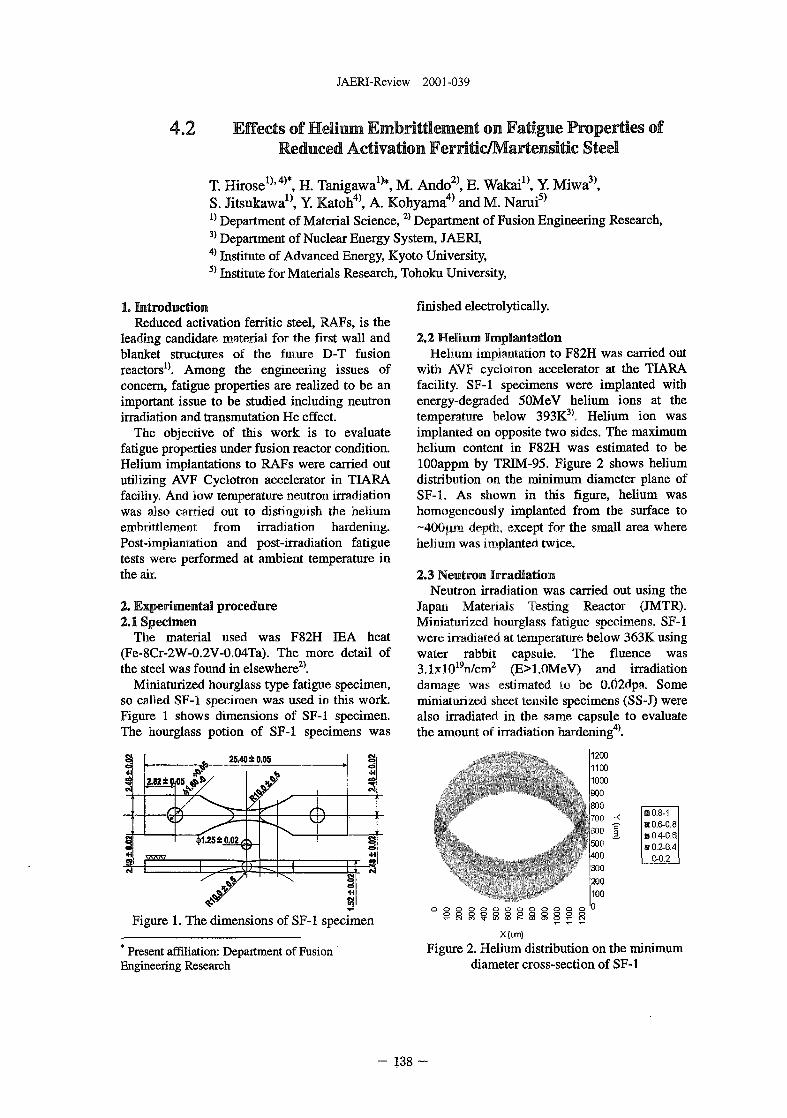
JAERI-Review 2001-039
4.2 Effects of Helium Embrittlemeet on Fatigue Properties ofReduced Activation Ferritic/Martensitic Steel
T. Hirose1)l4)\ H. Tanigawa1**, M. Ando2), E. Wakai1*, Y. Miwa3),S. Jitsukawa1*, Y. Katoh4), A. Kohyama4) andM. Narui5)
l) Depar tment of Material Science, 2) Depar tment of Fusion Engineer ing Research,3) Depar tment of Nuclear Energy System, JAERI ,4) Institute of Advanced Energy, Kyoto University,5) Institute for Materials Research, Tohoku University,
1. IntroductionReduced activation ferritic steel, RAFs, is the
leading candidate material for the first wall andblanket structures of the future D-T fusionreactors1'. Among the engineering issues ofconcern, fatigue properties are realized to be animportant issue to be studied including neutronirradiation and transmutation He effect.
The objective of this work is to evaluatefatigue properties under fusion reactor condition.Helium implantations to RAFs were carried oututilizing AVF Cyclotron accelerator in TIARAfacility. And low temperature neutron irradiationwas also carried out to distinguish the heliumembrittlement from irradiation hardening.Post-implantation and post-irradiation fatiguetests were performed at ambient temperature inthe air.
2. Experimental procedure2.1 Specimen
The material used was F82H IEA heat(Fe-8Cr-2W-0.2V-0.04Ta). The more detail ofthe steel was found in elsewhere2'.
Miniaturized hourglass type fatigue specimen,so called SF-1 specimen was used in this work.Figure 1 shows dimensions of SF-1 specimen.The hourglass potion of SF-1 specimens was
Figure 1. The dimensions of SF-1 specimen
* Present affiliation: Department of FusionEngineering Research
finished electrolytically.
2.2 Helium ImplantationHelium implantation to F82H was carried out
with AVF cyclotron accelerator at the TIARAfacility. SF-1 specimens were implanted withenergy-degraded 50MeV helium ions at thetemperature below 393K3). Helium ion wasimplanted on opposite two sides. The maximumhelium content in F82H was estimated to belOOappm by TRIM-95. Figure 2 shows heliumdistribution on the minimum diameter plane ofSF-1. As shown in this figure, helium washomogeneously implanted from the surface to~40Gjxm depth, except for the small area wherehelium was implanted twice.
2.3 Neutron IrradiationNeutron irradiation was carried out using the
Japan Materials Testing Reactor (JMTR).Miniaturized hourglass fatigue specimens, SF-1were irradiated at temperature below 363K usingwater rabbit capsule. The fluence was3.1xl019n/cm2 (E>1.0MeV) and irradiationdamage was estimated to be 0.02dpa. Someminiaturized sheet tensile specimens (SS-J) werealso irradiated in the same capsule to evaluatethe amount of irradiation hardening4'.
1200
1130
j 1010
ifiljr. i
'i 'i
i it
o o o o o o o o o o o
El!.VI)
..V0
!00
0
• 0.8-1• 0.6-0.8S 0.4-0.6.m 0.2-0.4
0-0.2
X(um)
Figure 2. Helium distribution on the minimumdiameter cross-section of SF-1
- 138
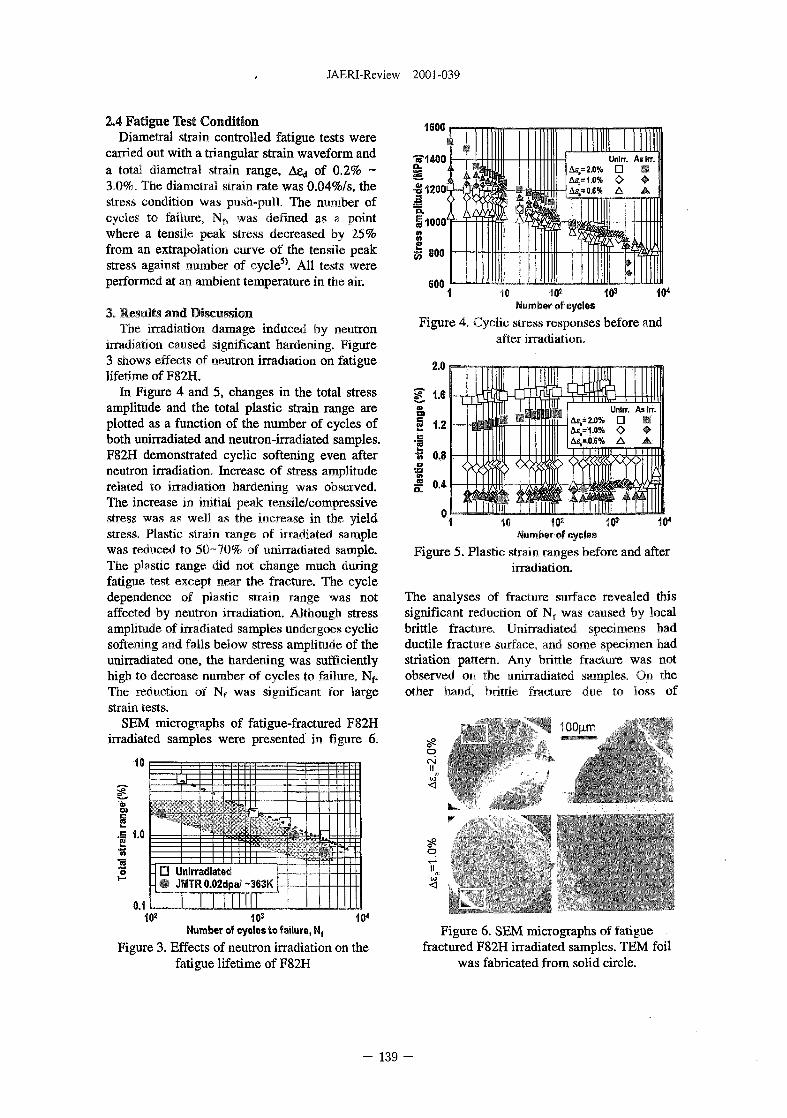
JAERI-Review 2001-039
2.4 Fatigue Test ConditionDiametral strain controlled fatigue tests were
carried out with a triangular strain waveform anda total diametral strain range, Aed of 0.2% ~3,0%. The diametral strain rate was 0.04%/s, thestress condition was push-pull. The number ofcycles to failure, Nf, was defined as a pointwhere a tensile peak stress decreased by 25%from an extrapolation curve of the tensile peakstress against number of cycle5). All tests wereperformed at an ambient temperature in the air.
3. Results and DiscussionThe irradiation damage induced by neutron
irradiation caused significant hardening. Figure3 shows effects of neutron irradiation on fatiguelifetime of F82H.
In Figure 4 and 5, changes in the total stressamplitude and the total plastic strain range areplotted as a function of the number of cycles ofboth unirradiated and neutron-irradiated samples.F82H demonstrated cyclic softening even afterneutron irradiation. Increase of stress amplituderelated to irradiation hardening was observed.The increase in initial peak tensile/compressivestress was as well as the increase in the yieldstress. Plastic strain range of irradiated samplewas reduced to 50-70% of unirradiated sample.The plastic range did not change much duringfatigue test except near the fracture. The cycledependence of plastic strain range was notaffected by neutron irradiation. Although stressamplitude of irradiated samples undergoes cyclicsoftening and falls below stress amplitude of theunirradiated one, the hardening was sufficientlyhigh to decrease number of cycles to failure, Nf.The reduction of Nf was significant for largestrain tests.
SEM micrographs of fatigue-fractured F82Hirradiated samples were presented in figure 6.
1600
1 0 L
CO
I•§ 10
s
0.1
zz±zzn±:: rzz n z i
D Unirradiatee• JMTR0.02tipaS~363K,
10' 103 104
Number of cycles to failure, N,
Figure 3. Effects of neutron irradiation on thefatigue lifetime of F82H
Unlrr. AsftT.Ae,=2.0% D •
O •A A
1 10 W 103
Number of cyclesFigure 4. Cyclic stress responses before and
after irradiation.
Unlrr. AIIIT., •
As,=10% O •: A
WNumber-of eyeles
Figure 5. Plastic strain ranges before and afterirradiation.
The analyses of fracture surface revealed thissignificant reduction of Nf was caused by localbrittle fracture. Unirradiated specimens hadductile fracture surface, and some specimen hadstriation pattern. Any brittle fracture was notobserved on the unirradiated samples. On theother hand, brittle fracture due to loss of
. OOurr
p
II
Figure 6. SEM micrographs of fatiguefractured F82H irradiated samples. TEM foil
was fabricated from solid circle.
- 139 -
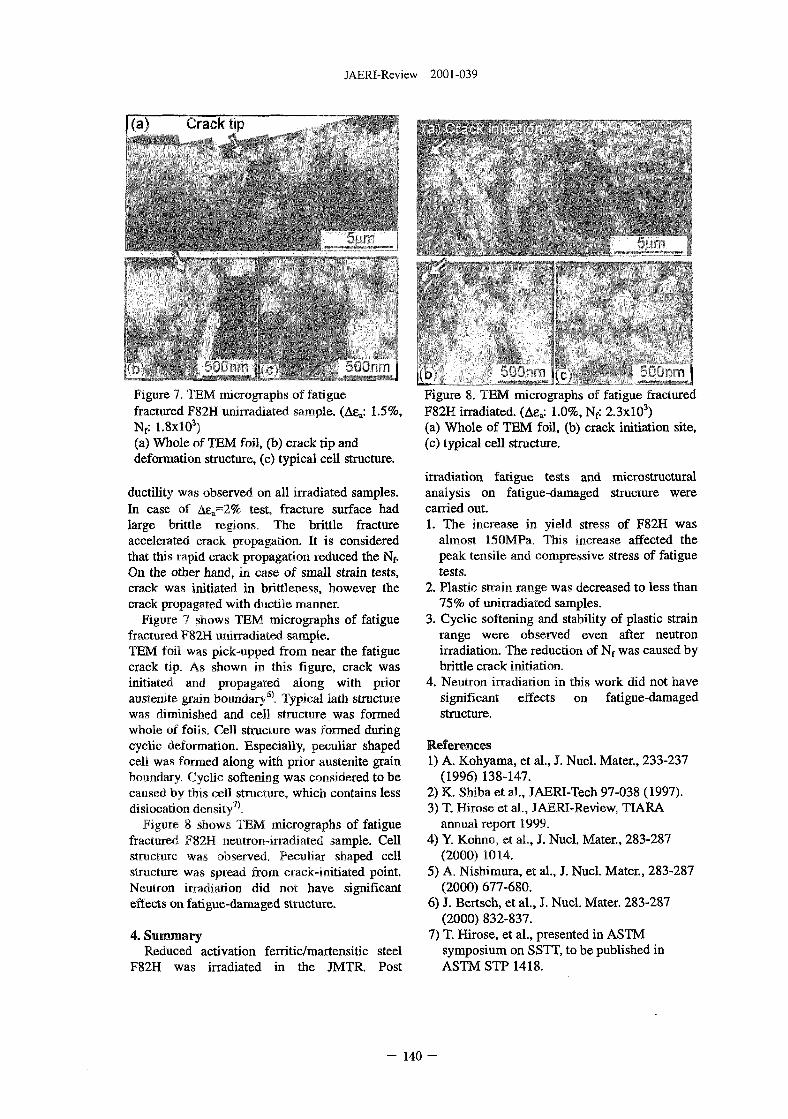
JAERI-Review 2001-039
v-rack
Figure 7. TEM micrographs of fatiguefractured F82H unirradiated sample. (Aea: 1.5%,Nf: 1.8xl03)(a) Whole of TEM foil, (b) crack tip anddeformation structure, (c) typical cell structure.
ductility was observed on all irradiated samples.In case of Ae£=2% test, fracture surface hadlarge brittle regions. The brittle fractureaccelerated crack propagation. It is consideredthat this rapid crack propagation reduced the Nf.On the other hand, in case of small strain tests,crack was initiated in brittleness, however thecrack propagated with ductile manner.
Figure 7 shows TEM micrographs of fatiguefractured F82H unirradiated sample.TEM foil was pick-upped from near the fatiguecrack tip. As shown in this figure, crack wasinitiated and propagated along with prioraustenite grain boundary65. Typical lath structurewas diminished and cell structure was formedwhole of foils. Cell structure was formed duringcyclic deformation. Especially, peculiar shapedcell was formed along with prior austenite grainboundary. Cyclic softening was considered to becaused by this cell structure, which contains lessdislocation density7'.
Figure 8 shows TEM micrographs of fatiguefractured F82H neutron-irradiated sample. Cellstructure was observed. Peculiar shaped cellstructure was spread from crack-initiated point.Neutron irradiation did not have significanteffects on fatigue-damaged structure.
4. SummaryReduced activation ferritic/martensitic steel
F82H was irradiated in the JMTR. Post
Figure 8. TEM micrographs of fatigue fracturedF82H irradiated. (Aea: 1.0%, Nf: 2.3xlO3)(a) Whole of TEM foil, (b) crack initiation site,(c) typical cell structure.
irradiation fatigue tests and microstructuralanalysis on fatigue-damaged structure werecarried out.1. The increase in yield stress of F82H was
almost 150MPa. This increase affected thepeak tensile and compressive stress of fatiguetests.
2. Plastic strain range was decreased to less than75% of unirradiated samples.
3. Cyclic softening and stability of plastic strainrange were observed even after neutronirradiation. The reduction of Nf was caused bybrittle crack initiation.
4. Neutron irradiation in this work did not havesignificant effects on fatigue-damagedstructure.
References1) A. Kohyama, et al., J. Nucl. Mater., 233-237
(1996) 138-147.2) K. Shiba et al., JAERI-Tech 97-038 (1997).3) T. Hirose et al., JAERI-Review, TIARA
annual report 1999.4) Y. Kohno, et al., J. Nucl. Mater., 283-287
(2000) 1014.5) A. Nishimura, et al., J. Nucl. Mater., 283-287
(2000) 677-680.6) J. Bertsch, et al., J. Nucl. Mater. 283-287
(2000) 832-837.7) T. Hirose, et al., presented in ASTM
symposium on SSTT, to be published inASTM STP 1418.
- 140 -
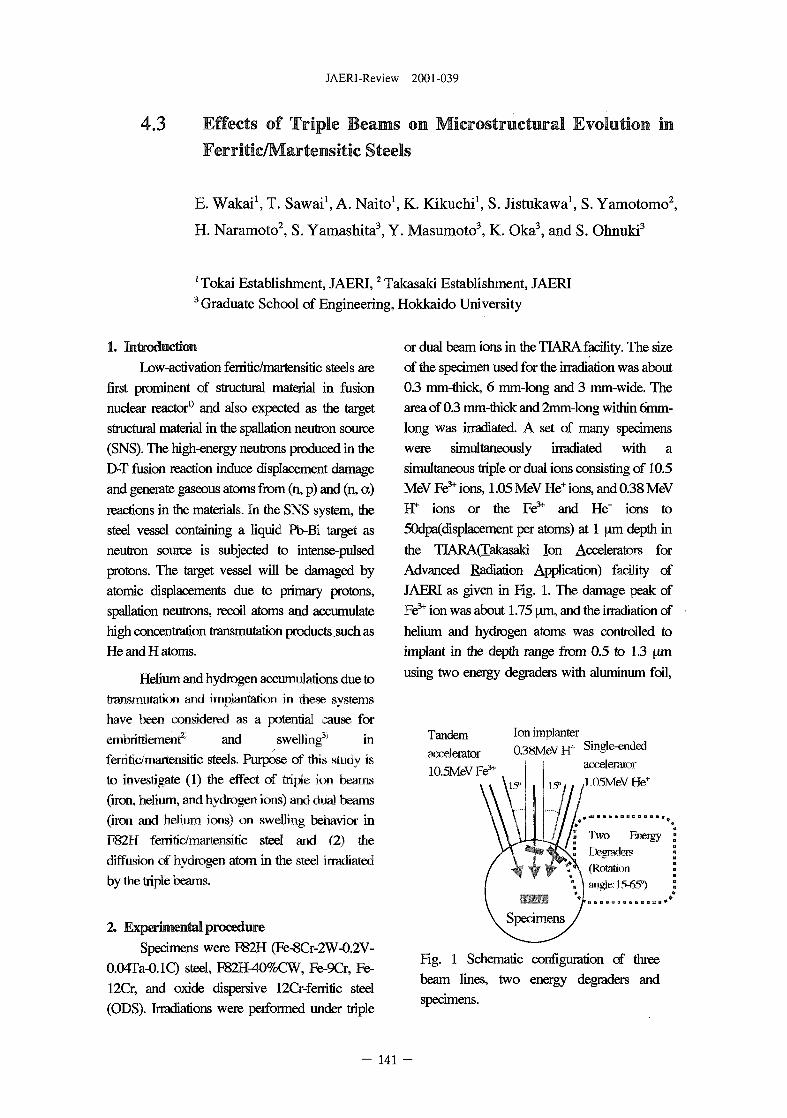
JAERI-Review 2001-039
4.3 Effects of Triple Beams on Microstructural Evolution in
Ferritic/Martensitic Steels
E. Wakai1, T. Sawai1, A. Naito1, K. Kikuchi1, S. Jistukawa1, S. Yamotomo2,
H. Naramoto2, S. Yamashita3, Y. Masumoto3, K. Oka3, and S. Ohnuki3
'Tokai Establishment, JAERI,2 Takasaki Establishment, JAERI3 Graduate School of Engineering, Hokkaido University
1. Introduction
Low-activation ferritic/martensitic steels are
first prominent of structural material in fusion
nuclear reactor0 and also expected as the target
structural material in the spallation neutron source
(SNS). The high-energy neutrons produced in the
D-T fusion reaction induce displacement damage
and generate gaseous atoms from (n, p) and (n, a)
reactions in the materials. In the SNS system, the
steel vessel containing a liquid Pb-Bi target as
neutron source is subjected to intense-pulsed
protons. The target vessel will be damaged by
atomic displacements due to primary protons,
spallation neutrons, recoil atoms and accumulate
high concentration transmutation products such as
He and H atoms.
Helium and hydrogen accumulations due to
transmutation and implantation in these systems
have been considered as a potential cause for
embrittlement?' and swelling3' in
ferritic/marfensitic steels. Purpose of this study is
to investigate (1) the effect of triple ion beams
(iron, helium, and hydrogen ions) and dual beams
(iron and helium ions) on swelling behavior in
F82H ferritic/martensitic steel and (2) the
diffusion of hydrogen atom in the steel irradiated
by the triple beams.
2. Experimental procedure
Specimens were F82H (Fe-8Cr-2W-0.2V-
0.04Ta-0.1Q steel, F82H-40%CW, Fe-9Cr, Fe-
12Cr, and oxide dispersive 12Cr-ferritic steel
(ODS). Irradiations were performed under triple
or dual beam ions in the TIARA facility. The size
of the specimen used for the irradiation was about
0.3 mm-ihick, 6 mm-long and 3 mm-wide. The
area of 0.3 mm-thick and 2mm-long within 6mm-
long was irradiated. A set of many specimens
were simultaneously irradiated with a
simultaneous triple or dual ions consisting of 10.5
MeV Fe3* ions, 1.05 MeV He+ ions, and 0.38 MeV
H+ ions or the Fe3* and He+ ions to
50dpa(displacement per atoms) at 1 urn depth in
the TIARA(Takasaki Ion Accelerators for
Advanced Radiation Application) facility of
JAERI as given in Fig. 1. The damage peak of
Fe3* ion was about 1.75 \im, and the irradiation of
helium and hydrogen atoms was controlled to
implant in the depth range from 0.5 to 1.3 ym
using two energy degraders with aluminum foil,
Tandemaccelerator10.5MeVFe*
Ion implanter038MeVH+ Single-ended
accelerator
,1.05MeV He+
Two BiergyDegraders(Rotationangle: 15-65°)
Fig. 1 Schematic configuration of three
beam lines, two energy degraders and
specimens.
- 141
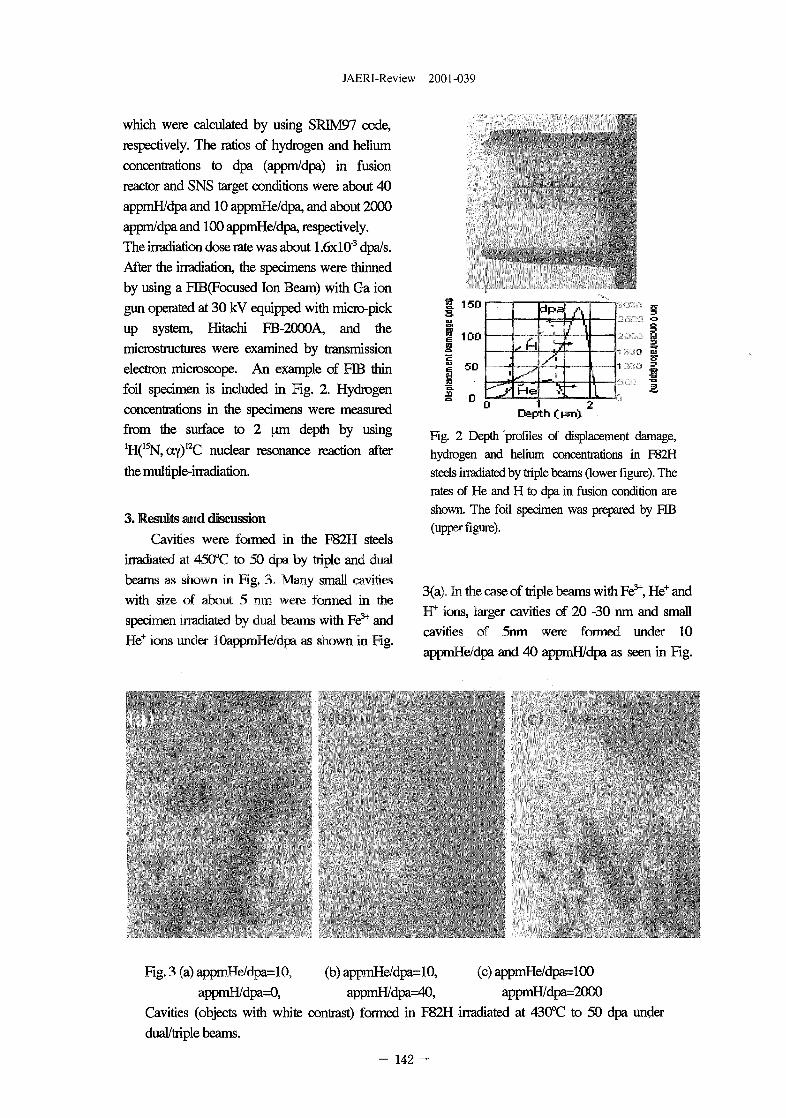
JAERI-Review 2001-039
which were calculated by using SRIM97 code,
respectively. The ratios of hydrogen and helium
concentrations to dpa (appm/dpa) in fusion
reactor and SNS target conditions were about 40
appmH/dpa and 10 appmHe/dpa, and about 2000
appm/dpa and 100 appmHe/dpa, respectively.
The irradiation dose rate was about 1.6xlO'3 dpa/s.
After the irradiation, the specimens were thinned
by using a FIB(Focused Ion Beam) with Ga ion
gun operated at 30 kV equipped with micro-pick
up system, Hitachi FB-2000A, and the
microstructures were examined by transmission
electron microscope. An example of HOB thin
foil specimen is included in Fig. 2. Hydrogen
concentrations in the specimens were measured
from the surface to 2 \an depth by usingJH(15N, ay)12C nuclear resonance reaction after
the multiple-irradiation.
3. Results and discussion
Cavities were formed in the F82H steels
irradiated at 450°C to 50 dpa by triple and dual
beams as shown in Fig. 3. Many small cavities
with size of about 5 ran were formed in the
specimen irradiated by dual beams with Fe5* and
He+ ions under lOappmHe/dpa as shown in Fig.
1 15DsI 1DDpacg 50
S n
1
He| ^
i\
11 2
Depth f h»n)
1 i
Fig. 2 Depth profiles of displacement damage,
hydrogen and helium concentrations in F82H
steels irradiated by triple beams (lower figure). The
rates of He and H to dpa in fusion condition are
shown. The foil specimen was prepared by HB
(upper figure).
3(a). In the case of triple beams with Fe51', He+ and
H+ ions, larger cavities of 20 -30 nra and small
cavities of 5nm were formed under 10
appmHe/dpa and 40 appmH/dpa as seen in Fig.
Fig. 3 (a) appmHe/dpa=10, (b) appmHe/dpa=10, (c) appmHe/dpa=100
appmH/dpa=0, appmH/dpa=40, appmH/dpa=2000
Cavities (objects with white contrast) formed in F82H irradiated at 430°C to 50 dpa under
dual/triple beams.
- 142 -
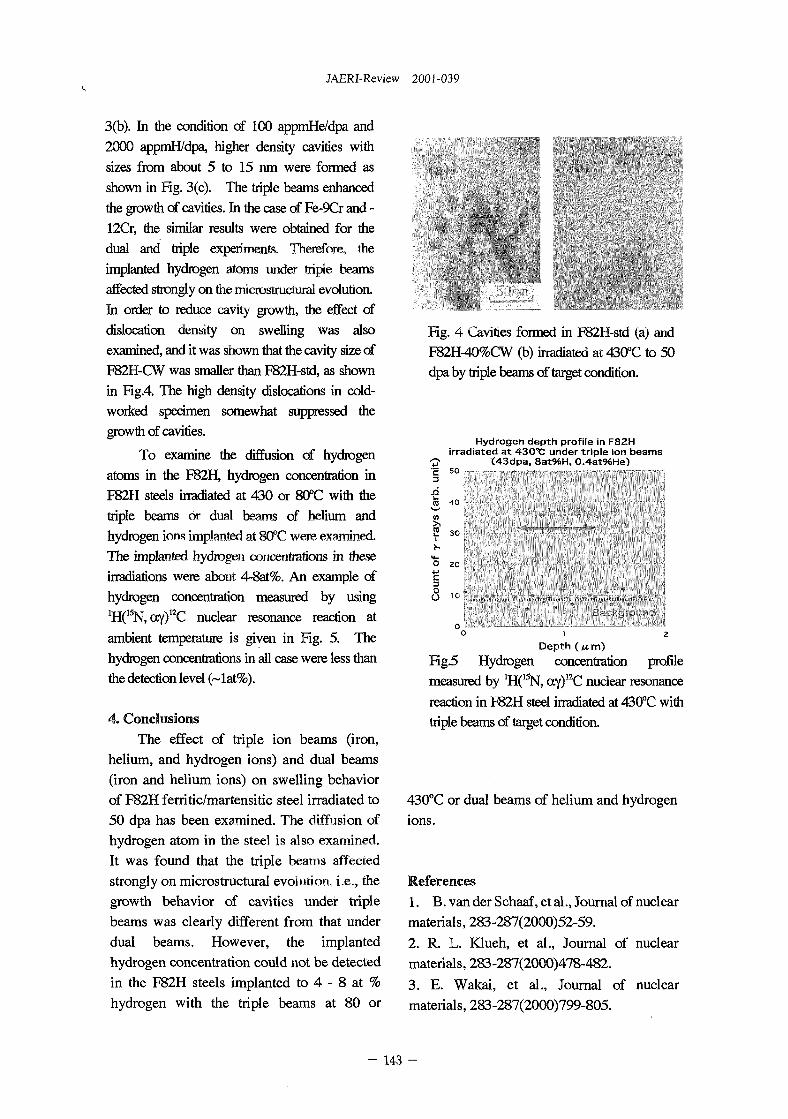
JAERI-Review 2001-039
3(b). In the condition of 100 appmHe/dpa and2000 appmH/dpa, higher density cavities withsizes from about 5 to 15 ran were formed asshown in Fig. 3(c). The triple beams enhancedthe growth of cavities. In the case of Fe-9Cr and -12Cr, the similar results were obtained for thedual and triple experiments. Therefore, theimplanted hydrogen atoms under triple beamsaffected strongly on the microstructural evolution.In order to reduce cavity growth, the effect ofdislocation density on swelling was alsoexamined, and it was shown that the cavity size ofF82H-CW was smaller than F82H-std, as shownin Fig.4. The high density dislocations in cold-worked specimen somewhat suppressed thegrowth of cavities.
To examine the diffusion of hydrogenatoms in the F82H, hydrogen concentration inF82H steels irradiated at 430 or 80°C with thetriple beams or dual beams of helium andhydrogen ions implanted at 80°C were examined.The implanted hydrogen concentrations in theseirradiations were about 4-8at%. An example ofhydrogen concentration measured by using^(^N, ay)12C nuclear resonance reaction atambient temperature is given in Fig. 5. Thehydrogen concentrations in all case were less thanthe detection level (~lat%).
4. Conclusions
The effect of triple ion beams (iron,helium, and hydrogen ions) and dual beams(iron and helium ions) on swelling behaviorof F82H ferritic/martensitic steel irradiated to50 dpa has been examined. The diffusion ofhydrogen atom in the steel is also examined.It was found that the triple beams affectedstrongly on microstructural evolution, i.e., thegrowth behavior of cavities under triplebeams was clearly different from that underdual beams. However, the implantedhydrogen concentration could not be detectedin the F82H steels implanted to 4 - 8 at %hydrogen with the triple beams at 80 or
Fig. 4 Cavities formed in F82H-std (a) andF82BM0%CW (b) irradiated at 430°C to 50dpa by triple beams of target condition.
Hydrogen depth profile in F8ZHirradiated at 430"C under triple ion beams
(43dpa, 8at%H, 0.4at%He)50
ra 40
!; 30
O 20
Depth («.m)
Fig5 Hydrogen concentration profilemeasured by 'H^N, ay)12C nuclear resonancereaction in F82H steel irradiated at 430°C withtriple beams of target condition.
430°C or dual beams of helium and hydrogen
ions.
References
1. B. van der Schaaf, et al., Journal of nuclear
materials, 283-287(2000)52-59.
2. R. L. Klueh, et al., Journal of nuclear
materials, 283-287(2000)478-482.
3. E. Wakai, et al., Journal of nuclear
materials, 283-287(2000)799-805.
- 143 -
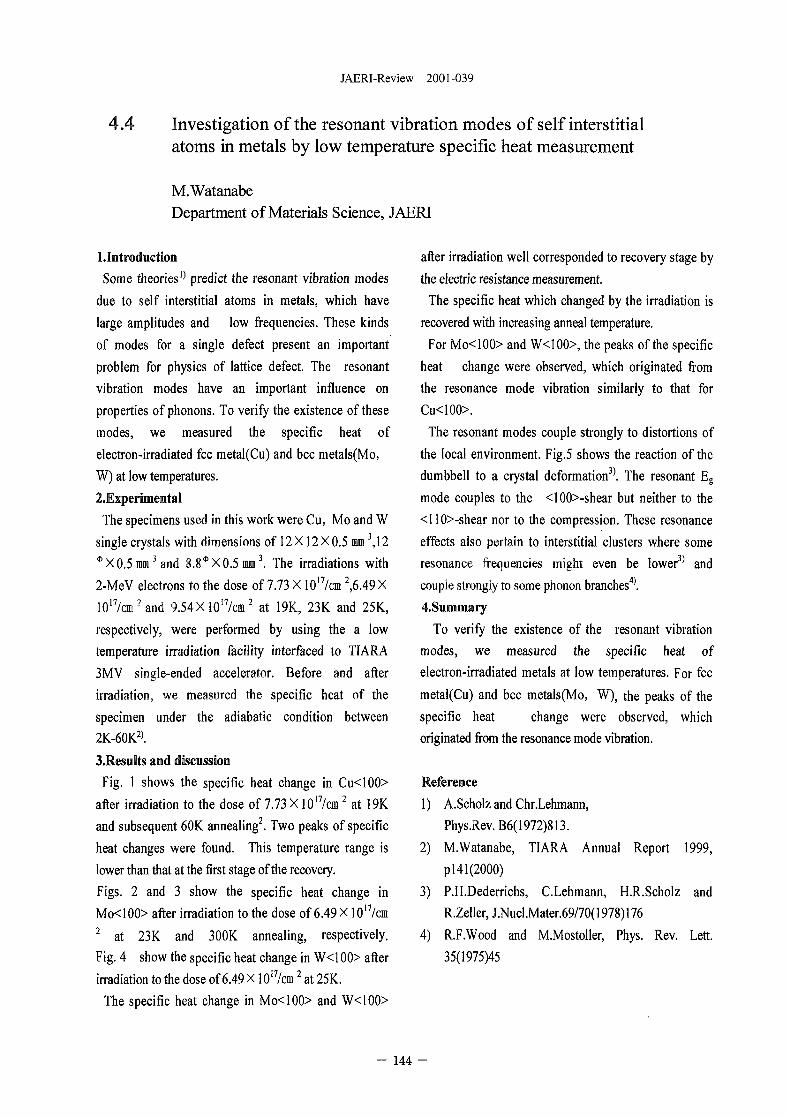
JAERI-Review 2001-039
4.4 Investigation of the resonant vibration modes of self interstitialatoms in metals by low temperature specific heat measurement
M.WatanabeDepartment of Materials Science, JAERI
lJntroduction
Some theories'' predict the resonant vibration modes
due to self interstitial atoms in metals, which have
large amplitudes and low frequencies. These kinds
of modes for a single defect present an important
problem for physics of lattice defect. The resonant
vibration modes have an important influence on
properties of phonons. To verify the existence of these
modes, we measured the specific heat of
electron-irradiated fee metal(Cu) and bec metals(Mo,
W) at low temperatures.
2.£xperimental
The specimens used in this work were Cu, Mo and W
single crystals with dimensions of 12 X12 X 0.5 mm 3,12
*X0.5 mm3 and 8.8*X0.5 mm3. The irradiations with
2-MeV electrons to the dose of 7.73 X 10¹⁷/cm 2,6.49 X
1017/cm2 and 9.54X10¹⁷/cm2 at 19K, 23K and 25K,
respectively, were performed by using the a low
temperature irradiation facility interfaced to TIARA
3MV single-ended accelerator. Before and after
irradiation, we measured the specific heat of the
specimen under the adiabatic condition between
2K-60K2).
3.Results and discussion
Fig. 1 shows the specific heat change in Cu<100>
after irradiation to the dose of 7.73 X 10¹⁷/cm2 at 19K
and subsequent 60K annealing2. Two peaks of specific
heat changes were found. This temperature range is
lower than that at the first stage of the recovery.
Figs. 2 and 3 show the specific heat change in
Mo<100> after irradiation to the dose of 6.49 X 10¹⁷/cm2 at 23K and 300K annealing, respectively.
Fig. 4 show the specific heat change in W<100> after
irradiation to the dose of 6.49 X10I7/cm2 at 25K.
The specific heat change in Mo<100> and W<100>
after irradiation well corresponded to recovery stage by
the electric resistance measurement.
The specific heat which changed by the irradiation is
recovered with increasing anneal temperature.
For Mo<100> and W<100>, the peaks of the specific
heat change were observed, which originated from
the resonance mode vibration similarly to that for
Cu<100>.
The resonant modes couple strongly to distortions of
the local environment. Fig.5 shows the reaction of the
dumbbell to a crystal deformation3'. The resonant Eg
mode couples to the <100>-shear but neither to the
<110>-shear nor to the compression. These resonance
effects also pertain to interstitial clusters where some
resonance frequencies might even be lower3' and
couple strongly to some phonon branches4'.
4.Summary
To verify the existence of the resonant vibration
modes, we measured the specific heat of
electron-irradiated metals at low temperatures. For fee
metal(Cu) and bec metals(Mo, W), the peaks of the
specific heat change were observed, which
originated from the resonance mode vibration.
Reference
1) A.Scholz and Chr.Lehmann,
Phys.Rev.B6(1972)813.
2) M.Watanabe, TIARA Annual Report 1999,
pl41(2000)
3) P.H.Dederrichs, C.Lehmann, H.R.Scholz and
R.Zeller,J.Nucl.Mater.69/70(1978)176
4) R.F.Wood and M.Mostoller, Phys. Rev. Lett.
35(1975)45
- 144 -
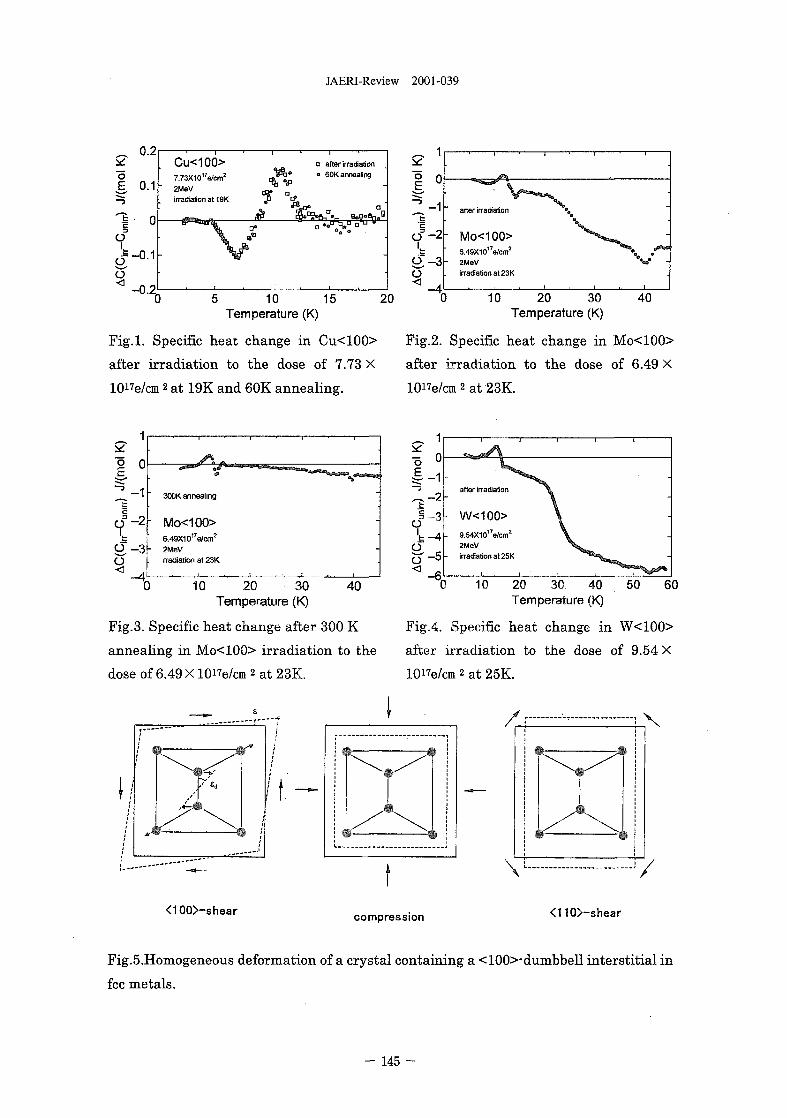
JAERI-Review 2001-039
Cu<100>7.73X10"e/cm2
2MeVirradiation at 19K
5 10 15Temperature (K)
Fig.l. Specific heat change in Cu<100>
after irradiation to the dose of 7.73 X
1017e/cm 2 at 19K and 60K annealing.
IO -
after irradation
Mo<100>6.49X1 o"e/cm2
2MeVirradation at 23K
10 20 30Temperature (K)
40
Fig.2. Specific heat change in Mo<100>
after irradiation to the dose of 6.49 X
10"e/cm 2 at 23K.
o
1
0
- 1 -
• I 1 I •
300K annealing
- Mo<100>6.49X10¹⁷e/cnr*
- 2MeV(radiation at 23K
i • i
-
10 20 30Temperature (K)
40
Fig.3. Specific heat change after 300 K
annealing in Mo<100> irradiation to the
dose of 6.49 X 10"e/cm 2 at 23K.
o 0
O<
after irradiation
W<100>9.54X10¹⁷e/cm2
2MeVirradiation at 25K
0 10 20 30 40Temperature (K)
Fig.4. Specific heat change in W<100>
after irradiation to the dose of 9.54 X
10i7e/cm 2 at 25K.
<100>-shearcompression <110>-shear
Fig.5.Homogeneous deformation of a crystal containing a <100>-dumbbell interstitial in
fee metals.
- 145 -
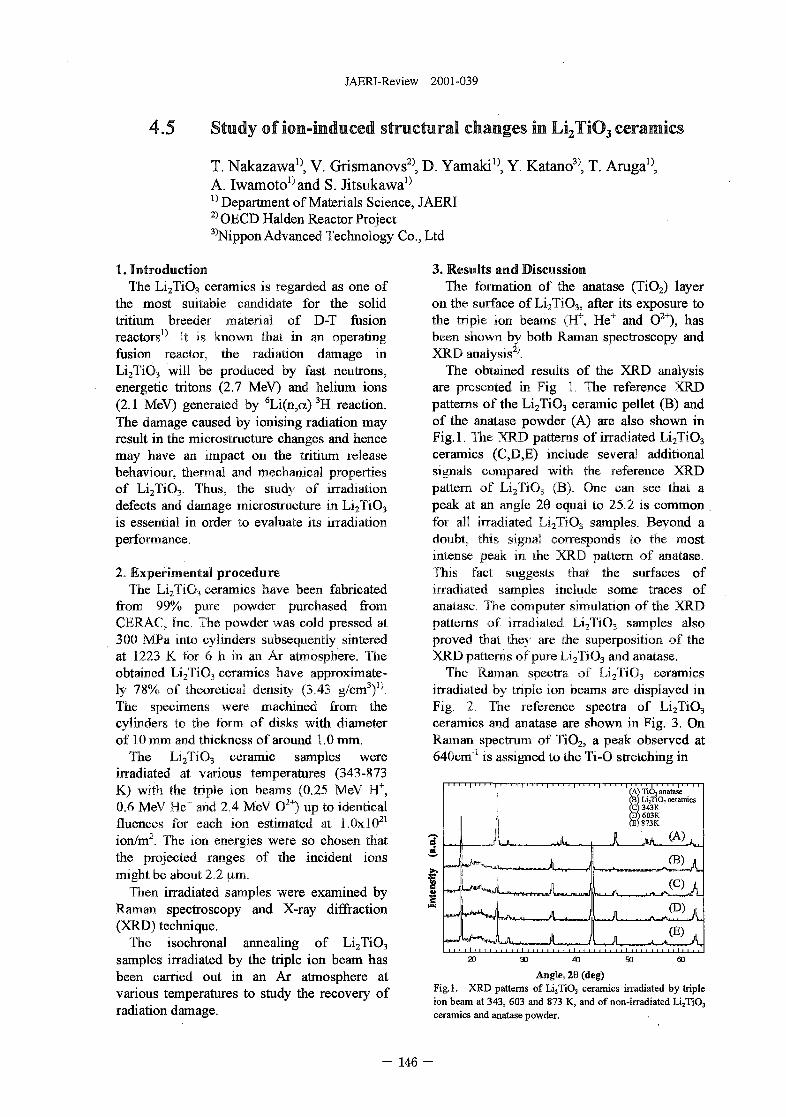
JAERI-Review 2001-039
4.5 Study of ion-Induced structural changes in Li2TiO3 ceramics
T. Nakazawa!), V. Grismanovs2), D. Yamaki1^ Y. Katano3), T. Aruga!),A. Iwamoto^and S. Jitsukawa!)
:) Department of Materials Science, JAERI2)OECD Halden Reactor Project3)Nippon Advanced Technology Co., Ltd
1. IntroductionThe Li2Ti03 ceramics is regarded as one of
the most suitable candidate for the solidtritium breeder material of D-T fusionreactors^. It is known that in an operatingfusion reactor, the radiation damage inLi2Ti03 will be produced by fast neutrons,energetic tritons (2.7 MeV) and helium ions(2.1 MeV) generated by 6Li(n,cx) 3H reaction.The damage caused by ionising radiation mayresult in the microstructure changes and hencemay have an impact on the tritium releasebehaviour, thermal and mechanical propertiesof Li2Ti03. Thus, the study of irradiationdefects and damage microstructure in Li2Ti03
is essential in order to evaluate its irradiationperformance.
2. Experimental procedureThe Li2Ti03 ceramics have been fabricated
from 99% pure powder purchased fromCERAC, Inc. The powder was cold pressed at300 MPa into cylinders subsequently sinteredat 1223 K for 6 h in an Ar atmosphere. Theobtained Li2Ti03 ceramics have approximate-ly 78% of theoretical density (3.43 g/cm3)0
The specimens were machined from thecylinders to the form of disks with diameterof 10 mm and thickness of around 1.0 mm.
The Li2Ti03 ceramic samples wereirradiated at various temperatures (343-873K) with the triple ion beams (0.25 MeV H+,0.6 MeV He+ and 2.4 MeV O2+) up to identicalfluences for each ion estimated at l.OxlO21
ion/m2. The ion energies were so chosen thatthe projected ranges of the incident ionsmight be about 2.2 (xm.
Then irradiated samples were examined byRaman spectroscopy and X-ray diffraction(XRD) technique.
The isochronal annealing of Li2Ti03
samples irradiated by the triple ion beam hasbeen carried out in an Ar atmosphere atvarious temperatures to study the recovery ofradiation damage.
3. Results and DiscussionThe formation of the anatase (TiO2) layer
on the surface of Li2Ti03, after its exposure tothe triple ion beams (H+, He+ and O2+), hasbeen shown by both Raman spectroscopy andXRD analysis2'*.
The obtained results of the XRD analysisare presented in Fig. 1. The reference XRDpatterns of the Li2Ti03 ceramic pellet (B) andof the anatase powder (A) are also shown inFig.l. The XRD patterns of irradiated Li2Ti03
ceramics (C,D,E) include several additionalsignals compared with the reference XRDpattern of Li2Ti03 (B), One can see that apeak at an angle 20 equal to 25.2 is commonfor all irradiated Li2Ti03 samples. Beyond adoubt, this signal corresponds to the mostintense peak in the XRD pattern of anatase.This fact suggests that the surfaces ofirradiated samples include some traces ofanatase. The computer simulation of the XRDpatterns of irradiated Li2Ti03 samples alsoproved that they are the superposition of theXRD patterns of pure Li2Ti03 and anatase.
The Raman spectra of Li2Ti03 ceramicsirradiated by triple ion beams are displayed inFig. 2. The reference spectra of Li2Ti03
ceramics and anatase are shown in Fig. 3. OnRaman spectrum of TiO2, a peak observed at640cm1 is assigned to the Ti-0 stretching in
(A) TiO, anataseLijTiO? ceramics343K
D) 603KJ873K
Angle, 29 (deg)Fig. 1. XRD patterns of Li2Ti03 ceramics irradiated by tripleion beam at 343, 603 and 873 K, and of non-irradiated Li2TiO3
ceramics and anatase powder.
- 146 -
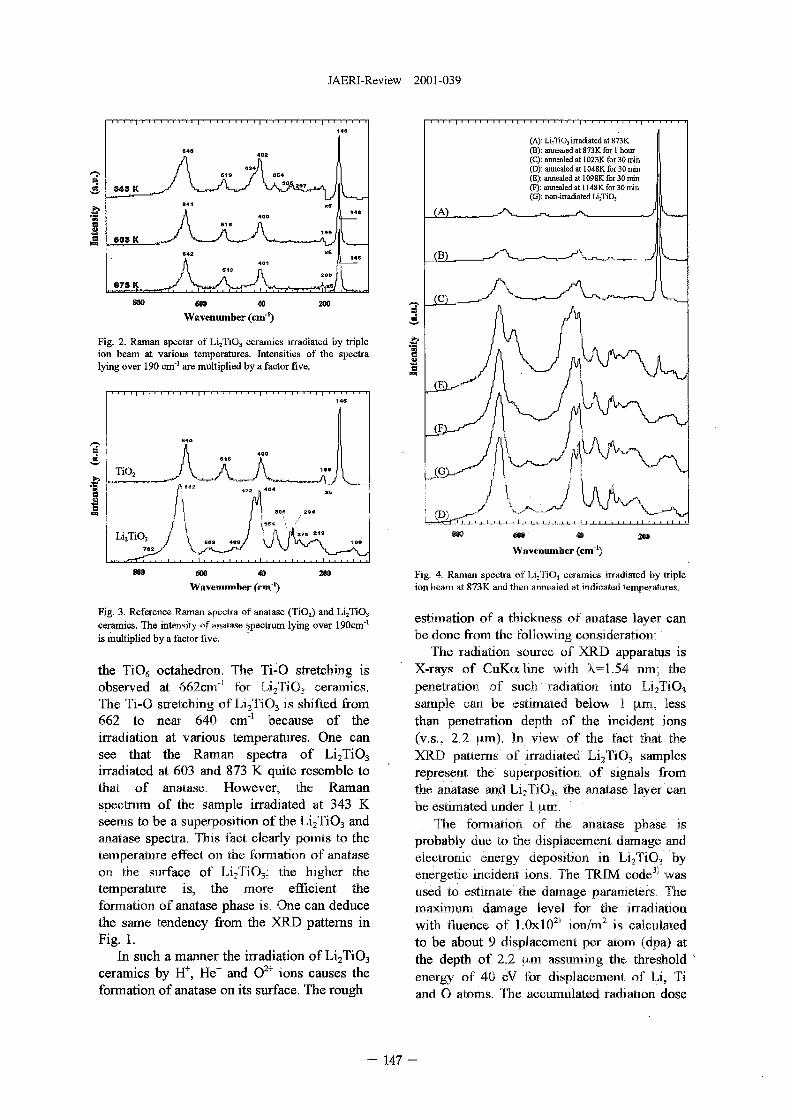
JAERI-Review 2001-039
&
fI
343K ^ ,
60S K ^
873 K. . . - •>. . . . P i . >. > ^
6 4 3
/IA641
A842
A
619
616
A61S
4 0 2
/ I
4 0 0
401
A
146
XE
199
146
146
r40 200
Wavenumber (cm1)
Fig. 2. Raman spectar of Li2TiG3 ceramics irradiated by tripleion beam at various temperatures. Intensities of the spectralying over 190 cm"1 are multiplied by a factor five.
600 48
Wavenumber (cm"1)200
Fig. 3. Reference Raman spectra of anatase (TiO2) and Li2TiO3
ceramics. The intensity of anatase spectrum lying over 190cm"1
is multiplied by a factor five.
the TiO6 octahedron. The Ti-0 stretching isobserved at 662cm4 for Li2TiQ3 ceramics.The Ti-0 stretching of Li2Ti03 is shifted from662 to near 640 cm"1 because of theirradiation at various temperatures. One cansee that the Raman spectra of Li2Ti03
irradiated at 603 and 873 K quite resemble tothat of anatase. However, the Ramanspectrum of the sample irradiated at 343 Kseems to be a superposition of the Li2Ti03 andanatase spectra. This fact clearly points to thetemperature effect on the formation of anataseon the surface of Li2Ti03; the higher thetemperature is, the more efficient theformation of anatase phase is. One can deducethe same tendency from the XRD patterns inFig. 1.
In such a manner the irradiation of Li2Ti03
ceramics by H+, He+ and O2+ ions causes theformation of anatase on its surface. The rough
(A): Li,TiO3 inadiated at 873K(B): annealed at 873K for 1 hour(C): annealed at 1023K for 30 min(D): annealed at 1048K for 30 min(E): annealed at 1098K for 30 min(F): annealed at 1148K for 30 min(G): non-irradiated LijTiO]
Wavenumber (cm )
Fig. 4. Raman spectra of Li2TiO3 ceramics irradiated by tripleion beam at 873K and then annealed at indicated temperatures.
estimation of a thickness of anatase layer canbe done from the following consideration:
The radiation source of XRD apparatus isX-rays of CuKa line with X=1.54 nm; thepenetration of such, radiation into Li2Ti03
sample can be estimated below 1 |xm, lessthan penetration depth of the incident ions(vs., 2.2 (xm). In view of the fact that theXRD patterns of irradiated Li2Ti03 samplesrepresent the superposition of signals fromthe anatase and Li2Ti03, the anatase layer canbe estimated under 1 \im.
The formation of the anatase phase isprobably due to the displacement damage andelectronic energy deposition in Li2Ti03 byenergetic incident ions. The TRIM code3'*1 wasused to estimate the damage parameters. Themaximum damage level for the irradiationwith fluence of l.OxlO21 ion/m2 is calculatedto be about 9 displacement per atom (dpa) atthe depth of 2.2 ^m assuming the thresholdenergy of 40 eV for displacement of Li, Tiand O atoms. The accumulated radiation dose
- 147 -
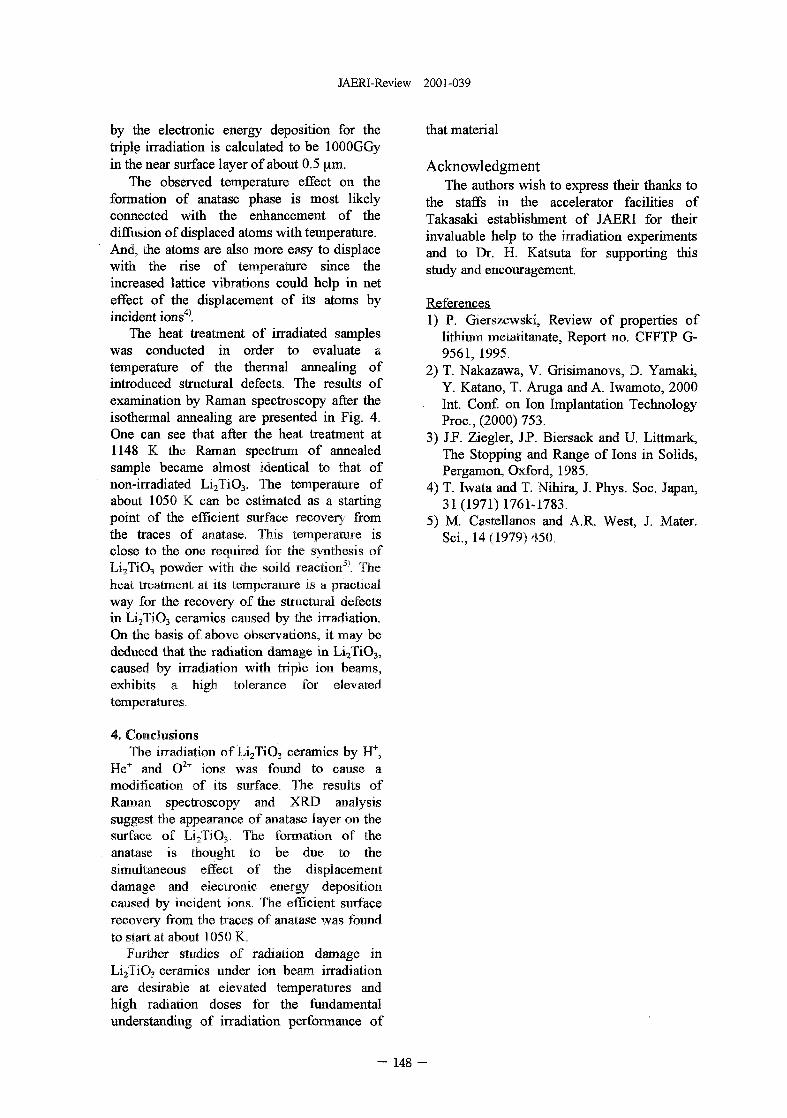
JAERI-Review 2001-039
by the electronic energy deposition for thetriple irradiation is calculated to be lOOOGGyin the near surface layer of about 0.5 urn.
The observed temperature effect on theformation of anatase phase is most likelyconnected with the enhancement of thediffusion of displaced atoms with temperature.And, the atoms are also more easy to displacewith the rise of temperature since theincreased lattice vibrations could help in neteffect of the displacement of its atoms byincident ions4).
The heat treatment of irradiated sampleswas conducted in order to evaluate atemperature of the thermal annealing ofintroduced structural defects. The results ofexamination by Raman spectroscopy after theisothermal annealing are presented in Fig. 4.One can see that after the heat treatment at1148 K the Raman spectrum of annealedsample became almost identical to that ofnon-irradiated Li2Ti03. The temperature ofabout 1050 K can be estimated as a startingpoint of the efficient surface recovery fromthe traces of anatase. This temperature isclose to the one required for the synthesis ofLi2Ti03 powder with the soild reaction3'. Theheat treatment at its temperature is a practicalway for the recovery of the structural defectsin Li2Ti03 ceramics caused by the irradiation.On the basis of above observations, it may bededuced that the radiation damage in Li2TiO3,caused by irradiation with triple ion beams,exhibits a high tolerance for elevatedtemperatures.
4. ConclusionsThe irradiation of Li2Ti03 ceramics by H+,
He+ and O2+ ions was found to cause amodification of its surface, The results ofRaman spectroscopy and XRD analysissuggest the appearance of anatase layer on thesurface of Li2Ti03. The formation of theanatase is thought to be due to thesimultaneous effect of the displacementdamage and electronic energy depositioncaused by incident ions. The efficient surfacerecovery from the traces of anatase was foundto start at about 1050 K.
Further studies of radiation damage inLi2Ti03 ceramics under ion beam irradiationare desirable at elevated temperatures andhigh radiation doses for the fundamentalunderstanding of irradiation performance of
that material
AcknowledgmentThe authors wish to express their thanks to
the staffs in the accelerator facilities ofTakasaki establishment of JAERI for theirinvaluable help to the irradiation experimentsand to Dr. H. Katsuta for supporting thisstudy and encouragement.
References1) P. Gierszewski, Review of properties of
lithium metatitanate, Report no. CFFTP G-9561, 1995.
2) T. Nakazawa, V. Grisimanovs, D. Yamaki,Y. Katano, T. Aruga and A. Iwamoto, 2000Int. Conf. on Ion Implantation TechnologyProc, (2000)753.
3) JF. Ziegler, JP. Biersack and U. Littmark,The Stopping and Range of Ions in Solids,Pergamon, Oxford, 1985.
4) T. Iwata and T. Nihira, J. Phys. Soc. Japan,31(1971)1761-1783.
5) M. Castellanos and A.R. West, J. Mater.Sci., 14(1979)450.
- 148 -
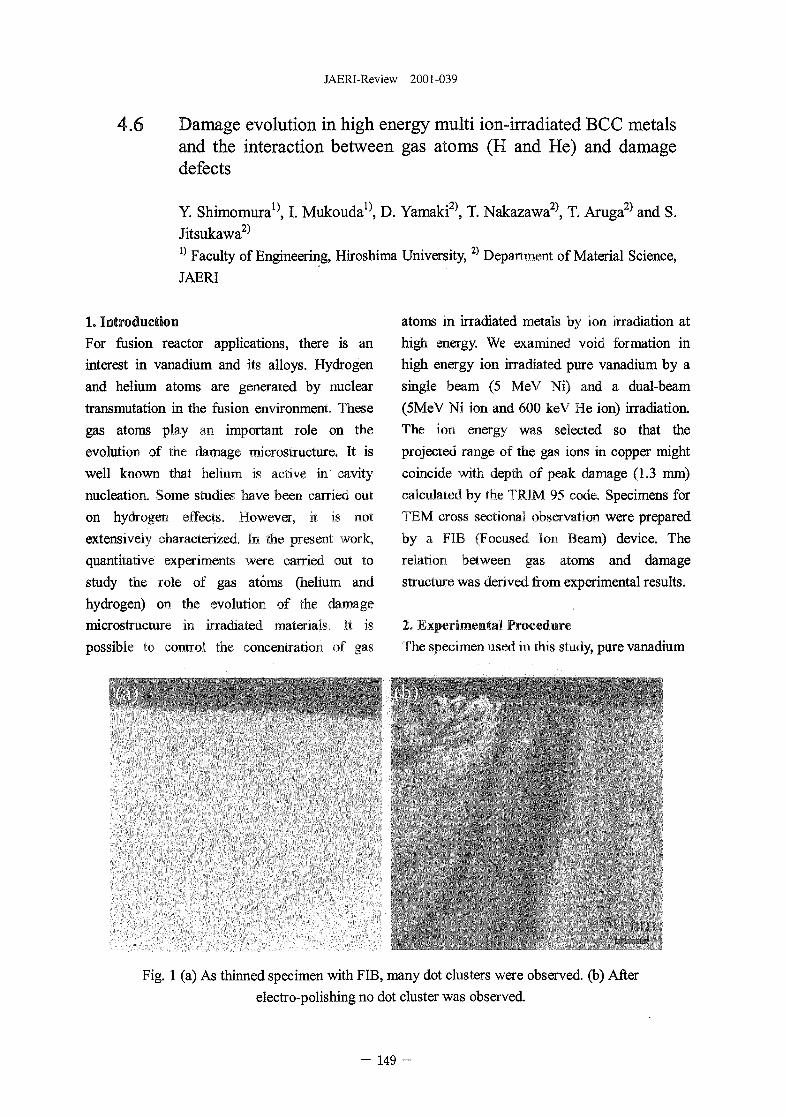
JAERI-Review 2001-039
4.6 Damage evolution in high energy multi ion-irradiated BCC metalsand the interaction between gas atoms (H and He) and damagedefects
Y. Shimomura1^ I. Mukouda1}, D. Yamaki2), T. Nakazawa2), T. Aruga2) and S.
Jitsukawa2)
l) Faculty of Engineering, Hiroshima University,2) Department of Material Science,
JAERI
1. Introduction
For fusion reactor applications, there is an
interest in vanadium and its alloys. Hydrogen
and helium atoms are generated by nuclear
transmutation in the fusion environment. These
gas atoms play an important role on the
evolution of the damage microstructure. It is
well known that helium is active in cavity
nucleation. Some studies have been carried out
on hydrogen effects. However, it is not
extensively characterized. In the present work,
quantitative experiments were carried out to
study the role of gas atoms (helium and
hydrogen) on the evolution of the damage
microstructure in irradiated materials. It is
possible to control the concentration of gas
atoms in irradiated metals by ion irradiation at
high energy. We examined void formation in
high energy ion irradiated pure vanadium by a
single beam (5 MeV Ni) and a dual-beam
(5MeV Ni ion and 600 keV He ion) irradiation.
The ion energy was selected so that the
projected range of the gas ions in copper might
coincide with depth of peak damage (1.3 mm)
calculated by the TRIM 95 code. Specimens for
TEM cross sectional observation were prepared
by a FIB (Focused Ion Beam) device. The
relation between gas atoms and damage
structure was derived from experimental results.
2. Experimental Procedure
The specimen used in this study, pure vanadium
Fig. 1 (a) As thinned specimen with FIB, many dot clusters were observed, (b) After
electro-polishing no dot cluster was observed.
- 149 -
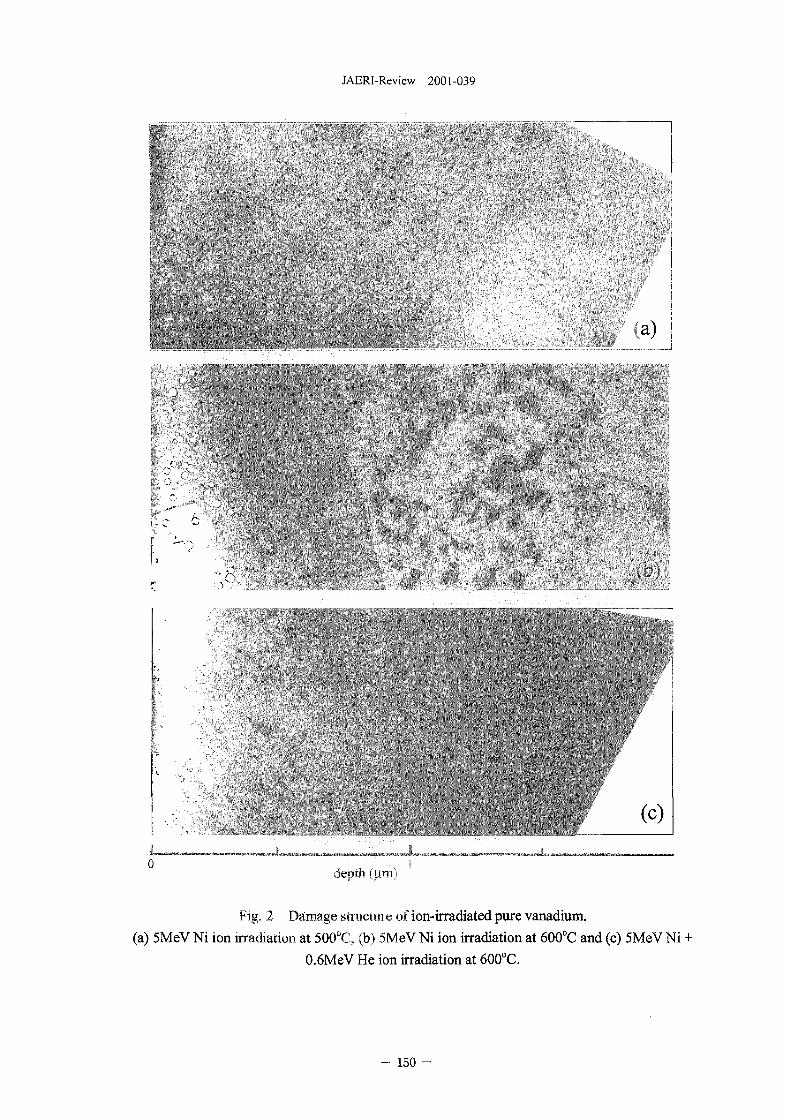
JAERI-Review 2001-039
i
a)
(c)
L - - - ' - — r
0 1depth (um)
Fig. 2 Damage structure of ion-irradiated pure vanadium.
(a) 5MeV Ni ion irradiation at 500°C, (b) 5MeV Ni ion irradiation at 600°C and (c) 5MeV Ni +
0.6MeV He ion irradiation at 600°C.
- 150 -
JAERI-Review 2001-039
had nominal purity of 99.8%. Cut annealed disks
of 3mm in diameter and 0.05 mm in thickness
was prepared [1-3]. The high energy ion
irradiation was carried out with accelerators of
TIARA at Takasaki-establishment of JAERI.
The ions stop within the depth of a few microns
from surface level and damage was formed up to
this depth. Pure vanadium was irradiated at 500
and 600°C. For the quantitative investigation,
damage structure has to be observed as a
function of the depth. We utilized FIB
microscopy. To preserve the surface position of
ion-irradiated metals, we deposited tungsten on
the irradiated surface. In our previous work, it
was found that interstitial atoms form their
clusters throughout FIB-thinned specimens as
shown in Fig. l(a). To overcome this difficulty,
we developed the TEM specimen preparation
method which is a combination of FIB thinning
and an electro- polishing. The specimens were
electro-polished to remove damaged region by
FIB, after electro-polishing no dot defects were
observed as shown in Fig. l(b).
3. Results and Discussion
When only nickel ion was irradiated, voids were
formed in the region from the surface to the
depth of about 0.5 (j,m irradiated at 500 and
600°C (Fig. 2(a) and 2(b). However in the region
of damage peak, voids were not observed. The
needle-like precipitate of about lOOnm in length
was observed for all samples covering the whole
penetration depth of ion. It is thought that the
precipitate is carbide. Moreover, in the sample
irradiated at 600°C, the granular precipitate was
observed in the domain of the 1.0 to 1.5 (im
depth. While voids formation was observed
within the whole ion penetration depth in the
sample irradiated with Ni + He ions
simultaneously as shown in Fig. 2(c). The
needle-like precipitate was observed also in
sample irradiated with Ni + He ions.
References
[1] I. Mukouda, Y. Shimomura, T. Iiyama Y.
Katano, D. Yamaki, T. Nakazawa and K. Noda,
Mat. Res. Soc. Symp, Proc. Vol. 540 (1999)
549-554.
[2] Y. Shimomura and I. Mukouda, Mat. Res.
Soc. Symp. Proc. Vol. 540 (1999) 527-532.
[3] I. Mukouda, Y. Shimomura, T. Iiyama, Y.
Harada, Y. Katano, T. Nakazawa, D. Yamaki and
K. Noda, J. Nucl. Mater. 283-287 (2000)
302-305.
- 151 -
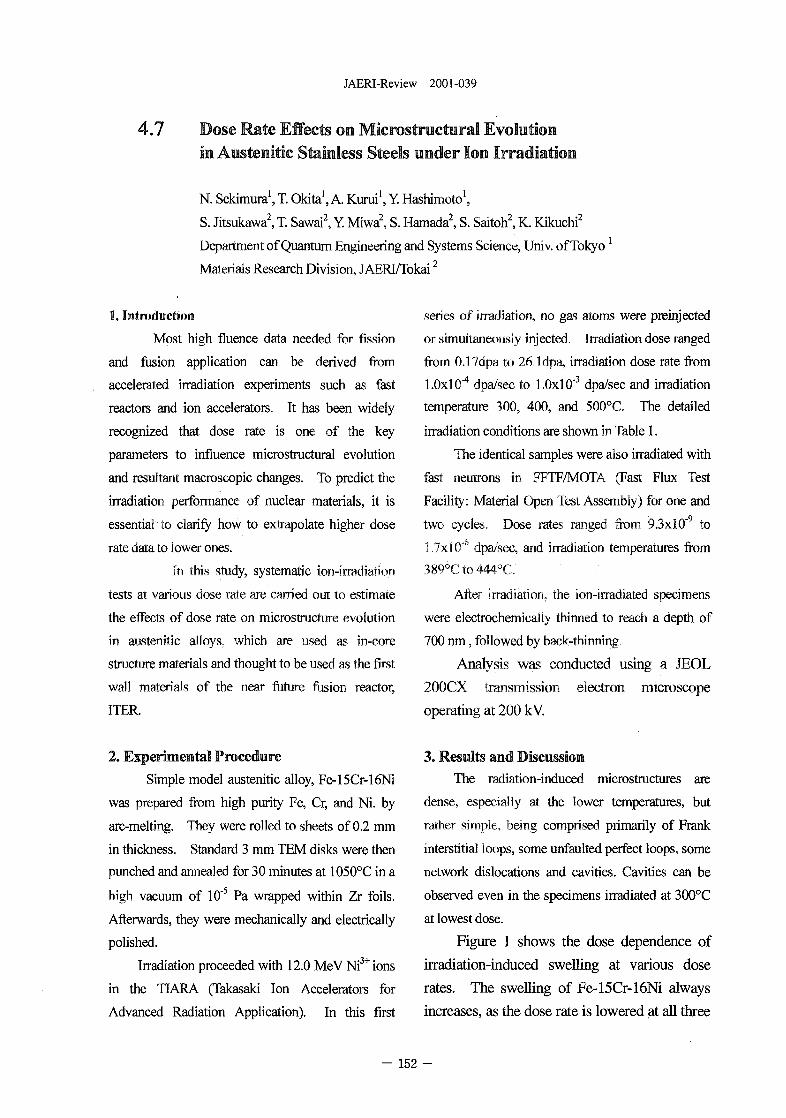
JAERI-Review 2001-039
4.7 Dose Rate Effects on Microstructural Evolutionin Austenitic Stainless Steels under Ion Irradiation
N. Sekimura1, T. Okita1, A. Kurui1, Y. Hashimoto1,
S. Jitsukawa2, T. Sawai2, Y. Miwa2, S. Hamada2, S. Saitoh2, K. Kikuchi2
Department of Quantum Engineering and Systems Science, Univ. of Tokyo'
Materials Research Division, J AERl/Tokai2
1. Introduction
Most high fluence data needed for fission
and fusion application can be derived from
accelerated irradiation experiments such as fast
reactors and ion accelerators. It has been widely
recognized that dose rate is one of the key
parameters to influence microstructural evolution
and resultant macroscopic changes. To predict the
irradiation performance of nuclear materials, it is
essential to clarify how to extrapolate higher dose
rate data to lower ones.
In this study, systematic ion-irradiation
tests at various dose rate are carried out to estimate
the effects of dose rate on microstructure evolution
in austenitic alloys, which are used as in-core
structure materials and thought to be used as the first
wall materials of the near future fusion reactor,
ITER.
2. Experimental Procedure
Simple model austenitic alloy, Fe-15Cr-16Ni
was prepared from high purity Fe, Cr, and Ni. by
arc-melting. They were rolled to sheets of 0.2 mm
in thickness. Standard 3 mm TEM disks were then
punched and annealed for 30 minutes at 1050°C in a
high vacuum of 10"5 Pa wrapped within Zr foils.
Afterwards, they were mechanically and electrically
polished.
Irradiation proceeded with 12.0 MeV Ni3+ ions
in the TIARA (Takasaki Ion Accelerators for
Advanced Radiation Application). In this first
series of irradiation, no gas atoms were preinjected
or simultaneously injected. Irradiation dose ranged
from 0.17dpa to 26.1dpa, irradiation dose rate from
l.OxlO"4 dpa/sec to l.OxlO"3 dpa/sec and irradiation
temperature 300, 400, and 500°C. The detailed
irradiation conditions are shown in Table 1.
The identical samples were also irradiated with
fast neutrons in FFTF/MOTA (Fast Flux Test
Facility: Material Open Test Assembly) for one and
two cycles. Dose rates ranged from 9.3x10" to
1.7xlO~6 dpa/sec, and irradiation temperatures from
389°Cto444°C,
After irradiation, the ion-irradiated specimens
were electrochemically thinned to reach a depth of
700 nm, followed by back-thinning.
Analysis was conducted using a JEOL
200CX transmission electron microscope
operating at 200 kV.
3 . Results a n d Discussion
The radiation-induced microstructures are
dense, especially at the lower temperatures, but
rather simple, being comprised primarily of Frank
interstitial loops, some unfaulted perfect loops, some
network dislocations and cavities. Cavities can be
observed even in the specimens irradiated at 300°C
at lowest dose.
Figure 1 shows the dose dependence of
irradiation-induced swelling at various dose
rates. The swelling of Fe-15Cr-16Ni always
increases, as the dose rate is lowered at all three
- 152 -
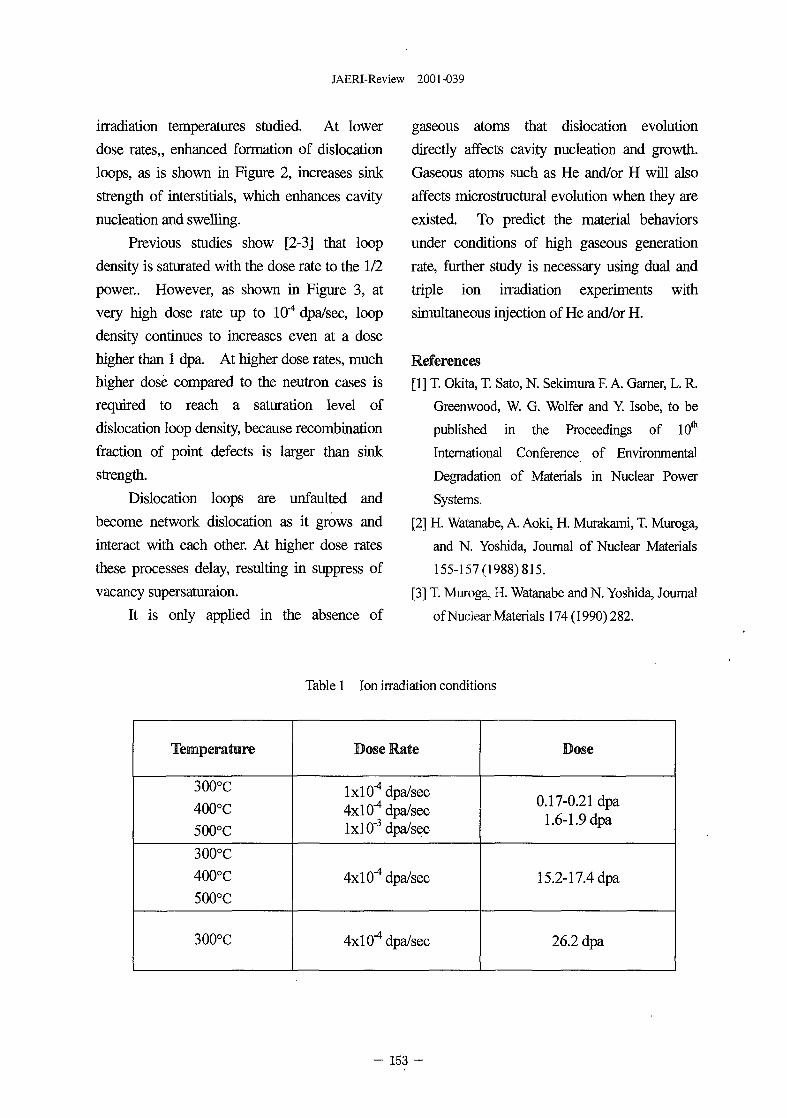
JAERI-Review 2001-039
irradiation temperatures studied. At lower
dose rates,, enhanced formation of dislocation
loops, as is shown in Figure 2, increases sink
strength of interstitials, which enhances cavity
nucleation and swelling.
Previous studies show [2-3] that loop
density is saturated with the dose rate to the 1/2
power.. However, as shown in Figure 3, at
very high dose rate up to 10"4 dpa/sec, loop
density continues to increases even at a dose
higher than 1 dpa. At higher dose rates, much
higher dose compared to the neutron cases is
required to reach a saturation level of
dislocation loop density, because recombination
fraction of point defects is larger than sink
strength.
Dislocation loops are unfaulted and
become network dislocation as it grows and
interact with each other. At higher dose rates
these processes delay, resulting in suppress of
vacancy supersaturaion.
It is only applied in the absence of
gaseous atoms that dislocation evolution
directly affects cavity nucleation and growth.
Gaseous atoms such as He and/or H will also
affects microstructural evolution when they are
existed. To predict the material behaviors
under conditions of high gaseous generation
rate, further study is necessary using dual and
triple ion irradiation experiments with
simultaneous injection of He and/or H.
References
[1] T. Okita, T. Sato, N. Sekimura F. A. Garner, L. R.
Greenwood, W. G. Wolfer and Y. Isobe, to be
published in the Proceedings of 10th
International Conference of Environmental
Degradation of Materials in Nuclear Power
Systems.
[2] H. Watana.be, A. Aoki, H. Murakami, T. Muroga,
and N. Yoshida, Journal of Nuclear Materials
155-157(1988)815.
[3] T. Muroga, H. Watanabe and N. Yoshida, Journal
of Nuclear Materials 174 (1990) 282.
Table 1 Ion irradiation conditions
Temperature
300°C
400°C
500°C
300°C
400°C
500°C
300°C
Dose Rate
lxlO"4 dpa/sec4x10"4 dpa/seclxl 0'3 dpa/sec
4x10"4 dpa/sec
4xlO"4dpa/sec
Dose
0.17-0.21 dpa1.6-1.9 dpa
15.2-17.4 dpa
26.2 dpa
- 153
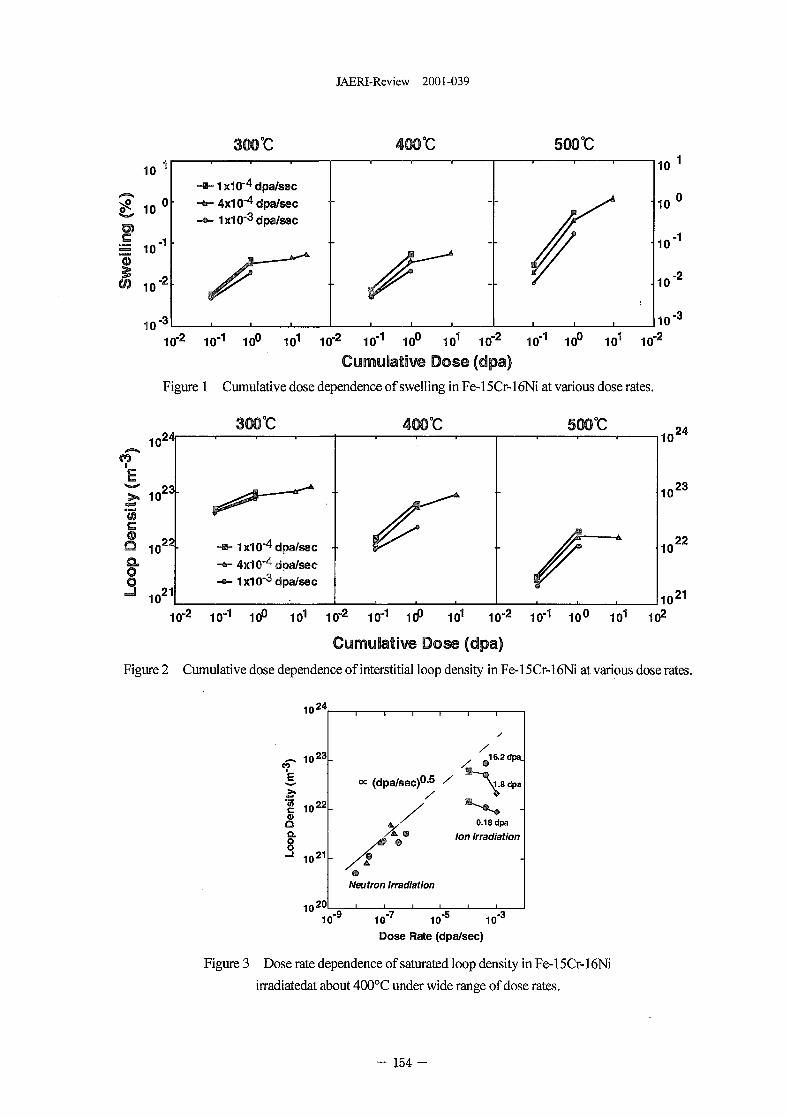
3Q0°C
JAERI-Review 2001-039
4Q0°C 500°C
10
110-2
10'
-»-1x10⁻⁴dpa/sec-*-4x10"4 dpa/sec-®- 1 x W 3 dpa/sec
: s~ :10
10
10
10
-1
-2
10"
10'2 10"1 10° 101 10"2 10'1 10° 101 10'2 10"1 10° 101 10"2
Cumulative Dose (dpa)Figure 1 Cumulative dose dependence of swelling in Fe-15Cr-16Ni at various dose rates.
30Q°C 4CM°C 5C»0C10*
10
W
Q 1 0
a.oo
22
1021
•*• 1 x10"4 dpa/sec
-*-4x10"4 dpa/sec-®- 1x10'3 dpa/sec
1024
1023
1022
1021
10"2 10"1 10° 101 10"2 10"1 1CP 101 10"2 10"1 10° 101 102
Cumulative Dose (dpa)
Figure 2 Cumulative dose dependence of interstitial loop density in Fe-15Cr-16Ni at various dose rates.
1024
\
1023-
22c 10
a
-J , n 2i10"
10 20
l i l t
-
« (dpa/sec)0-5 -/
- Ao
Neutron Irradiation
/
#16.2d|ML
0.18 dpa
Ion Irradiation
-
10" 10-7 10"5 10"
Dose Rate (dpa/sec)
Figure 3 Dose rate dependence of saturated loop density in Fe-15Cr-16Ni
irradiatedat about 400°C under wide range of dose rates.
- 1 5 4 -
JAERI-Review 2001-039
4.8 Effect of Simultaneous Ion Irradiation on MicrostructuralChange of SiC/SiC Composites at High Temperature
T. Taguchi1^ E. Wakai1}, N. Igawa1^ S. Nogami2), A. Hasegawa2),L.L. Snead3) and SJitsukawa0
^Department of Materials Science, JAERI2)Department of Quantum Science and Energy Engineering, Tohoku Universityj)Metals and Ceramics Division, Oak Ridge National Laboratory
1. Introduction
Ceramic matrix composites show excellent
mechanical properties at high temperature and
also non-catastrophic failure behavior. The
materials, therefore, are expected to be used for
structural applications at high temperature. In
particular, SiC/SiC composites are expected to be
one of the candidate materials for first wall and
blanket components in a fusion reactor because
of their low residual radioactivity after neutron
irradiation. Under the fusion condition, He and H
atoms are produced by 14MeV neutron from
transmutation reactions of (n,a) and (n,p),
respectively. These transmutation rates in SiC are
larger than those in the other candidate materials
such as ferritic steels and vanadium alloys1)l2).
The synergistic effect of gas atoms and
displacement damage on microstructural change
in the SiC/SiC composites had been examined at
temperature lower than 800°Cj). However, the
material will be used at temperature ranging from
800 to 1200°C in a fusion reactor.
In this study, we investigated the effect of
simultaneous triple irradiation of He, H and Si
ions on microstructural change of SiC/SiC
composites at temperature higher than 800°C.
2.Experimental procedure
2.1 Materials and preparation
The 2D plane weave of Tyranno SA SiC
fiber fabric was chosen in this study. SiC/SiC
composite examined in this study was fabricated
by forced thermal gradient chemical vapor
Laboratory. The density and porosity of this
composite were 2.76 g/cnr1 and 10.8 %,
respectively. The fiber volume fraction was about
37%. This composite has the carbon layer as the
interface between matrix and fiber and the
thickness of the layer was about 150 nm. The
surface of the specimen was polished with
diamond blade of #8000. The size of specimen was
lmm-width, 5 mm-long and 0.4 mm-thick.
2.2 Irradiation
The simultaneous ion irradiation was carried
out at TIARA facility of JAERI/Takasaki. The
specimen was simultaneously irradiated at
1000°C by 6.00MeV Si2+ ions, 1.2MeVHe+ and
250keV H1" ions. HeT ion implantation was
performed with using aluminum foil energy
degrader in order to control He distribution in the
depth range of about 1.5-2.2 jJ. m from the
specimen surface. Figure 1 shows the
distributions of He and H concentration and
displacement damage as a function of depth from
the surface in SiC calculated by TRIM code4). In
this study, the displacement threshold energies of
Si and C were assumed to be 35 eV and 20 eV5),
respectively The irradiation was performed to 10
dpa at the depth of 2 urn as shown in Fig. 1.
2.3 Microstructure observation
The focused ion beam processing was used
to prepare a foil specimen for transmission
electron microscopy (TEM) observation. The foil
specimen contains the fiber, matrix and interface
- 155 -
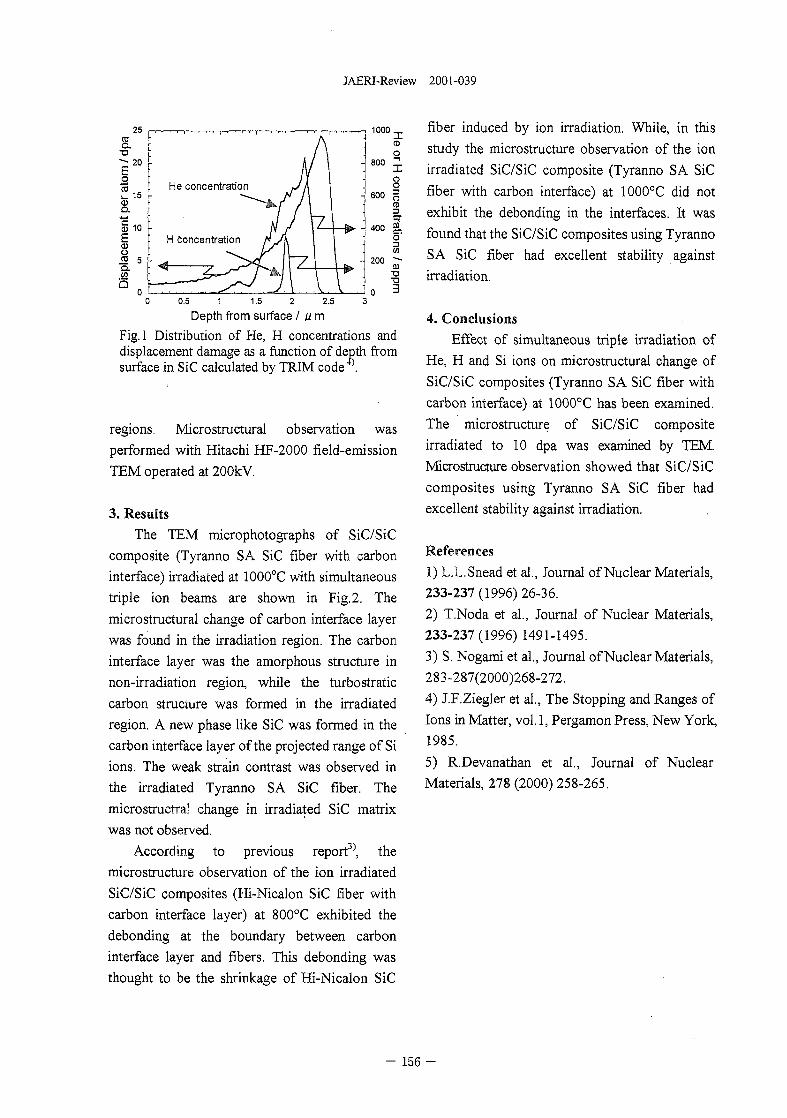
JAERI-Review 2001-039
25
0.5 1 1.5 2 2.5 3
Depth from surface / u m
Fig. 1 Distribution of He, H concentrations anddisplacement damage as a function of depth fromsurface in SiC calculated by TRIM code \
regions. Microstructural observation was
performed with Hitachi HF-2000 field-emission
TEM operated at 200kV.
3. Results
The TEM microphotographs of SiC/SiC
composite (Tyranno SA SiC fiber with carbon
interface) irradiated at 1000°C with simultaneous
triple ion beams are shown in Fig. 2. The
microstructural change of carbon interface layer
was found in the irradiation region. The carbon
interface layer was the amorphous structure in
non-irradiation region, while the turbostratic
carbon structure was formed in the irradiated
region. A new phase like SiC was formed in the
carbon interface layer of the projected range of Si
ions. The weak strain contrast was observed in
the irradiated Tyranno SA SiC fiber. The
microstructral change in irradiated SiC matrix
was not observed.
According to previous reportj), the
microstructure observation of the ion irradiated
SiC/SiC composites (Hi-Nicalon SiC fiber with
carbon interface layer) at 800°C exhibited the
debonding at the boundary between carbon
interface layer and fibers. This debonding was
thought to be the shrinkage of Hi-Nicalon SiC
fiber induced by ion irradiation. While, in this
study the microstructure observation of the ion
irradiated SiC/SiC composite (Tyranno SA SiC
fiber with carbon interface) at 1000°C did not
exhibit the debonding in the interfaces. It was
found that the SiC/SiC composites using Tyranno
SA SiC fiber had excellent stability against
irradiation.
4. Conclusions
Effect of simultaneous triple irradiation of
He, H and Si ions on microstructural change of
SiC/SiC composites (Tyranno SA SiC fiber with
carbon interface) at 1000°C has been examined.
The microstructure of SiC/SiC composite
irradiated to 10 dpa was examined by TEM.
Microstructure observation showed that SiC/SiC
composites using Tyranno SA SiC fiber had
excellent stability against irradiation.
References
1) L.L.Snead et al., Journal of Nuclear Materials,
233-237(1996)26-36.
2) T.Noda et al., Journal of Nuclear Materials,
233-237(1996)1491-1495.
3) S. Nogami et al., Journal of Nuclear Materials,
283-287(2000)268-272.
4) J.F.Ziegler et al., The Stopping and Ranges of
Ions in Matter, vol. 1, Pergamon Press, New York,
1985.
5) R.Devanathan et al., Journal of Nuclear
Materials, 278 (2000) 258-265.
- 156 -
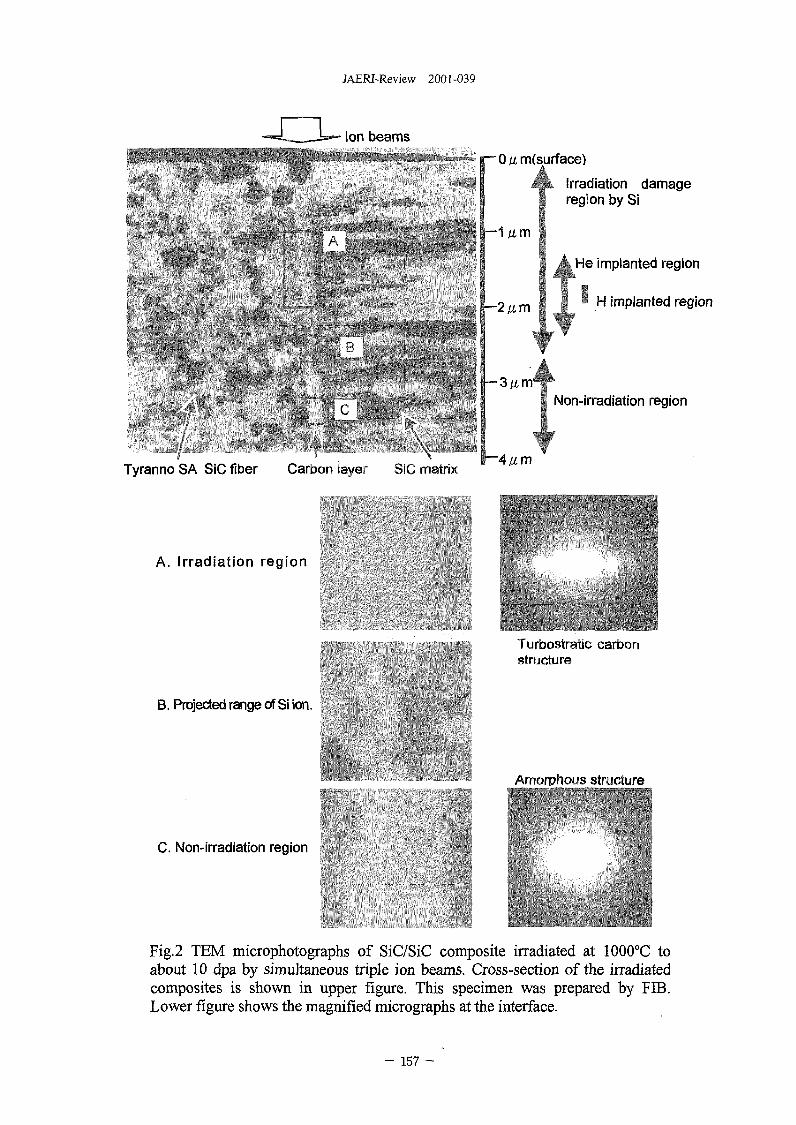
JAERI-Review 2001-039
Ion beams
—Otf m(surface)
rirradiation damageregion by Si
He implanted region
H implanted region
— 3 ti rrr rNon-irradiation region
Tyranno SA SiC fiber Carbon layer SiC matrix,.. I4ixm
A. Irradiation region
Turbostratic carbonstructure
B. Projected range of Si ion.
Amorphous structure
C. Non-irradiation region
Fig.2 TEM microphotographs of SiC/SiC composite irradiated at 1000°C toabout 10 dpa by simultaneous triple ion beams. Cross-section of the irradiatedcomposites is shown in upper figure. This specimen was prepared by FIB.Lower figure shows the magnified micrographs at the interface.
- 157 -
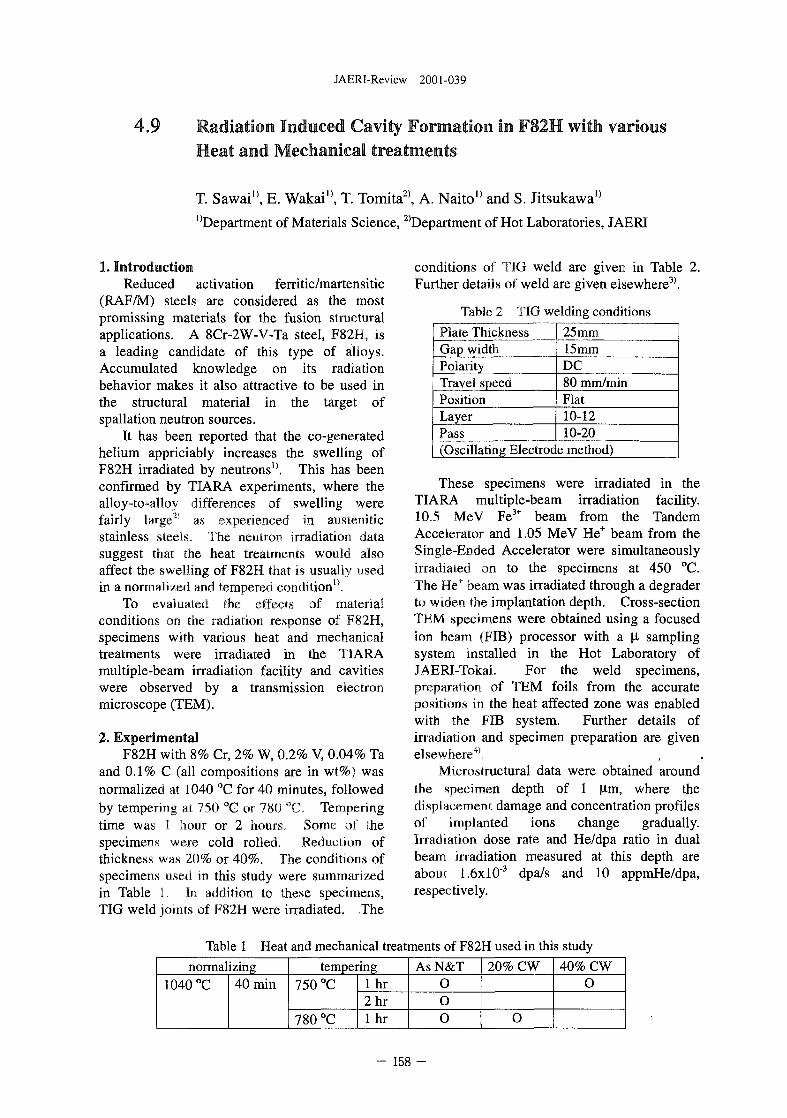
JAERI-Review 2001-039
4.9 Radiation Induced Cavity Formation in F82H with variousHeat and Mechanical treatments
T. Sawai", E. Wakain, T. Tomita2), A. Naito" and S. Jitsukawa0
"Department of Materials Science, 2>Department of Hot Laboratories, JAERI
1. IntroductionReduced activation ferritic/martensitic
(RAF/M) steels are considered as the mostpromissing materials for the fusion structuralapplications. A 8Cr-2W-V-Ta steel, F82H, isa leading candidate of this type of alloys.Accumulated knowledge on its radiationbehavior makes it also attractive to be used inthe structural material in the target ofspallation neutron sources.
It has been reported that the co-generatedhelium appriciably increases the swelling ofF82H irradiated by neutrons0. This has beenconfirmed by TIARA experiments, where thealloy-to-alloy differences of swelling werefairly large2' as experienced in austeniticstainless steels. The neutron irradiation datasuggest that the heat treatments would alsoaffect the swelling of F82H that is usually usedin a normalized and tempered condition".
To evaluated the effects of materialconditions on the radiation response of F82H,specimens with various heat and mechanicaltreatments were irradiated in the TIARAmultiple-beam irradiation facility and cavitieswere observed by a transmission electronmicroscope (TEM).
2. ExperimentalF82H with 8% Cr, 2% W, 0.2% V, 0.04% Ta
and 0.1% C (all compositions are in wt%) wasnormalized at 1040 °C for 40 minutes, followedby tempering at 750 °C or 780 °C. Temperingtime was 1 hour or 2 hours. Some of thespecimens were cold rolled. Reduction ofthickness was 20% or 40%. The conditions ofspecimens used in this study were summarizedin Table I. In addition to these specimens,TIG weld joints of F82H were irradiated. The
conditions of TIG weld are given in Table 2.Further details of weld are given elsewhere3).
Table 2 TIG welding conditions
Plate ThicknessGap widthPolarityTravel speedPositionLayerPass
25 mm15mmDC80 mm/minFlat10-1210-20
(Oscillating Electrode method)
These specimens were irradiated in theTIARA multiple-beam irradiation facility.10.5 MeV Fe3+ beam from the TandemAccelerator and 1.05 MeV He+ beam from theSingle-Ended Accelerator were simultaneouslyirradiated on to the specimens at 450 °C.The He+ beam was irradiated through a degraderto widen the implantation depth. Cross-sectionTEM specimens were obtained using a focusedion beam (FIB) processor with a \x samplingsystem installed in the Hot Laboratory ofJAERI-Tokai. For the weld specimens,preparation of TEM foils from the accuratepositions in the heat affected zone was enabledwith the FIB system. Further details ofirradiation and specimen preparation are givenelsewhere4',
Microstructural data were obtained aroundthe specimen depth of 1 M-m, where thedisplacement damage and concentration profilesof implanted ions change gradually.Irradiation dose rate and He/dpa ratio in dualbeam irradiation measured at this depth areabout 1.6xlO'3 dpa/s and 10 appmHe/dpa,respectively.
Table 1 Heat and mechanical treatments of F82H used in this study
normalizing1040°C 40 min
tempering750 °C
780 °C
l h r2hr1 hr
AsN&TOO
o
20% CW
o
40% CW
o
- 158 -
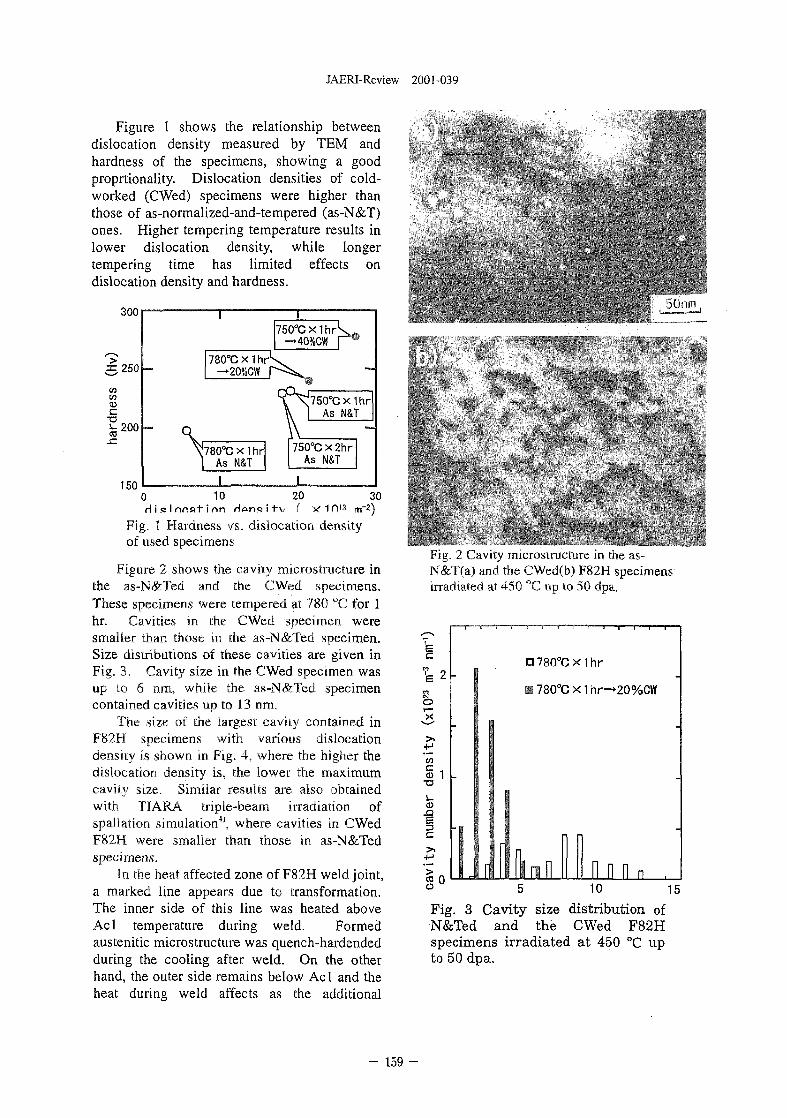
JAERI-Review 2001-039
Figure I shows the relationship betweendislocation density measured by TEM andhardness of the specimens, showing a goodproprtionality. Dislocation densities of cold-worked (CWed) specimens were higher thanthose of as-normalized-and-tempered (as-N&T)ones. Higher tempering temperature results inlower dislocation density, while longertempering time has limited effects ondislocation density and hardness.
300
,250
COCOasc
"2 200-C
150
780°Cx1hr'—20%CW
;780°Cx1hrI As N&T
750°Cx1hrAs N&T
750°Cx2hrAs N&T
0 10 20H i s I nr.at i An Hons i t v f
30x 1013 m"2)
Fig. i Hardness vs. dislocation densityof used specimens
Figure 2 shows the cavity microstructure inthe as-N&Ted and the CWed specimens.These specimens were tempered at 780 °C for 1hr. Cavities in the CWed specimen weresmaller than those in the as-N&Ted specimen.Size distributions of these cavities are given inFig. 3, Cavity size in the CWed specimen wasup to 6 nm. while the as-N&Ted specimencontained cavities up to 13 nm.
The size of the largest cavity contained inF82H specimens with various dislocationdensity is shown in Fig. 4, where the higher thedislocation density is, the lower the maximumcavity size. Similar results are also obtainedwith TIARA triple-beam irradiation ofspallation simulation41, where cavities in CWedF82H were smaller than those in as-N&Tedspecimens.
In the heat affected zone of F82H weld joint,a marked line appears due to transformation.The inner side of this line was heated aboveAcl temperature during weld. Formedaustenitic microstructure was quench-hardendedduring the cooling after weld. On the otherhand, the outer side remains below Ac 1 and theheat during weld affects as the additional
) ( . • • M
Fig, 2 Cavity microstructure in the as-N&T(a) and the CWed(b) F82H specimensirradiated at 450 °C up to 50 dpa.
>>CO
Si•a
1°
D780°Gx1hr
• 780°C X1 hr-»-20%CW
10 15
Fig. 3 Cavity size distribution ofN&Ted and the CWed F82Hspecimens irradiated at 450 °C upto 50 dpa.
- 159 -
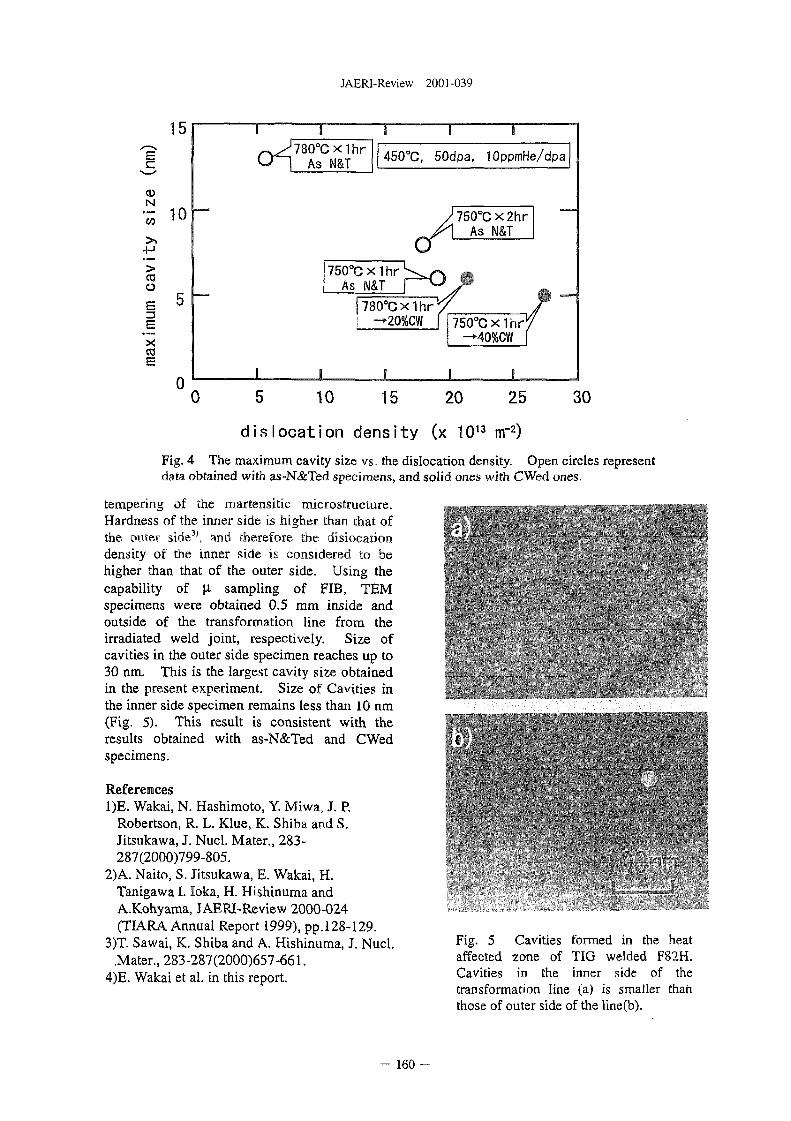
JAERI-Review 2001-039
15
E
0)N
>cao
x
0
1 I I
rv>78O°Cx1hrv ~ / " l As N&T
I i
I 1
450°C, 50dpa, 10ppmHe/dpa
750°Cx1hr l-^ /^As N&T r ^
780°Cxihr^~^20%CW f
I
/)750°Cx2hr1 As N&T
4750°Cxihr! /
-*40%CW f
1 1
sr
0 10 15 20 25 30
dislocation density (x 1013 m~2)
Fig. 4 The maximum cavity size vs. the dislocation density. Open circles representdata obtained with as-N&Ted specimens, and solid ones with CWed ones.
tempering of the martensitic microstructure.Hardness of the inner side is higher than that ofthe outer side3', and therefore the dislocationdensity of the inner side is considered to behigher than that of the outer side. Using thecapability of u sampling of FIB, TEMspecimens were obtained 0.5 mm inside andoutside of the transformation line from theirradiated weld joint, respectively. Size ofcavities in the outer side specimen reaches up to30 nm. This is the largest cavity size obtainedin the present experiment. Size of Cavities inthe inner side specimen remains less than 10 nm(Fig. 5). This result is consistent with theresults obtained with as-N&Ted and CWed tspecimens.
References1)E. Wakai, N. Hashimoto, Y. Miwa, J. P.
Robertson, R. L. Klue, K. Shiba and S.Jitsukawa, J. Nucl. Mater., 283-287(2000)799-805.
2)A. Naito, S. Jitsukawa, E. Wakai, H.Tanigawa I. loka, H. Hishinuma andA.Kohyama, JAERI-Review 2000-024(TIARA Annual Report 1999), pp.128-129.
3)T. Sawai, K. Shiba and A. Hishinuma, J. Nucl. F i§- 5 Cavities formed in the heat.Mater., 283-287(2000)657-661. affected zone of TIG welded F82H.
4)E. Wakai et al. in this report. Cavities in the inner side of thetransformation line (a) is smaller thanthose of outer side of the line(b).
160 -
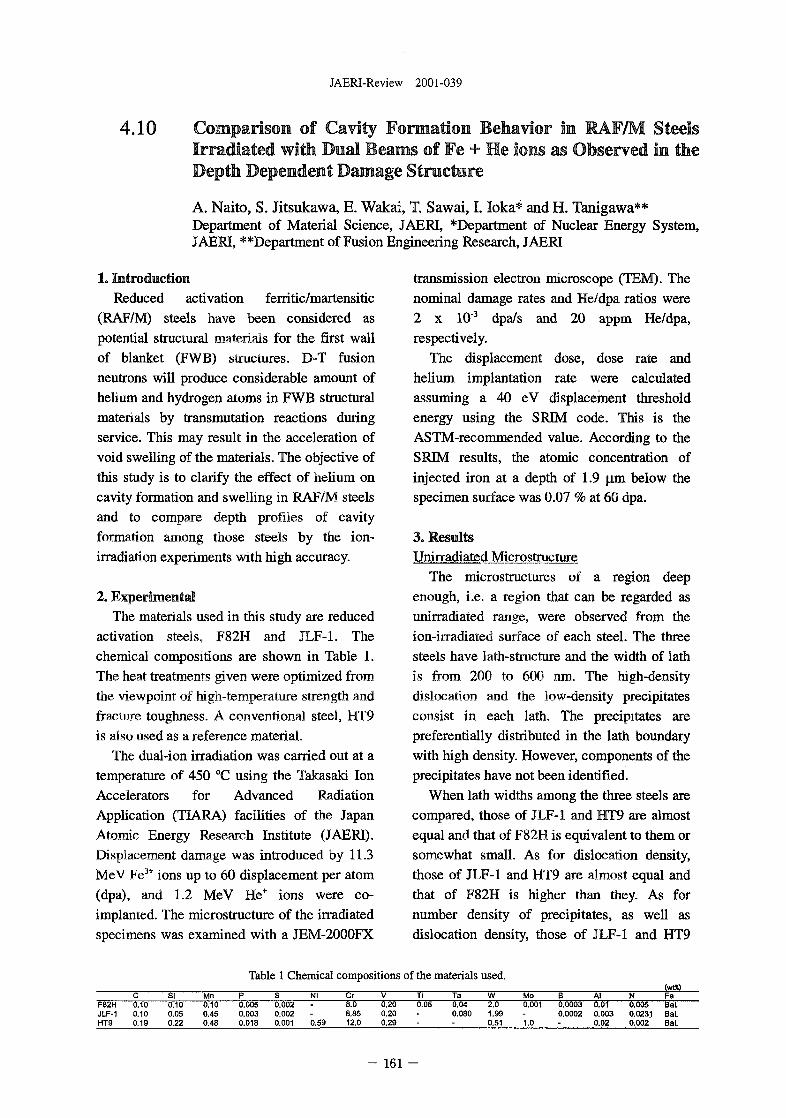
JAERI-Review 2001-039
4.10 Comparison of Cavity Formation Behavior in KAF/M SteelsIrradiated with Dual Beams of Fe + He Ions as Observed in theDepth Dependent Damage Structure
A. Naito, S. Jitsukawa, E. Wakai, T. Sawai, I. loka* and H. Tanigawa**Department of Material Science, JAERI, *Department of Nuclear Energy System,JAERI, **Department of Fusion Engineering Research, JAERI
1. IntroductionReduced activation ferritic/martensitic
(RAF/M) steels have been considered aspotential structural materials for the first wallof blanket (FWB) structures. D-T fusionneutrons will produce considerable amount ofhelium and hydrogen atoms in FWB structuralmaterials by transmutation reactions duringservice. This may result in the acceleration ofvoid swelling of the materials. The objective ofthis study is to clarify the effect of helium oncavity formation and swelling in RAF/M steelsand to compare depth profiles of cavityformation among those steels by the ion-irradiation experiments with high accuracy.
2. ExperimentalThe materials used in this study are reduced
activation steels, F82H and JLF-1. Thechemical compositions are shown in Table 1.The heat treatments given were optimized fromthe viewpoint of high-temperature strength andfracture toughness. A conventional steel, HT9is also used as a reference material.
The dual-ion irradiation was carried out at atemperature of 450 °C using the Takasaki IonAccelerators for Advanced RadiationApplication (TIARA) facilities of the JapanAtomic Energy Research Institute (JAERI).Displacement damage was introduced by 11.3MeV Fe3* ions up to 60 displacement per atom(dpa), and 1.2 MeV He* ions were co-implanted. The microstructure of the irradiatedspecimens was examined with a JEM-2000FX
transmission electron microscope (TEM). Thenominal damage rates and He/dpa ratios were2 x 103 dpa/s and 20 appm He/dpa,respectively.
The displacement dose, dose rate andhelium implantation rate were calculatedassuming a 40 eV displacement thresholdenergy using the SRIM code. This is theASTM-recommended value. According to theSRIM results, the atomic concentration ofinjected iron at a depth of 1.9 (im below thespecimen surface was 0.07 % at 60 dpa.
3. ResultsUnirradiated Microstructure
The microstructures of a region deepenough, i.e. a region that can be regarded asunirradiated range, were observed from theion-irradiated surface of each steel. The threesteels have lath-structure and the width of lathis from 200 to 600 nm. The high-densitydislocation and the low-density precipitatesconsist in each lath. The precipitates arepreferentially distributed in the lath boundarywith high density. However, components of theprecipitates have not been identified.
When lath widths among the three steels arecompared, those of JLF-1 and HT9 are almostequal and that of F82H is equivalent to them orsomewhat small. As for dislocation density,those of JLF-1 and HT9 are almost equal andthat of F82H is higher than they. As fornumber density of precipitates, as well asdislocation density, those of JLF-1 and HT9
Table 1 Chemical compositions of the materials used.(wt»
F82HJLF-1HT9
C0.100.100.19
SI0.100.050.22
Mn0.100.450.48
P0.0050.0030.018
S0.0020.0020.001
Ni
0.59
Cr8.08.8512.0
V0.200.200.29
- 161
Ti0.05
Ta0.040.080
W2.01.990.51
Mo0.001
1.0
B0.00030.0002
Al0.010.0030.02
N0.0050.02310.002
FeBal.Bal.Bal.
JAERI-Review 2001-039
are almost equal and that of F82H is higherthan they.
Irradiated MicrostructureThe damage microstructures produced by
ion-irradiation were observed at the range fromthe ion-irradiated surface to about 3 um depth.When they are compared with those ofunirradiated range, there were no changes inlath structure, dislocation density and thedistribution of precipitates for the three steels.
Cavities were formed in the radiation-damaged range for the three steels. In the caseof JLF-1 steel, the cavities were observed fromthe ion-incident surface to the depth of 2.8 um.The distribution of cavities differs significantlyfor each lath. Cavity is formed to near thesurface in some laths, and no cavity is formedin other laths. The distribution of cavities ineach lath is relatively heterogeneous. In everylath, the zone in which cavity is not formedalong the lath boundary, i.e. denuded zone isobserved by the width about 70 nm.
In the case of HT9 steel, the cavities wereobserved from the ion incident surface to thedepth of 2.4 jim. The differences in thedistribution of cavity for each lath observed inJLF-1 steel are hardly observed. Thedistribution of cavity in each lath is relativelyheterogeneous as well as JLF-1 steel. Thedenuded zone observed in JLF-1 steel was notobserved in HT9 steel.
In the case of F82H steel, the cavities wereobserved from the ion incident surface to thedepth of 2,4 um. The differences in thedistribution of cavity for each lath observed inJLF-1 steel are hardly observed similarly toHT9 steel. The distribution of cavity in eachlath is relatively heterogeneous similarly toboth JLF-1 and HT9 steels. The denuded zonewas also not observed in F82H steel.
The depth dependence of the numberdensity of cavity, average cavity size, and thelevel of swelling is shown in Fig. 1 for eachsteel. In the case of JLF-1 steel, the depth
dependence of number density shows that theformation range of cavity is in a depth of 0.2 to2.8 (im from the ion incident surface. The peakof number density is located at a depth of 2.0to 2.2 um. This peak depth corresponds to aposition about 0.2 um deeper than the peakdamage depth and the mean projected range ofhelium. The half-value width of numberdensity is about 0.3 urn. This value is nearlyequal to the half-value width of the implantedhelium. Significant bi-modal distribution wasshown in the size distributions at 1.6 to 2.0 um.The average cavity size showed maximum at adepth of 1.2 to 1.4 jim. The swelling levelshowed a peak at a depth of 1.6 to 2.0 um.This depth approximately agrees with the peakdamage depth, the mean projected range ofhelium and the depth range in which the bi-modal size distribution are shown.
In the case of HT9 steel, the depthdependence of number density shows that theformation range of cavity is in a depth of 0.2 to2.8 um from the ion incident surface. The peakof number density is located at a depth of 2.0to 2.2 um. This peak depth corresponds to aposition about 0.2 am deeper than the peakdamage depth and the mean projected range ofhelium. The half-value width of numberdensity is about 0.3 um. Bi-modal distributionwas shown in the size distribution at 1.8 to 2.0um. The average cavity size showed maximumat a depth of 1.4 to 1.6 um. The swelling levelshowed a peak at a depth of 1.8 to 2,0 um.
In the case of F82H steel, the depthdependence of number density shows that theformation range of cavity is in a depth of 0.0 to2.4 um from the ion incident surface. The peakof number density is located at a depth of 2.0to 2.2 um. This peak depth corresponds to aposition about 0.2 um deeper than the peakdamage depth and the mean projected range ofhelium. The half-value width of numberdensity is about 0.8 um. This value isequivalent to an about 3 times of the half-valuewidth of the implanted helium. The bi-modal
- 162 -
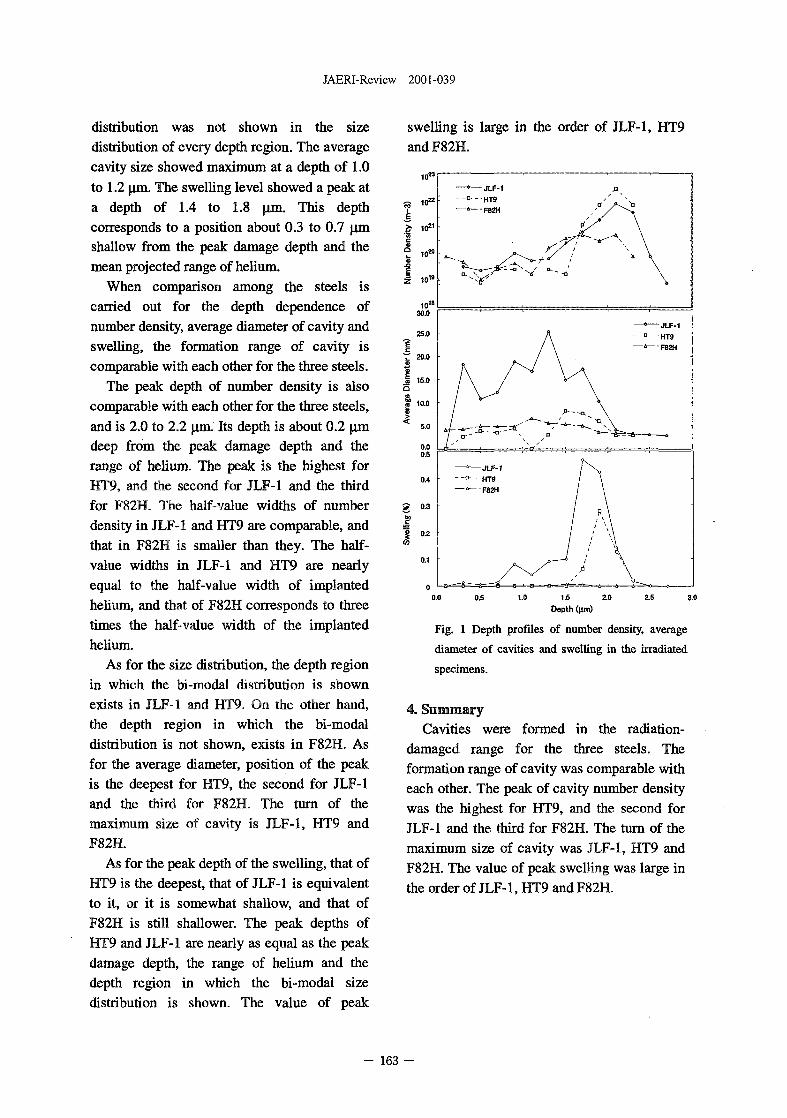
JAERI-Review 2001-039
distribution was not shown in the sizedistribution of every depth region. The averagecavity size showed maximum at a depth of 1.0to 1.2 \wa.. The swelling level showed a peak ata depth of 1.4 to 1.8 \tm. This depthcorresponds to a position about 0.3 to 0.7 (imshallow from the peak damage depth and themean projected range of helium.
When comparison among the steels iscarried out for the depth dependence ofnumber density, average diameter of cavity andswelling, the formation range of cavity iscomparable with each other for the three steels.
The peak depth of number density is alsocomparable with each other for the three steels,and is 2.0 to 2.2 jim. Its depth is about 0.2 pmdeep from the peak damage depth and therange of helium. The peak is the highest forHT9, and the second for JLF-1 and the thirdfor F82H. The half-value widths of numberdensity in JLF-1 and HT9 are comparable, andthat in F82H is smaller than they. The half-value widths in JLF-1 and HT9 are nearlyequal to the half-value width of implantedhelium, and that of F82H corresponds to threetimes the half-value width of the implantedhelium.
As for the size distribution, the depth regionin which the bi-modal distribution is shownexists in JLF-1 and HT9. On the other hand,the depth region in which the bi-modaldistribution is not shown, exists in F82H. Asfor the average diameter, position of the peakis the deepest for HT9, the second for JLF-1and the third for F82H. The turn of themaximum size of cavity is JLF-1, HT9 andF82H.
As for the peak depth of the swelling, that ofHT9 is the deepest, that of JLF-1 is equivalentto it, or it is somewhat shallow, and that ofF82H is still shallower. The peak depths ofHT9 and JLF-1 are nearly as equal as the peakdamage depth, the range of helium and thedepth region in which the bi-modal sizedistribution is shown. The value of peak
swelling is large in the order of JLF-1, HT9and F82H.
1.5 2.0
Depth (urn)
Fig. 1 Depth profiles of number density, average
diameter of cavities and swelling in the irradiated
specimens.
4. SummaryCavities were formed in the radiation-
damaged range for the three steels. Theformation range of cavity was comparable witheach other. The peak of cavity number densitywas the highest for HT9, and the second forJLF-1 and the third for F82H. The turn of themaximum size of cavity was JLF-1, HT9 andF82H. The value of peak swelling was large inthe order of JLF-1, HT9 and F82H.
- 163 -
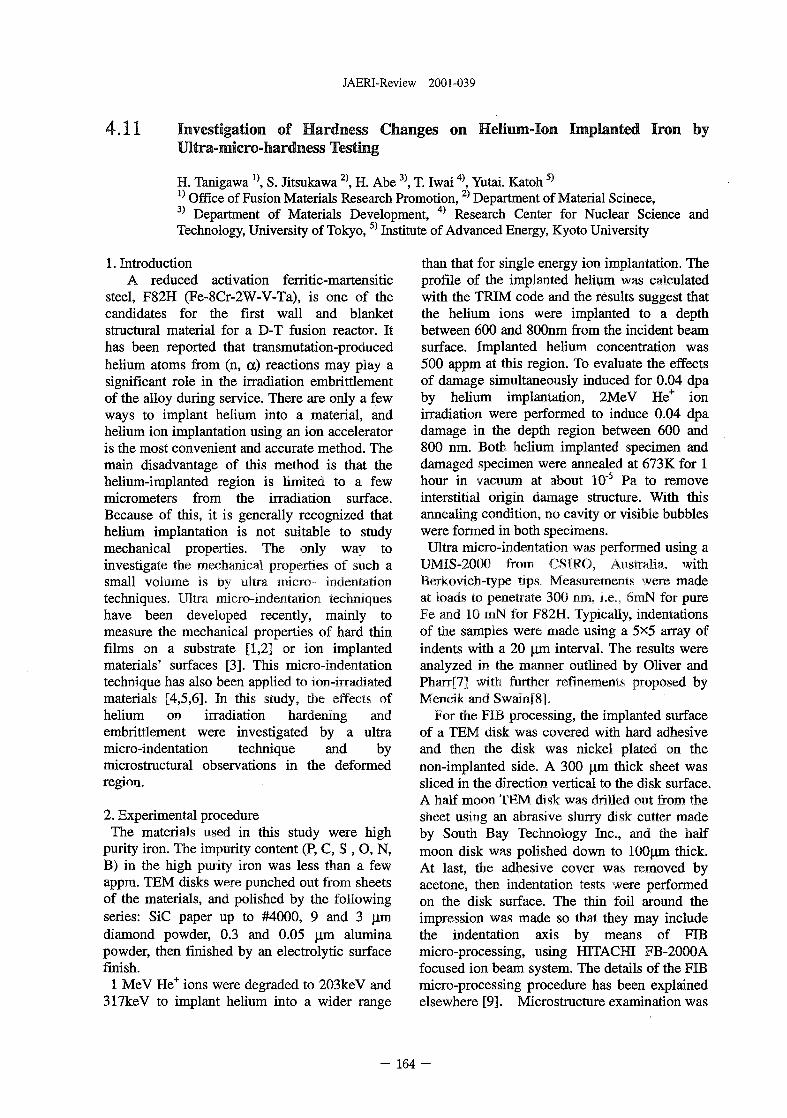
JAERI-Review 2001-039
4.11 Investigation of Hardness Changes on Helium-Ion Implanted Iron byUltra-micro-hardness Testing
H. Tanigawa1}, S. Jitsukawa 2), H. Abe3), T. Iwai4), Yutai. Katoh5)
0 Office of Fusion Materials Research Promotion,2) Department of Material Scinece,3) Department of Materials Development, 4) Research Center for Nuclear Science andTechnology, University of Tokyo,5) Institute of Advanced Energy, Kyoto University
1. IntroductionA reduced activation ferritic-martensitic
steel, F82H (Fe-8Cr-2W-V-Ta), is one of thecandidates for the first wall and blanketstructural material for a D-T fusion reactor. Ithas been reported that transmutation-producedhelium atoms from (n, a) reactions may play asignificant role in the irradiation embrittlementof the alloy during service. There are only a fewways to implant helium into a material, andhelium ion implantation using an ion acceleratoris the most convenient and accurate method. Themain disadvantage of this method is that thehelium-implanted region is limited to a fewmicrometers from the irradiation surface.Because of this, it is generally recognized thathelium implantation is not suitable to studymechanical properties. The only way toinvestigate the mechanical properties of such asmall volume is by ultra micro- indentationtechniques. Ultra micro-indentation techniqueshave been developed recently, mainly tomeasure the mechanical properties of hard thinfilms on a substrate [1,2] or ion implantedmaterials' surfaces [3]. This micro-indentationtechnique has also been applied to ion-irradiatedmaterials [4,5,6]. In this study, the effects ofhelium on irradiation hardening andembrittlement were investigated by a ultramicro-indentation technique and bymicrostructural observations in the deformedregion.
2. Experimental procedureThe materials used in this study were high
purity iron. The impurity content (P, C, S , O, N,B) in the high purity iron was less than a fewappm. TEM disks were punched out from sheetsof the materials, and polished by the followingseries: SiC paper up to #4000, 9 and 3 jjmdiamond powder, 0.3 and 0.05 |im aluminapowder, then finished by an electrolytic surfacefinish.
1 MeV He+ ions were degraded to 203keV and317keV to implant helium into a wider range
than that for single energy ion implantation. Theprofile of the implanted helium was calculatedwith the TRIM code and the results suggest thatthe helium ions were implanted to a depthbetween 600 and 800nm from the incident beamsurface. Implanted helium concentration was500 appm at this region. To evaluate the effectsof damage simultaneously induced for 0.04 dpaby helium implantation, 2MeV He+ ionirradiation were performed to induce 0.04 dpadamage in the depth region between 600 and800 nm. Both helium implanted specimen anddamaged specimen were annealed at 673K for 1hour in vacuum at about 10"5 Pa to removeinterstitial origin damage structure. With thisannealing condition, no cavity or visible bubbleswere formed in both specimens.
Ultra micro-indentation was performed using aUMIS-2000 from CSIRO, Australia, withBerkovich-type tips. Measurements were madeat loads to penetrate 300 nm, i.e., 6mN for pureFe and 10 mN for F82H. Typically, indentationsof the samples were made using a 5x5 array ofindents with a 20 |xm interval. The results wereanalyzed in the manner outlined by Oliver andPharr[7] with further refinements proposed byMencik and Swain [8].
For the FIB processing, the implanted surfaceof a TEM disk was covered with hard adhesiveand then the disk was nickel plated on thenon-implanted side. A 300 urn thick sheet wassliced in the direction vertical to the disk surface.A half moon TEM disk was drilled out from thesheet using an abrasive slurry disk cutter madeby South Bay Technology Inc., and the halfmoon disk was polished down to lOO^m thick.At last, the adhesive cover was removed byacetone, then indentation tests were performedon the disk surface. The thin foil around theimpression was made so that they may includethe indentation axis by means of FIBmicro-processing, using HITACHI FB-2000Afocused ion beam system. The details of the FIBmicro-processing procedure has been explainedelsewhere [9]. Microstructure examination was
- 164 -
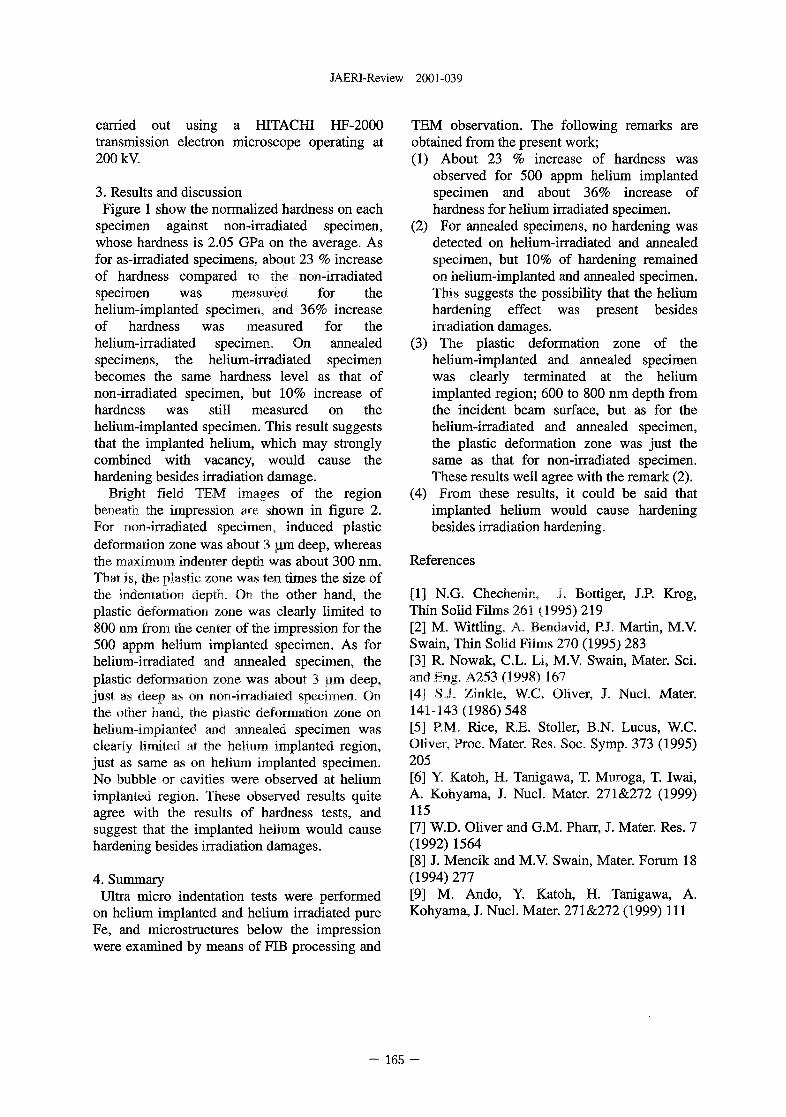
JAERI-Review 2001-039
carried out using a HITACHI HF-2000transmission electron microscope operating at200 kV.
3. Results and discussionFigure 1 show the normalized hardness on each
specimen against non-irradiated specimen,whose hardness is 2.05 GPa on the average. Asfor as-irradiated specimens, about 23 % increaseof hardness compared to the non-irradiatedspecimen was measured for thehelium-implanted specimen, and 36% increaseof hardness was measured for thehelium-irradiated specimen. On annealedspecimens, the helium-irradiated specimenbecomes the same hardness level as that ofnon-irradiated specimen, but 10% increase ofhardness was still measured on thehelium-implanted specimen. This result suggeststhat the implanted helium, which may stronglycombined with vacancy, would cause thehardening besides irradiation damage.
Bright field TEM images of the regionbeneath the impression are shown in figure 2.For non-irradiated specimen, induced plasticdeformation zone was about 3 jim deep, whereasthe maximum indenter depth was about 300 nm.That is, the plastic zone was ten times the size ofthe indentation depth. On the other hand, theplastic deformation zone was clearly limited to800 nm from the center of the impression for the500 appm helium implanted specimen. As forhelium-irradiated and annealed specimen, theplastic deformation zone was about 3 yxn deep,just as deep as on non-irradiated specimen. Onthe other hand, the plastic deformation zone onhelium-implanted and annealed specimen wasclearly limited at the helium implanted region,just as same as on helium implanted specimen.No bubble or cavities were observed at heliumimplanted region. These observed results quiteagree with the results of hardness tests, andsuggest that the implanted helium would causehardening besides irradiation damages.
4. SummaryUltra micro indentation tests were performed
on helium implanted and helium irradiated pureFe, and microstructures below the impressionwere examined by means of FIB processing and
TEM observation. The following remarks areobtained from the present work;(1) About 23 % increase of hardness was
observed for 500 appm helium implantedspecimen and about 36% increase ofhardness for helium irradiated specimen.
(2) For annealed specimens, no hardening wasdetected on helium-irradiated and annealedspecimen, but 10% of hardening remainedon helium-implanted and annealed specimen.This suggests the possibility that the heliumhardening effect was present besidesirradiation damages.
(3) The plastic deformation zone of thehelium-implanted and annealed specimenwas clearly terminated at the heliumimplanted region; 600 to 800 nm depth fromthe incident beam surface, but as for thehelium-irradiated and annealed specimen,the plastic deformation zone was just thesame as that for non-irradiated specimen.These results well agree with the remark (2).
(4) From these results, it could be said thatimplanted helium would cause hardeningbesides irradiation hardening.
References
[1] N.G. Chechenin, J. Bottiger, J.P. Krog,Thin Solid Films 261 (1995) 219[2] M. Wittling, A. Bendavid, P.J. Martin, M.V.Swain, Thin Solid Films 270 (1995) 283[3] R. Nowak, C.L. Li, M.V. Swain, Mater. Sci.and Eng. A253 (1998) 167[4] S.J. Zinkle, W.C. Oliver, J. Nucl. Mater.141-143 (1986) 548[5] P.M. Rice, R.E. Stoller, B.N. Lucus, W.C.Oliver, Proc. Mater. Res. Soc. Symp. 373 (1995)205[6] Y. Katoh, H. Tanigawa, T. Muroga, T. Iwai,A. Kohyama, J. Nucl. Mater. 271&272 (1999)115[7] W.D. Oliver and G.M. Pharr, J. Mater. Res. 7(1992)1564[8] J. Mencik and M.V. Swain, Mater. Forum 18(1994)277[9] M. Ando, Y. Katoh, H. Tanigawa, A.Kohyama, J. Nucl. Mater. 271&272 (1999) 111
- 165 -
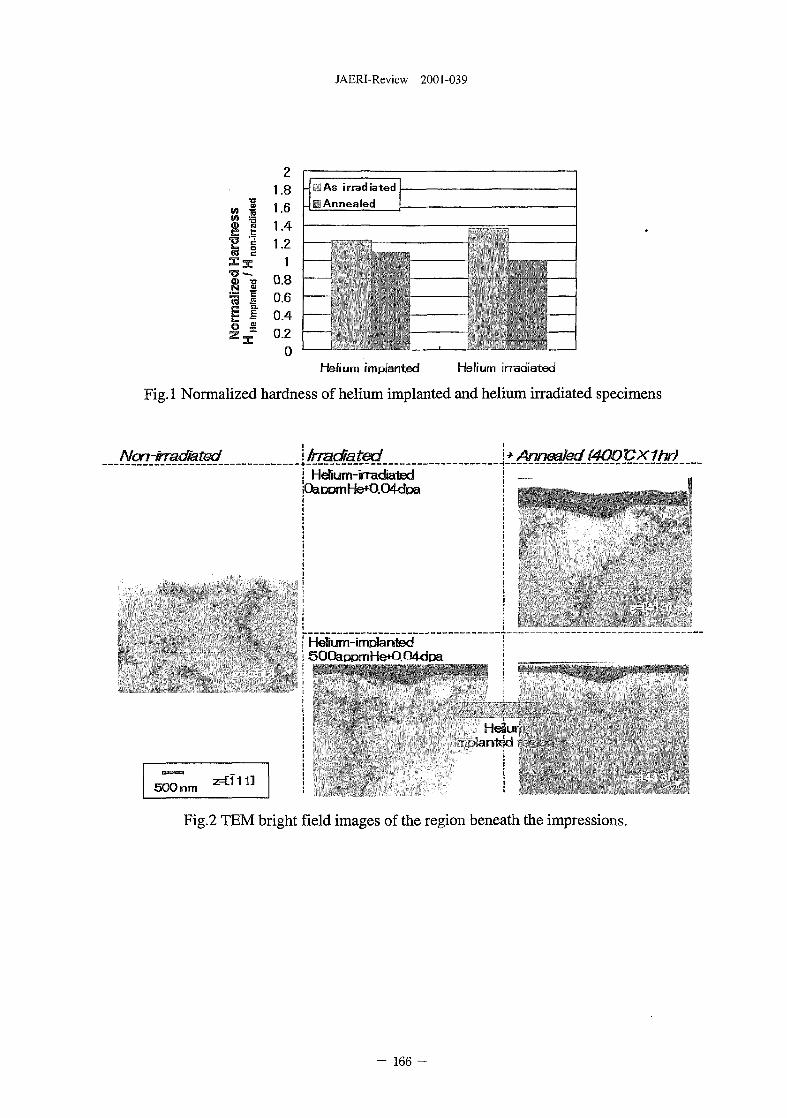
JAERI-Review 2001-039
mto
n i
21.81.61.41.2
10.80.60.40.2
0
- As irradiatedAnnealed
Helium implanted Helium irradiated
Fig.l Normalized hardness of helium implanted and helium irradiated specimens
Non-ima.dfa.txf i frmdrated i+Annealed (4OO Vxihr)Helium-irradiated
iOaraxnHe+O.CHdpa
Hdium-imrianted
He8u»..anted
z=C111]
Fig.2 TEM bright field images of the region beneath the impressions.
- 166 -
JAERI-Review 2001-039
4.12 Effect of ion Irradiation on corrosion behavior of austeniticstainless steel
I.Ioka, S.Hamada, MLFutakawa, A.Naito1', K.Kiuchi, S.Kuroiwa2),
S.Miyamoto2' and K.Ogura2)
Department of Nuclear Energy System, JAERI,
1) Department of Material Science, JAERI, 2)The Japan Atomic Power Company
1. Introduction
In the upgrading of the power reactor,
ultra-high burnup extension of fuel
(>100GWd/t) seems to be promising for
economy, waste reduction and energy
resource security. The realization of the new
technology is dependent on the development
of high-performance cladding tube. New
stable austenitic stainless steel, Fe-highCr-
highNi alloy, is developed as a candidate
cladding material from the point of neutron
economy, irradiation resistance, mechanical
property, radioactivity and water-corrosion
resistance of practical alloys°'2). Irradiation
Assisted Stress Corrosion Cracking (IASCC)
in the austenitic stainless steel is one of
largest problems.
It is believed that inverse segregation of
Cr and segregation of impurities (such as P, S,
and Si) in grain boundary by the irradiation
mainly caused IASCC of the austenitic
stainless steel. As quantitative evaluation
method of the grain boundary, electro-
chemical potentiokinetic reactivation (EPR)
test and potentiostatic electrolytic test are
being tried in the sensitized stainless steel, the
neutron irradiated material and the ion
irradiated material(3'6). However, it is difficult
to accurately evaluate the intergranular
corrosion in the irradiated material since
corrosion resistance in grain itself deteriorates
by introduced radiation defects. Then, the
development of ISACC resistance evaluation
technique, which consists of the ion
irradiation and the residual stress by the
indentation and the electrochemical corrosion,
is advanced. In the report, the change in
surface appearance of ion irradiated Type 316
stainless steel (SUS316) which is the
comparison material of the candidate cladding
material was examined to confirm the
capability of this technique.
2. Experimental
Specimen is a disk of 3mm in diameter
with 0.2mm thickness. The electrochemically
polished specimens were irradiated in triple
(12MeV Ni3+, 750keV He+ and 290keV H+)
ion beam modes at a temperature of 300°C.
The TRIM code was used to compute the
implanted ion concentration and the
displacement dose as a function of depth
beneath the specimen surface. The
displacement damage in the specimen is
mainly attributed to Ni3+ ion implantation.
The peak dose is about 22dpa around 2um.
The peak values of concentration of Ni, He
and H atoms are about 6000appm, 260appm
and 2500appm, respectively. The peak
positions of implanted He+ and H+ ions are
controlled so that the effect of implanted Ni3+
ions can be neglected. The He/dpa and H/dpa
ratios of the specimens are about 24 and 230,
respectively, at the depth of approximately
1.3um In case of the full MOX-ABWR of
burn-up lOOGWd/t, helium and hydrogen
which are created by the nuclear
transformation reaction are 120appm and
- 167 -
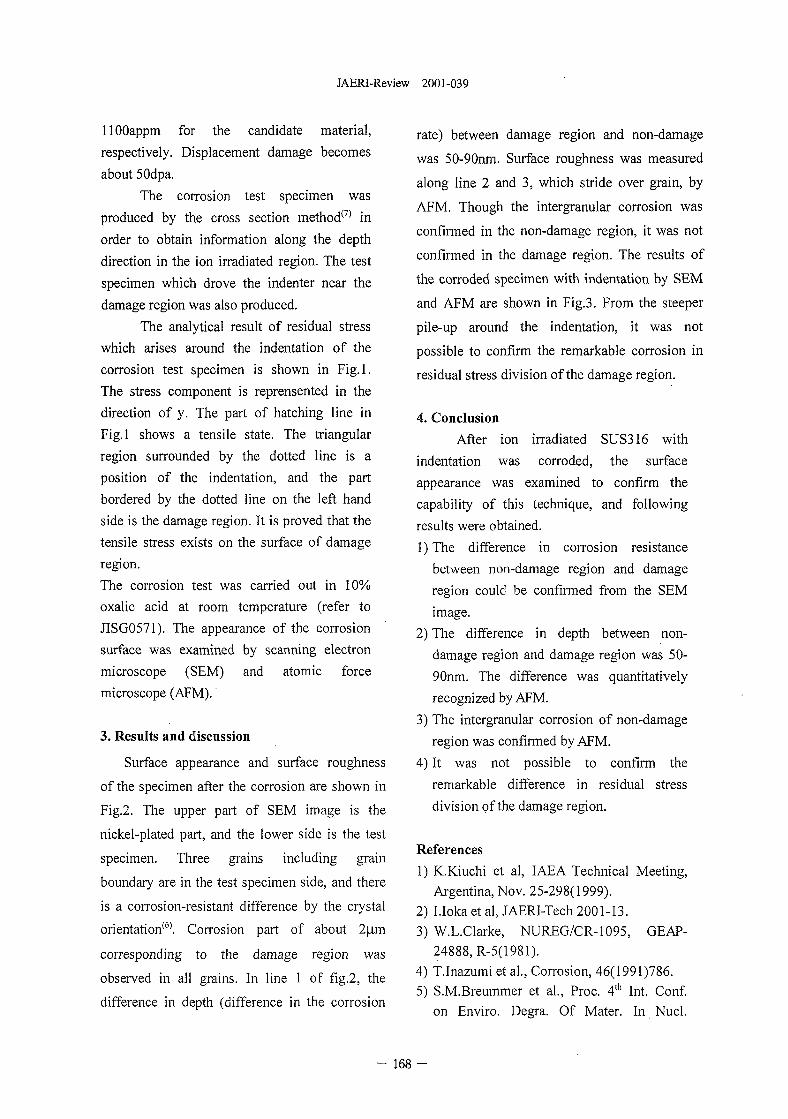
JAERI-Review 2001-039
HOOappm for the candidate material,
respectively. Displacement damage becomes
about 50dpa.
The corrosion test specimen was
produced by the cross section method(7) in
order to obtain information along the depth
direction in the ion irradiated region. The test
specimen which drove the indenter near the
damage region was also produced.
The analytical result of residual stress
which arises around the indentation of the
corrosion test specimen is shown in Fig.l.
The stress component is reprensented in the
direction of y. The part of hatching line in
Fig.l shows a tensile state. The triangular
region surrounded by the dotted line is a
position of the indentation, and the part
bordered by the dotted line on the left hand
side is the damage region. It is proved that the
tensile stress exists on the surface of damage
region.
The corrosion test was carried out in 10%
oxalic acid at room temperature (refer to
JISG0571). The appearance of the corrosion
surface was examined by scanning electron
microscope (SEM) and atomic force
microscope (AFM).
3. Results and discussion
Surface appearance and surface roughness
of the specimen after the corrosion are shown in
Fig.2. The upper part of SEM image is the
nickel-plated part, and the lower side is the test
specimen. Three grains including grain
boundary are in the test specimen side, and there
is a corrosion-resistant difference by the crystal
orientation05'. Corrosion part of about 2|j,m
corresponding to the damage region was
observed in all grains. In line 1 of fig.2, the
difference in depth (difference in the corrosion
rate) between damage region and non-damage
was 50-90nm. Surface roughness was measured
along line 2 and 3, which stride over grain, by
AFM. Though the intergranular corrosion was
confirmed in the non-damage region, it was not
confirmed in the damage region. The results of
the corroded specimen with indentation by SEM
and AFM are shown in Fig.3. From the steeper
pile-up around the indentation, it was not
possible to confirm the remarkable corrosion in
residual stress division of the damage region.
4. Conclusion
After ion irradiated SUS316 with
indentation was corroded, the surface
appearance was examined to confirm the
capability of this technique, and following
results were obtained.
l)The difference in corrosion resistance
between non-damage region and damage
region could be confirmed from the SEM
image.
2) The difference in depth between non-
damage region and damage region was 50-
90nm. The difference was quantitatively
recognized by AFM.
3) The intergranular corrosion of non-damage
region was confirmed by AFM.
4) It was not possible to confirm the
remarkable difference in residual stress
division of the damage region.
References
1) K.Kiuchi et al, IAEA Technical Meeting,Argentina, Nov. 25-298(1999).
2) I.Ioka et al, JAERI-Tech 2001-13.
3) W.L.Clarke, NUREG/CR-1095, GEAP-24888, R-5(1981).
4) T.Inazumi et al., Corrosion, 46(1991)786.5) S.M.Breummer et al., Proc. 4th Int. Conf.
on Enviro. Degra. Of Mater. In Nucl.
- 168 -
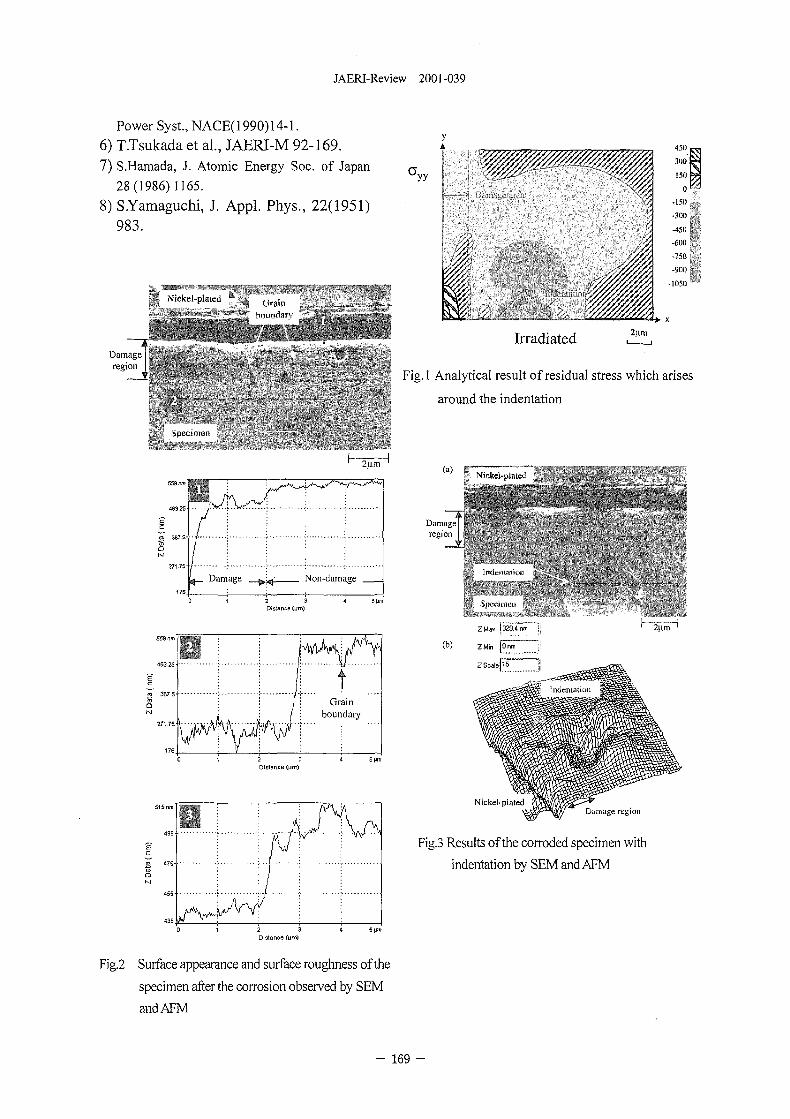
JAERI-Review 2001-039
Power Syst, NACE( 1990) 14-1.
6) T.Tsukada et a l , JAERI-M 92-169.
7) S.Hamada, J. Atomic Energy Soc. of Japan
28(1986)1165.
8) S.Yamaguchi, J. Appl. Phys., 22(1951)
983.
Damageregion
ii iii'ir'
yA
yy
451),
3001
150 |
0
-150
-300
-450
-600
-750
-900
-1050
Irradiated • *"",
Fig.l Analytical result of residual stress which arises
around the indentation
Damage
S 367 5-
Q
Non-damage
\"*£
V
I
Grainboundary
2 3Distance (urn)
Fig.2 Surface appearance and surface roughness of the
specimen after the corrosion observed by SEM
and AFM
(a)
Damageregion
(b)
Nickel-platedDamage region
Fig.3 Results of the corroded specimen with
indentation by SEM and AFM
- 169 -
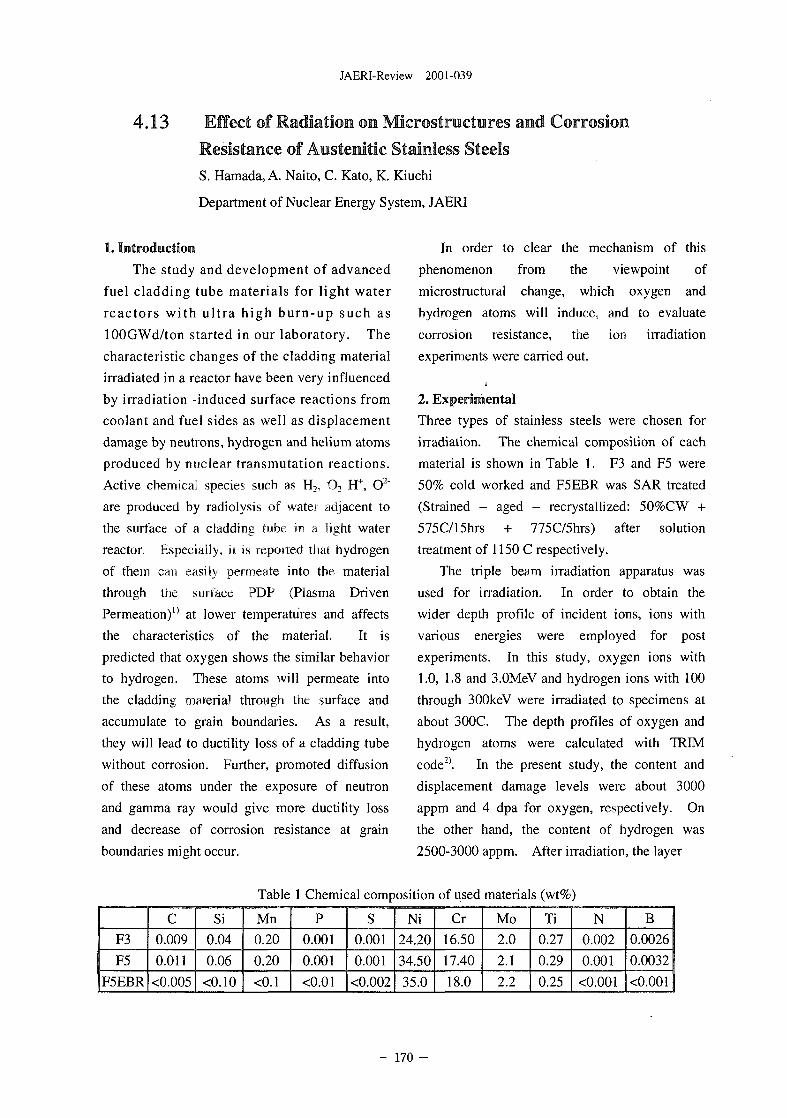
JAERI-Review 2001-039
4.13 Effect of Radiation on MIcrostructures and CorrosionResistance of Austenitic Stainless SteelsS. Hamada, A. Naito, C. Kato, K. Kiuchi
Department of Nuclear Energy System, JAERI
1. Introduction
The study and development of advanced
fuel cladding tube materials for light water
reactors with ultra high burn-up such as
lOOGWd/ton started in our laboratory. The
characteristic changes of the cladding material
irradiated in a reactor have been very influenced
by irradiation -induced surface reactions from
coolant and fuel sides as well as displacement
damage by neutrons, hydrogen and helium atoms
produced by nuclear transmutation reactions.
Active chemical species such as H2, O2 H+, O2"
are produced by radiolysis of water adjacent to
the surface of a cladding tube in a light water
reactor. Especially, it is reported that hydrogen
of them can easily permeate into the material
through the surface PDP (Plasma Driven
Permeation)" at lower temperatures and affects
the characteristics of the material. It is
predicted that oxygen shows the similar behavior
to hydrogen. These atoms will permeate into
the cladding material through the surface and
accumulate to grain boundaries. As a result,
they will lead to ductility loss of a cladding tube
without corrosion. Further, promoted diffusion
of these atoms under the exposure of neutron
and gamma ray would give more ductility loss
and decrease of corrosion resistance at grain
boundaries might occur.
In order to clear the mechanism of this
phenomenon from the viewpoint of
microstructural change, which oxygen and
hydrogen atoms will induce, and to evaluate
corrosion resistance, the ion irradiation
experiments were carried out.
2. Experimental
Three types of stainless steels were chosen for
irradiation. The chemical composition of each
material is shown in Table 1. F3 and F5 were
50% cold worked and F5EBR was SAR treated
(Strained - aged - recrystallized: 50%CW +
575C/15hrs + 775C/5hrs) after solution
treatment of 1150 C respectively.
The triple beam irradiation apparatus was
used for irradiation. In order to obtain the
wider depth profile of incident ions, ions with
various energies were employed for post
experiments. In this study, oxygen ions with
1.0, 1,8 and 3.0MeV and hydrogen ions with 100
through 300keV were irradiated to specimens at
about 300C. The depth profiles of oxygen and
hydrogen atoms were calculated with TRIM
code2). In the present study, the content and
displacement damage levels were about 3000
appm and 4 dpa for oxygen, respectively. On
the other hand, the content of hydrogen was
2500-3000 appm. After irradiation, the layer
F3
F5
F5EBR
C
0.009
0.011
<0.005
Si
0.04
0.06
<0.10
Table
Mn
0.20
0.20
<0.1
1 Chemical composition
P0.001
0.001
<0.01
s0.001
0.001
<0.002
Ni
24.20
34.50
35.0
of used
Cr
16.50
17.40
18.0
materials (wt%)
Mo
2.0
2.1
2.2
Ti
0.27
0.29
0.25
N
0.002
0.001
<0.001
B
0.0026
0.0032
<0.001
- 1 7 0 -
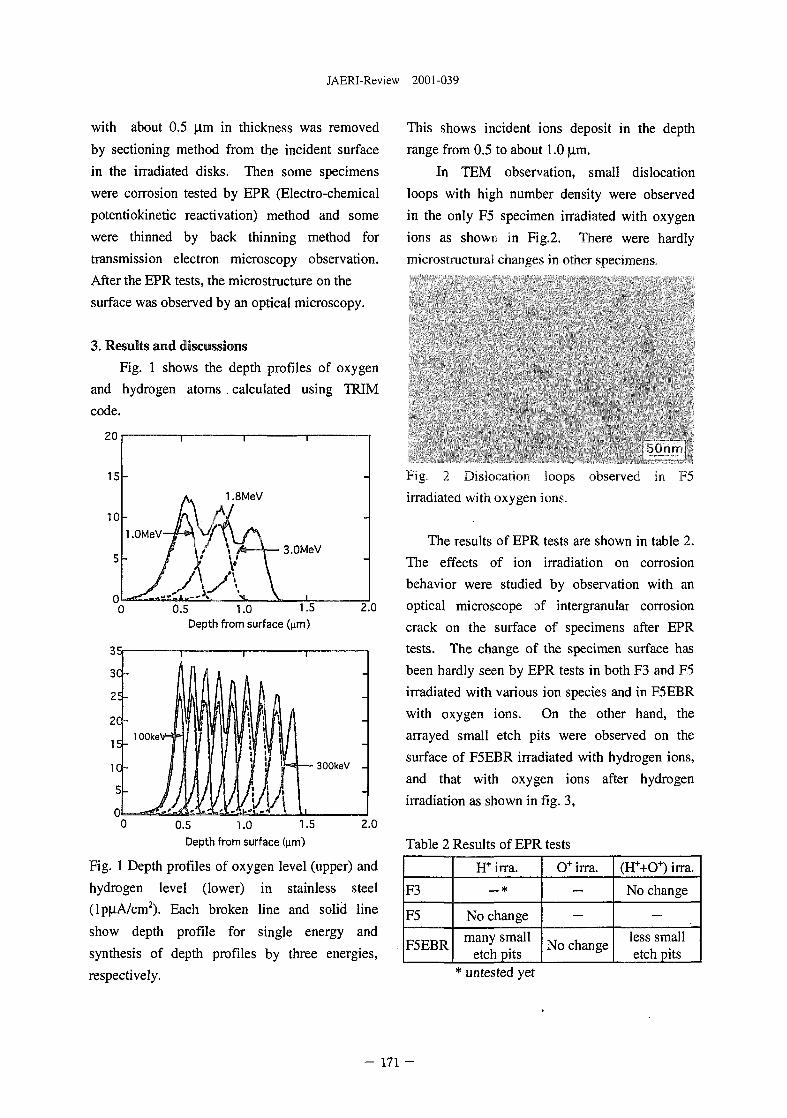
JAERI-Review 2001-039
with about 0.5 |J,m in thickness was removed
by sectioning method from the incident surface
in the irradiated disks. Then some specimens
were corrosion tested by EPR (Electro-chemical
potentiokinetic reactivation) method and some
were thinned by back thinning method for
transmission electron microscopy observation.
After the EPR tests, the microstructure on the
surface was observed by an optical microscopy.
This shows incident ions deposit in the depth
range from 0.5 to about 1.0 |J.m.
In TEM observation, small dislocation
loops with high number density were observed
in the only F5 specimen irradiated with oxygen
ions as shown in Fig.2. There were hardly
microstructura! changes in other specimens.
3. Results and discussions
Fig. 1 shows the depth profiles of oxygen
and hydrogen atoms . calculated using TRIM
code.
20
15
1.8MeV
3.0MeV
0.5 1.0 1.5Depth from surface (\im)
2.0
35
0.5 1.0 1.5Depth from surface (nm)
2.0
Fig. 1 Depth profiles of oxygen level (upper) and
hydrogen level (lower) in stainless steel
(lp|j.A/cm2). Each broken line and solid line
show depth profile for single energy and
synthesis of depth profiles by three energies,
respectively.
ilinrr
Fig. 2 Dislocation loops observed in F5
irradiated with oxygen ions.
The results of EPR tests are shown in table 2.
The effects of ion irradiation on corrosion
behavior were studied by observation with an
optical microscope of intergranular corrosion
crack on the surface of specimens after EPR
tests. The change of the specimen surface has
been hardly seen by EPR tests in both F3 and F5
irradiated with various ion species and in F5EBR
with oxygen ions. On the other hand, the
arrayed small etch pits were observed on the
surface of F5EBR irradiated with hydrogen ions,
and that with oxygen ions after hydrogen
irradiation as shown in fig. 3,
Table 2 Results of EPR tests
F3
F5
F5EBR
H+ irra.__*
No change
many smalletch pits
O+ irra.
—
—
No change
(H++O+) irra.
No change
—
less smalletch pits
* untested yet
- 171 -
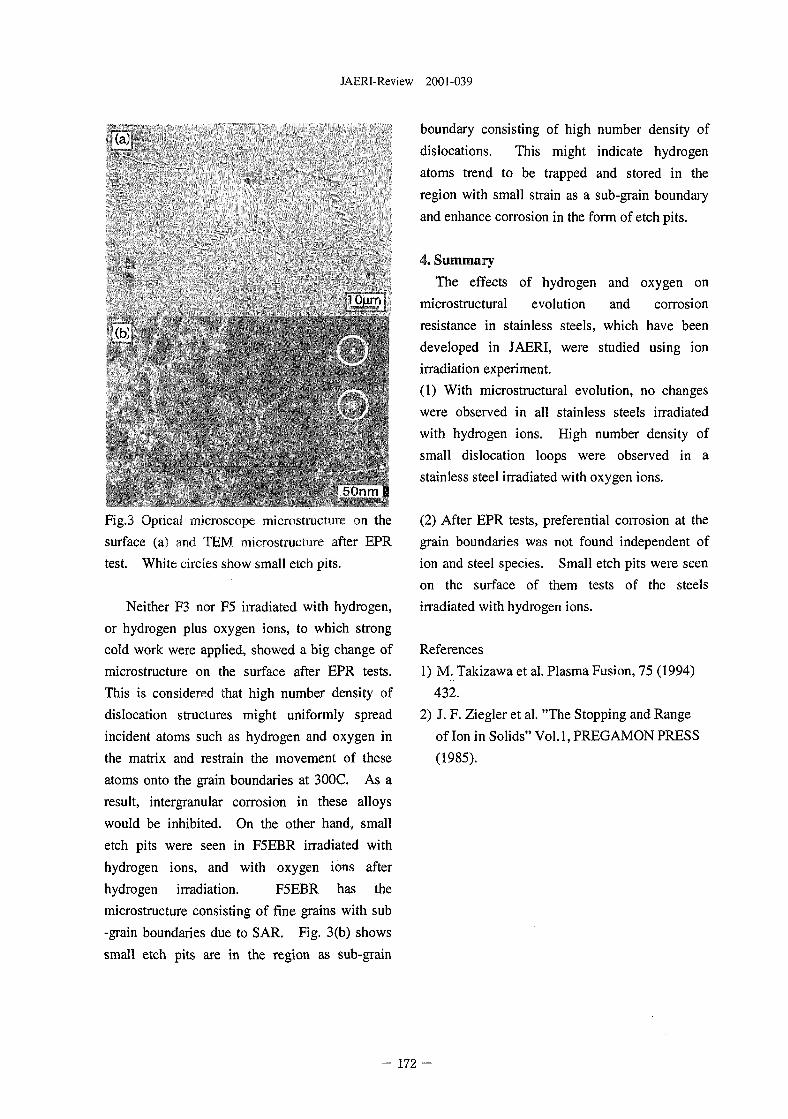
JAERI-Review 2001-039
(a;
lpurfi
S'lnm 13
Fig.3 Optical microscope microstructun; .in the
surface (a) and TEM microstructure after EPR
test. White circles show small etch pits.
Neither F3 nor F5 irradiated with hydrogen,
or hydrogen plus oxygen ions, to which strong
cold work were applied, showed a big change of
microstructure on the surface after EPR tests.
This is considered that high number density of
dislocation structures might uniformly spread
incident atoms such as hydrogen and oxygen in
the matrix and restrain the movement of these
atoms onto the grain boundaries at 300C. As a
result, intergranular corrosion in these alloys
would be inhibited. On the other hand, small
etch pits were seen in F5EBR irradiated with
hydrogen ions, and with oxygen ions after
hydrogen irradiation. F5EBR has the
microstructure consisting of fine grains with sub
-grain boundaries due to SAR. Fig. 3(b) shows
small etch pits are in the region as sub-grain
boundary consisting of high number density of
dislocations. This might indicate hydrogen
atoms trend to be trapped and stored in the
region with small strain as a sub-grain boundary
and enhance corrosion in the form of etch pits.
4. Summary
The effects of hydrogen and oxygen on
microstructural evolution and corrosion
resistance in stainless steels, which have been
developed in JAERI, were studied using ion
irradiation experiment.
(1) With microstructural evolution, no changes
were observed in all stainless steels irradiated
with hydrogen ions. High number density of
small dislocation loops were observed in a
stainless steel irradiated with oxygen ions.
(2) After EPR tests, preferential corrosion at the
grain boundaries was not found independent of
ion and steel species. Small etch pits were seen
on the surface of them tests of the steels
irradiated with hydrogen ions.
References
1) M. Takizawa et al. Plasma Fusion, 75 (1994)
432.
2) J. F. Ziegler et al. "The Stopping and Range
of Ion in Solids" Vol.1, PREGAMON PRESS
(1985).
- 172
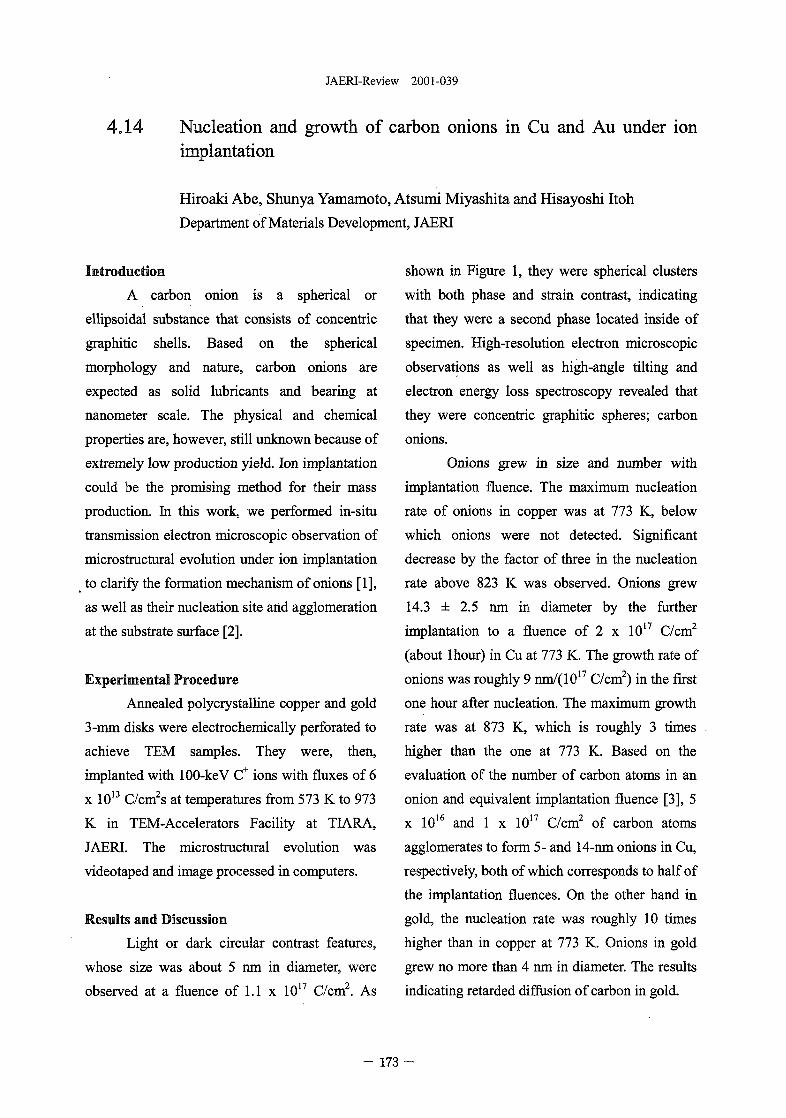
JAERI-Review 2001-039
4.14 Nucleation and growth of carbon onions in Cu and Au under ionimplantation
Hiroaki Abe, Shunya Yamamoto, Atsumi Miyashita and Hisayoshi Itoh
Department of Materials Development, JAERI
Introduction
A carbon onion is a spherical or
ellipsoidal substance that consists of concentric
graphitic shells. Based on the spherical
morphology and nature, carbon onions are
expected as solid lubricants and bearing at
nanometer scale. The physical and chemical
properties are, however, still unknown because of
extremely low production yield. Ion implantation
could be the promising method for their mass
production. In this work, we performed in-situ
transmission electron microscopic observation of
microstructural evolution under ion implantation
to clarify the formation mechanism of onions [1],
as well as their nucleation site and agglomeration
at the substrate surface [2].
Experimental Procedure
Annealed polycrystalline copper and gold
3-mm disks were electrochemically perforated to
achieve TEM samples. They were, then,
implanted with 100-keV C+ ions with fluxes of 6
x 1013 C/cm2s at temperatures from 573 K to 973
K in TEM-Accelerators Facility at TIARA,
JAERI. The microstructural evolution was
videotaped and image processed in computers.
Results and Discussion
Light or dark circular contrast features,
whose size was about 5 nm in diameter, were
observed at a fluence of 1.1 x 10¹⁷ C/cm2. As
shown in Figure 1, they were spherical clusters
with both phase and strain contrast, indicating
that they were a second phase located inside of
specimen. High-resolution electron microscopic
observations as well as high-angle tilting and
electron energy loss spectroscopy revealed that
they were concentric graphitic spheres; carbon
onions.
Onions grew in size and number with
implantation fluence. The maximum nucleation
rate of onions in copper was at 773 K, below
which onions were not detected. Significant
decrease by the factor of three in the nucleation
rate above 823 K was observed. Onions grew
14.3 ± 2.5 nm in diameter by the further
implantation to a fluence of 2 x 10¹⁷ C/cm2
(about lhour) in Cu at 773 K. The growth rate of
onions was roughly 9 nm/(1017 C/cm2) in the first
one hour after nucleation. The maximum growth
rate was at 873 K, which is roughly 3 times
higher than the one at 773 K. Based on the
evaluation of the number of carbon atoms in an
onion and equivalent implantation fluence [3], 5
x 1016 and 1 x 10¹⁷ C/cm2 of carbon atoms
agglomerates to form 5- and 14-nm onions in Cu,
respectively, both of which corresponds to half of
the implantation fluences. On the other hand in
gold, the nucleation rate was roughly 10 times
higher than in copper at 773 K. Onions in gold
grew no more than 4 nm in diameter. The results
indicating retarded diffusion of carbon in gold.
- 173
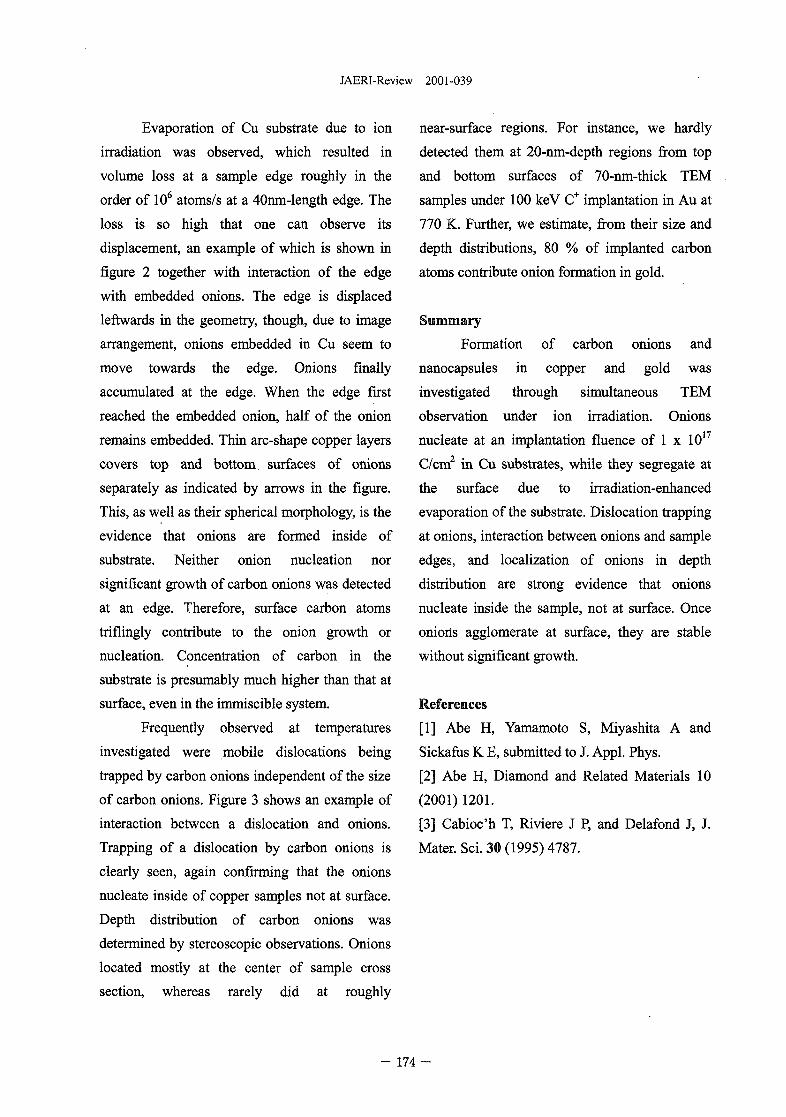
JAERI-Review 2001-039
Evaporation of Cu substrate due to ion
irradiation was observed, which resulted in
volume loss at a sample edge roughly in the
order of 106 atoms/s at a 40nm-length edge. The
loss is so high that one can observe its
displacement, an example of which is shown in
figure 2 together with interaction of the edge
with embedded onions. The edge is displaced
leftwards in the geometry, though, due to image
arrangement, onions embedded in Cu seem to
move towards the edge. Onions finally
accumulated at the edge. When the edge first
reached the embedded onion, half of the onion
remains embedded. Thin arc-shape copper layers
covers top and bottom surfaces of onions
separately as indicated by arrows in the figure.
This, as well as their spherical morphology, is the
evidence that onions are formed inside of
substrate. Neither onion nucleation nor
significant growth of carbon onions was detected
at an edge. Therefore, surface carbon atoms
triflingly contribute to the onion growth or
nucleation. Concentration of carbon in the
substrate is presumably much higher than that at
surface, even in the immiscible system.
Frequently observed at temperatures
investigated were mobile dislocations being
trapped by carbon onions independent of the size
of carbon onions. Figure 3 shows an example of
interaction between a dislocation and onions.
Trapping of a dislocation by carbon onions is
clearly seen, again confirming that the onions
nucleate inside of copper samples not at surface.
Depth distribution of carbon onions was
determined by stereoscopic observations. Onions
located mostly at the center of sample cross
section, whereas rarely did at roughly
near-surface regions. For instance, we hardly
detected them at 20-nm-depth regions from top
and bottom surfaces of 70-nm-thick TEM
samples under 100 keV C+ implantation in Au at
770 K. Further, we estimate, from their size and
depth distributions, 80 % of implanted carbon
atoms contribute onion formation in gold.
Summary
Formation of carbon onions and
nanocapsules in copper and gold was
investigated through simultaneous TEM
observation under ion irradiation. Onions
nucleate at an implantation fluence of 1 x 10¹⁷
C/cm2 in Cu substrates, while they segregate at
the surface due to irradiation-enhanced
evaporation of the substrate. Dislocation trapping
at onions, interaction between onions and sample
edges, and localization of onions in depth
distribution are strong evidence that onions
nucleate inside the sample, not at surface. Once
oniorts agglomerate at surface, they are stable
without significant growth.
References
[1] Abe H, Yamamoto S, Miyashita A and
Sickafus K E, submitted to J. Appl. Phys.
[2] Abe H, Diamond and Related Materials 10
(2001)1201.
[3] Cabioc'h T, Riviere J P, and Delafond J, J.
Mater. Sci. 30 (1995) 4787.
- 174
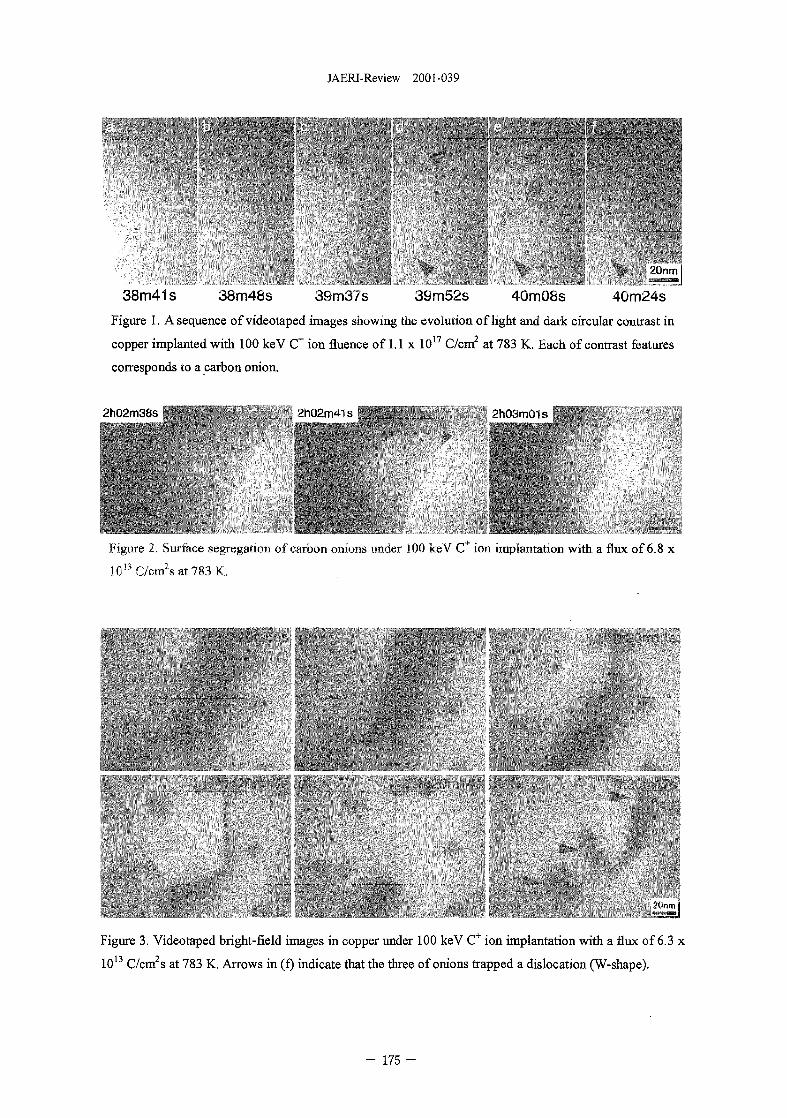
JAERI-Review 2001-039
38m41s 38m48s 39m37s 39m52s 40m08s 40m24sFigure 1. A sequence of videotaped images showing the evolution of light and dark circular contrast in
copper implanted with 100 keV C+ ion fluence of 1.1 x 10¹⁷ C/cm2 at 783 K. Each of contrast features
corresponds to a carbon onion.
2hO2m3bs
Figure 2. Surface segregation of carbon onions under 100 keV C ion implantation with a flux of 6.8 x
1013C/cm2sat783K.
Figure 3. Videotaped bright-field images in copper under 100 keV C+ ion implantation with a flux of 6.3 x
1013 C/cm2s at 783 K. Arrows in (f) indicate that the three of onions trapped a dislocation (W-shape).
- 175 -
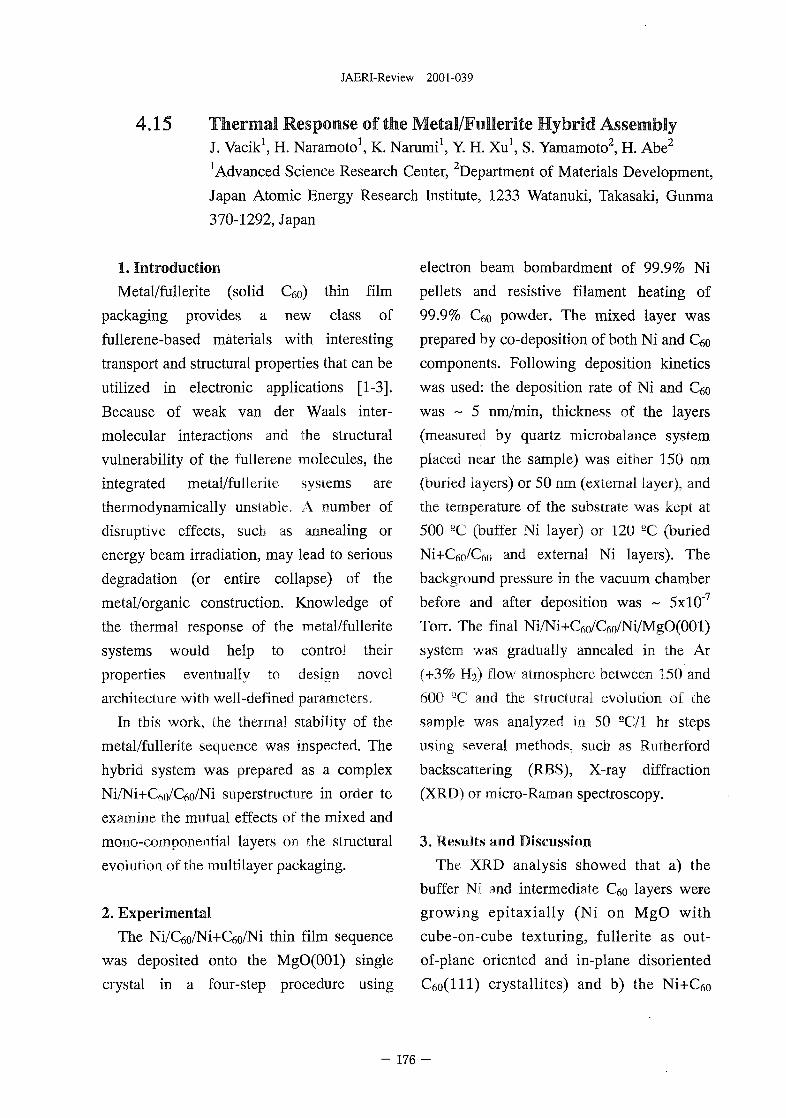
JAERI-Review 2001-039
4.15 Thermal Response of the Metal/Fullerite Hybrid AssemblyJ. Vacik1, H. Naramoto1, K. Narumi1, Y. H. Xu1, S. Yamamoto2, H. Abe2
Advanced Science Research Center, department of Materials Development,
Japan Atomic Energy Research Institute, 1233 Watanuki, Takasaki, Gunma
370-1292, Japan
1. Introduction
Metal/fullerite (solid C6o) thin film
packaging provides a new class of
fullerene-based materials with interesting
transport and structural properties that can be
utilized in electronic applications [1-3].
Because of weak van der Waals inter-
molecular interactions and the structural
vulnerability of the fullerene molecules, the
integrated metal/fullerite systems are
therrnodynamically unstable. A number of
disruptive effects, such as annealing or
energy beam irradiation, may lead to serious
degradation (or entire collapse) of the
metal/organic construction. Knowledge of
the thermal response of the metal/fullerite
systems would help to control their
properties eventually to design novel
architecture with well-defined parameters.
In this work, the thermal stability of the
metal/fullerite sequence was inspected. The
hybrid system was prepared as a complex
Ni/Ni+C6o/C6o/Ni superstructure in order to
examine the mutual effects of the mixed and
mono-componential layers on the structural
evolution of the multilayer packaging.
2. Experimental
The Ni/Cfio/Ni+C6o/Ni thin film sequence
was deposited onto the MgO(OOl) single
crystal in a four-step procedure using
electron beam bombardment of 99.9% Ni
pellets and resistive filament heating of
99.9% C6o powder. The mixed layer was
prepared by co-deposition of both Ni and C6o
components. Following deposition kinetics
was used: the deposition rate of Ni and C6o
was ~ 5 nm/min, thickness of the layers
(measured by quartz microbalance system
placed near the sample) was either 150 nm
(buried layers) or 50 nm (external layer), and
the temperature of the substrate was kept at
500 2C (buffer Ni layer) or 120 aC (buried
Ni+Ct,o/C6o and external Ni layers). The
background pressure in the vacuum chamber
before and after deposition was ~ 5xlO"7
Torr. The final Ni/Ni+Cfio/Cfi0/Ni/MgO(001)
system was gradually annealed in the Ar
(+3% Ha) flow atmosphere between 150 and
600 QC and the structural evolution of the
sample was analyzed in 50 SC/1 hr steps
using several methods, such as Rutherford
backscattering (RBS), X-ray diffraction
(XRD) or micro-Raman spectroscopy.
3. Results and Discussion
The XRD analysis showed that a) the
buffer Ni and intermediate €50 layers were
growing epitaxially (Ni on MgO with
cube-on-cube texturing, fullerite as out-
of-plane oriented and in-plane disoriented
C6o(Hl) crystallites) and b) the Ni+C60
- 1 7 6 -
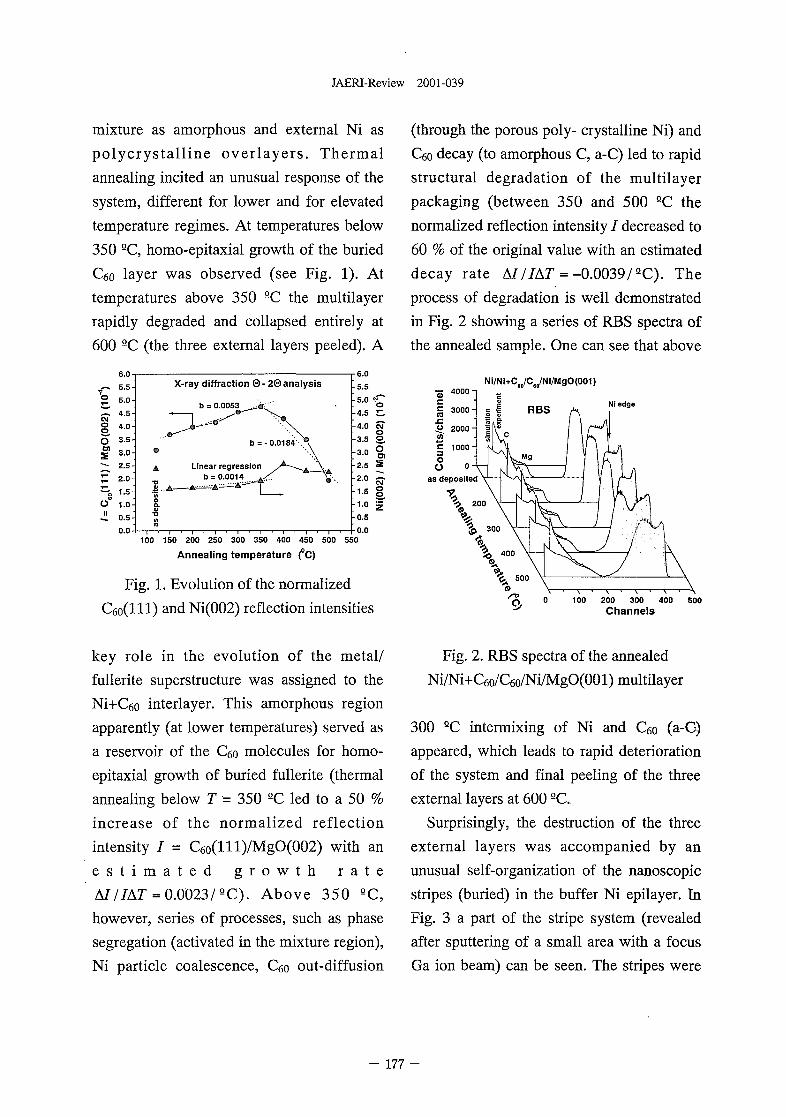
JAERI-Review 2001-039
mixture as amorphous and external Ni as
polycrystal l ine overlayers . Thermal
annealing incited an unusual response of the
system, different for lower and for elevated
temperature regimes. At temperatures below
350 SC, homo-epitaxial growth of the buried
C6o layer was observed (see Fig. 1). At
temperatures above 350 eC the multilayer
rapidly degraded and collapsed entirely at
600 9C (the three external layers peeled). A
CMO
6.05.5-5.04.54.0
O 3-5
S 3-0
X 2S~£ 2.0-
o i.o-Jl o.5:
0.0
X-ray diffraction 0 - 20analysis
o
A
b= -0.0184'."
Linear regression yA~-- .A_b = 0.0014 . /
6.0
-5.5
-5.0
-4.5
4.0
-3.5
-3.0
-2.5
-2.0
-1.5
-1.0
-0.5
0.0
CMoo.O
100 150 200 250 300 350 400 450 500
Annealing temperature (°C)550
Fig. 1. Evolution of the normalized
C6o(lll) and Ni(002) reflection intensities
(through the porous poly- crystalline Ni) and
C6o decay (to amorphous C, a-C) led to rapid
structural degradation of the multilayer
packaging (between 350 and 500 QC the
normalized reflection intensity / decreased to
60 % of the original value with an estimated
decay rate A///AT =-0.0039/QC). The
process of degradation is well demonstrated
in Fig. 2 showing a series of RBS spectra of
the annealed sample. One can see that above
Ni/Ni+CJCJNf/MgOfOOl)
N!edge
100 200 300 400
Channels500
key role in the evolution of the metal/
fullerite superstructure was assigned to the
Ni+Ceo interlayer. This amorphous region
apparently (at lower temperatures) served as
a reservoir of the Cfio molecules for homo-
epitaxial growth of buried fullerite (thermal
annealing below T = 350 SC led to a 50 %
increase of the normalized reflection
intensity / = C60(lll)/MgO(002) with an
e s t i m a t e d g r o w t h r a t e
MllhX- 0.0023/ SC). Above 350 SC,
however, series of processes, such as phase
segregation (activated in the mixture region),
Ni particle coalescence, C6o out-diffusion
Fig. 2. RBS spectra of the annealed
Ni/Ni+C6o/C60/Ni/MgO(001) multilayer
300 SC intermixing of Ni and C60 (a-G)
appeared, which leads to rapid deterioration
of the system and final peeling of the three
external layers at 600 QC.
Surprisingly, the destruction of the three
external layers was accompanied by an
unusual self-organization of the nanoscopic
stripes (buried) in the buffer Ni epilayer. In
Fig. 3 a part of the stripe system (revealed
after sputtering of a small area with a focus
Ga ion beam) can be seen. The stripes were
- 1 7 7 -
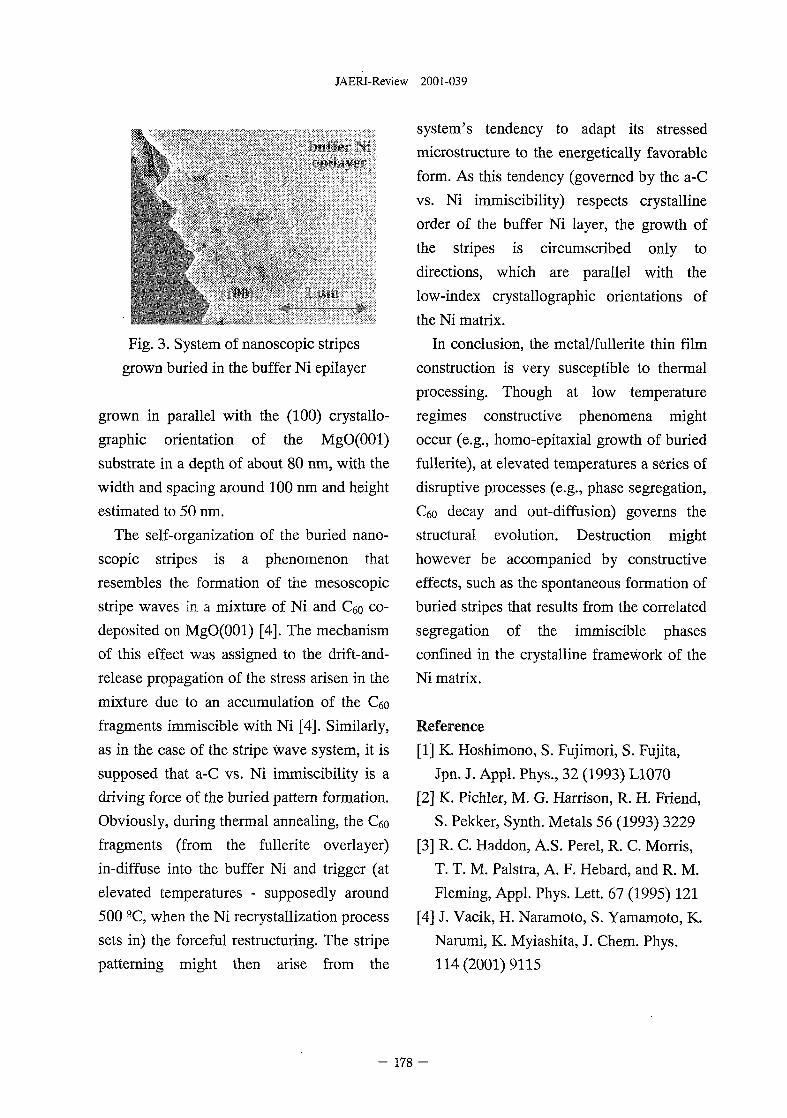
JAERI-Review 2001-039
Fig. 3. System of nanoscopic stripes
grown buried in the buffer Ni epilayer
grown in parallel with the (100) crystallo-
graphic orientation of the MgO(OOl)
substrate in a depth of about 80 nm, with the
width and spacing around 100 nm and height
estimated to 50 nm.
The self-organization of the buried nano-
scopic stripes is a phenomenon that
resembles the formation of the mesoscopic
stripe waves in a mixture of Ni and C6o co-
deposited on MgO(OOl) [4]. The mechanism
of this effect was assigned to the drift-and-
release propagation of the stress arisen in the
mixture due to an accumulation of the Ceo
fragments immiscible with Ni [4]. Similarly,
as in the case of the stripe wave system, it is
supposed that a-C vs. Ni immiscibility is a
driving force of the buried pattern formation.
Obviously, during thermal annealing, the C6o
fragments (from the fullerite overlayer)
in-diffuse into the buffer Ni and trigger (at
elevated temperatures - supposedly around
500 QC, when the Ni recrystallization process
sets in) the forceful restructuring. The stripe
patterning might then arise from the
system's tendency to adapt its stressed
microstructure to the energetically favorable
form. As this tendency (governed by the a-C
vs. Ni immiscibility) respects crystalline
order of the buffer Ni layer, the growth of
the stripes is circumscribed only to
directions, which are parallel with the
low-index crystallographic orientations of
the Ni matrix.
In conclusion, the metal/fullerite thin film
construction is very susceptible to thermal
processing. Though at low temperature
regimes constructive phenomena might
occur (e.g., homo-epitaxial growth of buried
fullerite), at elevated temperatures a series of
disruptive processes (e.g., phase segregation,
C6o decay and out-diffusion) governs the
structural evolution. Destruction might
however be accompanied by constructive
effects, such as the spontaneous formation of
buried stripes that results from the correlated
segregation of the immiscible phases
confined in the crystalline framework of the
Ni matrix.
Reference
[1] K. Hoshimono, S. Fujimori, S. Fujita,
Jpn. J. Appl. Phys., 32 (1993) L1070
[2] K. Pichler, M. G. Harrison, R. H. Friend,
S. Pekker, Synth. Metals 56 (1993) 3229
[3] R. C. Haddon, A.S. Perel, R. C. Morris,
T. T. M. Palstra, A. F. Hebard, and R. M.
Fleming, Appl. Phys. Lett. 67 (1995) 121
[4] J. Vacik, H. Naramoto, S. Yamamoto, K.
Narumi, K. Myiashita, J. Chem. Phys.
114 (2001) 9115
- 178 -
JAERI-Review 2001-039
4.16 Deposition and Characterization of Carbon Films Preparedby lon-Bombardment-AssIsted Method
X. D. Zhu1}, Y. H. Xu1}, H. Naramoto1^ K. Narumi1^ A. Miyashita2), K. Miyashita3)
^Advanced Sci. Res. Center, ^Dept. of Materials Development, JAERI
^ Gunma Pref. Industrial Technology Research Laboratory
1. Introduction
Carbon-based materials with various bonding
states present tremendous differences in their
materials properties and structures. Great effort
has been made to fabricate carbon-based films
by employing ion beam methods, because the
methods are originally non-equilibrium ones
and have several kinds of advantages such as the
independent controllability of the ion species,
ion energy, and ion current density. The
common products obtained by these methods
are diamond-like carbon films with the various
fraction of sp3 bonding. It remains far from the
strict science even though a few reports have
claimed the success of diamond film preparation
in ion beam methods .
In the present study, the ion beam assisted
deposition technique was employed to prepare
carbon-based thin films. By optimizing the
deposition parameters, we have successfully
found the growth conditions to prepare high
quality C6o, diamondlike carbon, and
nanocrystalline diamond films on mirror-
polished Si wafers.
2. Experiment
High purity Ceo power (99.99%) was heated
to sublimate C&o vapor as carbon source.
Growing film was bombarded simultaneously
by Ne+ ions with the incident angle of 60° from
the substrate normal. The background pressure
in the chamber was less 5 x 10"5 Pa. The working
pressure was maintained around 6xlO"4Pa. The
bonding nature was analyzed with Renishaw
2000 imaging microscope using 514 nm Ar+ ion
laser with the power less than lmW. For the
structural analysis X-ray system (Geiger Flex
RAD-III, RIGAKU) equipped with a powder
diffraction goniometer was operated at the
power of 50kV, 30mA.
3. Results and Discussion
Fig.l depicts the Raman spectra of the specimen
prepared at nearly room temperature with Ne+ ion
bombardments of three different energies. It can be
recognized that the quality of Qo films can be
improved as the Ne+ ion energy increases up to
500eV, which demonstrates the stable closed-cage
structure of Qo and its remarkable resilience. With
the further increase of Ne+ ion energy up to 700eV,
the deposited films show the typical DLC features
in the Raman spectra. The formation of DLC films
can be well interpreted by the subplatation model 2\
Under 1.5keV Ne+ ion bombardment with different
substrate temperatures, it is found that the
separation between G and D lines in the Raman
spectra becomes larger with the substrate
temperature increase. This phenomenon is much
more pronounced at higher temperatures,
indicating that the films become more graphitic.
Associated with this change in the Raman spectra,
the significant morphological transition from
growth mounds to ripple structure occurs in grown
- 179 -
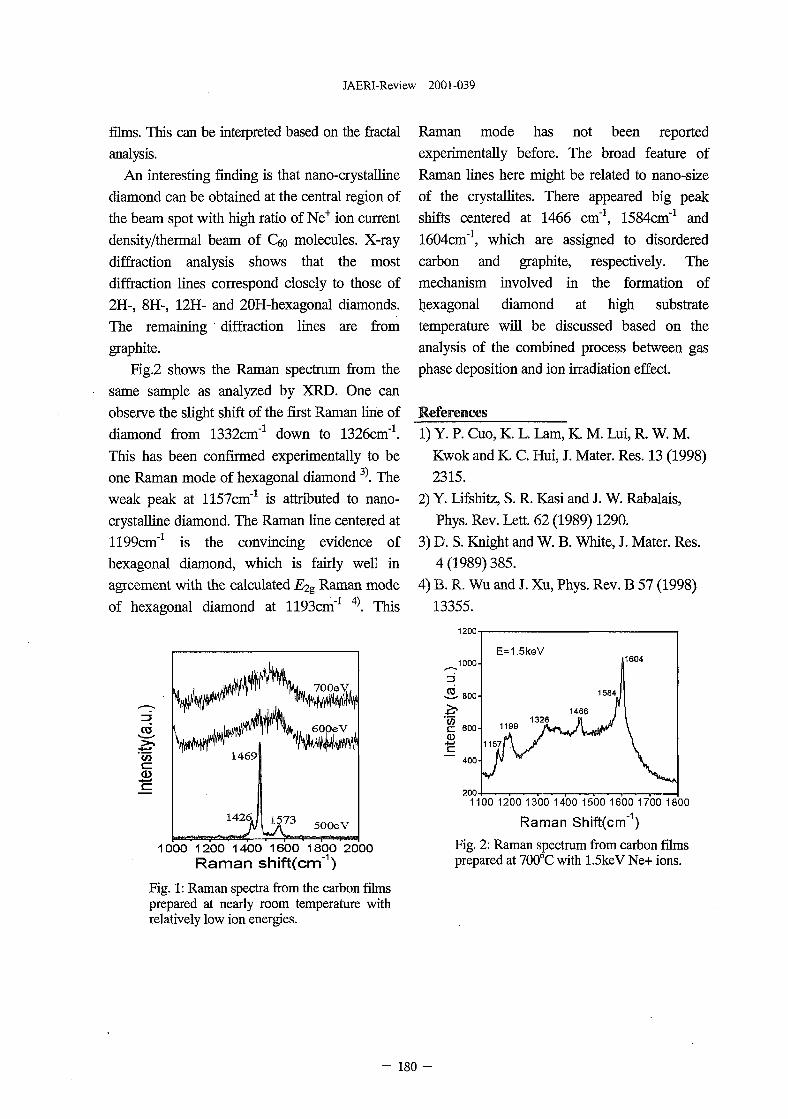
JAERI-Review 2001-039
films. This can be interpreted based on the fractal
analysis.
An interesting finding is that nano-crystalline
diamond can be obtained at the central region of
the beam spot with high ratio of Ne+ ion current
density/thermal beam of C6o molecules. X-ray
diffraction analysis shows that the most
diffraction lines correspond closely to those of
2H-, 8H-, 12H- and 20H-hexagonal diamonds.
The remaining diffraction lines are from
graphite.
Fig.2 shows the Raman spectrum from the
same sample as analyzed by XRD. One can
observe the slight shift of the first Raman line of
diamond from 1332cm"1 down to 1326cm"1.
This has been confirmed experimentally to be
one Raman mode of hexagonal diamond 3). The
weak peak at 1157cm"1 is attributed to nano-
crystalline diamond. The Raman line centered at
1199cm"1 is the convincing evidence of
hexagonal diamond, which is fairly well in
agreement with the calculated 2?2g Raman mode
of hexagonal diamond at 1193cm"1 . This
CO
a>
1469
142' 1573 500eV
1OOO 1200 1400 1600 1800 2000Raman shift(cm"1)
Fig. 1: Raman spectra from the carbon filmsprepared at nearly room temperature withrelatively low ion energies.
Raman mode has not been reported
experimentally before. The broad feature of
Raman lines here might be related to nano-size
of the crystallites. There appeared big peak
shifts centered at 1466 cm"1, 1584cm"1 and
1604cm"1, which are assigned to disordered
carbon and graphite, respectively. The
mechanism involved in the formation of
hexagonal diamond at high substrate
temperature will be discussed based on the
analysis of the combined process between gas
phase deposition and ion irradiation effect.
References
1) Y. P. Cuo, K. L. Lam, K. M. Lui, R. W. M.
Kwok and K. C. Hui, J. Mater. Res. 13 (1998)
2315.
2) Y. Lifshitz, S. R. Kasi and J. W. Rabalais,
Phys. Rev. Lett. 62 (1989) 1290.
3) D. S. Knight and W. B. White, J. Mater. Res.
4(1989)385.
4) B. R. Wu and J. Xu, Phys. Rev. B 57 (1998)
13355.
3
(0
1100 1200 1300 1400 1500 1600 1700 1800
Raman Shift(cm"1)
Fig. 2: Raman spectrum from carbon filmsprepared at 700°C with 1.5keV Ne+ ions.
1000-
800-
600-
400-
200-
E=1
1199
1157j\
1/*tLff
5keV11604
I1584JI
1466 |1326 M j / \
y v
- 1 8 0 -
JAERI-Review 2001-039
4.17 Evolution of Co+C60 Structures during Co-depositionand Subsequent Annealing
V. Lavrentiev1'*, H. Abe2, S. Yamamoto2, H. Naramoto1, K. Narumi1 and K.
Miyashita3
'Advanced Science Research Center; 2Dept. of Mater. Development, JAERI,3Gunma Pref. Industrial Technology Research Lab.
Cobalt has several interesting aspects as
magnetic materials, and the magnetic
properties can be improved crucially owing
to the encapsulation of cobalt
nano-particles by some nonmagnetic
materials. Since the recent successes for
the encapsulation of cobalt by a
graphite-like layer, it has been tempting us
to perform the similar covering by Ceo
molecules layers. To make the
encapsulated structure acceptable for the
applications we intended to design it as
thin film with the perfect smoothness and
the excellent adhesion to the substrate.
To realize our intention we employed an
idea to use the mixture between Co and Ceo-
The mixed films were prepared by the
simultaneous deposition of cobalt (electron
beam evaporation) and C6o (thermal
sublimation). The co-deposition was made
onto a-Al2O3 (0001) substrate under 10"5
Pa. For TEM analysis the same
co-deposition experiment was carried out
on cleaved (001) NaCl single crystals. For
the characterization of mixed C0+C60 films
AFM, SEM and Raman spectroscopy were
employed.
The optical inspection of co-deposited
films shows the metallic gloss on films
surface and the excellent adhesion to the
(X-AI2O3 substrate. The detailed analysis
on the film surface and the cross section
by AFM and SEM permitted us to induce
the conclusion about the performance of
encapsulation during the co-deposition.
The structure of the film deposited at room
temperature (RT) looks like the
agglomerates of nano-granules with the
order of 20-30 nm in diameter (Fig. 1).
Moreover, one can see the hilly structure
with the height of 20 nm. The density of
the hills depends on the thermal conditions
in the deposition and the subsequent
thermal annealing.
*On leave from Inst. of Applied Physics, Academy of Sciences of Ukraine, Sumy, Ukraine.
. - 181 -
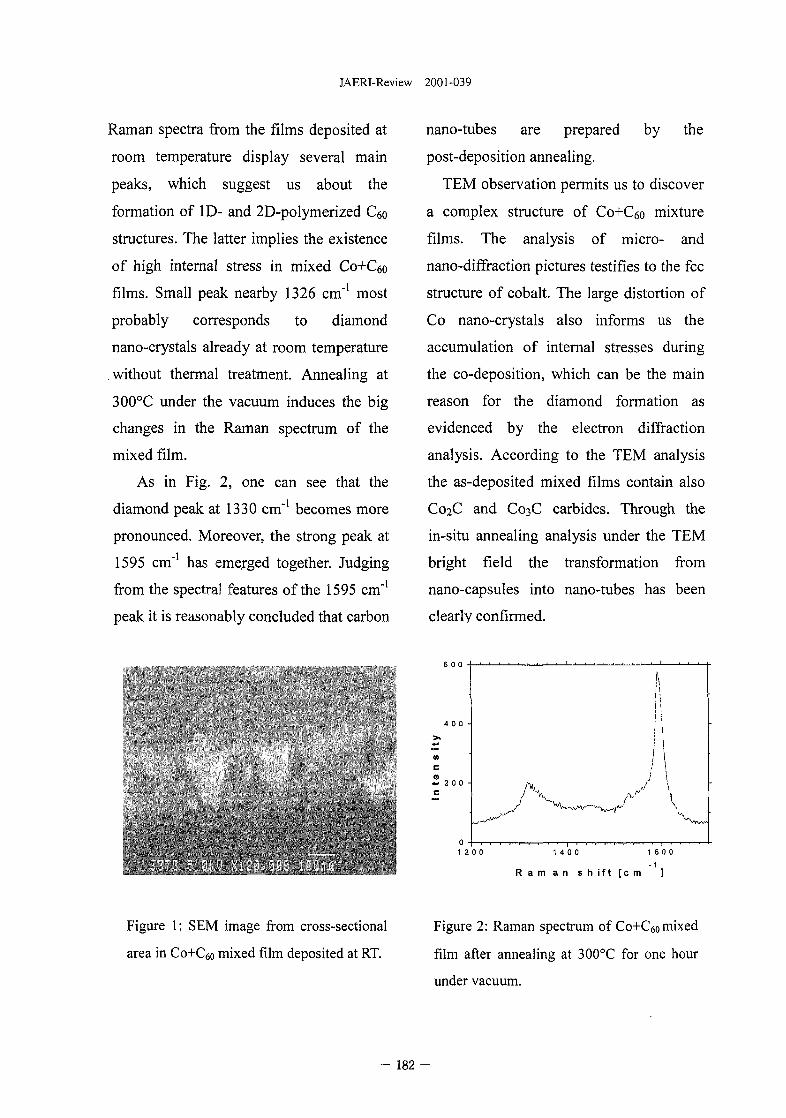
JAERI-Review 2001-039
Raman spectra from the films deposited at
room temperature display several main
peaks, which suggest us about the
formation of ID- and 2D-polymerized C6o
structures. The latter implies the existence
of high internal stress in mixed C0+C60
films. Small peak nearby 1326 cm"1 most
probably corresponds to diamond
nano-crystals already at room temperature
without thermal treatment. Annealing at
300°C under the vacuum induces the big
changes in the Raman spectrum of the
mixed film.
As in Fig. 2, one can see that the
diamond peak at 1330 cm'1 becomes more
pronounced. Moreover, the strong peak at
1595 cm"1 has emerged together. Judging
from the spectral features of the 1595 cm"1
peak it is reasonably concluded that carbon
nano-tubes are prepared by the
post-deposition annealing.
TEM observation permits us to discover
a complex structure of C0+C60 mixture
films. The analysis of micro- and
nano-diffraction pictures testifies to the fee
structure of cobalt. The large distortion of
Co nano-crystals also informs us the
accumulation of internal stresses during
the co-deposition, which can be the main
reason for the diamond formation as
evidenced by the electron diffraction
analysis. According to the TEM analysis
the as-deposited mixed films contain also
C02C and C03C carbides. Through the
in-situ annealing analysis under the TEM
bright field the transformation from
nano-capsules into nano-tubes has been
clearly confirmed.
6 0 0
1 2 0 0 14 0 0
R a m a n s h i f t [c m ]
Figure 1: SEM image from cross-sectional
area in C0+C60 mixed film deposited at RT.
Figure 2: Raman spectrum of Co+C6o mixed
film after annealing at 300°C for one hour
under vacuum.
- 182 -
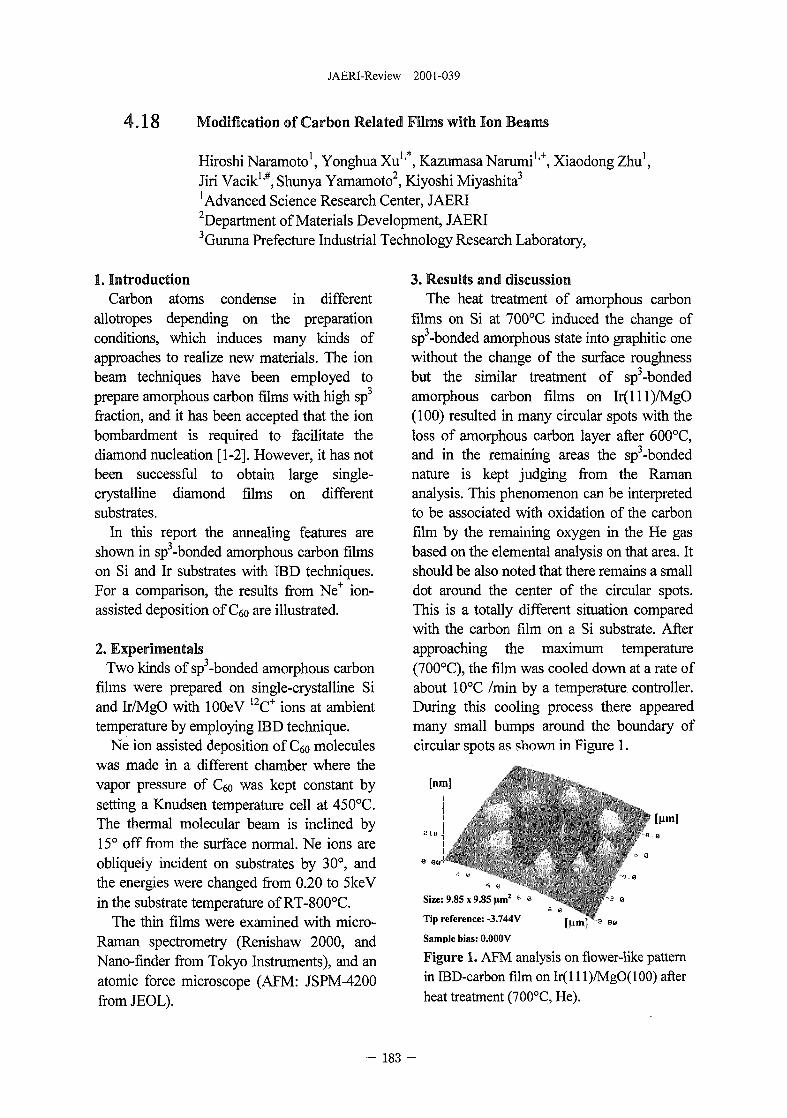
JAERI-Review 2001-039
4 . 1 8 Modification of Carbon Related Films with Ion Beams
Hiroshi Naramoto1, Yonghua Xu1'*, KazumasaNarumi1'4", Xiaodong Zhu1,Jiri Vacik''#, Shunya Yamamoto2, Kiyoshi Miyashita3
'Advanced Science Research Center, JAERIdepartment of Materials Development, JAERI3Gunma Prefecture Industrial Technology Research Laboratory,
1. IntroductionCarbon atoms condense in different
allotropes depending on the preparationconditions, which induces many kinds ofapproaches to realize new materials. The ionbeam techniques have been employed toprepare amorphous carbon films with high sp3
fraction, and it has been accepted that the ionbombardment is required to facilitate thediamond nucleation [1-2]. However, it has notbeen successful to obtain large single-crystalline diamond films on differentsubstrates.
In this report the annealing features areshown in sp3-bonded amorphous carbon filmson Si and Ir substrates with IBD techniques.For a comparison, the results from Ne+ ion-assisted deposition of C6o are illustrated.
2. ExperimentalTwo kinds of sp3-bonded amorphous carbon
films were prepared on single-crystalline Siand Ir/MgO with lOOeV !2C+ ions at ambienttemperature by employing IBD technique.
Ne ion assisted deposition of C6o moleculeswas made in a different chamber where thevapor pressure of Ceo was kept constant bysetting a Knudsen temperature cell at 450°C.The thermal molecular beam is inclined by15° off from the surface normal. Ne ions areobliquely incident on substrates by 30°, andthe energies were changed from 0.20 to 5keVin the substrate temperature of RT-800°C.
The thin films were examined with micro-Raman spectrometry (Renishaw 2000, andNano-fmder from Tokyo Instruments), and anatomic force microscope (AFM: JSPM-4200from JEOL).
3. Results and discussionThe heat treatment of amorphous carbon
films on Si at 700°C induced the change ofsp3-bonded amorphous state into graphitic onewithout the change of the surface roughnessbut the similar treatment of sp3-bondedamorphous carbon films on Ir(lll)/MgO(100) resulted in many circular spots with theloss of amorphous carbon layer after 600°C,and in the remaining areas the sp3-bondednature is kept judging from the Ramananalysis. This phenomenon can be interpretedto be associated with oxidation of the carbonfilm by the remaining oxygen in the He gasbased on the elemental analysis on that area. Itshould be also noted that there remains a smalldot around the center of the circular spots.This is a totally different situation comparedwith the carbon film on a Si substrate. Afterapproaching the maximum temperature(700°C), the film was cooled down at a rate ofabout 10°C /min by a temperature, controller.During this cooling process there appearedmany small bumps around the boundary ofcircular spots as shown in Figure 1.
[urn]
Size: 9.85 x').85nm: • •
Tip reference: -3.744V [ u m p 8 °B
Sample bias: 0.000V
Figure 1. AFM analysis on flower-like patternin EBD-carbon film on Ir(l 1 l)/MgO(100) afterheat treatment (700°C, He).
183 -
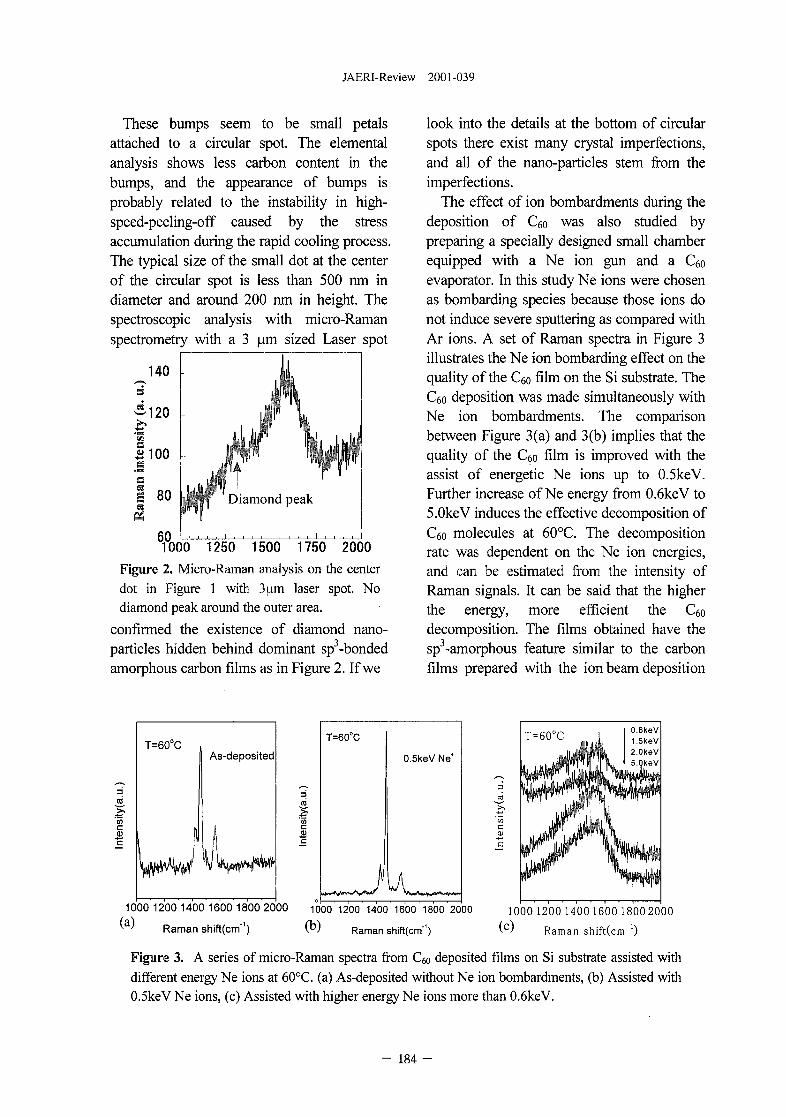
JAERI-Review 2001-039
These bumps seem to be small petalsattached to a circular spot. The elementalanalysis shows less carbon content in thebumps, and the appearance of bumps isprobably related to the instability in high-speed-peeling-off caused by the stressaccumulation during the rapid cooling process.The typical size of the small dot at the centerof the circular spot is less than 500 nm indiameter and around 200 nm in height. Thespectroscopic analysis with micro-Ramanspectrometry with a 3 urn sized Laser spot
T000 1250 1500 1750 2000Figure 2. Micro-Raman analysis on the centerdot in Figure 1 with 3 urn laser spot. Nodiamond peak around the outer area,
confirmed the existence of diamond nano-particles hidden behind dominant sp3-bondedamorphous carbon films as in Figure 2. If we
look into the details at the bottom of circularspots there exist many crystal imperfections,and all of the nano-particles stem from theimperfections.
The effect of ion bombardments during thedeposition of C6o was also studied bypreparing a specially designed small chamberequipped with a Ne ion gun and a C6oevaporator. In this study Ne ions were chosenas bombarding species because those ions donot induce severe sputtering as compared withAr ions. A set of Raman spectra in Figure 3illustrates the Ne ion bombarding effect on thequality of the C6o film on the Si substrate. TheCeo deposition was made simultaneously withNe ion bombardments. The comparisonbetween Figure 3(a) and 3(b) implies that thequality of the C6o film is improved with theassist of energetic Ne ions up to 0.5keV.Further increase of Ne energy from 0.6keV to5.0keV induces the effective decomposition ofC6o molecules at 60°C. The decompositionrate was dependent on the Ne ion energies,and can be estimated from the intensity ofRaman signals. It can be said that the higherthe energy, more efficient the C6odecomposition. The films obtained have thesp3-amorphous feature similar to the carbonfilms prepared with the ion beam deposition
T=60°C .
I NI
As-deposited
1\
u.)
ty(a
tens
i
T=60°C
i
0.5keV Ne*
a.u.
>,
ens
c
T=60°C
HP1
0.6keV1.5keV2.0keV5.0keV
1000 1200 1400 1600 1800 2000
(a) Raman shift(crrf )
1000 1200 1400 1600 1800 2000
(b) Raman shift(cm"1)
1000120014001600 18002000
(c) Raman shift(cm ')
Figure 3. A series of micro-Raman spectra from C6o deposited films on Si substrate assisted with
different energy Ne ions at 60°C. (a) As-deposited without Ne ion bombardments, (b) Assisted with
0.5keV Ne ions, (c) Assisted with higher energy Ne ions more than 0.6keV.
- 184 -
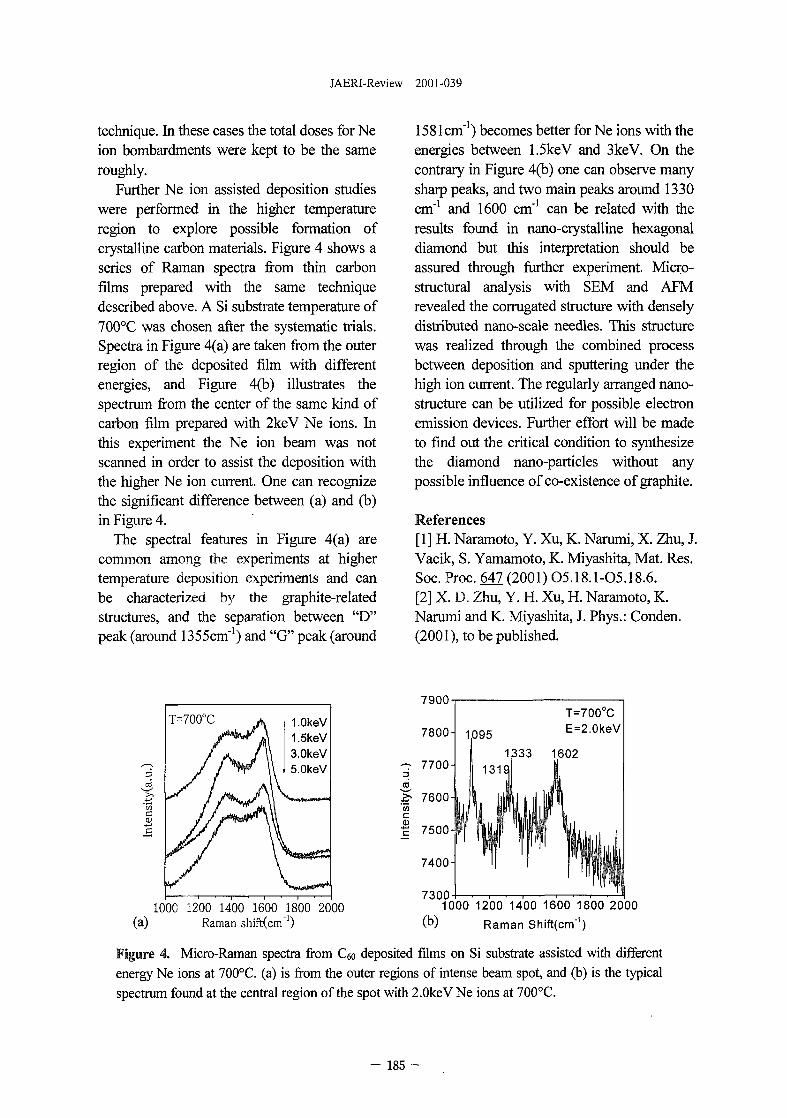
JAERI-Review 2001-039
technique. In these cases the total doses for Neion bombardments were kept to be the sameroughly.
Further Ne ion assisted deposition studieswere performed in the higher temperatureregion to explore possible formation ofcrystalline carbon materials. Figure 4 shows aseries of Raman spectra from thin carbonfilms prepared with the same techniquedescribed above. A Si substrate temperature of700°C was chosen after the systematic trials.Spectra in Figure 4(a) are taken from the outerregion of the deposited film with differentenergies, and Figure 4(b) illustrates thespectrum from the center of the same kind ofcarbon film prepared with 2keV Ne ions. Inthis experiment the Ne ion beam was notscanned in order to assist the deposition withthe higher Ne ion current. One can recognizethe significant difference between (a) and (b)in Figure 4.
The spectral features in Figure 4(a) arecommon among the experiments at highertemperature deposition experiments and canbe characterized by the graphite-relatedstructures, and the separation between "D"peak (around 1355cm"1) and "G" peak (around
1581cm"1) becomes better for Ne ions with theenergies between 1.5keV and 3keV. On thecontrary in Figure 4(b) one can observe manysharp peaks, and two main peaks around 1330cm"1 and 1600 cm"1 can be related with theresults found in nano-crystalline hexagonaldiamond but this interpretation should beassured through further experiment. Micro-structural analysis with SEM and AFMrevealed the corrugated structure with denselydistributed nano-scale needles. This structurewas realized through the combined processbetween deposition and sputtering under thehigh ion current. The regularly arranged nano-structure can be utilized for possible electronemission devices. Further effort will be madeto find out the critical condition to synthesizethe diamond nano-particles without anypossible influence of co-existence of graphite.
References[1] H. Naramoto, Y. Xu, K. Narumi, X. Zhu, J.Vacik, S. Yamamoto, K. Miyashita, Mat. Res.Soc. Proc. 642 (2001) 05.18.1-05.18.6.[2] X. D. Zhu, Y. H. Xu, H. Naramoto, K.Narumi and K. Miyashita, J. Phys.: Conden.(2001), to be published.
d
+~>
c
s
T=700°C A
/ /Su/\\//V\\//J2/\\\
LOkeV1.5keV3.0keV5.0keV
7900
1000 1200 1400 1600 1800 2000(a) Raman shiftman"1)
7300001000 1200 1400 1600 1800 2000
Raman Shift(cm"1)
Figure 4. Micro-Raman spectra from C«) deposited films on Si substrate assisted with different
energy Ne ions at 700°C. (a) is from the outer regions of intense beam spot, and (b) is the typical
spectrum found at the central region of the spot with 2.0keV Ne ions at 700°C.
- 185 -
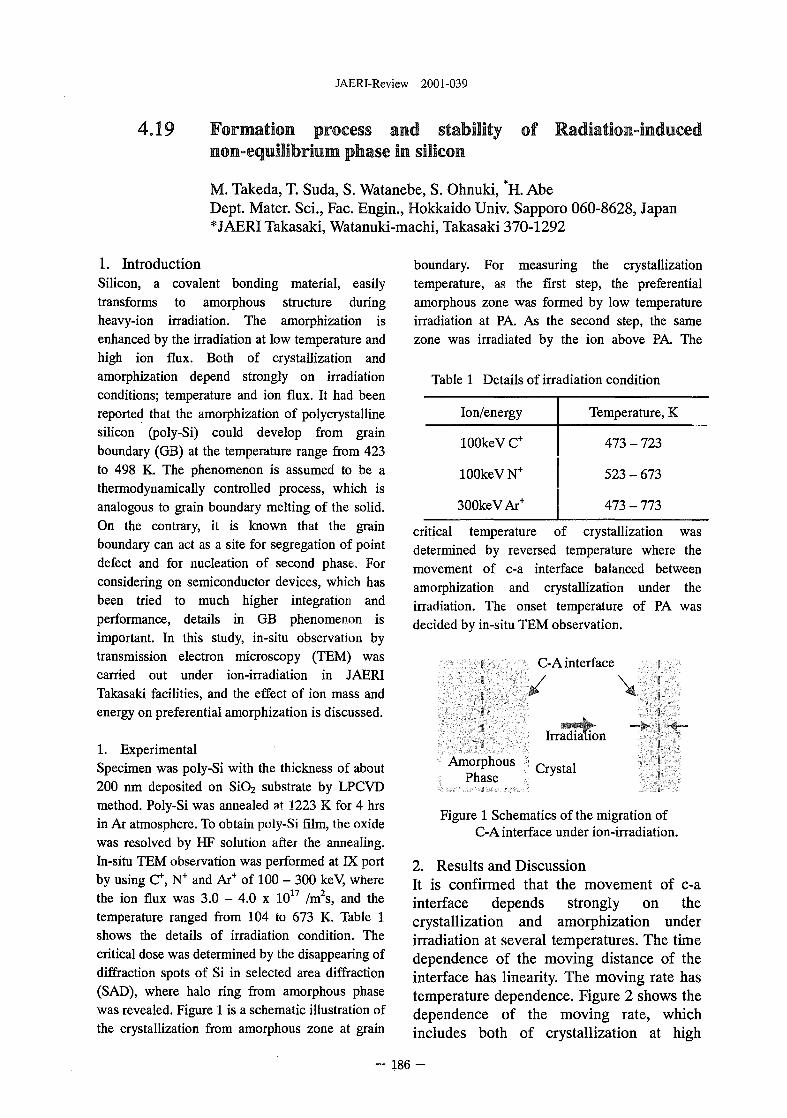
JAERI-Review 2001-039
4.19 Formation process and stabilitynon-equilibrium phase in silicon
of Radiation-induced
M. Takeda, T. Suda, S. Watanebe, S. Ohnuki, H. AbeDept. Mater. Sci., Fac. Engin., Hokkaido Univ. Sapporo 060-8628, Japan*JAERI Takasaki, Watanuki-machi, Takasaki 370-1292
1. IntroductionSilicon, a covalent bonding material, easilytransforms to amorphous structure duringheavy-ion irradiation. The amorphization isenhanced by the irradiation at low temperature andhigh ion flux. Both of crystallization andamorphization depend strongly on irradiationconditions; temperature and ion flux. It had beenreported that the amorphization of polycrystallinesilicon (poly-Si) could develop from grainboundary (GB) at the temperature range from 423to 498 K. The phenomenon is assumed to be athermodynamically controlled process, which isanalogous to grain boundary melting of the solid.On the contrary, it is known that the grainboundary can act as a site for segregation of pointdefect and for nucleation of second phase. Forconsidering on semiconductor devices, which hasbeen tried to much higher integration andperformance, details in GB phenomenon isimportant. In this study, in-situ observation bytransmission electron microscopy (TEM) wascarried out under ion-irradiation in JAERITakasaki facilities, and the effect of ion mass andenergy on preferential amorphization is discussed.
1. ExperimentalSpecimen was poly-Si with the thickness of about200 nm deposited on SiO2 substrate by LPCVDmethod. Poly-Si was annealed at 1223 K for 4 hrsin Ar atmosphere. To obtain poly-Si film, the oxidewas resolved by HF solution after the annealing.In-situ TEM observation was performed at IX portby using C+, N+ and Ar+ of 100 - 300 keV, wherethe ion flux was 3.0 - 4.0 x 10¹⁷ /m2s, and thetemperature ranged from 104 to 673 K. Table 1shows the details of irradiation condition. Thecritical dose was determined by the disappearing ofdiffraction spots of Si in selected area diffraction(SAD), where halo ring from amorphous phasewas revealed. Figure 1 is a schematic illustration ofthe crystallization from amorphous zone at grain
boundary. For measuring the crystallizationtemperature, as the first step, the preferentialamorphous zone was formed by low temperatureirradiation at PA. As the second step, the samezone was irradiated by the ion above PA. The
Table 1 Details of irradiation condition
Ion/energy
lOOkeV C+
100keVN+
300keVAr+
Temperature, K
473 - 723
523 - 673
473 - 773
critical temperature of crystallization wasdetermined by reversed temperature where themovement of c-a interface balanced betweenamorphization and crystallization under theirradiation. The onset temperature of PA wasdecided by in-situ TEM observation.
ss
AmorphousPhase
C-A interface
Irradiation«>>•
Figure 1 Schematics of the migration ofC-A interface under ion-irradiation.
2. Results and DiscussionIt is confirmed that the movement of c-ainterface depends strongly on thecrystallization and amorphization underirradiation at several temperatures. The timedependence of the moving distance of theinterface has linearity. The moving rate hastemperature dependence. Figure 2 shows thedependence of the moving rate, whichincludes both of crystallization at high
- 1 8 6 -
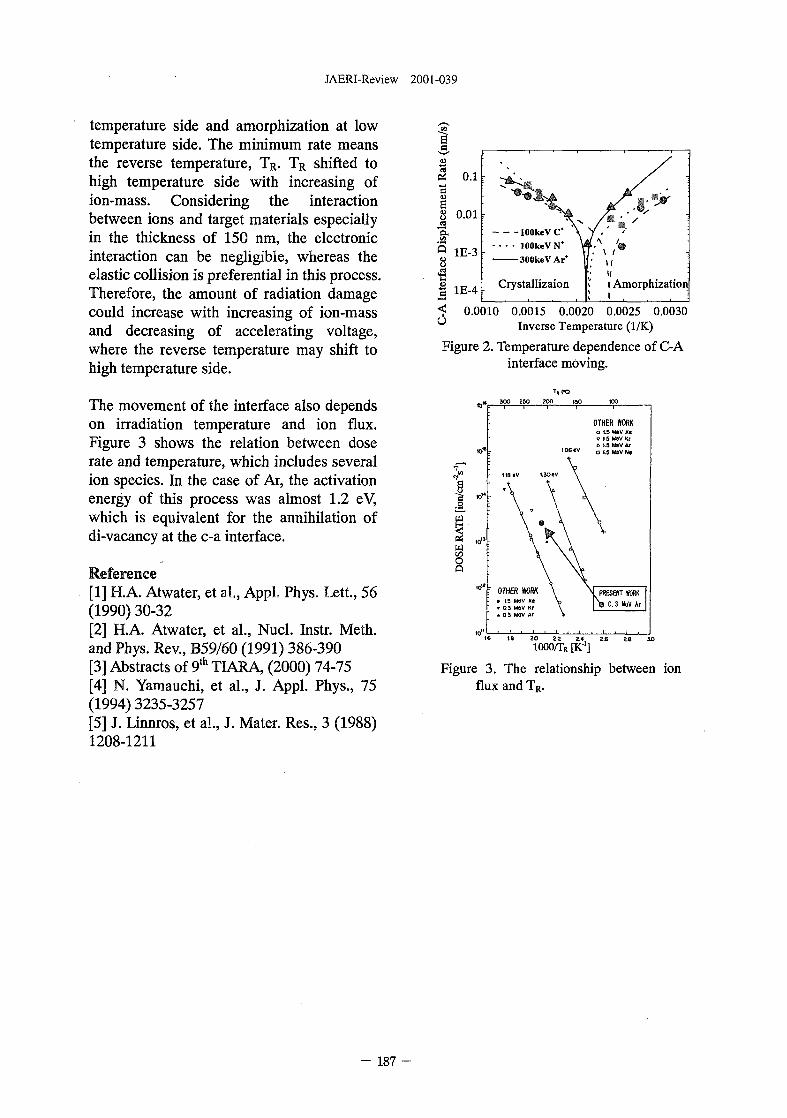
JAERI-Review 2001-039
temperature side and amorphization at lowtemperature side. The minimum rate meansthe reverse temperature, TR. TR shifted tohigh temperature side with increasing ofion-mass. Considering the interactionbetween ions and target materials especiallyin the thickness of 150 nm, the electronicinteraction can be negligible, whereas theelastic collision is preferential in this process.Therefore, the amount of radiation damagecould increase with increasing of ion-massand decreasing of accelerating voltage,where the reverse temperature may shift tohigh temperature side.
The movement of the interface also dependson irradiation temperature and ion flux.Figure 3 shows the relation between doserate and temperature, which includes severalion species. In the case of Ar, the activationenergy of this process was almost 1.2 eV,which is equivalent for the annihilation ofdi-vacancy at the c-a interface.
Reference[1] H.A. Atwater, et al., Appl. Phys. Lett., 56(1990)30-32[2] H.A. Atwater, et al., Nucl. Instr. Meth.and Phys. Rev., B59/60 (1991) 386-390[3] Abstracts of 9th TIARA, (2000) 74-75[4] N. Yamauchi, et al., J. Appl. Phys., 75(1994) 3235-3257[5] J. linnros, et al., J. Mater. Res., 3 (1988)1208-1211
sc
? 0.1cuS8 o.oi
.S3Q 1E-3
-Q;
lOOkeVC*
- - - - lOOkeV N*
300keVAr*
CrystallizaionI 1E"4
< 0.0010 0.0015 0.0020 0.0025 0.0030u Inverse Temperature (1/K)
Figure 2. Temperature dependence of C-Ainterface moving.
300 2SO 200
10"
§•
16 1.8 20 2.2 2.4 2.6 28 5O1 0 0 0 / T R [K"1]
Figure 3. The relationship between ionflux and TR.
- 187
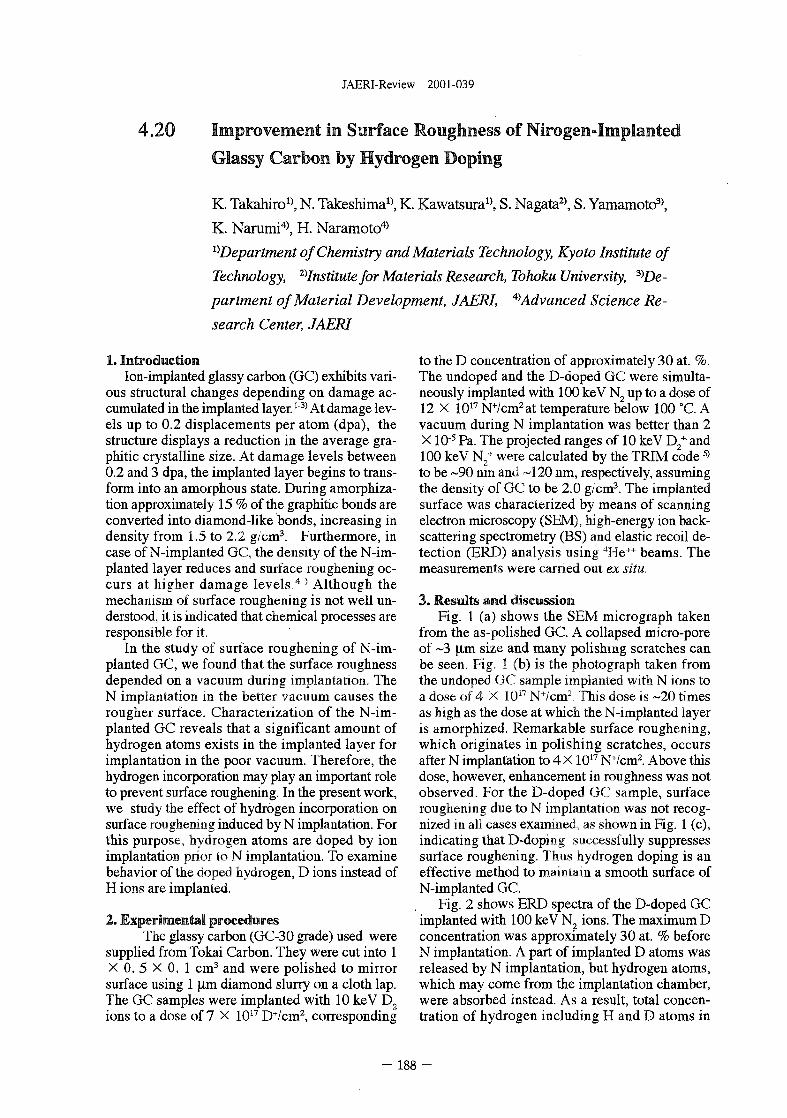
JAERI-Review 2001-039
4.20 Improvement in Surface Roughness of Nirogen-Implanted
Glassy Carbon by Hydrogen Doping
K. Takahiro1), N. Takeshima", K. Kawatsura1), S. Nagata2), S. Yamamoto3),
K. Narumi4), H. Naramoto4)
^Department of Chemistry and Materials Technology, Kyoto Institute of
Technology, ^Institute for Materials Research, Tohoku University, ^De-
partment of Material Development, JAERI, ^Advanced Science Re-
search Center, JAERI
1. IntroductionIon-implanted glassy carbon (GC) exhibits vari-
ous structural changes depending on damage ac-cumulated in the implanted layer.13> At damage lev-els up to 0.2 displacements per atom (dpa), thestructure displays a reduction in the average gra-phitic crystalline size. At damage levels between0.2 and 3 dpa, the implanted layer begins to trans-form into an amorphous state. During amorphiza-tion approximately 15 % of the graphitic bonds areconverted into diamond-like bonds, increasing indensity from 1.5 to 2.2 g/cm3. Furthermore, incase of N-implanted GC, the density of the N-im-planted layer reduces and surface roughening oc-curs at higher damage levels.4 ' Although themechanism of surface roughening is not well un-derstood, it is indicated that chemical processes areresponsible for it.
In the study of surface roughening of N-im-planted GC, we found that the surface roughnessdepended on a vacuum during implantation. TheN implantation in the better vacuum causes therougher surface. Characterization of the N-im-planted GC reveals that a significant amount ofhydrogen atoms exists in the implanted layer forimplantation in the poor vacuum. Therefore, thehydrogen incorporation may play an important roleto prevent surface roughening. In the present work,we study the effect of hydrogen incorporation onsurface roughening induced by N implantation. Forthis purpose, hydrogen atoms are doped by ionimplantation prior to N implantation. To examinebehavior of the doped hydrogen, D ions instead ofH ions are implanted.
2. Experimental proceduresThe glassy carbon (GC-30 grade) used were
supplied from Tokai Carbon. They were cut into 1X 0. 5 X 0. 1 cm3 and were polished to mirrorsurface using 1 |j,m diamond slurry on a cloth lap.The GC samples were implanted with 10 keV D2
ions to a dose of 7 X 10¹⁷ D+/cm2, corresponding
to the D concentration of approximately 30 at. %.The undoped and the D-doped GC were simulta-neously implanted with 100 keV N2 up to a dose of12 X 1017 N+/cm2at temperature below 100 °C. Avacuum during N implantation was better than 2X10'5 Pa. The projected ranges of 10 keV D2
+ and100 keV N2
+ were calculated by the TRIM code *>to be ~90 nm and ~120 nm, respectively, assumingthe density of GC to be 2.0 g/cm3. The implantedsurface was characterized by means of scanningelectron microscopy (SEM), high-energy ion back-scattering spectrometry (BS) and elastic recoil de-tection (ERD) analysis using 4He++ beams. Themeasurements were carried out ex situ,
3. Results and discussionFig. 1 (a) shows the SEM micrograph taken
from the as-polished GC. A collapsed micro-poreof ~3 n,m size and many polishing scratches canbe seen. Fig. 1 (b) is the photograph taken fromthe undoped GC sample implanted with N ions toa dose of 4 X 10¹⁷ N+/cm2. This dose is ~20 timesas high as the dose at which the N-implanted layeris amorphized. Remarkable surface roughening,which originates in polishing scratches, occursafter N implantation to 4 X 10¹⁷ N+/cm2. Above thisdose, however, enhancement in roughness was notobserved. For the D-doped GC sample, surfaceroughening due to N implantation was not recog-nized in all cases examined, as shown in Fig. 1 (c),indicating that D-doping successfully suppressessurface roughening. Thus hydrogen doping is aneffective method to maintain a smooth surface ofN-implanted GC.
Fig. 2 shows ERD spectra of the D-doped GCimplanted with 100 keV N2 ions. The maximum Dconcentration was approximately 30 at. % beforeN implantation. A part of implanted D atoms wasreleased by N implantation, but hydrogen atoms,which may come from the implantation chamber,were absorbed instead. As a result, total concen-tration of hydrogen including H and D atoms in
- 1 8 8 -
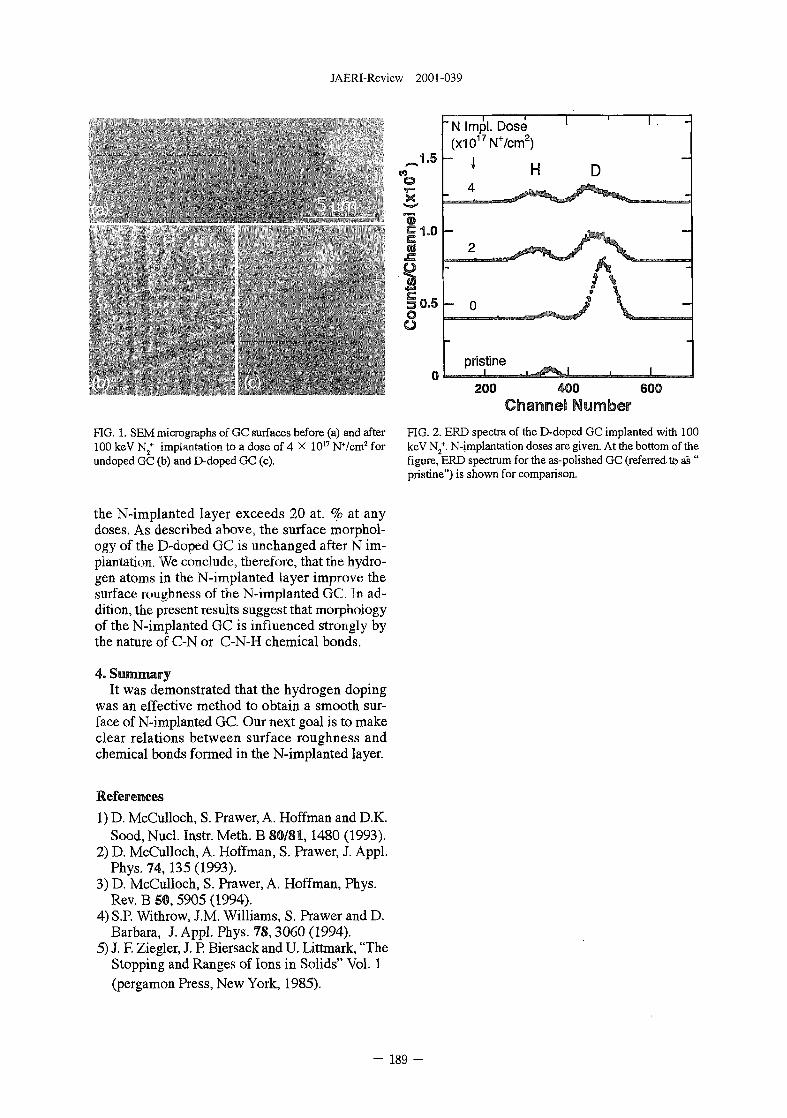
JAERI-Review 2001-039
FIG. 1. SEM micrographs of GC surfaces before (a) and after100 keV N2
+ implantation to a dose of 4 X 10¹⁷ N+/cm2 forundoped GC (b) and D-doped GC (c).
200 400 600Channel Number
FIG. 2. ERD spectra of the D-doped GC implanted with 100keV N2
+. N-implantation doses are given. At the bottom of thefigure, ERD spectrum for the as-polished GC (referred, to as "pristine") is shown for comparison.
the N-implanted layer exceeds 20 at. % at anydoses. As described above, the surface morphol-ogy of the D-doped GC is unchanged after N im-plantation. We conclude, therefore, that the hydro-gen atoms in the N-implanted layer improve thesurface roughness of the N-implanted GC. In ad-dition, the present results suggest that morphologyof the N-implanted GC is influenced strongly bythe nature of C-N or C-N-H chemical bonds.
4. SummaryIt was demonstrated that the hydrogen doping
was an effective method to obtain a smooth sur-face of N-implanted GC. Our next goal is to makeclear relations between surface roughness andchemical bonds formed in the N-implanted layer.
References
1) D. McCulloch, S. Prawer, A. Hoffman and D.K.Sood, Nucl. Instr. Meth. B 80/81,1480 (1993).
2) D. McCulloch, A. Hoffman, S. Prawer, J. Appl.Phys. 74, 135 (1993).
3) D. McCulloch, S. Prawer, A. Hoffman, Phys.Rev. B 50,5905 (1994).
4) S.P. Withrow, J.M. Williams, S. Prawer and D.Barbara, J. Appl. Phys. 78,3060 (1994).
5) J. F. Ziegler, J. P. Biersack and U. Littmark, "TheStopping and Ranges of Ions in Solids" Vol. 1(pergamon Press, New York, 1985).
- 189 -
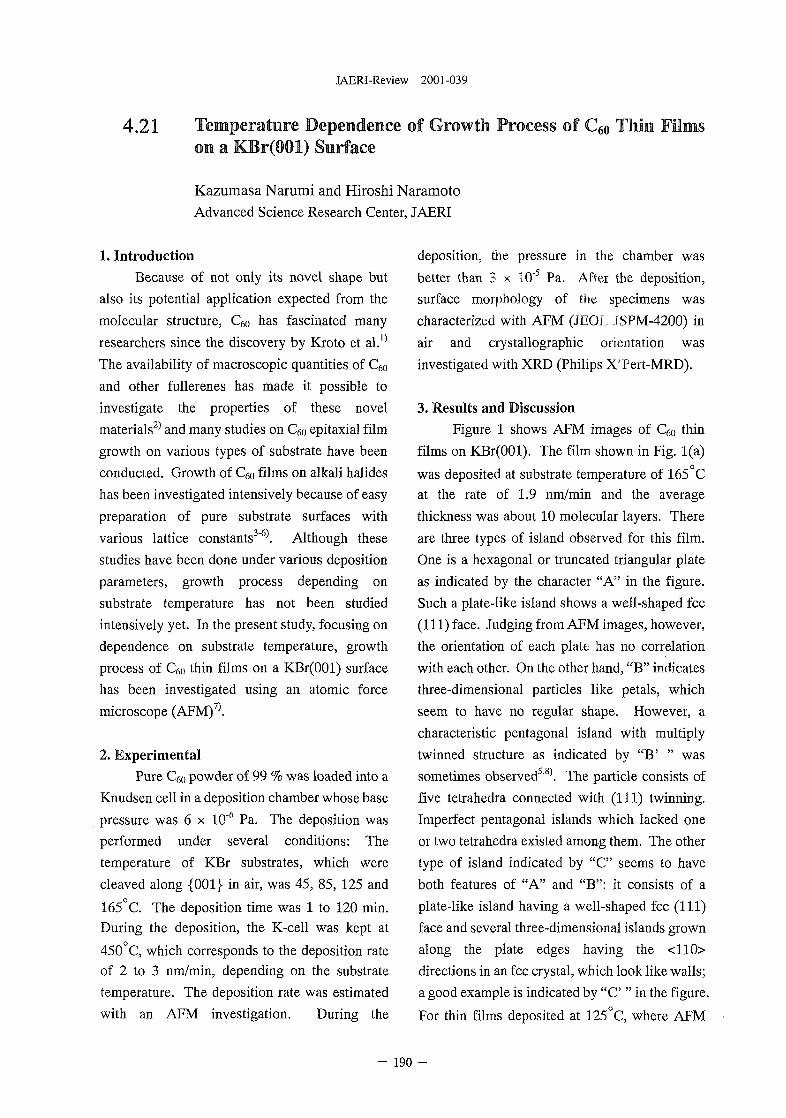
JAERI-Review 2001-039
4.21 Temperature Dependence of Growth Process of C60 Thin Filmson a KBr(OOl) Surface
Kazumasa Narumi and Hiroshi Naramoto
Advanced Science Research Center, JAERI
1. Introduction
Because of not only its novel shape but
also its potential application expected from the
molecular structure, C6() has fascinated many
researchers since the discovery by Kioto et al.1'
The availability of macroscopic quantities of C6()
and other fullerenes has made it possible to
investigate the properties of these novel
materials2^ and many studies on Cfio epitaxial film
growth on various types of substrate have been
conducted. Growth of Cm films on alkali halides
has been investigated intensively because of easy
preparation of pure substrate surfaces with
various lattice constants3"6). Although these
studies have been done under various deposition
parameters, growth process depending on
substrate temperature has not been studied
intensively yet. In the present study, focusing on
dependence on substrate temperature, growth
process of Q,o thin films on a KBr(OOl) surface
has been investigated using an atomic force
microscope (AFM)7).
2. Experimental
Pure Ceo powder of 99 % was loaded into a
Knudsen cell in a deposition chamber whose base
pressure was 6 x 10"6 Pa. The deposition was
performed under several conditions: The
temperature of KBr substrates, which were
cleaved along {001} in air, was 45, 85, 125 and
165 C. The deposition time was 1 to 120 min.During the deposition, the K-cell was kept at
450°C, which corresponds to the deposition rate
of 2 to 3 nm/min, depending on the substrate
temperature. The deposition rate was estimated
with an AFM investigation. During the
deposition, the pressure in the chamber was
better than 3 x 10"5 Pa. After the deposition,
surface morphology of the specimens was
characterized with AFM (JEOL JSPM-4200) in
air and crystallographic orientation was
investigated with XRD (Philips X'Pert-MRD).
3. Results and Discussion
Figure 1 shows AFM images of C60 thin
films on KBr(OOl). The film shown in Fig. l(a)
was deposited at substrate temperature of 165 C
at the rate of 1.9 nm/min and the average
thickness was about 10 molecular layers. There
are three types of island observed for this film.
One is a hexagonal or truncated triangular plate
as indicated by the character "A" in the figure.
Such a plate-like island shows a well-shaped fee
(111) face. Judging from AFM images, however,
the orientation of each plate has no correlation
with each other. On the other hand, "B" indicates
three-dimensional particles like petals, which
seem to have no regular shape. However, a
characteristic pentagonal island with multiply
twinned structure as indicated by "B' " was
sometimes observed5'8). The particle consists of
five tetrahedra connected with (111) twinning.
Imperfect pentagonal islands which lacked one
or two tetrahedra existed among them. The other
type of island indicated by "C" seems to have
both features of "A" and "B": it consists of a
plate-like island having a well-shaped fee (111)
face and several three-dimensional islands grown
along the plate edges having the <110>
directions in an fee crystal, which look like walls;
a good example is indicated by " C " in the figure.
For thin films deposited at 125°C, where AFM
- 190 -
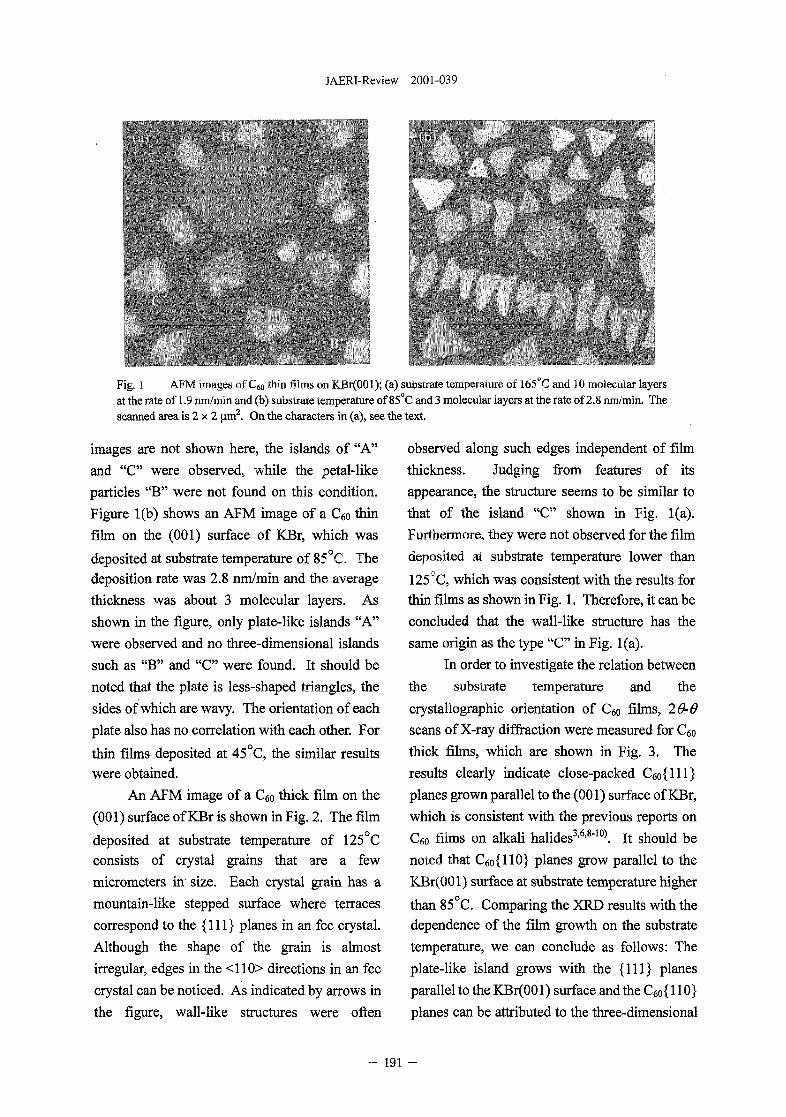
JAERI-Review 2001-039
Fig. 1 AFM images of C60 thin films on KBr(001); (a) substrate temperature of 165°C and 10 molecular layersat the rate of 1.9 nm/min and (b) substrate temperature of 85°C and 3 molecular layers at the rate of 2.8 nm/min. Thescanned area is 2 x 2 urn2. On the characters in (a), see the text.
images are not shown here, the islands of "A"
and "C" were observed, while the petal-like
particles "B" were not found on this condition.
Figure l(b) shows an AFM image of a Ceo thin
film on the (001) surface of KBr, which was
deposited at substrate temperature of 85°C. The
deposition rate was 2.8 nm/min and the average
thickness was about 3 molecular layers. As
shown in the figure, only plate-like islands "A"
were observed and no three-dimensional islands
such as "B" and "C" were found. It should be
noted that the plate is less-shaped triangles, the
sides of which are wavy. The orientation of each
plate also has no correlation with each other. For
thin films deposited at 45°C, the similar results
were obtained.
An AFM image of a Cgo thick film on the
(001) surface of KBr is shown in Fig. 2. The film
deposited at substrate temperature of 125°C
consists of crystal grains that are a few
micrometers irr size. Each crystal grain has a
mountain-like stepped surface where terraces
correspond to the {111} planes in an fee crystal.
Although the shape of the grain is almost
irregular, edges in the <110> directions in an fee
crystal can be noticed. As indicated by arrows in
the figure, wall-like structures were often
observed along such edges independent of film
thickness. Judging from features of its
appearance, the structure seems to be similar to
that of the island "C" shown in Fig. l(a).
Furthermore, they were not observed for the film
deposited at substrate temperature lower than
125°C, which was consistent with the results for
thin films as shown in Fig. 1. Therefore, it can be
concluded that the wall-like structure has the
same origin as the type "C" in Fig. l(a).
In order to investigate the relation between
the substrate temperature and the
crystallographic orientation of C6o films, 29-6
scans of X-ray diffraction were measured for Ceo
thick films, which are shown in Fig. 3. The
results clearly indicate close-packed QoOl l}
planes grown parallel to the (001) surface of KBr,
which is consistent with the previous reports on
C60 films on alkali halides3AiM0). It should be
noted that C6o{HO} planes grow parallel to the
KBr(OOl) surface at substrate temperature higher
than 85°C. Comparing the XRD results with the
dependence of the film growth on the substrate
temperature, we can conclude as follows: The
plate-like island grows with the {111} planes
parallel to the KBr(OOl) surface andtheC60{110}
planes can be attributed to the three-dimensional
- 191 -
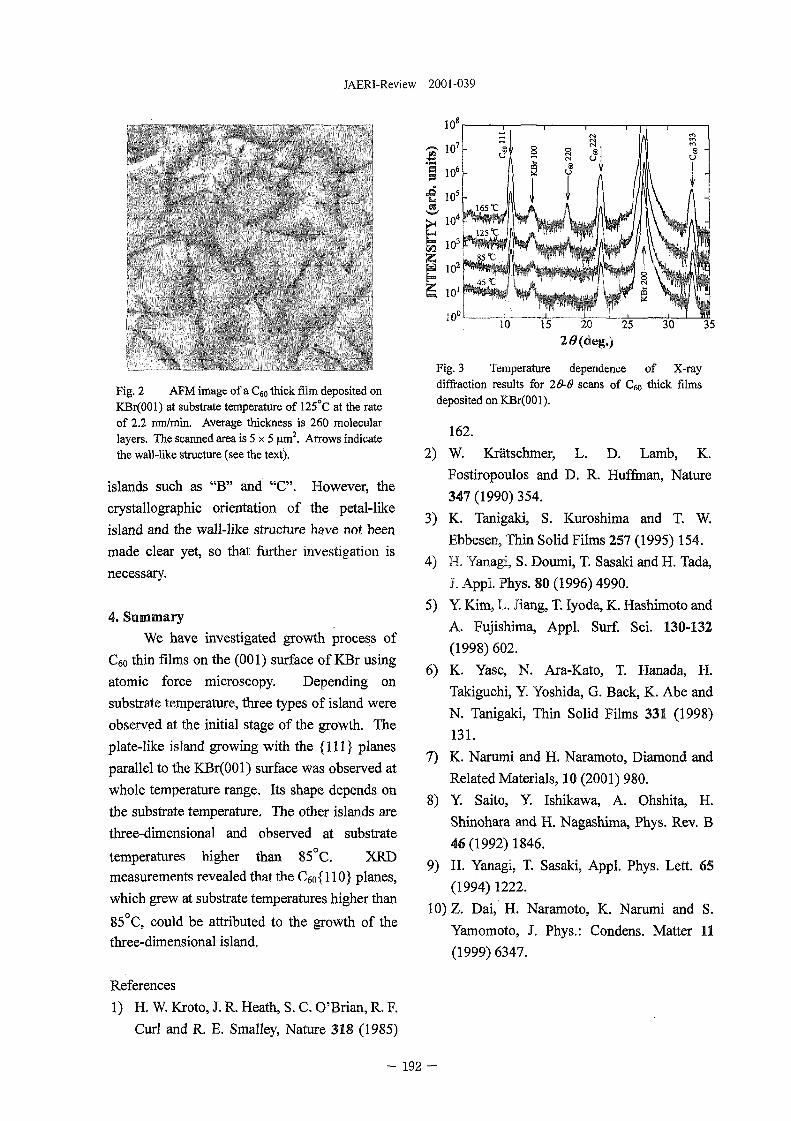
JAERI-Review 2001-039
10"
Fig. 2 AFM image of a Qo thick film deposited onKBr(OOl) at substrate temperature of 125°C at the rateof 2.2 nm/min. Average thickness is 260 molecularlayers. The scanned area is 5 x 5 urn2. Arrows indicatethe wall-like structure (see the text).
islands such as "B" and "C". However, the
crystallographic orientation of the petal-like
island and the wall-like structure have not been
made clear yet, so that further investigation is
necessary.
4. Summary
We have investigated growth process of
Ceo thin films on the (001) surface of KBr using
atomic force microscopy. Depending on
substrate temperature, three types of island were
observed at the initial stage of the growth. The
plate-like island growing with the {111} planes
parallel to the KBr(OOl) surface was observed at
whole temperature range. Its shape depends on
the substrate temperature. The other islands are
three-dimensional and observed at substrate
temperatures higher than 85°C. XRD
measurements revealed that the C6o{llO} planes,
which grew at substrate temperatures higher than
85°C, could be attributed to the growth of thethree-dimensional island.
References
1) H. W. Kroto, J. R. Heath, S. C. O'Brian, R. F.
Curl and R. E. Smalley, Nature 318 (1985)
,165tI J
45 tMS* \J\.V^i-M
10 15 2C 25 30 35
-S io5h
l(f
1C
1(
10
10°
Fig. 3 Temperature dependence of X-raydiffraction results for 29-0 scans of C^ thick filmsdeposited on KBr(OOl).
162.
2) W. Kratschmer, L. D. Lamb, K.
Fostiropoulos and D. R. Huffman, Nature
347 (1990)354.
3) K. Tanigaki, S. Kuroshima and T. W.
Ebbesen, Thin Solid Films 257 (1995) 154.
4) H. Yanagi, S. Doumi, T. Sasaki and H. Tada,
J. Appl. Phys. 80 (1996) 4990.
5) Y. Kim, L. Jiang, T. Iyoda, K. Hashimoto and
A. Fujishima, Appl. Surf. Sci. 130-132
(1998) 602.
6) K. Yase, N. Ara-Kato, T. Hanada, H.
Takiguchi, Y. Yoshida, G. Back, K. Abe and
N. Tanigaki, Thin Solid Films 331 (1998)
131.
7) K. Narumi and H. Naramoto, Diamond and
Related Materials, 10 (2001) 980.
8) Y. Saito, Y. Ishikawa, A. Ohshita, H.
Shinohara and H. Nagashima, Phys. Rev. B
46 (1992)1846.
9) H. Yanagi, T. Sasaki, Appl. Phys. Lett. 65
(1994)1222.
10) Z. Dai, H. Naramoto, K. Narumi and S.
Yamomoto, J. Phys.: Condens. Matter 11
(1999) 6347.
- 192 -
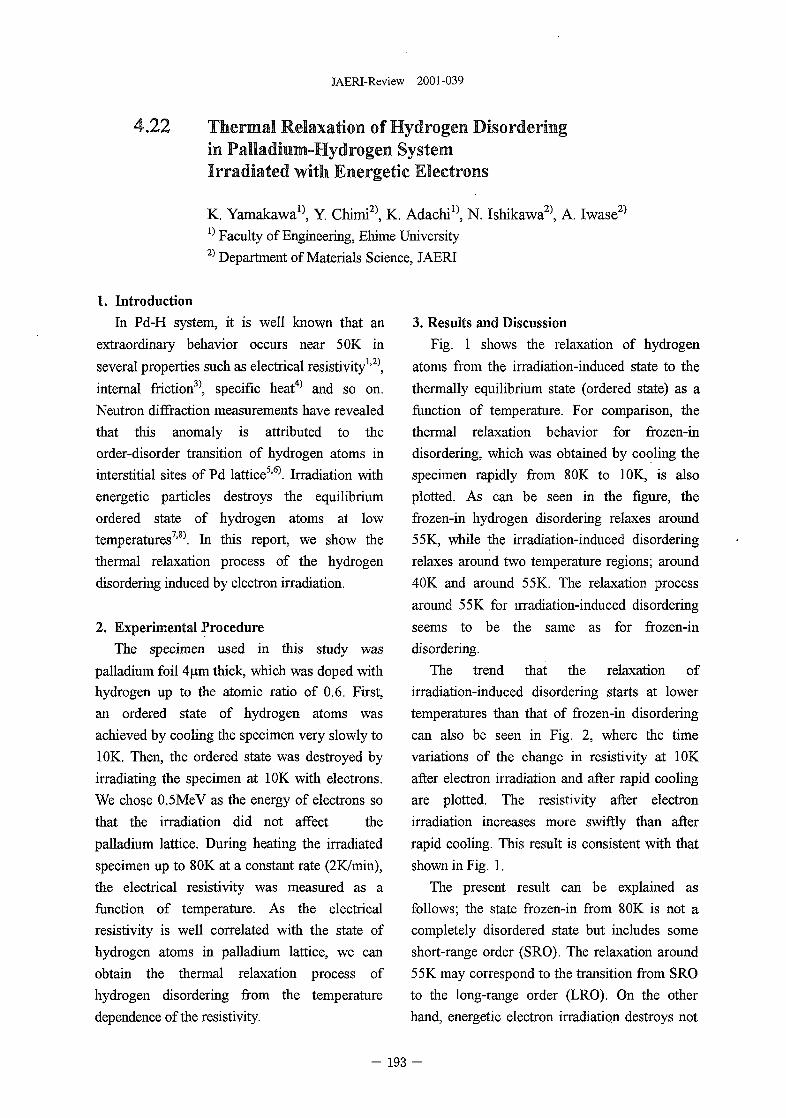
JAERI-Review 2001-039
4.22 Thermal Relaxation of Hydrogen Disorderingin Palladium-Hydrogen SystemIrradiated with Energetic Electrons
K. Yamakawa1}, Y. Chimi2), K. Adachi1^ N. Ishikawa2), A. Iwase2)
'-1 Faculty of Engineering, Ehime University2) Department of Materials Science, JAERI
1. Introduction
In Pd-H system, it is well known that an
extraordinary behavior occurs near 5 OK in
several properties such as electrical resistivity1'25,
internal friction3-1, specific heat4) and so on.
Neutron diffraction measurements have revealed
that this anomaly is attributed to the
order-disorder transition of hydrogen atoms in
interstitial sites of Pd lattice5'6-1. Irradiation with
energetic particles destroys the equilibrium
ordered state of hydrogen atoms at low
temperatures7'85. In this report, we show the
thermal relaxation process of the hydrogen
disordering induced by electron irradiation.
2. Experimental Procedure
The specimen used in this study was
palladium foil 4um thick, which was doped with
hydrogen up to the atomic ratio of 0.6. First,
an ordered state of hydrogen atoms was
achieved by cooling the specimen very slowly to
10K. Then, the ordered state was destroyed by
irradiating the specimen at 10K with electrons.
We chose 0.5MeV as the energy of electrons so
that the irradiation did not affect the
palladium lattice. During heating the irradiated
specimen up to 80K at a constant rate (2K/min),
the electrical resistivity was measured as a
function of temperature. As the electrical
resistivity is well correlated with the state of
hydrogen atoms in palladium lattice, we can
obtain the thermal relaxation process of
hydrogen disordering from the temperature
dependence of the resistivity.
3. Results and Discussion
Fig. 1 shows the relaxation of hydrogen
atoms from the irradiation-induced state to the
thermally equilibrium state (ordered state) as a
function of temperature. For comparison, the
thermal relaxation behavior for frozen-in
disordering, which was obtained by cooling the
specimen rapidly from 80K to 10K, is also
plotted. As can be seen in the figure, the
frozen-in hydrogen disordering relaxes around
55K, while the irradiation-induced disordering
relaxes around two temperature regions; around
40K and around 55K. The relaxation process
around 55K for irradiation-induced disordering
seems to be the same as for frozen-in
disordering.
The trend that the relaxation of
irradiation-induced disordering starts at lower
temperatures than that of frozen-in disordering
can also be seen in Fig. 2, where the time
variations of the change in resistivity at 10K
after electron irradiation and after rapid cooling
are plotted. The resistivity after electron
irradiation increases more swiftly than after
rapid cooling. This result is consistent with that
shown in Fig. 1.
The present result can be explained as
follows; the state frozen-in from 80K is not a
completely disordered state but includes some
short-range order (SRO). The relaxation around
55K may correspond to the transition from SRO
to the long-range order (LRO). On the other
hand, energetic electron irradiation destroys not
- 193 -
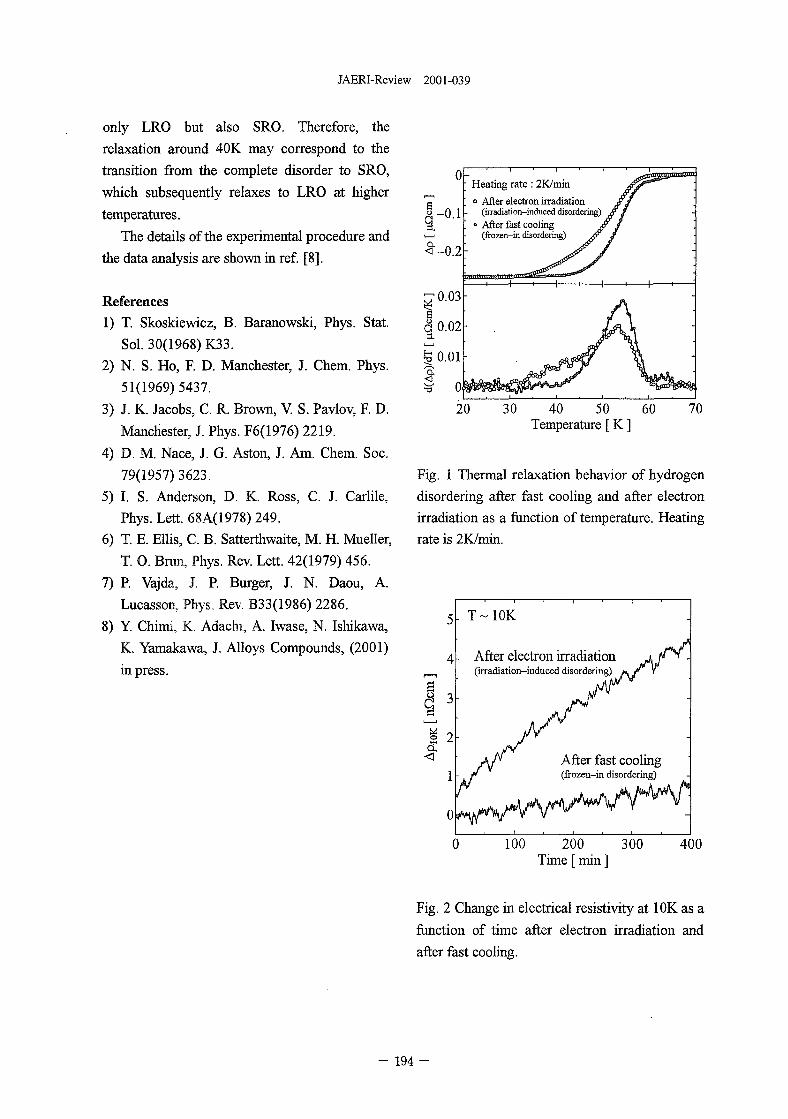
JAERI-Review 2001-039
only LRO but also SRO. Therefore, the
relaxation around 40K may correspond to the
transition from the complete disorder to SRO,
which subsequently relaxes to LRO at higher
temperatures.
The details of the experimental procedure and
the data analysis are shown in ref. [8].
References
1) T. Skoskiewicz, B. Baranowski, Phys. Stat.
Sol. 30(1968) K33.
2) N. S. Ho, F. D. Manchester, J. Chem. Phys.
51(1969)5437.
3) J. K. Jacobs, C. R. Brown, V. S. Pavlov, F. D.
Manchester, J. Phys. F6(1976) 2219.
4) D. M. Nace, J. G. Aston, J. Am. Chem. Soc.
79(1957)3623.
5) I. S. Anderson, D. K. Ross, C. J. Carlile,
Phys. Lett. 68A(1978) 249.
6) T. E. Ellis, C. B. Satterthwaite, M. H. Mueller,
T. 0. Brun, Phys. Rev. Lett. 42(1979) 456.
7) P. Vajda, J. P. Burger, J. N. Daou, A.
Lucasson, Phys. Rev. B33(1986) 2286.
8) Y. Chimi, K. Adacbi, A. Iwase, N. Ishikawa,
K. Yamakawa, J. Alloys Compounds, (2001)
in press.
3 -0 1
<-0.2
[7 0.03
a 0.02
Heating rate : 2K/min
° After electron iiradiation(irradiation-induced disordering)
• After fast cooling(frozen-in disordering)
20 30 40 50 60Temperature [ K ]
Fig. 1 Thermal relaxation behavior of hydrogen
disordering after fast cooling and after electron
irradiation as a function of temperature. Heating
rate is 2K/min.
T-10K
After electron irradiation(irradiation-induced disordering)
After fast cooling(frozen-in disordering)
100 200 300Time [ min ]
400
Fig. 2 Change in electrical resistivity at 1 OK as a
function of time after electron irradiation and
after fast cooling.
- 1 9 4 -
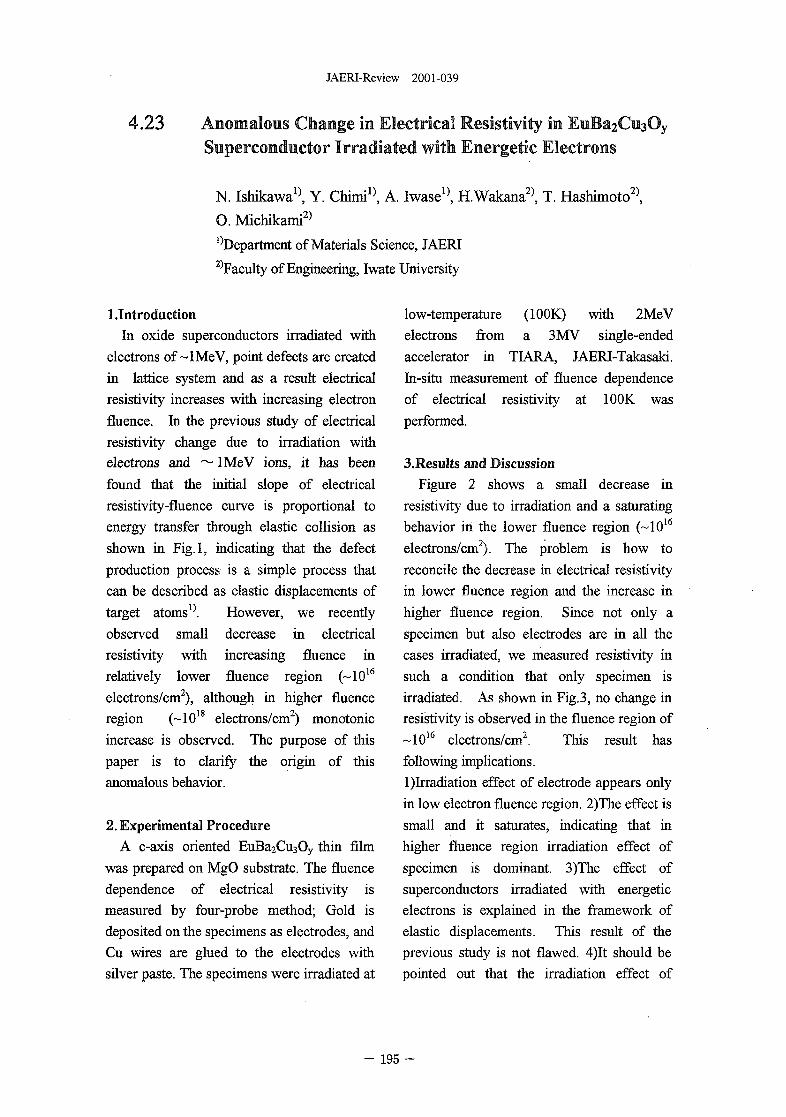
JAERI-Review 2001-039
4.23 Anomalous Change in Electrical Resistivity in EuBa2C«3QySuperconductor Irradiated with Energetic Electrons
N. Ishikawa1^ Y. Chimi^, A. Iwase1}, H.Wakana2), T. Hashimoto2),
O. Michikami2)
^Department of Materials Science, JAERI2)Faculty of Engineering, Iwate University
l.Introduction
In oxide superconductors irradiated with
electrons of ~lMeV, point defects are created
in lattice system and as a result electrical
resistivity increases with increasing electron
fluence. In the previous study of electrical
resistivity change due to irradiation with
electrons and ~ lMeV ions, it has been
found that the initial slope of electrical
resistivity-fluence curve is proportional to
energy transfer through elastic collision as
shown in Fig.l, indicating that the defect
production process is a simple process that
can be described as elastic displacements of
target atoms15. However, we recently
observed small decrease in electrical
resistivity with increasing fluence in
relatively lower fluence region (~1016
electrons/cm2), although in higher fluence
region (~1018 electrons/cm2) monotonic
increase is observed. The purpose of this
paper is to clarify the origin of this
anomalous behavior.
2. Experimental Procedure
A c-axis oriented EuBa2CusOy thin film
was prepared on MgO substrate. The fluence
dependence of electrical resistivity is
measured by four-probe method; Gold is
deposited on the specimens as electrodes, and
Cu wires are glued to the electrodes with
silver paste. The specimens were irradiated at
low-temperature (100K) with 2MeV
electrons from a 3MV single-ended
accelerator in TIARA, JAERI-Takasaki.
In-situ measurement of fluence dependence
of electrical resistivity at 100K was
performed.
3.Resu!ts and Discussion
Figure 2 shows a small decrease in
resistivity due to irradiation and a saturating
behavior in the lower fluence region (~1016
electrons/cm2). The problem is how to
reconcile the decrease in electrical resistivity
in lower fluence region and the increase in
higher fluence region. Since not only a
specimen but also electrodes are in all the
cases irradiated, we measured resistivity in
such a condition that only specimen is
irradiated. As shown in Fig.3, no change in
resistivity is observed in the fluence region of
~1016 electrons/cm2. This result has
following implications.
l)Irradiation effect of electrode appears only
in low electron fluence region. 2)The effect is
small and it saturates, indicating that in
higher fluence region irradiation effect of
specimen is dominant. 3)The effect of
superconductors irradiated with energetic
electrons is explained in the framework of
elastic displacements. This result of the
previous study is not flawed. 4)It should be
pointed out that the irradiation effect of
- 195 -
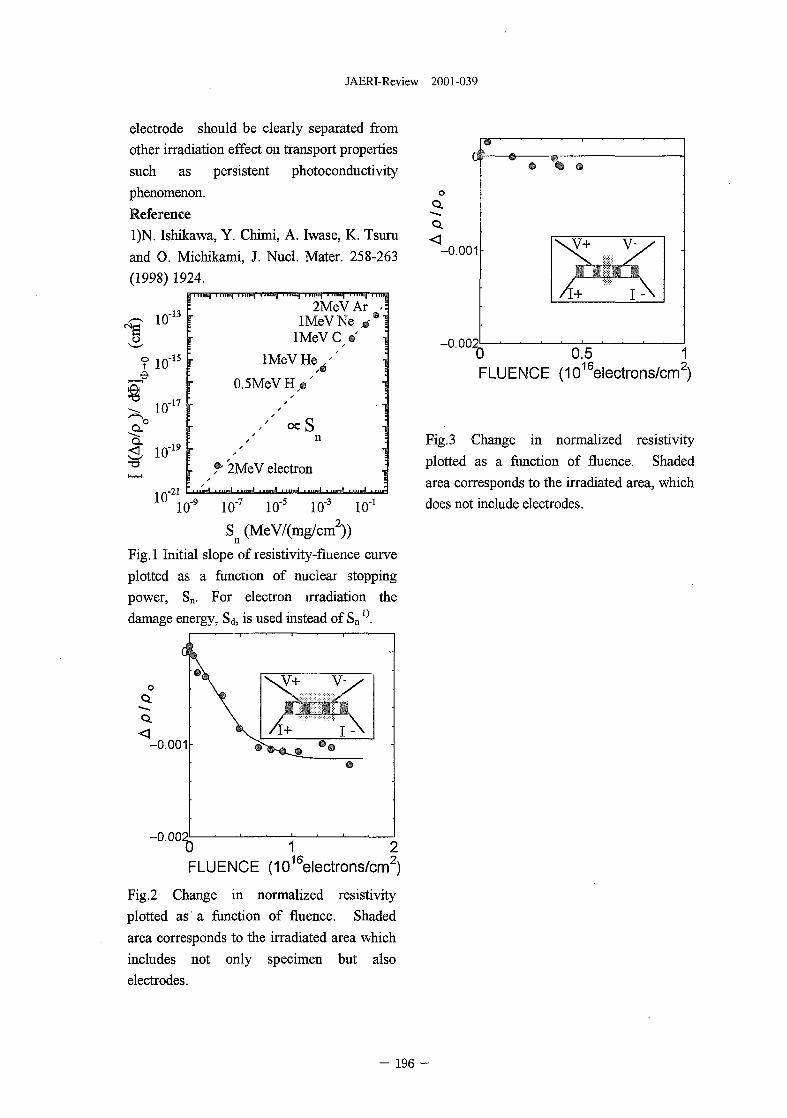
JAERI-Review 2001-039
electrode should be clearly separated from
other irradiation effect on transport properties
such as persistent photoconductivity
phenomenon.
Reference
1)N. Ishikawa, Y. Chimi, A. Iwase, K. Tsuru
and 0. Michikami, J. Nucl. Mater. 258-263
(1998) 1924.
10',-13
Tiffe
,-15
io-175I: io- 1 9
2MeVArlMeVNe *
lMeV C •'
, «-21 Lj
lMeV HeA
0.5MeVHV•
/ ocSn
2MeV electron 1,.„) . . .„•
10"9 10'7 10'5 10"3 1O"1
S (MeV/(mg/cm2))
Fig. 1 Initial slope of resistivity-fluence curve
plotted as a function of nuclear stopping
power, Sn. For electron irradiation the
damage energy, Sd, is used instead of Sn!).
oQ.
-0.001
-0.00:
FLUENCE (1016electrons/cm2)
Fig.2 Change in normalized resistivity
plotted as a function of fluence. Shaded
area corresponds to the irradiated area which
includes not only specimen but also
electrodes.
oQ.
-0 .001 •
-0.00:
•
/ I+
r i i-
D 0.5 1FLUENCE (1016electrons/cm2)
Fig.3 Change in normalized resistivity
plotted as a function of fluence. Shaded
area corresponds to the irradiated area, which
does not include electrodes.
- 196 -
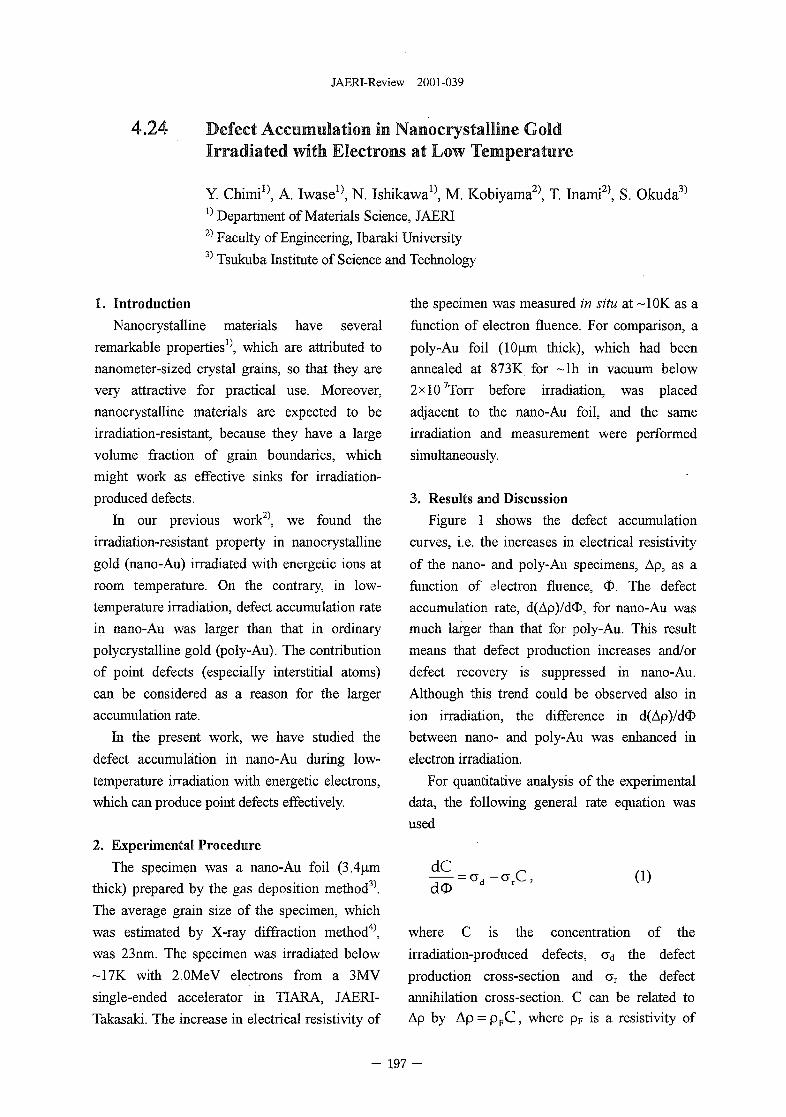
JAERI-Review 2001-039
4.24 Defect Accumulation in Nanocrystalline GoldIrradiated with Electrons at Low Temperature
Y. Chimi1}, A. Iwase1^ N. Ishikawa1}, M. Kobiyama2), T. Inami2), S. Okuda3)
1) Depar tment o f Mater ia ls Science, J A E R I2) Facul ty of Engineering, Ibaraki University3) Tsukuba Institute of Science and Technology
1. Introduction
Nanocrystalline materials have several
remarkable properties1-1, which are attributed to
nanometer-sized crystal grains, so that they are
very attractive for practical use. Moreover,
nanocrystalline materials are expected to be
irradiation-resistant, because they have a large
volume fraction of grain boundaries, which
might work as effective sinks for irradiation-
produced defects.
In our previous work2), we found the
irradiation-resistant property in nanocrystalline
gold (nano-Au) irradiated with energetic ions at
room temperature. On the contrary, in low-
temperature irradiation, defect accumulation rate
in nano-Au was larger than that in ordinary
polycrystalline gold (poly-Au). The contribution
of point defects (especially interstitial atoms)
can be considered as a reason for the larger
accumulation rate.
In the present work, we have studied the
defect accumulation in nano-Au during low-
temperature irradiation with energetic electrons,
which can produce point defects effectively.
2. Experimental Procedure
The specimen was a nano-Au foil (3.4u.m
thick) prepared by the gas deposition method3-1.
The average grain size of the specimen, which
was estimated by X-ray diffraction method4),
was 23nm. The specimen was irradiated below
~17K with 2.0MeV electrons from a 3MV
single-ended accelerator in TIARA, JAERI-
Takasaki. The increase in electrical resistivity of
the specimen was measured in situ at ~10K as a
function of electron fluence. For comparison, a
poly-Au foil (lOum thick), which had been
annealed at 873K for ~lh in vacuum below
2><10"7Torr before irradiation, was placed
adjacent to the nano-Au foil, and the same
irradiation and measurement were performed
simultaneously.
3. Results and Discussion
Figure 1 shows the defect accumulation
curves, i.e. the increases in electrical resistivity
of the nano- and poly-Au specimens, Ap, as a
function of electron fluence, O. The defect
accumulation rate, d(Ap)/d<D, for nano-Au was
much larger than that for poly-Au. This result
means that defect production increases and/or
defect recovery is suppressed in nano-Au.
Although this trend could be observed also in
ion irradiation, the difference in d(Ap)/dd>
between nano- and poly-Au was enhanced in
electron irradiation.
For quantitative analysis of the experimental
data, the following general rate equation was
used
dCd<D
= ad-CTrC, (1)
where C is the concentration of the
irradiation-produced defects, ad the defect
production cross-section and ar the defect
annihilation cross-section. C can be related to
Ap by Ap = p F C, where pF is a resistivity of
- 197 -
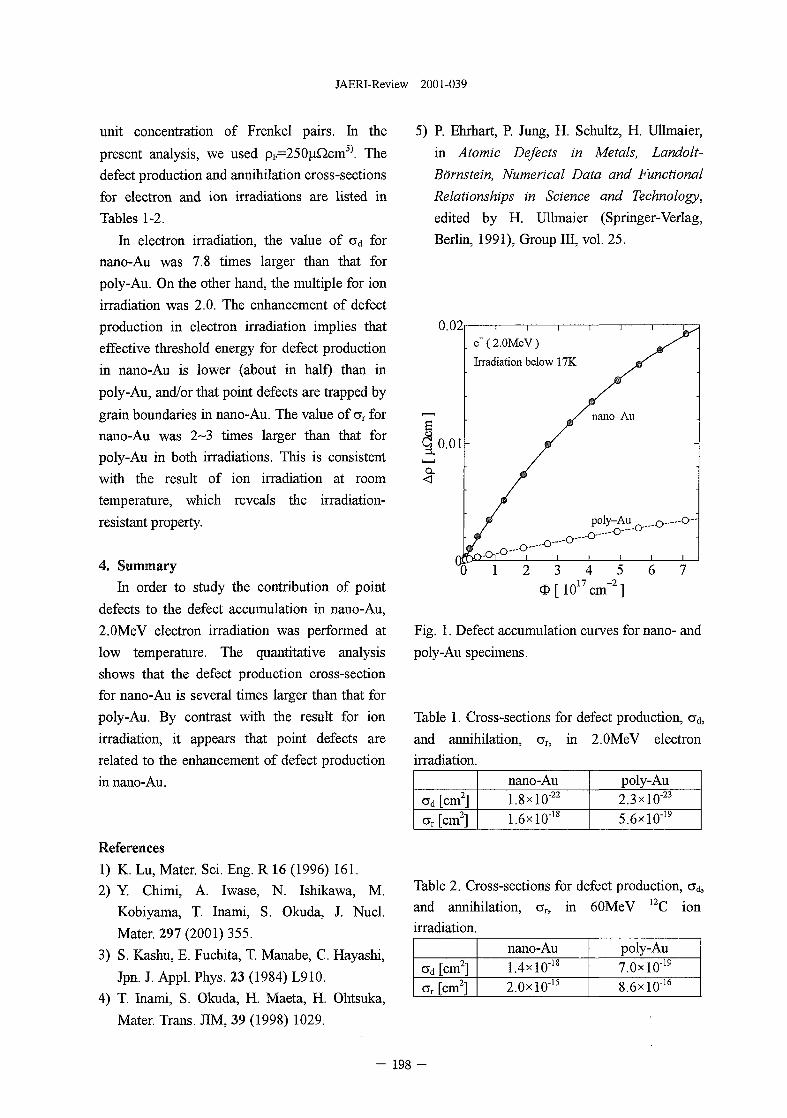
JAERI-Review 2001-039
unit concentration of Frenkel pairs. In the
present analysis, we used pF=250^Ocm5:i. The
defect production and annihilation cross-sections
for electron and ion irradiations are listed in
Tables 1-2.
In electron irradiation, the value of ad for
nano-Au was 7.8 times larger than that for
poly-Au. On the other hand, the multiple for ion
irradiation was 2.0. The enhancement of defect
production in electron irradiation implies that
effective threshold energy for defect production
in nano-Au is lower (about in half) than in
poly-Au, and/or that point defects are trapped by
grain boundaries in nano-Au. The value of ar for
nano-Au was 2-3 times larger than that for
poly-Au in both irradiations. This is consistent
with the result of ion irradiation at room
temperature, which reveals the irradiation-
resistant property.
4. Summary
In order to study the contribution of point
defects to the defect accumulation in nano-Au,
2.0MeV electron irradiation was performed at
low temperature. The quantitative analysis
shows that the defect production cross-section
for nano-Au is several times larger than that for
poly-Au. By contrast with the result for ion
irradiation, it appears that point defects are
related to the enhancement of defect production
in nano-Au.
References
1) K. Lu, Mater. Sci. Eng. R 16 (1996) 161.
2) Y. Chimi, A. Iwase, N. Ishikawa, M.
Kobiyama, T. Inami, S. Okuda, J. Nucl.
Mater. 297 (2001) 355.
3) S. Kashu, E. Fuchita, T. Manabe, C. Hayashi,
Jpn. J. Appl. Phys. 23 (1984) L910.
4) T. Inami, S. Okuda, H. Maeta, H. Ohtsuka,
Mater. Trans. JIM, 39 (1998) 1029.
5) P. Ehrhart, P. Jung, H. Schultz, H. Ullmaier,
in Atomic Defects in Metals, Landolt-
Bornstein, Numerical Data and Functional
Relationships in Science and Technology,
edited by H. Ullmaier (Springer-Verlag,
Berlin, 1991), Group III, vol. 25.
0.02
0.01
e (2.0MeV)
Irradiation below 17K
poly-Au O . . - O -,—-O-
O>[1017cm~2]
Fig. 1. Defect accumulation curves for nano- and
poly-Au specimens.
Table 1. Cross-sections for defect production, ad,
and annihilation, CTr, in 2.0MeV electron
irradiation.
ad [cm2]
a r [cm2]
nano-Au
1.8xlO"22
1.6xlO"18
poly-Au
2.3 xlO"23
5.6xlO"19
Table 2. Cross-sections for defect production, ad,
and annihilation, ar, in 60MeV 12C ion
irradiation.
ad [cm2]
<7r [cm2]
nano-Au
1.4xlO"ls
2.0xl0"15
poly-Au
7.0xl0"19
8.6xlO"16
- 198 -
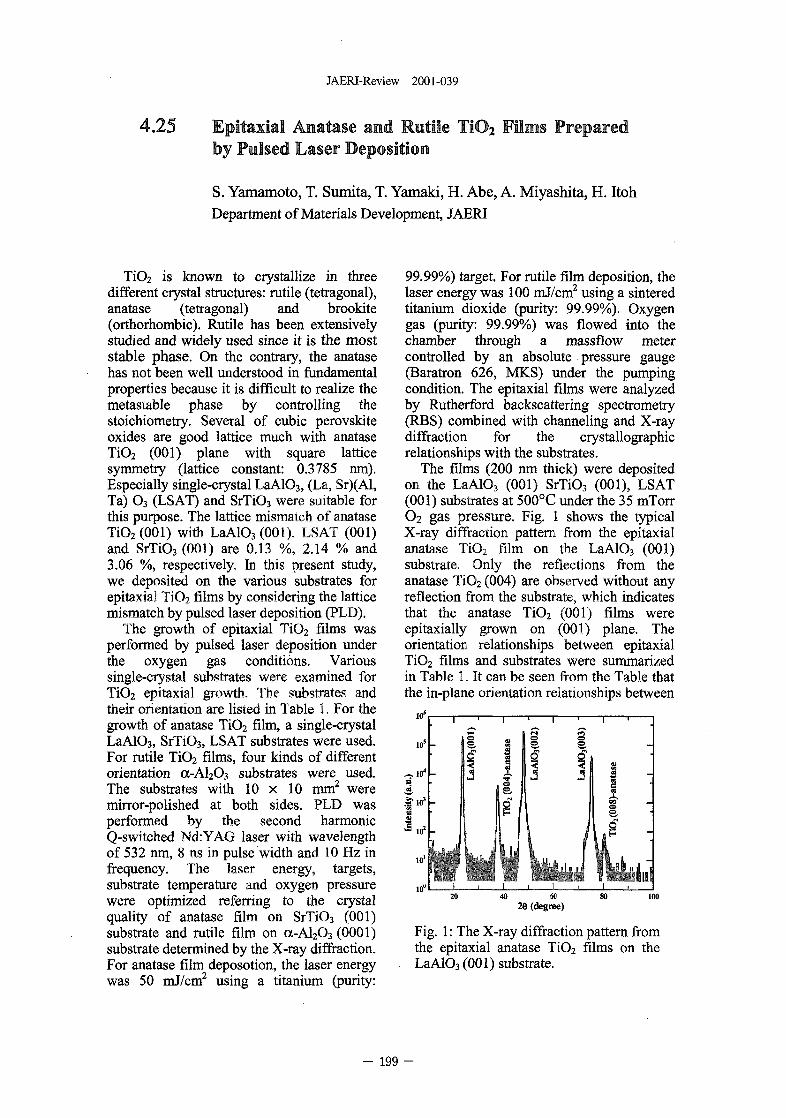
JAERI-Review 2001-039
4.25 Epitaxial Amatase and Rutile TiO2 Films Preparedby Pulsed Laser Deposition
S. Yamamoto, T. Sumita, T. Yamaki, H. Abe, A. Miyashita, H. Itoh
Department of Materials Development, JAERI
TiO2 is known to crystallize in threedifferent crystal structures: rutile (tetragonal),anatase (tetragonal) and brookite(orthorhombic). Rutile has been extensivelystudied and widely used since it is the moststable phase. On the contrary, the anatasehas not been well understood in fundamentalproperties because it is difficult to realize themetastable phase by controlling thestoichiometry. Several of cubic perovskiteoxides are good lattice much with anataseTiO2 (001) plane with square latticesymmetry (lattice constant: 0.3785 nm).Especially single-crystal LaA103, (La, Sr)(Al,Ta) O3 (LSAT) and SrTiO3 were suitable forthis purpose. The lattice mismatch of anataseTiO2 (001) with LaAlO3 (001), LSAT (001)and SrTiO3 (001) are 0.13 %, 2.14 % and3.06 %, respectively. In this present study,we deposited on the various substrates forepitaxial TiO2 films by considering the latticemismatch by pulsed laser deposition (PLD).
The growth of epitaxial TiO2 films wasperformed by pulsed laser deposition underthe oxygen gas conditions. Varioussingle-crystal substrates were examined forTiO2 epitaxial growth. The substrates andtheir orientation are listed in Table 1. For thegrowth of anatase TiO2 film, a single-crystalLaAlO3, SrTiO3, LSAT substrates were used.For rutile TiO2 films, four kinds of differentorientation a-Al2O3 substrates were used.The substrates with 10 x 10 mm2 weremirror-polished at both sides. PLD wasperformed by the second harmonicQ-switched Nd:YAG laser with wavelengthof 532 nm, 8 ns in pulse width and 10 Hz infrequency. The laser energy, targets,substrate temperature and oxygen pressurewere optimized referring to the crystalquality of anatase film on SrTiO3 (001)substrate and rutile film on a-Al2O3 (0001)substrate determined by the X-ray diffraction.For anatase film deposotion, the laser energywas 50 mJ/cm2 using a titanium (purity:
99.99%) target. For rutile film deposition, thelaser energy was 100 mJ/cm2 using a sinteredtitanium dioxide (purity: 99.99%). Oxygengas (purity: 99.99%) was flowed into thechamber through a massflow metercontrolled by an absolute pressure gauge(Baratron 626, MKS) under the pumpingcondition. The epitaxial films were analyzedby Rutherford backscattering spectrometry(RBS) combined with channeling and X-raydiffraction for the crystallographicrelationships with the substrates.
The films (200 nm thick) were depositedon the LaA103 (001) SrTiO3 (001), LSAT(001) substrates at 500°C under the 35 mTorrO2 gas pressure. Fig. 1 shows the typicalX-ray diffraction pattern from the epitaxialanatase TiO2 film on the LaAlO3 (001)substrate. Only the reflections from theanatase TiO2 (004) are observed without anyreflection from the substrate, which indicatesthat the anatase TiO2 (001) films wereepitaxially grown on (001) plane. Theorientation relationships between epitaxialTiO2 films and substrates were summarizedin Table 1. It can be seen from the Table thatthe in-plane orientation relationships between
40 6026 (degree)
Fig. 1: The X-ray diffraction pattern fromthe epitaxial anatase TiO2 films on theLaAlO3 (001) substrate.
- 199 -
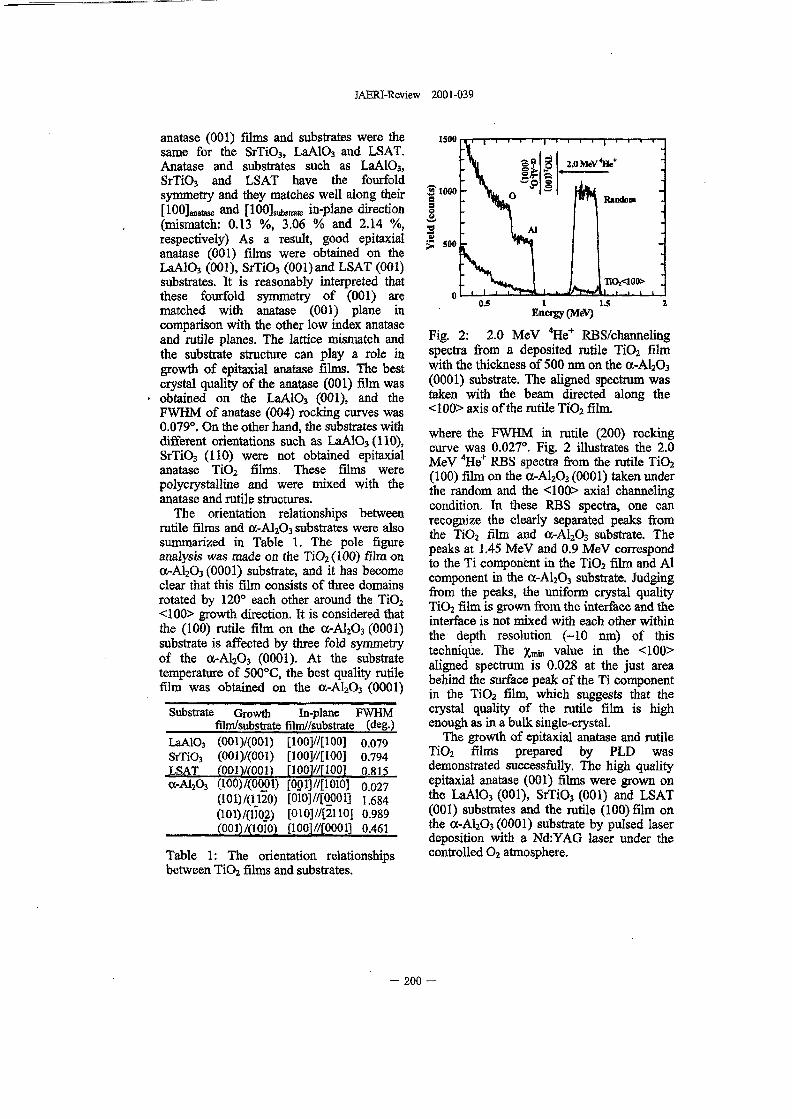
JAERI-Review 2001-039
anatase (001) films and substrates were thesame for the SrTiO3, LaAlOs and LSAT.Anatase and substrates such as LaAlO3,SrTiO3 and LSAT have the fourfoldsymmetry and they matches well along their[100]matese and [100]SUbStra» in-plane direction(mismatch: 0.13 %, 3.06 % and 2.14 %,respectively) As a result, good epitaxialanatase (001) films were obtained on theLaAlOj (001), SrTiOj (001) and LSAT (001)substrates. It is reasonably interpreted thatthese fourfold symmetry of (001) arematched with anatase (001) plane incomparison with the other low index anataseand rutile planes. The lattice mismatch andthe substrate structure can play a role ingrowth of epitaxial anatase films. The bestcrystal quality of the anatase (001) film wasobtained on the LaAlO3 (001), and theFWHM of anatase (004) rocking curves was0.079°. On the other hand, the substrates withdifferent orientations such as LaAlO3(110),SrTiO3 (110) were not obtained epitaxialanatase TiO2 films. These films werepolycrystalline and were mixed with theanatase and rutile structures.
The orientation relationships betweenrutile films and OC-A1203 substrates were alsosummarized in Table 1. The pole figureanalysis was made on the TiO2(100) film ona-AUCb (0001) substrate, and it has becomeclear that this film consists of three domainsrotated by 120° each other around the TiO2
<100> growth direction. It is considered thatthe (100) rutile film on the a-Al2O3 (0001)substrate is affected by three fold symmetryof the a-A!2O3 (0001). At the substratetemperature of 500°C, the best quality rutilefilm was obtained on the a-A!2O3 (0001)
Substrate Growthfilm/substrate
In-plane FWHMfilm/Zsubstrate (deg.)
LaA103 (001)/(001)SrTiOj (001)/(001)LSAT (001W001)
0.079[100]//[100] 0.794nooy/nooi o.8is
(ioo)/(oqpi)(101) /(1120)
(ooiVdoIo)
0.027[010]//[0001] 1.684[010]//[2110] 0.989[100]//[0001j 0.461
Table 1: The orientation relationshipsbetween TiO2 films and substrates.
1500
42 1000s
500 r
:V i?
1 Al
.8§
Random
_
TIOz<100> !
OS 1 1.5Energy (MeV)
Fig. 2: 2.0 MeV 4He+ RBS/channelingspectra from a deposited rutile TiO2 filmwith the thickness of 500 nm on the a-Al2O3
(0001) substrate. The aligned spectrum wastaken with the beam directed along the<100> axis of the rutile TiO2 film.
where the FWHM in rutile (200) rockingcurve was 0.027°. Fig. 2 illustrates the 2.0MeV 4He+ RBS spectra from the rutile TiO2
(100) film on the <X-A12O3 (0001) taken underthe random and the <100> axial channelingcondition. In these RBS spectra, one canrecognize the clearly separated peaks fromthe TiO2 film and CC-A12O3 substrate. Thepeaks at 1.45 MeV and 0.9 MeV correspondto the Ti component in the TiO2 film and Alcomponent in the a-Al2O3 substrate. Judgingfrom the peaks, the uniform crystal qualityTiO2 film is grown from the interface and theinterface is not mixed with each other withinthe depth resolution (-10 nm) of thistechnique. The xmjn value in the <100>aligned spectrum is 0.028 at the just areabehind the surface peak of the Ti componentin the TiO2 film, which suggests that thecrystal quality of the rutile film is highenough as in a bulk single-crystal.
The growth of epitaxial anatase and rutileTiO2 films prepared by PLD wasdemonstrated successfully. The high qualityepitaxial anatase (001) films were grown onthe LaAlO3 (001), SrTiO3 (001) and LSAT(001) substrates and the rutile (100) film onthe a-Al2O3 (0001) substrate by pulsed laserdeposition with a Nd:YAG laser under thecontrolled O2 atmosphere.
- 200
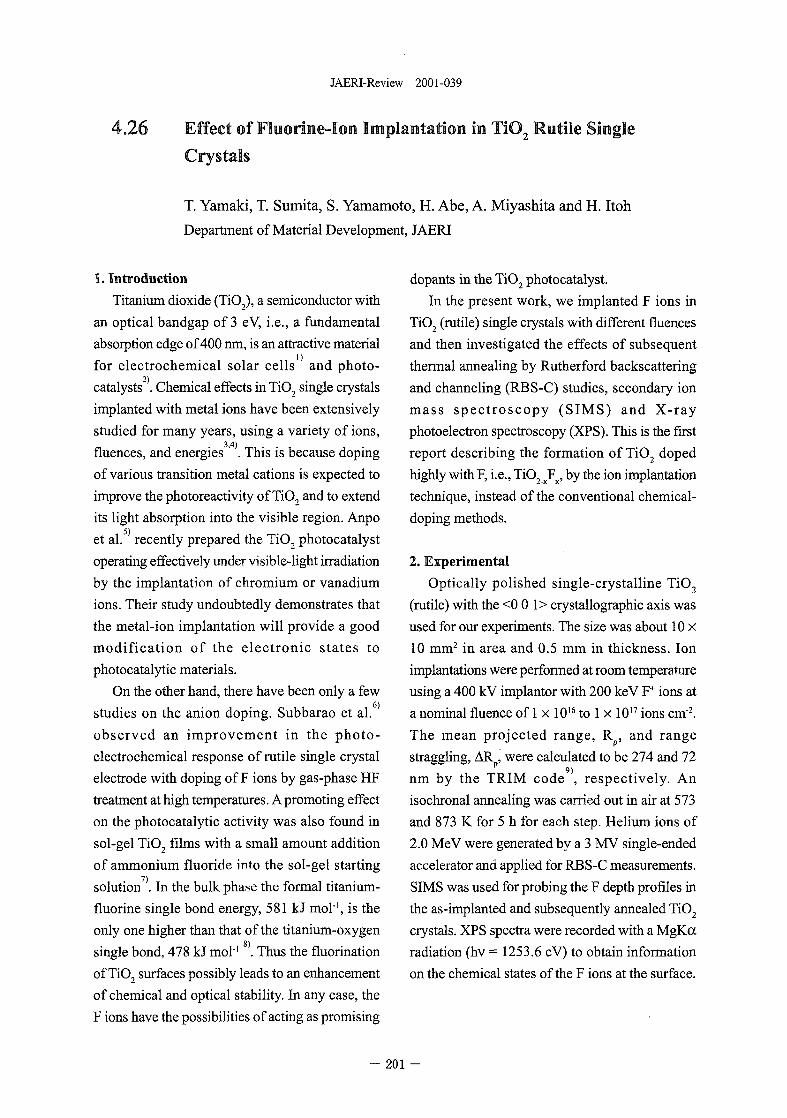
JAERI-Review 2001-039
4.26 Effect of Fluorine-Ion Implantation in TiQ2 Rutile SingleCrystals
T. Yamaki, T. Sumita, S. Yamamoto, H. Abe, A. Miyashita and H. Itoh
Department of Material Development, JAERI
1. Introduction
Titanium dioxide (TiO2), a semiconductor with
an optical bandgap of 3 eV, i.e., a fundamental
absorption edge of 400 nm, is an attractive material
for electrochemical solar cells and photo-
catalysts . Chemical effects in TiO2 single crystals
implanted with metal ions have been extensively
studied for many years, using a variety of ions,3,4)
fluences, and energies . This is because doping
of various transition metal cations is expected to
improve the photoreactivity of TiO, and to extend
its light absorption into the visible region. Anpo
et al. recently prepared the TiO2 photocatalyst
operating effectively under visible-light irradiation
by the implantation of chromium or vanadium
ions. Their study undoubtedly demonstrates that
the metal-ion implantation will provide a good
modification of the electronic states to
photocatalytic materials.
On the other hand, there have been only a few
studies on the anion doping. Subbarao et al.
observed an improvement in the photo-
electrochemical response of rutile single crystal
electrode with doping of F ions by gas-phase HF
treatment at high temperatures. A promoting effect
on the photocatalytic activity was also found in
sol-gel TiO, films with a small amount addition
of ammonium fluoride into the sol-gel starting
solution . In the bulk phase the formal titanium-
fluorine single bond energy, 581 kJ mol"', is the
only one higher than that of the titanium-oxygen
single bond, 478 kJ mol"1 . Thus the fluorination
of TiO, surfaces possibly leads to an enhancement
of chemical and optical stability. In any case, the
F ions have the possibilities of acting as promising
dopants in the TiO, photocatalyst.
In the present work, we implanted F ions in
TiO2 (rutile) single crystals with different fluences
and then investigated the effects of subsequent
thermal annealing by Rutherford backscattering
and channeling (RBS-C) studies, secondary ion
mass spectroscopy (SIMS) and X-ray
photoelectron spectroscopy (XPS). This is the first
report describing the formation of TiO2 doped
highly with F, i.e., TiO,_xFx, by the ion implantation
technique, instead of the conventional chemical-
doping methods.
2. Experimental
Optically polished single-crystalline TiO,
(rutile) with the <0 0 1> crystallographic axis was
used for our experiments. The size was about 10 x
10 mm2 in area and 0.5 mm in thickness. Ion
implantations were performed at room temperature
using a 400 kV implantor with 200 keV F+ ions at
a nominal fluence of 1 x 10¹⁶ to 1 x 10¹⁷ ions cm-2.
The mean projected range, R , and range
straggling, AR , were calculated to be 274 and 729)
nm by the TRIM code , respectively. An
isochronal annealing was carried out in air at 573
and 873 K for 5 h for each step. Helium ions of
2.0 MeV were generated by a 3 MV single-ended
accelerator and applied for RBS-C measurements.
SIMS was used for probing the F depth profiles in
the as-implanted and subsequently annealed TiO,
crystals. XPS spectra were recorded with a MgKa
radiation (hv = 1253.6 eV) to obtain information
on the chemical states of the F ions at the surface.
- 201 -
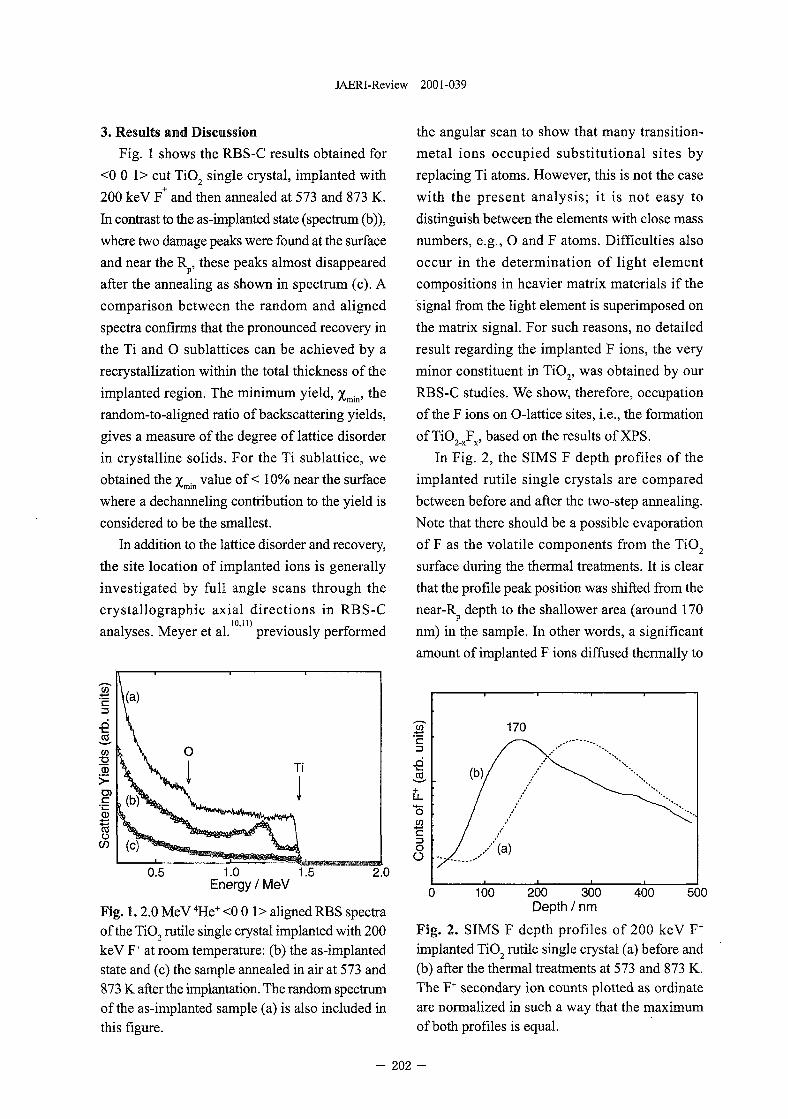
JAERI-Review 2001-039
3. Results and Discussion
Fig. 1 shows the RBS-C results obtained for
<0 0 1> cut TiO2 single crystal, implanted with
200 keV F+ and then annealed at 573 and 873 K.
In contrast to the as-implanted state (spectrum (b)),
where two damage peaks were found at the surface
and near the R , these peaks almost disappeared
after the annealing as shown in spectrum (c). A
comparison between the random and aligned
spectra confirms that the pronounced recovery in
the Ti and O sublattices can be achieved by a
recrystallization within the total thickness of the
implanted region. The minimum yield, %min, the
random-to-aligned ratio of backscattering yields,
gives a measure of the degree of lattice disorder
in crystalline solids. For the Ti sublattice, we
obtained the Y . value of < 10% near the surface
where a dechanneling contribution to the yield is
considered to be the smallest.
In addition to the lattice disorder and recovery,
the site location of implanted ions is generally
investigated by full angle scans through the
crystallographic axial directions in RBS-C
analyses. Meyer et al. previously performed
nits
)
_Q
inCO
ing
Yie
ld
&
0
\(a)
I\\
V,(bfVV ^
0
Ja. ^ ^ ^ V ^ H ^
Ti
1\
0.5 1.0Energy / MeV
1.5 2.0
Fig. 1.2.0 MeV 4He+ <0 0 1> aligned RBS spectraof the TiO2 rutile single crystal implanted with 200keV F+ at room temperature: (b) the as-implantedstate and (c) the sample annealed in air at 573 and873 K after the implantation. The random spectrumof the as-implanted sample (a) is also included inthis figure.
the angular scan to show that many transition-
metal ions occupied substitutional sites by
replacing Ti atoms. However, this is not the case
with the present analysis; it is not easy to
distinguish between the elements with close mass
numbers, e.g., O and F atoms. Difficulties also
occur in the determination of light element
compositions in heavier matrix materials if the
signal from the light element is superimposed on
the matrix signal. For such reasons, no detailed
result regarding the implanted F ions, the very
minor constituent in TiO2, was obtained by our
RBS-C studies. We show, therefore, occupation
of the F ions on O-lattice sites, i.e., the formation
of TiO, F , based on the results of XPS.2-x x'
In Fig. 2, the SIMS F depth profiles of the
implanted rutile single crystals are compared
between before and after the two-step annealing.
Note that there should be a possible evaporation
of F as the volatile components from the TiO2
surface during the thermal treatments. It is clear
that the profile peak position was shifted from the
near-R depth to the shallower area (around 170
nm) in the sample. In other words, a significant
amount of implanted F ions diffused thermally to
100 200 300Depth / nm
400 500
Fig. 2. SIMS F depth profiles of 200 keV F+
implanted TiO2 rutile single crystal (a) before and(b) after the thermal treatments at 573 and 873 K.The F+ secondary ion counts plotted as ordinateare normalized in such a way that the maximumof both profiles is equal.
- 202
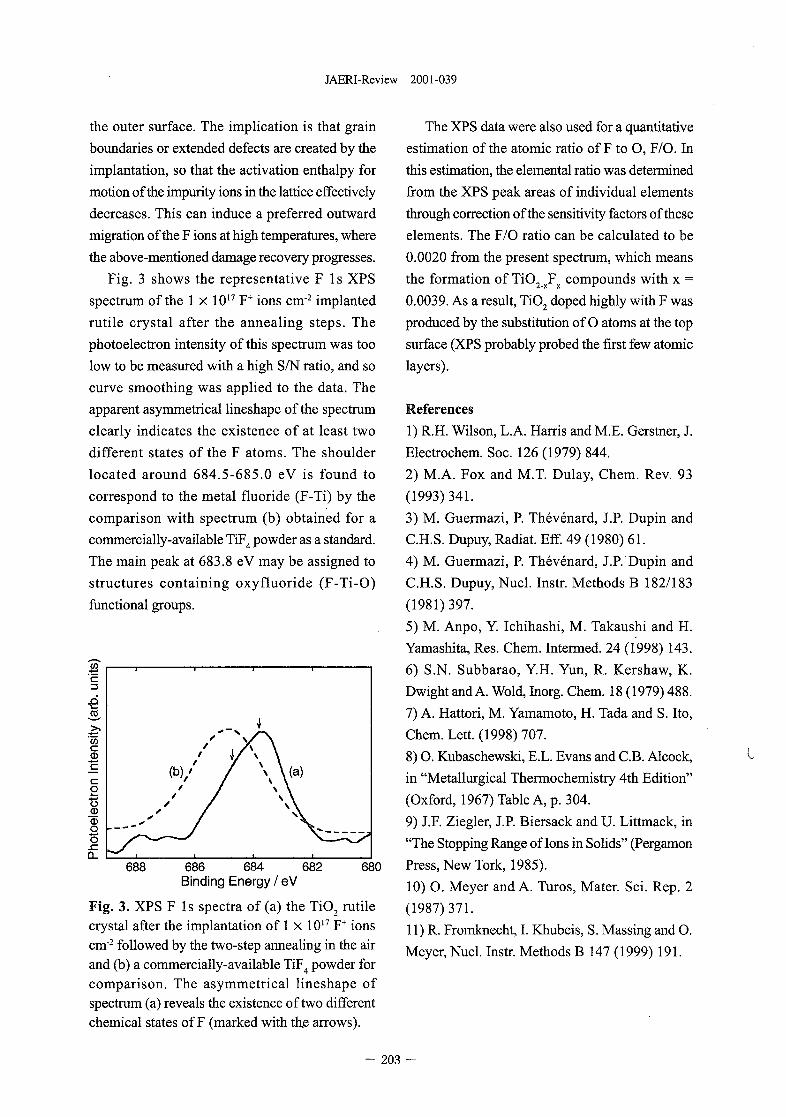
JAERI-Review 2001-039
the outer surface. The implication is that grain
boundaries or extended defects are created by the
implantation, so that the activation enthalpy for
motion of the impurity ions in the lattice effectively
decreases. This can induce a preferred outward
migration of the F ions at high temperatures, where
the above-mentioned damage recovery progresses.
Fig. 3 shows the representative F Is XPS
spectrum of the 1 x 10¹⁷ F+ ions cm"2 implanted
rutile crystal after the annealing steps. The
photoelectron intensity of this spectrum was too
low to be measured with a high S/N ratio, and so
curve smoothing was applied to the data. The
apparent asymmetrical lineshape of the spectrum
clearly indicates the existence of at least two
different states of the F atoms. The shoulder
located around 684.5-685.0 eV is found to
correspond to the metal fluoride (F-Ti) by the
comparison with spectrum (b) obtained for a
commercially-available TiF4 powder as a standard.
The main peak at 683.8 eV may be assigned to
structures containing oxyfluoride (F-Ti-O)
functional groups.
688 686 684 682Binding Energy / eV
680
Fig. 3. XPS F Is spectra of (a) the TiO, rutilecrystal after the implantation of 1 x 10¹⁷ F+ ionscm"2 followed by the two-step annealing in the airand (b) a commercially-available TiF4 powder forcomparison. The asymmetrical lineshape ofspectrum (a) reveals the existence of two differentchemical states of F (marked with the arrows).
The XPS data were also used for a quantitative
estimation of the atomic ratio of F to O, F/O. In
this estimation, the elemental ratio was determined
from the XPS peak areas of individual elements
through correction of the sensitivity factors of these
elements. The F/O ratio can be calculated to be
0.0020 from the present spectrum, which means
the formation of TiO2JFx compounds with x =
0.0039. As a result, TiO2 doped highly with F was
produced by the substitution of O atoms at the top
surface (XPS probably probed the first few atomic
layers).
References
1) R.H. Wilson, L.A. Harris and M.E. Gerstner, J.
Electrochem. Soc. 126 (1979) 844.
2) M.A. Fox and M.T. Dulay, Chem. Rev. 93
(1993)341.
3) M. Guermazi, P. Thevenard, J.P. Dupin and
C.H.S. Dupuy, Radiat. Eff. 49 (1980) 61.
4) M. Guermazi, P. Thevenard, J.P. Dupin and
C.H.S. Dupuy, Nucl. Instr. Methods B 182/183
(1981)397.
5) M. Anpo, Y. Ichihashi, M. Takaushi and H.
Yamashita, Res. Chem. Intermed. 24 (1998) 143.
6) S.N. Subbarao, Y.H. Yun, R. Kershaw, K.
Dwight and A. Wold, Inorg. Chem. 18 (1979) 488.
7) A. Hattori, M. Yamamoto, H. Tada and S. Ito,
Chem. Lett. (1998) 707.
8) O. Kubaschewski, E.L. Evans and C.B. Alcock,
in "Metallurgical Thermochemistry 4th Edition"
(Oxford, 1967) Table A, p. 304.
9) J.F. Ziegler, J.P. Biersack and U. Littmack, in
"The Stopping Range of Ions in Solids" (Pergamon
Press, New Tork, 1985).
10) O. Meyer and A. Turos, Mater. Sci. Rep. 2
(1987)371.
11) R. Fromknecht, I. Khubeis, S. Massing and O.
Meyer, Nucl. Instr. Methods B 147 (1999) 191.
- 203 -
JAERI-Review 2001-039
5. Material Analysis
5.1 In-situ Observation of Growth Processes of Transition Metal Compound Thin Filmsby Carbon-implantation 207
Y.Kasukabe, Y.Fujino, M.Osaka, Y.Yamada, and H.Abe,5.2 Development of In-situ Ion Beam Analysis of Adsorbate Atoms at the Solid-liquid
Interface 210
J.Yuhara, N.Kishi, H.Suzuki, K.Soda, K.Morita, T.Ohnuki, S.YamamotoK.Narumi, H.Naramoto, and K.Saito
5.3 Carbon KVV Auger Electron Emission from HOPG Bombarded by Fast Protons 212H.Kudo, K.Haruyama, T.Kinoshita, S.Ishii, S.Seki, K.Narumi, and H.Naramoto
5.4 Characterization of Defects and Hydrogen Absorption in Pd Irradiated with Protons 215H.Abe, A.Uedono, H.Uchida, Z.Q.Chen, S.Okada, and H.Itoh
5.5 Chemical Modifications of Polycarbonate by Cn+ Cluster Irradiation 218
K.Hirata, Y.Saitoh, K.Narumi, Y.Kobayashi, and K.Arakawa
- 205 -
JAERI-Review 2001-039
5.1 In-situ Observation of Growth Processes of Transition MetalCompound Thin Films by Carbon-Implantation
Y. Kasukabe, Y. Fujino, M. Osaka15, Y. Yamada1^ H. Abe2)
International Student Center/Department of Electronic Engineering, Tohoku
University, ^Department of Quantum Science and Energy Engineering, Tohoku
University, 2)Department of Materials Development, JAERI.
1. Introduction
It is well known that in transition metals thevalence d orbitals are more contracted thanvalence s and p orbitals, and split in energy bythe bonding interaction with the ligand atomssuch as carbon (C) and nitrogen (N) ones. Thebonding interaction gives rise to transformationsof the transition metal sublattice, and to covalentproperties as well as metallic and ionic ones.These properties make the compoundsinteresting for both fundamental researches andtechnological applications such as hard coatingsand diffusion barriers in microcircuits.1'2" Thecarbides of titanium (Ti), one of the typicaltransition metals, are technologically importantas corrosion-resistant coatings on cutting tools.2)
It has been revealed that properties ofepitaxially-grown Ti compound films aresuperior to those of polycrystalline ones. Thus,much interest has been focused on the epitaxialfilms. Recently, it was reported that NaCl-typeTiN films were epitaxially grown by theN-implantation into evaporated Ti films.3^However, the growth process of epitaxial Ticarbide films by C-implantation has not beensufficiently understood.
The purpose of this work is first, to throwlight on changes of the crystallographic structureof Ti films by C-implantation, using in-situtransmission electron microscopy (TEM), andthen to discuss the epitaxial growth mechanismof Ti carbide films.
2. Experimental
Detailed descriptions of the preparation ofevaporated-Ti films were presented in the earlierpaper.3) The 100-nm-thick Ti films were
evaporated by an electron-beam heating methodin an ultra-high vacuum onto thermally cleanedNaCl substrates held at room temperature (RT).The ultimate pressure in the working chamberwas less than 4xlO"9 Torr. Evaporated Ti filmswere divided into two kinds of samples: one wasseparated from the NaCl substrate for TEMobservation, and the other remained on thesubstrate for Rutherford backscatteringspectrometry (RBS) using a well-collimated 3.5MeV 4He+ beam. The implantations of carbonions (C+) with 26 keV were performed in the400 kV analytical and high resolution TEMcombined with ion accelerators,^ and also in the400 kV ion implantation facility atJAERI-Takasaki. According to the MonteCarlo simulation using the TRIM code, theprojected range of C+ with 26 keV was 54 nm,and thus most of the implanted ions are thoughtto be retained inside the Ti films. TheC-concentrations in Ti films were able to beestimated from the implantation dose measuredby a Faraday cage. The maximum dose in thisexperiment was 3.06xl017 ions/cm2, whichcorresponded to the C/Ti ratio of 0.54: theaverage atomic concentration of C in the Ti film.
3. Results and discussion
Typical RBS spectra taken from theunimplanted Ti film and the N-implanted Ti filmwith N/Ti=0.54 are shown in Fig. I. It can beseen that after the implantation, the peak of Cappears clearly throughout the depth of the Tifilm, whereas the height of the Ti peak decreasesslightly, owing to the existence of C in the Tifilm. These results manifest the carbonizing ofevaporated-Ti films by C-implantation. The
- 207 -
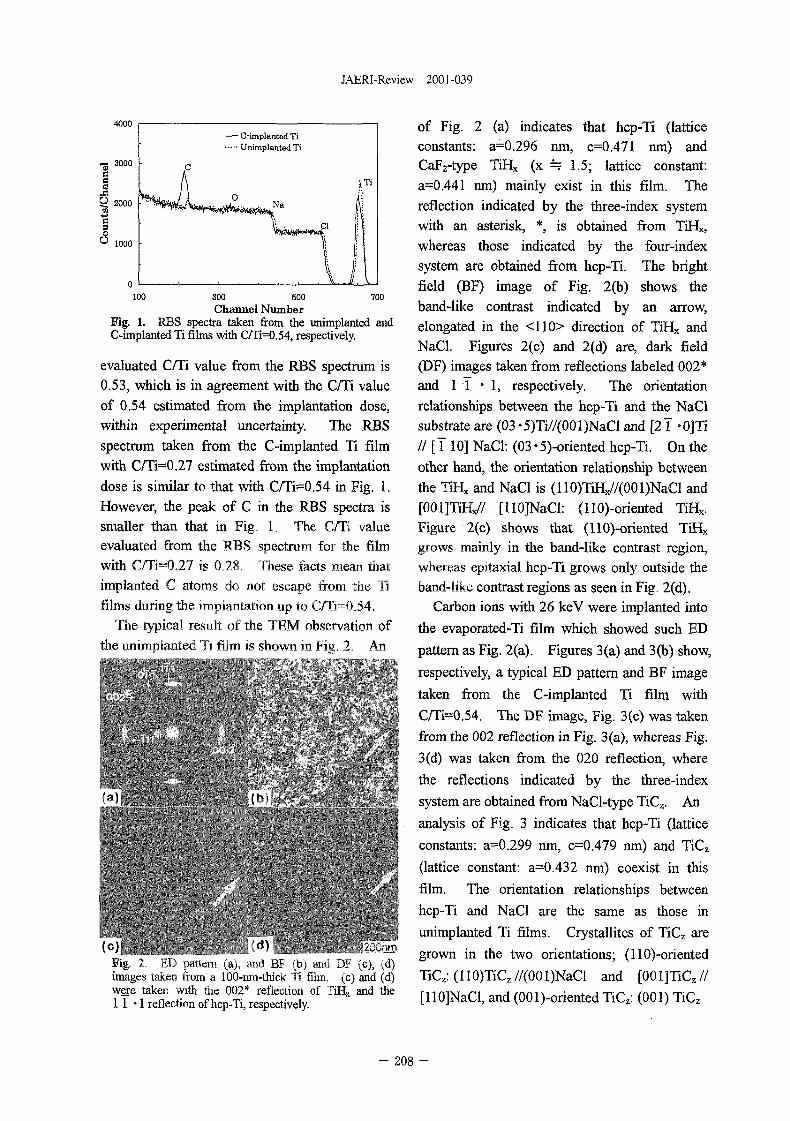
JAERI-Review 2001-039
4000
— C-implanted TiUnimplanted Ti
Na
ci
o100 300 500 700
Channel NumberFig. 1. RBS spectra taken from the unimplanted andC-implanted Ti films with C/Ti=0.54, respectively.
evaluated C/Ti value from the RBS spectrum is0.53, which is in agreement with the C/Ti valueof 0.54 estimated from the implantation dose,within experimental uncertainty. The RBSspectrum taken from the C-implanted Ti filmwith C/Ti=0.27 estimated from the implantationdose is similar to that with C/Ti=0.54 in Fig. 1.However, the peak of C in the RBS spectra issmaller than that in Fig, 1. The C/Ti valueevaluated from the RBS spectrum for the filmwith C/Ti=0.27 is 0.28. These facts mean thatimplanted C atoms do not escape from the Tifilms during the implantation up to C/Ti=0.54.
The typical result of the TEM observation ofthe unimplanted Ti film is shown in Fig. 2. An
(c) fi) 2 ^ ir
Fig. 2. ~ED pattern (a), and BF (b) and DF (c), (d)images taken from a 100-nm-thick Ti film, (c) and (d)were taken with the 002* reflection of TiHx and the1 1 - 1 reflection of hcp-Ti, respectively.
of Fig. 2 (a) indicates that hcp-Ti (latticeconstants: a=0.296 nm, c=0.471 nm) andCaF2-type TiHx (x == 1.5; lattice constant:a=0.441 nm) mainly exist in this film. Thereflection indicated by the three-index systemwith an asterisk, *, is obtained from TiHx,whereas those indicated by the four-indexsystem are obtained from hcp-Ti. The brightfield (BF) image of Fig. 2(b) shows theband-like contrast indicated by an arrow,elongated in the <110> direction of TiHx andNaCl. Figures 2(c) and 2(d) are, dark field(DF) images taken from reflections labeled 002*and 1 1 • 1, respectively. The orientationrelationships between the hcp-Ti and the NaClsubstrate are (03-5)Ti//(001)NaCl and [21 -0]Ti// [110] NaCl: (03 • 5)-oriented hcp-Ti. On theother hand, the orientation relationship betweenthe TiHx and NaCl is (110)TiHx//(001)NaCl and[001]TiHx// [110]NaCl: (llO)-oriented TiHx.Figure 2(c) shows that (HO)-oriented TiHx
grows mainly in the band-like contrast region,whereas epitaxial hcp-Ti grows only outside theband-like contrast regions as seen in Fig. 2(d).
Carbon ions with 26 keV were implanted into
the evaporated-Ti film which showed such ED
pattern as Fig. 2(a). Figures 3 (a) and 3(b) show,
respectively, a typical ED pattern and BF image
taken from the C-implanted Ti film with
C/Ti=0.54. The DF image, Fig. 3(c) was taken
from the 002 reflection in Fig. 3 (a), whereas Fig.
3(d) was taken from the 020 reflection, where
the reflections indicated by the three-index
system are obtained from NaCl-type TiCz. An
analysis of Fig. 3 indicates that hcp-Ti (lattice
constants: a=0.299 nm, c=0.479 nm) and TiCz
(lattice constant: a=0.432 nm) coexist in this
film. The orientation relationships between
hcp-Ti and NaCl are the same as those in
unimplanted Ti films. Crystallites of TiCz are
grown in the two orientations; (HO)-oriented
TiCz:(110)TiCz//(001)NaCl and [001]TiCz//
[110]NaCl, and (OOl)-oriented TiCz: (001) TiCz
- 208 -
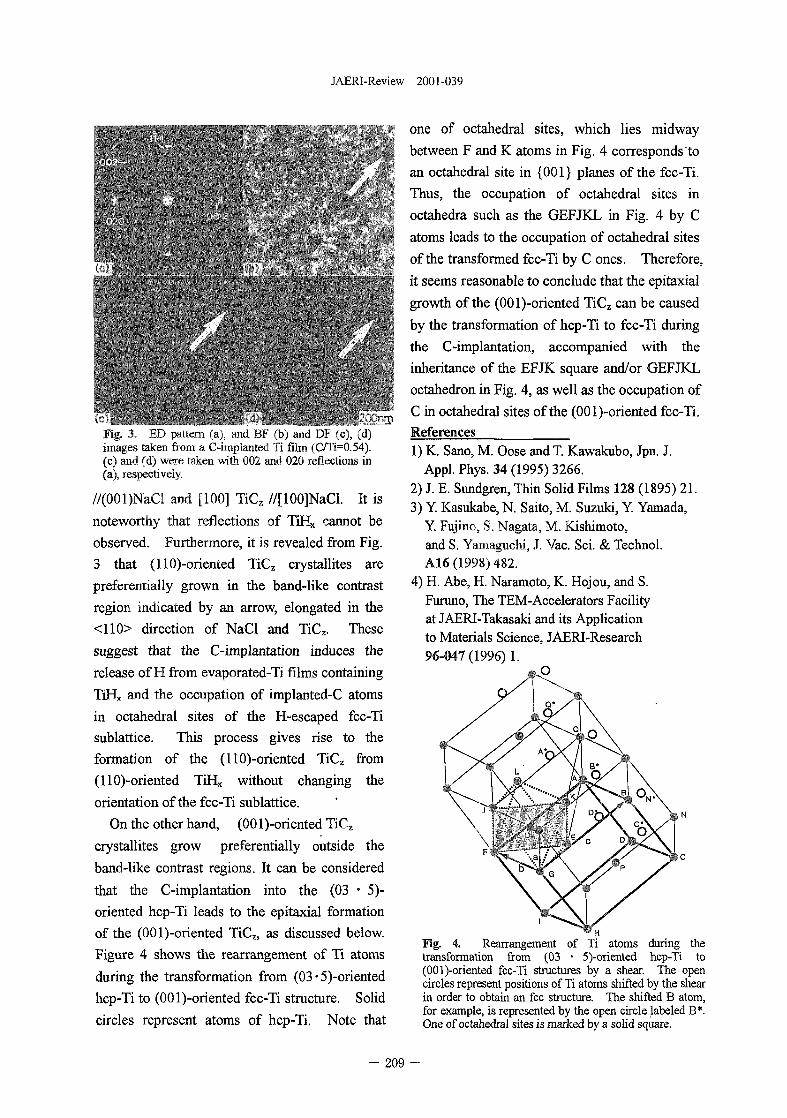
JAERI-Review 2001-039
Fig. 3. ED pattern (a), and BF (b) and DF (c), (d)images taken from a C-impIanted Ti film (C/Ti=0,54).(c) and (d) were taken with 002 and 020 reflections in(a), respectively.
//(OOl)NaCt and [100] TiCz //[100]NaCl. It is
noteworthy that reflections of TiHx cannot be
observed. Furthermore, it is revealed from Fig.
3 that (HO)-oriented TiCz crystallites are
preferentially grown in the band-like contrast
region indicated by an arrow, elongated in the
<110> direction of NaCl and TiCz. These
suggest that the C-implantation induces the
release of H from evaporated-Ti films containing
TiHx and the occupation of implanted-C atoms
in octahedral sites of the H-escaped fcc-Ti
sublattice. This process gives rise to the
formation of the (HO)-oriented TiCz from
(HO)-oriented TiHx without changing the
orientation of the fcc-Ti sublattice.
On the other hand, (00l)-oriented TiCz
crystallites grow preferentially outside the
band-like contrast regions. It can be considered
that the C-implantation into the (03 • 5)-
oriented hcp-Ti leads to the epitaxial formation
of the (OOl)-oriented TiCz, as discussed below.
Figure 4 shows the rearrangement of Ti atoms
during the transformation from (03'5)-oriented
hcp-Ti to (OOl)-oriented fcc-Ti structure. Solid
circles represent atoms of hcp-Ti. Note that
one of octahedral sites, which lies midway
between F and K atoms in Fig. 4 corresponds "to
an octahedral site in {001} planes of the fcc-Ti.
Thus, the occupation of octahedral sites in
octahedra such as the GEFJKL in Fig. 4 by C
atoms leads to the occupation of octahedral sites
of the transformed fcc-Ti by C ones. Therefore,
it seems reasonable to conclude that the epitaxial
growth of the (OOl)-oriented TiCz can be caused
by the transformation of hcp-Ti to fcc-Ti during
the C-implantation, accompanied with the
inheritance of the EFJK square and/or GEFJKL
octahedron in Fig. 4, as well as the occupation of
C in octahedral sites of the (OOl)-oriented fcc-Ti.
References
1) K. Sano, M. Oose and T. Kawakubo, Jpn. J.Appl. Phys. 34 (1995) 3266.
2) J. E. Sundgren, Thin Solid Films 128 (1895) 21.3) Y. Kasukabe, N. Saito, M. Suzuki, Y. Yamada,
Y. Fujino, S. Nagata, M. Kishimoto,and S. Yamaguchi, J. Vac. Sci. & Technol.A16 (1998) 482.
4) H. Abe, H. Naramoto, K. Hojou, and S.Furuno, The TEM-Accelerators Facilityat JAERI-Takasaki and its Applicationto Materials Science, JAERI-Research96-047(1996)1.
Fig. 4. Rearrangement of Ti atoms during thetransformation from (03 • 5)-oriented hcp-Ti to(OOl)-oriented fcc-Ti structures by a shear. The opencircles represent positions of Ti atoms shifted by the shearin order to obtain an fee structure. The shifted B atom,for example, is represented by the open circle labeled B*.One of octahedral sites is marked by a solid square.
- 209 -
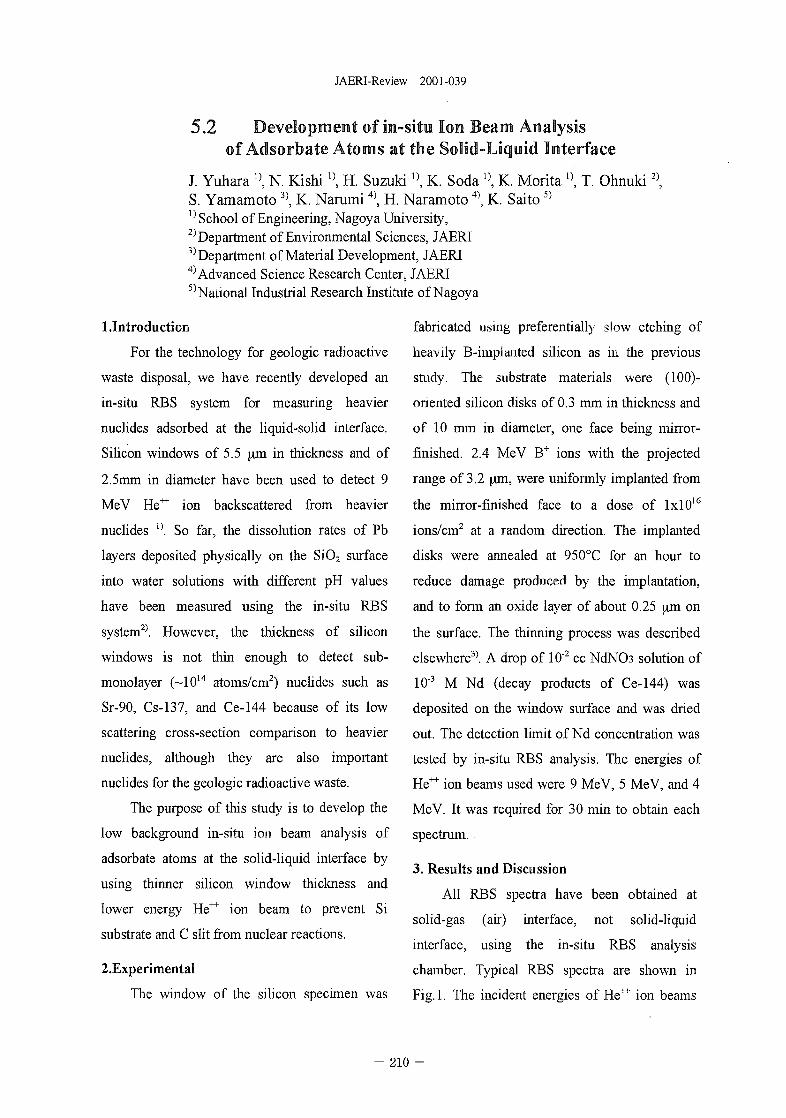
JAERI-Review 2001-039
5.2 Development of in-situ Ion Beam Analysisof Adsorbate Atoms at the Solid-Liquid Interface
J. Yuhara l\ N. Kishi l\ H. Suzuki]), K. Soda 1}, K. Morita °, T. Ohnuki2),S. Yamamoto3), K. Narumi4), H. Naramoto4), K. Saito5)
1) School of Engineering, Nagoya University,2) Department of Environmental Sciences, JAER13) Department of Material Development, JAERI4) Advanced Science Research Center, JAERI5) National Industrial Research Institute of Nagoya
1.Introduction
For the technology for geologic radioactive
waste disposal, we have recently developed an
in-situ RBS system for measuring heavier
nuclides adsorbed at the liquid-solid interface.
fabricated using preferentially slow etching of
heavily B-irnpianted silicon as in the previous
study. The substrate materials were (100)-
oriented silicon disks of 0.3 mm in thickness and
of 10 mm in diameter, one face being mirror-
Silicon windows of 5.5 yon in thickness and of finished. 2.4 MeV B+ ions with the projected
2.5mm in diameter have been used to detect 9
MeV He""" ion backscattered from heavier
nuclides 1}. So far, the dissolution rates of Pb
layers deposited physically on the SiO2 surface
into water solutions with different pH values
have been measured using the in-situ RBS
system2). However, the thickness of silicon
windows is not thin enough to detect sub-
monolayer (~1014 atoms/cm2) nuclides such as
Sr-90, Cs-137, and Ce-144 because of its low
scattering cross-section comparison to heavier
nuclides, although they are also important
nuclides for the geologic radioactive waste.
The purpose of this study is to develop the
low background in-situ ion beam analysis of
adsorbate atoms at the solid-liquid interface by
using thinner silicon window thickness and
lower energy He"1""1" ion beam to prevent Si
substrate and C slit from nuclear reactions.
2.ExperimentaI
The window of the silicon specimen was
range of 3.2 \\m, were uniformly implanted from
the mirror-finished face to a dose of lxl016
ions/cm2 at a random direction. The implanted
disks were annealed at 950°C for an hour to
reduce damage produced by the implantation,
and to form an oxide layer of about 0.25 jun on
the surface. The thinning process was described
elsewhere3). A drop of 10"2 cc NdNO3 solution of
10"3 M Nd (decay products of Ce-144) was
deposited on the window surface and was dried
out. The detection limit of Nd concentration was
tested by in-situ RBS analysis. The energies of
He"1"1" ion beams used were 9 MeV, 5 MeV, and 4
MeV. It was required for 30 min to obtain each
spectrum.
3. Results and Discussion
All RBS spectra have been obtained at
solid-gas (air) interface, not solid-liquid
interface, using the in-situ RBS analysis
chamber. Typical RBS spectra are shown in
Fig. 1. The incident energies of He4"4" ion beams
- 210 -
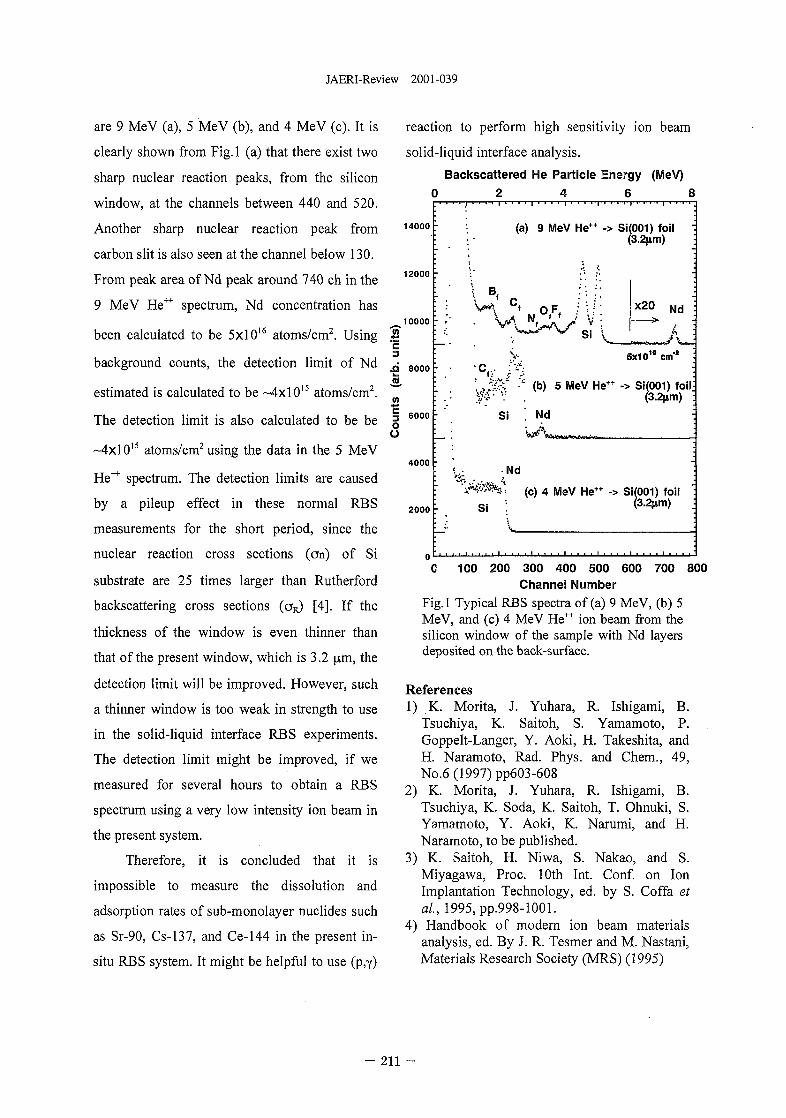
JAERI-Review 2001-039
are 9 MeV (a), 5 MeV (b), and 4 MeV (c). It is
clearly shown from Fig.l (a) that there exist two
sharp nuclear reaction peaks, from the silicon
window, at the channels between 440 and 520.
Another sharp nuclear reaction peak from
carbon slit is also seen at the channel below 130.
From peak area of Nd peak around 740 ch in the
9 MeV He'1"1' spectrum, Nd concentration has
been calculated to be 5x10¹⁶ atoms/cm2. Using
background counts, the detection limit of Nd
estimated is calculated to be ~4xlO15 atoms/cm2.
The detection limit is also calculated to be be
~4xlO15 atoms/cm2 using the data in the 5 MeV
He"1"1" spectrum. The detection limits are caused
by a pileup effect in these normal RBS
measurements for the short period, since the
nuclear reaction cross sections (an) of Si
substrate are 25 times larger than Rutherford
backscattering cross sections (OR) [4]. If the
thickness of the window is even thinner than
that of the present window, which is 3.2 ^m, the
detection limit will be improved. However, such
a thinner window is too weak in strength to use
in the solid-liquid interface RBS experiments.
The detection limit might be improved, if we
measured for several hours to obtain a RBS
spectrum using a very low intensity ion beam in
the present system.
Therefore, it is concluded that it is
impossible to measure the dissolution and
adsorption rates of sub-monolayer nuclides such
as Sr-90, Cs-137, and Ce-144 in the present in-
situ RBS system. It might be helpful to use (p,y)
reaction to perform high sensitivity ion beam
solid-liquid interface analysis.
Backscattered He Particle Energy (MeV)
14000
12000
10000
8 0 0 0
6000
4000
2000
(a) 9 MeV He++ -> Si(001) foil(3.2nm)
• W N£k' J VSi v
x20 Nd
>,
(b) 5 MeV He+t -> Si(001) foil:(3.2nm)
Si . Nd
S i
(c) 4 MeV He++ -> Si(001) foil(3.2nm)
0 100 200 300 400 500 600 700 800Channel Number
Fig.l Typical RBS spectra of (a) 9 MeV, (b) 5MeV, and (c) 4 MeV He"1"1" ion beam from thesilicon window of the sample with Nd layersdeposited on the back-surface.
References1) K. Morita, J. Yuhara, R. Ishigami, B.
Tsuchiya, K. Saitoh, S. Yamamoto, P.Goppelt-Langer, Y. Aoki, H. Takeshita, andH. Naramoto, Rad. Phys. and Chem., 49,No.6(1997)pp603-608
2) K. Morita, J. Yuhara, R. Ishigami, B.Tsuchiya, K. Soda, K. Saitoh, T. Ohnuki, S.Yamamoto, Y. Aoki, K. Narumi, and H.Naramoto, to be published.
3) K. Saitoh, H. Niwa, S. Nakao, and S.Miyagawa, Proc. 10th Int. Conf. on IonImplantation Technology, ed. by S. Coffa etal, 1995, pp.998-1001.
4) Handbook of modern ion beam materialsanalysis, ed. By J. R. Tesmer and M. Nastani,Materials Research Society (MRS) (1995)
- 211 -
JAERI-Review 2001-039
5.3 Carbon K W Aeger Electron Emission from HOPG Bombarded byFast Protons
H. Kudol>, K. Haruyama1', T. Kinoshita^, S. Ishii2), S. Seki3>, K. Narumi4>, H. Naramoto4)
''Institute of Applied Physics, Univ. of Tsukuba, 'Advanced Science Research2*Tandem accelerator center, Univ. of Tsukuba3)SSL, Tsukuba4)Advanced Science Research Center, JAERI
1. Introduction
We have studied ion-induced Auger electron
emission under the condition that Auger yields
depend on a layered structure of the target material,
so that the commonly used macroscopic treatment
of Auger yields must be modified. Since Auger
peaks are superposed on the continuum energy
spectrum, precise analysis of such structure-
sensitive yields requires knowledge on the
continuum (background) yield, which results
mainly from the binary-encounter processes.l) A
recently established technique, i.e. 180° ion-
induced electron spectroscopy, has a characteristic
feature that the continuum energy spectrum is
independent of the tilt angle of the surface of a
solid target.2-3) The 180° electron spectroscopy
therefore allows direct comparison of the electron
spectra measured under oblique incidence
conditions on the surface.
2. Experiment
We have used highly oriented pyrolytic
graphite (HOPG) as a sample, which has a typical
layer structure of hexagon network of carbon
atoms. The bond length in the carbon network is
1.42 A and the layer spacing is 3.35 A. A fresh and
flat surface of HOPG(0001) was obtained by
peeling of the surface layer using an adhesive tape.
Observations by an atomic force microscope in air
assured that the fresh (0001) surface is atomically
flat except for steps of a few monolayers, which
are separated from each other typically by a
micronmeter. The HOPG samples were bombarded
by 1 MeV H+. Under the present experimental
conditions, the critical angle of HOPG(0001)
planar channeling (~0.42°) is much less than the
values of the incidence angle 6 relative to the
surface, so that specular reflection of the ions does
not occur.
We have measured energy spectra of carbon
K W Auger electrons (kinetic energy EA=26O eV)
which are emitted at 180° with respect to the beam
direction, while it is bombarded by 1 MeV H+. The
electron measurements have been carried out using
a 45° parallel-plate spectrometer of the double
deflection type under the pressure of 3 x 10~7 Pa.
For a geometrical reason, the influence of
scattering of the emitted electrons by the steps
must be minimized for observations at 180°.
When the HOPG surface is oblique to the ion
beam, i.e., to the spectrometer direction, the Auger
electron produced inside the target moves towards
the surface and is emitted from the surface in the
180° direction after they are refracted at the
surface, owing to the work function of ~5 eV.
3. Results and discussion
The Auger peak height can commonly be
- 212 -
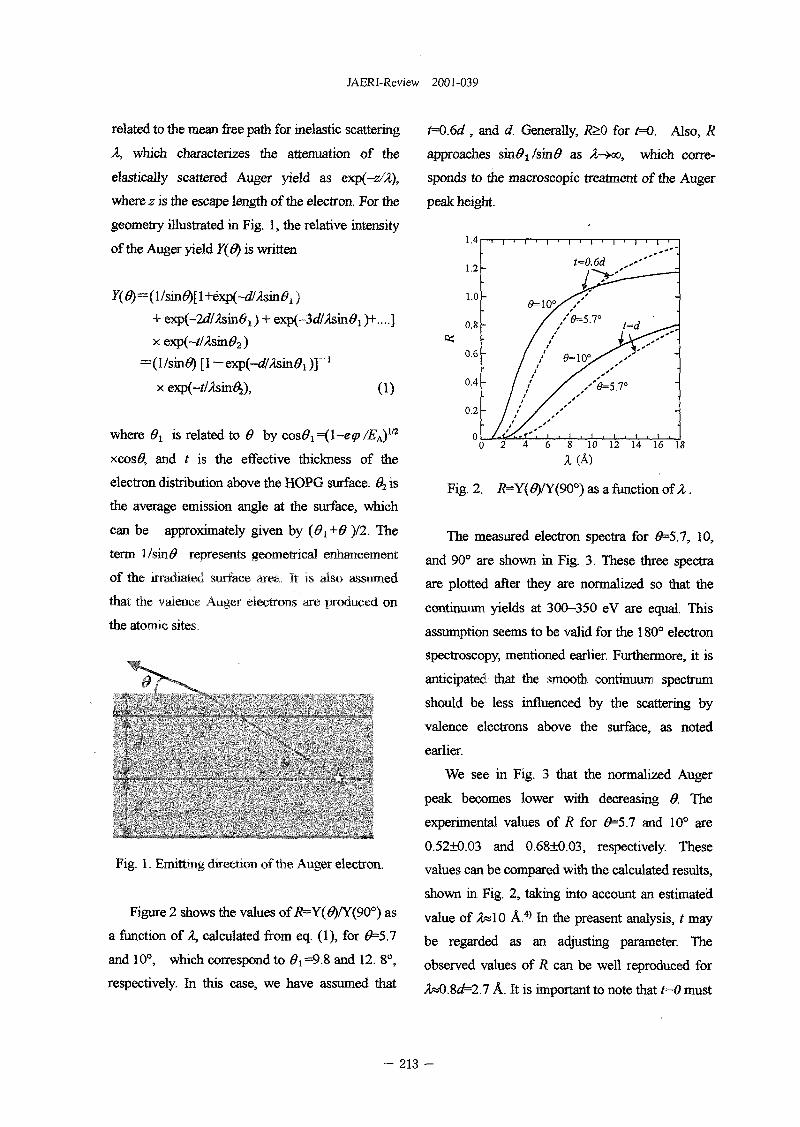
JAERI-Review 2001-039
related to the mean free path for inelastic scattering
X, which characterizes the attenuation of the
elastically scattered Auger yield as exp(-z/X),
where z is the escape length of the electron. For the
geometry illustrated in Fig. 1, the relative intensity
of the Auger yield Y{6) is written
)
x exp(~t/Xsin02)
(l/sin#) [1 -
(1)
where 0X is related to 0 by cos&i={l-e(p /EA)m
xcos#, and t is the effective thickness of the
electron distribution above the HOPG surface. 02 is
the average emission angle at the surface, which
can be approximately given by (0i+0 )/2. The
term \/sin0 represents geometrical enhancement
of the irradiated surface area. It is also assumed
that the valence Auger electrons are produced on
the atomic sites.
0
Fig. 1. Emitting direction of the Auger electron.
Figure 2 shows the values of i?=Y(0)/Y(9O°) as
a function of X, calculated from eq. (1), for #=5.7
and 10°, which correspond to 0t=9.8 and 12. 8°,
respectively. In this case, we have assumed that
t=0.6d , and d. Generally, R>0 for t=Q. Also, R
approaches sva01/s\n0 as A-»oo, which corre-
sponds to the macroscopic treatment of the Auger
peak height.
Fig. 2. i?=Y(<9)/Y(90°) as a function of X.
The measured electron spectra for 9=51, 10,
and 90° are shown in Fig. 3. These three spectra
are plotted after they are normalized so that the
continuum yields at 300-350 eV are equal. This
assumption seems to be valid for the 180° electron
spectroscopy, mentioned earlier. Furthermore, it is
anticipated that the smooth continuum spectrum
should be less influenced by the scattering by
valence electrons above the surface, as noted
earlier.
We see in Fig. 3 that the normalized Auger
peak becomes lower with decreasing 8. The
experimental values of R for #=5.7 and 10° are
0.52+0.03 and 0.68±0.03, respectively. These
values can be compared with the calculated results,
shown in Fig. 2, taking into account an estimated
value of ,2«10 A.4) In the preasent analysis, t may
be regarded as an adjusting parameter. The
observed values of R can be well reproduced for
X*0.Sd=2.7 A. It is important to note that t=0 must
- 213 -
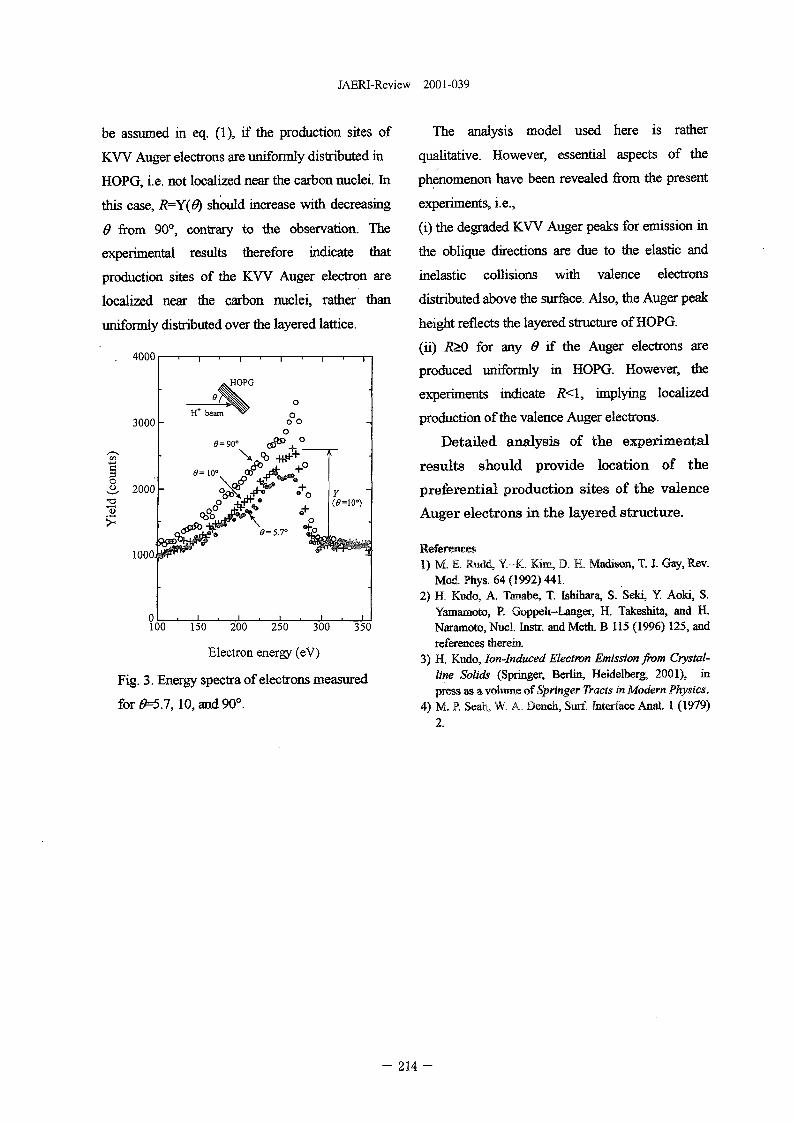
JAERI-Review 2001-039
be assumed in eq. (1), if the production sites of
K W Auger electrons are uniformly distributed in
HOPG, i.e. not localized near the carbon nuclei. In
this case, R=Y(9) should increase with decreasing
9 from 90°, contrary to the observation. The
experimental results therefore indicate that
production sites of the K W Auger electron are
localized near the carbon nuclei, rather than
uniformly distributed over the layered lattice.
4000
3000 -
2000 -
1000.
150 200 250 300 350
Electron energy (eV)
Fig. 3. Energy spectra of electrons measured
for 6=5.1,10, and 90°.
The analysis model used here is rather
qualitative. However, essential aspects of the
phenomenon have been revealed from the present
experiments, i.e.,
(i) the degraded K W Auger peaks for emission in
the oblique directions are due to the elastic and
inelastic collisions with valence electrons
distributed above the surface. Also, the Auger peak
height reflects the layered structure of HOPG.
(ii) R>0 for any 9 if the Auger electrons are
produced uniformly in HOPG. However, the
experiments indicate R<\, implying localized
production of the valence Auger electrons.
Detailed analysis of the experimental
results should provide location of the
preferential production sites of the valence
Auger electrons in the layered structure.
References1) M. E. Rudd, Y.-K. Kim, D. H. Madison, T. J. Gay, Rev.
Mod. Phys. 64(1992)441.2) H. Kudo, A. Tanabe, T. Ishihara, S. Seki, Y. Aoki, S.
Yamamoto, P. Goppeit-Langer, H. Takeshita, and H.Naramoto, Nucl. Instr. and Meth. B 115 (1996) 125, andreferences therein.
3) H. Kudo, Ion-Induced Electron Emission from Crystal-line Solids (Springer, Berlin, Heidelberg, 2001), inpress as a volume of Springer Tracts in Modern Physics.
4) M. P. Seafa, W. A. Bench, Surf. Interface Anal. 1 (1979)2.
- 214 -
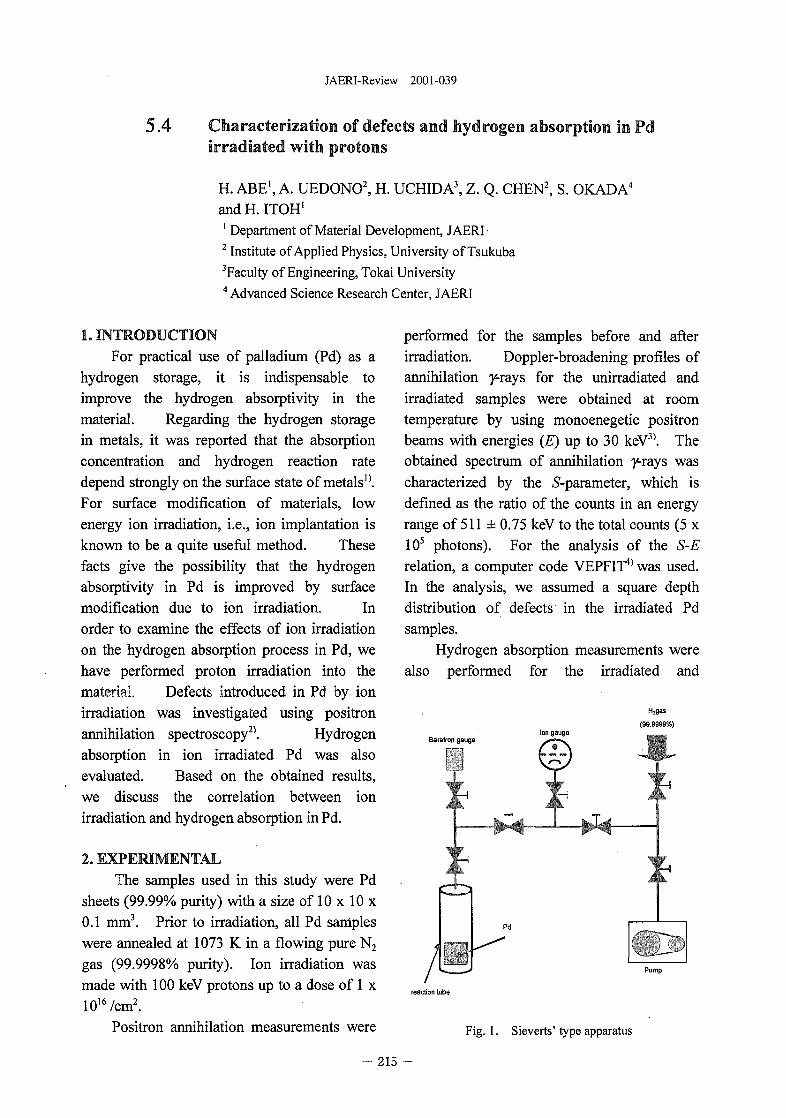
JAERI-Review 2001-039
5.4 Characterization of defects and hydrogen absorption in Pdirradiated with protons
H. ABE1, A. UEDONO2, H. UCHIDA3, Z. Q. CHEN2, S. OKADA4
and H. ITOH1
1 Department of Material Development, JAERI-2 Institute of Applied Physics, University of Tsukuba3Faculty of Engineering, Tokai University4 Advanced Science Research Center, JAERI
1. INTRODUCTIONFor practical use of palladium (Pd) as a
hydrogen storage, it is indispensable toimprove the hydrogen absorptivity in thematerial. Regarding the hydrogen storagein metals, it was reported that the absorptionconcentration and hydrogen reaction ratedepend strongly on the surface state of metals0.For surface modification of materials, lowenergy ion irradiation, i.e., ion implantation isknown to be a quite useful method. Thesefacts give the possibility that the hydrogenabsorptivity in Pd is improved by surfacemodification due to ion irradiation. In
order to examine the effects of ion irradiationon the hydrogen absorption process in Pd, wehave performed proton irradiation into thematerial. Defects introduced in Pd by ionirradiation was investigated using positronannihilation spectroscopy2). Hydrogen
absorption in ion irradiated Pd was alsoevaluated. Based on the obtained results,we discuss the correlation between ionirradiation and hydrogen absorption in Pd.
2. EXPERIMENTALThe samples used in this study were Pd
sheets (99.99% purity) with a size of 10 x 10 x0.1 mm3. Prior to irradiation, all Pd sampleswere annealed at 1073 K in a flowing pure N2
gas (99.9998% purity). Ion irradiation wasmade with 100 keV protons up to a dose of 1 x10¹⁶/cm2.
Positron annihilation measurements were
performed for the samples before and afterirradiation. Doppler-broadening profiles ofannihilation y-rays for the unirradiated andirradiated samples were obtained at roomtemperature by using monoenegetic positronbeams with energies (E) up to 30 keV3). Theobtained spectrum of annihilation y-rays wascharacterized by the S-parameter, which isdefined as the ratio of the counts in an energyrange of 511 ± 0.75 keV to the total counts (5 x10⁵ photons). For the analysis of the S-Erelation, a computer code VEPFIT41 was used.In the analysis, we assumed a square depthdistribution of defects in the irradiated Pdsamples.
Hydrogen absorption measurements werealso performed for the irradiated and
H,gas
Baratron gauge
Pump
reaction tube
Fig. 1. Sieverts' type apparatus
- 215 -
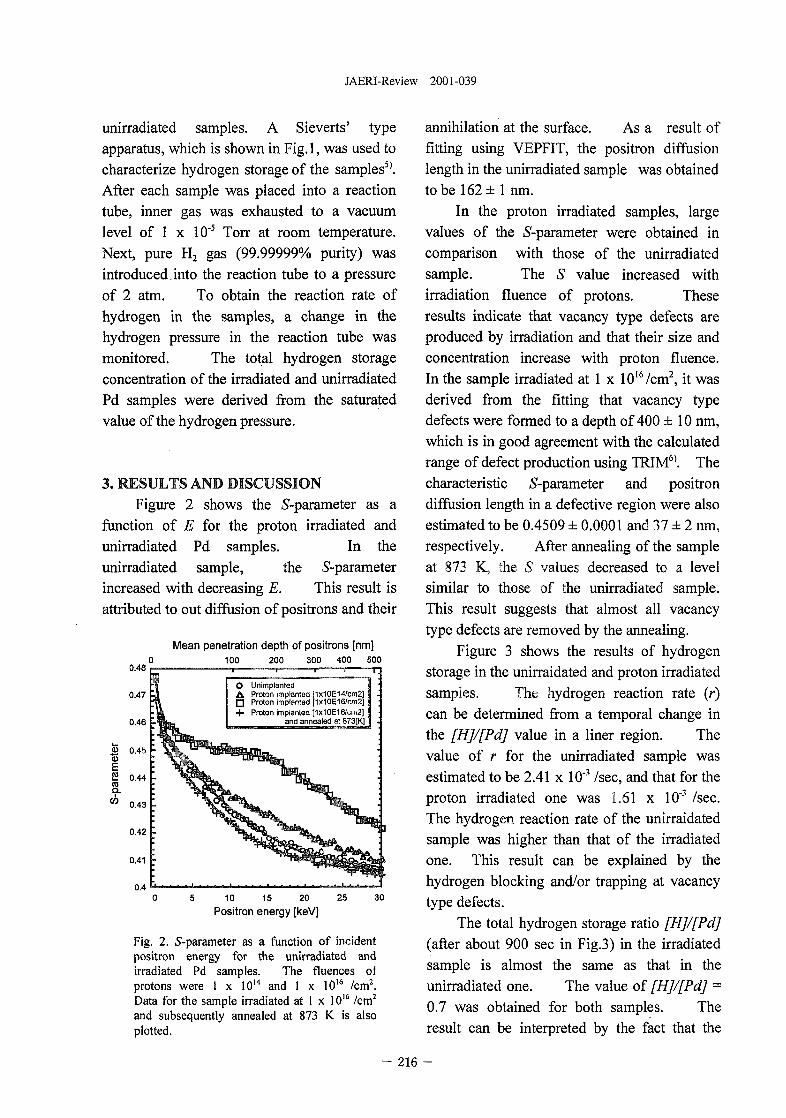
JAERI-Review 2001-039
unirradiated samples. A Sieverts' typeapparatus, which is shown in Fig.l, was used tocharacterize hydrogen storage of the samples5'.After each sample was placed into a reactiontube, inner gas was exhausted to a vacuumlevel of 1 x 10'5 Torr at room temperature.Next, pure H2 gas (99.99999% purity) wasintroduced.into the reaction tube to a pressureof 2 atm. To obtain the reaction rate ofhydrogen in the samples, a change in thehydrogen pressure in the reaction tube wasmonitored. The total hydrogen storage
concentration of the irradiated and unirradiatedPd samples were derived from the saturatedvalue of the hydrogen pressure.
3. RESULTS AND DISCUSSIONFigure 2 shows the iS-parameter as a
function of E for the proton irradiated andunirradiated Pd samples. In theunirradiated sample, the S-parameterincreased with decreasing E. This result isattributed to out diffusion of positrons and their
0.48
Mean penetration depth of positrons [nm]100 200 300 400 500
UntmplantedProton implanted iix10£14/cm2]
• Proton implanted [1x10E16/cm2]Proton implanted [1x10E16/cm2]
and annealed at 873[K]
10 15 20
Positron energy [keV]
Fig. 2. S-parameter as a function of incidentpositron energy for the unirradiated andirradiated Pd samples. The fluences ofprotons were 1 x 10¹⁴ and 1 x 10'6 /cm2.Data for the sample irradiated at 1 x 10¹⁶ /cm2
and subsequently annealed at 873 K is alsoplotted.
annihilation at the surface. As a result offitting using VEPFIT, the positron diffusionlength in the unirradiated sample was obtainedto be 162 ± 1 nm.
In the proton irradiated samples, largevalues of the S-parameter were obtained incomparison with those of the unirradiatedsample. The S value increased withirradiation fluence of protons. Theseresults indicate that vacancy type defects areproduced by irradiation and that their size andconcentration increase with proton fluence.In the sample irradiated at 1 x 10l6/cm2, it wasderived from the fitting that vacancy typedefects were formed to a depth of 400 ±10 nm,which is in good agreement with the calculatedrange of defect production using TRIM6). Thecharacteristic S-parameter and positrondiffusion length in a defective region were alsoestimated to be 0.4509 ± 0.0001 and 37 ± 2 nm,respectively. After annealing of the sampleat 873 K, the S values decreased to a levelsimilar to those of the unirradiated sample.This result suggests that almost all vacancytype defects are removed by the annealing.
Figure 3 shows the results of hydrogenstorage in the unirraidated and proton irradiatedsamples. The hydrogen reaction rate (r)can be determined from a temporal change inthe [HJ/fPdJ value in a liner region. Thevalue of r for the unirradiated sample wasestimated to be 2.41 x 10'3 /sec, and that for theproton irradiated one was 1.61 x 10"3 /sec.The hydrogen reaction rate of the unirraidatedsample was higher than that of the irradiatedone. This result can be explained by thehydrogen blocking and/or trapping at vacancytype defects.
The total hydrogen storage ratio [H]/[Pd](after about 900 sec in Fig.3) in the irradiatedsample is almost the same as that in theunirradiated one. The value of [H]/[Pd] =0.7 was obtained for both samples. Theresult can be interpreted by the fact that the
216 -
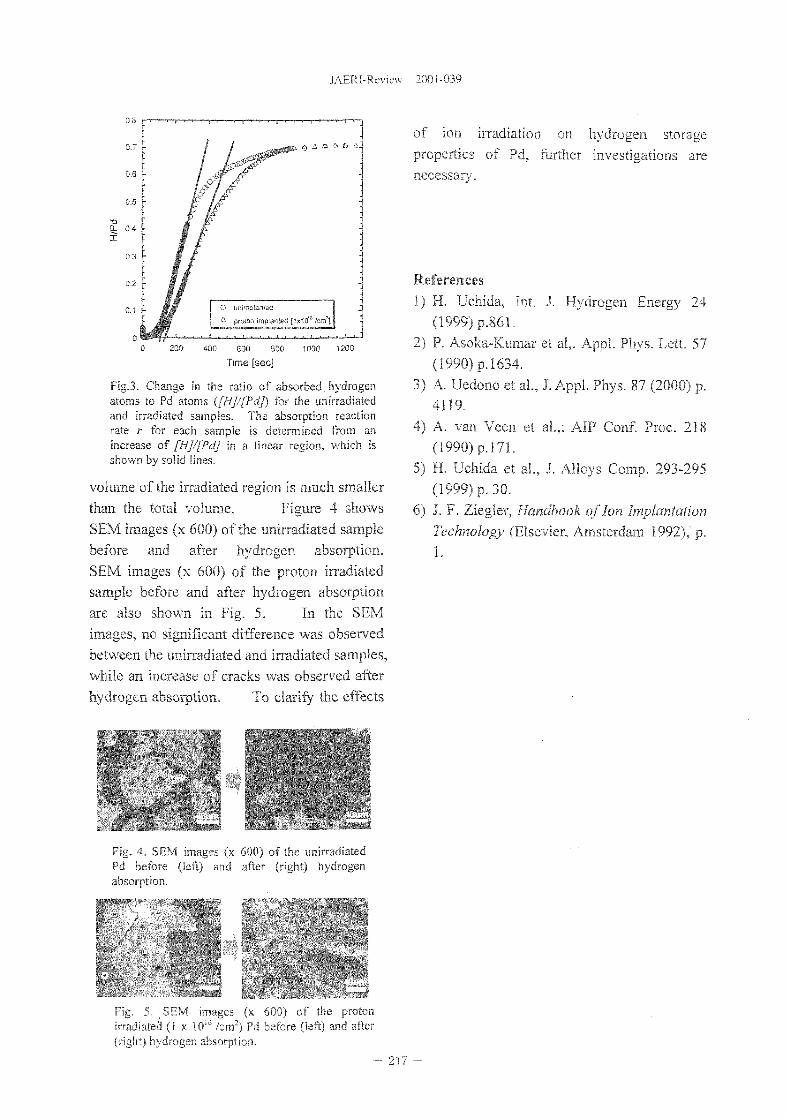
JAERI-Review 2001-039
400 600 800
Time [sec]1000
Fig.3. Change in the ratio of absorbed hydrogenatoms to Pd atoms ([H]/[Pd]) for the unirradiatedand irradiated samples. The absorption reactionrate r for each sample is determined from anincrease of [HJ/fPdJ in a linear region, which isshown by solid lines.
volume of the irradiated region is much smallerthan the total volume. Figure 4 showsSEM images (x 600) of the unirradiated samplebefore and after hydrogen absorption.SEM images (x 600) of the proton irradiatedsample before and after hydrogen absorptionare also shown in Fig. 5. In the SEMimages, BO significant difference was observedbetween the unirradiated and irradiated samples,while an increase of cracks was observed afterhydrogen absorption. To clarify the effects
of ion irradiation on hydrogen storageproperties of Pd, further investigations arenecessary.
References1) H. Ucfaida, Int. J. Hydrogen Energy 24
(1999)p.861.2) P. Asoka-Kumar et al,. Appl. Phys. Lett, 5?
(1990)p.l634.3) A. Uedono et al., J. Appl. Phys. 87 (2000) p.
4119.4) A. van Veen et al.,: AIP Conf. Proc. 218
(1990)p.l71.5) H. Ucfaida et al., J. Alloys Comp. 293-295
(1999) p. 30.6) J. F. Ziegler, Handbook of Ion Implantation
Technology (Elsevier, Amsterdam 1992), p.1.
Fig. 4. SEM images (x 600) of the unirradiatedPd before (left) and after (right) hydrogenabsorption.
Fig. 5. SEM images (x 600) of the protonirradiated (1 x 10¹⁶ /cm2) Pd before (let) and after(right) hydrogen absorption.
- 217 -
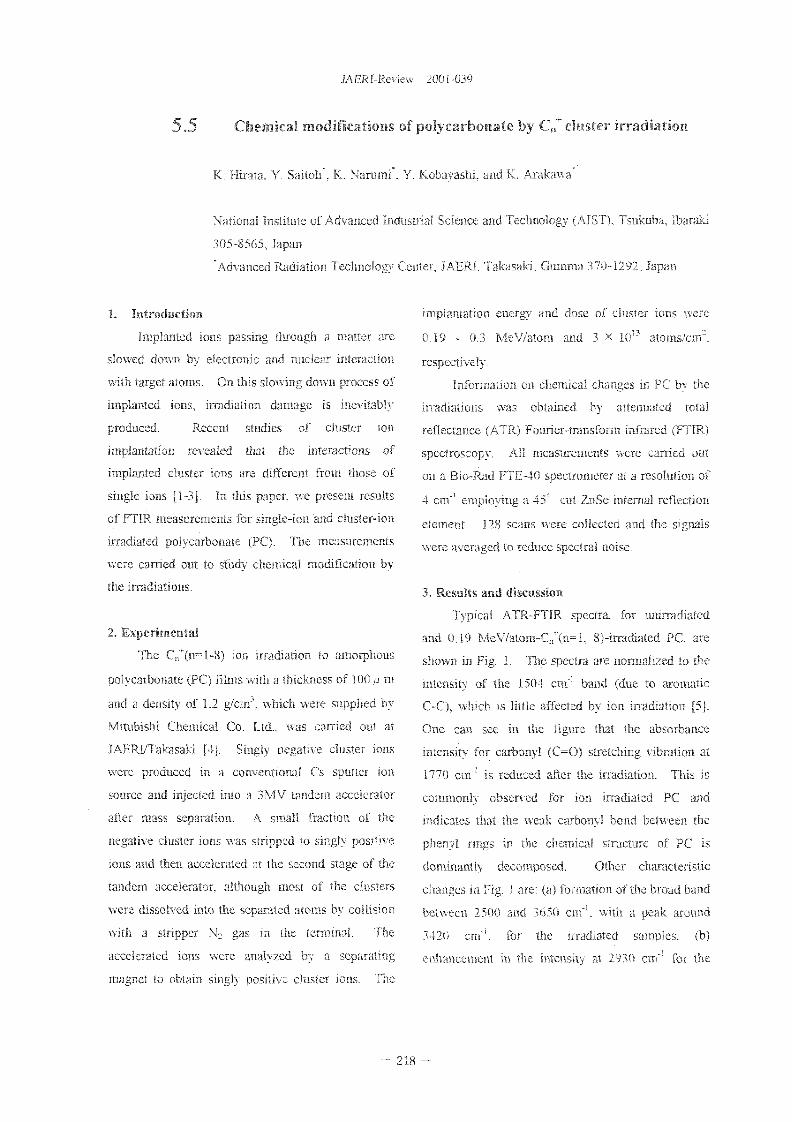
JAERI-Review 2001-039
5.5 Chemlcai modifications of polycarbonate by Cn+ cluster irradiation
K. Hirata. Y. Saitoh". K. Narumi*. Y. Kobayashi. and K. Arakawa"
National Institute of Advanced Industrial Science and Technology (AIST). Tsukuba. Ibaraki
305-8565. Japan
"Advanced Radiation Technology Center. JAEW. Takasaki. Gumma 370-1292. Japan
1. Introduction
Implanted Ions passing through a matter are
slowed down by electronic and nuclear interaction
with target atoms. On this slowing down process of
implanted ions, irradiation damage is inevitably
produced. Recent studies of cluster ion
implantation revealed that the interactions of
implanted cluster ions are different from those of
single ions [1-3]. In this paper, we present results
of FTIR measurements for single-ion and cluster-ion
irradiated polycarbonate (PC). The measurements
were carried out to study chemical modification by
the irradiations,
2. Experimental
The C,r(n=l-8) ion irradiation to amorphous
polycarbonate (PC) films with a thickness of 100 y m
and a density of 1.2 g/cm\ which were supplied by
Mitubishi Chemical Co. Ltd.. was earned out at
JAERJ/Takasaki [4], Singly negative cluster ions
were produced in a conventional Cs sputter ion
source and injected into a 3MV tandem accelerator
after mass separation. A small fraction of the
negative cluster ions was stripped to singly positive
ions and then accelerated at the second stage of the
tandem accelerator, although most of the clusters
were dissolved into the separated atoms by collision
with a stripper 'N;. gas in the terminal. The
accelerated ions were analyzed by a separating
magnet to obtain, singly positive cluster ions. The
implantation energy and dose of cluster ions were
0.19 - 0.3 MeV/atom and 3 x io13 atoms/cm2.
respectively.
Information on chemical changes in PC by the
irradiations was obtained by attenuated total
reflectance (ATR) Fourier-transform infrared (FTIR)
spectroscopy. All measurements were earned out
on a Bio-Rad FTE-40 spectrometer at a resolution of
4 cm"1 employing a 45'" cut ZnSe internal reflection
element. 128 scans were collected and the signals
were averaged lo reduce spectral noise.
3. Results and discussion
Typical ATR-FTIR spectra, for uiiirradiated
and 0.19 MeV/atom-Cn'(n=i. 8)-irradiated PC. are
shown in Fig. I. The spectra are normalized to the
intensity of the 1504 cm"1 band (due to aromatic
C-C). which is little affected by ion irradiation [5].
One can see in the figure that the absorbance
intensity for carbonyl (€=O) stretching vibration at
1770 cm"1 is reduced after the irradiation. This is
commonly observed for ion irradiated PC and
indicates that the weak carbonyl bond between the
phenyl rings in the chemical structure of PC is
doniinanlly decomposed. Other characteristic
changes in Fig. 1 are: (a) formation of the broad band
between 2500 and 3650 cm", with a peak around
3420 cm4, for the irradiated samples, (b)
enhancement in the intensity at 2930 cm"1 for the
— 218 —
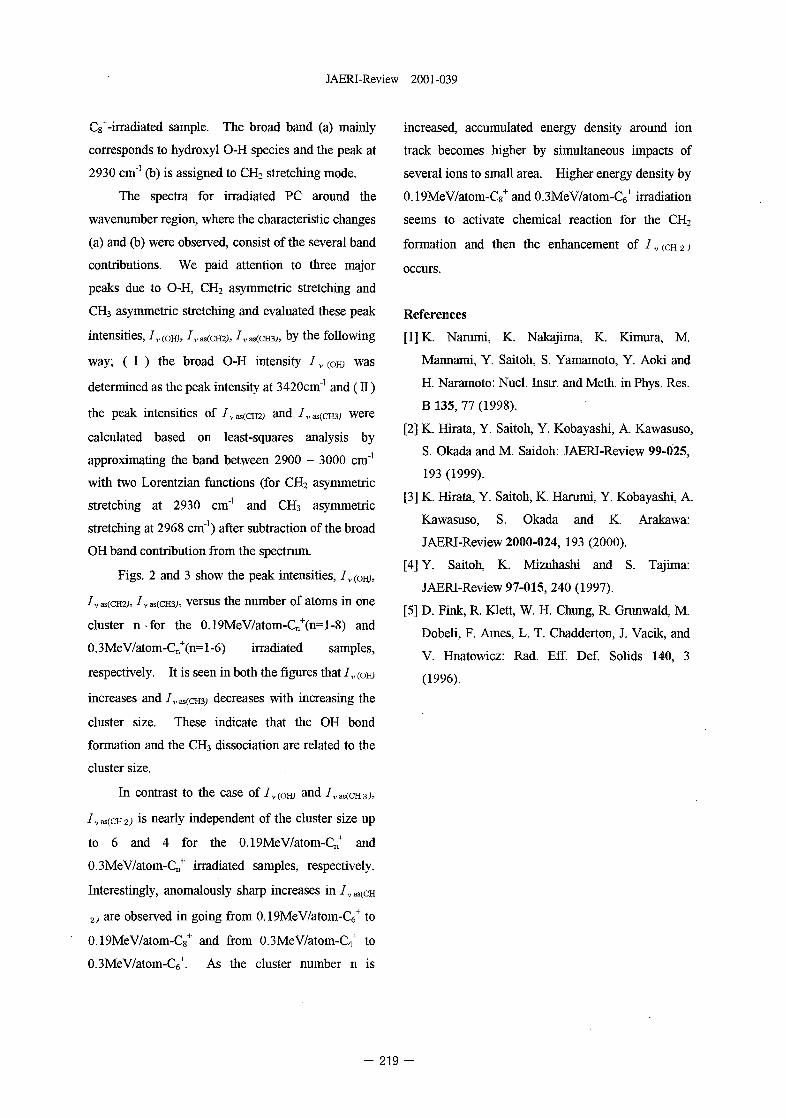
JAERI-Review 2001-039
Cg+-irradiated sample. The broad band (a) mainly
corresponds to hydroxyl O-H species and the peak at
2930 cm"1 (b) is assigned to CH2 stretching mode.
The spectra for irradiated PC around the
wavenumber region, where the characteristic changes
(a) and (b) were observed, consist of the several band
contributions. We paid attention to three major
peaks due to O-H, CH2 asymmetric stretching and
CH3 asymmetric stretching and evaluated these peak
intensities, /V(OHJ, /v^cucy, J W O D J , by the following
way; ( I ) the broad O-H intensity / v (OHJ was
determined as the peak intensity at 3420cm"1 and (II)
the peak intensities of /vas(CHz> and /vaS(CH3j were
calculated based on least-squares analysis by
approximating the band between 2900 - 3000 cm"1
with two Lorentzian functions (for CH2 asymmetric
stretching at 2930 cm"1 and CH3 asymmetric
stretching at 2968 cm"1) after subtraction of the broad
OH band contribution from the spectrum.
Figs. 2 and 3 show the peak intensities, /V(OHJ,
/vas(CH2;, /vas(CH3;, versus the number of atoms in one
cluster n for the 0.19MeV/atom-Cn+(n=l-8) and
0.3MeV/atom-Cn+(n=l-6) irradiated samples,
respectively. It is seen in both the figures that /,, (OHJ
increases and /vM(CH3j decreases with increasing the
cluster size. These indicate that the OH bond
formation and the CH3 dissociation are related to the
cluster size.
In contrast to the case of/V(OHJ and /vaS(CH3;,
/vas(CH2j is nearly independent of the cluster size up
to 6 and 4 for the 0.19MeV/atom-Cn+ and
0.3MeV/atom-Cn+ irradiated samples, respectively.
Interestingly, anomalously sharp increases in /„ as(CH
2) are observed in going from 0.19MeV/atom-C6+ to
0.19MeV/atom-C8+ and from 0.3MeV/atom-C4
+ to
0.3MeV/atom-C6+. As the cluster number n is
increased, accumulated energy density around ion
track becomes higher by simultaneous impacts of
several ions to small area. Higher energy density by
0.19MeV/atom-C8+ and 0.3MeV/atom-C6
+ irradiation
seems to activate chemical reaction for the CH2
formation and then the enhancement of / v (CH 2;
occurs.
References
[1] K. Narumi, K. Nakajima, K. Kimura, M
Mannami, Y. Saitoh, S. Yamamoto, Y. Aoki and
H. Naramoto: Nucl. Instr. and Meth. in Phys. Res.
B 135, 77 (1998).
[2] K. Hirata, Y. Saitoh, Y. Kobayashi, A. Kawasuso,
S. Okada and M. Saidoh: JAERI-Review 99-025,
193 (1999).
[3] K. Hirata, Y. Saitoh, K. Harami, Y Kobayashi, A.
Kawasuso, S. Okada and K. Arakawa:
JAERI-Review 2000-024, 193 (2000).
[4]Y. Saitoh, K. Mizuhashi and S. Tajima:
JAERI-Review 97-015, 240 (1997).
[5] D. Fink, R. Klett, W. H. Chung, R. Grunwald, M.
Dobeli, F. Ames, L. T. Chadderton, J. Vacik, and
V. Hnatowicz: Rad. Eff. Def. Solids 140, 3
(1996).
219 -
JAERI-Review 2001-039
3
CO
•e0
JS<
unirradiated
C, + -irradiated
C *-irradiated
3
38I
4000 3500 3000
wave numbeKcm"1)
2500 2000 1800 1600 1400 1200 1000
wave number(cm )
Fig. 1 ATR-FTIR spectra for unirradiated and 0.19 MeV/atom-Cn+(n=l, 8)-irradiated PC.
0.20
0.002 4 6cluster number
Fig. 2 Peak intensities, /V(OHJ> - vascory, - vas(CH3;, as a function of the number of atoms in one cluster n for
0.19MeV/atom-Cn+(n=l-8).
ensit>
0.15
0.10
0.05
0.00
A
-
_l 0 H
/
b
• i i .
CH3
* *
CH2
i i 1 i i r 1 i i . 1 i
Fig. 3 Peak intensities, /V(OHJ. ^va0.3MeV/atom-Cn
+(n= 1 -6).
2 4 6 8cluster number
. as a function of the number of atoms in one cluster n for
220
JAERI-Review 2001-039
6. Nuclear Science and RI Production
6.1 Development of a Laser Ion Source with an Ohmic-heating Ionizer for theTIARA-ISOL 223
M.Koizumi, A.Osa, M.Oshima, T.Sekine, and H.Miyatake6.2 Internal Conversion Electron Measurements in the Decay of the Proton-rich Isotope
126Ce using an On-line Mass Separator 226M.Shibata, T.Shindou, H.Yamamoto, K.Kawade, A.Taniguchi, A.Osa,M.Koizumi, and T.Sekine
6.3 Synthesis of Endohedral 133Xe-fullerene by Ion Implantation 228S.Watanabe, N.S.Ishioka, T.Sekine, A.Osa, M.Koizumi, H.Muramatsu,H.Shimomura, and K.Yoshikawa
6.4 Excitation Functions of Rhenium Isotopes on the " 'WCd.xn) Reactions andProduction of No-carrier-added 185Re 230
N.S.Ishioka, S.Watanabe, A.Osa, M.Koizumi, H.Matsuoka, and T.Sekine
- 221 -
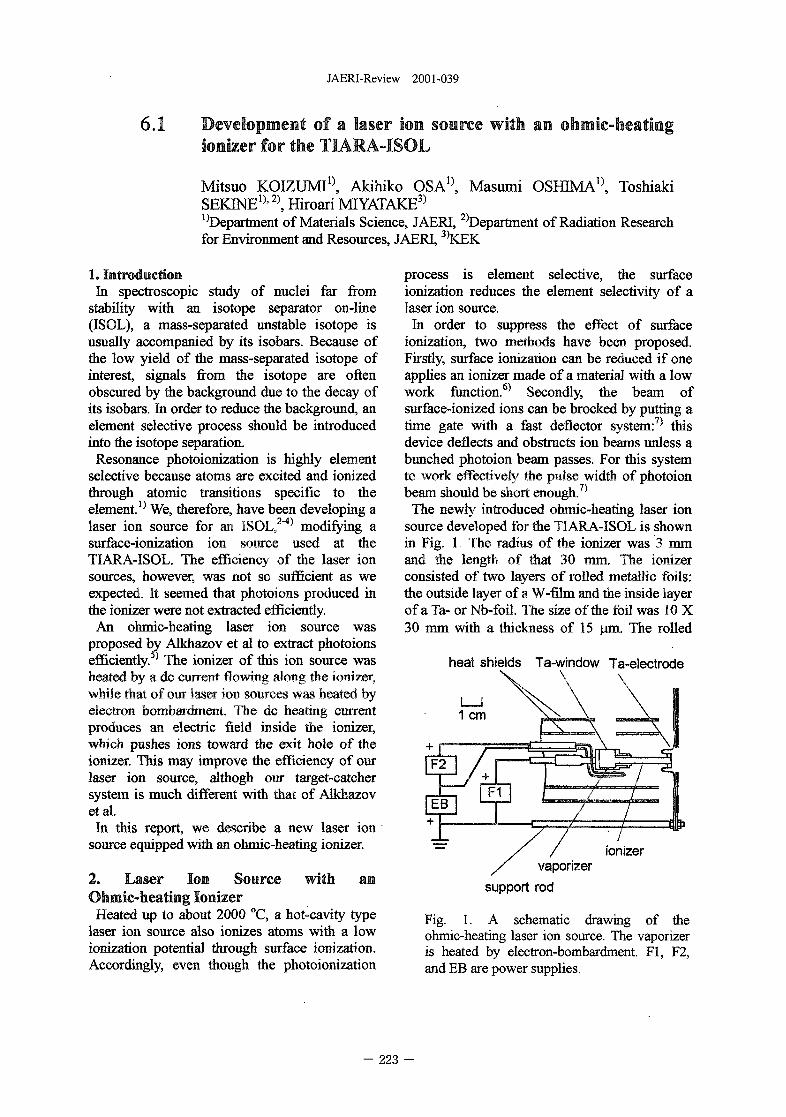
JAERI-Review 2001-039
6.1 Development of a laser ion source with an ohmic-heatingIonizer for the TIARA-ISOL
Mitsuo KOIZUMI1^ Akihiko OSA1}, Masumi OSHIMA1^ ToshiakiSEKINE1^2), Hiroari MIYATAKE3)
^Department of Materials Science, JAERI, 2)Department of Radiation Researchfor Environment and Resources, JAERI, 3)KEK
1. IntroductionIn spectroscopic study of nuclei far from
stability with an isotope separator on-line(ISOL), a mass-separated unstable isotope isusually accompanied by its isobars. Because ofthe low yield of the mass-separated isotope ofinterest, signals from the isotope are oftenobscured by the background due to the decay ofits isobars. In order to reduce the background, anelement selective process should be introducedinto the isotope separation.
Resonance photoionization is highly elementselective because atoms are excited and ionizedthrough atomic transitions specific to theelement.^ We, therefore, have been developing alaser ion source for an ISOL,2'4^ modifying asurface-ionization ion source used at theTIARA-ISOL. The efficiency of the laser ionsources, however, was not so sufficient as weexpected. It seemed that photoions produced inthe ionizer were not extracted efficiently.
An ohmic-heating laser ion source wasproposed by Alkhazov et al to extract photoionsefficiently. The ionizer of this ion source washeated by a dc current flowing along the ionizer,while that of our laser ion sources was heated byelectron bombardment. The dc heating currentproduces an electric field inside the ionizer,which pushes ions toward the exit hole of theionizer. This may improve the efficiency of ourlaser ion source, althogh our target-catchersystem is much different with that of Alkhazovetal.
In this report, we describe a new laser ionsource equipped with an ohmic-heating ionizer.
2. Laser Ion Source with anQfamic-faeatimg Ionizer
Heated up to about 2000 °C, a hot-cavity typelaser ion source also ionizes atoms with a lowionization potential through surface ionization.Accordingly, even though the photoionization
process is element selective, the surfaceionization reduces the element selectivity of alaser ion source.
In order to suppress the effect of surfaceionization, two methods have been proposed.Firstly, surface ionization can be reduced if oneapplies an ionizer made of a material with a lowwork function.6) Secondly, the beam ofsurface-ionized ions can be brocked by putting atime gate with a fast deflector system:7) thisdevice deflects and obstructs ion beams unless abunched photoion beam passes. For this systemto work effectively the pulse width of photoionbeam should be short enough.7*
The newly introduced ohmic-heating laser ionsource developed for the TIARA-ISOL is shownin Fig. 1. The radius of the ionizer was 3 mmand the length of that 30 mm. The ionizerconsisted of two layers of rolled metallic foils:the outside layer of a W-film and the inside layerof a Ta- or Nb-foil. The size of the foil was 10 X30 mm with a thickness of 15 |um. The rolled
heat shields Ta-window Ta-electrode
ionizervaporizer
support rod
Fig. 1. A schematic drawing of theohmic-heating laser ion source. The vaporizeris heated by electron-bombardment. Fl, F2,and EB are power supplies.
- 223 -
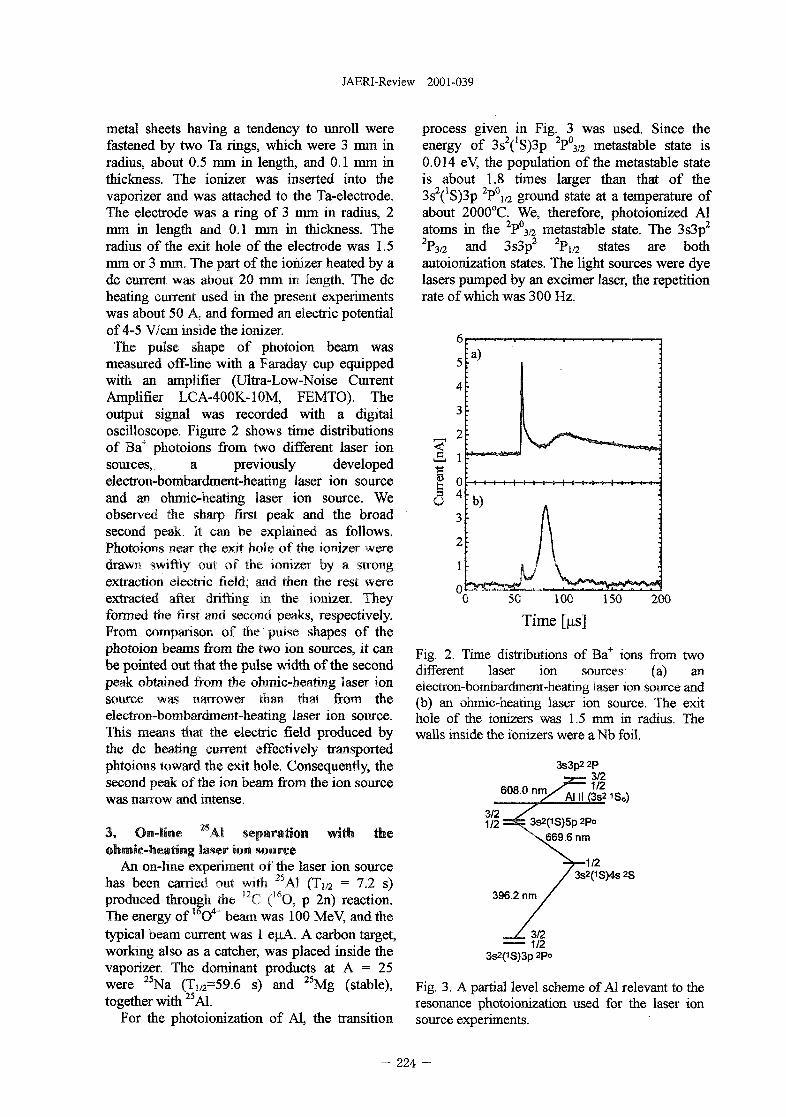
JAERI-Review 2001-039
metal sheets having a tendency to unroll werefastened by two Ta rings, which were 3 mm inradius, about 0.5 mm in length, and 0.1 mm inthickness. The ionizer was inserted into thevaporizer and was attached to the Ta-electrode.The electrode was a ring of 3 mm in radius, 2mm in length and 0.1 mm in thickness. Theradius of the exit hole of the electrode was 1.5mm or 3 mm. The part of the ionizer heated by adc current was about 20 mm in length. The dcheating current used in the present experimentswas about 50 A, and formed an electric potentialof 4-5 V/cm inside the ionizer.
The pulse shape of photoion beam wasmeasured off-line with a Faraday cup equippedwith an amplifier (Ultra-Low-Noise CurrentAmplifier LCA-400K-10M, FEMTO). Theoutput signal was recorded with a digitaloscilloscope. Figure 2 shows time distributionsof Baf photoions from two different laser ionsources, a previously developedelectron-bombardment-hearing laser ion sourceand an ohmic-heating laser ion source. Weobserved the sharp first peak and the broadsecond peak. It can be explained as follows.Photoions near the exit hole of the ionizei weredrawn swiftly out of the ionizer by a strongextraction electric field; and then the rest wereextracted after drifting in the ionizer. Theyformed the first and second peaks, respectively.From comparison of the pulse shapes of thephotoion beams from the two ion sources, it canbe pointed out that the pulse width of the secondpeak obtained from the ohmic-heating laser ionsource was narrower than that from theelectron-bombardment-heating laser ion source.This means that the electric field produced bythe dc heating current effectively transportedphtoions toward the exit hole. Consequently, thesecond peak of the ion beam from the ion sourcewas narrow and intense.
3. On-line KAI separation with theohmic-heating laser ion source
An on-line experiment of the laser ion sourcehas been carried out with 25A1 (T1/2 = 7.2 s)produced through the !2C (I6O, p 2n) reaction.The energy of O4" beam was 100 MeV, and thetypical beam current was 1 e(xA. A carbon target,working also as a catcher, was placed inside thevaporizer. The dominant products at A = 25were 25Na (Tj/2=59.6 s) and 25Mg (stable),together with 25A1.
For the photoionization of Al, the transition
process given in Fig. 3 was used. Since theenergy of 3s2(1S)3p 2P°3/2 metastable state is0.014 eV, the population of the metastable stateis about 1.8 times larger than that of the3s2('S)3p 2P°1/2 ground state at a temperature ofabout 2000°C. We, therefore, photoionized Alatoms in the 2P°3/2 metastable state. The 3s3p2
2P3/2 and 3s3p2 2Pi/2 states are bothautoionization states. The light sources were dyelasers pumped by an excimer laser, the repetitionrate of which was 300 Hz.
150 200
Fig. 2. Time distributions of Ba+ ions from twodifferent laser ion sources: (a) anelectron-bombardment-heatmg laser ion source and(b) an ohimc-heating laser ion source. The exithole of the ionizers was 1.5 mm in radius. Thewalls inside the ionizers were a Nb foil.
608.0 i3/21/2
1SO )
3s2(iS)5p 2Po669.6 nm
1/23s2(iS)4s2S
3/21/2
3s2(1S)3p2Po
Fig. 3. A partial level scheme of Al relevant to theresonance photoionization used for the laser ionsource experiments.
- 224 -
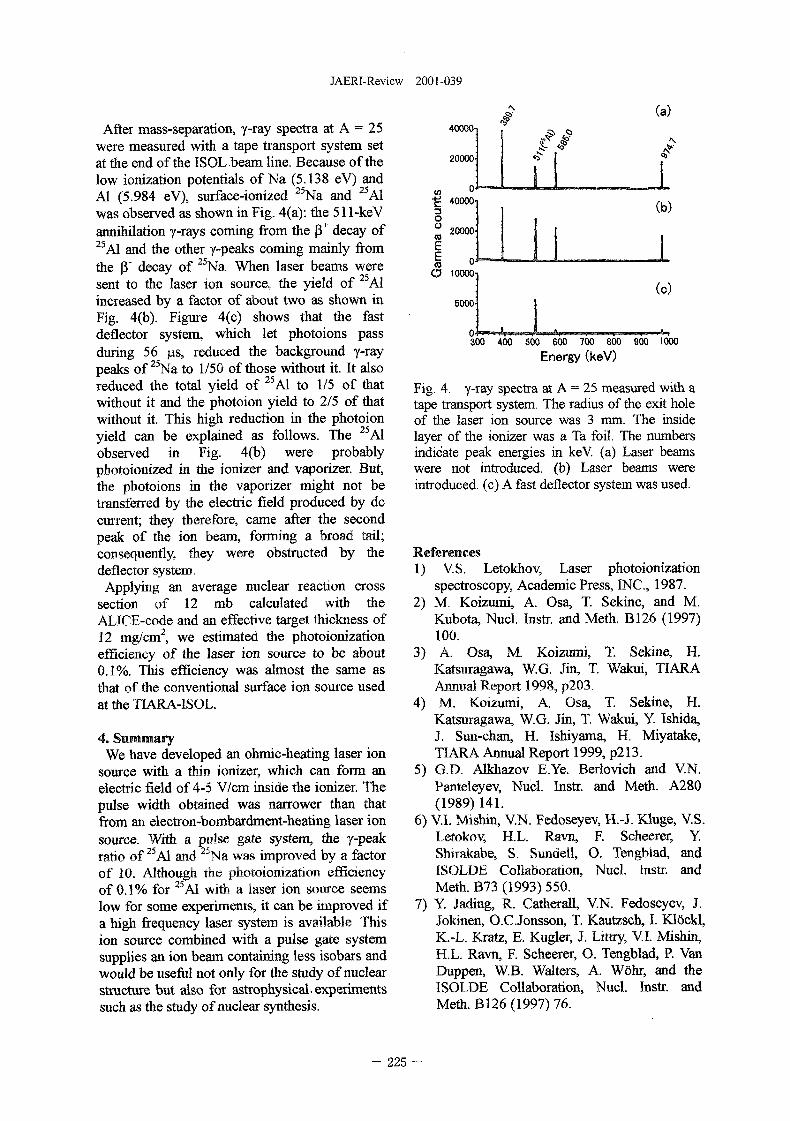
JAERI-Review 2001-039
(a)After mass-separation, y-ray spectra at A = 25
were measured with a tape transport system setat the end of the ISOL beam line. Because of thelow ionization potentials of Na (5.138 eV) andAl (5.984 eV), surface-ionized 25Na and 25A1was observed as shown in Fig. 4(a): the 511-keVannihilation y-rays coming from the P+ decay of25Al and the other y-peaks coming mainly fromthe P' decay of 25Na. When laser beams weresent to the laser ion source, the yield of 25A1increased by a factor of about two as shown inFig. 4(b). Figure 4(c) shows that the fastdeflector system, which let photoions passduring 56 |as, reduced the background y-raypeaks of 25Na to 1/50 of those without it. It alsoreduced the total yield of 25A1 to 1/5 of thatwithout it and the photoion yield to 2/5 of thatwithout it. This high reduction in the photoionyield can be explained as follows. The Alobserved in Fig. 4(b) were probablyphotoionized in the ionizer and vaporizer. But,the photoions in the vaporizer might not betransferred by the electric field produced by dccurrent; they therefore, came after the secondpeak of the ion beam, forming a broad tail;consequently, they were obstructed by thedeflector system.
Applying an average nuclear reaction crosssection of 12 mb calculated with theALlCE-code and an effective target thickness of12 mg/cm2, we estimated the photoionizationefficiency of the laser ion source to be about0.1%. This efficiency was almost the same asthat of the conventional surface ion source usedat the T1ARA-ISOL.
4. SummaryWe have developed an ohmic-heating laser ion
source with a thin ionizer, which can form anelectric field of 4-5 V/cm inside the ionizer. Thepulse width obtained was narrower than thatfrom an electron-bombardment-heating laser ionsource. With a pulse gate system, the y-peakratio of 25A1 and 25Na was improved by a factorof 10. Although the photoionizarion efficiencyof 0.1% for 25A1 with a laser ion source seemslow for some experiments, it can be improved ifa high frequency laser system is available, Thision source combined with a pulse gate systemsupplies an ion beam containing less isobars andwould be useful not only for the study of nuclearstructure but also for astrophysical- experimentssuch as the study of nuclear synthesis.
400001
20000
° 20000'
ECO "
O 10000-
5000'0'
(b)
I I(c)
* •
300 400 500 600 700 800 900 1000
Energy (keV)
Fig, 4. y-ray spectra at A = 25 measured with atape transport system. The radius of the exit holeof the laser ion source was 3 mm. The insidelayer of the ionizer was a Ta foil. The numbersindicate peak energies in keV. (a) Laser beamswere not introduced, (b) Laser beams wereintroduced, (c) A fast deflector system was used.
References1) V.S. Letokhov, Laser photoionization
spectroscopy, Academic Press, INC., 1987.2) M. Koizumi, A. Osa, T. Sekine, and M.
Kubota, Nucl. Instr. and Meth. B126 (1997)100.A. Osa, M. Koizumi, T. Sekine, H.3)
4)
Katsuragawa, W.G. Jin, T. Wakui, TIARAAnnual Report 1998, p203.M. Koizumi, A. Osa, T. Sekine, H.
Katsuragawa, W.G. Jin, T. Wakui, Y. Ishida,J. Sun-chan, H. Ishiyama, H. Miyatake,TIARA Annual Report 1999, p213.
5) G.D. Alkhazov E.Ye. Beriovich and V.N.Panteleyev, Nucl. Instr. and Meth. A280(1989) 141.
6) V.I. Mishin, V.N. Fedoseyev, H.-J. Kluge, V.S.Letokov, H.L. Ravn, F. Scheerer, Y.Shirakabe, S. Simdell, O. Tengblad, andISOLDE Collaboration, Nucl. Instr. andMeth. B73 (1993) 550.
7) Y. Jading, R. Catherall, V.N. Fedoseyev, J.Jokinen, O.C.Jonsson, T. Kautzsch, I. Klockl,K.-L. Kratz, E. Kugler, J. Littry, V.I. Mishin,H.L. Ravn, F. Scheerer, O. Tengblad, P. VanDuppen, W.B. Walters, A. Wohr, and theISOLDE Collaboration, Nucl. Instr. andMeth. B126 (1997) 76.
- 225 -
JAERI-Review 2001-039
6.2 Internal Conversion Electron Measurements in the Decay of the126Proton-rich Isotope Ce using an On-line Mass Separator
M. Shibata, T. Shindou, H. Yamamoto, K. Kawade, A. Taniguchi*, A. Osa**, M.
Koizumi , T. Sekine
Graduate School of Engineering, Nagoya University, *Research Reactor Institute,
Kyoto University, ^Department of Materials Science, JAERI, ***Department of
Radiation Research for Environment and Resources, JAERI
1. Introduction
Spins and parities of excited states are
important information for nuclear structure far
from the stability line. When differences of
spin values between isomers are large, internal
conversion electron (ICE) measurement is an
effective method to identify isomeric states.
Concerning the doubly odd nuclide 126La, the
gp and y-y angular correlation have been
already measured and the level structure of its
daughter nuclide of 126Ba have been studied
well by using the on-line mass separator
installed at the AVF cyclotron in JAERI,
Takasaki (TIARA-ISOL). From the data,
Asai et alP and Kojima et al.2^ proposed the
decay scheme with low-spin and high-spin
isomeric states whose half-lives of 50 s and 54
s, respectively. Kojima et al?^ also deduced
the gp values to be 7910(400) and 7700(100)
keV, respectively. This result predicts an
isomeric state of about 200 keV, although the
gp values have large uncertainties. In this
region, other proton-rich lanthanum isotopes
have isomeric states similarly, while their level
orderings are also unknown. In order to
identify the isomeric state, we already
measured not only p-y delayed coincidences
but also p-y anti coincidences for 126Ce decay,
however, we could not observed it. The spin
differences between the two isomers are
expected to be large enough to observe the
ICEs according to Kojima et al? In this
experiment, we tried to identify the isomer by
measuring the ICE in the decay of 126Ce by
using a cooled Si(Li) detector installed at the
TIARA-ISOL.
2. Experiment
An Argon beam (36Ar8+, 195MeV) from
the AVF cyclotron was irradiated on 93.9%
enriched 94Mo targets for production of 126Ce.
The fusion-evaporation reaction products of126Ce were ionized by a surface ionization
technique in Ce monoxide (CeO+) and
mass-separated by the TAIRA-ISOL. The
mass-separated beams were implanted into a
computer-controlled aluminized Mylar tape
and transported to the counting position every
100 s of about 2 times the half-life of 126Ce
(T1/2= 54 s).
At the counting position, a Si(Li) detector (300
mm2 x 5 mm', provided by Eurisys Co.) for
ICEs. For y-ray measurements, an LEPS (50
mm'' x 10 cmr, Low Energy Photon
Spectrometer, provided by ORTEC Co.) was
adopted in order to measure the low energy
region below 820 keV carefully. Singles and
e"-y coincidence measurements were carried
out for 16 hours totally by setting the detectors
in 180° geometry.
3. Results and Discussion
A portion of the singles ICE spectrum
associated with the decay of 126Ce obtained
- 226
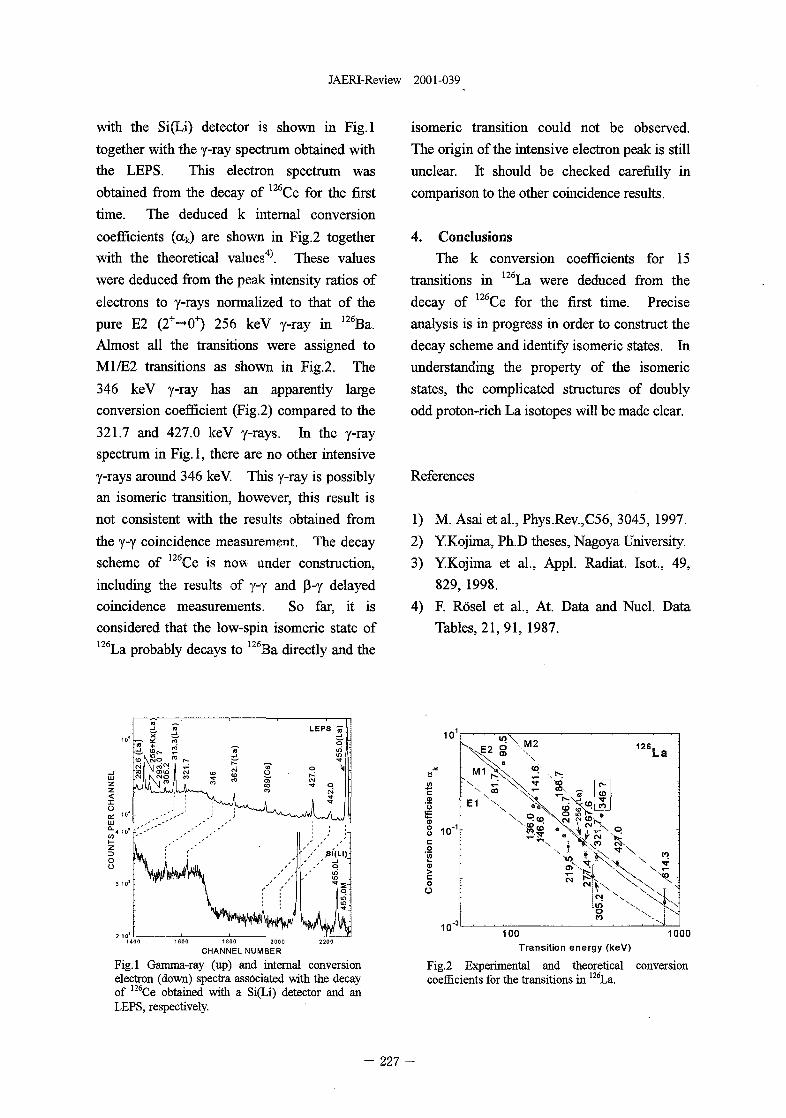
JAERI-Review 2001-039
with the Si(Li) detector is shown in Fig.l
together with the y-ray spectrum obtained with
the LEPS. This electron spectrum was
obtained from the decay of 126Ce for the first
time. The deduced k internal conversion
coefficients (ak) are shown in Fig.2 together
with the theoretical values4). These values
were deduced from the peak intensity ratios of
electrons to y-rays normalized to that of the
pure E2 (2+->0+) 256 keV y-ray in 126Ba.
Almost all the transitions were assigned to
M1/E2 transitions as shown in Fig.2. The
346 keV y-ray has an apparently large
conversion coefficient (Fig.2) compared to the
321.7 and 427.0 keV y-rays. In the y-ray
spectrum in Fig.l, there are no other intensive
y-rays around 346 keV. This y-ray is possibly
an isomeric transition, however, this result is
not consistent with the results obtained from
the y-y coincidence measurement. The decay
scheme of 126Ce is now under construction,
including the results of y-y and p-y delayed
coincidence measurements. So far, it is
considered that the low-spin isomeric state of126La probably decays to 126Ba directly and the
isomeric transition could not be observed.
The origin of the intensive electron peak is still
unclear. It should be checked carefully in
comparison to the other coincidence results.
4. Conclusions
The k conversion coefficients for 15
transitions in 126La were deduced from the
decay of 126Ce for the first time. Precise
analysis is in progress in order to construct the
decay scheme and identify isomeric states. In
understanding the property of the isomeric
states, the complicated structures of doubly
odd proton-rich La isotopes will be made clear.
References
1) M. Asai et al., Phys.Rev.,C56, 3045, 1997.
2) Y.Kojima, Ph.D theses, Nagoya University.
3) Y.Kojima et al., Appl. Radiat. Isot, 49,
829, 1998.
4) F. Rosel et al., At. Data and Nucl. Data
Tables, 21, 91, 1987.
1800 2000
CHANNEL NUMBER
Fig.l Gamma-ray (up) and internal conversionelectron (down) spectra associated with the decayof 12SCe obtained with a Si(Li) detector and anLEPS, respectively.
100 1000Transition energy (keV)
Fig.2 Experimental and theoretical conversioncoefficients for the transitions in 126La.
227 -
JAERI-Review 2001-039
6.3 Synthesis of Endofaedral 133Xe-FuIIerene by ion implantation
S. Watanabe1, N. S. Ishioka1, T. Sekine1, A. Osa2, M. Koizumi2, H.Muramatsu3, H. Shimomura3, K. Yoshikawa3
department of Radiation Research for Environment and Resources, department ofMaterials Science, 3Faculty of Education, Shinsyu University
1. IntroductionEndohedral fullerene, which encapsulates
one, two or three atoms within a fullerenecage, has been produced by usingarc-discharge, laser-vaporization andnuclear-reaction processes. The products bythese methods are mixtures of differentspecies of fullerenes, e.g., Cs2 and C84, withdifferent encapsulated atoms. To obtain aproduct containing one species ofendohedral fullerene in high purity,ion-implantation may be a promisingprocess, in particular for radioisotopes. Inthe literature, however, light elements suchas He and Li have been encapsulated intofullerene by ion-implantation. In the presentpaper, we describe the production ofendohedral !33Xe-fullerene by implantationof 133Xe ions into a fullerene target.
2. ExperimentalThe targets used for ion-implantation
were made by vacuum evaporation of 1 mgof C6o or C70 on Ni foils in an area of
1 T5
25mm<|). Implantation of Xe ions wascarried out with an isotope separator at anacceleration energy of 40 keV. After ionimplantation, the targets were dissolved ino-dichlorobenzene. The target solutionswere filtered through a millipore filter toremove insoluble materials. The filtrateswere injected into a column of 5PBB, 5PYEor Buckyprep supplied by Cosmosil andeluted with o-dichlorobenzene at a flow rateof 1 ml/min. The concentration of fullerenein the effluent was continuously monitoredby a UV detector. The effluent from the UV
detector was collected for 0.5 min intervaland the 133Xe radioactivity in each fractionwas measured by y-ray spectrometry.
•133,3. Results and Discussion
Figure 1 shows the elution curves of 1JJXeradioactivity and C60 concentration obtainedby using Buckyprep column. The peak ofthe UV chromatogram at 4 min correspondsto C60, as determined at the calibration run.The strong correlation observed between theC60 and 133Xe peaks corroborates theformation of 133Xe@C60, although the 133Xepeak was followed by a tail. The samestrong correlation was observed between C60and 12/Xe by Otsuki et al.1^ using a nuclearreaction for production of 127Xe@C6o, andalso between C60 and Ar by DiCamello etal.2^ applying high-pressure andhigh-temperature for production of Ar@C6o,although their column materials were not thesame as ours. Similar HPLC data obtainedfor the 133Xe-implanted C70 samplescorroborate the formation of Xe@C?o.
Our chromatograms are much simplerthan those reported by Otsuki et al^. Fromtheir chromatograms they reported thatdimers (C6o-C6o, 127Xe@C6o-C6o) wereproduced, while no distinct peak possiblycorresponding to a dimer was observed inthe present work. This difference indicatesthat our ion-implantation process was muchmilder than the process involving a nuclearreaction.
As mentioned above, the 133Xe peak wasfollowed by a tail. Similar tails wereobserved for the other column materials
- 228 -
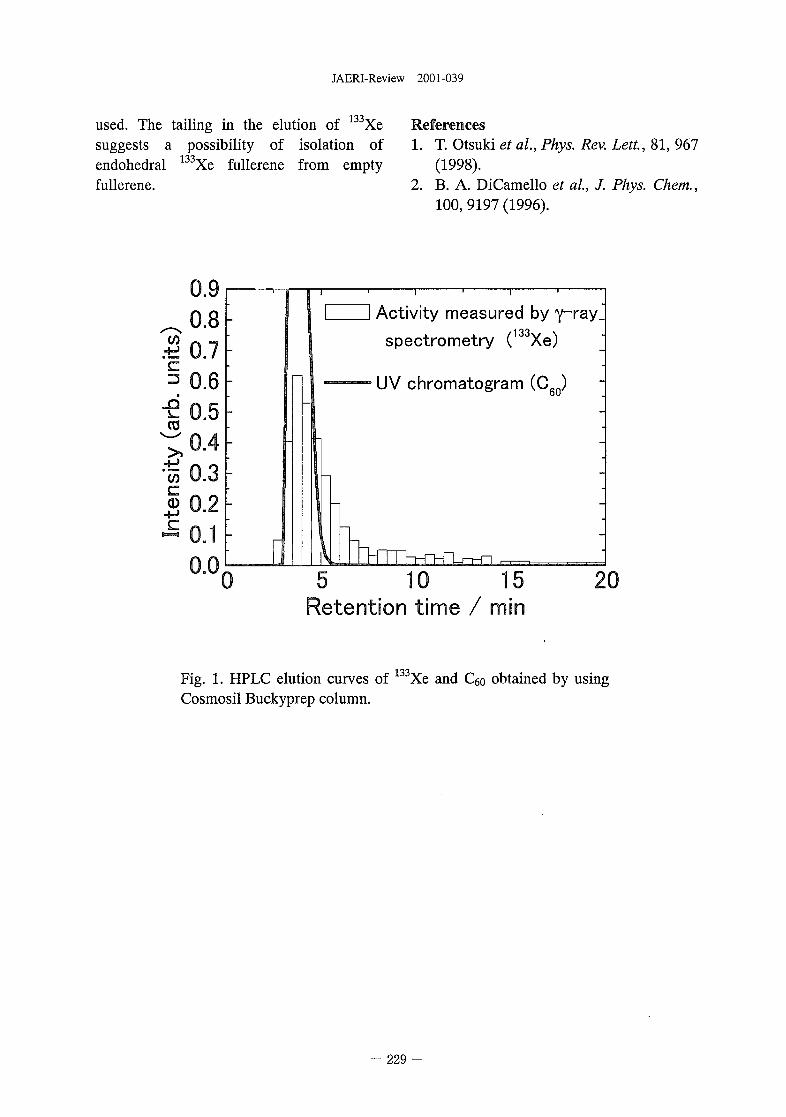
JAERI-Review 2001-039
used. The tailing in the elution of Xesuggests a possibility of isolation ofendohedralfullerene.
133Xe fullerene from empty
References1. T. Otsuki et al., Phys. Rev. Lett, 81, 967
(1998).2. B. A. DiCamello et al., J. Phys. Chem.,
100, 9197 (1996).
0.9_ 0 . 8±i 0.7§ 0.6•e 0.5^ 0 . 4•% 0.3
I 0.2•S0.1
0.00
r6 ' ! I
Activity measured by
spectrometry ( Xe)
UV chromatogram (C60)
h-rm-i-n-n5 10 15
Retention time / min20
Fig. 1. HPLC elution curves of 133Xe and C6o obtained by usingCosmosil Buckyprep column.
- 229 -
JAERI-Review 2001-039
6.4 Excitation Functions of Rhenium Isotopes on the natW(d,xn)Reactions and Production of No-Carrier-Added 186Re
N. S. Ishioka1, S. Watanabe1, A. Osa2, M. Koizumi2, H. Matsuoka3, T.Sekine1
'Department of Radiation Research for Environment and Resources, JAERT,2Deparrment of Materials Science, JAERI, ^Department of Research Reactor, JAERI
1. IntroductionRhenium-186 is regarded as one of the
best radionuclides used for radiotheraphyand radioimrnunotherapy due to its attractiveproperties which include emission ofhigh-energy j3 -rays (E/3 ;imx=I.O7 MeV)and decay to stable daughter with anappropriate half-life (Tm= 3.8 d). Especiallyfor radioimmunotherapy, the Re productis required to have very high specificactivity. Our earlier work illustrated thatno-carrier-added IS6Re can be producedusing the 186W(p,n)i86Re nuclear reaction onhighly isotopically enriched 186W.1}
However, the available physical yield of thisreaction is rather low (520 MBq/^iA usingan enriched 186W (100%) target at protonenergies 13.6—»0 MeV).
Exploring the feasibility of the productionof no-carrier-added 186Re using the186W(d,2n)186Re nuclear reaction, severalauthors have measured its excitationfunction at deuteron energies up to 21 MeV.2,J,4,5) jjjgy k a v e repOrte(j that the maximumcross section value is at least four times ofthat measured on the 186W(p,n)186Re reaction.However, there are considerable differencesbetween the reported excitation functions. Inaddition, excitation functions for otherdeuteron-induced reactions on tungstenisotopes, which are needed for evaluation ofthe radiochemical purity of the product, arescarce.
2. ExperimentalThe excitation functions were measured
using the stacked-foil technique.
Natural-composition tungsten foils of 28.5mg/cm2 were used as a target material. Thestacked targets consisting of tungsten,aluminum and copper foils were irradiatedwith a 35 MeV deuteron beam at the AVFcyclotron in TIARA. Irradiations werecarried out with a 1 \xA beam for 10 min.The incident beam energies at each tungstenfoil were calculated according to theOSCAR code7) which is made on the basisof Zieglers's formulas81. The averaged beamcurrent was determined from theradioactivity produced in the copper foils.After irradiation, radioactivities in the foilswere assayed by y-ray spectrometry using acalibrated Ge detector.
3. Results and DiscussionCross sections of
186W(d,2n)186Re, nalthe
W(d,xn)18M84Rereactions
andI86W(d,p)187W were deduced from the181-186r 187*DRe, 1O'W and 65Zn radioactivities byreference to the nuclear data9) and the crosssections of the 65Cu(d,2n)65Zn reactionreported by Fulmer et al.10)
Fig.l shows the excitation functions ofthe 186W(d,2n)186Re reaction obtained in thepresent work together with the previouslyreported ones and a theoretical one. Thepresent excitation function curve reaches itsmaximum of 450 mb at 13 MeV, which is ingood agreement with the result ofSzelecsenyi et al5) Although the crosssection values given by Zhenlan et al4) arein agreement with ours concerning themagnitude of the maximum, their curveshows a slight energy shift, as noted by
- 230 -
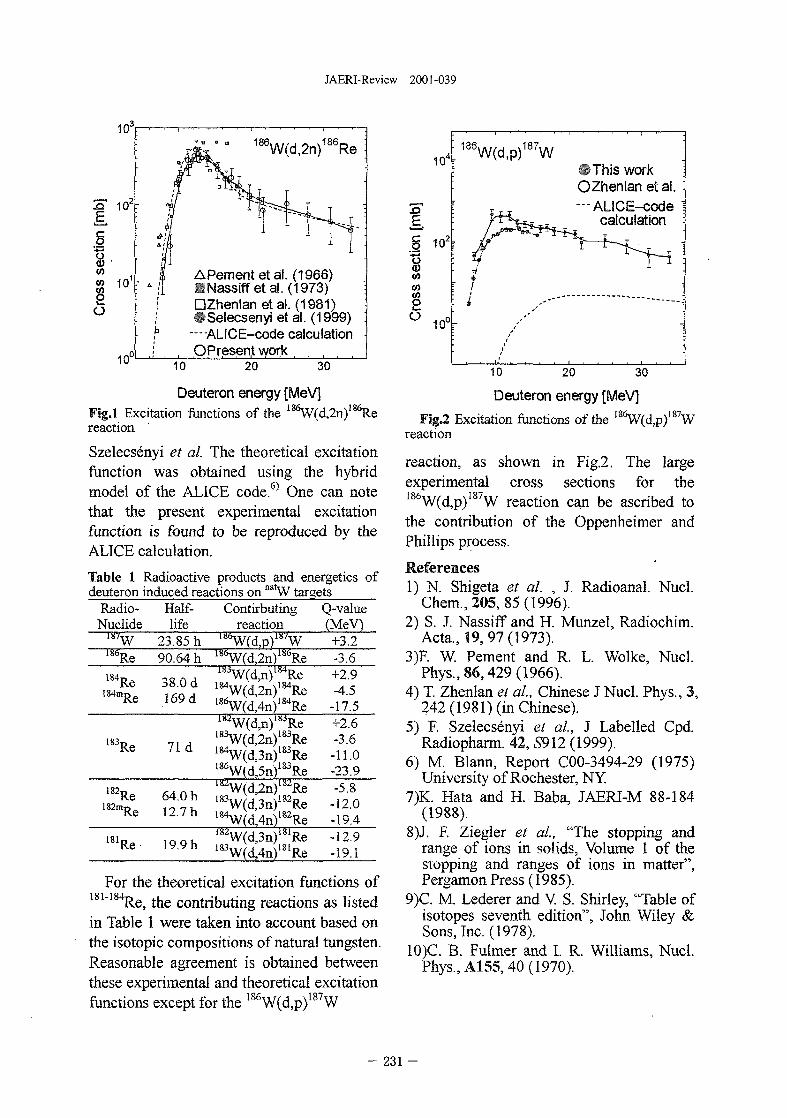
JAERI-Review 2001-039
10-
. Q 102r
186W(d,2n)186-
APementetal. (1966)Nassiffetal. (1973)
DZhenlanetal. (1981)Selecsenyi et al. (1999)
—-ALICE-code calculationOPresentwork
10 20 30
Deuteron energy [MeV3Fig.l Excitation functions of the 186W(d,2n)186Rereaction
Szelecsenyi et al. The theoretical excitation-function was obtained using the hybridmodel of the ALICE code.G) One can notethat the present experimental excitationfunction is found to be reproduced by theALTCE calculation.
Table 1 Radioactive products and energetics ofdeuteron induced reactions on natW targets
Radio-Nuclide
lii6Re184Re
I84mRe
183Re
I82Re182mRe
m Re
Half-life
23.85 h90.64 h
38.0 d169 d
71 d
64.0 h12.7h
19.9h
Contirbutingreaction
lll(>W(d,p)18/W1!i6W(d,2n)1!S6RelwW(d,n) l ! i4Re
184W(d,2n)184Re186W(d,4n)184Re182W(d,n)1!iJRe
183W(d,2n)183Re184W(d,3n)183Re186W(d,5n)iS3Re1S2W(d,2n)18/Re183W(d,3n)182Re184W(d,4n)182Re182W(d,3n)181Re183W(d,4n)18IRe
Q-value(MeV)+3.2-3.6+2.9-4.5
-17.5+2.6-3.6-11.0-23.9-5.8
-12.0-19.4-12.9-19.1
For the theoretical excitation functions of181"184Re, the contributing reactions as listedin Table 1 were taken into account based onthe isotopic compositions of natural tungsten.Reasonable agreement is obtained betweenthese experimental and theoretical excitationfunctions except for the 186W(d,p)187W
X)
ss s
ectio
nC
ro
104
102
10°
'_ 186W(d,p)187W
r
C* This work \OZhenlan et al. :— ALICE-code 1
calculation :
-=
10 20 30
Deuteron energy [MeV]
Fig.2 Excitation functions of the 186W(d,p)187Wreaction
reaction, as shown in Fig.2. The largeexperimental cross sections for the186W(d,p)187W reaction can be ascribed tothe contribution of the Oppenheimer andPhillips process.
References1) N. Shigeta et al. , J. Radioanal. Nucl.
Chem., 205, 85(1996).2) S. J. Nassiff and H. Munzel, Radiochim.
Acta., 19,97(1973).3)F. W. Pement and R. L. Wolke, Nucl.
Phys.,86,429(1966).4) T. Zhenlan et a!., Chinese J Nucl. Phys., 3,
242 (1981) (in Chinese).5) F. Szelecsenyi et al, J Labelled Cpd.
Radiopharm. 42,5912 (1999).6) M. Blann, Report C00-3494-29 (1975)
University of Rochester, NY7)K. Hata and HBaba , JAERI-M 88-184
(1988).8)J. F. Ziegler et al., 'The stopping and
range of ions in solids, Volume 1 of thestopping and ranges of ions in matter",Pergamon Press (1985).
9)C. M. Lederer and V. S. Shirley, 'Table ofisotopes seventh edition", John Wiley &Sons, Tnc. (1978).
10)C. B. Fulmer and I. R. Williams, Nucl.Phys., A155, 40 (1970).
- 2 3 1 -
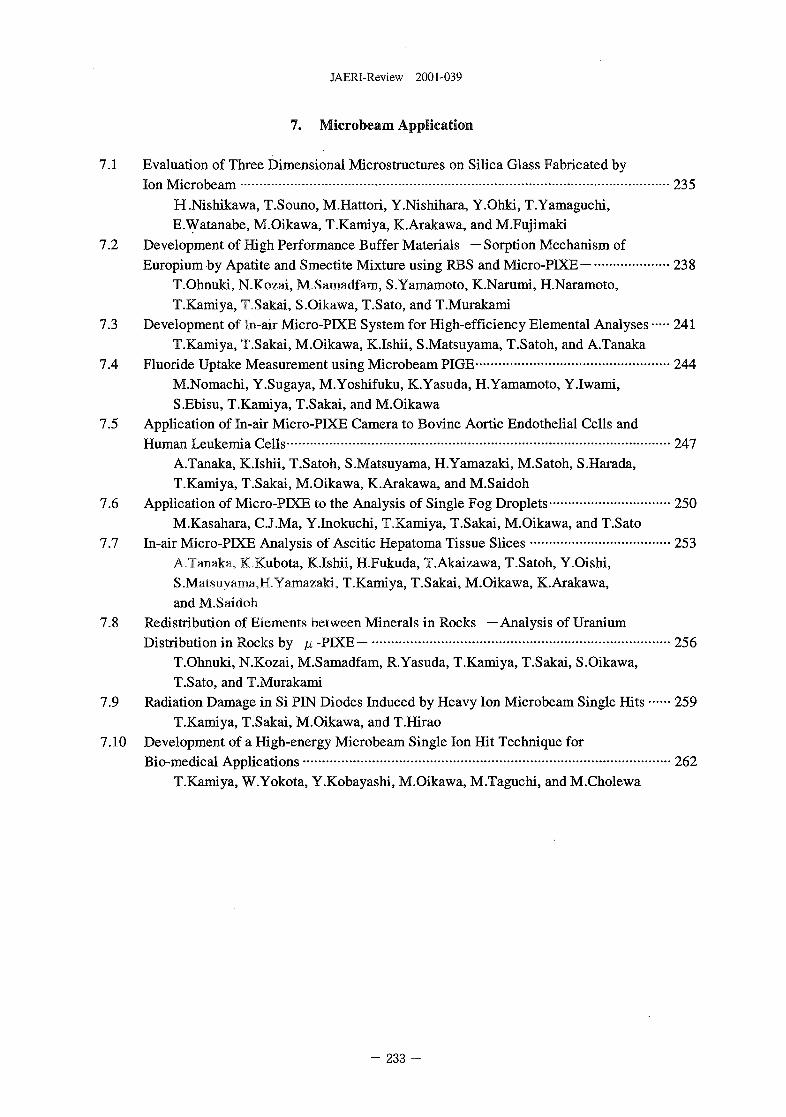
JAERI-Review 2001-039
7. Microbeam Application
7.1 Evaluation of Three Dimensional Microstructures on Silica Glass Fabricated byIon Microbeam 235
H.Nishikawa, T.Souno, M.Hattori, Y.Nishihara, Y.Ohki, T.Yamaguchi,E.Watanabe, M.Oikawa, T.Kamiya, K.Arakawa, and M.Fujimaki
7.2 Development of High Performance Buffer Materials — Sorption Mechanism ofEuropium by Apatite and Smectite Mixture using RBS and Micro-PIXE— 238
T.Ohnuki, N.Kozai, M.Samadfam, S.Yamamoto, K.Narumi, H.Naramoto,T.Kamiya, T.Sakai, S.Oikawa, T.Sato, and T.Murakami
7.3 Development of In-air Micro-PIXE System for High-efficiency Elemental Analyses 241T.Kamiya, T.Sakai, M.Oikawa, K.Ishii, S.Matsuyama, T.Satoh, and A.Tanaka
7.4 Fluoride Uptake Measurement using Microbeam PIGE 244M.Nomachi, Y.Sugaya, M.Yoshifuku, K.Yasuda, H.Yamamoto, Ylwami,S.Ebisu, T.Kamiya, T.Sakai, and M.Oikawa
7.5 Application of In-air Micro-PIXE Camera to Bovine Aortic Endothelial Cells andHuman Leukemia Cells 247
A.Tanaka, K.Ishii, T.Satoh, S.Matsuyama, H.Yamazaki, M.Satoh, S.Harada,T.Kamiya, T.Sakai, M.Oikawa, K.Arakawa, and M.Saidoh
7.6 Application of Micro-PIXE to the Analysis of Single Fog Droplets 250M.Kasahara, CJ.Ma, Y.Inokuchi, T.Kamiya, T.Sakai, M.Oikawa, and T.Sato
7.7 In-air Micro-PIXE Analysis of Ascitic Hepatoma Tissue Slices 253A.Tanaka, K.Kubota, K.Ishii, H.Fukuda, T.Akaizawa, T.Satoh, Y.Oishi,S.Matsuyama,H.Yamazaki, T.Kamiya, T.Sakai, M.Oikawa, K.Arakawa,and M.Saidoh
7.8 Redistribution of Elements between Minerals in Rocks —Analysis of UraniumDistribution in Rocks by p. -PIXE — 256
T.Ohnuki, N.Kozai, M.Samadfam, R.Yasuda, T.Kamiya, T.Sakai, S.Oikawa,T.Sato, and T.Murakami
7.9 Radiation Damage in Si PIN Diodes Induced by Heavy Ion Microbeam Single Hits 259T.Kamiya, T.Sakai, M.Oikawa, and T.Hirao
7.10 Development of a High-energy Microbeam Single Ion Hit Technique forBio-medical Applications 262
T.Kamiya, W.Yokota, Y.Kobayashi, M.Oikawa, M.Taguchi, and M.Cholewa
- 233 -
JAERI-Review 2001-039
7.1 Evaluation of Three Dimensional Microstructures on SilicaGlass Fabricated by Ion Microbeam
H. Nishikawa 1}, T. Souno l\ M. Hattori 2), Y. Nishihara 2\ Y. Ohki 2\ T. Yamaguchi 3 ) ,
E. Watanabe 3 ), M. Oikawa 4 ) , T. Kamiya 4 ) , K. Arakawa 4), M. Fuj imaki 5 )
!) Department of Electrical Engineering, Shibaura Institute of Technology2) Department of Electrical, Electronics, and Computer Engineering, Waseda Univ.3) Department of Electrical Engineering, Tokyo Metropolitan University4) Advanced Radiat ion Technology Center, J A E R I5) J apan Science and Technology Corporat ion
1. Introduction
Silica glass is an important material for
optical communications. Much attention has
been paid to the radiation effects induced by
high-energy particles and photons on silica glass
over the past several decades, since they have
capabilities in modifying the structures and
properties of the silica-based optical devices1-1. It
is therefore important to understand the changes
in silica glass induced by MeV order ion
implantation.
Refractive-index changes can be induced by
ion implantation for almost all kinds of silica
glass. Since the control of the refractive index is
possible by this technique, the ion implantation
is expected to be applied to the fabrication of
optical fiber gratings2'. This effect was mainly
determined by nuclear stopping power and can
be utilized for the fabrication of optical fiber
gratings.
The objective of this research is to
understand radiation effects on silica glass
induced by ion microbeam. Especially, aiming at
the formation of three dimensional
microstructures with modified optical and
topological properties, the present study focuses
on the spatial distribution of radiation effects
involved in the modification of various
properties of silica glass.
In this report, radiation effects on silica
induced by ion microbeam were investigated by
means of combined photoluminescence (PL) -
Raman microspectroscopy and atomic force
microscopy (AFM). We focused on the
electronic energy loss by which most defects are
induced, since it accounts for most of the total
energy loss in the case of MeV order ion
implantation. Irradiation of optical fibers using
ion microbeam was also performed for the
fabrication of optical fiber gratings.
2. Experimental Procedures
Ions ( Ff1", He2+, or Si5+ ) with energies in the
range of 2 to 18 MeV were implanted into
high-purity silica substrates with various OH
contents (<1 ppm to 1200 ppm) using a
microbeam line (TIARA, JAERI Takasaki, beam
diameter: ~1 um). Some of the samples were
implanted with rT at an energy of 4 MeV using
a tandem accelerator at the University of
Montreal.
Radiation effects by ion implantation were
investigated using a micro PL-Raman
spectrometer (JASCO) equipped with an Ar ion
- 235 -
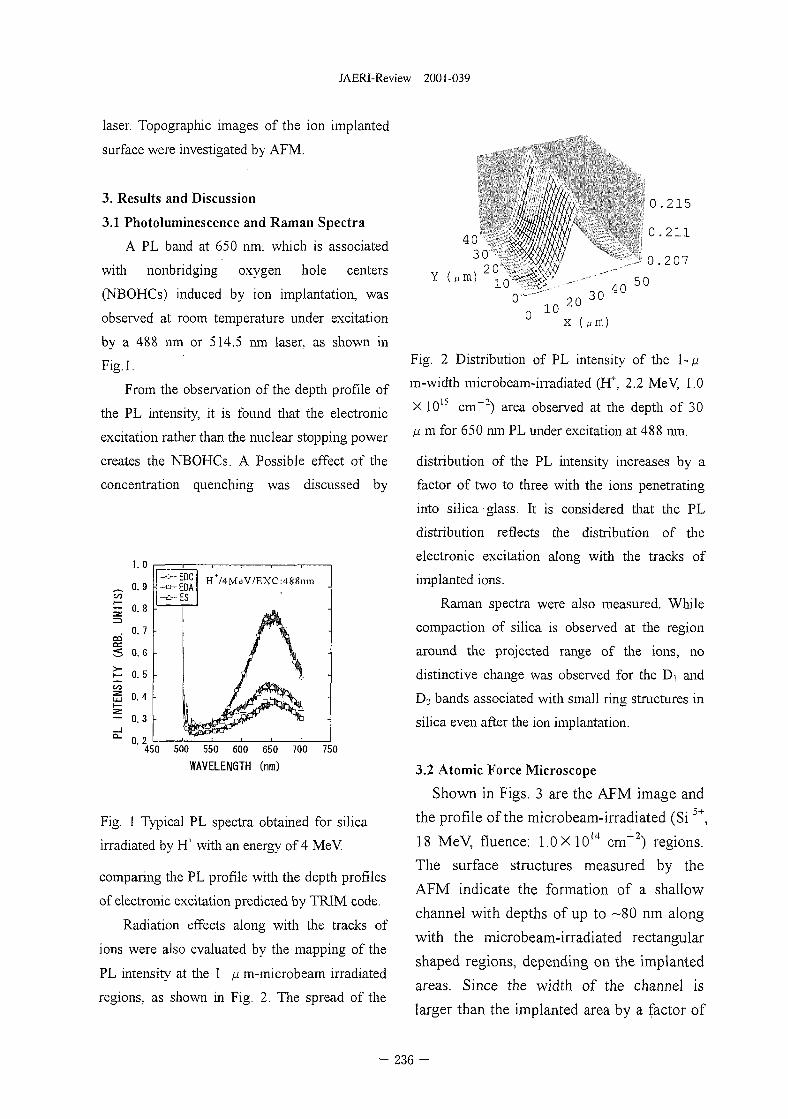
JAERI-Review 2001-039
laser. Topographic images of the ion implanted
surface were investigated by AFM.
3. Results and Discussion
3.1 Photoluminescence and Raman Spectra
A PL band at 650 nm: which is associated
with nonbridging oxygen hole centers
(NBOHCs) induced by ion implantation, was
observed at room temperature under excitation
by a 488 nm or 514.5 nm laser, as shown in
Fig. 1.
From the observation of the depth profile of
the PL intensity, it is found that the electronic
excitation rather than the nuclear stopping power
creates the NBOHCs. A Possible effect of the
concentration quenching was discussed by
1.0
0 9
. 0.7COa:S 0. 6
£j 0. 5
g 0. 4i—— 0.3_j
° - n •)
1—
- a - E D A- £ - ES
-
H+/4MeV/EXC:488nm
/ \
/ *
450 500 550 600 650 700 750
WAVELENGTH (nm)
Fig. 1 Typical PL spectra obtained for silica
irradiated by FT with an energy of 4 MeV.
comparing the PL profile with the depth profiles
of electronic excitation predicted by TRIM code.
Radiation effects along with the tracks of
ions were also evaluated by the mapping of the
PL intensity at the 1 fj. m-microbeam irradiated
regions, as shown in Fig. 2. The spread of the
3040
0
0
- 0
50
. 2 1 5
. 2 1 1
. 2 0 7
x (urn)
Fig. 2 Distribution of PL intensity of the l-/u
m-width microbeam-irradiated (FT, 2.2 MeV, 1.0
X 10ls cm"2) area observed at the depth of 30
fj. m for 650 nm PL under excitation at 488 nm.
distribution of the PL intensity increases by a
factor of two to three with the ions penetrating
into silica glass. It is considered that the PL
distribution reflects the distribution of the
electronic excitation along with the tracks of
implanted ions.
Raman spectra were also measured. While
compaction of silica is observed at the region
around the projected range of the ions, no
distinctive change was observed for the Dj and
D2 bands associated with small ring structures in
silica even after the ion implantation.
3.2 Atomic Force Microscope
Shown in Figs. 3 are the AFM image and
the profile of the microbeam-irradiated (Si"+,
18 MeV, fluence: 1.0X1014 cm"2) regions.
The surface structures measured by the
APM indicate the formation of a shallow
channel with depths of up to ~80 nm along
with the microbeam-irradiated rectangular
shaped regions, depending on the implanted
areas. Since the width of the channel is
larger than the implanted area by a factor of
- 236 -
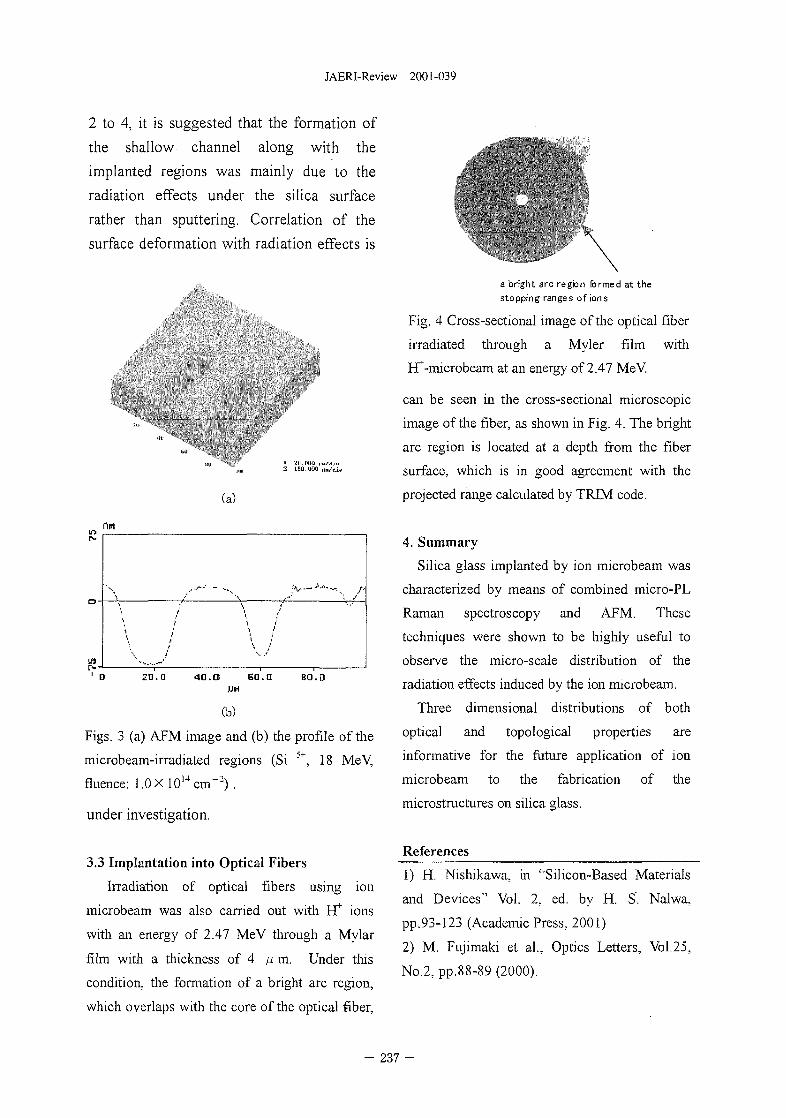
JAERI-Review 2001-039
2 to 4, it is suggested that the formation of
the shallow channel along with the
implanted regions was mainly due to the
radiation effects under the silica surface
rather than sputtering. Correlation of the
surface deformation with radiation effects is
(a)
4G.o 6a.a so.a
(b)
Figs. 3 (a) AFM image and (b) the profile of the
microbeam-irradiated regions (Si 5+, 18 MeV,
fluence: 1.0 X 1014 cm"2) .
under investigation.
3.3 Implantation into Optical Fibers
Irradiation of optical fibers using ion
microbeam was also carried out with KT ions
with an energy of 2.47 MeV through a Mylar
film with a thickness of 4 p. m. Under this
condition, the formation of a bright arc region,
which overlaps with the core of the optical fiber.
a bright arc region formed at thestopping ranges of ions
Fig. 4 Cross-sectional image of the optical fiber
irradiated through a Myler film with
HT-microbeam at an energy of 2.47 MeV.
can be seen in the cross-sectional microscopic
image of the fiber, as shown in Fig. 4. The bright
arc region is located at a depth from the fiber
surface, which is in good agreement with the
projected range calculated by TRIM code.
4. Summary
Silica glass implanted by ion microbeam was
characterized by means of combined micro-PL
Raman spectroscopy and AFM. These
techniques were shown to be highly useful to
observe the micro-scale distribution of the
radiation effects induced by the ion microbeam.
Three dimensional distributions of both
optical and topological properties are
informative for the future application of ion
microbeam to the fabrication of the
microstructures on silica glass.
References
1) H. Nishikawa, in '"Silicon-Based Materials
and Devices"' Vol. 2, ed. by H. S'. Nalwa,
pp.93-123 (Academic Press, 2001)
2) M. Fujimaki et al.. Optics Letters, Vol.25,
No.2, pp.88-89 (2000).
- 237 -
JAERI-Review 2001-039
7.2 Development of High Performance Buffer Materials-Sorption Mechanism of Europium by Apatite and Smectite
Mixture Using RBS and micro-PIXE-
Toshihiko OHNUKI*'1, Naofumi KOZAI*, Mohammad SAMADFAM*,Shunya YAMAMOTO**, Kazumasa NARUMI***, Hiroshi NARAMOTO***,Tomihiro KAM1YA****, Takuro SAKAI****, Shoichi OIKAWA****, TakahiroSATO**** and Takashi MURAKAMI*****
Department of Environmental Science, JAERI*, Dept. of Material Development,JAERI**, Avanced Science Research Center, JAERI***, Advanced RadiationTechnology Center, JAERI****, Mineralogical Institute, The University ofTokyo*****
detect elements in ppm level. The depthprofiles and the spatial distributions of Eu aredirectly obtained by RBS and micro-PIXE(u-PIXE) analyses, respectively. In thepresent study, the thin film containing apatiteand smectite are provided for the sorptionexperiments. Apatite and smectite areselected as the components by their highsorption performance3"5'.
1. IntroductionThe sorption behaviors of trivalent actinides
and lanthanides on the components ofgeosphere are debated subjects because of theirrelevance to potential migration fromradioactive wastes to biosphere. A majorquestion relating to sorption studies on soil androck (mixture of components) is how thesorption behavior on soil and rock can beestimated from the behaviors on the individualcomponents. It has been reported that eachcomponent in a mixture equally contributes tothe sorption of cesium and strontium11. Onthe other hand, cobalt is preferentially sorbedby Mn oxides/hydroxides for the sorption byMn oxides/hydroxides and smectite mixture2'.It is still question on the sorption behavior oftrivalent elements on a mixture of thecomponents.
We here propose the methodology using athin film of powdered components to clarifythe sorption behavior of Eu on the mixture.Due to very low solid/solution ratio, use of thethin film has the following advantages: (i)The solution of low Eu concentration can beused in the sorption experiment, (ii) Thesolution pH is constant during the sorptionexperiment, and (iii) Decrease of the Euconcentration in the solution is very low.However, if Eu is only sorbed on the surface ofthe thin film, the sorption behavior of Eu onthe thin film may be different from that of thepowdered mixture of components.
Rutherford backscattering spectroscopy(RBS) and proton-induced X-ray emission(PIXE) techniques are sensitive methods to
2. Experimental2.1 Sorption experiments
The single crystals of fluoroapatite(Ca5(PO4)3F) from Cerro de Marcado, Durango,Mexico, were used. Powdered samples ofapatite were prepared by grinding to less thanapproximately 0.05 mm in diameter. Smectite(Nao.33(Si3.67Alo.33)Al20|o(OH)2) was obtainedfrom Kunimine Kogyo Co. Ltd., Japan, andoriginated from Tsukinuno, Japan. X-raydiffraction patterns of the apatite and thesmectite showed that they did not containmeasurable impurities.
All solutions were prepared with ultrapuredeionized distilled water (DDI) water andreagent-grade chemicals. Eu solutions wereprepared by diluting a Eu(NO3)3 stock solutionin the DDI water to obtain Eu concentrationsof between l.OxlO'5 and l.OxlO"3 mol-L"'.The Eu solutions were adjusted to be in pH 4.5with a 1 M NaOH or 1 M HCI solution.
A 60 (J.1 solution of 1 g smectite *L"' with 1 gapatite-L"1 was placed on a glassy carbon plate.A thin film of the mixture of smectite andapatite was made by drying the above samplefor overnight at room temperature. The RBS
- 238
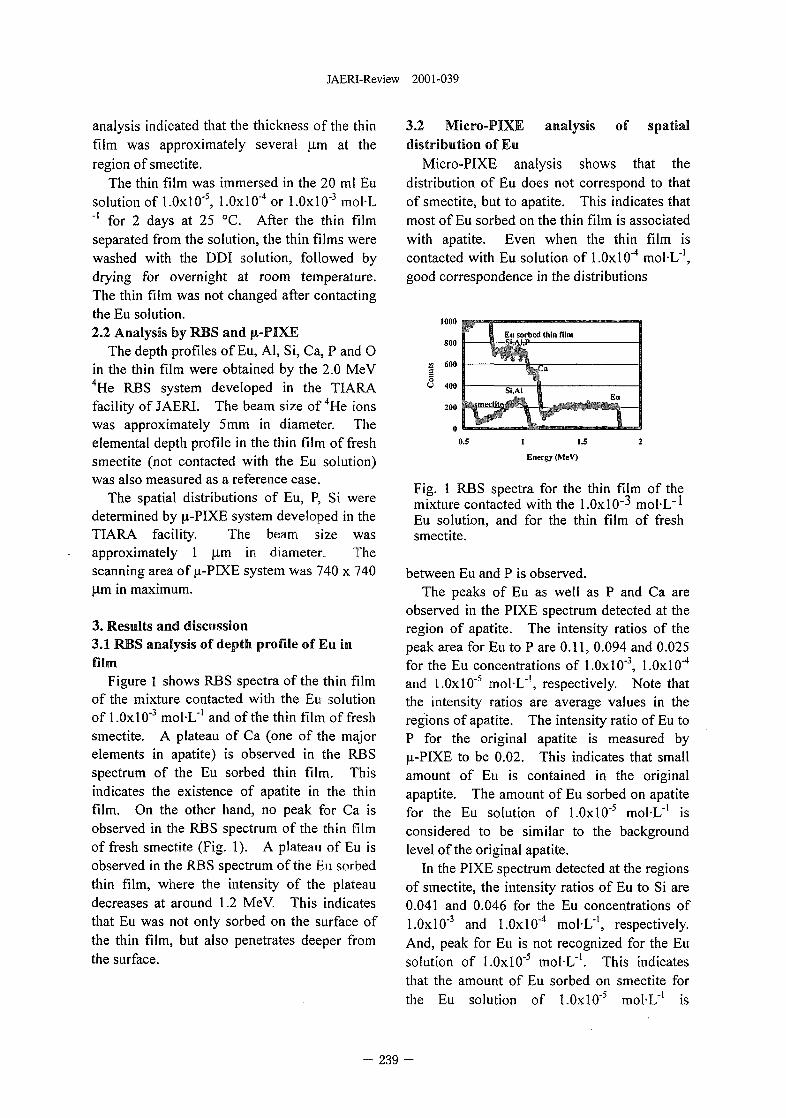
JAERI-Review 2001-039
analysis indicated that the thickness of the thinfilm was approximately several )j,m at theregion of smectite.
The thin film was immersed in the 20 ml Eusolution of l.OxlO"5, l.OxlO"4 or l.OxlO"3 mol-L'' for 2 days at 25 °C. After the thin filmseparated from the solution, the thin films werewashed with the DDI solution, followed bydrying for overnight at room temperature.The thin film was not changed after contactingthe Eu solution.2.2 Analysis by RBS and U.-PIXE
The depth profiles of Eu, Al, Si, Ca, P and Oin the thin film were obtained by the 2.0 MeV4He RBS system developed in the TIARAfacility of JAERI. The beam size of 4He ionswas approximately 5mm in diameter. Theelemental depth profile in the thin film of freshsmectite (not contacted with the Eu solution)was also measured as a reference case.
The spatial distributions of Eu, P, Si weredetermined by u-PIXE system developed in theTIARA facility. The beam size wasapproximately 1 |J.m in diameter. Thescanning area of |j.-PIXE system was 740 x 740|j.m in maximum.
3. Results and discussion3.1 RBS analysis of depth profile of Eu infilm
Figure 1 shows RBS spectra of the thin filmof the mixture contacted with the Eu solutionof l.OxlO"3 mol-L"1 and of the thin film of freshsmectite. A plateau of Ca (one of the majorelements in apatite) is observed in the RBSspectrum of the Eu sorbed thin film. Thisindicates the existence of apatite in the thinfilm. On the other hand, no peak for Ca isobserved in the RBS spectrum of the thin filmof fresh smectite (Fig. I). A plateau of Eu isobserved in the RBS spectrum of the Eu sorbedthin film, where the intensity of the plateaudecreases at around 1.2 MeV. This indicatesthat Eu was not only sorbed on the surface ofthe thin film, but also penetrates deeper fromthe surface.
3.2 Micro-PIXE analysis of spatialdistribution of Eu
Micro-PIXE analysis shows that thedistribution of Eu does not correspond to thatof smectite, but to apatite. This indicates thatmost of Eu sorbed on the thin film is associatedwith apatite. Even when the thin film iscontacted with Eu solution of l.OxlO"4 mol-L'1,good correspondence in the distributions
1 1.5 2
Energy (MeV)
Fig. 1 RBS spectra for the thin film of themixture contacted with the 1.0x10"^ molL"*Eu solution, and for the thin film of freshsmectite.
between Eu and P is observed.The peaks of Eu as well as P and Ca are
observed in the PIXE spectrum detected at theregion of apatite. The intensity ratios of thepeak area for Eu to P are 0.11, 0.094 and 0.025for the Eu concentrations of l.OxlO"3, l.OxlO"4
and l.OxlO"5 mol-L"', respectively. Note thatthe intensity ratios are average values in theregions of apatite. The intensity ratio of Eu toP for the original apatite is measured byu-PIXE to be 0.02. This indicates that smallamount of Eu is contained in the originalapaptite. The amount of Eu sorbed on apatitefor the Eu solution of l.OxlO"5 mol-L"1 isconsidered to be similar to the backgroundlevel of the original apatite.
In the PIXE spectrum detected at the regionsof smectite, the intensity ratios of Eu to Si are0.041 and 0.046 for the Eu concentrations ofl.OxlO"3 and l.OxlO"4 mol-L"1, respectively.And, peak for Eu is not recognized for the Eusolution of l.OxlO"5 mol-L"1. This indicatesthat the amount of Eu sorbed on smectite forthe Eu solution of l.OxlO"5 mol-L"1 is
239 -
JAERI-Review 2001-039
considered to be below the detection limit.Note that simple comparison of the intensityratio between apatite and smectite should notbe made because of different efficiencies forelements by u-PIXE and different molefractions in different minerals. And theintensity ratios are average values in theregions of smectite.
The u-PIXE results indicate that theamounts of Eu sorbed on either apatite orsmectite is constant, when the concentration ofEu is higher than l.OxlO"4 mol-L"1.3.3 Sorption behavior of Eu on smectite andapatite
More than 90 % of Eu is determined to betaken up by the powdered smectite. Thisindicates that smectite has high performance tosorb Eu. Because the sorbed Eu onto smectiteis desorbed by a 1 M KC1 solution, the Eusorption by smectite is reversible. More than90 % of Eu is sorbed by the powdered apatite,and thus apatite has also high performance tosorb Eu. The sorbed Eu is not desorbed by a1 M KCI solution. This indicates that Eu isirreversibly sorbed on apatite.3.4 Sorption mechanism of Eu on the thinfilm of the mixture
The constant intensity ratio of Eu to Si inthe region of smectite indicates that thesorption sites of smectite for Eu are saturatedfor Eu concentrations more than l.OxlO'4
mol-L"1. Cation exchange capacity (CEC) ofsmectite is measured to be 1 meq-g'1. Sincethe amount of smectite in the thin film is 60 jag,0.02 umole Eu can be sorbed on smectite.When Eu concentrations in the solution arehigher than l.OxlO"4 mol-L"1, total amount ofEu in 20 ml solutions is higher by 100 timesthan the CEC of smectite. This is the reasonfor the saturation for the sorption site ofsmectite in the thin film.
Most of Eu sorbed on the thin film isassociated with apatite. This suggests that thesorption capacity of apatite is higher thansmectite. Xu et al5) have clarified that thesorption capacity of the surface of apatite areapproximately 0.6 mmol-g"1 for Zn and Cd.Similar sorption capacity has been reported
by Takeuchi et al.6). Even though theapatite used in the present study is differentfrom those in their work, the sorption capacityof the apatite used in the presnt study is withinthe same order. The capacities reported aresimilar to CEC of smectite. If Eu is sorbed byion exchange reaction, Eu should be equallyassociated with both apatite and smectite in thethin film. This disagrees with the result byu-PIXE.
Ohnuki et al.3) have shown by RBS analysisthat some fraction of Eu is penetrated deeperfrom the surface of the single crystal specimenof apatite. This suggests that Eu is not onlysorbed on the surface of apatite, but alsopenetrated in the crystal structure of apatite.This penetration uptake apparently causes theincrease of sorption capacity and theirreversible sorption. Thus, the penetrationuptake causes that most of Eu sorbed on thethin film are associated with apatite.References1)D.A. Palmer, S.Y. Shiao, R.E. Meyer, J.A.Wethington, J. Inorg. Nucl. Chem., 43, (1981)3317.2) T. Ohnuki, N. Kozai, Radiochimica Acta, 68,(1995) 203.3] T. Ohnuki, N. Kozai, H. Isobe, T. Murakami,S. Yamamoto, Y. Aoki, H. Naramoto., J. Nucl.Sci.Tech., 34, (1997)58.4) J.O. Nriagu, Geochim. Cosmochim. Acta, 38,(1974)887.5) Y. Xu, D., F. W. Schwartz, S. J. Tralna,Environ. Sci. Technol., 28, (1994)1472.6) Y. Takeuchi, H. Arai, J. Chem. Eng.Japan, 23, (1990) 75.
- 240 -
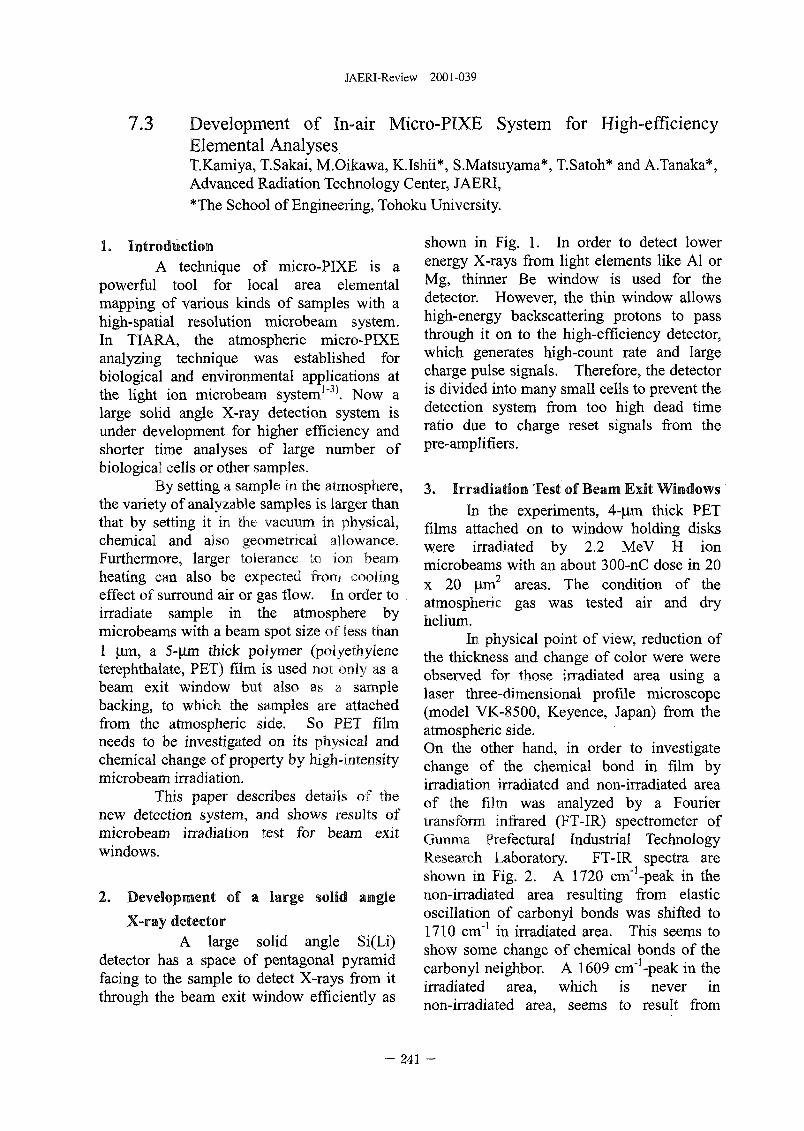
JAERI-Review 2001-039
7.3 Development of In-air Micro-PIXE System for High-efficiencyElemental AnalysesT.Kamiya, T.Sakai, M.Oikawa, K.Ishii*, S.Matsuyama*, T.Satoh* and A.Tanaka*,Advanced Radiation Technology Center, JAERI,*The School of Engineering, Tohoku University.
1. IntroductionA technique of micro-PIXE is a
powerful tool for local area elementalmapping of various kinds of samples with ahigh-spatial resolution microbeam system.In TIARA, the atmospheric micro-PIXEanalyzing technique was established forbiological and environmental applications atthe light ion microbeam system u3\ Now alarge solid angle X-ray detection system isunder development for higher efficiency andshorter time analyses of large number ofbiological cells or other samples.
By setting a sample in the atmosphere,the variety of analyzable samples is larger thanthat by setting it in the vacuum in physical,chemical and also geometrical allowance.Furthermore, larger tolerance to Ion beamheating can also be expected from coolingeffect of surround air or gas flow. In order toirradiate sample in the atmosphere bymicrobeams with a beam spot size of less than1 |Lim, a 5-jim thick polymer (polyethyleneterephthalate, PET) film is used not only as abeam exit window but also as a samplebacking, to which the samples are attachedfrom the atmospheric side. So PET filmneeds to be investigated on its physical andchemical change of property by high-intensitymicrobeam irradiation.
This paper describes details of thenew detection system, and shows results ofmicrobeam irradiation test for beam exitwindows.
2. Development of a large solid angle
X-ray detectorA large solid angle Si(Li)
detector has a space of pentagonal pyramidfacing to the sample to detect X-rays from itthrough the beam exit window efficiently as
shown in Fig. 1. In order to detect lowerenergy X-rays from light elements like Al orMg, thinner Be window is used for thedetector. However, the thin window allowshigh-energy backscattering protons to passthrough it on to the high-efficiency detector,which generates high-count rate and largecharge pulse signals. Therefore, the detectoris divided into many small cells to prevent thedetection system from too high dead timeratio due to charge reset signals from thepre-ampliflers.
3. Irradiation Test of Beam Exit WindowsIn the experiments, 4-|im thick PET
films attached on to window holding diskswere irradiated by 2.2 MeV H ionmicrobeams with an about 300-nC dose in 20x 20 Jim2 areas. The condition of theatmospheric gas was tested air and dryhelium.
In physical point of view, reduction ofthe thickness and change of color were wereobserved for those irradiated area using alaser three-dimensional profile microscope(model VK-8500, Keyence, Japan) from theatmospheric side.On the other hand, in order to investigatechange of the chemical bond in film byirradiation irradiated and non-irradiated areaof the film was analyzed by a Fouriertransform infrared (FT-IR) spectrometer ofGunma Prefectural Industrial TechnologyResearch Laboratory. FT-IR spectra areshown in Fig. 2. A 1720 cm"'-peak in thenon-irradiated area resulting from elasticoscillation of carbonyl bonds was shifted to1710 cm"1 in irradiated area. This seems toshow some change of chemical bonds of thecarbonyl neighbor. A 1609 cm"1-peak in theirradiated area, which is never innon-irradiated area, seems to result from
- 241 -
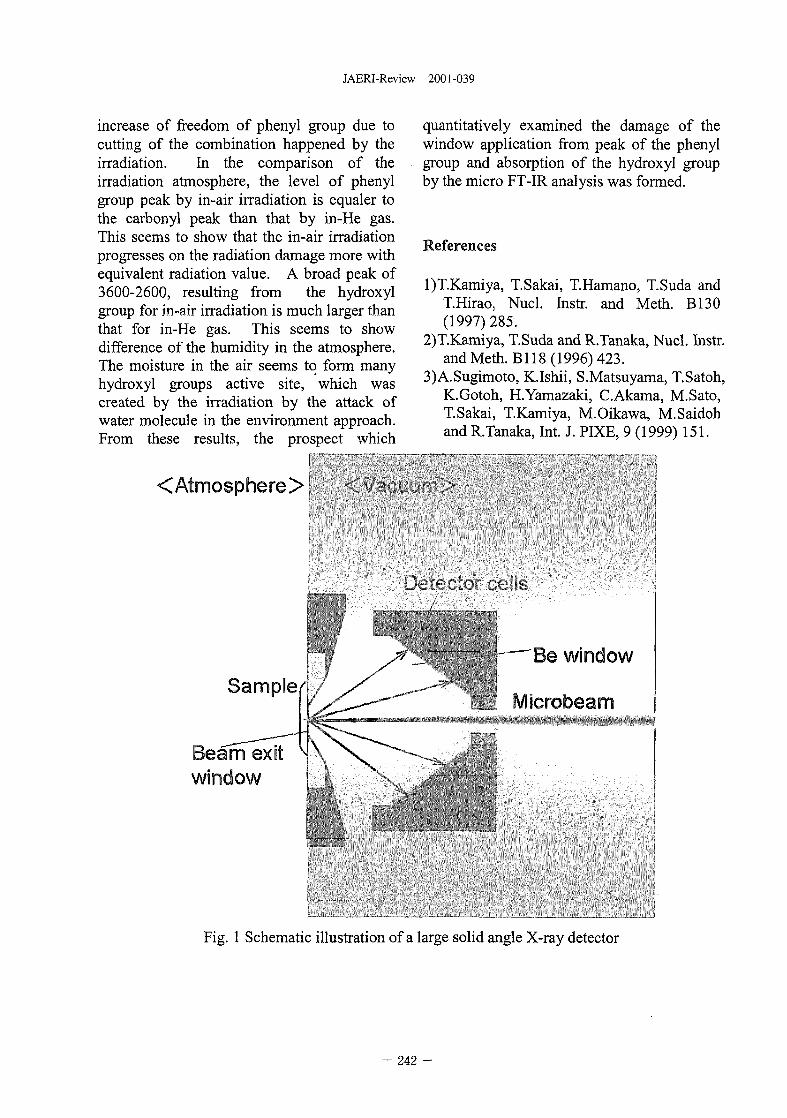
JAERI-Review 2001-039
increase of freedom of phenyl group due tocutting of the combination happened by theirradiation. In the comparison of theirradiation atmosphere, the level of phenylgroup peak by in-air irradiation is equaler tothe carbonyl peak than that by in-He gas.This seems to show that the in-air irradiationprogresses on the radiation damage more withequivalent radiation value. A broad peak of3600-2600, resulting from the hydroxylgroup for in-air irradiation is much larger thanthat for in-He gas. This seems to showdifference of the humidity in the atmosphere.The moisture in the air seems to form manyhydroxyl groups active site, which wascreated by the irradiation by the attack ofwater molecule in the environment approach.From these results, the prospect which
quantitatively examined the damage of thewindow application from peak of the phenylgroup and absorption of the hydroxyl groupby the micro FT-IR analysis was formed.
References
l)T.Kamiya, T.Sakai, T.Hamano, T.Suda andT.Hirao, Nucl. Instr. and Meth. B130(1997)285.
2)T.Kamiya, T.Suda and RTanaka, Nucl. Instr.and Meth. Bl 18 (1996) 423.
3)A.Sugimoto, KJshii, S.Matsuyama, T.Satoh,K.Gotoh, H.Yamazaki, C.Akama, M.Sato,T.Sakai, T.Kamiya, M.Oikawa, M.Saidohand R.Tanaka, Int. J. PIXE, 9 (1999) 151.
<Atmosphere>
SampleBe window
Microbeam
Beam exitwindow
Fig. 1 Schematic illustration of a large solid angle X-ray detector
- 242 -
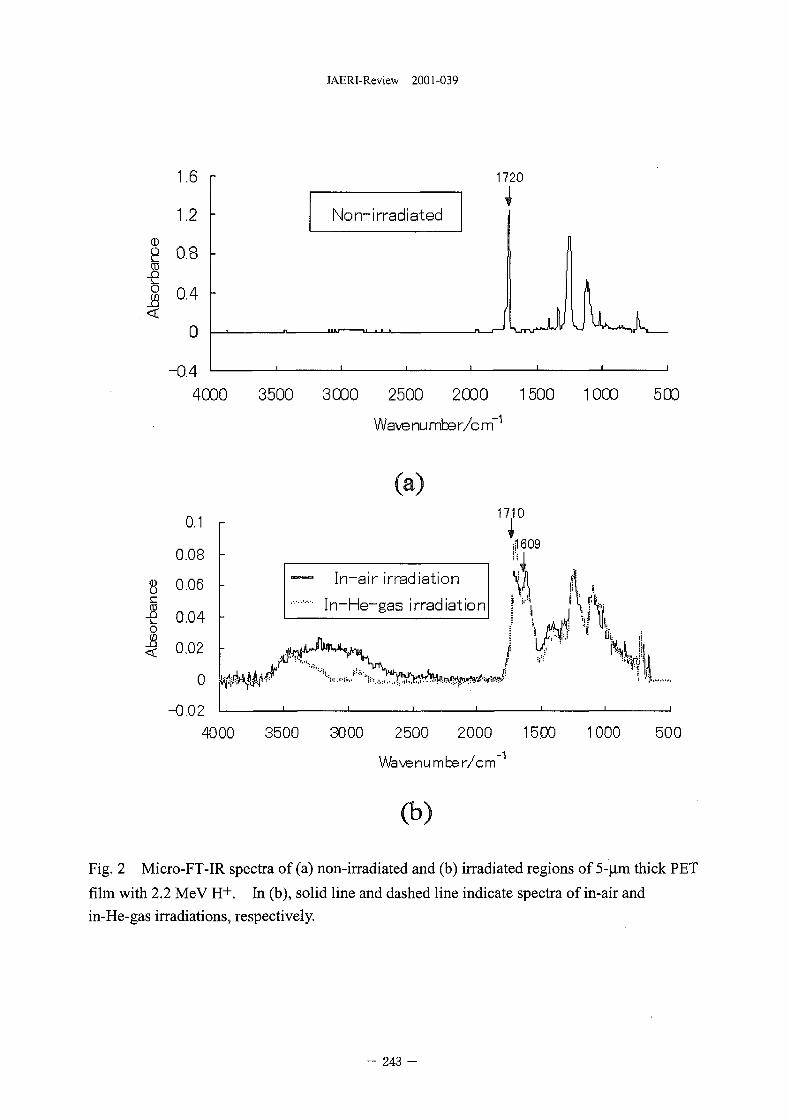
JAERI-Review 2001-039
<D
J9<
1.6
1.2
0.8
0.4
0
-0.4
1720
No n~ irradiated
4000 3500 3000 2500 2000 1500 1000
Wave nu mbe r/c rri~1
500
0.1
0.08
$ 0.06(0
-e o.o4oI 0.02
0
-0.02
4000
(a)1710
1609
In-air irradiation
In-He-gas irradiationli '
3500 3000 2500 2000 15.00 1000 500
Wa\e n u m be r/c m-1
(b)
Fig. 2 Micro-FT-IR spectra of (a) non-irradiated and (b) irradiated regions of 5-|im thick PET
film with 2.2 MeV H+. In (b), solid line and dashed line indicate spectra of in-air and
in-He-gas irradiations, respectively.
-- 243 -
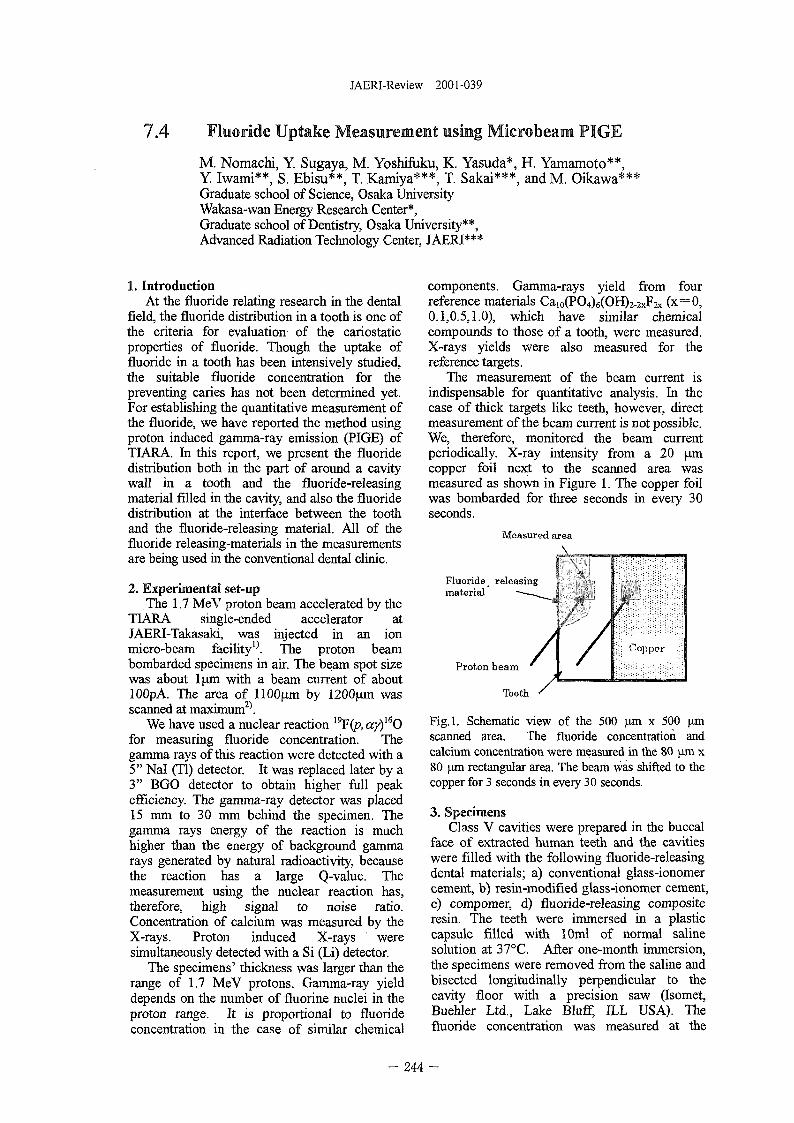
JAERI-Review 2001-039
7.4 Fluoride Uptake Measurement using Microbeam PIGE
M. Nomachi, Y. Sugaya, M. Yoshifuku, K. Yasuda*, H. Yamamoto**,Y. Iwami**, S. Ebisu**, T. Kamiya***, T. Sakai***, andM. Oikawa***Graduate school of Science, Osaka UniversityWakasa-wan Energy Research Center*,Graduate school of Dentistry, Osaka University**,Advanced Radiation Technology Center, JAERI***
1. IntroductionAt the fluoride relating research in the dental
field, the fluoride distribution in a tooth is one ofthe criteria for evaluation of the cariostaticproperties of fluoride. Though the uptake offluoride in a tooth has been intensively studied,the suitable fluoride concentration for thepreventing caries has not been determined yet.For establishing the quantitative measurement ofthe fluoride, we have reported the method usingproton induced gamma-ray emission (PIGE) ofTIARA. In this report, we present the fluoridedistribution both in the part of around a cavitywall in a tooth and the fluoride-releasingmaterial filled in the cavity, and also the fluoridedistribution at the interface between the toothand the fluoride-releasing material. All of thefluoride releasing-materials in the measurementsare being used in the conventional dental clinic.
2. Experimental set-upThe 1.7 MeV proton beam accelerated by the
TIARA single-ended accelerator atJAERI-Takasaki, was injected in an ionmicro-beam facility^. The proton beambombarded specimens in air. The beam spot sizewas about l\xm with a beam current of aboutlOOpA. The area of llOO^m by \2Q0\im wasscanned at maximum2).
We have used a nuclear reaction 19F(p, ay)x6Ofor measuring fluoride concentration. Thegamma rays of this reaction were detected with a5" Nal (Tl) detector. It was replaced later by a3" BGO detector to obtain higher full peakefficiency. The gamma-ray detector was placed15 mm to 30 mm behind the specimen. Thegamma rays energy of the reaction is muchhigher than the energy of background gammarays generated by natural radioactivity, becausethe reaction has a large Q-value. Themeasurement using the nuclear reaction has,therefore, high signal to noise ratio.Concentration of calcium was measured by theX-rays. Proton induced X-rays weresimultaneously detected with a Si (Li) detector.
The specimens' thickness was larger than therange of 1.7 MeV protons. Gamma-ray yielddepends on the number of fluorine nuclei in theproton range. It is proportional to fluorideconcentration in the case of similar chemical
components. Gamma-rays yield from fourreference materials Cai0(PO4)6(OH)2-2xF2x (x=0,0.1,0.5,1.0), which have similar chemicalcompounds to those of a tooth, were measured.X-rays yields were also measured for thereference targets.
The measurement of the beam current isindispensable for quantitative analysis. In thecase of thick targets like teeth, however, directmeasurement of the beam current is not possible.We, therefore, monitored the beam currentperiodically. X-ray intensity from a 20 |j.mcopper foil next to the scanned area wasmeasured as shown in Figure 1. The copper foilwas bombarded for three seconds in every 30seconds.
Measured area
Fluoride releasingmaterial
Proton beam
Tooth
Fig.l. Schematic view of the 500 um x 500 umscanned area. The fluoride concentration andcalcium concentration were measured in the 80 um x80 um rectangular area. The beam was shifted to thecopper for 3 seconds in every 30 seconds.
3. SpecimensClass V cavities were prepared in the buccal
face of extracted human teeth and the cavitieswere filled with the following fluoride-releasingdental materials; a) conventional glass-ionomercement, b) resin-modified glass-ionomer cement,c) compomer, d) fluoride-releasing compositeresin. The teeth were immersed in a plasticcapsule filled with 10ml of normal salinesolution at 37°C. After one-month immersion,the specimens were removed from the saline andbisected longitudinally perpendicular to thecavity floor with a precision saw (Isomet,Buehler Ltd., Lake Bluff, ILL USA). Thefluoride concentration was measured at the
244 -
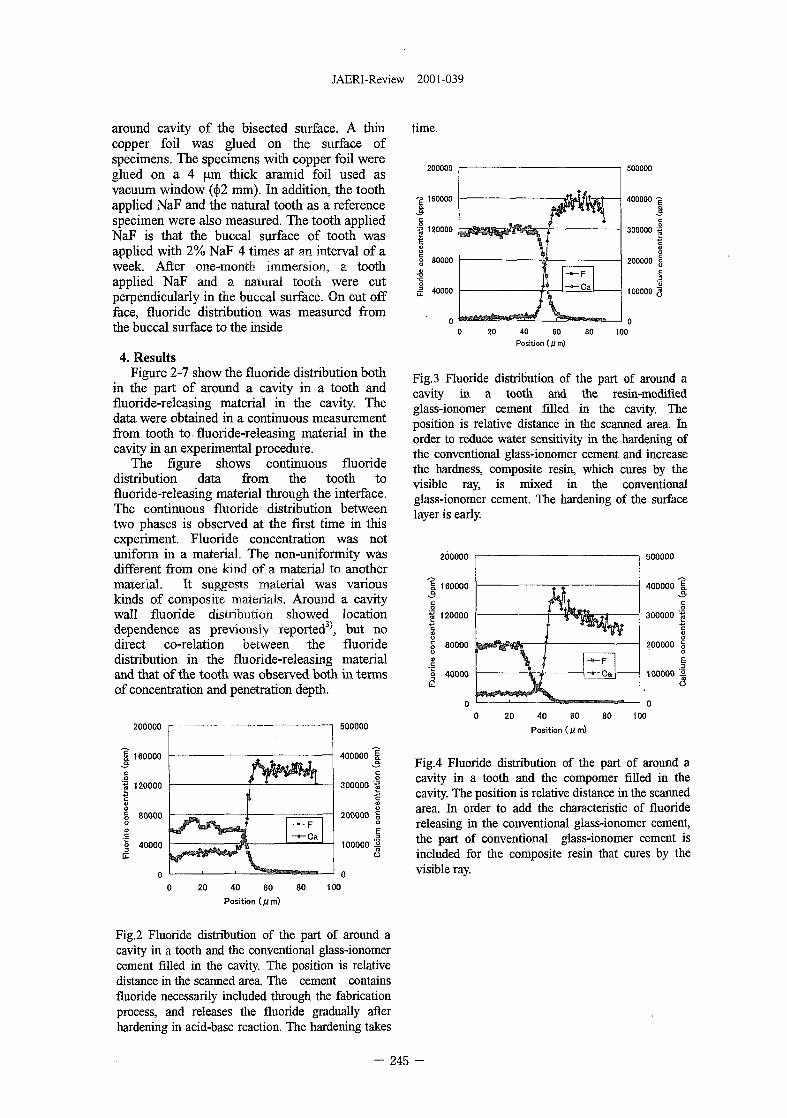
JAERI-Review 2001-039
around cavity of the bisected surface. A thincopper foil was glued on the surface ofspecimens. The specimens with copper foil wereglued on a 4 um thick aramid foil used asvacuum window ((|>2 mm). In addition, the toothapplied NaF and the natural tooth as a referencespecimen were also measured. The tooth appliedNaF is that the buccal surface of tooth wasapplied with 2% NaF 4 times at an interval of aweek. After one-month immersion, a toothapplied NaF and a natural tooth were cutperpendicularly in the buccal surface. On cut offface, fluoride distribution was measured fromthe buccal surface to the inside
4. ResultsFigure 2-7 show the fluoride distribution both
in the part of around a cavity in a tooth andfluoride-releasing material in the cavity. Thedata were obtained in a continuous measurementfrom tooth to.fluoride-releasing material in thecavity in an experimental procedure.
The figure shows continuous fluoridedistribution data from the tooth tofluoride-releasing material through the interface.The continuous fluoride distribution betweentwo phases is observed at the first time in thisexperiment. Fluoride concentration was notuniform in a material. The non-uniformity wasdifferent from one kind of a material to anothermaterial. It suggests material was variouskinds of composite materials. Around a cavitywall fluoride distribution showed locationdependence as previously reported3), but nodirect co-relation between the fluoridedistribution in the fluoride-releasing materialand that of the tooth was observed both in termsof concentration and penetration depth.
time.
200000 I 500000
200000 500000
too
Fig. 3 Fluoride distribution of the part of around acavity in a tooth and the resin-modifiedglass-ionomer cement filled in the cavity. Theposition is relative distance in the scanned area. Inorder to reduce water sensitivity in the hardening ofthe conventional glass-ionomer cement and increasethe hardness, composite resin, which cures by thevisible ray, is mixed in the conventionalglass-ionomer cement. The hardening of the surfacelayer is early.
200000
160000
500000
400000 I.3
120000
0 20 40 60 80
Position (U m)
Fig.4 Fluoride distribution of the part of around acavity in a tooth and the compomer filled in thecavity. The position is relative distance in the scannedarea. In order to add the characteristic of fluoridereleasing in the conventional glass-ionomer cement,the part of conventional glass-ionomer cement isincluded for the composite resin that cures by thevisible ray.
Fig.2 Fluoride distribution of the part of around acavity in a tooth and the conventional glass-ionomercement filled in the cavity. The position is relativedistance in the scanned area. The cement containsfluoride necessarily included through the fabricationprocess, and releases the fluoride gradually afterhardening in acid-base reaction. The hardening takes
245 -
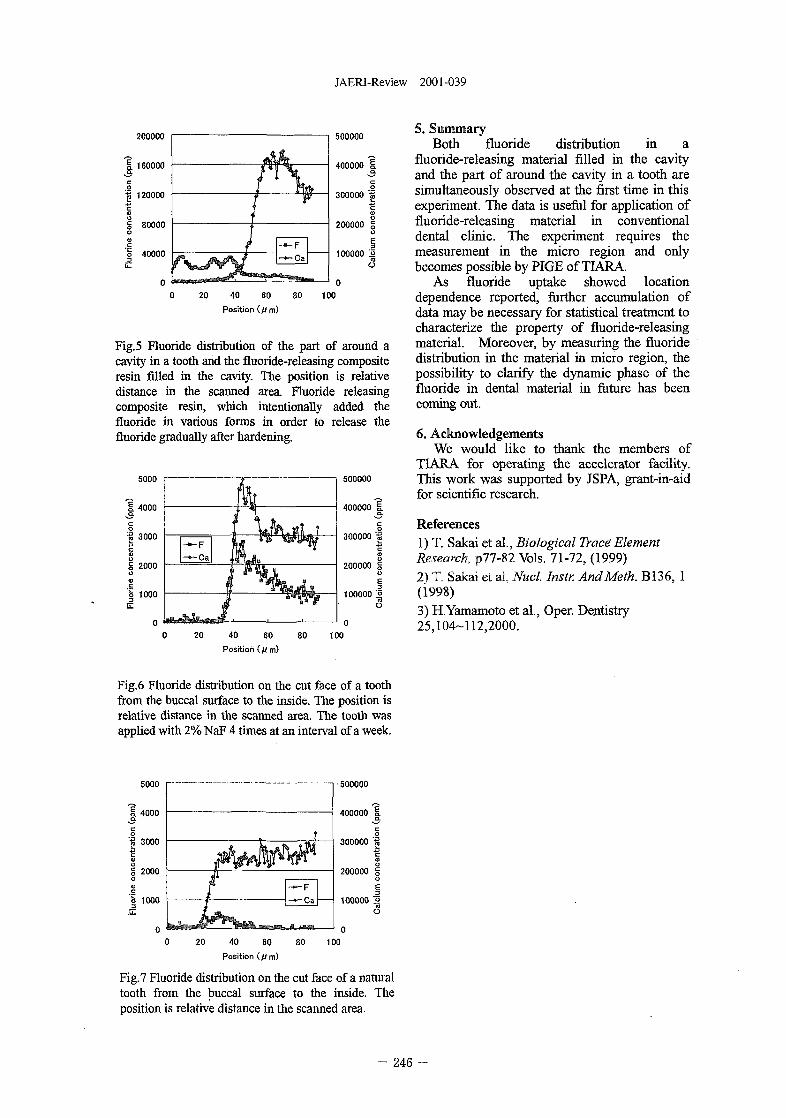
JAERI-Review 2001-039
200000
160000
500000
0 20 40 60 80
Position (//m)
Fig. 5 Fluoride distribution of the part of around acavity in a tooth and the fluoride-releasing compositeresin filled in the cavity. The position is relativedistance in the scanned area. Fluoride releasingcomposite resin, which intentionally added thefluoride in various forms in order to release thefluoride gradually after hardening.
5000 I 500000
20 40 60 80 tOO
Position (.Urn)
5. SummaryBoth fluoride distribution in a
fluoride-releasing material filled in the cavityand the part of around the cavity in a tooth aresimultaneously observed at the first time in thisexperiment. The data is useful for application offluoride-releasing material in conventionaldental clinic. The experiment requires themeasurement in the micro region and onlybecomes possible by PIGE of TIARA.
As fluoride uptake showed locationdependence reported, further accumulation ofdata may be necessary for statistical treatment tocharacterize the property of fluoride-releasingmaterial. Moreover, by measuring the fluoridedistribution in the material in micro region, thepossibility to clarify the dynamic phase of thefluoride in dental material in future has beencoming out.
6. AcknowledgementsWe would like to thank the members of
TIARA for operating the accelerator facility.This work was supported by JSPA, grant-in-aidfor scientific research.
References1) T. Sakai et al, Biological Trace ElementResearch, P77-82 Vols. 71-72, (1999)2) T. Sakai et at Nucl. Instr. AndMeth. B136, 1(1998)3) H.Yamamoto et al., Oper. Dentistry25,104-112,2000.
Fig. 6 Fluoride distribution on the cut face of a toothfrom the buccal surface to the inside. The position isrelative distance in the scanned area. The tooth wasapplied with 2% NaF 4 times at an interval of a week.
500000
20 40 60
Position (/!/m)
80 100
Fig.7 Fluoride distribution on the cut face of a naturaltooth from the buccal surface to the inside. Theposition is relative distance in the scanned area.
- 246 -
JAERI-Review 2001-039
7.5 Application of In-Air Micro-PIXE Camera to bovine aorticendothelial cells and human leukemia cells
ATanaka, K.Ishii, T.Satoh, S.Matsuyama, H.Yamazaki, M.Satoh*,
S.Harada**,T.Kamiya***, T.Sakai***, M.Oikawa***, K.Arakawa***,M.Saidoh***
Department of Quantum Science and Energy Engineering, Tohoku Univ.
Department of Mechatronics and Precision Engineering, Tohoku Univ.*
School of Medicine, Iwate Medical University**
Advanced Radiation Technology Center, JAERI***
1. Introduction
We are developing a micro-PIXE system at
the Division of Takasaki Ion Accelerators for
Advanced Radiation Application (TIARA) in
JAERI. It consists of a micro-beam system
combined with a 3MV single-ended
electrostatic accelerator, a beam position
control, and several X-ray detectors ' ~3) and
the target is settled in air. We call this system
In-Air Micro-PIXE camera since it takes a
picture of the elemental. The micro-beams
always scan on an interesting region of the
target. When an x-ray is detected, the x-ray
energy and the beam position are
simultaneously measured for each event3) and
the elemental maps can be obtained.
The cellular sample is easily damaged,
deformed or destroyed by the beam irradiation
in vacuum, and the elements contained are
sometimes evaporated. In the case of In-Air
Micro-PIXE, the target sample can be analyzed
in the atmospheric pressure and can be cooled
with the helium gas. This cooling was very
effective for keeping the good condition of the
cellular samples. If the target of biological
sample is in vacuum, the sample shrinks due to
beam irradiation and it results in the increase in
the density of elements in a beam spot4\ but
such phenomenon was not observed in the
In-Air micro-PIXE5).
We apply here the In-Air Micro-PIXE to
examine the DNA synthesis in the nucleus of
bovine aortic cell and an irradiation effect in
the human leukemia cells.
2. DNA synthesis in the nucleus of bovine
aortic endothelial cell
We incubated the bovine aortic endothelial
cells in the culture medium in which
bromodeoxyuridin (BrdU) (1:1000 for culture
medium) was supplemented, and in incubation
times for 6, 12, and 24 hours respectively. We
prepared the targets of cultured bovine aortic
endothelial cells by the technique described in
the previous report6^ and analyzed them by the
In-Air Micro-PIXE.
Major elements contained in the cells, P, S,
and K were observed and a trace amount of Br
could be clearly recognized. The distribution of
S agreed almost with the shape of the cell
observed by the microscope. The elements of P,
S, and K are concentrated in the central regions
- 247 -
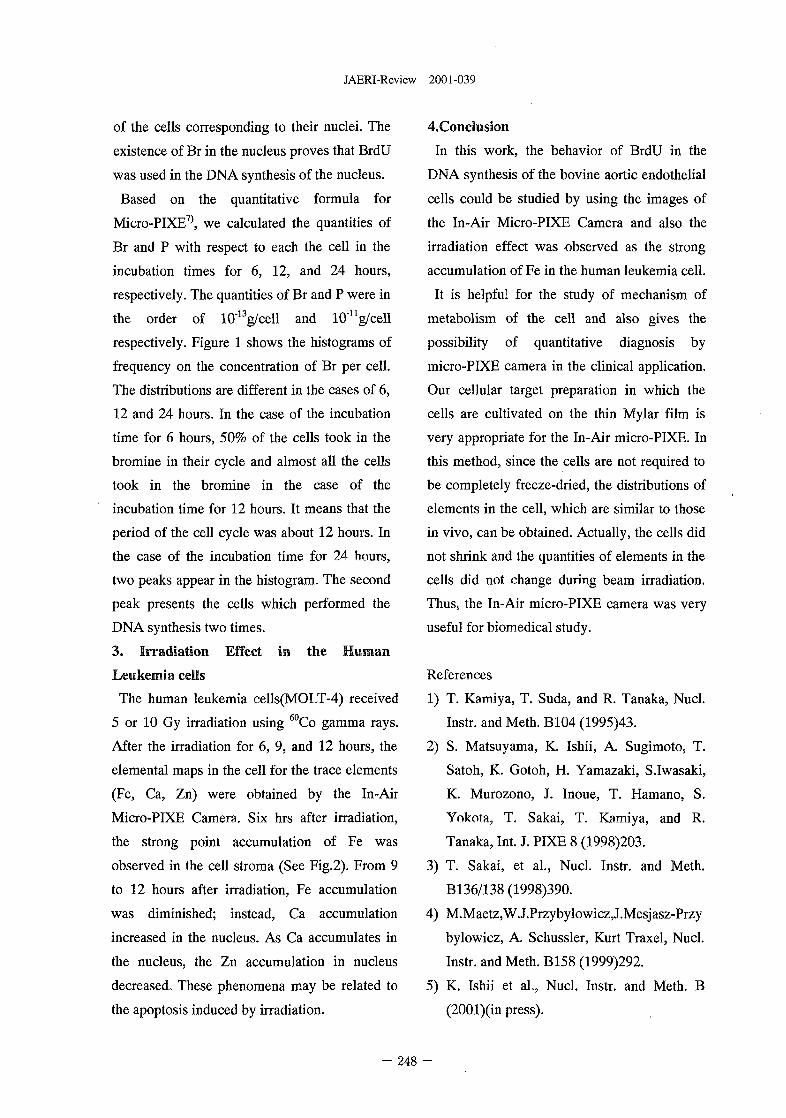
JAERI-Review 2001-039
of the cells corresponding to their nuclei. The
existence of Br in the nucleus proves that BrdU
was used in the DNA synthesis of the nucleus.
Based on the quantitative formula for
Micro-PIXE7), we calculated the quantities of
Br and P with respect to each the cell in the
incubation times for 6, 12, and 24 hours,
respectively. The quantities of Br and P were in
the order of 10"13g/cell and 10"ng/cell
respectively. Figure 1 shows the histograms of
frequency on the concentration of Br per cell.
The distributions are different in the cases of 6,
12 and 24 hours. In the case of the incubation
time for 6 hours, 50% of the cells took in the
bromine in their cycle and almost all the cells
took in the bromine in the case of the
incubation time for 12 hours. It means that the
period of the cell cycle was about 12 hours. In
the case of the incubation time for 24 hours,
two peaks appear in the histogram. The second
peak presents the cells which performed the
DNA synthesis two times.
3. Irradiation Effect in the Human
Leukemia cells
The human leukemia cells(MOLT-4) received
5 or 10 Gy irradiation using 60Co gamma rays.
After the irradiation for 6, 9, and 12 hours, the
elemental maps in the cell for the trace elements
(Fe, Ca, Zn) were obtained by the In-Air
Micro-PIXE Camera. Six hrs after irradiation,
the strong point accumulation of Fe was
observed in the cell stroma (See Fig.2). From 9
to 12 hours after irradiation, Fe accumulation
was diminished; instead, Ca accumulation
increased in the nucleus. As Ca accumulates in
the nucleus, the Zn accumulation in nucleus
decreased. These phenomena may be related to
the apoptosis induced by irradiation.
4.Condusion
In this work, the behavior of BrdU in the
DNA synthesis of the bovine aortic endothelial
cells could be studied by using the images of
the In-Air Micro-PIXE Camera and also the
irradiation effect was observed as the strong
accumulation of Fe in the human leukemia cell.
It is helpful for the study of mechanism of
metabolism of the cell and also gives the
possibility of quantitative diagnosis by
micro-PIXE camera in the clinical application.
Our cellular target preparation in which the
cells are cultivated on the thin Mylar film is
very appropriate for the In-Air micro-PIXE. In
this method, since the cells are not required to
be completely freeze-dried, the distributions of
elements in the cell, which are similar to those
in vivo, can be obtained. Actually, the cells did
not shrink and the quantities of elements in the
cells did not change during beam irradiation.
Thus, the In-Air micro-PIXE camera was very
useful for biomedical study.
References
1) T. Kamiya, T. Suda, and R. Tanaka, Nucl.
Instr. and Meth. B104 (1995)43.
2) S. Matsuyama, K. Ishii, A. Sugimoto, T.
Satoh, K. Gotoh, H. Yamazaki, S.Iwasaki,
K. Murozono, J. Inoue, T. Hamano, S.
Yokota, T. Sakai, T. Kamiya, and R.
Tanaka, Int. J. PIXE 8 (1998)203.
3) T. Sakai, et al., Nucl. Instr. and Meth.
B136/138 (1998)390.
4) M.Maetz,W.J.Przybylowicz,J.Mesjasz-Przy
bylowicz, A. Schussler, Kurt Traxel, Nucl.
Instr. and Meth. B158 (1999)292.
5) K. Ishii et al., Nucl. Instr. and Meth. B
(2001)(in press).
- 248 -
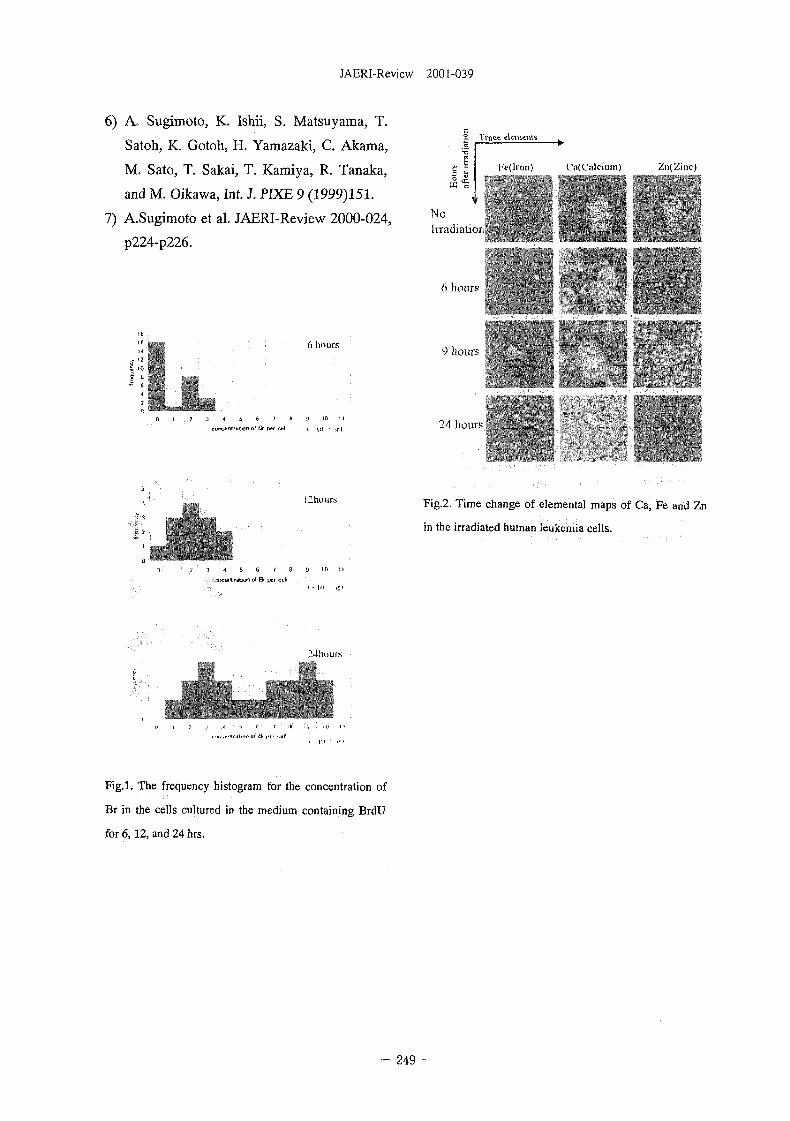
JAERI-Review 2001-039
6) A. Sugimoto, K. Ishii, S. Matsuyama, T.
Satoh, K. Gotoh, H. Yamazaki, C. Akama,
M. Sato, T. Sakai, T. Kamiya, R. Tanaka,
and M. Oikawa, Int. J. PIXE 9 (1999)151.
7) A.Sugimoto et al. JAERI-Review 2000-024,
P224-p226.
£ Truce elements
Fe(lron) L'a(C'nlcium) Zn(Zinc)
NoIrradiation
I 8 ;
6 hours
b hours
9 hours
24 hours
l^hours Fig.2. Time change of elemental maps of Ca, Fe and Zn
in the irradiated human leukemia cells.
4 5 6 / 8 9 10 IIiiceit ratjon d B per cfct
i . I " «•
24hnurs
Fig.l. The frequency histogram for the concentration of
Br in the cells cultured in the medium containing BrdU
for 6,12, and 24 hrs.
~ 249 -
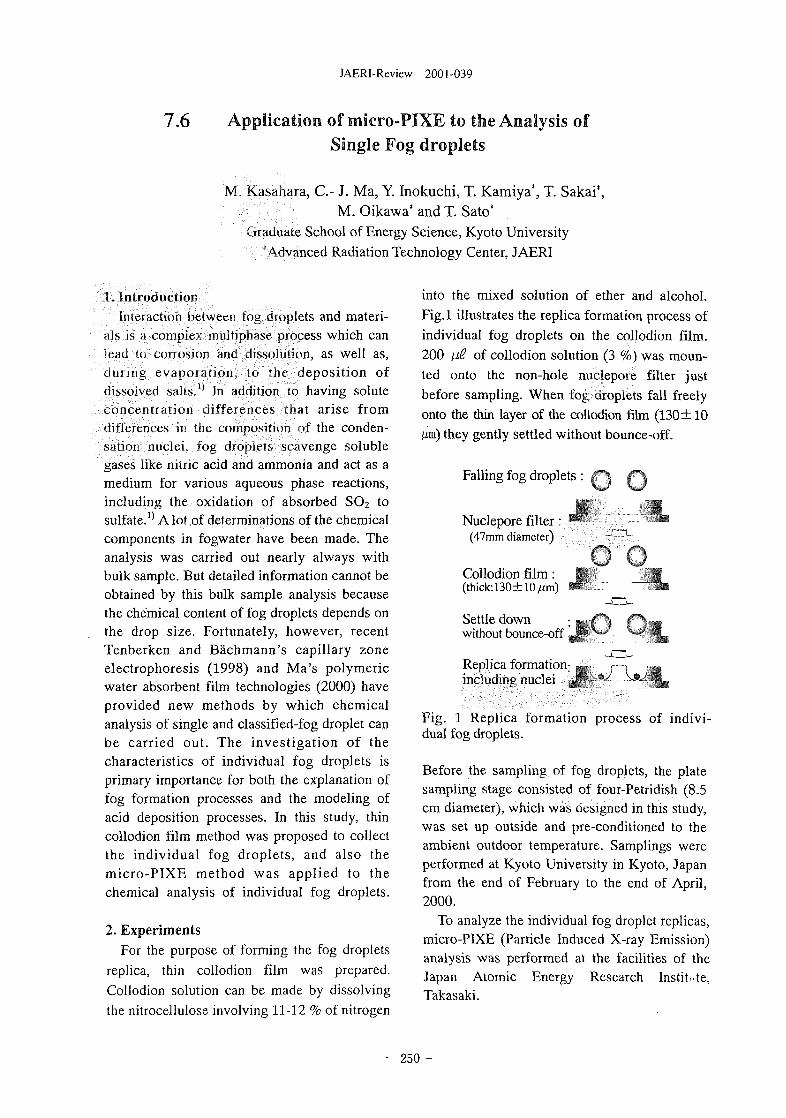
JAERI-Review 2001-039
7.6 Application of micro-PIXE to the Analysis ofSingle Fog droplets
M. Kasahara, C - J. Ma, Y. Inokuchi, T. Kamiya', T. Sakai*,M. Oikawa* and T. Sato'
Ciraduaie School of Energy Science, Kyoto University'Advanced Radiation Technology Center, JAERI
L Introductioninteraction between rog droplets and materi-
als is h complex multiphase process which canieaii u; corrosion and dissolution, as well as,doping evaporation, to vnt deposition ofdissolved salts.1' In addition ro having soluteconcentration differences rhat arise fromdifferences in the composition of the conden-sation nuclei, fog droplets scavenge solublegases like nitric acid and ammonia and act as amedium for various aqueous phase reactions,including the oxidation of absorbed SO2 tosulfate.^ A lot of determinations of the chemicalcomponents in fogwater have been made. Theanalysis was carried out nearly always withbulk sample. But detailed information cannot beobtained by this bulk sample analysis becausethe chemical content of fog droplets depends onthe drop size. Fortunately, however, recentTenberken and Bachmann's capillary zoneelectrophoresis (1998) and Ma's polymericwater absorbent film technologies (2000) haveprovided new methods by which chemicalanalysis of single and classified-fog droplet canbe carried out. The investigation of thecharacteristics of individual fog droplets isprimary importance for both the explanation offog formation processes and the modeling ofacid deposition processes. In this study, thincollodion film method was proposed to collectthe individual fog droplets, and also themicro-PIXE method was applied to thechemical analysis of individual fog droplets.
2. ExperimentsFor the purpose of forming the fog droplets
replica, thin collodion film was prepared.Collodion solution can be made by dissolvingthe nitrocellulose involving 11-12 % of nitrogen
into the mixed solution of ether and alcohol.Fig.l illustrates the replica formation process ofindividual fog droplets on the collodion film.200 p£ of collodion solution (3 %) was moun-ted onto the non-hole nueiepore filter justbefore sampling. When fog droplets fall freelyonto the thin layer of the collodion film (130 ±10ym) they gently settled without bounce-off.
Falling fog droplets : '""j f
ft-Nuclepore filter: m-
(47mm diameter) - '•
Collodion film: §§(thick:130±10,«m) S-'
Settle down : y f~^ ^ 2without bounce-off *M '—^ l~-/ S
Replica formation; ; vincluding nuclei j ^ "
; i •••£
Fig. 1 Replica formation process of indivi-dual fog droplets.
Before the sampling of fog droplets, the platesampling stage consisted of four-Petridish (8.5cm diameter), which was designed in this study,was set up outside and pre-conditioned to theambient outdoor temperature. Samplings wereperformed at Kyoto University in Kyoto, Japanfrom the end of February to the end of April,2000.
To analyze the individual fog droplet replicas,micro-PIXE (Particle Induced X-ray Emission)analysis was performed at the facilities of theJapan Atomic Energy Research Institute,Takasaki.
- 250 -
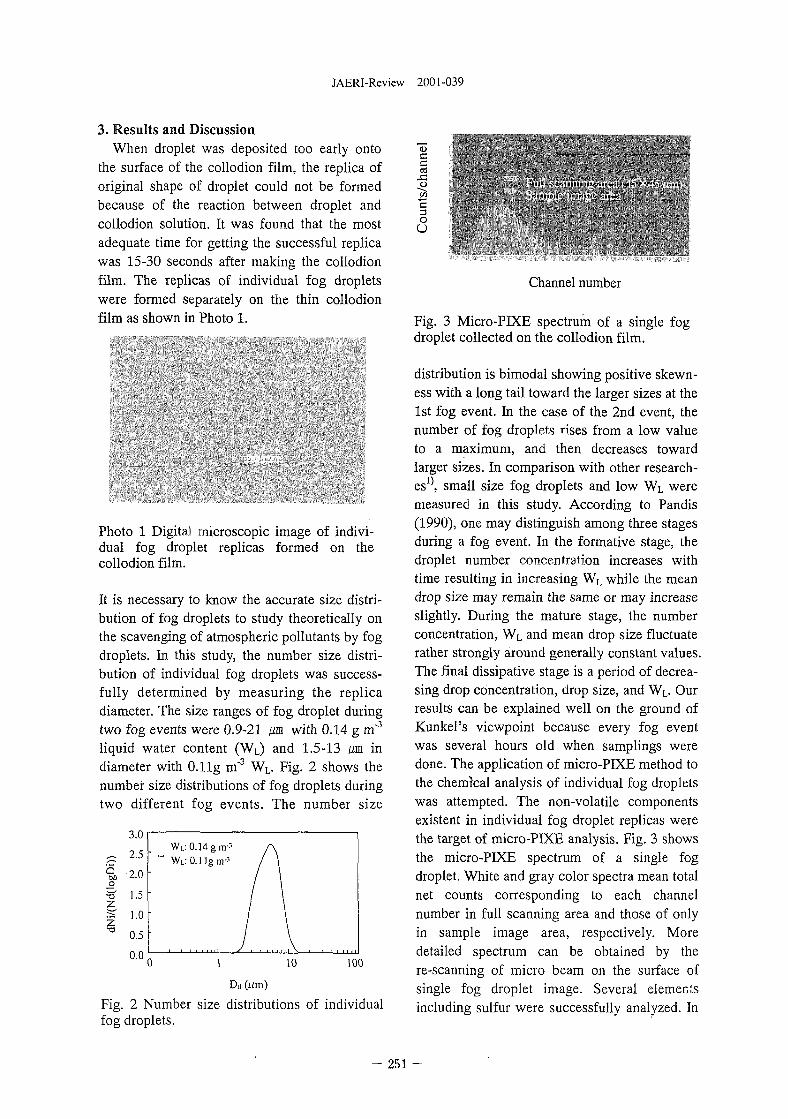
JAERI-Review 2001-039
3. Results and DiscussionWhen droplet was deposited too early onto
the surface of the collodion film, the replica oforiginal shape of droplet could not be formedbecause of the reaction between droplet andcollodion solution. It was found that the mostadequate time for getting the successful replicawas 15-30 seconds after making the collodionfilm. The replicas of individual fog dropletswere formed separately on the thin collodionfilm as shown in Photo 1.
C
ico
U
Channel number
Fig. 3 Micro-PIXE spectrum of a single fogdroplet collected on the collodion film.
Photo 1 Digital microscopic image of indivi-dual fog droplet replicas formed on thecollodion film.
It is necessary to know the accurate size distri-bution of fog droplets to study theoretically onthe scavenging of atmospheric pollutants by fogdroplets. In this study, the number size distri-bution of individual fog droplets was success-fully determined by measuring the replicadiameter. The size ranges of fog droplet duringtwo fog events were 0.9-21 urn with 0.14 g m"3
liquid water content (WL) and 1.5-13 urn indiameter with O.llg m"3 WL. Fig. 2 shows thenumber size distributions of fog droplets duringtwo different fog events. The number size
QM
T3
Fig,fog
3.0
2.5
2.0
1.5
1.0
0.5
0.0
WL: 0.14 g nr3
WL: O.llg m-3
0 1 10 100
D,i (urn)
2 Number size distributions of individualdroplets.
distribution is bimodal showing positive skewn-ess with a long tail toward the larger sizes at the1st fog event. In the case of the 2nd event, thenumber of fog droplets rises from a low valueto a maximum, and then decreases towardlarger sizes. In comparison with other research-es^, small size fog droplets and low WL weremeasured in this study. According to Pandis(1990), one may distinguish among three stagesduring a fog event. In the formative stage, thedroplet number concentration increases withtime resulting in increasing WL while the meandrop size may remain the same or may increaseslightly. During the mature stage, the numberconcentration, WL and mean drop size fluctuaterather strongly around generally constant values.The final dissipative stage is a period of decrea-sing drop concentration, drop size, and WL. Ourresults can be explained well on the ground ofKunkel's viewpoint because every fog eventwas several hours old when samplings weredone. The application of micro-PIXE method tothe chemical analysis of individual fog dropletswas attempted. The non-volatile componentsexistent in individual fog droplet replicas werethe target of micro-PIXE analysis. Fig. 3 showsthe micro-PIXE spectrum of a single fogdroplet. White and gray color spectra mean totalnet counts corresponding to each channelnumber in full scanning area and those of onlyin sample image area, respectively. Moredetailed spectrum can be obtained by there-scanning of micro beam on the surface ofsingle fog droplet image. Several elementsincluding sulfur were successfully analyzed. In
- 251 -
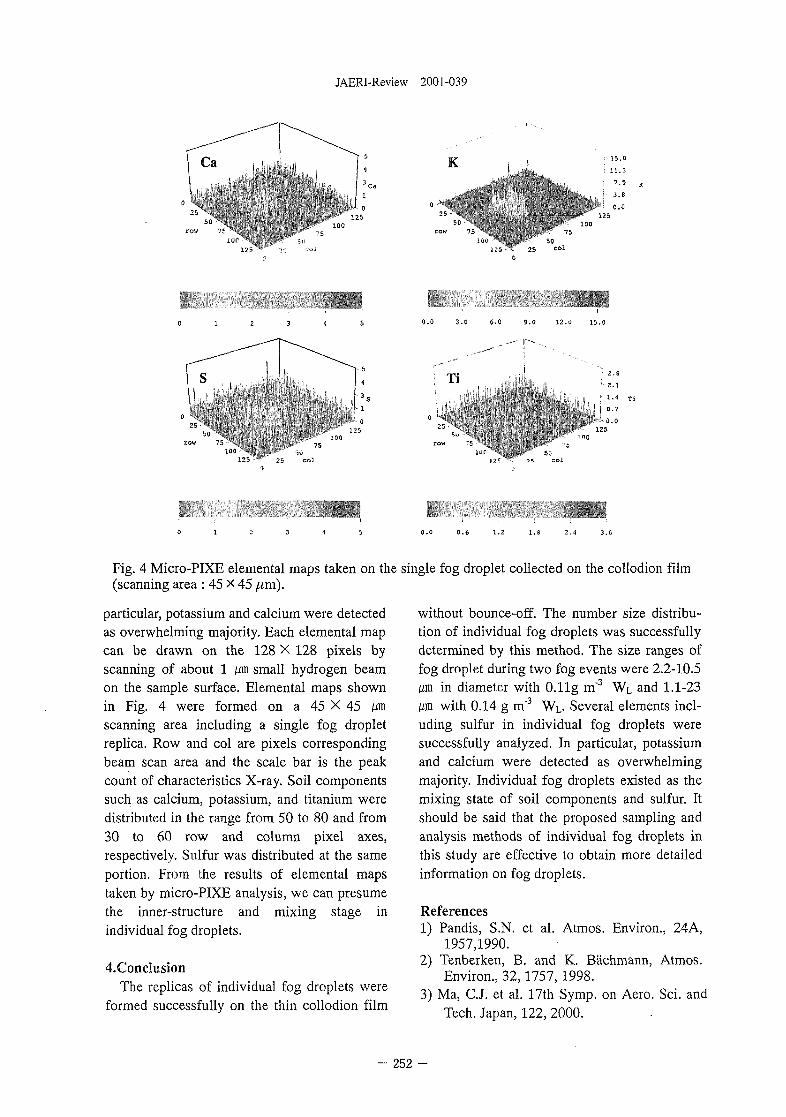
JAERI-Review 2001-039
o12S
K • 15.0
' 11.3
• 1,5
! 3.8
»! o.O125
0.0 3.0 6.0 5.0 12.0 15.0
0!5
Ti ' 2 . 81 2 . 1
1.4 T 1
I , 0 . 71 0.0
125
Fig. 4 Micro-PIXE elemental maps taken on the single fog droplet collected on the collodion film(scanning area : 45 X 45 fj.m).
particular, potassium and calcium were detectedas overwhelming majority. Each elemental mapcan be drawn on the 128 X 128 pixels byscanning of about 1 im. small hydrogen beamon the sample surface. Elemental maps shownin Fig. 4 were formed on a 45 X 45 ymscanning area including a single fog dropletreplica. Row and col are pixels correspondingbeam scan area and the scale bar is the peakcount of characteristics X-ray. Soil componentssuch as calcium, potassium, and titanium weredistributed in the range from 50 to 80 and from30 to 60 row and column pixel axes,respectively. Sulfur was distributed at the sameportion. From the results of elemental mapstaken by micro-PIXE analysis, we can presumethe inner-structure and mixing stage inindividual fog droplets.
4.ConclusionThe replicas of individual fog droplets were
formed successfully on the thin collodion film
without bounce-off. The number size distribu-tion of individual fog droplets was successfullydetermined by this method. The size ranges offog droplet during two fog events were 2.2-10.5lira in diameter with O.llg m"3 WL and 1.1-23um with 0.14 g m'3 WL. Several elements incl-uding sulfur in individual fog droplets weresuccessfully analyzed. In particular, potassiumand calcium were detected as overwhelmingmajority. Individual fog droplets existed as themixing state of soil components and sulfur. Itshould be said that the proposed sampling andanalysis methods of individual fog droplets inthis study are effective to obtain more detailedinformation on fog droplets.
References1) Pandis, S.N. et al. Atmos. Environ., 24A,
1957,1990.2) Tenberken, B. and K. Bachmann, Atmos.
Environ., 32, 1757, 1998.3) Ma, C.J. et al. 17th Symp. on Aero. Sci. and
Tech. Japan, 122, 2000.
- 252 -
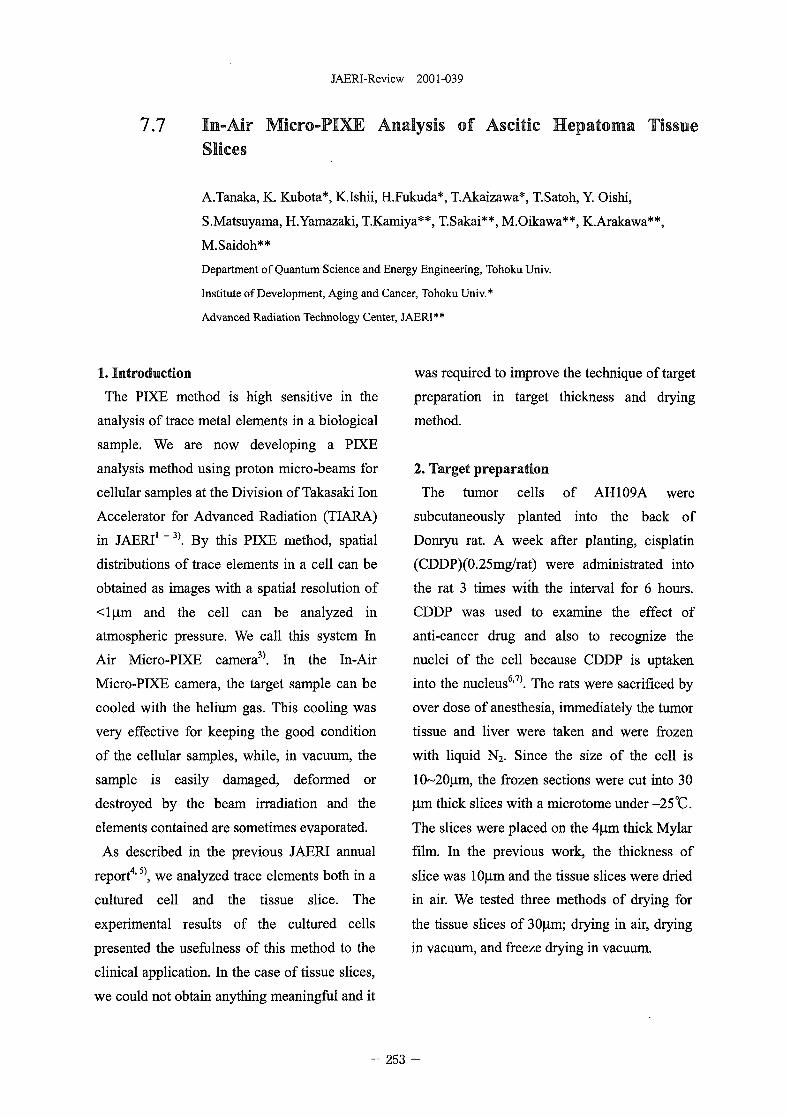
JAERI-Review 2001-039
7.7 In-Air Micro-PIXE Analysis of Ascitic Hepatoma TissueSlices
A.Tanaka, K. Kubota*, Kishii, H.Fukuda*, T.Akaizawa*, T.Satoh, Y. Oishi,
S.Matsuyama, H.Yamazaki, T.Kamiya**, T.Sakai**, M.Oikawa**, K.Arakawa**,
M.Saidoh**
Department of Quantum Science and Energy Engineering, Tohoku Univ.
Institute of Development, Aging and Cancer, Tohoku Univ.*
Advanced Radiation Technology Center, JAERI**
1. Introduction
The PIXE method is high sensitive in the
analysis of trace metal elements in a biological
sample. We are now developing a PIXE
analysis method using proton micro-beams for
cellular samples at the Division of Takasaki Ion
Accelerator for Advanced Radiation (TIARA)
in JAERI1 "3). By this PIXE method, spatial
distributions of trace elements in a cell can be
obtained as images with a spatial resolution of
<lp.m and the cell can be analyzed in
atmospheric pressure. We call this system In
Air Micro-PIXE camera3). In the In-Air
Micro-PIXE camera, the target sample can be
cooled with the helium gas. This cooling was
very effective for keeping the good condition
of the cellular samples, while, in vacuum, the
sample is easily damaged, deformed or
destroyed by the beam irradiation and the
elements contained are sometimes evaporated.
As described in the previous JAERI annual
report4'5), we analyzed trace elements both in a
cultured cell and the tissue slice. The
experimental results of the cultured cells
presented the usefulness of this method to the
clinical application. In the case of tissue slices,
we could not obtain anything meaningful and it
was required to improve the technique of target
preparation in target thickness and drying
method.
2. Target preparation
The tumor cells of AH 109 A were
subcutaneously planted into the back of
Donryu rat. A week after planting, cisplatin
(CDDP)(0.25mg/rat) were administrated into
the rat 3 times with the interval for 6 hours.
CDDP was used to examine the effect of
anti-cancer drug and also to recognize the
nuclei of the cell because CDDP is uptaken
into the nucleus6>7). The rats were sacrificed by
over dose of anesthesia, immediately the tumor
tissue and liver were taken and were frozen
with liquid N2. Since the size of the cell is
10~20um, the frozen sections were cut into 30
jam thick slices with a microtome under -25 °C.
The slices were placed on the 4\im thick Mylar
film. In the previous work, the thickness of
slice was 10|J.m and the tissue slices were dried
in air. We tested three methods of drying for
the tissue slices of 30(xm; drying in air, drying
in vacuum, and freeze drying in vacuum.
- 253
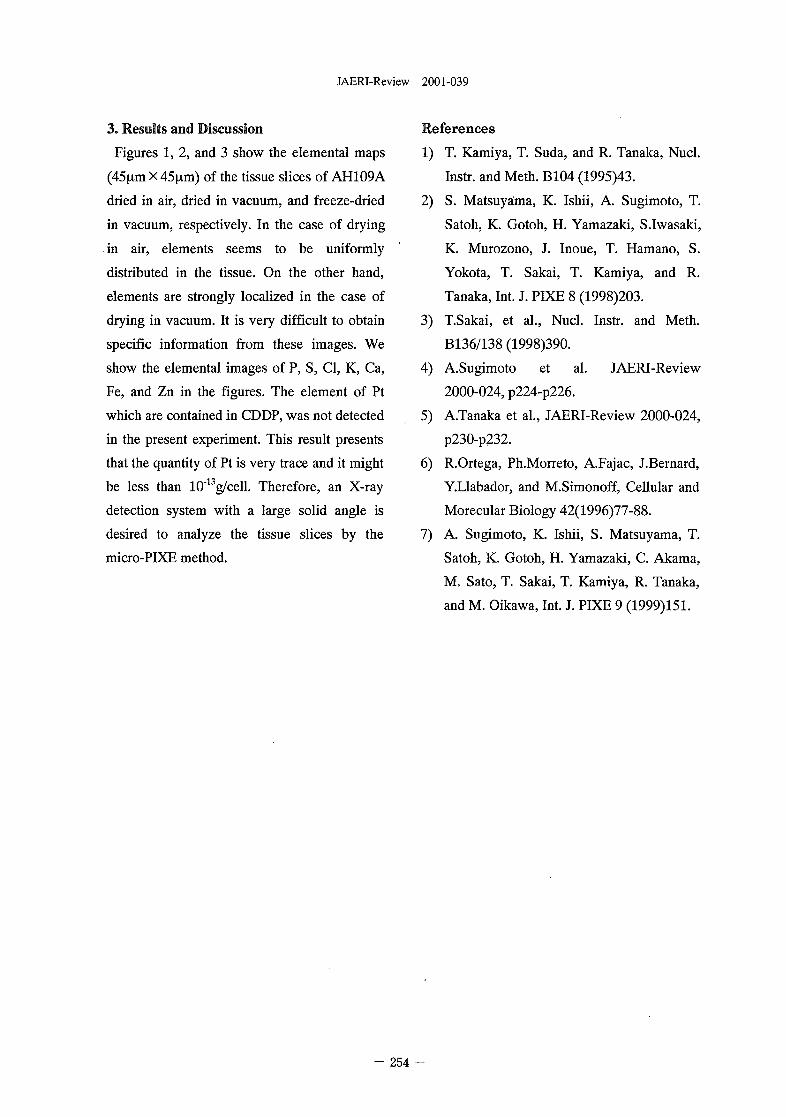
JAERI-Review 2001-039
3. Results and Discussion
Figures 1, 2, and 3 show the elemental maps
(45\im X 45\im) of the tissue slices of AH109A
dried in air, dried in vacuum, and freeze-dried
in vacuum, respectively. In the case of drying
in air, elements seems to be uniformly
distributed in the tissue. On the other hand,
elements are strongly localized in the case of
drying in vacuum. It is very difficult to obtain
specific information from these images. We
show the elemental images of P, S, Cl, K, Ca,
Fe, and Zn in the figures. The element of Pt
which are contained in CDDP, was not detected
in the present experiment. This result presents
that the quantity of Pt is very trace and it might
be less than 10"13g/cell. Therefore, an X-ray
detection system with a large solid angle is
desired to analyze the tissue slices by the
micro-PIXE method.
References
1) T. Kamiya, T. Suda, and R. Tanaka, Nucl.
Instr. and Meth. B104 (1995)43.
2) S. Matsuyama, K. Ishii, A. Sugimoto, T.
Satoh, K. Gotoh, H. Yamazaki, S.Iwasaki,
K. Murozono, J. Inoue, T. Hamano, S.
Yokota, T. Sakai, T. Kamiya, and R.
Tanaka, Int. J. PIXE 8 (1998)203.
3) T.Sakai, et al., Nucl. Instr. and Meth.
B136/138 (1998)390.
4) A.Sugimoto et al. JAERI-Review
2000-024, P224-p226.
5) A.Tanaka et al., JAERI-Review 2000-024,
P230-p232.
6) R.Ortega, Ph.Morreto, A.Fajac, J.Bernard,
Y.Llabador, and M.Simonoff, Cellular and
Morecular Biology 42(1996)77-88.
7) A. Sugimoto, K. Ishii, S. Matsuyama, T.
Satoh, K. Gotoh, H. Yamazaki, C. Akama,
M. Sato, T. Sakai, T. Kamiya, R. Tanaka,
and M. Oikawa, Int. J. PIXE 9 (1999)151.
- 254 -
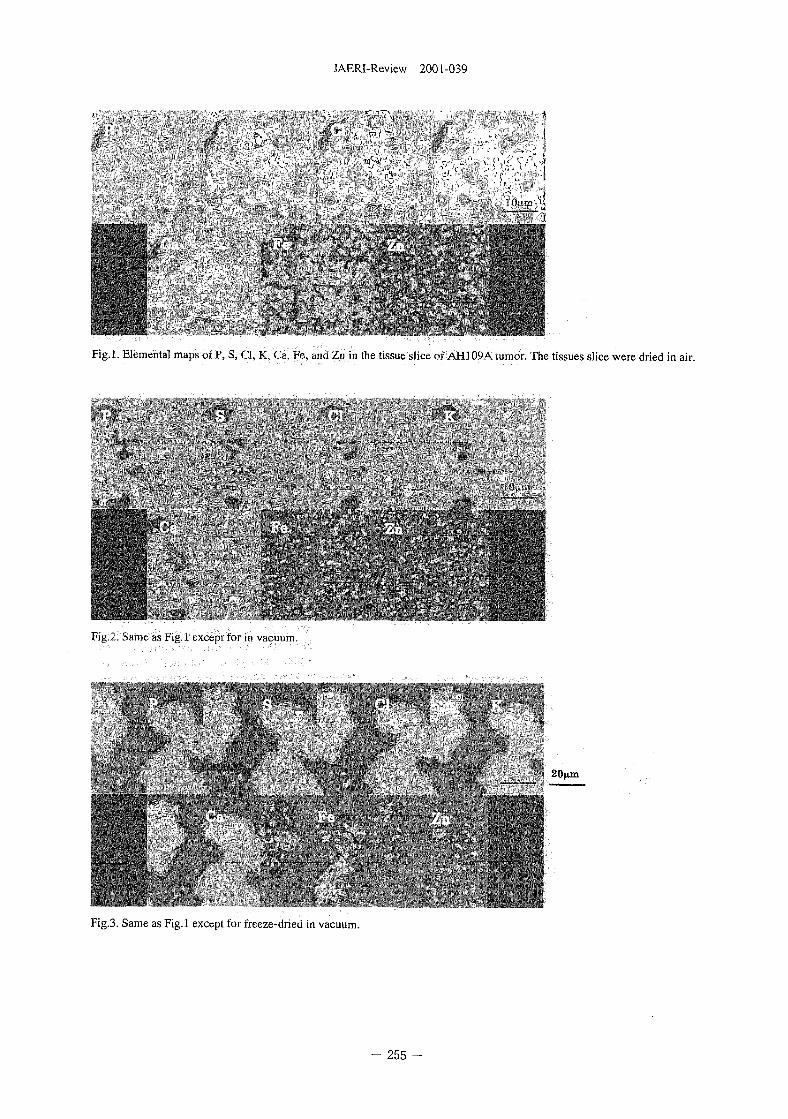
JAERI-Review 2001-039
r,-,...-1'1 iM\^V V.;"\,J
ft
Fig.l. Elemental maps ui Jt, S, Cl. K, C>.. Fe. ami Zn in the tissue slice of AH109A tumor. The tissues slice were dried in air.
Fig,2. Same as Fig.l except for in vacuum.
Fig.3. Same as Fig.l except for freeze-dried in vacuum.
- 255 -
JAERI-Review 2001-039
7.8 Redistribution of Elements between Minerals in Rocks-Analysis of Uranium Distribution in Rocks by JUHPIXE-
T. Ohnuki*, N. Kozai*, M. Samadfam*, R. Yasudn**, T. Kaniiya***,
T. Sakai***, Shoichi Oikawa****, Takahiro Sato**** and T. Murakami***"
Department of Environmental Science, JAERI*. Department of Hot Laboratories,
JAERI"*, Advanced Radiation Technology Center, JAERI***, Mineralogical
Institute, The University ofTokyo****
1. IntroductionThe mobility of dissolved U in natural water isaffected by processes" such as adsorption ordesorption of U ions and precipitation ordissolution of U-bearing minerals". Thus,oxidation states and chemical forms ofU-sorbed on minerals and/or the natureU-bearing minerals should be clarified tounderstand the behavior of U in environment.
The electron technology is introduced intomineralogical science in the 60's and early 70's.By employing this technique, mineralogicaianalysis using electron microprobe analysis(EMPA), scanning electron microscopy (SEM)and transmission electron microscopy (TEM)have been developed. Today SEM and EMFAare used as traditional methods to determine Uconcentrations and the nature of U-minerals at(im-scale in rock samples.
Application of high-energy ion beams alsogoes back to the early 70's. Particle inducedX-ray emission (PIXE) is one of the possiblemethods for detecting the elements in the levelof ppm2>. If we use the probe beams of umorder or less in diameter, U distribution in arock sample can be determined with such aspatial resolution. A light ion microbeamsystem with the spatia! resolution of less than 1pm was constructed on a beam line of 3 MVsingle-ended accelerator in the TIARA facilityat Japan Atomic Energy Research Institute(JAERI). A p-PIXE analyzing system wasdeveloped for chemical analysis with asub-micron level spatial resolution3'. Thus,mapping of U at the ppm level is available byM-PIXE.
Using u-PIXE, we examined thedistribution of U in rock samples collected atthe Koongarra U-deposit, Australia. Wefinally compared the relative advantages ofji-PIXE and SEM-EDS analyses for mappingof U in rock samples.
. Geological settingKoongarra is located in a tropical monsoon
climate. The host rode, a quartz-chlorite schist,and the primary U mineral, uraninite, havebeen weathered at the Koongarra U ore deposit.The primary ore deposit extends from justbelow the surface to a depth pf 60 rn. The rockscurrently at and near the surface have probablybeen subjected to weathering for more than onemillion yearsJ'5). In the "primary" ore deposit,uraninite has been partly altered to uranyl-leadoxides and uranyl silicates*'1. In the"secondary" ore deposit, extending to 20 mbelow the surface and formed by weathering ofthe primary ore deposit, the U(VI) oxides andsiiicates are further weathered and U is foundas urany! phosphates, mostly sale'eite"*'''.
3. ExperimentalThe rock samples were collected from
diamond-drill cores drilled upstream from the"secondary" ore deposit at Koongarra; they are,DDH65-97 (22.7 m depth from the surface)and DDH65-100 (23.5 m), respectively. Thetwo samples analyzed obtained from thetransition zone between the primary ore andthe weathered zone. Petrologica! thinsections of about 30 \im thick were made fromthe collected rock samples. The thin sectionswere initially checked by optical microscopy(OM). After the obseivation by OM, cores of6 mm in diameter were drilled in interestingregion of some of the thin sections for thefi-PlXE analysis. After the U.-PIXE analysis,SEM-EDS analysis on the same sample wascarried out.
A Proton beam with the energy of 2.6 MeVfrom the single-ended machine was used forp.-PIXE analysis. The beam spot wasapproximately 1 um in diameter. Themaximum scanning area for the ji-PIXEanalysis was 740 x 740 \im2.
2 5 6 -
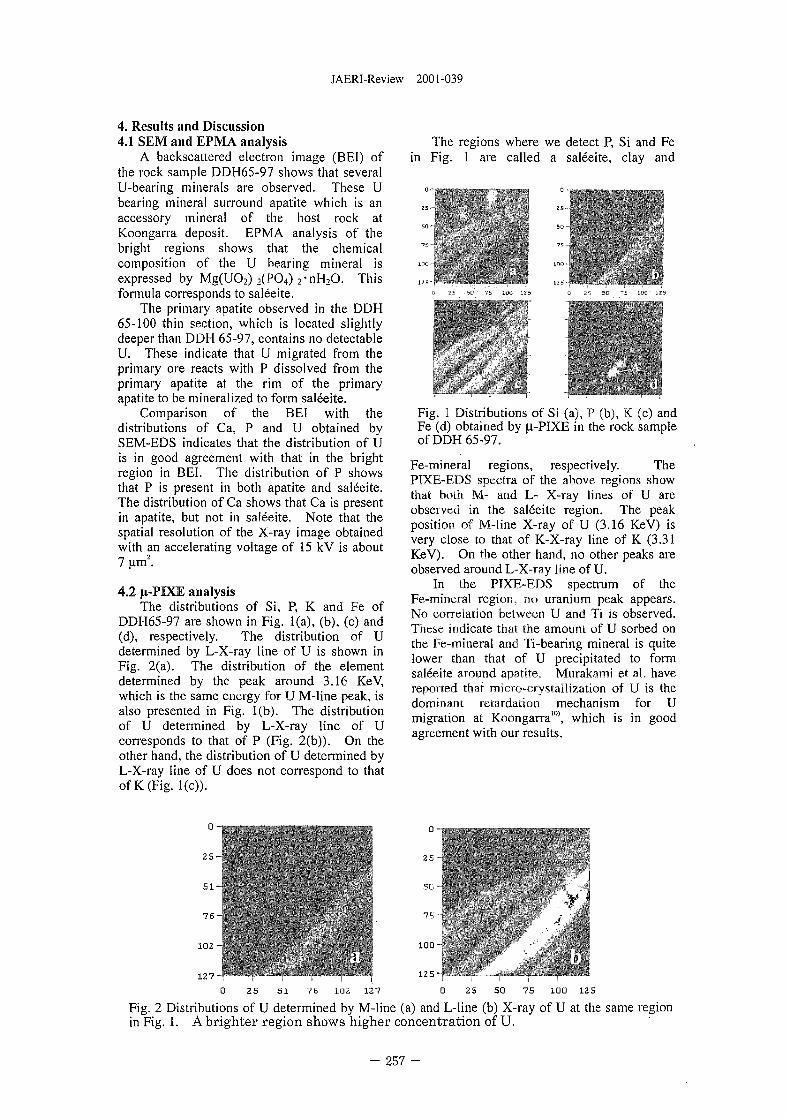
JAERI-Review 2001-039
4. Results and Discussion4.1 SEM and EPMA analysis
A backscattered electron image (BEI) ofthe rock sample DDH65-97 shows that severalU-bearing minerals are observed. These Ubearing mineral surround apatite which is anaccessory mineral of the host rock atKoongarra deposit. EPMA analysis of thebright regions shows that the chemicalcomposition of the U bearing mineral isexpressed by Mg(UO2) 2(PO4) 2-nH2O. Thisformula corresponds to saleeite.
The primary apatite observed in the DDH65-100 thin section, which is located slightlydeeper than DDH 65-97, contains no detectableU. These indicate that U migrated from theprimary ore reacts with P dissolved from theprimary apatite at the rim of the primaryapatite to be mineralized to form saleeite.
Comparison of the BEI with thedistributions of Ca, P and U obtained bySEM-EDS indicates that the distribution of Uis in good agreement with that in the brightregion in BEI. The distribution of P showsthat P is present in both apatite and saleeite.The distribution of Ca shows that Ca is presentin apatite, but not in saleeite. Note that thespatial resolution of the X-ray image obtainedwith an accelerating voltage of 15 kV is about7 urn2.
4.2 U.-PIXE analysisThe distributions of Si, P, K and Fe of
DDH65-97 are shown in Fig. l(a), (b), (c) and(d), respectively. The distribution of Udetermined by L-X-ray line of U is shown inFig. 2(a). The distribution of the elementdetermined by the peak around 3.16 KeV,which is the same energy for U M-line peak, isalso presented in Fig. l(b). The distributionof U determined by L-X-ray line of Ucorresponds to that of P (Fig. 2(b)). On theother hand, the distribution of U determined byL-X-ray line of U does not correspond to thatof K (Fig. l(c)).
The regions where we detect P, Si and Fein Fig. 1 are called a saleeite, clay and
2 5 ••
S O -
Fig. 1 Distributions of Si (a), P (b), K (c) andFe (d) obtained by (0.-PIXE in the rock sampleof DDH 65-97.
Fe-mineral regions, respectively. ThePIXE-EDS spectra of the above regions showthat both M- and L- X-ray lines of U areobserved in the saleeite region. The peakposition of M-line X-ray of U (3.16 KeV) isvery close to that of K-X-ray line of K (3.31KeV). On the other hand, no other peaks areobserved around L-X-ray line of U.
In the PTXE-EDS spectrum of theFe-minera! region, no uranium peak appears.No correlation between U and Ti is observed.These indicate that the amount of U sorbed onthe Fe-mineral and Ti-bearing mineral is quitelower than that of U precipitated to formsaleeite around apatite, Murakami et al, havereported that micro-crystallization of U is thedominant retardation mechanism for Umigration at Koongarra"", which is in goodagreement with our results.
o- o-
2 5 -
5 1 - 50 -
7 6 - 7 5 -
102- 100-
127 -,25 S I 76 102 127
12 S-,
25 50i
75 100 125
Fig. 2 Distributions of U determined by M-line (a) and L-line (b) X-ray of U at the same regionin Fig. 1. A brighter region shows higher concentration of U.
257
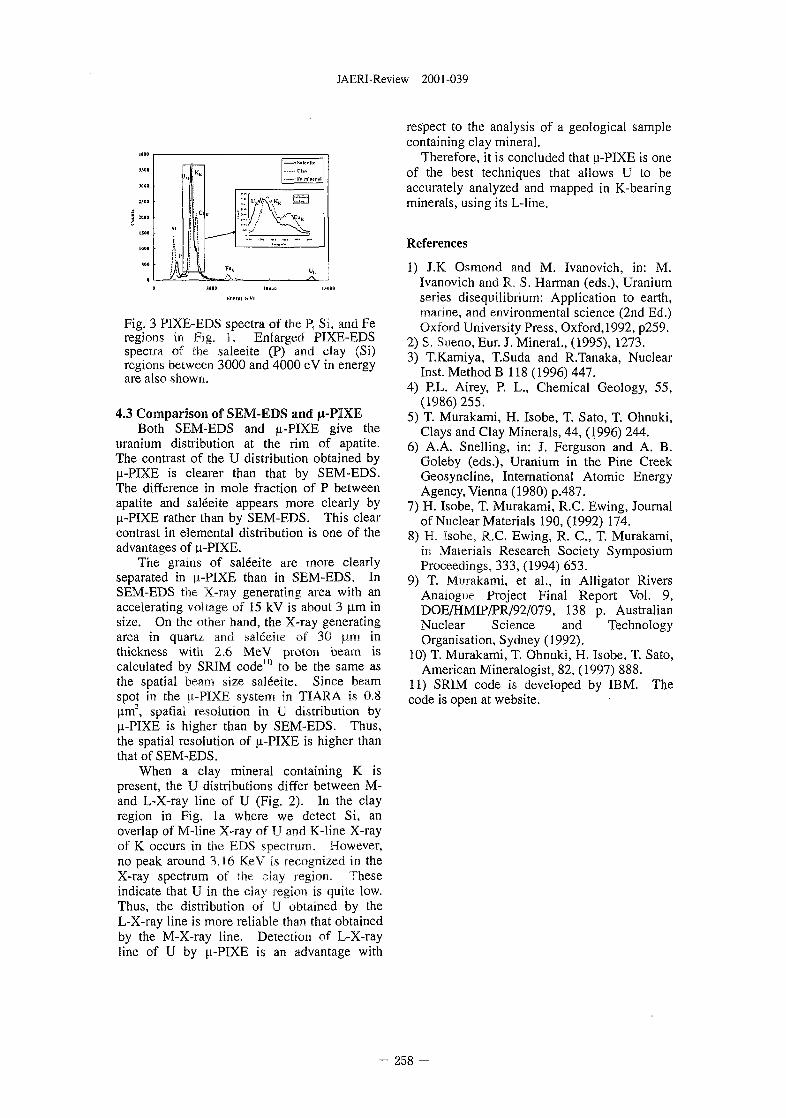
JAERI-Review 2001-039
.ISOO
.1000
2500
| 1000
ISOO
1000
JOO
SI
i
! • * '
4 K K
ii'j \
! " • •
„ • • '
Sukfitf
dill
Kr mlncrBl
Fig. 3 PIXE-EDS spectra of the P, Si, and Feregions in Fig. 1. Enlarged PIXE-EDSspectra of the saleeite (P) and clay (Si)regions between 3000 and 4000 eV in energyare also shown.
4.3 Comparison of SEM-EDS and fi-PIXEBoth SEM-EDS and u-PIXE give the
uranium distribution at the rim of apatite.The contrast of the U distribution obtained byu-PIXE is clearer than that by SEM-EDS.The difference in mole fraction of P betweenapatite and saleeite appears more clearly byu-PIXE rather than by SEM-EDS. This clearcontrast in elemental distribution is one of theadvantages of u-PIXE.
The grains of saleeite are more clearlyseparated in u-PIXE than in SEM-EDS. InSEM-EDS the X-ray generating area with anaccelerating voltage of 15 kV is about 3 u.m insize. On the other hand, the X-ray generatingarea in quartz and saleeite of 30 fim inthickness with 2.6 MeV proton beam iscalculated by SRIM code1" to be the same asthe spatial beam size saleeite. Since beamspot in the u-PIXE system in TIARA is 0,8|im2, spatial resolution in U distribution byu-PIXE is higher than by SEM-EDS. Thus,the spatial resolution of u-PIXE is higher thanthat of SEM-EDS.
When a clay mineral containing K ispresent, the U distributions differ between M-and L-X-ray line of U (Fig. 2). In the clayregion in Fig. la where we detect Si, anoverlap of M-line X-ray of U and K-line X-rayof K occurs in the EDS spectrum. However,no peak around 3,16 KeV is recognized in theX-ray spectrum of the clay region. Theseindicate that U in the clay region is quite low.Thus, the distribution of U obtained by theL-X-ray line is more reliable than that obtainedby the M-X-ray line. Detection of L-X-rayline of U by u-PIXE is an advantage with
respect to the analysis of a geological samplecontaining clay mineral.
Therefore, it is concluded that u-PIXE is oneof the best techniques that allows U to beaccurately analyzed and mapped in K-bearingminerals, using its L-line.
References
1) J.K Osmond and M. Ivanovich, in: M.Ivanovich and R. S. Harman (eds.), Uraniumseries disequilibrium: Application to earth,marine, and environmental science (2nd Ed.)Oxford University Press, Oxford, 1992, p259.
2) S. Sueno, Eur. J. Mineral., (1995), 1273.3) T.Kamiya, T.Suda and R.Tanaka, Nuclear
Inst. Method B 118 (1996) 447.4) P.L. Airey, P. L., Chemical Geology, 55,
(1986)255.5) T. Murakami, H. Isobe, T. Sato, T. Ohnuki,
Clays and Clay Minerals, 44, (1996) 244.6) A.A. Snelling, in: J. Ferguson and A. B.
Goleby (eds.), Uranium in the Pine CreekGeosyncline, International Atomic EnergyAgency, Vienna (1980) p.487.
7) H. Isobe, T. Murakami, R.C. Ewing, Journalof Nuclear Materials 190,(1992) 174.
8) H. Isobe, R.C. Ewing, R. C , T. Murakami,in Materials Research Society SymposiumProceedings, 333, (1994) 653.
9) T. Murakami, et al., in Alligator RiversAnalogue Project Final Report Vol. 9,DOE/HMIP/PR/92/079, 138 p. AustralianNuclear Science and TechnologyOrganisation, Sydney (1992).
10) T. Murakami, T. Ohnuki, H. Isobe, T. Sato,American Mineralogist, 82, (1997) 888.
11) SRIM code is developed by IBM. Thecode is open at website.
- 258 -
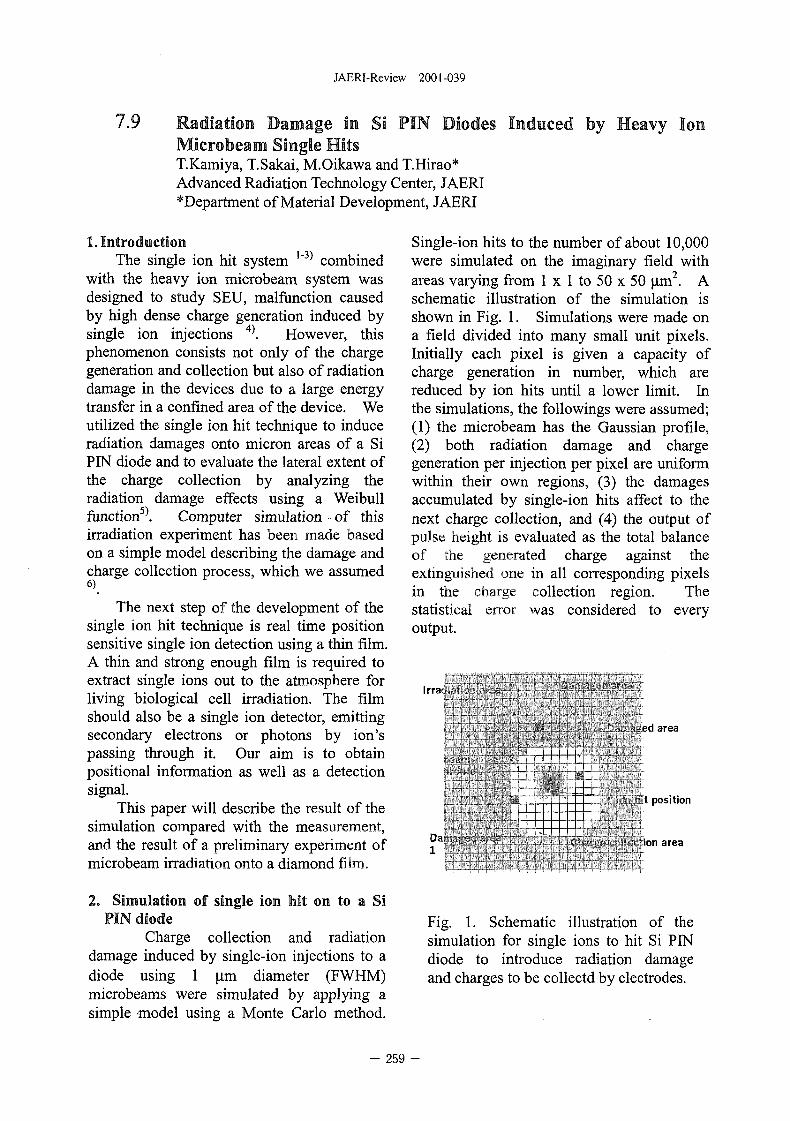
JAERI-Review 2001-039
7.9 Radiation Damage in SI PIN Diodes Induced by Heavy IonMicrobeam Single HitsT.Kamiya, T.Sakai, M.Oikawa and T.Hirao*Advanced Radiation Technology Center, JAERI*Department of Material Development, JAERI
1. IntroductionThe single ion hit system '"3) combined
with the heavy ion microbeam system wasdesigned to study SEU, malfunction causedby high dense charge generation induced bysingle ion injections 4). However, thisphenomenon consists not only of the chargegeneration and collection but also of radiationdamage in the devices due to a large energytransfer in a confined area of the device. Weutilized the single ion hit technique to induceradiation damages onto micron areas of a SiPIN diode and to evaluate the lateral extent ofthe charge collection by analyzing theradiation damage effects using a Weibullfunction5). Computer simulation of thisirradiation experiment has been made basedon a simple model describing the damage andcharge collection process, which we assumed6)
The next step of the development of thesingle ion hit technique is real time positionsensitive single ion detection using a thin film.A thin and strong enough film is required toextract single ions out to the atmosphere forliving biological cell irradiation. The filmshould also be a single ion detector, emittingsecondary electrons or photons by ion'spassing through it. Our aim is to obtainpositional information as well as a detectionsignal.
This paper will describe the result of thesimulation compared with the measurement,and the result of a preliminary experiment ofmicrobeam irradiation onto a diamond film.
2. Simulation of single ion hit on to a SiPIN diode
Charge collection and radiationdamage induced by single-ion injections to adiode using 1 fim diameter (FWHM)microbeams were simulated by applying asimple model using a Monte Carlo method.
Single-ion hits to the number of about 10,000were simulated on the imaginary field withareas varying from 1 x 1 to 50 x 50 |im2. Aschematic illustration of the simulation isshown in Fig. 1. Simulations were made ona field divided into many small unit pixels.Initially each pixel is given a capacity ofcharge generation in number, which arereduced by ion hits until a lower limit. Inthe simulations, the followings were assumed;(1) the microbeam has the Gaussian profile,(2) both radiation damage and chargegeneration per injection per pixel are uniformwithin their own regions, (3) the damagesaccumulated by single-ion hits affect to thenext charge collection, and (4) the output ofpulse height is evaluated as the total balanceof the generated charge against theextinguished one in all corresponding pixelsin the charge collection region. Thestatistical error was considered to everyoutput.
Irrat
ed area
t position
Da1
' ion area
Fig. 1. Schematic illustration of thesimulation for single ions to hit Si PINdiode to introduce radiation damageand charges to be collectd by electrodes.
- 259 -
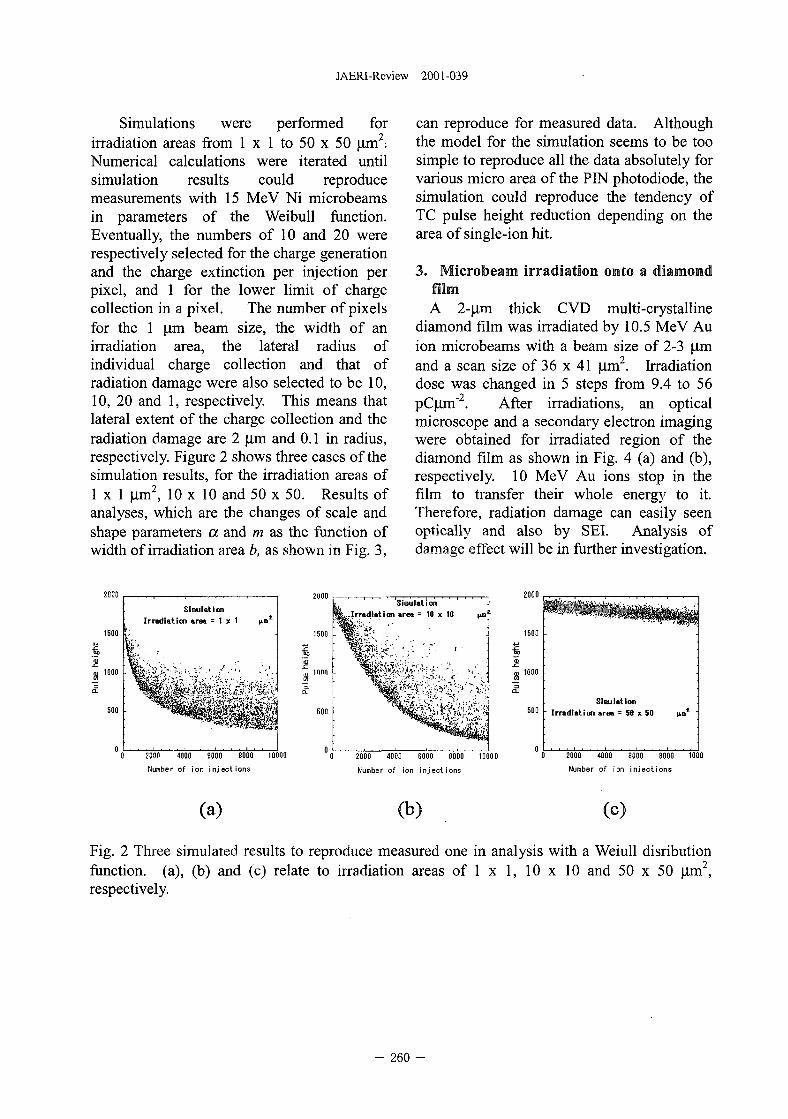
JAERI-Review 2001-039
Simulations were performed forirradiation areas from 1 x 1 to 50 x 50 jim2:Numerical calculations were iterated untilsimulation results could reproducemeasurements with 15 MeV Ni microbeamsin parameters of the Weibull function.Eventually, the numbers of 10 and 20 wererespectively selected for the charge generationand the charge extinction per injection perpixel, and 1 for the lower limit of chargecollection in a pixel. The number of pixelsfor the 1 |im beam size, the width of anirradiation area, the lateral radius ofindividual charge collection and that ofradiation damage were also selected to be 10,10, 20 and 1, respectively. This means thatlateral extent of the charge collection and theradiation damage are 2 |im and 0.1 in radius,respectively. Figure 2 shows three cases of thesimulation results, for the irradiation areas of1 x 1 |im2, 10 x 10 and 50 x 50. Results ofanalyses, which are the changes of scale andshape parameters a and m as the function ofwidth of irradiation area b, as shown in Fig. 3,
can reproduce for measured data. Althoughthe model for the simulation seems to be toosimple to reproduce all the data absolutely forvarious micro area of the PIN photodiode, thesimulation could reproduce the tendency ofTC pulse height reduction depending on thearea of single-ion hit.
3. Microbeam irradiation onto a diamondfilmA 2-|0,m thick CVD multi-crystalline
diamond film was irradiated by 10.5 MeV Auion microbeams with a beam size of 2-3 (Limand a scan size of 36 x 41 |im2. Irradiationdose was changed in 5 steps from 9.4 to 56pCjim"2. After irradiations, an opticalmicroscope and a secondary electron imagingwere obtained for irradiated region of thediamond film as shown in Fig. 4 (a) and (b),respectively. 10 MeV Au ions stop in thefilm to transfer their whole energy to it.Therefore, radiation damage can easily seenoptically and also by SEI. Analysis ofdamage effect will be in further investigation.
2000
1500
1000
soo
S i m u l a t i o nI r r a d i a t i o n a r e a = 1 x 1 I L B *
2000Simulation
.Irradiation area = 10 x 10
0 2000 4000 6000 8000 10000
Number of ion i n j e c t i o n s
2000 .
1500
•6
1000
500Simulation
Irradiation area = 50 x 50 iia1
0 2000 4000 8000 8000 10000
Number of ion i n j e c t i o n s
0 2000 4000 8000 8000 1000
Number of ion i n j e c t i o n s
(a) (b) (o)
Fig. 2 Three simulated results to reproduce measured one in analysis with a Weiull disributionfunction, (a), (b) and (c) relate to irradiation areas of 1 x 1, 10 x 10 and 50 x 50 |im2,respectively.
- 260 -
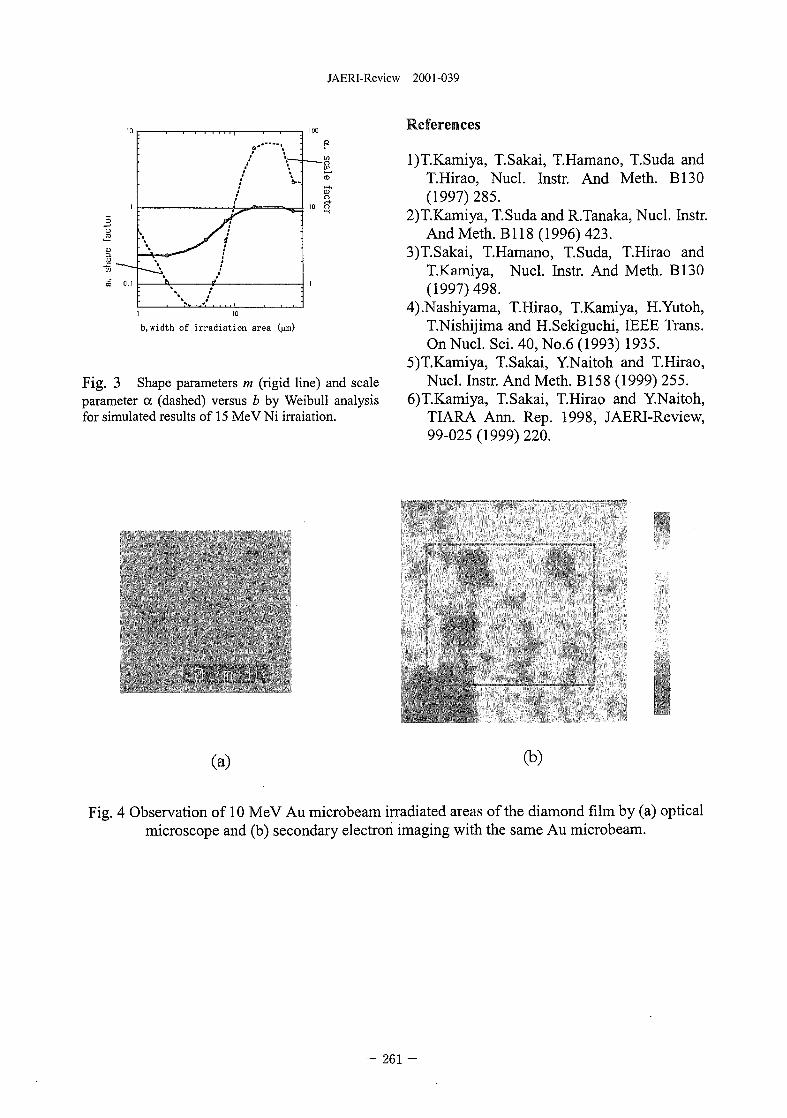
JAERI-Review 2001-039
i 10
b,width of irradiation area (ura)
Fig. 3 Shape parameters m (rigid line) and scaleparameter a (dashed) versus b by Weibull analysisfor simulated results of 15 MeV Ni irraiation.
References
l)T.Kamiya, T.Sakai, T.Hamano, T.Suda andT.Hirao, Nucl. Instr. And Meth. B130(1997)285.
2)T.Kamiya, T.Suda and R.Tanaka, Nucl. Instr.And Meth. Bl 18 (1996) 423.
3)T.Sakai, T.Hamano, T.Suda, T.Hirao andT.Kamiya, Nucl. Instr. And Meth. B130(1997)498.
4).Nashiyama, T.Hirao, T.Kamiya, H.Yutoh,T.Nishijima and H.Sekiguchi, IEEE Trans.On Nucl. Sci. 40,No.6 (1993) 1935.
5)T.Kamiya, T.Sakai, Y.Naitoh and T.Hirao,Nucl. Instr. And Meth. B158 (1999) 255.
6)T.Kamiya, T.Sakai, T.Hirao and Y.Naitoh,TIARA Ann. Rep. 1998, JAERI-Review,99-025(1999)220.
(a) (b)
Fig. 4 Observation of 10 MeV Au microbeam irradiated areas of the diamond film by (a) opticalmicroscope and (b) secondary electron imaging with the same Au microbeam.
- 261 -
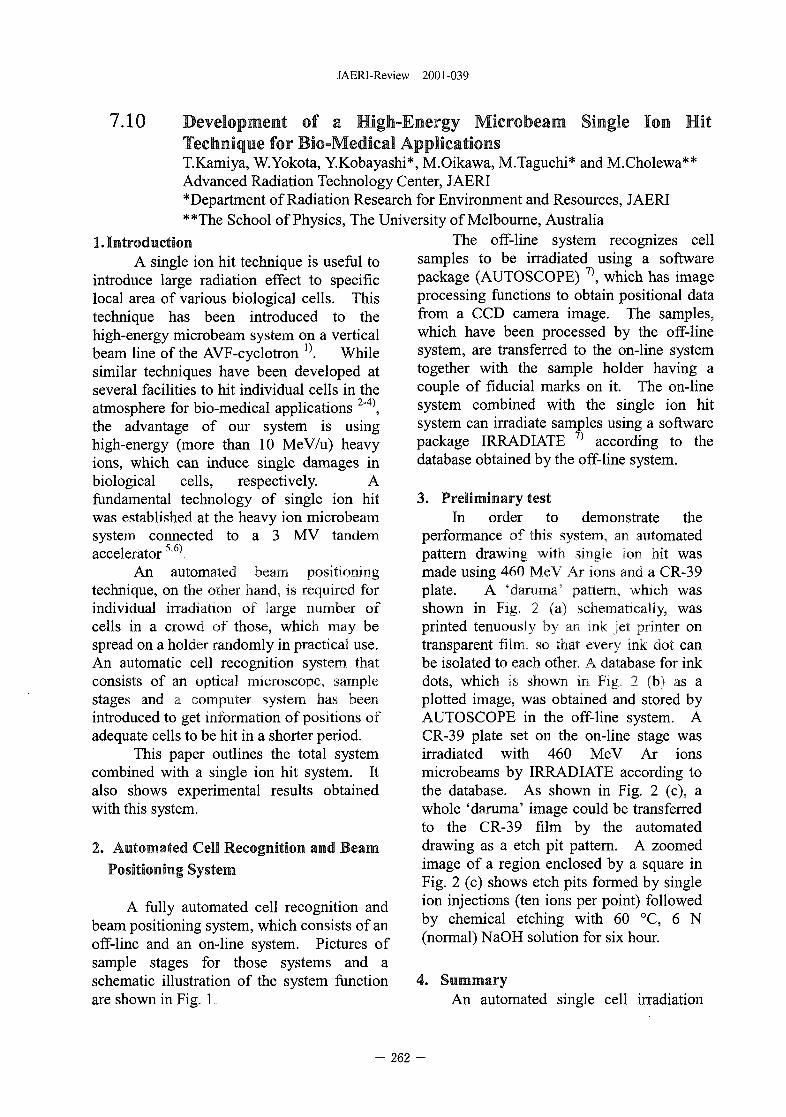
JAERI-Review 2001-039
7.10 Development of a High-Energy Microbeam Single Ion HitTechnique for Bio-Medical ApplicationsT.Kamiya, W.Yokota, Y.Kobayashi*, M.Oikawa, M.Taguchi* and M.Cholewa**Advanced Radiation Technology Center, JAERI*Department of Radiation Research for Environment and Resources, JAERI**The School of Physics, The University of Melbourne, Australia
1. IntroductionA single ion hit technique is useful to
introduce large radiation effect to specificlocal area of various biological cells. Thistechnique has been introduced to thehigh-energy microbeam system on a verticalbeam line of the AVF-cyclotron ]). Whilesimilar techniques have been developed atseveral facilities to hit individual cells in theatmosphere for bio-medical applications 2"4),the advantage of our system is usinghigh-energy (more than 10 MeV/u) heavyions, which can induce single damages inbiological cells, respectively. Afundamental technology of single ion hitwas established at the heavy ion microbeamsystem connected to a 3 MV tandemaccelerator5 6).
An automated beam positioningtechnique, on the other hand, is required forindividual irradiation of large number ofcells in a crowd of those, which may bespread on a holder randomly in practical use.An automatic cell recognition system thatconsists of an optical microscope, samplestages and a computer system has beenintroduced to get information of positions ofadequate cells to be hit in a shorter period.
This paper outlines the total systemcombined with a single ion hit system. Italso shows experimental results obtainedwith this system.
2. Automated Cell Recognition and BeamPositioning System
A fully automated cell recognition andbeam positioning system, which consists of anoff-line and an on-line system. Pictures ofsample stages for those systems and aschematic illustration of the system functionare shown in Fig. 1.
The off-line system recognizes cellsamples to be irradiated using a softwarepackage (AUTOSCOPE) 7), which has imageprocessing functions to obtain positional datafrom a CCD camera image. The samples,which have been processed by the off-linesystem, are transferred to the on-line systemtogether with the sample holder having acouple of fiducial marks on it. The on-linesystem combined with the single ion hitsystem can irradiate samples using a softwarepackage IRRADIATE 7) according to thedatabase obtained by the off-line system.
3. Preliminary testIn order to demonstrate the
performance of this system, an automatedpattern drawing with single ion hit wasmade using 460 MeV Ar ions and a CR-39plate. A 'daruma' pattern, which wasshown in Fig. 2 (a) schematically, wasprinted tenuously by an ink jet printer ontransparent film, so that every ink dot canbe isolated to each other. A database for inkdots, which is shown in Fig. 2 (b) as aplotted image, was obtained and stored byAUTOSCOPE in the off-line system. ACR-39 plate set on the on-line stage wasirradiated with 460 MeV Ar ionsmicrobeams by IRRADIATE according tothe database. As shown in Fig. 2 (c), awhole 'daruma' image could be transferredto the CR-39 film by the automateddrawing as a etch pit pattern. A zoomedimage of a region enclosed by a square inFig. 2 (c) shows etch pits formed by singleion injections (ten ions per point) followedby chemical etching with 60 °C, 6 N(normal) NaOH solution for six hour.
4. SummaryAn automated single cell irradiation
- 262 -
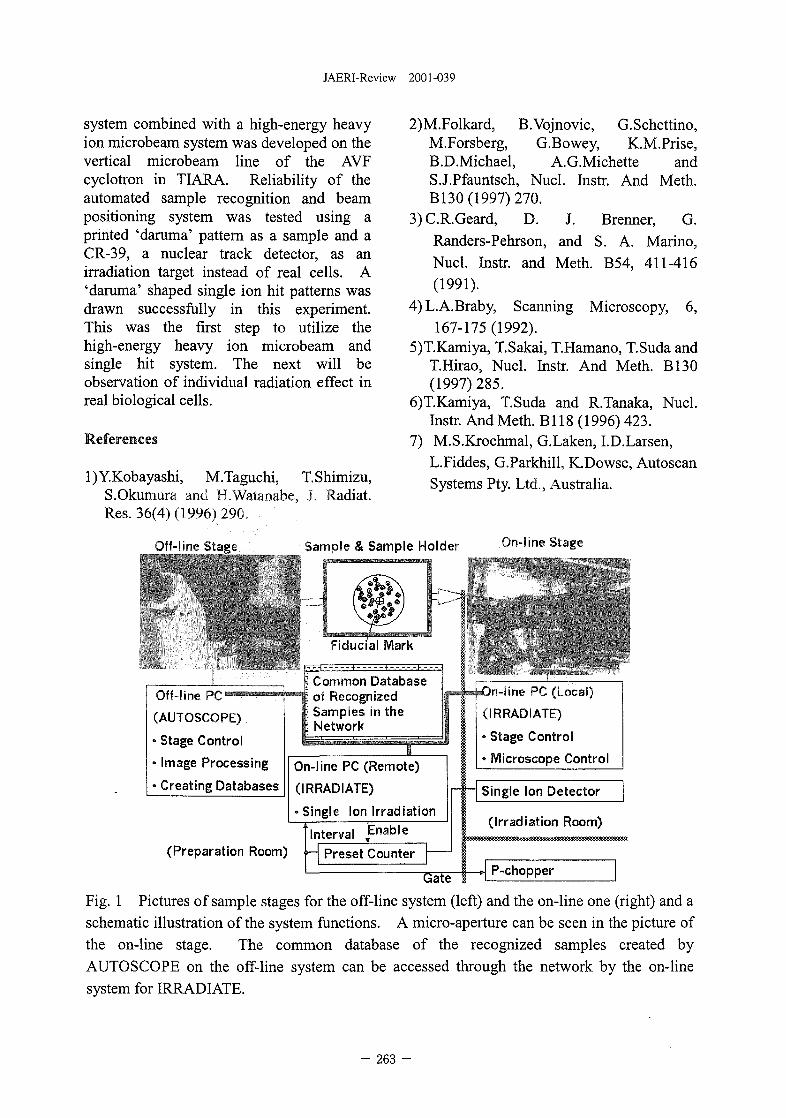
JAERI-Review 2001-039
system combined with a high-energy heavyion microbeam system was developed on thevertical microbeam line of the AVFcyclotron in TIARA. Reliability of theautomated sample recognition and beampositioning system was tested using aprinted 'daruma' pattern as a sample and aCR-39, a nuclear track detector, as anirradiation target instead of real cells. A'daruma' shaped single ion hit patterns wasdrawn successfully in this experiment.This was the first step to utilize thehigh-energy heavy ion microbeam andsingle hit system. The next will beobservation of individual radiation effect inreal biological cells.
References
l)Y.Kobayashi, M.Taguchi, T.Shimizu,S.Okumura and H.Watanabe, J. Radiat.Res. 36(4) (1996) 290,
2)M.Folkard, B.Vojnovic, G.Schettino,M.Forsberg, G.Bowey, K.M.Prise,B.D.Michael, A.G.Michette andS.J.Pfauntsch, Nucl. Instr. And Meth.B130 (1997) 270.
3) C.R.Geard, D. J.
Randers-Pehrson, and
Brenner, G.S. A. Marino,
Nucl. Instr. and Meth. B54, 411-416(1991).
4)L.A.Braby, Scanning Microscopy, 6,167-175 (1992).
5)T.Kamiya, T.Sakai, T.Hamano, T.Suda andT.Hirao, Nucl. Instr. And Meth. B130(1997) 285.
6)T.Kamiya, T.Suda and R.Tanaka, Nucl.Instr. And Meth. B118 (1996) 423.
7) M.S.Krochmal, G.Laken, I.D.Larsen,L.Fiddes, G.Parkhill, K.Dowse, AutoscanSystems Pty. Ltd., Australia.
Off-line Stage & Sample Holder On-line Stage
(AUTOSCOPE)
• Stage Control
• Image Processing
• Creating Databases
~iducial Mark
' Common Database| of RecognizedI Samples in the
Network
On-line PC (Remote)
(IRRADIATE)
•Single Ion Irradiation
(Preparation Room) ••—Interval Enable
Preset Counter
Gate
-A_On-line PC (Local)
OR RAD I ATE)
• Stage Control
• Microscope Control
Single Ion Detector
(Irradiation Room)
P-chopper
Fig. 1 Pictures of sample stages for the off-line system (left) and the on-line one (right) and aschematic illustration of the system functions. A micro-aperture can be seen in the picture ofthe on-line stage. The common database of the recognized samples created byAUTOSCOPE on the off-line system can be accessed through the network by the on-linesystem for IRRADIATE.
- 263 -
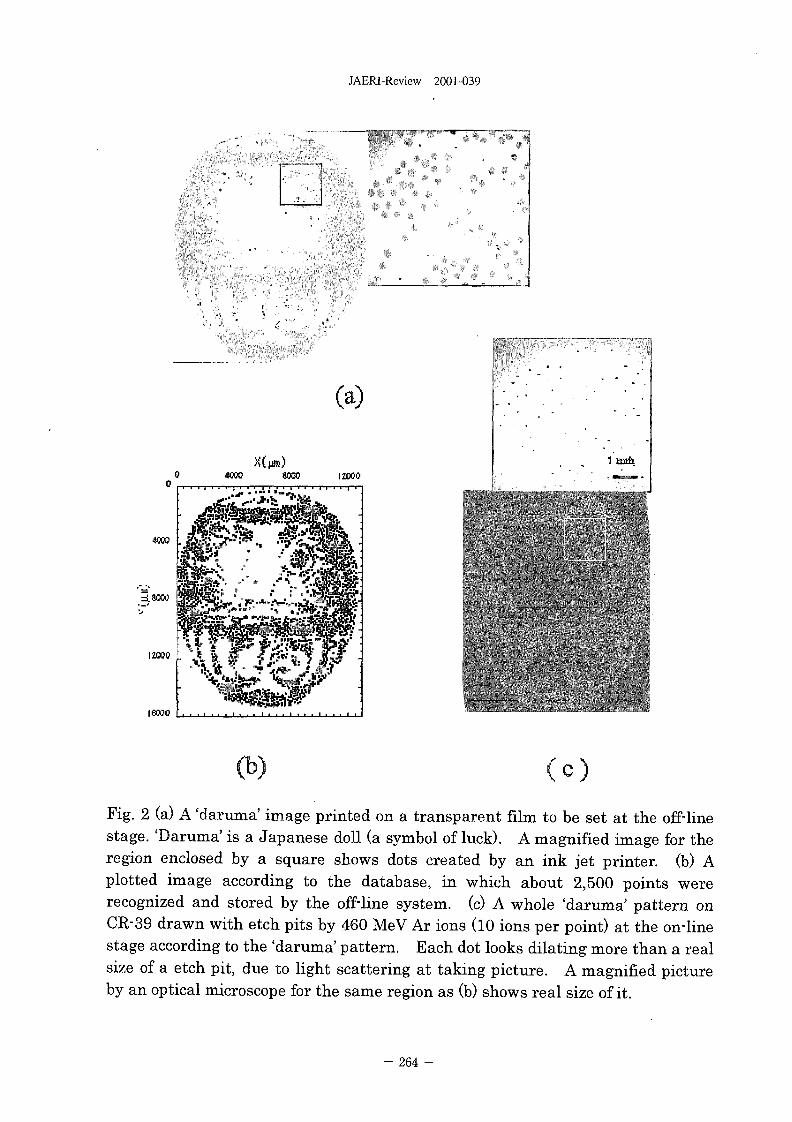
JAERl-Review 2001-039
L-:-'
4000 3000
(a)
12000
4000 .
=18000
12030 .
16000
(b) ( c )
Fig. 2 (a) A 'daruma' image printed on a transparent film to be set at the off-linestage. 'Daruma' is a Japanese doll (a symbol of luck). A magnified image for theregion enclosed by a square shows dots created by an ink jet printer, (b) Aplotted image according to the database, in which about 2,500 points wererecognized and stored by the off-line system, (c) A whole 'daruma' pattern onCR-39 drawn with etch pits by 460 MeV Ar ions (10 ions per point) at the on-linestage according to the 'daruma' pattern. Each dot looks dilating more than a realsize of a etch pit, due to light scattering at taking picture. A magnified pictureby an optical microscope for the same region as (b) shows real size of it.
2 6 4 -

JAERI-Review 2001-039
8. Radiation Shielding for Accelerator Facilities
8.1 Study of Particle Size Distribution of Radioactive Aerosols Formed by Irradiationof 65 MeV Quasi-monoenergetic Neutrons 267
A.Endo, H.Noguchi, S.Tanaka, Y.Kanda, Y.Oki, T.Iida, K.Sato, and S.Tsuda8.2 Measurement of Neutron Dose behind Iron Shield with Tissue Equivalent
Proportional Counter 270
Y.Nakane, Y.Sakamoto, Y.Harada, S.Tanaka, and T.Nunomiya8.3 Development of Neutron Monitor Using a Liquid Scintillator 273
E.Kim, A.Endo, S.Tsuda, F.Takahashi, M.Yoshizawa, Y.Yamaguchi, S.Tanaka,T.Shiomi, T.Nunomiya, R.A.H.Danielle, and T.Nakamura
- 265 -
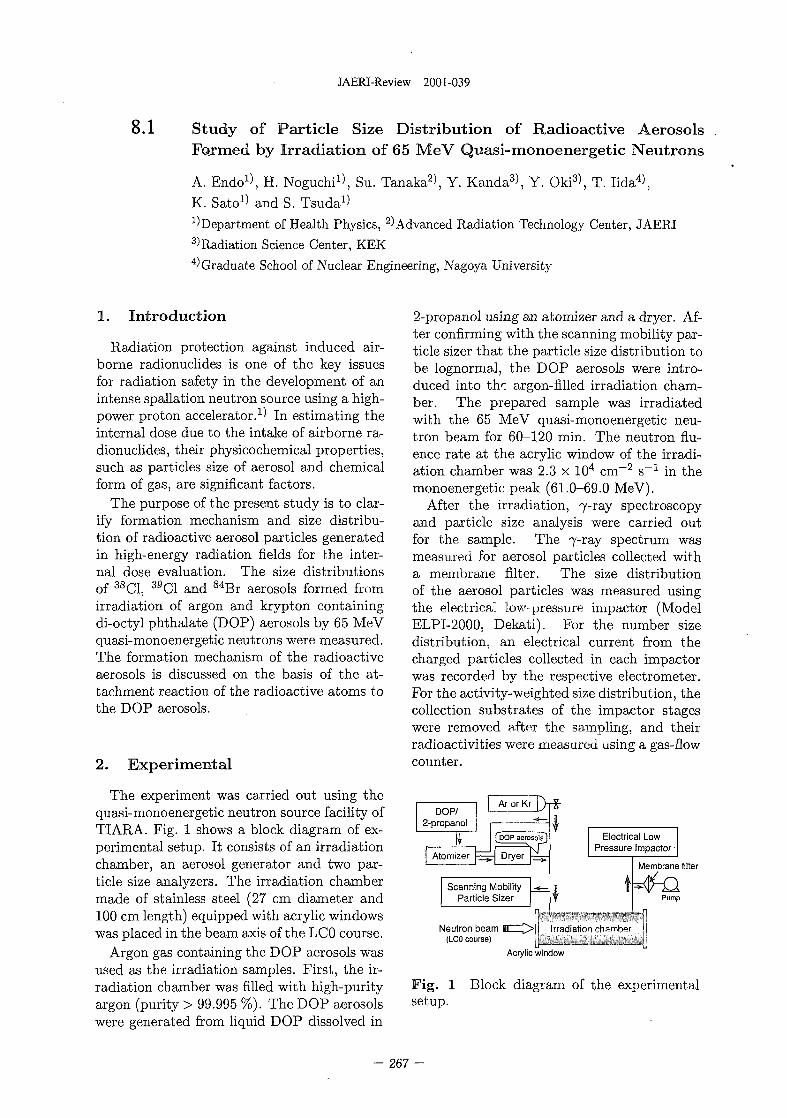
JAERI-Review 2001-039
8.1 Study of Particle Size Distribution of Radioactive AerosolsFoxmed by Irradiation of 65 MeV Quasi-monoenergetic Neutrons
A. Endo1), H. Noguchi1), Su. Tanaka2), Y. Kanda3\ Y. Oki3\ T. Iida4),K. Sato1) and S. Tsuda1)^Department of Health Physics, 2) Advanced Radiation Technology Center, JAERI3)Radiation Science Center, KEK4) Graduate School of Nuclear Engineering, Nagoya University
1. Introduction
Radiation protection against induced air-borne radionuclides is one of the key issuesfor radiation safety in the development of anintense spallation neutron source using a high-power proton accelerator.1) In estimating theinternal dose due to the intake of airborne ra-dionuclides, their physicochemical properties,such as particles size of aerosol and chemicalform of gas, are significant factors.
The purpose of the present study is to clar-ify formation mechanism and size distribu-tion of radioactive aerosol particles generatedin high-energy radiation fields for the inter-nal dose evaluation. The size distributionsof 38C1, 39C1 and 84Br aerosols formed fromirradiation of argon and krypton containingdi-octyl phthalate (DOP) aerosols by 65 MeVquasi-monoenergetic neutrons were measured.The formation mechanism of the radioactiveaerosols is discussed on the basis of the at-tachment reaction of the radioactive atoms tothe DOP aerosols.
2. Experimental
The experiment was carried out using thequasi-monoenergetic neutron source facility ofTIARA. Fig. 1 shows a block diagram of ex-perimental setup. It consists of an irradiationchamber, an aerosol generator and two par-ticle size analyzers. The irradiation chambermade of stainless steel (27 cm diameter and100 cm length) equipped with acrylic windowswas placed in the beam axis of the LC0 course.
Argon gas containing the DOP aerosols wasused as the irradiation samples. First, the ir-radiation chamber was filled with high-purityargon (purity > 99.995 %). The DOP aerosolswere generated from liquid DOP dissolved in
2-propanol using an atomizer and a dryer. Af-ter confirming with the scanning mobility par-ticle sizer that the particle size distribution tobe lognormal, the DOP aerosols were intro-duced into the argon-filled irradiation cham-ber. The prepared sample was irradiatedwith the 65 MeV quasi-monoenergetic neu-tron beam for 60-120 min. The neutron flu-ence rate at the acrylic window of the irradi-ation chamber was 2.3 x 104 cm~2 s^1 in themonoenergetic peak (61.0-69.0 MeV).
After the irradiation, 7-ray spectroscopyand particle size analysis were carried outfor the sample. The 7-ray spectrum wasmeasured for aerosol particles collected witha membrane filter. The size distributionof the aerosol particles was measured usingthe electrical low-pressure impactor (ModelELPI-2000, Dekati). For the number sizedistribution, an electrical current from thecharged particles collected in each impactorwas recorded by the respective electrometer.For the activity-weighted size distribution, thecollection substrates of the impactor stageswere removed after the sampling, and theirradioactivities were measured using a gas-flowcounter.
Membrane filter
Electrical LowPressure Impactor
Scanning MobilityParticle Sizer Pump
Neutron beam H ^>(LC0 course)
Acrylic window
Fig. 1 Block diagram of the experimentalsetup.
- 267 -
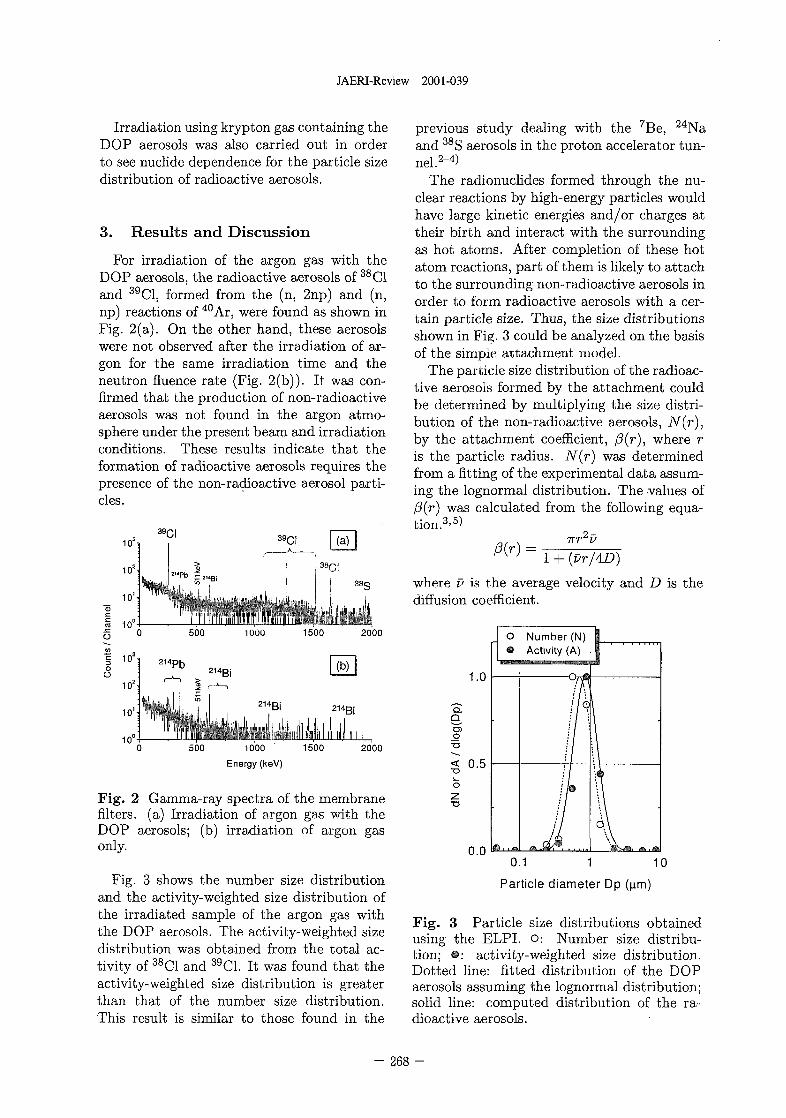
JAERI-Review 2001-039
Irradiation using krypton gas containing theDOP aerosols was also carried out in orderto see nuclide dependence for the particle sizedistribution of radioactive aerosols.
3. Results and Discussion
For irradiation of the argon gas with theDOP aerosols, the radioactive aerosols of 38C1and 39C1, formed from the (n, 2np) and (n,np) reactions of 40Ar, were found as shown inFig. 2(a). On the other hand, these aerosolswere not observed after the irradiation of ar-gon for the same irradiation time and theneutron fluence rate (Fig. 2(b)). It was con-firmed that the production of non-radioactiveaerosols was not found in the argon atmo-sphere under the present beam and irradiationconditions. These results indicate that theformation of radioactive aerosols requires thepresence of the non-radioactive aerosol parti-cles.
2000
500 1000 1500
Energy (keV)
2000
Fig. 2 Gamma-ray spectra of the membranefilters, (a) Irradiation of argon gas with theDOP aerosols; (b) irradiation of argon gasonly.
Fig. 3 shows the number size distributionand the activity-weighted size distribution ofthe irradiated sample of the argon gas withthe DOP aerosols. The activity-weighted sizedistribution was obtained from the total ac-tivity of 38C1 and 39C1. It was found that theactivity-weighted size distribution is greaterthan that of the number size distribution.This result is similar to those found in the
previous study dealing with the 7Be, 24Naand 38S aerosols in the proton accelerator tun-nel.2"4)
The radionuclides formed through the nu-clear reactions by high-energy particles wouldhave large kinetic energies and/or charges attheir birth and interact with the surroundingas hot atoms. After completion of these hotatom reactions, part of them is likely to attachto the surrounding non-radioactive aerosols inorder to form radioactive aerosols with a cer-tain particle size. Thus, the size distributionsshown in Fig. 3 could be analyzed on the basisof the simple attachment model.
The particle size distribution of the radioac-tive aerosols formed by the attachment couldbe determined by multiplying the size distri-bution of the non-radioactive aerosols, N(r),by the attachment coefficient, fl(r), where ris the particle radius. N(r) was determinedfrom a fitting of the experimental data assum-ing the lognormal distribution. The values off3(r) was calculated from the following equa-tion.3'5)
Trr vMVJ 1 + {yr/AD)
where v is the average velocity and D is thediffusion coefficient.
O
•o
o
1.0
0.5
n n
o•
Number (N)Activity (A)
1f
If_Ji:
11
1'.1
0.1 1 10
Particle diameter Dp (u.m)
Fig. 3 Particle size distributions obtainedusing the ELPI. O: Number size distribu-tion; • : activity-weighted size distribution.Dotted line: fitted distribution of the DOPaerosols assuming the lognormal distribution;solid line: computed distribution of the ra-dioactive aerosols.
- 268 -
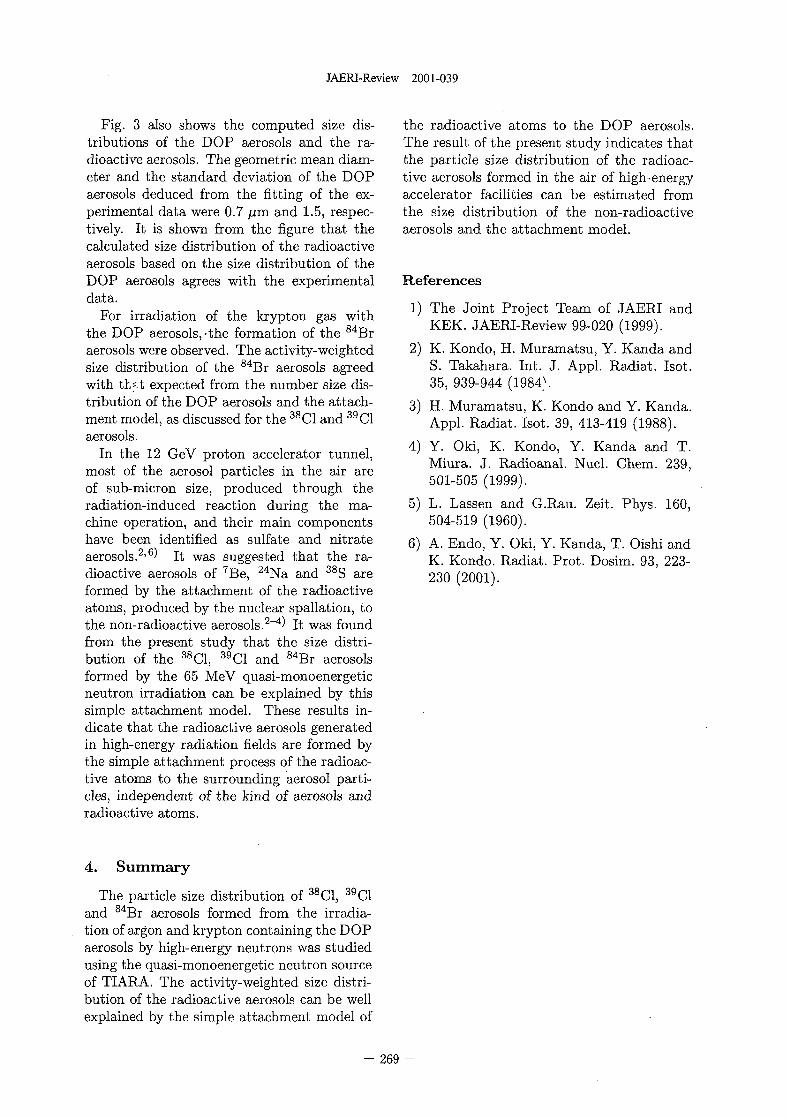
JAERI-Review 2001-039
Fig. 3 also shows the computed size dis-tributions of the DOP aerosols and the ra-dioactive aerosols. The geometric mean diam-eter and the standard deviation of the DOPaerosols deduced from the fitting of the ex-perimental data were 0.7 /j,m and 1.5, respec-tively. It is shown from the figure that thecalculated size distribution of the radioactiveaerosols based on the size distribution of theDOP aerosols agrees with the experimentaldata.
For irradiation of the krypton gas withthe DOP aerosols,-the formation of the 84Braerosols were observed. The activity-weightedsize distribution of the 84Br aerosols agreedwith th*.t expected from the number size dis-tribution of the DOP aerosols and the attach-ment model, as discussed for the 38C1 and 39C1aerosols.
In the 12 GeV proton accelerator tunnel,most of the aerosol particles in the air areof sub-micron size, produced through theradiation-induced reaction during the ma-chine operation, and their main componentshave been identified as sulfate and nitrateaerosols.2'6^ It was suggested that the ra-dioactive aerosols of 7Be, 24Na and 38S areformed by the attachment of the radioactiveatoms, produced by the nuclear spallation, tothe non-radioactive aerosols.2~4) It was foundfrom the present study that the size distri-bution of the 38C1, 39C1 and 84Br aerosolsformed by the 65 MeV quasi-monoenergeticneutron irradiation can be explained by thissimple attachment model. These results in-dicate that the radioactive aerosols generatedin high-energy radiation fields are formed bythe simple attachment process of the radioac-tive atoms to the surrounding aerosol parti-cles, independent of the kind of aerosols andradioactive atoms.
the radioactive atoms to the DOP aerosols.The result of the present study indicates thatthe particle size distribution of the radioac-tive aerosols formed in the air of high-energyaccelerator facilities can be estimated fromthe size distribution of the non-radioactiveaerosols and the attachment model.
References
1) The Joint Project Team of JAERI andKEK. JAERI-Review 99-020 (1999).
2) K. Kondo, H. Muramatsu, Y. Kanda andS. Takahara. Int. J. Appl. Radiat. Isot.35, 939-944 (1984V
3) H. Muramatsu, K. Kondo and Y. Kanda.Appl. Radiat. Isot. 39, 413-419 (1988).
4) Y. Oki, K. Kondo, Y. Kanda and T.Miura. J. Radioanal. Nucl. Chem. 239,501-505 (1999).
5) L. Lassen and G.Rau. Zeit. Phys. 160,504-519 (1960).
6) A. Endo, Y. Oki, Y. Kanda, T. Oishi andK. Kondo. Radiat. Prot. Dosim. 93, 223-230 (2001).
4. Summary
The particle size distribution of 38C1, 39C1and 84Br aerosols formed from the irradia-tion of argon and krypton containing the DOPaerosols by high-energy neutrons was studiedusing the quasi-monoenergetic neutron sourceof TIARA. The activity-weighted size distri-bution of the radioactive aerosols can be wellexplained by the simple attachment model of
- 269 -
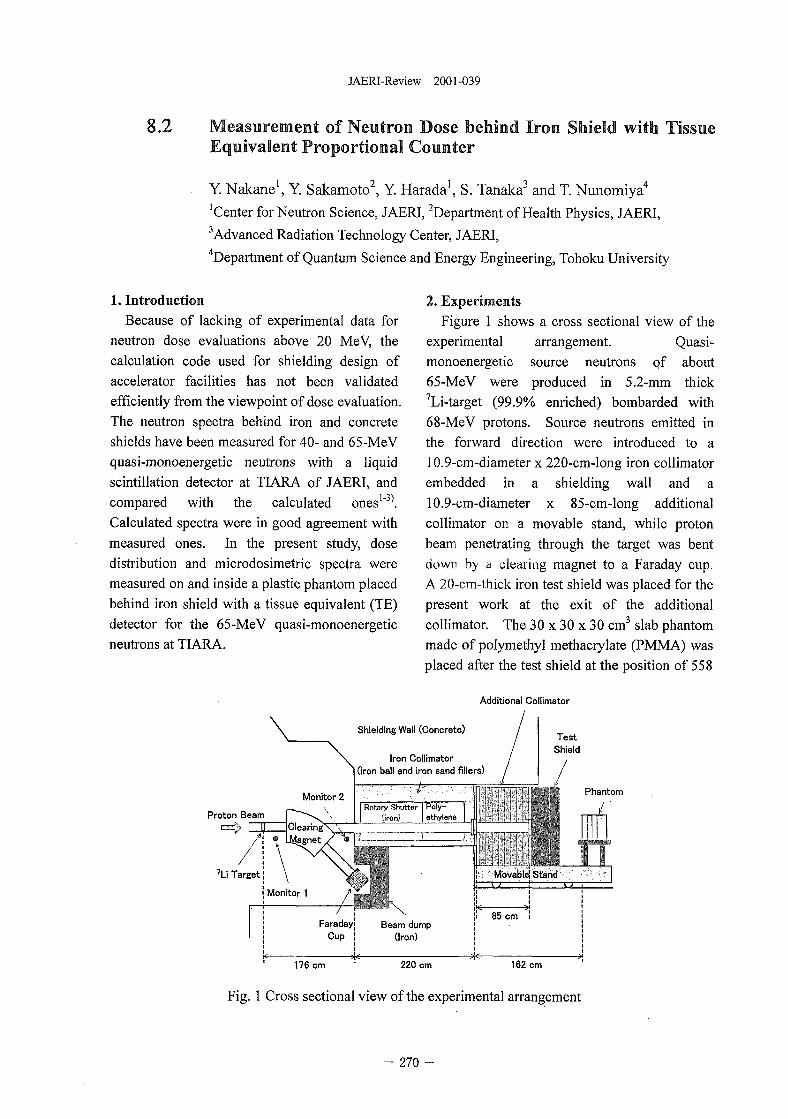
JAERI-Review 2001-039
8.2 Measurement of Neutron Bose behind Iron Shield with TissueEquivalent Proportional Counter
Y. Nakane1, Y. Sakamoto2, Y. Harada1, S. Tanaka3 and T. Nunomiya4
'Center for Neutron Science, JAERI, department of Health Physics, JAERI,3Advanced Radiation Technology Center, JAERI,
Department of Quantum Science and Energy Engineering, Tohoku University
1. Introduction
Because of lacking of experimental data forneutron dose evaluations above 20 MeV, thecalculation code used for shielding design ofaccelerator facilities has not been validatedefficiently from the viewpoint of dose evaluation.The neutron spectra behind iron and concreteshields have been measured for 40- and 65-MeVquasi-monoenergetic neutrons with a liquidscintillation detector at TIARA of JAERI, andcompared with the calculated ones1"^.Calculated spectra were in good agreement withmeasured ones. In the present study, dosedistribution and microdosimetric spectra weremeasured on and inside a plastic phantom placedbehind iron shield with a tissue equivalent (TE)detector for the 65-MeV quasi-monoenergeticneutrons at TIARA.
2. ExperimentsFigure 1 shows a cross sectional view of the
experimental arrangement. Quasi-
monoenergetic source neutrons of about65-MeV were produced in 5.2-mm thick7Li-target (99.9% enriched) bombarded with68-MeV protons. Source neutrons emitted inthe forward direction were introduced to a10.9-cm-diameter x 220-cm-long iron collimatorembedded in a shielding wall and a10.9-cm-diameter x 85-cm-long additionalcollimator on a movable stand, while protonbeam penetrating through the target was bentdown by a clearing magnet to a Faraday cup.A 20-cm-thick iron test shield was placed for thepresent work at the exit of the additionalcollimator. The 3 0 x 3 0 x 3 0 cm3 slab phantommade of polymethyl methacrylate (PMMA) wasplaced after the test shield at the position of 558
Additional Collimator
Shielding Wall (Concrete)
Iron Collimator(iron ball and iron sand fillers)
TestShield
Phantom
Proton Beam
176 cm ; 220 cm 162 cm
Fig. 1 Cross sectional view of the experimental arrangement
- 270
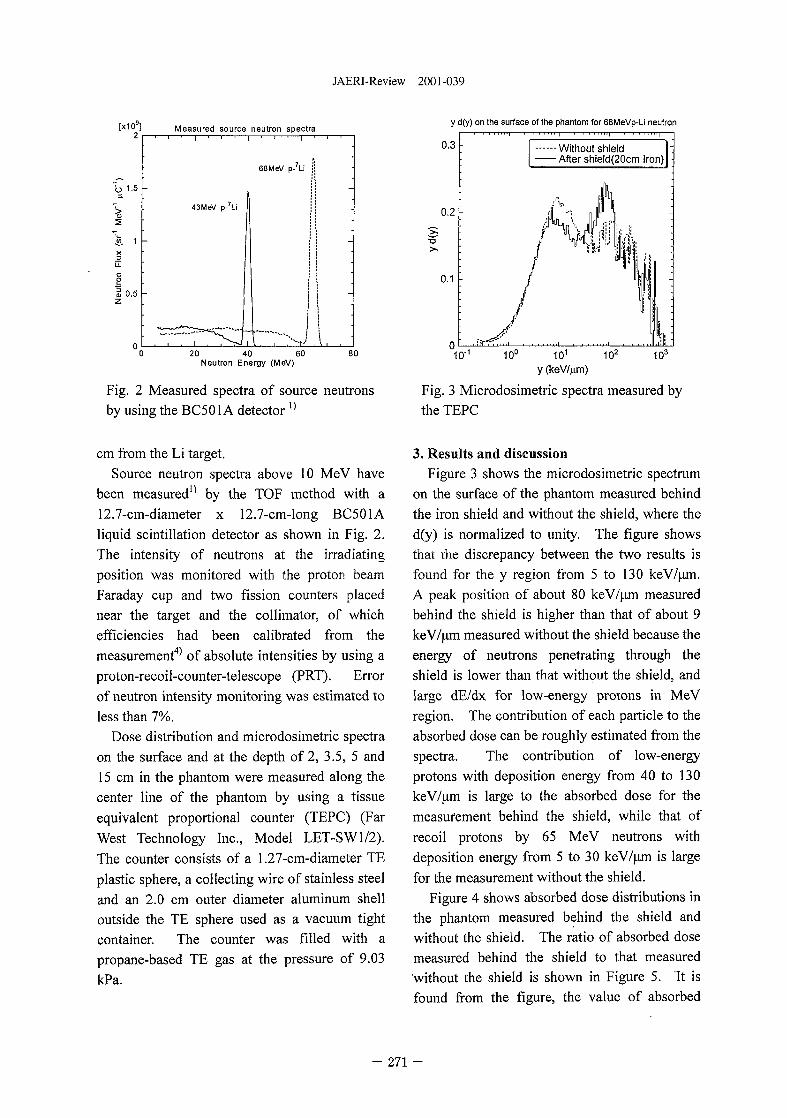
JAERI-Review 2001-039
1*1" 1 Measured source neutron spectray d(y) on the surface of the phantom for 68MeVp-Li neutron
b1 .5
0.5
\ ' I
68MeV p- Li
20 40 60Neutron Energy (MeV)
80
Fig. 2 Measured spectra of source neutronsby using the BC501A detector °
0.3
0.2
0.1
010"1 10°
Without shieldAfter shield(20cm Iron)
102 103
y (keV/um)
Fig. 3 Microdosimetric spectra measured bythe TEPC
cm from the Li target.
Source neutron spectra above 10 MeV havebeen measured15 by the TOF method with a12.7-cm-diameter x 12.7-cm-long BC501Aliquid scintillation detector as shown in Fig. 2.The intensity of neutrons at the irradiatingposition was monitored with the proton beamFaraday cup and two fission counters placednear the target and the collimator, of whichefficiencies had been calibrated from themeasurement45 of absolute intensities by using aproton-recoil-counter-telescope (PRT). Errorof neutron intensity monitoring was estimated toless than 7%.
Dose distribution and microdosimetric spectraon the surface and at the depth of 2, 3.5, 5 and15 cm in the phantom were measured along thecenter line of the phantom by using a tissueequivalent proportional counter (TEPC) (FarWest Technology Inc., Model LET-SW1/2).The counter consists of a 1.27-cm-diameter TEplastic sphere, a collecting wire of stainless steeland an 2.0 cm outer diameter aluminum shelloutside the TE sphere used as a vacuum tightcontainer. The counter was filled with apropane-based TE gas at the pressure of 9.03kPa.
3. Results and discussionFigure 3 shows the microdosimetric spectrum
on the surface of the phantom measured behindthe iron shield and without the shield, where thed(y) is normalized to unity. The figure showsthat the discrepancy between the two results isfound for the y region from 5 to 130 keV/u.m.A peak position of about 80 keV/p.m measuredbehind the shield is higher than that of about 9keV/um measured without the shield because theenergy of neutrons penetrating through theshield is lower than that without the shield, andlarge dE/dx for low-energy protons in MeVregion. The contribution of each particle to theabsorbed dose can be roughly estimated from thespectra. The contribution of low-energyprotons with deposition energy from 40 to 130keV/um is large to the absorbed dose for themeasurement behind the shield, while that ofrecoil protons by 65 MeV neutrons withdeposition energy from 5 to 30 keV/urn is largefor the measurement without the shield.
Figure 4 shows absorbed dose distributions inthe phantom measured behind the shield andwithout the shield. The ratio of absorbed dosemeasured behind the shield to that measuredwithout the shield is shown in Figure 5. It isfound from the figure, the value of absorbed
271 -
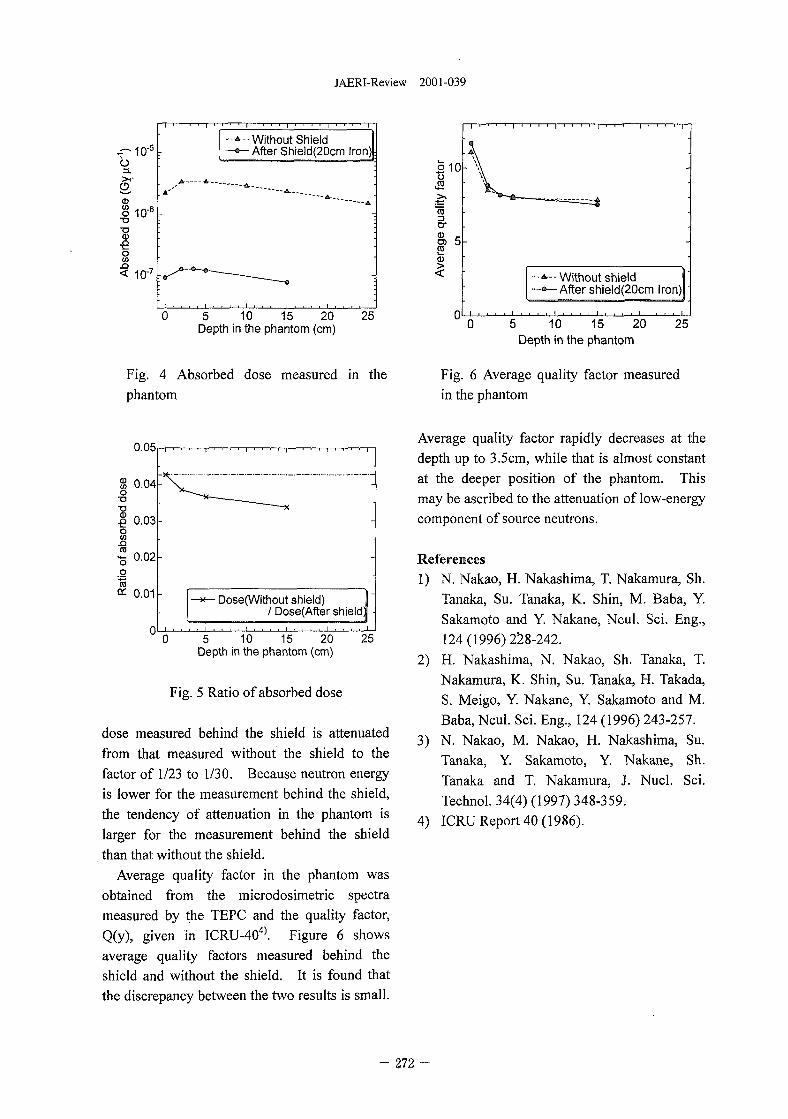
JAERI-Review 2001-039
^ 1 0 " 5
110*
Io< 10"7 r
--*--Without Shield—®— After Shield(20cm Iron)
. . * • - — * *
5 10 15 20Depth in the phantom (cm)
25
Fig. 4 Absorbed dose measured in thephantom
o10oto
cren 5
< - - * - Without shield—•— After shield(20cm Iron) "
5 10 15 20Depth in the phantom
25
Fig. 6 Average quality factor measuredin the phantom
0.05r-r
| 0.04
.8 0.03oin
1 0.02o
••s
oc 0.01
0
• Dose(Without shield)/ Dose(After shield]
5 10 15 20 25Depth in the phantom (cm)
Fig. 5 Ratio of absorbed dose
dose measured behind the shield is attenuatedfrom that measured without the shield to thefactor of 1/23 to 1/30. Because neutron energyis lower for the measurement behind the shield,the tendency of attenuation in the phantom islarger for the measurement behind the shieldthan that without the shield.
Average quality factor in the phantom wasobtained from the microdosimetric spectrameasured by the TEPC and the quality factor,Q(y), given in ICRU-404). Figure 6 showsaverage quality factors measured behind theshield and without the shield. It is found thatthe discrepancy between the two results is small.
Average quality factor rapidly decreases at thedepth up to 3.5cm, while that is almost constantat the deeper position of the phantom. Thismay be ascribed to the attenuation of low-energycomponent of source neutrons.
References1) N. Nakao, H. Nakashima, T. Nakamura, Sh.
Tanaka, Su. Tanaka, K. Shin, M. Baba, Y.Sakamoto and Y. Nakane, Ncul. Sci. Eng.,124 (1996) 228-242.
2) H. Nakashima, N. Nakao, Sh. Tanaka, T.Nakamura, K. Shin, Su. Tanaka, H. Takada,S. Meigo, Y. Nakane, Y. Sakamoto and M.Baba, Ncul. Sci. Eng., 124 (1996) 243-257.
3) N. Nakao, M. Nakao, H. Nakashima, Su.Tanaka, Y. Sakamoto, Y. Nakane, Sh.Tanaka and T. Nakamura, J. Nucl. Sci.Technol. 34(4) (1997) 348-359.
4) ICRU Report 40 (1986).
- 272 -
JAERI-Review 2001-039
8.3 Development of Neutron Monitor Using a Liquid Scintillator
E. Kim1, A. Endo1, S. Tsuda1, F. Takahashi1, M. Yoshizawa1, Y. Yamaguchi1,Su.Tanaka2, T. Shiomi3, T. Nunomiya3, R.A.H. Danielle3 and T. Nakamura3
1 Department of Health Physics,2 Advanced Radiation Technology Center, JAERI3 Department of Quantum Science and Energy Engineering, Tohoku University
1. Introduction
Intense neutron sources using high-powerproton accelerator have been developed forvarious fields of study, such as nuclear physics,material physics, radiotherapy. Radiationmonitoring of the neutrons in these facilities isvery important for radiation safety managementfor workers and the members of public.
The purpose of this study is to develop aneutron monitor that can evaluate dose ofneutrons in the energy range from thermalenergy to 100 MeV. In this work, a spectrumweight function (G function) method1>2) isapplied to a liquid scintillator and boron-loadedliquid scintillator that are usually used as aneutron spectrometer. This paper describes theprinciple of the G function method and thecalculation method of the G function. Next, themeasurement method of pulse height spectrum ispresented. Applicability of the present methodfor neutron dose evaluation is discussed.
2. Calculation of spectrum weight functionNeutron dose, H, in a radiation field is
evaluated by Equation (1) using neutron energyspectrum, which is obtained by unfolding ofpulse height spectrum.
H-fh{E)-m*E> (1)where h(E) is the dose conversion coefficientand 0(E) is the neutron energy spectrum.
Assuming an operator, G(ER), thatcorrelates response function of detector withdose per unit neutron fluence, h(E) is expressedas Equation (2) using G(ER)
h(E)=fR(E,ER)-G(ER)dER, (2)
where R(E,ER) is the response function ofdetector. Using Equations (1) and (2), H can bewritten as follows:
H = J(jR(E,ER)-G(ER)dER)^(E)dE
= fP(ER)-G(ER)dER, (3)
where P(E^) is the pulse height spectrum ofdetector. Therefore, using the operator G(ER), Hcan be directly evaluated from the pulse heightspectrum by multiplying the G(ER) usingEquation (3).
To calculate the G(ER) in Equation (2), it isnecessary to obtain the response function of thedetector and the dose conversion coefficients. Aset of response functions3^ of the liquidscintillator was calculated by the SCINFUL-Rcode4) for incident neutron energies up to80MeV and by the CECIL code5) above 80MeV.The response function of the boron-loaded liquidscintillator was evaluated using the pulse heightspectra measured in the neutron field. Theambient dose equivalent conversion coefficientswere taken from ICRP Publ. 746).
The G(ER) in Equation (2) was determinedby an unfolding method using successiveapproximation^. On calculating the G(ER)function, maximum iteration frequency was setto be 20 to avoid oscillation by more iterations.
3. ExperimentTo verify the response function of the
scintillator and the neutron dose evaluated by theG function, measurements of the pulse heightdistribution were carried out using somedifferent neutron sources which have continuousenergy spectra, mono-energetic spectra andquasi mono-energetic spectra. The experiment inthe neutron field having the continuous energyspectra was performed using the neutron sources2l2Cf and 241Am-Be of FRS at JAERI8). Thepulse height spectra for the mono-energeticneutrons and quasi mono-energetic neutronswere measured at FNL in Tohoku University9)
and at TIARA in JAERI10), respectively.Figure 1 shows the experimental arrange-
ment at TIARA. In order to evaluate theresponse function of the boron-loaded liquidscintillator, measurements of pulse heightspectra of this scintillator were carried out usingquasi mono-energetic neutrons of 41MeV and
- 273 -
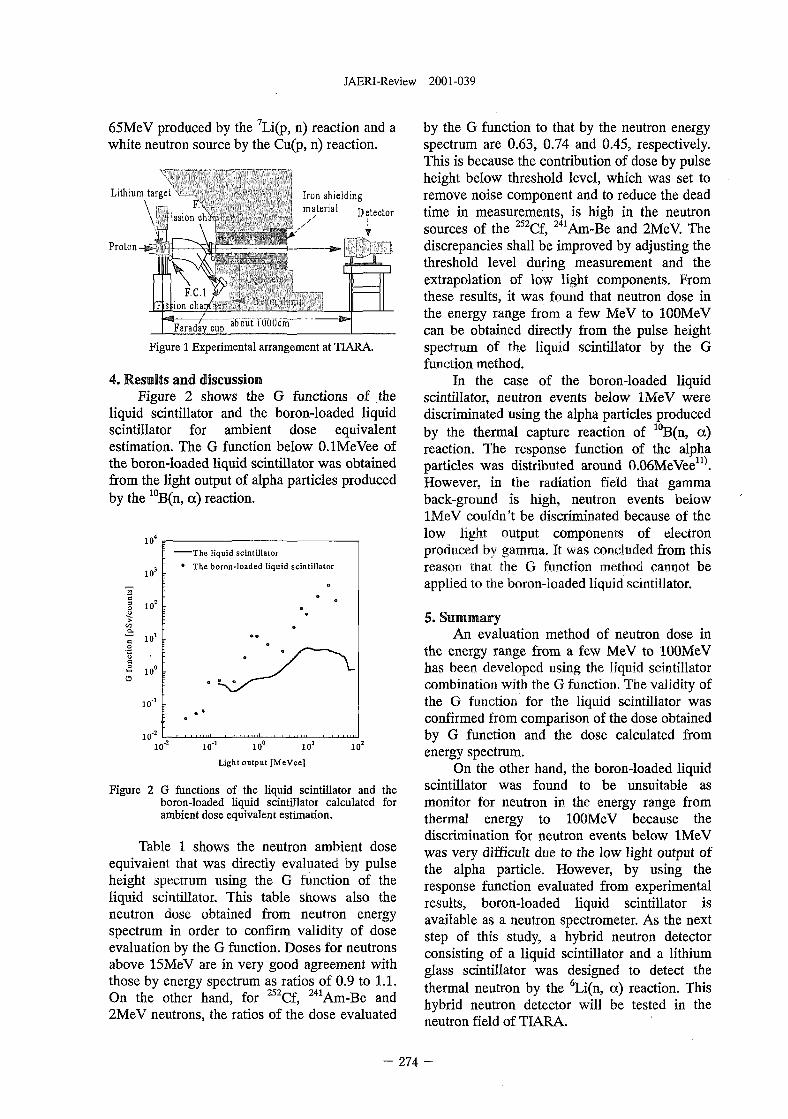
JAERI-Review 2001-039
65MeV produced by the 7Li(p, n) reaction and awhite neutron source by the Cu(p, n) reaction.
Lithium targetv.:
-issicm ch
XProton -*»-
Iron shieldingmaterial Detector
Figure 1 Experimental arrangement at TIARA.
4. Results and discussionFigure 2 shows the G functions of the
liquid scintillator and the boron-loaded liquidscintillator for ambient dose equivalentestimation. The G function below O.lMeVee ofthe boron-loaded liquid scintillator was obtainedfrom the light output of alpha particles producedby the 10B(n, a) reaction.
10'
10°
10'
10'
* 10"o
"The liquid scintillaior
The boron-loaded liquid scintillator
10" 10° 10" 101
Light output [MeVee]
10'
Figure 2 G functions of the liquid scintillator and theboron-loaded liquid scintillator calculated forambient dose equivalent estimation.
Table 1 shows the neutron ambient doseequivalent that was directly evaluated by pulseheight spectrum using the G function of theliquid scintillator. This table shows also theneutron dose obtained from neutron energyspectrum in order to confirm validity of doseevaluation by the G function. Doses for neutronsabove 15MeV are in very good agreement withthose by energy spectrum as ratios of 0.9 to 1.1.On the other hand, for 252Cf, 241Am-Be and2MeV neutrons, the ratios of the dose evaluated
by the G function to that by the neutron energyspectrum are 0.63, 0.74 and 0.45, respectively.This is because the contribution of dose by pulseheight below threshold level, which was set toremove noise component and to reduce the deadtime in measurements, is high in the neutronsources of the 252Cf, 241Arn-Be and 2MeV. Thediscrepancies shall be improved by adjusting thethreshold level during measurement and theextrapolation of low light components. Fromthese results, it was found that neutron dose inthe energy range from a few MeV to lOOMeVcan be obtained directly from the pulse heightspectrum of the liquid scintillator by the Gfunction method.
In the case of the boron-loaded liquidscintillator, neutron events below lMeV werediscriminated using the alpha particles producedby the thermal capture reaction of 10B(n, a)reaction. The response function of the alphaparticles was distributed around 0.06MeVeen).However, in the radiation field that gammaback-ground is high, neutron events belowlMeV couldn't be discriminated because of thelow light output components of electronproduced by gamma. It was concluded from thisreason that the G function method cannot beapplied to the boron-loaded liquid scintillator.
5. SummaryAn evaluation method of neutron dose in
the energy range from a few MeV to lOOMeVhas been developed using the liquid scintillatorcombination with the G function. The validity ofthe G function for the liquid scintillator wasconfirmed from comparison of the dose obtainedby G function and the dose calculated fromenergy spectrum.
On the other hand, the boron-loaded liquidscintillator was found to be unsuitable asmonitor for neutron in the energy range fromthermal energy to lOOMeV because thediscrimination for neutron events below lMeVwas very difficult due to the low light output ofthe alpha particle. However, by using theresponse function evaluated from experimentalresults, boron-loaded liquid scintillator isavailable as a neutron spectrometer. As the nextstep of this study, a hybrid neutron detectorconsisting of a liquid scintillator and a lithiumglass scintillator was designed to detect thethermal neutron by the 6Li(n, a) reaction. Thishybrid neutron detector will be tested in theneutron field of TIARA.
- 2 7 4 -
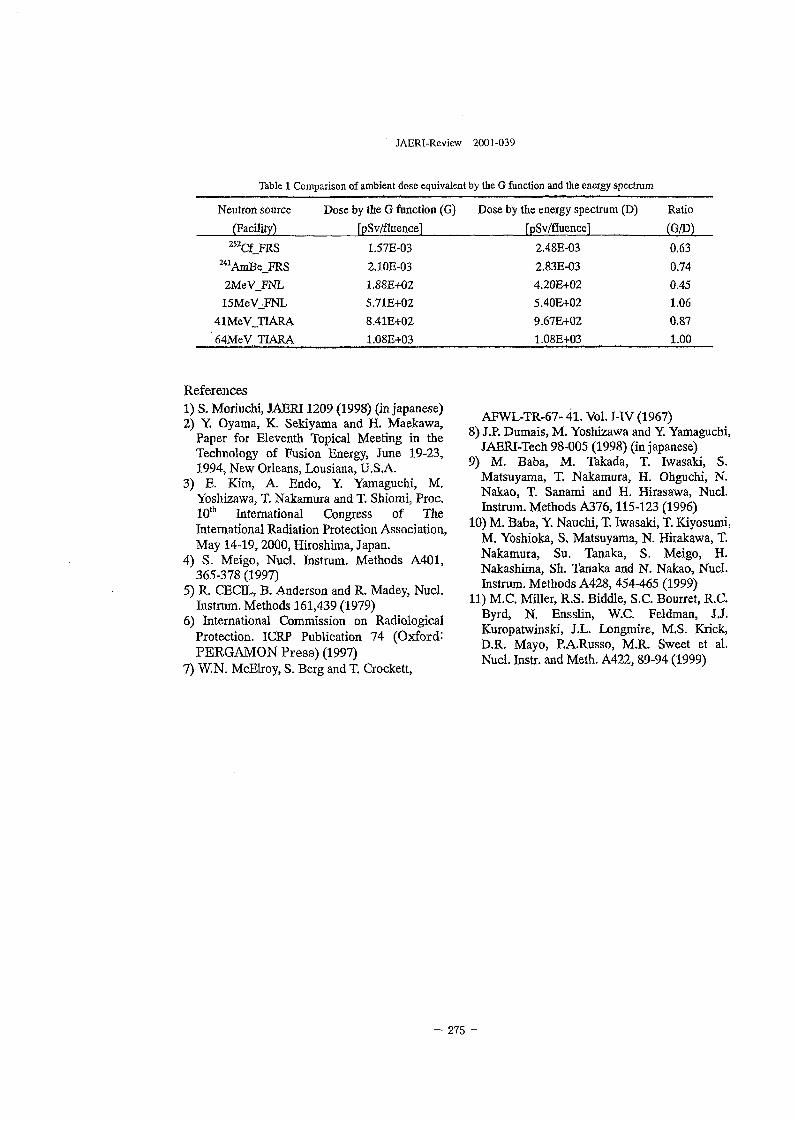
JAERI-Review 2001-039
Table 1 Comparison of ambient dose equivalent by the G function and the energy spectrum
Neutron source
(Facility)
^GLFRS241AmBe_FRS
2MeV FNL
ISMeVJFNL
41MeV_TIARA
64MeV TIARA
Dose by the G function (G)
[pSv/fluencel
1.57E-03
2.10E-03
1.88E+02
5.71E+02
8.41E+02
1.08E+03
Dose by the energy spectrum (D)
fpSv/fluencel
2.48E-03
2.83E-03
4.20E+02
5.40E+02
9.67E+02
1.08E+03
Ratio
(G/D)
0.63
0.74
0.45
1.06
0.87
1.00
References1) S. Moriuchi, JAERI 1209 (1998) (in Japanese)2) Y. Oyama, K. Sekiyama and H. Maekawa,
Paper for Eleventh Topical Meeting in theTechnology of Fusion Energy, June 19-23,1994, New Orleans, Lousiana, U.S.A.
3) E. Kim, A. Endo, Y. Yamaguchi, M.Yoshizawa, T. Nakamura and T. Shiomi, Proc.10th International Congress of TheInternational Radiation Protection Association,May 14-19,2000, Hiroshima, Japan.
4) S. Meigo, Nucl. Instrum. Methods A401,365-378 (1997)
5) R. CECIL, B. Anderson and R. Madey, Nucl.Instrum. Methods 161,439 (1979)
6) International Commission on RadiologicalProtection. ICRP Publication 74 (Oxford:PERGAMON Press) (1997)
7) W.N. McElroy, S. Berg and T. Crockett,
AFWL-TR-67- 41. Vol. I-IV (1967)8) J.P. Dumais, M. Yoshizawa and Y. Yamaguchi,
JAERI-Tech 98-005 (1998) (in Japanese)9) M. Baba, M. Takada, T. Iwasaki, S.
Matsuyama, T. Nakamura, H. Ohguchi, N.Nakao, T. Sanami and H. Hirasawa, Nucl.Instrum. Methods A376,115-123 (1996)
10) M. Baba, Y. Nauchi, T. Iwasaki, T. Kiyosumi,M. Yoshioka, S, Matsuyama, N. Hirakawa, T.Nakamura, Su. Tanaka, S. Meigo, H.Nakashima, Sh. Tanaka and N. Nakao, Nucl.Instrum. Methods A428, 454-465 (1999)
11) M.C. Miller, R.S. Biddle, S.C. Bourret, R.C.Byrd, N. Ensslin, W.C. Feldman, JJ.Kuropatwinski, J.L. Longmire, M.S. Krick,D.R. Mayo, P.A.Russo, M.R. Sweet et al.Nucl. Instr. and Meth. A422, 89-94 (1999)
- 275 -
JAERI-Review 2001-039
9. Accelerator Technology/TIARA General
9.1 Beam Energy Measurement by the Time-of-flight Technique 279S.Okumura, K.Arakawa, M.Fukuda, I.Ishibori, H.Tamura, T.Agematsu,T.Nara, W.Yokota, S.Kurashima, and T.Ishimoto
9.2 Study of Beam Energy Spreads for the Single-ended Accelerator using NuclearResonance Reactions (II) 281
Y.Ishii, A.Chiba, I.Takada, and S.Tajima9.3 Measurement of MeV Energy Cluster Ion Beam Current 283
Y.Saitoh, and Y Nakajima9.4 Development of Transparent-type Beam Current Monitor 285
Y.Nakajima, Y.Saitoh, and S.Tajima9.5 Development of the Sub-micron Ion Beam System at keV Range 287
Y.Ishii, A.Isoya, K.Arakawa, T.Kojima, and R.Tanaka9.6 Temperature Control of Cyclotron Magnet for Stabilization of Magnetic Field
Strength ; 290S.Okumura, S.Kurashima, T.Ishimoto, W.Yokota, K.Arakawa, M.Fukuda,Y.Nakamura, Llshibori, T.Nara, T.Agematsu, and H.Tamura
9.7 Present Status of JAERIAVF Cyclotron System 293Y.Nakamura, T.Nara, T.Agematsu, I.Ishibori, H.Tamura, S.Kurashima,W.Yokota, M.Fukuda, S.Okumura, K.Akaiwa, To.Yoshida, S.Ishiro,A.Matsumura, Y.Arakawa, Tu.Yoshida, S.Kanou, A.fliara, and K.Takano
9.8 Renewal of Computer Control System of the 3MV Tandem Accelerator 296K.Mizuhashi, S.Uno, A.Chiba, R.Kitchen, and S.Tajima
- 277 -
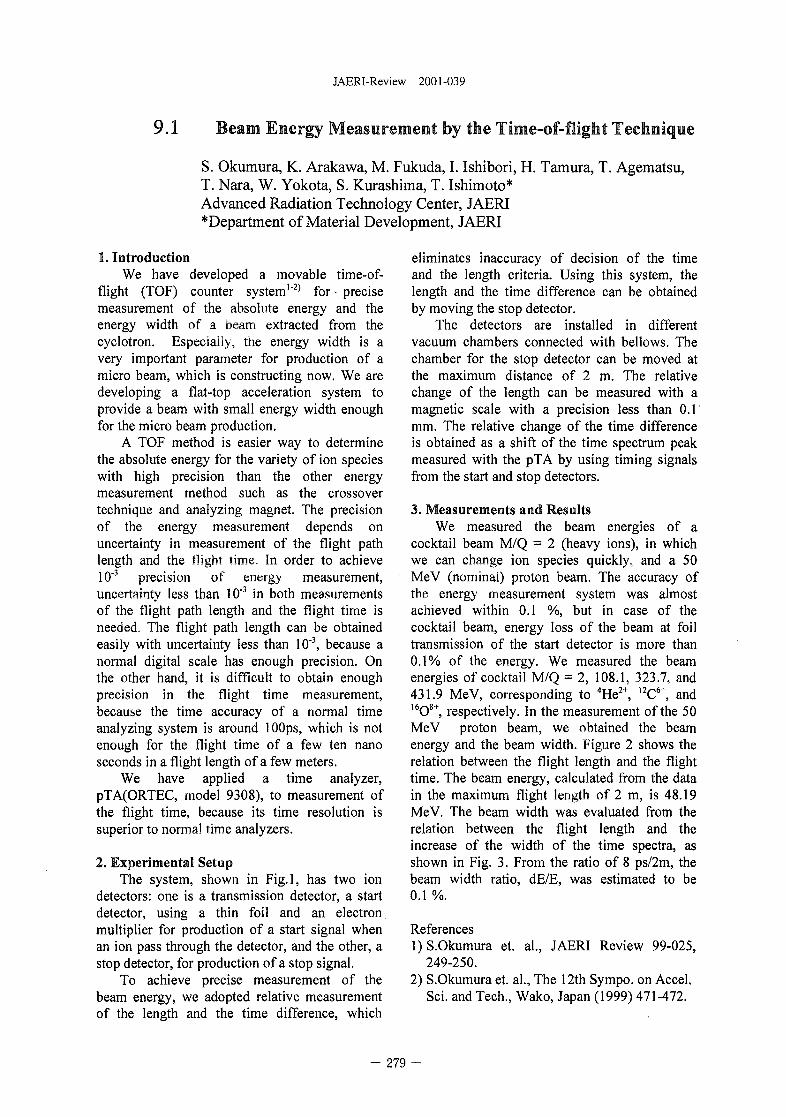
JAERI-Review 2001-039
9.1 Beam Energy Measurement by the Time-of-flight Technique
S. Okumura, K. Arakawa, M. Fukuda, I. Ishibori, H. Tamura, T. Agematsu,T. Nara, W. Yokota, S. Kurashima, T. Ishimoto*Advanced Radiation Technology Center, JAERI*Department of Material Development, JAERI
1. IntroductionWe have developed a movable time-of-
flight (TOF) counter system1"2' for - precisemeasurement of the absolute energy and theenergy width of a beam extracted from thecyclotron. Especially, the energy width is avery important parameter for production of amicro beam, which is constructing now. We aredeveloping a flat-top acceleration system toprovide a beam with small energy width enoughfor the micro beam production.
A TOF method is easier way to determinethe absolute energy for the variety of ion specieswith high precision than the other energymeasurement method such as the crossovertechnique and analyzing magnet. The precisionof the energy measurement depends onuncertainty in measurement of the flight pathlength and the flight time. In order to achieve10"3 precision of energy measurement,uncertainty less than 10'3 in both measurementsof the flight path length and the flight time isneeded. The flight path length can be obtainedeasily with uncertainty less than 10"3, because anormal digital scale has enough precision. Onthe other hand, it is difficult to obtain enoughprecision in the flight time measurement,because the time accuracy of a normal timeanalyzing system is around lOOps, which is notenough for the flight time of a few ten nanoseconds in a flight length of a few meters.
We have applied a time analyzer,pTA(ORTEC, model 9308), to measurement ofthe flight time, because its time resolution issuperior to normal time analyzers.
2. Experimental SetupThe system, shown in Fig.l, has two ion
detectors: one is a transmission detector, a startdetector, using a thin foil and an electronmultiplier for production of a start signal whenan ion pass through the detector, and the other, astop detector, for production of a stop signal.
To achieve precise measurement of thebeam energy, we adopted relative measurementof the length and the time difference, which
eliminates inaccuracy of decision of the timeand the length criteria. Using this system, thelength and the time difference can be obtainedby moving the stop detector.
The detectors are installed in differentvacuum chambers connected with bellows. Thechamber for the stop detector can be moved atthe maximum distance of 2 m. The relativechange of the length can be measured with amagnetic scale with a precision less than 0.1mm. The relative change of the time differenceis obtained as a shift of the time spectrum peakmeasured with the pTA by using timing signalsfrom the start and stop detectors.
3. Measurements and ResultsWe measured the beam energies of a
cocktail beam M/Q = 2 (heavy ions), in whichwe can change ion species quickly, and a 50MeV (nominal) proton beam. The accuracy ofthe energy measurement system was almostachieved within 0.1 %, but in case of thecocktail beam, energy loss of the beam at foiltransmission of the start detector is more than0.1% of the energy. We measured the beamenergies of cocktail M/Q = 2, 108.1, 323.7, and431.9 MeV, corresponding to 4He2+, I2C6+, and16O8+, respectively. In the measurement of the 50MeV proton beam, we obtained the beamenergy and the beam width. Figure 2 shows therelation between the flight length and the flighttime. The beam energy, calculated from the datain the maximum flight length of 2 m, is 48.19MeV. The beam width was evaluated from therelation between the flight length and theincrease of the width of the time spectra, asshown in Fig. 3. From the ratio of 8 ps/2m, thebeam width ratio, dE/E, was estimated to be0.1 %.
References1) S.Okumura et. al., JAERI Review 99-025,
249-250.2) S.Okumura et. al., The 12th Sympo. on Accel.
Sci. and Tech., Wako, Japan (1999) 471-472.
279 -
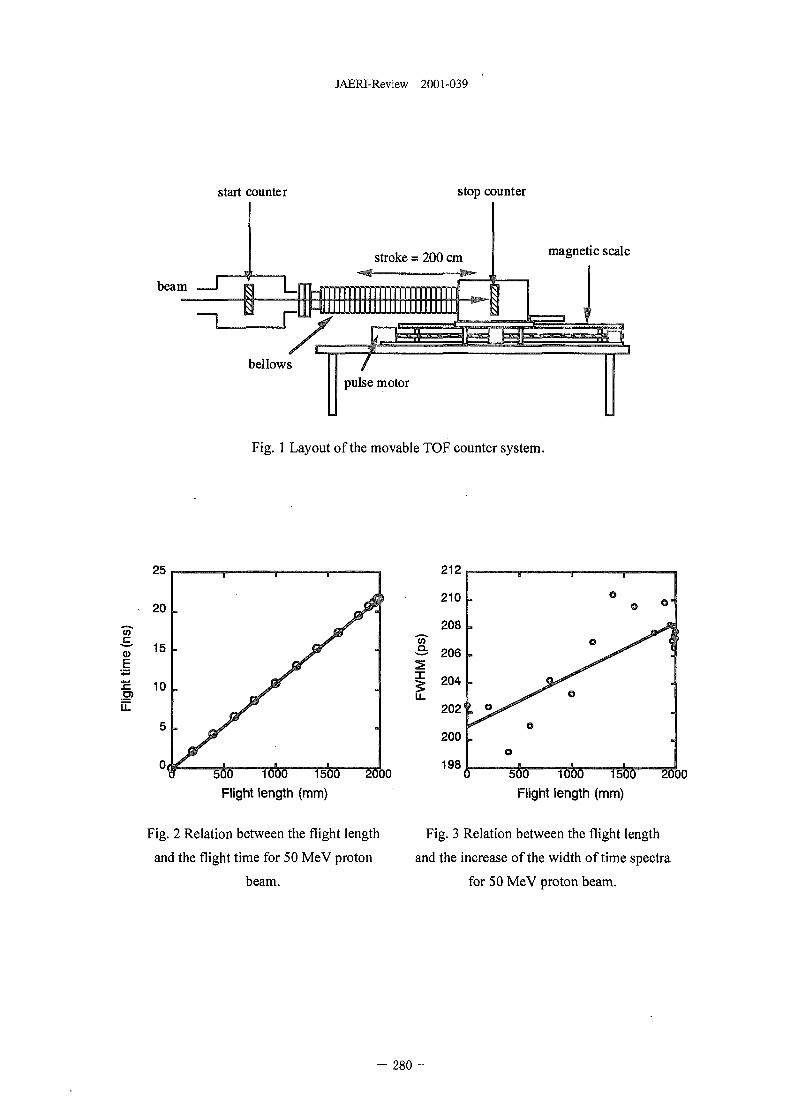
JAERI-Review 2001-039
beam
start counter stop counter
magnetic scale
Fig. 1 Layout of the movable TOF counter system.
OT
•4=
uZ
"Sfe" TTJOD T50JTFlight length (mm)
2000
Fig. 2 Relation between the flight length
and the flight time for 50 MeV proton
beam.
2000
Flight length (mm)
Fig. 3 Relation between the flight length
and the increase of the width of time spectra
for 50 MeV proton beam.
- 2 8 0 -
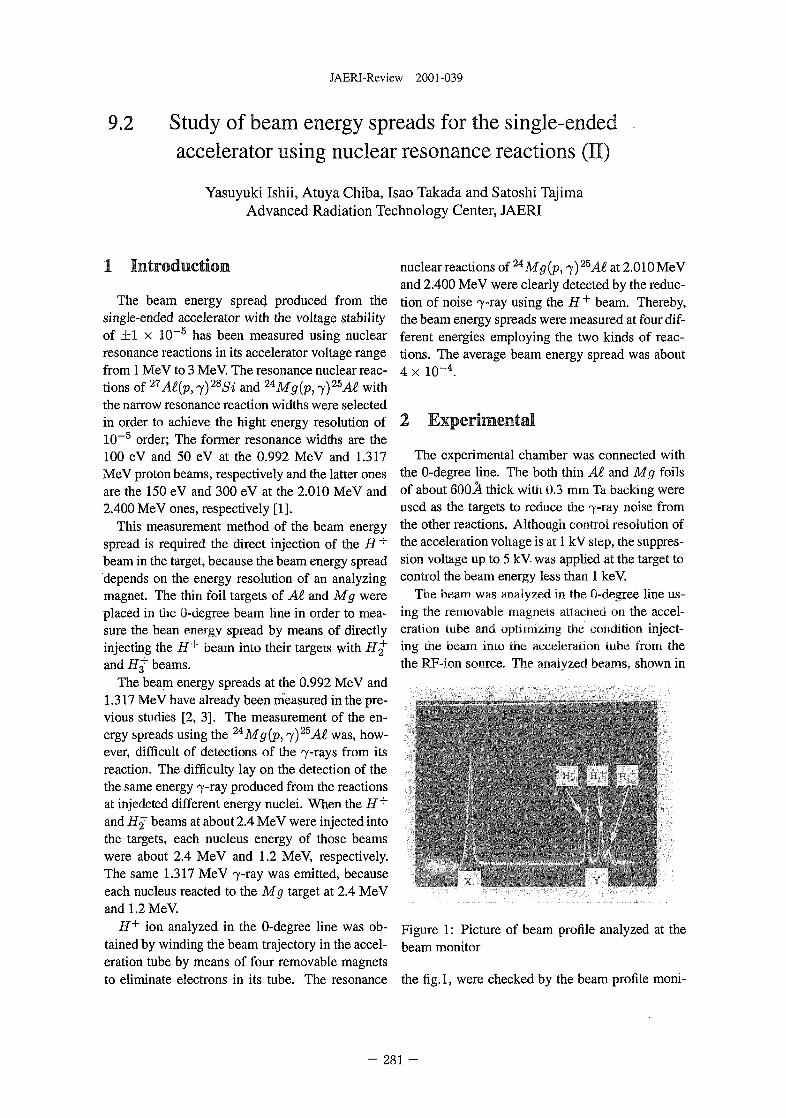
JAERI-Review 2001-039
9.2 Study of beam energy spreads for the single-endedaccelerator using nuclear resonance reactions (II)
Yasuyuki Ishii, Atuya Chiba, Isao Takada and Satoshi TajimaAdvanced Radiation Technology Center, JAERI
1 Introduction
The beam energy spread produced from thesingle-ended accelerator with the voltage stabilityof ±1 x 10~5 has been measured using nuclearresonance reactions in its accelerator voltage rangefrom 1 MeV to 3 MeV. The resonance nuclear reac-tions of 27A£(p, j)28Si and 24Mg(p, 7)25,4i withthe narrow resonance reaction widths were selectedin order to achieve the hight energy resolution of10~5 order; The former resonance widths are the100 eV and 50 eV at the 0.992 MeV and 1.317MeV proton beams, respectively and the latter onesare the 150 eV and 300 eV at the 2.010 MeV and2.400 MeV ones, respectively [1].
This measurement method of the beam energyspread is required the direct injection of the H+
beam in the target, because the beam energy spreaddepends on the energy resolution of an analyzingmagnet. The thin foil targets of Ai and Mg wereplaced in the 0-degree beam line in order to mea-sure the bean energy spread by means of directlyinjecting the H+ beam into their targets with H^and #3" beams.
The beam energy spreads at the 0.992 MeV and1.317 MeV have already been measured in the pre-vious studies [2, 3]. The measurement of the en-ergy spreads using the 24Mg(p, j)25A£ was, how-ever, difficult of detections of the 7-rays from itsreaction. The difficulty lay on the detection of thethe same energy 7-ray produced from the reactionsat injedcted different energy nuclei. When the H+
and if2" beams at about 2.4 MeV were injected intothe targets, each nucleus energy of those beamswere about 2.4 MeV and 1.2 MeV, respectively.The same 1.317 MeV 7-ray was emitted, becauseeach nucleus reacted to the Mg target at 2.4 MeVand 1.2 MeV.
H+ ion analyzed in the 0-degree line was ob-tained by winding the beam trajectory in the accel-eration tube by means of four removable magnetsto eliminate electrons in its tube. The resonance
nuclear reactions of 24Mg(p, 7) 25A£ at 2.010 MeVand 2.400 MeV were clearly detected by the reduc-tion of noise 7-ray using the H+ beam. Thereby,the beam energy spreads were measured at four dif-ferent energies employing the two kinds of reac-tions. The average beam energy spread was about4 x 10~4.
2 Experimental
The experimental chamber was connected withthe 0-degree line. The both thin At and Mg foilsof about 600A thick with 0.3 mm Ta backing wereused as the targets to reduce the 7-ray noise fromthe other reactions. Although control resolution ofthe acceleration voltage is at 1 kV step, the suppres-sion voltage up to 5 kV was applied at the target tocontrol the beam energy less than 1 keV.
The beam was analyzed in the 0-degree line us-ing the removable magnets attached on the accel-eration tube and optimizing the condition inject-ing the beam into the acceleration tube from thethe RF-ion source. The analyzed beams, shown in
Figure 1: Picture of beam profile analyzed at thebeam monitor
the fig.l, were checked by the beam profile moni-
281 -
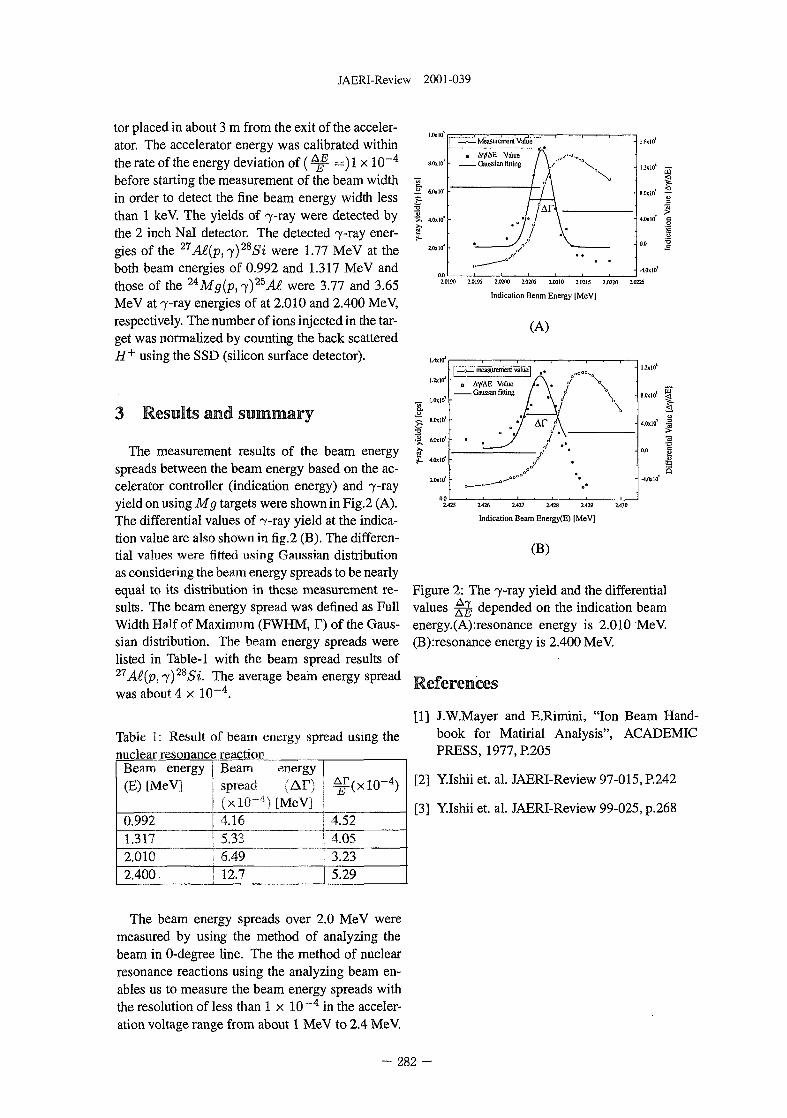
JAERI-Review 2001-039
tor placed in about 3 m from the exit of the acceler-ator. The accelerator energy was calibrated withinthe rate of the energy deviation of ( ^ =) 1 x 10~4
before starting the measurement of the beam widthin order to detect the fine beam energy width lessthan 1 keV. The yields of 7-ray were detected bythe 2 inch Nal detector. The detected 7-ray ener-gies of the 27Ae(p,^y)2SSi were 1.77 MeV at theboth beam energies of 0.992 and 1.317 MeV andthose of the 2AMg(p,~/)25A£ were 3.77 and 3.65MeV at 7-ray energies of at 2.010 and 2.400 MeV,respectively. The number of ions injected in the tar-get was normalized by counting the back scatteredH+ using the SSD (silicon surface detector).
3 Results and summary
The measurement results of the beam energyspreads between the beam energy based on the ac-celerator controller (indication energy) and 7-rayyield on using Mg targets were shown in Fig.2 (A).The differential values of 7-ray yield at the indica-tion value are also shown in fig.2 (B). The differen-tial values were fitted using Gaussian distributionas considering the beam energy spreads to be nearlyequal to its distribution in these measurement re-sults. The beam energy spread was defined as FullWidth Half of Maximum (FWHM, T) of the Gaus-sian distribution. The beam energy spreads werelisted in Table-1 with the beam spread results of27A£(p, 7)285z. The average beam energy spreadwas about 4 x 10~4.
Table 1: Result of beam energy spread using thenuclear resonance reaction
- I . J . Measurement Value" I -fix 10*
-
—
10190 2.0195 2.0200 2.0205 2.0210 2.0215 2.0220 2.0225
Indication Beam Energy |MeV]
(A)
1.4x10*
Uxl t f
1.0x10'
8.0x10'
6.0x10*
4.0x10*
2.0x10*
1 • 1 • 1 • 1
| —o— measurement value | # . aoOO^
o Ay/AE Value / • \ . fGaussan fitting / \ °
1
\
\ •
\
•
- 1.2x10*
- -4.0xl0'
Beam energy(E) [MeV]
0.9921.3172.0102.400.
Beam energyspread (Ar)(xl(T4)[MeV]4.165.336.4912.7
^ ( x l O " 4 )
4.524.053.235.29
0.02.425 2.426 2.427 2.428 1429 2430
Indication Beam Energy(E) (MeV]
(B)
Figure 2: The 7-ray yield and the differentialvalues £]§ depended on the indication beamenergy.(A):resonance energy is 2.010 MeV.(B):resonance energy is 2.400 MeV.
References
[1] J.W.Mayer and E.Rimini, "Ion Beam Hand-book for Matirial Analysis", ACADEMICPRESS, 1977, R205
[2] Y.Ishii et. al. JAERI-Review 97-015, P.242
[3] YJshii et. al. JAERI-Review 99-025, p.268
The beam energy spreads over 2.0 MeV weremeasured by using the method of analyzing thebeam in 0-degree line. The the method of nuclearresonance reactions using the analyzing beam en-ables us to measure the beam energy spreads withthe resolution of less than 1 x 10 ~4 in the acceler-ation voltage range from about 1 MeV to 2.4 MeV.
282 -
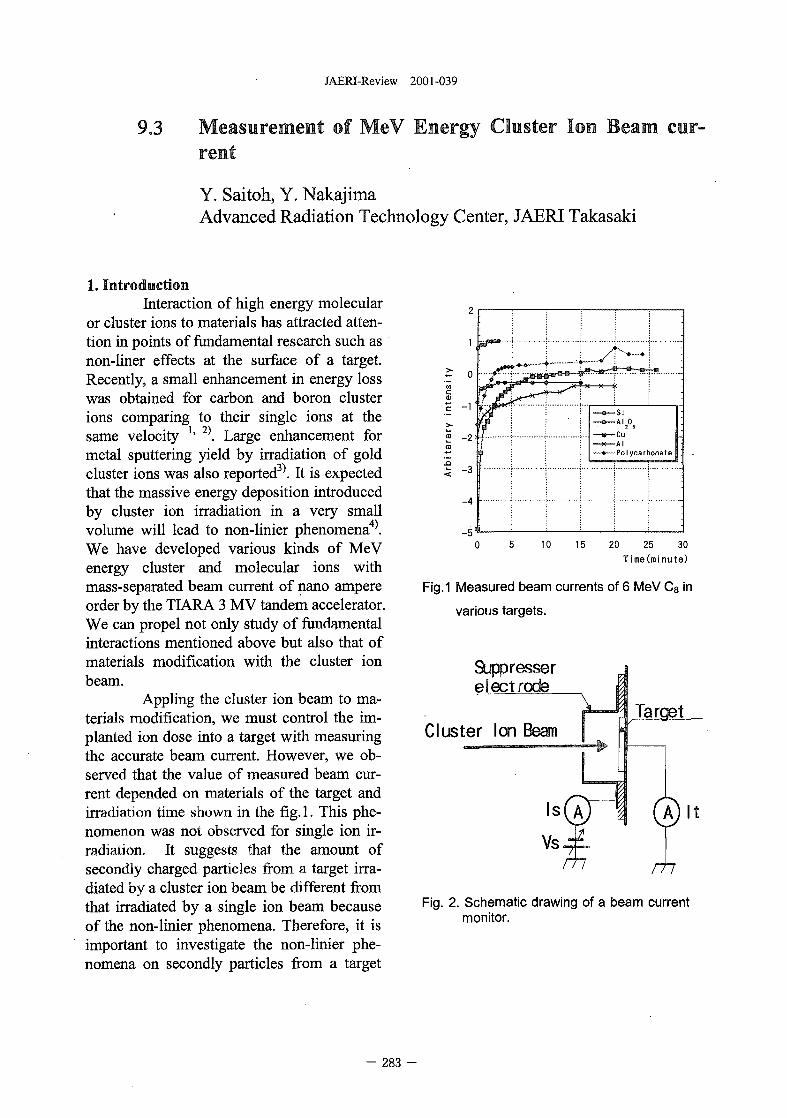
JAERI-Review 2001-039
9.3 Measurement of MeV Energy Cluster Ion Beam cur-rent
Y. Saitoh, Y. NakajimaAdvanced Radiation Technology Center, JAERI Takasaki
1. IntroductionInteraction of high energy molecular
or cluster ions to materials has attracted atten-tion in points of fundamental research such asnon-liner effects at the surface of a target.Recently, a small enhancement in energy losswas obtained for carbon and boron clusterions comparing to their single ions at thesame velocity l> 2\ Large enhancement formetal sputtering yield by irradiation of goldcluster ions was also reported3\ It is expectedthat the massive energy deposition introducedby cluster ion irradiation in a very smallvolume will lead to non-linier phenomena4^We have developed various kinds of MeVenergy cluster and molecular ions withmass-separated beam current of nano ampereorder by the TIARA 3 MV tandem accelerator.We can propel not only study of fundamentalinteractions mentioned above but also that ofmaterials modification with the cluster ionbeam.
Appling the cluster ion beam to ma-terials modification, we must control the im-planted ion dose into a target with measuringthe accurate beam current. However, we ob-served that the value of measured beam cur-rent depended on materials of the target andirradiation time shown in the fig. 1. This phe-nomenon was not observed for single ion ir-radiation. It suggests that the amount ofsecondly charged particles from a target irra-diated by a cluster ion beam be different fromthat irradiated by a single ion beam becauseof the non-linier phenomena. Therefore, it isimportant to investigate the non-linier phe-nomena on secondly particles from a target
0 5 10 15 20 25 30
Time(minute)
Fig.1 Measured beam currents of 6 MeV C8 in
various targets.
&jppresserelect rode
Cluster Ion team
rhFig. 2. Schematic drawing of a beam current
monitor.
- 283 -
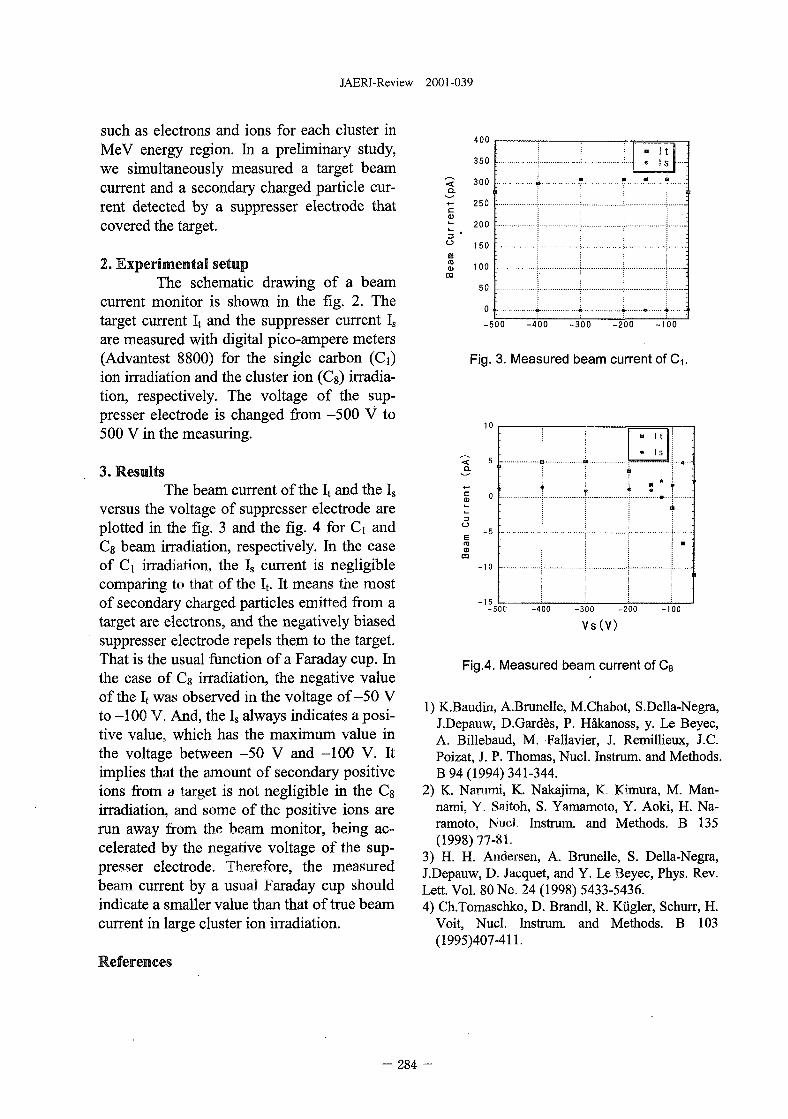
JAERI-Review 2001-039
such as electrons and ions for each cluster inMeV energy region. In a preliminary study,we simultaneously measured a target beamcurrent and a secondary charged particle cur-rent detected by a suppresser electrode thatcovered the target.
2. Experimental setupThe schematic drawing of a beam
current monitor is shown in the fig. 2. Thetarget current It and the suppresser current Is
are measured with digital pico-ampere meters(Advantest 8800) for the single carbon (Ci)ion irradiation and the cluster ion (Cg) irradia-tion, respectively. The voltage of the sup-presser electrode is changed from -500 V to500 V in the measuring.
3. ResultsThe beam current of the It and the Is
versus the voltage of suppresser electrode areplotted in the fig. 3 and the fig. 4 for Ci andCs beam irradiation, respectively. In the caseof Ci irradiation, the Is current is negligiblecomparing to that of the It. It means the mostof secondary charged particles emitted from atarget are electrons, and the negatively biasedsuppresser electrode repels them to the target.That is the usual function of a Faraday cup. Inthe case of Cs irradiation, the negative valueof the It was observed in the voltage of-50 Vto -100 V. And, the Is always indicates a posi-tive value, which has the maximum value inthe voltage between -50 V and -100 V. Itimplies that the amount of secondary positiveions from a target is not negligible in the Csirradiation, and some of the positive ions arerun away from the beam monitor, being ac-celerated by the negative voltage of the sup-presser electrode. Therefore, the measuredbeam current by a usual Faraday cup shouldindicate a smaller value than that of true beamcurrent in large cluster ion irradiation.
References
<Q.
r re
nt(
1 C
U!
Bea
n
400
350
300
250
200
150
100
50
i1 *
» It
n i
!
-500 -400 -300 -200 -100
Fig. 3. Measured beam current of Ci
<CL
10
0 -
-10 -
-15-500
• it
• is
1
• — • • • —
• ;
• [
i
-400 -300 -200 -100
Vs(V)
Fig.4. Measured beam current of C8
1) KLBaudin, A.Brunelle, M.Chabot, S.Della-Negra,J.Depauw, D.Gardes, P. Hakanoss, y. Le Beyec,A. Billebaud, M. Fallavier, J. Remillieux, J.C.Poizat, J. P. Thomas, Nucl. Instrum. and Methods.B 94 (1994) 341-344.
2) K. Narumi, K. Nakajima, K, Kimura, M. Man-nami, Y. Saitoh, S. Yamamoto, Y. Aoki, H. Na-ramoto, Nucl. Instrum. and Methods. B 135(1998)77-81.
3) H. H. Andersen, A. Brunelle, S. Della-Negra,J.Depauw, D. Jacquet, and Y. Le Beyec, Phys. Rev.Lett. Vol. 80 No, 24 (1998) 5433-5436.4) CLTomaschko, D. Brandl, R. Kiigler, Schurr, H.
Voit, Nucl. Instrum. and Methods. B 103(1995)407-411.
- 284 -
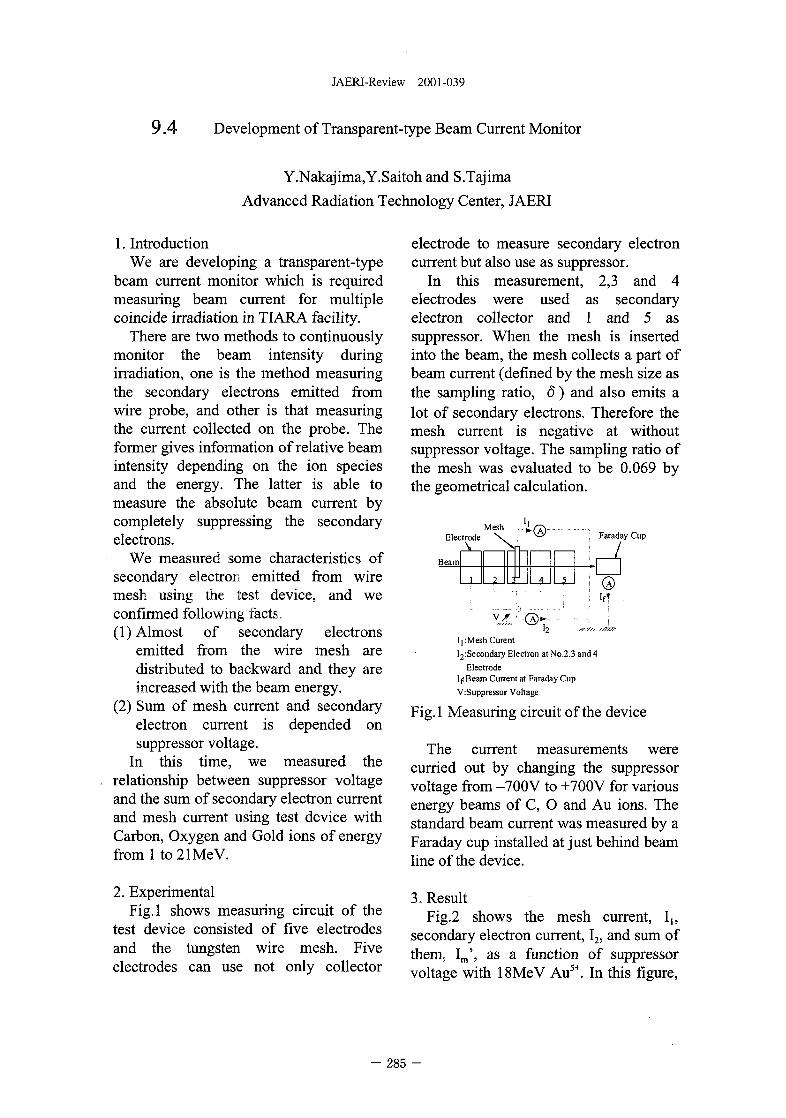
JAERI-Review 2001-039
9.4 Development of Transparent-type Beam Current Monitor
Y.Nakajima,Y.Saitoh and S.Tajima
Advanced Radiation Technology Center, JAERI
1. IntroductionWe are developing a transparent-type
beam current monitor which is requiredmeasuring beam current for multiplecoincide irradiation in TIARA facility.
There are two methods to continuouslymonitor the beam intensity duringirradiation, one is the method measuringthe secondary electrons emitted fromwire probe, and other is that measuringthe current collected on the probe. Theformer gives information of relative beamintensity depending on the ion speciesand the energy. The latter is able tomeasure the absolute beam current bycompletely suppressing the secondaryelectrons.
We measured some characteristics ofsecondary electron emitted from wiremesh using the test device, and weconfirmed following facts.(1) Almost of secondary electrons
emitted from the wire mesh aredistributed to backward and they areincreased with the beam energy.
(2) Sum of mesh current and secondaryelectron current is depended onsuppressor voltage.
In this time, we measured therelationship between suppressor voltageand the sum of secondary electron currentand mesh current using test device withCarbon, Oxygen and Gold ions of energyfrom 1 to21MeV.
2. ExperimentalFig.l shows measuring circuit of the
test device consisted of five electrodesand the tungsten wire mesh. Fiveelectrodes can use not only collector
electrode to measure secondary electroncurrent but also use as suppressor.
In this measurement, 2,3 and 4electrodes were used as secondaryelectron collector and 1 and 5 assuppressor. When the mesh is insertedinto the beam, the mesh collects a part ofbeam current (defined by the mesh size asthe sampling ratio, 6) and also emits alot of secondary electrons. Therefore themesh current is negative at withoutsuppressor voltage. The sampling ratio ofthe mesh was evaluated to be 0.069 bythe geometrical calculation.
MeshElectrode
ABeam
Faraday Cup
^Secondary Electron at No.2,3 and 4
Electrode
IfiBeam Current at Faraday Cup
V:Suppressor Voltage
Fig.l Measuring circuit of the device
The current measurements werecurried out by changing the suppressorvoltage from -700V to +700V for variousenergy beams of C, O and Au ions. Thestandard beam current was measured by aFaraday cup installed at just behind beamline of the device.
3. ResultFig.2 shows the mesh current, I,,
secondary electron current, I2, and sum ofthem, Im', as a function of suppressorvoltage with 18MeV Au5+. In this figure,
- 285 -
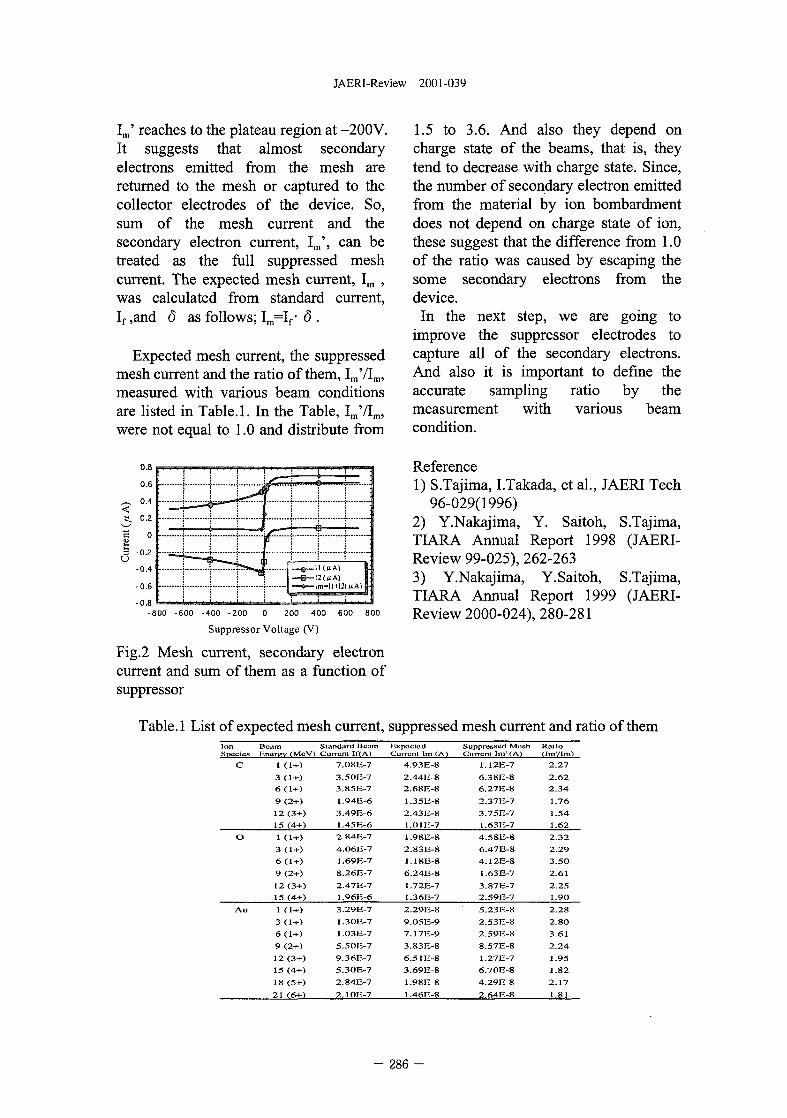
JAERI-Review 2001-039
Im' reaches to the plateau region at -200V.It suggests that almost secondaryelectrons emitted from the mesh arereturned to the mesh or captured to thecollector electrodes of the device. So,sum of the mesh current and thesecondary electron current, Im', can betreated as the full suppressed meshcurrent. The expected mesh current, Im ,was calculated from standard current,If ,and 6 as follows; Im=If • <5 .
Expected mesh current, the suppressedmesh current and the ratio of them, Im7Im,measured with various beam conditionsare listed in Table. 1. In the Table, Im7Im,were not equal to 1.0 and distribute from
1.5 to 3.6. And also they depend oncharge state of the beams, that is, theytend to decrease with charge state. Since,the number of secondary electron emittedfrom the material by ion bombardmentdoes not depend on charge state of ion,these suggest that the difference from 1.0of the ratio was caused by escaping thesome secondary electrons from thedevice.
In the next step, we are going toimprove the suppressor electrodes tocapture all of the secondary electrons.And also it is important to define theaccurate sampling ratio by themeasurement with various beamcondition.
0.8
0.6
, - , 0.4
S. 0.2
c 0
| - 0 . 2
-0.4
-0.6
-0.8-800 -600 -400 -200 0 200 400 600 800
Suppressor Voltage (V)
Fig.2 Mesh current, secondary electroncurrent and sum of them as a function ofsuppressor
• 11 I I I "
— M i l . 1*
r"'"J
r
!
a
•1(«A)2(«A)
UA) •
Reference1) S.Tajima, I.Takada, et al., JAERI Tech
96-029(1996)2) Y.Nakajima, Y. Saitoh, S.Tajima,TIARA Annual Report 1998 (JAERI-Review 99-025), 262-2633) Y.Nakajima, Y.Saitoh, S.Tajima,TIARA Annual Report 1999 (JAERI-Review 2000-024), 280-281
Table. 1 List of expected mesh current, suppressed mesh current and ratio of themIonSpecies
BeamKncrgy (McV)
Standard BeamCurrent I1(A)
KxpcctedCurrcnl Im (A)
Suppressed MeshCurrent Im' (A)
Ratio(Im'/Im)
c
o
A u
1 (1+)
3 (1+)
6(1+)
9 (2+)
12 (3+)
15 (4+)
1 (1+)
3 (1+)
6 (1+)
9 (2+)
12(3+)
15 (4+)
1 (1+)
3 (1+)
6 (1+)
9 (2+)
12(3+)
15 (4+)
18 (5+)
21 (6+)
7.O8E-7
3.50H-7
3.85B-7
1.9412-6
3.49E-6
1.45F.-6
2.K4K-7
4.06H-7
1.69K-7
8.26E-7
2.47E-7
1.96E-6
3.29K-7
1.3012-7
1.03E-7
5.50E-7
9.36E-7
5.30E-7
2.84E-7
2.1OE-7
4.93E-8
2.4412-8
2.68B-8
1.3512-8
2.43E-8
1.0115-7
1.98E-8
2.83E-8
1.1KE-8
6.24E-8
1.72E-7
1.36E-7
2.2912-8
9.05E-9
7.1712-9
3.83E-8
6.51E-8
3.69E-8
1.98E-8
1.46E-8
1.12E-7
6.38E-8
6.27E-8
2.37E-7
3.75E-7
1.6312-7
4.58H.-8
6.47E-8
4.12E-8
1.63E-7
3.87E-7
2.59B-7
5.23E-8
2.53E-8
2.5912-8
8.57E-8
1.27E-7
6.70E-8
4.29E-8
2.6412-8
2.27
2.62
2.34
1.76
1.54
1.62
2.32
2.29
3.50
2.61
2.25
1.90
2.28
2.80
3.SI
2.24
1.95
1.82
2.17
1.81
286
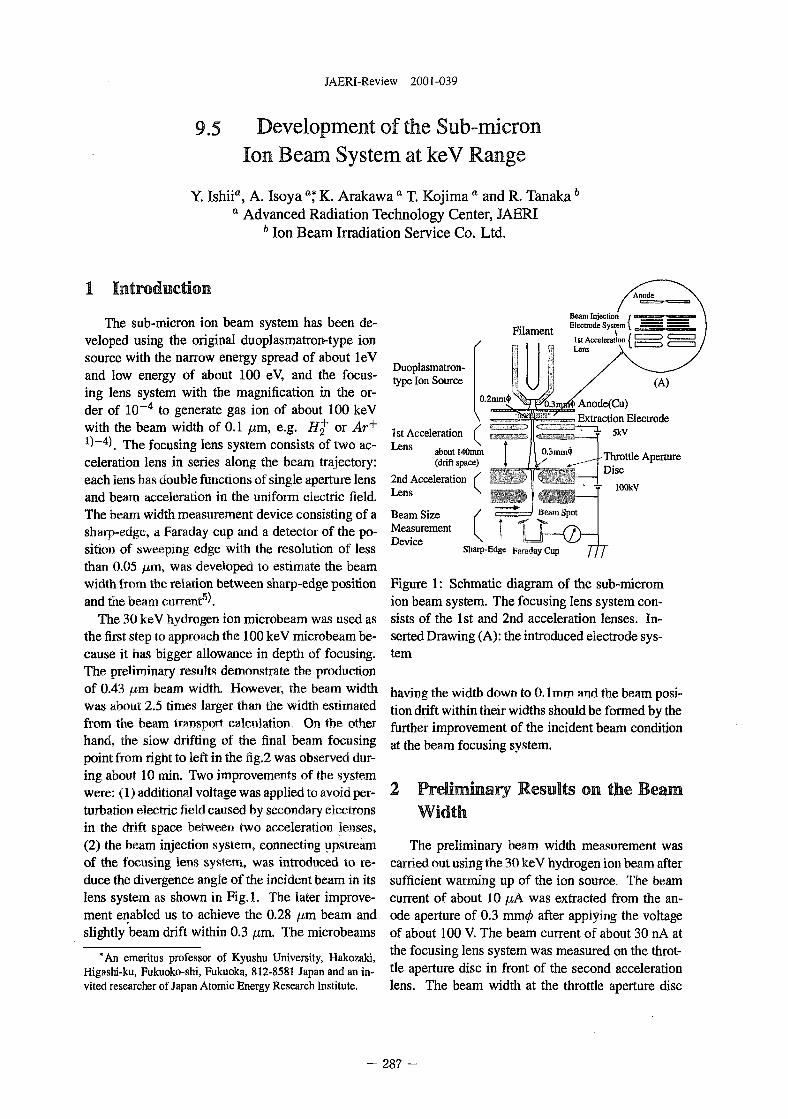
JAERI-Review 2001-039
9.5 Development of the Sub-micronIon Beam System at keV Range
Y. IshiP, A. Isoya a* K. Arakawa a T. Kojima a and R. Tanakab
a Advanced Radiation Technology Center, JAERIb Ion Beam Irradiation Service Co. Ltd.
1 Introduction
The sub-micron ion beam system has been de-veloped using the original duoplasmatron-type ionsource with the narrow energy spread of about leVand low energy of about 100 eV, and the focus-ing lens system with the magnification in the or-der of 10~4 to generate gas ion of about 100 keVwith the beam width of 0.1 fim, e.g. B.^ or Ar+
i)-4) xhe focusing lens system consists of two ac-celeration lens in series along the beam trajectory:each lens has double functions of single aperture lensand beam acceleration in the uniform electric field.The beam width measurement device consisting of asharp-edge, a Faraday cup and a detector of the po-sition of sweeping edge with the resolution of lessthan 0.05 /um, was developed to estimate the beamwidth from the relation between sharp-edge positionand the beam current5).
The 30 keV hydrogen ion microbeam was used asthe first step to approach the 100 keV microbeam be-cause it has bigger allowance in depth of focusing.The preliminary results demonstrate the productionof 0.43 jum beam width. However, the beam widthwas about 2.5 times larger than the width estimatedfrom the beam transport calculation. On the otherhand, the slow drifting of the final beam focusingpoint from right to left in the fig.2 was observed dur-ing about 10 min. Two improvements of the systemwere: (1) additional voltage was applied to avoid per-turbation electric field caused by secondary electronsin the drift space between two acceleration lenses,(2) the beam injection system, connecting upstreamof the focusing lens system, was introduced to re-duce the divergence angle of the incident beam in itslens system as shown in Fig.l. The later improve-ment enabled us to achieve the 0.28 /j,m beam andslightly beam drift within 0.3 fim. The microbeams
Duoplasmatron-type Ion Source
1st AccelerationL e n S about 140mm
(drift space)
2nd AccelerationLens
Beam SizeMeasurementDevice
Anode(Cu)Extraction Electrode
5kv
-Throttle ApertureDisc
Beam Spot
2)Sharp-Edge Faraday Cup Jfj
*An emeritus professor of Kyushu University, Hakozaki,Higashi-ku, Fukuoko-shi, Fukuoka, 812-8581 Japan and an in-vited researcher of Japan Atomic Energy Research Institute.
Figure 1: Schmatic diagram of the sub-micromion beam system. The focusing lens system con-sists of the 1st and 2nd acceleration lenses. In-serted Drawing (A): the introduced electrode sys-tem
having the width down to 0.1mm and the beam posi-tion drift within their widths should be formed by thefurther improvement of the incident beam conditionat the beam focusing system.
2 Preliminary Results on the BeamWidth
The preliminary beam width measurement wascarried out using the 30 keV hydrogen ion beam aftersufficient warming up of the ion source. The beamcurrent of about 10 /xA was extracted from the an-ode aperture of 0.3 mm</> after applying the voltageof about 100 V. The beam current of about 30 nA atthe focusing lens system was measured on the throt-tle aperture disc in front of the second accelerationlens. The beam width at the throttle aperture disc
- 287 -
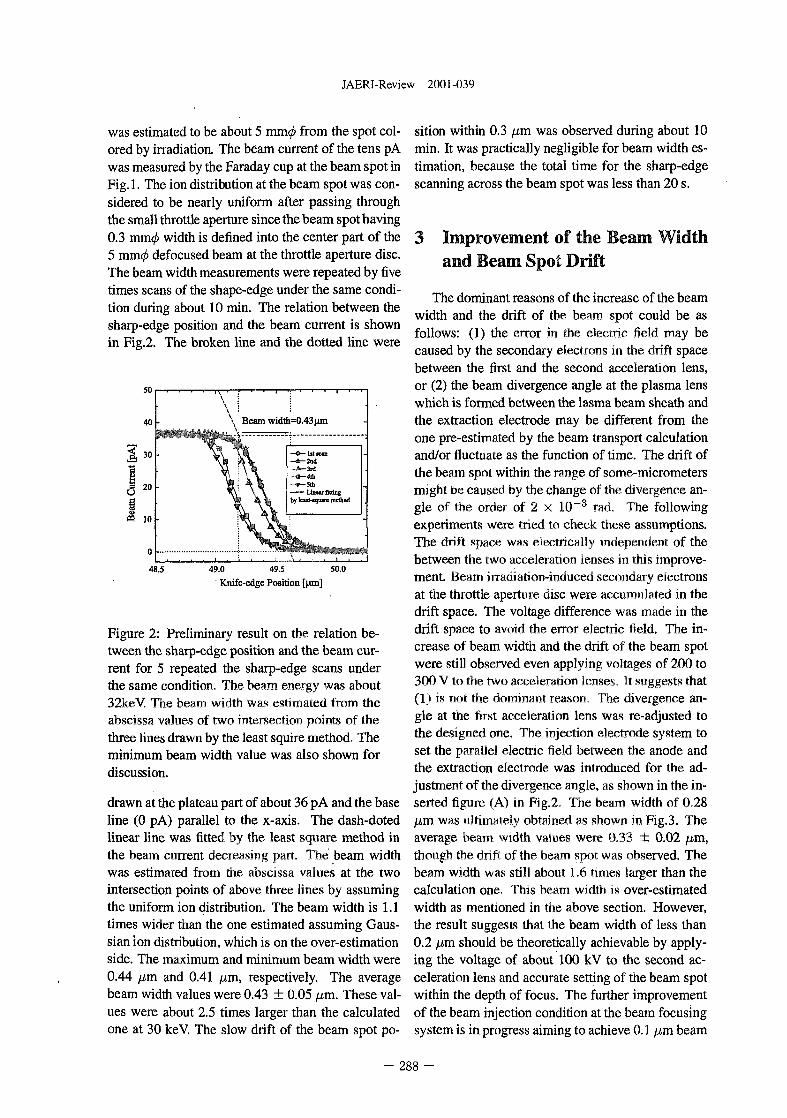
JAERI-Review 2001-039
was estimated to be about 5 mm</> from the spot col-ored by irradiation. The beam current of the tens pAwas measured by the Faraday cup at the beam spot inFig.l. The ion distribution at the beam spot was con-sidered to be nearly uniform after passing throughthe small throttle aperture since the beam spot having0.3 rnmcj) width is defined into the center part of the5 mm</> defocused beam at the throttle aperture disc.The beam width measurements were repeated by fivetimes scans of the shape-edge under the same condi-tion during about 10 min. The relation between thesharp-edge position and the beam current is shownin Fig.2. The broken line and the dotted line were
48.5 49.0 49.5 50.0
Knife-edge Position [|Jm]
Figure 2: Preliminary result on the relation be-tween the sharp-edge position and the beam cur-rent for 5 repeated the sharp-edge scans underthe same condition. The beam energy was about32keV. The beam width was estimated from theabscissa values of two intersection points of thethree lines drawn by the least squire method. Theminimum beam width value was also shown fordiscussion.
drawn at the plateau part of about 36 pA and the baseline (0 pA) parallel to the x-axis. The dash-dotedlinear line was fitted by the least square method inthe beam current decreasing part. The beam widthwas estimated from the abscissa values at the twointersection points of above three lines by assumingthe uniform ion distribution. The beam width is 1.1times wider than the one estimated assuming Gaus-sian ion distribution, which is on the over-estimationside. The maximum and minimum beam width were0.44 //m and 0.41 /um, respectively. The averagebeam width values were 0.43 ± 0.05 /j,m. These val-ues were about 2.5 times larger than the calculatedone at 30 keV. The slow drift of the beam spot po-
sition within 0.3 /im was observed during about 10min. It was practically negligible for beam width es-timation, because the total time for the sharp-edgescanning across the beam spot was less than 20 s.
3 Improvement of the Beam Widthand Beam Spot Drift
The dominant reasons of the increase of the beamwidth and the drift of the beam spot could be asfollows: (1) the error in the electric field may becaused by the secondary electrons in the drift spacebetween the first and the second acceleration lens,or (2) the beam divergence angle at the plasma lenswhich is formed between the lasma beam sheath andthe extraction electrode may be different from theone pre-estimated by the beam transport calculationand/or fluctuate as the function of time. The drift ofthe beam spot within the range of some-micrometersmight be caused by the change of the divergence an-gle of the order of 2 x 10 ~3 rad. The followingexperiments were tried to check these assumptions.The drift space was electrically independent of thebetween the two acceleration lenses in this improve-ment. Beam irradiation-induced secondary electronsat the throttle aperture disc were accumulated in thedrift space. The voltage difference was made in thedrift space to avoid the error electric field. The in-crease of beam width and the drift of the beam spotwere still observed even applying voltages of 200 to300 V to the two acceleration lenses. It suggests that(1) is not the dominant reason. The divergence an-gle at the first acceleration lens was re-adjusted tothe designed one. The injection electrode system toset the parallel electric field between the anode andthe extraction electrode was introduced for the ad-justment of the divergence angle, as shown in the in-serted figure (A) in Fig.2. The beam width of 0.28/zm was ultimately obtained as shown in Fig.3. Theaverage beam width values were 0.33 ± 0.02 jitm,though the drift of the beam spot was observed. Thebeam width was still about 1.6 times larger than thecalculation one. This beam width is over-estimatedwidth as mentioned in the above section. However,the result suggests that the beam width of less than0.2 /xm should be theoretically achievable by apply-ing the voltage of about 100 kV to the second ac-celeration lens and accurate setting of the beam spotwithin the depth of focus. The further improvementof the beam injection condition at the beam focusingsystem is in progress aiming to achieve 0.1 /im beam
- 288 -
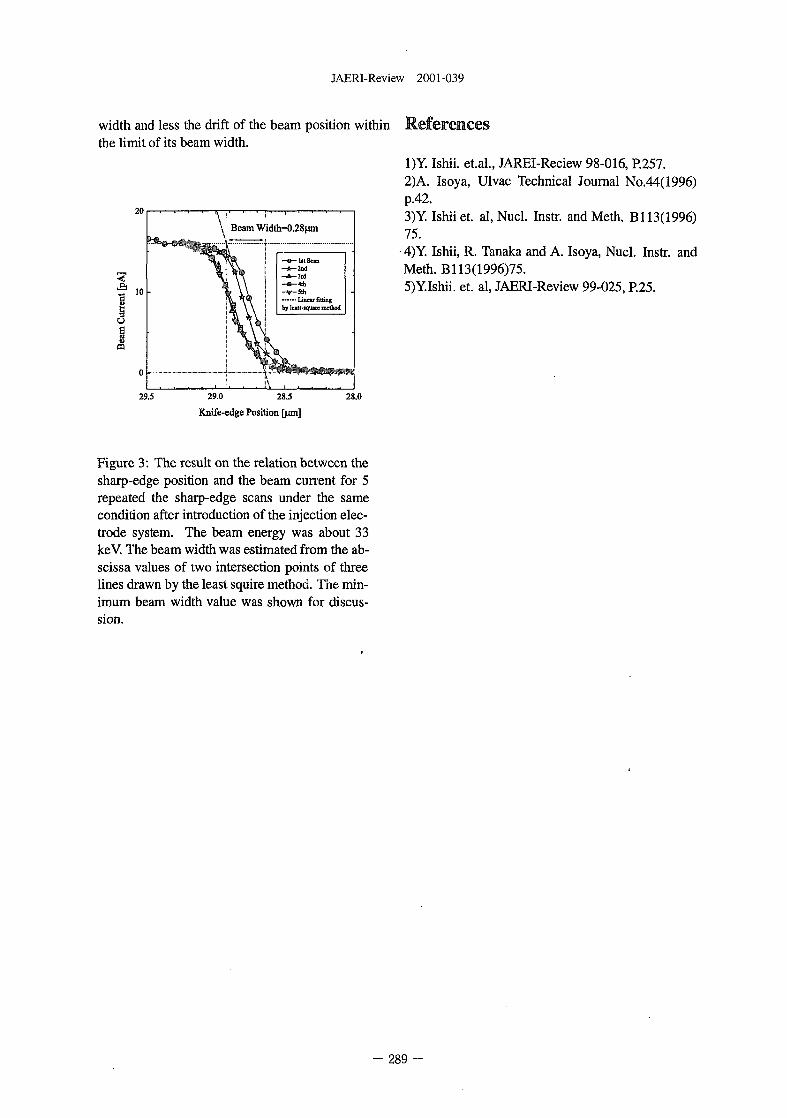
JAERI-Review 2001-039
width and less the drift of the beam position within R e f e r e n c e sthe limit of its beam width.
1)Y. Ishii. et.al., JAREI-Reciew 98-016, P.257.2)A. Isoya, Ulvac Technical Journal No.44(1996)p.42.3)Y. Ishii et. al, Nucl. Instr. and Meth. B 113(1996)75.
-4)Y. Ishii, R. Tanaka and A. Isoya, Nucl. Instr. andMeth. Bl 13(1996)75.5)Y.Ishii. et. al, JAERI-Review 99-025, P.25.
20
\ BeamWidth=0.28mnT.L
- l i t Sew-2nd
29.5 29.0 28.5
Knife-edge Position [|4m]
28.0
Figure 3: The result on the relation between thesharp-edge position and the beam current for 5repeated the sharp-edge scans under the samecondition after introduction of the injection elec-trode system. The beam energy was about 33keV. The beam width was estimated from the ab-scissa values of two intersection points of threelines drawn by the least squire method. The min-imum beam width value was shown for discus-sion.
- 289 -
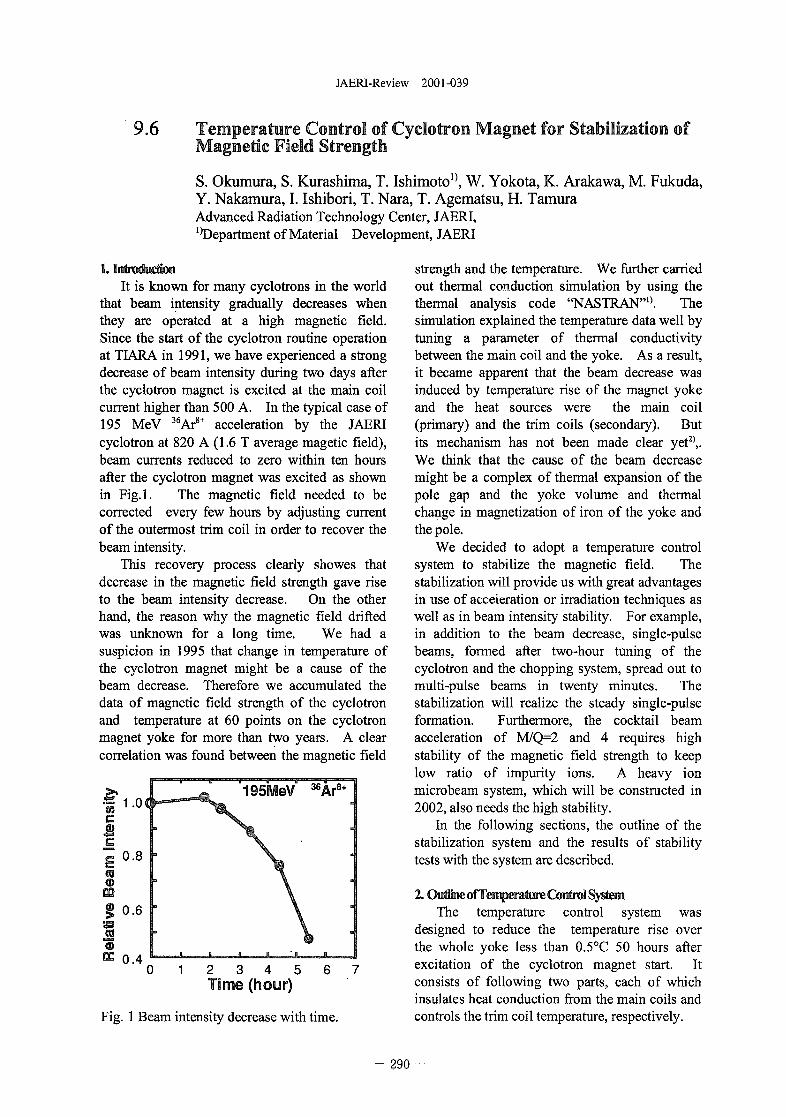
JAERI-Review 2001-039
9.6 Temperature Control of Cyclotron Magnet for Stabilization ofMagnetic Field Strength
S. Okumura, S. Kurashima, T. Ishimoto1^ W. Yokota, K. Arakawa, M. Fukuda,Y. Nakamura, I. Ishibori, T. Nara, T. Agematsu, H. TamuraAdvanced Radiation Technology Center, JAERI,department of Material Development, JAERI
1. IntroductionIt is known for many cyclotrons in the world
that beam intensity gradually decreases whenthey are operated at a high magnetic field.Since the start of the cyclotron routine operationat TIARA in 1991, we have experienced a strongdecrease of beam intensity during two days afterthe cyclotron magnet is excited at the main coilcurrent higher than 500 A. In the typical case of195 MeV 36Ar8+ acceleration by the JAERIcyclotron at 820 A (1.6 T average magetic field),beam currents reduced to zero within ten hoursafter the cyclotron magnet was excited as shownin Fig.l. The magnetic field needed to becorrected every few hours by adjusting currentof the outermost trim coil in order to recover thebeam intensity.
This recovery process clearly showes thatdecrease in the magnetic field strength gave riseto the beam intensity decrease. On the otherhand, the reason why the magnetic field driftedwas unknown for a long time. We had asuspicion in 1995 that change in temperature ofthe cyclotron magnet might be a cause of thebeam decrease. Therefore we accumulated thedata of magnetic field strength of the cyclotronand temperature at 60 points on the cyclotronmagnet yoke for more than two years. A clearcorrelation was found between the magnetic field
2 3 4 5Time (hour)
Fig. 1 Beam intensity decrease with time.
strength and the temperature. We further carriedout thermal conduction simulation by using thethermal analysis code "NASTRAN"0. Thesimulation explained the temperature data well bytuning a parameter of thermal conductivitybetween the main coil and the yoke. As a result,it became apparent that the beam decrease wasinduced by temperature rise of the magnet yokeand the heat sources were the main coil(primary) and the trim coils (secondary). Butits mechanism has not been made clear yet2',.We think that the cause of the beam decreasemight be a complex of thermal expansion of thepole gap and the yoke volume and thermalchange in magnetization of iron of the yoke andthe pole.
We decided to adopt a temperature controlsystem to stabilize the magnetic field. Thestabilization will provide us with great advantagesin use of acceleration or irradiation techniques aswell as in beam intensity stability. For example,in addition to the beam decrease, single-pulsebeams, formed after two-hour tuning of thecyclotron and the chopping system, spread out tomulti-pulse beams in twenty minutes. Thestabilization will realize the steady single-pulseformation. Furthermore, the cocktail beamacceleration of M/Q=2 and 4 requires highstability of the magnetic field strength to keeplow ratio of impurity ions. A heavy ionmicrobeam system, which will be constructed in2002, also needs the high stability.
In the following sections, the outline of thestabilization system and the results of stabilitytests with the system are described.
2. Outline ofTenperature Control SystemThe temperature control system was
designed to reduce the temperature rise overthe whole yoke less than 0.5°C 50 hours afterexcitation of the cyclotron magnet start. Itconsists of following two parts, each of whichinsulates heat conduction from the main coils andcontrols the trim coil temperature, respectively.
- 2 9 0 -
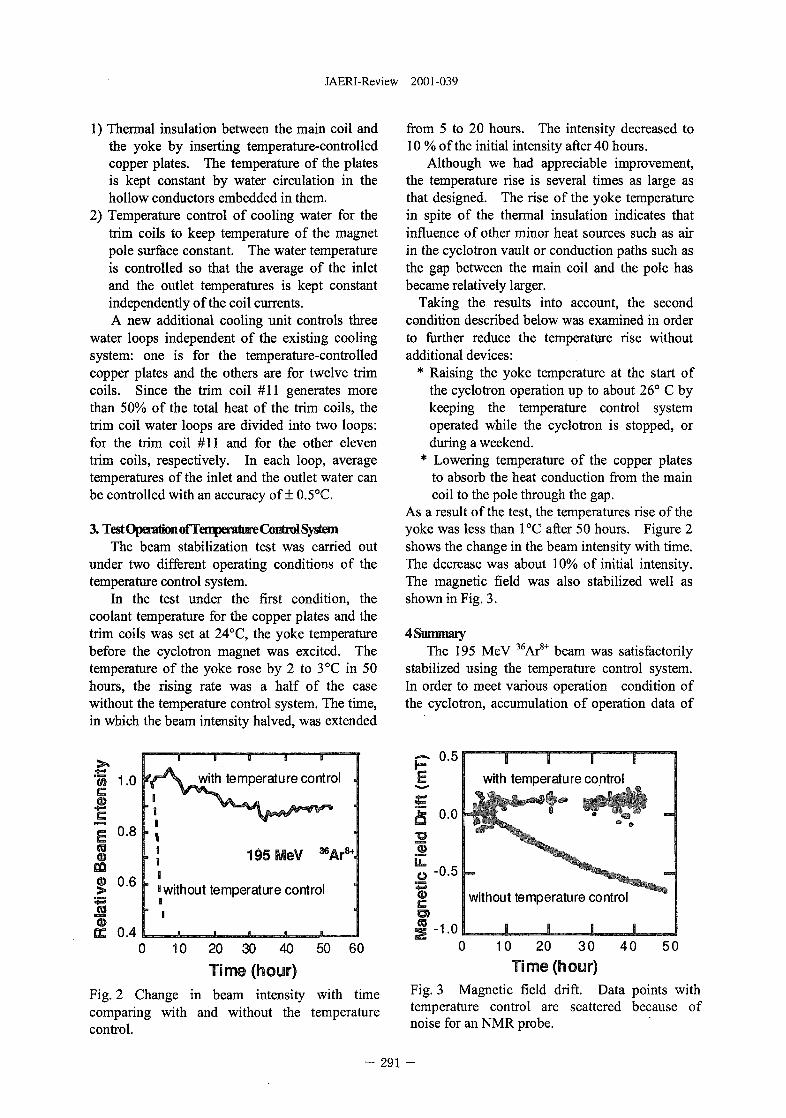
JAERI-Review 2001-039
1) Thermal insulation between the main coil andthe yoke by inserting temperature-controlledcopper plates. The temperature of the platesis kept constant by water circulation in thehollow conductors embedded in them.
2) Temperature control of cooling water for thetrim coils to keep temperature of the magnetpole surface constant. The water temperatureis controlled so that the average of the inletand the outlet temperatures is kept constantindependently of the coil currents.A new additional cooling unit controls three
water loops independent of the existing coolingsystem: one is for the temperature-controlledcopper plates and the others are for twelve trimcoils. Since the trim coil #11 generates morethan 50% of the total heat of the trim coils, thetrim coil water loops are divided into two loops:for the trim coil #11 and for the other eleventrim coils, respectively. In each loop, averagetemperatures of the inlet and the outlet water canbe controlled with an accuracy of ± 0.5°C.
The beam stabilization test was carried outunder two different operating conditions of thetemperature control system.
In the test under the first condition, thecoolant temperature for the copper plates and thetrim coils was set at 24°C, the yoke temperaturebefore the cyclotron magnet was excited. Thetemperature of the yoke rose by 2 to 3 °C in 50hours, the rising rate was a half of the casewithout the temperature control system. The time,in which the beam intensity halved, was extended
0 10 20 30 40 50 60
Time (hour)Fig. 2 Change in beam intensity with timecomparing with and without the temperaturecontrol.
from 5 to 20 hours. The intensity decreased to10 % of the initial intensity after 40 hours.
Although we had appreciable improvement,the temperature rise is several times as large asthat designed. The rise of the yoke temperaturein spite of the thermal insulation indicates thatinfluence of other minor heat sources such as airin the cyclotron vault or conduction paths such asthe gap between the main coil and the pole hasbecame relatively larger.
Taking the results into account, the secondcondition described below was examined in orderto further reduce the temperature rise withoutadditional devices:
* Raising the yoke temperature at the start ofthe cyclotron operation up to about 26° C bykeeping the temperature control systemoperated while the cyclotron is stopped, orduring a weekend.
* Lowering temperature of the copper platesto absorb the heat conduction from the maincoil to the pole through the gap.
As a result of the test, the temperatures rise of theyoke was less than 1°C after 50 hours. Figure 2shows the change in the beam intensity with time.The decrease was about 10% of initial intensity.The magnetic field was also stabilized well asshown in Fig. 3.
4 SummaryThe 195 MeV 36Ar8+ beam was satisfactorily
stabilized using the temperature control system.In order to meet various operation condition ofthe cyclotron, accumulation of operation data of
sity
cBcE©
1
lati
©BE
1.0
0.8
0.6
0.4
i 1 i i •
fj-*\ with temperature control .
• 1
• 5 195 MeV ^Ar8 4 .
'without temperature controlg
" i
P
2EotlD)
s
0.5
-1.0
with temperature control
without temperature control
I0 10 20 30 40 50
Time (hour)Fig. 3 Magnetic field drift. Data points withtemperature control are scattered because ofnoise for an NMR probe.
- 291
JAERI-Review 2001-039
the temperature control system is indispensable aswell as more careful optimization of the systemparameters.
Monitoring the magnetic field is one of themost useful tools for the stabilization. It isvery difficult, however, to use an NMR probe inthe acceleration space because of poor uniformityof the magnetic field and noisy environment.Monitoring the, beam phase may be a goodsubstitution to get information of an averagechange in the magnetic field at each radius.
Since the major conduction paths from thebig heat sources were cut off, influence of theminer heat path of air gap between the main coilsand the yoke has been relatively enhanced. Inaddition we sometimes observed influence ofchanging air temperature of the cyclotron vault.Therefore tight heat shields over a wide surface ofthe cyclotron yoke will be necessary for higherstability.
Referencesl)Y.Nakamura, S.Okumura, M.Sano, T.Nara,
T.Ishimoto, S.Kurashima, W.Yokota,K.Arakawa, K.Saitoh, T.Fukuda, J.Kanakura,M.Fukuda, I.Ishibori, H.Tamura, TAgematsu,JAERI TIARA Annual Report 1999, JAERI-Review 2000-024,282-284.
2)M.Fukuda, K.Arakawa, S.Okumura, I.Ishibori,T.Nara, Y.Nakamura, W.Yokota, T.Agematsu,H.Tamura, A.Matsumura, JAERI TIARAAnnual Report 1998, JAERI-Review 99-025,251-253.
- 292 -
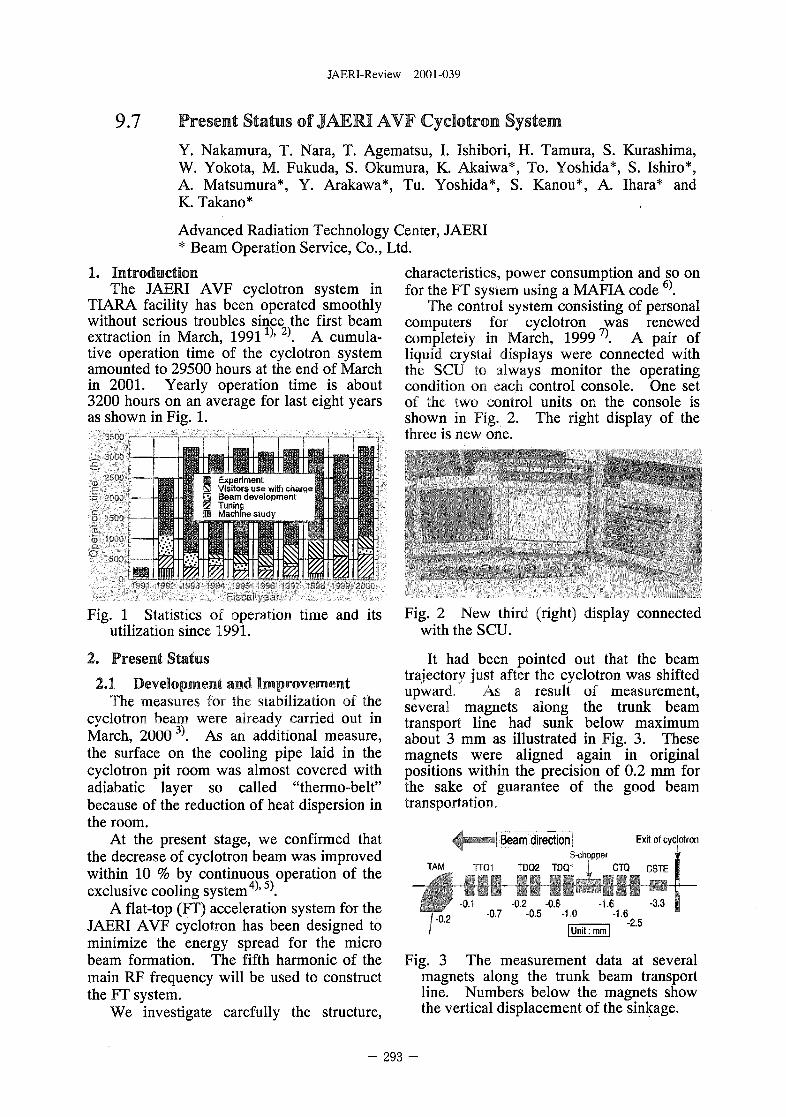
JAERI-Review 2001-039
9.7 Present Status of JAERIAVF Cyclotron SystemY. Nakamura, T. Nara, T. Agematsu, I. Ishibori, H. Tamura, S. Kurashima,W. Yokota, M. Fukuda, S. Okumura, K. Akaiwa*, To. Yoshida*, S. Ishiro*,A. Matsumura*, Y. Arakawa*, Tu. Yoshida*, S. Kanou*, A. Ihara* andK. Takano*
Advanced Radiation Technology Center, JAERI* Beam Operation Service, Co., Ltd.
1. IntroductionThe JAERI AVF cyclotron system in
TIARA facility has been operated smoothlywithout serious troubles since the first beamextraction in March, 1991 ' 2\ A cumula-tive operation time of the cyclotron systemamounted to 29500 hours at the end of Marchin 2001. Yearly operation time is about3200 hours on an average for last eight yearsas shown in Fig. 1.
/isitors use witii cuaruaSeam develoomentTunine
characteristics, power consumption and so onfor the FT system using a MAFIA code 6\
The control system consisting of personalcomputers for cyclotron was renewedcompletely in March, 1999 7\ A pair ofliquid crystal displays were connected withthe SCU to always monitor the operatingcondition on each control console. One setof the two control units on the console isshown in Fig. 2. The right display of thethree is new one.
Fig. 1 Statistics oi jpcrnuon time and itsutilization since 1991.
2. Present Status
2.1 Development and ImprovementThe measures for the stabilization of the
cyclotron beam were already carried out inMarch, 2000 3\ As an additional measure,the surface on the cooling pipe laid in thecyclotron pit room was almost covered withadiabatic layer so called "thermo-belt"because of the reduction of heat dispersion inthe room.
At the present stage, we confirmed thatthe decrease of cyclotron beam was improvedwithin 10 % by continuous operation of theexclusive cooling system4^' 5\
A flat-top (FT) acceleration system for theJAERI AVF cyclotron has been designed tominimize the energy spread for the microbeam formation. The fifth harmonic of themain RF frequency will be used to constructthe FT system.
We investigate carefully the structure,
Fig. 2 New thiro jignt) display connectedwith the SCU.
It had been pointed out that the beamtrajectory just after the cyclotron was shiftedupward. As a result of measurement,several magnets along the trunk beamtransport line had sunk below maximumabout 3 mm as illustrated in Fig. 3. Thesemagnets were aligned again in originalpositions within the precision of 0.2 mm forthe sake of guarantee of the good beamtransportation.
Beam direction I Exit of cyclotron
1AIV
-0.2
S-ohopper'10- DQ2 TDQ- CTQ OSTF
0.-. -0.2 -O.t -1.6 -3.0 |>j-0.7 -0.5 -1.0 -1.6
_2 gI Unit: mm I
IFig. 3 The measurement data at several
magnets along the trunk beam transportline. Numbers below the magnets showthe vertical displacement of the sinkage.
- 293 -
JAERI-Review 2001-039
Five controllers for TMP's installed in theswitching magnet room on the first floor weremoved to the cyclotron pit room in thebasement where the radiation level is lower,because they had to be sometimes repaired sofar owing to theaccumulated radiationdamage.
A new control rackwas installed at thecable distribution areain the pit room asshown in Fig. 4. Ofcourse, a lot of cablesand wires for thecontrollers were alsorenewed and pene-trated through the bent F i 4 N e w c o n t r o l
sleeves between two mc^ fQf xjy[p'sfloors.
In order to improve the uniformity ofbeam fluence for the scanner, the phasecontrol of triangular scanning wave In threebeam scanners was made possible so that thescanning pitch on the target plane became tobe narrower.
New scanning frequency of 0.25 Hz wasadded on the scanner equipped with LDcourse.
2.2 Maintenance and Repair
Four mechanical-seal pumps with electricmotors for the circulation of cooling waterwere renewed preventively. The manufact-uring period for these pumps is more thanthree months since they are usually begun tomake after the order from a customer.These pumps had been operated for about35000 hours since the installation in 1990.
An appearance of the pump for cyclotronsystem, when the factory test was done, isshown in Fig. 5.
Furthermore, the control mode for coolingtower on the building roof was also modifiedto the continuous operation using an inverterfrom the intermittent ON-OFF motion.
Serious water leakage from the magneticchannel occurred at the "Vebeo" fitting forthe introduction of coil current. The metalfitting contacted directly with neighbor onebecause the shrinkable tube covering thefitting suffered from deep damage by heatingfor a long-term operation. Therefore, themeltdown was caused by rare-shortening ofthe metal fitting through large coil current.
We examined the difference of surfacetemperature between stainless steel and brassmaterial for the metal fitting. A measure-ment result of saturated temperature is shownin Fig. 6. As the surface temperature on theshrinkable plastic tube was restrained below70 °C with maximum coil current of 1430 A,finally we chose the "Swagelok" fitting madeof brass.
JleifH tntpno :
- Brass
Fig. 5 An appearance of mechanical-sealpump. The rated flow rate of this pump is56 m3/h and the range of lift is 150 m.
Fig. 6 A comparison of surface temperaturebetween stainless steel and brass fitting.
The vacuum chamber of the OCTOPUSwas filled fully with cooling water on accountof the serious leakage. The OCTOPUS wasdisassembled completely for internal cleaning,polishing and replacement of gaskets. TheHYPERNANOGAN was operated for theexperiments about two weeks instead of theOCTOPUS.
In the periodical maintenance in lastsummer, principal items were performed asfollowings:(1) Addition on several digital flow switches
in the exclusive cooling system for thestabilization of cyclotron beam,
- 2 9 4 -
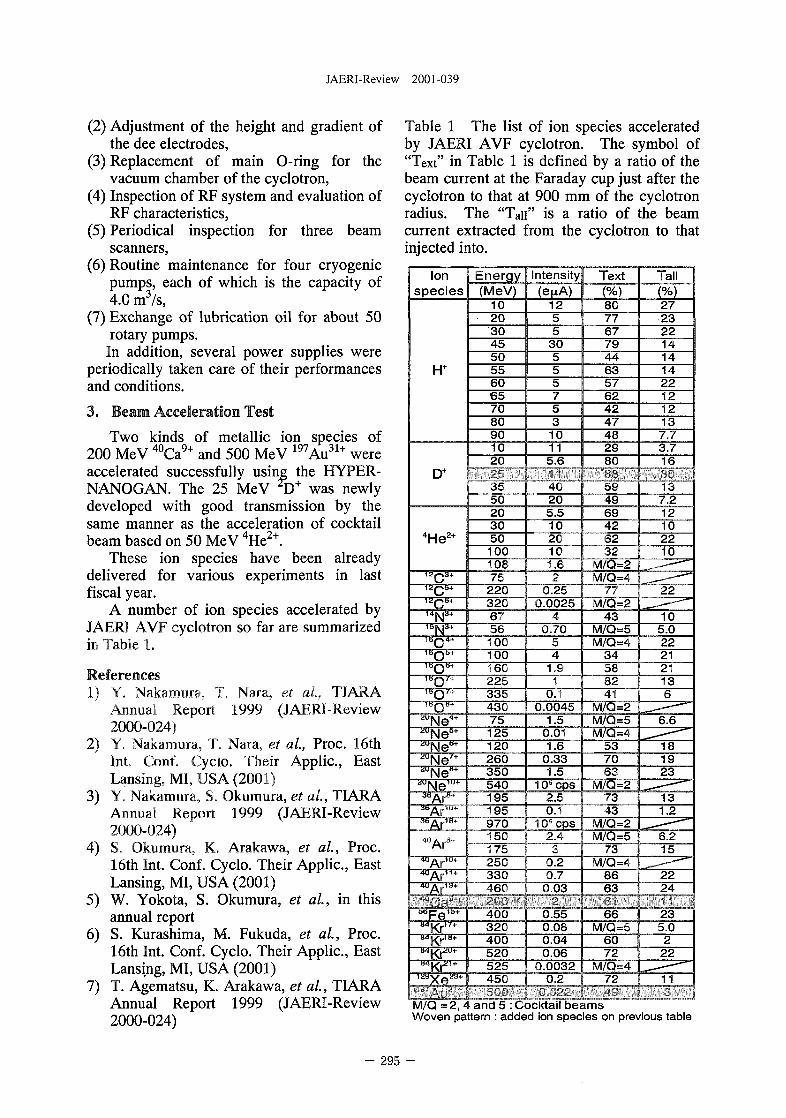
JAERI-Review 2001-039
(2) Adjustment of the height and gradient ofthe dee electrodes,
(3) Replacement of main O-ring for thevacuum chamber of the cyclotron,
(4) Inspection of RF system and evaluation ofRF characteristics,
(5) Periodical inspection for three beamscanners,
(6) Routine maintenance for four cryogenicpumps, each of which is the capacity of4.0 m3/s,
(7) Exchange of lubrication oil for about 50rotary pumps.In addition, several power supplies were
periodically taken care of their performancesand conditions.
3. Beam Acceleration Test
Two kinds of metallic ion species of200 MeV 40Ca9+ and 500 MeV 197Au31+ wereaccelerated successfully using the HYPER-NANOGAN. The 25 MeV rD+ was newlydeveloped with good transmission by thesame manner as the acceleration of cocktailbeam based on 50 MeV 4He2+.
These ion species have been alreadydelivered for various experiments in lastfiscal year.
A number of ion species accelerated byJAERI AVF cyclotron so far are summarizedin Table 1.
References1) Y. Nakamura, T, Nara, et al, TIARA
Annual Report 1999 (JAERI-Review2000-024)
2) Y. Nakamura, T. Nara, et al, Proc. 16thInt. Conf. Cyclo. Their Applic, EastLansing, MI, USA (2001)
3) Y. Nakamura, S. Okumura, et al., TIARAAnnual Report 1999 (JAERI-Review2000-024)
4) S. Okumura, K. Arakawa, et al, Proc.16th Int. Conf. Cyclo. Their Applic., EastLansing, MI, USA (2001)
5) W. Yokota, S. Okumura, et al., in thisannual report
6) S. Kurashima, M. Fukuda, et al., Proc.16th Int. Conf. Cyclo. Their Applic., EastLansing, MI, USA (2001)
7) T. Agematsu, K. Arakawa, et al., TIARAAnnual Report 1999 (JAERI-Review2000-024)
Table 1 The list of ion species acceleratedby JAERI AVF cyclotron. The symbol of"Text" in Table 1 is defined by a ratio of thebeam current at the Faraday cup just after thecyclotron to that at 900 mm of the cyclotronradius. The "Tail" is a ratio of the beamcurrent extracted from the cyclotron to thatinjected into.
Ionspecies
H+
Energy(MeV)
102030455055606 57080901020
Intensity(enA)
1255
30555753
10115.6
Text
(%)80776779446357624247482980
Tall
(%)272322141414221212137.73.716
D+
4He :.2+
*N3+
T6Q5
Ne4*20K op*Ne5
a!Ku»Re6
""Ne"*
°Ar8+
3550203050100
40205.51020101.6
7522C 0.25320 0.00256756 0.7010C10016C22S335
1.91
TJX
594969426232
M/Q=2M/Q=4
77iWQ=2
43M/Q=5M/Q=4
34
137.212102210
22
105.02221
43041
751251202 6 03 5 0540195
0.0045 Rv1/Q=21.5 M/Q=5
0.011.6
0.331.5
105 cps2.5
M/Q=4537063
M/Q=273
195 0.1 43970 ; 10° cps QVI/Q=215C 2.4 M/Q=5
2113
6.6
181923
131.2
6.217525C 0.2330 0.7*6C 0 03
73 15
8663
2224
8 4 Kr 1 7 +
8 W +
-OTRpts-
4 0 032C4005 2 052545C
0.550.080.040.06
0.00320.2
66M/Q=5
6072
M/Q=472
|
L
235.0
222
11
M/Q =2,4 and 5 : Cocktail beamsWoven pattern : added ion species on previous table
- 295 -
JAERI-Review 2001 -039
9.8 Renewal of computer control system of the 3MV tandem accelerator
K. Mizuhashi0, S. Uno11, A. Chiba0, R. Kitchen21 and S. Tajima0
11 Advanced Radiation Technology Center, JAERI21 National Electrostatics Corp. USA
1 .Introduction
The 3MV tandem accelerator has been
operating for over ten years since 1990. We had
many troubles on the computer control system
of the tandem accelerator so far. For example,
the old system had five operation terminals and
three terminals had broken for the last few years.
These became serious problems since the
computer maker would not support our
computer control system providing the replaced
parts any more. So we make plan to renew the
computer control system. This was timely
planned, because the main computer broke at
just before the completion of the renewal work
plan. A basic construction of new computer
control system is the same as the previous
system ". The general-purpose computers were
used on the new system to keep the support of
the maker for long term and also some new
software functions were introduced to make
machine operation easy.
2. New computer control system
A new computer system consists of six
personal computers. Each computer is
connected by the Ethernet network and runs a
Linux operating system. This networked
computer system controls the devices through
the five CAMAC interfaces. The CAMAC
system was out of the renewal, so that the
existing equipments were reused. New personal
computer installing 800 MHz Pentium processor,
250MB RAM and 9GB hard disk, is remarkable
powerful machine as compared with previous
one installed 25MHz processor, 4MB RAM and
390MB hard disk.
New computer control system succeeds the
ability of the previous one, so it has the old and
new function of operation. In order to smoothly
operate the accelerator using the computer
system, it is necessary for the system to respond
quickly and to handle easily. A response speed
of the new system is so over lOHz that is
enough for the congruity operation. The
operator is able to operate easily the accelerator
with the graphic page on CRT (Fig.l) using
mouse and keyboard. In addition to above
feature, new system has new functions as
follows.
Fig.l Graphical page (beam handling page)
3. New functions
The new functions are introduced for the
saving of operating work. Main functions are
described below.
- 296 -
JAERI-Review 2001-039
3-1. Watching
New system watches the read back data of
the important devices of the accelerator instead
of the operator. It makes alarm for the operator
with sound when the read back data is out the
permissive range. This function can watch seven
parameters and continuously write them on the
CRT at the same time (Fig.2). The full range of
the time-axis is 5 minutes when the sampling
time of data is 0.5 seconds.
Fig.2 Watching window of parameter
3-2. Scaling
This function scales new control value of the
magnetic and electrostatic devices and it
automatically changes about twenty-five
parameters to scaled them for the new ion
conditions (energy, mass, charge state). So the
operator does not need to make the new
parameter about many devices to control an ion
beam but only need to finely adjust them. The
main scaling equations are noted below.
Bn = Bb • (Mn/Mb)l/2 • (En/Eb)
ia • (Qb/Qn) (1)
Vn = V b • (En/Eb) • (Qb/Qn) (2)
Where, B is magnetic field of the magnetic
devices, M is mass of ion, E is energy of
accelerated ion, Q is a charge state, V is voltage
of the electrostatic device. Suffix n is new data
and b is based data for scaling.
3-3. Calculating
This function calculates the mass and energy
of accelerated ion by using calibrated bending
radius and magnetic field of the bending
magnet.
When we accelerate element or molecular
ions by the tandem accelerator, there are so
many kinds of ion species and conditions at the
some points of the accelerator. For example,
many isotopes and combinations at the injection
line and many masses and charge numbers at the
post acceleration line, that operator was
sometime confused. This function supports for
operator on objective ion.
4. Summary
The TIARA tandem accelerator is operating
from 8:30 a.m. to 11 p.m. every day. So it is
difficult for the operator to keep the watching of
the parameter for long time during operation.
The beam trouble sometime happened such as
beam escape and decrease during experiment.
By using the control system with new function,
the handling performance is improved and the
saving of operating work is achieved. Further,
the performances of safety operation are
improved, because the computer watches the
important parameters during operation of the
accelerator.
Reference:
1) R. D. Rathmell, R. L. Kitchen, T. R. Luck and
M. L. Sundquist, Nuclear Instruments and
Methods in Physics Research B56/57 (1991)
1072-1075
297 -
JAERI-Review 2001-039
10. Status of TIARA 2000
10.1 Utilization of TIARA Facilities 301Utilization and Coordination Division
10.2 Operation of the Electrostatic Accelerators 303I.Takada, K.Mizuhashi, S.Uno, K.Ohkoshi, Y.Nakajima, A.Chiba, Y.Saitoh,Y.Ishii, T.Kamiya, and T.Sakai
10.3 Operation of JAERI AVF Cyclotron System 304Y.Nakamura, T.Nara, T.Agematsu, I.Ishibori, H.Tamura, S.Kurashima,W.Yokota, M.Fukuda, S.Okumura, K.Akaiwa, To.Yoshida, S.Ishiro,A.Matsumura, Tu.Yoshida, Y.Arakawa, S.Kanou, A.Ihara, and K.Takano
10.4 Radiation Control & Radioactive Waste Management in TIARA 305Safety Division & Utilities and Maintenance DivisionDepartment of Administrative Services, JAERI.
- 299 -
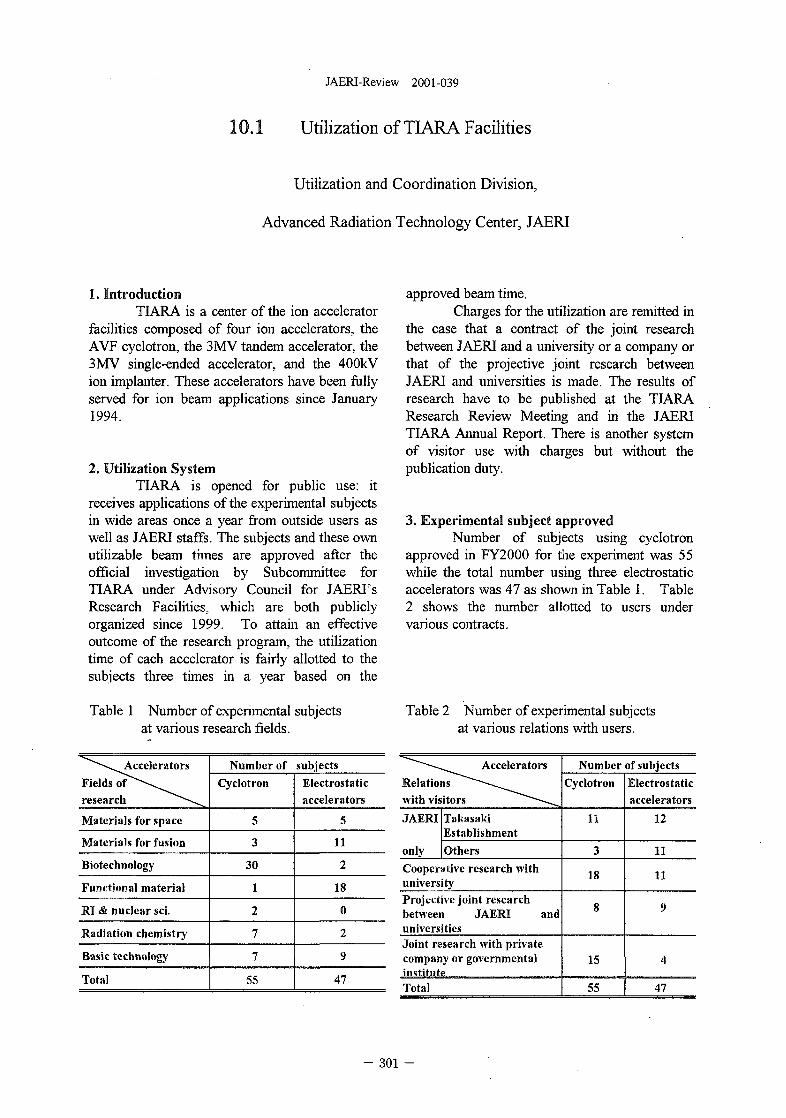
JAERI-Review 2001-039
10.1 Utilization of TIARA Facilities
Utilization and Coordination Division,
Advanced Radiation Technology Center, JAERI
1. IntroductionTIARA is a center of the ion accelerator
facilities composed of four ion accelerators, theAVF cyclotron, the 3MV tandem accelerator, the3MV single-ended accelerator, and the 400kVion implanter. These accelerators have been fullyserved for ion beam applications since January1994.
2. Utilization SystemTIARA is opened for public use: it
receives applications of the experimental subjectsin wide areas once a year from outside users aswell as JAERI staffs. The subjects and these ownutilizable beam times are approved after theofficial investigation by Subcommittee forTIARA under Advisory Council for JAERI'sResearch Facilities, which are both publiclyorganized since 1999. To attain an effectiveoutcome of the research program, the utilizationtime of each accelerator is fairly allotted to thesubjects three times in a year based on the
Table 1 Number of experimental subjectsat various research fields.
Fields o f^" \ ^^research J ^ \ » .
Materials for space
Materials for fusion
Biotechnology
Functional material
RI & nuclear sci.
Radiation chemistry
Basic technology
Total
Number ofCyclotron
5
3.
30
1
2
7
7
55
subjectsElectrostaticaccelerators
5
11
2
18
0
2
9
47
approved beam time.Charges for the utilization are remitted in
the case that a contract of the joint researchbetween JAERI and a university or a company orthat of the projective joint research betweenJAERI and universities is made. The results ofresearch have to be published at the TIARAResearch Review Meeting and in the JAERITIARA Annual Report. There is another systemof visitor use with charges but without thepublication duty.
3. Experimental subject approvedNumber of subjects using cyclotron
approved in FY2000 for the experiment was 55while the total number using three electrostaticaccelerators was 47 as shown in Table 1. Table2 shows the number allotted to users undervarious contracts.
Table 2 Number of experimental subjectsat various relations with users.
^~~---~^_^^ Accelerators
Relations ~-~^^^with visitors — - ^
JAERI
only
TakasakiEstablishmentOthers
Cooperative research withuniversityProjective joint researchbetween JAERI anduniversitiesJoint research with privatecompany or governmentalinstituteTotal
Number of subjectsCyclotron
11
3
18
8
15
55
Electrostaticaccelerators
12
11
11
9
4
47
- 301 -
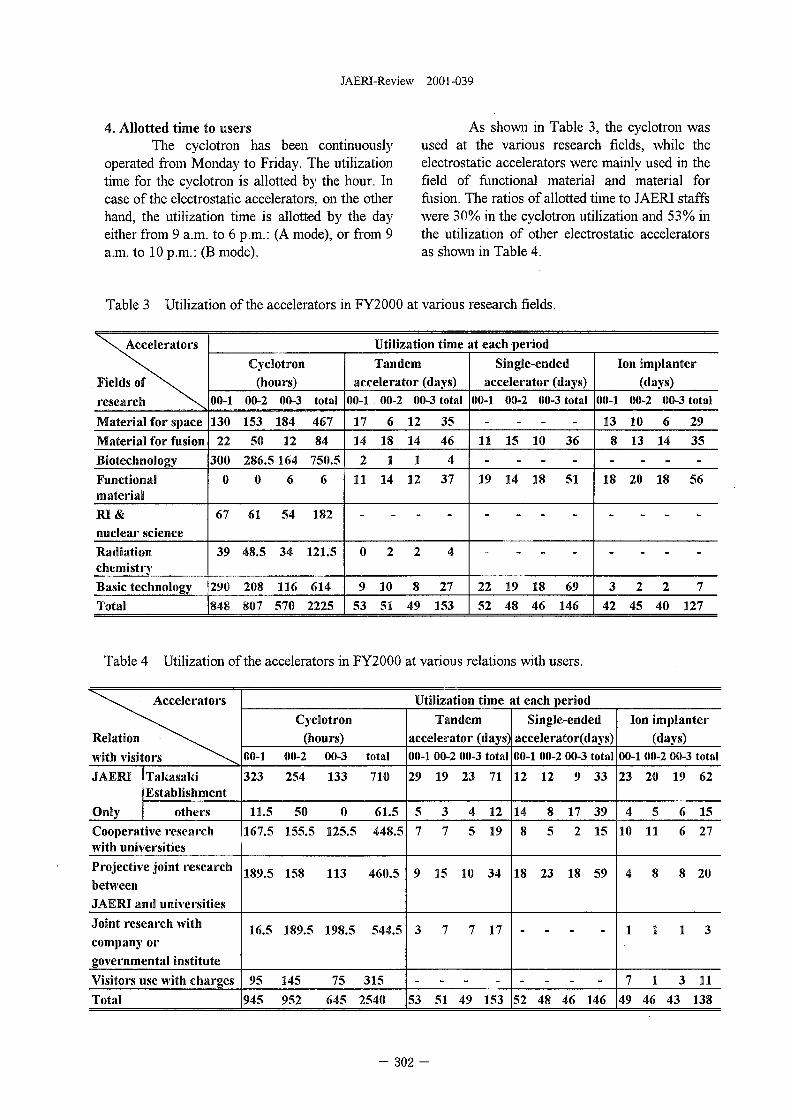
JAERI-Review 2001-039
4. Allotted time to usersThe cyclotron has been continuously
operated from Monday to Friday. The utilizationtime for the cyclotron is allotted by the hour. Incase of the electrostatic accelerators, on the otherhand, the utilization time is allotted by the dayeither from 9 a.m. to 6 p.m.: (A mode), or from 9a.m. to 10 p.m.: (B mode).
As shown in Table 3. the cyclotron wasused at the various research fields, while theelectrostatic accelerators were mainly used in thefield of functional material and material forfusion. The ratios of allotted time to JAERI staffswere 30% in the cyclotron utilization and 53% inthe utilization of other electrostatic acceleratorsas shown in Table 4.
Table 3 Utilization of the accelerators in FY2000 at various research fields.
^\Accelerators
Fields of ^ vresearch ^ \
Material for spaceMaterial for fusionBiotechnologyFunctionalmaterialRI&nuclear scienceRadiationchemistrvBasic technologyTotal
00-1
130
22
300
0
67
39
290
848
Cyclotron(hours)
00-2
153
50
286.f
0
61
48.5
208
807
00-3
184
12
!164
6
54
34
116
570
total
467
84
750.5
6
182
121.5
614
2225
Utilization time .Tandem
accelerator (days)00-1
17
14
2
11
-
0
9
53
00-2
6
18
1
14
-
2
10
51
00-3 total
12
14
1
12
-
2
8
49
35
46
4
37
-
4
27
153
it each periodSingle-ended
accelerator (days)00-1
-
11-
19
-
-
22
52
00-2 00-3 total
-
15 10-
14 18
-
-
19 1848 46
-
36
-
51
-
-
69
146
Ion implanter(days)
00-1
13
8
-
18
-
-
3
42
00-2
10
13
-
20
-
-
2
45
00-3 total
6 2914 35
-
18 56
-
-
2 7
40 127
Table 4 Utilization of the accelerators in FY2000 at various relations with users.
^^v. Accelerators
Relation ^ \ .with visitors ^ \JAERI
Only
TakasakiEstablishment
othersCooperative researchwith universitiesProjective joint researchbetweenJAERI and universitiesJoint research withcompany orgovernmental instituteVisitors use with chargesTotal
00-1
323
11.5167.5
189.5
16.5
95
945
Cyclotron(hours)
00-2
254
50
155.5
158
189.5
145
952
00-3
133
0
125.5
113
198.5
75
645
total
710
61.5448.5
460.5
544.5
315
2540
Utilization timeTandem
accelerator (days)00-1
29
5
7
9
3
-
53
00-2
19
3
7
15
7
-
51
00-3 total
23
4
5
10
7
-
49
71
12
19
34
17
-
153
at each periodSingle-ended
accelerator(days)00-1 00-2 00-3 total
12 12 9 33
14 8 17 39
8 5 2 15
18 23 18 59
52 48 46 146
Ion implanter(days)
00-]
23
4
10
4
1
7
49
I 00-2
20
5
11
8
1
1
46
. 00-3
19
6
6
8
1
3
43
total
62
15
27
20
3
11
138
- 302 -
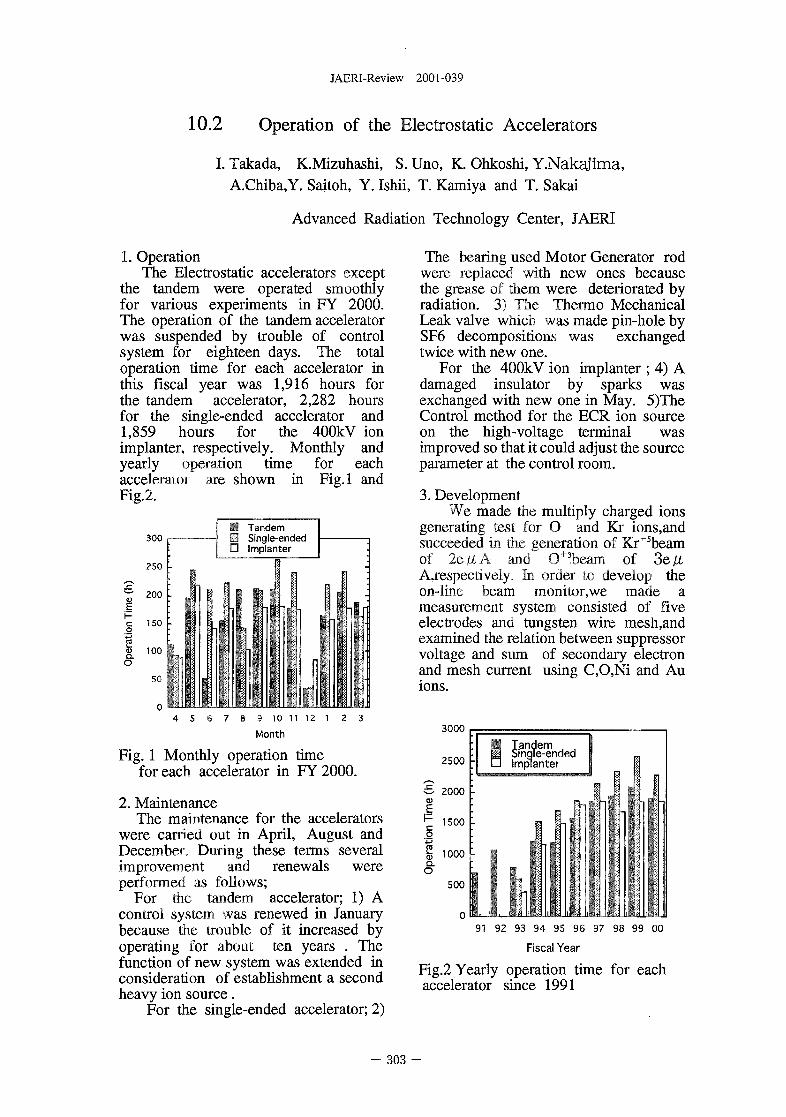
JAERI-Review 2001-039
10.2 Operation of the Electrostatic Accelerators
I. Takada, K.Mizuhashi, S. Uno, K. Ohkoshi, Y.Nakajima,A.Chiba,Y. Saitoh, Y. Ishii, T. Kamiya and T. Sakai
Advanced Radiation Technology Center, JAERI
1. OperationThe Electrostatic accelerators except
the tandem were operated smoothlyfor various experiments in FY 2000.The operation of the tandem acceleratorwas suspended by trouble of controlsystem for eighteen days. The totaloperation time for each accelerator inthis fiscal year was 1,916 hours forthe tandem accelerator, 2,282 hoursfor the single-ended accelerator and1,859 hours for the 400kV ionimplanter, respectively. Monthly andyearly operation time for eachaccelerator are shown in Fig.l andFig.2.
300
250
f 20°c 150ora<5 100O
50
-
E
tiN
1
I f[
p
• Tandemigle-ende
D Implanter
P I
Hi JU
• : : lM l 1
n :1 J \1 Lt
i II\ II ""i ^ i
1 .i " '
n• c
4 5 6 7 8 9 10 11 12 1 2 3
Month
Fig. 1 Monthly operation timefor each accelerator in FY 2000.
2. MaintenanceThe maintenance for the accelerators
were carried out in April, August andDecember. During these terms severalimprovement and renewals wereperformed as follows;
For the tandem accelerator; 1) Acontrol system was renewed in Januarybecause the trouble of it increased byoperating for about ten years . Thefunction of new system was extended inconsideration of establishment a secondheavy ion source.
For the single-ended accelerator; 2)
The bearing used Motor Generator rodwere replaced with new ones becausethe grease of them were deteriorated byradiation. 3) The Thermo MechanicalLeak valve which was made pin-hole bySF6 decompositions was exchangedtwice with new one.
For the 400kV ion implanter ; 4) Adamaged insulator by sparks wasexchanged with new one in May. 5)TheControl method for the ECR ion sourceon the high-voltage terminal wasimproved so that it could adjust the sourceparameter at the control room.
3. DevelopmentWe made the multiply charged ions
generating test for O and Kr ions,andsucceeded in the generation of Kr+5beamof 2e/xA and O+3beam of 2>&jlA,respectively. In order to develop theon-line beam monitor,we made ameasurement system consisted of fiveelectrodes and tungsten wire mesh,andexamined the relation between suppressorvoltage and sum of secondary electronand mesh current using C,O,Ni and Auions.
Tandem , , i]Ea Single-ended n• Implanter j
3000
2500
£• 2000
^ 1500
v 1000
500
o IL L nJli JIMJ J_l!i:91 92 93 94 95 96 97 98 99 00
Fiscal Year
Fig.2 Yearly operation time for eachaccelerator since 1991
- 303 -
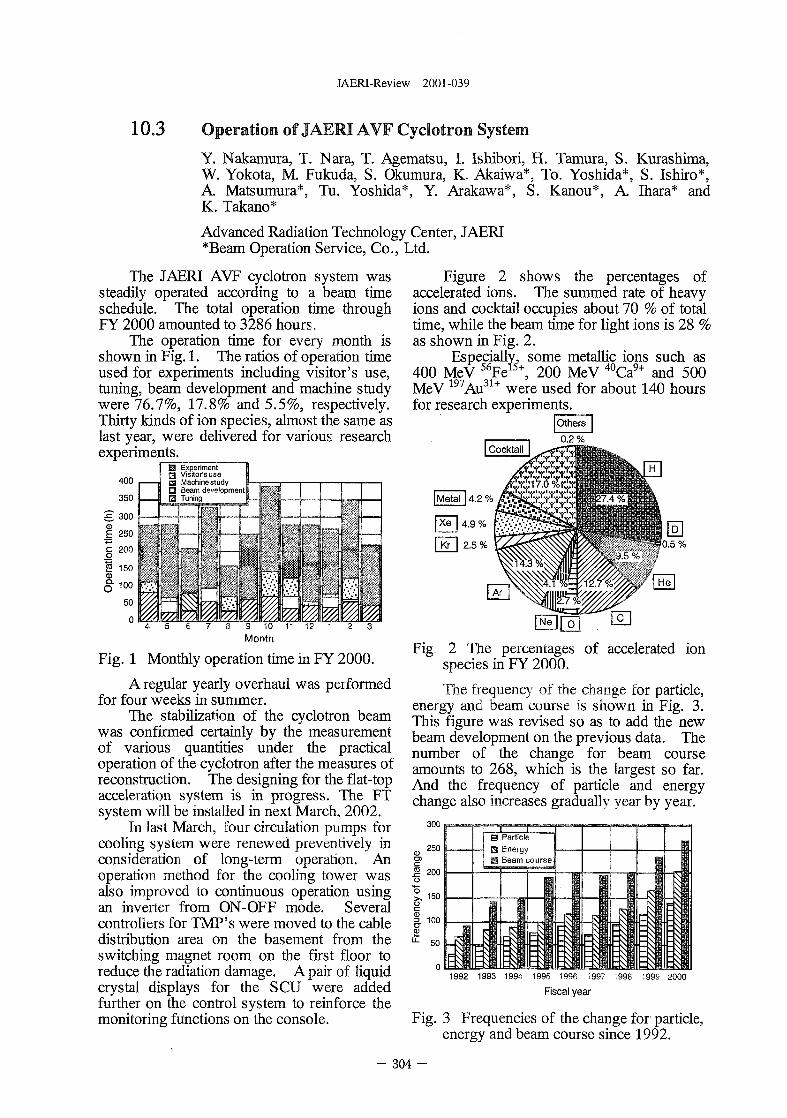
JAERI-Review 2001-039
10.3 Operation of JAERI AVF Cyclotron System
Y. Nakamura, T. Nara, T. Agematsu, I. Ishibori, H. Tamura, S. Kurashima,W. Yokota, M. Fukuda, S. Okumura, K. Akaiwa*, To. Yoshida*, S. Ishiro*,A Matsumura*, Tu. Yoshida*, Y. Arakawa*, S. Kanou*, A Ihara* andK. Takano*
Advanced Radiation Technology Center, JAERI*Beam Operation Service, Co., Ltd.
The JAERI AVF cyclotron system wassteadily operated according to a beam timeschedule. The total operation time throughFY 2000 amounted to 3286 hours.
The operation time for every month isshown in Fig. 1. The ratios of operation timeused for experiments including visitor's use,tuning, beam development and machine studywere 76.7%, 17.8% and 5.5%, respectively.Thirty kinds of ion species, almost the same aslast year, were delivered for various researchexperiments.
400
350
£. 300oE 250
^ ExperimentQ Visitor's useIS Machine studyD Beam cwolopmentE2 Tuning
Fig. 1 Monthly operation time in FY 2000.
A regular yearly overhaul was performedfor four weeks in summer.
The stabilization of the cyclotron beamwas confirmed certainly by the measurementof various quantities under the practicaloperation of the cyclotron after the measures ofreconstruction. The designing for the flat-topacceleration system is in progress. The FTsystem will be installed in next March, 2002.
In last March, four circulation pumps forcooling system were renewed preventively inconsideration of long-term operation. Anoperation method for the cooling tower wasalso improved to continuous operation usingan inverter from ON-OFF mode. Severalcontrollers for TMP's were moved to the cabledistribution area on the basement from theswitching magnet room on the first floor toreduce the radiation damage. A pair of liquidcrystal displays for the SCU were addedfurther on the control system to reinforce themonitoring functions on the console.
Figure 2 shows the percentages ofaccelerated ions. The summed rate of heavyions and cocktail occupies about 70 % of totaltime, while the beam time for light ions is 28 %as shown in Fig. 2.
Especially, some metallic ions such as400 MeV 56Fe15+, 200 MeV 40Ca9+ and 500MeV 197Au31+ were used for about 140 hoursfor research experiments.
Fig. 2 The percentages of accelerated ionspecies in FY 2000.
The frequency of the change for particle,energy and beam course is shown in Fig. 3.This figure was revised so as to add the newbeam development on the previous data. Thenumber of the change for beam courseamounts to 268, which is the largest so far.And the frequency of particle and energychange also increases gradually year by year.
1992 1993 1994 1995 1996 199? 1998 1999 2000
Fiscal year
Fig. 3 Frequencies of the change for particle,energy and beam course since 1992.
- 304 -
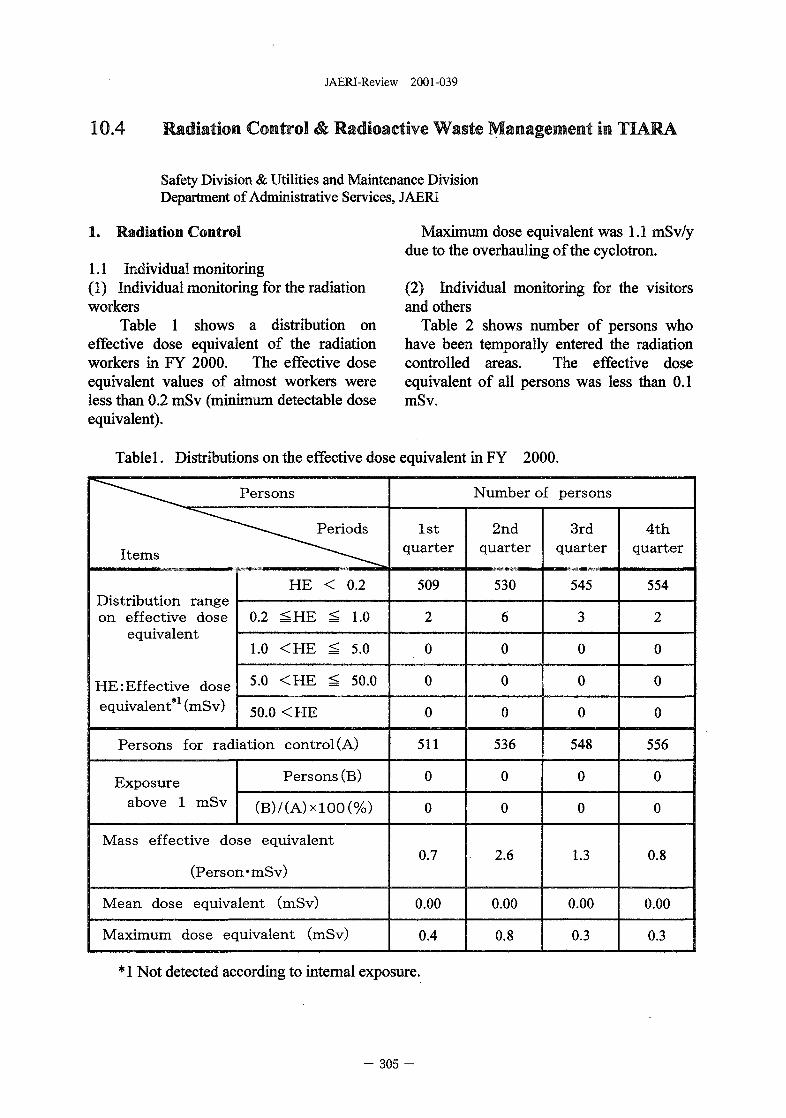
JAERI-Review 2001-039
10.4 Radiation Control & Radioactive Waste Management in TIARA
Safety Division & Utilities and Maintenance DivisionDepartment of Administrative Services, JAERI
1. Radiation Control
1.1 Individual monitoring(1) Individual monitoring for the radiationworkers
Table 1 shows a distribution oneffective dose equivalent of the radiationworkers in FY 2000. The effective doseequivalent values of almost workers wereless than 0.2 mSv (minimum detectable doseequivalent).
Maximum dose equivalent was 1.1 mSv/ydue to the overhauling of the cyclotron.
(2) Individual monitoring for the visitorsand others
Table 2 shows number of persons whohave been temporally entered the radiationcontrolled areas. The effective doseequivalent of all persons was less than 0.1mSv.
Table 1. Distributions on the effective dose equivalent
"~~--- ^^ Persons
^"""""^---^^^ Periods
Items ~~"---^^^
Distribution rangeon effective dose
equivalent
HE: Effective doseequivalent*1 (mSv)
HE < 0.2
0.2 ^ H E ^ 1.0
1.0 < H E ^ 5.0
5.0 < H E ^ 50.0
50.0 <HE
Persons for radiation control (A)
Exposureabove 1 mSv
Persons (B)
(B)/(A)xlOO(%)
Mass effective dose equivalent
(Person #mSv)
Mean dose equivalent (mSv)
Maximum dose equivalent (mSv)
inFY 2000.
Number of persons
1stquarter
509
2
0
0
0
511
0
0
0.7
0.00
0.4
2ndquarter
530
6
0
0
0
536
0
0
2.6
0.00
0.8
3rdquarter
545
3
0
0
0
548
0
0
1.3
0.00
0.3
4thquarter
554
2
0
0
0
556
0
0
0.8
0.00
0.3
* 1 Not detected according to internal exposure.
305 -
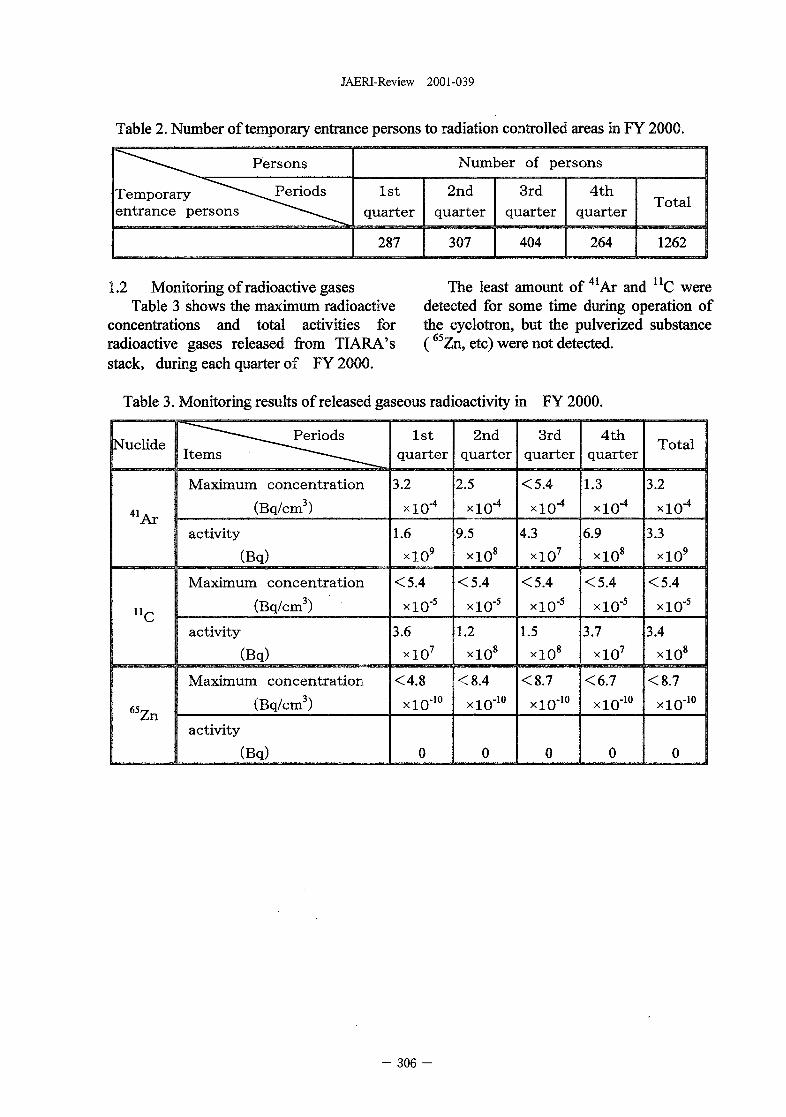
JAERI-Review 2001-039
Table 2. Number of temporary entrance persons to radiation controlled areas in FY 2000.
^-«^^^ Persons
Temporary ^ " " ~ ^ ^ P e r i o d sentrance persons ^~~~-^-^^^
Number of persons
1st
quarter
287
2nd
quarter
307
3rd
quarter
404
4th
quarter
264
Total
1262
1.2 Monitoring of radioactive gasesTable 3 shows the maximum radioactive
concentrations and total activities forradioactive gases released from TIARA'sstack, during each quarter of FY 2000.
The least amount of 41Ar and n C weredetected for some time during operation ofthe cyclotron, but the pulverized substance(65Zn, etc) were not detected.
Table 3. Monitoring results of released gaseous radioactivity in FY 2000.
Nuclide
41Ar
n C
65Zn
-~-—^___PeriodsI t e m s """"•"•*-»•—^^_^
Maximum concentration
(Bq/cm3)
activity
(Bq)
Maximum concentration
(Bq/cm3)
activity
(Bq)
Maximum concentration
(Bq/cm3)
activity
(Bq)
1stquarter
3.2
xlO"4
1.6
xlO9
<5.4
xlO"5
3.6
xlO7
<4.8
xlO"10
0
2ndquarter
2.5
xlO"4
9.5
xlO8
<5.4
xlO"5
1.2
xlO8
<8.4
xlO"10
0
3rdquarter
<5.4
xlO"4
4.3
xlO7
<5.4
xlO"5
1.5
xlO8
<8.7
xlO"10
0
4thquarter
1.3
xlO"4
6.9
xlO8
<5.4
xlO'5
3.7
xlO7
<6.7
xlO"10
0
Total
3.2
xlO"4
3.3
xlO9
<5.4
xlO"5
3.4
xlO8
<8.7
xlO"10
0
306 -
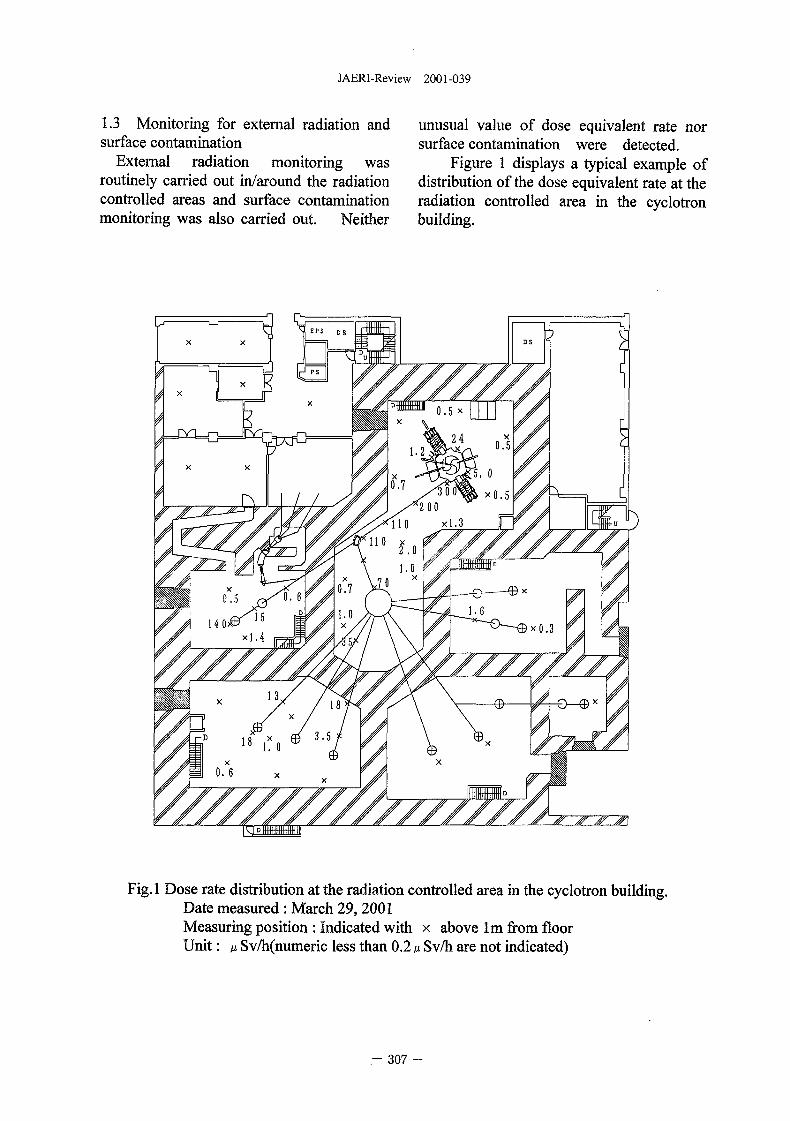
JAERI-Review 2001-039
1.3 Monitoring for external radiation andsurface contamination
External radiation monitoring wasroutinely carried out in/around the radiationcontrolled areas and surface contaminationmonitoring was also carried out. Neither
unusual value of dose equivalent rate norsurface contamination were detected.
Figure 1 displays a typical example ofdistribution of the dose equivalent rate at theradiation controlled area in the cyclotronbuilding.
Fig.l Dose rate distribution at the radiation controlled area in the cyclotron building.Date measured : March 29,2001Measuring position : Indicated with x above lm from floorUnit: u Sv/h(numeric less than 0.2 n Sv/h are not indicated)
- 307
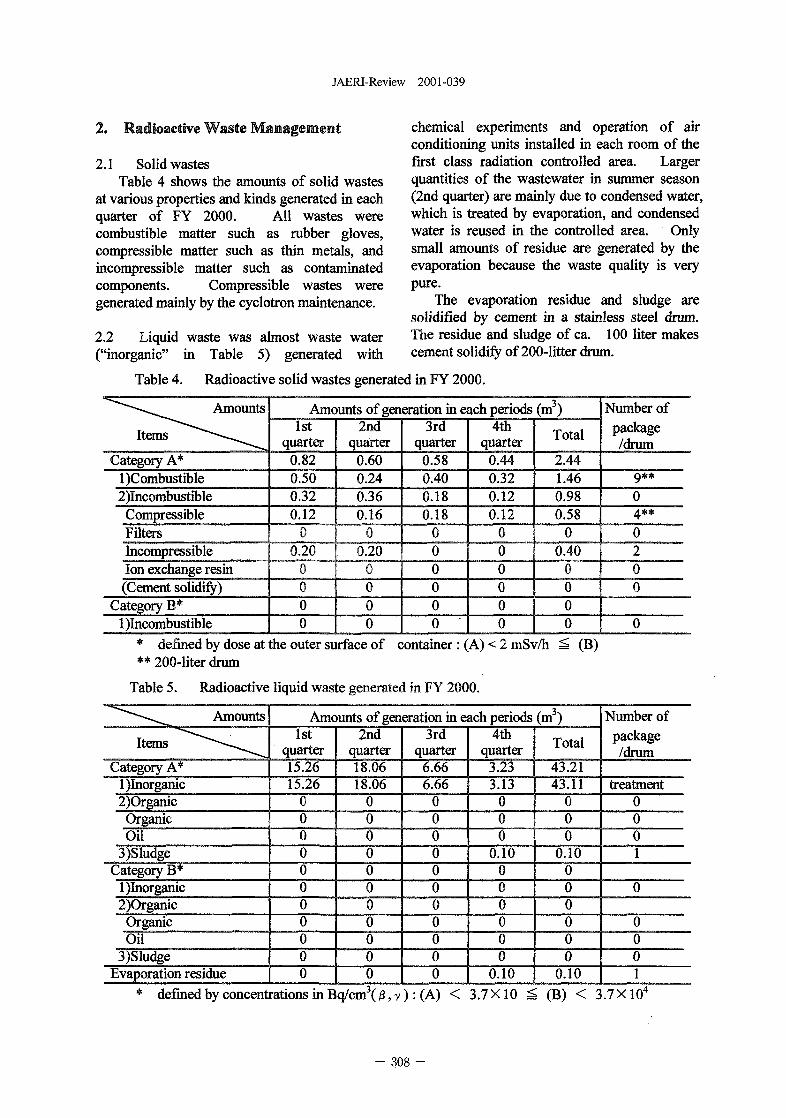
JAERI-Review 2001-039
2. Radioactive Waste Management
2.1 Solid wastesTable 4 shows the amounts of solid wastes
at various properties and kinds generated in eachquarter of FY 2000. All wastes werecombustible matter such as rubber gloves,compressible matter such as thin metals, andincompressible matter such as contaminatedcomponents. Compressible wastes weregenerated mainly by the cyclotron maintenance.
2.2 Liquid waste was almost waste water("inorganic" in Table 5) generated with
chemical experiments and operation of airconditioning units installed in each room of thefirst class radiation controlled area. Largerquantities of the wastewater in summer season(2nd quarter) are mainly due to condensed water,which is treated by evaporation, and condensedwater is reused in the controlled area. Onlysmall amounts of residue are generated by theevaporation because the waste quality is verypure.
The evaporation residue and sludge aresolidified by cement in a stainless steel drum.The residue and sludge of ca. 100 liter makescement solidify of 200-litter drum.
Table 4. Radioactive solid wastes generated in FY 2000.
^^•""-^^^ Amounts
Items ^ " " - ^ - « ^ ^ ^
Category A*l)Combustible2)Incombustible
CompressibleFiltersIncompressibleIon exchange resin(Cement solidify)
Category B*l)Incombustible
Amounts of generation in each periods (m3)1st
quarter0.820.500.320.12
| 0
0000
2ndquarter
0.600.240.360.16
00.20
0000
3rdquarter
0.580.400.180.18
000000
4thquarter
0.440.320.120.12
000000
Total
2.441.460.980.58
00.40
0000
Number ofpackage/drum
9**04**0200
0
* defined by dose at the outer surface of container : (A) < 2 mSv/h ^ (B)** 200-liter drum
Table 5. Radioactive liquid waste generated in FY 2000.
— ^ ^ Amounts
Items ^"""""---^^^
Category A*l)Inorganic2)Organic
OrganicOil
3)SludgeCategory B*
l)Inorganic2)Organic
OrganicOil
3)SludgeEvaporation residue
Amounts of generation in each periods (m3)1st
quarter15.2615.26
00000000000
2ndquarter18.0618.06
00000000000
3rdquarter
6.666.66
00000000000
4thquarter
3.233.13
000
0.10000000
0.10
Total
43.2143.11
000
0.10000000
0.10
Number ofpackage/drum
treatment0001
0
0001
definedbyconcentrationsmBq/cm3(/3,y):(A) < 3.7X10 ^ (B) < 3.7X10⁴
- 308 -
JAERI-Review 2001-039
Appendix
Appendix 1. List of Publication 311Al.l Publications in Journal 311A1.2 Publications in Proceeding 318
Appendix 2. Type of Research Collaboration 325Appendix 3. Organization and Personnel of TIARA 327
- 309 -
JAERI-Review 2001-039
Appendix 1. LIST OF PUBLICATION
A 1.1 Publications in Journal10J01T. Hirao, H. Itoh, S. Okada, and I. Nashiyama.,Studies of single-event transient current inducedin GaAs and Si diodes by energetic heavy ionsRadiat. Phys. Chem., 60, 269-272 (2001)T SCS 02001
10J02T. Hirao, J.S. Laird, H. Mori, S. Onoda, andH. Itoh.,The investigation of charge transport propertiesof SOI semiconductor devices using a heavy ionmicrobeamSolid State Phenomena, 78-79, 395-400 (2001)T SCS 02001
10J03J.S. Laird, T. Hirao, H. Mori, S. Onoda, andH. Itoh,A system for ultra-fast transient ion and pulsedlaser current microscopies as a function oftemperatureSolid State Phenomena, 78-79, 401-406 (2001)T SCS 02001
10J04H. Mori,T. Hirao, S. Onoda, H. Itoh, S. Okada,and Y. Okamoto,Profiling of collimated swift ion micro-beamusing 16Mbit DRAMRadiat. Phys. Chem., 60, 273-276 (2001)C SCS 01001
Crystallization of an amorphous layer inP+-implanted 6H-SiC studied by monoenergeticpositron beamsJ. Appl. Phys., 87, 4119-4125 (2000)I SCS 02003
10J07T. Ohshima, M. Yoshikawa, H. Itoh,Effect of gamma-ray irradiation on thecharacteristics of 6H Silicon Carbide Metal-Oxide-Semiconductor Field Effect Transistorwith hydrogen-annealed gate oxideJ. Appl. Phys., (in press.)I SCS 02003
10J08T. Tanaka, T. Ohshima, H. Itoh, S. Okada,A. Wakahara and A. Yoshida,Effect of electron irradiation on properties ofCuInSe2 thin filmsJpn. J. Appl. Phys., 39 (Suppl.39-1), 192-193(2000)I SCS 02004
10J09M. Taguchi, K. Hayano, Y. Xu, M. Moriyama,Y. Kobayashi, H. Hiratsuka, and S. Ohno,Yields of tyrosine isomers in the radiolysis ofaqueous phenylalanine solution by energeticheavy ionsRadiat. Phys. Chem., 60, 263-268(2001)
C RCO 01008
10J05
T. Ohshima, K. Abe, H. Itoh, M. Yoshikawa,
K. Kojima, I. Nashiyama, and S. Okada,
Electrical Activation of Phosphorus-Donors Introduced in
6H-SiC by Hot-implantation
Appl. Phys., A 71, 141-145(2000)
I SCS 02003
10J10
M. Taguchi, M. Moriyama, H. Namba, and
H. Hiratsuka,
Yield of acridine C-rafical produced
irradiation with energetic heaby ions
Radiat. Phys. Chem., (submitted)C RCO 01008
bv
10J06A. Uedono, S. Tanigawa, T. Ohshima, H. Itoh,M. Yoshikawa, I. Nashiyama, T. Frank, G. Pensl.R. Suzuki, T. Ohdaira, and T. Mikado,
10J11Y. Hase, A. Tanaka, T. Baba, and H.Watanabe,Frill is required for petal and sepal developmentin Arabidopsis
- 311 -
JAERI-Review 2001-039
Plant.)., 24(1), 24-32 (2000). Supplement (2001),p.53C BIT 01012
10J12M. Kawai, Y. Kobayashi, A. Hirata, Y. Oono,H. Watanabe, and H. Uchimiya,Ion beam as a noble tool to induce apoptosis-likecell death in roots of maize (Zea mays L.)Plant Biotech., 7, 305-308 (2000)C BIT 01029
10J13Y. Kobayashi, M. Taguchi, and H. Watanabe,Use of a collimated heavy ion Microbeam forirradiating cells individuallyExt. absttract: Radiat. Res., 153, 228-229(2000)C BIT 01026
10J14S. Matsuhashi, H. Uchida, and T. Kume,Positron imaging for plant study using positronemitting tracer imaging system(PETIS) andimaging. Plate(IP)Radioisotopes, 49, 558-570(2000)C BIT 1032
10J15S. Matsuhashi and T. Kume,Development of positron imaging method forplant studyRadiat. Chem., 70, 20-25(2000)C BIT 1032
10J16N. Ohtake, T. Sato, H. Fujitake, K. Sueyoshi,T. Ohyama, N.S. Ishioka, S. Watanabe,A. Osa, T. Sekine, S. Matsuhashi, T. Ito,T. Mizuniwa, T. Kume, S. Hashimoto, andA. Tsuji,Rapid N transport to pods and seeds inN-deficient soybean plantsJ. Exp. Bot., 277-283(2001)C BIT 01033
10J17S. Mori, S. Kiyomiya, H. Nakanishi,
N.S. Ishioka, S. Watanabe, A. Osa, S. Matsuhashi,S. Hashimoto, T. Sekine, H. Uchida,S. Nishiyama, H. Tsukada, and A. Tsuji,Visualization of 15O-water flow in tomato andrice in the light and dark using a positron-emitting tracer imaging system(PETIS)SoilSci. Plant Nutr., 46, 975-979(2000)C BIT 01034
10J18S. Kiyomiya, H. Nakanishi, H. Uchida, A. Tsuji,S. Nishiyama, M. Futatsubashi, H. Tsukada,N.S. Ishioka, H. Tsukada, and A. Tsuji,ljN-Translocation in rice under differentenvironmental conditions using positron emittingtracer imaging systemPlant Physiol, 125, 1743-1753(20001)C BIT 01034
10J19N. Bughio, H. Nakanishi, S. Kiyomiya,S. Matsuhashi, N.S. Ishioka, S. Watanabe,H. Uchida, A. Tsuji, A. Osa, T. Kume,S. Hashimoto, T. Sekine, and S. Mori,ReaI-time[uC]methionine translocation in barleyin relation to mugineic acid phytosiderophorebiosynthesisPlanta, (2001), (in press.)C BIT 01034
10J20J. Furukawa, H. Yokota, K. Tanoi, S. Ueoka,S. Matsuhashi, N.S. Ishioka, S. Watanabe,H. Uchida, A. Tsuji, T. Itoh, T. Mizuniwa,A. Osa, and T.M. Nakanishi,Vanadium uptake manner and an effect ofvanadium treatment on water movement in acowpea plant by PETISJ. Radioanal. Nucl. Chem., (in press.)C BIT 1036
10J21T.M. Nakanishi, J. Furukawa, K. Tanoi,H. Yokota, S. Ueoka, N. Ishioka, S. Watanabe,A. Osa, T. Sekine, T. Itoh, T. Mizuniwa,S. Matsuhashi, S. Hashimoto, H. Uchida, andA. Tsuji,Water uptake and transport imaging of soybean
- 312 -
JAERI-Review 2001-039
plant by PETIS (Positron emitting tracer imagingsystem)J. Radioanal. Nucl. Chem., (in press.)C BIT 1036
Crosslinking of polydimethylsiloxane in heavyion tracksNucl. Instr .Meth., B, (in press.)C RCO 01046
10J22T.M. Nakanishi, H. Yokota, K. Tanoi,J. Furukawa, N. Ikeue, Y. Ohkuni, H. Uchida,and A. Tsuji,Circadian rhythm in 15O-labeled water uptakemanner of a soybean plant by PETIS (Positronemitting tracer imaging system)Radioisotopes, 50, 163-168 (2001)C BIT 1036
10J23T.M. Nakanishi, H. Yokota, K. Tanoi, N. Ikeue,Y. Ohkuni, J. Furukawa, N.S. Ishioka,S. Watanabe, A. Osa, T. Sekine, S. Matsuhashi,T. Itoh, T. Kume, H. Uchida, and A. Tsuji,Comparison of 15O-labeled and 18F-labeled wateruptake in a soybean plant by PETIS (Positronemitting tracer imaging system)Radioisotopes, 50, 265-269(2001)C BIT 1036
10J24Y. Nakayama, K. Imagawa, M. Tagashira,M. Nakai, H. Kudoh, M. Sugimoto, N. Kasai, andT. Seguchi,Evaluation and analysis of thermal controlmaterials under ground simulation test for spaceenvironment effectsHigh Perform. Polym., (in press.)C, T RCO 01041,02037
10J25L.O. Peng,P.Y. Apel,Y. Maekawa andM. Yoshida,Conductometric study of the radial track etchrate:Free shape analysisNucl. Instr. Meth. Phys. Res., B168, 527-532(2000)C RCO 1042
10J26H. Koizumi, M. Taguchi, Y. Kobayashi, andT. Ichikawa,
10J27S. Ohno, K. Furukawa, M. Taguchi, T. Kojima,and H. Watanabe,An ion-track model based on experimentalmeasurements and its application to calculateradiolysis yieldsRadial Phys. Chem., 60, 259-262(2001)C RCO 01045
10J28M. Taguchi, M. Moriyama, H. Namba, andH. Hiratsuka,Yield of acridine C-radical produced byirradiation with energetic heavy ionsRadial Phys. Chem., (in press.)C RCO 01008
10J29E. Wakai, T. Sawai, A. Naito, and S. JitsukawaMicrostructural development and swellingbehavior of F82H steel irradiated by dual beamsJ. Electron. Microscopy, (to be printed in 2001.)T, I, S IOM 01007/02011
10J30E. Wakai, T. Sawai, K. Tomita, K. Furuya,A. Naito, S. Yamashita, S. Ohnuki,S. Yamamoto, H. Naramoto, and S. Jitsukawa,Radiation effects of ferric steel irradiated bydual/triple ion beamsJ. Nucl. Mater., (accepted)T, I, S IOM 01007/02011
10J31K. Furuya, E. Wakai, T. Sawai, M. Ando,S. Jitsukawa, and H. Takeuchi,Microstructural and hardness examinations ofHIP jointed F82H steel irradiated bysimultaneous triple ion beamsJ. Nucl. Mater., (accepted)T, I, S IOM 01007/02011
10J32
3 1 3 -
JAERI-Review 2001-039
T. Sawai, E. Wakai, K. Tomita, A. Naito, andS. Jitsukawa,Radiation-induced cavity formation in F82H withvarious heat and mechanical treatment./. Nucl. Mater., (accepted.)T, I, S IOM 01007/02011
10J33Y. Shimomura and I.Mukouda,Development of vacancy clusters in neutron-irradiated copper at high temperatureJ. Nucl. Mater., 283-287, 249-254(2000)T, I, S IOM 02008
10J34I. Mukouda, Y. Shimomura, T. liyama,Y. Harada, Y. Katano, T. Nakazawa, D. Yamaki,and K. Noda,Microstructure in pure copper irradiated bysimultaneous multi-ion beam of hydrogen,helium and self ions/. Nucl. Mater., 283-287, 302-305(2000)T, I, S IOM 02008
10J35N. Sekimura, S. Yonamine, T .Sawai, Y. Arai,A. Naito, Y. Miwa, and S. Hamada,Synergistic effects of hydrogen and herium onmicrostructural evolution in vanadium alloys bytriple ion beam irradiationJ. Nucl .Mater., 283-287, 224-228(2000)T, S, I IOM 02009
10J36T. Okita, T. Kamada, and N. Sekimura,Effects of dose rate on microstructural evolutionand swelling under neutron irradiationJ. Nucl. Mater., 283-287, 224-228(2000)T, S, I IOM 02009
10J37T. Taguchi, E. Wakai, N. Igawa, L.L. Snead, andS. Jitsukawa,Effect of simultaneous ion irradiation onmicrostructural change of SiC/SiC composites athigh temperetureJ. Nucl. Mater., (ICFRM-10, accepted)T, I S IOM 02010
10J38H. Abe,Nucleation of carbon onions and nanocapsulesunder ion implantation at high temperatureDiamond and Related Mater., 10, 1201(2001)I IOM 2019
10J39H. Tanigawa, H. Abe, S. Jitsukawa, T. Iwai,H. Serizawa, and Y. Katoh,Role of local melting on intergranular fracture ofFe-P binary alloyMater. Transact., JIM , (submitted)I IOM 2014
10J40E. Wakai, A. Hishinuma, H. Abe, S. Takagi, andK. Abiko,Microstructural evolution of Fe-50Cr-xW modelalloys during Fe+ ion IrradiationMater. Transact., JIM 41, 1176-1179(2000)I IOM 2012
10J41Y. Kasukabe, H. Tani, H. Abe, and Y. Yamada,In-situ transmission electron microscopy andelectron energy loss, Spectroscopy observation ofTiN grown by N-implantationJpn. J. Appl, Phys., 39, 4395-4399(2000)I IOM 2021
10J42I. Vacik, H. Naramoto, J. Cervena,V. Hnatowicz, I. Peka, and D. Fink,Absorption of molten fluoride salts in glassycarbon, pyrographite and Hastelloy BJ.Nucl. Mater., 289, 308-314(2001)O IOM
10J43J. Vacik, H. Naramoto, S. Yamamoto, andK. Narumi,Patern formation induced by co-deposition of NiandC60onMgO(100)J. Chem. Phys., 114, 9115-9119 (2001)O. I IOM
10J44
- 3 1 4 -
JAERI-Review 2001-039
J. Vacik, V. Hnatowicz, J. Cervena,H. Naramoto, S. Yamamoto, and D. Fink,Energy loss and energy straggling of light ions infulleriteFullerence Sci. and Techn., 9(2), 67-79(2001)T IOM 02026
10J45J. Vacik, S. Yamamoto, H. Naramoto, andK. Narumi,Epitaxial recrystallization of the Ni film on theMGO(001) substrateJ. Crystal Growth, (submitted)T . IOM 02026
10J46J. Vacik, H. Naramoto, S. Yamamoto,K. Narumi, H. Abe, and Y.H. Xu,Thermally incited degradation of theNi/C60/Ni/MgO(100) sequenceSurface Sci., (submitted)O IOM 02026
10J47J. Vacik, H. Naramoto, S. Yamamoto,K. Narumi, Y. Xu, and K. Miyashita,Thermal response of the Ni/Ni+C60/Ni/MgO(100)systemSurface Science, (submitted)O IOM
10J48X. Xu, Y. Xu, H. Naramoto, K. Narumi, andK. Miyashita,Role of simultaneous Ne+ ion bombardments inpreparing carbon films from Ceo vaporThin Solid Film, (submitted)O IOM
10J49H. Naramoto, S. Yamamoto, and K. Narumi,RBS/Channeling analysis of implanted immisiblespeciesNucl. Instr. Meth., B161-163, 534-538 (2000)I, S IOM 02026
10J50
J. Vacik, H. Naramoto, V. Hnatowicz,J. Cervena, I. Peka, and D. Fink,Absorption of molten Fuloride salts in Glassycarbon, Pyrographite and Hastelloy BJ.Nucl. Mater., 289, 308-314(2001)S IOM 02026
10J51Z. Tang, ZJ. Zhang, K. Narumi, Y. Xu,H. Naramoto, and S. Nagai,Effect of mass-selected ion species on structureand properties of diamond-like carbon filmsJ. Appl.Phys., 89, 1959-1964(2001)O IOM 02026
10J52Y. Chimi, K. Adachi, A. Iwase, N. Ishikawa, andK.Yamakawa,Thermal relaxation of hydrogen disordering inPd-H system irradiated with high-energy particlesJ. Alloys and Compounds (2001), (in press.)S IOM 02028
10J53S. Yamamoto, T. Sumita, and A. Miyashita,Preparation of TiO2-anatase films on Si(001)substrate with TiN and SrTiO3 as buffer layersJ. Phys. Condens. Matter, 13, 2875(2001)S IOM 02022
10J54T. Yamaki, and K.Asai,Alternate multiplayer deposition fromammonium amphiphiles and titanium dioxidecrystalline nanosheets using the Langmuir-Blodgett techniqueLangmuir, 17, 2564(2001)I, S, O IOM 02036
10J55S. Sumita, T. Yamaki, S. Yamamoto, andA. Miyashita,A new characterization method of photocatalyticactivity in semiconductorphotocatalystsJapn. J. Appl. Phys., Pt.l, 40, 4007(2001)I, S, O IOM 02036
10J56
315 -
JAERI-Review 2001-039
T. Yamaki, R. Shinohara, and K. Asai,Formation of hybrid monolayers andLangmuir-Blodgett-typemultilayers fromammonium cations and TiO2 crystallinenanosheetsThin Solid Films, (in press.)I, S, O IOM 02036
10J57Y. Kasukabe, H. Tani, H. Abe, andY. Yamada,In-situ transmission electron microscopy andelectron energy loss spectroscopy observation ofTiN grown by N-implantationJapn. J. Appl. Phys., 39, 4395-4399 (2000)I IOM 02021.
10J58H. Kudo, N. Nakamura, K. Shibuya, K. Narumi,S. Yamamoto, H. Naramoto, K. Sumitomo, andS. Seki,Ion-induced electron emission from Si crystaltargets covered with noncrystalline Si layersNucl. Instr. & Meth., 168, 181-191(2000)I MAN 02023
10J59H. Kudo, T. Kumaki, K. Haruyama,Y. Tsukamoto, S. Seki, andH. Naramoto,Structural analysis of bent KC1 and NaCl crystalswith ion-induced electron spectroscopyNucl. Instr. Meth., B174, 512-518(2001)0 MAN 02023
10J60A. Uedono, S. Tanigawa, T. Ohshima, H. Itoh,Y. Aoki, M. Miyashita, and I. Nashiyama,Oxygen-related defects in O+-implanted 6H-SiCstudied by Monoenergetic positron beamsJ. Appl. Phys., 86, 5392(1999)1 IOM 02032
10J61S. Watanabe, N.S. Ishioka, A. Osa,I. Koizumi, T. Sekine, S. Kiyomiya,H. Nakanishi, and S. MoriProduction of positron emitters of metallicelements to study plant uptake and distributionRctdiochim. Acta. (in press.)
C NRI
10J62T. Ohnuki, N. Kozai, M. Samadfam,S. Yamamoto,, K. Narumi, H. Naramoto,T. Kamiya, T. Sakai, and T. Murakami,Study on uptake of europium by the thin film ofapatite and smectite mixture using RBS andmicro-PIXENucl. Instr. And Meth. B, (in press.)T, C IOM 02035
10J63H. Yamamoto, Y. Iwai, T. Unezaki, Y. Tomii,And Y. Tsuchitani,Fluoride uptake around cavity walls; Two-dimentional mapping by electron probemicroanalysisOpen Dentistry, 25,104-112(2000)S ACT 02040
10J64C.J. Ma, M. Kasahara, K.C. Hwang,K.C.Choi, S.B.Choi, and J.J.Lee,Physicochemical characteristics of single Asiandust storm particlesJ. Kor. Soc. Atmos. Envir., 16/E, 29-38(2000)S ACT 02043
10J65C.J. Ma, M. Kasahara, R. Holler andT. Kamiya,Characteristics of single particles sampled inJapan during the Asian dust-storm periodAtmos. Envir., 35/15, 2707-2714 (2001)S ACT 02043
10J66T. Ohnuki, N. Kozai, M. Samadfan, T. Kamiya,T. Sakai, and T. Murakami,Analysis of uranium distribution in rocks byu-PIXENucl. Instr. Meth., B, (in press.)T, C IOM 02046
10J67Y. Nakane and Y. Sakamoto,Measurement of absorbed dose distributions in a
- 316 -

JAERI-Review 2001-039
plastic phantom, irradiated by 40- and 65-MeVquasi-monoenergetic neutronsNucl. Instr. Meth., A459, 552 (2001)C RSH 01053
- 317 -
JAERI-Review 2001-039
A 1.2 Publications in Proceeding
10C01N. Nemoto, H. Shindou, S. Kuboyama,S. Matsuda, H .Itoh, S. Okada, andI. Nashiyama,Relationship between single-event upsetimmunity and fablication processes of recentmemories5th Europian Conference Radiation and itsEffects on Components and System(RADECS99)C SCS 01002
10C02N. Nemoto, H. Shindou, S. Kuboyama,S. Matsuda, K. Sugimoto, I. Nashiyama, andH. Itoh,Development of 1M gate CMOS gate arrayEuropian Space Components ConferenceC SCS 01002
10C03A. Makihara, H. Shindou, N. Nemoto,S. Kuboyama, S. Matsuda, T. Ohshima, T. Hirao,H. Itoh, S. Buchner, and A.B. CampbellAnalysis of single-ion multiple-bit upset in high-density DRAMsThe IEEE Nuclear and Space Radiation EffectsConference(NSREC 2000)C SCS 01002
10C04J.S. Laird, T. Hirao, H. Mori, S. Onoda, andH. Itoh,The development of a new data collection systemand chamber for transient ion beam and laserbeam induced current measurements as afunction of temoeratureThe 4th International Workshop on RadiationEffects of Semiconductor Devices for SpaceApplication, pp.97-102, Tsukuba, Oct. 11-13,(2000)T SCS 02001
10C05
H. Mori,T. Hirao, S. Onoda, H. Itoh, S. Okada,and Y. Okamoto,Profiling of collimated swift ion micro-beamusing 16MbitDRAMInternational Symposium on "Prospects forApplication of Radiation towards the 21thcentury" (Japan) •C SCS 01001
10C06T .Ohshima, H. Itoh, and M. Yoshikawa,Enhancement of electrical activation ofaluminum acceptors in 6H-SiC byCo-implantation of carbon ionsProceedings of the 3rd European Conference onSilicon Carbide and Related Materials (ECSCRM2000), Kloster Baanz (Germany), September2000, Materials Science Forum, Vols. 353-356,575-578 (2001)I SCS 02003
10C07L .Hae-Seok, H. Okada, A. Wakahara,A. Yoshida, T. Ohshima, H. Itoh, S. Kawakita,M. Imaizumi, and S. Matsuda,Effect of proton irradiation on electricalproperties of CuInSe2 thin films12th International Photovoltaic Science andEngineering Conference, JEJU, June 11-15,p.91-92(2001)I SCS 02004
10C08Y. Hase, and A. Tanaka,Analysis of frill mutant that affects petal andsepal development in ArabidopsisPlant Cell Physiology, Vol.42,Supplement(2000), p.53C BIT 01012
10C09Y. Sasuga, Y. Kami, M. Ooshima, G. Takata,Y. Kobayashi, Y. Sakata, Y. Oono, Y. Kobayashi,S. Tanaka, and H. Takenagaka,Isolation of response deficient mutants to
318 -
JAERI-Review 2001-039
environments from plant seeds irradiated withion-beam
Abs. of 10th TIARA Research ReviewMeeting( Takasaki, June 18-19), 153-154(2001)C BIT 01030
10C10T. Funayama, Y. Kobayashi, M. Taguchi,H. Watanabe, and K. Yamamoto,Irradiation of collimated heavy ion beam onindividual cells :The method for detecting ionTracks at irradiation timeAbstracts of the 5th International Workshop onMicrobeam Probes of Cellar Radiation Response(Stresajtaly, May 26-27), (2001) p.27-28C BIT 01026
10C11Y. Kobayashi, T. Funayama, S. Wada,M. Tanaka, T.Kamiya, W. Yokota, H. Watanabe,and K. Yamamoto,The effect of single ion irradiation onmammalian cellsAbstract of the 10th TIARA Research ReviewMeeting(Takasaki, June 18-19,2001), p.145C BIT 01026
10C12Z.L. Tu, K. Shirai, R. Kanekatsu, K. Kiguchi,-Y. Kobayashi, M. Taguchi, and H. Watanabe,Radiosurgery by heavy ion beams for biologicalstudy of the silkworm, Bombyx moriProc. of 4th China Inter. Silk Conf, May 2000(China), p. 13-17C BIT 01027
10C13T.M. Nakanishi, T. Kataoka, J. Furukawa,K.Tanoi, H. Yokota, S. Ueoka, N.S. Ishioka,S. Watanabe, A. Osa, T. Sekine, T. Itoh,T. Mizuniwa, S. Matsuhashi, S. Hashimoto,H. Uchida, and A. Tsuji,Water uptake and transport imaging of CowpeaPlant by PETIS (Positron emitting tracer imagingsystem)Proc. of 5th International Conference on Methodsand Applications of Radioanalytical
Chemistry-MARC V, April 9-14, 2000 (Hawaii),p.158C BIT 1036 •
10C14
J. Furukawa, H. Yokota, K. Tanoi, S. UeokaN.S. Ishioka, S. Watanabe, A. Osa, T. Sekine,T. Itoh, T. Mizuniwa, S. Matsuhashi,S. Hashimoto, H. Uchida, A. Tsuji, andT.M. Nakanishi,Vanadium uptake manner and an effect ofvanadium treatment on water movement in acowpea plant by PETISProc. of 5th International Conference on Methodsand Applications of RadioanalyticalChemistry-MARC V, April 9-14 , 2000 (Hawaii),p.157C BIT 1036
10C15T.M. Nakanishi, J. Furukawa, K. Tanoi,H. Yokota, S. Ueoka, N.S. Ishioka, S. Watanabe,A. Osa, T. Sekine, T. Itoh, T. Mizuniwa,S. Matsuhashi, S. Hashimoto, H. Uchida, andA. Tsuji,Water uptake and transport imaging of CowpeaPlant by PETIS (Positron emitting tracer imagingsystem)Proc. of 12th Conference of the Federation ofEuropean Societies of Plant Physiology, August21-25 2000 (Budapest), p.57C BIT 1036
10C16Y. Nakayama, K. Imagawa, M. Tagashira,M. Nakai, H. Kudoh, M. Sugimoto, N. Kasai, andT. Seguchi,Evaluation and analysis of thermal controlmaterials under ground simulation test for spaceenvironment effectsProc. 8th ISMSE & 5th ICPMSE, 2000(Arcachon, France)C, T RCO 01041,02037
10C17H. Kudoh, M. Sugimoto, N. Kasai, T. Seguchi,K. Imagawa, Y. Nakayama, M. Tagashira, and
- 319 -
JAERI-Review 2001-039
M. Nakai,On-ground radiation resistant tests on polymerbased space materials - Thermal control film andflame resistant wire -Proc. 8th ISMSE & 5th ICPMSE, 2000(Arcachon, France)C, T RCO 01041, 02037
In-situ TEM observation of nucleation andgrowth of spherical graphitic clusters under ionimplantationEighth Conference on Frontiers of ElectronMicroscopy in Materials Science(FEMMS 2000)I IOM 2019
10C18Y. Maekawa, M. Yoshida, M. Asano andH. Koshikawa,Thermally stable and highly sensitive polymermembrances for ion and electron beam radiationInternational Application, Beijing-Chaina,Novermber 6-10(2000)C RCO 1042
10C19N. Sekimura,Modeling of radiation effects in fission andfusion reactor materialsProceedings of the Fifth Japan-ChainaSymposium on Materials for Advanced EnergySystems and Fission and Fusion Engineering(1999),p.221T, S, I IOM 02009
10C20T. Sawai,Cavity formation in irradiated F82HIEA Workshop on reduced activation ferritic/martensitic steels, Nov, 2000, JAERI-Conf.2001-007, pp. 162-179T, I, S IOM 02012
10C21E. Wakai, T. Sawai, A. Naito, and S. Jitsukawa,Microstructual development and swellingbehavior of F82H steel irradiated by dual ionbeamsEighth Conference on Frontiers of ElectronMicroscopy in Materials Science, (October, 2000,J. Electron Microscopy. (in press)T, I, S IOM 02012
10C22H. Abe, S. Yamamoto, A. Miyashita,
10C23J. Vacik, S. Yamamoto, H. Naramoto,K. Narumi, and H. Abe,Thermal stability of buried Ceo epitaxial layersProc. of the 17th Fullerene General Symposium,August 9-10, 1999(Gifu). p.137O IOM
10C24J. Vacik, S. Yamamoto, H. Naramoto,K. Narumi, and K. Miyashita,Mesoscopic patterning induced by co-depositionof C60 andNi on MgO(100)Proc. of the 18th Fullerene General Symposium,January 13-14, 2000 (Okazaki), p. 124O IOM
10C25J. Vacik, H. Naramoto, S. Yamamoto,K. Narumi. Y. Xu, and T. Tanabe,Growth of faceted crystal drolets from themixture of Ni and Ceo co-deposited on theMgO(100)Proc. of the 19th Fullerene General Symposium,July 27-28, 2000 (Kiryu), p.34T IOM
10C26J. Vacik, H. Naramoto, S. Yamamoto, andK. Narumi,Non-equilibrium growth of Ni + Ceo onMgO(100)TIARA Annual Report 1999,p.l60, AdvancedRadiation Technology Center, JAERI, October2000O IOM
10C27
J. Vacik, H. Naramoto, S. Yamamoto, and
- 320 -
JAERI-Review 2001-039
K. Narumi,Epitaxial re-crystallization of theNi/MgO(100)interfaceTIARA Annual Report 1999, p. 157, AdvancedRadiation Technology Center, JAERI, October2000T IOM 02026
10C28J. Vacik, H. Naramoto, S. Yamamoto, K. Narumi,and Y.H. Xu,Effect of energetic beam irradiation on thethermal evolution of the Ni-C6o systemsAbstracts of the 1st Open Symposium ofQuantum Science and Engineering Center, KyotoUniversity, p.80, October 28, 2000, KyotoT IOM 02026
10C29J. Vacik, H. Naramoto, S. Yamamoto,K. Narumi, and H. Abe,Structural variations of the Ni-C6o systemsinduced by energetic beam bombardment andthermal annealingProc. of the 11th Symposium on BeamEngineering of Advanced Material Syntheses-Including Bio-MedicalMaterials and Treatments BEAMS 2000, p. 135-138, November 21-22, 2000, TokyoT IOM 02026
10C30J. Vacik, H. Naramoto, S. Yamamoto, K. Narumi,and K. Miyashita,Mesoscopic patterning induced by Co-depositionof C60 and Ni on the MgO(100) single crystalProc. of Fall Meeting of Materials ResearchSociety, Abstracts, p.349, Nov.27-Dec.l, 2000,Boston, U.S.A.O IOM
10C31J. Vacik, H. Naramoto, S. Yamamoto, K. Narumi,and Y.H. Xu,Thermally incited structural variations of theNi-C60 systemsProc. of the 20th Fullerene General Symposium,
p.92, oral/poster contribution January, 22-23,2001, OkazakiO IOM
10C32J. Vacik, H. Naramoto, S. Yamamoto, and K. Narumi,Fabrication of mesoscopic stripes based onself-organization, The 4th InternationalSymposium on Inter. Materials NanoscopicStructure and Dynamics for New FunctionalMaterials and DevicesInvited poster,p.l8, Februry 6-7, 2001, OsakaUniversity, Osaka(The Best International Prize)O IOM
10C33J. Vacik, H. Naramoto, S. Yamamoto,K. Narumi, and Y.H. Xu,Thermal response of the metal/fullerite hybridassemblyAbstracts of the Tenth TIARA Research ReviewMeeting, 1P37, p.84, June 18-19, 2001,TakasakiO IOM
10C34J. Vacik, H. Naramoto, S. Yamamoto,K. Narumi, and Y.H. Xu,Unusual thermal response of the metal/fulleritesuperstructureProc. of the 21th Fullerene General Symposium,p.92, oral/poster contribution, July 25-27, 2001,TsukubaT IOM 02026
10C35J. Vacik, H. Naramoto, S. Yamamoto, andK. Narumi,Epitaxial recrystallization of the Ni films on theMgO(100) substrateProc. of the 13th International Conference onCrystal Growth Doshisha University Kyoto,Japan, 30 July-4 August, 2001O IOM
10C36H. Naramoto, Y. Xu, K. Narumi, X. Zhu,J. Vacik, S. Yamamoto, and K. Miyashita,
- 321 -
JAERI-Review 2001-039
Modification of carbon related films with energybeamsProc. of MRS Fall-Meeting (Boston, 2000)0 IOM
10C37H. Naramoto, X. Zhu, J. Vacik, Y. Xu,K. Narumi, S. Yamamoto, V.I. Lavrentiev, andK. Miyashita,Allotropic conversion of carbon-ralated films byusing energy beamsProc. Int. Symposium on Fullerene andClusters 2001 (St. Petersburg, July 2-6, 2001), (tobe published)O, T IOM
10C38H. Naramoto, Y. Xu, K. Narumi, X. Zhu,J. Vacik, S. Yamamoto, and K. Miyashita,Modification of Ceo carbon-lerated films withenergy beamsMat. Res. Soc. Symp. Proc.,647,05.18.1-05.18.6 (2001)1 IOM 02026
Nonmetal-ion implantationProceedings of the Eleventh Symposium onBeam Engineering of Advanced MaterialsSynthesis, p. 131, (November, 2000, Tokyo)I, S IOM 02036
10C42
A. Arai, K. Hirata, T. Sekiguchi, A. Kawasuso,Y. Kobayashi, and S. Okada,Effect of radiation damage on luminescence oferbium-implanted SiO2/Si studied by slowpositron beam6th International Workshop on Positron andPositronium Chemistry, June 1999I IOM 02032
10C43T. Ohshima, A. Uedono, H. Itoh, M. Yoshikawa,K. Kojima, I. Nashiyama, S. Okada, and K. Abe,Relationship between donor activation and defectannealing in 6H-SiC hot-implanted withphosphorus ionsMaterials Science Forum, 338-342(2000), p.857I IOM 02032
10C39K. Narumi, and H. Naramoto,AFM investigation of growth process of C6o thinfilms on a KBr(OOl) SurfaceDiamond and Related Materials 10, 980-983(2001)0 IOM, MAN 02027
10C40S. Yamamoto, T. Sumita, and A. Miyashita,Hydrogen analysis of extaxial Cu(l 11)/Nb(l 10)Multilayer using MeV ion beamsProc. of sixteenth international conference onthe application of accelerators in research andindustry, November 2000(Denton Texas, USA),(in press.)1 IOM 02022
10C44H. Abe, A. Uedono, H. Uchida, A. Komatsu,S. Okada, and H. Itoh,Positron annihilation studies of defects in ionimplanted PalladiumMaterials Science Forum, 363-365(2001), p. 156I IOM 02032
10C45T. Yamaguchi, E. Watanabe, T. Souno,H. Nishikawa, M. Fujimaki, and Y. Ohki,Evaluation of silica implanted by high-energyions using microspectroscopy (II)The 61st Autumn Meeting, 2000; The JapanSociety of Applied Physics, 6a-B-10, p.814, Sep.2000O IOM 02034
10C41T. Yamakim, T. Sumita, S. Yamamoto, andA. Miyashita,Surface modification of TiO? single crystals by
10C46T. Souno, H. Nishikawa, T. Yamaguchi,E. Watanabe, M. Fujimaki, and Y. Ohki,Characteristics of defects in silica implanted by
- 322 -
JAERI-Review 2001-039
high-energy ions during thermal treatmentThe 61st Autumn Meeting, 2000; The JapanSociety of Applied Physics, 6a-B-8, p .813, Sep.20000 IOM 02034
10C47T. Souno, H. Nishikawa, T. Yamaguchi,E. Watanabe, Y. Nishihara, M. Hattori,M. Fujimaki, Y. Ohki, M. Oikawa, T. Kamiya,and K. Arakawa,Microscopic Characterization of Ion-ImplantedSilica GlassProc. of the 32nd Symposium on Electricaland Electronic Insulating Materials and Applicationsin Systems, Pb-7, pp.269-272, Nov. 2000T, S IOM 02034
Evaluation of silica implanted with high—energyions using UV — excited microspectroscopyThe 48th Spring Meeting, 2001; The JapanSociety of Applied Physics and Related Societies,29a-ZL-9, p.942, Mar. 2001O IOM 02034
10C51M. Hattori, Y. Nishihara, M. Fujimaki, Y. Ohki,T. Souno, H. Nishikawa, T. Yamaguchi, E.Watanabe, M. Oikawa, T. Kamiya, andK. Arakawa,Characterization of ion-implanted silica glass byvacuum UV spectroscopyTechnical Meeting on Dielectrics and InsulatingMaterials, DEI-01-79, IEEJ, Mar. 2001IOM 02034
10C48T. Souno, H. Nishikawa, T. Yamaguchi, E.Watanabe, Y. Nishihara, M. Hattori, M. Fujimaki,Y. Ohki, M. Oikawa, T. Kamiya, andK. Arakawa ,Microspectroscopic Evaluation of Silica GlassImplanted by Ion MicrobeamThe 48th Spring Meeting, 2001; The Japan Society ofApplied Physics and Related Societies, 29a-ZL-3,p.940, Mar. 2001T,S IOM 02034
10C49M. Hattori, Y. Nishihara, M. Fujimaki, Y .Ohki,T. Souno, H. Nishikawa, T. Yamaguchi,E. Watanabe, M. Oikawa, T. Kamiya, andK. Arakawa,Densification of silica glass induced by ionimplantation, using ion microbeamThe 48th Spring Meeting, 2001; The Japan Society ofApplied Physics and Related Societies, 29a-ZL-7, p.941,Mar. 2001TS IOM 02034
10C50T. Yamaguchi, E. Watanabe, T. Souno,H. Nishikawa, Y. Nishihara, M. Hattori,M. Fujimaki,Y. Ohki, M. Oikawa, T. Kamiya,and K.Arakawa.
10C52K. Ishii, A. Sugimoto, T. Satoh, A. Tanaka,S. Matsuyama, C. Akama, M. Sato, T. Kamiya,T. Sakai, M. Saidoh, R. Tanaka, and M. Oikawa,Elemental analysis of cellular samples by airmicro-PIXEProc. of 7th Int.Conf. on Nuclear MicroprobeTechnology and Applications(Bordeaux, France,10-15 Sep.2000) to be published in Nucl. Instrr.and Meth., BS ACT 02045
10C53M. Kasahara, S. Akashi, C.-J. Ma and S. Tohno,Fixation and chemical analysis of single liquidparticleAm. Inst. of Phys., AIP Conf. Proc., 534, 15th
International Conference on Nucleation andAtmospheric Aerosols, August 2000 (Missouri,USA) ,p.736-739S ACT 02043
10C54
M. Kasahara, C.-J. Ma, T. Kamiya and T. Sakai,Applications of micro-PIXE to atmosphericaerosol studie,Proc. Intern. Conf. on Nuclear MicroprobeTechnology and Applications, Sept.2000(Bordeaux)
- 323 -
JAERI-Review 2001-039
S ACT 02043
10C55T. Kamiya, T. Sakai, M. Oikawa, and T. Hirao,Observation of individual radiation damage usingan automated single ion hit technique at theJAERI heavy ion Microbeam systemProc. of 7th Int. Conf. on Nuclear MicroprobeTechnology and Applications(Bordeaux, France,10-15 Sep.2000)(to be published in Nucl. Instrr.and Meth., B)T ACT 02039
10C56T. Kamiya, W. Yokota, Y. Kobayashi,M. Cholewa, M.S. Krochmal, G. Laken,I.D. Lasen, L. Fiddes, G. Parkhill, K. Dowsey,Development of an automated single cellirradiation system combined with a high-energyion Microbea'm systemProc. of 7th Int. Conf. on Nuclear MicroprobeTechnology and Applications(Bordeaux, France,10-15 Sep. 2000) (to be published in Nuci. Instr.and Meth., B)S ACT 01051
10C57E. Kim, A. Endo, Y. Yamaguchi, M. Yoshizawa,T. Nakamura, and T .Shiomi,Design of neutron monitor for wide energy rangefrom thermal to lOOMeVProc. 10th Intern. Congr. of The Intern.Radiat.Protec. Assoc, May 14-19, 2000, Hiroshima,JapanC RSH 1054
10C58W. Yokota, K. Arakawa, S. Okumura,M. Fukuda, T. Kamiya, and Y. Nakamura,Topics and Future Plans of Ion Beam Facilities atJAERIProc. of the 4th International Workshop onRadiation Effects on Semiconductor Devices forSpace Application (Tsukuba, 2000), p. 179C SCS, ACT
- 324 -
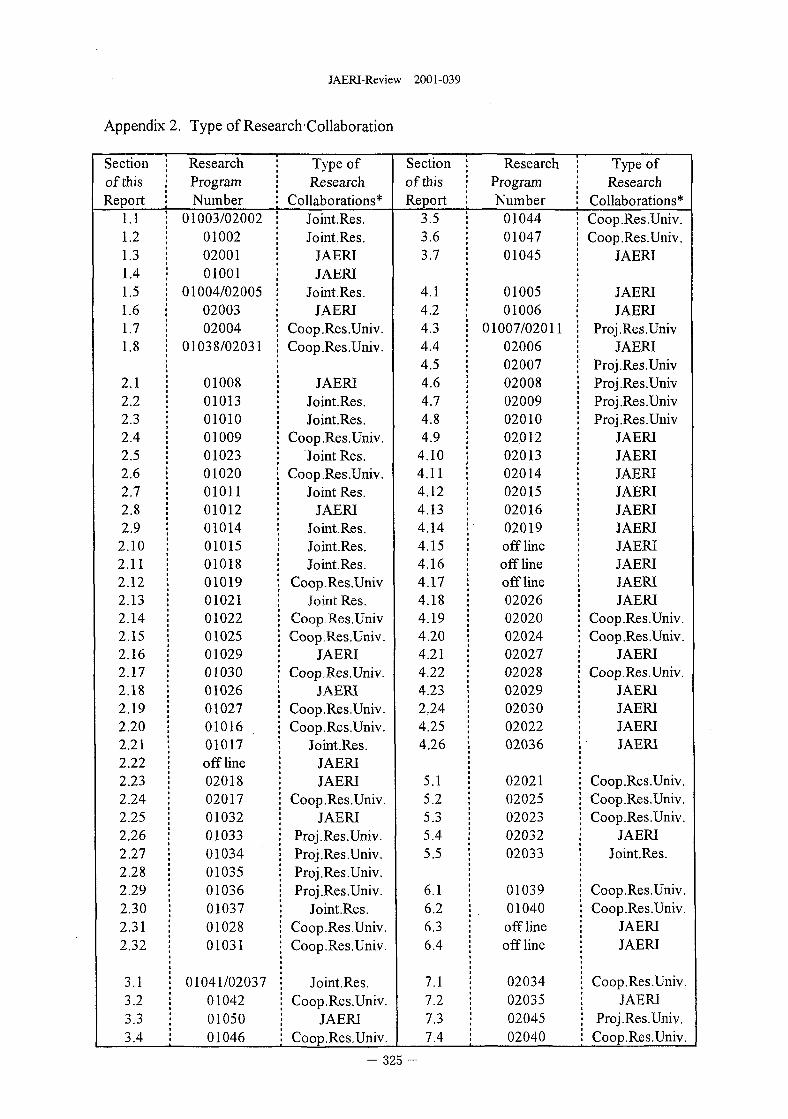
JAERI-Review 2001 -039
Appendix 2. Type of Research/Collaboration
Section |ofthisReport |
1 . 1 i1.21.31.41.51.61.71.8
2.12.22.32.42.52.62.72.82.92.102.112.122.132.142.152.162.172.182.192.202.212.222.232.242.252.262.272.282.292.302.312.32
3.13.23.33.4
Research :Program |Number !
01003/02002 •010020200101001
01004/020050200302004
01038/02031
010080101301010010090102301020010110101201014010150101801019010210102201025010290103001026010270101601017off line02018020170103201033010340103501036010370102801031
j 01041/02037: 01042j 01050: 01046
Type ofResearch
Collaborations*Joint.Res.Joint.Res.
JAERIJAERI
Joint.Res.JAERI
Coop.Res.Univ.Coop.Res.Univ.
JAERIJoint.Res.Joint.Res.
Coop.Res.Univ.Joint Res.
Coop.Res.Um'v.Joint Res.
JAERIJoint.Res.Joint.Res.Joint.Res.
Coop.Res.UnivJoint Res.
Coop.Res.UnivCoop Res.Univ.
JAERICoop.Res.Univ.
JAERICoop.Res.Univ.Coop.Res.Univ.
Joint.Res.JAERIJAERI
Coop.Res.Univ.JAERI
Proj.Res.Univ.Proj.Res.Univ.Proj .Res.Univ.Proj .Res.Univ.
| Joint.Res.Coop.Res.Univ.
| Coop.Res.Univ.
• Joint.Res.: Coop.Res.Univ.j JAERI: Coop.Res.Univ.
Section jofthis |Report j
3.5 i3.63.7
4.14.24.34.44.54.64.74.8 !4.9 |
4.104.114.124.134.144.154.164.174.184.194.204.214.224.232,244.254.26
5.15.25.35.45.5
6.16.26.36.4
7.17.27.37.4
Research jProgram •Number :
01044 i01047 j01045 j
01005 i01006 |
01007/02011 j02006 j02007 j02008 i0200902010020120201302014020150201602019 iofflineofflineoffline020260202002024020270202802029020300202202036
0202102025020230203202033
01039| 01040
offlineoffline
0203402035
• 02045i 02040
Type ofResearch
Collaborations*Coop.Res.Univ.Coop.Res.Univ.
JAERI
JAERIJAERI
Proj.Res.UnivJAERI
Proj.Res.UnivProj.Res.UnivProj.Res.UnivProj.Res.Univ
JAERIJAERIJAERIJAERIJAERIJAERIJAERIJAERIJAERIJAERI
Coop.Res.Univ.Coop.Res.Univ.
JAERICoop.Res.Univ.
JAER1JAERIJAERIJAERI
Coop.Res.Univ.Coop.Res.Univ.Coop.Res.Univ.
JAERIJoint.Res.
Coop.Res.Univ.Coop.Res.Univ.
j JAERI| JAERI
| Coop.Res.Univ.| JAERI• Proj.Res.Univ.i Coop.Res.Univ.
- 325 -
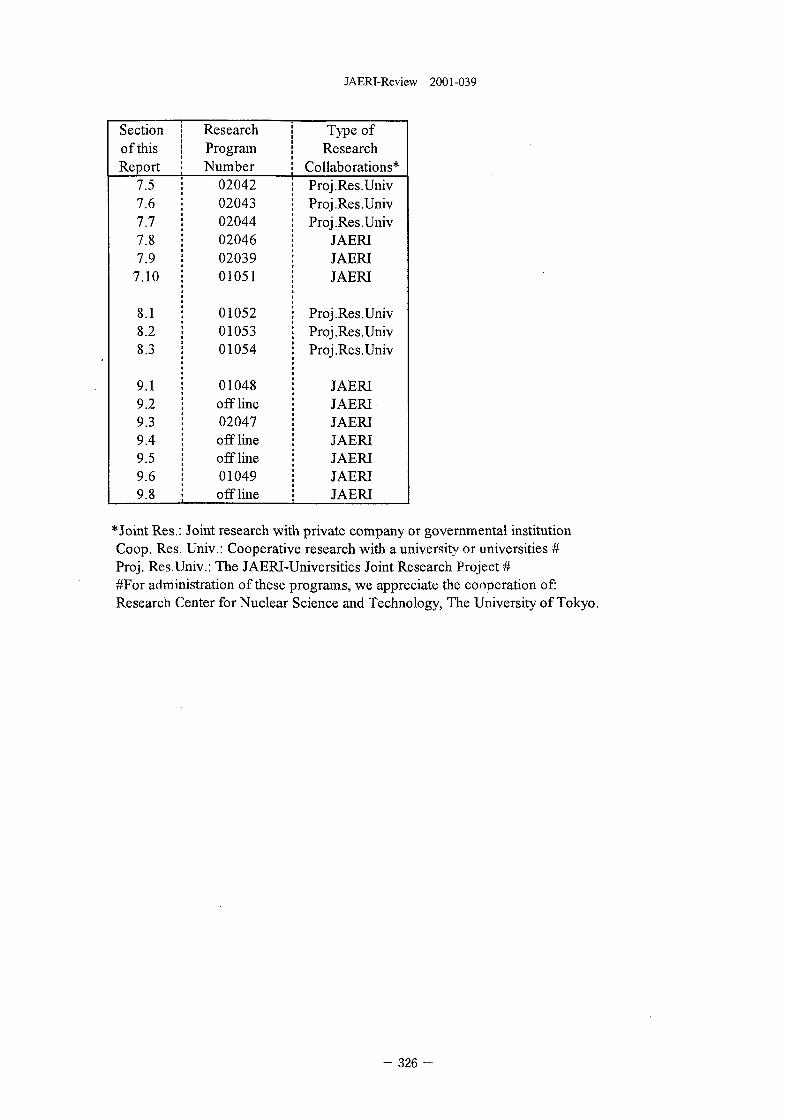
JAERI-Review 2001-039
Sectionof thisReport _,
7.57.67.77.87.9
7.10
8.1o.zo oO.J
9.19.29.39.49.59.69.8
ResearchProgramNumber
020420204302044020460203901051
010520105301054
01048offline02047offlineoffline01049offline
Type ofResearch
Collaborations*Proj.Res.UnivProj.Res.UnivProj.Res.Univ
JAERIJAERIJAERI
Proj.Res.UnivProj.Res.UnivProj.Res.Univ
JAERIJAERIJAERIJAERIJAERIJAERIJAERI
*Joint Res.: Joint research with private company or governmental institutionCoop. Res. Univ.: Cooperative research with a university or universities #Proj. Res.Univ.: The JAERI-Universities Joint Research Project ##For administration of these programs, we appreciate the cooperation of:Research Center for Nuclear Science and Technology, The University of Tokyo.
- 326 -
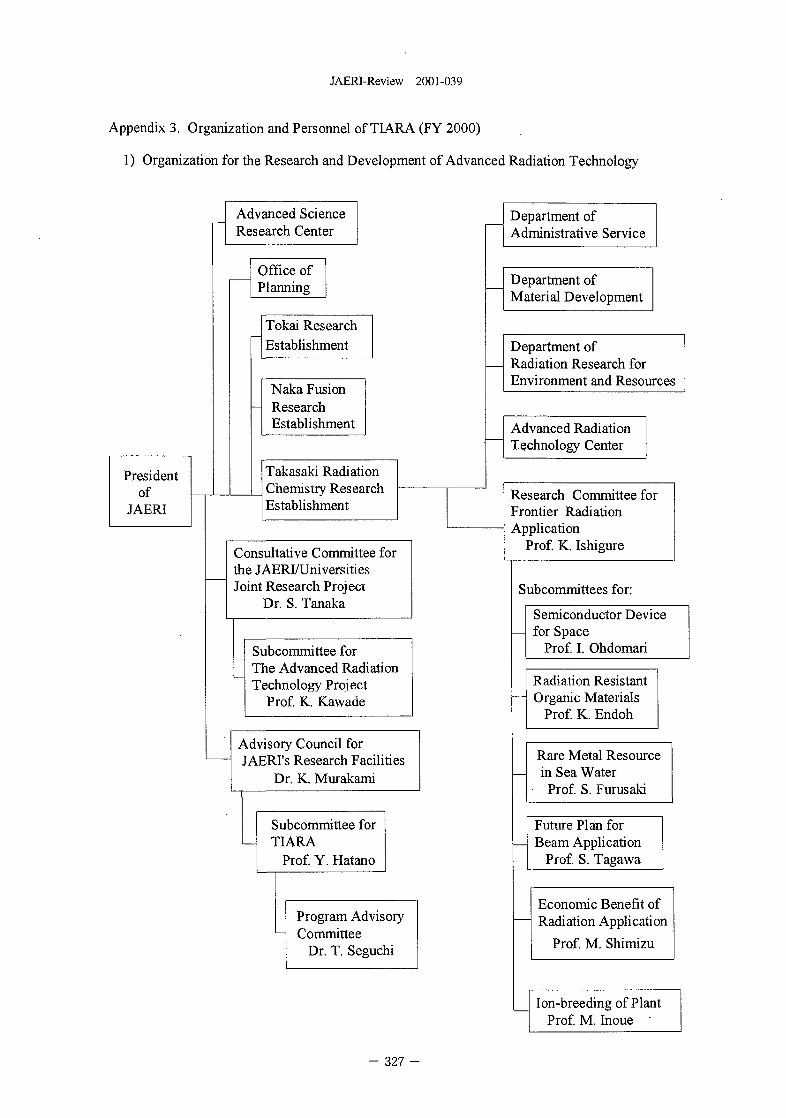
JAERI-Review 2001-039
Appendix 3. Organization and Personnel of TIARA (FY 2000)
1) Organization for the Research and Development of Advanced Radiation Technology
Presidentof
JAERI
Advanced ScienceResearch Center
Office ofPlanning
Tokai ResearchEstablishment
Naka FusionResearchEstablishment
Takasaki RadiationChemistry ResearchEstablishment
Consultative Committee forthe JAERI/UniversitiesJoint Research Project
Dr. S. Tanaka
Subcommittee forThe Advanced RadiationTechnology Project
Prof. K. Kawade
Advisory Council forJAERI's Research Facilities
Dr. K. Murakami
Subcommittee forTIARA
Prof. Y. Hatano
Program Advisor}'Committee
Dr. T. Seguchi
Department ofAdministrative Service
Department ofMaterial Development
Department ofRadiation Research forEnvironment and Resources
Advanced RadiationTechnology Center
Research Committee forFrontier RadiationApplication
Prof. K. Ishigure
Subcommittees for:
Semiconductor Devicefor Space
Prof. I. Ohdomari
Radiation ResistantOrganic Materials
Prof. K. Endoh
Rare Metal Resourcein Sea WaterProf. S. Furusaki
Future Plan forBeam Application
Prof. S. Tagawa
Economic Benefit ofRadiation Application
Prof. M. Shimizu
Ion-breeding of PlantProf. M. Inoue "
- 327 -
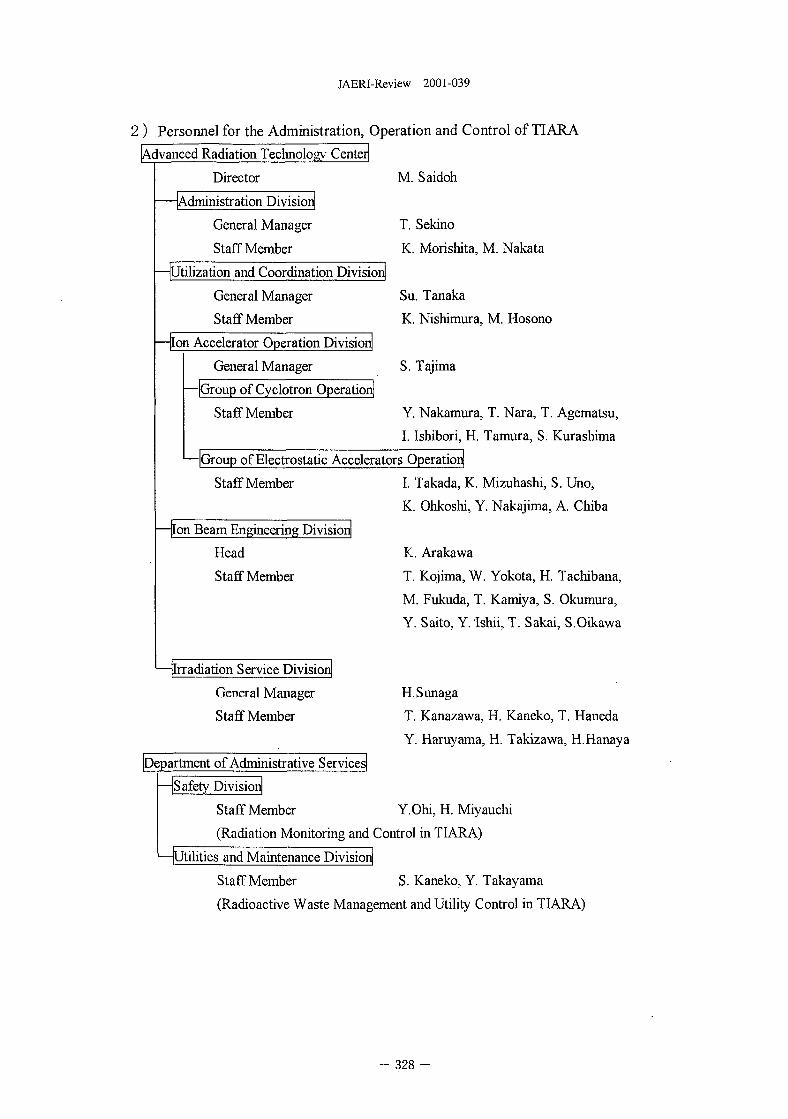
JAERI-Review 2001-039
2 ) Personnel for the Administration, Operation and Control of TIARA
Advanced Radiation Technology- Center
Director
Administration Division
General Manager
Staff Member
Utilization and Coordination Division
General Manager
Staff Member
Ion Accelerator Operation Division
General Manager
—[Group of Cyclotron Operation]
Staff Member
M. Saidoh
T. Sekino
K. Morishita, M. Nakata
Su. Tanaka
K. Nishimura, M. Hosono
S. Tajima
Y. Nakamura, T. Nara, T. Agematsu,
I. Ishibori, H. Tamura, S. Kurashima
Group of Electrostatic Accelerators Operation!
Staff Member
Ion Beam Engineering Division
Head
Staff Member
Irradiation Service Division
General Manager
Staff Member
I. Takada, K. Mizuhashi, S. Uno,
K. Ohkoshi, Y. Nakajima, A. Chiba
K. Arakawa
T. Kojima, W. Yokota, H. Tachibana,
M. Fukuda, T. Kamiya, S. Okumura,
Y. Saito, Y. Ishii, T. Sakai, S.Oikawa
H.Sunaga
T. Kanazawa, H. Kaneko, T. Haneda
Y. Haruyama, H. Takizawa, H.Hanaya
[Department of Administrative Services
Safety Division
Staff Member Y.Ohi, H. Miyauchi
(Radiation Monitoring and Control in TIARA)1—Utilities and Maintenance Division
Staff Member S. Kaneko, Y. Takayama
(Radioactive Waste Management and Utility Control in TIARA)
328 -
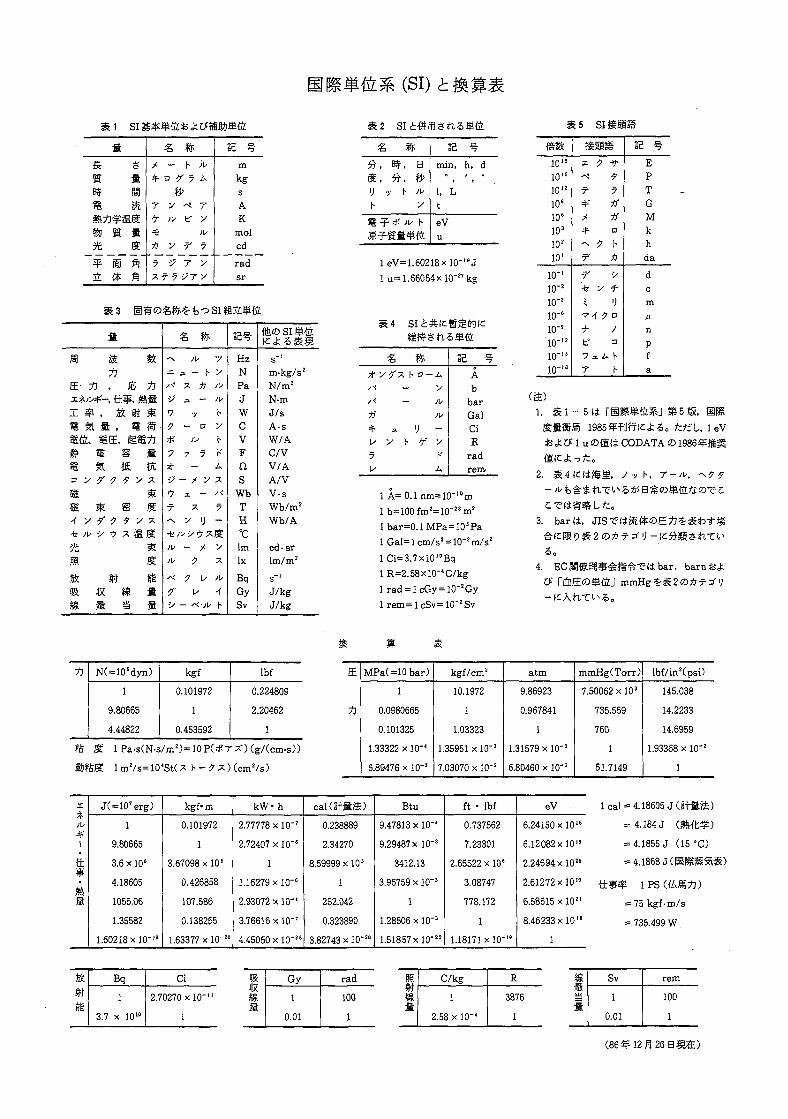
(SI) t
•2 SI simmm
ftftB#
yt
2.
SPel
IS S
ffi ftff ft
7
*
7
7
-
y
y
j?
ft
'" 7
t'
T*
7
A
7y
7
y
12 •§
m
kgsAK
molcd
radsr
E- ?
jC *$
H g
IfIt3 y58ffi-f y
yt
S ,^ E ,« %
9' 9 i
^' ^ iis -0 s
»R i
s ^
IE ?7
Si ^l | ft •
f £
I tn.
' y x
J «' y 7,
- S)g
16
^ S
—
is
7
9
7;*•i>
X
Hr
,1/
•y
* *
J. - (•
— O
7 7-
— / y
x —
y IJ
- y
9 uu
- « • »
-y
y
>\>
y
t-K
A
^.
7
-
ISy
JU
h
HzNPaJWCVF
as
WbTH°Clmlx
BqGySv
s -m-kg/s2
N/ro2
N-mJ / sA-sW/AC/VV/AA/VV-sWb/m2
Wb/A
cd-srlm/m2
s"'J/kgJ/kg
€ ft» , Bf, BS , 7>, f>i; ..j Y >\>
h y
I t ^ -t* yi/ t-
1 5 ~
min, h. d
1, Lt
eVu
1 eV=l.60218 x 10"" J
l u = 1.66054x10"" kg
icytf/ • <
/ <
13
u- y7
ftX h a — A- y- ;l/
'J -t- y y
KA
12 •§
Ab
barGalCiK
radrem
1 A=0.1nm=10-"m
lb=100fm2=10-28m2
1 bar=0.1MPa=10sPa
lGal=lcm/s 2 = 10-2rn/
lCi=3.7xlO"1Bq
lR=2.58xlO-C/kg
1 rad = lcGy=10"zGy
1 rem=lcSv=10-2Sv
10'8
10"10'2
109
10s
103
102
10'
io-lO"2
10"3
10"6
10"9
io-!
10""io-8
mX
--«
X
*
7
7-fe
-7 •
T
f
7
7
Bi l l
9 if
7
13a
9 h
•y
y x'J
/3
i. A h
h
15 %
EPTGMkhda
dcmu-n
Pfa
(&)
2. j | 4
3. barfi,
fc/;L, 1 eV
h, 7 - ^u, ~.9
2 O* r =' •; -
, barnfci
N(=105dyn)
1
9.80665
4.44822
kgf
0.101972
1
0.453592
lbf
0.224809
2.20462
1
1 Pa - s (N-s /m 2 )=10P(*7X)(g / (cm-s ) )
E MPa(=10bar)
1
0.0980665
0.101325
1.33322 x 10"'
6.89476 x 10"3
kgf/cm2
10.1972
1
1.03323
1.35951 x 10"3
7.03070 x 10"2
atm
9.86923
0.967841
1
1.31579 x 10'3
6.80460 x 10"2
mmHg(Torr)
7.50062 x 10³
735.559
760
1
51.7149
lbf/in2(ps0
145.038
14.2233
14.6959
1.93368 x 10'2
1
X
i\>
1
it
it
J(=10 'erg)
1
9.80665
3.6 xlO6
4.18605
1055.06
1.35582
1.60218x10-'
kgf-m
0.101972
1
3.67098 x 10 s
0.426858
107.586
0.138265
1.63377 x 1O"20
k W - h
2.77778 x 10"7
2.72407 x 10"6
1
1.16279 x 10'6
2.93072 x 1 0 -
3.76616 x 10"
4.45050 x 1 0 ' "
caKItaft)0.238889
2.34270
8.59999 x10 s
1
252.042
0.323890
3.82743 x 10"20
Btu
9.47813 x 10"'
9.29487 x 10"3
3412.13
3.96759 x 10"3
1
1.28506 x 10"3
1.51857xl0"22
ft • lbf
0.737562
7.23301
2.65522 x 10e
3.08747
778.172
1
1.18171 x l O - 9
eV
6.24150 x lO ' 8
6.12082x10"
2.24694x10"
2.61272 xlO19
6.58515 x l O 2 '
8.46233 x l O ' 8
1
Bq
1
3.7 x 10¹⁰
Ci
2.70270x10""
1
JRGy
i
0.01
rad
100
1
C/kg
1
2.58 x 10-
3876
1
l c a l = 4.18605 J ( i t f i r £ )
= 4.184J ( & { t ¥ )
= 4.1855 J (15 °C)
= 4.1868 J C B ^
75 kgf-m/s
735.499 W
Sv
1
0.01
rem
100
1
(86*j£ 12 £ 2 6 B


![Studer v Boettcher [2000] NSWCA 263 (24 November 2000)](https://static.fdokumen.com/doc/165x107/633372df3108fad7760f0e34/studer-v-boettcher-2000-nswca-263-24-november-2000.jpg)