
Rutherford Appleton Laboratory Annual Report 2000/2001
221
-
Upload
khangminh22 -
Category
Documents
-
view
2 -
download
0
Transcript of Rutherford Appleton Laboratory Annual Report 2000/2001


i Central Laser Facility Annual Report 2000/2001
Central Laser Facility
Rutherford Appleton Laboratory
Annual Report 2000/2001
Central Laser FacilityRutherford Appleton LaboratoryChilton, DidcotOxfordshire OX11 0QXTel. 44 (0) 1235 445655Fax. 44 (0) 1235 445888E-mail. [email protected] site. http://www.clf.rl.ac.uk
RAL Report No. RAL-TR-2001-030
The front cover shows Dr Stan Botchway using theconfocal laser microscope to investigate cell-to-cellcommunication as part of the new life scienceprogramme initiative.(Photograph courtesy of RAL Photographic Section).
ISBN 0902376160

Acknowledgements
Central Laser Facility Annual Report 2000/2001 ii
AcknowledgementsThe production team for this Annual Report was as follows:
Editor Brian WybornOverall Co-ordination Alison BrownProduction Dave BurgessChapter Editors David Neely, Roger Evans, Andrew Langley, Tony Parker, Colin Danson, Graeme HirstSection Editors Rob Clarke, David Neely, Margaret Notley, Pavel Matousek, Stanley Botchway, Waseem Shaikh,
Colin Danson, Andrew Langley, Mike Towrie, Cristina Hernandez-Gomez, Ian RossTechnical Support Chris Reason, RAL CLEO Support.
This report is available on the CLF’s Web Page Ref. http://www.clf.rl.ac.uk/.
The document has been reproduced by the RAL Reprographics Section.
Thanks to all the above for their contribution towards producing this report and of course to all the authors for their submissions.

Contents
iii Central Laser Facility Annual Report 2000/2001
ContentsForeword 1M H R Hutchinson
Overview of the Central Laser Facility 2C B Edwards
High Power Laser Programme 3
High Power Laser Programme - Short Pulse Plasma PhysicsA Multi-MeV proton probe for Inertial Confinement Fusion/ Fast Ignitor studies 4M Borghesi, D H Campbell, A Schiavi, O Willi, A J Mackinnon, M Galimberti, L A Gizzi
Detection of highly transient electric fields following ultra-intense laser interaction with solid targets 7M Borghesi, D H Campbell, M G Haines, A Schiavi, O Willi, A J Mackinnon, M Galimberti, L A Gizzi
Macroscopic evidence of soliton formation in multiterawatt laser plasma interaction 10M Borghesi, D H Campbell, A Schiavi, O Willi, F Pegoraro, S Bulanov, A J Mackinnon, M Galimberti, L A Gizzi
High energy electrons measurements in relativistic interactions with underdense plasmas 13M Galimberti, A Giulietti, D Giulietti1, L A Gizzi, M Borghesi, D H Campbell, A Schiavi, O Willi
Observation of Relativistic Electron Transport through Dense Preformed Plasmas 15D H Campbell, A Schiavi, O Willi, M Borghesi, A J Mackinnon, M Galimberti, L A Gizzi, W Nazarov
Proton imaging of E-field structures in laser-produced plasmas 17A Schiavi, D H Campbell, O Willi, M Borghesi
Laboratory measurements of magnetic fields greater than 300 MegaGauss 20M Tatarakis, I Watts, F N Beg, E L Clark, A E Dangor, M G Haines, M Zepf, K Krushelnick, P A Norreys
Measurements of plasma propagation instabilities of high current laser produced electron beams 23M Tatarakis, M Zepf, F N Beg, E L Clark, A E Dangor, K Krushelnick, K W D Ledingham, I Spencer, P A Norreys, R J Clarke
Excitation of relativistic electron plasma waves by the short-pulse beatwave process 25B Walton, Z Najmudin, M-S Wei, C Marle, K Krushelnick, A E Dangor, R J Clarke, M J Poulter, C Hernandez-Gomez,S Hawkes, D Neely, C N Danson, J L Collier
Gamma - radiography using a laser-plasma accelerator 27R D Edwards, M A Sinclair, T J Goldsack, K Krushelnick, F N Beg, E L Clark, A E Dangor,M Tatarakis, M Zepf, K W D Ledingham, I Spencer, P A Norreys, R J Clarke
Dynamics of the Critical Surface in High Intensity Laser-Solid Interactions: Modulation of the XUV Harmonic Spectra 29I Watts, M Zepf, E L Clark, M Tatarakis, K Krushelnick, A E Dangor, R M Allott, R J Clarke, D Neely, P A Norreys
Relativistic Self-Phase Modulation in a Plasma 32I Watts, M Zepf, E L Clark, M Tatarakis, K Krushelnick, A E Dangor, R M Allott, R J Clarke, D Neely, P A Norreys
The effect of target heating on fast ion production during intense laser-plasma interactions 35E L Clark, F N Beg, A E Dangor, M Tatarakis, M S Wei, M Zepf, K Krushelnick, K W D Ledingham,I Spencer, P A Norreys, R J Clarke
High Power Laser Programme - Long Pulse Plasma Physics and X-ray Laser PhysicsUsing Vulcan to Recreate Planetary Cores 37G W Collins, P M Celliers, D G Hicks, A J Mackinnon, S J Moon, R Cauble, L B DaSilva,M Koenig, A Benuzzi-Mounaix, G Huser, R Jeanloz, K M Lee, L R Benedetti, E Henry, D Batani,P Loubeyre, O Willi, J Pasley, H Gessner, D Neely, M Notley, C Danson
Direct observation of strong coupling in a dense plasma 42D Riley, I Weaver, D McSherry, D Neely, E Nardi
Saturated x-ray lasers at 196Å and 231Å and imaging of the Ne-like Ni XRL 45S J Topping, R Keenan, C L S Lewis, Y Abou Ali, G J Tallents, M Notley, D Neely
High Power Laser Programme - Theory and ComputationAtomic data for modelling of lasers 47K M Aggarwal, F P Keenan, P H Norrington, S J Rose
Atoms and molecules in intense laser fields using the R-matrix Floquet approach 50H W van der Hart, P G Burke, J Colgan, D H Glass
Interaction of Relativistically Self-Focussed Light Filaments 52R G Evans, C Ren,
Magnetic Field Penetration into Warm Plasma - Electron heating and Rayleigh Taylor Instability 55R G Evans
Theory for Magnetised Exploding Foil Experiments 58P Helander, K G McClements, R O Dendy, N C Woolsey

Contents
Central Laser Facility Annual Report 2000/2001 iv
A General Dispersion Relation for the Parametric Instability of Ultraintense, Circularly Polarized Laser Light 59H C Barr, L J Hill
High Power Laser Programme – Femtosecond Pulse Physics
Spatially Resolved Atomic Ionisation Processes in High Intensity Femtosecond Laser Pulses 61A El-Zein, J H Sanderson, W A Bryan, T R J Goodworth, I D Williams, P McKenna, I M G JohnstonP F Taday, E J Divall, A J Langley
Ion Momentum Imaging of Carbonyl Sulphide in High Intensity Femtosecond Laser Pulses 63J H Sanderson, T R J Goodworth, W A Bryan, A El-Zein, P F Taday, E J Divall, A J Langley
High Intensity Femtosecond Laser Interactions with a Fast H2+ Beam 65
J H Sanderson, W A Bryan, A El-Zein, T R J Goodworth, I D Williams, P McKenna, I M G JohnstonP F Taday, E J Divall, A J Langley
First demonstration of guiding of high-intensity laser pulses in a hydrogen-filled capillary discharge waveguide 67D J Spence, A Butler, S M Hooker
Femtosecond OPCPA in the UV 70K Osvay, G Kurdi, J Klebniczki, M Csatári, I N Ross, E J Divall, C H J Hooker, A J Langley
Lasers for Science Facility Programme 73
Lasers for Science Facility Programme – ChemistryUsing Ultrafast Time-resolved Infrared Spectroscopy to Probe the Nature of the Excited Statesof d6 and d8 Transition Metal Complexes 74D C Grills, J Dyer, J A Weinstein, M W George, M Towrie, P Matousek, A W Parker
Early photochemical dynamics of charge transfer excited organometallic complexes: Ultrafast CO dissociation fromCharge-Transfer Excited States of [Cr(CO)4(bpy)] and [Mn(Br)(CO)3(
iPr-DAB)] 76I R Farrell, A Vlcek, Jr., D C Grills, M W George
TR3, Kerr-gate emission and PIRATE study of Interligand Electron Transfer in [Re(MQ+)(CO)3(dmb)]2+ 78A Vlcek, Jr., D J Liard, I R Farrell, P Matousek, M Towrie
Structure of the Intramolecular Charge Transfer State of 4-Dimethylaminobenzonitrile (DMABN):Determined by Time-Resolved Resonance Raman Spectroscopy 80W M Kwok, C Ma, D Phillips, P Matousek, A W Parker, M Towrie, W T Toner
Time-resolved Study of the Triplet State of 4-dimethylaminobenzonitrile (DMABN) 83C Ma, W M Kwok, D Phillips, P Matousek, A W Parker, M Towrie, W T Toner
ps-TR3 Observation of the Iso-CH2Cl-I and Iso-CH2I-Cl Photoproducts from the “Photoisomerization”Reactions of CH2ClI in the Solution Phase 86W M Kwok, C Ma, D Phillips, A W Parker, M Towrie, P Matousek, X Zheng, D L Phillips
ps-TR3 Observation of the Iso-CH2I-I Photoproduct from the “Photoisomerization” Reaction of CH2I2
in the Solution Phase 88W M Kwok, C Ma, D Phillips, A W Parker, M Towrie, P Matousek, D L Phillips
Kerr Gated ps-TR3 Study of Porphyrin-Oligonucleotide Exciplex Formation 90P Mojzes, P Praus, V Baumruk, P Matousek, M Towrie, P-Y Turpin
Nanosecond Laser Flash Photolysis and Time-Resolved Resonance Raman Spectroscopy of CarotenoidNeutral Radicals 92D J McGarvey, A El-Agamey, ACantrell, I P Clark, S Tavender
Picosecond Kerr Gated Time-resolved Raman Spectroscopy of Solids: Capabilities and Limitationsfor Fluorescence Rejection 94N Everall, P Matousek, M Towrie, A W Parker
Ion-dip Spectroscopy of Ephedrine and its diastereoisomer pseudoephedrine 97P Butz, R T Kroemer, N A Macleod, L C Snoek, F O Talbot, J P Simons
Excited State Dynamics of Organo-Lanthanide Electroluminescent Phosphors: The Propertiesof Tb(tb-pmp)3 and Gd(tb-pmp)3 101J R G Thorne, J M Rey, R G Denning, V Christou, S Botchway
Two-Photon Spectroscopy of Thulium(III) in the Elpasolite Cs2NaYCl6:Tm 102J R G Thorne, Qinghua Zeng, R G Denning
Crystallographic Studies on Excited-State Molecular Complexes 104J M Cole, P R Raithby
Laser tweezers - Lattice forces in 2-D crystalline monolayers 107R Aveyard, B P Binks, J H Clint, P D I Fletcher, B Neumann, V N Paunov, J Annesley, D Nees,A W Parker, A D Ward, A N Burgess
Ultrafast Spectroscopic Investigations of Metal Complexes Containing the DNA-Intercalating Dipyridophenazine (dppz) Ligand 109C G Coates, M Coletti, J J McGarvey, P Matousek, M Towrie, A W Parker

Contents
v Central Laser Facility Annual Report 2000/2001
Lasers for Science Facility Programme – Biology
The Dynamics of a Single Tryptophan Residue in the Myosin Catalytic Domain 113A Málnási-Csizmadia, R J Woolley, C R Bagshaw, S W Botchway
X-ray spectrum characterization for biological dosimetry 115M A Hill, D L Stevens, W Shaikh
Multiphoton UV and X-ray micro-irradation to track intra- and inter-cellular dynamics 117R A Meldrum, G O Edwards, J K Chipman, C W Wharton, S W Botchway, G J Hirst, W Shaikh
Two-photon fluorescence correlation microscopy for pharmacokinetic studies 120S Tatarkova, C Lloyd, D A Berk
Lasers for Science Facility Programme - PhysicsCalibrated Diffraction Gratings for the Analysis of Laser-Plasma X-Ray Spectra 123A G Michette, S J Pfauntsch, T Graf
X-ray Masks and Metal Patterns 125J A Cairns, M R Davidson, G J Berry, W Shaikh, G Hirst, M Deer
Acoustic Instability of Fully Premixed Flames 128C M Coats, Z Chang, P D Williams
Poling of Optical Fibres using a Frequency Doubled Argon Laser 130R J Potton
Use of diffractive optical elements in laser micro-machining 132Z J Laczik
Photoluminescence from Silicon Nanostructures 134K W Kolasinski, A Wellner, R Neuendorf, C X Pedersen, R E Palmer
Laser Science and Development 137
Laser Science and Development - Vulcan Petawatt Vulcan Petawatt Upgrade Overview 138C B Edwards
Construction of the Buildings and Services for the Vulcan Petawatt Upgrade 139B E Wyborn, R M Allott, P A Brummitt, C N Danson, C B Edwards, J A C Govans, B J Gray, S Hancock, M R Harman,P E Hatton, P Holligan, A R Jackson, W J Lester, Z A Miljus, D Neely, D R Neville, D A Pepler, M R Pitts, C J ReasonD A Rodkiss, A G Ryder, R W W Wyatt, R J Mason, J P H Bradley, J M Henstridge, R Lascelles, A M Lewis, D MatthewsonT Rennie, A M Shepherd, J Skrzyniarz, J C Stamp
Vacuum System Design for Vulcan Petawatt Interaction and Compression Chambers 144D A Rodkiss, P Holligan, M Harman
Vulcan Pulsed Power Installation and Commissioning 146R W W Wyatt, J C Aldis, P A Brummitt, C N Danson, C B Edwards, B C Eltham, A J Frackiewicz, J A C Govans, B J GrayS Hancock, P E Hatton, P Holligan, M H R Hutchinson, A R Jackson, T Knott,W J Lester, J M A Loose, D R Neville, Z A MiljusD A Pepler, M R Pitts, C J Reason, K J Rodgers, D A Rodkiss, A G Ryder, G P Warner, G N Wiggins, B E Wyborn
Vulcan Petawatt Compressor Chamber Design 148C N Danson, J C Aldis, R Allott, R Clark, J L Collier, C B Edwards, S Hancock, P E Hatton, D Neely, B E Wyborn
Interaction Chamber for the Vulcan Petawatt Upgrade 150C Ziener, R Allott, C Danson, R Day, C Edwards, S Hancock, P Hatton, D Neely, D Rodkiss, B E Wyborn
940 mm mirror and grating mount design 151S Hancock, J C Aldis, J L Collier, C Danson, A J Frackiewicz, P E Hatton, P Holligan, T Winstone, R W Wyatt, B E Wyborn
Capacitor Bank Control System Upgrade 152D A Pepler, P Holligan, C J Reason, W J Lester, R W W Wyatt
Laser Science and Development – VulcanAdaptive optics trials on Vulcan 153S Hawkes, J Collier, C Hooker, C Reason, C Edwards, C Hernandez-Gomez, C Danson, I Ross, C Haefner
Scanning Third Order Autocorrelator for Contrast Measurement in Vulcan 156C Hernandez-Gomez, E Thurston, J Collier
Transmissive Grating CPA System Design for the Vulcan Laser 157M J Poulter, D Neely, J Collier, R Clarke, C Danson
New Vulcan Cleanroom Complex 160T B Winstone, A J Frackiewicz, R Wellstood, C N Danson, D A Rodkiss

Contents
Central Laser Facility Annual Report 2000/2001 vi
A Four-channel Beam Diagnostic System for Vulcan 161D Cole, T Spencer, A Kidd, J Collier
Axial Line-Focus With A Binary-Phase Fresnel Zone Plate 163D A Pepler, P M Godfrey, C N Danson
Laser Science and Development - Lasers for Science FacilityThe PIRATE Development 165M Towrie, P D Bailey, R Barton, P Matousek, A W Parker, M W George, D C Grills
Fluorescence Suppression in Raman Spectroscopy using a High Performance Picosecond Kerr Gate 168P Matousek, M Towrie, A W Parker, C Ma, W M Kwok, D Phillips, W T Toner
Development of a Time Correlated-Single Photon Counting Multiphoton Laser Scanning Confocal Microscope 170S W Botchway, A W Parker, I Barba, K Brindle
Developments in the EPSRC Laser Loan Pool 172S Tavender, A W Parker, M Towrie
Laser Science and Development - Laser Optics and Laser DesignDevelopment of large-aperture bimorph adaptive mirrors 175C J Hooker, L Coffe, J L Collier
A predictive analysis of the performance of a bimorph adaptive mirror 177J Collier, C Hooker
An analysis and optimisation of optical parametric chirped pulse amplification 181I N Ross, P Matousek, G H C New
A Laser System Design for the Photo-injector Option for the CERN Linear Collider 184I N Ross, S J Hutchins
Design of a 5 PW Optical Parametric Chirped Pulse Amplifier for the Iodine Laser Asterix IV 188P Matousek, I N Ross, B Rus
Possible Electro-optic Materials for use in Vacuum Ultra Violet Pockels Cells 191M J Deer, G J Hirst, W Shaikh
AppendicesOperational StatisticsOperational Statistics – Vulcan 194A Kidd, P Godfrey, D Pepler, C Danson
Operational Statistics – Astra 195A J Langley
Operational Statistics – Lasers for Science Facility 196S M Tavender, M Towrie, A W Parker
Publications 199
Panel Membership and CLF Structure 209
Author Index 213

Foreword
1 Central Laser Facility Annual Report 2000/2001
This annual report for the Central Laser Facility (CLF) is an account of workcarried out by its users in collaboration with facility staff during the financialyear 2000-01.
The Vulcan laser has continued to provide a world-leading facility for thestudy of the interaction of very intense radiation with matter. The intensitiesavailable from the CPA beamline are now approaching 1020 W/cm2 and thishas enabled an extensive programme to be carried out on the study of matterunder extreme conditions which is relevant to both microscopic andastronomical objects. Short pulses of energetic electrons and protonsproduced from laser-irradiated targets have enabled new studies of processesimportant to particle acceleration and the fast ignition scheme for InertialFusion Energy to take place. This has included exciting progress in thedevelopment of high-resolution proton radiography, which can detect highlytransient electric and magnetic fields in laser-produced plasmas. In addition,the measurement of the highest magnetic fields ever produced in thelaboratory have been achieved in laser-plasma interactions at > 1019 W/cm2.On a different scale, an accurate knowledge of the equation of state (EOS) forplanetary constituents under extreme conditions of temperature and pressure isimportant in developing models of planetary cores and, using the long pulsefacility of Vulcan and precompressed samples for the first time, the EOS ofwater has been studied from the propagation of laser-driven shock waves.
The Astra laser continues to provide a complementary source to Vulcan for the study of high intensity interactions. These haveincluded the dynamics of ionisation and dissociation of atoms and small molecules at high irradiances. The demonstration of efficientguiding of high-intensity pulses in waveguides, by increasing the laser-plasma interaction lengths at high intensities, is a significantcontribution to a wide range of processes including harmonic generation, laser wakefield accelerators and x-ray lasers.
A broadly based programme in chemistry, physics and biology has been carried out within the Lasers for Science Facility. Thesehave exploited the sub-picosecond capabilities of the ultra-fast laboratory and the use of Kerr gated transient Raman scattering for thestudy of photochemical dynamics. In addition, the technique of two-photon fluorescence correlation microscopy has enabled thestudy of the kinetics of drug distribution and action in situ. The Laser Loan Pool has continued to benefit from the EPSRC-fundedcapital investment programme in making available advanced laser systems to university users in their own laboratories.
A marked feature of the past year has been the growth of demand from UK and other scientists for access to the Central LaserFacility and this has outstripped the amount of time which can currently be made available.
The quality of the science being carried out within the CLF continues to be of very high quality and has been identified as beingworld-leading in the EPSRC “Forward Look at Atomic and Molecular Physics” research in the UK. With the commissioning of theVulcan PetaWatt laser in 2002, I believe we can look forward with confidence to the continuing success of the CLF and its manyusers.
Foreword
M H R Hutchinson
Central Laser Facility, CLRC Rutherford Appleton Laboratory, Chilton, Didcot, Oxon., OX11 0QX, UK
Email address [email protected]

Overview of the Central Laser Facility
Central Laser Facility Annual Report 2000/2001 2
Laser Facilities for Users
The Central Laser Facility (CLF) is a world leading centre forresearch using lasers. Facilities available to users include theVulcan Nd: glass laser which delivers multi- TW beams to twotarget areas, the Astra ultra- short pulse interaction facilitybased on titanium sapphire laser technology, a range of state ofthe art table top laser systems and specialised diagnosticinstruments within the Lasers for Science Facility and the LaserLoan Pool.
Vulcan
Vulcan is a highly versatile large scale Nd: glass laserinstallation which delivers a maximum of 2.5kJ of energy in itssix 10cm and two 15cm beamlines to two target areas, each ofwhich is equipped with frequency conversion optics to enableERWK PDQG PRSHUDWLRQRIDOOEHDPV$UDQJHRISXOVHdurations are available from 100ps to 20ns in variousgeometries.
A short pulse (700fs) high irradiance (~10 20 Wcm -2) chirpedpulse amplification (CPA) capability is available, with vacuumpropagation to target and reflective beam focusing optics.Additional low energy beams, including sub- picosecond CPAprobes, are provided for diagnostics with high temporalresolution. The system is fully characterised and equipped withadvanced diagnostics.
Vulcan Petawatt Project
A 3 year development of Vulcan’s CPA beamline to thePetawatt level began in April 1999. The project involves theaddition of an additional stage of disc amplifiers, theconstruction of a large aperture vacuum beam compressor and anew target chamber within a new target area building.
The new building was completed, on schedule, in December2000. The vacuum compressor and target chamber amplifierswill be installed during the summer. Following vacuum testsand thorough cleaning, the beam optics will be installed readyfor the alignment tests and beamline commissioning which willtake place early in 2002. Demonstration of Petawatt output isscheduled for the end of June, 2002. The development isfunded through an EPSRC research grant.
Lasers for Science Facility (LSF)
The LSF operates a suite of state of the art table- top lasersystems and associated instrumentation giving users access tohighly tuneable (vuv - ir) and variable pulse width (ns to fs)laser radiation. This includes lasers for ns and ps time- resolvedresonance Raman spectroscopy (TR3), a unique dualwavelength kHz femtosecond synchronised pump- probeapparatus based on OPA technology, a high average power laserplasma x- ray source and a fast gated (100ps) confocalmicroscopy laboratory.
The Ultrafast Spectroscopy Laboratory has recently developedthe high brightness PIRATE source (Picosecond InfraredAbsorption and Transient Excitation). The Ultrafast Laboratoryis heavily subscribed by users for a wide range of experimentsin chemistry, physics, biological and material sciences.Demand for beam time is so high that funding is being soughtfrom EPSRC for a second system.
Laser Loan Pool
Compact laser systems are made available to UK researchersfor periods of up to 6 months at the user’s home institution.Systems available include: nanosecond tunable YAG pumpeddye lasers (with frequency up-conversion and down-conversioncovering from 205 to 4500 nm), an excimer laser (operatingdown to 157 nm), a CW frequency doubled argon ion laser andan all solid state femtosecond Titanium Sapphire(680-1020 nm). To complement the lasers, a wide range ofancillary and diagnostic equipment is available.
Astra
The Astra facility is based on titanium sapphire lasertechnology which gives users access to high intensity laserpulses at 10Hz. Repetition rate.
The facility supplies laser pulses to two target areassimultaneously. Target Area I provides pulses of 50fs durationwith an energy of 10mJ, producing irradiance on target inexcess of 1016 Wcm -2. The Target Area II currently delivers300 mJ in 50fs with target irradiance in the 1018 Wcm-2 regime.
Engineering Services
Mechanical, electrical and computing support is provided forthe operation of the laser facilities at the CLF, for theexperimental programmes on these facilities and for the CLF’sresearch and development activities. Access to mechanical andelectrical CAD tools and workshop facilities enable a rapidresponse to be provided to users.
Access to Facilities
The primary funding source of the Central Laser Facility are theUK Research Councils, who make beam time available for UKUniversity researchers and their overseas collaborators throughthe responsive mode grant mechanism.
A small proportion of access is available for "Direct Access", toenable rapid access for urgent, topical and proof of principleexperiments. Bids for Direct Access beam time are peerreviewed by an expert panel who advise the Director of the CLFon scientific priority, etc. Calls for Direct Access are publicisedin scientific journals and on the CLF Web site.
Beamtime is available for European researchers and theircollaborators through the EU Access to Large ScaleInfrastructure programme organised under the ImprovingHuman Potential (IHP) theme within the Fifth FrameworkProgramme. Calls for Proposals are publicised in PhysicsToday and on the CLF Web site.
Hiring of the facilities and access to CLF expertise is alsoavailable on a commercial basis for industrial research anddevelopment.
The Laser Loan Pool is funded directly by an EPSRC rollingprogramme. These facilities are available to all UK researchersperforming work falling within the EPSRC science programme.
CLF Web site
Further information on the CLF, its facilities, and the scientificprogrammes is available on the CLF Web site athttp://www.clf.rl.ac.uk/
Overview of the Central Laser Facility
C B Edwards
Central Laser Facility, CLRC Rutherford Appleton Laboratory, Chilton, Didcot, Oxon., OX11 0QX, UK
Main contact email address: [email protected]

High Power Laser Programme
3 Central Laser Facility Annual Report 2000/2001
High Power Laser Programme
1) Short Pulse Plasma Physics
2) Long Pulse Plasma Physics and X-Ray Laser Physics
3) Theory and Computation
4) Femtosecond Pulse Physics

High Power Laser Programme – Short Pulse Plasma Physics
Central Laser Facility Annual Report 2000/2001 4
Introduction
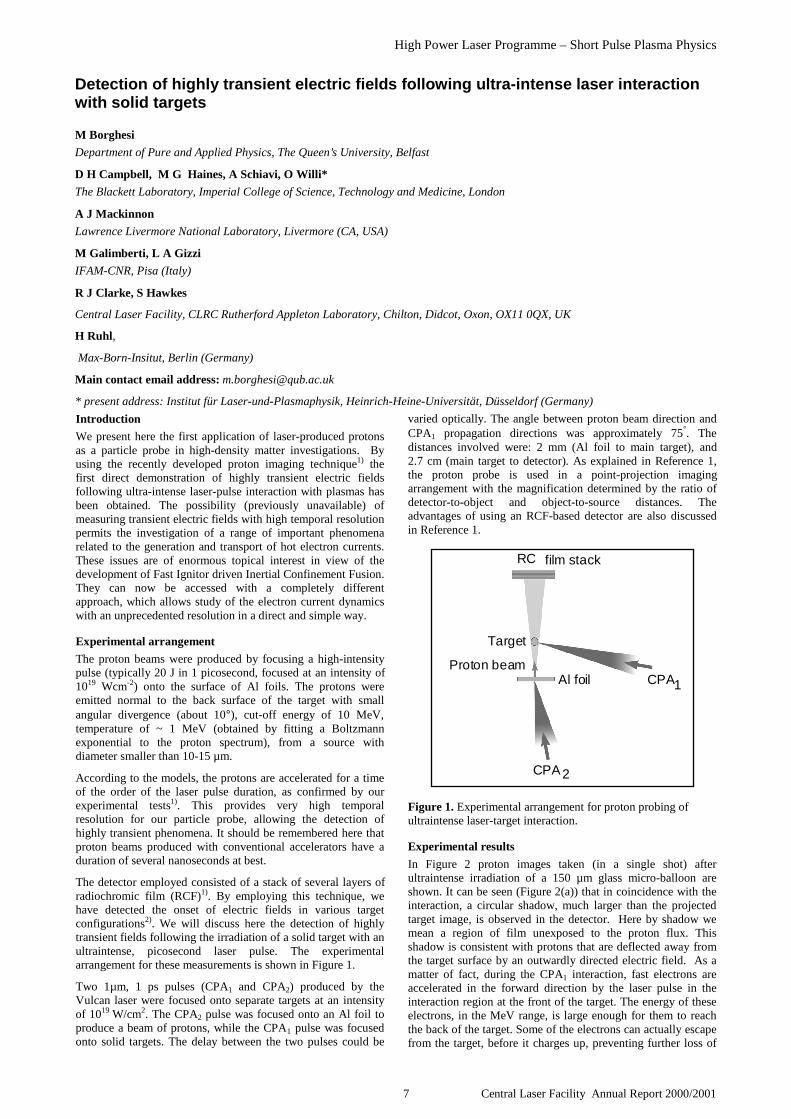
In a number of experiments, performed with different lasersystems and in different interaction conditions, protons withenergies up to several tens of MeV have been detected behindthin foils irradiated with high intensity pulses1,2). In theseexperiments it was seen that the particle beams are directedalong the normal to the back surface of the target, and have asmall angular aperture at the highest energies. As proton beamsare observed even using targets which nominally do not containhydrogen, protons are thought to originate from hydro-carbonimpurities located on the target surfaces or from bulkcontamination of the target. Proposed theoretical modelsindicate that the protons gain their energy from the enormousHOHFWULF ILHOG a0H9 P VHW XS E\ ODVHU DFFHOHUDWHG IDVWelectrons via space-charge at the back target surface3-5). Inparticular, Particle-in-Cell simulations suggest that the protonbeam charge will be globally neutralized by a co-moving cloudof MeV electrons 5). The particular properties of these beamsmake them of great interest for application as a probe in high-density matter investigations. The use of protons as aradiographic source is an idea which has circulated for manyyears 6). Applications of proton radiography have been proposedin the biomedical area or in testing of thick systems. Linear orcyclotron accelerators are used to obtain the proton energiesrequired for these applications. Laser-produced proton beamsrepresent a feasible alternative with enormous potential whenhigh spatial/temporal resolution is required.
A particularly interesting application of laser-produced protonbeams is the detection of electric and magnetic fields generatedduring the interaction of intense laser pulses with high densityplasmas. In this context, proton imaging can be developed as adiagnostic with great potential for Inertial Confinement Fusion(ICF) studies. For example, the possibility of accessing directlyelectric field distributions in dense plasmas may shed new lighton issues such as hydrodynamic and electromagneticinstabilities highly detrimental for ICF. The technique also hasgreat potential for studying the complex and yet unexploredelectric and magnetic field distributions in indirect drive targetassemblies. In the Fast Ignitor context, it will contribute to thestudy of the large transient electric and magnetic fieldsgenerated in high-intensity laser-matter interactions. Themagnitude and characteristics of these fields are currently thesubject of much conjecture in the short pulse, high-intensityplasma physics community.
In this paper the principles of the technique and the results of aseries of experimental tests, in which the proton source has been
applied for the first time as a particle probe in a range of laser-plasma interaction conditions, will be presented and discussed.
Mylar (1.4 g/cc)
Adhesive (1.4 g/cc)
Active gel (1 g/cc)
Al filter
Stack of RC film layersA B
(a) (b) 270 µm
Protonbeam
Figure1. Schematic of (a) a layer of Radiochromic film;(b) set-up for spectrally resolved proton beam detection.
Diagnostic set-up
The Vulcan Nd:glass laser operating in the Chirped PulseAmplification mode (CPA) was used in the experiment. Themain targets (used for the production of the proton beams)were Al foils, 1-2 mm wide and 3 - 25 µm thick. The 1.054 mmCPA interaction pulse, 1 ps in duration, with energy up to 100 Jwas focused by an F/3.5 off-axis parabola (OAP) onto thecentre of the main target. The incidence was about 15° offnormal. The focal spot varied between 8 and 10 µm in diameterat full width at half maximum (FWHM), containing 30-40 % ofthe energy, and giving intensities up to 5-7x10¹⁹ W/cm2.
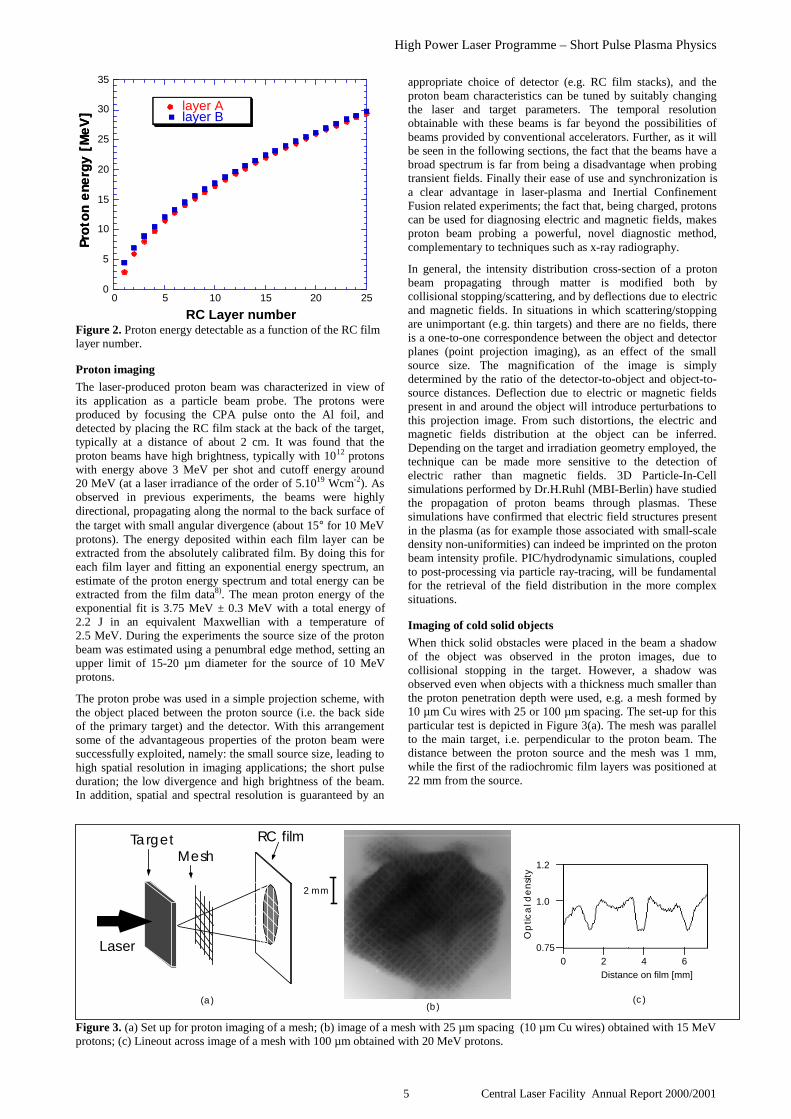
The detector employed in the experimental tests consisted of astack of several layers of radiochromic (RC) film. As shown inFigure 1(a) the film consists of 270 µm thick plastic containinga double layer of organic dye, which reacts to ionizingradiation7). The equivalent dose of energetic protons stopped inthe film can be measured from the changes in optical densityundergone by the film, yielding information on the number andenergy of the protons. By using them in a stack, each layer offilm acts as a filter for the following layers. In fact protonsdeposit energy mainly in the Bragg peak at the end of theirrange8). Due to this, the contribution on each RC film layer willbe mainly due to protons within a narrow energy range. Theproton energies detectable as a function of the detector's depthsare shown in Figure 2. Plastic track detectors were also used onsome occasions to confirm that the structures observed weredue to protons and not to electrons or x-rays to which the RCfilm is also sensitive. A 25 µm Al filter was placed in front ofthe first layer of film giving a minimum detectable protonenergy of about 3 MeV.
A Multi-MeV proton probe for Inertial Confinement Fusion/ Fast Ignitor studies
M Borghesi
Department of Pure and Applied Physics, The Queen’s University, Belfast
D H Campbell, A Schiavi, O Willi*
The Blackett Laboratory, Imperial College of Science, Technology, and Medicine, London
A J Mackinnon
Lawrence Livermore National Laboratory, Livermore (CA, USA)
M Galimberti, L A Gizzi
IFAM-CNR, Pisa (Italy)
R J Clarke, S Hawkes
Central Laser Facility, CLRC Rutherford Appleton Laboratory, Chilton, Didcot, Oxon, OX11 0QX, UK
H Ruhl,
Max-Born-Insitut, Berlin (Germany)
Main contact email address: [email protected]
* present address: Institut für Laser-und-Plasmaphysik, Heinrich-Heine-Universität, Düsseldorf (Germany)
High Power Laser Programme – Short Pulse Plasma Physics
5 Central Laser Facility Annual Report 2000/2001
Prot
on e
nerg
y [M
eV]
0
5
10
15
20
25
30
35
0 5 10 15 20 25
layer Alayer B
RC Layer number
Prot
on e
nerg
y [M
eV]
Figure 2. Proton energy detectable as a function of the RC filmlayer number.
Proton imaging
The laser-produced proton beam was characterized in view ofits application as a particle beam probe. The protons wereproduced by focusing the CPA pulse onto the Al foil, anddetected by placing the RC film stack at the back of the target,typically at a distance of about 2 cm. It was found that theproton beams have high brightness, typically with 1012 protonswith energy above 3 MeV per shot and cutoff energy around20 MeV (at a laser irradiance of the order of 5.1019 Wcm-2). Asobserved in previous experiments, the beams were highlydirectional, propagating along the normal to the back surface ofthe target with small angular divergence (about 15° for 10 MeVprotons). The energy deposited within each film layer can beextracted from the absolutely calibrated film. By doing this foreach film layer and fitting an exponential energy spectrum, anestimate of the proton energy spectrum and total energy can beextracted from the film data8). The mean proton energy of theexponential fit is 3.75 MeV ± 0.3 MeV with a total energy of2.2 J in an equivalent Maxwellian with a temperature of2.5 MeV. During the experiments the source size of the protonbeam was estimated using a penumbral edge method, setting anupper limit of 15-20 µm diameter for the source of 10 MeVprotons.
The proton probe was used in a simple projection scheme, withthe object placed between the proton source (i.e. the back sideof the primary target) and the detector. With this arrangementsome of the advantageous properties of the proton beam weresuccessfully exploited, namely: the small source size, leading tohigh spatial resolution in imaging applications; the short pulseduration; the low divergence and high brightness of the beam.In addition, spatial and spectral resolution is guaranteed by an
appropriate choice of detector (e.g. RC film stacks), and theproton beam characteristics can be tuned by suitably changingthe laser and target parameters. The temporal resolutionobtainable with these beams is far beyond the possibilities ofbeams provided by conventional accelerators. Further, as it willbe seen in the following sections, the fact that the beams have abroad spectrum is far from being a disadvantage when probingtransient fields. Finally their ease of use and synchronization isa clear advantage in laser-plasma and Inertial ConfinementFusion related experiments; the fact that, being charged, protonscan be used for diagnosing electric and magnetic fields, makesproton beam probing a powerful, novel diagnostic method,complementary to techniques such as x-ray radiography.
In general, the intensity distribution cross-section of a protonbeam propagating through matter is modified both bycollisional stopping/scattering, and by deflections due to electricand magnetic fields. In situations in which scattering/stoppingare unimportant (e.g. thin targets) and there are no fields, thereis a one-to-one correspondence between the object and detectorplanes (point projection imaging), as an effect of the smallsource size. The magnification of the image is simplydetermined by the ratio of the detector-to-object and object-to-source distances. Deflection due to electric or magnetic fieldspresent in and around the object will introduce perturbations tothis projection image. From such distortions, the electric andmagnetic fields distribution at the object can be inferred.Depending on the target and irradiation geometry employed, thetechnique can be made more sensitive to the detection ofelectric rather than magnetic fields. 3D Particle-In-Cellsimulations performed by Dr.H.Ruhl (MBI-Berlin) have studiedthe propagation of proton beams through plasmas. Thesesimulations have confirmed that electric field structures presentin the plasma (as for example those associated with small-scaledensity non-uniformities) can indeed be imprinted on the protonbeam intensity profile. PIC/hydrodynamic simulations, coupledto post-processing via particle ray-tracing, will be fundamentalfor the retrieval of the field distribution in the more complexsituations.
Imaging of cold solid objects
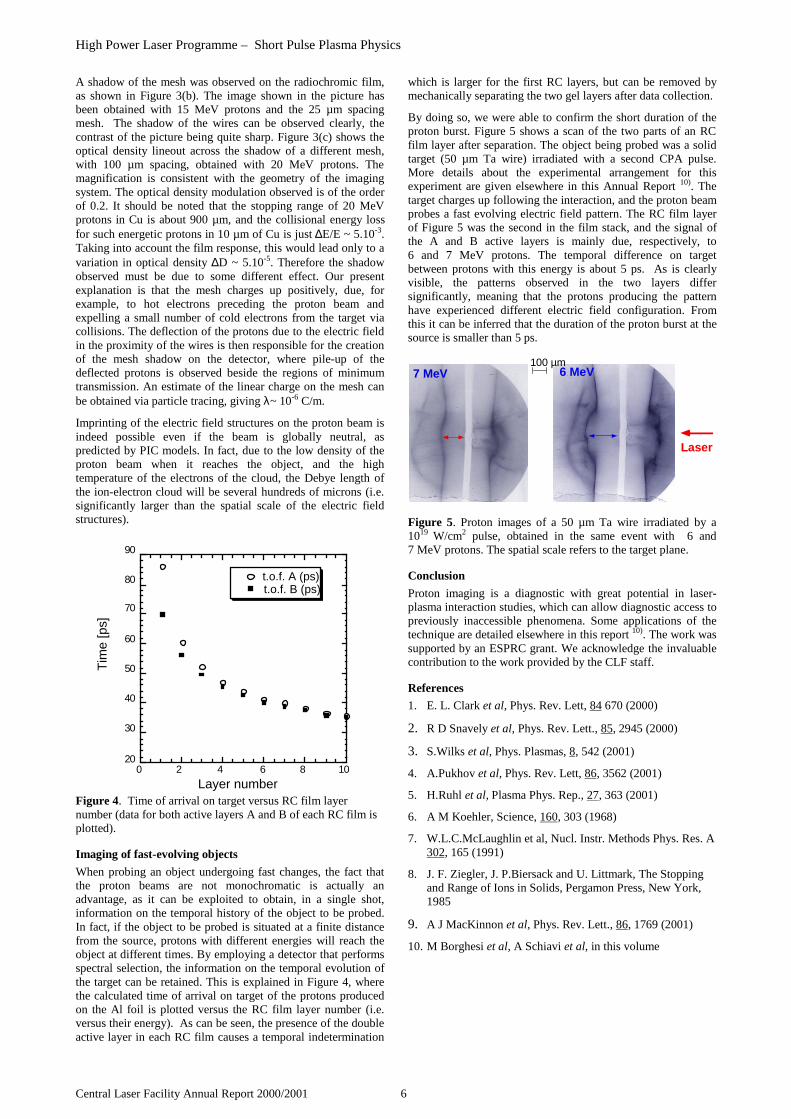
When thick solid obstacles were placed in the beam a shadowof the object was observed in the proton images, due tocollisional stopping in the target. However, a shadow wasobserved even when objects with a thickness much smaller thanthe proton penetration depth were used, e.g. a mesh formed by10 µm Cu wires with 25 or 100 µm spacing. The set-up for thisparticular test is depicted in Figure 3(a). The mesh was parallelto the main target, i.e. perpendicular to the proton beam. Thedistance between the proton source and the mesh was 1 mm,while the first of the radiochromic film layers was positioned at22 mm from the source.
TargetMesh
RC film
(a)(b)
(c)
0 2 4Distance on film [mm]
0.75
1.0
1.2
Op
tica
l de
nsit
y
2 mm
Laser6
Figure 3. (a) Set up for proton imaging of a mesh; (b) image of a mesh with 25 µm spacing (10 µm Cu wires) obtained with 15 MeVprotons; (c) Lineout across image of a mesh with 100 µm obtained with 20 MeV protons.
High Power Laser Programme – Short Pulse Plasma Physics
Central Laser Facility Annual Report 2000/2001 6
A shadow of the mesh was observed on the radiochromic film,as shown in Figure 3(b). The image shown in the picture hasbeen obtained with 15 MeV protons and the 25 µm spacingmesh. The shadow of the wires can be observed clearly, thecontrast of the picture being quite sharp. Figure 3(c) shows theoptical density lineout across the shadow of a different mesh,with 100 µm spacing, obtained with 20 MeV protons. Themagnification is consistent with the geometry of the imagingsystem. The optical density modulation observed is of the orderof 0.2. It should be noted that the stopping range of 20 MeVprotons in Cu is about 900 µm, and the collisional energy lossfor such energetic protons in 10 µm of Cu is just ∆E/E ~ 5.10-3.Taking into account the film response, this would lead only to avariation in optical density ∆D ~ 5.10-5. Therefore the shadowobserved must be due to some different effect. Our presentexplanation is that the mesh charges up positively, due, forexample, to hot electrons preceding the proton beam andexpelling a small number of cold electrons from the target viacollisions. The deflection of the protons due to the electric fieldin the proximity of the wires is then responsible for the creationof the mesh shadow on the detector, where pile-up of thedeflected protons is observed beside the regions of minimumtransmission. An estimate of the linear charge on the mesh canbe obtained via particle tracing, giving λ~ 10-6 C/m.
Imprinting of the electric field structures on the proton beam isindeed possible even if the beam is globally neutral, aspredicted by PIC models. In fact, due to the low density of theproton beam when it reaches the object, and the hightemperature of the electrons of the cloud, the Debye length ofthe ion-electron cloud will be several hundreds of microns (i.e.significantly larger than the spatial scale of the electric fieldstructures).
20
30
40
50
60
70
80
90
0 2 4 6 8 10
t.o.f. A (ps)t.o.f. B (ps)
Layer number
Tim
e [p
s]
Figure 4. Time of arrival on target versus RC film layernumber (data for both active layers A and B of each RC film isplotted).
Imaging of fast-evolving objects
When probing an object undergoing fast changes, the fact thatthe proton beams are not monochromatic is actually anadvantage, as it can be exploited to obtain, in a single shot,information on the temporal history of the object to be probed.In fact, if the object to be probed is situated at a finite distancefrom the source, protons with different energies will reach theobject at different times. By employing a detector that performsspectral selection, the information on the temporal evolution ofthe target can be retained. This is explained in Figure 4, wherethe calculated time of arrival on target of the protons producedon the Al foil is plotted versus the RC film layer number (i.e.versus their energy). As can be seen, the presence of the doubleactive layer in each RC film causes a temporal indetermination
which is larger for the first RC layers, but can be removed bymechanically separating the two gel layers after data collection.
By doing so, we were able to confirm the short duration of theproton burst. Figure 5 shows a scan of the two parts of an RCfilm layer after separation. The object being probed was a solidtarget (50 µm Ta wire) irradiated with a second CPA pulse.More details about the experimental arrangement for thisexperiment are given elsewhere in this Annual Report 10). Thetarget charges up following the interaction, and the proton beamprobes a fast evolving electric field pattern. The RC film layerof Figure 5 was the second in the film stack, and the signal ofthe A and B active layers is mainly due, respectively, to6 and 7 MeV protons. The temporal difference on targetbetween protons with this energy is about 5 ps. As is clearlyvisible, the patterns observed in the two layers differsignificantly, meaning that the protons producing the patternhave experienced different electric field configuration. Fromthis it can be inferred that the duration of the proton burst at thesource is smaller than 5 ps.
7 MeV 6 MeV 100 µm
Laser
Figure 5. Proton images of a 50 µm Ta wire irradiated by a1019 W/cm2 pulse, obtained in the same event with 6 and7 MeV protons. The spatial scale refers to the target plane.
Conclusion
Proton imaging is a diagnostic with great potential in laser-plasma interaction studies, which can allow diagnostic access topreviously inaccessible phenomena. Some applications of thetechnique are detailed elsewhere in this report 10). The work wassupported by an ESPRC grant. We acknowledge the invaluablecontribution to the work provided by the CLF staff.
References
1. E. L. Clark et al, Phys. Rev. Lett, 84 670 (2000)
2. R D Snavely et al, Phys. Rev. Lett., 85, 2945 (2000)
3. S.Wilks et al, Phys. Plasmas, 8, 542 (2001)
4. A.Pukhov et al, Phys. Rev. Lett, 86, 3562 (2001)
5. H.Ruhl et al, Plasma Phys. Rep., 27, 363 (2001)
6. A M Koehler, Science, 160, 303 (1968)
7. W.L.C.McLaughlin et al, Nucl. Instr. Methods Phys. Res. A302, 165 (1991)
8. J. F. Ziegler, J. P.Biersack and U. Littmark, The Stoppingand Range of Ions in Solids, Pergamon Press, New York,1985
9. A J MacKinnon et al, Phys. Rev. Lett., 86, 1769 (2001)
10. M Borghesi et al, A Schiavi et al, in this volume
High Power Laser Programme – Short Pulse Plasma Physics
7 Central Laser Facility Annual Report 2000/2001
Introduction
We present here the first application of laser-produced protonsas a particle probe in high-density matter investigations. Byusing the recently developed proton imaging technique1) thefirst direct demonstration of highly transient electric fieldsfollowing ultra-intense laser-pulse interaction with plasmas hasbeen obtained. The possibility (previously unavailable) ofmeasuring transient electric fields with high temporal resolutionpermits the investigation of a range of important phenomenarelated to the generation and transport of hot electron currents.These issues are of enormous topical interest in view of thedevelopment of Fast Ignitor driven Inertial Confinement Fusion.They can now be accessed with a completely differentapproach, which allows study of the electron current dynamicswith an unprecedented resolution in a direct and simple way.
Experimental arrangement
The proton beams were produced by focusing a high-intensitypulse (typically 20 J in 1 picosecond, focused at an intensity of1019 Wcm-2) onto the surface of Al foils. The protons wereemitted normal to the back surface of the target with smallangular divergence (about 10°), cut-off energy of 10 MeV,temperature of ~ 1 MeV (obtained by fitting a Boltzmannexponential to the proton spectrum), from a source withdiameter smaller than 10-15 µm.
According to the models, the protons are accelerated for a timeof the order of the laser pulse duration, as confirmed by ourexperimental tests1). This provides very high temporalresolution for our particle probe, allowing the detection ofhighly transient phenomena. It should be remembered here thatproton beams produced with conventional accelerators have aduration of several nanoseconds at best.
The detector employed consisted of a stack of several layers ofradiochromic film (RCF)1). By employing this technique, wehave detected the onset of electric fields in various targetconfigurations2). We will discuss here the detection of highlytransient fields following the irradiation of a solid target with anultraintense, picosecond laser pulse. The experimentalarrangement for these measurements is shown in Figure 1.
Two 1µm, 1 ps pulses (CPA1 and CPA2) produced by theVulcan laser were focused onto separate targets at an intensityof 1019 W/cm2. The CPA2 pulse was focused onto an Al foil toproduce a beam of protons, while the CPA1 pulse was focusedonto solid targets. The delay between the two pulses could be
varied optically. The angle between proton beam direction andCPA1 propagation directions was approximately 75°. Thedistances involved were: 2 mm (Al foil to main target), and2.7 cm (main target to detector). As explained in Reference 1,the proton probe is used in a point-projection imagingarrangement with the magnification determined by the ratio ofdetector-to-object and object-to-source distances. Theadvantages of using an RCF-based detector are also discussedin Reference 1.
CPA1
CPA2
Al foilProton beam
Target
RC film stack
Figure 1. Experimental arrangement for proton probing ofultraintense laser-target interaction.
Experimental results
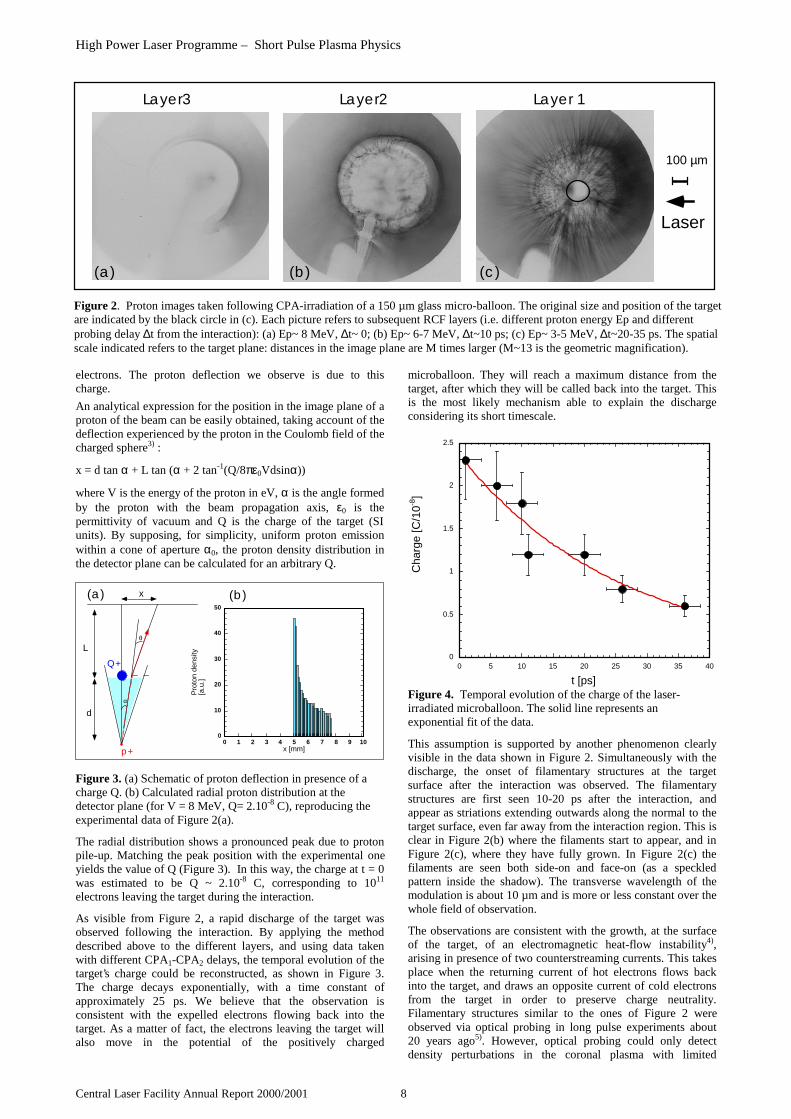
In Figure 2 proton images taken (in a single shot) afterultraintense irradiation of a 150 µm glass micro-balloon areshown. It can be seen (Figure 2(a)) that in coincidence with theinteraction, a circular shadow, much larger than the projectedtarget image, is observed in the detector. Here by shadow wemean a region of film unexposed to the proton flux. Thisshadow is consistent with protons that are deflected away fromthe target surface by an outwardly directed electric field. As amatter of fact, during the CPA1 interaction, fast electrons areaccelerated in the forward direction by the laser pulse in theinteraction region at the front of the target. The energy of theseelectrons, in the MeV range, is large enough for them to reachthe back of the target. Some of the electrons can actually escapefrom the target, before it charges up, preventing further loss of
Detection of highly transient electric fields following ultra-intense laser interactionwith solid targets
M Borghesi
Department of Pure and Applied Physics, The Queen’s University, Belfast
D H Campbell, M G Haines, A Schiavi, O Willi*
The Blackett Laboratory, Imperial College of Science, Technology and Medicine, London
A J Mackinnon
Lawrence Livermore National Laboratory, Livermore (CA, USA)
M Galimberti, L A Gizzi
IFAM-CNR, Pisa (Italy)
R J Clarke, S Hawkes
Central Laser Facility, CLRC Rutherford Appleton Laboratory, Chilton, Didcot, Oxon, OX11 0QX, UK
H Ruhl,
Max-Born-Insitut, Berlin (Germany)
Main contact email address: [email protected]
* present address: Institut für Laser-und-Plasmaphysik, Heinrich-Heine-Universität, Düsseldorf (Germany)
High Power Laser Programme – Short Pulse Plasma Physics
Central Laser Facility Annual Report 2000/2001 8
electrons. The proton deflection we observe is due to thischarge.
An analytical expression for the position in the image plane of aproton of the beam can be easily obtained, taking account of thedeflection experienced by the proton in the Coulomb field of thecharged sphere3) :
x = d tan α + L tan (α + 2 tan-1(Q/8πε0Vdsinα))
where V is the energy of the proton in eV, α is the angle formedby the proton with the beam propagation axis, ε0 is thepermittivity of vacuum and Q is the charge of the target (SIunits). By supposing, for simplicity, uniform proton emissionwithin a cone of aperture α0, the proton density distribution inthe detector plane can be calculated for an arbitrary Q.
Q+
θ
α
p+
x:
L
d
0
10
20
30
40
50
0 1 2 3 4 5 6 7 8 9 10
Pro
ton
dens
ity[a
.u.]
x [mm]
(a) (b)
Figure 3. (a) Schematic of proton deflection in presence of acharge Q. (b) Calculated radial proton distribution at thedetector plane (for V = 8 MeV, Q= 2.10-8 C), reproducing theexperimental data of Figure 2(a).
The radial distribution shows a pronounced peak due to protonpile-up. Matching the peak position with the experimental oneyields the value of Q (Figure 3). In this way, the charge at t = 0was estimated to be Q ~ 2.10-8 C, corresponding to 1011
electrons leaving the target during the interaction.
As visible from Figure 2, a rapid discharge of the target wasobserved following the interaction. By applying the methoddescribed above to the different layers, and using data takenwith different CPA1-CPA2 delays, the temporal evolution of thetarget’s charge could be reconstructed, as shown in Figure 3.The charge decays exponentially, with a time constant ofapproximately 25 ps. We believe that the observation isconsistent with the expelled electrons flowing back into thetarget. As a matter of fact, the electrons leaving the target willalso move in the potential of the positively charged
microballoon. They will reach a maximum distance from thetarget, after which they will be called back into the target. Thisis the most likely mechanism able to explain the dischargeconsidering its short timescale.
0
0.5
1
1.5
2
2.5
0 5 10 15 20 25 30 35 40
Cha
rge
[C/1
0-8]
t [ps]Figure 4. Temporal evolution of the charge of the laser-irradiated microballoon. The solid line represents anexponential fit of the data.
This assumption is supported by another phenomenon clearlyvisible in the data shown in Figure 2. Simultaneously with thedischarge, the onset of filamentary structures at the targetsurface after the interaction was observed. The filamentarystructures are first seen 10-20 ps after the interaction, andappear as striations extending outwards along the normal to thetarget surface, even far away from the interaction region. This isclear in Figure 2(b) where the filaments start to appear, and inFigure 2(c), where they have fully grown. In Figure 2(c) thefilaments are seen both side-on and face-on (as a speckledpattern inside the shadow). The transverse wavelength of themodulation is about 10 µm and is more or less constant over thewhole field of observation.
The observations are consistent with the growth, at the surfaceof the target, of an electromagnetic heat-flow instability4),arising in presence of two counterstreaming currents. This takesplace when the returning current of hot electrons flows backinto the target, and draws an opposite current of cold electronsfrom the target in order to preserve charge neutrality.Filamentary structures similar to the ones of Figure 2 wereobserved via optical probing in long pulse experiments about20 years ago5). However, optical probing could only detectdensity perturbations in the coronal plasma with limited
Laser
100 µm
(c)(b)(a)
Layer 1Layer2Layer3
Figure 2. Proton images taken following CPA-irradiation of a 150 µm glass micro-balloon. The original size and position of the targetare indicated by the black circle in (c). Each picture refers to subsequent RCF layers (i.e. different proton energy Ep and differentprobing delay ∆t from the interaction): (a) Ep~ 8 MeV, ∆t~ 0; (b) Ep~ 6-7 MeV, ∆t~10 ps; (c) Ep~ 3-5 MeV, ∆t~20-35 ps. The spatialscale indicated refers to the target plane: distances in the image plane are M times larger (M~13 is the geometric magnification).

High Power Laser Programme – Short Pulse Plasma Physics
9 Central Laser Facility Annual Report 2000/2001
temporal resolution, and only speculations could be made on theorigin and nature of the filaments in that experimental setting.
Heat-flow instabilities have been studied theoretically for a longtime due to their potentially detrimental effect on compressionin conventional Inertial Confinement Fusion (ICF), and, morerecently, due to the renewed interest in fast electron transportassociated with the Fast Ignitor Scheme for ICF. Theelectrothermal instability6), which takes place in presence ofcounter-streaming flows of collisionless hot electrons and coldcollisional electrons is particularly relevant to our experimentalconditions. As the instability causes magnetized filamentationof both hot and cold currents, the effect is imprinted on thediagnostic proton beam via the associated electric fields,transverse to the filaments. The instability grows at the targetsurface and the perturbations are transported out by theexpanding plasma. Essentially the magnetic fields are frozeninto the ablating plasma. Reference 6 provides order ofmagnitude scaling laws (which are independent from theintensity of the hot electron flux) for the growth rate α and thetransverse wavelength λ of the modulation, i.e.α[s
−1] = 2.8⋅10
−8n0 Z / ATe
3 2, λ[m]= 2.41⋅10
10Te
2A n0 Z .
n0 and Te are density and temperature of the cold electrons, Zand A charge and atomic number of the target material. Forexample, by using the density of solid glass (n0~ 5.1028 m-3), Zand A for Si (main constituent of the glass target) andTe= 500 eV, one obtains α-1 ~ 15 ps and λ ~ 5 µm, of the orderof the observations. It should be noted that a 500 eVtemperature is consistent with the upper bound imposed by thevalidity condition of the model (cold mean-free path less thancollisionless skin depth). Once the magnetic field of theinstability has grown sufficiently (Ω0τc>1), the thermalconduction reduces, the condition no longer applies, but thefilaments become frozen-in.
Features similar to the ones discussed up to now were observedduring the interaction with a range of solid targets. Particularlydramatic effects were observed probing the interaction of theCPA1 pulse with small diameter metal wires. Figure 5 showsproton images of the interaction with a 50 µm Ta wire. TheRCF layers shown (second layers of the RCF stacks,corresponding to proton energies of 6-7 MeV) have beenobtained in separate shots for different CPA1-CPA2 delays.When the proton probe arrived on target before the CPA2
interaction pulse (e.g., t=-10 ps, 1st image in Figure 5), only theshadow of the Ta wire, thick enough to slow down the protonsis visible, with some small effect visible in the interactionregion due to preplasma present ahead of the interaction.However when the probe is incident with the interaction adramatic effect is observed, with the protons being deflectedaway from the wire surface, which again charges up due to hotelectron expulsion. Even in this case the charge is seen to decayin a few tens of picoseconds, and filamentary structures are seento appear. In this case the onset of pronounced horizontalfeatures above and below the interaction axis is also detected.This data is still being analysed. However we think this
structure may be related to the radial expansion of shocksfollowing the interaction, likely presenting non-neutral regionsat their leading front. The complex pattern observed with RCFwas reproduced when CR39, a nuclear track detector was used.The data of Figure 6 was obtained with a layer of CR39 filmplaced immediately behind one of the RCF layers shown inFigure 5 (the third from the left). Allowing for the timedifference and the lower spatial resolution of CR39, the featuresare all reproduced, providing further confirmation that all thefeatures observed are due to protons within the estimatedenergy range.
500 µm
(6.25 mm)
Figure 6. Proton image obtained with CR39 (8MeV protons).The detector was placed immediately after the central layer ofFigure 5.
Conclusion
Proton imaging has enormous potential for the diagnosis offundamental physical problems, which were impossible toexplore up to now. By using this diagnostic, for the first timethe measurement of very large, highly transient electric fields inplasmas has been obtained, determining their evolution on apicosecond scale with micrometric spatial resolution. Inparticular, global charge-up of a microscopic target irradiatedby a high-intensity laser has been observed for the first time.
References
1. M.Borghesi et al, in this Annual report
2. M.Borghesi et al; A.Schiavi et al, in this Annual report
3. O.Klemperer , Electron physics, Butterworths, London(1972)
4. M H Key ,Compression and hydrodynamics, in Laser-plasma Interactions 3, SUSSP 29 (1985)
5. O Willi et al, Opt. Comm., 41, 110 (1982)
6. M Haines, Phys. Rev. Lett., 47, 918 (1981)
Figure 5. Temporal evolution of proton images of the interaction zone for different interaction-probing delays. The target was a50 µm Ta wire and the energy of the protons employed was 6-7 MeV. The delay between CPA1 interaction and probing is indicatedabove each of the pictures. Spatial scales for both the target and the image plane (between bracket) are indicated.
High Power Laser Programme – Short Pulse Plasma Physics
Central Laser Facility Annual Report 2000/2001 10
Introduction
Experiments studying the interaction of ultraintense, ultrashortlaser pulses with plasmas provide unique laboratory conditionsfor the study of the collective nonlinear dynamics of amacroscopic system in the relativistic regime. In addition,investigating the structure of the nonlinear coherent modes inthe wake of a short laser pulse is of great practical interest asit shows how the laser pulse energy can be transferred to theelectromagnetic fields in the plasma and to fast particles.Coherent structures, such as solitons and vortices arefundamental features of this nonlinear interaction. Indeed,analytical and numerical results1-2) have shown that low-frequency, slowly propagating, sub-cycle solitons can begenerated in the interaction of ultra short ultraintense laserpulses with underdense plasmas.
A significant fraction of the laser pulse energy can be trapped inthese structures in the form of electromagnetic energyoscillating at a frequency smaller than the Langmuir frequency
pe of the surrounding plasma. The typical size of thesesolitons is of the order of the collisionless electron skin depthde F pe. The fields inside the solitons consist of synchronouslyoscillating electric and magnetic fields plus a steadyelectrostatic field which arises from the charge separation aselectrons are pushed outwards by the ponderomotive force ofthe oscillating fields.
As yet no direct experimental proof of soliton generation in thelaser plasma interaction has been obtained. Indeed theexperimental detection of such structures poses phenomenalchallenges due to their microscopic scale and to their transientnature.
Here we report the experimental observation of bubble-likestructures in proton images3) of laser-produced plasmas, whichwe interpret as the macroscopic remnants of solitons formedduring the interaction with the ultra-intense pulse. Theobserved structures correspond to localized depletion regions inthe cross section of a transverse-propagating proton probebeam. We believe that these are the first experimentalobservations of quasi-neutral cavitated post-solitons. Thebubbles appear as the protons are deflected away by thelocalized electric field at the edges of the cavitated areas. This
interpretation is supported by computational and analyticalresults.
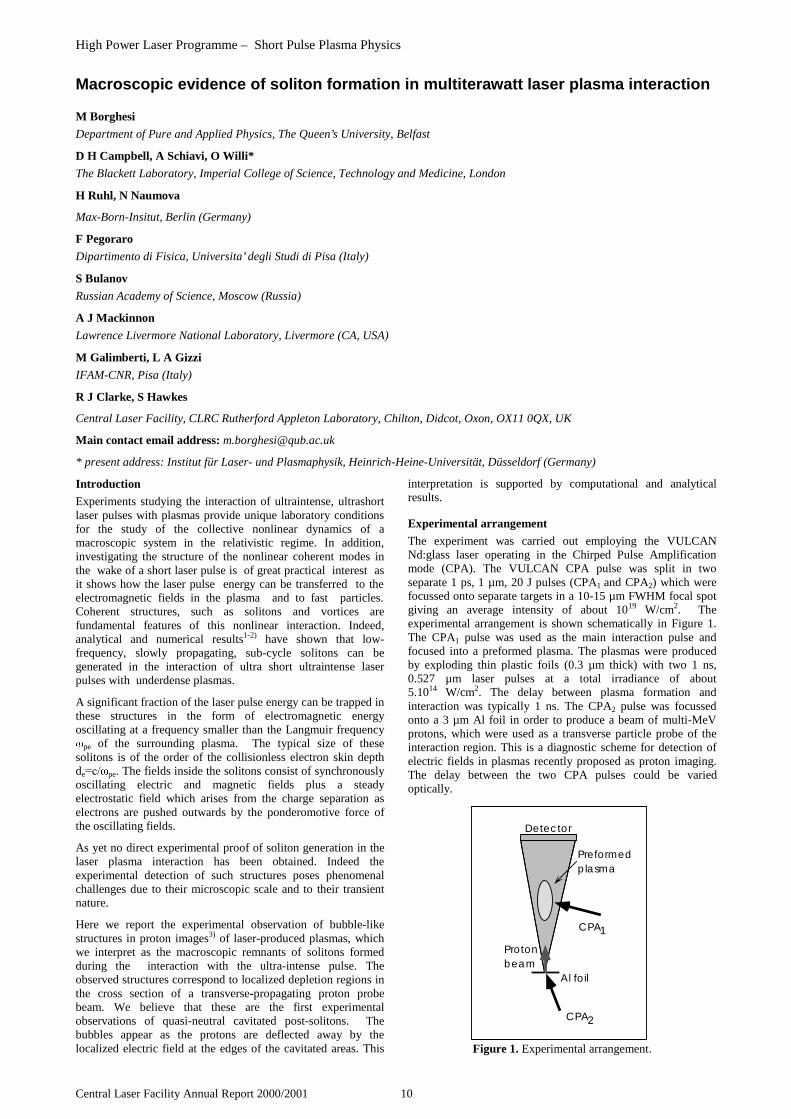
Experimental arrangement
The experiment was carried out employing the VULCANNd:glass laser operating in the Chirped Pulse Amplificationmode (CPA). The VULCAN CPA pulse was split in twoseparate 1 ps, 1 µm, 20 J pulses (CPA1 and CPA2) which werefocussed onto separate targets in a 10-15 µm FWHM focal spotgiving an average intensity of about 1019 W/cm2. Theexperimental arrangement is shown schematically in Figure 1.The CPA1 pulse was used as the main interaction pulse andfocused into a preformed plasma. The plasmas were producedby exploding thin plastic foils (0.3 µm thick) with two 1 ns,0.527 µm laser pulses at a total irradiance of about5.1014 W/cm2. The delay between plasma formation andinteraction was typically 1 ns. The CPA2 pulse was focussedonto a 3 µm Al foil in order to produce a beam of multi-MeVprotons, which were used as a transverse particle probe of theinteraction region. This is a diagnostic scheme for detection ofelectric fields in plasmas recently proposed as proton imaging.The delay between the two CPA pulses could be variedoptically.
CPA1
CPA2
Protonbeam
Preformedplasma
Detector
Al foil
Figure 1. Experimental arrangement.
Macroscopic evidence of soliton formation in multiterawatt laser plasma interaction
M Borghesi
Department of Pure and Applied Physics, The Queen’s University, Belfast
D H Campbell, A Schiavi, O Willi*
The Blackett Laboratory, Imperial College of Science, Technology and Medicine, London
H Ruhl, N Naumova
Max-Born-Insitut, Berlin (Germany)
F Pegoraro
Dipartimento di Fisica, Universita’ degli Studi di Pisa (Italy)
S Bulanov
Russian Academy of Science, Moscow (Russia)
A J Mackinnon
Lawrence Livermore National Laboratory, Livermore (CA, USA)
M Galimberti, L A Gizzi
IFAM-CNR, Pisa (Italy)
R J Clarke, S Hawkes
Central Laser Facility, CLRC Rutherford Appleton Laboratory, Chilton, Didcot, Oxon, OX11 0QX, UK
Main contact email address: [email protected]
* present address: Institut für Laser- und Plasmaphysik, Heinrich-Heine-Universität, Düsseldorf (Germany)
High Power Laser Programme – Short Pulse Plasma Physics
11 Central Laser Facility Annual Report 2000/2001
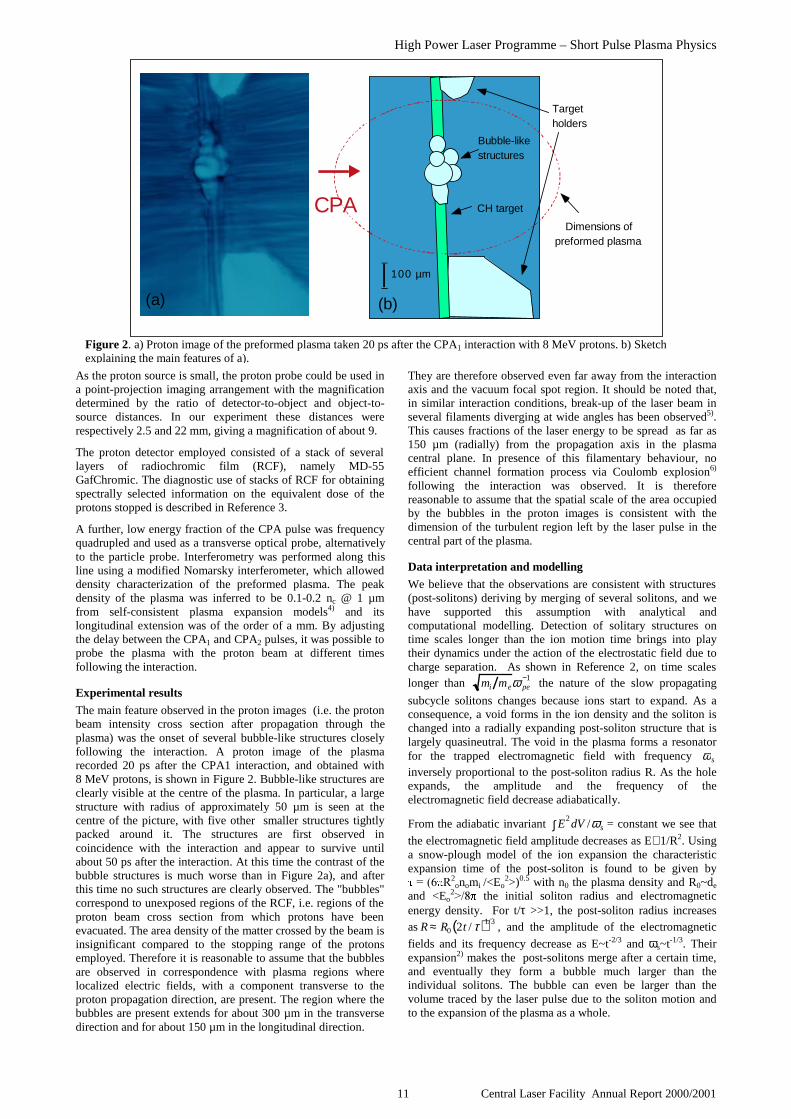
As the proton source is small, the proton probe could be used ina point-projection imaging arrangement with the magnificationdetermined by the ratio of detector-to-object and object-to-source distances. In our experiment these distances wererespectively 2.5 and 22 mm, giving a magnification of about 9.
The proton detector employed consisted of a stack of severallayers of radiochromic film (RCF), namely MD-55GafChromic. The diagnostic use of stacks of RCF for obtainingspectrally selected information on the equivalent dose of theprotons stopped is described in Reference 3.
A further, low energy fraction of the CPA pulse was frequencyquadrupled and used as a transverse optical probe, alternativelyto the particle probe. Interferometry was performed along thisline using a modified Nomarsky interferometer, which alloweddensity characterization of the preformed plasma. The peakdensity of the plasma was inferred to be 0.1-0.2 nc @ 1 µmfrom self-consistent plasma expansion models4) and itslongitudinal extension was of the order of a mm. By adjustingthe delay between the CPA1 and CPA2 pulses, it was possible toprobe the plasma with the proton beam at different timesfollowing the interaction.
Experimental results
The main feature observed in the proton images (i.e. the protonbeam intensity cross section after propagation through theplasma) was the onset of several bubble-like structures closelyfollowing the interaction. A proton image of the plasmarecorded 20 ps after the CPA1 interaction, and obtained with8 MeV protons, is shown in Figure 2. Bubble-like structures areclearly visible at the centre of the plasma. In particular, a largestructure with radius of approximately 50 µm is seen at thecentre of the picture, with five other smaller structures tightlypacked around it. The structures are first observed incoincidence with the interaction and appear to survive untilabout 50 ps after the interaction. At this time the contrast of thebubble structures is much worse than in Figure 2a), and afterthis time no such structures are clearly observed. The "bubbles"correspond to unexposed regions of the RCF, i.e. regions of theproton beam cross section from which protons have beenevacuated. The area density of the matter crossed by the beam isinsignificant compared to the stopping range of the protonsemployed. Therefore it is reasonable to assume that the bubblesare observed in correspondence with plasma regions wherelocalized electric fields, with a component transverse to theproton propagation direction, are present. The region where thebubbles are present extends for about 300 µm in the transversedirection and for about 150 µm in the longitudinal direction.
They are therefore observed even far away from the interactionaxis and the vacuum focal spot region. It should be noted that,in similar interaction conditions, break-up of the laser beam inseveral filaments diverging at wide angles has been observed5).This causes fractions of the laser energy to be spread as far as150 µm (radially) from the propagation axis in the plasmacentral plane. In presence of this filamentary behaviour, noefficient channel formation process via Coulomb explosion6)
following the interaction was observed. It is thereforereasonable to assume that the spatial scale of the area occupiedby the bubbles in the proton images is consistent with thedimension of the turbulent region left by the laser pulse in thecentral part of the plasma.
Data interpretation and modelling
We believe that the observations are consistent with structures(post-solitons) deriving by merging of several solitons, and wehave supported this assumption with analytical andcomputational modelling. Detection of solitary structures ontime scales longer than the ion motion time brings into playtheir dynamics under the action of the electrostatic field due tocharge separation. As shown in Reference 2, on time scaleslonger than mi meω pe
−1 the nature of the slow propagating
subcycle solitons changes because ions start to expand. As aconsequence, a void forms in the ion density and the soliton ischanged into a radially expanding post-soliton structure that islargely quasineutral. The void in the plasma forms a resonatorfor the trapped electromagnetic field with frequency ω s
inversely proportional to the post-soliton radius R. As the holeexpands, the amplitude and the frequency of theelectromagnetic field decrease adiabatically.
From the adiabatic invariant E2
∫ dV /ω s = constant we see that
the electromagnetic field amplitude decreases as E∝1/R2. Usinga snow-plough model of the ion expansion the characteristicexpansion time of the post-soliton is found to be given by 52
onomi /<Eo2>)0.5 with n0 the plasma density and R0~de
and <Eo2! the initial soliton radius and electromagnetic
energy density. For t/τ >>1, the post-soliton radius increasesasR ≈ R0 2t / τ( )1/3
, and the amplitude of the electromagnetic
fields and its frequency decrease as E~t-2/3 and ωs~t-1/3. Theirexpansion2) makes the post-solitons merge after a certain time,and eventually they form a bubble much larger than theindividual solitons. The bubble can even be larger than thevolume traced by the laser pulse due to the soliton motion andto the expansion of the plasma as a whole.
1 0 0 µ m
C P A
Bubble-like structures
CH target
Target holders
Dimensions of preformed plasma
(a) (b)
Figure 2. a) Proton image of the preformed plasma taken 20 ps after the CPA1 interaction with 8 MeV protons. b) Sketchexplaining the main features of a).
High Power Laser Programme – Short Pulse Plasma Physics
Central Laser Facility Annual Report 2000/2001 12
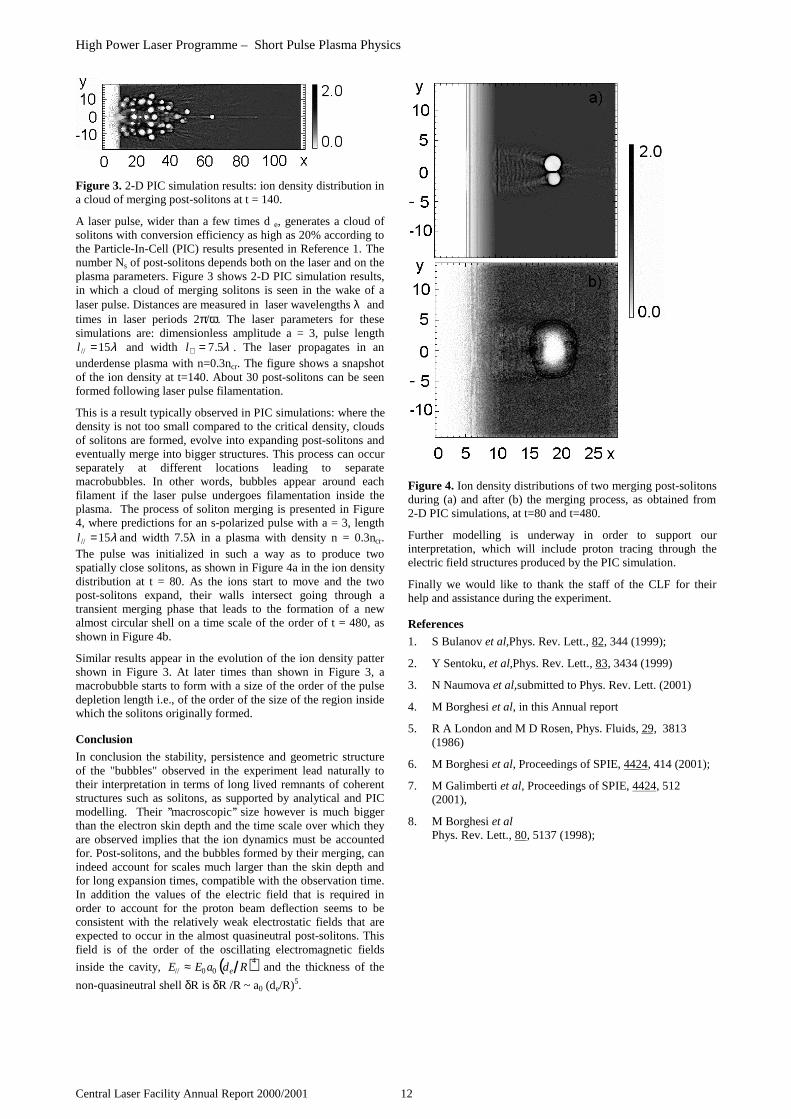
Figure 3. 2-D PIC simulation results: ion density distribution ina cloud of merging post-solitons at t = 140.
A laser pulse, wider than a few times d e, generates a cloud ofsolitons with conversion efficiency as high as 20% according tothe Particle-In-Cell (PIC) results presented in Reference 1. Thenumber Ns of post-solitons depends both on the laser and on theplasma parameters. Figure 3 shows 2-D PIC simulation results,in which a cloud of merging solitons is seen in the wake of alaser pulse. Distances are measured in laser wavelengths λ andtimes in laser periods 2π/ω. The laser parameters for thesesimulations are: dimensionless amplitude a = 3, pulse lengthl// =15λ and width l⊥ = 7.5λ . The laser propagates in anunderdense plasma with n=0.3ncr. The figure shows a snapshotof the ion density at t=140. About 30 post-solitons can be seenformed following laser pulse filamentation.
This is a result typically observed in PIC simulations: where thedensity is not too small compared to the critical density, cloudsof solitons are formed, evolve into expanding post-solitons andeventually merge into bigger structures. This process can occurseparately at different locations leading to separatemacrobubbles. In other words, bubbles appear around eachfilament if the laser pulse undergoes filamentation inside theplasma. The process of soliton merging is presented in Figure4, where predictions for an s-polarized pulse with a = 3, lengthl// =15λ and width 7.5λ in a plasma with density n = 0.3ncr.The pulse was initialized in such a way as to produce twospatially close solitons, as shown in Figure 4a in the ion densitydistribution at t = 80. As the ions start to move and the twopost-solitons expand, their walls intersect going through atransient merging phase that leads to the formation of a newalmost circular shell on a time scale of the order of t = 480, asshown in Figure 4b.
Similar results appear in the evolution of the ion density pattershown in Figure 3. At later times than shown in Figure 3, amacrobubble starts to form with a size of the order of the pulsedepletion length i.e., of the order of the size of the region insidewhich the solitons originally formed.
Conclusion
In conclusion the stability, persistence and geometric structureof the "bubbles" observed in the experiment lead naturally totheir interpretation in terms of long lived remnants of coherentstructures such as solitons, as supported by analytical and PICmodelling. Their ’’macroscopic’’ size however is much biggerthan the electron skin depth and the time scale over which theyare observed implies that the ion dynamics must be accountedfor. Post-solitons, and the bubbles formed by their merging, canindeed account for scales much larger than the skin depth andfor long expansion times, compatible with the observation time.In addition the values of the electric field that is required inorder to account for the proton beam deflection seems to beconsistent with the relatively weak electrostatic fields that areexpected to occur in the almost quasineutral post-solitons. Thisfield is of the order of the oscillating electromagnetic fields
inside the cavity, E// ≈ E0 a0 de R( )4 and the thickness of the
non-quasineutral shell δR is δR /R ~ a0 (de/R)5.
Figure 4. Ion density distributions of two merging post-solitonsduring (a) and after (b) the merging process, as obtained from2-D PIC simulations, at t=80 and t=480.
Further modelling is underway in order to support ourinterpretation, which will include proton tracing through theelectric field structures produced by the PIC simulation.
Finally we would like to thank the staff of the CLF for theirhelp and assistance during the experiment.
References
1. S Bulanov et al,Phys. Rev. Lett., 82, 344 (1999);
2. Y Sentoku, et al,Phys. Rev. Lett., 83, 3434 (1999)
3. N Naumova et al,submitted to Phys. Rev. Lett. (2001)
4. M Borghesi et al, in this Annual report
5. R A London and M D Rosen, Phys. Fluids, 29, 3813(1986)
6. M Borghesi et al, Proceedings of SPIE, 4424, 414 (2001);
7. M Galimberti et al, Proceedings of SPIE, 4424, 512(2001),
8. M Borghesi et alPhys. Rev. Lett., 80, 5137 (1998);

High Power Laser Programme – Short Pulse Plasma Physics
13 Central Laser Facility Annual Report 2000/2001
Introduction
In a previous experiment 1) on the propagation of an intenseshort pulse (50J, 1ps) in a preformed channel created by aprecursor pulse (25J, 1ps) clear evidence was found of acorrelation between fast electrons generated by the interactionand the “age” of the channel, i.e. the delay between the channelforming pulse and the interaction pulse. An important issue tobe addressed in that experiment was the correlation of thosemeasurements with angular and spectral features of high energyelectrons. To this purpose we have designed a multilayerradiochromic-based detector for energetic charged particles(SHEEBA). When exposed to such high energy particles, theactive layers within the film absorb energy and change opticaldensity. The exposure to high energy protons also results innuclear activation of the film, which is monitored using aGeiger counter. The absence of activation in the results shownhere is additional evidence that our signal was entirely due toelectrons.
Here we report on the first SHEEBA measurements of thespectral and angular distribution of fast electrons generated inthe case of interactions of intense CPA pulses with underdenseplasmas. Our measurements demonstrate that this simpledetector, in combination with appropriate numerical analysistools, provides a powerful diagnostic technique for this class ofexperiments.
Experimental setup
The plasma was generated by irradiating a 0.3 µm thick plasticfoil (FORMAVAR) with two heating beams ( λ = 527 nm,
τ = 1 ns, 100J per beam) at I=5.1014 W cm-2. A CPA laser beam(λ =1053 nm, ∆t=1 ps, up to 120 J) was focused (off-axisparabola f/3.5) on this plasma 1.3 ns after the heating beams.The peak density at the time of interaction was estimated to benc/10. The density was characterized by Nomanskyinterferometry using a UV laser pulse (λ=267 nm, ∆t=1 ps).Finally, the detector (SHEEBA) was placed at 2 cm from(behind) the target on the main laser pulse propagation axis.The layer set-up used for SHEEBA is shown in Figure 1.
6
7 8 9 10 11 12 13 145
4
3
2
1
e-
Layer Number
Radiochromic FilmsAl 25 µ m
Al 1.5 m m Fe 1.5 m m
Figure 1. Set-up used for the fast electrons detectors SHEEBA.
Experimental results and discussion
Figure 2 shows the optical density distribution for the variouslayers of the detector due to exposure to energetic electronsgenerated by the interaction of a 120 J CPA pulse focused on
High energy electron measurements in relativistic interactions with underdenseplasmas
M Galimberti1, A Giulietti, D Giulietti1, L A Gizzi
Intense Laser Irradiation Laboratory - IFAM, Area della Ricerca CNR, via Moruzzi, 1 56124 Pisa (Italy)1Also at Dipartimento di Fisica, Università di Pisa and INFM, Pisa, Italy
M Borghesi
Department of Pure and Applied Physics, The Queen's University, Belfast BT7 1NN, UK
D H Campbell, A Schiavi, O Willi
Imperial College of Science, Technology and Medicine, SW7 2BZ, London, UK
Main contact email address: [email protected]
Figure 2. Optical density distribution for the various layers of the detector due to exposure to energetic electrons.

High Power Laser Programme – Short Pulse Plasma Physics
Central Laser Facility Annual Report 2000/2001 14
the preformed plasma.
These images clearly show that the electrons are confined in acone of small aperture, less than 10 degrees. As we proceedfrom layer 1 to layer 14, the overall optical density decreasesand the small scale structures are smoothed out as a result ofelectron propagation/diffusion through the layers.
109
1010
1011
1012
1013
1014
0 5 10 15 20
Ele
ctro
n nu
mbe
r (N
e/M
eV)
Electron energy (MeV)
Figure 3. Overall reconstructed spectrum of the electrons fromradiochromic films data.
A quantitative analysis of these images has been carried outusing a Montecarlo simulation code based on the libraryGEANT 4.2.0 (2) in order to obtain the spectral distribution ofthe electrons. Our analysis shows that two populations ofelectrons exist, which are well characterised by two differenttemperatures of 133±23 keV and 5.23±0.84 MeV, respectively(see Figure 3). Several physical mechanisms can account for thegeneration of high energy electrons including direct laseracceleration 3) and acceleration in the plasma waves generatedby forward Raman scattering 4). In fact, many experiments havebeen reported in which high energy electrons have beenobserved where, depending on the interaction conditions, eachof these mechanisms is claimed to play a dominant role.
It is interesting to observe that in one of these experiments 5) atwo-temperature hot-electron energy distribution was alreadyobserved in conditions similar to those of our experiment andwas ultimately attributed to direct laser acceleration. In thatexperiment fast electrons were detected using a magneticspectrometer with a small angular acceptance looking at 45°from the laser axis in the forward direction. In contrast, in ourexperiment most of the fast electrons were found to be emittedin a narrow cone in the forward direction. This measurementwas possible thanks to the large angular acceptance and highangular resolution of our detector. Although the analysis ofthese data is still in progress, it is clear that our measurementsprovide basic information for the identification of the physicalmechanisms at the origin of high energy electrons and, inparticular, of the two-temperature distribution.
Conclusions
We used a detector based on radiochromic film to measure theproperties of high-energy electrons generated during ultra-intense laser-plasma interactions. The detector could be placedvery close to the target and allowed the angular distribution ofthe electrons to be measured directly. The spectrum of theelectrons was also obtained with the aid of simulations. Ourresults show that this detection system offers a good alternativeto conventional high energy electron spectrometers, usuallyheavy and bulky and characterised by a small angularacceptance. Also, the angular distribution of high energyelectrons can be measuresd directly in a single shot.
Acknowledgements
The authors wish to thank the staff of the Central Laser Facilityfor their assistance and support throughout the experiment. Theexperiment was funded by an EPSRC grant. Support from theTMR European Network "Xray Probing Of the StructuralEvolution of Matter", XPOSE (contract N. HPRN-CT-2000-00160) is also acknowledged.
References
1. L.A.Gizzi et al., accepted for publication, Laser ParticleBeam 19, (2001).
2. GEANT4: LCB Status Report/RD44, CERN/LHCC-98-44,(1998)
3. A. Pukhov and J. Mayer-ter-Vehen, Phys. Rev. Lett. 76,3975 (1996).
4. W.B.Mori et al., Phys. Rev. Lett. 72, 1482 (1994).
5. G. Malka et al., Phys. Rev. Lett. 79, 2053 (1997).

High Power Laser Programme – Short Pulse Plasma Physics
15 Central Laser Facility Annual Report 2000/2001
Introduction
The Fast Ignitor scheme1) for ICF relies on the transport of laserenergy to the core of a compressed fuel pellet. It is necessaryfor an ultra intense laser pulse to propagate through plasmareaching many times critical density via hole boring andinduced transparency. In the final stage of energy transport, thelaser pulse is converted into relativistic electrons, which thenmust propagate to the core to ignite the fuel. Studies ofpropagation of laser pulses and relativistic electrons throughhundreds of microns of overdense plasma are of greatimportance to the realisation of the Fast Ignitor Scheme.
An experimental campaign performed on the Vulcan Laser atthe Rutherford Appleton Laboratory, UK has studied theinteraction of ultra-intense laser pulses with plasmas severaltimes critical. In previous experimental work2), novel use wasmade of pre-ionised foam targets in an attempt to measure laserpropagation through overdense plasma. Here, in an extensionof this work, we present observations of the propagation ofrelativistic electrons through up to 200µm of overdenseplasmas.
Experimental Arrangement
The set-up is shown in Figure 1. Overdense plasmas werepreformed using soft x-ray heating of low-density foam targets.The target composition was triacrylate, doped 10% by weightwith chlorine. Washer supported, parylene backed foams withdensity 20mg/cc and length 50 µm were used in addition to200 µm long, freestanding foams with density 30 mg/cc. TheFoams were placed 50 µm behind a pair of 700 Å gold burn-through foils. Two 600 ps heating beams of the Vulcan laserwere frequency doubled to 527 nm and focused onto the foilswith an intensity of 2×10¹⁴ W/cm2. The soft x-ray emissionfrom the rear of the foils caused volumetric ionisation of thefoam within a nanosecond, producing a uniform, overdense
plasma. A picosecond CPA pulse was subsequently focusedinto the plasma with an off-axis parabola producing an intensityon-target of 5×10¹⁹
W/cm2.
Several diagnostics were employed in the experiment. Softx-ray pinhole cameras, filtered for radiation below 500eV, werepositioned at the front and rear of the target. The rear of thetarget was imaged at 1054 nm onto a CCD camera using a lenspositioned behind the target. In addition, a picosecond UVprobe pulse was used to produce a shadowgram of the target at
Observation of Relativistic Electron Transport through Dense Preformed Plasmas
D H Campbell, A Schiavi, O Willi
Blackett Laboratory, Imperial College of Science, Technology and Medicine, London, SW7 2BZ
M Borghesi
Department of Pure and Applied Physics, The Queen’s University, Belfast, UK
A J Mackinnon
Lawrence Livermore National Laboratory, Livermore, US
M Galimberti, L A Gizzi
IFAM-CNR, 56100 Pisa, Italy
W Nazarov
Chemistry Department, University of Dundee, UK
Main contact email address: [email protected]
Figure 1. Beam and diagnostic arrangement.
Figure 2. Soft x-ray images of a 30mg/cc, 200µm long foam.

High Power Laser Programme – Short Pulse Plasma Physics
Central Laser Facility Annual Report 2000/2001 16
varying stages following the interaction.
Results
Figure 2 presents x-ray images recorded by the front and rearpinhole cameras. The overlay shows the position of the inneredges of the two gold foils. The two large dark spotscorrespond to the x-ray emission from the laser heating of thefoils. Between the foils, a dark feature can be seen. Thiscorresponds to the laser direction and appears to extendthroughout the target.
Figure 3 presents images from the CCD camera behind thetarget. In the case of the thinner foams, a compact, bright spotis seen. This corresponds to the position of the laser focal spotwhen no target is present and is of similar size being less than20µm in diameter. The energy from this emissive spot is verylow, representing less than 10-5 of the incident laser energy.Figure 3 b) shows an image of the rear of a 200 µm foam. Onthis longer foam the spot is broken up and spread over an arearoughly 50µm in diameter. This breaking-up was not seen inearlier experiments when only the compact emission spot wasobserved from thinner foams.
Plasma Simulations
The plasma conditions were simulated with the 1D Lagrangianhydrocode, MEDUSA. Figure 4 presents the simulated densityprofiles at the time of interaction from foams of density20mg/cc and 30mg/cc. The plasma density is similar for thetwo targets, reaching 6-8 times the critical density. The 0.1 µmplastic foil on the rear of the 20 mg/cc foam leads to higherdensity than would otherwise be the case. This suggests that theCPA interacts with plasmas of similar density when the twotarget types are used.
Discussion
The emission from the target rear is unlikely to be due to directlaser propagation. In order to propagate, the laser intensitymust remain above the threshold for induced transparencythroughout the target. This would have resulted in a significantamount of the incident energy being transmitted. It is morelikely therefore, that the laser energy is converted intorelativistic electrons, which propagate through the target. Asthe electrons pass through the rear surface, they emit visibleradiation, either as transition radiation as they leave the plasmaor via synchrotron emission as charge separation acceleratesthem back onto the target. These processes have been
introduced to explain similar observations in other experimentswith solid density targets3).
In thinner foams, 50 µm long, the electron transport appears tobe collimated whilst filamentation takes place over longerpropagation distances, up to 200 µm. This lends support tocomputational studies that predict that the electron stream isunstable as it interacts with the opposing cold return current4, 5).This return current of background electrons is highlycollisional, unlike the relativistic current, which it balances, andit is likely that this produces the x-ray signal on the pinholecameras.
In addition, previous work2) presented shadowgraphs showinglocalised expansion of the rear of the target attributable to a hotelectron current propagating to the rear side6).
Conclusion
These observations represent the first measurements of electrontransport in a plasma below solid density and as such are ofgreat relevance to fast ignition studies. We have observedfilamentation and break-up of a relativistic electron beam over a200 µm length in plasma with 6 to 8 times the critical densityfor 1 µm radiation. This effect may have significant impact onthe Fast Ignitor where it is desirable for highly collimatedelectron beams to propagate through high-density plasma. PICsimulations are underway to investigate the electron transportparameters in this density regime.
Acknowledgements
We extend our thanks to the staff of the Central Laser Facilityfor their invaluable assistance and support. This work wasfunded with an EPSRC grant.
References
1. M. Tabak et al, Phys. Plasmas, 1 1626 (1994)
2. D.H.Campbell et al, CLF ANNUAL Report, RAL-TR-2000-034 Rutherford Appleton Laboratory.
3. S. D. Baton et al, Proceedings of 5th Workshop on FastIgnition of Fusion Targets, 28th EPS Conference onControlled Fusion and Plasma Physics, June 2001 (To bepublished)
4. H. Ruhl et al, Proceedings of 5th Workshop on FastIgnition of Fusion Targets, June 2001 (To be published)
5. K. Mima et al, Proceedings of 5th Workshop on FastIgnition of Fusion Targets, June 2001 (To be published)
6. Tatarakis et al, Phys. Rev. Lett. 81, 999 (1998)
Figure 4. 1D simulation results showing electron density atthe time of CPA interaction for two target types.
Electron Density of Ionised Foams
1.00
E+
201.
00E
+21
1.00
E+
22
-100 -50 0 50 100 150 200 250 300Distance (µm)
Ele
ctro
n de
nsity
/cc
30mg/cc
20mg/cc
nc
Original foam lengths
Figure 3. Emission from the rear of a) a 20 mg/cc, 50 µmlong foam and b) a 30 mg/cc, 200 µm long foam.

High Power Laser Programme – Short Pulse Plasma Physics
17 Central Laser Facility Annual Report 2000/2001
Introduction
Charge displacement and currents generate electromagneticfields in plasmas via a wide range of mechanisms. These fieldscannot be directly observed by optical probing or X-rayradiography techniques, which are sensitive to plasma densityand temperature variations. A more direct measurement couldbe obtained by using charged particles. MeV protons have along stopping range in matter, therefore when probing plasmaswith small area densities, these particles are not sensitive toplasma density modulations, and their propagation is primarilyaffected by the presence of electromagnetic fields.
Over the last two years we have been developing a newdiagnostic based on laser produced proton beams. Protons withenergies of up to several tens of MeV were generated byirradiating thin solid targets at laser intensities in the order of1019 W cm-2 and above. Preliminary experiments wereconducted to characterise this proton source1-3). The protonsources have been employed as a particle probe in thedevelopment of a novel diagnostic scheme named protonimaging4).
Here we report on a series of experiments carried out on theVulcan laser at the Rutherford Appleton Laboratory, wheredifferent plasma conditions of interest to Inertial ConfinementFusion were diagnosed using the laser-produced proton beam asa probe.
Experimental set-up
The proton beam used for imaging was produced by focusingthe CPA beam of the Vulcan laser onto a 25 µm Aluminiumfoil. The pulse had a wavelength of 1 µm and a gaussiantemporal profile with duration of 1 ps. A 12 µm FWHM focalspot was obtained by using an f/3.5 off-axis parabolic mirror.The intensity generated on target was typically of the order of5.1019 W cm-2.
A layered stack of radiochromic film (RCF)5) was placed alongthe normal to the rear surface of the Al foil to collect theprotons generated by the CPA interaction. A 25 µm Al filter infront of the RCF stack stopped UV and X-ray radiation below10 keV.
The plasma to be probed was produced by irradiating 25 µm Alfoil targets. These were placed in the propagation cone of theproton beam. The surface of the foils was oriented along ornormal to the propagation of the protons to obtain side-on(Figure 1) and face-on images of the plasma. The plasmaforming laser beam was a 600ps flat-top pulse. It had awavelength of 527 nm and was focused with an f/10 lens tointensities in the range 1014 - 1015 W cm-2. The focal spot sizewas changed from shot to shot by defocusing the lens. Focalspots from 100 µm to 300 µm in diameter were produced toprovide different irradiation regimes. On some shots PhaseZone Plates were inserted in the heating beam just after thefocusing lens and the focal spot produced had a nominaldiameter of 250 µm.
The distance from the proton source to the centre of the plasmawas set to 2 mm, and the distance from the source to thedetector stack was about 22 mm. The correspondinggeometrical magnification was around 10 - 12 times, dependingon the RCF layer considered.
In the face-on set-up a 4ω probe was used to measure bytransverse interferometry the plasma density at the time ofinteraction of the proton beam with the plasma. The probe had a266 nm wavelength (nc ~ 17.1021 electrons/cc) and was 2-3 psin duration.
Figure 1. Set-up for side-on probing (top view).
Proton images
Figure 2 presents two RCF layers corresponding to a protonenergy of 17.6 MeV.
Panel a) shows the cross section of the proton beam after thepropagation through a 25 µm Al foil, as in the face-on set-up. Inthis laser shot, no plasma was formed on the foil target. Thefolding structures are caused by inhomogeneities in theelectrostatic sheath that accelerate the protons at the rear side ofthe source foil. The presence of the target in the line of sight isnot detected because the area density of a 25 µm Al foil is toolow to affect significantly protons with energy of 17 MeV.
Figure 2b presents a face-on image taken at the peak of theplasma-forming laser pulse: in this case the protons goingthrough the plasma are displaced, scattered or stopped by thee.m. fields generated during the laser interaction.
Figure 2. Face-on proton images (a) without plasma and(b) with plasma.
Evolution in time
The temporal evolution of the observed structures was recordedby changing the delay between the plasma forming pulse andthe CPA pulse. Images taken at the early stages of the laserinteraction show the formation of these structures, which growand become fully developed towards the end of the pulse
Proton imaging of E-field structures in laser-produced plasmas
A Schiavi, D H Campbell, O Willi
Blackett Laboratory, Imperial College of Science, Technology and Medicine, London, SW7 2BZ
M Borghesi
Department of Pure and Applied Physics, The Queen’s University, Belfast, UK
Main contact email address: [email protected]

High Power Laser Programme – Short Pulse Plasma Physics
Central Laser Facility Annual Report 2000/2001 18
(Figure 3). Just after the end of the laser pulse, the structuresdisappear and the pattern is almost indistinguishable from theone observed in absence of plasma. This observation suggeststhat the e.m. fields in the plasma are set up and sustained byenergy input coming from the laser. The time scale for therelaxation of the e.m. fields is less than a few 100 ps.
Figure 4 shows an overlay of a side-on proton image with thedensity profile obtained from transverse interferometry. Thedetected structures extend from solid density far out into thecoronal region.
Dependence on irradiation parameters
When the irradiation conditions of the target were changed,distinct modifications on the recorded ion pattern wereobserved. This fact confirms that the fields experienced by theprotons are closely related to the interaction of the laser pulsewith the plasma.
Face-on images show a fine structure made of cells, the size ofwhich is changing with the properties of the focal spot. In ourexperiments, tight focus conditions lead to a uniform pattern ofsmall cells about 60 µm in diameter. Larger focal spotscorrespond to a reduced number of bigger cells (~100 µm).
The presence of a PZP introduces a fine-scale regularmodulation on the laser profile, which is transferred to the e.m.field structures inside the plasma, and subsequently detected bythe ion beam. Side-on shots reveal a regular modulation inimage intensity when PZPs are used.
Simulations
Present day PIC codes can be used to investigate the protonacceleration mechanism in ultra-intense laser interaction withsolid targets6,7). However these codes cannot follow thepropagation of a proton beam on the centimetre scale of ourexperiments, due to computational constraints. Therefore we arepresently developing a 3D ray-tracing code especially tailoredto the parameters of our experiments. We intend to use this codeto obtain the order of magnitude of the e.m. fields inside theplasma. Assuming different configurations for the fields, we caninvestigate the processes potentially accountable for theobserved structures, and we could in principle discriminatebetween the several processes that lead to the formation of thee.m. fields. The basic assumption is that protons propagateinside the plasma as test-particles. Interaction between thedifferent parts of the ion beam is neglected: to support thisassumption, we point out that the number density of the protonbeam is at least a factor 105 smaller than critical density of theplasma, when the protons interact with the target.
Preliminary simulations with a 2D version of the ray-tracingcode were carried out assuming tubular E-field structures, likethe ones that could be induced by density modulations causedby laser hot spots. We assumed that the tubes had a 60 µmdiameter and were 100 µm long. The radial E-field inside thetubes was varied in intensity until the formation of the tubularpattern was observed (Figure 5, next page). This sets a lowerlimit for the intensity of the electric field. We found that the E-field that could explain the experimentally observed pattern isof the order of 5.108 V/m.
At intensities of 1010 V/m the protons are deflected so muchthat the proton beam starts focusing into beamlets (Figure 5c).This invalidates the assumption that the protons propagateindependently as test-particles, and sets an upper limit for theE-field under our hypotheses.
Conclusions
For the first time a laser-produced proton beam was used todiagnose a preformed plasma. Direct information about the e.m.field distribution inside the plasma was stored in the ion beamand subsequently recorded on a detector. Maps of the angulardistribution of the beam were obtained at selected proton energyranges. The temporal evolution of the observed structures andthe modifications caused by different irradiation conditionswere also investigated. Many concurrent phenomena could leadto the observed ion patterns, and therefore extensive modellingand interpretative work is needed in order to identify the
Figure 3. Face-on proton probing at different times;arrows show the time of proton interaction with respectto the plasma-forming pulse.
Figure 4. Side-on structures extending into the low densityregion of the plasma plume.

High Power Laser Programme – Short Pulse Plasma Physics
19 Central Laser Facility Annual Report 2000/2001
fundamental processes that affect the propagation of the protonbeam through the plasma.
Figure 5. 2D ray-tracing maps for 13MeV protons propagatingthrough tubular structures 100µm long and 60 µm in diameter.
Acknowledgements
Our thanks go to Prof. M.Haines for the useful discussions andremarks. We would like to acknowledge the contribution to theexperiments given by all members of the Central Laser Facility.
References
1. M Borghesi et alCLF Annual Report 1999/2000, pg. 18
2. AJ Mackinnon et alPhys. Rev. Lett. 86, 1769 (2001)
3. M Borghesi et alProceedings of the International Conference on Lasers2000, SOQUE, McLean, Virginia (2001)
4. M Borghesi et alCLF Annual Report 2000/2001
5. McLaughlin, W.L.C. et al,Nucl. Instr. Methods Phys. Res. A, 302, 165 (1991)
6. H. Ruhl et al., Plasma Phys. Rep. 27, 363 (2001)
7. A. Pukhov, Phys. Rev. Lett. 86, 3562 (2001)

High Power Laser Programme – Short Pulse Plasma Physics
Central Laser Facility Annual Report 2000/2001 20
Introduction
Recent advances in laser technology have enabled experimentsusing laser pulses focused to extreme intensities – thus makingpossible the exploration of new regimes in both atomic andplasma physics1). For example, when an ultra-high power laserpulse is focused into dense plasma, the generation of magneticfields up to 109 Gauss has been predicted 2-5). Here we reportmeasurements of the highest ever magnetic fields produced in alaboratory, which were achieved during ultra-high intensity(I >1019 Wcm-2) laser-plasma interaction experiments. Weshow that polarisation measurements of self-generatedharmonics of the laser provides a convenient method fordiagnosing the magnetic field in these interactions – and thatour experimental measurements indicate the existence of fieldsin excess of 300 MegaGauss. Measurements of these fields areimportant for evaluating the use of intense lasers in variouspotential applications and perhaps for understanding thecomplex physics of exotic astrophysical objects such as neutronstars 6).
Very large magnetic fields (up to 1 GigaGauss) have beenpredicted by both computer simulations 2-4) and analyticalcalculations 5) to exist in the high density region of the plasmasproduced during ultra high intensity laser-matter interactions.These fields are predicted to be localised near the criticaldensity surface, i.e., the region where the laser frequency equalsthe plasma frequency and where most of the laser absorptiontakes place. Spontaneous magnetic fields can be generated byelectron temperature and density gradients7)
(i.e. ∂ B∂ t
∝ ∇ n e × ∇ T e), by the radiation pressure
associated with the laser pulse itself 5), as well as by the currentof fast electrons generated during the interaction 3). Thegeneration of fields by the above sources becomes similar inmagnitude at very high laser intensity.
Existing diagnostic techniques for magnetic fields areinadequate for measurements where the plasma density is veryhigh (ne ~ 1021 cm-3) since the steep plasma density gradients inthese regions cause unacceptable refraction of external laserprobe beams. Until now only the outer low-density plasma(ne ~1019-1020 cm-3) magnetic field (less than 10 MegaGauss)has been measured 8,9) – which is far lower than that predictedto exist near the critical surface. Thus, the development of newdiagnostic techniques is required for detecting the highestmagnetic fields which may exist only in a very small volume ofvery high density material and may only last for picoseconddurations.
In this article we describe the first observations of the hugemagnetic fields near the critical density surface during highintensity (I > 1019 Wcm-2) short pulse (τ ~ 1 ps) laser-plasmainteractions using polarimetry measurements of self-generatedharmonics of the laser frequency. High order laser harmonics(up to the 75th) have been previously observed from similarexperiments10) and are produced by the current of hot electronswhich is driven by the laser field across the critical surfaceduring the interaction. Since these harmonics propagate out ofthe high density region isotropically and are generated at thecritical surface with the same polarisation as the incident laserbeam, we have found that the measurement of the finalpolarisation of these harmonics is a powerful technique which
can be used to infer the magnitude of magnetic fields throughwhich they travel. In particular, use of self-generated laserharmonics is convenient since they are produced at precisely thesame time as the large magnetic fields are generated andpropagate so that their k-vectors are perpendicular to azimuthalmagnetic fields in the plasma – which greatly simplifies datainterpretation (see Figure 1).
Figure 1. Schematic of experimental set-up.
All of the previous theoretical work 2-5) implies that the largestmagnetic fields are in the azimuthal direction about the laseraxis of propagation – which is also what is observed here.
Experimental work
In our experiments, we use lower order harmonics (i.e., the 2nd,3rd, 4th harmonics) generated at the critical surface as well as the3/2 harmonic generated at the quarter-critical density surface asdiagnostic tools to measure the self generated magnetic fields.This measurement is possible since the plasma in the presenceof a magnetic field is birefringent and/or optically activedepending on the propagation direction of the electromagneticwave. The former is known as linear anisotropy and producesthe Cotton-Mouton effect (an induced ellipticity) and the latteras circular plasma anisotropy which produces the Faraday effect(or rotation of the polarisation vector). An important differencebetween these two effects at lower field strengths is that theCotton Mouton effect scales like λ3 while the Faraday effectscales like λ2 (where λ is the radiation wavelength).Consequently, comparison of the polarisation states of differentharmonics can determine the relative importance of theseeffects, and measurements of the polarisation parameters of thescattered harmonics (i.e. the Stokes vectors) can preciselydetermine the transition matrix and hence the magnetic fielddistribution which connects the initial Stokes vector of theelectromagnetic wave (before the plasma) and the final Stokesvector (after the plasma)11).
The results presented here were obtained using the highintensity Vulcan laser system at the Rutherford AppletonLaboratory. This laser delivers pulses at a wavelength of1.054 µm, with an energy up to 60 J and a duration of0.8 – 1 picoseconds. The beam was p-polarised and wasfocused to a 12 µm diameter spot producing a maximum
Laboratory measurements of magnetic fields greater than 300 MegaGauss
M Tatarakis, I Watts, F N Beg, E L Clark, A E Dangor, M G Haines, M Zepf , K Krushelnick
The Blackett Laboratory, Imperial College of Science, Technology and Medicine, University of London, SW7 2BZ,UK
P A Norreys
Central Laser Facility, CLRC Rutherford Appleton Laboratory, Chilton, Didcot, Oxon, OX11 0QX, UK
Main contact email address: [email protected]
High Power Laser Programme – Short Pulse Plasma Physics
21 Central Laser Facility Annual Report 2000/2001
intensity of about 8 x 10¹⁹ Wcm-2 on a thin solid target. Inorder to measure the self-generated magnetic field during theinteraction the Stokes parameters of the 4th, 3rd and 2nd
harmonics are measured with polarimeters which use highdynamic range CCD arrays as detectors. At the entrance to thepolarimeters, interference filters are placed in order to select thedesired harmonic. Each polarimeter has four channelsconsisting of one reference channel, two channels withpolarisers set at 0o and 45o respectively and a channel with apolariser at 45o followed by a λ/4 waveplate. The results ofthese measurements can thus completely determine thepolarisation state of the incident radiation. Calibration shots,i.e. shots without polarisers, are used to measure the efficiencyof each channel.
The initial polarisation of the harmonics is linear and is thesame as that of the main interaction beam (p-polarised). Thiswas verified experimentally from very low energy shots (lessthan 1 J). The angle that the harmonics enter the magnetic field(15 degrees) can be determined from the collection optics butcan also be calculated experimentally from the initial Stokesparameter from shots at low laser intensity. The uncertainty inthis angle is the principal source of error in the measuredmagnetic field.
Consequently, from each of these measurements we candetermine the magnitude of the magnetic field using only asingle assumption, i.e. that for the plasma density scalelength –which was estimated from computational simulations of theinteraction. It should be emphasised that no other theoreticalassumptions or simplifications were used to calculate the field.
Figure 2. Measured magnetic field vs. incident laser intensityas determined from polarimetry of 2nd (diamonds), 3rd (squares)and 4th harmonics (filled circles).
Figure 2 shows the magnetic field strength versus laser intensityas measured using the 4ω, 3ω and 2ω harmonics of the laser.The peak density used is the relativistically corrected criticaldensity value (e.g. ne = 2.4 x 1021 cm-3 for I ~ 2 x 10¹⁹ W/cm-2)which is assumed to decrease exponentially with a scalelengthof 1 µm. At low intensities (I ~ 1017 W/cm2) measurements ofall three harmonics give similar results (Bmax ~ 80 MegaGauss)while as the intensity increases, the results diverge. It can beseen that fields in excess of 300 MG are suggested by themeasurements of the 4th harmonic.
Plasma density gradients can also produce depolarisation oflight12,13). However we estimate that this effect is small since inour experiments the measured radiation is propagating onaverage along the direction of the density gradient. This effectis also much less important for harmonic (higher frequency)radiation.
It is important to note that there is no change of the state of thepolarisation of the 3/2 harmonic (i.e. the 3/2 harmonic was
p-polarised for an incident p-polarised laser beam) whichimplies that the magnetic field which affects the polarisation ofthe scattered harmonics is localised between the critical densitysurface and the quarter critical density surfaces where the 3/2emission is produced14). The measured magnetic field istherefore that produced in the very highest density regions. Inaddition, no significant change of the magnetic field strengthwas observed when observations were made at different angles.Analysis was also performed to determine the relativeimportance of magnetic field components parallel to thepropagation direction of the harmonics (i.e. the Faraday effect)and these measurements indicated that that the B || componentis negligible – confirming that the magnetic field producedduring the interaction is azimuthal.
Figure 2 can be understood if one considers the effects ofextreme magnetic fields on harmonic propagation. When anelectromagnetic wave propagates in a plasma with its k vectorperpendicular to B, the extraordinary wave (X-wave), i.e. withan electric field vector perpendicular to the magnetic field, canexperience cutoffs and resonances, see Figure 3.
Cutoffs occur when the index of refraction is equal to zero andresonances when the index approaches infinity. The X-wave isreflected when it encounters a cutoff and is absorbed in aresonance (at the upper hybrid frequency). For example, thecutoffs for the 4ω, 3ω and 2ω harmonics occur at341 MegaGauss, 224 MegaGauss and 81 MegaGaussrespectively for a density of ne = 2.4 x 1021cm-3. It isconsequently impossible to measure fields higher than thisusing the Cotton Mouton effect – so Figure 2 simply indicatesthat the harmonics measured are those produced in an extendedregion of plasma just beyond the extent of the region in whichthe magnetic field exceeds the cutoff value.
The ordinary wave (with E parallel to B) is unaffected by thesecutoffs and resonances. This means that if a field larger thanthe cutoff field exists in the plasma and if this field extends overa region larger than the location where that particular harmonicis generated – only the ordinary wave will be able to propagateto the detector and consequently only the s-polarised wave canbe observed.
This is precisely what is measured in our experiments for thevery highest intensity shots. Figure 4 presents data from twohigh intensity shots (I ~ 8 x 10¹⁹ W/cm2) for the 4ω harmonic.Figure 4(A) is a calibration shot where no polarisers were used
Figure 3. Plot of lower cut-offs for various harmonics of1.054 µm radiation (in terms of plasma electron densityand magnetic field). Harmonics produced at high electrondensity will only exhibit a cut-off if a very large magneticfield exists in the plasma (i.e. the X-wave cannot propagateacross the curve indicated). This plot indicates that thistechnique may be suitable for measurements of fieldstrengths up to 1 GigaGauss.
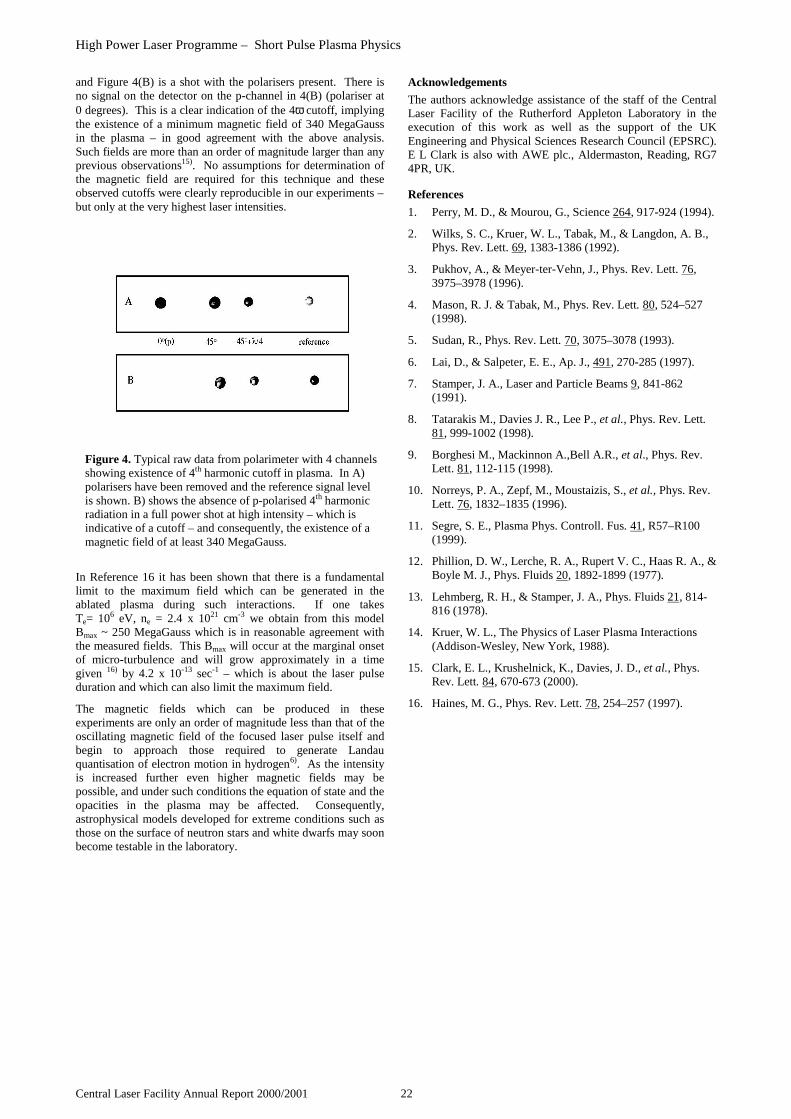
High Power Laser Programme – Short Pulse Plasma Physics
Central Laser Facility Annual Report 2000/2001 22
and Figure 4(B) is a shot with the polarisers present. There isno signal on the detector on the p-channel in 4(B) (polariser at0 degrees). This is a clear indication of the 4ω cutoff, implyingthe existence of a minimum magnetic field of 340 MegaGaussin the plasma – in good agreement with the above analysis.Such fields are more than an order of magnitude larger than anyprevious observations15). No assumptions for determination ofthe magnetic field are required for this technique and theseobserved cutoffs were clearly reproducible in our experiments –but only at the very highest laser intensities.
In Reference 16 it has been shown that there is a fundamentallimit to the maximum field which can be generated in theablated plasma during such interactions. If one takesTe= 106 eV, ne = 2.4 x 1021 cm-3 we obtain from this modelBmax ~ 250 MegaGauss which is in reasonable agreement withthe measured fields. This Bmax will occur at the marginal onsetof micro-turbulence and will grow approximately in a timegiven 16) by 4.2 x 10-13 sec-1 – which is about the laser pulseduration and which can also limit the maximum field.
The magnetic fields which can be produced in theseexperiments are only an order of magnitude less than that of theoscillating magnetic field of the focused laser pulse itself andbegin to approach those required to generate Landauquantisation of electron motion in hydrogen6). As the intensityis increased further even higher magnetic fields may bepossible, and under such conditions the equation of state and theopacities in the plasma may be affected. Consequently,astrophysical models developed for extreme conditions such asthose on the surface of neutron stars and white dwarfs may soonbecome testable in the laboratory.
Acknowledgements
The authors acknowledge assistance of the staff of the CentralLaser Facility of the Rutherford Appleton Laboratory in theexecution of this work as well as the support of the UKEngineering and Physical Sciences Research Council (EPSRC).E L Clark is also with AWE plc., Aldermaston, Reading, RG74PR, UK.
References
1. Perry, M. D., & Mourou, G., Science 264, 917-924 (1994).
2. Wilks, S. C., Kruer, W. L., Tabak, M., & Langdon, A. B.,Phys. Rev. Lett. 69, 1383-1386 (1992).
3. Pukhov, A., & Meyer-ter-Vehn, J., Phys. Rev. Lett. 76,3975–3978 (1996).
4. Mason, R. J. & Tabak, M., Phys. Rev. Lett. 80, 524–527(1998).
5. Sudan, R., Phys. Rev. Lett. 70, 3075–3078 (1993).
6. Lai, D., & Salpeter, E. E., Ap. J., 491, 270-285 (1997).
7. Stamper, J. A., Laser and Particle Beams 9, 841-862(1991).
8. Tatarakis M., Davies J. R., Lee P., et al., Phys. Rev. Lett.81, 999-1002 (1998).
9. Borghesi M., Mackinnon A.,Bell A.R., et al., Phys. Rev.Lett. 81, 112-115 (1998).
10. Norreys, P. A., Zepf, M., Moustaizis, S., et al., Phys. Rev.Lett. 76, 1832–1835 (1996).
11. Segre, S. E., Plasma Phys. Controll. Fus. 41, R57–R100(1999).
12. Phillion, D. W., Lerche, R. A., Rupert V. C., Haas R. A., &Boyle M. J., Phys. Fluids 20, 1892-1899 (1977).
13. Lehmberg, R. H., & Stamper, J. A., Phys. Fluids 21, 814-816 (1978).
14. Kruer, W. L., The Physics of Laser Plasma Interactions(Addison-Wesley, New York, 1988).
15. Clark, E. L., Krushelnick, K., Davies, J. D., et al., Phys.Rev. Lett. 84, 670-673 (2000).
16. Haines, M. G., Phys. Rev. Lett. 78, 254–257 (1997).
Figure 4. Typical raw data from polarimeter with 4 channelsshowing existence of 4th harmonic cutoff in plasma. In A)polarisers have been removed and the reference signal levelis shown. B) shows the absence of p-polarised 4th harmonicradiation in a full power shot at high intensity – which isindicative of a cutoff – and consequently, the existence of amagnetic field of at least 340 MegaGauss.

High Power Laser Programme – Short Pulse Plasma Physics
23 Central Laser Facility Annual Report 2000/2001
Introduction
When a high intensity laser pulse is focused onto a plasma, veryenergetic electrons and ions can be observed from interactionswith either gaseous or solid density plasma targets 1-3). Theonset of this regime is roughly Iλ2 = 1.3 x 10¹⁸ Wcm-2µm2,where the average kinetic energy of an electron oscillating inthe laser field becomes equivalent to its rest mass. Currently,the most powerful lasers have been able to achieve focusedintensities in excess of 1020 Wcm-2 with laser pulses containingup to several hundred Joules of energy 4), indicating thatrelativistic plasmas can now be easily achieved in thelaboratory.
One of the most exciting potential applications for these exoticlaser-produced plasmas is in the context of the Fast Ignitionscheme5) for inertial confinement fusion (ICF). In this scheme,a high power laser pulse generates an intense electron beam atthe edge of a cold, highly compressed plasma of deuterium andtritium (DT). This electron beam can then locally heat a regionof the DT core to fusion temperatures, which subsequentlysparks a burn wave able to propagate throughout the remainderof the pellet. The separation of compression and heating stagesin ICF greatly reduces the total energy requirements for thedriving beams – and also reduces the symmetry constraints forthe initial compression. However, much of the physicsinvolved in this scheme is unknown at present.
In fact, there is a significant difference in scale between theparameters of hot electron “beams” currently produced inexperiments and those envisaged for the full Fast Ignitor.Clearly only large-scale experiments will answer all of thequestions concerning electron beam generation efficiency,propagation, and energy deposition in such high densityplasmas – however, it is possible to estimate the parameters ofthe electron beams required to heat the necessary hotspot ofρr = 0.3gcm-2 to achieve ignition. For ρ = 300 gcm-3, onerequires ~ 10 kJ of energy with Eaverage= 1.5 MeV – whichimplies 4 x 10¹⁶ electrons. The ρr of the hot spot requires abeam diameter of 20 µm and implies a beam density of3 x 1023 electrons/cm3 – in the case of a 1 ps pulse. Thiscorresponds to the electron density in a ~ 3 gcm-3 DT(deuterium-tritium) plasma.
The electron beams currently generated in experiments havebeam currents significantly above the Alfvén current:
IA = 1.7 x 10⁴ βγ = 54 kA for γ = 3,
This is the limiting electron beam current in vacuum. Inprevious experiments, bremsstrahlung measurements at 50 Jincident laser energy suggest that 4 x 10¹² – 2 x 10¹³ hotelectrons are produced (10 - 50% conversion efficiency). Thelarge uncertainty is a result of the uncertainty in the temperaturemeasurement, which indicates hot electron temperatures around1.5 - 2 MeV 2). The electron current in present experiments istherefore 10 – 50 times IA and the electron beam density is~ 1020 cm-3.
Electron beams greater than the Alfvén current can onlypropagate in a plasma if they are almost perfectly compensatedby a cold return current produced by the background electrons.In present experiments, the forward current density is typicallyless than 10-3 of the target electron plasma density and is easilycompensated. However, as the electron beam density increasesand approaches the background electron density, it will becomemuch more difficult to compensate for the beam current.Consequently, stable propagation of these beams will be moredifficult – especially in the fast ignition regime. Indeed, thereare many questions associated with electron beam propagationin this regime which have yet to be studied.
One avenue for investigating these electron beams with presentlaser systems is to allow the beam generated from a relativisticlaser interaction with a solid target to propagate from the solidtarget into a lower density gas. The electron beam density isthen comparable to the density of the cold backgroundelectrons. It is also much easier to diagnose low densityplasmas than high density ones. Note that the electron beamtemperature in our experiments is similar to that envisaged forthe Fast Ignitor.
Experiment
These experiments were carried out using the CPA beam of theVulcan Nd:Glass laser system.6). The laser has a wavelength of1.054 µm, a pulse-length of 0.9 – 1.2 ps and a pulse energy of50 – 70 J. The laser beam (111 mm x 200 mm) was focusedonto the target surface using an f.l.= 600 mm off-axis parabolicmirror. The laser beam was p-polarised and was incident onto athin solid target at an angle of 45o. The peak intensity wasmeasured to be about 5 x 10¹⁹ W/cm2. The targets weretypically thin foils of aluminium or mylar (CH) and all of theoptics for the beam after compression were placed in a vacuumchamber evacuated to less than 10-4 mbar pressure.
In this experiment, a gas jet was placed immediately behind thefoil target. The gas/plasma was probed transversely usingpicosecond shadowgraphy and Moire deflectometry(interferometry) with a picosecond duration 527 nm diagnosticbeam to observe plasma density gradients associated with thepropagation of the laser-produced electron beam7). Thesupersonic gas jet produced a high density region of gas(~5 x 10¹⁹ atoms/cm3) of either helium or argon. The electrondensity in this plasma was around 1020 electrons/cm3 in the caseof helium and around 1021 electrons/cm3 in argon.
Electrons in the gas are initially in bound states in atoms and arequickly ionised during the interaction. This process can beobserved in Figure 1 which shows a shadowgraph of theionisation process. This shadowgraph was taken synchronouslywith the interaction of the main laser beam at the front of thetarget. The observed filaments are likely due to ionisation ofthe gas by diverging electron beams produced during the initialphase of the intense laser interaction. Note that it is notpossible for the laser radiation to propagate through thesealuminium or mylar plasmas – since the targets were generally50 µm thick. Consequently, the structures observed in the
Measurements of plasma propagation instabilities of high current laser producedelectron beams
M Tatarakis, M Zepf, F N Beg, E L Clark, A E Dangor, K Krushelnick
The Blackett Laboratory, Imperial College of Science, Technology and Medicine, London SW7 2BZ
K W D Ledingham, I Spencer
Department of Physics and Astronomy, University of Glasgow, Glasgow G12 8QQ UK
P A Norreys, R J Clarke
Central Laser Facility, CLRC Rutherford Appleton Laboratory, Chilton, Didcot, Oxon, OX11 0QX , UK
Main contact email address: [email protected]
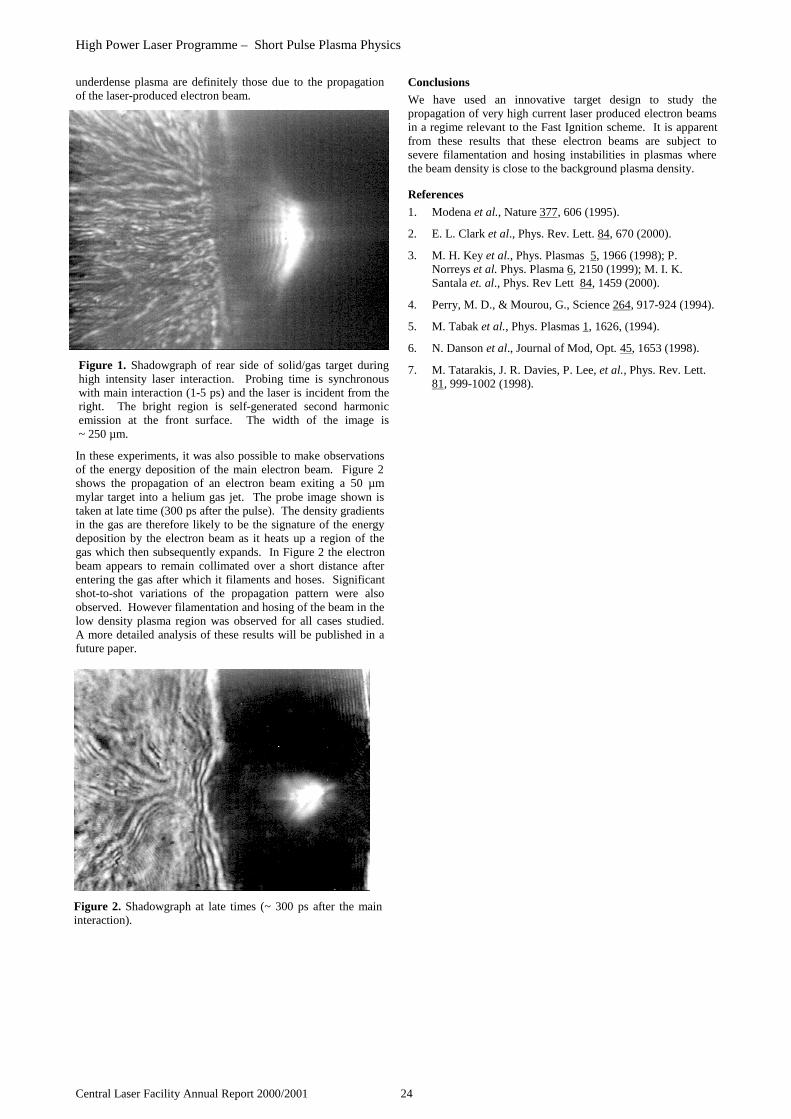
High Power Laser Programme – Short Pulse Plasma Physics
Central Laser Facility Annual Report 2000/2001 24
underdense plasma are definitely those due to the propagationof the laser-produced electron beam.
In these experiments, it was also possible to make observationsof the energy deposition of the main electron beam. Figure 2shows the propagation of an electron beam exiting a 50 µmmylar target into a helium gas jet. The probe image shown istaken at late time (300 ps after the pulse). The density gradientsin the gas are therefore likely to be the signature of the energydeposition by the electron beam as it heats up a region of thegas which then subsequently expands. In Figure 2 the electronbeam appears to remain collimated over a short distance afterentering the gas after which it filaments and hoses. Significantshot-to-shot variations of the propagation pattern were alsoobserved. However filamentation and hosing of the beam in thelow density plasma region was observed for all cases studied.A more detailed analysis of these results will be published in afuture paper.
Conclusions
We have used an innovative target design to study thepropagation of very high current laser produced electron beamsin a regime relevant to the Fast Ignition scheme. It is apparentfrom these results that these electron beams are subject tosevere filamentation and hosing instabilities in plasmas wherethe beam density is close to the background plasma density.
References
1. Modena et al., Nature 377, 606 (1995).
2. E. L. Clark et al., Phys. Rev. Lett. 84, 670 (2000).
3. M. H. Key et al., Phys. Plasmas 5, 1966 (1998); P.Norreys et al. Phys. Plasma 6, 2150 (1999); M. I. K.Santala et. al., Phys. Rev Lett 84, 1459 (2000).
4. Perry, M. D., & Mourou, G., Science 264, 917-924 (1994).
5. M. Tabak et al., Phys. Plasmas 1, 1626, (1994).
6. N. Danson et al., Journal of Mod, Opt. 45, 1653 (1998).
7. M. Tatarakis, J. R. Davies, P. Lee, et al., Phys. Rev. Lett.81, 999-1002 (1998).
Figure 1. Shadowgraph of rear side of solid/gas target duringhigh intensity laser interaction. Probing time is synchronouswith main interaction (1-5 ps) and the laser is incident from theright. The bright region is self-generated second harmonicemission at the front surface. The width of the image is~ 250 µm.
Figure 2. Shadowgraph at late times (~ 300 ps after the maininteraction).

High Power Laser Programme – Short Pulse Plasma Physics
25 Central Laser Facility Annual Report 2000/2001
Introduction
The beatwave scheme has been the subject of investigation forsome time as a method for the production of high-energyelectron beams with laser-produced plasmas1-3). The processinvolves the collinear superposition of two laser wavelengthswhich modulate the wavepacket at the ’beat’ frequency; theponderomotive force associated with the E-field gradient ofthese beats stimulates the growth of a plasma wave if thewavelength difference is matched to the electron plasmafrequency, ωp, of the target plasma. Charged particles with avelocity similar to the plasma wave phase velocity can gainenergy from the longitudinal electric field of the wave andbecome accelerated4).
Growth of the plasma wave is limited by the relativistic massincrease of oscillating electrons5), so that ωp decreases and thebeat is no longer resonant. However, if the laser pulse length ismuch longer than the ion plasma period, electron oscillationscouple to ion motion via the modulational instability (MI), andthe wave amplitude is instead limited by energy lost into ionacoustic waves6). Previous beatwave experiments have usedlaser pulse lengths of 90 ps or more so that the amplitude issaturated by the MI rather than by relativistic effects. In thisexperiment, a shorter (3-4 ps) and more intense pulse wasemployed in order to side-step the modulational instability, sothat the wave may be driven to relativistic amplitudes.
Experimental Set-Up
The experiment was performed with the Nd:glass Vulcan CPAlaser system at RAL using a Ti:Sapphire mode-lockedoscillator. To obtain the two frequencies for the beatwave amask was placed between the two diffraction gratings of theCPA stretcher (Figure 1). The mask had slits to select twonarrow frequency bands from the input bandwidth to passthrough the laser amplifier chain: these two bands were thustemporally separated throughout the chain to prevent non-linearinteractions within the laser medium7).
Figure 1. Modifications to the CPA stretcher for the beatwave.
Figure 2. An image from the autocorrelator showing the beats.
The width and separation of the slits could be adjusted tochoose the beat frequency and the bandwidth of its componentfrequencies. A separation of ∆λ = 5.3 nm was obtained as acompromise between maximising the beat frequency whilekeeping both component frequencies within the laser gainbandwidth. Each component had a bandwidth of about 1 nm.
After amplification and recompression, the two componentswere overlapped temporally and spatially; the compressiongratings could also be adjusted to generate a positive ornegative chirp on the recompressed pulse. A single-shotautocorrelator showed the intensity modulations due to thebeating and could be used to check the overlap - see Figure 2.
The pulse is then focused with a 0.6 m off-axis parabolic mirrorinto a chamber filled with low pressure hydrogen gas. Thetransmitted beam was imaged onto an optical spectrometer todetermine the forward scattered spectrum.
Results
The average energy on target per pulse was approximately30 J, delivered into a focal spot with dimensions about10µm × 30µm. The modification of the CPA stretcher had theeffect of reducing the output energy and increasing the pulselength due to the reduced bandwidth, and a minimumcompressed pulse length of 3 ps was achieved. This resulted inan intensity of about 3×10¹⁸ Wcm-2 at focus. A measurement ofthe spectrum of the incoming beam showed that the balance inenergy between the two frequencies was about 5:3 in favour ofthe higher frequency. Given a beat composed of wavelengths at1050.7 nm and 1056.0 nm, the frequency of the beat envelopewas 1.43×10¹² s-1, which equals the plasma frequency of a gaswith electron density of ne0 = 2.55×1016 cm-3: assuming that thelaser completely ionises the gas without altering its density, thisrequires an initial gas fill pressure of 0.47 mbar (at S.T.P.).
The presence of the plasma wave was detected by measuringthe Raman scattering of the transmitted beam, whereby theplasma wave mixes with the incident electromagnetic waves toproduce side-bands in the transmitted spectrum, spaced fromthe incident frequencies by ∆λ. The intensity of these side-bands may be used to estimate the amplitude of the plasmawave. However, two frequencies co-propagating through a non-linear medium (such as the neutral gas between the compression
Excitation of relativistic electron plasma waves by the short-pulse beatwaveprocess
B Walton, Z Najmudin, M-S Wei, C Marle, K Krushelnick, A E Dangor
Blackett Laboratory, Imperial College of Science, Technology and Medicine, London SW7 2BZ, UK
R J Clarke, M J Poulter, C Hernandez-Gomez, S Hawkes, D Neely, C N Danson, J L Collier
Central Laser Facility, CLRC Rutherford Appleton Laboratory, Chilton, Didcot, Oxon, OX11 0QX, UK
S Fritzler, V Malka
LULI, Ecole Polytechique,91128 Palaiseau Cedex, France
Main contact email address: [email protected]
Gr a t ing 2
Mir r o r
Le ns 1 Le n s 2
Ma sk
Slits
6 20 fs
2 00 p s
Gr a t in g 1
3ps
700fs

High Power Laser Programme – Short Pulse Plasma Physics
Central Laser Facility Annual Report 2000/2001 26
δne
=2E
πγem
ecτσ 4ω
1ω
2
gratings and the focus) also undergo atomic cross-phasemodulation, a process which produces side-bands with the samewavelength separation, and so methods must be found todistinguish between them.
Figure 3. Transmitted beam spectrum showing the incidentfundamental frequencies and the scattered side-bands.
A series of shots was taken with the Vulcan laser into hydrogengas, varying the gas pressure for each shot, and measuring theintensity of the side-bands each time. Figure 3 shows the outputfrom the spectrometer, recorded on a 16-bit Andor CCDcamera. A plot of the variation with electron density of theintensity of the first side-band (Iside) on each side of thefundamentals is shown in Figure 4. The side-band intensities arescaled against the energy of the laser, to account for shot-to-shot variations, and the electron densities have been scaled tothe resonant density derived from the beat frequency. The blueside-bands appear to be more intense than the red; this isprobably due to ionisation-induced blue-shifting.
The plot (Figure 4) shows an increase in side-band intensitywith electron density, superimposed upon which is a sharp peakat a density of 11.7 ne0. The underlying increasing trend is mostlikely to be due to cross-phase modulation in the neutral gasatmosphere, as the non-linear refractive index increases linearlywith gas density, but the peak is almost certainly due to thecreation of an electron plasma wave by the beatwave process,despite its appearance at a density many times ne0. There is alsoan apparent peak at 21 ne0, but more data is needed to find out ifthat is due to a real plasma effect.
Discussion
A simple explanation of why the resonance peak in the side-band intensity is shifted to a higher electron density may liewith the effect of the ponderomotive force associated with theradial electric field gradient of the laser focal spot. Assumingthat the field strength decreases with distance from the beamaxis, this acts to expel electrons from the middle of the beam,creating a density depression there and a density surplus at thebeam edge.
Therefore, if the electron density of the plasma is higher thanne0 to begin with, the ponderomotive force of the beam couldbring it down to a value which is resonant with the beat. Asteady-state approximation for the density depression may becalculated by equating the outward ponderomotive forceexerted on the electrons by the laser with the inward attractivespace-charge force due to the remaining positive ions:
(1)
for a Gaussian pulse profile with waist σ, length τ, and energyE. With the beam parameters outlined above, an electrondensity depression of δne ≈ 1016 cm-3 can be expected, which isof the correct order of magnitude to account for the shift inresonance shown in Figure 4.
It can be concluded from this data that the short pulse beatwaveprocess has been successfully demonstrated to generate plasmawaves. However, a quantitative measurement of the amplitudeof the wave must wait for further modelling work to beundertaken.
References
1. F Amiranoff et. al.Phys. Rev. Lett., 74 5220, (1995)
2. A E Dangor et. al.Plasma Phys. Controlled Fusion, 16 65, (1994)
3. C E Clayton et. al.Phys. Rev. Lett., 70 37, (1993)
4. T Tajima and J DawsonPhys. Rev. Lett., 43 267, (1979)
5. M N Rosenbluth and C S LiuPhys. Rev. Lett., 29 701, (1972)
6. P Mora et. al.Phys. Rev. Lett., 61 1611, (1988)
7. D Neely et. al.IEEE Trans. on Plasma Science, 28 1116, (2000)
5HGIXQGDPHQWDO
QP
VWQGUHG
VLGHEDQGV
%OXHIXQGDPHQWDO
QP
VWQGEOXH
VLGHEDQGV
QP
:DYHOHQJWKQP
Is ide/Ishot ( firs t red s ideband)
Is ide/2*Ishot ( firs t blue s ideband)
QHQH
Figure 4. Plot of side-band intensities against electron density.
I si
de /
I sh
ot

High Power Laser Programme – Short Pulse Plasma Physics
27 Central Laser Facility Annual Report 2000/2001
Introduction
High intensity laser-plasma interactions at intensities greaterthan 1019 W/cm2 have recently allowed the exploration of newregimes in plasma physics. Such interactions can produce fastelectrons with energies greater than 100 MeV 1), gamma rays oftens of MeV 2) and energetic ions of up to several hundredMeV 3). There are clearly many potential applications for theseenergetic particles such as compact accelerators1), inertialfusion4), and as diagnostic probe beams of high densitymaterial. The use of these lasers as a source of MeV x-rays forproviding deep-penetration radiographs of dense matter has alsorecently been discussed5). This application of laser-producedplasmas is particularly attractive since such sources may soonbe scalable to “table-top” sizes and to high repetition rates. Itmay also be possible to obtain multiple views of an object fromarbitrary angles – thus potentially enabling 3-dimensionalradiographic “movies” of dense, rapidly moving objects such asinertially confined fusion targets.
Experiment
This report describes experiments conducted at the RutherfordAppleton Laboratory using the ultra-high power Vulcan Laserfacility to examine the feasibility of this application. In thiswork, we compare the use of both high Z solid targets and lowdensity gas jet targets for γ-ray generation. The γ-rays aretypically generated in a secondary process – since electrons areinitially accelerated during the laser plasma interaction whichsubsequently emit hard x-rays via bremsstrahlung as they arestopped in solid material. In this work, we show that thegamma rays produced in a laser accelerator configuration aremuch more collimated and can be generated more efficientlythan in a simple solid target interaction.
In these experiments, we used lithium fluoride dosimeters(TLDs) to measure the total radiation output as well as thedirection and the spectrum of the radiation. The gamma raysource was then also used to radiograph thick high-density testobjects.
The laser interaction region was surrounded by an array ofsixteen tungsten collimators to provide complete angularinformation concerning the x-ray flux. The tungstencollimators were constructed using specially made kinematicmounts so that their positions would be known precisely. Thedosimetry was performed by inserting four standard colour-coded TLD plastic pots separated by 4 mm long cylindricaltungsten plugs in a 5 mm diameter 10 cm long cylindrical holein the centre of each of the collimators. Up to seventeen ofthese cylinders were distributed around the target chamber andthe doses on each TLR were measured using a standard reader.
In addition to the TLD/collimator assemblies which measuredfiltered dose, a number of TLD pots were fielded to look at the“bare” dose. These were placed inside small perspex cylindersto ensure electron equilibrium and were sensitive to photonenergies above 1 keV.
In these experiments the Vulcan 6) high power beam wastransported into an evacuated target chamber where it wasfocussed by an off-axis parabolic mirror to a spot of about10 µm diameter. The maximum intensity was about5 x 1019 W/cm2 in the work described here. In the initial set ofexperiments a solid target was used which was angled at 45° tothe direction of beam propagation.
For simplicity an “effective” energy was assumed for the lasergenerated electron beam (Veffective), and consequently theattenuation values for the TLDs through the collimator could becalculated for each TLD for varying energies from 0.2 MeV to14 MeV. Target absorption was ignored as an initialapproximation. To derive the energy from a particular result,ratios from the first TLD to the others were used since theunattenuated dose was not directly measured. The x-rayspectrum could then be deduced by comparing the ratios of thefielded TLDs to predicted values for a given Veffective.
A total of 22 shots was fired with TLDs fielded during this setof experiments and a maximum of 70 TLD containers was usedper shot. Background measurements were taken regularly tomaintain the accuracy of the TLDs with the lowest readings.Fourteen shots were fired using a solid target of gold ortantalum of differing thicknesses.
Figure 1 shows raw TLD measurements taken from a shot ontosolid tantalum targets, 1.75 mm thick and angled at 45 degreesto the laser axis. In general, such shots produce their peak doseat an angle of at least 30 degrees to the laser beam axis.Unfortunately, TLDs could not be fielded at 45 degrees wherethe peak dose would have been expected due to spacelimitations. For each angle three values for Veffective could begenerated, one from each of the green, blue and yellow TLDs.A weighted average of the data was then taken, skewed towardsthe front TLDs as these received higher doses and so should beless susceptible to errors.
Gamma - radiography using a laser-plasma accelerator
R D Edwards, M A Sinclair, T J Goldsack
Radiation Physics Department, AWE plc, Aldermaston, Reading, RG7 4PR, UK
K Krushelnick, F N Beg, E L Clark, A E Dangor, M Tatarakis, M Zepf
The Blackett Laboratory, Imperial College of Science, Technology and Medicine, London SW7 2BZ
K W D Ledingham, I Spencer
Department of Physics and Astronomy, University of Glasgow, Glasgow G12 8QQ UK
P A Norreys, R J Clarke
Central Laser Facility, CLRC Rutherford Appleton Laboratory, Chilton, Didcot, Oxon, OX11 0QX, UK
Main contact email address: [email protected]
8 0
Angle from Laser axis
- 1 8 0 0 - 1 2 0 - 6 0 6 0 1 8 0 1 2 0
7 0
6 0
5 0
4 0
3 0
2 0
1 0
0
Dos
e m
R @
1m
Figure 1. TLD signal levels with respect to angle for a typicalsolid target shot. The peak signal occurs in the directionapproximately normal to the target surface.
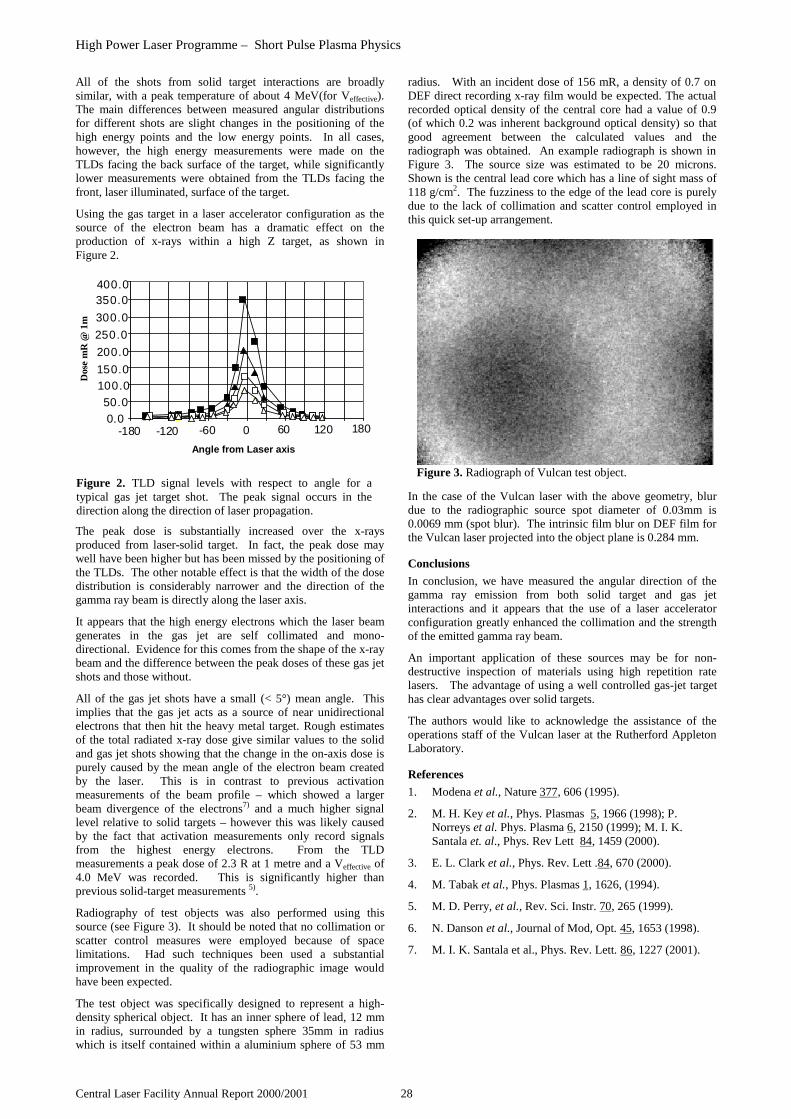
High Power Laser Programme – Short Pulse Plasma Physics
Central Laser Facility Annual Report 2000/2001 28
All of the shots from solid target interactions are broadlysimilar, with a peak temperature of about 4 MeV(for Veffective).The main differences between measured angular distributionsfor different shots are slight changes in the positioning of thehigh energy points and the low energy points. In all cases,however, the high energy measurements were made on theTLDs facing the back surface of the target, while significantlylower measurements were obtained from the TLDs facing thefront, laser illuminated, surface of the target.
Using the gas target in a laser accelerator configuration as thesource of the electron beam has a dramatic effect on theproduction of x-rays within a high Z target, as shown inFigure 2.
The peak dose is substantially increased over the x-raysproduced from laser-solid target. In fact, the peak dose maywell have been higher but has been missed by the positioning ofthe TLDs. The other notable effect is that the width of the dosedistribution is considerably narrower and the direction of thegamma ray beam is directly along the laser axis.
It appears that the high energy electrons which the laser beamgenerates in the gas jet are self collimated and mono-directional. Evidence for this comes from the shape of the x-raybeam and the difference between the peak doses of these gas jetshots and those without.
All of the gas jet shots have a small (< 5°) mean angle. Thisimplies that the gas jet acts as a source of near unidirectionalelectrons that then hit the heavy metal target. Rough estimatesof the total radiated x-ray dose give similar values to the solidand gas jet shots showing that the change in the on-axis dose ispurely caused by the mean angle of the electron beam createdby the laser. This is in contrast to previous activationmeasurements of the beam profile – which showed a largerbeam divergence of the electrons7) and a much higher signallevel relative to solid targets – however this was likely causedby the fact that activation measurements only record signalsfrom the highest energy electrons. From the TLDmeasurements a peak dose of 2.3 R at 1 metre and a Veffective of4.0 MeV was recorded. This is significantly higher thanprevious solid-target measurements 5).
Radiography of test objects was also performed using thissource (see Figure 3). It should be noted that no collimation orscatter control measures were employed because of spacelimitations. Had such techniques been used a substantialimprovement in the quality of the radiographic image wouldhave been expected.
The test object was specifically designed to represent a high-density spherical object. It has an inner sphere of lead, 12 mmin radius, surrounded by a tungsten sphere 35mm in radiuswhich is itself contained within a aluminium sphere of 53 mm
radius. With an incident dose of 156 mR, a density of 0.7 onDEF direct recording x-ray film would be expected. The actualrecorded optical density of the central core had a value of 0.9(of which 0.2 was inherent background optical density) so thatgood agreement between the calculated values and theradiograph was obtained. An example radiograph is shown inFigure 3. The source size was estimated to be 20 microns.Shown is the central lead core which has a line of sight mass of118 g/cm2. The fuzziness to the edge of the lead core is purelydue to the lack of collimation and scatter control employed inthis quick set-up arrangement.
In the case of the Vulcan laser with the above geometry, blurdue to the radiographic source spot diameter of 0.03mm is0.0069 mm (spot blur). The intrinsic film blur on DEF film forthe Vulcan laser projected into the object plane is 0.284 mm.
Conclusions
In conclusion, we have measured the angular direction of thegamma ray emission from both solid target and gas jetinteractions and it appears that the use of a laser acceleratorconfiguration greatly enhanced the collimation and the strengthof the emitted gamma ray beam.
An important application of these sources may be for non-destructive inspection of materials using high repetition ratelasers. The advantage of using a well controlled gas-jet targethas clear advantages over solid targets.
The authors would like to acknowledge the assistance of theoperations staff of the Vulcan laser at the Rutherford AppletonLaboratory.
References
1. Modena et al., Nature 377, 606 (1995).
2. M. H. Key et al., Phys. Plasmas 5, 1966 (1998); P.Norreys et al. Phys. Plasma 6, 2150 (1999); M. I. K.Santala et. al., Phys. Rev Lett 84, 1459 (2000).
3. E. L. Clark et al., Phys. Rev. Lett .84, 670 (2000).
4. M. Tabak et al., Phys. Plasmas 1, 1626, (1994).
5. M. D. Perry, et al., Rev. Sci. Instr. 70, 265 (1999).
6. N. Danson et al., Journal of Mod, Opt. 45, 1653 (1998).
7. M. I. K. Santala et al., Phys. Rev. Lett. 86, 1227 (2001).
Angle from Laser axis
0 . 0
5 0 . 0
1 0 0 . 0
1 5 0 . 0
2 0 0 . 0
2 5 0 . 0
3 0 0 . 0
3 5 0 . 0
4 0 0 . 0
- 1 8 0 0 - 1 2 0 - 6 0 6 0 1 8 0 1 2 0
Dos
e m
R @
1m
Figure 2. TLD signal levels with respect to angle for atypical gas jet target shot. The peak signal occurs in thedirection along the direction of laser propagation.
Figure 3. Radiograph of Vulcan test object.

High Power Laser Programme – Short Pulse Plasma Physics
29 Central Laser Facility Annual Report 2000/2001
Introduction
The high intensities available with current lasers(I ~ 1020 Wcm-2) have led to a wealth of novel phenomenaobserved in solid interactions. These include the generation ofrelativistic electrons, beams of gamma rays, energetic protons(up to 50 MeV) as well as laser induced nuclear reactions1-4).The small spatial and temporal scales ( < 10 µm, < 1 ps) makeit difficult to diagnose these interactions in detail usingconventional techniques. Measurements of the emission of highorder harmonics of the fundamental laser frequency can be apowerful diagnostic of the physical processes and plasmaconditions in the interaction region5-8) in addition to being ofinterest as a bright source of XUV radiation. Norreys et al 9)
using values of Iλ2 up to 1019: P2cm-2 have observed up tothe 75th harmonic of a 1.053 µm laser with a conversionefficiency of 10-6. The harmonic generation is due to theelectrons dragged across the vacuum-solid interface by theelectric field of the laser pulse. Harmonic generation can alsobe understood by a simple model based on the phasemodulation experienced by the light on reflection from theoscillating plasma-vacuum boundary10-12).
In this paper we report the first observations of the modulatedspectral structure of harmonics generated from solids. Ourresults show that at Iλ2 ~ 1019 : P2cm-2 the spectrum ismodulated with a periodicity of 2 to 4 harmonics. Theexperimental results are compared to PIC simulations whichshow that at high intensity the amplitude of the critical surfaceoscillation increases and is no longer purely sinusoidal at thelaser frequency. We show that the modulation results directlyfrom the motion of the reflecting surface. Good agreement isfound when the trajectory of the critical surface, derived fromPIC simulations, is used with the “moving mirror” model.Consequently the dynamics of the critical surface can beinferred from the experimental observation of the harmonicspectrum and this may prove to be an important diagnostictechnique in future high-intensity experiments.
Experiment and simulation
The experiment was performed on the Vulcan laser system atthe Rutherford Appleton Laboratory, delivering 0.7 - 1.0 pspulses at 1.053 microns with energies up to 50 J onto target.The rectangular beam, 20 x 11 cm2, was focused by an on-axisparabolic mirror (f = 22 cm).
The target consisted of an optically polished fused silica slab setat 45o angle of incidence with the beam p-polarized. Theenergy on target and pulse duration were monitored on a shot-to-shot basis. The focused intensity on target was estimatedfrom the maximum ion energy in the blow-off plasma usingCR39 nuclear track detectors11,13,14). Another measure of theshot intensity was obtained from the hole boring velocity of thecritical surface measured by the Doppler shift of the harmonics5,
15). The intensity (I) on target was up to 1.0 x 10¹⁹ Wcm-2.
The laser pre-pulse was determined in a previous experiment tobe about 10-6 of the peak intensity. The sub-critical plasmaproduced by this pre-pulse in front of the target was measuredby optical probing and found to have a scale-length which wastypically less than 10 µm.
The harmonic emission in the specularly reflected direction wasobserved by a slit-less flat-field XUV spectrometer 10,17). Thisconsisted of a gold-coated cylindrical grazing-incidencecollection mirror followed by a variable line-spaced grating,also at grazing-incidence. The acceptance angle of the mirrorand grating was 1 x 10⁻⁶ sr. The mirror and grating wereorientated perpendicular to each other to produce an astigmaticline image in the detector plane of the harmonic emittingplasma at the target. The dispersed radiation was split into twowavelength regions and detected separately. The region540 - 276 Å was intercepted by a plane gold-coated mirror set at65 degrees incidence and directed onto a double micro-channelplate (MCP) detector coupled to an intensified optical 8-bitcharge-coupled-device (CCD). The region 85 – 272 Å wasdetected by a back-thinned XUV sensitive 16-bit CCD detector.Thus harmonic emission from the 20th to 120th order could bedetected simultaneously. The absolute spectrometer responsewas calculated using the measured mirror reflectivities, thegrating calibration18), the transmission of any filters used andthe calibrated MCP/CCD detector response19). The conversionefficiency of each harmonic was calculated assuming uniformemission into 2π sr. This assumption is reasonable in view ofprevious measurements 9,20).
A typical spectrum showing the 20th (526.5 Å ) to 37th(284.6 Å) harmonics and corrected for the spectrometerresponse and background is shown in Figure 1a.
Dynamics of the Critical Surface in High Intensity Laser-Solid Interactions:Modulation of the XUV Harmonic Spectra
I Watts, M Zepf, E L Clark, M Tatarakis, K Krushelnick, A E Dangor
The Blackett Laboratory, Imperial College of Science, Technology and Medicine, Prince Consort Road, London SW7 2BZ, UK
R M Allott, R J Clarke, D Neely, P A Norreys
Central Laser Facility, CLRC Rutherford Appleton Laboratory, Chilton, Didcot, Oxon, OX11 0QX, UK
Main contact email address: [email protected]
0
1
2
3
4
5
250 300 350 400 450 500 550
(a)
Con
vers
ion
Effi
cien
cy (
10-6 )
Wavelength (Å)
37t h 30t h 22n d
0
1
2
3
4
5
6
250 300 350 400 450 500 550
(b)
Con
vers
ion
Effi
cien
cy (
10-5 )
Wavelength (Å)
20t h30t h
Figure 1. Lineouts of typical harmonic spectra for (a) highintensity I ~ 1019 W/cm2 and (b) low intensity I ~ 1018 W/cm2.
(a)
(b)
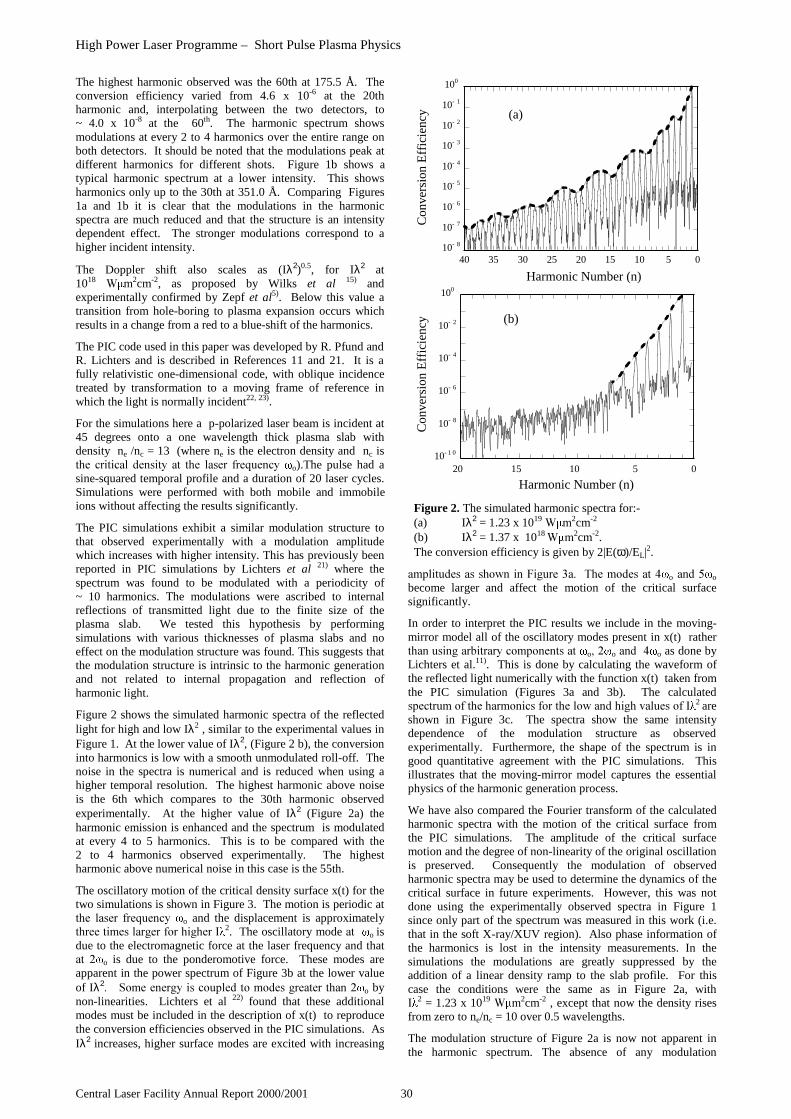
High Power Laser Programme – Short Pulse Plasma Physics
Central Laser Facility Annual Report 2000/2001 30
The highest harmonic observed was the 60th at 175.5 Å. Theconversion efficiency varied from 4.6 x 10⁻⁶ at the 20thharmonic and, interpolating between the two detectors, to~ 4.0 x 10⁻⁸ at the 60th. The harmonic spectrum showsmodulations at every 2 to 4 harmonics over the entire range onboth detectors. It should be noted that the modulations peak atdifferent harmonics for different shots. Figure 1b shows atypical harmonic spectrum at a lower intensity. This showsharmonics only up to the 30th at 351.0 Å. Comparing Figures1a and 1b it is clear that the modulations in the harmonicspectra are much reduced and that the structure is an intensitydependent effect. The stronger modulations correspond to ahigher incident intensity.
The Doppler shift also scales as (Iλ2)0.5, for Iλ2 at1018 : P2cm-2, as proposed by Wilks et al 15) andexperimentally confirmed by Zepf et al5). Below this value atransition from hole-boring to plasma expansion occurs whichresults in a change from a red to a blue-shift of the harmonics.
The PIC code used in this paper was developed by R. Pfund andR. Lichters and is described in References 11 and 21. It is afully relativistic one-dimensional code, with oblique incidencetreated by transformation to a moving frame of reference inwhich the light is normally incident22, 23).
For the simulations here a p-polarized laser beam is incident at45 degrees onto a one wavelength thick plasma slab withdensity ne /nc = 13 (where ne is the electron density and nc isWKH FULWLFDO GHQVLW\ DW WKH ODVHU IUHTXHQF\ o).The pulse had asine-squared temporal profile and a duration of 20 laser cycles.Simulations were performed with both mobile and immobileions without affecting the results significantly.
The PIC simulations exhibit a similar modulation structure tothat observed experimentally with a modulation amplitudewhich increases with higher intensity. This has previously beenreported in PIC simulations by Lichters et al 21) where thespectrum was found to be modulated with a periodicity of~ 10 harmonics. The modulations were ascribed to internalreflections of transmitted light due to the finite size of theplasma slab. We tested this hypothesis by performingsimulations with various thicknesses of plasma slabs and noeffect on the modulation structure was found. This suggests thatthe modulation structure is intrinsic to the harmonic generationand not related to internal propagation and reflection ofharmonic light.
Figure 2 shows the simulated harmonic spectra of the reflectedlight for high and low Iλ2 , similar to the experimental values inFigure 1. At the lower value of Iλ2, (Figure 2 b), the conversioninto harmonics is low with a smooth unmodulated roll-off. Thenoise in the spectra is numerical and is reduced when using ahigher temporal resolution. The highest harmonic above noiseis the 6th which compares to the 30th harmonic observedexperimentally. At the higher value of Iλ2 (Figure 2a) theharmonic emission is enhanced and the spectrum is modulatedat every 4 to 5 harmonics. This is to be compared with the2 to 4 harmonics observed experimentally. The highestharmonic above numerical noise in this case is the 55th.
The oscillatory motion of the critical density surface x(t) for thetwo simulations is shown in Figure 3. The motion is periodic atWKH ODVHU IUHTXHQF\ o and the displacement is approximatelyWKUHHWLPHVODUJHUIRUKLJKHU, 2. The oscillatory mode DW o isdue to the electromagnetic force at the laser frequency and thatDW o is due to the ponderomotive force. These modes areapparent in the power spectrum of Figure 3b at the lower valueof Iλ2 6RPHHQHUJ\LVFRXSOHGWRPRGHVJUHDWHUWKDQ o bynon-linearities. Lichters et al 22) found that these additionalmodes must be included in the description of x(t) to reproducethe conversion efficiencies observed in the PIC simulations. AsIλ2 increases, higher surface modes are excited with increasing
DPSOLWXGHVDVVKRZQLQ)LJXUHD7KHPRGHVDW oDQG o
become larger and affect the motion of the critical surfacesignificantly.
In order to interpret the PIC results we include in the moving-mirror model all of the oscillatory modes present in x(t) ratherWKDQXVLQJDUELWUDU\FRPSRQHQWVDW o oDQG o as done byLichters et al.11). This is done by calculating the waveform ofthe reflected light numerically with the function x(t) taken fromthe PIC simulation (Figures 3a and 3b). The calculatedVSHFWUXPRIWKHKDUPRQLFVIRUWKHORZDQGKLJKYDOXHVRI, 2 areshown in Figure 3c. The spectra show the same intensitydependence of the modulation structure as observedexperimentally. Furthermore, the shape of the spectrum is ingood quantitative agreement with the PIC simulations. Thisillustrates that the moving-mirror model captures the essentialphysics of the harmonic generation process.
We have also compared the Fourier transform of the calculatedharmonic spectra with the motion of the critical surface fromthe PIC simulations. The amplitude of the critical surfacemotion and the degree of non-linearity of the original oscillationis preserved. Consequently the modulation of observedharmonic spectra may be used to determine the dynamics of thecritical surface in future experiments. However, this was notdone using the experimentally observed spectra in Figure 1since only part of the spectrum was measured in this work (i.e.that in the soft X-ray/XUV region). Also phase information ofthe harmonics is lost in the intensity measurements. In thesimulations the modulations are greatly suppressed by theaddition of a linear density ramp to the slab profile. For thiscase the conditions were the same as in Figure 2a, with, 2 = 1.23 x 10¹⁹ : P2cm-2 , except that now the density risesfrom zero to ne/nc = 10 over 0.5 wavelengths.
The modulation structure of Figure 2a is now not apparent inthe harmonic spectrum. The absence of any modulation
10- 8
10- 7
10- 6
10- 5
10- 4
10- 3
10- 2
10- 1
100
0510152025303540
(a)
Con
vers
ion
Effi
cien
cy
Harmonic Number (n)
10- 1 0
10- 8
10- 6
10- 4
10- 2
100
05101520
(b)
Con
vers
ion
Effi
cien
cy
Harmonic Number (n)
Figure 2. The simulated harmonic spectra for:-(a) Iλ2 = 1.23 x 10¹⁹: P2cm-2
(b) Iλ2 = 1.37 x 10¹⁸ : P2cm-2.The conversion efficiency is given by 2|E(ω)/EL|2.

High Power Laser Programme – Short Pulse Plasma Physics
31 Central Laser Facility Annual Report 2000/2001
structure demonstrates that this effect depends on initial scale-length as well as the incident intensity. The PIC simulationshows that now no single critical surface exists and that layersof ablating plasma gives rise to multiple overdense reflectinglayers. Even at lower intensities it has been shown analyticallyby Kingham et al24) that the reflection of the incident wave is nolonger localized at the critical surface in the presence of a rampand regions above critical density can also contribute to thegeneration of the harmonic spectrum21). For the experimentalconditions considered in this paper the scale-length prior to thearrival of the laser pulse is typically in the range of 1 - 6 µm.This is in contrast to the sharp plasma discontinuity that isimplicit in the moving mirror model. It is therefore surprisingthat the moving mirror model and the PIC simulations using astep profile agree so closely with the experimental observations.However, the large laser pressures can lead to significantsteepening of the density profile5) if the pulse is sufficientlylong. At the same time, the laser expels most of the plasmafrom the focal region, creating the kind of vacuum-plasmaboundary that is required to produce the modulation structure.
That this is indeed the case has been shown previously byinvestigating the conversion efficiency at different pre-pulselevels6). For short pulse lengths a rapid drop of the conversionefficiency with increasing pre-pulse was observed. By contrast,experiments with ~ 1 ps pulses 9) were insensitive to the level ofpre-pulse and showed conversion efficiencies in goodagreement with PIC simulations for short or step-like densityprofiles. The modulation structure should therefore be a goodindicator of high contrast ratios for shorter duration laser pulses(< 200 fs).
To summarize, the experimentally observed modulation of theharmonic spectrum agrees with the PIC simulation. Themodulation is due to the introduction of higher modes ofoscillation of the critical surface x(t) and can be described interms of the moving mirror model. Observations of themodulational structure of harmonic emission from highintensity interactions may be important as a diagnostic tool ofthe behavior of the critical surface, for example in “fast ignitor”type experiments. Measurements of the modulational structureof harmonic emission from several different angles canpotentially provide 3-dimensional information on the criticalsurface dynamics under intense laser irradiation. Understandingthis effect may also be important for determining the suitabilityof this XUV source for future applications.
Acknowledgements
The authors are indebted to Prof. J. Meyer-ter-Vehn for the useof the PIC simulation software. The work was supported by theUnited Kingdom Engineering and Physical Sciences ResearchCouncil (EPSRC).
References
1-4 E. L. Clark et al., Phys.Rev. Lett. 85, 1654 (2000), S. P.Hatchett et al., Phys. Plasmas 7, 2076 (2000), M. I. K.Santala et al., Appl. Phys. Lett. 78, 19 (2001), K. W. D.Ledingham et al., Phys. Rev. Lett. 84 , 899 (2000).
5-8 M. Zepf et al. , Phys. Plasmas 3, 3242 (1996), M. Zepf etal., Phys. Rev. E 58 ,R5253 (1998), R. Hassner et al.,Opt. Lett. 22, 1491 (1997), W. Theobald et al. , Phys.Rev. Lett. 77, 298 (1996).
9. P. A. Norreys et al., Phys. Rev. Lett. 76 , 1832 (1996).10. S. V. Bulanov, N. M. Naumova and F. Pegoraro, Phys.
Plasmas 1, 745 (1994).11. R. Lichters, J. Mey d K. Rzazewski, Appl. Phys. B - Lasers
Opt. 63, 499 (199612. D. von der Linde and K. Rzazewski, Appl. Phys. B -
Lasers Opt. 63, 499 (1996)13. F.N. Beg et al., Phys. Plasmas 4, 447 (1997).14. A.P. Fews et al., Phys. Rev. Lett. 73, 1801 (1994).15. S.C. Wilks et al., Phys. Rev. Lett. 69, 1383 (1992).16. D. Neely et al., Rutherford Appleton Laboratory Technical
Report, RAL-TR-95-025, 113 (199517. D. Neely (private communication).18. D. Neely and D. M. Chambers, Rutherford Appleton
Laboratory Technical Report, RAL-TR-96-74, (1997).19. M. Zepf et al., Rutherford Appleton Laboratory Technical
Report, RAL-TR-95-025, 115 (1995).20. D.M. Chambers et al., Opt. Comm. 148, 289 (1998).21. R. Lichters and J. Meyer-ter-Vehn, Inst. Phys. Conf. Ser.
154, 221 (1997).
22. A. Bourdier, Phys. Fluids 26, 1804 (1983).
23. A.R. Bell, Astro. Space Sci. 256, 13 (1998).24. R. Kingham et al., Phys. Rev. Lett. 86, 810 (2001).J.
Meyer-ter-Vehn and A. Pukhov, Phys. Plasmas 3, 3425(1996).
Figure 3. (a), (b), the motion of the critical surface x(t) fromthe simulations.Inset shows the different modes of oscillation.(a) Iλ2 = 1.23 x 10¹⁹: P2cm-2
(b) Iλ2 = 1.37 x 10¹⁸: P2cm-2
(c) Calculated conversion into harmonics using theoscillating mirror model. Closed circles correspond toIλ2 = 1.23 x 10¹⁹ : P2cm-2 and closed squares correspond toIλ2 = 1.37 x 10¹⁸ : P2cm-2. The open symbols show the PICsimulation results of Figure 2 for comparison.

High Power Laser Programme – Short Pulse Plasma Physics
Central Laser Facility Annual Report 2000/2001 32
Introduction
The rapid development of modern laser systems has led tointensities exceeding 1020 Wcm-2, where many new phenomenahave been observed in laser-matter interaction experiments.These include the generation of relativistic electrons, gammarays, energetic protons and laser induced nuclear reactions 1-4).Also, relativistic non-linear optical effects in the plasma beginto become important5) and phenomena such as harmonicgeneration6), relativistic self-focusing and parametricinstabilities have been observed 7-10).
Self-phase modulation (SPM) has been studied extensively insolids and gases11) and is a result of an intensity dependentindex of refraction. In plasmas, SPM has been studiedtheoretically5,12) and is predicted to occur when the quivervelocity of an electron in the laser field becomes relativistic(a = posc/mec > 1) so that the refractive index is modified by therelativistic increase in electron mass. SPM is the temporalequivalent of self-focusing.
In this report we present the first direct measurements ofrelativistic SPM of a laser pulse in a plasma. Qualitativeobservations of SPM have been observed previously in Zhanget al 13). However, to date, no quantitative measurements of thiseffect have been reported. In our experiments the plasma isproduced in front of a solid target by the prepulse (preplasma)of a high power laser. SPM of the light occurs as it travelsthrough the under-dense pre-plasma and alters the spectrum ofthe incident laser on target, which is reflected in the spectralprofile of the harmonics generated in the laser-solid interaction.The harmonics are generated at the relativistic critical density ofthe laser wavelength, ne = γnc, where ne is the electron density,nc is the critical density for the laser and γ is the relativisticfactor. Since scattered light at the fundamental frequency is notat relativistic intensities it will in general not be able to leavethe plasma. For this reason observations of the 3rd harmonic,which has a 9 times larger critical density, were used. Thespectral profile is compared for two pre-plasmas with differentdensity distributions. The observed SPM agrees well withtheoretical predictions. A spectral shift is also observed which isconsistent with the motion of the critical surface due to hole-boring 14, 15).
Experiment
The experiment was performed on the Vulcan laser system atthe Rutherford Appleton Laboratory. This laser delivered0.7 - 1.0 ps pulses at a wavelength of 1.053 µm with energiesup to 80 J on target. The beam of dimension 22 x 11 cm2 wasfocused onto target by an off-axis parabolic mirror of focallength f = 60 cm. The target consisted of an optically polishedfused silica slab at 45o angle of incidence with the beamp-polarised. A penumbral imaging camera monitored the softX-ray spot size and this, combined with the laser energy,yielded the focused intensity. An independent measure of theintensity was obtained by using CR39 plastic nuclear trackdetectors to measure the maximum ion energies in the blow-offplasma 12, 16). The pre-plasma produced by the laser pre-pulsewas monitored with a 0.633 µm transverse optical probe. Thespectrum of the third harmonic, at 351 nm, was observed with aspectrometer viewing along the target normal.
The intensity on target was up to ~ 3.0 x 10¹⁹ Wcm-2. Thediameter of the focal spot was ~ 10 µm. The bandwidth of thelaser was transform limited with ∆λ = 1.89 ± 0.16 nm. The laserpre-pulse has been measured previously to be ~ 10-6 of the peakintensity at 40 ps before the peak of the pulse17). With this pre-pulse the scale-length was found to be typically less than10 µm.
In the experiments reported here a smaller scale-length wasproduced by reducing the laser pre-pulse with a pair of plasmamirrors18). These consisted of two anti-reflection coated opticalflats. The damage threshold of the coatings was ~ 1013 Wcm-2.Incident light at intensities below this value passed through theglass and did not reach the target. The pre-pulse was reduced inthis manner by a factor of 103 - 104, this limit being due to theresidual reflectivity of the glass flat. The set-up is shown inFigure 1.
The laser energy reaching the target was measured with acalorimeter and found to be ~ 46% of the incident laser energy.The spectrum of the third harmonic was measured as a functionof the laser intensity without and with the plasma mirrors, i.e.for large and small scale-length pre-plasmas.
Typical spectra are shown in Figure 2. In both cases thespectrum is broadened and shifted and exhibits a multi-peakstructure. This is characteristic of SPM. The broadening andshift are functions of the laser intensity but the individual peaksremain constant with a width of 0.27 ± 0.04 nm (FWHM). Theresolution of the spectrometer was 0.07 nm. A larger number ofpeaks is observed in the long scale-length pre-plasma over abroader spectral width.
The spectrum is red-shifted, the shift scaling as (Iλ2)0.5. This isin agreement with hole boring at the critical surface, as seen inthe simulations by Wilks et al 14) and measured by Zepf et al 15).In the smaller scale-length pre-plasma a slight blue-shift isobserved as expected and is due to the plasma pressureexceeding the laser ponderomotive pressure. The transitionfrom a red to a blue shift, depends on the pre-pulse, and isdiscussed in detail in Kalashnikov et al 19).
Relativistic Self-Phase Modulation in a Plasma
I Watts, M Zepf, E L Clark, M Tatarakis, K Krushelnick, A E Dangor
The Blackett Laboratory, Imperial College of Science, Technology and Medicine, Prince Consort Road, London SW7 2BZ, UK
R M Allott, R J Clarke, D Neely, P A Norreys
Central Laser Facility, CLRC Rutherford Appleton Laboratory, Chilton, Didcot, Oxon, OX11 0QX, UK
Main contact email address: [email protected]
(a) (b)
Spectrometer
Spectrometer
Target
Plasma mirror
Plasma mirror
Target
Figure 1. The configuration of the plasma mirrors.(a) Without the plasma mirrors the laser pre-pulse typicallyproduced a ~ 10 µm pre-plasma. (b) With the plasma mirrorsthe pre-pulse is reduced leading to a smaller scale-length pre-plasma.

High Power Laser Programme – Short Pulse Plasma Physics
33 Central Laser Facility Annual Report 2000/2001
The full spectral width is plotted as a function of Iλ2 for largeand small scalelengths in Figure 3. Higher order harmonics upto the 30th at 35.1 nm were observed with a separate detector.The wavelength shift and broadening of the spectral profile wasalso evident for these harmonics. However, the resolution of theinstrument was not high enough to observe the associated multi-peak structure.
Relativistic SPM can be calculated as follows. The angularfrequency change is 20)
∆ω(t)= -d/dt φ(t) (1)
where φ(t)is the phase shift
φ ( t ) =ωc
ηdx0
xc
∫ (2)
Here η = [1 − ne(x)/γ (t)nc]1/2 is the refractive index and
γ(t) = [1 + a(t)2/2]1/2 is the relativistic factor.
The index of refraction only requires relativistic corrections tothe motion of plasma electrons since the pulse duration is muchshorter than typical ion motion timescales. The normalizedmomentum, a = posc/mec, is related to the laser intensity by, 2 = a2 x 1.37 x 1018 Wcm-2.
For a linearly ramped density profile with ne(x) = ncx/LEquations 1 and 2 give :-
δω ( t ) = −2
3
ω o L
c
d
dtγ ( t )[ ] (3)
where the integration has been up to γnc
The frequency change δω is to the red in the leading part of thepulse and to the blue in the rear. There are thus two times withthe same value of δω. At these times the pulse has the samefrequency but will have different phase. The multi-peakstructure is a result of the constructive and destructiveinterference of these waves. The full spectral width, calculatedfrom the peak to peak value of ∆ω for pre-plasmas of differentlinear scalelengths, is also plotted in Figure 3. A scale-length ofL/λ ~ 6 matches the experiment when the full laser pre-pulsewas used. This agrees well with the scale-length measured bytransverse laser probing. With the reduced pre-pulse obtainedby use of the plasma mirrors a good fit is obtained for a scale-length L/λ ~ 2. The number of peaks in the spectral profile is alinear function of the maximum phase change φmax
11). Thenumber of peaks M is given by φmax ~ (M-1/2)π. Forscalelengths L/λ = 2 and L/λ = 6 calculating φmax from Equation2 gives M = 4 and M = 11 respectively. These are in reasonableagreement with the spectral profiles shown in Figure 2 andcorroborates the scalelengths inferred from the data in Figure 3.
The spectral profile can be calculated by taking the square ofthe Fourier transform of E(t)exp(iφt), where E(t) is the laserelectric field and φ(t) is from Equation 2. This is shown inFigure 4 for linear density ramps with L/λ = 2 and L/λ = 6,assuming a Gaussian pulse shape (0.5 ps 1/e intensity half-
0
4 104
8 104
1.2 105
345 350 355 360
Inte
nsity
(ar
b.un
its)
Wavelength (nm)
λ3 0.2 nm
Figure 2. Lineout of typical 3rd harmonic spectra at(a) Iλ2 = 2.0 x 10¹⁹: P2/cm2 with pre-pulse (dashed line) and(b) at Iλ2 = 2.3 x 10¹⁹: P2/cm2 with reduced pre-pulse (solidline). The transform limited bandwidth is ~ 0.2 nm.
0
5
10
15
20
0 1 101 9 2 101 9 3 101 9
Spe
ctra
l Wid
th (
nm)
Iλ2 (Wcm-2µm2)
L/λ = 4
L/λ = 2
L/λ = 6
L/λ = 8(b)
Figure 3. The full spectral width of the third harmonicSORWWHGDVDIXQFWLRQRI, 2. The closed circles represent thedata obtained with low pre-pulse. Open circles represent thedata obtained for larger pre-pulse. The lines represent thecalculated spectral width for relativistic SPM with varyinglinear ramp scale-lengths.
0.0
0.5
1.0
1.5
2.0
-10 -5 0 5 10
Inte
nsity
(ar
b. u
nits
)
∆ λ3 (nm)
(a) L = 6 λ
0.0
0.5
1.0
1.5
-10 -5 0 5 10
Inte
nsity
(ar
b. u
nits
)
∆λ3 (nm)
(b) L = 2 λ0.52 nm
Figure 4. The calculated spectral profile from the Fouriertransform of the electric field given for (a) L = 6 λ and (b)L = 2 λ. The transform limited bandwidth was ∆λ = 0.26nm.

High Power Laser Programme – Short Pulse Plasma Physics
Central Laser Facility Annual Report 2000/2001 34
width) with peak intensity Io = 1.2 x 10¹⁹ Wcm-2. The width ofthe individual peaks is related to the assumed bandwidth, whichfor the 3rd harmonic is 0.26 nm. The average measured widthof the peaks in Figure 2 is 0.27 ± 0.04 nm.
The calculated spectrum (Figure 4) has a minimum at thecentral wavelength whereas the experimental profile (Figure 2)has a maximum. The analysis of Bulanov 12) found that thespectral profile is a minimum for a non-relativistic pulse (a < 1)and a maximum for a relativistic pulse in the situation where aconstant uniform plasma density was assumed. This is indeedfound to be the case when the integration of Equation 2 iscarried out to the critical density nc. However, when theintegration is evaluated up to the relativistic cut-off γnc theresulting profile is a minimum. An analysis of SPM with anexponential density profile ne(x) = ncexp[-x/L] shows a similarbehaviour and results. For high intensity laser-plasmaexperiments the effect of ponderomotive steepening at thecritical surface results in extremely short scale-length plasmas20,
21). Therefore the difference in position of the relativistic andnon-relativistic critical densities is likely to be small and mayexplain the measured spectral profile. A more detailed analysisis needed to fully model the experimental conditions and toinclude other effects such as the intensity dependence of hole-boring and the time dependence of the density profile n = n(x,t).However, the main effect is clearly due to relativistic SPM.
In addition, the contribution of SPM on the spectrum due toatomic non-linearities is not expected to play a significant rolesince the susceptibilities for highly ionized atoms are toosmall22).
The suitability of the harmonics produced from intense laser-solid interactions as a source of coherent XUV radiation hasbeen shown to be limited by pre-plasma formation 23). Thisleads to a reduced source brightness at higher intensities due tospectral broadening, a broadened angular emission distributionand reduced conversion efficiencies. The results presented heredemonstrate that the formation of pre-plasma is efficientlysuppressed by the use of plasma mirrors. This may lead toenhanced brightness characteristics of the high-order harmonicsproduced in future experiments.
To summarize, observations of the third harmonic spectralprofile show varying degrees of shifting, broadening andmodulation with different levels of laser pre-pulse. Thesefeatures are consistent with the effect of relativistic SPM of thefundamental laser light as it travels through the underdense pre-plasma. This is the first quantitative measurement of relativisticSPM in a plasma and demonstrates the importance ofrelativistic non-linear plasma effects in the high intensityregime. As higher laser intensities are achieved the role ofrelativistic SPM in laser-plasma interaction experiments willbecome increasingly important 24). For instance the spectralextent of the broadening given by Equation 3 forIo ~ 1021 Wcm-2 is such that ∆ω/ω ~ 1 implying that the regionof laser energy deposition will be greatly enlarged. This willclearly affect hot electron and X-ray production and may haveimportant implications for some of the technologicalapplications foreseen for these lasers. Consequently thisconfirmation of theory is also important for “fast-ignition” andlaser-plasma accelerator research in addition to relativistic non-linear optics.
Acknowledgements
This work was supported by the United Kingdom, EngineeringPhysical Sciences Research Council (EPSRC).
References
1. M. I. K. Santala et al., Appl. Phys. Lett. 78, 19 (2001).
2. E. L. Clark et al., Phys. Rev. Lett. 85, 1654 (2000).
3. S. P. Hatchett et al., Phys. Plas. 7, 2076 (2000).
4. K. W. D. Ledingham et al., Phys. Rev. Lett. 84, 899(2000).
5. W. B. Mori, IEEE J. Quantum Elect. 33, 1942 (1997).
6. S. Y. Chen, A. Maksimchuk and D. Umstadter, Nature396, 653 (1998).
7. Z. Najmudin et al., IEEE Trans. Plas. Sci. 28, 1057(2000).
8. D. Gordon et al., Phys. Rev. Lett. 80, 2133 (1998).
9. K. Krushelnick et al., Phys. Rev. Lett. 78, 4047 (1997).
10. M. Borghesi et al., Phys. Rev. Lett. 78, 879 (1997).
11. G. P. Agrawal, Nonlinear Fiber Optics, Academic Press,(1989).
12. S. V. Bulanov et al., Physica Scripta T63, 258 (1996).
13. J. Zhang et al., Phys. Rev. A 54, 1597 (1996).
14. S. Wilks et al., Phys. Rev. Lett. 69, 1383 (1992).
15. M. Zepf et al., Phys. Plas. 3, 3242 (1996).
16. F. N. Beg et al., Phys. Plas. 4, 447 (1997).
17. C. N. Danson et al., Opt. Comm. 103, 392 (1993).
18. D. M. Gold et al., Opt. Lett. 19, 2006 (1994).
19. M. P. Kalashnikov et al., Phys. Rev. Lett. 73, 260 (1994).
20. D. T. Attwood et al., Phys. Rev. Lett. 40, 184 (1978).
21. K. G. Estabrook, E. J. Valeo and W. L. Kruer, Phys. Fluids18, 1151 (1975).
22. P. Sprangle, E. Esarey, and B. Hafizi, Phys. Rev. E 56,5894 (1997).
23. M. Zepf et al., Phys. Rev. E 58, R5253 (1998).
24. M. Tabak et al., Phys. Plas. 1, 1626 (1994).

High Power Laser Programme – Short Pulse Plasma Physics
35 Central Laser Facility Annual Report 2000/2001
Introduction
Recent experimental work investigating laser plasmainteractions at intensities greater than 1019 W/cm2 has shownthat the plasmas produced during intense laser-matterinteractions can potentially be efficient sources of energeticelectrons1), gamma rays2), and ions3).
In general, energetic ions produced by these interactions areaccelerated by a plasma sheath generated by the hot electronpopulation in the plasma. There are many potential applicationsfor such energetic particles such as compact accelerators4) andas diagnostic probe beams of high density plasmas. In addition,the results of these experiments are interesting for technologicalapplications since such sources should be scalable to “table-top”sizes.
Generally, the majority of the energy in the ions is carried byprotons which are accelerated preferentially with respect toheavier ions. The lighter protons move at much highervelocities and consequently tend to “short-circuit” theaccelerating electric fields – which therefore limits the peakenergy of other ion species. In solid target interactions theseprotons originate from a surface contamination layer on thetarget – which is largely composed of water and/or vacuumpump oil. Both of these surface contaminants contain hydrogen– which provides the source of the observed protons in theexperiments 5).
In this report, we describe experiments which attempt to removethe contamination layer through heating of the target. Since theboiling/melting points of the thin targets used (aluminium orgold) are typically much higher than that of water or pump oil,we show that this is an effective way to remove the protoncomponent from the accelerated ion spectrum. Using aThomson parabola ion spectrometer we also show that the totalnumber of protons is significantly reduced and thatconsequently, the energy of the heavier ions which remain issignificantly increased.
Experiment
These experiments were carried out using the CPA beam of theVulcan Nd:Glass laser system. The laser wavelength was1.054 µm, the pulse length was 0.9 – 1.2 ps, and the energyincident on target was 20 – 50 J. The laser beam (111 mm x200 mm) was focused onto the target surface using an on-axisparabolic mirror of focal length 225 mm. The laser beam wasp-polarised and was incident on the target at an angle of 45o.The peak intensity was measured to be about 2 x 10¹⁹ W/cm2.The targets were typically thin foils of gold and the target andall of the optics for the beam after compression were placed in avacuum chamber evacuated to less than 10-4 mbar pressure.
A specially designed target mount was used which was capableof heating a target to a temperature of greater than 400 oC. Thetarget was held in position over a small heating element(filament) which heated the target radiatively. The targettemperature was monitored using a thermocouple and wasmaintained at a constant level prior to each shot.
Energetic ions were measured using a Thomson parabola ionspectrometer which was placed approximately 1 metre from thetarget and was aligned to the front of the target at an angle ofapproximately 20 degrees from target normal. CR39 – anuclear track detector – was used as the detector.
Figure 1 shows the measured proton spectrum from theThomson parabola diagnostic from an interaction at a laserintensity of 2 × 10¹⁹ W/cm2 with 100 µm thick gold targets.The number of protons from heated targets (Figure 1B) wasreduced by more than an order of magnitude when compared tounheated gold targets at a similar laser intensity (Figure 1A).The peak energy of the measured protons was also significantlyreduced and does not approach the diagnostic limit of 11 MeVas in the unheated target.
Although these targets were heated to temperatures greater than400 oC there were still significant amounts of carbon ionsremaining and although the number of carbon ions was reduced– the energy of these carbons was increased significantly.
Figure 2 shows the spectrum of the carbon ions from twoconsecutive shots – one which used a heated target (Fig. 2B and2D) and one which did not (Fig. 2A and 2C). Clearly, from thespectra there are still carbon ions present. However in theheated targets the peak energy has increased by more than10 MeV. While the number of low energy carbon ions has beenreduced the entire distribution has been shifted to higherenergies. The spectra of the C6+ ions are shown in Fig 2A and2B and the C5+ ion spectra are shown in Fig 2C and 2D. This isin contrast to the fact that the proton number and maximumenergy have been radically reduced.
From the Thomson parabola measurements it was also apparentthat the number, energy, and ionization stage of the gold ionsalso significantly increased – although it was not possible tomake spectra of this data due to the low signal level and theuncertainty in the ionisation stage ( i.e., the parabolas from themany ionisation stages were observed to overlap).
The effect of target heating on fast ion production during intense laser-plasmainteractions
E L Clark, F N Beg, A E Dangor, M Tatarakis, M S Wei, M Zepf, K Krushelnick
The Blackett Laboratory, Imperial College of Science, Technology and Medicine, London SW7 2BZ, UK
K W D Ledingham, I Spencer
Department of Physics and Astronomy, University of Glasgow, Glasgow G12 8QQ, UK
P A Norreys, R J Clarke
Central Laser Facility, CLRC Rutherford Appleton Laboratory, Chilton, Didcot, Oxon, OX11 0QX, UK
Main contact email address: [email protected]
10 9
10 10
10 11
10 12
2 3 4 5 6 7 8 9 10
num
ber
of p
roto
ns/M
eV/s
terr
adia
n
energy (MeV)
A
B
Figure 1. A) proton spectrum from unheated gold targetB) from heated (400 oC)gold target.
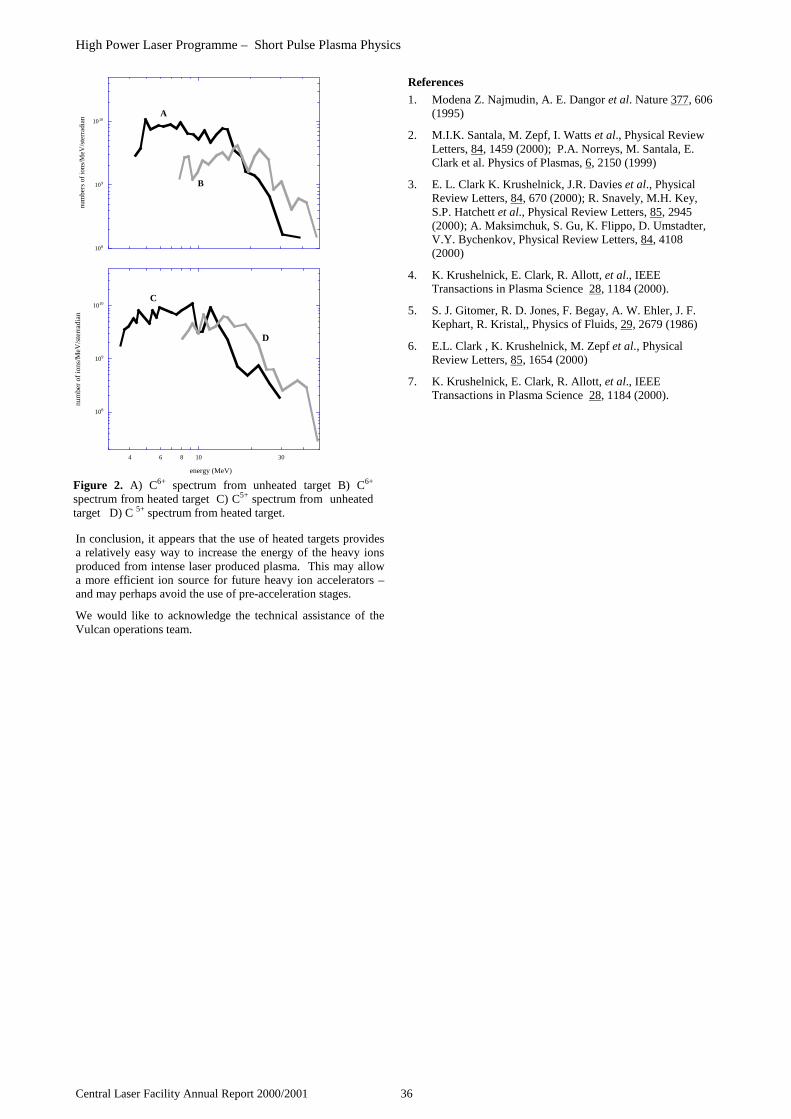
High Power Laser Programme – Short Pulse Plasma Physics
Central Laser Facility Annual Report 2000/2001 36
In conclusion, it appears that the use of heated targets providesa relatively easy way to increase the energy of the heavy ionsproduced from intense laser produced plasma. This may allowa more efficient ion source for future heavy ion accelerators –and may perhaps avoid the use of pre-acceleration stages.
We would like to acknowledge the technical assistance of theVulcan operations team.
References
1. Modena Z. Najmudin, A. E. Dangor et al. Nature 377, 606(1995)
2. M.I.K. Santala, M. Zepf, I. Watts et al., Physical ReviewLetters, 84, 1459 (2000); P.A. Norreys, M. Santala, E.Clark et al. Physics of Plasmas, 6, 2150 (1999)
3. E. L. Clark K. Krushelnick, J.R. Davies et al., PhysicalReview Letters, 84, 670 (2000); R. Snavely, M.H. Key,S.P. Hatchett et al., Physical Review Letters, 85, 2945(2000); A. Maksimchuk, S. Gu, K. Flippo, D. Umstadter,V.Y. Bychenkov, Physical Review Letters, 84, 4108(2000)
4. K. Krushelnick, E. Clark, R. Allott, et al., IEEETransactions in Plasma Science 28, 1184 (2000).
5. S. J. Gitomer, R. D. Jones, F. Begay, A. W. Ehler, J. F.Kephart, R. Kristal,, Physics of Fluids, 29, 2679 (1986)
6. E.L. Clark , K. Krushelnick, M. Zepf et al., PhysicalReview Letters, 85, 1654 (2000)
7. K. Krushelnick, E. Clark, R. Allott, et al., IEEETransactions in Plasma Science 28, 1184 (2000).
108
109
1010
num
bers
of
ions
/MeV
/ste
rrad
ian
A
B
108
109
1010
4 6 8 10 30
num
ber
of io
ns/M
eV/s
terr
adia
n
energy (MeV)
C
D
Figure 2. A) C6+ spectrum from unheated target B) C6+
spectrum from heated target C) C5+ spectrum from unheatedtarget D) C 5+ spectrum from heated target.
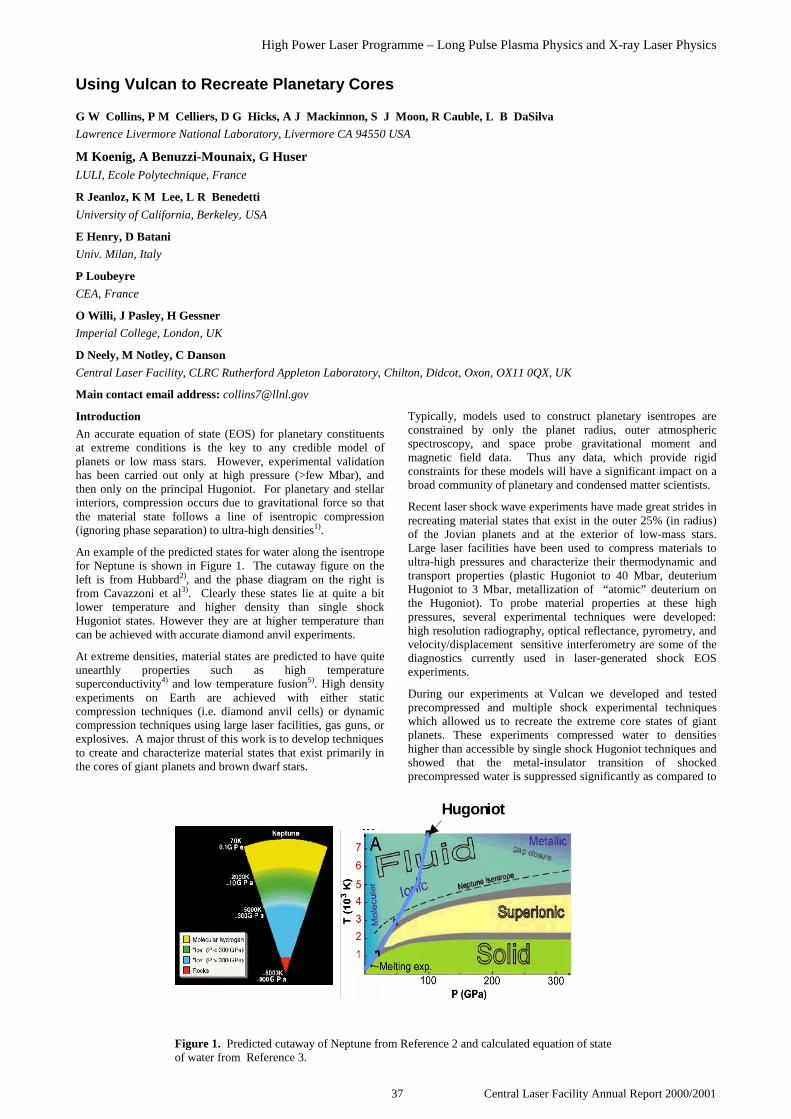
High Power Laser Programme – Long Pulse Plasma Physics and X-ray Laser Physics
37 Central Laser Facility Annual Report 2000/2001
Introduction
An accurate equation of state (EOS) for planetary constituentsat extreme conditions is the key to any credible model ofplanets or low mass stars. However, experimental validationhas been carried out only at high pressure (>few Mbar), andthen only on the principal Hugoniot. For planetary and stellarinteriors, compression occurs due to gravitational force so thatthe material state follows a line of isentropic compression(ignoring phase separation) to ultra-high densities1).
An example of the predicted states for water along the isentropefor Neptune is shown in Figure 1. The cutaway figure on theleft is from Hubbard2), and the phase diagram on the right isfrom Cavazzoni et al3). Clearly these states lie at quite a bitlower temperature and higher density than single shockHugoniot states. However they are at higher temperature thancan be achieved with accurate diamond anvil experiments.
At extreme densities, material states are predicted to have quiteunearthly properties such as high temperaturesuperconductivity4) and low temperature fusion5). High densityexperiments on Earth are achieved with either staticcompression techniques (i.e. diamond anvil cells) or dynamiccompression techniques using large laser facilities, gas guns, orexplosives. A major thrust of this work is to develop techniquesto create and characterize material states that exist primarily inthe cores of giant planets and brown dwarf stars.
Typically, models used to construct planetary isentropes areconstrained by only the planet radius, outer atmosphericspectroscopy, and space probe gravitational moment andmagnetic field data. Thus any data, which provide rigidconstraints for these models will have a significant impact on abroad community of planetary and condensed matter scientists.
Recent laser shock wave experiments have made great strides inrecreating material states that exist in the outer 25% (in radius)of the Jovian planets and at the exterior of low-mass stars.Large laser facilities have been used to compress materials toultra-high pressures and characterize their thermodynamic andtransport properties (plastic Hugoniot to 40 Mbar, deuteriumHugoniot to 3 Mbar, metallization of “atomic” deuterium onthe Hugoniot). To probe material properties at these highpressures, several experimental techniques were developed:high resolution radiography, optical reflectance, pyrometry, andvelocity/displacement sensitive interferometry are some of thediagnostics currently used in laser-generated shock EOSexperiments.
During our experiments at Vulcan we developed and testedprecompressed and multiple shock experimental techniqueswhich allowed us to recreate the extreme core states of giantplanets. These experiments compressed water to densitieshigher than accessible by single shock Hugoniot techniques andshowed that the metal-insulator transition of shockedprecompressed water is suppressed significantly as compared to
Using Vulcan to Recreate Planetary Cores
G W Collins, P M Celliers, D G Hicks, A J Mackinnon, S J Moon, R Cauble, L B DaSilva
Lawrence Livermore National Laboratory, Livermore CA 94550 USA
M Koenig, A Benuzzi-Mounaix, G HuserLULI, Ecole Polytechnique, France
R Jeanloz, K M Lee, L R Benedetti
University of California, Berkeley, USA
E Henry, D Batani
Univ. Milan, Italy
P Loubeyre
CEA, France
O Willi, J Pasley, H Gessner
Imperial College, London, UK
D Neely, M Notley, C Danson
Central Laser Facility, CLRC Rutherford Appleton Laboratory, Chilton, Didcot, Oxon, OX11 0QX, UK
Main contact email address: [email protected]
Hugoniot
Figure 1. Predicted cutaway of Neptune from Reference 2 and calculated equation of stateof water from Reference 3.
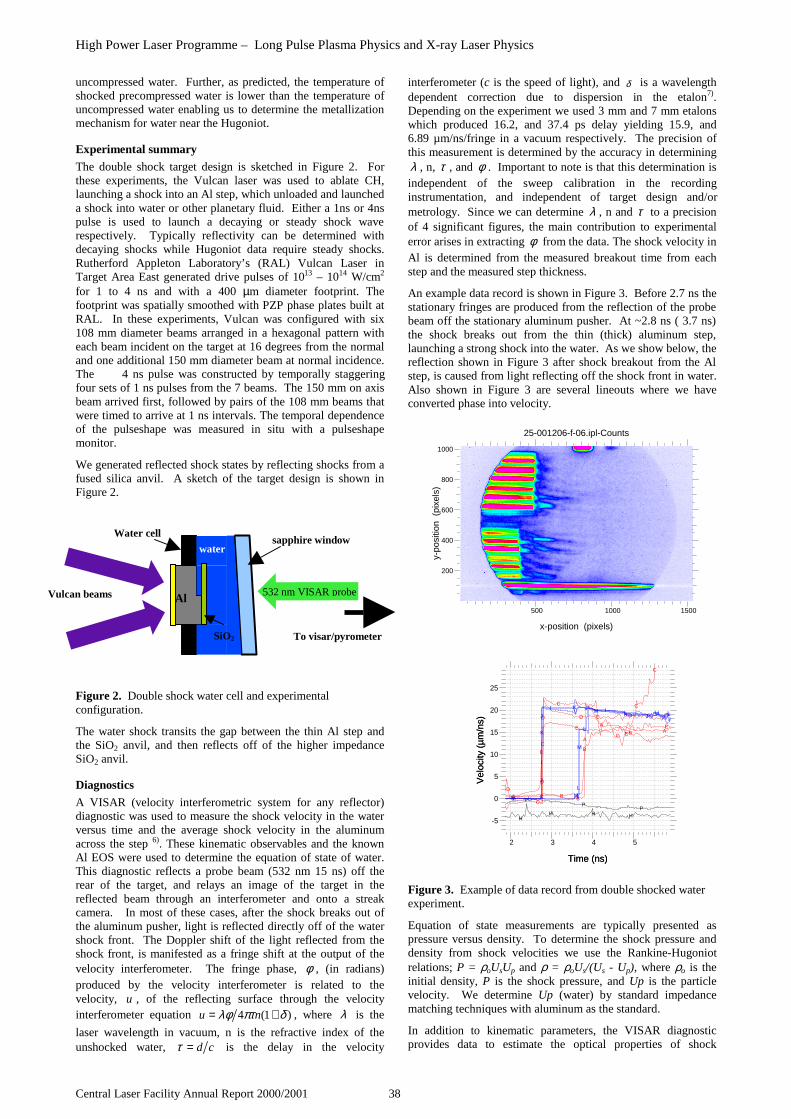
High Power Laser Programme – Long Pulse Plasma Physics and X-ray Laser Physics
Central Laser Facility Annual Report 2000/2001 38
uncompressed water. Further, as predicted, the temperature ofshocked precompressed water is lower than the temperature ofuncompressed water enabling us to determine the metallizationmechanism for water near the Hugoniot.
Experimental summary
The double shock target design is sketched in Figure 2. Forthese experiments, the Vulcan laser was used to ablate CH,launching a shock into an Al step, which unloaded and launcheda shock into water or other planetary fluid. Either a 1ns or 4nspulse is used to launch a decaying or steady shock waverespectively. Typically reflectivity can be determined withdecaying shocks while Hugoniot data require steady shocks.Rutherford Appleton Laboratory’s (RAL) Vulcan Laser inTarget Area East generated drive pulses of 1013 – 1014 W/cm2
for 1 to 4 ns and with a 400 µm diameter footprint. Thefootprint was spatially smoothed with PZP phase plates built atRAL. In these experiments, Vulcan was configured with six108 mm diameter beams arranged in a hexagonal pattern witheach beam incident on the target at 16 degrees from the normaland one additional 150 mm diameter beam at normal incidence.The 4 ns pulse was constructed by temporally staggeringfour sets of 1 ns pulses from the 7 beams. The 150 mm on axisbeam arrived first, followed by pairs of the 108 mm beams thatwere timed to arrive at 1 ns intervals. The temporal dependenceof the pulseshape was measured in situ with a pulseshapemonitor.
We generated reflected shock states by reflecting shocks from afused silica anvil. A sketch of the target design is shown inFigure 2.
Figure 2. Double shock water cell and experimentalconfiguration.
The water shock transits the gap between the thin Al step andthe SiO2 anvil, and then reflects off of the higher impedanceSiO2 anvil.
Diagnostics
A VISAR (velocity interferometric system for any reflector)diagnostic was used to measure the shock velocity in the waterversus time and the average shock velocity in the aluminumacross the step 6). These kinematic observables and the knownAl EOS were used to determine the equation of state of water.This diagnostic reflects a probe beam (532 nm 15 ns) off therear of the target, and relays an image of the target in thereflected beam through an interferometer and onto a streakcamera. In most of these cases, after the shock breaks out ofthe aluminum pusher, light is reflected directly off of the watershock front. The Doppler shift of the light reflected from theshock front, is manifested as a fringe shift at the output of thevelocity interferometer. The fringe phase, φ , (in radians)produced by the velocity interferometer is related to thevelocity, u , of the reflecting surface through the velocityinterferometer equation )1(4 δπτλφ += nu , where λ is the
laser wavelength in vacuum, n is the refractive index of theunshocked water, cd=τ is the delay in the velocity
interferometer (c is the speed of light), and δ is a wavelengthdependent correction due to dispersion in the etalon7).Depending on the experiment we used 3 mm and 7 mm etalonswhich produced 16.2, and 37.4 ps delay yielding 15.9, and6.89 µm/ns/fringe in a vacuum respectively. The precision ofthis measurement is determined by the accuracy in determiningλ , n, τ , and φ . Important to note is that this determination isindependent of the sweep calibration in the recordinginstrumentation, and independent of target design and/ormetrology. Since we can determine λ , n and τ to a precisionof 4 significant figures, the main contribution to experimentalerror arises in extracting φ from the data. The shock velocity inAl is determined from the measured breakout time from eachstep and the measured step thickness.
An example data record is shown in Figure 3. Before 2.7 ns thestationary fringes are produced from the reflection of the probebeam off the stationary aluminum pusher. At ~2.8 ns ( 3.7 ns)the shock breaks out from the thin (thick) aluminum step,launching a strong shock into the water. As we show below, thereflection shown in Figure 3 after shock breakout from the Alstep, is caused from light reflecting off the shock front in water.Also shown in Figure 3 are several lineouts where we haveconverted phase into velocity.
Figure 3. Example of data record from double shocked waterexperiment.
Equation of state measurements are typically presented aspressure versus density. To determine the shock pressure anddensity from shock velocities we use the Rankine-Hugoniotrelations; P = ρoUsUp and ρ = ρoUs/(Us - Up), where ρo is theinitial density, P is the shock pressure, and Up is the particlevelocity. We determine Up (water) by standard impedancematching techniques with aluminum as the standard.
In addition to kinematic parameters, the VISAR diagnosticprovides data to estimate the optical properties of shock
500 1000 1500
200
400
600
800
1000
25-001206-f-06.ipl-Counts
x-position (pixels)
y-po
sitio
n (
pixe
ls)
sapphire windowWater cell
water
Al 532 nm VISAR probeVulcan beams
A A
A
AA
B
B
B
C
C
C
C
C
C
C
DD
D D D
E
E
EE
E
HH H H
I
I
I II
J
J
J
J
K
K
KK
L
L
L
L L
M M
M
M M
PP
P
2 3 4 5
-5
0
5
10
15
20
25
Time (ns)
Vel
ocity
(µm
/ns)
Time (ns)
Vel
ocity
(µm
/ns)
To visar/pyrometerSiO2

High Power Laser Programme – Long Pulse Plasma Physics and X-ray Laser Physics
39 Central Laser Facility Annual Report 2000/2001
compressed dielectrics. In the image shown above, (Figure 3),the strong shock in water reflects light so that we track theshock front velocity and can estimate the reflectance of theshock front. In the case of weaker shocks, the shocked materialcan be opaque or transparent depending on the shock intensityand intrinsic properties of the material.
Temperature is an important thermodynamic parameter butcannot be determined from the Rankine-Hugoniot equations.Temperature must be measured independently from shock andparticle velocities. Typically, temperature of transparentshocked materials is measured from the thermal emission. Weextracted T by determining the spectral radiance, I(λ) for a graybody Planck spectrum,
I λ( ) = ε λ( )2πhc2
λ5 exphc
λkbT−1
−1
(1)
with T as a fit parameter, c, h, and kb taking on their usualdefinitions, and the emissivity, ε(λ), estimated from recentmulti-wavelength reflectivity data described below.
To determine the spectral radiance from the sample wecalibrated the transmission of our optics using a calibrated graybody source and the sensitivity of the streak camera bydetermining the response to a known intensity of a pulsed laser.An example data record for a double shock target is shown inFigure 4. The temperature plotted in Figure 4 assumes anemissivity of 1. This is clearly not the case. To estimate theemissivity and determine the correct shock temperature we usethe reflectance data described above, and use a minimumconductivity model to estimate the collision time and then aDrude model is used to estimate carrier concentration. We thencalculate the emissivity using a Drude model with theseparameters evaluated at 610 nm.
Figure 4. Shock emission at 610nm in water contained in adouble shock cell.
Precompressed targets
A novel combination of the laser-driven shock technique withdiamond anvil cell compression techniques is shown inFigure 5. With this target we used diamond flats to maintain apre-compressed volume of our sample material at a staticpressure of up to 1 GPa during the experiment. The laser drivergeometry described above results in two significant designconstraints for achieving Hugoniot data on pre-compressedsamples. First, the intensity and short pulse length require that
the anvil through which the laser shock travels be extremelythin—no more than 200 µm. To ensure jump conditions arevalid the shock must be steady. In order to have a steady shockwave persist into the sample with a square 4 ns pulse, the shockwave must propagate through the anvil and sample before theend-of-pulse rarefraction catches up. In addition, the shockplanarity needs to be adequate for accurate inspection of theshock velocity. Thus, the spot size of the laser must be largeenough so that side rarefactions do not erode the shock planarityto more than ~ 75 µm. Second, the laser spot size and beampath require a large aperture radius (hence unsupported anvilradius), r, and aperture angle, θ, in the high-pressure cell itself(Figure 5).
In order to satisfy the needs for a thin anvil having a largeunsupported aperture, we chose the strongest material known,diamond. Use of a diamond anvil cell is well established andthe sample can be probed before and during the experiment dueto the optical transparency of the anvil. Hence, the thickness,pressure and other characteristics of the pre-compressed samplecan be determined before the Hugoniot experiment.
Figure 5. Schematic cross-section of diamond-cellconfiguration used for laser-driven shock experiments onprecompressed samples.
Other features significant in the apparatus shown in Figure 5 arethe wide openings (300µm radius holes) in the tungsten carbide(WC) supports which allow ample shock laser entry (θ = 35°opening) and VISAR access (18.5° opening). Thin diamondsare pushed together to apply pressure on a small sample ofwater (~30 nL) held in a hole within a stainless steel gasket100 µm thick. An Al step is glued on the thinnest diamond andused to measure the breakout times (velocities, and ultimatelyshock pressure) with VISAR7). A few ruby grains are placed inthe sample chamber for precompression pressure measurementsvia ruby fluorescence8). There is a 1000 Å Al flash coating onthe rear side of the thinnest diamond to lower the critical depthof shock ablation, and an anti-reflection coating on the thickerdiamond for the VISAR measurement.
Plasma generated by ablation of the backing plate is a source ofhigh energy x-rays that can preheat the sample. Also, the blow-off plasma absorbs the laser beam far from the target reducingthe shock intensity significantly. In order to avoid preheat,plasma blow-off and laser damage to the DAC, a wide coneangle (θ = 35°) and diamond support hole (300 µm radius) wereincorporated into the design of the support plate for thediamond as well as the surrounding diamond cell. Thisgeometry, although accommodating to the laser shock, providesless support for the anvil and is therefore less than ideal for thethin diamond flats.
Characteristics of Thin Diamond Anvils
The diamond flat can be modeled as a uniformly-loaded circularplate, such that a simple relation exists between the maximum
Bla
ck B
ody
Tem
pera
ture
(eV
)
7LPH V

High Power Laser Programme – Long Pulse Plasma Physics and X-ray Laser Physics
Central Laser Facility Annual Report 2000/2001 40
pressure load w and the anvil thickness t,
2
21
t
rSkw m=
where Sm is the maximum stress achieved in the diamond (here,the tensile strength of diamond), r is the unsupported radius andk1 is a constant equal to 0.833 (simply supported disc) or 1.333(disc with fixed edges)9). For r = 300 µm and t = 200 µm andusing the value of tensile strength of diamond 4), 2.8 GPa, wearrive at a maximum load of between 1.0 (simply supported)and 1.7 GPa (fixed edges).
Determining the initial pressure–density–internal energyconditions (Po, ρo, Eo) in the pre-compressed sample is key forHugoniot measurements. The precompression pressure Po wasmeasured in the water via ruby fluorescence8). Using theequation of state of water by Saul and Wagner10), the initialdensity ρo and energy Eo were determined.
White-light interferometry was used to determine the product ofthe index of refraction and distance nd 11). The height of the Alstep (known a priori) placed into the sample to aid in theVISAR measurements was used as d; determining the index ofrefraction for the compressed water sample was thereforestraightforward (Figure 6).
Figure 6. Index of refraction as a function of pressure for H2Owater, ice VI and ice VII at room temperature. The valuesobtained in the present study (closed circles) compare well withprevious results of Loubeyre et al.12), (closed squares);Schiebener et al., (closed diamonds)13); and Shimizu et al.,(open triangles) 14). In one run, ice VI crystals were observed ata pressure less than the nominal freezing pressure, indicating apossibly metastable condition15).
Despite the fragility of the diamond flats, it was possible to pre-compress water to ~1 GPa (ρo ~1.2 g/cm3), as predicted by theabove models. These precompressed samples were laser-shocked up to pressures of ~200 GPa and temperatures to~10,000 K, see References 11, 12. In order to achieve higherinitial pressures (and therefore densities), the laser intensity andduration must be increased to allow for thicker diamonds flats.For instance, the maximum load that a 500 µm thick diamondflat could withstand is predicted to lie between 6.5 (simply-supported) and 12.5 GPa (fixed-at-edges).
Results and Discussion
To test our experimental setup we compared single shock waterEOS data with that collected on the Omega laser facility. Theresult shown in Figure 7 reveals good agreement between datacollected at Omega and Vulcan. The double shock data reachedthe highest pressure off Hugoniot values. However, for thisdiscussion we will focus on the results of the precompressedexperiments.
Figure 7. Shock velocity versus particle velocity for waterimpedance matched to aluminum.
Four successful shots were achieved on pre-compressed targets:the highest pressure shot produced a reflecting shock, the lowestpressure produced shock-compressed material that remainedtransparent, and the two in between shocked the material into anopaque state, thus straddling the insulator-conducting transitionand allowing a comparison with the principal Hugoniot states.All targets were pre-compressed to between 0.7 – 0.95 GPa,giving initial densities of 1.2 g/cm3, 20 % above liquid density,and a refractive index of 1.4. An example of a precompressedVISAR data record is shown in Figure 8.
$O+XJRQLRW
0HDVXUHG$O
VKRFNVSHHG
$OUHOHDVH
3UHFRPSUHVVHG
+
+XJRQLRW
3UHFRPSUHVVHG
GRXEOHVKRFN+
+XJRQLRW
6KRFN
)ULQJHVKLIW
6KRFN
)ULQJHVKLIW
QV
µP
6KRFN
6KRFN
RSDTXH
6KRFN
QV
6WDFNHGODVHU
SXOVHVSURGXFHG
PXOWLSOHVKRFNV
Figure 8. Example of pre-compressed water VISAR datarecord and analysis.
Shock pressures were determined by:
(1) the measured break-out times in the aluminum steptogether with the known step height yield the shockvelocity in the Al,
(2) the shock velocity in the water from the VISARmeasurements,
(3) impedance matching provided a model-based result forthe state of shocked water.
On shots where VISAR fringes could be observed either fromthe reflective water shock front, or from the moving aluminuminterface, the pressure could also be determined directly usingimpedance matching with the known aluminum EOS. Thesemodel-based and direct techniques were in agreement for thetransparent and reflecting shock states. For the opaque regime, ashock temperature was found for a single shot. This measuredtemperature was in agreement with the model-basedtemperature derived from impedance matching to the aluminumshock speed. Within the range explored by this experiment, it

High Power Laser Programme – Long Pulse Plasma Physics and X-ray Laser Physics
41 Central Laser Facility Annual Report 2000/2001
thus appears that the SESAME EOS for water is in agreementwith experiment.
The highest pressure shot at ~ 4 Mbar produced a weaklyreflecting shock. While the shock reflectivity could not beprecisely determined due to the curvature of the shock front, itappeared clear that the reflectivity was significantly less thanthe 50% value found on the principal Hugoniot at the samepressure.
Pre-compression thus appears to reduce the electronicconductivity. This sheds some light on the mechanism behindthe insulator-conductor transition in water. At 4 Mbar,SESAME calculations indicate that the density and temperatureare 3.7 g/cm3 and 3.6 eV on the principal Hugoniot and4.0 g/cm3 and 2.8 eV in this pre-compressed shot. If the metal-insulator transition were due to a Mott transition, the higherdensity in the pre-compressed targets should increase theelectronic conductivity of water rather than decrease it. On theother hand, if the transition were due to thermally-inducedelectron excitations, the lower temperature of the pre-compressed targets would reduce the reflectivity of the shock,as in fact these results show. Our experiments thus provideevidence that the insulator-conductor transition on the principalHugoniot in water is thermally induced.
0.0
0.1
0.2
0.3
0.4
0.5
0.6
Pressure (Mbar)
PrecompressedHugoniot
PrincipalHugoniot
1 2 3 4 5
5
H
I
O
H
F
W
L
Y
L
W
\
ρ JFP
7 H9
ρ JFP
7 H9
Figure 9. Reflectivity from principal Hugoniot and pre-compressed Hugoniot experiments versus pressure.
At the lowest pressure accessed, a shock of 0.5 Mbar wasshown to be transparent to the VISAR probe. This contrastswith water states on the principal Hugoniot, which were foundto be opaque above 0.35 Mbar. Such a delayed onset of thetransparent-opaque transition in pre-compressed water isconsistent with the observation given above that the lowertemperatures achieved in pre-compressed water reduce charge-carrier excitation.
An interesting observation in this shot was the effect of multipleshock states. The multiple shocks arose accidentally from thearrangement of stacked laser pulses. In order to produce the 4 nsdrive pulse, it was necessary to arrange the seven 1 ns beams insequence. However, early in the campaign, the pulse widths hadnot been optimized and gaps still existed between eachnanosecond of the 4 ns drive. On this particular shot, the laterpulses were stronger than earlier ones, leading to a sequence ofshocks of increasing strength that converged in time. TheVISAR streak shows these shocks as successive fringe shifts.The initial transparent state at 0.5 Mbar is described above andis confirmed by both SESAME calculations and measuredfringe shifts16). The second shock state can only be inferredfrom the fringe shift, and is found to be about 1.4 Mbar, basedon SESAME. The third shock accesses the opaque state ofwater at some unknown, higher pressure. The striking result ofthis shot is that a double-shocked state of pre-compressed wateris found to be transparent up to 1.4 Mbar, with a correspondingtemperature of 0.3 eV. Combining these results, the two-dimensional P-T diagram of water can begin to be mapped outin terms of the regions of transparent, opaque, and reflectingshocks as shown in Figure 10. Even modest pre-compression of
samples can lead to important extensions in our understandingof material properties.
5HIOHFWLQJ
2SDTXH
7UDQVSDUHQW
3ULQFLSDO
+XJRQLRW
'RXEOH
VKRFN
Figure 10. Summary of the optical properties along theprincipal Hugoniot (line) and precompressed experiments(diamonds) in the T-P plane.
References
1. Hubbard, W. B. Science 214, 145(1981). Hubbard, W. B.Guillot, T., Lunine, J. I., Burrows, A. Saumon, D., Marley,M. S., & Freedman, R. S. 1997, Phys. Plasmas 4, 2011
2. W. B. Hubbard, Science 214, 145 (1981).
3. Cavazzoni et al, Science 284, 788 (1999).
4. N. W. Ashcroft, Phys. World 8, 43 (July, 1995).
5. S. Ishimaru, Rev. Mod. Phys. 65, 255 (1993).
6. P.M.Celliers et al, Appl. Phys. Lett. 73, 1320 (1998).
7. L. M. Barker and R. E. Hollenbach, J. Appl. Phys., 43,4669-4675 (1972); L. M. Barker and K. W. Schuler, J.Appl. Phys., 45, 3692-3 (1974).
8. Mao, H. K. et al., J. Appl. Phys. 49, 3276-3283 (1978).
9. Timoshenko, S. , Strength of Materials , Part II: AdvancedTheory and Problems, D. Van Nostrand Company,Princeton, New Jersey, 1956, pp. 76-144.
10. Saul, A. and Wagner, W., J. Phys. Chem. Ref. Data 18,1537-564 (1989).
11. Le Toullec, R. et al., Phys. Rev. B 40, 2368-2378 (1989).
12. Loubeyre, P. et al., unpublished (2000).
13. Schiebener, P. et al., J. Phys. Chem. Ref. Data 19, 677-717(1990).
14. Shimizu, H. et al., Phys. Rev. B 53, 6107-6110 (1996).
15. Tkachev, S. et al., J. Chem. Phys. 105, 3722-3725 (1996).
16. Note that in the case of transparent shocks, the fringe shiftscorrespond to the particle velocity of the shocked water,since the reflection occurs at the aluminum-water interface.Consequently the refractive index of shocked water needsto be taken into account. Based on diamond cellmeasurements of water at similar densities, it is found thatthe refractive index of water almost follows Gladstone-Dale scaling, which means that the corrections to theinferred particle velocity are small. In this case they areless than 5 %. It is thus reasonable to assume thatuncertainties in the inferred fringe shift due to unknownrefractive index effects are in fact small.

High Power Laser Programme – Long Pulse Plasma Physics and X-ray Laser Physics
Central Laser Facility Annual Report 2000/2001 42
Introduction
The properties of dense plasmas are of wide interest, forexample, to researchers in inertial confinement fusion, laser-ablation, stellar structure as well as planetary physics 1,2). Animportant phenomenon in such plasmas is strong coupling 3).This occurs when the Coulomb interaction energy between pairsof ions is greater than their thermal kinetic energy and leads toshort range order, as in a liquid metal. This phenomenon isexpected to have a significant effect on many plasma propertiessuch as thermal and electrical conductivity. We describe hereexperiments in which strong coupling of a plasma is observed ina direct way via measurements of the X-ray scatteringcross-sections. The measured cross-sections are wellreproduced by theoretical simulations. This success points tothe possibility of developing the technique of X-ray scatteringinto a powerful new diagnostic of dense plasmas.
The strong coupling parameter for ions in a plasma wasintroduced by Brush, Sahlin and Teller 4), and is given by:-
Here Z*e is the average ionic charge, Ri is the average inter-ionic separation and kT the average ion temperature. For laser-plasmas this parameter is commonly above unity for at leastpart of the plasma. In order to investigate this phenomenon in areasonably rigorous way with X-ray scattering methods we haveused radiative heating of a thin foil to produce a plasma withrelatively uniform conditions at Γ >1.
Experiments
The experiments were carried out at the Vulcan Laser Facilityof the Rutherford Appleton Laboratory. Figure 1 shows aschematic of the experiment. A brief outline is as follows: themain heating beams were approximately Gaussian in shape with800ps full-width at half maximum (FWHM) duration. Sixbeams were used to irradiate the Au foils (3 each side). Eachbeam delivered ~70J at 532nm wavelength. Focusing withphased-zone plates (PZP) gave a smooth flat topped profile of1.5mm diameter, resulting in an irradiance of 1013 Wcm-2. Thegold foils were 1500Å thick with a 0.5µm layer of CHsupporting them on the side facing away from the lasers. TheX-ray emission from this type of foil has been wellcharacterised by others 5,6) and is similar to a black bodyemitting at a radiation temperature of ~66eV for our case. TheAu foils were placed facing each other 8mm apart. Theexperiments were related to earlier work7) with single sidedirradiation, which was however inconclusive, due to poorertemporal resolution and more severe temperature and densitygradients.
Backlighter beams (80ps)
Pinhole arrangement
Ti foil disk
Crystal Spectrometer
Cooled CCD“Straight through” photons
Au foil
Scatter photons
Heating beams (1ns)
Sample foil
Figure 1. Schematic of the experiment (not to scale). Thetiming between the main heating pulses and the back-lighterpulses was stable and controllable to ~30ps. X-ray streakmeasurements showed that the Ti He-α X-ray pulse durationwas 80-100ps. Extensive test shots showed that the screeningshields (not shown) ensured that only photons scattered fromthe sample foil were collected.
The sample Al foil was 1µm thick and coated with 0.2µm ofCH on each side. The CH coating on both the Au heating foilsand on the target absorbed much of the longer wavelength softX-rays which would otherwise be absorbed close to the Alsurface, leading to strong temperature gradients. The CH layeron the sample also helped to constrain the expansion of the Aland thus reduced density gradients. The sample foil was placedbetween the Au foils and at 45° to them as in Figure 1. The Alsamples were 5mmx5mm in size, but only a spot 2.1x2.8mmwas probed. Because of the geometry, for parts of the foil awayfrom the centre, the heating is asymmetric. We believe that thelateral non-uniformity caused by this is less important than theaxial variations that exist due to the preferential absorption inthe outer part of the foil. However, a full analysis of lateralheating variation still needs to be carried out. At a controlledtime later, a shorter (80ps) pair of laser pulses were used to heata Ti foil target. This resulted in a laser-plasma that was a strongsource of He-like Ti radiation, in particular the1s2-1s2p 1P (He-α line) and 3P transitions at 2.6Å and theassociated Li-like dielectronic satellites. This radiation passed
Direct observation of strong coupling in a dense plasma
D Riley, I Weaver, D McSherry
School of Mathematics and Physics, The Queen’s University of Belfast, University Road, Belfast BT7 1NN, UK
D Neely
Central Laser Facility, CLRC Rutherford Appleton Laboratory, Chilton, Didcot, Oxon, OX11 OQX, UK
M Dunne
AWE plc, Reading RG7 4PR, Berks, England
E Nardi
Department of Particle Physics, Weizmann Institute of Science Il-76100 Rehovot, Israel
Main contact e-mail address: [email protected]
2)*(
kTiR
eZ=Γ (1)
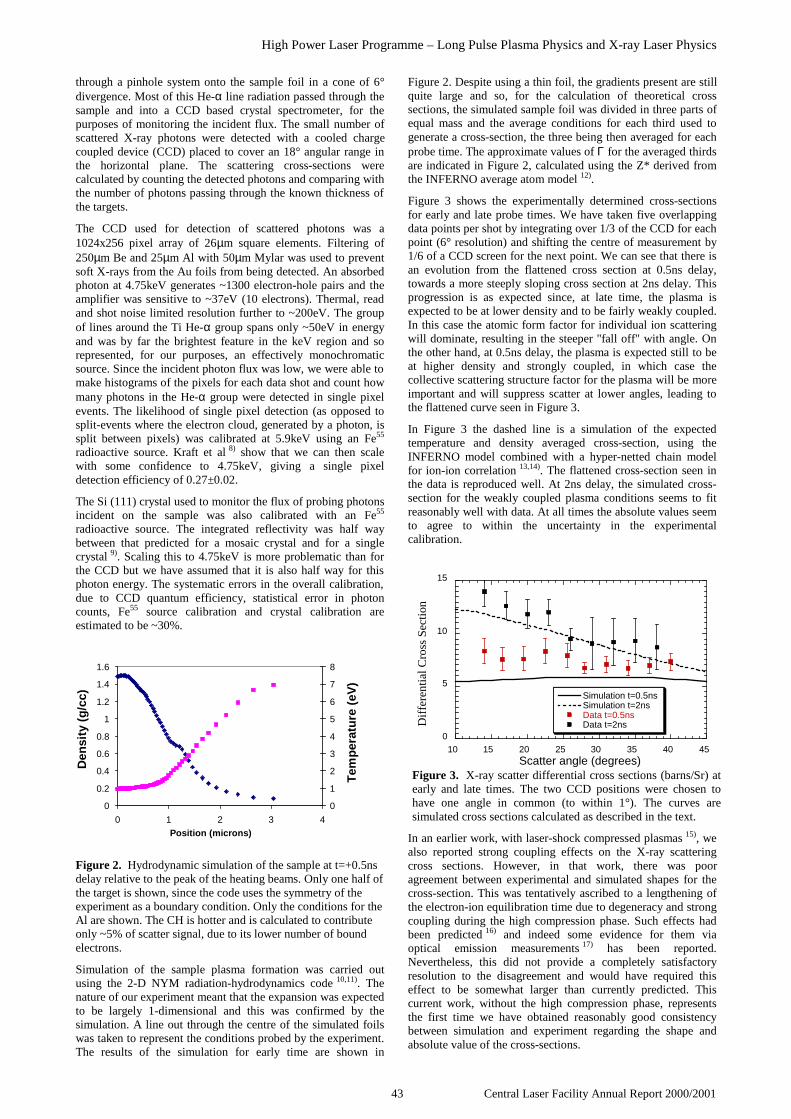
High Power Laser Programme – Long Pulse Plasma Physics and X-ray Laser Physics
43 Central Laser Facility Annual Report 2000/2001
through a pinhole system onto the sample foil in a cone of 6°divergence. Most of this He-α line radiation passed through thesample and into a CCD based crystal spectrometer, for thepurposes of monitoring the incident flux. The small number ofscattered X-ray photons were detected with a cooled chargecoupled device (CCD) placed to cover an 18° angular range inthe horizontal plane. The scattering cross-sections werecalculated by counting the detected photons and comparing withthe number of photons passing through the known thickness ofthe targets.
The CCD used for detection of scattered photons was a1024x256 pixel array of 26µm square elements. Filtering of250µm Be and 25µm Al with 50µm Mylar was used to preventsoft X-rays from the Au foils from being detected. An absorbedphoton at 4.75keV generates ~1300 electron-hole pairs and theamplifier was sensitive to ~37eV (10 electrons). Thermal, readand shot noise limited resolution further to ~200eV. The groupof lines around the Ti He-α group spans only ~50eV in energyand was by far the brightest feature in the keV region and sorepresented, for our purposes, an effectively monochromaticsource. Since the incident photon flux was low, we were able tomake histograms of the pixels for each data shot and count howmany photons in the He-α group were detected in single pixelevents. The likelihood of single pixel detection (as opposed tosplit-events where the electron cloud, generated by a photon, issplit between pixels) was calibrated at 5.9keV using an Fe55
radioactive source. Kraft et al 8) show that we can then scalewith some confidence to 4.75keV, giving a single pixeldetection efficiency of 0.27±0.02.
The Si (111) crystal used to monitor the flux of probing photonsincident on the sample was also calibrated with an Fe55
radioactive source. The integrated reflectivity was half waybetween that predicted for a mosaic crystal and for a singlecrystal 9). Scaling this to 4.75keV is more problematic than forthe CCD but we have assumed that it is also half way for thisphoton energy. The systematic errors in the overall calibration,due to CCD quantum efficiency, statistical error in photoncounts, Fe55 source calibration and crystal calibration areestimated to be ~30%.
Figure 2. Hydrodynamic simulation of the sample at t=+0.5nsdelay relative to the peak of the heating beams. Only one half ofthe target is shown, since the code uses the symmetry of theexperiment as a boundary condition. Only the conditions for theAl are shown. The CH is hotter and is calculated to contributeonly ~5% of scatter signal, due to its lower number of boundelectrons.
Simulation of the sample plasma formation was carried outusing the 2-D NYM radiation-hydrodynamics code 10,11). Thenature of our experiment meant that the expansion was expectedto be largely 1-dimensional and this was confirmed by thesimulation. A line out through the centre of the simulated foilswas taken to represent the conditions probed by the experiment.The results of the simulation for early time are shown in
Figure 2. Despite using a thin foil, the gradients present are stillquite large and so, for the calculation of theoretical crosssections, the simulated sample foil was divided in three parts ofequal mass and the average conditions for each third used togenerate a cross-section, the three being then averaged for eachprobe time. The approximate values of Γ for the averaged thirdsare indicated in Figure 2, calculated using the Z* derived fromthe INFERNO average atom model 12).
Figure 3 shows the experimentally determined cross-sectionsfor early and late probe times. We have taken five overlappingdata points per shot by integrating over 1/3 of the CCD for eachpoint (6° resolution) and shifting the centre of measurement by1/6 of a CCD screen for the next point. We can see that there isan evolution from the flattened cross section at 0.5ns delay,towards a more steeply sloping cross section at 2ns delay. Thisprogression is as expected since, at late time, the plasma isexpected to be at lower density and to be fairly weakly coupled.In this case the atomic form factor for individual ion scatteringwill dominate, resulting in the steeper "fall off" with angle. Onthe other hand, at 0.5ns delay, the plasma is expected still to beat higher density and strongly coupled, in which case thecollective scattering structure factor for the plasma will be moreimportant and will suppress scatter at lower angles, leading tothe flattened curve seen in Figure 3.
In Figure 3 the dashed line is a simulation of the expectedtemperature and density averaged cross-section, using theINFERNO model combined with a hyper-netted chain modelfor ion-ion correlation 13,14). The flattened cross-section seen inthe data is reproduced well. At 2ns delay, the simulated cross-section for the weakly coupled plasma conditions seems to fitreasonably well with data. At all times the absolute values seemto agree to within the uncertainty in the experimentalcalibration.
In an earlier work, with laser-shock compressed plasmas 15), wealso reported strong coupling effects on the X-ray scatteringcross sections. However, in that work, there was pooragreement between experimental and simulated shapes for thecross-section. This was tentatively ascribed to a lengthening ofthe electron-ion equilibration time due to degeneracy and strongcoupling during the high compression phase. Such effects hadbeen predicted 16) and indeed some evidence for them viaoptical emission measurements 17) has been reported.Nevertheless, this did not provide a completely satisfactoryresolution to the disagreement and would have required thiseffect to be somewhat larger than currently predicted. Thiscurrent work, without the high compression phase, representsthe first time we have obtained reasonably good consistencybetween simulation and experiment regarding the shape andabsolute value of the cross-sections.
0 0.2 0.4 0.6 0.8
1 1.2 1.4 1.6
0 1 2 3 4 Position (microns)
0 1 2 3 4 5 6 7 8
Den
sity
(g
/cc)
Tem
per
atu
re (
eV)
0
5
10
15
10 15 20 25 30 35 40 45
Simulation t=0.5nsSimulation t=2nsData t=0.5nsData t=2ns
Scatter angle (degrees)Figure 3. X-ray scatter differential cross sections (barns/Sr) atearly and late times. The two CCD positions were chosen tohave one angle in common (to within 1°). The curves aresimulated cross sections calculated as described in the text.
Dif
fere
ntia
l Cro
ss S
ectio
n

High Power Laser Programme – Long Pulse Plasma Physics and X-ray Laser Physics
Central Laser Facility Annual Report 2000/2001 44
Discussion
In our analysis we also tried the ACTEX 18) ionisation model.For the high density core of the foil at t=0.5ns, ACTEX predictslittle or no ionisation and consequently a scattering profile morelike the late time curve in Figure 3. However, it should be notedthat neither ACTEX nor INFERNO were designed for theplasma conditions of this experiment. The INFERNO model,used to predict ionisation, includes bound states, scatteringresonance states as well as free continuum states. Electronswhich occupy the resonance states are neither strictly localisedor totally free. However, narrow resonances can be viewed asbasically bound whereas wide resonances as encountered herefor the t=0.5ns case are better approximated by free electronstates 19). At t=0.5ns, in the high density core of the foil, weobtain Z*=1.6 where 0.8 of these electrons are in the wide presonance states. If we treat these resonance electrons as boundthen the effective Γ falls to only ~5 and the simulatedcross-section at this time is not so well matched to experimentbut is closer to the weakly coupled curve.
The significance of this work is that the broad regime we areable to investigate by these means is intermediate between thewell researched areas of plasmas and liquid metals and is by nomeans completely understood theoretically. The occurrence ofsuch matter in a wide range of arenas from astrophysics topulsed laser deposition, is a strong motivation for further work.Furthermore, for this type of plasma, many methods of plasmadiagnosis are difficult. Optical emission and absorptionspectroscopy are hampered by high opacity and broadening ofspectral features. X-ray absorption spectroscopy is alsohampered by the difficulty of distinguishing between lowionisation states. For example, in the current case, K-αabsorption spectroscopy is prevented by the filled L-shell of theAl ions. Finally, our analysis shows that this method, (althoughperhaps in a more refined experiment with better uniformity)may be useful in determining not only the validity of differentionisation models, but also how we interpret the idea of averageionisation in such plasmas.
Acknowledgements
We would like to thank A McMullan, A McCloskey and A MMcEvoy for their contributions to crystal calibration work andthe staff of the Central Laser Facility for providing the excellentlaser facilities and support. This work was funded by theEngineering and Physical Sciences Research Council.
References
1. D. Alfe, M.J. Gillan and G.D. Price, Nature 401 462-464(1999)
2. T. Guillot, Science, 286, 72-77 (1999)
3. S. Ichimaru, Rev. Mod. Phys, 54, 1017-1059 (1982)
4. S. Brush, H. Sahlin and E Teller, J. Chem. Phys. 45 2102(1966)
5. D.R. Kania et. al. Phys. Rev. A, 46(12) 7853-7868 (1992)
6. C.A. Back et. al. J. Quant. Spectrosc. Radiat. Transfer, 51,19-25 (1994)
7. D. Riley, N.C. Woolsey, D. McSherry and E. Nardi, J.Quant. Spectrosc. Radiat. Transfer, 65, 463-470 (2000)
8. R.P. Kraft et. al. Nucl. Inst. Methods A 366 192-202(1995)
9. B.L. Henke, E.M. Gullikson and J.C. Davis, Atomic Dataand Nuclear Data Tables, 1993, 54, 181-342
10. P.C. Thompson and P.D. Roberts, Laser and ParticleBeams, 2 pp13-26 (1984).
11. P.C. Thompson, P.D. Roberts, N.J. Freeman and P.T.G.Flynn, J.Phys.D: 14, p1215 (1981)
12. D.A. Liberman, Phys. Rev. B 20, p4981 (1979)
13. Y. Rosenfeld, Phys. Rev. E 47, p2766 (1993)
14. E. Nardi, Z. Zinamon, D. Riley, and N.C. Woolsey, Phys.Rev. E 57, 4693-4697 (1998)
15. D. Riley, N.C. Woolsey, D. McSherry, I. Weaver, A.Djaoui and E. Nardi, Phys. Rev. Lett. 84(8) 1704-1707(2000)
16. M.W.C. Dharma-wardana and F. Perrot, Phys. Rev. E58(3) 3705 (1998)
17. A. Ng, P. Celliers, G. Xu, and A. Forsman, Phys. Rev. E52(4) PtB 4299 (1995)
18. R. J. Harrach and F. J. Rogers J. Appl. Phys. 52, p5592(1981)
19. R.M. More, Advances in Atomic and Molecular Physics21, 305-356 (1985)
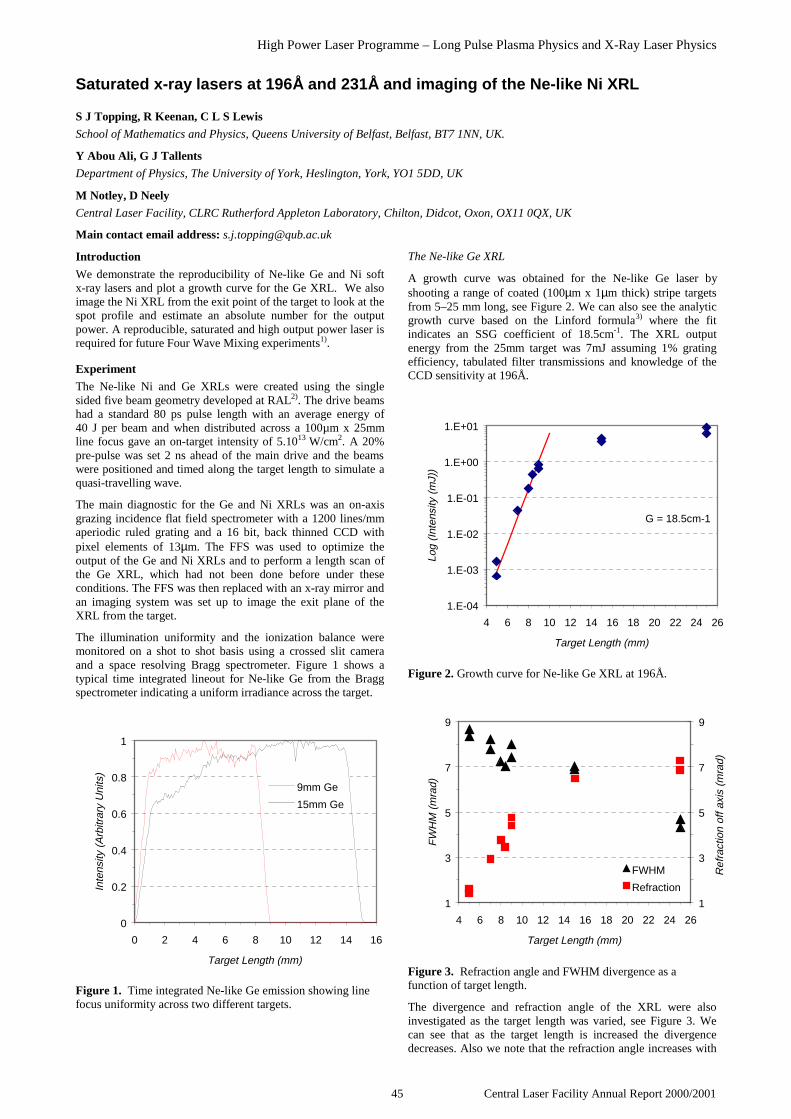
High Power Laser Programme – Long Pulse Plasma Physics and X-Ray Laser Physics
45 Central Laser Facility Annual Report 2000/2001
Introduction
We demonstrate the reproducibility of Ne-like Ge and Ni softx-ray lasers and plot a growth curve for the Ge XRL. We alsoimage the Ni XRL from the exit point of the target to look at thespot profile and estimate an absolute number for the outputpower. A reproducible, saturated and high output power laser isrequired for future Four Wave Mixing experiments1).
Experiment
The Ne-like Ni and Ge XRLs were created using the singlesided five beam geometry developed at RAL2). The drive beamshad a standard 80 ps pulse length with an average energy of40 J per beam and when distributed across a 100µm x 25mmline focus gave an on-target intensity of 5.1013 W/cm2. A 20%pre-pulse was set 2 ns ahead of the main drive and the beamswere positioned and timed along the target length to simulate aquasi-travelling wave.
The main diagnostic for the Ge and Ni XRLs was an on-axisgrazing incidence flat field spectrometer with a 1200 lines/mmaperiodic ruled grating and a 16 bit, back thinned CCD withpixel elements of 13µm. The FFS was used to optimize theoutput of the Ge and Ni XRLs and to perform a length scan ofthe Ge XRL, which had not been done before under theseconditions. The FFS was then replaced with an x-ray mirror andan imaging system was set up to image the exit plane of theXRL from the target.
The illumination uniformity and the ionization balance weremonitored on a shot to shot basis using a crossed slit cameraand a space resolving Bragg spectrometer. Figure 1 shows atypical time integrated lineout for Ne-like Ge from the Braggspectrometer indicating a uniform irradiance across the target.
0
0.2
0.4
0.6
0.8
1
0 2 4 6 8 10 12 14 16
Target Length (mm)
Inte
nsity
(A
rbitr
ary
Uni
ts)
9mm Ge
15mm Ge
Figure 1. Time integrated Ne-like Ge emission showing linefocus uniformity across two different targets.
The Ne-like Ge XRL
A growth curve was obtained for the Ne-like Ge laser byshooting a range of coated (100µm x 1µm thick) stripe targetsfrom 5–25 mm long, see Figure 2. We can also see the analyticgrowth curve based on the Linford formula3) where the fitindicates an SSG coefficient of 18.5cm-1. The XRL outputenergy from the 25mm target was 7mJ assuming 1% gratingefficiency, tabulated filter transmissions and knowledge of theCCD sensitivity at 196Å.
1.E-04
1.E-03
1.E-02
1.E-01
1.E+00
1.E+01
4 6 8 10 12 14 16 18 20 22 24 26
Target Length (mm)
Log
(Int
ensi
ty (
mJ)
)
G = 18.5cm-1
Figure 2. Growth curve for Ne-like Ge XRL at 196Å.
1
3
5
7
9
4 6 8 10 12 14 16 18 20 22 24 26
Target Length (mm)
FW
HM
(m
rad)
1
3
5
7
9R
efra
ctio
n of
f axi
s (m
rad)
FWHM
Refraction
Figure 3. Refraction angle and FWHM divergence as afunction of target length.
The divergence and refraction angle of the XRL were alsoinvestigated as the target length was varied, see Figure 3. Wecan see that as the target length is increased the divergencedecreases. Also we note that the refraction angle increases with
Saturated x-ray lasers at 196 Å and 231Å and imaging of the Ne-like Ni XRL
S J Topping, R Keenan, C L S Lewis
School of Mathematics and Physics, Queens University of Belfast, Belfast, BT7 1NN, UK.
Y Abou Ali, G J Tallents
Department of Physics, The University of York, Heslington, York, YO1 5DD, UK
M Notley, D Neely
Central Laser Facility, CLRC Rutherford Appleton Laboratory, Chilton, Didcot, Oxon, OX11 0QX, UK
Main contact email address: [email protected]

Science – High Power Laser Programme – Long Pulse Plasma Physics and X-Ray Laser Physics
Central Laser Facility Annual Report 2000/2001 46
increasing target length up to the point where saturation takeseffect.
The Ne-like Ni XRL
We also shot 25mm Ni slab targets and the output of the NiXRL was measured at 5mJ assuming 1% grating efficiency,knowledge of the CCD sensitivity at 231Å and from tabulatedfilter transmissions. The exit plane of the XRL from the targetposition was then imaged using a spherical multilayer mirror atnear normal incidence and a second x-ray mirror to relay theimage to the CCD at x40 magnification as shown in Figure 4.
5 x 1 0 8 m m
@ 1 0 5 4 n mX - r a y l a s e re x i t p o i n t
2 5 m m N iS l a b t a r g e t
5 0 c m R O CX R M
1 m R O CX R M
C C D
5 x 1 0 8 m m
@ 1 0 5 4 n mX - r a y l a s e re x i t p o i n t
2 5 m m N iS l a b t a r g e t
5 0 c m R O CX R M
1 m R O CX R M
C C D
Figure 4. XRL Imaging Setup.
260µ
m
1 3 5 µ m
1 9
0 µ
m
0 r e t r a c t io n
1 5 5 µ m7 0 µ m r e t r a c t io n
1 9 0 µ m
2 9 0 µ
m
1 7 0 µ m re t r a c t io n
2 6
0 µ
m26
0µm
1 3 5 µ m
1 9
0 µ
m
0 r e t r a c t io n
1 5 5 µ m7 0 µ m r e t r a c t io n
1 5 5 µ m7 0 µ m r e t r a c t io n
1 9 0 µ m
2 9 0 µ
m
1 7 0 µ m re t r a c t io n
2 6
0 µ
m
Figure 5. Image of Ne-like Ni XRL at exit point for0, 70, 170 µm target retractions.
Figure 5 shows images of the XRL at different target retractions(i.e. the target is moved back from best focus) with the FWHM
of the spot size indicated. We can clearly see the increase inspot size as the target is retracted due to a larger area of the pre-plasma being heated by the main drive beams. The outputenergy of the XRL also increases as the target is retracted andpeaks between 70-100µm retraction at ~15mJ, see Figure 6.
0.0
5.0
10.0
15.0
20.0
0 20 40 60 80 100 120 140 160 180
Target Retraction (microns)
Out
put (
mJ)
Figure 6. Ni XRL output dependence on target retraction.
0
0.05
0.1
0.15
0.2
0.25
0.3
17 18 19 20 21 22 23 24 25 26 27
Wavelength (nm)
Ref
lect
ivity
1m ROC
0.5m ROC
Figure 7. Measured reflectivity of multilayer mirrors.
Conclusions
From the Ne-like Ni XRL images we were able to obtain avalue for the XRL output energy. This was based on measuredreflectivity (at Queens University, see Figure 7) of the XRMsused in the imaging set-up and knowledge of the CCDsensitivity at 231Å. By comparing this value to the Ni XRLoutput energy from the FFS it was then possible to estimate thegrating efficiency for the FFS, which was found to be 1%. Theresults from the Ge length scan will be used by York Universityto model the Ge XRL output energy using EHYBRID4) andimprove the quality of the simulation.
References
1. R.M.N. O’Rourke, CLF Annual Report, (1999).
2. R Keenan et al, CLF Annual Report, (1999).
3. Gary J. Linford et al, Applied Optics, 13, No.2, (1974).
4. J A Plowes et al, Opt. Commun., 116, 260 (1995)
High Power Laser Programme – Theory and Computation
47 Central Laser Facility Annual Report 2000/2001
Introduction
Large laser amplification in the EUV and X-ray regions hasbeen observed in the past, using particularly the Ne-like and Ni-like ions such as Gd, Se, Ge and Ti. For reliable modelling ofthe plasmas, atomic data for energy levels, radiative rates andexcitation rate coefficients are required. There are manytheoretical calculations for the Ne-like ions, but for Ni-like ionsthere are few - see, for example, Hagelstein1) and Zhang et al2).Hagelstein has calculated the relevant atomic data for Ni-likeGd XXXVII, whereas Zhang et al have computed these for aseries of ions with 60 <= Z <= 92. Although these calculationsinvolve a large number of fine-structure levels including thoseof n=4, and have included configuration interaction (CI) andrelativistic effects, the works suffer from two majordeficiencies. Firstly, the radiative rates and collision strengthsare reported for the resonance transitions only, whereas data arealso required for transitions among the excited levels. Secondly,these workers have used the Distorted Wave (DW) code for thecomputations of collision strengths (Ω), which they havecomputed at only a few energies above thresholds. Therefore,they have omitted resonances in the threshold region, which arelikely to significantly contribute to the calculations of excitationrate coefficients, even at the high temperatures at which the dataare required. Therefore, we aim to explore the contribution ofresonances to the excitation rate coefficients, and to report thecollision data for all transitions. Energy levels and radiativerates are calculated for six Ni-like ions namely, Nd XXXII,Sm XXXV, Eu XXXVI, Gd XXXVII, Ta XXXXVI, andW XXXXVII, whereas computations for Ω and excitation rateshave been performed only for Gd XXXVII as a test case.
Energy Levels and Radiative Rates
To generate the wavefunctions, we have used the fullyrelativistic GRASP code of Dyall et al3), and to calculate Ω theDirac Atomic R-matrix Code (DARC) of Norrington andGrant4). For the computations of energy levels and radiativerates, we have included the lowest 107 fine-structure levelsarising from the (1s22s22p6) 3s23p23d10, 3s23p63d94l,3s23p53d104l and 3s3p63d104l configurations. The specific listof these energy levels has already been reported5,6). However,the corresponding calculations for Ω are restricted to the lowest59 levels because of computational limitations. CI has beenincluded among the above listed configurations, and the optionof EAL (extended average level), in which the weighted trace ofa Hamiltonian is minimised, is chosen in the GRASP code. Thecalculations fully include the relativistic effects, and are in the jjcoupling scheme.
Our calculated energy levels and radiative rates (A- values) forthe above listed ions have already been reported by Aggarwal etal5,6). Our level energies agree excellently within 1 eV withthose of Zhang et al2) and with Fournier7) for W XXXXVII.However, the orders of the levels is slightly different in a fewinstances. This is perhaps a direct consequence of the inclusionof larger CI by Zhang et al, as Hagelstein1) (who has used thesame configurations as us) also obtains the same energy orderfor Gd XXXVII. However, the level energies of Hagelstein arethe highest among the three calculations, and differ up to 5 eV,
corresponding to only ~0.3%. Additionally, it must beemphasized here that because of strong mixing, especiallyamong the higher levels, the identification of a particular levelis sometimes ambiguous. At present, there is no unique way toidentify each level, and the absence of experimental energiescomplicates this further. Therefore, it is possible that some ofthe levels may be misplaced.
The comparison of oscillator strengths (f-values) can be madefor allowed transitions from the ground level only, as these arethe only data available in the literature. Among 13 suchtransitions, the agreement between our f-values and those ofothers for the first 11 transitions are highly satisfactory, and arewithin 10%. However, differences are significantly large for theremaining two transitions. In particular, the f-value of Zhang etal2) for the 1-95 (3s23p63d10 1S0-3s3p63d104p3/2
1Po) transition inSm XXXV is larger than ours by a factor of six, whiledifferences in other instances range from 10% to a factor ofthree. Such large differences partly arise due to the inclusion oflarger or smaller CI, but mostly because of the crossing over ofthe levels. However, neither do we see any indication forsudden enhancement in our calculations nor do we expect itfrom the general behaviour of f with Z. Inclusion of a larger setof orbitals (n >= 5) in the calculations of Zhang et al2) may beresponsible for this abrupt increase in the values of f for some ofthe transitions. Generally, the inclusion of higher orbitals, andhence larger CI, improves the quality of wavefunctions butlimited inclusion may not necessarily do so. To elaborate, it ispossible that the inclusion of n = 6 orbitals may improve thef- values for the above transitions. However, in the absence ofother calculations including larger CI, it is difficult to concludewhich one of the two calculations is better. We have obtainedaccurate energy levels and a good agreement between the lengthand velocity forms of the oscillator strengths, and therefore,have confidence in our results.
The agreement between the length and velocity forms of ourcalculated oscillator strengths is within 20% for all the strong(i.e. f >= 0.10) transitions. Exceptions to this are 2 transitionsin Nd XXXIII, Sm XXXV and Eu XXXVI, and 1 transition inGd XXXVII, Ta XXXXVI and W XXXXVII, for which theagreements are within 40%. Not only is this overall goodagreement highly satisfactory, but it also gives a clear indicationof the accuracy of the results. The agreement between thelength and velocity forms for transitions with f-values < 0.10 ismuch poorer but is not unexpected given the large number oftransitions considered. To conclude, the energy levels and theradiative rates reported for 6 Ni-like ions are fairly accurate,and are in excellent agreement with those available in theliterature.
Collision Strengths
To compute our collision strengths, we have used the DARCprogram of Norrington and Grant4). This program includes therelativistic effects in a systematic way, in both the targetdescription as well as in the scattering model. It is based on thejj coupling scheme and uses the Dirac-Coulomb Hamiltonian inthe R-matrix approach. However, because of the inclusion offine-structure in the definition of channel coupling, the matrix
Atomic data for modelling of lasers
K M Aggarwal, F P Keenan
Department of Pure & Applied Physics, Queen’s University, Belfast BT7 1NN, UK
P H Norrington
Dept. of Applied Maths& Theoretical Physics, Queen’s University, Belfast BT7 1NN, UK
S J Rose
Central Laser Facility, CLRC Rutherford Appleton Laboratory, Chilton, Didcot, Oxon, OX11 0QX, UK
Main contact email address: [email protected]

High Power Laser Programme – Theory and Computation
Central Laser Facility Annual Report 2000/2001 48
size of the Hamiltonian increases substantially, making thecalculations computationally more expensive. For this reason,we had to restrict our computations of Ω to the lowest 59 levels.As a test case, we have first performed the calculations forGd XXXVII. Those for other ions will be performed in future.
The details of the calculations have already been described byAggarwal et al5). To recapitulate, the R-matrix boundary radiushas been taken to be 1.64 au, and 20 continuum orbitals havebeen included for each channel angular momentum for theexpansion of the wave function. Contribution from all partialwaves with angular momentum J <= 40.5 has been included, Ωhave been computed up to an energy of 800 Ryd, more thansufficient for the calculation of accurate excitation and de-excitation rate coefficients up to a temperature of 3×10⁷ K.
Collision strengths at 4 representative energies of 200, 400, 600and 800 Ryd for resonance transitions in Gd XXXVII have beenpresented and discussed by Aggarwal et al5). Correspondingresults for remaining transitions and at other energies may beobtained from the first author. At energies below 400 Ryd, theΩ of Hagelstein1) and Zhang et al2) differ by less than 10% formost of the transitions and by 13% for one transition only(1-25) - see1) for level identification. However, at the highestelectron energy (around 600 Ryd) at which Zhang et al havereported their Ω, the differences with our DARC calculationsare rather striking, especially for the 1-3 and 1-5 transitions. Forthese two transitions, not only the RDW Ω values are higher byup to 25% but also appear to be out of place, as they show asudden enhancement at this energy in contrast to the smoothervariation of Ω at lower energies - see Figures 6 and 7 ofAggarwal et al5). Other transitions which show a similar abruptrise in the value of Ω at the highest energy of Zhang et al’scalculations, are those with upper levels 20, 25, 30, 33, and 58.As noticed earlier, the RDW Ω are higher by up to 25% at thehighest common energy. All of these transitions (includingthose two discussed above) are electric quadrupole (0e–2e)transitions, and hence are forbidden in the jj coupling scheme.The magnitudes of collision strengths for these transitions arecomparatively small, and the contribution (if any) of the higherneglected partial waves is negligible. Therefore, we see noreason why the values of Ω for such forbidden transitionsshould rise at higher energies and conclude that the reported Ωof Zhang et al at the highest energy of their calculations are inerror, at least for some of the transitions.
In the threshold energy region Ω have been computed at over13000 energies in order to delineate resonances. Close to thethresholds the energy mesh is 0.001 Ryd and at energies below96.50 Ryd, it is not greater than 0.002 Ryd. However, in theremaining threshold region (96.5 to 106.70 Ryd) it graduallybut non uniformly increases up to 0.010 Ryd. This means thatfor transitions whose upper levels J are >= 35 (see5) for leveldefinitions), the energy mesh is comparatively coarser.However, this should not significantly affect the accuracy of thecalculated excitation rates, as no large resonances have beenobserved in this energy range. The accuracy for rates isnormally affected if there are large resonances and have notbeen resolved in a finer energy mesh in order to have their truewidths, and hence may lead to an overestimation. On the otherhand, there could be a possibility of missing a few resonancesbecause of the coarser mesh adopted. A few tests made with afiner mesh in the above energy range have not shown anynoticeable effects. Since this is contrary to what we observed inthe range below 96.50 Ryd, we have confidence in our results.
Excitation Rate Coefficients
The only results available in the literature for the excitation ratecoefficients are by Hagelstein1) for resonance transitions inGd XXXVII. A comparison made between our presentlycalculated excitation rates and those of Hagelstein, shows thatthe resonances have enhanced the values of rates up to an orderof magnitude at lower temperatures. But it is interesting to notethat even at the highest temperature of the calculations i.e.Te = 2500 eV, the contribution of resonances has enhanced thevalues of rates by over a factor of five for some of thetransitions. For other transitions the effect of resonances hasbeen comparatively smaller, and for transitions with their upperlevels J >= 35, the differences between the two sets of rates atthe highest temperature are within 25%. The detailed results inthe numerical form along with further comparisons will soon bepresented. However, in Table 1 we present our preliminaryresults for some transitions, and the corresponding availableresults of Hagelstein1), at the lowest and the highesttemperatures, have also been included for comparisons.
Conclusions
In conclusion, we have calculated energy levels and radiativerates among the 107 fine-structure levels of Ni-like ions. Theexperimental energy values for these levels are not available,but the agreement with other available theoretical energies iswithin 0.3%. Collision strengths at energies above thresholdshave also been computed, for transitions among the lowest 59levels of Gd XXXVII. The results obtained for Ω have beencompared with those available, and are found to be in excellentagreement (within 10%), but at energies below 400 Ryd only.At higher energy, the differences are of up to 25% for some ofthe forbidden transitions, for which the earlier available RDWΩ are overestimated. Since a large range of partial waves hasbeen included in order to obtain convergence, and relativistic(and CI, although limited) effects have also been included inboth the target description and the scattering model, we expectour results of Ω to be accurate to within 10%. The differencesamong various calculations for the f-values are morepronounced, although the agreement between the length andvelocity forms in our calculations is generally within 10%.Excitation rates computed for resonance transitions inGd XXXVII are found to be enhanced, in comparison withthose obtained from non resonant Ω, by about an order ofmagnitude for many transitions. We hope these new results willbe of significant use in laser applications.
References
1. P. L. Hagelstein,Phys. Rev. A 34 874 (1986)
2. H. L. Zhang, D. H. Sampson and C. J. Fontes,Atomic Data Nucl. Data Tables 48 91 (1991)
3. K. G. Dyall, I. P. Grant, C. T. Johnson, F. A. Parpia and E.P. PlummerComput. Phys. Commun. 55 425 (1989)
4. P. H. Norrington and I. P. Grant,Comput. Phys. Commun. - in prep (2001)
5. K. M. Aggarwal, P. H. Norrington, K. L. Bell, F. P.Keenan, G. J. Pert, and S. J. Rose J.Phys. B 32 5067 (1999)
6. K. M. Aggarwal, P. H. Norrington, K. L. Bell, F. P.Keenan, G. J. Pert, and S. J. RoseAtomic Data Nucl. Data Tables 74 157 (2000)
7. K. B. Founier, Atomic Data Nucl. Data Tables 68 1(1998)

High Power Laser Programme – Theory and Computation
49 Central Laser Facility Annual Report 2000/2001
Transition Te=500h 500 700 1000 1500 2000 2500 2500h
1- 2 3.283-13 4.782-12 5.494-12 5.270-12 4.268-12 3.411-12 2.778-12 4.638-131- 3 1.110-12 1.018-11 1.218-11 1.228-11 1.072-11 9.201-12 8.015-12 2.903-121- 4 1.370-13 2.037-12 2.399-12 2.344-12 1.925-12 1.548-12 1.265-12 2.014-131- 5 7.666-13 5.788-12 7.034-12 7.203-12 6.402-12 5.571-12 4.906-12 2.053-121- 6 2.898-13 2.645-12 3.245-12 3.289-12 2.798-12 2.302-12 1.912-12 4.746-131- 7 5.305-13 3.234-12 4.047-12 4.228-12 3.792-12 3.287-12 2.871-12 1.268-121- 8 2.132-13 2.149-12 2.659-12 2.704-12 2.300-12 1.888-12 1.565-12 3.517-131- 9 9.426-13 6.347-12 8.234-12 9.073-12 8.916-12 8.454-12 8.015-12 3.778-121-10 3.678-13 1.592-12 2.044-12 2.169-12 1.937-12 1.645-12 1.398-12 6.265-131-11 2.005-13 1.609-12 2.020-12 2.086-12 1.804-12 1.498-12 1.251-12 3.494-131-12 2.000-12 7.508-12 1.032-11 1.229-11 1.343-11 1.379-11 1.387-11 8.772-121-13 2.827-13 1.611-12 2.058-12 2.192-12 2.007-12 1.767-12 1.561-12 7.379-131-14 7.167-14 2.696-13 3.604-13 3.962-13 3.663-13 3.177-13 2.740-13 1.354-131-15 3.029-13 1.312-12 1.790-12 2.069-12 2.132-12 2.078-12 2.005-12 1.132-121-16 4.018-13 1.331-12 1.799-12 2.035-12 1.995-12 1.843-12 1.688-12 1.105-121-17 1.197-13 8.805-13 1.130-12 1.187-12 1.040-12 8.691-13 7.287-13 2.144-131-18 4.759-13 8.647-13 1.275-12 1.530-12 1.537-12 1.399-12 1.247-12 9.724-131-19 4.942-13 8.517-13 1.274-12 1.564-12 1.634-12 1.549-12 1.433-12 1.127-121-20 4.791-13 8.913-13 1.323-12 1.616-12 1.686-12 1.602-12 1.488-12 1.282-121-21 3.367-13 7.094-13 1.020-12 1.190-12 1.156-12 1.028-12 8.995-13 6.177-131-22 2.926-13 1.491-12 2.048-12 2.281-12 2.113-12 1.826-12 1.568-12 5.874-131-23 6.000-13 1.012-12 1.515-12 1.840-12 1.860-12 1.696-12 1.510-12 1.179-121-24 3.851-13 7.710-13 1.134-12 1.354-12 1.345-12 1.214-12 1.073-12 7.598-131-25 1.092-12 1.396-12 2.285-12 3.151-12 3.846-12 4.116-12 4.195-12 4.238-121-26 2.972-13 5.657-13 8.438-13 1.025-12 1.048-12 9.711-13 8.802-13 6.388-131-27 9.633-13 1.711-12 2.700-12 3.554-12 4.082-12 4.170-12 4.098-12 3.411-121-28 2.483-13 1.909-12 2.608-12 2.870-12 2.609-12 2.222-12 1.885-12 5.192-131-29 3.308-13 9.016-13 1.319-12 1.554-12 1.514-12 1.347-12 1.178-12 6.774-131-30 6.444-13 9.958-13 1.605-12 2.174-12 2.604-12 2.755-12 2.788-12 2.571-121-31 2.939-13 5.079-13 7.704-13 9.454-13 9.653-13 8.859-13 7.926-13 6.349-131-32 4.261-13 6.779-13 1.051-12 1.326-12 1.415-12 1.354-12 1.259-12 1.027-121-33 4.771-13 7.301-13 1.163-12 1.527-12 1.730-12 1.744-12 1.697-12 1.534-121-34 2.777-13 5.216-13 7.769-13 9.337-13 9.300-13 8.383-13 7.396-13 5.411-131-35 1.416-11 1.600-11 2.868-11 4.226-11 5.375-11 5.817-11 5.936-11 5.619-111-36 1.160-13 1.440-13 2.417-13 3.228-13 3.546-13 3.385-13 3.104-13 2.848-131-37 1.102-12 1.099-12 2.273-12 3.909-12 5.952-12 7.326-12 8.230-12 7.011-121-38 2.107-13 2.429-13 4.076-13 5.434-13 5.948-13 5.661-13 5.180-13 5.068-131-39 6.046-13 6.830-13 1.176-12 1.624-12 1.875-12 1.877-12 1.799-12 1.628-121-40 6.398-13 6.750-13 1.138-12 1.521-12 1.663-12 1.579-12 1.441-12 1.436-121-41 3.518-13 3.902-13 6.687-13 9.172-13 1.053-12 1.052-12 1.009-12 9.291-131-42 6.683-13 6.199-13 1.048-12 1.400-12 1.526-12 1.444-12 1.314-12 1.285-121-43 4.582-13 3.946-13 6.621-13 8.778-13 9.499-13 8.947-13 8.114-13 7.173-131-44 4.668-13 4.528-13 7.635-13 1.019-12 1.114-12 1.061-12 9.712-13 9.367-131-45 4.806-13 3.495-13 5.842-13 7.708-13 8.291-13 7.776-13 7.027-13 6.043-131-46 5.285-13 4.288-13 7.251-13 9.671-13 1.051-12 9.927-13 9.016-13 8.268-131-47 3.844-13 2.530-13 4.255-13 5.673-13 6.235-13 5.997-13 5.566-13 4.349-131-48 8.288-13 8.213-13 1.566-12 2.440-12 3.280-12 3.678-12 3.848-12 3.831-121-49 7.041-12 7.056-12 1.413-11 2.319-11 3.319-11 3.902-11 4.238-11 3.832-111-50 5.879-13 6.266-13 1.077-12 1.460-12 1.616-12 1.544-12 1.415-12 1.396-121-51 3.921-13 3.531-13 6.093-13 8.261-13 9.108-13 8.670-13 7.917-13 7.849-131-52 3.443-13 3.263-13 5.600-13 7.557-13 8.297-13 7.876-13 7.177-13 6.882-131-53 2.800-13 3.019-13 5.311-13 7.430-13 8.667-13 8.738-13 8.432-13 7.808-131-54 2.733-13 2.594-13 4.473-13 6.072-13 6.734-13 6.462-13 5.952-13 5.798-131-55 6.835-13 6.816-13 1.311-12 2.047-12 2.746-12 3.069-12 3.202-12 3.201-121-56 4.588-13 2.678-13 4.588-13 6.163-13 6.716-13 6.334-13 5.741-13 4.569-131-57 8.032-14 8.371-14 1.494-13 2.096-13 2.402-13 2.350-13 2.193-13 2.176-131-58 4.416-13 4.231-13 8.460-13 1.375-12 1.928-12 2.221-12 2.370-12 2.325-121-59 3.581-11 3.641-11 7.499-11 1.258-10 1.835-10 2.179-10 2.381-10 2.118-10
Table 1. Excitation rates (cm3/s) for some transitions in Gd XXXVII as a function of Te (in eV). The superscript h denotes theresults of Hagelstein1). a-b ≡ a×10-b.

High Power Laser Programme – Theory and Computation
Central Laser Facility Annual Report 2000/2001 50
Introduction
The study of multi-electron atoms and molecules in strong laserfields has been one of the areas of atomic and molecular physicsthat has attracted considerable interest over the last decade.Since the atomic structure is significantly disturbed when themagnitude of the laser field becomes comparable to themagnitude of the inter-particle interactions, many surprisingphenomena, such as high-harmonic generation, have beenobserved experimentally for atoms in strong laser fields. Toobtain a coherent understanding of these phenomena, manytheoretical approaches have been proposed, ranging fromextensive time-dependent calculations 1,2) to simple modelcalculations 3,4).
We are particularly interested in the development of a time-independent method for the description of atoms and moleculesin strong laser fields : the R-matrix Floquet approach 5,6). In theR-matrix Floquet approach, the time-dependent wave functionof the system is transformed into a time-independent one by theFourier-Floquet Ansatz. As a consequence of this Ansatz, thenet number of photons absorbed or emitted becomes an integralpart of the wave function.
In the present report, we describe some recent advances madefor two systems in particular, H2 and Ar7+. A recent paper 6)
discussed R-matrix-Floquet theory applied to molecular multi-photon processes. At present, this theory describes theinteraction of intense linearly polarized laser fields witharbitrary multi-electron diatomic molecules, and forms thebeginning of a program of work, which aims to complementrecent experimental work on multi-photon ionization processesin light molecules. In order to evaluate the merits of themolecular R-matrix Floquet code, we presently concentrate ourattention on H2.
In addition to molecular processes, atomic processes in intenselaser fields are of strong topical interest. For example, highly-charged ions have been studied extensively at the Central LaserFacility 7). Very few multi-photon calculations have beenperformed for highly-charged ions, but the characteristics of theR-matrix Floquet approach are such that calculations for highly-charged ions in intense laser fields should be significantlysimpler and faster than calculations for neutral atoms in intenselaser fields. In response to the experimental interest, we havestarted a program to examine highly-charged ions in intenselaser fields.
Multi-photon ionization of H2
A comprehensive study of one-, two- and four-photonionization rates for H2 has recently been published 8). Here weexamine four-photon ionization rates for H2 calculated at thefrequency of the KrF laser. A one-state approximation is used todescribe the H2
+ target state. The accuracy of thisapproximation is discussed in more detail in 8). We presentresults for four-photon ionization at the KrF laser frequency fora range of intensities and for three internuclear separations,R=1.2 a.u., 1.4 a.u. and 1.6 a.u. It is well known that as thelaser intensity increases, the ionization potential increases byapproximately the ponderomotive energy and in a similar way
also the energy levels of excited bound states increase. Hence asthe intensity increases the energy of four-photon absorptionrelative to the ν=0 vibrational level of the H2
+ ground statedecreases and so the intensity dependence in Figure 1 is fromright to left. The upper axis in Figure 1 gives this intensitydependence for the internuclear separation R=1.4 a.u. ForR=1.2 a.u. and R=1.6 a.u. the intensity dependence is onlyslightly different. The results in Figure 1 indicate that at anintensity of 3.1013 W/cm2, the KrF laser frequency is close toresonance with the second excited state when R=1.4 a.u.However, when the intensity has increased to about1.7.1014 W/cm2 the KrF laser frequency corresponds to aresonance between the ground state and the first excited state.This gives rise to the large resonance-enhanced multi-photonionization (REMPI) peak in the R=1.4 a.u. curve in the centre ofFigure 1. Peaks are also found in the R=1.2 a.u. and R=1.6 a.u.curves due to the resonance with the first excited state of H2.These occur for different intensities and hence differentenergies relative to the ν=0 vibrational level of H2.
Figure 1. Four-photon ionization rates at the KrF laserfrequency are shown for internuclear separations of R=1.2 a.u.(green dot-dashed curve), R=1.4 a.u. (blue solid curve) andR=1.6 a.u. (red dashed curve). The lower axis gives the energyin a.u. above the H2
+ ν=0 ground state and the upper axis givesthe corresponding intensity of the laser in 1014 W/cm2 whenR=1.4 a.u.
Also marked in Figure 1 are the ν=12 vibrational level of theH2
+ 2Σg+ ground state and the dissociation limit. The energy
above the ν=0 level will be divided between the photoelectronand vibronic excitation or dissociation of the residual molecularion. These results indicate that as the laser intensity (and alsofrequency) is varied the energy available for these processesalso varies. This suggests that varying the laser parametersshould enable the population in different vibrational levels ofthe residual ion to be controlled due to resonance effects. Thiscould be important in a number of ways. Consider, for example,experiments on the multi-photon ionization of the H2
+ ion.
Atoms and molecules in intense laser fields using the R-matrix Floquet approach
H W van der Hart, P G Burke
Department of Applied Mathematics and Theoretical Physics, Queen’s University Belfast, Belfast BT7 1NN
J Colgan
Department of Physics, Auburn University, Auburn AL 36849, USA.
D H Glass
School of Information and Software Engineering, University of Ulster, Newtownabbey, Co. Antrim BT37 0QB
Main contact email address: [email protected]
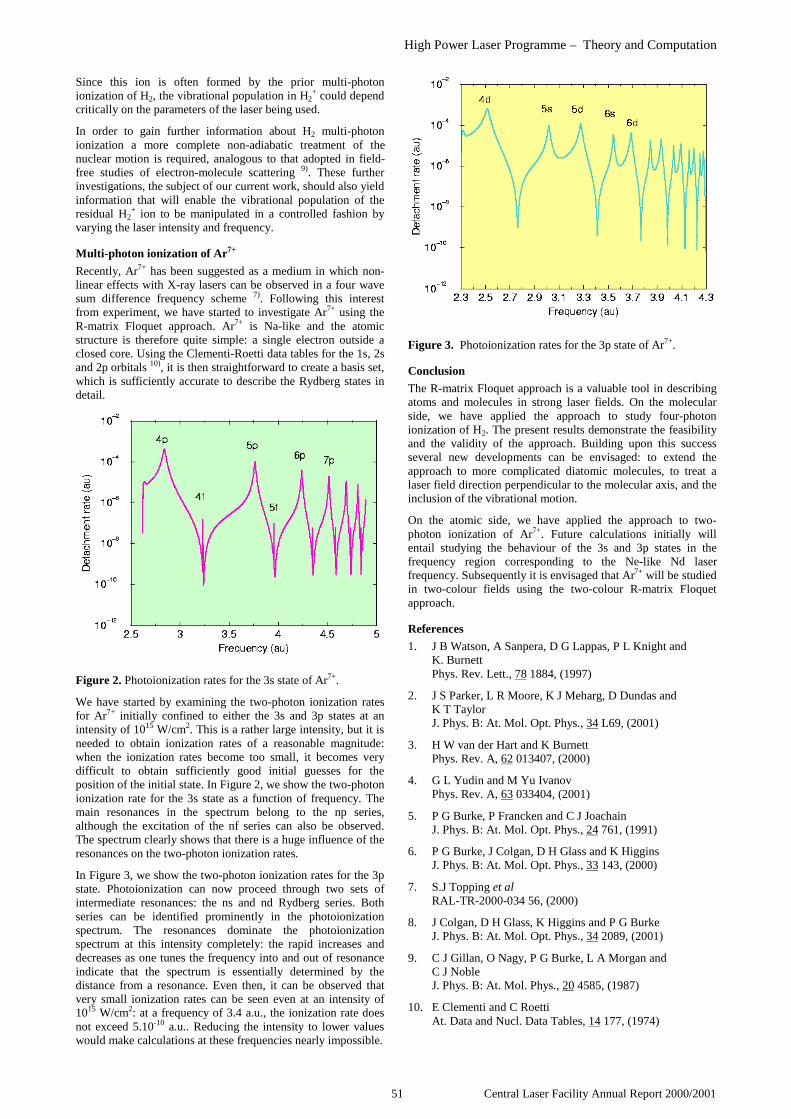
High Power Laser Programme – Theory and Computation
51 Central Laser Facility Annual Report 2000/2001
Since this ion is often formed by the prior multi-photonionization of H2, the vibrational population in H2
+ could dependcritically on the parameters of the laser being used.
In order to gain further information about H2 multi-photonionization a more complete non-adiabatic treatment of thenuclear motion is required, analogous to that adopted in field-free studies of electron-molecule scattering 9). These furtherinvestigations, the subject of our current work, should also yieldinformation that will enable the vibrational population of theresidual H2
+ ion to be manipulated in a controlled fashion byvarying the laser intensity and frequency.
Multi-photon ionization of Ar7+
Recently, Ar7+ has been suggested as a medium in which non-linear effects with X-ray lasers can be observed in a four wavesum difference frequency scheme 7). Following this interestfrom experiment, we have started to investigate Ar7+ using theR-matrix Floquet approach. Ar7+ is Na-like and the atomicstructure is therefore quite simple: a single electron outside aclosed core. Using the Clementi-Roetti data tables for the 1s, 2sand 2p orbitals 10), it is then straightforward to create a basis set,which is sufficiently accurate to describe the Rydberg states indetail.
Figure 2. Photoionization rates for the 3s state of Ar7+.
We have started by examining the two-photon ionization ratesfor Ar7+ initially confined to either the 3s and 3p states at anintensity of 1015 W/cm2. This is a rather large intensity, but it isneeded to obtain ionization rates of a reasonable magnitude:when the ionization rates become too small, it becomes verydifficult to obtain sufficiently good initial guesses for theposition of the initial state. In Figure 2, we show the two-photonionization rate for the 3s state as a function of frequency. Themain resonances in the spectrum belong to the np series,although the excitation of the nf series can also be observed.The spectrum clearly shows that there is a huge influence of theresonances on the two-photon ionization rates.
In Figure 3, we show the two-photon ionization rates for the 3pstate. Photoionization can now proceed through two sets ofintermediate resonances: the ns and nd Rydberg series. Bothseries can be identified prominently in the photoionizationspectrum. The resonances dominate the photoionizationspectrum at this intensity completely: the rapid increases anddecreases as one tunes the frequency into and out of resonanceindicate that the spectrum is essentially determined by thedistance from a resonance. Even then, it can be observed thatvery small ionization rates can be seen even at an intensity of1015 W/cm2: at a frequency of 3.4 a.u., the ionization rate doesnot exceed 5.10-10 a.u.. Reducing the intensity to lower valueswould make calculations at these frequencies nearly impossible.
Figure 3. Photoionization rates for the 3p state of Ar7+.
Conclusion
The R-matrix Floquet approach is a valuable tool in describingatoms and molecules in strong laser fields. On the molecularside, we have applied the approach to study four-photonionization of H2. The present results demonstrate the feasibilityand the validity of the approach. Building upon this successseveral new developments can be envisaged: to extend theapproach to more complicated diatomic molecules, to treat alaser field direction perpendicular to the molecular axis, and theinclusion of the vibrational motion.
On the atomic side, we have applied the approach to two-photon ionization of Ar7+. Future calculations initially willentail studying the behaviour of the 3s and 3p states in thefrequency region corresponding to the Ne-like Nd laserfrequency. Subsequently it is envisaged that Ar7+ will be studiedin two-colour fields using the two-colour R-matrix Floquetapproach.
References
1. J B Watson, A Sanpera, D G Lappas, P L Knight andK. BurnettPhys. Rev. Lett., 78 1884, (1997)
2. J S Parker, L R Moore, K J Meharg, D Dundas andK T TaylorJ. Phys. B: At. Mol. Opt. Phys., 34 L69, (2001)
3. H W van der Hart and K BurnettPhys. Rev. A, 62 013407, (2000)
4. G L Yudin and M Yu IvanovPhys. Rev. A, 63 033404, (2001)
5. P G Burke, P Francken and C J JoachainJ. Phys. B: At. Mol. Opt. Phys., 24 761, (1991)
6. P G Burke, J Colgan, D H Glass and K HigginsJ. Phys. B: At. Mol. Opt. Phys., 33 143, (2000)
7. S.J Topping et alRAL-TR-2000-034 56, (2000)
8. J Colgan, D H Glass, K Higgins and P G BurkeJ. Phys. B: At. Mol. Opt. Phys., 34 2089, (2001)
9. C J Gillan, O Nagy, P G Burke, L A Morgan andC J NobleJ. Phys. B: At. Mol. Phys., 20 4585, (1987)
10. E Clementi and C RoettiAt. Data and Nucl. Data Tables, 14 177, (1974)

High Power Laser Programme – Theory and Computation
Central Laser Facility Annual Report 2000/2001 52
Introduction
There is a long history of the study of light filaments trapped orself-focussed by the non-linear refractive index of the mediumin which the light is propagating. Non-linearity typically arisesfrom the atomic or thermal properties of the propagationmedium and in the case of a plasma there are two quite distincteffects. At very high intensities (vo ~ c) there is the relativisticnon-linearity where the increased mass of electrons oscillatingin the intense laser field acts to reduce the plasma frequencyand hence increase the refractive index. On longer time scalesthere is also the ponderomotive effect where plasma electronsare expelled from the laser focus, again reducing the plasmafrequency and operating whenever vo ~ vth.
The threshold and dynamics of self-focussing of single lightfilaments are well studied, usually using the paraxialapproximation for propagation of the light wave and sometimesusing variational methods so that the functional form of thedistribution of light intensity is assumed and parameters such asthe width and central intensity are followed.
Related Work
Investigation of the interaction of multiple light filaments inplasma is rather more limited. Sartang, Evans and Toner1)
followed the evolution of the paraxial wave equation (non-linear Schrodinger equation) in the presence of a ponderomotivetype of non-linearity and observed filaments combining andsplitting in different circumstances. Wilks et al2) looked atcases of strong self-focussing followed by spreading and beambreakup. Vidal and Johnston3) showed the formation of multiplefilaments from a single intense laser but did not follow theinteraction of the filaments. Berger et al4) simulatedfilamentation and Brillouin scatter occurring at the same time.
A very comprehensive paper by Schmitt5) includes analytic andnumerical treatment of filamentation, the break up of singlebeams into multiple filaments and the statistical effects ofchanging laser beam patterns as a function of time (ISI). Ren etal6) used a fully three dimensional PIC model of laser light in aplasma to demonstrate the mutual attraction of two skew beamswhich results in the light filaments twisting and forming abraided pattern. The simple dynamics of the braiding werereproduced using a variational method to follow the centroids oftwo Gaussian beams.
In the non-plasma context Stegeman and Segev7) review theinteraction of optical solitons
Detailed Interaction of Two Filaments
The work described here uses the same PIC code as Ren et al6)
(Hemker8)) but in its 2-1/2 dimensional form, to simulate beamsof light with no gradients in the third (x3) dimension althoughall three components of E, B, and j exist.
The simulation region is 225c/ωp units in the direction ofpropagation (x1) and 75 c/ωp in the transverse direction x2.Two laser beams are introduced at the x1 = 0 boundary, 10 c/ωp
across and with their centres at x2 = 25c/ωp and x2 = 50 c/ωp.The simulation is shown schematically in Figure 1.
Figure 1. Schematic of the PIC simulation of two laser beamsentering a uniform slab of plasma.
The plasma is a uniform slab at ne = 0.2nc with two small‘ramps’ at the entrance and exit planes to minimise surfaceeffects. The laser beams are defined in terms of theirdimensionless amplitude a0 = (eE/mωc) and have a0 = 2 anda0 = 3 to provide a degree of asymmetry to the calculation.Both beams are well above the threshold for relativistic self-focussing. The laser beams ‘turn on’ with a risetime of around20 ωp
-1.
The simulation proceeds up to a time t = 332 ωp-1 at which the
laser pulses have propagated across the whole of the mesh. Thesimulation uses ions with a mass of 1836 me so 332 ωpe
-1 isequivalent to 7.8ωpi
-1 and there is plenty of time for the ions andelectrons to move in response to the ponderomotive forces. Thesimulation is thus of a mix of relativistic and ponderomotiveself-focussing. Figure 2 shows the E2 field representing themain component of the laser light at t = 332 ωp
-1.
Figure 2. The transverse (E2) component of the laser waves at atime of t = 332 ωp
-1.
Interaction of Relativistically Self-Focussed Light Filaments
R G Evans
Department of Physics, University of York, Heslington, York YO10 5DD
C Ren
Plasma Physics Group, UCLA, Los Angeles Ca,USA
Main contact email address: [email protected]
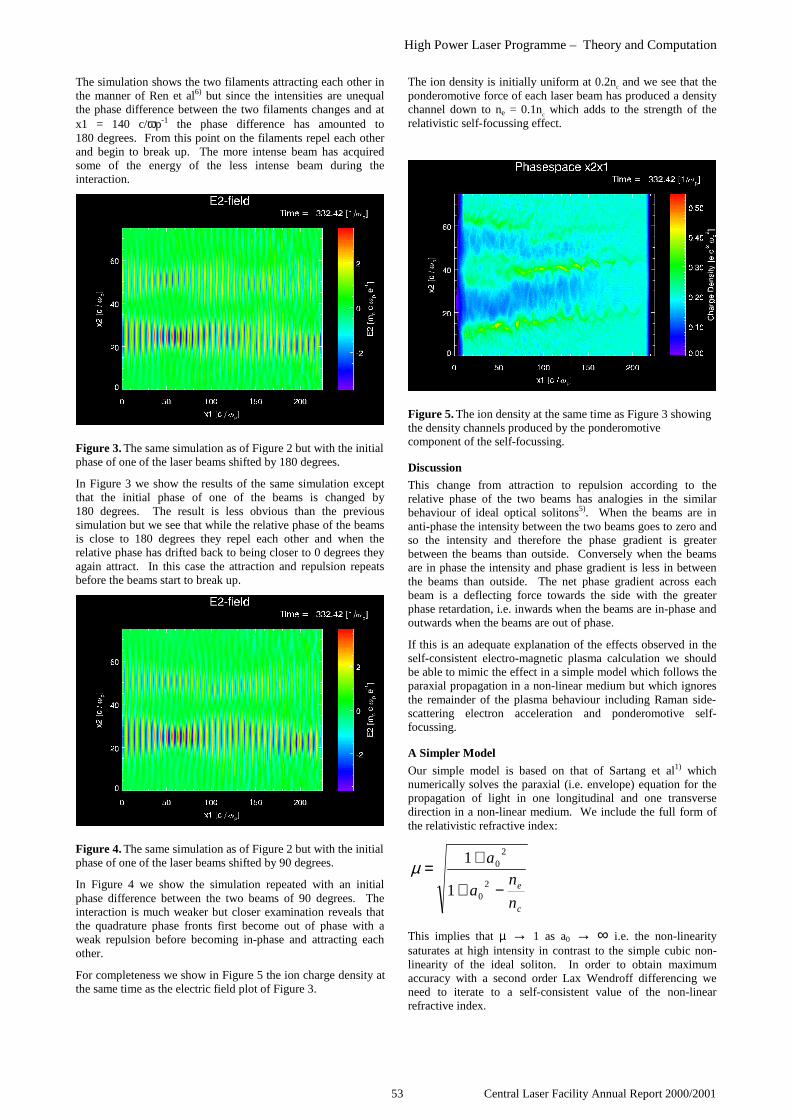
High Power Laser Programme – Theory and Computation
53 Central Laser Facility Annual Report 2000/2001
The simulation shows the two filaments attracting each other inthe manner of Ren et al6) but since the intensities are unequalthe phase difference between the two filaments changes and atx1 = 140 c/ωp-1 the phase difference has amounted to180 degrees. From this point on the filaments repel each otherand begin to break up. The more intense beam has acquiredsome of the energy of the less intense beam during theinteraction.
Figure 3. The same simulation as of Figure 2 but with the initialphase of one of the laser beams shifted by 180 degrees.
In Figure 3 we show the results of the same simulation exceptthat the initial phase of one of the beams is changed by180 degrees. The result is less obvious than the previoussimulation but we see that while the relative phase of the beamsis close to 180 degrees they repel each other and when therelative phase has drifted back to being closer to 0 degrees theyagain attract. In this case the attraction and repulsion repeatsbefore the beams start to break up.
Figure 4. The same simulation as of Figure 2 but with the initialphase of one of the laser beams shifted by 90 degrees.
In Figure 4 we show the simulation repeated with an initialphase difference between the two beams of 90 degrees. Theinteraction is much weaker but closer examination reveals thatthe quadrature phase fronts first become out of phase with aweak repulsion before becoming in-phase and attracting eachother.
For completeness we show in Figure 5 the ion charge density atthe same time as the electric field plot of Figure 3.
The ion density is initially uniform at 0.2nc and we see that theponderomotive force of each laser beam has produced a densitychannel down to ne = 0.1nc which adds to the strength of therelativistic self-focussing effect.
Figure 5. The ion density at the same time as Figure 3 showingthe density channels produced by the ponderomotivecomponent of the self-focussing.
Discussion
This change from attraction to repulsion according to therelative phase of the two beams has analogies in the similarbehaviour of ideal optical solitons5). When the beams are inanti-phase the intensity between the two beams goes to zero andso the intensity and therefore the phase gradient is greaterbetween the beams than outside. Conversely when the beamsare in phase the intensity and phase gradient is less in betweenthe beams than outside. The net phase gradient across eachbeam is a deflecting force towards the side with the greaterphase retardation, i.e. inwards when the beams are in-phase andoutwards when the beams are out of phase.
If this is an adequate explanation of the effects observed in theself-consistent electro-magnetic plasma calculation we shouldbe able to mimic the effect in a simple model which follows theparaxial propagation in a non-linear medium but which ignoresthe remainder of the plasma behaviour including Raman side-scattering electron acceleration and ponderomotive self-focussing.
A Simpler Model
Our simple model is based on that of Sartang et al1) whichnumerically solves the paraxial (i.e. envelope) equation for thepropagation of light in one longitudinal and one transversedirection in a non-linear medium. We include the full form ofthe relativistic refractive index:
c
e
n
na
a
−+
+=
20
20
1
1µ
This implies that µ → 1 as a0 → ∞ i.e. the non-linearitysaturates at high intensity in contrast to the simple cubic non-linearity of the ideal soliton. In order to obtain maximumaccuracy with a second order Lax Wendroff differencing weneed to iterate to a self-consistent value of the non-linearrefractive index.

High Power Laser Programme – Theory and Computation
Central Laser Facility Annual Report 2000/2001 54
The results are shown in Figures 6, 7 and 8.
Figure 6. The paraxial simulation of the interaction of twolight filaments for the same initial parameters and spatial scalesas Figure 2. The colour bar for amplitude a0 ranges linearlyfrom 0 to 5. The filaments attract but more slowly than inFigure 2.
Figure 7. The paraxial simulation repeated but with the initialamplitude of one beam reversed as in Figure 3. The colourscale is as in Figure 5. There is now weak repulsion betweenthe two beams.
Figure 8. The simulation repeated again but with an initialphase difference between the two beams of 90 degrees. Theinteraction is initially weaker leading to repulsion at later times.
The simple paraxial model does not reproduce the details of thefull PIC simulations but good qualitative agreement is obtainedin all three cases. The in-phase case shows the beams attractingand the more intense beam growing at the expense of theweaker beam. The initially out of phase case shows a weakerrepulsion of the beams and a second self-focussing. Thequadrature simulation shows the weakest of all the interactionsleading eventually to weak repulsion. In view of the fact thatthe simple model has a weaker self-focussing force due to theomission of the ponderomotive effect we consider this overallsimilarity to give good confirmation that the explanation givenearlier of attraction or repulsion of filaments based on theirrelative phase is essentially correct.
Other work has shown that the influence of the mutual Ramanscattering between the beams and the electron currents inducedby particle acceleration may be important in somecircumstances but to lowest order the two filament interactionappears to be dominated by the simple non-linear opticsphenomena.
Acknowledgement
R G Evans acknowledges the support of a William Penneyresearch Fellowship and the provision of supercomputerresources at AWE Aldermaston.
References
1. S Sartang, R G Evans and W T TonerJ Phys D, Appl Phys, 16, 955 (1983)
2. S Wilks, P E Young, J Hammer, M Tabak, W L KruerPhys Rev Lett 73, 22, 2994 (1994)
3. F Vidal and T W JohnstonPhys Rev Lett, 77, 1282 (1996)
4. R L Berger, B F Lasinski, A B Langdon, T B Kaiser, B BAfeyan, B I Cohen, C H Still, E A WilliamsPhys Rev Lett 75, 6, 1078 (1995)
5. A J SchmittPhys Fluids 31, 3079 (1988)
6. C Ren, R G Hemker, R A Fonseca, B J Duda, W B MoriPhys Rev Lett 85, 10, 2124 (2000)
7. G I Stegeman and M SegevScience 286, 1518 (1999)
8. R G HemkerPhD Thesis UCLA 2000 alsoR G Hemker et al, Proceedings of the 1999 ParticleAccelerator Conference, New YorkIEEE Piscataway NJ, 1999, p3672

High Power Laser Programme – Theory and Computation
55 Central Laser Facility Annual Report 2000/2001
Introduction
This study is motivated by the recent experiment of Woolsey etal1) at the CLF, designed to produce plasma conditions whichwould enable the study of a magnetised collisionless shock inthe laboratory with application to a variety of astrophysicallyinteresting situations. One of the open questions in thatexperiment is to what extent an external magnetic field canpenetrate a pre-formed laser plasma.
The simplest argument is that the laser plasma is almostcollisionless, of high electrical conductivity and so the magneticfield will be shielded out of the interior of the plasma by a skincurrent. The skin current and the penetration of the field will belimited to a collisionless skin depth c/ωp. Inclusion of the finiteconductivity for the conditions of Reference 1 leads to apenetration of less than twice the collisionless value.
Further consideration2) shows that for large magnetic fields themagnitude of the skin current implies an electron drift velocitygreater than the electron thermal speed and the possibility thation-acoustic turbulence may give rise to an increased resistivityand increased penetration depth. Moreover once the magneticpressure becomes greater than the plasma pressure there is alsothe possibility of a Rayleigh Taylor type fluid instability as the‘low density’ magnetic field attempts to accelerate the ‘highdensity’ plasma. These two effects occur on different timescales, the ion acoustic turbulence growing on a time scale of1/ωpi while the Rayleigh Taylor modes will grow on a longerhydrodynamic timescale.
The precise value of the electron drift velocity needed to initiatethe ion-acoustic turbulence is not well established under allconditions but if we assume that the condition may be writtenvcrit = αve where ve is the electron thermal velocity and the skincurrent flows only in a collisionless skin depth c/ωp then we canderive the interesting relationship
(B2/8π)/(nemeve2) = α2 / 16π (1)
Most theories of current driven ion-acoustic turbulence give avalue for α of the order of (me/mi)
1/2, i.e. α << 1, so thisequation gives an ordering for the appearance of the turbulentskin current and Rayleigh Taylor instabilities. If the pressure ofthe magnetic field is smaller than the plasma electron pressureby more than the factor of α2/16π then neither of theinstabilities should occur. As the magnetic pressure increasesfirst the current driven instability appears when the magneticpressure is still much less than the plasma pressure but theRayleigh Taylor instability will not appear until the magneticpressure becomes comparable to the plasma pressure and iscapable of imparting significant acceleration to the plasma.
This situation is related to the tearing modes of magneticallyconfined plasmas and the disruption phenomena that initiatesolar flares. In all cases the initial magnetic field energy isdestroyed by instabilities which break the original symmetrymuch faster than would be deduced from purely collisional timescales.
Simulations
While the Rayleigh Taylor aspects of the above problem can besimulated using MHD methods which are more efficient forlong time scale problems we have taken advantage of theavailability of the PIC code Osiris2) which runs efficiently on
multiple parallel processors and simulated the problem for longenough to observe both effects described above.
There is an intrinsic difficulty in setting up the problemdescribed above since the source of the magnetic field istypically of dimensions much larger than can be included self-consistently in the model. Attempting to initialise a magneticfield at t=0 is not viable since it assumes just that which we aretrying to calculate. Instead we have introduced additionalparticle species into Osiris which form a current sheet andwhich can be accelerated by fictitious external forces. Theinitial condition with j = 0 is then field-free and as the currentsheet grows the magnetic field propagates away from the sourceat the speed of light and interacts with the test plasma to form aself-consistent solution.
We have chosen to make the particles of the skin current verymassive and so resistant to any back reaction from the plasma.In the real world problem the reaction back on the field sourcesis largely irrelevant due to the transit time delays.
The magnetic field rise time must be slow, ie 10 – 100 x ωp-1 so
that there is little magnetic energy in the Fourier componentswith frequencies greater than the plasma frequency which candirectly penetrate the test plasma.
The initial conditions of the PIC simulation are shown inFigure 1 with the dimensions in units of c/ωp. x1 and x2 are thespace coordinates of the simulation while all x3 derivatives arezero.
Figure 1. Schematic of the Osiris simulation.
The simulation evolves with the current sheet growing fromJ = 0 at t=0 to a steady value at t=100ωp
-1 which gives amagnetic field of 0.7 mcωp/e between the current sheet and thetest plasma.
As the simulation proceeds the expected skin current appears(Figure 2) and this skin current eventually becomes turbulent(Figure 3).
Magnetic Field Penetration into Warm Plasma – Electron heating and RayleighTaylor Instability
R G Evans
Physics Department, University of York, Heslington, York YO10 5DD
Main contact email address: [email protected]

High Power Laser Programme – Theory and Computation
Central Laser Facility Annual Report 2000/2001 56
Figure 2. Electron phase space at t = 153.9 ωp-1 showing the
skin current in the test plasma in the x2 direction induced by theapplied magnetic field B3 and decaying over the collisionlessskin depth c/ωp.
Figure 3. Electron phase space at t = 461 ωp-1 showing the
spread in electron velocities as turbulence develops in thetransverse skin current.
Figure 4. Magnetic field out of the plane of the simulation att = 153.9 ωp
-1 showing the almost planar interface with the testplasma.
At the same time that turbulence and heating has beendeveloping in the region of the induced skin current, the testplasma has been accelerating under the influence of jskin x B.
The profiles of B3, the main component of applied magneticfield, show a development of surface ripples reminiscent of theReyleigh Taylor fluid instability. This sequence is shown inFigures 5, 6 and 7 with the characteristic non-linear RayleighTaylor behaviour that small wavelength modes grow fastest butalso saturate soonest leaving longer wavelength modesdominant at later times.
Figure 5. Magnetic field at t = 307.8ωp-1 showing the instability
developing with a wavelength around 2 – 3 c/ωp .
Figure 6. At t = 615 ωp-1 the instability of the interface is most
developed at longer wavelengths around 5 c/ωp.
The characteristic wavelength of the ‘Rayleigh Taylor’ modesgrows from about 2 c/ωp to about 5 c/ωp between t = 307ωp
-1
and t = 615 ωp-1.
Apart from the very latest times where the influence of the righthand boundary has clearly perturbed the test plasma we seealmost no penetration of the applied field beyond the region ofthe turbulent skin current. The electron drift instability hasgenerated strong turbulence and electron heating but withoutmaking significant changes to the effective resistivity andmagnetic diffusion.
The electron phase space at this time shows similarperturbations to the magnetic field plots (Figure 7).

High Power Laser Programme – Theory and Computation
57 Central Laser Facility Annual Report 2000/2001
Figure 7. The electron density plot at t = 615ωp-1 showing
similar structure to the interface in the magnetic field plot.
On the other hand the ion phase space shows more structureincluding what we believe to be a succession of shock waves asthe test plasma is impulsively accelerated by the magnetic field(Figure 8).
Figure 8. Ion density plot at t = 615 ωp-1 showing more small
scale structure than the equivalent electron density plot.
Acknowledgement
R G Evans acknowledges the support of a Wiliam PenneyResearch Fellowship and the use of supercomputing resourcesat AWE Aldermaston.
Conclusion
These simulations contain a wealth of information that needmore detailed analysis but already show the viability of the PICapproach to these long time scale problems given fast moderncomputers.
An immediate conclusion regarding the Woolsey et alexperiment is that there is unlikely to be any significantmagnetic field penetration into the flowing plasma and that theturbulent skin current may confuse the observation ofmagnetised collisionless shocks. On the other hand thepossibility exists of measuring the turbulence in the skin currentwhich is itself of considerable interest given its closeconnection with other laboratory and astrophysical plasmaconditions. The observation of a magnetic Rayleigh Taylorinstability is also an interesting prospect.
References
1. N C Woolsey, Y Abou Ali, R G Evans, R A D Grundy, S JPeschte, P G Carolan, N J Conway, R O Dendy, PHelander, K G McClements, J G Kirk, P A Norreys, M MNotley, S J RosePhysics of Plasmas 8, 2439 (2001)
2. P Helander, K G McClements, R O Dendy, N C WoolseyCLF Annual Report (2001)
3. R G HemkerPhD Thesis UCLA 2000 alsoR G Hemker et al Proceedings of the 1999 ParticleAccelerator Conference, New YorkIEEE Piscataway NJ, 1999, p3672
High Power Laser Programme – Theory and Computation
Central Laser Facility Annual Report 2000/2001 58
This note presents analytical modelling of the simplest aspectsof ongoing experiments using the Vulcan laser to simulateastrophysical shocks by producing collisions between twoexploding foils1). The purpose is to understand the basicdynamics of the plasma and the magnetic field in theseexperiments, and to gain some analytical insight into the outputfrom numerical simulations of the experiments using theMEDUSA 1) and POLLUX 2) codes. Specifically, we try to clarifywhy the plasma flow becomes supersonic even though it ispurely thermally driven; how nonuniformities imparted by thelaser beam can survive in the plasma while its transversedimension expands by a factor of several thousand; and whetherthe magnetic field can penetrate into the plasma despite thesmall collisional and collisionless skin depths.
Hydrodynamics
The simplest model of an exploding foil is that furnished by theisothermal, one-dimensional fluid equations,
( )0=
∂∂+
∂∂
x
nu
t
n (1)
x
n
n
c
x
uu
t
u s
∂∂−=
∂∂+
∂∂ 2
where n is the electron number density, u the velocity, andcs = (Te/ mi)
1/2 the isothermal sound speed. The electronpressure is taken to dominate over the ion pressure since theelectrons outnumber the ions. The magnetic field does not affectfluid-like aspects of the plasma dynamics if β=2µ0 nT/B2>>1.These equations have solutions with Gaussian density profilesand linear velocity profiles 3),
( ) ( ) )(2/1 2
, tLxetLtxn −−∝ and ( )L
Lxtxu
&=, (2)
where the scale length L(t) satisfies
( )0
)(
220
ln2ln20
LLc
L
scL
dst
s
tL
L s
≈+
= ∫ & (3)
The last, approximate, equality holds if the initial velocity, 0L& ,
vanishes and if L(t)>>L(0)=L0. This solution, which mightreasonably describe the early stages of the exploding foilexperiments before the two foil plasmas have had time tointeract, enables us to understand two features of theexperiments: the supersonic nature of the plasma expansion andthe possibility of density fluctuations remaining in the plasmafor a relatively long time. The initial foil thickness is aboutL0=0.1 µm, and the flow speed at the time of the collision, whenx=L=0.5 mm, thus becomes u~4cs, in rough quantitativeagreement with the Mach number observed in the simulations.The expansion is thus strongly supersonic although it is purelythermally driven. In this respect the flow is rather similar to thesolar wind. Now suppose that the plasma is filamented at t=0,perhaps because the laser irradiation is non-uniform. We expectsound waves to flatten filaments that have the scale length λ (orsmaller) in the time λ/cs. However, since the Mach numberexceeds unity, at the time (3) when the collision occurs this stillleaves filaments with scale lengths
( )
mm1.0ln2 0
≈≥λLL
L (4)
intact, as indeed observed in the experiments.
Magnetic field penetration
A question of prime importance is whether the magnetic fieldproduced by Helmholtz coils surrounding foils penetrates intothe plasma. Insofar as the plasma is ideally conducting, only thefield initially frozen into the plasma would be present there.This field would become very weak as it is attenuated by afactor L/L0~5000 when the plasma expands. The collisionlessskin depth is very small in the experiment, δe=c/ωpe~2 µm ifn=1025 m-3, and the resistive skin depth is also small,δskin=c/ωpe= (ηt/µ0)
1/2 ~10 µm for Te =1 keV if the Spitzervalue is used for the resistivity η. While this may suggest thatthe plasma is indeed ideal, Spitzer resistivity is, in fact, notapplicable since the electron mean-free path is of the order of0.3 mm, which is much larger than δskin. We are thus led toconsider other mechanisms which control the resistivity of theplasma. One such mechanism is micro-turbulence excited if thecurrent density becomes high enough. This turbulence gives riseto an anomalous resistivity which acts to limit the current tostay below some value related to the sound speed, j<αncs, anddetermined by the constant α 4). If the electrons drift fasterthrough the plasma than indicated by this limit, ion acoustic orlower-hybrid waves become unstable. This instability is thenstrong enough to scatter the electrons and thus reduce thecurrent to near the stability threshold. If this limiting current issmaller than the Spitzer skin current, this implies enhancedmagnetic field penetration since it limits the sharpness ofmagnetic field variation. Indeed, Ampere’s law in a slab,dB/dx=µ0j, then implies the following lower bound on thepenetration scale length
βα
δ=µα
>2
0
2i
sB nec
BL (5)
where the collisionless ion skin depth δi=(mi/me)δe is about0.1 mm if n=1025 m-3. The factor α is believed to be somewhatlarger than unity, but not very large and certainly smaller than(mi/me)
1/2 since this would correspond to a current comparableto the electron thermal speed, leading to the excitation of a two-stream instability. As the magnetic field reaches tens of teslas inthe experiments, the factor β is not very much larger than unity,suggesting that LB~δi, so that anomalous resistivity could allowthe magnetic field to penetrate into the plasma.
This work was funded jointly by the EPSRC, EURATOM andthe Department of Trade and Industry.
References
1. N. C. Woolsey et al, Phys. Plasmas 8, 2439 (2001).
2. R. G. Evans, N. C. Woolsey, CLF Annual Report 1999-2000, p 77.
3. J. Dawson, P. Kaw, B. Green, Phys. Fluids 12, 875 (1969).
4. R. M. Kulsrud, Phys. Plasmas 5, 1599 (1998); J. Aparicio,M. G. Haines, R. J. Hastie, J. P. Wainwright, Phys.Plasmas 5, 3180 (1998).
Theory for Magnetised Exploding Foil Experiments
P Helander, K G McClements, R O Dendy
EURATOM/UKAEA Fusion Association, Culham Science Centre, Abingdon, Oxfordshire OX14 3DB, UK
N C Woolsey
Department of Physics, University of York, Heslington, York YO1 5DD, UK
Main contact email address: [email protected]
High Power Laser Programme – Theory and Computation
59 Central Laser Facility Annual Report 2000/2001
Introduction
Circular polarization is often assumed to facilitate analysiswhen studying the propagation of laser light in plasma atintensities where the electron quiver velocity is stronglyrelativistic. This is because there is an exact analytic form forlarge amplitude circularly polarized plane waves due to thevanishing of the v x B force. This wave is a pure transverseelectromagnetic wave in which electrons move in circles atconstant speed and relativistic mass increase. In contrast,ultraintense linearly polarized laser light is a longitudinal-transverse anharmonic wave with oscillations in the electronlongitudinal motion and electron mass increase. In the case ofboth polarizations, such pulses are rapidly unstable tofluctuations in density and mass increase. The general treatmentof the parametric instability of ultraintense, linearly polarizedlaser light has proved elusive until recently 1,2). For this reason,much current theory has assumed circularly polarized laser light3,4). Even so, the extension of stability theory to arbitrarily highintensities and valid for any accessible density is notstraightforward. Quesnel et al 4) first obtained a general solutionfor the parametric instability of circularly polarized laser light.They derived and numerically solved a system of fourth orderdifference equations, which involved 7-dimensional unknownsand coefficients, which were 7×7 matrices. We present here amuch-simplified representation for this case in the form of asystem of fourth order difference equations for a single scalarunknown with scalar coefficients.
The Difference Equation
The circularly polarized vector potential for the laser light is
a0 = eA0/mec2 = a0 (0, sin η, cos η)
where the phase η = k0x - ω0t. The electrons have momentump0 = meca0, constant relativistic mass γ0 = (1 + a0
2)1/2 andconstant speed v0 = ca0/γ0. The mass increase gives a reducedplasma frequency ωpr = ωp0/γ0
1/2. The dispersion relation ismodified to ω0
2 = ωpr2 + k0
2c2.
Let Ψ = (n/γ)1 be the first order fluctuation in the ratio ofdensity to mass increase (effectively the ‘relativistic’ plasmafrequency 4πne2/meγ). From linear theory 2) we eventuallyderive the 4th order linear difference equation for Ψ
0),(),( 00
2
2
=++Ψ∑−=
kkk mmm
m ωωωα
where the coefficients are
+++=
−−++⊥ ),(
1
),(
1)2(
4),(
)( 222
2
20
0 kkk ωωω
ωωεα
DDck
c
v
D pr
+−=
±±
⊥± ),(),(2
01 kk ω
ωωωα
DD
vk
),(
1
4
20
2
2±±
⊥± =
kωα
D
vk
and ε (ω) = ω2 - ωpr2, D (ω,k) = ω2 - ωpr
2 –k2c2, ω± = ω ± ω0,k± = k ± k0. k⊥ is the perpendicular wavenumber. Solutionsdepend only on the two parameters ωprv0/ω0c and k⊥v0/ω0. Thisform is entirely equivalent to that of Quesnel et al 4) but
involves only a scalar unknown Ψ (instead of a 7 dimensionalvector) and scalar coefficients α0, α±1 and α±2 (instead of 7 × 7matrices). The coefficients of the difference equationcorrespond to a doubly infinite, symmetric, penta-diagonalmatrix.
The one-dimensional dispersion relation (k⊥ = 0) is given byα0 = 0 and represents a closed coupling between modes ω andω±. (This is also the same form as for the approximate 4-wavelinearly polarized case valid when a0 <1.) This case has beenanalyzed in detail by Guérin et al 3) showing the various mixesof the relativistic modulational instability, forwards andbackwards stimulated Raman scattering. The closed systemprevents the occurrence of higher order processes, such asstimulated harmonic generation.
This is no longer the case for 2/3-dimensional processesinvolving obliquely propagating modes where the off diagonalelements couple an infinite hierarchy of modes. As such itdescribes additionally the relativistic filamentation instability,stimulated (Raman) side scattering and the two-plasmon decayinstability as well as higher order processes such as stimulatedRaman harmonic generation. However, it is a routine exerciseto solve the dispersion relation, i.e. to evaluate and solve thedeterminant of the coefficients of this symmetric penta-diagonalsystem (truncated to include sufficient coupled modes).
This form allows approximate analytic formulae to be deducedfor the growth rates in special cases, such as for low density(n << ncr, where ncr = γ0nc is the relativistic critical densityaccessible by self-induced transparency due to the electron massincrease) or for weakly relativistic regimes (a0 ≤ 1). Forexample, expressions for three-wave Raman growth rates areroutinely derived:
2/1
0
220
)(
2/1
2
−
−=Γ ⊥
prpr
spr kkkv
ωωωω
where ks2c2 = ω0(ω0 - 2ωpr), k
2 = kx2 + k⊥
2 and kx = k0 ± ksx . Interms of the scattering angle θ, this takes the form
2/12
020
2
0
00
2
sin1cos21
)(22
−
−+
−=Γ θθ
ωωω
k
k
k
kvk ss
pr
pr
Conclusions
A simpler form than has hitherto been available to describe thedispersion characteristics of all electronic parametricinstabilities for circularly polarized light has been deduced.Within the constraints as a cold plasma model, it is valid forarbitrary density and laser intensity.
References
1. H. C. Barr, P. Mason and D. M. Parr, Phys. Rev. Lett. 83,1606 (1999).
2. H. C. Barr, P. Mason and D. M. Parr, Phys. Plasmas. 7,2604 (2000).
3. S. Guérin, G. Laval, P. Mora, J. C. Adam, A. Héron and A.Bendib, Phys. Plasmas. 2, 2807 (1995).
4. B. Quesnel, P. Mora, J. C. Adam, S. Guérin, A. Héron andA. Laval, Phys. Rev. Lett. 78, 2132 (1997).
A General Dispersion Relation for the Parametric Instability of Ultraintense,Circularly Polarized Laser Light
H C Barr, L J Hill
Physics Department, University of York, Heslington, York, YO10 5DD
Main contact email address: [email protected]

High Power Laser Programme – Theory and Computation
Central Laser Facility Annual Report 2000/2001 60

High Power Laser Programme- Femtosecond Pulse Physics
61 Central Laser Facility Annual Report 2000/2001
Introduction
Ionisation of xenon up to Xe6+ has been investigated using aZ-scan technique to spatially resolve individual processeswithin the focused laser spot. Experimental data has beendescribed well by considering the relative volume contributionsfrom each ionisation stage within the confocal volume.
Experimental Configuration
Experiments are performed using 65fs 800nm (10Hz) laserpulses from the Astra femtosecond laser facility. A 25cm lens isused to shallow focus the pulses, resulting in a large confocalvolume. Pulse integrity is monitored using a frequency resolvedoptical gating (FROG) technique and shot to shot fluctuationsare discriminated at a 5% level.
Z-scan experiments are performed using a modified interactionchamber of the ion beam apparatus, 1, 2) as shown in Figure 1.
Figure 1. Schematic diagram of z-scan apparatus.
Target gas is effused into the vacuum chamber via ahypodermic needle, located 10mm beneath the interactionregion, to a typical pressure of 10-7 mbar. Ions produced duringthe laser interaction are extracted through a 0.5mm slit anddetected using conventional time of flight techniques. The laserfocal spot position along the z-axis is controlled by a Newportmotion controller driving a lens mounted to a sub-micronprecision translation stage. This allows excellent z-scanresolution of the confocal volume.
Confocal Volume Characteristics
Laser pulses are assumed to be Gaussian in r and Lorentzianalong z 3), isointensity contours are calculated using (1).
+
+−=
0
2
02
0
20
1
ln12 I
z
zI
z
zr
s
ω (1)
Here z0 is the Rayleigh range and Is is the process saturationintensity. The nth ionisation stage (An+) will be bound betweenthe saturation contours for An+ and A(n+1)+. These contours takethe distinctive form of peanut-shape lobes, as shown inFigure 2. The volume unique to each ionisation stage V’(A n+) isgiven by:-
V’(A n+) = V(Is(An+)) – V(Is(A
(n+1)+)) (2)
where V(Is) is given by:
−−−−+−=
21
101tan
3
421
10
3
423
10
9
240
2
tI
I
tI
I
tI
IV
λ
ωπ (3)
When the 0.5mm slit is present, only a thin slice (∆z) of theconfocal volume is observed. In this case, the volume equationsmust be modified4) to calculate the individual ionisation stagevolumes observed through the slit.
+
+∆=
−
∆
12
0
0
2
0
20 1ln1
2 z
z
I
I
z
zzV
sz ωπ (4)
Figure 2. Cross section through the laser confocal volumeshowing sequential ionisation stages bound by correspondingisointensity contours.
Results and Analysis
Depending on the region of the confocal volume exposed to thedetector through the slit, different ionisation stages will beobserved with different relative strengths. Figure 3a shows atypical time of flight spectrum for xenon where no slit is presentand the whole confocal volume is exposed to the detector.Conversely, with the slit present and situated close to the focus,higher charge states will dominate with little contribution fromsingly and doubly ionised channels. This is illustrated inFigure 3b.
Spatially Resolved Atomic Ionisation Processes in High Intensity FemtosecondLaser Pulses
A El-Zein, J H Sanderson, W A Bryan, T R J Goodworth
Dept. Physics & Astronomy, University College London, Gower Street, London, WC1E 6BT
I D Williams, P McKenna, I M G Johnston
Dept. Physics, Queen’s University Belfast, Belfast BT7 1NN
P F Taday, E J Divall, A J Langley
Central Laser Facility, CLRC Rutherford Appleton Laboratory, Chilton, Didcot, Oxon, OX11 0QX, UK
Main contact email address: [email protected]
Lens
0.5mmpinhole
+280 V
0 V
r
z
ChanneltronTranslation
MotionController
PCTDS744A DSO 0 V+280 V
HypodermicNeedle
r
z
-7 -1-3-5 1 3 5 7
0
20
15
25
10
5
-20
-15
-25
-10
-5
Xe+
Xe2+
Xe3+
Xe4+
Xe5+
z value (mm)
Rad
ius
(µm
)
Xe6+
Slit V1f
V2f
V3f
V4f
V5f
V6f
V1s
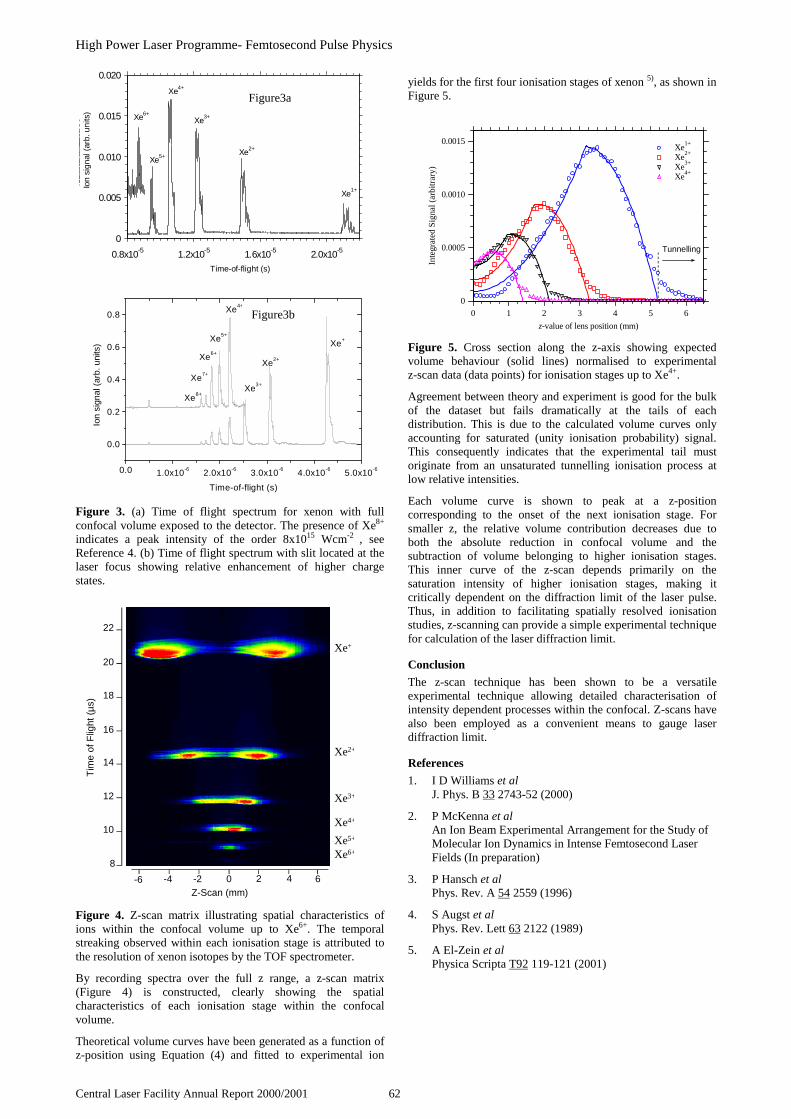
High Power Laser Programme- Femtosecond Pulse Physics
Central Laser Facility Annual Report 2000/2001 62
0.0 1.0x10⁻⁶ 2.0x10⁻⁶ 3.0x10⁻⁶ 4.0x10⁻⁶ 5.0x10⁻⁶
0.0
0.2
0.4
0.6
0.8
Xe8+
Xe7+
Xe5+
Xe6+
Xe4+
Xe3+
Xe2+
Xe+
Ion
sign
al (
arb.
uni
ts)
Time-of-flight (s)
Figure 3. (a) Time of flight spectrum for xenon with fullconfocal volume exposed to the detector. The presence of Xe8+
indicates a peak intensity of the order 8x10¹⁵ Wcm-2 , seeReference 4. (b) Time of flight spectrum with slit located at thelaser focus showing relative enhancement of higher chargestates.
Figure 4. Z-scan matrix illustrating spatial characteristics ofions within the confocal volume up to Xe6+. The temporalstreaking observed within each ionisation stage is attributed tothe resolution of xenon isotopes by the TOF spectrometer.
By recording spectra over the full z range, a z-scan matrix(Figure 4) is constructed, clearly showing the spatialcharacteristics of each ionisation stage within the confocalvolume.
Theoretical volume curves have been generated as a function ofz-position using Equation (4) and fitted to experimental ion
yields for the first four ionisation stages of xenon 5), as shown inFigure 5.
Figure 5. Cross section along the z-axis showing expectedvolume behaviour (solid lines) normalised to experimentalz-scan data (data points) for ionisation stages up to Xe4+.
Agreement between theory and experiment is good for the bulkof the dataset but fails dramatically at the tails of eachdistribution. This is due to the calculated volume curves onlyaccounting for saturated (unity ionisation probability) signal.This consequently indicates that the experimental tail mustoriginate from an unsaturated tunnelling ionisation process atlow relative intensities.
Each volume curve is shown to peak at a z-positioncorresponding to the onset of the next ionisation stage. Forsmaller z, the relative volume contribution decreases due toboth the absolute reduction in confocal volume and thesubtraction of volume belonging to higher ionisation stages.This inner curve of the z-scan depends primarily on thesaturation intensity of higher ionisation stages, making itcritically dependent on the diffraction limit of the laser pulse.Thus, in addition to facilitating spatially resolved ionisationstudies, z-scanning can provide a simple experimental techniquefor calculation of the laser diffraction limit.
Conclusion
The z-scan technique has been shown to be a versatileexperimental technique allowing detailed characterisation ofintensity dependent processes within the confocal. Z-scans havealso been employed as a convenient means to gauge laserdiffraction limit.
References
1. I D Williams et alJ. Phys. B 33 2743-52 (2000)
2. P McKenna et alAn Ion Beam Experimental Arrangement for the Study ofMolecular Ion Dynamics in Intense Femtosecond LaserFields (In preparation)
3. P Hansch et alPhys. Rev. A 54 2559 (1996)
4. S Augst et alPhys. Rev. Lett 63 2122 (1989)
5. A El-Zein et alPhysica Scripta T92 119-121 (2001)
X e 6 +
0
0 . 0 0 5
0 . 0 1 0
0 . 0 1 5
0 . 0 2 0
0 . 8 x 1 0 - 5 1 . 2 x 1 0 - 5 1 . 6 x 1 0 - 5 2 . 0 x 1 0 - 5
X e 5 +
X e 4 +
X e 3 +
X e 2 +
X e 1 +
T o F ( s )
S ig n a l(a rb itra ry )
Time-of-flight (s)
Ion
sign
al (
arb.
uni
ts)
0
0.0005
0.0010
0.0015
0 1 2 3 4 5 6
Xe1+
Xe2+
Xe3+
Xe4+
z-value of lens position (mm)
Inte
grat
ed S
igna
l (ar
bitr
ary)
Tunnelling
Tim
e of
Flig
ht (
µs)
10
8
12
14
16
18
20
22
0-6 2 4 6-4 -2Z-Scan (mm)
Xe+
Xe2+
Xe3+
Xe4+
Xe6+
Xe5+
Figure3a
Figure3b

High Power Laser Programme- Femtosecond Pulse Physics
63 Central Laser Facility Annual Report 2000/2001
Introduction
Following recent work on the geometry modification and laserinduced molecular reorientation of H2O 1) and CO2
2), we reporton the Coulomb explosion dynamics of OCS in high intensityfemtosecond laser pulses using time of flight momentumimaging techniques. Unlike CO2 and H2O, OCS is a highlyasymmetric molecule. This makes it an ideal candidate forstudies of geometry modification in high intensity laser pulses,as subtle changes in both bond length and bond angle willappear more pronounced relative to other symmetric triatomicsusing this momentum imaging technique.
Experimental results have indicated the presence of a non-linearCoulomb explosion geometry with bond lengths approximatelytwice equilibrium internuclear separation, in agreement withenhanced ionisation theory. Experimental results have beenconfirmed using Monte Carlo simulations and a two-dimensional classical field ionisation model.
Experimental Configuration
The time of flight mass spectrometer and laser system remainlargely unchanged from previous studies1), and so will only bedescribed briefly.
Laser pulses of 790nm, 55fs (10Hz) were reflection focussedinto the Wiley-McLaren type spectrometer using an f/5spherical mirror to produce a focus with peak intensity2x1015 Wcm-2 and a waist of 12µm. The target gas was effuseddirectly into the interaction region via a hypodermic needle to afill pressure of 10-7 mbar (background 10-10 mbar). Laser pulseswere gated (5% discrimination) to reduce fluctuations.Polarisation of the incoming pulses was computer controlled viaa Newport precision rotation stage housing a λ/2-plate. Goodsignal-to-noise ratio allowed each time of flight spectrum, asshown in Figure 1, to be constructed from an average of 100laser pulses.
Figure 1. Typical time of flight spectra for OCS with laserpolarisation axis parallel to the detection axis.
Results
Prior to the ion momentum imaging of carbonyl sulphide, acovariance map 3) was generated to assist identification of
observed ionisation channels. The covariance map shown inFigure 2 was built up over 104 individual laser shots. Duringthis period the target gas pressure was reduced to 4x10⁻⁹ mbarin order to reduce the possibility of false coincidences byensuring that, on average, only a single molecule undergoesCoulomb explosion per laser shot.
Figure 2. Covariance map of carbonyl sulphide.104 laser pulsesof 55fs duration at 790nm, and peak intensity of 2x10¹⁵ Wcm-2.
Production of ion momentum maps requires sequential time offlight spectra to be recorded as a function of laser polarisationangle (θ) with respect to the detection axis, forming a time offlight matrix. The time of flight matrix for OCS, shown inFigure 3, was constructed using 100 shot averaged spectra andextends from 0° (parallel) to 360° in 2° increments.
Figure 3. Time of flight matrix for OCS.
Ion Momentum Imaging of Carbonyl Sulphide in High Intensity Femtosecond LaserPulses
J H Sanderson, T R J Goodworth, W A Bryan, A El-Zein
Dept. Physics & Astronomy, University College London, Gower Street, London, WC1E 6BT
P F Taday, E J Divall, A J Langley
Central Laser Facility, CLRC Rutherford Appleton Laboratory, Chilton, Didcot, Oxon, OX11 0QX, UK
Main contact email address: [email protected]
1
2
3
4
5
6
7
8
910111213
Channels
1.) O+ + S2+
2.) C+ + S2+ / O+
3.) O+ + S4+ / O2+
4.) C2+ + S2+ / O+
5.) C+ + S4+ / O2+
6.) C2+ + S3+
7.) O3+ + S4+
8.) C3+ + S4+ / O2+
9.) O2+ + S3+
10.) O2+ + S4+
11.) C2+ + S4+ / O2+
12.) O3+ + C2+
13.) O3+ + C3+
0° 90° 180° 270° 360°
0.75
0.50
0.25
Tim
e of
Flig
ht (
µs)
Polarisation Angle
O+
C+
S3+
O2+
S5+
C2+
O3+
C3+
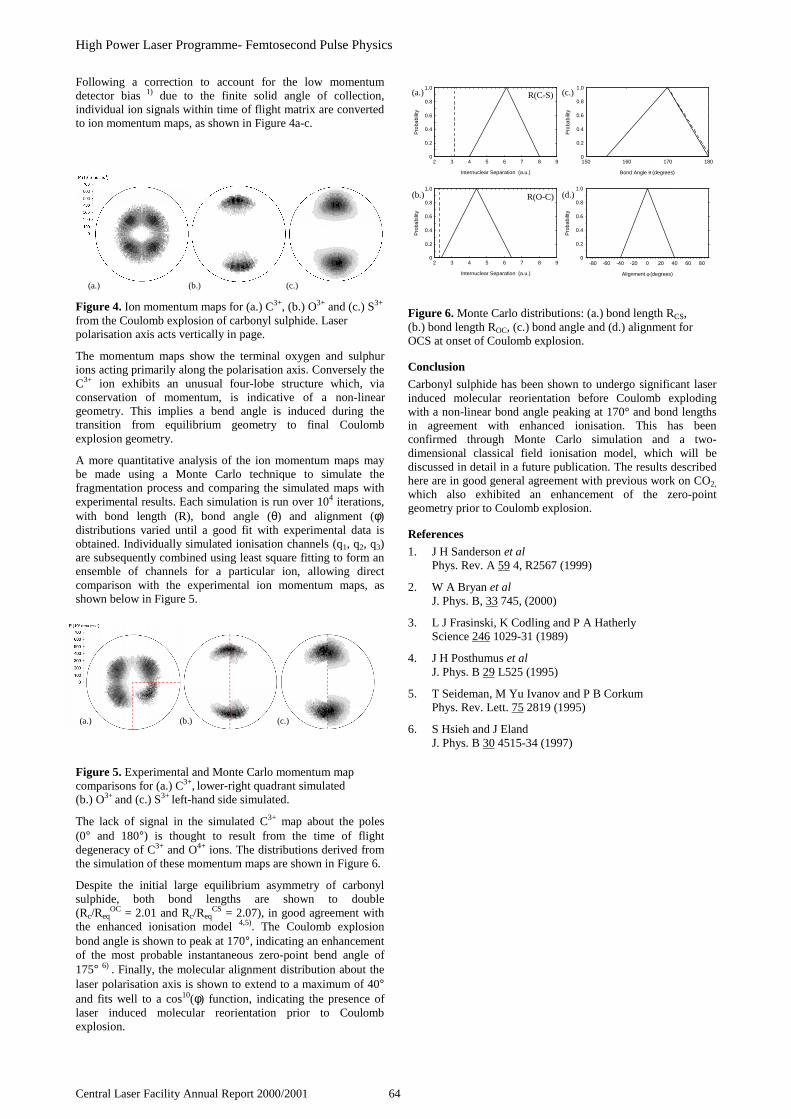
High Power Laser Programme- Femtosecond Pulse Physics
Central Laser Facility Annual Report 2000/2001 64
Following a correction to account for the low momentumdetector bias 1) due to the finite solid angle of collection,individual ion signals within time of flight matrix are convertedto ion momentum maps, as shown in Figure 4a-c.
Figure 4. Ion momentum maps for (a.) C3+, (b.) O3+ and (c.) S3+
from the Coulomb explosion of carbonyl sulphide. Laserpolarisation axis acts vertically in page.
The momentum maps show the terminal oxygen and sulphurions acting primarily along the polarisation axis. Conversely theC3+ ion exhibits an unusual four-lobe structure which, viaconservation of momentum, is indicative of a non-lineargeometry. This implies a bend angle is induced during thetransition from equilibrium geometry to final Coulombexplosion geometry.
A more quantitative analysis of the ion momentum maps maybe made using a Monte Carlo technique to simulate thefragmentation process and comparing the simulated maps withexperimental results. Each simulation is run over 104 iterations,with bond length (R), bond angle (θ) and alignment (φ)distributions varied until a good fit with experimental data isobtained. Individually simulated ionisation channels (q1, q2, q3)are subsequently combined using least square fitting to form anensemble of channels for a particular ion, allowing directcomparison with the experimental ion momentum maps, asshown below in Figure 5.
Figure 5. Experimental and Monte Carlo momentum mapcomparisons for (a.) C3+, lower-right quadrant simulated(b.) O3+ and (c.) S3+ left-hand side simulated.
The lack of signal in the simulated C3+ map about the poles(0° and 180°) is thought to result from the time of flightdegeneracy of C3+ and O4+ ions. The distributions derived fromthe simulation of these momentum maps are shown in Figure 6.
Despite the initial large equilibrium asymmetry of carbonylsulphide, both bond lengths are shown to double(Rc/Req
OC = 2.01 and Rc/ReqCS = 2.07), in good agreement with
the enhanced ionisation model 4,5). The Coulomb explosionbond angle is shown to peak at 170°, indicating an enhancementof the most probable instantaneous zero-point bend angle of175° 6) . Finally, the molecular alignment distribution about thelaser polarisation axis is shown to extend to a maximum of 40°and fits well to a cos10(φ) function, indicating the presence oflaser induced molecular reorientation prior to Coulombexplosion.
Figure 6. Monte Carlo distributions: (a.) bond length RCS,(b.) bond length ROC, (c.) bond angle and (d.) alignment forOCS at onset of Coulomb explosion.
Conclusion
Carbonyl sulphide has been shown to undergo significant laserinduced molecular reorientation before Coulomb explodingwith a non-linear bond angle peaking at 170° and bond lengthsin agreement with enhanced ionisation. This has beenconfirmed through Monte Carlo simulation and a two-dimensional classical field ionisation model, which will bediscussed in detail in a future publication. The results describedhere are in good general agreement with previous work on CO2,
which also exhibited an enhancement of the zero-pointgeometry prior to Coulomb explosion.
References
1. J H Sanderson et alPhys. Rev. A 59 4, R2567 (1999)
2. W A Bryan et alJ. Phys. B, 33 745, (2000)
3. L J Frasinski, K Codling and P A HatherlyScience 246 1029-31 (1989)
4. J H Posthumus et alJ. Phys. B 29 L525 (1995)
5. T Seideman, M Yu Ivanov and P B CorkumPhys. Rev. Lett. 75 2819 (1995)
6. S Hsieh and J ElandJ. Phys. B 30 4515-34 (1997)
(a.) (b.) (c.)
(a.) (b.) (c.)
0
0.2
0.4
0.6
0.8
1.0
-80 -60 -40 -20 0 20 40 60 80
Alignment φ (degrees)
Pro
babi
lity
0
0.2
0.4
0.6
0.8
1.0
2 3 4 5 6 7 8 9
Internuclear Separation (a.u.)
Pro
babi
lity
0
0.2
0.4
0.6
0.8
1.0
2 3 4 5 6 7 8 9
Internuclear Separation (a.u.)
Pro
babi
lity
0
0.2
0.4
0.6
0.8
1.0
150 160 170 180
Bond Angle θ (degrees)
Pro
babi
lity
(a.) (c.)
(b.) (d.)
R(C-S)
R(O-C)

High Power Laser Programme- Femtosecond Pulse Physics
65 Central Laser Facility Annual Report 2000/2001
Introduction
Recently reported by this collaboration was the first observationand measurement of both neutral and charged dissociativeproducts from the interaction of a fast H2
+ molecular ion beamwith a high intensity femtosecond laser pulse1). In this report wecompare angular distributions to neutral targets, and discussfragment yields in terms of the effective interaction volume forboth the dissociation (0,1) and Coulomb explosion (1,1)processes.
Experimental Configuration
Both the laser and ion beam apparatus have been discussed indetail elsewhere2). Consequently only salient points will bementioned here.
H2+ ions are formed in a plasma discharge source with a
standard Franck-Condon vibrational distribution and areextracted and momentum selected before acceleration to 1kV.Laser pulses of 65fs, 790nm (10Hz rep.) with a focusedintensity of 5x10¹⁵ Wcm-2 and a waist of 10µm intersect the ionbeam perpendicularly in the interaction region. Deflector platesprior to the interaction region allow ion beam steering andpulsing to avoid detector saturation. Neutral products aredetected on-axis using conventional time of flight techniqueswith the laser polarisation orientated parallel to the ion beamaxis. Conversely, ions are electrostatically deflected through a45° parallel-plate analyser to the ion channel electron multiplierwith laser polarisation perpendicular to the ion beam axis. Theresidual primary beam is dumped in a Faraday cup.
Results and Analysis
Experimental results confirm the presence of two fragmentationchannels, namely dissociation (1) and Coulomb explosion (2).
Figure 1. Dressed potential diagram for H2+ highlighting the
one, two and three-photon adiabatic avoided crossings forintense 800nm radiation.
HHnv),g(1s2H ++++ →h (1)
eHHnv),g(1s2H ++++++ →h (2)
The dissociation mechanism is best understood by considering adressed potential model 3) with an adiabatic avoided crossing ofthe 1 photon resonant 1sσg and 2pσu potential curves, whilst theCoulomb explosion channel results from enhanced ionisation 4)
at the critical distance.
Angular distributions of the neutral dissociation products havebeen measured by rotating the laser polarisation axis withrespect to the detection axis and recording neutral yield as afunction of angle (θ), as shown in Figure 2.
Figure 2. Neutral yield from dissociation of H2+ (left) and
proton yield from H2+ formed from a neutral H2 molecular
precursor (right).
Dissociation products from the molecular ion fit well to acos2(θ) form, which is indicative of the absence of laser inducedmolecular reorientation. Conversely the dissociative productyield from neutral H2 fit a tight cos7(θ) distribution indicatingthe presence of laser induced alignment. This discrepancybetween the pure molecular ion and the molecular ion formedfrom H2 in the leading edge of the evolving laser pulse iscurrently believed to result from the prompt dissociation of thepure molecular ion early in the laser pulse. In contrast, theneutral molecule must undergo primary ionisation at a thresholdintensity of 3x10¹³ Wcm-2 prior to dissociation5).
Consideration must also be given to the temperature of thetargets. Rotational excitation, which will compete against laserinduced alignment, for a thermal H2 target will be very small incomparison to the H2
+ molecular ions formed in a hot plasmadischarge source.
Neutral dissociation products and protons from the (1,1)Coulomb explosion channel have also been investigated as afunction of peak laser intensity, as shown in Figure 3.
High Intensity Femtosecond Laser Interactions with a Fast H2+ Beam
J H Sanderson, W A Bryan, A El-Zein, T R J Goodworth
Dept. Physics & Astronomy, University College London, Gower Street, London, WC1E 6BT
I D Williams, P McKenna, I M G Johnston
Dept. Physics, Queen’s University Belfast, Belfast BT7 1NN
P F Taday, E J Divall, A J Langley
Central Laser Facility, CLRC Rutherford Appleton Laboratory, Chilton, Didcot, Oxon, OX11 0QX, UK
Main contact email address: [email protected]
0ω
1ω
2ω
3ω
1sσg
2pσu
Internuclear separation, R (a.u.)
1 2 3 4 5 6 7 8 9 10
0
-1
-2
-3
-4
-5
Fie
ld-d
ress
ed p
oten
tial e
nerg
y (e
V)
0 90 180 270 360
Polarisation Angle (degrees)
0 90 180 270 360
Polarisation Angle (degrees)

High Power Laser Programme- Femtosecond Pulse Physics
Central Laser Facility Annual Report 2000/2001 66
1
10
100
1014 1015 1016
Laser Intensity (Wcm-2)
Fra
gmen
t Yie
ld (
arb.
uni
ts)
Figure 3. (0,1) dissociation (∇) and (1,1) Coulomb explosion( ) channels from H2
+ as a function of peak laser intensity.
Unlike the primary ionisation of H2, which has a well defined,relatively high threshold intensity, the photodissociation of H2
+
has a very low threshold (2x10¹¹ Wcm-2) 6), and may even beconsidered in terms of a one photon resonance withH2
+ (1sσg, v = 9). Consequently significant interaction volumewill lie beyond the Airy disk. Apertures present in the opticalsystem mean laser pulses will undergo diffraction, resulting inFraunhofer fringing on the low intensity wings of the pulse, asshown in Figure 4. Although too weak to contribute to the (1,1)Coulomb explosion channel, the fringe region will contributeheavily to the (0,1) dissociation channel due to the large relativeinteraction volume. This point has also recently been consideredby Frasinski 6).
1010
1012
1014
1016
1 10 100 1000
I0 = 1x10¹⁶ Wcm-2
I0 = 1x10¹³ Wcm-2
I0 = 3x10¹⁶ Wcm-2
r-3
(1,1) Threshold Intensity
(0,1) Saturation Intensity
Spot Size (µm)
Foc
used
Inte
nsity
(W
cm-2
)
Figure 4. Typical diffracted laser pulses for various peakintensities. The radial behaviour of fringes beyond the Airy diskfalls like r-3. Superimposed on these graphs are the (0,1) and(1,1) process thresholds.
Whilst the radial intensity dependence I(r) within the Airy diskstill behaves in a Gaussian fashion, diffraction causes thefringed region to fall like I(r) ∝ r1/3. The common interactionvolume of the crossed ion and laser beams, known as aSteinmetz volume, is found to scale like V(r) ∝ I2.66 with laserradius, assuming a fixed ion beam diameter.
Thus the effective interaction volume of the fringe regionbehaves like V(I) ∝ I2.66/3 or I0.88. As illustrated in Figure 5, thislinear volume expansion in log-log space fits the (0,1) channelwell, indicating the (0,1) process originates from the lowintensity diffracted wings of the laser pulse.
The Coulomb explosion threshold intensity is sufficiently highto ensure all signal is confined within the Gaussian Airy disk.Volume as a function of laser intensity for this region is given
analytically by (3) below. However, if the laser spot size islarger than the ion beam dimensions, the bound form (4) of theequation must be used.
−−−−+−=
21
101tan
3
421
10
3
423
10
9
240
2
tI
I
tI
I
tI
IV
λ
ωπ (3)
( ) ( )( )
−−++
++= δδδ
δδδ
λ
ωπ 1tan
3
43
9
22
1
0ln3
3
140
2
tI
IV (4)
Here I0 and It are the peak and threshold intensities respectivelyand δ is the ratio of the ion beam radius to the Rayleigh range.
The (1,1) channel also fits well for a threshold intensity of8x1014 Wcm-2, implying a saturated (1,1) process originatingentirely from within the Airy disk.
1
10
100
1014 1015 1016
Laser Intensity (Wcm-2)
Fra
gmen
t Yie
ld (
arb.
uni
ts)
Figure 5. Effective interaction volume fits to (0,1) dissociationchannel (red), and (1,1) Coulomb explosion channel (blue).
Conclusion
Significant differences in the angular characteristics of the H2+
molecular ion and the molecular ion formed from neutral H2
have been identified and discussed. The (0,1) and (1,1)mechanisms in H2
+ have been described in terms of theeffective interaction volume produced by a diffracted laserpulse.
References
1. I D Williams et alJ. Phys. B 33 2743-52 (2000)
2. I D Williams et alCLF Annual Report (1998-9) pg 94
3. A Giusti-Suzor et alJ. Phys. B 28 309-39 (1995)
4. J H Posthumus et alJ. Phys. B 29 L525 (1995)
5. J H Posthumus et alJ. Phys. B 32 L1-9 (1999)
6. L J FrasinskiOn the significant differences in H2+ dissociation.(In preparation, J. Phys. B)
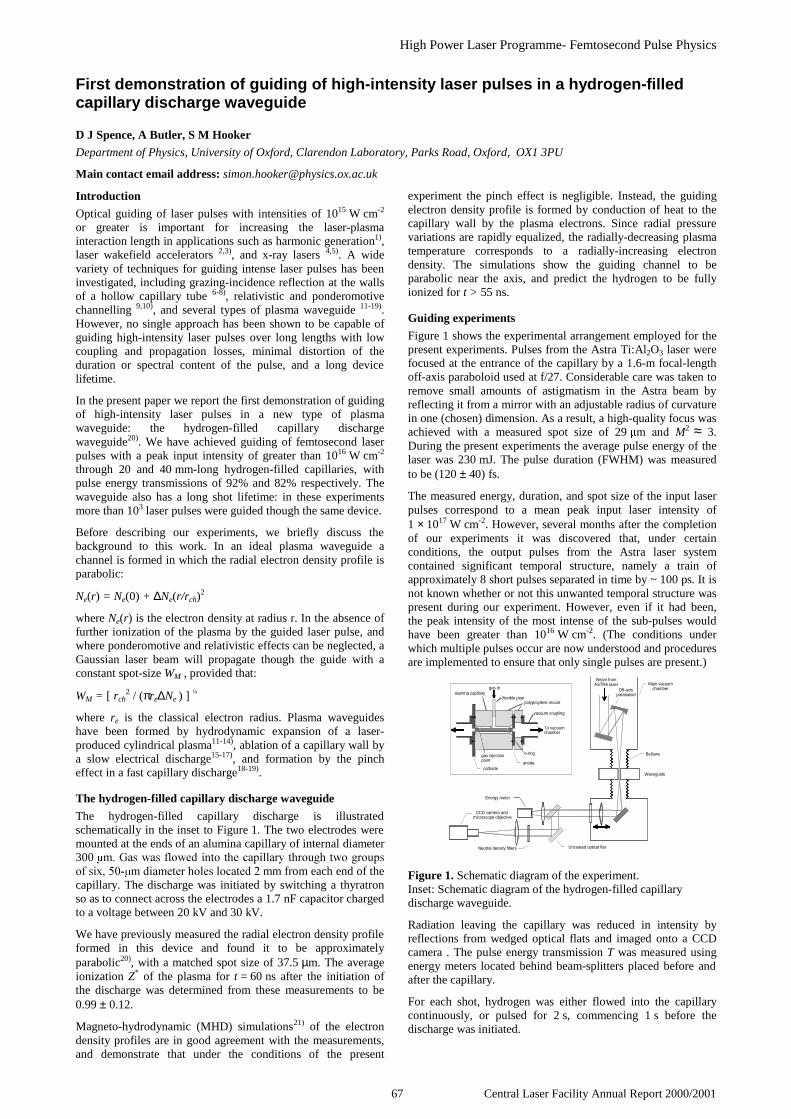
High Power Laser Programme- Femtosecond Pulse Physics
67 Central Laser Facility Annual Report 2000/2001
Introduction
Optical guiding of laser pulses with intensities of 1015 W cm-2
or greater is important for increasing the laser-plasmainteraction length in applications such as harmonic generation1),laser wakefield accelerators 2,3), and x-ray lasers 4,5). A widevariety of techniques for guiding intense laser pulses has beeninvestigated, including grazing-incidence reflection at the wallsof a hollow capillary tube 6-8), relativistic and ponderomotivechannelling 9,10), and several types of plasma waveguide 11-19).However, no single approach has been shown to be capable ofguiding high-intensity laser pulses over long lengths with lowcoupling and propagation losses, minimal distortion of theduration or spectral content of the pulse, and a long devicelifetime.
In the present paper we report the first demonstration of guidingof high-intensity laser pulses in a new type of plasmawaveguide: the hydrogen-filled capillary dischargewaveguide20). We have achieved guiding of femtosecond laserpulses with a peak input intensity of greater than 1016 W cm-2
through 20 and 40 mm-long hydrogen-filled capillaries, withpulse energy transmissions of 92% and 82% respectively. Thewaveguide also has a long shot lifetime: in these experimentsmore than 103 laser pulses were guided though the same device.
Before describing our experiments, we briefly discuss thebackground to this work. In an ideal plasma waveguide achannel is formed in which the radial electron density profile isparabolic:
Ne(r) = Ne(0) + ∆Ne(r/rch)2
where Ne(r) is the electron density at radius r. In the absence offurther ionization of the plasma by the guided laser pulse, andwhere ponderomotive and relativistic effects can be neglected, aGaussian laser beam will propagate though the guide with aconstant spot-size WM , provided that:
WM = [ rch2 / (πre∆Ne ) ]
¼
where re is the classical electron radius. Plasma waveguideshave been formed by hydrodynamic expansion of a laser-produced cylindrical plasma11-14), ablation of a capillary wall bya slow electrical discharge15-17), and formation by the pincheffect in a fast capillary discharge18-19).
The hydrogen-filled capillary discharge waveguide
The hydrogen-filled capillary discharge is illustratedschematically in the inset to Figure 1. The two electrodes weremounted at the ends of an alumina capillary of internal diameter300 P*DVZDVIORZHGLQWRWKHFDSLOODU\WKURXJKWZRJURXSVRIVL[ PGLDPHWHUKROHVORFDWHG mm from each end of thecapillary. The discharge was initiated by switching a thyratronso as to connect across the electrodes a 1.7 nF capacitor chargedto a voltage between 20 kV and 30 kV.
We have previously measured the radial electron density profileformed in this device and found it to be approximatelyparabolic20), with a matched spot size of 37.5 µm. The averageionization Z* of the plasma for t = 60 ns after the initiation ofthe discharge was determined from these measurements to be0.99 ± 0.12.
Magneto-hydrodynamic (MHD) simulations21) of the electrondensity profiles are in good agreement with the measurements,and demonstrate that under the conditions of the present
experiment the pinch effect is negligible. Instead, the guidingelectron density profile is formed by conduction of heat to thecapillary wall by the plasma electrons. Since radial pressurevariations are rapidly equalized, the radially-decreasing plasmatemperature corresponds to a radially-increasing electrondensity. The simulations show the guiding channel to beparabolic near the axis, and predict the hydrogen to be fullyionized for t > 55 ns.
Guiding experiments
Figure 1 shows the experimental arrangement employed for thepresent experiments. Pulses from the Astra Ti:Al2O3 laser werefocused at the entrance of the capillary by a 1.6-m focal-lengthoff-axis paraboloid used at f/27. Considerable care was taken toremove small amounts of astigmatism in the Astra beam byreflecting it from a mirror with an adjustable radius of curvaturein one (chosen) dimension. As a result, a high-quality focus wasachieved with a measured spot size of 29 P DQG M2 ≈ 3.During the present experiments the average pulse energy of thelaser was 230 mJ. The pulse duration (FWHM) was measuredto be (120 ± 40) fs.
The measured energy, duration, and spot size of the input laserpulses correspond to a mean peak input laser intensity of1 × 1017 W cm-2. However, several months after the completionof our experiments it was discovered that, under certainconditions, the output pulses from the Astra laser systemcontained significant temporal structure, namely a train ofapproximately 8 short pulses separated in time by ~ 100 ps. It isnot known whether or not this unwanted temporal structure waspresent during our experiment. However, even if it had been,the peak intensity of the most intense of the sub-pulses wouldhave been greater than 1016 W cm-2. (The conditions underwhich multiple pulses occur are now understood and proceduresare implemented to ensure that only single pulses are present.)
Uncoated optical flat
vacuum coupling
Energy meter
CCD camera and microscope objective
Neutral density filters
alumina capillary
cathode
To vacuumchamber
gas injectionpoint
anode
o-ring
polyproylene mountflexible pipe
gas in
Waveguide
Bellows
Main vacuumchamber
Beam fromASTRA laser
Off-axisparabaloid
Figure 1. Schematic diagram of the experiment.Inset: Schematic diagram of the hydrogen-filled capillarydischarge waveguide.
Radiation leaving the capillary was reduced in intensity byreflections from wedged optical flats and imaged onto a CCDcamera . The pulse energy transmission T was measured usingenergy meters located behind beam-splitters placed before andafter the capillary.
For each shot, hydrogen was either flowed into the capillarycontinuously, or pulsed for 2 s, commencing 1 s before thedischarge was initiated.
First demonstration of guiding of high-intensity laser pulses in a hydrogen-filledcapillary discharge waveguide
D J Spence, A Butler, S M Hooker
Department of Physics, University of Oxford, Clarendon Laboratory, Parks Road, Oxford, OX1 3PU
Main contact email address: [email protected]
High Power Laser Programme- Femtosecond Pulse Physics
Central Laser Facility Annual Report 2000/2001 68
Results
Figure 2 shows the measured transmission as a function of thedelay t for a 20 mm-long capillary waveguide, together with thetemporal variation of the discharge current, for a hydrogenpressure of 67 mbar. Note that the small current pulse prior tothe main current arose from charging of the coaxial cableconnecting the electrodes to the rest of the circuit, and did notpass through the capillary.
Figure 2. Measured transmission T as a function of the delay tfor 20 mm (circles) and 40 mm (triangles) long capillaries. Thesolid line shows the discharge current for the 20 mm-longcapillary.
For the 20 mm-long capillaries it is seen that prior to theinitiation of the discharge T is approximately 12%, the lowtransmission resulting from ionization-induced defocusing ofthe laser pulse by the neutral hydrogen inside the capillary. Thetransmission rises to approximately (92 ± 3)% within 60 ns ofthe onset of the current pulse, and is maintained at this value fort up to approximately 270 ns. For longer delays T decreasesslowly.
Figure 2 also shows the measured temporal variation of T for a40 mm-long capillary. In order to achieve gas breakdown thecharging voltage of the storage capacitor was increased to30 kV, limited by the thyratron, and the initial hydrogenpressure was reduced to 30 mbar. The temporal profile of thedischarge current was very similar to that recorded with the20 mm capillary, the peak current being 300 A. However, thedischarge breakdown was less reliable, which may explain theincreased scatter in T. It is seen that for the 40 mm capillary thetemporal variation of T is broadly similar to that of the 20 mmcapillary, although the duration of very high transmissionappears to be shorter. The best transmission occurs for tbetween approximately 40 and 120 ns, during whichT = (82 ± 5)%.
Figure 3 shows transverse intensity profiles of the laser pulsemeasured in the plane of the capillary entrance (with thecapillary removed), and in the exit plane of the 20 mm-longcapillary for several values of t. It is seen that prior to the onsetof the discharge current the transmitted laser pulse energy islow, and distributed across the entire diameter of the capillary.For t > 0 the transmitted pulse energy initially increases with t,and becomes constrained to the axial region of the capillary. Forexample for the pulse recorded at t = 206 ns, the output beamspot size is 33 µm, T = 92%, and the peak axial fluence is 70%of that of the input laser pulse. For longer delays thetransmission and spot size of the exiting beam decrease andincrease respectively.
Discussion of results
Our previous measurements and MHD simulations have shownthat the guiding electron density profile is formed within 60 nsof the onset of the discharge current. This is consistent with theobserved rapid increase in T immediately after the onset of thedischarge. The MHD simulations show that the curvature of theelectron density profile evolves only slowly during the currentpulse. This explains the fact that for the 20 mm capillary high
pulse energy transmission is maintained for approximately200 ns before a decrease in the degree of ionization, loss ofplasma, and changes in the curvature of the electron densityprofile cause the transmission to be reduced, and the transverseprofile of the transmitted beam to deteriorate. It is likely thatchanges in the guiding electron profile are more critical whenguiding over 40 mm, which may be the reason that the veryhigh transmission was found to last for a shorter interval in thiscase.
Figure 3. Fluence profiles of the pulses transmitted through a20 mm-long capillary as a function of the delay t, together withthat of the input pulses. The profiles have been normalized tothe mean peak fluence of the input pulses.
It should be emphasized that the plasma channel formed by thehydrogen-filled capillary discharge waveguide is essentiallyfully ionized, and parabolic. As such ionization-inducedde-focusing will not occur, and the channel should operate as analmost perfect plasma waveguide. Any mis-match between theinput spot size W0 of the laser pulses and the matched spot sizeWM of the waveguide will cause the spot size of the guided laserpulse to oscillate with propagation distance, but thecorresponding oscillations in the axial intensity of the guidedpulse are relatively small.
Since the guiding channel is essentially fully ionized, temporaldistortion of the pulse due to ionization should not occur, andpulse-stretching is restricted to modal dispersion (if the inputspot size is mis-matched), and group velocity dispersion (GVD)in the plasma. Calculations show that pulse-stretching causedby GVD is less than 1 fs for the conditions of the presentexperiment.
As discussed above, it is not known whether unwanted temporalstructure on the laser pulses was present during ourexperiments. However, since the plasma channel is essentiallyfully ionized, the effect of any individual sub-pulse on theplasma channel would have been negligible: the peak intensityof any sub-pulse would have been too low for any movement ofthe plasma by the ponderomotive force to occur; and heating ofthe plasma by ionization, or by inverse bremsstrahlung heating,

High Power Laser Programme- Femtosecond Pulse Physics
69 Central Laser Facility Annual Report 2000/2001
would be negligible. Hence, it is expected that if such temporalstructure were present each sub-pulse would propagate throughthe plasma independently. The fact that for the 20 mm-longcapillaries the measured pulse transmission was as high as 92%is further evidence for this.
Finally, we note that during these experiments more than 103
laser pulses were guided through a single 20 mm capillary at thefull input intensity, with no apparent degradation of the guidingperformance.
Conclusions
The hydrogen-filled capillary discharge waveguide combinesseveral important features. The plasma channel is composed offully ionized hydrogen, and so does not suffer fromionization-induced de-focusing22), or temporal and spectraldistortion of the laser pulse. The device is relatively simple: noauxiliary lasers are required; and since the plasma channel islong lived, the discharge circuit does not require very low jittertriggering. Furthermore, since the capillary is not ablated by thedischarge current, the capillary lifetime is long.
In summary, we have reported the first demonstration of theguiding of high-intensity laser pulses in a new type ofwaveguide: the hydrogen-filled capillary discharge waveguide.Low-loss guiding of femtosecond laser pulses with a peak inputintensity of greater than 1016 W cm-2 was demonstrated. Morethan 103 laser pulses were guided though the same device withno degradation of the guiding performance.
Finally, we note that very recently we have completed newguiding experiments with Astra in which the unwanted temporalstructure which may have existed in the present experiments didnot occur. An initial analysis of those results indicates that laserpulses with a peak input intensity of at least 1017 W cm-2 wereguided over distances of up to 50 mm with a pulse energytransmission similar to that reported here. These new resultswill be described in more detail in a future publication.
Acknowledgements
The authors would like to acknowledge invaluable technicalassistance from the Astra laser and target area support staff atthe Rutherford Appleton Laboratory. David Spence would liketo thank EPSRC and the Rutherford Appleton Laboratory for aCASE studentship, and Arthur Butler appreciates the support ofan EPSRC research studentship. Simon Hooker is grateful to theRoyal Society for the support of a University ResearchFellowship. This work was supported by the EPSRC via grantGR/M88969.
References
1. H. M. Milchberg, C. G. Durfee, and T. J. McIlrath, Phys.Rev. Lett. 75, 2494, (1995).
2. E. Esarey, P. Sprangle, J. Krall, et al., IEEE Trans. PlasmaSci. 24, 252, (1996).
3. E. Esarey, P. Sprangle, J. Krall, et al., Physics of Fluids B-Plasma Physics 5, 2690, (1993).
4. D. V. Korobkin, C. H. Nam, S. Suckewer, et al., Phys.Rev. Lett. 77, 5206, (1996).
5. B. E. Lemoff, G. Y. Yin, C. L. Gordon, et al., Phys. Rev.Lett. 74, 1574, (1995).
6. S. Jackel, R. Burris, J. Grun, et al., Opt. Lett. 20, 1086,(1995).
7. C. Courtois, B. Cros, G. Malka, et al., J. Opt. Soc. Am. B-Opt. Phys. 17, 864, (2000).
8. F. Dorchies, J. R. Marques, B. Cros, et al., Phys. Rev. Lett.82, 4655, (1999).
9. P. Monot, T. Auguste, P. Gibbon, et al., Phys. Rev. Lett.74, 2953, (1995).
10. A. B. Borisov, A. V. Borovskiy, V. V. Korobkin, et al.,Phys. Rev. Lett. 68, 2309, (1992).
11. C. G. Durfee and H. M. Milchberg, Phys. Rev. Lett. 71,2409, (1993).
12. S. P. Nikitin, I. Alexeev, J. Fan, et al., Phys. Rev. E 59,R3839, (1999).
13. P. Volfbeyn, E. Esarey, and W. P. Leemans, Phys. Plasmas6, 2269, (1999).
14. E. W. Gaul, S. P. Le Blanc, A. R. Rundquist, et al., Appl.Phys. Lett. 77, 4112, (2000).
15. Y. Ehrlich, C. Cohen, A. Zigler, et al., Phys. Rev. Lett. 77,4186, (1996).
16. D. Kaganovich, A. Ting, C. I. Moore, et al., Phys. Rev. E59, R4769, (1999).
17. S. M. Hooker, D. J. Spence, and R. A. Smith, J. Opt. Soc.Am. B-Opt. Phys. 17, 90, (2000).
18. T. Hosokai, M. Kando, H. Dewa, et al., Opt. Lett. 25, 10,(2000).
19. C. Fauser and H. Langhoff, Appl. Phys. B-Lasers Opt. 71,607, (2000).
20. D. J. Spence and S. M. Hooker, Phys. Rev. E 6302, 5401,(2001).
21. N. A. Bobrova, A. A. Esaulov, J.-I. Sakai, et al., Submittedto Phys. Rev. E (2001).
22. D. J. Spence and S. M. Hooker, J. Opt. Soc. Am. B-Opt.Phys. 17, 1565, (2000)
High Power Laser Programme- Femtosecond Pulse Physics
Central Laser Facility Annual Report 2000/2001 70
Introduction
So far intense femtosecond laser pulses in the spectral range ofshort wavelength visible (SVIS) and UV have been generatedvia second harmonic and sum frequency generation. However,due to the dispersion and related problems in nonlinear crystalsthe requirement of broadband frequency conversion limits theachievable energy of the generated pulse. Also, the narrowspectral gain of the readily available excimer laser amplifierslimits the bandwidth of amplification1-2) while the relativelybroadband newly developed solid state materials exhibit a smallgain only3). During the past few years papers have beenpublished about successful experiments on optical parametricchirped pulse amplification (OPCPA), in which short pulse NIRand IR laser pulses were efficiently amplified usingfemtosecond or nanosecond pump lasers4-9).
In this first experiment we demonstrate efficient amplification ofbroadband, stretched femtosecond pulses at 400 nm, to ourknowledge for the first time, using non-colinear optical parametricamplification pumped by picosecond 267 nm pulses. The effect ofsaturation and the geometry of the interacting pulses on thespectral gain are also investigated.
Experimental
In our experiment a part of the 800 nm fundamental beam ofAstra laser was used (Figure 1). The stretched and amplifiedpulses with a bandwidth (FWHM) of 20 nm were left slightlyover-compressed resulting in a pulse length of 1.85 ps. A smallfraction of this beam generated the signal pulse at 400 nm in a100 µm BBO crystal while the majority was used to obtain thepump pulse at 267 nm in a two-stage frequency converter. Thegenerated pump pulse was further stretched in double pass by a68° fused silica prism pair and subsequently spectrally filteredproviding a smooth spatial profile. Two CCD cameras wereused both measuring the beam waist of the pump and signalpulses giving 550 µm and 140 µm, respectively and monitoringtheir spatial overlap in the 12 mm long BBO amplifier.
The temporal width and phase of the fundamental (800 nm)pulse were established from the spectrum by using a fittingalgorithm to a multiple shot autocorrelation measurement(Figure 2). The pump (267 nm) pulses were similarlycharacterised from their spectra and a cross correlationmeasurement with the fundamental pulse. The signal (400 nm)pulse was assumed to inherit the phase of the signal pulse10), soit could be obtained from measuring the spectra only. Thetemporal width (Figure 2c) and the resulting peak intensity ofthe negatively stretched signal and pump pulses are1.2 ps, 0.1 MW/cm2 and 3.5 ps, 2 GW/cm2, respectively.
-4 -2 0 2 4Delay (ps)
0.0
0.2
0.4
0.6
0.8
1.0
Inte
nsity
(a.
u.)
Fitted
Measured
-6 -4 -2 0 2 4Delay (ps)
0.0
0.2
0.4
0.6
0.8
1.0
Inte
nsity
(a.
u.)
Fitted
Measured
-6 -4 -2 0 2 4Delay (ps)
0.0
0.2
0.4
0.6
0.8
1.0
Inte
nsity
(a.
u.)
Leading edge ↓
Fundamental
Signal
Pump
Figure 2. (a) Autocorrelation and (b) crosscorrelation of thefundamental and the pump pulses, respectively, and (c) thetemporal shape of the retrieved pulses.
Femtosecond OPCPA in the UV
K Osvay, G Kurdi, J Klebniczki, M Csatári
Department of Optics and Quantum Electronics, University of Szeged, P.O.Box 406, Szeged 6701, Hungary
I N Ross, E J Divall, C H J Hooker, A J Langley
Central Laser Facility, CLRC Rutherford Appleton Laboratory, Chilton, Didcot, Oxon, OX11 0QX, UK
Main contact email address: [email protected]
3'
&RPSUHVVRU
SV→SV
QHJDWLYHO\VWUHWFKHG
WUOLPIV
&&'
&&'
λ6+* 7+*
$675$ODVHU
IV→SV
QP+] 1
)
3
X
P
S
1)6LJQDO
6SHFWURJUDSK
6+*
'HOD\
%%2
ILOWHUV
ILOWHUV
PP PP
PP
PP
PP
Figure 1. Experimental scheme
a
c
b

High Power Laser Programme- Femtosecond Pulse Physics
71 Central Laser Facility Annual Report 2000/2001
Results and discussion
Figure 3 shows the recorded spectra at different intensities ofthe input signal. The highest gain corresponds to the lowestinput signal while the lowest gain was recorded when the pumpwas depleted (see also Figure 4). When the amplification is notsaturated then the amplified spectra fits very well to the inputspectrum along the whole spectral range of 392 nm - 408 nm(Figure 3a). In the case of pump depletion, however, the moreenhanced shorter wavelength side of the spectrum (Figure 3b)resulted in the 3.8 ps group delay between the pump and signalpulses in the BBO crystal and the inherent feature of opticalparametric processes: the peak of the spectrum cannot beamplified further, moreover, its energy is transformed back tothe pump. The slight asymmetry in amplification between theshorter and longer wavelength side of the spectrum, which issignificant only in the depleted case, corresponds well to theslightly non-flat spectral gain11).
a
392 396 400 404 408Wavelength [nm]
0.0
0.2
0.4
0.6
0.8
1.0
Inte
nsity
(a.
u.)
Amplified
Input
Gain=3500
b
392 396 400 404 408Wavelength [nm]
0.0
0.2
0.4
0.6
0.8
1.0
Inte
nsity
(a.
u.)
Amplified
Input
Gain=450
395 400 405 410 415Wavelength [nm]
1E-2
1E-1
1E+0
1E+1
1E+2
1E+3
1E+4
Rel
ativ
e in
tens
ity Input signal (a.u)
76
16.7
4.5
1
Input
Figure 3. Spectra of the amplified signal at different inputpowers at a pump intensity of 2 GW/cm2.
0.0 0.5 1.0 1.5Input pulse (nJ)
0
1000
2000
3000
Gai
n
Pump: 2GW/cm2
Measured
Power fit
Figure 4. The measured gain vs. input signal.
Because of the shot-to-shot instability of the Astra laser inenergy (±10 %), pointing direction (±0.1 mrad) and spectrumespecially in the wings, all the spectra displayed above are anaverage of three measurements. Since the combined effect ofthese three is not really predictable and hard to distinguish, away to give an impression for the accuracy of the experiment isto display the spectra of three subsequent amplified signals andtheir average (Figure 5a).
392 396 400 404 408Wavelength [nm]
0.0
0.2
0.4
0.6
0.8
1.0
Inte
nsity
(a.
u.)
Averaged
390 395 400 405 410Wavelength [nm]
0.0
0.2
0.4
0.6
0.8
1.0
Inte
nsity
(a.
u.)
Input signal
@ +0.15°
@ -0.15°
Figure 5. Spectra of the amplified signal at different inputpowers at a pump intensity of 2 GW/cm2.
The effect of angular misalignment is shown in Figure 5b. Forthe available bottom-to-bottom signal bandwidth of 17 nm thetheory11) allows for a deviation of 0.02° for the noncollinearangle from the optimal one. As can be seen, the tolerance ofalignment for the amplified spectra is better than could beexpected from the theory. One reason for this is that due togroup delay difference between the signal and pump pulses theeffective crystal length upon amplification is much less than theavailable physical length of 12 mm.
0 1 2Pump intensity (GW/cm2)
0
1000
2000
3000
Gai
n
Input: 0.02nJ
Measured
Power fit
Figure 6. The measured gain vs. pump intensity.
The gain was also recorded at different levels of pump intensityfor weak input signals (Figure 6). It has to be mentioned thatvery strong two photon absorption (TPA) of the pump beam inBBO was observed resulting in only 30% transmission at thepeak and hence lower gain. The fact that apart from TPA thegain can, according to the theory, be fitted by the power ofpump intensity, gives the other reason for assuming a reducedeffective crystal length.
Acknowledgement
This work was supported by OTKA #33018 and FKFP0170/2001. K.O., G.K., J.K and M.Cs. gratefully acknowledgethe support of the European Commission’s Framework V IHPLarge Scale Facility Access Programme.
References
1. M J Shaw et al., J. Chem. Phys., 105 1815, (1996)
2. S Szatmari et al., Appl. Phys. B 58 (1994) 211
3. Z Liu et al., Ultrafast Phenomena XII, 99, (Springer 2001)
4. K Osvay and I N Ross, RAL Riport TR-98-080 173,(1998)
5. I N Ross et al., Appl. Opt. 39 2422, (2000)
6. G. Dubeitis et al., Opt. Commun. 88 437, (1992)
7. G Cerullo et al., Opt. Lett. 23 1283, (1998)
8. A Shirakawa et al., Appl. Phys. Lett. 74 2268 (1999)
9. E Riedle et al., Appl. Phys. B 71 457 (2000)
10. E Sidick et al., J.Opt.Soc.Am. B 12 1713 (1995)
11. I N Ross et al., Opt. Commun. 144 125, (1997)
c
a b

High Power Laser Programme- Femtosecond Pulse Physics
Central Laser Facility Annual Report 2000/2001 72

Lasers for Science Facility Programme - Chemistry
73 Central Laser Facility Annual Report 2000/2001
Lasers for Science Facility Programme
1) Chemistry
2) Biology
3) Physics

Lasers for Science Facility Programme – Chemistry
Central Laser Facility Annual Report 2000/2001 74
Introduction
We are currently developing the PIRATE (Picosecond InfraredAbsorption and Transient Excitation) facility in the UltrafastSpectroscopy Laboratory. This has provided a tunable sourceof ultrashort pulses in the mid-IR fingerprint region(1000 – 3000 cm-1). The output can be generated in two modes:(i) narrowband (ca. 25 cm-1 FWHM) 1 ps pulses for pumpingspecific IR transitions and (ii) broadband(ca. 150 – 200 cm-1 FWHM) 150 fs pulses for use in spectrallydispersed time-resolved infrared (TRIR) spectroscopy, using64-element linear IR array detectors. The IR pulses areperfectly synchronised with the UV/visible/NIR pulses from theexisting OPAs, thus providing the opportunity to perform bothconventional TRIR experiments and more complex 3-colourexperiments such as UV pump-IR pump-TR3 probe. A moredetailed description of the PIRATE apparatus is given in theLaser Science and Development Section of this report (page165). In this paper we present some applications of broadbandmultichannel TRIR spectroscopy using the PIRATE system toprobe the excited states of d6 and d8 transition metal complexes.
TRIR Spectroscopy of d6 Transition Metal Complexes:Infrared Probes for DNA
TRIR spectroscopy is a powerful probe of the excited statenature of transition metal complexes1), particularly those whichpossess strong IR reporters, such as CO or CN, bound to themetal centre. The positions and bandwidths of ν(CO) andν(CN) IR absorptions are extremely sensitive to electronic andmolecular structure. Thus by monitoring changes in the IRabsorption spectra upon photoexcitation, we are able to directlyprobe the electronic redistribution occurring in the excited state.
There is currently considerable interest in the design oftransition metal complexes which interact strongly with DNA.Once bound to the DNA helix, they have the potential to act asprobes of the structural changes and electron transfer processesthat can occur along the helix. Traditionally, research in thisarea has focussed on complexes of Ru(II), Rh(III) and Cu(I)with polypyridine ligands, particularly the strong intercalatordppz (dppz = dipyrido[3,2-a:2',3'-c]phenazine)2). Thesecomplexes are known to possess low lying metal-to-ligandcharge transfer (MLCT) excited states. This property enhancestheir ability to act as reporters of their surroundings via themolecular ‘light switch’ effect3). Our strategy has been to designa family of neutral and charged complexes based onfac-[(dppz-R,R')Re(CO)3(L)] 0,+ (see Figure 1) and assess theirsuitability to act as IR probes of DNA. These complexes havethe advantage of possessing a tricarbonyl moiety, which offers astructural probe with which to investigate the nature of theirlowest excited states.
Re
CO
LOC
OC N
N N
N RR’
0,+
Figure 1. A series of fac-[(dppz-R,R')Re(CO)3(L)] 0,+
complexes have been studied using ps-TRIR spectroscopy.
Before studying the complexes in the presence of DNA it isnecessary to elucidate their photophysical properties in solution,which until now have remained somewhat ambiguous. Wehave therefore used broadband ps-TRIR spectroscopy to probethe effect of ligand substitution on the nature of the lowestexcited states of this family of complexes, with a view toultimately designing Re-dppz complexes with tunable excitedstates that are suitable for DNA probing.
Figure 2 shows the ps-TRIR spectra recorded in the ν(CO)region for two of the complexes studied. The spectrumobtained with the charged complex,fac-[(dppz)Re(CO)3(py)]+[PF6]
- is given in Figure 2(a). Thetwo negative bands correspond to a depletion of the groundstate upon photolysis. Two positive bands, corresponding to anew species, are observed at lower frequencies relative to theground state. The positions of these bands are characteristic ofa dppz based π → π* excited state. This is because theπ* orbitals of dppz are slightly more electron donating than theπ orbitals. Thus, population of the dppz π* orbitals in theexcited state causes a small increase in π-back bonding from themetal to the CO ligands and a characteristic negative shift in theν(CO) vibrations.
∆ A
bso
rban
ce
2150 2100 2050 2000 1950 1900
Wavenumbers (cm-1)
(a)
(b)
∆ OD = 0.002
∆ OD = 0.001
Figure 2. TRIR spectra of (a) fac-[(dppz)Re(CO)3(py)]+[PF6]-
in MeCN and (b) fac-[(dppz)Re(CO)3Cl] in CH2Cl2, recorded100 ps after 400 nm photolysis.
Replacing the pyridine ligand with Cl- yields the neutralcomplex, fac-[(dppz)Re(CO)3Cl]. The TRIR spectrum of thiscomplex, recorded 100 ps after 400 nm photolysis, is shown inFigure 2(b). The negative bands indicate depletion of theground state species and three new bands are observed, shiftedto higher frequencies relative to the ground state bands. Such apositive shift in the ν(CO) bands is characteristic of adπ(Re) → π*(dppz) MLCT excited state. This is because in anMLCT excited state there is a reduction of electron density atthe metal centre, causing a corresponding reduction in π-backdonation and thus a strengthening of the CO bonds.
Using Ultrafast Time-resolved Infrared Spectroscopy to Probe the Nature of theExcited States of d6 and d8 Transition Metal Complexes
D C Grills, J Dyer, J A Weinstein, M W George
School of Chemistry, University of Nottingham, University Park, Nottingham, NG7 2RD, UK
M Towrie, P Matousek, A W Parker
Central Laser Facility, CLRC Rutherford Appleton Laboratory, Chilton, Didcot, Oxon, OX11 0QX, UK
Main contact email address: [email protected]

Lasers for Science Facility Programme - Chemistry
75 Central Laser Facility Annual Report 2000/2001
In both cases discussed above, the excited state bands wereobserved to appear within the laser flash and were stable overthe timescale of the experiment (1.5 ns). Although a complexpossessing a low lying MLCT excited state was produced, thisspecies was neutral. It is highly desirable for a DNA probe tobe positively charged since this would enhance its ability tobind to the DNA base pairs in the helix. Work is currently inprogress to study a large series of charged complexes with thePIRATE system and these will be the subject of a forthcomingpublication. The experiments presented above havedemonstrated that ps-TRIR spectroscopy is an extremelypowerful technique for studying the nature of the lowest excitedstates of transition metal carbonyl complexes.
TRIR Spectroscopy of d8 Transition Metal Complexes
The majority of transition metal complexes that have beenstudied using TRIR spectroscopy1) have been based ond6 chromophores, e.g. ReI, RuII or OsII. It is surprising thatrelatively few d8 complexes have been studied using TRIRsince these species have the potential to act as DNAintercalators and building blocks for supramolecularelectron/energy conducting units. However, the short excitedstate lifetimes of d8 chromophores have been a limiting factor inthe application of TRIR to these systems.
In addition to the strong metal bound IR reporter ligands, COand CN, it has previously been shown that peripheral IRreporter groups, such as carboxylic acids and esters, bonded toother ligands can also be used as spectroscopic handles in TRIRinvestigations4). We have used the PIRATE facility to probe theexcited state dynamics of [Pt(4,4’-(COOEt)2-2,2’-bpy)Cl2] byfollowing changes in the electronic density on the peripheralester groups (shown as red bonds below) bound to theα-diimine ligand.
Pt
O O
C2H5
OOC2H5
NN
ClCl
Figure 3(a) shows the ground state FTIR spectrum of[Pt(4,4’-(COOEt)2-2,2’-bpy)Cl2] in CH2Cl2. It exhibits a strongν(CO) band at 1733 cm-1 due to the ester groups bound to thebipyridyl ligand. A series of ps-TRIR spectra recorded at timeintervals between 500 fs and 200 ps following 400 nmphotolysis is presented in Figure 3(b). There is aninstantaneous bleaching of the parent absorption concomitantwith the production of a new ν(CO) band at ca. 1707 cm-1. Thebleach and transient bands both decay back to the baseline on a100 ps timescale. The decay of the transient band isaccompanied by a small shift of the band maximum to higherfrequency, which is characteristic of a vibrational cooling of theexcited state.
The negative shift of the ν(CO) absorption upon photolysisreflects an increase of electronic density on the ester groups ofthe diimine which causes a weakening of the C=O bonds. Themagnitude of the shift is consistent with that observedpreviously4) upon formation of the MLCT state in[Ru(bpy)2(4,4’-(COOEt)2-2,2’-bpy)]2+, thus supporting theassignment of the excited state of[Pt(4,4’-(COOEt)2-2,2’-bpy)Cl2] as MLCT.
∆ A
bso
rban
ce
1780 1760 1740 1720 1700 1680 1660 1640
Wavenumbers (cm-1)
200150100500Time delay (ps)
∆ O
D
Abs
orba
nce
∆ OD = 0.001
(a)
(b)(c)
Figure 3. (a) FTIR of [Pt(4,4’-(COOEt)2-2,2’-bpy)Cl2] inCH2Cl2. (b) TRIR spectra of this solution from 500 fs to 200 psafter 400 nm excitation. (c) Kinetic decay traces for thetransient and bleach, obtained from Lorentzian curve fits.
The dynamics of the excited state process have been analysedby performing multi-Lorentzian curve fits of the data at eachtime delay. Assuming that the transient band is composed ofone vibrationally hot and one vibrationally cool component, theresulting kinetic traces for the transient and bleach are shown inFigure 3(c). These reveal that the lifetime of the MLCT excitedstate and thus the rate of back electron transfer is 10.2 ± 1.5 ps.This is consistent with [Pt(4,4’-(COOEt)2-2,2’-bpy)Cl2] beingnon-emissive in fluid solution at room temperature. Analysis ofthe hot and cool transient band heights reveals that thevibrational cooling of the MLCT excited state occurs with atime constant of 1.9 ps.
Conclusions
In this paper we have demonstrated the potential of the PIRATEsystem for broadband ps-TRIR spectroscopy. Using PIRATEwe have studied the excited states of a series of d6 transitionmetal carbonyl complexes, which are potential probes of DNA.We have shown how a subtle change in the ligand set allows usto tune the nature of the excited state, thus allowing the designof complexes for specific applications. We have also reportedthe first ultrafast TRIR study of a d8 transition metal complex.In this experiment we probed the excited state dynamics bymonitoring the IR absorptions of organic reporter groupsattached to an α-diimine ligand. Changes in the IR spectralprofile on the picosecond timescale allowed the nature of thelowest excited state of [Pt(4,4’-(COOEt)2-2,2’-bpy)Cl2] to beassigned as MLCT. It is clear that the PIRATE facility willprove to be an invaluable addition to the Ultrafast SpectroscopyLaboratory, providing access to the complementary techniqueof ps-TRIR.
References
1. M W George and J J TurnerCoord. Chem. Rev., 177 201, (1998)
2. K E Erkkila, D T Odom and J K BartonChem. Rev., 99 2777, (1999)
3. A E Friedman, J C Chambron, J P Sauvage, N J Turro andJ K BartonJ. Am. Chem. Soc., 112 4960, (1990)
4. P Y Chen, K M Omberg, D A Kavaliunas, J A Treadway,R A Palmer and T J MeyerInorg. Chem., 36 954, (1997)

Lasers for Science Facility Programme – Chemistry
Central Laser Facility Annual Report 2000/2001 76
Introduction
In previous articles1,2), we have described mechanistic studies ofthe photochemistry of various transition metal complexescontaining low-energy charge transfer excited states. Inparticular, we have investigated the behaviour of[Cr(CO)4(bpy)] and fac-[Mn(Br)(CO)3(
iPr-DAB)] with time-resolved visible absorption spectroscopy on the ultrafast(femtosecond – picosecond) timescale. The mechanisms wehave proposed in the past, however, have been suggested on thebasis of kinetic data and by comparison with slower time-resolved techniques. Direct structural characterisation of thespecies involved with the photochemistry of the aforementionedchromium and manganese complexes has only recently beenmade possible by the application of the newly developedPIRATE time-resolved infrared spectroscopy apparatus at theRutherford Appleton Laboratory’s Lasers for Science Facility.
The results we describe here represent one of the first uses ofthe PIRATE system to study the mechanisms of photochemicalreactions.
Carbonyl photodissociation from [Cr(CO)4(bpy)]
It is known that CO loss from [Cr(CO)4(bpy)] proceeds via adissociative mechanism from a CrES\PHWDOWROLJDQGFKDUJHtransfer (MLCT) excited state1). The quantum yield for theprocess varies from 0.02 to 0.2, depending on excitationwavelength and temperature3). In the past, studies involvingtime-resolved visible absorption spectroscopy have identifiedtwo unreactive (trapping) MLCT states which decay to theground state, thereby decreasing the quantum yield from thetheoretical maximum of one. We have also determined that theoutcome of the photochemistry of the complex (ie. thebranching ratio between the reactive and unreactive pathways)is determined at the very earliest times after excitation ( IV 7KH DLP RI WKH 3,5$7( VWXG\ ZDV WR SUREH WKLVmechanism using infrared spectroscopy by directly observingthe presence of the photoproduct after short time delays andmonitoring the decay of the MLCT trapping states to the groundstate.
We recorded the infrared absorption spectrum of[Cr(CO)4(bpy)] in CH2Cl2 at various time delays (1 ps to 1 ns)after irradiation with 500 nm laser pulses of 150 fs width(FWHM) (see Figure 1). At early times after excitation theVSHFWUXP FRQVLVWV RI D VHW RI EDQGV DW QHJDWLYH DEVRUEDQFHwhich accurately represent the ground state infrared absorptionspectrum of the complex (1827, 1884, 1900 and 2009 cm-1). Athigher stretching frequencies than this, a very broad absorptionextending from 1925 to 2070 cm-1 is seen. This signal decaysover time, disappearing completely within 500 ps. Positiveshifts of carbonyl ligand stretches, relative to the ground state,are characteristic of a reduction in electron density at the metalcentre4). Accordingly, we assign the 1925 – 2070 cm-1
absorption to one or more MLCT states of [Cr(CO)4(bpy)]. Thedecay of the band over time fits reasonably well to a doubleH[SRQHQWLDO GHFD\ IXQFWLRQ ZLWK OLIHWLPHV 1 § SV DQG
2 § 2 ps, which is in broad agreement with the results of aprevious time-resolved visible absorption study1). Crucially, it isfound that the bleach absorption due to depletion of the ground
state reforms with the same kinetics, implying that the decay ofthe excited states is, indeed, to the ground state.
1750 1800 1850 1900 1950 2000 2050 2100
-0.015
-0.010
-0.005
0.000
0.005
∆ A
bsor
banc
e
wavenumber /cm-1
Figure 1. Time-resolved infrared spectra of [Cr(CO)4(bpy)] inCH2Cl2 following 500 nm, 150 fs FWHM laser excitation. Timedelays: SV 2 ps; 10 ps; 30 ps; 50 ps; 100 ps; 200 ps; 1000 ps.
A reasonably sharp band at 1791 cm-1 is observed. This isshifted down in frequency relative to the ground state and isfully developed at 1 ps after excitation, showing no evolutionover the first nanosecond. Additionally, a sharp band at 1919 cm-1 is seen in spectra measured at delay times of 30 psand longer. It is possible that this band is also present in thespectra measured between 1 and 20 ps being as it is obscured bythe more intense ground-state bleach absorption at 1900 cm-1. As the ground state is reformed over time and thebleach absorption bands decrease in intensity, the 1919 cm-1
band is revealed. Accordingly the 1919 and 1791 cm-1 bandsare assigned to the photodissociation productfac-[Cr(sol)(CO)3(bpy)] (sol = CH2Cl2) by comparison withprevious ns-TRIR studies.4) The presence of this band at theearliest times after excitation suggests that CO loss does indeedoccur in the very shortest times following MLCT excitation andis not a consequence of the decay of a 3MLCT trapping state.
It should be emphasised that the signals assigned here to thetransient species formed by the MLCT excitation of[Cr(CO)4(bpy)] consist of many separate, overlapping IRabsorption bands. The existence of two [Cr(CO)4(bpy)] excitedstates and one fac-[Cr(CO)3(bpy)] photoproduct species makesa complete spectral deconvolution a difficult task.
Carbonyl dissociation from fac-[Mn(Br)(CO)3(iPr-DAB)]
CO loss is known to be the initial step in the fac merisomerisation of fac-[Mn(Br)(CO)3(
iPr-DAB)]. This isaccompanied by migration of bromide to the equatorial plane.In non-coordinating solvents, fast recombination of the metalfragment with CO occurs, thus yielding the mer isomer of the
Early photochemical dynamics of charge transfer excited organometalliccomplexes: Ultrafast CO dissociation from Charge-Transfer Excited States of[Cr(CO)4(bpy)] and [Mn(Br)(CO)3(iPr-DAB)]
I R Farrell, A Vlcek Jr.
Department of Chemistry, Queen Mary, University of London. London E1 4NS
D C Grills, M W George
School of Chemistry, University of Nottingham, University Park, Nottingham NG7 2RD
Main contact email address: [email protected]

Lasers for Science Facility Programme - Chemistry
77 Central Laser Facility Annual Report 2000/2001
complex. This thermally isomerises to the more stable facisomer on a timescale of seconds. In contrast to this, whenirradiation is carried out in strongly coordinating solvents(eg. pyridine), the dissociated CO is replaced by solvent and thedicarbonyl complex cis,cis-[Mn(Br)(sol)(CO)2(
iPr-DAB)] (sol =solvent) is formed (see Figure 2).
Br
MnOC N
OC
CO
NBr
MnOC N
OC
CO
N
CO
MnBr N
OC
CO
NSol
MnBr N
OC
CO
N
In non-coordinatingsolvents, eg. toluene
In coordinatingsolvents, eg. pyridine
Sol = solvent
*hν
Figure 2. Photochemistry of fac-[Mn(Br)(CO)3(iPr-DAB)].
Although the precise mechanism of this chemistry has not yetbeen fully explained, it is known that the reaction is triggeredby the excitation of an electron from a mixed character metal-KDOLGHPROHFXODURUELWDOLQWRD RUELWDORIWKHiPr-DAB ligand;so called MLCT/XLCT excitation. Density functional theory(DFT) calculations of the MLCT/XLCT excited state potentialenergy surfaces along various coordinates have indicated thepresence of large, insurmountable barriers towards thedissociation of both the equatorial and axial CO ligands5). Thesecalculations have also suggested that the most likely carbonylloss pathway involves dissociation of an equatorial CO,concerted with migration of the bromide ligand into theequatorial plane, albeit still involving a large energy barrier. Toovercome this, the authors of the study5) propose that thereaction involves resonance coupling between the excited andground states, thus facilitating tunneling through the barrier.This process is expected to occur with a reduced probability,compared with the direct loss of CO from, say,[Cr(CO)4(bpy)]1). Hence the primary photochemical step in thedissociative isomerisation is expected to occur on a timescaleconsiderably longer than the 20-400 fs range known for directCO dissociation6).
From previous time-resolved UV/visible absorption studies onthe ultrafast timescale2), we have established the presence of asingle species immediately after excitation (absorbing at600 nm) which decays with a lifetime of 11 ps to form a secondspecies (absorbing at 560 nm). This is a clean conversiondisplaying a clear isosbestic point. However, due to thedifficulty in distinguishing excited states and photoproductsfrom each other, using UV/visible spectroscopy alone, we areleft with at least two mechanistic interpretations:
(i) Guided by the DFT calculations5), the 600 nm band isattributed to the MLCT/XLCT excited state and the11 ps process to the concerted CO dissociation andbromide migration.
(ii) Alternatively, if it is assumed that the CO liganddissociates in an ultrafast manner (in a similar fashionto the aforementioned [Cr(CO)4(bpy)] complex), the600 nm band can be ascribed to the CO loss product[Mn(Br)(CO)2(
iPr-DAB)] with the 11 ps processrepresenting solely Br migration.
As we have seen from the case of [Cr(CO)4(bpy)], time-resolved infrared absorption spectroscopy is a powerfultechnique for discriminating between excited states anddissociation photoproducts. In the situation where an excitedstate is present after excitation, we would expect to see a set of
CO stretching bands of identical pattern to the ground state, butshifted to higher frequency. In the case of the photoproductbeing present at early times, a new pattern of bands shouldappear at lower frequencies.
The time-resolved infrared absorption spectrum offac-[Mn(Br)(CO)3(
iPr-DAB)] in pyridine solution 2 ps after150 fs (FWHM), 500 nm excitation is shown in Figure 3. Theabsence of any new bands at higher energies than the highestground state band (2025 cm-1) precludes the possible existenceof a charge transfer excited state directly after excitation andthus excludes hypothesis (i), above.
1800 1850 1900 1950 2000 2050 2100
-0.004
-0.003
-0.002
-0.001
0.000
0.001
∆ ab
sorb
ance
wavenumber / cm-1
Figure 3. Time-resolved infrared spectrum offac-[Mn(Br)(CO)3(
iPr-DAB)] in pyridine solution 2ps after 500 nm, 150 fs (FWHM) excitation.
The appearance of a photoproduct with ν(C-O) bands at lowerstretching frequencies than the ground state is tentativelyassigned to the CO loss photoproduct [Mn(Br)(CO)2(
iPr-DAB)],formed by ultrafast dissociation of CO from an excited state.
This experiment suggests that the movement of Br into thevacant equatorial position is not concerted with CO loss, aspredicted by theory, but is a separate event, most likelyoccurring with a lifetime of 11 ps. However, the role ofvibrational excited states is still being investigated.
Conclusions
The PIRATE facility at the Rutherford Appleton Laboratory hasprovided the users of the LSF with an invaluable tool for thestructural characterisation of excited states and transientphotoproducts which, until now, have only been observable bymeans of their electronic-absorption UV/visible chromophores.
References
1. R. Farrell, P. Matousek, and A. Vlcek, Jr., J. Am. Chem.Soc., 121, 5296, (1999).
2. R. Farrell and A. Vlcek, Jr., Coord. Chem. Rev., 208, 87,(2000).
3. J. Vichova, F. Hartl, and A. Vlcek, Jr., J. Am. Chem.Soc., 114, 10903, (1992).
4. G. Virrels, M. W. George, J. J. Turner, J. Peters, and A.Vlcek, Jr., Organometallics, 15, 4089, (1996).
5. A. Rosa, G. Ricciardi, E. J. Baerends, and D. J. Stufkens, J.Phys. Chem., 100, 15346, (1996).
6. A. Vlcek, Coord. Chem. Rev., 200, 933, (2000).
Lasers for Science Facility Programme – Chemistry
Central Laser Facility Annual Report 2000/2001 78
Introduction
Irradiation of [Re(MQ+)(CO)3(dmb)]2+ (MQ+ = N-methyl-4,4’-bipyridinium, dmb = 4,4’-dimethly-2,2’-bipyridine) in the near
UV region (330-400 nm) populates simultaneously Re→dmb
and Re→MQ+ MLCT excited states, (Figure 1), abbreviatedhereinafter MLCT(dmb) and MLCT(MQ+), respectively. TheMLCT(dmb) state can be viewed as
[ReII(MQ+)(CO)3(dmb•−)]2+. Its population is followed by aninter-ligand electron transfer:
[ReII(MQ+)(CO)3(dmb•−)]2+ → [ReII(MQ•)(CO)3(dmb)]2+ (1)
which produces a relaxed MLCT(MQ+) excited state formulated
as [ReII(MQ•)(CO)3(dmb)]2+, see Figure 1.
[ReII (MQ+)(CO)3(dmb·-)]2+*
[ReI (MQ+)(CO)3(dmb)]2+
[ReII(MQ··)(CO)3(dmb) ]2+*hυ
ket
kb
hυMLCT(MQ+)
MLCT(dmb)
ko
Figure 1. Excited state reaction pathways.
In order to understand the dynamics of this reaction, we havestudied fs-ps TR visible absorption spectra in acetonitrile andethylene glycol. The spectra show a weak absorption in the420-470 nm region due to the MLCT(dmb) excited state
[ReII(MQ+)(CO)3(dmb•−)]2+ and a very strong absorption band
centred at 640 nm, which belongs to the MQ• chromophore of
the MLCT(MQ+) state, that is the [ReII(MQ•)(CO)3(dmb)]2+ET
product. Time constant of the MLCT(dmb) → MLCT(MQ•)
inter-ligand ET was determined1) as 8.3±0.4 ps in CH3CN and
14.0±1.6 ps in ethylene glycol.
Time Resolved Resonance Raman (TR3)
Although the fs-ps TR visible absorption spectra have affordeda straightforward mechanistic picture and accurate kinetic data,some important information about the inter-ligand ET is stillmissing: (i) Are some of the high-frequency vibrations activatedduring the inter-ligand ET and does this activation persist on alonger time-scale? (ii) Is the ET product formed vibrationallyrelaxed or hot (excited)? (iii) Are the vibrational relaxationdynamics solvent-dependent? (iv) Is the Re(CO)3 moietyaffected by the inter-ligand ET?
To answer these questions, it is necessary to resort to time-resolved vibrational spectroscopic techniques, namely to ps-TRresonance Raman (TR3) and IR absorption. Shown in Figure 2are the TR3 spectra of [Re(MQ+)(CO)3(dmb)]2+ in CH3CN. Thespectra were measured with the Raman probe wavelength of
600 nm, that is in resonance with the MQ• absorption band.
They show only Raman bands due to vibrations of the MQ•
ligand:2) ν(CC)ir/ν(CC) 1648 cm-1, ν(CN)/γ(CCH) 1516 cm-1,
γ(CCH)/ν(CC)ir 1352 cm-1 and γ(CCN)/ν(CN) 1018 cm-1.
800 1000 1200 1400 1600 1800 2000
500 100 50 30 20 15 10 7 5 3 2 1
Wavelength / cm-1
Figure 2. TR3 spectra of [Re(MQ+)(CO)3(dmb)]2+ in CH3CNmeasured between 1 and 500 ps after laser pulse excitation at400 nm. The spectra were measured with the Raman probewavelength of 600 nm.
(CC)ir denotes the inter-ring C-C bond. All the MQ• Ramanpeaks are present already in the spectra measured at 1 ps withlow intensities. Their integrated intensities then grow with atime constant approximately corresponding to the ET time. TheRaman peak positions show a dynamic shift by 4-7 cm-1 withtime to higher wavenumbers. This shift depends exponentiallyon the time for all bands studied and the corresponding lifetimedepends on the particular peak and the solvent. In CH3CN time
constants of 24.2 ± 2.2, 16.1 ± 2.2 and 15.1 ± 3.1 ps weredetermined for the peaks at 1516, 1352 and 1018 cm-1. Ramanpeak widths decrease with time constants slightly lower than
those found for the peak shifts: 17.3 ± 3.4, 10.0 ± 4.1, 12.4 ±4.1 ps, respectively. Surprisingly, kinetics of peak shifts andnarrowing in ethylene glycol are faster than in CH3CN,occurring in the range 11-16 ps and 1-7 ps, respectively. Theabsolute values of the dynamic peak shifts being very small inboth solvents, it is obvious that all the Raman peaks observedoccur very close to their final positions already at the earliesttime delays measured, 1-2 ps. Moreover, no anti-Stokes peakswere observed in the ps TR3 spectra. Hence, it can be concludedthat the promoting high-frequency modes relax faster or
alongside the dmb•−→MQ+ interligand ET. There is noevidence for a specific activation of high-frequency vibrations
in the ET product [Re(MQ•)(CO)3(dmb)]2+. At the same time,
the small upward dynamic shifts and broadening of the MQ•Raman peaks show that the extra energy discharged in the ETreaction (ca. 0.5 eV) is rapidly redistributed into many low
frequency vibrations, leaving the [ReII(MQ•)(CO)3(dmb)]2+ ETproduct initially vibrationally hot. A final relaxation thenfollows on a time scale of a few tenths of picoseconds.
Time Resolved Emission Spectra
The Kerr Gate was used to measure the temporal evolution ofthe emission profile.
Time-resolved emission (Figure 3) shows a strong, broadabsorption centred around 530 nm, which decays, while
TR3, Kerr-gate emission and PIRATE study of Interligand Electron Transfer in[Re(MQ+)(CO)3(dmb)]2+
AVlcek, Jr., D J Liard, I R Farrell
Department of Chemistry, Queen Mary and Westfield College, University of London, Mile End, London E1 4NS, UK
P Matousek, M Towrie
Central Laser Facility, CLRC Rutherford Appleton Laboratory, Chilton, Didcot, Oxon, OX11 0QX, UK
Main contact email address: [email protected]

Lasers for Science Facility Programme - Chemistry
79 Central Laser Facility Annual Report 2000/2001
another, much weaker band centred at 680 nm grows. Thesecorrespond to MLCT(dmb) and MLCT(MQ+) respectively asseen from the transient absorption spectra.
450 500 550 600 650 700 750
5 10 15 60 60*15
Wavelength / nm
Figure 3. Time –resolved emission of [Re(MQ+)(CO3)(dmb)]2+
in CH3CN.
Time Resolved Infra-Red Absorption (PIRATE)
The final piece of mechanistic information on the interligandET reaction (1) came from picosecond TR IR absorption spectra(Figure 4). Optical excitation of [Re(Et-py)(CO)3(dmb)]+
populates an MLCT(dmb) excited state, which can be described
as [ReII(Et-py)(CO)3(dmb•−)]+. Accordingly, the ps IRabsorption pattern shows three bands shifted to higherfrequencies (1970(w), 2011(w), 2060(s) cm-1) relative to theirground state positions (1930(br), 2034(s), cm-1, the formercomprising two unresolved bands).This is caused by the
depopulation of Re(dπ) orbitals on Re→dmb MLCT
excitation which diminishes the Re→CO π back donation. Theps TR-IR spectra show just a small upward shift and narrowduring the first 10 ps due to relaxation. Excited state bands donot change further, in accordance with a long3MLCT excited state lifetime. TR-IR spectra of[Re(MQ+)(CO)3(dmb)]2+ measured at early times afterexcitation show the typical MLCT(dmb) spectral pattern(1960(vw), 2010(vw), 2060(m) cm-1) due to initial formation of
[Re(MQ+)(CO)3(dmb•−)]2+. In addition, a weak band at2100 cm-1 is already present at 1 ps. Subsequently, its intensityincreases with a time constant approximately equal to that of the
ET reaction (1). Intensity of the [Re(MQ+)(CO)3(dmb•−)]2+
bands decreases concomitantly. The new spectral pattern(1997(vw), 2100(s) cm-1) corresponds to the ET product
[ReII(MQ•)(CO)3(dmb)]2+. The large difference between the IR
spectral patterns of [Re(MQ+)(CO)3(dmb•−)]2+ and
[ReII(MQ•)(CO)3(dmb)]2+ is rather surprising. It shows that thestructure and electron distribution in the Re(CO)3 fragment areboth strongly affected by the interligand ET. The upward shift
of the highest ν(CO) band indicates a decrease of electrondensity on the metal, presumably due to a higher localization of
the excited electron on the MQ• ligand as compared with
dmb•−. It is also interesting to note that the position of the
highest ν(CO) band of [ReII(MQ•)(CO)3(dmb)]2+ does notchange with time after 2 ps. This shows that the ET reaction isaccompanied by very fast redistribution of vibrational energy tolow-frequency modes and solvent librations. This conclusionagrees with the TR3 results discussed above.
-0.010
-0.005
0.000
0.005
0.010 1 ps 2 ps 4 ps 8 ps 16 ps 36 ps
∆ ab
sorb
ance
1900 1950 2000 2050 2100
-0.012
-0.008
-0.004
0.000
0.004
1 ps 2 ps 3 ps 6 ps 11 ps 100 ps
Wavenumber / cm-1
Figure 4. Top: TR-IR spectra of [Re(MQ+)(CO3)(dmb)]2+ inCH3CN. Bottom: TR-IR spectra of [Re(Et-py)CO3)(dmb)]+ inCH3CN.
Conclusion
The picosecond TR visible absorption spectra of
[Re(MQ+)(CO)3(dmb•−)]2+ allowed us to determine accuratelythe kinetics of the inter-ligand ET (1) and to identify bothexcited states involved. The latter was possible due to the fact
that the dmb•− and MQ• chromophores present in the initial andfinal state, respectively, have characteristic visible absorptionbands. TR vibrational spectra confirmed this mechanism andbrought additional information on the molecular details of theET reaction. The ps TR-IR and TR3 have shown that the ET is
accompanied by very fast energy dissipation from ν(CO) and
MQ•-localized high-frequency vibrations. The small time-dependent shifts of Raman peaks observed by TR3 show that atleast part of this energy is redistributed intramolecularly, intolow-frequency skeletal modes. Moreover, TR-IR spectraindicate that the interligand ET is accompanied by structuralchanges of the Re(CO)3 moiety and increasing localization ofthe excited electron.
References
1. D. J. Liard, A. Vlcek, Jr. Inorg Chem, 39, 2000, 485.
2. J. R. Schoonover, P. Chen, W. D. Bates, R. B. Dyer, T. J.Meyer, Inorg. Chem. 33, 1994, 793.
3. M. Towrie, A. W. Parker, W. Shaikh, P. Matousek, Meas.Sci. Technol. 9, 1998, 816.

Lasers for Science Facility Programme – Chemistry
Central Laser Facility Annual Report 2000/2001 80
Introduction
The structure of the intramolecular charge transfer (ICT) stateof DMABN, formed only in polar solvent, has been a subject ofspeculation for more than 40 years1). Monomolecular modelsinterpreting the nature and structure of the ICT state fall intofour main classes: TICT (Twisted ICT)2), WICT (WaggedICT)3), PICT (Planar ICT)4), and RICT (Rehybridisation ICT)5).All have an ICT mechanism in common but they differ inmodes related to the ICT reaction.
Direct experimental evidence for the structure of the ICT stateof DMABN in solution has recently been obtained using time-resolved infrared (TRIR)6-8) and picosecond Kerr gated time-resolved resonance Raman (ps-K-TR3) spectroscopy9,10). Theobservation of the ICT state C≡N stretching mode at~2100 cm-1 rules out the RICT model as this model predicts a~1650 cm-1 C≡N stretch frequency which is far away from thatobserved by both TRIR and ps-K-TR3. This leaves theremaining three models in dispute. With the aim ofdiscriminating between the TICT and PICT models Dryer andKummrow11) have performed full optimization ab initoCASSCF calculations. They conclude that an experimentaldetermination of the frequency of phenyl-amino stretchingmode, ν(ph-N), will allow a final decision between the TICTand PICT models to be made. The TICT model predicts adownshift of the ν(ph-N) frequency relative to the ground statewhilst the PICT model requires an up-shift. However, Thecrucial ν(ph-N) mode has to date not been identified until ourrecent ps-K-TR3 study. We report here the ps-K-TR3 results ofthe ICT state of DMABN and its isotopic labeled analogousDMABN-N15, DMABN-d4, and DMABN-d6 in order to helpvibrational mode assignments. The results provide newevidence and shed light on the determination of the ICT statestructure.
Experimental arrangements
The experiments were carried out using a TR3 system based onoptical parametric amplifiers (OPAs), described elsewhere10)
with 90o collection configuration12). The pump wavelength was267 nm. Probe wavelength of 330 nm was used in resonancewith the strong electronic transitions of the ICT state ofDMABN13). Pump and probe beams had 5-10 and 1-5 µJenergy/pulse, respectively, ~1 ps pulse-length, and parallelpolarisations. Solution filter of trans-stilbene was placed infront of the spectrometer to block the Rayleigh lines andscattered pump light. Details of acquisition methods and theKerr gate are given in Reference 14. Here we used an improvedsystem based on benzene with throughput up to 30 %(excluding polariser losses). Each spectrum shown is the sum of3 individual background-subtracted spectra with accumulationtimes typically of 2000 seconds. The filters attenuated all bandsbelow 900 cm-1.
Since both the ground and ICT state of DMABN absorb in the330 nm regain, transient resonance Raman (TR2) spectra of theICT state were obtained also by single-color pump probemethod. The 330 nm laser, ~20 ns pulse duration, was
generated by frequency doubling of 660 nm dye (DCM) laserpulse pumped by 308 nm excimer laser. The detail of obtainingthe TR2 spectra can be found in Reference 15.
Acetonitrile Raman bands were used to calibrate all the spectrawith an estimated accuracy of +/- 10 cm-1 and +/- 3 cm-1 inabsolute frequency for the ps-K-TR3 and TR2 spectra,respectively. The spectra are not corrected for variations inthroughput and detector efficiency.
Spectroscopic grade solvents were used as received.Commercial available DMABN was re-crystallized three timesbefore use. DMABN-N15, DMABN-d6, and DMABN-d4 weresynthesized according to References 3, 16, 17, and their puritiesconfirmed by NMR and mass spectroscopic analysis. Sampleconcentrations were 5 - 10 x 10-3 mol dm-3 for the ps-K-TR3 andTR2 experiments.
Results
Figure 1 shows Ps-K-TR3 spectra of the ICT state of DMABN,DMABN-N15, DMABN-d6, and DMABN-d4 in methanolobtained at 50 ps delay time between pump and probe pulses.
Figure 1. Ps-K-TR3 spectra of the ICT state of (a) DMABN,(b) DMABN-N15, (c) DMABN-d6 and (d) DMABN-d4 obtainedwith 267 nm pump, 330 nm probe wavelengths at 50 ps delaytime in methanol.
Figure 2 shows the TR2 spectra of the four compounds. Theclose resemblance of all spectral features in the TR2 to thecorresponding ps-K-TR3 spectra demonstrates that theyoriginate from the same state, the ICT state of DMABN. Thisobservation is also supported by the position of the cyano C 1stretching frequency, which serves as a marker band to identifythe state being probed6,7,9).
Structure of the Intramolecular Charge Transfer State of 4-Dimethylaminobenzonitrile(DMABN): Determined by Time-Resolved Resonance Raman Spectroscopy
W M Kwok, C Ma, D Phillips
Department of Chemistry, Imperial College, London SW7 2AY, UK
P Matousek, A W Parker, M Towrie
Central Laser Facility, CLRC Rutherford Appleton Laboratory, Chilton, Didcot, Oxon, OX11 0QX, UK
W T Toner
Department of Physics, Clarendon Laboratory, Parks Road, Oxford, OX1 3PU, UK
Main contact email address: [email protected]
600 800 1000 1200 1400 1600 1800 2000 2200
Wavenumber (cm-1)
2095
1580
1120
750
12501010 1165
1100 12758471160
726
(a)
(b)
(c)
(d)

Lasers for Science Facility Programme - Chemistry
81 Central Laser Facility Annual Report 2000/2001
Figure 2. TR2 spectra of the ICT state of (a) DMABN, (b) DMABN-N15, (c) DMABN-d6 and (d) DMABN-d4 obtainedwith 330 nm excitation in methanol.
The TR2 data offer superior spectral resolution. For example,for DMABN and DMABN-N15, the broad strong asymmetric~1120 cm-1 band observed using the picosecond apparatus isresolved into two bands at ~1170 and ~1116 cm-1, and the weakfeatures observed in the corresponding ps-K-TR3 spectra allappear more clearly in the TR2 spectra, such as the bands at907, 984, 1221, 1281 cm-1 for DMABN and 903, 987, 1221,1261 cm-1 for DMABN-N15 (Figure 2). Band frequencies andrelative intensities computed from Lorentzian fitting of thespectra displayed in Figure 2 are listed in Table 1 with theirtentative assignment included. The assignments were madebased on comparison with frequencies and isotopic shifts ofcorresponding modes of the ground state compounds.Vibrational analysis based on ab initio DFT calculation forDMABN and its various isotopic labeled analogues has beenreported very recently by Okamoto et al 18) and ourselves 19).
Table 1. Frequencies and provisional assignments of resonanceRaman bands of the ICT state of DMABN, DMABN-N15,DMABN-d6 and DMABN-d4.
a
a: Relative intensities of bands are indicated inside parentheses
b: From Reference 10
c: Bands are from ps-K-TR3 spectra shown in Figure 1
? band with uncertain assignment.
Discussion
Frequencies of C≡N stretching and ring local modes, observedat 2096, ~1580, ~1221, ~1170, ~984, and ~756 cm-1 for the ICTstate of DMABN are found to be very similar to those of thebenzonitrile radical anion recorded at: 2093, 1592, 1268, 1178,991, and 760 cm-1 20). This implies that the benzonitrilesubgroup in the ICT state of DMABN resembles thebenzonitrile radical anion, which is consistent with a full chargetransfer mechanism from the dimethylamino to the benzonitrilegroup suggested by the TICT model. Frequency downshift ofthe ring CC stretching modes, such as ∆ν = ~ 28 cm-1 for theWilson 8a C=C vibration, on-going from the ground state toICT state indicates loosening of the ring skeleton upon the ICTstate formation. In addition, the substantial increase indifference between the Wilson 8a and 19a C=C modes of theICT state (131 cm-1) in comparison with the ground state (79 cm-1)18,19) implies that the ICT state structure gains somequinoidal character when compared with the ground statestructure.
Three bands of the ICT state, 1281, 1116, 907 cm-1 were foundto be sensitive to the amino group substitutions. They wereattributed consequently to modes dominated by vibrations of theν(ph-N), methyl rocking ( s
Me) and symmetric N-(CH3)2
stretching (νs(NC2)). It is important to note that, comparing withthe ground state, the νs(ph-N) frequency shifts down by~96 cm-1 for the ICT state.
It has been shown by extensive studies of the geometry andelectronic conformation of aromatic amino compounds that theνs(ph-N) mode could be viewed as a good probe for evaluatingthe bonding configuration around the amino N atom and theelectronic distribution of the aromatic amine compounds21,22).The frequencies of typical single and double C-N bonds are~1200 and ~1600 cm-1, respectively. Structure of the groundstate DMABN has been determined by X-ray diffraction andmicrowave spectroscopy to be slightly pyramidal with ~11-15o
wagging angle23,24). Its amino conformation is therefore similarto well studied closely related compound dimethylaniline(DMA, ~27o wagging angle)21,22). The electronic couplingbetween the amino nitrogen lone pair electrons and the phenylULQJ V\VWHPQ FRQMXJDWLRQLVTXLWHH[WHQVLYHLQWKHJURXQGstate of DMABN as indicated by the 1377 cm-1 νs(ph-N)frequency18,19). Thus, the ~96 cm-1 down shift of this mode ongoing from the ground state to the ICT state implies aVXEVWDQWLDO GHFUHDVH LQ WKH Q LQWHUDFWLRQ DQG HOHFWURQLFisolation of the amino from the benzonitrile subgroups. This isin good agreement with the minimum overlap principle of theTICT model but contrary to the strong electronic couplingproposed by the PICT model. It is also consistent with the TICTmodel νs(ph-N) frequency shift predicted theoretically byDryer and Kummrow11).
In addition, we found that the frequencies and isotopic shifts ofthe amino related modes, the ν(ph-N), s
Me and νs(NC2) of theICT state of DMABN are similar to those of DMA-H+ (1245, 1132, 900 cm-1). For DMA-H+, involvement ofthe nitrogen lone pair in an N-H bond leads to substantialHOHFWURQLFGHFRXSOLQJIURPWKHULQJ V\VWHP7KHDPLQRJURXSof DMA-H+ has thus been suggested to be a pure pyramidal sp3
hybridization conformation25), different from the planar or nearplanar sp2 hybridization conformation of neutral DMA andground state of DMABN. The resemblance of the amino relatedmodes of the ICT state of DMABN to DMA-H+ indicates on theone hand, the electronic isolation of the amino group from therest of the molecule which lends further support to the TICTmodel; on the other hand, an sp3 pyramidal character of the ICTstate amino group. Theoretical studies show that a waggingmotion of the DMABN amino group alone cannot lead to astable high polar excited state26). However, a mainly twistingstructure combined with some wagging of the amino groupmight be a realistic conformation for the ICT state. Such a
Assignment DMABN DMABN-N15 DMABN-d6 DMABN-d4
C≡N 2095(1.00) 2095(1.00) 2095(1.00) 2095(1.00)C=C (8a) 1580(1.19) 1578(1.50) 1581(1.15) 1553(1.03)
1502(0.60) 1504(0.36)C=C (19a) 1446(0.17)b 1448(0.13)b
1358(0.12) 1352(0.11) 1358(0.11)
ν(ph-N) (13) 1281(0.08) 1261(0.09) 1249(0.28) 1271(0.22)
ν(ph-CN) (7a) 1221(0.06) 1221(0.04) 1212(0.21) 1105(0.07)CH bend (9a) 1170(0.18) 1170(0.25) 1166(0.41) 847(0.30)
ρsMe 1116(0.44) 1115(0.51) 1017(0.33) 1160(0.45)
CH bend (18a) 984(0.06) 987(0.07) 985(0.05)
νs(NC2) 907(0.17) 903(0.22) 801(0.11) 899 (0.01)? ring breath (1) 756(0.84) 755(1.13) 747(0.81) 726(0.71)
1+ρsMe 1856c 1864c 1765c
600 800 1000 1200 1400 1600 1800 2000 2200
Wavenumber (cm-1)
2095
1580
1116
756
11701221
12811358
907
984
903 1261
801
985 1017
1166
1249
1358
747
127111051083
847
726 1553
1160
(a)
(b)
(c)
(d)

Lasers for Science Facility Programme – Chemistry
Central Laser Facility Annual Report 2000/2001 82
structure has been suggested by CASSCF study of DMABNperformed by Serrano-Andres et al27). We notice that a fulloptimisation of the ICT state structure considering both thetwisting and wagging motion and also including possiblesolvation effects is still lacking. It is hoped that the datapresented here can stimulate this much needed work.
Conclusion
The ~96 cm-1 downshift of the mode dominated by ν(ph-N)stretching and close resemblance of C 1 VWUHWFKLQJ DQG ULQJlocal mode frequencies of this state to those found in thebenzonitrile radical anion provide unequivocal experimentalevidence of a full charge transfer from the amino to thebenzonitrile subgroup. This is consistent with the electronicdecoupling TICT model. However, because the spectroscopicevidence shows similarities with protonated dimethylaniline(DMA-H+), the results also suggest some pyramidal characterfor the ICT state amino conformation.
References
1. E Lippert, W Rettig, V Bonacic-Koutecky, F Heisel and JA MieheAdv. Chem. Phys., 68 1, (1987)
2. K Rotkiewicz, K H Grellmann and Z R GrabowskiChem. Phys. Lett., 19 315, (1973).
3. W Schuddeboom, S A Jonker, J M Warman, U Leinhos, WKuhnle, and K A ZachariasseJ. Phys. Chem., 96 10809, (1992).
4. K A Zachariasse, M Grobys, T Von der Haar, A Hebecker,Y V Ilchev, Y -B Jiang, O Morawski and W KuhnleJ. Photochem. Photobiol. A: Chem., 102 59, (1996).
5. A L Sobolewski, W Sudholt and W DomckeChem. Phys. Lett., 259 119, (1996)
6. M Hashimoto and H HamaguchiJ. Phys. Chem., 99 7875, (1995).
7. C Chudoba, A Kummrow, J Dreyer, J Stenger, E T JNibbering, T Elsaesser and K A ZachariasseChem. Phys. Lett., 309 357, (1999)
8. H. OkamotoJ. Phys. Chem. A, 104 4182, (2000)
9. W M Kwok, C Ma, P Matousek, A W Parker, D Phillipsand M TowrieJ. Phys. Chem. A, 104 4188, (2000)
10. W M Kwok, C Ma, P Matousek, A W Parker, D Phillips,W T Toner and M TowrieChem. Phys. Lett., 322 395, (2000)
11. J Dreyer and A KummrowJ. Am. Chem. Soc., 122 2577, (2000)
12. M Towrie, A W Parker, W Shaikh and P MatousekMeas. Sci. Technol., 9 816, (1998)
13. T Okada, M Uesugi, G Kohler, K Rechthaler, KRotkiewicz, W Rettig and G GrabnerChem. Phys., 241 327, (1999).
14. P Matousek, M Towrie, A Stanley, and A W ParkerAppl. Spectrosc., 53 1485, (1999)
15. W M Kwok, C Ma, P Matousek, A W Parker, D Phillips,W T Toner, M Towrie and S UmapathyJ. Phys. Chem. A, 105 984, (2001)
16. R H Mitchell, Y Chen and J ZhangOrg. Prep. Proced. Int., 29 715, (1997)
17. L Friedman and H ShechterJ. Org. Chem., 26 2522, (1961).
18. H Okamoto, H Inishi, Y Nakamura, S Kohtani and RNakagakiChem. Phys., 260 193, (2000)
19. W M Kwok, I Gould, C Ma, M Puranik, S Umapathy, PMatousek, A W Parker, D Phillips, W T Toner and MTowriePhys. Chem. Chem. Phys., 3 2424, (2001)
20. I Juchnovski, C Tsvetanov and I PanayotovMonatsh. Chem., 100 1980, (1969)
21. A M Brouwer and R WilbrandtJ. Phys. Chem., 100 9678, (1996)
22. O Poizat and V GuichardJ. Chem. Phys., 90 4697, (1989)
23. A Heine, R H Irmer, D Stalke, W Kuhnle and K AZachariasseActa Crystallog. B, 50 363, (1994)
24. O Kajimoto, H Yokoyama, Y Ooshima and Y EndoChem. Phys. Lett., 179 455, (1991)
25. V Guichard, A Bourkba, M-F Lautie and O PoizatSpectrochimica Acta., 45A 187, (1989)
26. A -D Gorse and M PesquerJ. Phys. Chem., 99 4039, (1995)
27. L Serrano-Andres, M Merchan, B O Roos and R LindhJ. Am. Chem. Soc., 117 3189, (1995)

Lasers for Science Facility Programme - Chemistry
83 Central Laser Facility Annual Report 2000/2001
Introduction
The triplet state of DMABN has been extensively studiedexperimentally1-4), and theoretically5,6). Intersystem crossing(ISC) has been shown to be the principal non-radiativedeactivation channel for singlet excited states, the LE and ICTstate, irrespective of solvent polarity2,7,8). However, theelectronic and structural properties of the lowest triplet (3T1)state and their sensitivity to solvent polarity thus remainXQFOHDU$OWKRXJKPRVWZRUN VXJJHVWV DSODQDU QDWXUH IRUthe 3T1 state irrespective of solvent polarity1-3), the view ischallenged by TRIR studies performed by Hashimoto andHamaguchi which identify a twisted charge transfer triplet state(3TICT) in polar solvent9). In particular, no vibrational bands of3T1 have previously been reported, other than the C≡N stretch.Although the frequency of this mode reflects the extent ofnegative charge localization on the cyano group, it alone cannot be used to determine structure, which is mostly related tothe conformation of the dimethylaniline subgroup. FrequenciesRI WKH DPLQR QLWURJHQSKHQ\O ULQJ VWUHWFKLQJ PRGH SK1and ring modes, such as C=C stretching vibrations, are essentialin evaluation of its bonding configuration10-12). The lack ofstructural data has led to controversy on both the tripletgeometry (planar or TICT) and the ISC mechanism. Here wepresent and discuss time-resolved resonance Raman (TR3) andtransient absorption (TA) data that directly resolve these issues.
Experimental arrangements
Experimental detail is described in Reference 13. In short, thens-TR3 spectra were obtained with 308 nm pump and 532 nmprobe wavelengths. Pump and probe energies were between 0.5and 1 mJ, the repetition rate was 10 Hz. The spectra wereaccumulated over 20-100 min. with pump only and probe onlyspectra being subtracted. Argon bubbling conditions were usedon the sample solution to remove oxygen. Acetonitrile Ramanbands were used to calibrate the spectra with an estimatedaccuracy of +/- 5 cm-1 in absolute frequency. Transientabsorption was measured using the arrangement described inReference 14, with a pump wavelength of 267 nm, under“magic angle” conditions.
Spectroscopic grade solvents were used as received.Commercially available DMABN was re-crystallized threetimes before use. DMABN-N15, DMABN-d6, and DMABN-d4
were synthesized according to References 15, 16, 17, and theirpurities confirmed by NMR and mass spectroscopic analysis.Sample concentrations were 1 - 5 x 10⁻³ mol dm-3 for the TAand TR3 experiments.
Results
TA spectra of DMABN in ethanol from 400 to 700 nm recordedat various delay times are displayed in Figure 1. A broad bandpeaking at ~550 nm grows in as the ~420 nm peak decays on atimescale extending to 3 ns. An isosbestic point at ~450 nmindicates conversion between two distinct states. Referring tothe TA and flash photolysis measurement performed by Okadaet al 1) and Köhler et al 2), the early time ~420 nm band wasattributed to Sn – S1 absorption from the 1TICT state, while thelater time ~550 nm band was attributed to Tn – T1 absorption
from the 3T1 state. It is important to note that the temporalevolution of the TA spectra shows clearly the precursor-successor relationship between the ICT singlet and the tripletstate of DMABN. The time-dependence of the 1TICT to 3T1
conversion is consistent with the ~2 x 10⁸ s-1 ISC rate constantreported before7,8). As the ~550 nm Tn – T1
absorption was alsoobserved in nonpolar solvent2), we chose 532 nm as probewavelength for the TR3 experiments.
Figure 1. Transient absorption spectra of DMABN in ethanolobtained with 267 nm excitation.
ns-TR3 spectra of the 3T1 state of DMABN in nonpolar solventhexane and polar solvent methanol are shown in Figure 1. Theresemblance seen in Figure 2 between the spectra in the twosolvents is striking evidence that the same state is formed inboth solvents. The ~2040 cm-1 frequency of the C≡N bandcoincides with the TRIR C≡N frequency recorded byHashimoto and Hamaguchi9) in butanol at ~100 ns delay timeand we conclude we are probing the same state here, in bothmethanol and hexane. However, our observation of the sameC≡N frequency also in nonpolar solvent is different from theTRIR study which presents one unusually broad and lowintensity IR absorption band at ~2000 cm-1 in hexane andattributed to an alternative triplet state.
Figure 2. ns-TR3 spectra of the 3T1 state of DMABN in hexane(a) and methanol (b) obtained by using gated O-SMA diodearray detector with 308 nm pump and 532 nm probewavelengths at 100 ns delay time.
Time-resolved Study of the Triplet State of 4-dimethylaminobenzonitrile (DMABN)
C Ma, W M Kwok, D Phillips
Department of Chemistry, Imperial College, London SW7 2AY, UK
P Matousek, A W Parker, M Towrie
Central Laser Facility, CLRC Rutherford Appleton Laboratory, Chilton, Didcot, Oxon, OX11 0QX, UK
W T Toner
Department of Physics, Clarendon Laboratory, Parks Road, Oxford, OX1 3PU, UK
Main contact email address: [email protected]
0
0.002
0.004
0.006
0.008
0.01
0.012
0.014
0.016
0.018
0.02
400 450 500 550 600 650 700Wavelength (nm)
∆ O
. D.
500
3000
532 nm probe
750
1000
1500
2000
700 900 1100 1300 1500 1700 1900 2100
Raman Shift (cm-1)
Inte
nsit
y
Methanol (b)
Hexane (a)
2035
1481
1564
1441
1361
1219
1150
937
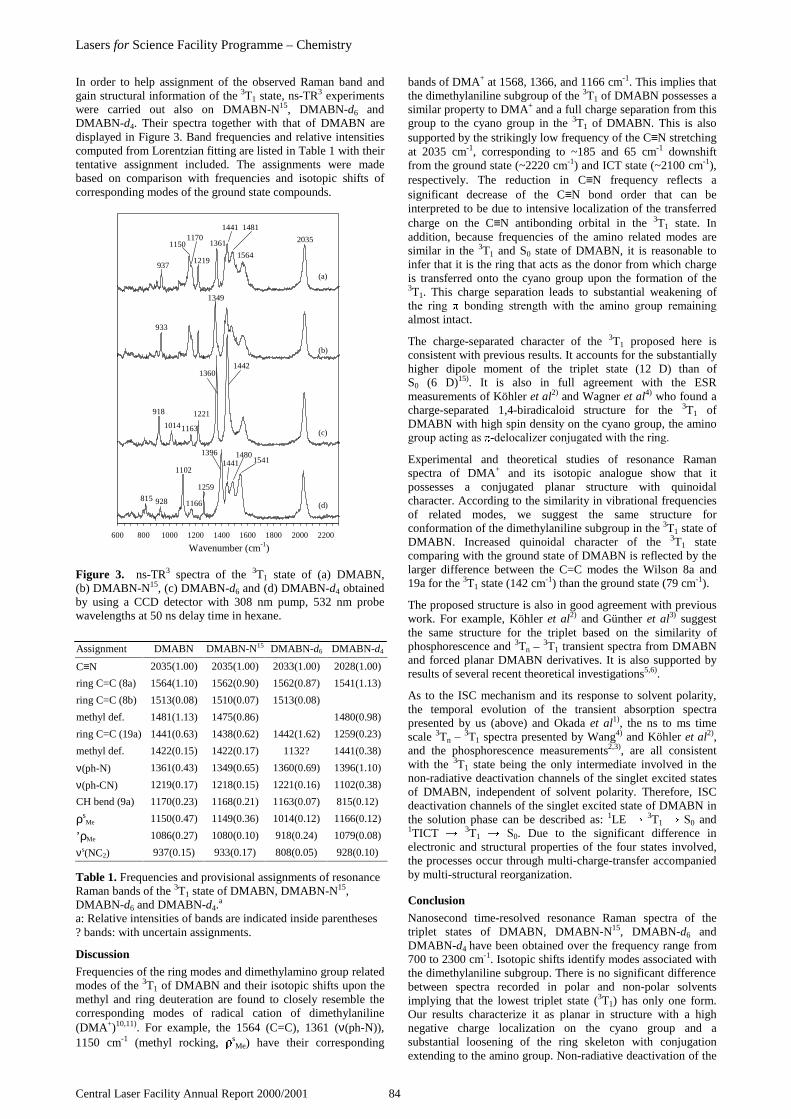
Lasers for Science Facility Programme – Chemistry
Central Laser Facility Annual Report 2000/2001 84
In order to help assignment of the observed Raman band andgain structural information of the 3T1 state, ns-TR3 experimentswere carried out also on DMABN-N15, DMABN-d6 andDMABN-d4. Their spectra together with that of DMABN aredisplayed in Figure 3. Band frequencies and relative intensitiescomputed from Lorentzian fitting are listed in Table 1 with theirtentative assignment included. The assignments were madebased on comparison with frequencies and isotopic shifts ofcorresponding modes of the ground state compounds.
Figure 3. ns-TR3 spectra of the 3T1 state of (a) DMABN, (b) DMABN-N15, (c) DMABN-d6 and (d) DMABN-d4 obtainedby using a CCD detector with 308 nm pump, 532 nm probewavelengths at 50 ns delay time in hexane.
Table 1. Frequencies and provisional assignments of resonanceRaman bands of the 3T1 state of DMABN, DMABN-N15,DMABN-d6 and DMABN-d4.
a
a: Relative intensities of bands are indicated inside parentheses? bands: with uncertain assignments.
Discussion
Frequencies of the ring modes and dimethylamino group relatedmodes of the 3T1 of DMABN and their isotopic shifts upon themethyl and ring deuteration are found to closely resemble thecorresponding modes of radical cation of dimethylaniline(DMA+)10,11). For example, the 1564 (C=C), 1361 (ν(ph-N)),1150 cm-1 (methyl rocking, s
Me) have their corresponding
bands of DMA+ at 1568, 1366, and 1166 cm-1. This implies thatthe dimethylaniline subgroup of the 3T1 of DMABN possesses asimilar property to DMA+ and a full charge separation from thisgroup to the cyano group in the 3T1 of DMABN. This is alsosupported by the strikingly low frequency of the C≡N stretchingat 2035 cm-1, corresponding to ~185 and 65 cm-1 downshiftfrom the ground state (~2220 cm-1) and ICT state (~2100 cm-1),respectively. The reduction in C≡N frequency reflects asignificant decrease of the C≡N bond order that can beinterpreted to be due to intensive localization of the transferredcharge on the C≡N antibonding orbital in the 3T1 state. Inaddition, because frequencies of the amino related modes aresimilar in the 3T1 and S0 state of DMABN, it is reasonable toinfer that it is the ring that acts as the donor from which chargeis transferred onto the cyano group upon the formation of the3T1. This charge separation leads to substantial weakening ofWKH ULQJ ERQGLQJ VWUHQJWK ZLWK WKH DPLQR JURXS UHPDLQLQJalmost intact.
The charge-separated character of the 3T1 proposed here isconsistent with previous results. It accounts for the substantiallyhigher dipole moment of the triplet state (12 D) than ofS0 (6 D)15). It is also in full agreement with the ESRmeasurements of Köhler et al2) and Wagner et al4) who found acharge-separated 1,4-biradicaloid structure for the 3T1 ofDMABN with high spin density on the cyano group, the aminoJURXSDFWLQJDV GHORFDOL]HUFRQMXJDWHGZLWKWKHULQJ
Experimental and theoretical studies of resonance Ramanspectra of DMA+ and its isotopic analogue show that itpossesses a conjugated planar structure with quinoidalcharacter. According to the similarity in vibrational frequenciesof related modes, we suggest the same structure forconformation of the dimethylaniline subgroup in the 3T1 state ofDMABN. Increased quinoidal character of the 3T1 statecomparing with the ground state of DMABN is reflected by thelarger difference between the C=C modes the Wilson 8a and19a for the 3T1 state (142 cm-1) than the ground state (79 cm-1).
The proposed structure is also in good agreement with previouswork. For example, Köhler et al2) and Günther et al3) suggestthe same structure for the triplet based on the similarity ofphosphorescence and 3Tn – 3T1 transient spectra from DMABNand forced planar DMABN derivatives. It is also supported byresults of several recent theoretical investigations5,6).
As to the ISC mechanism and its response to solvent polarity,the temporal evolution of the transient absorption spectrapresented by us (above) and Okada et al1), the ns to ms timescale 3Tn – 3T1 spectra presented by Wang4) and Köhler et al2),and the phosphorescence measurements2,3), are all consistentwith the 3T1 state being the only intermediate involved in thenon-radiative deactivation channels of the singlet excited statesof DMABN, independent of solvent polarity. Therefore, ISCdeactivation channels of the singlet excited state of DMABN inthe solution phase can be described as: 1LE 3T1 60 and1TICT 3T1 60. Due to the significant difference inelectronic and structural properties of the four states involved,the processes occur through multi-charge-transfer accompaniedby multi-structural reorganization.
Conclusion
Nanosecond time-resolved resonance Raman spectra of thetriplet states of DMABN, DMABN-N15, DMABN-d6 andDMABN-d4
have been obtained over the frequency range from700 to 2300 cm-1. Isotopic shifts identify modes associated withthe dimethylaniline subgroup. There is no significant differencebetween spectra recorded in polar and non-polar solventsimplying that the lowest triplet state (3T1) has only one form.Our results characterize it as planar in structure with a highnegative charge localization on the cyano group and asubstantial loosening of the ring skeleton with conjugationextending to the amino group. Non-radiative deactivation of the
Assignment DMABN DMABN-N15 DMABN-d6 DMABN-d4
C≡N 2035(1.00) 2035(1.00) 2033(1.00) 2028(1.00)
ring C=C (8a) 1564(1.10) 1562(0.90) 1562(0.87) 1541(1.13)
ring C=C (8b) 1513(0.08) 1510(0.07) 1513(0.08)
methyl def. 1481(1.13) 1475(0.86) 1480(0.98)
ring C=C (19a) 1441(0.63) 1438(0.62) 1442(1.62) 1259(0.23)
methyl def. 1422(0.15) 1422(0.17) 1132? 1441(0.38)
ν(ph-N) 1361(0.43) 1349(0.65) 1360(0.69) 1396(1.10)
ν(ph-CN) 1219(0.17) 1218(0.15) 1221(0.16) 1102(0.38)
CH bend (9a) 1170(0.23) 1168(0.21) 1163(0.07) 815(0.12)
ρsMe 1150(0.47) 1149(0.36) 1014(0.12) 1166(0.12)
’ρMe 1086(0.27) 1080(0.10) 918(0.24) 1079(0.08)
νs(NC2) 937(0.15) 933(0.17) 808(0.05) 928(0.10)
600 800 1000 1200 1400 1600 1800 2000 2200
Wavenumber (cm-1)
(a)
(b)
(c)
(d)
2035
1564
14811441
1361
1219
11701150
937
933
1349
14421360
1221
1163
918
1014
15411441
1259
14801396
1166928815
1102

Lasers for Science Facility Programme - Chemistry
85 Central Laser Facility Annual Report 2000/2001
singlet intramolecular charge transfer state through ISC isdiscussed in relation to the transient absorption spectra.
References
1. T Okada, M Uesugi, G Kohler, K Rechthaler, KRotkiewicz, W Rettig and G GrabnerChem. Phys., 241 327, (1999).
2. G Köhler, G Grabner and K Rotkiewicz Chem. Phys., 173 275, (1993)
3. R Günther, D Oelkrug and W Rettig, J. Phys Chem., 978512, (1993).
4. Y Wang, J. Chem. Soc., Faraday Trans., 84 1809, (1988).
5. P Purkayastha, P K Bhattacharyya, S C Bera, and NChattopadhyay, Phys. Chem. Chem. Phys., 1 3253, (1999).
6. C. Bulliard, M Allan, G Wirtz, E. Haselbach, K AZachariasse, N Detzer and S Grimme, J. Phys. Chem. A,103 7766, (1999).
7. N. Chattopadhyay, J. Rommens, M Van der Auweraer, andF C De Schryver, Chem. Phys. Lett., 264 265, (1997).
8. N Chattopadhyay, M Van der Auweraer and F C DeSchryver, Chem. Phys. Lett., 279 303, (1997).
9. M Hashimoto and H HamaguchiJ. Phys. Chem., 99 7875, (1995).
10. A M Brouwer and R WilbrandtJ. Phys. Chem., 100 9678, (1996).
11. O Poizat and V GuichardJ. Chem. Phys., 90 4697, (1989).
12. W M Kwok, C Ma, P Matousek, A W Parker, D Phillips,W T Toner, M. Towrie and S UmapathyJ. Phys. Chem. A, 105 984, (2001).
13. C Ma, W M Kwok, P Matousek, A W Parker, D Phillips,W T Toner and M Towrie,J. Phys. Chem. A, 105 4648, (2001).
14. W M Kwok, C Ma, P Matousek, A W Parker, D Phillipsand M. TowrieJ. Phys. Chem. A, 104 4188, (2000).
15. W Schuddeboom, S A Jonker, J M Warman, U Leinhos, WKuhnle and K A ZachariasseJ. Phys. Chem., 96 10809, (1992).
16. R H Mitchell, Y Chen and J ZhangOrg. Prep. Proced. Int., 29 715, (1997).
17. L Friedman and H. ShechterJ. Org. Chem., 26 2522, (1961).
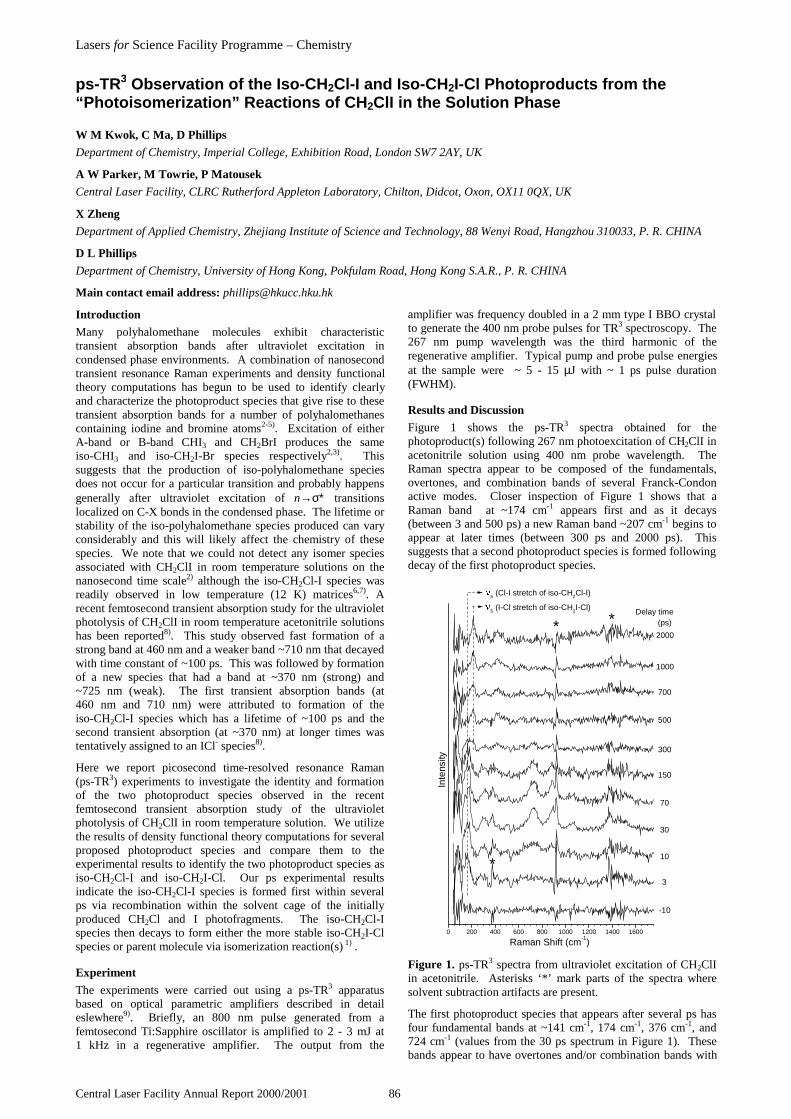
Lasers for Science Facility Programme – Chemistry
Central Laser Facility Annual Report 2000/2001 86
Introduction
Many polyhalomethane molecules exhibit characteristictransient absorption bands after ultraviolet excitation incondensed phase environments. A combination of nanosecondtransient resonance Raman experiments and density functionaltheory computations has begun to be used to identify clearlyand characterize the photoproduct species that give rise to thesetransient absorption bands for a number of polyhalomethanescontaining iodine and bromine atoms2-5). Excitation of eitherA-band or B-band CHI3 and CH2BrI produces the sameiso-CHI3 and iso-CH2I-Br species respectively2,3). Thissuggests that the production of iso-polyhalomethane speciesdoes not occur for a particular transition and probably happensgenerally after ultraviolet excitation of n→σ∗ transitionslocalized on C-X bonds in the condensed phase. The lifetime orstability of the iso-polyhalomethane species produced can varyconsiderably and this will likely affect the chemistry of thesespecies. We note that we could not detect any isomer speciesassociated with CH2ClI in room temperature solutions on thenanosecond time scale2) although the iso-CH2Cl-I species wasreadily observed in low temperature (12 K) matrices6,7). Arecent femtosecond transient absorption study for the ultravioletphotolysis of CH2ClI in room temperature acetonitrile solutionshas been reported8). This study observed fast formation of astrong band at 460 nm and a weaker band ~710 nm that decayedwith time constant of ~100 ps. This was followed by formationof a new species that had a band at ~370 nm (strong) and~725 nm (weak). The first transient absorption bands (at460 nm and 710 nm) were attributed to formation of theiso-CH2Cl-I species which has a lifetime of ~100 ps and thesecond transient absorption (at ~370 nm) at longer times wastentatively assigned to an ICl- species8).
Here we report picosecond time-resolved resonance Raman(ps-TR3) experiments to investigate the identity and formationof the two photoproduct species observed in the recentfemtosecond transient absorption study of the ultravioletphotolysis of CH2ClI in room temperature solution. We utilizethe results of density functional theory computations for severalproposed photoproduct species and compare them to theexperimental results to identify the two photoproduct species asiso-CH2Cl-I and iso-CH2I-Cl. Our ps experimental resultsindicate the iso-CH2Cl-I species is formed first within severalps via recombination within the solvent cage of the initiallyproduced CH2Cl and I photofragments. The iso-CH2Cl-Ispecies then decays to form either the more stable iso-CH2I-Clspecies or parent molecule via isomerization reaction(s) 1) .
Experiment
The experiments were carried out using a ps-TR3 apparatusbased on optical parametric amplifiers described in detaileslewhere9). Briefly, an 800 nm pulse generated from afemtosecond Ti:Sapphire oscillator is amplified to 2 - 3 mJ at1 kHz in a regenerative amplifier. The output from the
amplifier was frequency doubled in a 2 mm type I BBO crystalto generate the 400 nm probe pulses for TR3 spectroscopy. The267 nm pump wavelength was the third harmonic of theregenerative amplifier. Typical pump and probe pulse energiesat the sample were ~ 5 - 15 µJ with ~ 1 ps pulse duration(FWHM).
Results and Discussion
Figure 1 shows the ps-TR3 spectra obtained for thephotoproduct(s) following 267 nm photoexcitation of CH2ClI inacetonitrile solution using 400 nm probe wavelength. TheRaman spectra appear to be composed of the fundamentals,overtones, and combination bands of several Franck-Condonactive modes. Closer inspection of Figure 1 shows that aRaman band at ~174 cm-1 appears first and as it decays(between 3 and 500 ps) a new Raman band ~207 cm-1 begins toappear at later times (between 300 ps and 2000 ps). Thissuggests that a second photoproduct species is formed followingdecay of the first photoproduct species.
Figure 1. ps-TR3 spectra from ultraviolet excitation of CH2ClIin acetonitrile. Asterisks ‘*’ mark parts of the spectra wheresolvent subtraction artifacts are present.
The first photoproduct species that appears after several ps hasfour fundamental bands at ~141 cm-1, 174 cm-1, 376 cm-1, and724 cm-1 (values from the 30 ps spectrum in Figure 1). Thesebands appear to have overtones and/or combination bands with
ps-TR3 Observation of the Iso-CH2Cl-I and Iso-CH2I-Cl Photoproducts from the“Photoisomerization” Reactions of CH 2ClI in the Solution Phase
W M Kwok, C Ma, D Phillips
Department of Chemistry, Imperial College, Exhibition Road, London SW7 2AY, UK
A W Parker, M Towrie, P Matousek
Central Laser Facility, CLRC Rutherford Appleton Laboratory, Chilton, Didcot, Oxon, OX11 0QX, UK
X Zheng
Department of Applied Chemistry, Zhejiang Institute of Science and Technology, 88 Wenyi Road, Hangzhou 310033, P. R. CHINA
D L Phillips
Department of Chemistry, University of Hong Kong, Pokfulam Road, Hong Kong S.A.R., P. R. CHINA
Main contact email address: [email protected]
0 200 400 600 800 1000 1200 1400 1600
n5 (Cl-I stretch of iso-CH2Cl-I)
n5 (I-Cl stretch of iso-CH2I-Cl)
2000
1000
**
*
Delay time (ps)
-10
3
10
30
70
150
300
500
700
Inte
nsity
Raman Shift (cm-1)

Lasers for Science Facility Programme - Chemistry
87 Central Laser Facility Annual Report 2000/2001
Table I. Comparison of the experimental fundamental vibrational frequencies (in cm-1) found from the ps-TR3 spectra (this work) tothe calculated B3LYP/Sadlej-PVTZ density functional theory vibrational frequencies.
each other. The four fundamental Raman bands exhibit goodagreement with the computed vibrational frequencies for iso-CH2Cl-I but not the other probable photoproduct species shownin Table I. For instance, the ~141 cm-1, 174 cm-1, 376 cm-1, and724 cm-1 experimental vibrational frequencies agree better withthe values computed for iso-CH2Cl-I (at 136 cm-1, 194 cm-1,420 cm-1 and 760 cm-1 respectively) compared to those for iso-CH2I-Cl (at 113 cm-1, 236 cm-1, 494 cm-1 and 686 cm-1
respectively). The first photoproduct species clearly shows twolow frequency Raman bands at ~141 cm-1 and 174 cm-1 thathave a combination band ~303 cm-1. However, the CH2ClI+
cation has only one low frequency mode below 200 cm-1 at~191 cm-1 (see Table I) and can be ruled out as the speciesresponsible for the first photoproduct resonance Raman spectrashown in Figure 1. Similarly, the CH2Cl radical has no lowfrequency modes below 200 cm-1 and can also be ruled out asthe identity of the first photoproduct species. The computedelectronic transition energies and oscillator strengths1) areconsistent with the assignment of the first photoproduct speciesto the iso-CH2Cl-I species but not the other species examined.Comparison of our experimental results for both the vibrationalfrequencies and the electronic absorption transition observed ina recent femtosecond study at ~460 nm8) clearly demonstratesthat the first photoproduct species is the iso-CH2Cl-I species.This is consistent with the proposed assignment of Åkesson andco-workers8). Thus, we assign the vibrational fundamentals ofthe first photoproduct species (iso-CH2Cl-I) as follows: the141 cm-1 fundamental to the ν6 C-Cl-I bend mode, the 174 cm-1
fundamental to the ν5 Cl-I stretch mode, the 376 cm-1
fundamental to the ν9 CH2 twist mode and the 724 cm-1
fundamental to the ν4 CH2 wag mode.
The second photoproduct species that begins to appear as thefirst photoproduct species disappears in the 300-500 ps regionalso has at least two low frequency fundamental modes. TheCH2Cl radical can thus be ruled out as the second photoproductspecies. Since there appear to be at least two fundamentalvibrational modes, this also rules out the possibilities ofdiatomic photoproduct species like the ICl- ion or ICl molecule.The CH2ClI+ cation does not seem too likely for the followingreasons: the computed 379 cm-1 mode is fairly far away fromthe experimentally observed 312 cm-1 Raman band, thecomputed electronic absorption transitions1) are also far fromthe experimental ~370 nm transient absorption band observedfor the second photoproduct species in a recent femtosecondstudy8), and the oscillator strengths for the computed electronictransitions1) are relatively weak. The most likely candidate forthe second photoproduct is the iso-CH2I-Cl species if weassume the 312 cm-1 Raman band in the experiment is acombination band of two lower frequency modes as wasobserved in the iso-CH2Cl-I species ps-TR3 spectra. This wouldgive a ~105 cm-1 fundamental frequency which forms acombination band with the strong 207 cm-1 fundamental. The105 cm-1 fundamental can be assigned to the iso-CH2I-Clcomputed 113 cm-1 ν6 C-I-Cl bend mode and the experimental
207 cm-1 Raman band could be assigned to the computed236 cm-1 ν5 I-Cl stretch mode. The iso-CH2I-Cl computedelectronic transition position at 332 nm1) is reasonably close tothe experimental transient absorption band ~370 nm observed inthe femtosecond experiments8) and the calculated oscillatorstrength (0.4008) for this transition is large. TheB3LYP/Sadlej-PVTZ density functional theory computationalresults indicate the iso-CH2I-Cl species is about 4.54 kcal/molmore stable than the iso-CH2Cl-I species1). This is consistentwith our assignment of the first photoproduct (which has alifetime of ~100 ps) to the iso-CH2Cl-I species and the secondphotoproduct species (which has a longer lifetime on the orderof hundreds of ps to nanoseconds) to the iso-CH2I-Cl species.We note that this situation is similar to that found for theiso-CH2Br-I and iso-CH2I-Br species. The iso-CH2I-Br specieswas computed to be more stable by ~4.1 kcal/mol and was theonly species with a sufficiently long lifetime to be observed innanosecond transient resonance Raman study3). We note thatthe assignment of the second photoproduct species toiso-CH2I-Cl is not as clear cut as the first photoproduct speciesassignment to iso-CH2Cl-I. However, the assignment of thesecond photoproduct to iso-CH2I-Cl is consistent with theexperimental and computational data available at this time.
References
1. W. M. Kwok, C. Ma, A. W. Parker, D. Phillips, M.Towrie, P. Matousek, X. Zheng and D. L. PhillipsJ. Chem. Phys., 114 7536, (2001)
2. X. Zheng and D. L. PhillipsChem. Phys. Lett., 324 175, (2000)
3. X. Zheng and D. L. PhillipsJ. Chem. Phys., 113 3194, (2000)
4. X. Zheng, W. M. Kwok and D. L. PhillipsJ. Phys. Chem. A, 104 10464, (2000)
5. X. Zheng, W.-H. Fang and D. L. PhillipsJ. Chem. Phys., 113 10934, (2000)
6. G. Maier and H. P. ReisenauerAngew. Chem. Int. Ed. Engl., 25 819, (1986)
7. G. Maier and H. P. Reisenauer, J. Lu, L. J. Schaad, and B.A. Hess Jr.J. Am. Chem. Soc., 112 5117, (1990)
8. A. N. Tarnovsky, M. Wall, M. Rasmusson, T. Pascher, andE. ÅkessonJ. Chin. Chem. Soc. (Taipei), 47 769, (2000)
9. M.Towrie, P.Matousek, A.W.Parker and W.ShaikhMeas. Sci. Technol., 9 816, (1998)
Experiment Experiment Calculated iso-CH2Cl-I Calculated iso-CH2I-Cl Calculated CH2ClI+ cation Calculated CH2Cl Fig 1. 30ps spectrum Fig 1. 500ps spectrum B3LYP/Sadlej-PVTZ B3LYP/Sadlej-PVTZ B3LYP/Sadlej-PVTZ B3LYP/Sadlej-PVTZ
A’ ν1, sym. CH str. 3119 A1 ν1, sym. CH str. 3114 A’ ν1, sym. CH str. 3002 A’ ν1, CH sym. str. 3134 ν2, CH2 scissor 1409 ν2, CH2 scissor 1361 ν2, CH2 def. or sciss. 1321 ν2, CH2 def. or scissor 1361 ν3, C-Cl stretch 975 ν3, C-I stretch 794 ν3, CH2 wag 1103 ν3, C-Cl str. 827
724 ν4, CH2 wag 760 ν4, CH2 wag 686 ν4, C-Cl stretch 783 ν4, CH2 wag 242 174 207 ν5, Cl-I stretch 194 ν5, I-Cl stretch 236 ν5, C-I stretch 379 A” ν5, CH asym. str. 3307 141 105a ν6, C-Cl-I bend 136 ν6, C-I-Cl bend 113 ν6, I-C-Cl bend 191 ν6, CH2 rock 978
A” ν7, asym. CH str. 3276 A” ν7, asym. CH str. 3254 A” ν7, asym. CH str. 3050 ν8, CH2 rock 1020 ν8, CH2 rock 869 ν8, CH2 twist 1050
376 ν9, CH2 twist 420 ν9, CH2 twist 494 ν9, CH2 rock 527 aValue obtained from subtraction of vibrational frequency for ν5 from the combination band ν5 + ν6 in the 500 ps 400 nm Raman spectrum. str.=stretch; sym.=symmetric; asym.=asymmetric; def.=deformation

Lasers for Science Facility Programme – Chemistry
Central Laser Facility Annual Report 2000/2001 88
Introduction
Polyhalomethanes have been observed in the atmosphere andare potentially important sources of reactive halogen species inthe atmosphere. Polyhalomethanes are also of interest insynthetic chemistry for cyclopropanation reactions. Ultravioletexcitation of gas phase polyhalomethanes usually leads to adirect carbon-halogen bond breaking reaction(s). Molecularbeam anisotropy measurements show these primary reaction(s)typically occur in a time much less than the rotational period ofthe parent molecule and photofragment translationalspectroscopy experiments for CH2I2, CH2BrI, and CF2I2,indicate that the polyatomic photofragment typically receiveslarge amounts of internal excitation of their rotational andvibrational degrees of freedom. This is consistent with theobservation that the direct photodissociation reactions proceedalong multidimensional reactions coordinates as deduced fromresonance Raman (RR) investigations of the short-timephotodissociation dynamics in both gas and solutions.
While the ultraviolet photodissociation reaction of CH2I2 in thegas phase appears relatively well understood, the situation forits photodissociation in condensed phases remains murky withmany conflicting reports. Ultraviolet excitation, directphotoionization and radiolysis of CH2I2 in condensed phaseenvironments leads to formation of characteristic absorptionbands ~385 nm (strong intensity) and ~570 nm (moderateintensity) that have been assigned to several different probablephotoproduct species like trapped electrons2), the CH2I2
+
cation3) or the iso-CH2I-I4) species. Several femtosecond
transient absorption experiments have been done to follow theformation and decay of the photoproduct species2-4). Althoughthe three different femtosecond studies exhibited similar resultswith a fast rise followed by a fast decay and then by a slowerrise, three different interpretations were given because of theirdiffering assignments for the photoproduct species responsiblefor the 385 nm and 570 nm transient absorption bands. Arecent nanosecond transient resonance Raman (ns-TR2) anddensity functional theory (DFT) investigation5) demonstratedthat the iso-CH2I-I species is mostly responsible for the intense~385 nm transient absorption band.
In here, we report picosecond time-resolved resonance Raman(ps-TR3) experiments that probe the initial formation of the hotiso-CH2I-I photoproduct following ultraviolet excitation ofCH2I2 in room temperature solutions. These experimentsestablish a connection between the ultrafast time scale and thelonger ns time scale observation of the iso-CH2I-I photoproduct.
Experiment
The experiments were carried out using a ps-TR3 apparatusbased on optical parametric amplifiers described in detaileslewhere6). Briefly, an 800 nm pulse generated from afemtosecond Ti:Sapphire oscillator is amplified to 2 - 3 mJ at1 kHz in a regenerative amplifier. The output from theamplifier was frequency doubled in a 2 mm type I BBO crystalto generate the 400 nm probe pluses for TR3 spectroscopy. The267 nm pump wavelength was the third harmonic of theregenerative amplifier. Typical pump and probe pulse energies
at the sample were ~ 5 - 15 µJ with ~ 1 ps pulse duration(FWHM).
Results and Discussion
The ps-TR3 spectra obtained for photoproducts produced fromultraviolet excitation of CH2I2 are shown in Figure 1 (Stokesand anti-Stokes spectra) for experiments carried out incyclohexane solution and in Figure 2 for experiments inacetonitrile solution. Figure 3 compares a ns-TR2 spectrum ofiso-CH2I-I in cyclohexane solution (obtained with 309 nmpump and 416 nm probe excitation wavelengths) to the ps-TR3
spectra with 30 ps and 500 ps pump-probe time delays incyclohexane solution and 15 ps and 100 ps pump-probe timedelays in acetonitrile solution.
Figure 1. ps-TR3 spectra of the iso-CH2I-I photoproductproduced from ultraviolet excitation of CH2I2 in cyclohexane.
Figure 2. ps-TR3 spectra of the iso-CH2I-I photoproductproduced from ultraviolet excitation of CH2I2 in acetonitrile.
Inspection of Figure 3 shows that the RR spectra are all similarto one another and suggests that the same photoproduct speciesis observed in the ns-TR2 spectrum and the ps-TR3 spectra.Table I compares the experimental fundamental vibrationalfrequencies (ns-TR2 spectrum, ps-TR3 spectra and previously
ps-TR3 Observation of the Iso-CH2I-I Photoproduct from the “Photoisomerization”Reaction of CH2I2 in the Solution Phase
W M Kwok, C Ma, D Phillips
Department of Chemistry, Imperial College, Exhibition Road, London SW7 2AY, UK
A W Parker, M Towrie, P Matousek
Central Laser Facility, CLRC Rutherford Appleton Laboratory, Chilton, Didcot, Oxon, OX11 0QX, UK
D L Phillips
Department of Chemistry, University of Hong Kong, Pokfulam Road, Hong Kong S.A.R., P. R. CHINA
Main contact email address: [email protected]
0 500 1000 1500
Raman Shift (cm-1)
Rel
ativ
e In
ten
sity
Stokes ps-TR3 of iso-CH2I-I in cyclohexane solution
5000
500
100
50
40
30
20
18
15
12
10
8
6
5
4
3
2
1
0
-1
Delay time(ps)
-1000 -500 0Raman Shift (cm-1)
Rel
ativ
e In
ten
sity
Anti-Stokes ps-TR3 of iso-CH2I-I in cyclohexane solution
x 5
Delay time(ps)
1000
100
50
40
30
20
15
10
5
3
1
0 500 1000 1500
Raman Shift (cm-1)
Rel
ativ
e In
ten
sity
Stokes ps-TR3 of iso-CH2I-I in acetonitrile solution
Delay time(ps)
10001005040
30
20
18151210
75
4321
0-1
-10
-1000 -500 0
Raman Shift (cm-1)
Rel
ativ
e In
ten
sity
Delay time(ps)
Anti-stokes ps-TR3 of iso-CH2I-I in acetonitrile solution
1000
10050
40
3020
18
15
12
1075
432
10
-1-10
x 5

Lasers for Science Facility Programme - Chemistry
89 Central Laser Facility Annual Report 2000/2001
reported infrared spectra) to the DFT computations done forseveral species (iso-CH2I-I, CH2I2
+ radical cation or CH2Iradical) proposed to be the photoproduct responsible for the~385 nm transient absorption observed after ultravioletphotoexcitation of CH2I2 in the condensed phase. Inspection ofTable I shows that the fundamental vibrational bands of the RRand infrared spectra have values that agree well with thosecomputed for the iso-CH2I-I species but not with either of theother proposed species (the CH2I2
+ and the CH2I). We also notethe experimental Raman bands assigned to the nominal C-Istretch (ν3) and CH2 wag (ν4) fundamental of the photoproductspecies exhibit very good agreement with the infrared bandsobserved for iso-CH2I2 in low temperature solid matrices.Isotopic shift data from ns-TR2 spectra and infrared spectra aswell as DFT computed electronic absorption transition energiesand oscillator strengths are all consistent with the assignment ofthe photoproduct to the iso-CH2I-I species. Therefore, the RRspectra in conjunction with results from DFT computationsunequivocally indicate the iso-CH2I-I species is predominantlyresponsible for the ps to ns ~385 nm transient absorption bandin solution. Comparison of the resonance Raman spectra shownin Figures 1-3 indicates that this is true for ultraviolet excitationof CH2I2 in nonpolar solvents like cyclohexane as well as inpolar solvents such as acetonitrile.
Figure 3. A comparison of RR spectra of iso-CH2I-I.
Examination of the ps-TR3 spectra in Figures 1-2 indicates thatRaman bands attributable to the iso-CH2I-I photoproduct beginto appear within several picoseconds (~8 ps in cyclohexanesolution and ~5 ps in acetonitrile solution) after ultravioletexcitation of CH2I2 in the solution phase. These RR bands growin intensity as time increases and appear to shift somewhat tohigher vibrational frequencies. Examination of Figures 1-2shows that the RR bands tend to shift from lower to highervibrational frequency and become more intense as the iso-CH2I-I Raman bands appear in the 4 ps to 20 ps time scale. Thevibrational frequency shifts are only readily apparent at timesbetween 4 ps and 18 ps in both cyclohexane and acetonitrilesolvents although the changes seem to occur somewhat faster inacetonitrile. Our ps-TR3 results show a good correlation withchanges found in the femtosecond transient absorption spectraobserved by Åkesson and coworkers4) in acetonitrile solvent at
times between 3 ps and 50 ps that they tentatively ascribe tovibrational cooling of the hot iso-CH2I-I photoproduct. Theirtransient absorption spectra between 3 ps and 50 ps showabsorption in the range 350 to 500 nm that is relatively flat,broad and weak at 3 ps that begins to sharpen and becomesmore intense from 3 ps to 50 ps with most of this changeoccurring between 3 and 20 ps. This behavior is very similar towhat we observe in our ps-TR3 spectra with most of thevibrational frequency shifts and intensity changes occurring inthe first 20 ps or so with some additional sharpening of theRaman bands and increase of intensity at longer times. Ourps-TR3 results confirm that the iso-CH2I-I photoproduct isformed vibrationally hot within several picoseconds and thenundergoes subsequent vibrational cooling between 4 ps to 50 ps.Examination of the anti-Stokes spectral changes as a function oftime in cyclohexane solvent (Figure 1) and acetonitrile solvent(Figure 2) provides additional support for this interpretation.Between 5 ps and 100 ps in the anti-Stokes RR spectra obtainedin cyclohexane solvent, the ν3, ν3+ν5, 4ν5+ν6/ν3-ν5, 4ν5 and 3ν5
first grow in intensity and then decrease in intensity until theyare similar to that observed at 1000 ps. This behavior alsoindicates a highly excited iso-CH2I-I species that isvibrationally cooling between 5 ps and 50 ps. The anti-StokesRR spectra in acetonitrile solvent (Figure 2) also exhibit similarbehavior.
Vibrational Mode B3LYP/ ns RR in C6H12 IR in low T solid 30 ps RRSadlej TZVP (ref. 5) in C6H12
CH2I-I (CD2I-I)A’ ν1, CH2 sym. str. 3131 (2260) ---------- 3028 (2213) ν2, CH2 scissor 1340 (1011) ---------- 1373 (1041-1033) ν3, C-I stretch 755 (645) 701 (640) 714/705 (645) 694 ν4, CH2 wag 619 (476) 619 (496) 622-611 (498-486) 606 ν5, I-I stretch 128 (128) 128 (128) ----------- 121 ν6, C-I-I bend 99 (93) ? (~110) -----------A” ν7, CH2 asym. str. 3281 (2451) ----------- 3151 (2378) ν8, CH2 rock 865 (697) ----------- ----------- ν9, CH2 twist 447 (318) 487 ? (352 ?) -----------
CH2I2+
A1 ν1, CH sym. str. 3103 (2246) ν2, CH2 def. 1365 (1003) ν3, CI sym. str. 551 (522) ν4, ICI bend 114 (114)B1 ν5, CH asym. str. 3220 (2401) ν6, CH2 rock 755 (576)A2 ν7, CH2 twist 983 (696)B2 ν8, CH2 wag 1080 (813) ν9, CI asym. str. 517 (490)
CH2I
A1 ν1, CH sym. str. 3126 (2252) ν2, CH2 def. 1309 (974) ν3, C-I stretch 614 (576)B1 ν4, CH2 wag 234 (180)B2 ν5, CH asym. str. 3288 (2457) ν6, CH2 rock 832 (619)
str.=stretch; sym.=symmetric; asym.=asymmetric; def.=deformation
Table I. A comparison of fundamental vibrational frequencies(in cm-1) of three proposed products of photo excitation ofCH2I2 in solution.
References
1. W. M. Kwok, C. Ma, A. W. Parker, D. Phillips, M.Towrie, P. Matousek and D. L. PhillipsJ. Chem. Phys., 113 7471, (2000)
2. B. J. Schwartz, J. C. King, J. Z. Zhang, and C. B. HarrisChem. Phys. Lett., 203 503, (1993)
3. K. Saitow, Y. Naitoh, K. Tominaga, and Y. YoshiharaChem. Phys. Lett., 262 621, (1996)
4. A. N. Tarnovsky, J.-L. Alvarez, A. P. Yartsev, V.Sündstrom, and E. ÅkessonChem. Phys. Lett., 312 121, (1999)
5. X. Zheng and D. L. PhillipsJ. Phys. Chem. A, 104 6880, (2000)
6. M.Towrie, P.Matousek, A.W.Parker and W.ShaikhMeas. Sci. Technol., 9 816, (1998)
0 500 1000
n
3- n
5
43 4
2
32 2
15 ps
100 ps
30 ps
500 ps
iso-CH2I-I
n
3+ n
5
n
3+ n
5
n
4+ n
5
n
3
n
4
n
5+ n
9
n
5+ n
6
n
9 / n
5
n
5 + n
6
n
5 / n
5+ n
6
n
5 / n
5+ n
6
n
5
n
6
Rel
ativ
e In
tens
ity
Raman Shift (cm-1)

Lasers for Science Facility Programme – Chemistry
Central Laser Facility Annual Report 2000/2001 90
Introduction
Water-soluble cationic (metallo)porphyrins complexed withnucleic acids are widely investigated owing to their possible usein photodynamic therapy of cancer. Besides the promisingmedical applications, cationic porphyrins are interesting also asspecific probes of local nucleic acid base pairs and/or sequencecomposition, structure, conformation and dynamics1,2).
Figure 1. Structure of Cu(II) 5,10,15,20-meso-tetrakis(4-N-methylpyridyl) porphyrin (CuP).
Among (metallo)porphyrins studied in complexes with nucleicacids, the copper(II) derivative of cationic5,10,15,20-meso-tetrakis(4-N-methylpyridyl) porphine (CuP,see Figure 1) has recently attracted particular interest because ofits ability to form, in excited state, transient axially coordinatedcomplex (exciplex) with an oxygen-containing ligand from itsclose proximity1,2). Since a C=O group of thymine (uracil) wasidentified as the CuP axial ligand1), formation of the CuP*C=Oexciplex can serve as an indicator of the proper distance andappropriate orientation between the C=O group and the centreof the CuP macrocycle, thus providing valuable structuralinformation about the CuP microenvironment. Besides theCuP*C=O species, formation of a concurrent CuP*H2Oexciplex (having water molecule as its fifth axial ligand) wasapproved2) in aqueous solutions containing free CuP. As bothexciplex species exhibit virtually identical Raman features2),they cannot be discerned by nanosecond pulse excitedresonance Raman spectra, if the system contains fractions ofboth complexed and free CuP. Nevertheless, the CuP*H2O andCuP*C=O species can be distinguished by their picosecondtime-resolved resonance Raman (ps-TR3) spectra due todifferent relaxation kinetics, as their corresponding lifetimesdiffer in orders of magnitude ( ~10 ps and ~ 1-3 ns,respectively2)).
Previously, exciplex formation was studied preferentially withdouble-stranded polynucleotides and natural dsDNA havingregular double-helical structure. Apart from the studies1-4)
showing that CuP exciplex can be formed also with single-stranded poly(dT), poly(rU) and some oligothymidylates(d(pT)n), no systematic investigation was carried out withcorresponding nucleosides and mononucleotides. Especiallychallenging was a question whether and under which conditionsinteraction with deoxythymidine (dT) or deoxythymidine5’-monophosphate (dTMP) units would be sufficient forexciplex formation, or whether some secondary structure,provided by sufficiently long oligonucleotide, is required. Ourrecent spectrophotometric titration (will be published),
monitored by absorption in the CuP Soret band, revealed thatCuP mixed with dTMP yields two distinct types of molecularcomplexes having 1:1 (CuPÂG703DQG&X3ÂG703)2) (oreven higher but spectroscopically indiscernible) stoichiometries,the latter being spectroscopically very close to the CuPcomplexed with d(pT)9 (CuPÂGS79). The aim of the presentstudy was to show that this spectroscopic resemblance reflectssome common structural features, i.e. that a local environmentfavourable for exciplex formation in complexes with single-stranded oligomers can be mimicked by molecular complexeswith mononucleotides.
Results and Discussion
Titration of the CuP solution (fixed total concentration of~ 3 × 10⁻⁵ M) with dT, dTMP and d(pT)9 was monitored by theprobe-only (∆t = -50 ps) and pump-and-probe (∆t = +50 ps; toeliminate contribution from the fast relaxing CuP*H2O species)ps-TR3 spectra. Nucleotide concentration was increasedstepwise to cover fully the interesting region of the nucleotide-to-porphyrin ratio (R). Instead of pumping via relatively weakCuP Q-band (~ 550 nm) used in the recent ps-TR3 study2), asingle colour arrangement ( λpump = λprobe = 420 nm) withexcitation in the CuP Soret band (~ 424 nm) was applied toincrease conversion of the CuP into its excited state. UndesiredRaman scattering from the intense pump pulses (pulse energy of~ 9 µJ at the sample) was rejected by means of a Kerr gate (3 psresolution). Details of the experimental setup and the Kerr gatewere given elsewhere5). The ps-TR3 spectra were normalizedusing an internal intensity standard (~ 982 cm-1 Raman band ofthe 0.2 M SO4
2- present in all samples).
Figure 2. Normalized probe-only ps-TR3 spectra of the CuPmixed with dTMP. Nucleotide-to-porphyrin ratio of~ 10 (a), ~ 100 (b), ~ 600 (c) and ~ 5000 (d).
As illustrated by the CuP mixed with dTMP (Figure 2), probe-only excitation yields CuP ground-state Raman features (ν2 andν4 bands) regardless of the nucleotide-to-porphyrin ration R,whereas the pump-and-probe spectra (Figure 3) exhibit also
Kerr Gated ps-TR3 Study of Porphyrin-Oligonucleotide Exciplex Formation
P Mojzes, P Praus, V Baumruk
Institute of Physics, Charles University, Ke Karlovu 5, CZ-12116 Prague 2, Czech Republic
P Matousek, M Towrie
Central Laser Facility, CLRC Rutherford Appleton Laboratory, Chilton, Didcot, Oxon, OX11 0QX, UK
P-Y Turpin
LPBC, University of P & M Curie, 4 Place Jussieu, Case 138, F-75252 Paris Cedex 05, France
Main contact email address: [email protected]
Wavenumber [cm-1]1050 1200 1350 1500 1650
stan
dard
ν4
ν2
a)
b)
c)
d)
∆t = - 50 ps

Lasers for Science Facility Programme - Chemistry
91 Central Laser Facility Annual Report 2000/2001
CuP exciplex features (ν2* and ν4* bands), the relative intensityof which increases with R.
Figure 3. Normalized pump-and-probe ps-TR3 spectra of theCuP mixed with dTMP. Nucleotide-to-porphyrin ratio of~ 10 (a), ~ 100 (b), ~ 600 (c) and ~ 5000 (d).
For all (oligo)nucleotides studied, detailed analysis of theps-TR3 data by means of a factor (SVD) analysis revealedgradual spectral changes in their probe-only ps-TR3 spectra aswell. The changes reflect an increasing fraction of thecomplexed CuP. Under experimental conditions used in thepresent study, the extent of the spectral changes in the pump-and-probe ps-TR3 spectra (overall decrease of the total Ramansignal and intensity ratio between exciplex and ground-statefeatures) for the CuP complexed with dTMP at R ~ 5000 wasfound to be virtually identical with that of CuP complexed withd(pT)9, R > 10 (i.e. [d(pT)9]/[CuP] > 1). Thus, at extremely highconcentrations of mononucleotide, the CuP can form molecularcomplexes providing an environment similar to that generatedby a secondary structure of the oligonucleotide. Nevertheless,since two distinct molecular complexes of 1:1 and 1:2 (orhigher) stoichiometries can be formed with dTMP (and dT),effectiveness of the exciplex formation (evaluated directly fromthe pump-and-probe ps-TR3 spectra by means of the factoranalysis) was confronted with their relative fractions.
Figure 4. Distribution of the CuP complexes as a function ofthe dTMP-to-CuP ratio vs. effectiveness of the CuP*C=Oexciplex formation.
A close match between exciplex effectiveness and distributioncurve of the CuP.(dTMP)2 complex (Figure 4) clearly identifiesspecies responsible for exciplex formation. Nevertheless, slightdeviation from the CuP.(dTMP)2 distribution seems to suggestsubstantial participation of the complexes of stoichiometries
higher than 1:2. Concerning the complexes with dT, similarbehaviour was observed as for complexes with dTMP.
Figure 5. Distribution of the CuP complexes as a function ofthe d(pT)9-to-CuP ratio vs. effectiveness of the CuP*C=Oexciplex formation.
In the case of d(pT)9, a single spectral species attributable to a1:1 CuP.d(pT)9 complex was revealed by spectrophotometrictitration (will be published). As shown on Figure 5, the samecomplex is fully responsible for the CuP exciplex formation.
Conclusions
By means of the Kerr gated ps-TR3 spectroscopy it was shownthat CuP*C=O exciplex can be effectively formed in molecularcomplexes with dTMP as well as dT. Nevertheless, among twospectroscopically distinct complex species formed withmononucleotides, only molecular complexes of higherstoichiometries than 1:2 seem to provide a microenvironmentfavourable for exciplex formation. Considering contemporarythoughts about requirements for axial coordination giving riseto exciplex1,2), some structural features of the CuP molecularcomplexes with mononucleotides can be suggested:
The 1:1 species can be characterised by a more-less «coplanar»arrangement of the porphyrin macrocycle and thymine planes,thus stabilised mainly by stacking interactions. It is formedpreferentially in the CuP mixtures with dT and dTMP at lownucleotide-to-porphyrin ratios, and is not favourable for theCuP*C=O exciplex formation.
The 1:2 (and higher) species is characterised by a more-less«perpendicular» arrangement of the porphyrin macrocycle andthymine planes. It is stabilised by van der Waals’s interactionsof other types than stacking and formed preferentially in theCuP mixtures with dT and dTMP at extremely high nucleotide-to-porphyrin ratios. Its structure seems to be favourable forCuP*C=O exciplex formation.
References
1. P Mojzes, L Chinsky and P-Y TurpinJ. Phys. Chem., 97 4841, (1993)
2. S G Kruglik, P Mojzes, Y Mizutani, T Kitagawa and P-YTurpin, J. Phys. Chem. B, 105 5018, (2001)
3. V A Orlovich, V V Ermolenkov, S G Kruglik, P Mojzesand P-Y Turpin, Spectroscopy of Biological Molecules:Modern Trends (Eds.: P Carmona et al), Kluwer Acad.Publ., 393, (1997)
4. V S Chirvony; V A Galievsky; I V Sazanovich and P-YTurpin, J. Photochem. Photobiol., 52 43, (1999)
5. P Matousek, M Towrie, A Stanley and A W ParkerAppl. Spectrosc., 53 1485, (1999)
CuP + dTMP∆t = + 50 ps
[dTMP]/[CuP]0.01 0.1 1 10 100 1000
Rel
ativ
e F
ract
ion
0.0
0.2
0.4
0.6
0.8
1.0
Free CuPCuP.dTMPCuP.(dTMP)2
Exciplex
Wavenumber [cm-1]1050 1200 1350 1500 1650
stan
dard
ν4ν4*ν2ν2*
a)
b)
c)
d)
∆t = + 50 psCuP + oligo(dT)9
∆t = + 50 ps
[oligo(dT)9]/[CuP]0.001 0.01 0.1 1 10
Rel
ativ
e F
ract
ion
0.0
0.2
0.4
0.6
0.8
1.0
Free CuPCuP.oligo(dT)9
Exciplex

Lasers for Science Facility Programme – Chemistry
Central Laser Facility Annual Report 2000/2001 92
Introduction
In recent years we have been engaged on a research programmedirected towards characterisation of the free radical scavengingproperties of carotenoids and the properties of the carotenoidradical products arising from such reactions 1-5).Epidemiological evidence suggests that diets rich in fruit andvegetables can reduce the risk of cardiovascular disease andcertain types of cancer. Dietary carotenoids are constituents offruit and vegetables and there is much interest in their potentialprotective properties. One possibility is that carotenoidsfunction as free-radical scavenging antioxidants, interceptingoxygen-centred radicals (Scheme 2) such as peroxyl radicals,which arise as propagating species during lipid peroxidation(Scheme 1) for example. Hence, it has been suggested thatcarotenoids may act as chain-breaking antioxidants therebyreducing oxidative stress in organisms by scavenging damagingperoxyl, alkoxyl and other radicals. We have previouslycombined nanosecond laser flash photolysis, pulse radiolysisand TR3 to study the kinetics of carotenoid reactions withnumerous free radicals as well as advancing understanding ofthe reaction mechanisms and properties of carotenoidradicals 1-5).
Precursor
ROO.
ROOH
Initiation
Propagation
Termination
R.
O2
ROO.
ROO. ROO.
R. +
+ RH R.+
+ Products
Scheme 1. The principal steps involved in free-radical inducedlipid peroxidation.
Figure 1. Structure of 7, 7’-dihydro-β-carotene (77DH).
Electron Transfer
H-atom abstraction
Addition
ROO. CAR+
ROO. CAR+
ROO. CAR+
ROO- CAR.++
ROOH +
ROO-CAR
CAR
Scheme 2. Possible reactions of carotenoids (CAR) withperoxyl radicals.
For carotenoids to act as antioxidants in this way, the carotenoidradicals produced must not be capable of propagating free-radical chain reactions, which could result in pro-oxidantbehaviour. In order to address this issue it is necessary, first ofall, to establish whether carotenoid radicals react with oxygen.
The work reported here focuses on the spectroscopic and kineticproperties of the different types of carotenoid radicals that areformed as a result of scavenging reactive peroxyl radicalsderived from carbonyl pre-cursors (Scheme 3) in polar and non-polar environments. The methods used include nanosecondlaser flash photolysis coupled with kinetic UV-VIS-NIRabsorption spectroscopy and TR3.
O O
H2C
O
OO
O
O
hν (266 nm)
H2C
k-CO (~3 x 10⁶ s-1)
O2 O2
O2
phenylacetylperoxylbenzylperoxyl
DBK
Scheme 3. Generation of peroxyl radicals by laser photolysisof dibenzyl ketone (DBK).
Results and Discussion
Laser excitation (266 nm) of dibenzyl ketone (DBK) in hexaneor methanol containing carotenoid leads to the α-cleavageproducts shown in Scheme 3. In the absence of oxygen thecarotenoid is stable to the experimental conditions and nobleaching of the ground state absorption is evident, indicatinglow reactivity towards benzyl radicals. However, in thepresence of oxygen rapid bleaching of the carotenoid absorptionis observed in both methanol and hexane with bimolecularquenching rate constants in the range of 109 M-1 s-1 (measureddirectly or by competition kinetics using a free radical probe).Detailed studies of the oxygen concentration dependence of theextent of carotenoid bleaching strongly suggests thatphenylacetylperoxyl (PAP) radical is primarily responsible forthe observed carotenoid reactions and that the contribution fromreaction with benzylperoxyl radical is insignificant under theseconditions.
Contrasting behaviour is observed in methanol and hexane,despite the fact that the reactions are rapid in both solvents. Inmethanol transient absorption features are observed in thevisible and near infrared, and there are at least two near infraredabsorbing carotenoid radical species (at ~690 and ~780 nm for77DH, Figure 3) displaying different kinetic behaviour. Inhexane no near infrared absorption features are observed, butstrong visible absorption bands are apparent (Figures 2 and 4).
-10
-5
0
5
360 380 400 420 440 460
25.5 us
81 us
169 us
332 us
913 us
absAb
so
rba
nc
e c
ha
ng
e/1
0-2
wavelength/nm
Figure 2. Transient absorption spectra for 77DH (~10-5 M)following 266 nm excitation of DBK in air-equilibrated hexane.The spectrum in light blue is the absorption spectrum of 77DH.
Nanosecond Laser Flash Photolysis and Time-Resolved Resonance RamanSpectroscopy of Carotenoid Neutral Radicals
D J McGarvey, A El-Agamey, A Cantrell
Lennard-Jones Laboratories, School of Chemistry & Physics, Keele University, Keele, Staffs, ST5 5BG
I P Clark, S Tavender
Central Laser Facility, CLRC Rutherford Appleton Laboratory, Chilton, Didcot, Oxon, OX11 0QX, UK
Main contact email address: [email protected]
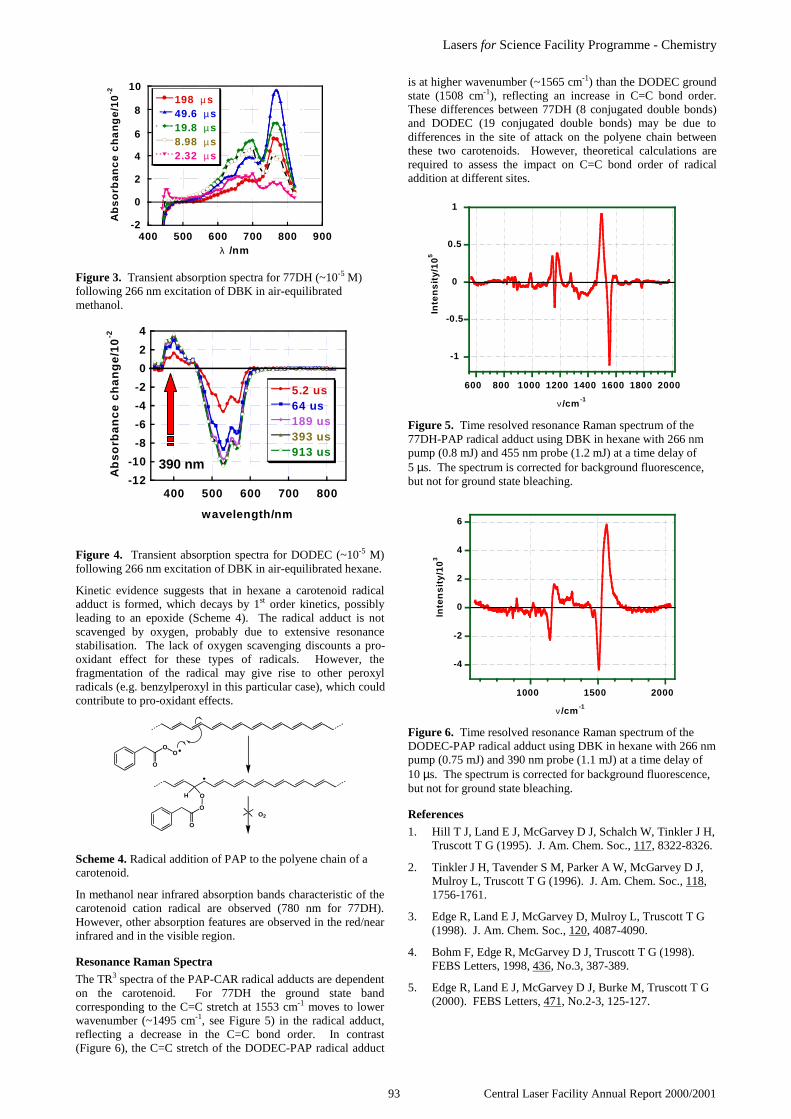
Lasers for Science Facility Programme - Chemistry
93 Central Laser Facility Annual Report 2000/2001
400 500 600 700 800 900
198 µ s49.6 µs19.8 µs8.98 µs2.32 µs
Ab
so
rba
nc
e c
ha
ng
e/1
0-2
λ /nm
0
2
4
6
8
10
-2
Figure 3. Transient absorption spectra for 77DH (~10-5 M)following 266 nm excitation of DBK in air-equilibratedmethanol.
-12
-10
-8
-6
-4
-2
0
2
4
400 500 600 700 800
5.2 us64 us189 us393 us913 us
Ab
so
rba
nc
e c
ha
ng
e/1
0-2
wavelength/nm
Figure 4. Transient absorption spectra for DODEC (~10-5 M)following 266 nm excitation of DBK in air-equilibrated hexane.
Kinetic evidence suggests that in hexane a carotenoid radicaladduct is formed, which decays by 1st order kinetics, possiblyleading to an epoxide (Scheme 4). The radical adduct is notscavenged by oxygen, probably due to extensive resonancestabilisation. The lack of oxygen scavenging discounts a pro-oxidant effect for these types of radicals. However, thefragmentation of the radical may give rise to other peroxylradicals (e.g. benzylperoxyl in this particular case), which couldcontribute to pro-oxidant effects.
O
OO
H O
O
OO2
Scheme 4. Radical addition of PAP to the polyene chain of acarotenoid.
In methanol near infrared absorption bands characteristic of thecarotenoid cation radical are observed (780 nm for 77DH).However, other absorption features are observed in the red/nearinfrared and in the visible region.
Resonance Raman Spectra
The TR3 spectra of the PAP-CAR radical adducts are dependenton the carotenoid. For 77DH the ground state bandcorresponding to the C=C stretch at 1553 cm-1 moves to lowerwavenumber (~1495 cm-1, see Figure 5) in the radical adduct,reflecting a decrease in the C=C bond order. In contrast(Figure 6), the C=C stretch of the DODEC-PAP radical adduct
is at higher wavenumber (~1565 cm-1) than the DODEC groundstate (1508 cm-1), reflecting an increase in C=C bond order.These differences between 77DH (8 conjugated double bonds)and DODEC (19 conjugated double bonds) may be due todifferences in the site of attack on the polyene chain betweenthese two carotenoids. However, theoretical calculations arerequired to assess the impact on C=C bond order of radicaladdition at different sites.
-1
-0.5
0
0.5
1
600 800 1000 1200 1400 1600 1800 2000
Inte
ns
ity/
10
5
ν /cm-1
Figure 5. Time resolved resonance Raman spectrum of the77DH-PAP radical adduct using DBK in hexane with 266 nmpump (0.8 mJ) and 455 nm probe (1.2 mJ) at a time delay of5 µs. The spectrum is corrected for background fluorescence,but not for ground state bleaching.
-4
-2
0
2
4
6
1000 1500 2000
Inte
ns
ity
/10
3
ν /cm-1
Figure 6. Time resolved resonance Raman spectrum of theDODEC-PAP radical adduct using DBK in hexane with 266 nmpump (0.75 mJ) and 390 nm probe (1.1 mJ) at a time delay of10 µs. The spectrum is corrected for background fluorescence,but not for ground state bleaching.
References
1. Hill T J, Land E J, McGarvey D J, Schalch W, Tinkler J H,Truscott T G (1995). J. Am. Chem. Soc., 117, 8322-8326.
2. Tinkler J H, Tavender S M, Parker A W, McGarvey D J,Mulroy L, Truscott T G (1996). J. Am. Chem. Soc., 118,1756-1761.
3. Edge R, Land E J, McGarvey D, Mulroy L, Truscott T G(1998). J. Am. Chem. Soc., 120, 4087-4090.
4. Bohm F, Edge R, McGarvey D J, Truscott T G (1998).FEBS Letters, 1998, 436, No.3, 387-389.
5. Edge R, Land E J, McGarvey D J, Burke M, Truscott T G(2000). FEBS Letters, 471, No.2-3, 125-127.
390 nm

Lasers for Science Facility Programme – Chemistry
Central Laser Facility Annual Report 2000/2001 94
Introduction
Raman spectroscopy is an extremely powerful tool forcharacterizing the physical and chemical properties of materials.It is widely employed as both a research and a routine analyticaltool in industrial and academic laboratories, and ongoingdevelopments in laser, optical and detector technology meanthat it will continue to grow in importance. However, in somecases intense fluorescence swamps the weak Raman signal.This, along with possible laser-induced sample damage, is themajor disadvantage of what is otherwise a very versatile tool.
The usual approach to avoid fluorescence is to change the laserwavelength to avoid electronic excitation, but it is not alwayspossible to find an effective wavelength. Sometimes thisnecessitates using a near-IR (NIR) laser and an interferometerdetector (Fourier Transform Raman spectroscopy). However,NIR-excited Raman spectroscopy is inherently insensitive,giving relatively low signal/noise (S/N) data, and a number ofsystems still fluoresce strongly or decompose under NIR laserexcitation. Also, self-absorption in organic and aqueoussystems can significantly distort spectral intensities and makequantitative analysis difficult. Therefore, alternative ways toobtain Raman spectra from highly fluorescent samples are stillneeded.
One “generic” solution that has been under development forthree decades is to use a pulsed laser and time-resolveddetection to allow the Raman photons to be discriminated fromthe broad fluorescence background. The Raman interaction timeis virtually instantaneous (<< 1 ps), whereas fluorescenceemission is statistically relatively slow, with hundreds orthousands of picoseconds elapsing between electronic excitationand radiative decay. If we illuminate a thin transparent samplewith a very short (~1 ps) laser pulse, all of the Raman photonswill be generated within 1 ps, whereas most of the fluorescencephotons will be emitted at much longer times (nanoseconds). Ifthe detection system is gated so as to detect only those photonsscattered or emitted during the laser pulse, we will collect all ofthe Raman photons but reject the majority of the fluorescence.
Two rather different time-resolved approaches have been mosteffective in yielding high quality Raman data from highlyfluorescent materials. The first used a streak-camera to providetime-resolved Raman data (~10 ps resolution, up to 2 kHzrepetition rate)1). This gave an estimated improvement of ~280for a fluorophore with τf ~ 4 ns. The second method used a Kerrgate with ~3 ps full width at half maximum (FWHM) and650 Hz repetition rate. The Kerr gate was used to time-resolvethe light that is allowed to pass into a spectrograph-CCDcombination2). This system achieved three orders of magnitudesuppression of the background from a fluorophore withτf ~ 2 ns, and produced excellent Raman signals that werecompletely obscured in the ungated spectra.
Both of the systems noted above have been demonstrated towork well using liquid samples that were doped withfluorescent dyes. However, many industrially relevant samplesare clear or opaque solids (powders, films, fibres…), wherethere is potential for (a) multiple reflections that can blur the
time response and (b) laser absorption and damage. The latter isa concern because although the average laser power of an OPAmay be only a few mW, the peak power can be rather high(MW), which raises the possibility of non-linear absorption anddamage. The aim of this work was therefore to establishwhether this same technology provides useful Raman data fromindustrially-relevant materials, and to study the effect ofmultiple scattering / reflections in heterogeneous materials.
Experimental
Spectrometer
The laser and Kerr-gated detector system used in this work weredesigned and constructed at the Rutherford AppletonLaboratory, Oxfordshire, UK, and have been described in detailelsewhere2,3). In the experiments on solid samples describedhere, the original collection mirror has been replaced with a10 cm focal length, f/2 collection lens. In all of the experimentsdescribed in this article, the exciting laser wavelength was fixedat 400 nm, with a pulse rate of ~1 kHz, a pulse width of ca 1 ps,a peak pulse power of between 1 - 5 MW and an average powerof 1 - 5 mW at the sample. The beams were focused to a spotdiameter of 200 - 400 µm, and scatter was collected at ~90o
geometry with respect to the probe beam. Before this work itwas not known whether the high peak pulse powers wouldcause significant degradation of solids, since in the past it hasonly been used on flowing liquids. Therefore, we tested thesystem using a number of solids that fluoresce under visibleexcitation. Spectra were obtained in gated mode, and also fromthe same sample with the gate permanently “open” (by rotatingthe polarizer after the Kerr cell to be parallel to the one beforethe cell and turning off the laser beam that drives the cell). Forbands at around 1600 cm-1, the spectrometer transmission in the'open' state was about a factor of 3 lower than for gatedoperation. This is because in the gated configuration, thepolarizer after the Kerr gate is aligned with the spectrometeraxis of maximum transmission. The presented data are notcorrected for this difference. It should also be noted that thethroughput of the gate, given by the efficiency with which thebeam polarisation can be rotated, could in theory reach 100 %,but is typically ~ 40% for liquids. The efficiency for lightscattered from solids is typically lower, and can vary withsample geometry. The precise origin of this has not beeninvestigated.
For one of the samples, comparative Raman data were alsoobtained using a Perkin Elmer 1760 FT-Raman spectrometer(1064 nm laser), operating with 100 mW of laser power on thesample and acquiring data at 16 cm-1 resolution.
Samples
Three polymer films were examined in these studies, namelyPEEK (poly(aryl-ether-ether-ketone)), ~ 250 µm thick, apolyimide (Upilex SGA, ~ 25 µm thick), and a developmentalgrade of PPS (poly(phenylene sulphide)), ~ 100 µm thick. ICIPLC supplied all the samples, which were a light “straw”colour, bright yellow and dark brown respectively. All of thesesamples exhibit intense fluorescence under visible laser
Picosecond Kerr Gated Time-resolved Raman Spectroscopy of Solids: Capabilitiesand Limitations for Fluorescence Rejection
N Everall
ICI PLC, Wilton Research Centre, PO Box 90, Wilton, Middlesbrough, Cleveland, TS90 8JE
T Hahn
National Starch and Chemical, 10 Finderne Avenue, Bridgewater, New Jersey, USA
P Matousek, M Towrie, A W Parker
Central Laser Facility, CLRC Rutherford Appleton Laboratory, Chilton, Didcot, Oxon, OX11 0QX, UK
Main contact email address: [email protected]
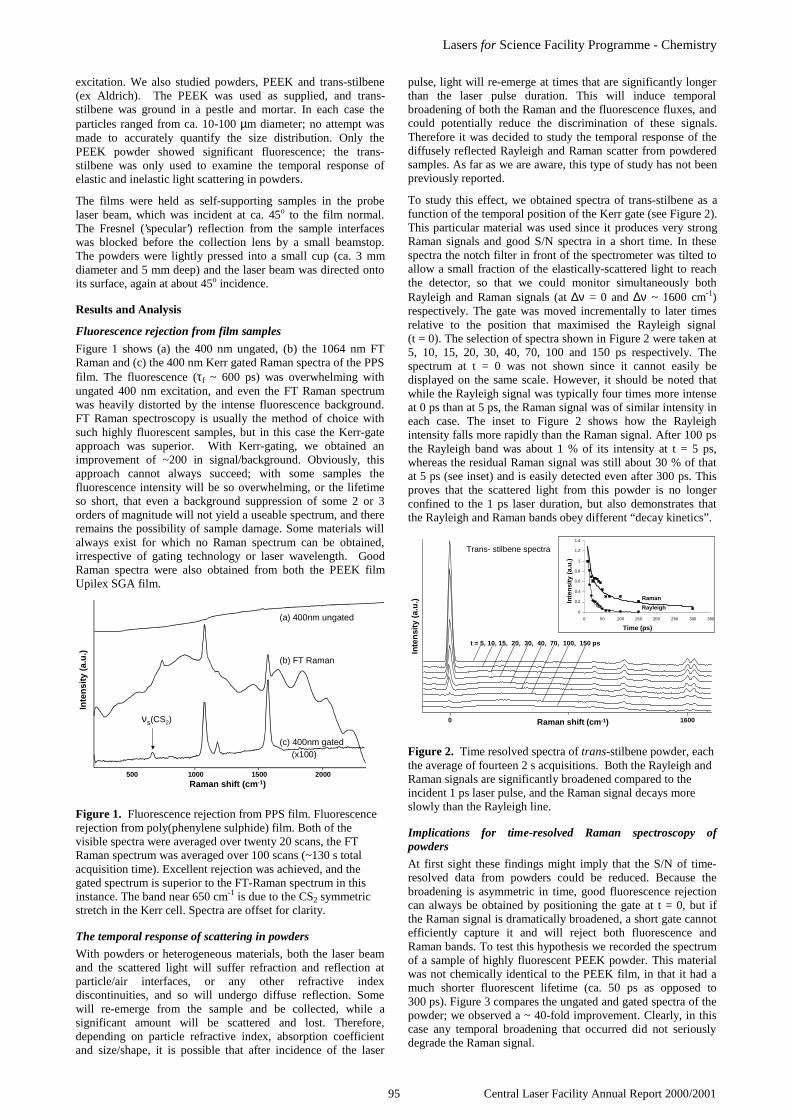
Lasers for Science Facility Programme - Chemistry
95 Central Laser Facility Annual Report 2000/2001
excitation. We also studied powders, PEEK and trans-stilbene(ex Aldrich). The PEEK was used as supplied, and trans-stilbene was ground in a pestle and mortar. In each case theparticles ranged from ca. 10-100 µm diameter; no attempt wasmade to accurately quantify the size distribution. Only thePEEK powder showed significant fluorescence; the trans-stilbene was only used to examine the temporal response ofelastic and inelastic light scattering in powders.
The films were held as self-supporting samples in the probelaser beam, which was incident at ca. 45o to the film normal.The Fresnel (’specular’) reflection from the sample interfaceswas blocked before the collection lens by a small beamstop.The powders were lightly pressed into a small cup (ca. 3 mmdiameter and 5 mm deep) and the laser beam was directed ontoits surface, again at about 45o incidence.
Results and Analysis
Fluorescence rejection from film samples
Figure 1 shows (a) the 400 nm ungated, (b) the 1064 nm FTRaman and (c) the 400 nm Kerr gated Raman spectra of the PPSfilm. The fluorescence (τf ~ 600 ps) was overwhelming withungated 400 nm excitation, and even the FT Raman spectrumwas heavily distorted by the intense fluorescence background.FT Raman spectroscopy is usually the method of choice withsuch highly fluorescent samples, but in this case the Kerr-gateapproach was superior. With Kerr-gating, we obtained animprovement of ~200 in signal/background. Obviously, thisapproach cannot always succeed; with some samples thefluorescence intensity will be so overwhelming, or the lifetimeso short, that even a background suppression of some 2 or 3orders of magnitude will not yield a useable spectrum, and thereremains the possibility of sample damage. Some materials willalways exist for which no Raman spectrum can be obtained,irrespective of gating technology or laser wavelength. GoodRaman spectra were also obtained from both the PEEK filmUpilex SGA film.
500 1000 1500 2000 Raman shift (cm-1)
Inte
nsi
ty (
a.u
.)
(a) 400nm ungated
(b) FT Raman
(c) 400nm gated (x100)
νs(CS2)
Figure 1. Fluorescence rejection from PPS film. Fluorescencerejection from poly(phenylene sulphide) film. Both of thevisible spectra were averaged over twenty 20 scans, the FTRaman spectrum was averaged over 100 scans (~130 s totalacquisition time). Excellent rejection was achieved, and thegated spectrum is superior to the FT-Raman spectrum in thisinstance. The band near 650 cm-1 is due to the CS2 symmetricstretch in the Kerr cell. Spectra are offset for clarity.
The temporal response of scattering in powders
With powders or heterogeneous materials, both the laser beamand the scattered light will suffer refraction and reflection atparticle/air interfaces, or any other refractive indexdiscontinuities, and so will undergo diffuse reflection. Somewill re-emerge from the sample and be collected, while asignificant amount will be scattered and lost. Therefore,depending on particle refractive index, absorption coefficientand size/shape, it is possible that after incidence of the laser
pulse, light will re-emerge at times that are significantly longerthan the laser pulse duration. This will induce temporalbroadening of both the Raman and the fluorescence fluxes, andcould potentially reduce the discrimination of these signals.Therefore it was decided to study the temporal response of thediffusely reflected Rayleigh and Raman scatter from powderedsamples. As far as we are aware, this type of study has not beenpreviously reported.
To study this effect, we obtained spectra of trans-stilbene as afunction of the temporal position of the Kerr gate (see Figure 2).This particular material was used since it produces very strongRaman signals and good S/N spectra in a short time. In thesespectra the notch filter in front of the spectrometer was tilted toallow a small fraction of the elastically-scattered light to reachthe detector, so that we could monitor simultaneously bothRayleigh and Raman signals (at ∆ν = 0 and ∆ν ~ 1600 cm-1)respectively. The gate was moved incrementally to later timesrelative to the position that maximised the Rayleigh signal(t = 0). The selection of spectra shown in Figure 2 were taken at5, 10, 15, 20, 30, 40, 70, 100 and 150 ps respectively. Thespectrum at t = 0 was not shown since it cannot easily bedisplayed on the same scale. However, it should be noted thatwhile the Rayleigh signal was typically four times more intenseat 0 ps than at 5 ps, the Raman signal was of similar intensity ineach case. The inset to Figure 2 shows how the Rayleighintensity falls more rapidly than the Raman signal. After 100 psthe Rayleigh band was about 1 % of its intensity at t = 5 ps,whereas the residual Raman signal was still about 30 % of thatat 5 ps (see inset) and is easily detected even after 300 ps. Thisproves that the scattered light from this powder is no longerconfined to the 1 ps laser duration, but also demonstrates thatthe Rayleigh and Raman bands obey different “decay kinetics”.
Trans- stilbene spectra
16000 Raman shift (cm-1)
Inte
nsi
ty (
a.u
.)
t = 5, 10, 15, 20, 30, 40, 70, 100, 150 ps
0
0.2
0.4
0.6
0.8
1
1.2
1.4
0 50 100 150 200 250 300 350
Time (ps)
Inte
nsi
ty (
a.u
.)
Raman
Rayleigh
Figure 2. Time resolved spectra of trans-stilbene powder, eachthe average of fourteen 2 s acquisitions. Both the Rayleigh andRaman signals are significantly broadened compared to theincident 1 ps laser pulse, and the Raman signal decays moreslowly than the Rayleigh line.
Implications for time-resolved Raman spectroscopy ofpowders
At first sight these findings might imply that the S/N of time-resolved data from powders could be reduced. Because thebroadening is asymmetric in time, good fluorescence rejectioncan always be obtained by positioning the gate at t = 0, but ifthe Raman signal is dramatically broadened, a short gate cannotefficiently capture it and will reject both fluorescence andRaman bands. To test this hypothesis we recorded the spectrumof a sample of highly fluorescent PEEK powder. This materialwas not chemically identical to the PEEK film, in that it had amuch shorter fluorescent lifetime (ca. 50 ps as opposed to300 ps). Figure 3 compares the ungated and gated spectra of thepowder; we observed a ~ 40-fold improvement. Clearly, in thiscase any temporal broadening that occurred did not seriouslydegrade the Raman signal.

Lasers for Science Facility Programme – Chemistry
Central Laser Facility Annual Report 2000/2001 96
500 1000 1500 2000 2500
Raman shift (cm-1)
Inte
nsi
ty (
a.u
.)
PEEK Powder
(a) 400nm ungated
(b) 400nm gated (x10)
Figure 3. Fluorescence rejection with PEEK powder. Eachspectrum was averaged over twenty 3 s scans. Again, thefluorescence background was efficiently rejected.
Future Work
To our knowledge, the possibility of utilizing time-resolvedRayleigh and Raman spectroscopy to study diffuse reflectionhas not been previously explored, and this study representsmerely a preliminary investigation. The following questionsimmediately arise. Can the temporal response of the scatteringbe related to particle properties such as size, shape, packing,and optical absorption? How reproducible are the temporalcurves? Can the effect provide insight into the optics of diffusescattering or the nature of dense powders or dispersions? Canthe particle size be reduced sufficiently to eliminate the effect?Can the shape of the Raman response be understood on aquantitative physical basis?
Probably the most immediately fruitful future work would be
i) to compare the Raman and Rayleigh profiles from samplesprepared with well-defined particle size distributions, tothoroughly investigate the effect of particle size,
ii) to investigate the effect of optical absorption and
iii) to analyse very thin powder samples, in order to minimisethe possibility for diffuse reflectance.
Of course, further studies are also needed to assess to whatextent temporal blurring prevents effective time-resolvedfluorescence rejection with powders; our present work isinconclusive in this respect.
We hope to report these studies in future publications. A fullaccount of the presented work has been submitted forpublication4).
Conclusions
Kerr-gated picosecond time resolved Raman spectroscopydramatically reduces the fluorescent background from solidmaterials. With powdered materials, the Raman and Rayleightemporal response following irradiation with a 1 ps laser pulsecan be significantly broadened, due to the long intra-samplepath-lengths that arise when photons are diffusely reflected.Photons can re-emerge from a powder hundreds of picosecondsafter termination of the irradiating pulse, blurring the temporaldistinction between Raman and fluorescence photons. Itremains to be seen whether this temporal blurring will limit thegeneral applicability of time resolved fluorescence rejectionwith powders.
As an aside, these effects could also have implications forpump-probe studies of powders. In the presence of diffusereflectance it becomes difficult to define precisely the timebetween the pump and probe pulses, since the pump photonscould persist for significant time periods.
Acknowledgements
The authors are grateful to the ICI Measurement ScienceStrategy Team for funding this study, and thank ICI PLC forgranting permission to publish this work.
References
1. T Tahara and H Hamaguchi Appl. Spectrosc. 47 391,(1993)
2. P Matousek, M Towrie, A Stanley and A W Parker Appl.Spectrosc. 53 1485, (1999)
3. P Matousek, M Towrie, C Ma, W M Kwok, D Phillips, WT Toner and A W Parker Fluorescence Suppression inResonance Raman Spectroscopy using a High PerformancePicosecond Kerr Gate J. Raman Spectrocopy (2001),submitted; also elsewhere in this report
4. N Everall, T Hahn, P Matousek, A W Parker and MTowrie Picosecond Time-Resolved Raman Spectroscopyof Solids: Capabilities and Limitations for FluorescenceRejection Appl. Spectrosc. (2001), submitted.

Lasers for Science Facility Programme - Chemistry
97 Central Laser Facility Annual Report 2000/2001
Introduction
Chirality plays a vital role in the action of pharmaceuticals onthe human body. The interactions between such molecules andan enzyme binding site (itself formed from chiral sub-units)depend on the shape adopted by the molecule which is itself acomplex balance between bonded and non-bonded forces.Hydrogen bonding is ubiquitous, both externally with thebinding site and with water molecules, and internally betweenthe functional groups of the molecule itself.
The ephedra series of pharmaceuticals (see Figure 1) share anumber of structural characteristics with the naturalneurotransmitter adrenaline and have similar pharmacologicaleffects, principally on the cardiovascular system. Ephedrinediffers from its diastereoisomer pseudoephedrine by the changeof one chiral centre. This seemingly minor change increases themelting point from 36°C in ephedrine to 120°C in the case ofpseudoephedrine. Such dramatic changes indicate differences ininter-molecular interactions in the crystal phase. To examinesimilar effects in an isolated system we have studied ephedrineand pseudoephedrine in the environment of a jet-cooledsupersonic expansion1).
In recent years, there has been a determined effort by a numberof groups to explore the conformational preferences of smallbiomolecules2,3). Powerful techniques such as infra-red ion-dipspectroscopy have been used to probe the hydrogen bondingnature of OH, NH and CH functional groups. The extraordinarysensitivity of such groups to the local hydrogen bondingnetwork provides an ideal means to probe the conformationallandscape. The technique is even more powerful whencombined with time-of-flight mass spectrometry with its abilityto mass separate ions. Such a combination allows an infra-redspectrum to be obtained which is both mass and energyselected; a situation which is crucial for the study of weaklybound clusters. Two distinct experiments were carried out;firstly the UV laser was tuned onto a resonant band and the IRscanned over the region of interest (3100-3800 cm-1) to obtain aresonant ion-dip infra-red spectrum (RIDIRS). The secondconfiguration consisted of a fixed IR frequency and thescanning of the UV laser allowing the identification of featuresin the UV spectrum originating from the same conformer.
The combination of such techniques with high-level quantum-chemical calculations allows the assignment of discreteconformational structures to experimental features with a highdegree of confidence. Advances in computer technology meanthat calculations on small biomolecules (containing up totwenty or thirty atoms) with methods that include electroncorrelation (e.g. second order Moller-Plesset perturbationtheory) and with large basis sets which include polarisation anddiffuse functions are now routine.
Ephedrine
The Resonant 2-Photon Ionisation (R2PI) spectrum ofephedrine is shown in Figure 2. It consists of one dominantfeature (A) and a considerably weaker band (X) which wasidentified by spectral hole-burning. Also shown in Figure 2 arethe RIDIRS spectra of both features which consist of an intensepeak around 3500 cm-1 assigned to an OH vibrational mode(A: 3493 cm-1 and X: 3540 cm-1) and a much weaker feature at3378 cm-1 in A due to the NH stretching mode. The red-shift ofthe OH band relative to a free alcohol (~3660-3680 cm-1)indicates the presence of a hydrogen bond in which the OHgroups acts as the proton donor. The two features to the blue ofthe OH mode for feature A are assigned to combination bandsof the OH stretch with low-frequency torsional motions of theside-chain.
Ab-initio calculations, performed at a variety of levels, indicatethat the lowest lying conformers of ephedrine consist of thosewith an intramolecular hydrogen bond between the functionalgroups of the side-chain in which the OH acts as proton donorand the NH group as acceptor. Structures with the opposinggeometry are found to lie considerably higher in energy(ca. 10 kJmol-1). The four low-lying structures are shown inFigure 3 with the relative energies from MP2/6-311G**
Ion-dip Spectroscopy of Ephedrine and its diastereoisomer pseudoephedrine
P Butz, R T Kroemer, N A Macleod, L C Snoek, F O Talbot, J P Simons
Physical and Theoretical Chemistry Laboratory, South Parks Road, Oxford, OX1 3QZ
Main contact email address: [email protected]
Figure 1. Molecules of interest.
Figure 2. Resonant 2-Photon Ionisation (R2PI) spectrum ofephedrine (top panel). The lower panel shows experimental IRspectra of features A and X. Also shown are calculated infra-red spectra for the three low-lying conformers fromB3LYP/6-31+G* calculation. Scaling factors of 0.9734 forOH modes and 0.956 for NH modes were derived fromprevious work on related molecules.
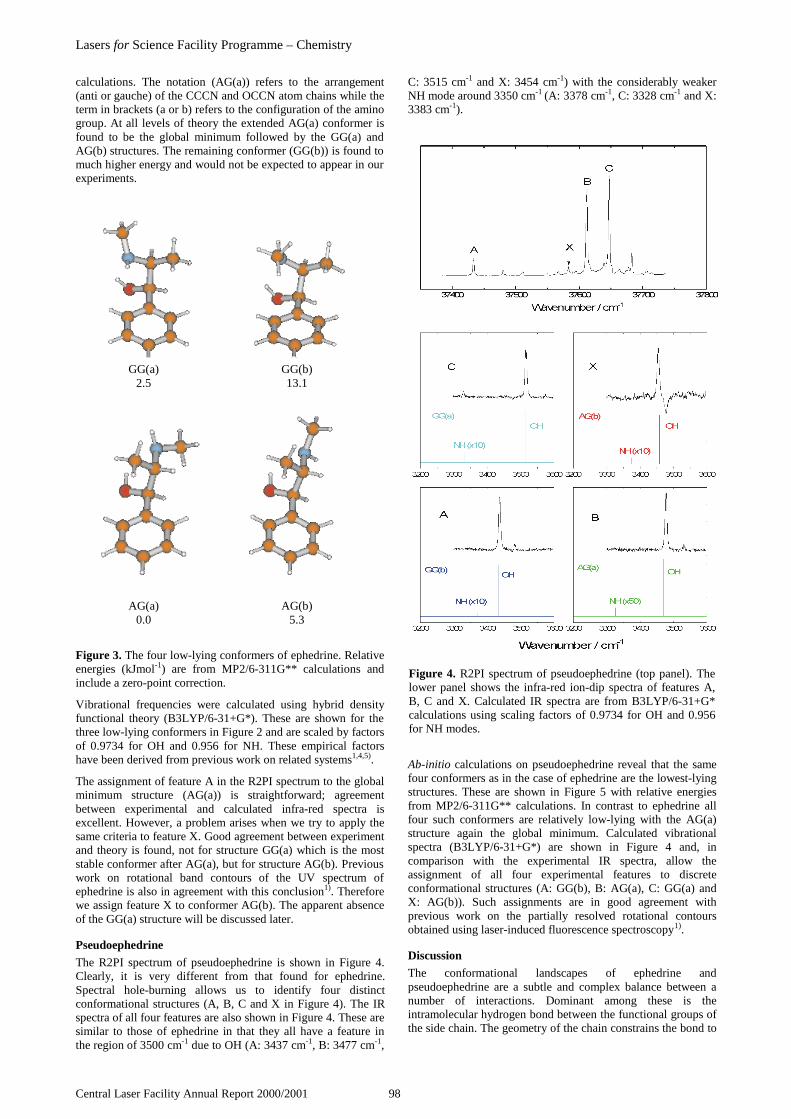
Lasers for Science Facility Programme – Chemistry
Central Laser Facility Annual Report 2000/2001 98
calculations. The notation (AG(a)) refers to the arrangement(anti or gauche) of the CCCN and OCCN atom chains while theterm in brackets (a or b) refers to the configuration of the aminogroup. At all levels of theory the extended AG(a) conformer isfound to be the global minimum followed by the GG(a) andAG(b) structures. The remaining conformer (GG(b)) is found tomuch higher energy and would not be expected to appear in ourexperiments.
Figure 3. The four low-lying conformers of ephedrine. Relativeenergies (kJmol-1) are from MP2/6-311G** calculations andinclude a zero-point correction.
Vibrational frequencies were calculated using hybrid densityfunctional theory (B3LYP/6-31+G*). These are shown for thethree low-lying conformers in Figure 2 and are scaled by factorsof 0.9734 for OH and 0.956 for NH. These empirical factorshave been derived from previous work on related systems1,4,5).
The assignment of feature A in the R2PI spectrum to the globalminimum structure (AG(a)) is straightforward; agreementbetween experimental and calculated infra-red spectra isexcellent. However, a problem arises when we try to apply thesame criteria to feature X. Good agreement between experimentand theory is found, not for structure GG(a) which is the moststable conformer after AG(a), but for structure AG(b). Previouswork on rotational band contours of the UV spectrum ofephedrine is also in agreement with this conclusion1). Thereforewe assign feature X to conformer AG(b). The apparent absenceof the GG(a) structure will be discussed later.
Pseudoephedrine
The R2PI spectrum of pseudoephedrine is shown in Figure 4.Clearly, it is very different from that found for ephedrine.Spectral hole-burning allows us to identify four distinctconformational structures (A, B, C and X in Figure 4). The IRspectra of all four features are also shown in Figure 4. These aresimilar to those of ephedrine in that they all have a feature inthe region of 3500 cm-1 due to OH (A: 3437 cm-1, B: 3477 cm-1,
C: 3515 cm-1 and X: 3454 cm-1) with the considerably weakerNH mode around 3350 cm-1 (A: 3378 cm-1, C: 3328 cm-1 and X:3383 cm-1).
Ab-initio calculations on pseudoephedrine reveal that the samefour conformers as in the case of ephedrine are the lowest-lyingstructures. These are shown in Figure 5 with relative energiesfrom MP2/6-311G** calculations. In contrast to ephedrine allfour such conformers are relatively low-lying with the AG(a)structure again the global minimum. Calculated vibrationalspectra (B3LYP/6-31+G*) are shown in Figure 4 and, incomparison with the experimental IR spectra, allow theassignment of all four experimental features to discreteconformational structures (A: GG(b), B: AG(a), C: GG(a) andX: AG(b)). Such assignments are in good agreement withprevious work on the partially resolved rotational contoursobtained using laser-induced fluorescence spectroscopy1).
Discussion
The conformational landscapes of ephedrine andpseudoephedrine are a subtle and complex balance between anumber of interactions. Dominant among these is theintramolecular hydrogen bond between the functional groups ofthe side chain. The geometry of the chain constrains the bond to
Figure 4. R2PI spectrum of pseudoephedrine (top panel). Thelower panel shows the infra-red ion-dip spectra of features A,B, C and X. Calculated IR spectra are from B3LYP/6-31+G*calculations using scaling factors of 0.9734 for OH and 0.956for NH modes.
GG(a)2.5
GG(b)13.1
AG(a)0.0
AG(b)5.3

Lasers for Science Facility Programme - Chemistry
99 Central Laser Facility Annual Report 2000/2001
a non-optimum configuration with OH…N distances in theregion of 220 pm and OHN angles around 120°.
These compare with the values from the phenol-ammoniacluster7) (OH…N: 199 pm and ∠OHN: 170°). However, therange of the vibrational frequency of the OH mode for all sixstructures is of the order of 100 cm-1 indicating the presence ofother interactions that influence the strength of the hydrogenbond (and hence the resulting red-shift) through co-operativeeffects. Examination of the structures presented in Figures 3 and5 provides some clues to the identity of these interactions; inparticular structures GG(a) and GG(b) of pseudoephedrine.These two conformers (assigned to features C and Arespectively) differ only in the configuration of the aminogroup. However, the OH stretching frequency of GG(b) is red-shifted by approximately 80 cm-1 relative to that of GG(a). Thesecret lies in the orientation of the two methyl groups of theside-chain relative to each other and to the aromatic ring. Instructure GG(a) the two are arranged in a gauche fashionreminiscent of that of butane and the N-methyl group pointsaway from the ring. A further stabilising influence is providedby a hydrogen bond between the NH group and the π-system ofthe aromatic ring. This is manifested in the red-shift (andgreater intensity) of the NH stretch (see Figure 4). Theinversion of the amino-group (equivalent to exchanging themethyl group and the proton) results in a structure (GG(b)) inwhich such an interaction is no longer possible; instead theN-methyl group points directly towards the aromatic ring. Toalleviate this destabilising influence there is a significantdistortion of the side-chain which has the (beneficial) side-effect of improving the geometry of the intramolecularhydrogen bond. Furthermore, the two methyl groups are
orientated in the most energetically favourable staggeredconfiguration. This combination of factors greatly depends onthe local structure of the side-chain and is highly dependent onthe absolute configuration of the chiral centres.
The combination of experiment and theory has allowed us todiscern the conformational landscapes of ephedrine andpseudoephedrine. In the case of the former the assignments ofdiscrete structures to experimental features provides a suprisingresult. Two conformers were observed corresponding to theAG(a) and AG(b) structures. The conformer GG(a),intermediate in energy between these structures was notobserved. Calculations using a number of methods and basissets failed to resolve the situation; indeed, the relative energiesof AG(b) and GG(a) remained remarkably stable at all levels oftheory. Calculations on the relaxation of GG(a) to the globalminimum (AG(a)) yield a barrier greater than 1000 cm-1, fargreater than that found for systems in which conformerrelaxation is significant7) and we do not expect such a pathwayto be viable in this case. We can only speculate on the absenceof this structure from the experimental spectra; a weaktransition moment and the lack of facile relaxation pathwaysfrom higher conformers to GG(a) may both play a role.
Ephedrine-Water complexes
The R2PI spectra of ephedrine-water recorded in the monomer(M+), monomer-water1 (MW1
+) and monomer-water2 (MW2+)
mass channels are shown in Figure 6. A number of features dueto water clusters are observed (B, C, C*, D and E).Fragmentation of the cluster after ionisation with the resultingloss of at least one water molecule is common and wetentatively assign features C and E to a water1 cluster, B and Dto water2 and C* to water3. Currently we are attempting toconfirm these assignments by ion-dip experiments.
37550 37600 37650
Mass Channel
MW1
+
MW2
+
M+
E (W1)D (W
2)C (W
1)
C* (W3)
B (W2)A
Wavenumber / cm-1
Infra-red ion-dip spectra of the water1 clusters (peaks C and E)are shown in Figure 7 along with calculated vibrational spectrafor the three lowest-lying structures. At present, theexperimental spectra do not extend to the region where theOH…N mode is expected. Relative energies and structures ofthe three low-lying water1 conformers are shown in Figure 8.On the basis of comparison between (the incomplete)experiment and calculation we tentatively assign feature C tothe AG(a)-W1 structure and peak E to the GG(a)-W1 cluster.
Figure 6. R2PI spectra of ephedrine-water clusters recordedin the monomer (M+), monomer-water1 (MW1
+) andmonomer-water2 (MW2
+) mass channels.
Figure 5. Calculated structures of pseudoephedrine.Relative energies (kJmol-1) from MP2/6-311G** andinclude a zero-point correction.
GG(a)2.7
GG(b)1.3
AG(a)0.0
AG(b)4.8

Lasers for Science Facility Programme – Chemistry
Central Laser Facility Annual Report 2000/2001 100
Figure 8. Structures of the three lowest-lying water clusters ofephedrine. Calculated energies are from MP2/6-311G** andinclude a zero-point correction.
Discussion
Hydration of ephedrine occurs across the intramolecularhydrogen bond; one strained H-bond is replaced with two moreconventional bonds (OH(eph) → O and OH(wat) → N). Toaccommodate this, the side-chain is significantly distorted fromthe monomer geometry (the OCCN dihedral angle opens byapproximately 20°); interactions between the methyl groups andbetween the NH and the aromatic ring are altered which, inturn, influences the relative stability of the individualconformers.
However, in the case of ephedrine hydration has only a minoreffect on the relative energies of the conformers. It is interestingto note that, contrary to the case for the monomer, the singlyhydrated cluster of structure GG(a) is observed. Such a situationhas been noted for a number of small biomolecules8) and isusually attributed to the inhibition of non-radiative decay of theexcited electronic state by cluster formation. In the case ofephedrine we can only speculate about the behavior of structureGG(a) and its hydrate. Future work, currently in progress, willextend the infra-red spectra to cover the remaining OH band.
Conclusion
The conformational landscapes of the diastereoisomersephedrine and pseudoephedrine have been examined using acombination of ab-initio calculations with a variety ofexperimental techniques. Assignments of experimental featuresto discrete structures have been made by comparison ofexperimental infra-red spectra with calculated vibrationalspectra; two conformers were assigned in ephedrine and four inpseudoephedrine. In all six structures the principal stabilisingfactor was an intramolecular hydrogen bond between thefunctional groups of the side-chain with the OH group acting asproton donor. Secondary interactions, including methyl-methyland NH-π, modified both the relative energy of the conformersand the strength of the principal hydrogen bond through co-operative effects. In the case of ephedrine the assignment of theweaker conformer was contrary to the calculated relativeenergies. The absence of the GG(a) conformer was tentativelyexplained by a weak transition dipole-moment and the lack offacile relaxation pathways to this structure from higherconformers. However, the 1:1 hydrate of this structure could beobserved experimentally. Little or no change in the relativeenergy of the conformers was found on hydration.
Acknowledgements
We wish to thank the EPSRC for grant support (NAM and PB)and the Leverhulme trust for postdoctoral support (FOT andLCS). We also thank the Lasers for Science Facility at theRutherford Appleton Laboratory for the loan of a laser.
References
1. P. Butz, R.T. Kroemer, N.A. Macleod & J.P. Simons.J.Phys.Chem.A. 2001, 105, 544.
2. G.M. Florio, C.J. Gruenloh, R.C. Quimpo & T.S. Zwier.J.Chem.Phys. 2000, 113, 11143.
3. E.G. Robertson & J.P. Simons. PCCP. 2001, 3, 1.
4. E.G. Robertson. Chem.Phys.Lett. 2000, 325, 299.
5. L.C. Snoek, E.G. Robertson, R.T. Kroemer & J.P. Simons.Chem.Phys.Lett. 2000, 321, 49.
6. A. Iwasaki, A. Fujii, T. Watanabe, T. Ebata & N. Makami.J.Phys.Chem. 1996, 100, 16053.
7. P.D. Godfrey & R.D. Brown. J.Mol.Struct. 1996, 376, 65.
8. E.G. Robertson, M.R. Hockridge, P.D. Jelfs & J.P.Simons. PCCP, 2001, 3, 786.
Figure 7. Infra-red ion-dip spectra of ephedrine-water1
(features C and E). Also shown are calculated spectra for thethree low-lying conformers (GG(a)-W1, AG(a)-W1 andAG(b)-W1) calculated at the B3LYP/6-31+G* level with ascaling factors of 0.976 and 0.956 for OH and NH modesrespectively.
GG(a)-W1
(2.8)
AG(a)-W1
(0.0)
AG(b)-W1
(5.3)
3000 3100 3200 3300 3400 3500 3600 3700 3800
AG(b)-W1
NH
NOH OOH
OHfree
NH
NHOHfree
NOH
NOH
OOH
OOHOHfree
GG(a)-W1
AG(a)-W1
C
E
Wavenumber / cm-1
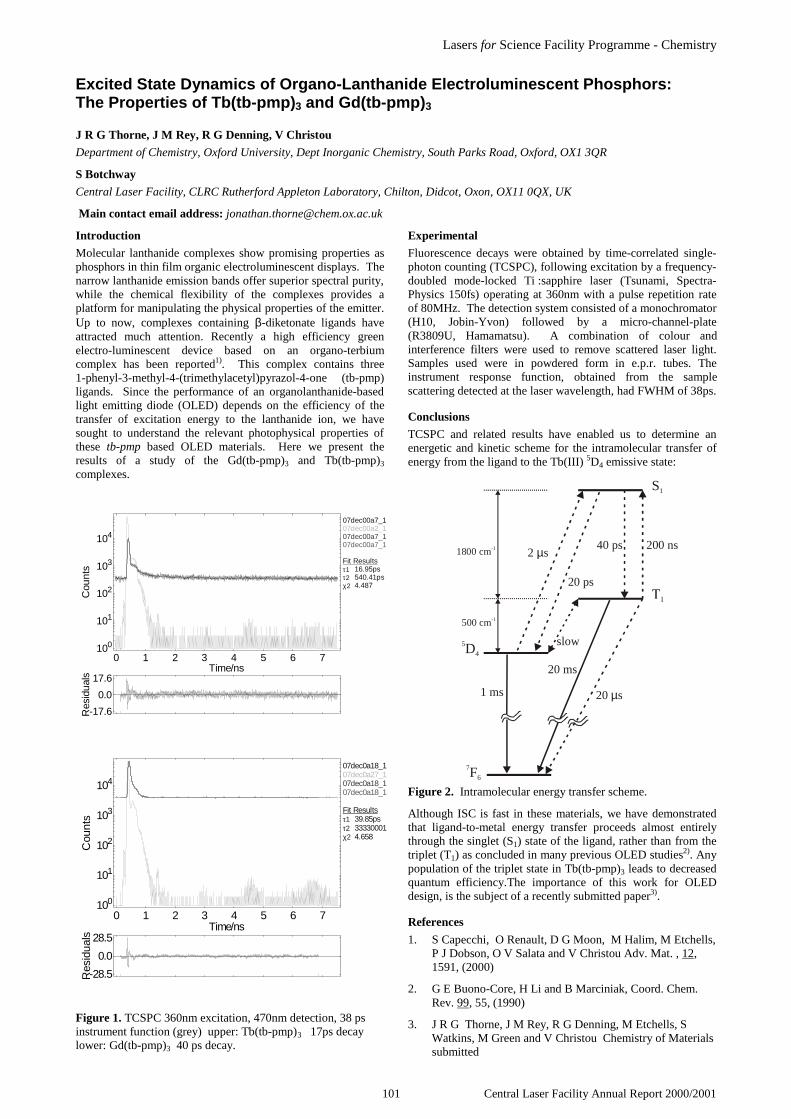
Lasers for Science Facility Programme - Chemistry
101 Central Laser Facility Annual Report 2000/2001
Introduction
Molecular lanthanide complexes show promising properties asphosphors in thin film organic electroluminescent displays. Thenarrow lanthanide emission bands offer superior spectral purity,while the chemical flexibility of the complexes provides aplatform for manipulating the physical properties of the emitter.Up to now, complexes containing β-diketonate ligands haveattracted much attention. Recently a high efficiency greenelectro-luminescent device based on an organo-terbiumcomplex has been reported1). This complex contains three1-phenyl-3-methyl-4-(trimethylacetyl)pyrazol-4-one (tb-pmp)ligands. Since the performance of an organolanthanide-basedlight emitting diode (OLED) depends on the efficiency of thetransfer of excitation energy to the lanthanide ion, we havesought to understand the relevant photophysical properties ofthese tb-pmp based OLED materials. Here we present theresults of a study of the Gd(tb-pmp)3 and Tb(tb-pmp)3
complexes.
010
110
210
310
410
0 1 2 3 4 5 6 7
17.6
0.0
-17.6
Cou
nts
Res
idua
ls
Time/ns
07dec00a7_107dec00a2_107dec00a7_107dec00a7_1
Fit Resultsτ1 16.95psτ2 540.41psχ2 4.487
010
110
210
310
410
0 1 2 3 4 5 6 7
28.5
0.0
-28.5
Cou
nts
Res
idua
ls
Time/ns
07dec0a18_107dec0a27_107dec0a18_107dec0a18_1
Fit Resultsτ1 39.85psτ2 33330001χ2 4.658
Figure 1. TCSPC 360nm excitation, 470nm detection, 38 psinstrument function (grey) upper: Tb(tb-pmp)3 17ps decaylower: Gd(tb-pmp)3 40 ps decay.
Experimental
Fluorescence decays were obtained by time-correlated single-photon counting (TCSPC), following excitation by a frequency-doubled mode-locked Ti :sapphire laser (Tsunami, Spectra-Physics 150fs) operating at 360nm with a pulse repetition rateof 80MHz. The detection system consisted of a monochromator(H10, Jobin-Yvon) followed by a micro-channel-plate(R3809U, Hamamatsu). A combination of colour andinterference filters were used to remove scattered laser light.Samples used were in powdered form in e.p.r. tubes. Theinstrument response function, obtained from the samplescattering detected at the laser wavelength, had FWHM of 38ps.
Conclusions
TCSPC and related results have enabled us to determine anenergetic and kinetic scheme for the intramolecular transfer ofenergy from the ligand to the Tb(III) 5D4 emissive state:
5D4
7F6
S1
500 cm-1
1800 cm-1
20 sµ
20 ms
20 ps
40 ps2 sµ 200 ns
1 ms
slow
Figure 2. Intramolecular energy transfer scheme.
Although ISC is fast in these materials, we have demonstratedthat ligand-to-metal energy transfer proceeds almost entirelythrough the singlet (S1) state of the ligand, rather than from thetriplet (T1) as concluded in many previous OLED studies2). Anypopulation of the triplet state in Tb(tb-pmp)3 leads to decreasedquantum efficiency.The importance of this work for OLEDdesign, is the subject of a recently submitted paper3).
References
1. S Capecchi, O Renault, D G Moon, M Halim, M Etchells,P J Dobson, O V Salata and V Christou Adv. Mat. , 12,1591, (2000)
2. G E Buono-Core, H Li and B Marciniak, Coord. Chem.Rev. 99, 55, (1990)
3. J R G Thorne, J M Rey, R G Denning, M Etchells, SWatkins, M Green and V Christou Chemistry of Materialssubmitted
Excited State Dynamics of Organo-Lanthanide Electroluminescent Phosphors:The Properties of Tb(tb-pmp)3 and Gd(tb-pmp)3
J R G Thorne, J M Rey, R G Denning, V Christou
Department of Chemistry, Oxford University, Dept Inorganic Chemistry, South Parks Road, Oxford, OX1 3QR
S Botchway
Central Laser Facility, CLRC Rutherford Appleton Laboratory, Chilton, Didcot, Oxon, OX11 0QX, UK
Main contact email address: [email protected]

Lasers for Science Facility Programme – Chemistry
Central Laser Facility Annual Report 2000/2001 102
Introduction
Two-photon fluorescence excitation (TPE) spectroscopy, usinga tuneable nanosecond pulsed laser, provides a good probe ofparity-conserving transitions in the solid state that areinaccessible to one-photon spectroscopy. We have used thistechnique previously to obtain polarised f-f spectra of Tb(III),Eu(III) and Sm(III) ions free of phonon structure, thatconclusively identify large numbers of crystal-field levels1).Although some 100 or so electronic states can be identified ineach of these ions, these constitute a small fraction of the fullmanifold of the fN states. As such, they provide only limitedscope for testing an empirical Hamiltonian. We have nowreported the energies of almost all the forty f-electron statesexpected for the much simpler case of the f12 Tm(III) ion in acubic site2), with the aim of identifying more clearly thelimitations of a conventional crystal field (CF) Hamiltonian.
The crystal field is expressed as the sum of 1-electron operators:
∑=qki
kq
kqCF iuBH
,,
)()( )( (1)
where )()( iu kq is a unit tensor operator for the ith f-electron, of
rank k where k = 2, 4, 6, and q is restricted by symmetry. Arigorous test of the validity of this simple model needs a largeenergy level data set, and a small number of CF parameters.The cubic environment provided by the elpasolite latticerequires only two such parameters, B0
(4) and B0(6) , and is ideal
for this purpose.
A more realistic Hamiltonian introduces the influence ofelectron-correlation on the CF3), and includes a spin-correlatedpart, the SCCF, described by the additional perturbation:
)(. )(
,,
)( iubH kqi
qki
kqSCCF sS∑= (2)
The parameters )(k
qb are a measure of the modification to the
CF arising from the dependence of the radial part of thewavefunction of the ith 4f electron on its spin orientation si
relative to the total spin S, in response to exchange interactions.The relative importance of these SCCF corrections is measured
by the parameters )()()( k
qk
qk
q Bbc = such that:
)()()(
,,
.1)( kqi
kq
kq
qkiTOTAL ciuBH sS+= ∑ (3)
However, alternative physical mechanisms can also bedescribed by this form of parameterisation. One such appliesparticularly to those lanthanides (e.g. Sm(III), Eu(III), Tm(III),Yb(III)) that have low-energy ligand-to-metal-f charge-transfer(CT) states. Configuration interactions between these CT statesand the fN manifold provides a description of f-orbital covalencythat can incorporate a degree of spin-polarisation. Tm(III)ought to provide the simplest and most clear-cut demonstrationof this effect, because CT transitions occur at particularly lowenergy.
Experimental
We chose broadband emission in the range 300-400 nm as aprobe of the 2-photon absorption in Tm(III) crystals. Thiswavelength region is far from the exciting wavelengths(550-600 nm) and eliminates the detection of scattered laserlight. It encompasses emissions 3H6 ← 1D2 at 355 nm (shouldinternal cross-relaxation processes depopulate 1I6) together withthe transition 3F4 ← 1I6 at 345 nm. Photons were counted for aperiod of 1 ms following a 100 microsecond delay after thelaser pulse. The emission lifetimes at 350 nm and 450 nm for5% doped Tm(III) crystals was ~250 microseconds at 77 K.
In lanthanide 2-photon absorption, it is essential that there be awindow at the laser wavelength free of 1-photon absorption, inorder to avoid resonant excited state absorption (sequential2-photon absorption or upconversion). In Tm(III) thesparseness of excited states makes the likelihood of 1- and2-photon coincidence improbable. No up-conversionfluorescence was detected in the regions used for the excitation.
The most significant region of the excitation spectrum, in theregion of the 1I6 origin, for which no data had previously beenavailable from single photon studies, is shown in Figure 1 attwo different temperatures. The energy axis (wavenumber)represents the single-photon excitation energy or twice theenergy of the exciting laser beam. The symmetries of the statesare identified from their polarization: knowledge of hot band(56 and 148 cm-1) structure2) allows identification of forbiddentransitions. The line designations (30-37), in the Figure, labelsome of the 40 crystal field electronic states.
34000 34200 34400 34600 34800 35000 35200 35400 35600 35800 36000
37
3P1
1I6
3P0
148 cm-177K
Cs2NaY0.95Tm0.05Cl6
56 cm-1
34000 34200 34400 34600 34800 35000 35200 35400 35600 35800 36000
35 3634333130
10K
Wavenumber (cm-1)
Figure 1. TPE spectra for Cs2NaTm0.05Y0.95Cl
6 1I6,
3P0,1.
Results
Due to the small number of electronic states, assignment of thespectrum is relatively straightforward on the basis of a1-electron crystal field operator, using the F-shell program ofM.F.Reid. The crystal field parameters are given in column 2 ofTable 1.
Table 1 illustrates the very large deviations from 1-electrontheory. Best fit effective crystal field parameters for the subsetof energetically high-lying singlet states of the Tm(III) ionexceed those of the subset of low-lying triplet states by ~60%.
Two-Photon Spectroscopy of Thulium(III) in the Elpasolite Cs2NaYCl6:Tm
J R G Thorne, Qinghua Zeng, R G Denning
Department of Chemistry, Oxford University, Inorganic Chemistry, South Parks Road, Oxford, OX1 3QR
Main contact email address: [email protected]

Lasers for Science Facility Programme - Chemistry
103 Central Laser Facility Annual Report 2000/2001
Levels All “Triplets” “Singlets”
No. Levels 36 14 10
B0
(4) /cm-1 1919 1483 2396
B0
(6) /cm-1 214 189 250
Table 1. Crystal field parameters, B, for Tm(III).
From Equation (3) we also derive SCCF parameters(c0
(4)= +0.41, c0(6)= +0.24). These values are some of the
largest ever reported, values of |c|= ~0.1 being more commonfor the lanthanides, and express mathematically the breakdownof 1-electron crystal field theory.
A comparison with other lanthanide hexa-halide complexespredicts CT transitions in TmCl6
3- near 210 nm (48000 cm-1).Transfer of an electron to Tm(III) f12, of either spin, generatesCT states derived from the same f13 doublet configuration of thethulium(II) ion. However CT states at 48000 cm-1 generated inthis way, should mix much more effectively with the singletstates of Tm(III) near 35000 cm-1, than with the energeticallydistant triplets. We believe that the much increased CF in thesinglet states of Tm(III) in a chloride environment, as expressedin large positive SCCF coefficients, is therefore dominated bythe influence of differential CT mixing and covalency.
Conclusions
We have obtained two-photon excitation spectra forthulium(III) in the elpasolite Cs2NaYCl6:Tm. 37 out of the totalof 40 crystal field levels have been assigned, with the aid of aone-electron crystal field Hamiltonian, representing the mostextensive data set so far reported for Tm(III) at a cubic site.
Deviations from 1-body crystal field theory have been shown tobe very large (~60%) for Tm(III) in Cs2NaYCl6:Tm. This resultis underpinned by two-photon selection rules and polarisationsthat provide a secure assignment of the majority of the CFcomponents of the characteristic 1I6 multiplet. These deviationsare well described by the use of spin-correlated CF parameters.We believe the clear failure of the 1-body model in the Tm(III)ion is a consequence of the preferential admixture of low-lyingligand-to-metal charge-transfer states into the singlet states ofthe ion, leading to a large increase in the effective one-bodycrystal field parameters, relative to those in the triplet states.
Acknowledgments
We thank the Royal Society for support for Q.Z. under theRoyal Fellowships Programme, EPSRC and the Lasers forScience Facility, Rutherford Appleton Laboratory for the loanof a PDL dye laser.
References
1. J R G Thorne , C S McCaw and R G Denning, Chem.Phys. Lett. 319, 185, (2000) and refs. therein
2. J R G Thorne, Qinghua Zeng and R G Denning, J. Phys.Condensed Matter, in press
3. B R Judd, Phys. Rev. Lett. 39, 242, (1977)

Lasers for Science Facility Programme – Chemistry
Central Laser Facility Annual Report 2000/2001 104
Introduction
The photophysics of organometallic complexes has attracted awide level of interest over recent years on account of the veryapplied nature of their emissive properties: e.g. forsemiconductor devices, non-linear optical components andlight-emitting diodes. The origin of these properties lies in thenature of the excited-states of these materials1,2). The effects areprevalent in organometallic species due to their low-valentmetal centre and the high degree of covalency between themetal and its ligands which results in the presence of varioustypes of low energy excited states. The accessibility of thesevarious states and thus the energy, intensity and lifetime of theassociated emission depends inherently on the metal type andthe nature of the ligands. In principle, one can therefore tunematerials to exhibit specific emissive properties by judiciouslyvarying the metal and ligand type. However, this requires athorough knowledge of the exact nature of excited state that isresponsible for the emission. This is no trivial matter, since thisemissive state is usually a mixture of various types of low-lyingexcited states. One can infer a certain level of informationindirectly through UV/vis spectroscopic measurements bycomparing the different emission wavelengths, lifetimes andquantum yields for a given series of complexes e.g. 3,4). Suchinferences can be supported by theoretical molecular orbital-based calculations e.g. 5). Such work undoubtedly providesinvaluable preliminary information. However, in Cambridgeand Bath we are developing a new crystallographic techniquethat will enable us to see the nature of the excited statedirectly6). This technique exploits the recent advances in single-crystal X-ray diffraction instrumentation and pump-probetechnology such that the crystal structure of a compound, whilstin its excited-state, can be realised.
Structural manifestations of excited-states
There are essentially seven possible types of excited statespresent in organometallic complexes: (i) metal-centred (MC)states, (ii) intraligand (IL) states, (iii) metal-to-ligand charge-transfer (MLCT) states, (iv) ligand-to-metal charge-transfer(LMCT), (v) metal-to-metal charge transfer (MMCT), (vi)metal-to-solvent charge transfer (MSCT) and (vii) solvent-to-metal charge transfer (SMCT).
MC or IL excited states correspond to electronic transitionsbetween two orbitals on the same metal or ligand respectively.Low energy MC states are present in compounds where theM-M interatomic distance in the ground state is shorter thantwice the sum of van der Waals radius of the metal and theshorter the distance the lower the energy of the excited state1).This distance is perturbed in the excited state, either contractingor expanding depending on the nature of the orbitals involved.Low energy IL excited states occur in complexes where itsbinding to a metal does not alter significantly its electronicnature from that in its unbound state. Its involvement inemissive properties will also alter the relevant distances withinthe ligand but these are less detectable than the aforementionedM-M perturbations since the initial distances in ligands aremarkedly smaller and thus also are the changes in them.
MLCT and LMCT states originate from electronic transitionsfrom a metal-centred orbital to a ligand-localised orbital andvice versa respectively. MLCT type transitions are commonlyinvolved in the photophysics of organometallic complexes since
the metal is low-valent and the ligand acceptor orbitals are lowin energy. In contrast, the contribution of a LMCT state toemissive phenomena in organometallic complexes is rare4). Thisis because the carbon based ligand donors are high in thespectrochemical series which results in ligand field energies thatare much larger than excited states arising from other types oftransitions. Indeed, LMCT states are generally observed only inorganometallic complexes that contain metals in high oxidationstates. The contribution of either MLCT or LMCT states to thecharacter of the emissive state will perturb markedly theelectron density between the metal and the ligand concerned,compared to that in the ground state.
MMCT states involve electronic transitions between orbitals ontwo metal centres. In the majority of cases, these states are theresult of sigma-bonding to sigma-antibonding transitions andthus lead to efficient M-M bond breaking2). Such states arepoorly characterised but those of low energy are likely to bemost prevalent in cluster complexes where the MMCT statesare more delocalised over the core of the metals. In contrast,MSCT and SMCT states that arise from electronic transitionsfrom a metal-centred orbital to a solvent-localised orbital andvice versa respectively, involve a bond making process. Incommon with MMCT states, only a handful of MSCT andSMCT states have been characterised for organometalliccomplexes despite the fact that emission wavelengths andlifetimes of such materials are commonly altered significantlyby the presence of different solvent media and in comparison tosolid-state measurements.
The character of the emissive state can also change significantlywith temperature since the different types of electronictransitions are affected to various degrees by thermal effects,thus rendering different levels of mixing of excited states indiffering thermal conditions7). Such temperature effects tend tobe most stark in cases where metal-based electronic transitionsshow strong spin-orbit coupling on cooling, thus increasingtheir excited state energies to the extent that an energy cross-over with an unaffected IL state is incurred. This renders theformerly preponderant metal-based character absent and the ILstate dominant in the emissive state. This will evidently affectthe wavelength of the emissive state. Furthermore, IL statesoften occur via a spin-forbidden transition and thus emissionlifetimes can increase dramatically with temperature in suchcases. In more general terms, an increase in emission lifetime isusually concurrent with a reduction in temperature to someextent anyway due to the increase in quantum yield (population)of the emissive state. Given that our ultimate goal is to be ableto tune organometallic materials to tailor specific physicalproperties, it is crucial that we obtain a comprehensiveunderstanding of the true character of their emissive states, bothat ambient and low temperatures.
Experimental methodology and results
In order to identify and quantify the type of excited-state inhand, one needs to be able to assess the nature of the associatedelectronic perturbations ensuing. The determination of anexcited-state crystal structure via single-crystal X-raydiffraction is an ideal way to realise such information since thechange in the electron-density distribution between the groundand emissive state, in affected areas of the molecule, can bemapped out using this technique. Moreover, where the changesare sufficiently distinct, differences owing to excited-state
Crystallographic Studies on Excited-State Molecular Complexes
J M Cole
Department of Chemistry, University of Cambridge, Lensfield Road, Cambridge, CB2 1EW. UK.
P R Raithby
Department of Chemistry, University of Bath, Claverton Down, Bath, BA2 7AY. UK.
Main contact email address: [email protected]

Lasers for Science Facility Programme - Chemistry
105 Central Laser Facility Annual Report 2000/2001
perturbations can be detected simply by analysing changes incertain bond-geometries.
Practically, however, the development of pump-probe single-crystal X-ray diffraction is non-trivial, especially given thetypically ephemeral nature of excited-states, and the struggle toachieve a sufficiently high percentage of molecules in theirexcited-state within a crystal, without destroying it (maximumpossible conversion appears to be ~20-30%). In all of theexperiments reported herein, the careful optimisation of thelasing power density was therefore an important consideration,the laser used in this case being the NSL-4 10Hz Nd:YAG laser.Another major consideration was to collect data as fast aspossible and, in this respect, we have exploited the recentadvances in single-crystal area-detector technology, allexperiments being conducted using an Enraf Nonius Kappa-CCD diffractometer (Figure 1). Such an instrument enables oneto collect a full data-set in minutes to several hours, therebyallowing excited-state structure determinations on compoundswith long-lived excited-states (>30 minutes) using basic steady-state methods. In this respect, experiments were performed onthe compound, Na2Fe(CN)5NO.2H2O, since it has ananomalously long-lived excited-state lifetime, τ = 107s. Thisexcited-state structure has already been determined usingsimilar X-ray diffraction methods by Coppens et al6), who is apioneer in this new field, and thus, these experiments served asan ideal means to test the technique with our experimental set-up. Two conventional data collections were performed on thecompound, one with the laser (at λ=488nm) optically pumpingthe crystal for ~2 hours between the two experiments. The first-order difference obtained yielded the perturbation with respectto the excited-state as realised by Coppens et al6).
Figure 1. An annotated photo of a basic Enraf Nonius Kappa-CCD diffractometer. C = crystal position, D = detector,M = microscope, X = X-ray housing, source and shutter. Thefour degrees of angular freedom of the sample are marked withgreen arrows. In the experiments described herein, the coolingapparatus is not shown but comes in from above and the laserbeam comes in from the back right, near the X-ray collimator(the pencil-shaped object to the right of the crystal).
Many components of the experimental set-up were optimisedduring this period, before turning our efforts to the moredemanding continuous optical-pumping methodology, the targetcompound here being the 4,4’-dihydrobenzophenone:4,13-diaza-18-crown-6 complex. Here, an XRD experiment wasperformed in tandem with continuous optical pumping(λ=488nm), and the difference between these results and that ofthe ground-state structure determined, prior to pumping, wasascertained. This compound has an emissive lifetime of 50 ms
at 50K and we estimate that this continuous pumpingmethodology can be used with our set-up for compounds withlifetimes > 20ms, under optimum conditions. Results showed aperturbation in the hydrogen-bonding geometry: for the contact,O-H…N (labelled ‘A’ in Figure 2), the H…N distance in theground/excited state structure was found to be 1.71(2)/1.78(2)Årespectively.
Figure 2. The hydrogen-bonding network of 4,4’-dihydrobenzophenone: 4,13-diaza-18-crown-6.
Whilst we are currently restricted to studies of compounds withexcited-state lifetimes of > 20 ms, further work is in progress toenable the study of compounds with notably shorter emissivelifetimes (of the order of µs).
Concurrently, we have also been carrying out similar workusing synchrotron radiation, where the pulsed X-ray source,inherent to a synchrotron, can be time-gated with respect to thelaser pulse, such that a nanosecond time-structure can berealised. In this regard, the laboratory set-up described abovewas also very useful for the preliminary checking stages of ananosecond time-resolved synchrotron X-ray diffractionexperiment that we performed at the ESRF, France, on a Recarbene complex8) (Figure 3) in November 2000. The data fromthis experiment are still being processed, owing to theconcomitant modifications required to adapt standard XRDdata-processing software routines for this developmental work.However, what is expected is a perturbation of the Re-C bondand immediate surrounding geometry since the accompanyingtime-resolved UV/vis measurements on this compound predictthat 3MLCT, d(Re) -> π*(diimine) transitions dominate theemissive state character of the compound. Data pre-processingindicates a perturbation of ~0.6Å in the cell parameter, b, andduring the experiment the crystal colour changed from yellowto red upon optical pumping (λ = 400 nm, using a femtosecondlaser provided by the ESRF).
Further work is also in progress regarding the determination ofexcited-state structures as a function of temperature. Asmentioned earlier, the lifetime and/or the character of theemissive-state of a compound can change dramatically withtemperature. All of the experiments described above werecarried out using an Oxford Cryosystems Cryostream thatoperates down to a temperature of 100K. However, by loweringthe sample temperature further, one can often increase (by up toseveral orders of magnitude) the excited-state lifetime of agiven compound, such that steady-state or continuous opticalpumping methodologies become viable for the determination oftheir excited-state crystal structure. In order to exploit thistemperature effect, at the close of the Laser Loan Pool period,we took receipt of the newly-developed Helix© open-flowhelium cryostat cooling system (Tmin = 28K) and conductedpreliminary tests with this as a part of the experimental set-up,

Lasers for Science Facility Programme – Chemistry
Central Laser Facility Annual Report 2000/2001 106
as an alternative to the Oxford Cryosystems Cryostream. Suchfeasibility tests have proved very positive, such that we shouldbe able to capitalise on the benefits of this additional ancillaryequipment in subsequent development work.
Figure 3. A schematic chemical diagram of the Re carbenecomplex studied at the ESRF.
Conclusions
Given the highly challenging experimental nature of thisproject, the bulk of the work in these initial stages of ourdevelopmental programme has comprised the testing andoptimising of several test-case compounds. This has led toseveral promising results alone, and has afforded a firm basis ofa good initial experimental set-up for further work. It has alsoenabled us to perform important preliminary work on our firstvery short-lived (nanosecond time-resolution) target compoundwhich has potential as a building block for light-emitting-diodes. These results are being analysed at present but showpromise at these early stages. Plans for further experiments andinstrument development are now in place, including aims torealise microsecond lifetime experiments and to explore thetemperature effects of the excited-state through the greaterexploitation of the new Helix© cooling system (Tmin=28K) tothe experimental set-up.
Acknowledgements
The authors wish to thank Dr. Robert Less for the synthesis ofthe Rhenium carbene complex. JMC is also grateful toSt. Catharine’s College, Cambridge, for a Junior ResearchFellowship.
References
1. V. W. W. Yam, K. K. W. Lo and K. M. C. Wong, J.Organomet. Chem. 578, 3, (1999)
2. F. Barigelletti and L. Flamigni, Chem. Soc. Rev. 29, 1,(2000)
3. A. J. Lees, Chem. Rev. 87, 711, (1987)
4. V. W. W. Yam and K. K. W. Lo, Chem. Soc. Rev. 29, 323,(1999)
5. C. R. Wang, K. W. W. Lo, W. K. M. Fung and V. W. W.Yam, Chem. Phys. Lett. 296, 505, (1998)
6. P. Coppens, D. V. Fomitchev, M. D. Carducci and K.Culp, J. Chem. Soc., Dalton Trans, 865, (1998)
7. A. Juris, V. Balzani, F. Barigelletti, S. Campagna, P.Belser, A. von Zelewsky, Coord. Chem. Rev. 84, 85,(1988)
8. W-M. Xue, M. C. W. Chan, Z-M. Su, K-K. Cheung, S-T.Lui and C-M. Che, Organomet. 17, 1622, (1998)
NN
C
ReCON
N
CO
CO
= 2,2’-bipyridineNN

Lasers for Science Facility Programme - Chemistry
107 Central Laser Facility Annual Report 2000/2001
Introduction
Colloidal particles with radii in the nm to µm range may,depending on their wettability, adsorb very strongly at the oil-water interface1). Oil-in-water, water-in-oil and multipleemulsions can be stabilized by particles alone for a wide rangeof applications including agrochemical, cosmetic andpharmaceutical formulations2). The aim of the study describedhere was to use the laser tweezer apparatus developed at theCentral Laser Facility, RAL to probe the lattice forces presentwithin 2-D monolayers of spherical particles at an oil-waterinterface.
The particle monolayers
The system examined consisted of monodisperse, polystyrenespheres of 2.6 µm diameter which were spread at the interfacebetween water and a mixture of decane/undecane. The upperoil phase composition was adjusted so as to have the sameviscosity as the lower water phase. The polymer particles werespread by injecting a dispersion of the particles in iso-propanoldirectly onto the oil-water interface using a microsyringe.Following this procedure, all particles injected end up at theinterface (i.e. none are in the bulk liquids) and the particleconcentration within the interface is easily adjusted by variationof the amount injected. The small amount of iso-propanolspreading solvent is almost entirely lost by dissolution in thebulk liquids; surface tension measurements have shown thatonly minor traces are adsorbed at the oil-water interface.
Figure 1. Optical micrograph of 2.6 µm diameter polystyrenespheres adsorbed at the oil-water interface. The particle centre-to-centre separation is 5.8 µm.
Figure 1 shows a micrograph image of a particle monolayerprepared as described above. Owing to the presence of verylong range lateral repulsive forces between the particles (actingover many µm), the particle monolayers spontaneously formordered 2-D hexagonal lattices. Adjustment of the particlesurface concentration enables the particle centre-to-centredistance L to be varied over the range 4 to 15 µm. Based onmonolayer surface pressure studies, the origin of the long-rangerepulsion between particles is thought to be electrostaticrepulsion acting through the oil phase and resulting from asmall fractional ionization of dissociable surface groups presenton the particle surfaces1). Capillary forces, resulting from
distortion of the oil-water interface caused by particle buoyancyeffects, are estimated to be insignificant here, i.e. the oil-waterinterface is estimated to be virtually planar.
For this particle/solvent system, the contact angle formedbetween the oil-water interface and the particle surface isestimated to be 70 - 80o, measured through the lower waterphase1). Hence, the particles are slightly more immersed in thelower water phase than the upper oil phase. Equal immersion inboth phases would correspond to a contact angle of 90o.
The laser tweezer apparatus
The laser tweezer setup is fully described in Reference 3.Briefly, the sample is mounted on the stage of an invertedmicroscope. The trap laser (continuous wave, variable powerNd:YAG) enters the sample from below and is focused by themicroscope objective. In the configuration used here, the trap isformed at the waist of the beam focus which is located in theplane of the oil-water interface. Figure 2 shows a schematicside view of the sample cell, particle monolayer and laser beamlight path. Key features of the apparatus include: (i) the abilityto steer a single trap and the creation of multiple, steerable trapsusing fast-response acousto-optic deflection of the trap laser,(ii) sensing of the particle deflection within the trap using aposition sensitive detector, (iii) the trapping force experiencedby a single particle can be varied (in the pN range) byadjustment of the incident power of the trap laser, (iv) themicroscope stage can be moved laterally under computercontrol using piezoelectric translators and (v) fast framemicroscope image acquisition for subsequent image analysis.For the experiments described here, the acousto-optic deflectorand position sensitive detector were still under development andwere not used.
Figure 2. Schematic side view of the sample cell showing theparticle array adsorbed at the oil-water interface and the traplaser light path.
Determination of lattice forces within the particlemonolayers
A single particle, either isolated or within a 2-D crystallinearray of particles, was trapped using a set laser power. We thenapplied an oscillatory lateral movement to the microscope stage.The lateral position profile was a smoothed triangular waveformof amplitude larger than the centre-to-centre particle separationL. The maximum stage velocity, and hence that of the liquidplus particle array surrounding the trapped particle, was vmax.
Laser tweezers – Lattice forces in 2-D crystalline monolayers
R Aveyard, B P Binks, J H Clint, P D I Fletcher, B Neumann, V N Paunov
Surfactant & Colloid Group, Department of Chemistry, University of Hull, Hull, HU6 7RX
J Annesley, D Nees, A W Parker, A D Ward
Central Laser Facility, CLRC Rutherford Appleton Laboratory, Chilton, Didcot, Oxon, OX11 0QX, UK
A N Burgess
ICI PLC, PO Box 90, Wilton Centre, Middlesborough, Cleveland, TS90 8JE
Main contact email address: [email protected]

Lasers for Science Facility Programme – Chemistry
Central Laser Facility Annual Report 2000/2001 108
The trapping laser power was then decreased to determine thecritical power P* which was just sufficient to hold the particlewithin the trap against the forces associated with the fluid plusparticle array motion as a function of the velocity vmax.
The variation of P* versus vmax for a single isolated particle inthe absence of a particle array was used to obtain the calibrationconversion of P* into force values. The hydrodynamic dragforce fdrag experienced by a sphere, of radius a, with a liquid ofviscosity η, and moving with a velocity vmax is given by
maxdrag av6f πη= (1)
Equation (1) is strictly applicable only in isotropic,homogeneous fluids. For the case of a particle located in theoil-water interface, Equation (1) remains true when theviscosities of the two liquids are equal and the particle isequally immersed in both liquids (corresponding to the contactangle being 90o). However, for the system considered here, thecontact angle is not exactly 90o and hence the use of equation(1) to convert values of P* to fdrag introduces a small systematicerror.
Figure 3. Variation of ftotal with vmax for an isolated particle andarrays with lattice spacings L (in µm units) as indicated in thelegend.
Figure 3 shows plots of the measured force ftotal versus vmax foran isolated particle and for a series of 2-D crystalline arrays ofdifferent particle centre-to-centre separations L. For theisolated particle, the plot is linear with zero intercept, indicatingthat the critical hydrodynamic drag force required to free theparticle from the laser trap is proportional to vmax , as expectedfrom Equation (1). For particle arrays with L > 6 µm, the plotsare approximately parallel to the isolated particle case but theintercepts increase with decreasing L. This observationindicates that the measured total force ftotal is the sum of twoterms as follows.
( ) ( )Lfvff latticemaxdragtotal += (2)
The first term, fdrag, is the velocity dependent hydrodynamicdrag force, equal to that seen for the isolated particle. Thesecond term, flattice, is a velocity independent (at leastapproximately) force associated with the flow of the latticearound the laser trapped particle. The force flattice is a functionof the lattice spacing parameter L.
For lattice spacings L < 6 µm, the slope dftotal/dvmax increasessharply. When the particle surface concentration is high, theforce associated with the lattice flow around the trapped particlebecomes dependent on the velocity. The crossover in behaviourat which flattice switches from being velocity independent tobeing velocity dependent appears to occur at a fairly sharplydefined value of lattice spacing L of about 6.5 µm.
The variation of flattice with lattice spacing (expressed as L/2a,i.e. normalized relative to the particle diameter) is shown inFigure 4. The plot of flattice with lattice spacing has a similarshape to that of the plot of monolayer surface pressure versuslattice spacing, as described in Reference 1.
Conclusions and future outlook
We have successfully determined the force exerted on a particleadsorbed at the oil-water interface as 2-D crystalline arrays ofadsorbed particles flow around it. This force, flattice, isapproximately velocity independent for L/2a > 2.3. For smallerlattice spacings, there is a crossover in behaviour and flattice
becomes velocity dependent. The force flattice decreases withincreasing lattice spacing, similar to the variation of monolayersurface pressure.
Following these first laser tweezer experiments with 2-Dparticle arrays at the oil-water interface, a number of interestingquestions remain unanswered and are currently being pursued.The force flattice is expected to be related to the equilibriumparticle-particle force versus separation relationship. We planto measure this equilibrium force law directly using theacousto-optic deflector to create two traps with controlledseparation. The position sensitive detector will allowmeasurement of the force on one trapped particle as a functionof the distance to the second. Secondly, we are currently usingmolecular dynamics simulations to model the dynamic forceflattice for different velocities using an assumed equilibrium forcelaw. Lastly, we are planning experiments with a range ofdifferent particle types, oils and aqueous phases in order toelucidate the origins of the very long range inter-particlerepulsion.
The laser tweezer facility at RAL offers a powerful, user-friendly tool to probe colloidal interactions in a very wide rangeof synthetic and biological systems, both at interfaces (as in thisstudy) and in bulk phases.
AcknowledgementsWe thank ICI, Wilton and the Central Laser Facility, CLRC forfinancial support.
References
1. R Aveyard, JH Clint, D Nees and VN Paunov Langmuir,16 1969 (2000)
2. BP Binks and SO Lumsdon, Langmuir, 16, 8622 (2000)
3. D Nees, S.W. Botchway, M Towrie, AD Ward, AW Parkerand A Burgess, Central Laser Facility Ann. Rep.1999/2000, 209.
0
5
10
0 100 200 300 400
vmax/micron s-1
f tota
l/pN
isolated
12.45
10.35
10
9.7
8.7
7.2
7.1
6
5.8
0
1
2
3
4
5
6
0 2 4 6 8
L/2a
f latti
ce/p
NFigure 4. Variation of flattice with normalized lattice spacingL/2a.

Lasers for Science Facility Programme - Chemistry
109 Central Laser Facility Annual Report 2000/2001
In bu ffer
In D N A11 :1
Introduction
Metal complexes which bind to DNA have been studiedextensively by a number of research groups over recent years,with emphasis on understanding the photophysical and redoxperturbations that are imposed through interaction with theDNA strand1-4). The implications for clinical/diagnostic utilityand for enhancing the understanding of natural DNA-mediatedbiological mechanisms are considerable.
Previous picosecond time-resolved resonance Raman (ps-TR3)experiments performed at the CLF by the Queen’s groupfocused on providing definitive ultrafast dynamic and electroniccharacterisation of the key lowest excited states involved in thebiologically relevant ‘light-switch’ photophysical effect,exhibited by the complex [Ru(phen)2dppz]2+ (1) (phen = 1,10phenanthroline; dppz = dipyridophenazine)1). This effectmanifests as a marked enhancement of luminescence of thecomplex when intercalated through the dppz ligand to DNA, orin non-aqueous solvent. The ultrafast studies proved to beconfirmatory of the presence of two key dppz-based 3MLCTstates, the relative energy ordering of which is tunable throughlocal solvent environment of the dppz ligand. Interestinglyps-TR3 studies also appeared to point to the existence of a third,solvent sensitive ‘precursor’ state through which the excitedcomplex progresses, prior to arriving at the lowest MLCTstates2).
N
N
phen tap
N
N
N
N
RuIIRuII
N
N
dppz
RuII
N
N
Figure 1. Diagram of Ligand Structures.
Recent ultrafast studies at CLF have been centred on othermetal complexes containing the intercalating dppz ligand. Onecomplex, [Ru(tap)2dppz]2+ (2) (tap = 1,4,5,8tetraazaphenanthrene), is structurally analogous to (1). The tapligand is a structural analogue of phenanthroline, with extranitrogens at the 5 and 8 positions. Binding to DNA persiststhrough the dppz ligand. However, preliminary nanosecondtransient Raman investigations on this system have suggestedthat the lowest excited MLCT state is based on one of the tapligands(3). Further, preliminary photophysical evidence hasbeen acquired describing photooxidation of guanine base by theexcited state of (2), when bound to DNA, resulting in formation
of the electron transfer species [RuII (tap)(tap.-)(dppz)]+ and G.+
3) . Preliminary ps-TR3 experiments have been carried out alsoon the complex [Re(CO)3dppz.py]+ (3),4) for which initialnanosecond studies have suggested prominent involvement of atriplet π -π∗ lowest excited state centred on the dppz ligand.
Results and Discussion
(a) [Ru(tap)2dppz]2+
Picosecond transient absorption (ps-TA) spectra of (2) in bufferare shown in Figure 2 (a). The wavelength range covered wassufficient to encompass both the regions of ground statedepletion between ~ 400 - 500nm and of positive transientabsorption beyond 500nm. The overall ∆A profile here istypical of that for a 3MLCT state of Ru-polypyridyl complexes.
Figure 2. Picosecond transient absorption spectra of (2): (a) inbuffer, (b) [DNA phosphate]:[Ru] ratio of 11:1. Recorded bymultichannel detector at a range of time delays between –1 and1500ps after excitation at λex. = 400 nm (ca. 1ps pulse duration).Shown for each kinetic series is a kinetic plot derived throughintegration of signal intensities at pixel values between430 –475nm and 490 – 505 nm for each trace within the series.
As mentioned above, the 3MLCT state in this case is ‘tap-based’. Interestingly however, upon changing the time delaybetween pump pulse and interrogating continuum, the precisewavelength at which the absorption profile crosses the ∆A zero
Ultrafast Spectroscopic Investigations of Metal Complexes Containing the DNA-Intercalating Dipyridophenazine (dppz) Ligand
C G Coates, M Coletti, J J McGarvey
School of Chemistry, The Queen’s University of Belfast, Belfast, BT9 5AG, UK.
P Matousek, M Towrie, A W Parker
Central Laser Facility, CLRC Rutherford Appleton Laboratory, Chilton, Didcot, Oxon, OX11 0QX, UK.
Main contact email address: [email protected]

Lasers for Science Facility Programme – Chemistry
Central Laser Facility Annual Report 2000/2001 110
Ru(tap)2dppzin buffer 12
87
1412 16
1015
44
1000 1500 2000
1199
- 20
7 ps
20 ps100 ps500 ps
1500 ps
Raman Shift / cm -1
Rel
ativ
e In
tens
ity
1465
ps1000 1500 2000
Raman Shift / cm-1
Rel
ativ
e In
tens
ity
7 ps – 1500 ps
20 ps – 1500 ps
100 ps – 1500 ps
500 ps– 1500 ps
Excited statesubtractions
line (at ca. 500nm) shifts gradually to longer wavelength as thetime delay is increased. Also, in the region of excited statedepletion, an unusual effect was observed, in that the bleach didnot reach its maximum extent immediately following theexcitation pulse but gradually increased over the time rangeinterrogated. Further, the profile of the bleach region changedgradually with time, depleting more with time at longerwavelengths, than on the shorter wavelength side, indicatingdepletion of a transient absorption which had been counteringthe bleach more on the long wavelength side. Theseobservations suggest progression through an absorbingintermediate excited state. Absorption due to this state, while itmust overlap significantly with the absorption of the later3MLCT state in the region beyond 500 nm, also seems to extendfurther to the short wavelength side of 500nm. Parallelinvestigations of (2) in acetonitrile showed a very similar seriesof spectra, indicating little solvent dependence for the spectralchanges, in contrast to the marked solvent-dependentphotophysics of (1) 1,2) .
Figure 2 (b) shows ps-TA spectra recorded of (2) in DNA at a[DNA phosphate]:[Ru] binding ratio of 11:1. Clearly, thekinetics are significantly perturbed upon DNA binding,observable through comparison of the integrated kinetic plotsshown for the ‘bleach’ and ‘zero-absorbance’ regions with therespective plots for the complex in the absence of DNA. Thereare marked differences from Figure 2 (a) at the zero ∆A point,which appears not to shift to longer wavelength with increasingtime delay. Indeed, the reverse tends to occur in this case(although the effect is smaller), the shortest wavelength ‘zeroabsorbance’ cross-over actually corresponding to the longesttime-delay (1500 ps). Also, the profile of the ground statebleach no longer follows a pattern of delay steadily increasingwith time, nor does the profile of this region changesignificantly with time delay as was observed in the absence ofDNA. However, the main region of positive absorption doesseem to follow a pattern similar to that seen for the complex inabsence of DNA.
These spectral distinctions observed when (2) is bound toDNA are subtle but significant. The differences becomeespecially evident upon comparison of the kinetic plotsderived from both the regions of ‘bleach’ and ‘zero’absorbance cross-over (Figure 2 (b)), with the correspondingkinetic plots for the complex in the absence of DNA (Figure 2(a)). The overall perturbation to the spectra in the presence ofDNA can be ascribed to the grow-in of a transient absorption.The fact that the main region of positive absorption does seemto follow a pattern similar to that seen for the complex inabsence of DNA, suggests progression to a state characterised
by the same π∗−π∗ transitions, most likely of the anionic tap.-
species. A tap.- moiety present in the species would account forthe absorption in the wavelength region beyond 500nm.
Consideration of complementary evidence, from such studies asluminescent lifetime/steady-state measurements andnanosecond TR2 spectroscopy, indicating that the excited stateof (2) when bound to DNA is quenched3) suggests that the mostlikely conclusion from the ps-TA data is that photo-inducedelectron transfer from the DNA base, guanine, to the lowest3MLCT state of (2) is taking place:
RuIII(tap.-)(tap)(dppz) + G → RuII(tap.-)(tap)(dppz) + G.+
The RuII species resulting from such an electron transfer to theRuIII centre, would obviously bear considerable resemblance tothe complex in its electronic ground state, with the obviousdifference that one of the tap ligands would now be in anionicform. One effect of this extra electron density on a tap ligandmight be to destabilise the dπ-orbitals of the RuII centre, thuscausing a red-shift in the remaining MLCT transitions of thereduced complex (as illustrated in Figure 3 - inset). Given theoriginal positions of the MLCT absorption bands of the groundstate complex, the reduced transient species may reasonably beexpected to exhibit MLCT absorption in the wavelength regionaround or below 500nm. What we see then in the picosecondtransient absorption data for (2) bound to DNA, is this reducedspecies undergoing what can be described as a dynamicperturbation caused by the electron transfer from the guanine.An electrochemical ‘model’ for the guanine-reduced transientspecies has in effect been provided by the first reduced speciesof (2) generated in an optically transparent thin-layerelectrochemical cell. The electronic absorption spectrum of thisspecies shows depletion of MLCT absorption bands and aconcomitant grow-in of absorption further to the red3) .
Figure 4. ps-TR3 spectra of (2) in buffer at 400/480 nm pumpand probe at various delay times. Inset: Series of spectragenerated through subtracting the pure excited state spectrum at1500 ps from each excited state spectrum at early times.
Thus, as summarised in the scheme of Figure 3, a plausiblephotophysical picture which may now be associated with theps-TA spectra of (2) in the absence and presence of DNA runsas follows:
Excitation and progression to a 3MLCT state takes place via anintermediate state (as yet unspecifiable) over the time rangestudied (1.5ns). In the absence of DNA, the 3MLCT state formsefficiently and is readily identifiable by the spectra discussedabove. A similar process has been observed for the complex inacetonitrile.
viaintermediate
RuII
tap tap
dppz
RuIII
tap tap.-
dppz
hν
(MLCT)
(red-shifted MLCTs)
G
G.+
RuII
tap tap.-
dppz
Very Rapid
tap
dπ
π∗
tap.-
dπ
π∗
> 1 ns
Figure 3. Scheme illustrating photophysical pathway of (2) inpresence and absence of DNA.

Lasers for Science Facility Programme - Chemistry
111 Central Laser Facility Annual Report 2000/2001
-20ps
4ps
10ps30ps
60ps
100ps200ps500ps1000ps
Solvent 1273 14
0514
1214
56
1310
1324
Rel
ativ
e In
tens
ity
1200 1400 16001000Raman Shift / cm-1
4ps
10ps
30ps
60ps100ps200ps500ps1000ps
1362
1404
1273
1420
1200 1400 1600Raman Shift / cm-1
4-1000ps
10-1000ps30-1000ps
60-1000ps100-1000ps
1362
1266
1200 1400 16001000
Raman Shift / cm-1
(a)
(b)(c)
When (2) is bound to DNA, an extremely rapid electron transferfrom the guanine base to 3MLCT takes place upon formation ofthe latter. The electron transfer is too fast to be resolved here onthe timescale used. Thus, the spectra appear to representtransition from the intermediate state to the reduced species,occurring at a similar rate to the process above in absence ofDNA. In actual fact, progression through the intermediatespecies represents the rate-determining step for forward electrontransfer with DNA (a process which has never been monitoreddirectly by spectroscopic means due to the almost instantaneousnature of the process in nucleic acids), the intermediate stateitself being at too negative a potential to induce the electrontransfer process. The reverse electron transfer process isexpected to occur beyond the time range probed.
Preliminary ps-TR3 experiments have been performed on (2) inabsence of DNA in an attempt to probe more extensively thephotophysical processes in the sub-nanosecond time-regime.These initial spectra, recorded with 480 nm probe wavelength inorder to attempt to establish resonance with the intermediatestate, are shown in Figure 4. Spectral subtractions have beenused to provide evidence of sub-picosecond dynamics in theTR3 series. Similar experiments are presently being carried outon (2) in presence and absence of DNA under more optimisedconditions of spectral resolution and sample concentrations.
Figure 5. (a) ps-TR3 spectra of (3) in buffer at 400 / 480 nmpump and probe at various delay times; (b) Pure excited statespectra generated through subtraction of the –20 ps spectrum,cancelling on ground state features; (c) Series of spectragenerated through subtracting the pure excited state spectrum at1000 ps from each early delay pure excited state spectrum.
(b) [Re(CO)3dppz.py]+
Picosecond-TR3 spectra recorded of (3) at 400nm pump /480nm probe over time delays spanning 4 – 1000 ps are shownin Fig. 5 (a). Bands at later time delays are consistent with thoseobserved in complementary nanosecond TR3 studies performedin Belfast, and are attributable to formation of the intraligandtriplet π−π* state of dppz, from which it decays over severalhundred nanoseconds. However, further manipulation of the ps-TR3 data, through subtraction of ground state (Figure 5 (b)) andsubsequent subtraction of the 1000 ps pure excited state spectrafrom those at earlier time delays (Figure 5 (c)), reveals aprocess occurring over approx. 100 ps. Whilst ‘long-lived’vibrational cooling cannot be ruled out due to the presence ofthe co-ordinated CO groups, it is conceivable that this dynamicevent represents conversion from an earlier excited state.Furthermore, the bands distinct to the spectra at early times, asrevealed through the subtractions in Figure 5 (c) are coincident
with some known bands of the dppz.- radical anion. Thus, the
480nm probe wavelength may be in pre-resonance at earlytimes with the long-wavelength transitions (~ 500nm) of a statewhich is MLCT in nature. Further ultrafast experiments areplanned in order to determine the precise photophysics of thiscomplex in a variety of media. Preliminary evidence of photo-induced electron transfer between DNA and this complex4) ispresently being sought at experiments at the CLF.
Acknowledgements
We wish to thank Dr A. Kirsch-de Mesmaeker for a sample of[Ru(tap)2dppz]2+ and Prof. J.M. Kelly for the sample of[Re(CO)3dppz.py]+ and project input. We also thankDr M. George for useful discussions.
We acknowledge support of this work by EPSRC (Grant no.GR/M45696).
References
1. E J C Olson, H D Hormann, A M Jonkman, M R Arkin, ED A Stemp, J K Barton and P F Barbara, J. Amer. Chem.Soc., 119, 11458, (1997).
2. (a) C G Coates, L Jacquet, J J McGarvey, S E J Bell, A HR Al-Obaidi and J M Kelly, J. Amer. Chem. Soc., 119,7130, (1997). (b) C.G. Coates, J. Olofsson, M. Coletti, J.J.McGarvey, B. Onfelt, P. Lincoln, B. Norden, E. Tuite, P.Matousek and A.W. Parker, J. Phys. Chem. B, (2001), inpress.
3. C G Coates, P. Callaghan, J. J. McGarvey, J. M. Kelly, L.Jacquet and A. K-De Mesmaeker, J. Molec. Struct.,(2001), in press.
4. H D Stoeffler, N B Thornton, S L Tempkin, K S Schanze,J. Amer. Chem. Soc., 177, 7119, (1995).

Lasers for Science Facility Programme – Chemistry
Central Laser Facility Annual Report 2000/2001 112

Lasers for Science Facility - Biology
113 Central Laser Facility Annual Report 2000/2001
Introduction
Myosin is a motor protein that converts the chemical energy ofATP into mechanical work. This enzyme exists in all eukaryoticcells. The most commonly known myosin type is myosin IIlocated within muscle and is responsible for its contraction.Actin is the other essential component of muscle. Actin andmyosin form a filamentous structure (the sarcomere) andcontraction is the consequence of relative movement of amyosin filament and actin filaments.
Myosin alone has a relatively low ATPase activity, but thisincreases greatly in the presence of actin. ATP turnover (frombinding to product release) is a multiple-step reaction. Based onthe simplified Lymn-Taylor model1), myosin binds to actinstrongly in the absence of ATP. Upon addition of ATP the twoproteins dissociate and during ATP hydrolysis myosin goesthrough a large conformational change (pre-power stroke).During product release (inorganic phosphate and ADP) myosinrebinds to actin and in a reverse conformational step (powerstroke) it pulls the actin filament thus causing contraction.
Recently, the most studied myosin II originates fromDictyostelium discoideum, because it offers a very efficientexpression and molecular biology system, its catalytic fragmentcrystallizes relatively easily and it behaves similarly to myosinII-s from other sources. Myosin (Dictyostelium) has beencrystallised in the presence of different nucleotide analogs thatmimic certain conformational and kinetic states. The atomicstructures show essentially two different conformations calledopen and closed states. In a theoretical approach they wereassumed to be the post-power stroke and pre-power strokestates, respectively.
The kinetic mechanism of ATP hydrolysis by all myosin IIappears similar. Although the absolute values of the rateconstant of equivalent steps may differ, their ratios are such thata similar distribution of nucleotide states is obtained during thesteady state. The mechanism has been studied mainly byfollowing intrinsic fluorescence changes of myosin. In ourstudies we used a recombinant mutant Dictyostelium myosincatalytic domain (W501+ mutant) in which all of the tryptophanresidues, except W501, were replaced with phenylalanine.These mutations do not affect the enzymic properties but give avery efficient experimental tool. W501 is the only nativetryptophan in Dictyostelium myosin that responds to theaddition of a nucleotide and so by eliminating the others non-responding background signal is reduced. W501 is located inthe region where the main conformational change occurs duringthe open-closed transition coupled with the pre-power strokeand the power stroke.
By modifying the Bagshaw and Trentham scheme, weestablished an eight-step model2) for the myosin ATPasereaction:
M+ATP 0$73 0†ATP 0 $73 0 $'33L
(M†ADP.Pi) 0†ADP+Pi 0$'3 0$'3
In this scheme “†” and “*” indicate a fluorescence decrease andenhancement, respectively. The fluorescence decrease is relatedto the conformational change coupled with nucleotide binding.The large increase indicates the open-closed transition followedby the hydrolysis step. States in parentheses are present at nearnegligible concentrations. Under the usual conditions of assay,the M*ADP.Pi state predominates during the steady-statehydrolysis of ATP. By adding the Pi analog AlF4 to theD. discoideum M†ADP complex (open state), a stableM*ADP.AlF4 complex (closed state) can be made which has anenhanced fluorescent state and provides a useful analog of theM*ADP.Pi state for spectroscopic studies. Care is required,however, in relating a particular analog state to a particularATPase intermediate because in many cases these complexesexist as a mixture of conformations.
We further investigated the W501 tryptophan fluorescence tofind whether single states can be coupled directly to certainspectroscopic states 3).
Time-resolved Fluorescence Measurements
Time-resolved fluorescence measurements were carried outusing the time-correlated single-photon counting method at theRutherford Appleton Laboratory, Central Laser Facility.Samples (5-25 µM) were excited at 296 nm, achieved with afrequency-doubled, cavity-dumped, mode-locked synchronouslypumped dye laser (Spectra-Physics model 3500) operating at4 MHz with a pulse width of 10 ps. The fluorescence emissionwas collected via a WG335/UG11 filter combination (WG320was used for tyrosine emission) using an MCP-PMTphotomultiplier tube (Hamamatsu, R3809U) with response timeof 85 ps. The WG335 filter was used in preference to theWG320 filter in these studies to minimize the potentialscattering artifact and tyrosine contribution to the signal. Time-resolved anisotropy was measured through a film polarizer(Halbo Optics, DPUV-25) in the emission channel, and thevertical and horizontally polarized light was collectedsequentially. The total emission intensity for lifetimemeasurements was calculated by summing Iv + 2·Ih. A wedgedepolarizer was placed in front of the photomultiplier tube, andthe G factor of the detector was confirmed as unity by excitationwith horizontally polarized light. The data were collected in1024 channels (width 40 ps) using the Becker and Hickl GmbH(Berlin) single time-correlated single photon counting pc cardmodule (SPC-700). The standard functions of the single photoncounting setup, such as time-to-amplitude converter andconstant fraction discriminator, were computer-controlled withsoftware supplied with the SPC-700 module.
Results
Time-resolved fluorescence measurements were carried out inthe absence and presence of nucleotides and nucleotide analogs.We found that lifetime decay was well fitted by twoFRPSRQHQWV ZLWK YDOXHV RI WKH RUGHU RI DQG QVInterestingly on addition of nucleotides, these lifetimes did notchange significantly; rather, the fractional amplitudes changed.The change in mean lifetime is in the direction expected fromthe observed emission intensity, ATP and ADP. AlF4 causes arelative increase in the 5 ns component and an increase in the
The Dynamics of a Single Tryptophan Residue in the Myosin Catalytic Domain
A Málnási-Csizmadia, R J Woolley, C R Bagshaw
Department of Biochemistry, University of Leicester, Leicester LE1 7RH, UK
M Kovács
Department of Biochemistry, Eötvös University of Science, Budapest, Puskin u.8. H-1088, Hungary
S W Botchway
Central Laser Facility, CLRC Rutherford Appleton Laboratory, Chilton, Didcot, Oxon, OX11 0QX , UK
Main contact email address: [email protected]

Lasers for Science Facility - Biology
Central Laser Facility Annual Report 2000/2001 114
overall emission intensity, whereas ADP causes a smallerchange in the opposite direction. So the nucleotide inducedchanges in emission intensity contain a dynamically quenchedcomponent. However, quantitative comparison shows that thechange in lifetime is only a partial explanation of the change inemission intensity. In all of the three states (apo, ADP, ATP (orADP.AlF4)) a significant statically quenched component exists.Thus, a large proportion (RIWKHSRSXODWLRQ:IRUPVa ground state complex with a quenching centre that changesthe absorption characteristics and causes the exited state toreturn to the ground state by a nonradiative mechanism.
Also we measured steady-state and time-resolved anisotropy ofthe W501+ mutant. In the steady-state measurement, we foundno significant anisotropy change on addition of any nucleotide.The value observed of 0.21 at 20 ºC was close to the limitingvalue of 0.23 measured in the presence of 90% glycerol at 9 ºC.In contrast, anisotropy dropped to 0.1 in the presence of 7 Mguanidium hydrochloride, a denaturating agent. These datasuggest that W501 is very immobile in its native environment.The difference between the limiting anisotropy value and thetheoretical maximum value of 0.4 is indicative of a difference inthe angle between the absorption and emission dipoles and/orsmall amplitude, high frequency motions (t<<1 ns) that lead topartial depolarization.
These steady-state studies were complemented with time-resolved anisotropy measurements. As expected, a high limitinganisotropy value was observed (around 0.2) with only a slightdecay over 40 ns in all records. The short lifetime of tryptophanresults in a limited ability to follow the anisotropy decaybeyond 10-20 ns. However, because a protein solution israndomly oriented, there should be no residual anisotropy atinfinite time, and the data may be analyzed by force fitting to anexponential function that decays to zero. With such an analysis,VLQJOHURWDWLRQDOFRUUHODWLRQWLPHV RI WKH order of 50-70 ns,were obtained for all nucleotide states of the D. discoideummotor domain (Table I). We found no systematic difference in
for the different nucleotide states in three independent runs.This time scale is close to that expected for the whole proteinmolecule. Although we cannot rule out a second slowerrotational correlation time, the calculated limit from the wholeprotein motion indicates that this would not be longer thanabout 150 ns. As a control sample we measured the anisotropydecay of human serum albumin (molecular weight 66,000 Da)under the same conditions and found the rotational correlationWLPH RIWKHVORZFRPSRQHQWWREH ns at 20 °C, in goodagreement with 38.6 ns determined by phase fluorometry.Overall, the time-resolved anisotropy data corroborate thesteady-state values and demonstrate that the W501 has littleindependent motion relative to the rotational correlation time ofthe whole protein in all nucleotide states examined.
Conclusions
In conclusion, the time-resolved fluorescence data presentedhere show that W501 experiences at least three differentmicroenvironments. The coupling between the occupancy of thenucleotide site and the W501 environment does not correspondto a simple one-to-one relationship. Rather, nucleotide bindingallows the W501 side chain to redistribute among differentenvironments on a time scale of >5 ns and <20 µs. It is thereforenot possible to equate a particular nucleotide state or a particulargross conformation (open or closed state), to a unique set of
coordinates for W501 and its surrounding residues, as might beimplied by some crystal structures. This behavior has beenreported in other probe studies that reflect gross conformationalrearrangements of the myosin motor domain. Nevertheless, thecrystal structures are valuable in defining the potentialenvironments that surround the W501 side chain.
Figure 1. Schematic diagram to show the interconversion ofW501 microstates and their relationship to nucleotide states.Panel a, the mechanism of W501 fluorescence quenchinginvolves three microstates, one of which (M0) is staticallyquenched (effective fluorescence lifetime = 0), whereas theother two (M1 and M5) have lifetimes of close to 1 or 5 ns.Panel b, microstates are in rapid equilibrium compared withchemical steps and gross conformational changes and aredistributed according to the fractional occupancy.Panel c, corresponding transitions as applied to the first threechemical steps of the ATPase pathway.References
1. M A Geeves and K C Holmes Annu Rev Biochem 68 687-728, (1999)
2. A Málnási-Csizmadia, R J Woolley, and C R BagshawBiochemistry 39 16135-16146 (2000)
3. A Málnási-Csizmadia, R J Woolley, M Kovács, S WBotchway, C R Bagshaw, J. Biol. Chem., 276 19483-19490 2001)
Fluorescence lifetime Anisotropy
StateRelative fluorescence
emissionRelative
absorbanceQuantum
yieldRelative quantum
yield A1 1 A2 2
Relative normalizedarea Ass A0
ns ns nsApo 1.00 1.00 0.058 1.00 0.42 1.00 0.58 4.92 1.00 0.210 0.209 59 ± 4ATP 1.85 1.13 0.095 1.64 0.25 1.11 0.75 4.78 1.18 0.216 0.191 59 ± 2ADP 0.82 1.00 0.047 0.82 0.45 0.91 0.55 4.74 0.92 0.214 0.194 54 ± 2ADP · AlF 1.88 1.14 0.095 1.64 0.27 1.37 0.73 4.82 1.19 0.216 0.203 68 ± 4
Table 1. W501 spectroscopic properties.

Lasers for Science Facility - Biology
115 Central Laser Facility Annual Report 2000/2001
Introduction
A high-flux biological irradiation facility has been designed foruse with the RAL laser-plasma induced ultrasoft x-ray source.The high intensity and broad beam, together with the reducedx-ray source-to-sample distance has been used to overcome thehigh attenuation of low energy x-rays and produce high doserates in the sample, enabling a range of biological and chemicalendpoints to be measured. A polypropylene target is ofparticular interest emitting characteristic x-ray lines rangingfrom ~300 eV up to ~ 500 eV, with the main x-ray line(C VI Lα) at 367eV.
Knowledge of the x-ray spectrum is important, not only todetermine the average x-ray energy incident on the sample butalso for accurate dosimetry.
Sample irradiation
Samples are irradiated in glass walled dishes (3cm internal dia.)with a 0.9 µm mylar base. These samples typically includemammalian cells grown on the mylar base as an attachedmonolayer (~ 5 µm thick). Alternatively, lymphocytes orplasmid DNA are spread evenly across the mylar base under aCR39 disc to form a uniform layer (typically 8 µm thick).These samples are positioned directly above the source ofx-rays, which were produced by focusing KrF excimer laserpulses onto a moving polypropylene tape. Between the x-raysource and the dish is helium gas at atmospheric pressure and aUV/light filter.
Dosimetry
Dosimetry is carried out by replacing the sample dish with aphotodiode. This is then cross-calibrated before and after eachexposure with a second monitor photodiode with identicalfilters, which is then used to monitor the dose during sampleirradiations. The main dosimetry photodiode also has a 0.9 µmmylar dish base filter to allow for attenuation in the sample dishbase.
For monoenergetic x-rays of energy E, the photon fluence onthe incident surface of the sample, Φs, is given by equation (1)
AHeds kkΦ=Φ (1)
The photon fluence incident on the main dosimetry diode isgiven by equation (2)
SAE
Qd =Φ (2)
where Q is the charge collected by this diode through anaperture, area A. The sensitivity of the x-ray diode is energydependent and in the case of soft x-rays is given by equation (3)
[ ]deS SiSi ρρµε )/(exp)/( −= (3)
where e is the electronic charge, ε is the energy required togenerate an electron hole pair in silicon, (µ/ρ)Si the massattenuation coefficient of the x-rays in silicon which has densityρSi and d is the dead layer thickness of the detector. The targetto sample dish distance, ts, is 53.9 mm compared with a target to
diode distance, td, of 74.7 mm. The correction factor, kHe, forthe increased helium path is given by equation (4)
( )
( )( )[ ]sdHeHe
sdHe tt
ttk
−−=
(/exp
/ 2
ρρµ(4)
where (µ/ρ)He and ρHe respectively represent the massattenuation coefficient and density of helium. Theexperimentally determined factor kA, corrects for the variationin photon flux across the whole of the sample area compared tothe smaller region, A, seen by the diode.
The absorbed dose at the entrance surface of the sample can becalculated by using the equation (5)
( ) ED senssurf ρµ /Φ= (5)
where (µen/ρ)s is the mass energy absorption coefficient of thesample. These low energy x-rays are attenuated in the sample,therefore the mean absorbed dose in the sample can becalculated by using the equation (6)
( )[ ]( ) sss
ssssurfmean x
xDD
ρρµρρµ
/
/exp1 −−= (6)
where (µ/ρ)s and ρs represent the mass attenuation coefficientand the density of the sample with thickness xs.
The mass energy absorption coefficient of the sample and themass attenuation coefficients of the sample, helium and siliconare all energy dependent. Therefore for a spectrum of x-rayenergies, these equations would have to be integrated over thewhole energy range. Attenuation through the sample willtypically result in an increase in the mean x-ray energy withdepth. For accurate dosimetry it is important not only to knowthe relative intensities of the main x-ray lines but also todetermine the contribution of the continuous background x-rayspectrum, which extends to much higher energies. This maydominate if the main characteristic lines are heavily attenuatedby the system.
Monitor photodiode
main dosimetric diode
mylar filter
UV/light filter
mylar filter on apertureUV/light filter
polypropylene tape
KrF eximer laserpulses ( λ=248nm)
x-rays
helium at atmosphericpressure
Wheels containing upto 8 attenuators each
Figure 1. Schematic of experimental set-up used for attenuationmeasurements.
Attenuation measurements
To access the contribution of the background x-ray continuum,attenuation measurements were made. This was achieved bycomparing the ratio of charge collected from two photodiodes
X-ray spectrum characterization for biological dosimetry
M A Hill , D L Stevens
MRC Radiation & Genome Stability Unit, Harwell, Didcot, Oxon., OX11 0RD, UK
W Shaikh
Central Laser Facility, CLRC Rutherford Appleton Laboratory, Chilton, Didcot, Oxon, OX11 0QX, UK
Main contact email address: [email protected]
Lasers for Science Facility - Biology
Central Laser Facility Annual Report 2000/2001 116
with various thicknesses of attenuating films positioned in frontof the main dosimetry diode (now 141 mm from the target).This is shown schematically in Figure 1.
The results of initial experiments performed using mylar andaluminium attenuators, with and without a mylar dish base filterand using a 0.4 µm aluminium UV/light filter, are shown inFigure 2.
Figure 2. Attenuation data obtained with a 0.4 µm aluminiumUV/light filter.
The gradients of these attenuation curves after traversing a0.9 µm mylar dish base corresponds to that expected fromx-rays with energies in the range 650 to 700 eV. This is muchhigher than the energy of the characteristic emission lines. Thegraphs also indicate a further increase in the average x-rayenergy with increasing attenuation.
On-going experiments are testing the use of titanium UV/lightfilters, which have an absorption edge at ~ 450 eV, to helpreduce the higher energy component.
Conclusions
The results indicate that the background x-ray continuum iscritically important for these experiments. The x-ray spectra canalso be determined by theoretical simulations. The intention isto compare these experimental data with those predicted bysimulations in order to obtain realistic x-ray spectra fordosimetric calculations.

Lasers for Science Facility - Biology
117 Central Laser Facility Annual Report 2000/2001
The molecular dynamics of DNA repair
Interactions between proteins and nucleic acids havetraditionally been analysed by gel electrophoresis. Theseconventional molecular biology techniques require that bulkproteins and nucleic acids are isolated from many thousands oreven millions of cells. A reasonable amount of product has to bepresent in order for it to be stained and visualised in a gel.Radio-labeling of the constituents of interest increases thesensitivity of detection, but the radioactive emission from thelabeling isotopes is measured on a bulk population ofmolecules. Organic molecules can now be labeled with an arrayof fluorescent markers. Together with the recent developmentsin optical microscopy, this has made direct visualisation of theterritory of a single molecule possible.
Using the traditional analytical gel methods, biologists relied onderiving models to describe the dynamics of molecularinteractions which led to the final result. In many cases thesemodels remain untested and some of the more challenging andthought provoking concepts were considered not to be testable.Technological advances, which have opened the way toexamination of molecular biological machinery at work in thecell, provoke a robust challenge to this view.
Currently, one of the most intriguing questions which is stirringscientific activity is ‘how is DNA synthesis (the duplication ofgenetic material) organised at the architectural level in thecell ?’ Considering that the DNA in each human cell would be3 metres long if stretched out, the packaging and making of newDNA in a 10 micron nucleus must be very intricate. Thedisputed concept is whether the proteins which duplicate theDNA track along the DNA or the DNA moves through fixedprotein complexes as it replicates.
It is known that chromatin ( DNA + histones ) is organised inloops around fixed sites at the nuclear matrix1). These loops arepulled through these sites and loops with new DNA extrudedduring DNA replication. These loops are 200-300nm in size.
DNA may be damaged by UV-C light (ca. 260nm) whichinduces distortions in the DNA. The predominant distortionsproduced are cyclcobutane pyrimidine dimers (CPDs) and 6-4photoproducts (6-4pps). The cell can execute a repair system toremove these lesions. This is known as nucleotide excisionrepair where a piece of DNA containing the lesion is cut out andnew DNA synthesised in its place. The polymerases whichcarry out the repair replication are the same enzymes that areresponsible for DNA replication during cell division. It wouldseem, therefore, reasonable to suppose that this DNA repairactivity may be organised in a similar manner to that of normalsynthesis.
The DNA lesions can be tagged by fluorescent markers onantibodies or proteins which bind to the lesions. These will thenform positional markers on the DNA, which if not repairedquickly, may reveal movement of the DNA in an intervalfollowing the induction of the lesions. This could only berevealed if the lesions are induced in a very small area, at best,as small as the 200 –300nm chromatin loops. The probability ofdetecting such small changes will be increased if the inductionof lesions is projected in a recognisable pattern in a cell nucleus.Distortion of the pattern as well as the time dependence of
disappearance of elements of the pattern will reveal the natureof the dynamics or the repair system. If the number of lesions iskept low, there will also be more chance of detecting repair at asite where proteins are fixed. Larger amounts of damage willplace a greater demand and induce the cell to make newproteins. The diffusion of these proteins may obscure the factthat repair is taking place at fixed sites.
Putative model of movement of DNA damage sites
Figure 1. A site of DNA damage which is indicated by theyellow star is drawn closer to the replication factories as theDNA loops are drawn through the matrix attachment sites.
Figure 2. Diagram showing dimensions of the mammalian celland the pattern of induced DNA damage.
An equally important reason for inducing the low levels oflesions in distinct patterns is to confirm the authenticity of thestaining by fluorophore tagged proteins. If the distribution offluorescent markers reflect the original pattern, it confirms thatmarkers are binding to DNA lesions and not creating artifacts offluorescent aggregates.
At least two approaches are being tried to create a microfocusedpattern of DNA damage in a cell nucleus.
The first is using UV light of 248nm wavelength which is verynear to the peak of absorption of DNA and the induction ofCPDs. An attenuated 248nm UV laser beam is projectedthrough a mask with a pattern of 10µm holes on a 400µmsquare. The filtered light is then passed through a 100x UVmicroscope objective. This should reduce the pattern of lightfrom the objective to 100nm holes on a 4µm square, butbecause of the diffraction limitations of the light the hole size islikely to be, at best, 200nm. The cells are grown in a culture
Multiphoton UV and X-ray micro-irradation to track intra- and inter-cellulardynamics
R A Meldrum, G O Edwards, J K Chipman, C W Wharton
School of Biosciences, University of Birmingham, Edgbaston , Birmingham , B15 2TT , UK
S W Botchway, G J Hirst, W Shaikh
Central Laser Facility, CLRC Rutherford Appleton Laboratory, Chilton, Didcot, Oxon, OX11 0QX, UK
Main contact email address: [email protected]
µP
µP
µP QP
&HOO
QXFOHXV
300nm
origins
Polymerisation sites
Replication factories
..ES

Lasers for Science Facility - Biology
Central Laser Facility Annual Report 2000/2001 118
dish with a base of fused silica which sits on a precision xyzstage. Glycerol is placed between the objective lens and thesilica base of the cell dish in order to minimise the diffraction ofthe light.
A second approach uses multiphoton absorption processes toinduce patterns of DNA damage in the cell nucleus. The~250-260 nm pseudo UV focused light is generated from nearinfra-red laser pulses through multi-photon reactions.
An antibody to thymidine dimers has been used to stain DNAdamage sites in cell nuclei. Recent results are very promisingand indicate that we can induce submicron areas of DNAdamage in a cell nucleus.
Intercellular gap junction communication
The survival of individual cells which have been exposed toradiation is determined by the effectiveness of the DNA repairmechanisms described above, but recent research has shownthat cells in populations do not have to be directly irradiated inorder to suffer damage. An important dynamic cellular processwhich controls the spread of the effects of damage through acell population is gap junction intercellular communication(GJIC). It is not possible to study the mechanisms of GJIC inirradiated cells unless the radiation is carefully confined tosingle cells. The dispersal of tracks or the range of penetrationof radiation of high photon energy will not ensure that directradiation effects will be limited to the territory of one cell at atime. This is most important if GJIC is the focus of interest ascells will have to be in contact with each other.
The energy of Cu x-rays from the CLF laser plasma x-raysource are low enough (1.1KeV) that the interaction of theradiation with cellular components can only take place in cellson which the x-rays impinge. Thus it is one of the few sourcesin the world which can be used to study gap junctioncommunication in irradiated cells with some reliability. Thex-ray spectrum from the laser plasma source is sufficiently softfor long range scattering to be very weak.
Using the CLF x-ray source, we previously observed asituation where toxic effects were passed from irradiated tonon-irradiated cells. A monolayer of cultured cells was partiallyshielded from the x-rays, but death of cells in the shielded areasalso took place. Amplification of cell death took place only inconfluent irradiated cell cultures, suggesting that the mechanismrequires cell to cell contact. Since death of non-irradiatedneighbour cells did not occur in non-contacting irradiatedmonolayers, the toxic effects were not spread by reactiveoxygen species (ROS) or cytokines (death molecules) releasedinto or generated in the culture medium.
We designated this amplified cell death in the irradiatedconfluent monolayers ‘contagious cell death’ since it appears torequire inter-cellular contact in order to occur. A primeregulator of this effect is therefore likely to be the functioningof gap junction communication. Gap junctions act like valvesbetween cells which are in contact and control the passage ofstimulatory or inhibitory molecules between cells. They are nothighly selective as to the molecules they allow to pass but canbe ‘open’ or ‘closed’. In this way, they control a social co-operation between cells of the multicellular organism and play avital role in tissue development and function. They arecomprised of a hexameric arrangement of connexin moleculeswhich allow the inter-cell transfer of low molecular weightmaterials (<1kDa). Their role is thought to be important inmaintaining tissue homeostasis and co-ordination and they areparticulary important in the control of cell proliferation 2). Gapjunctions may also be able to mediate the transfer of potentiallydamaging molecules such as ROS and Ca++. Under conditionsof extreme toxicity, gap junctions close, presumably to protectthe tissue against the spread of toxic species which promote
necrosis. There are several implications regarding the spread ofdamage to neighbouring cells including:
i) the amplification of damage to embryonic cells duringdevelopment;
ii) the amplification of radiation induced mutation;
iii) the potential for ‘bystander’ ( i.e remote) effects inradiotherapy;
iv) significant amplification of effects of low doses ofradiation such as may be received from environmentalcontamination.
The laser plasma x-ray source is a highly appropriate andnecessary tool to use for the study of ‘bystander’ effects inradiation. It can produce x-rays which are spatially very welldefined. This means that a single cell, lines of cells of only onecell width, groups of several cells or a number of single cellsspatially separated may be exposed to radiation with no risk ofthe radiation at the shielded cells. The number and pattern of thecells irradiated can be dictated by the design of the maskthrough which the x-rays reach the cell monolayer. It isessential that the mask be machined to produce very welldefined sharp edges when the x-rays travel through the micro-spaces. This technology provides a means whereby effectstransmitted from irradiated cells to non-irradiated cells may bequantified as the number of cells and the geometry of an area ofcells exposed can be determined with some reliability. Becauseof this spatial control of the x-rays, it is an especially suitablesource to use to determine the role that GJIC plays in radiationbystander effects. A further advantage over most soft x-raysources, is that because of the pulsed nature of the source, thedose of x-rays can be controlled and as the system is capable ofdelivering 3Gy s-1, a substantial dose may be given in a veryshort time.
Sharp edged focused radiation from the laser plasma softx-rays
A 25µm x 3mm slit was manufactured in a disc of stainlesssteel of 13µm thickness which was fitted into the wall of thechamber directly above the point of the laser plasma. Stainlesssteel is completely opaque to the 1.1KeV x-rays. An aluminiumfilter (3µm thick) placed between the x-ray source and the x-rayoutlet excluded all visible and UV light. The 1µm Hostaphanbase of the cell culture dish is also opaque to UV light. Filmwith a layer of radiochromic chemical a few microns thick onone surface (Gafchromic Film , ISP Technologies Inc.) wasplaced face down on Hostaphan over the micro-slit in thestainless steel. This was then exposed to the x-ray plasma forseveral minutes. A sharp edged image exactly 25µm wide and3mm long was obtained on the film as shown in the micrographbelow. This supports the idea that these x-rays will not spreadto cells that are not directly above the slit in the mask.
Figure 3. Image of 1.1KeV Cu x-Rays through the 25 micronslit.
Gap junction intercellular communication was studied inprimary rat hepatocytes 3) and an immortalised cell line,MH1C1. The MH1C1 cell line originates from the epithelium of
25 microns

Lasers for Science Facility - Biology
119 Central Laser Facility Annual Report 2000/2001
rat liver hepatoma but despite it’s tumorgenic phenotype, wasshown to express connexin 32 (Cx32) 4). This led to theexpectation that these cells may have functioning gap junctions,but when tested by a scrape loading assay and compared toanother cell line, WB F344 (non-transformed rat liver epithelialcells) there was virtually no migration of the lucifer yellow dye,a gap junction indicator, through the monolayer of contactingcells. WB F344 cells have been shown to express connexin 43which may be a more reliable indicator of functioning gapjunctions 4).
A B
Figure 4. A. The migration of lucifer yellow dye through aconfluent population of WB F344 cells can clearly be seen. Thedye was loaded by scratching the cell monolayer as shown.B. MH1C1 cells subjected to the same procedure show nospread of the dye indicating cellular gap junctions process.
Partial irradiation of cell monolayers
In preliminary experiments, MH1C1 cells were grown toconfluence and irradiated through a slit, 3mm in length and200µm in width. The incident dose of radiation was 100Gy. Theirradiated cells over the slit were stained with 10µMdihyroethidium which fluoresced at 488nm excitation. Incontrast, contacting cells which were shielded from theradiation showed no staining. Dihyroethidium is oxidised by thesuperoxide anion to produce ethidium bromide whichintercalates with DNA. No spread of the dye to non-irradiatedcells was observed.
Figure 5. Partially irradiated WKURXJK VOLW P [ PPmonolayer of MH1C1 cells stained by dihyroethidium.
Cells were also irradiated over a 25µm x 3mm slit with anincident dose of 100Gy. Helium in the interior of the targetchamber was replaced with vacuum which ensured closecontact of the hostphan base of the cell dish with the micro-machined slit in the stainless steel mask. This time an area ofcells greater than 25µm in width was stained with thedihyroethidium dye. Since the MH1C1 cells had been shown tolack GJIC, it was concluded that the downward pull created bythe vacuum on the hostaphan membrane over the slit imposed astress on adjoining cells which caused them to produce reactiveoxygen species.
Caution must therefore be exercised when using markers suchas dyes that identify reactive oxygen species or dyes which staincalcium ions. Changes in the cellular levels of these species canbe produced by stress induced by the technical proceduresthemselves.
The spread of these changes amongst contacting cells may alsoreflect membrane potential effects as well as gap junctiontransport.
References
1. Cook, P.R. Science, 284,1790-1795 1999
2. Chipman,J.K. Human Experimental Toxicology, 15, 995.1996
3. Elcock F.J., Deag, E., Roberts,R.A. and Chipman, J.K.Toxicological Sciences, 56, 86-94 , 2000.
4. Ren, P. de Feijter, A.W., Paul, D.L. and Ruch, R.J..Carcinogenesis 15, 1807-1813. 1994
200µm
Lasers for Science Facility - Biology
Central Laser Facility Annual Report 2000/2001 120
Abstract
Two-photon fluorescence correlation microscopy of fluorescentbiomolecules provides spatially resolved measurements ofconcentration and mobility, potentially allowing one to quantifythe kinetics of drug distribution and action in situ. The use oftwo-photon fluorescence excitation offers substantially betterperformance when compared with conventional fluorescencemethods. We present the basic features of an experimental set-up based on a relatively simple fibre-optic interface with ourexisting research microscope. Preliminary experimental resultswith two-photon excitation are presented for a suitable dye.Despite some technical problems the proposed design is simple,requires relatively low-cost optics and has a reasonably lowdispersion on the optical elements.
Introduction
Fluorescence correlation spectroscopy (FCS) providesinformation about fluorescent particle concentration andmobility in a small volume illuminated by a focused laser beam.The method has been used extensively in recent years to probevarious biochemical interactions between molecules. Themethod has even been used to measure binding at cell surfacesand to probe the internal microenvironment of individual cells.We are attempting to use the technique to gain insight into thedynamics of fluorescently labeled biopharmaceuticals in livingtissue. The method is attractive because it is the only opticalmethod that could potentially provide a measure of absoluteconcentration (i.e. particles per femtolitre) with µm-level spatialresolution. Moreover, by measuring the characteristic particletransit time within the illuminated volume, the methodquantifies the rate of tissue penetration and processes such ashindered diffusion and binding. Hence the method is extremelyattractive for the study of biopharmaceutical pharmacokinetics,where the microscopic dispositon of large, complex biologicalmolecules in living tissue is a prevalent problem.
The light absorbing and scattering properties of most tissues area practical barrier to the use of FCS in vivo. The use of twophoton fluorescence excitation could overcome these problemsby providing a fluorescence excitation source that betterpenetrates tissue with less photo-damage. The advantages oftwo-photon fluorescence excitation in applications such aslaser-scanning confocal fluorescence microscopy are welldocumented1). The advantages of two-photon excitation aredeeper penetration of red and near-infrared light into the turbidtissue allowing excitation of specific biological moleculeslabelled with fluorescent dye in their native environment insidethe cells, better background rejection of out-of-focusfluorescence, and a lower threshold for photobleaching andphoto-damage of living cells. In combination with conventionalmicroscopy, two-photon fluorescence correlation providesmolecular dynamics measurements at high spatial resolution.
The principle of two-photon spectroscopy is that a fluorescentmolecule absorbs two photons nearly simultaneously, instead ofa single higher-energy photon, to cause the transition to themetastable excited state. As the probability or equivalently thecross-section of this process is significantly less than for single-photon absorption it is necessary to provide sufficient powerdensity to achieve the two-photon event. The lifetime of usualfluorophores in the excited state is of the order of a fewnanoseconds so the excitation pulse should be even shorter toattain a suitably high power density with a suitably low averageflux. A traditional source providing ultra-short pulses is a
titanium-sapphire laser. It can generate femtosecond pulses witha repetition rate of 80-100 MHz. A high repetition rate isnecessary to renew the population of the excited state each timeafter the fluorescence has decayed. Another importantparameter is the peak power. It was estimated that a focusedbeam power of several tens of milliwatts is sufficient to reachthe saturation level for maximum output fluorescence.
The aim of the present study was to provide a simple fibre opticinterface for easily and safely adding a TPCM capability to anexisting wide-field fluorescence microscope. It was desirable touse fibre optics because of the safety and practicalconsiderations of operating in a biological laboratory. Wewanted to avoid direct contact of the laser output with abiohazard environment whilst also limiting the possibleexposure of biological scientists to a naked, high power, nearlyinvisible beam. We recognised that the transmission of pulsesthrough fibres and the microscope optical elements wouldbroaden pulses and limit the peak power. This article is focusedmainly on the technical aspects and feasibility of a novelexperimental set-up for TPCM.
Materials and Methods
The two-photon correlation set-up consists of a modified Nikonupright research microscope E800, femtosecond titanium-sapphire laser and computer-based correlator. The opticalarrangement is shown schematically in Figure 1. The basicelement of two-photon excitation is a laser source generatingfemtosecond pulses. It includes the pump laser, Spectra PhysicsMillennium, with an output of 5 W and Tsunami femtosecondTi:Sapphire laser all mounted on an optical breadboard. Thenominal pulse width in the wavelength range 790-850 nm is80 fs with repetition rate 82 MHz and with average outputpower up to 1 W at optimal conditions.
Figure 1. Schematic of optical arrangement for two-photoncorrelation experiment.
Laser output is launched into a fused gradient index coupler(50/125mm, Laser 2000) using a Gradium achromatic doublet(Newport). The effective lens NA matched to the NA of thefibre to ensure a stable light split and no modal noise due toenvironmental perturbations. To ensure a stable modal patternthe splitter legs were each 2m long. The unused splitter legswere index matched to reduce reflections. Typically a launchefficiency of 70% was achieved. Similar optics were used torefocus the light for collection.
We used the same fibre as both the source and detector aperture.In most cases a single mode fibre is preferred to serve as asource to allow a diffraction limited spot and minimumtemporal spread of the pulse. However single mode fibres are
Two-photon fluorescence correlation microscopy for pharmacokinetic studies
S Tatarkova, C Lloyd, D A Berk
School of Pharmacy & Pharmaceutical Sciences, University of Manchester, Oxford Road, Manchester, M13 9PL
Main contact email address: [email protected]

Lasers for Science Facility - Biology
121 Central Laser Facility Annual Report 2000/2001
efficient only on a narrow wavelength range and have a lownumerical aperture making them inefficient for combinedemission and detection of different wavelengths. Whilst themultimode fibre can support a very large number of modesentering and emerging from the fibre under the different angles,these finally give rise to high pulse dispersion and enlargementof the effective illumination spot. The gradient index fibrereduces this by its parabolic index profile making it an optimumcompromise. The incorporation of the excitation and emissionlight into single fibre path offers flexibility, stable alignmentand safe operation of the whole optical scheme. We used amultimode fibre coupler to split the optical signal in ratio 50:50onto two equivalent arms. One was coupled to the titanium-sapphire laser and the other delivered fluorescence to aphotodetector. The last tip of the fibre was connected directly toa spectrum analyser which traced continuously the shape ofpulses and effectiveness of coupling.
The fibre output was collimated into a parallel beam using agood quality achromatic lens so that the diameter matched thediameter of the back aperture of the microscope objective. Therear port of the microscope and the video port were usedequivalently for coupling light into the Nikon microscope. Thesample was viewed in epifluorescence mode, in most cases witha 40X/0.6 Plan Fluor objective.
In order to reject background laser illumination caused bymultiple reflections inside the fibre coupler a fibre opticsU-bracket assembly (OZ Optics Ltd.) was inserted into the pathof the fluorescence. It was designed to transmit light from theoptical fibre, across an air gap, and back into a second fibrewith low losses. The assembly itself served as a spatial filterproviding better conditions for focusing the fluorescence lightat the average wavelength 530 nm and discriminating againstother wavelengths, in particular and most importantly the laserwavelength. But, since a large amount of laser light could stillpropagate beyond this, low-pass and band-pass filters wereinserted into the air gap to select a particular fluorescence band.
The detection system was the same as used previously forsingle-photon experiments2). Fibre output was focused onto theface of a silicon avalanche photodiode (APD) which operates insingle photon counting mode (SPCM-AQ-121, EG&G). Outputof SPCM directly fed the computer-based correlator(ALV-5000/Fast, ALV-GmbH, Langen, Germany). Correlationdata was analysed by ALV-software and SigmaPlot’2000package by using a Marquardt nonlinear least-square fittingroutine.
During femtosecond pulse propagation through the fibre opticsand microscope glass, pulses are spread in time due to groupvelocity dispersion. It was estimated previously3) that the finalpulse width at the sample should be on the order of 150 fs.Most implementations avoid the use of fibre elements in theirset-up design as introducing additional pulse dispersion.However this implies mounting quite bulky laser equipment onthe same vibration isolated surface together with themicroscope. This can sometimes be unacceptable. For example,when working with biological hazards the laser equipmentshould be well separated from chemical and biological hazardsto avoid dangers of contamination. Fibre optics offers flexibilityin design, safety, and stability in performance. We examined thespectral broadening introduced by the fibre. On the photographsbelow we present the undisturbed spectrum from the laser andthe spectrum at the fibre output. The actual deterioration ofpulse characteristics was less than 30%, which implies abroadening of the final pulse width to 100-110 fs. In the case ofsufficient peak intensity this pulse broadening is tolerable.
A conventional step index fibre is often used in opticalarrangements but this suffers from modal dispersion. Oftenfibre length is restricted to reduce this problem but this leads to
a second problem of unstable modal patterns which may beaffected by environmental factors and give rise to false signals.
The gradient index fibre coupler allows a mere 30%(20-30 femtosecond) increase in pulse width whilst allowing ahighly stable alignment even with a fibre length of 4m. Whilstmonomode fibre is costly and requires a very high degree ofcleanliness the GRIN fibre is highly economic($0.5/metre) and less prone to cleanliness issues making it moresuited to many microscopy applications. Two-photon operationin the near IR region increasingly allows these standardcommunications fibres and components to be used.
The crucial element is the microscope objective, which shouldhave excellent achromatic properties and near IR lighttransmission. Good achromatic performance is importantbecause the focus point for both excitation and emissionwavelengths, widely separated in two-photon spectroscopy,should coincide as two-photon excitation is a highly "confocal"event. The fluorescence can be excited uniquely within the focalplane and nowhere else.
The power at the sample is reported3) to require a few tens mWwell focused on the sample. Despite the 50% loss of powerassociated with the fibre coupler the major power loss occurredat the interface with the microscope optics.
Results and Discussion
Two-photon excitation spectra for traditional fluorophores arenot widely available in the literature. Although the excitationwavelength for the two-photon process is roughly twice that ofthe single photon process, significant deviations have beenreported. As the data about two-photon absorption crosssections is quite limited, we have compared the fluorescenceintensity from different dyes on the different wavelengthswithin the tunable range of the Ti:Sapph laser. Rhodamine 6Gabsorbs single photons at 528 nm (green) peak and emits the
Figure 2. Laser emission spectra. Undisturbed (upper) andpassed through multimode fibre (lower).

Lasers for Science Facility - Biology
Central Laser Facility Annual Report 2000/2001 122
fluorescence photons at a peak of 551 nm in the yellow region.We observed a maximum in rhodamine 6G fluorescence whenexcited at a wavelength between 800 and 830 nm that is slightlyless then reported previously4) (850 nm). Another fluorophorewe used was calcein, which can absorb single photons around494 nm (blue) and emit in a bright green spectrum around517 nm. We found that calcein had a bright emission yield withmaximum excitation around 765 nm. Both fluorophores couldbe excited at the same wavelength, for example at 780 nm andhad distinguishable emissions – one green and the otheryellow, that may find further application in dual-colourfluorescence spectroscopy or cross-correlation spectroscopy.
We attempted to observe two-photon absorption by moleculesof PicoGreen fluorophore in the presence of DNA. Thisfluorophore is an extremely sensitive marker of dsDNA forquantitative measurement of small amounts of DNA, withexcitation at 502 nm for single photon absorption, and emissionat 523 nm. Despite our expectations we were unable to observeany two-photon fluorescence. We hypothesise that this absenceof fluorescence is due to the relatively low power density in oursystem.
Calibration
An autocorrelation function was recorded from the cell filledwith an aqueous solution of calcein. The data were recordedwith an average photon count rate of 2.5 kHz. The excitationwavelength was 780 nm. The autocorrelation decay timeconstant at 2 ms leads to an estimate of the detection volumediameter as 3 µm. The theoretical equation for a single diffusingcomponent2) gives a good fit to experimental data shown by thesolid line in Figure 3.
time, ms
1e-4 1e-3 1e-2 1e-1 1e+0 1e+1 1e+2 1e+3 1e+4 1e+5
-1
0
1
2
3
Figure 3. The experimental autocorrelation function for Calceindiffusion in water.
The triplet state is not apparent in the data. In contrast, an initialrapid decay in the autocorrelation function is observed in theequivalent single-photon correlation experiment. With two-photon excitation, it may be difficult to reach the powersaturation at which transient non-emission states are induced.The same effect has been reported for Rhodamine 6G and TexasRed4).
In conclusion we developed an experimental set-up for two-photon correlation spectroscopy with flexible designappropriate for biological applications in which it is desirable toisolate the laser system from the potentially hazardousenvironment. The optical scheme is based on the incorporationof excitation and emission light into the single fibre pathwayallowing the automatic alignment of illumination and detectionareas and good stability of the whole scheme. Although, due tofemtosecond pulse propagation through the fibre, pulses werespread in time due to group velocity dispersion, the gradient
index fibre which we used allowed a mere 30%(20-30 femtosecond) increase in pulse width.
We were able to produce two-photon fluorescence with highlyfocused laser light on the microscope stage that could beobserved even by the naked eye. Further optimisation of theoptical parameters is needed to improve some performancecharacteristics such as the spot size, excitation pulse width andpeak power.
We examined appropriate fluorescent dyes that can performefficient two-photon excitation. We found that Rhodamine 6Gand Calcein have comparable emission yield characteristics andoverlapping excitation spectra. Both of them can besuccessfully excited at 780 nm whilst their fluorescenceemissions lie in different spectral bands – around 517 nm forCalcein and 551 nm for Rh6G. The cross-correlation or dual-colour experiment can be developed on the basis of our designimplementing the same fibre coupler that will split thefluorescent signal into two equivalent arms with additionalspectral filtering of each component.
We calibrated our set-up by measuring the translationaldiffusion of Calcein molecules in water. The estimated size ofspot was around 3 mm.
Despite difficulties of good maintenance of expensive andbulky laser equipment, two-photon excitation microscopy is anextremely sensitive and precise technique for measuringmolecular dynamics within femtoliter excitation volumes. Thismajor advantage of two-photon technique can be exploitedwhen imaging thick and turbid biological samples.
Acknowledgments
This work was supported by a grant from the Biotechnologyand Biological Sciences Research Council of the UK. TheCentral Laser Facility at Rutherford Appleton Laboratoryprovided the laser system under their laser loan scheme.
References
1. J B PawleyHandbook of Biological Confocal Microscopy –2nd ed.(1995)
2. S Tatarkova, C Lloyd, AK Verma, S Khaira, and DA Berk.Application of fluorescence correlation spectroscopy fordrug delivery to tumor tissue, in SPIE Proceeding,vol.4164, (2000), in press.
3. Y Chen, J.Muller, K.Berland, and E.Gratton.Fluorescence correlation spectroscopy, Methods 19, 243-252 (1999).
4. K G.Heinze, A Koltermann, and P Schwille.Simultaneous two-photon excitation of distinct labels fordual-color fluorescence crosscorrelation analysis, PNAS97, 10377-10382 (2000).

Lasers for Science Facility - Physics
123 Central Laser Facility Annual Report 2000/2001
Introduction
In the development of the laboratory x-ray microscope1) carefulsource characterisation is needed. This requires determinationof the laser-plasma source size and spectral emissioncharacteristics, both of which have been carried out previouslyusing the original LSF target chamber and (reversed) audio tapetargets2,3). However, in that work the diffraction grating used inthe transmission grating spectrometer was not calibrated interms of its efficiency. Although a degree of self-calibrationwas possible in the analysis, quantitative spectral intensitiescould not readily be obtained. Also, the measurements had notbeen performed using the target chamber built for the x-raymicroscope or using a range of targets to identify materialssuitable for elemental and chemical state mapping, whichrequire a tunable source.
In this report a preliminary analysis of spectra recorded withcalibrated transmission gratings is presented (although it shouldbe noted that the calibration analysis is not complete). Thespectra were recorded on Kodak DEF film using a range of tapetargets. The x-ray microscope target drive was designed to usevideo tape, since this provides more “tracks” than audio tapedoes, allowing longer times between tape changes. In earliermicroscopy experiments it had been observed that reversedBASF Vision video tape appeared to give higher emission inthe C VI Lyα line at 3.37 nm than other types of video tape did,possibly due to a carbon coating on the tape. Thecharacterisation was therefore carried out for severalcommercially available video tapes, reversed to present theplastic (Mylar) or carbon surface to the laser beam andunreversed to form a metallic plasma suitable for a tunablesource. Uncoated Mylar was also used.
Unfortunately the lasers in the LSF x-ray laboratory performedinconsistently during the experiments, making quantitativecomparisons between the different types of tape difficult.
The gratings
The gratings were made by electron-beam lithography followedby nickel electroplating. The nominal period was 300 nm, witha mark to period ratio of approximately 0.5. The spectralresolution is determined by two instrumental effects, thenumber of grating lines illuminated and the variation inincidence angle across the grating3). The former gives betterspectral resolution as the grating aperture increases while thelatter gives worse and thus there is an optimum aperture size, of≈ 20 µm for the experimental parameters in use. Gratings weretherefore made with square aperture sizes of 15µm, 20µm and30µm (Figure 1a). They are supported by 500×500 µm siliconnitride (Si3N4) membranes on 5×5mm silicon chips, and theSi3N4 around the gratings is coated with thick nickel so that itis reasonably opaque to soft x-rays. Each chip contains twogratings, as shown in Figure 1b. The lines of each grating areperpendicular to those of the other so that, with a horizontalx-ray beam, one will diffract horizontally and one vertically,eliminating alignment problems.
The incident and diffracted intensities of the gratings have beenmeasured over a range of wavelengths at the BeijingSynchrotron Radiation Facility. An example of a diffractionpattern, recorded at a wavelength of 4.43 nm, is shown inFigure 2a; the zero-orders of both gratings can clearly be seen,as can the two first-order peaks of one of the gratings. Higherorders of the monochromator are also visible. The first-orderpeaks are asymmetrical due to the spectral resolution of the
monochromator. To allow the most accurate determination ofthe diffraction efficiencies the peaks have been fitted totwo-dimensional Pearson IV distributions3), which take accountof the asymmetries, and an example of a fit is shown inFigure 2b. The fits show that the actual grating periods are≈260 nm, indicating a possible mis-calibration during thelithography stage, while the shorter wavelength data containscomponents due to second-order diffraction from the grating,indicating that the mark/period ratio is not quite 0.5. Thequantitative analysis of these results is continuing.
Laser-plasma spectra
For each tape/grating combination spectra were recorded for arange of laser shots, typically several hundred to severalthousand. This was to allow self-calibration of the film, butsince so many shots were needed, the variable laserperformance may mean that this will not be possible. In thepreliminary analysis, the spectra for each combination have
Calibrated Diffraction Gratings for the Analysis of Laser-Plasma X-Ray Spectra
A G Michette, S J Pfauntsch, T Graf
Department of Physics, King’s College London, Strand, London WC2R 2LS
Main contact email address: [email protected]
Figure 1. (a) An electron micrograph of one of the gratings.The distances x are either 15 µm, 20 µm or 30 µm. (b) Theorientation of the two gratings on each chip.
x
x
(a)
(b)
Figure 2. (a) Diffraction from the grating recorded atλ = 4.43 nm using the Beijing synchrotron. The intensity scale islogarithmic, and the zero orders are saturated. (b) Fit to thediffraction spectrum (except the zero orders) using the PearsonIV function.
(a)
(b)
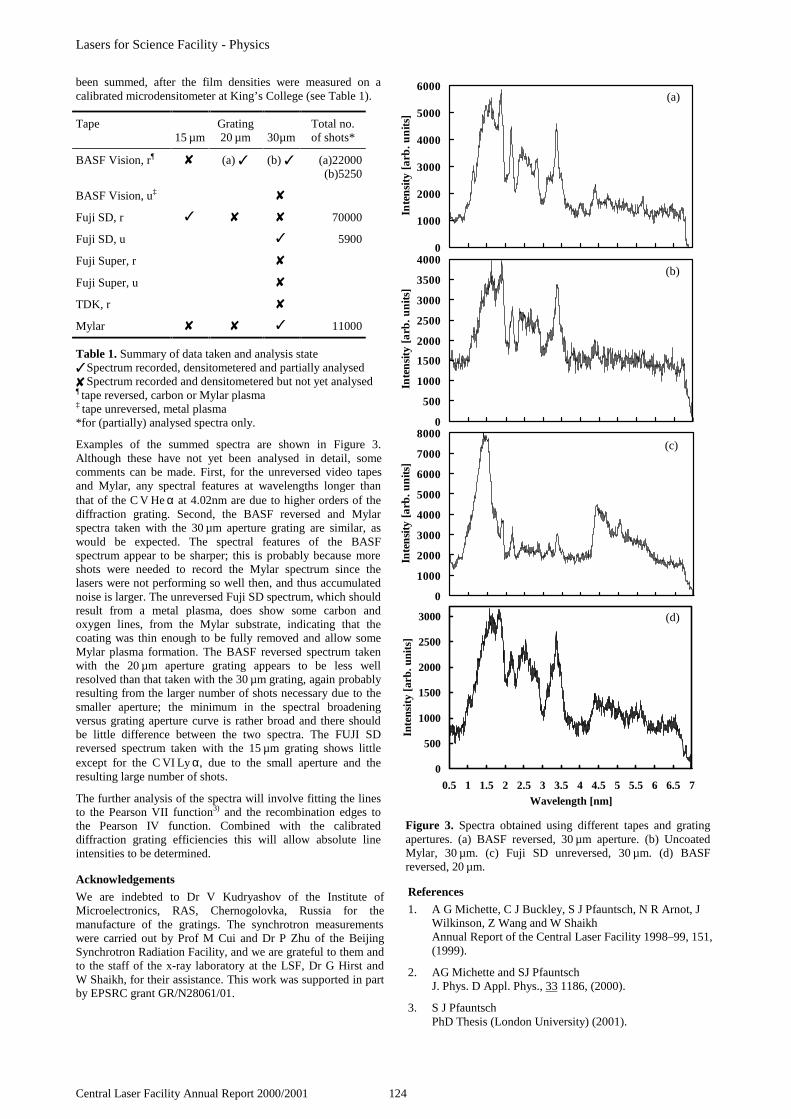
Lasers for Science Facility - Physics
Central Laser Facility Annual Report 2000/2001 124
been summed, after the film densities were measured on acalibrated microdensitometer at King’s College (see Table 1).
Tape15 µm
Grating20 µm 30µm
Total no.of shots*
BASF Vision, r¶ (a) (b) (a)22000(b)5250
BASF Vision, u‡
Fuji SD, r 70000
Fuji SD, u 5900
Fuji Super, r
Fuji Super, u
TDK, r
Mylar 11000
Table 1. Summary of data taken and analysis state Spectrum recorded, densitometered and partially analysed Spectrum recorded and densitometered but not yet analysed¶ tape reversed, carbon or Mylar plasma‡ tape unreversed, metal plasma*for (partially) analysed spectra only.
Examples of the summed spectra are shown in Figure 3.Although these have not yet been analysed in detail, somecomments can be made. First, for the unreversed video tapesand Mylar, any spectral features at wavelengths longer thanthat of the C V He α at 4.02nm are due to higher orders of thediffraction grating. Second, the BASF reversed and Mylarspectra taken with the 30 µm aperture grating are similar, aswould be expected. The spectral features of the BASFspectrum appear to be sharper; this is probably because moreshots were needed to record the Mylar spectrum since thelasers were not performing so well then, and thus accumulatednoise is larger. The unreversed Fuji SD spectrum, which shouldresult from a metal plasma, does show some carbon andoxygen lines, from the Mylar substrate, indicating that thecoating was thin enough to be fully removed and allow someMylar plasma formation. The BASF reversed spectrum takenwith the 20 µm aperture grating appears to be less wellresolved than that taken with the 30 µm grating, again probablyresulting from the larger number of shots necessary due to thesmaller aperture; the minimum in the spectral broadeningversus grating aperture curve is rather broad and there shouldbe little difference between the two spectra. The FUJI SDreversed spectrum taken with the 15 µm grating shows littleexcept for the C VI Lyα, due to the small aperture and theresulting large number of shots.
The further analysis of the spectra will involve fitting the linesto the Pearson VII function3) and the recombination edges tothe Pearson IV function. Combined with the calibrateddiffraction grating efficiencies this will allow absolute lineintensities to be determined.
Acknowledgements
We are indebted to Dr V Kudryashov of the Institute ofMicroelectronics, RAS, Chernogolovka, Russia for themanufacture of the gratings. The synchrotron measurementswere carried out by Prof M Cui and Dr P Zhu of the BeijingSynchrotron Radiation Facility, and we are grateful to them andto the staff of the x-ray laboratory at the LSF, Dr G Hirst andW Shaikh, for their assistance. This work was supported in partby EPSRC grant GR/N28061/01.
References
1. A G Michette, C J Buckley, S J Pfauntsch, N R Arnot, JWilkinson, Z Wang and W ShaikhAnnual Report of the Central Laser Facility 1998–99, 151,(1999).
2. AG Michette and SJ PfauntschJ. Phys. D Appl. Phys., 33 1186, (2000).
3. S J PfauntschPhD Thesis (London University) (2001).
0
1000
2000
3000
4000
5000
6000
0.5 1 1.5 2 2.5 3 3.5 4 4.5 5 5.5 6 6.5 7Wavelength [nm]
Inte
nsit
y [a
rb. u
nit
s]
Figure 3. Spectra obtained using different tapes and gratingapertures. (a) BASF reversed, 30 µm aperture. (b) UncoatedMylar, 30 µm. (c) Fuji SD unreversed, 30 µm. (d) BASFreversed, 20 µm.
0
500
1000
1500
2000
2500
3000
3500
4000
0.5 1 1.5 2 2.5 3 3.5 4 4.5 5 5.5 6 6.5 7Wavelength [nm]
Inte
nsit
y [a
rb. u
nits
]
0
1000
2000
3000
4000
5000
6000
7000
8000
0.5 1 1.5 2 2.5 3 3.5 4 4.5 5 5.5 6 6.5 7Wavelength [nm]
Inte
nsity
[arb
. uni
ts]
0
500
1000
1500
2000
2500
3000
0.5 1 1.5 2 2.5 3 3.5 4 4.5 5 5.5 6 6.5 7Wavelength [nm]
Inte
nsit
y [a
rb. u
nits
]
(a)
(b)
(c)
(d)
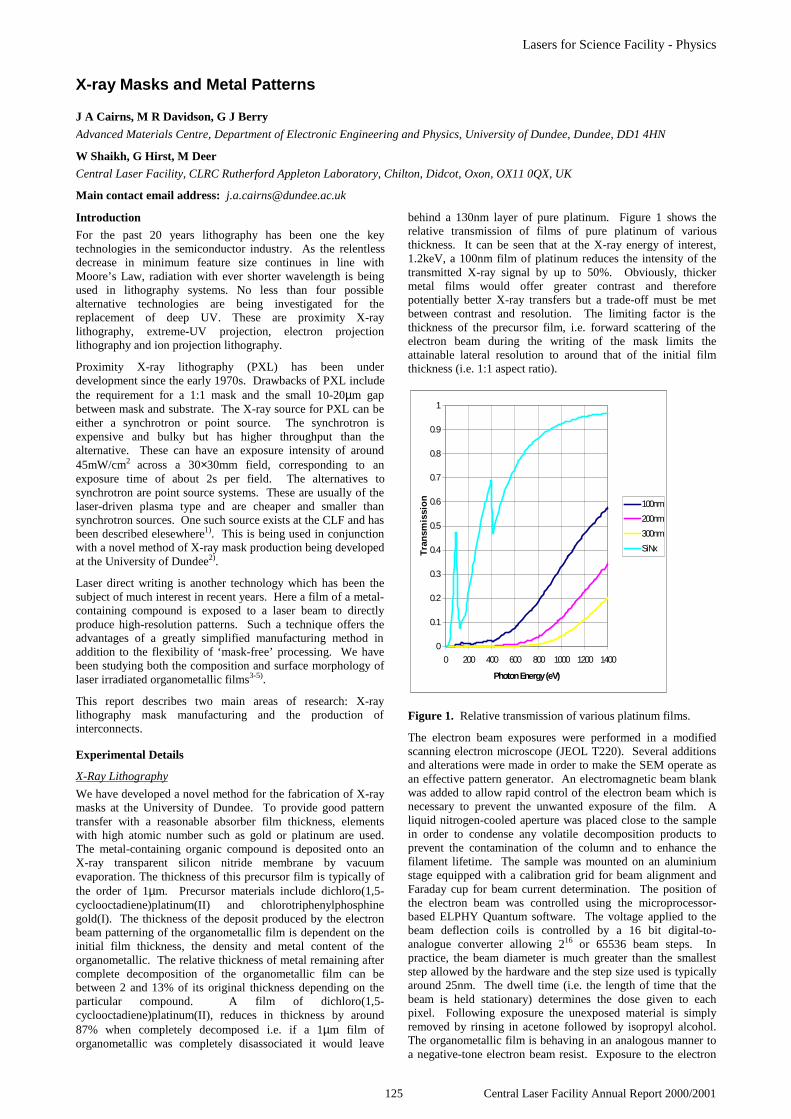
Lasers for Science Facility - Physics
125 Central Laser Facility Annual Report 2000/2001
Introduction
For the past 20 years lithography has been one the keytechnologies in the semiconductor industry. As the relentlessdecrease in minimum feature size continues in line withMoore’s Law, radiation with ever shorter wavelength is beingused in lithography systems. No less than four possiblealternative technologies are being investigated for thereplacement of deep UV. These are proximity X-raylithography, extreme-UV projection, electron projectionlithography and ion projection lithography.
Proximity X-ray lithography (PXL) has been underdevelopment since the early 1970s. Drawbacks of PXL includethe requirement for a 1:1 mask and the small 10-20µm gapbetween mask and substrate. The X-ray source for PXL can beeither a synchrotron or point source. The synchrotron isexpensive and bulky but has higher throughput than thealternative. These can have an exposure intensity of around45mW/cm2 across a 30×30mm field, corresponding to anexposure time of about 2s per field. The alternatives tosynchrotron are point source systems. These are usually of thelaser-driven plasma type and are cheaper and smaller thansynchrotron sources. One such source exists at the CLF and hasbeen described elesewhere1). This is being used in conjunctionwith a novel method of X-ray mask production being developedat the University of Dundee2).
Laser direct writing is another technology which has been thesubject of much interest in recent years. Here a film of a metal-containing compound is exposed to a laser beam to directlyproduce high-resolution patterns. Such a technique offers theadvantages of a greatly simplified manufacturing method inaddition to the flexibility of ‘mask-free’ processing. We havebeen studying both the composition and surface morphology oflaser irradiated organometallic films3-5).
This report describes two main areas of research: X-raylithography mask manufacturing and the production ofinterconnects.
Experimental Details
X-Ray Lithography
We have developed a novel method for the fabrication of X-raymasks at the University of Dundee. To provide good patterntransfer with a reasonable absorber film thickness, elementswith high atomic number such as gold or platinum are used.The metal-containing organic compound is deposited onto anX-ray transparent silicon nitride membrane by vacuumevaporation. The thickness of this precursor film is typically ofthe order of 1µm. Precursor materials include dichloro(1,5-cyclooctadiene)platinum(II) and chlorotriphenylphosphinegold(I). The thickness of the deposit produced by the electronbeam patterning of the organometallic film is dependent on theinitial film thickness, the density and metal content of theorganometallic. The relative thickness of metal remaining aftercomplete decomposition of the organometallic film can bebetween 2 and 13% of its original thickness depending on theparticular compound. A film of dichloro(1,5-cyclooctadiene)platinum(II), reduces in thickness by around87% when completely decomposed i.e. if a 1µm film oforganometallic was completely disassociated it would leave
behind a 130nm layer of pure platinum. Figure 1 shows therelative transmission of films of pure platinum of variousthickness. It can be seen that at the X-ray energy of interest,1.2keV, a 100nm film of platinum reduces the intensity of thetransmitted X-ray signal by up to 50%. Obviously, thickermetal films would offer greater contrast and thereforepotentially better X-ray transfers but a trade-off must be metbetween contrast and resolution. The limiting factor is thethickness of the precursor film, i.e. forward scattering of theelectron beam during the writing of the mask limits theattainable lateral resolution to around that of the initial filmthickness (i.e. 1:1 aspect ratio).
0
0.1
0.2
0.3
0.4
0.5
0.6
0.7
0.8
0.9
1
0 200 400 600 800 1000 1200 1400
Photon Energy (eV)
Tra
nsm
issi
on
100nm
200nm
300nm
SiNx
Figure 1. Relative transmission of various platinum films.
The electron beam exposures were performed in a modifiedscanning electron microscope (JEOL T220). Several additionsand alterations were made in order to make the SEM operate asan effective pattern generator. An electromagnetic beam blankwas added to allow rapid control of the electron beam which isnecessary to prevent the unwanted exposure of the film. Aliquid nitrogen-cooled aperture was placed close to the samplein order to condense any volatile decomposition products toprevent the contamination of the column and to enhance thefilament lifetime. The sample was mounted on an aluminiumstage equipped with a calibration grid for beam alignment andFaraday cup for beam current determination. The position ofthe electron beam was controlled using the microprocessor-based ELPHY Quantum software. The voltage applied to thebeam deflection coils is controlled by a 16 bit digital-to-analogue converter allowing 216 or 65536 beam steps. Inpractice, the beam diameter is much greater than the smalleststep allowed by the hardware and the step size used is typicallyaround 25nm. The dwell time (i.e. the length of time that thebeam is held stationary) determines the dose given to eachpixel. Following exposure the unexposed material is simplyremoved by rinsing in acetone followed by isopropyl alcohol.The organometallic film is behaving in an analogous manner toa negative-tone electron beam resist. Exposure to the electron
X-ray Masks and Metal Patterns
J A Cairns, M R Davidson, G J Berry
Advanced Materials Centre, Department of Electronic Engineering and Physics, University of Dundee, Dundee, DD1 4HN
W Shaikh, G Hirst, M Deer
Central Laser Facility, CLRC Rutherford Appleton Laboratory, Chilton, Didcot, Oxon, OX11 0QX, UK
Main contact email address: [email protected]

Lasers for Science Facility - Physics
Central Laser Facility Annual Report 2000/2001 126
beam causes the irradiated material to become less soluble inthe rinsing solvent. Figure 2 shows a contrast curve fordichloro(1,5-cyclooctadiene)platinum(II). This sample wasirradiated with 30keV electrons. The thickness of the film afterexposure was measured by atomic force microscopy.
0
0.2
0.4
0.6
0.8
1
1.2
1 10 100 1000
Exposure Dose (mC/cm2)
No
rmal
iesd
Film
Th
ickn
ess
Rem
ain
ing
Figure 2. Contrast curve for dichloro(1,5-cyclooctadiene)platinum(II).
From Figure 2 it can be seen that the sensitivity of thisparticular organometallic is approximately 50mC/cm2. At thisdose the thickness of the electron beam written deposit isapproximately the same thickness as the precursor film.Absorber patterns with dimensions of 200nm can routinely beproduced using this technique. When thinner organometallicfilms are used, even narrower line widths down to 60nm can beproduced. Figure 3 shows an example of a high-resolutionmetal pattern produced by electron beam irradiation ofdichloro(1,5-cyclooctadiene)platinum(II).
Figure 3. Scanning electron micrograph of high-resolutionabsorber pattern.
X-Ray exposures were performed using a copper Lα sourcewith photon energies of around 1.2keV. A beryllium filter wasused to prevent the UV-exposure of the resist and also toprevent target debris from contaminating the mask assembly.The resist used in the recent experiments (Shipley DUV3) wasspecifically manufactured for deep-UV lithography andconsequently was not very sensitive to the soft X-ray radiationused here. At around 80mJ/cm2, the sensitivity to copperX-rays was around four times less than the resist used in ourprevious experiments and it also had poorer contrast properties.
Laser Processing of Organometallic Films
The second series of experiments performed in the UV X-raylab were to investigate the effect of deep UV irradiation on theorganometallic films. These experiments aim to investigate thepossible application of organometallic materials in theproduction of interconnects. For use as interconnects it isessential that the electrical conductivity of the depositedmaterial is close to the value for the bulk metal. A consequenceof using organometallic materials is that the laser-irradiatedfilms invariably contain impurities, which are predominantlycarbonaceous. The simplest method to remove these is toanneal the films. This not only purifies the deposit but alsoresults in a marked improvement in its electrical properties.Figure 4 shows the improvement in resistivity as a function ofannealing temperature for a film of laser irradiatedcis-dichlorobis(triphenyl-phosphine)platinum(II).
0.001
0.01
0.1
1
10
100
0 500 1000 1500
Annealing Temperature (oC)
Ele
ctri
cal R
esis
tivi
ty (
oh
m.c
m)
Figure 4. Effect of Annealing on resistivity of laser irradiatedorganometallic films.
Annealing to 1000°C improves the conductivity of the films byover four orders of magnitude.
An alternative approach to the formation of interconnects is toproduce a pattern of platinum containing material which canthen be copper plated to produce a highly conductive copperfilm. In this case a film of a platinum-containing organometallicis irradiated to produce a seed layer. This is then coated withcopper in an electroless plating bath. This is a catalytic processand only takes place in the presence of a metal such as platinum
Figure 5. Scanning electron micrograph of 5µm wide copperplated tracks.

Lasers for Science Facility - Physics
127 Central Laser Facility Annual Report 2000/2001
or palladium. The key advantage of this process is that themetal layer does not need to be pure and can also be very thin(<10nm). This is ideally suited to these materials and we havedemonstrated the ability to produce good quality 5µm metaltracks with conductivities close to that of the bulk metal.Figure 5 shows an example of copper tracks produced using thistechnique.
Conclusions
We have demonstrated the fabrication of X-ray masks by theelectron beam irradiation of organometallic films. Platinumlines of widths down to 60nm can be produced although thethickness of these deposits would require a resist of highercontrast than that currently available for successful X-raylithography.
The production of metal tracks for interconnect applications hasalso been demonstrated. Two main methods of fabrication havebeen used: 1) irradiation of the organometallic film followed bya thermal processing step and 2) laser irradiation followed byelectroless copper plating.
Acknowledgements
This work was funded by an Engineering and Physical SciencesResearch Council grant, number GR/M41223. The authorswould also like to thank Compugraphics International Ltd forthe production of photomasks used in this work.
References
1. I.C.E. Turcu et al, 1W Plasma X-ray Source forLithography at 1nm Wavelength, Rev. Sci. Instrum., 67(9),(1996), 3245-3247.
2. Novel route for the production of X-ray masks from arange of organometallic films. MR Davidson et al,Microelectronic Eng.,41/42, 1998, 279-282.
3. Thermal stability and analysis of laser deposited platinumfilms, G J Berry, et al, Materials research symposiumseries, 624, 2000, 249-254
4. Analysis of metal features produced by uv irradiation oforganometallic films, G J Berry et al, Applied SurfaceScience, 162, 2000, 504-507.
5. Analysis of laser irradiated platinum films, M.R. Davidsonet al, Paper presented at EMAS 2001.
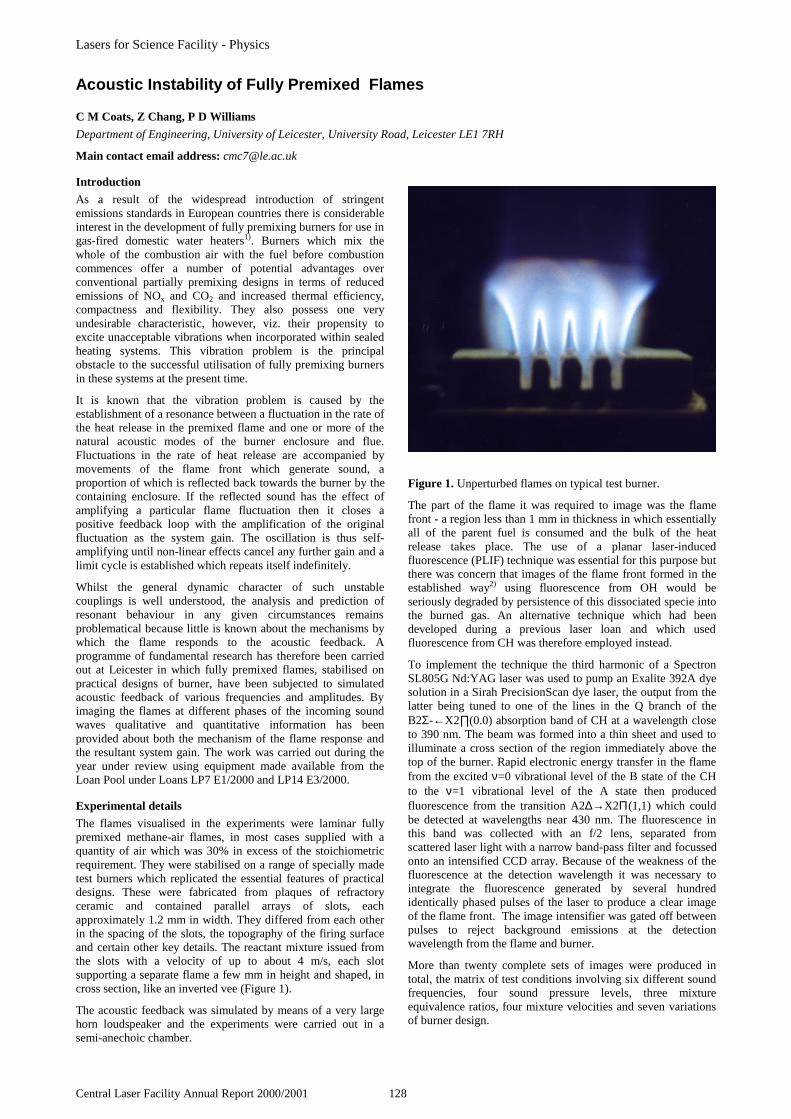
Lasers for Science Facility - Physics
Central Laser Facility Annual Report 2000/2001 128
Introduction
As a result of the widespread introduction of stringentemissions standards in European countries there is considerableinterest in the development of fully premixing burners for use ingas-fired domestic water heaters1). Burners which mix thewhole of the combustion air with the fuel before combustioncommences offer a number of potential advantages overconventional partially premixing designs in terms of reducedemissions of NOx and CO2 and increased thermal efficiency,compactness and flexibility. They also possess one veryundesirable characteristic, however, viz. their propensity toexcite unacceptable vibrations when incorporated within sealedheating systems. This vibration problem is the principalobstacle to the successful utilisation of fully premixing burnersin these systems at the present time.
It is known that the vibration problem is caused by theestablishment of a resonance between a fluctuation in the rate ofthe heat release in the premixed flame and one or more of thenatural acoustic modes of the burner enclosure and flue.Fluctuations in the rate of heat release are accompanied bymovements of the flame front which generate sound, aproportion of which is reflected back towards the burner by thecontaining enclosure. If the reflected sound has the effect ofamplifying a particular flame fluctuation then it closes apositive feedback loop with the amplification of the originalfluctuation as the system gain. The oscillation is thus self-amplifying until non-linear effects cancel any further gain and alimit cycle is established which repeats itself indefinitely.
Whilst the general dynamic character of such unstablecouplings is well understood, the analysis and prediction ofresonant behaviour in any given circumstances remainsproblematical because little is known about the mechanisms bywhich the flame responds to the acoustic feedback. Aprogramme of fundamental research has therefore been carriedout at Leicester in which fully premixed flames, stabilised onpractical designs of burner, have been subjected to simulatedacoustic feedback of various frequencies and amplitudes. Byimaging the flames at different phases of the incoming soundwaves qualitative and quantitative information has beenprovided about both the mechanism of the flame response andthe resultant system gain. The work was carried out during theyear under review using equipment made available from theLoan Pool under Loans LP7 E1/2000 and LP14 E3/2000.
Experimental details
The flames visualised in the experiments were laminar fullypremixed methane-air flames, in most cases supplied with aquantity of air which was 30% in excess of the stoichiometricrequirement. They were stabilised on a range of specially madetest burners which replicated the essential features of practicaldesigns. These were fabricated from plaques of refractoryceramic and contained parallel arrays of slots, eachapproximately 1.2 mm in width. They differed from each otherin the spacing of the slots, the topography of the firing surfaceand certain other key details. The reactant mixture issued fromthe slots with a velocity of up to about 4 m/s, each slotsupporting a separate flame a few mm in height and shaped, incross section, like an inverted vee (Figure 1).
The acoustic feedback was simulated by means of a very largehorn loudspeaker and the experiments were carried out in asemi-anechoic chamber.
Figure 1. Unperturbed flames on typical test burner.
The part of the flame it was required to image was the flamefront - a region less than 1 mm in thickness in which essentiallyall of the parent fuel is consumed and the bulk of the heatrelease takes place. The use of a planar laser-inducedfluorescence (PLIF) technique was essential for this purpose butthere was concern that images of the flame front formed in theestablished way2) using fluorescence from OH would beseriously degraded by persistence of this dissociated specie intothe burned gas. An alternative technique which had beendeveloped during a previous laser loan and which usedfluorescence from CH was therefore employed instead.
To implement the technique the third harmonic of a SpectronSL805G Nd:YAG laser was used to pump an Exalite 392A dyesolution in a Sirah PrecisionScan dye laser, the output from thelatter being tuned to one of the lines in the Q branch of theB2Σ-←X2∏(0.0) absorption band of CH at a wavelength closeto 390 nm. The beam was formed into a thin sheet and used toilluminate a cross section of the region immediately above thetop of the burner. Rapid electronic energy transfer in the flamefrom the excited ν=0 vibrational level of the B state of the CHto the ν=1 vibrational level of the A state then producedfluorescence from the transition A2∆→X2Π(1,1) which couldbe detected at wavelengths near 430 nm. The fluorescence inthis band was collected with an f/2 lens, separated fromscattered laser light with a narrow band-pass filter and focussedonto an intensified CCD array. Because of the weakness of thefluorescence at the detection wavelength it was necessary tointegrate the fluorescence generated by several hundredidentically phased pulses of the laser to produce a clear imageof the flame front. The image intensifier was gated off betweenpulses to reject background emissions at the detectionwavelength from the flame and burner.
More than twenty complete sets of images were produced intotal, the matrix of test conditions involving six different soundfrequencies, four sound pressure levels, three mixtureequivalence ratios, four mixture velocities and seven variationsof burner design.
Acoustic Instability of Fully Premixed Flames
C M Coats, Z Chang, P D Williams
Department of Engineering, University of Leicester, University Road, Leicester LE1 7RH
Main contact email address: [email protected]

Lasers for Science Facility - Physics
129 Central Laser Facility Annual Report 2000/2001
Figure 2. Oscillating flames imaged at 90° increments of phase.
Figure 3. Correlation between heat release rate and acousticpressure for case of Figure 2.
Results
Four representative flame images, taken from one of the testsequences, are presented in Figure 2. The flames are hereoscillating at a frequency of 600 Hz and the pressure level ofthe sound waves incident on the burner is slightly in excess of130 dB. It can be seen that each flame responds to the acousticforcing in a strictly periodic manner, growing in length andforming a swollen head which, if the disturbance grows to asufficiently large amplitude, detaches itself from the main bodyof the flame. Similar patterns of oscillation were seen in most ofthe test cases although the amplitude of the oscillation and itsphase relationship to the acoustic field varied from case to case.
Qualitative and quantitative information extracted from theimage sequences is being used to improve our understanding ofthe very complex aeroacoustic mechanisms by which the flamesrespond to acoustic feedback in practical situations and also todetermine the extent to which the sound waves are amplified ordamped by the flame oscillation. The critical parameters in thelatter context are the instantaneous rate of the heat release in theflame (which can be estimated quite accurately from detailedexamination of the individual images) and its phase relation tothe acoustic pressure. Figure 3 shows the correlation betweenthese two parameters for the flame oscillation of Figure 2. Inthis particular case the heat release rate and the acousticpressure are in phase with each other only for part of the cycleand so, by Rayleigh’s criterion3), the amplification of the soundwaves by the flame oscillation will have been relatively weak.
References
1. T H Twist and K J A HargreavesProc. 2nd Int. Conf. on Combustion and EmissionsControl, London, p. 011/1, (1995)
2. A C Eckbreth, Laser Diagnostics for Combustion,Temperature and Species, Abacus, (1988)
3. Lord Rayleigh , The Theory of Sound, Vol. II, Dover, pp.224-235, (1945)
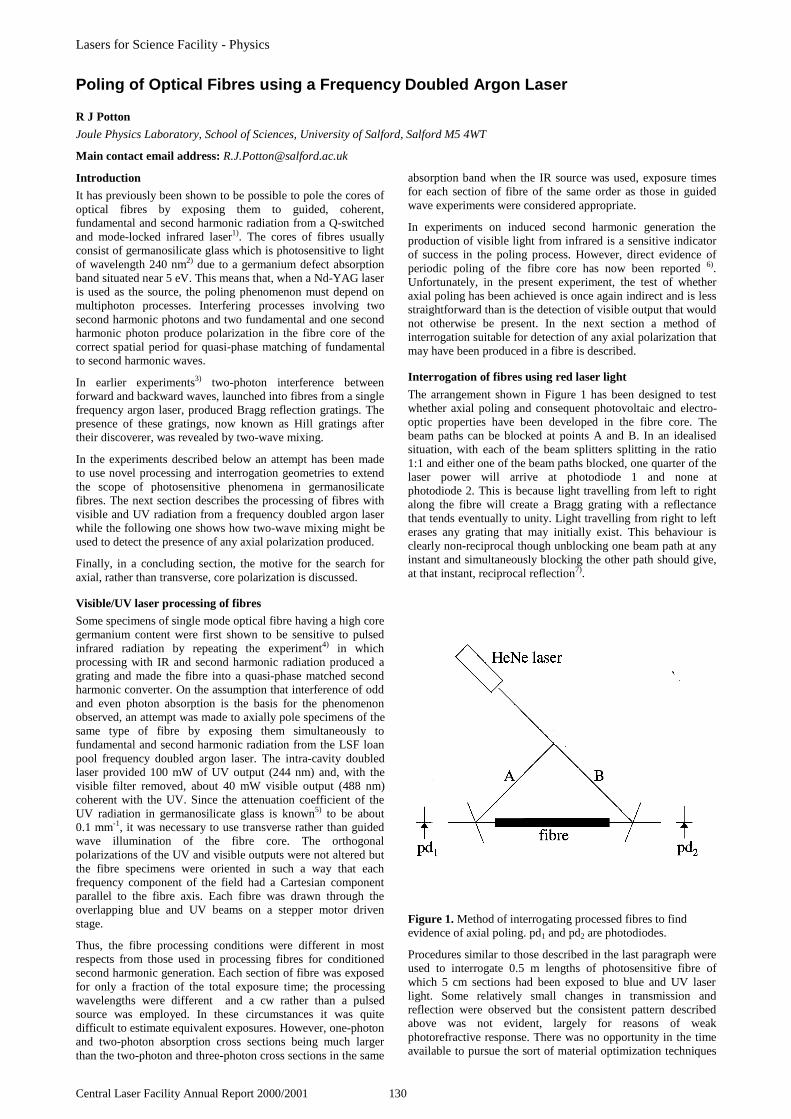
Lasers for Science Facility - Physics
Central Laser Facility Annual Report 2000/2001 130
Introduction
It has previously been shown to be possible to pole the cores ofoptical fibres by exposing them to guided, coherent,fundamental and second harmonic radiation from a Q-switchedand mode-locked infrared laser1). The cores of fibres usuallyconsist of germanosilicate glass which is photosensitive to lightof wavelength 240 nm2) due to a germanium defect absorptionband situated near 5 eV. This means that, when a Nd-YAG laseris used as the source, the poling phenomenon must depend onmultiphoton processes. Interfering processes involving twosecond harmonic photons and two fundamental and one secondharmonic photon produce polarization in the fibre core of thecorrect spatial period for quasi-phase matching of fundamentalto second harmonic waves.
In earlier experiments3) two-photon interference betweenforward and backward waves, launched into fibres from a singlefrequency argon laser, produced Bragg reflection gratings. Thepresence of these gratings, now known as Hill gratings aftertheir discoverer, was revealed by two-wave mixing.
In the experiments described below an attempt has been madeto use novel processing and interrogation geometries to extendthe scope of photosensitive phenomena in germanosilicatefibres. The next section describes the processing of fibres withvisible and UV radiation from a frequency doubled argon laserwhile the following one shows how two-wave mixing might beused to detect the presence of any axial polarization produced.
Finally, in a concluding section, the motive for the search foraxial, rather than transverse, core polarization is discussed.
Visible/UV laser processing of fibres
Some specimens of single mode optical fibre having a high coregermanium content were first shown to be sensitive to pulsedinfrared radiation by repeating the experiment4) in whichprocessing with IR and second harmonic radiation produced agrating and made the fibre into a quasi-phase matched secondharmonic converter. On the assumption that interference of oddand even photon absorption is the basis for the phenomenonobserved, an attempt was made to axially pole specimens of thesame type of fibre by exposing them simultaneously tofundamental and second harmonic radiation from the LSF loanpool frequency doubled argon laser. The intra-cavity doubledlaser provided 100 mW of UV output (244 nm) and, with thevisible filter removed, about 40 mW visible output (488 nm)coherent with the UV. Since the attenuation coefficient of theUV radiation in germanosilicate glass is known5) to be about0.1 mm-1, it was necessary to use transverse rather than guidedwave illumination of the fibre core. The orthogonalpolarizations of the UV and visible outputs were not altered butthe fibre specimens were oriented in such a way that eachfrequency component of the field had a Cartesian componentparallel to the fibre axis. Each fibre was drawn through theoverlapping blue and UV beams on a stepper motor drivenstage.
Thus, the fibre processing conditions were different in mostrespects from those used in processing fibres for conditionedsecond harmonic generation. Each section of fibre was exposedfor only a fraction of the total exposure time; the processingwavelengths were different and a cw rather than a pulsedsource was employed. In these circumstances it was quitedifficult to estimate equivalent exposures. However, one-photonand two-photon absorption cross sections being much largerthan the two-photon and three-photon cross sections in the same
absorption band when the IR source was used, exposure timesfor each section of fibre of the same order as those in guidedwave experiments were considered appropriate.
In experiments on induced second harmonic generation theproduction of visible light from infrared is a sensitive indicatorof success in the poling process. However, direct evidence ofperiodic poling of the fibre core has now been reported 6).Unfortunately, in the present experiment, the test of whetheraxial poling has been achieved is once again indirect and is lessstraightforward than is the detection of visible output that wouldnot otherwise be present. In the next section a method ofinterrogation suitable for detection of any axial polarization thatmay have been produced in a fibre is described.
Interrogation of fibres using red laser light
The arrangement shown in Figure 1 has been designed to testwhether axial poling and consequent photovoltaic and electro-optic properties have been developed in the fibre core. Thebeam paths can be blocked at points A and B. In an idealisedsituation, with each of the beam splitters splitting in the ratio1:1 and either one of the beam paths blocked, one quarter of thelaser power will arrive at photodiode 1 and none atphotodiode 2. This is because light travelling from left to rightalong the fibre will create a Bragg grating with a reflectancethat tends eventually to unity. Light travelling from right to lefterases any grating that may initially exist. This behaviour isclearly non-reciprocal though unblocking one beam path at anyinstant and simultaneously blocking the other path should give,at that instant, reciprocal reflection7).
Figure 1. Method of interrogating processed fibres to findevidence of axial poling. pd1 and pd2 are photodiodes.
Procedures similar to those described in the last paragraph wereused to interrogate 0.5 m lengths of photosensitive fibre ofwhich 5 cm sections had been exposed to blue and UV laserlight. Some relatively small changes in transmission andreflection were observed but the consistent pattern describedabove was not evident, largely for reasons of weakphotorefractive response. There was no opportunity in the timeavailable to pursue the sort of material optimization techniques
Poling of Optical Fibres using a Frequency Doubled Argon Laser
R J Potton
Joule Physics Laboratory, School of Sciences, University of Salford, Salford M5 4WT
Main contact email address: [email protected]

Lasers for Science Facility - Physics
131 Central Laser Facility Annual Report 2000/2001
that are known to be effective in experiments with conventionalphotorefractive crystals.
Conclusions
Attempts at poling optical fibres that have been reported up tonow8) have been directed toward producing transverse corepolarization for electro-optic modulators and parametricfrequency converters and amplifiers. In an axially poled fibrethe formation of Hill gratings by guided visible light may beexpected to be a very efficient process. This is because two-wave mixing by the classical photorefractive mechanism9) ofphotovoltaic, electro-optic, response is allowed in the loweredsymmetry of the poled medium. Axial poling endows the fibrewith a preferred guiding direction and opens the way to non-reciprocal fibre devices of a new type10).
It has not yet been possible to demonstrate such effectsconvincingly but there seems to be no reason why, in principle,they should not be achievable.
Acknowledgement
I am very grateful for the loan of the CLF laser loan poolfrequency doubled argon laser that has allowed thisinvestigation to be carried out.
References
1. U Osterberg and W Margulis, Dye laser pumped byNd:YAG laser pulses frequency doubled in a glass opticalfibre, Opt. Lett. , 11, 516-518, (1986)
2. K Awazu, Kawazoe and M Yamane, Simultaneousgeneration of optical absorption bands at 5.14 and 0.452eV in 9SiO2:GeO2 glasses heated under an H2 atmosphere,J. Appl. Phys., 68, 2713-2718, (1990)
3. K O Hill, Y Fuji, D C Johnson and B S Kawasaki,Photosensitivity of optical fibre waveguides: applicationsto reflection filter fabrication, Appl. Phys. Lett., 32, 647-649, (1978)
4. R H Stolen and H W K Tom, Self-organised phase-matched harmonic generation in glass fibres, Opt. Lett.,12, 585-587, (1987)
5. V Mizrahi and R M Atkins, Constant fluorescence duringphase grating formation and defect band bleaching inoptical fibres under 5.1 eV laser exposure, Elect. Lett., 28,2210-2211, (1992)
6. W Margulis, F Laurell and B Lesche, Imaging of nonlineargratings in frequency-doubling fibres, Nature, 378, 699-701, (1995)
7. C Gu and P Yeh, Reciprocity in photorefractive wavemixing, Opt. Lett., 16, 455-457, (1991)
8. P G Kazansky, P St J Russell and H Takebe, Glass FibrePoling and Applications, J. Lightwave Tech., 15, 1484-1493, (1997)
9. P Gunter, Holography, coherent-light amplification andoptical-phase conjugation with photorefractive materials,Phys. Rep., 93, 199-299, (1982)
10. D C Jones and G Cook, Non-reciprocal transmissionthrough photorefractive crystals in the transient regimeusing reflection geometry, Opt. Comm., 180, 391-402,(2000)

Lasers for Science Facility - Physics
Central Laser Facility Annual Report 2000/2001 132
Introduction
The increased availability and reduced price of high-powerlaser sources have made laser material processing one of thecurrent mainstream techniques. Laser systems are now routinelyused for annealing, cutting of sheet materials and for weldingcomplex structures. Micro-machining of materials by directlaser ablation is now used by an increasing number ofcompanies to create new products and fabricate existing onesmore efficiently.
Present state of the art systems use conventional optics and donot have dynamic control over the optical parameters of thesystem. In these systems a single diffraction limited focussedspot is used, and generally the laser power and workpieceposition relative to the laser beam (focus position) are the onlyfree parameters. Due to the finite depth of focus of suchconventional optics the performance of current systems isseverely limited outside the focal plane 1).
We have used diffractive optics to modify the pupil function ofthe focusing lens in a laser micro-machining system in order tocorrect for aberrations initially present in the system, and toenhance the 3-D machining performance.
Experimental
The test optical system was based on a 4-f configuration (seeFigure 1): a collimated 532 nm wavelength 6.5 mm diameterlight beam from a Spectra Physics GCR11 Q-switchedfrequency doubled YAG laser (S) was incident, after passingthrough a polarizing beam splitter cube (PBS), on a 256x256pixel ferro-electric liquid crystal spatial light modulator (SLM,Displaytech SLM256P). This combination of the SLM and PBSprovides a complex amplitude transmissivity with uniformPDJQLWXGH DQG RU SKDVH VKLIW 7KH VSDWLDO OLJKWPRGXODWRUwas positioned in the back focal plane of an f=250 mm plano-convex singlet (L1), which produced the optical Fouriertransform of the spatial light modulator pattern. The spatiallight modulator patterns were designed to incorporate a carriergrating, which produced distinct diffraction orders in theFourier plane. From the optical Fourier transform the +1diffraction order was selected by a 2.5 mm diameter aperture(A). The aperture size was selected such that the zero order wasjust excluded when the +1 diffraction order was placed atnormalized optical co-ordinates vx=vy ZLWK WKH DSHUWXUHcentred on it. The transmitted diffraction order was then inverseFourier transformed by a second plano-convex singlet(L2, f=300 mm) to generate the wavefront that was used toilluminate the pupil of a NA=0.2 objective lens (O). Theobjective lens pupil was under-filled resulting in an effectiveNA of 0.083. The specimen (W) was mounted on a 3-Dpositioning stage assembly (P) in the focus of the objective lens.The positioning stages and the laser were operating under fullcomputer control.
Figure 1. Schematic diagram of optical system.
A CCD camera and colour filter (F) were also added to enabledirect viewing of the specimen during machining andalignment.
Diffractive optics design procedures
For the design of the diffractive optical elements, ‘filters’ in thefollowing, a direct binary search algorithm was used 2). First thefilter is divided into 256x256 square pixels corresponding to theUHVROXWLRQRI WKH VSDWLDO OLJKWPRGXODWRU DQGD UDQGRP RUinitial phase is assumed for each pixel. The algorithm operatesE\WRJJOLQJWKHSKDVHVKLIWYDOXHEHWZHHQDQG IRUUDQGRPO\selected filter pixels, calculating the least-squares error betweenthe intensities that would be generated by the modified filter atgiven 3-D positions and a set of intensity values that wereprescribed for those positions, and then accepting or rejectingthe pixel change depending on whether the error decreased orincreased. Using the above procedure two-level filters weredesigned with the peak target intensity positions displaced fromthe origin, i.e. with a carrier grating having a spatial frequencythat placed the +1 diffraction order at vx=vy QRUPDOL]HGoptical co-ordinates) in the plane of aperture A. The actualdesign process for the filters consisted of two steps.
First, filters were designed to compensate for increasingamounts of primary Zernike aberrations by specifying a singletarget point for which the intensity was maximized. Thesefilters were then loaded onto the SLM, and the intensity profilein the focussed spot of the experimental setup was measured.The aberration coefficients were then repeatedly adjusted andthe filters re-designed until a practically diffraction limitedfocussed spot was obtained (‘corrected system’). The systemwas found to have significant astigmatism and a small amountof spherical aberration. Figure 2 shows calculated estimates ofthe original un-corrected intensity point spread function (PSF)for the system, the SLM pattern and corresponding pupil phasedistribution, and the corrected intensity PSF.
Figure 2. XZ (a) and YZ (b) sections from the calculatedestimate of the intensity PSF for the original un-correctedsystem. Binary two level SLM pattern (c) used to create pupilphase distribution (d) for aberration correction. XZ (e) and YZ(f) sections from the calculated estimate of the intensity PSF forthe corrected system.
During the second stage of the design process the aberrationcoefficients were kept constant and intensity values werespecified for additional points. The positions and requiredintensities for these additional points were selected in such away so as to obtain an axially extended focussed spot while thelateral extent of the spot was forced to stay constant at the
Use of diffractive optical elements in laser micro-machining
Z J Laczik
University of Oxford, Department of Engineering Science, Parks Road, Oxford OX1 3PJ, UK
Main contact email address: [email protected]
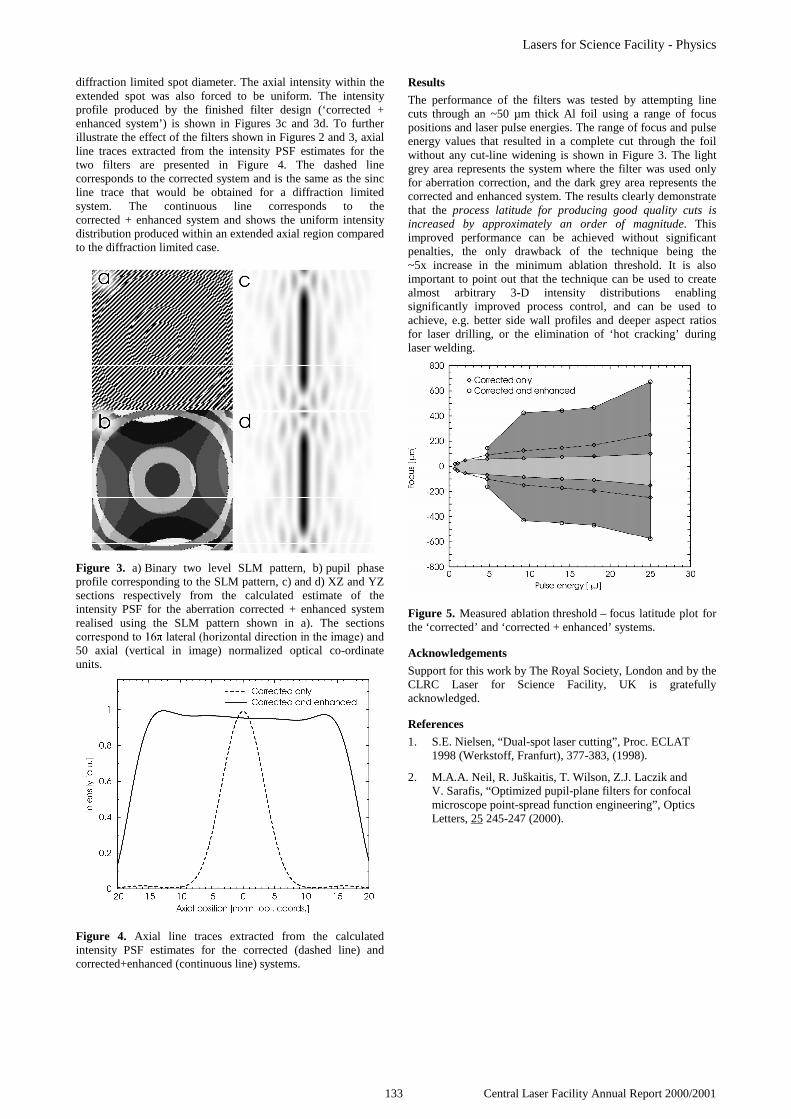
Lasers for Science Facility - Physics
133 Central Laser Facility Annual Report 2000/2001
diffraction limited spot diameter. The axial intensity within theextended spot was also forced to be uniform. The intensityprofile produced by the finished filter design (‘corrected +enhanced system’) is shown in Figures 3c and 3d. To furtherillustrate the effect of the filters shown in Figures 2 and 3, axialline traces extracted from the intensity PSF estimates for thetwo filters are presented in Figure 4. The dashed linecorresponds to the corrected system and is the same as the sincline trace that would be obtained for a diffraction limitedsystem. The continuous line corresponds to thecorrected + enhanced system and shows the uniform intensitydistribution produced within an extended axial region comparedto the diffraction limited case.
Figure 3. a) Binary two level SLM pattern, b) pupil phaseprofile corresponding to the SLM pattern, c) and d) XZ and YZsections respectively from the calculated estimate of theintensity PSF for the aberration corrected + enhanced systemrealised using the SLM pattern shown in a). The sectionsFRUUHVSRQGWR ODWHUDOKRUL]RQWDOGLUHFWLRQLQWKHLPDJHDQG50 axial (vertical in image) normalized optical co-ordinateunits.
Figure 4. Axial line traces extracted from the calculatedintensity PSF estimates for the corrected (dashed line) andcorrected+enhanced (continuous line) systems.
Results
The performance of the filters was tested by attempting linecuts through an ~50 µm thick Al foil using a range of focuspositions and laser pulse energies. The range of focus and pulseenergy values that resulted in a complete cut through the foilwithout any cut-line widening is shown in Figure 3. The lightgrey area represents the system where the filter was used onlyfor aberration correction, and the dark grey area represents thecorrected and enhanced system. The results clearly demonstratethat the process latitude for producing good quality cuts isincreased by approximately an order of magnitude. Thisimproved performance can be achieved without significantpenalties, the only drawback of the technique being the~5x increase in the minimum ablation threshold. It is alsoimportant to point out that the technique can be used to createalmost arbitrary 3-D intensity distributions enablingsignificantly improved process control, and can be used toachieve, e.g. better side wall profiles and deeper aspect ratiosfor laser drilling, or the elimination of ‘hot cracking’ duringlaser welding.
Figure 5. Measured ablation threshold – focus latitude plot forthe ‘corrected’ and ‘corrected + enhanced’ systems.
Acknowledgements
Support for this work by The Royal Society, London and by theCLRC Laser for Science Facility, UK is gratefullyacknowledged.
References
1. S.E. Nielsen, “Dual-spot laser cutting”, Proc. ECLAT1998 (Werkstoff, Franfurt), 377-383, (1998).
2. M.A.A. Neil, R. Juškaitis, T. Wilson, Z.J. Laczik andV. Sarafis, “Optimized pupil-plane filters for confocalmicroscope point-spread function engineering”, OpticsLetters, 25 245-247 (2000).
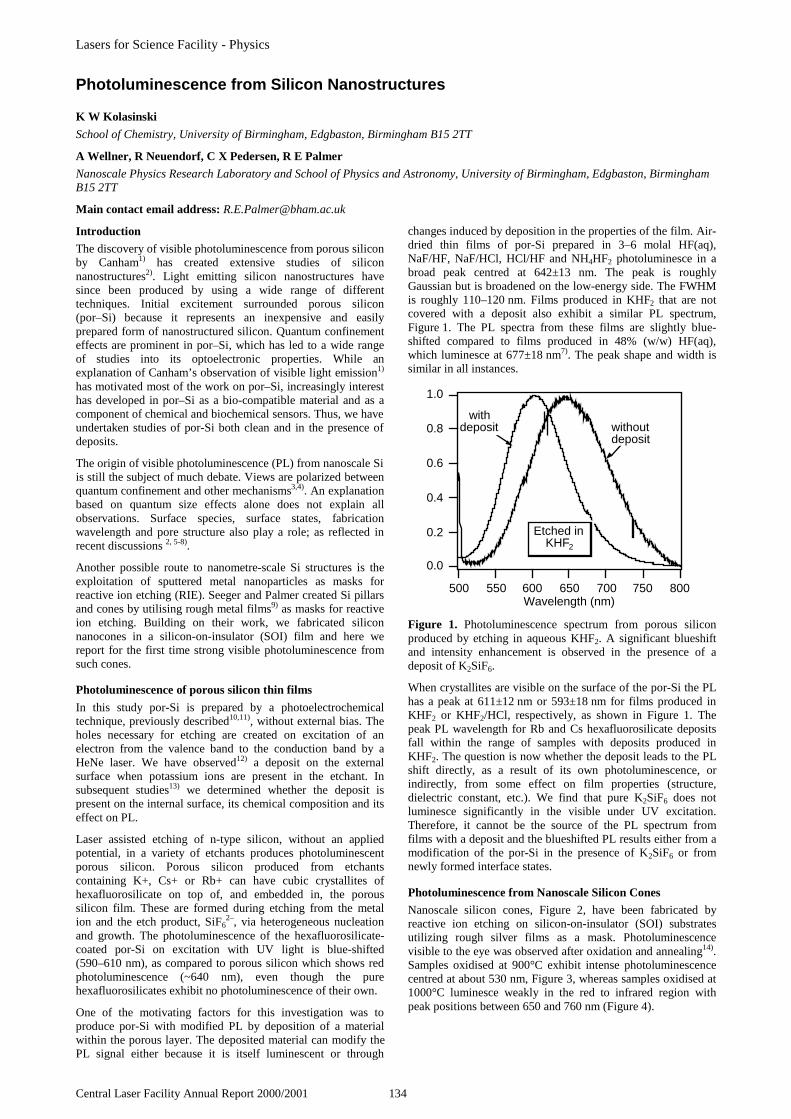
Lasers for Science Facility - Physics
Central Laser Facility Annual Report 2000/2001 134
Introduction
The discovery of visible photoluminescence from porous siliconby Canham1) has created extensive studies of siliconnanostructures2). Light emitting silicon nanostructures havesince been produced by using a wide range of differenttechniques. Initial excitement surrounded porous silicon(por–Si) because it represents an inexpensive and easilyprepared form of nanostructured silicon. Quantum confinementeffects are prominent in por–Si, which has led to a wide rangeof studies into its optoelectronic properties. While anexplanation of Canham’s observation of visible light emission1)
has motivated most of the work on por–Si, increasingly interesthas developed in por–Si as a bio-compatible material and as acomponent of chemical and biochemical sensors. Thus, we haveundertaken studies of por-Si both clean and in the presence ofdeposits.
The origin of visible photoluminescence (PL) from nanoscale Siis still the subject of much debate. Views are polarized betweenquantum confinement and other mechanisms3,4). An explanationbased on quantum size effects alone does not explain allobservations. Surface species, surface states, fabricationwavelength and pore structure also play a role; as reflected inrecent discussions 2, 5-8).
Another possible route to nanometre-scale Si structures is theexploitation of sputtered metal nanoparticles as masks forreactive ion etching (RIE). Seeger and Palmer created Si pillarsand cones by utilising rough metal films9) as masks for reactiveion etching. Building on their work, we fabricated siliconnanocones in a silicon-on-insulator (SOI) film and here wereport for the first time strong visible photoluminescence fromsuch cones.
Photoluminescence of porous silicon thin films
In this study por-Si is prepared by a photoelectrochemicaltechnique, previously described10,11), without external bias. Theholes necessary for etching are created on excitation of anelectron from the valence band to the conduction band by aHeNe laser. We have observed12) a deposit on the externalsurface when potassium ions are present in the etchant. Insubsequent studies13) we determined whether the deposit ispresent on the internal surface, its chemical composition and itseffect on PL.
Laser assisted etching of n-type silicon, without an appliedpotential, in a variety of etchants produces photoluminescentporous silicon. Porous silicon produced from etchantscontaining K+, Cs+ or Rb+ can have cubic crystallites ofhexafluorosilicate on top of, and embedded in, the poroussilicon film. These are formed during etching from the metalion and the etch product, SiF6
2–, via heterogeneous nucleationand growth. The photoluminescence of the hexafluorosilicate-coated por-Si on excitation with UV light is blue-shifted(590–610 nm), as compared to porous silicon which shows redphotoluminescence (~640 nm), even though the purehexafluorosilicates exhibit no photoluminescence of their own.
One of the motivating factors for this investigation was toproduce por-Si with modified PL by deposition of a materialwithin the porous layer. The deposited material can modify thePL signal either because it is itself luminescent or through
changes induced by deposition in the properties of the film. Air-dried thin films of por-Si prepared in 3–6 molal HF(aq),NaF/HF, NaF/HCl, HCl/HF and NH4HF2 photoluminesce in abroad peak centred at 642±13 nm. The peak is roughlyGaussian but is broadened on the low-energy side. The FWHMis roughly 110–120 nm. Films produced in KHF2 that are notcovered with a deposit also exhibit a similar PL spectrum,Figure 1. The PL spectra from these films are slightly blue-shifted compared to films produced in 48% (w/w) HF(aq),which luminesce at 677±18 nm7). The peak shape and width issimilar in all instances.
Figure 1. Photoluminescence spectrum from porous siliconproduced by etching in aqueous KHF2. A significant blueshiftand intensity enhancement is observed in the presence of adeposit of K2SiF6.
When crystallites are visible on the surface of the por-Si the PLhas a peak at 611±12 nm or 593±18 nm for films produced inKHF2 or KHF2/HCl, respectively, as shown in Figure 1. Thepeak PL wavelength for Rb and Cs hexafluorosilicate depositsfall within the range of samples with deposits produced inKHF2. The question is now whether the deposit leads to the PLshift directly, as a result of its own photoluminescence, orindirectly, from some effect on film properties (structure,dielectric constant, etc.). We find that pure K2SiF6 does notluminesce significantly in the visible under UV excitation.Therefore, it cannot be the source of the PL spectrum fromfilms with a deposit and the blueshifted PL results either from amodification of the por-Si in the presence of K2SiF6 or fromnewly formed interface states.
Photoluminescence from Nanoscale Silicon Cones
Nanoscale silicon cones, Figure 2, have been fabricated byreactive ion etching on silicon-on-insulator (SOI) substratesutilizing rough silver films as a mask. Photoluminescencevisible to the eye was observed after oxidation and annealing14).Samples oxidised at 900°C exhibit intense photoluminescencecentred at about 530 nm, Figure 3, whereas samples oxidised at1000°C luminesce weakly in the red to infrared region withpeak positions between 650 and 760 nm (Figure 4).
Photoluminescence from Silicon Nanostructures
K W Kolasinski
School of Chemistry, University of Birmingham, Edgbaston, Birmingham B15 2TT
A Wellner, R Neuendorf, C X Pedersen, R E Palmer
Nanoscale Physics Research Laboratory and School of Physics and Astronomy, University of Birmingham, Edgbaston, BirminghamB15 2TT
Main contact email address: [email protected]
1.0
0.8
0.6
0.4
0.2
0.0
800750700650600550500Wavelength (nm)
Etched in KHF2
withoutdeposit
withdeposit

Lasers for Science Facility - Physics
135 Central Laser Facility Annual Report 2000/2001
Silicon nanocones fabricated on Si(111) substrates acted as areference system since the cones are not isolated from thesubstrate by a wide band gap layer. The samples also showedvisible photoluminescence after repeated oxidation in a dryoxygen atmosphere and annealing in nitrogen. Samplesoxidised at 900°C were found to emit light in the yellow regionsimilar to cones etched on silicon-on-insulator. Thisphotoluminescence and its intensity evolution can be
understood in terms of defect creation and annealing. Conesetched on Si(111) substrates oxidised at 1000°C exhibit weakred photoluminescence centred at 650 to 670 nm. This type ofphotoluminescence most likely arises from a defect in the oxidewhereas photoluminescence signals centred at higherwavelengths were attributed to a quantum confinement effect insilicon clusters, or a combination of a quantum confinementeffect and Si/SiO2 interface states.
Conclusions
Diverse silicon nanostructures exhibit efficient visiblephotoluminescence. The radiative mechanisms remain complexand difficult to elucidate; however, it is becoming increasinglycertain that various mechanisms are responsible for lightemission depending on the conditions under which the siliconnanostructures are formed.
The results demonstrate to our knowledge the first siliconnanocones fabricated by reactive ion etching in silicon-on-insulator which exhibit photoluminescence. In the future itwould be interesting to explore the photoluminescenceproperties of ordered arrays of silicon cones or pillarsbecause.of their narrower size distribution and since suchstructures should also display a photonic band gap.
References
1. L. T. CanhamAppl. Phys. Lett. 57, 1046, (1990).
2. G. Cullis, L. T. Canham, and P. D. J. CalcottJ. Appl. Phys. 82, 909, (1997).
3. S. M. Prokes, J. Mater. Res. 11, 305, (1996).
4. P. D. J. Calcott, K. J. Nash, L. T. Canham, M. J. Kane, andD. Brumhead, J. Lumin. 57, 257, (1993).
5. F. Ozanam, J.-N. Chazalviel, and R. B. WehrspohnThin Solid Films 297, 53, (1997).
6. M. Chang and Y. F. ChenJ. Appl. Phys. 82, 3514, (1997).
7. W. Kolasinski, M. Aindow, J. C. Barnard, S. Ganguly, L.Koker, A. Wellner, R. E. Palmer, C. Field, P. Hamley, andM. Poliakoff, J. Appl. Phys. 88, 2472, (2000).
8. W. Kolasinski, J. C. Barnard, L. Koker, S. Ganguly, and R.E. Palmer, Mater. Sci. Eng. B 69-70, 156, (2000).
9. K. Seeger and R. E. PalmerJ. Phys. D 32, L129, (1999).
10. L. Koker and K. W. KolasinskiJ. Appl. Phys. 86, 1800, (1999).
11. L. Koker and K. W. KolasinskiPhys. Chem. Chem. Phys. 2, 277, (2000).
12. A. Wellner, L. Koker, K. W. Kolasinski, M. Aindow, andR. E. Palmer, Phys. Status Solidi A 182, 87, (2000).
13. L. Koker, P. A. J. Sherratt, K. W. Kolasinski, A. Wellner,R. Neuendorf, and R. E. Palmer, J. Phys. Chem. B, (inpreparation).
14. A. Wellner, R.E. Palmer, Z.G. Zheng, C.J. Kiely, K.W.Kolasinski, J. Appl. Phys. (submitted)
Figure 3. Typical PL spectra of silicon cones oxidised at900°C etched in silicon-on-insulator substrates. The insetshows the evolution of the peak intensity with oxidationtime; the lines are drawn to guide the eye.
Figure 2. Scanning electron micrograph of silicon cones onan insulating oxide layer (tilted 30°) after etching andcleaning.
Figure 4. Typical PL spectra of silicon cones oxidised at1000°C etched in silicon-on-insulator substrates. The insetshows the evolution of the peak intensity with oxidationtime; the lines are drawn to guide the eye.

Lasers for Science Facility - Physics
Central Laser Facility Annual Report 2000/2001 136

Laser Science and Development
137 Central Laser Facility Annual Report 2000/2001
Laser Science and Development
1) Vulcan Petawatt
2) Vulcan
3) Astra
4) Lasers for Science Facility
5) Laser Optics and Laser Design

Laser Science and Development – Vulcan Petawatt
Central Laser Facility Annual Report 2000/2001 138
On the 1st April 2001 the Vulcan Petawatt upgrade was 2 yearsin to a 3.3 year project to enhance the ultra-short pulsecapabilities of Vulcan to the Petawatt level. The upgrade isfunded through an EPSRC grant and a collaborationarrangement with Lawrence Livermore National Laboratories(LLNL) US which provides ex-NOVA laser components inexchange for beam time on Vulcan. The upgrade will deliverPetawatt power to target with the capability of adding additionalbeams in the future for plasma probing and heating. A briefsummary of the main areas of activity is given below withfurther details described in the following articles.
Target area building
A major milestone of the project was the construction of alarge, new target area adjacent to the existing laser facilities tohouse the Petawatt beam compression gratings and interactionchamber. The building was completed ahead of schedule andofficially handed over to RAL at the end of December 2000.The completion of the new Petawatt target area building wasmarked with a small celebration for staff and contractors on 24January 2001. The photograph below, Figure 1, showsProf. Henry Hutchinson, Director of the Central Laser Facility,explaining how the new laser will enhance the currentcapabilities of the CLF’s Vulcan laser and stimulate thescientific programme of its users.
Pulsed power upgrade
The reconstruction of the Vulcan capacitor bank using highenergy density capacitors from NOVA was critical to theupgrade. All major components including capacitors, triggersand charging units were pre-assembled and tested off-linethroughout the year. Vulcan was taken off-line to users inJanuary 2001 for three months to enable the work to proceed.The installation went according to schedule, helpedconsiderably by meticulous planning of every stage. Aftersome minor problems with electrical noise were solved, Vulcanwas back on-line to users in April 2001.
Design of the compression and interaction chambers
The design of the two large vacuum vessels in the Petawatttarget area has been a major activity for the CLF’s EngineeringGroup during the year. The 71 ton compressor chamber iscomposed of three main sections. Two cylindrical vessels ateither end hold the 1m aperture pulse compression gratings.They are connected by a 13m long centre section whichtransports the beam under vacuum between the gratings.
The interaction vessel is box-like in construction,5m x 3m x 2m, and weighing 60 tons. In use it will besurrounded by 70 tons of lead, aluminium and polytheneradiation shielding. The chamber supports all major geometriesfor user experiments as detailed in last year’s Report and retainsversatility for future enhancements. The chambers are undermanufacture and scheduled to be installed in mid-2001.
Clean Room Infrastructure
In support of the Vulcan Upgrade project, a new cleanroomfacility has been established in R2 for the purposes of handlingand testing large aperture optics up to 1 m in diameter and forservicing disc amplifiers. The facility is in close proximity tothe capacitor test bank which is used to test the halfshells andcompleted amplifiers off-line. The location of the wholecleanroom complex in one contiguous unit improves thecleanliness achievable, minimises component handling andtransportation and makes amplifier servicing more efficient.
Project Management
The Vulcan Upgrade Project is managed according to theprocesses defined by the CLRC's Corporate ProjectManagement (CPM). The project is controlled by the ProjectManagement Committee under the chairmanship of Dr TGWalker, CE of CCLRC. The PMC membership includes ProfsO Willi and J Wark (Principle users of Vulcan), Dr D Watsonand Mr. D Harman (EPSRC), Prof. MHR Hutchinson (Director,CLF) and Dr C Edwards (Vulcan Petawatt Project Manager).
Vulcan Petawatt Upgrade Overview
CB Edwards
Central Laser Facility, CLRC Rutherford Appleton Laboratory, Chilton, Didcot, Oxon, OX11 0QX, UK
Main contact email address: [email protected]
Figure 1. Henry Hutchinson describes the Petawatt upgrade and explains its future impact on the user community.

Laser Science and Development – Vulcan Petawatt
139 Central Laser Facility Annual Report 2000/2001
Introduction
Last year we reported on the design of the building for theVulcan Petawatt Upgrade 1). This article sets out the progressmade on construction during the past year.
The building plan is shown in Figure 1 for reference.
Modifications to existing buildings
Target Area 2 ceased to be operational in April 2000 and workcommenced to join it with the Users Area. This involved theremoval of all the equipment from the areas, the removal of theinterconnecting wall, the re-routing of the stairs and corridorover to the South Control Room, and the installation of a newcorridor to the new Target Area Petawatt (TAP) building.
Early in 2001 the wall between Laser Area 3 and Target Area 2was removed and it was decided to remove the YLF OscillatorRoom completely as well as re-siting air conditioning plant.This gap has been temporarily filled to enable VulcanOperations to continue whist the new Petawatt amplifier chainand diagnostics area (Laser Area 4) is established andequipment commissioned. This wall will eventually beremoved.
New building and services
The specification for the new building was outlined in lastyear’s article 1). The following describes the building progressthrough the year.
The contract for the new building was placed with Knowles andSon and construction work started on the 14th February 2000.
Upon digging the foundations, electrical supply cables to R1were discovered to run directly under the proposed wall.Bridging foundations then had to be laid over these.
The foundations for the walls were completed at the beginningof April.
By the middle of April the main steel frame for the entirebuilding was erected.
As part of the building two large 1 metre thick reinforcedconcrete plinths were constructed by mid May, one to supportthe compressor chamber and one to support the interactionchamber. The plinths are necessary to ensure stability of theoptics that make up the pulse compressor. Photo 1 shows thesituation at this stage.
The floor of the target area, with in-built ducts, was completedin June. Construction of the concrete shielding inner wall andthe brick outer wall progressed significantly. Photo 2 shows thesituation at this stage.
During July the building work advanced rapidly with both theinternal concrete shielding wall and the external brick wallrising to the upper levels.
Building work continued through August. The installation ofthe 5 T crane was the first sign of internal work on the building.
The fitting of the aluminium roof in September saw the buildinglooking externally complete whilst the inside walls werefinished with plasterboard. Installation of plant for thebuilding’s air conditioning services also began. Photo 3 showsthe situation at this stage.
The completion of lighting, suspended ceiling and otherservices saw the building nearing completion in November.
The building was completed ahead of schedule and officiallyhanded over to RAL by the end of December 2000.
Photo 4 shows the completed building following the tarmacingof the perimeter road. This should be compared with theimpression of the building published last year 1) , Figure 3.
Services
Following completion of the building, work has beenprogressing on the installation of the basic infrastructureservices required to operate the Petawatt laser.
Photo 5 shows the building air conditioning plant installed onthe 1st floor of the new plant room.
Additional power distribution has been installed for plant readyfor commissioning the facility. The CLF’s N2 distribution pipe-work has been extended to provide N2 for cooling amplifiersand pneumatically operated equipment. A computer networkand telephone backbone has been extended to the new areas. Acomprehensive trigger/signal network has been installedbetween TAP, its Control Room and the existing Vulcan.
On the ground floor of the plant room the large roots/rotaryvacuum pumpsets, the twin air compressors and receiver for thecompressor and interaction chambers pump down and let uphave been sited ready for final installation and commissioning(see Photo 6).
Future work
The vinyl floor will be laid after the large compression andinteraction chambers have been delivered and the largetemporary opening in the south wall will then be sealed upwhen the large equipment has been commissioned.
The laser interlocks will be installed soon during a convenientslot in the Vulcan operations program.
The temporary walls between LA3, LA4 and TAP will beremoved and additional lead shielding doors and concreteshielding walls added at a convenient time.
Conclusions
The construction of the Petawatt Target Area building andmodifications to the existing Vulcan laser building have beencompleted on schedule thanks to the efforts of many membersof CLRC staff and contractors and await the installation andcommissioning of the Petawatt laser itself.
References
1. B E Wyborn, Central Laser Facility Annual Report 1999-2000, RAL-TR-2000-034, pg 184
Construction of the Buildings and Services for the Vulcan Petawatt Upgrade
B E Wyborn, R M Allott, P A Brummitt, C N Danson, C B Edwards, J A C Govans, B J Gray, S Hancock, M R Harman,P E Hatton, P Holligan, A R Jackson, W J Lester, Z A Miljus, D Neely, D R Neville, D A Pepler, M R Pitts, C J Reason,D A Rodkiss, A G Ryder, R W W Wyatt
Central Laser Facility, CLRC Rutherford Appleton Laboratory, Chilton, Didcot, Oxon, OX11 0QX, UK
R J Mason, J P H Bradley, J M Henstridge, R Lascelles, A M Lewis, D Matthewson, T Rennie, A M Shepherd, J Skrzyniarz,J C Stamp
Engineering Department, CLRC Rutherford Appleton Laboratory, Chilton, Didcot, Oxon, OX11 0QX, UK
Main contact email address: [email protected]

Laser Science and Development – Vulcan Petawatt
Central Laser Facility Annual Report 2000/2001 140
Photo 1. Building as at May 2000 - Foundations complete, steel framework erected, reinforced concrete plinths cast.
Photo 2. Building as at June 2000 – Floor complete, internal concrete shielding and external brick wall being erected.

Laser Science and Development – Vulcan Petawatt
141 Central Laser Facility Annual Report 2000/2001
Photo 3. Building as at September 2000 – Internal concrete shielding and external brick wall nearly complete, crane installed,aluminium roof installed, building services plant being installed internally.
Photo 4. Building as at December 2000 – Building and road complete.

Laser Science and Development – Vulcan Petawatt
Central Laser Facility Annual Report 2000/2001 142
Photo 5. Air Conditioning Plant on 1st Floor of new Plant Room.
Photo 6. Vaccum pumpsets and Let up compressors and receiver on Ground Floor of new Plant Room.

Laser Science and Development – Vulcan Petawatt
143 Central Laser Facility Annual Report 2000/2001
Figure 1. Plan of Vulcan Petawatt Building.
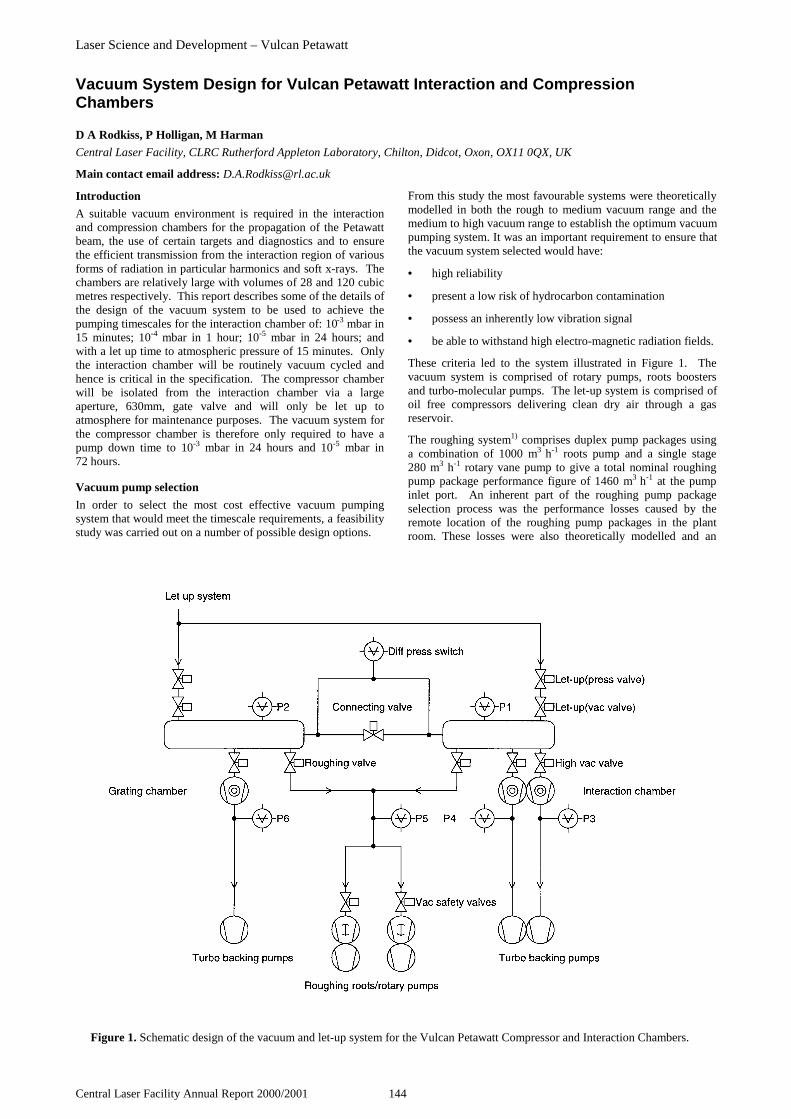
Laser Science and Development – Vulcan Petawatt
Central Laser Facility Annual Report 2000/2001 144
Introduction
A suitable vacuum environment is required in the interactionand compression chambers for the propagation of the Petawattbeam, the use of certain targets and diagnostics and to ensurethe efficient transmission from the interaction region of variousforms of radiation in particular harmonics and soft x-rays. Thechambers are relatively large with volumes of 28 and 120 cubicmetres respectively. This report describes some of the details ofthe design of the vacuum system to be used to achieve thepumping timescales for the interaction chamber of: 10-3 mbar in15 minutes; 10-4 mbar in 1 hour; 10-5 mbar in 24 hours; andwith a let up time to atmospheric pressure of 15 minutes. Onlythe interaction chamber will be routinely vacuum cycled andhence is critical in the specification. The compressor chamberwill be isolated from the interaction chamber via a largeaperture, 630mm, gate valve and will only be let up toatmosphere for maintenance purposes. The vacuum system forthe compressor chamber is therefore only required to have apump down time to 10-3 mbar in 24 hours and 10-5 mbar in72 hours.
Vacuum pump selection
In order to select the most cost effective vacuum pumpingsystem that would meet the timescale requirements, a feasibilitystudy was carried out on a number of possible design options.
From this study the most favourable systems were theoreticallymodelled in both the rough to medium vacuum range and themedium to high vacuum range to establish the optimum vacuumpumping system. It was an important requirement to ensure thatthe vacuum system selected would have:
• high reliability
• present a low risk of hydrocarbon contamination
• possess an inherently low vibration signal
• be able to withstand high electro-magnetic radiation fields.
These criteria led to the system illustrated in Figure 1. Thevacuum system is comprised of rotary pumps, roots boostersand turbo-molecular pumps. The let-up system is comprised ofoil free compressors delivering clean dry air through a gasreservoir.
The roughing system1) comprises duplex pump packages usinga combination of 1000 m3 h-1 roots pump and a single stage280 m3 h-1 rotary vane pump to give a total nominal roughingpump package performance figure of 1460 m3 h-1 at the pumpinlet port. An inherent part of the roughing pump packageselection process was the performance losses caused by theremote location of the roughing pump packages in the plantroom. These losses were also theoretically modelled and an
Vacuum System Design for Vulcan Petawatt Interaction and CompressionChambers
D A Rodkiss, P Holligan, M Harman
Central Laser Facility, CLRC Rutherford Appleton Laboratory, Chilton, Didcot, Oxon, OX11 0QX, UK
Main contact email address: [email protected]
Figure 1. Schematic design of the vacuum and let-up system for the Vulcan Petawatt Compressor and Interaction Chambers.

Laser Science and Development – Vulcan Petawatt
145 Central Laser Facility Annual Report 2000/2001
optimum roughing pipeline diameter of 160 mm was selected.The roughing pump package location was chosen because of theconsiderable heat and noise generated by the vacuum pumpswhen operating under full load conditions. Additionally as thesurface areas are very large within both vacuum chambers thesurface outgassing from the pumped volumes has beenminimised by the use of low outgassing materials wherepossible and electrodeless nickel plating of the vacuum chamberinteriors.
The roughing pump packages are capable of an ultimatepressure of < 6 x 10⁻³ mbar, which provides for a wide marginof ultimate pressure performance at maximum pumping speedto complement the performance characteristics of the 2000 l s-1
high throughput Turbomolecular vacuum pumps2). Thesepumps were selected as they meet all the performance criteriawith the additional benefits of the ability to handle high gasloads at high fore-vacuum pressures and require minimal lowcost maintenance. From the theoretical modeling process it wasagain established that duplex pumps would be required to meetthe specification requirements on the interaction chamber andthat one pump would be capable of maintaining the vacuum tospecification within the compression chamber. TheTurbomolecular pumps are all close coupled through a gatevalve to each chamber for increased pumping speed andflexibility. The backing pumps for each Turbomolecular pumpare also close coupled to maximise performance and minimisecost.
The theoretical performance of the complete system is shown inFigure 2 (a) and (b). The Compressor Chamber is calculated topump down to 10-3 mbar in 2 hours and 10-4 mbar in 24 hours.The Interaction Chamber is calculated to pump down to10-3 mbar in 20 minutes and 10-4 mbar in 1 hour. These timesare largely within the specification highlighted in theintroduction with the exception of the pump down to 10-3 mbarin 20 minutes for the interaction chamber which was cost
constrained. It should be noted that these estimates are basedon a clean environment and could be lengthened dependent onuser diagnostic and target requirements.
Let-Up System
With large volume vacuum chambers housing delicate opticalcomponents such as those used in the Petawatt upgrade there-pressurisation process requires a let-up system that will notdamage or contaminate the optics and chamber interior. Anycontamination of the chamber interior also compromisessubsequent re-evacuation cycles, as contamination productssuch as water vapour can greatly extend the chamber cycletimes. The Petawatt let-up system consists of duplex oil freecompressors capable of delivering 30 l/s at 7 bar with forced airaftercooling, refrigerant dryer and 0.01 micron filtration stagesto produce oil free, clean dry air at high pressure, which by theincorporation of a pressurised reservoir will meet the requiredre-pressurisation timescale specification.
Control system
The system designed to control the vacuum and let-upcomponents and their sequence of operation consists of amodular Programmable Logic Controller (PLC) system3), with auser terminal including a colour graphics screen. The modulesconsist of digital I/O, relay outputs and analogue inputs. Thedigital I/O is used to operate solenoid valves and return thevalve status, and the relay outputs are used to engage thecontactors that supply the vacuum pumps. An analogue signalis taken from the vacuum gauge controller which allows thechamber pressure to be displayed on the graphics screen. Aschematic diagram is also displayed, showing pump operationand valve position, with various pump down and let-up optionsavailable.
Conclusion
A vacuum and let-up system has been designed to fully meet orexceed the operational performance requirements of the VulcanPetawatt Compressor and Interaction Chambers.
References
1. Leybold Vacuum, Plough Lane, London, UK
2. Pfeiffer Vacuum, 2-4 Cromwell Business Centre, NewportPagnell, UK
3. Schneider Ltd., Windsor Road, Maidenhead, UK
Pump Down Grating Chamber
1.00E-05
1.00E-04
1.00E-03
1.00E-02
1.00E-01
1.00E+00
1.00E+01
1.00E+02
1.00E+03
0 5 10 15 20 25 30
TIme (hrs)
Pre
ssu
re(m
bar
s)
Pump Down Interaction Chamber
1.00E-04
1.00E-03
1.00E-02
1.00E-01
1.00E+00
1.00E+01
1.00E+02
1.00E+03
0 10 20 30 40 50 60 70
Time (minutes)
Pre
ssu
re (
mb
ar)
Figure 2. Theoretical pump down curve of (a) TheCompressor Chamber. (b) The Interaction Chamber.

Laser Science and Development – Vulcan Petawatt
Central Laser Facility Annual Report 2000/2001 146
Overview
Before the Petawatt upgrade was financed for the Vulcan laserit was recognised that the disc amplifier pulsed powerequipment was vulnerable to total failure through componentobsolescence. One power supply unit was a remnant of theinitial 1976-77 installation, and was at this time supporting thesix main output amplifiers. In light of the serious implicationsfor the facility, funding to replace the pulsed power equipmentwas sought, and agreed by the EPSRC.
The proposal presented costing for a multi-channeled, modulardisc amplifier system utilising switched mode units to chargeeach capacitor bank, to be further enhanced by new Ignitrontrigger modules to provide a reliable amplifier cascadetriggering option. The cascade firing of amplifiers provides aconvenient and accurate mechanism for balancing the relativeindividual beam intensities, or otherwise as required.
At this time a proposal to upgrade the Vulcan laser to Petawattcapability was under discussion which concluded with fundingbeing provided by EPSRC and hardware made available fromthe closure of the Nova laser at Lawrence Livermore NationalLaboratories (LLNL) in the US. This hardware included
capacitors, ignitrons, racks, resistors and fuses all of whichwould be used in the Vulcan pulsed power system. As a resultof this development, the pulsed power upgrade project wasincorporated into the Vulcan laser upgrade project.
The Upgrade Requirement
The proposed laser upgrade involved boosting the output withthe addition of three Nova 208mm amplifiers, and to provideisolation with a 208mm Faraday Rotator. To accommodate thishardware one target area, a user computer room and anoscillator room would be converted into an extension of thelaser (LA4). A new building would provide for a sixteen-metrebeam compression chamber, and a new interaction chamber.Space would be generated to accommodate the extra pulsedpower requirement by replacing the existing capacitor bankswith a reconfigured installation utilizing higher densitycapacitors from Nova powered from switched mode powerunits.
Pulsed Power Project
It was clear that successful completion of the installation withinthe allotted period from January to April 2001 would require
Vulcan Pulsed Power Installation and Commissioning
R W W Wyatt, J C Aldis, P A Brummitt, C N Danson, C B Edwards, B C Eltham, A J Frackiewicz, J A C Govans, B J Gray,S Hancock, P E Hatton, P Holligan, M H R Hutchinson, A R Jackson, T Knott, W J Lester, J M A Loose, D R Neville,Z A Miljus, D A Pepler, M R Pitts, C J Reason, K J Rodgers, D A Rodkiss, A G Ryder, G P Warner, G N Wiggins,B E Wyborn
Central Laser Facility, CLRC Rutherford Appleton Laboratory, Chilton, Didcot, Oxon, OX11 0QX, UK
Main contact email address: [email protected]
Figure 1. Paul Holligan of the CLF Electrical Engineering Section adjusting a PFN following installation of the new Vulcanpulsed power area.
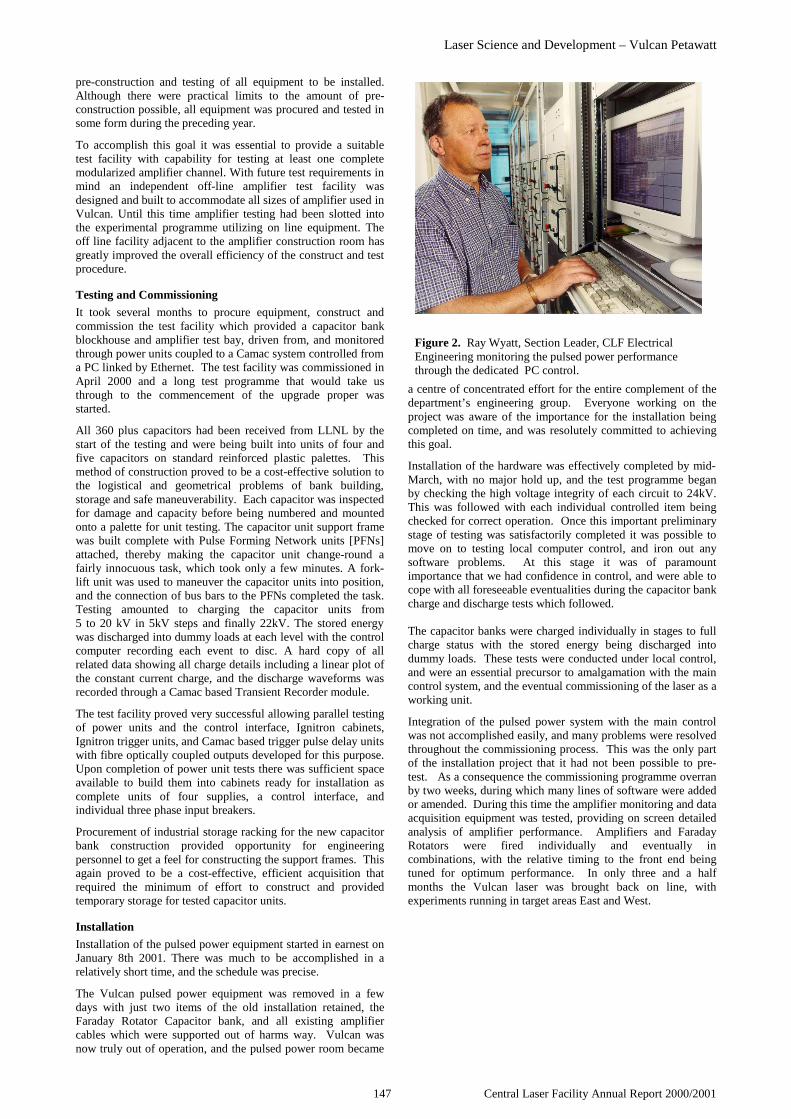
Laser Science and Development – Vulcan Petawatt
147 Central Laser Facility Annual Report 2000/2001
pre-construction and testing of all equipment to be installed.Although there were practical limits to the amount of pre-construction possible, all equipment was procured and tested insome form during the preceding year.
To accomplish this goal it was essential to provide a suitabletest facility with capability for testing at least one completemodularized amplifier channel. With future test requirements inmind an independent off-line amplifier test facility wasdesigned and built to accommodate all sizes of amplifier used inVulcan. Until this time amplifier testing had been slotted intothe experimental programme utilizing on line equipment. Theoff line facility adjacent to the amplifier construction room hasgreatly improved the overall efficiency of the construct and testprocedure.
Testing and Commissioning
It took several months to procure equipment, construct andcommission the test facility which provided a capacitor bankblockhouse and amplifier test bay, driven from, and monitoredthrough power units coupled to a Camac system controlled froma PC linked by Ethernet. The test facility was commissioned inApril 2000 and a long test programme that would take usthrough to the commencement of the upgrade proper wasstarted.
All 360 plus capacitors had been received from LLNL by thestart of the testing and were being built into units of four andfive capacitors on standard reinforced plastic palettes. Thismethod of construction proved to be a cost-effective solution tothe logistical and geometrical problems of bank building,storage and safe maneuverability. Each capacitor was inspectedfor damage and capacity before being numbered and mountedonto a palette for unit testing. The capacitor unit support framewas built complete with Pulse Forming Network units [PFNs]attached, thereby making the capacitor unit change-round afairly innocuous task, which took only a few minutes. A fork-lift unit was used to maneuver the capacitor units into position,and the connection of bus bars to the PFNs completed the task.Testing amounted to charging the capacitor units from5 to 20 kV in 5kV steps and finally 22kV. The stored energywas discharged into dummy loads at each level with the controlcomputer recording each event to disc. A hard copy of allrelated data showing all charge details including a linear plot ofthe constant current charge, and the discharge waveforms wasrecorded through a Camac based Transient Recorder module.
The test facility proved very successful allowing parallel testingof power units and the control interface, Ignitron cabinets,Ignitron trigger units, and Camac based trigger pulse delay unitswith fibre optically coupled outputs developed for this purpose.Upon completion of power unit tests there was sufficient spaceavailable to build them into cabinets ready for installation ascomplete units of four supplies, a control interface, andindividual three phase input breakers.
Procurement of industrial storage racking for the new capacitorbank construction provided opportunity for engineeringpersonnel to get a feel for constructing the support frames. Thisagain proved to be a cost-effective, efficient acquisition thatrequired the minimum of effort to construct and providedtemporary storage for tested capacitor units.
Installation
Installation of the pulsed power equipment started in earnest onJanuary 8th 2001. There was much to be accomplished in arelatively short time, and the schedule was precise.
The Vulcan pulsed power equipment was removed in a fewdays with just two items of the old installation retained, theFaraday Rotator Capacitor bank, and all existing amplifiercables which were supported out of harms way. Vulcan wasnow truly out of operation, and the pulsed power room became
a centre of concentrated effort for the entire complement of thedepartment’s engineering group. Everyone working on theproject was aware of the importance for the installation beingcompleted on time, and was resolutely committed to achievingthis goal.
Installation of the hardware was effectively completed by mid-March, with no major hold up, and the test programme beganby checking the high voltage integrity of each circuit to 24kV.This was followed with each individual controlled item beingchecked for correct operation. Once this important preliminarystage of testing was satisfactorily completed it was possible tomove on to testing local computer control, and iron out anysoftware problems. At this stage it was of paramountimportance that we had confidence in control, and were able tocope with all foreseeable eventualities during the capacitor bankcharge and discharge tests which followed.
The capacitor banks were charged individually in stages to fullcharge status with the stored energy being discharged intodummy loads. These tests were conducted under local control,and were an essential precursor to amalgamation with the maincontrol system, and the eventual commissioning of the laser as aworking unit.
Integration of the pulsed power system with the main controlwas not accomplished easily, and many problems were resolvedthroughout the commissioning process. This was the only partof the installation project that it had not been possible to pre-test. As a consequence the commissioning programme overranby two weeks, during which many lines of software were addedor amended. During this time the amplifier monitoring and dataacquisition equipment was tested, providing on screen detailedanalysis of amplifier performance. Amplifiers and FaradayRotators were fired individually and eventually incombinations, with the relative timing to the front end beingtuned for optimum performance. In only three and a halfmonths the Vulcan laser was brought back on line, withexperiments running in target areas East and West.
Figure 2. Ray Wyatt, Section Leader, CLF ElectricalEngineering monitoring the pulsed power performancethrough the dedicated PC control.

Laser Science and Development – Vulcan Petawatt
Central Laser Facility Annual Report 2000/2001 148
Introduction
The compressor chamber houses the two large aperture(940 mm) diffraction gratings under vacuum to preserve pulsefidelity to target. The beam configuration, the beam size andthe footprint of the optical mounts largely governed the size anddesign of the chamber. The chamber will be manufactured inthree main parts: two cylindrical vessels that house the optics,and a rectangular transport section between the two. Thechamber will be manufactured from nickel plated mild steel. Itwill weigh 71 tons and has a volume of 120 cubic metres. Itwill have a turbo-molecular vacuum system capable of pumpingdown to 10-3 mBar in 24 hours or 10-5 mBar in 3 days.
An artist’s impression of the inside of the chamber is shown inFigure 1. The beam enters the chamber via an expandingvacuum spatial filter (shown in green below) which is part ofthe same vacuum system to minimise the number of optics inthe beam. The beam is collimated with a 14m focal length lensthen turned using one of the reworked LLNL large aperturemirrors onto the first of the grating pair. After compression thebeam is turned into the main interaction chamber using apartially transmissive mirror. The 0.2% leakage through theback of the mirror is used for compressed beam diagnosis and isrepresented as the red focusing beam at the top of Figure 1.
Foundations
In order to achieve optimum compression the grating stability isof critical importance. The angular mismatch that can betolerated between the two gratings is 18 micro radians and thesensitivity to the pointing accuracy of the incoming beam is2 milliradians. In order to achieve these criteria the buildingwas designed with an independent plinth (foundation) for thecompressor chamber. This measured 19m x 4.7m and was 1mdeep made up of reinforced concrete. It is designed in this wayso that the compressor chamber will be supported on a stiff‘raft’ and that this will allow some independent movement ofthe foundations within the target area. This could be
particularly important when the 70 tons of shielding is installedaround the interaction chamber.
Chamber design
The chamber was designed in-house with detailed drawingsprovided by an external contractor 1). Its cost and therequirement for vacuum and laser cleanliness drove the materialspecification, with the whole chamber manufactured fromNickel-plated mild steel.
The first of the tanks contains the collimating lens from theexpanding Vacuum Spatial Filter, a 940 mm diameter turningmirror and the second of the compressor gratings. The secondtank contains the first grating, diagnostic mirrors and the finalturning mirror in to the interaction chamber. The tanks aremade from 25 mm thick rolled mild steel, are 4.5 m in diameterand 2.0 m high. Ports are made available for beam access andto diagnose the beam. A set of six ports in each chamber willallow feed-throughs for electrical cables for the mirror drives.
The floors of the compressor tanks are 85 mm thick and will besecured directly to the plinth via a 600 x 600 mm array of pre-tensioned vacuum sealed bolts. This will reduce the deflectionof the floor under vacuum thus giving a stable surface for themounting of the lenses and diagnostic mirrors. The gratingsand the first turning mirror, which require additional stability,are supported through the tank floor directly on to the concreteplinth and vacuum isolated via bellows assemblies.
The lids of the two tanks are each spun from a single sheet of25 mm thick mild steel. Each lid weighs 4 tons and for mirrorinstallation and removal will have to be taken off the tankcompletely with the internal crane, which has a capacity of5 tons. For more routine personnel access a 600 mm port isprovided in the lid. A smaller port is provided centrally in orderto illuminate the tanks.
The beam transport tube between the two tanks is of3.5m x 0.85m rectangular section. To resist buckling under
Vulcan Petawatt Compressor Chamber Design
C N Danson, J C Aldis, R Allott, R Clark, J L Collier, C B Edwards, S Hancock, P E Hatton, D Neely, B E Wyborn
Central Laser Facility, CLRC Rutherford Appleton Laboratory, Chilton, Didcot, Oxon, OX11 0QX, UK
Main contact email address: [email protected]
Figure 1. Artist’s impression of the inside of the compressor chamber showing the incoming beam in green (bottom left), thediagnostic beam as a focusing red beam (top) and the interaction chamber (bottom right).
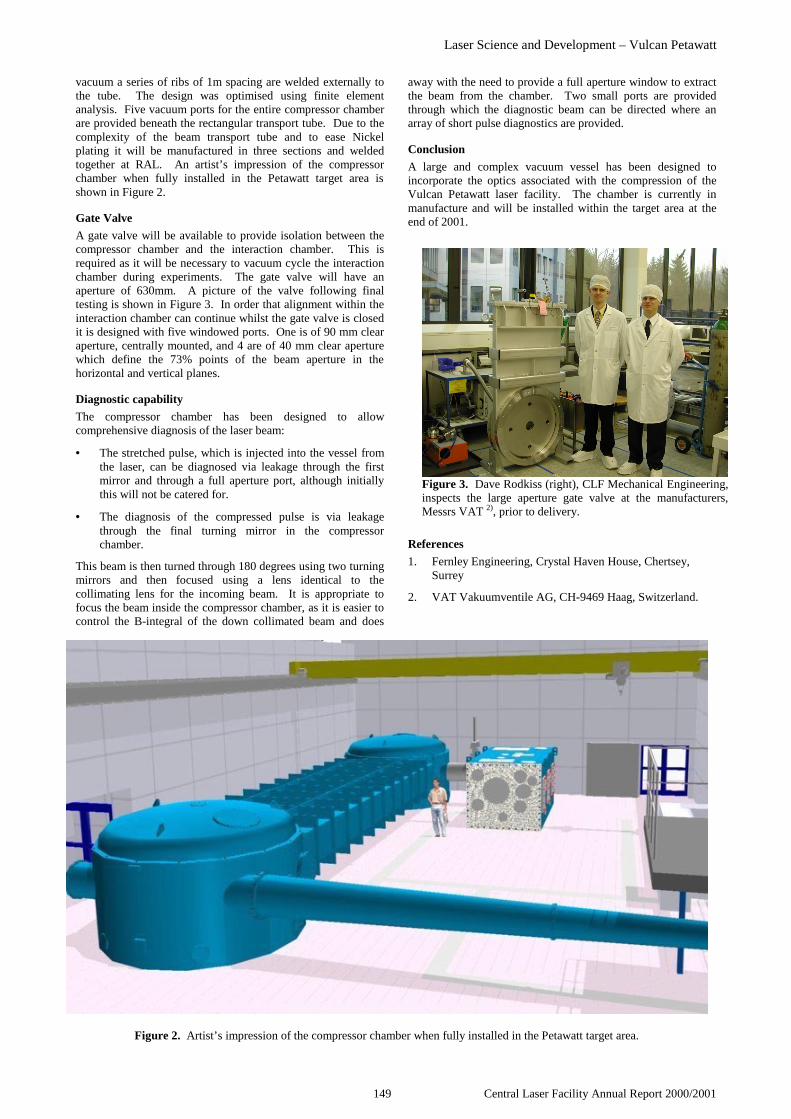
Laser Science and Development – Vulcan Petawatt
149 Central Laser Facility Annual Report 2000/2001
vacuum a series of ribs of 1m spacing are welded externally tothe tube. The design was optimised using finite elementanalysis. Five vacuum ports for the entire compressor chamberare provided beneath the rectangular transport tube. Due to thecomplexity of the beam transport tube and to ease Nickelplating it will be manufactured in three sections and weldedtogether at RAL. An artist’s impression of the compressorchamber when fully installed in the Petawatt target area isshown in Figure 2.
Gate Valve
A gate valve will be available to provide isolation between thecompressor chamber and the interaction chamber. This isrequired as it will be necessary to vacuum cycle the interactionchamber during experiments. The gate valve will have anaperture of 630mm. A picture of the valve following finaltesting is shown in Figure 3. In order that alignment within theinteraction chamber can continue whilst the gate valve is closedit is designed with five windowed ports. One is of 90 mm clearaperture, centrally mounted, and 4 are of 40 mm clear aperturewhich define the 73% points of the beam aperture in thehorizontal and vertical planes.
Diagnostic capability
The compressor chamber has been designed to allowcomprehensive diagnosis of the laser beam:
• The stretched pulse, which is injected into the vessel fromthe laser, can be diagnosed via leakage through the firstmirror and through a full aperture port, although initiallythis will not be catered for.
• The diagnosis of the compressed pulse is via leakagethrough the final turning mirror in the compressorchamber.
This beam is then turned through 180 degrees using two turningmirrors and then focused using a lens identical to thecollimating lens for the incoming beam. It is appropriate tofocus the beam inside the compressor chamber, as it is easier tocontrol the B-integral of the down collimated beam and does
away with the need to provide a full aperture window to extractthe beam from the chamber. Two small ports are providedthrough which the diagnostic beam can be directed where anarray of short pulse diagnostics are provided.
Conclusion
A large and complex vacuum vessel has been designed toincorporate the optics associated with the compression of theVulcan Petawatt laser facility. The chamber is currently inmanufacture and will be installed within the target area at theend of 2001.
References
1. Fernley Engineering, Crystal Haven House, Chertsey,Surrey
2. VAT Vakuumventile AG, CH-9469 Haag, Switzerland.
Figure 3. Dave Rodkiss (right), CLF Mechanical Engineering,inspects the large aperture gate valve at the manufacturers,Messrs VAT 2), prior to delivery.
Figure 2. Artist’s impression of the compressor chamber when fully installed in the Petawatt target area.
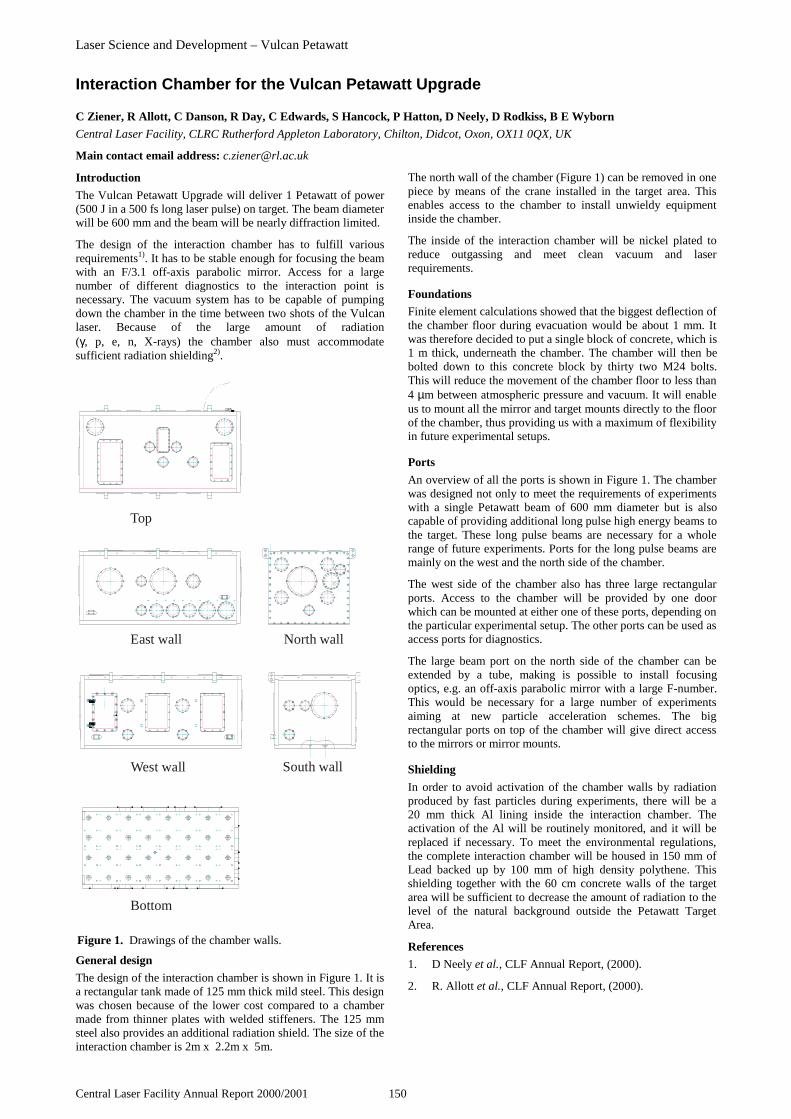
Laser Science and Development – Vulcan Petawatt
Central Laser Facility Annual Report 2000/2001 150
Introduction
The Vulcan Petawatt Upgrade will deliver 1 Petawatt of power(500 J in a 500 fs long laser pulse) on target. The beam diameterwill be 600 mm and the beam will be nearly diffraction limited.
The design of the interaction chamber has to fulfill variousrequirements1). It has to be stable enough for focusing the beamwith an F/3.1 off-axis parabolic mirror. Access for a largenumber of different diagnostics to the interaction point isnecessary. The vacuum system has to be capable of pumpingdown the chamber in the time between two shots of the Vulcanlaser. Because of the large amount of radiation(γ, p, e, n, X-rays) the chamber also must accommodatesufficient radiation shielding2).
General design
The design of the interaction chamber is shown in Figure 1. It isa rectangular tank made of 125 mm thick mild steel. This designwas chosen because of the lower cost compared to a chambermade from thinner plates with welded stiffeners. The 125 mmsteel also provides an additional radiation shield. The size of theinteraction chamber is 2m x 2.2m x 5m.
The north wall of the chamber (Figure 1) can be removed in onepiece by means of the crane installed in the target area. Thisenables access to the chamber to install unwieldy equipmentinside the chamber.
The inside of the interaction chamber will be nickel plated toreduce outgassing and meet clean vacuum and laserrequirements.
Foundations
Finite element calculations showed that the biggest deflection ofthe chamber floor during evacuation would be about 1 mm. Itwas therefore decided to put a single block of concrete, which is1 m thick, underneath the chamber. The chamber will then bebolted down to this concrete block by thirty two M24 bolts.This will reduce the movement of the chamber floor to less than4 µm between atmospheric pressure and vacuum. It will enableus to mount all the mirror and target mounts directly to the floorof the chamber, thus providing us with a maximum of flexibilityin future experimental setups.
Ports
An overview of all the ports is shown in Figure 1. The chamberwas designed not only to meet the requirements of experimentswith a single Petawatt beam of 600 mm diameter but is alsocapable of providing additional long pulse high energy beams tothe target. These long pulse beams are necessary for a wholerange of future experiments. Ports for the long pulse beams aremainly on the west and the north side of the chamber.
The west side of the chamber also has three large rectangularports. Access to the chamber will be provided by one doorwhich can be mounted at either one of these ports, depending onthe particular experimental setup. The other ports can be used asaccess ports for diagnostics.
The large beam port on the north side of the chamber can beextended by a tube, making is possible to install focusingoptics, e.g. an off-axis parabolic mirror with a large F-number.This would be necessary for a large number of experimentsaiming at new particle acceleration schemes. The bigrectangular ports on top of the chamber will give direct accessto the mirrors or mirror mounts.
Shielding
In order to avoid activation of the chamber walls by radiationproduced by fast particles during experiments, there will be a20 mm thick Al lining inside the interaction chamber. Theactivation of the Al will be routinely monitored, and it will bereplaced if necessary. To meet the environmental regulations,the complete interaction chamber will be housed in 150 mm ofLead backed up by 100 mm of high density polythene. Thisshielding together with the 60 cm concrete walls of the targetarea will be sufficient to decrease the amount of radiation to thelevel of the natural background outside the Petawatt TargetArea.
References
1. D Neely et al., CLF Annual Report, (2000).
2. R. Allott et al., CLF Annual Report, (2000).
Interaction Chamber for the Vulcan Petawatt Upgrade
C Ziener, R Allott, C Danson, R Day, C Edwards, S Hancock, P Hatton, D Neely, D Rodkiss, B E Wyborn
Central Laser Facility, CLRC Rutherford Appleton Laboratory, Chilton, Didcot, Oxon, OX11 0QX, UK
Main contact email address: [email protected]
Top
East wall North wall
West wall South wall
Bottom
Figure 1. Drawings of the chamber walls.

Laser Science and Development – Vulcan Petawatt
151 Central Laser Facility Annual Report 2000/2001
The large optics used within the compressor and interactionchambers of the Vulcan Petawatt target area required mounts tobe designed to provide adequate stability and resolution ofadjustment. The compressor system was designed using twomain turning mirrors, two diagnostic mirrors, two lenses andtwo gratings. In addition the interaction chamber houses aturning mirror and the focussing parabola. All these opticscould be mounted using a similar system with specificrequirements individually catered for, i.e. translations androtations. Nine mounts were acquired of the LLNL designwhich were originally used to support mirrors off the Novaspace-frame. This did not lead to a compact or vacuumcompatible design but with significant modification it will bepossible to use these mounts for the upgrade.
The Petawatt upgrade required the mounts to be housed withinthe vacuum chambers, plus occupying as small a footprint aspossible to minimise the size of the chambers. This wasachieved by utilising the main body of the LLNL mounts bycutting and re-welding the framework to enable the x-ypositioning slides to be used. The mirror bezel was alsoretained by mounting it vertically on existing mounting flats asshown in Figure 1. With the addition of radial slides to give themirror tip and tilt about its front face a fully gimbaled designwas achieved. This design was then used to house both the lensassemblies with the extra design feature of rotation about thecentre axis mounts for the gratings, and the off-axis parabola.The specification of the adjustment range and degree is given inthe table below.
A common mirror adjuster was designed in order to achieve therequired degree of accuracy in a cost-effective manner. Thismechanism consists of a floating ball nut and screw unit housedwithin pivot bearing assemblies. This allows the linearmovement to be transmitted to the angular rotation required fortip, tilt, and rotation. For the x-y movement the pivots allow theunits to be mounted at any angle therefore allowing for anymisalignment. The ball screw is driven via a solid coupling bya stepping motor or manual adjuster. This motion is achieved bya combined thrust and roller bearing to eliminate any hysteresisand backlash in the unit.
Each of the adjusters could be manually or remotely operatedbut once inside the vacuum, accessibility to the drives and thevulnerability of the optics to mechanical damage led to thedecision to motorise all of the adjusters with stepper motors.
The system designed to control the movement of the mirrorsand gratings consists of two Parker 6K8 Motion Controllers,which provide sixteen axes of stepper motor control via ParkerL25 Stepper drives. A resolution of 4000 steps per revolution isused to meet the required specification. As there is norequirement for all of the axes to be moved simultaneously,each stepper motor is wired to the chamber wall and connectedto the stepper drive when motion is required. The software tocontrol the motions and provide the user interface is written inLabView, and provides the user with incremental or specificposition commands.
The mount was tested using a 30cm aperture interferometeroperating at 630 nm. Vertical or horizontal fringes wereindividually resolvable by eye which easily enabled angularposition measurement of the mount to better than 1 µrad. It wasnot possible to test all aspects of its function due to a limitednumber of drive actuators. Thus, the tests concentrated on thetwo important aspects of its fine adjustment function – theperformance of the vertical and horizontal axis fine angularadjustment and an assessment of the angular orthogonality ofthe vertical and horizontal axis. The vertical axis adjustmentresolution was measured at ~1 µrad with a reproducibility of~4 µrad over a 2 mrad adjustment cycle. The horizontal axisdisplayed a similar performance. There was no measurablecoupling between the horizontal and vertical motions. The testsproved the mount met the exacting specification of the Petawattoptics and approval was given to incorporate this into theupgrade design.
AdjustmentRange
HorizontalAxis
VerticalAxis
LongitudinalAxis
AngularAdjustmentRange
± 5° fine ± 5° fine variable+ 45° coarsevariable mirrors± 180 ° coarsevariable gratings
± 5° fine
LinearAdjustmentRange
± 50 mm(+300 mmfinal turningmirror)
No adjustment ± 50 mm
940 mm mirror and grating mount design
S Hancock, J C Aldis, J L Collier, C Danson, A J Frackiewicz, P E Hatton, P Holligan, T Winstone, R W Wyatt, B Wyborn
Central Laser Facility, CLRC Rutherford Appleton Laboratory, Chilton, Didcot, Oxon, OX11 0QX, UK
Main contact email address: [email protected]
Fine Adjustment Resolution Reproducibility
Vertical Axis Rotation (Tilt) < 5 µrad < 5 µrad
Horizontal Axis Rotation (Tip) < 300 µrad < 300 µrad
Longitudinal Axis Rotation(Rot)
< 30 µrad < 30 µrad
Longitudinal Translation 0.1 mm 0.1 mm
Horizontal Translation 0.1 mm 0.1 mm
Figure 1. Mirror mount.

Laser Science and Development – Vulcan Petawatt
Central Laser Facility Annual Report 2000/2001 152
Introduction
The capacitor bank upgrade for the Petawatt system has beenmore than just a re-fit of high-density capacitors. Individualpower supply units (PSU) are now in use, one per disc amplifierassembly. The modular pulsed power installation provides amore readily serviceable assembly with independent amplifierunits designed to improve system flexibility and reliability.
A more critical circuit monitoring system also provides shot toshot information about each amplifier circuit performance. Thesensitivity is such that during testing the status of a faulty8000 Amp fuse was manifested by deformation of the dischargecurrent waveform. This is a vast improvement on the previoussystem sensitivity where signals were derived from the totalamplifier current at the Ignitrons rather than individual lampcircuits at the amplifier. Previously, a universal PSU problemmeant that up to 6 amplifiers could be out of commission at thesame time. The new system allows for individual PSUs to bereplaced and also adds flexibility in allowing tuning of the highvoltage to cater for mismatches in the amplifier gain profiles.
Computer Control
The upgraded capacitor bank has required the commissioning ofa local computer control system due to the desire to have muchfiner control of the capacitor bank interlocks and of thecharging sequences. The local computer runs a multi-threadedDelphi application under Windows NT that continuouslymonitors the many interlock signals produced by each powermodule. It also monitors the serial communications link thatenables the local computer to work with the main DOS-based
Vulcan control network. When receiving commands to, forexample, test interlocks or to charge the high voltage powersupplies, the system responds with the appropriate data oraction.
Waveform Digitisation
As already implied, one significant improvement of the upgradeis in the use of multi-channel waveform digitizers. These areCAMAC modules each of which has 8 individual inputstypically digitizing at rates of 500 kHz. This allows2 microsecond resolution which is fast enough to detect fasttransient effects without generating too much data.
Each of the 15 disc amplifiers has four pairs of flashlamp cablesand an earth return, with 3 Faraday rotators monitored as well.There are a total of 78 waveforms captured and analyzed pershot.
The graphs below show the type of data obtained from thewaveform digitizers, demonstrating successful and unsuccessfulfirings of the amplifiers. The control computer is programmedto learn what a good shot is on the basis of the peak height andthe full-width half-maximum (FWHM) of each signal and toreport errors to the operator.
Development
Although only just commissioned, the capacitor controlprogram will be under constant enhancement and is expected toaid troubleshooting by presenting detailed fault analysis orprediction of failure to the operators.
Capacitor Bank Control System Upgrade
D A Pepler, P Holligan, C J Reason, W J Lester, R W W Wyatt
Central Laser Facility, CLRC Rutherford Appleton Laboratory, Chilton, Didcot, Oxon, OX11 0QX, UK
Main contact email address: [email protected]
-125
-100
-75
-50
-25
0
25
50
75
100
125
0 500 1000 1500 2000-125
-100
-75
-50
-25
0
25
50
75
100
125
0 200 400 600 800 1000 1200 1400 1600 1800 2000
-25
-20
-15
-10
-5
0
5
10
15
20
25
1100 1200 1300 1400
-125
-100
-75
-50
-25
0
25
50
75
100
125
0 500 1000 1500 2000
Figure 1. Graphs showing the outputs from the waveform digitizers for one of the 150 mm diameter disc amplifiers. Each discamplifier has four flashlamps and one earth return signal, which in the diagrams above are colour coded : 1 - cyan; 2 - magenta;3 - yellow; 4 - dark blue; earth return - green. Each graph is displaying data values in counts (y-axis) versus time in microseconds(x-axis). The top left graph shows a normal set of signals for a successful firing with a flat earth return; the top right graph shows a shotwhere one of the flashlamps and the earth return signal show abnormal disturbances due to a cracked lamp. This disturbance is shownin close up in the lower left graph. The lower right graph shows a shot where the amplifier had a catastrophic failure.

Laser Science and Development - Vulcan
153 Central Laser Facility Annual Report 2000/2001
Introduction
In high power lasers, such as Vulcan, large aperture adaptiveoptics (AO) are not only needed to correct the wavefront inorder to improve their focusability, but in the Petawatt regimetemporal pulse compression becomes a function of spatialwavefront quality. A large aperture dynamic wavefrontcorrector has been developed within the CLF for use on theVulcan Petawatt beam line.
Experimental setup
Following the preliminary tests conducted in the Vulcan targetareas, a number of improvements were made for the secondround of trials, which took place in the Vulcan laser hall. Theseconcentrated on greater quality control of optics used in theH[SHULPHQWDO VHWXSZLWKDOORSWLFVEHLQJEHWWHU WKDQ 3HDNValley (P-V). The local reference beam, critical for goodcorrection, used in these trials showed a wavefront quality of39
Figure 1 details the adaptive optics trials set up in the VulcanLaser hall. This takes Beam 7 from Vulcan and retro-reflects itwith either the adaptive mirror, or a high quality reference flat.After this a beam splitter is used to generate the wavefrontsensor channel and also propagates the beam to the diagnosticsbench. A drop in mirror also allows the local reference beam tobe injected into the setup if desired. The diagnostics usedincluded a radial shear interferometer2) for wavefront sensing,an input far-field CCD camera, a corrected far-field CCDcamera, and a 16-bit far-field CCD camera.
Adaptive mirror and wavefront sensor
The adaptive mirror used in these trials is based on bi-morph
technology developed in the CLF and comprises a 64-elementlow voltage corrective mirror, shown in Figure 2. The Bi-morphsubstrate is constructed from 4 separate PZT elements, gluedtogether in quadrants to form a larger substrate.
Wavefront sensing is achieved using a Fresnel zone plate arrayHartman wavefront sensor. This consists of an array of 80amplitude Fresnel zone plates shown in Figure 3. The far-fieldspot locations are proportional to local wavefront gradients;hence changes in the far-field spot locations indicate changes inthe wavefront gradients. The individual spot locations are
Adaptive optics trials on Vulcan
S Hawkes, J Collier, C Hooker, C Reason, C Edwards, C Hernandez-Gomez, C Danson, I Ross
Central Laser Facility, CLRC Rutherford Appleton Laboratory, Chilton, Didcot, Oxon, OX11 0QX, UK.
C Haefner
GSI, Darmstadt, Germany
Main contact email address: [email protected]
Goldcoating (1µm)
Pyrex(3 mm)
Coppermesh (30 µm)
PZT Substrate(250 µm)
Nickel plate(transducer pattern)(20 µm)
64 element electrodepattern formed on rear
surface of adaptivemirror
Figure 2. Bi-morph mirror architecture used in the adaptiveoptics trials.
&RUUHFWHGEHDP$EHUUDWHGEHDP5HIHUHQFHEHDP
2XWSXWIURP9XOFDQ
+DUWPDQSODWH
&:</)
'HIRUPDEOHPLUURU
'URSLQUHIHUHQFHPLUURU
'URSLQPLUURU
$GDSWLYHRSWLFVHQVRU
,QSXWIDUILHOG
&RUUHFWHGIDUILHOGV
5DGLDOVKHDULQWHUIHURPHWHU
ELW&&'
Figure 1. Experimental layout.
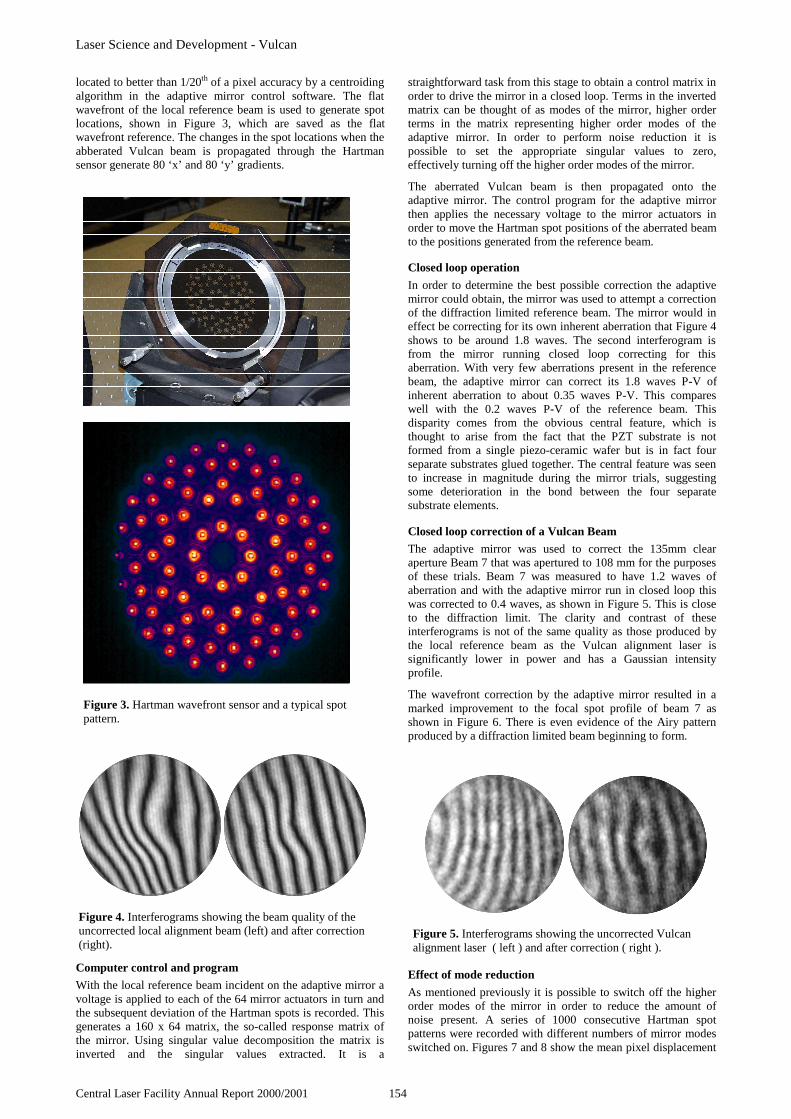
Laser Science and Development - Vulcan
Central Laser Facility Annual Report 2000/2001 154
located to better than 1/20th of a pixel accuracy by a centroidingalgorithm in the adaptive mirror control software. The flatwavefront of the local reference beam is used to generate spotlocations, shown in Figure 3, which are saved as the flatwavefront reference. The changes in the spot locations when theabberated Vulcan beam is propagated through the Hartmansensor generate 80 ‘x’ and 80 ‘y’ gradients.
Computer control and program
With the local reference beam incident on the adaptive mirror avoltage is applied to each of the 64 mirror actuators in turn andthe subsequent deviation of the Hartman spots is recorded. Thisgenerates a 160 x 64 matrix, the so-called response matrix ofthe mirror. Using singular value decomposition the matrix isinverted and the singular values extracted. It is a
straightforward task from this stage to obtain a control matrix inorder to drive the mirror in a closed loop. Terms in the invertedmatrix can be thought of as modes of the mirror, higher orderterms in the matrix representing higher order modes of theadaptive mirror. In order to perform noise reduction it ispossible to set the appropriate singular values to zero,effectively turning off the higher order modes of the mirror.
The aberrated Vulcan beam is then propagated onto theadaptive mirror. The control program for the adaptive mirrorthen applies the necessary voltage to the mirror actuators inorder to move the Hartman spot positions of the aberrated beamto the positions generated from the reference beam.
Closed loop operation
In order to determine the best possible correction the adaptivemirror could obtain, the mirror was used to attempt a correctionof the diffraction limited reference beam. The mirror would ineffect be correcting for its own inherent aberration that Figure 4shows to be around 1.8 waves. The second interferogram isfrom the mirror running closed loop correcting for thisaberration. With very few aberrations present in the referencebeam, the adaptive mirror can correct its 1.8 waves P-V ofinherent aberration to about 0.35 waves P-V. This compareswell with the 0.2 waves P-V of the reference beam. Thisdisparity comes from the obvious central feature, which isthought to arise from the fact that the PZT substrate is notformed from a single piezo-ceramic wafer but is in fact fourseparate substrates glued together. The central feature was seento increase in magnitude during the mirror trials, suggestingsome deterioration in the bond between the four separatesubstrate elements.
Closed loop correction of a Vulcan Beam
The adaptive mirror was used to correct the 135mm clearaperture Beam 7 that was apertured to 108 mm for the purposesof these trials. Beam 7 was measured to have 1.2 waves ofaberration and with the adaptive mirror run in closed loop thiswas corrected to 0.4 waves, as shown in Figure 5. This is closeto the diffraction limit. The clarity and contrast of theseinterferograms is not of the same quality as those produced bythe local reference beam as the Vulcan alignment laser issignificantly lower in power and has a Gaussian intensityprofile.
The wavefront correction by the adaptive mirror resulted in amarked improvement to the focal spot profile of beam 7 asshown in Figure 6. There is even evidence of the Airy patternproduced by a diffraction limited beam beginning to form.
Effect of mode reduction
As mentioned previously it is possible to switch off the higherorder modes of the mirror in order to reduce the amount ofnoise present. A series of 1000 consecutive Hartman spotpatterns were recorded with different numbers of mirror modesswitched on. Figures 7 and 8 show the mean pixel displacement
Figure 3. Hartman wavefront sensor and a typical spotpattern.
Figure 4. Interferograms showing the beam quality of theuncorrected local alignment beam (left) and after correction(right).
Figure 5. Interferograms showing the uncorrected Vulcanalignment laser ( left ) and after correction ( right ).

Laser Science and Development - Vulcan
155 Central Laser Facility Annual Report 2000/2001
and pixel variance for the 5 different Hartman spot rings. Notethe effect of the central feature, seen on the interferograms, onthe central ring of Hartman spots. There is an optimum numberof modes to use in order to make a correction. With reference toFigure 7, as more modes are introduced the mean Pixeldisplacement falls rapidly to a minimum value at about 20. Theaverage pixel displacement is then seen to rise gradually, thecause of which is the introduction of more noise from the higherorder modes. Figure 8 shows the pixel variance of the pixelmeans rising gradually as more modes are switched on.
Environmental testing
A series of environmental tests was also conducted with theadaptive mirror placed in a retro-reflective position after thebeam 7 amplifier, the position it would nominally be used in thePetawatt upgrade. It is important to determine the survivabilityof the adaptive mirror in this electrically and magneticallyhostile environment. In order to generate the maximum possibleamount of noise, the entire Vulcan disc amplifier system wasfired, with the adaptive optic correcting the Vulcan alignmentlaser. This appeared to have no impact on the effectiveness ofthe correction with the mirror in this position. Figure 9 showsthe Vulcan alignment laser and the amplified Vulcan alignmentlaser, recorded when the disc amplifiers were fired. It isimportant to note that the far field in Figure 9 (right) is
saturated but that the performance of the mirror is in no wayaffected by the noise, i.e. there is no radical change to thefarfield image.
Conclusions
We have demonstrated using an adaptive mirror developedwithin the CLF that the Vulcan beam quality can bedynamically improved to ~ 0.4 waves from ~1.2 waves p-v. Thesystem has been repeatedly tested in an electrically hostileenvironment and proved to be unaffected.
A new mirror is currently being manufactured that will bring usclose to the diffraction limit. This mirror uses a single slab ofPZT to form the piezo actuators, which will in principle removethe central feature observed using the current prototype. ThisAO system will be installed on the Petawatt beam line.
References
1. C.J. Hooker et al, Central Laser Facility Annual Report1998-1999, RAL-TR-1999-034, P199-200
2. C Hernandez-Gomez et al, Central Laser Facility annualreport 1997-1998, RAL-TR-2000-034, P165
Figure 6. Beam 7 farfield images showing an uncorrectedand corrected focal spot.
0
0.1
0.2
0.3
0.4
0.5
0.6
0.7
0 20 40 60 80
Maximum Allowed Mode
Mea
n P
ixel
Dis
pla
cem
ent
Ring 1
Ring 2
Ring 3
Ring 4
Ring 5
Figure 7. Mean pixel displacement.
0
0.01
0.02
0.03
0.04
0.05
0.06
0.07
0 10 20 30 40 50 60 70
Maximum Allowed Mode
Pix
el V
aria
nce
Ring 1
Ring 2
Ring 3
Ring 4
Ring 5
Figure 8. Variance of the mean pixel displacement.
Figure 9. Beam 7 alignment laser far-field, before a disc shot(left) and on the shot (right).

Laser Science and Development - Vulcan
Central Laser Facility Annual Report 2000/2001 156
Introduction
A scanning cross correlator has been developed for contrastmeasurements in the Vulcan laser system. It is important inCPA systems to have detailed knowledge of pulse shape andcontrast ratio. To measure the pulse shape of an optical signalI(t) the method used is intensity third order autocorrelationA3(τ), defined as:
( )( ) ( )
( ) ( )∫∫
×
×−=
dttItI
dttItIA
2
2
3
ττ (1)
where τ is a delay parameter. The function A3(τ) is asymmetricand thus it is possible to differentiate temporal activity ahead ofthe main pulse from temporal activity behind.
To generate this 3rd order autocorrelation function with opticalsignals two non-linear processes are required. The first is aprocess that can produce the I2(t) response to an optical signalwith an intensity function I(t). This can be achieved by secondharmonic generation of I(t). The second is a process that canproduce a response that arises from the product of the twoarbitrary intensity functions I2(t) and I(t). Such a process is sumfrequency mixing.
Layout
The autocorrelator has been designed to minimise the numberof parallel surfaces which give rise to post pulses. It has alsobeen designed to have a larger dynamic range than devicespreviously used to measure the contrast of the Vulcan laser 1-2).
The layout of the autocorrelator is shown in Figure 1. It consistsof two arms: the main arm and reference arm. The main armmeasures the third order autocorrelation signals for differentdelays τ of the signal I(t) i.e. the numerator in Equation (1),while the reference arm measures the 3rdorder autocorrelatorsignal generated by the two pulses I2(t) and I(t) overlapped atτ=0, i.e. the denominator in Equation (1).
The input beam is focussed onto a BBO crystal to generate theinitial second harmonic signal. This process is type I to ensure
that the fundamental signal and its harmonic are orthogonallypolarised.
The reference arm is generated by a refection off a pellicle asthe beam is directed to the main arm. The reflected collinearpulses are then frequency mixed in a BBO crystal. Thereference frequency mixed signal is then detected by aphotomultiplier. An intereference filter prevents thefundamental and 2nd harmonic signals reaching the photomultiplier.
In the main arm in order to impose a delay τ in the infraredpulse I(t) with respect to its second harmonic I2(t) both signalsare separated spatially. The collinear pulses are injected onto aWollaston prism, which imposes an angle of ~28° between thetwo beams due to their orthogonal polarisation.
Once separated the fundamental pulse and its second harmonicare directed onto a pair of retro cubes. The second harmonicbeam follows a fixed length path while for the infrared pulse thepath can be changed on a shot to shot basis to achieve differenttemporal delays τ. The height of both beams is altered by theretros such that they return above the input path to theWollaston. The Wollaston recombines the beams spatially andthey are then focussed on to a BBO crystal where both signalsare frequency mixed generating the autocorrelator signal. Thisis detected by a photomultiplier tube and an interference filter.
Characterisation
To test the diagnostic, initially the output of one of the VulcanFront End oscillators (TiS) was examined. The result is shownin Figure 2. With a train of 150 fs pulses of 0.5 nJ, thediagnostic shows a dynamic range of 105. A post pulse isclearly visible which is believed to be caused by the parallelsurfaces in the input waveplate.
Figure 2. Contrast measurements for TiS oscillator .
References
1. J Collier, C Hernandez-Gomez, R Allot, C N Danson, AHall, ‘A Single Shot 3rd Order Auto-Correlator for PulseContrast and Pulse Shape Measurements’, Laser andparticle beams (in press)
2. S Luan, M H R Hutchinson, R A Smith, F Zhou, ‘Highdynamic range third-order correlation measurement ofpicosecond laser pulse shapes’, Meas. Sci. Technol., 4,1426-1429, 1993
Scanning Third Order Autocorrelator for Contrast Measurement in Vulcan
C Hernandez-Gomez, E Thurston, J Collier
Central Laser Facility, CLRC Rutherford Appleton Laboratory, Chilton, Didcot, Oxon, OX11 0QX, UK
Main contact email address: [email protected]
1.E+00
1.E+01
1.E+02
1.E+03
1.E+04
1.E+05
1.E+06
0.000 1.000 2.000 3.000 4.000T ime ( ps )
λ/2I/P F1= 200mm BBO F2 = 75mmM1
M4
M5
R1
R2
WollastonPrism
M6
M7
F3 = 150mm
M8BBOF4 = 120mm
ND’s Time delay, τ
Pellicle M2
BBOF6 = 120mm
ND’s
PMT InterferenceFilter
M3
F5 = 150mm
PMTInterferenceFilter
Figure 1. Schematic layout of the autocorrelator.

Laser Science and Development - Vulcan
157 Central Laser Facility Annual Report 2000/2001
Introduction
Transmissive diffraction grating systems have severaladvantages over their reflective counterpart for high-energylaser pulse compression. They exhibit higher damage fluences,enabling more energy to be delivered to target for a given beamsize, and can also be easily operated at the littrow angle,achieving maximum efficiency. This paper will show that atransmissive Chirped Pulse Amplification (CPA) system canoperate optimally over pulse durations between 10 ps and300 ps. The transmissive system proposed for Vulcan discussedin this paper will be capable of delivering up to 20 TW ofpower to target, and operate without the need for vacuum beamcompression.
Benefits of a Transmissive Grating System
Conventional reflective CPA grating compressors are ultimatelylimited in their maximum energy handling abilities by thedamage fluence of the grating surface. Past studies indicate thatin the sub-ps to 300 ps pulse duration range, the gold-coatedgratings exhibit single shot damage at ~ 0.4 J/cm2 1,4,5). Theaverage operational fluence limit is set to around 1/3 of thesingle shot damage fluence threshold for safe running. Thisaccommodates the shot to shot variations in the energy andquality of the pulse delivered, and ensures grating lifetimes oftens of thousands of shots in normal operation.
The single shot damage fluence for fused silica is ~ 10 timesthat of gold in the 10 ps to 300 ps regime. This is reducedslightly if anti-reflection coatings are added to the substrate toincrease the total throughput efficiency of a transmissive CPAcompressor.
0
200
400
600
800
1000
1 10 100 1000 10000
Pulse Duration (ps)
Del
iver
ed E
nerg
y (J
)
LONG PULSE
Equivalent beam diameter reflective CPA pulse
TG-CPA, Damage Fluence limited, 1/3 thresholdfor coated fused silica
Figure 1. Deliverable energy as a function of laser pulseduration for three proposed beam lines of diameter 208 mmoperating at 1053 nm.
Figure 1 gives an indication of how the deliverable energy isrestricted due to the damage limits for a Transmissive GratingCPA (TG-CPA) system compared to a similar aperture(φ 208mm) long pulse beam line, and an equivalent reflective
CPA line. The long pulse curve is derived from operationalexperience and will exhibit an energy limit due to the maximumpossible energy being extracted from the laser gain medium (atpulses >1 ns). The central and lower sections of this curve areinfluenced by the B-integral damage limits for the system 1-3,7).Published data tells us that the damage fluence for gold-coatedreflective gratings is constant up to around 100 ps pulseduration. This explains the uniform nature of the equivalentreflective CPA beam line graph. The damage fluence thresholdcurve for the coated transmission optics was estimated using thesame published experimental data 1-3). Again, the intention is tooperate at approximately 1/3 of this threshold fluence. The TG-CPA plot in Figure 1 indicates the damage threshold limiteddeliverable energy, and is independent of any beam propagationeffects. Clearly, the TG-CPA line will deliver the greateramount of energy to target over a large range of pulse durations.
General Compressor Requirements
To maintain pulse fidelity it is important for any pulserecompression system to reverse the effects of the stretcher toas large an extent as possible. It is intended that Vulcan willdeliver a 600 ps, 600 J chirped pulse of 2 nm bandwidth to the“Petawatt” target area.
It is essential to select a system that will not only fulfill thescientific requirements, but also fit into the target area, beviable in an engineering sense, and remain economicallyplausible.
The system design should contain the least possible amount oftransmissive optics, keeping the B-integral to a minimum1,7).Larger B-integral leads to small scale beam break-up and selffocusing which can cause optical damage. It is thereforepractical to suggest that the target chamber window be removedand replaced with a transmissive focusing optic, leading thebeam directly to target position. Figure 2 gives a representationof how this set-up may be constructed. The transmissivegratings may simply sit on plinths with no vacuum required.
Grating
F/10 Lens acts as vacuum window
Grating
Interaction chamber
Figure 2. Target area layout diagram for the Transmissive CPAsystem proposed for Vulcan.
There is a large range of possible solutions for the proposedTG-CPA system. Compromises must be made between the
Transmissive Grating CPA System Design for the Vulcan Laser
M J Poulter, D Neely, J Collier, R Clarke, C Danson
Central Laser Facility, CLRC Rutherford Appleton Laboratory, Chilton, Didcot, Oxon, OX11 0QX, UK
J BrittenLawrence Livermore National Laboratory, Livermore, CA 94550, USA.
Main contact email address: [email protected]

Laser Science and Development - Vulcan
Central Laser Facility Annual Report 2000/2001 158
various parameters of grating length, line density, separationand input angle such that the most sensible design is attained.
Lines/mm
Inpu
t ang
le d
egre
es
Figure 3. Available output diffraction orders as beam inputangle alters over various grating line densities.
For a grating to operate at high efficiency, light should bediffracted into only one order at a time. Figure 3 shows thesolution set for the existence of output diffraction orders as theinput beam angle is varied as a function of grating line densityfor a 1053 nm beam. The region of potential high efficiency isshown in Figure 3 as the white unshaded area where only thedesired first order will exist. The Littrow curve shows thesolution set within this parameter range along which maximumtransmissive diffraction efficiency will occur in relation to thegrating line density used. The maximum diffraction efficiencyfor a grating with a symmetrical groove profile occurs when theBragg conditions are satisfied. The transmissive system caneasily operate under this condition thus delivering the highestpossible diffraction efficiencies. Ideally, the system wouldoperate at the intersection of the littrow curve and the desiredcompression solution set. Figure 3 also includes varioussolution sets to show the line followed by a constant arbitrarycompression rate.
Higher grating line densities essentially give larger spectraldispersion. This means that the grating separation can besmaller to give the same pulse compression value. It is thisincreased dispersion however, along with an increased footprintdue to a larger littrow input angle, that forces the grating lengthto increase. The length of the second grating must be sufficientto accommodate the footprint of a 208 mm input beam diameterat littrow, and the spectral divergence of the first grating, at theline densities available. The useful standard line densitiesavailable are 1330, 1480, 1550 and 1740 lines/mm. A systemthat uses grating line densities under 1330 lines/mm will exhibitan excessively large grating separation, and any grating withover 1740 lines/mm becomes both expensive and difficult toproduce. Table 1 shows the results of a geometrically modelledCPA compressor system to preserve the optimum compressionof the 600ps chirped pulse from a matching stretcher.
Linedensity
L/mm
Inputangle
degrees
Beamdeviation
degrees
Gratingseparation
m
Fractionalbeamspread
cm
1330 44 91 25 0.271480 51 78 15 0.221550 55 71 12 0.201740 66 47 5 0.17
Table 1. Geometrically modelled parameters required for atransmissive CPA system to achieve a compression of 600pswith a 2nm bandwidth, operating at the Littrow input angle,with a 208 mm diameter input beam.
Grating parallelism
It is essential to ensure parallelism between the twocompression gratings to deliver optimum focusability andcompressability of the output pulse. Any non-parallelism willinduce a wavefront spectral divergence anomaly in the pulsedue to the residual dispersion of the laser light.
The Vulcan laser system has a number of wavelengths that canbe utilized to monitor grating parallelism. These wavelengthsare injected into the system and the gratings optimized until anyspectral dispersion between the beams is eliminated. Theseinjected wavelengths lie at 1047 nm and 1053 nm (dichroicNd:YLF oscillator), and 1064 nm (Nd:YAG oscillator). At asuitable incident angle onto the first grating, these wavelengthswill fill or partially fill the second of the two transmissivegratings. The extent to which they fill the second grating willdetermine the effective aperture with which the specificwavelength is then incident onto the focusing optic, (seeFigures 2 and 4). This in turn will affect the full width halfmaximum (FWHM) of the resulting focal spot.
System modeling demonstrates that the 1064 nm beam willdeviate from the Vulcan central wavelength of 1053 nm by suchan amount as to totally miss the second grating on all four of theinitially proposed grating systems. Thus, the alignment systemwill be limited to the use of the 1047 nm, λS and 1053 nm, λL
wavelengths of the Nd:YLF when adjusting for non-parallelism.
ψφ
λL
λS
dL
dS
Figure 4. Extent of second transmissive grating fill at the twoincremental wavelengths. φ represents the angular non-parallelism between the two transmissive gratings.
The maximum recompression grating misalignment error thatcan be permitted before seriously affecting the output angulardivergence, ψ and thus, intensity in the focal plane, is assignedthe term φm 1,6). For an m times diffraction limited beam ofspectral bandwidth ∆λB (using nth order of diffraction), φm canbe approximated to the first order using the followingexpression:
0tanθλλφ
npL
m
B
m
∆≈ (1)
θ0 is the resultant output angle from the first (input) grating. Land p represent the second (output) grating parameters ofgrating length (m), and grating period (lines/m) respectively.
The modelled data shown in Table 2 gives an indication of thetolerances associated with the setup and alignment of atransmissive compressor system, with respect to the grating linedensity used. The intrinsic divergence of the Vulcan beam is~ 20 µrads. Table 2 reveals that the maximum angulardivergence of the 2nm bandwidth produced in alignment, ξ, hasa negligible effect on the overall output beam divergence.
Optimum Compressor Design and Geometry
The line density of the gratings will determine many of thephysical characteristics of the compressor system. As the linedensity increases the gratings operate at large incidence angles.Longer gratings are therefore required to accommodate the
Laser Science and Development - Vulcan
159 Central Laser Facility Annual Report 2000/2001
beam. However, as Table 1 shows the separation between thegratings required to achieve a given pulse compression reducesas the line density increases. Also, the beam smoothing effectdue to spectral dispersion on the second grating is largest forlower line density gratings. This can help minimize self-focusing effects in the final optics of the system.
Table 2. Table of theoretical tolerance values in non-parallelism for each compressor grating period studied. ξ is themaximum angular divergence of the 2 nm bandwidth outputbeam of Vulcan after the gratings are aligned, due to residualdispersion.
A survey of the Vulcan upgrade target area indicates that for thesystem to fit into the available space no more than 12m ispermissible between the gratings. The 1740 lines/mmdiffraction grating compressor system requires only 5m toobtain the correct pulse compression. However, 72 cm longgrating substrates are required and manufacturing efficient highline density transmission gratings is more complex. As Table 1indicates, the 1550 lines/mm grating system would satisfy thegrating separation criteria (11.9m) with the grating length ofonly 54 cm.
To obtain maximum recompression of the laser pulse thecompressor grating setup should ‘match’ the stretcherconfiguration exactly in terms of grating line density, inputangle and grating separation. This is only true however if theshortest attainable pulse lengths are required. To operate in thedesired 10-300 ps regime it is necessary to ‘de-tune’ the systemaway from maximum pulse compression. Reducing the gratingseparation of the compressor, or stretcher to suit can do this. Itwas found that it is possible to run a compressor system withgrating periods differing from the stretcher. In the case of a1480 lines/mm stretcher in conjunction with a 1550 lines/mmcompressor, the recompressed pulse will exhibit a slight non-linear variation in pulse duration over the 2nm bandwidthpresent. This amounts to a temporal defect of ~ 0.45 ps (seeFigure 5). When operating in the 10-300 ps pulse duration rangethis value can be seen to be negligible. The implication of this isof economic benefit, since the 1480 lines/mm stretcher gratingsthat are already available to Vulcan can be used in conjunctionwith the proposed 1550 lines/mm compressor gratings.
Using the calculated efficiency of the grating (85% into desiredorder), the maximum deliverable energy for the TG-CPAsystem will be 420J (see Figure 6). It is considered that themaximum B-integral which could be tolerated before opticaldamage due to self focusing or beam breakup in the focal planeat this energy, will limit the system to 6 < B < 12. The operating
curves (dashed curves) corresponding to B=6 and B=12 areshown on Figure 6. The marked solid line on Figure 6 showsthe estimated damage fluence limits for the gratings. The flatportion of these lines is determined by the maximumdeliverable energy of the 208 mm beam line for a 600 ps pulse.Clearly, the performance of the system will be restricted at theshorter pulse durations in the 10-300 ps range by self-focusingdamage mechanisms rather than average fluence effects.
0
200
400
600
800
1000
1 10 100 1000 10000Pulse Duration (ps)
Del
iver
ed E
nerg
y (J
)
LONG PULSE
TG-CPA, B-Integral limited, B=6
TG-CPA, B-Integral limitted, B=12
Equivalent beam diameter reflectiveCPA pulse
TG-CPA, Damage Fluence limited,1/3 threshold for coated fused silica
Figure 6. Deliverable energy as a function of laser pulseduration for three proposed beam lines of diameter 208 mmoperating at 1053 nm. The TG-CPA plot indicates 3 variations:one theoretical damage (due to average fluence effects)threshold line, and two forecasted deliverable lines limited bydamage due to self focusing at B-integrals of 6 and 12.
Conclusions
It is clear that a transmissive grating chirped pulse amplificationsystem can efficiently deliver multi terrawatt beams to target, inthe 10-300ps pulse duration range. The proposed design relieson compressing a pulse in air and then using the final focusingoptic as the air/vacuum interface. The deliverable energy isultimately limited by self focusing damage within the fusedsilica substrates of the final compressor grating and focusingoptic. The maximum deliverable power at B = 6 is 20 TW at20 ps and 1.4 TW at 300 ps. A B-intergal of 12 can be toleratedbefore the self focusing damage mechanisms are replaced bythe average fluence effects of the pulse (at the shorter pulselengths) as the limiting threshold factor. Up to 40 TW at 10 pscan be achieved at a B-integral of 12, providing that the focalspot degradation can be tolerated.
References
1. M. J. Poulter. RAL Technical Report (TG-CPA) (2001)
2. B. C. Stuart, M. D. Feit, S. Herman, A. M. Rubenchik, B.W. Shore, and M.D. Perry. Phys. Rev. Lett, B 53, No.4,(1996)
3. H. T. Nguyen, B. W. Shore, S. J. Bryan, J. A. Britten, R.D. Boyd, and M. D. Perry. Opt. Lett, 22, No.3 (1997)
4. B. W. Shore, M.D. Perry, J.A. Britten, R. D. Boyd, M. D.Feit, H.T. Hguyen, R. Chow, G. E. Loomis, and L. Li.,J.Opt. Soc. Am. A, 14, No.5 (1997)
5. R. D. Boyd, J. A. Britten, D. E. Decker, B. W. Shore, B. C.Stuart, M. D. Perry and L. Li. App. Opt, 34, No.10 (1995)
6. D. Neely, C. N. Danson, C. B. Edwards, D. Pepler, D.Rodkiss, I. N. Ross, P. Taday, and F. Walsh. RAL. Ann.Report, p124 (1994)
7. R. A. Cairns, and J. J. Sanderson.‘Laser-PlasmaInteractions’, (1979)
Linedensity
l/mm
Inputgrating
length cm
Finalgrating
length cm
φm
mrads
ξµrads
1330 35 48 2.01 7.31480 40 51 0.89 5.21550 43 55 0.63 4.81740 62 72 0.20 4.0
-0.45
-0.25
-0.05
1052 1053 1054Wavelength (nm)
Stre
tch
(ps
)
Figure 5. Graph showing the residual stretch between a1480 lines/mm stretcher (51.2 degrees incident angle,15.20 m separation) and a 1550 lines/mm compressor(54.7 degrees incident angle, 11.78 m separation).

Laser Science and Development - Vulcan
Central Laser Facility Annual Report 2000/2001 160
The Vulcan Upgrade project established the clean-room facilitywithin R2 for the purposes of handling and testing largeaperture optics up to 1 m in diameter. The facility had adelivery area, storage area, clean handling area with class 100cleanhoods and access to the Interferometer area with the300 mm aperture Fizeau Interferometer1). The facility wasalongside the capacitor test bank which was used to test thehalfshells and completed amplifiers off-line.
At this time the clean-room complex was spread across twobuildings with three non-interconnected sites. The rodamplifier assembly area was always designed to be stand-alone.However with the testing of the halfshells and disc amplifierstaking place in R2 this meant the amplifiers crossing betweenbuildings on a regular basis as part of the assembly procedure.Following a short feasibility study it was seen that with arelatively modest investment it would be possible to reduce thisto one journey between buildings.
The assembly and testing of disc amplifiers became a muchsmoother operation with the amplifier testing nearby. The partsfor the amplifier were cleaned in the pre-clean class 10,000 areabefore being cleaned in the high pressure spraybooth. Theseclean items were then assembled in the class 100 area beforemoving into the amplifier test area.
The filtration systems needed to be upgraded in order to ensurethat the areas were class 10,000 compatible and also to providea positive pressure to ensure that any particulate matter wasforced away when the clean-room doors were opened. This wasachieved by fitting four recirculating HEPA filter units into theroof of the clean-room. Two additional HEPA filter units werefitted into the clean-room ceiling taking air from outside theclean-room complex to produce a positive pressure within. Theair conditioning was also upgraded to counteract the increasedheat input.
The high pressure water spraybooth2,3) has been commissionedin R2 ensuring a high cleanliness route for mechanical
assembly of the disc amplifiers. The pumping system wasupgraded, as it became increasingly difficult to find spares forthe old diaphragm type pump. After an extensive search asupplier4) was found of ceramic piston pumps which werecompatible with the pressure requirements of 1000 psi at thespraybooth and also with the cleanliness specification.
The clean-room move brought the relocation of the highpressure water spray booth, used for the cleaning of mostcomponents within the disc amplifiers, to R2 and in the processthe upgrading of the high pressure pump. The optics handlinghoods have been slightly adapted to suit both their originalpurpose and act as a clean assembly facility. A class 100 crossflow clean hood has also been appended to the clean handlingarea to provide an environment for cleaning and assembly ofthe 108 phosphate discs assemblies. A second cross flow hoodwas installed in the preparation area for the handling offlashlamps and disc protection plates.
The whole clean-room complex under one roof has enabled usto streamline the clean-room processes and ensure a moreefficient amplifier building programme. The clean-room movehas also enabled the Vulcan Oscillator to expand to fit all theexisting oscillators under one roof and to incorporate theupgrade stretcher.
References
1. T B Winstone et al CLF Annual Report 1999-2000, RAL-TR-2000-034, 219
2. T B Winstone et al, CLF Annual Report 1996-97, RAL-TR-97-045, 201
3. R A Wellstood et al, Institute of Science TechnologyScience Technology Publication August 2000 (No. 47), 14
4. Dennis Roberts Ltd, 49, Gosbrook Road, Caversham,Reading, RG4 8BT
New Vulcan Cleanroom Complex
T B Winstone, A J Frackiewicz, R Wellstood, C N Danson, D A Rodkiss
Central Laser Facility, CLRC Rutherford Appleton Laboratory, Chilton, Didcot, Oxon, OX11 0QX, UK.
Main contact email address: [email protected]
Figure 1. Robert Wellstood cleaning an amplifier chassis in the new cleanroom complex.
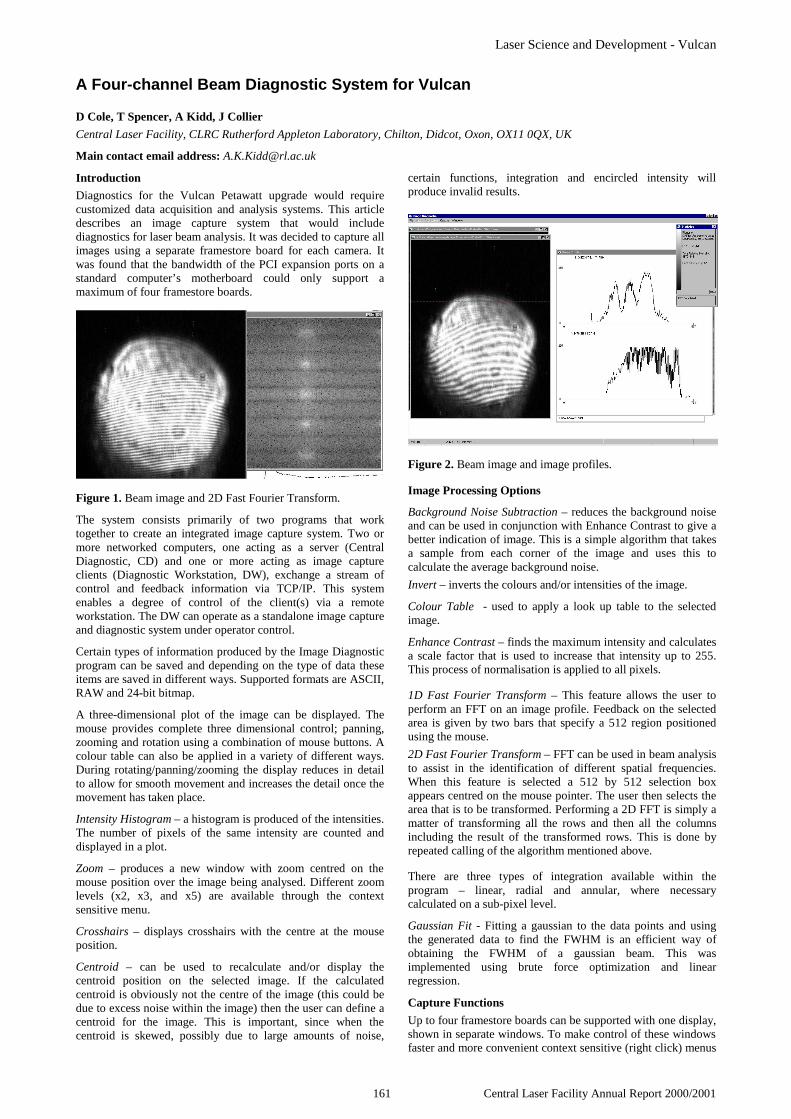
Laser Science and Development - Vulcan
161 Central Laser Facility Annual Report 2000/2001
Introduction
Diagnostics for the Vulcan Petawatt upgrade would requirecustomized data acquisition and analysis systems. This articledescribes an image capture system that would includediagnostics for laser beam analysis. It was decided to capture allimages using a separate framestore board for each camera. Itwas found that the bandwidth of the PCI expansion ports on astandard computer’s motherboard could only support amaximum of four framestore boards.
Figure 1. Beam image and 2D Fast Fourier Transform.
The system consists primarily of two programs that worktogether to create an integrated image capture system. Two ormore networked computers, one acting as a server (CentralDiagnostic, CD) and one or more acting as image captureclients (Diagnostic Workstation, DW), exchange a stream ofcontrol and feedback information via TCP/IP. This systemenables a degree of control of the client(s) via a remoteworkstation. The DW can operate as a standalone image captureand diagnostic system under operator control.
Certain types of information produced by the Image Diagnosticprogram can be saved and depending on the type of data theseitems are saved in different ways. Supported formats are ASCII,RAW and 24-bit bitmap.
A three-dimensional plot of the image can be displayed. Themouse provides complete three dimensional control; panning,zooming and rotation using a combination of mouse buttons. Acolour table can also be applied in a variety of different ways.During rotating/panning/zooming the display reduces in detailto allow for smooth movement and increases the detail once themovement has taken place.
Intensity Histogram – a histogram is produced of the intensities.The number of pixels of the same intensity are counted anddisplayed in a plot.
Zoom – produces a new window with zoom centred on themouse position over the image being analysed. Different zoomlevels (x2, x3, and x5) are available through the contextsensitive menu.
Crosshairs – displays crosshairs with the centre at the mouseposition.
Centroid – can be used to recalculate and/or display thecentroid position on the selected image. If the calculatedcentroid is obviously not the centre of the image (this could bedue to excess noise within the image) then the user can define acentroid for the image. This is important, since when thecentroid is skewed, possibly due to large amounts of noise,
certain functions, integration and encircled intensity willproduce invalid results.
Figure 2. Beam image and image profiles.
Image Processing Options
Background Noise Subtraction – reduces the background noiseand can be used in conjunction with Enhance Contrast to give abetter indication of image. This is a simple algorithm that takesa sample from each corner of the image and uses this tocalculate the average background noise.
Invert – inverts the colours and/or intensities of the image.
Colour Table - used to apply a look up table to the selectedimage.
Enhance Contrast – finds the maximum intensity and calculatesa scale factor that is used to increase that intensity up to 255.This process of normalisation is applied to all pixels.
1D Fast Fourier Transform – This feature allows the user toperform an FFT on an image profile. Feedback on the selectedarea is given by two bars that specify a 512 region positionedusing the mouse.
2D Fast Fourier Transform – FFT can be used in beam analysisto assist in the identification of different spatial frequencies.When this feature is selected a 512 by 512 selection boxappears centred on the mouse pointer. The user then selects thearea that is to be transformed. Performing a 2D FFT is simply amatter of transforming all the rows and then all the columnsincluding the result of the transformed rows. This is done byrepeated calling of the algorithm mentioned above.
There are three types of integration available within theprogram – linear, radial and annular, where necessarycalculated on a sub-pixel level.
Gaussian Fit - Fitting a gaussian to the data points and usingthe generated data to find the FWHM is an efficient way ofobtaining the FWHM of a gaussian beam. This wasimplemented using brute force optimization and linearregression.
Capture Functions
Up to four framestore boards can be supported with one display,shown in separate windows. To make control of these windowsfaster and more convenient context sensitive (right click) menus
A Four-channel Beam Diagnostic System for Vulcan
D Cole, T Spencer, A Kidd, J Collier
Central Laser Facility, CLRC Rutherford Appleton Laboratory, Chilton, Didcot, Oxon, OX11 0QX, UK
Main contact email address: [email protected]
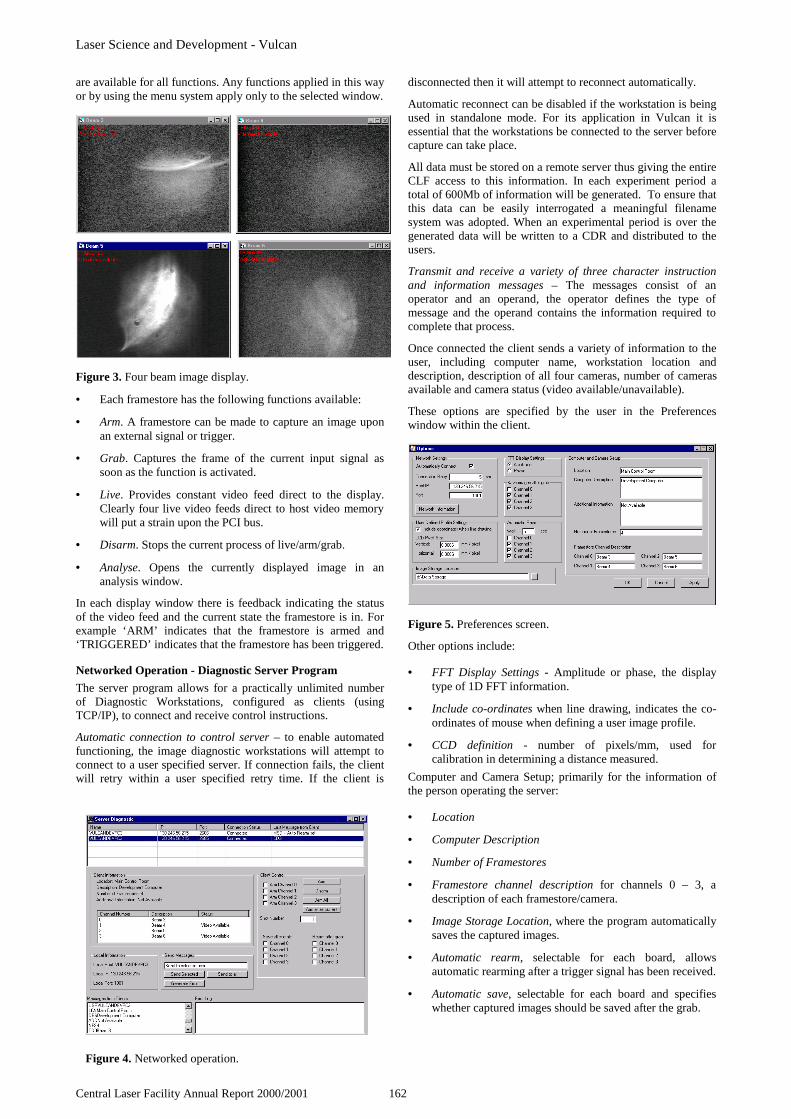
Laser Science and Development - Vulcan
Central Laser Facility Annual Report 2000/2001 162
are available for all functions. Any functions applied in this wayor by using the menu system apply only to the selected window.
Figure 3. Four beam image display.
• Each framestore has the following functions available:
• Arm. A framestore can be made to capture an image uponan external signal or trigger.
• Grab. Captures the frame of the current input signal assoon as the function is activated.
• Live. Provides constant video feed direct to the display.Clearly four live video feeds direct to host video memorywill put a strain upon the PCI bus.
• Disarm. Stops the current process of live/arm/grab.
• Analyse. Opens the currently displayed image in ananalysis window.
In each display window there is feedback indicating the statusof the video feed and the current state the framestore is in. Forexample ‘ARM’ indicates that the framestore is armed and‘TRIGGERED’ indicates that the framestore has been triggered.
Networked Operation - Diagnostic Server Program
The server program allows for a practically unlimited numberof Diagnostic Workstations, configured as clients (usingTCP/IP), to connect and receive control instructions.
Automatic connection to control server – to enable automatedfunctioning, the image diagnostic workstations will attempt toconnect to a user specified server. If connection fails, the clientwill retry within a user specified retry time. If the client is
disconnected then it will attempt to reconnect automatically.
Automatic reconnect can be disabled if the workstation is beingused in standalone mode. For its application in Vulcan it isessential that the workstations be connected to the server beforecapture can take place.
All data must be stored on a remote server thus giving the entireCLF access to this information. In each experiment period atotal of 600Mb of information will be generated. To ensure thatthis data can be easily interrogated a meaningful filenamesystem was adopted. When an experimental period is over thegenerated data will be written to a CDR and distributed to theusers.
Transmit and receive a variety of three character instructionand information messages – The messages consist of anoperator and an operand, the operator defines the type ofmessage and the operand contains the information required tocomplete that process.
Once connected the client sends a variety of information to theuser, including computer name, workstation location anddescription, description of all four cameras, number of camerasavailable and camera status (video available/unavailable).
These options are specified by the user in the Preferenceswindow within the client.
Figure 5. Preferences screen.
Other options include:
• FFT Display Settings - Amplitude or phase, the displaytype of 1D FFT information.
• Include co-ordinates when line drawing, indicates the co-ordinates of mouse when defining a user image profile.
• CCD definition - number of pixels/mm, used forcalibration in determining a distance measured.
Computer and Camera Setup; primarily for the information ofthe person operating the server:
• Location
• Computer Description
• Number of Framestores
• Framestore channel description for channels 0 – 3, adescription of each framestore/camera.
• Image Storage Location, where the program automaticallysaves the captured images.
• Automatic rearm, selectable for each board, allowsautomatic rearming after a trigger signal has been received.
• Automatic save, selectable for each board and specifieswhether captured images should be saved after the grab.
Figure 4. Networked operation.

Laser Science and Development - Vulcan
163 Central Laser Facility Annual Report 2000/2001
Introduction
Traditional methods to generate a line-focus along the axis ofan optical system have centred on the use of axicons 1).However, these devices are relatively expensive in largeaperture beamlines (> 100 mm diameter), they do not produceuniform intensity along the line focus and they have a fixedfocal length, limiting their use to a particular configuration.These limitations can be overcome by the use of binary phasediffractive optics that can be produced in large aperture, quicklyand cheaply. We propose a novel design of a binary phaseFresnel zone plate 2) that uses an azimuthal variation in focallength to achieve the desired focal intensity distribution for usewith a high power Nd:glass laser system.
First Principles
A Fresnel zone plate can be thought of geometrically as a lenswith a focal length ± FZ. This is related to the wavelength ofOLJKW WKH UDGLXVRO of the central zone and the refractiveindex n, as given in formula (1).
It is clear then that the focal length can be changed bymodifying the radius of the zone and it follows that an axial linefocus can be generated by a continual change in the radius ofthe zone structure as one sweeps around the plate. A Fresnelzone structure of this design is depicted in Figure 1a below withalmost a 40:1 variation in focal length. Figure 1b and 1c showthe normal circular Fresnel zone plate structure for two differentfocal lengths.
Experimental Design
The application of this technique is in the generation of an on-axis line focus for plasma physics experiments. The plate wasdesigned to be used in conjunction with a conventional lenswith a 700 mm focal length (FP), to generate a 10 mm long line
focus from a 10 cm diameter beam, using 526.5 nm laser light.
The basis for the design was to work out the range required forFZ using the simple lens formula (2), noting that the positiveorder diffraction results in a line inside the principal focal planeand the negative order diffraction produces a line beyond theprincipal focal. Effectively then, to produce a 10 mm line focus,one requires LL (the line length) to be 5 mm either side of theprincipal focal plane (making FC equal to 700 ± 5 mm). Usingthese values in formula (3), FZ is found to be around ± 97 m.
This is the minimum value of FZ which used on its own wouldproduce focal spots at ± 5 mm from the principal focal plane.Longer focal lengths then contribute to the axial line focus butto get to the principal plane one requires an infinite focallength! However, because of manufacturing tolerances with
Axial Line-Focus With A Binary-Phase Fresnel Zone Plate
D A Pepler, P M Godfrey, C N Danson
Central Laser Facility, CLRC Rutherford Appleton Laboratory, Chilton, Didcot, Oxon, OX11 0QX, UK.
Main contact email address: [email protected]
−±=
4
1 2 λλ
oZ
R
nF (1)
PZC FFF
111 += (2)
111
−
−=
PCZ FF
F (3)
PLLFF LSPC ∗−−= (4)
ZO FR λ≈ (5)
b c
a
Figure 1. Fresnel zone plate structures showing:- a) themodified Fresnel zone structure with a continual variation of Fz
between ~.2 m and ~ 90 m. (Arbitrary scaling). b) a standardplate with circular rings giving a Fz ~ 6 m. c) a standard platewith Fz ~ 1 m.
Figure 2. Image taken along the length of the axial focus, usingthe modified Fresnel zone design of Figure 1a, showing the highintensity cusp surrounding the central “spot”.
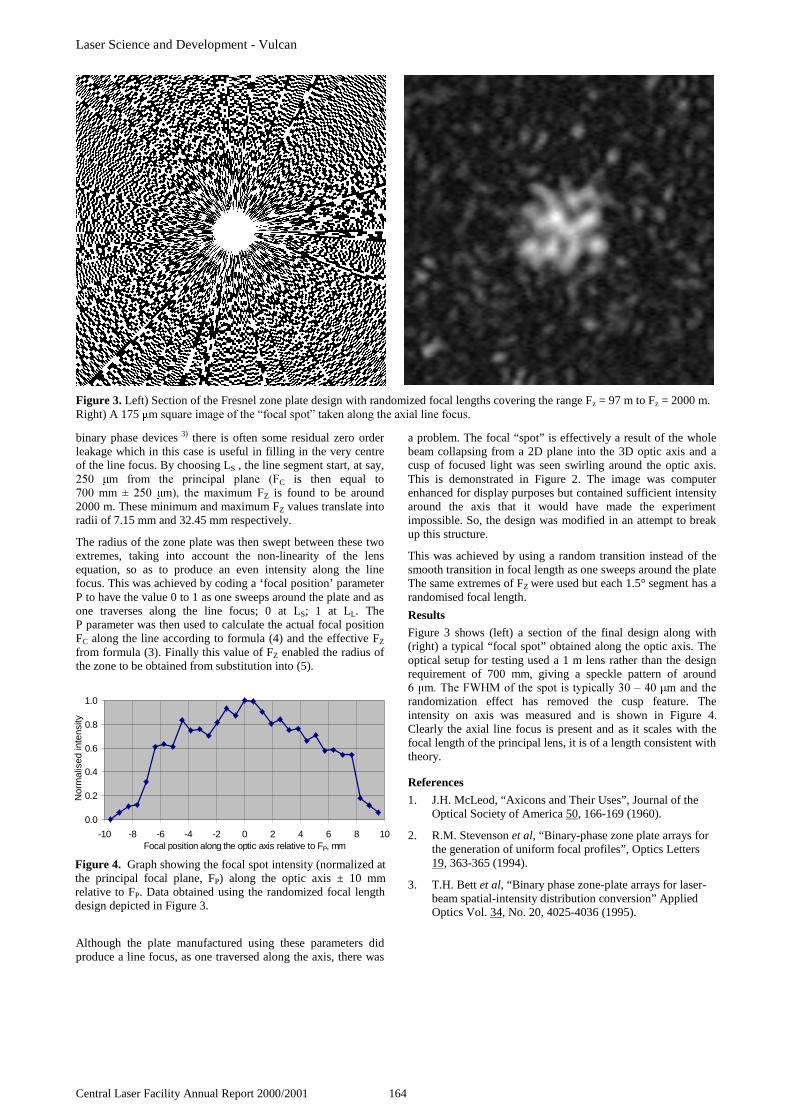
Laser Science and Development - Vulcan
Central Laser Facility Annual Report 2000/2001 164
binary phase devices 3) there is often some residual zero orderleakage which in this case is useful in filling in the very centreof the line focus. By choosing LS , the line segment start, at say, P IURP WKH SULQFLSDO SODQH )C is then equal toPP P WKH PD[LPXP )Z is found to be around2000 m. These minimum and maximum FZ values translate intoradii of 7.15 mm and 32.45 mm respectively.
The radius of the zone plate was then swept between these twoextremes, taking into account the non-linearity of the lensequation, so as to produce an even intensity along the linefocus. This was achieved by coding a ‘focal position’ parameterP to have the value 0 to 1 as one sweeps around the plate and asone traverses along the line focus; 0 at LS; 1 at LL. TheP parameter was then used to calculate the actual focal positionFC along the line according to formula (4) and the effective FZ
from formula (3). Finally this value of FZ enabled the radius ofthe zone to be obtained from substitution into (5).
Although the plate manufactured using these parameters didproduce a line focus, as one traversed along the axis, there was
a problem. The focal “spot” is effectively a result of the wholebeam collapsing from a 2D plane into the 3D optic axis and acusp of focused light was seen swirling around the optic axis.This is demonstrated in Figure 2. The image was computerenhanced for display purposes but contained sufficient intensityaround the axis that it would have made the experimentimpossible. So, the design was modified in an attempt to breakup this structure.
This was achieved by using a random transition instead of thesmooth transition in focal length as one sweeps around the plateThe same extremes of FZ were used but each 1.5° segment has arandomised focal length.
Results
Figure 3 shows (left) a section of the final design along with(right) a typical “focal spot” obtained along the optic axis. Theoptical setup for testing used a 1 m lens rather than the designrequirement of 700 mm, giving a speckle pattern of around P7KH):+0RIWKHVSRWLVW\SLFDOO\± PDQGWKHrandomization effect has removed the cusp feature. Theintensity on axis was measured and is shown in Figure 4.Clearly the axial line focus is present and as it scales with thefocal length of the principal lens, it is of a length consistent withtheory.
References
1. J.H. McLeod, “Axicons and Their Uses”, Journal of theOptical Society of America 50, 166-169 (1960).
2. R.M. Stevenson et al, “Binary-phase zone plate arrays forthe generation of uniform focal profiles”, Optics Letters19, 363-365 (1994).
3. T.H. Bett et al, “Binary phase zone-plate arrays for laser-beam spatial-intensity distribution conversion” AppliedOptics Vol. 34, No. 20, 4025-4036 (1995).
Figure 3. Left) Section of the Fresnel zone plate design with randomized focal lengths covering the range Fz = 97 m to Fz = 2000 m.Right) A 175 PVTXDUHLPDJHRIWKH³IRFDOVSRW´WDNHQDORQJWKHD[LDOOLQHIRFXV
Figure 4. Graph showing the focal spot intensity (normalized atthe principal focal plane, FP) along the optic axis ± 10 mmrelative to FP. Data obtained using the randomized focal lengthdesign depicted in Figure 3.
0.0
0.2
0.4
0.6
0.8
1.0
-10 -8 -6 -4 -2 0 2 4 6 8 10Focal position along the optic axis relative to FP, mm
Nor
mal
ised
inte
nsity

Laser Science and Development – Lasers for Science Facility
165 Central Laser Facility Annual Report 2000/2001
Introduction
The Picosecond Infrared Absorption and Transient Excitation(PIRATE) facility at the Rutherford Appleton Laboratory bringstogether novel laser technology and expertise in time-resolvedinfrared (TRIR) spectroscopy. The laser system uses recentdevelopments in non-linear optical materials to generatewavelengths into the mid-infrared ‘fingerprint’ region(1000 to 3000 cm-1). The Ultrafast Spectroscopy Laboratorynow has independently tunable light sources (200 nm – 10 µm)for pump and probe spectroscopy such as transient absorption(both infrared and visible), fluorescence and resonance Ramanspectroscopy1,2), with picosecond time resolution. This providesa unique combination of techniques for studying the energyrelaxation, structure and reactivity of short-lived (picosecond)intermediates formed during a chemical reaction in the solutionphase.
Two output configurations are possible for the PIRATE laser,either broadband 150-200 cm-1 femtosecond pulses forspectrally dispersed time resolved infrared spectroscopy ornarrowband 25 cm-1 picosecond pulses for experimentspumping/probing specific IR active modes.
Description
The layout of the Ultrafast Spectroscopy Laboratory OPAsystem is shown in Figure 1. The pump laser is a Ti:sapphireregenerative amplifier operating at 1 kHz repetition rate, atca. 800 nm, with an energy of 2-3 mJ per pulse. Theregenerative amplifier is seeded by a ~100 fs pulse from a
mode-locked Ti:sapphire laser. Spectral filtering of the seedbeam produces output of ca. 1 to 3 ps (FWHM) pulse durationand ca. 15 cm-1 to 7 cm-1 bandwidth respectively. An optionalfemtosecond stretcher/compressor arrangement provides anoutput of 150 fs and ~100 cm-1 bandwidth. In the picosecondmode the pulse is frequency doubled and split in order to pumptwo optical parametric amplifiers. Spectral filtering delivers1 ps pulses with ~ 35 cm-1 bandwidth (or optionally 2-3 ps with10-15 cm-1 bandwidth) with pulse energies of ~10 µJ across thetuning range of 470 - 700 nm (signal). Combined withupconversion and including the idler tunability, the overalltuning range is 205 - 2800 nm. A general description of thesystem can be found in Reference 1.
The PIRATE mid IR outputs are generated by frequency downconversion of the signal and idler outputs of an 800 nm pumpedOPA in silver gallium sulphide (AgGaS2). For high brightnessnarrow linewidth (~25 cm-1) mid IR light the picosecond modeof the pump laser is used. Spectrally dispersed time resolved IRspectroscopy uses the femtosecond mode to generate thebroadband (~150 cm-1) mid IR probe beam. This OPA is similarin design to that described by Hamm et al 2).
The full tuning range and approximate energy performance ofthe PIRATE system is illustrated at the bottom of Figure 1.
The Time Resolved IR (TRIR) system
TRIR directly probes the vibrations of molecules in a samplewhere a pump beam initiates a photochemical or photophysicalprocess. A <1 ps snap shot (probe) of the progress of the
The PIRATE Development
M Towrie, P D Bailey, R Barton, P Matousek, A W Parker
Central Laser Facility, CLRC Rutherford Appleton Laboratory, Chilton, Didcot, Oxon, OX11 0QX, UK
M W George, D C Grills
School of Chemistry, University of Nottingham, Nottingham, NG7 2RD, UK
Main contact email address: [email protected]
205 nm49,000 cm-1
460 nm22,000 cm-1
3.5 µm2,800 cm-1
12 µm830 cm-1
BBO & KTP OPA
2 Outputs>5 µJ
AgGaS2 or ZnGeP2
Down-conversion1 Output
~1 µJ
OPAUp-conversion
2 Outputs>5 µJ
Figure 1. Ultrafast Spectroscopy Laboratory: PIRATE SYSTEM.
Merlin &SupermerlinPump lasers
800nm ~1 mJ
SPITFIRE
2-pass Amplifier
3 mJ, 150 fs, 1-3 ps, c.800nm SHG OPG MIR1
MIR OUTPUTS
475-2500 nm
475-2500 nmOPG
OPG
220-475 nm
OPA
OPA
MIR2
OPA +
400 or800 nm
OPA

Laser Science and Development – Lasers for Science Facility
Central Laser Facility Annual Report 2000/2001 166
reaction is taken by measuring the changes in IR absorption ofthe initial and reactant species as a function of time delaybetween the pump and probe pulses. By using a broadbandprobe it is possible to simultaneously measure the absorptionspectrum over a range of wavelengths. Vibrational transitionsare generally weaker than electronic transitions and therefore anability to observe small absorbance changes down to 10-5 orbetter is desirable. For example in the range of species wewould like to probe, the expected absorption changes for verystrong absorbers such as metal carbonyls are ∆A ~10-1 - 10-2;for strong absorbers such as -C=O, -O-H and -C-H vibrations,∆A ~10-3 _ 10-4 and for moderate absorbers such as C=Cvibrations, ∆A ~10-5.
These low cross-sections place heavy constraints on the pulse topulse stability of the laser output and the stability and sensitivityof the detector and data acquisition system. The Hamm paperdescribes the potential stability of mid IR sources based onOPA technology. In our case only modest stability of the orderof +/-5% was achievable with additional large fluctuations dueto triggering and local thermal variations. To reduce the overalleffects of fluctuations we developed a sensitive multi-channelIR probe and reference approach to normalise out probevariations on a shot by shot basis as described below.
A key advance in picosecond TRIR has been the recentdevelopments in multi-channel MIR array detectors. Our TRIRapparatus comprises two 64 element mercury cadmium telluride(MCT) photoconductive detectors (MCT-13-64el detectorsfrom Infrared Associates Inc. and MCT-64000 pre-amplifiersfrom Infrared Systems Development Corp.) to detect the mid IRreference and probe signals. A customised analogue multiplexerreadout system has been designed and built. The data arecaptured and analysed in pump on/pump off pairs to create arolling average using the following equation:
∆AN = log[1 + IR/IP[ ((Iprobe/Iref)pump on - (Iprobe/Iref)pump off)]+∆AN-1 (N-1))/N
Here IR and IP are the final averages of the pump off spectra onthe reference and probe side respectively, and N is the totalnumber of acquisitions. Further software discriminationremoves large fluctuations in the signal, such as laser ‘dropouts’ or other large variations such as those associated with gasbubbles in the sample flow stream, on a shot by shot basis.
The simultaneous outputs of both 64 element MCT arrays arefed into a modified HX2 analogue multiplexer test boardPC20001/5 (User guide 11/7/97). The HX2 was designed at theRutherford Appleton Laboratory by the InstrumentDevelopment Group for charge detection from multi-elementX-Ray detector arrays. Each HX2 integrated circuit integratescharge (up to 60 pC +ve charge and 20 pC –ve charge) over 16
parallel input signals and has an electrical bandwidth of ~1MHzand integration period determined by internal or external clockcircuitry. The test board uses 4 HX2s to capture 64 channelssimultaneously with all readouts multiplexed into a singleoutput consisting of a sequence of 64 analogue voltages. Thebuffered output generates a ~12V full scale voltage. This boardincorporates pulse timing circuitry for charge integration downto ~20 µs as set by the basic clocking structure that was tied tothe readout rate. In order to match the detector response to theintegration period we provided an external clock pulse train todefine a ~ 2 µs integration period followed by a 14 µs readoutperiod. A second HX2 board, slaved to the first board, is usedto acquire the signals from the second MCT detector. Theoutputs from both boards are read out in simultaneous bursts of64 analogue signals, with each burst separated by 1 ms asdefined by the laser repetition rate.
The charge injected from the detectors into the HX2 is adjustedto give ~12 V output for a 4 V MCT detector input signal. Themultiplexed output has a full scale range of about 12 V andbaseline ripple of ~15 mV rms and noise of < 6 mV rms. Thenoise derives from the MCT detectors at the ~2 mV level andthe ripple from 50 Hz mains related modulation. The mainsripple is correlated in all analogue outputs and is largelyremoved in the subsequent data normalisation process.
A simple low pass RF filter is used to reduce high frequencynoise prior to digitisation. The HX2 board provides trigger andclock pulses to synchronise with the ADC. The analogue signalsare passed into two channels of an 8 channel simultaneoussampling, 12 bit resolution, Datel 416J ADC card housed in astandard 500 MHz PC. This card has capacity to acquire at upto 250 kHz on each channel. The data is then streamed to thePC RAM via the ADC FIFO and PC direct memory accesswhere data analysis such as signal discrimination, normalisationand averaging between detector channels is carried out on a shotby shot basis at 1 kHz. The experiments are carried out in apump and probe configuration where the pump laser is switchedon and off on an alternative shot basis using an opticalgalvanometer synchronised to the laser. A third channel of theADC is used to monitor the pump on/off status of the laser.
The general layout of the time resolved IR spectrometer isshown in Figure 2. The mid infrared probe beam generatedfrom the OPA is split into a reference and probe using a 50 %germanium beamsplitter. The probe beam is focused to about150 µm diameter into the sample cell using an f = 30 cm goldcoated spherical mirror. The transmitted light from the sampleis then imaged onto the spectrometer input slit that is set to0.5 mm width. A similar optical relay is used for the referencearm. Two CVI DKSP240 1/4m spectrometers disperse the IRbeams. They have the option of 150 l/mm (4000 nm blaze) and300 l/mm (2400 nm blaze) gold gratings with 25.6 and
Optical Rectification
Germanium 50% Beamsplitter
MIR SPECTROMETERS
6ns max delay line (50 fs resolution)
GALVANOMETER1/2 rep. rate
PUMP
MIR PROBE
HX2 Analogue Multiplexer
MCT-6400
MCT-6400
MIR REFERENCE
PROBE
CLOCK TIMING DELAY GENERATORS
PC & ADC
MCT DETECTORS
Figure 2. The PIRATE Time Resolved IR Spectrometer.

Laser Science and Development – Lasers for Science Facility
167 Central Laser Facility Annual Report 2000/2001
12.8 nm/mm dispersion respectively. An adaptation of the exitport and mirror increased the spectral window of thespectrometer from 25 mm to 35 mm, matching the dimensionsof the MCT diode array.
Figure 3 shows the sample chamber used for experiments withprobe wavelengths below 5.85 µm. This open jet system isused for the many samples that are prone to pump induceddegradation that often occurs on the surface of an enclosed flowcell. Low f number lenses image the jet onto the spectrometerslit. A CaF2 windowed compartment allows an inertatmosphere, and resistive heaters on the windows stopcondensation of solvent on the widows. This arrangement isalso suitable for transparent solvents and for UV VIS transientabsorption. For measurements in aqueous solution and below5.85 µm, in the solvent absorption regions, a thin movingenclosed flow cell is being designed.
Results
As an illustration of the capability of the PIRATE TRIRapparatus, two spectra are given.
Figure 4 shows the TRIR spectrum of para-chlorophenylazide(1) in n-hexane in an open flowing jet, after 2 minutes of dataaccumulation. Aryl azide compounds have potential as photo-labels and photo-resists. The spectrum shows the azide bleachand the didehydroazepine product (3) which is formed in~20 ps. The baseline noise level is better than ∆A = 10-4 andshows that with 100 times longer accumulation, sensitivity tobetter than the 10-5 level could be achieved.
Figure 5 shows the TRIR spectra of [(py)Re(CO)3(dppz)]+[PF6]-
taken in the open jet over a 300 cm-1 spectral range(two 150 cm-1 spectra joined) after 2 minutes accumulation.This complex is one member of a family of compounds thathave the potential to act as IR probes of the structural featuresof DNA and the electron transfer processes which occur only inthe DNA helix. This is because the character of their lowestlying excited states can be tuned, by ligand substitution, toinduce fluorescence when bound to specific sites in DNA.
The spectrum shows both negative and positive going featureswhich relate to the ground and excited state species. Thenegative going peaks are a bleach of the ground state absorptionbands caused by the depletion of ground state population. Thebroad positive going peaks are characteristic absorption bandsof a π-π* ligand based excited state.
Conclusions
The PIRATE system provides access to the complementarytechniques of TRIR, IR pump spectroscopy and time resolvedresonance Raman spectroscopy. Preliminary results demonstratesensitivity down to the ∆A ~10-4-10-5 level in around 1 minuteof accumulation time with an open flow jet configuration.
The RAL designed analogue multiplexer, in combination withthe Datel ADC, has potential for scaling to readout rates of8 kHz (128 elements) or 1 kHz (1024 elements).
Acknowledgements
M. S. Platz (Department of Chemistry, The Ohio StateUniversity, 100 West 18th Avenue, Columbus, OH43210-1173) for the azide sample. EPSRC for funding on grantGR/M40486.
References
1. M. Towrie et al. Meas. Sci. Technol. 9 (1998) 816
2. P.Hamm, R.A. Kaindl and J. Stenger. Opt. Lett. 25 (2000)1798
∆ A
bso
rban
ce
2200210020001900
Wavenumbers (cm-1)
∆ OD = 5 x 10⁻⁴
Cl
N3
Cl
N1
N
Cl
hν-N2
1 2 3
Figure 4. Transient IR spectrum of para-chlorophenylazide20 ps time delay after the pump pulse.
-10
-5
0
5
∆ A
bso
rban
ce (
x10
-3 )
2150 2100 2050 2000 1950 1900
Wavenumbers (cm-1
)
1 ps 2 ps 5 ps 10 ps 20 ps 50 ps 100 ps 1000 ps
Figure 5. Time-resolved IR spectra of[(py)Re(CO)3(dppz)]+[PF6]
- in CH3CN after 400 nm photolysis.The insert shows the pump probe time delays.
Sample
Jet
IR Pr obe
PumpHeating res istor s
CaF2 Collectionlens
Figure 3. The open solvent jet flow system.

Laser Science and Development – Lasers for Science Facility
Central Laser Facility Annual Report 2000/2001 168
Introduction
Raman spectra obtained using a probe beam wavelengthmatched to a molecular absorption band have exceptionalsensitivity and selectivity. The resonance greatly enhances theRaman signal from individual transition moments of thespecific molecule to be studied. Unfortunately, fluorescence isoften also strong, limiting observations in ground state studiesto particularly strong Raman bands. In many cases the probebeam - and the pump beam in time-resolved resonance Raman(TR3) experiments - may induce fluorescence in contaminantsor the solvent. In biological or industrial cases particularly, theconcentration of the molecule under study may be low. Toreject the fluorescence we have adopted the temporal gatingtechnique that uses the main distinguishing feature of theRaman scattering, its promptness. A short pulsed Raman signalis generated using a pulsed laser and the longer livedfluorescence is rejected in the time domain. Very short gatingtimes were achieved by Tahara and Hamaguchi1) who used astreak camera with effective time gating resolution of ~10 pslimited by trigger jitter. A similar concept but relying on anoptical Kerr gate 2-5) was proposed and demonstrated in groundstate Raman spectroscopy by Deffontaine et al 6) using 25 psgating pulses. This latter concept holds certain advantages overthe streak camera due to simplicity of the design and inherentabsence of jitter problems allowing potential access to shortergating times. We have recently demonstrated the feasibility ofKerr gate fluorescence suppression with ~ 3 ps time resolutionin Raman spectroscopy7). The prototype device had athroughput of about 30 % (excluding Fresnel losses on opticalelements) and extinction ratio 10-4 in the usable spectral rangeof 630 - 700 nm. However, we recognised the need and scopefor improvement in order to detect signals from much weakerRaman scattering systems and to greatly increase its spectralrange in order to use resonance enhancement for a wide rangeof molecules. Here we present our improved design andcharacterise the performance of the enhanced device. Thespecifications are transmittance in the open state of ~ 40 %(excluding Fresnel losses on optical elements), a higherrejection ratio of 10-5 and a substantially wider usable spectralrange 300 - 700 nm attained with a single pair of polarisers.This is achieved at the expense of a marginally lower temporalresolution, ~ 4 ps.
Description
The basic principle of the optical Kerr gate was described in ourearlier publication7). Briefly, the Kerr gate consists of twocrossed polarisers and a Kerr medium. In the closed state, lightcollected from the sample and collimated in an optical train iseffectively blocked by the crossed polarisers. Coincident intime with the Raman scattered light from the sample, a shortgating pulse of 800 nm wavelength that bypasses the polariserscreates a transient anisotropy within the Kerr medium by theoptical Kerr effect. The gating beam is polarised at 450. Theintensity is adjusted to create an effective λ/2 waveplate androtate the polarisation of the light from the sample by 90o
allowing it to be transmitted through the cross polariser for theduration of the gating pulse.
Kerr mediumPolariser
Sample
Gating pulse
Spec
trom
eter
40 mm 100 mm 100 mm 300 mm
f=100 mm f=100 mmCross polariser
filters
f=150 mm
f=300 mm
50 m
m
Pump/probe laser pulses
Figure 1. Optical arrangement of the Raman collection systemand the optical Kerr gate.
The improved Raman collection system consists of a paraboliccollection mirror (f# = 0.8) of 50 mm diameter, image relayfused silica lenses, a Kerr cell and two calcite Glan Taylorsegmented polarisers (see Figure 1). The 800 nm gating pulse isweakly focused into the Kerr cell to a diameter of ~ 1 – 2 mmusing a 150 mm focal length lens. The Kerr cell containingstatic CS2 was custom made with a 2 mm-path length andultrathin (300 µm) Spectrosil B walls. The polarisers were of41x41 mm aperture, manufactured to our specifications byHalbo Optics, replacing earlier sheet polarisers. The firstpolariser consists of two 20 x 41 mm segments of 20 mmthickness. The choice of 41 x 41 mm aperture is a compromisebetween the cost and optimum Raman throughput, with some14 % loss due to clipping on the polariser being tolerated. Theoptical thickness of the polariser is uniform to within ± 50 µmto keep the transit time variation of the Raman signal within thegate response time. The second polariser placed after the Kerrcell is manufactured to the same specifications except that it hasrelaxed thickness uniformity to within ± 1 mm.
The f = 10 cm lens placed immediately after the first polariserimages the sample interaction region into the Kerr cell. Therays emerging from the Kerr medium are then re-collimated bythe second f=10 cm lens, passed through the cross polariser andimaged onto spectrometer entrance slit using a 30 cm focallength lens with the f-number matching that of the 3-stagespectrometer (Triplemate). A home built Triplemate filter stageby-pass option was used in the experiments described here tooptimise transmission. The probe laser line was blocked using aholographic supernotch filter, glass edge absorbing filter or asolution filter. A concentrated solution of copper sulphate inwater in a 1 cm thick, 2 inch diameter, optical cell was placed infront of the spectrometer slit to block the 800 nm gating beam.The spectrometer throughput was determined to be 3.5-timeslower for horizontal polarisation (corresponds to measurementswith the polarisers oriented in parallel) compared to the verticalorientation (polarisers crossed) at ~ 2250 cm-1 when probing at400 nm. All photon counts given here for measurements withthe polarisers oriented in parallel ('without gate') are scaled toaccount for these differences.
A schematic diagram of the overall system is shown in Figure 2.Raman scattered light was collected at 90o to the probe beamdirection. One CCD count corresponded to one photoelectron.
Fluorescence Suppression in Raman Spectroscopy using a High PerformancePicosecond Kerr Gate
P Matousek, M Towrie, A W Parker
Central Laser Facility, CLRC Rutherford Appleton Laboratory, Chilton, Didcot, Oxon, OX11 0QX, UK
C Ma, W M Kwok, D Phillips
Department of Chemistry, Imperial College, London SW7 2AY
W T Toner
Department of Physics, Clarendon Laboratory, Parks Road, Oxford OX1 3PU
Main contact email address: [email protected]

Laser Science and Development – Lasers for Science Facility
169 Central Laser Facility Annual Report 2000/2001
The sample solution was re-circulated in an open liquid jet of0.5 mm diameter.
Spectra Physics
argon-ion fs Ti:S
regenerative amplifier800 nm / 1 ps / 3 mJ / 1 kHz
SHG
sampleKerr gate
spec
trom
eter
CCD
Nd:
YL
F
gate 800 nm/500 µJ
probepump
twin OPA/mix
Figure 2. Schematic diagram of the picosecond time-resolvedresonance Raman apparatus with the Kerr gate (K-TR3).
Our ps-TR3 apparatus uses a regenerative amplifier systemfollowed by a two pass linear amplifier (SuperSpitfire, SpectraPhysics/Positive Light) providing 800 nm, 1 ps, 2 - 3 mJfundamental pulses at 1 kHz repetition rate. The fundamentallaser output is split in two. 500 µJ is taken for the gating pulseto drive the Kerr gate and the remainder is frequency doubled topump two home built optical parametric amplifiers that generatethe synchronised, independently tunable pump and probe pulsesrequired for TR3 experiments. This configuration also enablesthe delivery of frequency doubled, 400 nm, and tripled,~266 nm, pulses with higher energies. For conventional groundstate Raman measurements, the pump beam is blocked.
The low wavelength limit of the CS2 Kerr gate is ~ 390 nm,determined by the electronic absorption of CS2. The wavelengthcoverage extends to 700 nm where the limit is set bybackground due to stimulated anti-Stokes emission induced bythe gating pulse in the Kerr medium. Coverage of the300 - 390 nm range is facilitated by using a benzene based Kerrgate capable of achieving a throughput of about 20 %.
Results
The temporal response of the gate was determined bymeasuring the intensity of the 2253 cm-1 Raman band ofacetonitrile and delaying the Raman probe pulse with respect tothe gating pulse. The data was best fit to a Gaussian profilewith FWHM 4.2 ps. With ~500 µJ of gate pulse energy, thethroughput of the Kerr gate in the open state is 40 % excludinglosses on optical elements, i.e. Fresnel and absorption losses. Incomparison with our earlier design7), the new gate provides anapproximately 2.7-fold increase in Raman flux reaching thedetector under the same experimental conditions. This is due toimproved collection efficiency of Raman light (x1.7) and ahigher overall transmission (x1.6) through the gate in the openstate due to more efficient opening of the gate.
To demonstrate the effectiveness of the Kerr device we haverecorded Raman spectra of an unpurified ‘industrial’ sample ofunleaded petrol taken directly from a motorcar petrol tank (seeFigure 3). The spectra obtained at 400 nm without the gate(polarisers oriented in parallel, gating pulse blocked) weredominated by a massive amount of fluorescence. Raman bandswere resolved from over 10,000 times more intensefluorescence background using the gate. The fluorescencelifetime was estimated to be ~30 ns.
The Kerr gate was also used for a TR3 spectroscopy of thehighly emissive intramolecular charge transfer (ICT) state ofDMABN 8) shedding new light on the 40 year old problem ofthe nature of the anomalous fluorescence observed in polarsolvents. The Kerr gate was also successfully used in ground
state Raman studies of highly emissive solid samples andmeasurements of picosecond time-resolved fluorescence.
01020
304050607080
500 1000 1500 2000
Wavenumber (cm-1)
Cou
nts/
s
with gate
5000x
0
100000
200000
300000
400000
500 1000 1500 2000
Wavenumber (cm-1)
Cou
nts/
s
without gate
Figure 3. Raman spectra of unleaded petrol measured (top)without the gate and (bottom) with the gate at 400 nm (1 ps,4 µJ, 1 kHz). The accumulation time was 400 s.
Conclusions
In summary, we have developed an improved, highperformance device, based on an optical gate with a responsetime ~4 ps, for the efficient suppression of fluorescence inRaman spectroscopy. The system further increases the generalapplicability of Raman spectroscopy and, in particular, holdsgreat promise for industrial and biological applications wherehigh levels of fluorescence are common.
Acknowledgements
This work was supported by EPSRC research grantsGR/L83943 and GR/L84001.
References
1. T Tahara and H Hamaguchi, Appl. Spectrosc. 47 391,(1993)
2. M A Dunguay and J W Hansen, Appl. Phys. Letters 15192, (1969)
3. R R Alfano and S L Shapiro, IEEE J. Quantum Electron.QE-8 528, (1972)
4. E P Ippen and C V Shank, Appl. Phys. Lett. 26 92, (1975)
5. H Kanbara, H Kobayashi, T Kaino, T Kurihara, N Ooba, KKubodera, J. Opt. Soc. Am. B 11 2216, (1994)
6. A Deffontaine, M Delhaye and M Bridoux , PulsedMultichannel Raman Technique. In Time-resolvedVibrational Spectroscopy, A Laubereau, M Stockburger(eds). Springer-Verlag, Berlin, 20 (1985)
7. P Matousek, M Towrie, A Stanley and A W Parker, Appl.Spectrosc. 53 1485, (1999)
8. W M Kwok, C Ma, P Matousek, A W Parker, D Phillips,W T Toner, M Towrie and S Umapathy, J. Phys. Chem. A105 984, (2001)

Laser Science and Development – Lasers for Science Facility
Central Laser Facility Annual Report 2000/2001 170
Introduction
Fluorescence Lifetime Imaging (FLIM) is a technique thatallows investigation of molecular interaction such as energytransfer and anisotropy correlation in subcellular entities1,2).These cellular processes affect the quantum state of themolecule of interest and lead to a change in the naturalfluorescence lifetime.
Confocal laser scanning microscopy (CLSM) allowsfluorescence imaging with resolution of 200-400nmdimensions. The ability of the technique to exclude out-of-focus information makes it possible to obtain 3D images ofeven thick samples with clarity. However, single photonexcitation normally used in this technique leads to photo-bleaching, rapid degradation and sample toxicity during therepeated raster scanning process. Multiphoton confocalmicroscopy 3) uses near infrared light (NIR) to excite thefluorophor by a non-linear process under high laser peak power(Figure 1).
The advantage of this technique is that the excitation is confinedonly to the focus of a high numerical aperture microscopeobjective, reduced specimen toxicity due to the NIR source andless photo bleaching.
In this report, we have combined time correlated single photoncounting technique, TCSPC, a technique for determining ultrashort molecular lifetime, with multiphoton -CLSM to study thephoto-physics of biomolecules 4). 5-hydyoxy tryptophan, themolecule of interest is incorporated within a protein in yeastcells.
Experimental
The multiphoton microscopy apparatus consists of laser light(Titanium Sapphire, 76 MHz, mode-locked, 120 fs, fromSpectra-Physics) focused to a diffraction-limited spot throughan oil objective and scanned across the sample (Figure 2).Specimens were illuminated at a microscope stage (OlympusIMT-2) by passing the beam through a 750 + 2 nm interferencefilter (Ealing), placed at the fluorescence attachment port of the
Development of a Time Correlated-Single Photon Counting Multiphoton LaserScanning Confocal Microscope
S W Botchway, A W Parker
Central Laser Facility, CLRC Rutherford Appleton Laboratory, Chilton, Didcot, Oxon, OX11 0QX, UK
I Barba, K Brindle
University of Cambridge, Department of Biochemistry
Main contact email address: [email protected]
Figure 1b. Multiphotonenergy diagram of 5-OH tryp, leading to thegreen fluorescenceobserved at 505 nm
2hν
Ground State
Intermediate
Excited State Intermediate
3h
Fluorescent photon for imaging
((5-OH-trpy).+ )*
(5-OH-trpy).+
5-OH-trpy
υ
Figure 1a. Non-linearmultiphoton process
photoionisation
Excited state
Figure 1. Multiphoton generation of green fluorescence.
Figure 2. Instrumentation - TCSPC confocal laser scanning fluorescence microscope .
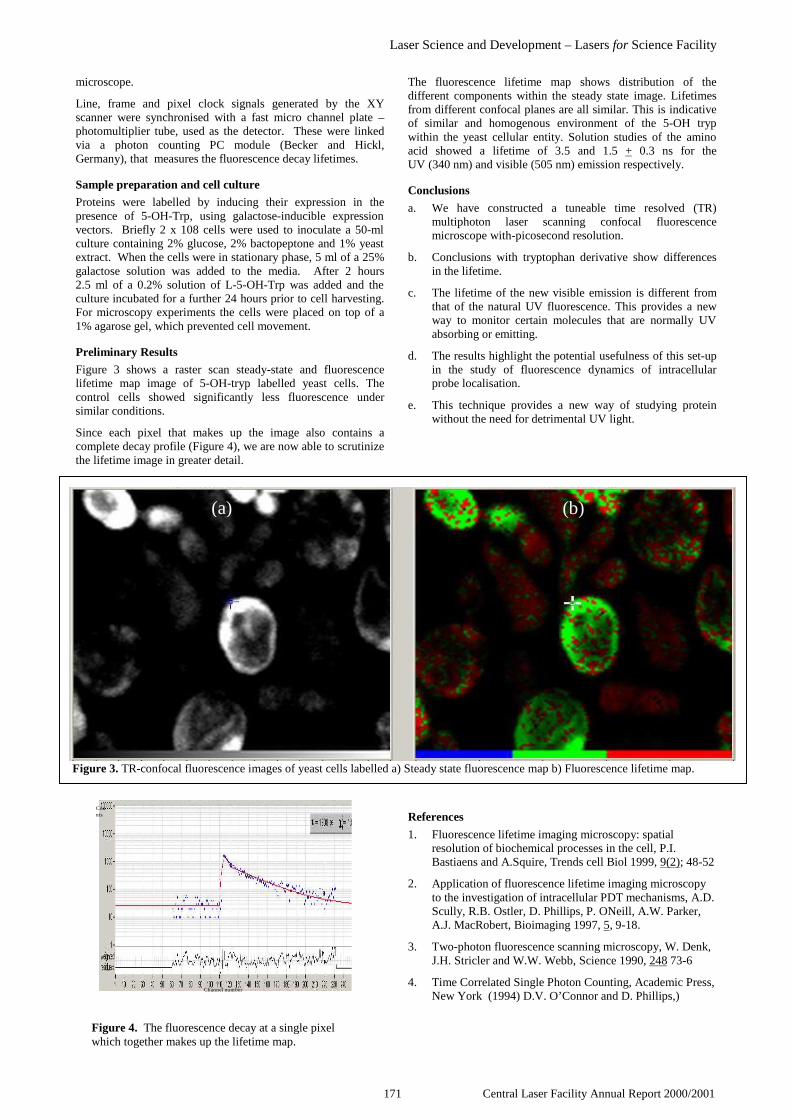
Laser Science and Development – Lasers for Science Facility
171 Central Laser Facility Annual Report 2000/2001
microscope.
Line, frame and pixel clock signals generated by the XYscanner were synchronised with a fast micro channel plate –photomultiplier tube, used as the detector. These were linkedvia a photon counting PC module (Becker and Hickl,Germany), that measures the fluorescence decay lifetimes.
Sample preparation and cell culture
Proteins were labelled by inducing their expression in thepresence of 5-OH-Trp, using galactose-inducible expressionvectors. Briefly 2 x 10⁸ cells were used to inoculate a 50-mlculture containing 2% glucose, 2% bactopeptone and 1% yeastextract. When the cells were in stationary phase, 5 ml of a 25%galactose solution was added to the media. After 2 hours2.5 ml of a 0.2% solution of L-5-OH-Trp was added and theculture incubated for a further 24 hours prior to cell harvesting.For microscopy experiments the cells were placed on top of a1% agarose gel, which prevented cell movement.
Preliminary Results
Figure 3 shows a raster scan steady-state and fluorescencelifetime map image of 5-OH-tryp labelled yeast cells. Thecontrol cells showed significantly less fluorescence undersimilar conditions.
Since each pixel that makes up the image also contains acomplete decay profile (Figure 4), we are now able to scrutinizethe lifetime image in greater detail.
The fluorescence lifetime map shows distribution of thedifferent components within the steady state image. Lifetimesfrom different confocal planes are all similar. This is indicativeof similar and homogenous environment of the 5-OH trypwithin the yeast cellular entity. Solution studies of the aminoacid showed a lifetime of 3.5 and 1.5 + 0.3 ns for theUV (340 nm) and visible (505 nm) emission respectively.
Conclusions
a. We have constructed a tuneable time resolved (TR)multiphoton laser scanning confocal fluorescencemicroscope with-picosecond resolution.
b. Conclusions with tryptophan derivative show differencesin the lifetime.
c. The lifetime of the new visible emission is different fromthat of the natural UV fluorescence. This provides a newway to monitor certain molecules that are normally UVabsorbing or emitting.
d. The results highlight the potential usefulness of this set-upin the study of fluorescence dynamics of intracellularprobe localisation.
e. This technique provides a new way of studying proteinwithout the need for detrimental UV light.
References
1. Fluorescence lifetime imaging microscopy: spatialresolution of biochemical processes in the cell, P.I.Bastiaens and A.Squire, Trends cell Biol 1999, 9(2); 48-52
2. Application of fluorescence lifetime imaging microscopyto the investigation of intracellular PDT mechanisms, A.D.Scully, R.B. Ostler, D. Phillips, P. ONeill, A.W. Parker,A.J. MacRobert, Bioimaging 1997, 5, 9-18.
3. Two-photon fluorescence scanning microscopy, W. Denk,J.H. Stricler and W.W. Webb, Science 1990, 248 73-6
4. Time Correlated Single Photon Counting, Academic Press,New York (1994) D.V. O’Connor and D. Phillips,)
Channel number
Counts
Figure 4. The fluorescence decay at a single pixelwhich together makes up the lifetime map.
Figure 3. TR-confocal fluorescence images of yeast cells labelled a) Steady state fluorescence map b) Fluorescence lifetime map.
(a) (b)

Laser Science and Development – Lasers for Science Facility
Central Laser Facility Annual Report 2000/2001 172
During the reporting year, the laser systems in the EPSRC LaserLoan Pool have been replaced as they reach the 5-year age limitset in the terms of the Loan Pool Grant. The Loan Pool aims toprovide state of the art laser systems that have a high degree offlexibility for wide ranging research while combining thereliability and robustness required for the Loan Poolenvironment.
The development of the Loan Pool is administered by the LSFon the basis of User requirements. We use all feedback fromthe UK research community such as from User report forms,meetings and questionnaires. We then purchase systems on thestrength of this feedback and on our assessment of technicalpracticality.
Nd:YAG pumped dye lasers remain extremely useful workhorse systems capable of broad tunablity, very high brightnessand narrow resolution. We continue to maintain five Nd:YAGlaser systems in the Loan Pool. However this year the twoSpectron Nd:YAG pump lasers for the Sirah dye lasers, theentire GCR11/PDL3 system, have been replaced with newlasers. The output specification range of the Nd:YAG/dye lasersystems is given in Table 1.
The trial of the femtosecond system within the Loan Pool hasproved very successful with it finding a wide range ofapplications such as multiphoton microscopy, surface harmonicgeneration and for the development of THz sources. In Junethe femtosecond system is to be replaced by a Verdi/MIRAsystem capable of very broad tuning range and with the optionof second and third harmonic generation. The specifications ofthe femtosecond system are given in Table 2.
The remainder of the Pool includes the fluoride excimer, andfrequency doubled argon ion. Full details of all the lasers andtheir specifications can be found on our web-site at:http://www.clf.rl.ac.uk/Access/lp/alsfll.html.
NSL1 replacement
The compact NSL1 system has been replaced with a morepowerful injection-seeded YAG/dye system with doubling andinfrared option. The system is a Continuum Powerlite 8010pumping a SIRAH dye laser. The dye laser has frequencydoubling and IR difference frequency mixing units to covermost of the spectral range from 215 nm to 4 µm. Injectionseeding of the Nd:YAG enables generation of IR light withlinewidth matching the performance of the dye laser. Deliveryof the Infrared unit is expected in mid June 2001 and is to beinstalled in the Department of Chemistry, Heriot-WattUniversity for Prof K McKendrick and will be used to study thereaction dynamics of O(3P) with vibrationally excited methane.
NSL2&3 replacements
In the first months of the year, the two Spectron Nd:YAGs werereplaced with Surelite III-10 systems used to pump the existingSirah dye lasers. These Surelite lasers are very compact in bothsize and weight. In the next few months the systems will bemounted on dedicated breadboards on trolleys to form acompact package that can be easily transported and wheeled inand out of User laboratories. In addition the systems are water-cooled and are supplied by a 13A plug making them versatileand easy to install. The service back up for both the Nd:YAGand the dye is from a single company to avoid downtimeoccasionally experienced with ‘hybrid’ systems. A diagram ofthe proposed layout is shown in Figure 1(a) and (b). One ofthese lasers has been used in Nottingham (Dr K Reid) and is
currently with Dr A Alexander in the Department of Chemistry,University of Edinburgh where it is being used to studyinterference in dissociation dynamics. The other system willshortly be used by Prof A Stace in Sussex University to studythe chemistry of nanodroplets.
The Tsunami system was placed in the Loan Pool to prove theviability of operating a femtosecond laser in the Loan Pool.The success of this project led to demand for a more modernfemtosecond system and the IRA Optima 900F with 10W Verdipump laser was purchased after normal European tender. TheMIRA has a single mirror set which provides tunability from700 to 1000 nm with <150 fs pulses. The 10W Verdi pumplaser provides sufficient power to maintain the laser well abovethreshold and can in itself provide stable single longitudinalmode green output.
A frequency doubling and tripling option on the MIRA willallow convenient access to new regions of the spectrum in theUV, near UV and visible regions of the spectrum.
The MIRA incorporates several diagnostics to give modelocking status, power and a fluorescence monitor to help aidalignments when re-alignment or re-configuring is necessary.
The system will be provided with an optical breadboard and asmall water chiller unit.
Developments in the EPSRC Laser Loan Pool
S Tavender, A W Parker, M Towrie
Central Laser Facility, CLRC Rutherford Appleton Laboratory, Chilton, Didcot, Oxon, OX11 0QX, UK
Main contact email address: [email protected]
Figure 1(b). Proposed layout of Surelite/Sirah laser (top view).
494 mmSIRAH DYE LASER
1180 mm
OUTPUT
*
200 mmSURELITE-III YAG LASER
770 mm174 mm
1180 mm
OUTPUT
YAGPOWERSUPPLY
SIRAH DYE LASER
TOOLS&
SPARES
207 - 240 mm
OSCCIRC
AMPCIRC
312 -345 mm
Figure 1(a). Proposed layout of Surelite/Sirah laser (sideview).
OUTPUT

Laser Science and Development – Lasers for Science Facility
173 Central Laser Facility Annual Report 2000/2001
Nd:YAG/DYE systems NSL1,2,3,4&6
Nd:YAG Specification range
Output 1064 nm 700 – 1200mJ
532 nm 300 - 600 mJ
355 nm 100 - 300 mJ
266 nm 50 – 100 mJ
Pulse length 4 – 9 ns
Linewidth 1 cm-1 (0.05 with seeding)
Dye output
Linewidth <0.1 cm-1
440 nm 10 - 25 mJ
570 nm 90 - 150 mJ
640 nm 55 - 60 mJ
Doubling 215 – 400 nm ~10% offundamental
DFG 1500-3000 nm >2 mJ
3000-4000 nm
Table 1. The general specifications of the Loan Pool Nd:YAGlasers.
FEMTOSECOND SYSTEM CWL1
Pump laser Verdi V10
Power >10W
Wavelength 532 nm
Linewidth <5 MHz (over 50 ms)
Femtosecond Laser
MIRA Optima 900F
Pulse length ~130 fs
Tuning range 700-980 nm (1000 nm typical)
Power 700 nm ~0.4W
750 nm ~ 1W
800 nm ~1.3W
850 nm ~1.1W
900 nm ~0.8W
950 nm ~0.6W
1000 nm ~0.2W
FREQUENCYCONVERSION
SHG Tuning range 350-500 nm ~10% conversion
THG Tuning range 240-320 nm ~3% conversion
Table 2. The specifications of the femtosecond laser system.

Laser Science and Development – Lasers for Science Facility
Central Laser Facility Annual Report 2000/2001 174
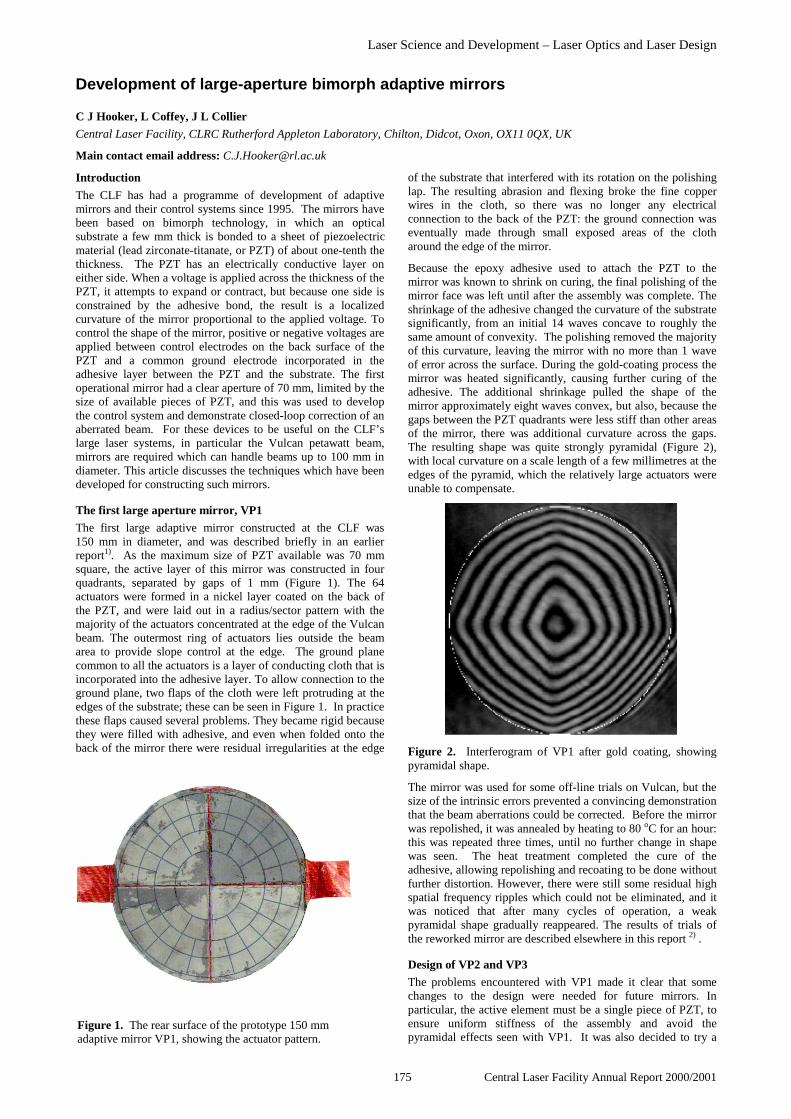
Laser Science and Development – Laser Optics and Laser Design
175 Central Laser Facility Annual Report 2000/2001
Introduction
The CLF has had a programme of development of adaptivemirrors and their control systems since 1995. The mirrors havebeen based on bimorph technology, in which an opticalsubstrate a few mm thick is bonded to a sheet of piezoelectricmaterial (lead zirconate-titanate, or PZT) of about one-tenth thethickness. The PZT has an electrically conductive layer oneither side. When a voltage is applied across the thickness of thePZT, it attempts to expand or contract, but because one side isconstrained by the adhesive bond, the result is a localizedcurvature of the mirror proportional to the applied voltage. Tocontrol the shape of the mirror, positive or negative voltages areapplied between control electrodes on the back surface of thePZT and a common ground electrode incorporated in theadhesive layer between the PZT and the substrate. The firstoperational mirror had a clear aperture of 70 mm, limited by thesize of available pieces of PZT, and this was used to developthe control system and demonstrate closed-loop correction of anaberrated beam. For these devices to be useful on the CLF’slarge laser systems, in particular the Vulcan petawatt beam,mirrors are required which can handle beams up to 100 mm indiameter. This article discusses the techniques which have beendeveloped for constructing such mirrors.
The first large aperture mirror, VP1
The first large adaptive mirror constructed at the CLF was150 mm in diameter, and was described briefly in an earlierreport1). As the maximum size of PZT available was 70 mmsquare, the active layer of this mirror was constructed in fourquadrants, separated by gaps of 1 mm (Figure 1). The 64actuators were formed in a nickel layer coated on the back ofthe PZT, and were laid out in a radius/sector pattern with themajority of the actuators concentrated at the edge of the Vulcanbeam. The outermost ring of actuators lies outside the beamarea to provide slope control at the edge. The ground planecommon to all the actuators is a layer of conducting cloth that isincorporated into the adhesive layer. To allow connection to theground plane, two flaps of the cloth were left protruding at theedges of the substrate; these can be seen in Figure 1. In practicethese flaps caused several problems. They became rigid becausethey were filled with adhesive, and even when folded onto theback of the mirror there were residual irregularities at the edge
of the substrate that interfered with its rotation on the polishinglap. The resulting abrasion and flexing broke the fine copperwires in the cloth, so there was no longer any electricalconnection to the back of the PZT: the ground connection waseventually made through small exposed areas of the clotharound the edge of the mirror.
Because the epoxy adhesive used to attach the PZT to themirror was known to shrink on curing, the final polishing of themirror face was left until after the assembly was complete. Theshrinkage of the adhesive changed the curvature of the substratesignificantly, from an initial 14 waves concave to roughly thesame amount of convexity. The polishing removed the majorityof this curvature, leaving the mirror with no more than 1 waveof error across the surface. During the gold-coating process themirror was heated significantly, causing further curing of theadhesive. The additional shrinkage pulled the shape of themirror approximately eight waves convex, but also, because thegaps between the PZT quadrants were less stiff than other areasof the mirror, there was additional curvature across the gaps.The resulting shape was quite strongly pyramidal (Figure 2),with local curvature on a scale length of a few millimetres at theedges of the pyramid, which the relatively large actuators wereunable to compensate.
Figure 2. Interferogram of VP1 after gold coating, showingpyramidal shape.
The mirror was used for some off-line trials on Vulcan, but thesize of the intrinsic errors prevented a convincing demonstrationthat the beam aberrations could be corrected. Before the mirrorwas repolished, it was annealed by heating to 80 oC for an hour:this was repeated three times, until no further change in shapewas seen. The heat treatment completed the cure of theadhesive, allowing repolishing and recoating to be done withoutfurther distortion. However, there were still some residual highspatial frequency ripples which could not be eliminated, and itwas noticed that after many cycles of operation, a weakpyramidal shape gradually reappeared. The results of trials ofthe reworked mirror are described elsewhere in this report 2) .
Design of VP2 and VP3
The problems encountered with VP1 made it clear that somechanges to the design were needed for future mirrors. Inparticular, the active element must be a single piece of PZT, toensure uniform stiffness of the assembly and avoid thepyramidal effects seen with VP1. It was also decided to try a
Development of large-aperture bimorph adaptive mirrors
C J Hooker, L Coffey, J L Collier
Central Laser Facility, CLRC Rutherford Appleton Laboratory, Chilton, Didcot, Oxon, OX11 0QX, UK
Main contact email address: [email protected]
Figure 1. The rear surface of the prototype 150 mmadaptive mirror VP1, showing the actuator pattern.

Laser Science and Development – Laser Optics and Laser Design
Central Laser Facility Annual Report 2000/2001 176
different type of adhesive, as the shrinkage of the epoxy used inVP1 was the main cause of the change of shape of the mirror.
PZT is not available in the required thickness at the diameterneeded for 150 mm aperture mirrors: discs of 120 mm diameterare supplied by the manufacturer at a minimum thickness of2 mm. However, PZT is a ceramic material of moderatehardness, and can be ground using conventional abrasives.Rather than attempting to thin the discs to 200 micronsseparately, it was decided to assemble the mirror with 2 mmthick PZT, and let the glass substrate act as a support during thegrinding. To test this technique, and at the same timeinvestigate different adhesives, three test assemblies were madeusing 76 mm diameter by 3 mm thick Pyrex substrates andsome 60 mm diameter by 4 mm thick discs of PZT that hadfailed quality control: these were supplied free by themanufacturer. Three adhesives were selected based on workdone at Imperial College3). These were a two-part acrylic andtwo different UV-curing types. Each assembly was made with alayer of conducting cloth between the substrate and the PZT, toreproduce the structure that would be present in the final mirror.
One of the three adhesives (the two-part acrylic) had a workingtime that was far too short to allow correct positioning of thecomponents. Of the UV-curing types, Holdtite ST3500 wasselected as the easiest to use for future mirrors, subject tosatisfactory performance. Grinding tests were carried out on allthree samples and worked well: standard optical grindingtechniques were used to thin the PZT to around 200 microns,although variations in the thickness of the adhesive layer didcause some variations in the PZT thickness. As the techniquefor thinning the PZT was a success, two full-sized mirrorassemblies were prepared, using 150 mm diameter substrateswith 112 mm PZT discs, bonded with ST3500. To avoid thedifficulties experienced with VP1, the conducting cloth for theground plane was cut as a circle 10 mm smaller than thesubstrate, and four areas were filled with conducting epoxyadhesive to serve as connection points to the cloth. The rear ofVP3 is shown in Figure 3, together with two of the testassemblies and PZT discs.
Figure 3. Adaptive optical elements. Front: two of the 76 mmtest assemblies with 60 mm PZT ground to 0.2 mm thickness;original 4 mm thick PZT disc. Back: Rear surface of VP3 aftergrinding; 120 mm diameter x 2 mm thick PZT disc.
Coating tests
While VP2 and VP3 were in preparation, coating tests werecarried out on the three small samples. As supplied, the PZTdiscs have a sintered silver conducting layer on each face,which is used for polarizing the material. The silver layer on theback is lost when the PZT is ground to thickness, so a newconducting layer must be applied to form the electrodestructure. This could be done by either evaporation or sputtering
of a suitable metal, possibly followed by an electroplating stageto increase the thickness of the coating. Sputtering is thepreferred coating process, as the PZT must be kept below theCurie temperature of 200 degrees, and the hot filament or boatrequired for evaporation can heat the substrate radiatively toquite high temperatures. Both nickel and copper were sputteredonto fine-ground glass substrates to determine the thickness thatwas achievable and to test the adhesion of the layer. Layerthicknesses of between 1 and 1.5 microns were formed withboth materials, but the coatings were soft and easily scratched.For later tests the surfaces were activated with HMDS(hexamethyldisilazane), which on PZT yielded a highlyadherent layer that could not be stripped with adhesive tape.The copper layers had low electrical resistance, and were idealfor forming the structure of the control electrodes. To confirmthat the PZT was not depolarised by the temperature rise duringsputtering, the coated electrode and the ground plane of onesample were connected to an audio-frequency signal generator:the assembly then acted as a loudspeaker, and the vibration ofthe PZT was clearly audible.
Electroplating was tried as a means of thickening the coating toaround ten microns, and although this was successful, theadhesion of the thickened layer to the ceramic was extremelypoor, so the idea of electroplating was abandoned. The finalstages in fabricating the new mirrors will be (1) coating the PZTwith 1–2 microns of copper, (2) creating a pattern of actuatorsin the copper by etching through a photoresist mask and (3)gold coating.
Figure 4. Proposed new actuator layout for VP3.
The actuators will be laid out in a radius/sector pattern similarto that of VP1. Experience with VP1 showed that the smallnumber of large centrally-placed actuators (a result ofconcentrating the correcting power at the edge of the beam) ledto an inability to correct certain types of errors. The new design(Figure 4) has 61 actuators: 49 of equal area within the beamfootprint and only 12 in the outer ring. This mirror should beready for trials on Vulcan in the autumn of 2001.
References
1. C J Hooker, E J Divall, W J Lester, K Moutzouris, C JReason and I N Ross, CLF Annual Report 1999-2000, 199
2. S J HawkesElsewhere in this report (2001).
3. E M Ellis, “Low-cost Bimorph Adaptive Mirrors”, Ph.D.thesis (April 1999)

Laser Science and Development – Laser Optics and Laser Design
177 Central Laser Facility Annual Report 2000/2001
Introduction
The de-formable mirror developed within the CLF is based onbimorph technology using an array of spatially distributedelectrodes in a particular pattern that provide 64 independentwave front correction channels1). Each electrode of arbitraryshape produces a generally localised radius of curvature changeof the mirror (i.e. change to the second derivative of the wavefront, or spatial phase). Thus its influence function in terms ofbeam spatial phase extends appreciably beyond the localconfines of a particular electrode shape. Wave front sensing iscurrently achieved using a modified 80 channel Hartmansensor2) which provides a measurement of spatially distributedwave front gradients in the horizontal and vertical directions.(i.e. first derivative of spatial phase). Sensing is performed in5 concentric rings about the beam centre with differing numbersof azimuthal channels.
Individual electrode influence functions in terms of the gradientchanges they produce are measured by the Hartman sensor toproduce a 64 x 160 element response matrix. During itsinversion to a control matrix using singular valuedecomposition, 64 eigen vectors with associated eigen(singular) values are produced. When spatially resolved to theoriginal Hartman sensor positions each eigen vector represents acharacteristic and individual wave front gradient pattern thatcan be corrected. We term the eigen vector, or this pattern in aclassical sense, as a mode of the system. The associated eigenvalue is proportional to the corrective power available to anyparticular mode. With this particular system, the challenge is tofind an electrode pattern that generates a modal basis that bestsupports any wave front gradient pattern that already exists in astatic way and also to accommodate those that are most likely tobe encountered from thermal and other sources. A computermodel has been developed to simulate this process. It predictsthe modal basis of the mirror for an arbitrary electrode patternand in turn applies this in both a static and dynamic way to thecorrection of known beam aberrations to predict its likelyperformance.
Model Description
On an (x,y) plane of a bimorph structure comprising of a sheetof PZT and a sheet of glass bonded directly together, the spatialdistribution of surface deformation W(x,y) is related to thespatial distribution of voltage V(x,y) through the differentialequation 3) :
0),(),( 24 =∇+∇ yxVAyxWwhere A is a constant dependent in a complex way on theproperties of the structure and ∇ is the Laplacian operator. Theexact value of A should be determined experimentally, but isarbitrary for the simulation provided it is spatially constant. IfV(x,y) is expressed as a 2D Fourier series of frequencies (n,m)with Fourier co-efficients V(n,m), then W(x,y) can also beexpressed as a 2D Fourier series with Fourier co-efficients,W(n,m) 4) where :
22
),(),(
mn
mnVmnW
+∝
Thus, in terms of a spatial transfer function the action of the bi-morph plate is to ‘filter’ the applied spatial frequencies in a1/(freq)2 way.
A predictive analysis of the performance of a bimorph adaptive mirror
J Collier, C Hooker
Central Laser Facility, CLRC Rutherford Appleton Laboratory, Chilton, Didcot, Oxon, OX11 0QX, UK
Main contact email address: [email protected]
Figure 1. Applied voltage pattern (left) and thecomputed mirror response (right).
Figure 2. The modal basis for two electrodegeometries – (a) top and (b) bottom.
a b

Laser Science and Development – Laser Optics and Laser Design
Central Laser Facility Annual Report 2000/2001 178
Figure 3. Eigen values of pattern (a) plotted against modenumber.
The response of the mirror can therefore be calculated in arelatively straightforward way. An arbitrary spatial voltagepattern is defined and a 2D Fast Fourier Transform (FFT)computed. A 1/(freq)2 amplitude filter is then applied and theinverse FFT computed. An example of an individual electrodeshape and its computed response is shown in Figure 1.
For absolute phase computations (wavefront mirror modes) anindividual electrode response is sampled on a grid.Alternatively for system modelling, the orthogonal differentialsof the response are sampled following the Hartman pattern. Themodel cycles through each electrode and builds up a matrix ofsampled responses as a function of electrode number, in exactlythe same way as the actual system described earlier does. It isthus possible to extract the modal basis of correction for thedesignated pattern of electrodes. An example of the modal basisfor two different electrode patterns is shown in Figure 2.
The modal patterns, shown in absolute phase (not gradient) areordered according to their singular values with bottom leftbeing the highest value and top right the lowest. It is evidentthat despite there being significant differences in thedistribution and size of the electrode patterns, the lowest ordermodes up to approximately number 24 are extremely similar ifnot identical. Differences in the modal basis only start to reflectthe differences in the electrode pattern above this number, andfor the highest order modes they are quite distinct.
The singular values for these distributions show that typically75% of the corrective power available is concentrated in thesefirst 24 modes as shown in Figure 3, with the remaining 40modes accounting for some 25% only. Additionally, thesehighest order modes are relatively very weak and both theirinitial determination and their subsequent stimulation arestrongly affected by noise. Indeed, it is usual during theformation of a particular control matrix to set the highest order(i.e. lowest value) singular values to zero above a certain modenumber, either in a step like way or using a tapering function.Thus the variation in the electrode patterns is only likely to beeffective in the mid band modes, and even then only account for15 % to 20 % of the corrective power.
Comparison to a real bi-morph mirror
Previous measurements of the wave front quality of the primaryCPA beam line of Vulcan established that the greatest static andthermally induced aberration occurred at the periphery of thebeam. Because the AO mirror was being designed for this beamline, the initial electrode design concentrated on placing moreactuators towards the outer edges of the beam with relatively
few in the centre of the beam. Another important element in thedesign of the electrode pattern was to include a ring of actuatorscompletely outside the diameter of the beam. This was to ensurethat it was always possible to correct gradients that occurred atthe very edge of the beam. The electrode pattern used is shownin Figure 4 and the predicted (phase) modal basis shownalongside. The mid band shows a high number of beam edgecorrection modes.
The real mirror is of course unlikely to behave in the exact sameway as the predicted modes above. This will be increasingly thecase for higher order modes that have very little powerassociated with them. The two main reasons for this are theeffect of noise (or errors) in the determination of the measuredelectrode influence functions and the fact that the “constant” Ais unlikely to be constant over the whole mirror surface as aresult of manufacturing and material errors. In order to makesome comparison of the measured ortho-normal basis of the realmirror and that of the computed basis, the illustration ofFigure 5 is presented.
In this Figure, the ortho-normal basis is measured and computedin phase gradient using a spatial sampling following theHartman pattern for both the real mirror and the model. The
Figure 4. Electrodepattern of the AO mirrorused and the computedmodal basis.
Figure 5. Comparison of the computed (left) and measured(right) ortho-normal basis of wavefront gradients. Colourlevel is gradient magnitude plotted against mode number(horizontal) and Hartman spot number (vertical).
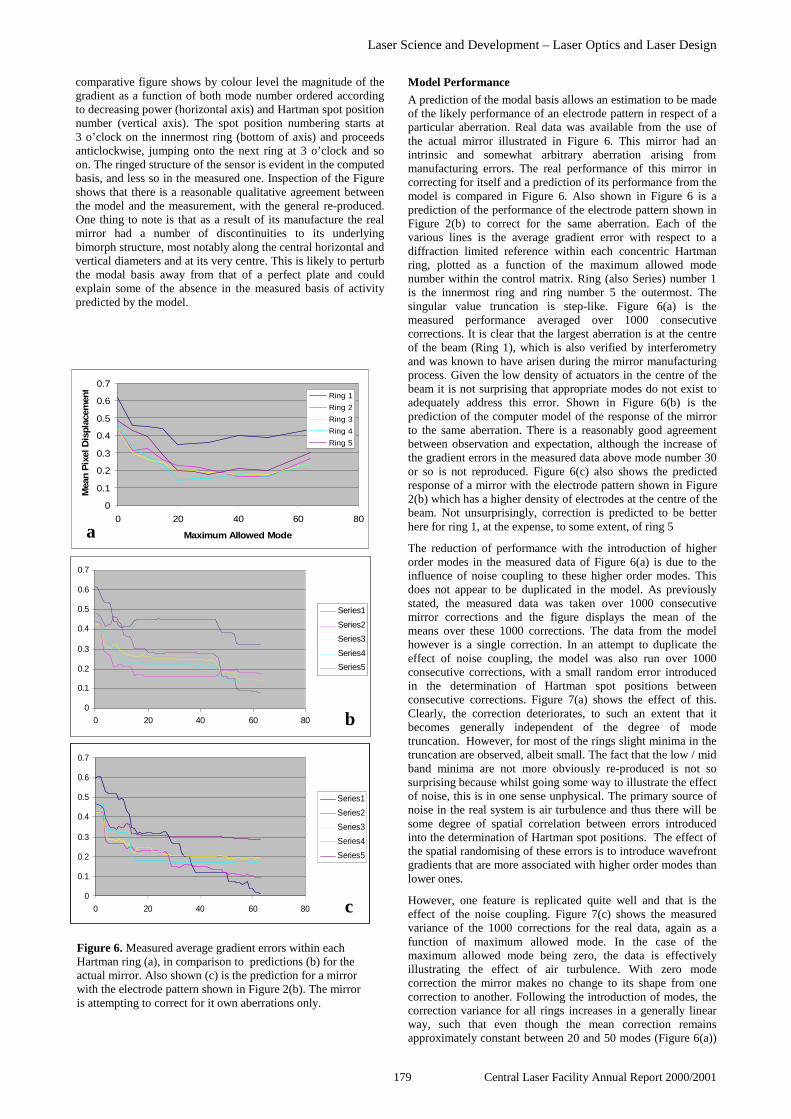
Laser Science and Development – Laser Optics and Laser Design
179 Central Laser Facility Annual Report 2000/2001
comparative figure shows by colour level the magnitude of thegradient as a function of both mode number ordered accordingto decreasing power (horizontal axis) and Hartman spot positionnumber (vertical axis). The spot position numbering starts at3 o’clock on the innermost ring (bottom of axis) and proceedsanticlockwise, jumping onto the next ring at 3 o’clock and soon. The ringed structure of the sensor is evident in the computedbasis, and less so in the measured one. Inspection of the Figureshows that there is a reasonable qualitative agreement betweenthe model and the measurement, with the general re-produced.One thing to note is that as a result of its manufacture the realmirror had a number of discontinuities to its underlyingbimorph structure, most notably along the central horizontal andvertical diameters and at its very centre. This is likely to perturbthe modal basis away from that of a perfect plate and couldexplain some of the absence in the measured basis of activitypredicted by the model.
Model Performance
A prediction of the modal basis allows an estimation to be madeof the likely performance of an electrode pattern in respect of aparticular aberration. Real data was available from the use ofthe actual mirror illustrated in Figure 6. This mirror had anintrinsic and somewhat arbitrary aberration arising frommanufacturing errors. The real performance of this mirror incorrecting for itself and a prediction of its performance from themodel is compared in Figure 6. Also shown in Figure 6 is aprediction of the performance of the electrode pattern shown inFigure 2(b) to correct for the same aberration. Each of thevarious lines is the average gradient error with respect to adiffraction limited reference within each concentric Hartmanring, plotted as a function of the maximum allowed modenumber within the control matrix. Ring (also Series) number 1is the innermost ring and ring number 5 the outermost. Thesingular value truncation is step-like. Figure 6(a) is themeasured performance averaged over 1000 consecutivecorrections. It is clear that the largest aberration is at the centreof the beam (Ring 1), which is also verified by interferometryand was known to have arisen during the mirror manufacturingprocess. Given the low density of actuators in the centre of thebeam it is not surprising that appropriate modes do not exist toadequately address this error. Shown in Figure 6(b) is theprediction of the computer model of the response of the mirrorto the same aberration. There is a reasonably good agreementbetween observation and expectation, although the increase ofthe gradient errors in the measured data above mode number 30or so is not reproduced. Figure 6(c) also shows the predictedresponse of a mirror with the electrode pattern shown in Figure2(b) which has a higher density of electrodes at the centre of thebeam. Not unsurprisingly, correction is predicted to be betterhere for ring 1, at the expense, to some extent, of ring 5
The reduction of performance with the introduction of higherorder modes in the measured data of Figure 6(a) is due to theinfluence of noise coupling to these higher order modes. Thisdoes not appear to be duplicated in the model. As previouslystated, the measured data was taken over 1000 consecutivemirror corrections and the figure displays the mean of themeans over these 1000 corrections. The data from the modelhowever is a single correction. In an attempt to duplicate theeffect of noise coupling, the model was also run over 1000consecutive corrections, with a small random error introducedin the determination of Hartman spot positions betweenconsecutive corrections. Figure 7(a) shows the effect of this.Clearly, the correction deteriorates, to such an extent that itbecomes generally independent of the degree of modetruncation. However, for most of the rings slight minima in thetruncation are observed, albeit small. The fact that the low / midband minima are not more obviously re-produced is not sosurprising because whilst going some way to illustrate the effectof noise, this is in one sense unphysical. The primary source ofnoise in the real system is air turbulence and thus there will besome degree of spatial correlation between errors introducedinto the determination of Hartman spot positions. The effect ofthe spatial randomising of these errors is to introduce wavefrontgradients that are more associated with higher order modes thanlower ones.
However, one feature is replicated quite well and that is theeffect of the noise coupling. Figure 7(c) shows the measuredvariance of the 1000 corrections for the real data, again as afunction of maximum allowed mode. In the case of themaximum allowed mode being zero, the data is effectivelyillustrating the effect of air turbulence. With zero modecorrection the mirror makes no change to its shape from onecorrection to another. Following the introduction of modes, thecorrection variance for all rings increases in a generally linearway, such that even though the mean correction remainsapproximately constant between 20 and 50 modes (Figure 6(a))
0
0.1
0.2
0.3
0.4
0.5
0.6
0.7
0 20 40 60 80
Series1
Series2
Series3
Series4
Series5
0
0.1
0.2
0.3
0.4
0.5
0.6
0.7
0 20 40 60 80
Maximum Allowed Mode
Mea
n P
ixel
Dis
plac
emen
t
Ring 1
Ring 2
Ring 3
Ring 4
Ring 5
0
0.1
0.2
0.3
0.4
0.5
0.6
0.7
0 20 40 60 80
Series1
Series2
Series3
Series4
Series5
a
b
c
Figure 6. Measured average gradient errors within eachHartman ring (a), in comparison to predictions (b) for theactual mirror. Also shown (c) is the prediction for a mirrorwith the electrode pattern shown in Figure 2(b). The mirroris attempting to correct for it own aberrations only.

Laser Science and Development – Laser Optics and Laser Design
Central Laser Facility Annual Report 2000/2001 180
it is increasingly unstable. The model, as shown in Figure 7(b),duplicates this very well.
Application to Vulcan Beam 7
One of the reasons for undertaking this modelling was toattempt to determine the best electrode pattern for theaberrations that were expected on one of the Vulcan beamlines.The existing mirror has a strong localised aberration in itscentre and Figure 6 has already indicated that with the existingactuator design, which was not intended to correct significantstructure in the centre of the beam, the performance of thesystem would be limited by the mirror aberration itself.Moreover, Figure 4 also illustrated that if this aberration were tobe a permanent feature of the mirror, then the electrode patternof Figure 2(b) would be a better choice.
Thus the model was run using the known aberration of Vulcanbeam 7 as an input and assuming that a next generation ofmirror could be manufactured that did not possess this centralfeature. It is likely that the central feature of the mirrorperturbed and created asymmetry to the real model basis for
correction, which the model would not have. Figure 8(a), showsthe predicted performance of the existing mirror geometry tocorrect for the known aberrations of Vulcan beam line 7 only.Also shown for comparison in 8(b) is the predicted performanceof the electrode pattern of Figure 2(b), which previously had asuperior performance when using the mirror aberration as aninput. The reverse is now true and indicates that theperformance of the existing electrode design is likely to bebetter than that of Figure 2(b) as intended. Furthermore, ithighlights the benefit of tailoring the electrode pattern to suitthe static and or expected aberrations present in any system.
Conclusion
We have developed a computer model of a piezoelectricbimorph adaptive mirror in terms of the applied electrodepattern. It is capable of predicting performance with respect toan arbitrary wavefront aberration. This has been verified withreasonable agreement experimentally. It will be used todetermine the optimum electrode pattern for a new adaptivemirror that will be installed on the primary Vulcan CPA beamline as part of the PetaWatt upgrade.
References
1. C Hooker, L Coffey, J. Collier, “Development of largeaperture bimorph adaptive mirrors”, elsewhere in thisreport
2. S Hawkes, J Collier, C Hooker, C Reason, C Edwards, CHernandez Gomez, C Danson, I Ross, C Haefner,“Adaptive Optics trials on Vulcan”, elsewhere in thisreport
3. E. Steinhaus, S Lipson, J. Opt. Soc. Am, 69, No. 3 (1979),“Bimorph piezoelectric flexible mirror”
4. P. Halevi, J. Opt. Soc. Am. 73, No1 (1983) , “Bimorphpiezoelectric flexible mirror: graphical solution andcomparison with experiment”
0
0.01
0.02
0.03
0.04
0.05
0.06
0.07
0 10 20 30 40 50 60 70
Maximum Allowed Mode
Pix
el V
aria
nce
Ring 1
Ring 2
Ring 3
Ring 4
Ring 5
0
0.1
0.2
0.3
0.4
0.5
0.6
0.7
0.8
0 10 20 30 40 50 60 70
Maximum Allowed Mode
Mea
n P
ixel
Dis
pla
cem
ent
Ring 1
Ring 2
Ring 3
Ring 4
Ring 5
0
0.005
0.01
0.015
0.02
0.025
0.03
0.035
0.04
0.045
0.05
0 10 20 30 40 50 60 70
Maximum Allowed Mode
Pix
el V
aria
nce
Ring 1
Ring 2
Ring 3
Ring 4
Ring 5
Figure 7. (a) Mean of the predicted average gradient errorswithin each Hartman ring over 1000 corrections with adeliberate random error introduced to the model to simulatenoise. Also shown is the variance within each ring over the1000 correction for both the model (b) and the measureddata (c).
a
b
c
0
0.1
0.2
0.3
0.4
0.5
0.6
0 20 40 60 80
Series1
Series2
Series3
Series4
Series5
0
0.1
0.2
0.3
0.4
0.5
0.6
0.7
0.8
0.9
0 20 40 60 80
Series1
Series2
Series3
Series4
Series5
a
b
Figure 8. Predicted performance of the existing mirrorelectrode pattern (a) for Vulcan beam line 7 assuming thatthe residual mirror aberrations have been removed. Alsoshown for comparison in (b) is the predicted performancefor the electrode pattern of Figure 2(b).

Laser Science and Development – Laser Optics and Laser Design
181 Central Laser Facility Annual Report 2000/2001
Introduction
We present a detailed analysis of optical parametric chirpedpulse amplification (OPCPA)1), including ways to optimise theprocess. We address the following specific issues:
a) The influence of chirp on the OPA process.
b) The optimisation of efficiency and bandwidth, particularly inthe presence of non-flat spatial and temporal pulse profiles.
c) The calculation of the additional phase imposed on theamplified signal pulse by the OPA process and its influence onthe final re-compressed pulse profile.
d) The effect of group velocity mismatch.
e) The tolerances to misalignment and input phase aberrationson the pump beam, and pump pulse bandwidth.
The primary analytical tool is a formulation based on that ofArmstrong et al2), which gives useful and instructive resultswhich have good validity for parameter ranges of interest.Examples include Nd:glass and Nd:YAG pumped OPCPAs.
Analysis
The analysis of Armstrong et al is based on the plane wavesolution of the coupled wave equations and assumes slowlyvarying pulse envelopes and a lossless medium. In a parameterrange where pulse chirp can be neglected, a simple analyticalsolution can be obtained for the intensity and phase of the threepropagating waves for the case of significant energy transfer.
It will be seen that, under conditions for maximum bandwidthof the OPCPA, the signal and idler have the same groupvelocity in the direction of the signal. This locks the twochirped pulses together and the requirement for validity is thatthe group time difference for signal and pump is smallcompared to the pump pulse duration.
Solution for intensity
With some manipulation and substitution the Armstrongsolution (Equation 6.9) can be re-written in terms of measurableparameters as:
( )( )( ) ( )∫
∆+−++−±=
f
isis gkfpfffp
dfgz
0 222
20cos1
2
θγγγγ
(1)
where:
isisp
peff cnnn
Idg
λλεπ
024=
( )01p
p
II
f −= = fractional depletion of the pump
( )( )0
02
p
s
s
ps I
I
ωω
γ = ; ( )( )0
02
p
i
i
pi I
I
ωω
γ =
( )( ) ( ) ( )000
0isp
p
IIII
p ++=
( ) ( ) ( ) ( )tttt isp φφφθ −−==∆k crystal phase mismatch per unit length
Equation (1) applies to any three-wave mixing process. For anOPA with zero input idler, Equation (1) reduces to:
( )( )∫
∆−+−
=f
s fgkfffp
dfgz
02
22
21
2
γ
(2)
Amplification continues until, at a value of z (defined as zA), thedenominator of Equation (2) falls to zero and the pumpdepletion reaches a maximum value determined by:
02
11 2
max
2
22max =−
∆−−− ss fg
k
pf γγ (3)
In the case of perfect phase matching ( N fmax = 1 and thepump is fully depleted; the pump to signal conversionefficiency is then 100% x s/ p. With increasing mismatch theconversion efficiency is reduced. For z > zA the processreverses symmetrically to transfer energy back into the pumpfrom the signal and idler.
Equation 2 has the form of a Jacobi elliptical integral, itssolution being written as the elliptical function ’sn’. Sinceenergy conservation requires that the pump depletion energy isdivided between signal and idler in proportion to theirfrequencies respectively, we can write the signal intensity as:
( ) ( )00 sp
sps IfII +=
ωω (4)
For practical applications it is useful to estimate the pulseenergies which can be calculated by integrating the intensityover space and time e.g.
dAdtIE ss ∫∫= (5)
Solution for phaseWith the increasing interest in shorter and shorter pulses,careful attention must be paid to the assessment of the spectralphase which is reflected in the temporal phase of amplifiedchirped pulses. The phase in a three-wave mixing process isobtained by solving the imaginary parts of the coupled waveequations, namely:
θρ
ρρωφcos
2
s
ip
s
ss
kK
dz
d−= ; θ
ρρρωφ
cos2
i
sp
i
ii
kK
dz
d−= ;
θρ
ρρωφcos
2
p
is
p
pp
kK
dz
d−= (6)
where the amplitude of each wave has been written in the form
( )φρ iexp , effc
K χπ2
2= ,
where eff is the effective nonlinear susceptibility.
Following the methods of Armstrong et al closed form solutionsfor the imaginary parts of the coupled equations can also befound, and for the case of an OPA with zero input idler thesereduce to:
( ) ∫ +∆+∆−=
2
2
220
γγφφ
f
dzkkzss
; ( ) ( )22
00kz
spi
∆−−−= πφφφ ;
( ) ∫ −∆−=
f
fdzkpp 12
0φφ (7)
Inspection of these equations leads to the following initialcomments about the phase effects in an OPA.
a) The phase of the amplified signal is independent ofthe initial phase of the pump and consequently it is possible tomaintain the optical quality of the signal while using forexample a pump with both spatial aberrations and havingtemporal phase variations resulting from a chirp.
An analysis and optimisation of optical parametric chirped pulse amplification
I N Ross, P Matousek
Central Laser Facility, CLRC Rutherford Appleton Laboratory, Chilton, Didcot, Oxon, OX11 0QX, UK
G H C New
Department of Physics, Imperial College of Science, Technology and Medicine, London SW7 2BZ, UK
Main contact email address: [email protected]
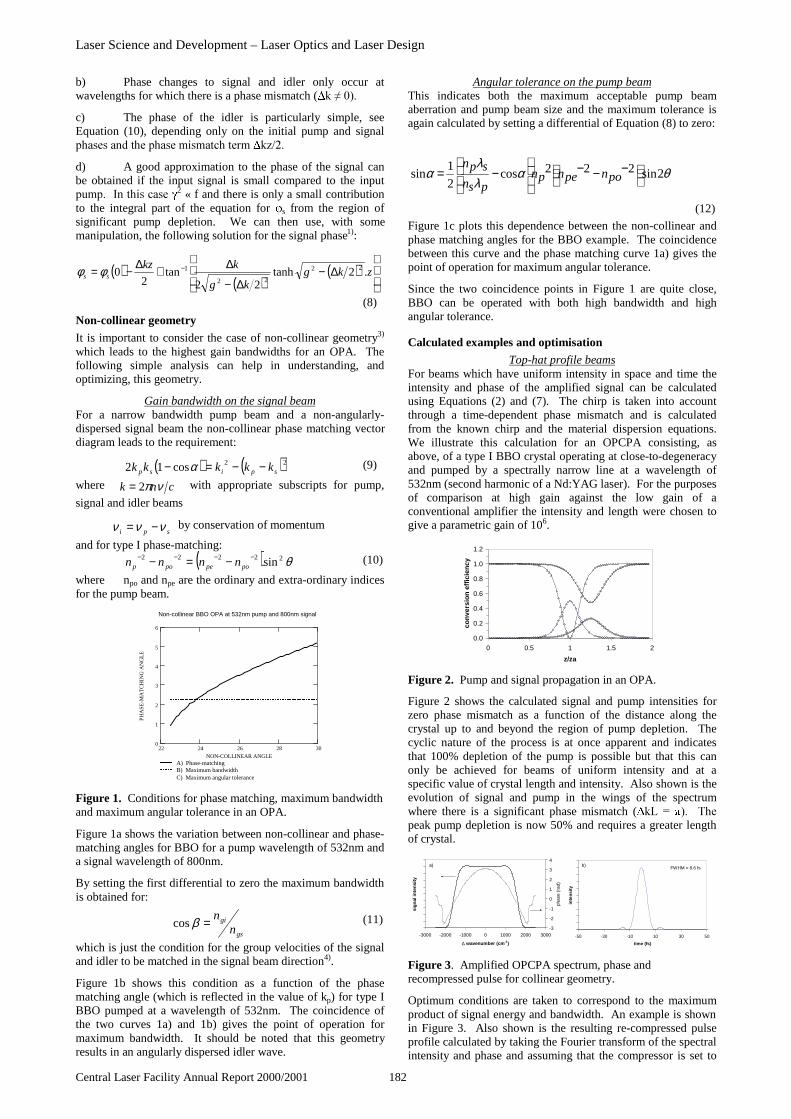
Laser Science and Development – Laser Optics and Laser Design
Central Laser Facility Annual Report 2000/2001 182
b) Phase changes to signal and idler only occur atwavelengths for which there is a phase mismatch ( N
c) The phase of the idler is particularly simple, seeEquation (10), depending only on the initial pump and signalSKDVHVDQGWKHSKDVHPLVPDWFKWHUP N]
d) A good approximation to the phase of the signal canbe obtained if the input signal is small compared to the inputSXPS,QWKLVFDVH 2 « f and there is only a small contributionto the integral part of the equation for s from the region ofsignificant pump depletion. We can then use, with somemanipulation, the following solution for the signal phase1):
( )( )
( )
∆−
∆−
∆+∆−= − zkgkg
kkzss .2tanh
22tan
20 22
22
1φφ
(8)
Non-collinear geometry
It is important to consider the case of non-collinear geometry3)
which leads to the highest gain bandwidths for an OPA. Thefollowing simple analysis can help in understanding, andoptimizing, this geometry.
Gain bandwidth on the signal beamFor a narrow bandwidth pump beam and a non-angularly-dispersed signal beam the non-collinear phase matching vectordiagram leads to the requirement:
( ) ( )22cos12 spisp kkkkk −−=− α (9)
where cnk νπ2= with appropriate subscripts for pump,
signal and idler beams
spi ννν −= by conservation of momentum
and for type I phase-matching:
( ) θ22222 sin−−−− −=− popepop nnnn (10)
where npo and npe are the ordinary and extra-ordinary indicesfor the pump beam.
Non-collinear BBO OPA at 532nm pump and 800nm signal
22 24 26 28 300
1
2
3
4
5
6
A) Phase-matchingB) Maximum bandwidthC) Maximum angular tolerance
NON-COLLINEAR ANGLE
PH
AS
E-M
AT
CH
ING
AN
GL
E
Figure 1. Conditions for phase matching, maximum bandwidthand maximum angular tolerance in an OPA.
Figure 1a shows the variation between non-collinear and phase-matching angles for BBO for a pump wavelength of 532nm anda signal wavelength of 800nm.
By setting the first differential to zero the maximum bandwidthis obtained for:
gs
gi
nn=βcos (11)
which is just the condition for the group velocities of the signaland idler to be matched in the signal beam direction4).
Figure 1b shows this condition as a function of the phasematching angle (which is reflected in the value of kp) for type IBBO pumped at a wavelength of 532nm. The coincidence ofthe two curves 1a) and 1b) gives the point of operation formaximum bandwidth. It should be noted that this geometryresults in an angularly dispersed idler wave.
Angular tolerance on the pump beamThis indicates both the maximum acceptable pump beamaberration and pump beam size and the maximum tolerance isagain calculated by setting a differential of Equation (8) to zero:
(12)
Figure 1c plots this dependence between the non-collinear andphase matching angles for the BBO example. The coincidencebetween this curve and the phase matching curve 1a) gives thepoint of operation for maximum angular tolerance.
Since the two coincidence points in Figure 1 are quite close,BBO can be operated with both high bandwidth and highangular tolerance.
Calculated examples and optimisation
Top-hat profile beamsFor beams which have uniform intensity in space and time theintensity and phase of the amplified signal can be calculatedusing Equations (2) and (7). The chirp is taken into accountthrough a time-dependent phase mismatch and is calculatedfrom the known chirp and the material dispersion equations.We illustrate this calculation for an OPCPA consisting, asabove, of a type I BBO crystal operating at close-to-degeneracyand pumped by a spectrally narrow line at a wavelength of532nm (second harmonic of a Nd:YAG laser). For the purposesof comparison at high gain against the low gain of aconventional amplifier the intensity and length were chosen togive a parametric gain of 106.
Figure 2. Pump and signal propagation in an OPA.
Figure 2 shows the calculated signal and pump intensities forzero phase mismatch as a function of the distance along thecrystal up to and beyond the region of pump depletion. Thecyclic nature of the process is at once apparent and indicatesthat 100% depletion of the pump is possible but that this canonly be achieved for beams of uniform intensity and at aspecific value of crystal length and intensity. Also shown is theevolution of signal and pump in the wings of the spectrumwhere there is a significant phase mismatch (N/ 7KHpeak pump depletion is now 50% and requires a greater lengthof crystal.
-3000 -2000 -1000 0 1000 2000 3000
∆ wavenumber (cm-1)
sig
nal
inte
nsi
ty
-3
-2
-1
0
1
2
3
4
phas
e (r
ad)
a)
-50 -30 -10 10 30 50
time (fs)
inte
nsi
ty
b) FWHM = 8.6 fs
Figure 3. Amplified OPCPA spectrum, phase andrecompressed pulse for collinear geometry.
Optimum conditions are taken to correspond to the maximumproduct of signal energy and bandwidth. An example is shownin Figure 3. Also shown is the resulting re-compressed pulseprofile calculated by taking the Fourier transform of the spectralintensity and phase and assuming that the compressor is set to
0.0
0.2
0.4
0.6
0.8
1.0
1.2
0 0.5 1 1.5 2
z/za
con
vers
ion
eff
icie
ncy
θαλλ
α 2sin222cos21
sin
−−−
−= ponpenpn
psnspn

Laser Science and Development – Laser Optics and Laser Design
183 Central Laser Facility Annual Report 2000/2001
compensate for linear, quadratic and cubic chirps. Althoughthis represents only an idealised case, the potential of theOPCPA scheme is demonstrated by these calculations whichgive an amplified bandwidth of 3150cm-1 and a re-compressedpulse duration of 8.6fs.
Spectral narrowing and performance limitsSince the bandwidth of an OPA is determined by the phasemismatch ( N/DQGWKH23$JDLQLVGHWHUPLQHGE\WKHSURGXFW
LI pγ , we can achieve both high gain and bandwidth by
minimising the length and maximising the pump intensity.However we must stay within the limit determined by the so-
called B-integral ( ∫=L
NL Idz0
γ ) (or other nonlinear
processes such as two-photon absorption or Raman generation).
Operational limits for a BBO OPA
0.01
0.1
1
10
100
1000
10000
100000
0.1 1 10 100
Crystal length in mm.
Pu
mp
inte
nsi
ty in
G
W/c
m^2
Gain = 1000000
B-integral = 1
Damage thresholdat 100psDamage thresholdat 10psDamage thresholdat 1ps
Figure 4. Operational limits for a BBO OPA.
Figure 4 plots the B-integral limit for BBO together with thecurve defining a gain of 106. The maximum intensity and hencealso bandwidth is determined by the crossover point of thesegraphs.
A further limiting process, optical damage, is also representedon Figure 4. In this example the intensity limit is determined bythe B-integral for pulse durations up to about 10ps. For longerpulses the damage threshold requires a reduction in the pumpintensity and an increase in the crystal length, leading toreduced gain bandwidth.
Maximum bandwidth optionAmplified bandwidths greater than shown by Figure 3 aregenerally possible using non-collinear geometry. Figure 5shows the gain bandwidth, phase and re-compressed pulseprofile for this option for BBO. The gain bandwidth is now4800cm-1 and the re-compressed pulse duration 5.7fs.
-4000 -2000 0 2000 4000
∆ wavenumber (cm-1)
sig
nal
inte
nsi
ty
-6
-4
-2
0
2
4
6
phas
e (r
ad)
a)
-10 -5 0 5 10
time (fs)
inte
nsi
ty
b) FWHM = 5.7 fs
Figure 5. Amplified OPCPA spectra, phase and recompressedpulse for non-collinear geometry.
Real beam profiles
We consider the realisable example of an OPCPA with a flat-top spatial distribution for both pump and signal beams and aGaussian distribution for their temporal profiles. Assumingequal pulse durations for pump and signal and the sameexample with BBO as discussed above, Figure 6 shows curvesfor the input and output signal when the crystal length (or pumpintensity) is set for maximum product of efficiency andbandwidth. The peak efficiency in this case is 27% from pumpto signal (54% depletion of the pump) with a 20% reduction insignal bandwidth during amplification. Further optimisation ofthe performance can be achieved by allowing a difference inpulse duration between the input pump and signal beams.Figure 7 shows the variation with pump pulse duration of thebest efficiency-bandwidth product and points to an optimumvalue of 1.75 for the ratio of the pulse durations and a 20%higher efficiency-bandwidth product.
Figure 6. OPCPA input and output spectra with real beams
0.0
0.2
0.4
0.6
0.8
1.0
1.2
1.4
0.5 1 1.5 2 2.5
τp/τs
Fs x
∆ν
Figure 7. Optimum ratio of pump to signal pulse duration.
Optimised beam profilingIt has been demonstrated5) that control of the beam profiles canlead to the achievement of maximum efficiency and bandwidthin an OPA. There are compensating pairs of profiles for pumpand signal which give optimum performance. The simplestsuch pair is a flat-top profile for each. If, as is usually the case,the pump beam profile cannot be made flat-top but is typicallyGaussian, the compensating signal beam profile is shaped likean ’inverted Gaussian’. This can be approximated in a multi-amplifier OPCPA by driving the earlier stages into heavysaturation.
50 100 150 200
0.01
0.02
0.03
0.04
0.05
Intensity /a.u.
-
-600-400-200 200 400 600Time/ps
0.2
0.4
0.6
0.8
1Intensity /a..u.
-600-400-200 200 400 600Time ps
0.2
0.4
0.6
0.8
1Intensity /a.u.
Nd:glass
fs seed / 1000cm-1/500 ps
750ps
527 nm
550J
SHG
KDPLBOLBOAmp1 Amp2 Amp3
165 J
6 PW
30 %
After compressor: 27 fs
Figure 8. Optimised OPCPA design using a PW pump laser.
Figure 8 shows the optimised design for a petawatt OPCPAscheme which uses a large Nd:glass laser to provide the pumpbeam. The calculated temporal profile generated by the pre-amplifiers is the required shape and leads to an output signalbeam with maximum efficiency and spectral bandwidth and anintensity profile which can be compressed to a short pulse withgood fidelity.
References
1. I.N.Ross et al. Opt. Comm. 144 125 (1997)
2. J.A.Armstrong et al. Phys. Rev. 127 1918 (1962)
3. G.M..Gale et al. Opt. Lett. 20 1562 (1995)
4. T.Wilhelm et al. Opt. Lett. 22 1494 (1997)
5. I.A.Begishev et al. Sov. J. Quant. Electr. 20 1100 (1990)
0
0.2
0.4
0.6
0.8
1
1.2
-2000 -1000 0 1000 2000
∆ wavenumber (cm-1)
inte
nsity
(a.
u.)
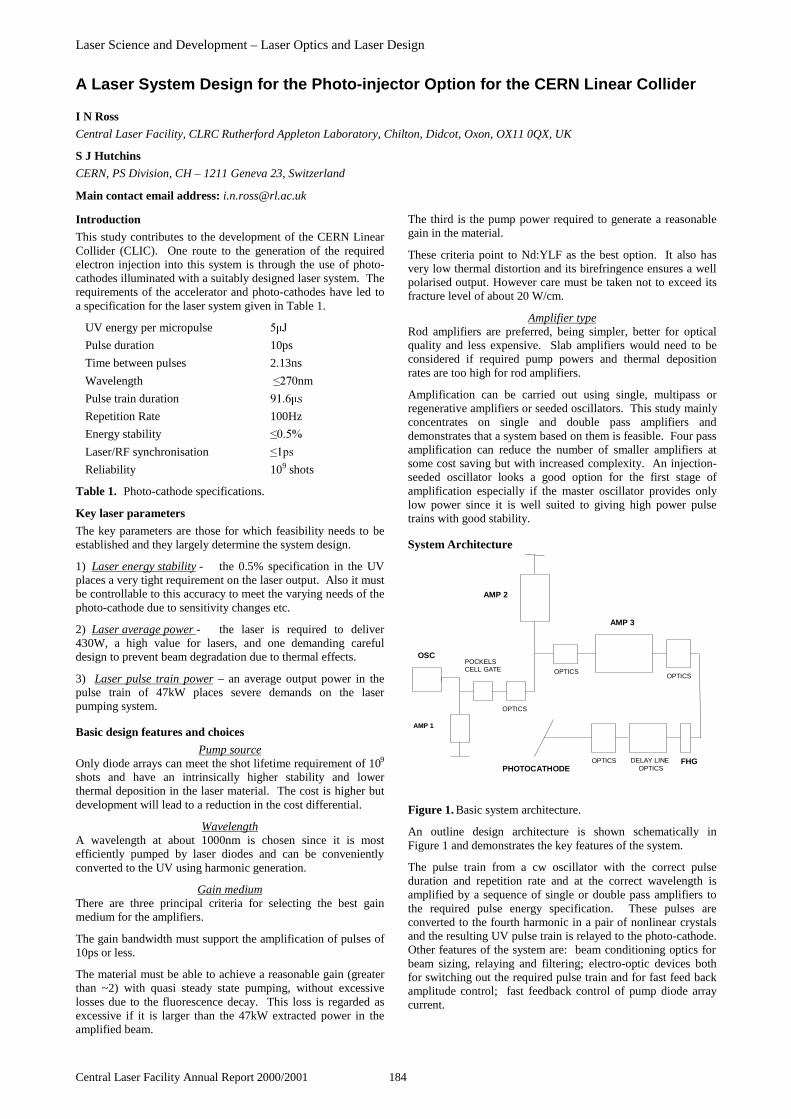
Laser Science and Development – Laser Optics and Laser Design
Central Laser Facility Annual Report 2000/2001 184
Introduction
This study contributes to the development of the CERN LinearCollider (CLIC). One route to the generation of the requiredelectron injection into this system is through the use of photo-cathodes illuminated with a suitably designed laser system. Therequirements of the accelerator and photo-cathodes have led toa specification for the laser system given in Table 1.
UV energy per micropulse -
Pulse duration 10ps
Time between pulses 2.13ns
Wavelength QP
Pulse train duration V
Repetition Rate 100Hz
Energy stability
Laser/RF synchronisation SV
Reliability 109 shots
Table 1. Photo-cathode specifications.
Key laser parameters
The key parameters are those for which feasibility needs to beestablished and they largely determine the system design.
1) Laser energy stability - the 0.5% specification in the UVplaces a very tight requirement on the laser output. Also it mustbe controllable to this accuracy to meet the varying needs of thephoto-cathode due to sensitivity changes etc.
2) Laser average power - the laser is required to deliver430W, a high value for lasers, and one demanding carefuldesign to prevent beam degradation due to thermal effects.
3) Laser pulse train power – an average output power in thepulse train of 47kW places severe demands on the laserpumping system.
Basic design features and choices
Pump sourceOnly diode arrays can meet the shot lifetime requirement of 109
shots and have an intrinsically higher stability and lowerthermal deposition in the laser material. The cost is higher butdevelopment will lead to a reduction in the cost differential.
WavelengthA wavelength at about 1000nm is chosen since it is mostefficiently pumped by laser diodes and can be convenientlyconverted to the UV using harmonic generation.
Gain mediumThere are three principal criteria for selecting the best gainmedium for the amplifiers.
The gain bandwidth must support the amplification of pulses of10ps or less.
The material must be able to achieve a reasonable gain (greaterthan ~2) with quasi steady state pumping, without excessivelosses due to the fluorescence decay. This loss is regarded asexcessive if it is larger than the 47kW extracted power in theamplified beam.
The third is the pump power required to generate a reasonablegain in the material.
These criteria point to Nd:YLF as the best option. It also hasvery low thermal distortion and its birefringence ensures a wellpolarised output. However care must be taken not to exceed itsfracture level of about 20 W/cm.
Amplifier typeRod amplifiers are preferred, being simpler, better for opticalquality and less expensive. Slab amplifiers would need to beconsidered if required pump powers and thermal depositionrates are too high for rod amplifiers.
Amplification can be carried out using single, multipass orregenerative amplifiers or seeded oscillators. This study mainlyconcentrates on single and double pass amplifiers anddemonstrates that a system based on them is feasible. Four passamplification can reduce the number of smaller amplifiers atsome cost saving but with increased complexity. An injection-seeded oscillator looks a good option for the first stage ofamplification especially if the master oscillator provides onlylow power since it is well suited to giving high power pulsetrains with good stability.
System Architecture
OSC
AMP 1
POCKELSCELL GATE
OPTICS
AMP 2
OPTICS
AMP 3
OPTICS
FHGDELAY LINEOPTICS
OPTICSPHOTOCATHODE
Figure 1. Basic system architecture.
An outline design architecture is shown schematically inFigure 1 and demonstrates the key features of the system.
The pulse train from a cw oscillator with the correct pulseduration and repetition rate and at the correct wavelength isamplified by a sequence of single or double pass amplifiers tothe required pulse energy specification. These pulses areconverted to the fourth harmonic in a pair of nonlinear crystalsand the resulting UV pulse train is relayed to the photo-cathode.Other features of the system are: beam conditioning optics forbeam sizing, relaying and filtering; electro-optic devices bothfor switching out the required pulse train and for fast feed backamplitude control; fast feedback control of pump diode arraycurrent.
A Laser System Design for the Photo-injector Option for the CERN Linear Collider
I N Ross
Central Laser Facility, CLRC Rutherford Appleton Laboratory, Chilton, Didcot, Oxon, OX11 0QX, UK
S J Hutchins
CERN, PS Division, CH – 1211 Geneva 23, Switzerland
Main contact email address: [email protected]

Laser Science and Development – Laser Optics and Laser Design
185 Central Laser Facility Annual Report 2000/2001
Detailed design considerations
The system can be conveniently broken down into a number ofaspects for detailed analysis:
1) General amplifier design considerations.2) Amplifier designs.3) Fourth harmonic generation.4) Laser damage threshold.5) System staging - including the disposition of the systemcomponents and the design of the beam conditioning optics.6) Stability - ways to control the intrinsic instabilities of thedesign through design changes and through the introductionof feedback mechanisms.
AmplificationIn this section an analysis is given of the dynamic gaincharacteristics of both single pass and double pass rodamplifiers subject to a spatially uniform pumping rate andhaving a spatially uniform input pulse train. Account is takenof: the diode pumping; the amplification of the beam; thedepletion of the stored energy by the beam; the fluorescencelosses; and the amplified spontaneous emission (ASE).
The approach taken is to specify the output requirements (pulsetrain power and energy stability) of the amplifier and to look forparameters which minimise the pump energy and maximise thetolerance on the input parameters. The aim is to try to establish’steady state’ operation of the amplifiers since this is most likelyto be able to satisfy the stability requirement. An importantfeature of steady state operation is the time for it to becomeestablished, since it is necessary that this is sufficiently shortthat it does not lead to unacceptably high pumping losses andthermal effects.
Steady state operationA simple and useful relationship can be found for the amplifierin steady state. In this case the extracted pulse train power isbalanced by the difference between the pumping rate andfluorescence losses. This can be written:
flsatabspout
BGF
DP
GP
τπη )1(
.2
ln..
4.)
11(
2 +−=− (1)
where p = fraction of the absorbed power (Pabs) reachingthe upper laser state and we assume a fast energy transferbetween the upper state levels.
Fsat = saturation fluence = K G = amplifier gainB = additional losses due to ASE
fl = intrinsic fluorescence decay time
The factor 2 is for a double pass amplifier (1 for single pass).
For example, inserting the values for Nd:YLF, setting B = 0 andtaking the output requirement for CLIC of P = 47kW gives:
2.ln34.076.0)1
1(47 DGPG abs −=− (2)
and for a 1cm diameter rod with gain x4, absorbed power mustbe = 46.4 + 0.6 = 47.0kW where the second term (+0.6) is thefluorescence loss.
A comparison between single and double pass amplification canalso be made using Equation (1). For amplifiers with the samegain the fluorescence loss term is a factor of 2 less for doublepass operation and requires less pump power to reach the samegain. For the two examples above the difference between singleand double pass is only an additional 0.3kW for Nd:YLF.
Full calculationThe calculation is characterised by the following parameters:
− The absorbed pump power Pabs which is assumeduniformly distributed over the rod.
− The input and output fluences Fin and Fout of a pulse in thepulse train.
− The diameter D and length L of the amplifier rod.
− The pulse fluence F(z,t) within the amplifier.
− 7KHJDLQFRHIILFLHQW z,t) within the amplifier.
The calculation increments through the pulse train calculatingfor each pulse its amplification and the resulting gaindistribution for the next pulse. An underlying assumption isthat the amplifier deals with each pulse sequentially in time, andthis may not be the case for multipass amplifiers. However theassumption is valid if, as in the case being considered, the pulsefluence is small compared with the saturation fluence and leadsto only a small incremental change in the gain coefficient.
The pulse fluence within the amplifier can be written:
∫=z
in dztzFtzF0
),(exp),( α for single pass (3)
++= ∫ ∫∫
L L
z
z
in dztzdztzdztzFtzF00
),(),(exp),(exp),( ααα
for double pass (4)
The incremental change in the gain coefficient from one pulseto the next has 3 contributions: an increase due to pumping; aloss due to fluorescence enhanced by amplified spontaneousemission, and depletion by the previous pulse. Consequently:
sat
R
fl
SSabs
sat
Rp
F
tzFtzBtz
LD
P
Ftz
),(.).,()1.().,(.4.),(
2
ηαττα
πτηη
α −+
−=∆
(5)where: R = level splitting ratio in the upper laser state and itis assumed that the equilibrium in the level populations is re-HVWDEOLVKHGLQDWLPHYHU\VKRUWFRPSDUHGZLWK S.
S = time separation of the pulses in the train
An analysis of ASE is given elsewhere. In order to include itseffect in this calculation approximate analytic expressions areused for B as follows:
5.03.0
..05.0 GL
DB
≈ for decoupled double pass amplifiers
GL
DB ..05.0
3.0
≈ for single pass amplifiers (6)
GL
DB .
2.05.0
3.0
≈ for close-coupled double pass amplifiers
Using these equations the dynamic development of both gainand pulse train fluence was evaluated to find a solution for aspecified output pulse train with less than 1% variation over therequired pulse train length. Figure 2 shows an example of theoutput pulse train for the case of a double pass amplifier with itsgain switched on in the presence of the input pulse train. Theoutput pulse energy rises to become stable (’steady state’) after acharacteristic response time. At later times the output is seen tobe stable to a very high degree. The process with the minimumresponse time is critically damped and evaluating a number ofdifferent simulations such as in Figure 2 we find the followingapproximation for critically damped Nd:YLF amplifiers:
with a response time sGµln.10≈
2/2402
.4cmkW
D
absP≈
π(7)

Laser Science and Development – Laser Optics and Laser Design
Central Laser Facility Annual Report 2000/2001 186
Figure 2. Double pass Nd:YLF amplifier with diodes initiatedat zero time and continuous injection of pulse train.
Another important parameter of the amplifier performance is itssensitivity to variations in the pump power and the input pulseenergy. These are illustrated in Figure 3 for which the inputenergy has been decreased by 1% and the pump power issuddenly LQFUHDVHGE\DIWHU V
Figure 3. Effect of small changes in input energy and pumppower.
The conclusion on sensitivity tests is:
Output variation = input variation / G + pump variation (8)
This is simple to demonstrate analytically by differentiatingEquation (1). Consequently by extending this argument throughseveral saturated amplifiers in series, the tolerance to the inputpulse energy increases with the total gain of the system. Therequirement for stability of the beam energy and pump power ofearly amplifiers and oscillator is very much relaxed.
:H DOVR QRWH D H UHVSRQVH WLPH RI DERXW V IRU D VXGGHQpump power change.
We can conclude that good output energy stability can beachieved after an acceptable initial period of pumping toconverge to steady state operation. If necessary this initialresponse time can be eliminated by pumping the amplifier for ashort period before switching in the input pulse train.
Double pass amplification gives slightly better performancethan single pass but involves additional optical elements.
Diode Pumping of the RodWe concentrate on the requirements for the final amplifier inCLIC since these are likely to be the most difficult to meet andestimates suggested that an absorbed pump power of 47kWwould be required. The problem is reduced to finding thesimplest design of pumping chamber which will contain asufficient number of diode arrays, will couple the diode powerefficiently to the rod, and will allow efficient cooling of the rod.
The maximum thermal loading on the rod for the final CLICamplifier is given by:
Thermal Power = Output Optical Power x
p
p
ηη−1
(9)
= 0.32 x Output Optical Power for Nd:YLF
Since the average output power requirement is 430W, thethermal deposition rate is 140W. This can be satisfied usingsimple flow-tube water immersion and a low flow rate.
The absorption efficiency of the rod has been analysed byBarnes et al1) and for the case being considered(Nd:YLF at 1% concentration, diode bandwidth = 5nm, averageof both polarisations) their results can be reduced to theapproximate expression:
( ) 77.0
42.0exp1 Dabs −−≈η (10)
For example, for an absorption efficiency greater than 80% therod diameter must be greater than 0.78cm. If the un-absorbedpump is reflected back into the rod for a second pass we canachieve 80% efficiency with rods of diameter 0.39cm.
STACKED DIODE ARRAY
WATER COOLINGSILICA TUBE
AMPLIFIER ROD
MIRROR COATINGS
Figure 4. Schematic of diode-pumped amplifier head.
Figure 4 illustrates a simple design suitable to meet therequirements of the CLIC photo-injector system. This designstacks 5 x 9 1cm2 DUUD\V DURXQG D [ FP ODVHU URGproviding at a maximum total output well above the required47kW. The estimated coupling efficiency of this design is 85%and the estimated absorption efficiency is 96%.
Thermal distortionA significant advantage of YLF is its low value of thermalfocusing. From Murray2) we derive the following relationshipIRUWKHWKHUPDOO\LQGXFHGIRFDOOHQJWKVLQWKHR DQGH planes at the principal wavelength of 1047nm:
tho P
Df2
.2.2= and th
e PDf
2.65.0−= respectively (11)
for D in mm and P in W
or, maximum ZDYHIURQWHUURU 0 = 0.05Pth or e = –0.19Pth P
Although Nd:YLF has less thermal distortion than othermaterials it is still necessary to use spherical and cylindricaloptics to correct for the resulting aberration.
Design of amplification systemThe specification for the CLIC system is given in Table 1. Amean pulse train power of 47kW is required, and it is importantto minimise the required pump power. A key parameter is thetotal gain of the amplifier system. Suitable oscillators up to100W output power have been demonstrated so we assume forthis design study that 30W is available. 30W input and 47kWoutput leads to the requirement for a gain of 1600.
A three amplifier system is preferred because it is moreconservative and places less demands on pump power and givesless thermal effects in the final amplifier. The total pumppower requirement is almost the same for all possible schemes.
The performance of the final amplifier is illustrated in Figure 5by the dependence of the output train pulse energy on the timeafter initiation of the pumping, and in the presence of a constantenergy input pulse train. The pump power required to achievethe specified performance is 48kW with a rod geometry of[FP7KHSXPSSXOVHGXUDWLRQUHTXLUHGWRJLYHD V
output pulse train with high stability is VDQGDW+]WKHaverage thermal deposition in the rod is 15W/cm which is lessthan but quite close to the thermal fracture limit of Nd:YLF3).
0 50 1000.99
1
1.01
(microseconds)
Out
put E
nerg
y (r
el)
0 50 1000.99
1
1.01
(microseconds)
Out
put E
nerg
y (r
el)

Laser Science and Development – Laser Optics and Laser Design
187 Central Laser Facility Annual Report 2000/2001
0 50 1000.99
1
1.01
microseconds
Out
put E
nerg
y (r
el)
0 100 2000.99
1
1.01
microseconds
Out
put e
nerg
y (r
el)
a) b)
Figure 5. CLIC a) final and b) penultimate amplifier givinggains of 4 and 20 respectively.
Operating the final amplifier in double pass would result in ashorter time to reach the steady state and reduce the thermalstress in the rod by about 18%, but with increased complexity.
The penultimate amplifier operating in double pass with a gainof 20 is also illustrated in Figure 5. The required pump powerLVN:IRUD [FPURG,QWKLVFDVHWRHQVXUHWKDWWKHsteady state is reached before the pump for the final amplifier isLQLWLDWHG WKH SXPS SXOVH GXUDWLRQ PXVW EH V ZLWK Dresulting thermal loading on the rod of 11W/cm.
Fourth harmonic generationFourth harmonic generation is needed to meet the requirementsof the photo-cathode and we have assumed a conversionefficiency of 10%. Although sensible to take a conservativeestimate for this design study it is important to improve on thisefficiency since this would lead to a significant reduction in thecost of the laser and in the loading of the final amplifier.
Fourth harmonic generation (FHG) uses two second harmonicgeneration (SHG) crystals in series and, in principle, each SHGprocess can be 100% efficient for pulses square in space andtime. For many systems 50% is generated leading to an FHGefficiency of 25%, but to do this it is necessary to be able toachieve the correct conditions at the crystal. These are:
for high efficiency: 04.0. 2
2
21
3fIL
deff
λλ
λ (12)
for sufficient bandwidth:
/YDOXHIRUFU\VWDODQGZDYHOHQJWKV (13)
for sufficient angular tolerance:
/YDOXHIRUFU\VWDODQGZDYHOHQJWKV (14)
where: deff = effective nonlinear coefficient in pm/VI = incident intensity in GW/cm2
L = crystal length in cmsubscripts 1,2 and 3 refer to the three wavelengths
LQSXWSXOVHEDQGZLGWKLQQP LQSXWEHDPGLYHUJHQFHLQmrad
Equation (13) determines the maximum length of crystalacceptable for the bandwidth of the laser. For 10ps pulses theminimum bandwidth is 1.5cm-1 (the transform limit for a 10pspulse). Having determined the crystal length, or less ifappropriate, Equation (12) is used to determine the pulseintensity required to achieve high efficiency. Equation (14)determines the acceptable divergence of the input beam.
Crystal parameters suggest that, using spatially flat top beams itshould not be difficult to achieve at least 50% conversion ateach stage and an overall conversion efficiency to the fourthharmonic of 25%, a factor of 2.5 higher than assumed for thisdesign study. BBO for both stages looks a good option since itallows the beams to be larger and have the same size. The mostcritical parameter may be the beam divergence requirement atthe fourth harmonic stage as this must be close to the diffractionlimit to achieve maximum efficiency. If this proves a problemthen KDP offers an attractive alternative.
Optical Damage RequirementEstimated minimum damage threshold (for anti-reflectioncoatings) for the CLIC output pulse train (4.2 J in 91 V LV40 J/cm2. Allowing for a safety factor of 4, maximum fluenceis 10 J/cm2 and minimum beam diameter is 7 mm. Thiscriterion allows us to have a calculated beam non-uniformity of2:1 and still have a factor of 2 in hand.
System StagingThe layout of the system and its optical design are determinedby the requirements of beam size and profile at all points in thesystem. These requirements are:
− The oscillator to generate a single mode beam.
− The beam diameter to match that of the amplifiers.
− For maximum efficiency the beam profile to be close totop hat at the final amplifier, harmonic crystals and photo-cathode.
− To minimise the risk of component damage, the peak toaverage intensity in the beam at all components should beless than 2.
The single mode generated profile is converted to as close totop hat as possible before the high efficiency amplifier stages.This profile is then image-relayed to subsequent amplifiers, intothe harmonic crystals and onto the photo-cathode. The imagerelays also enable the beam diameter to be matched to thefollowing stage.
The closest it is possible to approach a top hat distribution andmeet the requirement that the peak to average intensity must benowhere greater than 2 is demonstrated in Figure 6 for a ’super-Gaussian’ profile. In this case the profile FWHM is 9.4mm or94% of the final amplifier aperture.
0 5 100
0.5
1
mm
Inpu
t Int
ensi
ty
0 5000 1 1040
1
2
3
mm
Axi
al I
nten
sity
Figure 6. Super-Gaussian and down-stream diffraction pattern.
A schematic of the proposed optical layout of the system isshown in Figure 7.
OSC AMP 1
RELAY CYL PC LENS GATE
APODISER
RELAYCYL RELAYLENS
LENS
AMP 2 AMP 3
CYL LENS
RELAY DELAY PC FHG RELAY LINE PHASE
RETARDER
PHOTOCATHODE
Figure 7. Optical design for the photo-injector laser system.
Conclusions
A design for a laser system has been proposed to meet thespecifications appropriate for the CLIC drive beams. Thefeasibility of this system both in terms of performance and costhave been demonstrated.
References
1. N.P.Barnes et al. IEEE JQE 26, 558 (1990)
2. J.E.Murray, IEEE JQE QE-19 488 (1983)
3. W.F.Krupke et al. JOSA B3 111 (1986)
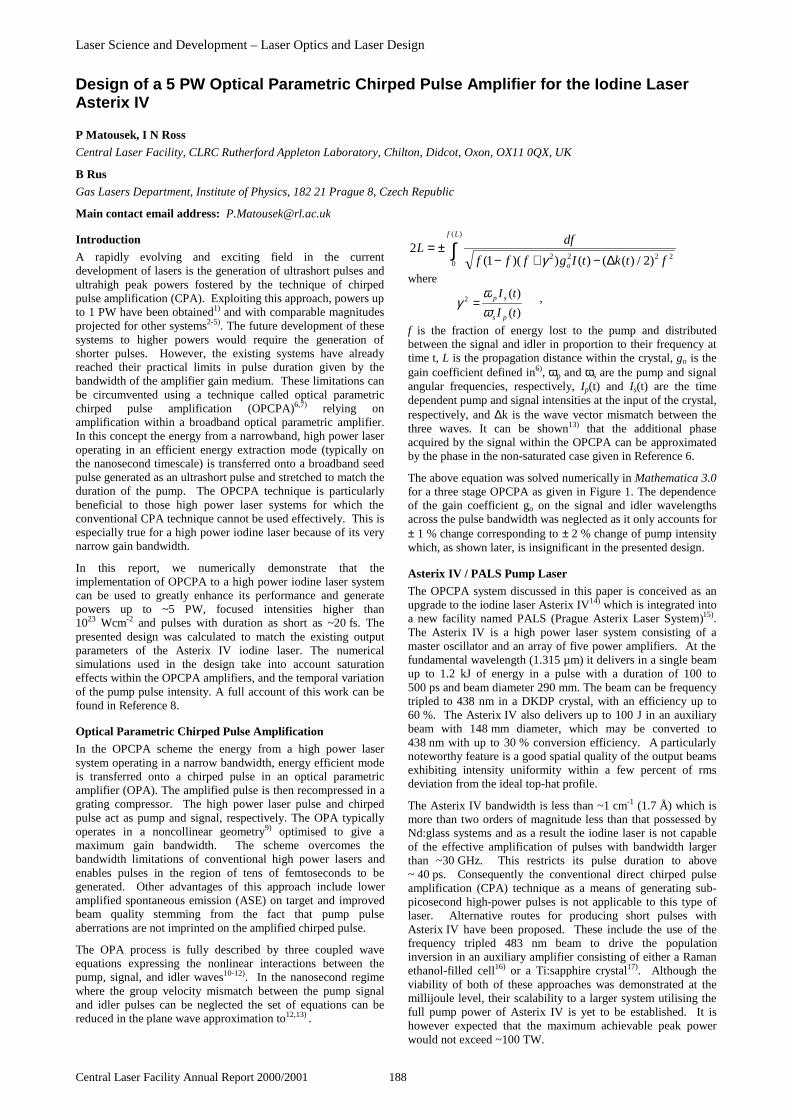
Laser Science and Development – Laser Optics and Laser Design
Central Laser Facility Annual Report 2000/2001 188
Introduction
A rapidly evolving and exciting field in the currentdevelopment of lasers is the generation of ultrashort pulses andultrahigh peak powers fostered by the technique of chirpedpulse amplification (CPA). Exploiting this approach, powers upto 1 PW have been obtained1) and with comparable magnitudesprojected for other systems2-5). The future development of thesesystems to higher powers would require the generation ofshorter pulses. However, the existing systems have alreadyreached their practical limits in pulse duration given by thebandwidth of the amplifier gain medium. These limitations canbe circumvented using a technique called optical parametricchirped pulse amplification (OPCPA)6,7) relying onamplification within a broadband optical parametric amplifier.In this concept the energy from a narrowband, high power laseroperating in an efficient energy extraction mode (typically onthe nanosecond timescale) is transferred onto a broadband seedpulse generated as an ultrashort pulse and stretched to match theduration of the pump. The OPCPA technique is particularlybeneficial to those high power laser systems for which theconventional CPA technique cannot be used effectively. This isespecially true for a high power iodine laser because of its verynarrow gain bandwidth.
In this report, we numerically demonstrate that theimplementation of OPCPA to a high power iodine laser systemcan be used to greatly enhance its performance and generatepowers up to ~5 PW, focused intensities higher than1023 Wcm-2 and pulses with duration as short as ~20 fs. Thepresented design was calculated to match the existing outputparameters of the Asterix IV iodine laser. The numericalsimulations used in the design take into account saturationeffects within the OPCPA amplifiers, and the temporal variationof the pump pulse intensity. A full account of this work can befound in Reference 8.
Optical Parametric Chirped Pulse Amplification
In the OPCPA scheme the energy from a high power lasersystem operating in a narrow bandwidth, energy efficient modeis transferred onto a chirped pulse in an optical parametricamplifier (OPA). The amplified pulse is then recompressed in agrating compressor. The high power laser pulse and chirpedpulse act as pump and signal, respectively. The OPA typicallyoperates in a noncollinear geometry9) optimised to give amaximum gain bandwidth. The scheme overcomes thebandwidth limitations of conventional high power lasers andenables pulses in the region of tens of femtoseconds to begenerated. Other advantages of this approach include loweramplified spontaneous emission (ASE) on target and improvedbeam quality stemming from the fact that pump pulseaberrations are not imprinted on the amplified chirped pulse.
The OPA process is fully described by three coupled waveequations expressing the nonlinear interactions between thepump, signal, and idler waves10-12). In the nanosecond regimewhere the group velocity mismatch between the pump signaland idler pulses can be neglected the set of equations can bereduced in the plane wave approximation to12,13) .
∫ ∆−+−±=
)(
02222 )2/)(()())(1(
2Lf
o ftktIgfff
dfL
γwhere
)(
)(2
tI
tI
ps
sp
ωω
γ = ,
f is the fraction of energy lost to the pump and distributedbetween the signal and idler in proportion to their frequency attime t, L is the propagation distance within the crystal, go is thegain coefficient defined in6), ωp and ωs are the pump and signalangular frequencies, respectively, Ip(t) and Is(t) are the timedependent pump and signal intensities at the input of the crystal,respectively, and ∆k is the wave vector mismatch between thethree waves. It can be shown13) that the additional phaseacquired by the signal within the OPCPA can be approximatedby the phase in the non-saturated case given in Reference 6.
The above equation was solved numerically in Mathematica 3.0for a three stage OPCPA as given in Figure 1. The dependenceof the gain coefficient go on the signal and idler wavelengthsacross the pulse bandwidth was neglected as it only accounts for± 1 % change corresponding to ± 2 % change of pump intensitywhich, as shown later, is insignificant in the presented design.
Asterix IV / PALS Pump Laser
The OPCPA system discussed in this paper is conceived as anupgrade to the iodine laser Asterix IV14) which is integrated intoa new facility named PALS (Prague Asterix Laser System)15).The Asterix IV is a high power laser system consisting of amaster oscillator and an array of five power amplifiers. At thefundamental wavelength (1.315 µm) it delivers in a single beamup to 1.2 kJ of energy in a pulse with a duration of 100 to500 ps and beam diameter 290 mm. The beam can be frequencytripled to 438 nm in a DKDP crystal, with an efficiency up to60 %. The Asterix IV also delivers up to 100 J in an auxiliarybeam with 148 mm diameter, which may be converted to438 nm with up to 30 % conversion efficiency. A particularlynoteworthy feature is a good spatial quality of the output beamsexhibiting intensity uniformity within a few percent of rmsdeviation from the ideal top-hat profile.
The Asterix IV bandwidth is less than ~1 cm-1 (1.7 Å) which ismore than two orders of magnitude less than that possessed byNd:glass systems and as a result the iodine laser is not capableof the effective amplification of pulses with bandwidth largerthan ~30 GHz. This restricts its pulse duration to above~ 40 ps. Consequently the conventional direct chirped pulseamplification (CPA) technique as a means of generating sub-picosecond high-power pulses is not applicable to this type oflaser. Alternative routes for producing short pulses withAsterix IV have been proposed. These include the use of thefrequency tripled 483 nm beam to drive the populationinversion in an auxiliary amplifier consisting of either a Ramanethanol-filled cell16) or a Ti:sapphire crystal17). Although theviability of both of these approaches was demonstrated at themillijoule level, their scalability to a larger system utilising thefull pump power of Asterix IV is yet to be established. It ishowever expected that the maximum achievable peak powerwould not exceed ~100 TW.
Design of a 5 PW Optical Parametric Chirped Pulse Amplifier for the Iodine LaserAsterix IV
P Matousek, I N Ross
Central Laser Facility, CLRC Rutherford Appleton Laboratory, Chilton, Didcot, Oxon, OX11 0QX, UK
B Rus
Gas Lasers Department, Institute of Physics, 182 21 Prague 8, Czech Republic
Main contact email address: [email protected]

Laser Science and Development – Laser Optics and Laser Design
189 Central Laser Facility Annual Report 2000/2001
In contrast, the Asterix IV iodine laser system is ideally suitedas a driver for an OPCPA as it has a high spatial uniformity andlarge pulse energy available in a single beam (500 J, 438 nm) ofsubnanosecond duration. Its third harmonic output (438 nm)can be used to pump an OPCPA consisting of LBO and KDPcrystals to amplify very broad band pulses at wavelengths(~785 nm) which can be conveniently generated by existingcommercial Ti:sapphire oscillators.
Figure 1. The proposed layout of the OPCPA system using thehigh-power iodine laser Asterix IV as a driver.
Design of an OPCPA Add-on System to Asterix IV
The conceptual layout of the OPCPA scheme is shown inFigure 1. The system consists of two LBO pre-amplifiers (ofthickness 13.5 mm and 12 mm, respectively) of a moderatesize, and a final, large aperture (270 mm diameter clearaperture, 45 mm thickness) KDP power-amplifier. The LBOstages are driven by the Asterix IV auxiliary beam using ~20 Jat 438 nm. The final KDP stage is pumped by the thirdharmonic of the main Asterix IV beam with energy 500 J,which is conservatively taken lower than the highest available.The third harmonic output was favoured over the second topump the OPCPA as its wavelength enables broader bandwidthto be amplified in the OPCPA. BBO crystals were alsoconsidered for use as pre-amplifier stages but providednarrower gain bandwidth than LBO crystals. The temporalshape of the pump pulse used in the modeling was Gaussianwith a nominal FWHM of 500 ps. A suitable seed pulse can begenerated from a Ti:sapphire oscillator with a sech2 temporalprofile and FWHM duration as short as 10 fs, corresponding toa spectral bandwidth ~1000 cm-1. The seed pulse is stretched(3.2 cm-1/ps) in a grating stretcher to several hundredpicoseconds and injected into the first LBO stage, temporallyoverlapping with the pump pulse. The amplified pulse iscompressed in a compressor with overall throughput 56%(assuming 70 % compressor throughput and additional 20 %loss due to spectral clipping in the compressor).
Optimized Configuration using 500 ps Pump Pulses
A non-zero angle between the signal and pump pulses was used(internal angles of 2.1 and 1.4 deg for LBO and KDP,respectively) in order
(i) to maximise the OPCPA bandwidth,
(ii) to enable a suitable phase mismatch to beintroduced by detuning the crystals to maximisethe amplifier bandwidths and
(iii) to help separate the beams after theamplification.
An additional feature of the optimisation was the variation ofboth the ratio of pump and signal pulse durations and the lengthof individual crystals while keeping the B-integral below unity.The highest peak power was obtained with the signal pulseshorter in duration by a factor 1.6 relative to the 500-ps pumppulse (~ 310 ps). The maximum achieved energy extractionefficiency in the final KDP amplifier was 36 % giving an outputenergy of 180 J.
Figure 3 shows the temporal profile of the signal pulse afterrecompression. The resulting pulse length is 21 fs. Byaccounting for losses in the compressor, the simulationdemonstrates that the peak powers up to 4.9 PW may begenerated. The overall intensity contrast of the pulse is betterthan 5x10⁻² and better than 10-3 outside the range ±100 fs. Theoutput pulse contrast can be improved by either spectral pulseshaping in the compressor or by operating the OPCPA in aregime optimised for highest contrast at some loss to the peakintensity.
-1000 -500 500 1000Time/ps
0.2
0.4
0.6
0.8
1Intensity/a.u.
Figure 2. Intensity temporal evolution for the input pump(black), output pump (blue) and output signal (red) pulses in thefinal KDP amplifier.
0
0.2
0.4
0.6
0.8
1
-100 -50 0 50 100
Time (fs)
Pul
se In
tens
ity (
a.u.
)
-6
-5
-4
-3
-2
-1
0
Log
Pul
se In
tens
ity
FWHM = 21 fs
Figure 3. The temporal profile of the output pulse afterrecompression, obtained by taking the Fourier transform of theoutput signal spectrum and residual phase.
Practical Aspects of the OPCPA Design
The beams are injected into the amplifiers using dichroicmirrors at the required non-collinear angle with respect to thesignal beam. The Amp3 is driven by the Asterix IV main beamwhich is telescoped from 290 to 270 mm to attain a higherpump fluence allowing the use of a shorter KDP crystal and toavoid possible problems with overfilling of the compressorgratings. The reduction of the Asterix IV main beam from 290to 270 mm may be accomplished most conveniently byadapting the output end of the current final spatial filter. TheAsterix IV / PALS beam divergence which is below 50 µrad iswell within the pump beam angular tolerance of OPCPAs in thepresented design. The input and output faces of the crystalsconstituting the amplifiers should be antireflection coated forthe signal and idler wavelengths, to minimise the internalreflection of these beams to avoid potential parasiticoscillations.
The ~10 fs seed pulse can be conveniently generated using aTi:sapphire oscillator synchronised to the 38 MHz radio-frequency driving the acousto-optical mode coupler of theAsterix IV oscillator. As the jitter of the Asterix IV oscillator iswell within 100 ps, it should not be a critical factor for the shot-
$VWHUL[ ,93$/6
7LVDSSKLUHRVFLOODWRU
N- SVP-
0DLQEHDP
$X[LOLDU\EHDP
-
QP
-
QP
)UHTXHQF\
WULSOLQJ
'.'3FU\VWDOV
Q-IV QP
VWUHWFKHU
FRPSUHVVRU
.'3
/%2/%2
$PS $PS $PS

Laser Science and Development – Laser Optics and Laser Design
Central Laser Facility Annual Report 2000/2001 190
to-shot stability of the performance of the proposed OPCPAchain8). The oscillator pulse having an energy of ~5 nJ isfrequency chirped to 310 ps in a stretcher. It is then injected tothe Amp1 to match the temporal peak of the pump pulse andamplified to ~0.24 mJ. Both the residual pump and the idler(~990 nm) waves are removed from the beamline prior to thebeam expander using their angular separation with respect tothe signal. Upon amplification to ~0.5 J in Amp2, the signalbeam is separated from the residual pump using a dichroicmirror while the idler wave is again eliminated using its angularseparation with respect to the signal beam. The finalamplification in the KDP stage is achieved with the total spatialoverlap of the signal and pump beams. Residual pump and idlerbeams are removed as for Amp2, requiring for the idler anoptical path of ~3.1 m. The signal fluence on the compressorgratings is ~0.3 Jcm-2, which is safely below the damagethreshold of currently available Au-coated gratings. In adouble-pass compressor involving commercially availablegratings 40 cm in size, designed to an angle of incidence of~45 degrees, the signal beam will underfill the first grating andwill be spectrally clipped at ~4 x FWHM on the second one18).Assuming a 56% efficiency of the compressor, we obtain thepower in the compressed beam of 4.9 PW representing animprovement by three orders of magnitude over the existingsystem.
Assuming a focusing reflective optic with the f-number equal to1 and 3 and a 2-times diffraction limited beam6) the estimatedfocused intensity available on target would be~ 1.6x10²³ Wcm-2 and 2x10²² W/cm2, respectively. Thisrepresents an improvement of five orders of magnitude over thehighest attainable focused intensity from the current AsterixIV / PALS system.
Conclusions
The presented design demonstrates that the OPCPA techniquepromises a very large increase in peak power (1000×), focusedintensity (100,000×) and reduction in duration for the highpower pulse down to 21 fs.
References
1. M D Perry, D Pennington, B C Stuart, G Tietbohl, J ABritten, C Brown, S Herman, B Golick, M Kartz, J Miller,H T Powell, M Vergino, and V Yanovsky Opt. Lett. 24160, (1999)
2. C N Danson, J Collier, D Neely, L J Barzanti, A Damerell,C B Edwards, M R H Hutchinson, M H Key, P A Norreys,D A Pepler, I N Ross, P F Taday, W T Toner, MTrentelman, F N Walsh, T B Winstone and R W W Wyatt,Journal of Modern Optics 45 1653, (1998)
3. C Rouyer, E Mazataud, I Allais, A Pierre, S Seznec, CSauteret, G Mourou and A Migus, Opt. Lett. 18 214,(1993)
4. C P J Barty, T Guo, C LeBlanc, F Raksi, C G RosePetruck,J A Squier, K R Wilson, V V Yakovlev and K Yamakawa ,Opt. Lett.21 668, (1996).
5. K Yamakawa, M Aoyama, S Matsuoka, H Takuma, D NFittinghoff and C P J Barty, IEEE Journal of SelectedTopics In Quantum Electronics 4 385, (1998)
6. I N Ross, P Matousek, M Towrie, A J Langley, and J LCollier, Optics Commun. 144 125, (1997)
7. A Dubeitis, G Jonusauskas and A Piskarskas, OpticsCommun. 88 437, (1992).
8. P Matousek, B Rus and I N Ross, IEEE Journal ofQuantum Electronics 36 158, (2000).
9. P Di Trapani, A Andreoni, C Solcia, P Foggi, R Danielius,A Dubietis and A Piskarskas, J. Opt. Soc. Am. B 12 2237,(1995)
10. A Yariv, Quantum Electronics, Third Edition, Chapter 16,J.Wiley&Sons, New York, 1989.
11. A Piskarskas, A Stabinis and A Yankauskas,Sov.Phys.Usp. 29 869, (1986)
12. J A Armstrong, N Bloembergen, J Ducuing and P SPershan, Phys.Rev.127 1918, (1962).
13. I N Ross and P Matousek, unpublished study, 1998.
14. H Baumhacker, G Brederlow, E Fill, R Volk, S Witkowskiand K J Witte, Appl. Phys. B 61 325, (1995).
15. B Rus, K Rohlena, J Skála, B Králiková, K Jungwirth, JUllschmied, K J Witte and H Baumhacker, LaserPart.Beams 17, 179 (1999)
16. H Schillinger and K J Witte, J.Opt.Soc.Am. B 101040,(1993)
17. H Baumhacker, G Brederlow, K Eidmann, E E Fill, AGrabtchikov, T Löwer, G Winhart and K J Witte, "TheAsterix IV iodine laser: performance and applications", inIodine Lasers and Applications, Proc. SPIE 2767, pp. 2-16,1996.
18. M Trentelman, I N Ross and C N Danson, Appl.Opt. 368567, (1997).

Laser Science and Development – Laser Optics and Laser Design
191 Central Laser Facility Annual Report 2000/2001
Introduction
Shutters have been used to modulate the output of light sourcessince optical science began. A very wide range of shutteringtechniques is available but few of these work in the vacuumultraviolet (VUV) part of the spectrum, usually considered tohave a long wavelength limit of ~190 nm. Particular problemsarise when the requirement is for high speed VUV shutters.
There are a number of applications for such devices but perhapsthe most important current one is the selection of single VUVpulses from synchrotrons. These are high average powerfacilities, providing radiation to many users at the same time.Their output consists of pulse trains lasting for hours, withintervals of just a few nanoseconds between pulses of 10-100 psduration. While the short inter-pulse interval is not a problemfor most experiments it does restrict the study of processes withrelatively long decay times. This can be accommodated to someextent by operating the synchrotron in “single-bunch” mode,where the inter-pulse interval can be hundreds of nanoseconds.However this leads to a substantial reduction in average powerwhich is unpopular with most of the other users. A much bettersolution would be to provide each of the synchrotron’sbeamlines with a fast shutter, allowing single pulses to beisolated. Unfortunately this is not currently practical in theVUV where the fastest shutters are based on the photoelasticeffect. This involves interrupting the beam using two crossedpolarisers with a quartz block between them. When the block isstressed by an acoustic wave it exhibits birefringence whichalters the polarisation of the light passing through it, therebyopening the shutter. However the acoustic waves cannot beswitched faster than a few hundred kilohertz, so photoelasticshutters are far too slow to select single pulses. Much fastershutters can be built using the electro-optic effect. Here thequartz block in a photoelastic shutter is replaced with a materialwhose birefringence depends on the applied electric field, ratherthan on mechanical stress. Electro-optic shutters, including onecalled the Pockels cell, can operate at gigahertz frequencies.
Pockels effect
The term “Pockels effect” is used to describe an electro-opticresponse where the induced birefringence is linearlyproportional to the applied electric field. The Pockels effect canonly occur in materials which are not centro-symmetric, i.e. inthe case of crystals, those that have no central point throughwhich each atom can be reflected onto an identical atom1). Thisis also a necessary condition for crystals to be piezoelectric. Ofthe 32 crystal classes, only 20 are not centro-symmetric, somany crystals are excluded from displaying the Pockels effect.The same is true of all disordered materials e.g. glasses andliquids in their natural states, although it is possible for “poled”glasses to have linear electro-optic coefficients2).
In order for a material to work successfully in a VUV Pockelscell it must be transparent in the VUV and have a sufficientlylarge electro-optic coefficient. To our knowledge the only non-centro-symmetric crystals which are known to transmit atwavelengths below 190 nm3) are the colquiriites, lithiumcalcium aluminium hexafluoride (commonly known as LiCAF)and its analogue, lithium strontium aluminium hexafluoride(LiSAF). A recent literature search revealed no reference totheir electro-optic coefficients so it was decided to attempt tomeasure these directly.
Figure 1. The crystal structure of LiCAF.
Linear electro-optic coefficient calculations
The linear electro-optic effect is described mathematically4) bythe following equation, which relates the change in thecomponents of the optical indicatrix, (1/n2)ij, to the componentsof the electric field vector, Ek, through the third rankelectro-optic tensor, r:
∆(1/n2)ij = rijkEk (1)
Since r is symmetric in the first two indices, the Einsteinsummation rule over equal indices can be used and r can bereduced to matrix form.
The crystal structure of LiCAF is shown in Figure 1 (LiSAF isidentical except that the calcium ions are replaced bystrontium). The structure has 3m symmetry and it can beshown5) that in this case ten of the elements of r are identicallyzero and only four of the remaining eight are independent. Inmore detail:
r =
00r
00r
0r0
r00
rr0
rr0
61
51
42
33
2322
1312
(2)
and
r12= -r22 = r61, r42 = r51, and r13 = r23 (3)
The actual size of any Pockels effect will depend on themagnitudes of r12, r13, r33 and r42. These are difficult to modelnumerically6) so the only way to establish whether LiCAF orLiSAF will be a useful Pockels material is to measure them.
In general applying an electric field to a Pockels materialchanges its refractive index in such a way as to steer, as well asretard, different polarisation components of the transmittedlight. Beam steering is undesirable in a practical shutter, soparticular geometrical arrangements are chosen to eliminate it.Two common arrangements are to propagate the light with its kvector perpendicular to the entrance and exit faces of the crystaland either parallel to the applied electric field or perpendicular
Possible Electro-optic Materials for use in Vacuum Ultra Violet Pockels Cells
M J Deer
Department of Physics, University of Bath, Bath, BA2 7AY,UK
G J Hirst, W Shaikh
Central Laser facility, CLRC Rutherford Appleton Laboratory, Chilton, Didcot, Oxon, OX11 0QX, UK
Main contact email address: [email protected]

Laser Science and Development – Laser Optics and Laser Design
Central Laser Facility Annual Report 2000/2001 192
(transverse) to it. It can be shown that an r matrix constrainedas in (2) and (3) leads to an identically zero birefringence whenthe E and k vectors are parallel, so only the transversearrangement can be used for Pockels materials with 3msymmetry. Such an arrangement is shown in Figure 2. Theretardance, Γ, i.e. the phase difference introduced between thelight polarised along the material’s optic axis and that polarisedparallel to it, is then given by:
−+−=dV
r2
n
dV
r2
nnn
cO
13
3o
33
3e
eo(4)
where c is the speed of light, ω is its angular frequency, no andne are the crystal’s refractive indices in the absence of anyapplied field and the other variables are as defined in Figure 2.The shutter is “closed” when the value of Γ is an even multipleof π radians and fully “open” when it is an odd multiple. Thelength of the Pockels material is usually adjusted so that Γ is anexact multiple of 2π radians when V=0.
Experimental setup
The experimental setup is shown in Figure 3. It is almostidentical to the schematic in Figure 2 except that a Babinet-Soleil compensator has been added between the first polariserand the crystal. This allows the total retardance to be adjusted toan odd multiple of π/2 radians which is the value at which theoutput is most sensitive to small changes in Γ.
Figure 3. Photograph of the experimental set-up.
The light source is a He-Ne laser operating at a wavelength of632.8 nm. The LiCAF and LiSAF crystals were provided byVLOC Inc7) and are mounted between spring-loaded solidelectrodes in a custom built cell. Their dimensions are given inTable 1. The high voltage comes from a commercial Pockelscall driver (Leysop Ltd) which can deliver up to 8 kV with afalltime to ground of less than 5 ns. The output signal is
monitored using a silicon photodiode (Thorlabs Inc, DET 210).To reduce the noise the system was fired repetitively and up to64 signals were averaged.
Crystal Length l (mm) Height d (mm)
LiCAF 6.00±0.005 6.00±0.005
LiSAF 10.02±0.005 9.38±0.005
Table1. Dimensions of the crystals.
Under good conditions the system should detect a retardancechange when the driver is fired of as little as 0.01 radians.
Results
Preliminary measurements have shown no Pockels effect ineither crystal. It would seem that the upper limits to the value of(ne
3r33 – no3r13) are approximately 4 × 10⁻⁸ cm/kV for LiCAF
and 5 × 10⁻⁸ cm/kV for LiSAF. A value of the order of10-6 cm/kV would be required to make a practical Pockels cellwithin the constraints of high voltage breakdown and useablecrystal length.
However the apparent absence of any Pockels effect may be dueto one or more experimental artifacts. In particular the highnatural birefringence of both materials (more than 103 radians ineach sample) means that strict crystal parallelism is required ifthe birefringence is not to vary significantly across the beamwidth. If it were present such variation would mask smallPockels signals.
It is planned to carry out more detailed measurements includinga calibration of the experimental set-up using a sample of KDP– a well-characterised Pockels material.
Conclusions
The colquiriite crystals LiCAF and LiSAF have been identifiedas being potential transverse Pockels materials in the VUV.However to be practically useful they must exhibit sizeableelectro-optic coefficients. An experimental set-up has beendesigned and built to measure these coefficients. Preliminaryresults suggest that any effects are very small. However furtherand more detailed experiments, including a calibration of theexperimental hardware, are under way.
References
1. See e.g. E Hecht,Optics (3rd edn.), publ Addison Wesley Longman, (1998)
2. X-C Long, R A Myers and S R J Brueck,Opt Letts, 19 1819, (1994)
3. K Shimamura, S L Baldochi, I M Ranieri, H Sato, T Fujita,V L Mazzocchi, C B R Parente, C O Paiva-Santos,C V Santilli, N Sarukura and T Fukuda,J Cryst Growth, 223 383, (2001)
4. P Gunter (ed),Nonlinear Optical Effects and Materials, publ Springer-Verlag, (2000)
5. A Yariv,Quantum Electronics (3rd edn.), publ Wiley, (1988)
6. S Popov, S V Svirko, P Yu and N I Zheludev,Susceptibility Tensors for Nonlinear Optics, publ IoP,(1995)
7. VLOC Inc, T826 Photonics Drive, New Port Richey,FL 34655, USA
Outputbeam
Pockels materialoptic axis
Inputbeam
V
Inputpolariser
Outputpolariser
Pockelsmaterial
d
l
Figure 2. Transverse Pockels cell arrangement, showing theapplied voltage, optic axis, polariser and beam directions.

Appendices – Operational Statistics
193 Central Laser Facility Annual Report 2000/2001
Schedules and Operational Statistics
1) Vulcan
2) Astra
3) Lasers for Science Facility
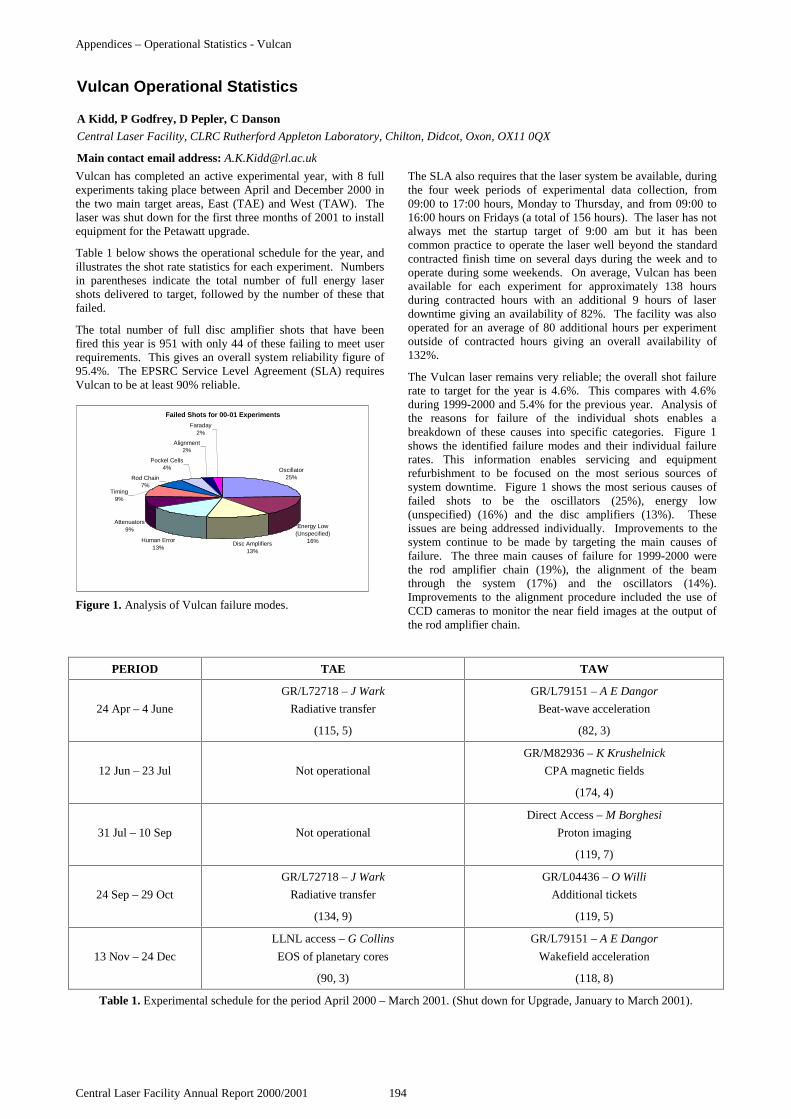
Appendices – Operational Statistics - Vulcan
Central Laser Facility Annual Report 2000/2001 194
Vulcan has completed an active experimental year, with 8 fullexperiments taking place between April and December 2000 inthe two main target areas, East (TAE) and West (TAW). Thelaser was shut down for the first three months of 2001 to installequipment for the Petawatt upgrade.
Table 1 below shows the operational schedule for the year, andillustrates the shot rate statistics for each experiment. Numbersin parentheses indicate the total number of full energy lasershots delivered to target, followed by the number of these thatfailed.
The total number of full disc amplifier shots that have beenfired this year is 951 with only 44 of these failing to meet userrequirements. This gives an overall system reliability figure of95.4%. The EPSRC Service Level Agreement (SLA) requiresVulcan to be at least 90% reliable.
Figure 1. Analysis of Vulcan failure modes.
The SLA also requires that the laser system be available, duringthe four week periods of experimental data collection, from09:00 to 17:00 hours, Monday to Thursday, and from 09:00 to16:00 hours on Fridays (a total of 156 hours). The laser has notalways met the startup target of 9:00 am but it has beencommon practice to operate the laser well beyond the standardcontracted finish time on several days during the week and tooperate during some weekends. On average, Vulcan has beenavailable for each experiment for approximately 138 hoursduring contracted hours with an additional 9 hours of laserdowntime giving an availability of 82%. The facility was alsooperated for an average of 80 additional hours per experimentoutside of contracted hours giving an overall availability of132%.
The Vulcan laser remains very reliable; the overall shot failurerate to target for the year is 4.6%. This compares with 4.6%during 1999-2000 and 5.4% for the previous year. Analysis ofthe reasons for failure of the individual shots enables abreakdown of these causes into specific categories. Figure 1shows the identified failure modes and their individual failurerates. This information enables servicing and equipmentrefurbishment to be focused on the most serious sources ofsystem downtime. Figure 1 shows the most serious causes offailed shots to be the oscillators (25%), energy low(unspecified) (16%) and the disc amplifiers (13%). Theseissues are being addressed individually. Improvements to thesystem continue to be made by targeting the main causes offailure. The three main causes of failure for 1999-2000 werethe rod amplifier chain (19%), the alignment of the beamthrough the system (17%) and the oscillators (14%).Improvements to the alignment procedure included the use ofCCD cameras to monitor the near field images at the output ofthe rod amplifier chain.
PERIOD TAE TAW
24 Apr – 4 June
GR/L72718 – J Wark
Radiative transfer
(115, 5)
GR/L79151 – A E Dangor
Beat-wave acceleration
(82, 3)
12 Jun – 23 Jul Not operational
GR/M82936 – K Krushelnick
CPA magnetic fields
(174, 4)
31 Jul – 10 Sep Not operational
Direct Access – M Borghesi
Proton imaging
(119, 7)
24 Sep – 29 Oct
GR/L72718 – J Wark
Radiative transfer
(134, 9)
GR/L04436 – O Willi
Additional tickets
(119, 5)
13 Nov – 24 Dec
LLNL access – G Collins
EOS of planetary cores
(90, 3)
GR/L79151 – A E Dangor
Wakefield acceleration
(118, 8)
Table 1. Experimental schedule for the period April 2000 – March 2001. (Shut down for Upgrade, January to March 2001).
Vulcan Operational Statistics
A Kidd, P Godfrey, D Pepler, C Danson
Central Laser Facility, CLRC Rutherford Appleton Laboratory, Chilton, Didcot, Oxon, OX11 0QX
Main contact email address: [email protected]
Failed Shots for 00-01 Experiments
Oscillator 25%
Energy Low (Unspecified)
16%Disc Amplifiers13%
Human Error 13%
Attenuators9%
Rod Chain 7%
Pockel Cells4%
Alignment2%
Faraday 2%
Timing 9%

Appendices – Operational Statistics - Astra
195 Central Laser Facility Annual Report 2000/2001
A total of 40 scheduled experiment weeks were carried out withthe Astra laser during the reporting period April 2000 to March2001. The EPSRC sponsored 73 % of the experiments whilstthe remainder were sponsored by the EU. All of theexperiments were physics based.
The Astra laser was available for experiments for an average of75 % of the time in normal day-time hours during scheduledexperiments. In 6 of the 8 experiments 100 % of day-timedown-time was made up in out-of-hours working. The averagelost-time made up was 88 % across all experiments. Reliabilitydefined as the time the laser was available as a percentage of thetotal time provided to scheduled experiments was 79 %.
Eleven weeks of development this year have helped Astra makea successful transition from a development programme to an
operational facility capable of delivering 5 TW pulses of 50 fsduration with focused intensities up to 1019 Wcm-2. Facilitydevelopment focused exclusively on characterising the systemand optimising it for the user programme. Pulse energy andbeam distribution, for example, have been improved by about25% as the performance of the final amplifier has beenenhanced with the installation of a better quality titanium-sapphire crystal. We have worked to reduce pre-pulse to ~10-5
of the main pulse, an essential requirement for manyexperiments. A suite of diagnostics are in place to supportexperiments – a single-shot autocorrelator to monitor pulseduration and on-line pulse spectrum, laser energy, far and near-field detectors are in place to monitor the laser through the day.A third-order correlator (TOC) is also available.
Astra Operational Statistics
A J Langley
Central Laser Facility, CLRC Rutherford Appleton Laboratory, Chilton, Didcot, Oxon, OX11 0QX
Main contact email address: [email protected]
Date Target Area 1 (ATA1) Target Area 2 (ATA2)
3 Apr10 Apr Ross Laser amplifier17 Apr (RAL) development24 Apr Gratings damage tests1 May System characterisation8 May Newell/Williams (UCL/Belfast)15 May Short pulse laser interactions22 May with positive ions and molecules Maintenance
29 May Hooker5 Jun Newell/Williams (Oxford)12 Jun (UCL/Belfast) Short wavelength lasers driven by19 Jun optical field ionisation26 Jun Direct access3 Jul to24 Jul
Laser maintenance and optimisation
31 Jul Maintenance7 Aug Hooker14 Aug (Oxford)21 Aug Capillary waveguides for driving28 Aug Short-wavelength lasers4 Sep11 Sep ∗18 Sep25 Sep Maintenance2 Oct Dangor9 Oct (IC)16 Oct Laser plasma wave generation23 Oct and electron acceleration30 Oct6 Nov to18 Dec
Laser maintenance and optimisation
25 Dec CHRISTMAS/NEW YEAR1 Jan Maintenance Maintenance8 Jan Osvay15 Jan (Szeged, Hungary) Dangor22 Jan Optical parametric chirped pulse amplification (IC)29 Jan of femtosecond pulses between 290 – 530nm5 Feb Laser plasma wave generation12 Feb and electron acceleration19 Feb26 Feb Maintenance5 Mar Ledingham12 Mar (Glasgow)19 Mar Osvay Proton production with a26 Mar (Szeged, Hungary) TW laser interacting with thin solid targets
Table 1. Astra Experiment Schedule 2000/2001 ∗ 5 week experiment over a 6 week period.
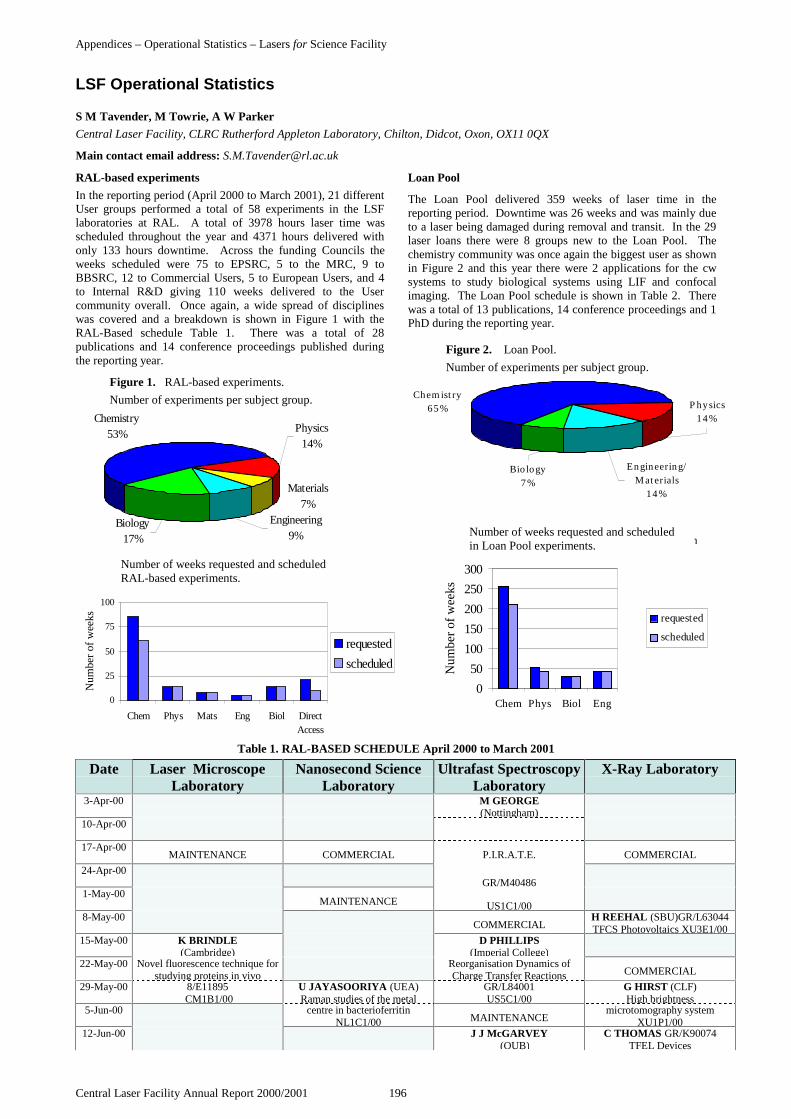
Appendices – Operational Statistics – Lasers for Science Facility
Central Laser Facility Annual Report 2000/2001 196
RAL-based experiments
In the reporting period (April 2000 to March 2001), 21 differentUser groups performed a total of 58 experiments in the LSFlaboratories at RAL. A total of 3978 hours laser time wasscheduled throughout the year and 4371 hours delivered withonly 133 hours downtime. Across the funding Councils theweeks scheduled were 75 to EPSRC, 5 to the MRC, 9 toBBSRC, 12 to Commercial Users, 5 to European Users, and 4to Internal R&D giving 110 weeks delivered to the Usercommunity overall. Once again, a wide spread of disciplineswas covered and a breakdown is shown in Figure 1 with theRAL-Based schedule Table 1. There was a total of 28publications and 14 conference proceedings published duringthe reporting year.
Loan Pool
The Loan Pool delivered 359 weeks of laser time in thereporting period. Downtime was 26 weeks and was mainly dueto a laser being damaged during removal and transit. In the 29laser loans there were 8 groups new to the Loan Pool. Thechemistry community was once again the biggest user as shownin Figure 2 and this year there were 2 applications for the cwsystems to study biological systems using LIF and confocalimaging. The Loan Pool schedule is shown in Table 2. Therewas a total of 13 publications, 14 conference proceedings and 1PhD during the reporting year.
Table 1. RAL-BASED SCHEDULE April 2000 to March 2001
Date Laser MicroscopeLaboratory
Nanosecond ScienceLaboratory
Ultrafast SpectroscopyLaboratory
X-Ray Laboratory
3-Apr-00 M GEORGE(Nottingham)
10-Apr-00
17-Apr-00MAINTENANCE COMMERCIAL P.I.R.A.T.E. COMMERCIAL
24-Apr-00GR/M40486
1-May-00MAINTENANCE US1C1/00
8-May-00COMMERCIAL
H REEHAL (SBU)GR/L63044TFCS Photovoltaics XU3E1/00
15-May-00 K BRINDLE(Cambridge)
D PHILLIPS(Imperial College)
22-May-00 Novel fluorescence technique forstudying proteins in vivo
Reorganisation Dynamics ofCharge Transfer Reactions COMMERCIAL
29-May-00 8/E11895 CM1B1/00
U JAYASOORIYA (UEA)Raman studies of the metal
GR/L84001US5C1/00
G HIRST (CLF)High brightness
5-Jun-00 centre in bacterioferritinNL1C1/00 MAINTENANCE
microtomography systemXU1P1/00
12-Jun-00 J J McGARVEY (QUB)
C THOMAS GR/K90074TFEL Devices
LSF Operational Statistics
S M Tavender, M Towrie, A W Parker
Central Laser Facility, CLRC Rutherford Appleton Laboratory, Chilton, Didcot, Oxon, OX11 0QX
Main contact email address: [email protected]
Fig. 1 Number of experiments per subject group - RAL-based experiments
Chemistry53% Physics
14%
Engineering9%
Biology17%
Materials7%
Fig 1. Number of weeks requested and scheduledRAL-based experiments
0
25
50
75
100
Chem Phys Mats Eng Biol DirectAccess
Num
ber
of w
eeks
requested
scheduled
Fig 2 . Num ber o f experim ent s per subject group - Loan P oo l
Chem ist ry65% P hysics
14%
Bio logy7%
Engineering/M at erials
14%
Fig. 1 Number of weeks requested and scheduled in Loan Pool 2000-01
0
50
100
150
200
250
300
Chem Phys Biol Eng
Num
ber
of w
eeks
requested
scheduled
Number of weeks requested and scheduledRAL-based experiments.
Figure 1. RAL-based experiments.
Number of experiments per subject group.
Figure 2. Loan Pool.
Number of experiments per subject group.
Number of weeks requested and scheduledin Loan Pool experiments.

Appendices – Operational Statistics – Lasers for Science Facility
197 Central Laser Facility Annual Report 2000/2001
Date Laser MicroscopeLaboratory
Nanosecond ScienceLaboratory
Ultrafast SpectroscopyLaboratory
X-Ray Laboratory
19-Jun-00 BAGSHAW (Leicester)Time-resolved fluorescence
DNA Interactions at colloidalsurfaces
G HIRST (CLF)High brightness
26-Jun-00 anisotropy of myosin91/C11088 CM5B2/00
GR/M45696US2C1/00
microtomography systemXU1P1/00 CEO
3-Jul-00DEVELOPMENT MAINTENANCE
10-Jul-00OF LASER
D PHILLIPS ReorganisationDynamics GR/L84001 NL2C1/00
K REID(Nottingham)
J CAIRNS (Dundee)Production of X-ray masks
17-Jul-00OPTICAL
A novel Probe ofIntramolecular Vibrational
GR/M41223XU2C2/00
24-Jul-00TWEEZERS
Energy Redistribution H REEHAL (SBU) GR/L63044TFCS Photovoltaics XU3E1/00
31-Jul-00MAINTENANCE
D PHILLIPS ReorganisationDynamics GR/L84001 NL5C2/00
GR/M83759US4C1/00
COMMERCIALQ99/179
7-Aug-00 D PHILLIPS(Imperial College)
14-Aug-00MAINTENANCE
Reorganisation Dynamics ofCharge Transfer Reactions
21-Aug-00 S KELLY (Hull)Photoluminescence of electro-
GR/L84001US11C2/00 MAINTENANCE
28-Aug-00 luminescent liquid crystalsGR/L41417 CM4M2/00
MAINTENANCE
4-Sep-00 M SEARLE(Nottingham)
M GEORGE (Nottingham)
11-Sep-00 Fast time-resolved infraredanalysis of beta-sheet
J CAIRNS (Dundee)Production
18-Sep-00 K BRINDLE (Cambridge)Novel fluorescence technique for
peptide folding in aqueoussolutions P.I.R.A.T.E.
of X-ray masksGR/M41223 XU5M2/00
25-Sep-00 studying proteins in vivo8/E11895 CM2B2/00
NL5C2/00
2-Oct-00 GR/M40486US9C2/00A
H REEHAL(SBU) GR/L63044TFCS Photovoltaics XU7E2/00
9-Oct-00DEVELOPMENT OF
D McGARVEY(Keele) MAINTENANCE
16-Oct-00LASER
Nanosecond TR3 ofcarotenoid radicals resulting
COMMERCIAL00/0050S
M HILL (MRC) Cellularradiobiology XU6B2/00
23-Oct-00OPTICAL TWEEZERS
from trappingphenylacetylperoxyl radical in
J J McGARVEY (QUB)DNA Interactions at colloidal
30-Oct-00 polar and non-polar solventsNL4C2/00
surfacesGR/M45696 US8C2/00
C WHARTON (Birmingham)Intracellular dynamics
6-Nov-00 C WHARTON Intracellulardynamics CM3P2/00 GR/N19052
M GEORGE (Nottingham)
GR/N19052XU8P2/00
13-Nov-00 P.I.R.A.T.E.
20-Nov-00 GR/M40486US9C2/00B
COMMERCIALQ99/179
27-Nov-00MAINTENANCE
M GEORGE (Nottingham)GR/M40486 US13C3/00A MAINTENANCE
4-Dec-00 D PHILLIPS(Imperial College)
M HILL (MRC) Cellularradiobiology XU13B3/00A
11-Dec-00 C WHARTON (Birmingham)GR/N19052 CM9P3/00A
Reorganisation Dynamics ofCharge Transfer Reactions
C WHARTON (Birmingham)GR/N19052 XU14P2/00
18-Dec-00 P O’NEILL (MRC) DNA Base Radical Ions CM8C3/00
GR/L84001US14C3/00
25-Dec-00
1-Jan-01X-MAS/
NEW YEAR8-Jan-01
MAINTENANCEA MICHETTE (King’s College)
Development of the15-Jan-01 COMMERIAL - LASER
TWEEZERS LatticeP MOJZES
(Czech Republic)Scanning X-Ray Microscope GR/N28061/01 XU10P3/00
22-Jan-01 forces in 2-D crystallinemonolayers CM6C3/00
D PHILLIPS (IC) GR/L84001 NL8C3/00
TR3 Study of Porphyrin -Oligonucleotide Exciplex
29-Jan-01 FormationUSEV11C3/00
P O’NEILL (MRC) EnergyDependence for Base Damage
5-Feb-01 K BRINDLE (Cambridge)8/E11895 CM7B3/00A
A VLCEK (QMWC)Early photochemical
in DNA by low energyPhotons XU11B3/00
12-Feb-01 COMMERIAL - LASERTWEEZERS Lattice
dynamics of chargetransfer excited MAINTENANCE
19-Feb-01 forces in 2-D crystallinemonolayers CM6C3/00
organometallic complexesGR/N11414 US15C3/00A
C WHARTON(Birmingham)
26-Feb-01 C WHARTON (Birmingham)GR/N19052 CM9P3/00B MAINTENANCE
Intracellular dynamicsGR/N19052 XU8P2/00
5-Mar-01MAINTENANCE
M GEORGE (Nottingham)
J CAIRNS (Dundee)Production
12-Mar-01 P.I.R.A.T.E. of X-ray masksGR/M41223 XU9M3/00
19-Mar-01 K BRINDLE (Cambridge)8/E11895 CM7B3/00B
GR/M40486US13C3/00B
H REEHAL (SBU) XU12E3/00Photovoltaics GR/L63044
26-Mar-01 A VLCEK (QMWC)GR/N11414 US15C3/00B
M HILL (MRC) Cellularradiobiology XU13B3/00B

Appendices – Operational Statistics – Lasers for Science Facility
Central Laser Facility Annual Report 2000/2001 198
Table 2.Delivered Loan Pool Schedule April 2000 to March 2001Date NSL1
YAG/DyeNSL2
YAG/DyeNSL3
YAG/DyeNSL4
YAG/DyeNSL5
Fluoride excimerNSL6
YAG/DyeCWL2 Ti:S
CWL3FreD Ar Ion
CW1Ar Ion
Apr 3 JONES COATS SIMONS TAYLOR SHIELDS
10 UNALLOCATED Edinburgh Leicester GEORGE Oxford ImperialCollege
Oxford
17 Nottingham GaN based
24 Supersonic jet UV/UV and semiconductors
May 1 Spectroscopyd
LP15E2/99 UNALLOCATED IR/UV LP31P3/99 FROST
8 Density Vibrational Ion-dip Heriot-Watt
15 DENNING functional Spectroscopy Spectroscopy
22 Oxford calculations COATS Of of amino acids LP27C3/99 NEUENDORF
29 of Leicester DNA base Amides andth i
Birmingham Visible laser
June 5 liquid crystal Radical ions: Hydratedl t
Induced
12 Two-photon Molecules A time- BERK Fluorescence
19 Spectroscopy Acoustic COLE/RAITHBY Resolved Manchester Optical Studies of
26 Of LP28C3/99 Instability Bath Infrared LP26C3/99 Two-photon Properties Dysplasia in
July 3 Lanthanide Of Investigation Fluorescence Of Human
10 Ions Fully Correlation Nanoscale Colonic tissue
17 SERVICE Premixed LP3C1/00 SIMONS Spectroscopy Silicon
24 AT SIRA Flames Crystallographic Oxford For Structures
31 Studies Studying
Aug 7 REPAIR On GEORGE Ion dip Drug LP30B3/99
14 OF Excited state Nottingham Spectroscopy Delivery
21 LP1C1/00 YAG Molecular Of In living
28 LP7E1/00 complexes neurotransmitters amino
Tissue LP6P1/00 RETIRED
Sept 4 Vibrational and their AWARDED
11 DENNING Spectroscopy Hydratedl t
To
18 Oxford COATS Of LP8B1/00 FROST
25 Leicester LP9C2/00 DNA base Herriot-Watt
Oct 2 Two-photon STACE Acoustic Radical ions:
9 Spectroscopy Sussex Instability KLENERMAN
16 Of Of COLE/RAITHBY Cambridge
23 Lanthanide Spectroscopic Fully Bath LP11C2/00
30 Ions Studies of Premixed POTTON
Nov 6 transition metal Flames 2-Photon Salford
13 complexes Crystallographic SIMONS Scanning
20 in the Studies On Oxford Microscopy
27 LP17C3/00 Gas phase Excited state and surface
Dec 4 Molecular Con-focal Optical
11 complexes Vibrational Imaging of Poling of
18 UNALLOCATED Spectroscopy Living cells Glasses for
25 LP14E3/00 Of DNA base non-linear
Jan2001
Radical ions Optical
08 LACZIK LP2C1/00 components
15 Oxford REID LP12C2/00
22 Nottingham LP13C2/00 LP15C3/00
29 Use of STACE Photoelectron
Feb 5 diffractive Sussex Angular LINFIELD LP16P3/00
12 Optical Distributions Cambridge
19 elements Cluster a Probe of UNALLOCATED UNALLOCATED LP15C3/00 Development
26 for enhanced Spectroscopy Intramolecular of an optical
Mar5 Micro- in Helium and high power
12 machining Nanodroplets Photoionizatio SIMONS terahertz LEGGATT
19 Dynamics Oxford source UMIST
26 LP22E3/00 LP19C3/00 LP18C3/00 SMITH LP6C1/01 LP21C3/00 LP23C3/00

Publications
199 Central Laser Facility Annual Report 2000/2001
Publications1) High Power Laser Programme – Vulcan Laser
2) High Power Laser Programme – Astra Laser
3) Lasers for Science Facility
4) Laser Science and Development

Publications
Central Laser Facility Annual Report 2000/2001 200
High Power Laser Programme – VulcanLaserJOURNAL PUBLICATIONS, BOOKS AND PUBLISHEDPROCEEDINGS
C A Back, N C Woolsey, T Missalla, O L Landen, S B Libby,L S Klein, R W LeeImplosions: an experimental testbed for high energy densityphysicsAstrophys J Suppl Series 127 (2) 227-232 (2000)
D Batani, J R Davies, A Bernardinello, F Pisani, M Koenig,T A Hall, S Ellwi, P Norreys, S Rose, A Djaoui, D NeelyExplanations for the observed increase in fast electronpenetration in laser shock compressed materialsPhys Rev E 61 (5) 5725-5733 (2000)
M E Beer, P K Patel, S J Rose, J S WarkCalculations of the modal photon densities and gain in a K/Clresonantly photopumped X-ray laserJ Quant Spectr & Rad Trans 65 (1-3) 71-81 (2000)
M Borghesi, A J MacKinnon, R Gaillard, G Malka, C Vickers,O Willi, A A Offenberger, B Canaud, J L Miquel, N Blanchot,J R Davies, A Pukhov, J Meyer-ter-VehnShort pulse interaction experiments for fast ignitor applicationsLaser and Particle Beams 18 (3) 389-397 (2000)
E L Clark, K Krushelnick, M Zepf, F N Beg, M Tatarakis,A Machacek, M I K Santala, I Watts, P A Norreys, A E DangorEnergetic heavy-ion and proton generation from ultraintenselaser-plasma interactions with solidsPhys Rev Letts 85 (8) 1654-1657 (2000)
S J Davidson, K Nazir, S J Rose, R Smith, G J TallentsShort-pulse laser opacity measurementsJ Quant Spectr & Rad Trans 65 (1-3) 151-160 (2000)
L A Gizzi, A Giulietti, O Willi, D RileySoft-x-ray emission dynamics in picosecond laser-producedplasmasPhys Rev E 62 (2) 2721-2727 (2000)
M J Grout, G J Pert, A DjaouiThe effect of Coulomb explosion ion heating in optical-fieldionised nitrogen X-ray laser schemesOpt Comm 177 (1-6) 333-345 (2000)
S M HookerInner shell soft x ray lasers driven by optical field ionizationCLEO 2000 Technical Digest, publ OSA, TOPS Vol.39 515-516 (2000)
S M HookerInner-shell soft X-ray lasers in Ne-like ions driven by opticalfield ionizationOpt Comm 182 (1-3) 209-219 (2000)
A Klisnick, P Zeitoun, D Ros, A Carillon, P Fourcade,S Hubert, G Jamelot, C L S Lewis, A G MacPhee,R M N O’Rourke, R Keenan, P V Nickles, K Janulewicz,M Kalashnikov, J Warwick, J-C Chanteloup, A Migus,E Salmon, C Sauteret, J P ZouTransient pumping of a Ni-like Ag X-ray laser with asubpicosecond pump pulse in a travelling-wave irradiationgeometryJOSA B 17 (6) 1093-1097 (2000)
K Krushelnick, E L Clark, R Allott, F N Beg, C N Danson,A Machacek, V Malka, Z Najmudin, D Neely, P A Norreys,M R Salvati, M I K Santala, M Tatarakis, I Watts, M Zepf,A E DangorUltra-high intensity laser-produced plasmas as a compactheavy ion injection sourceIEEE Trans Plasma Sci 28 (4) 1184-1189 (2000)
K Krushelnick, E Clark, Z Najmudin, M Salvati, M I K Santala,M Tatarakis, A E Dangor, V Malka, D Neely, R Allott,C DansonDiagnosis of peak laser intensity from high energy ionmeasurements during intense laser interactions withunderdense plasmasLaser and Particle Beams 18 (4) 595-600 (2000)
K Krushelnick, E L Clark, M Zepf, J R Davies, F N Beg,A Machacek, M I K Santala, M Tatarakis, I Watts, P A Norreys,A E DangorEnergetic proton production from relativistic laser interactionwith high density plasmasPhysics of Plasmas 7 (5) 2055-2061 (2000)
A C Machacek, J S WarkA versatile matrix-based solution for the two plasmon decayinstabilityPhysics of Plasmas 8 (3) 704-712 (2001)
A J Mackinnon, M Borghesi, S Hatchett, M H Key, P K Patel,H Campbell, A Schiavi, R Snavely, S C Wilks, O WilliEffect of plasma scale length on multi-MeV proton productionby intense laser pulsesPhys Rev Letts 86 (9) 1769-1772 (2001)
V Malka, C Coulaud, J P Geindre, V Lopez, Z Najmudin,D Neely, F AmiranoffCharacterization of neutral density profile in a wide range ofpressure of cylindrical pulsed gas jetsRev Sci Instr 71 (6) 2329-2333 (2000)
V Malka, J Faure, J R Marques, F Amiranoff, C Courtois,Z Najmudin, K Krushelnick, M R Salvati, A E DangorInteraction of ultraintense laser pulses with an underdense,preformed plasma channelIEEE Trans Plasma Sci 28 (4) 1078-1083 (2000)
Z Najmudin, R Allott, F Amiranoff, E L Clark, C N Danson,D F Gordon, C Joshi, K Krushelnick, V Malka, D Neely,M R Salvati, M I K Santala, M Tatarakis, A E DangorMeasurement of forward Raman scattering and electronacceleration from high-intensity laser-plasma interactions at527 nmIEEE Trans Plasma Sci 28 (4) 1084-1089 (2000)
Z Najmudin, A E Dangor, A Modena, M R Salvati,C E Clayton, C N Danson, D F Gordon, C Joshi, K A Marsh,V Malka, P Muggli, D Neely, F N WalshInvestigation of a channeling high-intensity laser beam inunderdense plasmasIEEE Trans Plasma Sci 28 (4) 1057-1070 (2000)
D Neely, J L Collier, R Allott, C N Danson, S Hawkes,Z Najmudin, R J Kingham, K Krushelnick, A E DangorProposed beatwave experiment at RAL with the Vulcan CPAlaserIEEE Trans Plasma Sci 28 (4) 1116-1121 (2000)
P A Norreys, R Allott, R J Clarke, J Collier, D Neely, S J Rose,M Zepf, M Santala, A R Bell, K Krushelnick, A E Dangor,N C Woolsey, R G Evans, H Habara, T Norimatsu, R KodamaExperimental studies of the advanced fast ignitor schemePhysics of Plasmas 7 (9) 3721-3726 (2000)
P K Patel, E Wolfrum, O Renner, A Loveridge, R Allott,D Neely, S J Rose, J S WarkX-ray line reabsorption in a rapidly expanding plasmaJ Quant Spectr & Rad Trans 65 (1-3) 429-439 (2000)

Publications
201 Central Laser Facility Annual Report 2000/2001
F Pisani, A Bernardinello, D Batani, A Antonicci, E Martinolli,M Koenig, L Gremillet, F Amiranoff, S Baton, J Davies, T Hall,D Scott, P Norreys, A Djaoui, C Rousseaux, P Fews,H Bandulet, H PepinExperimental evidence of electric inhibition in fast electronpenetration and of electric-field-limited fast electron transportin dense matterPhys Rev E 62 (5) R5927-5930 (2000)
D Riley, N C Woolsey, D McSherry, E NardiX-ray scattering from a radiatively heated plasmaJ Quant Spectr & Rad Trans 65 (1-3) 463-470 (2000)
S J RoseThe inclusion of Compton scattering in line radiation escapefactorsJ Quant Spectr & Rad Trans 65 (1-3) 471-475 (2000)
M I K Santala, Z Najmudin, E I Clark, M Tatarakis,K Krushelnick, A E Dangor, V Malka, J Faure, R Allott,R J ClarkeObservation of a hot high-current electron beam from aself-modulated laser wakefield acceleratorPhys Rev Letts 86 (7) 1227-1230 (2001)
M I K Santala, M Zepf, F N Beg, E L Clark, A E Dangor,K Krushelnick, M Tatarakis, I Watts, K W D Ledingham,T McCanny, I Spencer, A C Machacek, R Allott, R J Clarke,P A NorreysProduction of radioactive nuclides by energetic protonsgenerated from intense laser-plasma interactionsAppl Phys Letts 78 (1) 19-21 (2001)
D J Spence, S M HookerInvestigation of a hydrogen plasma waveguidePhys Rev E 63 (1 Pt 2) 015401(R) (2001)
D J Spence, S M HookerSimulations of the propagation of high intensity laser pulses indischarge ablated capillary waveguidesCLEO 2000 Technical Digest, publ OSA, TOPS Vol.39 293-294 (2000)
D J Spence, S M HookerSimulations of the propagation of high-intensity laser pulses indischarge-ablated capillary waveguidesJOSA B 17 (9) 1565-1570 (2000)
O Willi, L Barringer, C Vickers, D HoartyStudy of super- and subsonic ionization fronts in low-density,soft X-ray-irradiated foam targetsAstrophys J Suppl Series 127 (2 Pt 1) 527-531 (2000)
N C Woolsey, C A Back, R W Lee, A Calisti, C Mossé,R Stamm, B Talin, A Asfaw, L S KleinExperimental results on line shifts from dense plasmasJ Quant Spectr & Rad Trans 65 (1-3) 573-578 (2000)
PUBLISHED DURING 1999/2000
A C Cefalas, E Sarantopoulou, P Argitis, T W Ford, A D Stead,C N Danson, D NeelyFast, high resolution negative chemically amplified epoxyphotoresist for X ray imaging of living biological specimens inthe water windowProc LASERS '98, publ Society for Optical & QuantumElectronics, 649-652 (1999)
K Ledingham, T McCanny, P Graham, X Fang, R Singhal,J Magill, A Creswell, D Sanderson, R Allott, D Neely,P Norreys, M Santala, M Zepf, I Watts, E Clark, K Krushelnick,M Tatarakis, B Dangor, A Machecek, J WarkLaser induced nuclear reactionsAIP Conf Proc 454 229-234 (1999)
C I Moore, K Krushelnick, A Ting, H R Burris, R F Hubbard,P SprangleTransverse modulation of an electron beam generated inself-modulated laser wakefield accelerator experimentsPhys Rev E 61 (1) 788-792 (2000)
O Renner, P K Patel, J S Wark, E Krousky, P E Young,R W LeeVertical variant of a double channel-cut crystal spectrometerfor investigation of laser-generated plasmasRev Sci Instr 70 (7) 3025-3031 (1999)
P J Warwick, K A Janulewicz, M P Kalachnikov, A Klisnick,C L S Lewis, W Sandner, P V NicklesTransient inversion soft X ray lasersIEEE J Select Topics in Quant Electr 5 (6) 1447-1452 (1999)
IN PRESS AT END OF 2000/2001
A Bernardinello, D Batani, A Antonicci, F Pisani, M Koenig,L Gremillet, F Amiranoff, S Baton, E Martinolli, C Rousseaux,T A Hall, P Norreys, A DjaouiEffects of self-generated electric and magnetic fields in laser-generated fast electron propagation in solid materials: Electricinhibition and beam pinchingLaser and Particle Beams 19 (1) 59-65 (2001)
M Borghesi, H D Campbell, M Galimberti, L A Gizzi,A J MacKinnon, W Nazarov, A Schiavi, O WilliPropagation issues and fast particle source characterization inlaser-plasma interactions at intensities exceeding 1019 W/cm2
Proc SPIE 4424 414-417 (2001)
M Galimberti, A Giulietti, D Giulietti, L A Gizzi, M Borghesi,H D Campbell, A Schiavi, O WilliGamma-ray measurements in relativistic interactions withunderdense plasmasProc SPIE 4424 512-515 (2001)
N C Woolsey, Y A Ali, R G Evans, R A D Grundy, S J Pestehe,P G Carolan, N J Conway, R O Dendy, P Helander,K G McClements, J G Kirk, P A Norreys, M M Notley,S J RoseCollisionless shock and supernova remnant simulations onVULCANPhysics of Plasmas 8 (5) 2439-2445 (2001)
M Zepf, E L Clark, K Krushelnick, F N Beg, C Escoda,A E Dangor, M I K Santala, M Tatarakis, I F Watts,P A Norreys, R J Clarke, J R Davies, M A Sinclair,R D Edwards, T J Goldsack, I Spencer, K W D LedinghamFast particle generation and energy transport in laser-solidinteractionsPhysics of Plasmas 8 5 2323-2330 (2001)
CONFERENCE PRESENTATIONS
7th International Conference on X-ray Lasers, St Malo,France (Jun 2000)
K M Aggarwal, F P KeenanElectron impact excitation of A1 XIII: collision strengths andrate coefficients
K M Aggarwal, P H Norrington, K L Bell, F P Keenan,G J Pert, S J RoseElectron impact excitation of Gd XXXVII
K M Aggarwal, P H Norrington, K L Bell, F P Keenan,G J Pert, S J RoseEnergy levels and radiative rates for Ni-like ions with 60<Z<90
A Demir, G J Tallents, G J PertModelling of Ne-like Y resonance lines emitted from x-ray lasermedia

Publications
Central Laser Facility Annual Report 2000/2001 202
A Demir, G J Tallents, G J PertElectron temperature and density diagnostics using Li-like Tiresonance lines emitted from laser-produced plasma
R Keenan, C L S Lewis, R M N O’Rourke, G J Pert,G J Tallents, P Simms, S P McCabe, A G MacPhee, J Collier,R AllottSaturated output at 7.3 nm from travelling-wave CPA-pumpedNi-like Sm
R Keenan, C L S Lewis, S J Topping, G J Pert, G J Tallents,F Strati, A Klisnick, D Ros, J Kuba, R Smith, P V Nickles,K JanulewiczInner shell XRL transitions may be a useful route to thewater-window
R Keenan, C L S Lewis, S J Topping, G J Tallents, F Strati,G J Pert, A Klisnick, D Ros, J Kuba, R Smith, P V Nickles,K A Janulewicz, F Bortolotto, A G MacPhee, R J Clarke,R AllottDevelopments in X-ray laser pumping with travelling wave atVulcan
R E King, G J PertComputational modelling of short pulse X-ray laserexperiments
G J PertX-ray lasers pumped by ultra-short pulsed lasers
S J Pestehe, G J Tallents, F Strati, G J PertOpacity measurements across expanding x-ray laser media
F Strati, G J Tallents, S J Pestehe, C L S Lewis, A G MacPhee,R Keenan, R M N O’RourkeTravelling wave pumped soft x-ray lasers in collisionalexcitation
G J Tallents, F Strati, S J Pestehe, G J Pert, C L S Lewis,A MacPhee, R KeenanShort pulse pumped X-ray lasers
S J Topping, C L S Lewis, R M N O’Rourke, R Keenan,S Dobosz, G J Pert, G J TallentsFour wave sum difference frequency conversion of soft X-raysin a plasma
L M Upcraft, G J PertSimulation of collisionally pumped OFI lasers
Laser-Produced Plasmas, Dublin, Ireland (Jun 2000)
M BorghesiHigh-intensity laser-plasma interaction experiments for fastignitor applications
Euresco conference on Matter in Super Intense LaserFields, Maratea, Italy (Sept 2000)
M BorghesiPropagation and guiding of ultra-intense laser pulses throughpreformed plasmas
Ultraintense Laser Interaction and Applications 2, Pisa,Italy (Sept-Oct 2000)
A Bernardinello, D Batani, A Antonicci, F Pisani, M Koenig,F Amiranoff, S Baton, L Gremillet, E Martinolli, T Hall,C Rousseaux, P Norreys, H Bandulet, H PepinEffects of self generated electric and magnetic fields in lasergenerated fast electron propagation in solid materials: electricinhibition and beam pinching
A DjaouiICF target ignitions studies with non-local alpha particletransport
L A Gizzi, M Galimberti, A Giulietti, D Giulietti, M Borghesi,H D Campbell, A Schiavi, O WilliGamma-ray measurements in relativistic laser interactions withpreformed plasma channels
J Kuba, A Klisnick, D Ros, R Smith, P Fourcade, G Jamelot,J L Miquel, C Chenias-Popovics, J F Wyart, R Keenan,S J Topping, C L S Lewis, F Strati, G J Tallents, D Neely,R Clarke, J Collier, A G MacPhee, P Nickles, K A Janulewicz,F BortolottoTemporal profile of a transient x-ray laser
M Tatarakis, I Watts, K Krushelnick, M Zepf, P Norreys,E L Clark, A E DangorMagnetic fields of 30,000 tesla in relativistic laser solid targetinteractions
S J Topping, R Keenan, C L S Lewis, R M N O’Rourke,A G MacPhee, S Dobosz, G J TallentsProgress in FWSD non-linear effects with XRLs
O WilliPropagation of an ultra-intense laser beam through underdenseand overdense plasmas
42nd Annual Meeting of the Division of Plasma Physics ofThe American Physical society and the 10th InternationalCongress on Plasma Physics, Quebec City, Canada(Oct 2000)E L Clark, F N Beg, M Tatarakis, M Zepf, C Escoda,M Norefeldt, A E Dangor, K Krushelnick, P A Norreys,I Spencer, K W D LedinghamEnergetic particle generation from ultra intense laser plasmainteractions with solids
B Dangor, Z Najmudin, K Krushelnick E Clark, M Santala,M Tatarakis, C Danson, D Neely J Faure, V MalkaThe correlation of Raman side-scatter with relativisticself-focusing and implications for the generation of relativisticelectrons
K Krushelnick, Z Najmudin, B Walton, M A Delannoy,R Kingham, A E Dangor, D Neely, J Collier, R Clarke,C DansonHigh power short pulse beat wave experiments using VULCAN
J D Moody, P E Young, R L Berger, L Divol, A B Langdon,E A Williams, D M Chambers, J Hawreliak, P Sondhauss,J S WarkObservation of laser self-smoothing in an exploding foil plasma
A J Mackinnon, S Hatchett, M H Key, P Patel, R Snavely,R R Freeman, S Wilks, M Borghesi ,H Campbell, A Schiavi,O WilliEffect of plasma scalelength on MeV proton production in shortpulse high intensity laser plasma interactions
Z Najmudin, M Tatarakis, K Krushelnick, E Clark, M Santala,B Dangor, R Clarke, D Neely, J Faure, V MalkaInvestigating the inverse Faraday effect with an intense shortpulse laser
P Norreys, R J Clarke, I F Watts, M Tatarakis, M Zepf,F N Beg, K Krushelnick, M Santala, A E Dangor, A MachacekHarmonic emission measurements as a diagnostic of denseplasmas produced by high intensity laser interactions
M Tatarakis, K Krushelnick, F Beg, M Zepf, E L Clark,M Santala, A E Dangor, P Norreys, R Clarke, R Allott,I Spencer, K LedinghamMeasurements of energetic electron beams produced duringhigh intensity laser-plasma interactions using optical probingtechniques

Publications
203 Central Laser Facility Annual Report 2000/2001
N C Woolsey, Y Abou-Ali, P Carolan, N Conway, R O Dendy,R A D Grundy, P Helander, J G Kirk, K G McClements,P A Norreys, M M Notley, S J Peschte, S J RoseCollisionless shock and supernova remnant simulationexperiments on VULCAN
M ZepfFast particle generation and energy transport in laser-solidinteractions
International Conference on Lasers 2000, Albuquerque,USA (Dec 2000)
M BorghesiLaser propagation and fast particle generation in ultra-intenseinteraction experiments
O WilliLaser propagation in overdense plasmas
Plasmas In Super-Intense Laser Fields: Meeting of theMPQ Laser-Plasma-Group, Ringberg, Germany (Mar 2001)
P NorreysProspects for measuring Gigagauss magnetic fields usingharmonics from laser plasma surfaces
S RoseHigh-energy density plasmas produced by short laser pulses
O WilliProton imaging of laser-produced plasmas
N WoolseySpectroscopy of indirectly driven spherical implosion
M ZepfFast-ignitor experiments in a novel geometry
Workshop on Particle Sources with High Intensity Lasers,Milan, Italy (Mar 2001)
O WilliPlasma imaging with laser-produced multi-MeV protons
High Power Laser Programme – Astra LaserJOURNAL PUBLICATIONS, BOOKS AND PUBLISHEDPROCEEDINGS
L J Frasinski, J Plumridge, J H Posthumus, K Codling,P F Taday, E J Divall, A J Langley,Counterintuitive alignment of H2
+ in intense femtosecond laserfieldsPhys Rev Letts 86 (12) 2541-2544 (2001)
P Graham, X Fang, K W D Ledingham, R P Singhal,T McCanny, D J Smith, C Kosmidis, P Tzallas, A J Langley,P F TadayUnusual fragmentation patterns from disscociation of somesmall moleculesLaser and Particle Beams 18 (3) 417-432 (2000)
P Graham, K W D Ledingham, R P Singhal, T McCanny,S M Hankin, X Fang, P Tzallas, C Kosmidis, P F Taday,A J LangleyThe angular distributions of fragment ions from labelled andunlabelled N2O in intense laser fieldsJ Phys B-At Mol Opt Phys 33 (18) 3779-3794 (2000)
N Hay, M Castillejo, R de Nalda, E Springate, K J Mendham,J P MarangosHigh-order harmonic generation in cyclic organic moleculesPhys Rev A 61 053810 (2000)
J H Posthumus, J Plumridge, L J Frasinski, K CodlingDynamic Raman processes on the rising and falling edges ofintense laser pulsesLaser Physics 11 (2) 261-268 (2001)
J H Posthumus, J Plumridge, L J Frasinski, K Codling,E J Divall, A J Langley, P F TadaySlow protons as a signature of zero-photon dissociation of H2
+
in intense laser fieldsJ Phys B-At Mol Opt Phys 33 (16) L563-L569 (2000)
P Tzallas, C Kosmidis, P Graham, K W D Ledingham,T McCanny, S M Hankin, R P Singhal, P F Taday, A J LangleyCoulomb explosion in aromatic molecules and their deuteratedderivativesChem Phys Letts 332 (3-4) 236-242 (2000)
P Tzallas, C Kosmidis, K W D Ledingham, R P Singhal,T McCanny, P Graham, S M Hankin, P F Taday, A J LangleyOn the multielectron dissociative ionization of some cyclicaromatic molecules induced by strong laser fieldsJ Phys Chem A 105 (3) 529-536 (2001)
I D Williams, P McKenna, B Srigengan, I M G Johnston,W A Bryan, J H Sanderson, A El-Zein, T R J Goodworth,W R Newell, P F Taday, A J LangleyFast-beam study of H2
+ ions in an intense femtosecond laserfieldJ Phys B-At Mol Opt Phys 33 (14) 2743-2752 (2000)
CONFERENCE PRESENTATIONS
Ultraintense Laser Interaction and Applications 2, Pisa,Italy (Sept-Oct 2000)
A D Tasker, L Robson, S M Hankin, K W D Ledingham,R P Singhal, X Fang, T McCanny, C Kosmidis, P Tzallas,A J Langley, P F Taday, E J DivallAnalysis of nitrated polycyclic aromatic hydrocarbons (PAHS)using nanosecond laser desorption/femtosecond ionisation lasermass spectrometry (FLMS)
P Graham, K W D Ledingham, R P Singhal, T McCanny,S M Hankin, X Fang, P Tzallas, C Kosmidis, P F Taday,A J LangleyThe angular distributions of fragment ions arising fromtetrahedral CH3I
Lasers for Science FacilityJOURNAL PUBLICATIONS, BOOKS AND PUBLISHEDPROCEEDINGS
P Bakule, P E G Baird, M G Boshier, S L Cornish, D F Heller,K Jungmann, I C Lane, V Meyer, P G H Sandars, W T Toner,M Towrie, J C WallingA chirp-compensated, injection-seeded alexandrite laserAppl Phys B 71 (1) 11-17 (2000)
A Beeby, S W Botchway, I M Clarkson, S Faulkner,A W Parker, D Parker, J A G WilliamsLuminescence imaging microscopy and lifetime mapping usingkinetically stable lanthanide (III) complexesJ Photochem Photobiol B 57 (2-3) 83-89 (2000)
A C Benniston, P Matousek, A W ParkerKerr-gated picosecond time-resolved resonance Ramanspectroscopic probing of the excited states inΛ-[Ru(bipy)2dppz](BF4)2 (bipy=2,2’-bipyridyl,dppz=dipyrido[3,2-a:2’,3’-c]phenazine)J Raman Spec 31 (6) 503-507 (2000)
G J Berry, J A Cairns, M R Davidson, Y C Fan, A G Fitzgerald,J Thomson, W ShaikhAnalysis of metal features produced by uv irradiation oforganometallic filmsAppl Surf Sci 162-3 504-507 (2000)
G J Berry, J A Cairns, M R Davidson, Y C Fan, A G Fitzgerald,A H Fzea, J Lobban, P McGivern, J Thomson, W ShaikhThermal stability and analysis of laser deposited platinum filmsMRS Symposium Proc 624 249-254 (2001)

Publications
Central Laser Facility Annual Report 2000/2001 204
R H Bisby, S A Johnson, A W ParkerRadicals from one-electron oxidation of 4-aminoresorcinol:Models for the active site radical intermediate in copper amineoxidasesJ Phys Chem B 104 (24) 5832-5839 (2000)
F Bortolotto, D Batani, F Previdi, L Rebonato, E Turcu,R AllottStudy of a X-ray laser-plasma source for radiobiologicalexperiments: microdosimetry analysis and plasmacharacterisationEur Phys J D 11 (2) 309-320 (2000)
C J Buckley, G Dermody, N Khaleque, A G MichetteS J Pfauntsch, Z Wang, I C E Turcu, W Shaikh, R AllottA modified electron multiplier x-ray detector for synchrotronand laser plasma sourcesProc 6th International Conference on X-ray Microscopy, EdsW Meyer-Ilse, T Warwick, D Attwood, American Institute ofPhysics CP507, 405-410 (2000)
P Butz, R T Kroemer, N A Macleod, E G Robertson,J P SimonsConformational preferences of neurotransmitters:Norephedrine and the adrenaline analogue,2-methylamino-1-phenylethanolJ Phys Chem A 105 (6) 1050-1056 (2001)
P Butz, R T Kroemer, N A Macleod, J P SimonsConformational preferences of neurotransmitters: Ephedrineand its diastereoisomer, pseudoephedrineJ Phys Chem A 105 (3) 544-551 (2001)
D Chastaing, S D Le Picard, I R Sims, I W M SmithRate coefficients for the reactions of C(3PJ) atoms with C2H2,C2H4, CH3C=CH and H2C=C=CH2 at temperatures down to15 KAstron Astrophys 365 (2) 241-247 (2001)
G I Childs, C S Colley, J Dyer, D C Grills, X Z Sun, J Yang,M W GeorgeInvestigation into the reactivity of M(η5-C5R5)(CO)2(alkane) (M= Mn or Re; R = H, Me or Ph; alkane = n-heptane orcyclopentane) and Re(η5-C5H5)(CO)2(Xe) in solution atcryogenic and room temperatureJ Chem Soc Dalton Trans 12 1901-1906 (2000)
C M Coats, Z Chang, P D WilliamsPLIF visualisation of oscillating premixed methane-air flamesAlbum of visualisation 17 11-12 Visualisation Society of Japan,ISBN 0919-4630, (2000)
C S Colley, I P Clark, S R Griffiths-Jones, M W George,M S SearleSteady state and time-resolved IR spectroscopy of the nativeand unfolded states of bovine ubiqitin: protein stability andtemperature-jump kinetic measurements of protein folding atlow pHChem Comm 2000 (16) 1493-1494 (2000)
W M Cranton, E A Mastio, C B Thomas, C Tsakonas,R StevensLaser processing for enhanced performance thin filmelectroluminescent devicesElectronics Letts 36 (8) 754-756 (2000)
I R Farrell, P Matousek, C J Kleverlaan, A VlcekUltrafast dynamics of photochemical radical formation from[Re(R)(CO)3(dmb)] (R=Me,Et; dmb = 4,4’-dimethyl-2,2’-bipyridine): A femtosecond time-resolved visible absorptionstudyChem Eur J 6 (8) 1386-1394 (2000)
J S Hirsch, O Meighan, J-P Mosnier, P van Kampen,W W Whitty, J T Costello, C L S Lewis, A G MacPhee,G J Hirst, J Westhall, W ShaikhVacuum-ultraviolet resonant photoabsorption imaging of laserproduced plasmasJ Appl Phys 88 (9) 4953-4960 (2000)
J S Hirsch, O Meighan, J-P Mosnier, P van Kampen,W W Whitty, J T Costello, C L S Lewis, A G MacPhee,G J Hirst, J Westhall, W ShaikhVUV photoabsorption imaging of a laser produced Ca plasmaEurophys Conf Abstr 24D 70-71 (2000)
A E Jones, C A Christensen, D F Perepichka, A S Batsanov,A Beeby, P J Low, M R Bryce, A W ParkerPhotochemistry of the pi-extended9,10-bis(1,3-dithiol-2-ylidene)-9,10-dihydroanthracene system:Generation and characterisation of the radical cation, dication,and derived productsChem Eur J 7 (5) 973-978 (2001)W M Kwok, C Ma, P Matousek, A W Parker, D Phillips,W T Toner, M Towrie, S UmapathyA determination of the structure of the intramolecular chargetransfer state of 4-dimethylaminobenzonitrile (DMABN) bytime-resolved resonance Raman spectroscopyJ Phys Chem A 105 (6) 984-990 (2001)
W M Kwok, C Ma, A W Parker, D Phillips, M Towrie,P Matousek, D L PhillipsPicosecond time-resolved resonance Raman observation of theiso-CH2I-I photoproduct from the “photoisomerization”reaction of diiodomethane in the solution phaseJ Chem Phys 113 (17) 7471-7478 (2000)
W M Kwok, C Ma, D Phillips, P Matousek, A W Parker,M TowriePicosecond time-resolved study of 4-dimethylaminobenzonitrile(DMABN) in polar and nonpolar solventsJ Phys Chem A 104 (18) 4188-4197 (2000)
W M Kwok, C Ma, P Matousek, A W Parker, D Phillips,W T Toner, M TowrieTime-resolved resonance Raman spectra of the intramolecularcharge transfer state of DMABNChem Phys Letts 322 (5) 395-400 (2000)
C Ma, W M Kwok, P Matousek, A W Parker, D Phillips,W T Toner, M TowrieTime-resolved study of the photochemical reaction of4-dimethylaminobenzonitrile with carbon tetrachlorideJ Raman Spec 32 (2) 115-123 (2001)
E A Mastio, W M Cranton, C B ThomasPulsed laser annealing for high-efficiency thin filmelectroluminescent devicesJ Appl Phys 88 (3) 1606-1611 (2000)
V Meyer, S N Bagayev, P E G Baird, P Bakule, M G Boshier,A Breitrück, S L Cornish, S Dychkov, G H Eaton,A Grossmann, D Hübl, V W Hughes, K Jungmann, I C Lane,Yi-Wei Liu, D Lucas, Y Matyugin, J Merkel, G zu Putlitz,I Reinhard, P G H Sandars, R Santra, P Schmidt, C A Scott,W T Toner, M Towrie, K Träger, L Willmann, V YakhontovPulsed laser spectroscopy in muonium and deuteriumHyperfine Interacts 127 (1-4) 197-200 (2000)
A G Michette, Z WangSelection and suppression of soft x-ray spectral features usingoptimized multilayer coatingsJ Opt A Pure Appl Opt 3 (1) 61-66 (2001)
A G Michette, S J PfauntschLaser plasma x-ray line spectra fitted using the Pearson VIIfunctionJ Phys D Appl Phys 33 (10) 1186-1190 (2000)

Publications
205 Central Laser Facility Annual Report 2000/2001
A G Michette, C J Buckley, S J Pfauntsch, N R Arnot,J Wilkinson, Z Wang, N I Khaleque, G S DermodyThe King’s College laboratory scanning X-ray microscopeProc 6th Intl Conf X-ray Microscopy, Eds W Meyer-Ilse,T Warwick, D Attwood, American Institute of Physics CP507,420-423 (2000)
P O’Neill, A W ParkerRadiation induced damage migration in DNA: Base DamageDistributionRadiation Research Volume 2, Proc 11th Intl Congress of RadResearch 1999, Eds M Moriaty, C Mothersill, M Seymour,J F Edington, J F Ward, R J M Fry, Dublin Allen Press Inc,325-329 (2000)
L Puskar, P E Barran, R R Wright, D A Kirkwood, A J StaceThe ultraviolet photofragmentation of doubly chargedtransition metal complexes in the gas phase: Initial results for[Cu.(pyridine)n]
2+ and [Ag.(pyridine)n]2+ ions
J Chem Phys 112 (18) 7751-7754 (2000)
E G RobertsonIR-UV ion-dip spectroscopy of N-phenyl formamide, and itshydrated clustersChem Phys Letts 325 (1-3) 299-307 (2000)E G Robertson, M R Hockridge, P D Jelfs, J P SimonsIR-UV ion-dip spectroscopy of N-benzylformamide clusters:Stepwise hydration of a model peptideJ Phys Chem A 104 (50) 11714-11724 (2000)
L C Snoek, E G Robertson, R T Kromer, J P SimonsConformational landscapes in amino acids: infrared andultraviolet ion-dip spectroscopy of phenylalanine in the gasphaseChem Phys Letts 321 (1-2) 49-56 (2000)
Y Sonoda, W M Kwok, Z Petrasek, R Ostler, P Matousek,M Towrie, A W Parker, D PhillipsSolvent effects on the photophysical and photochemicalproperties of (E,E,E)-1,6-bis(4-nitrophenyl)hexa-1,3,5-trieneJ Chem Soc Perkin Trans 2 (3) 308-314 (2001)
S D Summers, H S Reehal, G J HirstKrF excimer laser crystallization of silicon thin filmsJ Mat Sci 11 (7) 557-563 (2000)
S Summers, L Wang, H S Reehal, G J HirstExcimer laser and aluminium induced crystallisation of siliconthin films on foreign substrates for solar cellsProc 16th European Photovoltaic Solar Energy Conference,Glasgow, 1541-1544 (2000)
A VlcekThe life and times of excited states of organometallic and co-ordination compoundsCoordination Chem Rev 200-202 933-977 (2000)
P.Matousek, M.Towrie, W.M.Kwok, C.Ma, D.Phillips,W.T.Toner, A.W.Parker,Rejection of fluorescence from Raman spectra using picosecondoptical gatingProceedings of the XVIIth International Conference on RamanSpectroscopy (ICORS 2000), John Wiley, 2000, p 190-191.
S.Schneider, J.Kurzawa, A.Stockmann, P.Matousek, M.Towrie,R.Engl, J.Daub,Photophysical properties of phenothiazine and pyrene baseddyades studied by picosecond time-gated Raman spectroscopyProceedings of the XVIIth International Conference on RamanSpectroscopy (ICORS 2000), John Wiley, 2000, p 252-253.
C.G.Coates, M.Coletti, P.L.Callaghan, J.McGarvey,Picosecond TR3 examination of the ’light-switch’ states of[Ru(phen)2dppz]2+Proceedings of the XVIIth International Conference on RamanSpectroscopy (ICORS 2000), John Wiley, 2000, p 744-745.
PUBLISHED DURING 1999/2000
E A Mastio, E Fogarassy, W M Cranton, C B ThomasAblation study on pulsed KrF laser annealedelectroluminescent ZnS:Mn/Y2O3 multilayers deposited on SiAppl Surf Sci 154-155 (1-4) 35-39 (2000)
J R G Thorne, C S McCaw, R G DenningSpin correlated crystal field analysis of lanthanide elpasolitesChem Phys Letts 319 (3-4) 185-190 (2000)
IN PRESS AT END OF 2000/2001
S Ameer-Beg, S M Ormson, R G Brown, P Matousek,M Towrie, E T J Nibbering, P Foggi, F V R NeuwahlUltrafast measurements of excited state intramolecular protontransfer (ESIPT) in room temperature solutions of3-hydroxyflavone and derivativesJ Phys Chem A 105 (15) 3709-3718 (2001)
W M Kwok, C Ma, A W Parker, D Phillips, M Towrie,P Matousek, X Zheng, D L PhillipsPicosecond time-resolved resonance Raman observation of theiso-CH2Cl-I and iso-CH2I-Cl photoproducts from the"photoisomerization" reactions of CH2ICl in the solution phaseJ Chem Phys 114 (17) 7536-7543 (2001)
C Ma, W M Kwok, P Matousek, A W Parker, D Phillips,W T Toner, M TowrieTime-resolved study of the triplet state of4-dimethylaminobenzonitrile (DMABN)J Phys Chem A 105 (19) 4648-4652 (2001)
P O’Neill, A W Parker, M A Plumb, L D A SiebbelesGuanine modification following ionisation of DNA occurspredominantly via intra- not interstrand charge migration: Anexperimental and theoretical studyJ Phys Chem B 105 (22) 5283-5290 (2001)
CONFERENCE PRESENTATIONS
MRS Symposium on Materials Development for DirectWrite Technologies, San Francisco, USA (Apr 2000)
G J Berry, J A Cairns, M R Davidson, Y C Fan, A G Fitzgerald,A H Fzea, J Lobban, P McGivern, J Thomson, W ShaikhThermal stability and analysis of laser deposited platinum films
Radiation Research Society 47th Annual Meeting,Albuquerque, USA (Apr-May 2000)
S W Botchway, P O'Neill, M G Makrigirogos, S Chakabrati,A W ParkerSelective direct or indirect damage in DNA and its baseconstituents by monophotonic ionisation or hydroxyl radicals
E-MRS, Strasbourg, France (May 2000)
D C Koutsogeorgis, E A Mastio, W M Cranton, C B ThomasPulsed KrF laser annealing of ZnS:Mn laterally emitting thinfilm electroluminescent displays
Workshop On Femtosecond Lasers And Applications,Stellenbosch, South Africa (May 2000)
A W ParkerCharacterising ultrafast processes through the eyes of ultrafastspectroscopy - physics or chemistry?
16th Photovoltaics Conference, Glasgow, UK (May 2000)
S Summers, L Wang, H S Reehal, G J HirstExcimer laser and aluminium induced crystallisation of siliconthin films on foreign substrates for solar cells

Publications
Central Laser Facility Annual Report 2000/2001 206
ERC Conference on Cluster-Surface Interaction 2000,Castelvecchio-Pascoli, Italy (Jun 2000)
A Wellner, S Pratontep, C Pederson, R Neuendorf, R Smith,K W Kolasinski, R E PalmerOptical properties of nanoscale silicon structures
32nd EGAS Conference, Vilnius, Lithuania (Jul 2000)
J S Hirsch, O Meighan, J-P Mosnier, P van Kampen,W W Whitty, J T Costello, C L S Lewis, A G MacPhee,G J Hirst, J Westhall, W ShaikhVUV photoabsorption imaging of a laser produced Ca plasma
IUPAC Photochemistry Conference, Dresden, Germany(Jul 2000)
E Tuite, P Lincoln, B Önfelt, J Olofsson, B Nordén,P Matousek, A W ParkerPicosecond transient absorption and TR3 of[Ru(phen)2(dppz)]2+: Solvation and charge separationdynamics in water, organic solvents and DNA
Gordon Research Conference on Light Emission fromSolids, Oxford, UK (Jul 2000)
C B Thomas, W CrantonLight piping etc., light loss mechanisms
Fast Reactions In Solution, Royal Society of Chemistry,Durham, UK (Aug 2000)
S M Tavender, A W Parker, M TowrieScientific highlights of the EPSRC Laser Loan Pool
A W ParkerKerr gated time-resolved resonance Raman spectroscopy:Intramolecular charge transfer and structural change
R H BisbyTime-resolved resonance Raman spectroscopy of the radicalfrom oxidation of 4-hydroxycinnamic acid
International Conference on Raman Spectroscopy, Beijing,China (Aug 2000)
C G Coates, M Coletti, P L CallaghanPicosecond TR3 examination of the ‘light-switch’ states of[Ru(phen)2dppz]2+
P Matousek, M Towrie, A W Parker, W M Kwok, C Ma,D Phillips, W T TonerRejection of fluorescence from Raman spectra using picosecondoptical gate
S Schneider, J Kurzawa, A Stockmann, P Matousek, M Towrie,R Engl, J DaubPhotophysical properties of phenothiazine and pyrene baseddyades studied by picosecond time-gated Raman spectroscopy
IOP Applied Optics and Opto-Electronics Conference,Loughborough, UK (Sept 2000)
R Bartlett, S Caulder, R Chandy, P Eldridge, J McTavish,P J Scully, I Clark, M Towrie, A W ParkerUV laser photo-induced refractive index changes in PMMA forapplication in plastic optical fibres (POF) and waveguides
14th International Conference on Optical Fibre Sensors,Venice, Italy (Oct 2000)
P J Scully, R Bartlett, S Caulder, P Eldridge, R Chandy,J McTavish, V Alexiou, I Clark, M Towrie, A W ParkerUV laser photo-induced refractive index changes inPoly-Methylmethacrylate and plastic optical fibres forapplication as sensors and devices
47th International American Vacuum SocietySymposium/Nano6, Boston, USA (Oct 2000)
A Wellner, R Neuendorf, R E PalmerFabrication and optical properties of ordered nanoscale siliconstructures
ISSPIC10 Conference, Atlanta, USA (Oct 2000)
A Wellner, R Neuendorf, R E PalmerFabrication and optical properties of ordered nanoscale siliconstructures
Optics - The Enabling Technology, Photonex Meeting,Coventry, UK (Oct 2000)
C M Coats, Z Chang, P D WilliamsDynamic visualisation of flame interaction with an acousticfield
ILS-XVI: 16th Interdisciplinary Laser Science ConferenceRhode Island, USA (Oct 2000)
J P Simons
Burton Memorial Lecture KCL (Feb 2001)
J P Simons
Instrumentation in Combustion, IOP Meeting, Cranfield,UK (Mar 2001)
C M Coats, Z Chang, P D WilliamsDynamic visualisation of flame interaction with an acousticfield
THESIS
D ShahDischarge-flow studies of reactions of halogen containingspecies of relevance to the atmosphereD Phil, University of Oxford
Laser Science and DevelopmentJOURNAL PUBLICATIONS, BOOKS AND PUBLISHEDPROCEEDINGS
J Collier, C B Edwards, C N Danson, M H R Hutchinson,D Neely, B WybornVulcan: a petawatt laser facility for 1021 W cm-2 experimentsCLEO/Europe 2000 Technical Digest, publ IEEEcat no 00TH8505, p174 (2000)
J L Collier, D Neely, R Allott, C N Danson, S Hawkes,Z Najmudin, R J Kingham, K Krushelnick, A E DangorSimultaneous dual wavelength CPA operation of the Vulcanlaser for particle acceleration experimentsIQEC 2000 Technical Digest, publ IEEE cat no 00TH8504,p228 (2000)
C Hernandez-Gomez, J Collier, I N Ross, C N Danson, F BuddA broad-band ultra-short pulse pre-amplifier for large scaleCPA facilitiesCLEO/Europe 2000 Technical Digest, publ IEEEcat no 00TH8505, p58 (2000)
C Hernandez-Gomez, J L Collier, S J Hawkes, C N Danson,C B Edwards, D A Pepler, I N Ross, T B WinstoneWave-front control of a large-aperture laser system by use of astatic phase correctorAppl Opt 39 (12) 1954-1961 (2000)

Publications
207 Central Laser Facility Annual Report 2000/2001
C J Hooker, E J Divall, W J Lester, K Moutzouris, C J Reason,I N RossA low cost adaptive optical system for laser wavefront controlProc 2nd International Workshop on Adaptive Optics forIndustry and Medicine, Ed G D Love, publ World Scientific(2000)
D Neely, R M Allott, R J Clarke, J L Collier, C N Danson,C B Edwards, C Hernandez-Gomez, M H R Hutchinson,M Notley, D A Pepler, M Randerson, I N Ross, J Springall,M Stubbs, T Winstone, A E DangorFrequency doubling multi-terawatt sub-picosecond pulses forplasma interactionsLaser and Particle Beams 18 (3) 405-409 (2000)
K Osvay, M Csatari, A Gaal, I N RossTemporal contrast of high intensity femtosecond UV pulsesJ Chinese Chem Soc 47 (4A) 855-857 (2000)
I N Ross, J L Collier, P Matousek, C N Danson, D Neely,R M Allott, D A Pepler, K OsvayGeneration of terawatt pulses by use of optical parametricchirped pulse amplificationAppl Opt 39 (15) 2422-2427 (2000)
I N Ross, P Matousek, J L CollierOptical parametric chirped pulse amplificationCLEO 2000 Technical Digest, publ OSA, p249 (2000)
R A Wellstood, C N Danson, A Frackiewicz, J Govans, M Pitts,D A Rodkiss, T B Winstone, B WybornHigh pressure water cleaning system for laser componentsIST Science and Technology 47 14-15 (2000)
CONFERENCE PRESENTATIONS
XXVI European Conference on Laser Interaction withMatter, Prague, Czech Republic (Jun 2000)J L Collier, R M Allott, C N Danson, C Hernandez-Gomez,P Matousek, D Neely, I N RossDemonstration of high power pulse production using opticalparametric chirped pulse amplification (OPCPA)
C B Edwards, J L Collier, C N Danson, M H R Hutchinson,D Neely, B WybornVulcan: a petawatt laser facility for experiments at 1021 W cm-2
B Rus, P Matousek, I N RossDesign of multi-petawatt optical parametric chirped pulseamplifier for the iodine laser Asterix IV/PALS
CLEO/Europe 2000, Nice, France, (Sept 2000)
C Hernandez-Gomez , J Collier, I N Ross, C N Danson, F BuddA broad-band, ultra-short pulse pre-amplifier for large scaleCPA facilities
J Collier, C B Edwards, C N Danson, M H R Hutchinson,D Neely, B WybornVulcan: a petawatt laser facility for 1021 W cm-2 experiments
IQEC 2000, Nice, France, 10th-15th September 2000
J L Collier, D Neely, R Allott, C N Danson, S Hawkes,Z Najmudin, R J Kingham, K Krushelnick, A E DangorSimultaneous dual wavelength CPA operation of the Vulcanlaser for particle acceleration experiments
Ultraintense Laser Interaction and Applications 2, Pisa,Italy (Sept-Oct 2000)
R Allott, P WrightUltra-high intensity laser plasma interactions: the radiologicalperspective
C N Danson, C B Edwards, M H R Hutchinson, D Neely,B WybornVulcan: a petawatt laser facility for experiments at 1021 W cm-2

Publications
Central Laser Facility Annual Report 2000/2001 208

Appendices – Panel Membership and CLF Structure
209 Central Laser Facility Annual Report 2000/2001
PANEL MEMBERSHIP ANDCLF STRUCTURE

Central Laser Facility Annual Report 2000/2001 210

Appendices – Panel Membership and CLF Structure
211 Central Laser Facility Annual Report 2000/2001
PANEL MEMBERSHIP
HIGH POWER LASER DIRECT ACCESS PANEL 2000/01
Professor G J Pert (Chairman)Department of PhysicsUniversity of York
Professor W GrahamPlasma & Laser Interaction PhysicsQueens University, Belfast
Dr J-C J GauthierLULIParis, France
Secretary: Dr A MacPheeRutherford Appleton Laboratory
Mr P C ThompsonAWEAldermaston
Professor S RoseClarendon LaboratoryUniversity of Oxford
Professor M G HainesPlasma Physics GroupImperial College
Research Council Representative:Mrs C ExtonEPSRC
LASERS for SCIENCE FACILITY PANEL 2000/01
Dr R Bisby (Chairman)Department of Biological SciencesUniversity of Salford
Professor J A CairnsDepartment of Electronic Engineering & PhysicsUniversity of Dundee
Dr R DevonshireDepartment of ChemistrySheffield University
Secretary: Dr I P ClarkRutherford Appleton Laboratory
Dr K G McKendrickDepartment of ChemistryHerriot-Watt University
Dr W R NewellDepartment of Physics & AstronomyUniversity College London
Research Council Representatives:Dr A BramleyEPSRC;Mrs C ExtonEPSRC;Dr C ThompsonBBSRC
CLF EURO EXPERIMENTS PANEL 2000/01
Professor C L S Lewis (Chairman)Department of Pure and Applied PhysicsQueen’s University of Belfast
Professor C FotakisInstitute of Electronic Structure and LaserFORTH, Greece
Professor D PhillipsDepartment of ChemistryImperial College
Secretary: Dr RM AllottRutherford Appleton Laboratory
Dr G MatthieussentLaboratoire Physique Gaz et Plasmas, Universite Paris XI -CNRS, France
Professor J Meyer-ter-VehnMax-Planck-Institut für QuantenoptikGarching, Germany
Dr Karel RohlenaInstitut of PhysicsPrague
Professor J KossanyiCNRS – Laboratoire des Materiaux MoléculairesThiais, France

Appendices – Panel Membership and CLF Structure
Central Laser Facility Annual Report 2000/2001 212
CENTRAL LASER FACILITY STRUCTURE 2000/01
DirectorProf Henry Hutchinson
Associate Director – High Power LasersDr Chris Edwards
Associate Director - PhysicsProf Steven Rose (to Dec 00)
Astra Finance & Administration
Prof Henry [email protected]
Mrs Alison [email protected]
Lasers for Science Facility Engineering and Technology
Dr Tony [email protected]
Mr Brian [email protected]
Target Area Laser Research & Development
Dr David [email protected]
Dr Ian [email protected]
Vulcan Physics
Mr Colin [email protected]
Prof Steven Rose (to Dec 00)[email protected]
Dr Peter Norreys (from Jan 00)[email protected]

Author Index
213 Central Laser Facility Annual Report 2000/2001
Abou Ali Y, 45, 57Aggarwal K M, 47Aldis J C, 146, 148, 151Allott R M, 29, 32, 139, 148, 150Annesley J, 107Aveyard R, 107, 108Bagshaw C R, 113, 114Bailey P D, 165Barba I, 170Barr H C, 59Barton R, 165Batani D, 37Baumruk V, 90Beg F N, 20, 23, 27, 35Benedetti L R, 37Benuzzi-Mounaix A, 37Berk D A, 120Berry G J, 125, 127Binks B P, 107Borghesi M, 4, 6, 7, 10, 12, 13, 15, 17, 19, 194Botchway S W, 101, 113, 114, 117, 170Bradley J P H, 139Brindle K, 170Brummitt P A, 139, 146Bryan W A, 61, 63, 64, 65Bulanov S, 10, 12Burgess A N, 107Burke P G, 50, 51Butler A, 67Butz P, 97Cairns J A, 125Campbell D H, 4, 7, 10, 13, 15, 17Cauble R, 37Celliers P M, 37Chang Z, 128Chipman J K, 117Christou V, 101Clark E L, 20, 22, 23, 27, 29, 32, 35Clark I P, 92Clark R, 148, 157Clarke R J, 4, 7, 10, 23, 25, 27, 29, 32, 35Clint J H, 107Coates C G, 109, 111Coats C M, 128Coffey L, 175, 180Cole D, 161Cole J M, 104Coletti M, 109Colgan J, 50, 51Collier J L, 25, 148, 151, 153, 156, 157, 161, 175, 177, 180,190Collins G W, 37Csatári M, 70Dangor A E, 20, 23, 25, 26, 27, 29, 32, 35, 194Danson C N, 25, 37, 139, 146, 148, 150, 151, 153, 156, 157,160, 180, 190, 194DaSilva L B, 37Davidson M R, 125Day R, 150Deer M J, 125, 191Dendy R O, 57, 58Denning R G, 101, 102, 103Divall E J, 61, 63, 65, 70, 175Dyer J, 74Edwards C B, 138, 139, 146, 148, 150, 153, 179, 190Edwards G O, 117Edwards R D, 27El-Agamey A, 92
Eltham B C, 146El-Zein A, 61, 62, 63, 65Evans R G, 52, 54, 55, 57Everall N, 94, 96Farrell I R, 76, 78Fletcher P D I, 107Frackiewicz A J, 146, 151, 160Galimberti M, 4, 7, 10, 12, 13, 15George M W, 74, 75, 76, 165Gessner H, 37Giulietti A, 13Giulietti D, 13Gizzi L A, 4, 7, 10, 13, 15Glass D H, 50, 51Godfrey P M, 163Goldsack T J, 27Goodworth T R J, 61, 63, 65Govans J A C, 139, 146Graf T, 123Gray B J, 139, 146Grills D C, 74, 76, 165Haefner C, 153, 179Haines M G, 7, 20Hancock S, 139, 146, 148, 150, 151Harman M R, 139, 144Hatton P E, 139, 146, 148, 150, 151Hawkes S, 4, 7, 10, 25, 153, 179Helander P, 57, 58Henry E, 37Henstridge J M, 139Hernandez-Gomez C, 25, 153, 155, 156Hicks D G, 37Hill L J, 59Hill M A, 115Hirst G J, 117, 124, 125, 191Holligan P, 139, 144, 146, 151, 152Hooker C, 70, 153, 174, 175, 176, 179Hooker S M, 67Huser G, 37Hutchins S J, 184Hutchinson M H R, 1, 146, 156Jackson A R, 139, 146Jeanloz R, 37Johnston I M G, 61, 65Keenan F P, 47Keenan R, 45, 46Kidd A, 161, 194Klebniczki J, 70Knott T, 146Koenig M, 37Kolasinski K W, 134Kroemer R T, 97Krushelnick K, 20, 23, 25, 27, 29, 32, 35, 194Kurdi G, 70Kwok W M, 80, 82, 83, 85, 86, 88, 96, 168, 169Laczik Z J, 132Langley A J, 61, 63, 65, 70, 190, 195Lascelles R, 139Ledingham K W D, 23, 27, 35Lee K M, 37Lester W J, 139, 146, 152, 175Lewis A M, 139Lewis C L S, 45Lloyd C, 120, 122Loose J M A, 146Loubeyre P, 37Ma C, 25, 80, 82, 83, 85, 86, 88, 96, 168, 169Mackinnon A J, 4, 7, 10, 15, 37
Author Index

Author Index
Central Laser Facility Annual Report 2000/2001 214
Macleod N A, 97Málnási-Csizmadia A, 113, 114Marle C, 25Mason R J, 139Matousek P, 74, 78, 80, 82, 83, 85, 86, 88, 90, 91, 94, 96, 109,165, 167, 169, 180, 188, 190Matthewson D, 139McClements K G, 57, 58McGarvey D J, 92McGarvey J J, 109, 111McKenna P, 61, 62, 65McSherry D, 42Meldrum R A, 117Michette A G, 123, 124Miljus Z A, 139, 146Mojzes P, 90, 91Moon S J, 37Najmudin Z, 25Nardi E, 42Nazarov W, 15Neely D, 25, 26, 29, 32, 37, 42, 45, 139, 148, 150, 157, 190Nees D, 107, 108Neuendorf R, 134Neumann B, 107Neville D R, 139, 146New G H C, 180Norreys P A, 20, 23, 27, 29, 32, 35, 57, 190Norrington P H, 47Notley M, 37, 45, 57Osvay K, 70, 71Palmer R E, 134Parker A W, 74, 80, 82, 83, 85, 86, 88, 91, 94, 96, 107, 109,165, 167, 169, 170, 172, 196Pasley J, 37Paunov V N, 107Pedersen C X, 134Pegoraro F, 10Pepler D A, 139, 146, 152, 163, 190Pfauntsch S J, 123, 124Phillips D, 80, 82, 83, 85, 86, 88, 96, 168, 169Phillips D L, 86, 88Pitts M R, 139, 146Potton R J, 130Poulter M J, 25, 157Praus P, 90Raithby P R, 104Reason C J, 139, 146, 152, 153, 176, 180Ren C, 52, 54Rennie T, 139Rey J M, 101Riley D, 42Rodgers K J, 146Rodkiss D A, 139, 144, 146, 150, 160Rose S J, 47, 57Ross I N, 70, 71, 153, 176, 181, 184, 188, 190Rus B, 188, 190Ryder A G, 139, 146Sanderson J H, 61, 63, 64, 65Schiavi A, 4, 6, 7, 10, 13, 15, 17Shaikh W, 82, 115, 117, 124, 125, 191Shepherd A M, 139Simons J P, 97Sinclair M A, 27Skrzyniarz J, 139Snoek L C, 97Spence D J, 67Spencer I, 23, 27, 35Spencer T, 161Stamp J C, 139Stevens D L, 115
Taday P F, 61, 63, 65, 190Talbot F O, 97Tallents G J, 45Tatarakis M, 20, 23, 27, 29, 32, 35Tatarkova S, 120, 122Thorne J R G, 101, 102, 103Thurston E, 156Toner W T, 54, 80, 82, 83, 85, 96, 167, 169, 190Topping S J, 45Towrie M, 74, 78, 80, 82, 83, 85, 86, 88, 90, 91, 94, 96, 108,109, 165, 167, 169, 172, 190, 196Turpin P-Y, 90, 91van der Hart H W, 50, 51Vlcek A, 76Walton B, 25Ward A D, 107Warner G P, 146Watts I, 20, 29, 32Weaver I, 42Wei M-S, 25, 35Weinstein J A, 74Wellner A, 134Wellstood R, 160Wharton C W, 117Wiggins G N, 146Willi O, 4, 7, 9, 10, 13, 15, 17, 37, 138, 194Williams I D, 61, 62, 65, 66Williams P D, 128Winstone T, 151Winstone T B, 160, 190Woolley R J, 113, 114Woolsey N C, 57, 58Wyatt, R W W, 139, 146, 152, 190Wyborn B E, 139, 146, 148, 150, 151Zeng Qinghua, 102, 103Zepf M, 20, 23, 27, 29, 32, 35Zheng X, 86Ziener C, 150