
D-dimer testing to determine the duration of anticoagulation therapy
Upload
independentCategory
view
0download
0
The three-dimensional structure of a photosystem II corecomplex determined by electron crystallographyEdward P Morris, Ben Hankamer, Daniella Zheleva, Giulia Friso and James Barber*
Background: Photosystem II (PSII) is a multisubunit protein complex which isembedded in the photosynthetic membranes of plants. It uses light energy tosplit water into molecular oxygen and reducing equivalents. PSII can be isolatedwith varying degrees of complexity in terms of its subunit composition andactivity. To date, no three-dimensional (3-D) structure of the PSII complex hasbeen determined which allows location of the proteins within the PSII complexand their orientation in relation to the thylakoid membrane.
Results: Two-dimensional (2-D) PSII core complex crystals composed of thetwo reaction centre proteins, D1 and D2, two chlorophyll-binding proteins,CP47 and CP43, cytb559 and associated low molecular weight proteins wereformed after reconstituting the isolated complex into purified thylakoid lipids.Electron micrographs of negatively stained crystals were used for 2-D and 3-Dimage analyses. In the resulting maps, the PSII complex is composed of twohalves related by twofold rotational symmetry, thus, confirming the dimericnature of the complex; each monomer appears to contain five domains.Comparison of the 3-D images with platinum shadowed images of the crystalsallowed the likely lumenal and stromal surfaces of the complex to be identifiedand regions contained within the membrane to be inferred. The projectionstructure of 2-D crystals of a smaller CP47–D1–D2–cytb559 complex wasused to identify the domains apparently associated with CP43.
Conclusion: The results indicate that PSII probably exists as a dimer in vivo.The extensive proteinaceous protrusions from the lumenal surface have beententatively assigned to hydrophilic loops of CP47 and CP43; the positioning ofthese loops possibly implies their involvement in the water-splitting process.
IntroductionPhotosystem II (PSII) is a multisubunit complex embed-ded in the thylakoid membranes of higher plants, algaeand cyanobacteria. It utilises light energy to catalyse aseries of electron transfer reactions which result in thesplitting of water into molecular oxygen, protons and elec-trons. These photochemical reactions drive the most oxidising process known to occur in biology. More impor-tantly, the water splitting reaction of PSII takes place on aglobal scale, and is responsible for the production ofatmospheric oxygen and, via the photosynthetic reactions,for almost all of the biomass on the planet.
The primary photochemical process that drives the water-splitting reaction occurs in the reaction centre (RC) ofPSII, which in its isolated form consists of the D1 and D2proteins, the α and β subunits of cytb559 and the psbIgene product [1,2]. In higher plants, two additional chloro-phyll a-binding proteins (CP47 and CP43) link the RC tothe outer antenna system [3]. The outer antenna systemconsists of six different chlorophyll a/b-binding proteins,
comprising the light-harvesting complex (Lhcb1–6),which function to harvest light and transfer the derivedexcitation energy to the photochemically active PSII core.The PSII core proteins (RC–CP47–CP43) are coupled tothe lumenally exposed oxygen-evolving complex (OEC)which consists of the 33kDa, 23kDa and 17kDa extrinsicproteins and a cluster of four Mn atoms [4–6].
The atomic structure of light-harvesting complex, LHCII(Lhcb1–3), in its trimeric form, has now been determinedto a resolution of 3.4 Å [7]. The high degree of sequencehomology among the proteins Lhcb1–6 suggests that allsix of these subunits have similar structures [8]. In con-trast and despite its importance, the structure of the PSIIcore is far less understood.
To date, only small three-dimensional (3-D) crystals of thePSII core have been obtained, and these diffract X-rays tooweakly to yield useful structural data [9-10]. Electron crys-tallography of two-dimensional (2-D) crystals has yielded anumber of top view projection maps, however. Most of the
Address: Photosynthesis Research Group,Wolfson Laboratories, Department of Biochemistry,Imperial College of Science, Technology &Medicine, London SW7 2AY, UK.
*Corresponding author.E-mail: [email protected]
Key words: photosynthesis, photosystem II, 3-Dstructure, electron microscopy, membrane proteincomplex
Received: 8 April 1997Revisions requested: 6 May 1997Revisions received: 16 May 1997Accepted: 20 May 1997
Structure 15 June 1997, 5:837–849http://biomednet.com/elecref/0969212600500837
© Current Biology Ltd ISSN 0969-2126
Research Article 837

crystallised complexes are of similar size and have similartopological features, the most prominent being a central lowdensity region flanked by two prominent regions of proteindensity, which appear to be related by a twofold rotationalsymmetry axis. Despite their similarities, these projectionmaps have been interpreted differently; some [11–16] pro-posed that the apparent twofold symmetry of the projectionmaps were indicative of a dimeric organisation of the PSIIcore particle, whereas others [17–20] concluded that theparticles observed were monomeric. It was argued [17] thata monomeric PSII complex containing the RC components,CP47 and CP43, may have a pseudosymmetry axis which isrelated to the structural similarities of D1 with D2 proteinand CP47 with CP43. The studies of Santini et al. [14] andHolzenburg and coworkers [17–19] were extended into thethird dimension. Santini et al. [14] concluded that thecentral low density region was a hole (coincident with thetwofold axis) separating the two halves of the PSII coredimer, whereas Holzenburg et al. [17] suggested it to be alumenally directed cavity within the monomer. The factthat the crystals prepared by both groups were obtained bythe delipidation of thylakoid membranes has made it diffi-cult to confirm the precise subunit composition and mol-ecular weight of the unit cell components and this hasexacerbated the monomer vs dimer debate.
We have recently reported the characterisation of purifiedmonomeric and dimeric CP47–CP43–33kDa-protein–RCcomplexes to a resolution of about 2.5 nm using the tech-nique of single particle image averaging [21]. Here, wereport the crystallisation of these purified PSII coredimers and extend the image analysis into the thirddimension. This approach has allowed us to determinewhether the PSII core monomer or dimer model is correct.To strengthen our conclusions still further, subcore(RC–CP47) crystals of the type reported by Nakazato et al.[22] were prepared and the images obtained from thesecrystals were compared with those of the PSII core dimer.This comparison also allowed us to locate CP43 and theRC–CP47 complexes within the PSII core dimer.
Results and discussionTwo-dimensional crystals of PSII core dimers: appearancein the electron microscope and protein compositionPSII core dimers (430kDa) solubilised in n-dodecyl-β-d-glucopyranoside (DM) were isolated by sucrose densitycentrifugation [23]. This complex consists of CP47, CP43,the 33kDa extrinsic subunit, the D1 and D2 proteins(Fig. 1, lane A), the α and β subunits of cytb559 and associ-ated low molecular weight polypeptides. This complexalso possessed oxygen evolving activity [23]. 2-D crystalswere obtained by mixing the isolated core dimers withvarying amounts of purified polar thylakoid lipids togetherwith 45mM n-heptyl-β-d-thioglucopyranoside (HTG).The mixture was then dialysed (see Materials andmethods) to remove the detergent and allow the formation
of protein-enriched lipid membranes. Different types ofcrystal were formed at varying protein:lipid ratios. At lowratios quite large (∼0.5–2µm diameter) vesicles and sheetswere formed with crystalline patches up to 0.5µm in length(e.g. negatively stained image in Fig. 2a). At increasedprotein:lipid ratios the lipid content became limiting andyielded crystalline tubular vesicles (see platinum shad-owed image in Fig. 2b) of diameter ∼0.2µm and between0.5 and 5µm long. The protein composition of the crystals,analysed by SDS-PAGE after harvesting by centrifugationand washing, was essentially equivalent to the startingmaterial as can be seen by comparing lanes A and B inFig. 1, except that the 33kDa extrinsic subunit has beenalmost completely lost during crystallisation. The addi-tional weaker bands in lane B (Figure 1) running below theD1 protein, at approximately 23.8kDa and 20.5kDa, havebeen previously identified as fragments of the D1 and D2proteins [23] and are presumably produced by a low levelof subunit clipping during the crystallisation step.
Image analysis and projection structure of PSII core dimers The unit cell dimensions and appearance in each form ofPSII core crystal were very similar, although the sheetform of crystal (Fig. 2a) appeared to be better orderedthan the tube form and therefore this type of crystal wasused for most of the image analysis. Fourier analysis of
838 Structure 1997, Vol 5 No 6
Figure 1
SDS-PAGE analysis of the subunit composition of PSII complexes beforeand after crystallisation showing the removal of the 33 kDa protein. LaneA: PSII core dimers isolated by sucrose density centrifugation. Lane B:crystallised PSII core dimers. Lane M: molecular mass markers (kDa). Thecrystallised complex is depleted of the 33kDa subunit but contains theproteins CP47, CP43, D1 and D2. Lower molecular weight proteins wereweakly stained in this gel system but have been reported previously [23].
CP47
CP43
33 kDa
D2
D1
23.8 kDa
20.5 kDa
A B M
104
80
46.9
33.5
28.3
19.8
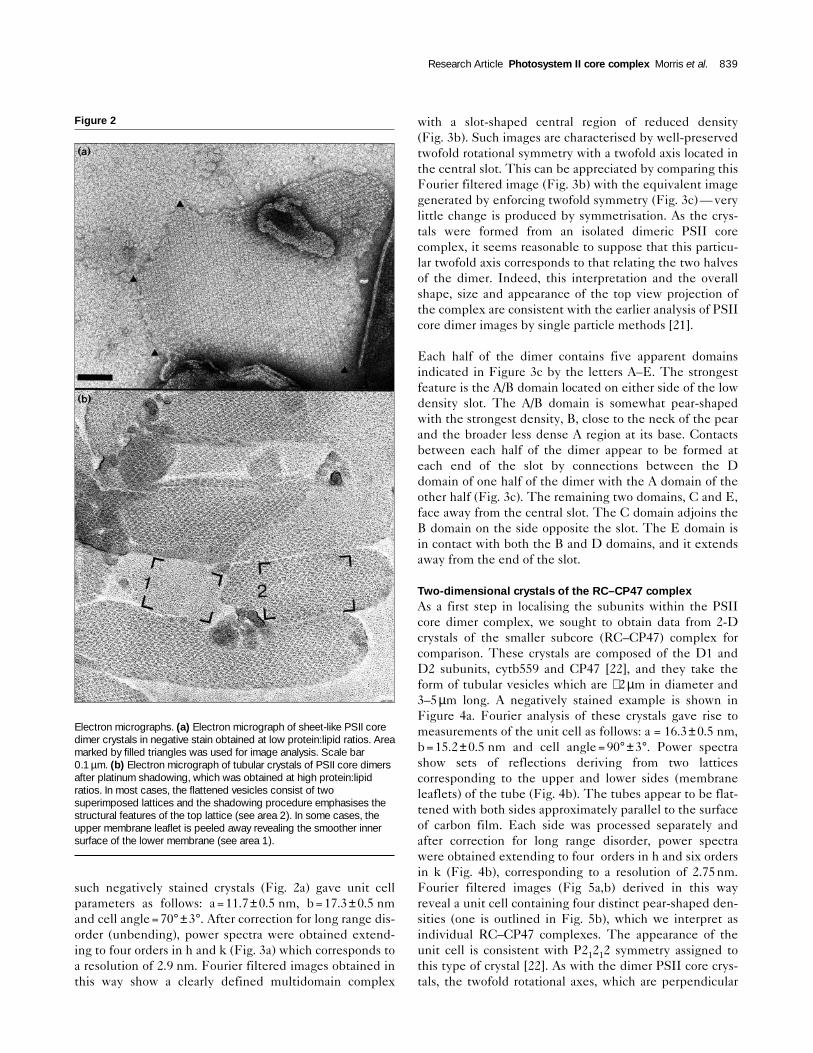
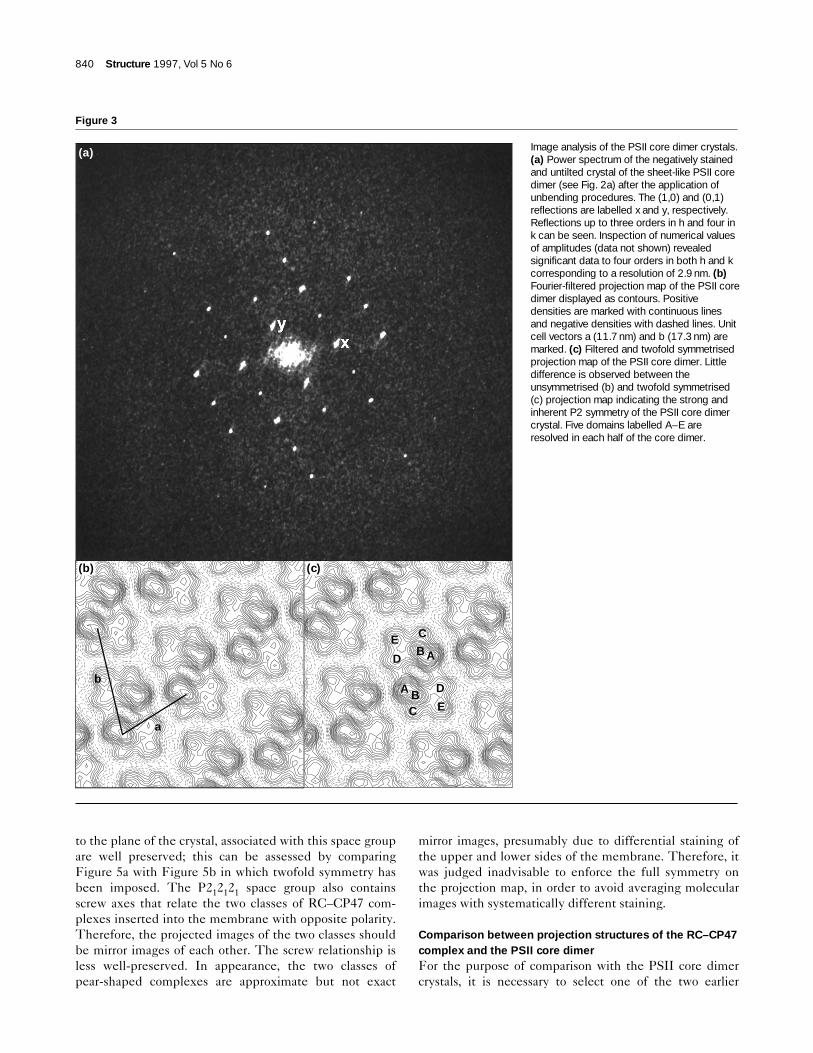
such negatively stained crystals (Fig. 2a) gave unit cellparameters as follows: a=11.7±0.5 nm, b=17.3±0.5 nmand cell angle=70°±3°. After correction for long range dis-order (unbending), power spectra were obtained extend-ing to four orders in h and k (Fig. 3a) which corresponds toa resolution of 2.9 nm. Fourier filtered images obtained inthis way show a clearly defined multidomain complex
with a slot-shaped central region of reduced density(Fig. 3b). Such images are characterised by well-preservedtwofold rotational symmetry with a twofold axis located inthe central slot. This can be appreciated by comparing thisFourier filtered image (Fig. 3b) with the equivalent imagegenerated by enforcing twofold symmetry (Fig. 3c)—verylittle change is produced by symmetrisation. As the crys-tals were formed from an isolated dimeric PSII corecomplex, it seems reasonable to suppose that this particu-lar twofold axis corresponds to that relating the two halvesof the dimer. Indeed, this interpretation and the overallshape, size and appearance of the top view projection ofthe complex are consistent with the earlier analysis of PSIIcore dimer images by single particle methods [21].
Each half of the dimer contains five apparent domainsindicated in Figure 3c by the letters A–E. The strongestfeature is the A/B domain located on either side of the lowdensity slot. The A/B domain is somewhat pear-shapedwith the strongest density, B, close to the neck of the pearand the broader less dense A region at its base. Contactsbetween each half of the dimer appear to be formed ateach end of the slot by connections between the Ddomain of one half of the dimer with the A domain of theother half (Fig. 3c). The remaining two domains, C and E,face away from the central slot. The C domain adjoins theB domain on the side opposite the slot. The E domain isin contact with both the B and D domains, and it extendsaway from the end of the slot.
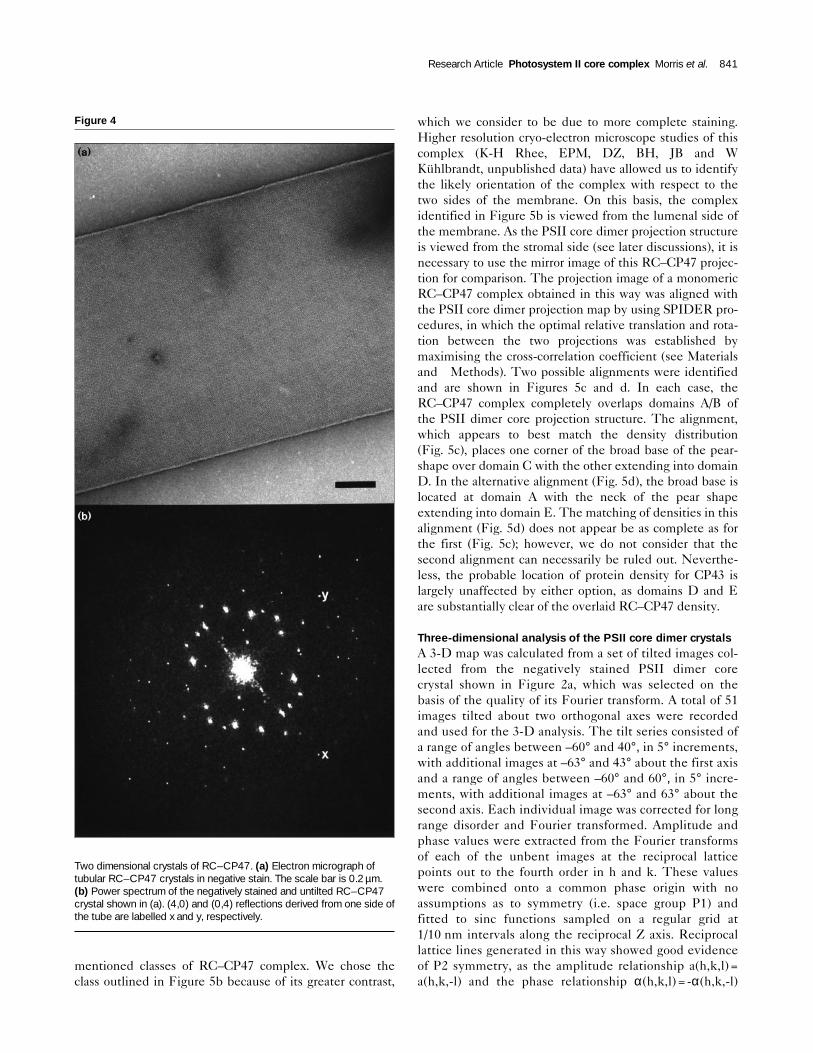
Two-dimensional crystals of the RC–CP47 complexAs a first step in localising the subunits within the PSIIcore dimer complex, we sought to obtain data from 2-Dcrystals of the smaller subcore (RC–CP47) complex forcomparison. These crystals are composed of the D1 andD2 subunits, cytb559 and CP47 [22], and they take theform of tubular vesicles which are ∼2 µm in diameter and3–5µm long. A negatively stained example is shown inFigure 4a. Fourier analysis of these crystals gave rise tomeasurements of the unit cell as follows: a = 16.3±0.5 nm,b=15.2 ±0.5 nm and cell angle =90°±3°. Power spectrashow sets of reflections deriving from two latticescorresponding to the upper and lower sides (membraneleaflets) of the tube (Fig. 4b). The tubes appear to be flat-tened with both sides approximately parallel to the surfaceof carbon film. Each side was processed separately andafter correction for long range disorder, power spectrawere obtained extending to four orders in h and six ordersin k (Fig. 4b), corresponding to a resolution of 2.75 nm.Fourier filtered images (Fig 5a,b) derived in this wayreveal a unit cell containing four distinct pear-shaped den-sities (one is outlined in Fig. 5b), which we interpret asindividual RC–CP47 complexes. The appearance of theunit cell is consistent with P21212 symmetry assigned tothis type of crystal [22]. As with the dimer PSII core crys-tals, the twofold rotational axes, which are perpendicular
Research Article Photosystem II core complex Morris et al. 839
Figure 2
Electron micrographs. (a) Electron micrograph of sheet-like PSII coredimer crystals in negative stain obtained at low protein:lipid ratios. Areamarked by filled triangles was used for image analysis. Scale bar0.1 µm. (b) Electron micrograph of tubular crystals of PSII core dimersafter platinum shadowing, which was obtained at high protein:lipidratios. In most cases, the flattened vesicles consist of twosuperimposed lattices and the shadowing procedure emphasises thestructural features of the top lattice (see area 2). In some cases, theupper membrane leaflet is peeled away revealing the smoother innersurface of the lower membrane (see area 1).
to the plane of the crystal, associated with this space groupare well preserved; this can be assessed by comparingFigure 5a with Figure 5b in which twofold symmetry hasbeen imposed. The P212121 space group also containsscrew axes that relate the two classes of RC–CP47 com-plexes inserted into the membrane with opposite polarity.Therefore, the projected images of the two classes shouldbe mirror images of each other. The screw relationship isless well-preserved. In appearance, the two classes ofpear-shaped complexes are approximate but not exact
mirror images, presumably due to differential staining ofthe upper and lower sides of the membrane. Therefore, itwas judged inadvisable to enforce the full symmetry onthe projection map, in order to avoid averaging molecularimages with systematically different staining.
Comparison between projection structures of the RC–CP47complex and the PSII core dimer For the purpose of comparison with the PSII core dimercrystals, it is necessary to select one of the two earlier
840 Structure 1997, Vol 5 No 6
Figure 3
Image analysis of the PSII core dimer crystals.(a) Power spectrum of the negatively stainedand untilted crystal of the sheet-like PSII coredimer (see Fig. 2a) after the application ofunbending procedures. The (1,0) and (0,1)reflections are labelled x and y, respectively.Reflections up to three orders in h and four ink can be seen. Inspection of numerical valuesof amplitudes (data not shown) revealedsignificant data to four orders in both h and kcorresponding to a resolution of 2.9 nm. (b)Fourier-filtered projection map of the PSII coredimer displayed as contours. Positivedensities are marked with continuous linesand negative densities with dashed lines. Unitcell vectors a (11.7 nm) and b (17.3 nm) aremarked. (c) Filtered and twofold symmetrisedprojection map of the PSII core dimer. Littledifference is observed between theunsymmetrised (b) and twofold symmetrised(c) projection map indicating the strong andinherent P2 symmetry of the PSII core dimercrystal. Five domains labelled A–E areresolved in each half of the core dimer.
(a)
a
b
A
A B
B
C
C
D
D
E
E
(b) (c)
mentioned classes of RC–CP47 complex. We chose theclass outlined in Figure 5b because of its greater contrast,
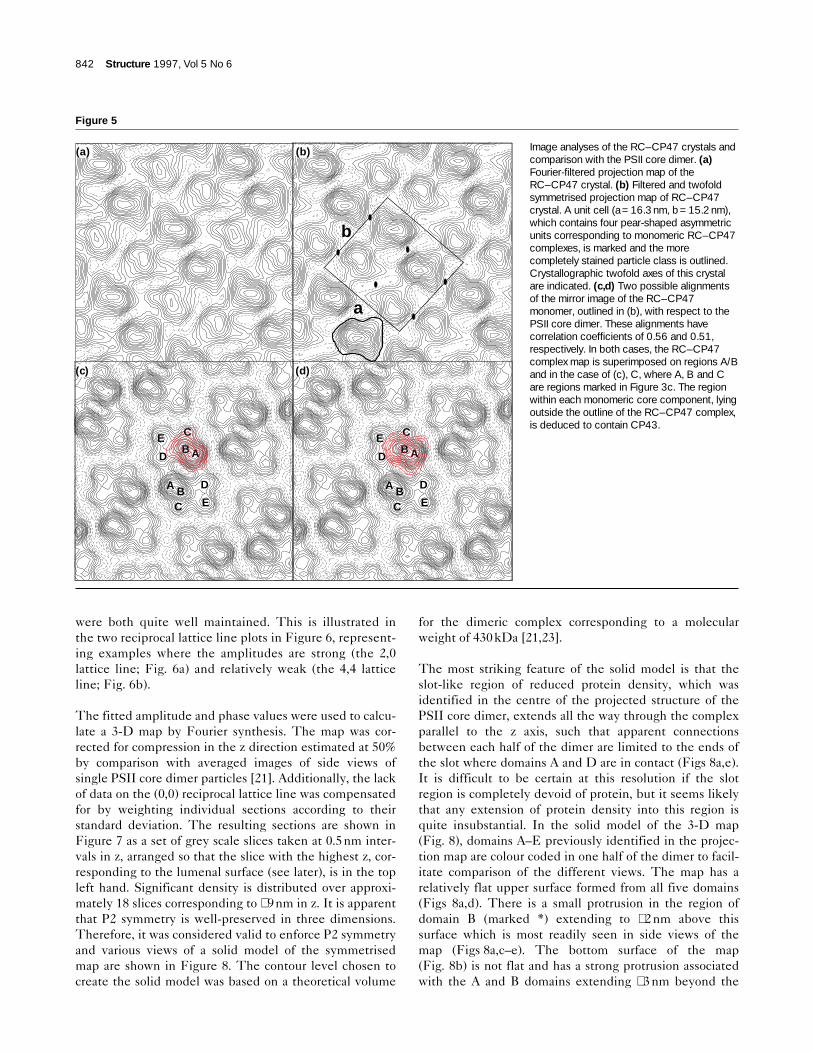
which we consider to be due to more complete staining.Higher resolution cryo-electron microscope studies of thiscomplex (K-H Rhee, EPM, DZ, BH, JB and WKühlbrandt, unpublished data) have allowed us to identifythe likely orientation of the complex with respect to thetwo sides of the membrane. On this basis, the complexidentified in Figure 5b is viewed from the lumenal side ofthe membrane. As the PSII core dimer projection structureis viewed from the stromal side (see later discussions), it isnecessary to use the mirror image of this RC–CP47 projec-tion for comparison. The projection image of a monomericRC–CP47 complex obtained in this way was aligned withthe PSII core dimer projection map by using SPIDER pro-cedures, in which the optimal relative translation and rota-tion between the two projections was established bymaximising the cross-correlation coefficient (see Materialsand Methods). Two possible alignments were identifiedand are shown in Figures 5c and d. In each case, theRC–CP47 complex completely overlaps domains A/B ofthe PSII dimer core projection structure. The alignment,which appears to best match the density distribution(Fig. 5c), places one corner of the broad base of the pear-shape over domain C with the other extending into domainD. In the alternative alignment (Fig. 5d), the broad base islocated at domain A with the neck of the pear shapeextending into domain E. The matching of densities in thisalignment (Fig. 5d) does not appear be as complete as forthe first (Fig. 5c); however, we do not consider that thesecond alignment can necessarily be ruled out. Neverthe-less, the probable location of protein density for CP43 islargely unaffected by either option, as domains D and Eare substantially clear of the overlaid RC–CP47 density.
Three-dimensional analysis of the PSII core dimer crystalsA 3-D map was calculated from a set of tilted images col-lected from the negatively stained PSII dimer corecrystal shown in Figure 2a, which was selected on thebasis of the quality of its Fourier transform. A total of 51images tilted about two orthogonal axes were recordedand used for the 3-D analysis. The tilt series consisted ofa range of angles between –60° and 40°, in 5° increments,with additional images at –63° and 43° about the first axisand a range of angles between –60° and 60°, in 5° incre-ments, with additional images at –63° and 63° about thesecond axis. Each individual image was corrected for longrange disorder and Fourier transformed. Amplitude andphase values were extracted from the Fourier transformsof each of the unbent images at the reciprocal latticepoints out to the fourth order in h and k. These valueswere combined onto a common phase origin with noassumptions as to symmetry (i.e. space group P1) andfitted to sinc functions sampled on a regular grid at1/10 nm intervals along the reciprocal Z axis. Reciprocallattice lines generated in this way showed good evidenceof P2 symmetry, as the amplitude relationship a(h,k,l) =a(h,k,-l) and the phase relationship α(h,k,l) = -α(h,k,-l)
Research Article Photosystem II core complex Morris et al. 841
Figure 4
Two dimensional crystals of RC–CP47. (a) Electron micrograph oftubular RC–CP47 crystals in negative stain. The scale bar is 0.2 µm.(b) Power spectrum of the negatively stained and untilted RC–CP47crystal shown in (a). (4,0) and (0,4) reflections derived from one side ofthe tube are labelled x and y, respectively.
were both quite well maintained. This is illustrated inthe two reciprocal lattice line plots in Figure 6, represent-ing examples where the amplitudes are strong (the 2,0lattice line; Fig. 6a) and relatively weak (the 4,4 latticeline; Fig. 6b).
The fitted amplitude and phase values were used to calcu-late a 3-D map by Fourier synthesis. The map was cor-rected for compression in the z direction estimated at 50%by comparison with averaged images of side views ofsingle PSII core dimer particles [21]. Additionally, the lackof data on the (0,0) reciprocal lattice line was compensatedfor by weighting individual sections according to theirstandard deviation. The resulting sections are shown inFigure 7 as a set of grey scale slices taken at 0.5nm inter-vals in z, arranged so that the slice with the highest z, cor-responding to the lumenal surface (see later), is in the topleft hand. Significant density is distributed over approxi-mately 18 slices corresponding to ∼9nm in z. It is apparentthat P2 symmetry is well-preserved in three dimensions.Therefore, it was considered valid to enforce P2 symmetryand various views of a solid model of the symmetrisedmap are shown in Figure 8. The contour level chosen tocreate the solid model was based on a theoretical volume
for the dimeric complex corresponding to a molecularweight of 430kDa [21,23].
The most striking feature of the solid model is that theslot-like region of reduced protein density, which wasidentified in the centre of the projected structure of thePSII core dimer, extends all the way through the complexparallel to the z axis, such that apparent connectionsbetween each half of the dimer are limited to the ends ofthe slot where domains A and D are in contact (Figs 8a,e).It is difficult to be certain at this resolution if the slotregion is completely devoid of protein, but it seems likelythat any extension of protein density into this region isquite insubstantial. In the solid model of the 3-D map(Fig. 8), domains A–E previously identified in the projec-tion map are colour coded in one half of the dimer to facil-itate comparison of the different views. The map has arelatively flat upper surface formed from all five domains(Figs 8a,d). There is a small protrusion in the region ofdomain B (marked *) extending to ∼2nm above thissurface which is most readily seen in side views of themap (Figs 8a,c–e). The bottom surface of the map(Fig. 8b) is not flat and has a strong protrusion associatedwith the A and B domains extending ∼3nm beyond the
842 Structure 1997, Vol 5 No 6
Figure 5
Image analyses of the RC–CP47 crystals andcomparison with the PSII core dimer. (a)Fourier-filtered projection map of theRC–CP47 crystal. (b) Filtered and twofoldsymmetrised projection map of RC–CP47crystal. A unit cell (a = 16.3 nm, b = 15.2 nm),which contains four pear-shaped asymmetricunits corresponding to monomeric RC–CP47complexes, is marked and the morecompletely stained particle class is outlined.Crystallographic twofold axes of this crystalare indicated. (c,d) Two possible alignmentsof the mirror image of the RC–CP47monomer, outlined in (b), with respect to thePSII core dimer. These alignments havecorrelation coefficients of 0.56 and 0.51,respectively. In both cases, the RC–CP47complex map is superimposed on regions A/Band in the case of (c), C, where A, B and Care regions marked in Figure 3c. The regionwithin each monomeric core component, lyingoutside the outline of the RC–CP47 complex,is deduced to contain CP43.
(c)
a
b
A
A B
B
C
C
D
D
E
E
A
A B
B
C
C
D
D
E
E
(a) (b)
(d)

other domains. At the lower extremity this protrusion isresolved into two peaks associated with the A and Bdomains (marked with open and closed circles, respec-tively, in Fig. 8c). Domain E (Fig. 8d) is tapered in the zdirection such that the top end is more massive than thebottom end. Domain D is tapered in the opposite direc-tion (Figs 8c–e), such that it is more massive and forms aflat ledge about 3nm from the bottom surface of thecomplex and becomes thinner towards the top surface. Aswell as being tapered, domain D is also tilted such that itstop end forms a link with domain A in the other half of thedimer, whereas at the bottom end of the dimer it forms ashelf projecting away from the end of the central slot(Fig. 8d). In contrast, domain C is fairly symmetricalshowing some taper at each end (Figs 8c,d).
The orientation and position of the PSII core dimer withinthe lipid bilayerThe features observed in the 3-D map appear to be limitedto protein components and possibly related cofactors — wewere not able to identify contributions from the lipid
bilayer in the map. Thus, from the map alone it is notpossible to determine either the position of the complexwithin the membrane or its orientation with respect to thelumenal and stromal sides of the membrane. For thispurpose, we made use of platinum shadowed images of thetubular vesicle type of PSII dimer core crystal (Fig. 2b).Previous analysis of negatively stained images of such crys-tals had shown the unit cell to be essentially equivalent tothat obtained in the sheet form (data not shown), therefore,it was possible to exploit the one-sided nature of platinumshadowing to identify individual sides of the crystal. Fourieranalysis of regions presumed to be the outside and insidesurfaces of the tubes gave rise to the power spectra shownin Figures 9a and b, respectively. In the former case, thepower spectra extends to two orders in h and three in k(Fig. 9a). The corresponding Fourier-filtered images(Fig. 9c) have an appearance that is most closely related tothe mirror image of the projection structure obtained innegative stain from the sheet-type crystals, implying thatthe two structures have been viewed from opposite sides ofthe lipid bilayer. This is supported by measurements of the
Research Article Photosystem II core complex Morris et al. 843
Figure 6
(a) (b)
Pha
ses
Am
plitu
des
( 2, 0) Lattice Line
-0.050 -0.025 0.000 0.025 0.050 Reciprocal angstroms
100.0
0.0
x
x
x
x
x x x
x
xx
xxxxxx
x
x
xx
x
x x
xx
x x
x
-180
-90
0
90
180
Pha
ses
Am
plitu
des
100.0
0.0
-180
-90
0
90
180
x x x x x x xxxxx
x
xxxx
xx
xxx x
x xx x x
x
( 4, 4) Lattice Line
-0.050 -0.025 0.000 0.025 0.050 Reciprocal angstroms
xx
x
x xx
x
xx
x
x
x
x
xxxx x
x
xx
x
xx
x
x x
xx
xx
xx xx
x
x
x
xx
xx
x
x
xx xxx xx x
x
x
Reciprocal lattice line plots of phase and amplitude data from tilted images of the PSII core dimer. Amplitude and phase data from (a) the (2,0)lattice line and (b) the (4,4) lattice line. Smooth curves derived from sinc functions were fitted to the data points (x) obtained from tilted images.
unit cell that show essentially the same dimensions for the aand b axes, but have a cell angle of ∼110° instead of 70°.The unit cell is composed of pairs of projections contrastedby the shadowing procedure each apparently composed ofthree domains and related by well-preserved twofold sym-metry (compare Fig. 9c with Fig. 9d, in which P2 symmetryhas been imposed). Aligning the mirror image of this struc-ture (Fig. 9d) with the negative stain projection image(Fig. 3c) shows these three domains to be associated withdomains A, B and a region in between domains D and E(Fig. 9e). This alignment was achieved using cross-correla-tion based methods (see earlier discussions).
As well as showing regions of clearly defined lattice (roughsurface), shadowed images of the crystalline tubes haveapparently smooth regions (see outlined area in Fig. 2b)which appear to be associated with the local detachmentof the upper membrane leaflet of the tube. We interpretthe smooth areas to be the inner surface of the membraneleaflet of the tube. This interpretation is supported byFourier analysis of the smooth areas which give rise topower spectra showing a weak but detectable (1,0) and(1,2) reflections that match the mirror image of the outer(rough) surface (Fig. 9b), as would be predicted for viewsof the inner surface. The smoothness of these regions,together with the corresponding weakness of their powerspectra, can be explained if the protein component of theinner surface of the tube extends only slightly from thesurface of the lipid bilayer. From the correspondence
between the shadowed rough surface of the tube and themirror image of the projection structure from the sheet-type crystal (Fig. 9a), it would seem that it is the uppersurface of the 3-D map of the PSII core dimer (Figs 8a,d)which is located at the inner surface of the tube. The rela-tive flatness of this surface (Fig. 8d) is consistent with thisscenario. Conversely, the relatively rough outer surface ofthe tubular crystal can be interpreted as arising from theprojection of at least part of the PSII core dimer structurewhich protrudes out of the lipid bilayer. These projectionswould then be formed from the lower surface of the PSIIcore dimer 3-D map (Figs 8b,d), in particular domains A,B and part of the D domain (Fig. 9e). The location of thecomplex within a schematic lipid bilayer as derived fromthese considerations is shown in Figure 10. This conclu-sion is consistent with the predicted transmembranetopology of the PSII polypeptides. In particular, the CP47and CP43 antenna subunits are thought to have largelumenal but small stromal loops linking their transmem-brane segments [3] and the reaction centre proteins, D1and D2, are also thought to have relatively extensivelumenal loops joining their transmembrane helices [24]. Ifthis is true, then we can assign a polarity to our model—the lower surface of the 3-D map (corresponding to therough outer surface of the crystalline tubes) is the lumenalside of the complex, and the upper surface is the stromalside. The arrangement of the complex within the lipidbilayer depicted in Figure 10 is consistent with earlierelectron microscope studies [25,26].
844 Structure 1997, Vol 5 No 6
Figure 7
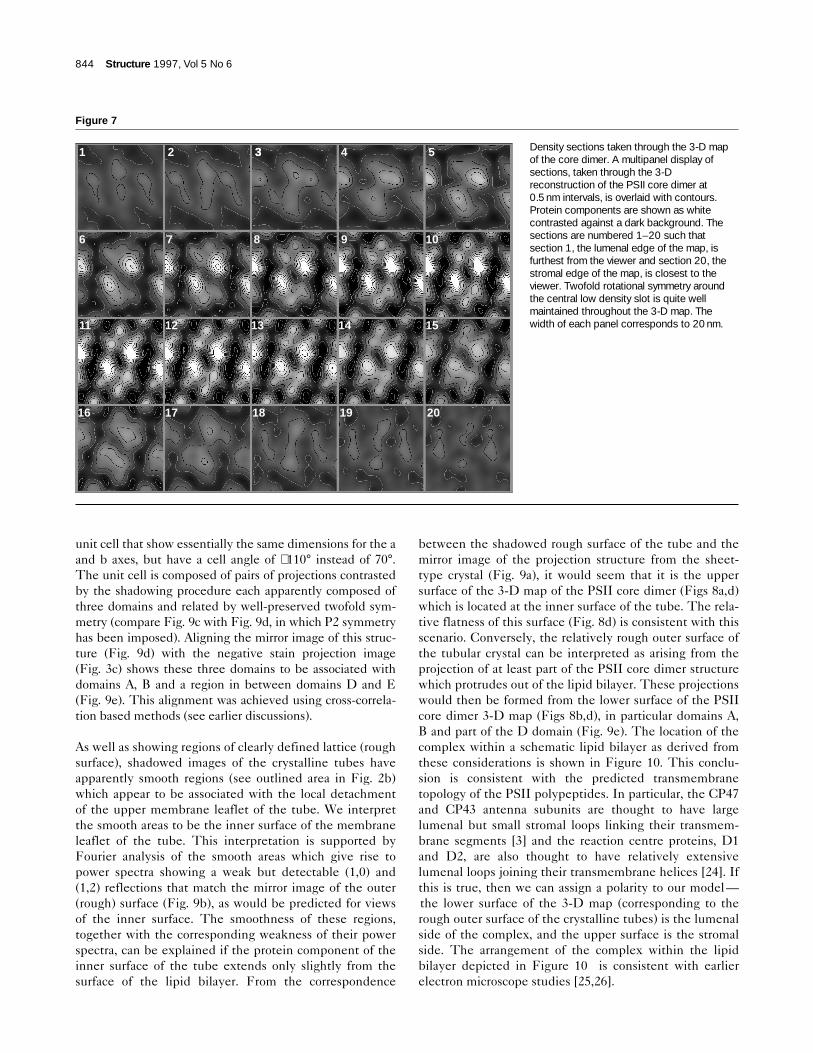
Density sections taken through the 3-D mapof the core dimer. A multipanel display ofsections, taken through the 3-Dreconstruction of the PSII core dimer at0.5 nm intervals, is overlaid with contours.Protein components are shown as whitecontrasted against a dark background. Thesections are numbered 1–20 such thatsection 1, the lumenal edge of the map, isfurthest from the viewer and section 20, thestromal edge of the map, is closest to theviewer. Twofold rotational symmetry aroundthe central low density slot is quite wellmaintained throughout the 3-D map. Thewidth of each panel corresponds to 20 nm.
1 2 33 4 5
6 7 8 9 10
11 12 13 14 15
16 17 18 19 20

Comparison of the PSII core dimer with previous PSII coreprojection structuresA number of PSII core projection structures have previ-ously been determined both by single particle analysis
[21] and from 2-D crystals [11–20]. The data from 2-Dcrystals that correspond most closely with the presentstudy are those from crystalline tubes formed by TritonX-100 treatment of thylakoid membranes. Projection
Research Article Photosystem II core complex Morris et al. 845
Figure 8
Surface representations of the 3-D map of thePSII core dimer (RC–CP47–CP43) viewed asstereo pairs. The orientation of each view isindicated by the X, Y and Z axes. The lengthof each axis corresponds to 2 nm. The Z axisis normal to the plane of the membrane. (a)Top view from the stromal side. Five domains(A–E) previously identified in projection arecolour coded in one half of the dimer. Astromal protrusion associated with domain Bis marked (*). (b) Top view from the lumenalside. Two protrusions on the lumenal surfaceassociated with domain A (open circles) anddomain B (closed circles) are marked. (c)Side view along the Y axis. The stromal (*)and lumenal densities (open and closedcircles) are marked. (d) Side view along theX axis. (e) Side view along the diagonalformed by the X and Y axes. The complex hasbeen sliced in half to reveal the surface facingthe central slot. Cut surfaces correspondingto the connections between each half of thedimer (domains A and D) are located in theregion assigned to the lipid bilayer (see text).

structures of this type of crystal in negative stain [13,15]and ice-embedded [15] match our projection map in termsof unit cell dimensions, the shape of the complex andapparent resolution. Related studies [11–14] suggest thatthe PSII particles observed were dimeric and this is nowconfirmed from the 3-D studies presented here. In con-trast, our work does not support the interpretation of thosewho considered similar crystals to have P1 rather than P2symmetry and, therefore, argued for the monomericorganization of PSII [17–20]. All of the complexes inter-
preted as monomers are similar in size and shape to thePSII core dimer presented here, having both a central lowdensity region (probably corresponding to the central slot)and two prominent regions of density either side of it. Inthese earlier crystals, the distances between the regions ofhigh density and the central hole are similar to thosebetween the two sets of A/B densities and the central slotof our PSII core dimer [27]. Furthermore, if the projectionmaps of the core complex of Holzenburg et al. [17–19] arere-interpreted as dimers, the densities that they denoted
846 Structure 1997, Vol 5 No 6
Figure 9
Identification of the stromal and lumenalsurfaces of the PSII core dimer. (a) Powerspectrum of rough, platinum shadowedsurface of the tubular core dimer crystalshown in Figure 2b (area 2). Second and thirdorder diffraction spots are seen in h and krespectively and the (1,0), (0,1) and (-1,2)reflections are labelled u,v and w, respectively.(b) Power spectrum of the smooth Ptshadowed surface (Fig. 2b, area 1) showing(1,0) and (-1,2) reflections labelled u and w,respectively. (c) Top view of the roughshadowed (lumenal) surface; a (11.7 nm) andb (17.3 nm) unit cell vectors are marked. (d)Twofold symmetrised top view of the roughshadowed (lumenal) surface of the PSII coredimer. (e) Alignment of a dimeric unit derivedfrom the mirrored and twofold symmetrisedshadowed lumenal surface (d) with the topview projection map of the core dimer (seeFig. 3c). The lumenally exposed mass islocated predominantly in the A/B and D/Eregions.
b
a
A
A B
B
C
C
D
D
E
E
A
A B
B
C
C
D
D
E
E
(c)
(e)
(d)
(a) (b)

II and IV correlate closely to the two density sets denoted(A/B) in our core dimer (Fig. 3c). Densities I and III[17–19] would then correspond to the D/E regions of thecore dimer. The misinterpretation of the PSII core as amonomer probably stems from the inclusion of noise inthe maps, which may arise from uncorrected latticedisorders [17,19].
The location of subunits within the PSII core complexdeduced from its comparison with the RC–CP47 complexis broadly consistent with previous antibody localisationanalysis of the D1 and cytb559 subunits in the crystallinetubes of PSII which places these components close to theA domain [15].
The shape and size of the 3-D map is essentially consis-tent with the earlier 3-D analysis of a dimeric PSII core 2-D crystal [14]. In this previous study, however, each halfof the dimer was simply composed of two domains pre-sumably corresponding to domains A/B/C and D/E of thepresent study, which is indicative of a lower effectiveresolution. The polarity of the complex with respect tothe membrane and the assignment of membrane span-ning and extrinsic regions deduced here is in generalagreement both with the above mentioned analysis [14]and with the more recent analysis of PSII core and super-core single particles [21].
Biological implicationsPhotosystem II (PSII) is the part of the photosyntheticapparatus of higher plants, algae and cyanobacteriawhich harnesses light energy to drive the reactions thatbring about the splitting of water. These photochemical
reactions are responsible for supplying the organismwith reducing equivalents necessary to convert carbondioxide to organic molecules and on a global scale main-taining the levels of oxygen in the atmosphere. In thisway, PSII plays a central role in sustaining the presentday biosphere and was responsible for creating the fossilfuel reserves. To understand fully the unique reactionscatalysed by this multisubunit membrane complex is notonly a major goal in biology, but could also contribute tothe development of new processes which use solarenergy to produce clean fuels.
In the present work, we have obtained, for the first time,a 3-D structure of a reconstituted, biochemically charac-terised, dimeric PSII complex composed of the reactioncentre (RC) and the CP47 and CP43 proteins. The CP47and CP43 proteins bind chlorophyll molecules, which inturn act as a light-harvesting system for the RC. In theRC, the light-induced excitation of electrons brings aboutcharge separation which drives the oxidation of water andreduction of a plastoquinone molecule. CP47 and CP43also contain large hydrophilic stretches of amino acidswhich probably have functions additional to light harvest-ing. The structure described in this paper was obtained byelectron microscopy and image analysis of 2-D crystals ata resolution of about 2.9nm in the x–y plane and about5nm in z. Each half of the dimer appears to be composedof five domains. By comparing the 2-D structure of thePSII complex with a 2-D projection map of a smallercomplex lacking CP43, it was possible to suggest the loca-tion of this protein at the periphery of the complex. The3-D map shows the PSII dimer to have a rather smoothsurface on the stromal side of the membrane formed from
Research Article Photosystem II core complex Morris et al. 847
Figure 10
Position of the PSII core dimer within thethylakoid lipid bilayer. Stereo views of solidmodels of the 3-D map of the PSII core dimerviewed approximately from the side. Theproposed position of the membrane is shownas a semi-transparent grey box 3.5 nm indepth. The domains in one half of the dimerare colour coded: A/B, pink; D, yellow; and E,blue. (a) The stromal side faces upwards andthe lumenal side faces down. (b) The lumenalside faces upwards.

all five domains. In contrast, the lumenal surface is morecontoured with major protrusions that are probably com-posed of the large hydrophilic loops of CP47 and CP43.This identification implies that these loops are involved inthe water-splitting process. Although the work reportedalso supports the view that PSII is normally organised asa dimer of two complexes, the reason why PSII dimerisesand thus the functional significance of the apparentpredominance of the dimeric form of PSII in vivois not yet understood.
Materials and methodsIsolation of thylakoid lipids Thylakoid lipids were isolated from spinach according to the methodused previously [28,29]. Essentially thylakoid membranes were pre-pared [30], suspended in boiling ethanol in the presence of anti-bumping granules and stirred for 3 min. The extract was then filteredthrough a Whatman No.1 filter and the residue washed first withmethanol and then with diethyl-ether. The filtrates were pooled and theextracted polar (lipid) and non-polar (pigments) lipids contained in theethanol:methanol:diethyl ether mixture were dried down using a rotaryevaporator before being resuspended in a small volume of a 2:1mixture of chloroform:methanol. The crude lipid extract was loaded onto a Kieselgel 60G/Silicic acid column (2:1 (w/w)) and the non-polarfraction eluted with chloroform. Residual pigments were predominantlyeluted from the column with a 1:10 acetone:chloroform mixture. Finallythe polar thylakoid lipid fraction was eluted with methanol, dried downusing a rotary evaporator and resuspended in chloroform containing0.1 mg ml–1 butylated hydroxytoluene.
Crystallisation of purified PSII core dimers and theD1–D2–cytb559–CP47 complexPSII core dimers were isolated from spinach as described by Hankameret al. [23] and crystallised as follows. Aliquots of the polar thylakoid lipidfraction were dried under a stream of nitrogen gas, solubilised in 40 mMMes pH 6.5, 20 mM NaCl, 1 mM sodium azide, 45 mM β-d-heptyl-thioglucopyranoside (HTG) and sonicated for 1 h at about 50°C. Aftercooling, the purified core dimers (0.5 mg/ml chlorophyll) were mixedwith the solubilised lipids and incubated on ice for 30 min fol-lowed by dialysis at room temperature against 20 mM NaCl, 40 mM MES-NaOH, 1 mM CaCl2, 1 mM zinc acetate, 1 mM sodium ascorbateand 1 µg/ml butylated hydroxytoluene pH 6.5 for several days. TheD1–D2–cytb559–CP47 (RC–CP47) complex was crystallised and thecrystals were purified using the previously described method [22,31].
Electron microscopyDialysed samples containing 2-D crystals were applied to carboncoated grids, washed with distilled water and either negatively stainedwith 1% uranyl acetate or rotary platinum shadowed in a JEOLJFD9010C freeze etch unit at an evaporation angle of 25°. The gridswere examined in a JEOL 1200EX electron microscope at an acceler-ating voltage of 80 kV. Images were recorded at calibrated magnifica-tions of 35 000 × and 43 750 × on Agfa Scientia film. A Lhesa videocamera system was used to minimise electron exposure during crystalselection and focusing. Tilted images for 3-D analyses were collectedusing a tilt-rotate holder.
Image processingElectron micrographs were digitised using a Joyce Loebl Scandigrotating drum densitometer at a step size of 25 µm corresponding to0.714 nm or 0.571 nm at the specimen level. MRC image analysis pro-grams together with locally developed software was used for 2-D and3-D analysis. These programs were run under Unix on DEC Alpha andSilicon Graphics workstations. Individual images were corrected forlong range disorder [32] and averaged projection maps calculated byFourier methods. Tilted images were processed in the same way,
combined in reciprocal space as previously described [33] and 3-Dmaps were then calculated with CCP4 programs [34]. Three-dimen-sional volumes were displayed using the visualisation programme, AVS(Advanced Visualisation Systems Inc). Procedures in the image pro-cessing programme, SPIDER [35], were used both to impose twofoldsymmetry upon averaged projections and to translationally and rotation-ally align individual averaged projections for purposes of comparison.
SDS-PAGEThe polypeptide compositions of the isolated PSII preparations wereanalysed by gradient SDS-PAGE (10–17% polyacrylamide) containing6 M urea [36]. The gels were stained with Coomassie R-250. For thispurpose samples containing the PSII core dimer crystals were washedtwice in dialysis buffer prior to solubilisation for electrophoresis.
AcknowledgementsWe thank Michael Chew for help with platinum shadowing, Olaf Kruse foradvice on lipid preparation and John Squire for providing the electron micro-scope, computers, film scanner and associated equipment. This work wassupported by grants awarded by the BBSRC to JB.
References1. Nanba, O. & Satoh, K. (1987). Isolation of a photosystem II reaction
center consisting of D-1 and D-2 polypeptides and cytochromeb-559. Proc. Natl. Acad. Sci. USA. 84, 109–112.
2. Barber, J., Chapman, D.J. & Telfer, A. (1987). Characterisation of aphotosystem II reaction centre isolated from chloroplasts of Pisumsativum. FEBS Lett. 220, 67–73.
3. Bricker, T.M. (1990). The structure and function of CPa-1 and CPa-2in photosystem II. Photosynth. Res. 24, 1–13.
4. Ikeuchi, M., Yuasa, M. & Inoue, Y. (1985). Simple and discreteisolation of an O2-evolving PSII reaction center complex retaining Mnand the extrinsic 33 kDa protein. FEBS Lett. 185, 316–322.
5. Murata, N. & Miyao, M. (1985). Extrinsic membrane proteins in thephotosynthetic oxygen-evolving complex. Trends Biochem. Sci. 10,122–124.
6. Frankel, L.K. & Bricker, T.M. (1992). Interaction of CPa-1 with themanganese-stabilizing protein of photosystem II: identification of domainson CPa-1 which are shielded from N-hydroxysuccinimide biotinylation bythe manganese-stabilizing protein. Biochemistry 31, 11059–11064.
7. Kühlbrandt, W., Wang, D.N. & Fujiyoshi, Y. (1994). Atomic model ofplant light-harvesting complex by electron crystallography. Nature 367,614–621.
8. Green, B.R. & Pichersky, E. (1994). Hypothesis for the evolution ofthree-helix Chl a/b and Chl a/c light-harvesting antenna proteins fromtwo-helix and four-helix ancestors. Photosynth. Res. 39, 149–162.
9. Adir, N., Okamura, M.Y. & Feher, G. (1992). Crystallization of the PSII-reaction centre. In Research in Photosynthesis, (Murata, N., ed) Vol. II,pp. 195–198. Kluwer Academic Press, Dordrecht, The Netherlands.
10. Fotinou, C., Kokkinidis, M., Fritzsch, G., Haase, W., Michel, H. &Ghanotakis, D.F. (1993). Characterization of a photosystem-II coreand its 3-D crystals. Photosynth. Res. 37, 41–48.
11. Bassi, R., Ghiretti Magaldi, A., Tognon, G., Giacometti, G.M. &Miller, K.R. (1989). Two-dimensional crystals of the Photosystem IIreaction center complex from higher plants. Eur. J. Cell Biol. 50,84–93.
12. Miller, K.R. & Jacob, J.S. (1991). Surface structure of the photosystemII complex. In Proceedings of the 49th Ann. Meeting ElectronMicroscopy Soc., (Bailey, G.W., ed), pp. 197, San Francisco Press,Box 6800, San Francisco, CA 94101–6800, USA.
13. Lyon, M.K., Marr, K.M. & Furcinitti, P.S. (1993). Formation andcharacterization of two-dimensional crystals of photosystem II. J.Struct. Biol. 110, 133–140.
14. Santini, C., Tidu, V., Tognon, G., Ghiretti Magaldi, A. & Bassi, R.(1994). Three-dimensional structure of higher plant photosystem IIreaction centre and evidence for its dimeric organization. Eur. J.Biochem. 221, 307–315.
15. Marr, K.M., Mastronarde, D.M. & Lyon, M.K. (1996). Two-dimensionalcrystals of photosystem II: biochemical characterization, cryoelectronmicroscope and localization of the D1 and cytochrome b559polypeptides. J. Cell Biol. 132, 823–833.
16. Marr, K.M., McFeeters, R.L. & Lyon, M.K. (1996). Isolation andstructural analysis of two-dimensional crystals of photosystem II fromH. vulgare viridis zb63. J. Struct. Biol. 117, 86–98.
848 Structure 1997, Vol 5 No 6

17. Holzenburg, A., Bewly, M.C., Wilson, F.H., Nicholson, W.V. & Ford,R.C. (1993) Three-dimensional structure of photosystem II. Nature363, 470–472.
18. Holzenburg, A., Shepherd F.H. & Ford R.C. (1994). Localization of theoxygen-evolving complex of photosystem II by Fourier differenceanalysis. Micron 25, 447–451.
19. Ford, R.C., Rosenberg, M.F., Shepherd, F.H., McPhie, P. &Holzenburg, A. (1995). Photosystem II 3-D structure and the role ofthe extrinsic subunits in photosynthetic oxygen evolution. Micron 26,133–140.
20. Tsiotis, G., Walz, T., Spyridaky, A., Lustig, A., Engel, E. & Ghanotakis,D. (1996). Tubular crystals of a photosystem II core complex. J. Mol.Biol. 259, 241–248.
21. Boekema, E.J., et al., & Rögner, M. (1995). Supramolecular structureof the photosystem II complex from green plants and cyanobacteria.Proc. Natl. Acad. Sci. USA. 92, 175–179.
22. Nakazato, K., Toyoshima, C., Enami, I. & Inoue, Y. (1996). Two-dimensional crystallization and cryo-electron microscopy ofPhotosystem II. J. Mol. Biol. 257, 225–232.
23. Hankamer, B., Nield, J., Zheleva, D., Boekema, E., Jansson S. &Barber, J. (1997). Isolation and biochemical characterisation ofmonomeric and dimeric photosystem II complexes from spinach andtheir relevance to the organisation of photosystem II in vivo. Eur. J.Biochem. 243, 422–429.
24. Erickson, J.M. & Rochaix, J.D. (1992). The molecular biology ofphotosystem II. In The Photosystems: Structure, Function andMolecular Biology. (Barber, J., ed), vol. 11, pp. 101–77, Elsevier,Amsterdam.
25. Simpson, D.J. (1979). Freeze-fracture studies on barley plastidmembranes. III. Location of the light harvesting chlorophyll-protein.Carlsberg Res. Commun. 44, 305–336.
26. Seibert, M., DeWit, M. & Staehelin, L.A. (1987). Structural localizationof the O2-evolving apparatus to multimeric (tetrameric) particles on thelumenal surface of freeze-etched photosynthetic membranes J. CellBiol. 105, 2257–2265.
27. Hankamer, B., Barber, J. & Boekema, E.J. (1997). Structure andmembrane organization of photosystem II in green plants. Ann. Rev.Plant Physiol. 48, 641–671.
28. O’Brien, J.S. & Benson, A.A. (1964). Isolation and fatty acidcomposition of the plant sulfolipids and galactolipids. J. Lipid Res. 5,432–436.
29. Schmid, G.H., Radunz, A. & Groeschel-Stewart, U. (1993).Herstellung von antiksrpern gegen nieder molekulare verbindungen. InImmunologie und ihre Anwendung in der Biologie. pp. 93–95, GeorgThieme Verlag, Stuttgart–New York.
30. Berthold, D.A., Babcock, G.T. & Yocum, C.F. (1981). A highlyresolved, oxygen-evolving photosystem II preparation from spinachthylakoid membranes—electron-paramagnetic resonance and electrontransport properties. FEBS Lett. 134, 231–234.
31. Nakazato, K., Toyoshima, C., Enami, I. & Inoue, Y. (1995). Formationand characterization of 2-D crystals of spinach PSII. InPhotosynthesis: from Light to Biosphere. Proceedings of the XthInternational Photosynthesis Congress, (Mathis, P., ed), vol. 3 pp.317–320, Kluwer Academic Publishers, The Netherlands.
32. Henderson, R., Baldwin, J.M., Downing, K.H., Lepault, J. & Zemlin, F.(1986). Structure of purple membrane from halobacterium–Halobium–recording, measurement and evaluation of electron-micrographs at3.5 Å resolution. Ultramicroscopy 19, 147–178.
33. Amos, L.A., Henderson, R. & Unwin, P.N.T. (1982). Three-dimensionalstructure determination by electron microscopy of two-dimensionalcrystals. Prog. Biophys. Molec. Biol. 39, 183–231.
34. Collaborative Computing Project Number 4. (1994) The CCP4 suite:programs for protein crystallography. Acta. Cryst. D 50, 760–767.
35. Frank, J., Shimkin, B. & Dowse, H. (1981). SPIDER: a modularsoftware system for electron image processing. Ultramicroscopy 6,343–358.
36. Laemmli U.K. (1970). Cleavage of structural proteins during theassembly of the head of bacteriophage T4. Nature 277, 680–685.
Research Article Photosystem II core complex Morris et al. 849
Copyright © 2022 FDOKUMEN