Three-dimensional organisation of the Runx1 locus
373
Three-dimensional organisation of the Runx1 locus Amarni Thomas A thesis submitted for the degree of Doctor of Philosophy Department of Pathology University of Otago Dunedin, New Zealand April 2021
-
Upload
khangminh22 -
Category
Documents
-
view
2 -
download
0
Transcript of Three-dimensional organisation of the Runx1 locus

Three-dimensional organisation of the Runx1
locus
Amarni Thomas
A thesis submitted for the degree of
Doctor of Philosophy
Department of Pathology
University of Otago
Dunedin, New Zealand
April 2021

ii
Abstract
The proper regulation of gene expression is crucial for cell-fate and lineage
determination of hematopoietic stem cells (HSCs). Dysregulated expression of genes that
drive haematopoietic differentiation can cause blood disorders, including leukaemia.
Connecting hematopoietic genes with their regulatory elements is central to correct gene
regulation, and is orchestrated by chromatin modifiers, including the genome organising
protein complex, cohesin.
The developmental transcription factor RUNX1/AML1 is a well-known
leukaemia-associated gene. Runx1 is an important regulator of haematopoiesis in
vertebrates; it is crucial for early myeloid differentiation, and plays a vital role in adult
blood development. Genetic disruptions to the RUNX1 gene are frequently associated
with Acute Myeloid Leukaemia (AML).
Despite the well-established role of RUNX1 in haematopoiesis and disease
contribution, the cis-regulatory mechanisms that modulate RUNX1 require further
elucidation. Gene regulatory elements, such as enhancers, located in non-coding DNA
are likely to be important for Runx1 transcription.
My PhD studies provided insight into mouse Runx1 enhancer functions and
highlighted the features of conserved human enhancers. I also used circular chromosome
conformation capture sequencing (4C-seq) to identify DNA interactions with the
previously identified +24 RUNX1 enhancer, which is essential for HSC expression of
RUNX1. Using cohesin-deficient K562 leukaemia cells, my work shows that cohesin is
required for the +24 enhancer (also known as eR1) to anchor an insulated neighbourhood
that shields RUNX1 from outside influences. Striking results from this work show that
the +24 Runx1 enhancer is a significant cohesin-dependent organiser of Chromosome 21
during megakaryocyte differentiation.

iii
In summary, my PhD studies identified a bouquet of enhancer-anchored
connections that regulate RUNX1 transcription in leukaemia cells at steady state and
during differentiation, and explain why cohesin loss dysregulates the expression of this
important leukaemogenic gene.

iv
Acknowledgements
First and foremost, I would like to thank my supervisor, Prof. Julia Horsfield for
her encouragement and guidance throughout the course of my PhD, as well as her
valuable career advice and support. Many thanks to the Chromosome Structure &
Development Lab Group for friendship, collegiality and making lab work enjoyable:
Alice, Amy, Anastasia, Bridget, Bryony, Caitlin, Chi, Jisha, Judith, Lisa, Megan,
Michael, Nabila, Nima, Noel, Sarada, Stephanie, Trent, Tanushree, Ute. Thanks to all the
wonderful writing group friends for the engaging discussions and enjoyable days
together.
I would also like to thank those who have helped with this PhD project: Dr.
William Schierding for his advice and bioinformatics training. Dr. Aaron Stevens for
guidance on G-quadruplex characterisation. Ute Zellhuber-McMillan for helping me
breed and characterise the F1 zebrafish lines. Noel Jhinku for making sure all the
zebrafish are well cared for. Dr. Robert Day for running my samples on the MiSeq. To
Dr. Judith Marsman for guidance with the 4C experiment. Dr. Jisha Antony for providing
counsel with lab experiments.
To my committee members, Dr. Jisha Antony, Dr. Judith Marsman, Prof. Julia
Horsfield, Prof. Justin O’Sullivan, Prof. Ian Morison, and my convenor Prof. Stephen
Robertson, for supporting me during my studies and providing exciting discussions.
Thanks to Prof. Motomi Osato for providing some of the Runx1 enhancer DNA essential
to this project, and for hosting me along with Prof. Hitoshi Takizawa at International
Research Centre for Medical Sciences Research, Kumamoto University, Japan. Thank
you to the Liggins Institute, University of Auckland, Prof. Justin O’Sullivan and Dr.
William Schierding for providing a space for me to learn bioinformatics and analsye my
data.

v
I gratefully acknowledge the funding I have received during the course of my
PhD. Cancer Research Trust New Zealand for awarding me a scholarship, University of
Otago Pūtea Tautoko - Student Fund, and Health Research South - Dunedin School of
Medicine for additional fees and stipend support. Marsden Fund (administered by the
Royal Society of New Zealand), Health Research Council of New Zealand and
Leukaemia and Blood Cancer New Zealand for supporting this project. International
Research Centre for Medical Sciences Research, Kumamoto University, Japan for
awarding me an internship to further develop molecular techniques. Lorne Genome
Conference, and Leukaemia and Blood Cancer New Zealand for providing travel
funding.
Thank you to the various workplaces who have made my PhD journey a unique
and fulfilling experience; Pathology Department, Research And Enterprise, Te Huka
Mātauraka, Disability Information And Support, Genetics Teaching Programme And
Genetics Otago.
Finally, the biggest thanks to my Mum, Dad, my brother Blake and my friends
for their enthusiasm, support and for brightening every day.

vi
Table of Contents
Abstract .......................................................................................................................... ii
Acknowledgements ........................................................................................................ iv
Table of Contents ........................................................................................................... vi
List of Figures ............................................................................................................ xvii
List of Tables ................................................................................................................ xxi
List of symbols and abbreviations............................................................................ xxiv
Nomenclature .......................................................................................................... xxviii
1 Chapter 1: Introduction ........................................................................................... 1
1.1 Haematopoiesis .................................................................................................. 1
1.1.1 Primitive and definitive haematopoiesis .................................................... 1
1.1.2 Transcription factors involved in haematopoiesis ...................................... 5
1.2 Haematological disorders .................................................................................. 6
1.2.1 Familial platelet disorder ............................................................................ 7
1.2.2 Acute Myeloid Leukaemia ......................................................................... 7
1.2.3 Leukaemogenesis ....................................................................................... 8
1.2.4 AML patient survival and treatment......................................................... 10
1.2.5 Cohesin mutation contributes to AML ..................................................... 12
1.3 RUNX1 is a leukaemia gene............................................................................. 16
1.3.1 Role of RUNX1 in normal embryonic and adult developmental processes..
.................................................................................................................. 18
1.3.2 Regulation of Runx1 ................................................................................. 18
1.3.3 Role of RUNX1 in AML progression ....................................................... 21
1.4 Three-dimensional genome structure............................................................... 24

vii
1.4.1 Topologically associated domains (TADs) .............................................. 25
1.5 Regulators of gene transcription ...................................................................... 27
1.5.1 Cohesin acts with other regulators to determine gene expression ............ 28
1.5.2 Cohesin and Runx1 ................................................................................... 29
1.5.3 Regulatory elements ................................................................................. 32
1.5.3.1 Enhancers .............................................................................................. 32
1.5.3.2 Silencers and insulators ........................................................................ 34
1.5.4 Techniques to determine three-dimensional conformation ...................... 35
1.5.5 Genome structure and disease .................................................................. 36
1.5.6 Regulatory regions of Runx1 .................................................................... 37
1.6 Zebrafish as a model organism ........................................................................ 39
1.6.1 Haematopoiesis in zebrafish ..................................................................... 42
1.7 Overall hypothesis and aims of this PhD ......................................................... 43
2 Chapter 2: Methods ................................................................................................ 46
2.1 Ethics consent and protocol approval .............................................................. 46
2.1.1 Zebrafish ................................................................................................... 46
2.1.2 Escherichia coli (E. coli) .......................................................................... 46
2.1.3 Cell culture ............................................................................................... 46
2.2 Materials .......................................................................................................... 46
2.3 Molecular biology techniques .......................................................................... 46
2.3.1 Plasmids and reporter constructs .............................................................. 46
2.3.2 Nanodrop .................................................................................................. 47
2.3.3 Agarose gel electrophoresis ...................................................................... 48
2.3.4 Primer design ............................................................................................ 48
2.3.5 Sequence confirmation and alignment ..................................................... 48

viii
2.3.6 Measuring Runx1 +24 enhancer G-quadruplexes..................................... 49
2.3.6.1 Runx1 +24 enhancer G-quadruplexes Oligo design ............................. 49
2.3.6.2 CD Spectrophotometer protocol ........................................................... 49
2.3.7 Site-Directed Mutagenesis of Runx1 +24 enhancer ................................. 50
2.3.7.1 Runx1 +24 enhancer Site-Directed Mutagenesis primer design ........... 50
2.3.7.2 Mutant Strand Synthesis Reaction (Thermal Cycling) ......................... 50
2.3.7.3 DnpI Digestion of the Mutant Strand Amplification Products ............. 51
2.3.8 Transformation of plasmids in competent cells........................................ 51
2.3.9 Plasmid purification preparation .............................................................. 52
2.3.10 Tol2 transposase mRNA synthesis ........................................................... 52
2.4 In vivo Zebrafish approaches ........................................................................... 53
2.4.1 Zebrafish strains ....................................................................................... 53
2.4.2 Maintenance ............................................................................................. 53
2.4.3 Feeding ..................................................................................................... 53
2.4.4 Breeding and embryo collection ............................................................... 54
2.4.5 Growing embryos ..................................................................................... 54
2.5 Zebrafish microinjection .................................................................................. 54
2.5.1 Needle pulling and calibration.................................................................. 54
2.5.2 Microinjection .......................................................................................... 56
2.5.3 Microscopy ............................................................................................... 56
2.6 Transgenic zebrafish analysis .......................................................................... 56
2.6.1 Zebrafish enhancer assay .......................................................................... 57
2.7 In vitro Cell culture and maintenance of cell lines .......................................... 57
2.7.1 Cell lines ................................................................................................... 57
2.7.2 Reviving cells from liquid nitrogen stocks ............................................... 58

ix
2.7.3 Splitting cells for new passage ................................................................. 59
2.7.3.1 Adherent cells (PNX, BHK/MKL, NIH/3T3) ...................................... 59
2.7.3.2 Suspension cells (K562, HPC7)............................................................ 59
2.7.3.3 K562 STAG2 R614-/- mutant lines ...................................................... 59
2.7.4 Freezing cells for liquid nitrogen storage ................................................. 60
2.8 Expression analysis .......................................................................................... 61
2.8.1 Total RNA purification............................................................................. 61
2.8.2 cDNA synthesis ........................................................................................ 61
2.8.3 Quantitative reverse-transcriptase PCR (qRT-PCR) ................................ 61
2.8.4 pGL4.23 Transfection............................................................................... 63
2.8.5 pGL4.23 Transfection analysis ................................................................. 63
2.8.6 Statistical analysis of luciferase assays .................................................... 64
2.9 In silico approaches for Enhancer analysis ...................................................... 64
2.9.1 Epigenetic analyses using ENCODE data ................................................ 64
2.9.2 Comparative analysis of cancer genomic datasets ................................... 66
2.9.3 Single nucleotide polymorphism (SNP) analysis ..................................... 67
2.10 Circular Chromatin Conformation Capture (4C) ............................................. 67
2.10.1 4C Design ................................................................................................. 68
2.10.2 Cross-linking of K562 cells ...................................................................... 68
2.10.3 Isolation of nuclei ..................................................................................... 69
2.10.4 First Digestion .......................................................................................... 69
2.10.5 First restriction enzyme inactivation ........................................................ 70
2.10.6 Ligation..................................................................................................... 70
2.10.7 Reverse cross-linking and DNA purification ........................................... 71
2.10.8 Second digestion ....................................................................................... 71

x
2.10.9 Removal of second restriction enzyme..................................................... 72
2.10.10 Second Ligation .................................................................................... 72
2.10.11 DNA purification with linear polyacrylamide (LPA) ........................... 73
2.10.12 4C Polymerase Chain Reaction ............................................................ 73
2.11 4C-seq Library preparation .............................................................................. 74
2.11.1 PCR purification ....................................................................................... 74
2.11.2 Adaptor ligation ........................................................................................ 74
2.11.3 Library purification .................................................................................. 76
2.11.4 Equal mixing of baits................................................................................ 77
2.11.4.1 MiSeq library .................................................................................... 77
2.11.4.2 HiSeq Library .................................................................................... 77
2.11.5 Next generation sequencing ..................................................................... 78
2.12 Processing of sequenced reads ......................................................................... 78
2.12.1 Generating read counts and data quality reports ...................................... 78
2.12.2 Demultiplexing of libraries based on indexed adaptors ........................... 78
2.12.3 Trimming of adaptors ............................................................................... 78
2.12.4 Demultiplexing of baits based on 4C primers .......................................... 78
2.12.4.1 HiSeq ................................................................................................. 79
2.12.4.2 MiSeq ................................................................................................ 79
2.13 Mapping of sequenced reads............................................................................ 80
2.13.1 Generating restriction enzyme digestion of Human Genome (hg19) ....... 80
2.13.2 Generate Bowtie2 reference files of RE digested genome. ...................... 81
2.13.3 Mapping of reads ...................................................................................... 81
2.13.4 Creating a counts file from mapped data .................................................. 81
2.13.5 Removing self-ligated and undigested reads ............................................ 82

xi
2.13.6 Removal of background noise .................................................................. 82
2.14 Analysing 4C interactions ................................................................................ 82
2.14.1 Identification of statistically significant interactions per condition ......... 83
2.14.2 Generation of ggplots ............................................................................... 84
2.14.3 Differential interactions using DESeq2 .................................................... 84
2.14.4 Overlap of significant interactions with genes ......................................... 84
2.14.5 Overlap of significant interactions with protein binding sites and enhancer
characteristics .......................................................................................................... 84
3 Chapter 3: Functional analysis of Runx1 enhancers ........................................... 85
3.1 Runx1 enhancers .............................................................................................. 85
3.1.1 Previously identified enhancers of Runx1 ................................................ 85
3.1.2 Previously identified long-range interactions with Runx1 promoters ...... 92
3.1.3 Functional enhancer characterisation assays ............................................ 97
3.2 Hypothesis ....................................................................................................... 98
3.3 Aims ................................................................................................................. 98
3.4 Characteristics of previously identified regulatory regions ............................. 99
3.4.1 Epigenetic and conservation analyses using ENCODE data .................... 99
Single nucleotide polymorphism (SNP) analysis .................................................. 106
3.4.2 Comparative analysis of cancer genomic datasets ................................. 111
3.5 Zebrafish enhancer reporter assays ................................................................ 114
3.5.1 Zebrafish Enhancer assay F0: ................................................................. 116
3.5.2 Zebrafish Enhancer assay F1: ................................................................. 120
3.6 Genomic characteristics of 4C identified functional novel enhancers .......... 121
3.6.1 Conservation and epigenetic analysis ..................................................... 122
3.6.2 Single nucleotide polymorphism (SNP) analysis ................................... 122

xii
3.6.3 Comparative analysis of cancer genomic datasets ................................. 123
3.7 Chapter summary ........................................................................................... 124
4 Chapter 4: Three-dimensional (3D) connections of Runx1 +24 ....................... 127
4.1 Introduction .................................................................................................... 127
4.1.1 Secondary structure of DNA .................................................................. 129
4.1.1.1 Secondary structure of Runx1 +24 ..................................................... 129
4.2 Hypothesis ..................................................................................................... 132
4.3 Aims ............................................................................................................... 132
4.4 Enhancer characteristics of RUNX1 +24 ....................................................... 133
4.4.1 Epigenetic analysis ................................................................................. 133
4.4.2 Single nucleotide polymorphism (SNP) analysis ................................... 133
4.4.3 Comparative analysis of cancer genomic datasets ................................. 133
4.5 Characterising Runx1 +24 G-quadruplex structure ....................................... 134
4.5.1 CD spectroscopy ..................................................................................... 134
4.5.2 Runx1 +24 G-quadruplex Luciferase reporter assay .............................. 136
4.6 Circular Chromatin Conformation Capture (4C) of Human RUNX1 +24 ..... 140
4.6.1 Quality check of 4C data ........................................................................ 141
4.6.2 Detection of significant interactions ....................................................... 143
4.7 Identification and Genomic Characteristics of Human RUNX1 +24 3D
Connections .............................................................................................................. 145
4.7.1 Visualisation of significant cis interactions ............................................ 145
4.7.2 Overview of significant near-bait interactions ....................................... 148
4.7.3 Significant interactions with known RUNX1 regulators ........................ 151
4.7.4 Significant interactions with other genes ............................................... 152
4.7.5 Overall significant RUNX1 +24 cis and near-bait interactions .............. 154

xiii
4.7.6 Trans interactions ................................................................................... 157
4.8 Chapter summary ........................................................................................... 159
4.8.1 RUNX1 +24 characteristics..................................................................... 159
4.8.2 RUNX1 +24 interactions ......................................................................... 161
5 Chapter 5: Cohesin insulates 3D connections of RUNX1 +24 during
megakaryocyte differentiation .................................................................................. 164
5.1 Introduction .................................................................................................... 164
5.2 Hypothesis ..................................................................................................... 166
5.3 Aims ............................................................................................................... 166
5.4 RUNX1 +24 significant interactions during normal megakaryocyte
differentiation............................................................................................................ 167
5.4.1 Visualisation of significant interactions during normal megakaryocyte
differentiation. ....................................................................................................... 167
5.4.2 Overview of significant changes in interactions during normal
megakaryocyte differentiation. ............................................................................. 168
5.4.3 Visualisation of significant near-bait interactions during normal
megakaryocyte differentiation. ............................................................................. 172
5.4.4 Overview of significant changes in near-bait interactions during normal
megakaryocyte differentiation. ............................................................................. 173
5.4.5 Significant interactions with other genes ............................................... 176
5.4.6 Overall significant RUNX1 +24 and near-bait interactions in K562 cells
during megakaryocyte differentiation ................................................................... 177
5.5 The effect of STAG2 deficiency on RUNX1 +24 significant interactions during
differentiation of K562 cells ..................................................................................... 180

xiv
5.5.1 Visualisation of significant interactions during cohesin impaired
“differentiation” .................................................................................................... 180
5.5.2 The effect of STAG2 deficiency on interactions during differentiation of
K562 cells ............................................................................................................. 181
5.5.3 The effect of STAG2 deficiency on near-bait interactions during
differentiation of K562 cells ................................................................................. 190
5.5.4 Significant changes in near-bait interactions caused by STAG2 deficiency
................................................................................................................ 191
5.5.5 Significant interactions with other genes ............................................... 196
5.5.6 Overall changes in and near-bait interactions mediated by RUNX1 +24
interactions during differentiation of K562 cells, WT versus STAG2-deficient .. 197
5.6 Chapter summary ........................................................................................... 200
5.6.1 RUNX1 +24 enhancer connections during K562 differentiation to
megakaryocytes ..................................................................................................... 200
5.6.1.1 Distant connections ............................................................................. 200
5.6.1.2 Connections within the RUNX1 TAD ................................................. 201
5.6.2 RUNX1 +24 enhancer connections during PMA treatment in STAG2
mutants 201
5.6.2.1 Baseline conditions: ............................................................................ 201
5.6.2.2 Mid-differentiation.............................................................................. 202
5.6.2.3 Post-differentiation ............................................................................. 202
6 Chapter 6: Discussions and Conclusions ............................................................ 204
6.1 Regulators of Runx1....................................................................................... 205
6.1.1 Mouse Runx1 enhancers ......................................................................... 205
6.1.2 Conserved human RUNX1 regulators ..................................................... 206

xv
6.1.3 G-quadruplex .......................................................................................... 208
6.1.4 Regulatory RNAs ................................................................................... 209
6.1.4.1 Enhancer RNA (eRNA) ...................................................................... 209
6.1.4.2 Long non-coding RNAs ...................................................................... 210
6.1.4.3 G-Quadruplex RNAs .......................................................................... 210
6.1.5 Could mutational load in regulatory elements also contribute to disease
progression? .......................................................................................................... 211
6.2 Organisational role of the RUNX1 +24 enhancer .......................................... 217
6.3 RUNX1 +24 enhancer connections during megakaryocyte differentiation ... 218
6.4 Cohesin/STAG2 dependency of RUNX1 +24 enhancer connections in K562
cells ....................................................................................................................... 221
6.4.1 K562 Limitations .................................................................................... 224
6.5 Future directions ............................................................................................ 224
6.5.1 RUNX1 +24 G-quadruplex ..................................................................... 225
6.5.2 Functional analysis of RUNX1 regulatory regions ................................. 225
6.5.3 RUNX1 +24 connections with genes ...................................................... 226
6.5.4 Roles of non-coding RNA in RUNX1 regulation ................................... 227
6.5.5 Further questions proposed by this research .......................................... 228
6.5.6 Clinical significance ............................................................................... 229
6.6 Overall conclusions........................................................................................ 229
References ................................................................................................................... 231
Appendix I: Materials ................................................................................................ 260
Chemical reagents and consumables used in this project ..................................... 260
Solutions and buffers ................................................................................................ 262
Appendix II: Plasmid maps ....................................................................................... 264
xvi
Zebrafish enhancer detector vector (ZED) ............................................................ 264
pCS-TP .................................................................................................................. 265
pGL4.23-GW ........................................................................................................ 266
pRL-TK ................................................................................................................. 267
pUC19 ................................................................................................................... 268
Appendix III: Primer list ........................................................................................... 269
Appendix IV: Prediction of G-quadruplexes ........................................................... 271
Appendix V: Sequencing report ................................................................................ 273
Appendix VI: Publication .......................................................................................... 275
Appendix VII: RUNX1 regulatory region Hg38 coordinates ................................. 287
Appendix VIII: 4C data processing .......................................................................... 288
RUNX1 +24 .......................................................................................................... 289
Appendix IX: WT 12 DMSO interaction peaks....................................................... 290
WT 12 DMSO cis significant interactions ............................................................ 290
WT 12 DMSO near-bait significant interactions .................................................. 292
Appendix X: Trans interaction peaks....................................................................... 297
Appendix XI: List of significant changes (cis) ......................................................... 301
WT cis significant changes during differentiation ................................................ 301
WT and STAG2 cis comparisons .......................................................................... 302
Appendix XII: List of significant changes (near-bait) ............................................ 305
WT near-bait significant changes during differentiation ...................................... 305
WT and STAG2 near-bait comparisons ................................................................ 307
Appendix XIII: List of gene connections .................................................................. 321
Appendix XIV: List of significant changes STAG2 12 DMSO compared STAG2 72
PMA ............................................................................................................................. 327

xvii
List of Figures
Figure 1.1: Schematic of haematopoiesis cell generation locations during human
development. .................................................................................................................... 3
Figure 1.2: Vertebrate primitive and definitive haematopoiesis cell development
pathways. .......................................................................................................................... 5
Figure 1.3: Structure of cohesin complex. ...................................................................... 13
Figure 1.4: The Runx protein. ........................................................................................ 17
Figure 1.5: Comparative genomic organisation of the Runx1 locus in human, mouse and
zebrafish. ........................................................................................................................ 20
Figure 1.6: RUNX1 gene common isoforms and leukaemic fusion isoforms. .............. 22
Figure 1.7: RUNX1 TAD Hi-C contact map of RUNX1 region in K562 cells. .............. 27
Figure 1.8: Cohesin mediated cis-regulatory DNA elements. ........................................ 34
Figure 1.9: Identified Runx1 regulatory regions............................................................. 39
Figure 1.10: Diagram of normal Danio rerio (zebrafish) development. ......................... 41
Figure 1.11: Schematic of haematopoiesis cell generation locations during zebrafish
development. .................................................................................................................. 43
Figure 2.1: Calibration slide with close up of 1 mm scale, each division is 0.01 mm. .. 55
Figure 2.2: Haemocytometer slide used for counting cells, each shaded grid is 1 mm2. 60
Figure 2.3: Quantitative PCR primer locations at human RUNX1. ................................ 62
Figure 2.4: Schematic outline of 4C process. ................................................................. 68
Figure 3.1: Schematic overview of the mouse Runx1 locus (chromosome 16:93,220,074-
92,589,466). .................................................................................................................... 96
Figure 3.2: Schematic overview of human RUNX1 locus (chromosome 21: 36,148,773-
36,872,777). .................................................................................................................... 97
Figure 3.3: Proportions of cancerous primary site mutations of regulatory regions. ... 113

xviii
Figure 3.4: Schematic representation of ZED assay vector. ........................................ 115
Figure 3.5: Putative mouse enhancers are active in hematopoietic regions in zebrafish.
...................................................................................................................................... 118
Figure 3.6: . Quantitative summary of GFP expression patterns generated by putative
mouse enhancers in zebrafish. ...................................................................................... 119
Figure 4.1: Hi-C contact map of the RUNX1 region in K562 cells. ............................. 128
Figure 4.2: Schematic representation of mouse +24 individual G-quadruplex. ........... 130
Figure 4.3: Predicted representation of Runx1 +24 mCRE G-quadruplex and mutated +24
mCRE. .......................................................................................................................... 134
Figure 4.4: CD spectroscopy of wild-type and mutant +24 G4s. ................................. 135
Figure 4.5: Schematic representation of the predicted Runx1+24 mCRE G-quadruplex in
parallel conformation and when base subsitutions are made at the +24 mCRE. ......... 136
Figure 4.6: Diagram of Luciferase reporter construct pGL4.23-GW. .......................... 137
Figure 4.7: Schematic representation of pGL4 Runx1+24 mCRE G-quadruplex in parallel
conformation and mutated +24 mCREs. ...................................................................... 138
Figure 4.8: Luciferase activity in response to the various +24 mCREs in the NIH/3T3
cell line. ........................................................................................................................ 139
Figure 4.9: RUNX1 +24 Mapped read count. ............................................................... 141
Figure 4.10: RUNX1 +24 4C quality evaluation. ......................................................... 143
Figure 4.11: RUNX1 +24 cis 4C profile (chr21) in K562 cells (WT 12 DMSO)......... 146
Figure 4.12: RUNX1 +24 significant cis interactions. .................................................. 147
Figure 4.13: Profile of RUNX1 +24 significant cis interactions. .................................. 148
Figure 4.14: RUNX1 +24 near-bait 4C profile. ............................................................ 149
Figure 4.15: RUNX1 +24 significant near-bait interactions (chr21:34999764-37572609).
...................................................................................................................................... 151

xix
Figure 4.16: RUNX1 +24 chromatin hub. ..................................................................... 155
Figure 5.1: Megakaryocyte differentiation with PMA stimulation RUNX1 +24 WT cis
4C profiles. ................................................................................................................... 168
Figure 5.2: Differentiation-induced changes to the RUNX1 +24 WT cis interactions. 170
Figure 5.3: Differentiation-induced changes in the number of RUNX1 +24 significant cis
interactions with super-enhancers in WT K562 cells. .................................................. 171
Figure 5.4: Megakaryocyte differentiation with PMA stimulation RUNX1 +24 WT near-
bait 4C profile. .............................................................................................................. 172
Figure 5.5: Differentiation-induced changes to the RUNX1 +24 WT near-bait
interactions. .................................................................................................................. 174
Figure 5.6: Changes to the RUNX1 +24-anchored chromatin hub during megakaryocyte
differentiation of K562 cells. ........................................................................................ 179
Figure 5.7: Time course of PMA stimulation of all RUNX1 +24 cis 4C profiles. ....... 181
Figure 5.8: Significant changes to the RUNX1 +24 cis baseline (12 DMSO) interactions
due to cohesin deficiency. ............................................................................................ 183
Figure 5.9: Features of RUNX1 +24 significant cis interactions in WT baseline and
STAG2 baseline cells (12 DMSO). .............................................................................. 184
Figure 5.10: Significant changes to the RUNX1 +24 12h PMA treatment cis interactions
due to cohesin deficiency. ............................................................................................ 186
Figure 5.11: Significant changes to the RUNX1 +24 72h PMA treatment cis interactions
due to cohesin deficiency. ............................................................................................ 188
Figure 5.12: Profile of RUNX1 +24 significant cis interactions with super-enhancers
during megakaryocyte differentiation with PMA stimulation in WT and STAG2 mutant
cells. .............................................................................................................................. 189
Figure 5.13: Time course PMA stimulation of all RUNX1 +24 near-bait 4C profiles. 191

xx
Figure 5.14: Significant changes to the RUNX1 +24 baseline (12 DMSO) of near-bait
interactions due to cohesin deficiency. ......................................................................... 193
Figure 5.15: Significant changes to the RUNX1 +24 near-bait interactions after 12h PMA
treatment due to cohesin deficiency. ............................................................................ 194
Figure 5.16: Significant changes to the RUNX1 +24 near-bait interactions after 72h PMA
treatment due to cohesin deficiency. ............................................................................ 196
Figure 5.17: The effect of cohesin deficiency on the RUNX1 +24 enhancer-anchored
chromatin hub in baseline (12 DMSO) conditions in K562 cells. ............................... 198
Figure 5.18: The effect of cohesin deficiency on the RUNX1 +24 enhancer-anchored
chromatin hub in mid-differentiation (12 PMA) conditions in K562 cells. ................. 199
Figure 5.19: The effect of cohesin deficiency on the RUNX1 +24 enhancer-anchored
chromatin hub in post-differentiation (72 PMA) conditions in K562 cells.................. 200
Figure 6.1:Schematic overview of human RUNX1 locus (hg19: chromosome 21:
36,148,773-36,872,777). .............................................................................................. 207
Appendix VIII Figure 1: RUNX1 +24 demultiplexed read count................................. 289
Appendix VIII Figure 2: RUNX1 +24 Mapped read count. ......................................... 289
Appendix VIII Figure 3: RUNX1 +24 4C quality evaluation. ...................................... 290
Appendix X Figure 1: RUNX1 +24 trans chromosome 1 reads. .................................. 297
Appendix X Figure 2: RUNX1 +24 chr 1 trans interactions. ....................................... 298
Appendix X Figure 3: RUNX1 +24 chr 3 trans interactions. ....................................... 299
Appendix X Figure 4: RUNX1 +24 chr 9 trans interactions. ....................................... 300

xxi
List of Tables
Table 2.1: Plasmids used in this study............................................................................ 47
Table 2.2: Runx1 +24 enhancer G-quadruplexes Oligo ................................................. 49
Table 2.3: Mutant strand synthesis reaction ................................................................... 51
Table 2.4: Cell lines used in this study ........................................................................... 58
Table 2.5: qRT-PCR reaction mix .................................................................................. 62
Table 2.6: Transfection components per well ................................................................ 63
Table 2.7: Analysed cell lines ........................................................................................ 66
Table 2.8: Analysed ENCODE annotations ................................................................... 66
Table 2.9: 4C-PCR reagents .......................................................................................... 74
Table 2.10: Optimised PCR conditions for 4C-PCR primers........................................ 74
Table 2.11: 4C-Seq Library and sequencing adapters ................................................... 76
Table 2.12: Primer sequences and lengths used for demultiplexing of 4C baits ........... 80
Table 2.13: Length of sequenced reads after trimming ................................................. 81
Table 3.1: Runx1 +24 regulatory region ........................................................................ 86
Table 3.2: Identified mouse Runx1 regulatory regions with available classifications ... 88
Table 3.3: Identified human RUNX1 regulatory regions with available classifications . 91
Table 3.4: Identified long range interactions with putative mouse Runx1 regulatory
regions. ........................................................................................................................... 94
Table 3.5: Analysed ENCODE annotations ................................................................. 101
Table 3.6: Conservation and annotations of previously identified Runx1 regulators ... 101
Table 3.7: Cell types with regulatory region RNA expression .................................... 105
Table 3.8: SNP analysis of previously identified Runx1 regulators ............................. 107
Table 3.9: Spread of 237 Runx1 regulatory region mutations that were found in ICGC
dataset represented in a range of primary tissue sites. .................................................. 112
xxii
Table 3.10: Conservation and annotations of novel Runx1 regulators ......................... 122
Table 3.11: SNP analysis of novel m-371 enhancer ..................................................... 123
Table 4.1: Conservation and annotations of RUNX1 +24 ............................................ 133
Table 4.2: Type and name of genes that interact with RUNX1 +24 ............................. 153
Table 4.3: Name of genes that interact with Runx1 +24 in HPC7s .............................. 154
Table 4.4: Annotations of identified putative regulatory region connections .............. 157
Table 4.5: Annotations of identified trans interactions ................................................ 158
Table 5.1: Annotations of identified putative regulatory region connections .............. 176
Table 5.2: Number of genes connected to RUNX1 +24 in WT cells ............................ 177
Table 5.3: Number of genes connected to RUNX1 +24 in WT cells ............................ 197
Table 6.1: Summary of conserved RUNX1 regulatory region analysis ........................ 215
Appendix III Table.1: Details of the primers used in this project ............................... 269
Appendix VII Table 1: Hg38 Genome coordinates for regulatory regions ................. 287
Appendix VIII Table 1: Read counts before and after primer demultiplexing ........... 288
Appendix IX Table 1: WT 12 DMSO cis interactions ................................................. 290
Appendix IX Table 2: WT 12 DMSO near-bait interactions ....................................... 292
Appendix XI Table 1: Differentially decreased cis interactions in WT 12 h PMA cells
compared to WT 12 h DMSO K562 cells .................................................................... 301
Appendix XI Table 2: Differentially decreased cis interactions in WT 72 h PMA cells
compared to WT 12 h DMSO K562 cells .................................................................... 301
Appendix XI Table 3: Differentially decreased cis interactions in STAG2 12h DMSO
cells compared to WT 12h DMSO K562 cells ............................................................. 302
Appendix XI Table 4: Differentially decreased cis interactions in STAG2 12 h PMA cells
compared to WT 12 h PMA K562 cells ....................................................................... 303

xxiii
Appendix XI Table 5: Differentially decreased cis interactions in STAG2 72 h PMA cells
compared to WT 72 h PMA K562 cells ....................................................................... 303
Appendix XII Table 1: Differentially connected near-bait interactions in WT 12 h PMA
cells compared to WT 12 h DMSO K562 cells ............................................................ 305
Appendix XII Table 2: Differentially connected near-bait interactions in WT 72 h PMA
cells compared to WT 12 h DMSO K562 cells ............................................................ 305
Appendix XII Table 3: Differentially connected near-bait interactions in STAG2 12 h
DMSO cells compared to WT 12 h DMSO K562 cells ............................................... 307
Appendix XII Table 4: Differentially connected near-bait interactions in STAG2 12 h
PMA cells compared to WT 12 h PMA K562 cells ..................................................... 316
Appendix XII Table 5: Differentially connected near-bait interactions in STAG2 72 h
PMA cells compared to WT 72 h PMA K562 cells ..................................................... 316
Appendix XIII Table 1: List of gene connecting to RUNX1 +24 connections in each
condition ....................................................................................................................... 321
Appendix XIV Table 1: Differential cis interactions in STAG2 72 h PMA cells compared
to STAG2 12 h DMSO K562 cells ............................................................................... 327
Appendix XIV Table 2: Differential near-bait interactions in STAG2 72 h PMA cells
compared to STAG2 12 h DMSO K562 cells .............................................................. 336

xxiv
List of symbols and abbreviations
°C Degrees Celsius 3C Chromosome Conformation Capture 3D Three-dimensional 4C Circularised Chromosome Conformation Capture 4C-seq 4C Sequencing 5C Chromosome Conformation Capture Carbon Copy AGM Aorta-Gonad Mesonephros AML Acute Myeloid Leukaemia
AML1 Acute Myeloid Leukemia 1 Protein
ANOVA One-Way Analysis of Variance
ATAC-seq Assay for Transposase-Accessible Chromatin Using Sequencing
ATP Adenosine Triphosphate
BET Bromodomain And Extra-Terminal Motif
BLAT Blast-Like Alignment Tool
bp Base Pair
BS Binding Sites
CAGE Cap-Analysis Gene Expression
CD Circular Dichroism
cDNA Complementary DNA
ChIA-PET Chromatin Interaction Analysis Using Paired-End Sequencing
ChIP Chromatin Immunoprecipitation
ChIP-seq Chromatin Immunoprecipitation and Sequencing
chr Chromosome
ChromHMM Chromatin State Predictions
CML Chronic Myelogenous Leukaemia
CMML Chronic Myelomonocytic Leukaemia
CRE cis-Regulatory Element
CTCF CCCTC Binding Factor

xxv
DA Dorsal Aorta
DMEM Dulbecco’s Modified Eagle’s Medium
DMSO Dimethyl Sulfoxide
DNA Deoxyribonucleic Acid
DNase I HS Dnase I Hypersensitive Sites
DNase-seq Dnase I Hypersensitive Sites Sequencing
dpf Days Post Fertilisation
DS-AMKL Down’s Syndrome Acute Megakaryoblastic Leukaemia
dsDNA Double-Stranded DNA ENCODE Encyclopedia of DNA Elements eQTL Expression Quantitative Trait Locus E. coli Escherichia coli eRNA Enhancer RNA FACs Fluorescence-Activated Cell Sorting FBS Fetal Bovine Serum FISH Fluorescent In Situ Hybridization FPD Familial Platelet Disorder G4 G-Quadruplex GFP Green Fluorescent Protein GTEx Genotype-Tissue Expression GWAS Genome-Wide Association Studies h hours H3K27ac Histone H3 Lysine 27 Acetylation H3K27me3 Histone H3 Lysine 27 Trimethylation H3K36me1 Histone H3 Lysine 36 Monomethylation H3K4me1 Histone H3 Lysine 4 Monomethylation H3K4me2 Histone H3 Lysine 4 Dimethylation H3K4me3 Histone H3 Lysine 4 Trimethylation H3K9ac Histone H3 Lysine 9 Acetylation HE Hemogenic Endothelium Hi-C Genome-Wide Chromatin Conformation Capture HL-60 Human Myelocytic Leukaemia Cell Line HPC7 Mouse Haematopoietic Progenitor Cells hpf Hours Post Fertilisation HS Hypersensitivity Sites HSCs Haematopoietic Stem Cells HSPC Hematopoietic Stem/Progenitor Cells IAC Intra -Arterial Clusters ICGC International Cancer Genome Consortium ICM Inner Cell Mass IMDM Isocove’s Modified Dulbecco’s Media INS Insulator Assay Vector inv Inversion of Chromosome

xxvi
K562 Chronic Myelogeneous Leukaemia Cells kb Kilobase L Litre LB Luria Broth LD Linkage Disequilibrium lncRNA Long Non-Coding RNA LPA Linear Polyacrylamide m Mouse MAF Minor Allele Frequency mb Megabase MDS Myelodysplastic Syndrome µg Microgram mg Milligram µL Microlitre mL Millilitre mm Micrometre mM Millimolar MPN Myeloproliferative Neoplasms mRNA Messenger Ribonucleic Acid µS Microsiemens MTG Monothiolglycerol ng Nanogram NIH/3T3 Mouse Embryonic Fibroblast Cells nl Nanolitre Registered Trademark Unregistered Trademark P Passage P1 Promoter 1 P2 Promoter 2 P3 Promoter 3 PBS Phosphate Buffered Saline pc Post Conception pCarA Cardiac Actin Promoter PCR Polymerase Chain Reaction pf Post Fertilisation PMA Phorbol 12- Myristate 13-Acetate PRC2 Polycomb Repressive Complex 2 PRO-seq Precision Run-On Sequencing PS Penicillin Streptomycin QC Quality Control qRT-PCR Quantitative Reverse-Transcriptase PCR R3C RNA‐Guided Chromatin Conformation Capture RACE Rapid Amplification Of cDNA Ends RE Restriction Enzyme RFP Red Fluorescent Protein RLU Relative Luciferase Units RNA Ribonucleic Acid RNA Pol II RNA Polymerase II RNA-seq Rpm Revolutions Per Minute

xxvii
Runx Runt-Related Runx1 Runt-Related Transcription Factor 1 Runx2 Runt-Related Transcription Factor 2 Runx3 Runt-Related Transcription Factor 3 S.E.M Standard Error of Mean SAM Sequence Alignment/Map sc Single Cell SCF Stem Cell Factor SDS Sodium Dodecyl Sulfate SELEX Systematic Evolution of Ligands By Exponential Enrichment SINE Short Interspersed Element siRNA Small Interfering RNA SNP Single Nucleotide Polymorphism t Translocation of Chromosome TAD Topologically Associated Domain TCGA The Cancer Genome Atlas TFBS Transcription Factor Binding Sites TFs Transcription Factors TL Tübingen long fin TSS Transcriptional Site Start UCSC University Of California, Santa Cruz UV Ultraviolet V Volt v/v Volume Per Volume WT Wild Type ZED Zebrafish Enhancer Detector

xxviii
Nomenclature
Specific gene and protein nomenclature applied to each species. All the gene
names are italicised, while protein names are not.
Species Gene Protein Zebrafish runx1 runx1 Mouse Runx1 Runx1 Human RUNX1 RUNX1 Multiple species Runx1 Runx1
xxix
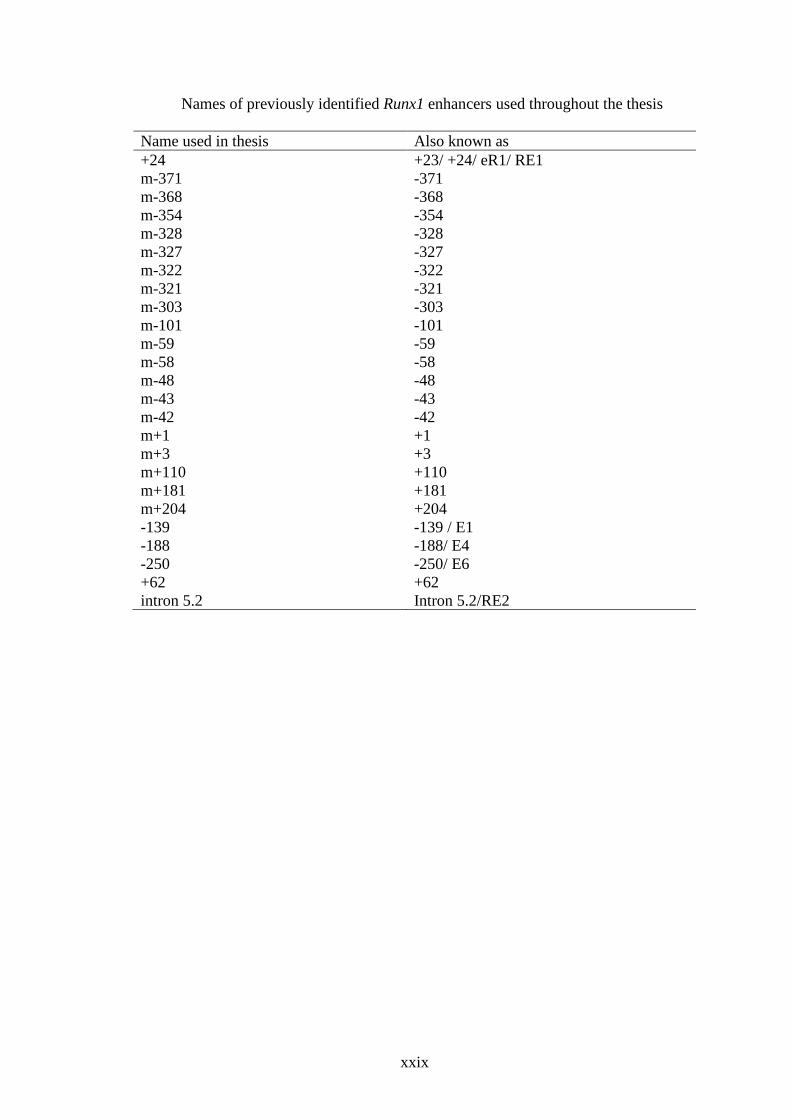
Names of previously identified Runx1 enhancers used throughout the thesis
Name used in thesis Also known as +24 +23/ +24/ eR1/ RE1 m-371 -371 m-368 -368 m-354 -354 m-328 -328 m-327 -327 m-322 -322 m-321 -321 m-303 -303 m-101 -101 m-59 -59 m-58 -58 m-48 -48 m-43 -43 m-42 -42 m+1 +1 m+3 +3 m+110 +110 m+181 +181 m+204 +204 -139 -139 / E1 -188 -188/ E4 -250 -250/ E6 +62 +62 intron 5.2 Intron 5.2/RE2

1
1 Chapter 1: Introduction
1.1 Haematopoiesis
Haematopoiesis is the formation, development and differentiation of all the blood
cellular components, and is fundamentally conserved throughout vertebrate evolution
(Davidson et al., 2004). Haematopoietic stem cells (HSCs) are the source of all blood cells that
are required throughout the lifetime of an organism. HSCs are capable of self-renewal and
differentiation into progenitor cells, which generate specialised haematopoietic cell lineages
(Dobrzycki et al., 2020). Haematopoiesis begins in the early stages of embryo development
(primitive) and carries on into adulthood (definitive) to maintain a steady supply of
haematopoietic cells over the lifespan of an organism (Orkin et al., 2008).
Correct spatiotemporal transcription of haematopoietic genes is essential in the
initiation of embryonic haematopoiesis, as well as in the maintenance of haematopoiesis in
adults (Dobrzycki et al., 2020). Combinations of regulatory factors (transcription factors,
enhancers, mediators, cohesins, insulators, silencers) help coordinate differentiation,
proliferation, ensure survival of haematopoietic cells, and maintain correct levels of
haematopoietic gene expression throughout life (Peng et al., 2018). Misexpression of crucial
haematopoietic genes can lead to failure to produce HSCs, or haematopoietic disorders that can
lead to leukaemia (Wilson et al., 2011). Therefore, understanding the drivers of normal
haematopoiesis can provide opportunities for intervention when haematopoiesis is
dysregulated.
1.1.1 Primitive and definitive haematopoiesis
In vertebrate embryos, haematopoiesis occurs in two sequential waves: “primitive” and
“definitive” (Orkin et al., 2008). Each wave occurs in anatomically distinct locations that vary
throughout development (Figure 1.1). The initial wave, known as primitive haematopoiesis,

2
specifies endothelial to haematopoietic precursors and takes place in the mammalian yolk sac
(Figure 1.1A) (Davidson et al., 2004; Dzierzak et al., 1998; Ivanovs et al., 2017; Julien et al.,
2016). The primary function of this wave is the production of red blood cells (erythrocytes),
which enable tissue oxygenation as the embryo undergoes rapid growth (Orkin et al., 2008).
The primitive wave is transient and rapidly superseded by the adult-type definitive
haematopoiesis. Definitive haematopoiesis produces multilineage self-renewing HSCs and
allows for the life-long production of all blood cells (Ciau-Uitz et al., 2014) (Figure 1.2). HSC
specification begins in cells from an endothelial precursor, termed the hemogenic endothelium
(HE) (Figure 1.2) (Bonkhofer et al., 2019; Gritz et al., 2016). Expression of the haematopoietic
gene Runx1 defines the distinct HE population (Gritz et al., 2016; Kalev-Zylinska et al., 2002).
These cells appear from HE in the aorta-gonad-mesonephros (AGM) region, then subsequently
colonise the fetal liver (Figure 1.1B) (Bonkhofer et al., 2019; Gritz et al., 2016). Finally, the
permanent location for HSCs to seed is in the bone marrow (Figure 1.1C) (Julien et al., 2016;
Martin et al., 2011). In mammals, initial production of B- and T- lymphocytes occurs in bone
marrow, and then cells migrate to other sites to complete development (Germain, 2002; Loder
et al., 1999) (Figure 1.1C).

3
Figure 1.1: Schematic of haematopoiesis cell generation locations during human development.
A) Primitive haematopoiesis occurs in the yolk sac blood island (blue) 16-17 days post conception (pc). B) Definitive haematopoiesis begins first in the Aorta-gonad-mesonephros (purple) 4 weeks pc, then in the foetal liver (orange) 5 weeks pc. C) Bone marrow (pink) is the lifelong source of adult definitive haematopoiesis from 12 weeks pc. The thymus (yellow) is the site of T lymphocyte development, whereas the spleen (brown) develops B lymphocytes. Figure is from Thomas (2015).
HSCs are required throughout an organism’s life to replenish precursors of multiple
lineages, as mature haematopoietic cells are predominantly short lived (Orkin et al., 2008).
HSCs must self-renew to maintain their own population, as well as produce differentiated blood
cells. In adult humans (Homo sapiens) and mice (Mus musculus), a limited number of HSCs
reside in the bone marrow and commence the cascade of cell differentiation (Albacker et al.,
2009). HSCs are at the root of progenitor cells which gradually produce mature haematopoietic
cells; this haematopoietic model is described as a multi-step process with cells becoming more
lineage-specific at each step (Figure 1.2). In this model, self-renewing HSCs, at the top give
rise to common progenitors/stem cells for the myeloid and lymphoid lineages. Following this
first step in lineage-restriction, myeloid stem cells give rise to proerythroblasts,

4
megakaryoblasts, myeloblasts and monoblasts; lymphoid stem cells, on the other hand, give
rise to B- and T- lymphocytes and large granular lymphocytes (Orkin et al., 2008).
Proerythroblasts differentiate into erythrocytes, these cells contain haemoglobin and
transporting oxygen from the lungs to different sites of the body. Erythrocytes make up 40-
45% of blood volume (Popel, 1989).
White blood cells or leukocytes are generated from both myeloid and lymphoid cell
types and contribute about ~1% of blood volume. Leukocytes are crucial in protection against
infection as they form the major part of the innate immune system (Lay et al., 1968; Trinchieri,
1989). Megakaryoblasts produce megakaryocytes and platelets; during thrombopoiesis,
megakaryocytes break into fragments to make platelets. Platelets are fundamental to blood
coagulation and wound healing (Opneja et al., 2019). Myeloblasts generate granulocytes;
basophils, neutrophils and eosinophils. Neutrophils are transient immediate-responders to
general infection, while basophils and eosinophils are predominantly connected to allergies
and inflammation (Ginhoux et al., 2014; van Furth et al., 1972). Monoblasts differentiate into
circulating monocytes and tissue-resident macrophages (Ginhoux et al., 2014; van Furth et al.,
1972).
Lymphoid derived T-lymphocytes and B-lymphocytes are crucial to adaptive
immunity. Large granular lymphocytes are innate cytotoxic cells that target cells that are virally
infected or cancerous; they target these compromised cells through the occurrence of
immunoglobulin or major histocompatibility complex class 1 receptors (Lay et al., 1968;
Trinchieri, 1989).

5
Figure 1.2: Vertebrate primitive and definitive haematopoiesis cell development pathways.
Primitive haematopoiesis is the initial wave of blood production which is transient and rapidly replaced by the adult-type definitive haematopoiesis (Highlighted in grey). Definitive haematopoiesis is the life-long production of all blood cells. Haematopoietic stem cells reside in the bone marrow in adult mammals and yield blood precursors devoted to unilineage differentiation and production of mature blood cells. HSCs are also capable of self-renewal.
1.1.2 Transcription factors involved in haematopoiesis
It is well established that a number of transcription factors are required to regulate the
fate determination of haematopoietic stem cell populations. These transcription factors include

6
(but are not limited to) Tal1, Runx1, Gata1, Gata2, Lmo2, Spi1, Notch and c-Myb in most
vertebrates (Okuda et al., 2001).
Primitive haematopoiesis is principally regulated by two factors; Gata1 (erythroid) and
Spi1 (myeloid) (Cantor et al., 2002). Mesodermal haematopoietic cell-fate specification is
facilitated by the basic-helix-loop-helix factors (Tal1 and Lmo2) in both haematopoietic waves
(Kim et al., 2007).
Erg and Gata2 are required for HSC survival and self-renewal (Ezoe et al., 2002;
Taoudi et al., 2011). Maintenance of HSCs is also co-ordinated through Notch, Wnt and Hox
signalling pathway factors. Runx1 is crucial for making HSCs in the AGM and subsequently
in definitive haematopoiesis Runx1 protein is required for correct megakaryocyte and
lymphocyte production (Ichikawa et al., 2004; North et al., 1999; North et al., 2004).
Dysregulation of normal haematopoiesis leads to a diverse range of diseases collectively called
haematological malignancies.
1.2 Haematological disorders
Misexpression of transcription factors can lead to failure to produce HSCs, or
haematopoietic disorders that can lead to leukaemia (Dobrzycki et al., 2020). There are many
different types of haematological disorders; including chromic myeloid leukaemia (CML),
acute myeloid leukaemia, familial platelet disorder, B- or T- cell lymphoblastic leukaemia.
This thesis will focus on myeloid dysplasias (acute myeloid leukaemia and familial platelet
disorder) as RUNX1 has a central role in disease progression.
Disruption of Runx1 leads to the complete loss of definitive haematopoiesis in all
lineages (Kalev-Zylinska et al., 2002; Okuda et al., 1996; Wang et al., 1996). Somatic
mutations in the RUNX1 gene are one of the most frequent mutations identified in the patients
with myeloid malignancies (Harada et al., 2005; Harada et al., 2009; Hayashi et al., 2017).
RUNX1 (runt-related transcription factor 1) is also known as AML1 (acute myeloid leukaemia

7
1 protein), as it was initially cloned from a chromosomal breakpoint normally associated with
acute myeloid leukaemia (Meyers et al., 1993; Miyoshi et al., 1991; Okuda et al., 2001).
RUNX1 mutations can result in familial platelet disorder, an inheritable blood disease, which
predisposes individuals to acute myeloid leukaemia (Ito et al., 2015).
1.2.1 Familial platelet disorder
Familial platelet disorder (FPD) is characterised by inherited platelet defects caused by
germline mutations in RUNX1 (Luddy et al., 1978; Song et al., 1999). Clinically, patients
present with mild to moderate thrombocytopenia, platelet dysfunction, bleeding, and an
increased predisposition of developing acute myeloid leukaemia (around a 35% of patients)
(Owen et al., 2008). Many RUNX1 variants are reported only in individual families; more than
70 families with inherited RUNX1 mutations have been identified (Sood et al., 2017). FPD can
almost exclusively be attributed to RUNX1 mutation or downregulation. RUNX1 mutations in
FPD generate null, hypomorphic, or dominant-negative alleles (Churpek et al., 2015; Krutein
et al., 2021; Latger-Cannard et al., 2016; Matheny et al., 2007; Song et al., 1999).
1.2.2 Acute Myeloid Leukaemia
Leukaemia is a common name given to cancers that develop in the bone marrow and
blood cells. Leukaemia occurs due to the dysregulation of a normal cell, which then enables
one cell type to proliferate in excess. Leukaemia is normally classified according to the original
cell lineage in which the cancer occurs. i.e., myeloid or lymphoid (Figure 1.2). The leukaemia
is further distinguished into two types: acute leukaemia, which progresses at a fast pace and
chronic leukaemia, which develops over a longer time period (Teittinen et al., 2012).
Therefore, Acute myeloid leukaemia (AML) is a fast developing leukaemia, which
occurs in the myeloid cell lineage. Whilst found predominantly in individuals over 65, 15-20%
of AML cases occur in childhood. (O'Donnell et al., 2012).

8
Chromosomal abnormalities such as t(9;21), t(9;11), t(8;21), inv(16), t(15;17) are
clinically distinctive in AMLs and indicate a genetic basis to leukemogenesis. However, major
chromosome abnormalities only describe 45% of AML cases (Betz et al., 2010). Unlike other
adult cancers, AML genomes have fewer somatic mutations, with a total of 23 genes
significantly mutated (CGARN, 2013). Molecular classification of AMLs can offer prognostic
information (Betz et al., 2010). Somatic driver mutations in genes have been identified in ~
80% of patients across various myeloid malignancies subtypes (Shallis et al., 2018). Within
the myeloid malignancies, a median of three somatic mutations per patient was observed
(Shallis et al., 2018). Several studies have detected at least one driver gene mutation in AML
patients (86%) (Bullinger et al., 2010; CGARN, 2013; Hou et al., 2020a; Papaemmanuil et al.,
2016; Yu et al., 2020). RUNX1 and other mutations (TP53, EZH2, ETV6, ASXL1, SRSF2)
predict poor overall survival (Yu et al., 2020). The prognostic significance of these mutations
appears to be maintained irrespective of whether these mutations are early or late events in
disease progression (Yu et al., 2020).Understanding the mutational profile of malignant cells,
helps define which treatments will be successful and the likelihood of relapse or achieving
remission (Assi et al., 2019; Conway O’Brien et al., 2014; Papaemmanuil et al., 2016; Shallis
et al., 2018; Tyner et al., 2018).
1.2.3 Leukaemogenesis
Gilliland et al., 2002 suggested a conventional model of leukaemogenesis, in which
they proposed that two different types of genetic mutations were necessary for malignant
transformation of the myeloid precursor (Gilliland et al., 2002; Jordan, 2002). Class I mutations
are understood to lead to unrestrained cellular proliferation and evasion of apoptosis, whereas
Class II mutations are associated with preventing differentiation. It is therefore suggested that
alone, Class I mutations lead to myeloproliferative diseases, however Class II mutations lead
to the development of myelodysplastic syndromes (Conway O’Brien et al., 2014).

9
Mutations in epigenetic modifier genes including DNA methylation and histone
modification have been found in a significant proportion of AML (Jaiswal et al., 2019; Shih et
al., 2012); these mutations do not fit into Class I or II. It is also been proposed that mutations
have to occur at a particular time in cell development and in a certain order to progress to
leukaemia (Murati et al., 2012). This evidence indicates that Gilliland’s conventional model is
an oversimplification of a more complex process. Each novel mutation and its potential roles
need to be thoroughly evaluated so that updated models of AML development can be defined.
As healthy individuals age, the haematopoietic cells become burdened with mutations
typically seen in AML patients (Young et al., 2016; Zink et al., 2017). Abnormal and excessive
growth of myeloid cells (myeloid neoplasms) develop due to a gradual gain of somatic
mutations in haematopoietic cells (Kim et al., 2016). Expansion of these myeloid neoplasms
may lead to a pre-leukaemic state. Pre-leukaemic clones are dynamic and can have several
founder mutations (Kim et al., 2016); even after treatment, these mutations can persist through
to complete remission and then lead to relapse with additional secondary mutations (Shlush et
al., 2014).
Founder haematopoietic mutations are largely characterised by mutations in genes
related to epigenetic control of the genome; these mutations are frequently observed in pre-
leukaemic clones (Desai et al., 2018). Chromatin and RNA splicing-associated factor
mutations can arise later, or alongside epigenetic gene mutations. Additionally, mutations in
transcription factors, and genes encoding signalling proteins occur as late events leading to
AML transformation (Papaemmanuil et al., 2016). Desai et al., (2018) studied 188 patients and
revealed mutations in epigenetic genes and splicing factors were evident up to 9.6 years before
AML onset; however, mutations in transcription factors were found to be late events tied to the
onset of AML (Desai et al., 2018). Therefore, AML is characterised by combinatorial
mutations that are attained in a hierarchical manner.

10
1.2.4 AML patient survival and treatment
The genetic and epigenetic profile of malignant cells influences the threat of relapse
and the likelihood of achieving remission (Conway O’Brien et al., 2014). Despite the high
variability in AML subtypes, the outcome for most is unfavourable. Patients aged 60 and under
achieve a remission with chemotherapy in approximately 70-80% of cases, whereas for those
over 60 it is 50% chance of remission (Bower et al., 2016; Burnett et al., 2011; Sweeney et al.,
2019). Despite achieving remission, without ongoing treatment most patients subsequently
relapse, typically within 6 months, and relapse is coupled with poor prognosis (Goyal et al.,
2016; Sweeney et al., 2019)
A small number of therapies targeted to mutational events have been developed for
patients with AML, although the current standard of care remains largely unchanged over the
past 30–40 years (Tyner et al., 2018). Rigorous chemotherapy is the conventional treatment
for AML and depending on the cancer’s genetic profile, bone marrow transplantation may also
be used (Ferrara et al., 2008). The combination of cytotoxic chemotherapy drugs used varies
depending on the patient’s age and karyotype (Ferrara et al., 2013). Chemotherapy drugs are
designed to target proliferating cells; however, other cells rapidly divide including those in
bone marrow, gastrointestinal mucosa, hair follicles and gonads, which results in adverse side
effects (Corrie, 2008).
Advanced age in most patients affects their ability to survive the side effects of
chemotherapy (Ferrara et al., 2008). In addition to improved antibiotic, antifungal, and antiviral
drugs to reduce infections, developments to improve supportive care include high quality
platelet transfusions and elimination of post transfusion hepatitis (Ferrara et al., 2013).
Increased understanding of the different disease mechanisms may detect potential therapeutic
targets and refine treatment strategies, and consequently improve survival rates.

11
Some targeted therapies for leukaemias exist, such as imatinib mesylate (Gleevec),
which is a very efficient treatments of Philadelphia chromosome positive chronic myeloid
leukemia (Kantarjian et al., 2002a; Kantarjian et al., 2002b). AML treatment has expanded to
include inhibitors for gene mutation-targeted therapies. For example, patients with FLT3-ITD–
mutated AML who were treated with FLT3-inhibitor therapy at diagnosis have demonstrated
significant survival benefit (Daver et al., 2015; DiNardo et al., 2016; Röllig et al., 2015; Stein,
2015; Stone et al., 2015).
AML with mutated transcription factor RUNX1, is considered a biologically distinct
subgroup due to its distinctive clinico-pathologic features and inferior prognosis (Gaidzik et
al., 2016). Currently no targeted or specific therapeutic options exist for RUNX1-mutated
patients, or patients with other high-risk genetic lesions such as chromatin-spliceosome
(including cohesin subunits) mutations, TP53 mutations, or complex cytogenetics (DiNardo et
al., 2016).
Papammanuil et al., (2016) found that 4% of AML patients sequenced contained no
driver mutations (Papaemmanuil et al., 2016). The molecular events that cause the
development and pathology of this leukaemia have so far not been completely defined.
Difficulties arise for clinicians when providing prognoses to AML patients without well-known
mutations. Changes to the known leukaemia genes by mutation in non-coding regulatory
regions, which could alter gene regulation; rather than mutations in protein-coding sequence,
may explain why not all instances of leukaemia harbour mutations in known genes. The cell-
fate of haematopoietic cells from a common progenitor relies upon the differential expression
of key haematopoietic genes. Mutations in these key genes, such as RUNX1, or changes to gene
regulation, could consequently alter normal blood development, and lead to the development
of leukaemia.

12
1.2.5 Cohesin mutation contributes to AML
Cohesin is a chromosome-associated multiprotein ring complex made up of four major
subunits: two structural maintenance subunits, Smc1a and Smc3, which form a closed ring
together with Rad21 and Stag1 or Stag2 (Figure 1.3) (Costantino et al., 2020; Feeney et al.,
2010; Gruber et al., 2003; Nasmyth et al., 2009).This multi-subunit protein complex was
originally characterised for its crucial role in sister chromatid cohesion, as it ensures accurate
sister chromatid segregation during mitosis (Downes et al., 1991; Michaelis et al., 1997).
Cohesin also plays a role in DNA double strand break repair, chromatin loop extrusion and
regulation of gene expression. Complete loss of cohesin function stops mitosis and thus results
in cell death. Reductions in cohesin functions alters the development of multiple organ systems
in humans, indicating that the correct expression of developmental genes are sensitive to
cohesin dosage (Cuartero et al., 2018b; Deardorff et al., 2020).
Somatic mutations to cohesin subunits are typically heterozygous, mutually exclusive,
and result in loss of function (17% frameshift, 70% missense)(CGARN, 2013). Mutations in
RAD21, SMC3, and STAG1 subunits are always heterozygous, whereas mutations in the X
chromosome-located genes SMC1A and STAG2 can result in complete loss of function due to
male hemizygosity, or wild-type silencing during X-inactivation in females (Kon et al., 2013;
Thota et al., 2014; Tsai et al., 2017). STAG2 and STAG1 have redundant roles in cell division,
therefore complete loss of STAG2 is tolerated due to partial compensation by STAG1 (Tsai et
al., 2017) Nevertheless, STAG1 and STAG2 have non-redundant roles in facilitating three-
dimensional (3D) genome organisation (Kojic et al., 2018). Combined loss of both STAG2 and
STAG1 is lethal to cells (Benedetti et al., 2017; Van Der Lelij et al., 2017).
Cohesin proteins are mutated, have reduced function, or are overexpressed in multiple
cancer types including brain, breast, prostate, bladder, pancreatic, colorectal, Ewing sarcoma,
and myeloid leukaemia (Balbás-Martínez et al., 2013; Brennan et al., 2013; Brohl et al., 2014;

13
Evers et al., 2014; Guo et al., 2013; Jones et al., 2012; Rhodes et al., 2011; Solomon et al.,
2013; Stephens et al., 2012; Taylor et al., 2014; Welch et al., 2012). STAG2 is one of 12 genes
that is mutated at significant frequencies in at least four different tumour types (Lawrence et
al., 2014).
Figure 1.3: Structure of cohesin complex.
Smc1 (blue), Smc3 (purple), Rad21 (pink) and Stag1 or Stag2 (yellow) form a tripartite ring. Figure is from Thomas (2015).
Multiple studies observed cohesin mutations in myeloid malignancies, providing
evidence of a role for cohesin in pathogenesis (Au et al., 2016; CGARN, 2013; Kon et al.,
2013; Leeke et al., 2014; Lindsley et al., 2015; Papaemmanuil et al., 2016; Rocquain et al.,
2010; Ruffalo et al., 2015; Thol et al., 2014; Wang et al., 2016; Welch et al., 2012; Welch et
al., 2016). Cohesin insufficiency has been shown to impair differentiation and alter overall
chromatin accessibility, as well as the transcription of RUNX1 (Mazumdar et al., 2015;
Mullenders et al., 2015; Viny et al., 2015).
Cohesin mutant AML is rarely aneuploid, with over half of AML patients exhibiting a
normal karyotype, demonstrating that mitotic defects are not likely to be involved in

14
leukemogenesis (Kon et al., 2013). AML patients with cohesin mutations do not typically have
a higher observed presence of chromosomal translocations (Fisher et al., 2017a; Heimbruch et
al., 2021). Except RAD21 mutations, which have been reported to co-occur with t(8:21) in
AML patients (Tsai et al., 2017; Wilde et al., 2019),
Deep sequencing established that mutations in subunits or regulators of the cohesin
complex occur in 20% of AML samples (CGARN, 2013; Fisher et al., 2017a; Heimbruch et
al., 2021; Leeke et al., 2014; Losada, 2014). Somatic cohesin defects are found in 12% of
myeloid malignancy patients and a further 15% of patients had low cohesin expression (Thota
et al., 2014). Previous research has highlighted that cohesin mutations occur early in
leukaemogenesis and mainly arise in pre-leukaemic cells (CGARN, 2013; Corces et al., 2017;
Kon et al., 2013; Thol et al., 2014; Welch et al., 2012).
Mutations in cohesin subunits occur in other myeloid malignancies, including
myelodysplastic syndrome (MDS), Down Syndrome acute megakaryoblastic leukaemia (DS-
AMKL), myeloproliferative neoplasms (MPN), chronic myelogenous leukaemia (CML), and
chronic myelomonocytic leukaemia (CMML) (Kon et al., 2013; Thota et al., 2014; Yoshida et
al., 2013). Cohesin mutations are recurrent in myeloid malignancies but not in lymphoid
malignancies, consistant with evidence showing cohesin-deficient cells have myeloid-skewed
differentiation(Chen et al., 2019; Cuartero et al., 2018b; Viny et al., 2019). Cohesin mutated
myeloid leukaemia cells have reduced levels of chromatin-bound cohesin components,
implying a loss of function mechanism (Kon et al., 2013). Cohesin mutations found in patients
are mutually exclusive, illustrating that a mutation in just one member of the complex is
sufficient to decrease cohesin activity (Kon et al., 2013; Thota et al., 2014). Patients with
cohesin mutations have a lower 5 year survival rate of 20% when compared to cohesin-WT
AML patients (48%) (Heimbruch et al., 2021). Cohesin mutations co-occur with other
leukaemogenic mutations, indicating cooperation between pathways (Welch et al., 2012).
15
Cohesin mutations have been shown to impair the differentiation of HSPCs in humans
and mice (Mazumdar et al., 2015; Mullenders et al., 2015; Viny et al., 2019; Viny et al., 2015).
Stag2 deletion in HSPCs had altered hematopoietic function, increased self-renewal, and
impaired differentiation. (Viny et al., 2019). Typically increased inflammatory signals in
HSPCs promotes myeloid differentiation. Chen et al., (2019) demonstrated that HSPCs with
impaired cohesin function had reduced inflammatory gene expression and increased resistance
to the differentiation inducing inflammation stimuli (Chen et al., 2019). STAG2 is frequently
mutated in myeloid malignancies and shows co-mutation patterns with other drivers, including
RUNX1. Combined loss of Runx1 and Stag2 leads to myeloid-skewed expansion of HSPC and
MDS in mice (Ochi et al., 2020). Concurrent loss of Stag1 and Stag2 in HSPCs is lethal to
cells. Alone, Stag2 loss decreases the chromatin accessibility and differentiation gene
transcription (Viny et al., 2019). Cohesin subunits have dose-dependent consequences which
alter chromatin structure and HSC function in mice (Viny et al., 2015). Complete loss of Smc3
induced bone marrow aplasia and mitotic defects, whereas Smc3 haploinsufficiency reduced
transcriptional capacity (Viny et al., 2015). Haploinsufficiency of Smc3 increased self-renewal
of cells and when combined with Flt3-ITD mutation could induce acute leukaemia in mice
(Viny et al., 2015). Chin et al., (2020) highlighted that cohesin mutations are synthetic lethal
with Wnt pathway stimulation, and suggested that cohesin mutant cells could progress to
oncogenesis by enhancing their Wnt signaling (Chin et al., 2020). Depletion of Rad21
enhanced self renewal in HSPCs by derepression of Polycomb Repressive Complex 2 (PRC2)
target genes (Fisher et al., 2017b). Fisher et al., (2017) showcased that cohesin function is
crucial for proper PRC2 complex mediated gene silencing, and dysregulation of this epigenetic
mechanism may underly leukemogenesis in AML patients with cohesin mutations (Fisher et
al., 2017b).

16
Together these studies provide evidence that cohesin mutations are a causal event in
acute myeloid leukaemogenesis. Overall cohesin mutations are implicated as a putative genetic
precursor for development of AML, but how the disease develops from these mutations has
not been resolved. One possibility is that impairment of cohesin’s regulatory role leads to
dysregulation of other important leukaemogenic genes.
1.3 RUNX1 is a leukaemia gene
RUNX1 belongs to the family of Runx transcription factors (TFs), which are essential
for lineage-specific gene expression in major developmental pathways.
Runx genes encode transcription factor proteins defined by the highly-conserved Runt
DNA-binding domain (Figure 1.4). The conserved Runt domain is a fundamental functional
component of Runx proteins (Rennert et al., 2003). The Runt domain is required for DNA
binding and interacting with the conserved non-DNA-binding partner CBFβ (Figure 1.4). Runx
family members all have important roles during lineage-specifying steps in both embryonic
and adult developmental processes; they appear to be involved in cell quiescence, proliferation,
lineage commitment and cell-fate determination in mammals and invertebrates (Coffman,
2003, 2009; Groner et al., 2017).

17
Figure 1.4: The Runx protein.
The Runt domain (dark blue) of the Runx protein (blue) directs binding to the Runx DNA-motif (grey box) near the promoter of target genes (black right angled arrow). It also binds with core-binding factor-β (CBF-β) protein (purple). The Runx proteins either activate or repress gene transcription through interactions with other transcription factors (TFs)(Orange) and co-activators (arrows), or co-repressors (blocked line).
Runx1 is essential for definitive haematopoiesis (Levanon et al., 2004; Li et al., 2002).
Runx2 is crucial for osteoblast development and proper bone formation (Komori et al., 1997).
Runx3 is needed for the development of dorsal root ganglia proprioceptive neurons and proper
control of gastric epithelium growth (Levanon et al., 2002; Li et al., 2002). Because each Runx
protein has a particular biological function, mutations in Runx genes are often the cause for
specific diseases. RUNX1 mutations can cause FPD (Ito et al., 2015). Point mutations in the
runt domain of RUNX2 are reported in cleidocranial dysplasia, in which patients exhibit
skeletal deformities of the collarbone, teeth and cranium (Ito et al., 2015; Otto et al., 2002).
Point mutations of RUNX3 are associated with stomach and bladder cancers (Ito et al., 2015).
Each gene contains P1 (distal promoter) and P2 (proximal promoter) that generate
alternative Runx isoforms (Levanon et al., 2004; Rennert et al., 2003). A dual promoter
structure is a characteristic feature of vertebrate Runx genes, as invertebrates only have P2
(Rennert et al., 2003). Since all vertebrate Runx genes have this conserved dual promoter
structure, it is likely to be crucial for correct regulation (Rennert et al., 2003).

18
1.3.1 Role of RUNX1 in normal embryonic and adult developmental
processes
Runx1 expression is crucial in early myeloid differentiation, as well as playing an
essential role in adult blood development (Okuda et al., 2001). Runx1-/- mice fail to generate
haematopoietic cell clusters from the vessel wall and consequentially cannot generate
haematopoietic stem cells (HSCs), leading to mid-gestation lethality (Okuda et al., 1996;
Yokomizo et al., 2001). The Runx1 protein initiates transcription of genes that help control the
development of blood cells. In particular, it plays an important role in the development of
pluripotent haematopoietic stem cells that have the potential to develop into all types of mature
blood cells. (Ichikawa et al., 2004; North et al., 1999; North et al., 2004).
As well as haematopoiesis, RUNX1 plays a role in development of dorsal root ganglia,
cranial sensory neurons, myofibroblasts and mesenchymal stem cells, regulation of hair follicle
stem cells, mammary stem cells, gastric stem cells, neural crest stem cells, and some possible
roles in intestinal stem cells and oral epithelial stem cells (Groner et al., 2017; Inoue et al.,
2008; Kim et al., 2014; Kramer et al., 2006; Theriault et al., 2004).
1.3.2 Regulation of Runx1
The dual promoter structure of the Runx genes allows for many different isoforms of
the gene to be produced (Figure 1.5) (Levanon et al., 2004). The regulation machinery of these
genes and spatiotemporal regulation of Runx are poorly understood. It is possible that the
spatial-temporal regulation is driven by different 3D arrangements of the chromosome in
different cell types.
In mammals, the dual promoter structure of Runx1 allows for the transcription of at
least three diverse isoforms (Levanon et al., 2004). Transcription from P2 produces Runx1a
and Runx1b, whereas transcription from P1 generates Runx1c (Figure 1.5) (Bee et al., 2009b).
P1 and P2 expression alone is not consistent with Runx1 tissue specificity, suggesting

19
additional enhancer elements are required for correct initiation of runx1 (Marsman et al., 2014).
The 5’UTR of Runx1c is conserved between mammals and zebrafish, and may be important
for the regulation of Runx1 expression (Marsman et al., 2014). Lam et al., 2009 showed the
first exon of P1 transcript was not needed for definitive or primitive haematopoiesis in
zebrafish (Lam et al., 2009).
Expression of Runx1-P1 and-P2 isoforms is tightly controlled during haematopoiesis.
In early mouse haematopoiesis, before the generation of HSCs, expression of the P2 isoforms
are prominent (Bee et al., 2010; Pozner et al., 2007). Runx1-P1 is expressed shortly after P2,
its expression is co-ordinated with the generation of HSCs (Bee et al., 2009b; Bee et al., 2010).
The main isoform in the mouse fetal liver is P1 driven, the liver is the main site of definitive
HSPC development (Bee et al., 2009b).
Horsfield et al., 2007 showed that homozygote rad21 cohesin mutants lack cell type
specific expression of runx1 and runx3, highlighting that cohesin is necessary for correct runx
expression. Cohesin may provide an additional mechanism by which Runx expression can be
coordinated with cell cycle, allowing cell proliferation and differentiation (Horsfield et al.,
2007).

20
Figure 1.5: Comparative genomic organisation of the Runx1 locus in human, mouse and zebrafish.
The exons (grey) are numbered according to Marsman et al., (2014). Untranslated regions are shown as white boxes. Distances between promoters (black right-angled arrows) is indicated in kilobases (kb). Figure is from Thomas (2015).

21
1.3.3 Role of RUNX1 in AML progression
The developmental transcription factor RUNX1/AML1 has been identified as a classic
leukaemia gene (Okuda et al., 2001). Germline mutations to the Runt binding domain result in
FPD with patients having a predisposition to acute myelogenous leukaemia (Ito et al., 2015).
Disruptions such as truncations and translocations to RUNX1 are frequently associated with
AML (Betz et al., 2010; Tighe et al., 1993).
RUNX1 is important for the differentiation of cells of all haematopoietic lineages, and
there are two categories of genetic changes: translocations and somatic mutations (Bellissimo
et al., 2017). In AML, RUNX1 mutations that occur due to chromosomal translocations have a
favourable prognosis, compared to somatic mutations which are associated with a poorer
prognosis (Byrd et al., 2002; Grimwade et al., 1998; Schlenk et al., 2003).
RUNX1 is altered by chromosomal translocations; these disruptions can generate
oncogenic fusion proteins like RUNX1-ETO t(8;21) and ETV6-RUNX1 t(12;21) (Figure 1.6).
10-15% of all AML cases are characterised by the most common translocation t(8;21)
(Reikvam et al., 2011; Tighe et al., 1993). This translocation creates a chimeric gene of the 5'-
region of the RUNX1 gene fused with the 3'-region of the ETO gene (RUNX1-ETO) (Erickson
et al., 1992; Miyoshi et al., 1993). RUNX1-ETO protein is predicted to bind to several target
genes and dysregulate haematopoiesis which results in AML (Ajore et al., 2010; Gardini et al.,
2008). The breakpoints in characterised RUNX1 translocations are often downstream of the
Runt homology domain (De Braekeleer et al., 2011). ETV6-RUNX1 translocation is the most
frequent gene fusion (~25%) in paediatric acute lymphoblastic leukemia (ALL)(Sun et al.,
2017). It is important to note that RUNX1 changes can lead to AML as well as to ALL (Sood
et al., 2017). This is not often the case for other genes involved in haematological malignancies.
Translocations can also create truncated RUNX1 protein that interfere with the wildtype protein

22
product (Cheng et al., 2018). Chromosomal translocations in RUNX1 often result in
haematopoietic malignancies, though the molecular mechanisms are not often described.
Figure 1.6: RUNX1 gene common isoforms and leukaemic fusion isoforms.
The exons are depicted as grey and blue, the runt binding domain is blue. Untranslated regions are shown as white boxes. Distances between the two promoters P1 and P2 (black right angled arrows) is indicated in kilobases (kb). Straight arrows indicate common chromosomal breakpoints. Isoforms and common leukaemic fusion isoforms are depicted.
Cheng et al., 2018 characterised a translocation that disrupts a regulatory element
between RUNX1 P1 and P2. This regulatory element was shown to “normally” silence RUNX1
P2 (Cheng et al., 2018). They proposed that the translocation increased P2 transcription and
may activate P1 expression via a positive feedback loop (Cheng et al., 2018). RUNX1a isoform
is transcribed from P2 and its overexpression has been previously noted in AML (Liu et al.,
2009). RUNX1a overexpression has also been observed in patients with myelodysplastic

23
syndromes and myeloproliferative neoplasms; interestingly, levels of expression increased as
the disease progressed (Sakurai et al., 2017).
Studies have identified breakpoints in similar regions between the distal promoters in
cases of paediatric AML, B-lineage acute lymphoblastic leukaemia, and FPD (Buijs et al.,
2012; Cheng et al., 2018; Gandemer et al., 2007). The occurrence of DNA double strand breaks
which underpin translocations have been linked to 3D genome organisation (Cuartero et al.,
2018a).
Mutations are significantly associated with increasing age and higher platelet counts.
3% of paediatric and 15% of adult de novo AML patients have somatic RUNX1 point mutations
(Sood et al., 2017). Further mutations are usually required on top of RUNX1 alteration for the
progression to leukaemia (Asou, 2003). Molecular mechanisms for haematopoietic
malignancies include disruption of intron 1, which deregulates promoters and causes RUNX1
overexpression (Gandemer et al., 2007). Aberrant regulation of RUNX1 promoters was seen in
the human myeloid leukaemia (HL-60) cell line, implying that promoter dysregulation may
lead to leukaemogenesis (Marsman et al., 2014).
These previous studies indicate that progression to AML can occur by disruption of
RUNX1 regulation. This disruption can be a translocation which alters the genome structure or
somatic mutations which alter the RUNX1 transcription. Cheng et al., 2018 showcased that
dysregulation of regulatory elements can produce aberrant RUNX1 and progress
leukaemogenesis.
The 3D genome influences the regulation of genes at the transcriptional level
(Holwerda et al., 2012; Lieberman-Aiden et al., 2009). For instance, 3D folding of chromatin
provides a mechanism for distal enhancers to interact with target promoters (Deng et al., 2010).
In cases where no mutation is found in the coding sequence, instead there may be mutations in
regulatory sequences, such as enhancers (Ng et al., 2010).

24
1.4 Three-dimensional genome structure
Though the genome is often represented as linear in order to view the annotations of its
features, the genome is in reality arranged in three-dimensions. The eukaryotic genome is
tightly packaged to sit within the spatial limits of a cell nucleus; yet it must permit movement,
remain flexible and allow for access of transcription and regulatory factors to the DNA
sequence (Deng et al., 2010).
Genome organisation relies on two mechanisms: compartmentalisation and chromatin
loop formation. (Nuebler et al., 2018). Nuebler et al., (2018) previously showed that active
process of loop extrusion counteracts compartmental segregation, which indicates that these
two mechanisms are mutually exclusive (Nuebler et al., 2018). Genome-wide chromatin
conformation capture (Hi-C) is a technique used to systematically interrogate interaction
frequencies between genomic regions. The development of Hi-C technology has demonstrated
the presence of spatially insulated genomic regions: topologically associated domains (TADs),
organised by chromatin loop extrusion (Dixon et al., 2012). Hi-C also revealed that each
genome territory separates into two chromosome compartments (compartmentalisation),
euchromatic (active) and heterochromatic (inactive) (Lieberman-Aiden et al., 2009).
Chromatin loop extrusion model uses the cohesin complex and CCCTC binding factor
(CTCF) to form stable DNA loops, which act as functional barriers between active and inactive
chromatin. Loop extrusion by cohesin and CTCF is important for the formation of TADs, and
cohesin and CTCF are enriched at TAD boundaries (Dixon et al., 2012; Rao et al., 2014). Loss
of CTCF relaxes the global domain structures, which results in increased contacts between
domains; loss of cohesin mostly affects interactions within domains (Li et al., 2013b; Zuin et
al., 2014). These observations have led to the chromatin loop extrusion model to describe how
TADs are formed: in this model, cohesin begins to extrude a chromatin loop until it encounters
an obstruction associated with the DNA (CTCF). Think of the DNA as a thread being pulled

25
through a needle’s eye (cohesin) to make a loop. The CTCF only functions as a barrier when
it is bound to the DNA in a specific orientation (Rao et al., 2014); directionality of CTCF sites
is important for loop formation, as sites that anchor loops are convergent (Merkenschlager et
al., 2016).
Compartmentalisation depicts the process in which proteins arrange themselves into
condensates and act as membrane-less organelles that cluster specific molecules (Hyman et al.,
2014; Shin et al., 2018). In these condensates there are often co-localisation of similar
transcription factors or polycomb proteins, suggesting that like attracts like. Hence why there
is euchromatic and heterochromatic compartments (Stadhouders et al., 2019).
1.4.1 Topologically associated domains (TADs)
TADs are characterised by an elevated number of chromatin interactions within a
genomic locality, with fewer interactions to outside regions (Lieberman-Aiden et al., 2009;
Rao et al., 2014). Genes positioned within the same TAD often have the same histone
modifications and are co-regulated (Rao et al., 2014). TADs are present in a wide range
different metazoan phyla, suggesting that they are ancient features of the genome (Harmston
et al., 2017). TADs have been under intense selective pressure, and act on the same functional
subset of genes, at least back to the common ancestor of chordates and arthropods (Harmston
et al., 2017).
Harmston et al., 2017 propose that chromatin structure is mainly defined by the need
to regulate important developmental genes. TADs often contain the regulatory elements
(enhancers, silencers and insulators) required to regulate the genes within that TAD. TADs
containing clusters of regulatory regions are enriched with conserved CTCF sites when
compared to TADs without clusters of regulatory regions (Harmston et al., 2017). This
suggests that these regions are isolated from neighbouring domains. Gómez-Marín et al., 2015
highlighted that diverging CTCF sites are a signature of TAD borders that are maintained
26
between species, suggesting that specific 3D organisation is highly conserved and under
intense selection pressure (Gómez-Marín et al., 2015).
Disruption of TAD boundaries allows erroneous contacts with regulatory elements of
neighbouring domains, which leads to misexpression of genes, including the activation of
oncogenes driving cancer progression (Kloetgen et al., 2019; Pope et al., 2014; Taub et al.,
1982; Zhan et al., 2017)(Bohlander, 2000; Look, 1997; Rawat et al., 2004).
Taub et al., (1982) described t(8;14) translocations in Burkitt's lymphoma which alter
gene expression through enhancer hijacking (Taub et al., 1982). Rewat et al., (2004) showed
that in the t(12;13) translocation, overexpression of CDX2 gene is leukaemogenic rather than
the ETV6-CDX2 fusion(Rawat et al., 2004). Chromosomal translocations like RUNX1-ETO
disrupt the well-established and conserved RUNX1 TAD (Figure 1.7).

27
Figure 1.7: RUNX1 TAD Hi-C contact map of RUNX1 region in K562 cells.
Hi-C data generated by Rao et al., (2014) was visualised in 3D genome browser at a 25-kb resolution (Wang et al., 2018). Every square is coloured according to the frequency of two regions interacting. The alternating yellow and blue bars are predicted TADs. RUNX1 is annotated according to its transcription direction (reverse strand). RUNX1 sits within its own isolated TAD.
1.5 Regulators of gene transcription
Most genes display individual characteristics that determine the site, level, and timing
of expression throughout development and the cell cycle (Kadauke et al., 2009). Accurate
spatiotemporal and quantitative gene expression is crucial for normal development and, in
many cases, is achieved by the interaction of promoters with cis-regulatory elements. In
addition, the chromatin must be ‘open’ for external factors to facilitate regulatory functions of
the DNA (Gilbert et al., 2004).
Genomic regions have been shown to be highly conserved across a diverse set of
vertebrate species (Abbasi et al., 2007). While some conserved regions correspond to coding
genes and non-coding RNAs, the remainder are unlikely to produce a functional transcript
(Rebolledo-Jaramillo et al., 2014). Non-coding DNA can play crucial roles in the regulation of

28
gene expression, as some conserved non-coding regions can contain transcriptional regulatory
modules, such as enhancers, insulators or silencers (Deng et al., 2010).
Highly conserved developmental genes are surrounded by clusters of conserved
regulatory elements. Expression patterns driven by regulatory regions often correlate with the
function of the closest genes; however, the overlap can be inconsistent with regulatory elements
controlling expression in genes further afield (Marsman et al., 2014; Smemo et al., 2014;
Spieler et al., 2014). Long-range chromatin interactions between promoters and regulatory
elements can be mediated by scaffolding proteins and transcription factors to regulate gene
expression (Phillips-Cremins et al., 2013).
The syntenic organisation of clusters of regulatory regions supports the idea that there
are combinations of regulatory elements controlling the complex expression patterns of
developmental genes. Synteny is required to retain the regulatory regions in cis with the genes
under long range interaction (Ritter et al., 2010).
1.5.1 Cohesin acts with other regulators to determine gene expression
Cohesin controls a large number of genes, as evidenced by altered expression profiles
when the multi-subunit protein is knocked down in mouse embryonic stem cells and drosophila
neuronal cells (Kagey et al., 2010; Schaaf et al., 2009). One of the potential mechanisms by
which cohesin regulates cell-type specific gene expression is by facilitating long-range
interactions through the formation of DNA loops. These chromatin loops could connect
regulatory elements and gene promoters over large distances (Strom et al., 2012).
Depending on the nature of the regulatory elements, formation of chromatin loops may
either facilitate or inhibit transcription from the interacting promoter. Cohesin and CTCF act
together to form regions that isolate enhancers from interacting with inappropriate gene
promoters (Canela et al., 2017; Phillips-Cremins et al., 2013); this can lead to cell-type and
gene-type specific transcriptional programmes. Simonis et al., 2006 showed that the mouse β-

29
globin locus is active in the fetal liver and inactive in the fetal brain due to CTCF and cohesin
mediated regulation. CTCF binding motifs sit within the β-globin locus and CTCF binding
varies depending on the cell type; different CTCF binding patterns change the 3D structure of
the β-globin locus, consequentially altering regulation in a cell-specific manner (Phillips et al.,
2009; Simonis et al., 2006). In human cells, both CTCF and cohesin were shown to be
necessary for long-range loop formations that are cell-type specific (Hou et al., 2010).
Disease-causing mutations are also found in cellular machinery that maintain 3D
structure, such as cohesin and CTCF. Hnisz et al., (2016) reported leukaemia cell genomes
with recurrent microdeletions that modified CTCF boundary sites. These mutations were
sufficient to activate proto-oncogenes (Hnisz et al., 2016). Schierding et al., (2020) highlighted
that several genes that are coregulated with cohesin loci are themselves intolerant to loss-of-
function mutations. These results emphasised the significance of correct regulation of cohesin
genes and indicated new pathways of cohesin related disease progression (Schierding et al.,
2020). Mutations in cohesin could inhibit cohesin binding to regulatory elements, thus varying
interactions with promoters and consequent gene expression. Alternatively, mutations in
regulatory elements to which cohesin binds could affect the binding of regulatory proteins and
modify transcription of the regulatory element’s gene target. Katainen et al., (2015) reported
recurrent mutations to CTCF and cohesin binding sites in cancer samples (Katainen et al.,
2015).
1.5.2 Cohesin and Runx1
Tissue-specific regulation of runx1 transcription in zebrafish is reliant on cohesin
(Horsfield et al., 2007). Horsfield et al., (2007) observed that a null mutation in the rad21
subunit of cohesin prevented runx1 expression in the haematopoietic mesoderm, but not in
Rohon-Beard neurons in the developing zebrafish embryo (Horsfield et al., 2007). This study

30
presented the first evidence that the transcriptional role of cohesin is tissue-specific in
haematopoietic precursors.
Subsequently, it was established that zebrafish runx1 is directly bound by cohesin and
CTCF at the promoters and contains an intronic regulatory element between runx1 promoters
(Marsman et al., 2014). Marsman et al., (2014) showed that depletion of cohesin in zebrafish
decreased the total amount of runx1 transcript produced overall, but the relative expression of
P1-regulated runx1 increased. Cohesin depletion in human myelocytic leukaemia (HL-60) cell
line enhanced RUNX1 transcription, implying that cohesin’s transcriptional role could be
conserved in humans (Marsman et al., 2014).
Down’s syndrome patients with acute megakaryoblastic leukaemia (DS-AMKL)
contain three copies of the RUNX1 gene (owing to trisomy 21), as well as a high frequency of
cohesin mutation (53% ) (Yoshida et al., 2013). As normal Runx1 expression requires cohesin,
the elevated rate of cohesin mutations in DS-AMKL patients indicates the strong possibility
that cohesin mutation is actively contributing to leukaemia progression (Leeke et al., 2014).
AML patients with mutations in genes regulating RNA splicing, chromatin (cohesin)
or in the RUNX1 gene have poor prognoses, with the various mutations contributing
independently and additively to the disease (Papaemmanuil et al., 2016). RUNX1 and cohesin
mutations co-occur or are enriched in 27-52% of AML samples (Heimbruch et al., 2021).
Mazumdar et al., (2015) showed that cohesin mutant cell lines with impaired differentiation
had increased chromatin accessibility and binding of ERG, GATA2 and RUNX1 (Mazumdar
et al., 2015).
Recently, Antony et al., (2020) showed that mutation of the STAG2 subunit of cohesin
in K562 cells disrupted RUNX1 expression during megakaryocyte differentation (Antony et
al., 2020). In the STAG2 mutant, RUNX1 showed increased chromatin accessibility. This
research also established that in wildtype K562 cells, RUNX1-P1 had a gradual increase in

31
transcription during phorbol 12-myristate 13-acetate (PMA)-stimulated megakaryocyte
differentiation. However, STAG2 mutants cells showed an aberrant spike in transcription of
RUNX1-P2 6-12h post-PMA stimulation (Antony et al., 2020). After 48h stimulation the
aberrant RUNX1 transcription observed in STAG2 mutant cells had returned to baseline. This
implies that the initial response to PMA stimulation in cohesin mutant cells (that have increased
chromatin accessibility at RUNX1), leads to unrestrained transcription (Antony et al., 2020).
Antony et al., (2020) decreased BRD4 binding and suppressed enhancer-driven
transcription by using a bromodomain and extra-terminal motif (BET) inhibitor protein called
JQ1 (Antony et al., 2020). BRD4 is a bromodomain-containing protein that interacts with
active enhancers (Bhagwat et al., 2016). When wildtype cells were JQ1-treated concurrently
with PMA, there was reduced RUNX1-P2 and ERG expression in parental cells, and
dramatically dampened aberrant expression peaks in STAG2 mutant cells. RUNX1-P1
expression is essential for megakaryocyte development and its transcription was completely
blocked by JQ1 in both parental and STAG2 mutant cells. These results suggest that STAG2
depletion deconstrains the chromatin surrounding RUNX1, which produces aberrant enhancer-
amplified transcription in response to differentiation signal. This study also highlighted that
the correct expression of RUNX1 is enhancer-driven.
Ochi et al., (2020) observed reduced enhancer–promoter loops in Runx1 and Stag2
double knockout mouse models. These double knockouts lead to myeloid-skewed expansion
of hematopoietic stem/progenitor cells (HSPC) and myelodysplastic syndromes (MDS) in
mice. The reduced loops were associated with genes important for regulation of HSPCs; these
same genes were downregulated in cohesin-mutated leukaemia samples (Ochi et al., 2020). In
the absence of Stag2 in HSPCs, Stag1 can still maintain TAD boundaries, however Stag1
cannot retain intra-TAD interactions, at differentiation genes (Viny et al., 2019).

32
The occurrence of RUNX1 and cohesin dysregulation in AML subtypes and in vitro
models provides further evidence that these two factors are likely to play important roles in
normal and abnormal haematopoiesis. Additionally, these studies support previous work that
suggests cohesin mediates interactions between cis-regulatory elements and the promoters of
Runx1 (Antony et al., 2020; Marsman, 2016; Marsman et al., 2014; Ochi et al., 2020).
1.5.3 Regulatory elements
Crucial to the development of multicellular organisms is the ability of cells to acquire
new cell-fates. Cell-fate decisions are driven by environmental cues that activate signal
transduction in the nucleus – the environmental cues initiate transcription factors that define
the specific gene-expression program for each cell type. Transcription factors take effect by
binding to defined DNA motifs within gene regulatory elements to control the rates of
transcription (Griffiths et al., 1999). There are two main types of protein regulated transcription
elements: enhancers and insulators (Figure 1.8).
1.5.3.1 Enhancers
Enhancers are regions characteristically found in non-coding DNA regions that
positively regulate promoters to stimulate transcription by recruiting specific transcription
factors, chromatin remodelling proteins, and RNA polymerase II (Marsman et al., 2012).
Enhancers are generally identified by distinct histone modifications including; histone H3
lysine 4 monomethylation (H3K4me1), histone H3 lysine 4 dimethylation (H3K4me2) histone
H3 lysine 4 trimethylation (H3K4me3), histone H3 lysine 9 acetylation (H3K9ac), histone H3
lysine 36 monomethylation (H3K36me1) and histone H3 lysine 27 acetylation (H3K27ac)
(Ong et al., 2012; Zentner et al., 2011). These histone marks determine which regions of DNA
are accessible for transcription factor binding (Gates et al., 2017; Lawrence et al., 2016). The
pattern of histone marks suggests whether a region is active, inactive, or poised, and
accordingly whether the enhancer status correlates with gene activity. Active transcription is

33
associated with histone marks such as H3K4me3 and H3K9ac at active promoters, H3K4me1
and H3K4me2 at active enhancers, and H3K27ac at both active promoters and enhancers.
Heterochromatic regions are zones of gene inactivation and are associated with H3K27me3
(Heintzman et al., 2007; Kolovos et al., 2012; Pokholok et al., 2005). Active enhancer
sequences are characterised by bound RNA polymerase II (RNA Pol II) and can produce
enhancer RNAs (eRNA) that contribute to gene regulation (Peng et al., 2018). These regions
are often identifiable by transcription factor binding, acetyltransferase p300, cohesin, and/or
CTCF (Zentner et al., 2011). In addition, active enhancers usually lack nucleosomes and are
sensitive to DNase I digestion (Kolovos et al., 2012). Enhancers regulate spatiotemporal gene
expression, and therefore direct developmental programmes (Ong et al., 2012).
The location or orientation of an enhancer is independent of its ability to interact with
a promoter. Enhancers have been traditionally identified based on their ability to drive
transcription in reporter gene assays (Peng et al., 2018). Enhancers can also be predicted by
computational methods, including: computational analysis of conserved non-coding sequence
and transcription factor binding motifs (Pennacchio et al., 2006; Visel et al., 2008; Woolfe et
al., 2004); analysis of chromatin immunoprecipitation and sequencing (ChIP-seq) to locate
binding of transcription factors, mediators, and histone modifications at the regions of interest
(Murakawa et al., 2016; Visel et al., 2009); chromatin accessibility assays to identify areas of
open chromatin (DNase-seq, ATAC-seq) (Buenrostro et al., 2013; Thurman et al., 2012);
detection of enhancer RNAs such as cap-analysis gene expression (CAGE) (Andersson et al.,
2014); revealing promoter-enhancer interactions using chromosome conformation capture (3C,
R3C, 4C, 5C, Hi-C, Promoter capture) (Dekker et al., 2002; Dostie et al., 2006; Lieberman-
Aiden et al., 2009; Simonis et al., 2006); and chromatin interaction analysis using paired-end
sequencing (ChIA-PET) (Fullwood et al., 2009).

34
1.5.3.2 Silencers and insulators
Conversely, suppression of gene expression during differentiation and cell cycle
progression is facilitated by silencers and insulators. Silencers prevent gene expression by
producing non-coding transcripts that recruit polycomb repressor complexes to target genes
(Boyer et al., 2006).
Insulators block the interaction between enhancers and promoters by confining regions
within repressed or active chromatin boundaries; insulators establish chromatin domains
(Kolovos et al., 2012; Levine, 2010; Splinter et al., 2006; West et al., 2002). Mutation of
insulators changes the pattern of gene expression and can lead to developmental defects
(Feinberg, 2007).
Figure 1.8: Cohesin mediated cis-regulatory DNA elements.
A) An enhancer (green) is recruited to activate gene expression through a physical interaction with the gene promoter (black arrow). Transcription factors (blue) are often present for binding. B) An insulator (orange) excludes the enhancer from interacting with the promoter, which prevents expression. CTCF (red) can demarcate domains of active and inactive chromatin by binding with cohesin (multi-coloured ring) and forming long-range loop formations. Figure is from Thomas (2015).
The three-dimensional genome conformation is crucial for efficient gene regulation.
CTCF and cohesin help mediate enhancer-promoter, insulator-insulator and insulator-promoter
interactions (Raab et al., 2010).

35
1.5.4 Techniques to determine three-dimensional conformation
A significant portion of our understanding of nuclear organisation has been discovered
through microscopic study of the nucleus, using techniques like fluorescent in situ
hybridization (FISH)(Dekker et al., 2015). However, as the resolution of these techniques is
low, it is difficult to reliably distinguish between a looped or linear conformation of two regions
(Williamson et al., 2014).
The majority of recent discoveries of sequence-specific chromatin structure have been
made using chromatin capture techniques which map physical genome interactions (Sanyal et
al., 2011; Splinter et al., 2011). 3C, 4C, 5C, and Hi-C involve chemical cross-linking of the
genomes capturing regions that are in close proximity, fragmenting chromatin (by digestion
with restriction enzymes), religating cross-linked regions, and identifying the interacting
regions by DNA sequencing (Hakim et al., 2012; Sanyal et al., 2011; Splinter et al., 2011).
Most of these methods allow the unbiased and genome-wide mapping of interactions without
prior knowledge of partners, thus permitting the discovery of new interactions.
Chromosome conformation capture (3C) investigates previously selected regions and
determines if there is an interaction between them (one versus one)(Dekker et al., 2002).
Circular chromosome conformation capture (4C), is utilised to investigate all interactions with
a chosen region, or ‘bait’, and can be detected through the use of next-generation sequencing
(one versus many)(Simonis et al., 2006; Zhao et al., 2006). 4C is typically used to identify all
genomic loci that interact with a particular gene or regulatory element. Chromosome
conformation capture carbon copy (5C) detects all interactions within a genomic region (many
versus many)(Dostie et al., 2006). Hi-C is determined from a promoter perspective and is used
to analyse all interactions within a genome (Lieberman-Aiden et al., 2009). Hi-C allows for
high throughput analysis and genome interaction maps to be created, which is valuable for

36
determining genomic structure. However, detection of specific local interactions is limited by
its resolution, detection of local interactions is better achieved using 4C.
1.5.5 Genome structure and disease
Recent research shows that disrupting the boundaries of TADs severely alters the
spatial organisation of a locus, which allows ectopic enhancer-promoter interactions and leads
to aberrant expression of target genes (Gómez-Marín et al., 2015; Lupiáñez et al., 2015).
Gómez-Marín et al., 2015 demonstrated that vertebrate Six genes share an evolutionarily-
conserved 3D chromatin architecture. When the conserved intergenic region containing the
TAD border between six3 and six2 was removed, there was a dramatic change to the gene
expression profile. This research demonstrates that evolutionarily-conserved TAD borders are
crucial to prevent competition between promoters for enhancers in opposing regulatory
landscapes (Acemel et al., 2017). This concept has been challenged by Williamson et al.,
(2019) who demonstrated that perturbations to the sonic hedgehog (Shh) TAD structure had
little or no detectable effect on Shh expression patterns or levels of Shh expression during
development (Williamson et al., 2019).
Multiple studies have shown the 3D context of the genome is a key determinant in the
development and progression of cancer. The probability of 3D contact between two loci
influences the extent of somatic copy number alterations in cancer cells (Engreitz et al., 2012;
Fudenberg et al., 2011; Zhang et al., 2012). Physical proximity is a major player of genomic
rearrangements which result in translocations (Chiarle et al., 2011; Klein et al., 2011).
Mutations to cohesin and CTCF have been shown to dysregulate 3D organisation of the
genome and perturb normal development (Anania et al., 2020; Hnisz et al., 2016).
Hypermethylation of specific CTCF sequences resulted in a loss of CTCF at a domain
boundary, which caused aberrant expression of an oncogene (Flavahan et al., 2016).

37
Northcott et al., (2014) and Weischenfeldt et al., (2017) describe somatic variants that
disrupt genome organisation, and result in enhancer jacking in cancer cells (Northcott et al.,
2014; Weischenfeldt et al., 2017).
Disease-associated variants are found in regulatory elements and in genes with equal
frequency, making these regions highly relevant to cancer (Ernst et al., 2011). More than 95%
of genome-wide association studies (GWAS) single nucleotide polymorphisms (SNPs) are
located in intergenic regions, of which over 75% are associated with open chromatin (DNase I
HS sites) implying a strong association to regulatory elements (Maurano et al., 2012). A variant
in a regulatory region may cause differential regulation of a cancer gene, and could be
functionally equivalent to a mutation in the coding sequence of the cancer gene itself. Recent
studies have shown alterations to regulatory regions reported in cancers (Zhang et al., 2020).
It is therefore possible that mutations in enhancers or insulators may change their function, and
subsequently could lead to altered regulation of key blood development gene(s) and the onset
of leukaemia (Stranger et al., 2007).
Understanding the connection between the 3D organisation of the genome and its
underlying biological function will allow a better interpretation of human pathogenesis.
1.5.6 Regulatory regions of Runx1
Both the specific haematopoietic and non-haematopoietic expression of Runx1 appear
to rely on enhancer elements, as the Runx1 promoters by themselves in vivo are unable to drive
any Runx1-specific activity (Bee et al., 2009a). Antony et al., (2020) highlighted the enhancer
regulated activity in aberrant megakaryocytic differentiation (Antony et al., 2020).
Understanding Runx1 enhancers and how they contribute to Runx1 organisation is imperative
to understanding the regulatory landscape of Runx1.
Numerous groups recognised an intronic enhancer of Runx1 specific to haematopoietic
cells. This mouse regulatory region is variously termed +23/ +24/eR1/RE1 (Bee et al., 2009a;

38
Koh et al., 2015; Markova et al., 2011; Ng et al., 2010; Nottingham et al., 2007). Significantly,
this enhancer was shown to be active in haemogenic endothelial cells and haematopoietic cell
clusters in the AGM equivalent region in both mice and zebrafish (Markova et al., 2011; Ng et
al., 2010; Schütte et al., 2016). Bee et al., (2009) showed the enhancer worked with both
promoters to drive HSC-specific gene expression (Bee et al., 2009a). Interestingly, this well-
known enhancer was also described as a silencer in HEK293 cells (Markova et al., 2011).
Other putative regulatory elements have been identified upstream of Runx1 and
between the P1 and P2 promoters in humans and mice (Figure 1.9)(Cheng et al., 2018; Gunnell
et al., 2016; Markova et al., 2011; Marsman, 2016; Marsman et al., 2017; Ng et al., 2010;
Schütte et al., 2016; Wilson et al., 2016).
Schütte et al., (2016) and Ng et al., (2010) identified 12 possible regulators of Runx1
in mice, with some regions functionally validated (Ng et al., 2010; Schütte et al., 2016). My
previous masters project investigated the functions of the putative regulatory regions described
by Ng et al., (2010) (Thomas, 2015). Nine further putative regulators were identified because
they physically interacted with Runx1 P1, P2 or +24 enhancer in mouse hematopoietic
progenitor cells (Marsman, 2016) (Figure 1.9A).
In humans, the interactions between RUNX1 promoters and two regulatory regions were
identified using chromosome conformation capture for two regions (Cheng et al., 2018;
Markova et al., 2011). Gunnell et al., (2016), characterised the functions of three potential
RUNX1 regulatory elements (Gunnell et al., 2016) (Figure 1.9B).

39
Figure 1.9: Identified Runx1 regulatory regions.
Regulatory elements are annotated with orange circles, grey boxes annotate exons. The blue boxes show the exons encoding the Runt binding domain. The two Runx1 promoters are represented by black right angled arrows A) Identified Human RUNX1 regulatory elements B) Identified mouse Runx1 regulatory regions.
However, not all of these elements have been tested for regulatory functionality, nor
examined for Runx1 promoter-enhancer interactions using chromosome conformation capture.
Interaction between regulatory elements and promoters of the Runx1 gene cannot be predicted,
as less than 50% of enhancers contact the nearest gene promoter. Previous research has used
zebrafish to characterise the functional roles of regulatory elements in vivo and demonstrated
the value of this animal model for studies of non-coding DNA (Bessa et al., 2009; Marsman et
al., 2014).
The spatiotemporal regulation of Runx1 is beginning to be understood; it is possible
that mutations in regulatory regions may explain AML progression in patients who have no
known protein-coding mutations, and perhaps in patients who have cohesin mutations.
1.6 Zebrafish as a model organism
The small tropical zebrafish (Danio rerio) is an important model organism for a variety
of studies. As developmental genes are highly conserved amongst vertebrates, development of
zebrafish can be compared to that of the mice and humans (Bopp et al., 2006; Kari et al., 2007;
Lieschke et al., 2007). Advantages of using zebrafish as an animal model for research include
the zebrafish’s rapid development and ability to lay hundreds of eggs in each mating, allowing

40
for large sample sizes. Additionally, their small size means they are simple and cost-efficient
to maintain and breed. In contrast to mammals, zebrafish eggs are externally fertilised and the
resulting embryos develop outside of the mother. The embryos are transparent, which allows
development to be easily visualised through a microscope (Teittinen et al., 2012).
Zebrafish develop rapidly, with fish reaching sexual maturity by 3-4 months post-
fertilisation. All major organs are formed by 5 days post-fertilisation (dpf) (Haffter et al., 1996)
(Figure 1.10). The zygote remains at the one-cell stage for approximately 40 minutes, allowing
for injections of reporter constructs, which can reveal gene expression in the developing
embryo. At ten hours post-fertilisation (hpf), somites and organs begin to form (Albacker et
al., 2009). The zebrafish begin to hatch from their clear chorions at 48 hpf, and they are
swimming freely by three dpf (Bopp et al., 2006).

41
Figure 1.10: Diagram of normal Danio rerio (zebrafish) development.
A) 1-cell stage embryo approximately 20 minutes post fertilisation (pf). B) 2-cell stage embryo approximately 40 minutes pf. C) Zebrafish embryo in clear chorion approximately 36 hours pf. D) Zebrafish embryo hatched from chorion approximately 48 hours pf. E) Zebrafish embryo 3-5 days pf. F) Zebrafish reach adulthood at approximately 3-4 months pf. Figure is from Thomas (2015).
Although the fish genome is immensely rearranged compared to the human genome,
several areas of local synteny and larger chromosomal regions are preserved (Martin et al.,
2011). The entire zebrafish genome has been sequenced and 70% of human genes have at least
one obvious zebrafish orthologue (Howe et al., 2013).

42
1.6.1 Haematopoiesis in zebrafish
The combination of visualisation, manipulation, and large-scale capabilities of
zebrafish allows for novel genome-wide studies. Zebrafish are particularly informative for the
analysis of haematopoietic development as blood circulation begins around 23-26 hpf within
the transparent embryos (Albacker et al., 2009). Comparable to other vertebrates,
haematopoiesis in zebrafish occurs in primitive and definitive waves (Paik et al., 2010;
Rasighaemi et al., 2015). The zebrafish primitive wave of haematopoiesis arises within the
intermediate cell mass (ICM) and generates primitive erythrocytes and limited myeloid
populations (Figure 1.11A). The ICM is functionally analogous to the embryonic yolk sac in
mammals (Davidson et al., 2004). These blood cells are seen in circulation until about four
dpf. The first definitive HSC markers are seen at 26 hpf, in the ventral wall of the dorsal aorta
(Figure 1.11B) (Kulkeaw et al., 2012; Orkin et al., 2008). The ventral wall of the dorsal aorta
of zebrafish is the equivalent of the AGM in mammals (Martin et al., 2011). HSCs emerge by
endothelial-to-haematopoietic transition in the dorsal aorta in zebrafish (Julien et al., 2016).
Finally, in zebrafish the permanent niche of HSCs is the kidney marrow (Figure 1.11C),
however in mammals, the permanent location for HSCs to seed is in the bone marrow
(Albacker et al., 2009).

43
Figure 1.11: Schematic of haematopoiesis cell generation locations during zebrafish development.
A) Primitive haematopoiesis occurs in the intermediate cell mass (blue) 12 hours post fertilisation (pf). B) Definitive haematopoiesis begins first in the ventral wall of the dorsal aorta (purple) 26 hours pf, then in the caudal haematopoietic tissue (orange) 2 days pf and finally in the kidney marrow (pink) 4 days pf. C) Kidney marrow (pink) is the life-long source of adult definitive haematopoiesis. Figure is from Thomas (2015).
1.7 Overall hypothesis and aims of this PhD
Runx1 has differing isoforms which are crucial to distinctive developmental and cell
cycle processes. Runx1 is essential for definitive haematopoiesis and dysregulations of RUNX1
are frequently associated with AML progression. Despite the well-established role of RUNX1
in haematopoiesis and disease contribution, there is limited understanding of the regulatory
mechanisms that drive cell-specific expression.
Previous identification of the +24 Runx1 regulatory element as an enhancer in
haematopoietic cells in zebrafish and mice, as well as dysregulation of a RUNX1 silencer
element in a leukaemia patient has highlighted the importance of regulatory elements in driving
correct RUNX1 expression. RUNX1-P1 expression is essential for megakaryocyte development

44
and is driven by enhancers. Investigating 3D structure of RUNX1 and functions of possible
regulatory elements may reveal important regulatory connections and provide rationale for
disease progressions.
Cohesin is crucial in correct genome organisation and gene regulation, and enhancer-
promoter interactions. Cohesin mutations are frequently seen in myeloid malignancies and in
several solid tumour types. The occurrence of RUNX1 and cohesin dysregulation in AML
subtypes and in vitro models suggests these two factors are likely to play important roles in
normal and abnormal haematopoiesis.
The overall aim of my study is to explore the potential of regulatory regions and cohesin
to modulate the transcription of Runx1.
I hypothesise that regions that interact with Runx1 promoters and Runx1 +24 enhancer
may have enhancer capabilities, and some may be conserved in humans. Furthermore, I predict
RUNX1 +24 is an important regulator of RUNX1 expression during megakaryocyte
differentiation, and coupled with reduced cohesin the correct genomic organisation cannot be
maintained.
To examine this hypothesis, first, I analysed the putative Runx1 regions
bioinformatically, to establish genomic characteristics and conservation, in order to determine
enhancer potential. I subsequently tested regions identified by 4C for functional ability and
cell-type specific regulation using zebrafish reporter assays (Chapter 3).
Second, I investigated RUNX1 +24 structural and genomic characteristics. I then
identified the significant 3D connections of RUNX1 +24 using chromosome conformation
capture (Chapter 4).
Third, to elucidate important connections of RUNX1 +24 during normal megakaryocyte
differentiation, I used chromosome conformation capture of megakaryocyte differentiation
time points and compared them to the baseline RUNX1 +24 interactions. To understand how

45
cohesin and 3D chromosome organisation influences RUNX1 transcription and impacts disease
progression, I compared the wild type differentiation interaction profiles to STAG2 mutant
cells at the same time points of PMA stimulation (Chapter 5).

46
2 Chapter 2: Methods
2.1 Ethics consent and protocol approval
2.1.1 Zebrafish
The University of Otago Animal Ethics Committee approved all zebrafish work (AEC
#95/14). University of Otago Animal Welfare Office Animal Ethics Training was undertaken
and any manipulations involved larvae no older than 30 days. Relevant work with transgenic
Zebrafish was approved by IBSC/EPA (GMC100225, GMD101727).
2.1.2 Escherichia coli (E. coli)
All E.coli work was undertaken under the approval codes GMC100216, GMC100219,
GMD101715, GMD101717.
2.1.3 Cell culture
All work with human cell lines was carried out under approval codes GMC100228,
GMD101730. Animal cell line work was performed under approval codes GMC100227,
GMD101729.
2.2 Materials
All materials, solutions and buffers used in this study are listed in Appendix I.
2.3 Molecular biology techniques
The mouse regulatory elements were previously identified in Ng et al., (2010) and in
Judith Marsman’s PhD (Marsman, 2016).
2.3.1 Plasmids and reporter constructs
Plasmids used in this project are listed in Table 2.1.
To determine the regulatory potential of selected mouse regulatory regions in vivo,
Zebrafish enhancer detector vector (ZED) and pGL4.23-GW reporter constructs were used.

47
mouse regulatory elements were previously cloned into ZED and pGL4.23-GW(Marsman,
2016; Thomas, 2015).
Maps of all plasmids are shown in Appendix II.
Table 2.1: Plasmids used in this study
Plasmid Relevant characteristics
Antibiotic selection
Source
Zebrafish enhancer reporter plasmids Zebrafish enhancer detector vector (ZED)
RFP expression across somites as internal control. Cell-specific GFP expression when an enhancer is cloned into vector.
Ampicillin José Bessa lab, Institute for Molecular and Cell Biology, Portugal (Bessa et al., 2009)
Zebrafish mRNA plasmid pCS-TP Tol2 mRNA plasmid
for integration of enhancer DNA into zebrafish
Ampicillin (Kawakami, 2005)
Cell Culture enhancer reporter plasmid
pGL4.23-GW Luciferase assay reporter construct
Ampicillin Jorge Ferrer lab, Imperial Centre for Translational and Experimental Medicine, Imperial College London (Pasquali et al., 2014)
Cell culture Luciferase control plasmid
pRL-TK Renilla control plasmid for luciferase assay
Ampicillin Promega
Control plasmid
pUC19 Control plasmid for transformation and transfection
Ampicillin Addgene
2.3.2 Nanodrop
Quantity and quality of plasmid DNA, genomic DNA or RNA was measured by
spectrophotometry, using a Nanodrop ND-1000, version 3.81 Spectrophotometer. 1 µL of

48
DNA or RNA was added to the well to measure sample purity and concentration by the
absorbance spectrum of UV-visible light.
2.3.3 Agarose gel electrophoresis
To determine if the production of PCR, mRNA or a restriction digest was successful,
products were run on an agarose gel. Unless otherwise stated 2 µL of PCR, mRNA or restriction
digest product was mixed with 8 µL of 1x loading dye and loaded onto a 60mL 1% agarose
gel, with 1x SYBR Green I (ThermoFisher) added before the gel set. A 1 kb plus DNA ladder
(Invitrogen) was used as a marker of band sizes. Gels were run at 100 Volts for 1 hour, then
visualised and photographed using a BioRad UV light transilluminator.
2.3.4 Primer design
To determine the best primers, the online program Primer3 was employed (Koressaar
et al., 2007; Untergasser et al., 2012). Primers were selected based on optimised efficiency (i.e.
Primer GC%, 18-13 bp length) and ordered from Integrated DNA Technologies.
2.3.5 Sequence confirmation and alignment
All sequence confirmations were carried out by Genetic Analysis Services (Department
of Anatomy, University of Otago) according to their protocol using a capillary ABI 3730xl
DNA Analyser. 200 ng of plasmid DNA was supplied for sequencing. Primer list is provided
in Appendix III.
To align sequences to their appropriate reference genome the sequences BLAST-like
alignment tool (BLAT) was applied (Kent, 2002). Sequences were viewed using 4Peaks
(Griekspoor et al., 2005). Ambiguous base calls were examined by eye and manually corrected
if necessary.

49
2.3.6 Measuring Runx1 +24 enhancer G-quadruplexes
To test the if Runx1 +24 enhancer contains G-quadruplex structures Circular dichroism
(CD) photospectrometer was used.
2.3.6.1 Runx1 +24 enhancer G-quadruplexes Oligo design
The G-quadruplex oligos were designed directly from the mouse Runx1 +24 predicted
G-quadruplexes (Appendix IV). A negative control Runx1 +24 oligo was also designed. The
negative oligo should not be able to function as a G-quadruplex.
Oligos (100 nM) were commercially synthesised (Integrated DNA Technologies,
Singapore), and reconstituted in nuclease-free H2O.
Table 2.2: Runx1 +24 enhancer G-quadruplexes Oligo
Oligo Sequence Runx1 +24 G-quadruplexes Oligo GGTGGGGGTGGG Runx1 +24 negative Oligo GGTGTGTGTGGG
2.3.6.2 CD Spectrophotometer protocol
To determine if the predicted G-quadruplexes Runx1 +24 enhancer are present in vitro,
CD spectrometer readings were used to measure ellipticity.
4 µM of each oligonucleotide was heated to 95 °C for 10 minutes then left to cool
(slowly in the heating block) to room temperature (22 °C) overnight for CD analyses the
following day. CD experiments were carried out in different buffers: 100 mM KCl pH 7
(positive control buffers) 100 mM NaCl, and 100 mM LiCl (negative control buffer). The
desired buffer pH was adjusted by relative quantities of Na2H2PO4 /Na2HPO4.H20 and
determined using a pH meter.
CD measurements were performed on a CD Spectrophotometer (Department of
Biochemistry, University of Otago) with a 1 mm path length quartz curvette (approx. 8000
µL). CD spectra were collected across 340 nm to 220 nm in 1 nm increments (continuous

50
scanning) and the reported spectra corresponded to the average of at least two scans. An
appropriate buffer blank correction was used for all spectra. The scanning speed of 200
nm/minute was used for preliminary investigations, with a response of 1 second and a band
width of 1 nm.
CD melting studies were performed to measure if there was a change in ellipticity as a
function of temperature across all wavelengths. Temperature was increased from 25 °C to 95
°C at a rate of 0.25°C min-1.
2.3.7 Site-Directed Mutagenesis of Runx1 +24 enhancer
To test whether the G-quadruplexes were functionally important for Runx1 +24
enhancer capability, pGL4.23-Runx1+24 G-quadruplex sites were mutated. Quikchange II
Site-Directed Mutagenesis Kit (Agilent Technology) was used to mutagenise the Runx1+24
enhancer within the pGL4.23-Runx1+24.
2.3.7.1 Runx1 +24 enhancer Site-Directed Mutagenesis primer design
Primers were designed using the online program QuikChange Primer Design
(https://www.agilent.com/store/primerDesignProgram.jsp) to ensure the desired mutation
(deletion or insertion) were in the middle of the primer with ~10-15 bases of correct sequence
on both sides and had a minimum GC content of 40%. The list of primers is available in
Appendix III.
2.3.7.2 Mutant Strand Synthesis Reaction (Thermal Cycling)
To generate point mutations in pGL4.23-Runx1+24, the mutant strand synthesis
reaction was PCR amplified. PCR amplification was performed in an Applied Biosystem
Thermal Cycler 2.08 as follows: 95 °C for 30 seconds; 12 cycles of 95 °C for 30 seconds, 55
°C for 1 minute, 68 °C for 4 minutes, finally 72 °C for 2 minutes. Following temperature
cycling, the reaction was cooled on ice for 2 minutes.

51
Table 2.3: Mutant strand synthesis reaction
Ligation components Amount per 50µL (reaction volume)
PfuUltra HF DNA polymerase reaction buffer (10x) 5 µL pGL4.23-Runx1+24 50 ng Oligonucleotide primer 2 125 ng Oligonucleotide primer 2 125n g dNTP mix 1 µL nuclease-free H2O to 50 µL PfuUltra HF DNA polymerase (2.5U/µL) 1 µL
2.3.7.3 DnpI Digestion of the Mutant Strand Amplification Products
1 µL DpnI (10U/µL) was added to the amplification reactions and incubated at 37 °C for 1
hour to digest any nonmutated supercoiled template dsDNA. Plasmids were then transformed
into competent cells (Section 2.3.8).
2.3.8 Transformation of plasmids in competent cells
All bacterial work was carried out using standard aseptic techniques.
Competent Escherichia coli (E. coli) STABLE3 (One Shot) and XL1 Blue (One Shot)
cells were used for transformation procedures. STABLE3 and XL1 Blue competent cells were
prepared in house.
pUC19 was used as a positive control for all transformations. All plasmid
transformations were carried out with a LacZ recombination positive control and MilliQ H2O
negative recombination control.
1 µL plasmid DNA was added to a vial of E. coli competent cells and mixed gently and
incubated on ice for 15 minutes. Samples were transferred to a water bath at 42°C for 30
seconds before placing on ice. 250 µL prewarmed Luria Broth (LB) was added and cells were
incubated at 37 °C for 1 hour with shaking (200 rpm).
After transformation, cells were spread on agar plates containing appropriate antibiotic,
Ampicillin (Sigma-Aldrich). The plates for the LacZ transformation control contained 50 µL
of 20 mg/mL X-gal (Sigma-Aldrich). 50 µL of competent cell mixture was spread on the first

52
half of the prewarmed plate, before cells were pelleted by centrifugation. Most of the
supernatant was discarded, and all remaining cells were resuspended in the remaining
supernatant and spread on the other half of the selective plate. Plates were incubated at 37 °C
overnight.
Recombination efficiency was identified by the blue/white colony ratio on the LacZ
plate. 2-4 individual colonies from successful transformations were picked with a wire loop.
Bacteria were then incubated at 37 °C overnight with shaking (200 rpm) in starter culture (4
mL LB containing 100 µg/mL of the appropriate antibiotic).
To prepare a large amount of plasmid, 1 mL of starter culture was added to 99 mL of
LB containing 100 µg/mL of the appropriate antibiotic, this was incubated at 37 °C overnight
with shaking (200 rpm).
To establish glycerol stocks of each successful transformation, 750 µL of the starter
culture was combined with 250 µL of glycerol (VMR Prolabo) and stored at -80°C.
2.3.9 Plasmid purification preparation
After glycerol stocks were made, the remaining bacterial culture was centrifuged at
13,300 g for 1 minute and the supernatant was discarded. Plasmids were prepared using the
Qiagen plasmid Miniprep kit for initial restriction enzyme digestion or sequencing
confirmation. Preparation of plasmids for experiments used the Macherey-Nagel maxi prep kit;
both were executed according to manufacturer’s manual. Plasmid DNA was eluted in 40 µL or
500 µL of elution buffer (5 mM Tris-HCl pH 8.5) respectively and stored at -20 °C.
2.3.10 Tol2 transposase mRNA synthesis
Tol2 sites permit transposon-mediated integration into the zebrafish genome with high
efficiency in the presence of Tol2 transposase mRNA (Kawakami, 2005). In order to
successfully integrate ZED reporter construct into zebrafish host genome, Tol2 mRNA is

53
required (Bessa et al., 2009). Ambion mMESSAGE mMACHINE® kit was used for in vitro
synthesis of large amounts of capped mRNA. To confirm successful mRNA synthesis the
product was run on a 1% agarose gel according to section 2.3.3.
2.4 In vivo Zebrafish approaches
Feeding, maintenance and breeding were performed according to the Otago Zebrafish
Facility Standard Operating Procedures.
2.4.1 Zebrafish strains
The strains of Zebrafish used in this project were wild-type (WT) AB/PS, and (WT)
WIK. AB/PS is an in-house line, previously created by outcrossing an AB fish with a pet-shop
fish. Transgenic lines created in this project were outcrossed onto Tübingen long fin (TL) fish
for easy differentiation between the transgenic and WT lines.
2.4.2 Maintenance
Zebrafish (Danio rerio) were housed in the Otago Zebrafish Facility (OZF), Pathology
Department, University of Otago, Dunedin. Each tank was kept at a temperature of 24-30 °C,
pH of 6.5-8.5 and a conductivity of 200-1000 µS. Water in the facility was purified using
ZebTEC system (Techniplast) of biological filters and UV light. Stocking density was
maintained at or below the maximum number of fish per 3.5 L tank; 15-20 adults or 20-30
younger fish (5-40 days old).
2.4.3 Feeding
Zebrafish were fed three times a day; two dry feedings and one live feeding. The dry
feed (ZM Ltd) was given morning and evening. The live feed was given to adult Zebrafish in
the afternoon and consisted of artemia (brine shrimp). Younger fish were given rotifers, as they
are smaller than artemia.

54
2.4.4 Breeding and embryo collection
Wild type Zebrafish breeding pairs were set up in specialised breeding tanks the
afternoon prior to embryo collection. The tanks contain a false bottom and a removable barrier
to separate male and females. The false bottom allows the eggs to fall through once they are
laid to prevent the parents consuming them. The natural internal breeding cue is light. The OZF
has automated lighting; from 10 pm until 8 am it is dark. Removal of barriers allows the
zebrafish to mate. To regulate breeding, barriers are removed from the tank just prior to
collection.
Embryos are collected through a fine sieve 10 minutes after laying, washed twice with
system water and transferred to a petri dish with E3 embryo medium. E3 medium promotes
growth and survival. Methylene blue (Sigma-Aldrich) is also added as it acts as an anti-fungal
agent, as zebrafish eggs are prone to fungal infection.
2.4.5 Growing embryos
Embryos are grown in a petri dish in E3 medium at 28.5 °C for normal development or
22.5 °C for slower development. The embryos hatch naturally at 2-3 days post fertilisation or
the chorion can be removed earlier using #55 Dumont Forceps. When the chorions are
discarded the media is changed to E3 without methylene blue.
2.5 Zebrafish microinjection
2.5.1 Needle pulling and calibration
A 1.0 mm OD borosilicate glass capillary (Harvard Apparatus) was pulled to form 2
needles using pulling programme 6 (P= 500, Heat= 600, Pull= 50, Vel = 75, Time= 120) on a
Sutter p-97 Flaming/Brown glass micropipette puller.
Injection solutions were well mixed and 2 µL loaded with a microloader pipette into
the needle. The needle was placed in the needle holder of an air-pressure MPPI3 system. 10

55
µL of Halocarbon oil 27 (Sigma-Aldrich) was pipetted onto a stage micrometre calibration
slide. Pressing the injection pedal released a droplet of injected solution, which floated on the
oil. The drop was measured to ensure it was 1 nl (Figure 2.1). Clean forceps were used to trim
needle tip and pulse duration was adjusted to change drop size when necessary. The pulse
duration of the pressure injector was set between 4.5 and 6.5 to minimise needle breakage and
embryo damage.
Figure 2.1: Calibration slide with close up of 1 mm scale, each division is 0.01 mm.
The grey circle represents the size of a 1 nl droplet

56
2.5.2 Microinjection
Injections were achieved by lining embryos up on a ridged plate and, under
magnification of a Leica M80 microscope, guiding the needle tip through the chorion to pierce
the yolk sac.
ZED injections were optimised and the following concentrations were injected 30ng/µL
ZED vector DNA, 120 ng/µL Tol2 transposase mRNA and Ultrapure DNase – RNase free
distilled H20.
The vector solutions were directly injected into the yolk sac at the one cell stage, to
ensure the dividing cell could uptake and integrate the plasmid into the host genome. For each
injected group, uninjected controls of the same batch were kept to observe normal development
and death rates.
2.5.3 Microscopy
In order to screen embryos for fluorescence, embryos were anaesthetised in 0.5ng/µL
tricaine and placed on a microscope slide. GFP3 and dsRED2 filters were applied to view
fluorescence.
If fluorescence was observed, samples were removed from E3 tricaine solution and
embryos were mounted in 3% methylcellulose (Sigma-Aldrich). The dechorionated embryos
were orientated with anterior on the left and dorsal at the top. Embryos were first imaged with
bright field, and then filters were employed to photograph the fluorescence.
Images were taken using a Leica M205 fluorescence microscope on the Leica
Application software.
2.6 Transgenic zebrafish analysis
To find out the function of the putative enhancers identified by Dr. Judith Marsman
ZED zebrafish reporter assays were used. DNA sequences of the putative enhancers were

57
previously cloned into ZED reporter constructs, then injected into the first cell of zebrafish
embryos. The enhancer test vectors contain Tol2 transposon sites which allow the reporter gene
constructs to be integrated into the gDNA. Transient expression of assays can be analysed in
F0; however, the F1 generation contain a germ line integration of the constructs, to avoid the
problem of a mosaic expression pattern seen in F0.
2.6.1 Zebrafish enhancer assay
ZED F0 embryos were dechorionated then imaged at 20-24 hours post fertilisation (hpf)
or 40 hpf using a Leica M205FA stereomicroscope and were imaged with a DFC490 camera
and LAS software (Leica Microsystems), images were processed using Adobe Photoshop.
ZED F1 embryos were also viewed at 20-24 hpf or 40 hpf 72 hpf and embryos with
were examined for GFP.
2.7 In vitro Cell culture and maintenance of cell lines
2.7.1 Cell lines
Cell lines were stored in a Thermo Scientific liquid nitrogen dewar. All cells were
maintained at 37 °C in a humidified environment with 5% CO2 incubator
HPC7 cell line was cultured in Isocove’s Modified Dulbecco’s Media (IMDM)
containing 10% fetal bovine serum (FBS) (Gibco, Life Technology) and 10% stem cell factor
(SCF) conditioned media, 1% Penicillin Streptomycin (P/S), 1.5x 10⁻⁴ M monothiolglycerol
(MTG).
BHK/MKL was cultured in Dulbecco’s Modified Eagle’s Medium (DMEM) containing
10% FBS. These cells contain a mouse SCF expression vector and the media collected from
these cell lines was used to produce SCF used for HPC7 media.
PNX and NIH/3T3 were cultured in DMEM containing 10% FBS.
K562 and K562 cell line variations were cultured in IMDM containing 10% FBS.
Differentiation to megakaryocytes was induced using 30 nM of phorbol 12- myristate 13-

58
acetate (Kuvardina et al., 2015)(PMA, Sigma-Aldrich). Control treatment of K562 cell line
variations used Dimethyl Sulfoxide (DMSO)(Sigma-Aldrich), which was prepared in the same
way as PMA.
Table 2.4: Cell lines used in this study
Cell line Media Remarks References K562 (Chronic Myelogeneous Leukaemia cells)
IMDM + 10% fetal bovine serum (FBS).
Sourced originally from ATCC (p10)
(Lozzio et al., 1975)
K562 STAG2 R614* -/-
IMDM + 10% FBS
Generated by Dr. Jisha Antony, a Postdoc in the Horsfield lab (p20)
(Antony et al., 2020)
PNX (Phoenix cells)
DMEM + 10% FBS
Sourced originally from Braithwaite lab (Pathology department, University of Otago, Dunedin, New Zealand)
(Swift et al., 1999)
HPC7 (mouse haematopoietic progenitor cells)
IMDM +10% SCF + 10% FBS + 1% P/S, 1.5x 10⁻⁴ M MTG
Sourced originally from Kathy Knezevic (Lowy Cancer Research centre, Sydney, Australia)
(Kolterud et al., 1998)
BHK/MKL (Baby Hamster Kidney cells)
DMEM + 10% FBS
Sourced originally from Kathy Knezevic (Lowy Cancer Research centre, Sydney, Australia)
(Yusta et al., 1999)
NIH/3T3 (Mouse embryonic fibroblast cells)
DMEM + 10% FBS
Sourced originally from Braithwaite lab (p15) (Pathology department, University of Otago, Dunedin, New Zealand)
(Todaro et al., 1963)
2.7.2 Reviving cells from liquid nitrogen stocks
Cell vials were removed from liquid nitrogen stocks and transferred on ice to 37 °C
water bath. Vials were rapidly thawed and the cell suspension added to 10 mL of pre-warmed
media in 15 mL falcon tube. Cells were pelleted by centrifugation (250 g for 5 minutes) and
supernatant was aspirated. Cells were resuspended in 10 mL of fresh media and plated in a
medium culture flask.

59
2.7.3 Splitting cells for new passage
2.7.3.1 Adherent cells (PNX, BHK/MKL, NIH/3T3)
The cells were allowed to form a monolayer and reach 70-90% confluence before
splitting for a new passage. The media was carefully aspirated and adherent cells were washed
with phosphate buffered saline (PBS). 0.005% trypsin (Life Technologies) was added and flask
was then incubated at 37 °C for 3-5 minutes. Media was added to flask to deactivate trypsin.
Cells were gently pipetted up and down to create a single cell suspension. Cells were spun at
250 g for 5 minutes and media was removed. The pellet was resuspended in fresh media to
create single cell suspension. 1 mL of cell suspension was added to a new culture flask with 10
mL fresh media to make a new passage. 1 mL of suspension was collected for cell counting
(Figure 2.2). Number of cells/mL was determined using a haemocytometer slide on a
microscope stage or Luna automatic cell counter.
2.7.3.2 Suspension cells (K562, HPC7)
Cells were observed every day for signs of growth. 1 mL of cell suspension was counted
each day to determine growth patterns and when the cell density reaches 0.7-0.8x10⁶ cells/mL
the culture was split to approximately 0.4x10⁶ cells/mL with fresh media. Number of cells/mL
was determined using a haemocytometer slide on a microscope stage. Cells were spun at 250
g for 5 minutes and media was removed and the pellet was resuspended in fresh media.
2.7.3.3 K562 STAG2 R614-/- mutant lines
Cells were semi-adherent so were grown in suspension cell flasks and treated as
suspension cells (Section 2.7.3.2).

60
Figure 2.2: Haemocytometer slide used for counting cells, each shaded grid is 1 mm2..
The black circles represent cells in the grid. The number of cells in each shaded grid is counted. The average is determined by dividing the total by 5. The number of cells/mL is calculated by grid averaged dilution factor (2)x 10 000
2.7.4 Freezing cells for liquid nitrogen storage
Single cell suspension (2.7.3) cells were centrifuged for 5 minutes at 250 g and
supernatant removed. The pellet was gently suspended in equal parts media and cryoprotectant
(20% DMSO in FBS), 500 µl of each per intended vial of frozen cells except for K562 and

61
K562 cell line variations which were suspended in media and 5% DMSO 1 mL per intended
vial. The cell suspension was aliquoted into each cryovial and then transferred to Nalgene Mr
Frosty. Mr Frosty was stored at -80 °C overnight then transferred to the liquid nitrogen dewar.
2.8 Expression analysis
2.8.1 Total RNA purification
To examine gene expression in cell lines, RNA was extracted from K562 and K562
STAG2 R614* mutant cell lines. Cells (5x10⁵) were collected by centrifugation. The extraction
procedure was carried out in accordance with the RNA purification method described in
Macherey-Nagel user manual. Concentration and purity of RNA was determined by Nanodrop
technique described in section 2.3.2. RNA was eluted in 40 µL Ultrapure DNase – RNase
free distilled H2O (Life Technology) and stored at -80 °C until required.
2.8.2 cDNA synthesis
Complementary DNA (cDNA) was synthesised from the RNA extracted in section
2.8.1 using 4 µL of qScript cDNA SuperMix (Quantabio), 500 ng of total RNA and RNase-
free H2O in a 20 µL reaction. Reverse transcription was performed in an Applied Biosystem
Thermal Cycler 2.08, at 25°C for 5 minutes, 42 °C for 30 minutes and finally 85 °C for 5
minutes. cDNA products were stored at -20 °C until required.
2.8.3 Quantitative reverse-transcriptase PCR (qRT-PCR)
qRT-PCR is a technique that quantitatively measures RNA following cDNA
conversion. This is achieved through real-time PCR. qRT-PCR was used to measure
endogenous ERG, KLF1, P1-/P2- generated, and total RUNX1 expression in K567 and K562
STAG2 R614* mutant lines cell lines.

62
Figure 2.3: Quantitative PCR primer locations at human RUNX1.
Schematic of human RUNX1 gene and transcripts are shown with exons in boxes and the 5’ and 3’ untranslated regions in white. P1 and P2 promoters are indicated with a black hooked arrow. Primers used for analysis of P1, P2 and total RUNX1 transcript expression by quantitative PCR are indicated with black arrowheads.
Relative gene expression was normalised to reference genes H-CYCLOPHILIN and
GAPDH. Dr. Jisha Antony previously validated each primer for 80-100% efficiency, with an
external standard curve, generated by serial dilutions of the cDNA. A list of primers is available
in Appendix III.
qRT-PCR mix was made for each primer set, in each cell line (Table 2.5).
Table 2.5: qRT-PCR reaction mix
Reagent Amount per 20µL (reaction volume) cDNA (500 ng) 1 µL 3µM Forward primer 1 µL 3µM Reverse primer 1 µL SYBR Green (2x) 10 µL Ultrapure DNase – RNase free distilled H20
7 µL
qRT-PCR was performed using LightCycler® 480 Instrument II (Roche Life Science)
using the following programme: 95 °C for 30 seconds and 40 cycles of 95 °C for 5 seconds, 60
°C for 30 seconds.

63
Analysis was carried out using qBase software, which utilised the ∆∆CT method. Graphs were
created using Prism 7 (GraphPad).
2.8.4 pGL4.23 Transfection
To determine the ability of the Runx1 +24 G-quadruplex to act as an enhancer in mouse
cells lines, NIH/3T3 cells were transfected with the pGL4.23 +24, pGL4.23 +24 g->t ,
pGL4.23 +24 t->a. Cultures were plated in a 96-well plate at 8x 10³ cells per well, and cells
were 30-50% confluent at time of transfection. Cells were transfected using Lipofectamine
3000 (Invitrogen) according to the manufacturer’s instructions. Plates were incubated at 37 °C
for 48 hours. A Renilla luciferase reporter construct was co-transfected with the mouse
regulatory elements pGL4 reporter constructs. Firefly and Renilla luciferases have distinct
evolutionary origins and dissimilar enzyme structures and substrate requirements. Renilla acts
as a transfection control.
Table 2.6: Transfection components per well
Component per well Amount per well Adherent cells 8x10³ cells
Lipofectamine 3000 dilution
Opti-MEM Media (Gibco, Life Technology)
5 µL
Lipofectamine 3000 0.2 µL Master Mix
Opti-MEM Media 5 µL Plasmid DNA 50 ng P3000 Reagent 0.2 µL Renilla 20 ng
2.8.5 pGL4.23 Transfection analysis
If pGL4.23-GW contains an enhancer there should be an increase in expression of
luciferase, which can be determined with a luminometer. Dual-Glo Luciferase Assay System
(Invitrogen) was used according to manufacturer’s instructions to measure luminescence.
Dual-Glo Reagent was added in equal parts to the volume of culture medium and mixed well.
Firefly luminescence was measured by Victor X3 plate reader after 10 minutes. Dual-Glo

64
Stop & Glo Reagent, equal to the original culture medium, was added to each well and mixed.
After 10 minutes Renilla luminescence was measured by Victor X3 plate reader.
2.8.6 Statistical analysis of luciferase assays
All analyses were performed in Prism 6. Significance of the differences observed was
assessed using ANOVA.
2.9 In silico approaches for Enhancer analysis
Genomic sequences surrounding the Runx1 locus for human (Homo sapiens) and mouse
(Mus musculus) were obtained from publicly available genome assemblies [human
(GRCh38/hg38 and GRCh37/hg19) assembly, and mouse (mm9 and mm10) assembly] on the
UCSC genome browser (Kent et al., 2002; Waterston et al., 2002). All genome alignments
were performed in accordance with previous Ng et al., 2010 alignments (Ng et al., 2010).
2.9.1 Epigenetic analyses using ENCODE data
ENCODE is the Encyclopaedia of DNA elements, a publicly available database of
functional protein, RNA and DNA elements in the human and mouse genomes, including
epigenetic marks and regulatory factors. Numerous other genomes are available for analysis
(Rosenbloom et al., 2013), but were not used in this study. To identify any patterns in
functionally validated regulatory elements as enhancers, various haematopoietic cell lines were
selected for analysis (Table 2.7). The ENCODE datasets were used to detect the presence of
various histone modifications, DNase I hypersensitivity sites, transcription factors and cohesin
binding sites (Table 2.8) (Barski et al., 2007; Raney et al., 2014; Rosenbloom et al., 2013;
Wilson et al., 2016). Analysis of ENCODE annotations was carried out using data submitted
by Stanford, Yale, University of Washington (UW) and Ludwig Institute for Cancer Research
(LICR).

65
In order to visualise the combined ENCODE cell line data, all sequences were
annotated using Geneious, program version R8.0.4 (Biomatters) (Kearse et al., 2012).
To determine the enhancer locations in different genome assemblies UCSC ‘liftOver’
tool was utilised to convert coordinates within a species (Rosenbloom et al., 2013).
To determine the human genome co-ordinates for functionally validated Runx1
enhancers, the identified enhancer sequences were searched using UCSC BLAT tool and NCBI
BLAST tool (Altschul et al., 1990; Kent, 2002). More genomic features of the conserved
enhancer regions were deduced by analysing the human coordinates using FANTOM 5
(Andersson et al., 2014; Lizio et al., 2015) and UCSC Genome Browser (Table 2.8).
ENCODE also has Chromatin State predictions (ChromHMM) for K562 cells (Kellis
et al., 2017). ChromHMM annotates the data based on epigenetic information. The predicted
chromatin states are active promoter, promoter flanking, inactive promoter, candidate strong
enhancer, candidate weak enhancer, distal CTCF/candidate insulator, transcription associated,
low activity proximal to active states, polycomb repressed, and heterochromatin /repetitive
/copy number variation. Transcription associated refers to transcriptional transition or
elongation (Ernst et al., 2010; Ernst et al., 2011).
Further regulatory markers for K562 cells were uploaded into UCSC genome browser
including; super-enhancers (Khan et al., 2016), silencers (Pang et al., 2020), cohesin mediated
chromatin accessibility (Antony et al., 2020).

66
Table 2.7: Analysed cell lines
Cell line Origin K562 Human Chronic Myelogeneous
Leukaemia cells Table 2.8: Analysed ENCODE annotations
Regulatory association ENCODE annotation Open chromatin DNase I hypersensitivity (HS) Transcription initiation RNA Pol II (phosphorylated at serine
5) Cohesin (subunit) RAD21, SMC3 CTCF binding sites CTCF Histone acetyltransferase that is recruited to transcriptionally active enhancers (an increase in the expression of target genes)
p300
H3K4me1/2 demethylase (mediates transcriptional repression)
LSD1
Super-enhancer previously annotated by Khan et al., (2016)
K562 Super-enhancers
Silencer previously annotated by Peng et al., (2020)
Silencers
Cohesin mediated chromatin accessibility previously annotated by Antony et al., (2020)
Chromatin sites that show increased accessibility in the absence of cohesin
Chromatin State ChromHMM Enhancer Enhancer-associated
histone methylation or acetylation marks
H3K27ac, H3K4me1, H3K4me2
Active promoters H3K27ac, H3K9ac, H3K4me3
Repressed promoters H3K9me3, H3K27me3 Haematopoiesis transcription factors
Erythroid development GATA1 Haematopoietic SPI1 Blood/ Stem progenitors TAL1,GATA2
2.9.2 Comparative analysis of cancer genomic datasets
To assess whether any AML patients had mutations in the conserved regulatory
elements regions, publicly available cancer genomic datasets were explored. Online tools were
used to categorise publicly available patient information, into different tumour types for
analysis. Sequence data at the RUNX1 locus was downloaded from all available AML cases.
The large-scale cancer genomics datasets were retrieved from International Cancer
Genome Consortium (ICGC) Data Portal [human Feb. 2009 (GRCh37/ hg19) assembly]

67
(Hudson et al., 2014; Zhang et al., 2011), The c-BioPortal for Cancer Genomics [human Feb.
2009 (GRCh37/ hg19) assembly] (Cerami et al., 2012; Gao et al., 2013) and The Cancer
Genome Atlas (TCGA) Data Portal [human Mar. 2006 (NCBI36/ hg18) assembly](CGARN,
2013).
2.9.3 Single nucleotide polymorphism (SNP) analysis
To deduce if there were any reported SNPs in each region GWAS catalog
(GRCh38/hg38) (Buniello et al., 2019), HaploReg v4.1 (GRCh37/hg19)(Ward et al., 2016)
were used. GWAS catalog shows SNPs chromosome locations and highlights any publications
that report on the function of that SNP. HaploReg v4.1 displays the genome characteristics and
transcription factor binding data for each SNP and predicts regulatory motif changes.
To establish if any SNPs had a minor allele frequency (MAF) of >1% Genotype-Tissue
Expression (GTEx) portal v8 (GRCh38/hg38) (https://gtexportal.org/home/) was used.
gnomAD browser (Karczewski et al., 2020) v2 1.1 (GRCh37/hg19) and v3 (GRCh38/hg38)
reviewed SNPs with MAF >1% for any ClinVar associations and/ or publications.
To identify which genes a SNP physically interacts with, the CoDeS3D pipeline
(Fadason et al., 2017) was used to interrogate Hi-C chromatin interaction libraries. This
pipeline identifies interactions across the genome with the SNPs, and then identifies SNPs
where the genetic variant correlates with the expression level of the spatially associated partner
gene [the SNP is an expression quantitative trait locus (eQTL)].
2.10 Circular Chromatin Conformation Capture (4C)
Circular chromatin conformation capture (4C) was used to elucidate the all interactions
with a chosen region or ‘bait’ (Figure 2.4). 4C sequencing libraries were prepared from 4C
material, each containing PCR products amplified by bait-specific primer pairs. Chromatin
connections with the bait were detected through the use of next-generation sequencing and data
processing.

68
Figure 2.4: Schematic outline of 4C process.
Chromatin in close contact is cross-linked using formaldehyde (1), then digested with the 1st Restriction Enzyme (RE) (2). Chromatin is ligated to fuse the RE cut ends of DNA fragments (3). Chromatin is reverse cross-linked using heat (4), then digested by a 2nd RE (5). DNA fragments are then ligated to form small circles, then regions of interest are PCR amplified using bait specific primers (6). Regions of interest are then deep-sequenced (7).
2.10.1 4C Design
To determine the best primers for the chosen 4C bait regions (P1-RUNX1, P2-RUNX1,
RUNX1+24, ERG+85), the sequences for each bait were searched for possible restriction
enzyme digest sites. An appropriate primary restriction enzyme would leave a bait fragment of
>500 bp for 4-bp cutters or >1500 for 6-bp cutters. An appropriate secondary enzyme would
chop the bait to be ideally >250 bp long. Once appropriate enzymes were selected, the online
program Primer3 was employed (Koressaar et al., 2007; Untergasser et al., 2012). All primers
were aligned to the genome using BLAST and BLAT. Primers were selected based on
optimised efficiency (i.e. Primer GC%, 18-13 bp length, shortest length to the restriction
enzyme site) and ordered from Integrated DNA Technologies. Primers are listed in Appendix
III.
2.10.2 Cross-linking of K562 cells
37% fomaldehyde was heated up to 65 °C for 15 minutes whilst vortexing every five
minutes then left to cool to room temperature. Two million cells in 20 mL petri dish were cross-

69
linked in 2% formaldehyde by addition of 1.1 mL of 37% formaldehyde to media, and mixed
into media with gentle swirling. Cells were then incubated with gentle rocking in a hybe oven
at 21 °C for 10 minutes. To stop cross-linking activity, 1 mL of 2.5 M glycine was added to
media with gentle swirling and then incubated for 5 minutes on ice with occasional swirling.
Cells were scraped off the dish and into a 50 mL falcon tube. Cells were spun at 250 g for 8
minutes at 4 °C. The supernatant was decanted, cells were washed (not resuspended) with 10
mL ice-cold 1x PBS and centrifuged at 250 g for 8 minutes at 4 °C. The supernatant was
decanted, cells were resuspended with 10 mL ice-cold 1x PBS and centrifuged at 250 g for 8
minutes at 4 °C. The supernatant was removed with a 10 mL pipette and the remaining volume
was removed with a p200 pipette. Pellets were stored at -80 °C.
2.10.3 Isolation of nuclei
Frozen pellets were resuspended in 10 mL lysis buffer (Appendix I) (1 mL first) and
incubated on ice for 30 minutes. Cells were Dounce homogenised 10 times up and down, then
centrifuged at 600 g for 5 minutes at 4 °C. The supernatant was removed and the pellet was
resuspended in 1 mL of ice-cold PBS and transferred to 1.5 mL Eppendorf tube. Cells were
centrifuged at 600 g for 5 minutes at 4 °C. The supernatant was decanted and the remaining
volume removed using a p200 pipette.
2.10.4 First Digestion
The pellets from 1.11.3 contain 2 million cells. Pellets of the same samples were
combined for a total of 4 million cells. Four million nuclei were resuspended in 76 µL
Ultrapure DNase – RNase free distilled H20 and 4 µL 10% sodium dodecyl sulfate (SDS)
and incubated at 60 °C for 10 minutes. SDS was neutralised by addition of 26.72 µL 15%
Triton X-100 and 245.28 µL Ultrapure DNase – RNase free distilled H20, then incubated at
37 °C for 20 minutes. Any aggregate was broken up every 5 minutes. 16 µL of sample was
taken out as undigested control and stored at -20 °C. 80 µL restriction buffer and 14 µL DpnII

70
restriction enzyme (50,000U/mL) (for 4 million cells; increased proportionally for more cells)
were added and the total volume was made up to 800 µL with Ultrapure DNase – RNase free
distilled H20. Samples were digested with tubes placed horizontally at 37 °C for 4 hours without
shaking. Every 10 minutes for the first hour and every 30 minutes after that samples were
gently mixed by inverting the tube. Lids were sealed with parafilm to prevent evaporation.
After digestion, 32 µL of sample was taken out as the digested control and stored at -20°C.
To analyse digestion success, undigested and digested controls were treated with
Proteinase K (Invitrogen). The undigested sample had 2.5 µL of 10 mg/mL Proteinase K and
70 µL of 10 mM Tris-HCl pH 7.5 added. The digested sample had 5 µL of 10 mg/mL Proteinase
K and 58 µL of 10 mM Tris-HCl pH 7.5 added, and both samples were incubated at 65 °C for
1 hour. 20 µl of each sample was run on 0.6% agarose gel for 1 hour at 100 Volts.
2.10.5 First restriction enzyme inactivation
The first restriction enzyme was heat inactivated at 65 °C for 20 minutes
2.10.6 Ligation
Two 15 mL Falcon tubes were prepared for ligation; one for ligated sample and one for
non-ligated sample. Both the samples had 2336 µL of Ultrapure DNase – RNase free distilled
H20 800 µL ligase buffer, 40 µL adenosine triphosphate (ATP) and 784 µL of sample added.
For the ligated sample, 40 µL Invitrogen T4 DNA ligase (500 U at 1 U/µL). For the non-ligated
sample 40 µL of Ultrapure DNase – RNase free distilled H20 was added. Samples were
incubated at 16 °C overnight while shaking vertically at 30 rpm. After incubation at 16 °C,
samples were incubated at room temperature for 30 minutes. After ligation, 90 µL of sample
was taken out as ligated and non-ligated controls and stored at -20 °C.
To check ligation efficiency, ligated and non-ligated controls were treated with 5 µL
of 10mg/mL Proteinase K at 65 °C for 1 hour. 40 µL of ligated and non-ligated controls were
run alongside 20 µL of digested control on 0.6% agarose gel for 1 hour at 100 Volts.

71
2.10.7 Reverse cross-linking and DNA purification
To reverse crosslink samples, 75 µg (7.5 µL of 10 mg/mL) of Proteinase K was added
to ligated and non-ligated samples and incubated overnight at 65 °C. For samples that were
treated with PMA for 72 hours, 150 µg of Proteinase K was added and samples were incubated
overnight at 65 °C.
RNA was degraded by addition of 75 µg (7.5 µL of 10 mg/mL) RNaseA to samples
and incubation at 37 °C for 45 minutes.
DNA was purified by phenol/chloroform extraction. An equal volume of
Phenol:Chloroform:Isoamyl Alcohol 25:24:1 (Sigma-Aldrich) was added to the samples.
Samples were vortexed for 30 seconds and spun at 4000 g (maximum speed) for 15 minutes at
room temperature. The aqueous phase was transferred to 15 mL Falcon tubes.
DNA was ethanol precipitated by adding 3 M NaOAC pH 5.6 to a concentration of 240
mM and 2.5 volumes absolute ethanol (Scharlab). Samples were vortexed and incubated at -80
°C for 1.5 hours or until frozen solid. Samples were centrifuged at 4000 g for 1 hour at 4 °C.
The supernatant was discarded and 5 mL of 70% ethanol was added. Samples were spun at
4000 g for 15 minutes at room temperature. The supernatant was discarded and tubes were re-
spun to collect any residual solution. Residual supernatant was removed using a p200 pipette.
Pellets were air-dried for around 10 minutes at room temperature and resuspended in 400 µL
of 10 mM Tris-HCl pH 7.5.
To check DNA purification of the undigested and digested sample, 60 µL of the sample
was taken out, 20 µL of which was run on 0.6% agarose gel for 1 hour at 100 Volts.
2.10.8 Second digestion
Samples were transferred to 1.5 mL tubes for digestion with CviQI. 40 µL of 10x
Buffer, 340 μL of sample and 80 U (8 μL) of 10000 U/mL CviQI and 12 µL of Ultrapure
DNase – RNase free distilled H20 (for a total of 400 µL), were digested overnight at 25 °C

72
while shaking with tubes placed horizontally at 30 rpm. Lids were sealed with parafilm to
prevent evaporation. After digestion, 10 µL of each sample was taken out as digested control
and combined with 100 µL 10 mM Tris-HCl pH 7.5 and stored at -20 °C.
To analyse digestion success, 20 μL of digested samples were run on a 0.6% agarose
gel for 1 hour at 100 Volts alongside purified ligated samples (Section 2.10.6).
2.10.9 Removal of second restriction enzyme
As CviQI cannot be heat inactivated, phenol:chloroform extraction was used to remove
restriction enzyme. Total volume was made up to 400 µL with Ultrapure DNase – RNase
free distilled H20, then an equal volume of phenol:chloroform was added to samples. Samples
were vortexed for 30 seconds, then centrifuged at 15000 rpm (max speed) for 10 minutes at
room temperature. The aqueous phase was transferred to 2 mL tube.
DNA was ethanol precipitated by adding 3 M NaOAC pH 5.6 to a concentration of 240
mM and 2.5 volumes absolute ethanol. Samples were vortexed and incubated at -80 °C for 1.5
hours or until frozen solid. Samples were centrifuged at 15000 rpm for 20 minutes at 4 °C.
Supernatant was removed and 1 mL of 70% ethanol was added. Samples were spun at 15000
rpm for 5 minutes at room temperature. The supernatant was removed and tubes were re-spun
to collect any residual solution. Residual supernatant was removed using a p200 pipette. Pellets
were air-dried for around 5-10 minutes at room temperature and resuspended in 400 µL of 10
mM Tris-HCl pH 7.5.
To check DNA purification, 10 µL of the sample was taken out, of which 2.5 µL was
run on 0.6% agarose gel for 1 hour at 100 Volts with the digested sample.
2.10.10 Second Ligation
Samples were transferred to 50 mL falcon tubes for ligation. To each sample, 1120 µL
ligation buffer, 56 µL of ATP and 40 µL ligase was added and the total volume was made up
73
to 5600 µL with Ultrapure DNase – RNase free distilled H20. Samples were incubated at
16°C overnight at 30rpm.
To check ligation, 80 µL of sample was taken out. 20 µL was run on 0.6% agarose gel
for 1 hour at 100 Volts with the purified digested sample.
2.10.11 DNA purification with linear polyacrylamide (LPA)
DNA was purified by adding 22.4 µL 20µg/mL linear polyacrylamide (LPA), NaOAC
to a final concentration of 240 mM, and 2 volumes of Ethanol to the samples. Samples were
incubated at -80 °C for 1.5 hours. Samples were then centrifuged at 4000 rpm (max speed) for
1 hour at 4 °C. The supernatant was removed and 5 mL 70% ethanol was added. Samples were
centrifuged at 4000 rpm for 15 minutes at room temperature. The supernatant was removed
and tubes were re-spun to collect any residual solution. Residual supernatant was removed
using a p200 pipette. Pellets were air-dried for around 5-10 minutes at room temperature and
resuspended in 160 µL of 10 mM Tris-HCl pH 7.5.
The concentration of samples was measured using the Qubit® 3.0 Fluorometer (Life
Technologies) and Qubit® double-stranded DNA (dsDNA) High Sensitivity Assay kit (Life
Technologies) according to the manufacturer’s instructions. Samples were stored at -20 °C.
2.10.12 4C Polymerase Chain Reaction
A total of 344 ng of DNA per bait was amplified by Polymerase Chain Reaction (PCR)
using Q5® Hot Start High-Fidelity 2x Master mix (New England Biolabs). For the final 4C-
PCR reactions a no-template control was used to control for DNA contamination. PCR reaction
conditions are listed below. Optimised amplification conditions, per primer set, are listed in
Table 2.10. Primer sequences are listed in Appendix III. Amplified products were run on 1.5%
agarose gel for 45 minutes.

74
Table 2.9: 4C-PCR reagents
Reagent Amount per 25µL (reaction volume) Q5® High-Fidelity 2x Master Mix 12.5 µL 10 µM Forward primer 1.25 µL 10 µM Reverse primer 1.25 µL Template DNA 86 ng nuclease-free H2O to 25 µL
The PCR protocol was optimised by varying the temperature of annealing phase (63.2
°C-67.8 °C). Amplification was performed in an Applied Biosystem Thermal Cycler 2.08 as
follows: 98°C for 30 seconds; 30 cycles of 98 °C for 10 seconds, 63.2 °C-67.8 °C for 15
seconds, 72 °C for 2 minutes, finally 72 °C for 2 minutes, 4 °C for ∞.
Table 2.10: Optimised PCR conditions for 4C-PCR primers
Primer set Annealing temperature (°C) RUNX1 P1 64.7 °C RUNX1 P2 67.8 °C RUNX1 +24 63.2 °C ERG +85 64.2 °C
2.11 4C-seq Library preparation
2.11.1 PCR purification
PCR products were cleaned up using the QIAquick PCR purification kit (Qiagen)
according to the manufacturer’s instructions. For each 4C-PCR, one column was used (the
maximum binding capacity of a column is 10 µg). DNA from column was eluted in a total of
30 µL elution buffer (5 mM Tris-HCl pH 8.5).
The concentration of samples was measured using the Qubit® 3.0 Fluorometer (Life
Technologies) and Qubit® double-stranded DNA (dsDNA) High Sensitivity Assay kit (Life
Technologies) according to the manufacturer’s instructions and samples were stored at -20 °C.
2.11.2 Adaptor ligation
Adapter ligation was performed by Dr. Jisha Antony (Horsfield lab, University of Otago).

75
Libraries were prepared using TruSeq® DNA PCR-Free preparation kit (Illumina)
according to the manufacturer’s instructions for Low Sample preparation. Based on the lowest
DNA concentration, 29 ng from each bait were pooled according to sample and the total
volume was made up to 50 µL with Ultrapure DNase – RNase free distilled H20.
Purified amplicon concentration was measured by Qubit® Fluorometer using dsDNA
High Sensitivity assay kit and average size of PCR products was measured on a 2100
Bioanalyser (Agilent Technologies) using a High Sensitivity DNA Kit (Agilent Technologies)
according to the manufacturer’s instructions. Bioanalyser data was analysed using 2100 Expert
software (Agilent Technologies).

76
Table 2.11: 4C-Seq Library and sequencing adapters
Library TruSeq® i7index
I7 Index sequence
TruSeq® i5 index
I5 Index sequence
WT_12_DMSO_1 UDI0001 CCGCGGTT UDI0001 AGCGCTAG
WT_12_DMSO_2 UDI0002 TTATAACC UDI0002 GATATCGA
WT_12_DMSO_3 UDI0003 GGACTTGG UDI0003 CGCAGACG
WT_12_DMSO_no_ligase UDI0004 AAGTCCAA UDI0004 TATGAGTA
WT_12_PMA_1 UDI0005 ATCCACTG UDI0005 AGGTGCGT
WT_12_PMA_2 UDI0006 GCTTGTCA UDI0006 GAACATAC
WT_12_PMA_3 UDI0007 CAAGCTAG UDI0007 ACATAGCG
WT_72_PMA_1 UDI0024 ATGAGGCC UDI0024 GTTAATTG
WT_72_PMA_2 UDI0009 AGTTCAGG UDI0009 CCAACAGA
WT_72_PMA_3 UDI0010 GACCTGAA UDI0010 TTGGTGAG
WT_72_PMA_no_ligase UDI0012 CTCTCGTC UDI0012 TATAACCT
ST37_12_DMSO_1 UDI0021 GGTACCTT UDI0021 AAGACGTC
ST37_12_DMSO_2 UDI0022 AACGTTCC UDI0022 GGAGTACT
ST37_12_DMSO_3 UDI0015 GGCTTAAG UDI0015 TCGTGACC
ST37_12_DMSO_no_ligase UDI0016 AATCCGGA UDI0016 CTACAGTT
ST37_12_PMA_1 UDI0017 TAATACAG UDI0017 ATATTCAC
ST37_12_PMA_2 UDI0018 CGGCGTGA UDI0018 GCGCCTGT
ST37_12_PMA_3 UDI0019 ATGTAAGT UDI0019 ACTCTATG
ST37_72_PMA_1 UDI0020 GCACGGAC UDI0020 GTCTCGCA
ST37_72_PMA_2 UDI0013 CCAAGTCT UDI0013 AAGGATGA
ST37_72_PMA_3 UDI0014 TTGGACTC UDI0014 GGAAGCAG
ST37_72_PMA_no _ligase UDI0023 GCAGAATT UDI0023 ACCGGCCA
2.11.3 Library purification
Library purification was performed by Dr. Jisha Antony (Horsfield lab, University of Otago).
Libraries were purified by removing fragments above 1 kb using Agencourt®
AMPure® XP beads (Beckman Coulter). The total volume was made up to 50 µL with
Ultrapure DNase – RNase free distilled H20. Beads were equilibrated at RT for at least 30

77
minutes and vortexed briefly before use. 0.5x of magnetic beads was added per sample and
mixed at 1800 rpm at room temperature on the thermomixer for 1 minute and then incubated
at room temperature for further 5 minutes. Samples were spun at 300 g for 1 minute at room
temperature. Beads were separated using a magnet until solution was clear (around 5 minutes)
and supernatant was removed. Beads were washed twice with 200 µL of 70-80% ethanol
(freshly made). Tubes were air dried at room temperature for 5 minutes. The magnet was
removed and 20 µL of TruSeq® DNA PCR-Free Resuspension buffer was added and mixed
until homogeneous. Solutions were incubated for 5 minutes at room temperature. The magnet
was applied until solution was clear (1-2 minutes). Eluates were transferred to DNA low-bind
0.2 mL tubes (Eppendorf).
2.11.4 Equal mixing of baits
Purified amplicon concentration was measured by Qubit® Fluorometer using dsDNA
High Sensitivity assay kit and average size of PCR products was measured on a 2100
Bioanalyser (Agilent Technologies) using a High Sensitivity DNA Kit (Agilent Technologies)
according to the manufacturer’s instructions. Bioanalyser data was analysed using 2100 Expert
software (Agilent Technologies).
2.11.4.1 MiSeq library
Samples were pooled by Dr. Jisha Antony (Horsfield lab, University of Otago) based
on average fragment size: 1 µL for libraries with average size of <1.5 kb and 2 µL for libraries
with average size of >1.5 kb. After pooling, samples were vacuum dried to reduce volume to
10 µL. 1 µL was run on the Bioanalyser.
2.11.4.2 HiSeq Library
Baits were mixed equimolarly based on concentration and average fragment size bait
mixed and adjusted based on the percentage of demultiplexed 4C baits obtained from an initial
MiSeq run.

78
2.11.5 Next generation sequencing
Final libraries were sequenced as 100 bp single-reads on an IlluminaTM HiSeq 2500 by
Otago Genomics Facility (OGF). Because the 4C-seq libraries have low diversity, they were
combined with 15% PhiX control (v/v). A trial library (PCR comparison) was sequenced as
151 bp reads on an IlluminaTM MiSeq by Dr. Rob Day (Cancer Genetics, Department of
Biochemistry, University of Otago).
2.12 Processing of sequenced reads
All code used and generated for this project can be found in Github:
(https://github.com/thoam810/4C_analysis).
2.12.1 Generating read counts and data quality reports
Quality and number of initial reads and demultiplexed reads were checked using:
https://github.com/thoam810/4C_analysis/blob/master/FASTQC_analysis_bash. Quality of
reads was assessed using FastQC software (Andrews, 2010), for each bait within the libraries
before and after demultiplexing.
2.12.2 Demultiplexing of libraries based on indexed adaptors
Libraries were demultiplexed based on 8 base index barcodes (see Table 2.11). For the
HiSeq run, libraries were demultiplexed by OGF (see Appendix V for report); for MiSeq runs,
libraries were demultiplexed automatically after the run.
2.12.3 Trimming of adaptors
Adaptor sequences were removed from bait demultiplexed reads by Sequencing
providers (HiSeq - OGF) and (MiSeq - Dr. Rob Day).
2.12.4 Demultiplexing of baits based on 4C primers
Baits were demultiplexed by Dr. William Schierding (University of Auckland).
79
2.12.4.1 HiSeq
Samples were sequenced using HiSeq2500 100 bp single end reads on two lanes. To
join reads for the different lanes samples files were concatenated
(https://github.com/thoam810/4C_analysis/blob/master/Concatenate_seq_bash). Baits were
demultiplexed based on 4C primers up to and including the restriction site, as listed in Table
2.12 (https://github.com/thoam810/4C_analysis/blob/master/demux_4C_hiseq.sl). Only reads
that had the forward and reverse primer and bait sequences in the correct orientation were
selected. No mismatches were allowed. Primer sequences were not removed from the reads.
2.12.4.2 MiSeq
Sequences used for demultiplexing of baits are 4C primers up to and including the
restriction site (no mismatches were allowed) as listed in Table 2.12.

80
Table 2.12: Primer sequences and lengths used for demultiplexing of 4C baits
Primer Sequence Length (bp) RUNX1 P1 F AACCAAGTCTGTCAGTCTCCTGTAC 25 RUNX1 P1 R GCTAACAAGCAGAGGAAGCAATATTTGTATAGAAT
AACAGAAAAAAAAGATC 52
RUNX1 P2 F GCCGGCTCCTGGAATTGGCCCGCGCGCCCCCGCCGCCGCGCCGCGCGCTACTGTAC
56
RUNX1 P2 R AGGATGTGCGTGCGTGTGTAACCCGAGCCGCCCGATC
37
RUNX1 +24 F ACGTGTCCACATTTTTCAGAAGTTGAATGGTTTTGTGTAATGGTAC
46
RUNX1 +24 R CAGTTACTTCGCCCATTGCTTTTTCTAAAGGATC 34 ERG +85 F CTCGCTGCTTAGGTGTAGTCCTTAGGAATGAAAATC
TGAACGTAGTAC 48
ERG +85 R TGGGGGAGACTGACAAATAGATC 23
2.13 Mapping of sequenced reads
Mapping of sequenced reads was carried out on Linex Server according to 4Cker
(Raviram et al., 2016).
2.13.1 Generating restriction enzyme digestion of Human Genome (hg19)
4C-Seq reads are usually mapped to a reduced genome which consists of unique
sequence fragments adjacent to the primary restriction enzyme sites in the genome. Mapping
to a reduced genome helps to remove inauthentic ligation events that do not result from
crosslinking.
The 4Cker script created a custom reduced genome using oligoMatch (Kent et al.,
2002) and fastaFromBed (Bedtools).
The fragment length should be longer than the length of the sequenced read (100 bp)
minus the size of adapter barcode (8 bp) and primer including the restriction enzyme (RE)
sequence (various bp see Table 2.11 and 2.12). As the longest sequence read was 69 bp
therefore, 70 bp fragment length for digestion was chosen.
In order to map reads to regions of Homo sapiens hg19 reference genome, the Human
genome file (Broad Institute) was digested into 70 bp fragments using an edited 4Cker script

81
and primary RE DpnII file (4Cker).
(https://github.com/thoam810/4C_analysis/blob/master/RE_digest_genome).
Table 2.13: Length of sequenced reads after trimming
Primer Sequenced read length after trimming (bp) RUNX1 P1 F 67 RUNX1 P1 R 40 RUNX1 P2 F 36 RUNX1 P2 R 55 RUNX1 +24 F 46 RUNX1 +24 R 58 ERG +85 F 44 ERG +85 R 69
2.13.2 Generate Bowtie2 reference files of RE digested genome.
The DpnII reduced genome was used to map 4C-Seq single-end reads using Bowtie2
(Langmead et al., 2012)
Bowtie2 requires specific index files which were created using the reduced genome
files: https://github.com/thoam810/4C_analysis/blob/master/bowtie2_build.
2.13.3 Mapping of reads
The 4C-seq single-end reads were aligned to the Bowtie2 DpnII reduced genome using:
https://github.com/thoam810/4C_analysis/blob/master/Alignment_bowtie. This generates
Sequence Alignment/Map (SAM) files of aligned and unaligned reads.
The sequenced reads were trimmed from the 5’ end based on the adapter sequence
length and bait primer sequence including the RE length. The 3’ end was trimmed by 5bp based
on the demultiplexed quality reports.
2.13.4 Creating a counts file from mapped data
The SAM output from bowtie2 reads (Section 2.13.2) were used to create a counts file
(.bedGraph) with number of reads per RE fragment using:
https://github.com/thoam810/4C_analysis/blob/master/mapped_data_counts_bedGraph. This

82
generates a tabulated bedGraph file with 4 columns: Chromosome number, location start of
fragment, location end of fragment, count.
2.13.5 Removing self-ligated and undigested reads
The self-ligated and undigested fragments were removed from the count files before
analysing 4C interactions using:
https://github.com/thoam810/4C_analysis/blob/master/remove_self_ligated_undigested.
To remove the self-ligated and undigested fragments for each bait, the coordinates for
the primer sequences (not including RE sequence) were found in the human reference
genome. Following this the sequence before and after the primer sequence were found. The
fragments that match the coordinates for the fragments before, after and including the primer
were removed.
2.13.6 Removal of background noise
Fragments that had reads in controls are considered background noise and these reads
were removed from the statistically significant interactions using:
https://github.com/thoam810/4C_analysis/blob/master/remove_controls.
Reads at fragments 10 kb up- and downstream of the bait were removed using:
https://github.com/thoam810/4C_analysis/blob/master/remove_bait_10kb.
2.14 Analysing 4C interactions
4C interaction analyses were done in R on a Linux server.
The interactions of a bait across the genome will differ depending on proximity to bait,
with closer interactions (near-bait) occurring at a higher frequency, followed by cis interaction
then trans interactions having the least amount of interaction with the bait region. 4Cker
provides different analyses for near-bait, cis and trans interactions.
4Cker interaction analysis checks if each samples passes quality control (QC) criteria.
To pass 4Cker QC, samples must have more than 1 million reads, more than 40% of reads on

83
the cis chromosome and more than 40% coverage in the 200 kb region near the bait. Krijger et
al., 2020 state that 50,000-100,000 reads are sufficient to generate 4C profiles that correlate to
the 4C profile of 1 million reads (Krijger et al., 2020). For this 4C, samples with more than
400,000 reads with more that 40% reads in cis and >30% reads in near-bait would be allowed
in analysis.
When checking RUNX1 P1, RUNX1 P2 and ERG +85 baits they did not pass the quality
control criteria, so these reads were not processed further.
2.14.1 Identification of statistically significant interactions per condition
To determine significant interactions, 4Cker reduces bias of PCR artifacts as fragments
with counts greater than the 75th quantile within a given window by trimming to this value.
As 4C signal is generally higher around the bait region and decreases in far-cis and
trans, different adaptive window sizes were used for read normalisation and creating smooth
spline in each data set.
Adaptive windows were used to obtain an analogous number of observed fragments for
each window. Window size is determined by the amount of signal detected in the region. This
results in small windows near the bait and regions where there is high coverage and larger
windows further away from the bait where there is low coverage.
The smooth spline (with a smoothing parameter of 0.75) is fitted to the window sizes
separately for each analysis. Significant interactions are determined by what read counts in
domains are called by all replicates, and are greater than the 90th quantile of the adaptive
window.
The value of 'k' determines the size of the adaptive windows. The following k values
were optimised based on comparison of raw reads to the normalised reads and analysed reads.
For the analysis near the bait k = 3, entire bait chromosome analysis k = 3 and trans analysis
used k = 15.

84
Significant 4C interactions for each condition were determined using;
https://github.com/thoam810/4C_analysis/blob/master/Analysing_4C_interactions.
2.14.2 Generation of ggplots
To plot the 4C profiles for all the conditions ggplot was utilised
(https://github.com/thoam810/4C_analysis/blob/master/4C_ggplots).
2.14.3 Differential interactions using DESeq2
Differential analysis was carried out between two conditions on the windows that are
interacting with the bait in at least 2 conditions. 4Cker has optimised this analysis for near-bait
and cis interactions. Significantly different domains were determined with a p-value of 0.05
using (https://github.com/thoam810/4C_analysis/blob/master/DESeq_diff_analysis).
2.14.4 Overlap of significant interactions with genes
Significant interactions were overlapped with UCSC K562 reference gene list using
(https://github.com/thoam810/4C_analysis/blob/master/map_gene_list).
2.14.5 Overlap of significant interactions with protein binding sites and
enhancer characteristics
See section 2.9.1

85
3 Chapter 3: Functional analysis of Runx1 enhancers
Some of the results from this chapter contributed to Marsman, J., Thomas, A., Osato,
M., O'Sullivan, J. M., & Horsfield, J. A. (2017). A DNA contact map for the mouse Runx1
gene identifies novel haematopoietic enhancers. Scientific Reports, 7, 13347 (Appendix VI).
3.1 Runx1 enhancers
The precise spatiotemporal expression of Runx1 requires the activity of cis-regulatory
elements, the majority of which have not been defined. In AML and other myeloid
malignancies where no mutation is found in the coding sequence, there may instead be
mutations in regulatory sequences that affect gene function (Cornish et al., 2019).
Understanding the regulatory landscape of RUNX1 will further increase understanding
of haematopoiesis as well as identify potential new regions for driver mutations in myeloid
malignancies. Recent studies have identified recurrent mutations in regulatory elements of
genes associated with oncogenesis, such in as the TAL1, ETV1, and PAX5 enhancers
(Mansour et al., 2014; Orlando et al., 2018; Puente et al., 2015), highlighting the importance
for determining functionality of non-coding elements.
Regulatory regions can be highly tissue-specific, are often spread over across the
chromatin, and only a small proportion of distal enhancers target the nearest transcript (Javierre
et al., 2016; Mifsud et al., 2015).
3.1.1 Previously identified enhancers of Runx1
Cis-regulatory elements (CREs), such as enhancers are able to control the expression
of genes by long-range chromatin interactions (Marsman et al., 2012).
Several research groups identified an important intronic Runx1 enhancer in mice:
Runx1 +23/+24/eR1/RE1 mouse conserved non-coding element (Bee et al., 2009a; Ng et al.,
2010; Nottingham et al., 2007) (Table 3.1). The naming of the element refers to the kilobases

86
(kb) downstream of each group’s reference point. The inconsistency of enhancer naming
between groups is because Ng et al., (2010) uses the transcriptional start site (TSS), +1 as the
reference point, whilst the other groups refer to this enhancer being 23.5 kb downstream from
the ATG of exon 1. The term eR1 proposed by Koh et al., (2015) refers to enhancer of Runx1
(Koh et al., 2015), whereas Tang et al., (2019) named it regulatory element 1 (RE1) (Tang et
al., 2018). Throughout this thesis, this previously described intronic enhancer will be referred
to as +24.
The +24 enhancer is responsible for the activation of Runx1 expression in
hematopoietic stem/progenitor cells (HSPCs) (Ng et al., 2010; Nottingham et al., 2007). Most
enhancers evolve rapidly and are rarely conserved at the DNA sequence level among species
due to positive evolutionary selection (Villar et al., 2015). Runx1 +24 is highly conserved in
eukaryotes, indicating an essential role in gene regulation. The discovery of +24 regulatory
element as a haemogenic endothelial cell-specific enhancer in mouse and zebrafish embryos
provided an insight into a mechanism for the targeted transcriptional regulation of Runx1
(Markova et al., 2011; Ng et al., 2010; Schütte et al., 2016).
Table 3.1: Runx1 +24 regulatory region
Regulatory region location (kb)
Name in this thesis
Identification methods Functional validation
Mouse and Human Runx1 relative to P1 +23/ +24/ eR1/RE1
+24 In silico conservation (interspecies DNA sequence homology) and DNase I hypersensitive sites (Markova et al., 2011; Ng et al., 2010; Nottingham et al., 2007).
Haematopoietic enhancer activity during mouse and zebrafish development. Luciferase enhancer activity in 416B, K562 and Jurkat haematopoietic cell lines. Thought to be a silencer in HEK293 cells (Markova et al., 2011; Marsman et al., 2017; Ng et al., 2010; Schütte et al., 2016)
This chapter will focus on the other candidate regulatory regions for Runx1, while
Chapter 4 provides a detailed analysis of the Runx1 +24 enhancer.

87
In this thesis enhancers are labelled according to sequence origin, and location relative
to Runx1 transcriptional start site (TSS): + means downstream from the Runx1 TSS at the P1
promoter, whereas – refers to upstream e.g. +62 is 62 kilobases (kb) downstream, from Runx1
TSS. If the sequence for the Runx1 regulatory element was discovered in mice, (m) is used
before the location label, human is unlabelled e.g. +62 sequence information is from humans
and m+110 is from mice.
In mice, Schütte et al., (2016) and Ng et al., (2010) used a combination of techniques
to identify 12 possible regulators of Runx1 with some functional identification (Table 3.2). My
previous masters project investigated the functions of the putative mouse regulatory regions
described by Ng et al., (2010).
Markova et al., (2011), Gunnell et al., (2010), Wang et al., (2014), Cheng et al., (2018),
and Nie et al., (2019) characterised the functions of potential human RUNX1 regulatory
elements. Some of these discoveries included identifying long-range interactions with RUNX1
promoters (Table 3.3).
Enhancers were predicted by several different methods including; computational
analysis of non-coding sequence for inter-species conservation, predicted transcription factor
binding motifs; analysis of chromatin immunoprecipitation sequencing (ChIP-seq) to locate
binding of transcription factors, mediators, and histone modifications at the regions of interest;
revealing promoter-enhancer interactions using chromosome conformation capture (4C, Hi-C)
and chromatin interaction analysis using paired-end sequencing (ChIA-PET).
In this Chapter I describe the conservation and features of previously identified and
novel Runx1 CREs, and identify the functional enhancer capability of regions previously
identified by 4C. This information will provide a deeper understanding of the regulation of
Runx1 transcription, with implications for causality and treatment of leukaemias with RUNX1
dysregulation.

88
Table 3.2: Identified mouse Runx1 regulatory regions with available classifications
Regulatory region location (kb)
Name in this thesis Identification methods Functional validation
-368 m-368 In silico Conservation (interspecies DNA sequence homology) and transcription factor binding motif analysis of sequences (Ng et al., 2010)
Potential enhancer activity within hematopoietic cells/tissues in 20-24 hpf zebrafish embryos (Thomas, 2015)
-328 m-328 ChIP-seq analysis of haematopoietic TFs (ERG, FLI1, GATA2, GFI1B, LYL1, MEIS1, SPI1, RUNX1 and TAL1) and H3K27ac (Schütte et al., 2016).
No enhancer activity observed in mice (Schütte et al., 2016).
-322 m-322 ChIP-seq analysis of haematopoietic TFs (ERG, FLI1, GATA2, GFI1B, LYL1, MEIS1, SPI1, RUNX1 and TAL1) and H3K27ac (Schütte et al., 2016).
Identified, but not tested for enhancer activity (Schütte et al., 2016).
-101 m-101 In silico Conservation (interspecies DNA sequence homology) and transcription factor binding motif analysis of sequences (Ng et al., 2010)
Potential enhancer activity within hematopoietic cells in 20-24 hpf zebrafish embryos (Thomas, 2015)
-59 m-59 ChIP-seq analysis of haematopoietic TFs (ERG, FLI1, GATA2, GFI1B, LYL1, MEIS1, SPI1, RUNX1 and TAL1) and H3K27ac (Schütte et al., 2016)..
Haematopoietic enhancer activity in E11.5 transgenic mice and luciferase enhancer activity in 416B cells (Schütte et al., 2016).
-43 m-43 ChIP-seq analysis of haematopoietic TFs (ERG, FLI1, GATA2, GFI1B, LYL1, MEIS1, SPI1, RUNX1 and TAL1) and H3K27ac (Schütte et al., 2016).
No enhancer activity observed in mice (Schütte et al., 2016).

89
Regulatory region location (kb)
Name in this thesis Identification methods Functional validation
-42 m-42 ChIP-seq analysis of haematopoietic TFs (ERG, FLI1, GATA2, GFI1B, LYL1, MEIS1, SPI1, RUNX1 and TAL1) and H3K27ac (Schütte et al., 2016).
No enhancer activity in observed mice (Schütte et al., 2016).
+1 m+1 ChIP-seq analysis of haematopoietic TFs (ERG, FLI1, GATA2, GFI1B, LYL1, MEIS1, SPI1, RUNX1 and TAL1) and H3K27ac (Schütte et al., 2016).
Identified, but not tested for enhancer activity (Schütte et al., 2016).
+3 m+3 ChIP-seq analysis of haematopoietic TFs (ERG, FLI1, GATA2, GFI1B, LYL1, MEIS1, SPI1, RUNX1 and TAL1) and H3K27ac (Schütte et al., 2016)..
Haematopoietic enhancer activity in E11.5 transgenic mice and luciferase enhancer activity in 416B cells (Schütte et al., 2016).
+110 m+110 In silico Conservation (interspecies DNA sequence homology) and transcription factor binding motif analysis of sequences (Ng et al., 2010)
Haematopoietic enhancer activity in E11.5 transgenic mice, potential enhancer activity within hematopoietic cells in 20-24 hpf zebrafish embryos and luciferase enhancer activity in 416B and Hela cell lines (Schütte et al., 2016; Thomas, 2015).
+181 m+181 ChIP-seq analysis of haematopoietic TFs (ERG, FLI1, GATA2, GFI1B, LYL1, MEIS1, SPI1, RUNX1 and TAL1) and H3K27ac (Schütte et al., 2016).
No enhancer activity in observed mice (Schütte et al., 2016).

90
Regulatory region location (kb)
Name in this thesis Identification methods Functional validation
+204 m+204 ChIP-seq analysis of haematopoietic TFs (ERG, FLI1, GATA2, GFI1B, LYL1, MEIS1, SPI1, RUNX1 and TAL1) and H3K27ac (Schütte et al., 2016)..
Haematopoietic enhancer activity in E11.5 transgenic mice and luciferase enhancer activity in 416B cells (Schütte et al., 2016).

91
Table 3.3: Identified human RUNX1 regulatory regions with available classifications
Regulatory region location (kb)
Name in this thesis Identification methods Functional validation
-139 / E1 -139 ChIP-seq analysis of EBNA2 (Gunnell et al., 2016).
Luciferase enhancer activity in GM12878 and EBV positive Burkitt’s Lymphoma cell lines (Gunnell et al., 2016).
-188/ E4 -188 ChIP-seq analysis of EBNA2 (Gunnell et al., 2016).
Alone drives a 4.3 fold increase in luciferase enhancer activity in GM12878 and EBV positive Burkitt’s Lymphoma cell lines. When combined with -139 and -250 it drives a five-fold increase in enhancer activity (Gunnell et al., 2016).
-250/ E6 -250 ChIP-seq analysis of EBNA2 (Gunnell et al., 2016).
Luciferase enhancer activity in GM12878 and EBV positive Burkitt’s Lymphoma cell lines (Gunnell et al., 2016).
+62 +62 ChIA-PET (RNA polymerase II) and DNase I hypersensitive sites and conserved binding sites for the SNAG repressors GFI1/GFI1B and SNAI1 (Cheng et al., 2018).
Silencer activity in K562, OCl-AML3, U937 cell lines (Cheng et al., 2018).
Intron 5.2/RE2 intron 5.2 In silico Conservation (interspecies DNA sequence homology) and DNase I hypersensitive sites (Markova et al., 2011).
No enhancer or silencer activity observed in K562, Jurkat and HEK293 cell lines (Markova et al., 2011).

92
3.1.2 Previously identified long-range interactions with Runx1
promoters
Interaction between predicted CREs and promoters of the Runx1 gene cannot be
assumed, as fewer than 50% of enhancers contact the nearest gene promoter (Li et al., 2012).
In order to determine the long-range interaction between Runx1 promoters and its CREs, Dr.
Judith Marsman performed circular chromosome conformation capture (4C) (Marsman, 2016)
in the mouse haematopoietic progenitor cell line, HPC7. 4C detects interactions with chosen
regions or “baits” through use of next-generation sequencing. HPC7 cells resemble early
haematopoietic progenitors (Kolterud et al., 1998) and were chosen because Runx1 expression
is crucial for the development of definitive haematopoietic stem- and progenitor cells (Cai et
al., 2011; Growney et al., 2005; Ichikawa et al., 2004; Okuda et al., 1996; Wang et al., 1996).
Quantitative PCR (qPCR) analysis showed that in HPC7 cells, the Runx1 P1 isoform is highly
expressed, whereas the Runx1 P2 isoform is not (Marsman, 2016).
Dr. Marsman’s selected baits for Runx1 4C, situated at the Runx1 P1 and Runx1 P2
promoters and at the Runx1 +24 enhancer. For each of these regions, one bait was located at
the core region, and another bait was located at a nearby (1.5-2 kb away) cohesin/CTCF binding
site.
Cohesin/CTCF binding sites upstream of Runx1 P1 and downstream of the Runx1 +24
enhancer are present in CH12, MEL and HPC7 cells, whereas cohesin/CTCF binding sites
upstream of Runx1 P2 are not present in HPC7 cells (Wilson et al., 2016). 4C analysis with
baits at the Runx1 -P1 and -P2 promoters allows for comparison of interactions between the
active Runx1 -P1 promoter and inactive -P2 promoter.
Runx1 P1 interacted with seven regions, as well as with the Runx1 +24 enhancer (Table
3.4). Each regulatory element recruits multiple blood transcription factors in HPC7 cells,
suggesting they function as haematopoietic-specific enhancers. They are named according to

93
their distance from the Runx1 P1 transcriptional start site: -371, -354, -327, -321, -303, -58, -
48, and +110.
Of these putative enhancers, two had been previously described; conserved Runx1 m-
368, m+110 (Ng et al., 2010; Thomas, 2015).

94
Table 3.4: Identified long range interactions with putative mouse Runx1 regulatory regions.
Regulatory region location (kb)
Name in this thesis Identification methods Interactions identified Functional validation
-371 m-371 3D interaction with Runx1 Promoters described by 4C and transcription factor binding motif analysis (Marsman, 2016).
Interacts with +24 and P1 in HPC7 cells identified by 4C (Marsman, 2016).
Not investigated.
-368 m-368 Conservation and transcription factor binding motif analysis (Ng et al., 2010)
Interacts with +24 and P1 in HPC7 identified by 4C (Marsman, 2016). Interacts with P1 in HPC-7 cells identified by Capture Hi-C (Wilson et al., 2016).
Potential enhancer activity within hematopoietic cells/tissue in 20-24 hpf zebrafish embryos (Thomas, 2015)
-354 m-354 3D interaction with Runx1 Promoters described by 4C and transcription factor binding motif analysis (Marsman, 2016).
Interacts with +24 and P1 in HPC7 cells identified by 4C (Marsman, 2016). Interacts with P1 in HPC-7 cells identified by Capture Hi-C (Wilson et al., 2016).
Not investigated.
-327 m-327 3D interaction with Runx1 Promoters described by 4C and transcription factor binding motif analysis (Marsman, 2016).
Interacts with +24 and P1 in HPC7 cells identified by 4C (Marsman, 2016). Interacts with P1 in HPC-7 cells identified by Capture Hi-C (Wilson et al., 2016).
Not investigated.
-321 m-321 3D interaction with Runx1 Promoters described by 4C and transcription factor binding motif analysis (Marsman, 2016).
Interacts with +24 and P1 in HPC7 cells identified by 4C (Marsman, 2016).
Not investigated.

95
Regulatory region location (kb)
Name in this thesis Identification methods Interactions identified Functional validation
Interacts with P1 in HPC-7 cells identified by Capture Hi-C (Wilson et al., 2016).
-303 m-303 3D interaction with Runx1 Promoters described by 4C and transcription factor binding motif analysis (Marsman, 2016).
Interacts with +24 and P2 in HPC7 cells identified by 4C (Marsman, 2016). Interacts with P1 in HPC-7 cells identified by Capture Hi-C (Wilson et al., 2016).
Not investigated.
-58 m-58 3D interaction with Runx1 Promoters described by 4C and transcription factor binding motif analysis (Marsman, 2016).
Interacts with +24 and P1 in HPC7 cells identified by 4C (Marsman, 2016).
Not investigated.
-48 m-48 3D interaction with Runx1 Promoters described by 4C and transcription factor binding motif analysis (Marsman, 2016).
Interacts with +24 and P1 in HPC7 cells identified by 4C (Marsman, 2016).
Not investigated.
+110 m+110 Conservation and transcription factor binding motif analysis (Ng et al., 2010)
Interacts with P1 in HPC7 cells identified by 4C (Marsman, 2016).
Haematopoietic enhancer activity in E11.5 transgenic mice, potential enhancer activity in hematopoietic sites in 20-24 hpf zebrafish embryos and luciferase enhancer activity in 416B and Hela cell lines (Schütte et al., 2016; Thomas, 2015).

96
4C data identified new cis elements bound by TFs, that could have regulatory functions.
The Runx1 +24 enhancer interacted with all of the putative elements, except m+110. Runx1 P1
connected to all the identified regions excluding m-303. Conversely, the Runx1 P2 promoter
showed fewer interactions with enhancer clusters, but did interact with the putative regulatory
sites m-303, m-48 and m+24.
Figure 3.1: Schematic overview of the mouse Runx1 locus (chromosome 16:93,220,074-92,589,466).
Previously identified regulatory regions are annotated with orange circles, novel regions detected by 4C (Marsman, 2016) are represented by yellow circles, grey boxes annotate exons. The blue boxes show the exons encoding the Runt binding domain. The two Runx1 promoters are represented by black right angled arrows.
In humans, the interactions between RUNX1 promoters and regulatory regions were
identified using 3C for two regions, +62 and intron 5.2. +62 interacts with RUNX1 -P2 in K562
and OCl-AML3 cell lines (Cheng et al., 2018). Intron 5.2 Interacts with RUNX1 -P1 and P2 in
K562, Jurkat and HEK293 cell lines (Markova et al., 2011).

97
Figure 3.2: Schematic overview of human RUNX1 locus (chromosome 21: 36,148,773-36,872,777).
Each human RUNX1 regulatory region is annotated with orange circles, grey boxes annotate exons. The blue boxes show the exons encoding the Runt binding domain. The two RUNX1 promoters are represented by black right angled arrows.
3.1.3 Functional enhancer characterisation assays
In order to determine the enhancer function of these identified regions, enhancer assays
can be used. Luciferase assays show the ability of a regulatory element to drive expression of
the firefly luciferase reporter gene Luc2 in cell lines. If the luciferase vector contains an
enhancer, there should be an increase in expression of luciferase, which can be determined with
a luminometer.
Zebrafish reporter assays can identify cell-type specific gene expression driven by
putative enhancers. If the zebrafish vector contains an enhancer there should be expression of
green fluorescent protein (GFP) in the cells that can respond to that enhancer. This is
determined by viewing zebrafish embryos during development under a fluorescent microscope.
The zebrafish enhancer assay vectors contain integration sites so that the reporter gene
constructs can be incorporated into the host genome. The Horsfield lab currently utilises three
reporter assays; ISceI-pBSII SK+ which integrates using I-Sce I sites, and Tol2Gata2 and ZED
which use Tol2 sites. Transient expression can be analysed in F0, however the F1 generation
contain a germ line integration of the constructs, to avoid the problem of a mosaic expression
pattern seen in F0.
98
By using zebrafish enhancer assays I can define whether these putative regulatory
elements influence any cell- and/or stage-specific Runx1 haematopoietic expression. It is
possible that mutations or defects in the regulation of in such elements may explain AML
progression in patients who have no known protein-coding mutations or perhaps patients who
have cohesin mutations. It is also necessary to determine whether the identified mouse
enhancers are conserved in humans.
3.2 Hypothesis
I hypothesise that the regions identified by Runx1 4C have enhancer capabilities and
some of them may be conserved in humans. As most enhancers rapidly evolve and are rarely
conserved at a sequence level between species, any regions that are conserved may have an
essential roles in RUNX1 gene regulation. Understanding the regulatory mechanisms that drive
cell-specific expression of RUNX1 in haematopoiesis will have implications for causality and
treatment of leukaemias with RUNX1 dysregulation.
3.3 Aims
1) Elucidate conservation and genomic characteristics of previously identified and
novel Runx1 cis-regulatory elements using bioinformatic tools.
2) Identify the enhancer ability of putative cis-regulatory elements previously
identified by 4C, using zebrafish reporter assays.

99
3.4 Characteristics of previously identified regulatory regions
In order to understand the overall contributions of regulatory regions to Runx1
haematopoietic expression and their potential to be dysregulated in myeloid malignancies, in
silico analyses were carried out. Bioinformatic tools can be used to determine conservation of
a regulatory regions, which cells these regions are active in and what transcription factors bind
to them.
3.4.1 Epigenetic and conservation analyses using ENCODE data
ENCODE project data from RUNX1-dependent Human Chronic Myelogenous
Leukaemia cells (K562) were analysed at each conserved locus (Barski et al., 2007; Raney et
al., 2014; Rosenbloom et al., 2013; Wilson et al., 2016) using the UCSC Genome Browser.
Elements included in the search for regulatory features were transcription factor
binding sites (TFBS), open chromatin (DNase I hypersensitivity), histone modifications, CTCF
binding sites, RNA polymerase II (Pol II), cohesin (RAD21 and SMC3 subunits) binding sites
(Table 3.5).
ENCODE also has Chromatin State predictions (ChromHMM) for K562 cells (Kellis
et al., 2017). ChromHMM annotates the data based on epigenetic information. The predicted
chromatin states are active promoter, promoter flanking, inactive promoter, candidate strong
enhancer, candidate weak enhancer, distal CTCF/candidate insulator, transcription associated,
polycomb repressed and heterochromatin/repetitive/copy number variation. Transcription
associated refers to transcriptional transition or elongation (Ernst et al., 2010; Ernst et al.,
2011).
Further gene regulatory markers for K562 cells were uploaded into UCSC genome
browser including; super-enhancers from dbSUPER (Khan et al., 2016), silencers annotated
by Pang et al., (2020) (Pang et al., 2020), cohesin-mediated chromatin accessibility (Antony
et al., 2020).

100
Conservation analysis identifies whether these regions could be important for human
haematopoiesis. The UCSC BLAT tool (Kent, 2002) and NCBI BLAST tool (Altschul et al.,
1990) were used to determine the human co-ordinates of mouse (m) Runx1 -368, -327, -321, -
58, -43, -42, +3, +1, +110, +181, +204. Mouse Runx1 m-368, m-368, m-327, m-58, m-43,
m+3, m+110 and m+204 were all found to be conserved in humans (Table 3.6). Runx1 m+204
sequence sits within the previously described RUNX1 intron 5.2.
When gathering sequence information about these regulatory regions I noted that three
regions identified by Dr. Judith Marsman corresponded to the regions described by Schütte et
al., (2016); Marsman’s m-327 is Schütte’s m-328, Marsman’s m-321 is Schütte’s m-322 and
Marsman’s m-58 is Schütte’s m-59. These will be referred to from now as m-327, m-321 and
m-58.
To convert coordinates within a species UCSC ‘liftOver’ tool was utilised (Rosenbloom
et al., 2013). Appendix VII contains the Hg38 locations of Runx1 regulatory regions.

101
Table 3.5: Analysed ENCODE annotations
Regulatory association ENCODE annotation Open chromatin DNase I hypersensitivity (HS) Transcription initiation RNA Pol II (phosphorylated at serine
5) Cohesin (subunit) RAD21, SMC3 CTCF binding sites CTCF Histone acetyltransferase that is recruited to transcriptionally active enhancers (an increase in the expression of target genes)
p300
H3K4me1/2 demethylase (mediates transcriptional repression)
LSD1
Super-enhancer previously annotated by Khan et al., (2016)
K562 Super-enhancers
Silencer previously annotated by Pang et al., (2020)
Silencers
Cohesin mediated chromatin accessibility previously annotated by Antony et al., (2020)
Chromatin sites that show increased accessibility in the absence of cohesin (STAG2)
Chromatin State ChromHMM Enhancer Enhancer-associated
histone methylation or acetylation marks
H3K27ac, H3K4me1, H3K4me2
Active promoters H3K27ac, H3K9ac, H3K4me3
Repressed promoters H3K9me3, H3K27me3 Haematopoiesis transcription factors
Erythroid development GATA1 Haematopoietic SPI1 Blood/ Stem progenitors TAL1, GATA2
Table 3.6: Conservation and annotations of previously identified Runx1 regulators
Regulatory region location relative to P1 (kb)
Genome coordinates (Hg19)
ENCODE annotation ChromHMM annotation
Cohesin-mediated chromatin accessibility
m-368 chr21:36849117-36849289
RNA Pol II, p300, LSD1, H3K27ac, H3K4me1, H3K4me3, H3K9ac, H3K9me3, H3K27me3
Strong Enhancer
No change in accessibility in K562 STAG2 mutants
m-327 chr21:36800068-36801396
p300, H3K4me1, H3K9ac, H3K9me3, H3K27me3
Repressed No change in accessibility in K562 STAG2 mutants

102
Regulatory region location relative to P1 (kb)
Genome coordinates (Hg19)
ENCODE annotation ChromHMM annotation
Cohesin-mediated chromatin accessibility
m-321 Not conserved between humans and mice
N/A N/A N/A
-250 chr21:36669712-36670621
RNA Pol II, p300, LSD1, H3K9me3, H3K27me3
Repressed No change in accessibility in K562 STAG2 mutants
-188 chr21:36608329-36608806
p300, H3K4me3, H3K9me3, H3K27me3, SPI1
Transcription Associated
No change in accessibility in K562 STAG2 mutants
-139 chr21:36561619-36562555
p300, H3K4me1, H3K4me3, H3K9ac, H3K9me3, SPI1
Weak enhancer, Transcription Associated
No change in accessibility in K562 STAG2 mutants
m-101 chr21:36542872-36543055
RNA Pol II, p300, LSD1, H3K27ac, H3K4me1, H3K4me3, H3K9me3,
Transcription Associated
No change in accessibility in K562 STAG2 mutants
m-58 chr21:36478706-36478906
DNase I HS, RNA Pol II, CTCF, p300, LSD1, H3K27ac, H3K4me1, H3K4me3, H3K9ac, H3K9me3, GATA1, TAL1, GATA2
Strong Enhancer
No change in accessibility in K562 STAG2 mutants
m-43 chr21:36464084-36464260
RNA Pol II, CTCF, p300, LSD1, H3K4me3, H3K9ac, H3K9me3
Weak Enhancer
No change in accessibility in K562 STAG2 mutants
m-42 Not conserved between humans and mice
N/A N/A N/A

103
Regulatory region location relative to P1 (kb)
Genome coordinates (Hg19)
ENCODE annotation ChromHMM annotation
Cohesin-mediated chromatin accessibility
m+1 Not conserved between humans and mice
N/A N/A N/A
m+3 chr21:36418472-36418744
RNA Pol II, CTCF, p300, LSD1, H3K4me1, H3K4me3, H3K9ac, H3K9me3
Transcription Associated
No change in accessibility in K562 STAG2 mutants
+62 chr21:36358933-36359953
DNase I HS, RNA Pol II, CTCF, p300, LSD1, H3K4me1, H3K4me3, H3K9ac, H3K9me3, H3K27me3
Weak Enhancer
No change in accessibility in K562 STAG2 mutants
m+110 chr21:36280710-36281200
DNase I HS, RNA Pol II, RAD21, p300, LSD1, H3K27ac, H3K4me1, H3K4me3, H3K9ac, H3K9me3, H3K27me3 GATA1, TAL1, GATA2
Strong Enhancer
Increased accessibility in K562 STAG2 mutants
m+181 Not conserved between humans and mice
N/A N/A N/A
Intron 5.2 containing m+204
chr21:36179311-36181581
DNase I HS, RNA Pol II, CTCF, p300, LSD1, H3K27ac, H3K4me1H3K9ac, H3K9me3, H3K27me3
Transcription Associated
Increased accessibility in K562 STAG2 mutants
m+204 Referred to from now as Intron 5.2 this thesis
chr21:36179925-36180456
DNase I HS, RNA Pol II, CTCF, p300, LSD1, H3K27ac, H3K4me1H3K9ac, H3K9me3, H3K27me3
Transcription Associated
Increased accessibility in K562 STAG2 mutants
Based on the ChromHMM data it appears that the in RUNX1-dependent K562 line m-
368, m-58, m+110 are all operating as strong enhancers, whilst -139, m-43, and +62 are
functioning as weak enhancers. Remarkably, +62 a known silencer in K562, also has enhancer-
associated histone methylation marks. Intron 5.2, m-101 and m+3 show the same regulatory

104
associations as the enhancers, however, they are labelled as transcription associated.
ChromHMM also reported -139 and -188 as transcription associated. Transcription associated
annotation could be due to their close proximity with exons when compared to the regions
annotated as enhancers, or it may indicate that these regions are producing RNA, such as
enhancer RNA (eRNA). Intron 5.2 and m+110 had increased accessibility in cohesin mutant
K562 cells. Antony et al., (2020) found that sites of increased accessibility were enriched for
motifs of enhancer-regulating bZIP or AP-1 factors (Antony et al., 2020). These regulatory
regions did not overlap with any known K562 super-enhancers or silencers. Interestingly, m-368
and m-327 are both within LOC100506403 an uncharacterised non-coding RNA and may
therefore play a role in its regulation as well.
m-368, -250, m-101, m-58, m-43, m+3, +62, m+110 and intron 5.2 were all bound by
LSD1 a mediator of transcriptional repression usually seen in silencers. SPI1 a haematopoietic
transcription factor was only bound to -139 and -188. Blood stem progenitor transcription
factor TAL1 and GATA2, as well as, GATA1 a marker of erythroid development were found
to bind m+110 and m-58.
These annotations provide a good overview of the likeliness of a region to be regulatory.
However, the analysis is limited to the types of cell lines that have been used for ChiP-seq by
previous groups, as well as which transcription factors were chosen. This may explain why no
consistent expression patterns could be observed in the available K562 data.
To further determine enhancer expression, FANTOM 5 data was considered. Rather
than assessing enhancers via chromatin accessibility and transcription factor binding,
FANTOM 5 detects enhancer RNAs using cap-analysis gene expression (CAGE). The
FANTOM 5 dataset is a compilation of many cell types and RNA transcription across the
genome. It can predict enhancer activity status based on whether short segments of RNA are

105
transcribed from the regulatory region. By understanding which cell types enhancers are
transcribed in, a pattern of enhancer arrangement may become apparent.
The FANTOM 5 data showed that not all regulatory regions produced enhancer RNA
(eRNA) in the cells available types for analysis. Regions m-368, -188, m-58, m-101 did not
have any eRNA expression. Although eRNA is typically used for enhancer identification, not
all active enhancers produce detectable eRNA (Mikhaylichenko et al., 2018; Sartorelli et al.,
2020). It remains unclear whether these enhancers produce low levels of eRNAs that are not
easily detectable with current methods.
All other regions expressed RNA in haematopoietic cells, however there was no
consistent expression patterns in other tissues (Table 3.7).
Table 3.7: Cell types with regulatory region RNA expression
Regulatory region location relative to P1 (kb)
Cell type expressing regulatory region RNA
m-368 Not expressed
m-327 Skin, Liver, Brain, Lung, Haematopoiesis, Stomach, Oesophagus, Colon, Gall Bladder, Mesenchymal
-250 Prostate, Brain, Haematopoiesis, Colon, Gall Bladder, Mesenchymal
-188 Not expressed
-139 Liver, Breast, Brain, Lung, Haematopoiesis, Oesophagus,
m-101 Not expressed
m-58 Not expressed

106
Regulatory region location relative to P1 (kb)
Cell type expressing regulatory region RNA
m-43 Brain, Lung, Haematopoiesis,
m+3 Haematopoiesis, Mesenchymal, Kidney
+62 Skin, Prostate, Liver, Breast, Brain, Lung, Haematopoiesis, Ovary, Oesophagus, Colon, Mesenchymal, Kidney
m+110 Prostate, Haematopoiesis
Intron 5.2
Skin, Prostate, Brain, Lung, Haematopoiesis, Stomach, Colon, Mesenchymal, Kidney
Single nucleotide polymorphism (SNP) analysis
Ernst. et al., (2011) highlighted that disease variants, such as single nucleotide polymorphisms
(SNPs) in genome-wide association studies (GWAS) frequently overlapped with enhancer
elements relevant to the disease cell type (Ernst et al., 2011). To determine if there were any
SNPs in each regulatory region, GWAS catalog (Buniello et al., 2019) and HaploReg v4.1
(Ward et al., 2016) were used. SNPs were also analysed to ensure they had a minor allele
frequency (MAF) of >1 % using the Genotype-Tissue Expression (GTEx) portal v8
(https://gtexportal.org/home/). gnomAD browser v2 1.1 and v3 (Koch, 2020) were used to
review SNPs with MAF >1 % for any ClinVar associations and/or publications. Some of the
SNPs identified in this research (Table 3.8) were linked to SNP variants with r2 values of >=
0.8 and r2 >= 1. As this was a preliminary investigation these linked SNPs were not investigated
further.
Multiple SNPs were identified in all of the regulatory regions except m-101. m-368,
m+110 and intron 5.2 contained SNPs that have functional effects in haematopoietic cells
(Table 3.8). Therefore, mutations in these regulatory regions have the potential to alter TF

107
binding sites and affect the regulatory activity of that region of DNA. Some of the other SNPs
may be functional, but have not yet been investigated.
Table 3.8: SNP analysis of previously identified Runx1 regulators
Regulatory region
Number of SNPs (MAF>=1%)
SNP name Predicted changes SNP function
m-368 3 rs116951441
not predicted to change any motifs
Not investigated
rs16993221 A to T change of rs16993221 alters 2 regulatory motifs BATF and IRF which work together in immune response.
Related to white blood cell count a crucial marker which contributes to chronic inflammation (p value: 2E-8)(Kong et al., 2013).
rs909143 The A to G change in rs909143 is predicted to affect 3 regulatory motifs
Has an eQTL with oesophagus and is related to gene expression of Kynurenine 3-monooxygenase gene in peripheral blood monocytes (p value: 1.84E-06)(Zeller et al., 2010).
m-327 2 rs4817723 not predicted to change any motifs.
Not investigated
rs12106380 T to G change of rs12106380 alters 6 regulatory motifs including GATA binding sites.
Not investigated
-250 3 rs57911917 not predicted to change any motifs
Not investigated
rs2834885 C to A change of rs2834885 alters 1 regulatory motif, PEBP.
Not investigated

108
Regulatory region
Number of SNPs (MAF>=1%)
SNP name Predicted changes SNP function
rs61607093 T to C change of rs61607093 alters 20 binding motifs including GATA3, Nanog, SPI1, Pax5 and p300
Not investigated
-188 1 rs35526434 C to T change alters 12 regulatory motifs including SPI1, PAX5 and p300.
Not investigated
-139 3 rs189789980
T to G change alters 3 regulatory motifs.
Not investigated
rs140039393
TTA to T change alters 4 binding motifs including Sox5.
Not investigated
rs2834825 G to A change alters 19 motifs including Pou2f2.
Not investigated
m-101 0 Not applicable
Not applicable Not applicable
m-58 13 rs2834768 G to A change of rs2834768 alters 13 regulatory motifs including MYC, TAL1 and multiple GATA sites.
Not investigated
rs2834769 C to T alters 3 binding motifs.
Not investigated
rs13049322 not predicted to change any motifs
Not investigated
rs73374626 G to A change alters 5 motifs including MYC
Not investigated
rs9984842 C to T is predicted to alter 12 motifs including KLF4, KLF7 and SP1.
Not investigated
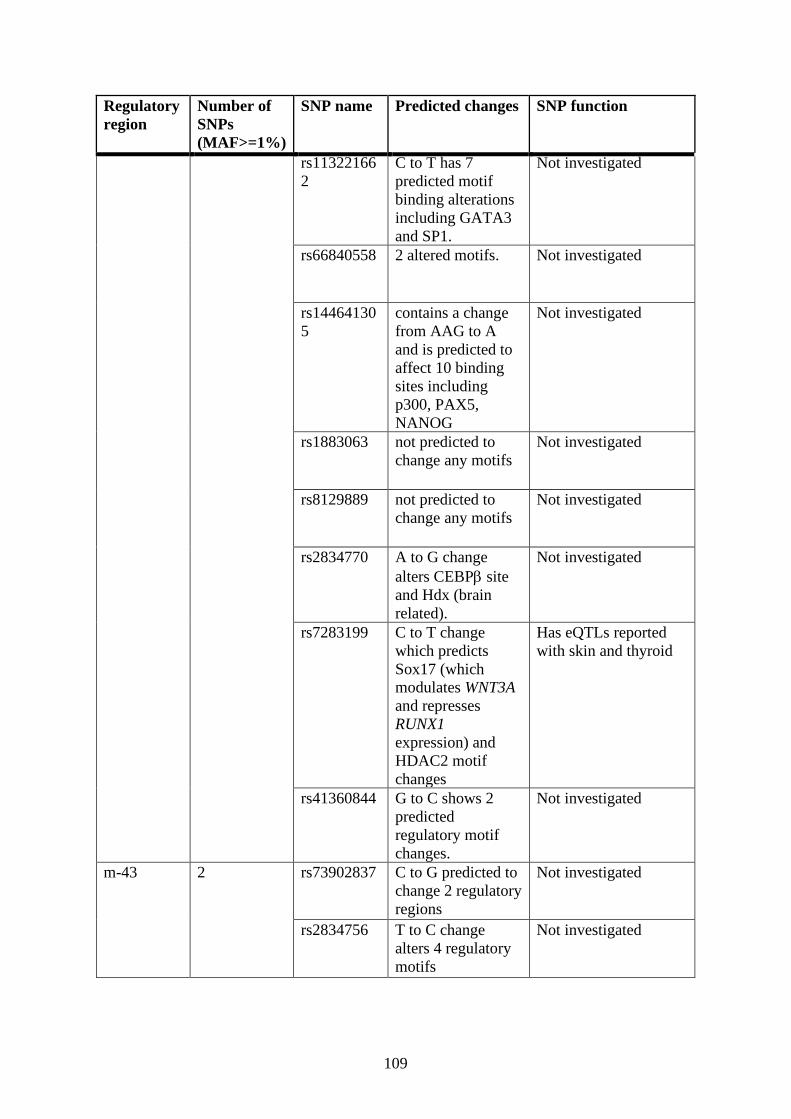
109
Regulatory region
Number of SNPs (MAF>=1%)
SNP name Predicted changes SNP function
rs113221662
C to T has 7 predicted motif binding alterations including GATA3 and SP1.
Not investigated
rs66840558 2 altered motifs. Not investigated
rs144641305
contains a change from AAG to A and is predicted to affect 10 binding sites including p300, PAX5, NANOG
Not investigated
rs1883063 not predicted to change any motifs
Not investigated
rs8129889 not predicted to change any motifs
Not investigated
rs2834770 A to G change alters CEBPβ site and Hdx (brain related).
Not investigated
rs7283199 C to T change which predicts Sox17 (which modulates WNT3A and represses RUNX1 expression) and HDAC2 motif changes
Has eQTLs reported with skin and thyroid
rs41360844 G to C shows 2 predicted regulatory motif changes.
Not investigated
m-43 2 rs73902837 C to G predicted to change 2 regulatory regions
Not investigated
rs2834756 T to C change alters 4 regulatory motifs
Not investigated
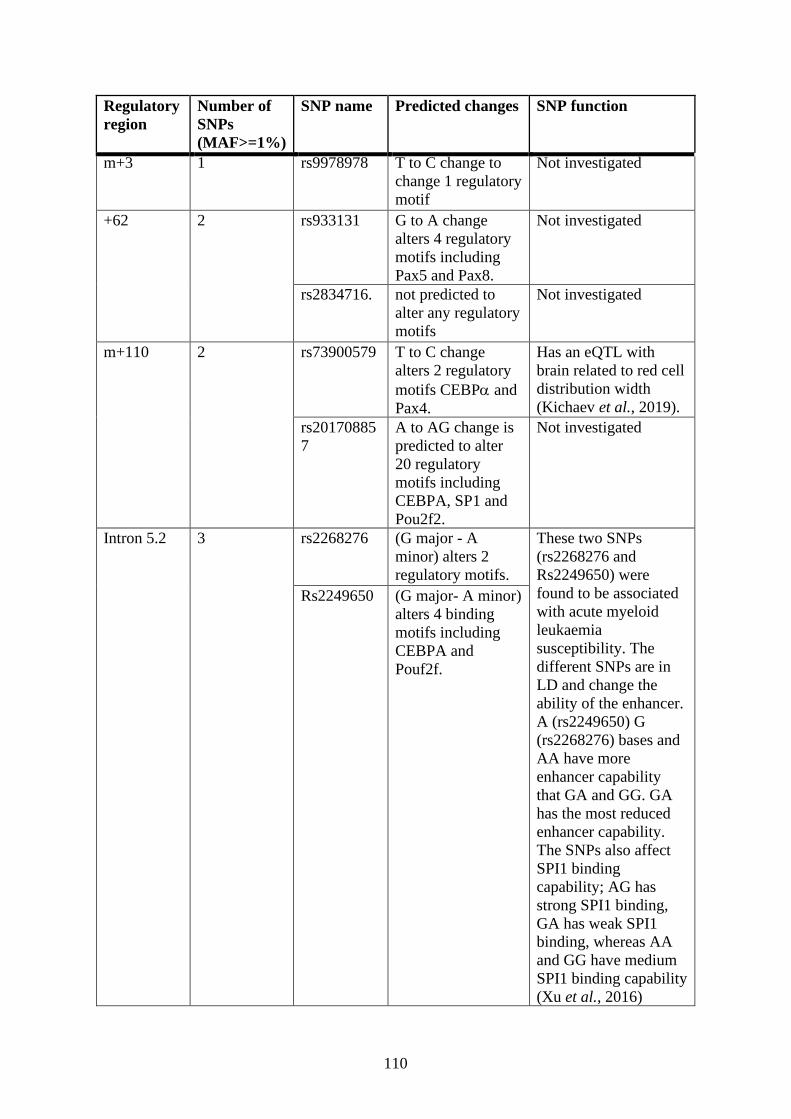
110
Regulatory region
Number of SNPs (MAF>=1%)
SNP name Predicted changes SNP function
m+3 1 rs9978978 T to C change to change 1 regulatory motif
Not investigated
+62 2 rs933131 G to A change alters 4 regulatory motifs including Pax5 and Pax8.
Not investigated
rs2834716. not predicted to alter any regulatory motifs
Not investigated
m+110 2 rs73900579 T to C change alters 2 regulatory motifs CEBPα and Pax4.
Has an eQTL with brain related to red cell distribution width (Kichaev et al., 2019).
rs201708857
A to AG change is predicted to alter 20 regulatory motifs including CEBPA, SP1 and Pou2f2.
Not investigated
Intron 5.2
3 rs2268276 (G major - A minor) alters 2 regulatory motifs.
These two SNPs (rs2268276 and Rs2249650) were found to be associated with acute myeloid leukaemia susceptibility. The different SNPs are in LD and change the ability of the enhancer. A (rs2249650) G (rs2268276) bases and AA have more enhancer capability that GA and GG. GA has the most reduced enhancer capability. The SNPs also affect SPI1 binding capability; AG has strong SPI1 binding, GA has weak SPI1 binding, whereas AA and GG have medium SPI1 binding capability (Xu et al., 2016)
Rs2249650 (G major- A minor) alters 4 binding motifs including CEBPA and Pouf2f.

111
Regulatory region
Number of SNPs (MAF>=1%)
SNP name Predicted changes SNP function
rs8130772 A to G alters 5 binding motifs including SP1 and FLI1.
Not investigated
To determine a potential regulatory relationship, Dr. William Schierding and I
identified which genes a SNP physically interacts with and whether that SNP-gene interaction
is supported by an allele-specific change in gene expression (CoDeS3D pipeline (Fadason et
al., 2018)). First, CoDeS3D interrogates 70 Hi-C chromatin interaction libraries (from a diverse
set of human cell lines) to identify interactions across the genome with the SNPs. Next, each
SNP is tested for an allele-specific association to the expression level of the spatially associated
partner gene (the SNP is an expression quantitative trait locus (eQTL).
Despite finding many regulatory spatial interactions between RUNX1 regulatory region
SNPs and RUNX1, none of them were supported by a significant eQTL interaction (FDR<
0.05). One reason for this lack of significance is that the CoDeS3D pipeline uses the GTEx
portal for eQTL outputs, which only can test 54 tissues sampled from healthy older individuals.
GTEx also only measures whole blood, rather than individual cell types, so cell type- or
disease-specific effects may not be detected.
3.4.2 Comparative analysis of cancer genomic datasets
To assess whether any AML patients had mutations in the conserved regulatory regions,
publicly available cancer genomic datasets were explored. Online tools were used to categorise
publicly available patient information into different tumour types for analysis.
The large-scale cancer genomics datasets were retrieved from International Cancer
Genome Consortium (ICGC) Data Portal (Hudson et al., 2014; Zhang et al., 2011), the c-
BioPortal for Cancer Genomics (Cerami et al., 2012; Gao et al., 2013) and the Cancer Genome
Atlas (TCGA) Data Portal (CGARN, 2013).

112
International Cancer Genome Consortium (ICGC) was the only database that allowed
for analysis of non-coding regions. RUNX1 regulatory regions (as defined in Table 3.6) were
analysed for mutations in cancer datasets, with 237 mutations found (Table 3.9). The number
of mutations observed in the different RUNX1 regulatory regions in haematopoietic- related
cancers was relatively low (6.75%). The majority of mutations in these regions occurred in
skin-related cancers (39.24%) (Table 3.9). However it is worth noting that even normal skin
has a high mutational load relative to other tissues (García-Nieto et al., 2019; Martincorena et
al., 2015).
Table 3.9: Spread of 237 Runx1 regulatory region mutations that were found in ICGC dataset represented
in a range of primary tissue sites.
Primary site of mutation Representation of found mutations (%) Skin 39.24% Liver 10.97% Brain 8.44% Oesophagus 8.02% Haematopoietic 6.75% Prostate 4.22% Breast 3.80% Pancreas 3.80% Lung 3.38% Ovary 2.53% Gall Bladder 2.53% Mesenchymal 1.69% Head and Neck 1.69% Stomach 1.27% Kidney 0.84% Colorectal 0.42% Uterus 0.42%
The regulatory regions showed different frequencies of mutations in this dataset (Figure
3.3). m-58 had the highest frequency of mutations with 81 incidences, followed by intron 5.2
(41) and then m-327 (27). m-58 also showed the highest incidence of mutation in
haematopoietic cancers (4). Each enhancer had a relatively diverse profile of primary mutations
sites (Figure 3.3)

113
Figure 3.3: Proportions of cancerous primary site mutations of regulatory regions.
Each of the regulatory regions displayed diverse cancerous primary site profiles. Primary site profiles are colour coded. Key is at the bottom of the figure. Total number of mutations excluding skin in each regulatory region shown at top of each bar. As normal skin has a high mutational load relative to other tissues it was not included in this diagram.
Some of the regulatory region SNPs (from Section 3.4.2) were reported in patients: an
oesophageal adenocarcinoma patient had the m-327 T>G rs12106380 SNP, another
oesophageal adenocarcinoma sample had the same G to A change reported in m-58 rs8129889
SNP. Three patients had -250 SNP rs2834885, two with acute myeloid leukaemia and one with
oesophageal adenocarcinoma. Four patients with malignant lymphoma had m-58 mutations
chr21:g.36480715C>A (rs199811665), chr21:g.36480761A>C and chr21:g.36481470C>T
(rs1440069314). None of these SNPs were reported in the GTEx portal. Two SNPs in +62 were
found in patients with acute myeloid leukaemia rs933131 and rs2834716. Interestingly, the
patient with rs2834716 also had the intron 5.2 SNPs (rs2268276 and rs2249650) which have
been previously associated with acute myeloid leukaemia susceptibility (Xu et al., 2016).

114
Intron 5.2 SNP rs2268276 was also found in a patient with lung cancer. Three other patients
also reported intron 5.2 SNP rs2249650, two with lung cancer, one with paediatric brain
tumour.
The genomic data in the ICGC Data portal contains multiple mutations per patient. The
analyses of these regions shows that some of the reported SNPs are found in AML patients,
however, it is unknown whether many of these SNP have a functional impact in these patients.
As was done for the analysis of intron 5.2 SNPs (Xu et al., 2016), there is a need to analyse
each of these SNPs for functional capability. Interestingly, the majority of cancers reported
with mutations in RUNX1 regulatory regions were not blood-specific, instead reflecting the
roles of RUNX1 in other tissues (Groner et al., 2017). The tissues highlighted as expressing
regulatory regions in FANTOM 5 data (Table 3.7) were the same primary sites of mutation in
ICGC data (Table 3.9, Figure 3.3).
3.5 Zebrafish enhancer reporter assays
To understand the tissue-specific activity of Runx1 regions that directly interact with Runx1 -
P1, -P2 and +24 (Marsman, 2016), zebrafish reporter assays were used.
DNA sequences of the putative enhancers were amplified from mouse gDNA then
cloned into zebrafish enhancer detector assay reporter constructs (Figure 3.4), and injected into
one-cell zebrafish embryos.

115
Figure 3.4: Schematic representation of ZED assay vector.
This vector contains two cassettes, the first cassette consists of cardiac actin promoter (blue) upstream of Red Fluorescent Protein (red). The second cassette contains the gateway cassette (yellow), which is immediately downstream of the gata2 promoter (blue), downstream of the green fluorescent protein (green). The second cassette is protected by insulator sequence (purple). Purple dotted line indicates the insulated sequence, which prevents positional effects from surrounding DNA, following integration. Tol2 sites (orange) allow for integration of vector into zebrafish genome. The vector contains two excision cassettes, one targeted by Flip-recombinase (FRT sites) and the other by Cre-recombinase (LoxP sites). Figure from Thomas (2015).
The zebrafish enhancer detector assay (ZED) is designed to have two different
cassettes; one to test enhancer activity of the regulatory element in a cell type specific manner
and a second cassette which functions as a an internal control for assessing injection efficiency
and a transgenic marker. If the regulatory region acts as an enhancer it will cooperate with the
gata2 promoter to drive cell-specific GFP expression. The enhancer detection cassette is
bordered by two insulator sequences which prevent interaction between the two cassettes. The
two insulator sequences also prevent position effects from the surrounding DNA following
integration, eliminating false positives. LoxP and FRT sites allow for deletion of either cassette
using Flipase or Cre recombinase. The internal control cassette utilises the cardiac actin
promoter (pCarA) to drive, Red Fluorescent Protein (RFP) expression in the somites, which
serves as a marker for successful transgene integration. The second cassette designed to test
the cell-type specific functional ability of a putative enhancer contains; a gateway entry site for
the putative enhancer, a gata2 minimal promoter and the enhanced GFP reporter gene.
Tol2 sites permit transposon-mediated integration into the zebrafish genome with high
efficiency in the presence of Tol2 transposase mRNA (Kawakami, 2005). Germline integration
into the host genome allows for expression of the ZED cassette in subsequent generations. If
116
vector is successfully integrated, non-mosaic expression patterns are seen. Unsuccessful or
partial integration can lead to inconsistent and mosaic expression.
3.5.1 Zebrafish Enhancer assay F0:
All putative mouse Runx1 enhancer regions identified by Dr. Marsman’s 4C (ZED
m+110, m-48, m-58, m-303, m-321, m-327, m-354, m-368 and m-371) and ZED +24 were
tested for enhancer activity in a zebrafish enhancer assay (Figure 3.4).
Runx1 +24 was used as a positive control and empty ZED assay vector was utilised as
a negative control. (Figure 3.5 A). Runx1 +24 drove GFP expression specifically in the
intermediate cell mass (ICM) and posterior blood island, which are sites of hematopoietic
progenitor cell production, at 20-24 hours post-fertilisation (hpf) (de Jong et al., 2005).
Eight of the nine putative enhancer regions ZED m+110, m-48, m-58, m-303, m-321,
m-354, m-368 and m-371, showed similar expression patterns to +24 (Figure 3.5 B). These 8
regions functioned as hematopoietic-specific enhancers in zebrafish, indicating that their
enhancer activity is conserved.
ZED m-303 also showed expression in the keratinocytes at 20-24 hours post
fertilisation (hpf) and 48 hpf as well as haematopoietic activity at 20-24 hpf (Figure 3.5 C).
ZED empty and ZED m-327 had no observed enhancer activity at these timepoints (Figure 3.5
A,B).
Further analysis of these Runx1 enhancers highlighted that each region had individual
expression patterns (Figure 3.6). Of the enhancer patterns +24, and m-368 had similar patterns
with the highest expression in the dorsal aorta (DA), followed by expression in the intermediate
cell mass (ICM). ICM is the site of the primitive wave of haematopoiesis and it generates
primitive erythrocytes and limited myeloid populations. The DA is a main axial vessel, which
carries blood away from the heart, towards the tail. The first wave of definitive haematopoiesis
arises in the ventral wall of the DA.

117
The m-371, m-354, -m-321, m-58 and m-48 enhancers drove the highest expression in
the ICM. m+110 produced even expression in the DA and ICM as well as in the tail bud of the
zebrafish. m-303 produced the highest expression keratinocytes in the tail lining, followed by
DA expression. High DA expression suggests m-371, m-368, m-354 and m+110 have the
potential to act as blood cell-specific enhancers, and may be involved in the initial wave of
definitive haematopoiesis.

118
Figure 3.5: Putative mouse enhancers are active in hematopoietic regions in zebrafish.
Whole mount representative lateral images of zebrafish embryos (20-24 hpf [A, B] and ~48 hpf [C]) that were injected with enhancer-GFP plasmids at the one-cell stage; left hand panels are merges with bright field, right hand panels are GFP fluorescence. (A) negative control ZED plasmid shows zero (image) or non-specific fluorescence, while positive control (+24) shows GFP expression in hematopoietic cells of the posterior blood island (red arrows) and intermediate cell mass (yellow arrows). (B) enhancer activity of m+110, m-48, m-58, m-303, m-321, m-327, m-354, m-368, m-371. (C) The m-303 enhancer also expressed GFP in keratinocytes (white arrow). The numbers in the right hand panels represent the number exhibiting the representative phenotype out of the total number of fluorescent embryos analysed. Figure originally used in Marsman et al., (2017) (Marsman et al., 2017) This image is used with permission under Creative Commons CC BY license.

119
Figure 3.6: . Quantitative summary of GFP expression patterns generated by putative mouse enhancers in
zebrafish.
For each enhancer construct (m+110, m- 48, m-58, m-303, m-321, m-327, m-354, m-368, -m371) and the negative (ZED) and positive (+24) controls, GFP expression data in different tissues is shown. Diagrams represent pooled expression from at least 5 photographed embryos per putative enhancer (20-24 hpf), displayed on illustrations of a 24 hpf zebrafish embryo. Categories of expression zones are colour-coded: key is at the bottom of the Figure. Bar graphs display the percentage of the total number of GFP-expressing embryos that show expression in each tissue category for each putative enhancer. The total number of expressing embryos analysed per construct is displayed in the top right corner of each graph. Figure originally used in Marsman et al., (2017) (Marsman et al., 2017) This image is used with permission under Creative Commons CC BY license.
120
The expression of enhancer assays in injected generation of zebrafish (F0) is mosaic
(not expressed in every cell), however this still provides information about tissue specific
activities for the identified enhancers. F1 fish can be grown and used for further analysis.
3.5.2 Zebrafish Enhancer assay F1:
Although strong enhancers were detected using transient GFP expression in zebrafish
reporter assays, it is more informative to analyse the F1 fluorescence, as each embryo should
have complete integration of the construct in all cells (Bessa et al., 2009). Cell-specific GFP
expression through development would reveal more precisely tissue-specific spatiotemporal
activity of the enhancer.
The injected generation, F0, which presented complete fluorescence in the somites of
embryos were selected to produce transgenic lines. When the F0 were sexually mature they
were out-crossed with wild type fish in order to determine the individual integration success of
the assay into the gametes. F1 fish can be grown and used for further analysis.
Ute Zellhuber-McMillan and I bred all the fish lines to try establish stable F1 lines.
Together we bred 11 different fish enhancer lines, from which over 140 fish were paired for
breeding and 116 fish produced embryos. The fish produced 15,314 embryos which were
screened for green fluorescence (20-24 hpf) and red fluorescence (48 hpf), however no
embryos showed any control somite RFP or enhancer GFP.
Lack of fluorescence does not appear to be a Tol2 mRNA issue, as others lines in the
lab have made successful F1 lines from the same Tol2 mRNA (Ketharnathan et al., 2018). It is
unlikely that the lack of fluorescence is due to injection technique as I clearly observed
fluorescence in F0, and have completed successful double injections for other projects during
my PhD (Meier et al., 2018). This could be a blood enhancer specific issue, as none of the
different plasmids used have produced successfully integrated F1 lines (I previously have used
ZED, SCE, Tol2Gata2). Personal communication with the Zon lab indicated that other

121
researchers have been unsuccessful in making haematopoietic specific enhancer F1 lines using
assays that contained the zebrafish gata2 promoter. It has been proposed that due to the delicate
nature of haematopoiesis, if the plasmid DNA is integrated into the zebrafish genome, it is
actively repressed to maintain the correct haematopoiesis. As the plasmid insert is repressed
there is no RFP or GFP expressed in F1 fish.
3.6 Genomic characteristics of 4C identified functional novel
enhancers
To understand if there was a rationale to the cell type patterns observed in the zebrafish
enhancer assays (Figure 3.6), Dr. Judith Marsman analysed the Runx1 4C identified regulatory
regions (Table 3.4) (Runx1 m+24, m+110, m-48, m-58, m-303, m-321, m-327, m-354, m-368
and m-371) in the available mouse haematopoietic progenitor cells (HPC7) ENCODE data. No
consistent patterns could be observed. Runx1 -327 had similar transcription factor binding to
other observed enhancers but no observed enhancer activity in zebrafish embryos. Interestingly
the Runx1 -368 does not bind any transcription factors, shows no sign of open chromatin
(DNase I HS site) and therefore does not appear to have a regulatory function in developing
haematopoietic cells.
Of the Runx1 4C identified regulatory regions, m-371, m-354, m-303 and m-48 were
novel. As noted in section 3.1.1 m-368, m-327, m-321, m-58 and m+110 were identified by
other groups (Ng et al., 2010; Schütte et al., 2016).
In order to further understand the novel Runx1 enhancers identified by Judith Marsman
(m-371, m-354, m-303 and m-48), I carried out the same in silico analysis used to define the
previously identified Runx1 regions (Section 3.4).

122
3.6.1 Conservation and epigenetic analysis
The only novel Runx1 enhancer that is conserved in humans is m-371 (Table 3.10).
This region shows transcription factor binding sites and chromatin modifications similar to that
found at m-58 and m+110. ChromHMM annotates this region as a strong enhancer like m-368,
m-58 and m+110. The m-371 enhancer region sits within the same uncharacterised non-coding
RNA LOC100506403 as m-368 and m-327.
m-354, m-303 and m-48 are mouse specific novel Runx1 enhancers.
Table 3.10: Conservation and annotations of novel Runx1 regulators
Regulatory region location relative to P1 (kb)
Genome coordinates (Hg19)
ENCODE annotation ChromHMM annotation
Cohesin mediated chromatin accessibility
m-371 chr21:36855111-36856085
DNase I HS, RNA Pol II, CTCF, p300, LSD1, H3K27ac, H3K4me1, H3K4me3, H3K9ac, H3K9me3, H3K27me3, GATA1, TAL1, GATA2
Strong Enhancer
Increased accessibility in K562 cohesin mutants
m-354 Not conserved between humans and mice
N/A N/A N/A
m-303 Not conserved between humans and mice
N/A N/A N/A
m-48 Not conserved between humans and mice
N/A N/A N/A
3.6.2 Single nucleotide polymorphism (SNP) analysis
The FANTOM 5 data showed that m-371 RNA was actively expressed in skin and
prostate cells. SNP analysis of m-371 showed that one of the two SNPs in this region is related

123
to Kynurenine 3-monooxygenase (KMO) expression in peripheral blood monocytes (Table
3.11) identical to m-368 SNP rs909143. KMO is typically researched in a neurological context,
as high KMO expression leads to neurodegeneration (Breton et al., 2000).
The 3D spatial interactions found by CoDeS3D pipeline between RUNX1 m-371 SNPs
and RUNX1, were not supported by any significant eQTL interactions.
Table 3.11: SNP analysis of novel m-371 enhancer
Regulatory region
Number of SNPs (MAF>=1%)
SNP name Predicted changes SNP function
m-371 2 rs2834944 The T to C change alters 4 regulatory motifs.
Not investigated
rs2834945 The T to C change is predicted to affect 11 regulatory motifs including GATA2 and PAX3 and PAX5.
Has an eQTL with oesophagus and is related to Gene expression of KMO in peripheral blood monocytes (p value: 1.36E-06)(Zeller et al., 2010).
3.6.3 Comparative analysis of cancer genomic datasets
The majority of m-371 mutations (n=23) presented with skin as the primary site
(40.90%), followed by prostate, liver and breast primary sites (13.63% each). m-371 also
presented in oesophagus (9.09%), pancreas (4.54%) and ovary (4.54%).
The FANTOM5 expression of m-371 in skin and prostate cells overlaps with the
primary tissues that contain m-371 mutations. This suggests that m-371 is an enhancer in skin
and prostate cells, as it is producing eRNA. Mutations in this enhancer, in skin and prostate
tissues may alter normal cell development.

124
3.7 Chapter summary
This work identified conservation of 9 out of the 16 mouse Runx1 regulatory regions
from mouse to human (m-371, m-368, m-327, m-101, m-58, m-43, m+3, m+110, m+204 ). m-
354, m-321, m-303, m-48, m-42, m+1 and m+181 are not conserved in human.
In K562 cells ChromHMM annotates m-368, m-58, m+110 -139, m-43, and +62 as
enhancers. Intron 5.2, m-101 and m+3 show the same regulatory associations as the enhancers,
however, they are instead labelled as transcription associated. This could be due to their close
proximity with exons when compared to the regions annotated as enhancers. ChromHMM also
reported -139 and -188 as transcription associated. m-371, m-368 and m-327 all sit within
LOC100506403, an uncharacterised non-coding RNA.
m-368, -250, m-101, m-58, m-43, m+3, +62, m+110 and intron 5.2 were all bound by
LSD1, a mediator of transcriptional repression usually seen in silencers. SPI1, a haematopoietic
transcription factor was only bound to -139 and -188. Blood stem progenitor transcription
factors TAL1 and GATA2, as well as GATA1, a marker of erythroid development, were found
to bind m-371, m+110 and m-58.
Cheng et al., (2018) characterised +62 as a silencer of RUNX1 P2 in K562, OCI-AML3
and U937 cells (Cheng et al., 2018). However in K562 cells +62 has ENCODE and
ChromHMM annotations associated with enhancer activity.
Intron 5.2, m+110 and m-371 regions were annotated as differentially opened
chromatin in the ATAC-seq of the cohesin mutant (Antony et al., 2020). This suggests these
enhancers’ interactions could be dependent on cohesin. In this chapter, I observed a
coincidence of cohesin subunit Rad21 binding in the absence of CTCF with +110 enhancer,
and CTCF binding with m-371, m-58, m-43, m+3, +62 and intron 5.2. This suggests that CTCF
and cohesin could independently mediate a subset of enhancer-promoter looping in
combination with transcription factors.

125
Nine of the 13 conserved RUNX1 regulatory regions produced eRNA in human
haematopoietic cells. SNP analysis identified SNPs in each of the conserved regulatory regions
except m-101. Of the 35 SNPs 5 had previously reported functional effects in haematopoietic
cells. The available AML genomic data is relatively limited because the majority of analyses
were done with exome sequencing data rather than whole genome sequencing data.
I functionally characterised novel Runx1 enhancers m-371, m-354, m-303 and m-48
using zebrafish enhancer assays. I also characterised previously identified m+110, -58, -321, -
327, -368 showing that all of these have enhancer capability except m-327. Despite the lack of
activity seen in embryos expressing m-327, this region spatially connects to the active promoter
Runx1 P1 and +24 in HPC7 cells so it may have another regulatory role in this hub. My analysis
showed enhancer activity in haematopoietic tissues of developing zebrafish embryos,
highlighting that they appear to be important in both primitive and definitive waves of
haematopoiesis.
After I functionally analysed the mouse enhancers using zebrafish reporter assays, Zhu
et al., (2020) further characterised m-371 using single cell (sc) ATAC-seq and scRNA-seq
from developing mice. m-371 is only accessible in pre- haemogenic endothelial (HE) cells and
in the intra -arterial clusters (IAC) in mice. This suggested it could initiate Runx1 P1 in pre-
HEs and contribute to expression of P1 in IACs (Zhu et al., 2020).
Of the enhancers functionally identified, all except +110 interacted with Runx1 +24
(Marsman, 2016), suggesting that +24 could be anchoring an enhancer hub. These CREs are
conserved between mice and humans suggesting they are fundamental for the correct regulation
of RUNX1.
This chapter has provided an insight into mouse Runx1 enhancer functions and
highlighted the features of conserved human enhancers. As shown in Dr. Judith Marsman’s 4C

126
analysis +24 is a central hub that binds most active Runx1 enhancers in HPC7s. +24 may also
be the organiser of correct enhancer-promoter interactions for Runx1 regulation.

127
4 Chapter 4: Three-dimensional (3D) connections of
Runx1 +24
4.1 Introduction
The three-dimensional (3D) organisation of the genome is non-random (Holwerda et
al., 2012; Lieberman-Aiden et al., 2009). The genome is organised into topologically
associated domains (TADs), formed by an elevated number of chromatin interactions within a
genomic locality, with fewer interactions to outside regions (Lieberman-Aiden et al., 2009;
Rao et al., 2014). Genes located within the same TAD often have the same histone
modifications and are co-regulated (Rao et al., 2014). The borders of domains are enriched for
cohesin and CTCF binding sites, housekeeping genes, short interspersed element (SINE)
retrotransposons and transfer RNAs (Dixon 2012). Loss of CTCF relaxes the global domain
structures, which increases contacts between domains, whereas loss of cohesin mostly affects
interactions within domains (Li et al., 2013b; Zuin et al., 2014). 3D connections of the genome
are predominantly detected by Hi-C and Promoter Capture sequencing, allowing for high
throughput analysis and subsequently the creation of genome interaction maps (example shown
in Figure 4.1).
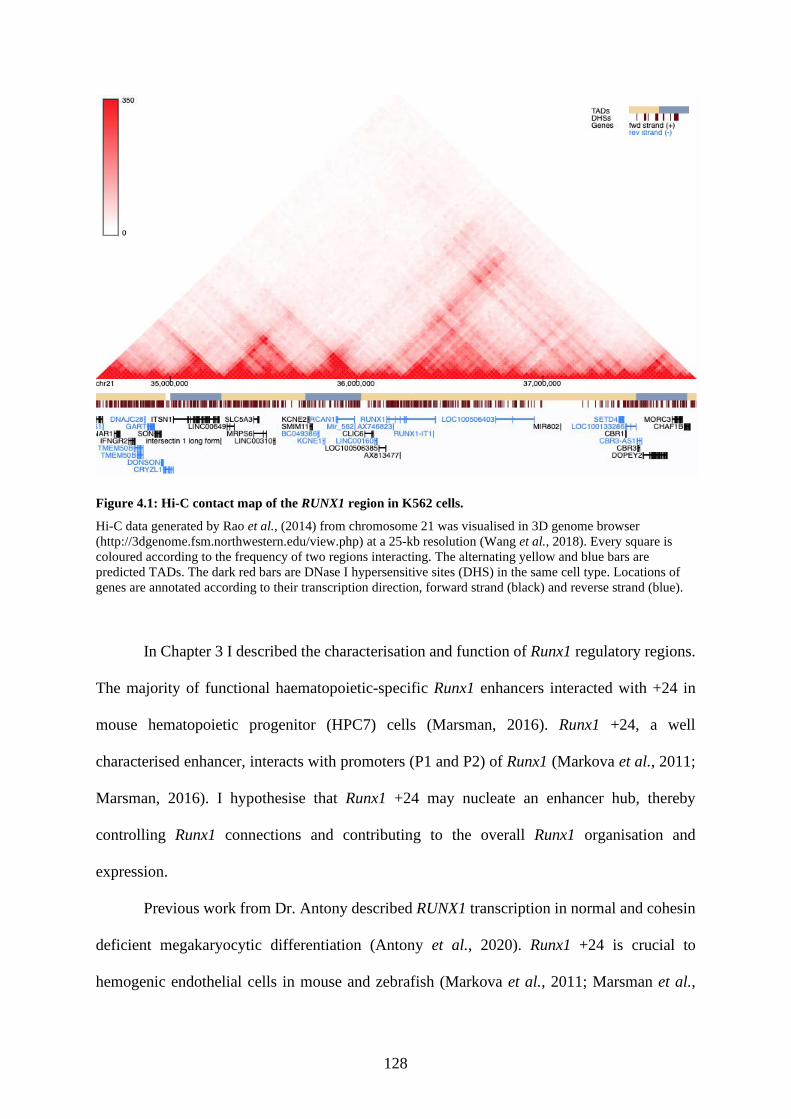
128
Figure 4.1: Hi-C contact map of the RUNX1 region in K562 cells.
Hi-C data generated by Rao et al., (2014) from chromosome 21 was visualised in 3D genome browser (http://3dgenome.fsm.northwestern.edu/view.php) at a 25-kb resolution (Wang et al., 2018). Every square is coloured according to the frequency of two regions interacting. The alternating yellow and blue bars are predicted TADs. The dark red bars are DNase I hypersensitive sites (DHS) in the same cell type. Locations of genes are annotated according to their transcription direction, forward strand (black) and reverse strand (blue).
In Chapter 3 I described the characterisation and function of Runx1 regulatory regions.
The majority of functional haematopoietic-specific Runx1 enhancers interacted with +24 in
mouse hematopoietic progenitor (HPC7) cells (Marsman, 2016). Runx1 +24, a well
characterised enhancer, interacts with promoters (P1 and P2) of Runx1 (Markova et al., 2011;
Marsman, 2016). I hypothesise that Runx1 +24 may nucleate an enhancer hub, thereby
controlling Runx1 connections and contributing to the overall Runx1 organisation and
expression.
Previous work from Dr. Antony described RUNX1 transcription in normal and cohesin
deficient megakaryocytic differentiation (Antony et al., 2020). Runx1 +24 is crucial to
hemogenic endothelial cells in mouse and zebrafish (Markova et al., 2011; Marsman et al.,

129
2017; Ng et al., 2010; Schütte et al., 2016). Interestingly this well-known enhancer was also
described as a silencer in the non-haematopoietic cell line, HEK293 (Markova et al., 2011).
Understanding where in the genome Runx1 +24 connects to and how it contributes to Runx1
organisation is imperative to understanding the transcriptional regulatory landscape of Runx1.
4.1.1 Secondary structure of DNA
G-quadruplexes are secondary structures that are often present in telomeres and also
gene promoters; however, their function remains elusive. Previous studies on G-quadruplexes
indicate possible roles for them in controlling gene expression (Du et al., 2007; Eddy et al.,
2008; Zhao et al., 2007).
4.1.1.1 Secondary structure of Runx1 +24
In my previous Master’s work, a possible G-quadruplex (G4) structure was identified
in the Runx1 +24 mouse cis-regulatory element (CRE). Despite multiple attempts and different
primers, the mCRE was never sequenced the full way through using Sanger sequencing. When
compared back to the mouse (mm9) +24 mCRE sequence sent by Professor Motomi Osato, it
was noted that the sequences stopped in the same place every time. The online tool QGRS
mapper was used to predict if there was a G-quadruplex structure (Kikin et al., 2006).
Two predicted quadruplex structures sit either side of the +24 region that could not be
sequenced. One was in the sense direction and the other was in the antisense direction.
Sequences can be found in Appendix IV. Each predicted structure has the potential to form a
four-stranded structure stabilised by G-quartets (Figure 4.2). G-quadruplex structures derive
stability from hydrogen bonding between guanines and stacking of G-quartets (Maizels et al.,
2013). Due to time constraints I have not investigated to see if this structure is predicted in the
human sequence.

130
Figure 4.2: Schematic representation of mouse +24 individual G-quadruplex.
Four guanines form a G-quartet, a planar ring around a central channel (represented by each grey rectangle). G-quadruplex structures derive stability from hydrogen bonding between guanines and stacking of G-quartets .
In the work described in this Chapter, I sought to understand how Runx1 +24 influences
the 3D structure and connectivity of the Runx1 locus. To understand how the formation of the
G-quadruplexes influences transcription, I measured the predicted mouse Runx1 G-quadruplex
3D structure integrity using a Circular Dichroism (CD) photospectrometer. I then determined
whether G-quadruplex structure impacts on enhancer capability by using luciferase assays in
mouse fibroblast (NIH/3T3) cells.
I used circular chromatin conformation capture (4C) to identify DNA-DNA interactions
with the RUNX1 +24 enhancer region. 4C is an unbiased approach that detects genome-wide
interactions with a chosen region or “bait” by using next generation sequencing of captured
fragments (van de Werken et al., 2012a). Identification of RUNX1 +24-anchored interactions
has potential to further elucidate the role of this enhancer by measuring its genomic
connectivity. 4C was performed in the K562 (chronic myelogenous leukaemia) cell line. In
K562, RUNX1 P1 expression was previously shown to have a key role in megakaryocyte
lineage determination (Draper et al., 2017). K562 cells can be induced to differentiate to the
megakaryocytic lineage (Kuvardina et al., 2015; Pencovich et al., 2011).

131
Majority of 3D chromatin mapping has been done in steady state cells. Cohesin
depletion has been shown to alter, and in some cases result in the complete collapse of TADs
(Waldman, 2020). Cuartero et al., (2018) and Antony et al., (2020) have recently shown upon
differentiation stimulation, the gene expression changes are more distinct in cohesin depleted
cells (Antony et al., 2020; Cuartero et al., 2018b). To determine the influence of cohesin and
enhancer specific connections in lineage specific regulation, the chromatin architecture should
be investigated before, during and after the differentiation process.
To understand the role of cohesin in enhancer connections and leukemic gene
regulation, K562 cells with CRISPR-CAS9 engineered STAG2 mutations were used to
determine the connectivity of RUNX1 +24. K562 cells were induced to differentiate to the
megakaryocytic lineage, using phorbol 12-myristate 13-acetate (PMA), so the role of RUNX1
+24 could be further understood. K562 lines with patient-specific STAG2 R614* mutation (-/-
) were previously generated by Dr. Antony.
Antony et al., (2020) highlighted the altered phenotype of K562 cells with STAG2
mutation using RNA seq (Antony et al., 2020). Using ATAC-seq Dr. Antony also noted altered
chromatin accessibility in K562 cells with STAG2 mutation. The RNA seq and ATAC seq
revealed that the gene expression changes observed are associated with altered chromatin
accessibility at regulatory regions and super-enhancers in STAG2 mutants (Antony et al.,
2020).
K562 cells are labelled as wild-type (WT) cells with the treatment condition (PMA or
DMSO) and timeframe also included in the nomenclature. STAG2 refers to the STAG2-mutant
K562 cells that were CRISPR edited to contain R614* mutation in the STAG2 subunit (Antony
et al., 2020). The baseline treatment condition was collected after 12 hours (h) of DMSO
treatment (12 DMSO). Cells were collected after 12 h of PMA treatment (12 PMA) and 72 h
of PMA treatment (72 PMA). 12 h of PMA treatment was chosen based on the aberrant RUNX1

132
and ERG expression spikes seen in STAG2 mutants at this timepoint (Antony et al., 2020) and
72 h is the time point when the aberrant expression spikes of RUNX1 seen in STAG2 mutants
return to non-PMA stimulated levels (Antony et al., 2020).
I chose RUNX1 +24 as a ‘bait’ to capture chromatin interactions because it is a strong
and well-characterised enhancer of RUNX1 transcription and therefore is likely to make
important regulatory contacts during haematopoietic cell differentiation. Identifying the +24
contacts in leukaemia cells may enhance our understanding of haematopoiesis and the
development of leukaemia.
4.2 Hypothesis
I hypothesise that RUNX1 +24 makes 3D genomic contacts that are important in the
regulation of RUNX1 expression.
4.3 Aims
1) Identify enhancer characteristics of RUNX1 +24 using bioinformatic tools.
2) Characterise a possible G-quadruplex structure in the mouse Runx1 +24 enhancer.
3) Identify the 3D connections of human RUNX1 +24 using 4C in K562 cells.
4) Determine genomic characteristics of significant chromatin interactions using
bioinformatic tools.

133
4.4 Enhancer characteristics of RUNX1 +24
RUNX1 +24 was analysed in the same manner as the other Runx1 regulatory regions
(Section 3.5).
4.4.1 Epigenetic analysis
The +24 region shows similar haematopoietic transcription factor binding sites and
chromatin modifications to m-371 m-58 and m+110. However, +24 has additional cohesin
(SMC3) and SPI1 binding. ChromHMM annotates this region as a strong enhancer, similar to
m-371, m-368, m-58 and m+110. Interestingly, +24 showed no change in chromatin
accessibility in K562 cohesin-mutant cells relative to wild type K562.
Table 4.1: Conservation and annotations of RUNX1 +24
Enhancer location relative to P1 (kb)
Genome coordinates (Hg19)
ENCODE annotation ChromHMM annotation
Cohesin mediated chromatin accessibility
+24 chr21:36399106-36399322
DNase I HS, RNA Pol II, SMC3, CTCF, p300, LSD1, H3K27ac, H3K4me1, H3K4me3, H3K9ac, H3K9me3, GATA1, SPI1, TAL1, GATA2
Strong Enhancer No change in accessibility in K562 cohesin mutants
4.4.2 Single nucleotide polymorphism (SNP) analysis
FANTOM5 data showed that +24 eRNA is actively expressed in haematopoietic cells.
No SNPs with a minor allele frequency (MAF) of >1% were detected in this region.
Consequently, 3D spatial interactions were not detected by the CoDeS3D pipeline due to the
lack of SNPs.
4.4.3 Comparative analysis of cancer genomic datasets
The International Cancer Genome Consortium (ICGC) reports 5 mutations in this
region from 5 donors. Primary sites of +24 mutations presented evenly with ovary, prostate,
breast, lung and haematopoietic cells (20%) in ICGC database. There is only one

134
haematopoietic mutation chr21:g.36399191A>T reported in a malignant lymphoma. The
FANTOM5 expression of +24 in haematopoietic cells overlaps with the primary ICGC tissues
that contained +24 mutations. The low number of mutations and lack of SNPs may suggest this
area is important for haematopoesis and a mutation may prevent normal development.
4.5 Characterising Runx1 +24 G-quadruplex structure
4.5.1 CD spectroscopy
G-quadruplexes (G4s) are generally classified according to strand orientation, loop
location and the number of strands involved in formation. To verify if the G4s predicted can
form in vitro, preliminary CD spectrometer readings were taken.
The predicted G4 structure GGTGGGGGTGGG, within the Runx1 +24 sequence is
made up of two G-quartets (Appendix IV) . Mutated G4 GGTGTGTGTGGG was generated as
a negative control with two Ts so that only one quartet can form, one quartet should be
insufficient for this structure to function as a G-quadruplex (Figure 4.3).
Figure 4.3: Predicted representation of Runx1 +24 mCRE G-quadruplex and mutated +24 mCRE.
A) Predicted Runx1 +24 mCRE G-quadruplex structure with two G-quartets (Grey rectangles). B) Predicted mutated Runx1 +24 mCRE structure. Blue Ts show the mutated base pairs so only one quartet can form.

135
CD experiments are carried out in different buffers: 100 mM KCl pH 7 (positive control
buffers); 100 mM NaCl, and 100 mM LiCl (negative control buffer). It is expected that G4s
will form in the KCl buffer because the buffer provides the K+ cation required to stabilise the
quartet. Both NaCl and LiCl donate fewer stable cations so the G4 should be less prominent;
at 95 °C, NaCl and LiCl should not support formation of the G4 structure.
Preliminary scans showed that at 25 °C the predicted +24 mCRE G-quadruplex was
forming a parallel stranded G4 formation (Figure 4.4A-C and Figure 4.5A). The mutated G-
quadruplex was unable to form any secondary structure because the DNA is in a parallel
formation (Figure 4.5B). The increase of temperature to 95 °C significantly decreased
structural stability in all buffers except for KCl (Figure 4.4D-F).
Figure 4.4: CD spectroscopy of wild-type and mutant +24 G4s.
Molar ellipticity (deg.cm2.dmol-1) is on the vertical axis and wavelength (nm) is on the horizontal axis. The blue line represents the CD spectra for the wild-type sequence and the orange line represents CD spectra for the mutant sequence. CD spectra of +24 G4 and mutant at A) 25 °C in the presence of 100 mM KCl. B) 25 °C in the presence of 100 mM NaCl. C) 25 °C in the presence of 100 mM LiCl. D) 95 °C in the presence of 100 mM KCl. E) 95 °C in the presence of 100 mM NaCl. F) 95 °C in the presence of 100 mM LiCl.
These preliminary scans indicate that a parallel G4 forms in vitro for the native
sequence. Based on the CD Spectra, the +24 G4 presents a positive peak at 260 nm and a
negative peak at 240 nm. This specific spectroscopic signature is representative of a parallel
G4, which suggests the strands are orientated in the same direction (Gattuso et al., 2016).
Figure 4.5 shows a schematic representation of the normal and mutated G4.

136
Figure 4.5: Schematic representation of the predicted Runx1+24 mCRE G-quadruplex in parallel
conformation and when base subsitutions are made at the +24 mCRE.
A) Predicted Runx1 +24 mCRE G-quadruplex structure in parallel formation with two G-quartets, based on CD spectrometer results (grey rectangles). Red arrows indicate 5’-3’ DNA arrangement B) Predicted mutated Runx1 +24 mCRE structure. Blue Ts show the mutated base pairs, preventing the formation of parallel quartets.
4.5.2 Runx1 +24 G-quadruplex Luciferase reporter assay
In order to determine whether an intact G-quadruplex is required for the functional
enhancer capability of the Runx1 +24 enhancer, luciferase reporter assays with mutated and
normal G-quadruplexes were used. The relative ability of constructs to drive expression of the
firefly luciferase reporter gene Luc2 (Phoinus pyralis) was determined. Luc2 was previously
cloned into the eukaryotic reporter gene vector pGL4.23-GW (Figure 4.6) (Pasquali et al.,
2014). A functional enhancer cloned into the Gateway site of pGL4.23-GW will increase
expression of Luc2 when transfected into a responsive cell line, which can be determined with
a luminometer.

137
Figure 4.6: Diagram of Luciferase reporter construct pGL4.23-GW.
This 4283 bp vector contains Gateway cassette (yellow) immediately upstream of the minimal promoter (blue). The minimal promoter (minP), a TATA-box promoter element, drives low basal expression, which allows for sensitive responses to promoterless regions of interest. The minP sits immediately upstream of the Luciferase reporter gene Luc2 (green) (Paguio et al., 2005). Figure from Thomas et al., (2015).
Runx1 +24 and modified +24 were cloned into the pGL4.23-GW (pGL4) vector (Figure
4.7) . The empty pGL4 plasmid was included to monitor background luciferase activity of the
reporter construct and acted as a negative control.
Runx1 +24 pGL4 has previously shown enhancer activity (Thomas, 2015). If the G-
quadruplex influences enhancer activity, we would expect the G to T mutation (g->t) in Runx1
+24 pGL4 to alter luciferase activity (Figure 4.7B). This g->t mutation is the same as the G4
mutant analysed in the CD analysis, so we know the G4 is unable to form. A control mutant,
Runx1 +24 pGL4 t->a (Figure 4.7 C) that alters base pairs in the loop region without affecting
the overall G4 structure was also generated.
I generated Runx1 +24 pGL4 g->t and t->a G4 mutants using site-directed mutagenesis.
This allowed for targeted base pairs to be altered efficiently. Mutations were confirmed by
Sanger sequencing.

138
Figure 4.7: Schematic representation of pGL4 Runx1+24 mCRE G-quadruplex in parallel conformation
and mutated +24 mCREs.
A) Predicted Runx1 +24 mCRE G-quadruplex structure in parallel formation with two G-quartets (grey rectangles). B) Mutated g->t Runx1 +24 mCRE structure. Blue Ts show the mutated base pairs and no quartets form in parallel formation. C) Mutated t->a Runx1 +24 mCRE structure. Blue As show the mutated base pairs and two quartets still form in parallel formation.
A Renilla luciferase reporter construct was co-transfected with the Runx1 +24 or +24
modified pGL4 reporter constructs. Firefly and Renilla luciferases have distinct evolutionary
origins, dissimilar enzyme structures and substrate requirements. These features allow these
two distinct luciferases to be used as dual reporters when co-transfected in a single well (Sherf
et al., 1996). Renilla was used as an internal control, to which the measurement of the pGL4
construct variants could be normalised.
The luminescence emitted was measured 48 h after transfection. To calculate the
relative luciferase units (RLU) of each reporter construct, the pGL4 luciferase value was
normalised to Renilla value to account for variations in transfection efficiency associated with
inter-sample variation. Results were expressed as Luciferase/Renilla ratios with vectors
carrying putative enhancers relative to the ratio of empty pGL4.23 vector (control).
In my previous Master’s project, NIH/3T3 (mouse fibroblast) cells showed a significant
upregulation of Runx1 +24 which indicates that +24 operates as an enhancer in this cell line.
NIH/3T3 cells express Runx1 P1, Runx1 P2 and total Runx1 at similar levels to the reference
genes (Thomas, 2015).

139
NIH/3T3 cell lines were co-transfected with the normal and mutated +24 pGL4
constructs (Figure 4.7) and Renilla, then assayed for their relative luciferase activity. Six
individual replicates were executed for each construct, and three biological repeats were
performed (Figure 4.8).
Figure 4.8: Luciferase activity in response to the various +24 mCREs in the NIH/3T3 cell line.
The data show enhancer activity of normal and mutated +24 pGL4 constructs compared to empty pGL4.23-GW plasmid in NIH/3T3 cells, p value <0.05 (*) <0.001(****). Mutated G-quadruplex g->t had significantly less enhancer activity than mutated t->a +24. However, there was no significant difference in enhancer expression when the unaltered Runx1 +24 was compared to the mutated +24s enhancer expression. The data were analysed by ANOVA using GraphPad Prism 6 and are represented as mean +/- standard error of mean (S.E.M) of at least three experiments (n=3). pGL4 luciferase value was normalised to Renilla value and expressed as relative luciferase units (RLU).
In the NIH/3T3 cell line, significant enhancement of luciferase activity was caused by
the Runx1 enhancer +24 mCRE (p <0.001) (Figure 4.8). The mutated Runx1 +24 G-

140
quadruplexes showed similar enhancement profiles to the normal Runx1+24 (p <0.001). The
non G4 forming mutant (g->t) showed significantly reduced expression when compared to the
control G4 mutant (t->a) (p <0.05). There was no significant difference between the unaltered
Runx1 +24 and the mutated Runx1 +24. Runx1 +24 g->t exhibited a minor decrease in enhancer
expression, whereas Runx1 +24 t->a showed a slight increase in enhancer expression when
compared to the unaltered Runx1 +24. This suggests that alterations to the loop regions of the
G4 could alter enhancer capability. However, the altered enhancement shown in the mutants is
modest, and was not statistically significant when compared to the normal Runx1 +24 G4.
G-quadruplexes are also capable of producing their own RNA, which have functional
roles (Beltran et al., 2019; Wang et al., 2017). This was not investigated in this research project.
4.6 Circular Chromatin Conformation Capture (4C) of
Human RUNX1 +24
Circular chromatin conformation capture (4C) was used to elucidate the connectivity
of the RUNX1 +24 enhancer region. The 4C sequencing libraries were prepared from 4C
material, each containing PCR products amplified by bait-specific primer pairs. The processing
of the sequencing data is available in Appendix VIII.
The guideline for the amount of mapped reads required for successful calling of 4C
data is 1 million, but identification of interactions can be done with less than 300,000 reads
(van de Werken et al., 2012a). A recent study has shown that 50,000–100,000 cis-mapped 4C
reads are sufficient to generate reproducible 4C profiles (Krijger et al., 2020). The number of
mapped reads for RUNX1 +24 bait in K562 and STAG2 mutant cells, in each library is shown
in Figure 4.9.
WT 12 PMA replicate 2 and WT 72 PMA replicate 2 had very low mapped reads, (1172
and 58721 respectively), however the rest of the libraries each had over 370,000 reads. This is

141
sufficient for successful interaction identification. Controls were cells that went through the 4C
process without the ligation steps.
Figure 4.9: RUNX1 +24 Mapped read count.
The number of mapped reads (millions) is shown for the individual conditions in replicate 1, 2, 3 or control.
4.6.1 Quality check of 4C data
Mapped reads were assigned to restriction fragments resulting in a read count per
fragment. To determine whether my Runx1 +24 4C data is of good quality and comparable to
other published 4C studies, I assessed the distribution of reads across fragments and correlation
of read counts between replicates.
The quality is measured by the proportion of reads on the same chromosome as the bait
(cis) and the proportion of reads around the bait viewpoint (near-bait:1 megabase either side of
the bait) (van de Werken et al., 2012a). The majority of the reads should be in close proximity
to the bait, captured and represented in the read count (van de Werken et al., 2012a). A high
number of reads on different chromosomes (trans) would indicate that the data originated from
random ligation events and therefore the data is of low quality. The general guideline of good
quality 4C data should have approximately 40% of reads in cis and at least 40% coverage in

142
the near-bait (Raviram et al., 2016; van de Werken et al., 2012a). For each condition, the
coverage of reads in cis and near-bait was calculated for all 3 replicates (Figure 4.10). The
majority of conditions had over 40% reads in cis and over 40% of fragments covered in the
near-bait. The STAG2 72 PMA replicate 1 had more than 40% coverage of fragments in near-
bait, but percentage of reads in cis was lower than 40% (31%). A low proportion of reads in
cis can indicate fixing conditions of the chromatin are not optimal, as more trans interactions
are detected, or that the bait forms a large number of trans interactions for structural or
regulatory purposes. Dr. Marsman previously allowed the +24 bait to be analysed in HPC7
cells with lower than 40% coverage in cis. The same parameter was extended to this analysis.
WT 12 PMA replicate 2 and WT 72 PMA replicate 2 had less than 40% reads in the near-bait
(14% and 39%). This factor combined with their low read count meant they were excluded
from further analysis.

143
Figure 4.10: RUNX1 +24 4C quality evaluation.
The coverage of fragments that had more than one read present within 0.1 megabases (Mb) on either side of the bait was plotted against the percentage of reads in cis over total. 4C data of WT 12 DMSO (light blue), WT 12 PMA (blue), WT 72 PMA (dark blue), STAG2 12 DMSO (yellow), STAG2 12 PMA (orange), STAG2 72 PMA (red) is plotted. Three points, corresponding to replicate 1, 2 and 3 are presented for each condition. Grey dotted lines indicate cut-off point for good quality data.
All samples that passed quality control were analysed using 4Cker, a bioinformatics
pipeline developed to analyse 4C and determine significant interactions (Raviram et al., 2016).
4.6.2 Detection of significant interactions
The interactions of a bait across the genome will differ depending on proximity to bait,
with closer interactions (near-bait) occurring at a higher frequency, followed by cis interaction
then trans interactions having the least amount of interaction with the bait region. 4Cker
provides different analyses for near-bait, cis and trans interactions.
Near-bait analysis was carried out for 1 Mb either side of the +24 bait (within the
RUNX1 domain). Cis analysis is carried out across chromosome 21, but excluded the near-bait
region. Trans analysis is carried out across all chromosomes except 21.

144
Statistically significant interactions were detected using the 4Cker package (Raviram
et al., 2016) using an adaptive window size of 3 fragments. Because the 4C signal is generally
higher around the bait region and decreases in far-cis and trans, different adaptive window
sizes were used for read normalisation and creating smooth spline in each data set. Adaptive
windows were used to obtain an analogous number of observed fragments for each window.
Window size is determined by the amount of signal detected in the region.
Fragments in close proximity to 4C baits have a higher read count compared to
fragments further away and when examined with the cis 4C analysis near-bait interactions
would be statistically significantly enriched. For this reason, cis interactions and near-bait
interactions were analysed separately, with near-bait analysis requiring a higher p-value to be
determined statistically significant by the 4Cker programme than the p-values of cis
interactions (Raviram et al., 2016). Significant interactions were visualised in the UCSC
browser.
To reduce errors due to mis-priming, fragments that had one or more reads in the control
samples were removed from the matching cell type and condition. Additionally, fragments
located 10 kb either side of RUNX1 +24 were removed. Fragments within 10 kb of the bait are
not informative because bait-proximal fragments have a high read count regardless of whether
there is a true interaction present or not. 4Cker combined the processed read counts per
fragment by normalising to the total number of reads in each replicate (Raviram et al., 2016).
Differential analysis between conditions was carried out between two conditions on the
windows that are interacting with the bait in at least 2 conditions. 4Cker has optimised this
analysis for near-bait and cis interactions. Significantly different domains were determined
with a p-value of 0.05.
This Chapter will interpret the RUNX1 +24 connections in normal K562 cells (WT 12
DMSO). Analysis of the other conditions is described in further detail in Chapter 5.

145
4.7 Identification and Genomic Characteristics of Human
RUNX1 +24 3D Connections
4.7.1 Visualisation of significant cis interactions
The mean normalised read count of all three WT 12 h DMSO replicates was plotted
across chromosome 21 locations using ggplot (Wickham et al., 2007) to generate the cis profile
of RUNX1 +24 connections in baseline K562 cells (Figure 4.11). Reads had a high coverage
around the +24 (5 megabases (Mb) surrounding the bait). Figure 4.11 reveals that RUNX1 +24
makes DNA-DNA contacts across the entire chromosome 21. The large normalised read peak
that shows an interaction around 45,000,000 (*) with PDE9A and BC033260.
Phosphodiesterase 9A (PDE9A) mRNA is detected throughout the body, but predominately in
the brain, whereas BC033260 is an uncharacterised long non-coding RNA (Harms et al., 2019;
Patel et al., 2018).

146
Figure 4.11: RUNX1 +24 cis 4C profile (chr21) in K562 cells (WT 12 DMSO).
Ggplot of the cis 4C profile, normalised read count of all WT 12 DMSO replicates is on the vertical axis and position on chromosome 21 is on the horizontal axis. * shows the large normalised read peak around 45,000,000 with PDE9A and BC033260.
WT 12 DMSO showed 115 significant cis interactions across the long arm of
chromosome 21. Once the overlap of the near-bait region is removed, there are 31 significant
cis interactions (Appendix IX) (Figure 4.12). These interactions extended across the known
TADs and ranging from chr21:16193679 to chr21:45164775. These interactions were further
categorised based on their chromatin characteristics using K562 ChromHMM and dbSUPER
enhancer annotations.

147
Figure 4.12: RUNX1 +24 significant cis interactions.
Chromosome 21 with RUNX1 +24 interactions represented by black arches. Each interaction is colour-coded according to its ChromHMM profile: key is at the bottom left of the figure. Super-enhancers were determined from dbSuper. Chromosome is aligned to the K562 Hi-C contact map. Yellow and blue bands show the predicted K562 TADs.
The majority of the interactions were with ChromHMM annotated regulatory elements
(enhancers and insulators) (Figure 4.13). Some regions that interact with RUNX1 +24 exhibit
multiple ChromHMM annotations, for example, location chr21:16193679-16290033
contained both insulator and strong enhancer regions. The region was also identified as
containing super-enhancers as determined by dbSUPER (Khan et al., 2016). The main
proportion of RUNX1 +24 interactions were to enhancer regions (58%), followed by
interactions to active promoters and insulators (both 32%). It also connects with some super-
enhancers so may be facilitating or restricting their 3D connections. Interestingly the +24
enhancer also interacted with regions of polycomb repressed chromatin (29%). This indicates

148
that +24 is not just acting as an enhancer hub (as previously described in Section 3.7); it may
also be holding regions of chromosome 21 to ensure that the chromatin is correctly organised
into inactive and active domains.
Figure 4.13: Profile of RUNX1 +24 significant cis interactions.
Percentage of interactions is on the vertical axis. Horizontal axis shows the ChromHMM annotations. Individual interactions can have multiple annotations.
4.7.2 Overview of significant near-bait interactions
Near-bait analysis considers the interaction 1 Mb either side of the bait (Raviram et al.,
2016). The mean normalised read count of all three WT 12 h DMSO replicates was plotted
across chromosome 21 near-bait locations using ggplot (Wickham et al., 2007) (Figure 4.14).
Domains are formed by high proportions of chromatin interactions in a genomic region, and
less to outside regions. Domain boundaries can be predicted by a decrease in read count
between two neighbouring regions. The TAD domain boundaries have already been reported
for K562 cells and were determined by Hi-C (Rao et al., 2014). In most human cell lines,
RUNX1 P1 and P2 promoters form TAD domain boundaries (Marsman, 2016).

149
When visualising the near-bait normalised read counts, the majority of reads are located
within 5 Mb surrounding the bait (Figure 4.14). Figure 4.14 indicates the near-bait genomic
interactions RUNX1 +24 is involved in.
Figure 4.14: RUNX1 +24 near-bait 4C profile.
Ggplot of the near-bait 4C profile, normalised read count is on the vertical axis and position on chromosome 21 is on the horizontal axis. Rao et al., (2014) K562 domain boundaries are shown in grey dotted lines. Domain locations in K562 cells were obtained from Rao et al., (2014) (Rao et al., 2014). Black arrows represent the RUNX1 promoters. RUNX1 is transcribed telomere to centromere implied by the direction of the black arrows of the RUNX1 promoters. * shows the large normalised read peak at human equivalent region of RUNX1 m -368.

150
When the K562 TAD domain boundaries are overlapped with the normalised WT 12
DMSO +24 reads we see RUNX1 +24 connections are primarily contained within the TAD
domain. However the interactions are not constrained by the upstream boundary, as there is a
similar read count between two neighbouring regions.
Interestingly the large normalised read peak (*) between 36,500,000 and 37,000,000
reflects an interaction with human equivalent region of RUNX1 m -368.
WT 12 DMSO showed 143 significant near-bait interactions (Appendix IX) (Figure
4.16). The majority of these interactions were upstream of RUNX1 P1. Similar to the cis
connections, most interactions connect to regions within genes or in intronic regions, implying
RUNX1 +24 connects with regulatory regions.
Genes within domains are potentially co-expressed and co-regulated with RUNX1. Dr.
Marsman defined the genes at the domain boundaries of K562 cells as CBR1, CLIC6, KCNE2
and SMIM11 (Marsman, 2016). These genes were determined to be involved in cellular
homeostasis and likely to have uniform expression in most cell types. Dixon et al., (2012)
hypothesised that genes with consistent transcription are frequently present at domain
boundaries and their high expression may contribute to boundary formation (Dixon et al.,
2012).

151
Figure 4.15: RUNX1 +24 significant near-bait interactions (chr21:34999764-37572609).
Chromosome 21 with positional zoom shown by the black box. RUNX1 is transcribed telomere to centromere implied by the direction of the black arrows of the RUNX1 promoters. In near-bait black box RUNX1 +24 interactions represented by black arches. RUNX1 +24 is represented by the yellow line. RUNX1 promoters are represented by blue lines and interactions to these promoters are shown in blue. RUNX1 regulatory regions are represented by orange lines and interactions to these regions are shown in orange. Chromosome is aligned to the UCSC K562 gene list and annotations. Dotted grey lines show Rao et al., (2014) K562 domain boundaries.
4.7.3 Significant interactions with known RUNX1 regulators
As demonstrated in the previous chapter RUNX1 has multiple different regulatory
regions that lie in the intronic and intergenic regions of RUNX1. I investigated whether RUNX1
+24 interacted with any of the characterised RUNX1 regulatory regions in K562 cells. Based
on the steady increase of RUNX1 P1 transcription after PMA stimulation (megakaryocyte
differentiation) in K562s (Antony et al., 2020), it was predicted that the RUNX1 +24 would
connect to multiple enhancers, as well as connecting with P1. Curiously the only RUNX1
promoter that +24 connected to in WT 12 DMSO was P2. RUNX1 +24 interacts with some of
the characterized human RUNX1 regulators examined in the previous chapter; m-368, m-101,

152
m-58, +62, m+110. RUNX1 +24 also interacted with the gene encoding the lncRNA RUNXOR.
Of note, there were a plethora of identified RUNX1 regulatory regions that were not connected
to RUNX1 +24, which is different to the Runx1 +24 connections seen in HPC7 cells. This
further supports the notion that different RUNX1 enhancers are used depending on cell type. It
is important to note that as this 4C only captures interactions from the +24 viewpoint. Other
enhancers may play important roles in RUNX1 regulation and connect directly with the RUNX1
promoters, without a RUNX1+24 interaction.
4.7.4 Significant interactions with other genes
To investigate which genes may be co-regulated with RUNX1, interactions occurring
with other genes were identified. Across Chromosome 21 RUNX1 +24 interacted with 63 genes
(Table 4.2). Gene interaction analysis identifies a connection with an overlap in the same
genomic region as a gene and does not necessarily reflect an interaction with a promoter or
exon of a gene. As seen in the ChromHMM analysis, the majority of interactions were with
regulatory regions (enhancers and insulators) across the chromosome (Figure 4.13).
The majority of genes that +24 interacts with are protein-coding genes (43%). However,
the other 57% of connections are to non-coding RNAs. A large proportion of these RNAs are
uncharacterised.
Non-coding RNAs have been shown to be involved in many biological processes,
including regulating transcription, cell-fate programming and maintaining genome 3D
organisation (Flynn et al., 2014; Geisler et al., 2013; Holoch et al., 2015; Li et al., 2019;
Nozawa et al., 2019; Sun et al., 2018). In particular, long non-coding RNAs have been shown
to activate or suppress transcriptional activity by interacting with chromatin modulating
proteins (Fan et al., 2015; Han et al., 2014; Jain et al., 2016; Prensner et al., 2013; Scarola et
al., 2015). In WT 12 DMSO, the connections to these RNAs may be important in maintaining
the chromatin states, to ensure correct gene regulation and overall maintenance of this cell type.

153
Table 4.2: Type and name of genes that interact with RUNX1 +24
Type Name
Protein-coding genes AP000322.53, BACE2, BRWD1, CBR1, CLIC6, DSCR3, DSCR4, ERG, GRIK1, HLCS, HMGN1, IFNAR2, IL10RB, LCA5L, PDE9A, PDXK, PKNOX1, PRDM15, PSMG1, RCAN1, RIPK4, SCAF4, SETD4, SMIM11A, SMIM11B, USP25, WRB
Pseudogene GAPDHP16, METTL21AP1, POLR2CP1, RAD23BLP, RBMX2P1, RBPMSLP, RNF6P1, RPL34P3, TIMM9P2
Antisense RNA AL773572.7, AP000688.11, AP001412.1, AP001626.2, AP001630.5, BRWD1-AS1, BRWD1-AS2, GRIK1-AS1, IL10RB-AS1, PLAC4
Long intergenic non-coding RNAs (LincRNA)
AF127936.3, AF127936.5, AF127936.7, AF015720.3, AP000318.2, AP000255.6, LINC00159, LINC01671, LINC01426, LOC100506403
Micro RNA (miRNA) MIR3197, MIR5692B
Miscellaneous RNA (miscRNA)
Y_RNA
Sense intronic RNA AP000688.14
Sense overlapping RNA BRWD1-IT1, RUNXOR
Small nuclear RNA (snRNA)
RNU6-992P
When comparing the expression of the gene list with Antony et al., (2020)’s RNA seq
expression analysis of K562s, there were no consistent patterns (expressed or not expressed)
of the connected genes in WT. Notably this supports the theory that the RUNX1 +24 is helping
to organise different domains across the chromosome into active and inactive domains.
Gene ontology analysis of genes that interact with RUNX1 +24 was not appropriate as
these genes were not consistently on or off. However, there was an exciting connection to ERG
Promoter 3. ERG is crucial to haematopoietic cell specific gene regulation and is also inactive
in WT 12 DMSO. ERG is a transcription factor involved in the differentiation and maturation

154
of megakaryocyte cells. ERG dysregulation is associated with several haematopoietic tumour
types including AML (Reddy et al., 1987; Shimizu et al., 1993). Dr. Marsman also found that
Runx1 +24 interacted with ERG in HPC7 cells (Marsman, 2016) (Table 4.3).
Altered +24 activity or connections may therefore contribute to haematopoietic
dysregulation.
The connections between Runx1 +24 and genes; Brwd1, Clic6, Dscr3, Erg, Hlcs,
Hmgn1 are seen in both HPC7 and K562 WT 12 DMSO cells (Table 4.3).Unlike in HPC7
cells +24 does not interact with TIAM1 in WT 12 DMSO cells (Table 4.3). TIAM1 is involved
in cell adhesion and migration and is dysregulated in haematopoietic cancers (Habets et al.,
1995; Ives et al., 1998).
Table 4.3: Name of genes that interact with Runx1 +24 in HPC7s
Gene name
Interactions observed with both HPC7 Runx1 +24 4C and K562 RUNX1 +24 4C
Brwd1, Clic6, Dscr3, Erg, Hlcs, Hmgn1
Interactions only observed in HPC7 Runx1 +24 4C
Atp5o, B3galt5, Cbr3, Chaf1b, Cldn14, Cryzl1, Dopey2, GM10785, Itsn1, Kcnj6, Kcnj15, Morc3, Mrps6, Slc5a3, Son, Tiam1, TMEM50b, Ttc3, 1600002D24Rik
4.7.5 Overall significant RUNX1 +24 cis and near-bait interactions
The cis connections showed significant interactions with ERG P3 and super-enhancer
regulatory regions between SAMSN1 and NRIP1 genes (Figure 4.17). The WT 12 D RUNX1
+24 connects with the known enhancers m-368, m-101, m-58, m+62, m+110. It also interacts
with known RUNX1 regulators long non-coding RNA RUNXOR and RUNX1 P2. Within the
near-bait connections, RUNX1 +24 connected with RUNX1 Exon 3. RUNX1 +24 also
connected to three previously undescribed regions +89, -96 and a regulatory region near
SLC5A3 Exon 2 and a MRPS6 intron (Figure 4.16).

155
Figure 4.16: RUNX1 +24 chromatin hub.
Yellow boxes represent UCSC annotated gene promoters and/or exons. Blue boxes show described RUNX1 regulators. Orange boxes annotate novel putative regulators.
The novel connections were further analysed using the same in silico approach (Chapter
3) to describe other regulatory regions. These annotations are described in Table 4.4.
ERG P3 is described by ChromHMM as an insulator and transcription-associated
region. Transcription-associated refers to transcriptional transition or elongation (Ernst et al.,
2010; Ernst et al., 2011). This region has both cohesin and CTCF binding as well as
haematopoietic transcription factor binding (SPI1, TAL1, GATA2). This region shows no
change in chromatin accessibility in cohesin mutant K562 cells.
The novel RUNX1 regulatory regions -96 and +89 are both annotated as weak enhancers
with transcription association. Intriguingly neither site is shown as open as there are no DNase
HS sites. +89 binds RNA Pol II, whereas -96 does not. These regions show no change in
chromatin accessibility in K562 cohesin mutant cells.

156
The novel regulatory region near SLC5A3 Exon 2 and a MRPS6 intron was annotated
by ChromHMM as containing both strong and weak enhancer regions. These regions showed
comparable transcription factor binding sites and chromatin modifications to known RUNX1
enhancers m-371, m-58 and m+110. This region also had increased accessibility in the cohesin
mutant K562 cells.
The cis connection and super-enhancer regulatory region between SAMSN1 and NRIP1
was annotated as containing strong enhancers, weak enhancers and insulators. This region has
both cohesin and CTCF binding as well as haematopoietic transcription factor binding of SPI1
and TAL1. This region showed decreased chromatin accessibility in cohesin mutant K562
cells. This region also contained uncharacterised super-enhancers (Hnisz et al., 2013; Khan et
al., 2016).

157
Table 4.4: Annotations of identified putative regulatory region connections
Feature/ Regulatory region location relative to RUNX1 P1 (kb)
Genome coordinates (Hg19)
ENCODE annotation in K562 cells
ChromHMM annotation in K562 cells
Cohesin mediated chromatin accessibility
ERG P3 chr21:39852633-39906157
DNase I HS, RNA Pol II, RAD21, SMC3, CTCF, p300, LSD1, H3K4me1, H3K27me3, SPI1, TAL1, GATA2
Insulator, Transcription Associated
No change in accessibility in K562 cohesin mutants
-96 chr21:36517085-36518628
P300, LSD1, H3K27ac, H3K4me1, H3K4me3, H3K9me3, TAL1
Weak Enhancer, Transcription Associated
No change in accessibility in K562 cohesin mutants
+89 chr21:36332447-36333601
RNA Pol II, CTCF, p300, LSD1, H3K4me1, H3K4me3, H3K9ac, H3K9me3
Weak Enhancer, Transcription Associated
No change in accessibility in K562 cohesin mutants
SLC5A3 Exon 2 MRPS6 intron
chr21:35474191-35488395
DNase I HS, RNA Pol II, CTCF, p300, LSD1, H3K27ac, H3K4me1, H3K4me3, H3K9ac, H3K9me3, GATA1, TAL1, GATA2
Strong Enhancer, Weak Enhancer,
Increased accessibility in K562 cohesin mutants
region between SAMSN1 and NRIP1 (cis interaction)
chr21:16193679-16290033
DNase I HS, RAD21, SMC3 CTCF, p300, H3K27ac, H3K4me1, H3K4me3, H3K9ac, H3K9me3, SPI1, TAL1,
Strong enhancer, Weak enhancer, Insulator
Decreased accessibility in K562 cohesin mutants
4.7.6 Trans interactions
The trans interactions of RUNX1 +24 could not be significantly investigated using
4Cker. The 4Cker analysis mapped the trans interactions to broad areas across various
chromosomes (Appendix X). This may be because when the software annotates regions as
significant, it does so based on the average of reads across the inputted window. As there were
low read numbers across most chromosomes, the software combined the reads across the
chromosome. This meant there were large (10,000 bp+) “interactions” called which spanned

158
across the different chromosomes. This gave no clear overview of sequencing read peaks hence
trans interactions were unable to be interpreted.
This 4C was designed to understand the cis and near-bait with the use of a 4 bp cutter.
Raviram et al., (2016) highlight in their experiment that 6 bp cutters are optimal for detecting
trans interactions (Raviram et al., 2016). The genome is cut more frequently with 4 bp cutters
and this increases resolution by over tenfold compared to 6 bp cutters (Raviram et al., 2016;
Van De Werken et al., 2012b).
To understand the trans interactions that could be detected, I looked at the raw read
peaks across the genome after control reads were removed (Appendix X). Based on peaks that
contained reads in 2 or more replicates I detected three trans interactions (Table 4.5). All peaks
were in intergenic regions and contained minimal ENCODE annotations.
Table 4.5: Annotations of identified trans interactions
Closest annotated Feature/gene
Genome coordinates (Hg19)
ENCODE annotation in K562 cells
ChromHMM annotation in K562 cells
Cohesin mediated chromatin accessibility
Region between KCNA2 and KCNA10
chr1:111,112,479-111,112,575
p300, H3K27me3 Polycomb repressed
No change in accessibility in K562 cohesin mutants
NLGN1 intergenic region
chr3:173,646,070-173,646,151
No binding Heterochromatin No change in accessibility in K562 cohesin mutants
Region between DDX58 and ACO1
chr9:32,452,626-32,452,711
p300 Transcription Associated
No change in accessibility in K562 cohesin mutants
HPC7 cells had one trans interaction between RUNX1 +24 and the overlapping
mitochondrial genes Gu332589 and Ak018753, however this was not seen in K562 cells.

159
RUNX1 is often translocated in AML and is usually with Chromosome 3 (EVI1), 8
(ETO), 16 (CBFB) and 12 (ETV6) (Sood et al., 2017). The RUNX1 +24 trans interactions do
not overlap with these frequent RUNX1 translocation points. The trans interaction on
chromosome 3 is over 4,782,000 bp away from EVI1.
It should be noted however that the K562 cells are unlikely to have a completely normal
karyotype and already carry BCR-ABL translocation. The BCR gene is normally on
chromosome number 22, ABL gene is normally on chromosome number 9 (McGahon et al.,
1997). Because the trans interactions were not able to be subjected to the same stringency as
cis and near-bait interactions, analysis of these interactions was not pursued further.
4.8 Chapter summary
4.8.1 RUNX1 +24 characteristics
RUNX1 +24 showed strong enhancer characteristics and active binding of
haematopoietic transcription factors. The FANTOM5 data showed that there is active
production of the +24 enhancer RNA (eRNA) in haematopoietic cell types.
Several studies have reported functional roles of eRNAs that foster enhancer-promoter
looping formation, promote transcription factor and co-regulator binding and support target
gene transcription (Bose et al., 2017; Hou et al., 2020b; Lai et al., 2013; Lam et al., 2013; Li
et al., 2013a; Melo et al., 2013; Panigrahi et al., 2018; Rahnamoun et al., 2018; Sigova et al.,
2015; Tsai et al., 2018). Enhancer RNA can also assist pause-release of RNA Pol II which
facilitates transcription elongation (Schaukowitch et al., 2014).
There are no SNPs with a MAF of >1% reported in RUNX1 +24 region. This could be
an underestimation, due to the limitations in identifying significant SNPs in haematopoietic
cells reported in the previous chapter (Section 3.4.2). The available AML genomic data
reported a low number (5) of mutations.

160
CRISPR/Cas9 editing of RUNX1 +24 (by targeting the whole intron) showed reduced
RUNX1 expression in OCI-AML5 cells (Mill et al., 2019). The majority of edited cells were
eradicated via apoptosis, while the viable edited cells had significantly decreased RUNX1
expression and inhibited growth (Mill et al., 2019). This research shows the importance of the
P1-P2 intron, which contains multiple RUNX1 regulatory elements.
The CD analysis showed that the G-quadruplexes observed in the mouse +24 element
are capable of forming parallel G-quadruplexes. G-quadruplex RNA is capable of targeting and
removing Polycomb repressive complex 2 from genes and allowing RNA-mediated regulation
(Beltran et al., 2019; Wang et al., 2017).
Luciferase assays showed that the mutations of G-quadruplex or mouse Runx1 +24 had
no significant effect on enhancer function. Given the overall organisational role of RUNX1 +24
seen in the 4C and possibility of G-quadruplex RNA, this assay is restricted in its ability to
assess the functional nature of this G-quadruplex, because it doesn’t take non-
transcriptional/structural roles into account. Therefore, luciferase assays may not capture the
changes in capability when the +24 G-quadruplex is mutated. Furthermore, the G-quadruplex
analysis was specific to the mouse sequence, so it may not recapitulate the function of the
human sequence. If the human sequence contains a G-quadruplex, CD analysis should be
repeated to determine the type of G-quadruplex, or its functional capacity.
It would be interesting to further investigate the possible functional roles of RUNX1
+24 eRNA and +24 G-quadruplex RNA. This could be done using precision run-on sequencing
(PRO-seq) and rapid amplification of cDNA ends (RACE). Pro-seq can define the position,
amount, and orientation of transcriptionally active RNA polymerases in the genome to a single-
nucleotide resolution (Hou et al., 2020b). RACE can map eRNAs by identifying the 5′ and 3′
ends of RNA and RT-qPCR can determine the expression levels of these eRNAs (Hou et al.,

161
2020b). The eRNAs could also be knocked down using small interfering RNA (siRNA) or
mutated using CRISPR/Cas9 (Hou et al., 2020b).
If the G-quadruplex was capable of forming RNA it would be fascinating to investigate
its targets or ability to bind to Runx1 protein. Previously Fukunaga et al., (2020) showed the
ability of a G-quadruplex RNA to bind to the ETO and dissociate the leukemic RUNX1-ETO
fusion protein from DNA (Fukunaga et al., 2020). This suggests that some G-quadruplex RNA
may serve as potential therapeutic agents for leukaemia.
4.8.2 RUNX1 +24 interactions
In K562 cells, RUNX1 +24 interactions occurred across the whole of Chromosome 21.
Previously, Hi-C and promoter capture-C showed conservative interactions of promoters
within TADs. Unexpectedly, the +24 enhancer interacted across the whole chromosome and
was not limited to the reported domain structure.
The majority of RUNX1 +24 interactions were with regulatory regions, however it is
connected to both active and inactive chromatin. This unexpected finding suggests that RUNX1
+24 is playing a role in the organisation of chromosome 21 in K562s, rather than a traditional
enhancer role.
The RUNX1 +24 connections were predominantly with non-coding RNAs, whose
expression profiles cannot be determined by the existing RNA-seq data. Antony et al., (2020)
RNA-seq data was unstranded and poly A+ enriched. Often non-coding RNA overlaps with
genes, if this applies to these non-coding RNAs, they would not get annotated by this data set.
The connections from RUNX1 +24 to non-coding RNAs, imply that RUNX1 +24 may be
providing connections across the chromatin to ensure correct transcription and repression for
maintenance of K562 cells. As non-coding RNAs are important for correct enhancer-promoter
looping, 3D genome organisation, and cell-fate processes, the +24 may be safeguarding the
chromatin structure and gene expression.

162
In HPC7 cells Runx1 +24 connected to the active P1 and inactive P2 Runx1 promoters
and connected to 7 Runx1 regulatory regions (m-371, m-368, m-354, m-327, m-321, m-303,
m-58, m-48). RUNX1 +24 in K562 cells connected to only one RUNX1 promoter (P2) which
is active as well as a small number of identified RUNX1 regulatory regions (m-368, m-101, m-
58, +62, and m+110). This reinforces the notion of different enhancer recruitment in order to
produce different cell types and generation of different RUNX1 isoforms.
There were some novel interactions identified; RUNXOR, ERG P3 and putative
regulatory regions -96, +89, SLC5A3 Exon 2 MRPS6 intron and a super-enhancer region
between SAMSN1 and NRIP1. These putative regulatory regions could be investigated further
for functional roles in K562 cells by using enhancer and insulator assays, including analysing
the combinatory roles of the regions.
RUNX1 +24 could be important for overall organisation and 3D structure of
chromosome 21. RUNX1 +24 interacts with coding genes, non-coding RNA, super-enhancers
and regulatory elements, and may be maintaining these connections to prevent transcription,
rather than the expected enhancer role. Further investigation to define the RNA-DNA
interactions proposed by this research could determine the importance of RUNX1+24 eRNAs,
possible G-quadruplex RNA and non-coding RNA connections seen in K562s. This could be
carried out by utilising previously generated RNA-DNA interactomes for K562s cells such as
Red-C from Gavrilov et al., (2020) (Gavrilov et al., 2020).
Some other questions arising from this research include: are there other well established
enhancers that connect across the chromosome? If so, are they significant for genome
organisation? Are there equivalents of RUNX1 +24 on different chromosomes? These could be
further discovered by using enhancers as baits for 4C experiments or establishing an equivalent
of Capture-C for enhancers.

163
This chapter describes my work determining how RUNX1 +24 interacts with other
DNA regions in steady-state K562 cells. However, enhancers become active when cells are
subjected to various stimuli, such as in differentiation. Cohesin insufficiency has been shown
to impair differentiation, alter overall chromatin accessibility, as well as the transcription of
RUNX1 (Mazumdar et al., 2015; Mullenders et al., 2015; Viny et al., 2015). RUNX1 P1 is
crucial for megakaryocyte differentiation and it is predicted that enhancers play key roles in
inducing the correct RUNX1 promoters. The following chapter describes experiments in which
the K562 cells were induced to differentiate to the megakaryocytic lineage, so the role of
RUNX1 +24 could be further understood. It also details how cohesin insufficiency affects the
RUNX1 +24 connections.

164
5 Chapter 5: Cohesin insulates 3D connections of RUNX1
+24 during megakaryocyte differentiation
5.1 Introduction
The previous chapter established the connectivity of the RUNX1 +24 enhancer and
suggests that this region connects to multiple DNA regions spanning chromosome 21 in K562
cells. RUNX1 P1 is crucial for megakaryocyte differentiation and it is predicted that enhancers
play key roles in selecting and inducing the correct RUNX1 promoters. Dr. Antony discovered
that enhancer activity is altered during megakaryocytic differentiation in cohesin-mutant cells
(Antony et al., 2020). Cohesin insufficiency impairs HSC differentiation, alters overall
chromatin accessibility, as well as the transcription of RUNX1 (Mazumdar et al., 2015;
Mullenders et al., 2015; Viny et al., 2015)
Overall, cohesin mutations are implicated as a putative genetic pathway for
development of AML, but how the disease arises from these mutations has not been
determined. Cohesin mutations co-occur with other mutations in leukaemogenic genes
indicating cooperation between pathways (Welch et al., 2012). One possibility is that
impairment of cohesin’s regulatory role leads to dysregulation of other important
leukaemogenic genes. The gene encoding cohesin subunit STAG2 is the most frequently
mutated of the cohesin genes (Van Der Lelij et al., 2017). STAG2 mutation can lead to complete
loss of STAG2 function due to mosaic inactivation of the X-linked wild type allele. Several
studies have shown STAG2 preferentially occupies enhancers and promoters, and promotes
cell-type-specific transcription, a function that is not compensated by cohesin-STAG1 (Arruda
et al., 2020; Cuadrado et al., 2019; De Koninck et al., 2020; Kojic et al., 2018; Viny et al.,
2019).

165
K562 cells with a patient-specific STAG2 R614* null mutation were previously
generated by Dr. Antony. Wild type (WT) and STAG2 mutant R614* K562 cells were
previously subjected to RNA-seq, revealing genome-wide gene expression changes. Using
ATAC-seq, Dr. Antony also noted altered chromatin accessibility in K562 cells with STAG2
mutation. The RNA-seq and ATAC-seq revealed that the gene expression changes observed
are associated with altered chromatin accessibility at regulatory regions and super-enhancers
in STAG2 mutants (Antony et al., 2020).
RUNX1 and ERG are important for HSC differentiation and both have intergenic
regions that are distinguished as super-enhancers in CD34+ cells (Khan et al., 2016). In Dr.
Antony’s dataset, ERG was the top differentially upregulated super-enhancer-associated gene
in the STAG2-/- mutant, while RUNX1 was one the genes that showed differential chromatin
accessibility.
K562 cells can be induced to differentiate towards the megakaryocyte lineage using
phorbol 12-myristate 13-acetate (PMA). Antony et al., (2020) used quantitative PCR (qPCR)
to measure specific gene expression changes over 72 hours (h) of PMA stimulation. WT cells
undergoing normal megakaryocyte differentiation had a gradual increase in transcription of
RUNX1 from its P1 promoter: RUNX1-P1 and ERG. However, STAG2-deficient cells showed
an aberrant spike in transcription of RUNX1 from its P2 promoter: RUNX1-P2 and ERG 6-12h
post-PMA stimulation (Antony et al., 2020)..
Dr. Antony showed that by 48 h post-stimulation, aberrant RUNX1 and ERG
transcription had returned to baseline in STAG2-deficient cells. This implies that PMA
stimulation of STAG2-deficient cells, which at baseline have increased chromatin accessibility
at RUNX1 and ERG, leads to transient unrestrained transcription (Antony et al., 2020).
Antony et al., (2020) used a bromodomain and extra-terminal motif (BET) inhibitor
protein called JQ1, to decrease BRD4 binding and suppress enhancer-driven transcription

166
(Antony et al., 2020). BRD4 is a bromodomain-containing protein that interacts with active
enhancers (Bhagwat et al., 2016). When K562 cells were treated with JQ1 concurrently with
PMA, there was reduced RUNX1-P2 and ERG expression in WT cells, and dramatically
dampened aberrant expression peaks in STAG2-deficient cells (Antony et al., 2020). . RUNX1-
P1 transcription was completely blocked by JQ1 in both WT and STAG2-deficient cells
(Antony et al., 2020). These results suggest that STAG2 depletion de-constrains the chromatin
surrounding RUNX1 and ERG, which produces aberrant enhancer-amplified transcription in
response to differentiation signal.
This Chapter describes the results of my research on: 1) the role of RUNX1 +24 in
megakaryocyte differentiation and 2) how cohesin insufficiency affects spatial connections
initiated by the RUNX1 +24 enhancer. For the first objective, K562 cells were induced with
PMA to differentiate towards the megakaryocytic lineage, so that the spatial connections
initiated by RUNX1 +24 during the differentiation process could be determined. For the second
objective, K562 cells with the STAG2 R614* null mutation were differentiated in parallel to
understand how cohesin deficiency affects +24 enhancer connections.
This experiment highlighted how the connectivity changes upon cohesin depletion and
may provide a mechanism for how cohesin mutations can lead to haematopoietic dysregulated
RUNX1 expression.
5.2 Hypothesis
I hypothesise that RUNX1+24 connections will alter during megakaryocyte
differentiation and without STAG2 these connections will not be maintained.
5.3 Aims
3) Elucidate connections of RUNX1 +24 during normal megakaryocyte differentiation.
4) Determine the change in significant chromatin interactions in STAG2-deficient
cells after PMA stimulation.

167
5.4 RUNX1 +24 significant interactions during normal
megakaryocyte differentiation.
The conditions chosen for this 4C were based on the gene expression analyses shown
by Antony et al., (2020). Differentiation to megakaryocytes was induced using PMA
(Kuvardina et al., 2015). Control treatment of K562 (WT) and STAG2-deficient cell lines used
Dimethyl Sulfoxide (DMSO), as the solvent in place of PMA. 12 h was chosen based on
abnormal transcription observed at this time in STAG2-deficient mutants. An end timepoint of
72 h was chosen because by this time, WT cells displayed differentiation markers and gene
transcription profiles consistent with megakaryocytes (Antony et al., 2020).
4Cker differential analysis was carried out on the windows that interact with the
RUNX1 +24 bait in at least 2 conditions, using DESeq2 (Love et al., 2014; Raviram et al.,
2016). This analysis only works for near-bait and cis interactions. A plot of significant
interactions was generated with a p-value of 0.05, however, to tease out true differences in
interactions, a more stringent cut-off for significance utilised an adjusted p value of 0.01.
Hereafter all p values refer to each interaction’s adjusted p value.
Significantly altered interactions and their log fold changes were visualised in the
UCSC browser.
5.4.1 Visualisation of significant interactions during normal
megakaryocyte differentiation.
The normalised read count for all WT conditions (WT 12 DMSO (control), WT 12
PMA, WT 72 PMA) was plotted across chromosome 21 using ggplot (Wickham et al., 2007)
to generate the cis profile of Runx1 +24 connections in unedited K562 cells (Figure 5.1). Reads
had a high coverage around the +24 bait. The profile remains relatively similar during
megakaryocyte differentiation; however, the number of normalised reads was reduced post-

168
stimulation. The large normalised read peak that shows an interaction around 45,000,000 (*)
with PDE9A and BC033260 in WT 12 DMSO dramatically decreased during differentiation.
Figure 5.1: Megakaryocyte differentiation with PMA stimulation RUNX1 +24 WT cis 4C profiles.
ggplots of the cis 4C profiles for WT DMSO 1, WT PMA 12 h and WT PMA 72 h. Normalised read count is on the vertical axis and position on chromosome 21 is on the horizontal axis. * large peak at PDE9A and BC033260 in WT 12 DMSO.
5.4.2 Overview of significant changes in interactions during normal
megakaryocyte differentiation.
Significantly altered interactions and their log fold changes were visualised in the
UCSC browser. Synonymous with WT 12 DMSO; the WT 12 PMA and WT 72 PMA profiles
showed that significant cis interactions spanned across the long arm of chromosome 21 (Figure
5.2). A list of all the statistically significant changes between conditions is available in
Appendix XI.
Over the differentiation time course RUNX1 +24 loses connections with a number of
regions across the chromatin. The significant cis differences between WT 12 DMSO and WT
12 PMA was loss of connection to ERG Promoter 3 (P3) with a Log2 fold change of -7.84 (p
169
value =0.0097) and regulatory region between SAMSN1 and NRIP1 (Log2 fold change of -
8.01, p value =0.0049) (Figure 5.2).
ERG is repressed in WT 12 DMSO control K562 cells. However, during differentiation
ERG expression slowly increases (Antony et al., 2020). ERG has three known promoters, and
can positively regulate its own expression (Thoms et al., 2011). The data suggest that the
RUNX1 +24 connection in WT 12 DMSO control K562 cells might constrain ERG expression,
and upon PMA treatment, ERG’s P3 is released to facilitate the expression of ERG.
When comparing the WT 12 DMSO and WT 72 PMA there are 12 lost interactions
(Log2 fold change ranges from -5.78 to -8.6, p values range from 0.0017 to 0.0081), including
loss of connections to ERG P3 and the regulatory region between SAMSN1 and NRIP1 (see
Appendix XI). Overall, megakaryocyte differentiation of K562 cells causes the RUNX1+24
enhancer to lose cis-interactions along chromosome 21.

170
Figure 5.2: Differentiation-induced changes to the RUNX1 +24 WT cis interactions.
Cis 4C profiles for WT DMSO 1, WT PMA 12 h and WT PMA 72 h. Chromosome 21 with WT DMSO 12 h RUNX1 +24 interactions represented by grey arches. Green arches show gained interactions compared to baseline (WT DMSO 12 h). Blue arches underneath the chromosome sketches highlight lost interactions compared to baseline. Each interaction is colour-coded according to its ChromHMM profile: key is at the bottom left of the figure. Super-enhancers were determined from dbSuper.

171
The ChromHMM annotations do not necessarily reflect the nature of these elements
during differentiation. The annotations were determined in steady-state K562 cells and
represent the baseline (WT 12 DMSO); therefore, the chromatin composition could be altered
after PMA stimulation.
The super-enhancers were identified regardless of the chromatin status as they were
from the collection of cells in dbSUPER (Khan et al., 2016). In WT 12 DMSO 16% (n= 5/31)
of the cis connections were with super-enhancers. In Chapter 4 I noted that RUNX1 +24
interactions with super-enhancers may be facilitating or restricting their 3D connections. There
is a decrease in super-enhancer cis-connections during differentiation (10.3%) (n= 3/29) (WT
12 PMA), the proportion of interactions with super-enhancers increases to 13.6% (n= 3/22)
after megakaryocyte differentiation at WT 72 PMA (Figure 5.3).
Figure 5.3: Differentiation-induced changes in the number of RUNX1 +24 significant cis interactions with
super-enhancers in WT K562 cells.
Percentage of interactions is on the vertical axis. Horizontal axis shows the treatment conditions WT DMSO (D) 12h, WT PMA (P) 12h and WT PMA 72h

172
5.4.3 Visualisation of significant near-bait interactions during normal
megakaryocyte differentiation.
The normalised read counts of all three time points in WT cells were plotted across
chromosome 21 near-bait locations using ggplot (Wickham et al., 2007) (Figure 5.4). The
majority of reads are located within specific regions surrounding RUNX1 +24 in WT 12
DMSO. Resembling the cis WT profiles, the number of normalised reads decreases as the cells
differentiate. Interestingly, the large normalised read peak which highlighted an interaction
with RUNX1 m -368 (*) and the surrounding area decreases in comparison to the baseline WT
12 DMSO connections (Figure 5.4). Overall, megakaryocyte differentiation of K562 cells
causes the RUNX1+24 enhancer to lose interactions within the RUNX1 TAD.
Figure 5.4: Megakaryocyte differentiation with PMA stimulation RUNX1 +24 WT near-bait 4C profile.
ggplot of the near-bait 4C profiles for WT DMSO 12 h, WT PMA 12 h and WT PMA 72 h, normalised read count is on the vertical axis and position on chromosome 21 is on the horizontal axis. The asterisk shows the large normalised read peak at human equivalent region of RUNX1 m -368.

173
5.4.4 Overview of significant changes in near-bait interactions during
normal megakaryocyte differentiation.
Similar to the cis results RUNX1 +24 progressively lost connections during
megakaryocyte differentiation. However, unlike cis interactions WT 12 PMA and WT 72 PMA
near-bait also showed some significantly increased connections (Figure 5.5). The statistically
significant changes between conditions is available in Appendix XII.

174
Figure 5.5: Differentiation-induced changes to the RUNX1 +24 WT near-bait interactions.
Near-bait 4C profiles for WT DMSO 12 h, WT PMA 12 h and WT PMA 72 h. Chromosome 21 with WT DMSO 12 h RUNX1 +24 interactions represented by grey arches. Green arches show gained interactions compared to baseline (WT DMSO 12 h). Blue arches underneath the diagrams highlight lost interactions compared to baseline. RUNX1 +24 is represented by the yellow line. RUNX1 promoters are represented by blue lines and interactions to these promoters are shown in blue. RUNX1 regulatory regions are represented by orange lines and interactions to these regions are shown in orange. Near-bait region is aligned to the UCSC K562 gene list and annotations. Dotted grey lines show Rao et al., (2014) K562 domain boundaries.

175
The previous chapter demonstrated the multiple near-bait connections surrounding
RUNX1 +24. The near-bait interactions observed during megakaryocyte differentiation reflect
the overall trend of a decrease in connections to RUNX1 +24. When assessing the WT 12
DMSO and WT 12 PMA there were 3 lost connections; -96, +89 and the SLC5A3 Exon 2
MRPS6 intron region (Log2 fold changes of -7.81,-7.62 and -8.94 and p values of 0.0034,
0.0015, 0.0014 respectively), connections that were previously described in Chapter 4.
Despite the overall loss of connections, after 12 h of PMA treatment there were some
significantly increased interactions with RUNX1 +24 (Log2 fold change ranges from 6.77 to
8.25, p values range from 5.3E-7 to 0.0020) see Appendix XII. These include some possible
regulatory regions +14, +54, +68, +142 between RUNX1 P1 and P2 (Table 5.1). RUNX1-IT1,
RUNX1 promoter 1, RUNX1 exon 1 and 2 are also recruited to the RUNX1 +24 hub (Figure
5.6). RUNX1-IT1 is a long non coding RNA which has been previously correlated with RUNX1.
(Liu et al., 2020). Expression of the RUNX1-IT1 enhanced RUNX1 transcription in pancreatic
cancer cells (Liu et al., 2020). Connections with m-368, m-58, RUNXOR, m+3, +62, m+11,
RUNX1 P2 and exon 3 remain stable with RUNX1 +24 during megakaryocyte differentiation.
The RUNX1 protein is capable regulating its own gene transcription (Martinez et al.,
2016). RUNX1 P1-driven expression is important for megakaryocyte differentiation (Draper et
al., 2017). During megakaryocyte differentiation RUNX1 P1-driven expression of RUNX1
gradually increases (Antony et al., 2020). In baseline K562 cells (WT 12 DMSO), RUNX1 P1
is not connected to RUNX1 +24 and the RUNX1 P1 driven expression is repressed (Chapter 4).
However, after PMA simulation RUNX1 P1 is recruited to RUNX1 +24 along with other
possible enhancers (Figure 5.6). In contrast, RUNX1 P2 transcript is stably expressed
throughout differentiation (Antony et al., 2020). Consistent with this, the connection between
RUNX1 P2 to RUNX1 +24 remains unchanged throughout differentiation.

176
After differentiating to megakaryocytes (WT 72 PMA) more near-bait connections are
lost (Log2 fold change ranges from -3.93 to -12.36, p values range from 1.4E-35 to 0.0095).
Contacts with some of the of the possible regulatory regions that were significant at 12 h after
PMA treatment +14, +54, +68, +142 are lost in differentiated cells. Interactions with RUNXOR,
RUNX1-IT1, RUNX1 P1, RUNX1 exon 1 and 2 are also lost. The only connection gained at 72
h of differentiation was with m-371 (Log2 fold changes of 5.95, p value of 0.0069).
Chromatin status at the near-bait regions with significantly increased connections was
analysed using ENCODE data as for Chapter 3 and 4 (Table 5.1).
Table 5.1: Annotations of identified putative regulatory region connections
Regulatory region location relative to P1 (kb)
Genome coordinates (Hg19)
ENCODE annotation in K562 cells
ChromHMM annotation in K562 cells
+14 chr21:36406427-36407599
RNA Pol II, CTCF, p300, LSD1, H3K27ac, H3K4me1, H3K4me3, H3K9me3, H3K27me3
Strong enhancer, Weak enhancer,
+54 chr21:36366550-36367612
DNase I HS, RNA Pol II, p300, LSD1, H3K27ac, H3K4me1, H3K4me3, H3K9ac, H3K9me3, H3K27me3
Strong enhancer, Weak enhancer,
+68 chr21:36352605-36353690
RNA Pol II, p300, LSD1, H3K4me1, H3K4me3, H3K9ac, H3K9me3
Weak enhancer, weak transcription
+142 chr21:36278644-36280049
DNase I HS, CTCF, p300, LSD1, H3K27ac, H3K4me1, H3K4me3, H3K9ac, H3K9me3
Strong enhancer
5.4.5 Significant interactions with other genes
Connections with genes were identified using the same methods as Section 4.7.4 and
are listed in Appendix XIII. The number of gene connections changes during differentiation
(Table 5.2). Interestingly the number of connected genes increased from 64 in the baseline to

177
154 (12 PMA) and then decreased to 140 (72 PMA). This is opposite to the trend of connections
which decreases overall. These connections need further investigation to determine gene type,
establish their expression level, as well as ascertain if there are any patterns in the type of gene.
However, as the gene interaction reflects an overlap with the region of a gene rather than a
promoter or exon of a gene, it may not be appropriate to assume the gene’s expression is
controlled by RUNX1 +24.
Table 5.2: Number of genes connected to RUNX1 +24 in WT cells
WT 12 DMSO WT 12 PMA WT 72 PMA
Number of genes connected to RUNX1 +24
64 154 140
5.4.6 Overall significant RUNX1 +24 and near-bait interactions in K562
cells during megakaryocyte differentiation
During PMA treatment there is an overall loss of connections to RUNX1 +24, however
as the cells are differentiating there are some significant changes in the near-bait. RUNX1 +24
maintains connections with the known enhancers m-368, m-58, m+3, +62, m+110 during
differentiation (Figure 5.6). It also sustains connections with RUNX1 P2 and RUNX1 exon 3.
However, the novel connections determined in Chapter 4 to -96, +89, SLC5A3 Exon 2 MRPS6
intron and super-enhancer regulatory regions between SAMSN1 and NRIP1 are lost during
differentiation. The connections to known RUNX1 regulator long non-coding RNA RUNXOR,
and ERG P3 are also lost during differentiation (Figure 5.6).
During differentiation (12 h post PMA treatment) The +24 enhancer makes some novel
connections to putative regulatory elements +14, +54, +68, +142 (Figure 5.6, Table 5.1)
RUNX1 +24 also gains connections with the RUNX1 promoter 1, exon 1 and 2.

178
After differentiation RUNX1 +24 loses the novel connections gained at 12 h of PMA
treatment (+14, +54, +68, +142), and with the long non-coding RNA RUNX1-IT1, RUNX1 P1,
exons 1 and 2. At 72 h once differentiation has occurred, there is a significant increase in the
interaction between RUNX1 +24 and m-371. m-371 is an important haematopoietic enhancer
in developing zebrafish and mice.

179
Figure 5.6: Changes to the RUNX1 +24-anchored chromatin hub during megakaryocyte differentiation of
K562 cells.
Yellow boxes represent UCSC annotated gene promoters and/or exons. Blue boxes show described RUNX1 regulators. Orange boxes annotate novel putative RUNX1 regulators.

180
5.5 The effect of STAG2 deficiency on RUNX1 +24 significant
interactions during differentiation of K562 cells
The STAG2 mutants 4C data was prepared in the same way as WT (STAG2 12 DMSO,
STAG2 12 PMA, STAG2 72 PMA). STAG2 mutants were compared to WT equivalent
condition and timepoint.
5.5.1 Visualisation of significant interactions during cohesin impaired
“differentiation”
The normalised read count of all WT conditions (WT 12 DMSO, WT 12 PMA, WT 72
PMA) and STAG2 mutant conditions (STAG2 12 DMSO, STAG2 12 PMA, STAG2 72 PMA)
were plotted across chromosome 21 using ggplot (Wickham et al., 2007) to generate the cis
profile of Runx1 +24 connections in baseline K562 cells and cohesin mutants (Figure 5.7). The
STAG2 mutant cells have a dramatic increase in connections across chromosome 21. Reads
had a high coverage around the +24 bait.
A comparison of the +24-mediated connections in WT 12 DMSO versus STAG2 12
DMSO show a similarly high number of reads around the RUNX1 +24 bait. However, the read
coverage across chromosome 21 is higher in STAG2 12 DMSO cells.
During PMA-induced differentiation, WT K562 cells lose connections overall. In
contrast, STAG2 mutants generally retained, or even gained, connections following stimulation
with PMA. After 12 h of PMA stimulation the pattern of connections in STAG2 mutants
approximates the wild type, but with a higher read and more distant connections. After 72 h of
PMA stimulation there was a dramatic increase in connections across chromosome 21 in
STAG2 72 PMA compared to WT 72 PMA.

181
Figure 5.7: Time course of PMA stimulation of all RUNX1 +24 cis 4C profiles.
ggplots of the cis 4C profiles for WT DMSO 1, WT PMA 12 h, WT PMA 72 h, STAG2 DMSO 12 h, STAG2 PMA 12 h and STAG2 PMA 72 h. Normalised read count is on the vertical axis and position on chromosome 21 is on the horizontal axis
5.5.2 The effect of STAG2 deficiency on interactions during
differentiation of K562 cells
Similar to the baseline WT cells, the baseline STAG2 mutant cells (STAG2 12 DMSO)
had significant cis interactions spanning the long arm of chromosome 21 (Figure 5.8). A list of
all the statistically significant changes between conditions is available in Appendix XI.

182
When comparing the WT 12 DMSO and STAG2 12 DMSO, there are 4 interactions
that are not present in the cohesin mutant baseline (Log2 fold change ranges from -6.66 to 5.15,
p values range from 0.0003 to 0.0078) including the super-enhancer regulatory region between
SAMSN1 and NRIP1 (Log2 fold change of -5.64, p value of 0.0047) (Appendix XI). However,
there are 20 regions interacting with RUNX1 +24 in STAG2 12 DMSO (Log2 fold change
ranges from 3.85 to 6.04, p values range from 0.0002 to 0.0097) that are not present in WT 12
DMSO (Figure 5.8). Overall, STAG2 deficiency causes the RUNX1+24 enhancer to make more
connections than in the WT cells.

183
Figure 5.8: Significant changes to the RUNX1 +24 cis baseline (12 DMSO) interactions due to cohesin
deficiency.
Cis 4C profiles for K562 STAG2 mutant DMSO 12h cells on Chromosome 21 with K562 WT DMSO 12h RUNX1 +24 interactions represented by grey arches. Green arches show a gained interaction compared to WT. Blue arches underneath the diagrams highlight lost interactions in STAG2 mutant cells compared to WT. Each interaction is colour-coded according to its ChromHMM profile: key is at the bottom left of the figure. Super-enhancers were determined from dbSuper.
These interactions were further categorised based on the K562 chromatin
characteristics using ChromHMM and dbSUPER annotations. Some regions that interact with
RUNX1 +24 exhibit multiple ChromHMM annotations (Figure 5.9).
Compared to WT cells, STAG2 mutant cells RUNX1 +24 have slightly fewer
interactions with enhancer regions (WT = 58%, STAG2 = 50%), active promoters (WT = 32%,
STAG2 = 28%), heterochromatin (WT = 10%, STAG2 = 7%), and polycomb repressed (WT

184
= 29%, STAG2 = 28%) regions. Interactions between RUNX1+24 and insulators increased
(WT = 32%, STAG2 = 48%). Poised promoters (WT = 16%, STAG2 = 22%) and super-
enhancers (WT = 16%, STAG2 = 24%) also had an increased number of connections with
RUNX1+24.
Figure 5.9: Features of RUNX1 +24 significant cis interactions in WT baseline and STAG2 baseline cells
(12 DMSO).
Percentage of interactions is on the vertical axis. Horizontal axis shows the ChromHMM annotations. Individual interactions can have multiple annotations.
During megakaryocyte differentiation of WT K562 cells (12 h post PMA stimulation),
the RUNX1 +24 enhancer lost 2 cis connections to ERG Promoter 3 (P3) and the regulatory
region between SAMSN1 and NRIP1. STAG2 12 PMA also lost the connection to ERG P3.
The connection to regulatory region between SAMSN1 and NRIP1 was not present in STAG2
12 DMSO, and this loss was maintained in STAG2 12 PMA (Figure 5.10). Most connections
observed in WT cells were conserved in the cohesin STAG2 mutant. However, one additional
cis connection was observed in STAG2 12 PMA (Log2 fold change of 8.83, p value of 0.0023)
(Appendix XI).

185
The overall similarity between RUNX1 +24 enhancer-mediated connections formed in
WT 12 PMA and STAG2 12 PMA was somewhat surprising based on the presence of
numerous new connections seen in the STAG2 baseline cells (Figure 5.8).

186
Figure 5.10: Significant changes to the RUNX1 +24 12h PMA treatment cis interactions due to cohesin
deficiency.
Cis 4C profiles for STAG2 mutant PMA 12h Chromosome 21 with time matched K562 WT PMA 12h RUNX1 +24 interactions represented by grey arches (WT 12 PMA). Green arches show a gained interaction compared to WT. Blue arches underneath the diagrams highlight lost interactions in STAG2 mutant cells compared to WT baseline. Each interaction is colour-coded according to its ChromHMM profile: key is at the bottom left of the figure. Super-enhancers were determined from dbSuper.
After 72 h of PMA treatment, the WT cells significantly lost connections across the
chromosome. In contrast, 72 h of PMA stimulation in STAG2 mutant cells led to the RUNX1

187
+24 enhancer dramatically gaining cis connections when compared to the WT treatment
condition (Figure 5.11).
There are 35 significantly increased cis connections in STAG2 72 h PMA cells (Log2
fold change ranges from 4.75 to 10.09, p values range from 3.5E-5 to 0.0094) see Appendix
XI. This correlates with the normalised read profile seen in Figure 5.7.

188
Figure 5.11: Significant changes to the RUNX1 +24 72h PMA treatment cis interactions due to cohesin
deficiency.
Cis 4C profiles for STAG2 mutant PMA 72h Chromosome 21 with time matched K562 WT PMA 72h RUNX1 +24 interactions represented by grey arches (WT 72 PMA). Green arches show an interaction that has been significantly gained compared to time matched WT condition. WT blue arches underneath the diagram show lost interactions compared to WT baseline. The STAG2 blue arch underneath the diagram shows an interaction that has been lost when compared to WT 72 PMA. Each interaction is colour-coded according to its ChromHMM profile: key is at the bottom left of the figure. Super-enhancers were determined from dbSuper.
All interactions observed across PMA treatment and cell line were further categorised
using super-enhancer annotations derived from dbSUPER (Khan et al., 2016). dbSUPER
annotations extend across multiple different cell-types. Compared to WT cells, in STAG2

189
mutant cells the RUNX1 +24 enhancer forms more interactions with super-enhancer regions
(Figure 5.12).
At the WT baseline (WT 12 DMSO) 16% (n= 5/31) of the connections RUNX1 +24
makes are with super-enhancers; this is increased in STAG2-deficient cells (STAG2 12
DMSO) to 24% (n= 11/46). During PMA-induced differentiation (12 h) the RUNX1+24
enhancer forms similar interactions in both WT and STAG2 mutant cells; 10% of the
connections are with super-enhancers (n= 3/29 and n= 3/30 respectively). 72 h after PMA
treatment, 14% (n= 3/22) of the connections to RUNX1 +24 are with super-enhancers in WT
cells. In contrast, in STAG2 mutant cells the percentage of interactions between RUNX1 +24
and super-enhancers is 22% (n= 12/55)(Figure 5.12).
Figure 5.12: Profile of RUNX1 +24 significant cis interactions with super-enhancers during megakaryocyte
differentiation with PMA stimulation in WT and STAG2 mutant cells.
Percentage of interactions is on the vertical axis. Horizontal axis shows the K562 cells treatment conditions WT DMSO (D) 12h, WT PMA (P) 12h and WT PMA 72h in green and STAG2 mutant STAG2 DMSO (D) 12h, STAG2 PMA (P) 12h and STAG2 PMA 72h in blue.

190
5.5.3 The effect of STAG2 deficiency on near-bait interactions during
differentiation of K562 cells
The normalised read count of all WT conditions (WT 12 DMSO, WT 12 PMA, WT 72
PMA) and STAG2 mutant conditions (STAG2 12 DMSO, STAG2 12 PMA, STAG2 72 PMA)
were plotted across chromosome 21 near-bait locations using ggplot (Wickham et al., 2007)
(Figure 5.13). During differentiation of WT cells, the majority of reads are located within
specific regions surrounding the RUNX1 +24 enhancer, and read count decreases as the cells
differentiate. However, RUNX1 +24-mediated interactions in STAG2 mutant cells give rise to
distinctly different interaction profiles.
Compared with WT cells, STAG2 12 DMSO lacks the peak around RUNX1 +24 and
has a higher level of background reads compared to WT 12 DMSO. During differentiation,
after 12 h of PMA treatment the RUNX1 +24-mediated interactions in STAG2 12 PMA
resembles the pattern of normalised reads seen in the WT 12 PMA. After 72 h there is a
dramatic increase in connections across the near-bait region in STAG2 72 PMA compared to
WT 72 PMA. The normalised read count profiles reflect the gain of connections in STAG2
mutants seen in the cis profiles.

191
Figure 5.13: Time course PMA stimulation of all RUNX1 +24 near-bait 4C profiles.
ggplot of the near-bait 4C profiles for WT DMSO 1, WT PMA 12 h, WT PMA 72 h, STAG2 DMSO 12 h, STAG2 PMA 12 h and STAG2 PMA 72 h. Normalised read count is on the vertical axis and position on chromosome 21 is on the horizontal axis.
5.5.4 Significant changes in near-bait interactions caused by
STAG2 deficiency
When comparing the WT 12 DMSO and STAG2 12 DMSO there are 176 interactions
present in WT cells that are not present in the cohesin mutant baseline (Log2 fold change ranges

192
from -10.69 to -2.62, p values range from 2.9E-17 to 0.0087). The statistically significant
changes between conditions is available in Appendix XII. These are within the 5 Mb region
surrounding the bait (Figure 5.14) The connections that decreased include RUNXOR, m+3,
+62, m+110, RUNX1 exon 3 and RUNX1 P2. However, in the STAG2 12 DMSO there are 83
regions interacting with RUNX1 +24 that are not present in WT 12 DMSO (Log2 fold change
ranges from 3.31 to 7.40, p values range from 4.4E-6 to 0.0096).

193
Figure 5.14: Significant changes to the RUNX1 +24 baseline (12 DMSO) of near-bait interactions due to
cohesin deficiency.
Near-bait 4C profiles for STAG2 mutant DMSO 12h Chromosome 21 with time matched K562 WT DMSO 12h RUNX1 +24 interactions represented by grey arches. Green arches show a gained interaction compared to time matched WT condition. Blue arches underneath the diagram represent lost interactions when compared to WT DMSO 12h. RUNX1 +24 is represented by the yellow line. RUNX1 promoters are represented by blue lines and interactions to these promoters are shown in blue. RUNX1 regulatory regions are represented by orange lines and interactions to these regions are shown in orange. Near-bait region is aligned to the UCSC K562 gene list and annotations. Dotted grey lines show Rao et al., (2014) K562 domain boundaries.
During megakaryocyte differentiation (12h post PMA stimulation) the WT cells
RUNX1 +24 significantly lost connections to -96, +89 and the SLC5A3 Exon 2 MRPS6 intron
region. STAG2 12 PMA maintains the connection with -96 and the SLC5A3 Exon 2 MRPS6
intron region (Log2 fold changes of 8.07 and 8.888, p values of 0.0053 and 0.0003

194
respectively). STAG2 12 PMA has one decreased connection when compared to WT 12 PMA
(Log2 fold change of -7.10, p value of 0.0033) see Appendix XII. In contrast to the DMSO
baseline, the cohesin mutant STAG2 12 PMA showed very similar connections to WT (Figure
5.15).
Figure 5.15: Significant changes to the RUNX1 +24 near-bait interactions after 12h PMA treatment due to
cohesin deficiency.
Near-bait 4C profiles for STAG2 mutant PMA 12h Chromosome 21 with time matched K562 WT PMA 12h RUNX1 +24 interactions represented by grey arches. WT green arches show gained interactions compared to WT DMSO 12h. The STAG2 green arch shows an interaction that has been significantly gained compared to time matched WT condition. WT blue arches beneath the diagram highlight lost interactions compared to WT baseline. The STAG2 blue arch beneath the diagram shows a lost interaction compared to WT 12 PMA. RUNX1 +24 is represented by the yellow line. RUNX1 promoters are represented by blue lines and interactions to these promoters are shown in blue. RUNX1 regulatory regions are represented by orange lines and interactions to these regions are shown in orange. Near-bait region is aligned to the UCSC K562 gene list and annotations. Dotted grey lines show Rao et al., (2014) K562 domain boundaries.

195
WT 72 PMA RUNX1 +24 had decreased interactions with +14, +54, +68, +142 regions,
RUNXOR, RUNX1 P1, as well as RUNX1 exon 1 and 2 and an increased connection with m-
371. STAG2 72 PMA also lost connections with +14, +54, +68, +142 regions, RUNX1 P1, and
RUNX1 exon 1, exon 2. However, RUNX1 +24 STAG2 72 PMA maintained connections with
RUNXOR and RUNX1-IT1 (Log2 fold changes of 8.28 and 4.15, p values of 2.0E-5 and 0.0096
respectively). RUNX1 +24 had a decreased connection with RUNX1 exon 3, m+3 and m-371
when compared with its WT counterpart (Log2 fold changes ranges from -6.05 to -7.37, p
values range from 3.6E-6 to 0.0003) There was a dramatic increase in the number of
connections to RUNX1 +24 however these regions require further investigation (Figure 5.16).
The connections are different between the STAG2 12 DMSO condition and STAG2 72
PMA as shown in Appendix XIV. These were not analysed further than looking at the adjusted
p value and Log2 fold change. Although these conditions have different profiles they do show
a similar trend; When compared to the equivalent WT condition, there is a decrease in the near-
bait connections 5 Mb either side of the bait and a dramatic increase in connections to RUNX1
+24 from regions 5 Mb to 10 Mb away from the bait.

196
Figure 5.16: Significant changes to the RUNX1 +24 near-bait interactions after 72h PMA treatment due to
cohesin deficiency.
Near-bait 4C profiles for STAG2 mutant PMA 72 h Chromosome 21 with time matched K562 WT PMA 72h RUNX1 +24 interactions represented by grey arches. WT green arches show gained interactions compared to WT DMSO 12 h. STAG2 green arches show gained interactions compared to time matched WT condition. WT blue arches beneath the diagram highlight lost interactions compared to WT baseline. STAG2 blue arches beneath the diagram highlight lost interactions compared to WT 72 PMA. RUNX1 +24 is represented by the yellow line. RUNX1 promoters are represented by blue lines and interactions to these promoters are shown in blue. RUNX1 regulatory regions are represented by orange lines and interactions to these regions are shown in orange. Near-bait region is aligned to the UCSC K562 gene list and annotations. Dotted grey lines show Rao et al., (2014) K562 domain boundaries.
5.5.5 Significant interactions with other genes
Connections with genes were identified using the same methods as Section 5.4.5 and
the resulting output is listed in Appendix XIII. The number of gene connections in STAG2

197
mutants is different to WT connections. STAG2 has almost double the number of gene
connections (121) at baseline compared to WT (64). The number of associated genes decreased
as the cells were treated with PMA (Table 5.3). Interestingly, despite the similar connection
profiles of +24 in WT and STAG2 mutant cells after 12 h of PMA treatment, the number of
gene connections varies between mutant and wild type, with fewer genes connected in the
STAG2 mutant cells. Surprisingly, even though the overall numbers of connections increased
in STAG2 mutants during differentiation compared with WT, the number of connections that
were associated with genes decreased. This may be because the gain in connections is to
intronic and intergenic regions, and/or there are multiple connections within the same gene. It
may also reflect the inability of STAG2 mutant cells to differentiate, as genes involved in
differentiation are not being recruited. These results are inconclusive without further
investigation as mentioned in Section 5.4.5.
Table 5.3: Number of genes connected to RUNX1 +24 in WT cells
WT 12 DMSO
WT 12 PMA
WT 72 PMA
STAG2 12 DMSO
STAG2 12 PMA
STAG2 72 PMA
Number of genes connected to RUNX1 +24
64 154 140 121 37 47
5.5.6 Overall changes in and near-bait interactions mediated by RUNX1
+24 interactions during differentiation of K562 cells, WT versus
STAG2-deficient
After 72 h PMA treatment, WT K562 cells have features consistent with
megakaryocyte identity. During megakaryocyte differentiation in WT K562 cells, there is an
overall loss of connections to the RUNX1 +24 enhancer, but a gain in connected genes. In

198
contrast, the RUNX1 +24 enhancer gains extra connections in STAG2 mutants, but loses
connections to other genes.
Figure 5.17 compares the baseline (12 DMSO) WT and STAG2 RUNX1 +24
connections with regions that may be important for megakaryocyte differentiation. WT 12
DMSO maintains connections with m-368, -96, m-58, m+3, m+62, +89, m+110, SLC5A3 Exon
2 MRPS6 intron, RUNXOR, RUNX1 P2, RUNX1 exon 3, ERG P3 and super-enhancer
regulatory regions between SAMSN1 and NRIP1. STAG2 12 DMSO maintains connections
with m-368, -96, m-58, +89, SLC5A3 Exon 2 MRPS6 intron, RUNX1 P2 and ERG P3.
However, it loses connections with m+3, m+62, m+110, RUNXOR, RUNX1 exon 3 and super-
enhancer regulatory regions between SAMSN1 and NRIP1.
Figure 5.17: The effect of cohesin deficiency on the RUNX1 +24 enhancer-anchored chromatin hub in
baseline (12 DMSO) conditions in K562 cells.
Yellow boxes represent UCSC annotated gene promoters and/or exons. Blue boxes show described RUNX1 regulators. Orange boxes annotate novel putative RUNX1 regulators.
In WT K562 cells, during differentiation (12 h PMA) the RUNX1 +24 enhancer gains
connections to +14, +54, +68, +142, RUNX1-IT1, RUNX1 promoter 1, exon 1 and 2. RUNX1
+24 maintains connections seen in WT 12 DMSO with m-368, m-58, m+3, m+62, m+110,
RUNXOR, RUNX1 P2, RUNX1 exon 3. In WT K562 cells, RUNX1 +24 decreased interactions

199
with -96, +89, SLC5A3 Exon 2 MRPS6 intron region, ERG P3 and super-enhancer regulatory
regions between SAMSN1 and NRIP1. The RUNX1 +24 enhancer in STAG2-deficient cells (12
h PMA) has a similar interaction landscape as WT 12 PMA, the obvious differences being that
STAG2 12 PMA RUNX1 +24 further maintains the interaction with -96 and SLC5A3 Exon 2
MRPS6 intron region, which are lost in the WT (Figure 5.18).
Figure 5.18: The effect of cohesin deficiency on the RUNX1 +24 enhancer-anchored chromatin hub in mid-
differentiation (12 PMA) conditions in K562 cells.
Yellow boxes represent UCSC annotated gene promoters and/or exons. Blue boxes show described RUNX1 regulators. Orange boxes annotate novel putative RUNX1 regulators.
In WT K562 cells, after differentiation (72 h PMA) the RUNX1 +24 enhancer interacts
with m-371, m-368, m-58, m+3, +62, m+110, RUNX1 P2 and exon 3. The RUNX1 +24
enhancer loses connections with +14, +54, +68, +142, RUNX1-IT1, RUNXOR , RUNX1
promoter 1, exon1 and 2. In STAG2-deficient cells (72 h PMA) RUNX1 +24 interacts with m-
368, m-58, +62, m+110, RUNX1 P2, RUNX1-IT1, RUNXOR. The RUNX1 +24 enhancer loses
connections with m-371, m+3, and RUNX1 exon 3 when compared to the WT (Figure 5.19)

200
Figure 5.19: The effect of cohesin deficiency on the RUNX1 +24 enhancer-anchored chromatin hub in post-
differentiation (72 PMA) conditions in K562 cells.
Yellow boxes represent UCSC annotated gene promoters and/or exons. Blue boxes show described RUNX1 regulators. Orange boxes annotate novel putative RUNX1 regulators.
Figure 5.17, 5.18 and 5.19 give an overview of the changes to the WT identified
connections mediated by the RUNX1 +24 enhancer. However, these summaries do not illustrate
the gained connections in STAG2 mutant cells. The regions that have increased interactions
with the RUNX1 +24 enhancer in STAG2 mutant cells require further analysis to determine
their functional relevance.
5.6 Chapter summary
5.6.1 RUNX1 +24 enhancer connections during K562 differentiation to
megakaryocytes
5.6.1.1 Distant connections
The RUNX1 +24 enhancer makes connections spanning chromosome 21 during
megakaryocyte differentiation. As differentiation occurs, there is a steady decrease of
interactions across the chromosome, including loss of the connection between RUNX1 +24 and
ERG P3. Because ERG expression slowly increases during differentiation, it is possible that
the interaction between the RUNX1 +24 enhancer and ERG P3 inhibits transcription from this

201
promoter in baseline conditions. During the onset of differentiation, the loss of ERG P3
connection with RUNX1 +24 may in turn allow ERG P3 initiate expression of ERG.
5.6.1.2 Connections within the RUNX1 TAD
During megakaryocyte differentiation, the RUNX1 +24 enhancer displays a dynamic
interaction landscape in WT K562 cells. Upon PMA treatment, RUNX1+24 connects with
possible regulatory elements -96, +14, +54, +68, +89, +142 and known regulator m-371.
Interactions between RUNX1 +24 and +14, +54, +68 and +142 were only observed during
differentiation (12h PMA). All of these regions were annotated in by ChromHMM as enhancers
in steady-state K562 cells. RUNX1 +24 maintains contact with a cluster of regulatory regions
m-368, m-58, m+3, +62 and m+110. Previously m-368, m-58, m+3 and m+110 had only been
described as enhancers in mice but were shown to be conserved in humans in Chapter 3.
Upon stimulation with PMA, K562 cells start to transcribe RUNX1 from the P1
promoter. P1-driven transcription of RUNX1 is essential for megakaryocyte differentiation.
Consistent with the idea that the interaction between RUNX1 +24 and RUNX1 P1 stimulates
P1-driven transcription, the connection between RUNX1 +24 and RUNX1 P1 increases during
differentiation (12h PMA). In contrast, RUNX1 P2 transcript is minimally expressed
throughout differentiation. The connection between RUNX1 P2 to RUNX1 +24 remains
unchanged throughout differentiation. After differentiation there is an increase in the
connection between RUNX1 +24 and m-371.
5.6.2 RUNX1 +24 enhancer connections during PMA treatment in
STAG2 mutants
5.6.2.1 Baseline conditions:
In contrast to WT K562 cells, in STAG2-deficient cells the RUNX1 +24 enhancer
makes many more connections across chromosome 21. Increased connections corresponded
with regions that are annotated as insulators and poised promoters. Despite the overall increase

202
in interactions, some connections that are present in WT K562 cells are lost. RUNX1 +24 loses
connections with m+3, m+62, m+110, RUNXOR, RUNX1 exon 3 and super-enhancer
regulatory regions between SAMSN1 and NRIP1.
5.6.2.2 Mid-differentiation
In STAG2-deficient K562 cells, transcription of RUNX1 from the P1 promoter fails to
be activated by PMA stimulation, and instead, there is ectopic expression from the P2
promoter. From this finding (and from the baseline connectivity) the expectation was that after
12 h of PMA treatment the RUNX1 +24 enhancer would have a vastly different interaction
profile in STAG2 mutants compared to WT. Surprisingly, the RUNX1 +24 enhancer forms
similar connections after 12 h PMA treatment in both WT and STAG2-deficient cells. The
RUNX1 +24 enhancer maintains the interaction with -96 and SLC5A3 Exon 2 MRPS6 intron
region, which are lost in the WT, in STAG2 mutants. Although ERG P3 is released upon PMA
stimulation in STAG2 mutant cells, just as it is in WT, expression of ERG is inappropriately
sensitised in STAG2 mutant cells. Further investigation is required to determine how ERG
becomes ectopically activated.
5.6.2.3 Post-differentiation
STAG2 mutant cells retained stem cell-like properties and failed to activate
megakaryocyte markers (Antony et al., 2020). After 72 h PMA treatment of STAG2 mutant
cells, interactions mediated by the RUNX1 +24 enhancer no longer resembles the WT profile.
The RUNX1 +24 enhancer mediates a vastly increased number of connections, and the profiles
of normalised read counts are chaotic when compared to the profiles of the WT RUNX1 +24
connections (Figure 5.7 and 5.14). After 72 h PMA treatment of STAG2 mutant cells, the
RUNX1 +24 enhancer maintains connections with RUNX1-IT1, RUNXOR, which are lost in
WT K562. The RUNX1 +24 enhancer lost interaction with m-371, m+3, and RUNX1 exon 3 in
STAG2 mutant cells; connections that are maintained in WT K562 (Figure 5.19).

203
The RUNX1 +24 enhancer contacted more super-enhancer regions in STAG2 mutant
cells compared to WT K562.

204
6 Chapter 6: Discussions and Conclusions
Runx1 is a transcription factor that is crucial for definitive haematopoiesis (Okuda et
al., 1996; Wang et al., 1996). RUNX1 has a significant role in the development to myeloid
malignancies, especially in Acute Myeloid Leukaemia (AML) (Ichikawa et al., 2013; Okuda
et al., 1996). runx1 expression in haematopoietic progenitor cells in zebrafish is reliant on
cohesin (Horsfield et al., 2007). Cohesin mutations have been recurrently identified in AML
and other myeloid malignancies (Leeke et al., 2014). Because karyotypically normal cells are
found with cohesin mutations, the mechanism by which cohesin mutation leads to leukaemia
is thought to be by dysregulation of target genes rather than mitotic defects (Thol et al., 2014).
Cohesin insufficiency impairs differentiation, alters overall chromatin accessibility, as well as
the transcription of RUNX1 (Mazumdar et al., 2015; Mullenders et al., 2015; Viny et al., 2015).
Cohesin regulates Runx1 expression, and RUNX1 plays a central role in the development of
myeloid malignancies, therefore cohesin-dependent RUNX1 expression may represent an
underlying mechanism that leads to myeloid malignancies (Leeke et al., 2014). The precise
spatiotemporal expression of Runx1 requires cis-regulatory elements, the majority of which
have not been defined.
In my PhD project, I set out to investigate the regulatory potential of Runx1 4C-
identified regions, and determine conservation of mouse Runx1 regulators in humans. This
work has provided an insight into mouse Runx1 enhancer functions and highlighted the features
of conserved human enhancers. Runx1 +24 was identified as an important intronic Runx1
enhancer in mice, and is crucial for the activation of Runx1 expression in hematopoietic
stem/progenitor cells (HSPCs) (Ng et al., 2010; Nottingham et al., 2007). Runx1 +24 is highly
conserved in eukaryotes, indicating an essential role in gene regulation. Runx1 +24 binds most
active Runx1 enhancers in mice HPCs and may anchor a regulatory hub that organises the
correct enhancer-promoter interactions for Runx1 regulation. Suppression of enhancers by BET

205
inhibitor proteins alters the expression of RUNX1 in haematopoietic cells (Antony et al., 2020).
I hypothesised that the RUNX1 +24 enhancer anchors an enhancer hub in human cells and is
important for correct RUNX1 expression, which may be disrupted in AML.
Chromatin conformation capture techniques were used in this project to understand the
role of RUNX1 +24 enhancer in 3D chromatin connections, and as a hub for functional
regulatory regions. The RUNX1 +24 enhancer connected across chromosome 21, defying
known TADs. It interacted with coding genes, non-coding RNA loci, super-enhancers and
regulatory elements, and may be maintaining these connections to prevent transcription, rather
than have a traditional enhancer role. The data suggests that the RUNX1 +24 enhancer could
be important for overall organisation and 3D structure of chromosome 21.
The results from my project highlighted the dynamic changes in the RUNX1 +24 hub
connections with RUNX1 and ERG, genes central in correct megakaryocyte development,
during differentiation of the chronic myeloid leukaemia cell line K562. Chromatin interaction
data identified putative RUNX1 regulators and demonstrated how cohesin insufficiency affects
the RUNX1 +24 enhancer connections. In cohesin-deficient cells, the number of RUNX1 +24
connections dramatically increased across chromosome 21. This suggests that cohesin STAG2
mutation leads to a de-constrained chromatin environment. Loss of insulation of chromatin
domains in STAG2 mutants enables aberrant enhancer-amplified transcription and may
contribute to the pathogenesis of AML.
6.1 Regulators of Runx1
6.1.1 Mouse Runx1 enhancers
This thesis describes the functional characterisation of novel Runx1 enhancers m-371,
m-354, m-303 and m-48, as well as the previously identified m+110, m-58, m-321, m-327, m-
368. The data show that all these elements have enhancer capability except m-327. Despite the
lack of activity seen in zebrafish embryos expressing m-327, this putative regulatory region

206
spatially connects to the active (P1) promoter of Runx1 and the Runx1 +24 enhancer in mouse
HPC7 cells, so it may have another regulatory role in this hub. All enhancers except m+110
interacted with the Runx1 +24 enhancer (Marsman, 2016), suggesting that the Runx1 +24
enhancer could be anchoring an enhancer hub in mouse HPC7 cells.
My analysis of these enhancers in haematopoietic tissues of developing zebrafish
embryos shows that they appear to be active during the primitive wave of haematopoiesis. A
complete summary of the spatiotemporal activity of the mouse Runx1 regulatory regions in
zebrafish is difficult to interpret, because zebrafish embryos were not continuously observed
throughout development. Some of the putative enhancer regions may drive cell-specific gene
expression at developmental periods not observed.
Recent research has demonstrated the potential of zebrafish models to assess the
function of human and mouse cis-regulatory elements, regardless of their sequence
conservation in zebrafish (Bhatia et al., 2013; Bhatia et al., 2014; Chahal et al., 2019;
Ketharnathan et al., 2018; Rainger et al., 2014; Ravi et al., 2013; Yuan et al., 2018). The
transcription factors (TFs) required by cis-regulatory elements for their function are still
present and utilised in the appropriate cell and tissue types (Bessa et al., 2009; Mann et al.,
2019). Enhancer assays highlight the value of the zebrafish model as a way to determine
functionality of regulatory sequences from other species.
6.1.2 Conserved human RUNX1 regulators
I found that 9 out of the 16 mouse Runx1 regulatory regions are conserved in human
(based on sequence analysis and ENCODE annotations), increasing the number of ‘known’
putative human RUNX1 regulatory regions from 6 to 14 (Figure 6.1). Conservation between
mice and humans suggests that these regulatory regions are fundamental for the correct
regulation of RUNX1. m-354, m-321, m-303, m-48, m-42, m+1 and m+181 were not conserved
in human.

207
Figure 6.1:Schematic overview of human RUNX1 locus (hg19: chromosome 21: 36,148,773-36,872,777).
Black text annotates the previously identified human RUNX1 regulatory regions. Blue text highlights the conserved mouse regulatory regions. Each regulatory region is annotated with orange circles, grey boxes annotate exons. The blue boxes show the exons encoding the Runt binding domain. The two RUNX1 promoters are represented by black right angled arrows.
Bioinformatic analysis of RUNX1 regulatory regions showed that not all of them appear
to be active in K562 cells (Table 6.1). ChromHMM annotates m-327 and -250 as repressed,
and m-368, m-58, m+110 -139, m-43, +24, +62 as active enhancers. Intron 5.2, m-101 and
m+3 show chromatin features of enhancers; however, they are labelled as transcription-
associated alongside -139 and -188. Transcription-associated annotation may be due to their
close proximity with exons when compared to the regions annotated as enhancers or it may
indicate that these regions are producing RNA, for instance enhancer RNA (eRNA).
The RUNX1 +24 enhancer has strong enhancer characteristics and recruits
haematopoietic transcription factors SP1, TAL1, GATA1 and GATA2. SPI also located to -
139 and -188. Haematopoietic transcription factors TAL1, GATA1 and GATA2 bind to m-
371, m-58 and m+110. These regions showed transcription factor binding sites and chromatin
modifications similar to that found at the RUNX1 +24 enhancer.
The RUNX1 +24 enhancer also recruits LSD1, a mediator of transcriptional repression
usually seen in silencers. Interestingly, nine other regulatory regions (m-371, m-368, -250, m-
101, m-58, m+3, +62, m+110 and intron 5.2) had LSD1 binding in K562 cells. Cheng et al.,
(2018) treated haematopoietic cells (chronic myelogenous leukaemia (K562), acute myeloid

208
leukaemia (OCI-AML3) and histiocytic lymphoma (U937)) with a LSD1 inhibitor and
observed upregulation of RUNX1, which implicates the role of LSD1 in repression of RUNX1
(Cheng et al., 2018). Kerenyi et al., (2013) previously showed Lsd1 is a crucial epigenetic
regulator of haematopoiesis in mice, because it represses key hematopoietic stem cell genes
including Runx1 (Kerenyi et al., 2013).
Cheng et al., (2018) characterised +62 as a silencer of RUNX1 P2 by measuring the
repressive effect of various deletion/mutant +62 luciferase constructs on transcription from the
P2 promoter. This functional assay was carried out in K562, OCI-AML3 and U937 cells
(Cheng et al., 2018). However, in K562 cells +62 has ENCODE and ChromHMM annotations
associated with enhancer activity. These regions with enhancer and silencer annotations may
have multiple roles depending on combinations of connections being made with the region
(promoters and other regulatory regions) and the cell type.
ATAC-seq (Antony et al., 2020) showed that intron 5.2, m+110 and m-371 regions
were in differentially open chromatin regions in STAG2 mutant K562 cells. This suggests that
cohesin influences the accessibility of these enhancers. I observed a coincidence of cohesin
subunit Rad21 binding in the absence of CTCF with m+110 enhancer, and CTCF binding with
m-371, m-58, m-43, m+3, +62 and intron 5.2. This suggested that CTCF and cohesin could
independently mediate a subset of enhancer-promoter looping in combination with
transcription factors.
6.1.3 G-quadruplex
The Circular Dichroism (CD) analysis showed that the predicted G-quadruplexes
observed in the mouse +24 element are capable of forming parallel G-quadruplexes in vitro.
The G-quadruplex analysis was specific to the mouse sequence so it may not reflect the human
sequence, the type of G-quadruplex, or its functional capacity. Luciferase assays showed that

209
the mutations of G-quadruplex in mouse Runx1 +24 had no significant effect on enhancer
function when tested in isolation in mouse fibroblast (NIH/3T3) cells.
6.1.4 Regulatory RNAs
Non-coding RNAs are involved in many biological processes, including transcription
regulation, cell-fate programming and genome 3D organisation (Beltran et al., 2019; Flynn et
al., 2014; Geisler et al., 2013; Holoch et al., 2015; Li et al., 2019; Nozawa et al., 2019; Sun et
al., 2018; Wang et al., 2017). Types of non-coding RNA include enhancer RNA (eRNA), Long
non-coding RNAs (LncRNAs) as well as G-quadruplex RNA.
6.1.4.1 Enhancer RNA (eRNA)
eRNA has been shown to be involved in functional roles including; assisting enhancer-
promoter looping formation, supporting pause-release of RNA Pol II which facilitates
transcription elongation, promoting transcription factor and co-regulator binding and aiding
target gene transcription (Bose et al., 2017; Hou et al., 2020b; Lai et al., 2013; Lam et al.,
2013; Li et al., 2013a; Melo et al., 2013; Panigrahi et al., 2018; Rahnamoun et al., 2018;
Schaukowitch et al., 2014; Sigova et al., 2015; Tsai et al., 2018). FANTOM5 data showed ten
of the 14 RUNX1 regulatory regions (m-371, m-327, -250, -139, m-43, m+3, +24, +62, m+110
and intron 5.2) produced eRNA in haematopoietic cells. Although eRNA is typically used for
enhancer identification, not all active enhancers produce detectable eRNA (Mikhaylichenko et
al., 2018; Sartorelli et al., 2020). It remains unclear whether these enhancers produce low levels
of eRNAs that are not easily detectable with current methods. ChromHMM labelled -188, -
139, m-101, m+3 and intron 5.2 as transcription-associated. This may be attributed to enhancer
RNA transcription, as m-139, m+3 and intron 5.2 all produce eRNAs. It remains to be
investigated whether the transcription association observed in m-188 and m-101 may also due
to enhancer RNA production.

210
6.1.4.2 Long non-coding RNAs
Long non-coding RNAs (LncRNAs) have been shown to activate or suppress
transcriptional activity by interacting with chromatin modulating proteins (Fan et al., 2015;
Han et al., 2014; Jain et al., 2016; Prensner et al., 2013; Scarola et al., 2015). RUNX1-IT1 and
RUNXOR LncRNAs have been shown to regulate RUNX1. Relatively little is known about
RUNX1-IT1, a long non-coding RNA expressed from in between m+3 and RUNX1 +24.
However, Liu et al., (2020) found RUNX1-IT1 enhanced the transcription of the RUNX1 gene
in pancreatic cancer cells (Liu et al., 2020).
Previous studies show RUNXOR, a long non-coding RNAs 3.8kb upstream of RUNX1
has the ability to regulate the RUNX1 P1 promoter (Nie et al., 2019; Wang et al., 2014).
RUNXOR activates P1 and causes a shift to P1 RUNX1c isoform expression. The binding of
RUNXOR lncRNA elicits DNA demethylation and induces active histone modification markers
in the P1 CpG island. Therefore RUNXOR could be essential for the P1/P2 switch during
normal haematopoiesis and potential tumorigenesis (Nie et al., 2019).
m-371, m-368 and m-327 all sit within an uncharacterised non-coding RNA
LOC100506403. Like RUNX1-IT1 and RUNXOR, this long non-coding RNA could also play
a role in regulating RUNX1, with these regions helping to determine its expression. My 4C data
showed that in baseline conditions (12 DMSO), wild type K562 cells had a dramatic peak of
normalised reads that indicates a connection to m-368. Which may indicate an essential role of
LOC100506403 in WT 12 DMSO cells.
6.1.4.3 G-Quadruplex RNAs
G-quadruplex RNA is capable of targeting and removing the Polycomb repressive
complex 2 from genes and allowing RNA-mediated regulation (Beltran et al., 2019; Wang et
al., 2017). Because part of the mouse Runx1 +24 enhancer is capable of forming a G-
quadruplex, it is possible that the Runx1 +24 enhancer RNA may also form a G-quadruplex.

211
Previously Fukunaga et al., (2020) showed that G-quadruplex RNA binds the ETO protein and
dissociates the leukemic RUNX1-ETO fusion protein from DNA (Fukunaga et al., 2020). This
suggests that some G-quadruplex RNAs may have potential as therapeutic agents for
leukaemia.
6.1.5 Could mutational load in regulatory elements also contribute to
disease progression?
Single nucleotide polymorphisms (SNPs) are present in each of the human RUNX1 conserved
regulatory regions, except +24 and m-101. m-371, m-368, m-58, m+110 and intron 5.2 SNPs
were reported in haematopoietic, brain, thyroid, skin and oesophagus cells. SNP frequency
could be an underestimate because of the scarcity of whole genome sequence in individual
haematopoietic cell types, AML, and other myeloid malignancy samples; this limits the ability
to identify significant SNPs and mutations in haematopoietic cells. The GTEx portal annotates
SNPs with MAF >1%, as well as eQTL outputs. The GTEx portal contains 54 tissues sampled
from healthy older individuals, and also only measures whole blood, rather than individual cell
types, so cell type- or disease-specific effects may not be detected.
There were no SNPS with MAF of >1% present in the RUNX1 +24 enhancer. This
suggests that there is strong selection pressure to prevent mutation of the RUNX1 +24 enhancer.
Consistent with this, functional studies suggest that the region containing RUNX1 +24 enhancer
is functionally important in haematopoietic cells. To determine the importance of the RUNX1
+24 enhancer for RUNX1 expression and function, Mill et al., (2019) CRISPR/Cas9 edited the
whole intron between RUNX1 P1 and P2 in OCI-AML5 cells (Mill et al., 2019). The majority
of the edited cells were eradicated via apoptosis, and the viable edited cells had significantly
decreased RUNX1 expression and slower growth (Mill et al., 2019). It is not clear whether the
observed phenotypes correspond uniquely to deletion of the RUNX1 +24 enhancer since the
entire P1-P2 intron was removed. Rather, this research shows the P1-P2 intronic region, which

212
contains multiple RUNX1 regulatory elements, is important for cell survival and RUNX1
expression.
Of the 35 SNPs identified in the conserved RUNX1 regulatory regions, 6 had previously
reported functional effects in haematopoietic cells. m-371 contains rs2834945, a T to C change
that is predicted to affect 11 regulatory motifs including GATA2. rs2834945 is related to
expression of Kynurenine 3-monooxygenase (KMO) in peripheral blood monocytes (Zeller et
al., 2010). KMO encodes a mitochondrion outer membrane protein that catalyses the
hydroxylation of L-tryptophan metabolite, L-kynurenine, to form L-3-hydroxykynurenine
(Alberati-Giani et al., 1997). KMO is typically investigated in a neurological context, as high
KMO expression leads to neurodegeneration (Breton et al., 2000).
m-368 harbours two functional SNPs: rs16993221 and rs909143. rs16993221 is related
to white blood cell count; it is a crucial marker that contributes to chronic inflammation (Kong
et al., 2013). The A to T change in rs16993221 alters two regulatory motifs, BATF and IRF,
which work together in immune response. The A to G change in rs909143 is also related to
expression of KMO in peripheral blood monocytes (Zeller et al., 2010) and is predicted to
affect two regulatory motifs (NR3C1, POU2F2).
Within m+110 sits rs73900579, a T to C change that alters two regulatory motifs and
is related to red cell distribution width (Kichaev et al., 2019).
Intron 5.2 contains two functional SNPS, rs2249650 and rs2268276; both are associated
with AML susceptibility. The different SNPs are in linkage disequilibrium (LD) and change
the ability of intron 5.2 to act as an enhancer. A (rs2249650) G (rs2268276) bases and AA have
more enhancer capability that GA and GG. GA has the most reduced enhancer capability. The
SNPs also affect SPI1 binding capability; AG has strong SPI1 binding, GA has weak SPI1
binding, whereas AA and GG have medium SPI1 binding capability (Xu et al., 2016).

213
Although not all SNPs found in this project have been functionally analysed, some of
the regulatory region SNPs were reported in patients with acute myeloid leukaemia. Two AML
patients had -250 SNP rs2834885, and two SNPs in +62 (rs933131 and rs2834716) were also
found in patients with AML. Interestingly, the patient with +62 rs2834716 also had the intron
5.2 SNPs (rs2268276 and rs2249650) which were previously associated with AML
susceptibility (Xu et al., 2016).
Five patients with malignant lymphoma reported mutations within regulatory regions
m-58 and +24 that are not reported as SNPs with a MAF of >1%. Four patients had m-58
mutations chr21:g.36480715C>A (rs199811665), chr21:g.36480761A>C and
chr21:g.36481470C>T (rs1440069314). One case of malignant myeloma reported a mutation
within +24, chr21:g.36399191A>T.
The available AML genomic data is relatively limited because the majority of analyses
were performed with exome sequencing data, rather than whole genome sequencing data. Lack
of whole genome data and individual SNP significance could lead to an underestimate of the
functional contribution of enhancer-region mutations to myeloproliferative disorders.
Xu et al., (2016)’s analysis of intron 5.2 SNPs showing that SNPs are functionally
relevant to leukaemia suggests a need to analyse each of the SNPs within regulatory regions
for functional capability. Determining and categorising SNPs may help us understand each
patient’s disease progression, individual responses to drugs, or susceptibility to relapse. Some
patients had SNPs with previously described functional effects on haematopoietic cells.
However, the SNP data for myeloproliferative disorders lacks significance because the
majority of SNP eQTL information comes from analysis of whole blood, rather than each
specific cell type.
There is good evidence suggesting that RUNX1 regulatory regions intron 5.2 and +62
are directly involved in disease progression, so further investigation of these regulatory regions

214
is necessary. Intron 5.2 contains SNPs that are associated with AML susceptibility, and in
addition, this regulatory region is the site of translocation in t(8;21) found in AML patients in
which RUNX and ETO genes recombine. Schnake et al., (2019) identified a long non-coding
RNA in intron 5.2, at a site of these frequent chromosomal translocations. This long non-coding
RNA results in a more relaxed chromatin organisation at intron 5.2 (at the location of the
breakpoint). Consequently, it is possible that this feature acts as a determinant of a higher
probability of double stranded breakages in myeloid cells, resulting in translocations (Schnake
et al., 2019).
The discovery of RUNX1 silencer +62 resulted from characterisation of a novel
t(5;21)(q13;q22) translocation involving RUNX1 that was acquired during the progression of
myelodysplastic syndrome to AML in a paediatric patient (Cheng et al., 2018). This
translocation did not generate RUNX1 fusion, but rather it aberrantly upregulated the P2
isoform of RUNX1. The authors state that the translocation facilitated upregulation of RUNX1
P2 because the silencer at +62 was removed.
Several groups have described chromatin rearrangements that lead to “enhancer
hijacking”, whereby enhancers from somewhere else in the genome are rearranged next to
genes leading to overexpression (Bohlander, 2000; Gröschel et al., 2014; Look, 1997;
Northcott et al., 2014; Peifer et al., 2015; Taub et al., 1982; Zhang et al., 2020). Taub et al.,
(1982) described t(8;14) translocations in Burkitt's lymphoma which alter gene expression
through enhancer hijacking (Taub et al., 1982). Rewat et al., (2004) showed that in the t(12;13)
translocation, overexpression of CDX2 gene is leukaemogenic rather than the ETV6-CDX2
fusion(Rawat et al., 2004).
The majority of translocations occur between RUNX1 P1 and P2; while the disruption
caused to enhancers has not yet been carefully categorised, these may be examples of enhancer
hijacking.

215
Table 6.1: Summary of conserved RUNX1 regulatory region analysis
Regulatory region
ChromHMM annotation in K562 cells
FANTOM5 eRNA
Functional enhancer
Cohesin binding K562
CTCF binding K562
Accessibility of chromatin in STAG2 mutant K562
SNPs Investigated Functional SNPs
Mutations seen in haematopoietic cells in cancer patients
m-371 Strong Enhancer ✓ ✓ ✗ ✓ Increased 2 1 ✗
m-368 Strong Enhancer ✗ ✓ ✗ ✗ No change 3 2 ✓
m-327 Repressed ✓ ✗ ✗ ✗ No change 2 0 ✗
-250 Repressed ✓ ✓ ✗ ✗ No change 3 0 ✓
-188 Transcription Associated
✗ ✓ ✗ ✗ No change 1 0 ✗
-139 Weak enhancer, Transcription Associated
✓ ✓ ✗ ✗ No change 3 0 ✗
m-101 Transcription Associated
✗ No available data
✗ ✗ No change 0 0 ✗
m-58 Strong Enhancer ✗ ✓ ✗ ✓ No change 13 0 ✓
m-43 Weak Enhancer ✓ No available data
✗ ✓ No change 2 0 ✗
m+3 Transcription Associated
✓ No available data
✗ ✓ No change 1 0 ✗
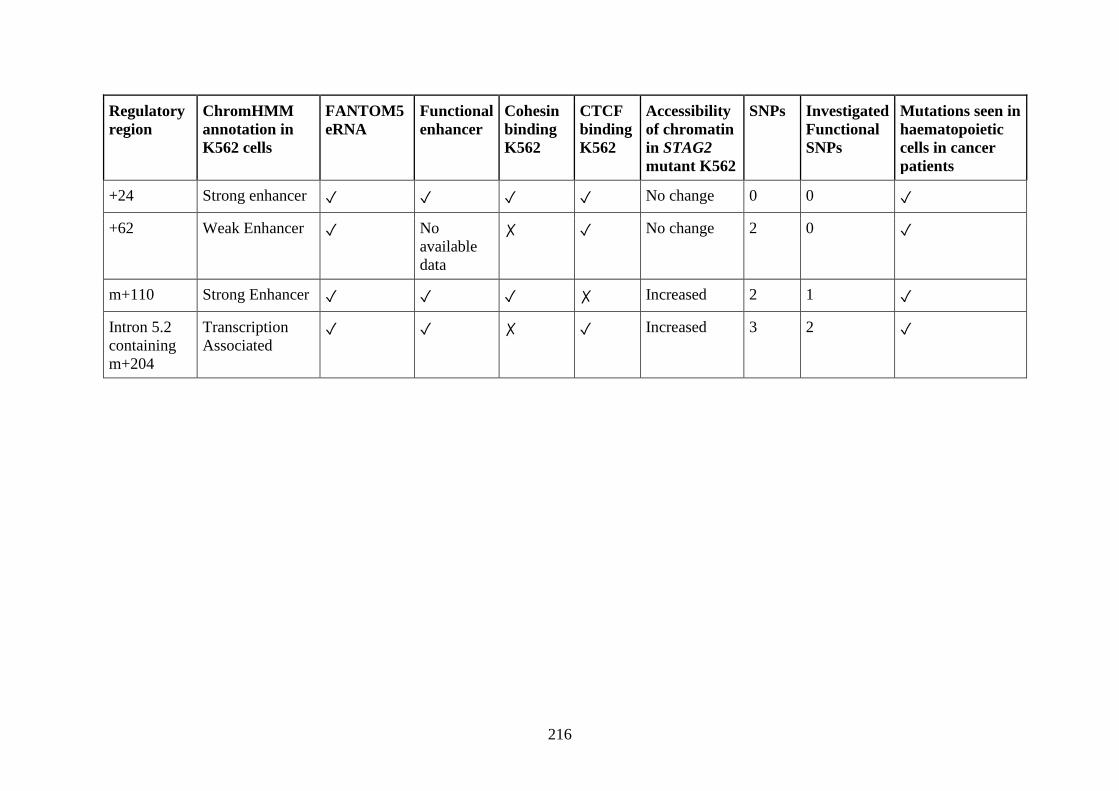
216
Regulatory region
ChromHMM annotation in K562 cells
FANTOM5 eRNA
Functional enhancer
Cohesin binding K562
CTCF binding K562
Accessibility of chromatin in STAG2 mutant K562
SNPs Investigated Functional SNPs
Mutations seen in haematopoietic cells in cancer patients
+24 Strong enhancer ✓ ✓ ✓ ✓ No change 0 0 ✓
+62 Weak Enhancer ✓ No available data
✗ ✓ No change 2 0 ✓
m+110 Strong Enhancer ✓ ✓ ✓ ✗ Increased 2 1 ✓
Intron 5.2 containing m+204
Transcription Associated
✓ ✓ ✗ ✓ Increased 3 2 ✓

217
6.2 Organisational role of the RUNX1 +24 enhancer
The mouse Runx1 +24 enhancer binds most other active Runx1 enhancers in murine
HPCs, and enhancer suppression in K562 results in altered RUNX1 expression. Therefore, I
hypothesised that the RUNX1 +24 enhancer organises a chromatin hub in human cells that is
crucial for correct RUNX1 expression. Circular chromosome conformation capture (4C) is a
technique that can be used to determine 3D chromatin interactions from a given viewpoint, or
‘bait’ (van de Werken et al., 2012a). I used the RUNX1 +24 enhancer as ‘bait’ in a 4C
experiment to determine the interacting DNA partners of this enhancer in K562 cells.
The majority of RUNX1 +24 interactions were with other regulatory regions that
include both active and inactive chromatin. The connections between the RUNX1 +24 enhancer
and other genes were predominantly with loci encoding non-coding RNAs.
Within the RUNX1 TAD, the RUNX1 +24 enhancer connects with other RUNX1
regulatory regions (m-368, m-101, m-58, and m+110) that had previously only been described
in mice, but have been shown in this thesis to be conserved in humans. RUNX1 +24 connected
to only one RUNX1 promoter (P2) and the previously identified +62 enhancer. RUNX1 +24
does not connect to all RUNX1 regulatory regions, consistent with the idea that different
enhancer recruitment occurs in diverse cell types to generate different RUNX1 isoforms. There
were some novel interactions identified; RUNXOR, ERG P3 and putative regulatory regions -
96, +89, SLC5A3 Exon 2 MRPS6 intron and a super-enhancer region between SAMSN1 and
NRIP1.
My 4C analysis shows that in K562 cells, the RUNX1 +24 enhancer makes multiple
connections within the RUNX1 TAD (‘near-bait’) and further afield on chromosome 21 (‘cis’).
The chromatin conformation methods, Hi-C and promoter Capture-C, show that gene
promoters usually form interactions within their own TADs. Due to the high resolution of 4C
interactions, it is apparent that the RUNX1 +24 enhancer was not constrained to within-TAD

218
interactions, but also formed connections across the whole of chromosome 21. These
interactions outside of TAD also altered with differentiation, so they are unlikely to be artifacts
of the 4C technique. This surprising finding suggests that the RUNX1 +24 enhancer possibly
organises a chromatin hub in K562 cells that involves much of chromosome 21. This implies
that the RUNX1 +24 enhancer forms a chromatin hub that ensures correct regulation of
transcription of several chromosome 21-linked loci in K562 cells.
6.3 RUNX1 +24 enhancer connections during megakaryocyte
differentiation
My 4C analysis in K562 cells shows that the RUNX1 +24 enhancer makes multiple
connections across chromosome 21. During megakaryocyte differentiation, transcription
factors are induced to initiate gene expression consistent with megakaryocyte development. Do
these transcription factors alter connections made by the RUNX1 +24 enhancer? To determine
differences in connections, I used the RUNX1 +24 enhancer as ‘bait’ in a 4C experiment in
K562 cells undergoing PMA-induced differentiation, sampled at mid-point (12 h) and end-
point (72 h) stages. I found that as differentiation occurs, there is a steady decrease in
interactions mediated by the RUNX1 +24 enhancer across chromosome 21, including a
decrease in strength of connection between RUNX1 +24 and ERG P3.
ERG expression slowly increases during megakaryocyte differentiation. ERG P3 is
constrained in the baseline K562 cells (12 DMSO) and shows insulator annotations. Following
PMA treatment, ERG P3 has a weakened connection with RUNX1 +24. This may be to allow
ERG P3 to activate and facilitate the expression of ERG. In steady-state K562 cells, the RUNX1
+24 enhancer could be safeguarding chromatin structure, including the insulation of regions to
prevent transcription e.g., at ERG P3 or at loci encoding non-coding RNA. Once the cell has
begun the differentiation process, RUNX1 +24 “releases” these regions to allow for their
domain specific regulation and/or expression as the cells differentiate to megakaryocytes.

219
The dynamic interaction landscape of the RUNX1 +24 enhancer during differentiation
of K562 cells highlights the need to further understand the roles of regulatory regions in
different cell types. During PMA treatment, the RUNX1 +24 enhancer forms new connections
with possible regulatory elements +14, +54, +68, +142 and known regulator m-371.
Interactions between the RUNX1 +24 enhancer and +14, +54, +68 and +142 and RUNX1-IT1
were only observed during differentiation (12 h PMA). These interactions were not observed
in steady-state K562 cells. Therefore, these regulatory regions may be important for RUNX1
regulation during megakaryocyte differentiation. All of these regions were annotated by
ChromHMM as enhancers in steady-state K562 cells, but this chromatin signature may not
reflect the nature of these elements during differentiation. The RUNX1 +24 enhancer maintains
existing contacts with regulatory regions m-368, m-58, m+3, +62 and m+110 throughout
differentiation.
The RUNX1 P2 transcript is minimally expressed throughout differentiation. The
connection between RUNX1 P2 to the RUNX1 +24 enhancer remains unchanged throughout
differentiation. Previously, +62 was shown to be a silencer of RUNX1 P2. RUNX1 +24 could
act to mediate the silencer interaction between P2 and +62. In contrast, interaction between the
RUNX1 +24 enhancer and RUNX1 P1 is increased during differentiation (12h PMA).
Transcription of RUNX1 from its P1 promoter is crucial for megakaryocyte differentiation
(Draper et al., 2017). Consistent with this, K562 cells had a gradual increase in transcription
of the P1 isoform of RUNX1 during PMA-induced differentiation (Antony et al., 2020).
In the presence of enhancer suppressor JQ1, RUNX1 P1 expression is suppressed,
suggesting that P1 expression in these cells is enhancer-driven (Antony et al., 2020). Since the
RUNX1 +24 enhancer recruits P1 during differentiation, its enhancer activity could be the target
of JQ1-mediated suppression of RUNX1 transcription.

220
Connection between RUNX1 +24, RUNX1 P1, and known RUNX1 regulatory RNAs
RUNXOR and RUNX1 -IT1 all decrease after differentiation. I speculate that it is likely,
following activation of RUNX1 P1 transcript during differentiation, that the RUNX1 +24
enhancer releases connections to regions that are crucial for the RUNX1 P1 switch because
they are no longer required.
After differentiation (72 h PMA), there is an increase in frequency of the connection
between RUNX1 +24 and m-371. This region was shown to act as a primitive haematopoietic-
specific enhancer in developing zebrafish (Chapter 3) and activates RUNX1 P1 in developing
mice (Zhu et al., 2020). The increase in connection of the RUNX1 +24 enhancer with m-371
in differentiated K562 megakaryocyte cells may indicate a role for m-371 in megakaryocyte
identity. m-371 also sits within LOC100506403 – this long non-coding RNA could also play a
similar role to RUNX1-IT1 and RUNXOR in regulating RUNX1, with the connection to m-371
helping to determine its expression.
Although the RUNX1 promoters dynamically interact with the RUNX1 +24 enhancer,
the 4C analysis is unable to determine what other regulatory elements the promoters connect
to. This is because the 4C analysis used only the bait within the RUNX1 +24 enhancer as the
viewpoint for 3D interactions. The combination of regulators used to control transcription of
RUNX1 appears to be very dynamic, but also suggest cell type dependency. For example,
despite previous evidence of intron 5.2 and the -250, -188 and -139 cluster acting as RUNX1
regulators, these regions did not interact with the RUNX1 +24 enhancer upon megakaryocyte
differentiation. They could instead interact directly with the promoter(s) or act in another cell
type.
Vukadin et al., (2020) describe SON protein as a negative regulator of RUNX1 and
inhibitor of megakaryocyte differentiation in chronic myeloid leukaemia cells. They showed
that SON obstructs megakaryocytic differentiation by directly binding to RUNX1 P2 and two

221
enhancer regions (the RUNX1 +24 enhancer and a “novel” +139 enhancer) (Vukadin et al.,
2020). +139 overlaps with m+110, suggesting that they represent the same human RUNX1
enhancer. This research supports the idea that the maintained connection of +m110/+139 with
the RUNX1 +24 enhancer during megakaryocyte differentiation is crucial for correct RUNX1
expression.
6.4 Cohesin/STAG2 dependency of RUNX1 +24 enhancer
connections in K562 cells
The cohesin complex mediates tissue-specific enhancer-promoter and enhancer-
enhancer communication (Canela et al., 2017; Phillips-Cremins et al., 2013; Strom et al.,
2012). Furthermore, evidence from our group shows convincingly that cohesin is required for
the normal transcription of Runx1 in developmental contexts (Antony et al., 2020; Horsfield et
al., 2007; Marsman et al., 2014). However, the exact mechanism of how cohesin regulates
Runx1 transcription is still unknown. It is possible that cohesin may influence the connections
between the Runx1 gene and its regulatory elements, and regulate Runx1 transcription in this
manner. To uncover potential mechanisms, I sought to determine how cohesin STAG2 mutation
affects connections formed by the RUNX1 +24 enhancer in steady-state K562 cells, and those
responding to a signal to undergo megakaryocyte differentiation.
In steady-state K562 cells, STAG2 mutation dramatically increased the number of
connections formed by the RUNX1 +24 enhancer in comparison to unedited wild type cells.
The new connections formed by the RUNX1 +24 enhancer in STAG2-deficient cells included
regions annotated by ChromHMM and dbSUPER as insulators, poised promoters and super-
enhancers; however, it is possible that these regions do not have the same chromatin features
in STAG2 mutant cells as they do in wild type. STAG2 mutant K562 cells have differentially
altered chromatin accessibility, including increased accessibility at super-enhancers and
decreased accessibility at CTCF sites (Antony et al., 2020).

222
ChromHMM annotates a region as an insulator based on a high frequency of CTCF
protein binding sites, CTCF motifs, and/or a higher frequency of H3K4me1 (Ernst et al., 2010).
CTCF sites are frequently found in TAD boundary regions or within super-enhancers (Shin,
2019). The STAG2 paralogue, STAG1, preferentially locates to CTCF sites and TAD
boundaries (Arruda et al., 2020), while STAG2 is normally found at enhancers, promoters, and
Polycomb-repressed domains (Arruda et al., 2020). Absence of STAG2 is tolerated because
STAG1 can substitute for many of STAG2’s functions in the cohesin complex (Benedetti et
al., 2017; Van Der Lelij et al., 2017). Increase in interactions of the RUNX1 +24 enhancer with
insulators and super-enhancers upon STAG2-deficiency raises the possibility that STAG1-
cohesin mediates new contacts at CTCF sites.
Chromatin organisation relies on two mechanisms: compartmentalisation and
chromatin loop extrusion, which are often considered to be counteracting each other (Nuebler
et al., 2018). In the chromatin loop extrusion model, cohesin and CTCF form stable loops that
act as functional barriers between active and inactive chromatin. Loop extrusion by cohesin is
crucial for the formation of TADs, and correct transcription relies on the insulated
neighbourhoods of TADs, including the constraint of enhancers to their gene targets (Dixon et
al., 2012; Nuebler et al., 2018; Rao et al., 2014). Compartmentalisation describes the process
in which proteins (including chromatin proteins) self-organise into phase-separated
condensates and act as membrane-less organelles that cluster specific molecules. Co-
localisation of transcription factors or polycomb group proteins are frequently observed,
suggesting like attracts like (Hyman et al., 2014; Shin et al., 2018; Stadhouders et al., 2019).
These membrane-less organelles have been suggested to carry out crucial roles in a range of
cellular processes (Boeynaems et al., 2018).
I hypothesise that increased interactions in STAG2-deficient K562 cells reflect a
scenario where compromised loop extrusion may not properly balance compartmentalisation.

223
Without STAG2, cohesin’s functions in domain organisation are compromised. As a result,
TAD boundaries may be destabilised, allowing the RUNX1 +24 enhancer to connect more
broadly across chromosome 21. Upon STAG2 depletion, compartmentalisation is the dominant
mechanism used to organise chromatin. This may explain the increase in connections from the
RUNX1 +24 enhancer to super-enhancers.
Super-enhancers are described as regions that specify cell identity, are densely bound
by mediators, chromatin factors and lineage-regulating master TFs, such as GATA1 and TAL1
in K562 cells (Hnisz et al., 2013; Huang et al., 2018; Khan et al., 2018; Parker et al., 2013;
Wang et al., 2019; Whyte et al., 2013). Super-enhancers contain a significantly higher
frequency of chromatin interactions compared to regular enhancers (Huang et al., 2018; Wang
et al., 2019). These characteristics indicate that RUNX1 +24 is acting as a super-enhancer in
K562 cells.
Wang et al., (2019) highlighted super-enhancers capability to attract the formation of
phase-separated condensates, and capacity to generate 3D genome structures that specifically
initiate the super-enhancer’s target genes (Wang et al., 2019). Sebari et al., (2018) provided
evidence that transcriptional coactivators such as BRD4 are components of the phase-separated
condensate, and that these condensates co-localise with super-enhancers (Sabari et al., 2018).
BRD4 recruitment required for transcription is known to occur independent of enhancer-
promoter connections (Crump et al., 2021). Together, these studies provide an explanation for
the surprisingly, similar connections forming, during differentiation (12 PMA) in STAG2
mutant cells and wild type.
The transcription factors that respond to PMA induction may be able to mediate correct
RUNX1 +24 connections regardless of cohesin deficiency. Transcription-specific 3D structure
could reflect phase-separated condensates formation , which are used to specifically initiate the
super-enhancer’s target genes. However, when transcription induction stops (72 PMA),
224
connections go back to being abnormal. This also reflects the observations of Antony et al.,
(2020); who found that the use of BET inhibitor, JQ1 to reduce BRD4 binding and dampens
super-enhancer driven transcription, prevented the aberrant RUNX1 and ERG signal-induced
transcription in STAG2 mutant cells (Antony et al., 2020).
6.4.1 K562 Limitations
This thesis used K562 cells to determine RUNX1 +24 connectivity. K562 are a chronic
myelogenous leukaemic (CML) cell line which expresses the BCR-ABL fusion gene
(McGahon et al., 1997). Previous research has highlighted that cohesin mutations occur early
in leukaemogenesis and mainly arise in pre-leukaemic cells (CGARN, 2013; Corces et al.,
2017; Kon et al., 2013; Thol et al., 2014; Welch et al., 2012). The CRISPR/Cas9 edited STAG2
subunit is an additional mutation, which sequentially occurred after leukaemogenesis, as such,
changes observed may be due to compounding effect of existing K562 mutational profile.
Cohesin mutations are more frequently observed in AML samples than CML, so interactions
may not reflect AML samples.
Observing RUNX1 +24 connections in other cell lines would be needed to see which of
the extensive connections are replicated. However, the K562 and STAG2 mutant K562 cell
lines were effective for understanding dynamic 3D connections during differentiation, and
highlighting possible cis-regulatory regions.
6.5 Future directions
The hypothesis of my study was that Runx1 expression is regulated by regulatory
elements that connect with super-enhancer Runx1 +24, and that these connections are
dependent on cohesin. Although my results did identify some functional enhancers and their
conservation in human genome, it would be worthwhile investigating the other functional roles
of these regions, their combinatory effects, and which other cell types utilise these regions.
Some putative regulatory regions had dynamic interactions with the RUNX1 +24 enhancer

225
depending on the stage of differentiation and presence of STAG2-cohesin. However, these
regions have no functional data so require further analysis.
6.5.1 RUNX1 +24 G-quadruplex
The Runx1 +24 G-quadruplex analysis was specific to the mouse sequence so it may
not reflect the human sequence, the type of G-quadruplex, or its functional capacity. The CD
analysis should be repeated with the human RUNX1 +24 G-quadruplexes.
G-quadruplexes can be selectively targeted by small binding ligands that can disrupt
translation (Bugaut et al., 2012). This has initiated a new approach in RNA-directed drug
design. If the G-quadruplex is present and functional in the human +24 region, further research
is required to validate it as a drug target. If there is dysregulation of the RUNX1 +24 enhancer
region, targeting of the G-quadruplexes may prove effective.
6.5.2 Functional analysis of RUNX1 regulatory regions
I only tested the functional enhancer capability of mouse Runx1 regulatory regions
identified in HPC7 cells by 4C. However, it would be worthwhile to further characterise the
enhancer capabilities of previously identified RUNX1 regulators; -250, -188, -139, m-101, m-
43, +62, and 4C identified regions; -96, +14, +54, +68, +89, +142, SLC5A3 Exon 2 MRPS6
intron and super-enhancer region between SAMSN1 and NRIP1.
When determining the enhancer potential of regulatory regions, it would be useful to
investigate other developmental time-points in more detail to analyse the different waves of
haematopoiesis. Primitive haematopoiesis occurs in zebrafish 12 hpf; definitive
haematopoiesis begins first in the ventral wall of the dorsal aorta from 36 hpf, then in the caudal
haematopoietic tissue 2 dpf, and finally in the kidney marrow 4 dpf. Viewing embryos during
these important time-points may provide further insight into Runx1 regulation. A semi-
automated imaging technique could be used to efficiently analyse more time-points (Romano
et al., 2014).

226
To determine the cell type-specific enhancer properties an alternative cell-specific
enhancer reporter without a gata2 promoter could be used, so that the plasmids can be
successfully integrated into F1 lines. As the enhancer reporter plasmids contain fluorescent
markers, fluorescence-activated cell sorting (FACs) can be used to find which zebrafish
haematopoietic cells contain GFP expression driven by the putative enhancers. This method
can be used to determine which haematopoietic cells have transcriptional machinery that
recognizes the enhancers based upon the fluorescent characteristics of each cell.
Expression patterns of these enhancers show no distinct patterns of collaboration, or
independence of roles between the enhancers. Enhancers could be working in combinations or
may be functionally redundant. It would be interesting to analyse enhancer function further
with combinations of candidates and/or CRISPR/Cas9 edited candidates in reporter assays.
Interestingly regulatory regions (m-368, -250, m-101, -96, m-58, m+3, +14, +54, +62,
+68, +89 m+110, +142, intron 5.2 and SLC5A3 Exon 2 MRPS6 intron) showed histone
demethylase LSD1 binding in K562 cells indicating they have potential to be epigenetically
regulated (repressed or activated). I have tested, their enhancer potential but It would be useful
to functionally test all regions for silencer activity to provide further clarity about the
regulatory capability of these regions. Silencer activity could be determined by measuring the
repressive effect of various deletion/mutant regulatory region luciferase constructs on RUNX1
promoters. Silencer activity could also be measured by using an insulator assay vector (INS)
in zebrafish; this vector expresses GFP across somites as internal control, and there is GFP
expression variance when an insulator is cloned into vector (Bessa et al., 2009; Marsman et
al., 2014).
6.5.3 RUNX1 +24 connections with genes
Although RUNX1 P1 and P2 promoters dynamically interact with the RUNX1 +24
enhancer, the 4C analysis could not determine what other DNA regions the P1 and P2

227
promoters independently connect to during megakaryocyte differentiation. Another 4C that
uses RUNX1 P1 and P2 as baits throughout differentiation would determine what connections
these promoters make independently of the RUNX1 +24 enhancer.
Future RNA-seq to determine gene expression levels during megakaryocyte
differentiation would be informative and subsequent integration with the current 4C data would
be useful on determining whether the RUNX1 +24 enhancer connections to genes are the
scaffolds for transcription.
The connection and subsequent release of silenced ERG P3 may be crucial for correct
ERG transcription regulation. The role of the P3 promoter in ERG expression and isoform-
specific transcription could be analysed further to understand the dynamic role of the RUNX1
+24 enhancer in ERG regulation.
6.5.4 Roles of non-coding RNA in RUNX1 regulation
It is possible that non-coding RNA elements including long non-coding RNA, eRNA,
and G-quadruplex RNA could influence RUNX1 regulation. However, more research is
required to determine the individual functional contributions of these RNAs in RUNX1
expression.
Chapter 3 described evidence that eRNA is expressed at most RUNX1 regulatory
regions. It would be informative to analyse the functional capability of these eRNAs, their
interactions, and their influence on RUNX1 regulation. It would be especially exciting to further
investigate the possible functional roles of the RUNX1 +24 enhancer eRNA and possible +24
G-quadruplex RNA. This could be done using precision run-on sequencing (PRO-seq) and
rapid amplification of cDNA ends (RACE). Pro-seq can define the position, amount, and
orientation of transcriptionally active RNA polymerases in the genome to a single-nucleotide
resolution (Hou et al., 2020b). RACE can map eRNAs by identifying the 5′ and 3′ ends of
RNA, and RT-qPCR can determine the expression levels of these eRNAs (Hou et al., 2020b).

228
eRNA targets could be analysed using RNA‐guided Chromatin Conformation Capture (R3C)
as demonstrated by Wang et al., (2014). Functionality could be analysed by eRNA knock down
using small interfering RNA (siRNA) or mutated using CRISPR/Cas9 (Hou et al., 2020b).
If the G-quadruplex is capable of forming RNA, it would be fascinating to investigate
its targets or ability to bind to RUNX1 protein. This could be carried out by isolating sequences
that bind to given targets with high affinity and specificity, using systematic evolution of
ligands by exponential enrichment (SELEX) (Ellington et al., 1990; Tuerk et al., 1990).
The results of this research also indicate a possible role for uncharacterised non-coding
RNA LOC10050640 in RUNX1 regulation. Regulatory regions m-371, m-368 and m-327 all
sit within LOC10050640 and may be involved in the regulation of this long non-coding RNA.
The role of RUNX1–IT1 in haematopoietic cells is currently unknown. More broadly, research
is also needed to determine the roles of other uncharacterised non-coding RNAs that the
RUNX1 +24 enhancer also makes connections with. Further investigation to define the RNA-
DNA interactions proposed by this research could determine the importance of the RUNX1 +24
enhancer eRNAs, possible G-quadruplex RNA and non-coding RNA connections seen in K562
cells. This could be carried out by utilising previously generated RNA-DNA interactomes for
K562 cells such as Red-C from Gavrilov et al., (2020) (Gavrilov et al., 2020).
6.5.5 Further questions proposed by this research
Several questions from this research remain unanswered, for example: are there other
strong enhancers that, like the RUNX1 +24 enhancer, connect across an entire chromosome? If
so, are they significant for genome organisation? Are there equivalents of the RUNX1 +24
enhancer on different chromosomes? These could be further discovered by using enhancers as
baits for 4C experiments, or by establishing an equivalent of Capture-C for enhancers.

229
6.5.6 Clinical significance
Tumour sequencing studies are helpful, but to have medical benefits to the patient, the
mechanisms of disease must be understood beyond a statistical correlation. Analysis of
available SNP and cancer mutation databases identified SNPs and mutations in RUNX1-
associated regulatory regions. It would be informative to carry out the same analysis on the
putative regulatory regions identified by the 4C.
Other than +62 and intron 5.2, the relevance of mutations to these regions to the
progression of AML is unknown. My study sets the scene for functional analyses to precisely
determine how RUNX1 is regulated, including CRISPR/Cas9-mediated interference with
enhancer activity. The results of my research also provide a rationale for screening patients
with mutations in enhancer regions. By analysing deep sequencing of AML patient samples
that have no identifiable mutations in the RUNX1 coding region or in other leukaemia genes,
mutations in regulatory regions that lead to dysregulated RUNX1 expression may be
discovered. Sequencing analyses that identify enhancer mutations could not only explain a
patient’s AML progression, they could provide future therapeutic targets.
6.6 Overall conclusions
The precise spatiotemporal expression of Runx1 requires cis-regulatory elements, the
majority of which have not been previously defined. In this PhD thesis, I describe research that
provides insight into mouse Runx1 enhancer functions, and highlights the features of conserved
human enhancers. My study identifies the regulatory regions that interact with the RUNX1 +24
enhancer and that are potentially crucial for megakaryocyte differentiation.
One of the more exciting findings to emerge from this study is that the RUNX1 +24
enhancer forms DNA contacts across chromosome 21, defying the boundaries of known TADs.
The RUNX1 +24 enhancer interacts with coding genes, non-coding RNA, super-enhancers and
regulatory elements, and may also maintain connections that prevent transcription as well as

230
enhance it. The findings suggest that the RUNX1 +24 enhancer could be important for overall
organisation and 3D structure of chromosome 21.
The results of my investigation show that cohesin STAG2-depletion de-constrains the
chromatin, allowing increased connections to the RUNX1 +24 enhancer hub and increased
super-enhancer interactions. This may result in aberrant enhancer-amplified transcription in
response to differentiation signals.
Overall, my study identified novel mechanisms for RUNX1 regulation, demonstrated
the role of the RUNX1 +24 enhancer in megakaryocyte differentiation, and the effect of cohesin
depletion on genome connectivity during differentiation.

231
References
Abbasi, A. A., Paparidis, Z., Malik, S., Goode, D. K., Callaway, H., Elgar, G., & Grzeschik, K.-H. (2007). Human GLI3 intragenic conserved non-coding sequences are tissue-specific enhancers. PLoS One, 2(4), e366. Acemel, R. D., Maeso, I., & Gómez‐Skarmeta, J. L. (2017). Topologically associated domains: a successful scaffold for the evolution of gene regulation in animals. Wiley Interdisciplinary Reviews: Developmental Biology, 6(3). Ajore, R., Dhanda, R. S., Gullberg, U., & Olsson, I. (2010). The leukemia associated ETO nuclear repressor gene is regulated by the GATA-1 transcription factor in erythroid/megakaryocytic cells. BMC molecular biology, 11(1), 38. Albacker, C. E., & Zon, L. I. (2009). Use of zebrafish to dissect gene programs regulating hematopoietic stem cells. In Regulatory Networks in Stem Cells (pp. 101-110): Humana Press. Alberati-Giani, D., Cesura, A. M., Broger, C., Warren, W. D., Röver, S., & Malherbe, P. (1997). Cloning and functional expression of human kynurenine 3‐monooxygenase. FEBS letters, 410(2-3), 407-412. Altschul, S. F., Gish, W., Miller, W., Myers, E. W., & Lipman, D. J. (1990). Basic local alignment search tool. Journal of molecular biology, 215(3), 403-410. Anania, C., & Lupiáñez, D. G. (2020). Order and disorder: abnormal 3D chromatin organization in human disease. Briefings in functional genomics, 19(2), 128-138. Andersson, R., Gebhard, C., Miguel-Escalada, I., Hoof, I., Bornholdt, J., Boyd, M., . . . Suzuki, T. (2014). An atlas of active enhancers across human cell types and tissues. Nature, 507(7493), 455-461. Andrews, S. (2010). FastQC: a quality control tool for high throughput sequence data. Antony, J., Gimenez, G., Taylor, T., Khatoon, U., Day, R., Morison, I. M., & Horsfield, J. A. (2020). BET inhibition prevents aberrant RUNX1 and ERG transcription in STAG2 mutant leukaemia cells. Journal of Molecular Cell Biology, 12(5), 397-399. doi:10.1093/jmcb/mjz114 Arruda, N. L., Carico, Z. M., Justice, M., Liu, Y. F., Zhou, J., Stefan, H. C., & Dowen, J. M. (2020). Distinct and overlapping roles of STAG1 and STAG2 in cohesin localization and gene expression in embryonic stem cells. Epigenetics & chromatin, 13(1), 1-17. Asou, N. (2003). The role of a Runt domain transcription factor AML1/RUNX1 in leukemogenesis and its clinical implications. Critical reviews in oncology/hematology, 45(2), 129-150. Assi, S. A., Imperato, M. R., Coleman, D. J., Pickin, A., Potluri, S., Ptasinska, A., . . . James, S. R. (2019). Subtype-specific regulatory network rewiring in acute myeloid leukemia. Nature genetics, 51(1), 151-162. Au, C. H., Wa, A., Ho, D. N., Chan, T. L., & Ma, E. S. (2016). Clinical evaluation of panel testing by next-generation sequencing (NGS) for gene mutations in myeloid neoplasms. Diagnostic pathology, 11(1), 1-12.

232
Balbás-Martínez, C., Sagrera, A., Carrillo-de-Santa-Pau, E., Earl, J., Márquez, M., Vazquez, M., . . . Bayés, M. (2013). Recurrent inactivation of STAG2 in bladder cancer is not associated with aneuploidy. Nature genetics, 45(12), 1464. Barski, A., Cuddapah, S., Cui, K., Roh, T.-Y., Schones, D. E., Wang, Z., . . . Zhao, K. (2007). High-resolution profiling of histone methylations in the human genome. Cell, 129(4), 823-837. Bee, T., Ashley, E. L., Bickley, S. R., Jarratt, A., Li, P.-S., Sloane-Stanley, J., . . . de Bruijn, M. F. (2009a). The mouse Runx1+ 23 hematopoietic stem cell enhancer confers hematopoietic specificity to both Runx1 promoters. Blood, 113(21), 5121-5124. Bee, T., Liddiard, K., Swiers, G., Bickley, S. R., Vink, C. S., Jarratt, A., . . . de Bruijn, M. F. (2009b). Alternative Runx1 promoter usage in mouse developmental hematopoiesis. Blood Cells, Molecules, and Diseases, 43(1), 35-42. Bee, T., Swiers, G., Muroi, S., Pozner, A., Nottingham, W., Santos, A. C., . . . de Bruijn, M. F. (2010). Nonredundant roles for Runx1 alternative promoters reflect their activity at discrete stages of developmental hematopoiesis. Blood, 115(15), 3042-3050. Bellissimo, D. C., & Speck, N. A. (2017). RUNX1 Mutations in Inherited and Sporadic Leukemia. Frontiers in Cell and Developmental Biology, 5, 111. doi:10.3389/fcell.2017.00111 Beltran, M., Tavares, M., Justin, N., Khandelwal, G., Ambrose, J., Foster, B. M., . . . Herrero, J. (2019). G-tract RNA removes Polycomb repressive complex 2 from genes. Nature structural & molecular biology, 26(10), 899-909. Benedetti, L., Cereda, M., Monteverde, L., Desai, N., & Ciccarelli, F. D. (2017). Synthetic lethal interaction between the tumour suppressor STAG2 and its paralog STAG1. Oncotarget, 8(23), 37619. Bessa, J., Tena, J. J., de la Calle‐Mustienes, E., Fernández‐Miñán, A., Naranjo, S., Fernández, A., . . . Casares, F. (2009). Zebrafish enhancer detection (ZED) vector: A new tool to facilitate transgenesis and the functional analysis of cis‐regulatory regions in zebrafish. Developmental Dynamics, 238(9), 2409-2417. Betz, B. L., & Hess, J. L. (2010). Acute myeloid leukemia diagnosis in the 21st century. Archives of pathology & laboratory medicine, 134(10), 1427-1433. Bhagwat, A. S., Roe, J.-S., Mok, B. Y., Hohmann, A. F., Shi, J., & Vakoc, C. R. (2016). BET bromodomain inhibition releases the mediator complex from select cis-regulatory elements. Cell reports, 15(3), 519-530. Bhatia, S., Bengani, H., Fish, M., Brown, A., Divizia, M. T., De Marco, R., . . . Kleinjan, D. A. (2013). Disruption of autoregulatory feedback by a mutation in a remote, ultraconserved PAX6 enhancer causes aniridia. The American Journal of Human Genetics, 93(6), 1126-1134. Bhatia, S., Monahan, J., Ravi, V., Gautier, P., Murdoch, E., Brenner, S., . . . Kleinjan, D. A. (2014). A survey of ancient conserved non-coding elements in the PAX6 locus reveals a landscape of interdigitated cis-regulatory archipelagos. Developmental biology, 387(2), 214-228. Boeynaems, S., Alberti, S., Fawzi, N. L., Mittag, T., Polymenidou, M., Rousseau, F., . . . Van Den Bosch, L. (2018). Protein phase separation: a new phase in cell biology. Trends in cell biology, 28(6), 420-435.

233
Bohlander, S. (2000). Fusion genes in leukemia: an emerging network. Cytogenetic and Genome Research, 91(1-4), 52-56. Bonkhofer, F., Rispoli, R., Pinheiro, P., Krecsmarik, M., Schneider-Swales, J., Tsang, I. H. C., . . . Patient, R. (2019). Blood stem cell-forming haemogenic endothelium in zebrafish derives from arterial endothelium. Nature communications, 10(1), 1-14. Bopp, S. K., Minuzzo, M., & Lettieri, T. (2006). The zebrafish (Danio rerio): an emerging model organism in the environmental field. Luxembourg: Institute for Environment and Sustainability, Joint Research Center, European Commission, European Communities. Bose, D. A., Donahue, G., Reinberg, D., Shiekhattar, R., Bonasio, R., & Berger, S. L. (2017). RNA binding to CBP stimulates histone acetylation and transcription. Cell, 168(1-2), 135-149. e122. Bower, H., Andersson, T. M., Björkholm, M., Dickman, P., Lambert, P. C., & Derolf, Å. R. (2016). Continued improvement in survival of acute myeloid leukemia patients: an application of the loss in expectation of life. Blood cancer journal, 6(2), e390-e390. Boyer, L. A., Plath, K., Zeitlinger, J., Brambrink, T., Medeiros, L. A., Lee, T. I., . . . Ray, M. K. (2006). Polycomb complexes repress developmental regulators in murine embryonic stem cells. Nature, 441(7091), 349-353. Brennan, C. W., Verhaak, R. G., McKenna, A., Campos, B., Noushmehr, H., Salama, S. R., . . . Berman, S. H. (2013). The somatic genomic landscape of glioblastoma. Cell, 155(2), 462-477. Breton, J., Avanzi, N., Magagnin, S., Covini, N., Magistrelli, G., Cozzi, L., & Isacchi, A. (2000). Functional characterization and mechanism of action of recombinant human kynurenine 3‐hydroxylase. European Journal of Biochemistry, 267(4), 1092-1099. Brohl, A. S., Solomon, D. A., Chang, W., Wang, J., Song, Y., Sindiri, S., . . . Shern, J. F. (2014). The genomic landscape of the Ewing Sarcoma family of tumors reveals recurrent STAG2 mutation. PLoS Genet, 10(7), e1004475. Buenrostro, J. D., Giresi, P. G., Zaba, L. C., Chang, H. Y., & Greenleaf, W. J. (2013). Transposition of native chromatin for fast and sensitive epigenomic profiling of open chromatin, DNA-binding proteins and nucleosome position. Nature methods, 10(12), 1213. Bugaut, A., & Balasubramanian, S. (2012). 5′-UTR RNA G-quadruplexes: translation regulation and targeting. Nucleic Acids Research, 40(11), 4727-4741. Buijs, A., Poot, M., van der Crabben, S., van der Zwaag, B., van Binsbergen, E., & van Roosmalen, M. J. (2012). Elucidation of a novel pathogenomic mechanism using genome-wide long mate-pair sequencing of a congenital t(16;21) in a series of three RUNX1-mutated FPD/AML pedigrees. Leukemia, 26. doi:10.1038/leu.2012.79 Bullinger, L., Krönke, J., Schön, C., Radtke, I., Urlbauer, K., Botzenhardt, U., . . . Schlenk, R. (2010). Identification of acquired copy number alterations and uniparental disomies in cytogenetically normal acute myeloid leukemia using high-resolution single-nucleotide polymorphism analysis. Leukemia, 24(2), 438-449. Buniello, A., MacArthur, J. A. L., Cerezo, M., Harris, L. W., Hayhurst, J., Malangone, C., . . . Sollis, E. (2019). The NHGRI-EBI GWAS Catalog of published genome-wide association studies, targeted arrays and summary statistics 2019. Nucleic Acids Research, 47(D1), D1005-D1012.

234
Burnett, A., Wetzler, M., & Lowenberg, B. (2011). Therapeutic advances in acute myeloid leukemia. J Clin Oncol, 29(5), 487-494. Byrd, J. C., Mrózek, K., Dodge, R. K., Carroll, A. J., Edwards, C. G., Arthur, D. C., . . . Watson, M. S. (2002). Pretreatment cytogenetic abnormalities are predictive of induction success, cumulative incidence of relapse, and overall survival in adult patients with de novo acute myeloid leukemia: results from Cancer and Leukemia Group B (CALGB 8461) Presented in part at the 43rd annual meeting of the American Society of Hematology, Orlando, FL, December 10, 2001, and published in abstract form. 59. Blood, The Journal of the American Society of Hematology, 100(13), 4325-4336. Cai, X., Gaudet, J. J., Mangan, J. K., Chen, M. J., De Obaldia, M. E., Oo, Z., . . . Speck, N. A. (2011). Runx1 loss minimally impacts long-term hematopoietic stem cells. PLoS One, 6(12), e28430. Canela, A., Maman, Y., Jung, S., Wong, N., Callen, E., Day, A., . . . Rao, S. S. (2017). Genome Organization Drives Chromosome Fragility. Cell. Cantor, A. B., & Orkin, S. H. (2002). Transcriptional regulation of erythropoiesis: an affair involving multiple partners. Oncogene, 21(21), 3368-3376. doi:10.1038/sj.onc.1205326 Cerami, E., Gao, J., Dogrusoz, U., Gross, B. E., Sumer, S. O., Aksoy, B. A., . . . Schultz, N. (2012). The cBio Cancer Genomics Portal: An open platform for exploring multidimensional cancer genomics data. Cancer discovery, 2(5), 401-404. doi:10.1158/2159-8290.CD-12-0095 CGARN. (2013). Cancer Genome Atlas Research Network (CGARN): Genomic and epigenomic landscapes of adult de novo acute myeloid leukemia. The New England journal of medicine, 368(22), 2059-2074. Chahal, G., Tyagi, S., & Ramialison, M. (2019). Navigating the non-coding genome in heart development and Congenital Heart Disease. Differentiation, 107, 11-23. Chen, Z., Amro, E. M., Becker, F., Hölzer, M., Rasa, S. M. M., Njeru, S. N., . . . Tang, D. (2019). Cohesin-mediated NF-κB signaling limits hematopoietic stem cell self-renewal in aging and inflammation. Journal of Experimental Medicine, 216(1), 152-175. Cheng, C.-K., Wong, T. H. Y., Wan, T. S. K., Wang, A. Z., Chan, N. P. H., Chan, N. C. N., . . . Ng, M. H. L. (2018). RUNX1 upregulation via disruption of long-range transcriptional control by a novel t(5;21)(q13;q22) translocation in acute myeloid leukemia. Molecular Cancer, 17(1), 133. doi:10.1186/s12943-018-0881-2 Chiarle, R., Zhang, Y., Frock, R. L., Lewis, S. M., Molinie, B., Ho, Y.-J., . . . Malkin, D. J. (2011). Genome-wide translocation sequencing reveals mechanisms of chromosome breaks and rearrangements in B cells. Cell, 147(1), 107-119. Chin, C. V., Antony, J., Ketharnathan, S., Labudina, A., Gimenez, G., Parsons, K. M., . . . Musio, A. (2020). Cohesin mutations are synthetic lethal with stimulation of WNT signaling. elife, 9, e61405. Churpek, J. E., Pyrtel, K., Kanchi, K.-L., Shao, J., Koboldt, D., Miller, C. A., . . . Fronick, C. (2015). Genomic analysis of germ line and somatic variants in familial myelodysplasia/acute myeloid leukemia. Blood, 126(22), 2484-2490. Ciau-Uitz, A., Monteiro, R., Kirmizitas, A., & Patient, R. (2014). Developmental hematopoiesis: ontogeny, genetic programming and conservation. Experimental hematology, 42(8), 669-683.

235
Coffman, J. A. (2003). Runx transcription factors and the developmental balance between cell proliferation and differentiation. Cell biology international, 27(4), 315-324. Coffman, J. A. (2009). Is Runx a linchpin for developmental signaling in metazoans? Journal of cellular biochemistry, 107(2), 194-202. Conway O’Brien, E., Prideaux, S., & Chevassut, T. (2014). The epigenetic landscape of acute myeloid leukemia. Advances in hematology, 2014. Corces, M. R., Chang, H. Y., & Majeti, R. (2017). Preleukemic Hematopoietic Stem Cells in Human Acute Myeloid Leukemia. Frontiers in oncology, 7, 263-263. doi:10.3389/fonc.2017.00263 Cornish, A. J., Hoang, P. H., Dobbins, S. E., Law, P. J., Chubb, D., Orlando, G., & Houlston, R. S. (2019). Identification of recurrent noncoding mutations in B-cell lymphoma using capture Hi-C. Blood Advances, 3(1), 21-32. Corrie, P. G. (2008). Cytotoxic chemotherapy: clinical aspects. Medicine, 36(1), 24-28. Costantino, L., Hsieh, T.-H. S., Lamothe, R., Darzacq, X., & Koshland, D. (2020). Cohesin residency determines chromatin loop patterns. elife, 9, e59889. Crump, N. T., Ballabio, E., Godfrey, L., Thorne, R., Repapi, E., Kerry, J., . . . Filippakopoulos, P. (2021). BET inhibition disrupts transcription but retains enhancer-promoter contact. Nature communications, 12(1), 1-15. Cuadrado, A., Giménez-Llorente, D., Kojic, A., Rodríguez-Corsino, M., Cuartero, Y., Martín-Serrano, G., . . . Losada, A. (2019). Specific contributions of cohesin-SA1 and cohesin-SA2 to TADs and polycomb domains in embryonic stem cells. Cell reports, 27(12), 3500-3510. e3504. Cuartero, S., & Merkenschlager, M. (2018a). Three-dimensional genome organization in normal and malignant haematopoiesis. Current opinion in hematology, 25(4), 323-328. Cuartero, S., Weiss, F. D., Dharmalingam, G., Guo, Y., Ing-Simmons, E., Masella, S., . . . Barozzi, I. (2018b). Control of inducible gene expression links cohesin to hematopoietic progenitor self-renewal and differentiation. Nature immunology, 19(9), 932-941. Daver, N., Cortes, J., Ravandi, F., Patel, K. P., Burger, J. A., Konopleva, M., & Kantarjian, H. (2015). Secondary mutations as mediators of resistance to targeted therapy in leukemia. Blood, The Journal of the American Society of Hematology, 125(21), 3236-3245. Davidson, A. J., & Zon, L. I. (2004). The ‘definitive’(and ‘primitive’) guide to zebrafish hematopoiesis. Oncogene, 23(43), 7233-7246. De Braekeleer, E., Douet-Guilbert, N., Morel, F., Le Bris, M. J., Férec, C., & De Braekeleer, M. (2011). RUNX1 translocations and fusion genes in malignant hemopathies. Future Oncol, 7. doi:10.2217/fon.10.158 de Jong, J. L., & Zon, L. I. (2005). Use of the zebrafish system to study primitive and definitive hematopoiesis. Annu. Rev. Genet., 39, 481-501. De Koninck, M., Lapi, E., Badía-Careaga, C., Cossío, I., Giménez-Llorente, D., Rodríguez-Corsino, M., . . . Real, F. X. (2020). Essential Roles of Cohesin STAG2 in Mouse Embryonic Development and Adult Tissue Homeostasis. Cell reports, 32(6), 108014. Deardorff, M. A., Noon, S. E., & Krantz, I. D. (2020). Cornelia de Lange syndrome. GeneReviews®[Internet].

236
Dekker, J., & Misteli, T. (2015). Long-range chromatin interactions. Cold Spring Harbor perspectives in biology, 7(10), a019356. Dekker, J., Rippe, K., Dekker, M., & Kleckner, N. (2002). Capturing chromosome conformation. science, 295(5558), 1306-1311. Deng, W., & Blobel, G. A. (2010). Do chromatin loops provide epigenetic gene expression states? Current opinion in genetics & development, 20(5), 548-554. Desai, P., Mencia-Trinchant, N., Savenkov, O., Simon, M. S., Cheang, G., Lee, S., . . . Hassane, D. C. (2018). Somatic mutations precede acute myeloid leukemia years before diagnosis. Nature Medicine, 24(7), 1015-1023. doi:10.1038/s41591-018-0081-z DiNardo, C. D., & Cortes, J. E. (2016). Mutations in AML: prognostic and therapeutic implications. Hematology 2014, the American Society of Hematology Education Program Book, 2016(1), 348-355. Dixon, J. R., Selvaraj, S., Yue, F., Kim, A., Li, Y., Shen, Y., . . . Ren, B. (2012). Topological domains in mammalian genomes identified by analysis of chromatin interactions. Nature, 485(7398), 376. Dobrzycki, T., Mahony, C. B., Krecsmarik, M., Koyunlar, C., Rispoli, R., Peulen-Zink, J., . . . Patient, R. (2020). Deletion of a conserved Gata2 enhancer impairs haemogenic endothelium programming and adult Zebrafish haematopoiesis. Communications biology, 3(1), 1-14. Dostie, J., Richmond, T. A., Arnaout, R. A., Selzer, R. R., Lee, W. L., Honan, T. A., . . . Nusbaum, C. (2006). Chromosome Conformation Capture Carbon Copy (5C): a massively parallel solution for mapping interactions between genomic elements. Genome Research, 16(10), 1299-1309. Downes, C. S., Mullinger, A. M., & Johnson, R. T. (1991). Inhibitors of DNA topoisomerase II prevent chromatid separation in mammalian cells but do not prevent exit from mitosis. Proceedings of the National Academy of Sciences, 88(20), 8895-8899. Draper, J. E., Sroczynska, P., Leong, H. S., Fadlullah, M. Z., Miller, C., Kouskoff, V., & Lacaud, G. (2017). Mouse RUNX1C regulates premegakaryocytic/erythroid output and maintains survival of megakaryocyte progenitors. Blood, The Journal of the American Society of Hematology, 130(3), 271-284. Du, Z., Kong, P., Gao, Y., & Li, N. (2007). Enrichment of G4 DNA motif in transcriptional regulatory region of chicken genome. Biochemical and biophysical research communications, 354(4), 1067-1070. Dzierzak, E., Medvinsky, A., & de Bruijn, M. (1998). Qualitative and quantitative aspects of haematopoietic cell development in the mammalian embryo. Immunology Today, 19(5), 228-236. Eddy, J., & Maizels, N. (2008). Conserved elements with potential to form polymorphic G-quadruplex structures in the first intron of human genes. Nucleic Acids Research, 36(4), 1321-1333. Ellington, A. D., & Szostak, J. W. (1990). In vitro selection of RNA molecules that bind specific ligands. Nature, 346(6287), 818-822. Engreitz, J. M., Agarwala, V., & Mirny, L. A. (2012). Three-dimensional genome architecture influences partner selection for chromosomal translocations in human disease. PLoS One, 7(9), e44196.

237
Erickson, P., Gao, J., Chang, K., Look, T., Whisenant, E., Raimondi, S., . . . Drabkin, H. (1992). Identification of breakpoints in t(8; 21) acute myelogenous leukemia and isolation of a fusion transcript, AML1/ETO, with similarity to Drosophila segmentation gene, runt. Blood, 80(7), 1825-1831. Ernst, J., & Kellis, M. (2010). Discovery and characterization of chromatin states for systematic annotation of the human genome. Nature biotechnology, 28(8), 817-825. Ernst, J., Kheradpour, P., Mikkelsen, T. S., Shoresh, N., Ward, L. D., Epstein, C. B., . . . Coyne, M. (2011). Mapping and analysis of chromatin state dynamics in nine human cell types. Nature, 473(7345), 43-49. Evers, L., Perez-Mancera, P. A., Lenkiewicz, E., Tang, N., Aust, D., Knösel, T., . . . Aziz, M. (2014). STAG2 is a clinically relevant tumor suppressor in pancreatic ductal adenocarcinoma. Genome Medicine, 6(1), 1-12. Ezoe, S., Matsumura, I., Nakata, S., Gale, K., Ishihara, K., Minegishi, N., . . . Kanakura, Y. (2002). GATA-2/estrogen receptor chimera regulates cytokine-dependent growth of hematopoietic cells through accumulation of p21(WAF1) and p27(Kip1) proteins. Blood, 100(10), 3512-3520. doi:10.1182/blood-2002-04-1177 Fadason, T., Ekblad, C., Ingram, J. R., Schierding, W. S., & O'Sullivan, J. M. (2017). Physical interactions and expression quantitative traits loci identify regulatory connections for obesity and type 2 diabetes associated SNPs. Frontiers in genetics, 8, 150. Fadason, T., Schierding, W., Lumley, T., & O’Sullivan, J. M. (2018). Chromatin interactions and expression quantitative trait loci reveal genetic drivers of multimorbidities. Nature communications, 9(1), 1-13. Fan, J., Xing, Y., Wen, X., Jia, R., Ni, H., He, J., . . . Ge, S. (2015). Long non-coding RNA ROR decoys gene-specific histone methylation to promote tumorigenesis. Genome Biology, 16(1), 1-17. Feeney, K., Wasson, C., & Parish, J. (2010). Cohesin: a regulator of genome integrity and gene expression. Biochemical Journal, 428, 147-161. Feinberg, A. P. (2007). Phenotypic plasticity and the epigenetics of human disease. Nature, 447(7143), 433-440. Ferrara, F., Palmieri, S., & Leoni, F. (2008). Clinically useful prognostic factors in acute myeloid leukemia. Critical reviews in oncology/hematology, 66(3), 181-193. Ferrara, F., & Schiffer, C. A. (2013). Acute myeloid leukaemia in adults. The Lancet, 381(9865), 484-495. Fisher, J. B., McNulty, M., Burke, M. J., Crispino, J. D., & Rao, S. (2017a). Cohesin mutations in myeloid malignancies. Trends in cancer, 3(4), 282-293. Fisher, J. B., Peterson, J., Reimer, M., Stelloh, C., Pulakanti, K., Gerbec, Z. J., . . . McNulty, M. (2017b). The cohesin subunit Rad21 is a negative regulator of hematopoietic self-renewal through epigenetic repression of Hoxa7 and Hoxa9. Leukemia, 31(3), 712-719. Flavahan, W. A., Drier, Y., Liau, B. B., Gillespie, S. M., Venteicher, A. S., Stemmer-Rachamimov, A. O., . . . Bernstein, B. E. (2016). Insulator dysfunction and oncogene activation in IDH mutant gliomas. Nature, 529(7584), 110-114. Flynn, R. A., & Chang, H. Y. (2014). Long noncoding RNAs in cell-fate programming and reprogramming. Cell Stem Cell, 14(6), 752-761.

238
Fudenberg, G., Getz, G., Meyerson, M., & Mirny, L. A. (2011). High order chromatin architecture shapes the landscape of chromosomal alterations in cancer. Nature biotechnology, 29(12), 1109-1113. Fukunaga, J., Nomura, Y., Tanaka, Y., Torigoe, H., Nakamura, Y., Sakamoto, T., & Kozu, T. (2020). AG‐quadruplex‐forming RNA aptamer binds to the MTG8 TAFH domain and dissociates the leukemic AML1‐MTG8 fusion protein from DNA. FEBS letters, 594(21), 3477-3489. Fullwood, M. J., Liu, M. H., Pan, Y. F., Liu, J., Xu, H., Mohamed, Y. B., . . . Mei, P. H. (2009). An oestrogen-receptor-α-bound human chromatin interactome. Nature, 462(7269), 58-64. Gaidzik, V., Teleanu, V., Papaemmanuil, E., Weber, D., Paschka, P., Hahn, J., . . . Horst, H. (2016). RUNX1 mutations in acute myeloid leukemia are associated with distinct clinico-pathologic and genetic features. Leukemia, 30(11), 2160-2168. Gandemer, V., Rio, A. G., de Tayrac, M., Sibut, V., Mottier, S., & Ly Sunnaram, B. (2007). Five distinct biological processes and 14 differentially expressed genes characterize TEL/AML1-positive leukemia. BMC genomics, 8. doi:10.1186/1471-2164-8-385 Gao, J., Aksoy, B. A., Dogrusoz, U., Dresdner, G., Gross, B., Sumer, S. O., . . . Schultz, N. (2013). Integrative analysis of complex cancer genomics and clinical profiles using the cBioPortal. Science Signaling, 6(269), pl1-pl1. doi:10.1126/scisignal.2004088 García-Nieto, P. E., Morrison, A. J., & Fraser, H. B. (2019). The somatic mutation landscape of the human body. Genome Biology, 20(1), 1-20. Gardini, A., Cesaroni, M., Luzi, L., Okumura, A. J., Biggs, J. R., Minardi, S. P., . . . Alcalay, M. (2008). AML1/ETO oncoprotein is directed to AML1 binding regions and co-localizes with AML1 and HEB on its targets. PLoS genetics, 4(11), e1000275. Gates, L. A., Foulds, C. E., & O'Malley, B. W. (2017). Histone Marks in the 'Driver's Seat': Functional Roles in Steering the Transcription Cycle. Trends in biochemical sciences, 42(12), 977-989. doi:10.1016/j.tibs.2017.10.004 Gattuso, H., Spinello, A., Terenzi, A., Assfeld, X., Barone, G., & Monari, A. (2016). Circular Dichroism of DNA G-Quadruplexes: Combining Modeling and Spectroscopy To Unravel Complex Structures. The Journal of Physical Chemistry B, 120(12), 3113-3121. doi:10.1021/acs.jpcb.6b00634 Gavrilov, A. A., Zharikova, A. A., Galitsyna, A. A., Luzhin, A. V., Rubanova, N. M., Golov, A. K., . . . Ulianov, S. V. (2020). Studying RNA–DNA interactome by Red-C identifies noncoding RNAs associated with various chromatin types and reveals transcription dynamics. Nucleic Acids Research. Geisler, S., & Coller, J. (2013). RNA in unexpected places: long non-coding RNA functions in diverse cellular contexts. Nature reviews Molecular cell biology, 14(11), 699-712. Germain, R. N. (2002). T-cell development and the CD4–CD8 lineage decision. Nature Reviews Immunology, 2(5), 309-322. Gilbert, N., Boyle, S., Fiegler, H., Woodfine, K., Carter, N. P., & Bickmore, W. A. (2004). Chromatin architecture of the human genome: gene-rich domains are enriched in open chromatin fibers. Cell, 118(5), 555-566. Gilliland, D. G., & Griffin, J. D. (2002). The roles of FLT3 in hematopoiesis and leukemia. Blood, The Journal of the American Society of Hematology, 100(5), 1532-1542.

239
Ginhoux, F., & Jung, S. (2014). Monocytes and macrophages: developmental pathways and tissue homeostasis. Nature Reviews Immunology, 14, 392. doi:10.1038/nri3671 Gómez-Marín, C., Tena, J. J., Acemel, R. D., López-Mayorga, M., Naranjo, S., de la Calle-Mustienes, E., . . . Vielmas, E. (2015). Evolutionary comparison reveals that diverging CTCF sites are signatures of ancestral topological associating domains borders. Proceedings of the National Academy of Sciences, 112(24), 7542-7547. Goyal, G., Gundabolu, K., Vallabhajosyula, S., Silberstein, P. T., & Bhatt, V. R. (2016). Reduced-intensity conditioning allogeneic hematopoietic-cell transplantation for older patients with acute myeloid leukemia. Therapeutic advances in hematology, 7(3), 131-141. Griekspoor, A., & Groothuis, T. (2005). 4Peaks: a program that helps molecular biologists to visualize and edit their DNA sequence files v1. 7. In. Griffiths, A. J. F., Miller, J. H., Suzuki, D. T., Lewontin, R. C., & Gelbart, W. M. (1999). An Introduction to Genetic Analysis: W H Freeman & Company. Grimwade, D., Walker, H., Oliver, F., Wheatley, K., Harrison, C., Harrison, G., . . . Burnett, A. (1998). The importance of diagnostic cytogenetics on outcome in AML: analysis of 1,612 patients entered into the MRC AML 10 trial. Blood, The Journal of the American Society of Hematology, 92(7), 2322-2333. Gritz, E., & Hirschi, K. K. (2016). Specification and function of hemogenic endothelium during embryogenesis. Cellular and Molecular Life Sciences, 73(8), 1547-1567. Groner, Y., Ito, Y., Liu, P., Neil, J. C., Speck, N. A., & van Wijnen, A. (2017). RUNX Proteins in Development and Cancer. In: Springer. Gröschel, S., Sanders, M. A., Hoogenboezem, R., de Wit, E., Bouwman, B. A., Erpelinck, C., . . . van Lom, K. (2014). A single oncogenic enhancer rearrangement causes concomitant EVI1 and GATA2 deregulation in leukemia. Cell, 157(2), 369-381. Growney, J. D., Shigematsu, H., Li, Z., Lee, B. H., Adelsperger, J., Rowan, R., . . . Williams, I. R. (2005). Loss of Runx1 perturbs adult hematopoiesis and is associated with a myeloproliferative phenotype. Blood, 106(2), 494-504. Gruber, S., Haering, C. H., & Nasmyth, K. (2003). Chromosomal cohesin forms a ring. Cell, 112(6), 765-777. Gunnell, A., Webb, H. M., Wood, C. D., McClellan, M. J., Wichaidit, B., Kempkes, B., . . . West, M. J. (2016). RUNX super-enhancer control through the Notch pathway by Epstein-Barr virus transcription factors regulates B cell growth. Nucleic Acids Research, 44(10), 4636-4650. Guo, G., Sun, X., Chen, C., Wu, S., Huang, P., Li, Z., . . . Zhou, Q. (2013). Whole-genome and whole-exome sequencing of bladder cancer identifies frequent alterations in genes involved in sister chromatid cohesion and segregation. Nature genetics, 45(12), 1459-1463. Habets, G., Van der Kammen, R., Stam, J. C., Michiels, F., & Collard, J. G. (1995). Sequence of the human invasion-inducing TIAM1 gene, its conservation in evolution and its expression in tumor cell lines of different tissue origin. Oncogene, 10(7), 1371-1376. Haffter, P., Granato, M., Brand, M., Mullins, M. C., Hammerschmidt, M., Kane, D. A., . . . Nusslein-Volhard, C. (1996). The identification of genes with unique and essential functions in the development of the zebrafish, Danio rerio. Development, 123(1), 1-36. Hakim, O., & Misteli, T. (2012). Chromosome conformation techniques. Cell, 148, 1068.

240
Han, P., Li, W., Lin, C.-H., Yang, J., Shang, C., Nurnberg, S. T., . . . Lin, C.-J. (2014). A long noncoding RNA protects the heart from pathological hypertrophy. Nature, 514(7520), 102-106. Harada, H., & Harada, Y. (2005). Point mutations in the AML1/RUNX1 gene associated with myelodysplastic syndrome. Critical Reviews™ in Eukaryotic Gene Expression, 15(3). Harada, Y., & Harada, H. (2009). Molecular pathways mediating MDS/AML with focus on AML1/RUNX1 point mutations. Journal of cellular physiology, 220(1), 16-20. Harms, J. F., Menniti, F. S., & Schmidt, C. J. (2019). Phosphodiesterase 9A in brain regulates cGMP signaling independent of nitric-oxide. Frontiers in neuroscience, 13, 837. Harmston, N., Ing-Simmons, E., Tan, G., Perry, M., Merkenschlager, M., & Lenhard, B. (2017). Topologically associating domains are ancient features that coincide with Metazoan clusters of extreme noncoding conservation. Nature communications, 8(1), 441-441. doi:10.1038/s41467-017-00524-5 Hayashi, Y., Harada, Y., Huang, G., & Harada, H. (2017). Myeloid neoplasms with germ line RUNX1 mutation. International journal of hematology, 106(2), 183-188. Heimbruch, K. E., Meyer, A. E., Agrawal, P., Viny, A. D., & Rao, S. (2021). A cohesive look at leukemogenesis: The cohesin complex and other driving mutations in AML. Neoplasia, 23(3), 337-347. Heintzman, N. D., Stuart, R. K., Hon, G., Fu, Y., Ching, C. W., Hawkins, R. D., . . . Ren, B. (2007). Distinct and predictive chromatin signatures of transcriptional promoters and enhancers in the human genome. Nat Genet, 39(3), 311-318. doi:10.1038/ng1966 Hnisz, D., Abraham, B. J., Lee, T. I., Lau, A., Saint-André, V., Sigova, A. A., . . . Young, R. A. (2013). Super-enhancers in the control of cell identity and disease. Cell, 155(4), 934-947. Hnisz, D., Weintraub, A. S., Day, D. S., Valton, A.-L., Bak, R. O., Li, C. H., . . . Young, R. A. (2016). Activation of proto-oncogenes by disruption of chromosome neighborhoods. science, 351(6280), 1454-1458. doi:10.1126/science.aad9024 Holoch, D., & Moazed, D. (2015). RNA-mediated epigenetic regulation of gene expression. Nature Reviews Genetics, 16(2), 71-84. Holwerda, S., & De Laat, W. (2012). Chromatin loops, gene positioning, and gene expression. Frontiers in genetics, 3, 217. Horsfield, J. A., Anagnostou, S. H., Hu, J. K.-H., Cho, K. H. Y., Geisler, R., Lieschke, G., . . . Crosier, P. S. (2007). Cohesin-dependent regulation of Runx genes. Development, 134(14), 2639-2649. Hou, C., Dale, R., & Dean, A. (2010). Cell type specificity of chromatin organization mediated by CTCF and cohesin. Proceedings of the National Academy of Sciences, 107(8), 3651-3656. Hou, H.-A., & Tien, H.-F. (2020a). Genomic landscape in acute myeloid leukemia and its implications in risk classification and targeted therapies. Journal of Biomedical Science, 27(1), 1-13. Hou, T. Y., & Kraus, W. L. (2020b). Spirits in the Material World: Enhancer RNAs in Transcriptional Regulation. Trends in biochemical sciences.

241
Howe, K., Clark, M. D., Torroja, C. F., Torrance, J., Berthelot, C., Muffato, M., . . . Matthews, L. (2013). The zebrafish reference genome sequence and its relationship to the human genome. Nature, 496(7446), 498-503. Huang, J., Li, K., Cai, W., Liu, X., Zhang, Y., Orkin, S. H., . . . Yuan, G.-C. (2018). Dissecting super-enhancer hierarchy based on chromatin interactions. Nature communications, 9(1), 1-12. Hudson, T. J., & Jennings, J. L. (2014). Abstract 4278: International Cancer Genome Consortium (ICGC). Cancer Research, 74(19 Supplement), 4278. doi:10.1158/1538-7445.am2014-4278 Hyman, A. A., Weber, C. A., & Jülicher, F. (2014). Liquid-liquid phase separation in biology. Annual review of cell and developmental biology, 30, 39-58. Ichikawa, M., Asai, T., Saito, T., Seo, S., Yamazaki, I., Yamagata, T., . . . Hirai, H. (2004). AML-1 is required for megakaryocytic maturation and lymphocytic differentiation, but not for maintenance of hematopoietic stem cells in adult hematopoiesis. Nat Med, 10(3), 299-304. doi:10.1038/nm997 Ichikawa, M., Yoshimi, A., Nakagawa, M., Nishimoto, N., Watanabe-Okochi, N., & Kurokawa, M. (2013). A role for RUNX1 in hematopoiesis and myeloid leukemia. International journal of hematology, 97(6), 726-734. Inoue, K.-i., Shiga, T., & Ito, Y. (2008). Runx transcription factors in neuronal development. Neural Development, 3(20), 8104-8103. Ito, Y., Bae, S.-C., & Chuang, L. S. H. (2015). The RUNX family: developmental regulators in cancer. Nature Reviews Cancer, 15(2), 81-95. Ivanovs, A., Rybtsov, S., Ng, E. S., Stanley, E. G., Elefanty, A. G., & Medvinsky, A. (2017). Human haematopoietic stem cell development: from the embryo to the dish. Development, 144(13), 2323-2337. doi:10.1242/dev.134866 Ives, J. H., Dagna‐Bricarelli, F., Basso, G., Antonarakis, S. E., Jee, R., Cotter, F., & Nižetić, D. (1998). Increased levels of a chromosome 21‐encoded tumour invasion and metastasis factor (TIAM1) mRNA in bone marrow of down syndrome children during the acute phase of AML (M7). Genes, Chromosomes and Cancer, 23(1), 61-66. Jain, A. K., Xi, Y., McCarthy, R., Allton, K., Akdemir, K. C., Patel, L. R., . . . Yang, L. (2016). LncPRESS1 is a p53-regulated LncRNA that safeguards pluripotency by disrupting SIRT6-mediated de-acetylation of histone H3K56. Molecular cell, 64(5), 967-981. Jaiswal, S., & Ebert, B. L. (2019). Clonal hematopoiesis in human aging and disease. science, 366(6465). Javierre, B. M., Burren, O. S., Wilder, S. P., Kreuzhuber, R., Hill, S. M., Sewitz, S., . . . Thiecke, M. J. (2016). Lineage-specific genome architecture links enhancers and non-coding disease variants to target gene promoters. Cell, 167(5), 1369-1384. e1319. Jones, D. T., Jäger, N., Kool, M., Zichner, T., Hutter, B., Sultan, M., . . . Stütz, A. M. (2012). Dissecting the genomic complexity underlying medulloblastoma. Nature, 488(7409), 100-105. Jordan, C. (2002). Unique molecular and cellular features of acute myelogenous leukemia stem cells. Leukemia, 16(4), 559-562. Julien, E., El Omar, R., & Tavian, M. (2016). Origin of the hematopoietic system in the human embryo. FEBS letters, 590(22), 3987-4001.

242
Kadauke, S., & Blobel, G. A. (2009). Chromatin loops in gene regulation. Biochimica et Biophysica Acta (BBA) - Gene Regulatory Mechanisms, 1789(1), 17-25. Kagey, M. H., Newman, J. J., Bilodeau, S., Zhan, Y., Orlando, D. A., van Berkum, N. L., . . . Levine, S. S. (2010). Mediator and cohesin connect gene expression and chromatin architecture. Nature, 467(7314), 430-435. Kalev-Zylinska, M. L., Horsfield, J. A., Flores, M. V. C., Postlethwait, J. H., Vitas, M. R., Baas, A. M., . . . Crosier, K. E. (2002). Runx1 is required for zebrafish blood and vessel development and expression of a human RUNX1-CBF2T1 transgene advances a model for studies of leukemogenesis. Development, 129(8), 2015-2030. Kantarjian, H., Sawyers, C., Hochhaus, A., Guilhot, F., Schiffer, C., Gambacorti-Passerini, C., . . . Zoellner, U. (2002a). Hematologic and cytogenetic responses to imatinib mesylate in chronic myelogenous leukemia. New England Journal of Medicine, 346(9), 645-652. Kantarjian, H. M., Cortes, J., O'Brien, S., Giles, F. J., Albitar, M., Rios, M. B., . . . Thomas, D. A. (2002b). Imatinib mesylate (STI571) therapy for Philadelphia chromosome–positive chronic myelogenous leukemia in blast phase. Blood, The Journal of the American Society of Hematology, 99(10), 3547-3553. Karczewski, K. J., Francioli, L. C., Tiao, G., Cummings, B. B., Alföldi, J., Wang, Q., . . . Birnbaum, D. P. (2020). The mutational constraint spectrum quantified from variation in 141,456 humans. Nature, 581(7809), 434-443. Kari, G., Rodeck, U., & Dicker, A. P. (2007). Zebrafish: An emerging model system for human disease and drug discovery. Clinical Pharmacology & Therapeutics, 82(1), 70-80. doi:10.1038/sj.clpt.6100223 Katainen, R., Dave, K., Pitkänen, E., Palin, K., Kivioja, T., Välimäki, N., . . . Cajuso, T. (2015). CTCF/cohesin-binding sites are frequently mutated in cancer. Nature genetics, 47(7), 818-821. Kawakami, K. (2005). Transposon tools and methods in zebrafish. Developmental Dynamics, 234(2), 244-254. Kearse, M., Moir, R., Wilson, A., Stones-Havas, S., Cheung, M., Sturrock, S., . . . Duran, C. (2012). Geneious Basic: an integrated and extendable desktop software platform for the organization and analysis of sequence data. Bioinformatics, 28(12), 1647-1649. Kellis, M., & Ernst, J. (2017). Chromatin-state discovery and genome annotation with ChromHMM. Nature Protocols, 12(12), 2478. Kent, W. J. (2002). BLAT—The BLAST-Like Alignment Tool. Genome Research, 12(4), 656-664. doi:10.1101/gr.229202 Kent, W. J., Sugnet, C. W., Furey, T. S., Roskin, K. M., Pringle, T. H., Zahler, A. M., . . . David. (2002). The Human Genome Browser at UCSC. Genome Research, 12(6), 996-1006. doi:10.1101/gr.229102 Kerenyi, M. A., Shao, Z., Hsu, Y.-J., Guo, G., Luc, S., O'Brien, K., . . . Orkin, S. H. (2013). Histone demethylase Lsd1 represses hematopoietic stem and progenitor cell signatures during blood cell maturation. elife, 2, e00633. Ketharnathan, S., Leask, M., Boocock, J., Phipps-Green, A. J., Antony, J., O’Sullivan, J. M., . . . Horsfield, J. A. (2018). A non-coding genetic variant maximally associated with serum urate levels is functionally linked to HNF4A-dependent PDZK1 expression. Human molecular genetics, 27(22), 3964-3973.

243
Khan, A., Mathelier, A., & Zhang, X. (2018). Super-enhancers are transcriptionally more active and cell type-specific than stretch enhancers. Epigenetics, 13(9), 910-922. Khan, A., & Zhang, X. (2016). dbSUPER: a database of super-enhancers in mouse and human genome. Nucleic Acids Research, 44(D1), D164-D171. doi:10.1093/nar/gkv1002 Kichaev, G., Bhatia, G., Loh, P.-R., Gazal, S., Burch, K., Freund, M. K., . . . Price, A. L. (2019). Leveraging Polygenic Functional Enrichment to Improve GWAS Power. The American Journal of Human Genetics, 104(1), 65-75. doi:10.1016/j.ajhg.2018.11.008 Kikin, O., D'Antonio, L., & Bagga, P. S. (2006). QGRS Mapper: a web-based server for predicting G-quadruplexes in nucleotide sequences. Nucleic Acids Research, 34(suppl 2), W676-W682. Kim, S. I., & Bresnick, E. H. (2007). Transcriptional control of erythropoiesis: emerging mechanisms and principles. Oncogene, 26, 6777. doi:10.1038/sj.onc.1210761 Kim, T., Yoshida, K., Kim, Y. K., Tyndel, M. S., Park, H. J., Choi, S. H., . . . Kim, D. D. (2016). Clonal dynamics in a single AML case tracked for 9 years reveals the complexity of leukemia progression. Leukemia, 30(2), 295-302. doi:10.1038/leu.2015.264 Kim, W., Barron, D. A., San Martin, R., Chan, K. S., Tran, L. L., Yang, F., . . . Rowley, D. R. (2014). RUNX1 is essential for mesenchymal stem cell proliferation and myofibroblast differentiation. Proceedings of the National Academy of Sciences, 111(46), 16389-16394. Klein, I. A., Resch, W., Jankovic, M., Oliveira, T., Yamane, A., Nakahashi, H., . . . Robbiani, D. F. (2011). Translocation-capture sequencing reveals the extent and nature of chromosomal rearrangements in B lymphocytes. Cell, 147(1), 95-106. Kloetgen, A., Thandapani, P., Tsirigos, A., & Aifantis, I. (2019). 3D Chromosomal Landscapes in Hematopoiesis and Immunity. Trends in Immunology, 40(9), 809-824. Koch, L. (2020). Exploring human genomic diversity with gnomAD. Nature Reviews Genetics, 21(8), 448-448. Koh, C. P., Ng, C., Nah, G., Wang, C. Q., Tergaonkar, V., Matsumura, T., . . . Osato, M. (2015). Hematopoietic stem cell enhancer: a powerful tool in stem cell biology. Histology and histopathology, 30(6), 661-672. Kojic, A., Cuadrado, A., De Koninck, M., Giménez-Llorente, D., Rodriguez-Corsino, M., Gómez-López, G., . . . Losada, A. (2018). Distinct roles of cohesin-SA1 and cohesin-SA2 in 3D chromosome organization. Nature structural & molecular biology, 25(6), 496-504. Kolovos, P., Knoch, T. A., Grosveld, F. G., Cook, P. R., & Papantonis, A. (2012). Enhancers and silencers: an integrated and simple model for their function. Epigenetics & chromatin, 5(1), 1-8. Kolterud, Å., & Carlsson, L. (1998). Expression of the LIM‐homeobox gene LH2 generates immortalized steel factor‐dependent multipotent hematopoietic precursors. The EMBO journal, 17(19), 5744-5756. Komori, T., Yagi, H., Nomura, S., Yamaguchi, A., Sasaki, K., Deguchi, K., . . . Kishimoto, T. (1997). Targeted Disruption of Cbfa1 Results in a Complete Lack of Bone Formation owing to Maturational Arrest of Osteoblasts. Cell, 89(5), 755-764. Kon, A., Shih, L.-Y., Minamino, M., Sanada, M., Shiraishi, Y., Nagata, Y., . . . Nakato, R. (2013). Recurrent mutations in multiple components of the cohesin complex in myeloid neoplasms. Nature genetics, 45(10), 1232-1237.

244
Kong, M., & Lee, C. (2013). Genetic associations with C-reactive protein level and white blood cell count in the KARE study. International Journal of Immunogenetics, 40(2), 120-125. doi:10.1111/j.1744-313X.2012.01141.x Koressaar, T., & Remm, M. (2007). Enhancements and modifications of primer design program Primer3. Bioinformatics, 23(10), 1289-1291. Kramer, I., Sigrist, M., de Nooij, J. C., Taniuchi, I., Jessell, T. M., & Arber, S. (2006). A role for Runx transcription factor signaling in dorsal root ganglion sensory neuron diversification. Neuron, 49(3), 379-393. Krijger, P. H., Geeven, G., Bianchi, V., Hilvering, C. R., & de Laat, W. (2020). 4C-seq from beginning to end: A detailed protocol for sample preparation and data analysis. Methods, 170, 17-32. Krutein, M. C., Hart, M. R., Anderson, D. J., Jeffery, J., Kotini, A. G., Dai, J., . . . Maguire, J. A. (2021). Restoring RUNX1 deficiency in RUNX1 familial platelet disorder by inhibiting its degradation. Blood Advances, 5(3), 687-699. Kulkeaw, K., & Sugiyama, D. (2012). Zebrafish erythropoiesis and the utility of fish as models of anemia. Stem cell research & therapy, 3(6), 1-11. Kuvardina, O. N., Herglotz, J., Kolodziej, S., Kohrs, N., Herkt, S., Wojcik, B., . . . Kumar, A. (2015). RUNX1 represses the erythroid gene expression program during megakaryocytic differentiation. Blood, blood-2014-2011-610519. Lai, F., Orom, U. A., Cesaroni, M., Beringer, M., Taatjes, D. J., Blobel, G. A., & Shiekhattar, R. (2013). Activating RNAs associate with Mediator to enhance chromatin architecture and transcription. Nature, 494(7438), 497-501. Lam, E. Y. N., Chau, J. Y., Kalev-Zylinska, M. L., Fountaine, T. M., Mead, R. S., Hall, C. J., . . . Flores, M. V. (2009). Zebrafish runx1 promoter-EGFP transgenics mark discrete sites of definitive blood progenitors. Blood, 113(6), 1241-1249. Lam, M. T., Cho, H., Lesch, H. P., Gosselin, D., Heinz, S., Tanaka-Oishi, Y., . . . Kosaka, M. (2013). Rev-Erbs repress macrophage gene expression by inhibiting enhancer-directed transcription. Nature, 498(7455), 511-515. Langmead, B., & Salzberg, S. L. (2012). Fast gapped-read alignment with Bowtie 2. Nature methods, 9(4), 357. Latger-Cannard, V., Philippe, C., Bouquet, A., Baccini, V., Alessi, M.-C., Ankri, A., . . . Daliphard, S. (2016). Haematological spectrum and genotype-phenotype correlations in nine unrelated families with RUNX1 mutations from the French network on inherited platelet disorders. Orphanet journal of rare diseases, 11(1), 1-15. Lawrence, M., Daujat, S., & Schneider, R. (2016). Lateral Thinking: How Histone Modifications Regulate Gene Expression. Trends Genet, 32(1), 42-56. doi:10.1016/j.tig.2015.10.007 Lawrence, M. S., Stojanov, P., Mermel, C. H., Robinson, J. T., Garraway, L. A., Golub, T. R., . . . Getz, G. (2014). Discovery and saturation analysis of cancer genes across 21 tumour types. Nature, 505(7484), 495-501. Lay, W. H., & Nussenzweig, V. (1968). RECEPTORS FOR COMPLEMENT ON LEUKOCYTES. The Journal of Experimental Medicine, 128(5), 991-1009. doi:10.1084/jem.128.5.991

245
Leeke, B., Marsman, J., O’Sullivan, J. M., & Horsfield, J. A. (2014). Cohesin mutations in myeloid malignancies: underlying mechanisms. Experimental Hematology & Oncology, 3, 13. Levanon, D., Bettoun, D., Harris‐Cerruti, C., Woolf, E., Negreanu, V., Eilam, R., . . . Fliegauf, M. (2002). The Runx3 transcription factor regulates development and survival of TrkC dorsal root ganglia neurons. The EMBO journal, 21(13), 3454-3463. Levanon, D., & Groner, Y. (2004). Structure and regulated expression of mammalian RUNX genes. Oncogene, 23(24), 4211-4219. Levine, M. (2010). Transcriptional enhancers in animal development and evolution. Current Biology, 20(17), R754-R763. Li, G., Ruan, X., Auerbach, R. K., Sandhu, K. S., Zheng, M., Wang, P., . . . Zhang, J. (2012). Extensive promoter-centered chromatin interactions provide a topological basis for transcription regulation. Cell, 148(1), 84-98. Li, Q.-L., Ito, K., Sakakura, C., Fukamachi, H., Inoue, K.-i., Chi, X.-Z., . . . Han, S.-B. (2002). Causal relationship between the loss of RUNX3 expression and gastric cancer. Cell, 109(1), 113-124. Li, W., Notani, D., Ma, Q., Tanasa, B., Nunez, E., Chen, A. Y., . . . Song, X. (2013a). Functional roles of enhancer RNAs for oestrogen-dependent transcriptional activation. Nature, 498(7455), 516-520. Li, X., & Fu, X.-D. (2019). Chromatin-associated RNAs as facilitators of functional genomic interactions. Nature Reviews Genetics, 20(9), 503-519. Li, Y., Huang, W., Niu, L., Umbach, D. M., Covo, S., & Li, L. (2013b). Characterization of constitutive CTCF/cohesin loci: a possible role in establishing topological domains in mammalian genomes. BMC genomics, 14(1), 553. Lieberman-Aiden, E., Van Berkum, N. L., Williams, L., Imakaev, M., Ragoczy, T., Telling, A., . . . Dorschner, M. O. (2009). Comprehensive mapping of long-range interactions reveals folding principles of the human genome. science, 326(5950), 289-293. Lieschke, G. J., & Currie, P. D. (2007). Animal models of human disease: zebrafish swim into view. Nature Reviews Genetics, 8(5), 353-367. Lindsley, R. C., Mar, B. G., Mazzola, E., Grauman, P. V., Shareef, S., Allen, S. L., . . . Erba, H. P. (2015). Acute myeloid leukemia ontogeny is defined by distinct somatic mutations. Blood, 125(9), 1367-1376. Liu, S., Zhang, J., Yin, L., Wang, X., Zheng, Y., Zhang, Y., . . . Zheng, P. (2020). The lncRNA RUNX1-IT1 regulates C-FOS transcription by interacting with RUNX1 in the process of pancreatic cancer proliferation, migration and invasion. Cell death & disease, 11(6), 1-17. Liu, X., Zhang, Q., Zhang, D. E., Zhou, C., Xing, H., Tian, Z., . . . Wang, J. (2009). Overexpression of an isoform of AML1 in acute leukemia and its potential role in leukemogenesis. Leukemia, 23, 739. doi:10.1038/leu.2008.350 Lizio, M., Harshbarger, J., Shimoji, H., Severin, J., Kasukawa, T., Sahin, S., . . . Ishikawa-Kato, S. (2015). Gateways to the FANTOM5 promoter level mammalian expression atlas. Genome Biology, 16(1), 22. Loder, F., Mutschler, B., Ray, R. J., Paige, C. J., Sideras, P., Torres, R., . . . Carsetti, R. (1999). B cell development in the spleen takes place in discrete steps and is determined by

246
the quality of B cell receptor–derived signals. The Journal of experimental medicine, 190(1), 75-90. Look, A. T. (1997). Oncogenic transcription factors in the human acute leukemias. science, 278(5340), 1059-1064. Losada, A. (2014). Cohesin in cancer: chromosome segregation and beyond. Nature Reviews Cancer, 14(6), 389-393. Love, M. I., Huber, W., & Anders, S. (2014). Moderated estimation of fold change and dispersion for RNA-seq data with DESeq2. Genome Biology, 15(12), 1-21. Lozzio, C. B., & Lozzio, B. B. (1975). Human chronic myelogenous leukemia cell-line with positive Philadelphia chromosome. Luddy, R. E., Champion, L. A., & Schwartz, A. D. (1978). A fatal myeloproliferative syndrome in a family with thrombocytopenia and platelet dysfunction. Cancer, 41(5), 1959-1963. Lupiáñez, D. G., Kraft, K., Heinrich, V., Krawitz, P., Brancati, F., Klopocki, E., . . . Laxova, R. (2015). Disruptions of topological chromatin domains cause pathogenic rewiring of gene-enhancer interactions. Cell, 161(5), 1012-1025. Maizels, N., & Gray, L. T. (2013). The G4 genome. PLoS genetics, 9(4), e1003468. Mann, A., & Bhatia, S. (2019). Zebrafish: A powerful model for understanding the functional relevance of noncoding region mutations in human genetic diseases. Biomedicines, 7(3), 71. Mansour, M. R., Abraham, B. J., Anders, L., Berezovskaya, A., Gutierrez, A., Durbin, A. D., . . . Silverman, L. B. (2014). An oncogenic super-enhancer formed through somatic mutation of a noncoding intergenic element. science, 346(6215), 1373-1377. Markova, E. N., Kantidze, O. L., & Razin, S. V. (2011). Transcriptional regulation and spatial organisation of the human AML1/RUNX1 gene. Journal of cellular biochemistry, 112(8), 1997-2005. Marsman, J. (2016). Transcriptional regulation of Runx1 gene. Pathology PhD thesis, Dunedin: Unversity of Otago. Marsman, J., & Horsfield, J. A. (2012). Long distance relationships: enhancer–promoter communication and dynamic gene transcription. Biochimica et Biophysica Acta (BBA) - Gene Regulatory Mechanisms, 1819(11), 1217-1227. Marsman, J., O'Neill, A. C., Kao, B. R., Rhodes, J. M., Meier, M., Antony, J., . . . Horsfield, J. A. (2014). Cohesin and CTCF differentially regulate spatiotemporal runx1 expression during zebrafish development. Biochimica et Biophysica Acta (BBA) - Gene Regulatory Mechanisms, 1839(1), 50-61. doi:10.1016/j.bbagrm.2013.11.007 Marsman, J., Thomas, A., Osato, M., O'Sullivan, J. M., & Horsfield, J. A. (2017). A DNA Contact Map for the Mouse Runx1 Gene Identifies Novel Hematopoietic Enhancers. bioRxiv. doi:10.1101/147793 Martin, C. S., Moriyama, A., & Zon, L. I. (2011). Hematopoietic stem cells, hematopoiesis and disease: lessons from the zebrafish model. Genome Medicine, 3(12), 83. Martincorena, I., Roshan, A., Gerstung, M., Ellis, P., Van Loo, P., McLaren, S., . . . Tubio, J. M. (2015). High burden and pervasive positive selection of somatic mutations in normal human skin. science, 348(6237), 880-886.

247
Martinez, M., Hinojosa, M., Trombly, D., Morin, V., Stein, J., & Stein, G. (2016). Transcriptional Auto-Regulation of RUNX1 P1 Promoter. PLoS One, 11. doi:10.1371/journal.pone.0149119 Matheny, C. J., Speck, M. E., Cushing, P. R., Zhou, Y., Corpora, T., Regan, M., . . . Gu, T. L. (2007). Disease mutations in RUNX1 and RUNX2 create nonfunctional, dominant‐negative, or hypomorphic alleles. The EMBO journal, 26(4), 1163-1175. Maurano, M. T., Humbert, R., Rynes, E., Thurman, R. E., Haugen, E., Wang, H., . . . Brody, J. (2012). Systematic localization of common disease-associated variation in regulatory DNA. science, 337(6099), 1190-1195. Mazumdar, C., Shen, Y., Xavy, S., Zhao, F., Reinisch, A., Li, R., . . . Chan, S. M. (2015). Leukemia-associated cohesin mutants dominantly enforce stem cell programs and impair human hematopoietic progenitor differentiation. Cell Stem Cell, 17(6), 675-688. McGahon, A. J., Brown, D. G., Martin, S. J., Amarante-Mendes, G. P., Cotter, T. G., Cohen, G. M., & Green, D. R. (1997). Downregulation of Bcr-Abl in K562 cells restores susceptibility to apoptosis: characterization of the apoptotic death. Cell Death & Differentiation, 4(2), 95-104. Meier, M., Grant, J., Dowdle, A., Thomas, A., Gerton, J., Collas, P., . . . Horsfield, J. A. (2018). Cohesin facilitates zygotic genome activation in zebrafish. Development, 145(1). doi:10.1242/dev.156521 Melo, C. A., Drost, J., Wijchers, P. J., van de Werken, H., de Wit, E., Vrielink, J. A. O., . . . Kalluri, R. (2013). eRNAs are required for p53-dependent enhancer activity and gene transcription. Molecular cell, 49(3), 524-535. Merkenschlager, M., & Nora, E. P. (2016). CTCF and cohesin in genome folding and transcriptional gene regulation. Annual review of genomics and human genetics, 17, 17-43. Meyers, S., Downing, J., & Hiebert, S. (1993). Identification of AML-1 and the (8; 21) translocation protein (AML-1/ETO) as sequence-specific DNA-binding proteins: the runt homology domain is required for DNA binding and protein-protein interactions. Molecular and cellular biology, 13(10), 6336-6345. Michaelis, C., Ciosk, R., & Nasmyth, K. (1997). Cohesins: chromosomal proteins that prevent premature separation of sister chromatids. Cell, 91(1), 35-45. Mifsud, B., Tavares-Cadete, F., Young, A. N., Sugar, R., Schoenfelder, S., Ferreira, L., . . . Ewels, P. A. (2015). Mapping long-range promoter contacts in human cells with high-resolution capture Hi-C. Nature genetics, 47(6), 598. Mikhaylichenko, O., Bondarenko, V., Harnett, D., Schor, I. E., Males, M., Viales, R. R., & Furlong, E. E. (2018). The degree of enhancer or promoter activity is reflected by the levels and directionality of eRNA transcription. Genes & development, 32(1), 42-57. Mill, C. P., Fiskus, W., DiNardo, C. D., Qian, Y., Raina, K., Rajapakshe, K., . . . Khoury, J. D. (2019). RUNX1-targeted therapy for AML expressing somatic or germline mutation in RUNX1. Blood, 134(1), 59-73. Miyoshi, H., Kozu, T., Shimizu, K., Enomoto, K., Maseki, N., Kaneko, Y., . . . Ohki, M. (1993). The t(8; 21) translocation in acute myeloid leukemia results in production of an AML1-MTG8 fusion transcript. The EMBO journal, 12(7), 2715. Miyoshi, H., Shimizu, K., Kozu, T., Maseki, N., Kaneko, Y., & Ohki, M. (1991). t (8; 21) breakpoints on chromosome 21 in acute myeloid leukemia are clustered within a limited

248
region of a single gene, AML1. Proceedings of the National Academy of Sciences, 88(23), 10431-10434. Mullenders, J., Aranda-Orgilles, B., Lhoumaud, P., Keller, M., Pae, J., Wang, K., . . . Gong, Y. (2015). Cohesin loss alters adult hematopoietic stem cell homeostasis, leading to myeloproliferative neoplasms. Journal of Experimental Medicine, 212(11), 1833-1850. Murakawa, Y., Yoshihara, M., Kawaji, H., Nishikawa, M., Zayed, H., Suzuki, H., . . . Consortium, F. (2016). Enhanced identification of transcriptional enhancers provides mechanistic insights into diseases. Trends in Genetics, 32(2), 76-88. Murati, A., Brecqueville, M., Devillier, R., Mozziconacci, M.-J., Gelsi-Boyer, V., & Birnbaum, D. (2012). Myeloid malignancies: mutations, models and management. BMC cancer, 12(1), 304. Nasmyth, K., & Haering, C. H. (2009). Cohesin: its roles and mechanisms. Annual review of genetics, 43. Ng, C. E. L., Yokomizo, T., Yamashita, N., Cirovic, B., Jin, H., Wen, Z., . . . Osato, M. (2010). A Runx1 intronic enhancer marks hemogenic endothelial cells and hematopoietic stem cells. Stem Cells, 28(10), 1869-1881. Nie, Y., Zhou, L., Wang, H., Chen, N., Jia, L., Wang, C., . . . Niu, C. (2019). Profiling the epigenetic interplay of lncRNA RUNXOR and oncogenic RUNX1 in breast cancer cells by gene in situ cis-activation. American journal of cancer research, 9(8), 1635. North, T., Gu, T. L., Stacy, T., Wang, Q., Howard, L., Binder, M., . . . Speck, N. A. (1999). Cbfa2 is required for the formation of intra-aortic hematopoietic clusters. Development, 126(11), 2563-2575. North, T. E., Stacy, T., Matheny, C. J., Speck, N. A., & de Bruijn, M. F. (2004). Runx1 is expressed in adult mouse hematopoietic stem cells and differentiating myeloid and lymphoid cells, but not in maturing erythroid cells. Stem Cells, 22(2), 158-168. doi:10.1634/stemcells.22-2-158 Northcott, P. A., Lee, C., Zichner, T., Stütz, A. M., Erkek, S., Kawauchi, D., . . . Sturm, D. (2014). Enhancer hijacking activates GFI1 family oncogenes in medulloblastoma. Nature, 511(7510), 428-434. Nottingham, W. T., Jarratt, A., Burgess, M., Speck, C. L., Cheng, J.-F., Prabhakar, S., . . . Kong-a-San, J. (2007). Runx1-mediated hematopoietic stem-cell emergence is controlled by a Gata/Ets/SCL-regulated enhancer. Blood, 110(13), 4188-4197. Nozawa, R.-S., & Gilbert, N. (2019). RNA: nuclear glue for folding the genome. Trends in cell biology, 29(3), 201-211. Nuebler, J., Fudenberg, G., Imakaev, M., Abdennur, N., & Mirny, L. A. (2018). Chromatin organization by an interplay of loop extrusion and compartmental segregation. Proceedings of the National Academy of Sciences, 115(29), E6697-E6706. O'Donnell, M. R., Abboud, C. N., Altman, J., Appelbaum, F. R., Arber, D. A., Attar, E., . . . Goorha, S. (2012). Acute myeloid leukemia. Journal of the National Comprehensive Cancer Network, 10(8), 984-1021. Ochi, Y., Kon, A., Sakata, T., Nakagawa, M. M., Nakazawa, N., Kakuta, M., . . . Morishita, D. (2020). Combined Cohesin–RUNX1 Deficiency Synergistically Perturbs Chromatin Looping and Causes Myelodysplastic Syndromes. Cancer discovery, 10(6), 836-853.

249
Okuda, T., Nishimura, M., Nakao, M., & Fujitaa, Y. (2001). RUNX1/AML1: a central player in hematopoiesis. International journal of hematology, 74(3), 252-257. Okuda, T., Van Deursen, J., Hiebert, S. W., Grosveld, G., & Downing, J. R. (1996). AML1, the target of multiple chromosomal translocations in human leukemia, is essential for normal fetal liver hematopoiesis. Cell, 84(2), 321-330. Ong, C. T., & Corces, V. G. (2012). Enhancers: emerging roles in cell fate specification. EMBO reports, 13(5), 423-430. Opneja, A., Kapoor, S., & Stavrou, E. X. (2019). Contribution of platelets, the coagulation and fibrinolytic systems to cutaneous wound healing. Thrombosis research, 179, 56-63. Orkin, S. H., & Zon, L. I. (2008). Hematopoiesis: an evolving paradigm for stem cell biology. Cell, 132(4), 631-644. Orlando, G., Law, P. J., Cornish, A. J., Dobbins, S. E., Chubb, D., Broderick, P., . . . Osborne, C. S. (2018). Promoter capture Hi-C-based identification of recurrent noncoding mutations in colorectal cancer. Nature genetics, 50(10), 1375-1380. Otto, F., Kanegane, H., & Mundlos, S. (2002). Mutations in the RUNX2 gene in patients with cleidocranial dysplasia. Human mutation, 19(3), 209-216. Owen, C. J., Toze, C. L., Koochin, A., Forrest, D. L., Smith, C. A., Stevens, J. M., . . . Leber, B. (2008). Five new pedigrees with inherited RUNX1 mutations causing familial platelet disorder with propensity to myeloid malignancy. Blood, The Journal of the American Society of Hematology, 112(12), 4639-4645. Paguio, A., Almond, B., Fan, F., Stecha, P., Garvin, D., Wood, M., & Wood, K. (2005). pGL4 Vectors: A new generation of luciferase reporter vectors. Promega Notes, 89(4). Paik, E. J., & Zon, L. I. (2010). Hematopoietic development in the zebrafish. Int J Dev Biol, 54(6-7), 1127-1137. doi:10.1387/ijdb.093042ep Pang, B., & Snyder, M. P. (2020). Systematic identification of silencers in human cells. Nature genetics, 52(3), 254-263. Panigrahi, A. K., Foulds, C. E., Lanz, R. B., Hamilton, R. A., Yi, P., Lonard, D. M., . . . O’Malley, B. W. (2018). SRC-3 coactivator governs dynamic estrogen-induced chromatin looping interactions during transcription. Molecular cell, 70(4), 679-694. e677. Papaemmanuil, E., Gerstung, M., Bullinger, L., Gaidzik, V. I., Paschka, P., Roberts, N. D., . . . Campbell, P. J. (2016). Genomic Classification and Prognosis in Acute Myeloid Leukemia. N Engl J Med, 374(23), 2209-2221. doi:10.1056/NEJMoa1516192 Parker, S. C., Stitzel, M. L., Taylor, D. L., Orozco, J. M., Erdos, M. R., Akiyama, J. A., . . . Black, B. L. (2013). Chromatin stretch enhancer states drive cell-specific gene regulation and harbor human disease risk variants. Proceedings of the National Academy of Sciences, 110(44), 17921-17926. Pasquali, L., Gaulton, K. J., Rodríguez-Seguí, S. A., Mularoni, L., Miguel-Escalada, I., Akerman, İ., . . . van de Bunt, M. (2014). Pancreatic islet enhancer clusters enriched in type 2 diabetes risk-associated variants. Nature genetics, 46(2), 136-143. Patel, N. S., Klett, J., Pilarzyk, K., ik Lee, D., Kass, D., Menniti, F. S., & Kelly, M. P. (2018). Identification of new PDE9A isoforms and how their expression and subcellular compartmentalization in the brain change across the life span. Neurobiology of aging, 65, 217-234.

250
Peifer, M., Hertwig, F., Roels, F., Dreidax, D., Gartlgruber, M., Menon, R., . . . Heuckmann, J. M. (2015). Telomerase activation by genomic rearrangements in high-risk neuroblastoma. Nature, 526(7575), 700-704. Pencovich, N., Jaschek, R., Tanay, A., & Groner, Y. (2011). Dynamic combinatorial interactions of RUNX1 and cooperating partners regulates megakaryocytic differentiation in cell line models. Blood, 117(1), e1-e14. Peng, Y., & Zhang, Y. (2018). Enhancer and super‐enhancer: Positive regulators in gene transcription. Animal models and experimental medicine, 1(3), 169-179. Pennacchio, L. A., Ahituv, N., Moses, A. M., Prabhakar, S., Nobrega, M. A., Shoukry, M., . . . Lewis, K. D. (2006). In vivo enhancer analysis of human conserved non-coding sequences. Nature, 444(7118), 499-502. Phillips, J. E., & Corces, V. G. (2009). CTCF: master weaver of the genome. Cell, 137(7), 1194-1211. Phillips-Cremins, J. E., & Corces, V. G. (2013). Chromatin insulators: linking genome organization to cellular function. Molecular cell, 50(4), 461-474. Pokholok, D. K., Harbison, C. T., Levine, S., Cole, M., Hannett, N. M., Lee, T. I., . . . Young, R. A. (2005). Genome-wide map of nucleosome acetylation and methylation in yeast. Cell, 122(4), 517-527. doi:10.1016/j.cell.2005.06.026 Pope, B. D., Ryba, T., Dileep, V., Yue, F., Wu, W., Denas, O., . . . Gilbert, D. M. (2014). Topologically associating domains are stable units of replication-timing regulation. Nature, 515(7527), 402-405. doi:10.1038/nature13986 Popel, A. S. (1989). Theory of oxygen transport to tissue. Crit Rev Biomed Eng, 17(3), 257-321. Pozner, A., Lotem, J., Xiao, C., Goldenberg, D., Brenner, O., Negreanu, V., . . . Groner, Y. (2007). Developmentally regulated promoter-switch transcriptionally controls Runx1 function during embryonic hematopoiesis. BMC developmental biology, 7(1), 1-19. Prensner, J. R., Iyer, M. K., Sahu, A., Asangani, I. A., Cao, Q., Patel, L., . . . Ghadessi, M. (2013). The long noncoding RNA SChLAP1 promotes aggressive prostate cancer and antagonizes the SWI/SNF complex. Nature genetics, 45(11), 1392. Puente, X. S., Beà, S., Valdés-Mas, R., Villamor, N., Gutiérrez-Abril, J., Martín-Subero, J. I., . . . Aymerich, M. (2015). Non-coding recurrent mutations in chronic lymphocytic leukaemia. Nature, 526(7574), 519-524. Raab, J. R., & Kamakaka, R. T. (2010). Insulators and promoters: closer than we think. Nature Reviews Genetics, 11(6), 439-446. Rahnamoun, H., Lee, J., Sun, Z., Lu, H., Ramsey, K. M., Komives, E. A., & Lauberth, S. M. (2018). RNAs interact with BRD4 to promote enhanced chromatin engagement and transcription activation. Nature structural & molecular biology, 25(8), 687-697. Rainger, J. K., Bhatia, S., Bengani, H., Gautier, P., Rainger, J., Pearson, M., . . . Palinkasova, B. (2014). Disruption of SATB2 or its long-range cis-regulation by SOX9 causes a syndromic form of Pierre Robin sequence. Human molecular genetics, 23(10), 2569-2579. Raney, B. J., Dreszer, T. R., Barber, G. P., Clawson, H., Fujita, P. A., Wang, T., . . . Kent, W. J. (2014). Track data hubs enable visualization of user-defined genome-wide annotations on the UCSC Genome Browser. Bioinformatics, 30(7), 1003-1005. doi:10.1093/bioinformatics/btt637
251
Rao, S. S., Huntley, M. H., Durand, N. C., Stamenova, E. K., Bochkov, I. D., Robinson, J. T., . . . Lander, E. S. (2014). A 3D map of the human genome at kilobase resolution reveals principles of chromatin looping. Cell, 159(7), 1665-1680. Rasighaemi, P., Basheer, F., Liongue, C., & Ward, A. C. (2015). Zebrafish as a model for leukemia and other hematopoietic disorders. Journal of hematology & oncology, 8, 29-29. doi:10.1186/s13045-015-0126-4 Ravi, V., Bhatia, S., Gautier, P., Loosli, F., Tay, B.-H., Tay, A., . . . Brenner, S. (2013). Sequencing of Pax6 loci from the elephant shark reveals a family of Pax6 genes in vertebrate genomes, forged by ancient duplications and divergences. PLoS Genet, 9(1), e1003177. Raviram, R., Rocha, P. P., Müller, C. L., Miraldi, E. R., Badri, S., Fu, Y., . . . Bonneau, R. (2016). 4C-ker: a method to reproducibly identify genome-wide interactions captured by 4C-Seq experiments. PLoS Computational Biology, 12(3), e1004780. Rawat, V. P., Cusan, M., Deshpande, A., Hiddemann, W., Quintanilla-Martinez, L., Humphries, R. K., . . . Buske, C. (2004). Ectopic expression of the homeobox gene Cdx2 is the transforming event in a mouse model of t (12; 13)(p13; q12) acute myeloid leukemia. Proceedings of the National Academy of Sciences, 101(3), 817-822. Rebolledo-Jaramillo, B., Alarcon, R. A., Fernandez, V. I., & Gutierrez, S. E. (2014). Cis-regulatory elements are harbored in Intron5 of the RUNX1 gene. BMC genomics, 15(1), 225. Reddy, E., Rao, V. N., & Papas, T. S. (1987). The erg gene: a human gene related to the ets oncogene. Proceedings of the National Academy of Sciences, 84(17), 6131-6135. Reikvam, H., Hatfield, K. J., Kittang, A. O., Hovland, R., & Bruserud, Ø. (2011). Acute myeloid leukemia with the t (8; 21) translocation: clinical consequences and biological implications. Journal of Biomedicine and Biotechnology, 2011. Rennert, J., Coffman, J. A., Mushegian, A. R., & Robertson, A. J. (2003). The evolution of Runx genes I. A comparative study of sequences from phylogenetically diverse model organisms. BMC evolutionary biology, 3(1), 4. Rhodes, J. M., McEwan, M., & Horsfield, J. A. (2011). Gene regulation by cohesin in cancer: is the ring an unexpected party to proliferation? Molecular Cancer Research, 9(12), 1587-1607. Ritter, D. I., Li, Q., Kostka, D., Pollard, K. S., Guo, S., & Chuang, J. H. (2010). The importance of being cis: evolution of orthologous fish and mammalian enhancer activity. Molecular biology and evolution, 27(10), 2322-2332. Rocquain, J., Gelsi‐Boyer, V., Adélaïde, J., Murati, A., Carbuccia, N., Vey, N., . . . Chaffanet, M. (2010). Alteration of cohesin genes in myeloid diseases. American journal of hematology, 85(9), 717-719. Röllig, C., Serve, H., Hüttmann, A., Noppeney, R., Müller-Tidow, C., Krug, U., . . . Einsele, H. (2015). Addition of sorafenib versus placebo to standard therapy in patients aged 60 years or younger with newly diagnosed acute myeloid leukaemia (SORAML): a multicentre, phase 2, randomised controlled trial. The lancet oncology, 16(16), 1691-1699. Romano, S. N., & Gorelick, D. A. (2014). Semi-automated Imaging of Tissue-specific Fluorescence in Zebrafish Embryos. Journal of Visualized Experiments(87), e51533-e51533. Rosenbloom, K. R., Sloan, C. A., Malladi, V. S., Dreszer, T. R., Learned, K., Kirkup, V. M., . . . Kent, W. J. (2013). ENCODE Data in the UCSC Genome Browser: year 5 update. Nucleic Acids Research, 41(D1), D56-D63. doi:10.1093/nar/gks1172

252
Ruffalo, M., Husseinzadeh, H., Makishima, H., Przychodzen, B., Ashkar, M., Koyutürk, M., . . . LaFramboise, T. (2015). Whole-exome sequencing enhances prognostic classification of myeloid malignancies. Journal of biomedical informatics, 58, 104-113. Sabari, B. R., Dall’Agnese, A., Boija, A., Klein, I. A., Coffey, E. L., Shrinivas, K., . . . Manteiga, J. C. (2018). Coactivator condensation at super-enhancers links phase separation and gene control. science, 361(6400). Sakurai, H., Harada, Y., Ogata, Y., Kagiyama, Y., Shingai, N., & Doki, N. (2017). Overexpression of RUNX1 short isoform has an important role in the development of myelodysplastic/myeloproliferative neoplasms. Blood Adv, 1. doi:10.1182/bloodadvances.2016002725 Sanyal, A., Baù, D., Martí-Renom, M. A., & Dekker, J. (2011). Chromatin globules: a common motif of higher order chromosome structure? Current opinion in cell biology, 23(3), 325-331. Sartorelli, V., & Lauberth, S. M. (2020). Enhancer RNAs are an important regulatory layer of the epigenome. Nature structural & molecular biology, 1-8. Scarola, M., Comisso, E., Pascolo, R., Chiaradia, R., Marion, R. M., Schneider, C., . . . Benetti, R. (2015). Epigenetic silencing of Oct4 by a complex containing SUV39H1 and Oct4 pseudogene lncRNA. Nature communications, 6(1), 1-13. Schaaf, C. A., Misulovin, Z., Sahota, G., Siddiqui, A. M., Schwartz, Y. B., Kahn, T. G., . . . Dorsett, D. (2009). Regulation of the Drosophila Enhancer of split and invected-engrailed gene complexes by sister chromatid cohesion proteins. PLoS One, 4(7), e6202. Schaukowitch, K., Joo, J.-Y., Liu, X., Watts, J. K., Martinez, C., & Kim, T.-K. (2014). Enhancer RNA facilitates NELF release from immediate early genes. Molecular cell, 56(1), 29-42. Schierding, W., Horsfield, J. A., & O'Sullivan, J. M. (2020). Low tolerance for transcriptional variation at cohesin genes is accompanied by functional links to disease-relevant pathways. Journal of medical genetics. Schlenk, R., Benner, A., Hartmann, F., Del Valle, F., Weber, C., Pralle, H., . . . Weber, W. (2003). Risk-adapted postremission therapy in acute myeloid leukemia: results of the German multicenter AML HD93 treatment trial. Leukemia, 17(8), 1521-1528. Schnake, N., Hinojosa, M., & Gutiérrez, S. (2019). Identification of a novel long non-coding RNA within RUNX1 intron 5. Human Genomics, 13(1), 33. Schütte, J., Wang, H., Antoniou, S., Jarratt, A., Wilson, N. K., Riepsaame, J., . . . Kinston, S. J. (2016). An experimentally validated network of nine haematopoietic transcription factors reveals mechanisms of cell state stability. Shallis, R. M., Ahmad, R., & Zeidan, A. M. (2018). The genetic and molecular pathogenesis of myelodysplastic syndromes. European journal of haematology, 101(3), 260-271. Sherf, B. A., Navarro, S. L., Hannah, R. R., & Wood, K. V. (1996). Dual-Luciferase® reporter assay: An advanced co-reporter technology integrating firefly and Renilla luciferase assays. Promega Notes, 57(2). Shih, A. H., Abdel-Wahab, O., Patel, J. P., & Levine, R. L. (2012). The role of mutations in epigenetic regulators in myeloid malignancies. Nature Reviews Cancer, 12(9), 599-612. Shimizu, K., Ichikawa, H., Tojo, A., Kaneko, Y., Maseki, N., Hayashi, Y., . . . Ohki, M. (1993). An ets-related gene, ERG, is rearranged in human myeloid leukemia with t (16; 21)

253
chromosomal translocation. Proceedings of the National Academy of Sciences, 90(21), 10280-10284. Shin, H. Y. (2019). The structural and functional roles of CTCF in the regulation of cell type-specific and human disease-associated super-enhancers. Genes & genomics, 41(3), 257-265. Shin, Y., Chang, Y.-C., Lee, D. S., Berry, J., Sanders, D. W., Ronceray, P., . . . Brangwynne, C. P. (2018). Liquid nuclear condensates mechanically sense and restructure the genome. Cell, 175(6), 1481-1491. e1413. Shlush, L. I., Zandi, S., Mitchell, A., Chen, W. C., Brandwein, J. M., Gupta, V., . . . Dick, J. E. (2014). Identification of pre-leukaemic haematopoietic stem cells in acute leukaemia. Nature, 506(7488), 328-333. doi:10.1038/nature13038 Sigova, A. A., Abraham, B. J., Ji, X., Molinie, B., Hannett, N. M., Guo, Y. E., . . . Young, R. A. (2015). Transcription factor trapping by RNA in gene regulatory elements. science, 350(6263), 978-981. Simonis, M., Klous, P., Splinter, E., Moshkin, Y., Willemsen, R., de Wit, E., . . . de Laat, W. (2006). Nuclear organization of active and inactive chromatin domains uncovered by chromosome conformation capture–on-chip (4C). Nature genetics, 38(11), 1348-1354. Smemo, S., Tena, J. J., Kim, K.-H., Gamazon, E. R., Sakabe, N. J., Gomez-Marin, C., . . . Nobrega, M. A. (2014). Obesity-associated variants within FTO form long-range functional connections with IRX3. Nature, 507(7492), 371-375. doi:10.1038/nature13138 Solomon, D. A., Kim, J.-S., Bondaruk, J., Shariat, S. F., Wang, Z.-F., Elkahloun, A. G., . . . Zhang, S. (2013). Frequent truncating mutations of STAG2 in bladder cancer. Nature genetics, 45(12), 1428-1430. Song, W.-J., Sullivan, M. G., Legare, R. D., Hutchings, S., Tan, X., Kufrin, D., . . . Hock, R. (1999). Haploinsufficiency of CBFA2 causes familial thrombocytopenia with propensity to develop acute myelogenous leukaemia. Nature genetics, 23(2), 166-175. Sood, R., Kamikubo, Y., & Liu, P. (2017). Role of RUNX1 in hematological malignancies. Blood, 129(15), 2070-2082. Spieler, D., Kaffe, M., Knauf, F., Bessa, J., Tena, J. J., Giesert, F., . . . Horsch, M. (2014). Restless legs syndrome-associated intronic common variant in Meis1 alters enhancer function in the developing telencephalon. Genome Research, 24(4), 592-603. Splinter, E., & De Laat, W. (2011). The complex transcription regulatory landscape of our genome: control in three dimensions. The EMBO journal, 30(21), 4345-4355. Splinter, E., Heath, H., Kooren, J., Palstra, R.-J., Klous, P., Grosveld, F., . . . de Laat, W. (2006). CTCF mediates long-range chromatin looping and local histone modification in the β-globin locus. Genes & development, 20(17), 2349-2354. Stadhouders, R., Filion, G. J., & Graf, T. (2019). Transcription factors and 3D genome conformation in cell-fate decisions. Nature, 569(7756), 345-354. Stein, E. M. (2015). Molecularly targeted therapies for acute myeloid leukemia. Hematology, 2015(1), 579-583. Stephens, P. J., Tarpey, P. S., Davies, H., Van Loo, P., Greenman, C., Wedge, D. C., . . . Bignell, G. R. (2012). The landscape of cancer genes and mutational processes in breast cancer. Nature, 486(7403), 400-404.

254
Stone, R. M., Mandrekar, S., Sanford, B. L., Geyer, S., Bloomfield, C. D., Dohner, K., . . . Klisovic, R. B. (2015). The multi-kinase inhibitor midostaurin (M) prolongs survival compared with placebo (P) in combination with daunorubicin (D)/cytarabine (C) induction (ind), high-dose C consolidation (consol), and as maintenance (maint) therapy in newly diagnosed acute myeloid leukemia (AML) patients (pts) age 18-60 with FLT3 mutations (muts): an international prospective randomized (rand) P-controlled double-blind trial (CALGB 10603/RATIFY [Alliance]). In: American Society of Hematology Washington, DC. Stranger, B. E., Nica, A. C., Forrest, M. S., Dimas, A., Bird, C. P., Beazley, C., . . . Koller, D. (2007). Population genomics of human gene expression. Nature genetics, 39(10), 1217-1224. Strom, L., & Dorsett, D. (2012). The ancient and evolving roles of cohesin in gene expression and DNA repair. Current Biology, 22(7), R240-250. Sun, C., Chang, L., & Zhu, X. (2017). Pathogenesis of ETV6/RUNX1-positive childhood acute lymphoblastic leukemia and mechanisms underlying its relapse. Oncotarget, 8(21), 35445. Sun, Q., Hao, Q., & Prasanth, K. V. (2018). Nuclear long noncoding RNAs: key regulators of gene expression. Trends in Genetics, 34(2), 142-157. Sweeney, C., & Vyas, P. (2019). The graft-versus-leukemia effect in AML. Frontiers in oncology, 9, 1217. Swift, S., Lorens, J., Achacoso, P., & Nolan, G. P. (1999). Rapid Production of Retroviruses for Efficient Gene Delivery to Mammalian Cells Using 293T Cell–Based Systems. Current Protocols in Immunology, 31(1), 10.17.14-10.17.29. doi:doi:10.1002/0471142735.im1017cs31 Tang, X., Sun, L., Wang, G., Chen, B., & Luo, F. (2018). RUNX1: A Regulator of NF-κB Signaling in Pulmonary Diseases. Current Protein and Peptide Science, 19(2), 172-178. Taoudi, S., Bee, T., Hilton, A., Knezevic, K., Scott, J., Willson, T. A., . . . Hilton, D. J. (2011). ERG dependence distinguishes developmental control of hematopoietic stem cell maintenance from hematopoietic specification. Genes Dev, 25(3), 251-262. doi:10.1101/gad.2009211 Taub, R., Kirsch, I., Morton, C., Lenoir, G., Swan, D., Tronick, S., . . . Leder, P. (1982). Translocation of the c-myc gene into the immunoglobulin heavy chain locus in human Burkitt lymphoma and murine plasmacytoma cells. Proceedings of the National Academy of Sciences, 79(24), 7837-7841. Taylor, C. F., Platt, F. M., Hurst, C. D., Thygesen, H. H., & Knowles, M. A. (2014). Frequent inactivating mutations of STAG2 in bladder cancer are associated with low tumour grade and stage and inversely related to chromosomal copy number changes. Human molecular genetics, 23(8), 1964-1974. Teittinen, K. J., Grönroos, T., Parikka, M., Rämet, M., & Lohi, O. (2012). The zebrafish as a tool in leukemia research. Leukemia research, 36(9), 1082-1088. Theriault, F. M., Roy, P., & Stifani, S. (2004). AML1/Runx1 is important for the development of hindbrain cholinergic branchiovisceral motor neurons and selected cranial sensory neurons. Proceedings of the National Academy of Sciences, 101(28), 10343-10348. Thol, F., Bollin, R., Gehlhaar, M., Walter, C., Dugas, M., Suchanek, K. J., . . . Wichmann, M. (2014). Mutations in the cohesin complex in acute myeloid leukemia: clinical and prognostic implications. Blood, 123(6), 914-920.

255
Thomas, A. (2015). Investigating the function of cis-regulatory elements for Runx1. Master of Science (Genetics) Thesis, Dunedin:University of Otago. Thoms, J. A., Birger, Y., Foster, S., Knezevic, K., Kirschenbaum, Y., Chandrakanthan, V., . . . Oram, S. H. (2011). ERG promotes T-acute lymphoblastic leukemia and is transcriptionally regulated in leukemic cells by a stem cell enhancer. Blood, 117(26), 7079-7089. Thota, S., Viny, A. D., Makishima, H., Spitzer, B., Radivoyevitch, T., Przychodzen, B., . . . Maciejewski, J. P. (2014). Genetic alterations of the cohesin complex genes in myeloid malignancies. Blood, 124(11), 1790-1798. doi:10.1182/blood-2014-04-567057 Thurman, R. E., Rynes, E., Humbert, R., Vierstra, J., Maurano, M. T., Haugen, E., . . . Vernot, B. (2012). The accessible chromatin landscape of the human genome. Nature, 489(7414), 75-82. Tighe, J. E., Daga, A., & Calabi, F. (1993). Translocation breakpoints are clustered on both chromosome 8 and chromosome 21 in the t (8; 21) of acute myeloid leukemia. Blood, 81(3), 592-596. Todaro, G. J., & Green, H. (1963). Quantitative studies of the growth of mouse embryo cells in culture and their development into established lines. Journal of Cell Biology, 17, 299-313. Trinchieri, G. (1989). Biology of Natural Killer Cells. In F. J. Dixon (Ed.), Advances in Immunology (Vol. 47, pp. 187-376): Academic Press. Tsai, C.-H., Hou, H.-A., Tang, J.-L., Kuo, Y.-Y., Chiu, Y.-C., Lin, C.-C., . . . Liu, M.-C. (2017). Prognostic impacts and dynamic changes of cohesin complex gene mutations in de novo acute myeloid leukemia. Blood cancer journal, 7(12), 1-7. Tsai, P.-F., Dell’Orso, S., Rodriguez, J., Vivanco, K. O., Ko, K.-D., Jiang, K., . . . Tran, M. (2018). A muscle-specific enhancer RNA mediates cohesin recruitment and regulates transcription in trans. Molecular cell, 71(1), 129-141. e128. Tuerk, C., & Gold, L. (1990). Systematic evolution of ligands by exponential enrichment: RNA ligands to bacteriophage T4 DNA polymerase. science, 249(4968), 505-510. Tyner, J. W., Tognon, C. E., Bottomly, D., Wilmot, B., Kurtz, S. E., Savage, S. L., . . . Abel, M. (2018). Functional genomic landscape of acute myeloid leukaemia. Nature, 562(7728), 526-531. Untergasser, A., Cutcutache, I., Koressaar, T., Ye, J., Faircloth, B. C., Remm, M., & Rozen, S. G. (2012). Primer3 - new capabilities and interfaces. Nucleic Acids Research, 40(15), e115-e115. van de Werken, H. J., de Vree, P. J., Splinter, E., Holwerda, S. J., Klous, P., de Wit, E., & de Laat, W. (2012a). 4C technology: protocols and data analysis. In Methods in enzymology (Vol. 513, pp. 89-112): Elsevier. Van De Werken, H. J., Landan, G., Holwerda, S. J., Hoichman, M., Klous, P., Chachik, R., . . . Bouwman, B. A. (2012b). Robust 4C-seq data analysis to screen for regulatory DNA interactions. Nature methods, 9(10), 969-972. Van Der Lelij, P., Lieb, S., Jude, J., Wutz, G., Santos, C. P., Falkenberg, K., . . . Hoffmann, T. (2017). Synthetic lethality between the cohesin subunits STAG1 and STAG2 in diverse cancer contexts. elife, 6, e26980. van Furth, R., Cohn, Z. A., Hirsch, J. G., Humphrey, J. H., Spector, W. G., & Langevoort, H. L. (1972). The mononuclear phagocyte system: a new classification of macrophages,

256
monocytes, and their precursor cells. Bulletin of the World Health Organization, 46(6), 845-852. Villar, D., Berthelot, C., Aldridge, S., Rayner, T. F., Lukk, M., Pignatelli, M., . . . Jasinska, A. J. (2015). Enhancer evolution across 20 mammalian species. Cell, 160(3), 554-566. Viny, A. D., Bowman, R. L., Liu, Y., Lavallée, V.-P., Eisman, S. E., Xiao, W., . . . Braunstein, S. (2019). Cohesin members Stag1 and Stag2 display distinct roles in chromatin accessibility and topological control of HSC self-renewal and differentiation. Cell Stem Cell, 25(5), 682-696. e688. Viny, A. D., Ott, C. J., Spitzer, B., Rivas, M., Meydan, C., Papalexi, E., . . . Chiu, A. (2015). Dose-dependent role of the cohesin complex in normal and malignant hematopoiesis. Journal of Experimental Medicine, 212(11), 1819-1832. Visel, A., Blow, M. J., Li, Z., Zhang, T., Akiyama, J. A., Holt, A., . . . Chen, F. (2009). ChIP-seq accurately predicts tissue-specific activity of enhancers. Nature, 457(7231), 854-858. Visel, A., Prabhakar, S., Akiyama, J. A., Shoukry, M., Lewis, K. D., Holt, A., . . . Pennacchio, L. A. (2008). Ultraconservation identifies a small subset of extremely constrained developmental enhancers. Nature genetics, 40(2), 158-160. Vukadin, L., Kim, J.-H., Park, E. Y., Stone, J. K., Ungerleider, N., Baddoo, M. C., . . . Giannini, H. (2020). SON inhibits megakaryocytic differentiation via repressing RUNX1 and the megakaryocytic gene expression program in acute megakaryoblastic leukemia. Cancer Gene Therapy, 1-16. Waldman, T. (2020). Emerging themes in cohesin cancer biology. Nature Reviews Cancer, 20(9), 504-515. Wang, B., Liu, Y., Hou, G., Wang, L., Lv, N., Xu, Y., . . . Jing, Y. (2016). Mutational spectrum and risk stratification of intermediate-risk acute myeloid leukemia patients based on next-generation sequencing. Oncotarget, 7(22), 32065. Wang, H., Li, W., Guo, R., Sun, J., Cui, J., Wang, G., . . . Hu, J. F. (2014). An intragenic long noncoding RNA interacts epigenetically with the RUNX1 promoter and enhancer chromatin DNA in hematopoietic malignancies. International journal of cancer, 135(12), 2783-2794. Wang, Q., Stacy, T., Binder, M., Marin-Padilla, M., Sharpe, A. H., & Speck, N. A. (1996). Disruption of the Cbfa2 gene causes necrosis and hemorrhaging in the central nervous system and blocks definitive hematopoiesis. Proceedings of the National Academy of Sciences, 93(8), 3444-3449. Wang, X., Cairns, M. J., & Yan, J. (2019). Super-enhancers in transcriptional regulation and genome organization. Nucleic Acids Research, 47(22), 11481-11496. Wang, X., Goodrich, K. J., Gooding, A. R., Naeem, H., Archer, S., Paucek, R. D., . . . Davidovich, C. (2017). Targeting of polycomb repressive complex 2 to RNA by short repeats of consecutive guanines. Molecular cell, 65(6), 1056-1067. e1055. Wang, Y., Song, F., Zhang, B., Zhang, L., Xu, J., Kuang, D., . . . Yue, F. (2018). The 3D Genome Browser: a web-based browser for visualizing 3D genome organization and long-range chromatin interactions. Genome Biology, 19(1), 151. doi:10.1186/s13059-018-1519-9 Ward, L. D., & Kellis, M. (2016). HaploReg v4: systematic mining of putative causal variants, cell types, regulators and target genes for human complex traits and disease. Nucleic Acids Research, 44(D1), D877-D881.

257
Waterston, R. H., Lindblad-Toh, K., Birney, E., Rogers, J., Abril, J. F., Agarwal, P., . . . Lander, E. S. (2002). Initial sequencing and comparative analysis of the mouse genome. Nature, 420(6915), 520-562. doi:10.1038/nature01262 Weischenfeldt, J., Dubash, T., Drainas, A. P., Mardin, B. R., Chen, Y., Stütz, A. M., . . . Raeder, B. (2017). Pan-cancer analysis of somatic copy-number alterations implicates IRS4 and IGF2 in enhancer hijacking. Nature genetics, 49(1), 65-74. Welch, J. S., Ley, T. J., Link, D. C., Miller, C. A., Larson, D. E., Koboldt, D. C., . . . Xia, J. (2012). The origin and evolution of mutations in acute myeloid leukemia. Cell, 150(2), 264-278. Welch, J. S., Petti, A. A., Miller, C. A., Fronick, C. C., O’Laughlin, M., Fulton, R. S., . . . Tandon, B. (2016). TP53 and decitabine in acute myeloid leukemia and myelodysplastic syndromes. New England Journal of Medicine, 375(21), 2023-2036. West, A. G., Gaszner, M., & Felsenfeld, G. (2002). Insulators: many functions, many mechanisms. Genes & development, 16(3), 271-288. Whyte, W. A., Orlando, D. A., Hnisz, D., Abraham, B. J., Lin, C. Y., Kagey, M. H., . . . Young, R. A. (2013). Master transcription factors and mediator establish super-enhancers at key cell identity genes. Cell, 153(2), 307-319. Wickham, H., & Wickham, M. H. (2007). The ggplot package. In. Wilde, L., Cooper, J., Wang, Z.-X., & Liu, J. (2019). Clinical, Cytogenetic, and Molecular Findings in Two Cases of Variant t (8; 21) Acute Myeloid Leukemia (AML). Frontiers in oncology, 9, 1016. Williamson, I., Berlivet, S., Eskeland, R., Boyle, S., Illingworth, R. S., Paquette, D., . . . Bickmore, W. A. (2014). Spatial genome organization: contrasting views from chromosome conformation capture and fluorescence in situ hybridization. Genes & Development, 28(24), 2778-2791. doi:10.1101/gad.251694.114 Williamson, I., Kane, L., Devenney, P. S., Flyamer, I. M., Anderson, E., Kilanowski, F., . . . Lettice, L. A. (2019). Developmentally regulated Shh expression is robust to TAD perturbations. Development, 146(19). Wilson, N. K., Calero-Nieto, F. J., Ferreira, R., & Göttgens, B. (2011). Transcriptional regulation of haematopoietic transcription factors. Stem cell research & therapy, 2(1), 1-8. Wilson, N. K., Schoenfelder, S., Hannah, R., Castillo, M. S., Schütte, J., Ladopoulos, V., . . . Moignard, V. (2016). Integrated genome-scale analysis of the transcriptional regulatory landscape in a blood stem/progenitor cell model. Blood, 127(13), e12-e23. Woolfe, A., Goodson, M., Goode, D. K., Snell, P., McEwen, G. K., Vavouri, T., . . . Kelly, K. (2004). Highly conserved non-coding sequences are associated with vertebrate development. PLoS Biol, 3(1), e7. Xu, X., Ren, X., Wang, H., Zhao, Y., Yi, Z., Wang, K., . . . Hu, Z. (2016). Identification and functional analysis of acute myeloid leukemia susceptibility associated single nucleotide polymorphisms at non-protein coding regions of RUNX1. Leukemia & lymphoma, 57(6), 1442-1449. Yokomizo, T., Ogawa, M., Osato, M., Kanno, T., Yoshida, H., Fujimoto, T., . . . Ito, Y. (2001). Requirement of Runx1/AML1/PEBP2alphaB for the generation of haematopoietic cells from endothelial cells. Genes Cells, 6(1), 13-23.

258
Yoshida, K., Toki, T., Okuno, Y., Kanezaki, R., Shiraishi, Y., Sato-Otsubo, A., . . . Suzuki, H. (2013). The landscape of somatic mutations in Down syndrome-related myeloid disorders. Nature genetics, 45(11), 1293-1299. Young, A. L., Challen, G. A., Birmann, B. M., & Druley, T. E. (2016). Clonal haematopoiesis harbouring AML-associated mutations is ubiquitous in healthy adults. Nat Commun, 7, 12484. doi:10.1038/ncomms12484 Yu, J., Li, Y., Li, T., Li, Y., Xing, H., Sun, H., . . . Xie, X. (2020). Gene mutational analysis by NGS and its clinical significance in patients with myelodysplastic syndrome and acute myeloid leukemia. Experimental Hematology & Oncology, 9(1), 1-11. Yuan, X., Song, M., Devine, P., Bruneau, B. G., Scott, I. C., & Wilson, M. D. (2018). Heart enhancers with deeply conserved regulatory activity are established early in zebrafish development. Nature communications, 9(1), 1-14. Yusta, B., Somwar, R., Wang, F., Munroe, D., Grinstein, S., Klip, A., & Drucker, D. J. (1999). Identification of glucagon-like peptide-2 (GLP-2)-activated signaling pathways in baby hamster kidney fibroblasts expressing the rat GLP-2 receptor. Journal of Biological Chemistry, 274(43), 30459-30467. Zeller, T., Wild, P., Szymczak, S., Rotival, M., Schillert, A., Castagne, R., . . . Cambien, F. (2010). Genetics and Beyond – The Transcriptome of Human Monocytes and Disease Susceptibility. PLoS One, 5(5), e10693. doi:10.1371/journal.pone.0010693 Zentner, G. E., Tesar, P. J., & Scacheri, P. C. (2011). Epigenetic signatures distinguish multiple classes of enhancers with distinct cellular functions. Genome Research, 21(8), 1273-1283. Zhan, Y., Mariani, L., Barozzi, I., Schulz, E. G., Blüthgen, N., Stadler, M., . . . Giorgetti, L. (2017). Reciprocal insulation analysis of Hi-C data shows that TADs represent a functionally but not structurally privileged scale in the hierarchical folding of chromosomes. Genome Res, 27(3), 479-490. doi:10.1101/gr.212803.116 Zhang, J., Baran, J., Cros, A., Guberman, J. M., Haider, S., Hsu, J., . . . Kasprzyk, A. (2011). International Cancer Genome Consortium Data Portal—a one-stop shop for cancer genomics data. Database (Oxford), 2011. doi:10.1093/database/bar026 Zhang, Y., Chen, F., Fonseca, N. A., He, Y., Fujita, M., Nakagawa, H., . . . Creighton, C. J. (2020). High-coverage whole-genome analysis of 1220 cancers reveals hundreds of genes deregulated by rearrangement-mediated cis-regulatory alterations. Nature communications, 11(1), 1-14. Zhang, Y., McCord, R. P., Ho, Y.-J., Lajoie, B. R., Hildebrand, D. G., Simon, A. C., . . . Dekker, J. (2012). Spatial organization of the mouse genome and its role in recurrent chromosomal translocations. Cell, 148(5), 908-921. Zhao, Y., Du, Z., & Li, N. (2007). Extensive selection for the enrichment of G4 DNA motifs in transcriptional regulatory regions of warm blooded animals. FEBS letters, 581(10), 1951-1956. Zhao, Z., Tavoosidana, G., Sjölinder, M., Göndör, A., Mariano, P., Wang, S., . . . Singh, U. (2006). Circular chromosome conformation capture (4C) uncovers extensive networks of epigenetically regulated intra-and interchromosomal interactions. Nature genetics, 38(11), 1341-1347.

259
Zhu, Q., Gao, P., Tober, J., Bennett, L., Chen, C., Uzun, Y., . . . Yu, W. (2020). Developmental trajectory of prehematopoietic stem cell formation from endothelium. Blood, The Journal of the American Society of Hematology, 136(7), 845-856. Zink, F., Stacey, S. N., Norddahl, G. L., Frigge, M. L., Magnusson, O. T., Jonsdottir, I., . . . Stefansson, K. (2017). Clonal hematopoiesis, with and without candidate driver mutations, is common in the elderly. Blood, 130(6), 742-752. doi:10.1182/blood-2017-02-769869 Zuin, J., Dixon, J. R., van der Reijden, M. I., Ye, Z., Kolovos, P., Brouwer, R. W., . . . van IJcken, W. F. (2014). Cohesin and CTCF differentially affect chromatin architecture and gene expression in human cells. Proceedings of the National Academy of Sciences, 111(3), 996-1001.

260
Appendix I: Materials
All solutions were made using sterile milli-Q water unless otherwise stated. The pH
adjustments were made using 1 M Hydrochloric acid (HCl) (BDH Prolabo) or Sodium
Hydroxide (NaOH) (VMR Prolabo). All primers were synthesized by ‘Integrated DNA
technologies’ [(IDT), Custom Science, NZ] unless otherwise specified.
Chemical reagents and consumables used in this project
Chemical (Abbreviation) Manufacturer Agar Bacteriological Oxoid Ltd, UK Ampicillin Sigma-Aldrich, USA Adenosine Triphosphate (ATP) Sigma-Aldrich, USA Agencourt® AMPure® XP beads Beckman Coulter Bacto Tryptone Bectone Dickinson and Co, USA Bgl II restriction enzyme mix New England Biolabs, UK Calcium Chloride VMR Prolabo, UK Chloramphenicol Sigma-Aldrich, USA CviQI restriction enzyme New England Biolabs, UK CviQI reaction 10x Buffer New England Biolabs, UK D-(+)-Glucose Sigma-Aldrich, USA Dimethyl sulfoxide (DMSO) Sigma-Aldrich, USA DNase Roche Applied Science,
Germany DMEM Gibco, Life Technology, USA DMSO Sigma-Aldrich, USA DpnI restriction enzyme New England Biolabs, UK DpnI reaction 10x buffer New England Biolabs, UK DpnII restriction enzyme New England Biolabs, UK DpnII reaction 10x buffer New England Biolabs, UK Dual-Glo® Luciferase Assay System Invitrogen, USA Eco RI restriction enzyme New England Biolabs, UK Eco RI reaction 10x buffer New England Biolabs, UK Ethanol Scharlab, Spain Ethyl 3-aminobenzoate methanesulfonate salt Sigma-Aldrich, USA Ethylene diamine tetracetic acid (EDTA) Fisher Scientific, USA Fetal bovine serum (FBS), NZ origin Gibco, Life Technology, USA Formaldehyde Sigma-Aldrich, USA Gateway LR Clonase II enzyme mix Invitrogen, USA Glacial acetic acid Analar Normapur, NZ Glycerol VMR Prolabo, UK Glycine Sigma-Aldrich, USA Halocarbon oil 27 Sigma-Aldrich, USA Hydrochloric acid BDH Prolabo, UK IMDM Gibco, Life Technology, USA T4 DNA ligase Invitrogen, USA

261
Chemical (Abbreviation) Manufacturer Ligase Buffer Invitrogen, USA Linear Polyacrylamide (LPA) Invitrogen, USA Lipofectamine 3000 Invitrogen, USA Lithium Chloride Sigma-Aldrich, USA Magnesium Sulfate Sigma-Aldrich, USA Meganuclease I-Sce I enzyme mix Roche Applied Science,
Germany Methylcellulose Sigma-Aldrich, USA Methylene Blue Sigma-Aldrich, USA Na2HPO4.H20 Merck, Germany Na2H2PO4 Merck, Germany OPTI-MEM reduced serum media Gibco, Life Technology, USA Phosphate buffer saline (PBS) solution Gibco, Life Technology, USA pCR8/GW/TOPO TA Cloning kit Life Technology, USA Penicillin Streptomycin Gibco, Life Technology, USA PfuUltra HF DNA polymerase Agilent Technologies, USA PfuUltra HF DNA polymerase reaction 10x buffer
Agilent Technologies, USA
Phenol:Chloroform:Isoamyl Alcohol 25:24:1 Sigma-Aldrich, USA Platinum Taq Polymerase Life Technology, USA PMA Sigma-Aldrich, USA Potassium Chloride BDH Prolabo, UK Proteinase K Invitrogen, USA P3000 Life Technology, USA qScript cDNA SuperMix Quanta BioSciences, USA Q5® Hot Start High-Fidelity 2x Master mix New England Biolabs RNaseA ThermoFisher, USA Sodium Bicarbonate Sigma-Aldrich, USA Sodium Chloride VMR Prolabo, UK Sodium Dodecyl Sulfate Sigma-Aldrich, USA Sodium Hydroxide VMR Prolabo, UK Spectinomycin Sigma-Aldrich, USA SYBR ® Green ThermoFisher, USA
Triton X-100 Sigma-Aldrich, USA
Trypan blue stain Sigma-Aldrich, USA
Trypsin-EDTA (0.5%), No phenol red Gibco, Life Technology, USA
Ultrapure Agarose Life Technology, USA
Ultrapure DNase – RNase free distilled water Life Technology, USA
X-gal Sigma-Aldrich, USA
Yeast extract Oxoid Ltd, UK
1 kb Plus DNA ladder Invitrogen, USA
1 M Tris (pH 8) J.T Baker, USA

262
Chemical (Abbreviation) Manufacturer 10x Transcription Buffer Roche Applied Science,
Germany 10 mM dNTPs Invitrogen, USA
Solutions and buffers
Luria-Broth (LB) Medium 10 g Bacto Tryptone (Becton Dickinson and Co), 5 g Yeast extract (Oxoid Ltd), 10 g Sodium Chloride (NaCl) (VMR Prolabo), make up to 1 litre with milli Q water. Sterilise by autoclaving.
LB agar Pre- autoclave LB medium with 1.5 % Agar Bacteriologial (Oxoid Ltd). Sterilise by autoclaving.
70% Ethanol Absolute ethanol dissolved in ddH2O at a final concentration of 70%
1x Tris-Acetate-EDTA (TAE) buffer 1 M TRIS (pH 8) (J.T Baker), Glacial acetic acid and 0.5 M (Analar Normapur) Ethylene diamine tetracetic acid (EDTA) (Fisher Scientific) (pH 8) added to milli Q H2O at a final concentration of 40 mM, 20 mM and 1 mM, respectively
1 % Agarose Gel 1 % Ultrapure Agarose (Life Technology) in 1 x TAE. For a 60 ml gel
1 x E3 (5 mM Sodium Chloride (NaCl) (VMR Prolabo), 0.17 mM Potassium Chloride (KCl) (BDH Prolabo), 0.33 mM CaCl2 (VMR Prolabo), 0.33 mM Magnesium Sulfate (MgSO4) (Sigma-Aldrich), 10 % (v/v) Methylene Blue (Sigma-Aldrich))
Tricaine 400 mg Tricaine powder (Ethyl 3-aminobenzoate methanesulfonate salt) (Sigma-Aldrich), 97.9 ml ddH2O, ~2.1 ml 1 M Tris pH 9. Adjust to pH 7. Store in freezer.
3 % Methylcellulose 3 % Methylcellulose (Sigma-Aldrich) in 1 x E3 solution.
Cyroprotectant Solution 20 % DMSO in FBS. Lysis buffer (10mL) 100 µL of 1 M Tris-HCl (pH 8.0), 20 µL
of 5 M NaCl, 200 µL of 20 % of NP-40, 1 tablet of protease inhibitors (Roche Diagnostics)
3 M NaOAC pH 5.6 246.1g sodium acetate (NaOAC), make up to 1 litre with milli Q water. Adjust to pH 5.6. Filter sterilise the solution.

263
2.5 M glycine 75 g glycine ), make up to 1 litre with milli Q water. Filter sterilise the solution.

264
Appendix II: Plasmid maps
Plasmid maps of constructs used in this study are presented below. Map of Zebrafish
enhancer detector vector (ZED) was obtained from Bessa et al., 2009 (Bessa et al., 2009).
Map of PCS-TP was obtained from Kawakami Lab website
(https://ztrap.nig.ac.jp/map2.html). pGL4.23-GW was obtained from Addgene
(https://www.addgene.org/60323/). pRL-TK map is from the Promega: pRL Renilla
Luciferase Control Reporter Vectors website:
(https://worldwide.promega.com/products/luciferase-assays/genetic-reporter-vectors-and-
cell-lines/prl-renilla-luciferase-control-reporter-vectors/?catNum=E2231). Map of pUC19
was obtained from Addgene (https://www.addgene.org/browse/sequence/74677/).
Zebrafish enhancer detector vector (ZED)

265
pCS-TP

266
pGL4.23-GW

267
pRL-TK

268
pUC19

269
Appendix III: Primer list
Appendix III Table.1: Details of the primers used in this project
Primer name Direction Sequence ZED insert confirmation mCNE1 forward AAAGGGAACAAAAGCTGGAG mCNE2 reverse AGTCGCTTCTCTTCGGTTGA pGL4.23-GW insert confirmation RVprimer3 forward CTAGCAAAATAGGCTGTCCC Runx1 +24 Site-Directed Mutagenesis Runx1 +24 g->t
forward CGTGTCAGGAAGGGTGTGTGTGGAACTTACACCTC
reverse GAGGTGTAAGTTCCACACACACCCTTCCTGACACG Runx1 +24 t->a
forward AGGTGTAAGTTCCTCCCCCTCCCTTCCTGACAC
reverse GTGTCAGGAAGGGAGGGGGAGGAACTTACACCT qRT-PCR primers Human GAPDH forward TGCACCACCAACTGCTTAGC reverse GGCATGGACTGTGGTCATGAG Human H-CYCLOPHILIN
forward ACGGCGAGCCCTTGG
reverse TTTCTGCTGTCTTTGGGACCT Human RUNX1 P1
forward TTTTCAGGAGGAAGCGATGG
reverse TGGCATCGTGGACGTCTCTA Human RUNX1 P2
forward TTGTGATGCGTATCCCCGTA
reverse TCATCATTGCCAGCCATCAC Human RUNX1 total
forward AGACCCTGCCCATCGCTTTC
reverse GGTTCTTCATGGCTGCGGTA Human ERG forward CGCAGAGTTATCGTGCCAGCAGAT reverse CCATATTCTTTCACCGCCCACTCC Human GATA1 forward TTGCCACATCCCCAAGGCGG reverse GGGGGAGGGGCTCTGAGGTC Human KLF1 forward TGACTTCCTCAAGTGGTGGC reverse GGTGAGGAGGAGATCCAGGT 4C bait primers Human RUNX1 P1
forward AACCAAGTCTGTCAGTCTCCTG
reverse GCTAACAAGCAGAGGAAGCAA Human RUNX1 +24
forward CACGTGTCCACATTTTTCAGA
reverse CAGTTACTTCGCCCATTGCT Human RUNX1 P2
forward GCCGGCTCCTGGAATTGG
reverse AGGATGTGCGTGCGTGTGTA

270
Primer name Direction Sequence Human ERG +85
forward CTCGCTGCTTAGGTGTAGTCC
reverse TGGGGGAGACTGACAAATAGA

271
Appendix IV: Prediction of G-quadruplexes
During my master’s work the sequence of +24 Runx1 mouse regulatory region was
obtained using forward (AAAGGGAACAAAAGCTGGAG) and reverse primers
(AGTCGCTTCTCTTCGGTTGA). Despite multiple attempts and different primers, the region
was never sequenced the full way through. When compared back to the mm9 +24 regulatory
element sequence sent by Dr. Motomi Osato, it was noted that the sequences stopped in the
same place every time. The online tool QGRS mapper was used to predict if there was a G-
quadruplex structure (Kikin et al., 2006). The Osato +24 mouse regulatory region sequence is
shown below. The area that could not be sequenced is underlined, the probable G-quadruplex
is highlighted in yellow. The most likely G-quadruplex is GGTGGGGGTGG, reverse
complement CCACCCCCACC. C rich residues could also be forming i-motifs, However these
are less likely to be biologically relevant as they form depending on the cell’s pH.
Forward sequence
TCAGCTCTGCACTGCACTAAGGAGTTTTTTATGGAAAGCAATGGTCCCAGT
GGCTGAAGGGTCCAGCAAGTGGCTGGTAGAGCCAGCAAGGAGCGATGGAGGGA
TGGTGTGAGGAGGAGACAGGAAGGGAGGCGGTGACACAGGCCTTCACAGGGCC
GCTGCAGCTAGGAACTGCTGCAAAAGCAAGCTGCCCACGTTATCAGTGGCGCGC
AGGCCTGCGGTTTTCTCGCTCTTGCAACCCGGCTTCAACTGCCGGTTTATTTTTCG
ACAAACAGGATGCCTCCATCTGAGGCTGTCAGCATCCCAGGCTCTTTGAGAAGA
AAAGAGGTAGTGAGGGCCCCACCCTAGAGCCCAGCCGGGAGGGGTGGGTGAGA
GGTCCTGTTTCTAGATGCTTCCCAGAGAAGTGAGAACCTAGCAGGTGCAGTGGCC
AGGGTTCAGGAGCGTGTCAGGAAGGGTGGGGGTGGAACTTACACCTCCCACCCC
CACCAGACTTAAATGGACTCCCCACCTCTGCATGGGTCCCAAGGCT
Reverse sequence

272
AGCCTTGGGACCCATGCAGAGGTGGGGAGTCCATTTAAGTCTGGTGGGGG
TGGGAGGTGTAAGTTCCACCCCCACCCTTCCTGACACGCTCCTGAACCCTGGCCA
CTGCACCTGCTAGGTTCTCACTTCTCTGGGAAGCATCTAGAAACAGGACCTCTCA
CCCACCCCTCCCGGCTGGGCTCTAGGGTGGGGCCCTCACTACCTCTTTTCTTCTCA
AAGAGCCTGGGATGCTGACAGCCTCAGATGGAGGCATCCTGTTTGTCGAAAAAT
AAACCGGCAGTTGAAGCCGGGTTGCAAGAGCGAGAAAACCGCAGGCCTGCGCG
CCACTGATAACGTGGGCAGCTTGCTTTTGCAGCAGTTCCTAGCTGCAGCGGCCCT
GTGAAGGCCTGTGTCACCGCCTCCCTTCCTGTCTCCTCCTCACACCATCCCTCCAT
CGCTCCTTGCTGGCTCTACCAGCCACTTGCTGGACCCTTCAGCCACTGGGACCAT
TGCTTTCCATAAAAAACTCCTTAGTGCAGTGCAGAGCTGA
When the overlapping sequence data was examined, a small chunk of sequence is
unable to be read (underlined area). Two predicted quadruplex structures sit either side of the
region that could not be sequenced.
AGCCTTGGGACCCATGCAGAGGTGGGGAGTCCATTTAAGTCTGGTGGGGG
TGGGAGGTGTAAGTTCCACCCCCACCCTTCCTGACACGCTCCTGAACCCTGGCCA
CTGCACCTGCTAGGTTCTCACTTCTCTGGGAAGCATCTAGAAACAGGACCTCTCA
CCCACCCCTCCCGGCTGGGCTCTAGGGTGGGGCCCTCACTACCTCTTTTCTTCTCA
AAGAGCCTGGGATGCTGACAGCCTCAGATGGAGGCATCCTGTTTGTCGAAAAAT
AAACCGGCAGTTGAAGCCGGGTTGCAAGAGCGAGAAAACCGCAGGCCTGCGCG
CCACTGATAACGTGGGCAGCTTGCTTTTGCAGCAGTTCCTAGCTGCAGCGGCCCT
GTGAAGGCCTGTGTCACCGCCTCCCTTCCTGTCTCCTCCTCACACCATCCCTCCAT
CGCTCCTTGCTGGCTCTACCAGCCACTTGCTGGACCCTTCAGCCACTGGGACCAT
TGCTTTCCATAAAAAACTCCTTAGTGCAGTGCAGAGCTG

273
Appendix V: Sequencing report
Libraries were demultiplexed by Otago Genomics Facility (OGF). A summary of the
sequencing for this project is below. The sequencing metrics are within Illumina's performance
specifications for low diversity libraries.

274

275
Appendix VI: Publication
Some of the results from Chapter 3 contributed to Marsman, J., Thomas, A., Osato, M.,
O'Sullivan, J. M., & Horsfield, J. A. (2017). A DNA contact map for the mouse Runx1 gene
identifies novel haematopoietic enhancers. Scientific Reports, 7, 13347

1SCIeNTIfIC REPORTs | 7: 13347 | DOI:10.1038/s41598-017-13748-8
www.nature.com/scientificreports
A DNA Contact Map for the Mouse Runx1 Gene Identifies Novel Haematopoietic EnhancersJudith Marsman1, Amarni Thomas1, Motomi Osato2,3, Justin M. O’Sullivan 4,5 & Julia A. Horsfield 1,5
The transcription factor Runx1 is essential for definitive haematopoiesis, and the RUNX1 gene is frequently translocated or mutated in leukaemia. Runx1 is transcribed from two promoters, P1 and P2, to give rise to different protein isoforms. Although the expression of Runx1 must be tightly regulated for normal blood development, the mechanisms that regulate Runx1 isoform expression during haematopoiesis remain poorly understood. Gene regulatory elements located in non-coding DNA are likely to be important for Runx1 transcription. Here we use circular chromosome conformation capture sequencing to identify DNA interactions with the P1 and P2 promoters of Runx1, and the previously identified +24 enhancer, in the mouse multipotent haematopoietic progenitor cell line HPC-7. The active promoter, P1, interacts with nine non-coding regions that are occupied by transcription factors within a 1 Mb topologically associated domain. Eight of nine regions function as blood-specific enhancers in zebrafish, of which two were previously shown to harbour blood-specific enhancer activity in mice. Interestingly, the +24 enhancer interacted with multiple distant regions on chromosome 16, suggesting it may regulate the expression of additional genes. The Runx1 DNA contact map identifies connections with multiple novel and known haematopoietic enhancers that are likely to be involved in regulating Runx1 expression in haematopoietic progenitor cells.
Runx1 is a key regulator of haematopoietic development. Deletion of Runx1 in mouse embryos is lethal in embry-onic stage (E) 12.5 due to the complete absence of definitive blood cell progenitors accompanied by extensive haemorrhaging1,2. Runx1 is crucial for haematopoietic stem cell (HSC) emergence and maintenance during development3, since conditional ablation of Runx1 in adult mice results in HSC exhaustion4. In acute myeloid leukaemia (AML) and myelodysplastic syndrome, RUNX1 function is frequently altered through mutations or translocations5, resulting in dysregulation of its target genes. While mutations directly affecting the RUNX1 pro-tein are common in leukaemia, mutations in regulatory elements that affect RUNX1 expression remain enigmatic. As yet unidentified mutations in regulatory elements, such as enhancers, could alter Runx1 expression, resulting in abnormal haematopoiesis.
Runx1 is transcribed from two promoters, P1 and P2, to give rise to different protein isoforms6. Expression of these isoforms is tightly controlled during haematopoiesis. At the onset of mouse haematopoiesis (E7.5), preced-ing the generation of HSCs, expression of the P2 isoform(s) is predominant7,8. P1 is expressed soon after P2, and its expression is synchronised with the generation of HSCs7,9. P1 expression is predominant in the mouse fetal liver, the main site of definitive haematopoietic stem/progenitor cell (HSPC) development from E12.5 onward9.
Regulatory elements, such as enhancers, can control the expression of genes via long-range chromatin interactions10. One previously identified Runx1 enhancer is located 24 kb downstream of the P1 transcriptional start site11,12. The +24 enhancer (also known as the +2313, or the +23.512 enhancer) is active in HSCs that express Runx1 dur-ing mouse embryogenesis11–13. The human equivalent of the +24 enhancer (+32 kb downstream of P1) directly contacts the promoters of RUNX1 in leukaemia cell lines14. In addition to the +24 enhancer, putative regulatory
1Department of Pathology, Dunedin School of Medicine, University of Otago, Dunedin, New Zealand. 2Cancer Science Institute, National University of Singapore, Singapore, 117599, Singapore. 3International Research Center for Medical Sciences, Kumamoto University, Kumamoto, Japan. 4Liggins Institute, The University of Auckland, Private Bag, 92019, Auckland, New Zealand. 5Maurice Wilkins Centre for Molecular Biodiscovery, The University of Auckland, Private Bag, 92019, Auckland, New Zealand. Correspondence and requests for materials should be addressed to J.A.H. (email: [email protected])
Received: 17 March 2017
Accepted: 2 October 2017
Published: xx xx xxxx
OPEN

www.nature.com/scientificreports/
2SCIeNTIfIC REPORTs | 7: 13347 | DOI:10.1038/s41598-017-13748-8
elements for RUNX1 have been identified upstream of RUNX1-P1 and between P1 and P2; however, whether they directly contact the RUNX1 promoters has not been investigated15,16.
Here we used circular chromosome conformation capture sequencing (4C-seq) to identify regulatory ele-ments that interact with an active Runx1 P1 promoter, versus an inactive P2 promoter. While Hi-C provides genome-wide contact profiles, and Capture Hi-C enriches for interactions with preselected genomic features (usually promoters), 4C-seq can generate very high resolution contact profiles from ‘baits’ of particular interest17. Therefore, 4C-seq can yield richer information about a selected genomic region than Hi-C or Capture Hi-C. HPC-7 is a well characterised mouse HSPC line with genomic annotations, including transcription factor (TF) binding, histone modifications and chromatin accessibility18–20. 4C-seq in HPC-7 cells identified nine haemato-poietic enhancers that interact with the P1 promoter and +24 enhancer, and that are occupied by haematopoietic TFs. Four of these were previously identified, three of which were functionally tested and two out of the three showed activity during mouse haematopoiesis15. Here we assessed the activity of all nine enhancers in zebrafish, and show that eight are active in zebrafish haematopoiesis. Further, the +24 enhancer was highly interactive both within a topologically associated domain (TAD) harbouring Runx1, as well as with loci outside the TAD. Collectively, our results point to the formation of a local ‘active chromatin hub’ controlling Runx1 expression in haematopoietic cells.
ResultsWe first confirmed that P1 is actively expressed in HPC-7 cells, while P2 is silent (Supplementary Fig. S1). 4C-seq in HPC-7 cells using the P1 and P2 promoters and the +24 enhancer as ‘baits’ identified genomic interactions at Runx1 (Fig. 1a). Bait locations were designed taking into account cohesin and CTCF binding sites near both promoters and the +24 enhancer. 4C baits were designed to regions of interest (P1, +24, P2), allowing for com-parison of interactions between the active P1 promoter and inactive P2 promoter, with secondary baits located at nearby cohesin/CTCF (cc) binding sites (P1cc, +24cc, P2cc) (Fig. 1a).
4C-seq in HPC-7 cells confirms the presence of a 1.1 Mb domain harbouring Runx1. For each bait, two replicate 4C-seq libraries and one control library were sequenced. Reads were predominantly located within a 1.1 Mb region surrounding the Runx1 gene (Fig. 1b,c), representing a TAD harbouring Runx1. From visual inspection of the contact profile (Fig. 1b,c), domain boundaries appear to be present at the Cbr1/Setd4 genes upstream of Runx1, and Clic6 downstream (Fig. 1b). A comparison with existing Hi-C data from mouse embryonic stem cells, mouse CH12 (erythroleukaemia) cells, human GM12878 (lymphoblastoid), human K562 (myeloid leukaemia) and human IMR90 (foetal lung) cells revealed that TAD boundaries are conserved, and that our 4C data is consistent with existing Hi-C data (Supplementary Fig. S2). Most P1 and +24 interac-tions take place upstream of the Runx1 gene (Fig. 1b,c). In contrast, there are fewer upstream interactions from P2, while downstream interactions are retained (Fig. 1b,c). There are no other coding genes within the Runx1 domain; however, three inactive non-coding genes19, Mir802 and the long non-coding RNAs 1810053B23Rik and 1700029J03Rik, are located near the upstream border of the TAD.
Interactions from ‘cc’ baits (cohesin/CTCF binding sites) were similar to their nearby corresponding baits at P1, +24 and P2 (Fig. 1b). We investigated whether significant interactions for the ‘cc’ baits have more overlap with other cohesin or CTCF binding sites than for the non ‘cc’ baits, but did not find any difference (data not shown). The ‘cc’ baits may be too close to the corresponding P1, P2 and +24 baits to resolve unique interactions, although they are separated by at least one restriction fragment.
Chromatin interactions anchored by the Runx1 P1 and P2 promoters and +24 enhancer. Most of the significant interactions for P1, P2 and the +24 enhancer occur within the 1.1 Mb domain (Fig. 1b). There are ~40–50 significant interactions for P1cc/P1 baits, ~60–75 for +24/+24cc baits, and ~30 for P2/P2cc baits (Fig. 1d). Strikingly, the +24 enhancer in particular forms many significant interactions outside the Runx1 domain (Fig. 1b,d). Many of these long-range interactions are with other genes or gene promoters on mouse chro-mosome 16 (Fig. 2). Expression levels of these genes in human tissues according to Genotype-Tissue Expression (GTEx, https://www.gtexportal.org/home/)21 did not reveal obvious tissue-specific expression patterns. However, among the genes contacted by +24 are Erg, a haematopoietic TF, and Tiam1 (T-cell lymphoma invasion and metastasis 1), involved in cell adhesion and cell migration. These distant connections suggest that +24 may also regulate other haematopoietic genes in adjacent domains.
Identification of haematopoietic enhancers. We hypothesised that DNA connections formed from the active P1 promoter and the +24 enhancer may correspond to haematopoietic enhancers that regulate Runx1 expression. To identify putative enhancers, we aligned significantly interacting sites with the occupancy of thirteen TFs involved in haematopoietic progenitor cell production; enhancer histone modifications and DNase I hyper-sensitivity sites18–20; and conserved non-coding elements (CNE), which were identified based on comparative genomics alignment and retroviral integration site mapping to indicate potential DNaseI hypersensitive sites11. We note that the +24 enhancer binds all thirteen haematopoietic progenitor TFs in HPC-7 cells (Fig. 3).
We selected putative enhancers based on the binding of at least six TFs involved in haematopoietic progenitor cell development (Fig. 3), and the presence of a significant interaction directly at, or within 2 kb, of the TF binding cluster. Based on these criteria, we found eight other potential enhancers within the Runx1 domain that form con-nections to the baits. These enhancers were named according to their distance from the P1 transcriptional start site: −371, −354, −327, −321, −303, −58, −48, and +110 (Fig. 3b). An additional interacting region at −368, a CNE, was located adjacent to a cluster of haematopoietic TFs (Fig. 3b). The +24 and +110 are also CNEs11. The putative enhancers either form distinct blocks upstream of Runx1-P1 (from −371 to −303 and −48 to −58), or fall between the P1 and P2 promoters (+24 and +110). Four out of nine of the identified putative enhancers

www.nature.com/scientificreports/
3SCIeNTIfIC REPORTs | 7: 13347 | DOI:10.1038/s41598-017-13748-8
Figure 1. Runx1 interaction profile reflects the activity of the P1 and P2 promoters and the +24 enhancer. (a) Location of 4C baits at the mouse Runx1 gene (mm10). Baits are P1cc, P1, +24, +24cc, P2cc and P2; ‘cc’: cohesin and CTCF binding site. ChIP-seq data of Rad21 (blue) and CTCF (pink) in MEL and CH12 cells were obtained from ENCODE51 and in HPC-7 cells from18,19. Exons are in grey and the +24 enhancer is in green. (b) 4C-seq profile (read per million normalised running mean of nine successive DpnII digestion fragments) for one replicate per bait with significant interactions (the top fifth percentile of interactions with a FDR of <0.01) that overlap in both replicates shown in a ~2.5 Mb region surrounding the Runx1 gene. The highest significant interactions (see Methods) are in red and other significant interactions in orange. Red dotted lines indicate the location of estimated domain boundaries. (c) Read distribution for both replicates of each bait. Line graphs represent the cumulative percentage of reads on chromosome 16 (y-axis) versus the distance from the bait (x-axis), shown in genomic coordinates on chromosome 16 (genome version mm10). The 0-value of each line indicates the location of each bait. (d) The number of significant interactions that overlap in both replicates inside (light grey) and outside (dark grey) the domain for each bait.

www.nature.com/scientificreports/
4SCIeNTIfIC REPORTs | 7: 13347 | DOI:10.1038/s41598-017-13748-8
(−327, −321, −58 and +110) were identified previously based on the binding of at least three blood TFs and the presence of a H3K27ac peak (denoting active chromatin) from a subset of the same HPC-7 datasets that we have used here15.
Eight out of nine putative enhancers (−371, −368, −354, −327, −321, −58, −48, and +110) form long-range interactions with the P1 promoter, the +24 enhancer, or both (Fig. 3b and Supplementary Table S1). The excep-tion was −303, which does not interact with P1, but instead with the +24 and the P2 promoter. The +24 enhancer interacts promiscuously within the whole domain. Filtering at maximum stringency (see Methods) showed that the +24 enhancer connects to all putative enhancers and both Runx1 promoters (Fig. 3b). In contrast, the inac-tive P2 promoter connects only to −303 and +24 (Fig. 3b and Supplementary Table S1). A specific interaction between +110 and P2 could not be resolved owing to a contiguous block of significant interactions throughout the short region between +110 and P2. A model of Runx1 interactions based on the 4C-seq results is shown in Fig. 4.
Long range chromatin interactions at haematopoietic enhancers. Long-range chromatin inter-actions can be mediated by cohesin and CTCF22, and cohesin is involved in transcription regulation at active genes23. We found that four of the nine enhancer loci (in addition to the +24 enhancer) coincide with Rad21 (cohesin) binding in the absence of CTCF (Fig. 3b and Supplementary Table S1). This is consistent with the idea that cohesin (but not necessarily CTCF) mediates local DNA-DNA interactions within TADs22. All Rad21 binding sites interacted with at least one ‘cc’ bait, therefore cohesin could mediate at least a subset of enhancer-promoter communication events in HPC-7 cells.
We compared the 4C interactions identified with recently published Capture Hi-C data in HPC-7 cells18 (Supplementary Fig. S3). Capture Hi-C data was only available for interactions anchored at P1, and has a lower coverage and resolution than our 4C-seq study (an average of ~18,000 reads per promoter for Capture Hi-C with a 6-cutter, and over 1 million reads per bait for 4C-seq with a 4-cutter). The Capture Hi-C study in HPC-7 cells identified 15 P1-interacting regions that were reproduced in our study (Supplementary Fig. S3). All of these are upstream of Runx1-P1, and most are within the −368 to −303 enhancer cluster (Supplementary Fig. S3). Therefore, our study provides additional Runx1-anchored interactions that were not previously described as con-nected to Runx1 promoters (enhancers −371, −48, −58 and +110).
Figure 2. Interactions of the Runx1 locus with other genes. Significant interactions that overlap with gene bodies or gene promoters (starting from 2 kb upstream of the gene transcriptional start site) are shown for the P1cc/P1 (a), +24/ +24cc (b) and P2cc/P2 baits (c) (assembly mm10).

www.nature.com/scientificreports/
5SCIeNTIfIC REPORTs | 7: 13347 | DOI:10.1038/s41598-017-13748-8
In vivo characterization of haematopoietic enhancers. Enhancer regions interacting with Runx1 recruit haematopoietic TFs in HPC-7 cells, therefore we determined if these regions act as enhancers in vivo. Each of the putative enhancers was tested for the ability to drive tissue-specific GFP expression in zebrafish embryos. Eight out of nine drove GFP expression specifically in the intermediate cell mass and posterior blood island, which are sites of haematopoietic progenitor cell production at 20–24 hours post-fertilisation (hpf)24 (Fig. 5a,b and Supplementary Fig. S4). Two of these (−58 and +110) were previously shown to be active during mouse haematopoiesis15. The −303 enhancer also expressed GFP in keratinocytes, particularly after 24 hpf (Figs 5c, S4). Interestingly, −303 was the only enhancer identified that interacted with the P2 promoter of Runx1, rather than P1. Despite the occupancy of multiple haematopoietic TFs in HPC-7 cells, and the presence of similar TF binding motifs compared to the other enhancers (Fig. 3 and Supplementary Tables 1 and 2, we did not observe enhancer activity for −327, consistent with a previous study in mice15.
In summary, we have assigned in vivo function to multiple putative enhancers upstream of Runx1 that were previously identified in silico18. These regions not only drive haematopoietic expression, but also physically con-nect with the Runx1-P1 promoter, lending confidence to the concept that they are bona fide regulators of Runx1 transcription.
Figure 3. The active P1 promoter and +24 enhancer interact with clusters of haematopoietic transcription factor binding sites. Significant interactions within the domain for each bait are shown together with the reference genes (mm9), CNEs11, TF binding sites (green), Rad21 and CTCF binding sites (black), H3K27ac, H3K4me3 and DNaseI hypersensitivity sites in HPC-7 cells18–20. A 3 Mb region (a) and two zoomed-in views (b) are shown. Locations of TF binding clusters containing at least six TF binding sites at the same location, and a significant interaction directly at or within 2 kb of each cluster, are indicated by arrows and named according to their distance from the P1 transcriptional start site. See also Supplementary Fig. S3.

www.nature.com/scientificreports/
6SCIeNTIfIC REPORTs | 7: 13347 | DOI:10.1038/s41598-017-13748-8
Discussion4C analysis in HPC-7 cells generated a high-resolution connectivity map of the genomic region harbouring Runx1, and confirmed previously identified upstream connections from P1 to putative regulatory elements18. Runx1 appears to be contained within a ~1 Mb chromatin domain, consistent with Hi-C analyses in other cell types25,26. We observed multiple connections both up- and downstream from all 4C-seq baits (Runx1-P1, Runx1-P2 and +24 enhancer). Significantly, there were many more upstream connections anchored by the active elements (Runx1-P1 and +24).
Surprisingly, the +24 enhancer forms many up- and downstream connections outside of the Runx1 TAD. These comprise up to one-third of all connections formed and include other haematopoietic genes, such as Tiam1 downstream, and Erg upstream. Erg and Tiam1 dysregulation is associated with several tumor types, including AML and B- and T-cell lymphomas27,28. Strikingly, these genes are located over 2 Mb away from Runx1. These findings raise the interesting possibility that the +24 enhancer acts as a scaffold to recruit multiple promoters, enhancers and TFs over long distances in cis. Connections to +24 identified by our 4C-seq may point to the identity of some of these genes.
Our 4C-seq data identified multiple chromatin connections that intersect with some of the strongest indicators of upstream enhancers characterised by the binding of clusters of TFs and epigenetic modifications18,20. Eight out of nine of these DNA regions are able to drive haematopoietic expression in zebrafish, strongly suggesting an in vivo function. Although previous studies had identified transcriptional activity for a subset of these enhancers15, or an interaction with the P1 promoter for an overlapping subset18, no single prior study has shown that enhanc-ers both interact with Runx1 promoters (and +24), and have transcriptional activity. Table 1 provides an overview of findings from these previous studies together with additional evidence from our study that connects spatial proximity with function. Two enhancers, termed −59 and +110, were previously shown to drive LacZ expression in mice15; these are equivalent to the −58 and +110 enhancers identified here. Our data show in addition that these regions are in contact with P1 and the +24 enhancer (Table 1). While the −327 enhancer has similar char-acteristics as the other enhancers identified here, neither a previous study in mice15 nor our study identified any enhancer activity for it (Table 1). The −368, −354, −327, −321 and −303 enhancers were found to interact with P1 in a Capture Hi-C study in HPC-7 cells (Table 1). Our study confirms the presence of these interactions, and in addition, shows that these enhancers also interact with either the +24 enhancer or P2 (Table 1).
The −303 enhancer interacts with P2 rather than P1 and, in addition to being active in haematopoietic sites, it drives expression in keratinocytes, indicating that it could act in a complex that keeps P2 silent; and/or that it regulates expression of Runx1 in other tissues. Interestingly, Runx1 is actively expressed in mouse keratinocytes where it is important for hair follicle development29. Neuronal cells also express Runx130, and there may be addi-tional regulatory elements that control Runx1 expression in a manner distinct from haematopoietic expression. In support of this idea, we previously determined that cohesin and CTCF influence runx1 expression in haemato-poietic, but not neuronal cells, in zebrafish31,32.
Cohesin and CTCF organise chromatin structure and when present in combination, they appear to negatively correlate with the HSPC TFs in HPC-7 cells18. However, we observed a coincidence of cohesin subunit Rad21 bind-ing in the absence of CTCF with four out of nine identified enhancers, as well as the +24 enhancer. This suggests that CTCF-independent cohesin mediates a subset of enhancer-promoter looping in combination with TFs. This interpretation is consistent with previously identified CTCF-independent functions for cohesin in genome organi-zation and transcription33. Importantly, cohesin mutations are prevalent in AML and other myeloid malignancies34, and are categorised together with RUNX1 and spliceosome mutations in a genetic category that confers poor prognosis in AML5. Cohesin mutations led to increased chromatin accessibility of Runx1 as measured by ATAC-seq.35, raising the possibility that spatiotemporal regulation of Runx1 is cohesin-dependent in mouse and human, as was previously observed in zebrafish31.
Figure 4. Model of chromatin interactions based on Runx1 4C-seq. 4C-seq baits are shown in red and identified interacting enhancers in blue. P1 is active, and P2 is inactive. P1 interacts with −371, −368, −354, −327, −321, −58, −48, +24 and +110; +24 interacts with −371, −368, −354, −327, −321, −303, −58, −48, +110 and P2; and P2 interacts with −303 and +24.

www.nature.com/scientificreports/
7SCIeNTIfIC REPORTs | 7: 13347 | DOI:10.1038/s41598-017-13748-8
4C-seq in HPC-7 cells has provided new high resolution connectivity data that sheds light on the genomic organization of Runx1, an important haematopoietic transcription factor. These data confirm and extend pre-vious analyses (Table 1), and furthermore, provide insight into the function of enhancers that have potential to
Figure 5. Putative mouse enhancers are active in haematopoietic regions in zebrafish. Whole mount representative lateral images of zebrafish embryos (20–24 hpf [a,b] and ~48 hpf [c]) that were injected with enhancer-GFP plasmids at the one-cell stage; left hand panels are merges with bright field, right hand panels are GFP fluorescence. (a) Negative control ZED plasmid shows zero (image) or non-specific fluorescence, while the positive control (+24) shows GFP expression in haematopoietic cells of the posterior blood island (red arrows) and intermediate cell mass (yellow arrows), which represent primitive blood cells. (b) Enhancer activity of +110, −48, −58, −303, −321, −327, −354, −368, −371. GFP expression was observed in primitive haematopoietic cells of the posterior blood island (red arrows) and intermediate cell mass (yellow arrows). (c) The −303 enhancer also expressed GFP in keratinocytes (white arrows in b,c). The numbers in the right hand panels represent the number exhibiting the representative phenotype out of the total number of fluorescent embryos analysed. See also Supplementary Fig. S4.

www.nature.com/scientificreports/
8SCIeNTIfIC REPORTs | 7: 13347 | DOI:10.1038/s41598-017-13748-8
regulate Runx1 expression. The data presented here set the scene for functional analyses to precisely determine how Runx1 is regulated, including CRISPR/Cas9-mediated interference with enhancer activity. They also provide a rationale for screening patients with myeloproliferative disorders for mutations in enhancer regions.
MethodsCell culture. HPC-7 cells were maintained at a density of 1–10 × 105 cells/mL in Iscove’s modified Dulbecco’s media (Gibco®) supplemented with 3.024 g/L sodium bicarbonate, 10% fetal bovine serum (Moregate, New Zealand), 10% stem cell factor conditioned media and 0.15 mM monothiolglycerol (Sigma-Aldrich) as previously described36. SCF-conditioned media was obtained from culturing BHK-MKL cells maintained in Dulbecco’s mod-ified Eagle media (Sigma-Aldrich) supplemented with 3.5 g/L glucose, 3.7 g/L Sodium Bicarbonate and 10% FBS.
4C-seq library preparation. 4C library preparation was performed as previously described37 with modi-fications. Three libraries were generated, two replicates (passage 8 and passage 10 cells) and one control (a 1:1 mix of both replicates for which the first ligation step was omitted). Cells were cross-linked in 2% formaldehyde, 5% FBS and 1x PBS for 10 minutes at room temperature while rotating. Formaldehyde was quenched with a final concentration of 125 mM glycine for 5 minutes on ice while inverting several times. Cell pellets were washed twice with ice-cold 1x PBS.
Nuclei were harvested by lysing the cell pellets in ice-cold lysis buffer (10 mM Tris pH 8.0, 10 mM NaCl, 0.2% NP-40, protease inhibitors) for 10 minutes on ice. Nuclei were then resuspended in 1.2x DpnII restriction buffer (New England Biolabs) and 0.3% SDS and incubated for 1 hour at 37 °C while shaking. Triton X-100 was then added to a final concentration of 1.8% and the reaction was left at 37 °C while shaking for another hour. Chromatin was digested with 800 U of DpnII overnight at 37 °C while shaking. DpnII was inactivated by adding SDS to a final concentration of 1.3% and incubating at 65 °C for 20 minutes. Nuclei were diluted into a volume of 7 mL containing 1.01x T4 DNA ligase buffer (Life Technologies) and Triton-X100 at a final concentration of 1% and incubated at 37 °C for 1 hour. Ligations were carried out with 100 U of T4 ligase (Life Technologies) for 4.5 hours at 16 °C and 30 minutes at room temperature while shaking. For control libraries, ligase was omitted. Samples were proteinase K treated and reverse-crosslinked overnight at 65 °C. Samples were then treated with RNase A at 37 °C for 30 minutes. DNA was purified by phenol/chloroform extraction and ethanol precipitated.
A second digestion was performed with 25 U of BfaI (New England Biolabs) for P1 and P2 baits or MseI (New England Biolabs) for +24 baits in restriction buffer overnight at 37 °C while shaking. Restriction was inactivated by adding SDS to a final concentration of 1.3% and incubating at 65 °C for 20 minutes. A second ligation was performed in the same way as the first ligation, except that ligations were incubated overnight. DNA was purified with two phenol/chloroform extractions and one chloroform extraction followed by ethanol precipitation. DNA
Enhancer location relative to P1 (kb)
Interactions identified by other studies Previous functional validation Findings from our study
−371 — NoneInteracts with +24 and P1. Enhancer activity in hematopoietic sites in 20–24 hpf zebrafish embryos.
−368 Interacts with P1 in HPC-7 cells (Capture Hi-C by Wilson et al.)18 None
Interacts with +24 and P1. Enhancer activity in hematopoietic sites in 20–24 hpf zebrafish embryos.
−354 Interacts with P1 in HPC-7 cells (Capture Hi-C by Wilson et al.)18 None
Interacts with +24 and P1. Enhancer activity in hematopoietic sites in 20–24 hpf zebrafish embryos.
−327 Interacts with P1 in HPC-7 cells (Capture Hi-C by Wilson et al.)18 No enhancer activity in mice (Schutte et al.)15 Interacts with +24 and P1. No enhancer
activity in zebrafish.
−321 Interacts with P1 in HPC-7 cells (Capture Hi-C by Wilson et al.)18
Identified, but not tested for enhancer activity (Schutte et al.)15
Interacts with +24 and P1. Enhancer activity in hematopoietic sites in 20–24 hpf zebrafish embryos.
−303 Interacts with P1 in HPC-7 cells (Capture Hi-C by Wilson et al.)18 None
Interacts with +24 and P2. Enhancer activity in hematopoietic sites in 20–24 hpf zebrafish embryos and in keratinocytes from 20 hpf.
−58 —Haematopoietic enhancer activity in E11.5 transgenic mice and luciferase enhancer activity in 416B cells (Schutte et al.)15
Interacts with +24 and P1. Enhancer activity in hematopoietic sites in 20–24 hpf zebrafish embryos.
−48 — NoneInteracts with +24 and P1. Enhancer activity in hematopoietic sites in 20–24 hpf zebrafish embryos.
+24Interacts with P1 and P2 in human leukaemia cell lines (3 C by Markova et al.)14
Haematopoietic enhancer activity in mouse and zebrafish development and luciferase enhancer activity in 416B cells (Nottingham et al., 2009, Ng et al., 2010, Schutte et al.)11,12,15
Interacts with P1 and P2. Enhancer activity in hematopoietic sites in 20–24 hpf zebrafish embryos.
+110 —Haematopoietic enhancer activity in E11.5 transgenic mice and luciferase enhancer activity in 416B cells (Schutte et al.)15
Interacts with P1. Enhancer activity in hematopoietic sites in 20–24 hpf zebrafish embryos.
Table 1. Previous findings on enhancers and new findings from this study.

www.nature.com/scientificreports/
9SCIeNTIfIC REPORTs | 7: 13347 | DOI:10.1038/s41598-017-13748-8
concentrations were measured using a Qubit® 3.0 Fluorometer (Life Technologies) and Qubit® double-stranded DNA (dsDNA) High Sensitivity Assay kit (Life Technologies).
For each bait, a total of 1 μg of DNA was amplified by PCR using Q5® High-Fidelity DNA Polymerase (New England Biolabs). Bait primer sequences are listed in Supplementary Table S3. PCR products were purified using the QIAquick PCR Purification kit (QIAGEN). DNA concentrations were measured using a Qubit® 3.0 Fluorometer and average fragment size by the 2100 Bioanalyser (Agilent Technologies) using a High Sensitivity DNA Kit (Agilent Technologies). Amplicons from the six different baits were mixed equally based on the concen-tration, average fragment size and ratio of demultiplexed 4C baits obtained from an initial MiSeq run. Libraries were prepared with Prep2SeqTM DNA Library Prep Kit from IlluminaTM (Affymetrix) and TruSeq® adaptors (Illumina). Libraries were mixed equimolarly and sequenced as 125 bp paired-end reads on two IlluminaTM HiSeq 2500 lanes by New Zealand Genomics Limited.
4C-seq data analysis. 4C-seq data was analysed in command-line and the R statistical environment38, and visualised using the University of California, Santa Cruz (UCSC) genome browser (http://genome.ucsc.edu/) with mouse assemblies mm9 or mm1039,40, or with the R package ggplot241. Baits were demultiplexed based on bait primer sequences up to and including the digestion site using a custom awk script, allowing 0 mismatches. Only read pairs that had the forward and reverse bait sequences in the correct orientation were selected. Adapter sequences, bait sequences up to but excluding the digestion site, and bases with a Phred quality score under 20 were then trimmed from the reads, using the fastq-multx, fastq-mcf and cleanadaptors v1.24 tools42,43. Quality of reads was assessed using FastQC (http://www.bioinformatics.babraham.ac.uk/projects/fastqc/)44.
Reads with a minimum length of 30 bp were mapped to the mm10 reference genome using Bowtie145, allow-ing 0 mismatches. Mapped reads were assigned to DpnII digestion fragments using fourSig46. The following reads were removed from the files: 1) self-ligated reads, 2) uncut reads (fragments adjacent to baits), and 3) reads at fragments that have at least 1 read in the control (non-ligated) library. The running mean was calculated from the sum of read counts from nine successive fragments, which was obtained using fourSig46, and was read per million normalised.
Significant interaction calling was performed using the R package fourSig with the following settings: window size of 3, 1000 iterations, fdr of 0.01, fdr.prob of 0.05 (which selects the top fifth percentile of interactions with a FDR of <0.01), and only included mappable fragments46. Significant interactions were called for two regions: 1) the whole of chr16, and 2) from chr16:92,250,000-93,635,000 (within the domain). Significant interactions in both replicates were overlapped using the bedIntersect tool from UCSC47.
In the fourSig package, significant interactions can be categorised into three categories: 1) interactions that are significant after the reads from the fragment with the highest read count is removed, 2) interactions that are significant when the fragment with the highest read count is averaged to the read counts of the neighbouring frag-ments, and 3) interactions that are significant only when all fragment read counts are included46. For this study, only category 1 and 2 interactions that overlap between both replicates were included, as they are more likely to represent true interactions (because they span multiple fragments), and were previously shown to be more reproducible between replicates than single-fragment interactions46. Furthermore, we distinguished category 1 interactions that overlap between both replicates from other category 1 and 2 interactions by colouring them red and orange, respectively, to visualise the most significant interactions. For conversion from assembly mm10 to mm9, the liftOver tool from UCSC was used (http://genome.ucsc.edu/)47. Gene annotations used in Figures are UCSC reference genes.
Zebrafish enhancer assay. Runx1 regulatory regions were amplified from HPC-7 gDNA or from I-SceI-zhsp70 plasmid containing the −368, +24 and +110 sequences11 (primer sequences are in Supplementary Table S3), and cloned into the zebrafish enhancer detection vector48. Plasmid purifications were performed with the NucleoSpin® Plasmid or NucleoBond® Xtra Midi prep kits (Machery-Nagel). Primers amplified the TF binding peak +/− 200 bp, except for −321 which (due to a repetitive region) did not have a 200-bp extension on the 3′ end. The −368, +24 and +110 fragments are 471, 529 and 579 bp, respectively11. A mixture of 30 pg vector DNA and 120 pg Tol2 transposase mRNA49 was injected into 1-cell zebrafish embryos. Embryos were imaged at 20–24 or ~48 hpf using a Leica M205FA stereomicroscope with a DFC490 camera and LAS software (Leica Microsystems), images were processed using Adobe Photoshop. Zebrafish were maintained as described previously50 and zebrafish handling and procedures were carried out in accordance with the Otago Zebrafish Facility Standard Operating Procedures. The University of Otago Animal Ethics Committee approved all zebraf-ish research under approval AEC 48/11.
Identification of conserved non-coding elements. Mouse conserved non-coding elements (mCNEs) were identified as described previously11.
ChIP-seq, Capture Hi-C and DNase I hypersensitivity data. Occupancy of the transcription factors Erg, Fli1, Scl, Runx1, Gata2, E2A, Ldb1, Lyl1, Lmo2, Gfi1b, Meis1, Myb, phospho-Stat1, Pu.1, Stat3, Eto2, Cebp-α, Cebp-β, Elf1, Nfe2, p53, cMyc, Egr1, E2f4, cFos, Mac and Jun; Rad21 and CTCF; H3K27ac and H3K4me3; DNase I hypersensitivity sites; and Capture Hi-C data in HPC-7 cells was obtained from previously published data18–20. Rad21, Smc3 and CTCF chromatin immunoprecipitation sequencing (ChIP-seq) data in MEL and CH12 cells were obtained from ENCODE51.
Availability of data. The 4C-seq dataset is accessible through GEO Series accession number GSE86994 (https://www.ncbi.nlm.nih.gov/geo/query/acc.cgi?acc = GSE86994).

www.nature.com/scientificreports/
1 0SCIeNTIfIC REPORTs | 7: 13347 | DOI:10.1038/s41598-017-13748-8
References 1. Okuda, T., van Deursen, J., Hiebert, S. W., Grosveld, G. & Downing, J. R. AML1, the target of multiple chromosomal translocations
in human leukemia, is essential for normal fetal liver hematopoiesis. Cell 84, 321–30 (1996). 2. Wang, Q. et al. Disruption of the Cbfa2 gene causes necrosis and hemorrhaging in the central nervous system and blocks definitive
hematopoiesis. Proc Natl Acad Sci USA 93, 3444–9 (1996). 3. Swiers, G., de Bruijn, M. & Speck, N. A. Hematopoietic stem cell emergence in the conceptus and the role of Runx1. The International
journal of developmental biology 54, 1151–63 (2010). 4. Growney, J. D. et al. Loss of Runx1 perturbs adult hematopoiesis and is associated with a myeloproliferative phenotype. Blood 106,
494–504 (2005). 5. Papaemmanuil, E. et al. Genomic Classification and Prognosis in Acute Myeloid Leukemia. N Engl J Med 374, 2209–21 (2016). 6. Levanon, D. & Groner, Y. Structure and regulated expression of mammalian RUNX genes. Oncogene 23, 4211–9 (2004). 7. Bee, T. et al. Nonredundant roles for Runx1 alternative promoters reflect their activity at discrete stages of developmental
hematopoiesis. Blood 115, 3042–50 (2010). 8. Pozner, A. et al. Developmentally regulated promoter-switch transcriptionally controls Runx1 function during embryonic
hematopoiesis. BMC developmental biology 7, 84 (2007). 9. Bee, T. et al. Alternative Runx1 promoter usage in mouse developmental hematopoiesis. Blood cells, molecules & diseases 43, 35–42
(2009). 10. Marsman, J. & Horsfield, J. A. Long distance relationships: enhancer-promoter communication and dynamic gene transcription.
Biochimica et biophysica acta 1819, 1217–27 (2012). 11. Ng, C. E. et al. A Runx1 intronic enhancer marks hemogenic endothelial cells and hematopoietic stem cells. Stem Cells 28, 1869–81
(2010). 12. Nottingham, W. T. et al. Runx1-mediated hematopoietic stem-cell emergence is controlled by a Gata/Ets/SCL-regulated enhancer.
Blood 110, 4188–97 (2007). 13. Bee, T. et al. The mouse Runx1 +23 hematopoietic stem cell enhancer confers hematopoietic specificity to both Runx1 promoters.
Blood 113, 5121–4 (2009). 14. Markova, E. N., Kantidze, O. L. & Razin, S. V. Transcriptional regulation and spatial organisation of the human AML1/RUNX1 gene.
J Cell Biochem 112, 1997–2005 (2011). 15. Schütte, J. et al. An experimentally validated network of nine haematopoietic transcription factors reveals mechanisms of cell state
stability. eLife 5, e11469 (2016). 16. Gunnell, A. et al. RUNX super-enhancer control through the Notch pathway by Epstein-Barr virus transcription factors regulates B
cell growth. Nucleic Acids Res 44, 4636–50 (2016). 17. Sati, S. & Cavalli, G. Chromosome conformation capture technologies and their impact in understanding genome function.
Chromosoma (2016). 18. Wilson, N. K. et al. Integrated genome-scale analysis of the transcriptional regulatory landscape in a blood stem/progenitor cell
model. Blood 127, e12–e23 (2016). 19. Calero-Nieto, F. J. et al. Key regulators control distinct transcriptional programmes in blood progenitor and mast cells. EMBO J 33,
1212–26 (2014). 20. Wilson, N. K. et al. Combinatorial transcriptional control in blood stem/progenitor cells: genome-wide analysis of ten major
transcriptional regulators. Cell Stem Cell 7, 532–44 (2010). 21. Consortium, G. T. The Genotype-Tissue Expression (GTEx) project. Nat Genet 45, 580–5 (2013). 22. Merkenschlager, M. & Nora, E. P. CTCF and Cohesin in Genome Folding and Transcriptional Gene Regulation. Annu Rev Genomics
Hum Genet 31, 17–43 (2016). 23. Dorsett, D. & Merkenschlager, M. Cohesin at active genes: a unifying theme for cohesin and gene expression from model organisms
to humans. Curr Opin Cell Biol 25, 327–33 (2013). 24. de Jong, J. L. & Zon, L. I. Use of the zebrafish system to study primitive and definitive hematopoiesis. Annu Rev Genet 39, 481–501
(2005). 25. Rao, S. S. et al. A 3D map of the human genome at kilobase resolution reveals principles of chromatin looping. Cell 159, 1665–80
(2014). 26. Dixon, J. R. et al. Topological domains in mammalian genomes identified by analysis of chromatin interactions. Nature 485, 376–80
(2012). 27. Ives, J. H. et al. Increased levels of a chromosome 21-encoded tumour invasion and metastasis factor (TIAM1) mRNA in bone
marrow of Down syndrome children during the acute phase of AML(M7). Genes, chromosomes & cancer 23, 61–6 (1998). 28. Shimizu, K. et al. An ets-related gene, ERG, is rearranged in human myeloid leukemia with t(16;21) chromosomal translocation.
Proceedings of the National Academy of Sciences of the United States of America 90, 10280–4 (1993). 29. Ortt, K., Raveh, E., Gat, U. & Sinha, S. A chromatin immunoprecipitation screen in mouse keratinocytes reveals Runx1 as a direct
transcriptional target of DeltaNp63. J Cell Biochem 104, 1204–19 (2008). 30. Inoue, K., Shiga, T. & Ito, Y. Runx transcription factors in neuronal development. Neural development 3, 20 (2008). 31. Horsfield, J. A. et al. Cohesin-dependent regulation of Runx genes. Development 134, 2639–49 (2007). 32. Marsman, J. et al. Cohesin and CTCF differentially regulate spatiotemporal runx1 expression during zebrafish development. Biochim
Biophys Acta 1839, 50–61 (2014). 33. Zuin, J. et al. Cohesin and CTCF differentially affect chromatin architecture and gene expression in human cells. Proc Natl Acad Sci
USA 111, 996–1001 (2014). 34. Leeke, B., Marsman, J., O’Sullivan, J. M. & Horsfield, J. A. Cohesin mutations in myeloid malignancies: underlying mechanisms. Exp
Hematol Oncol 3, 13 (2014). 35. Mazumdar, C. et al. Leukemia-Associated Cohesin Mutants Dominantly Enforce Stem Cell Programs and Impair Human
Hematopoietic Progenitor Differentiation. Cell Stem Cell 17, 675–688 (2015). 36 Pinto do, O. P., Kolterud, A. & Carlsson, L. Expression of the LIM-homeobox gene LH2 generates immortalized steel factor-
dependent multipotent hematopoietic precursors. EMBO J 17, 5744–56 (1998). 37. van de Werken, H. J. et al. 4C technology: protocols and data analysis. Methods Enzymol 513, 89–112 (2012). 38. Team, R. R: A Language and Environment for Statistical Computing. Vienna, Austria: R Foundation for Statistical Computing. (R:
A Language and Environment for Statistical Computing. Vienna, Austria: R Foundation for Statistical Computing., Vienna, Austria, 2016).
39. Kent, W. J. et al. The human genome browser at UCSC. Genome Res 12, 996–1006 (2002). 40. Mouse Genome Sequencing, C. et al. Initial sequencing and comparative analysis of the mouse genome. Nature 420, 520–62 (2002). 41. Wickham, H. ggplot2: Elegant Graphics for Data Analysis (Springer-Verlag New York, 2009). 42. Aronesty, E. Ea-utils: Command-line tools for processing biological sequencing data. (ExpressionAnalysis, Durham, NC, 2011). 43. Chatterjee, A., Stockwell, P. A., Rodger, E. J. & Morison, I. M. Comparison of alignment software for genome-wide bisulphite
sequence data. Nucleic Acids Res 40, e79 (2012). 44. Andrews, S. FastQC A Quality Control tool for High Throughput Sequence Data. 45. Langmead, B., Trapnell, C., Pop, M. & Salzberg, S. L. Ultrafast and memory-efficient alignment of short DNA sequences to the
human genome. Genome Biol 10, R25 (2009).

www.nature.com/scientificreports/
1 1SCIeNTIfIC REPORTs | 7: 13347 | DOI:10.1038/s41598-017-13748-8
46. Williams, R. L. Jr et al. fourSig: a method for determining chromosomal interactions in 4C-Seq data. Nucleic Acids Res 42, e68 (2014).
47. Kent, W. J. et al. The human genome browser at UCSC. Genome research 12, 996–1006 (2002). 48. Bessa, J. et al. Zebrafish enhancer detection (ZED) vector: a new tool to facilitate transgenesis and the functional analysis of cis-
regulatory regions in zebrafish. Developmental dynamics: an official publication of the American Association of Anatomists 238, 2409–17 (2009).
49. Kawakami, K. Transposon tools and methods in zebrafish. Dev Dyn 234, 244–54 (2005). 50. Westerfield, M. The Zebrafish Book. A guide for the laboratory use of zebrafish (Brachydanio rerio). (University of Oregon Press,
Eugene, Oregon, 1995). 51. Rosenbloom, K. R. et al. ENCODE data in the UCSC Genome Browser: year 5 update. Nucleic Acids Res 41, D56–63 (2013).
AcknowledgementsHPC-7 and BHK/MKL cells were kindly provided by Kathy Knezevic and John Pimanda. TruSeq® adaptors were kindly provided by Ian Morison. The authors would like to thank Anita Dunbier and Sofie Van Huffel for help with development of 4C protocols, and Noel Jhinku for expert management of the Otago Zebrafish Facility. This research was funded by the Royal Society of NZ Marsden Fund [grant number 11-UOO-027 to JAH] and the Health Research Council of NZ [grant number 15/229 to JAH].
Author ContributionsJ.M., A.T., M.O., J.M.O., J.A.H., designed experiments; J.M., A.T., performed experiments; J.M., A.T., M.O., J.M.O., J.A.H. analysed data; A.T. produced the graphic for Fig. S4; J.M. and J.A.H. wrote the paper with input from the other authors.
Additional InformationSupplementary information accompanies this paper at https://doi.org/10.1038/s41598-017-13748-8.Competing Interests: The authors declare that they have no competing interests.Publisher's note: Springer Nature remains neutral with regard to jurisdictional claims in published maps and institutional affiliations.
Open Access This article is licensed under a Creative Commons Attribution 4.0 International License, which permits use, sharing, adaptation, distribution and reproduction in any medium or
format, as long as you give appropriate credit to the original author(s) and the source, provide a link to the Cre-ative Commons license, and indicate if changes were made. The images or other third party material in this article are included in the article’s Creative Commons license, unless indicated otherwise in a credit line to the material. If material is not included in the article’s Creative Commons license and your intended use is not per-mitted by statutory regulation or exceeds the permitted use, you will need to obtain permission directly from the copyright holder. To view a copy of this license, visit http://creativecommons.org/licenses/by/4.0/. © The Author(s) 2017

287
Appendix VII: RUNX1 regulatory region Hg38
coordinates
Appendix VII Table 1: Hg38 Genome coordinates for regulatory regions
Regulatory region location relative to P1 (kb)
Genome coordinates (Hg38)
m-371 chr21:35482813-35483787 m-368 chr21:35476819-35476991 m-327 chr21:35428582-35428982 m-321 Not conserved between humans and mice -250 chr21:35297414-35298323 -188 chr21:35236032-35236509 -139 chr21:35189322-35190258 m-101 chr21:35170398-35170666 m-58 chr21:35106408-35106609 m-43 chr21:35091787-35091963 m+24 chr21:35026809-35027025 m-42 Not conserved between humans and mice m+1 Not conserved between humans and mice m+3 chr21:35046175-35046447 +62 chr21:34986636-34987656 m+110 chr21:34908536-34908897 m+181 Not conserved between humans and mice Intron 5.2 containing m+204 chr21:34807014-34809284

288
Appendix VIII: 4C data processing
The 4C sequencing libraries were prepared from 4C material, each containing PCR
products amplified by bait specific primer pairs. The read counts were determined from the
original sequencing library counts given by Otago Genomics Facility (Appendix VIII Table 1).
The baits were demultiplexed by Dr. William Schierding (University of Auckland). The
number of reads that demultiplexed to baits within each library was also determined (Appendix
VIII Table 1).
Appendix VIII Table 1: Read counts before and after primer demultiplexing
Library Original Read Count
Demultiplexed Read Count
4533_16 K562 WT DMSO 1 11,747,923 3,973,768 4533_17 K562 WT DMSO 2 6,124,022 3,218,192 4533_18 K562 WT DMSO 3 4,231,900 2,511,463 4533_19 Control K562 WT DMSO 2,854,280 1,395,817 4533_20 K562 WT 12h PMA 1 4,568,245 3,389,303 4533_21 K562 WT 12h PMA 2 6,851,198 1,672,071 4533_22 K562 WT 12h PMA 3 4,223,579 1,999,157 4533_23 K562 WT 72h PMA 1 6,349,712 4,105,424 4533_24 K562 WT 72h PMA 2 2,934,889 2,094,222 4533_25 K562 WT 72h PMA 3 4,357,508 2,707,894 4533_26 Control K562 WT 72 PMA 3,087,335 1,844,770 4533_27 K562 -/- DMSO 1 3,948,820 2,712,143 4533_28 K562 -/- DMSO 2 4,173,877 2,528,795 4533_29 K562 -/- DMSO 3 7,181,545 3,739,103 4533_30 Control K562 -/- DMSO 31,255,638 92,067 4533_31 K562 -/- 12h PMA 1 7,077,762 3,115,038 4533_32 K562 -/- 12h PMA 2 8,657,941 3,624,719 4533_33 K562 -/- 12h PMA 3 3,914,040 2,136,044 4533_34 K562 -/- 72h PMA 1 6,648,572 3,795,374 4533_35 K562 -/- 72h PMA 2 6,463,080 3,398,746 4533_36 K562 -/- 72h PMA 3 23,085,885 3,480,265 4533_37 Control K562 -/- 72 PMA 4,041,648 2,265,435
After demultiplexing of primers, the reverse sequenced reads were mapped to a reduced
genome based on the primary RE used in the first digestion (Dpn II). The majority of RUNX1
+24 reads aligned to the reduced genome. Appendix VIII Figure 1 and 2 have very similar read

289
numbers. The quality evaluation compares the read distributions to determine if a replicate is
high enough quality to be included in the 4C interaction analysis (Appendix VIII Figure 3).
RUNX1 +24
Appendix VIII Figure 1: RUNX1 +24 demultiplexed read count.
The number of demultiplexed reads (millions) is shown for the individual conditions in replicate 1, 2, 3 or
control.
Appendix VIII Figure 2: RUNX1 +24 Mapped read count.
The number of mapped reads (millions) is shown for the individual conditions in replicate 1, 2, 3 or control.

290
Appendix VIII Figure 3: RUNX1 +24 4C quality evaluation.
The coverage of fragments that had more than one read present within 0.1 mb on either side of the bait was plotted against the percentage of reads in cis over total. 4C data of WT 12 DMSO (light blue), WT 12 PMA (blue), WT 72 PMA (dark blue), STAG2 12 DMSO (yellow), STAG2 12 PMA (orange), STAG2 72 PMA (red) is plotted. Three points, corresponding to replicate 1, 2 and 3 are presented for each condition. Grey dotted lines indicate cut-off point for good quality data.
Appendix IX: WT 12 DMSO interaction peaks
Table of all the statistically significant interactions with RUNX1 +24 in WT 12 DMSO
cells
WT 12 DMSO cis significant interactions
Appendix IX Table 1: WT 12 DMSO cis interactions
Chromosome location (Chr21)
Start End 16102849 16290033
17054388 17167830
18444178 18546244
22870115 23124047

291
Chromosome location (Chr21)
Start End 24350542 24638310
27615547 27687280
28569260 28782031
31067134 31287024
33094489 33125735
33479993 33507790
34626170 34659645
34,861,779 34,886,331
35064167 35082568
37435929 37444466
37450343 37453283
37471800 37474965
38,064,789 38,088,359
38205868 38217764
38326452 38338678
38630433 38645058
39302387 39354604
39457439 39483268
39837197 39941694
40549637 40807167
41078121 41274056
42531449 42597547
43171342 43223493
43,820,942 43,905,318
44021469 44133209
44350268 44425222
45126172 45164937

292
WT 12 DMSO near-bait significant interactions
Appendix IX Table 2: WT 12 DMSO near-bait interactions
Chromosome location (Chr21)
Start End 35474191 35488395
36120292 36122672
36123862 36126228
36125047 36127409
36156784 36159142
36157963 36160322
36243806 36245595
36253381 36255044
36264639 36266171
36265409 36266933
36271428 36272893
36277225 36278641
36277936 36279346
36279349 36280749
36280051 36281446
36280751 36282141
36281449 36282833
36282836 36284211
36288291 36289632
36290969 36292295
36293617 36294930
36294275 36295584
36305857 36307115
36313951 36315177
36314565 36315788
36316400 36317616
36317009 36318223
36317617 36318829

293
Chromosome location (Chr21)
Start End 36324230 36325417
36326010 36327189
36328367 36329537
36328953 36330121
36329538 36330704
36331867 36333024
36332447 36333601
36333602 36334752
36335327 36336470
36335900 36337041
36337042 36338179
36337611 36338746
36338180 36339312
36338747 36339877
36339878 36341004
36340442 36341565
36341005 36342126
36341566 36342686
36343803 36344915
36346578 36347680
36347130 36348230
36347681 36348780
36348231 36349329
36348781 36349876
36353148 36354232
36353690 36354773
36357470 36358544
36358545 36359617
36361223 36362291
36361757 36362824
36363358 36364423

294
Chromosome location (Chr21)
Start End 36367613 36368674
36368143 36369205
36370796 36371857
36371327 36372388
36375572 36376634
36376103 36377166
36377697 36378762
36379295 36380362
36379828 36380896
36380361 36381430
36380895 36381965
36382500 36383573
36383036 36384111
36384110 36385187
36386806 36387890
36387347 36388434
36409375 36410564
36409969 36411162
36412365 36413572
36412969 36414179
36414790 36416010
36415400 36416624
36416012 36417240
36416626 36417857
36417242 36418476
36417859 36419097
36418478 36419719
36425395 36426671
36426033 36427312
36426673 36427955
36427314 36428599

295
Chromosome location (Chr21)
Start End 36427956 36429244
36428600 36429891
36429246 36430539
36432493 36433799
36433146 36434455
36433800 36435112
36441738 36443074
36443075 36444413
36447775 36449123
36449124 36450475
36449799 36451151
36455222 36456582
36455902 36457263
36464790 36466165
36465477 36466854
36468234 36469615
36468924 36470307
36469616 36471000
36470308 36471694
36471001 36472388
36474478 36475874
36475176 36476573
36479385 36480795
36482213 36483633
36482923 36484346
36483634 36485060
36484347 36485775
36485061 36486492
36489374 36490822
36499642 36501131
36501880 36503377

296
Chromosome location (Chr21)
Start End 36507905 36509423
36508664 36510185
36517085 36518628
36547820 36549434
36548627 36550243
36549435 36551053
36551054 36552676
36569979 36571652
36575859 36577549
36598256 36600012
36599134 36600892
36613306 36615093
36689136 36690961
36690048 36691870
36692776 36694589
36699984 36701773
36700879 36702664
36707985 36709750
36716767 36718514
36769828 36771700
36770764 36772642
36845802 36848109

297
Appendix X: Trans interaction peaks
The trans interactions of RUNX1 +24 could not be significantly investigated using 4C-
ker. The 4Cker analysis showed bands that spanned across large areas of the various
chromosomes the trans interactions that could be detected, I looked at the raw read peaks across
the genome (Appendix IX Figure 1). Based on peaks that contained reads in 2 or more
replicates I detected three trans interactions (Appendix IX Figure 2-4). All peaks were in
intergenic regions and contained minimal ENCODE annotations.
Appendix X Figure 1: RUNX1 +24 trans chromosome 1 reads.
UCSC genome browser snapshot of normalised read count showing chromosome (chr) 1 reads from all three replicates.

298
Appendix X Figure 2: RUNX1 +24 chr 1 trans interactions.
UCSC genome browser snapshot of normalised read count showing reads from all three replicates highlighting the possible chr 1 trans interaction

299
Appendix X Figure 3: RUNX1 +24 chr 3 trans interactions.
UCSC genome browser snapshot of normalised read count showing reads from all three replicates highlighting the possible chr 3 trans interaction

300
Appendix X Figure 4: RUNX1 +24 chr 9 trans interactions.
UCSC genome browser snapshot of normalised read count showing reads from all three replicates highlighting the possible chr 9 trans interaction.
301
Appendix XI: List of significant changes (cis)
Lists of all the statistically significant cis changes between conditions
WT cis significant changes during differentiation
Appendix XI Table 1: Differentially decreased cis interactions in WT 12 h PMA cells compared to WT 12 h DMSO K562 cells
Chromosome location (Chr21) log2FoldChange Adjusted p value
Start End
16193679 16290033 -8.0131141 0.00497879
39852633 39906157 -7.8384879 0.00978024
Appendix XI Table 2: Differentially decreased cis interactions in WT 72 h PMA cells compared to WT 12 h DMSO K562 cells
Chromosome location (Chr21) log2FoldChange Adjusted p value
Start End
22876545 23117188 -7.4296378 0.00362255
24372136 24630993 -5.7785282 0.00383509
28570440 28782508 -7.895935 0.00817325
31223207 31350841 -8.8622479 0.00193125
34626170 34659645 -6.4021928 0.00554615
34861883 34886153 -6.2869926 0.00584545
38065170 38088150 -7.50213 0.00211092
39302647 39354164 -7.8347453 0.00178676
43171342 43273433 -6.5989095 0.00645605
43821554 43904818 -8.3977348 0.00050987

302
WT and STAG2 cis comparisons
Appendix XI Table 3: Differentially decreased cis interactions in STAG2 12h DMSO cells compared to WT 12h DMSO K562 cells
Chromosome location (Chr21) log2FoldChange Adjusted p value
Start End
15789630 15905266 4.93016724 0.00656758
16193679 16290033 -5.6375836 0.00465524
16337170 16447658 4.39988775 0.00144947
26749583 26912507 6.04072918 0.00276931
30766929 30848918 6.02534263 0.00029361
30975222 31069884 3.84968539 0.00943295
34232784 34274588 5.95696286 0.00150594
34738802 34767851 3.99116934 0.00827214
34965396 34986172 4.06506145 0.0074603
35064266 35082455 -5.5186585 0.00780053
38065170 38088150 -5.1459938 0.00711804
38099808 38123104 3.88469303 0.00595205
38111456 38134838 5.55176215 0.00821735
38790145 38825524 4.39693366 0.00587422
39225824 39276819 4.59711214 0.00883934
39251322 39302562 4.68523129 0.00971659
39379992 39431602 5.13275693 0.0034974
39561223 39613465 5.48301289 0.00504078
40092657 40145586 5.52330128 0.00367745
40383991 40437879 4.6125032 0.00692396
41082235 41192923 -6.659979 0.00036723
41137579 41253995 -6.518779 0.00213839
42327921 42467118 4.93843987 0.00575986
44546192 44629845 4.3041222 0.00671446
44588018 44672916 6.00732878 0.00022353

303
Appendix XI Table 4: Differentially decreased cis interactions in STAG2 12 h PMA cells compared to WT 12 h PMA K562 cells
Chromosome location (Chr21) log2FoldChange Adjusted p value
Start End
36516987 36518381 8.83443992 00.0023261 Appendix XI Table 5: Differentially decreased cis interactions in STAG2 72 h PMA cells compared to WT 72 h PMA K562 cells
Chromosome location (Chr21) log2FoldChange Adjusted p value
Start End
17658804 17929142 8.77960408 3.54E-05
17795376 18062908 5.99772569 0.00353314
18653456 18833421 5.86735877 0.00232339
22762987 22996867 6.37260654 0.00782695
22876545 23117188 10.0927403 1.21E-05
26749583 26912507 8.04883755 0.00207552
27308690 27428828 7.25476493 0.00509219
27367527 27490129 7.74087843 0.00509219
27426968 27553290 8.28178011 0.00214456
28570440 28782508 8.32963928 0.00275066
28997265 29212346 6.8981528 0.00358326
29427589 29629288 6.36801489 0.00379672
30646160 30726999 6.42810586 0.00190139
31826262 31999444 4.97135124 0.00939023
32513939 32620098 5.65073304 0.00866759
33094489 33156981 4.74896145 0.00866759
34169753 34211768 7.7060914 0.00015066
34943785 34965232 7.39162623 0.0010998
34954679 34975784 6.62312295 0.00399488
37516547 37524058 5.84397019 0.00095948
37520302 37527914 5.92987926 0.00232339
37535840 37543879 8.92597012 0.00015066
37720265 37734202 8.49654733 0.00315786

304
Chromosome location (Chr21) log2FoldChange Adjusted p value
Start End
38755847 38789797 5.92670113 0.00296832
39431609 39483268 5.62911118 0.00855271
40198325 40251084 5.08928081 0.00207552
41812481 41960561 6.81246138 0.00351648
43821554 43904818 7.13610776 0.00388488
44313418 44387118 6.5161103 0.00156909
44927619 45009217 6.82470303 0.00866759
46067813 46187451 6.81361389 0.00263408
46127632 46249867 7.68983358 0.00052257
47058514 47214415 6.88001354 0.00124792
47136465 47289912 5.62989411 0.00233245
47432325 47569238 6.40367744 0.00142847
305
Appendix XII: List of significant changes (near-bait)
Lists of all the statistically significant near-bait changes between conditions
WT near-bait significant changes during differentiation
Appendix XII Table 1: Differentially connected near-bait interactions in WT 12 h PMA cells compared to WT 12 h DMSO K562 cells
Chromosome location (Chr21) log2FoldChange Adjusted p value
Start End
35474191 35488395 -8.9377799 0.00013656
36278644 36280049 6.80655514 0.00194086
36332447 36333601 -7.6163228 0.00154466
36352605 36353690 8.07237223 0.00044141
36366550 36367612 6.76625148 0.00046604
36406427 36407599 8.25342937 5.34E-07
36410566 36411762 7.97117671 1.17E-05
36420971 36422856 7.47613931 0.00204346
36517085 36518628 -7.8123099 0.00337409
Appendix XII Table 2: Differentially connected near-bait interactions in WT 72 h PMA cells compared to WT 12 h DMSO K562 cells
Chromosome location (Chr21) log2FoldChange Adjusted p value
Start End
36278644 36280049 -8.4916179 0.00011101
36324230 36325417 -9.7177426 8.72E-05
36326010 36327189 -9.9312191 1.98E-06
36349329 36350423 -5.0850069 0.00025395
36351516 36352604 -6.4430378 0.00243444
36352061 36353147 -6.4430378 0.00243444
36352605 36353690 -9.8028067 2.51E-05
36353690 36354773 -10.007951 8.07E-06
36357470 36358544 -11.333388 2.69E-13

306
Chromosome location (Chr21) log2FoldChange Adjusted p value
Start End
36366550 36367612 -8.4053431 2.59E-05
36375572 36376634 -11.252854 2.29E-13
36377697 36378762 -10.717736 6.58E-10
36379295 36380362 -12.360236 5.70E-15
36379828 36380896 -4.8535823 2.15E-05
36380361 36381430 -3.9254633 0.00055942
36380895 36381965 -4.0813855 0.00262689
36383573 36384648 -3.5709246 0.00168646
36384110 36385187 -12.034618 6.48E-15
36384648 36385726 -10.183231 3.33E-06
36387347 36388434 -5.9110333 8.45E-07
36390068 36391163 -6.9307593 1.69E-11
36390614 36391712 -3.8287182 0.00154049
36391711 36392813 -13.697569 9.54E-21
36392261 36393366 -13.781015 9.54E-21
36393365 36394474 -10.689796 1.86E-12
36393918 36395030 -11.706035 8.92E-16
36394473 36395587 -11.160013 7.62E-14
36395028 36396145 -8.4361378 1.20E-05
36395586 36396705 -12.292107 8.92E-16
36396144 36397266 -12.317332 3.42E-16
36397827 36398958 -17.523158 1.40E-35
36399523 36400657 -12.06068 1.38E-18
36400090 36401227 -11.753278 5.96E-16
36400658 36401798 -3.7399723 0.00119426
36401228 36402371 -12.495422 8.92E-16
36401799 36402945 -13.775696 1.32E-20
36402372 36403521 -8.2326817 6.06E-12
36403523 36404678 -4.7434083 5.04E-06
36404100 36405259 -3.3574145 0.00265467
36405261 36406426 -5.5279129 2.50E-06

307
Chromosome location (Chr21) log2FoldChange Adjusted p value
Start End
36405843 36407012 -11.666767 7.09E-14
36406427 36407599 -9.8620529 3.89E-08
36407013 36408189 -9.4757263 8.22E-07
36410566 36411762 -9.6137529 7.05E-07
36412365 36413572 -10.271704 1.98E-06
36412969 36414179 -5.4552266 0.00954996
36420971 36422225 -9.2193533 0.00014574
36421598 36422856 -9.2193533 0.00014574
36427314 36428599 -10.593799 3.32E-09
36465477 36466854 -9.4216804 8.20E-06
36479385 36480795 -4.1398039 0.00622221
36508664 36510185 -8.5117676 0.00151198 36598256 36600012 -5.3745211 0.00237202
37108487 37112215 5.94585879 0.0068571 WT and STAG2 near-bait comparisons
Appendix XII Table 3: Differentially connected near-bait interactions in STAG2 12 h DMSO cells compared to WT 12 h DMSO K562 cells
Chromosome location (Chr21) log2FoldChange Adjusted p value
Start End
35442448 35454754 5.14667346 0.00604543
35488228 35503117 7.20660582 6.37E-05
35510591 35526316 5.13712908 0.00958697
35600268 35616837 5.63045291 0.00190404
35608619 35625055 5.39764041 0.00313695
35686013 35699118 5.05439121 0.00336181
35692775 35705461 6.00241513 0.00036696
35699325 35711598 5.92593227 0.00511254
35734347 35744470 4.69026964 0.00330434
35739543 35749398 4.87776795 0.00739212

308
Chromosome location (Chr21) log2FoldChange Adjusted p value
Start End
35903813 35913177 6.16813376 0.0003288
35922480 35931468 5.15510497 0.00202299
35979513 35986245 4.15306452 0.00272369
36120292 36122672 -5.0846932 0.00165723
36123862 36126228 -6.3081783 0.00204766
36125047 36127409 -6.3378073 0.00217929
36126230 36128589 5.37656029 0.00055046
36127411 36129767 5.44025738 0.00532178
36156784 36159142 -5.9130815 0.00347325
36157963 36160322 -4.9202346 0.00236422
36215926 36218078 5.72381578 0.00143193
36238267 36240133 5.10258129 0.00313695
36243806 36245595 -7.2643134 2.92E-05
36253381 36255044 -5.5051643 0.00051481
36261516 36263082 5.54363525 0.00201202
36264639 36266171 -4.6884026 0.00198188
36265409 36266933 -4.6884026 0.00198188
36266175 36267691 7.33095815 2.50E-05
36271428 36272893 -6.5493485 0.00012837
36277225 36278641 -8.5036482 6.15E-07
36277936 36279346 -8.5019255 7.48E-09
36279349 36280749 -6.1583448 0.00133455
36280051 36281446 -7.2873161 5.50E-06
36280751 36282141 -8.5801776 1.12E-09
36281449 36282833 -8.9300293 1.04E-10
36282836 36284211 -5.7549271 0.00062342
36288291 36289632 -6.526985 8.70E-05
36290969 36292295 -4.543678 0.00052385
36292958 36294274 5.09197601 0.00514143
36293617 36294930 -6.0870697 8.83E-06
36294275 36295584 -6.0372376 0.00018546
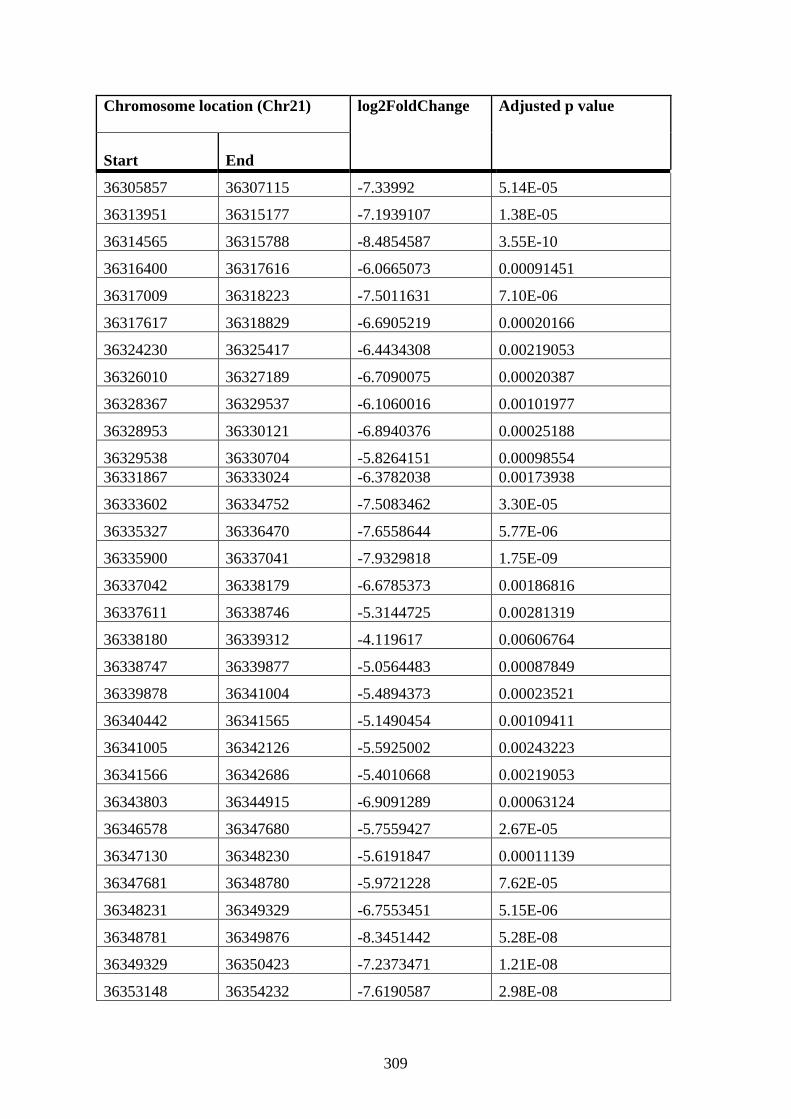
309
Chromosome location (Chr21) log2FoldChange Adjusted p value
Start End
36305857 36307115 -7.33992 5.14E-05
36313951 36315177 -7.1939107 1.38E-05
36314565 36315788 -8.4854587 3.55E-10
36316400 36317616 -6.0665073 0.00091451
36317009 36318223 -7.5011631 7.10E-06
36317617 36318829 -6.6905219 0.00020166
36324230 36325417 -6.4434308 0.00219053
36326010 36327189 -6.7090075 0.00020387
36328367 36329537 -6.1060016 0.00101977
36328953 36330121 -6.8940376 0.00025188
36329538 36330704 -5.8264151 0.00098554 36331867 36333024 -6.3782038 0.00173938
36333602 36334752 -7.5083462 3.30E-05
36335327 36336470 -7.6558644 5.77E-06
36335900 36337041 -7.9329818 1.75E-09
36337042 36338179 -6.6785373 0.00186816
36337611 36338746 -5.3144725 0.00281319
36338180 36339312 -4.119617 0.00606764
36338747 36339877 -5.0564483 0.00087849
36339878 36341004 -5.4894373 0.00023521
36340442 36341565 -5.1490454 0.00109411
36341005 36342126 -5.5925002 0.00243223
36341566 36342686 -5.4010668 0.00219053
36343803 36344915 -6.9091289 0.00063124
36346578 36347680 -5.7559427 2.67E-05
36347130 36348230 -5.6191847 0.00011139
36347681 36348780 -5.9721228 7.62E-05
36348231 36349329 -6.7553451 5.15E-06
36348781 36349876 -8.3451442 5.28E-08
36349329 36350423 -7.2373471 1.21E-08
36353148 36354232 -7.6190587 2.98E-08

310
Chromosome location (Chr21) log2FoldChange Adjusted p value
Start End
36353690 36354773 -6.7603357 0.00052385
36357470 36358544 -8.2201229 5.59E-10
36358545 36359617 -5.0586849 0.00053423
36361223 36362291 -6.3245385 0.00018379
36361757 36362824 -7.7342382 5.85E-07
36363358 36364423 -4.2037648 0.00842511
36367613 36368674 -5.3934605 0.00532178
36368143 36369205 -7.6240911 1.65E-07
36368674 36369735 -7.8172476 1.57E-08
36369205 36370266 -6.0627492 0.0004902
36370796 36371857 -7.1648961 7.03E-07
36371327 36372388 -7.1668825 6.26E-07
36375572 36376634 -8.1453593 5.00E-10
36376103 36377166 -9.3578651 5.39E-14
36376634 36377698 -8.6138615 3.31E-10
36377166 36378230 -7.2504001 8.36E-07
36377697 36378762 -7.5580953 4.60E-07
36378230 36379295 -8.4133492 1.87E-09
36378762 36379828 -9.1784314 2.31E-12
36379295 36380362 -9.2348118 1.02E-11
36379828 36380896 -9.6763744 6.47E-14
36380361 36381430 -2.6218818 0.00652073
36380895 36381965 -3.3237615 0.00243029
36381430 36382501 -5.9783881 0.00249267
36382500 36383573 -5.7246547 0.00453991
36383036 36384111 -8.4451345 2.92E-11
36383573 36384648 -9.2083949 6.67E-14
36384110 36385187 -8.9215142 1.54E-11
36384648 36385726 -6.9420433 0.00025483
36386806 36387890 -8.5415748 3.55E-10
36387347 36388434 -9.0233909 1.55E-11

311
Chromosome location (Chr21) log2FoldChange Adjusted p value
Start End
36387890 36388978 -8.8873084 1.85E-11
36388433 36389523 -7.9683448 1.95E-08
36388977 36390069 -6.9327362 2.49E-06
36389522 36390615 -8.2426883 3.30E-09
36390068 36391163 -9.9377838 7.34E-15
36390614 36391712 -9.6751239 3.60E-14
36391162 36392262 -9.0775585 9.77E-12
36391711 36392813 -10.61135 2.95E-17
36392261 36393366 -10.689834 2.95E-17
36393365 36394474 -7.5904273 4.51E-09
36393918 36395030 -8.6248651 2.98E-12
36394473 36395587 -8.0668095 2.29E-10
36395028 36396145 -5.2569823 0.0015807
36395586 36396705 -9.1849292 2.02E-12
36396144 36397266 -9.2193345 6.15E-13
36396704 36397829 -9.0894818 8.09E-14
36397265 36398393 -8.967531 6.11E-12
36400090 36401227 -8.675502 1.80E-12
36400658 36401798 -9.2692792 7.93E-14
36401228 36402371 -9.378327 2.02E-12
36401799 36402945 -5.038744 7.61E-08
36402372 36403521 -3.5759767 0.00187333
36403523 36404678 -9.3643406 4.72E-14
36404100 36405259 -10.122268 6.08E-17
36404680 36405841 -9.1409659 2.10E-11
36405261 36406426 -8.2309386 4.38E-10
36405843 36407012 -8.5509922 1.38E-10
36407013 36408189 3.99025471 0.00241178
36408190 36409373 -7.4028371 1.83E-08
36409375 36410564 -5.8642315 0.00036696
36409969 36411162 -6.3031778 5.49E-05

312
Chromosome location (Chr21) log2FoldChange Adjusted p value
Start End
36412365 36413572 -7.0352108 0.00016797
36412969 36414179 -7.7426722 1.46E-05
36414790 36416010 -4.6024336 0.00552198
36415400 36416624 -7.9606583 3.87E-08
36416012 36417240 -8.2026183 5.28E-08
36416626 36417857 -6.4008285 1.11E-06
36417242 36418476 -7.2248679 3.94E-07
36417859 36419097 -8.6052284 3.53E-10
36418478 36419719 -9.0721955 2.10E-11
36425395 36426671 -6.1071262 0.00045891
36426033 36427312 -3.2468646 0.00427006
36426673 36427955 -5.5419205 1.03E-07
36427314 36428599 -7.4220256 1.58E-06
36427956 36429244 -7.2037424 6.20E-07
36428600 36429891 -7.6476059 5.36E-09
36429246 36430539 -6.7768232 2.50E-05
36432493 36433799 -5.4958363 0.00874461
36433146 36434455 -6.6494338 0.00223817
36433800 36435112 -6.8541375 0.00085553
36441738 36443074 -5.8566927 0.00652073
36443075 36444413 -5.9206517 0.00249267
36446428 36447774 7.39577926 2.96E-05
36447775 36449123 -6.6516338 4.41E-06
36449124 36450475 -5.6525322 0.00666041
36449799 36451151 -5.6819926 0.00326723
36455222 36456582 -5.9937473 0.00190552
36455902 36457263 -4.5299829 0.00652073
36464790 36466165 -6.4190745 0.00010023
36465477 36466854 -6.1987382 0.00070554
36468234 36469615 -5.8512261 0.00088366
36468924 36470307 -6.8216637 1.71E-06

313
Chromosome location (Chr21) log2FoldChange Adjusted p value
Start End
36469616 36471000 -6.8430583 7.69E-07
36470308 36471694 -7.453335 1.17E-07
36471001 36472388 -7.582741 2.40E-06
36471694 36473083 -6.7916012 0.0001583
36474478 36475874 -9.0531798 5.21E-13
36475176 36476573 -7.7620541 1.05E-06
36476574 36477976 4.5685569 0.0094656
36482213 36483633 -6.0956116 0.00219053
36482923 36484346 -6.1011021 0.00196216
36483634 36485060 -7.5770118 3.59E-05
36484347 36485775 -8.8197034 1.55E-11
36485061 36486492 -4.1300057 0.00056245
36489374 36490822 -4.6474085 0.00292553
36499642 36501131 -5.0309972 0.00810328
36501880 36503377 -5.8853815 0.00109411
36507905 36509423 -5.2677341 0.00433536
36510186 36511710 4.20340063 0.00745852
36547820 36549434 -5.0367016 0.00268999
36548627 36550243 -6.1675094 3.01E-05
36549435 36551053 -5.6311423 0.00690644
36551054 36552676 -6.0681017 0.0046105
36569979 36571652 -5.8495268 0.00299595
36575859 36577549 -8.1808458 8.61E-10
36586087 36587810 5.45802724 0.00225476
36599134 36600892 -7.70849 0.00071704
36613306 36615093 -6.6973562 1.05E-06
36639644 36641497 4.98883571 0.00388645
36643358 36645221 6.65546515 0.00076291
36644289 36646155 4.44734443 0.00452901
36675275 36677141 6.26116299 0.00199485
36678070 36679930 4.12581365 0.00954415

314
Chromosome location (Chr21) log2FoldChange Adjusted p value
Start End
36681781 36683630 5.27931924 0.00840389
36689136 36690961 -6.0643028 0.0065149
36690048 36691870 -6.2983822 0.00056685
36692776 36694589 -6.5063716 0.00100762
36699984 36701773 -5.0619114 0.00491749
36700879 36702664 -5.3418691 0.00359391
36707985 36709750 -5.6312265 0.00214273
36716767 36718514 -6.0836102 0.00242154
36720257 36721999 4.76772143 0.00383356
36760629 36762445 6.69185046 6.37E-05
36769828 36771700 -5.4890296 0.00539627
36770764 36772642 -5.0261707 0.00831542
36780318 36782271 5.18649867 0.00453307
36817180 36819432 5.41118856 0.00788438
36820565 36822832 4.62864398 0.0055187
36830832 36833128 3.91908454 0.00316182
36833129 36835428 6.36933438 0.00084076
36834279 36836579 7.26272323 8.89E-05
36838884 36841188 4.91703132 0.00840389
36845802 36848109 -5.5795055 0.00055954
36861965 36864276 5.4450722 0.00057203
36863120 36865432 5.94395026 0.00075854
36880462 36882777 5.11807537 0.00104606
36895580 36897926 3.31146263 0.00889445
36896753 36899103 4.04485602 0.00281761
36905029 36907416 4.68161925 0.00606764
36915906 36918366 4.73789359 0.0032947
36917136 36919606 4.96756688 0.00784981
36958414 36961325 4.74411509 0.00074215
36959870 36962799 5.84583263 0.00204766
36981249 36984462 4.96011295 0.00056245

315
Chromosome location (Chr21) log2FoldChange Adjusted p value
Start End
36982856 36986093 5.03870752 0.00056245
36991078 36994449 4.9324713 0.00491749
37008653 37012362 4.85873578 0.00382578
37028134 37032277 6.1739032 0.00104737
37030206 37034396 5.79386359 0.00225476
37032301 37036541 6.74526785 0.00074215
37034421 37038710 5.82107512 0.00222416
37036565 37040905 5.76476449 0.00064035
37038735 37043124 5.90300992 0.00011139
37043150 37047640 4.45955355 0.00235656
37052283 37056975 5.01655284 0.00666041
37095061 37100368 5.23676744 0.00434717
37103038 37108370 5.31556159 0.00195862
37105704 37111038 5.79920985 0.00054327
37159176 37163807 4.10587535 0.00840389
37170498 37174877 7.33275151 4.41E-06
37172687 37177018 5.49103364 0.00612315
37174853 37179137 5.24234056 0.00313695
37181212 37185366 5.85259436 0.00105398
37195362 37199276 4.48212577 0.00190552
37222017 37225778 5.30380422 0.00634469
37237127 37240932 6.31057776 0.00142198
37256273 37260121 6.2641119 0.00062633
37258197 37262045 6.06703571 0.00217929
37260121 37263969 6.10036762 0.00109411
37317455 37321316 5.98073692 0.00022105
37319385 37323257 5.83117255 0.00190552
37325210 37329115 6.6395281 5.82E-05
37356988 37360994 5.84564246 0.00074215
37358991 37362993 5.94765868 0.00165723
37382680 37386536 5.32308698 0.00195583

316
Chromosome location (Chr21) log2FoldChange Adjusted p value
Start End
37384608 37388447 5.56009357 0.00199325 Appendix XII Table 4: Differentially connected near-bait interactions in STAG2 12 h PMA cells compared to WT 12 h PMA K562 cells
Chromosome location (Chr21) log2FoldChange Adjusted p value
Start End
35474191 35488395 8.88363712 0.00039423
36329538 36330704 -7.104548 0.00325246
36517085 36518628 8.07291617 0.00534208 Appendix XII Table 5: Differentially connected near-bait interactions in STAG2 72 h PMA cells compared to WT 72 h PMA K562 cells
Chromosome location (Chr21) log2FoldChange Adjusted p value Start
Start End
35616930 35633181 6.39080745 0.00248597
35820274 35829140 5.5848525 0.00097742
35824675 35833604 5.60497619 0.002314
35861078 35870515 5.67484009 0.00573638
35865777 35875254 6.38202372 0.00294739
36037368 36041588 5.93157339 0.00653349
36085729 36088522 5.19853978 2.60E-05
36087139 36089905 3.82433892 0.00644468
36095322 36097948 5.91682845 0.00492169
36103113 36105633 5.99928094 0.00569621
36126230 36128589 5.74903532 0.00151667
36212646 36214832 6.07280288 0.00314296
36230511 36232484 4.39631305 0.00082114
36231504 36233463 5.13758583 0.0092545
36245601 36247365 4.08172618 0.00950164
36246489 36248241 4.13413137 0.00769454

317
Chromosome location (Chr21) log2FoldChange Adjusted p value Start
Start End
36247371 36249111 3.68908087 0.00950164
36255049 36256690 4.35292358 0.00644468
36255874 36257506 4.11377844 0.00961065
36264639 36266171 -6.0507818 0.00031558
36265409 36266933 -6.0507818 0.00031558
36277936 36279346 -6.3021965 0.00037603
36278644 36280049 11.6729562 1.33E-09
36280751 36282141 3.78712369 0.0070179
36281449 36282833 3.48142505 0.00992013
36290302 36291632 2.88412113 0.00779809
36293617 36294930 4.04452087 0.0011826
36294275 36295584 4.6285964 0.00333127
36296890 36298187 -5.8193993 0.0048044
36321841 36323037 3.32492625 0.00601396
36326010 36327189 9.70851274 6.56E-06
36329538 36330704 -5.3848816 0.00813909
36353690 36354773 9.46576918 4.07E-05
36357470 36358544 10.7800466 6.46E-11
36358008 36359081 -6.1100997 0.0006696
36358545 36359617 -5.509932 0.00471123
36359081 36360153 4.41661147 0.00242101
36359617 36360688 3.72348938 0.00011918
36368143 36369205 -5.3552475 0.00242101
36375572 36376634 10.5041155 7.68E-11
36378230 36379295 -5.9803434 0.00038571
36378762 36379828 -6.2605281 4.97E-05
36379828 36380896 -4.7731068 0.00242101
36380895 36381965 3.59887114 0.00569621
36384110 36385187 10.3846842 1.70E-10
36386806 36387890 -5.2050704 0.00189496
36387890 36388978 -7.26707 3.12E-06

318
Chromosome location (Chr21) log2FoldChange Adjusted p value Start
Start End
36388433 36389523 -7.0197525 2.31E-05
36389522 36390615 3.71566016 0.00693617
36390614 36391712 -5.8030608 0.00010992
36391162 36392262 -5.3553286 0.00091074
36396704 36397829 -6.1154249 1.69E-05 36397265 36398393 -5.9315806 0.00011918
36400658 36401798 -5.4946701 0.00018284
36401799 36402945 9.67500252 8.95E-10
36403523 36404678 -4.5884313 0.002314
36404100 36405259 -6.7406599 1.60E-06
36405261 36406426 4.97333288 4.59E-05
36408190 36409373 -6.8682933 6.56E-06
36409375 36410564 4.14902314 0.00961065
36412365 36413572 9.90821104 8.81E-06
36412969 36414179 5.19516829 0.006363
36415400 36416624 -5.3966426 0.002314
36417242 36418476 3.55214792 0.00964533
36418478 36419719 -7.3674023 3.66E-06
36427314 36428599 8.28077489 2.02E-05
36438413 36439740 6.19923091 0.00355447
36439076 36440405 5.34938019 0.00781592
36447101 36448448 3.42138535 0.00964533
36447775 36449123 3.57663208 0.00973886
36462046 36463416 5.37629124 0.00091074
36466854 36468233 4.03332205 0.00678425
36467544 36468924 4.03332205 0.00678425
36468924 36470307 -5.051629 0.00303796
36470308 36471694 3.53892576 0.00955617
36473780 36475175 4.22259507 0.00195782
36474478 36475874 3.02786348 0.00781592
36476574 36477976 7.73871874 0.00086778

319
Chromosome location (Chr21) log2FoldChange Adjusted p value Start
Start End
36483634 36485060 -5.6762586 0.00949249
36525620 36527182 -5.0371467 0.0098543
36548627 36550243 3.83613999 0.00674913
36564157 36565814 -5.8356448 0.00350161
36564985 36566644 -5.6011714 0.002314
36574173 36575858 3.91851685 0.0048044
36576704 36578397 4.09421663 0.00569621
36581802 36583511 4.57197733 0.00781592
36583512 36585226 -5.8699908 0.00294739
36598256 36600012 6.96899254 1.69E-05
36599134 36600892 8.45991798 0.0005704
36613306 36615093 4.45512151 0.00042992
36624088 36625898 4.88082738 0.00813909
36624993 36626806 5.09223372 0.00189172
36626807 36628624 3.59833853 0.00779809
36627716 36629535 3.92259217 0.0098543
36638718 36640569 5.23900589 0.00950164
36639644 36641497 5.30117871 0.00781592
36654596 36656478 6.9292274 0.0008546
36728951 36730687 4.62761545 0.00314296
36729819 36731555 4.37422906 0.00775817
36735029 36736767 9.11645074 0.0001077
36739379 36741122 4.39342681 0.00346245
36756124 36757918 5.238339 0.00779809
36777412 36779341 3.42447573 0.00798702
36786243 36788249 3.67964767 0.00678425
36787246 36789261 3.86273218 0.00632354
36810491 36812704 5.61215239 0.002314
36845802 36848109 5.854747 0.0001077
36846955 36849263 5.16856943 3.66E-06
36848109 36850417 3.85732002 0.00035811

320
Chromosome location (Chr21) log2FoldChange Adjusted p value Start
Start End
36853880 36856189 -5.2477179 0.00973886
36885096 36887417 5.06153769 0.00964533
36895580 36897926 4.68289553 0.00156111
36896753 36899103 4.72151154 0.00314296
36911032 36913456 4.01547479 0.00709354
36933626 36936251 4.86453523 0.00272994
36934938 36937577 5.12703258 0.00248597
37056999 37061790 5.78297835 0.00747781
37059395 37064233 6.08828716 0.00242101
37061814 37066698 5.31314356 0.00813909
37084541 37089766 6.46491345 0.002314
37087154 37092404 6.25238487 0.00091074
37113699 37119014 5.88738966 0.00303796
37116357 37121658 5.63425786 0.00967932
37170498 37174877 4.73204438 0.00882689
37187383 37191422 4.94111543 0.00781592
37199264 37203129 7.52992906 0.00015582
37205031 37208841 4.95470397 0.00758695
37212613 37216380 5.08057016 6.35E-05
37214497 37218259 5.81850888 0.00082114
37246671 37250505 9.29052153 1.69E-05
37263969 37267814 6.15339897 0.00314296
37283130 37286944 5.57851522 0.00272994
37302154 37305960 5.87814043 0.00346245
37305962 37309776 3.96493041 0.00604611
37307869 37311688 4.63176966 0.00011918
37309778 37313604 4.43627766 0.00426435
37313608 37317450 5.33377368 0.00398626
37315529 37319381 5.18200797 0.00781592
37346971 37350974 7.54451589 0.00069152
37348973 37352979 6.87174577 0.00729703

321
Chromosome location (Chr21) log2FoldChange Adjusted p value Start
Start End
37374884 37378805 5.53180004 0.00346245
Appendix XIII: List of gene connections
To investigate which genes may be co-regulated with RUNX1, interactions occurring
with other genes were identified. Gene interaction analysis identifies a connection with an
overlap in the same genomic region as a gene, and does not necessarily reflect an interaction
with a promoter or exon of a gene.
Appendix XIII Table 1: List of gene connecting to RUNX1 +24 connections in each condition
WT 12 D WT 12 P WT 72 P STAG2 12 D
STAG2 12 P STAG2 72 P
AF127936.3 AF015262.2 AF064858.10
AF064858.10
AF240627.2 AF064858.6
AF127936.5 AF015720.3 AF064858.11
AF127577.11
AP000255.6 AP000253.1
AF127936.7 AF064858.6 AF064858.6 AIRE AP000688.14
AP000254.8
AL773572.7 AF127577.12
AF064858.8 AP000255.6 BRWD1 AP000962.1
AP000255.6 AF127577.13
AF064860.5 AP000320.6 BRWD1-AS1
AP001628.6
AP000688.11
AF129075.5 AF064860.7 AP000563.2 BRWD1-AS2
AP001628.7
AP000688.14
AL773572.7 AF124730.4 AP000569.9 CBR3-AS1 AP001630.5
AP001412.1 AP000223.42
AF127936.3 AP000688.11
CLIC6 BX322557.10
AP001626.2 AP000233.4 AF127936.5 AP000688.14
DOPEY2 C21orf62-AS1
AP001630.5 AP000282.3 AF129075.5 AP000688.15
HLCS CLIC6
BACE2 AP000320.6 AF246928.1 AP000705.6 HMGN1 DSCAM BRWD1 AP000474.1 AGPAT3 AP000705.7 IL10RB DSCR4 BRWD1-AS1
AP000563.2 AJ006998.2 AP000705.8 ITSN1 ERVH48-1
BRWD1-AS2
AP000688.11
AL109761.5 AP000959.2 KCNE2 H2AFZP1
BRWD1-IT1 AP000688.14
AP000255.6 AP001136.2 LINC00160 HMGN1

322
WT 12 D WT 12 P WT 72 P STAG2 12 D
STAG2 12 P STAG2 72 P
CBR1 AP000688.29
AP000318.2 AP001412.1 LINC01426 KCNE1
CLIC6 AP000695.4 AP000320.6 AP001628.6 LINC01436 KCNE1B DSCR3 AP000696.2 AP000322.5
3 AP003900.6 MIR548X LINC00160
DSCR4 AP000705.6 AP000477.2 ATP5J MIR548XHG
LINC00205
GAPDHP16 AP000705.7 AP000477.3 BAGE2 MORC3 LINC00315 GRIK1 AP000705.8 AP000569.9 bP-
2171C21.3 PAXBP1 LINC00334
GRIK1-AS1 AP001042.1 AP000688.14
bP-2171C21.4
PAXBP1-AS1
LINC01426
HLCS AP001043.1 AP000688.15
bP-2189O9.2
SCAF4 LINC01549
HMGN1 AP001412.1 AP000688.29
BRWD1 SETD4 LINC01668
IFNAR2 AP001610.5 AP000695.6 C21orf62-AS1
SYNJ1 MIR5692B
IL10RB AP001619.2 AP001042.1 CBR3-AS1 Y_RNA MIR99A IL10RB-AS1
AP001619.3 AP001437.1 CLIC6 LOC100506403
MIR99AHG
LCA5L AP003900.6 AP001469.5 CRYZL1 RUNXOR MIRLET7C LINC00159 ATP5J AP001469.7 CYCSP41 AF015720.3 NDUFV3 LINC01671 BACE2 AP001469.9 DNMT3L AP000322.5
3 PDE9A
METTL21AP1
BACH1 AP001625.4 DOPEY2 CH507-396I9.3
POFUT2
MIR3197 BAGE2 AP001625.5 DSCR3 CMP21-97G8.2
RNU6-113P
MIR5692B BRWD1 AP001625.6 DSCR4 KCNE1 SCAF4 PDE9A BTF3L4P1 ATP5J DSCR8 KCNE1B SETD4 PDXK BTF3P6 BACH1 DYRK1A RCAN1 SNORA81 PKNOX1 BX322557.1
0 BRWD1 ERG RUNX1-IT1 SOD1
PLAC4 C2CD2 BRWD1-IT1 EZH2P1
TRAPPC10 POLR2CP1 CBR1 BTF3L4P1 FAM207A
WDR4
PRDM15 CCT8 C21orf91 FAM3B
Y_RNA PSMG1 CHAF1B C21orf91-
OT1 FDX1P2
LOC100506403
RAD23BLP CLDN14 C2CD2 GABPA
RUNXOR RBMX2P1 CLDN17 CBR1 GART
AF015720.3
RBPMSLP CLIC6 CBR3-AS1 GRIK1
AP000322.53
RIPK4 CXADR CCT8 HLCS
CH507-396I9.3

323
WT 12 D WT 12 P WT 72 P STAG2 12 D
STAG2 12 P STAG2 72 P
RNF6P1 CYCSP41 CH507-396I9.3
HUNK
CMP21-97G8.2
RNU6-992P DOPEY2 CLDN14 IL10RB
RUNX1-IT1 RUNX1 DSCAM CLIC6 ITGB2
SCAF4 DSCAM-IT1 CMP21-97G8.1
ITGB2-AS1
SETD4 DSCR3 CXADR ITSN1
TIMM9P2 DYRK1A DSCAM JAM2
USP25 ERG DYRK1A KCNE2
WRB EVA1C ERG KRTAP10-10
Y_RNA EZH2P1 ETS2 KRTAP10-11
AF015720.3 FAM3B EVA1C KRTAP10-6
AP000318.2 FDX1P2 EXOSC3P1 KRTAP10-7
AP000322.53
GABPA FDX1P2 KRTAP10-8
LINC01426 GART GABPA KRTAP10-9
RCAN1 GRIK1 GAPDHP14 LCA5L
RPL34P3 HLCS GAPDHP16 LINC00114
SMIM11A HLCS-IT1 GRIK1 LINC00160
SMIM11B HUNK GRIK1-AS1 LINC00649
LOC100506403
IMMTP1 HLCS LINC01424
RUNXOR ITSN1 HMGN1 LINC01547
JAM2 HUNK LINC01684
KCNE2 IGSF5 LL21NC02-1C16.1
KCNJ6 ITSN1 LL21NC02-
1C16.2
KCNJ6-AS1 JAM2 MAPK6PS2
KRTAP10-12
KCNE1 MIR3648-2
KRTAP10-13P
KCNE2 MIR3687-2
KRTAP12-1 KCNJ15 MIR6508
KRTAP12-2 KRTAP10-1 MX2
KRTAP12-3 KRTAP10-
10 NCAM2
KRTAP12-4 KRTAP10-
11 NDUFV3
LINC00160 KRTAP10-2 NRIP1
LINC00205 KRTAP10-3 PFKL
LINC00310 KRTAP10-4 PIGP

324
WT 12 D WT 12 P WT 72 P STAG2 12 D
STAG2 12 P STAG2 72 P
LINC00315 KRTAP10-5 PRDM15
LINC00334 KRTAP10-6 PSMG1
LINC00649 KRTAP10-7 PTTG1IP
LINC01426 KRTAP10-8 RCAN1
LINC01436 KRTAP10-9 RIPK4
LINC01684 LINC00160 RNF6P1
LINC01700 LINC00189 RNU4-45P
LLPHP2 LINC00310 RP1-
100J12.1
LTN1 LINC00649 RP11-
313P22.1
MAP3K7CL LINC01426 RP11-
589M2.1
MIR155HG LINC01436 RPL3P1
MIR3197 LSS RRP1B
MORC3 LTN1 RSPH1
MRPL39 MAP3K7CL RWDD2B
MRPS6 MCM3AP SAMSN1
MX1 MCM3AP-AS1
SCAF4
MX2 MEMO1P1 SETD4
MYL6P1 METTL21AP1
SH3BGR
NRIP1 MRPS6 SMIM11A
OLIG2 OLIG2 SMIM11B
PIGP PAXBP1 SNRPGP13
PLAC4 PAXBP1-AS1
SON
POFUT2 PIGP SUMO3
PRDM15 POLR2CP1 TIAM1
PSMG1 RCAN1 TPTE
RN7SL163P RIMKLBP1 TSPEAR
RNA5SP489 RN7SL163P TTC3
RNGTTP1 RNF6P1 UBASH3A
RNU4-45P RP1-
100J12.1 UBE2G2
RNU6-1149P
RP11-313P22.1
USP16
RNU6-696P RPL12P9 VN1R7P
RNU6-992P RPL23P2 WDR4
RP1-100J12.1
RPL34P3 WRB

325
WT 12 D WT 12 P WT 72 P STAG2 12 D
STAG2 12 P STAG2 72 P
RP1-225L15.1
RPL39P40 LOC100506403
RP11-313P22.1
RSPH1 AF015720.3
RP11-589M2.1
RWDD2B AP000318.2
RPL23P2 SAMSN1 KCNE1
RPL34P3 SCAF4 LINC00310
RPL39P40 SETD4 LINC01426
RPSAP64 SLC37A1 MIR802
RWDD2B SMIM11A MRPS6
SAMSN1 SMIM11B RPS20P1
SAMSN1-AS1
SYNJ1 RPS5P2
SETD4 TIMM9P2 SLC5A3
SMIM11A TSPEAR
SMIM11B TTC3
SNORA3 U3
SNORA62 USP16
SNORA80A WRB
SRSF9P1 Y_RNA
TIAM1 ZBTB21
TMPRSS2 ZNF295-
AS1
TPTE LOC100506
403
TSPEAR AF015720.3
TTC3 C21orf140
UBASH3A CH507-
396I9.7
UMODL1 CMP21-
97G8.2
UMODL1-AS1
KCNE1B
URB1 MIR802
URB1-AS1 RPS20P1
USP16 RUNX1
VN1R7P SLC5A3
Y_RNA SNORA11
LOC100506403
RUNXOR
AP000318.2

326
WT 12 D WT 12 P WT 72 P STAG2 12 D
STAG2 12 P STAG2 72 P
AP000322.53
C21orf140
CH507-396I9.3
CH507-396I9.7
CMP21-97G8.1
CMP21-97G8.2
KCNE1
RCAN1
RPS5P2
SLC5A3
RUNX1-IT1

327
Appendix XIV: List of significant changes STAG2 12
DMSO compared STAG2 72 PMA
Appendix XIV Table 1: Differential cis interactions in STAG2 72 h PMA cells compared to STAG2 12 h DMSO K562 cells
Chromosome location (Chr21) log2FoldChange Adjusted p value
Start End
16193679 16290033 5.86391632 0.00342781
16287686 16392414 -4.8616436 0.00409359
16337170 16447658 -6.2817559 0.00012778
22535850 22765112 -5.3708546 0.00321359
22876545 23117188 5.43274265 0.00202892
23369288 23626457 -5.6528021 0.00375885
23878355 24124540 5.05342004 0.00364158
24761799 25024643 6.15905653 0.00200644
32389417 32510405 4.90346805 0.00474697
32513939 32620098 4.80628151 0.00831305
33218357 33277752 -4.894004 0.00644409
33999313 34042381 4.99233029 0.0072539
34253734 34295441 -4.5073628 0.00819366
34643232 34676058 -5.6689901 0.00199124
35143611 35160271 -5.7105858 0.00205897
35152010 35168532 -5.8140152 0.00203572
35160337 35176727 -5.8371813 0.00382979
35232484 35247888 -5.8832819 0.00186227
35240230 35255545 -5.9020399 0.00219482
35300676 35315394 -6.3841202 0.00031727
35308065 35322722 -7.0977311 0.00049094
35436900 35450845 -5.4020436 0.00279414
35443887 35457803 -5.7110624 0.00808936
35478603 35492364 -6.1583276 0.00397153
35485500 35499228 -7.3015989 0.00041831
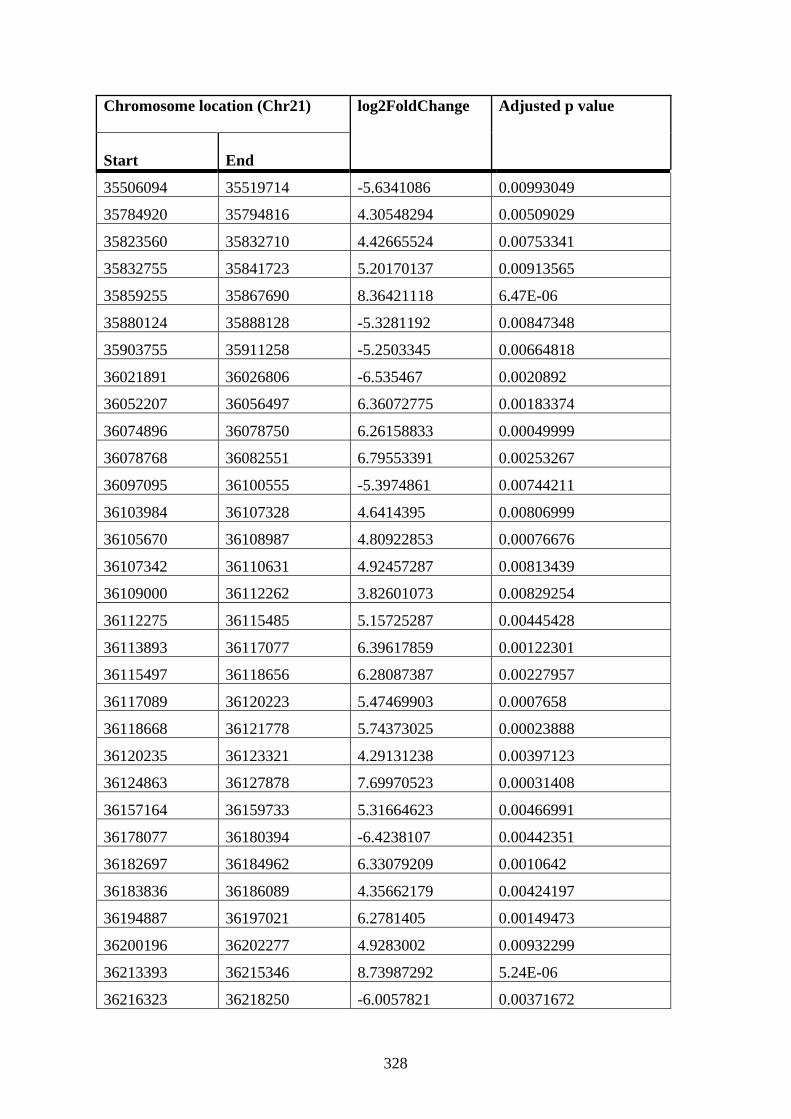
328
Chromosome location (Chr21) log2FoldChange Adjusted p value
Start End
35506094 35519714 -5.6341086 0.00993049
35784920 35794816 4.30548294 0.00509029
35823560 35832710 4.42665524 0.00753341
35832755 35841723 5.20170137 0.00913565
35859255 35867690 8.36421118 6.47E-06
35880124 35888128 -5.3281192 0.00847348
35903755 35911258 -5.2503345 0.00664818
36021891 36026806 -6.535467 0.0020892
36052207 36056497 6.36072775 0.00183374
36074896 36078750 6.26158833 0.00049999
36078768 36082551 6.79553391 0.00253267
36097095 36100555 -5.3974861 0.00744211
36103984 36107328 4.6414395 0.00806999
36105670 36108987 4.80922853 0.00076676
36107342 36110631 4.92457287 0.00813439
36109000 36112262 3.82601073 0.00829254
36112275 36115485 5.15725287 0.00445428
36113893 36117077 6.39617859 0.00122301
36115497 36118656 6.28087387 0.00227957
36117089 36120223 5.47469903 0.0007658
36118668 36121778 5.74373025 0.00023888
36120235 36123321 4.29131238 0.00397123
36124863 36127878 7.69970523 0.00031408
36157164 36159733 5.31664623 0.00466991
36178077 36180394 -6.4238107 0.00442351
36182697 36184962 6.33079209 0.0010642
36183836 36186089 4.35662179 0.00424197
36194887 36197021 6.2781405 0.00149473
36200196 36202277 4.9283002 0.00932299
36213393 36215346 8.73987292 5.24E-06
36216323 36218250 -6.0057821 0.00371672

329
Chromosome location (Chr21) log2FoldChange Adjusted p value
Start End
36243603 36245303 7.23413186 0.00012512
36250339 36251990 6.41840825 0.00232423
36253634 36255261 4.29466569 0.00520545
36255264 36256880 6.54826795 3.05E-06
36256075 36257685 6.7786123 1.28E-06
36257688 36259287 -5.7516519 0.0022048
36266370 36267913 -5.4044968 0.00522296
36267144 36268682 -5.5749242 0.00318493
36269452 36270976 -6.1952272 0.00042122
36270979 36272494 5.24954146 8.02E-05
36271738 36273249 5.05029119 0.00466991
36278479 36279951 9.11879907 4.07E-08
36279217 36280685 9.10568924 1.27E-08
36280687 36282148 9.96475177 2.53E-11
36281420 36282876 10.0030672 2.11E-11
36282150 36283603 7.2543056 5.17E-05
36282878 36284327 7.267999 2.71E-05
36287208 36288634 5.4507541 0.0009367
36287923 36289346 5.48484313 0.00103209
36289348 36290764 -5.3562441 0.00474829
36290765 36292175 6.16887781 7.97E-07
36291472 36292878 8.49998497 9.96E-10
36293581 36294976 9.48666016 1.69E-11
36294280 36295673 9.42356641 4.13E-09
36305263 36306608 7.78796024 0.00024295
36309954 36311281 7.00839478 7.71E-05
36311282 36312604 3.874062 0.00903138
36311944 36313264 9.62390448 2.18E-10
36313924 36315237 4.9712562 0.00731705
36316548 36317852 6.15266037 0.00170019
36317201 36318502 9.11561781 1.50E-09

330
Chromosome location (Chr21) log2FoldChange Adjusted p value
Start End
36317853 36319152 9.31437377 2.64E-07
36321741 36323028 3.48271698 0.00296189
36322386 36323671 5.0790562 0.0032143
36324953 36326231 4.94922112 0.00085693
36331937 36333195 6.78039204 0.0016612
36333196 36334450 5.39157606 0.00498829
36335078 36336327 9.16501077 1.40E-07
36335703 36336952 8.22164842 4.77E-09
36336952 36338198 8.75800874 1.10E-05
36337576 36338819 8.33783655 6.32E-09
36338198 36339441 3.92381229 0.00396733
36338820 36340061 5.05953517 0.00189014
36340062 36341300 6.38840711 6.78E-06
36340682 36341919 6.09958357 0.00069069
36341301 36342536 5.71437787 0.00202855
36343771 36345001 7.75787409 0.00011951
36346844 36348068 7.40707966 1.11E-07
36347456 36348680 6.98617274 8.03E-07
36348069 36349291 8.01430446 1.16E-07
36348680 36349902 7.63758264 3.05E-06
36349292 36350512 -4.1354402 0.00625147
36352947 36354161 9.36897263 1.97E-10
36353555 36354768 6.77679685 0.0008522
36357190 36358398 8.10083758 6.32E-09
36357795 36359002 -5.1152283 0.0021679
36359002 36360208 6.20858216 9.77E-07
36360811 36362014 5.65592073 0.00093715
36361413 36362615 7.08985193 3.05E-06
36363217 36364417 5.6998418 0.00062424
36368612 36369807 7.96066213 7.07E-08
36369210 36370405 7.79227784 5.41E-06
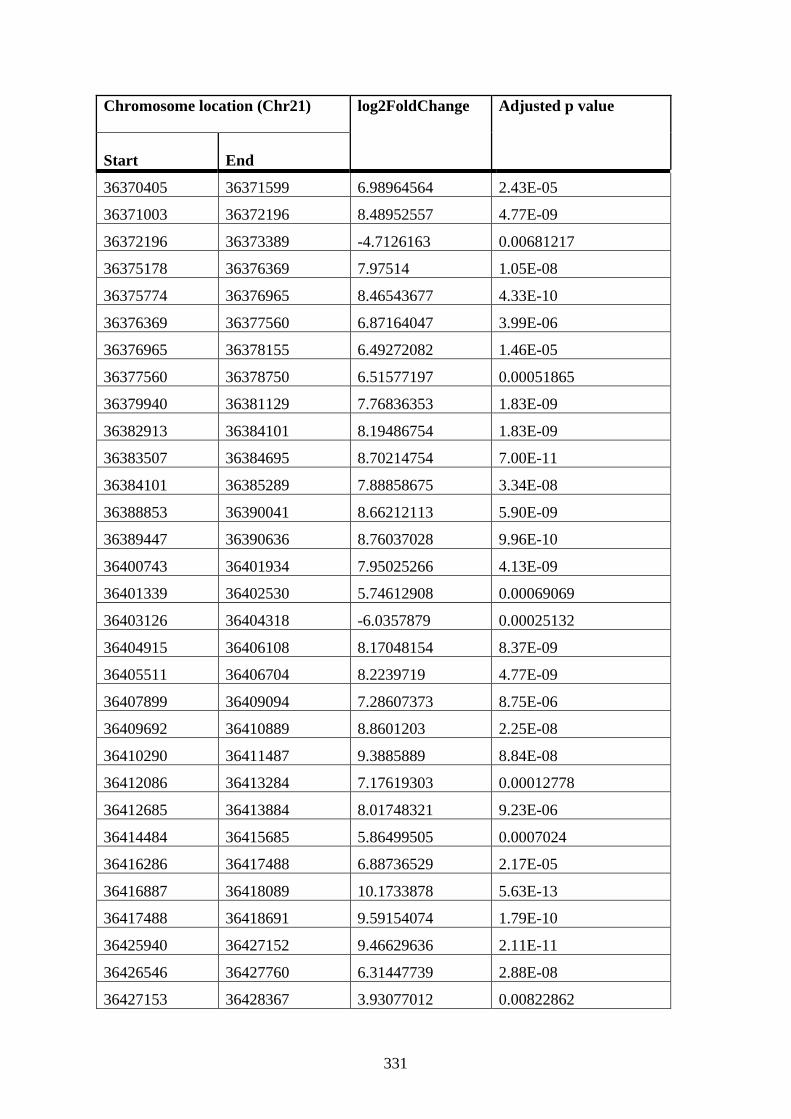
331
Chromosome location (Chr21) log2FoldChange Adjusted p value
Start End
36370405 36371599 6.98964564 2.43E-05
36371003 36372196 8.48952557 4.77E-09
36372196 36373389 -4.7126163 0.00681217
36375178 36376369 7.97514 1.05E-08
36375774 36376965 8.46543677 4.33E-10
36376369 36377560 6.87164047 3.99E-06
36376965 36378155 6.49272082 1.46E-05
36377560 36378750 6.51577197 0.00051865
36379940 36381129 7.76836353 1.83E-09
36382913 36384101 8.19486754 1.83E-09
36383507 36384695 8.70214754 7.00E-11
36384101 36385289 7.88858675 3.34E-08
36388853 36390041 8.66212113 5.90E-09
36389447 36390636 8.76037028 9.96E-10
36400743 36401934 7.95025266 4.13E-09
36401339 36402530 5.74612908 0.00069069
36403126 36404318 -6.0357879 0.00025132
36404915 36406108 8.17048154 8.37E-09
36405511 36406704 8.2239719 4.77E-09
36407899 36409094 7.28607373 8.75E-06
36409692 36410889 8.8601203 2.25E-08
36410290 36411487 9.3885889 8.84E-08
36412086 36413284 7.17619303 0.00012778
36412685 36413884 8.01748321 9.23E-06
36414484 36415685 5.86499505 0.0007024
36416286 36417488 6.88736529 2.17E-05
36416887 36418089 10.1733878 5.63E-13
36417488 36418691 9.59154074 1.79E-10
36425940 36427152 9.46629636 2.11E-11
36426546 36427760 6.31447739 2.88E-08
36427153 36428367 3.93077012 0.00822862

332
Chromosome location (Chr21) log2FoldChange Adjusted p value
Start End
36427760 36428975 6.59679415 6.53E-05
36428367 36429583 7.65349876 1.40E-07
36428975 36430192 7.26378089 1.10E-06
36438757 36439987 6.91199385 0.00065793
36439372 36440603 6.14925001 0.00924672
36444930 36446170 4.71329953 0.00943458
36447413 36448657 9.30726002 7.08E-10
36448035 36449280 7.82083118 3.06E-05
36454913 36456170 5.79710857 0.00306027
36455542 36456800 6.12998107 0.00253267
36460592 36461860 -6.8333284 0.00091342
36469524 36470810 7.30008641 1.92E-07
36470167 36471454 8.5845074 5.10E-09
36470810 36472099 8.68900968 2.08E-07
36474685 36475982 9.99750841 5.63E-13
36475334 36476631 6.07165637 0.00049999
36477933 36479237 6.63647668 0.0002694
36484482 36485800 8.23693073 5.18E-06
36485141 36486460 4.67621314 0.00031408
36493775 36495114 -5.8752384 0.00266934
36507315 36508686 5.44741229 0.00466335
36508000 36509373 7.91544296 2.06E-05
36525409 36526824 -5.4466584 0.00614928
36526116 36527533 -5.4517141 0.00176164
36527534 36528954 6.18594195 0.00418337
36547749 36549219 6.62979028 0.00219296
36548484 36549956 9.16765578 9.96E-10
36552172 36553653 4.78145992 0.00044474
36562621 36564128 6.40969238 0.00313258
36564884 36566396 -4.6857336 0.00779839
36567155 36568672 9.22163454 1.40E-07

333
Chromosome location (Chr21) log2FoldChange Adjusted p value
Start End
36567914 36569433 9.05790068 8.03E-07
36568673 36570195 7.16735245 0.0015729
36571722 36573251 -4.8063868 0.00855029
36574785 36576321 3.51398395 0.00253267
36575553 36577091 8.58721717 1.94E-08
36576322 36577862 9.07635381 9.96E-10
36577092 36578634 4.08026932 0.00253267
36580956 36582508 4.44860024 0.00118968
36581732 36583285 5.43783997 0.00051611
36584065 36585624 5.19288271 0.00393797
36594271 36595854 6.15128015 0.00160141
36598238 36599831 5.36914918 0.00046146
36599035 36600629 9.99934587 1.32E-06
36609474 36611093 -4.3698555 0.00462971
36612719 36614346 5.11568005 0.00397123
36613532 36615161 9.58710989 1.69E-11
36620074 36621719 5.03147673 0.00847348
36625022 36626677 5.05492652 0.00065793
36625849 36627507 4.03410268 0.00869538
36629171 36630836 -7.003066 0.00091276
36630003 36631671 -6.9765212 0.0007058
36631672 36633343 -5.2309112 0.00349047
36632508 36634181 -5.0187545 0.0068581
36635020 36636700 3.92357996 0.00346738
36635860 36637541 4.70853391 0.00589323
36644310 36646011 -5.1397395 0.00534331
36678230 36680011 -6.1696126 0.00065238
36680012 36681798 -5.4258578 0.00152795
36680905 36682693 -5.8357132 0.00152115
36692611 36694428 8.50167259 2.29E-05
36699911 36701747 5.08698912 0.00891689

334
Chromosome location (Chr21) log2FoldChange Adjusted p value
Start End
36700829 36702667 5.57415448 0.00397999
36701748 36703588 5.27879921 0.00574901
36708215 36710072 7.88117736 1.56E-05
36711005 36712870 7.86184739 0.00085693
36721336 36723230 9.67340601 1.30E-06
36722283 36724180 7.52574543 0.00011951
36737632 36739576 5.64719404 0.0033521
36740553 36742506 8.81583236 1.11E-07
36755374 36757378 5.10121704 0.00235956
36760401 36762422 -6.4717096 0.0009367
36761411 36763436 -6.7162771 6.46E-06
36769564 36771619 6.72228717 0.00399923
36785192 36787309 -5.2462769 0.00187615
36793723 36795876 -6.4362647 0.00016942
36803497 36805693 6.06936737 0.00025205
36809012 36811232 9.17706758 4.08E-06
36810122 36812348 8.86807383 5.75E-06
36819097 36821364 -5.9229886 0.00024525
36829396 36831713 -6.6250797 0.00085578
36847072 36849476 3.19423968 0.00602858
36853113 36855549 5.81392578 0.0073898
36862945 36865433 -6.4243639 0.00175456
36880669 36883253 -5.789861 0.00360003
36915511 36918300 -5.4894569 0.00108972
36938338 36941266 6.49251367 0.00022981
36947191 36950174 6.6451659 0.00209437
36951679 36954690 8.74416556 2.80E-07
36957728 36960776 -4.267691 0.00693789
36962314 36965390 5.81521445 0.00010327
36963852 36966937 6.6754402 3.30E-05
36973177 36976319 5.71456785 0.00410491

335
Chromosome location (Chr21) log2FoldChange Adjusted p value
Start End
36990714 36993959 -5.8539048 0.00393797
36992337 36995591 -5.6809478 0.00545778
37008816 37012162 -5.3731915 0.00642581
37036116 37039601 -7.0225175 0.00051611
37106625 37110350 -6.2762985 0.00160141
37157395 37161183 5.53000647 0.00410395
37187773 37191580 5.65172598 0.00093715
37212576 37216405 4.03696126 0.0009367
37245306 37249188 6.70840535 0.00035383
37247247 37251133 6.7562262 0.00031408
37376917 37381656 6.39608048 0.00034011
37430352 37435904 -6.2005704 0.00083817
37456313 37462375 -6.1134865 0.00932299
37539859 37548012 -5.5442088 0.00334075
37592907 37602638 6.7819362 0.0009367
37634048 37645088 -4.2859502 0.00785999
37674649 37687034 -5.2094426 0.00642581
37865474 37884227 7.43317842 0.00011951
38182100 38205843 6.36973826 0.00315036
38426343 38451967 -6.075009 0.00175456
38439155 38464954 -4.9213404 0.00473672
38601369 38630247 -5.4469672 0.00837855
38790145 38825524 -4.5339137 0.00832257
38844384 38882175 -4.3926606 0.0076947
39379992 39431602 -6.0661361 0.00202892
39959632 40013021 7.35958173 0.00038437
40383991 40437879 -5.9831322 0.00186227
40521163 40578110 -6.1239067 0.00160141
40549637 40607654 -7.4662199 3.51E-05
41082235 41192923 5.30969732 0.00720145
41960980 42110232 5.70041547 0.00511626
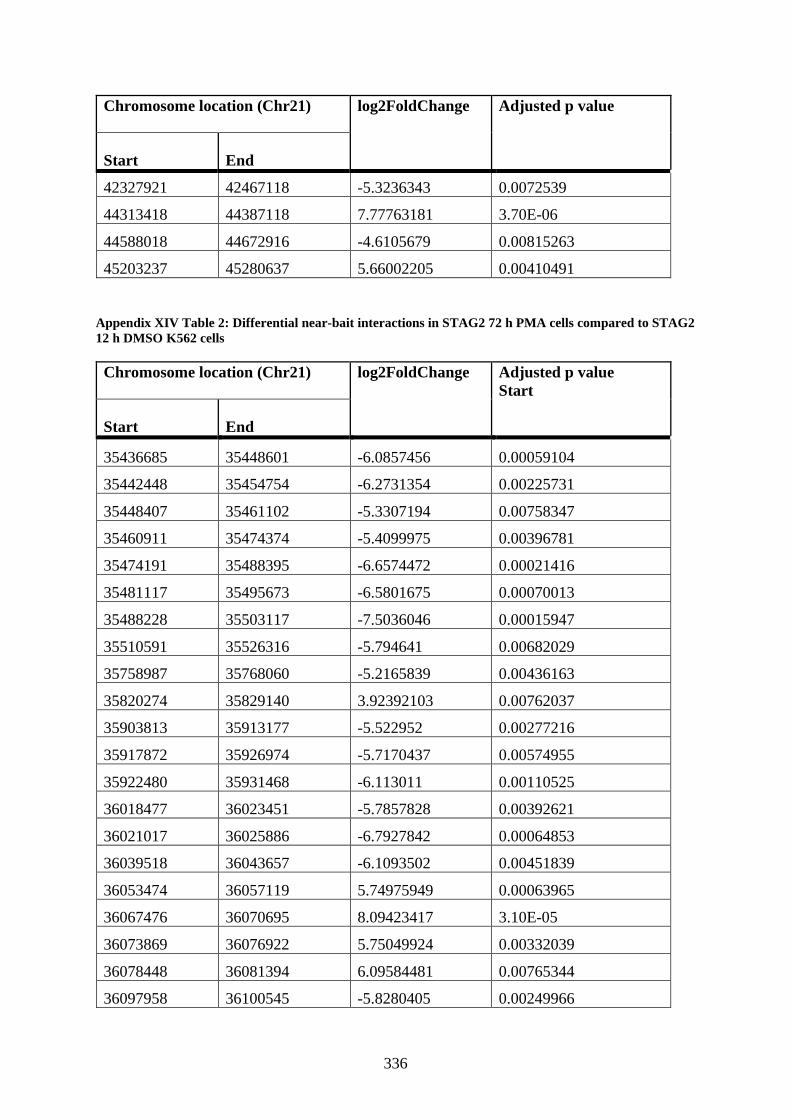
336
Chromosome location (Chr21) log2FoldChange Adjusted p value
Start End
42327921 42467118 -5.3236343 0.0072539
44313418 44387118 7.77763181 3.70E-06
44588018 44672916 -4.6105679 0.00815263
45203237 45280637 5.66002205 0.00410491
Appendix XIV Table 2: Differential near-bait interactions in STAG2 72 h PMA cells compared to STAG2 12 h DMSO K562 cells
Chromosome location (Chr21) log2FoldChange Adjusted p value Start
Start End
35436685 35448601 -6.0857456 0.00059104
35442448 35454754 -6.2731354 0.00225731
35448407 35461102 -5.3307194 0.00758347
35460911 35474374 -5.4099975 0.00396781
35474191 35488395 -6.6574472 0.00021416
35481117 35495673 -6.5801675 0.00070013
35488228 35503117 -7.5036046 0.00015947
35510591 35526316 -5.794641 0.00682029
35758987 35768060 -5.2165839 0.00436163
35820274 35829140 3.92392103 0.00762037
35903813 35913177 -5.522952 0.00277216
35917872 35926974 -5.7170437 0.00574955
35922480 35931468 -6.113011 0.00110525
36018477 36023451 -5.7857828 0.00392621
36021017 36025886 -6.7927842 0.00064853
36039518 36043657 -6.1093502 0.00451839
36053474 36057119 5.74975949 0.00063965
36067476 36070695 8.09423417 3.10E-05
36073869 36076922 5.75049924 0.00332039
36078448 36081394 6.09584481 0.00765344
36097958 36100545 -5.8280405 0.00249966

337
Chromosome location (Chr21) log2FoldChange Adjusted p value Start
Start End
36106893 36109371 8.88047564 6.43E-07
36108138 36110604 8.41167605 7.90E-06
36111836 36114270 5.79605247 0.0008147
36113058 36115482 4.50555696 0.00858253
36114274 36116689 5.70466809 0.00362316
36117896 36120289 4.91532515 0.00054761
36119096 36121482 5.09296712 0.0005213
36120292 36122672 8.16806929 9.78E-08
36121485 36123860 3.52660994 0.00623036
36123862 36126228 6.83826906 0.00081453
36125047 36127409 7.17074017 0.00050799
36157963 36160322 4.70290259 0.00407907
36178044 36180403 -6.5938745 0.00186164
36182762 36185114 5.77498867 0.00250278
36183939 36186289 3.78948919 0.0093649
36209319 36211537 6.65970543 0.00332039
36212646 36214832 5.17999525 0.00343304
36213745 36215920 4.60367943 0.00623036
36215926 36218078 -6.2287521 0.00162394
36243806 36245595 6.03604449 0.00077209
36253381 36255044 6.4051837 4.04E-05
36255049 36256690 5.40118095 5.45E-05
36255874 36257506 6.13577976 4.78E-06
36257511 36259122 -6.071433 0.0005773
36261516 36263082 -5.5745924 0.00440467
36266175 36267691 -5.693073 0.00186164
36266936 36268445 -5.8929383 0.00092378
36269199 36270685 -4.7459043 0.00396781
36271428 36272893 7.39629365 1.32E-05
36278644 36280049 8.47626445 2.67E-07
36279349 36280749 5.88273561 0.00229365

338
Chromosome location (Chr21) log2FoldChange Adjusted p value Start
Start End
36280751 36282141 9.32271791 9.28E-11
36281449 36282833 9.35755075 5.57E-11
36282143 36283523 6.57986117 0.00012543
36282836 36284211 6.59308126 7.17E-05
36288291 36289632 8.41409446 2.34E-07
36290969 36292295 4.93437188 0.00015032
36293617 36294930 8.87598018 5.57E-11
36294275 36295584 8.73704516 2.01E-08
36296239 36297539 -4.9893355 0.00789699
36296890 36298187 -4.8207939 0.00789699
36314565 36315788 7.49896603 7.50E-08
36316400 36317616 5.93787377 0.00130598
36317009 36318223 7.64886122 5.92E-06
36317617 36318829 8.6586326 7.12E-07
36321841 36323037 2.85880135 0.00530882
36322440 36323634 4.47423164 0.00624517
36326010 36327189 6.48630118 0.00040072
36331867 36333024 6.10489364 0.00279432
36333602 36334752 5.22177302 0.00589405
36335327 36336470 8.61424774 3.23E-07
36335900 36337041 8.53667475 1.96E-10
36337042 36338179 8.08807553 0.00012543
36337611 36338746 5.3259128 0.00297428
36339878 36341004 6.67090109 5.25E-06
36340442 36341565 4.41760746 0.00624517
36341005 36342126 5.29524101 0.00458437
36341566 36342686 5.04193019 0.00472812
36343803 36344915 6.01427329 0.00340964
36346578 36347680 6.91611197 3.18E-07
36347130 36348230 6.51125992 5.99E-06
36348231 36349329 7.41012673 6.09E-07

339
Chromosome location (Chr21) log2FoldChange Adjusted p value Start
Start End
36348781 36349876 7.07821381 8.52E-06
36353148 36354232 8.71656398 3.22E-10
36353690 36354773 6.2181543 0.00160582
36357470 36358544 7.66678156 1.93E-08
36358008 36359081 -5.798246 0.00022941
36359081 36360153 5.45257467 2.37E-05
36361223 36362291 5.91568037 0.00057599
36361757 36362824 5.96298918 0.00024763
36368674 36369735 6.1916237 2.00E-05
36369205 36370266 7.16297674 2.76E-05
36370796 36371857 7.9559838 4.25E-08
36371327 36372388 7.95799941 3.91E-08
36372388 36373449 -5.0616276 0.00231887
36375572 36376634 7.39662037 4.22E-08
36376103 36377166 7.9155326 4.23E-10
36376634 36377698 7.20737095 3.50E-07
36377166 36378230 6.00247042 9.26E-05
36381430 36382501 6.25125031 0.00167117
36383036 36384111 7.58060482 7.62E-09
36383573 36384648 8.19239228 9.17E-11
36384110 36385187 7.27158077 1.01E-07
36388977 36390069 8.04050851 4.58E-08
36389522 36390615 8.18851773 9.50E-09
36402372 36403521 -3.3526677 0.00615
36402947 36404099 -6.4052802 5.56E-05
36404680 36405841 7.07708111 6.41E-07
36405261 36406426 7.67635857 1.65E-08
36407013 36408189 -6.0414894 0.00012123
36409375 36410564 8.16295853 2.63E-07
36409969 36411162 8.58969704 1.89E-08
36412365 36413572 6.67171768 0.00045194

340
Chromosome location (Chr21) log2FoldChange Adjusted p value Start
Start End
36412969 36414179 7.48261385 3.87E-05
36414790 36416010 5.19805826 0.00169526
36416012 36417240 6.47370689 4.25E-05
36416626 36417857 8.32922355 1.96E-10
36417242 36418476 8.93449959 3.22E-10
36417859 36419097 8.70673298 4.23E-10
36425395 36426671 6.48656042 0.0001889
36426033 36427312 3.57574031 0.00163044
36426673 36427955 5.26153509 7.12E-07
36427314 36428599 5.10900159 0.00187829
36427956 36429244 7.04581518 1.63E-06
36428600 36429891 7.15848213 1.01E-07
36429892 36431189 -5.9821829 0.00141003
36438413 36439740 5.99517147 0.00297428
36439076 36440405 6.23445205 0.00130598
36446428 36447774 -5.7569719 0.00197578
36447101 36448448 4.89204718 1.31E-05
36447775 36449123 8.79337306 7.24E-10
36455222 36456582 5.4545644 0.00504532
36460677 36462045 -7.0332119 0.0002511
36469616 36471000 6.74924793 1.63E-06
36470308 36471694 7.98815314 2.01E-08
36471001 36472388 8.00746203 7.12E-07
36474478 36475874 9.60736861 1.17E-13
36475176 36476573 5.68780928 0.0007157
36481504 36482922 -5.8163104 0.00162394
36484347 36485775 8.59528198 1.52E-10
36485061 36486492 3.8841857 0.00132208
36493739 36495204 -6.1089012 0.00074837
36507148 36508663 5.26009344 0.00630545
36507905 36509423 7.34675317 4.36E-05

341
Chromosome location (Chr21) log2FoldChange Adjusted p value Start
Start End
36513242 36514775 -5.3173362 0.00395153
36516314 36517855 -5.5017113 0.00467387
36520951 36522503 -5.0549633 0.00674828
36525620 36527182 -5.9381324 0.00050799
36529533 36531103 -5.2801418 0.00162394
36537423 36539010 -5.510789 0.00049537
36538217 36539806 -5.2311225 0.00605158
36547820 36549434 6.90041921 2.56E-05
36548627 36550243 8.56415831 3.08E-09
36549435 36551053 8.4001037 3.10E-05
36551865 36553489 4.07906958 0.00112378
36564157 36565814 -5.3641166 0.00220175
36564985 36566644 -5.5645765 0.00050915
36566645 36568309 8.87079792 3.00E-06
36567477 36569143 8.44738811 3.57E-06
36571653 36573330 -5.0946442 0.00277375
36575015 36576703 2.89255552 0.00485284
36575859 36577549 9.23549274 3.18E-11
36576704 36578397 3.36271086 0.00769729
36580949 36582655 3.66835445 0.00352294
36581802 36583511 4.64640089 0.00160582
36598256 36600012 4.60675253 0.00126352
36599134 36600892 9.27003353 3.57E-05
36609742 36611522 -5.0781173 0.00030496
36612414 36614199 -6.4072496 0.00079017
36613306 36615093 9.02751731 5.57E-11
36615989 36617781 -5.1702582 0.00498024
36617782 36619578 5.98150753 0.00140614
36624993 36626806 4.22364429 0.00234029
36628625 36630448 -7.2845038 0.00034806
36629536 36631361 -7.3250371 0.00023556

342
Chromosome location (Chr21) log2FoldChange Adjusted p value Start
Start End
36631362 36633192 -5.386783 0.00028369
36632277 36634110 -5.2554689 0.00229365
36635950 36637793 3.72955132 0.00432525
36644289 36646155 -5.4874679 0.00201106
36645222 36647089 -5.7016239 0.00455515
36663073 36664956 -6.1681355 0.00220175
36678070 36679930 -5.9626629 0.00093922
36679928 36681783 -6.3506823 6.52E-05
36680855 36682707 -6.4303147 0.0002511
36681781 36683630 -5.8688247 0.00575549
36692776 36694589 7.82142793 5.81E-05
36693683 36695492 -4.2375019 0.0092254
36700879 36702664 4.90280398 0.00861558
36710630 36712389 7.35556765 0.00067607
36711509 36713267 7.26403527 0.00171581
36721128 36722869 9.0055117 2.52E-06
36734160 36735898 -4.5910204 0.00809055
36749016 36750781 -6.8938244 5.59E-05
36755229 36757019 4.44296764 0.00348182
36756124 36757918 8.00306112 1.79E-05
36760629 36762445 -6.8698039 0.00022941
36761537 36763358 -7.1788108 2.34E-07
36764276 36766112 5.80709303 0.00407907
36769828 36771700 6.11400191 0.00186684
36770764 36772642 5.66022215 0.00272098
36774541 36776448 4.68783611 0.00156114
36785244 36787241 -5.7724043 0.00021416
36793363 36795435 -6.8419092 3.79E-06
36794399 36796481 -6.1091525 0.00200109
36801784 36803931 5.77163822 0.00433589
36803935 36806100 5.34462276 0.00182957

343
Chromosome location (Chr21) log2FoldChange Adjusted p value Start
Start End
36809388 36811594 8.14513954 6.21E-05
36810491 36812704 4.52197815 0.00407907
36811597 36813817 -4.3276266 0.00634438
36829685 36831979 -7.1834139 5.23E-05
36838884 36841188 -5.5325229 0.00652333
36845802 36848109 10.2038466 5.57E-11
36846955 36849263 2.65570785 0.00758347
36863120 36865432 -6.7298954 0.00057648
36867743 36870055 5.59197015 0.00506037
36876991 36879304 -6.1757115 0.00017592
36880462 36882777 -6.1215596 0.00056329
36902651 36905026 -6.0752014 0.00498024
36912244 36914677 -6.6823463 0.00103827
36915906 36918366 -5.6577655 0.00187829
36947079 36949855 5.96104556 0.00452362
36948467 36951259 6.78019674 0.0004733
36958414 36961325 -5.2806253 0.00051959
36962808 36965773 5.01921642 0.00058573
36964290 36967274 5.59505943 0.00045611
36973386 36976488 7.34270572 6.52E-05
36991078 36994449 -6.363725 0.00112452
36992763 36996164 -5.6514451 0.0034993
37008653 37012362 -5.7851037 0.0020801
37043150 37047640 -6.4945969 0.00013199
37045395 37049936 -4.1547449 0.00943078
37097715 37103034 -4.5778842 0.00451839
37105704 37111038 -4.6751958 0.00650289
37134665 37139771 6.31946179 0.00049537
37187383 37191422 4.83341234 0.00257763
37212613 37216380 3.51274477 0.00163945
37229550 37233329 6.17766054 0.00200687

344
Chromosome location (Chr21) log2FoldChange Adjusted p value Start
Start End
37246671 37250505 6.06968467 0.00092378
37256273 37260121 -6.2127862 0.00179831
37360992 37364988 4.59646079 0.00856585
37376844 37380751 5.86772378 0.00112378
37380743 37384617 -5.7182386 0.00630545