Thick-skinned deformation observed on deep seismic reflection profiles in western Argentina
16
TECTONICS, VOL. 9, NO. 4, PAGES 773-788, AUGUST 1990 THICK-SKINNED DEFORMATION OBSERVED ON DEEP SEISMIC REFLECTION PROFILES IN WESTERN ARGENTINA D. B. Snyder 1 Department of Geological Sciences, Comell University,Ithaca, New York V. A. Ramos Universidad de Buenos Aires, Buenos Aires, Argentina R. W. Allmendinger Department of Geological Sciences, Comell University,Ithaca, New York Abstract. One of the first deepseismic reflection profiles in South America has resulted from reprocessing nearly 90 km of 96 channel Vibroseis datathatwere originallycollected by YPF (the Argentine NationalOil Company) across the Sierra de la Huerta in the Sierras Pampeanas of western Argentina.Reprocessed sections show thefollowing features in the upper 20 km of crust: (1) prominent layering within Carboniferous(?) to Quatemary strata; and (2) a complex suite of faint reflections which are interpreted to define bothextensional and compressional faults. The Mesozoicstrata are bounded by oneor morewest-dipping normal faults. One or two east-dipping thrust faultsshallow with depth, a geometry similar to the RockyMountain foreland of the westem U.S. A. One thrust has a clearsurface trace. Although lacking evidence of surface scarps or clearfault planereflections, panels of constant dip domain seen in the seismic data justify the application of fault-bend folding techniques to suggest that a second, deeper fault becomes nearly flat at 15-20 km. Cumulative Cenozoic offset on the thrusts beneath the Sierra de la Huerta is about 13 km. A well-locatedearthquake 1Now at Bullard Laboratories, Department of Earth Sciences, Universityof Cambridge, Cambridge, England Copyright 1990 by theAmerican Geophysical Union. Papernumber89TC03486. 0278-7407/90/89TC-03486510.00 hypocenter lies within the footwallblockof a major thrust and is presumed to represent susidiary thrust motionalonga secondary high-angle fault. Gravity models suggest thatthethrust ramps may nucleate at an anomalous dense mass in the middle or lower crust. Interpretation of lower crustal structure is hampered by thelack of clear reflections, presumably dueto small-scale and low-amplitude impedance contrast variations of lithologic unitsat those depths. Consideration of recorrelation limitations andsignal penetration constraints provide likely rationale for the scarcity of clear reflections in thebasement rocks of the region, but low reflectance of mafic metamorphic rocks remains a possible explanation. INTRODUCTION To date, few deep seismic reflection profiles have been obtained in South America. The Argentine Lithosphere Program (CAPLI) hasdeveloped a cooperative project with theArgentine National Oil Company (YPF, Yacimientos Petrolfferos Fiscales) and theCornell Andes Project in order to produce deep seismic reflection profiles of the crest beneath the Sierras Pampeanas of westem Argentina (Figure 1). YPF madeavailable nearly90 km of Vibroseis data collected in 1981-82. The seismic sections were originally processed to 4 s (hereand hereafter all timesare two-way traveltimes), were displayed with great horizontal exaggeration, andwere used primarily in seismic stratigraphy and structural studies of the basin strata. These data have been extensively reprocessed at Comell University and will be further interpreted by members of CAPLI using recent detailed geologic field mapping, gravity surveys, andresults from local seismicity networks.
-
Upload
independent -
Category
Documents
-
view
1 -
download
0
Transcript of Thick-skinned deformation observed on deep seismic reflection profiles in western Argentina

TECTONICS, VOL. 9, NO. 4, PAGES 773-788, AUGUST 1990
THICK-SKINNED DEFORMATION OBSERVED ON DEEP SEISMIC REFLECTION PROFILES IN WESTERN ARGENTINA
D. B. Snyder 1 Department of Geological Sciences, Comell University, Ithaca, New York
V. A. Ramos
Universidad de Buenos Aires, Buenos Aires, Argentina
R. W. Allmendinger Department of Geological Sciences, Comell University, Ithaca, New York
Abstract. One of the first deep seismic reflection profiles in South America has resulted from reprocessing nearly 90 km of 96 channel Vibroseis data that were originally collected by YPF (the Argentine National Oil Company) across the Sierra de la Huerta in the Sierras Pampeanas of western Argentina. Reprocessed sections show the following features in the upper 20 km of crust: (1) prominent layering within Carboniferous(?) to Quatemary strata; and (2) a complex suite of faint reflections which are interpreted to define both extensional and compressional faults. The Mesozoic strata are bounded by one or more west-dipping normal faults. One or two east-dipping thrust faults shallow with depth, a geometry similar to the Rocky Mountain foreland of the westem U.S. A. One thrust has a
clear surface trace. Although lacking evidence of surface scarps or clear fault plane reflections, panels of constant dip domain seen in the seismic data justify the application of fault-bend folding techniques to suggest that a second, deeper fault becomes nearly flat at 15-20 km. Cumulative Cenozoic offset on the thrusts beneath the Sierra de la
Huerta is about 13 km. A well-located earthquake
1Now at Bullard Laboratories, Department of Earth Sciences, University of Cambridge, Cambridge, England
Copyright 1990 by the American Geophysical Union.
Paper number 89TC03486. 0278-7407/90/89TC-03486510.00
hypocenter lies within the footwall block of a major thrust and is presumed to represent susidiary thrust motion along a secondary high-angle fault. Gravity models suggest that the thrust ramps may nucleate at an anomalous dense mass in the middle or lower
crust. Interpretation of lower crustal structure is hampered by the lack of clear reflections, presumably due to small-scale and low-amplitude impedance contrast variations of lithologic units at those depths. Consideration of recorrelation limitations and signal penetration constraints provide likely rationale for the scarcity of clear reflections in the basement rocks of the region, but low reflectance of mafic metamorphic rocks remains a possible explanation.
INTRODUCTION
To date, few deep seismic reflection profiles have been obtained in South America. The Argentine Lithosphere Program (CAPLI) has developed a cooperative project with the Argentine National Oil Company (YPF, Yacimientos Petrolfferos Fiscales) and the Cornell Andes Project in order to produce deep seismic reflection profiles of the crest beneath the Sierras Pampeanas of westem Argentina (Figure 1). YPF made available nearly 90 km of Vibroseis data collected in 1981-82. The seismic sections were
originally processed to 4 s (here and hereafter all times are two-way travel times), were displayed with great horizontal exaggeration, and were used primarily in seismic stratigraphy and structural studies of the basin strata. These data have been
extensively reprocessed at Comell University and will be further interpreted by members of CAPLI using recent detailed geologic field mapping, gravity surveys, and results from local seismicity networks.

774 Snyder et al.: Pampeanas Reflection Profries
32 •
31 ø
s
ß •q,;•,,; Sierra San Juan ,;••e, de Palo ';•.•
upper Paleozoi½
'"':":-- '• Cretace o us [•• metamorphic marble
metamorphic basement
6'8 ø W
Bermejo Basin
Line 2 Chepes • ,,•%:",.
Las Salinas Basin
Line 1 0 25
krn
6'7 o
Fig. 1. Local geology [Bossi, 1976] and geography of the study area. Solid square locates a major aftershock of 1977 earthquake [Kadinsky-Cade et al., 1985]. Some fault locations were constrained by the seismic data.
Here we describe the reprocessing and its impact on our understanding of tectonic processes in the eastern Andes of Argentina. More specifically, signal penetration and reflectance of the crust are examined, upper crustal structures are identified and analyzed using fault-bend-fold methods [Suppe, 1985], and funally, possible lower crustal characteristics are discussed by drawing together all the information.
Compared to the total amount of Vibroseis data collected worldwide, only a small part has optimized seismic signal to noise ratios at two-way travel times as great as 10 s. Most petroleum industry exploration is limited to recording 4-6 s of data, and thus a vast database capable of addressing deep crustal structure would become accessible if suitable
industry data were reprocessed using Vibroseis recorrelation to extend the seismic records to 10 s or
more [e.g., Finckh et al., 1984; Rotstein and Trachtman, 1986; Okaya and Jarchow, 1989]. The inherent drawbacks of recorrelation have plagued past users, and these drawbacks must be evaluated in every geologic region and on every profile in which the process is used. Numerous tests have convinced us of its viability within the Sierras Pampeanas and we recommend its further use elsewhere in western
Argentina. The technique is currently being applied to similar Vibroseis data, collected 50 km south of
our study area, and does show some reflections within the lower crust.
VIBROSEIS DATA REPROCESSING
Summary of Acquisition and Reprocessing
The data used in this study were collected in 1981- 82 as part of a program to investigate shallow exploration targets. Records of VP (vibration point)- gathers show that data with high signal-to-noise ratio were obtained within the specifications of the survey (Figure 2). Specifications (Table 1) worth note and further discussion are: (1) relatively low amounts of power entered the desert surface because only two or three vibrators each making 8 sweeps formed the source array; (2) the closely spaced, symmetric nature of the recording array does not permit velocity analysis beyond 10 km depths; and (3) daily start up tests and similar rune adjustments in parameters to optimize the recording of weak signal were not conducted. These handicaps result direc0y from the original target of the exploration and the difficult terrain involved in the survey, and are therefore likely to appear in most projects attempting the recorrelation of Vibroseis data.
The main goals of our study were therefore the

Snyder et al.: Pampeanas Reflection Profries 775
Fig. 2. Typical vibrator-point gather.
choice of reprocessing techniques and the usefulness and practicality of each in overcoming these handicaps, as well as the previously unseen deeper data themselves. We consider the following to constitute a basic reprocessing sequence for these data from Sierra de la Huerta in the Sierras
Pampeanas (Figure 1): recorrelation, elevation static corrections, deconvolution, despiking, bandpass frequency filtering, amplitude balancing, F-K domain filtering, normal move-out corrections and gathering into CMPs, muting, velocity analysis, and stacking. Several of these steps will be discussed in more detail.
The field data, collected at a sample rate of 4 ms for YPF by Petty-Ray Geophysical and resampled to 8 ms at Cornell for economy, were first recorrelated using a self-truncating sweep whose frequency content diminished with travel time (Figure 3) [e.g. Okaya and Jarchow, 1989]. The main effect of this reduced bandwidth is to enhance the sidelobes of the
associated Klauder wavelet and to thus produce a multicyclic event instead of an optimal sharp spike (Figure 3).
The most critical processing step was the reduction
TABLE 1. Acquisition and Processing Parameters
Parameter Value used
Data Acquisition Data length (s) 16 or 20 Shot interval (m) 25 CDP interval (m) 12.5 Fold 24
Sample rate (ms) 4 Source
Vibrator Mertz-9
Number 2-3 at 8 sweeps per vibrator Sweep frequency (Hz) 15 w> 60, linear
Receivers
System MDS-10 Near/far offset (m) 200/1375 Channels 96
Spread symmetric, split
Processing Sample interval (ms) 8 Recorrelation self-truncating sweep Geometric spreading Elevation statics correction
Deconvolution (ms lag) 36-40 Despiking Bandpass filter(Hz) 17-58 (120 dB/octave rolloff) Amplitude balancing FK filter NMO stack
Weighted summing 1:3:1
of predominantly low-frequency noise by despiking, bandpass f'dtering (17-58 Hz with a 120 dB/octave rolloff), and frequency-wavenumber (F-K) domain f'dtering. The F-K f'dter (C. Caruso, unpublished computer program, 1987) was designed to remove all signal propagating at less than 2.5 kms-1. Near- surface reflected waves with these velocities are of
such large amplitude that the f'dter attenuated, but did not remove them. The falter did enhance deeper reflections by removing much of the low frequency noise that propagated at low velocities. This low- frequency noise presumably represents both man- made and naturally occurring surface noise as well as seismic signal scattered within the low-velocity, near- surface rocks. Examination of vibrator-point gathers after filtering (Figure 2) indicates variable degrees of success in the filtering due to the variation of signal- to-noise ratio along the line, and subsequent stacks confinn that little signal amplitude remmed from the lower crust. Most importantly, by performing pre- stack filtering, any artifacts produced by the œflters become negligible in the stacked data. This small amount of residual noise from filtering is far preferable to the large amounts of noise that originally obscured signal from the lower crust.

776 Snyder et al.: Pampeanas Reflection Profiles
20 M
Vibrate
15 Hz
60 Hz
Synthetic K!auder
wavelets
Listen' 4s event 10s event 13s event 16s event
iff
15
o 15 35
• 0.2S •' • Number of octaves: 2.0 1.5 1.0
two-way
travel
time
[ [ I I I (M O 03
TWO - WAY TIME, seconds
Fig. 3. Bandwidth decay with depth produced by recorrelation using a self-truncating sweep. On the fight, the gray background indicates theoretical bandwidth versus travel- time; black bars show observed bandwidths. Synthetic arrivals shown on the left result from the convolution of the autocorrelation of the associated input signal with a spike earth response; note growth of side lobes of the Klauder wavelet and hence multicyclic nature of possible reflections with decreasing bandwidth.
Following the gathering at common mid-points (CMPs) and the muting of air waves and first refracted arrivals that survived the F-K filter, optimum stacking was achieved by combining normal moveout velocity functions used in the original processing by YPF with those determined at Cornell to maximize semblance. Estimates of RMS
or average velocities from the maximum coherency (stacking) velocities [Al-Chalabi, 1974] proved elusive due to the lack of prominant reflectors beyond the first few seconds, but did show slow (1.7 kms-1) velocities associated with some reflectors that
distinguishes them as multiples, sideswipe effects or reflected surface waves.
Assessing Signal Penetration
The continual dear defmition of pronounced reflections from basinal sedimentary rocks throughout the processing sequence, if augmented by evidence that seismic signal may penetrate and retum from depths of 25-30 km, can indicate that recorrelation using a self-truncating sweep provides a successful processing technique for seismic data from the Argentine Andes. One indicator of signal penetration is the behavior of amplitude decay curves [Mayer and Brown, 1986]. Such curves from our data set show continuous exponential decay to 7- 10 s on near-offset traces in over 90% of the fries tested
(Figure 4). In addition, displays of vibrator-point
gathers with no gain control or amplitude balancing applied show a discemible cutoff of signal energy at about 7 s. Frequency bandpass filtering of these gathers (Figure 5) indicates that high frequency (> 30 Hz) signal energy did not penetrate to 20 km depths and that low frequency (18 - 30 Hz) signal penetrated little deeper than 25 - 30 kilometers.
Based on these various tests, and assuming that in- the-plane components of energy scattered within the near-surface rocks is removed by F-K filters, we conclude that some seismic signal has been returned from depths correlative with 7- 10 s two-way travel time. These depths based on amplitude decay studies of individual traces, vibrator-point gathers, and range-offset stacks, are consistent with those of similar studies of signal return in deep reflection data from throughout North America and continental Europe [e.g., Mayer and Brown, 1986], although lateral variations in signal penetration here in the Argentine study may be relatively greater. Because clear reflections are not seen in our data, we hypothesize that the layering within the amphibolite- grade metamorphic crustal rock of the Sierras Pampeanas has dimensions unsuitable for reflecting the seismic waves of this survey that penetrate to 20- km depths. Impedance contrast layers at least 2500 m in extent (first Fresnel zone) and greater than 50 m in thickness are required to defme reflections at these depths. Actual layering within these rocks may have dimensions smaller than those required.

Snyder et al.: Pampeanas Reflection Profries 777
C•10 7- o
10 5 .
103 -
File 385 Traces 86-96
I I ,
I i •,•,'• j ' File 430 Traces 49-59 ' , ,"'. ...... ' '"'¾ "' "1'i ',..:
Fig. 4. Amplitude decay curves for represemive groups of far (86-96) and near (49-59) traces, before f'fitering or deconvolution. Each plot represents a sum of 10 adjacent traces; although from different VPs, these traces represent nearly identical receiver points. The upper plot is a maxima envelope; the lower one is a running average. Solid line indicates linear decay expected from the decrease in bandwidth due to recorrelation. The trends of the lines first become nearly parallel at about 9 s.
REGIONAL SETtING
The Sierras Pampeanas terrane is one of a trio of major terranes of pre-Carboniferous age that make up most of westem South America between latitudes 29 ø
- 33 ø S [Ramos et al., 1986, Ramos, 1988]. This
region today coincides with a shallowly dipping segmem of the subducted Nazca plate, little late Cenozoic volcanism, and pronounced crustal seismicity to depths as great as 40 km [Chinn and Isacks, 1983; Jordan et al., 1983; Bevis and Isacks, 1984; Triep and Cardinelli, 1984; Kay et al., 1987;
..... •:': ß •, :':"'d' ........................... : ....... •I, -: 3•:= ..... •• • ••:•i,:,•:;•;: :•:• :• m
:::::::::::::::::::::::::::::::::::::::::: •::•:'::::[:::- •ff5;•5•,:• • '•
_: .... :::_.:_:_:_: :.:.:::::::X•:'.u• % ............ : .... _ .... •• .... •,,: q•:,::• 7.• '• :•:?:';i:'•;i'•:'i?•l•, ••>•?:•it:¾;i;ig!• s•
_;•.,_.::.;•...- . . . ......
88-80Hz 18-48H z 15-• 0 H z
Fig. 5. Mid-cmstl (5 - 10 s) p•els of a v$rator •t gather (• 1815, l•e 1) cont•g d•fer•g •equencies. Liffie Ngh •equency ener• •netrates to $ese dept• of about 20 •, lower •equencies •ish m•ke•y ne• 7 s. Traces 1 t•ough 96 •e ßsplayed left to d•t •ong $e ho•ont• •s of $e p•el.
778 Snyder et al.: Pampeanas Reflection Profries
Smalley and Isacks, 1987; Allmendinger et al., 1990].
The Precambrian to lower Paleozoic crust of the
Sierras Pampeanas terrane comprises an ancient mobile belt constructed along the former southwestern margin of the Brazilian shield [Dalla Salda, 1987; Ramos, 1988]. The terrane forms a distinct metamorphic and plutonic province that was probably part of the South American continent by the start of the Phanerozoic. The seismic lines lie in the
terrane's western domain, which has a Precambrian- early Paleozoic regional metamorphism of low to medium (amphibolite) grade [Caminos et al., 1982; Spinelli, 1983; Dalla Salda and Varela, 1984; Dalla Salda, 1987] and contains some early Paleozoic granitoids and migmatites as well as outcrops of, locally, eclogite-grade metamorphic rocks [Mirre, 1971]. Outcrops of the Precambrian-early Paleozoic rocks show the interference patterns of two or three fold systems related to shear zones and thrust faults seen at microscopic, mesoscopic, and megascopic scales [Dalla Salda, 1987].
A general geological history of the region has been assembled in recent years [e.g., Criado Roque et al., 1981; Ramos, 1988]. Throughout early and middle Paleozoic time, the Pampeanas terrane was a volcanic arc associated with subduction and accretion to the
west: a setting of uplift, regional metamorphism, and local intrusion (Figure 6). The metamorphic rocks exposed in a regionally extensive peneplane surface
Mesozo•
Paleozoic
Precambrian
".:'.:...•.V:•• sand dunes, alluvium Cenozoic •"-'"'";•'"ooo'•"•"•:•'•o•o (100- 2000 m)
• _• 0% & & • • & • I• Las Mulitas Fm. 00000000006 .., ,..•
~ 6.7 Ma o•• oooooooooo m
38 - 10 Ma •ooooooooo½ I.,- •c:n ,.•
•. o......%.o...• ......... :::::::::::::::::::::::::::::::::::::
• . • • ':::'"'"'"'•:'.':'•"• ."..'.".'2• (0- •00 m)
• :" "':J;![:':_':!'[:;_':;'•[:!•' ;: :'"':- .'. _.."i: ::• (400 m)
'.'.'.'.'.'.'.•'X'X'X'X':•':_-tEsquina Colo rada Fm. :5:5:5:•-Z-:5:.Z-_'-:5:-_-•, (1300 m) '"'"' ""' "''''':' '" '•• Paganzo 6roup •c•i%•'. r"r•a •&,-_'""•_ (75 m)
.,+•-_-_• crystalline •4. 4- 4- 4- 4- •) basement
strike-slip
thrusting
extension
I metamorphism & intrusion
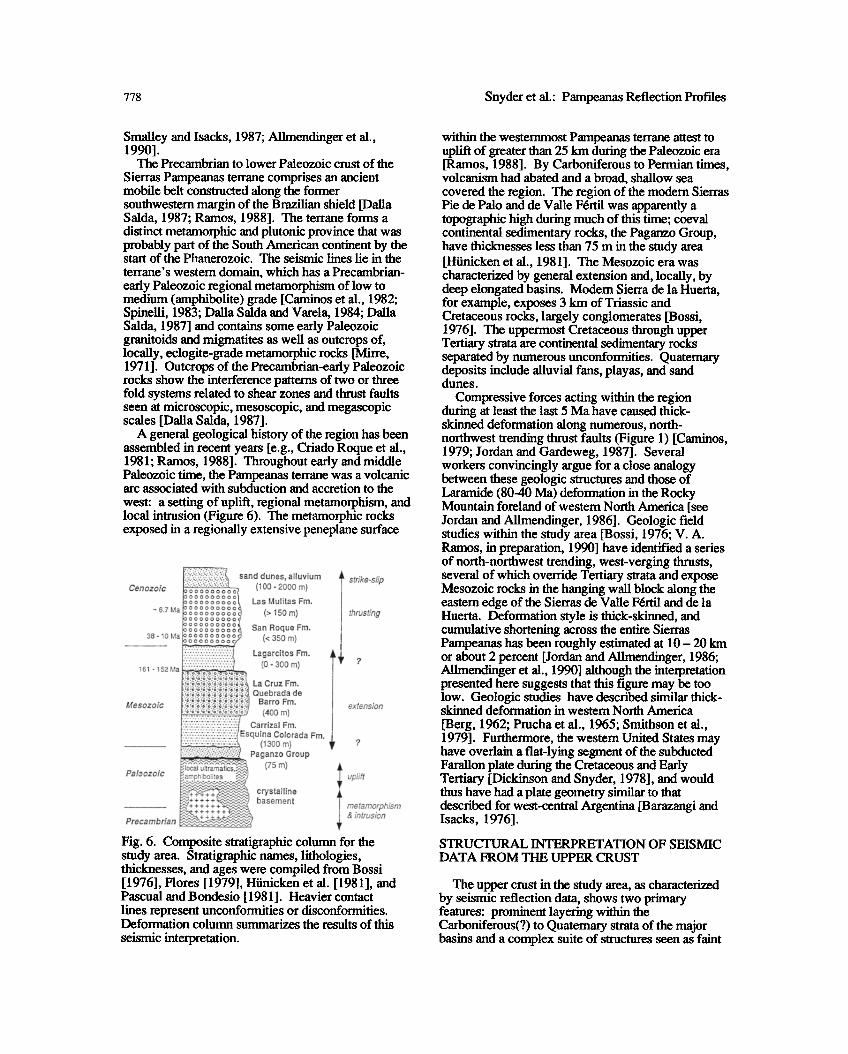
Fig. 6. Composite stratigraphic column for the study area. Stratigraphic names, lithologies, thicknesses, and ages were compiled from Bossi [ 1976], Flores [ 1979], Hiinicken et al. [ 1981 ], and Pascual and Bondesio [ 1981]. Heavier contact lines represent unconformities or disconformities. Deformation column summarizes the results of this
seismic interpretation.
within the westernmost Pampeanas terrane attest to uplift of greater than 25 Ion during the Paleozoic era [Ramos, 1988]. By Carboniferous to Permian times, volcanism had abated and a broad, shallow sea covered the region. The region of the modem Sierras Pie de Palo and de Valle F6rtil was apparently a topographic high during much of this time; coeval continental sedimentary rocks, the Paganzo Group, have thicknesses less than 75 m in the study area [Hiinicken et al., 1981]. The Mesozoic era was characterized by general extension and, locally, by deep elongated basins. Modem Sierra de la Huerta, for example, exposes 3 km of Triassic and Cretaceous rocks, largely conglomerates [Bossi, 1976]. The uppermost Cretaceous through upper Tertiary strata are continental sedimentary rocks separated by numerous unconformities. Quaternary deposits include alluvial fans, playas, and sand dunes.
Compressive forces acting within the region during at least the last 5 Ma have caused thick- skinned deformation along numerous, north- northwest trending thrust faults (Figure 1) [Caminos, 1979; Jordan and Gardeweg, 1987]. Several workers convincingly argue for a close analogy between these geologic structures and those of Laramide (80-40 Ma) deformation in the Rocky Mountain foreland of western North America [see Jordan and Allmendinger, 1986]. Geologic field studies within the study area [Bossi, 1976; V. A. Ramos, in preparation, 1990] have identified a series of north-northwest trending, west-verging thrusts, several of which override Tertiary strata and expose Mesozoic rocks in the hanging wall block along the eastern edge of the Sierras de Valle F6rtil and de la Huerta. Deformation style is thick-skinned, and cumulative shortening across the entire Sierras Pampeanas has been roughly estimated at 10- 20 km or about 2 percent [Jordan and Allmendinger, 1986; Allmendinger et al., 1990] although the interpretation presented here suggests that this figure may be too low. Geologic studies have described similar thick- skinned deformation in western North America
[Berg, 1962; Prucha et al., 1965; Smithson et al., 1979]. Furthermore, the western United States may have overlain a flat-lying segment of the subducted Farallon plate during the Cretaceous and Early Tertiary [Dickinson and Snyder, 1978], and would thus have had a plate geometry similar to that described for west-central Argentina [Barazangi and Isacks, 1976].
STRUCTURAL INTERPRETATION OF SEISMIC DATA FROM THE UPPER CRUST
The upper crust in the study area, as characterized by seismic reflection data, shows two primary features: prominent layering within the Carboniferous(?) to Quaternary strata of the major basins and a complex suite of structures seen as faint
Snyder et al.: Pampeanas Reflection Profries 779
reflections within the basement rocks of the upper crust (Figure 7). The geologic features observed here are shnilar to, though apparently less well developed than, those observed in the deep seismic survey of the Wind River Range [Smithson et al., 1979; Gries, 1983; Lynn et al., 1983; Sharry et al., 1986]. The structures inferred from reflections in the Sierras Pampeanas survey appear to defme a system of thrusts, ramps, and normal faults.
Basin Strata
Carboniferous(?) to Quatemary sedimentary rocks underlie both the Bermejo Valley to the west of Sierra de la Huerta and the Las Salinas Basin to the east.
These basin strata produce strikingly continuous and well-defined reflectors in sections along both seismic lines (Figures 7 and 8). The basal nonconformity, as well as at least two internal disconformities, can be discerned between VPs 2000-2700 of eastern line 1
(Figure 8). Similar interval velocities and overall thicknesses of the lower velocity rocks at both the eastern and western ends of line 1 suggest that Triassic, Cretaceous, and Tertiary strata overlie Precambrian-Early Paleozoic rock in both basins
(Figure 9). Field mapping in the central, topographically high part of line 2 [Bossi, 1976; V. A. Ramos, in preparation, 1990] reveals Triassic and Cretaceous rocks, thin remnants of a Mesozoic basin covering the metamorphic basement. Normal fatfits of small displacement cut the Triassic rocks in many outcrops.
Extensive erosion during the Paleozoic era IMirre, 1971; Dalla Salda and Varela, 1984] produced a bevelled erosional surface now exposed on many mountain blocks of the Sierras Pampeanas, including Sierras Pie de Palo and de Valle F6rtil [Jordan and Allmendinger, 1986; Jordan et al., 1990]. This surface appears as the basal nonconformity on the seismic sections (Figures 7 to 11), where numerous diffractions distinctively characterize this nonconformity (peneplane) surface seismically (Figure 8).
Synchronous with, and subsequent to, the erosion and bevelling of the basement rocks, a broad series of non-marine to marginal marine sedimentary basins formed and filled with clastic strata known
collectively as the Paganzo Group (Figure 6). These strata typically have a 1000-2000 m thickness, but locally may be either absent or more than 4000 m
_ VE I0:1 A) c
vP4ooo 3500 5000 / A 2500 2000 1500 I I I I/ • i
fV c VPI200 I000 800 600 r A CN400 2:00 0 r I I I I f 91 I I
--
_ 2km •
500m
0
-2
-4
-8sec
500 400m
-5
IOsec
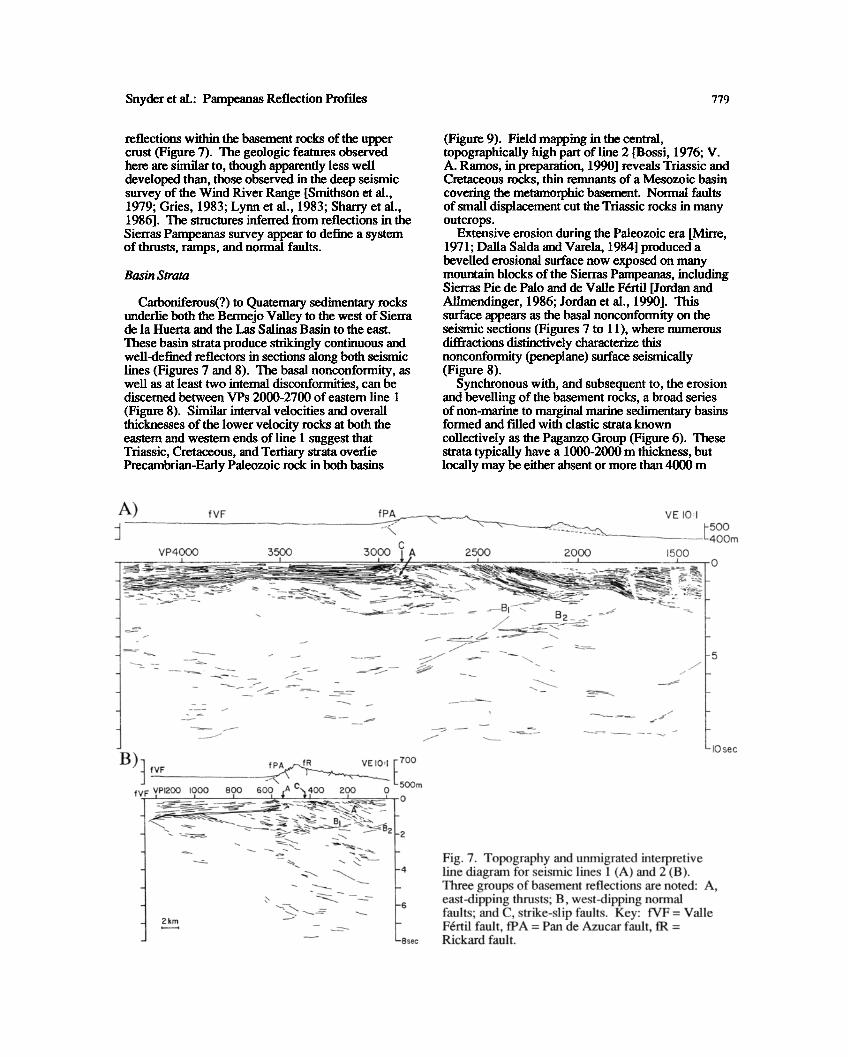
Fig. 7. Topography and unmigrated interpretive line diagram for seismic lines 1 (A) and 2 (B). Three groups of basement reflections are noted: A, east-dipping thrusts; B, west-dipping normal faults; and C, strike-slip faults. Key: fVF = Valle F6rtil fatfit, fPA = Pan de Azucar fatfit, fR = Rickard fault.

780 Snyder et al.: Pampeanas Reflection Profiles
2 Km
peneplane surface VP25,00 disconformities 23,00 21100 ul----•----'•• -•,• ',,.,_..• • ••' •....•:.-.._•.•_- _•,•-...,-,,.•,.••:•,•,,•,•:•,,._,.,._•,•.;•:.•: :i:--•",:•::-•....:: ..... •: ........ ß .::• .... ..:• .',•-:•. ..... :" .-;... i
I:--'•--•-.•.:•.•.•....•.•:.-..-•.•.•..•-.•.•`•.•---•••.t..•..•..•.-•.•:•..``•``•.``•`-```••.• .... '•'• -- --- ' '• -'-- --••.•:-•' :-:: ....... - . :•:•:.-.-.----....:•--';-&.A-?::•_'---_;--::'--'--'-"';':':':-" '• •-: ..: '-::• ' --'!
• •'. '::Y;-- --;.;: L_': .'-t.•'c: L-'-:-?-• .-7.'..:.;:..'.-Z•::-_'•f."•.'-- L-':•'-;.• -,-' ::'.,-'::-_'••.-:•;:--•---'•'•':•'.:•.• --.'-.:?•L •_ -- "-'•-.'•-•-: -.-:.• ;•-;_' :•-_'•..•5----- --::-:-Z-:,: :-.--..' :•-:-...-,•-•: :•.• -::'•..:-.•'•: •": :•:.,-- -:•::•.r-:.:•.L': •.:?-•--.'•7?•:-:'Z•.t:;-:..'::r--?:::L•'c•c.':--':•:•.:_• 1 .•?:. ..... -• ';•..•:---:-:_%?•:?¾.•--.---:'--•:??¾L':::•.•:-_'•.t-'_--':' '•--•--- :•. _. ¾%--'.?
Fig. 8. Seismic section of the eastern flank of Sierra de la Huerta along line 1 (Fig. 7A) showing the prominent reflections from Mesozoic and Tertiary strata. Three major unconformities are indicated along the topographic profile at the top. Cretaceous sediments appear the least reflective. Numbers at fight represent dip-corrected interval velocities in knxs-•. Highlighted area shows termination of reflections along projected trace of reflection B 1-
thick [Hiinicken et al., 1981; Salfity and Gorustovich, 1983]. Some Paganzo Group strata are present on the uptilted eastern flank of Sierra de la Huerta and may occur at the westernmost end of the profile (1.9 s at VPs 1500 and 2200; 1.5 s at VP 4200 in Figures 7A and 12) where weak reflections with interval velocities of 5.2- 5.6 kms-• (Figure 9) mark the section. The majority of these reflections
are more likely Triassic strata that locally form thick depocenters and can be grouped into three subunits near line 2 [Bossi, 1976]. The Triassic strata extend eastward only to about VP 2100 on line 1 where they terminate abruptly and may be mmcated by a fault (circled area in Figure 8; see below). Cretaceous strata found along the eastern margin of the ranges (K in Figures 1, 8, and 12) contain mostly
VP # --> 4200
2 I
3600 3200 2500- 2400 2200 1900 1500
:::::::::::::::::::::::::::::::::::::::::::::::::::::::::::::::::::::::::::::::::::::::::::::::::::::::::::i:i:i:i:i:i:i:!!iii!iiiii!!::::...:...:...:•:::•: '.:•'.:•i •"' ' ............. ' ........................................................ ::::::::::::::::::::::::::::::::::::::::::::::::::::::::::::::::::::::::::::: -•' -••.-.•... --.,.••.;.,.;.,.• •o.'.o.:o.:o :o :o :o :•, ;'. v. •_'.-._'..`•.•.•..•.•..•.•...•.•......:..•......:.:...:.:.:.:.:•:.:.:.:.:•:.:.:.:.:.:.:.:.:.:.:.:• :::::::::::::::::::::::::::::::::: ........................... .:.:•....•• '••-'.•... '••••'_•..•..•..•'•..• .'.•..'•L•::;5•'..."...•'.... '....'•....:•:::3'8;:.... •....:." ..`.•!i:!:!:!:!:!:i:!:i:i:i:i:!:!:i:i:i:!:!:!:i:i:!:i:i:!:!:!:!:!:!:i:i:i:i:i:i:!:!:!:!:!:i:i:i:i:i:i:i:i:i:i:i :::::::::::::::::::::::::::: '/ ' ' ' ' ' ' '•o'o'o'o'o-•2 '••• •••.••. -••- .,-•-•.•-•,.•-• •-"•-•-• '•'• '•'•' ' ' "•' '%•"..... '"• :.......' '. ,•-.G.•::::::::::::•=======================================================================================
j,,: •.,. •.,. :•' ' -' '"- '-" ' ' "•"••.',•'•........•_. •.. `....•i:i:i:i.-..:..•ii:i!i:i!ii:i:!ii:i:!:i:i:i:!:i:!:!:i:i:i:i:i:i:i:!:i:i:i:!:i:i:i:i:i:!:i:!:i:i:!:i: ........... .,- .,. •.- .,. :,.-•.,-•.;. :o.'-o;• ..... •:o:o '.-'.-'.--..'..v.-.-.... ...... -.-....-.v.-.-.-.-...-.-.-.-.-.-.-.-.-.-...-...v.-.-.-.-.-.-.-.-.v i•"c.•".•'• i• !• !• i• i.• "•"•"ø'ø'""'ø' '••:.' •'.•' •' • :•'•! :;•:;• :?"'ø•'-"-'.____ '_;c;c:•-'::•:; •.' • '• s, -•..--• .•.....-:..... ,.....-.-.,..-.,-..-.•:: ........ :.:. :.:.:.:.:. :. :.:. :. :. :.:.:.:.:.: • •:.:...:.: ................... •. •.. ........
,:i.• ..,,:,,....'.o.....•• "- -- -ø:ø'-" "ø:"••':•'••'-":"-'•:!'"'"'"'"'"'"'"'"'"'""'"'"" ' .-.-:-.-.-:-:.:.:-:.:.:.:.:.,,.o:.:.:.:.: •;;;; ;--- oo o• ;;;•.c•••.--•.•;•r-'--------------'---- - ß - - ß -'-'-'.... '.....'N•' .••:.••`..•:•:::::::::::::::::::::::::::::::::::::::::::::::::::::::::::::::::::::::::.:.:.::::::::: ;5 :• :;5 :;5 :;5 :;5 :;5;."'"' "" "'o o o'.o. ß ' '_ •.'.'•:• •L.N.:.:•:•:.:.:.:.:.:•:.:.:.:.:.:.:.:.:.:.:.:.:.:.:.:.:.:.:.:.:.:.:.:.:•:.:.:.:.:.:.:.:.:.
...... •.,.•.,-•.,-•. 6.2 •.,.•.,.•.,.•.,.•.,.• 6.0 C,.•.•.,.•.,.•.,.•.,.•.,.•.,-•.• .• .• ••• t.;5 t.:'. C. ::: :: •.: :: :.c.::?::::::::::::::::::::::::::::::::::::::::::::::::::::::::::::::::::::
...................................... .,.-.,.-.,.-.,.-.,.-.,.-.,.-.,.-.,.-.,.-.,.<,.<,.- ....... •...•.--_.•..%?,,.•,,.-•,.,.,.,.•.,.,.,.,..,:• interval velocities in km/s
Fig. 9. Interval velocities along line 1 calculated from maximum coherency stacking velocities using Dix's equation modified for dipping reflections. Patterns as in Figure 1. Solid lines show grouping of velocities: for VP < 3000, based on known stratigraphy, for VPs > 3000, based on similarity of velocities. Tertiary rocks are thus interpreted to overlie Triassic and possibly Cretaceous strata in the western basin.

Snyder et al.: Pampeanas Reflection Profdes 781
fPA,A • VP3000 C -•" 2750 2500 2250
'-' F% ••:-• ....... - -• •••••••••••• •.'• •:•;•"•'• •• •-•'.•.•:--'•,.:-'-•(.....• ...................... •___-• • ........... :., -. . - .... . ...... _• ...... . ....... •. _•-,.•;.• - •. ........ ..•-_•_.. __ _
• - .-• .;-7 - '•-• --• :- • • ;-':.-•c•:•--.-- -• •:•.-.:•.-:' :-- .... ••••••
.7- .•'L•:•-•7;• ' •:.'-"::);'•-•-.•-:':""• '• •-••"• .••-•••••••.•.•-.-.:•.•.•`•-•;..•.•:•.•.•`•:•:-:-:•{•:•.•:-.:•.•:`•;`•.•`• '- .... ••::••:_-_.- '7 • '_, .. :.•- :'c- •-:•L• ;: '-• 1-- ,•;c •--: -:' - '•-- -•• :-•• ••••• •.•:._-• • ':" ::-,,':; : :;::';:.:½: :--c r ,• :..!--" • eL;'. '. '-:. .• ..- •2-•:-c7:- •-•-, ,-•:- •.•- -- ' _ -c •'•7•'z':: .-•_• '- •7 :-"' "-'-7:.- --- •-' •.'---C--- •"" - --- 'c -'- -- "'--'-" '-' ;.• .' .- -."'." -• c.•.'- .' •';---7' --:" - - -" '.: '• 'z:7 ':'•'--'• • •.• •' <' -
?:.-• '•7.:..-'---"' :.:-" ;" '• 7': :.7..•::•J½-,;•: .'. •_..' ;'7 '•.. - ;•:•- ?'•::'• :"• f.•:'• :.;'-. ';-. '[-• •. ?.::..-• •7':+ •:;'-( .•-:-:•: •7'?-.• "-¾ ::•:?•.'•', ;•:: ::: :•'•,.•--: ..; ;: :.-:. 5½-'•
•A
Fig. 10. Migrated section of the upper part of line 1 from a segment on the crest of the mountain range. A three-layer velocity model based on interval velocities in Figure 9 was used. Some reflections interpreted as faults (B 1) are more sharply defined, others (A) are faint and discontinous. Highlight #1 shows apparent toplap. Highlight #2 shows boundary between subhorizontal and west-dipping grain in seismic data.
conglomerates and continemal sediments [Bossi, 1976] and coincide with a 800-m thick reflector-free zone on the seismic section.
Tertiary strata up to 1200 rn thick are marked by numerous, evenly-spaced reflections in both eastern and western basins of line 1; line 2 does not extend far enough to the east to image these strata (Figure 7). The Tertiary strata appear to form continuous layers over deformed Mesozoic strata in both the western basin and beneath the sand dunes in the
eastern basin (1.0 s at VP 2150 in Figure 8). The existing Tertiary section thickens to the east of the sand dunes; if not an erosional effect, this would indicate a depocenter farther to the east.
The timing of deformations within the basin strata is poorly constrained by the imprecision with which individual reflections in the seismic section can be
correlated with stratigraphic units as well as by the lack of precise dates on those units. Two types of faults have been interpreted from the seismic data: west-dipping normal faults (e.g., B ! in Figures 7, 8, and 10) and east-dipping thrusts (A in Figures 7, 10, and 11). Key timing relationships for the normal faulting (B !) are found near VP 2100 of line 1, where reflectors confidently identified with Triassic
and Cretaceous strata abra presumed basemere rock (much less reflective, 6.3 kms-1 interval velocities), whereas reflectors higher in the section are unbroken (Figures 7 and 9). A gently west-dipping reflector in the basemere (B 1 in Figure 8) projects into this zone of terminating reflectors so as to form a likely normal fault contact. The reflector dips a maximum of 45- 50 ø to the west after migration and restoration of overlying strata to horizontal. Inferred normal displacemeres occur mostly in Mesozoic strata (Figure 6). The normal fault appears to form the eastern structural border of a Mesozoic basin.
The remainder of stratal disruption seen on the seismic sections appears to be due to thrusting and reverse faulting. A prominem monocline in the lower basin strata at VP 3680 of line 1 and VP 1200 of line
2 (Figure 7) overlies a faint, east-dipping reflector that could be interpreted as a west-verging thrust in the center of the western basin. The lower half of the
sedimentary section, presumed Triassic and Cretaceous(?) in age on the basis of interval velocity studies and drilling in the basin 100-150 km to the south and to the north (Figure 9) [Ortiz and Jordan, unpublished data, 1985], is arched whereas the upper half (probably Tertiary) is continuous and flat-lying.

782 Snyder et al.: Pampeanas Reflection Profries
fPA _ _ VP500 fR 0
•3 .,,2,• .- :.•' •-. - :-_-: ._-. -- : - -.•.-.: i- :'•: - '-'-":':-::'."-' - .-'--::' :-' - '-;-;- -:;"-.- ::'..:- -•':-. œ-" '•- '- '-
;.:'_'--' /.'--.-:_:- .:-.': .' .'--:- •' •.'. "':?'::':-•-:.•A--' :-:' % :::-;':-%'""'-'-?•:::-.'?'-- ::'.'%'-" :-:-'.-'.--z'--- .'-:--.-':/•. ::-'--:'•
--:.-•_-'-'.---.;-. :•---_:'-':.--.-. :.'-':. :.-:•: •-: '- '•".;.-.-'_-: :•-: •-': :'. ;' -:. _-L:z::;:'•.---'--•J" :-"- --_-.--
8
Fig. 11. Migrated section of the upper part of line 2 from a segment on the crest of the mountain range. Highlighted area shows toplap near the surface at VP 450 that may mark the projection of reflector Al into the Rickard fault (fR) observed at the surface. Discontinuous reflectors (A, B) are seen within the Precambrian-Early Paleozoic basement rocks.
The Pan de Azucar fault (Figures 7 and 11) truncates and overthrusts the presumed Mesozoic strata, and slightly offsets the Tertiary strata near VP 3000 on line 1 (Figure 10) and near VP 600 on line 2 (Figure 11). These faults were likely active following the period of normal faulting and during the early Tertiary. The Pan de Azucar fault remained active later than its inferred western neighbor because it offsets strata that are undeformed west of the Pan de
Azucar fault, strata here tentatively correlated with the 38-10 Ma San Roque Formation (Figure 6) [Pascual and Bondesio, 1981 ]. Farther to the east, a pair of near-vertical reverse faults or fight folds deform and offset the entire Carboniferous(?)-Tertiary section by about 750 m and 100 m at VPs 1700 and 1450, respectively, on line 1 (Figures 7 and 12).
Uppermost Basement Structures
A faint pattern of reflections appears amid the numerous, discontinuous reflections within the
basement on each seismic section. This pattern may be viewed as having three components (A, B, C in Figures 7, 10 and 11). First and most important are several faint, subparallel reflections that dip about 30 ø eastward on migrated but non-depth-converted sections (A in Figures 10 and 11). These reflections can typically be traced continuously, with care, for up to 6 km horizontally and somethnes discontinuously over larger distances (Figure 7). The clearest of these eastward-dipping features projects downward from the surface trace of the Pan de Azucar thrust and forms a boundary between a part of the section with horizontal to eastward- dipping grain and one with westward-dipping grain (see area near 1.4 s, VP 2800 in Figure 10). The Pan de Azucar fault displays no associated prominent reflection (Figure 10); it may not juxtapose rocks of significant impedance contrast or the high mafic content of any cataclasite, or mylonite at depth may not provide significant impedance contrast [Fountain et al., 1984, 1987]. Many of the reflections in this

Snyder et al.: Pampeanas Reflection Profries 783
c
v4ooo ,5oo 5o,oo ! 25oo 2ooo ,500 I I I I i
I 0 -I J• -I -II -I 0
x/x/ / \ / \ / \ N/ N. / / \ / \/\
ß
_ -20km
J fVF f'7 f•,,•.•••_ VE I0:1 [700 ' •"'-'"-'-"• '500m VPI200 800 400 0
,
9 -
_
• . _
_
20kin
Fig. 12. Topography and depth-converted structural interpretation of seismic lines 1 and 2. Roman numerals indicate dip domain in fault-bend folding model [Suppe, 1985]. Near-vertical lines in section represent dip domain boundaries associated with changes in dip of reflections, but not the reflections themselves. Focal mechanism
below VP 900, taken from Chinn and Isacks [1983], was projected oreo the seismic cross section. Key: fVF = Valle F6rtil fatfit, tiaa = Pan de Azucar fault, fR = Rickard fatfit.
east-dipping set have senses of dip similar to reflections from basinal strata higher in the section and thus are suspected of being mtfitiples; however, the same pattern of deep reflectors appears below a thin to nonexistent sedimemary cover and those, at least, probably are not multiples.
Jordan and Allmendinger [1986] used the shallow dips of basin strata observed in outcrops on the eastern flank of Sierra de la Huerta to infer that the
Pan de Azucar fault, a thrust fault bounding the western flank of the mountain, is a listric fault along which the entire moumain block has rotated [Erslev, 1986]. This geometry accounts for the rotation of the mountain block without producing space problems within the basemere rocks. This remains a viable, complete interpretation of the observed mountain- block faulting.
Further resolution of the nature of this block
rotation is provided by the reprocessed seismic data presented here. Clearly visible domains of similar dip within the basin strata are separated from each other by localized fold axes within and east of Sierra de la Huerta (VPs 2200-2500 in Figure 10). This
stratal deformation can be interpreted structurally using the fault-bend folding technique of Suppe [1985] (Figure 12), a method which assumes that folds restfit from bends in underlying faults. A constraint on the location of one of these faults is
provided by the reprocessed seismic data, which has clearly defined the geometry of the Pan de Azucar fault beneath the mountain crest to depths of at least 5 km (1.4 s at VP 2800 in Figure 10). The resulting constructions (Figure 12) are permissible, but not defmitive interpretations of the near-surface structure.
By combining the geometries of basin strata seen on the reprocessed seismic sections with the assumptions of layer-parallel slip inherent in the fault-bend-fold technique, a structural framework with which to correlate possible structures with ill- defined reflections deeper in the seismic section can be developed. Measured dips within the basin strata, 12.5 ø and 23 ø within the two dip domains on the eastern flank of the mountain for example (VPs 2200-2500 in Figures 7 and 10), closely match dips of 12 ø and 23.5 ø that are predicted by the fault-bend- folding techniques for the first and second back-

784 Snyder et al.: Pampeanas Reflection Profries
EARTHQUAKE HYPOCENTER
THRUST FAULTS
BASEMENT ROCK E
-•• •- C/1 LœUL A rED OBSERVE 2
So. Pie de Polo So. de io Huerto So. de Chepes
-0.8 -0.3 -0.6 S.L. ' ---• ........ • •".'.'- ..... ' ..........
J
I i [ I •
0 200 •00 •00 Distance, Km VE • •.5
Fig. 13. Cartoon of possible crustal structure beneath the Sierra de Valle F6rtil mountain range based on reflection data, gravity anomalies, and metamorphism-derived unroof'mg estimates. The entire crust is assumed to have a mafic composition and to be thickened via both underplating and crustal duplexing along thrusts. Sierra Pie de Palo appears to be centered in an area of excess mid- or lower-crustal mass (laminated lower crust reaches higher crustal levels) and of greater seismicity (duplexing most active). Observed gravity curve was isostatically corrected from data of Introcaso [1980]. Numbers on section indicate density contrast in 10-3 kg m 3.
dipping domains of thrusts cutting up stratigraphic section at a fundamental or primary cutoff angle of 12 ø. Similar indentifications of dip domain can be made consistently across most of the seismic section to produce a dip spectrum (Figure 12). The order of individual dip domains reaches a maximum of II in the strata of the eastern mountain flank, and thus predicts two underlying thrust ramps [Suppe, 1985]. One ramp likely occurs on the downdip part of the Pan de Azucar fault (Figures 7 and 12). The second ramp may occur within the Pan de Azucar fault zone or on a deeper fault. Deeper fatfits are not seen in the seismic data, but can be tentatively correlated with disruption of basin strata associated with the Valle Fertfl fault discussed above and with faint reflections
observed at 3-7 s travel times (A in Figures 10 and 11). If two distinct thrust zones are assumed, restoration of the thrusted blocks above the Valle
F6rtil and Pan de Azucar fault, so as to reconstruct subhorizontal Mesozoic basin strata, indicates 5 and 8 km of Cenozoic offset, respectively, on these two faults (Figure 12). It must be emphasized however, that the only evidence of a second, deeper thrust is the dip domain analysis of the fault-bend folding technique.
Recent studies of large earthquakes within this study area support the existence of active thrusts. By combining the spatial distribution of aftershocks
derived from a temporary local network, focal mechanism solutions from ISC data, and releveling data, Kadinsky-Cade et al. [ 1985] modeled a blind, west-dipping thrust, 80-km long, 17 to 30 km beneath Sierra Pie de Palo. Chinn and Isacks [1983] matched teleseismic waves from a Ms 5.8
earthquake, located about 7 km NNW of VP 900 on line 2 (Figure 1), to an earthquake model with a depth of 15 km and a thrust focal mechanism (Figure 12). The preferred nodal plane dips more steeply than observed seismic reflection trends, but this may be a focal solution for a major aftershock occurring on a subsidiary fault within the footwall block of the more regional faults inferred here. In general, rapture planes of large earthquakes in this region are consistent with the family of structures suggested by the structural interpretation of the reflections.
The second component of the reflection pattern appears as subparallel, semicontinuous reflections, dipping 20-25 ø to the west (B in Figures 7, 10 and 11), that intersect but do not displace the first set. One prominent reflection, B 1, in this secondary set occurs between VPs 2200-2500 on line 1 at 2-2.5 s
(Figures 7 and 8) where it seems to originate at the base of the sedimentary strata in the basin to the east and along the horizon of numerous diffractions. This feature might be attributed to a reflected refraction from a near-vertical fatfit plane [see Smithson et al.,

Snyder et al.: Pampeanas Reflection Profries 785
1979] or a direct reflection from a west-dipping fault plane. Lower basin reflections in this area, which can be traced from surface outcrops of Triassic and Cretaceous strata, appear to terminate where reflection B 1 intersects the basal nonconformity, however, reflections in the Tertiary section continue to the east. The sand dunes on the surface may strongly disrupt signal from otherwise continuous reflector strata at deeper levels, but the clarity of the Tertiary strata and high interval velocities (6.3 kms-1 in Figure 9) associated with the relatively reflection- free zone immediately below them suggest that Mesozoic strata are truncated here. Thus, these relations favor an interpretation of a pre-Tertiary normal fault.
The third component of the pattern comains very shallow features that are closely tied to mapped surface faults along the western range crest on both sections (C in Figure 7). The near-surface termination of reflector A1 looks like toplap on the section of line 2 (VP 410 in Figure 11), but this termination of reflections can also be closely correlated with the Rickard fault [Bossi, 1976], along which diverse field evidence (V. A. Ramos, in preparation, 1990) indicates left-lateral displacemere of possibly several kilometers. A nearly identical reflection geometry occurs along line 1 at VP 2885 (Figure 10). Our structural interpretation predicts shallowly dipping thrust structures at depth beneath these features (Figure 12). Strike-slip faults seen at the surface may accommodate strike-slip motion within the thrust system by splaying off lower-angle thrusts below.
INTERPRETATION OF SEISMIC IMAGES OF THE LOWER CRUST
Identifying reflections from the lower crust with the present data is particularly complex due to the limited bandwidth and signal penetration of the survey and the lack of other geophysical data addressing lower crustal rock type and structure. Detailed gravity surveys and local seismic array studies [Pujol et al., 1988] should provide much needed constraints on crustal thickness and structure
[e.g., Introcaso et al., 1987]. At present we use isostasy arguments combined with regional gravity observations [Introcaso, 1980] to infer a 40-45 km crustal thickness for an area with an average elevation of about 600 m above sea level.
Amplitude decay analyses discussed earlier indicate that seismic reflection records can outline
details of structures in the metamorphic crustal rocks to mid-crustal depths of about 20 km (9-•-_1 s) if such structures are larger than the resolution of the seismic waves (e.g., the Rayleigh and first Fresnel zone criteria). No prominent zone of lower crustal reflections, such as those observed on some recent deeper seismic reflection profiles [e.g., BIRPS and ECORS, 1986; Allmendinger et al., 1987],
demarcates the lower crust or Moho on our limited
section. Reduced bandwidth at lower crustal depths hinders recognition of any such reflections in our data because they will appear as 'fat', multicyclic features with low amplitude. An apparent decrease in reflector density has been noted at travel times of about 7 s on line 1 (Figure 5) and may represent a transition in rock characteristics if not attributed
entirely as a limit of signal penetration and rerum. Although the seismic data alone are unable to
directly characterize the lower crust in this area, the results from the upper crust presented here do add to those of recent gravity, petrologic and geochronologic studies. Uplift during the late Precambrian and Paleozoic eras probably was accomplished by crustal thickening related to structural processes such as thrusting and duplexing (similar to that suggested by Sugrez et al. [1983] and Isacks [1988] for the modem Andes) and to thermal- magmatic processes such as crustal intrusion and underplating [Criado Roque et al., 1981; Furlong and Fountain, 1986]. The documented Paleozoic history of magmatism and metamorphism at the paleocominemal margin provides a tectonic setting in which underplating or intrusion might be expected. First-order, regional-scale gravity modelling (Figure 13) [Introcaso, 1980] suggests a positive density anomaly in the middle to lower crust. The anomaly is cemered on Sierras Pie de Palo, de la Huerta, and de Valle F6rtil and does not extend as far east as Sierra
de Chepes. The anomalous mass cannot be uniquely located, but it coincides with the footwall, not the hanging wall, of the thrust system described here beneath Sierra de la Huerta. This higher density material may constitute a lower-crustal heterogeneity, composed of intrusions, eclogite-grade metamorphic rocks [Mirre, 1971 ] or underplated mafic magmas, that has an effect on crustal deformation above it in
the upper crust.
DISCUSSION AND CONCLUSIONS
One main result of this study is that recorrelation of shallow seismic data to extended travel times can
be a viable technique in deep exploration if special care in noise reduction and array design, particularly input energy, is also taken. The present study did not consider recorrelation with a constant reduced
sweep to produce traces with uniformly 'fat' Klauder wavelet signal pulses. Instead, the self-truncating correlation sweep resulted in an upper section whose fidelity matches that of the original survey, a section from which reflections and other features can be
traced or extrapolated to greater travel times where resolution deteriorates. The resulting inherent variation in pulse shape with travel time is preferable to the greatly reduced resolution over the entire section associated with a reduced bandwidth recorrelation.
Test studies of amplitude and frequency bandwidth decay with travel time indicate that deterioration of

786 Snyder et al.: Pampeanas Reflection Profries
the data matches that typically encountered in deep Vibroseis crustal studies and is not entirely attributable to the recorrelation process. Either Pampean basement rocks contain very low impedance contrasts, or near-surface conditions are so variable as to cause the stacking process to deteriorate reflection coherence and continuity. In either case, no prominent deep reflections occur with which to better assess the utility of recorrelation. A few weak reflections within the basement appear high enough in the section to be interpreted and characterized as structures. Some of these features
may be traceable to almost 10 s to demonstrate the resolution of the data at the associated 20-25 km
depths in the crust. This extrapolation to depth suggests that if rock unit thicknesses, continuity, and impedances were suitable for high amplitude reflections in this area, then present reprocessing of the data should have revealed some features on the
sections. Pampeanas basement has low seismic reflectance, both near the surface and at depth.
Surface faults mapped within the study area, particularly the Valle F6rtil and Pan de Azucar faults (Figure 11), are not imaged as prominent reflections on the seismic sections, but do correlate with transitions in free scale seismic fabric, such as changes in orientation of short reflection segments. Indeed, the few shallowly-dipping reflections noted in the sections may not be faults or shear zones, but layering within the amphibolite rocks that is inherited from Precambrian or Paleozoic times. In general, the strong mafic character and, possibly, associated low impedance contrasts of the basement rocks in the Pampeanan terrane may be poorly suited to high seismic wave reflectance [Fountain et al., 1984, 1987].
A wide range of geologic information can currently be assembled to study the crust of the Sierras Pampeanas, and more will become available in the near future. Compilation of focal mechanisms, aftershock distributions, and coseismic surface deformation [Chinn and Isacks, 1983; Kadinsky- Cade et al., 1985] strongly argues for the existence of reverse fault surfaces along which the uppermost crust deforms. Surface mapping [e.g., Bossi, 1976] has demonstrated a series of eastward-dipping thrusts, primarily in the Sierras de la Huerta and de Valle F6rtil. The seismic reflection data suggest both east- and westward-dipping fault zones. Beneath the western flank of the mountain block, east-dipping thrusts dominate and have been active perhaps before (see VP 3600 line 1) and certainly during (see VP 2900 same line) the accumulation of Tertiary sediments. Beneath the eastem mountain flank, west-dipping faults with normal displacement appear to be older. Models of thick-skinned deformation, made using cross section balancing techniques of fault-bend folds plus ramp and flat geometries, can be made consistent with these observations.
Individual faults may have moved in diverse geologic
periods, but the resulting pattern of thick-skinned deformation resembles that observed in thin-skinned
thrust belts. The youngest thrusting may warp and offset older layering or banding in the metamorphic basement, a relationship similar to but much more poorly def'med than those of faults cutting stratal boundaries typically seen in thin-skinned deformation.
No clear observation or feature within the
Vibroseis data defines a style of basement deformation, particularly within the lower crust. Careful study and discussion of recorrelation limitations, signal penetration constraints, possible low reflectance of the mafic metamorphic rocks taken together with models of balanced cross sections, gravity observations, and petrologic studies nevertheless provide a consistent (or admissible) description of deformation in the westem Sierra Pampeanas, as well as a possible explanation for the scarcity of observed reflections.
Acknowledgments. We thank YPF for making available the data for reprocessing and members of the Cornell Andes Project for many lively discussions. Acknowledgment is also made to the Donors of the Petroleum Research Fund, administered by the American Chemical Society, for partial support of this research. We also thank the National Science Foundation of the United States for
support through grant EAR-8607468. INSTOC of Comell University Contribution 136.
REFERENCES
Al-Chalabi, M., An analysis of stacking, RMS, average, and interval velocities over a horizontally layered ground, Geophys. Prospect., 22,458- 475, 1974.
Allmendinger, R. W., T. A. Hauge, E. C. Hauser, C. J. Potter, S. L. Klemperer, K. D. Nelson, P. Knuepfer, and J. Oliver, Overview of the COCORP 40 ø N Transect, western U.S. A.: The fabric of an orogenic belt, Geol. Soc. Am. Bull., 98, 308-319, 1987.
Allmendinger, R. W., D. Figueroa, D. B. Snyder, J. Beer, C. Mpodozis, and B. Isacks, Foreland shortening in an amagmatic mountain belt, Tectonics, in press, 1990.
Barazangi, M., and B. Isacks, Spacial distribution of earthquakes and subduction of the Nazca plate beneath South America, Geology, 4, 686-692, 1976.
Berg, R. R., Mountain flank thrusting in Rocky Mountain foreland, Wyoming and Colorado, Am. Assoc. Pet. Geol., 46, 2019-2032, 1962.
Bevis, M., and B. L. Isacks, Hypocentral trend surface analysis: Probing the geometry of Benioff zones, J. Geophys. Res., 89, 6153-6170, 1984.
Bossi, G., 1976, Geologia de la cuenca de Marayes- E1 Carrizal (provincia de San Juan, Repfiblica

Snyder et al.: Pampeanas Reflection Prof'des
Argemina), Congr. Geol. Argent. (Acta) 60, 1, 23-38, 1976.
British Institutions Reflection Profding Syndicate (BIRPS) and Etude de la Coute Continemale et Oceanique par Reflexion et Refracion Sismique (ECORS), Deep seismic reflection profding between England, France, and Ireland, J. Geol. Soc. London, 143, 45-52, 1986.
Caminos, R., Cordillera Frontal, in Segundo Simposio de Geologfa Regional Argentina, 1,397- 454, Academia Nacional Ciencias, C6rdoba, 1979.
Caminos, R., C. A. Cingolani, F. Herve, and E. Linares, Geochronology of the pre-Andean metamorphism and magmatism in the Andean Cordillera between latitudes 30 ø and 36 ø S, Earth Sci. Rev., 18, 333-352, 1982.
Chinn, D. S., and B. L. Isacks, Accurate source depths and focal mechanisms of shallow earthquakes in westem South America and in the New Hebrides island arc, Tectonics, 2,529-564, 1983.
Criado Roque, P., C. Mombm, and V. A. Ramos, Estmctura e interpretaci6n tect6nica, in Geologia de la provincia de San Luis, Relat. Congr. Geol. Argent. 80, 155-192, 1981.
Dalla Salda, Luis, Basement tectonics of the southem Pampean ranges, Argentina, Tectonics, 6, 249- 260, 1987.
Dalla Salda, L. H., and R. Varela, E1 metamorfismo en el tercio sur de la Sierra Pie de Palo, San Juan, Asoc. Geol. Argent. Rev., 4, 68-93, 1984.
Dickinson, W. R., and W. S. Snyder, Plate tectonics of the Laramide orogeny, Mem. Geol. Soc. Am. 151,355-366, 1978.
Erslev, E. A., Basement balancing of Rocky Mountain foreland uplifts, Geology, 14, 259-262, 1986.
Finckh, P., J. Ansorge, S. Mueller, and C. Sprecher, Deep crustal reflections from a Vibroseis survey in northem Switzerland, Tectonophysics, 109, 1-14, 1984.
Flores, M., Cuenca de San Luis, in Segundo Simposio de Geologœa Regional Argentina, 1,745- 767, Academia Nacional de Ciencias, C6rdoba, 1979.
Fountain, D. M., et al., Seismic reflectivity of mylonite zones in the crest, Geology, 12, 195- 198, 1984.
Fountain, D. M., D. T. McDonough, and J. M. Gorham, Seismic reflection models of cominental crest based on metamorphic terrains, Geophys. J. R. Astron. Soc., 89, 61-66, 1987.
Furlong, K. P., and D. M. Foumain, Cominemal crustal underplating: thermal considerations and seismic-petrologic consequences, J. Geophys. Res., 91, 8285-8294, 1986.
Gries, R., Oil and gas prospecting beneath Precambrian of foreland thrust plates in Rocky Mountains, Am. Assoc. Pet. Geol. Bull., 67, 1- 28, 1983.
787
Hiinicken, M. A., C. L. Azcuy, and M. V. Pensa, Sedimemitas Paleozoicas, in Geologia recursos naturales de la provincia de San Luis, Relat. Congr. Geol. Argent. 80, 55-77, 1981.
Introcaso, A., Resultados gravim6tricos en la banda latitudinal de Argentina central y paises vecinos, Rev. Geofis., Inst. Panam. de Geogr. Hist., 12, 5-25, 1980.
Introcaso, A., A. Lion, and V. A. Ramos, La estmctura profunda de las Sierras de C6rdoba, Asoc. Geol. Argent. Rev., submitted 1987.
Isacks, Bryan L., The Altiplano-Puna and the Bolivian Orocline, J. Geophys. Res., 93, 3211- 3231, 1988.
Jordan, T. E., and R. W. Allmendinger, The Sierras Pampeanas of Argentina: a modem analogue of Rocky Mountain foreland deformation, Am. J. Sci., 286, 737-764, 1986.
Jordan, T. E., and M. Gardeweg, Tectonic evolution of the late Cenozoic Central Andes, in Mesozoic and Cenozoic Evolution of the Pacific Margins, edited by Z. Ben-Avraham, pp. 193-207, Oxford University Press, New York, 1987.
Jordan, T. E., B. L. Isacks, R. W. Allmendinger, J. A. Brewer, V. A. Ramos, and C. J. Ando, Andean tectonics related to geometry of subducted Nazca Plate, Geol. Soc. Am. Bull., 94, 341-361, 1983.
Jordan, T. E., P. Zeitler, V. Ramos, and A. J. W. Gleadow, Thermochronometric data on the development of the basement peneplain in the Sierras Pampeanas, Argentina, J. S. Am. Earth Sci., 2,207-222, 1989.
Kadinsky-Cade, K., R. Reilinger, and B. Isacks, Surface deformations associated with the
November 23, 1977 Caucete, Argentina, earthquake sequence, J. Geophys. Res., 90, 12,691-12,700, 1985.
Kay, S. M., V. Maksaev, R. Moscoso, C. Mpodozis, and C. Nasi, Probing the lithosphere: mid-Tertiary magmatism in Chile (29ø-30ø30'S) over the modem zone of subhorizontal subduction, J. Geophys. Res., 92, 6173-6189, 1987.
Lynn, H. B., S. Quam, and G. A. Thompson, Depth migration and interpretation of the COCORP, Wind River, Wyoming, seismic reflection data, Geology, 11,462-469, 1983.
Mayer, J. R., and L. D. Brown, Signal penetration in the COCORP Basin and Range-Colorado Plateau survey, Geophysics, 51, 1050-1055, 1986.
Mitre, J. C., Caracterizaci6n de una comarca de metamorfismo regional epizonal de alto grado: la sierra de Valle F6rtil, provincia de San Juan, Repdblica Argentina, Asoc. Geol. Argent. Rev., 26, 1, 113-127, 1971.
Okaya, D. A., and C. M. Jarchow, Extraction of deep crustal reflections fxom shallow Vibroseis data using extended correlation, Geophysics, 54, 555-562, 1989.
Pascual, R., and P. Bondesio, Sedimentitas
788 Snyder et al.: Pampeanas Reflection Proœdes
cenozoicas, in Geologfa recursos naturales de la provincia de San Luis, Relat. Congr. Geol. Argent. 8 ø , 117-154, 1981.
Prucha, J. J., J. A. Graham, and R. P. Nickelson, Basement controlled deformation in Wyoming province of Rocky Mountain foreland, Am. Assoc. Pet. Geol. Bull.,49, 966-992, 1965.
Pujol, J., J-M. Chiu, R. Smalley, Jr., J. Vlasity, D. Vlasity, A. Johnston, J. Bollwerk, G. Steiner, B. Isacks, T. Cahill, M. Regnier, J-L. Chatelain, F. Bondoux, J. Castano, and N. Puebla, Joint hypocentral location of earthquakes recorded in the Andes foreland in Argentina, Eos Trans. AGU, 69, 1316, 1988,
Ramos, V. A., The tectonics of the central Andes; 30 ø to 33 ø S latitude, Spec. Pap. Geol. Soc. Am., 218, 31-54, 1988.
Ramos, V. A., T. E. Jordan, R. W. Allmendinger, C. Mpodozis, S. M. Kay, J. M. Cortes, and M. Palma, Paleozoic terranes of the central Argentine- Chilean Andes, Tectonics, 5, 855-880, 1986.
Rotstein, Y., and P. Trachtman, On the use of seismic reflection surveys from oil exploration in deep crustal studies, Phys. Earth Planet. Inter., 43, 236-243, 1986.
Salfity, J. A., and S. Gomstovich, Paleogeograffa de la cuenca del Grupo Paganzo (Paleozoico superior), Asoc. Geol. Argent. Rev., 38, 437- 453, 1983.
Shm't3r , J., R. T. Langan, D. B. Jovanovich, G. M. Jones, N. R. Hill, and T. M. Guidish, Enhanced imaging of the COCORP seismic line, Wind River Mountains, in Reflection Seismology: A Global Perspective, Geodyn. Ser. vol. 13, edited by M. Barazangi, and L. Brown, pp 223-236, AGU, Washington, D.C., 1986.
Smalley, R. F., Jr., and B. L. Isacks, A high-
resolution local network study of the Nazca Plate Wadati-Benioff zone under westem Argentina, J. Geophys. Res., 92, 13,903-13,912, 1987.
Smithson, S. B., J. A. Brewer, S. Kaufman, J. E. Oliver, and C. A. Hurich, Structure of the Laramide Wind River Uplift, Wyoming, from COCORP deep reflection data and from gravity data, J. Geophys. Res., 84, 5955-5972, 1979.
Spinelli, R. O., Edades potasio-argon de algunas rocas de la Sierra de Valle F6rtil, provincia San Juan, Asoc. Geol. Argent. Rev., 38, 405-411, 1983.
Su,4xez, G., P. Molnar, and B.C. Burchfiel, Seismicity, fault plane solutions, depth of faulting and active tectonics of the Andes of Peru, Ecuador, and southem Columbia, J. Geophys. Res., 88, 10,403-10,428, 1983.
Suppe, John, Principles of Structural Geology, Prentice-Hall, Englewood Cliffs, New Jersey, 1985.
Triep, E.G., and C. B. Cardinelli, Mecanismos de sismos en las Sierras Pampeanas occidentales, Congr. Geol. Argent. (Acta) 90, 3, 61-80, 1984.
R. Allmendinger, Department of Geological Sciences, Comell University, Ithaca, New York, 14853, USA
V. Ramos, Universidad de Buenos Aires, Buenos Aires, Argentina
D. Snyder, B.I.R.P.S., Bullard Laboratories, Depamnent of Earth Sciences, University of Cambridge, Cambridge, CB3 0EZ, England
(Received April 7, 1989; revised October 31, 1989; accepted November 10, 1989.)