Thermosolvatochromism of Merocyanine Polarity Indicators in Pure and Aqueous Solvents: Relevance of...
16
FULL PAPER DOI: 10.1002/ejoc.200700805 Thermo-Solvatochromism of Merocyanine Polarity Probes – What Are the Consequences of Increasing Probe Lipophilicity through Annelation? Clarissa T. Martins, [a] Michelle S. Lima, [a] Erick L. Bastos, [b] and Omar A. El Seoud* [a] Keywords: Solvatochromism / Thermo-solvatochromism / Merocyanine dyes / Binary solvent mixtures The question raised in the title has been answered by com- paring the solvatochromism of two series of polarity probes, the lipophilicities of which were increased either by increas- ing the length of an alkyl group (R) attached to a fixed pyr- idine-based structure or through annelation (i.e., by fusing benzene rings onto a central pyridine-based structure). The following novel solvatochromic probes were synthesized: 2,6-dibromo-4-[(E)-2-(1-methylquinolinium-4-yl)ethenyl]- phenolate (MeQMBr 2 ) and 2,6-dibromo-4-[(E)-2-(1-methyl- acridinium-4-yl)ethenyl)]phenolate (MeAMBr 2 ). The solva- tochromic behavior of these probes, along with that of 2,6- dibromo-4-[(E)-2-(1-methylpyridinium-4-yl)ethenyl]phenol- ate (MePMBr 2 ) was analyzed in terms of increasing probe lipophilicity, through annelation. Values of the empirical sol- vent polarity scale [E T (MePMBr 2 )] in kcal mol –1 correlated linearly with E T (30), the corresponding values for the exten- sively employed probe 2,6-diphenyl-4-(2,4,6-triphenylpyridi- nium-1-yl)phenolate (RB). On the other hand, the nonlinear correlations of E T (MeQMBr 2 ) or E T (MeAMBr 2 ) with E T (30) are described by second-order polynomials. Possible reasons for this behavior include: i) self-aggregation of the probe, ii) photoinduced cis/trans isomerization of the dye, and iii) probe structure- and solvent-dependent contributions of the quinonoid and zwitterionic limiting formulas to the ground and excited states of the probe. We show that mecha- nisms (i) and (ii) are not operative under the experimental conditions employed; experimental evidence (NMR) and theoretical calculations are presented to support the conjec- Introduction The study of solvatochromic substances or polarity indi- cators (hereafter referred to as “probes”) in pure liquids and binary solvent mixtures is important because: 1. the re- sults obtained shed light on the factors that affect solvation, 2. the study of thermo-solvatochromism (effect of tempera- ture on solvatochromism) can be used to calculate the en- [a] Instituto de Química, Universidade de São Paulo, C.P. 26077, 05513-970, São Paulo, S.P., Brazil Fax: +55-11-3091-3874 E-mail: [email protected] [b] Centro de Ciências Naturais e Humanas, Fundação Universid- ade Federal do ABC, 09210-170, Santo André, S.P., Brazil Supporting information for this article is available on the WWW under http://www.eurjoc.org or from the author. Eur. J. Org. Chem. 2008, 1165–1180 © 2008 Wiley-VCH Verlag GmbH & Co. KGaA, Weinheim 1165 ture that the length of the central ethenylic bond in the dye increases in the order MeAMBr 2 MeQMBr 2 MePMBr 2 . That is, the contribution of the zwitterionic limiting formula predominates for the latter probe, as is also the case for RB, this being the reason for the observed linear correlation be- tween the E T (MePMBr 2 ) and the E T (30) scales. The effect of increasing probe lipophilicity on solvatochromic behavior therefore depends on the strategy employed. Increasing the length of R affects solvatochromism much less than annel- ation, because the former structural change hardly perturbs the energy of the intramolecular charge-transfer transition responsible for solvatochromism. The thermo-solvatochromic behavior (effect of temperature on solvatochromism) of the three probes was studied in mixtures of water with propanol and/or with DMSO. The solvation model used explicitly con- siders the presence of three “species” in the system: bulk solution and probe solvation shell [namely, water (W), or- ganic solvent (Solv)], and solvent–water hydrogen-bonded aggregate (Solv-W). For aqueous propanol, the probe is ef- ficiently solvated by Solv-W; the strong interaction of DMSO with W drastically decreases the efficiency of Solv-W in sol- vating the probe, relative to its precursor solvents. Tempera- ture increases resulted in desolvation of the probes, due to the concomitant reduction in the structured characters of the components of the binary mixtures. (© Wiley-VCH Verlag GmbH & Co. KGaA, 69451 Weinheim, Germany, 2008) ergy of desolvation that occurs when the temperature is in- creased, and 3. the phenomenon involved in solvatochro- mism (excitation of the probe ground state) serves as a sim- ple model for other processes. Recent results have indicated that the molecular structure of the probe and the physicochemical properties of the sol- vent, or of the binary solvent mixture, are most relevant to solvation (see point 1. above). [1–6] Although desolvation of reactants and activated complexes contributes to tempera- ture effects on reaction rates, there is no obvious way to calculate this contribution to ∆H from the Arrhenius plot. This desolvation energy is readily calculated for the probe from its thermo-solvatochromic data (point 2.). The magni- tude of this energy is sizeable relative to the activation en- thalpies of many organic reactions (e.g., ranging from 2.1 to 3.7 kcal mol –1 over a 50 ºC range in aqueous alcohols). [4]
-
Upload
independent -
Category
Documents
-
view
1 -
download
0
Transcript of Thermosolvatochromism of Merocyanine Polarity Indicators in Pure and Aqueous Solvents: Relevance of...
FULL PAPER
DOI: 10.1002/ejoc.200700805
Thermo-Solvatochromism of Merocyanine Polarity Probes – What Are theConsequences of Increasing Probe Lipophilicity through Annelation?
Clarissa T. Martins,[a] Michelle S. Lima,[a] Erick L. Bastos,[b] and Omar A. El Seoud*[a]
Keywords: Solvatochromism / Thermo-solvatochromism / Merocyanine dyes / Binary solvent mixtures
The question raised in the title has been answered by com-paring the solvatochromism of two series of polarity probes,the lipophilicities of which were increased either by increas-ing the length of an alkyl group (R) attached to a fixed pyr-idine-based structure or through annelation (i.e., by fusingbenzene rings onto a central pyridine-based structure). Thefollowing novel solvatochromic probes were synthesized:2,6-dibromo-4-[(E)-2-(1-methylquinolinium-4-yl)ethenyl]-phenolate (MeQMBr2) and 2,6-dibromo-4-[(E)-2-(1-methyl-acridinium-4-yl)ethenyl)]phenolate (MeAMBr2). The solva-tochromic behavior of these probes, along with that of 2,6-dibromo-4-[(E)-2-(1-methylpyridinium-4-yl)ethenyl]phenol-ate (MePMBr2) was analyzed in terms of increasing probelipophilicity, through annelation. Values of the empirical sol-vent polarity scale [ET(MePMBr2)] in kcalmol–1 correlatedlinearly with ET(30), the corresponding values for the exten-sively employed probe 2,6-diphenyl-4-(2,4,6-triphenylpyridi-nium-1-yl)phenolate (RB). On the other hand, the nonlinearcorrelations of ET(MeQMBr2) or ET(MeAMBr2) with ET(30)are described by second-order polynomials. Possible reasonsfor this behavior include: i) self-aggregation of the probe,ii) photoinduced cis/trans isomerization of the dye, andiii) probe structure- and solvent-dependent contributions ofthe quinonoid and zwitterionic limiting formulas to theground and excited states of the probe. We show that mecha-nisms (i) and (ii) are not operative under the experimentalconditions employed; experimental evidence (NMR) andtheoretical calculations are presented to support the conjec-
Introduction
The study of solvatochromic substances or polarity indi-cators (hereafter referred to as “probes”) in pure liquidsand binary solvent mixtures is important because: 1. the re-sults obtained shed light on the factors that affect solvation,2. the study of thermo-solvatochromism (effect of tempera-ture on solvatochromism) can be used to calculate the en-
[a] Instituto de Química, Universidade de São Paulo,C.P. 26077, 05513-970, São Paulo, S.P., BrazilFax: +55-11-3091-3874E-mail: [email protected]
[b] Centro de Ciências Naturais e Humanas, Fundação Universid-ade Federal do ABC,09210-170, Santo André, S.P., BrazilSupporting information for this article is available on theWWW under http://www.eurjoc.org or from the author.
Eur. J. Org. Chem. 2008, 1165–1180 © 2008 Wiley-VCH Verlag GmbH & Co. KGaA, Weinheim 1165
ture that the length of the central ethenylic bond in the dyeincreases in the order MeAMBr2 � MeQMBr2 � MePMBr2.That is, the contribution of the zwitterionic limiting formulapredominates for the latter probe, as is also the case for RB,this being the reason for the observed linear correlation be-tween the ET(MePMBr2) and the ET(30) scales. The effect ofincreasing probe lipophilicity on solvatochromic behaviortherefore depends on the strategy employed. Increasing thelength of R affects solvatochromism much less than annel-ation, because the former structural change hardly perturbsthe energy of the intramolecular charge-transfer transitionresponsible for solvatochromism. The thermo-solvatochromicbehavior (effect of temperature on solvatochromism) of thethree probes was studied in mixtures of water with propanoland/or with DMSO. The solvation model used explicitly con-siders the presence of three “species” in the system: bulksolution and probe solvation shell [namely, water (W), or-ganic solvent (Solv)], and solvent–water hydrogen-bondedaggregate (Solv-W). For aqueous propanol, the probe is ef-ficiently solvated by Solv-W; the strong interaction of DMSOwith W drastically decreases the efficiency of Solv-W in sol-vating the probe, relative to its precursor solvents. Tempera-ture increases resulted in desolvation of the probes, due tothe concomitant reduction in the structured characters of thecomponents of the binary mixtures.
(© Wiley-VCH Verlag GmbH & Co. KGaA, 69451 Weinheim,Germany, 2008)
ergy of desolvation that occurs when the temperature is in-creased, and 3. the phenomenon involved in solvatochro-mism (excitation of the probe ground state) serves as a sim-ple model for other processes.
Recent results have indicated that the molecular structureof the probe and the physicochemical properties of the sol-vent, or of the binary solvent mixture, are most relevant tosolvation (see point 1. above).[1–6] Although desolvation ofreactants and activated complexes contributes to tempera-ture effects on reaction rates, there is no obvious way tocalculate this contribution to ∆H� from the Arrhenius plot.This desolvation energy is readily calculated for the probefrom its thermo-solvatochromic data (point 2.). The magni-tude of this energy is sizeable relative to the activation en-thalpies of many organic reactions (e.g., ranging from 2.1to 3.7 kcalmol–1 over a 50 ºC range in aqueous alcohols).[4]
C. T. Martins, M. S. Lima, E. L. Bastos, O. A. El Seoud,FULL PAPERExamples of point 3. include the almost identical responsesof the rate constants of pH-independent hydrolyses of acti-vated esters (carbonate, chloroformate, and perfluorobuty-rate) and of solvatochromic probes to the compositions ofbinary solvent mixtures.[7,8] More recently, probes of dif-ferent lipophilicities have successfully been employed to ex-plain the phenomenon of “gelation” of lysozyme solutionsin water/tetramethylurea mixtures. Briefly, the enzyme ispreferentially solvated by the organic component of the bi-nary mixture; the biomacromolecule/solvent hydrophobicinteractions play an important role in the gelation phenom-enon.[9] These similar responses to solvent compositions areremarkable because of their distinct origins: attack of wateron an acyl group, disruption of the native conformation ofan enzyme, and excitation of a ground state of a probe,respectively.
Information is obtained from solvatochromic studies byexamining the dependence of an empirical solvent polarityscale [ET(probe)] defined by Equation (1) on some experi-mental variable.
ET(probe) [kcal mol–1] = 28591.5/λmax [nm] (1)
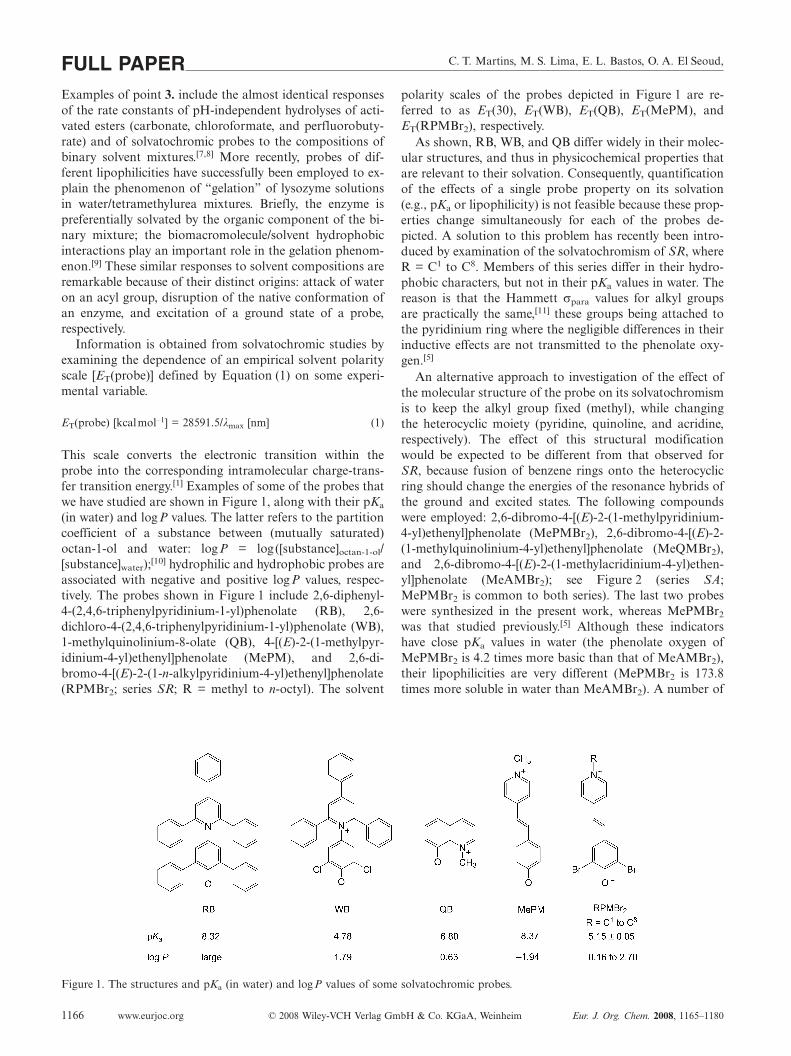
This scale converts the electronic transition within theprobe into the corresponding intramolecular charge-trans-fer transition energy.[1] Examples of some of the probes thatwe have studied are shown in Figure 1, along with their pKa
(in water) and logP values. The latter refers to the partitioncoefficient of a substance between (mutually saturated)octan-1-ol and water: logP = log([substance]octan-1-ol/[substance]water);[10] hydrophilic and hydrophobic probes areassociated with negative and positive logP values, respec-tively. The probes shown in Figure 1 include 2,6-diphenyl-4-(2,4,6-triphenylpyridinium-1-yl)phenolate (RB), 2,6-dichloro-4-(2,4,6-triphenylpyridinium-1-yl)phenolate (WB),1-methylquinolinium-8-olate (QB), 4-[(E)-2-(1-methylpyr-idinium-4-yl)ethenyl]phenolate (MePM), and 2,6-di-bromo-4-[(E)-2-(1-n-alkylpyridinium-4-yl)ethenyl]phenolate(RPMBr2; series SR; R = methyl to n-octyl). The solvent
Figure 1. The structures and pKa (in water) and logP values of some solvatochromic probes.
www.eurjoc.org © 2008 Wiley-VCH Verlag GmbH & Co. KGaA, Weinheim Eur. J. Org. Chem. 2008, 1165–11801166
polarity scales of the probes depicted in Figure 1 are re-ferred to as ET(30), ET(WB), ET(QB), ET(MePM), andET(RPMBr2), respectively.
As shown, RB, WB, and QB differ widely in their molec-ular structures, and thus in physicochemical properties thatare relevant to their solvation. Consequently, quantificationof the effects of a single probe property on its solvation(e.g., pKa or lipophilicity) is not feasible because these prop-erties change simultaneously for each of the probes de-picted. A solution to this problem has recently been intro-duced by examination of the solvatochromism of SR, whereR = C1 to C8. Members of this series differ in their hydro-phobic characters, but not in their pKa values in water. Thereason is that the Hammett σpara values for alkyl groupsare practically the same,[11] these groups being attached tothe pyridinium ring where the negligible differences in theirinductive effects are not transmitted to the phenolate oxy-gen.[5]
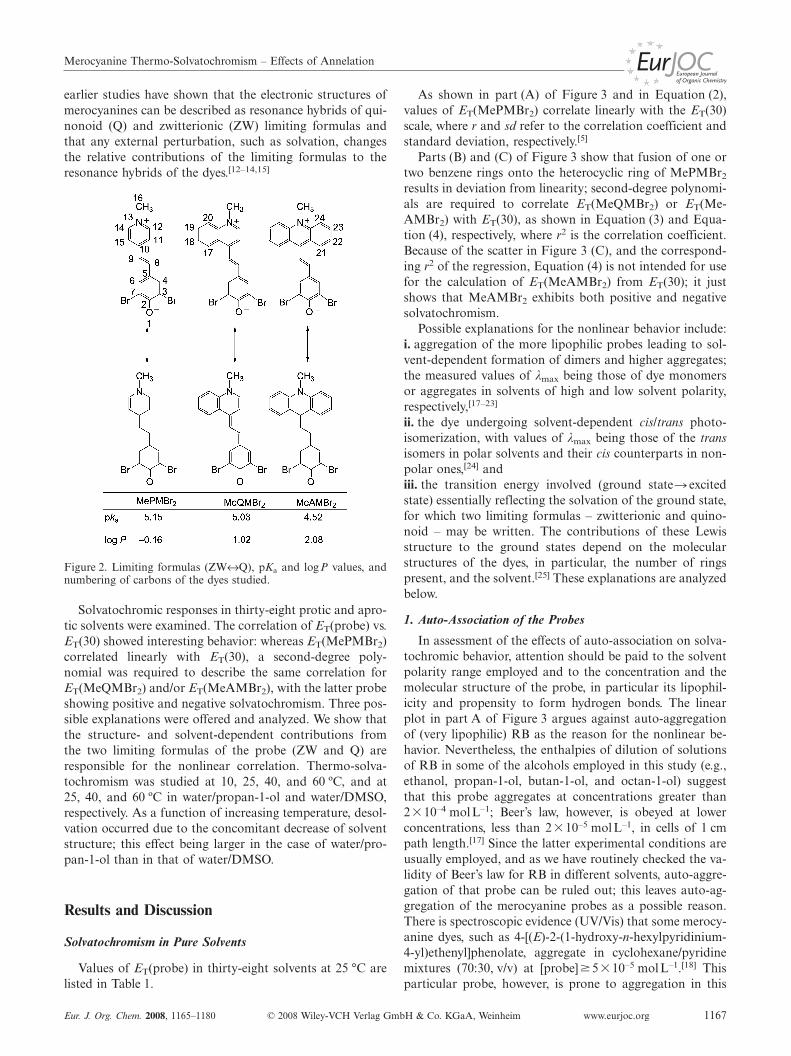
An alternative approach to investigation of the effect ofthe molecular structure of the probe on its solvatochromismis to keep the alkyl group fixed (methyl), while changingthe heterocyclic moiety (pyridine, quinoline, and acridine,respectively). The effect of this structural modificationwould be expected to be different from that observed forSR, because fusion of benzene rings onto the heterocyclicring should change the energies of the resonance hybrids ofthe ground and excited states. The following compoundswere employed: 2,6-dibromo-4-[(E)-2-(1-methylpyridinium-4-yl)ethenyl]phenolate (MePMBr2), 2,6-dibromo-4-[(E)-2-(1-methylquinolinium-4-yl)ethenyl]phenolate (MeQMBr2),and 2,6-dibromo-4-[(E)-2-(1-methylacridinium-4-yl)ethen-yl]phenolate (MeAMBr2); see Figure 2 (series SA;MePMBr2 is common to both series). The last two probeswere synthesized in the present work, whereas MePMBr2
was that studied previously.[5] Although these indicatorshave close pKa values in water (the phenolate oxygen ofMePMBr2 is 4.2 times more basic than that of MeAMBr2),their lipophilicities are very different (MePMBr2 is 173.8times more soluble in water than MeAMBr2). A number of
Merocyanine Thermo-Solvatochromism – Effects of Annelation
earlier studies have shown that the electronic structures ofmerocyanines can be described as resonance hybrids of qui-nonoid (Q) and zwitterionic (ZW) limiting formulas andthat any external perturbation, such as solvation, changesthe relative contributions of the limiting formulas to theresonance hybrids of the dyes.[12–14,15]
Figure 2. Limiting formulas (ZW↔Q), pKa and log P values, andnumbering of carbons of the dyes studied.
Solvatochromic responses in thirty-eight protic and apro-tic solvents were examined. The correlation of ET(probe) vs.ET(30) showed interesting behavior: whereas ET(MePMBr2)correlated linearly with ET(30), a second-degree poly-nomial was required to describe the same correlation forET(MeQMBr2) and/or ET(MeAMBr2), with the latter probeshowing positive and negative solvatochromism. Three pos-sible explanations were offered and analyzed. We show thatthe structure- and solvent-dependent contributions fromthe two limiting formulas of the probe (ZW and Q) areresponsible for the nonlinear correlation. Thermo-solva-tochromism was studied at 10, 25, 40, and 60 ºC, and at25, 40, and 60 ºC in water/propan-1-ol and water/DMSO,respectively. As a function of increasing temperature, desol-vation occurred due to the concomitant decrease of solventstructure; this effect being larger in the case of water/pro-pan-1-ol than in that of water/DMSO.
Results and Discussion
Solvatochromism in Pure Solvents
Values of ET(probe) in thirty-eight solvents at 25 °C arelisted in Table 1.
Eur. J. Org. Chem. 2008, 1165–1180 © 2008 Wiley-VCH Verlag GmbH & Co. KGaA, Weinheim www.eurjoc.org 1167
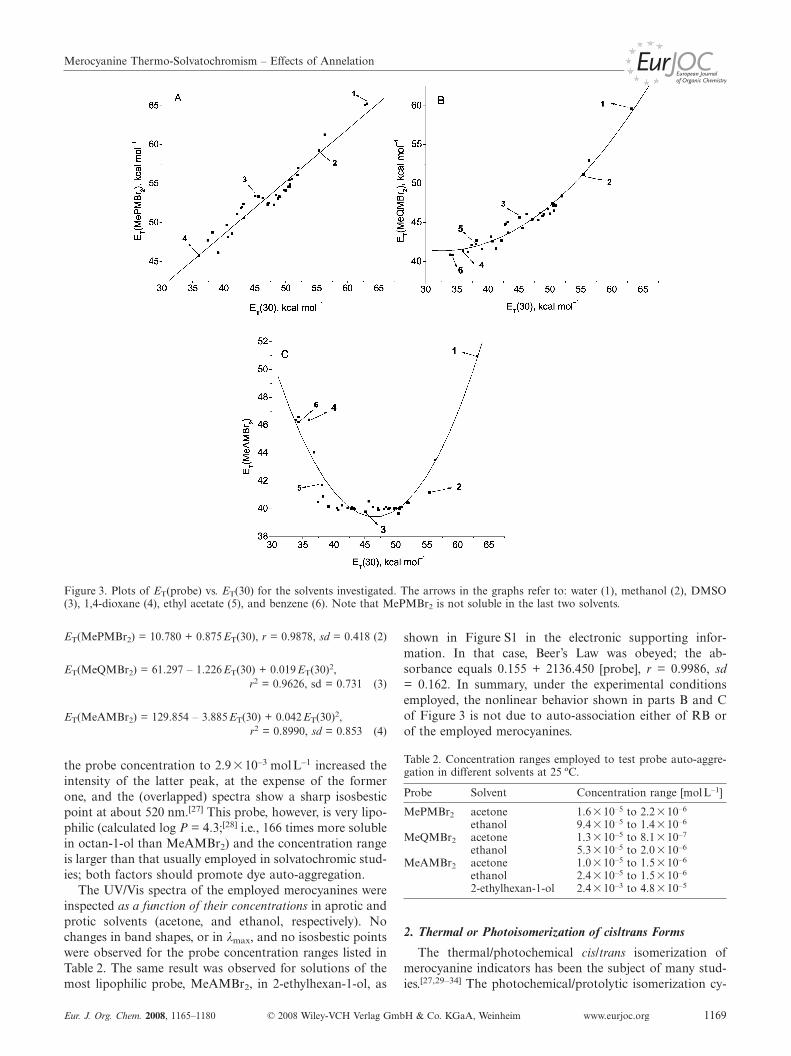
As shown in part (A) of Figure 3 and in Equation (2),values of ET(MePMBr2) correlate linearly with the ET(30)scale, where r and sd refer to the correlation coefficient andstandard deviation, respectively.[5]
Parts (B) and (C) of Figure 3 show that fusion of one ortwo benzene rings onto the heterocyclic ring of MePMBr2
results in deviation from linearity; second-degree polynomi-als are required to correlate ET(MeQMBr2) or ET(Me-AMBr2) with ET(30), as shown in Equation (3) and Equa-tion (4), respectively, where r2 is the correlation coefficient.Because of the scatter in Figure 3 (C), and the correspond-ing r2 of the regression, Equation (4) is not intended for usefor the calculation of ET(MeAMBr2) from ET(30); it justshows that MeAMBr2 exhibits both positive and negativesolvatochromism.
Possible explanations for the nonlinear behavior include:i. aggregation of the more lipophilic probes leading to sol-vent-dependent formation of dimers and higher aggregates;the measured values of λmax being those of dye monomersor aggregates in solvents of high and low solvent polarity,respectively,[17–23]
ii. the dye undergoing solvent-dependent cis/trans photo-isomerization, with values of λmax being those of the transisomers in polar solvents and their cis counterparts in non-polar ones,[24] andiii. the transition energy involved (ground state�excitedstate) essentially reflecting the solvation of the ground state,for which two limiting formulas – zwitterionic and quino-noid – may be written. The contributions of these Lewisstructure to the ground states depend on the molecularstructures of the dyes, in particular, the number of ringspresent, and the solvent.[25] These explanations are analyzedbelow.
1. Auto-Association of the Probes
In assessment of the effects of auto-association on solva-tochromic behavior, attention should be paid to the solventpolarity range employed and to the concentration and themolecular structure of the probe, in particular its lipophil-icity and propensity to form hydrogen bonds. The linearplot in part A of Figure 3 argues against auto-aggregationof (very lipophilic) RB as the reason for the nonlinear be-havior. Nevertheless, the enthalpies of dilution of solutionsof RB in some of the alcohols employed in this study (e.g.,ethanol, propan-1-ol, butan-1-ol, and octan-1-ol) suggestthat this probe aggregates at concentrations greater than2�10–4 molL–1; Beer’s law, however, is obeyed at lowerconcentrations, less than 2�10–5 molL–1, in cells of 1 cmpath length.[17] Since the latter experimental conditions areusually employed, and as we have routinely checked the va-lidity of Beer’s law for RB in different solvents, auto-aggre-gation of that probe can be ruled out; this leaves auto-ag-gregation of the merocyanine probes as a possible reason.There is spectroscopic evidence (UV/Vis) that some merocy-anine dyes, such as 4-[(E)-2-(1-hydroxy-n-hexylpyridinium-4-yl)ethenyl]phenolate, aggregate in cyclohexane/pyridinemixtures (70:30, v/v) at [probe]�5�10–5 molL–1.[18] Thisparticular probe, however, is prone to aggregation in this
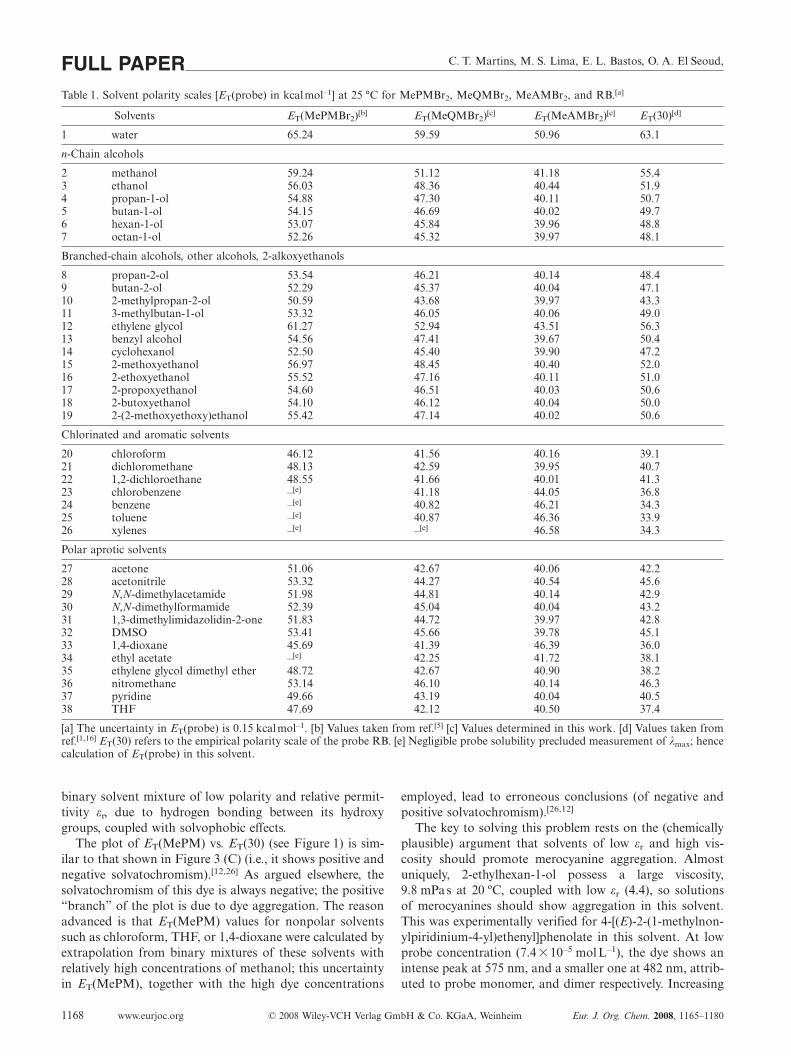
C. T. Martins, M. S. Lima, E. L. Bastos, O. A. El Seoud,FULL PAPERTable 1. Solvent polarity scales [ET(probe) in kcalmol–1] at 25 °C for MePMBr2, MeQMBr2, MeAMBr2, and RB.[a]
Solvents ET(MePMBr2)[b] ET(MeQMBr2)[c] ET(MeAMBr2)[c] ET(30)[d]
1 water 65.24 59.59 50.96 63.1
n-Chain alcohols
2 methanol 59.24 51.12 41.18 55.43 ethanol 56.03 48.36 40.44 51.94 propan-1-ol 54.88 47.30 40.11 50.75 butan-1-ol 54.15 46.69 40.02 49.76 hexan-1-ol 53.07 45.84 39.96 48.87 octan-1-ol 52.26 45.32 39.97 48.1
Branched-chain alcohols, other alcohols, 2-alkoxyethanols
8 propan-2-ol 53.54 46.21 40.14 48.49 butan-2-ol 52.29 45.37 40.04 47.110 2-methylpropan-2-ol 50.59 43.68 39.97 43.311 3-methylbutan-1-ol 53.32 46.05 40.06 49.012 ethylene glycol 61.27 52.94 43.51 56.313 benzyl alcohol 54.56 47.41 39.67 50.414 cyclohexanol 52.50 45.40 39.90 47.215 2-methoxyethanol 56.97 48.45 40.40 52.016 2-ethoxyethanol 55.52 47.16 40.11 51.017 2-propoxyethanol 54.60 46.51 40.03 50.618 2-butoxyethanol 54.10 46.12 40.04 50.019 2-(2-methoxyethoxy)ethanol 55.42 47.14 40.02 50.6
Chlorinated and aromatic solvents
20 chloroform 46.12 41.56 40.16 39.121 dichloromethane 48.13 42.59 39.95 40.722 1,2-dichloroethane 48.55 41.66 40.01 41.323 chlorobenzene –[e] 41.18 44.05 36.824 benzene –[e] 40.82 46.21 34.325 toluene –[e] 40.87 46.36 33.926 xylenes –[e] –[e] 46.58 34.3
Polar aprotic solvents
27 acetone 51.06 42.67 40.06 42.228 acetonitrile 53.32 44.27 40.54 45.629 N,N-dimethylacetamide 51.98 44.81 40.14 42.930 N,N-dimethylformamide 52.39 45.04 40.04 43.231 1,3-dimethylimidazolidin-2-one 51.83 44.72 39.97 42.832 DMSO 53.41 45.66 39.78 45.133 1,4-dioxane 45.69 41.39 46.39 36.034 ethyl acetate –[e] 42.25 41.72 38.135 ethylene glycol dimethyl ether 48.72 42.67 40.90 38.236 nitromethane 53.14 46.10 40.14 46.337 pyridine 49.66 43.19 40.04 40.538 THF 47.69 42.12 40.50 37.4
[a] The uncertainty in ET(probe) is 0.15 kcalmol–1. [b] Values taken from ref.[5] [c] Values determined in this work. [d] Values taken fromref.[1,16] ET(30) refers to the empirical polarity scale of the probe RB. [e] Negligible probe solubility precluded measurement of λmax; hencecalculation of ET(probe) in this solvent.
binary solvent mixture of low polarity and relative permit-tivity εr, due to hydrogen bonding between its hydroxygroups, coupled with solvophobic effects.
The plot of ET(MePM) vs. ET(30) (see Figure 1) is sim-ilar to that shown in Figure 3 (C) (i.e., it shows positive andnegative solvatochromism).[12,26] As argued elsewhere, thesolvatochromism of this dye is always negative; the positive“branch” of the plot is due to dye aggregation. The reasonadvanced is that ET(MePM) values for nonpolar solventssuch as chloroform, THF, or 1,4-dioxane were calculated byextrapolation from binary mixtures of these solvents withrelatively high concentrations of methanol; this uncertaintyin ET(MePM), together with the high dye concentrations
www.eurjoc.org © 2008 Wiley-VCH Verlag GmbH & Co. KGaA, Weinheim Eur. J. Org. Chem. 2008, 1165–11801168
employed, lead to erroneous conclusions (of negative andpositive solvatochromism).[26,12]
The key to solving this problem rests on the (chemicallyplausible) argument that solvents of low εr and high vis-cosity should promote merocyanine aggregation. Almostuniquely, 2-ethylhexan-1-ol possess a large viscosity,9.8 mPas at 20 ºC, coupled with low εr (4.4), so solutionsof merocyanines should show aggregation in this solvent.This was experimentally verified for 4-[(E)-2-(1-methylnon-ylpiridinium-4-yl)ethenyl]phenolate in this solvent. At lowprobe concentration (7.4�10–5 molL–1), the dye shows anintense peak at 575 nm, and a smaller one at 482 nm, attrib-uted to probe monomer, and dimer respectively. Increasing
Merocyanine Thermo-Solvatochromism – Effects of Annelation
Figure 3. Plots of ET(probe) vs. ET(30) for the solvents investigated. The arrows in the graphs refer to: water (1), methanol (2), DMSO(3), 1,4-dioxane (4), ethyl acetate (5), and benzene (6). Note that MePMBr2 is not soluble in the last two solvents.
ET(MePMBr2) = 10.780 + 0.875ET(30), r = 0.9878, sd = 0.418 (2)
ET(MeQMBr2) = 61.297 – 1.226ET(30) + 0.019ET(30)2,r2 = 0.9626, sd = 0.731 (3)
ET(MeAMBr2) = 129.854 – 3.885ET(30) + 0.042ET(30)2,r2 = 0.8990, sd = 0.853 (4)
the probe concentration to 2.9�10–3 molL–1 increased theintensity of the latter peak, at the expense of the formerone, and the (overlapped) spectra show a sharp isosbesticpoint at about 520 nm.[27] This probe, however, is very lipo-philic (calculated log P = 4.3;[28] i.e., 166 times more solublein octan-1-ol than MeAMBr2) and the concentration rangeis larger than that usually employed in solvatochromic stud-ies; both factors should promote dye auto-aggregation.
The UV/Vis spectra of the employed merocyanines wereinspected as a function of their concentrations in aprotic andprotic solvents (acetone, and ethanol, respectively). Nochanges in band shapes, or in λmax, and no isosbestic pointswere observed for the probe concentration ranges listed inTable 2. The same result was observed for solutions of themost lipophilic probe, MeAMBr2, in 2-ethylhexan-1-ol, as
Eur. J. Org. Chem. 2008, 1165–1180 © 2008 Wiley-VCH Verlag GmbH & Co. KGaA, Weinheim www.eurjoc.org 1169
shown in Figure S1 in the electronic supporting infor-mation. In that case, Beer’s Law was obeyed; the ab-sorbance equals 0.155 + 2136.450 [probe], r = 0.9986, sd= 0.162. In summary, under the experimental conditionsemployed, the nonlinear behavior shown in parts B and Cof Figure 3 is not due to auto-association either of RB orof the employed merocyanines.
Table 2. Concentration ranges employed to test probe auto-aggre-gation in different solvents at 25 ºC.
Probe Solvent Concentration range [molL–1]
MePMBr2 acetone 1.6�10–5 to 2.2�10–6
ethanol 9.4�10–5 to 1.4�10–6
MeQMBr2 acetone 1.3�10–5 to 8.1�10–7
ethanol 5.3�10–5 to 2.0�10–6
MeAMBr2 acetone 1.0�10–5 to 1.5�10–6
ethanol 2.4�10–5 to 1.5�10–6
2-ethylhexan-1-ol 2.4�10–3 to 4.8�10–5
2. Thermal or Photoisomerization of cis/trans Forms
The thermal/photochemical cis/trans isomerization ofmerocyanine indicators has been the subject of many stud-ies.[27,29–34] The photochemical/protolytic isomerization cy-
C. T. Martins, M. S. Lima, E. L. Bastos, O. A. El Seoud,FULL PAPER
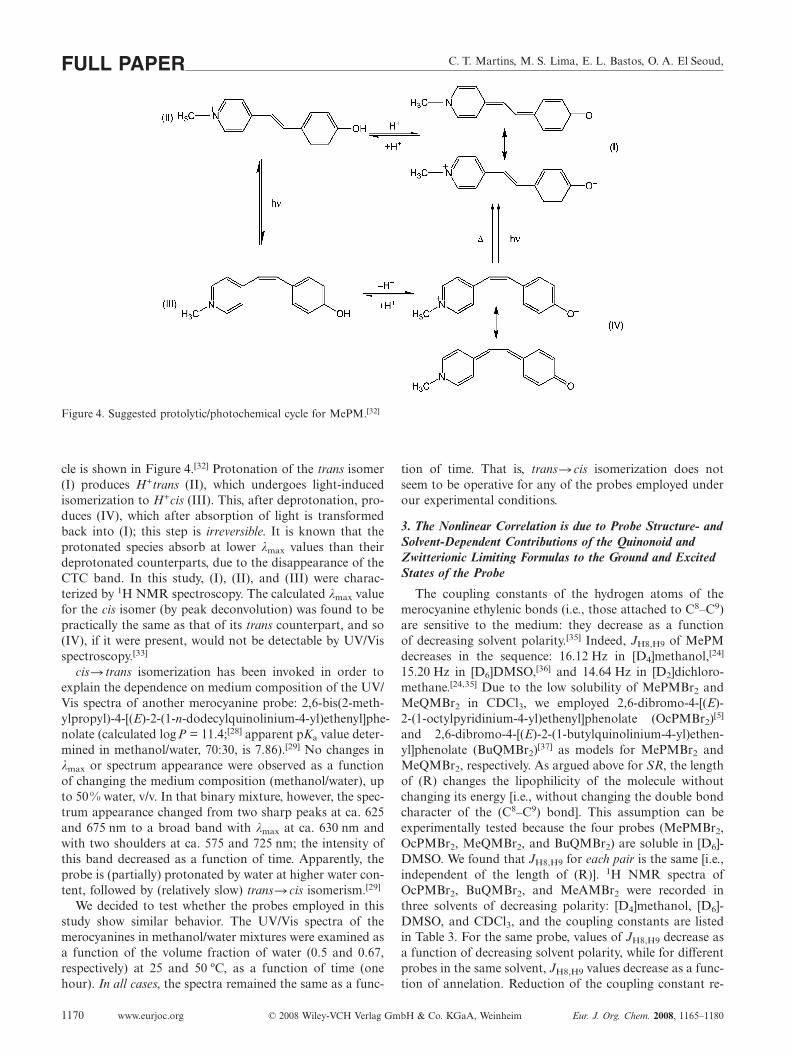
Figure 4. Suggested protolytic/photochemical cycle for MePM.[32]
cle is shown in Figure 4.[32] Protonation of the trans isomer(I) produces H+trans (II), which undergoes light-inducedisomerization to H+cis (III). This, after deprotonation, pro-duces (IV), which after absorption of light is transformedback into (I); this step is irreversible. It is known that theprotonated species absorb at lower λmax values than theirdeprotonated counterparts, due to the disappearance of theCTC band. In this study, (I), (II), and (III) were charac-terized by 1H NMR spectroscopy. The calculated λmax valuefor the cis isomer (by peak deconvolution) was found to bepractically the same as that of its trans counterpart, and so(IV), if it were present, would not be detectable by UV/Visspectroscopy.[33]
cis� trans isomerization has been invoked in order toexplain the dependence on medium composition of the UV/Vis spectra of another merocyanine probe: 2,6-bis(2-meth-ylpropyl)-4-[(E)-2-(1-n-dodecylquinolinium-4-yl)ethenyl]phe-nolate (calculated logP = 11.4;[28] apparent pKa value deter-mined in methanol/water, 70:30, is 7.86).[29] No changes inλmax or spectrum appearance were observed as a functionof changing the medium composition (methanol/water), upto 50% water, v/v. In that binary mixture, however, the spec-trum appearance changed from two sharp peaks at ca. 625and 675 nm to a broad band with λmax at ca. 630 nm andwith two shoulders at ca. 575 and 725 nm; the intensity ofthis band decreased as a function of time. Apparently, theprobe is (partially) protonated by water at higher water con-tent, followed by (relatively slow) trans�cis isomerism.[29]
We decided to test whether the probes employed in thisstudy show similar behavior. The UV/Vis spectra of themerocyanines in methanol/water mixtures were examined asa function of the volume fraction of water (0.5 and 0.67,respectively) at 25 and 50 ºC, as a function of time (onehour). In all cases, the spectra remained the same as a func-
www.eurjoc.org © 2008 Wiley-VCH Verlag GmbH & Co. KGaA, Weinheim Eur. J. Org. Chem. 2008, 1165–11801170
tion of time. That is, trans�cis isomerization does notseem to be operative for any of the probes employed underour experimental conditions.
3. The Nonlinear Correlation is due to Probe Structure- andSolvent-Dependent Contributions of the Quinonoid andZwitterionic Limiting Formulas to the Ground and ExcitedStates of the Probe
The coupling constants of the hydrogen atoms of themerocyanine ethylenic bonds (i.e., those attached to C8–C9)are sensitive to the medium: they decrease as a functionof decreasing solvent polarity.[35] Indeed, JH8,H9 of MePMdecreases in the sequence: 16.12 Hz in [D4]methanol,[24]
15.20 Hz in [D6]DMSO,[36] and 14.64 Hz in [D2]dichloro-methane.[24,35] Due to the low solubility of MePMBr2 andMeQMBr2 in CDCl3, we employed 2,6-dibromo-4-[(E)-2-(1-octylpyridinium-4-yl)ethenyl]phenolate (OcPMBr2)[5]
and 2,6-dibromo-4-[(E)-2-(1-butylquinolinium-4-yl)ethen-yl]phenolate (BuQMBr2)[37] as models for MePMBr2 andMeQMBr2, respectively. As argued above for SR, the lengthof (R) changes the lipophilicity of the molecule withoutchanging its energy [i.e., without changing the double bondcharacter of the (C8–C9) bond]. This assumption can beexperimentally tested because the four probes (MePMBr2,OcPMBr2, MeQMBr2, and BuQMBr2) are soluble in [D6]-DMSO. We found that JH8,H9 for each pair is the same [i.e.,independent of the length of (R)]. 1H NMR spectra ofOcPMBr2, BuQMBr2, and MeAMBr2 were recorded inthree solvents of decreasing polarity: [D4]methanol, [D6]-DMSO, and CDCl3, and the coupling constants are listedin Table 3. For the same probe, values of JH8,H9 decrease asa function of decreasing solvent polarity, while for differentprobes in the same solvent, JH8,H9 values decrease as a func-tion of annelation. Reduction of the coupling constant re-
Merocyanine Thermo-Solvatochromism – Effects of Annelation
flects a concomitant reduction in the double bond characterof (C8–C9). In other words, the zwitterionic character ofthe molecule is reduced as a function of decreasing solventpolarity, and of increasing numbers of benzene rings pres-ent.
Table 3. 1H NMR coupling constants (J [Hz]) of the central C8–C9
bonds of the probes OcPMBr2, BuQMBr2, and MeAMBr2.
Coupling constant, JH8,H9 [Hz]Probe/solvent CDCl3 [D6]DMSO [D4]Methanol
OcPMBr2 15.0 15.8 15.9BuQMBr2 13.9 15.0 15.5MeAMBr2 13.2 13.8 15.0
In conclusion, the nonlinear behavior observed inparts (B) and (C) of Figure 3 is not due to aggregation ofany of the probes, cannot be traced to photoinducedtrans/cis isomerization of the conjugate acids, and is consis-tent with the dependence of JH8,H9 on the molecular struc-ture of the probe and the polarity of the solvent. This de-pendence is due to variable, probe structure- and solvent-dependent contributions of the two limiting formulas (zwit-terionic and quinonoid) to the ground and excited states ofthe probe.
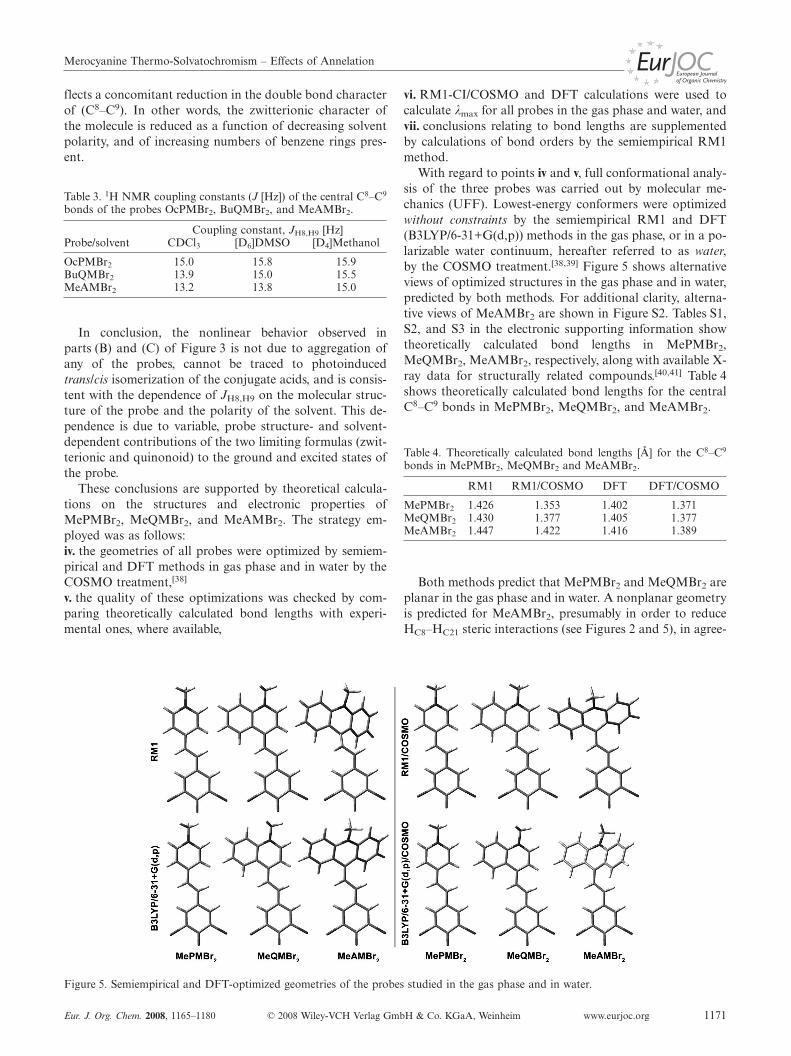
These conclusions are supported by theoretical calcula-tions on the structures and electronic properties ofMePMBr2, MeQMBr2, and MeAMBr2. The strategy em-ployed was as follows:iv. the geometries of all probes were optimized by semiem-pirical and DFT methods in gas phase and in water by theCOSMO treatment,[38]
v. the quality of these optimizations was checked by com-paring theoretically calculated bond lengths with experi-mental ones, where available,
Figure 5. Semiempirical and DFT-optimized geometries of the probes studied in the gas phase and in water.
Eur. J. Org. Chem. 2008, 1165–1180 © 2008 Wiley-VCH Verlag GmbH & Co. KGaA, Weinheim www.eurjoc.org 1171
vi. RM1-CI/COSMO and DFT calculations were used tocalculate λmax for all probes in the gas phase and water, andvii. conclusions relating to bond lengths are supplementedby calculations of bond orders by the semiempirical RM1method.
With regard to points iv and v, full conformational analy-sis of the three probes was carried out by molecular me-chanics (UFF). Lowest-energy conformers were optimizedwithout constraints by the semiempirical RM1 and DFT(B3LYP/6-31+G(d,p)) methods in the gas phase, or in a po-larizable water continuum, hereafter referred to as water,by the COSMO treatment.[38,39] Figure 5 shows alternativeviews of optimized structures in the gas phase and in water,predicted by both methods. For additional clarity, alterna-tive views of MeAMBr2 are shown in Figure S2. Tables S1,S2, and S3 in the electronic supporting information showtheoretically calculated bond lengths in MePMBr2,MeQMBr2, MeAMBr2, respectively, along with available X-ray data for structurally related compounds.[40,41] Table 4shows theoretically calculated bond lengths for the centralC8–C9 bonds in MePMBr2, MeQMBr2, and MeAMBr2.
Table 4. Theoretically calculated bond lengths [Å] for the C8–C9
bonds in MePMBr2, MeQMBr2 and MeAMBr2.
RM1 RM1/COSMO DFT DFT/COSMO
MePMBr2 1.426 1.353 1.402 1.371MeQMBr2 1.430 1.377 1.405 1.377MeAMBr2 1.447 1.422 1.416 1.389
Both methods predict that MePMBr2 and MeQMBr2 areplanar in the gas phase and in water. A nonplanar geometryis predicted for MeAMBr2, presumably in order to reduceHC8–HC21 steric interactions (see Figures 2 and 5), in agree-
C. T. Martins, M. S. Lima, E. L. Bastos, O. A. El Seoud,FULL PAPERment with X-ray data for Me2ASO4.[41] The use of the Cs
symmetry point group imposes planarity on the acridiniummoiety of MeAMBr2. We have also imposed this constraintand repeated the calculation by RM1/COSMO; the energycalculated was found to be 9.2 kJmol–1 higher than thatpreviously calculated (no symmetry constraint, Figure S3).
A comparison of theoretically calculated bond lengthswith X-ray-based ones corroborates the correctness of theapproach employed. First let us consider MePMBr2 and itsprecursor MePM. The two bromine atoms in the ortho posi-tions in the phenolate moiety of the former probe shouldaffect the O1–C2 (ipso) bond length significantly. Therefore,it is legitimate to exclude the data relating to this bond fromregression analysis. As shown from the r values in Table S1,the correlation is poor for gas-phase data (r�0.67), but isgood for optimization in water (r�0.94), with both meth-ods (RM1 and DFT) giving compatible results. Note thatMePM·3H2O crystals were employed in the X-ray measure-ments;[40] this may have contributed to the agreement be-tween data calculated for a compound in water (MePMBr2)and those for a crystal (MePM).
To the best of our knowledge, there are no crystallo-graphic data for any acridine-based merocyanine. Thereforewe compared theoretically calculated bonds for the acridin-ium moiety of MeAMBr2 and the corresponding X-ray-based ones for Me2AcSO4; the atom numbering of the lattercompound is the same as that employed for the acridiniummoiety of MeAMBr2 (Figure 2). For the latter probe, ex-clusion of the data for C10–C11 and C10–C15 led to excellentcorrelations, even for the DFT-based data in the gas phase(Table S3).
Calculated wavelengths (λmaxcalc ) in the gas phase and in
water (see viii. below) were obtained by performing single-point energy calculations on DFT-optimized geometries ofthe three probes employed; adiabatic approximation to thetime-dependent density functional theory (TDDFT), or themulti-electron configuration interaction (MECI) were em-
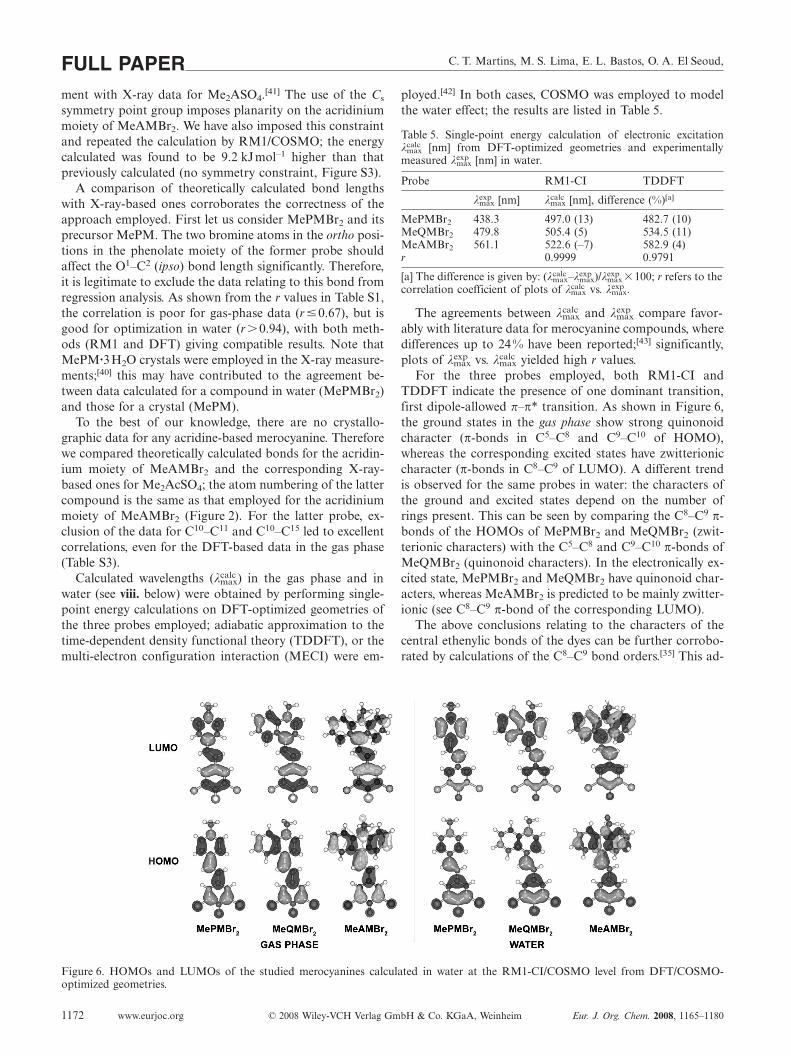
Figure 6. HOMOs and LUMOs of the studied merocyanines calculated in water at the RM1-CI/COSMO level from DFT/COSMO-optimized geometries.
www.eurjoc.org © 2008 Wiley-VCH Verlag GmbH & Co. KGaA, Weinheim Eur. J. Org. Chem. 2008, 1165–11801172
ployed.[42] In both cases, COSMO was employed to modelthe water effect; the results are listed in Table 5.
Table 5. Single-point energy calculation of electronic excitationλmax
calc [nm] from DFT-optimized geometries and experimentallymeasured λmax
exp [nm] in water.
Probe RM1-CI TDDFT
λmaxexp [nm] λmax
calc [nm], difference (%)[a]
MePMBr2 438.3 497.0 (13) 482.7 (10)MeQMBr2 479.8 505.4 (5) 534.5 (11)MeAMBr2 561.1 522.6 (–7) 582.9 (4)r 0.9999 0.9791
[a] The difference is given by: (λmaxcalc –λmax
exp )/λmaxexp �100; r refers to the
correlation coefficient of plots of λmaxcalc vs. λmax
exp .
The agreements between λmaxcalc and λmax
exp compare favor-ably with literature data for merocyanine compounds, wheredifferences up to 24% have been reported;[43] significantly,plots of λmax
exp vs. λmaxcalc yielded high r values.
For the three probes employed, both RM1-CI andTDDFT indicate the presence of one dominant transition,first dipole-allowed π–π* transition. As shown in Figure 6,the ground states in the gas phase show strong quinonoidcharacter (π-bonds in C5–C8 and C9–C10 of HOMO),whereas the corresponding excited states have zwitterioniccharacter (π-bonds in C8–C9 of LUMO). A different trendis observed for the same probes in water: the characters ofthe ground and excited states depend on the number ofrings present. This can be seen by comparing the C8–C9 π-bonds of the HOMOs of MePMBr2 and MeQMBr2 (zwit-terionic characters) with the C5–C8 and C9–C10 π-bonds ofMeQMBr2 (quinonoid characters). In the electronically ex-cited state, MePMBr2 and MeQMBr2 have quinonoid char-acters, whereas MeAMBr2 is predicted to be mainly zwitter-ionic (see C8–C9 π-bond of the corresponding LUMO).
The above conclusions relating to the characters of thecentral ethenylic bonds of the dyes can be further corrobo-rated by calculations of the C8–C9 bond orders.[35] This ad-
Merocyanine Thermo-Solvatochromism – Effects of Annelation
ditional calculation is important because interpretation ofthe results (in terms of bond character) does not requireadditional information, such as (unavailable) X-ray data fora model for MeQMBr2. Bond orders both in the gas phaseand in water were calculated by single-point calculations inthe ground states (S0, RM1) and the first electronic excitedstates (S1, RM1-CI) from DFT-optimized geometries.[35]
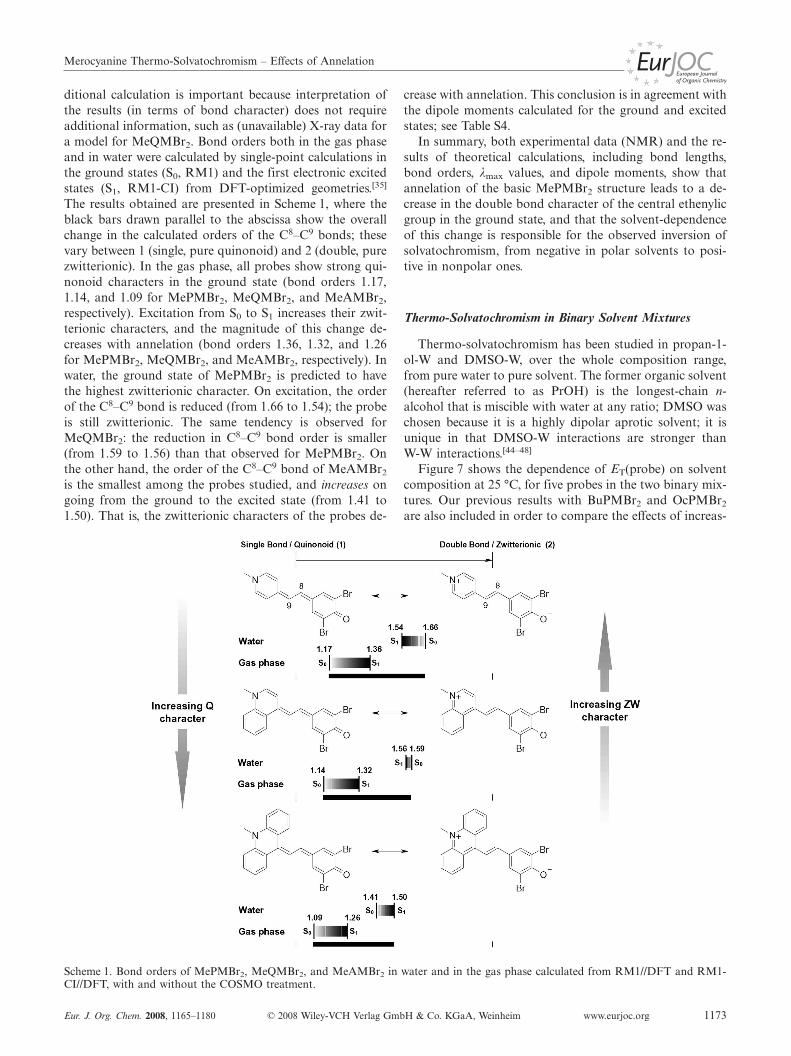
The results obtained are presented in Scheme 1, where theblack bars drawn parallel to the abscissa show the overallchange in the calculated orders of the C8–C9 bonds; thesevary between 1 (single, pure quinonoid) and 2 (double, purezwitterionic). In the gas phase, all probes show strong qui-nonoid characters in the ground state (bond orders 1.17,1.14, and 1.09 for MePMBr2, MeQMBr2, and MeAMBr2,respectively). Excitation from S0 to S1 increases their zwit-terionic characters, and the magnitude of this change de-creases with annelation (bond orders 1.36, 1.32, and 1.26for MePMBr2, MeQMBr2, and MeAMBr2, respectively). Inwater, the ground state of MePMBr2 is predicted to havethe highest zwitterionic character. On excitation, the orderof the C8–C9 bond is reduced (from 1.66 to 1.54); the probeis still zwitterionic. The same tendency is observed forMeQMBr2: the reduction in C8–C9 bond order is smaller(from 1.59 to 1.56) than that observed for MePMBr2. Onthe other hand, the order of the C8–C9 bond of MeAMBr2
is the smallest among the probes studied, and increases ongoing from the ground to the excited state (from 1.41 to1.50). That is, the zwitterionic characters of the probes de-
Scheme 1. Bond orders of MePMBr2, MeQMBr2, and MeAMBr2 in water and in the gas phase calculated from RM1//DFT and RM1-CI//DFT, with and without the COSMO treatment.
Eur. J. Org. Chem. 2008, 1165–1180 © 2008 Wiley-VCH Verlag GmbH & Co. KGaA, Weinheim www.eurjoc.org 1173
crease with annelation. This conclusion is in agreement withthe dipole moments calculated for the ground and excitedstates; see Table S4.
In summary, both experimental data (NMR) and the re-sults of theoretical calculations, including bond lengths,bond orders, λmax values, and dipole moments, show thatannelation of the basic MePMBr2 structure leads to a de-crease in the double bond character of the central ethenylicgroup in the ground state, and that the solvent-dependenceof this change is responsible for the observed inversion ofsolvatochromism, from negative in polar solvents to posi-tive in nonpolar ones.
Thermo-Solvatochromism in Binary Solvent Mixtures
Thermo-solvatochromism has been studied in propan-1-ol-W and DMSO-W, over the whole composition range,from pure water to pure solvent. The former organic solvent(hereafter referred to as PrOH) is the longest-chain n-alcohol that is miscible with water at any ratio; DMSO waschosen because it is a highly dipolar aprotic solvent; it isunique in that DMSO-W interactions are stronger thanW-W interactions.[44–48]
Figure 7 shows the dependence of ET(probe) on solventcomposition at 25 °C, for five probes in the two binary mix-tures. Our previous results with BuPMBr2 and OcPMBr2
are also included in order to compare the effects of increas-
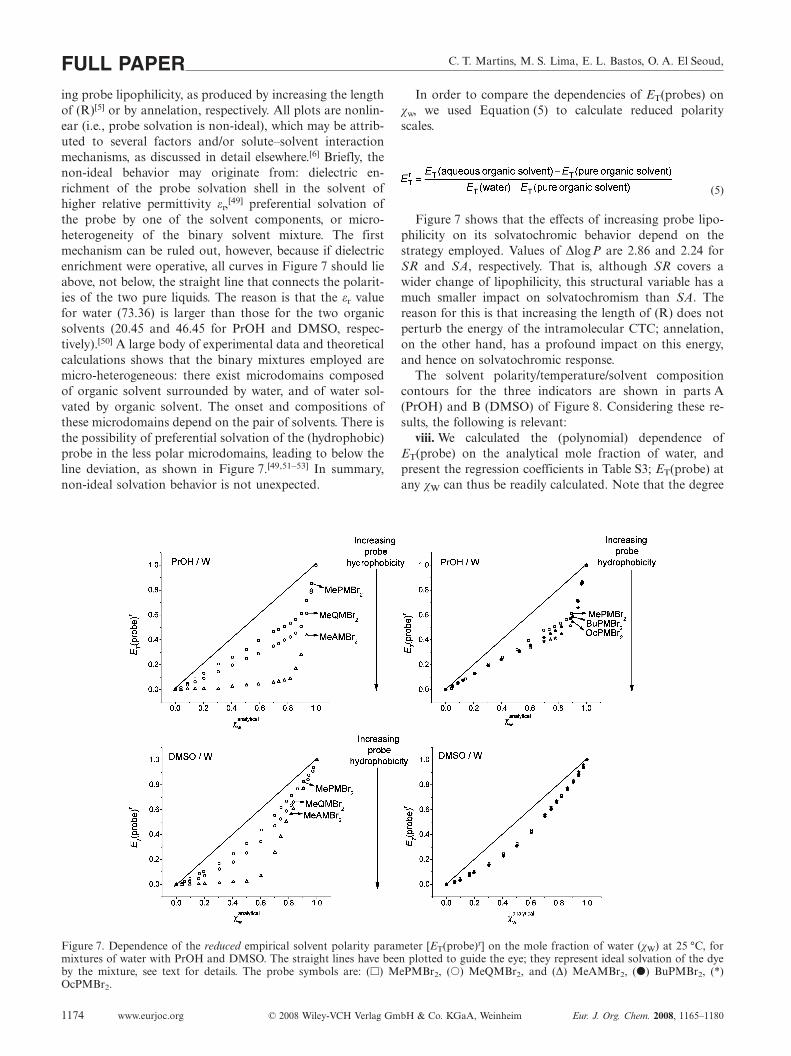
C. T. Martins, M. S. Lima, E. L. Bastos, O. A. El Seoud,FULL PAPERing probe lipophilicity, as produced by increasing the lengthof (R)[5] or by annelation, respectively. All plots are nonlin-ear (i.e., probe solvation is non-ideal), which may be attrib-uted to several factors and/or solute–solvent interactionmechanisms, as discussed in detail elsewhere.[6] Briefly, thenon-ideal behavior may originate from: dielectric en-richment of the probe solvation shell in the solvent ofhigher relative permittivity εr,[49] preferential solvation ofthe probe by one of the solvent components, or micro-heterogeneity of the binary solvent mixture. The firstmechanism can be ruled out, however, because if dielectricenrichment were operative, all curves in Figure 7 should lieabove, not below, the straight line that connects the polarit-ies of the two pure liquids. The reason is that the εr valuefor water (73.36) is larger than those for the two organicsolvents (20.45 and 46.45 for PrOH and DMSO, respec-tively).[50] A large body of experimental data and theoreticalcalculations shows that the binary mixtures employed aremicro-heterogeneous: there exist microdomains composedof organic solvent surrounded by water, and of water sol-vated by organic solvent. The onset and compositions ofthese microdomains depend on the pair of solvents. There isthe possibility of preferential solvation of the (hydrophobic)probe in the less polar microdomains, leading to below theline deviation, as shown in Figure 7.[49,51–53] In summary,non-ideal solvation behavior is not unexpected.
Figure 7. Dependence of the reduced empirical solvent polarity parameter [ET(probe)r] on the mole fraction of water (χW) at 25 °C, formixtures of water with PrOH and DMSO. The straight lines have been plotted to guide the eye; they represent ideal solvation of the dyeby the mixture, see text for details. The probe symbols are: (�) MePMBr2, (�) MeQMBr2, and (∆) MeAMBr2, (�) BuPMBr2, (*)OcPMBr2.
www.eurjoc.org © 2008 Wiley-VCH Verlag GmbH & Co. KGaA, Weinheim Eur. J. Org. Chem. 2008, 1165–11801174
In order to compare the dependencies of ET(probes) onχw, we used Equation (5) to calculate reduced polarityscales.
(5)
Figure 7 shows that the effects of increasing probe lipo-philicity on its solvatochromic behavior depend on thestrategy employed. Values of ∆logP are 2.86 and 2.24 forSR and SA, respectively. That is, although SR covers awider change of lipophilicity, this structural variable has amuch smaller impact on solvatochromism than SA. Thereason for this is that increasing the length of (R) does notperturb the energy of the intramolecular CTC; annelation,on the other hand, has a profound impact on this energy,and hence on solvatochromic response.
The solvent polarity/temperature/solvent compositioncontours for the three indicators are shown in parts A(PrOH) and B (DMSO) of Figure 8. Considering these re-sults, the following is relevant:
viii. We calculated the (polynomial) dependence ofET(probe) on the analytical mole fraction of water, andpresent the regression coefficients in Table S3; ET(probe) atany χW can thus be readily calculated. Note that the degree
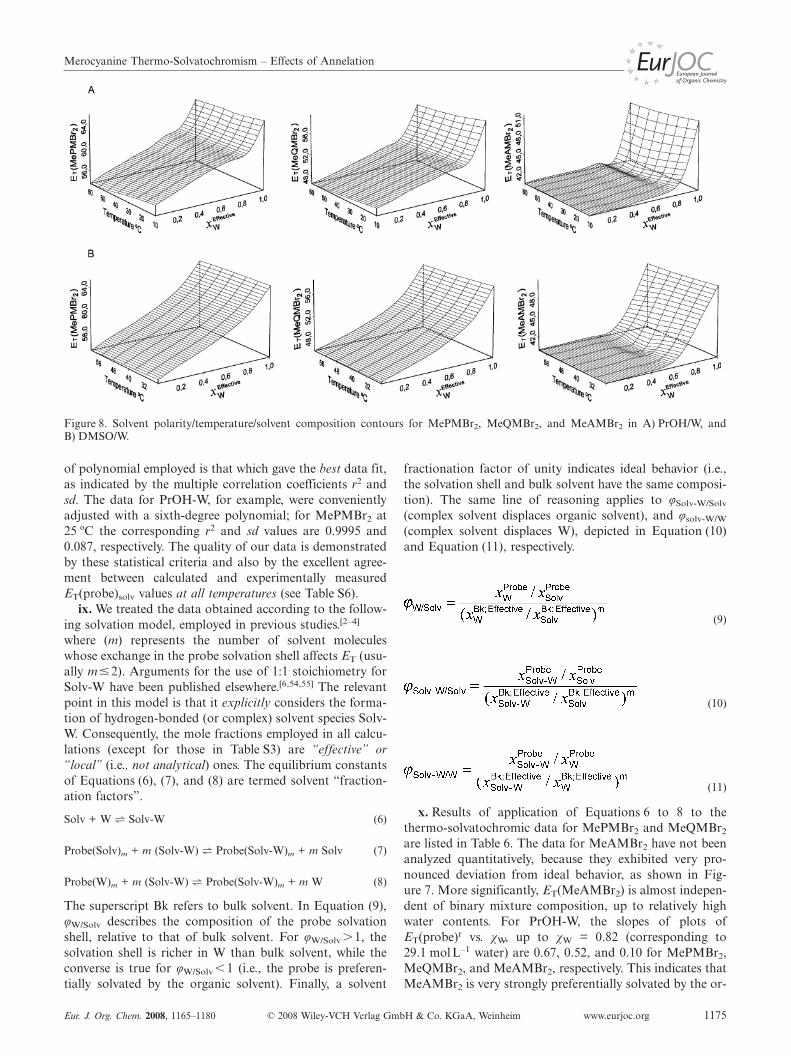
Merocyanine Thermo-Solvatochromism – Effects of Annelation
Figure 8. Solvent polarity/temperature/solvent composition contours for MePMBr2, MeQMBr2, and MeAMBr2 in A) PrOH/W, andB) DMSO/W.
of polynomial employed is that which gave the best data fit,as indicated by the multiple correlation coefficients r2 andsd. The data for PrOH-W, for example, were convenientlyadjusted with a sixth-degree polynomial; for MePMBr2 at25 ºC the corresponding r2 and sd values are 0.9995 and0.087, respectively. The quality of our data is demonstratedby these statistical criteria and also by the excellent agree-ment between calculated and experimentally measuredET(probe)solv values at all temperatures (see Table S6).
ix. We treated the data obtained according to the follow-ing solvation model, employed in previous studies.[2–4]
where (m) represents the number of solvent moleculeswhose exchange in the probe solvation shell affects ET (usu-ally m�2). Arguments for the use of 1:1 stoichiometry forSolv-W have been published elsewhere.[6,54,55] The relevantpoint in this model is that it explicitly considers the forma-tion of hydrogen-bonded (or complex) solvent species Solv-W. Consequently, the mole fractions employed in all calcu-lations (except for those in Table S3) are “effective” or“local” (i.e., not analytical) ones. The equilibrium constantsof Equations (6), (7), and (8) are termed solvent “fraction-ation factors”.
Solv + W h Solv-W (6)
Probe(Solv)m + m (Solv-W) h Probe(Solv-W)m + m Solv (7)
Probe(W)m + m (Solv-W) h Probe(Solv-W)m + m W (8)
The superscript Bk refers to bulk solvent. In Equation (9),φW/Solv describes the composition of the probe solvationshell, relative to that of bulk solvent. For φW/Solv �1, thesolvation shell is richer in W than bulk solvent, while theconverse is true for φW/Solv �1 (i.e., the probe is preferen-tially solvated by the organic solvent). Finally, a solvent
Eur. J. Org. Chem. 2008, 1165–1180 © 2008 Wiley-VCH Verlag GmbH & Co. KGaA, Weinheim www.eurjoc.org 1175
fractionation factor of unity indicates ideal behavior (i.e.,the solvation shell and bulk solvent have the same composi-tion). The same line of reasoning applies to φSolv-W/Solv
(complex solvent displaces organic solvent), and φsolv-W/W
(complex solvent displaces W), depicted in Equation (10)and Equation (11), respectively.
(9)
(10)
(11)
x. Results of application of Equations 6 to 8 to thethermo-solvatochromic data for MePMBr2 and MeQMBr2
are listed in Table 6. The data for MeAMBr2 have not beenanalyzed quantitatively, because they exhibited very pro-nounced deviation from ideal behavior, as shown in Fig-ure 7. More significantly, ET(MeAMBr2) is almost indepen-dent of binary mixture composition, up to relatively highwater contents. For PrOH-W, the slopes of plots ofET(probe)r vs. χW, up to χW = 0.82 (corresponding to29.1 molL–1 water) are 0.67, 0.52, and 0.10 for MePMBr2,MeQMBr2, and MeAMBr2, respectively. This indicates thatMeAMBr2 is very strongly preferentially solvated by the or-
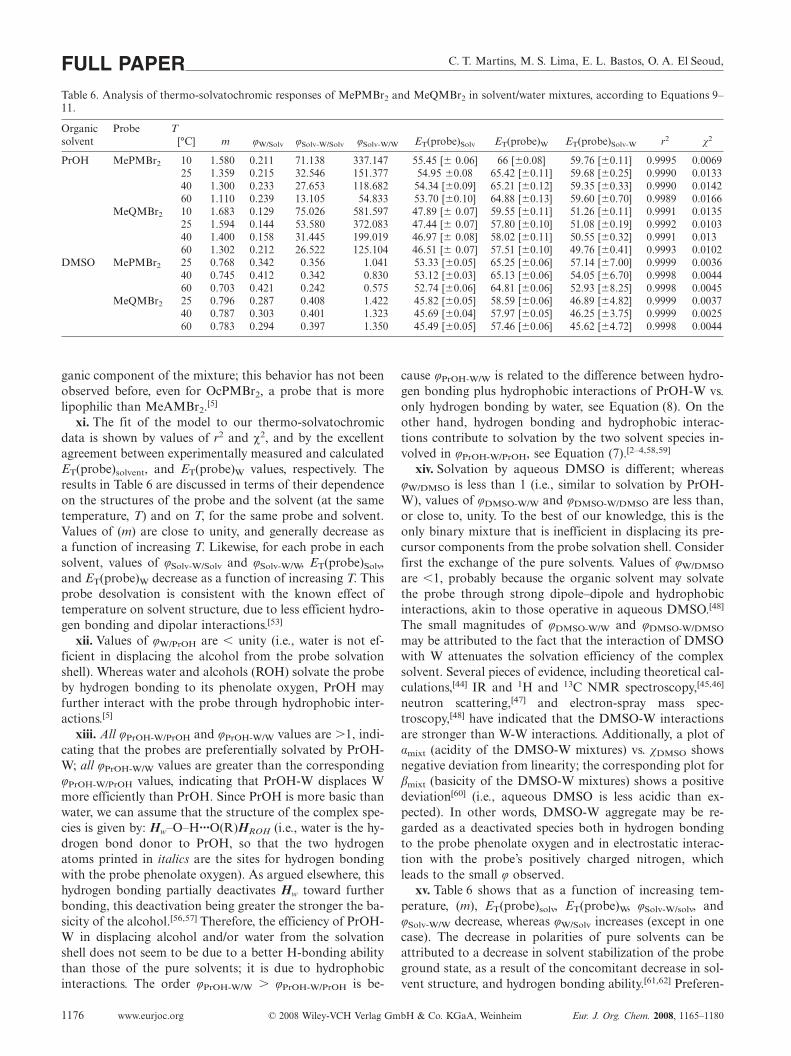
C. T. Martins, M. S. Lima, E. L. Bastos, O. A. El Seoud,FULL PAPERTable 6. Analysis of thermo-solvatochromic responses of MePMBr2 and MeQMBr2 in solvent/water mixtures, according to Equations 9–11.
Organic Probe Tsolvent [°C] m φW/Solv φSolv-W/Solv φSolv-W/W ET(probe)Solv ET(probe)W ET(probe)Solv-W r2 χ2
PrOH MePMBr2 10 1.580 0.211 71.138 337.147 55.45 [� 0.06] 66 [�0.08] 59.76 [�0.11] 0.9995 0.006925 1.359 0.215 32.546 151.377 54.95 �0.08 65.42 [�0.11] 59.68 [�0.25] 0.9990 0.013340 1.300 0.233 27.653 118.682 54.34 [�0.09] 65.21 [�0.12] 59.35 [�0.33] 0.9990 0.014260 1.110 0.239 13.105 54.833 53.70 [�0.10] 64.88 [�0.13] 59.60 [�0.70] 0.9989 0.0166
MeQMBr2 10 1.683 0.129 75.026 581.597 47.89 [� 0.07] 59.55 [�0.11] 51.26 [�0.11] 0.9991 0.013525 1.594 0.144 53.580 372.083 47.44 [� 0.07] 57.80 [�0.10] 51.08 [�0.19] 0.9992 0.010340 1.400 0.158 31.445 199.019 46.97 [� 0.08] 58.02 [�0.11] 50.55 [�0.32] 0.9991 0.01360 1.302 0.212 26.522 125.104 46.51 [� 0.07] 57.51 [�0.10] 49.76 [�0.41] 0.9993 0.0102
DMSO MePMBr2 25 0.768 0.342 0.356 1.041 53.33 [�0.05] 65.25 [�0.06] 57.14 [�7.00] 0.9999 0.003640 0.745 0.412 0.342 0.830 53.12 [�0.03] 65.13 [�0.06] 54.05 [�6.70] 0.9998 0.004460 0.703 0.421 0.242 0.575 52.74 [�0.06] 64.81 [�0.06] 52.93 [�8.25] 0.9998 0.0045
MeQMBr2 25 0.796 0.287 0.408 1.422 45.82 [�0.05] 58.59 [�0.06] 46.89 [�4.82] 0.9999 0.003740 0.787 0.303 0.401 1.323 45.69 [�0.04] 57.97 [�0.05] 46.25 [�3.75] 0.9999 0.002560 0.783 0.294 0.397 1.350 45.49 [�0.05] 57.46 [�0.06] 45.62 [�4.72] 0.9998 0.0044
ganic component of the mixture; this behavior has not beenobserved before, even for OcPMBr2, a probe that is morelipophilic than MeAMBr2.[5]
xi. The fit of the model to our thermo-solvatochromicdata is shown by values of r2 and χ2, and by the excellentagreement between experimentally measured and calculatedET(probe)solvent, and ET(probe)W values, respectively. Theresults in Table 6 are discussed in terms of their dependenceon the structures of the probe and the solvent (at the sametemperature, T) and on T, for the same probe and solvent.Values of (m) are close to unity, and generally decrease asa function of increasing T. Likewise, for each probe in eachsolvent, values of φSolv-W/Solv and φSolv-W/W, ET(probe)Solv,and ET(probe)W decrease as a function of increasing T. Thisprobe desolvation is consistent with the known effect oftemperature on solvent structure, due to less efficient hydro-gen bonding and dipolar interactions.[53]
xii. Values of φW/PrOH are � unity (i.e., water is not ef-ficient in displacing the alcohol from the probe solvationshell). Whereas water and alcohols (ROH) solvate the probeby hydrogen bonding to its phenolate oxygen, PrOH mayfurther interact with the probe through hydrophobic inter-actions.[5]
xiii. All φPrOH-W/PrOH and φPrOH-W/W values are �1, indi-cating that the probes are preferentially solvated by PrOH-W; all φPrOH-W/W values are greater than the correspondingφPrOH-W/PrOH values, indicating that PrOH-W displaces Wmore efficiently than PrOH. Since PrOH is more basic thanwater, we can assume that the structure of the complex spe-cies is given by: Hw–O–H···O(R)HROH (i.e., water is the hy-drogen bond donor to PrOH, so that the two hydrogenatoms printed in italics are the sites for hydrogen bondingwith the probe phenolate oxygen). As argued elsewhere, thishydrogen bonding partially deactivates Hw toward furtherbonding, this deactivation being greater the stronger the ba-sicity of the alcohol.[56,57] Therefore, the efficiency of PrOH-W in displacing alcohol and/or water from the solvationshell does not seem to be due to a better H-bonding abilitythan those of the pure solvents; it is due to hydrophobicinteractions. The order φPrOH-W/W � φPrOH-W/PrOH is be-
www.eurjoc.org © 2008 Wiley-VCH Verlag GmbH & Co. KGaA, Weinheim Eur. J. Org. Chem. 2008, 1165–11801176
cause φPrOH-W/W is related to the difference between hydro-gen bonding plus hydrophobic interactions of PrOH-W vs.only hydrogen bonding by water, see Equation (8). On theother hand, hydrogen bonding and hydrophobic interac-tions contribute to solvation by the two solvent species in-volved in φPrOH-W/PrOH, see Equation (7).[2–4,58,59]
xiv. Solvation by aqueous DMSO is different; whereasφW/DMSO is less than 1 (i.e., similar to solvation by PrOH-W), values of φDMSO-W/W and φDMSO-W/DMSO are less than,or close to, unity. To the best of our knowledge, this is theonly binary mixture that is inefficient in displacing its pre-cursor components from the probe solvation shell. Considerfirst the exchange of the pure solvents. Values of φW/DMSO
are �1, probably because the organic solvent may solvatethe probe through strong dipole–dipole and hydrophobicinteractions, akin to those operative in aqueous DMSO.[48]
The small magnitudes of φDMSO-W/W and φDMSO-W/DMSO
may be attributed to the fact that the interaction of DMSOwith W attenuates the solvation efficiency of the complexsolvent. Several pieces of evidence, including theoretical cal-culations,[44] IR and 1H and 13C NMR spectroscopy,[45,46]
neutron scattering,[47] and electron-spray mass spec-troscopy,[48] have indicated that the DMSO-W interactionsare stronger than W-W interactions. Additionally, a plot ofαmixt (acidity of the DMSO-W mixtures) vs. χDMSO showsnegative deviation from linearity; the corresponding plot forβmixt (basicity of the DMSO-W mixtures) shows a positivedeviation[60] (i.e., aqueous DMSO is less acidic than ex-pected). In other words, DMSO-W aggregate may be re-garded as a deactivated species both in hydrogen bondingto the probe phenolate oxygen and in electrostatic interac-tion with the probe’s positively charged nitrogen, whichleads to the small φ observed.
xv. Table 6 shows that as a function of increasing tem-perature, (m), ET(probe)solv, ET(probe)W, φSolv-W/solv, andφSolv-W/W decrease, whereas φW/Solv increases (except in onecase). The decrease in polarities of pure solvents can beattributed to a decrease in solvent stabilization of the probeground state, as a result of the concomitant decrease in sol-vent structure, and hydrogen bonding ability.[61,62] Preferen-
Merocyanine Thermo-Solvatochromism – Effects of Annelation
tial “clustering” of water and solvents as a function of in-creasing temperature means that the strengths of Solv-Winteractions decrease in the same direction,[52,53,63–66] with aconcomitant decrease in ability to displace both waterand solvent. This explains the decrease in φSolv-W/Solv andφSolv-W/W as a function of increasing T.
xvi. The effects of probe lipophilicity on the compositionof its solvation shell becomes readily apparent when valuesof φ are compared (Table 6). For both binary mixtures, atcomparable temperatures, all φW/Solv values are smaller, andall φSolv-W/Solv and φSolv-W/W values are larger for MeQMBr2
than the corresponding values for MePMBr2. This depen-dence on probe structure can be analyzed by consideringthe solvent/solute interaction mechanisms discussed above;the relative contribution of hydrophobic interactions in-creases as a function of increasing probe lipophilicity. Thisleads to less efficient displacement of Solv by W, and moreefficient displacement of W and Solv by Solv-W in case ofthe more lipophilic probe, MeQMBr2.
Conclusions
Solvation in pure solvents is due to interactions that de-pend on the properties of the solute: namely, structure, pKa,and lipophilicity, and the solvent. Evaluation of the relativeimportance of these interactions requires the study ofprobes of appropriate structures, such as the SA and SRseries. ET(MePMBr2) correlates linearly with ET(30); thenonlinear correlations of MeQMBr2 and MeAMBr2 aredue to probe molecular structure- and solvent-dependentcontributions of the limiting zwitterionic and quinonoidstructures to the corresponding resonance hybrids. This ex-planation is in agreement with experimentally obtainedNMR spectroscopic data and with theoretical calculationsof bond lengths, bond orders, and λmax. Thermo-solvatoch-romism in binary solvent mixtures can be described by amechanism based on solvent exchange equilibria betweenthe species present in solution (W, Solv, and Solv-W com-plexes, respectively) and their counterparts in the probe sol-vation shell. The non-ideal dependence of ET(probes) onχW is mainly due to preferential solvation of the probe, es-pecially by Solv-W; aqueous DMSO is an exception. Thetemperature effect on φ has been interpreted in terms of thestructures of water and solvent and their mutual interac-tions. Temperature increases result in gradual desolvationof every probe, in all binary mixtures; desolvation energiesdepend on the hydrophobicity of the probe and the solvent.A salient point of this study is that the consequences ofincreasing probe lipophilicity for its solvation depend onthe strategy employed in introducing this structural modifi-
(13)
Eur. J. Org. Chem. 2008, 1165–1180 © 2008 Wiley-VCH Verlag GmbH & Co. KGaA, Weinheim www.eurjoc.org 1177
cation. Although the lipophilic character of the SR serieschanges by a factor of 724, plots of ET(probe) vs. χW aresimilar, showing only progressive dependence on the lipo-philicity of the probe. Changing lipophilicity through annel-ation affects the solvatochromic responses of the threeprobes noticeably, because this change has a profound im-pact on the energy of the probe ground and excited states;the latter acquires less zwitterionic character as a functionon fusion of benzene rings.
Calculations
Calculation of the Dissociation Constant of Solv-W, Kdissoc ,χSpecies
Effective, and Solvent Fractionation Factors
For the solvents studied, Kdissoc and χSpeciesEffective were avail-
able from previous studies.[5] Calculation of these param-eters has been discussed in details elsewhere, and will beaddressed here only briefly.[2–4] Knowledge of Kdissoc (calcu-lated on the basis of dependence of density on the composi-tion of the binary mixture) allows calculation of the effec-tive mole fractions of all solvent species present. The probesolvation micro-sphere is composed of W, Solv, and Solv-W. Observed ET (ET
Obs) is the sum of the polarity of eachcomponent, ET
W, ETSolv, ET
Solv-W, respectively, multiplied bythe corresponding mole fraction in the probe solvationmicro-sphere, χW
Probe, χSolvProbe and χSolv-W
Probe , respectively.Equations (12) and (13) can then be solved to obtain
ETSolv-W, and the appropriate solvent fractionation factors,
respectively.
(12)
The input data to solve Equation (13) include ETObs, ET
W,ET
Solv, and χSpeciesEffective, along with initial estimates of (m),
ETSolv-W, and the appropriate φ; values of φSolv-W/W are ob-
tained by dividing φSolv-W/Solv by φW/Solv.
Experimental SectionMaterials: All chemicals were purchased from Acros or Merck. Thesolvents were purified by the recommended procedures,[67] followedby storing over activated type 4-Å molecular sieves. Their puritieswere established from their densities (DMA 40 densimeter, An-ton Paar, Graz) and from agreement between their experimentallydetermined ET(30) and published data.[1,16]
Apparatus: Melting points were determined with an IA 6304 appa-ratus (Electrothermal, London). Elemental analyses were per-formed on a Perkin–Elmer 2400 CHN-analyzer (Perkin–Elmer,Wellesley), in the Analytical Center of this Institute. IR and NMR
C. T. Martins, M. S. Lima, E. L. Bastos, O. A. El Seoud,FULL PAPERspectra were recorded with a Bruker Victor-22 FTIR spectrometer(Bruker Optics, Ettlingen), and a Varian Innova 300 NMR spec-trometer (Varian, Palo Alto). Analysis of the 1H NMR and 13CNMR spectroscopic data was based on simulation of the 1-D spec-tra, the DQF-COSY, and HETCOR experiments.[68] A vortexmixer (ThermoFischer Scientific, Waltham) or a sonication bath(Laborette 17, Fretsch, Berlin) were employed to accelerate probedissolution.
Synthesis of the Probes Employed
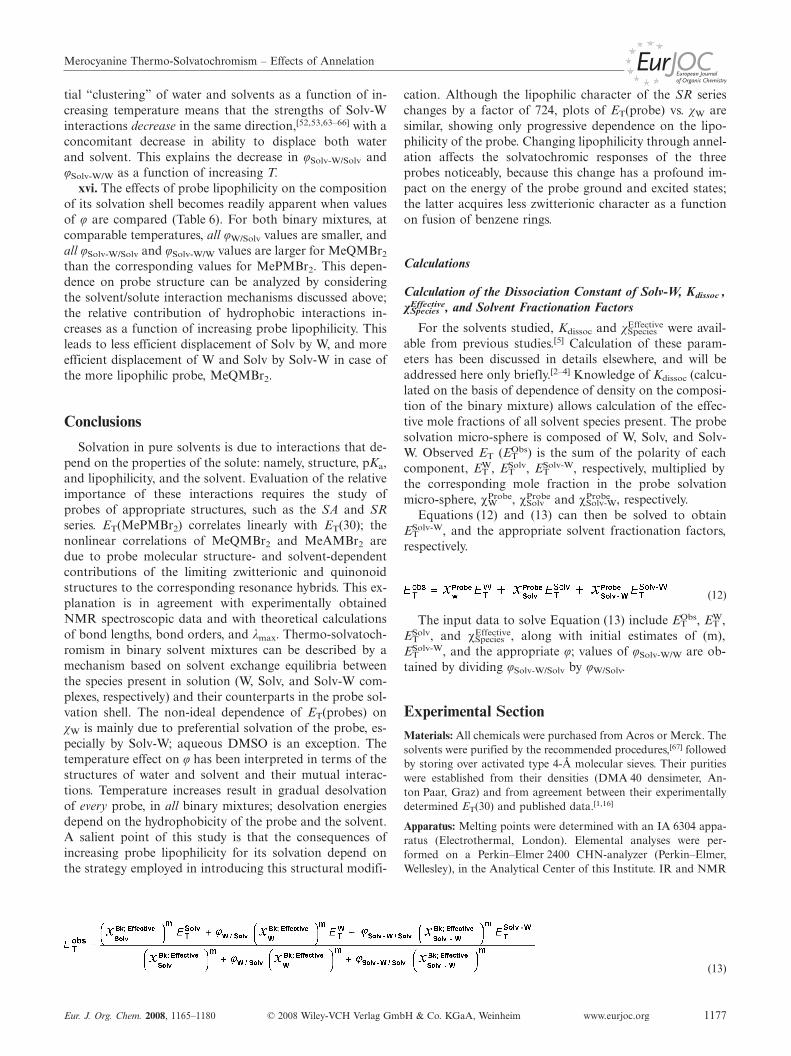
2,6-Dibromo-4[(E)-2-(1-methylquinolinium-4-yl-)ethenyl]phenolate(MeQMBr2): The synthesis of 1,4-dimethylquinolinium iodide wascarried out as described previously for MePMBr2.[5] The reactionbetween methyl iodide and 4-methylquinoline [Equation (14)] wascarried out in acetonitrile, followed by removal of the excess ofCH3I and solvent to give a light amber liquid, the purity of whichwas established by TLC; ethanol/acetic acid/chloroform eluent(1:1:18, by volume). The aldehyde, 3,5-dibromo-4-hydroxybenzal-dehyde, was available from a previous study.[37] Condensation ofthe aldehyde with 1,4-dimethylquinolinium iodide in the presenceof piperidine, followed by treatment with KOH [Equation (15)],gave MeQMBr2 as red–purple crystals; these were washed with hotwater and dried. Yield 70%, m.p. 270–271 °C. IR (KBr): ν̃ = 3028(νC–H), 1593 (νC=C), 1213 (νC–N), 1036 (νC–Br) cm–1. Calculated forC18H13Br2NO (%): C 51.58, H 3.13, N 3.34; found C 50.82, H 3.56,N 3.34. The 1H NMR results are given in Table 7.
(14)
(15)
MeAMBr2 was synthesized as shown in Equations (16) and (17).
(16)
The synthesis of 9,10-dimethylacridinium sulfate from (CH3)2SO4
and 9-methylacridine was carried out as given elsewhere[69] [Equa-tion (16)]. Excess dimethyl sulfate and solvent were removed bydistillation, and the yellow product was recrystallized from meth-anol. Condensation of the methyl sulfate salt with 3,5-dibromo-4-
www.eurjoc.org © 2008 Wiley-VCH Verlag GmbH & Co. KGaA, Weinheim Eur. J. Org. Chem. 2008, 1165–11801178
(17)
hydroxybenzaldehyde in propan-2-ol, followed by treatment withKOH and recrystallization from methanol [Equation (17)], gavedark greenish-blue crystals, which were washed with water anddried. Yield 70%, decomposes at 209 °C. IR (KBr): ν̃ = 3034(νC–H), 1601 (νC=C), 1202 (νC–N), 1044 (νC–Br) cm–1. Calculated forC22H15Br2NO (%): C 56.32, H 3.22, N 2.99; found C 55.38, H 2.93,N 2.99. The 1H NMR results are listed in Table 7.
Spectrometric Determination of logP, the Partition Coefficient ofthe Probe Between Water and Octan-1-ol: The aqueous phase wasa phosphate buffer solution (0.05 molL–1, pH 7.50). Equal volumesof this buffer and octan-1-ol were agitated for one hour (tube ro-tator), and the phases separated. A probe solution [5�10–4 molL–1
in (buffer-saturated) octan-1-ol] was prepared, and its absorbance(AInitial) was recorded. An aliquot of this solution (VOctanol) wasagitated with (octan-1-ol saturated) phosphate buffer (VBuffer)
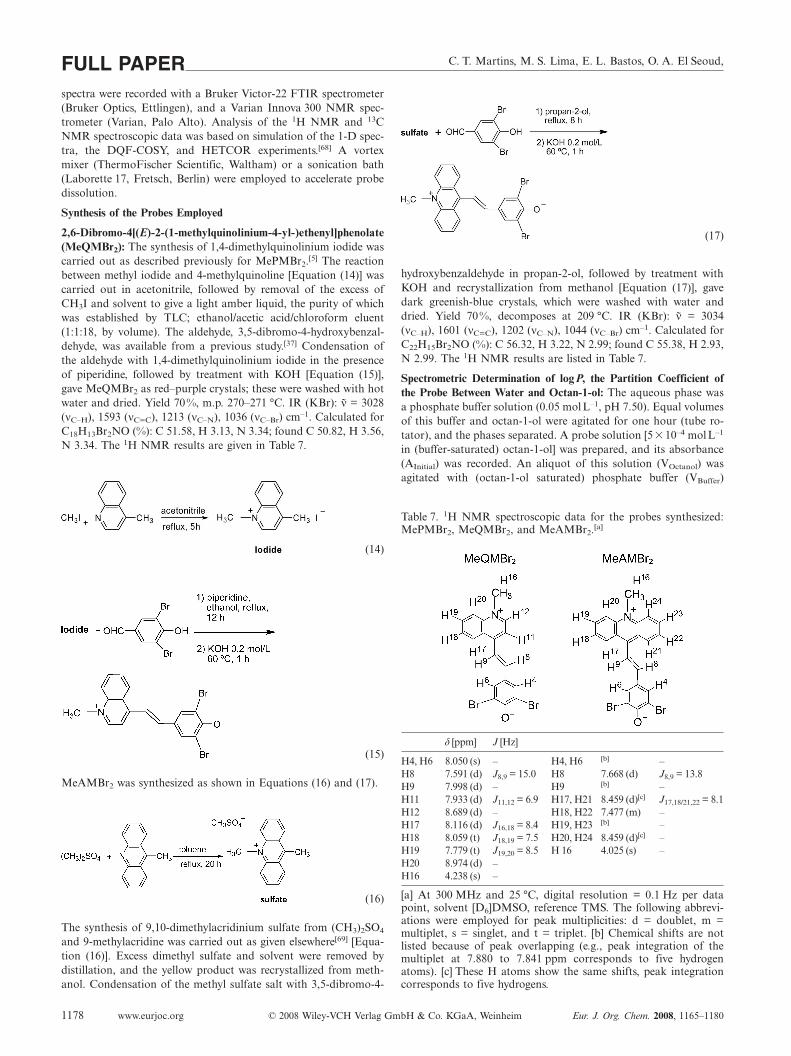
Table 7. 1H NMR spectroscopic data for the probes synthesized:MePMBr2, MeQMBr2, and MeAMBr2.[a]
δ [ppm] J [Hz]
H4, H6 8.050 (s) – H4, H6 [b] –H8 7.591 (d) J8,9 = 15.0 H8 7.668 (d) J8,9 = 13.8H9 7.998 (d) – H9 [b] –H11 7.933 (d) J11,12 = 6.9 H17, H21 8.459 (d)[c] J17,18/21,22 = 8.1H12 8.689 (d) – H18, H22 7.477 (m) –H17 8.116 (d) J16,18 = 8.4 H19, H23 [b] –H18 8.059 (t) J18,19 = 7.5 H20, H24 8.459 (d)[c] –H19 7.779 (t) J19,20 = 8.5 H 16 4.025 (s) –H20 8.974 (d) –H16 4.238 (s) –
[a] At 300 MHz and 25 °C, digital resolution = 0.1 Hz per datapoint, solvent [D6]DMSO, reference TMS. The following abbrevi-ations were employed for peak multiplicities: d = doublet, m =multiplet, s = singlet, and t = triplet. [b] Chemical shifts are notlisted because of peak overlapping (e.g., peak integration of themultiplet at 7.880 to 7.841 ppm corresponds to five hydrogenatoms). [c] These H atoms show the same shifts, peak integrationcorresponds to five hydrogens.
Merocyanine Thermo-Solvatochromism – Effects of Annelation
at room temperature for 6 h. After phase separation at 25 °C, theabsorbance (AEquilibrium) of the octan-1-ol phase was measured,and the partition coefficient was calculated from: logP =log [AEquilibrium �VBuffer/(AInitial – AEquilibrium)�VOctanol]. Values oflogP were found to be: 1.02�0.01 and 2.08�0.1, for MeQMBr2
and MeAMBr2, respectively.
Spectrometric Determination of the Apparent pKa Values of theProbes: The pKa values were calculated from the Henderson–Has-selbach equation.[70] A methanolic probe solution was added topotassium hydrogen phthalate buffer (0.05 molL–1) so that the finalconcentration of the probe was 5 �10–4 molL–1 and the final vol-ume fraction of methanol was �5%. The concentrations of theprobe zwitterionic form were measured at 25 °C, at 480 nm forMeQMBr2 and 562 nm for MeAMBr2. The apparent pKa values ofthe probes were found to be 5.03�0.02 and 4.52�0.02 forMeQMBr2 and MeAMBr2, respectively.
Spectroscopic Determination of ET(Probe) in Pure Solvents and inBinary Solvent Mixtures: Aliquots of the probe solution in acetonewere pipetted into 2 mL volumetric tubes, followed by evaporationof the solvent at room temperature, under reduced pressure, overP4O10. Pure solvents, and/or binary solvent mixtures were addedso that the probe final concentration was 10–5 to 10–6 molL–1.
A Shimadzu UV 2550 UV/Vis spectrophotometer, was used. Thetemperature inside the thermostatted cell-holder was controlled towithin �0.05 °C with a digital thermometer (model 4000A, YellowSprings Instruments, Ohio). Each spectrum was recorded twice ata rate of 140 nmmin–1; the values of λmax were determined fromthe first derivative of the absorption spectra. The uncertainties inET(MePMBr2), ET(MeQMBr2), and ET(MeAMBr2) are0.15 kcalmol–1. Thermo-solvatochromism was studied in mixtures,16 per set, of water with PrOH (from 10 to 60 °C) and DMSO(from 25 to 60 °C). DMSO mixtures were not studied in 10 °C be-cause the pure solvent freezes at this temperature.
Quantum Chemical Calculations: Structures of MePMBr2,MeQMBr2, and MeAMBr2 were optimized by the RM1 semiem-pirical method, as implemented in MOPAC2007.[39,71] Geometryoptimization and vertical excitation energy calculations were per-formed by the multi-electron configuration interaction (MECI) ap-proach and the RM1 method, hereafter referred to as RM1-CI.The active space was constructed with five molecular orbitals(MOs) and two double-filled levels [C.I. = (5,2), 100 configurationsin active space]. Solvent effects on the optical properties were mod-eled with the conductor-like screening model (COSMO)[38]
Further optimization was performed at the DFT level, with thehybrid B3LYP exchange-correlation functional and the 6-31+G(d,p) basis set as implemented in the Gaussian 03 quantummechanical package.[72–74]
Vertical excitation energies were calculated from DFT and RM1geometries with the adiabatic approximation of the TDDFT byuse of the B3LYP functional and the 6-31+G(d,p) basis set. Allcalculations were performed both in gas phase and with the CO-SMO polarizeable continuum aqueous solvent model coupled toB3LYP/6-31+G(d,p). All geometry optimizations were performedwithout any constraints, except when otherwise indicated. Station-ary points were confirmed as minima via vibrational frequency cal-culations. Coordinates for optimized geometries are listed inTable S5. All calculations were performed at the advanced comput-ing facilities (LCCA) of the University of São Paulo.
Supporting Information (see also the footnote on the first page ofthis article): Absorption spectra of MeAMBr2 at different probeconcentrations in 2-ethyl-1-hexanol; semi-empirical- and DFT-op-
Eur. J. Org. Chem. 2008, 1165–1180 © 2008 Wiley-VCH Verlag GmbH & Co. KGaA, Weinheim www.eurjoc.org 1179
timized geometries of MeAMBr2 in the gas phase and in water;RM1-optimized geometry of MeAMBr2 in water, calculated by im-posing Cs symmetry point group. Theoretically calculated bondlengths (in Å) for MePMBr2 and crystallographic data of MePM.Theoretically calculated bond lengths (in Å) for MeQMBr2. Theo-retically calculated bond lengths (in Å) for MeAMBr2 and crystal-lographic data of 9,10-dimethylacridinium methyl sulfate, Me2-
ASO4. Dipole moments of the probes in the ground and excitedstate, calculated by RM1 and RM1-CI methods in water (CO-SMO). Coordinates for optimized geometries for all the probesstudied. Thermo-solvatochromic data for MePMBr2, MeQMBr2
and MeAMBr2 in binary solvent mixtures.
Acknowledgments
We thank the State of São Paulo Research Foundation (FAPESP)for financial support (grant 2004/15400-5), and research fellow-ships 04/15677-7 and 07/00684-6, to C. T. M. and E. L. B., theNational Council for Scientific and Technological Research(CNPq) for a research productivity fellowship to O. A. E. S. (grant305547/2003-8), and a PIBIC fellowship to M. S. Lima. We alsothank Dr. P. A. R. Pires and Mr. C. Guizzo for their help, and theLCCA for making computation facilities available to us.
[1] C. Reichardt, in Solvents and Solvent Effects in Organic Chem-istry, 3rd ed., VCH, Weinheim, 2003, p. 389.
[2] E. B. Tada, P. L. Silva, O. A. El Seoud, J. Phys. Org. Chem.2003, 16, 691–699.
[3] E. B. Tada, P. L. Silva, O. A. El Seoud, Phys. Chem. Chem.Phys. 2003, 5, 5378–5385.
[4] E. B. Tada, P. L. Silva, C. Tavares, O. A. El Seoud, J. Phys. Org.Chem. 2005, 18, 398–407.
[5] C. T. Martins, M. S. Lima, O. A. El Seoud, J. Org. Chem. 2006,71, 9068–9079.
[6] O. A. El Seoud, Pure Appl. Chem. 2007, 79, 1135–1151.[7] O. A. El Seoud, M. I. El Seoud, J. P. S. Farah, J. Org. Chem.
1997, 62, 5928–5933.[8] F. Siviero, O. A. El Seoud, J. Phys. Org. Chem. 2006, 19, 793–
802.[9] M. A. Silva, C. T. Martins, E. P. G. Arêas, O. A. El Seoud, Pol.
J. Chem. 2007, 81, 1135–1145.[10] A. J. Leo, C. Hansch, Perspect. Drug Discovery Des. 1999, 17,
1–25.[11] C. Hansch, A. J. Leo, R. W. Taft, Chem. Rev. 1991, 91, 165–
195.[12] H. G. Benson, J. N. Murrell, J. Chem. Soc. Faraday Trans. 2
1972, 68, 137.[13] A. Botrel, A. Lebeuze, P. Jacques, H. Strub, J. Chem. Soc. Fara-
day Trans. 2 1984, 80, 1235–1252.[14] E. Buncel, S. Rajagopal, Acc. Chem. Res. 1990, 23, 226–231.[15] A. Abbotto, L. Beverina, S. Bradamante, A. Facchetti, C.
Klein, G. A. Pagani, M. Redi-Abshiro, R. Wortmann, Chem.Eur. J. 2003, 9, 1991–2007.
[16] C. Reichardt, in Solvents and Solvent Effects in Organic Chem-istry, 3rd ed., VCH, Weinheim, 2003, p. 147.
[17] C. Machado, M. D. Nascimento, M. C. Rezende, A. E. Beezer,Thermochim. Acta 1999, 328, 155–159.
[18] M. Niedbalska, I. Gruda, Can. J. Chem. 1990, 68, 691–695.[19] R. Palepu, H. Gharibi, D. M. Bloor, E. Wynjones, Langmuir
1993, 9, 110–112.[20] W. Binanalimbele, R. Zana, Colloid Polym. Sci. 1989, 267, 440–
447.[21] D. J. Lee, W. H. Huang, Colloid Polym. Sci. 1996, 274, 160–
165.[22] J. Penfold, E. Staples, I. Tucker, P. Cummins, J. Colloid Inter-
face Sci. 1997, 185, 424–431.
C. T. Martins, M. S. Lima, E. L. Bastos, O. A. El Seoud,FULL PAPER[23] R. Nagarajan, C. C. Wang, Langmuir 2000, 16, 5242–5251.[24] M. Tsukada, Y. Mineo, K. Itoh, J. Phys. Chem. 1989, 93, 7989–
7992.[25] M. C. Rezende, J. Braz. Chem. Soc. 1997, 8, 631–635.[26] P. Jacques, J. Phys. Chem. 1986, 90, 5535–5539.[27] J. O. Morley, R. M. Morley, A. L. Fitton, J. Am. Chem. Soc.
1998, 120, 11479–11488.[28] ACD Labs Software, version V8:19, 1994–2006.[29] H. Hisamoto, H. Tohma, T. Yamada, K. Yamauchi, D. Sis-
wanta, N. Yoshioka, K. Suzuki, Anal. Chim. Acta 1998, 373,271–289.
[30] K. J. Dennis, T. Luong, M. L. Reshwan, M. J. Minch, J. Phys.Chem. 1993, 97, 8328–8335.
[31] J. Catalan, E. Mena, W. Meutermans, J. Elguero, J. Phys.Chem. 1992, 96, 3615–3621.
[32] E. Hammam, A. M. El Nahas, J. Phys. Chem. A 1998, 102,9739–9744.
[33] U. Steiner, M. H. Abdelkader, P. Fischer, H. E. A. Kramer, J.Am. Chem. Soc. 1978, 100, 3190–3197.
[34] M. H. Abdelkader, U. Steiner, J. Chem. Educ. 1983, 60, 160–162.
[35] D. Armstron, P. G. Perkins, J. J. P. Stewart, J. Chem. Soc. Dal-ton Trans. 1973, 838–840.
[36] E. B. Tada, Solvatochromism in solvents and in micellar systems,Ph.D. Thesis, University of São Paulo, São Paulo, 2004.
[37] C. T. Martins, M. S. Lima, O. A. El Seoud, J. Phys. Org. Chem.2005, 18, 1072–1085.
[38] F. Eckert, A. Klamt, Aiche J. 2002, 48, 369–385.[39] G. B. Rocha, R. O. Freire, A. M. Simas, J. J. P. Stewart, J. Com-
put. Chem. 2006, 27, 1101–1111.[40] D. J. A. Deridder, D. Heijdenrijk, H. Schenk, R. A. Dommisse,
G. L. Lemiere, J. A. Lepoivre, F. A. Alderweireldt, Acta Crys-tallogr. 1990, 46, 2197–2199.
[41] J. Meszko, A. Sikorrski, O. M. Huta, A. Konitz, J. Blazejowski,Acta Crystallogr. 2002, 58, 669–671.
[42] E. Runge, E. K. U. Gross, Phys. Rev. Lett. 1984, 52, 997–1000.[43] M. Guillaume, B. Champagne, F. Zutterman, J. Phys. Chem.
A 2006, 110, 13007–13013.[44] I. A. Borin, M. S. Skaf, J. Chem. Phys. 1999, 110, 6412–6420.[45] K. Mizuno, S. Imafuji, T. Ochi, T. Ohta, S. Maeda, J. Phys.
Chem. B 2000, 104, 11001–11005.[46] S. N. Shashkov, M. A. Kiselev, S. N. Tioutiounnikov, A. M. Ki-
selev, P. Lesieur, Physica B 1999, 271, 184–191.[47] J. T. Cabral, A. Luzar, J. Teixeira, M. C. Bellissent-Funel, J.
Chem. Phys. 2000, 113, 8736–8745.[48] D. N. Shin, J. W. Wijnen, J. B. F. N. Engberts, A. Wakisaka, J.
Phys. Chem. B 2001, 105, 6759–6762.[49] P. G. N. Suppan, in Solvatochromism, Royal Society of Chemis-
try, Cambridge, 1997, pp. 21–67.
www.eurjoc.org © 2008 Wiley-VCH Verlag GmbH & Co. KGaA, Weinheim Eur. J. Org. Chem. 2008, 1165–11801180
[50] D. R. Lide, CRC Handbook of Chemistry and Physics, 85th ed.,CRC Press, Boca Raton, 2005.
[51] Y. Marcus, Chem. Soc. Rev. 1993, 22, 409–416.[52] I. Shulgin, E. Ruckenstein, J. Phys. Chem. B 1999, 103, 872–
877.[53] Y. Marcus, Monatsh. Chem. 2001, 132, 1387–1411.[54] C. Rafols, M. Roses, E. Bosch, J. Chem. Soc. Perkin Trans. 2
1997, 243–248.[55] U. Buhvestov, F. Rived, C. Rafols, E. Bosch, M. Roses, J. Phys.
Org. Chem. 1998, 11, 185–192.[56] B. Kingston, M. C. R. Symons, J. Chem. Soc. Faraday Trans.
2 1973, 69, 978–992.[57] M. C. R. Symons, Pure Appl. Chem. 1986, 58, 1121–1132.[58] E. B. Tada, L. P. Novaki, O. A. El Seoud, J. Phys. Org. Chem.
2000, 13, 679–687.[59] M. S. Antonious, E. B. Tada, O. A. El Seoud, J. Phys. Org.
Chem. 2002, 15, 403–412.[60] J. Catalan, C. Diaz, F. Garcia-Blanco, J. Org. Chem. 2001, 66,
5846–5852.[61] R. Zana, M. J. Eliebari, J. Phys. Chem. 1993, 97, 11134–11136.[62] J. R. Haak, J. B. F. N. Engberts, Recl. Trav. Chim. Pays-Bas
1986, 105, 307–311.[63] K. R. Harris, P. J. Newitt, J. Phys. Chem. A 1999, 103, 6508–
6513.[64] K. Nishikawa, H. Hayashi, T. Iijima, J. Phys. Chem. 1989, 93,
6559–6565.[65] M. Huelsekopf, R. Ludwig, J. Mol. Liq. 2000, 85, 105–125.[66] I. Shulgin, E. Ruckenstein, J. Phys. Chem. B 1999, 103, 2496–
2503.[67] W. L. F. Armarego, C. L. L. Chai, in Purification of Laboratory
Chemicals, 5th ed., Elsevier, New York, 2003, p. 80.[68] T. D. W. Claridge, in High Resolution NMR Techniques in Or-
ganic Chemistry, Pergamon, New York, 1999, p. 148.[69] C. Huber, K. Fahnrich, C. Krause, T. Werner, J. Photochem.
Photobiol. A 1999, 128, 111–120.[70] E. V. Anslyn, D. A. Dougherty, in Modern Physical Organic
Chemistry; University Science Books, Sausalito, 2004, p. 259.[71] J. J. P. Stewart, MOPAC2007, version 7.176 W, 2007.[72] M. J. Frisch, G. W. Trucks, G. E. Scuseria, M. A. Robb, J. R.
Cheeseman, J. Montgomery, Gaussian, Inc., Wallington CT,2004.
[73] C. T. Lee, W. T. Yang, R. G. Parr, Phys. Rev. B 1988, 37, 785–789.
[74] A. D. Becke, J. Chem. Phys. 1993, 98, 5648–5652.Received: August 29, 2007
Published Online: January 15, 2008