TN 19: Gradient Elution In Ion Chromatography - Thermo Fisher
Upload
khangminh22Category
view
4download
0
The world leader in serving science
Sept 17, 2021
Investor Day 2021
ServingScience.
ServingSociety.

Safe Harbor / Non-GAAP Measures
2
Various remarks that we may make in the following presentations about the company’s future expectations, plans and prospects constitute forward-looking statements for purposes of the safe harbor provisions under The Private Securities Litigation Reform Act of 1995. Actual results may differ materially from those indicated by these forward-looking statements as a result of various important factors, including those discussed in our Annual Report on Form 10-K for the year ended December 31, 2020 and our subsequent Form 10-Qs, under the caption “Risk Factors,” which are on file with the Securities and Exchange Commission and available in the “Investors” section of our website under the heading “SEC Filings.” Important factors that could cause actual results to differ materially from those indicated by forward-looking statements include risks and uncertainties relating to: the need to develop new products and adapt to significant technological change; implementation of strategies for improving internal growth; general economic conditions and related uncertainties; dependence on customers’ capital spending policies and government funding policies; the effect of economic and political conditions and exchange rate fluctuations on international operations; use and protection of intellectual property; the effect of changes in governmental regulations; and the effect of laws and regulations governing government contracts, as well as the possibility that expected benefits related to recent or pending acquisitions, including our pending acquisition of PPD, Inc., may not materialize as expected. While we may elect to update forward-looking statements at some point in the future, we specifically disclaim any obligation to do so, even if estimates change, therefore, you should not rely on these forward-looking statements as representing our views as of any date subsequent to today.
During these presentations, we will be referring to certain financial measures not prepared in accordance with generally accepted accounting principles, or GAAP, including adjusted EPS, adjusted operating margin and free cash flow. The non-GAAP financial measures of Thermo Fisher’s results of operations and cash flows included in these presentations are not meant to be considered superior to or a substitute for Thermo Fisher’s results of operations prepared in accordance with GAAP. Definitions of these non-GAAP financial measures and, for historical periods, a reconciliation of the non-GAAP financial measures to the most directly comparable GAAP measures is available in the appendix to these presentations.
Please note that the attached presentations contain financial projections and other forward-looking statements that are specific to the date of the presentations – September 17, 2021 – and should not be considered current after such date.

Agenda
Rafael TejadaVice President, Investor Relations
Welcome and Safe Harbor
Marc CasperChairman, President andChief Executive Officer
Consistently Creating Value for All of Our Stakeholders
Mark StevensonExecutive Vice President andChief Operating Officer
Michel LagardeExecutive Vice President
Our Proven Growth Strategy in Action
Stephen WilliamsonSenior Vice President andChief Financial Officer
Consistently Delivering Exceptional Financial Results
Marc Casper Summary and Q&A

The world leader in serving science
Marc N. Casper
Chairman, President and Chief Executive Officer
Investor Day September 17, 2021
Consistently Creating Value for
All Our Stakeholders
Option 2

Key takeaways of the day
5
• Incredibly well-positioned industry leader serving very attractive end markets
• Proven growth strategy powered by our PPI Business System
• Leading the industry in the COVID-19 response and enhancing our competitive position
• Outstanding financial track record and outlook, with long-term, high-single-digit organic revenue growth
• Our comprehensive ESG strategy creates sustainable value for all our stakeholders

6
Our Mission is our purpose
We enable our customers to make the world
healthier, cleaner and safer

World leader in serving science
7
Unmatched depth of capabilities• Leading innovative technologies
• Deep applications expertise
• Premier productivity partner
• Comprehensive pharma
services offering
Industry-leading scale • Exceptional commercial reach
• Unique customer access
• Extensive global footprint
Powered by our Practical Process Improvement (PPI) Business System
employees90,000
R&D investment$1.4B
revenue$35B
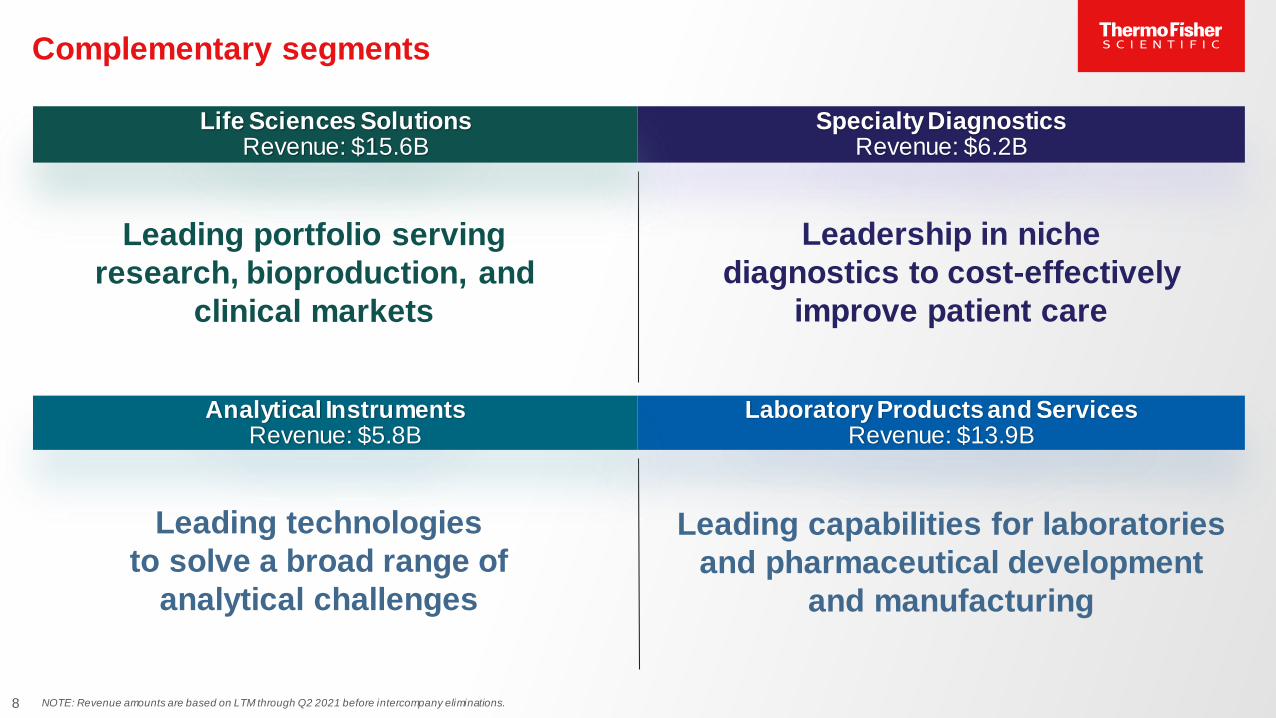
Complementary segments
8
Leadership in niche
diagnostics to cost-effectively
improve patient care
Leading portfolio serving
research, bioproduction, and
clinical markets
Leading capabilities for laboratories
and pharmaceutical development
and manufacturing
Leading technologies
to solve a broad range of
analytical challenges
NOTE: Revenue amounts are based on LTM through Q2 2021 before intercompany eliminations.
Specialty DiagnosticsRevenue: $6.2B
Laboratory Products and ServicesRevenue: $13.9B
Analytical InstrumentsRevenue: $5.8B
Life Sciences SolutionsRevenue: $15.6B

Breadth and depth of capabilities
9
Specialty DiagnosticsRevenue: $6.2B
AllType NGS Assays
High-resolution Genotyping
Microbiology
Antimicrobial Susceptibility
Testing Solutions
Clinical Diagnostics
B·R·A·H·M·SPCT Biomarkers
Accula Systempoint-of-care PCRmolecular testing
ImmunoDiagnostics
ImmunoCA P Allergy and
EliA Autoimmunity Tests
Phadia 200
Transplant
Diagnostics
Viral TransportMedia and Collection
Laboratory Products and ServicesRevenue: $13.9B
Lab Equipment &
Consumables
Research &
Safety Channel
Pharma Services
Nalgene/
Nunc
Labw are E1 Cliptip
Electronic Pipette System
GP PRO
Centrifuge
Analytical InstrumentsRevenue: $5.8B
Electron
MicroscopyChromatography & Mass Spectrometry
Orbitrap Exploris
480 MS
Vanquish Core
UHPLC
Life Sciences SolutionsRevenue: $15.6B
Biosciences
Cell Culture
Media
Genetic Sciences BioProduction
Genexus
Integrated
SequencerHyPerforma DynaDrive
Single-Use Bioreactor
TaqPath COVID19
rtPCR test kit
Healthcare
Market Channel
Instrument and
Enterprise Services
Chemical Analysis
Laboratory
Chemicals
NOTE: Revenue amounts are based on LTM through Q2 2021 before intercompany eliminations.
TSX Series
ULT Storage
Cascadion
Helios 5 EXL
Wafer Dual Beam
SEM
Tundra
Cryo-TEM
Spectra Ultra
scanning TEM
Orbitrap IQ-X Tribrid
mass spectrometer
Niton XL5
Handheld XRF
Analyzer
Linspector
in-line Li-ion battery QC
QuantStudio 7
Real-Time PCR Systems
GeneArt
CRISPR Gene
Editing
Molecular Biology
Reagents & Kits

Consistently creating value for all our stakeholders
10
Enabled by the power of our PPI Business System and our mission-driven culture
Communities
Enhancing our local
communities and
improving the world
for current and
future generations
Customers
Helping accelerate
innovation and enhance
productivity, making it
rational for customers to
want to do more business
with us
Shareholders
Outstanding financial
track record and outlook
for value creation
Colleagues
A great place to have
a mission-driven career

Consistently delivering exceptional performance
2010 2020
12% CAGR
Revenue ($B)
$10.4
$32.2
2010 2020
19% CAGR
Adjusted EPS
$19.55
2010 2020
19% CAGR
Free Cash Flow ($B)
$1.2
$6.8
$3.43
11
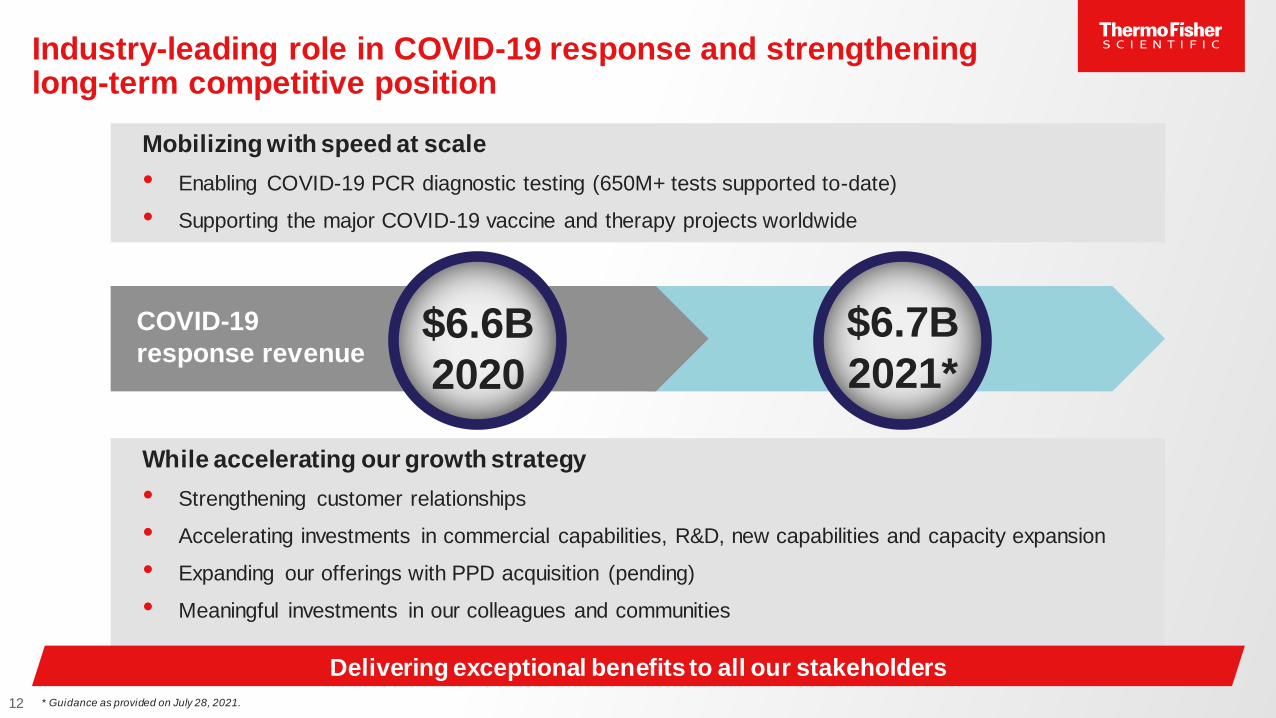
While accelerating our growth strategy
• Strengthening customer relationships
• Accelerating investments in commercial capabilities, R&D, new capabilities and capacity expansion
• Expanding our offerings with PPD acquisition (pending)
• Meaningful investments in our colleagues and communities
12
Delivering exceptional benefits to all our stakeholders
Industry-leading role in COVID-19 response and strengthening long-term competitive position
Mobilizing with speed at scale
• Enabling COVID-19 PCR diagnostic testing (650M+ tests supported to-date)
• Supporting the major COVID-19 vaccine and therapy projects worldwide
$6.6B
2020
$6.7B
2021*
COVID-19
response revenue
* Guidance as provided on July 28, 2021.
Exceptionally positioned for a terrific future
13
Industry leader serving very attractive end markets
Proven growth strategy drives share gain
Proven approach to capital deployment
Delivering value for all our stakeholders
1
2
3
4

Exceptionally positioned for a terrific future
14
Industry leader serving very attractive end markets1
2
3
4

15
$170B market
with 4% - 6%
long-term Core
market growth
We serve very attractive end markets
Strong and durable market growth
• Favorable demographic trends globally
• Scientific advances in life sciences research
• Robust funding environment for Biotech
• Increased need for outsourcing/partnering by customers
• Heightened investment outlook driven by COVID-19
impact on Pharma & Biotech funding, supply chain
security and infectious disease research

Strategic evolution in end-market exposure
NOTE: Amounts based on LTM. Percentages are before intercompany eliminations and may not sum to 100% due to rounding. 16
Increased our presence in the rapidly growing Pharma and Biotech segment
2016 Pro Forma Core Revenue (LTM)*
*Q2 2021 Pro Forma Core Revenue = total Thermo Fisher revenue, excluding testing and testing -related response revenue, plus PPD revenue.
$18.3BRevenue
Pharma
& Biotech
31%
Academic
& Government
25%
Industrial
& Applied
20%
Diagnostics
& Healthcare
24%
$35.3BRevenue
Pharma
& Biotech
56%
Industrial
& Applied
13%
Diagnostics
& Healthcare
15%
Academic &
Government
16%

Exceptionally positioned for a terrific future
17
Proven growth strategy drives share gain
1
2
3
4

Our proven growth strategy drives share gain
long-term Core organic
revenue growth
18
7% - 9%• Commitment to high-impact innovation
• Scale in high-growth and
emerging markets
• Unique customer value proposition
B
A
C

19
Commitment to high-impact innovation
• $1.4B investment in R&D
• Business-specific R&D teams with
deep expertise
• Benefits from differentiated customer
access and technological depth
across the company
• A commitment and track record
of delivering best-in-class products
A

High-impact innovation strategy: Resulting in outstanding product launches
20
Cell Therapy Workflow SolutionsComplete offering of fit-for-purpose instruments, reagents
and consumables across the cell therapy workflow
Accelerating advanced therapies
Spectra Ultra scanning TEMScanning transmission electron microscope (TEM)
for imaging of beam-sensitive materials
Automating semiconductor process control
Discovering novel drug targets
Oncomine Comprehensive Assay PlusProfiles 500+ unique genes for single and multiple gene
biomarker insights
Advancing precision medicine
Next-Generation TaqPath COVID-19 2.0 TestAdvanced assay design for current and emerging SARS-
CoV-2 variants
More accurate diagnostics
Orbitrap IQ-X Tribrid mass spectrometerUnique depth of analysis and unparalleled accuracy and
precision to advance small-molecule analysis
Scaling up bioprocessing
HyPerforma DynaDrive Single-Use Bioreactor Innovative bioreactors with high performance across
volumes up to 5,000L
Enabling life sciences
Enabling diagnostics Enabling material science
A

21
China
India
S. Korea
$7.1BRevenueLatin
America
E. Europe
M.E.,Africa
S.E. Asia
Our key differentiators
• Unique depth of product and service offerings
• Leading scale
• Leading commercial infrastructure
• Expanding e-commerce platform
• Outstanding supply-chain capabilities
• Localized R&D and manufacturing
Scale in high-growth and emerging markets
Leading scale and depth create a differentiated experience for our customers
NOTE: Amounts based on LTM through Q2 2021.
B

22
Enabling China’s fast-growing Pharma and Biotech market
Supplying BioParks with our comprehensive life sciences research offerings
Formed Joint Venture with Innoforceand establishing biologics production facility
Constructed new Suzhou Single Use Technology (SUT) Factory
Supporting China’s BioPark life
sciences research centers
Increasing biologics
manufacturing capacity
Supplying bioprocessing solutions for
drug development and manufacturing
Our Approach
• Continuing to expand our local capabilities and capacity
• Enabling emerging Chinese Biotech customers
• Locally developed and manufactured products tailored to China market needs
B

Leading Pharma
Services offering
Leading Life Sciences offering
Research Bioproduction
We help our customers accelerate innovation and enhance productivity, underpinned by quality
Enabling customers with our leading Life
Sciences and Pharma Services offerings
• Unique customer access
• Increase share of wallet with existing customers
• Launch steady stream of high-impact innovative products
• Leading research and safety market channel enables our customers’ research activities
• Provide comprehensive value-added Pharma Services
• Continuously enhance our offering through strategic acquisitions
Our Approach
23
Unique customer value proposition: Pharma & BiotechC

CU
ST
OM
ER
INS
IGH
T
DIF
FE
RE
NT
IAT
ED
OF
FE
RIN
G
24
Large Biopharma
Small and Emerging Biotech
Trusted biopharma
relationships
Collaborations with key
academic andhealthcareinstitutions
Best-in-class products
Portfolio
breadth
Deep expertise
and accumulated experience
Pharma
Services
capabilities
The trusted partner to Pharma & Biotech customersC

Exceptionally positioned for a terrific future
25
Proven approach to capital deployment
1
2
3
4

Our capital deployment strategy remains unchanged
26
% of Capital we expect
to deploy over time
M&A 60 - 75%
Return of
Capital25 - 40%
• Fully fund high-ROI organic opex and
capex opportunities
• M&A is the primary focus of our capital
deployment strategy
• Fragmented industry and our proven
M&A playbook create ample opportunities
• Expect share buybacks to remain the
primary means of returning capital
• Expect dividend to consistently increase
over time
• Capital deployment mix will vary
in a given year
We will continue to effectively deploy substantial amounts of capital

• Rigorous selection criteria
• Enhances our customer offering
• Strengthens our strategic position
• Creates shareholder value
• Disciplined decision-making
• Proven integration process
• Enhanced financial and operational
performance of acquired company
• Excellent cost and revenue synergy realization
Market remains fragmented, providing
ample future opportunities
Thermo Fisher
plus top
2 players
100s of
smaller
companies
Successful M&A strategy
Proven capital deployment methodology
Creating significant value for our shareholders
27

28
Proven track record of consistent capital deployment and value creation
2013
2010
2016
2017
2018
2021
* Transaction pending
2011
Improved performance of each acquisition, benefitting customers, colleagues, and the overall company
*

29
• PPD – a leading Clinical Research Organization
• Natural extension of our value proposition and capabilities for our pharma and biotech customers
• Cash purchase price of $17.4B plus the assumption of approximately $3.5B of net debt
• Financially compelling and expected to be immediately and significantly accretive to adjusted EPS in first
twelve months after close
• Expected to close by the end of 2021
Acquisition of PPD - creating customer and shareholder value

30
Strategic rationale for acquisition of PPD
• Establishes Thermo Fisher as a global leader in the attractive high growth clinical research services industry
• Natural extension of our capabilities to meet the needs of pharma and biotech, our largest and
fastest growing end market
• Creates meaningful benefit for our customers
• The acquisition further enables us to partner with our customers as they move from a scientific idea
to an approved medicine
• Compelling combination creates the opportunity to meaningfully reduce both the time and cost to bring
innovative therapies to market
• Generates substantial synergies and delivers attractive financial benefits to create shareholder value

31
PPD acquisition update
• The business is performing very well
• On track for Q4 close
• Integration planning underway
• Received foreign investment clearances
• Regulatory filings in process
• Initiated financing
• Expected to deliver $1.50 in adjusted
EPS in first year of ownership

Exceptionally positioned for a terrific future
32
Delivering value for all our stakeholders
1
2
3
4
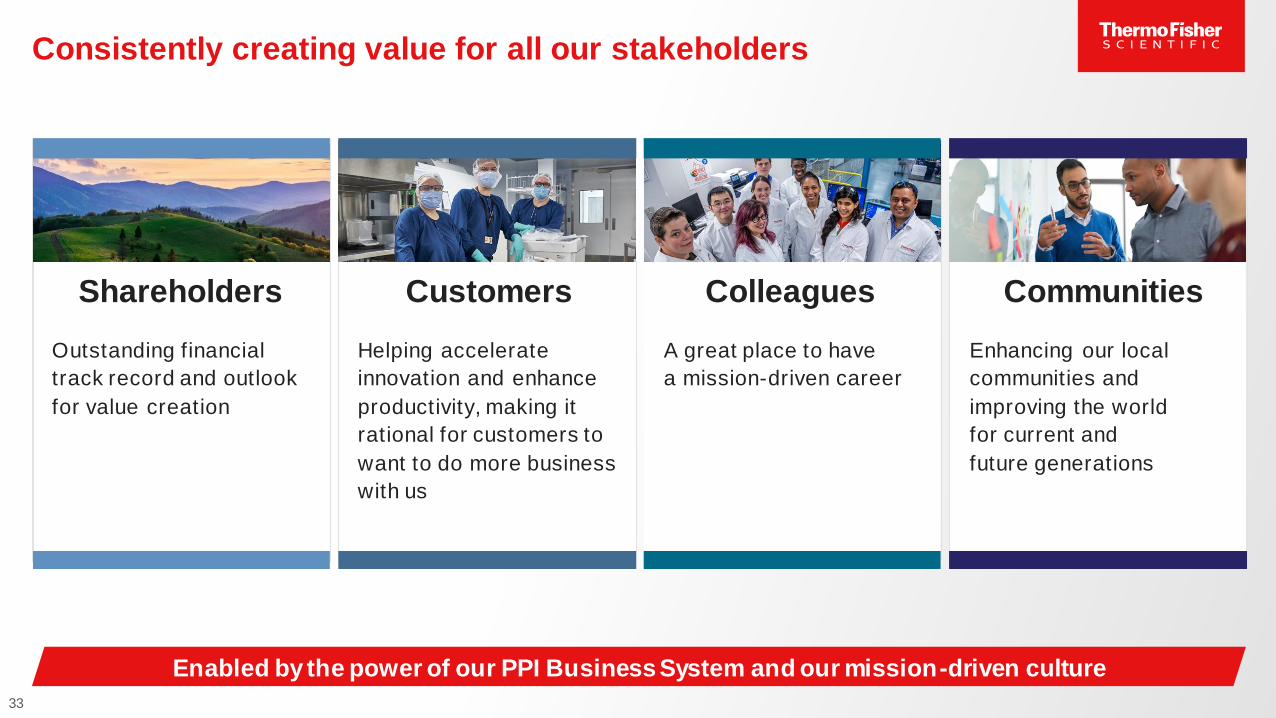
Consistently creating value for all our stakeholders
33
Enabled by the power of our PPI Business System and our mission-driven culture
Communities
Enhancing our local
communities and
improving the world
for current and
future generations
Customers
Helping accelerate
innovation and enhance
productivity, making it
rational for customers to
want to do more business
with us
Shareholders
Outstanding financial
track record and outlook
for value creation
Colleagues
A great place to have
a mission-driven career

34
Our culture and PPI Business System are critical to our success
Our Culture & PPI Business System enable us to:
• Our Mission is to enable our customers to make the world
healthier, cleaner and safer
• Our products, technologies and services benefit society globally
It starts with
our Mission
Increase customer
allegiance
Drive operational
excellence and
continuous
improvement
Operate with
speed at scale
Do business
the right way
Delivering value for all our stakeholders

Environment
• Reducing our environmental impact and driving operational efficiency
• Innovating for our customers enables them to meet their own sustainability goals
Our comprehensive ESG strategy creates sustainable valuefor all our stakeholders
35
Governance
• Strong corporate governance and business practices appropriately manage risk
• Transparency on ESG performance ensures accountability
Social
• Attracting, developing, and retaining diverse colleagues creates competitive advantage
• Giving back to our communities strengthens our relationships
Robust
Stakeholder
Engagement
Committed to doing business the right way

Environment Social Governance
Actively addressing climate risks minimizes our
environmental impact and drives operational efficiency:
• 30% reduction in greenhouse gas emissions by 2030
• Net-zero carbon emissions by 2050
• 32 Zero Waste sites diverting >90% from landfill
• PPI Business System drives daily process
optimization and builds environmental efficiency
Innovating for our customers enables them to meet their own sustainability goals, and increases affinity
for our products and services:
• 54 greener product categories
• Paper cooler for sustainable cold-chain shipping
• Eco-labeling of cold temperature storage portfolio
Attracting and retaining diverse colleagues creates
competitive advantage:
• Award-winning culture with engrained commitment to diversity and inclusion
• HBCU recruitment effort on track to hire 500
graduates
Giving back to our communities strengthens local positioning and relationships, and inspires the next
generation of innovators:
• STEM education strategy for underserved students
• 300+ community outreach teams
• $25M impact investment empowers Black communities / businesses impacted by the pandemic
Strong corporate governance and business practices
minimize risk:
• Board oversight of ESG strategy and initiatives
• Active and robust shareholder engagements
Greater transparency of material ESG drivers ensures accountability:
• Annual performance reporting aligned to GRI, CDP,
SASB and UN SDGs
• EEO-1 data disclosed for U.S. representation insights
• Higher year over year scores from rating agencies ISS, MSCI and Sustainalytics confirm progress
Delivering value for all our stakeholders
Our comprehensive ESG strategy creates sustainable value for all our stakeholders
36

Exceptionally positioned for a terrific future
37
Industry leader serving very attractive end markets
Proven growth strategy drives share gain
Proven approach to capital deployment
Delivering value for all our stakeholders
1
2
3
4

The world leader in serving science
Mark Stevenson
Our Proven Growth Strategy
in Action
Executive Vice President and Chief Operating Officer
Investor Day September 17, 2021
Michel Lagarde
Executive Vice President

Rich set of opportunities to enable our customers’ success
39
Pharma & Biotech
Academic & Government
• Enabling new scientific advances that
eventually fuel development pipelines
of for-profit companies
Industrial & Applied
• Facilitating research and
development in materials
science and sustainable energy
Diagnostics & Healthcare
• Enabling the adoption
of precision medicine
Focus for this presentation
NOTE: Amounts based on LTM. Percentages are before intercompany eliminations and may not sum to 100% due to rounding.
*Q2 2021 Pro Forma Core Revenue = total Thermo Fisher revenue, excluding testing and testing -related response revenue, plus PPD revenue.
$35.3BRevenue
Pharma
& Biotech
56%
Industrial
& Applied
13%
Diagnostics
& Healthcare
15%
Academic &
Government
16%
• Supporting our customers from scientific idea
to approved medicine

Key takeaways
40
• Proven track record for driving growth in Pharma & Biotech
• Bright prospects for strong growth in this segment
• Robust market growth outlook for Pharma & Biotech
• Exceptionally well-positioned to fuel exciting opportunities for our customers, and continue
to strengthen our customer value proposition
• Differentiated approach to support advanced therapies and new modalities

Proven track record of driving growth in Pharma & Biotech
41
We help our customers accelerate innovation and
enhance productivity, underpinned by quality
Thermo Fisher revenue and average
organic growth from Pharma & Biotech
2010 2015 2020
$5.1B$2.6B
• Trusted partner to Pharma & Biotech customers, who benefit
from our thought leadership and accumulated experience
• Industry-leading depth and breadth of capabilities that span
the drug development cycle
• Continuously strengthening this offering through organic
investments and strategic acquisitions
$12.4B

Depth and breadth of capabilities provided by our businesses
42
Our businesses that serve Pharma and Biotech customers
Laboratory Products and Services
Analytical InstrumentsLife Sciences Solutions
Biosciences Genetic Sciences BioProduction
• Reagents and
instruments that enable
novel drug discovery
• Essential building
blocks for development
and manufacturing
of advanced therapies
(e.g., mRNA)
• Comprehensive offering
of platforms, assays,
and consumables for
a full range of genetic
analysis solutions
• Companion diagnostics
(next generation
sequencing)
• Proven portfolio of
technologies for the
successful production
of biologic therapies
and vaccines, that span
development through
large-scale commercial
production
Chromatography &
Mass SpectrometryElectron Microscopy Chemical Analysis
• Innovative technologies to enable advanced scientific trends
• Process analytical technologies and solutions for biopharma QA/QC
Research & Safety Channel Lab Products and Lab Chemicals Pharma Services PPD (pending acquisition)
• Distribution channel providing choice,
convenience, and aggregation
• Leading eCommerce presence
• Full range of lab equipment, consumables
and chemicals
• Development and
manufacturing services
• Expertise with advanced
therapies
• Clinical trial supplies
• Global network
• Clinical Research Services
• Laboratory Services
Pro Forma Core Revenue from Pharma & Biotech (LTM): $20B**Q2 2021 Pro Forma Core Revenue = total Thermo Fisher revenue, excluding testing and testing -related response revenue, plus PPD revenue.

Helping customers accelerate innovation and enhance productivity
Solutions to discover new therapeuticsSupport across all phases of
clinical development
Facilitating scale-up to
commercial production
Trusted partner offering thought leadership and the benefit of our accumulated experience
43
Early discovery and research Development Clinical trials Commercial production
Early discovery and research Development Clinical trials Commercial production
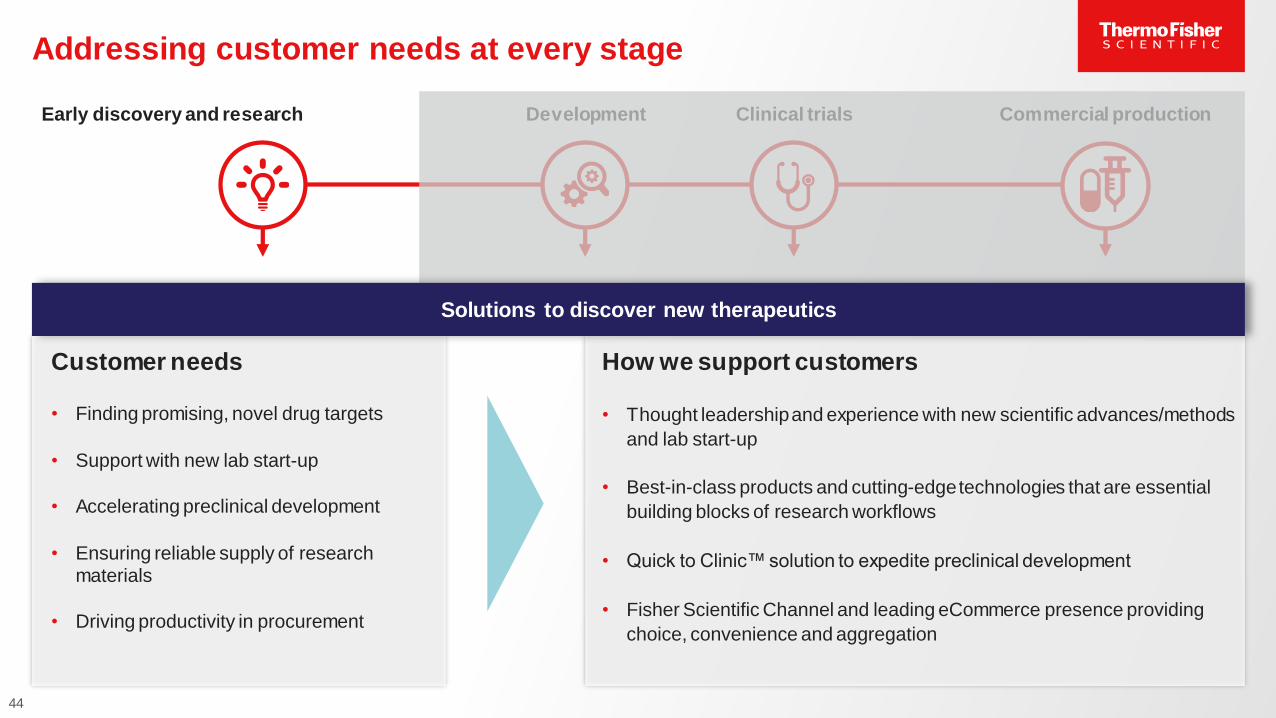
Addressing customer needs at every stage
44
Customer needs
• Finding promising, novel drug targets
• Support with new lab start-up
• Accelerating preclinical development
• Ensuring reliable supply of research materials
• Driving productivity in procurement
How we support customers
• Thought leadership and experience with new scientific advances/methods
and lab start-up
• Best-in-class products and cutting-edge technologies that are essential
building blocks of research workflows
• Quick to Clinic™ solution to expedite preclinical development
• Fisher Scientific Channel and leading eCommerce presence providing
choice, convenience and aggregation
44
Solutions to discover new therapeutics

Early discovery and research Development Clinical trials Commercial production
Addressing customer needs at every stage
Customer needs
• Solutions to formulation and process development challenges
• Expertise in design and executionof clinical trials
• Accelerating drug development timelines
• Assurance of supply
How we support customers
• Leading expertise and accumulated experience in development solutions and new modalities
• Bioprocessing solutions from our Biosciences and BioProductionbusinesses for clinical scale manufacturing
• Quick to Care™ solution offering parallel drug substance anddrug product development (including new modalities)
• Resilient supply chain management
• Labeling, packaging, and logistics for clinical trials
• Clinical research services, including patient recruitment, and design and execution of clinical studies (pending PPD acquisition)
45
Support across all phases of clinical development

Early discovery and research Development Clinical trials Commercial production
Facilitating scale-up to commercial production
Addressing customer needs at every stage
Customer needs
• Support for in-house commercial-scale
production and/or reliable external
manufacturing capabilities
• Manufacturing capabilities and
experience with new modalities
How we support customers
• Bioprocessing solutions to enable customers to scale up manufacturing capabilities to commercial requirements
• Industry-leading, commercial-scale manufacturing expertise in our Pharma Services business
• Deep experience with manufacturing of biologics, small molecules, and
new modalities (e.g., viral vectors, mRNA and cell therapy)
• Global cGMP manufacturing footprint with regional presence to ensure
supply chain resilience
• Best-in-class quality processes and systems
46

Bright prospects for strong growth in Pharma & Biotech
47
Exceptionally well-positioned to enable exciting developments in Pharma & Biotech
Differentiated approach to support advanced therapies and new modalities3
Capitalizing on a robust market growth outlook1
Continue to strengthen our customer value proposition2

Bright prospects for strong growth in Pharma & Biotech
48
3
Capitalizing on a robust market growth outlook1
2
Exceptionally well-positioned to enable exciting developments in Pharma & Biotech

49
Healthy
pipelines
Favorable
regulatory
climate
Scientific
breakthroughs and
rise of novel therapies
~18,000No. of drugs in pipeline
41%Share of biologics in pipeline
53No. of FDA novel drug
approvals
Strong biopharma
funding
environment
$22BGlobal VC funding
$200BBiopharma R&D spend
Attractive market dynamics and strong funding drive strong and durable market growth
2020
>1,600# of cell and gene therapies in
pipeline
50+mRNA vaccine and therapy
targets in the pipeline
Robust market growth outlook for Pharma & Biotech1

Bright prospects for strong growth in Pharma & Biotech
50
3
1
Continue to strengthen our customer value proposition2
Exceptionally well-positioned to enable exciting developments in Pharma & Biotech

51
Discovery Development and Manufacturing
Fit-for-purpose innovation aimed at addressing specific needs of Pharma and Biotech customers
Tundra
Cryo-TEM
Optimized for drug
discovery and
optimization of drug
candidates
Cell Culture
media & reagents
Designed to improve yield and
reduce variability
Gibco CTS Rotea
cell-processing system
Centrifugation system for
cell therapy development
and manufacturing
Orbitrap Exploris
480 MS
High throughput
proteomics and
biopharma applications
HyPerforma DynaDrive
single-use bioreactor
Improved design, scalability
and optimal cell culture
performance
Select recent examples of new product launches for biopharma applications
GeneArt
CRISPR Gene Editing
Synthetic biology tools
enabling drug discovery
Investing in high-impact innovation for Pharma & Biotech 2

Investing in capacity expansion and new capabilities
Capacity expansion in
BioProduction
• Cell culture, single use
technology, and purification
Capacity expansion in
Pharma Services
• Sterile fill-finish and
biologics drug substance
New capabilities
Biosciences business
• Expanding capacity for enzymes
and nucleotides that are critical
for mRNA vaccines and therapies
Pharma Services business
• Development and manufacturing
capabilities for new modalities
(mRNA, cell therapy, viral
vector/gene therapy, plasmids)
$1.0B$1.2B
$2.1B
Fueling exciting opportunities for our Pharma & Biotech customers
Alleviating significant capacity
constraints
Addressing surging demand
Enabling advanced therapies
Investments to support robust customer demand in our
Biosciences, BioProduction, and Pharma Services businesses
52
2
$4.3BCapex in 2020-22

53
>2x capacity by end of 2022
Single-use technology
>3x capacity by end of 2022
Purification resins
Harmonizing materials and processes, and ensuring dual supply and regional sourcing for materials
$1.0B capital investment to expand our global manufacturing network and bolster our supply chain
Bedford, MA
2 Capacity expansion in BioProduction
Singapore
>2x capacity by end of 2023
Cell culture
Inchinnan, UK
●
● Expansion site ● Existing site

54
Biologic drug substance
>2x capacity by end of 2023
Sterile fill/finish
>2x increase in the number of
lines over next 4 yearsGreenville, NC
● Expansion site ● Existing site
$2.1B capital investment to expand capacity for biologics and sterile fill finish
2 Capacity expansion in Pharma Services
Hangzhou, China

55
2
$1.2B investment in new capabilities that enable advanced therapies
Biosciences – Nucleotides and enzymes for vaccines
Mitigating risk for customers through secondary
manufacturing locations for redundant supply
Pharma Services – Cell therapy, Viral vector/gene therapy,
Plasmid, and mRNA manufacturing
Establishing new capabilities and scientific leadership
in rapidly growing modalities
Austin, TX
New capabilities
Plainville, MA
Vilnius, Lithuania
Carlsbad, CA

Contract development & manufacturing
2017
Viral vector services
2018
Cork, Ireland site
2019
Partnership - Lengnau,
Switzerland
2020
Clinical research services
(2021, Pending)
Henogen SA viral vector sites
2021
56
Discovery ManufacturingDevelopment
Spectral cell sorting
2021
Programmable dye platform
2020
Cell culture media
2018
Continuously strengthening our offering via strategic M&A
Advanced cytometry offeringsto advance cell analysis and enable
deeper biological insights
Extending our capabilities and expanding manufacturing capacity
for advanced therapies

Bright prospects for strong growth in Pharma & Biotech
57
Differentiated approach to support advanced therapies and new modalities3
1
2
Exceptionally well-positioned to enable exciting developments in Pharma & Biotech

58
3
Trusted biopharma
relationships
Collaborations with key
academic andhealthcareinstitutions
Best-in-class products
Portfolio
breadth
Deep expertise and accumulated experience
Pharma
Services
capabilities
Approach is repeated across multiple new modalities
CU
ST
OM
ER
INS
IGH
T
DIF
FE
RE
NT
IAT
ED
OF
FE
RIN
G
Differentiated approach to support advanced therapies and new modalities

59
3
Trusted biopharma
relationships
Best-in-class products
Portfolio
breadth
Pharma
Services
capabilities
Applying the approach to establish leadership in mRNA
DIF
FE
RE
NT
IAT
ED
OF
FE
RIN
G
Leading oligos, enzymes, and purification resins, ULT freezers,
and single use technologies
Investing in mRNA manufacturing capabilitiesMonza, IT
Collaborating with Pfizer and Moderna to understand
mRNA COVID-19 vaccine manufacturing needs
Strong pre-pandemic relationships with leading
mRNA researchers and VCs
End-to-end mRNA workflow
Deep expertise and accumulated experience
CU
ST
OM
ER
INS
IGH
T
Collaborations with key
academic andhealthcareinstitutions
Synthesis Purification Delivery
Template
development
IVT RNA
synthesis
RNA
synthesis
Formulation
and delivery
Transcript
purification
Differentiated approach to support advanced therapies and new modalities: mRNA example

60
3
Trusted biopharma
relationships
Best-in-class products
Portfolio
breadth
Pharma
Services
capabilities
Applying the approach to establish leadership in cell therapy
DIF
FE
RE
NT
IAT
ED
OF
FE
RIN
G
Leading instruments and reagents
Standardized Cell Therapy workflow
Thermo Fisher Scientific Cell
Therapy Manufacturing and
Collaboration Center in
partnership with UCSF
Clinical Development Site, San Francisco
Rapid turnaround time
Low cost to patient
Quality and Safety
Identifying customer needs
Strategic Collaborations TeamCollaborations
with keyacademic and
healthcareinstitutions
CU
ST
OM
ER
INS
IGH
T
Deep expertise and accumulated experience
Differentiated approach to support advanced therapies and new modalities: Cell Therapy example

Key takeaways
61
• Proven track record for driving growth in Pharma & Biotech
• Bright prospects for strong growth in this segment
• Robust market growth outlook for Pharma & Biotech
• Exceptionally well-positioned to fuel exciting opportunities for our customers, and continue
to strengthen our customer value proposition
• Differentiated approach to support advanced therapies and new modalities

The world leader in serving science
Stephen Williamson
Senior Vice President and Chief Financial Officer
Investor Day September 17, 2021
Consistently Delivering
Exceptional Financial Results

Very attractive long-term financial profile
63
• Incredible track record
• Serve very attractive end markets with exceptional position
in Pharma and Biotech
• Delivering differentiated impact for all stakeholders during
the pandemic and investing for the future
• Proven growth strategy that enables customer success
• Exceptional execution through the PPI Business System
• Disciplined capital deployment generating excellent returns
• Will continue to deliver very strong adjusted EPS growth,
free cash flow and ROI
Consistently delivering exceptional financial results

Agenda
64
Incredible track record
2021 guidance recap
Initial 2022 guidance
2023 - 2025 financial model
1
2
3
4

Agenda
65
Incredible track record1
2
3
4

Consistently delivering exceptional performance
66
2010 2020
12% CAGR
Revenue ($B)
$10.4
$32.2
2010 2020
19% CAGR
Adjusted EPS
$19.55
2010 2020
19% CAGR
Free Cash Flow ($B)
$1.2
$6.8
$3.43

67
Accelerated high-return organic investments
R&D ($B) Capex ($B)
Investing across all key technology areas, including:
• Biosciences
• Bioproduction
• Electron Microscopy
• Genetic Sciences
• Mass Spectrometry
Adding new capacity and capabilities:
• Biosciences
• Bioproduction
• Genetic Sciences
• Lab Products
• Pharma Services
Fueling exceptional long-term organic growth
2019 2020 2021
$1.0
$1.2$1.4
2019 2020 2021
$0.9
$1.5
$2.6
1. Estimated 2021 R&D expense.
2. Mid-point of 2021 guidance as provided on July 28, 2021.
21

Agenda
68
2021 guidance recap
1
2
3
4

2021 Full-year guidance: Key assumptions
As provided on July 28, 2021
69
Revenue
• Total company organic growth: 9%
• 12% base business organic growth
• $6.7B of COVID-19 response revenue
• FX tailwind over 2020: $525M
Adjusted Operating Margin
• Adjusted operating margin: 29.7%
Free Cash Flow
• Free Cash Flow: $7.0B
• Net capital expenditure: $2.5B - $2.7B
Tax Rate
• 2021 tax rate: 14%
Capital Deployment
• PPD acquisition:
• Purchase price: $17.4B in cash plus the assumption of ~$3.5B net debt
• Expected to close by the end of the year,no operational impact included in 2021 guidance
• Placeholder for pre-financing interest cost ($40M/$0.10 of adjusted EPS) assumed in guidance
• Other M&A:
• $1.4B deployed in 2021 on other M&A (includinga European viral vector business and Mesa Biotech)
• Share Buybacks: $2.0B of share buybacks, already completed in Q1
• Dividends: $400M of dividends for thefull year, an 18% increase from 2020

2021 Full-year guidance: Summary
70
2021
Guidance*
2020
Actual
Revenue $35.9B $32.2B
Organic Growth 9% 25%
Adj. Operating Margin 29.7% 29.7%
Adjusted EPS $22.07 $19.55
Adjusted EPS Growth 13% 58%
Another year of excellent financial performance
* 2021 Guidance as provided on July 28, 2021.

2021 Revenue framing
71
• Core revenue represents the revenue from the ongoing business and includes vaccine and therapy
related response revenue, which is expected to convert to non-COVID-19 customer revenue
over time
• Testing response revenue represents COVID-19 testing and testing-related response revenue,
the majority of which will ramp down as the pandemic comes to an end
* 2021 Guidance as provided on July 28, 2021.
Total company
2021 revenue
$35.9B*Testing
response
revenue
Core revenue
$31.0B $4.9B

Agenda
72
Initial 2022 guidance
1
2
3
4

2022 Initial full-year guidance: Key assumptions
73
Revenue
• 8% Core organic revenue growth
• $750M of testing response revenue
• $6.0B of revenue from PPD
• FX tailwind over 2021: $50M
Adjusted Operating Margin
• Adjusted operating margin: 25.2%. Includes PPD at mid-teens and rest of business at 27.1%
Free Cash Flow
• Free Cash Flow: $7.0B
• Net capital expenditure: $2.5 - $2.75B
Interest Cost
• Net interest cost: $525M, including PPD financing
Tax Rate
• 2022 tax rate: 13%
• Assumes no significant tax reform changes
Capital Deployment
• PPD acquisition:
• Assumed to close 12/31/21
• Contributes $1.50 to adjusted EPS in 2022
• Assumed $75M of non-cash deferred revenue disallowance in 2022, ~($0.16) of EPS impact
• Share Buybacks: $2.0B of share buybacks
• Share count: 397 million
• Dividends: Assumed $460M of dividends for the full year, 15% increase from 2021

2022 Initial full-year guidance: Summary
74
Another year of excellent financial performance
Initial 2022
Guidance
2021
Guidance*
Revenue $40.3B $35.9B
Adjusted EPS $21.16 $22.07
• For each additional $100M of testing response revenue, over and above the $750M
assumed in the initial guide, we would expect ~$0.06 of additional adjusted EPS
* 2021 Guidance as provided on July 28, 2021.

2022 Initial full-year guidance: Comparison to 2019 long-term model
75
Consistently delivering on commitments
2022 Adj EPS 3-yr CAGR
2019 analyst meeting outlook $17.40 - $18.60 13 - 15%
Initial 2022 guidance $21.16 20%
* 2021 Guidance as provided on July 28, 2021.
Agenda
76
2023 - 2025 financial model
1
2
3
4

2023 - 2025 financial model
77
Continuing our track record of consistently delivering exceptional financial returns
A combination of very strong operational execution and disciplined
capital deployment generates exceptional shareholder returns
2022 (G) 2025 (M) 3-yr CAGR
Adjusted EPS $21.16 $31.04 - $31.84 14 - 15%
(G) = Initial 2022 guidance provided September 17, 2021.
(M) = 2023 - 2025 long-term financial model.

2023 - 2025 financial model: Operational assumptions before future capital deployment
78
40 - 50 bps of margin expansion
• PPI Business System drives operational excellence, creating the capacity to invest for
growth and deliver margin expansion
• Half of the 40 - 50 bps comes from volume leverage and price
• The other half comes from continuing to drive efficiency across the company and
the synergies from the PPD acquisition
Margin
expansion
Free Cash
Flow
Adjusted ROIC Annual growth of 140 bps
Free cash flow growth in-line with adjusted EPS growth
Revenue 7 - 9% Core organic growth

2023 - 2025 financial model: Operational performance before capital deployment
79
Expected Operational Outlook Excluding Impact of Capital Deployment
2022 (G) 2025 (M) 3-yr CAGR
Revenue $40.3B $48.8 - $50.8B 7 - 9% Core organic
Adjusted Operating Margin 25.2% >26% 40 - 50 bps
Adjusted Operating Income $10.2B $12.9 - $13.7B 8 - 11% growth
Adjusted ROIC 13% 17% 140 bps
An exceptionally strong operational outlook(G) = Initial 2022 guidance provided September 17, 2021.
(M) = 2023 - 2025 long-term financial model.

Our capital deployment strategy remains unchanged
80
% of Capital we expect
to deploy over time
M&A 60 - 75%
Return of
Capital25 - 40%
• Fully fund high-ROI organic opex and
capex opportunities
• M&A is the primary focus of our capital
deployment strategy
• Fragmented industry and our proven
M&A playbook create ample opportunities
• Expect share buybacks to remain the
primary means of returning capital
• Expect dividend to consistently increase
over time
• Capital deployment mix will vary
in a given year
We will continue to effectively deploy substantial amounts of capital

2023 - 2025 financial model: Including capital deployment
81
Below-the-line and capital deployment assumptions:
• Deploy $48B of capital 2023 - 2025:
• 65% M&A and 35% share buybacks/dividends
• Dividends increasing in line with adj EPS growth
• Leverage – maintaining investment grade:
• Model assumes 2.75x year-end leverage 2023 - 2025, actual leverage will depend on time and scale of M&A
• Tax rate: No significant changes assumed in the model, tax rate increases ~25bps per year to 13.75% in 2025
A combination of strong operational execution and disciplined capital deployment
generates exceptional shareholder returns
2022 (G) 2025 (M) 3-yr CAGR
Adjusted EPS $21.16 $31.04 - $31.84 14 - 15%
(G) = Initial 2022 guidance provided September 17, 2021.
(M) = 2023 - 2025 long-term financial model.

Very attractive long-term financial profile
82
7-9% Core organic growth
40-50bps margin expansion
Substantial capital deployment
Mid-teens adj. EPS growth
• Incredible track record
• Serve very attractive end markets with exceptional position
in Pharma and Biotech
• Delivering differentiated impact for all stakeholders during
the pandemic and investing for the future
• Proven growth strategy that enables customer success
• Exceptional execution through the PPI Business System
• Disciplined capital deployment generating excellent returns
• Will continue to deliver very strong adjusted EPS growth,
free cash flow and ROI
Consistently delivering exceptional financial results

Consistently Delivering Exceptional Financial Results: Appendix
83

Attractive revenue profile
84 NOTE: Revenue and percentages based on unaudited LTM through Q2 2021.
Consumables
59%
Services
20%
Instruments
21%Europe
27%
Asia-Pacific
18%
ROW
3%
52%
North America
Diverse Customer Basein Attractive End Markets
Industry - Leading Scale in Emerging Markets
Strong RecurringRevenue Mix
Revenue: $38.3B
Industrial& Applied
12%
Diagnostics& Healthcare
35%Pharma
& Biotech
38%
Academic &Government
15%

Strategic evolution in end-market exposure
NOTE: Amounts based on LTM. Percentages are before intercompany eliminations and may not sum to 100% due to rounding. 85
Increased our presence in the rapidly growing Pharma and Biotech segment
2016 Pro Forma Core Revenue (LTM)*
*Q2 2021 Pro Forma Core Revenue = total Thermo Fisher revenue, excluding testing and testing -related response revenue, plus PPD revenue.
$18.3BRevenue
Pharma
& Biotech
31%
Academic
& Government
25%
Industrial
& Applied
20%
Diagnostics
& Healthcare
24%
$35.3BRevenue
Pharma
& Biotech
56%
Industrial
& Applied
13%
Diagnostics
& Healthcare
15%
Academic &
Government
16%

Breadth and depth of capabilities
86
Specialty DiagnosticsRevenue: $6.2B
AllType NGS Assays
High-resolution Genotyping
Microbiology
Antimicrobial Susceptibility
Testing Solutions
Clinical Diagnostics
B·R·A·H·M·SPCT Biomarkers
Accula Systempoint-of-care PCRmolecular testing
ImmunoDiagnostics
ImmunoCA P Allergy and
EliA Autoimmunity Tests
Phadia 200
Transplant
Diagnostics
Viral TransportMedia and Collection
Laboratory Products and ServicesRevenue: $13.9B
Lab Equipment &
Consumables
Research &
Safety Channel
Pharma Services
Nalgene/
Nunc
Labw are E1 Cliptip
Electronic Pipette System
GP PRO
Centrifuge
Analytical InstrumentsRevenue: $5.8B
Electron
MicroscopyChromatography & Mass Spectrometry
Orbitrap Exploris
480 MS
Vanquish Core
UHPLC
Life Sciences SolutionsRevenue: $15.6B
Biosciences
Cell Culture
Media
Genetic Sciences BioProduction
Genexus
Integrated
SequencerHyPerforma DynaDrive
Single-Use Bioreactor
TaqPath COVID19
rtPCR test kit
Healthcare
Market Channel
Instrument and
Enterprise Services
Chemical Analysis
Laboratory
Chemicals
NOTE: Revenue amounts are based on LTM through Q2 2021 before intercompany eliminations.
TSX Series
ULT Storage
Cascadion
Helios 5 EXL
Wafer Dual Beam
SEM
Tundra
Cryo-TEM
Spectra Ultra
scanning TEM
Orbitrap IQ-X Tribrid
mass spectrometer
Niton XL5
Handheld XRF
Analyzer
Linspector
in-line Li-ion battery QC
QuantStudio 7
Real-Time PCR Systems
GeneArt
CRISPR Gene
Editing
Molecular Biology
Reagents & Kits

The world leader in serving science
Appendix
ServingScience.
ServingSociety.

88
Marc N. CasperChairman,President and Chief ExecutiveOfficerMarc Casper has been president and chief executive officer of Thermo Fisher Scientific since October 2009.He was also elected chairman of the board in February 2020.
Marc joined Thermo Electron Corporation in 2001 as president of the Life Sciences sector. He was named senior vice president in 2003, and in 2005 assumed responsibility for all of the company’s operating divisions. After the merger creating Thermo Fisher Scientific in 2006, Marc was named executive vice president and president of its Analytical Technologies businesses, and in 2008 he became the company’s Chief Operating Officer.
Prior to joining Thermo Fisher, Marc served as president, chief executive officer and a director of Kendro Laboratory Products. Previously, he worked for clinical diagnostics provider Dade Behring Inc., serving as president–Americas. Marc began his career as a strategy consultant at Bain & Company and later joined Bain Capital.
Marc serves on the boards of Wesleyan University, Mass General Brigham, and the U.S.-China Business Council. Previously, he was a director of the Advisory Board Company, Zimmer Holdings, U.S. Bancorp andBrigham & Women’s Hospital. Marc earned an MBA with high distinction from Harvard Business School andis a graduate of Wesleyan University, where he received a bachelor’s degree in economics.

89
Mark P. StevensonExecutiveVice President and Chief Operating OfficerMark Stevenson has been Executive Vice President and Chief Operating Officer of Thermo Fisher Scientific since August 2017 and has responsibility for the company’s life sciences, analytical instruments, laboratory products and specialty diagnostics businesses as well as the company’s innovation and digital strategy. He joined the companyas Executive Vice President and President, Life Sciences Solutions, through the acquisition of Life Technologiesin 2014.
Mark previously served as President and Chief Operating Officer of Life Technologies, and President and Chief Operating Officer of Applied Biosystems prior to its merger with Invitrogen Corporation in 2008.
Mark received his MBA from Henley Management School in the U.K. and his bachelor’s degree in chemistry from the University of Reading, also in the U.K. He serves on the board of the Personalized Medicine Coalition.

90
Michel LagardeExecutiveVice PresidentMichel was named Executive Vice President in September 2019, with responsibility for Thermo Fisher’s pharma services and customer channels businesses, as well as the company’s corporate accounts function. In January 2021, Michel also assumed responsibility for the bioproduction business as well as our key geographic regions.He joined the company as President, Pharma Services, through the acquisition of Patheon in 2017.
Michel previously served as President and Chief Operating officer of Patheon from 2016 to 2017, and prior to that, he was Managing Director at JLL Partners, a leading middle-market private equity firm focused on healthcare.At JLL, Michel worked with several of the organization’s portfolio companies, including Patheon, where he helped the executive committee transform the company into a global provider of biopharma development and commercial manufacturing services.
Before joining JLL, Michel was Chief Executive Officer and Chief Financial Officer (CFO) of the Domestic Appliances and Personal Care division of Philips Electronics North America. He also previously served as CFO of Philips Electronics in Indonesia and Financial Controller of Philips Electronics Hong Kong.
Michel earned a bachelor’s degree in business administration from European University in Antwerp and an executive master’s degree in finance and control from the University of Maastricht and University of Amsterdam.

91
Stephen WilliamsonSenior Vice President and Chief Financial OfficerIn August 2015, Stephen was named Senior Vice President and Chief Financial Officer, responsible for the company’s finance, tax, treasury, and global business services functions. He joined the company in 2001 as Vice President, European Financial Operations, based in the U.K., and oversaw the company’s integration activities across Europe. In 2004, Stephen moved to the U.S. and held finance leadership roles for a number of the company’s operating businesses. In 2008, he became Vice President of Financial Operations for Thermo Fisher Scientific and led the finance support function for all of the company’s businesses.
Stephen joined Thermo Fisher from Honeywell International (formerly AlliedSignal), where he served as Vice President and Chief Financial Officer, Asia-Pacific, in Singapore and held other finance roles in corporate development and operational finance. He began his career with Price Waterhouse in the transaction support group and the audit practice, working in both London and New York.
Stephen holds a bachelor's degree in accounting and finance from the University of Wales and is a member of the Institute of Chartered Accountants of England and Wales. Stephen serves on the board of International Flavors and Fragrances Inc.

The world leader in serving science
ServingServing
science.society.
GAAP/Non-GAAP Reconciliation and Financial Package
September 17, 2021

Page 2
Use of Non-GAAP Financial Measures In addition to the financial measures prepared in accordance with generally accepted accounting principles (GAAP), we use certain non-GAAP financial measures, including adjusted EPS, adjusted operating income and adjusted operating margin, which exclude certain acquisition-related costs, such as charges for the sale of inventories revalued at the date of acquisition and significant transaction costs; restructuring and other costs/income; and amortization of acquisition-related intangible assets. Adjusted EPS also excludes certain other gains and losses that are either isolated or cannot be expected to occur again with any predictability, tax provisions/benefits related to the previous items, the impact of significant tax audits or events and the results of discontinued operations. We exclude the above items because they are outside of our normal operations and/or, in certain cases, are difficult to forecast accurately for future periods. We also use a non-GAAP measure, free cash flow, which is cash flow from continuing operations, less net capital expenditures, to provide a view of the continuing operations’ ability to generate cash for use in acquisitions and other investing and financing activities. We believe that the use of non-GAAP measures helps investors to gain a better understanding of our core operating results and future prospects, consistent with how management measures and forecasts the company’s performance, especially when comparing such results to previous periods or forecasts.
For example:
We exclude costs and tax effects associated with restructuring activities, such as reducing overhead and consolidating facilities. We believe that the costs related to these restructuring activities are not indicative of our normal operating costs.
We exclude certain acquisition-related costs, including charges for the sale of inventories revalued at the date of acquisition and significant transaction costs. We exclude these costs because we do not believe they are indicative of our normal operating costs.
We exclude the expense and tax effects associated with the amortization of acquisition-related intangible assets because a significant portion of the purchase price for acquisitions may be allocated to intangible assets that have lives of up to 20 years. Exclusion of the amortization expense allows comparisons of operating results that are consistent over time for both our newly acquired and long-held businesses and with both acquisitive and non-acquisitive peer companies.
We also exclude certain gains/losses and related tax effects and the impact of significant tax audits or events (such as changes in deferred taxes from enacted tax rate changes or the impacts of tax reform legislation in the U.S.), which are either isolated or cannot be expected to occur again with any predictability and that we believe are not indicative of our normal operating gains and losses. For example, we exclude gains/losses from items such as the sale of a business or real estate, significant litigation-related matters, curtailments of pension plans, the early retirement of debt and discontinued operations.
We also report free cash flow, which is cash flow from continuing operations, less net capital expenditures, to provide a view of the continuing operations’ ability to generate cash for use in acquisitions and other investing and financing activities.
Thermo Fisher Scientific’s management uses these non-GAAP measures, in addition to GAAP financial measures, as the basis for measuring the company’s core operating performance and comparing such performance to that of prior periods and to the performance of our competitors. Such measures are also used by management in their financial and operating decision-making and for compensation purposes.
The non-GAAP financial measures of Thermo Fisher Scientific’s results of operations and cash flows included herein are not meant to be considered superior to or a substitute for Thermo Fisher Scientific’s results of operations prepared in accordance with GAAP. Reconciliations of such non-GAAP financial measures to the most directly comparable GAAP financial measures are set forth in the accompanying tables.
Thermo Fisher Scientific does not provide GAAP financial measures on a forward-looking basis because we are unable to predict with reasonable certainty and without unreasonable effort items such as the timing and amount of future restructuring actions and acquisition-related charges as well as gains or losses from sales of real estate and businesses, the early retirement of debt and the outcome of legal proceedings. The timing and amount of these items are uncertain and could be material to Thermo Fisher Scientific's results computed in accordance with GAAP.
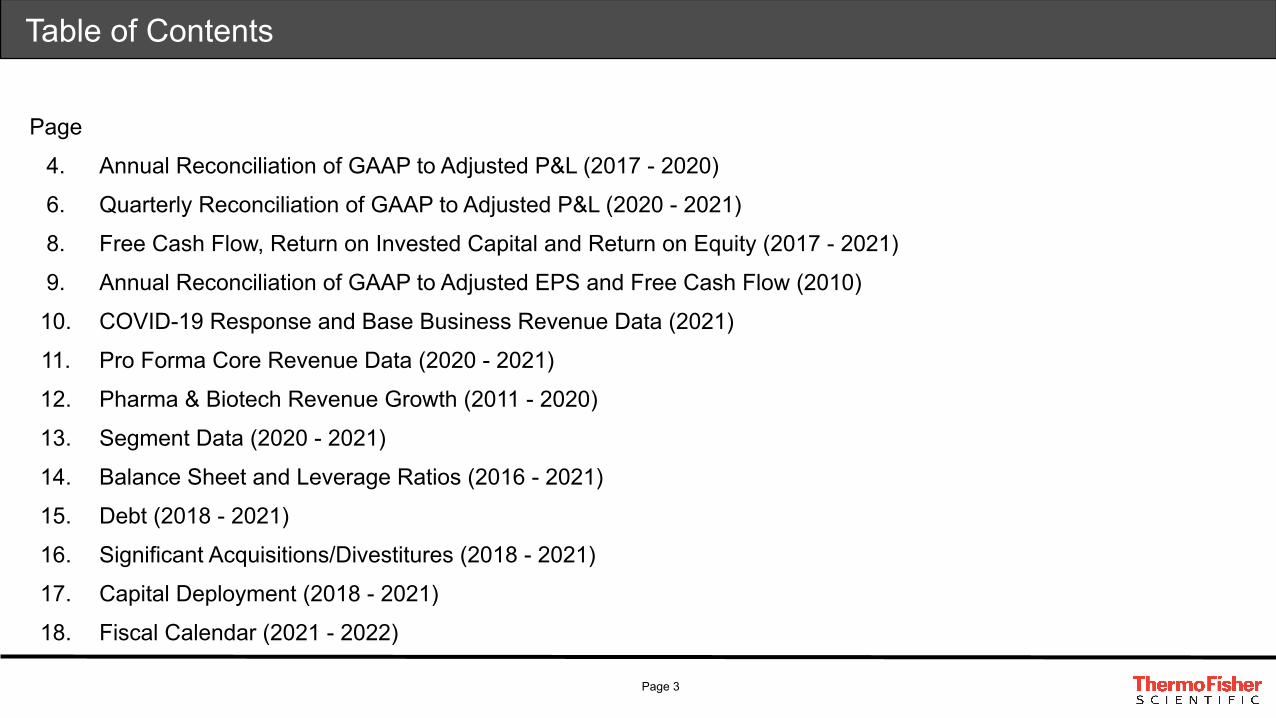
Page 3
Table of Contents
Page
4. Annual Reconciliation of GAAP to Adjusted P&L (2017 - 2020)
6. Quarterly Reconciliation of GAAP to Adjusted P&L (2020 - 2021)
8. Free Cash Flow, Return on Invested Capital and Return on Equity (2017 - 2021)
9. Annual Reconciliation of GAAP to Adjusted EPS and Free Cash Flow (2010)
10. COVID-19 Response and Base Business Revenue Data (2021)
11. Pro Forma Core Revenue Data (2020 - 2021)
12. Pharma & Biotech Revenue Growth (2011 - 2020)
13. Segment Data (2020 - 2021)
14. Balance Sheet and Leverage Ratios (2016 - 2021)
15. Debt (2018 - 2021)
16. Significant Acquisitions/Divestitures (2018 - 2021)
17. Capital Deployment (2018 - 2021)
18. Fiscal Calendar (2021 - 2022)

Page 4
Annual Reconciliation of GAAP to Adjusted P&L
(Dollars in millions except EPS) 2017 2018 2019 2020
GAAP Consolidated Revenues 20,918 24,358 25,542 32,218
Revenue Growth 14% 16% 5% 26%Acquisitions net of Divestitures 9% 7% 1% 0%Currency Translation 0% 1% -2% 1%Organic Revenue Growth 5% 8% 6% 25%
$ % $ % $ % $ %
GAAP Gross Margin 9,448 45.2 % 10,857 44.6 % 11,328 44.3 % 16,004 49.7 %Cost of Revenues Charges (a) 123 0.6 % 12 0.1 % 17 0.1 % 6 0.0 %Amortization of Acquisition-related Intangible Assets 512 2.4 % 507 2.0 % 499 2.0 % 501 1.5 %Adjusted Gross Margin 10,083 48.2 % 11,376 46.7 % 11,844 46.4 % 16,511 51.2 %
GAAP SG&A Expense 5,504 26.3 % 6,057 24.9 % 6,144 24.1 % 6,930 21.5 %Selling, General and Administrative (Charges) Credits (b) (78) -0.4 % (29) -0.1 % (62) -0.2 % 10 0.0 %Amortization of Acquisition-related Intangible Assets (1,082) -5.1 % (1,234) -5.1 % (1,214) -4.8 % (1,166) -3.6 %Adjusted SG&A Expense 4,344 20.8 % 4,794 19.7 % 4,868 19.1 % 5,774 17.9 %
GAAP R&D Expense 887 4.2 % 967 4.0 % 1,003 3.9 % 1,181 3.7 %
GAAP Operating Income 2,960 14.2 % 3,783 15.5 % 4,594 18.0 % 7,794 24.2 %Cost of Revenues Charges (a) 123 0.6 % 12 0.1 % 17 0.1 % 6 0.0 %Selling, General and Administrative Charges (Credits) (b) 78 0.4 % 29 0.1 % 62 0.2 % (10) 0.0 %Restructuring and Other Costs (Income) (c) 97 0.4 % 50 0.2 % (413) -1.6 % 99 0.3 %Amortization of Acquisition-related Intangible Assets 1,594 7.6 % 1,741 7.2 % 1,713 6.7 % 1,667 5.2 %Adjusted Operating Income 4,852 23.2 % 5,615 23.1 % 5,973 23.4 % 9,556 29.7 %
Add back Depreciation Expense 439 2.1 % 526 2.1 % 564 2.2 % 658 2.0 %Adjusted EBITDA 5,291 25.3 % 6,141 25.2 % 6,537 25.6 % 10,214 31.7 %
(a) The excluded items from cost of revenues include inventory charges, principally for the sale of inventories revalued at the date of acquisition; accelerated depreciation on assets to be abandoned as a result of real estate consolidation; and charges/credits to conform the accounting policies of recently acquired businesses to the company's accounting policies.(b) The excluded items from selling, general and administrative charges (credits) include significant transaction/integration costs (including reimbursements thereof) related to recent/terminated acquisitions and a divestiture; charges/credits for changes in estimates of contingent acquisition consideration; charges/income associated with product liability litigation; accelerated depreciation on fixed assets to be abandoned due to integration synergies and facility consolidations; and in 2017, charges to conform the accounting policies of recently acquired businesses to the company's accounting policies.
(c) Restructuring and other costs (income) consist principally of severance and retention costs; abandoned facility and other expenses of real estate consolidation; impairments of long-lived assets; significant gains and losses on litigation-related matters; gains on the sale of businesses, product lines and property; in 2017, curtailments/settlements of pension plans; in 2018, environmental remediation costs; and in 2017 and 2018, hurricane response costs.
(Annual P&L Reconciliation continued on the next page)

Page 5
Annual Reconciliation of GAAP to Adjusted P&L
(Dollars in millions except EPS) 2017 2018 2019 2020
$ % $ % $ % $ %GAAP Tax Provision 201 8.3 % 324 9.9 % 374 9.2 % 850 11.8 %Tax Effect of Adjusted Items (e) 364 4.7 % 284 2.0 % 244 1.8 % 448 2.5 %Adjusted Tax Provision 565 13.0 % 608 11.9 % 618 11.0 % 1,298 14.3 %
GAAP Other (Expense) Income (20) 9 (72) (81) Adjustments (d) (19) (25) (144) (121) Adjusted Other (Expense) Income (1) 34 72 40
GAAP Net Income 2,225 2,938 3,696 6,375 Cost of Revenues Charges (a) 123 12 17 6 Selling, General and Administrative Charges (Credits) (b) 78 29 62 (10) Restructuring and Other Costs (Income) (c) 97 50 (413) 99 Amortization of Acquisition-related Intangible Assets 1,594 1,741 1,713 1,667 Other Expense (d) 19 25 144 121 Income Tax Benefit (e) (364) (284) (244) (448) Loss from Discontinued Operations, Net of Tax 3 — — — Adjusted Net Income 3,775 4,511 4,975 7,810
GAAP Diluted EPS 5.59 7.24 9.17 15.96 GAAP Diluted EPS Growth 10 % 30 % 27 % 74 %
Cost of Revenues Charges, Net of Tax (a) 0.21 0.02 0.03 0.01 Selling, General and Administrative Charges (Credits), Net of Tax (b) 0.17 0.06 0.12 (0.02) Restructuring and Other Costs (Income), Net of Tax (c) 0.18 0.09 (0.56) 0.19 Amortization of Acquisition-related Intangible Assets, Net of Tax 2.86 3.34 3.30 3.24 Other Expense, Net of Tax (d) 0.03 0.05 0.27 0.23 Income Tax Provision (Benefit) (e) 0.44 0.32 0.02 (0.06) Loss from Discontinued Operations, Net of Tax 0.01 0.00 0.00 0.00 Adjusted Diluted EPS 9.49 11.12 12.35 19.55
Adjusted Diluted EPS Growth 15 % 17 % 11 % 58 %
(a) The excluded items from cost of revenues include inventory charges, principally for the sale of inventories revalued at the date of acquisition; accelerated depreciation on assets to be abandoned as a result of real estate consolidation; and charges/credits to conform the accounting policies of recently acquired businesses to the company's accounting policies.
(b) The excluded items from selling, general and administrative charges (credits) include significant transaction/integration costs (including reimbursements thereof) related to recent/terminated acquisitions and a divestiture; charges/credits for changes in estimates of contingent acquisition consideration; charges/income associated with product liability litigation; accelerated depreciation on fixed assets to be abandoned due to integration synergies and facility consolidations; and in 2017, charges to conform the accounting policies of recently acquired businesses to the company's accounting policies.
(c) Restructuring and other costs (income) consist principally of severance and retention costs; abandoned facility and other expenses of real estate consolidation; impairments of long-lived assets; significant gains and losses on litigation-related matters; gains on the sale of businesses, product lines and property; in 2017, curtailments/settlements of pension plans; in 2018, environmental remediation costs; and in 2017 and 2018, hurricane response costs.
(d) The excluded items from other expense represent gains and losses on investments; losses on the extinguishment of debt; in 2020, charges related to terminated interest rate swaps; in 2017 and 2020, costs to obtain short-term financing commitments related to acquisitions; and in 2018 and future years, curtailments/settlements of pension plans.
(e) The excluded items from income tax benefit/provision include the tax benefits/provisions related to the above excluded items, the impact of the resolution of significant tax audits, the tax effects from adjusting the company's deferred tax balances as a result of tax rate changes, and in 2017, 2018 and 2019, adjustments to the impacts of U.S. tax reform legislation.

Page 6
Quarterly Reconciliation of GAAP to Adjusted P&L(Dollars in millions except EPS) Q1-20 Q2-20 Q3-20 Q4-20 Q1-21 Q2-21
RevenueLife Sciences Solutions Segment 1,774 2,602 3,424 4,368 4,203 3,557Analytical Instruments Segment 1,101 1,051 1,336 1,636 1,387 1,481Specialty Diagnostics Segment 958 988 1,430 1,967 1,615 1,235Laboratory Products and Services Segment 2,730 2,787 3,112 3,616 3,597 3,583Eliminations (333) (511) (781) (1,037) (896) (583)Total Revenue 6,230 6,917 8,521 10,550 9,906 9,273
Reported Revenue Growth 2% 10% 36% 54% 59% 34%Acquisitions net of Divestitures 1% 0% 1% 0% 2% 2%Currency Translation -1% -1% 1% 3% 4% 5%Organic Revenue Growth 2% 11% 34% 51% 53% 28% **
$ % $ % $ % $ % $ % $ %
GAAP Cost of Goods Sold 3,490 56.0 % 3,540 51.2 % 4,190 49.2 % 4,994 47.3 % 4,697 47.4 % 4,749 51.2 %Cost of Revenues Charges (a) (2) -0.1 % (2) 0.0 % (1) 0.0 % (1) 0.0 % (8) -0.1 % — 0.0 %Amortization of Acquisition-related Intangible Assets (125) -1.9 % (124) -1.8 % (125) -1.5 % (127) -1.2 % (140) -1.4 % (164) -1.8 %Adjusted Cost of Goods Sold 3,363 54.0 % 3,414 49.4 % 4,064 47.7 % 4,866 46.1 % 4,549 45.9 % 4,585 49.4 %
GAAP Gross Margin 2,740 44.0 % 3,377 48.8 % 4,331 50.8 % 5,556 52.7 % 5,209 52.6 % 4,524 48.8 %Cost of Revenues Charges (a) 2 0.1 % 2 0.0 % 1 0.0 % 1 0.0 % 8 0.1 % — 0.0 %Amortization of Acquisition-related Intangible Assets 125 1.9 % 124 1.8 % 125 1.5 % 127 1.2 % 140 1.4 % 164 1.8 %Adjusted Gross Margin 2,867 46.0 % 3,503 50.6 % 4,457 52.3 % 5,684 53.9 % 5,357 54.1 % 4,688 50.6 %
GAAP SG&A Expense 1,551 24.9 % 1,710 24.7 % 1,592 18.7 % 2,077 19.7 % 1,826 18.4 % 1,899 20.5 %Selling, General and Administrative (Charges) Credits (b) (6) -0.1 % (42) -0.6 % 55 0.7 % 3 0.0 % (16) -0.1 % 42 0.4 %Amortization of Acquisition-related Intangible Assets (300) -4.8 % (293) -4.2 % (289) -3.4 % (284) -2.7 % (283) -2.9 % (285) -3.0 %Adjusted SG&A Expense 1,245 20.0 % 1,375 19.9 % 1,358 16.0 % 1,796 17.0 % 1,527 15.4 % 1,656 17.9 %
GAAP R&D Expense 245 3.9 % 264 3.8 % 296 3.5 % 376 3.6 % 320 3.2 % 343 3.7 %
GAAP Operating Income 906 14.5 % 1,391 20.1 % 2,426 28.5 % 3,071 29.1 % 3,049 30.8 % 2,163 23.3 %Cost of Revenues Charges (a) 2 0.1 % 2 0.0 % 1 0.0 % 1 0.0 % 8 0.1 % — 0.0 %Selling, General and Administrative Charges (Credits) (b) 6 0.1 % 42 0.6 % (55) -0.7 % (3) 0.0 % 16 0.1 % (42) -0.4 %Restructuring and Other Costs (c) 38 0.6 % 12 0.2 % 17 0.2 % 32 0.3 % 14 0.1 % 119 1.3 %Amortization of Acquisition-related Intangible Assets 425 6.8 % 417 6.1 % 414 4.9 % 411 3.9 % 423 4.3 % 449 4.8 %Adjusted Operating Income 1,377 22.1 % 1,864 27.0 % 2,803 32.9 % 3,512 33.3 % 3,510 35.4 % 2,689 29.0 %
Add back Depreciation Expense 149 2.4 % 157 2.2 % 161 1.9 % 191 1.8 % 198 2.0 % 211 2.3 %Adjusted EBITDA 1,526 24.5 % 2,021 29.2 % 2,964 34.8 % 3,703 35.1 % 3,708 37.4 % 2,900 31.3 %
** Results do not sum due to rounding.
(a) The excluded items from cost of revenues include inventory charges, principally for the sale of inventories revalued at the date of acquisition; accelerated depreciation on assets to be abandoned as a result of real estate consolidation; and in Q1 2020, charges to conform the accounting policies of recently acquired businesses to the company's accounting policies.
(b) The excluded items from selling, general and administrative charges (credits) include significant transaction/integration costs (and reimbursements thereof) related to recent/terminated acquisitions; charges/credits for changes in estimates of contingent acquisition consideration; and in Q3 2020 and Q4 2020, income/charges associated with product liability litigation.
(c) Restructuring and other costs consist principally of severance and retention costs; abandoned facility and other expenses of real estate consolidation; impairments of long-lived assets; significant gains and losses on litigation-related matters; gains on the sale of businesses, product lines and property; and in Q1 2021, charges for compensation contractually due to employees of acquired businesses at the date of acquisition.
(Quarterly P&L Reconciliation continued on the next page)

Page 7
Quarterly Reconciliation of GAAP to Adjusted P&L(Dollars in millions except EPS) Q1-20 Q2-20 Q3-20 Q4-20 Q1-21 Q2-21
$ % $ % $ % $ % $ % $ %
GAAP Tax Provision 40 4.8 % 97 7.8 % 319 14.2 % 394 13.6 % 416 15.1 % 219 10.7 %Tax Effect of Adjusted Items (e) 98 5.7 % 104 3.7 % 100 1.5 % 146 2.4 % 130 0.9 % 142 3.3 %Adjusted Tax Provision 138 10.5 % 201 11.5 % 419 15.7 % 540 16.0 % 546 16.0 % 361 14.0 %
GAAP Other Income (Expense) 12 (9) (39) (45) (183) (5) Adjustments (d) (14) (25) (40) (42) (197) (8) Adjusted Other Income (Expense) 26 16 1 (3) 14 3
GAAP Net Income 788 1,156 1,933 2,498 2,337 1,828 Cost of Revenues Charges (a) 2 2 1 1 8 — Selling, General and Administrative Charges (Credits) (b) 6 42 (55) (3) 16 (42) Restructuring and Other Costs (c) 38 12 17 32 14 119 Amortization of Acquisition-related Intangible Assets 425 417 414 411 423 449 Other Expense (d) 14 25 40 42 197 8 Income Tax Benefit (e) (98) (104) (100) (146) (130) (142) Adjusted Net Income 1,175 1,550 2,250 2,835 2,865 2,220
GAAP Diluted EPS 1.97 2.90 4.84 6.24 5.88 4.61 GAAP Diluted EPS Growth -2 % 5 % 157 % 151 % 198 % 59 %
Cost of Revenues Charges, Net of Tax (a) 0.01 0.00 0.00 0.00 0.01 0.00 Selling, General and Administrative Charges (Credits), Net of Tax (b) 0.01 0.08 (0.11) 0.00 0.03 (0.11) Restructuring and Other Costs, Net of Tax (c) 0.07 0.03 0.03 0.06 0.03 0.23 Amortization of Acquisition-related Intangible Assets, Net of Tax 0.83 0.85 0.82 0.75 0.84 0.88 Other Expense, Net of Tax (d) 0.03 0.05 0.08 0.08 0.43 0.01 Income Tax Provision (Benefit) (e) 0.02 (0.02) (0.03) (0.04) (0.01) (0.02) Adjusted Diluted EPS 2.94 3.89 5.63 7.09 7.21 5.60
Adjusted Diluted EPS Growth 5 % 28 % 91 % 100 % 145 % 44 %
Reconciliation of Free Cash FlowGAAP Net Cash Provided by Operating Activities 356 1,886 2,708 3,339 1,978 2,227 Purchases of Property, Plant, and Equipment (253) (269) (366) (586) (628) (540) Proceeds from Sale of Property, Plant and Equipment 4 2 1 1 5 — Free Cash Flow 107 1,619 2,343 2,754 1,355 1,687
(a) The excluded items from cost of revenues include inventory charges, principally for the sale of inventories revalued at the date of acquisition; accelerated depreciation on assets to be abandoned as a result of real estate consolidation; and in Q1 2020, charges to conform the accounting policies of recently acquired businesses to the company's accounting policies.
(b) The excluded items from selling, general and administrative charges (credits) include significant transaction/integration costs (and reimbursements thereof) related to recent/terminated acquisitions; charges/credits for changes in estimates of contingent acquisition consideration; and in Q3 2020 and Q4 2020, income/charges associated with product liability litigation.
(c) Restructuring and other costs consist principally of severance and retention costs; abandoned facility and other expenses of real estate consolidation; impairments of long-lived assets; significant gains and losses on litigation-related matters; gains on the sale of businesses, product lines and property; and in Q1 2021, charges for compensation contractually due to employees of acquired businesses at the date of acquisition.
(d) The excluded items from other income/expense represent gains and losses on investments; losses on the early extinguishment of debt; net charges for the settlement/curtailment of pension plans; costs to obtain short-term financing commitments related to pending/terminated acquisitions; and in Q4 2020, charges related to terminated interest rate swaps.
(e) The excluded items from income tax benefit/provision include the tax benefits/provisions related to the above excluded items, the impact of the resolution of significant tax audits, and the tax effects from adjusting the company's deferred tax balances as a result of tax rate changes.

Page 8
Free Cash Flow, Return on Invested Capital and Return on Equity(Dollars in millions) 2017 2018 2019 2020 Q2 2021
Reconciliation of Free Cash Flow
GAAP Net Cash Provided by Operating Activities 4,005 4,543 4,973 8,289 2,227
Net Cash Used in Discontinued Operations 1 — — — —
Purchases of Property, Plant, and Equipment (508) (758) (926) (1,474) (540)
Proceeds from Sale of Property, Plant and Equipment 7 50 36 8 —
Free Cash Flow 3,505 3,835 4,083 6,823 1,687
GAAP Return on Invested Capital (ROIC) 5.4 % 6.7 % 8.2 % 14.0 % 18.4 %
Cost of Revenues Charges (a) 0.3 % 0.0 % 0.0 % 0.0 % 0.0 %
Selling, General and Administrative Charges (Credits) (b) 0.2 % 0.1 % 0.1 % 0.0 % -0.2 %
Restructuring and Other Costs (Income) (c) 0.2 % 0.1 % -0.9 % 0.2 % 0.4 %
Amortization of Acquisition-related Intangible Assets 3.9 % 3.9 % 3.8 % 3.7 % 3.6 %
Net Interest Expense 0.8 % 0.9 % 0.8 % 0.8 % 0.8 %
Other Expense (d) 0.0 % 0.0 % 0.3 % 0.2 % 0.6 %
Income Tax Benefit (e) -0.8 % -0.8 % -0.5 % -1.0 % -1.1 %
Loss from Discontinued Operations, Net of Tax 0.0 % 0.0 % 0.0 % 0.0 % 0.0 %
Adjusted ROIC 10.0 % 10.9 % 11.8 % 17.9 % 22.5 %
GAAP Return on Equity (ROE) 9.5 % 11.3 % 12.9 % 20.6 % 25.6 %
Cost of Revenues Charges (a) 0.5 % 0.0 % 0.1 % 0.0 % 0.0 %
Selling, General and Administrative Charges (Credits) (b) 0.3 % 0.1 % 0.2 % 0.0 % -0.3 %
Restructuring and Other Costs (Income) (c) 0.4 % 0.2 % -1.4 % 0.3 % 0.5 %
Amortization of Acquisition-related Intangible Assets 6.9 % 6.6 % 6.0 % 5.4 % 5.0 %
Net Interest Expense 1.4 % 1.5 % 1.2 % 1.2 % 1.1 %
Other Expense (d) 0.1 % 0.1 % 0.5 % 0.4 % 0.8 %
Income Tax Benefit (e) -1.4 % -1.3 % -0.9 % -1.5 % -1.5 %
Loss from Discontinued Operations, Net of Tax 0.0 % 0.0 % 0.0 % 0.0 % 0.0 %
Adjusted ROE 17.7 % 18.5 % 18.6 % 26.4 % 31.2 %
Definitions:
Invested capital is equity plus short-term and long-term debt and net liabilities of discontinued operations less cash and short-term investments. Adjusted return on invested capital is trailing twelve months adjusted net income excluding net interest expense, net of tax benefit therefrom, divided by trailing five quarters average invested capital.Adjusted return on equity is trailing twelve months adjusted net income excluding net interest expense, net of tax benefit therefrom, divided by trailing five quarters average shareholders' equity.
(a) The excluded items from cost of revenues include inventory charges, principally for the sale of inventories revalued at the date of acquisition; accelerated depreciation on assets to be abandoned as a result of real estate consolidation; and charges/credits to conform the accounting policies of recently acquired businesses to the company's accounting policies.
(b) The excluded items from selling, general and administrative charges (credits) include significant transaction/integration costs (including reimbursements thereof) related to recent/terminated acquisitions and a divestiture; charges/credits for changes in estimates of contingent acquisition consideration; charges/income associated with product liability litigation; accelerated depreciation on fixed assets to be abandoned due to integration synergies and facility consolidations; and in 2017, charges to conform the accounting policies of recently acquired businesses to the company's accounting policies.
(c) Restructuring and other costs (income) consist principally of severance and retention costs; abandoned facility and other expenses of real estate consolidation; impairments of long-lived assets; significant gains and losses on litigation-related matters; gains on the sale of businesses, product lines and property; in 2021, charges for compensation contractually due to employees of acquired businesses at the date of acquisition; in 2018, environmental remediation costs; in 2017, curtailments/settlements of pension plans; and in 2017 and 2018, hurricane response costs.
(d) The excluded items from other expense represent gains and losses on investments; losses on the extinguishment of debt; in 2018 and future years, curtailments/settlements of pension plans; in 2020, charges related to terminated interest rate swaps; and in 2017, 2020 and 2021, costs to obtain short-term financing commitments related to pending/terminated acquisitions.
(e) The excluded items from income tax benefit/provision include the tax benefits/provisions related to the above excluded items, the impact of the resolution of significant tax audits, the tax effects from adjusting the company's deferred tax balances as a result of tax rate changes, and in 2017, 2018 and 2019, adjustments to the impacts of U.S. tax reform legislation.
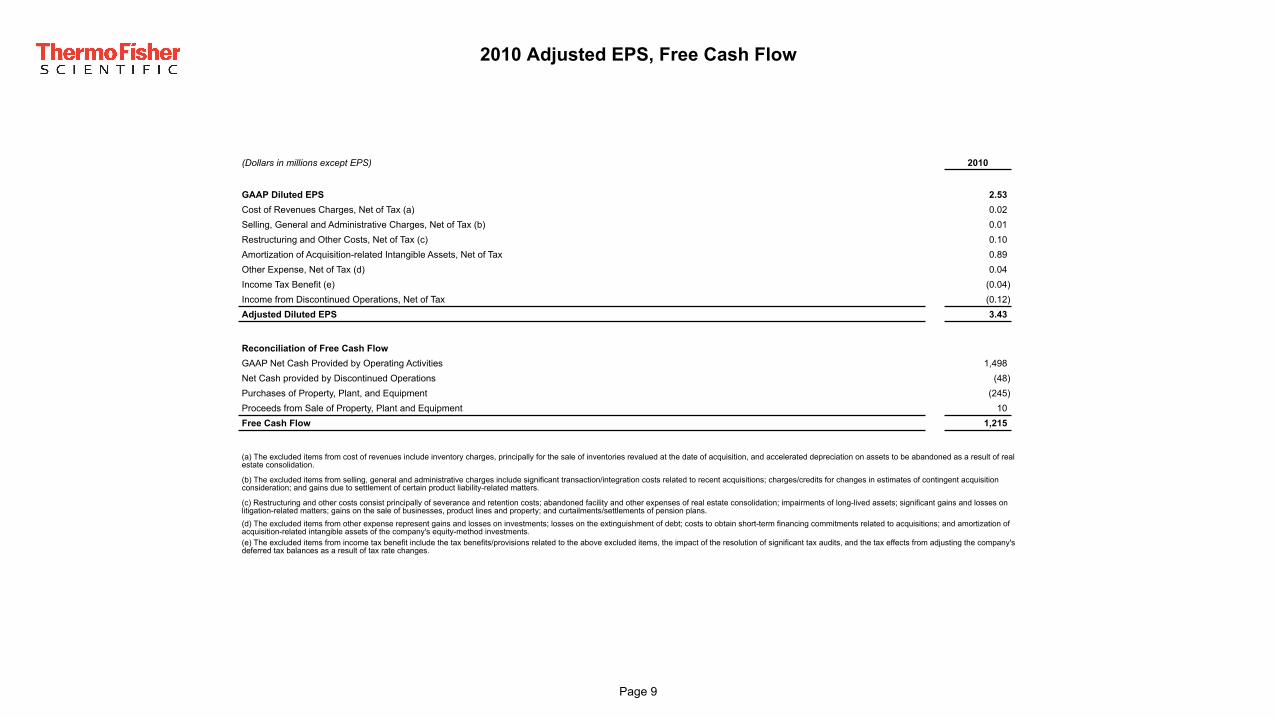
Page 9
2010 Adjusted EPS, Free Cash Flow
(Dollars in millions except EPS) 2010
GAAP Diluted EPS 2.53 Cost of Revenues Charges, Net of Tax (a) 0.02 Selling, General and Administrative Charges, Net of Tax (b) 0.01 Restructuring and Other Costs, Net of Tax (c) 0.10 Amortization of Acquisition-related Intangible Assets, Net of Tax 0.89 Other Expense, Net of Tax (d) 0.04 Income Tax Benefit (e) (0.04) Income from Discontinued Operations, Net of Tax (0.12) Adjusted Diluted EPS 3.43
Reconciliation of Free Cash FlowGAAP Net Cash Provided by Operating Activities 1,498 Net Cash provided by Discontinued Operations (48) Purchases of Property, Plant, and Equipment (245) Proceeds from Sale of Property, Plant and Equipment 10 Free Cash Flow 1,215
(a) The excluded items from cost of revenues include inventory charges, principally for the sale of inventories revalued at the date of acquisition, and accelerated depreciation on assets to be abandoned as a result of real estate consolidation.
(b) The excluded items from selling, general and administrative charges include significant transaction/integration costs related to recent acquisitions; charges/credits for changes in estimates of contingent acquisition consideration; and gains due to settlement of certain product liability-related matters.
(c) Restructuring and other costs consist principally of severance and retention costs; abandoned facility and other expenses of real estate consolidation; impairments of long-lived assets; significant gains and losses on litigation-related matters; gains on the sale of businesses, product lines and property; and curtailments/settlements of pension plans.(d) The excluded items from other expense represent gains and losses on investments; losses on the extinguishment of debt; costs to obtain short-term financing commitments related to acquisitions; and amortization of acquisition-related intangible assets of the company's equity-method investments. (e) The excluded items from income tax benefit include the tax benefits/provisions related to the above excluded items, the impact of the resolution of significant tax audits, and the tax effects from adjusting the company's deferred tax balances as a result of tax rate changes.

Page 10
COVID-19 Response and Base Business Revenue Data
Q1-21 Q2-21
Revenue Growth 59% 34%COVID-19 Response Revenue (a) (b) 43% 2%Base Business Revenue Growth 16% 32%Acquisitions 0% 0%Currency Translation 3% 5%Base Business Organic Revenue Growth 13% 27%
(a) COVID-19 response revenue includes effects of COVID-19 response revenues from acquired businesses and foreign currency translation.
(b) Adjustment to exclude the impact of COVID-19 response revenue.

Page 11
Pro Forma Core Revenue
(Dollars in billions) Q3 2020 Q4 2020 Q1 2021 Q2 2021Last twelve
months
Pro Forma Core Revenue
Total Thermo Fisher Revenue 8.5 10.6 9.9 9.3 38.3 Less: Testing and testing-related Response Revenue (a) (1.8) (2.9) (2.4) (1.4) (8.5) Plus: PPD Revenue 1.2 1.4 1.4 1.6 5.6 Pro Forma Core Revenue 7.9 9.0 ** 8.9 9.5 35.3 **
Pro Forma Core Revenue from Pharma & Biotech
Total Pharma & Biotech Revenue 3.2 3.6 3.8 4.0 14.6 Less: Testing and testing-related Response Revenue (a) — (0.1) (0.1) (0.1) (0.3) Plus: PPD Revenue 1.2 1.4 1.4 1.6 5.6 Pro Forma Core Revenue from Pharma & Biotech 4.4 4.9 5.1 5.5 19.9
(a) Testing and testing-related response revenue = Total COVID-19 response revenue less Vaccines & Therapies related revenue.** Results do not sum due to rounding.

Page 12
Pharma & Biotech Revenue Growth
2011 2012 2013 2014 2015 2016 2017 2018 2019 2020
Pharma & BiotechReported Revenue Growth 11 % 10 % 10 % 34 % 8 % 12 % 21 % 36 % 12 % 18 %Acquisitions net of Divestitures 3 % 3 % 1 % 27 % 3 % 3 % 14 % 21 % 3 % 2 %Currency Translation 2 % -2 % 0 % -1 % -6 % -1 % 0 % 1 % -2 % 0 %Organic Revenue Growth 5 % ** 9 % 9 % 7 % ** 12 % ** 10 % 7 % 14 % 11 % 16 %
** Results do not sum due to rounding.

Page 13
Segment Data
(Dollars in millions) Q1-20 Q2-20 Q3-20 Q4-20 2020 Q1-21 Q2-21
Life Sciences Solutions SegmentRevenues 1,774 2,602 3,424 4,368 12,168 4,203 3,557Total Revenue Growth 10% 52% 101% 138% 77% 137% 37%Acquisitions net of Divestitures 0% 0% 0% 0% 0% 2% 2%Currency Translation -1% -3% 1% 4% 0% 6% 5%Organic Revenue Growth 12% ** 55% 100% 134% 77% 129% 29% **
Operating Income 675 1,234 1,879 2,321 6,109 2,279 1,718Operating Income Margin 38.0% 47.4% 54.9% 53.1% 50.2% 54.2% 48.3%Operating Income Margin Expansion +3.1 pts +11.8 pts +20.4 pts +15.6 pts +14.5 pts +16.2 pts +0.9 pts
Analytical Instruments SegmentRevenues 1,101 1,051 1,336 1,636 5,124 1,387 1,481Total Revenue Growth -17% -21% -2% 8% -7% 26% 41%Acquisitions net of Divestitures 0% 0% 0% 0% 0% 0% 0%Currency Translation -1% -1% 1% 3% 1% 4% 5%Organic Revenue Growth -16% -20% -3% 5% -8% 22% 36%
Operating Income 171 135 171 331 808 272 280Operating Income Margin 15.5% 12.9% 12.8% 20.2% 15.8% 19.6% 18.9%Operating Income Margin Expansion -5.8 pts -8.7 pts -10.2 pts -5.8 pts -7.3 pts +4.1 pts +6.0 pts
Specialty Diagnostics SegmentRevenues 958 988 1,430 1,967 5,343 1,615 1,235Total Revenue Growth 0% 5% 63% 109% 44% 69% 25%Acquisitions net of Divestitures -7% -7% 0% 0% -5% 0% 0%Currency Translation -1% -1% 1% 2% 0% 3% 4%Organic Revenue Growth 8% 12% ** 62% 107% 48% ** 65% ** 21%
Operating Income 236 214 398 520 1,368 428 245Operating Income Margin 24.7% 21.6% 27.9% 26.4% 25.6% 26.5% 19.9%Operating Income Margin Expansion -0.6 pts -4.1 pts +2.6 pts +2.7 pts +0.6 pts +1.8 pts -1.7 pts
Laboratory Products & Services SegmentRevenues 2,730 2,787 3,112 3,616 12,245 3,597 3,583Total Revenue Growth 9% 6% 19% 28% 16% 32% 29%Acquisitions net of Divestitures 4% 2% 1% 0% 2% 3% 2%Currency Translation -1% -1% 1% 2% 0% 3% 4%Organic Revenue Growth 6% 5% 16% ** 25% ** 13% ** 26% 23%
Operating Income 295 281 355 340 1,271 531 446Operating Income Margin 10.8% 10.1% 11.4% 9.4% 10.4% 14.8% 12.4%Operating Income Margin Expansion -0.5 pts -3.0 pts -0.2 pts -4.4 pts -2.1 pts +4.0 pts +2.3 pts
** Results do not sum due to rounding.

Page 14
Balance Sheet and Leverage Ratios(Dollars in millions)
12/31/2016 12/31/2017 12/31/2018 12/31/2019 12/31/2020 4/3/2021 7/3/2021
AssetsCurrent Assets:
Cash and cash equivalents 786 1,335 2,103 2,399 10,325 5,583 7,023
Accounts receivable, net 3,049 3,879 4,136 4,349 5,741 5,554 5,476 Inventories 2,213 2,971 3,005 3,370 4,029 4,342 4,625 Other current assets 973 1,236 1,381 1,775 1,862 2,206 2,136
Total Current Assets 7,021 9,421 10,625 11,893 21,957 17,685 19,260
Property, Plant and Equipment, Net 2,578 4,047 4,165 4,749 5,912 6,133 6,560 Acquisition-related Intangible Assets, Net 13,969 16,684 14,978 14,014 12,685 12,831 12,390
Other Assets 1,012 1,227 1,117 2,011 2,457 2,459 2,584 Goodwill 21,328 25,290 25,347 25,714 26,041 26,823 26,904
45,908 56,669 56,232 58,381 69,052 65,931 67,698
Liabilities and Shareholders' Equity
Current Liabilities: Short-term obligations and current maturities of long-term obligations 1,255 2,135 1,271 676 2,628 4 4 Accounts payable 926 1,428 1,615 1,920 2,175 2,146 2,098
Other current liabilities 2,685 3,485 3,261 3,601 5,501 4,845 4,823
Total Current Liabilities 4,866 7,048 6,147 6,197 10,304 6,995 6,925
Other Long-term Liabilities 4,130 5,335 4,780 5,433 5,134 5,237 5,146
Long-term Obligations 15,372 18,873 17,719 17,076 19,107 18,641 18,773
Total Shareholders' Equity 21,540 25,413 27,586 29,675 34,507 35,058 36,854
45,908 56,669 56,232 58,381 69,052 65,931 67,698
Leverage Ratios
Total Debt / TTM EBITDA 4.0 X 4.2 X 3.1 X 2.6 X 2.1 X 1.5 X 1.4 XEffect of Adjusted Items -0.4 X -0.2 X 0.0 X 0.1 X 0.0 X 0.0 X 0.0 X
Total Debt / Adjusted TTM EBITDA (a) 3.6 X 4.0 X 3.1 X 2.7 X 2.1 X 1.5 X 1.4 X
Net Debt (b) / TTM EBITDA 3.8 X 3.9 X 2.8 X 2.2 X 1.1 X 1.1 X 0.9 XEffect of Adjusted Items -0.4 X -0.2 X -0.1 X 0.1 X 0.0 X 0.0 X 0.0 X
Net Debt (b) / Adjusted TTM EBITDA (a) 3.4 X 3.7 X 2.7 X 2.3 X 1.1 X 1.1 X 0.9 X
(a) Adjusted EBITDA equals adjusted operating income excluding depreciation.
(b) Net debt is short-term and long-term debt less cash.
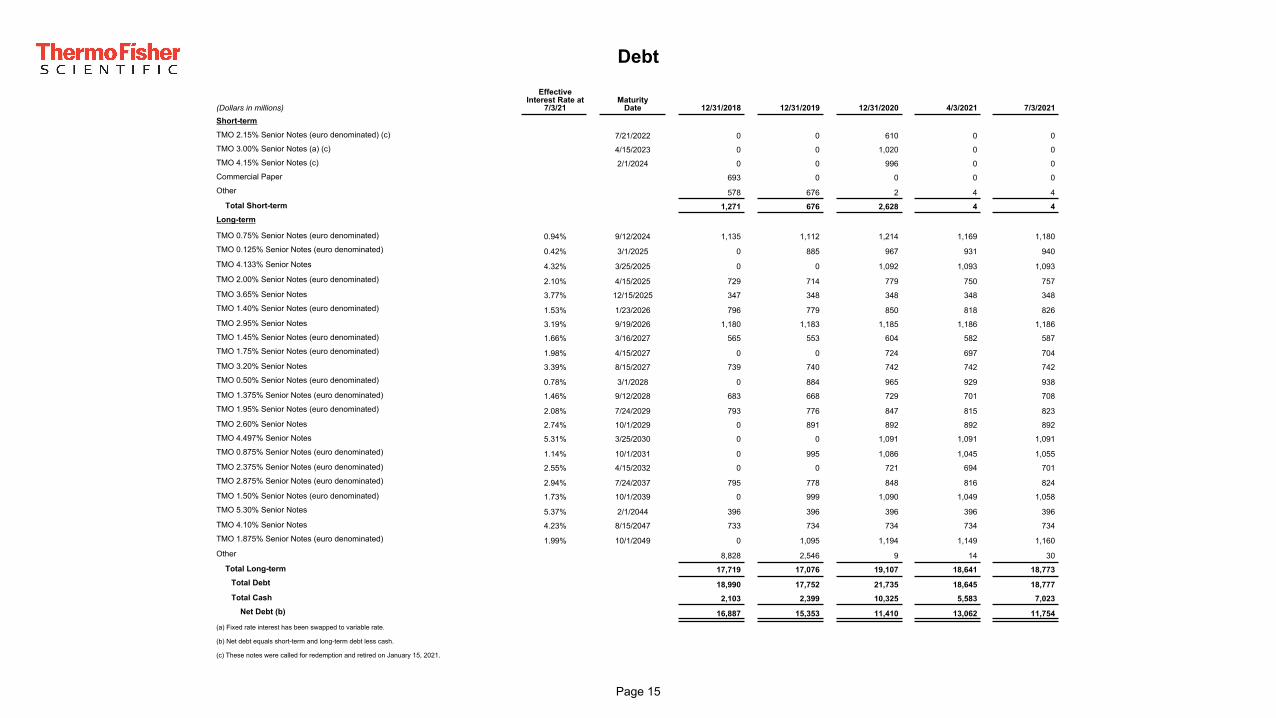
Page 15
Debt
(Dollars in millions)
Effective Interest Rate at
7/3/21Maturity
Date 12/31/2018 12/31/2019 12/31/2020 4/3/2021 7/3/2021Short-term
TMO 2.15% Senior Notes (euro denominated) (c) 7/21/2022 0 0 610 0 0 TMO 3.00% Senior Notes (a) (c) 4/15/2023 0 0 1,020 0 0 TMO 4.15% Senior Notes (c) 2/1/2024 0 0 996 0 0 Commercial Paper 693 0 0 0 0 Other 578 676 2 4 4
Total Short-term 1,271 676 2,628 4 4 Long-term
TMO 0.75% Senior Notes (euro denominated) 0.94% 9/12/2024 1,135 1,112 1,214 1,169 1,180 TMO 0.125% Senior Notes (euro denominated) 0.42% 3/1/2025 0 885 967 931 940 TMO 4.133% Senior Notes 4.32% 3/25/2025 0 0 1,092 1,093 1,093 TMO 2.00% Senior Notes (euro denominated) 2.10% 4/15/2025 729 714 779 750 757 TMO 3.65% Senior Notes 3.77% 12/15/2025 347 348 348 348 348 TMO 1.40% Senior Notes (euro denominated) 1.53% 1/23/2026 796 779 850 818 826 TMO 2.95% Senior Notes 3.19% 9/19/2026 1,180 1,183 1,185 1,186 1,186 TMO 1.45% Senior Notes (euro denominated) 1.66% 3/16/2027 565 553 604 582 587 TMO 1.75% Senior Notes (euro denominated) 1.98% 4/15/2027 0 0 724 697 704 TMO 3.20% Senior Notes 3.39% 8/15/2027 739 740 742 742 742 TMO 0.50% Senior Notes (euro denominated) 0.78% 3/1/2028 0 884 965 929 938 TMO 1.375% Senior Notes (euro denominated) 1.46% 9/12/2028 683 668 729 701 708 TMO 1.95% Senior Notes (euro denominated) 2.08% 7/24/2029 793 776 847 815 823 TMO 2.60% Senior Notes 2.74% 10/1/2029 0 891 892 892 892 TMO 4.497% Senior Notes 5.31% 3/25/2030 0 0 1,091 1,091 1,091 TMO 0.875% Senior Notes (euro denominated) 1.14% 10/1/2031 0 995 1,086 1,045 1,055 TMO 2.375% Senior Notes (euro denominated) 2.55% 4/15/2032 0 0 721 694 701 TMO 2.875% Senior Notes (euro denominated) 2.94% 7/24/2037 795 778 848 816 824 TMO 1.50% Senior Notes (euro denominated) 1.73% 10/1/2039 0 999 1,090 1,049 1,058 TMO 5.30% Senior Notes 5.37% 2/1/2044 396 396 396 396 396 TMO 4.10% Senior Notes 4.23% 8/15/2047 733 734 734 734 734 TMO 1.875% Senior Notes (euro denominated) 1.99% 10/1/2049 0 1,095 1,194 1,149 1,160 Other 8,828 2,546 9 14 30
Total Long-term 17,719 17,076 19,107 18,641 18,773 Total Debt 18,990 17,752 21,735 18,645 18,777 Total Cash 2,103 2,399 10,325 5,583 7,023
Net Debt (b) 16,887 15,353 11,410 13,062 11,754 (a) Fixed rate interest has been swapped to variable rate.
(b) Net debt equals short-term and long-term debt less cash.
(c) These notes were called for redemption and retired on January 15, 2021.

Page 16
2018 - 2021 Significant Acquisitions/Divestitures
Transaction Closing Date Entity
Acquisition orDivestiture Business Description
Principal Segment
Revenue (a)(millions)
2021
February 25 Mesa Biotech, Inc. Acquisition Point-of-care molecular diagnostics provider LSS $45
January 15 European viral vector business Acquisition Leading provider of contract viral vector manufacturing services for vaccines and therapies LPS €80
2019
October 1 API Facility from GSK in Cork, Ireland Acquisition Manufacturer of complex active pharmaceutical ingredients (API) LPS N/A (b)
June 28 Anatomical Pathology business Divestiture Provider of microscope slides, instruments and consumables SDS $344
April 30 Brammer Bio Acquisition Leader in viral vector manufacturing for gene and cell therapies LPS $140
2018
October 25 Advanced Bioprocessing business Acquisition Provider of cell culture supplements that increase yield and reduce variability in the production of biologic drugs LSS $100
(a) Approximate revenue from prior full year reporting period as of the announcement date.(b) Facility purchase from a customer.

Page 17
Capital Deployment
Share Buybacks2018 2019 2020 Q1-2021 Q2-2021
Total Number of Shares Purchased (millions) 2 6 4 4 —
Average Price Paid per Share $231.91 $251.43 $331.76 $487.73 $0.00
Total Spend ($ millions) $500 $1,500 $1,500 $2,000 $0
Remaining Share Repurchase Authorization (in millions) as of 7/28/2021: $500
Dividends Paid
2018 2019 2020 Q1-2021 Q2-2021
Amount per Share $0.66 $0.74 $0.85 $0.22 $0.26
Future declarations of dividends are subject to board approval and may be adjusted as business needs or market conditions change.

Page 18
Fiscal Calendar2021 FISCAL CALENDAR
FIRST QUARTER SECOND QUARTER THIRD QUARTER FOURTH QUARTERMonth S M T W T F S Week Month S M T W T F S Week Month S M T W T F S Week Month S M T W T F S Week
1 23 4 5 6 7 8 9 1 4 5 6 7 8 9 10 14 4 5 6 7 8 9 10 27 3 4 5 6 7 8 9 40
JAN 10 11 12 13 14 15 16 2 APR 11 12 13 14 15 16 17 15 JULY 11 12 13 14 15 16 17 28 OCT 10 11 12 13 14 15 16 41
5 17 18 19 20 21 22 23 3 5 18 19 20 21 22 23 24 16 5 18 19 20 21 22 23 24 29 5 17 18 19 20 21 22 23 42
Weeks 24 25 26 27 28 29 30 4 Weeks 25 26 27 28 29 30 1 17 Weeks 25 26 27 28 29 30 31 30 Weeks 24 25 26 27 28 29 30 43
31 1 2 3 4 5 6 5 2 3 4 5 6 7 8 18 1 2 3 4 5 6 7 31 31 1 2 3 4 5 6 44
7 8 9 10 11 12 13 6 9 10 11 12 13 14 15 19 8 9 10 11 12 13 14 32 7 8 9 10 11 12 13 45
FEB 14 15 16 17 18 19 20 7 MAY 16 17 18 19 20 21 22 20 AUG 15 16 17 18 19 20 21 33 NOV 14 15 16 17 18 19 20 46
4 21 22 23 24 25 26 27 8 4 23 24 25 26 27 28 29 21 4 22 23 24 25 26 27 28 34 4 21 22 23 24 25 26 27 47
Weeks 28 1 2 3 4 5 6 9 Weeks 30 31 1 2 3 4 5 22 Weeks 29 30 31 1 2 3 4 35 Weeks 28 29 30 1 2 3 4 48
7 8 9 10 11 12 13 10 6 7 8 9 10 11 12 23 5 6 7 8 9 10 11 36 5 6 7 8 9 10 11 49
MAR 14 15 16 17 18 19 20 11 JUNE 13 14 15 16 17 18 19 24 SEPT 12 13 14 15 16 17 18 37 DEC 12 13 14 15 16 17 18 50
4 21 22 23 24 25 26 27 12 4 20 21 22 23 24 25 26 25 4 19 20 21 22 23 24 25 38 4 19 20 21 22 23 24 25 51
Weeks 28 29 30 31 1 2 3 13 Weeks 27 28 29 30 1 2 3 26 Weeks 26 27 28 29 30 1 2 39 Weeks 26 27 28 29 30 31 52
CHANGE IN DAYS VERSUS PRIOR YEAR + 3 CHANGE IN DAYS VERSUS PRIOR YEAR 0 CHANGE IN DAYS VERSUS PRIOR YEAR 0 CHANGE IN DAYS VERSUS PRIOR YEAR - 4
2022 FISCAL CALENDAR
FIRST QUARTER SECOND QUARTER THIRD QUARTER FOURTH QUARTERMonth S M T W T F S Week Month S M T W T F S Week Month S M T W T F S Week Month S M T W T F S Week
12 3 4 5 6 7 8 1 3 4 5 6 7 8 9 14 3 4 5 6 7 8 9 27 2 3 4 5 6 7 8 40
JAN 9 10 11 12 13 14 15 2 APR 10 11 12 13 14 15 16 15 JULY 10 11 12 13 14 15 16 28 OCT 9 10 11 12 13 14 15 41
5 16 17 18 19 20 21 22 3 5 17 18 19 20 21 22 23 16 5 17 18 19 20 21 22 23 29 5 16 17 18 19 20 21 22 42
Weeks 23 24 25 26 27 28 29 4 Weeks 24 25 26 27 28 29 30 17 Weeks 24 25 26 27 28 29 30 30 Weeks 23 24 25 26 27 28 29 43
30 31 1 2 3 4 5 5 1 2 3 4 5 6 7 18 31 1 2 3 4 5 6 31 30 31 1 2 3 4 5 44
6 7 8 9 10 11 12 6 8 9 10 11 12 13 14 19 7 8 9 10 11 12 13 32 6 7 8 9 10 11 12 45
FEB 13 14 15 16 17 18 19 7 MAY 15 16 17 18 19 20 21 20 AUG 14 15 16 17 18 19 20 33 NOV 13 14 15 16 17 18 19 46
4 20 21 22 23 24 25 26 8 4 22 23 24 25 26 27 28 21 4 21 22 23 24 25 26 27 34 4 20 21 22 23 24 25 26 47
Weeks 27 28 1 2 3 4 5 9 Weeks 29 30 31 1 2 3 4 22 Weeks 28 29 30 31 1 2 3 35 Weeks 27 28 29 30 1 2 3 48
6 7 8 9 10 11 12 10 5 6 7 8 9 10 11 23 4 5 6 7 8 9 10 36 4 5 6 7 8 9 10 49
MAR 13 14 15 16 17 18 19 11 JUNE 12 13 14 15 16 17 18 24 SEPT 11 12 13 14 15 16 17 37 DEC 11 12 13 14 15 16 17 50
4 20 21 22 23 24 25 26 12 4 19 20 21 22 23 24 25 25 4 18 19 20 21 22 23 24 38 4 18 19 20 21 22 23 24 51
Weeks 27 28 29 30 31 1 2 13 Weeks 26 27 28 29 30 1 2 26 Weeks 25 26 27 28 29 30 1 39 Weeks 25 26 27 28 29 30 31 52
CHANGE IN DAYS VERSUS PRIOR YEAR 0 CHANGE IN DAYS VERSUS PRIOR YEAR 0 CHANGE IN DAYS VERSUS PRIOR YEAR 0 CHANGE IN DAYS VERSUS PRIOR YEAR 0
Copyright © 2022 FDOKUMEN