Thermal Unfolding of Proteins Probed at the Single Molecule Level Using Nanopores
6
Thermal Unfolding of Proteins Probed at the Single Molecule Level Using Nanopores Linda Payet, †,‡ Marle ̀ ne Martinho, †,⊥ Manuela Pastoriza-Gallego, ‡ Jean-Michel Betton, § Loïc Auvray, ∥ Juan Pelta,* ,†,‡ and Je ́ rôme Mathe ́ * ,† † LAMBE, UMR 8587 CNRS-CEA-UEVE, Universite ́ d’E ́ vry val d’Essonne, E ́ vry, France ‡ LAMBE, UMR 8587 CNRS-CEA-UEVE, Universite ́ de Cergy-Pontoise, Cergy-Pontoise Cedex, France § Unite ́ de Biochimie Structurale, CNRS-URA 3528, Institut Pasteur, Paris, France ∥ Laboratoire MSC, CNRS UMR-7057, Universite ́ Paris-Diderot, Paris, France * S Supporting Information ABSTRACT: The nanopore technique has great potential to discriminate conformations of proteins. It is a very interesting system to mimic and understand the process of translocation of biomacromolecules through a cellular membrane. In particular, the unfolding and folding of proteins before and after going through the nanopore are not well understood. We study the thermal unfolding of a protein, probed by two protein nanopores: aerolysin and α-hemolysin. At room temperature, the native folded protein does not enter into the pore. When we increase the temperature from 25 to 50 °C, the molecules unfold and the event frequency of current blockade increases. A similar sigmoid function fits the normalized event frequency evolution for both nanopores, thus the unfolding curve does not depend on the structure and the net charge of the nanopore. We performed also a circular dichroism bulk experiment. We obtain the same melting temperature (around 45 °C) using the bulk and single molecule techniques. N anopores with ionic current measurements are the subject of extensive research in the field of sensing and characterization of single biopolymers. 1 This technique consists in measuring continuously an ionic current through a channel induced by an externally applied electric field. When a macromolecule goes through the pore, the current temporarily falls down. The frequency and the duration of the current variations are characteristic of the physical chemistry such as conformation and charge of the diffusing molecule. In particular, studies had exhibited the potential of using nanopores for single-stranded DNA or RNA ultrafast and low cost sequencing 2 and to detect selectively microRNA biomarkers 3 useful, for example, in cancer diagnosis. 4 The study of proteins by nanopore presents also a great interest and it is promising for applications. The nanopore technique was shown to be suitable to probe the structure of peptides, 5−7 to perform binding essays, 8−11 to study protein translocation, 12−19 and also to follow the unfolding process of proteins in the presence of denaturing agent 13,20 or the folding of peptides and proteins by metal ions. 21,22 The transport of unfolded protein through a channel plays a role in biological processes: protein import or export, protein synthesis or degradation. Human diseases are related to bad transport or misfolding. 23 The understanding of the connection between protein translocation and folding is crucial. After their translocation, polypeptide chains need to be correctly refolded to be functional. 24,25 Given the first results obtained, the nanopore technique looks extremely promising to mimic and describe the protein translocation processes that take place in living organisms. Approaches to study protein folding/unfolding are essentially of two kinds: classical bulk experiments, such as circular dichroism (CD) or fluorescence spectroscopy, and single- molecule sensing, such as atomic force microscopy (AFM), optical tweezers, or fluorescence resonance energy transfer (FRET). 26−28 Nanopores retain qualities of both types: the frequency of probing events is sufficiently high to easily yield significant statistics, which is an important feature of bulk measurements and hard to attain with AFM. However, while bulk measurements necessarily give averaging results across the sample, the pore probes macromolecules one-by-one and thus enables, for example, the separate analysis of the dynamics of several coexisting conformations in a sample. 20 Also, contrary to the other single-molecule techniques, nanopores do not require labeled molecules, so the preparation of the samples is simpler and the molecules are not chemically modified. While it is well established that unfolding is necessary for some proteins to pass through narrow channels, only two studies describe the unfolding curves of proteins as a function of the denaturing agent concentration and their transport against an external parameter: curves of unfolded maltose binding protein (MBP) and a mutant as a function of Received: January 13, 2012 Accepted: April 9, 2012 Published: April 9, 2012 Article pubs.acs.org/ac © 2012 American Chemical Society 4071 dx.doi.org/10.1021/ac300129e | Anal. Chem. 2012, 84, 4071−4076
-
Upload
independent -
Category
Documents
-
view
0 -
download
0
Transcript of Thermal Unfolding of Proteins Probed at the Single Molecule Level Using Nanopores

Thermal Unfolding of Proteins Probed at the Single Molecule LevelUsing NanoporesLinda Payet,†,‡ Marlene Martinho,†,⊥ Manuela Pastoriza-Gallego,‡ Jean-Michel Betton,§ Loïc Auvray,∥
Juan Pelta,*,†,‡ and Jero me Mathe*,†
†LAMBE, UMR 8587 CNRS-CEA-UEVE, Universite d’Evry val d’Essonne, Evry, France‡LAMBE, UMR 8587 CNRS-CEA-UEVE, Universite de Cergy-Pontoise, Cergy-Pontoise Cedex, France§Unite de Biochimie Structurale, CNRS-URA 3528, Institut Pasteur, Paris, France∥Laboratoire MSC, CNRS UMR-7057, Universite Paris-Diderot, Paris, France
*S Supporting Information
ABSTRACT: The nanopore technique has great potential to discriminateconformations of proteins. It is a very interesting system to mimic andunderstand the process of translocation of biomacromolecules through acellular membrane. In particular, the unfolding and folding of proteinsbefore and after going through the nanopore are not well understood. Westudy the thermal unfolding of a protein, probed by two proteinnanopores: aerolysin and α-hemolysin. At room temperature, the nativefolded protein does not enter into the pore. When we increase thetemperature from 25 to 50 °C, the molecules unfold and the event frequency of current blockade increases. A similar sigmoidfunction fits the normalized event frequency evolution for both nanopores, thus the unfolding curve does not depend on thestructure and the net charge of the nanopore. We performed also a circular dichroism bulk experiment. We obtain the samemelting temperature (around 45 °C) using the bulk and single molecule techniques.
Nanopores with ionic current measurements are thesubject of extensive research in the field of sensing and
characterization of single biopolymers.1 This technique consistsin measuring continuously an ionic current through a channelinduced by an externally applied electric field. When amacromolecule goes through the pore, the current temporarilyfalls down. The frequency and the duration of the currentvariations are characteristic of the physical chemistry such asconformation and charge of the diffusing molecule. Inparticular, studies had exhibited the potential of usingnanopores for single-stranded DNA or RNA ultrafast and lowcost sequencing2 and to detect selectively microRNAbiomarkers3 useful, for example, in cancer diagnosis.4 Thestudy of proteins by nanopore presents also a great interest andit is promising for applications. The nanopore technique wasshown to be suitable to probe the structure of peptides,5−7 toperform binding essays,8−11 to study protein translocation,12−19
and also to follow the unfolding process of proteins in thepresence of denaturing agent13,20 or the folding of peptides andproteins by metal ions.21,22 The transport of unfolded proteinthrough a channel plays a role in biological processes: proteinimport or export, protein synthesis or degradation. Humandiseases are related to bad transport or misfolding.23 Theunderstanding of the connection between protein translocationand folding is crucial. After their translocation, polypeptidechains need to be correctly refolded to be functional.24,25 Giventhe first results obtained, the nanopore technique looks
extremely promising to mimic and describe the proteintranslocation processes that take place in living organisms.Approaches to study protein folding/unfolding are essentially
of two kinds: classical bulk experiments, such as circulardichroism (CD) or fluorescence spectroscopy, and single-molecule sensing, such as atomic force microscopy (AFM),optical tweezers, or fluorescence resonance energy transfer(FRET).26−28 Nanopores retain qualities of both types: thefrequency of probing events is sufficiently high to easily yieldsignificant statistics, which is an important feature of bulkmeasurements and hard to attain with AFM. However, whilebulk measurements necessarily give averaging results across thesample, the pore probes macromolecules one-by-one and thusenables, for example, the separate analysis of the dynamics ofseveral coexisting conformations in a sample.20 Also, contraryto the other single-molecule techniques, nanopores do notrequire labeled molecules, so the preparation of the samples issimpler and the molecules are not chemically modified.While it is well established that unfolding is necessary for
some proteins to pass through narrow channels, only twostudies describe the unfolding curves of proteins as a functionof the denaturing agent concentration and their transportagainst an external parameter: curves of unfolded maltosebinding protein (MBP) and a mutant as a function of
Received: January 13, 2012Accepted: April 9, 2012Published: April 9, 2012
Article
pubs.acs.org/ac
© 2012 American Chemical Society 4071 dx.doi.org/10.1021/ac300129e | Anal. Chem. 2012, 84, 4071−4076
guanidium chloride concentration has been obtained with theevolution of event frequency of current blockades in an α-hemolysin13 or an aerolysin pore.29
We use in this study two passive channels, α-hemolysin andaerolysin. The structure of α-hemolysin was solved by Song etal.30 For aerolysin, there is no crystal structure available, yetelectron microscopy provides a model of the pore shape31,32 tobe compared with α-hemolysin’s one. It shows that as α-hemolysin, the aerolysin channel is heptameric and formed a β-barrel that can perforate the membranes. In contrast with α-hemolysin, aerolysin has no vestibule domain. The length ofboth nanopores are similar (around 10 nm), but the diameterof α-hemolysin (1.5−4.6 nm) is larger than the aerolysin one(1−1.7 nm). On the other hand, the net charge of the poresdiffers widely: +7e for α-hemolysin against −52e for aerolysin.In this paper, we are interested in the study of protein
denaturation by temperature. Temperature can easily becombined with nanopore technique in a reversible way withoutotherwise disturbing the samples, and this fact is important forfurther observation of the refolding process. We study thethermal unfolding of MalE219, a variant of MBP, using twodifferent protein nanopores, aerolysin and α-hemolysin (α-HL).We confirm that aerolysin, due to its smaller diameter, is abetter candidate to detect different conformations of proteins.We also compare the thermodynamic data obtained with thenanopore technique and CD experiments.
■ EXPERIMENTAL SECTIONMBP is a recombinant protein of Escherichia coli widely studiedas a model of protein folding and translocation.33 We work withone of its destabilized variants, MalE219,17 which allowsnanopore experiments in a convenient range of temperature, aswe will show. As MBP, the size and the net charge of MalE219are 370 residues (40 707 Da) and −8e, respectively. Theseproteins consist of two domains forming an ellipsoidal structurewith overall dimensions of 30 Å × 40 Å × 65 Å.34
Electrical recording setup used is similar to the one presentedby Bates et al.35 For details on statistical analysis, see the
Supporting Information. The recordings were performed at 70mV for aerolysin and at 100 mV for α-hemolysin. We foundthat according to the protein nanopore, these voltage bias areoptimized to have stable experimental conditions for a longtime and at any temperature. By recording the current−voltagecurves, we check the stability of the pores (i.e., no gatingobserved) under the different experimental conditions (datanot shown). It is well-known that lipid bilayers and α-hemolysin nanopores are stable at high temperature (up tonearly 100 °C).36 We showed that it is also the case foraerolysin at least up to 70 °C. The protein, MalE219, is addedin the cis-chamber (see definition in the SupportingInformation).
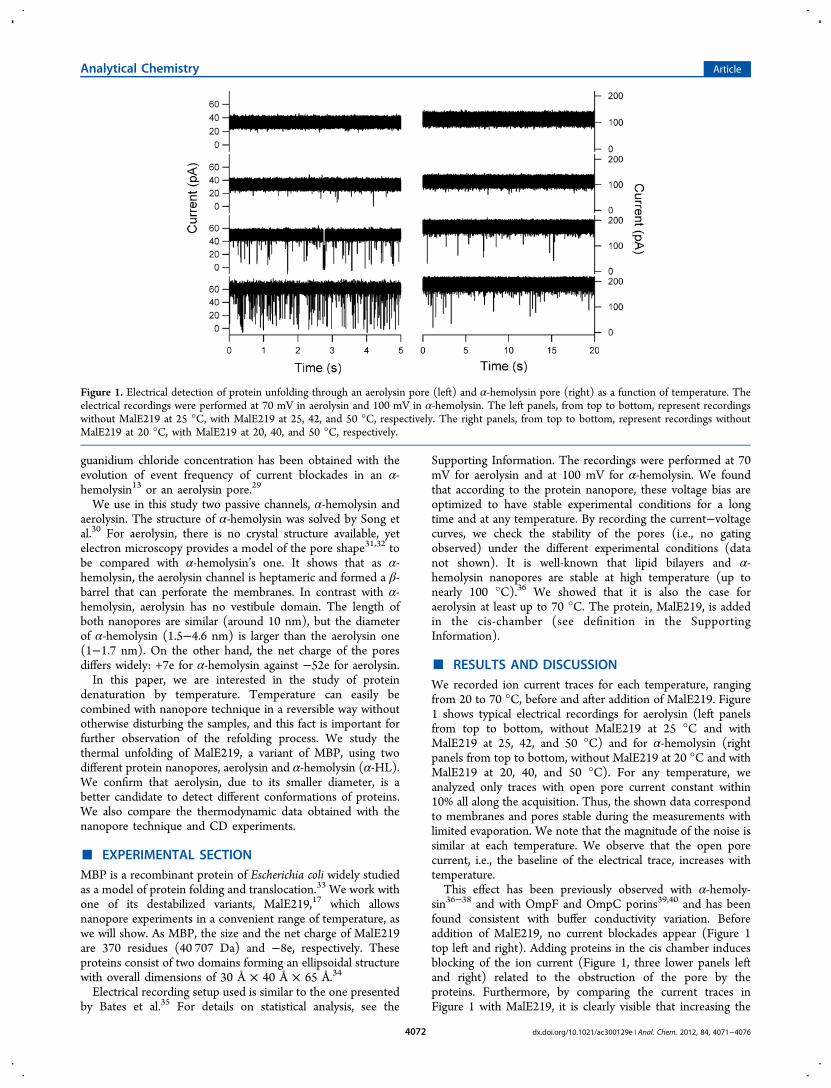
■ RESULTS AND DISCUSSIONWe recorded ion current traces for each temperature, rangingfrom 20 to 70 °C, before and after addition of MalE219. Figure1 shows typical electrical recordings for aerolysin (left panelsfrom top to bottom, without MalE219 at 25 °C and withMalE219 at 25, 42, and 50 °C) and for α-hemolysin (rightpanels from top to bottom, without MalE219 at 20 °C and withMalE219 at 20, 40, and 50 °C). For any temperature, weanalyzed only traces with open pore current constant within10% all along the acquisition. Thus, the shown data correspondto membranes and pores stable during the measurements withlimited evaporation. We note that the magnitude of the noise issimilar at each temperature. We observe that the open porecurrent, i.e., the baseline of the electrical trace, increases withtemperature.This effect has been previously observed with α-hemoly-
sin36−38 and with OmpF and OmpC porins39,40 and has beenfound consistent with buffer conductivity variation. Beforeaddition of MalE219, no current blockades appear (Figure 1top left and right). Adding proteins in the cis chamber inducesblocking of the ion current (Figure 1, three lower panels leftand right) related to the obstruction of the pore by theproteins. Furthermore, by comparing the current traces inFigure 1 with MalE219, it is clearly visible that increasing the
Figure 1. Electrical detection of protein unfolding through an aerolysin pore (left) and α-hemolysin pore (right) as a function of temperature. Theelectrical recordings were performed at 70 mV in aerolysin and 100 mV in α-hemolysin. The left panels, from top to bottom, represent recordingswithout MalE219 at 25 °C, with MalE219 at 25, 42, and 50 °C, respectively. The right panels, from top to bottom, represent recordings withoutMalE219 at 20 °C, with MalE219 at 20, 40, and 50 °C, respectively.
Analytical Chemistry Article
dx.doi.org/10.1021/ac300129e | Anal. Chem. 2012, 84, 4071−40764072
temperature from 50 °C increases the event frequency. Theincrease of the event rate with temperature could be due to theenhancement of thermal motion, which makes the diffusion ofMalE219 in any conformation to the pore more frequent. Infact, we will show below that the increase of the event rate withtemperature is mainly related to thermal unfolding of theprotein, the same way that we showed previously that the eventfrequency increases with denaturing agent concentration fordifferent proteins.13,29 We also observe that different levels ofblockades exist at any temperature.To characterize theses different current blockades, we
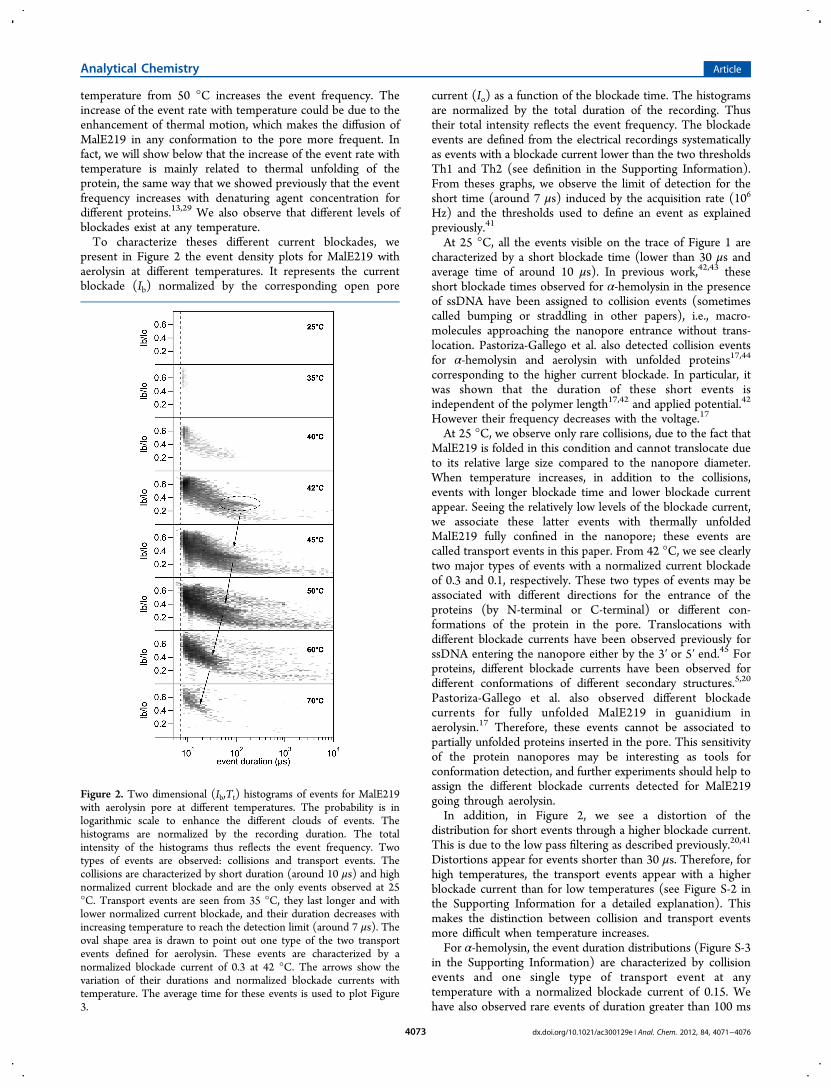
present in Figure 2 the event density plots for MalE219 withaerolysin at different temperatures. It represents the currentblockade (Ib) normalized by the corresponding open pore
current (Io) as a function of the blockade time. The histogramsare normalized by the total duration of the recording. Thustheir total intensity reflects the event frequency. The blockadeevents are defined from the electrical recordings systematicallyas events with a blockade current lower than the two thresholdsTh1 and Th2 (see definition in the Supporting Information).From theses graphs, we observe the limit of detection for theshort time (around 7 μs) induced by the acquisition rate (106
Hz) and the thresholds used to define an event as explainedpreviously.41
At 25 °C, all the events visible on the trace of Figure 1 arecharacterized by a short blockade time (lower than 30 μs andaverage time of around 10 μs). In previous work,42,43 theseshort blockade times observed for α-hemolysin in the presenceof ssDNA have been assigned to collision events (sometimescalled bumping or straddling in other papers), i.e., macro-molecules approaching the nanopore entrance without trans-location. Pastoriza-Gallego et al. also detected collision eventsfor α-hemolysin and aerolysin with unfolded proteins17,44
corresponding to the higher current blockade. In particular, itwas shown that the duration of these short events isindependent of the polymer length17,42 and applied potential.42
However their frequency decreases with the voltage.17
At 25 °C, we observe only rare collisions, due to the fact thatMalE219 is folded in this condition and cannot translocate dueto its relative large size compared to the nanopore diameter.When temperature increases, in addition to the collisions,events with longer blockade time and lower blockade currentappear. Seeing the relatively low levels of the blockade current,we associate these latter events with thermally unfoldedMalE219 fully confined in the nanopore; these events arecalled transport events in this paper. From 42 °C, we see clearlytwo major types of events with a normalized current blockadeof 0.3 and 0.1, respectively. These two types of events may beassociated with different directions for the entrance of theproteins (by N-terminal or C-terminal) or different con-formations of the protein in the pore. Translocations withdifferent blockade currents have been observed previously forssDNA entering the nanopore either by the 3′ or 5′ end.45 Forproteins, different blockade currents have been observed fordifferent conformations of different secondary structures.5,20
Pastoriza-Gallego et al. also observed different blockadecurrents for fully unfolded MalE219 in guanidium inaerolysin.17 Therefore, these events cannot be associated topartially unfolded proteins inserted in the pore. This sensitivityof the protein nanopores may be interesting as tools forconformation detection, and further experiments should help toassign the different blockade currents detected for MalE219going through aerolysin.In addition, in Figure 2, we see a distortion of the
distribution for short events through a higher blockade current.This is due to the low pass filtering as described previously.20,41
Distortions appear for events shorter than 30 μs. Therefore, forhigh temperatures, the transport events appear with a higherblockade current than for low temperatures (see Figure S-2 inthe Supporting Information for a detailed explanation). Thismakes the distinction between collision and transport eventsmore difficult when temperature increases.For α-hemolysin, the event duration distributions (Figure S-3
in the Supporting Information) are characterized by collisionevents and one single type of transport event at anytemperature with a normalized blockade current of 0.15. Wehave also observed rare events of duration greater than 100 ms
Figure 2. Two dimensional (Ib,Tt) histograms of events for MalE219with aerolysin pore at different temperatures. The probability is inlogarithmic scale to enhance the different clouds of events. Thehistograms are normalized by the recording duration. The totalintensity of the histograms thus reflects the event frequency. Twotypes of events are observed: collisions and transport events. Thecollisions are characterized by short duration (around 10 μs) and highnormalized current blockade and are the only events observed at 25°C. Transport events are seen from 35 °C, they last longer and withlower normalized current blockade, and their duration decreases withincreasing temperature to reach the detection limit (around 7 μs). Theoval shape area is drawn to point out one type of the two transportevents defined for aerolysin. These events are characterized by anormalized blockade current of 0.3 at 42 °C. The arrows show thevariation of their durations and normalized blockade currents withtemperature. The average time for these events is used to plot Figure3.
Analytical Chemistry Article
dx.doi.org/10.1021/ac300129e | Anal. Chem. 2012, 84, 4071−40764073
below 42 °C associated with partially folded proteins blockingthe pore entrance. These partially folded conformations havebeen previously observed for chemically denaturated wild typeMalE,13 and we recently determined using NMR that theseevents are probably due to proteins partially unfolded by theirC-terminal end.46
In Figure 3, we represent the average blockade time as afunction of temperature for α-hemolysin and for aerolysin. For
α-hemolysin, this time is defined by the longer characteristictime obtained from the time distribution fit. For aerolysin, sinceseveral time scales can be extracted from the event durationdistributions, we focused on the event with a normalizedcurrent of 0.3 which are clearly visible from 42 °C. This timescale does not characterize all the events, but its evolution withtemperature clearly shows a decrease of the transport time withtemperature. As expected, the dynamics of MalE219 isaccelerated with an increase of temperature, but at hightemperature (from 60 °C), the blockade time reaches a plateaudue to the resolution limit of the technique, as we will seebelow. This behavior has been observed for ssDNA trans-locating α-hemolysin for temperature varying from 15 to 40°C37 and also for ampicillin in OmpF from 5 to 55 °C.47 Wealso notice that the transport dynamics of MalE219 aresystematically slower in aerolysin compared to α-hemolysin.This agrees with our previous investigation where we foundthat the mean transport time of chemically unfolded protein ishigher in aerolysin compared to α-hemolysin for the sameapplied voltage.17 This difference may be due also to theexistence of a more slowing down interaction of the proteinwith aerolysin than with α-hemolysin. The interaction betweenthe protein and the pore may be of three kinds: electrostatic,hydrophobic, or steric. Electrostatic interactions may influencetransport time as Rincor-Restrepo et al. described for ssDNA.48
However, considering the overall charge of the protein, we canexpect these interactions to be weak. We also expect very fewhydrophobic interactions between the pore and the proteinbecause at any temperature, although the proteins confined inthe nanopore are completely unfolded, the pores are notdenatured. The main difference in diffusion through therespective pore may be explained by different geometry alongthe nanopore: smaller diameter was suggested for aerolysinallowing more steric interactions. It is useful to remember thissensitivity difference between aerolysin and α-hemolysin whenone has to choose a pore for single-molecule detection, inparticular for identification of different conformation states of amacromolecule.
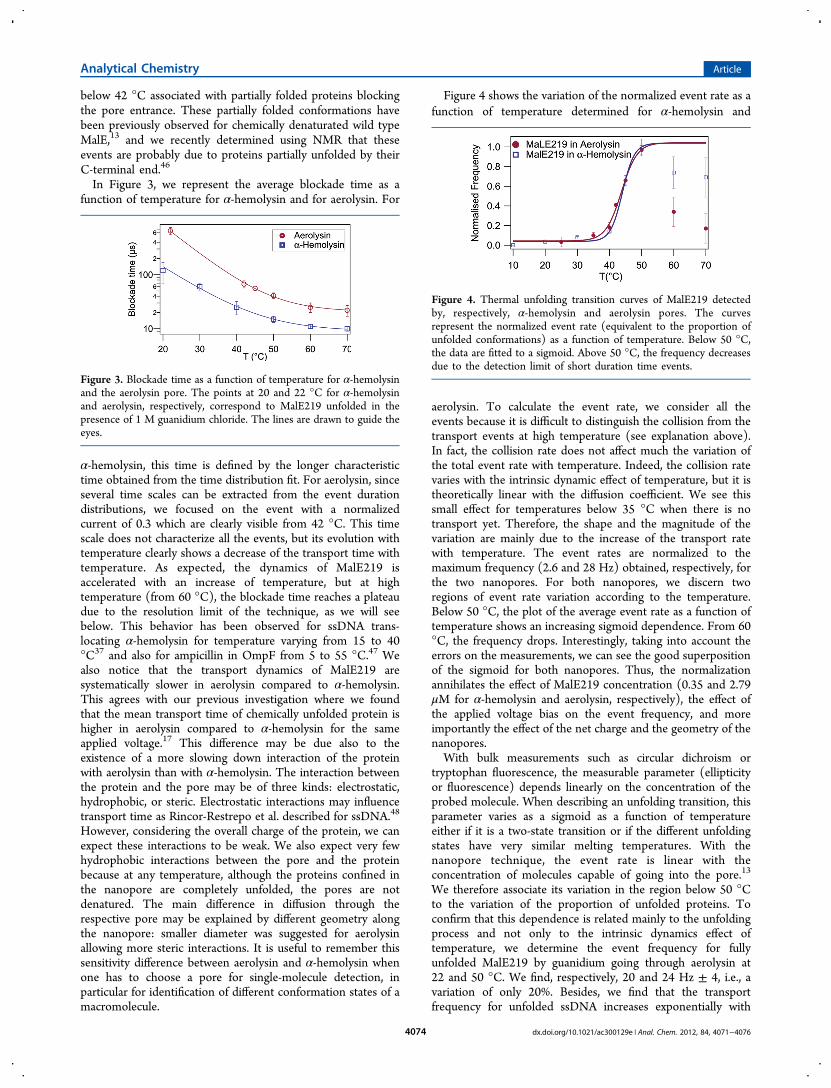
Figure 4 shows the variation of the normalized event rate as afunction of temperature determined for α-hemolysin and
aerolysin. To calculate the event rate, we consider all theevents because it is difficult to distinguish the collision from thetransport events at high temperature (see explanation above).In fact, the collision rate does not affect much the variation ofthe total event rate with temperature. Indeed, the collision ratevaries with the intrinsic dynamic effect of temperature, but it istheoretically linear with the diffusion coefficient. We see thissmall effect for temperatures below 35 °C when there is notransport yet. Therefore, the shape and the magnitude of thevariation are mainly due to the increase of the transport ratewith temperature. The event rates are normalized to themaximum frequency (2.6 and 28 Hz) obtained, respectively, forthe two nanopores. For both nanopores, we discern tworegions of event rate variation according to the temperature.Below 50 °C, the plot of the average event rate as a function oftemperature shows an increasing sigmoid dependence. From 60°C, the frequency drops. Interestingly, taking into account theerrors on the measurements, we can see the good superpositionof the sigmoid for both nanopores. Thus, the normalizationannihilates the effect of MalE219 concentration (0.35 and 2.79μM for α-hemolysin and aerolysin, respectively), the effect ofthe applied voltage bias on the event frequency, and moreimportantly the effect of the net charge and the geometry of thenanopores.With bulk measurements such as circular dichroism or
tryptophan fluorescence, the measurable parameter (ellipticityor fluorescence) depends linearly on the concentration of theprobed molecule. When describing an unfolding transition, thisparameter varies as a sigmoid as a function of temperatureeither if it is a two-state transition or if the different unfoldingstates have very similar melting temperatures. With thenanopore technique, the event rate is linear with theconcentration of molecules capable of going into the pore.13
We therefore associate its variation in the region below 50 °Cto the variation of the proportion of unfolded proteins. Toconfirm that this dependence is related mainly to the unfoldingprocess and not only to the intrinsic dynamics effect oftemperature, we determine the event frequency for fullyunfolded MalE219 by guanidium going through aerolysin at22 and 50 °C. We find, respectively, 20 and 24 Hz ± 4, i.e., avariation of only 20%. Besides, we find that the transportfrequency for unfolded ssDNA increases exponentially with
Figure 3. Blockade time as a function of temperature for α-hemolysinand the aerolysin pore. The points at 20 and 22 °C for α-hemolysinand aerolysin, respectively, correspond to MalE219 unfolded in thepresence of 1 M guanidium chloride. The lines are drawn to guide theeyes.
Figure 4. Thermal unfolding transition curves of MalE219 detectedby, respectively, α-hemolysin and aerolysin pores. The curvesrepresent the normalized event rate (equivalent to the proportion ofunfolded conformations) as a function of temperature. Below 50 °C,the data are fitted to a sigmoid. Above 50 °C, the frequency decreasesdue to the detection limit of short duration time events.
Analytical Chemistry Article
dx.doi.org/10.1021/ac300129e | Anal. Chem. 2012, 84, 4071−40764074

temperature and not with a sigmoid dependence (data to bepublished). This sigmoid dependence agrees with our previouswork, where we followed the nanopore technique with thedenaturation of proteins by a chemical agent.13,29
For temperature higher than 50 °C, the rate drops. Thiswould have been explained by aggregation of proteins if wewould have observed in parallel an increase of the transporttime with temperature in this region. In contrast, as we noticeabove, the event duration decreases to reach a plateaucorresponding to the limit of detection (see Figure 2) of theshort time events. Therefore more and more events are too fastto be resolved at high temperature inducing a decrease in theobserved event rate. Kozhinjampara et al. had also observed thistype of frequency decrease at high temperature for trans-location of antibiotic through OmpF membrane channels.47 Toextend the measurement of the event rate at a highertemperature, one could increase the transport time byincreasing the viscosity of the buffer, for example.By comparing the single-molecule nanopore data (for
temperature below 50 °C) to CD bulk detection of thermalunfolding, we confirm again that the sigmoidal variation of theevent rate is related to the unfolding process. In Figure 5, we
display the CD thermal unfolding curve for MalE219. Althoughwe may have different unfolding conformations, a sigmoidfunction is the best fit for the data obtained with both methods.We determine the melting temperature of MalE219: 44 °C ± 1and 45.5 °C ± 0.5, respectively, for the nanopore technique andCD measurements. Thus, both techniques give values that arein good agreement.
■ CONCLUSIONSIn conclusion, we demonstrate that we can study thermalunfolding of proteins by electrical detection of single-moleculegoing through nanopores. For both aerolysin and α-hemolysin,as noticed previously, we detected mainly two types of events:(1) short events with high blockade currents corresponding tocollisions which appear at any temperature and (2) long eventswith low blockade current and with duration associated totransport. These latter events arise when temperature increasesand are therefore related to the thermally unfolded proteinscrossing the nanopore. As expected, transport dynamics aresped up by thermal motion. Also, for both nanopores, the eventfrequency, linearly related to the proportion of unfoldedproteins, varies as a function of temperature as a growing
sigmoid. Thus, the thermal unfolding transition does notdepend on the nanopore net charge and geometry. We showthat melting temperature determined by the nanoporetechnique agrees with the one determined by circulardichroism. While CD gives structural information on averagefor all the states in solution, nanopores allow one to detectprotein conformations at the single molecule level. In particular,we observe with aerolysin that we may have differentconformations of unfolded MalE219 in the pore. The nanoporetechnique has great potential to help resolve fundamentalquestions concerning the interaction of macromolecules withnanopores and their translocation in vivo in addition to be usedas chemical or conformation sensors.
■ ASSOCIATED CONTENT*S Supporting InformationAdditional information as noted in text. This material isavailable free of charge via the Internet at http://pubs.acs.org.
■ AUTHOR INFORMATIONCorresponding Author*E-mail: [email protected] (J.P.); [email protected] (J.M.).
Present Address⊥Laboratoire de Bioenergetique et Ingenierie des Proteines,Equipe de Biophysique des Metalloproteines, CNRS UPR9036, Marseille, France.
NotesThe authors declare no competing financial interest.
■ ACKNOWLEDGMENTSAt the time of the data acquisition Linda Payet and MarleneMartinho were Postdoctoral Fellows of Genopole. This workwas supported by grant funding from ANR Blanche “TRANS-FOLDPROT” BLAN08-1_339991. We thank F. Gisous VanDer Goot for the vector of recombinant aerolysin.
■ REFERENCES(1) Howorka, S.; Siwy, Z. Chem. Soc. Rev. 2009, 38, 2360−2384.(2) Branton, D.; et al. Nat. Biotechnol. 2008, 26, 1146−1153.(3) Wanunu, M.; Dadosh, T.; Ray, V.; Jin, J.; McReynolds, L.;Drndic, M. Nat. Nanotechnol. 2010, 5, 807−814.(4) Wang, Y.; Zheng, D.; Tan, Q.; Wang, M. X.; Gu, L.-Q. Nat.Nanotechnol. 2011, 6, 668−674.(5) Sutherland, T. C.; Long, Y.-T.; Stefureac, R.-I.; Bediako-Amoa, I.;Kraatz, H.-B.; Lee, J. S. Nano Lett. 2004, 4, 1273−1277.(6) Stefureac, R.; Long, Y.-t.; Kraatz, H.-B.; Howard, P.; Lee, J. S.Biochemistry 2006, 45, 9172−9179.(7) Wang, H.-Y.; Ying, Y.-L.; Li, Y.; Kraatz, H.-B.; Long, Y.-T. Anal.Chem. 2011, 83, 1746−1752.(8) Movileanu, L.; Schmittschmitt, J. P.; Martin Scholtz, J.; Bayley, H.Biophys. J. 2005, 89, 1030−1045.(9) Han, A.; Creus, M.; Schulermann, G.; Linder, V.; Ward, T. R.; deRooij, N. F.; Staufer, U. Anal. Chem. 2008, 80, 4651−4658.(10) Sexton, L. T.; Horne, L. P.; Sherrill, S. A.; Bishop, G. W.; Baker,L. A.; Martin, C. R. J. Am. Chem. Soc. 2007, 129, 13144−13152.(11) Niedzwiecki, D. J.; Grazul, J.; Movileanu, L. J. Am. Chem. Soc.2010, 132, 10816−10822.(12) Fologea, D.; Ledden, B.; McNabb, D. S.; Li, J. Appl. Phys. Lett.2007, 91, 539011−539013.(13) Oukhaled, G.; Mathe, J.; Biance, A. L.; Bacri, L.; Betton, J. M.;Lairez, D.; Pelta, J.; Auvray, L. Phys. Rev. Lett. 2007, 98, 15801−15805.(14) Mohammad, M.; Movileanu, L. Eur. Biophys. J. 2008, 37, 913−925.
Figure 5. Thermal unfolding transition curve of MalE219 assessed bycircular dichroism. The curve represents the normalized unfoldedfraction of MalE219 as a function of temperature. The normalized datawere obtained from the measurement of the ellipticity at 222 nm witha scan rate of 0.5 °C min−1 and after baseline subtraction. The data arefitted to a sigmoid.
Analytical Chemistry Article
dx.doi.org/10.1021/ac300129e | Anal. Chem. 2012, 84, 4071−40764075

(15) Makarov, D. E. Acc. Chem. Res. 2009, 42, 281−289.(16) Firnkes, M.; Pedone, D.; Knezevic, J.; Doblinger, J.; Rant, U.Nano Lett. 2010, 10, 2162−2167.(17) Pastoriza-Gallego, M.; Rabah, L.; Gibrat, G.; Thiebot, B.; vander Goot, F. G.; Auvray, L.; Betton, J.-M.; Pelta, J. J. Am. Chem. Soc.2011, 133, 2923−2931.(18) Freedman, K. J.; Jurgens, M.; Prabhu, A.; Ahn, C. W.; Jemth, P.;Edel, J. B.; Kim, M. J. Anal. Chem. 2011, 83, 5137−5144.(19) Yusko, E. C.; Johnson, J. M.; Majd, S.; Prangkio, P.; Rollings, R.C.; Li, J.; Yang, J.; Mayer, M. Nat. Nanotechnol. 2011, 6, 253−260.(20) Talaga, D. S.; Li, J. J. Am. Chem. Soc. 2009, 131, 9287−9297.(21) Stefureac, R.; Waldner, L.; Howard, P.; Lee, J. S. Small 2008, 4,59−63.(22) Baran, C.; Smith, G. S. T.; Bamm, V. V.; Harauz, G.; Lee, J. S.Biochem. Biophys. Res. Commun. 2010, 391, 224−9.(23) Dobson, C. M. Nature 2003, 426, 884−890.(24) Rapoport, T. A. Nature 2007, 450, 663−669.(25) Wickner, W.; Schekman, R. Science 2005, 310, 1452−1456.(26) Borgia, A.; Williams, P. M.; Clarke, J. Annu. Rev. Biochem. 2008,77, 101−125.(27) Kapanidis, A. N.; Strick, T. Trends Biochem. Sci. 2009, 34, 234−243.(28) Crampton, N.; Brockwell, D. J. Curr. Opin. Struct. Biol. 2010, 20,508−517.(29) Merstoff, C.; Cressiot, B.; Pastoriza-Gallego, M.; Oukhaled, A.;Betton, J.-M.; Auvray, L.; Pelta, J. ACS Chem. Biol. 2012, DOI:10.1021/cb2004737.(30) Song, L.; Hobaugh, M. R.; Shustak, C.; Cheley, S.; Bayley, H.;Gouaux, J. E. Science 1996, 274, 1859−1865.(31) Parker, M. W.; Buckley, J. T.; Postma, J. P. M; Tucker, A. D.;Leonard, K.; Pattus, F.; Tsernoglou, D. Nature 1994, 367, 292−295.(32) Tsitrin, Y.; Morton, C. J.; El Bez, C.; Paumard, P.; Velluz, M.-C.;Adrian, M.; Dubochet, J.; Parker, M. W.; Lanzavecchia, S.; van derGoot, F. G. Nat. Struct. Mol. Biol. 2002, 9, 729−733.(33) Miot, M.; Betton, J.-M. Microb. Cell Fact. 2004, 3, 4.(34) Spurlino, J. C.; Lu, G. Y.; Quiocho, F. A. J. Biol. Chem. 1991,266, 5202−5219.(35) Bates, M.; Burns, M.; Meller, A. Biophys. J. 2003, 84, 2366−2372.(36) Kang, X. f.; Gu, L. Q.; Cheley, S.; Bayley, H. Angew. Chem., Int.Ed. 2005, 44, 1495−1499.(37) Meller, A.; Branton, D. Electrophoresis 2002, 23, 2583−2591.(38) Jung, Y.; Bayley, H.; Movileanu, L. J. Am. Chem. Soc. 2006, 128,15332−15340.(39) Chimerel, C.; Movileanu, L.; Pezeshki, S.; Winterhalter, M.;Kleinekathofer, U. Eur. Biophys. J. 2008, 38, 121−125.(40) Biro , I.; Pezeshki, S.; Weingart, H.; Winterhalter, M.;Kleinekathofer, U. Biophys. J. 2010, 98, 1830−1839.(41) Pedone, D.; Firnkes, M.; Rant, U. Anal. Chem. 2009, 81, 9689−9694.(42) Kasianowicz, J.; Brandin, E.; Branton, D.; Deamer, D. Proc. Natl.Acad. Sci. U.S.A. 1996, 93, 13770−13773.(43) Meller, A.; Nivon, L.; Brandin, E.; Golovchenko, J.; Branton, D.Proc. Natl. Acad. Sci. U.S.A. 2000, 97, 1079−1084.(44) Pastoriza-Gallego, M.; Gibrat, G.; Thiebot, B.; Betton, J.-M.;Pelta, J. Biochim. Biophys. Acta, Biomembr. 2009, 1788, 1377−1386.(45) Mathe, J.; Aksimentiev, A.; Nelson, D. R.; Schulten, K.; Meller,A. Proc. Natl. Acad. Sci. U.S.A. 2005, 102, 12377−12382.(46) Merstorf, C.; Maciejak, O.; Mathe, J.; Pastoriza-Gallego, M.;Thiebot, B.; Clement, M.-J.; Curmi, P. A.; Pelta, J.; Auvray, L.; Savarin,P. Biochemistry, submitted for publication.(47) Mahendran, K.; Chimerel, C.; Mach, T.; Winterhalter, M. Eur.Biophys. J. 2009, 38, 1141−1145.(48) Rincon-Restrepo, M.; Mikhailova, E.; Bayley, H.; Maglia, G.Nano Lett. 2011, 11, 746−750.
Analytical Chemistry Article
dx.doi.org/10.1021/ac300129e | Anal. Chem. 2012, 84, 4071−40764076