Thermal Characteristic Analysis of Sodium in Diluted Oxygen ...
10
Processes 2022, 10, 704. https://doi.org/10.3390/pr10040704 www.mdpi.com/journal/processes Article Thermal Characteristic Analysis of Sodium in Diluted Oxygen via Thermogravimetric Approach Fang Chen, Xi-Lin Dong *, Yan Tang *, An-Chi Huang, Mei-Lin Zhang, Qing-Chun Kang, Zhong-Jun Shu and Zhi-Xiang Xing School of Environmental and Safety Engineering, Changzhou University, Changzhou 213164, China; [email protected] (F.C.); [email protected] (A.-C.H.); [email protected] (M.-L.Z.); [email protected] (Q.-C.K.); [email protected] (Z.-J.S.); [email protected] (Z.-X.X.) * Correspondence: [email protected] (X.-L.D.); [email protected] (Y.T.) Abstract: As the main reactor type of the fourth-generation nuclear power systems, sodium-cooled fast reactors are now designed and built worldwide. A sodium pool cooling circulation process is indispensable in a sodium-cooled fast reactor. However, the sodium pool fire design is the basis of accidents in sodium-cooled fast reactors. The fire hazard caused by the sodium–oxygen reaction and fast reactor safety have attracted extensive attention. Dry powder is widely used as an effective fire- extinguishing agent to control sodium fire. The sodium will burn in an oxygen-depleted atmosphere when using dry powder to cover fire. In this study, the change law of thermogravimetry of melted sodium is studied by thermogravimetric analysis (TGA) and the apparent activation energy (Ea) is obtained, which has a linear relationship with the oxygen concentration. The results can provide a reference for improving the engineering design standards of sodium fire suppression systems and can also be incorporated into simulation software to improve the accuracy of fire suppression sim- ulations. Keywords: sodium oxygen reaction; sodium pool fire; thermogravimetric analysis; apparent activation energy; oxygen concentration 1. Introduction The concept of the fourth-generation nuclear reactor was proposed at the annual meeting of the American Nuclear Society in 1996. Not only are sodium-cooled fast reac- tors advanced, but they also possess advantages of safety and sustainability [1]. Therefore, they have excellent development potential. The small core volume and high thermal power rate of fast reactors necessitate a coolant with favourable heat transfer performance and weak neutron moderation [2]. Liquid sodium is therefore an ideal coolant for fast neutron reactors because it has a high thermal conductivity and functions over a wide temperature range (97.8–883 °C) [3], it can slow down the neutron velocity and hinder the chain reaction in the fast reactor; consequently, increasingly high pressure will not be gen- erated in operation. At present, liquid sodium is an ideal coolant for fast neutron reactor. The heat transfer system of the sodium-cooled fast reactor system consists of three parts [4]: the primary sodium circuit, the secondary sodium circuit, and the steam circu- lation system. The heat from the core is transferred to the secondary sodium circuit through the sodium in the primary sodium circuit, heating the make-up water in the steam circulation system, producing high-temperature and high-pressure steam, and pro- moting power generation. Subsequently, the cooled sodium flows back to the sodium pump and circulates again [5]; the details are shown in Figure 1. The sodium pool cooling circulation system is an irreplaceable part of the sodium-cooled fast reactor. However, the particular chemical property of sodium is its activity; it can easily react with oxygen. This Citation: Chen, F.; Dong, X.-L.; Tang, Y.; Huang, A.-C.; Zhang, M.-L.; Kang, Q.-C.; Shu, Z.-J.; Xing, Z.-X. Thermal Characteristic Analysis of Sodium in Dilute Oxygen via Thermogravimetric Approach. Processes 2022, 10, 704. https://doi.org/10.3390/pr10040704 Academic Editor: Alfredo Iranzo Received: 21 February 2022 Accepted: 4 April 2022 Published: 5 April 2022 Publisher’s Note: MDPI stays neu- tral with regard to jurisdictional claims in published maps and institu- tional affiliations. Copyright: © 2022 by the authors. Li- censee MDPI, Basel, Switzerland. This article is an open access article distributed under the terms and con- ditions of the Creative Commons At- tribution (CC BY) license (https://cre- ativecommons.org/licenses/by/4.0/).
-
Upload
khangminh22 -
Category
Documents
-
view
2 -
download
0
Transcript of Thermal Characteristic Analysis of Sodium in Diluted Oxygen ...

Processes 2022, 10, 704. https://doi.org/10.3390/pr10040704 www.mdpi.com/journal/processes
Article
Thermal Characteristic Analysis of Sodium in Diluted Oxygen via Thermogravimetric Approach Fang Chen, Xi-Lin Dong *, Yan Tang *, An-Chi Huang, Mei-Lin Zhang, Qing-Chun Kang, Zhong-Jun Shu and Zhi-Xiang Xing
School of Environmental and Safety Engineering, Changzhou University, Changzhou 213164, China; [email protected] (F.C.); [email protected] (A.-C.H.); [email protected] (M.-L.Z.); [email protected] (Q.-C.K.); [email protected] (Z.-J.S.); [email protected] (Z.-X.X.) * Correspondence: [email protected] (X.-L.D.); [email protected] (Y.T.)
Abstract: As the main reactor type of the fourth-generation nuclear power systems, sodium-cooled fast reactors are now designed and built worldwide. A sodium pool cooling circulation process is indispensable in a sodium-cooled fast reactor. However, the sodium pool fire design is the basis of accidents in sodium-cooled fast reactors. The fire hazard caused by the sodium–oxygen reaction and fast reactor safety have attracted extensive attention. Dry powder is widely used as an effective fire-extinguishing agent to control sodium fire. The sodium will burn in an oxygen-depleted atmosphere when using dry powder to cover fire. In this study, the change law of thermogravimetry of melted sodium is studied by thermogravimetric analysis (TGA) and the apparent activation energy (Ea) is obtained, which has a linear relationship with the oxygen concentration. The results can provide a reference for improving the engineering design standards of sodium fire suppression systems and can also be incorporated into simulation software to improve the accuracy of fire suppression sim-ulations.
Keywords: sodium oxygen reaction; sodium pool fire; thermogravimetric analysis; apparent activation energy; oxygen concentration
1. Introduction The concept of the fourth-generation nuclear reactor was proposed at the annual
meeting of the American Nuclear Society in 1996. Not only are sodium-cooled fast reac-tors advanced, but they also possess advantages of safety and sustainability [1]. Therefore, they have excellent development potential. The small core volume and high thermal power rate of fast reactors necessitate a coolant with favourable heat transfer performance and weak neutron moderation [2]. Liquid sodium is therefore an ideal coolant for fast neutron reactors because it has a high thermal conductivity and functions over a wide temperature range (97.8–883 °C) [3], it can slow down the neutron velocity and hinder the chain reaction in the fast reactor; consequently, increasingly high pressure will not be gen-erated in operation. At present, liquid sodium is an ideal coolant for fast neutron reactor.
The heat transfer system of the sodium-cooled fast reactor system consists of three parts [4]: the primary sodium circuit, the secondary sodium circuit, and the steam circu-lation system. The heat from the core is transferred to the secondary sodium circuit through the sodium in the primary sodium circuit, heating the make-up water in the steam circulation system, producing high-temperature and high-pressure steam, and pro-moting power generation. Subsequently, the cooled sodium flows back to the sodium pump and circulates again [5]; the details are shown in Figure 1. The sodium pool cooling circulation system is an irreplaceable part of the sodium-cooled fast reactor. However, the particular chemical property of sodium is its activity; it can easily react with oxygen. This
Citation: Chen, F.; Dong, X.-L.;
Tang, Y.; Huang, A.-C.;
Zhang, M.-L.; Kang, Q.-C.; Shu, Z.-J.;
Xing, Z.-X. Thermal Characteristic
Analysis of Sodium in Dilute
Oxygen via Thermogravimetric
Approach. Processes 2022, 10, 704.
https://doi.org/10.3390/pr10040704
Academic Editor: Alfredo Iranzo
Received: 21 February 2022
Accepted: 4 April 2022
Published: 5 April 2022
Publisher’s Note: MDPI stays neu-
tral with regard to jurisdictional
claims in published maps and institu-
tional affiliations.
Copyright: © 2022 by the authors. Li-
censee MDPI, Basel, Switzerland.
This article is an open access article
distributed under the terms and con-
ditions of the Creative Commons At-
tribution (CC BY) license (https://cre-
ativecommons.org/licenses/by/4.0/).

Processes 2022, 10, 704 2 of 10
characteristic determines its potential fire risk as a fast neutron reactor coolant, and its safety has attracted extensive attention.
Figure 1. Schematic diagram of sodium-cooled fast reactor system.
Existing research has mainly focused on the combustion law of melted sodium in atmospheric air. Subramani [6] studied the diffusion of burning liquid sodium under iso-thermal and nonisothermal (burning) conditions. The results show that the nonisothermal effects of liquid sodium spreading can be neglected for the case of spreading or burning liquid sodium on a ground surface such as concrete or soil. Garcia [2] and Mitsuhiro Aoy-agi [7] established the basic conservation equation of sodium pool flame combustion, and combined with the basic conservation formula of the simulation platform, established the numerical model of sodium pool flame combustion. Subsequent studies focused on the influence of sodium pool diameter and initial air temperature [8], the depth of sodium pool [9] on combustion speed, and the influence of oxygen concentration on fire time [10]. However, the influence of oxygen concentration on chemical reaction parameters and so-dium activation energy (Ea) at the fire site has rarely been examined.
In a fire, the combustion mechanism of sodium fire will change greatly, regardless of whether inert gas (such as Ar or N2) flooding fire extinguishing systems or dry powder fire extinguishing systems are used. These changes are especially pronounced when dry powder fire extinguishing agents are used [11]. Because of the barrier effect of the powder coating, airborne oxidants can only diffuse downward from the upper surface of the pow-der layer through the gaps between the powder particles. Meanwhile, the flame area on the liquid sodium surface is compressed by the dry powder layer and disappears. The sodium vapour on the surface of the liquid sodium diffuses upward slowly through the gaps between the powder particles and meets the oxidant in the powder, causing an oxi-dation reaction, and a flameless combustion zone is formed in the powder layer [12].
First, the variation in sodium thermogravimetry (TG), given by the first derivative of thermogravimetry (DTG) and combustion characteristic parameter (Cb) with temperature under different oxygen concentrations, is measured and calculated. Second, the Ea of so-dium in each reaction stage is obtained by kinetic methods. Finally, the relationship be-tween Ea and different oxygen concentrations is analyzed [13]. The research results of this study will help provide a deep understanding of sodium–oxygen reactions in sodium pool fire and provide a reference for sodium fire emergency fighting to stop accidents associated with sodium leakage fire and explosion.
2. Experimental and Methods 2.1. Materials
The sodium used in the present experiment was purchased from the Shanghai Titan Scientific Company, with a purity of 99.5% and of reagent grade quality. Sodium is a standard chemical reagent that can be prepared at a high-quality grade. The physical properties of sodium are listed in Table 1 [14]. Sodium is stored in a glove box filled with
Control rods
circulating pump
circulating pump
sodium
Intermediate heat
exchangersteam
generator
water supply
steam
sodium

Processes 2022, 10, 704 3 of 10
pure argon. Before the experiment, 1.7 ± 0.3 mg of sodium was placed in a supporting standard sapphire crucible (70 µL).
Table 1. Physical properties of sodium under standard pressure.
Physical Property Numerical Value Unit Density 970 (20 °C); 784 (700 °C) K/gm3
Melting Point 98 °C Boiling Point 881 °C
Molar Heat Capacity 28.23 J/(mol·°C) Thermal Conductivity 142 W/(m·K)
Melting Heat 2.6 kJ/mol Heat of Vaporization 101 kJ/mol
In instances of sodium leakage, sodium generates sodium oxide (Na2O) by reacting with air. Under conditions of oxygen deficiency, the sodium–oxygen reaction mainly re-sults in the formation of Na2O.
2𝑁𝑁𝑁𝑁(𝑙𝑙) + 12𝑂𝑂2(𝑔𝑔) → 𝑁𝑁𝑁𝑁2𝑂𝑂(𝑆𝑆) ∆𝐻𝐻 = −416𝑘𝑘𝑘𝑘 𝑚𝑚𝑚𝑚𝑙𝑙⁄ , (1)
2.2. Thermogravimetric Analysis TGA2 (produced by Mettler Toledo Co., Zurich, Switzerland) was used in the exper-
iment. During the scan over the increase, the weight loss of sodium is obsevered, its ther-mal characteristics and changes are obtained by thermogravimetric analysis [15,16]. In this study, the experimental temperature range is from 30 to 600 °C, and the rates of heating (β) are 1, 3, 5, 7, and 9 °C/min, as planned. The test is conducted at a flow rate of 50 mL/min when the oxygen concentration is 4%, 8%, 16%, and 21%, as arranged, respectively [17].
3. Results and Simulation 3.1. Thermogravimetric Analysis
Thermogravimetric experiments obtained the TG and DTG curves in Figure 2 corre-sponding to the tested sodium samples with different oxygen concentrations at the rates of heating, as indicated.
0 100 200 300 400 500 60090
100
110
120
130
140
150
160
170 β=1°C/min β=3°C/min β=5°C/min β=7°C/min β=9°C/min
Mas
s Cha
nge
( %)
Temperature(°C)
β=1°C/min
β=3°C/min
β=5°C/min
β=7°C/minβ=9°C/min
TG-4%
0 100 200 300 400 500 600
0.000
0.002
0.004
0.006
0.008 β=1°C/min β=3°C/min β=5°C/min β=7°C/min β=9°C/min
Mas
s Cha
nge
Rat
e
( %/m
in)
Temperature( ℃)
β=1°C/min β=3°C/min
β=5°C/minβ=7°C/minβ=9°C/min
DTG-4%
(a) (b)

Processes 2022, 10, 704 4 of 10
0 100 200 300 400 500 60090
100
110
120
130
140
150
160
170 β=1°C/min β=3°C/min β=5°C/min β=7°C/min β=9°C/min
Mas
s Cha
nge
( %)
Temperature(°C)
β=1°C/min
β=3°C/min
β=5°C/minβ=7°C/minβ=9°C/min
TG-8%
0 100 200 300 400 500 600
0.000
0.002
0.004
0.006
0.008 β=1°C/min β=3°C/min β=5°C/min β=7°C/min β=9°C/min
DTG-8%
Mas
s Cha
nge
Rat
e
( %/m
in)
Temperature(°C)
β=1°C/minβ=3°C/min
β=9°C/minβ=7°C/minβ=5°C/min
(c) (d)
0 100 200 300 400 500 600
100
110
120
130
140
150
160
170 β=1°C/min β=3°C/min β=5°C/min β=7°C/min β=9°C/min
Mas
s Cha
nge
( %)
Temperature(°C)
β=1°C/min
β=3°C/min
β=5°C/minβ=7°C/minβ=9°C/min
TG-16%
0 100 200 300 400 500 600
-0.002
0.000
0.002
0.004
0.006
0.008
0.010 β=1°C/min β=3°C/min β=5°C/min β=7°C/min β=9°C/min
Mas
s Cha
nge
Rat
e
( %/m
in)
Temperature(°C)
β=1°C/min
β=3°C/minβ=5°C/min
β=7°C/minβ=9°C/min
DTG-16%
(e) (f)
0 100 200 300 400 500 600
100
110
120
130
140
150
160
170 β=1°C/min β=3°C/min β=5°C/min β=7°C/min β=9°C/min
β=1°C/min
Mas
s Cha
nge
( %)
Temperature(°C)
β=3°C/min
β=5°C/minβ=7°C/minβ=9°C/min
TG-21%
0 100 200 300 400 500 600
-0.002
0.000
0.002
0.004
0.006
0.008
0.010 β=1°C/min β=3°C/min β=5°C/min β=7°C/min β=9°C/min
Mas
s Cha
nge
Rat
e
( %/m
in)
Temperature(°C)
β=1°C/min
β=3°C/minβ=5°C/minβ=7°C/min
β=9°C/min
DTG-21%
(g) (h)
Figure 2. TG and DTG curves for sodium at oxygen concentrations of 4% (a,b), 8% (c,d), 16% (e,f), and 21% (g,h).
As indicated in Figure 2, TG and DTG in the oxidation process of sodium have the same overall change in trend, regardless of the experimental condition. The complete ox-idation process can be divided into three stages: 1. Surface oxidation stage. TG curves are obtained in the temperature range of 30–100
°C. At this stage, the exothermic oxidation of sodium occurs and the mass increases substantially.
2. Stable endothermic stage. The mass increases slowly between 100 and 280 °C, and the heat release rate decreases in this stage because of the sodium oxide film that forms on the sodium surface in the initial stage, which hinders further oxidation.
3. Membrane rupture oxidation–combustion stage. The testing temperature is 280–350 °C, because the expansion coefficient of the sodium is greater than that of the external
Processes 2022, 10, 704 5 of 10
sodium oxide film; when sodium expands past a certain point, the generated expand-ing pressure leads to the rupture of the sodium oxide film formed at the earlier stage, and the uncovered sodium then continues to oxidize at higher temperatures, leading to rapid combustion and heat release from the exothermic reaction of the sodium [18–20]. In the DTG (b, d, f, and h) curves, due to the oxidation in the previous stage, the thick
oxide film covering the sodium prevents further oxidation of the sodium, resulting in a slow increase in the surface layer thickness and an increase in the internal sodium heat absorption rate. The thermal curves show that the oxidation sequence of sodium repeats itself because of the exothermic oxidation of the surface. This sequence proceeds as fol-lows: first, the coated sodium oxide undergoes endothermic weight gain; second, the so-dium oxide film ruptures; and third, the bare sodium surface undergoes exothermic oxi-dation and endothermic melting [21,22]. Figure 3 summarizes the typical variation char-acteristics of TG and DTG in this testing process.
0 100 200 300 400 500 600
100
110
120
130
140
150
160
170
Mas
s Cha
nge
( %)
Temperature(°C)
Tangent 1
.
Tangent 2
.
Tc
Ti
0.000
0.002
0.004
0.006
0.008
Mas
s Cha
nge
Rate
)
Tmax
Surfaceoxidation stage
Stable endothermic stage
Membrane rupture-Oxidation-Combustion stage
TGDTG
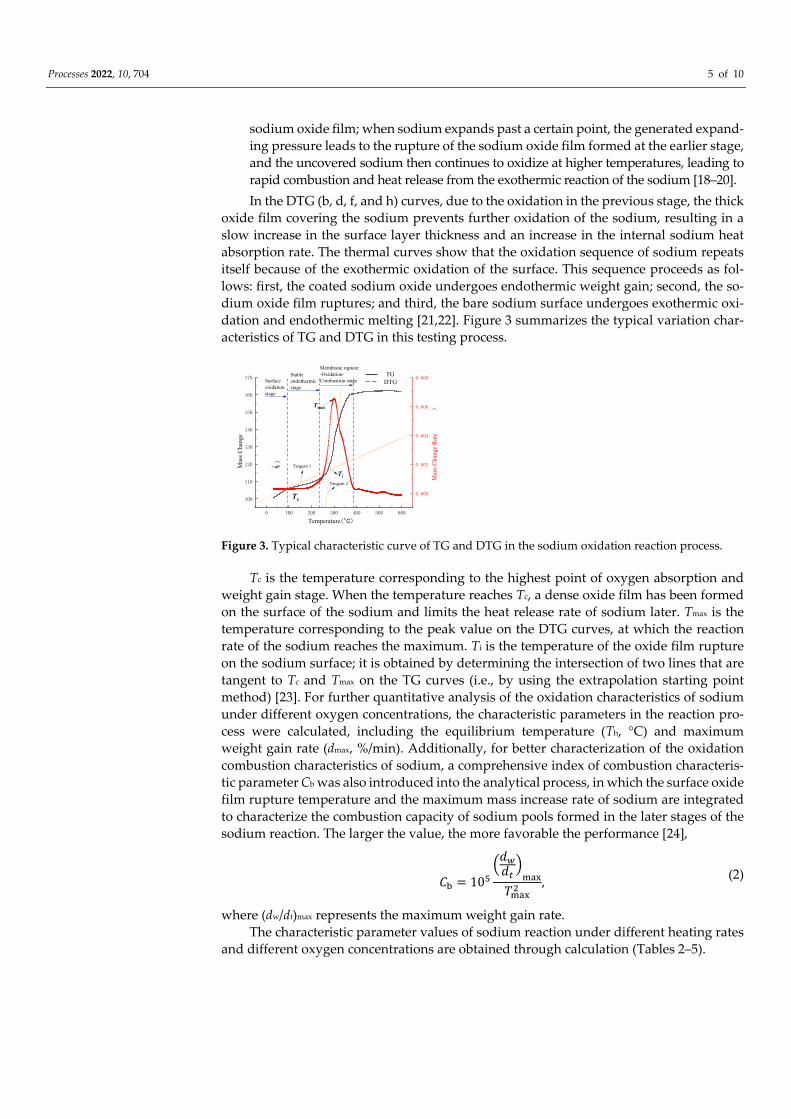
Figure 3. Typical characteristic curve of TG and DTG in the sodium oxidation reaction process.
Tc is the temperature corresponding to the highest point of oxygen absorption and weight gain stage. When the temperature reaches Tc, a dense oxide film has been formed on the surface of the sodium and limits the heat release rate of sodium later. Tmax is the temperature corresponding to the peak value on the DTG curves, at which the reaction rate of the sodium reaches the maximum. Ti is the temperature of the oxide film rupture on the sodium surface; it is obtained by determining the intersection of two lines that are tangent to Tc and Tmax on the TG curves (i.e., by using the extrapolation starting point method) [23]. For further quantitative analysis of the oxidation characteristics of sodium under different oxygen concentrations, the characteristic parameters in the reaction pro-cess were calculated, including the equilibrium temperature (Th, °C) and maximum weight gain rate (dmax, %/min). Additionally, for better characterization of the oxidation combustion characteristics of sodium, a comprehensive index of combustion characteris-tic parameter Cb was also introduced into the analytical process, in which the surface oxide film rupture temperature and the maximum mass increase rate of sodium are integrated to characterize the combustion capacity of sodium pools formed in the later stages of the sodium reaction. The larger the value, the more favorable the performance [24],
𝐶𝐶b = 105�𝑑𝑑𝑤𝑤𝑑𝑑𝑡𝑡
�max
𝑇𝑇max2 , (2)
where (dw/dt)max represents the maximum weight gain rate. The characteristic parameter values of sodium reaction under different heating rates
and different oxygen concentrations are obtained through calculation (Tables 2–5).

Processes 2022, 10, 704 6 of 10
Table 2. Characteristic parameters of sodium–oxygen reaction at the oxygen concentration of 4%.
β (°C/min) 1 3 5 7 9
Ti (°C) 305.11 313.09 294.41 305.59 293.46 Th (°C) 309.31 341.25 354.08 383.27 396.45
Tmax (°C) 288.48 309.60 315.5 330.65 339.9 dmax (%/min) 0.22 0.52 0.59 0.78 0.86
Cb 0.26 0.54 0.59 0.71 0.74
Table 3. Characteristic parameters of sodium–oxygen reaction at the oxygen concentration of 8%.
β (°C/min) 1 3 5 7 9
Ti (°C) 311.08 299.6 305.43 293.14 298.56 Th (°C) 310.45 336.70 361.50 388.98 420.90
Tmax (°C) 288.60 299.80 315.58 320.97 330.6 dmax (%/min) 0.23 0.46 0.65 0.73 0.79
Cb 0.28 0.51 0.65 0.71 0.72
Table 4. Characteristic parameters of sodium–oxygen reaction at the oxygen concentration of 16%.
β (°C/min) 1 3 5 7 9
Ti (°C) 290.58 287.87 292.02 274.30 287.87 Th (°C) 303.62 320.75 338.70 369.50 379.95
Tmax (°C) 280.77 298.60 302.58 305.8 315.9 dmax (%/min) 0.24 0.51 0.63 0.78 0.88
Cb 0.30 0.57 0.69 0.83 0.88
Table 5. Characteristic parameters of sodium–oxygen reaction at the oxygen concentration of 21%.
β (°C/min)
1 3 5 7 9
Ti (°C) 266.32 271.91 281.33 286.43 311.17 Th (°C) 303.03 332.65 347.33 373.47 385.65
Tmax (°C) 280.45 287.85 295.583 300.2 317.40 dmax (%/min) 0.26 0.51 0.71 0.83 0.93
Cb 0.33 0.62 0.81 0.92 0.93
Comparing across Tables 2–5, the data show that at the same oxygen concentration, as β increases, the temperature of oxide film rupturing on the sodium surface, the equilib-rium temperature at the later stage of oxidation combustion and combustion characteristic parameters increase when the sodium reaction rate reaches the maximum value. This in-dicates that temperature plays a substantial role in promoting sodium combustion. For example, in the Monju accident in Japan on 8 December, 1995, 640 kg of sodium vapour was sprayed out of the pipeline, sodium exposed to the air burned violently, sodium aer-osol diffused rapidly, and the room temperature in the fire area soared to 1500 °C [25]. Therefore, once an accident occurs, the rapid increase in its heating rate will further accel-erate sodium combustion.
As indicated by a longitudinal analysis of the data in the tables above, the tempera-ture of each parameter decreases with oxygen concentration at the same heating rate. A simple calculation and conversion indicated that the time required to reach the character-istic parameter temperature is decreasing. When the oxygen concentration decreases from

Processes 2022, 10, 704 7 of 10
21% to 16%, the change in the time required to meet each parameter is relatively small, but this time changes greatly when the oxygen concentration decreased from 16% to 8%. For example, for the maximum increasing temperature (Tmax), when the heating rate is 5 °C/min, the time difference required for the oxygen concentration to decrease from 21% to 16% is 84 s; while the time needed for the oxygen concentration to reduce from 16% to 8% is 156 s, an interval 186% greater than the decrease from 21% to 16%. The critical point of maximum combustion increase is the temperature at which the ultimate weight gain rate reaches the maximum value under the competing action of sodium melting and oxi-dation. The time required to achieve this temperature increases slowly from an oxygen concentration of 21% to an oxygen concentration of 16%, but then rapidly increases from a concentration of 16% to an oxygen concentration of 8%, indicating that the oxidation combustion intensity of sodium is greatly weakened.
3.2. Nonisothermal Kinetic Analysis 3.2.1. Thermal Analysis Method
In 1920, the emergence of thermal analysis methods led to the gradual emergence of the study of material reaction kinetics and was further developed in the 1950s. The study of kinetic methods in thermal analysis reflects the researchers’ pursuit of the essence of complex concepts and the continued perfection of kinetic research theory. This research encompasses from the kinetic equations of homogeneous isothermal reaction to the het-erogeneous nonisothermal reaction systems, and from simple kinetic approaches to com-plex designs. Thermal analysis kinetics is a process in which various calorimetric instru-ments are used to determine the changes that can be detected at different thermal param-eters in the reaction system, following which kinetic reaction parameters are determined through a series of analyses according to the changes in the aforementioned parameters. In this study, the Kissinger method is used to process the experimental data [26–29].
3.2.2. Kissinger Method The Kissinger method [30], also known as a maximum method, is used to calculate
the value of Ea, which can be expressed as:
ln(𝛽𝛽𝑇𝑇m2
) = ln �−𝐴𝐴𝐴𝐴𝐸𝐸a
𝑓𝑓′(𝛼𝛼𝑚𝑚)� −𝐸𝐸a𝐴𝐴𝑇𝑇m
, (3)
According to formula (3), take ln( 𝛽𝛽𝑇𝑇P2), plot 1/Tp, and calculate Ea according to the
slope and intercept of the straight line [31,32].
3.3 Relationship between Ea and Oxygen Concentration As shown in Figure 4, the Ea decreases with the decrease in oxygen concentration, mainly
because the progress of the sodium–oxygen reaction is related to oxygen partial pressure.
0.00162 0.00165 0.00168 0.00171 0.00174 0.00177 0.00180-13.0
-12.5
-12.0
-11.5
-11.0
-10.5
ln (β/
T2 P)
1/TP (1/K)
21% y=-24081x+31.12 R2=0.917 Ea=200.215KJ mol-1
16% y=-20428x+24.28 R2=0.959 Ea=169.837KJ mol-1
8% y=-15893x+15.85 R2=0.942 Ea=132.14KJ mol-1
4% y=-13636x+11.74 R2=0.956 Ea=113.373KJ mol-1
Figure 4. Solution of Ea of sodium at different oxygen concentrations using Kissinger method.

Processes 2022, 10, 704 8 of 10
The above conclusions can be explained by the oxygen diffusion-based model [8]. In this approach, it is assumed that the sodium–air reaction is infinitely fast and occurs at the pool surface. This means that the oxygen concentration at the pool surface is zero. A two-step oxidation mechanism is assumed for the sodium–air reaction with sodium oxide and sodium dioxide as the byproducts, which is given as follows:
𝑁𝑁𝑁𝑁𝑁𝑁(𝑔𝑔) + 𝑏𝑏𝑂𝑂2(𝑔𝑔) → (1 − 𝑠𝑠)𝑁𝑁𝑁𝑁2𝑂𝑂(𝑠𝑠) + 𝑠𝑠𝑁𝑁𝑁𝑁2𝑂𝑂2(𝑠𝑠) + 𝐻𝐻c, (4)
where a and b are stoichiometric coefficients of sodium and oxidizer, s is the stoichiometric ratio, and Hc is heat of combustion in J/kg.
The oxygen diffusion-based model described above is validated against the sodium pool experiments of Newman and Payne [33]. They conducted sodium pool combustion experiments in an ambient environment with three different initial oxygen concentrations, 4%, 9.5%, and 21% (by vol.). The results obtained using the oxygen diffusion-based model are in good agreement with the experiments. At lower oxygen concentrations, only so-dium monoxide is present, which means that the stoichiometric ratio is 0, while at higher oxygen concentrations, Na2O further reacts to form Na2O2, which means that the stoichi-ometric ratio is 1. As a consequence, with the increase in oxygen concentration, the so-dium–oxygen reaction will more easily generate sodium peroxide, since sodium peroxide is more stable than sodium oxide, it will hinder the progress of the sodium–oxygen reac-tion, and the value of Ea increases accordingly.
Ea and oxygen concentration calculated usingthe Kissinger method (Figure 5) were linearly related by the best-fit equation:
𝐸𝐸a = 5.06x + 91.87, (5)
where x (in %) is the oxygen concentration.
2 4 6 8 10 12 14 16 18 20 22100
120
140
160
180
200
E a( kJ/
mol
)
Oxygen Concentration(% )
y=5.06x+91.87R2=0.997
Figure 5. Linear relationship between Ea of sodium and oxygen concentration.
4. Conclusions This study analyzed the complete process of the oxidative combustion of sodium at
different oxygen concentrations using TG. The changes in TG, DTG, and reaction charac-teristic parameters are analyzed with heating rate and oxygen concentration. The Ea of oxida-tive sodium combustion is calculated by using the Kissinger method, and the relationship of Ea with oxygen concentration is determined. The main conclusions are as follows: 1. As indicated by the TG curve, the complete oxidation combustion process of sodium
can be divided into three stages. These stages are the surface oxidation stage, which occurs in the temperature range from 30 to 100 °C; the stable endothermic stage, which occurs in the temperature range from 100 to 280 °C; and the membrane rupture oxidation combustion stage, which occurs at the temperature range from 280 to 350 °C.

Processes 2022, 10, 704 9 of 10
2. At the same oxygen concentration, as the heating rate increases, increases were also noted in the temperature of the oxide film rupture on the sodium surface, in the tem-perature when the sodium reaction rate reaches the maximum, in the equilibrium temperature in the later stages of oxidation combustion, and in the combustion char-acteristic parameters; all showed an upward trend. Conversely, at the same heating rate, with the decrease in oxygen concentration, the time required to reach the char-acteristic parameter temperature increases and changes greatly when the oxygen concentration decreases from 16% to 8%;
3. The Ea of different oxygen concentrations is calculated by the Kissinger method, and the Ea decreases with decreases in oxygen concentration, mainly because the progress of the sodium–oxygen reaction is related to the partial pressure of oxygen. Ea was linearly related to oxygen concentration. Under certain other conditions, at higher oxygen concentrations, the reaction of Na2O formation was more inhibited and the sodium pool fire more easily formed highly toxic combustion products of aerosols. Therefore, at the early stages of sodium leakage, immediate measures should be im-
plemented to prevent the generation of corrosive aerosols from damaging the sodium-cooled fast reactor and causing more serious accidents. In addition, it provides a theoretical basis for the preparation of fire extinguishing system engineering design and sodium fire emergency rescue guide, and meets the needs of sodium-cooled fast reactor engineering con-struction.
Author Contributions: Conceptualization, F.C.; methodology, Y.T.; and A.-C.H.; validation, Z.-J.S. and M.-L.Z.; formal analysis, M.-L.Z. and F.C.; resources, Q.-C.K.; writing—original draft prepara-tion, F.C.; writing—review and editing, Y.T and A.-C.H.; project administration, X.-L.D. and Z.-X.X.; funding acquisition, X.-L.D and Z.-X.X. All authors have read and agreed to the published version of the manuscript.
Funding: This work was supported by the Science and Technology Plan Project of Fire Rescue Bu-reau of Emergency Management Department (grant number 2021XFCX18); Jiangsu Province Post-graduate Research and Practice Innovation Project (grant number KYCX21_2879); and General Nat-ural Science Research Project of Jiangsu Universities in 2020 (No. 20KJB620002).
Institutional Review Board Statement: Not applicable.
Informed Consent Statement: Not applicable.
Conflicts of Interest: The authors declare no conflicts of interest.
References 1. Ge, L.; Lu, T.; Shan, J.; Liu, D. Application of a 3D model in the transient system analysis of sodium-cooled fast reactor. Ann.
Nucl. Energy 2020, 135, 106967. 2. Garcia, M.; Herranz, L.E.; Kissane, M.P. Theoretical assessment of particle generation from sodium pool fires. Nucl. Eng. Des.
2016, 310, 470–483. https://doi.org/10.1016/j.nucengdes.2016.10.024. 3. Lebel, L.S.; Girault, N. Aerosol generation from sodium pool fires: Learning from the 1980s-era EMIS experiments and model-
ling. Nucl. Eng. Des. 2018, 330, 36–50. https://doi.org/10.1016/j.nucengdes.2018.01.030. 4. Sungjoo, L.; Byungun, Y.; Juneseuk, S. Effects of Nuclear Energy on Sustainable Development and Energy Security: Sodium-
Cooled Fast Reactor Case. Sustainability 2016, 8, 979. 5. Kim, M.H.; Nguyen, V.T.; Im, S.; Jung, Y.; Kim, B.J. Experimental Validation of Flow Uniformity Improvement by a Perforated
Plate in the Heat Exchanger of SFR Steam Generator. Energies 2021, 14, 5846. 6. Subramani, A.; Jayanti, S.; Shet, U.S.P.; Selvaraj, P. Dynamics of liquid sodium pool spreading under sodium fire conditions.
Nucl. Eng. Des. 2009, 239, 1354–1361. https://doi.org/10.1016/j.nucengdes.2009.04.002. 7. Aoyagi, M.; Uchibori, A.; Kikuchi, S.; Takata, T.; Ohno, S.; Ohshima, H. Identification of important phenomena through the
PIRT process for development of sodium fire analysis codes. Nucl. Eng. Des. 2019, 353, 110240. https://doi.org/10.1016/j.nuceng-des.2019.110240.
8. Sathiah, P.; Roelofs, F. Numerical modeling of sodium fire—Part II: Pool combustion and combined spray and pool combustion. Nucl. Eng. Des. 2014, 278, 739–752. https://doi.org/10.1016/j.nucengdes.2014.05.037.
9. Subramani, A.; Jayanti, S. Experimental studies on burning behaviour of liquid sodium in a shallow pool. Nucl. Eng. Des. 2010, 240, 3462–3466. https://doi.org/10.1016/j.nucengdes.2010.05.014.

Processes 2022, 10, 704 10 of 10
10. Makino, A.; Fukada, H. Ignition and combustion of a falling, single sodium droplet. Proc. Combust. Inst. 2005, 30, 2047–2054. https://doi.org/10.1016/j.proci.2004.07.013.
11. An, D.; Sunderland, P.B.; Lathrop, D.P. Suppression of sodium fires with liquid nitrogen. Fire Saf. J. 2013, 58, 204–207. 12. Nur, K.; Laurent, B.; Thierry, G.; Cendrine, G.; Henri, B. The role of powder physicochemical properties on the extinction per-
formance of an extinguishing powder for sodium fires. Nucl. Eng. Des. 2019, 346, 24–34. 13. Xn, A.; Zhong, Z.B. Extinguishment of sodium fires with Graphite@Stearate core-shell structured particles. Fire Saf. J. 2019, 111,
102933. 14. Saravanan, S.M.; Rao, P.M.; Raghupathy, S. Analysis of liquid sodium spills spreading on floor surface pertaining to sodium
pool fire events in SFR cells. Nucl. Eng. Des. 2020, 363, 110614. 15. Wang, J.; Jia, H.; Tang, Y.; Xiong, X.; Ding, L. Thermal stability and non-isothermal crystallization kinetics of metallocene poly
(ethylene-butene-hexene) /high fluid polypropylene copolymer blends. Thermochim. Acta 2017, 647, 55–61. 16. Tsai, Y.T.; Liao, J.Y.; Shu, C.M. Explosion characteristics of chlorodifluoromethane and isobutane at high temperature and pres-
sure using a 20-L apparatus. Int. J. Refrig. 2018, 96, 155–160. 17. Yang, M.; Chen, X.; Wang, Y.; Yuan, B.; Niu, Y.; Zhang, Y.; Liao, R.; Zhang, Z. Comparative evaluation of thermal decomposition
behavior and thermal stability of powdered ammonium nitrate under different atmosphere conditions. J. Hazard. Mater. 2017, 337, 10–19.
18. Jeurgens, L.; Sloof, W.; Tichelaar, F.; Mittemeijer, E. Thermodynamic stability of amorphous oxide films on metals: Application to aluminum oxide films on aluminum substrates. Phys. Rev. B 2000, 62, 4707–4719.
19. Wang, Q.; Shen, Z.; Jiang, J.; Wang, Q.; Shu, C.M.; Sun, Y.; Wang, L. Suppression effects of ammonium dihydrogen phosphate dry powder and melamine pyrophosphate powder on an aluminium dust cloud explosion. J. Loss Prev. Process Ind. 2020, 68, 104312.
20. Hasani, S.; Soleymani, A.P.; Panjepour, M.; Ghaei, A. A Tension Analysis During Oxidation of Pure Aluminum Powder Particles: Non-isothermal Condition. Oxid. Met. 2014, 82, 209–224.
21. Rosenband, V. Thermo-mechanical aspects of the heterogeneous ignition of metals. Combust. Flame 2004, 137, 366–375. 22. Trunov, M.A.; Schoenitz, M.; Dreizin, E. Ignition of Aluminum Powders Under Different Experimental Conditions. Propellants
Explos. Pyrotech. 2005, 30, 36–43. 23. Mahidin; Usui, H.; Ishikawa, S.; Hamdani. The Evaluation of Spontaneous Combustion Characteristics and Properties of Raw
and Upgraded Indonesian Low Rank Coals. Coal Prep. 2002, 22, 81–91. 24. Xu, C.; Sun, X. Combustion characteristic of biomass by using TG-DTG-DSC thermoanalysis. J. Huazhong Univ. Sci. Technol. Nat.
Sci. Ed. 2007, 3, 126–128. 25. Makino, A. Ignition Delay and Limit of Ignitability for Sodium Pool (Theory and Experimental Comparisons). JSME Int. J. Ser.
B Fluids Therm. Eng. 2006, 49, 92–101. 26. National Fire Protection Association. Fire Protection Guide on Hazardous Materials; National Fire Protection Association: Quincy,
MA, USA, 1972. 27. Anderson, O.L.; Stuart, D.A. Calculation of Activation Energy of Ionic Conductivity in Silica Glasses by Classical Methods. J.
Am. Ceram. Soc. 2010, 37, 573–580. 28. Xie, L.-J.; Jiang, J.-C.; Huang, A.-C.; Tang, Y.; Liu, Y.-C.; Zhou, H.-L.; Xing, Z.-X. Calorimetric Evaluation of Thermal Stability of
Organic Liquid Hydrogen Storage Materials and Metal Oxide Additives. Energies 2022, 15, 2236. 29. Huang, A.-C.; Chuang, Y.-K.; Huang, C.-F.; Shu, C.-M. Thermokinetic analysis of the stability of malic and salicylic acids in
cosmeceutical formulations containing metal oxides. J. Therm. Anal. Calorim. 2018, 132, 165–172. 30. Xu, X.; Pan, R.; Chen, R. Comparative Thermal Degradation Behaviors and Kinetic Mechanisms of Typical Hardwood and
Softwood in Oxygenous Atmosphere. Processes 2021, 9, 1598. 31. Farjas, J.; Roura, P. Exact analytical solution for the Kissinger equation: Determination of the peak temperature and general
properties of thermally activated transformations. Thermochim. Acta 2014, 598, 51–58. 32. Vyazovkin, S. Kissinger Method in Kinetics of Materials: Things to Beware and Be Aware of. Molecules 2020, 25, 2813. 33. Newman, R.N.; Payne, J. The burning rates of sodium pool fires. Combust. Flame 1978, 33, 291–297.