Thermal and physical properties of 30SrO–40SiO 2–20B 2O 3–10A 2O 3 (A = La, Y, Al) glasses and...
8
This article appeared in a journal published by Elsevier. The attached copy is furnished to the author for internal non-commercial research and education use, including for instruction at the authors institution and sharing with colleagues. Other uses, including reproduction and distribution, or selling or licensing copies, or posting to personal, institutional or third party websites are prohibited. In most cases authors are permitted to post their version of the article (e.g. in Word or Tex form) to their personal website or institutional repository. Authors requiring further information regarding Elsevier’s archiving and manuscript policies are encouraged to visit: http://www.elsevier.com/copyright
-
Upload
independent -
Category
Documents
-
view
1 -
download
0
Transcript of Thermal and physical properties of 30SrO–40SiO 2–20B 2O 3–10A 2O 3 (A = La, Y, Al) glasses and...

This article appeared in a journal published by Elsevier. The attachedcopy is furnished to the author for internal non-commercial researchand education use, including for instruction at the authors institution
and sharing with colleagues.
Other uses, including reproduction and distribution, or selling orlicensing copies, or posting to personal, institutional or third party
websites are prohibited.
In most cases authors are permitted to post their version of thearticle (e.g. in Word or Tex form) to their personal website orinstitutional repository. Authors requiring further information
regarding Elsevier’s archiving and manuscript policies areencouraged to visit:
http://www.elsevier.com/copyright

Author's personal copy
Thermal and physical properties of 30SrO–40SiO2–20B2O3–10A2O3 (A = La, Y, Al)glasses and their chemical reaction with bismuth vanadate for SOFC
Vishal Kumar, Sarita Sharma, O.P. Pandey, K. Singh ⁎School of Physics and Materials Science, Thapar University, Patiala-147004, India
a b s t r a c ta r t i c l e i n f o
Article history:Received 16 April 2009Received in revised form 4 December 2009Accepted 7 December 2009
Keywords:GlassesX-ray diffractionCrystallizationFTIR
SiO2–B2O3–SrO–A2O3 (A = Y, La, Al) based glasses were investigated for their physical and thermalproperties by density measurements and differential thermal analysis (DTA). The crystallization activationenergies were determined by using variable heating rates in DTA. The chemical interaction studies of theseglasses with Bi4V1.8Al0.2O11 electrolyte were also performed at 800 °C for different heat treatment durations.During chemical interaction in all the samples SrVSi2O7 phase has formed. However, its volume fractiondepends on the chemical nature of the modifiers used in glass and duration of heat treatment. Apart fromSrVSi2O7 phase, AVO4 and A2SiO5 (A= Y, La, Al, Bi) phases are also present in the glass electrolyte interactionproduct mass. The formed phases were identified using X-ray diffraction. Fourier Transform Infrared (FTIR)spectroscopy has been done to identify the functional group and modification in bond structure andfunctional group with respect to the heat treatment duration in these samples. The results have beendiscussed on the basis of field strength of various cations and activation energy of crystallization.
© 2009 Elsevier B.V. All rights reserved.
1. Introduction
Planar design of solid oxide fuel cells (SOFC) has some advantagesover tubular design such as higher current density with simplemanufacturing. However, this design requires a suitable sealantfor preventing the fuel gas and air mixing during operation of fuelcell [1–3]. Apart from this, sealing materials should not form anydetrimental phasewith other components of SOFC during its operationbecause these undesirable crystalline phase(s) may influence theefficiency and long-term stability of SOFCs [4]. In order tomaintain theperformance of the SOFC, the sealing material must have chemicalcompatibility with other components of SOFC such as electrodes, solidelectrolytes etc. In order to meet above requirement glass and glassceramics can be used as sealing material in SOFC. The glass getsconverted into glass ceramic at higher temperature andmake adhesivebondwith other components of SOFC. The devitrification phenomenonof glass results in the formation of a mixture of crystalline phase(s) indifferent volume fractions.
Many researchers have tried to develop high ionic conductingelectrolytes in intermediate temperature range (600–800 ºC) toreduce the working temperature of SOFC. Recently, high ionicconductivity has been reported in doped bismuth vanadate (DBiV)[5]. So, it is worthwhile to study the chemical interaction between
different glass sealants and doped bismuth vanadate (DBiV) tovisualize the sealing capability of the glasses.
Based on our earlier study [6,7] three different glasses wereselected for chemical interaction with DBiV for different duration. Thepurpose of the present study is to understand the interaction kineticsof glass with electrolyte at different temperatures whichmay result information of different phases. Since, formed phases and their volumefraction may change the stability, thermal expansion coefficient (TEC)andmechanical strength of the stack [8], the study will help to predicttheir viability and suitability as SOFC materials.
2. Experimental techniques
The composition of glasses and DBiV, used in the present in-vestigation, is given in Table 1. In brief Bi4V1.8Al0.2O11 was synthesizedby taking high purity oxides of constituent element in desiredstoichiometric ratio. These oxides were mixed properly in a ball millin acetone medium. Pellets of the milled and dried powders weremade and calcined at 700 °C for 12 h in air followed by its grindingand sintering at 800 °C for 12 h. Similarly glasses were also made bytaking constituent oxides in defined stoichiometric ratio followed bygrinding andmelting at 1500 °C using different intermediate stages ofheating to facilitate calcinations and homogenization. The glasscompositions along with designation (S1, S2, and S3) are given inTable 1. The details of preparation of doped Bi4V1.8Al0.2O11 system andsealant glass SiO2–B2O3–SrO–A2O3 (A = Y, La, Al) are given in ourearlier work [6,7]. For interaction study powders of glasses and DBiVwere mixed in 3:1 ratio by weight and heated at 800 °C for 1, 10 and
Solid State Ionics 181 (2010) 79–85
⁎ Corresponding author. Tel.: +91 1752393130; fax: +91 1752393005.E-mail address: [email protected] (K. Singh).
0167-2738/$ – see front matter © 2009 Elsevier B.V. All rights reserved.doi:10.1016/j.ssi.2009.12.005
Contents lists available at ScienceDirect
Solid State Ionics
j ourna l homepage: www.e lsev ie r.com/ locate /ss i
Author's personal copy
100 h as given below and the resultant products IS1, IS2 and IS3 werecharacterized subsequently.
S1 + DBiV→1;10;100h
800 -CIS1
S2 + DBiV→1;10;100h
800 -CIS2
S3 + DBiV→1;10;100h
800 -CIS3
2.1. Density measurement
The density of glass samples was measured by Archimedesprinciple using microbalance with xylene as buoyant. Density datawas used to calculate the molar volume (Vm), excess volume (Ve),oxygen molar volume (Vo) of as cast glasses using the followingequation:
Vm =Mρ
ð1Þ
M denotes the molar mass of the investigated glass.
Ve = Vm−∑ixiVmðiÞ ð2Þ
Here, Vm(i) is the molar volume of each oxide constituent, xi is themolar concentration of every oxide in glass composition. The molarvolume of the oxygen contents Vo of the glasses was calculated usingEq. (3) below.
Vo =∑ixiMi
ρ∑inixi
ð3Þ
Where, Mi and ni is the molar weight of the oxide and oxygencontent in the ith oxides respectively.
2.2. Thermal characterization
The thermal properties of glasses were investigated usingdifferential thermal analyzer (DTA). DTA measurements wereperformed at different heating rates (10, 20, 30, 40 ºC min−1) withDiamond Pyris TG/DTA (Perkin Elmer) using Al2O3 powder asreference material in air and nitrogen atmosphere both and variationin nature of peaks were observed.
2.3. Sample preparation for chemical interaction
The ratio of glass and doped bismuth vanadate were 3:1 (wt.%),respectively. The powders of both the components were ground inwet media for 1 h by mortar and pestle. The ground powder was keptin recrystallized alumina crucible and heated at 800 °C for 1, 10 and100 h. The temperature variation of furnace at 800 °C was ±5 °C.
2.4. X-ray diffraction
The X-ray diffraction was done to identify various crystallinephases and their volume fraction. The XRD were performed usingRigaku model Geiger diffractogram with CuKα radiation (λ=1.54 Å)obtained from copper target using in built Ni filter.
2.5. Dilatometer study
The dilatometer study was performed using Netzsch DIL 402 PC inthe temperature range 100–650 ºC to determine the thermal expan-sion coefficient (TEC) of glass (S2) and doped bismuth vanadate(Bi4V1.8Al0.2O11) as a representative samples. A diffusion couple wasmade by pressing a glass fret (S2) (1.5×2) mm over a pellet ofbismuth vanadate (diameter 2 mm and 1.5 mm thick) and heated inresistance furnace for 1 h at 800 °C to determine its thermalexpansion coefficient. During the experiment the heating rate was5 °C in oxidizing atmosphere.
2.6. FTIR spectroscopy
FTIR spectra were recorded in the range 1500 to 400 cm−1 usingPerkin Elmer — Spectrum RX-1. A spectral resolution of FTIRspectroscopy was ±1 cm−1. For it the glass powder (2 mg) and KBr(200 mg) was mixed in an agate mortar and then pressed into 13 mmdiameter pellets. For each sample, the FTIR spectrum represents anaverage of twenty scan, whichwere normalized to the spectrum of thestandard KBr pellet.
3. Results and discussion
3.1. Density analysis
The densities of as cast glasses, molar volume (Vm), excess volume(Ve) and oxygen molar volume (Vo) are summarized in Table 2. In thepresent glasses the measured density could not show any particulartrend with increasing atomic mass of the intermediate oxides in glasscomposition. The excess volume, Ve is negative in glass S3. On theother hand, glass S1 and S2 exhibit positive value of excess volume.These results indicate that S1 and S2 glass exhibit more open structureas compared to S3 glass. Similar results have also been reported inLa2O3 and Cr2O3 containing diopside glasses [9]. In other words, theaddition of Al2O3 leads to compactness in glass structure due toconversion of non bridging oxygen to bridging oxygen inside the glass[10,11].
3.2. Differential thermal analysis
Fig. 1 shows a typical DTA curve of S1 glass sample at differentheating rates, which has been used for interaction study. All curvesexhibit small endothermic peak that is attributed to the glasstransition temperature (Tg). In the present work, the onset of thepeaks on the thermal curves was taken as Tg. The glass transitiontemperature (Tg), crystallization temperature (Tc) and peak crystal-lization temperature (Tp) of all the glasses are given in Table 3. Withincrease in heating rate the crystallization peaks were observed to
Table 1Sample label, glasses and electrolyte with different heat treatment durations.
Sample label Glass composition(mol%) with sample label
Electrolyte Heat treatmentdurations (h)
IS1 30SrO–40SiO2–20B2O3–10Y2O3
(S1)Bi4V1.8Al0.2O11 1, 10, 100
IS2 30SrO–40SiO2–20B2O3–10La2O3
(S2)Bi4V1.8Al0.2O11 1, 10, 100
IS3 30SrO–40SiO2–20B2O3–10Al2O3
(S3)Bi4V1.8Al0.2O11 1, 10, 100
Table 2Densities, molar volume, oxygen molar volume and excess volume of glass S1, S2 andS3.
Glass Density(g cm−3)
Molar volume,Vm (cm3 mol−1)
O2 molar vol., Vo
(cm3 mol−1)Excessvolume, Ve
S1 3.466 26.42 13.212 1.94S2 3.695 27.49 13.745 2.41S3 3.805 20.8 10.406 −1.81
80 V. Kumar et al. / Solid State Ionics 181 (2010) 79–85

Author's personal copy
shift towards higher temperature for all the glasses. The shift incrystallization peaks with increase in heating rate is a manifestation ofdelayed nucleation in glass since the peak maxima will occur attemperature at which the rate of transfer of viscous liquid into crystalobtains maximum value [12]. Ray [13] have reported that Tg is relatedto the density of covalent cross-linking, number and strength of co-ordinate links formed between oxygen atoms and the cations as wellas the oxygen density of network. Higher values of these factorscorrespond to higher Tg. Intermediate oxides play an important role inglasses for their change in thermal properties as they can act as anetwork former as well as network modifier depending uponchemical nature of the cations. In the present glasses the S1 glassshows higher Tg because Y3+ exhibit higher field strength than La3+
(S2) glass. Moreover, the Y–O bond strength is more as compared toLa–O bonds. Contrary to this, in case of S3 sample where (Al3+=0.52 Å) cation size is smaller than Y3+ (0.9 Å) and La3+ (1.03 Å)cations exhibit low Tg. It might be attributed due to lower value of Vo
(oxygen molar volume) of S3 sample. This may lead to formation ofAl–O–Al clusters which exist in the form of AlO6 polyhedra and areknown to weaken the glass network [14].
Thermal data obtained fromDTAwas used to calculate the thermalstability, fragility index and activation energy for crystallization of allglasses [9].
3.2.1. Thermal stability (TS)The thermal stability (TS) of glass can be defined by following
relationship [15]:
TS = Tc−Tg ð4Þ
The larger difference between Tc and Tg indicates the mostthermally stable glass. Saad and Poulin [16] suggested anothercriterion for the thermal stability of the glasses, which can beexplained as follows:
S = ðTp–TcÞðTc–TgÞ = Tg ð5Þ
The thermal stability parameter, S, reflects the resistance todevitrification after the formation of the glass. In Eq. (5), (Tp−Tc) isrelated to the rate of devitrification of the glassy phases. On the otherhand, a high value of (Tc−Tg) delays the nucleation process. Thethermal stability of S3 sample is higher than S1 and S2 glasses. Thecrystallization process depends on the nucleation process. The crys-tallization is furthermore delayed because of the strong networkoffered by smaller cations.
However, in case of S3 glass there is large difference in (Tc−Tg)values as shown in Table 3. Addition of Al2O3 in glass prevents thecrystallization which is well documented in literature [17].
3.2.2. Fragility index (F)Structural relaxation is a general phenomenon occurring when a
glass is maintained at a temperature below its glass transitiontemperature (Tg). Glass forming liquids that exhibit an approximatelyArrhenius temperature dependence of the viscosity are defined asstrong glass formers. However, non-Arrhenius behavior of glassformers arises due to fragile behavior of glass [18]. Fragile glasseshave higher ionic bond character as compared to covalent bondcomponent. The covalent bond character is observed to decrease inhigher atomic number elements [19]. S2 glass containing La2O3 as anintermediate oxide has higher atomic number than S1and S3 glasses.It was found that the limit for kinetically strong-glass-forming (KS)liquids is reached for a low value of F (F≈16) [20], while the limit forkinetically fragile-glass-forming (KF) liquids is characterized by a highvalue of F (F≈200) [21].
The fragility index can be calculated using the followingrelation [22,23]
F = Eg = RTg ln 10 ð6Þ
Fig. 1. A typical DTA plot of S1 glass at different heating rates: (a) 10 °C min−1,(b) 20 °C min−1, (c) 30 °C min−1, and (d) 40 °C min−1.
Table 3Thermal stability (TS), fragility index (F), activation energy (Ep), glass transition temperature (Tg), crystallization temperature (Tc), peak crystallization temperature (Tp), andmelting temperature (Tm) of glasses along with glass powder weight for heating rates of 10, 20, 30, and 40 °C min−1.
Glass Heating rate (°C min−1) Glass powder weight (mg) Tg (°C) Tc (°C) Tp (°C) Tm (°C) TS F Ep (kJ mol−1)
S1 10 21.62 720 785 825 870 3.82 19.1 33420 19.04 734 807 848 88930 18.76 745 820 862 90040 15.53 750 828 867 925
S2 10 12.41 714 757 807 830 2.92 36.4 29520 13.22 719 800 830 85230 13.95 724 790 836 88240 13.89 730 804 846 900
S3 10 11.90 690 760 808 854 5.52 15.8 34620 13.30 705 780 820 86130 16.37 720 790 835 87240 14.56 724 806 850 888
81V. Kumar et al. / Solid State Ionics 181 (2010) 79–85

Author's personal copy
Where Eg is the activation energy for glass transition and iscalculated using following equation [24,25].
lnðT2g = βÞ = ðEg = RTgÞ + constant ð7aÞ
where β is heating rate and R is gas constant. From the experimentaldata a graph between ln (Tg2/β) versus (1000/Tg) was plotted. Theslope of this graph gives the activation energy of glass transition. Inthe present glasses, S2 glass is more fragile as compared to S1 andS3 samples as shown in Table 3. It again indicates that replacement ofLa3+ leads to modify the network and introduces higher ioniccharacter in local units in the present glass network.
3.2.3. Activation energy (Ep) calculationThe activation energy of crystallization (Ep) for all the glasses were
calculated using Eq. 7b
lnðT2p = βÞ = ðEp = RTpÞ + constant ð7bÞ
where β is heating rate and R is gas constant. From the experimentaldata a graph between ln (Tp2/β) versus (1000/Tp) was plotted. Theslope of this graph gives the activation energy of crystallization. TheKissinger plot for activation energy of S1, S2 and S3 glasses is shown inFig. 2. The higher activation energy is observed in S3 glass followed byS1 and S2 glasses as shown in Table 2. The variation in activationenergy is due to higher field strength of Al3+ than Y3+ and La3+. Thelower values of thermal stability, activation energy of crystallizationand higher fragility index (F) for S2 glass is due to close proximity ofionic radii of La3+ (1.22 Å)and Sr2+ (1.27 Å) cation field strength.However, the valence state of La3+ is more than Sr2+. This means thatsome non bridging oxygen becomes bridging but at the same time, theinter-segment forces introduced by La3+ is comparable to Sr2+. Sincethe stronger inter-segment forces is introduced by the smaller cation(Al3+ and Y3+) which may cause more tightening of the networkwith a consequent increase of the activation energy. Additionally,the presence of Al2O3 has a marked effect to prevent the crystal-lization. If Al2O3 concentration is less than 5 mol% it does not exhibitany phase separation. However, if Al2O3 content increases, it leads tophase separation. The structural role of Al3+ for its deviation in natureis because of variation in coordination number of Al3+. Higher coordi-nation number leads to phase separation [14].
3.3. Dilatometric studies
Fig. 3 shows a typical dilatometric curve of S2 and DiBV coupledsample. The thermal expansion coefficient of the glass and electrolytewere also investigated separately. The thermal expansion coefficient
(TEC) of S2 glass and DiBV is 8×10⁻⁶/K and 8.5×10⁻⁶/K respectively.The TEC value of diffusion couple (glass S2 and DiBV) is 7.8×10⁻⁶/Kwhich is very close to reported value of TEC of other components ofSOFCs [26]. The S2 glass was selected for diffusion couple because itcrystallizes at faster rate as has been reported in our earlier study [7].The purpose of present study was to compare the TEC of diffusioncouple with the individual values of TEC for glass (S2) and DiBV to seethe feasibility of its application in SOFC.
3.4. XRD analysis
The XRD pattern of all samples is shown in Figs. 4–6. The phasesformed in all the samples are A2SiO5, AVO4, SrVSi2O7 phases (A = Y,
Fig. 2. Kissinger plot of S1, S2 and S3 glasses.
Fig. 3. Dilatometer plot of IS2 diffusion couple.
Fig. 4. XRD pattern of IS1 sample heat treated at 800 °C: (a) 1 h, (b) 10 h, and (c) 100 h.
82 V. Kumar et al. / Solid State Ionics 181 (2010) 79–85

Author's personal copy
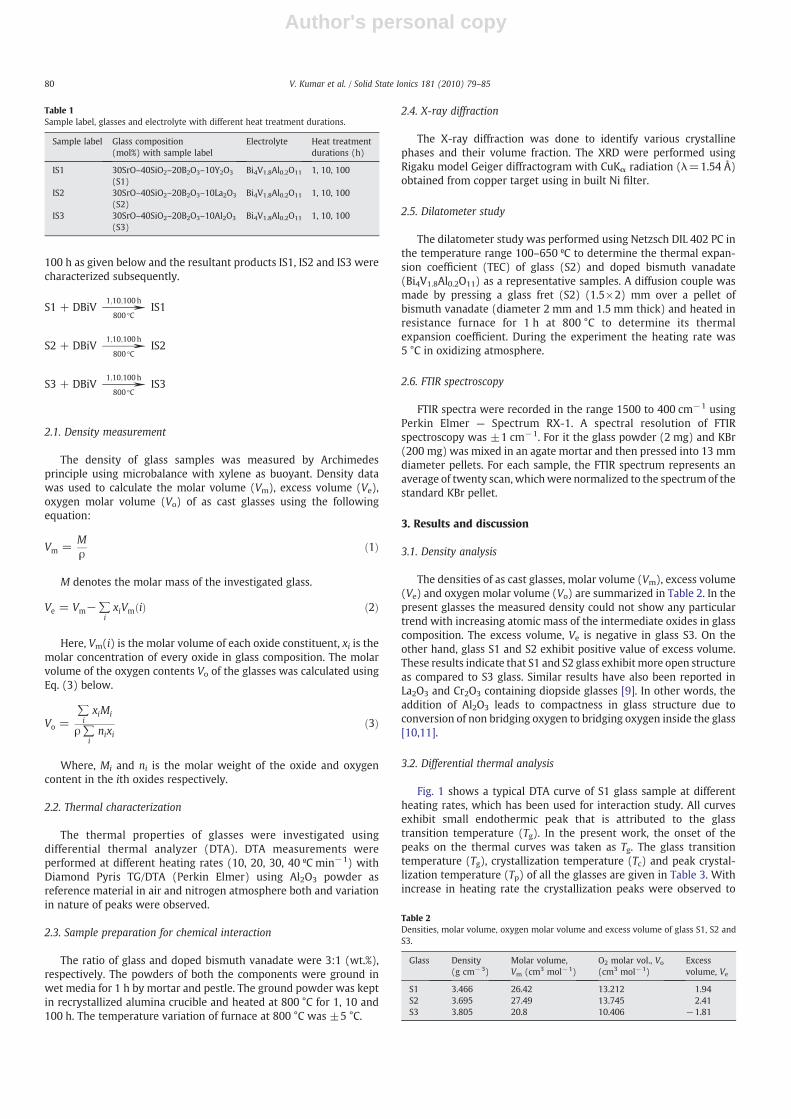
La, Al). Apart from this, DiBV phase also gets modified in all the threesamples. The estimation of volume fraction of crystalline phase(s) wasdone using internal standard method as described by Cullity [27]. Thevolume fraction of A2SiO5 phase increases with increase in heattreatment duration in IS1 sample. As the duration of heat treatmentprogresses, the volume fraction of Y2SiO5 phase increases due todiffusion of Y and Si from the glassmatrix [14,28]. The volume fractionof other phases increases as compared to volume fraction of Y2SiO5
phase. It is because of the fact that crystallization temperature of S1glass is higher than other two glasses (S2 and S3). Therefore thenucleation of A2SiO5 phase in IS1 sample might have started late assupported by DTA data also. On the other hand, SrVSi2O7 phase (ICDD751067) has formed due to interaction of bismuth vanadate withglasses. Since perovskite layer, V2O5 in Bi4V1.8Al0.2O11 is highlydisordered [5], so V5+ easily interacts with glass matrix and formsthe SrVSi2O7 phase. The volume fraction of this phase shows an
increasing trend in IS1 sample. However, reverse trend is observed inIS2 sample with heat treatment duration. In case of IS3 the volumefraction could not change appreciably with respect to heat treatmentduration. At the same time AVO4 phase could not follow any trend intheir volume fraction as given in Figs. 7–9. Bi12V2O23 phase in (IS1)remains almost constant with increasing heat treatment durations.Basically, V5+ is smaller cation and is highly mobile. It diffuses outfrom Bi4V1.8Al0.2O11 phase and interacts with glass easily to formYVO4
and SrVSi2O7 phases. Al3+ being smaller in quantity participate in theform of either solid solution or become part of glass constituent.
Thermal data of IS2 glass shows lower thermal stability, higherfragility index and lower activation energy of crystallization thanother two glasses. Thus, La2SiO5 and LaVO4 phases might havenucleated during early stage of heat treatment in IS2 sample due tolower activation energy of crystallization of glass. Moreover, La2SiO5
and LaVO4 phases exhibit triclinic crystal structure, which is lesssymmetric; as a result their volume fraction decreases with increasein heat treatment duration as shown in Fig. 8. On the other hand, thevolume fraction of SrVSi2O7 phase increases with 100 h heattreatment. Since SrVSi2O7 phase is structurally orthorhombic andmore symmetric than triclinic LaVO4 and La2SiO5 phases so thefavourable conditions for its growth exists. In this sample thestructure of DiBV gets modified by migration of Bi +3 ions from itslattice site. Since ionic radii of La3+ (1.03 Å)is same as that of Bi3+
Fig. 5. XRD pattern of IS2 sample heat treated at 800 °C: (a) 1 h, (b) 10 h, and (c) 100 h.
Fig. 6. XRD pattern of IS3 sample heat treated at 800 °C: (a) 1 h, (b) 10 h, and (c) 100 h.
Fig. 7. Volume fraction of crystalline phases formed during heat treatment of IS1sample.
Fig. 8. Volume fraction of crystalline phases formed during heat treatment of IS2sample.
83V. Kumar et al. / Solid State Ionics 181 (2010) 79–85
Author's personal copy
(1.03 Å) so La3+ can easily replace Bi3+ and occupy the site in LaVO4
crystalline phase. Interestingly in case of IS3 sample, the volumefraction of the phases could not change drastically even after longhour heat treatment. Moreover, in this sample, doped bismuthvanadate is not modified during interaction study.
Bahadur et al. [4,14] have reported that during initial stage ofcrystallization, Si+4 rich phase is nucleated in the glass matrix and inthe later stage of heat treatment the other cations occupy the siteduring growth process. In the present study too during initial stage ofinteraction between glasses and doped bismuth vanadate, lesssymmetric phases or layer structured phases might have formedwhich at the later stage of heat treatment may get converted intomore stable phases. The formation of the crystalline phases duringheat treatment is governed by the chemical nature of the intermediateoxides and the existing local arrangement of the cations within theglass matrix and their affinity with doped bismuth vanadate.
3.5. FTIR investigation
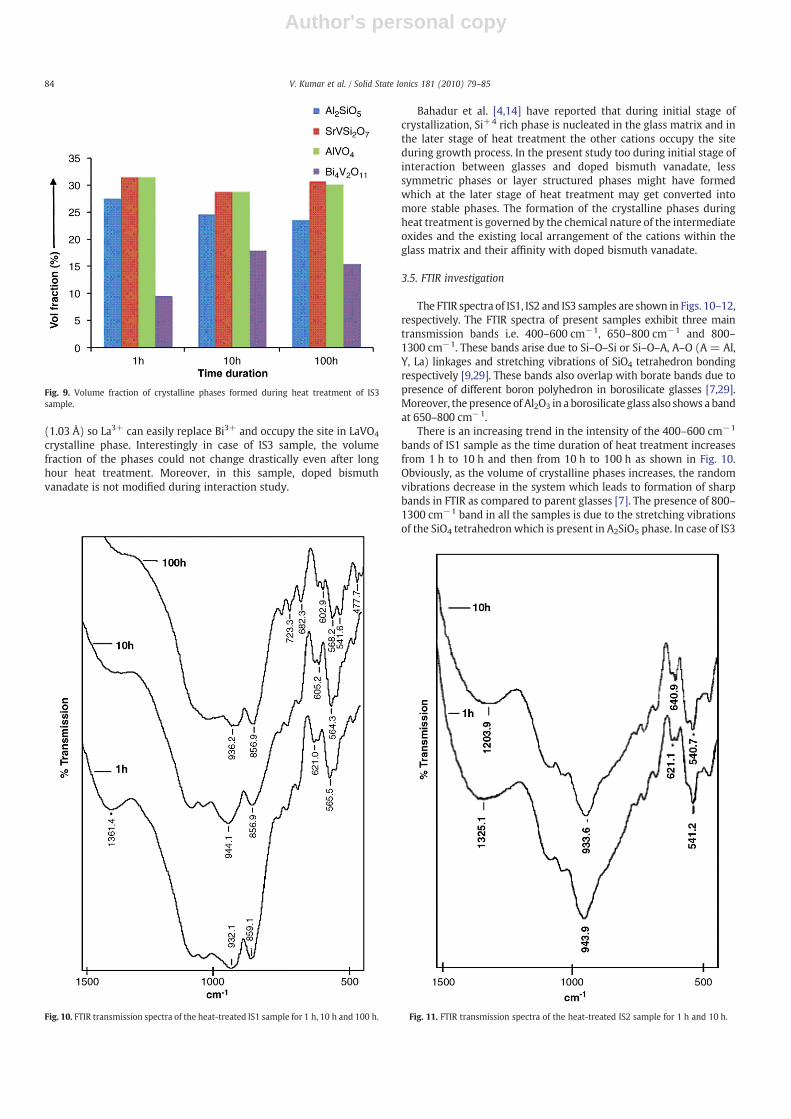
The FTIR spectra of IS1, IS2 and IS3 samples are shown in Figs. 10–12,respectively. The FTIR spectra of present samples exhibit three maintransmission bands i.e. 400–600 cm−1, 650–800 cm−1 and 800–1300 cm−1. These bands arise due to Si–O–Si or Si–O–A, A–O (A = Al,Y, La) linkages and stretching vibrations of SiO4 tetrahedron bondingrespectively [9,29]. These bands also overlap with borate bands due topresence of different boron polyhedron in borosilicate glasses [7,29].Moreover, the presence of Al2O3 in a borosilicate glass also shows a bandat 650–800 cm−1.
There is an increasing trend in the intensity of the 400–600 cm−1
bands of IS1 sample as the time duration of heat treatment increasesfrom 1 h to 10 h and then from 10 h to 100 h as shown in Fig. 10.Obviously, as the volume of crystalline phases increases, the randomvibrations decrease in the system which leads to formation of sharpbands in FTIR as compared to parent glasses [7]. The presence of 800–1300 cm−1 band in all the samples is due to the stretching vibrationsof the SiO4 tetrahedron which is present in A2SiO5 phase. In case of IS3
Fig. 9. Volume fraction of crystalline phases formed during heat treatment of IS3sample.
Fig. 10. FTIR transmission spectra of the heat-treated IS1 sample for 1 h, 10 h and 100 h. Fig. 11. FTIR transmission spectra of the heat-treated IS2 sample for 1 h and 10 h.
84 V. Kumar et al. / Solid State Ionics 181 (2010) 79–85

Author's personal copy
sample the intensity of band has not changed with heat treatmentduration as the volume of this phase remains constant as shown inFig. 9. The region 650–800 cm−1 is the weak intensity region havingbending vibrations of A–O bond almost centered around 723 cm−1
and its peak intensity increases with heat treatment duration in IS1sample. This may be attributed due to volume enhancement of Y2SiO5
phase as shown in Figs. 4 and 7.In addition to this, the FTIR spectra of IS1 and IS2 show striking
difference, due to change in intensity and increase in sharpness of950 cm−1 and 1325 cm−1 band in IS2 sample. On the other hand, thisparticular band in IS3 sample could not show any change with respectto heat treatment duration. Interestingly, IS2 samples also exhibitremarkable differences in the volume fraction of different crystallinephases with respect to heat treatment duration (Figs. 5 and 8). A peakat 943.9 cm−1 is also observed in 1 h heat treatment as shown inFig. 11. This peak might be attributed to BO4 stretching [7,29] whichshifts to lowerwave numberwith increased intensity as time durationincreases. There is another peak at 1303 cm−1 after 1 h heattreatment, which also corresponds to B–O vibrations in BO3 triangle,and intensity of this peak increases as the time duration of heattreatment increases [29].
In the IS3 sample, a band is observed at 650–800 cm−1 due tostretching vibration of Al–O bonds in AlVO4 where Al3+ ions are infourfold coordination [18]. Apart from this, a broad band is found at
1400 cm−1 after 1 h heat treatment and this peak gets broadened asthe heat treatment progresses. This can be attributed due to the B–Ovibrations in BO3 triangle and shift towards lower wave numbers asthe time duration for heat treatment progresses suggesting somestructural change in aluminosilicate network due to formation ofsome crystalline phase [9].
4. Conclusions
In all the three samples, S3 glass shows higher chemical andthermal stability with doped bismuth vanadate. In all reactionproducts, SrVSi2O7, AVO4 and A2SiO5 (A = Y, La, Al) phases areformed. Apart from this, chemical composition of Bi4V1.8Al1.8O11
electrolyte gets modified due to diffusion of V5+ and Bi3+ into glassesespecially where Y2O3 and La2O3 were used as intermediate oxides inglasses. Cristobalite phase which is detrimental for SOFC applicationdid not form in any reaction product. The FTIR spectra of all thesamples exhibit three bands i.e. 400–600 cm−1, 650–800 cm−1 and800–1300 cm−1. These spectra are assigned to bending vibrations ofthe Si–O–Si linkages, bending vibrations of the A–O (A=Y, La, and Al)bonds and stretching vibrations of the SiO4 tetrahedron with thedifferent numbers of bridging oxygen atoms. The study indicates thatS3 glass can work as a sealant for DBiV at working temperature ofSOFC.
Acknowledgement
We are highly thankful to the Department of Science andTechnology, India, for providing us the financial support to carry outthis work under research scheme SR/S2/CMP-48/20.
References
[1] K. Eichler, G. Solow, P. Otschik, W. Schaffrath, J. Eur. Ceram. Soc. 19 (1999) 1101.[2] K.L. Ley, M. Krumpelt, R. Kumar, J.H. Meiser, I.J. Bloom, J. Mater. Res. 11 (1996)
1489.[3] H. Larsen, P.F. James, J. Mater. Sci. 33 (1998) 2499.[4] D. Bahadur, N. Lahl, K. Singh, L. Singheiser, K. Hilpert, J. Electrochem. Soc. 151
(2004) A558.[5] F. Abraham, J.C. Biovin, G. Mairesse, G. Nowogrocki, Solid State Ionics 40–41
(1990) 934.[6] R. Kant, K. Singh, O.P. Pandey, Int. J. Hydrogen Energy 33 (2008) 455.[7] V. Kumar, A. Arora, O.P. Pandey, K. Singh, Int. J. Hydrogen Energy 33 (2008) 434.[8] R.F. Wang, Z. Lu, C.Q. Liu, R.B. Zhu, X.Q. Huang, B. Wei, N. Ai, W.H. Su, J. Alloys.
Comp. 432 (2007) 189.[9] A. Goel, D.U. Tulyaganov, V. Kharton, Acta Mater. 56 (2008) 3065.[10] M. Benoit, S. Ispas, M.E. Tuckerman, Phys. Rev. B 64 (2001) 224,205.[11] Manupriya, K.S. Thind, K. Singh, G. Sharma, V. Rajendran, Phys. Status Solidi A 206
(2009) 1447.[12] A. Arora, E.R. Shaaban, K. Singh, O.P. Pandey, J. Non-Cryst. Solids 354 (2008) 3944.[13] N.H. Ray, J. Non-Cryst. Solids 15 (1974) 423.[14] N. Lahl, K. Singh, L. Singheiser, K. Hilpert, D. Bahadur, J. Mater. Sci. 35 (2000) 3089.[15] S. Mahadevan, A. Giridhar, A.K. Singh, J. Non-Cryst. Solids 88 (1986) 11.[16] M. Saad, M. Poulin, Mater. Sci. Forum 19–20 (1987) 11.[17] T. Schwickest, R. Sievering, P. Geasee, R. Conradt, Mat. Wiss. u. Werkstofftech. 33
(2002) 363.[18] R. Bohmer, K.L. Nagi, C.A. Angell, D.J. Plazek, J. Chem. Phys. 99 (1993) 4201.[19] V. Raghavan, Materials Science & Engineering, Prentice-Hall of India, Private
Limited, New Delhi, 2004, p. 75.[20] T.A. Viglis, Phys. Rev. B 47 (1993) 2882.[21] R. Bohmer, C.A. Angell, in: R. Richert, A. Blumen (Eds.), Disorder Effects on Relaxation
Processes, Springer, Berlin, 1994, p. 110.[22] K. Chebli, J.M. Saiter, J. Grenet, A. Hamou, G. Saffarini, Physica B 304 (2001) 228.[23] M.M. Wakkad, E.K. Shokr, S.H. Mohamed, J. Non-Cryst. Solids 265 (2000) 157.[24] H.S. Chen, J. Non-Cryst. Solids 27 (1978) 257.[25] H.E. Kissinger, Ann. Chem. 29 (1957) 1702.[26] F. Tietz, Ionics 5 (1999) 129.[27] B.D. Cullity, Elements of X-ray Diffraction3rd Ed, Prentice-Hall Inc., Upper Saddle
River, New Jersey, 1977 411 pp.[28] K. Singh, N. Gupta, O.P. Pandey, J. Mater. Sci. 42 (2007) 6426.[29] F.H.A. Elbatal, M.M.I."Magda M.I." was changed to "M.M.I." as the given name.
Please check if this is correct. Khalil, Mater. Chem. Phys. 82 (2003) 375.
Fig. 12. FTIR transmission spectra of the heat-treated IS3 sample for 1 h, 10 h. and 100 h.
85V. Kumar et al. / Solid State Ionics 181 (2010) 79–85