Joinability of different thermoplastic polymers with aluminium AA6082 sheets by mechanical clinching
Upload
independentCategory
view
3download
0
Tnc
Ma
b
a
ARRAA
KTNLCT
1
TTsopmwbaoohclps[(
0d
Thermochimica Acta 510 (2010) 185–194
Contents lists available at ScienceDirect
Thermochimica Acta
journa l homepage: www.e lsev ier .com/ locate / tca
hermal and morphological analysis of thermoplastic polyurethane–clayanocomposites: Comparison of efficacy of dual modified laponite vs.ommercial montmorillonites
anas Mondala, Pijush K. Chattopadhyaya, S. Chattopadhyaya,∗, Dipak Kumar Setuab
Rubber Technology Centre, Indian Institute of Technology, Kharagpur 721302, IndiaDefence Materials and Stores R and D Establishment, Kanpur 208103, India
r t i c l e i n f o
rticle history:eceived 3 May 2010eceived in revised form 8 July 2010ccepted 9 July 2010vailable online 16 July 2010
a b s t r a c t
Thermoplastic polyurethane (TPU)–clay nanocomposites were studied with respect to thermal propertiesand morphology. Different types of clay, e.g. modified laponite (ionic followed by covalent modificationusing different silanes) and montmorillonites (e.g. Cloisite 30B and Nanomer I.30E) were used. Activationenergies (E) for thermal decomposition of nanocomposites were determined by Flynn and Wall technique.The changes in ‘E’ value with the level of conversion suggest a complicated degradation rate. Lifetime
eywords:hermoplastic polyurethaneanocompositesaponiteloisitehermal analysis
of composites was estimated by Toop’s equation revealing higher lifetime for montmorillonite basedcomposites. It was found that dual modification of laponite was sometimes more effective/equivalentto commercial montmorillonites regarding viscoelastic properties and thermo-dimensional stabilities ofnanocomposites. Phase morphology, filler dispersion, RMS roughness obtained from SEM (including X-raydot mapping), AFM analyses revealed the role of aggregates in degradation of properties of composites.Moreover, thermo-physical properties were dependent on the aspect ratio, polarity, and aggregation
o TPU
characteristics of clay int. Introduction
Thermoplastic polyurethane (TPU), especially the segmentedPU, has become popular for potential smart applications [1–3].he development of ‘TPU-nanocomposite’ is another field fetchingignificant interest in scientific community where mostly nan-clay and nanosilica [4], carbon nano-particle/fiber/tubes [5] and,olyhedral oligomeric silsesquioxane (POSS) [6], etc. have com-only been used. Though the thermal stability studies of TPU isidely reported, but for TPU–nanoclay composites they are yet to
e fully explored. Some of the previous studies have shown thatn optimum level of thermal stability can be achieved using 1–3%f modified nanoclay in the TPU-nanocomposites [7,8]. Reportsn the use of montmorilonite (MMT), a natural layered silicate,ave become common place [8]. However, laponite, the syntheticounter part of MMT, is relatively less popular in the publishediterature [8]. Owing to the hydrophobic nature of TPU, the clay
latelets need to be surface modified to interact with the polymeruch that the gallery spacing reaches to the stage of exfoliation9]. In this context, surface modification of fillers by a surfactantby single modification) has usually become the trend and also∗ Corresponding author. Tel.: +91 3222 281758; fax: +91 3222 282292.E-mail address: [email protected] (S. Chattopadhyay).
040-6031/$ – see front matter © 2010 Elsevier B.V. All rights reserved.oi:10.1016/j.tca.2010.07.013
.© 2010 Elsevier B.V. All rights reserved.
widely reported. However, scope of a dual modification sometimescan be more profitable but not explored [10]. Single modificationis basically an ionic modification, whereas in the dual modifica-tion process the singly modified clay (by ion exchange) is furthermodified covalently by another surfactant.
In order to determine the thermal stability of polymeric materi-als, many model equations are routinely been used basically, whichare differently modified or rearranged form of the basic Arrheniusequation which is based on the rate of degradation of the materialand corresponding activation energy of the decomposition process.The determination of an activation energy parameter from a singleintegral TGA curve has been found to involve cumbersome curve-fitting techniques. Flynn and Wall’s technique is a quick, simplemethod for determining activation energies directly from weightloss vs. temperature data at several heating rates [11]. On the otherhand, Toop’s equation can correlate life theory and TGA theory ofa polymer. The equation is a shorter and more accurate alternativeto the conventional expensive aging programs [12].
In this paper, we seek to derive a clearer picture of the effectof surface modification of various types of clay on the morphol-
ogy, thermal, and thermo-dimensional stability over a range oftemperature of the TPU–clay nanocomposites. Activation ener-gies were evaluated from TGA data using well-known Flynn andWall’s technique [11]. Lifetimes of the nanocomposites, for thefirst time in reported literature, have been calculated using the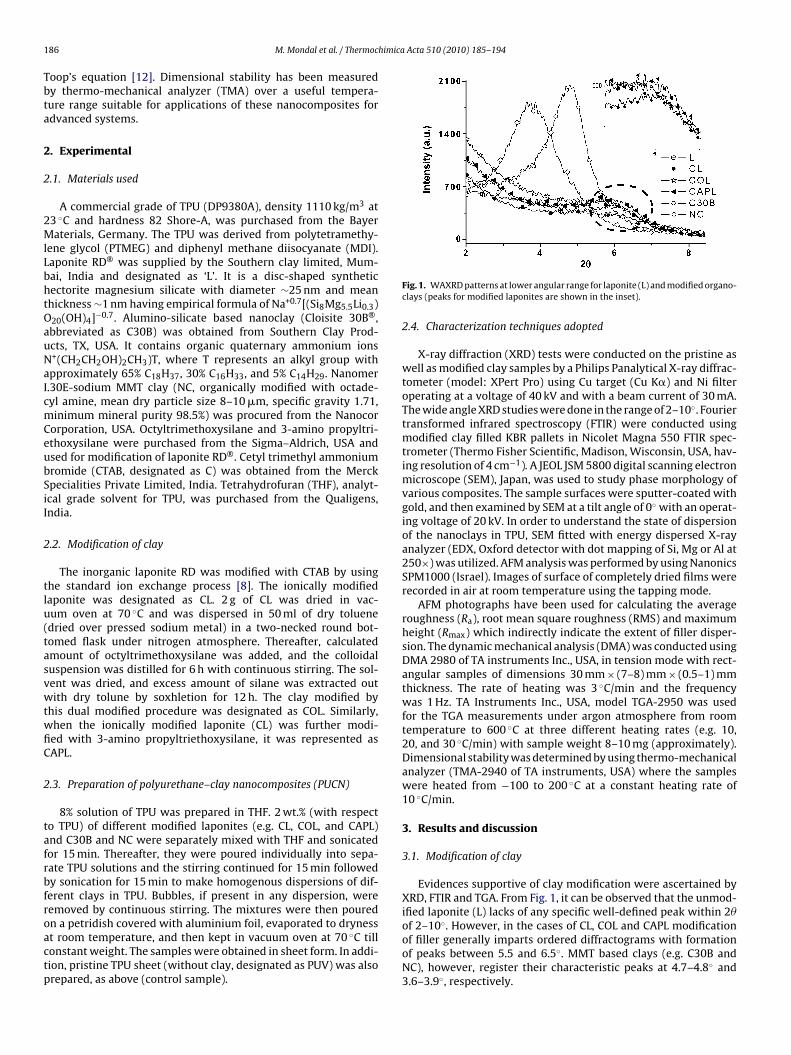
1 himica Acta 510 (2010) 185–194
Tbta
2
2
2MlLbhtOauNaIcmCeubSiI
2
tlu(tasvwtwfiC
2
tafrbfroactp
86 M. Mondal et al. / Thermoc
oop’s equation [12]. Dimensional stability has been measuredy thermo-mechanical analyzer (TMA) over a useful tempera-ure range suitable for applications of these nanocomposites fordvanced systems.
. Experimental
.1. Materials used
A commercial grade of TPU (DP9380A), density 1110 kg/m3 at3 ◦C and hardness 82 Shore-A, was purchased from the Bayeraterials, Germany. The TPU was derived from polytetramethy-
ene glycol (PTMEG) and diphenyl methane diisocyanate (MDI).aponite RD® was supplied by the Southern clay limited, Mum-ai, India and designated as ‘L’. It is a disc-shaped syntheticectorite magnesium silicate with diameter ∼25 nm and meanhickness ∼1 nm having empirical formula of Na+0.7[(Si8Mg5.5Li0.3)20(OH)4]−0.7. Alumino-silicate based nanoclay (Cloisite 30B®,bbreviated as C30B) was obtained from Southern Clay Prod-cts, TX, USA. It contains organic quaternary ammonium ions+(CH2CH2OH)2CH3)T, where T represents an alkyl group withpproximately 65% C18H37, 30% C16H33, and 5% C14H29. Nanomer.30E-sodium MMT clay (NC, organically modified with octade-yl amine, mean dry particle size 8–10 �m, specific gravity 1.71,inimum mineral purity 98.5%) was procured from the Nanocor
orporation, USA. Octyltrimethoxysilane and 3-amino propyltri-thoxysilane were purchased from the Sigma–Aldrich, USA andsed for modification of laponite RD®. Cetyl trimethyl ammoniumromide (CTAB, designated as C) was obtained from the Merckpecialities Private Limited, India. Tetrahydrofuran (THF), analyt-cal grade solvent for TPU, was purchased from the Qualigens,ndia.
.2. Modification of clay
The inorganic laponite RD was modified with CTAB by usinghe standard ion exchange process [8]. The ionically modifiedaponite was designated as CL. 2 g of CL was dried in vac-um oven at 70 ◦C and was dispersed in 50 ml of dry toluenedried over pressed sodium metal) in a two-necked round bot-omed flask under nitrogen atmosphere. Thereafter, calculatedmount of octyltrimethoxysilane was added, and the colloidaluspension was distilled for 6 h with continuous stirring. The sol-ent was dried, and excess amount of silane was extracted outith dry tolune by soxhletion for 12 h. The clay modified by
his dual modified procedure was designated as COL. Similarly,hen the ionically modified laponite (CL) was further modi-ed with 3-amino propyltriethoxysilane, it was represented asAPL.
.3. Preparation of polyurethane–clay nanocomposites (PUCN)
8% solution of TPU was prepared in THF. 2 wt.% (with respecto TPU) of different modified laponites (e.g. CL, COL, and CAPL)nd C30B and NC were separately mixed with THF and sonicatedor 15 min. Thereafter, they were poured individually into sepa-ate TPU solutions and the stirring continued for 15 min followedy sonication for 15 min to make homogenous dispersions of dif-erent clays in TPU. Bubbles, if present in any dispersion, wereemoved by continuous stirring. The mixtures were then poured
n a petridish covered with aluminium foil, evaporated to drynesst room temperature, and then kept in vacuum oven at 70 ◦C tillonstant weight. The samples were obtained in sheet form. In addi-ion, pristine TPU sheet (without clay, designated as PUV) was alsorepared, as above (control sample).Fig. 1. WAXRD patterns at lower angular range for laponite (L) and modified organo-clays (peaks for modified laponites are shown in the inset).
2.4. Characterization techniques adopted
X-ray diffraction (XRD) tests were conducted on the pristine aswell as modified clay samples by a Philips Panalytical X-ray diffrac-tometer (model: XPert Pro) using Cu target (Cu K�) and Ni filteroperating at a voltage of 40 kV and with a beam current of 30 mA.The wide angle XRD studies were done in the range of 2–10◦. Fouriertransformed infrared spectroscopy (FTIR) were conducted usingmodified clay filled KBR pallets in Nicolet Magna 550 FTIR spec-trometer (Thermo Fisher Scientific, Madison, Wisconsin, USA, hav-ing resolution of 4 cm−1). A JEOL JSM 5800 digital scanning electronmicroscope (SEM), Japan, was used to study phase morphology ofvarious composites. The sample surfaces were sputter-coated withgold, and then examined by SEM at a tilt angle of 0◦ with an operat-ing voltage of 20 kV. In order to understand the state of dispersionof the nanoclays in TPU, SEM fitted with energy dispersed X-rayanalyzer (EDX, Oxford detector with dot mapping of Si, Mg or Al at250×) was utilized. AFM analysis was performed by using NanonicsSPM1000 (Israel). Images of surface of completely dried films wererecorded in air at room temperature using the tapping mode.
AFM photographs have been used for calculating the averageroughness (Ra), root mean square roughness (RMS) and maximumheight (Rmax) which indirectly indicate the extent of filler disper-sion. The dynamic mechanical analysis (DMA) was conducted usingDMA 2980 of TA instruments Inc., USA, in tension mode with rect-angular samples of dimensions 30 mm × (7–8) mm × (0.5–1) mmthickness. The rate of heating was 3 ◦C/min and the frequencywas 1 Hz. TA Instruments Inc., USA, model TGA-2950 was usedfor the TGA measurements under argon atmosphere from roomtemperature to 600 ◦C at three different heating rates (e.g. 10,20, and 30 ◦C/min) with sample weight 8–10 mg (approximately).Dimensional stability was determined by using thermo-mechanicalanalyzer (TMA-2940 of TA instruments, USA) where the sampleswere heated from −100 to 200 ◦C at a constant heating rate of10 ◦C/min.
3. Results and discussion
3.1. Modification of clay
Evidences supportive of clay modification were ascertained byXRD, FTIR and TGA. From Fig. 1, it can be observed that the unmod-ified laponite (L) lacks of any specific well-defined peak within 2�
of 2–10◦. However, in the cases of CL, COL and CAPL modificationof filler generally imparts ordered diffractograms with formationof peaks between 5.5 and 6.5◦. MMT based clays (e.g. C30B andNC), however, register their characteristic peaks at 4.7–4.8◦ and3.6–3.9◦, respectively.
M. Mondal et al. / Thermochimica Acta 510 (2010) 185–194 187
Scheme 1. Schematic representation of Cloisite 30B showing lesser spacing due tointense H-bonding.
Ss
clNMoi
o(upp–CC(oigeli
Table 1FTIR band frequencies of various modified laponites.
Sample ID Band frequency (cm−1) Assigned bond
CL 1475 C–Hbend
2850 C–Hstr
2927 C–Hstr
COL 540 Si–O–Sibend
3428 O–Hstr
1655 O–Hbend
2850 C–Hstr
2927 C–Hstr
CAPL 540 Si–O–Sibend
3428 O–Hstr
1655 O–Hbend
resulted in better dispersion of the filler particles into the TPU
cheme 2. Schematic representation of Nanomer I.30E showing increased gallerypacing owing to the weaker H-bonding.
C30B with stronger polar-polar (–OH) interactions between thelay gallery and surface modifying agent than that of NC, registersower inter-gallery spacing (1.83 nm, approximately) compared toC (2.26 nm). Similar observation in case of differently modifiedMTs is reported in the literature [8,13]. Schematic representation
f the −OH groups involved in polar-polar interactions are depictedn Schemes 1 and 2.
FTIR spectra as assigned in Table 1 give evidences of formationf new peaks corresponding to 1475 cm−1 (C–Hbend), 2850 cm−1
C–Hstr), and 2927 cm−1 (C–Hstr) in case of CL as compared tonmodified laponite (L, devoid of any C–H bond) which confirmresence of duly modified surface by CTAB by cation exchangerocess [14]. Interestingly, the C–H stretching peaks of >CH2 andCH3 groups (2850 and 2927 cm−1) were observed in case of bothOL and CAPL. The presence of the peaks, in case of both COL andAPL, at 3428 cm−1 (O–Hstr), 1655 cm−1 (O–Hbend) and 540 cm−1
Si–O–Sibend) (Table 1, Scheme 3) were also observed. The additionf an extra peak corresponding to N–Hbend at 1563 cm−1 is notedn case of CAPL only. Of course, the signals corresponding to O–H
roup (both stretching and bending) might be due to presence ofither of the absorbed water or O–H bond present in the pristineaponite itself. Summary of FTIR observations confirms appropriateonic and covalent modifications of laponite.Scheme 3. Covalent bond formation due to silylation of surfactant
1563 N–Hbend
2850 C–Hstr
2927 C–Hstr
TGA thermograms of the modified (single/dual) clay show ther-mal degradation to the extent of 14.5, 21.0, and 21.0%, respectively,for CL, COL, and CAPL in between 200 and 600 ◦C as compared topristine laponite (L, with a negligible amount of degradation). TGAresults, giving higher thermal degradation values for organicallymodified versions of laponite [15] are, therefore, supportive of XRDand FTIR findings.
3.2. Characterization of TPU–clay nanocomposites
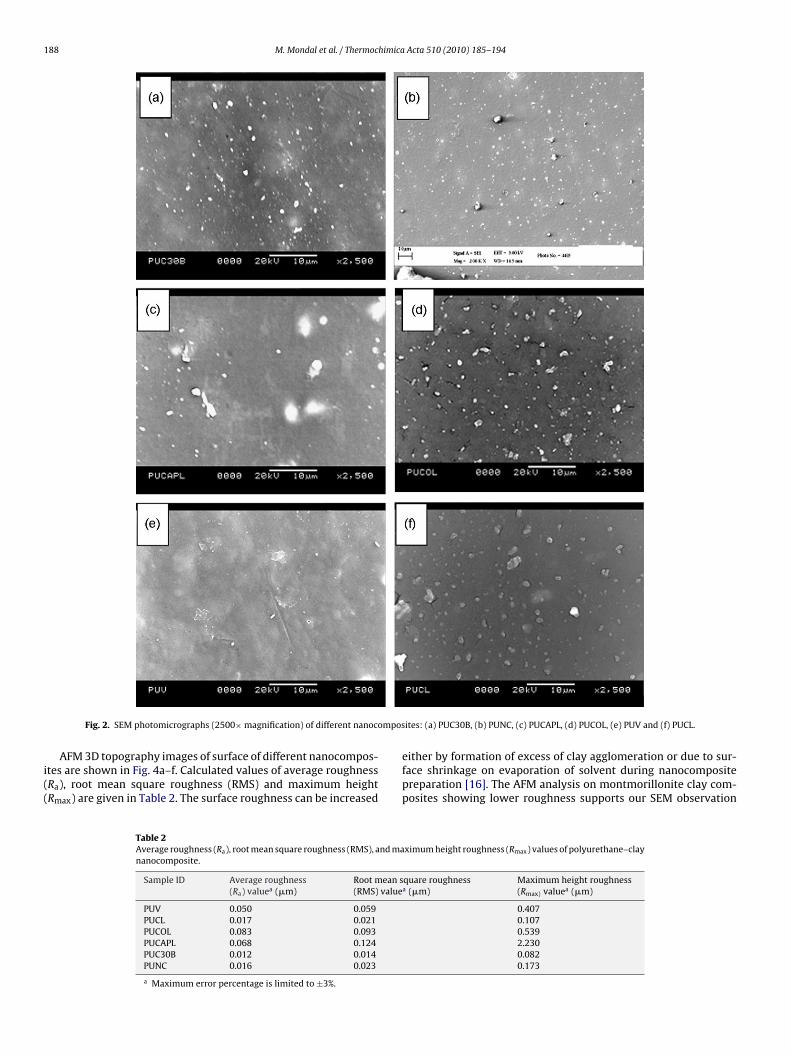
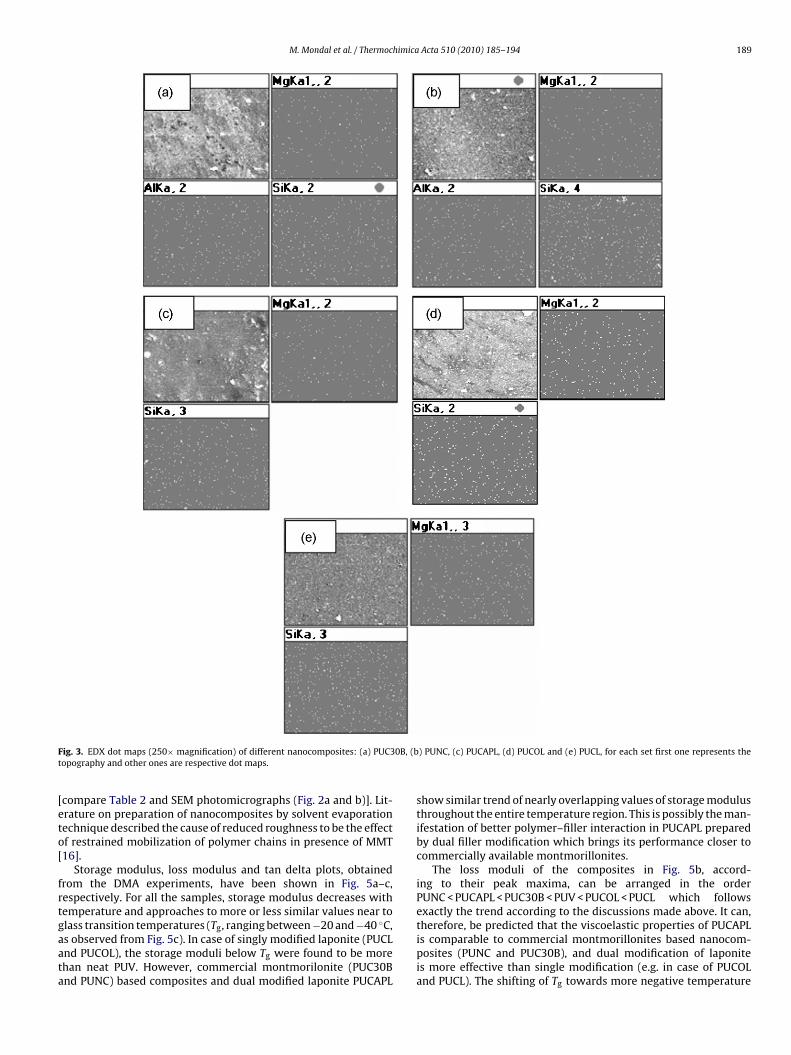
SEM photomicrographs (Fig. 2) and their respective EDX dotmaps (Fig. 3) exhibit the nature of dispersion as well as the sizeof the dispersed particles in the matrix. The brighter features inthe figures represent the clay aggregates. The EDX dot maps fur-ther confirm the presence of Si on the rough bloomed surface. Allthe modified montmorillonite based nanocomposites like PUC30B(Fig. 2a) and PUNC (Fig. 2b) show uniform clay dispersion intothe matrix. Attainment of optimum amount of the polar surfac-tant through dual surface modification onto surface of organo-clay
matrix. As a result, dual modified composites PUCAPL (Fig. 2c) andPUCOL (Fig. 2d) show better filler dispersion than PUCL (Fig. 2f).As expected, the absence of filler in neat PU generates a smoothsurface (Fig. 2e) contrary to nanocomposites.
modified laponite clay and their characteristic IR frequency.
188 M. Mondal et al. / Thermochimica Acta 510 (2010) 185–194
mpos
i((
Fig. 2. SEM photomicrographs (2500× magnification) of different nanoco
AFM 3D topography images of surface of different nanocompos-tes are shown in Fig. 4a–f. Calculated values of average roughnessRa), root mean square roughness (RMS) and maximum heightRmax) are given in Table 2. The surface roughness can be increased
Table 2Average roughness (Ra), root mean square roughness (RMS), and mananocomposite.
Sample ID Average roughness(Ra) valuea (�m)
Root mean s(RMS) value
PUV 0.050 0.059PUCL 0.017 0.021PUCOL 0.083 0.093PUCAPL 0.068 0.124PUC30B 0.012 0.014PUNC 0.016 0.023
a Maximum error percentage is limited to ±3%.
ites: (a) PUC30B, (b) PUNC, (c) PUCAPL, (d) PUCOL, (e) PUV and (f) PUCL.
either by formation of excess of clay agglomeration or due to sur-face shrinkage on evaporation of solvent during nanocompositepreparation [16]. The AFM analysis on montmorillonite clay com-posites showing lower roughness supports our SEM observation
ximum height roughness (Rmax) values of polyurethane–clay
quare roughnessa (�m)
Maximum height roughness(Rmax) valuea (�m)
0.4070.1070.5392.2300.0820.173
M. Mondal et al. / Thermochimica Acta 510 (2010) 185–194 189
F 0B, (bt
[eto[
frtgaata
ig. 3. EDX dot maps (250× magnification) of different nanocomposites: (a) PUC3opography and other ones are respective dot maps.
compare Table 2 and SEM photomicrographs (Fig. 2a and b)]. Lit-rature on preparation of nanocomposites by solvent evaporationechnique described the cause of reduced roughness to be the effectf restrained mobilization of polymer chains in presence of MMT16].
Storage modulus, loss modulus and tan delta plots, obtainedrom the DMA experiments, have been shown in Fig. 5a–c,espectively. For all the samples, storage modulus decreases withemperature and approaches to more or less similar values near to
lass transition temperatures (Tg, ranging between −20 and −40 ◦C,s observed from Fig. 5c). In case of singly modified laponite (PUCLnd PUCOL), the storage moduli below Tg were found to be morehan neat PUV. However, commercial montmorilonite (PUC30Bnd PUNC) based composites and dual modified laponite PUCAPL) PUNC, (c) PUCAPL, (d) PUCOL and (e) PUCL, for each set first one represents the
show similar trend of nearly overlapping values of storage modulusthroughout the entire temperature region. This is possibly the man-ifestation of better polymer–filler interaction in PUCAPL preparedby dual filler modification which brings its performance closer tocommercially available montmorillonites.
The loss moduli of the composites in Fig. 5b, accord-ing to their peak maxima, can be arranged in the orderPUNC < PUCAPL < PUC30B < PUV < PUCOL < PUCL which followsexactly the trend according to the discussions made above. It can,
therefore, be predicted that the viscoelastic properties of PUCAPLis comparable to commercial montmorillonites based nanocom-posites (PUNC and PUC30B), and dual modification of laponiteis more effective than single modification (e.g. in case of PUCOLand PUCL). The shifting of Tg towards more negative temperature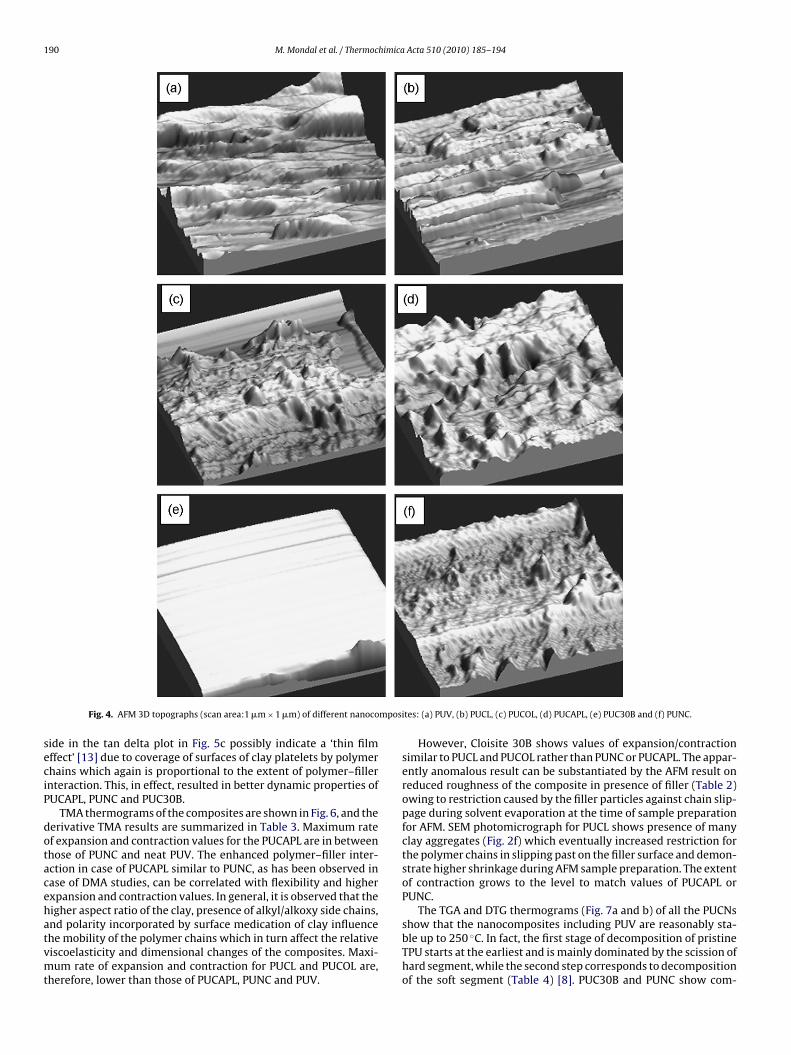
190 M. Mondal et al. / Thermochimica Acta 510 (2010) 185–194
mpos
seciP
dotacehatvmt
Fig. 4. AFM 3D topographs (scan area:1 �m × 1 �m) of different nanoco
ide in the tan delta plot in Fig. 5c possibly indicate a ‘thin filmffect’ [13] due to coverage of surfaces of clay platelets by polymerhains which again is proportional to the extent of polymer–fillernteraction. This, in effect, resulted in better dynamic properties ofUCAPL, PUNC and PUC30B.
TMA thermograms of the composites are shown in Fig. 6, and theerivative TMA results are summarized in Table 3. Maximum ratef expansion and contraction values for the PUCAPL are in betweenhose of PUNC and neat PUV. The enhanced polymer–filler inter-ction in case of PUCAPL similar to PUNC, as has been observed inase of DMA studies, can be correlated with flexibility and higherxpansion and contraction values. In general, it is observed that theigher aspect ratio of the clay, presence of alkyl/alkoxy side chains,
nd polarity incorporated by surface medication of clay influencehe mobility of the polymer chains which in turn affect the relativeiscoelasticity and dimensional changes of the composites. Maxi-um rate of expansion and contraction for PUCL and PUCOL are,herefore, lower than those of PUCAPL, PUNC and PUV.
ites: (a) PUV, (b) PUCL, (c) PUCOL, (d) PUCAPL, (e) PUC30B and (f) PUNC.
However, Cloisite 30B shows values of expansion/contractionsimilar to PUCL and PUCOL rather than PUNC or PUCAPL. The appar-ently anomalous result can be substantiated by the AFM result onreduced roughness of the composite in presence of filler (Table 2)owing to restriction caused by the filler particles against chain slip-page during solvent evaporation at the time of sample preparationfor AFM. SEM photomicrograph for PUCL shows presence of manyclay aggregates (Fig. 2f) which eventually increased restriction forthe polymer chains in slipping past on the filler surface and demon-strate higher shrinkage during AFM sample preparation. The extentof contraction grows to the level to match values of PUCAPL orPUNC.
The TGA and DTG thermograms (Fig. 7a and b) of all the PUCNs
show that the nanocomposites including PUV are reasonably sta-ble up to 250 ◦C. In fact, the first stage of decomposition of pristineTPU starts at the earliest and is mainly dominated by the scission ofhard segment, while the second step corresponds to decompositionof the soft segment (Table 4) [8]. PUC30B and PUNC show com-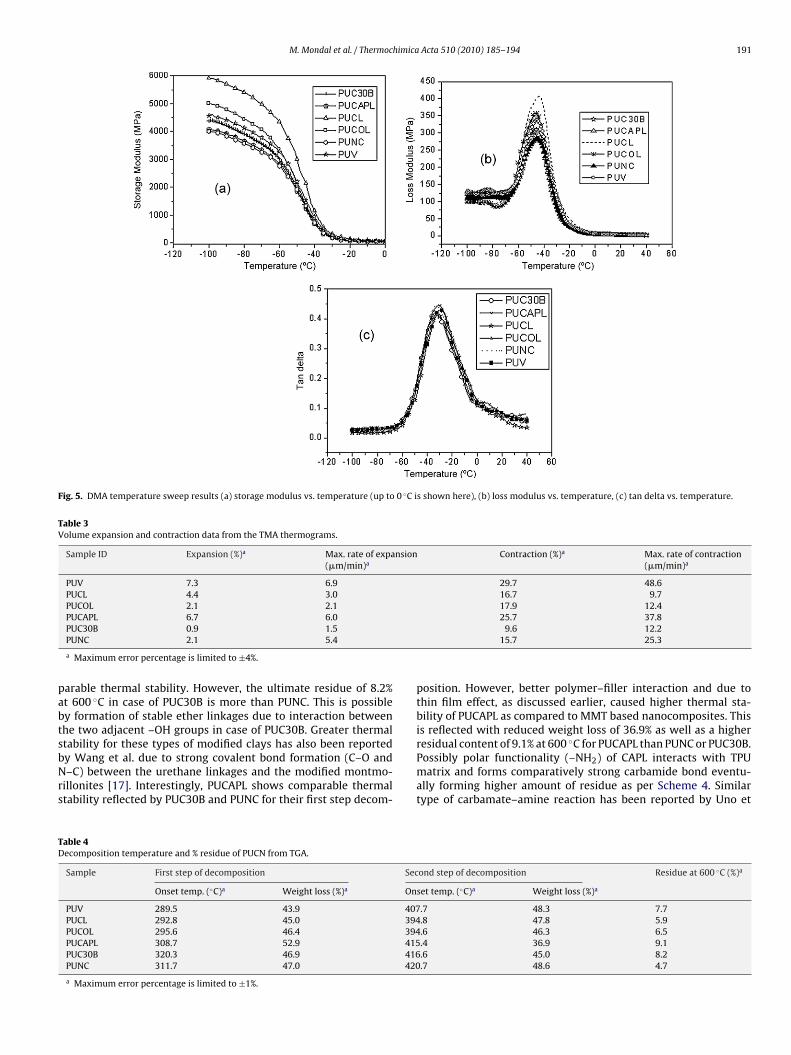
M. Mondal et al. / Thermochimica Acta 510 (2010) 185–194 191
Fig. 5. DMA temperature sweep results (a) storage modulus vs. temperature (up to 0 ◦C is shown here), (b) loss modulus vs. temperature, (c) tan delta vs. temperature.
Table 3Volume expansion and contraction data from the TMA thermograms.
Sample ID Expansion (%)a Max. rate of expansion(�m/min)a
Contraction (%)a Max. rate of contraction(�m/min)a
PUV 7.3 6.9 29.7 48.6PUCL 4.4 3.0 16.7 9.7PUCOL 2.1 2.1 17.9 12.4PUCAPL 6.7 6.0 25.7 37.8
pabtsbNrs
TD
PUC30B 0.9 1.5PUNC 2.1 5.4
a Maximum error percentage is limited to ±4%.
arable thermal stability. However, the ultimate residue of 8.2%t 600 ◦C in case of PUC30B is more than PUNC. This is possibley formation of stable ether linkages due to interaction betweenhe two adjacent –OH groups in case of PUC30B. Greater thermaltability for these types of modified clays has also been reported
y Wang et al. due to strong covalent bond formation (C–O and–C) between the urethane linkages and the modified montmo-illonites [17]. Interestingly, PUCAPL shows comparable thermaltability reflected by PUC30B and PUNC for their first step decom-
able 4ecomposition temperature and % residue of PUCN from TGA.
Sample First step of decomposition Sec
Onset temp. (◦C)a Weight loss (%)a On
PUV 289.5 43.9 407PUCL 292.8 45.0 394PUCOL 295.6 46.4 394PUCAPL 308.7 52.9 415PUC30B 320.3 46.9 416PUNC 311.7 47.0 420
a Maximum error percentage is limited to ±1%.
9.6 12.215.7 25.3
position. However, better polymer–filler interaction and due tothin film effect, as discussed earlier, caused higher thermal sta-bility of PUCAPL as compared to MMT based nanocomposites. Thisis reflected with reduced weight loss of 36.9% as well as a higherresidual content of 9.1% at 600 ◦C for PUCAPL than PUNC or PUC30B.
Possibly polar functionality (–NH2) of CAPL interacts with TPUmatrix and forms comparatively strong carbamide bond eventu-ally forming higher amount of residue as per Scheme 4. Similartype of carbamate–amine reaction has been reported by Uno etond step of decomposition Residue at 600 ◦C (%)a
set temp. (◦C)a Weight loss (%)a
.7 48.3 7.7
.8 47.8 5.9
.6 46.3 6.5
.4 36.9 9.1
.6 45.0 8.2
.7 48.6 4.7

192 M. Mondal et al. / Thermochimica Acta 510 (2010) 185–194
y for P
aaP
3m
AebtPBBadbtOctws
Fp
thermal degradation of these nanocomposites follows a compli-cated rate process. For the samples PUCOL, PUNC having nonpolarmodified clay, requirement of activation energy is higher at higherconversion levels. At higher temperature, nanocomposite havingclay with polar (–OH, –NH2, etc.) modification gives rise to ran-
Scheme 4. Possible decomposition pathwa
l. [18]. Other modified laponite based nanocomposites, e.g. PUCLnd PUCOL show less thermal stabilities than PUCAPL, PUC30B orUNC.
.3. Kinetics of thermal decomposition by multiple heating rateethod
Kinetic results, calculated using Flynn–Wall technique (Eq. (1) inppendix), have been summarized in Table 5. All the kinetic param-ters are computed using the software Universal V4.2E providedy TA instruments, USA. The results show that similar activa-ion energies (E) are required for decomposition of PUCAPL, andUC30B, while it is marginally higher in the case of PUCL and PUCOL.ut PUNC always shows considerably higher activation energies.eyond 20% conversion, values of E become similar for PUV, PUCOLnd PUCL, as by then all the surface modifiers must have beenegraded to attain the required stage of decomposition. It can alsoe observed that at 20% percent conversion and higher, necessi-ates a higher level of activation energy for PUV, PUCL and PUCOL.
n the contrary, for PUCAPL, PUC30B and PUNC, as the percentageonversion is increased, the activation energy level decreases ini-ially up to 20% conversion level, and thereafter they are increasedith increasing conversion level. As activation energy is not con-tant for various extent of conversion, it can be inferred that the
ig. 6. TMA thermograms of the polyurethane–clay nanocomposites and virginolyurethane (PUV) at a heating rate of 10 ◦C/min.
U reacting with polar functionality of clay.
Fig. 7. (a) TGA thermograms of the polyurethane–clay nanocomposites and virginpolyurethane (PUV) at a heating rate of 10 ◦C/min. (b) DTG thermograms of thepolyurethane–clay nanocomposites and virgin polyurethane (PUV) at a heating rateof 10 ◦C/min.
M. Mondal et al. / Thermochimica Acta 510 (2010) 185–194 193
Table 5Kinetic results calculated using Flynn–Wall technique.
Conversion (%) Activation energy, Ea (kJ/mol)
PUV PUCL PUCOL PUCAPL PUC30B PUNC
5 61.5 98.4 92.5 91.7 92.6 159.510 63.7 101.5 97.0 89.6 89.7 140.615 71.6 101.0 102.2 88.9 87.3 136.420 85.6 102.8 108.3 91.2 87.4 138.325 100.8 106.6 115.9 94.2 89.1 141.030 112.0 112.6 121.9 97.7 90.7 146.335 120.8 120.3 127.40 132.5 129.6 133.
a Maximum error percentage is limited to ±2%.
Fa
dimht
3
utwTbrnsirPmPtApw
4
1
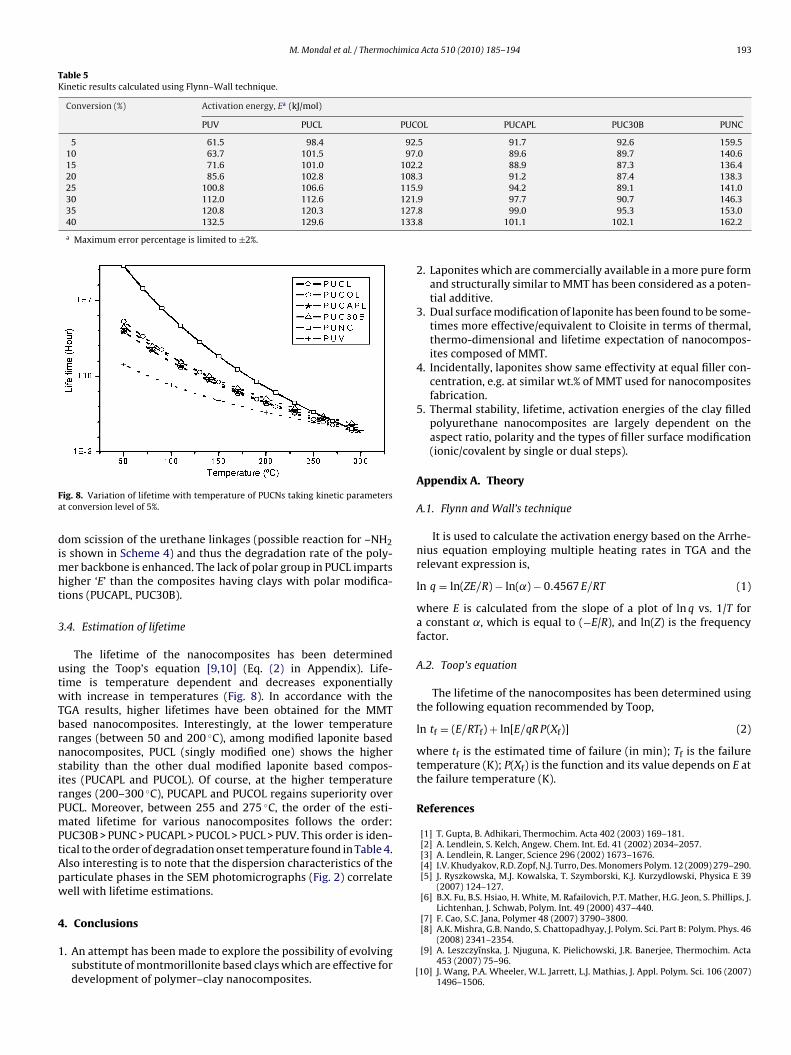
ig. 8. Variation of lifetime with temperature of PUCNs taking kinetic parameterst conversion level of 5%.
om scission of the urethane linkages (possible reaction for –NH2s shown in Scheme 4) and thus the degradation rate of the poly-
er backbone is enhanced. The lack of polar group in PUCL impartsigher ‘E’ than the composites having clays with polar modifica-ions (PUCAPL, PUC30B).
.4. Estimation of lifetime
The lifetime of the nanocomposites has been determinedsing the Toop’s equation [9,10] (Eq. (2) in Appendix). Life-ime is temperature dependent and decreases exponentiallyith increase in temperatures (Fig. 8). In accordance with the
GA results, higher lifetimes have been obtained for the MMTased nanocomposites. Interestingly, at the lower temperatureanges (between 50 and 200 ◦C), among modified laponite basedanocomposites, PUCL (singly modified one) shows the highertability than the other dual modified laponite based compos-tes (PUCAPL and PUCOL). Of course, at the higher temperatureanges (200–300 ◦C), PUCAPL and PUCOL regains superiority overUCL. Moreover, between 255 and 275 ◦C, the order of the esti-ated lifetime for various nanocomposites follows the order:
UC30B > PUNC > PUCAPL > PUCOL > PUCL > PUV. This order is iden-ical to the order of degradation onset temperature found in Table 4.lso interesting is to note that the dispersion characteristics of thearticulate phases in the SEM photomicrographs (Fig. 2) correlateell with lifetime estimations.
. Conclusions
. An attempt has been made to explore the possibility of evolvingsubstitute of montmorillonite based clays which are effective fordevelopment of polymer–clay nanocomposites.
[
8 99.0 95.3 153.08 101.1 102.1 162.2
2. Laponites which are commercially available in a more pure formand structurally similar to MMT has been considered as a poten-tial additive.
3. Dual surface modification of laponite has been found to be some-times more effective/equivalent to Cloisite in terms of thermal,thermo-dimensional and lifetime expectation of nanocompos-ites composed of MMT.
4. Incidentally, laponites show same effectivity at equal filler con-centration, e.g. at similar wt.% of MMT used for nanocompositesfabrication.
5. Thermal stability, lifetime, activation energies of the clay filledpolyurethane nanocomposites are largely dependent on theaspect ratio, polarity and the types of filler surface modification(ionic/covalent by single or dual steps).
Appendix A. Theory
A.1. Flynn and Wall’s technique
It is used to calculate the activation energy based on the Arrhe-nius equation employing multiple heating rates in TGA and therelevant expression is,
ln q = ln(ZE/R) − ln(˛) − 0.4567 E/RT (1)
where E is calculated from the slope of a plot of ln q vs. 1/T fora constant ˛, which is equal to (−E/R), and ln(Z) is the frequencyfactor.
A.2. Toop’s equation
The lifetime of the nanocomposites has been determined usingthe following equation recommended by Toop,
ln tf = (E/RTf) + ln[E/qR P(Xf)] (2)
where tf is the estimated time of failure (in min); Tf is the failuretemperature (K); P(Xf) is the function and its value depends on E atthe failure temperature (K).
References
[1] T. Gupta, B. Adhikari, Thermochim. Acta 402 (2003) 169–181.[2] A. Lendlein, S. Kelch, Angew. Chem. Int. Ed. 41 (2002) 2034–2057.[3] A. Lendlein, R. Langer, Science 296 (2002) 1673–1676.[4] I.V. Khudyakov, R.D. Zopf, N.J. Turro, Des. Monomers Polym. 12 (2009) 279–290.[5] J. Ryszkowska, M.J. Kowalska, T. Szymborski, K.J. Kurzydlowski, Physica E 39
(2007) 124–127.[6] B.X. Fu, B.S. Hsiao, H. White, M. Rafailovich, P.T. Mather, H.G. Jeon, S. Phillips, J.
Lichtenhan, J. Schwab, Polym. Int. 49 (2000) 437–440.[7] F. Cao, S.C. Jana, Polymer 48 (2007) 3790–3800.
[8] A.K. Mishra, G.B. Nando, S. Chattopadhyay, J. Polym. Sci. Part B: Polym. Phys. 46(2008) 2341–2354.[9] A. Leszczyı̌nska, J. Njuguna, K. Pielichowski, J.R. Banerjee, Thermochim. Acta
453 (2007) 75–96.10] J. Wang, P.A. Wheeler, W.L. Jarrett, L.J. Mathias, J. Appl. Polym. Sci. 106 (2007)
1496–1506.

1 himica
[[[
[
94 M. Mondal et al. / Thermoc
11] J.H. Flynn, L.A. Wall, J. Polym. Sci. Part B: Polym. Lett. 4 (1966) 323–328.12] P. Paik, K.K. Kar, Polym. Degrad. Stab. 93 (2008) 24–35.13] S. Praveen, P.K. Chattopadhyay, P. Albert, V.G. Dalvi, B.C. Chakraborty, S. Chat-
topadhyay, Composites: Part A 40 (2009) 309–316.14] N.N. Herrera, J.L. Putaux, E.B. Lami, Prog. Solid State Chem. 34 (2006) 121–
137.
[
[
[[
Acta 510 (2010) 185–194
15] N.N. Herrera, J.M. Letoffe, J.L. Putaux, L. David, E.B. Lami, Langmuir 20 (2004)1564–1571.
16] H.C. Kuan, C.M. Ma, W.P. Chuang, H.Y. Su, J. Polym. Sci. Part B: Polym. Phys. 43(2005) 1–12.
17] C.H. Wang, Y.T. Shieh, S. Nutt, J. Appl. Polym. Sci. 114 (2009) 1025–1032.18] K. Uno, K. Niume, T. Nakayama, Y. Iwakura, Polym. J. 6 (1974) 348–355.
Copyright © 2022 FDOKUMEN