Classification of montmorillonites
169
Classification of montmorillonites Zur Erlangung des akademischen Grades eines Doktors der Naturwissenschaften an der Fakultät für Bauingenieur-, Geo- und Umweltwissenschaften der Universität Karlsruhe genehmigte Dissertation von Felicitas Wolters aus Bochum 2005 Tag der mündlichen Prüfung: 6.07.2005 Referent: Prof. Dr. R. Nüesch Koreferent: Prof. Dr. G. Lagaly
-
Upload
khangminh22 -
Category
Documents
-
view
5 -
download
0
Transcript of Classification of montmorillonites

Classification of montmorillonites
Zur Erlangung des akademischen Grades einesDoktors der Naturwissenschaften an der Fakultät für Bauingenieur-, Geo- und Umweltwissenschaften der
Universität Karlsruhegenehmigte
Dissertation
von
Felicitas Wolters
ausBochum
2005
Tag der mündlichen Prüfung: 6.07.2005Referent: Prof. Dr. R. NüeschKoreferent: Prof. Dr. G. Lagaly


Acknowledgments
First of all I would like to thank Katja Emmerich who encouraged my interest on ben-tonites proposing the theme of a classification of smectites, a theme some people regarded critically at the beginning of our study. I am much obliged to her for the discus-sions and for the liberals I had in choosing the direction and main thematic emphasis of the thesis.
Prof. Dr. h. c. G. Lagaly supported this work with helpful discussions and advice. Prof. Dr. R. Nüesch accepted me in his work group at the Forschungszentrum Karlsruhe.
The research was supported by the Federal Institute for Geosciences and Resources (BGR), Hannover, and by the Institute for Technical Chemistry - Water Technology and Geotechnical Division, Forschungszentrum Karlsruhe. Support was also given by the DAAD during a 3-month scholarship at the Institute for Geotechnology, ETH Zürich.
Dr. R. Ahlers, Prof. M. F. Brigatti and Dr. G. Kahr supplied the main smectites sam-ples.
I wish to thank the group of the technical mineralogy at BGR, especially Christian Wöhrl and Dieter Weck. Also working in this group, Katherina Rüping managed to live together with me for one and a half year in Hannover. For accurate XRF analyses I have to thank Frank Korte and Detlef Requard.
I am grateful to Peter Weidler for his constructive criticism of the work and acknowl-edge Doreen Rapp and Sylvia Wieczoreck for the first proofreading of the chapters.
Attention is drawn also on Markus Pohlmann, Frank Friedrich and Marian Janek for some discussions - to Günter Kahr, Andreas Bauer, Michael Plötze, Helge Stanjek, Bruno Lanson and Stefan Kaufhold for helpful advice.
Helge Stanjek established the contact to Ursel and Fritz Wagner, who not only did the Mössbauer spectroscopy but also spend some time with me analyzing the spectra as well as Heike Reuter.
Annett Steudel and Kyra Seibert supported me at the end of my lab works by doing some of the time consuming measurements I would not have managed alone.
My parents in law, thanks for helping so much renovating at our home while, or in spite, I had to work for this topic.
And Christian, thank you for your constant support!
My acknowledgement is also for all of those who are not listed but supported the work in any way.


Table of contents
1. Introduction . . . . . . . . . . . . . . . . . . . . . . . . . . . . . . . . . . . . . . . . . . . . 1
1.1 The nomenclature of clay minerals . . . . . . . . . . . . . . . . . . . . . . . . . . . . . . . . . 2
1.2 Classification of montmorillonites - history and limits . . . . . . . . . . . . . . . . . . 6
1.3 The old and the new classification system . . . . . . . . . . . . . . . . . . . . . . . . . . . 12
2. Materials and Methods . . . . . . . . . . . . . . . . . . . . . . . . . . . . . . . . . . 19
2.1 Materials . . . . . . . . . . . . . . . . . . . . . . . . . . . . . . . . . . . . . . . . . . . . . . . . . . . . . 19
2.2 Methods . . . . . . . . . . . . . . . . . . . . . . . . . . . . . . . . . . . . . . . . . . . . . . . . . . . . . 20
2.2.1 Pretreatment of bulk samples . . . . . . . . . . . . . . . . . . . . . . . . . . . . . . 20
2.2.2 Chemical pretreatment and particle size separation . . . . . . . . . . . . . 21
2.2.3 Cation exchange capacity (CEC) . . . . . . . . . . . . . . . . . . . . . . . . . . . 24
2.2.4 Determination of layer-charge . . . . . . . . . . . . . . . . . . . . . . . . . . . . . 25
2.2.5 X-ray diffraction (XRD) . . . . . . . . . . . . . . . . . . . . . . . . . . . . . . . . . . 27
2.2.6 Estimation of excess SiO2 in the < 0.2 µm fraction of the smectites 27
2.2.7 X-ray fluorescence (XRF) . . . . . . . . . . . . . . . . . . . . . . . . . . . . . . . . . 28
2.2.8 Simultaneous thermal analysis (STA) . . . . . . . . . . . . . . . . . . . . . . . . 29
2.2.9 Mössbauer-Spectroscopy . . . . . . . . . . . . . . . . . . . . . . . . . . . . . . . . . 30
2.2.10 Determination of the structural formula . . . . . . . . . . . . . . . . . . . . . . 31
3. The complete set of parameters . . . . . . . . . . . . . . . . . . . . . . . . . . . 35
3.1 Identification of smectites . . . . . . . . . . . . . . . . . . . . . . . . . . . . . . . . . . . . . . . 35
3.2 Layer charge and cation exchange capacity . . . . . . . . . . . . . . . . . . . . . . . . . . 36
3.3 Analytical composition . . . . . . . . . . . . . . . . . . . . . . . . . . . . . . . . . . . . . . . . . 40
3.4 Discrepancies between theoretical and measured charge densities and CEC
values . . . . . . . . . . . . . . . . . . . . . . . . . . . . . . . . . . . . . . . . . . . . . . . . . . . . . . . 43
3.5 Potassium-test . . . . . . . . . . . . . . . . . . . . . . . . . . . . . . . . . . . . . . . . . . . . . . . . 46
I

4. Thermal reactions of smectites and cv - tv ratios . . . . . . . . . . . . . 53
4.1 Theory . . . . . . . . . . . . . . . . . . . . . . . . . . . . . . . . . . . . . . . . . . . . . . . . . . . . . . 54
4.1.1 Thermal reactions of smectites . . . . . . . . . . . . . . . . . . . . . . . . . . . . . 54
4.1.2 Structure of the octahedral sheet . . . . . . . . . . . . . . . . . . . . . . . . . . . . 56
4.2 Determination of cis- and trans-vacant proportions in mixtures of smectite . 58
4.3 Results: cis- and trans-vacant character of the samples . . . . . . . . . . . . . . . . . 61
5. Mössbauer studies . . . . . . . . . . . . . . . . . . . . . . . . . . . . . . . . . . . . . . 67
5.1 Introduction . . . . . . . . . . . . . . . . . . . . . . . . . . . . . . . . . . . . . . . . . . . . . . . . . . 67
5.2 Experimental . . . . . . . . . . . . . . . . . . . . . . . . . . . . . . . . . . . . . . . . . . . . . . . . . 68
5.3 Mössbauer spectra . . . . . . . . . . . . . . . . . . . . . . . . . . . . . . . . . . . . . . . . . . . . . 68
5.4 Correction of the structural formula . . . . . . . . . . . . . . . . . . . . . . . . . . . . . . . . 73
6. Relations between structural properties . . . . . . . . . . . . . . . . . . . . 77
6.1 Ternary diagrams and layer charge . . . . . . . . . . . . . . . . . . . . . . . . . . . . . . . . 77
6.2 Trans vacancies and layer charge . . . . . . . . . . . . . . . . . . . . . . . . . . . . . . . . . . 79
6.3 Influence of substitution on tetrahedral charge and octahedral structure . . . 79
6.4 Octahedral cation distribution . . . . . . . . . . . . . . . . . . . . . . . . . . . . . . . . . . . . 82
7. Classification . . . . . . . . . . . . . . . . . . . . . . . . . . . . . . . . . . . . . . . . . . 87
8. Summary . . . . . . . . . . . . . . . . . . . . . . . . . . . . . . . . . . . . . . . . . . . . . 95
II

Figure index
Figure 1.1 Management system for classifications. . . . . . . . . . . . . . . . . . . . . . . . . . 2
Figure 1.2 Structural terms of reference and their equivalents in French and German.. . . . . . . . . . . . . . . . . . . . . . . . . . . . . . . . . . . . . . . . . . . . . . . . . . . 4
Figure 1.3 Tetrahedral charge versus layer charge obtained from literature data of 300 samples. The layer charge (eq/Fu) is given for 209 samples. Those with tetrahedral charge > 100% are excluded. Data include montmorillonites and beidellites, few saponites and nontronites. . . . . 12
Figure 2.1 Transition from mono- to bilayer; arrangement of alkylammonium chains depending on their lengths and the cation density (derived from Lagaly, 1981) . . . . . . . . . . . . . . . . . . . . . . . . . . . . . . . . . . . . . . . . 26
Figure 2.2 Calibration curve for SiO2 of the external standards with lower and upper error bars (confidential limit 95%). . . . . . . . . . . . . . . . . . . . . . . . 28
Figure 3.1 Example for bimodal charge distributions with a) the maximum at lower charge densities and b) with similar maxima of cation densities. . . . . . . . . . . . . . . . . . . . . . . . . . . . . . . . . . . . . . . . . . . . . . . . . . 38
Figure 3.2 Example for a) monomodal charge distribution and b) for „trimodal“ charge distributions. . . . . . . . . . . . . . . . . . . . . . . . . . . . . . . . . . . . . . . . . 38
Figure 3.3 Layer charge determined by the alkylammonium method and layer charge calculated from the chemical composition . . . . . . . . . . . . . . . . . 43
Figure 3.4 Discrepancies between measured and calculated CEC in meq/100g using the chemical formulas calculated according to Stevens (1945) and to Köster (1977). . . . . . . . . . . . . . . . . . . . . . . . . . . . . . . . . . . . . . . . 45
Figure 3.5 Basal reflections of potassium saturated samples at various temperatures and EG solvations. . . . . . . . . . . . . . . . . . . . . . . . . . . . . . . 47
Figure 3.6 Potassium saturated samples (<0.2µm fraction), air dried ethylene glycol solvated. Measurement conditions: Cu Kα, 3s, 0.02 steps, 2 -35°2Θ. . . . . . . . . . . . . . . . . . . . . . . . . . . . . . . . . . . . . . . . . . . . . . . . . 48
Figure 3.7 a) Basal spacings and b) coefficient of variance of potassium saturated samples related to measured and calculated layer charges. . . . . . . . . . . 50
Figure 4.1 Example for a cis-vacant variety of a smectite. Sample 2LP, < 0.2 µm fraction. (DSC: solid line, TG: dashed line, m/e = 18: remaining line) . . . . . . . . . . . . . . . . . . . . . . . . . . . . . . . . . . . . . . . . . . . 55
III

Figure 4.2 Example for a trans-vacant variety of a smectite. Sample 41ValC18, < 0.2 µm fraction. (DSC: solid line, TG: dashed line, m/e = 18: remaining line) . . . . . . . . . . . . . . . . . . . . . . . . . . . . . . . . . . . 55
Figure 4.3 Trans (a)- and cis (b)- isomer of octahedral coordinated cations. . . . . . 56
Figure 4.4 Projection of the octahedral sheet of a dioctahedral 2:1 clay mineral perpendicular to the c-axis. a) cis-vacant variety (cv), b) trans-vacant variety (tv), c) definition of the position cis and trans by the position of the hydroxyl groups. . . . . . . . . . . . . . . . . . . . . . . . . . . . . . . . . . . . . . 57
Figure 4.5 Curves sample amount (PA-curves) of T DHX of 26/27ValdolC14 < 2 µm fraction mixed with 25Volclay < 2 µm. Pure samples and mixtures were measured after equilibration at 53% rh. Sample weights were corrected to dry weight at 375°C. . . . . . . . . . . . . . . . . . . 59
Figure 4.6 MS curves of evolved water m/e = 18 (in arbitrary units EGA = evolved gas analysis).. . . . . . . . . . . . . . . . . . . . . . . . . . . . . . . . . . . . . . . 60
Figure 4.7 Calculated cis- and trans-vacant proportions of the investigated sample-mixtures. . . . . . . . . . . . . . . . . . . . . . . . . . . . . . . . . . . . . . . . . . . 61
Figure 4.8 Examples of cv varieties. a) Sample 8UAS < 0.2 µm with 100% cv parts. b) Sample 2LP < 0.2 µm with 89% cv and 11% tv parts. Observed = MS curve of m/e = 18 (in arbitrary units EGA = evolved gas analysis). . . . . . . . . . . . . . . . . . . . . . . . . . . . . . . . . . . . . . . 63
Figure 4.9 Examples of cv/tv varieties. a) Sample 4JUP < 0.2 µm with 56% cv proportions. b) Sample 12TR01 < 0.2 µm with 61% cv proportions. Observed = MS curve of m/e = 18 (in arbitrary units EGA = evolved gas analysis). . . . . . . . . . . . . . . . . . . . . . . . . . . . . . . . . . . . . . . . . . . . . . 64
Figure 4.10 Examples of tv/cv varieties. a) Sample 3 7th Mayo < 0.2 µm with 48% cv proportions. b) Sample 36M650 < 0.2 µm with 26% cv proportions. Observed = MS curve of m/e = 18 (in arbitrary units EGA = evolved gas analysis). . . . . . . . . . . . . . . . . . . . . . . . . . . . . . . . . . . . . . . . . . . . . . 64
Figure 4.11 Trans-vacant (tv) variety examples. a) Sample 37BB< 0.2 µm with 22% cv proportions. b) Sample 38MW < 0.2 µm with 25% cv proportions. Observed = mass spectrometer curve of m/e = 18 (in arbitrary units EGA = evolved gas analysis). . . . . . . . . . . . . . . . . . . . . . . . . . . . . . . . . 65
Figure 5.1 Mössbauer spectra of sample 41ValC18, bulk and < 0.2 µm, taken at room temperature and 4.2 K. . . . . . . . . . . . . . . . . . . . . . . . . . . . . . . . . . 69
Figure 5.2 Mössbauer spectra of sample 5MC, bulk and < 0.2 µm, taken at room temperature and 4.2 K. . . . . . . . . . . . . . . . . . . . . . . . . . . . . . . . . . . . . . . 69
Figure 5.3 Mössbauer spectra of sample 21D01, bulk and < 0.2 µm, taken at
IV

room temperature and 4.2 K. . . . . . . . . . . . . . . . . . . . . . . . . . . . . . . . . . 70
Figure 5.4 Mössbauer spectra of sample 19USA02, bulk and < 0.2 µm, taken at room temperature and 4.2 K. . . . . . . . . . . . . . . . . . . . . . . . . . . . . . . . 71
Figure 5.5 Mössbauer spectra of sample 10MBV, bulk and < 0.2 µm, taken at room temperature and 4.2 K. . . . . . . . . . . . . . . . . . . . . . . . . . . . . . . 73
Figure 6.1 Octahedral cation distribution following the chemical formula calculated according Stevens (1945). Layer charges derived from the formula after the classification of Schultz (1969). . . . . . . . . . . . . . . . . . . . . . . . 78
Figure 6.2 Octahedral cation distribution following the chemical formula calculated according Köster (1977). Layer charges derived from alkylammonium after the classification of Schultz (1969). . . . . . . . . . . . . . . . . . . . . . . . 78
Figure 6.3 Comparison of calculated (from the structural formula of Stevens (1945) and measured layer charge (alkylammonium) related to trans-vacancies. . . . . . . . . . . . . . . . . . . . . . . . . . . . . . . . . . . . . . . . . . . . 79
Figure 6.4 Relation of Mg(VI)2+ to a) trans vacancies b) tetrahedral charge expressed as Al(IV)3+/FU. . . . . . . . . . . . . . . . . . . . . . . . . . . . . . . . . . . . 80
Figure 6.5 Relation of Fe(VI)3+ to a) the part of trans vacancies and b) tetrahedral charge expressed as Al(IV)3+/FU. . . . . . . . . . . . . . . . . . . 81
Figure 6.6 Relation of a) tetrahedral charge to trans vacancies and b) octahedral cations Mg2++Fe3+ to Al(IV)3+. . . . . . . . . . . . . . . . . . . . . 82
Figure 6.7 Octahedral cation distribution calculated according to Köster (1977) and Al3+(IV) substitution. . . . . . . . . . . . . . . . . . . . . . . . . . . . . . . . . . . . 83
Figure 6.8 Octahedral cation distribution calculated according to Köster (1977) and cis- and trans-vacant parts. . . . . . . . . . . . . . . . . . . . . . . . . . . . . . . . 83
Figure 6.9 Octahedral cation distribution in the system 2Al 3+, 2Mg2+ and 2Fe3+ showing a continuous series between montmorillontes and nontronites. . . . . . . . . . . . . . . . . . . . . . . . . . . . . . . . . . . . . . . . . . . . 84
V

VI

Table index
Table 1.1 Classification of layer silicates according to the report of the CMS nomenclature committee Martin et al. (1991). (ξ/FU = charge per formula unit) . . . . . . . . . . . . . . . . . . . . . . . . . . . . . . . . . . . . . . . . . . . . . . 5
Table 1.2 Classification of montmorillonites according to Grim and Kulbicki (1961). . . . . . . . . . . . . . . . . . . . . . . . . . . . . . . . . . . . . . . . . . . . . . . . . . . . 7
Table 1.3 Discrepancy between the limits of low, medium and high charged montmorillonites. . . . . . . . . . . . . . . . . . . . . . . . . . . . . . . . . . . . . . . . . . . . 8
Table 1.4 Characteristics of the seven groups of montmorillonites and beidellites defined by Schultz (1969). . . . . . . . . . . . . . . . . . . . . . . . . . . . . . . . . . . . . 9
Table 1.5 Comparison of the names for montmorillonites and beidellites proposed by Schultz (1969), Brigatti and Poppi (1981) and Bri-gatti (1983). . . . . . . . . . . . . . . . . . . . . . . . . . . . . . . . . . . . . . . . . . . . . . . 11
Table 1.6 Structural feature and methods to collect necessary information. . . . . . 13
Table 1.7 Discrimination between montmorillonite and beidellite according to IMA rules. . . . . . . . . . . . . . . . . . . . . . . . . . . . . . . . . . . . . . . . . . . . . . 14
Table 1.8 Limits for cis-and trans-vacancies in octahedral sheets in di-octahedral smectites. . . . . . . . . . . . . . . . . . . . . . . . . . . . . . . . . . . . . . 15
Table 1.9 Division of the new classification system of expandable 2:1 clay minerals, montmorillonites and beidellites., . . . . . . . . . . . . . . . . . . . . . 16
Table 2.1 Samples and sample data. . . . . . . . . . . . . . . . . . . . . . . . . . . . . . . . . . . . 19
Table 2.2 Techniques to characterize smectites and minimum sample amount. . . 21
Table 2.3 Relative error or variance for the single elements determined in XRF. 29
Table 2.4 Experimental parameters for STA. . . . . . . . . . . . . . . . . . . . . . . . . . . . . 30
Table 3.1 Layer charges determined by the alkylammonium method with nc = 4-18 and the mean charge obtained from exchange of alkylammonium with nc = 12. Layer charge is given in equiva-lents per half unit cell (< 0.2 µm fraction). . . . . . . . . . . . . . . . . . . . . . . 37
Table 3.2 CEC values obtained by copper triethylenetetramine exchange. . . . . . . 39
Table 3.3 Structural fomulae calculated from XRF based on O10(OH)2 (Köster, 1977). Total iron content was determined as Fe3+
VII

(< 0.2 µm fraction). . . . . . . . . . . . . . . . . . . . . . . . . . . . . . . . . . . . . . . . . 41
Table 3.4 Discrepancies in measured and calculated layer charges determined according to Stevens (1945) and by the calculation of Köster (1977). Location of charge was evaluated by the calculation according to Köster (1977) (< 0.2 µm fraction). . . . . . . . . . . . . . . . . . . . . . . . . . . . . 44
Table 3.5 Influence of different calculations of the structural formula on the calculated cation exchange capacities for sample 37BB. . . . . . . . . . . . 46
Table 3.6 Peak positions of d(00l) for air dried samples ethylene glycol solvated, K+-test. . . . . . . . . . . . . . . . . . . . . . . . . . . . . . . . . . . . . . . . . . . . . . . . . . . 49
Table 3.7 Borderlines of layer charge regions based on the K+-test. . . . . . . . . . . . 51
Table 4.1 Parameters for the fitting procedure. . . . . . . . . . . . . . . . . . . . . . . . . . . . 58
Table 4.2 Relation of cv and tv parts and application of the classification system. (-) = shoulder, (+) = well resolved peak, (±) = broadened peak of the mass spectrometer curve of m/e = 18 (< 0.2 µm fraction). . . . . . . . . . . 62
Table 5.1 Quadrupole splitting (QS) and isomer shift (IS) of < 0.2 µm fractions taken at room temperature. . . . . . . . . . . . . . . . . . . . . . . . . . . . . . . . . . . 72
Table 5.2 Content of Fe2+ and Fe3+ of total iron obtained from room temperature measurements. . . . . . . . . . . . . . . . . . . . . . . . . . . . . . . . . . . 74
Table 5.3 Calculated structural formulae according to Köster (1977) assu-ming all iron as Fe3+. . . . . . . . . . . . . . . . . . . . . . . . . . . . . . . . . . . . . . . . 74
Table 5.4 Recalculated structural formulae according to Köster (1977) with the determined Fe2+ amounts. . . . . . . . . . . . . . . . . . . . . . . . . . . . . . . . . . . . 74
Table 7.1 Parameters proposed of the new classification system. . . . . . . . . . . . . . 87
Table 7.2 Application of the new descriptive classification system. . . . . . . . . . . . 88
Table 7.3 Low-charged cv montmorillonites (Otay-type I) and trivial names. . . . 90
Table 7.4 Low-charged cv beidellitic montmorillonites / (Wyoming-type I) and trivial names. . . . . . . . . . . . . . . . . . . . . . . . . . . . . . . . . . . . . . . . . . . . . . 90
Table 7.5 Low-charged cv/tv montmorillonites (Otay-type II) and trivial names. 90
Table 7.6 Low-charged cv/tv beidellitic montmorillonites / Wyoming-type II and trivial names. . . . . . . . . . . . . . . . . . . . . . . . . . . . . . . . . . . . . . . . . . . 90
Table 7.7 Low-charged tv/cv beidellitic montmorillonites and trivial names. . . . 91
VIII

Table 7.8 Low-charged tv/cv ferrian beidellitic montmorillonites and trivial names. . . . . . . . . . . . . . . . . . . . . . . . . . . . . . . . . . . . . . . . . . . . . . . . . . . 91
Table 7.9 Low-charged tv ferrian beidellitic montmorillonites and trivial names. 91
Table 7.10 Low-charged tv beidellitic montmorillonites and trivial names. . . . . . . 91
Table 7.11 Low-charged tv/cv ferrian montmorillonitic beidellite and trivial names. . . . . . . . . . . . . . . . . . . . . . . . . . . . . . . . . . . . . . . . . . . . . . . . . . . 92
Table 7.12 Low-charged tv/cv montmorillonitic beidellite and trivial names. . . . . 92
Table 7.13 Medium-charged cv montmorillonitic beidellite and trivial names. . . . 92
Table 7.14 The new classification system and trivial names, based on literature data given by Schultz (1969) and Brigatti (1983) and our investigation. . . . . . . . . . . . . . . . . . . . . . . . . . . . . . . . . . . . . . . . 92
IX

X

1. Introduction
1. Introduction
Besides fabric and phase content the structure of smectites is most important for prop-erties and various applications of swellable clays. Bentonites vary widely in fabric, min-eralogical composition and chemistry and structure of smectites. The question is, how to find the ideal or most suitable bentonite for different applications such as geotechnical barriers in radioactive waste disposals, clay-polymer-nanocomposites or molding sands in foundries. In connection with varied applications the reconstruction of reaction mech-anisms is an important topic. To answer these questions an unambiguous characterization of smectites is necessary.
The structure of montmorillonite and other smectites is well known since nearly seven decades (Hofmann et al., 1933). For about the same period several classification systems were proposed. Analysis of smectites is still a difficult task. The turbostratic disorder prevents an easy description of the octahedral sheet structure. Therefore in early classifi-cations chemistry was overrated prior to the introduction of more sophisticated methods to characterize the structure. Until now classifications disregarded the dehydroxylation behavior, which means that the structure of the octahedral sheet in smectites remained unconsidered. Although the cis- and trans-vacant character of the dioctahedral smectites is long known, a manageable proof for cis- and trans-vacancies was lacking for the smec-tites until that time. It is possible to determine the structure of the octahedral sheet for illites by X-ray diffraction. This is not possible for smectites because of their turbostratic disorder. Drits et al. (1995) showed that the dehydroxylation temperature of all dioctahe-dral 2:1 clay minerals is related to the structure of the octahedral sheet. Trans-vacant minerals dehydroxylate at 550 °C and cis-vacant varieties at 700 °C. Mixed types with two dehydroxylation peaks also exist. Thus, the cis- or trans-vacant character of mont-morillonites can be determined by simultaneous thermal analysis (STA).
Involving the measured layer charge is moreover important as most smectites show 30% lower charge compared to the calculated one. Köster (1977) proposed therefore to involve the measured layer charge in calculating the stoichiometric composition. This procedure results in accurate cation exchange capacities (CEC) calculated with the mea-sured layer charge. Those CEC values calculated according to Stevens (1945) or Schultz (1969) were by far too high compared to the measured CEC.
1

1. Introduction
The first part of this chapter describes the nomenclature and the development of the classification of clay minerals. The second part pays special interest to the classification of smectites, which became a matter of great interest in the 1960´s. In the third part a new classification system is introduced which takes into account rules of IMA and AIPEA and trivial names used in common classification systems to characterize mont-morillonites definitely.
1.1 The nomenclature of clay minerals
As the management system for classifications, we can imagine a house with several parties. It contains three substantial components: On the top, laws and rules (IMA/AIPEA) have to be followed, than we find in the center the administration level and finally the data (chemistry and structure) build the basement (figure 1.1).
In the roof we find the IMA and the AIPEA: IMA is the „International Mineralogical Association“, this organization provides rules for mineral descriptions and their specifi-cations, these have the character of laws. AIPEA is the „Association Internationale pour l´Etude des Argiles“ (it has a Nomenclature Committee). It applies IMA´s laws and defines additional rules for phyllosilicates. The administration unites the data from struc-ture and chemistry and uses the laws and rules of IMA and AIPEA. Earlier classifica-tions of clays were based on chemical composition. The structure was more or less neglected. Later classifications tended to overrate the meaning of the structure and underrated the chemistry. Today, we try to achieve a balance between structure and the chemical compositions as a base for classifications. Chemistry supplies a lot more data and for structure determinations improved methods are available. The administration level corresponds to the classification level.
Figure 1.1 Management system for classifications.
2

1. Introduction
Ross and Hendricks (1945) presented a comprehensive review of chemical analysis and structural formula calculations of minerals that were named montmorillonite-group at this time. The role of Al3+ to be located either in the octahedral sheet for montmorillo-nites or in the tetrahedral sheet for beidellites was already known. Expanded 2:1 minerals include loosely bound cations and layers of water between the silicate sheets. In their cal-culations the „bases“ or interlayer cations Na+, Ca2+ or K+ compensate the negative layer charge.
At that time the „montmorillonite group“ was defined by their swelling behavior and their exchangeable interlayer cations. The swelling or hydration and dehydration was firstly described by Hofmann et al. (1933). They first determined the structure of mont-morillonite by XRD measurement. They found that the structure is similar to pyrophyl-lite but the distance of the layers is not constant along the c-axes and varies with the water content. The first basal reflection d(001) was shown to be variable.
Ross and Hendricks (1945) considered montmorillonites and beidellites to form a complete series of solid solutions. As a general formula for minerals of the montmorillo-nite-beidellite and nontronite-saponite group the authors gave
[Al a-y, Fey, Mgy] [Si 4-x Alx] O10 [OH]2
as foundation for a clarified nomenclature. The actual general formula for di- and triocta-
hedral clay minerals is given by Jasmund and Lagaly (1993)
M ν+ ξ/ν (H2O)n {(Me3+, Me2+, Me+)6-x 2 to 3 (Si4-y Aly) O10 (OH)2}ξ
The Nomenclature Subcommittee of the British Clay Minerals Group presented by Brown (1955) differentiated 1:1 and 2:1 minerals and in these groups di- and trioctahe-dral minerals. The general basal reflections of the minerals were listed but not definitely involved in the nomenclature. The term „smectite“ was proposed as a group name for the first time. This group included all swelling 2:1 minerals that can be expanded with ethyl-ene glycol to about 17 Å separating it from the similar group of vermiculites. Neverthe-less later Warshaw and Roy (1961) considered vermiculites near the montmorillonite-group.
Mackenzie (1959) presented various classification schemes to encourage the discus-sion on the nomenclature of clay minerals. Until now, most classifications made divi-sions in family (1:1, 2:1), group name, octahedral character and mineral expansion behavior. Stoichiometric compositions and first basal spacings were sometimes involved. The classifications were a combination of structural and chemical features.
The layer charge was definitely included in the classification scheme for phyllosili-cates in the „Summary of recommendations of AIPEA Nomenclature Committee“ pre-sented by Bailey (1980). The phyllosilicates were divided into groups, each containing a
3

1. Introduction
di- and trioctahedral subgroup. Each subgroup was divided into mineral species. The name „smectite“ was accepted as the group name for clay minerals with a layer charge (ξ) between 0.2 and 0.6 per formula unit (FU). The definition of a phyllosilicate was cited from Brindley and Pedro (1972) as „Clay minerals belong to the family of phyllo-silicate and contain continuous two-dimensional tetrahedral sheet of composition T2O5(T = Si, Al, Be...) with tetrahedra linked by sharing three corners of each, and the fourth corner pointing in any direction. The tetrahedral sheets are linked in the unit structure to octahedral sheets, or to groups of coordinated cations, or individual cations“. Figure 1.2illustrates the structural terms for a 2:1 clay mineral.
In the recommendation the classification scheme for phyllosilicates related to clay minerals was given by layer type (1:1 or 2:1), group (range of charge per formula unit), subgroup (differentiation between the di- and trioctahedral character) and species (min-eral names like talc, montmorillonite, beidellite, saponite, muscovite etc.).
The report of the Clay Mineral Society (CMS) nomenclature committee (Martin et al. 1991), which is an affiliated society to the AIPEA, contained further discrimination between planar hydrous phyllosilicates and non-planar hydrous phyllosilicates. The fol-lowing table 1.1 for the classification of planar hydrous phyllosilicates presented in this report was slightly modified in Moore and Reynolds (1997) considering the improved knowledge concerning the illites. (Comment: the table listed in Moore and Reynolds (1997) is based on the recommendations of 1980, we use here the one of 1991, including
Figure 1.2 Structural terms of reference and their equivalents in French and German. 1 = unit structure / unité strucurale / Struktureinheit 2 = layer / feuillet / Schichtpaket 3 + 4 = (tetrahedral / octahedral) sheet / couche / Schicht5 = interlayer / esapace interfoliaire / Zwischenschicht6 = plane / plan / Ebene
4

1. Introduction
the modification for illite published in Moore and Reynolds (1997)).
In a joint report of the AIPEA and CMS nomenclature committees Guggenheim and Martin (1995) presented recommendations for the definition of the terms „clay“ and „clay mineral“. The definition of „clay“ is given as „naturally occurring material com-
Table 1.1 Classification of layer silicates according to the report of the CMS nomenclature committee Martin et al. (1991). (ξ/FU = charge per formula unit)
Layer type
Interlayer mate-rial (ξ/FU)
Group Octahedral char-acter
Species, examples
1:1 None or H2O only (ξ 0)
Serpentine-kaolin
Trioctahedral
Dioctahedral
Di-trioctahedral
Lizardite, Berthierine, Ames-ite, Cronstedtite, …Kaolinite, Dickite, Nacrite, Halloysite (planar)Odinite
2:1 None (ξ 0)
Talc-pyro-phyllite
Trioctahedral Dioctahedral
Talc, Willemsite Pyrophyllite, Ferripyrophyl-lite
Hydrated exchangeable cations (ξ 0,2-0,6)
Smectite Trioctahedral
Dioctahedral
Saponite, Hectorite, Sauco-nite, Nontronite, SwineforditeMontmorillonite, Beidellite, Nontronite, Volkonskoite
Hydrated exchangeable cations (ξ 0,6-0,9)
Vermiculite Trioctahedral
Dioctahedral
Trioctahedral Vermiculite
Dioctahedral Vermiculite
Non-hydrated monovalent cations(ξ 0,6-0,9)
Illite Trioctahedral?Dioctahedral Illite, Glauconite
Non-hydrated monovalent cations (ξ 1)
True mica Trioctahedral
Dioctahedral
Biotite, Phlogopite, LepidoliteMuscovite, Celadonite, Paragonite
Non-hydrated divalent cat-ions (ξ 2)
Brittle mica
Trioctahedral Dioctahedral
Clintonite, KinoshitaliteMargarite
Hydroxide sheet (ξ = variable)
Chlorite Trioctahedral
DioctahedralDi-trioctahedral
Clinochlor, Chamosite, Pen-nantiteDonbassiteCookeite, Sudoite
2:1 Regularly inter-stratified (ξ = variable)
Variable Trioctahedral Dioctahedral
Corrensite, Aliettite, …Rectorite, Tosudite
~~
~~
~~
~~
~~
~~
~~
5

1. Introduction
posed primarily of fine-grained minerals, which is generally plastic at appropriate water contents and will harden with dried or fired. Although clay usually contains phyllosili-cates, it may contain other materials that impart plasticity and harden when dried or fired. Associated phases in clay may include materials that do not impart plasticity and organic matter“.
The term „clay mineral“ was defined to „refer to phyllosilicate minerals which impart plasticity to clay and which harden upon drying or firing“. The discrepancy between the use of clay as a specific material and the use for a particle size fraction is discussed. They focus to the plasticity of clay minerals, which need not to be phyllosilicates conclusively but may also be hydroxide minerals.
Recently, Varadachari and Mukherjee (2004) investigated the composition of 464 clay minerals by statistical techniques. Referring on literature data they discriminated illite, glauconite, celadonite, montmorillonite, beidellite, nontronite and saponite. The authors´ main result was that smectites differ from micas only in their total layer charge and K-level, which is in agree with the defined limits. The main emphasis of our work is on a classification of montmorillonites. Therefore this classification could not be incorporated here.
1.2 Classification of montmorillonites - history and limits
The classification of montmorillonites by Grim and Kulbicki (1961) is based on phase transformations and re-crystallization products of the H+-exchanged < 2 µm fraction of montmorillonites at high temperatures. On the basis of the thermal behavior, they distin-guished two main groups. They found that the dioctahedral montmorillonites do not form a continuous isomorphic series proved by the analytical data like cation exchange capac-ity (CEC), chemical analysis, infrared spectroscopy (IR), X-ray diffraction (XRD), K-test and phase transformations. Nevertheless, their structural formula calculations did not consider the true layer charge as the layer charge could not be determined - the alkylam-monium method was introduced 10 years later by Lagaly and Weiss (1971) - thus, their charge was estimated by the analytical formula, which can differ up to 30% and more from the measured charge.
Grim and Kulbicki (1961) considered layer charge and octahedral cation population and distribution but neglected the dehydroxylation behavior. They defined Wyoming- and Cheto-type (Table 1.2) differing primarily in the distribution of the (calculated) layer charge. Low contents of Mg2+ substituting for Al3+ and a low layer charge characterize the Wyoming-type in contrast to the Cheto-type, which has high a content of Mg2+ and a higher layer charge. Mixtures of Cheto- and Wyoming-type also exist. The Cheto- and Wyoming-type differ in phase transformations above 1000 °C. The Cheto-type develops
6

1. Introduction
at high temperature β-quartz, β-cristobalite and cordierite whereas Wyoming-type trans-forms into cristobalite and mullite. The authors mentioned that not every aluminous montmorillonite belong to the two classes. Samples with abundant iron only showed cristobalite as high temperature phases, and the endothermic dehydroxylation peak tem-peratures were displaced to lower temperatures compared to the aluminous types.
The chemical compositions indicated two groups, corresponding to those derived from high temperature transformations. The replacements in the Cheto-type were men-tioned to be more regular, which was explained by the high-temperature phases. In the case of random distribution both types of high-temperature phases, cordierite and mul-lite, should occur. If this is not the case, they concluded that Mg is regular distributed (high-temperature phase: cordierite). In contrast, in the Wyoming-type Mg2+ was expected to be random distributed and therefore shows mullite as high temperature-phases. In case of clustering of Mg2+ in the Wyoming-type, cordierite should be possible.
Grim and Kulbicki (1961) mentioned that the chemical composition and structure influence the thermal behavior. They were the first who introduced a ternary diagram for the distribution of octahedral cations in smectites. An explanation for the varying dehy-droxylation temperatures did not exist at this time. An additional test, the K+-test, was helpful in discriminating Cheto- and Wyoming-type. In this test the sample was treated with 1 M KCl and the XRD of air-dried and 100 °C treated textured samples with fol-
Table 1.2 Classification of montmorillonites according to Grim and Kulbicki (1961).
Wyoming-type Mixture of Wyoming- and Cheto-type
Cheto-type
Lower layer charge and con-tents of Mg2+ for Al3+
Intermediate distribution of octahedral cations and intermediate chemical composition
Higher layer charge and con-tents of Mg2+ for Al3+
Octahedral cations in random distribution
Octahedral cation distribution statistically / ordered
Mostly < 5% tetrahedral Si4+ is replaced by Al3+ but some have more than 5%
< 5% tetrahedral Si4+ is replaced by Al3+
5-15% octahedral iron < 5% octahedral iron
5-10% of octahedral Al3+ is replaced by Mg
25-35% of octahedral Al3+ is replaced by Mg2+
Σ O* ≤ 2
* Σ O = sum of octahedral cations per formula unit in mol
Σ O* > 2
No influence by K+-test Retardation of expansion with ethylene glycol by K+-test
7

1. Introduction
lowing ethylene glycol treatment is recorded. The Wyoming-type with a lower layer charge and CEC showed no effect of potassium treatment. Types with higher calculated charge showed reduction and retardation in the amount of expansion after ethylene gly-col treatment (Cheto-type).
Schultz (1969) developed a classification based on the amount and location of charge and the proportion of tetrahedral charge. He also measured the dehydroxylation tempera-ture and the amount of hydroxyl groups, but documented one peak temperature only, even if there were two peaks. He defined seven types of montmorillonites and beidel-lites: ideal montmorillonites Wyoming-type, Chambers-type (which corresponds to the mixture of Cheto-and Wyoming-type of Grim and Kulbicki (1961)), Tatilla-type, Otay-type (which corresponds to the Cheto-type of Grim and Kulbicki (1961)), ideal beidellite and non-ideal beidellite and non-ideal montmorillonite. Ideal types dehydroxylate at about 700 °C and non-ideal at about 550 °C. Wyoming-type samples display a low layer charge and only beidellite has a dominant tetrahedral charge. Schultz (1969) used the Greene-Kelly test to differentiate between montmorillonite and beidellite. The authors confirm the results of K+-test of Grim and Kulbicki (1961).
Re-expansion with ethylene glycol after K+-saturation is due to the net layer charge. Low charged smectites again expanded to 17 Å and high charged expanded to less than 17 Å. Christidis and Eberl (2003) used this test recently as a method for calculation of layer charge and charge distribution and gained similar results though they modified the method. Schultz (1969) treated the samples at 300°C for half an hour before saturating with ethylene glycol, Christidis and Eberl (2003) used room temperature. Their borders between low, medium and high charged smectites are somewhat different than those pro-posed by Schultz (1969) (Table 1.3).
The problem arising is that the layer charges were calculated by the structural formula obtained from chemical analysis, with an unknown deviation from the true layer charge. This will be discussed in chapter 3.4. The border to high charged smectites of 0.425 eq/FU determined by the K-test is due to the expansion behavior. Samples with a charge < 0.425 eq/FU expand to 17 Å and samples with a charge > 0.425 eq/FU do not.
Table 1.3 Discrepancy between the limits of low, medium and high charged montmorillo-nites.
layer charges[ξ/FU]
Low chargedrational series of
d(00l)
Medium chargedirrational series of
d(00l)
High chargedd(00l) < 17 (16.6)
Schultz (1969) 0.2... 0.375 0.375... 0.425 0.425... 0.6
Christidis and Eberl (2003)
0.2... 0.42 0.42... 0.46 0.46... 0.6
8

1. Introduction
A diagram showing octahedral versus tetrahedral charge as discrimination between the groups is presented by Schultz (1969). This diagram allowed the assignment to groups. It was obvious that mostly Wyoming-type showed a net ξ < 0.425 and a tetrahe-dral charge of 15-50%. Tatilla- and Chambers-type were documented with a net ξ > 0.425, all of these with a tetrahedral charge of 15-50%. Otay-type was classified with ξ > 0.425 and a tetrahedral charge of 15%. Beidellites were documented to show both, ξ > and < 0.425 but tetrahedral charge > 50% (Table 1.4). Despite, within each group sam-ples occurred, which did not fulfill these criteria. For example Wyoming-type montmo-rillonites also include samples with a ξ > 0.425 or Otay-type samples have a higher proportion than 15% of tetrahedral charge. Chambers-type samples exist with ξ > 0.425 and a tetrahedral charge < 15%.
*Ideal montmorillonites; O = octahedral; T = tetrahedral; dhx = dehydroxylation temperature; ξ = layer charge
The Li+-test (Greene-Kelly or Hofmann-Klemen test) was used to distinguish between montmorillonite and beidellite (Hofmann and Klemen, 1950). The theory is that
Table 1.4 Characteristics of the seven groups of montmorillonites and beidellites defined by Schultz (1969).
Type
Mea
n ξ
(cal
cula
ted)
Rel
ativ
e lo
catio
n of
ξ
MgO
%
Fe2O
3 % D
hx
amou
nt o
f OH
-gro
ups
per
FU
Max
-min
. ξ
[eq/
FU]
Cor
resp
ondi
ng
octa
hedr
al
stru
ctur
e
Wyoming* Low < 0.425
O > T15-50% T
2-3 3-4 700-725
= 2 0.31 - 0.54
cv
Tatilla* High > 0.425
O > T15-50% T
2-4 < 1 700-735
= 2 0.45 - 0.53
cv
Otay* High > 0.425
O >> T0-15% T
3,5-5 1-2 650-690
= 2 0.38 - 0.60
cv
Chambers* High > 0.425
O > T15-50% T
3-4,5 1-4 660-690
= 2 0.42 - 0.64
cv
Non-ideal beidellite
Mostly high
O > T 0-2 0-8 550-600
> 2 0.35 - 0.50
tv/cv?
ideal beidellite
Vari-able
T>50% T
0 0 720-760
= 2 0.46 - 0.68
cv?
Non-ideal montmorillo-nite
Mostly high
O > T 2-4 5-10 550-590
< 2? 0.33 / 0.66?
tv?
9

1. Introduction
Li+ ions enter the octahedral sheet via bi-trigonal cavities in the tetrahedral sheet when the Li+-saturated clay mineral is heated to 300 °C. Previously vacant octahedral cation sites are occupied by Li+ if the layer charge is located in the octahedral sheet. The net layer charge is neutralized and the clay mineral did not expand after ethylene glycol treatment. Li+ is expected to have no influence on the charge of beidellites. The clay did not collapse as no vacancies exist in the tetrahedral sheet and the Li+ ions cannot surpass the tetrahedral sheet with excess charge.
The results of Schultz (1969) displayed similarities between the percentages of tetra-hedral charges derived from the chemical composition and measured by the Li+-test. In some cases the measured values lie below the calculated values. Hence, the question arise whether it is possible, that the Li+ ions migrate nevertheless to vacant sites of the octahedral sheet and neutralize parts of the tetrahedral charge. This would explain lower values obtained with the Li+-test. Köster et al. (1999) were in doubt of the reliability of the Hofmann-Klemen test as there exist samples which exhibit an almost perfect mont-morillonitic charge distribution. This was indicated by the structural formula calculated from the chemical analysis. But the Li+-test revealed a certain expendability indicating a beidellitic character. The case of samples which are beidellitic according to their calcu-lated structural formula but loose expendability after Li-test also exist.
With differential thermal analysis (DTA) Schultz (1969) discriminated two types of smectites: One type was regarded to have an ideal dehydroxylation temperature and the other type was regarded to have a non-ideal dehydroxylation temperature. According to Schultz (1969) ideal montmorillonites and beidellites dehydroxylate between 660 °C and 735 °C and non-ideal between 550 °C and 600 °C. The analyses were performed with samples of 500 mg. This caused approximately 50 °C higher peak temperatures than for samples measured with 100 mg as standard amount according to Smykatz-Kloss (1974).
Later Tsipursky and Drits (1984) and Drits et al. (1995) proved that the dehydroxyla-tion temperature for all dioctahedral 2:1 clay minerals is related to the structure of the octahedral sheet. Trans-vacant minerals dehydroxylated at 500 °C peak temperature and cis-vacant dehydroxylated at 700 °C. Thus nowadays the non-ideal dehydroxylat-ing dioctahedral 2:1 layer silicate corresponds to the trans-vacant variety and the ideal dehydroxylating mineral corresponds to the cis-vacant variety.
Based on the system of Schultz (1969), Brigatti and Poppi (1981) and Brigatti (1983) gave ranges of the composition for the different types. They characterized members of the dioctahedral montmorillonite series on the basis of crystallochemical data especially on the basis of octahedral and tetrahedral populations. Their classification pays special interest to the content of iron in the octahedral layer and smectites were grouped into eight solid solution ranges. The names used by the authors were Wyoming,- Tatilla-, Otay-, and Chambers-type, non-ideal montmorillonite, nontronite, beidellite and Fe-rich
~~~~
10

1. Introduction
beidellite. Their Fe-rich montmorillonite and beidellite correspond to non-ideal montmo-rillonite and beidellite. The iron content in the octahedral sheet of montmorillonite and beidellite is less than 15% of the cations in the octahedral sheet and for non-ideal or iron-rich montmorillonites and beidellites 15-30%.
Brigatti and Poppi (1981) also indicated the iron content of nontronite to be more than 75% in the octahedral sheet. They showed the dependence between iron content, b- and d(060)-value, respectively, and dehydroxylation temperature. Brigatti (1983) claimed for a miscibility gap between montmorillonite and beidellite and to nontronite whereas Vogt and Köster (1978) favor a continuous series between montmorillonite and beidellite. According to Mayayo et al. (2000) there seems to be no compositional gap between montmorillonite and beidellite or saponite and stevensite of the smectites of the catal-ayud-basin in Spain. Their ternary diagram of the octahedral cations shows only a gap between di- and trioctahedral smectites. Due to the amount of iron there is a gap between nontronite and montmorillonite respective beidellite. Brigatti (1983) documented the amount of Fe(VI) in montmorillonite or beidellite to be less than 15% whereas the con-tent in nontronite is > 75%. Fe-rich montmorillonite and beidellite which were named non-ideal montmorillonite and beidellite in Schultz (1969) (Table 1.5) and belong to the 15-30%.
,
New methods allowed to modify the classification system. Intercalation with alkylammonium according to Lagaly and Weiss (1971) gave insight into the cation density and charge distribution of layer silicates. Structural formula calculations should be performed according to Köster (1977) which means that the measured layer charge has to be involved in the calculation of the composition. Tsipursky and Drits (1984) and Drits et al. (1995) discovered that the thermal behavior of dioctahedral 2:1 clay minerals
Table 1.5 Comparison of the names for montmorillonites and beidellites proposed by Schultz (1969), Brigatti and Poppi (1981) and Brigatti (1983).
Wyoming Tatilla Chambers (Cheto-
Wyoming)
Otay (Cheto)
Non-ideal beidellite
Ideal beid-ellite
Non-ideal mont.
Schultz (1969)
Low ξO* > T*
* O = octahedral charge, T = tetrahedral charge
High ξO > T
High ξO > T
High ξO >> T
? High ξ O < T
? ξ T
?high ξ O > T
Brigatti & Poppi (1981, 1983)
Fe(VI) < 15%
Fe(VI) 15-30%(Fe-rich beid.)
Fe(VI) < 15%
Fe(VI) 15-30% (Fe-rich mont.)
11

1. Introduction
is directly related to the structure of the octahedral sheet. These two aspects are incorpo-rated in the new classification system.
1.3 The old and the new classification system
As some smectites of the groups mentioned above do not fit into the common classifi-cation systems, we propose a combination of systematic names and trivial names to char-acterize montmorillonites definitely. The approach of the smectite classification (especially pointing to montmorillonites) here reflects the opinion that the classification should be based on chemical data, layer charge, octahedral sheet structure, tetrahedral charge, Fe-content and the mineral itself. Trivial names like "Otay-type montmorillo-nite" taking into account common classification systems based on Schultz (1969) are valid for suitable samples. Various smectite data were collected from literature, and we tried to combine these data with our system. In many cases, however, data sets from liter-ature are not complete regarding the required information. In most cases the literature data do not contain layer charges measured by the alkylammonium method. Even sam-ples named montmorillonite did not fulfill the definition of a smectite of 0.2-0.6 eq/FU and display higher or lower given layer charges (Figure 1.3).
Figure 1.3 Tetrahedral charge versus layer charge obtained from literature data of 300 sam-ples. The layer charge (eq/Fu) is given for 209 samples. Those with tetrahedral charge > 100% are excluded. Data include montmorillonites and beidellites, few saponites and nontronites. (Due to the limited place the references are not listed.)
12

1. Introduction
Furthermore, some samples would have more than 100% tetrahedral charge. Last but not least the most literature data do not provide information about the octahedral struc-ture via STA measurements and the actually measured layer charge.
A disadvantage of the common classification systems is that samples exist which can-not be classified as any type proposed in the literature. Samples originating from other places than Wyoming, Otay, Tatilla etc. are difficult to characterize. Exceptions exist even within the given groups. A systematic name in form of adjectives is an advantage especially for those samples which are difficult to classify. Table 1.6 lists the structural features and the required methods to obtain the information.
Within the smectite group even the montmorillonites show distinct differences in chemistry, octahedral sheet structure, Fe-content, layer charge and location of charge. To describe these differences we suggest to use well defined adjectives. The names mont-morillonite / beidellite or even their trivial names Wyoming-type etc. do not bear infor-mation of the minerals characteristics, though its demand is increasing for industrial applications. The adjective, that gives information on the chemistry of the mineral (Hey and Gottardi, 1980, Nickel and Mandarino, 1987) and is not considered to be part of the name. It may precise the name and is not connected to it (Nickel and Grice 1998), which makes variations possible. It should be avoided to use the adjectives as hyphenated chemical prefix.
.
Mineral
Identification of smectites is performed by comparing the diffraction patterns of air-dried and ethylene glycol solvated samples. Equilibrated at air and room temperature and moderate humidity smectites with the interlayer cation Na+ give d(001) = 12.4 Å and with Ca2+, Mg2+ as interlayer cation a reflection between 15-15.4 Å. Ethylene glycol sol-vation shifts the basal spacing to about 17 Å.
Location of charge
Greene-Kelly (1955) suggested the boundary of 50% tetrahedral charge due to substi-tution to distinguish montmorillonite from beidellite. The 50% border for the discrimina-
Table 1.6 Structural feature and methods to collect necessary information.
Layer charge Octahedral structure
Fe-content Location of charge Mineral
Alkylammo-nium methodK+-test
STA XRF Mössbauer spectroscopy
O / T* [%] derived from sum formulaHofmann-Klemen-test
*percent octahedral/tetrahedral charge of total charge
XRD:d(001) air/EGXRF
13

1. Introduction
tion between beidellite and montmorillonite which is widely accepted in literature (Güven 1988) (Table 1.7). Most montmorillonites have tetrahedral substitutions which is often expressed with the term beidellitic. Actually, a general rule for the use of this term does not exist. For an easy use of the system we set the limits according to IMA rules. The use of the IMA rules allowed to build sub-groups in Wyoming- and Otay-type (chapter 7).
Iron content
According to Nickel and Mandarino (1987) one should use the latin derived terms for substituting elements. The term iron-rich should be avoided regarding the IMA rules but is widely used in clay mineralogy. Fe-rich really means in clay mineralogy that the inter-layer cations are mostly Fe. The IMA (Nickel and Grice 1998) suggest to use the ending of „-oan“ for the element with lower valence and „-ian“ for higher valence. If the valence is not known they recommend to use the more likely or more common valence state. This leads in the case for Fe-bearing montmorillonites to ferrian montmorillonite for those materials having dominant substitution of Fe3+ in the octahedral sheet. The results which we obtained lead to the conclusion that it is better to follow the IMA rules con-cerning the octahedral Fe which indicates that no miscibility gap exist to nontronite/beid-ellite (chapter 6.4).
In the nomenclature of micas (Rieder et al., 1998) an example for muscovite is given. Rubidian e.g. should be used only if the element in question exceeds 10% but not 50% of the real occupancy of the respective position in the endmember formula involved. For the presented example a rubidian muscovite may contain between 0.1 and 0.5 Rb atoms / FU. Following strictly the rules of IMA analogously a ferrian montmorillonite may con-tain 0.1 to 0.5 Fe atoms / FU. If the content of the element is less it is allowed to use the term Fe-containing.
According to Brigatti and Poppi (1981) the lower limit of their boundary at 15 - 30% Fe of octahedral cations (= 0.3 - 0.6 atoms / FU) has shown to be reliable in their and our analyses. In contrast Güven (1988) proposed 15-50% octahedral iron for iron-rich smec-tites. Güven´s (1988) upper limitations should be used. It proved, referring on own and
Table 1.7 Discrimination between montmorillonite and beidellite according to IMA rules.
Montmorillonite Beidellitic montmorillonite
Montmorillo-nitic Beidellite
Beidellite
location of charge: O / T *[%]
* percent octahedral/tetrahedral charge (due to substitution) of total charge
O 90 - 100T 0 - 10
O 50 - 90T 10 - 50
O 10 - 50T 50 - 90
O 0 - 10T 90 - 100
14

1. Introduction
literature data, that no miscibility gaps exist concerning the octahedral iron of montmo-rillonites, beidellites and nontronites. Therefore in this study smectites containing 0 - 15% Fe (= 0 - 0.3 Fe / FU) are called smectites. Smectites with 15 to 50% of octahedral cations (= 0.3 - 1.0 atoms / FU) should be named ferrian montmorillonites.
Octahedral structure
The structure of the octahedral sheet can be determined by evolved gas analysis (EGA) of evolved water in STA measurements as Drits et al. (1998) proposed by inte-grating the areas below the fitted peaks. According to the general 50% rule it is proposed to set the boarders at 25%, 50% and 75% (Table 1.8). A variety containing for example 75- 100% cis-vacant parts shall have the term cv. Increasing trans-vacant parts (25 - 50%) are expressed by a double name like cis/trans-vacant (cv/tv) montmorillonite. For the calculation of the cis- and trans-vacant proportion the boundary of the peak tempera-ture between cis- and trans-varieties was set at 600 °C according to Drits et al. (1998). The cis- and trans-vacant proportions were determined by fitting the mass spectrometer curves of evolved water (m/e = 18) and the integration of the identified peaks. The ratio between the areas of the peaks reflects the ratio between cis- and trans-vacant layers.
Layer charge
For the division of charges we refer to the results of Schultz (1969). Low charged smectites have charges of 0.2 - 0.375 eq/FU, medium charged 0.375 - 0.425 eq/FU and high charged 0.425 - 0.6 eq/FU (table 1.3). It has to be mentioned that these values refer on the calculated layer charges of the chemical composition. We will discuss these limits in comparison with the measured cation densities in chapter 3.4.
The old and new classification systems were tested for a series of 30 samples. For these samples all required data were measured and their validity was ensured by cross-checks. Some of the samples had to be discarded from the stock because they contained
Table 1.8 Limits for cis-and trans-vacancies in octahedral sheets in di-octahedral smec-tites.
Border cv/tv: 600°C *
* (Drits et al. 1998)
cis-vacantcv
cis-trans-vacant cv/tv
trans-cis-vacant tv/cv
trans-vacant tv
% area m/e =18 of mass spectrometer curves referred to cis-and trans-vacant proportion
cv 100-75tv 0-25
cv 75-50tv 50-25
cv 50-25tv 50-75
tvcv 25-0
tv 75-100
15

1. Introduction
large amounts of kaolinite or illite, even in the < 0.2 µm fraction. One sample did not consist of bentonite in spite the supplier information.
Table 1.9 summarizes the limits of each parameter used in the new classification and the information which can be obtained.
Table 1.9 Division of the new classification system of expandable 2:1 clay minerals, mont-morillonites and beidellites.,
Literature
Bailey, S.W. (1980) Summary of recommendations of AIPEA nomenclature committee. Clays and Clay Minerals, 28, 73-78.
Brigatti, M.F. (1983) Relationship between composition and structure in Fe-rich smectites. Clay Minerals, 18, 177-186.
Brigatti, M.F. and Poppi, L. (1981) A mathematical model to distinguish the members of the dio-ctahedral smectite series. Clay Minerals, 16, 81-89.
Brindley, G.W. and Pedro, G. (1972) Report of the AIPEA Nomenclature Committee. Newsletter 7, 8-13.
Brown, G. (1955) Report of the clay minerals group sub-committee on nomenclature of clay min-erals. Clay Minerals Bulletin, 2, 294-301.
Christidis, G.E. and Eberl, D.D. (2003) Determination of layer-charge characteristics. Clays and Clay Minerals, 51, 644-655.
Drits, V.A., Besson, G. and Muller, F. (1995) An improved model for structural transformations of heat-treated aluminous dioctahedral 2:1 layer silicates. Clays and Clay Minerals, 43, 718-731.
Drits, V.A., Lindgreen, H., Salyn, A.L., Ylagan, R. and McCarty, D.K. (1998) Semiquantitative determination of trans-vacant and cis-vacant 2:1 layers in illites and illite-smectites by thermal analysis and X-ray diffraction. American Mineralogist, 83, 1188-1198.
Greene-Kelly, R. (1955) Dehydration of montmorillonite minerals. Mineralogical Magazine, 30, 604-615.
Grim, R.E. and Kulbicki, G. (1961) Montmorillonite: High Temperature Reactions and Classifi-cation. The American Mineralogist, 46, 1329-1369.
Structural feature noun or adjective limits
Layer charge [eq/FU] low-chargedmedium-chargedhigh-charged
0.2-0.3750.375-0.4250.425-0.6
Octahedral structure [%] area m/e =18
cv cv/tvtv/cvtv
cv 75-100 / tv 0-25cv 50-75/ tv 25-50cv 25-50 / tv 50-75cv 0-25 / tv 75-100
Fe-content[%] of octahedral / [mol/FU]
---ferrian
0-15 / 0.0-0.315-50 / 0.3-1.0
Location of charge/substitu-tion O / T [%](resulting mineral name)
montmorillonitebeidellitic montmorillonitemontmorillonitic beidellitebeidellite
O 90 - 100 / T 0 - 10O 50 - 90 / T 10 - 50O 10 - 50 / T 50 - 90O 0 - 10 / T 90 - 100
16

1. Introduction
Guggenheim, S. and Martin, R.T. (1995) Definition of Clay and Clay Minerals: Joint report of the AIPEA nomenclature and CMS nomenclature committees. Clays and Clay Minerals, 43, 255-256.
Hey, M.H. and Gottardi, G. (1980) On the use of names, prefixes and suffixes, and adjectival modifiers in the mineralogical nomeclature. Canadian Mineralogist, 18, 261-262.
Hofmann, U., Endell, K. and Wilm, D. (1933) Kristallstruktur und Quellung von Montmorillo-nite. Zeitschrift für Kristallographie, 86, 340-349.
Hofmann, U. and Klemen, R. (1950) Verlust der Austauschfähigkeit von Lithiumionen aus Ben-tonit durch Erhitzung. Zeitschrift für Anorganische und Allgemeine Chemie, 262, 95-99.
Jasmund, K. and Lagaly, G. (1993) Tonminerale und Tone. Steinkopff Verlag, Darmstadt, 490.Köster, H.M. (1977) Die Berechnung kristallchemischer Strukturformeln von 2:1 - Schichtsil-
ikaten unter Berücksichtigung der gemessenen Zwischenschichtladungen und Katione-numtauschkapazitäten, sowie der Darstellung der Ladungsverteilung in der Struktur mittels Dreieckskoordinaten. Clay Minerals, 12, 45-54.
Köster, H.M., Ehrlicher, U., Gilg, H.A., Jordan, R., Murad, E. and Onnich, K. (1999) Mineralog-ical and chemical characteristics of five nontronites and Fe-rich smectites. Clay Miner-als, 34, 579-599.
Lagaly, G. (1994) Layer Charge Determination by Alkylammonium Ions in Layer charge charac-teristics of 2:1 silicate clay minerals. Mermut, A. R. (edt.), The Clay Minerals Society, Boulder, 1-46.
Lagaly, G. and Weiss, A. (1971) Anordnung und Orientierung kationischer Tenside auf ebenen Silicatoberflächen Teil IV. Kolloid-Zeitschrift und Zeitschrift für Polymere, 243, 48-55.
Mackenzie, R.C. (1959) The classification and nomenclature of clay minerals. Clay Minerals Bulletin, 4, 52-66.
Martin, R.T., Bailey, S.W., Eberl, D.D., Fanning, D.S., Guggenheim, S., Kodama, H., Pevear, D.R., Srodon, J. and Wicks, F.J. (1991) Report of the Clay Minerals Society nomencla-ture committee: Revised classification of clay materials. Clays and Clay Minerals, 39, 333-335.
Mayayo, M.J., Bauluz, B. and Gonzalez Lopez, J.M. (2000) Variations in the chemistry of smec-tites from the Calatayud Basin (NE Spain). Clay Minerals, 35, 365-374.
Moore, D.M. and Reynolds jr., R.C. (1997) X-ray diffraction and the identification and analysis of clay minerals. 2 ed., University Press, Oxford, 378.
Nickel, E.H. and Grice, J.D. (1998) The IMA Commision on new minerals and mineral names: Procedures and guidelines on nomenclature. The Canadian Mneralogist, 36, 3-16.
Nickel, E.H. and Mandarino, J.A. (1987) Procedures involving the IMA commision on new min-erals and mineral names, and guidelines on minerals nomenclature. Canadian Mineralo-gist, 25, 353-377.
Rieder, M., Cavazzini, G., D´Yakanov, Y., Frank-Kamenetskii, V.A., Gottardi, G., Guggenheim, S., Koval, P.V., Müller, G., Neiva, A.M.R., Radoslovich, E.W., Robert, J.-L., Sassi, F.P., Takeda, H., Weiss, Z. and Wones, D.R. (1998) Nomenclature of micas. The Canadian Mineralogist, 36, 41-48.
Ross, C.S. and Hendricks, S.B. (1945) Minerals of the montmorillonite group. Their origin and relation to soilsand clays. Professional Paper 205-B, Unites States Department of the interior, 79.
Schultz, L.G. (1969) Lithium and potassium absorption, dehydroxylation temperature and struc-tural water content of aluminous smectites. Clays and Clay Minerals, 17, 115-149.
Smykatz-Kloss, W. (1974) Differential Thermal Analysis. Wyllie, P. J. (edt.), Minerals, Rocks and Inorganic Materials, Springer-Verlag, Berlin, 185.
Tsipursky, S.I. and Drits, V.A. (1984) The distribution of octahedral cations in the 2:1 layers of dioctahedral smectites studied by oblique texture electron diffraction. Clay Minerals, 19, 177-192.
Varadachari, C. and Mukherjee, G. (2004) Discriminant ananlysis of clay mineral composition.
17

1. Introduction
Clays and Clay Minerals, 52, 311-320.Vogt, K. and Köster, H.M. (1978) Zur Mineralogie, Kristallchemie und Geochemie einiger Mont-
morillonite aus Bentoniten. Clay Minerals, 13, 25-43.Warshaw, C.M. and Roy, R. (1961) Classification and a scheme for the identification of layer sil-
icates. Geological Society of America Bulletin, 72, 1455-1492.
18

2. Materials and Methods
2. Materials and Methods
2.1 Materials
Various institutes placed 32 samples at our disposal for investigations. The samples are of different origin and provenance. They are clays or bentonites consisting mainly of minerals of the smectite group (Table 2.1).
Table 2.1 Samples and sample data.
sample name provenance supplier
2LP Lago Pelegrino Argentina K. Emmerich / FZK
3 7thMayo 7th Mayo Argentina K. Emmerich / FZK
4Jup Jupiter Argentina K. Emmerich / FZK
5MC Ca-montmorillonite Italy, Mandas Cagliari
M. F. Brigatti / Uni-versity of Modena (UM)
6GPC Ca-montmorillonite Italy, S. Giuliano di Puglio, Campobasso
M. F. Brigatti / UM
7EMC Ca-montmorillonite Italy, S. Erocedi, Magliano, Cam-pobasso
M. F. Brigatti / UM
8UAS Ca-montmorillonite Italy, Uri Alghero, Sassari
M. F. Brigatti / UM
10MBV Fe-rich montmorillo-nite
Italy, Monte Bro-simo, Vicenza
M. F. Brigatti / UM
12TR01 TR 01 R. Ahlers / Süd-Che-mie (SC)
13TR02 TR 02 R. Ahlers / SC
14TR03 TR 03 R. Ahlers / SC
15TR04 TR 04 R. Ahlers / SC
16GR01 GR 01 R. Ahlers / SC
17GR02 GR 02 R. Ahlers / SC
19

2. Materials and Methods
*These two charges were later subsumed under the number 26/27 Valdol
2.2 Methods
2.2.1 Pretreatment of bulk samples
The samples delivered with inherent moisture were air-dried and reduced to particles < 2 mm with a jawbreaker. Large amounts were separated into equal parts. Samples
18USA01 USA 01 R. Ahlers / SC
19USA02 USA 02 R. Ahlers / SC
20MEX01 MEX 01 R. Ahlers / SC
21D01 D 01 R. Ahlers / SC
24Beid Beidellite Unter-rupsrath / ETH
Germany, Unter-rupsrath
G. Kahr / ETHZ
25Volclay Volclay / ETH USA, Wyoming G. Kahr / ETHZ
26Valdol * Valdol, Bentonite C14 *
Italy, Valdagno G. Kahr / ETHZ
27Valdol KE * Valdol, Bentonite C14 *
Italy, Valdagno K. Emmerich / FZK
28SB SW B3 SB; Almeria Spain, Almeria K. Emmerich / FZK
31BAR 3 Armenian bentonite from mine
Armenia R. Nüesch / FZK
32Volclay SW B2 Vo, Volclay USA K. Emmerich / FZK
33CA SW B1 CA, Calcigel Germany K. Emmerich / FZK
34M70 Montana I/S mixed layer
USA, Wyoming G. Kahr / ETHZ
35B31 K-bentonite Sweden, Kinnekulle G. Kahr / ETHZ
36M650 Mlety 650 (D) Czech Republic G. Kahr / ETHZ
37BB Berkbond England/ Britain G. Kahr / ETHZ
38MW Mill white n.4 USA, Arkansas G. Kahr / ETHZ
39G Q-I Geko Q-I Italy G. Kahr / ETHZ
41ValC18 Valdol, Bentonite C18
Italy, Valdagno G. Kahr / ETHZ
42Linden Linden Germany, Bavaria K. Emmerich / FZK
Table 2.1 Samples and sample data.
sample name provenance supplier
20

2. Materials and Methods
which we obtained as powder were not submitted to any pretreatment. X-ray diffraction (XRD) of randomly ordered powder, X-ray fluorescence (XRF), simultaneous-thermal-analysis (STA) and cation exchange capacity (CEC) were performed from the bulk mate-rial. Selected samples were analyzed by Mössbauer spectroscopy. A chemical pretreat-ment and particle size separation is very important to characterize smectites. The minimum sample amount for a complete characterization of the < 2 µm and < 0.2 mm fraction was 2 g of each fraction. Table 2.2 lists the methods and the particular informa-tion which can be obtained.
2.2.2 Chemical pretreatment and particle size separation
The separation of the clay minerals is important for the investigation of the properties of bentonites as they mainly consist of smectites. The aim of the project was to obtain a reliable structural formula of the smectites. It is necessary to separate the < 2 µm and < 0.2 µm fraction. In general only very few amounts of quartz or cristobalite are present in these fractions, and the smectite minerals are enriched. As mentioned above 2 g are nec-essary for a characterization of each fraction. The determination of the CEC of the bulk material can serve as a method to determine the minimum amount of bulk material from which the smectites have to be enriched. Before starting with the separation of fractions perturbing substances have to be removed. In the bulk samples carbonates, iron-oxides and organic matter were found. Coatings of these substances can result in aggregation or cementation of the clay minerals and an inadequate dispersion of the sample. A sample containing for example more than 5 weight percent carbonate inhibits by its coagulation the production of a stable dispersion (Moore and Reynolds, 1997; Tributh and Lagaly, 1986a). By dissolving calcium ions the suspension becomes unstable and coagulate, thus the grain size fractionation will not be effective. The chemical pretreatment to eliminate
Table 2.2 Techniques to characterize smectites and minimum sample amount.
method information minimum sample amount required
XRD identification of mineral by (001) and impurities
200 mg
XRF chemical composition 2*600 mg
STA octahedral structure 100 mg
Cu-Trien cation exchange capacity 2*50 mg
n-alkylammonium method layer charge 50 or 100 mg per chain
Mössbauer spectroscopy distinction and coordination of Fe2+ and Fe3+
300 mg + 300 mg bulk sam-ple
~~
21

2. Materials and Methods
these impurities was performed according to Tributh and Lagaly (1986a), Dohrmann (1999), Emmerich (2000) and Mehra and Jackson (1960). As the treatment was partly modified a detailed description of the methods is given below. All samples were treated in the same way even if a perturbing substance was not found to make sure that the sam-ples underlie the same reactions and conditions.
Removal of carbonate
Calcium carbonate is dissolved by an acetic acid-acetate buffer. Calcium acetate is washed out: CaCO3 + 2CH3COOH → Ca(CH3COO)2 + CO2 + H2O
Equipment Scale, beaker, graduated flask, pH-meter, magnetic stirrer, centrifuge, 500 ml centrifuge tubeChemicalsSodium acetate p.a. (CH3COONa), acetic acid 100% p.a. (CH3COOH), sodium chloride p.a. (NaCl), de-ionized water.Brief description A 2 molar sodium acetate solution was mixed with a 2 molar acetic acid solution at a ratio of 2 to 1 and attuned to pH 4.8. About 200 ml buffer are added to 20 g sample amount in a beaker and stirred. No heating was applied. The reaction time took up to several days, depending on the car-bonate content. The reaction was finished when no more bubbles of carbon dioxide raised. The suspension was centrifuged and washed 4 times with a 1 molar sodium chloride solution. The sample was washed with de-ionized water. Centrifugation was carried out at 3500 - 4000 rpm for 15-20 min, depending on the sample.ErrorToo short reaction times may result in incomplete dissolution of carbonates, especially dolomite. At pH lower than 4.8 the clay minerals structure can be attacked.
Removal of iron oxide
Iron oxides and aluminum hydroxide are dissolved by a reducing and complexing agent. This was performed according to Mehra and Jackson (1960) with a buffered dithionite-citrate system. The iron oxide is reduced by the dithionite and complexed by citrate. The solubility of the iron oxides decreases with an increasing pH-value. The oxi-dation potential of the sodium dithionite (Na2S2O4) increases with increasing pH. An optimum pH occurs at pH 7.3. In this region the solubility of the iron oxide and the oxi-dation potential of the sodium dithionite provide best values. As OH- - ions are con-sumed during the oxidation of Na2S2O4 to Na2SO4, an effective buffer like sodium hydrogen carbonate has to be used.
EquipmentScale, beaker, graduated flask, pH-meter, magnetic stirrer, centrifuge, 500 ml centrifuge tumblersChemicalsTri-sodium citrate p.a. (C6H5O7Na3), sodium hydrogen carbonate p.a. (NaHCO3), sodium dithionite LAB (Na2S2O4), sodium chloride p.a. (NaCl), de-ionized water
22

2. Materials and Methods
Brief descriptionA 0.3 molar sodium citrate solution was mixed with a 1 molar sodium hydrogen carbonate solu-tion in a ratio 8:1. 225 ml of this solution were added to 20 g sample in a beaker. The dispersion was heated to 80 °C and 5 g of the solid dithionite were added carefully. The temperature was kept for 15 min. Thereafter, the suspension was cooled, centrifuged and washed with sodium chloride before starting the procedure a second time. Finally the sample was centrifuged and washed again 4 times with 1 molar sodium chloride solution and again with de-ionized water. Centrifugation took place at 3500 - 4000 r/min for 15-20 minutes.ErrorTributh and Lagaly (1986a) are pointing at a possible change of the layer charge during oxidation and reduction treatments. High charged clay minerals show after this procedure an increased cat-ion exchange capacity (CEC). The original amount of Fe3+ and CEC is recovered by a following oxidation with H2O2.
Removal of organic matter
Hydrogen peroxide destroys organic matter (OM) effectively.
EquipmentBeaker, measuring cylinder, magnetic stirrer, centrifuge, 500 ml centrifuge tumblersChemicalsHydrogen peroxide 30% p.a. (H2O2), sodium chloride p.a. (NaCl), de-ionized waterBrief descriptionAfter the removal of iron oxides the washed samples were filled again in a beaker. The hydrogen peroxide was added step wise to the suspension. In case of intense reactions the solution was adjusted to 5% and stirred over night before adjusting to 10%. The complete decomposition of the organic matter could take several days. A heating to 60 °C for 15 min accelerated the reac-tion. This was done for samples with no significant reaction. The reaction was finished when no more carbon dioxide arose. Samples which were blue colored after the dithionite treatment regained their original color after the oxidation with hydrogen peroxide. The washing of the sam-ple took place as described above. The sample had to be washed finally with de-ionized water until no longer a transparent supernatant was attained after centrifugation. The dispersion was ready for grain size fractionation.ErrorIn some cases a composition of organic matter may remain.
Separation of the < 2 µm and < 0.2 µm fractions
From the purified samples the fraction < 2 µm was obtained by sedimentation and the fraction < 0.2 µm by centrifugation of the < 2 µm suspension. On an average density of 2.5 to 3 g/cm³ the solid content of the bentonite must not exceed 2.5 g per liter de-ionized water to avoid a mutual influence of the particles. A convenient proportion for bentonites amounts to 2 to 2.5 g per liter de-ionized water (Tributh and Lagaly, 1986b). For smec-tites it is important that the samples are Na+-saturated to obtain a stable dispersion. Oth-erwise the particles are not fully dispersed. The settling time for the particles follows the Stokes law. For sedimentation in a gravity field the gravity force is included in the calcu-lation, for centrifugation centrifugal acceleration is counted in the calculation.
The settling time of a particle in gravity field is:
23

2. Materials and Methods
equation (1)
The settling time in the centrifuge is determined by: equation (2)
Herein η0 is the viscosity of water, ρ the density of the clay mineral, ρ0 the density of water (depending on the temperature), h the settling distance of the particles and d the particle diameter. In equation (1) g is the gravity force and in equation (2) 4rp²(R/60)2 gives the centrifugal acceleration with r the radius of the particle and R/60 as rotation per minute.
EquipmentScale, 5 l beaker or measuring cylinder, timer, a U-shaped glass pipe, Peleus ball, water jet pump, china-bowls, Multifuge 3S-R Hereaus/Kendro, tubes for dialysis (Nadir, 25A poresize), agate mortarChemicalsSodium chloride p.a. (NaCl)Brief descriptionThe dispersion that passed a 63 µm sieve was filled up in several beakers with the adequate amount of de-ionized water to obtain the required solid content of the dispersion. The dispersion was stirred and after the calculated time the fraction < 2 µm was separated and coagulated with NaCl (the amount of NaCl is depending on the sample amount). The dialysis tube were cleaned in boiling water two times over day to eliminate contaminations. The NaCl containing bentonite dispersion was dialyzed until the conductivity of water reached 3 µS. The dialysis needed 1-2 weeks. A part of this chloride free dispersion was centrifuged to obtain the < 0.2 µm fraction. The times for centrifugation were calculated according to Tributh and Lagaly (1986b).The cen-trifugation was performed in a temperature constant centrifuge mostly, at 22 °C. Both chloride free fractions were dried at 65 °C. The dried samples were milled slightly in an agate mortar. ErrorAn error occurs with the centrifugation of the < 0.2 µm fraction by the acceleration and decelera-tion. An estimation of this error yielded deviations < 2% from the needed equivalent diameter (personal communication Markus Pohlmann, FZK).
The preparation of the 32 samples took 13 months due to the limited capacities of the equipment.
t18η0
ρ ρ0–( ) g×----------------------------- h
d2-----×=
t18η0
ρ ρ0–( ) 4rπ2× R 60⁄( )2×----------------------------------------------------------------- dh
d2------×=
24

2. Materials and Methods
2.2.3 Cation exchange capacity (CEC)
The properties of the smectites are determined by their layer charge and cation exchange capacity (CEC). The overall CEC is the sum of exchangeable interlayer cations and cations at the clay minerals edges. The first quantity is defined by the layer charge and is pH independent. The amount of the edge located cations is pH dependent and can reach up to 20% at pH 7 for smectites (Lagaly, 1981). Recently, Kaufhold et al. (2002) showed that edge located cations comprise an average value of 10%. Low charged smec-tites exhibit a higher measurable CEC than the highly charged illites. The measurable CEC of illites is distinct lower as one would expect when regarding the layer charge. because only the cations at the edges and surfaces are exchangeable (Lagaly and Köster, 1993).
To determine the CEC the exchangeable cations were replaced by the copper triethyl-enetetramine cations (Meier and Kahr, 1999). The consummation of the Cu-triethylene-tetramine was determined by photometry in the clear supernatant.
EquipmentUV-vis Spectrometer Shimadzu UV-160, graduated flask, photometer trays, weighing glasses, desiccatorChemicals0.1 mol/l solution copper sulfate (CuSO4)*5H2O, triethylenetetramine purum, oversaturated magnesium nitrate solution (Mg(NO3)2) (53% rh), desiccator, de-ionized waterBrief descriptionThe samples were stored over magnesium nitrate (53%rh) at least for 24 h. 50 mg of the sample was weighted in a centrifuge flask. 6 ml of the 0.01 molar Cu-complex solution were added. 10 ml de-ionized water was added and the sample was shaken for two hours. A complete exchange of the Cu2+-complex with the interlayer cations is guaranteed by this procedure. The solution was centrifuged at a minimum of 3500 r/min for 10 min and the blue clear supernatant was mea-sured in a photometer at a wavelength of about 580 nm. Before starting with the measurements a calibration curve with standard concentrations 0.000 mol, 0.001, 0.002 and 0.004 mol was made.ErrorThe precision of the method was determined to be 2% according to Kaiser and Specker (1956).
AnnotationSimultaneously to the CEC measurement the dry weight of the sample has to be determined. Oth-erwise the obtained values are underestimated. We used to store the samples over magnesium nitrate and determined the dry weight by STA measurements. The CEC was twice measured for the samples, and the error of the method itself was calculated to be 2%.
2.2.4 Determination of layer-charge
The cation density and the charge distribution of the smectites was determined by the alkylammonium method (Lagaly and Weiss, 1971, Lagaly, 1989, 1994). The interlayer cations of the smectites were displaced by alkylammonium ions of various chain lengths. The basal spacing of the alkylammonium derivatives was measured by X-ray diffraction after washing and drying (Lagaly, 1994).
25

2. Materials and Methods
With increasing chain length the basal spacings increase. Short chains cause monolay-ers, longer chains are oriented in bilayers and very long chains produce pseudotrimolec-ular layers. The comparison of the area of an alkylammonium ion (Ac) and the equivalent area that is available for an interlayer cation (Ae) provides the basis for the determination of the cation density. The interlayer cation density is not in all interlayer spaces constant but varies from interlayer space to interlayer space. Thus, there is in most cases a hetero-geneous charge distribution. The cation density and the charge density are identical only for homogenous charge distribution. Ae is the area which is available for a monolayer alkylammonium cation (Ac < Ae). The monolayer rearranges into a bilayer at Ac = Ae
when the charge distribution is homogenous. For heterogeneous charge distribution the transition from mono- to bilayer (figure 2.1) needs several chain lengths and the charge distribution of the cation densities is determined from this transition.
For the calculation of the cation densities the peak migration curve according to (Lagaly, 1981) was used. The mean layer charge was calculated from the cation densities and their relative frequencies.
EquipmentScale, 10 ml centrifuge flask, X-ray diffractometer Siemens D5000, sample holderChemicals: alkylammonium ions (chain lengths 4 to 18), formic acid, ethanol, muscovite as line standard for XRD (Merck)Brief descriptionThe amount of added alkylammonium salt has to be twice the CEC which is for the smectites on the average 1 meq/g. Each 50 mg sample was treated with the various n- alkylammonium formi-ate solutions from nc= 4 to nc= 18 (except nc = 17). We chose this solution instead of the pro-posed alkylammonium chloride solutions (Lagaly and Weiss, 1971) as the formiates provide a better solubility for the longer chains (pers. com. G. Kahr, ETHZ). The clay was dispersed with 3 ml formiate and the dispersion was held at 65 °C over night in an oven. After 24 h the solid was
Figure 2.1 Transition from mono- to bilayer; arrangement of alkylammonium chains depending on their lengths and the cation density (derived from Lagaly, 1981)
Ac = 5.7nc + 14
Ae = a0 b0/2ξ
2ξ = a0 b0/5.7nc + 14
26

2. Materials and Methods
separated by centrifugation, washed with ethanol and once again dispersed in fresh alkylammo-nium formiate solution and stored at 65 °C. The sample was washed free of the excess alkylam-monium formiate solution with ethanol (about 8 times for chain length nc = 4 - 13, for chain nc = 13 - 18 about 13 times). Two washings followed with pure ethanol. Textured samples were prepared and dried at 65 °C. They were stored in a desiccator over P2O5 until their basal reflec-tions were recorded by XRD.ErrorThe particle size correction is necessary for particles < 0.1 µm and for chain length nc = 9. Values for particle size correction for the < 0.2 µm fraction were taken from (Lagaly, 1994). Calcula-tions for particle size correction can be found in Westfehling (1987). The LP factor (Lorentz-Polarisation factor) which shifts the position of the intensity maximum at small angles to slightly larger d-values is not necessary for smectites according to Lagaly (1994). The influence on the cation density is 0.01 charges per unit.
2.2.5 X-ray diffraction (XRD)
X-ray diffraction was used for mineral identification, detection of impurities, layer charge determination and K+-test. The sodium saturated smectite expand from 12.4 Å in the air dried state to about 17 Å ethylene glycol solvated.
EquipmentX-ray diffractometer Siemens D5000 with a graphite secondary monochromator and CuKα radi-ation (λ = 1,5418 Å), Software DiffPlus Evaluation program. Brief descriptionA powder pattern was made from the bulk material. From the < 2 µm and < 0.2 µm oriented pat-terns were made. Oriented samples were prepared by dispersing 80 mg of the < 2 µm and < 0.2 µm fraction in 2 ml deionized water. The dispersions were pipetted on glass slides with a diame-ter of 2.5 mm and dried under atmospheric conditions overnight at room temperature. Thereafter, these samples were solvated at least two days with ethylene glycol in a desiccator under vacuum. We recorded the samples at 2-35° 2Θ, 0.02° Θ steps and 3 sec/step with 40 kV/40 mA.
2.2.6 Estimation of excess SiO2 in the < 0.2 µm fraction of the smectites
Some samples contained cristobalite which causes a wrong stoichiometric composi-tion. Therefore, a correction of the stoichiometric composition obtained from RFA-data had to be performed. After estimation of the SiO2-content, the composition of the oxides was recalculated and the formula corrected.
EquipmentAgate mortar, scale, 1.2 mm teflon rings for XRD sample holders, X-ray diffractometer Siemens D5000ChemicalsMerck silica gel 0.1-0.2 mmBrief descriptionThe external standard method was used to determine the amount of cristobalite in the smectites. From an external standard silica gel with the same maximum of a broadened reflection like the strong reflection at 4.05 Å for cristobalite in the sample, a calibration curve was made. A smec-tite (sample 18USA01) which contained no excess cristobalite was used as matrix - to this smec-tite silica gel was added in different concentrations and the mixture was mortared in an agate
27

2. Materials and Methods
mortar before preparing for XRD as powder samples. A first calibration with 3, 5, 10, 20, 30, 50 and 100% SiO2 showed good R² values but worse P-values. Therefore a calibration curve lying in the range of the estimated SiO2 content with 1, 2, 3, 5, 7.5, 10, 12.5, 15, 20, 25, 30% SiO2 was made. This regression analysis showed good R²- and P-values and could be used for the quantifi-cation of the SiO2 in the smectites. Additional a definite amount of SiO2 (5%) was added to the smectites which was corrected for SiO2 in an additional control. The external standards and the samples were recorded at 20.5- 23.5 2 Θ, 20s and 0.01 steps/sec with 40 kV/40 mA. The net areas of the recorded samples and the external standards were determined with the DiffplusEVA-program. Error The regression analyses showed R² = 0.993 and P < 0.005 for the calculated calibration curve (figure 2.2). Nevertheless, an absolute error of 1% in the region 1 - 12.5% and an error of 2% in the region 15 - 30% was detected. For this reason the relative error in samples with low amounts of SiO2 is high and decreases with increasing amount of cristobalite.
2.2.7 X-ray fluorescence (XRF)
X-ray fluorescence was performed to determine the chemical composition of the bulk sample material, the < 2 µm and < 0.2 µm fraction. The analysis is important for the cal-culation of the structural formula of the smectite minerals. The samples were prepared (after determining the loss on ignition) by mixing it with a flux material and melting into glass beds. These glass beds were analyzed by a wavelength dispersive X-ray fluores-cence spectrometer. The sample is irradiated by X-rays, which in turn cause the X-ray fluorescence of the atoms within the sample. This secondary radiation is collimated onto a diffraction crystal and its intensity at selected peak and background positions in the X-ray spectrum was measured using a detector mounted onto a goniometer.
EquipmentWavelength dispersive X-ray spectrometers (WD XRF) PW 1480 and PW 2400 controlled by Phillips X40 software. The PW 1480 with a 2.5 kW/80 kV chromium anode X-ray tube is used for the elements CaO, K2O, TiO2, Ba, Sc, Cs and Sb. The PW 2400 with a 2.7 kW/60 kV rhod-ium anode x-ray tube is used for SiO2, Al2O3, Fe2O3, MnO, MgO, Na2O, P2O5, SO3, Fluoride, Cl, As, Bi, Ce, Cr, Cu, Ga, Hf, La, Mo, Nb, Nd and Ni.
Figure 2.2 Calibration curve for SiO2 of the external standards with lower and upper error bars (confidential limit 95%).
cps
SiO
2%
R² = 0.993P < 0.005
28
2. Materials and Methods
ChemicalsLithium metaborate (Alfa Flux no. 100 A Spectroflux coarse LiBO2 100%), lithium tetraborate (Li2B4O7, Merck Spectromelt A 10), lithium bromide (LiBr)Pt95-Au5 crucibles and commercial automatic fluxer are used for the fusion (Herzog 12/1500) Brief descriptionThe samples were milled to a particle size less than 40 µm. Loss on ignition was determined by heating 1000 mg (600 mg) of sample material for 10 min at 1030°C. After mixing the residue with 5 g lithium metaborate (for 600 mg 2.5 g lithium metaborate and 2.415 g lithium tetrabo-rate) and 25 g lithium bromide, the material was fluxed in Pt/Au-crucibles in an automatic melt-ing furnace for 20 min at 1200°.ErrorIn every set of analyzed samples we measured an internal standard. The relative error or variance for the single elements is listed in the following table 2.3.
2.2.8 Simultaneous thermal analysis (STA)
Simultaneous thermal analysis (STA) is a very considerable application additional to XRD, XRF, layer charge determination etc. in the field of clay mineralogy. The most important reason for investigating clay minerals by STA is the consideration of water in the clay minerals. There are three different types of water in the clay minerals: adsorbed water in the pores, interlayer water between the layers and water bound in the structure. The structural water for this study is of great importance, as it is used as a tool to charac-terize the smectites by their dehydroxylation temperature. In general thermogravimetry (TG) and differential thermal analysis (DTA) or differential scanning calorimetry (DSC) are measured simultaneously. As a common method the evolved gas analysis (EGA) is combined with these methods (DIN 51005, 1983).
Thermal methods in general include static and dynamic procedures. Mostly the static method serves for the determination of the water content. The sample is dried at a con-stant temperature until the constant dry weight of the sample is reached. With dynamic procedures the sample is submitted to an adjusted temperature-time-program while the sample continuously is subjected to a definite heating rate. Conventionally, an endother-mic reaction that requires heat is graphed sloping down whereas an exothermic reaction that releases heat is graphed sloping up (Lombardi, 1980). The gases which are evolved during the reaction of the sample are directed via a capillary from the heater to the mass spectrometer and detected there. Emmerich (2000), Niederbudde et al. (2002) gave detailed overviews of the thermoanalytical methods. General experimental parameters are listed in table 2.4.
Table 2.3 Relative error or variance for the single elements determined in XRF.
element SiO2 TiO2 Al2O3 Fe2O3 MnO MgO CaO Na2O K2O LOI
variance 0.43 1.7 1.29 0.48 3.93 0.9 0.85 2.96 4.11 3.86
29

2. Materials and Methods
Table 2.4 Experimental parameters for STA.
Equipment Netzsch STA 449C Jupiter, QMS 430C Aeolos, purge gas N2, Software Proteus Netzsch, PeakFitChemicalsMg(NO3)2, gas canister of synthetic air (20.5% O2 in N2) and N2 (quality 4.8)Brief descriptionBefore analyzing a sample, it was stored in an desiccator over a mixture of Mg(NO3)2 sol and solid Mg(NO3)2 (53% rh) at a minimum of 24 h to make sure that the samples are measured under constant humidity conditions. Sample amounts of 100 mg were heated at a rate of 10 K/min from 30 to 1000 °C. The oven gas was streaming with 70 ml/min. 20 ml/min protective gas, N2, and 50 ml/min purge gas, air were used. These are convenient conditions for the detection of gases by MS with the DCS/TG measurements (Niederbudde et al., 2002).The temperatures given in this study are peak temperatures. The peak temperatures of the DTA and MS curves show a maximum difference of 2 °C for water (m/e = 18). Of great interest was the determination of the cis- and trans-vacant parts in the smectites. This and the results of the experiments are described in detail in chapter 4. RemarkFor STA it is useful to produce homo ionic, Na+-saturated smectites. This ensures the differentia-tion between dehydration and dehydroxylation (Niederbudde et al., 2002). Identification of the single reaction intervals is made easier. Dehydroxylation temperature varies with the ionic radius also according to Mackenzie and Bishui (1958) and Emmerich (1999).
2.2.9 Mössbauer-Spectroscopy
As XRF gives only information of the bulk iron content, another method was neces-sary to get a more detailed information on the iron valence and coordination state for some samples. The Mössbauer method enables the distinction of Fe2+ and Fe3+ and its coordination state, four or six, in clay minerals. Mössbauer discovered 1957 the recoil free emission and resonant absorption of nuclear γ-rays in solids (Wertheim, 1964). In Mössbauer spectroscopy γ-rays are used as a probe of nuclear energy levels which, in turn are sensitive to the detailed local electron configuration and electric and magnetic
Sample holder Pt 10% / PtRh
Thermocouples Pt80Rh20 crucible with and without lid
Amount of sample material 100 mg
Reference material Empty crucible
Grain size of sample material Bulk sample gently mortared, < 2 µm, < 0.2 µm
Furnace atmosphere Purge gas flowing air, synthetic, filtered:50 ml/min protective ga; N2 20 ml/min,
Heating rate 10 K/min
Packing density Slightly or non pressing
30

2. Materials and Methods
field of the solid. Differentiation between various oxidation states (local electron config-uration), spin states (local electron configuration, magnetic interactions) and structural environments (electric/crystal field effects) is possible (Hawthorne, 1995, Wertheim, 1964). As source for iron spectra serve 57Co. Transition from the excited state to the ground state is coupled with several γ-ray emissions. The 14.4 keV emitted γ-ray is used for the Mössbauer spectroscopy.
The magnetic dipole splitting provides a sensitive tool for the detection of magneti-cally ordered states and makes it possible to measure their properties. The magnetic hyperfine structure thus gives information on Curie temperature and magnetic ordering of the sample.
The quadrupole splitting (QS) depends on the gradient of the electric field produced by the other ions in the lattice. It is related to the point symmetry of the lattice surround-ing the atom under study and yields structural information like the coordination state of the iron. The separation of the two lines of an 57Fe doublet of the QS is determined.
The chemical or isomer shift (IS) measures the charge density of the atomic electrons at the nucleus and is therefore directly related to chemical bonding and covalency (Wer-theim, 1964). It gives information about the oxidation state of iron. The isomer shift is the shift deviating from the center of the spectrum of zero velocity and related to metallic iron. QS and IS are given in mm/s related to the source velocity.
EquipmentMeasurements were performed for one sample group (no. I) by U. and F. Wagner, TU-Munich at room temperature and liquid helium temperature. Another sample group (no. II) was measured by H. Reuter and S. Schlabach, IMF-III at FZK. A description of the method is given by Wagner and Wagner (2004) and detailed experimental description can be found in Wagner and Kyek (2004).Brief description About 300 mg sample of the < 0.2 µm or < 2 µm fraction and the untreated bulk sample material with known bulk iron content is each placed in a sample holder and irradiated by the γ-rays emit-ted by a 57Co source. The Co source is moved with a constant velocity relative to the sample holder and the resulting absorption is detected.
2.2.10 Determination of the structural formula
Before calculating the stoichiometric composition of smectites, it is essential to ensure that the chemical analysis only represents the mineral of interest. Corrections of the XRF data for samples containing cristobalite have to be done as explained above. The error of the method was 0.25 to 0.5% for Si for a sample with 0 - 2% cristobalite and decreases with increasing amount of cristobalite. Concerning TiO2 and P2O5, different assumptions are suggested in literature. Olphen (1962) and Köster (1977) consider TiO2and P2O5 as mineral impurities. Bain and Smith (1992) mention that any Ti present in the analysis of clays most likely occur as anatase. In the absence of direct evidence of a par-
31

2. Materials and Methods
ticular Ti-mineral, the quantity of TiO2 is simply subtracted. Bain and Smith (1992) assume that small amounts of P2O5, SO3 and CO2 are present as unidentified impurities. Only Newman (1987) assigns TiO2 to the octahedral sheet.
The stoichiometric composition of the smectites were calculated using two different methods. One is according to Stevens (1945) or other authors and refers to 22 negative charges. The other method is established by Köster in 1977 and involves the measured layer charge in the calculation. The calculation of Stevens leads to strong differences between measured and calculated layer charge1. There are differences up to 0.2 eq/FU. Nevertheless the method was used for comparisons as most characterizations of smec-tites refer on the calculated and not the measured charge. An example for this difference in calculation is presented in chapter 3.4. In spite that the method of Stevens (1946) is quite common, we prefer the calculation evaluated by Köster (1977). In this method the distribution of the 22 cation charges in tetrahedral, octahedral and interlayer positions are given considering the measured layer charge. A detailed description of the chemical composition for 2:1 clay minerals and their differentiation by charge is given in chapter 1. For the calculation of the stoichiometric composition of smectites Köster (1977) used the measured layer charges. CEC values are not helpful for smectites, as up to 20% of the CEC result from the edges of the smectite minerals. In his method Köster (1977) used relative cation numbers2 and relative cation charges3 (named rKZ and rKL in the original paper). The weight percents of the chemical analysis are performed in rKZ and rKL val-ues. The rKL values correspond to the „equivalents“ of cation used by Bain and Smith (1992). Bain and Smith´s (1992) or Stevens´ (1945) proportionality factor is equivalent to Köster´s factor X = ΣrKL/(22-ξ). In contrast to Köster (1977), Stevens (1945) refers only to 22 anion charges instead of 22 anion charges minus the measured layer charge. Dividing the rKZ and rKL values gives the number of cations per FU and its correspond-ing charges in the framework. To summarize: the necessary data to obtain the structural formula are XRF, measured layer charge, and CEC for a crosscheck. A calculation sheet including both methods for comparisons can be obtained on request via [email protected].
Literature
DIN 51005 (1983) Thermische Analyse, Begriffe. Berlin.Dohrmann, R. (1999) Aufbereitung der Tonminerale - Von der Probe zum Präparat. 2. European
Workshop on Clay Mineralogy, Jena.Drits, V.A., Lindgreen, H., Salyn, A.L., Ylagan, R. and McCarty, D.K. (1998) Semiquantitative
determination of trans-vacant and cis-vacant 2:1 layers in illites and illite-smectites by thermal analysis and X-ray diffraction. American Mineralogist, 83, 1188-1198.
1.In the further text „calculated layer charge“ means the charge obtained by calculation of the structural formula. The „measured layer charge“ is obtained by the alkylammonium method (Laga-ly and Weiss, 1971)2.rKZ = (weight percent oxide * number of cations in oxide * 1000)/molar mass3.rKL = rKZ * charge of cation
32

2. Materials and Methods
Emmerich, K. (2000) Die geotechnische Bedeutung des Dehydroxilierungsverhaltens quell-fähiger Tonminerale. Dissertation, Veröffentlichungen des Instituts für Geotechnik (IGT) der ETH Zurich 135.
Hawthorne, F.C. Mössbauer spectroscopy. 255-340.Hemminger, W.F. and Cammenga, H.K. (1989) Methoden der Thermischen Analyse. Anleitun-
gen für die chemische Laboratoriumspraxis, Springer Verlag, Heidelberg, 299.Hofmann, V. and Klemen, R. (1950) Verlust der Austauschfähigkeit von Lithiumionen aus Ben-
tonit durch Erhitzung. Zeitschrift für Anorganische und Allgemeine Chemie, 262, 95-99.Kaiser, H. and Specker, H. (1956) Bewertung und Vergleich von Analyseverfahren. Z. Anal.
Chem., 149, 46-66.Kaufhold, S., Dohrmann, R., Ufer, K. and Meyer, F.M. (2002) Comparison of methods for the
quantification of montmorillonite in bentonites. Applied Clay Science, 22, 145-151.Köster, H.M. (1977) Die Berechnung kristallchemischer Strukturformeln von 2:1 - Schichtsil-
ikaten unter Berücksichtigung der gemessenen Zwischenschichtladungen und Katione-numtauschkapazitäten, sowie der Darstellung der Ladungsverteilung in der Struktur mittels Dreieckskoordinaten. Clay Minerals, 12, 45-54.
Lagaly, G. (1981) Characterization of clays by organic compounds. Clay Minerals, 16, 1-21.Lagaly, G. (1989) Erkennung und Identifizierung von Tonmineralen mit organischen Stoffen.
Jahrestagung der DTTG, 86-129.Lagaly, G. (1994) Layer Charge Determination by Alkylammonium Ions in Layer charge charac-
teristics of 2:1 silicate clay minerals. Mermut, A. R. (edt.), The Clay Minerals Society, Boulder, 1-46.
Lagaly, G. and Köster, H.M. (1993) Tone und Tonminerale in Tonminerale und Tone. Jasmund, K.et al. (edts.), Steinkopff Verlag, Darmstadt, 1-32.
Lagaly, G. and Weiss, A. (1971) Anordnung und Orientierung kationischer Tenside auf ebenen Silicatoberflächen Teil IV. Kolloid-Zeitschrift und Zeitschrift für Polymere, 243, 48-55.
Lombardi, G. (1980) For better thermal analysis. International Confederation for Thermal Analy-sis (ICTA).
Mehra, O.P. and Jackson, M.L. (1960) Iron oxide removal from soils and clays by a dithionite-citrate-system buffered with sodium bicarbonate. 7th National conference on Clays and Clay Minerals, Washington, D.C., 317-327.
Meier, L.P. and Kahr, G. (1999) Determination of the cation exchange capacity (CEC) of clay minerals using the complexies of Copper (II) ion with Triethylenetetramine and Tretra-ethylenepentamine. Clay and Clay Minerals, 47, 386-388.
Moore, D.M. and Reynolds jr., R.C. (1997) X-ray diffraction and the identification and analysis of clay minerals. 2 ed., University Press, Oxford, 378.
Newman, A.C.D. (1987) Chemistry of Clays and Clay minerals. Mineralogical Society mono-graph, 1 ed., Wiley-Interscience, London, New York, 480.
Niederbudde, E.-A., Stanjek, H. and Emmerich, K. (2002) Tonminerale Methodik in Handbuch der Bodenkunde.
Smykatz-Kloss, W. (1974) Differential Thermal Analysis. Wyllie, P. J. (edt.), Minerals, Rocks and Inorganic Materials, Springer-Verlag, Berlin, 185.
Tributh, H. and Lagaly, G.A. (1986a) Aufbereitung und Identifizierung von Boden- und Lager-stättentonen. I. Aufbereitung der Proben im Labor. GIT Fachzeitschrift für das Labora-torium, 30, 524-529
Tributh, H. and Lagaly, G.A. (1986b) Aufbereitung und Identifizierung von Boden- und Lager-stättentonen. II. Korngrößenanalyse und Gewinnung der Tonsubfraktion. GIT Fachzeitschrift für das Laboratorium, 30, 771-776
Wertheim, G.K. (1964) Mössbauer effect: principles and application. 116.Westfehling, R. (1987) Über den Ladungsnullpunkt von Tonmineralen. Dissertation, Institut für
anorganische Chemie, Christian-Albrechts-Universität, Kiel.
33
2. Materials and Methods
34

3. The complete set of parameters
3. The complete set of parameters
The chemical composition, layer charge and cation exchange capacity have been mea-sured for 28 smectites. The layer charge calculated from the structural formula only based on the chemical composition (Stevens, 1945) is considerably higher than the layer charge measured with the alkylammonium method (Lagaly and Weiss, 1971, Lagaly, 1994). The measured charges are about 30% lower than the calculated. The recalculated cation exchange capacities (CEC) determined from the measured layer charge and the molar mass are consistent with measured CEC values. In contrast, the calculated CEC values determined from the calculated layer charge and the molar mass (Stevens, 1945) are in general too high compared to the measured ones. The potassium test was per-formed for selected samples. As described in literature, there is a tendency of low charged smectites to expand over 17 Å and of those with high charges to loose expend-ability after potassium saturation and ethylene glycol solvation. There is a discrepancy between the expected mean layer charges according to Christidis and Eberl (2003) or Schultz (1969) and the measured layer charges. The expendability did not vary signifi-cantly as a function of layer charge as samples with nearly the same layer charge expanded from 13.5 Å to > 17 Å. The structural formula should be calculated according to Köster (1977).
3.1 Identification of smectites
The smectites were characterized by XRD, layer charge, CEC and XRF measure-ments. The < 2 µm and < 0.2 µm fractions of the samples were analyzed. In most cases, the stoichiometric composition was calculated for the < 0.2 µm fraction. This fraction commonly contains pure smectite whereas the < 2 µm fraction may contain quartz, mica/illite or kaolinite. Nevertheless, some samples showed even in the < 0.2 µm fraction some amount of SiO2, indicated by a reflection at about 4.04 Å typical for opal / cristo-balite (chapter 2.2.6). XRD patterns of textured Na+-saturated samples showed mostly a first basal reflection between 11.3 to 12.6 Å. Low values are due to a dry laboratory atmosphere as the samples expanded with ethylene glycol from 16.8 to 17.1 Å indicating smectite. The samples displayed rational series of the basal reflections. Two samples,
35

3. The complete set of parameters
34M70 and 35B31/32, originating from Montana and Kinnekulle, contained mixed layer illite / smectite.
Sample 34M70 imparts approximately 60% illite and a minor amount of kaolinite. Sample 35B31/32 contains 65% illite which is comparable with literature data (Müller-Vonmoos et al., 1991). These two samples are excluded from the classification as they are not pure smectites.
For samples with a very small shoulder at about 10 Å the existence of mixed layers was tested by saturating the sample with SrCl2. This treatment shifts the first basal spac-ing to 15.4 Å. In case of a pure smectite the shoulder at ~10 Å vanishes. The test indi-cated that the samples were pure smectite.
3.2 Layer charge and cation exchange capacity
Layer charge determination of smectites is important as it is used as one criterion for classification. The mean layer charges for the analyzed smectites range from 0.27 to 0.38 eq/FU.
Comparing the data of the layer charges determined according to Lagaly (1994) with the mean layer charge obtained by rapid estimation of Olis et al. (1990), for most sam-ples the values are equal or differ only up to 0.02 eq/FU. The layer charges and mean layer charges obtained by the two methods are given in Table 3.1.
The charge distributions allow to distinguish three kinds of histograms: Dominating are bimodal distributions, monomodal distributions occur seldom. For some smectites the distribution shows three maxima. Within the bimodal distributions one can differenti-ate between those with a maximum at lower charge densities and those with two almost equivalent frequencies. Figure 3.1 a) and b) present examples for bimodal distributions. Samples 7EMC, 12TR01 and 19USA02 belong to the subgroup with two equivalent weighted frequencies.
Monomodal distributions occur for 6GPC, 28SB, 33CA and 36M650 (Figure 3.2a). For samples 14TR03, 38MW and 41ValC18 it is difficult to classify as mono- or bimodal because three clear peaks were found (Figure 3.2b).
36

3. The complete set of parameters
Table 3.1 Layer charges determined by the alkylammonium method with nc = 4-18 and the mean charge obtained from exchange of alkylammonium with nc = 12. Layer charge is given in equivalents per half unit cell (< 0.2 µm fraction).
Sample no. Layer charge according to Lagaly (1994)
[eq/FU]
Mean layer charge (nc = 12) according to Olis et al.(1990)
[eq/FU]
2LP 0.28 0.29
3, 7th Mayo 0.3 0.31
4JUP 0.29 0.30
5MC 0.28 0.28
6GPC 0.33 0.34
7EMC 0.28 0.29
8UAS 0.34 0.33
12TR01 0.36 0.38
13TR02 0.35 0.37
14TR03 0.37 0.38
16GR01 0.31 0.31
17GR02 0.29 0.3
18USA01 0.27 0.28
19USA02 0.30 0.31
21D01 0.29 0.31
24Beid* n.d. 0.38
25 Volclay* n.d. 0.27
26-27 Valdol C14* n.d. 0.27
28SB 0.36 0.39
31BAR3 0.32 0.32
32Volclay 0.27 0.27
33CA 0.30 0.30
36M650 0.3 0.30
37BB 0.28 0.26
38MW 0.27 0.26
39GQ-I 0.35 0.37
41ValC18 0.31 0.37
42Linden*
* < 2µm fraction
0.32 n.d.
37

3. The complete set of parameters
The CEC values measured by the copper complex exchange (Meier and Kahr, 1999) were obtained from bulk material and the < 2 µm and < 0.2 µm fraction. The bulk mate-rial gave the lowest CEC values. This corresponds to the amount of smectite in the sam-ple and accessory minerals. For most samples the increase of the CEC to the < 2 µm and to < 0.2 µm fraction (Table 3.2) is due to further enrichment of smectite. However, some < 0.2 µm samples show lower CEC values than their corresponding < 2 µm fraction. This behavior was found in other studies (Kaufhold et al., 2002) but can not be explained
Figure 3.1 Example for bimodal charge distributions with a) the maximum at lower charge densities and b) with similar maxima of cation densities.
Figure 3.2 Example for a) monomodal charge distribution and b) for „trimodal“ charge distributions.
a) b)
38

3. The complete set of parameters
yet. Jasmund and Lagaly (1993) documented the different charge densities for smectites in various particle size fractions. It is possible that some samples in the < 0.2 µm fraction are composed of lower charged layers compared to the < 2 µm fraction.
Table 3.2 CEC values obtained by copper triethylenetetramine exchange.
Sample no. CEC bulk material [meq/100 g]
CEC < 2 µm fraction [meq/100 g]
CEC < 0.2µm fraction [meq/100 g]
2LP 91 96 94
3, 7th Mayo 77 89 89
4JUP 70 81 91
5MC 69 85 81
6GPC 48 58 75
7EMC 62 69 73
8UAS 81 101 97
12TR01 79 91 99
13TR02 103 112 113
14TR03 119 122 112
16GR01 95 102 101
17GR02 54 63 73
18USA01 84 91 93
19USA02 76 94 98
21D01 73 87 85
24Beid n.d.* 101 n.d.
25Volclay n.d.* 87 n.d.
26Valdol n.d.* 83 n.d.
28 B 75 95 102
31BAR 3 77 87 97
32Volclay 85 88 81
33CA 63 75 87
36M 650 71 87 77
37BB 78 90 89
38MW 89 86 84
39G Q-I 95 108 109
41Val C18 54 84 85
42Linden n.d.* 103 n.d.
39

3. The complete set of parameters
3.3 Analytical composition
The chemical formulae were determined using the method proposed by Köster (1977). Based on the assumption of 22 negative charges [O10(OH)2], the measured layer charge determined by the alkylammonium method is included. On average, the smectites have a molar mass of 375 g/mol. All smectites of the montmorillonite-beidellite series are specified having substitution in both, the tetrahedral and the octahedral sheet. Sam-ples 5MC, 8UAS, 13TR02, 14TR03, 16GR01, 18USA01, 25Volcay, 31BAR3 and 32Volclay contain less then 0.05 mol/FU tetrahedral Al3+. The part of tetrahedral charge due to substitution does not exceed 15% in these samples. In the octahedral sheet, as usual for montmorillonites, Mg2+ is dominant. When the content of iron exceeds 0.3 mol/FU it becomes the dominant substituting element. Sample numbers 3, 4, 26, 33, 36, 37, 38 and 41 show a ratio of 1.1 to 2.5 of Fe/Mg. Table 3.3 presents the composition of all samples.
Homoionic saturation with Na+ has been carried out successful as none of the Na+
treated samples contained Ca2+ as interlayer cation. The XRF analyzes revealed CaO values < 0.05%. Potassium remained in the interlayer space below 0.1 mol/FU. Only sample 6GPC shows 0.11 mol/FU K+. Most analyzed smectites display an octahedral filling exceeding 2 mol/FU. Usually it does not exceed 2.07 mol/FU, only two samples showed values below 2 mol/FU. In conformance with these results Köster (1977) declares as common structural formula for 2:1 clay minerals:
Me+x+y-2w Me2+
w {(Me3+2-y Me2+
y+3z)2+z [Me3+x Si4-x O10 (OH,F)2]}
Magnesium substitution (Mg2+ for Al3+) in the octahedral sheet is responsible for trio-ctahedral domains because of possible clustering. This population > 2.07 mol/FU leads to further compensation of negative charge and might be one reason for the difference of measured and calculated layer charge (Figure 3.3). In 1983 Brigatti showed that the assumption of 2 mol/FU in the octahedral sheet is incorrect regarding the b-values derived from d (060).
The chemical formula of all samples were also calculated according to Stevens (1945). Octahedral cation populations varied between 1.93 and 2.05 mol/FU but were mostly below 2.0. All plots illustrated in this work refer to the data calculated according to Köster (1977).
40

3. The complete set of parameters
Tabl
e 3.
3St
ruct
ural
fom
ulae
cal
cula
ted
from
XR
F ba
sed
on O
10(O
H) 2
(Kös
ter,
1977
). To
tal i
ron
cont
ent w
as d
eter
min
ed a
s Fe3+
(< 0
.2 µ
m fr
actio
n).
Sam
ple
no.
IVSi
4+IV
Al3+
VI A
l3+V
I Fe3 +
VI M
g2+Σ
OC
a2+N
a+K
+m
olar
m
ass
2LP
3.93
0.07
1.52
0.22
0.28
2.02
0.00
0.28
0.01
373.
21
3, 7
th
May
o3.
910.
091.
370.
350.
312.
030.
000.
270.
0437
8.08
4 JU
P 3.
840.
161.
450.
390.
192.
030.
000.
230.
0237
7.77
5MC
3.96
0.04
1.36
0.32
0.34
2.02
0.00
0.31
0.01
376.
66
6GPC
3.87
0.13
1.4
0.31
0.33
2.04
0.00
0.22
0.12
379.
07
7EM
C3.
900.
101.
590.
160.
32.
060.
000.
240.
0037
0.49
8UA
S3.
990.
011.
410.
170.
452.
030.
000.
360.
0137
3.49
12TR
013.
940.
061.
560.
070.
412.
040.
000.
340.
0137
0.47
13TR
023.
980.
021.
360.
170.
542.
070.
000.
340.
0137
3.86
14TR
033.
990.
011.
420.
090.
562.
070.
000.
360.
0037
1.58
16G
R01
3.97
0.03
1.58
0.09
0.35
2.02
0.00
0.31
0.00
369.
62
17G
R02
3.90
0.10
1.65
0.09
0.29
2.03
0.00
0.30
0.00
369.
74
18U
SA01
3.96
0.04
1.51
0.21
0.31
2.03
0.00
0.25
0.01
372.
46
19U
SA02
3.95
0.05
1.42
0.29
0.31
2.02
0.00
0.29
0.00
375.
02
41

3. The complete set of parameters
21D
013.
910.
091.
390.
310.
342.
040.
000.
230.
0337
5.52
24B
eid*
3.70
0.30
1.8
0.01
0.24
2.05
0.00
0.38
0.00
369.
72
25Vo
lcla
y*3.
970.
031.
590.
180.
232.
000.
000.
250.
0137
1.01
26-2
7 Va
l-do
l C14
*3.
900.
101.
300.
410.
352.
060.
000.
170.
0938
0.16
28SB
3.93
0.07
1.36
0.23
0.47
2.06
0.00
0.30
0.06
376.
49
31B
AR
33.
990.
011.
360.
290.
382.
030.
000.
250.
0437
5.79
32Vo
lcla
y3.
970.
031.
590.
180.
222.
010.
000.
270.
0137
0.17
33C
A3.
930.
071.
540.
30.
121.
960.
000.
220.
0837
5.69
36M
650
3.81
0.19
1.32
0.46
0.29
2.07
0.00
0.23
0.03
380.
96
37B
B3.
880.
121.
190.
580.
282.
050.
000.
240.
0138
3.44
38M
W3.
870.
131.
340.
430.
282.
050.
000.
250.
0137
9.33
39G
-I3.
940.
061.
350.
240.
452.
040.
000.
360.
0337
6.51
41Va
lC18
3.86
0.14
1.25
0.45
0.37
2.07
0.01
0.20
0.09
382.
57
42Li
nden
*3.
950.
051.
460.
180.
392.
030.
000.
350.
0037
3.28
* <
2 µm
frac
tion
Tabl
e 3.
3St
ruct
ural
fom
ulae
cal
cula
ted
from
XR
F ba
sed
on O
10(O
H) 2
(Kös
ter,
1977
). To
tal i
ron
cont
ent w
as d
eter
min
ed a
s Fe3+
(< 0
.2 µ
m fr
actio
n).
Sam
ple
no.
IVSi
4+IV
Al3+
VI A
l3+V
I Fe3 +
VI M
g2+Σ
OC
a2+N
a+K
+m
olar
m
ass
42

3. The complete set of parameters
3.4 Discrepancies between theoretical and measured charge densities and CEC values
Determining the layer charge of smectites is still a difficult and time consuming task. Various trails were made to measure layer charges with faster methods (Olis et al., 1990, Christidis and Eberl, 2003). However, for an exact determination of the layer charge and charge distribution the alkylammonium method is still appropriate. The potassium test, which was recently renewed by Christidis and Eberl (2003), is discussed in chapter 3.5. Even today, in most cases the average layer charge is derived from chemical formula cal-culated from the chemical analysis. Layer charges determined by this method are on an average about 28% higher than those obtained by the alkylammonium method (Figure 3.3 and Table 3.4).
An extreme difference of 50% was found for sample 26/27ValdolC14. Similar differ-ences are documented by Laird et al. (1989). The authors claimed for an inaccurate esti-mate for packing density of the alkylammonium cations in the interlayer space.
Most of the analyzed smectites have between 10 to 50% charge located in the tetrahe-dral sheet. Sample 8UAS has a tetrahedral charge of 3%, increasing up to 10% for sam-ples 14, 31 13, 16 to 32. Samples 4, 36 and 24 exhibit more than 50% of the tetrahedral charge. The Unterrupsrath Beidellite (24) has a tetrahedral charge of 77% (Table 3.4).
Figure 3.3 Layer charge determined by the alkylammonium method and layer charge cal-culated from the chemical composition
43

3. The complete set of parameters
Table 3.4 Discrepancies in measured and calculated layer charges determined according to Stevens (1945) and by the calculation of Köster (1977). Location of charge was evaluated by the calculation according to Köster (1977) (< 0.2 µm fraction).
Sample no. measuredξ
[eq/FU]
mean ξ
(Olis et al. 1990) [eq/FU]
calculatedξ
(Köster, 1977)
[eq/FU]
calculatedξ
(Stevens, 1946)
[eq/FU]
tetrahe-dral
ξ
[eq/FU]
octahe-dral
ξ
[eq/FU]
tetrahe-dral
ξ
[%]
2LP 0.28 0.29 0.29 0.37 0.07 0.22 24
3 7th Mayo 0.30 0.31 0.31 0.42 0.09 0.22 29
4JUP 0.29 0.30 0.26 0.37 0.16 0.10 62
5MC 0.28 0.28 0.32 0.40 0.04 0.28 13
6GPC 0.33 0.34 0.34 0.45 0.13 0.21 38
7EMC 0.28 0.29 0.25 0.40 0.10 0.15 40
8UAS 0.34 0.33 0.37 0.48 0.01 0.36 3
12TR02 0.36 0.38 0.35 0.42 0.06 0.29 17
13TR02 0.35 0.37 0.35 0.48 0.02 0.33 6
14TR03 0.37 0.38 0.36 0.47 0.01 0.35 3
16GR01 0.31 0.31 0.32 0.40 0.03 0.29 9
17GR02 0.29 0.3 0.30 0.38 0.10 0.20 33
18USA01 0.27 0.28 0.26 0.41 0.04 0.22 15
19USA02 0.30 0.31 0.30 0.39 0.05 0.25 17
21D01 0.29 0.31 0.31 0.42 0.09 0.22 29
24Beid* n.d. 0.38 0.39 0.54 0.30 0.09 77
25Volclay* n.d. 0.27 0.26 0.45 0.03 0.23 12
26-27* ValdolC14
n.d. 0.27 0.27 0.55 0.10 0.17 37
28SB 0.36 0.39 0.36 0.47 0.07 0.29 19
31BAR3 0.32 0.32 0.30 0.41 0.01 0.29 3
32Volclay 0.27 0.27 0.28 0.39 0.03 0.25 11
33CA 0.30 0.30 0.31 0.42 0.07 0.24 23
36M650 0.30 0.30 0.27 0.34 0.19 0.08 70
37BB 0.28 0.26 0.25 0.42 0.12 0.13 48
38MW 0.27 0.26 0.26 0.37 0.13 0.13 50
39GQ-I 0.35 0.37 0.39 0.41 0.06 0.33 15
41ValC18 0.31 0.37 0.30 0.45 0.14 0.16 47
42Linden* 0.32 n.d. 0.35 0.36 0.05 0.30 14
* < 2 µm fraction
44

3. The complete set of parameters
Kaufhold et al. (2002) developed a method for the quantification of the montmorillo-nite content in bentonites. Also, the layer charge was calculated with some assumptions. The method requires the pH independent CEC, quantitative determination of the mont-morillonite content and the average molar mass. The obtained layer charges are similar to the measured ones. This supports the accuracy of the alkylammonium method in con-trast to Laird et al. (1989).
A comparison of calculated and measured layer charges supports the accuracy of the structural formula calculation of Köster (1977). Calculated CEC values differ from mea-sured CEC values for both of the structural formula calculations. CEC values calculated with the theoretical layer charge and the molar mass derived from structural formula according to Stevens (1945) are generally higher compared to the measured CEC values. However, the calculated CEC values are expected to be lower than the measured values. Approximately 10 to 20% of the charge is located at the edges of the smectite minerals (Lagaly, 1981, Kaufhold et al., 2002). The CEC values calculated in accordance with Köster (1977) satisfy this condition (Figure 3.4).
The structural formula for the smectites was recalculated based on Kaufhold et al. (2002) and Köster (1977) involving the measured CEC values instead of the measured layer charges. Köster (1977) proposed to involve the layer charge because of the vari-able, pH-depending charge at the edges of smectites. Nevertheless, we calculated the structural formulae on the basis of measured CEC assuming 80% permanent charge as starting point for the calculation. Unfortunately the contribution of permanent layer charges varies from smectite to smectite. The resulting calculated layer charge differed
Figure 3.4 Discrepancies between measured and calculated CEC in meq/100g using the chemical formulas calculated according to Stevens (1945) and to Köster (1977).
45

3. The complete set of parameters
therefore for some samples from the actually measured layer charge. For these cases the CEC (permanent) had to be adjusted until the values of the measured charge were reached.
It should be possible to calculate the layer charge with accuracy using the permanent CEC and the chemical composition. Determination of the part of permanent charge can be done based on Kaufhold et al. (2003).
Exemplarily the various results of CEC and layer charge calculations are presented for sample 37BB in Table 3.5. The influence on the stoichiometric composition is quite visible for this example. The influence on layer charge and CEC is important for all sam-ples. The calculated values approaching to Stevens´ (1945) are by far too high compared to those structural formula calculations according to Köster (1977).
Stoichiometric composition for sample 37BB is given as:
Me+0.25 (Si3.88 Al3+0.12) (Al3+
1.19 Al3+0.58 Mg2+
0.28) [O10 (OH)2] (Köster, 1977)
Me+0.41 (Si3.85 Al3+
0.15) (Al3+1.15 Al3+
0.58 Mg2+0.27) [O10 (OH)2] (Stevens, 1945)
Measured data in Table 3.5 are obtained for CEC by exchange with the Cu2+- complex and for layer charge by the exchange with alkylammonium ions. Calculated data were obtained according to Stevens (1949) and to Köster (1977). Based on XRF are the CEC values and the calculated layer charge according to Stevens (1945). The CEC calculated according to Köster (1977) is derived from XRF and measured layer charge.
.
3.5 Potassium-test
The potassium-test was included as a rapid method to estimate the layer charge of smectites. Grim and Kulbicki (1961) demonstrated that the behavior of smectites treated with potassium chloride is different for the two types of bentonites they had defined. Due to the different behavior they concluded that low charged smectites still expand over 17 Å with ethylene glycol solvation but high charged samples expand to about 15 Å. They treated the samples for 2 h at 100 °C. Later Schultz (1969) carried out the test treat-ing the samples at 300 °C. He defined three groups:
Table 3.5 Influence of different calculations of the structural formula on the calculated cat-ion exchange capacities for sample 37BB.
parameter measured dataevaluation, calculated data
Stevens (1945) Köster (1977)
CEC [meq/100g] 86 109 73
layer charge [eq/FU] 0.28 0.42 0.25
46

3. The complete set of parameters
• Smectites with a greater charge than 0.75 eq/2FU expand to 17 Å with a rational series of basal spacings.
• Smectites with a charge between 0.75 and 0.85 eq/2FU expand to 17 Å with an irrational series of basal reflections.
• Reexpansion (13 - 16 Å) is limited for samples with a layer charge > 0.85 eq/2FU.Christidis and Eberl (2003) involved the same parameters but different borders and
the samples were not heated in their investigation. As varying measurement conditions are mentioned in literature we investigated the
samples under the different conditions. The smectites were treated with KCl in amounts 20 times the average CEC of 100 meq/100 g and the dispersions were dialyzed after-wards to remove excess salts. The chloride free solutions were prepared on glass slides and treated at room temperature, 100 °C and 300 °C before XRD measurements. After-wards each sample was recorded ethylene glycol solvated.
As expected, the various temperatures gave different expansion values (Figure 3.5). Especially the samples heated to 300 °C collapsed in most cases. Higher temperatures yielded in general lower basal spacings. Only sample 17GR02 expanded above 17 Å with ethylene glycol when heated to 300 °C, whereas samples 2, 3, 4 and 18 expanded at air and EG treatment. Samples 16, 17 and 19 displayed even higher d (001) values after 300°C heating than the air dried samples. The reason for this is not clear.
Figure 3.5 Basal reflections of potassium saturated samples at various temperatures and EG solvations.
d (0
01) Å
47

3. The complete set of parameters
Brindley and Brown (1980) documented that beidellite shows basal spacings below 14 Å after K+-saturation and EG solvation. Therefore, this test is probably restricted to pure montmorillonites. The presence of tetrahedral charge is assumed to favour irrevers-ible collapse of smectite layers after K+-saturation (Calarge et al. 2003). This could not be confirmed for our investigated samples. For example sample 4JUP with a tetrahedral charge of 62% expanded to 17.3 Å. In contrast sample 16GR01 collapsed after potas-sium treatment though its tetrahedral charge was only 9% (Table 3.6). Horváth and Novak (1975) stated that there is no relation between the amount of the fixed potassium and the value of tetrahedral charge.
Figure 3.6 presents samples which seem to match the system ofChristidis and Eberl (2003). One could think that samples 2 and 17, which expand above 17 Å belong to low charged smectites. But the coefficient of variance (Moore and Reynolds, 1997) gave, even for these samples, values far above 0.75 (Table 3.6). The coefficient of variation gives information on the interstratification respective mixed layering of clay minerals. The series of basal reflections is rational when periodic spacing obeys the Bragg´s Law nλ = 2dsinθ with integral series of d. The coefficient of variation can be calculated by means of the standard deviation of the reflections normalized by their order. CV is defined as (100 * stdev) / mean. Any series with a CV > 0.75% is defined as non-integral or irrational (Moore and Reynolds, 1997).
Regarding the defined regions for layer charges of Christidis and Eberl (2003), sam-ples 17GR02, 2LP, 18USA01, 3 7th Mayo, 4JUP, 19USA02, 21D01 and 31BAR3 would
Figure 3.6 Potassium saturated samples (<0.2µm fraction), air dried ethylene glycol sol-vated. Measurement conditions: Cu Kα, 3s, 0.02 steps, 2-35°2Θ.
48
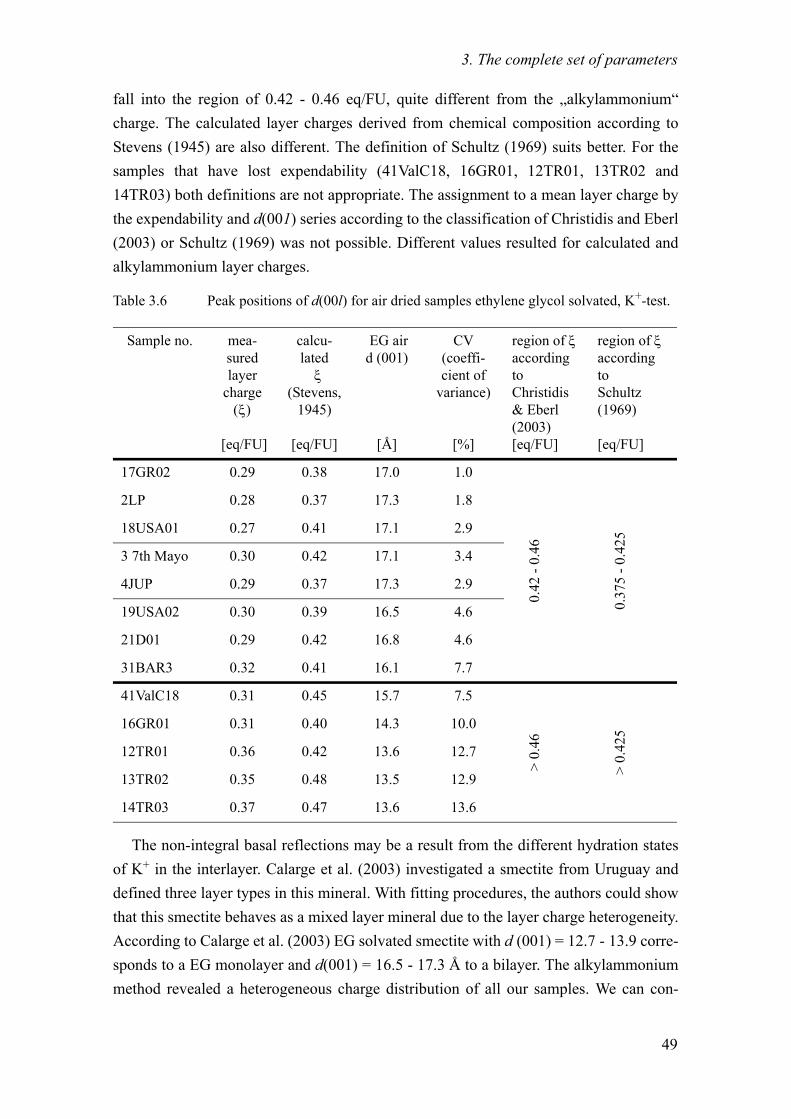
3. The complete set of parameters
fall into the region of 0.42 - 0.46 eq/FU, quite different from the „alkylammonium“ charge. The calculated layer charges derived from chemical composition according to Stevens (1945) are also different. The definition of Schultz (1969) suits better. For the samples that have lost expendability (41ValC18, 16GR01, 12TR01, 13TR02 and 14TR03) both definitions are not appropriate. The assignment to a mean layer charge by the expendability and d(001) series according to the classification of Christidis and Eberl (2003) or Schultz (1969) was not possible. Different values resulted for calculated and alkylammonium layer charges.
The non-integral basal reflections may be a result from the different hydration states of K+ in the interlayer. Calarge et al. (2003) investigated a smectite from Uruguay and defined three layer types in this mineral. With fitting procedures, the authors could show that this smectite behaves as a mixed layer mineral due to the layer charge heterogeneity. According to Calarge et al. (2003) EG solvated smectite with d (001) = 12.7 - 13.9 corre-sponds to a EG monolayer and d(001) = 16.5 - 17.3 Å to a bilayer. The alkylammonium method revealed a heterogeneous charge distribution of all our samples. We can con-
Table 3.6 Peak positions of d(00l) for air dried samples ethylene glycol solvated, K+-test.
Sample no. mea-sured layer
charge (ξ)
[eq/FU]
calcu-lated ξ
(Stevens, 1945)
[eq/FU]
EG air d (001)
[Å]
CV (coeffi-cient of
variance)
[%]
region of ξ according to Christidis & Eberl (2003) [eq/FU]
region of ξ according to Schultz (1969)
[eq/FU]
17GR02 0.29 0.38 17.0 1.0
0.42
- 0.
46
0.37
5 - 0
.425
2LP 0.28 0.37 17.3 1.8
18USA01 0.27 0.41 17.1 2.9
3 7th Mayo 0.30 0.42 17.1 3.4
4JUP 0.29 0.37 17.3 2.9
19USA02 0.30 0.39 16.5 4.6
21D01 0.29 0.42 16.8 4.6
31BAR3 0.32 0.41 16.1 7.7
41ValC18 0.31 0.45 15.7 7.5
> 0.
46
> 0.
42516GR01 0.31 0.40 14.3 10.0
12TR01 0.36 0.42 13.6 12.7
13TR02 0.35 0.48 13.5 12.9
14TR03 0.37 0.47 13.6 13.6
49

3. The complete set of parameters
clude that the non-integral basal reflections are therefore caused by the charge heteroge-neity.
Nevertheless, there is a relation between the coefficient of variation and the measured layer charge. Figure 3.7 a) presents the relation between layer charge and the basal reflection of the K+-saturated EG-solvated samples. With increasing layer charge the d(001) decreases. Figure 3.7 b) shows the relation between the layer charge and the coef-ficient of variation. With increasing layer charge the coefficient of variation increases. The relation between the coefficient of variation and the measured layer charge is better than the calculated layer charge. Both graphs in Figure 3.7 indicate the low regression coefficient1 of R² = 0.57 (a) and R² = 0.50 (b) and thus a low significance of the calcu-lated layer charge. In contrast, a high significance appears for the measured n-alkylam-monium layer charge (R² = 0.78 and 0.82, respectively). We conclude that the potassium test should be compared to measured layer charges (determined by the alkylammonium method) rather than to the calculated values obtained from chemical formula.
With regard to these results, the K+-test borderlines for layer charges must be modi-fied (Table 3.7). Expansion values for d(001) = 16.5 - 17.3 Å due to 2EG layers (Calarge et al., 2003) and coefficient of variation below 5 are typical for smectites with a layer charge < 0.3 eq/FU. Samples with a layer charge > 0.35 eq/FU exhibit d(001) < 14 Å which corresponds to the one EG layer according to Calarge et al. (2003).
1.R2 is the coefficient of multiple determination. It is the fraction of total variation of Y which is explained by the regression R2= SSregression/SStotal. It ranges from 0 (no explanation of the va-riation) to 1 (a perfect explanation). For each term if P < 0.05, that term was a significant source of Y's variation: [*] P = 0.05-0.01; [**] P = 0.01-0.001, [***] P < 0.001; P > 0.05 = not significant.
Figure 3.7 a) Basal spacings and b) coefficient of variance of potassium saturated samples related to measured and calculated layer charges.
a) b)
50

3. The complete set of parameters
Conclusion: The definition of montmorillonite should be based on the measured layer charges and not, as commonly used, the calculated charges derived from chemical for-mula. Involving the measured layer charges in the formula calculations as proposed by Köster (1977) reveals more reliable values of the cation exchange capacities when calcu-lated from the chemical formula. This CEC can differ up to 20% from the measured CEC and is, as expected, lower than the measured one. Comparing the data of the layer charges determined according to Lagaly (1994) with the mean layer charge obtained by the rapid estimation of Olis et al. (1990), the values of most samples are equal or differ up to 0.02 eq/FU. Only for very low layer charges, the estimation of Olis et al. (1990) gives much too high values. Thus, the rapid estimation of the layer charge by the method of Olis et al. (1990) remains the better alternative compared to the potassium test.
Literature
Brigatti, M.F. (1983) Relationship between composition and structure in Fe-rich smectites. Clay Minerals, 18, 177-186.
Brindley, G.W. and Brown, G. (1980) Crystal structures of clay minerals and their x-ray identifi-cation. Mineralogical Society, London, 495.
Calarge, L., Lanson, B., Meunier, A. and Formoso, M.L. (2003) The smectitic minerals in a ben-tonite deposit from Melo (Uruguay). Clay Minerals, 38, 25-34.
Christidis, G.E. and Eberl, D.D. (2003) Determination of layer-charge characteristics. Clays and Clay Minerals, 51, 644-655.
Grim, R.E. and Kulbicki, G. (1961) Montmorillonite: High Temperature Reactions and Classifi-cation. The American Mineralogist, 46, 1329-1369.
Horváth, I. and Novak, I. (1975) Potassium fixation and the charge of the montmorillonite layer. Proceedings of the International Clay Conference, 185-189.
Jasmund, K. and Lagaly, G. (1993) Tonminerale und Tone. Steinkopff Verlag, Darmstadt, 490.Kaufhold, S., Dohrmann, R., Ufer, K. and Meyer, F.M. (2002) Comparison of methods for the
quantification of montmorillonite in bentonites. Applied Clay Science, 22, 145-151.Köster, H.M. (1977) Die Berechnung kristallchemischer Strukturformeln von 2:1 - Schichtsil-
ikaten unter Berücksichtigung der gemessenen Zwischenschichtladungen und Katione-numtauschkapazitäten, sowie der Darstellung der Ladungsverteilung in der Struktur mittels Dreieckskoordinaten. Clay Minerals, 12, 45-54.
Lagaly, G. (1981) Characterization of clays by organic compounds. Clay Minerals, 16, 1-21.Lagaly, G. (1994) Layer Charge Determination by Alkylammonium Ions in Layer charge charac-
teristics of 2:1 silicate clay minerals. Mermut, A. R. (edt.), The Clay Minerals Society,
Table 3.7 Borderlines of layer charge regions based on the K+-test.
low charged intermediate „high“charged
[eq/FU] 0.2-0.3 0.3-0.35 > 0.35
b. sp. *1[Å] > 16.3 14 ~ 16.3 < 14
CV *2 [%]
* 1: b. sp. = basal spacing recorded at room temperature and EG solvated 2: CV = coefficient of variation
< 5 5 - 12 > 12
51

3. The complete set of parameters
Boulder, 1-46.Laird, D.A., Scott, A.D. and Fenton, T.E. (1989) Evaluation of the alkylammonium method of
determining layer charge. Clays and Clay Minerals, 37, 41-46.Meier, L.P. and Kahr, G. (1999) Determination of the cation exchange capacity (CEC) of clay
minerals using the complexies of Copper (II) ion with Triethylenetetramine and Tretra-ethylenepentamine. Clay and Clay Minerals, 47, 386-388.
Moore, D.M. and Reynolds jr., R.C. (1997) X-ray diffraction and the identification and analysis of clay minerals. 2 ed., University Press, Oxford, 378.
Müller-Vonmoos, M., Bucher, F., Kahr, G. and Mayor, P.-A. (1991) Wechsellagerungen und Quellverhalten von Kalium-Bentoniten. Technischer Bericht 91-13, NAGRA, 44.
Müller-Vonmoos, M., Kahr, G. and Madsen, F.T. (1989) Bestimmung der Zwischenschichtladung von Smectit-Illit-Wechslellagerungen in Kalium-Bentoniten. Beiträge der Deutschen Ton- und Tonmineralogiegruppe, Gießen.
Olis, A.C., Malla, P.B. and Douglas, L.A. (1990) The rapid estimation of the layer charges of 2:1 expanding clays from a single alkylammonium ion expansion. Clay Minerals, 25, 39-50.
Schultz, L.G. (1969) Lithium and potassium absorption, dehydroxylation temperature and struc-tural water content of aluminous smectites. Clays and Clay Minerals, 17, 115-149.
Stevens, R.E. (1945) A system for calculating analyses of micas and related minerals to end members. U.S. Geol. Survey Bull., 950, 101-119.
52

4. Thermal reactions of smectites and cv - tv ratios
4. Thermal reactions of smectites and cv - tv ratios
To define minerals of the smectite group comprehensively, their octahedral structure has to be known; a tool to characterize the minerals of the smectite group regarding chemistry and structure is necessary. This chapter summarizes results of the determina-tion of cis- and trans-vacant parts in mixtures of known smectites. This tool was after-wards used to determine the octahedral structure of natural smectite samples.
Güven (1988) reviewed the structure of di- and trioctahedral smectites based on the classifications made by Grim and Kulbicki (1961), Schultz (1969) and Brigatti (1983). The knowledge about the location of the cations in the smectite structure and the distri-bution of the cations in the octahedral sheet is important for a classification of smectites. As smectites show turbostratic disorder, their octahedral structure cannot be determined by XRD as it is possible for illites.
In the past, dehydroxylation of illites at 500 °C and dehydroxylation of montmorillo-nites at 700 °C was designated „normal“ or „typical“ or „ideal“. A different behavior was called „abnormal“, „untypical“ or „non-ideal“ (Cole, 1955, Cole and Hosking, 1957, Heller et al., 1962, Greene-Kelly, 1966). „Abnormal“ illites dehydroxylate at 700 °C and „abnormal“ smectites at 500 °C. Drits et al. (1995) showed that the dehydroxylation tem-perature corresponds to the structure of the octahedral layer of all dioctahedral 2:1 clay minerals. Cis-vacant (cv) minerals dehydroxylate at 700 °C and trans-vacant (tv) variet-ies dehydroxylate at 500 to 550 °C. Hence, thermal analysis provides information on the structure of the octahedral sheet. The boundary between cis-vacant and trans-vacant lies at about 600 °C (peak temperature) according to Drits et al. (1998) under standard condi-tions (see chapter 2.2.8). STA also provides information on the interaction between inter-layer water/cation and structural water. The dehydroxylation peak temperature depends on the structural arrangement of cations in the octahedral sheet in smectites.
In this study, STA was used to calculate the ratio of cis - and trans-vacancies in smec-tites by determining the peak areas of the evolved water curves. First, the method was tested with defined mixtures and afterwards applied to the < 0.2 µm fractions of the sam-ples under investigation. Peak fitting evidenced that pure cis-vacant samples are found but seldom. Most abundant are mixtures of cis- and trans-vacancies with emphasis on cis-vacancies. Pure trans-vacant samples were not found in our series of samples.
53

4. Thermal reactions of smectites and cv - tv ratios
4.1 Theory
4.1.1 Thermal reactions of smectites
Smectites display four characteristic reactions. Dehydration, dehydroxylation, decom-position and recrystallisation (Niederbudde et al., 2002). During dehydration adsorbed water from outer surface and interlayer water from inner surfaces desorbed in an endot-hermic reaction between room temperature and 300 °C (Mackenzie, 1970; Greene-Kelly, 1966). Above 400 °C dehydroxylation takes place as endothermic reaction. Structural water from two hydroxyl groups migrate out of the mineral structure according to the reaction . On the one hand the structure of the octahedral sheet, cis-vacant and trans-vacant varieties, leads for aluminous 2:1 clay minerals to different dehydroxylation temperatures. On the other hand the bonding of the hydroxyl groups affects the endothermic peak position. The dehydroxylation temperature increases as Fe-OH < Al-OH < Mg-OH (Köster and Schwertmann, 1993). Ferrigenious 2:1 clay minerals like nontronites release structural water between 450 and 600 °C and aluminous 2:1 clay minerals between 500 and 700 °C (Niederbudde et al., 2002). Trioctahedral minerals like saponite show dehydroxylation temperatures between 750 and 850 °C. Decomposition and recrystallisation reveal varying intensities and sometimes only one of the two reac-tions is observed. Decomposition (endothermic reaction) and recrystallisation (exother-mic reaction) take place between 850 and 950 °C.
Figures 4.1 and 4.2 present examples of the thermal reactions of mainly cis-vacant and trans-vacant montmorillonites. Both samples dehydrate at about 150 °C. The reac-tion is completed at 300 °C. Some of the purified < 0.2 µm fraction samples displayed an exothermic reaction near 300 °C which was not detected in the bulk sample material. Description of small amounts of CO2 in MS curves indicated organic matter which was probably not completely during the purification of the smectite.
In sample 2LP (Figure 4.1), a cis-vacant variety, only two steps for mass loss are recorded whereas the trans-vacant variety 41ValC18 displays three distinct mass changes (Figure 4.2). At about 600 °C the TG curve exhibits two levels of mass loss for the mixed trans-vacant mineral with lower amounts of cis-vacancies.
In general, decomposition / recrystallisation reactions were detected above 800 °C at varying temperature. These reactions are not accompanied by further mass change or release of gas. The mass spectrometer curves of evolved water (m/e=18) were used within the region 300-900 °C to discriminate cis-and trans-vacant parts. The procedure is described in chapter 4.2.
2 OH( ) H2O Or+→
54

4. Thermal reactions of smectites and cv - tv ratios
Figure 4.1 Example for a cis-vacant variety of a smectite. Sample 2LP, < 0.2 µm fraction. (DSC: solid line, TG: dashed line, m/e = 18: remaining line)
Figure 4.2 Example for a trans-vacant variety of a smectite. Sample 41ValC18, < 0.2 µm fraction. (DSC: solid line, TG: dashed line, m/e = 18: remaining line)
-60
-50
-40
-30
-20
-10
0
DSC /uV
86
88
90
92
94
96
98
100
TG /%
100 200 300 400 500 600 700 800 900 1000Temperatur /°C
0
0.2
0.4
0.6
0.8
1.0
1.2
1.4
Ionenstrom *10-10 /A
m18
DSC
TG
147 °C
678 °C
871 °C
925 °C
-14.52 %
-9.94 %
-4.58 %
146 °C
680 °C
[6]
[6][7][9]
↑ Exo
temperature / °CEGAunits
0.2
0.4
0.6
0.8
1.0
1.2
Ionenstrom *10-10 /A
100 200 300 400 500 600 700 800 900 1000Temperatur /°C
-50
-40
-30
-20
-10
DSC /uV
88
90
92
94
96
98
100
TG /%
m18
DSC
TG
151 °C
555 °C 607 °C
855 °C
889 °C
-12.83 %
-8.07 %
-3.22 %
-1.54 %
148 °C
556 °C 646 °C
[6]
[6][12]
↑ Exo
temperature/ °CEGA units
55

4. Thermal reactions of smectites and cv - tv ratios
4.1.2 Structure of the octahedral sheet
To explain the different dehydroxylation behavior we need to understand the cis- and trans-isomers of an octahedra. A cis- or trans-position is defined by the position of the hydroxyl groups (Figure 4.3). At the trans octahedron (Figure 4.3 a) the two hydroxyl groups are positioned at opposite corners. The cis-position (Figure 4.3 b) is characterized by two hydroxyl groups at one edge.
The 2:1 clay minerals can either be di- or trioctahedral. For the trioctahedral ones all three octahedra of a formula unit are occupied, commonly with magnesium. For the dio-ctahedral ones only two of the three sites are occupied (for example by aluminium) and so vacancies remain in the octahedral sheet.
Figure 4.4 shows a projection of an octahedral sheet of a cis- and a trans-vacant vari-ety of a dioctahedral 2:1 clay mineral. There exist one trans- and two cis-positions (fig-ure 4.4 c). In older literature M1 is used for trans-position and M2 for cis-position. The terms cis- and trans in clay mineralogy were introduced by Tsipursky and Drits (1984). There is an easy way to find out whether an octahedron is a cis- or trans-position. One have to look for the two hydroxyl groups of a single octahedral position. If the two hydroxyl groups for the regarded octahedra are situated at opposite corners, than it is the trans-octahedron or position (= M1 site).
Changing to another octahedron (M2 site), again, looking for the hydroxyl groups one can now see that they lie at the same edge. For the other octahedron in the M2 site it is the same situation. The two cis-octahedra share the two OH-groups on the common edge.
Occupied positions in Figure 4.4 a) and b) are marked with M and vacancies are marked with V. For the dioctahedral 2:1 clay minerals one of the cis- or the trans-posi-tions is empty. In Figure 4.4 a) the trans position with opposite hydroxyl-groups is filled up. One of the two cis-positions is occupied, but the other is vacant. This is the so called
Figure 4.3 Trans (a)- and cis (b)- isomer of octahedral coordinated cations.
a) b)
56

4. Thermal reactions of smectites and cv - tv ratios
cis-vacant (cv) variety. In figure 4.4 b) the trans-position is empty, and the two cis-posi-tions are occupied. We call this the trans-vacant (tv) variety.
Very important is that both variations occur in nature. There are cv and tv varieties and, in addition, mixtures of these two. It is also possible to transform a cv clay mineral into a tv one and vice versa (Drits et al., 1995, Emmerich et al., 1999, 2001).
The process of dehydroxylation is described by Drits et al. (1995). In aluminous 2:1 clay minerals the dehydroxylation occurs in two stages. First, two adjacent OH-groups are replaced by a single residual oxygen: . The Al3+-cations, which occupied cis- and trans-sites become five and six coordinated. Second, Al3+-cations migrate from a trans-site to a cis-site. Thus, cv becomes tv during the dehydroxylation of aluminous clay minerals. The distances of the hydroxyl groups are longer in cv montmo-rillonites (2,85-2,88 Å) than in tv varieties (2.40-2.50 Å) and require therefore a higher dehydroxylation energy than tv montmorillonites (Drits et al., 1995). Emmerich et al. (1999, 2001) converted a cv montmorillonite into a tv variety by dehydroxylation and rehydroxylation. The rehydroxylated sample showed a 190 °C lower dehydroxylation temperature than the initial material. The opposite behavior was detected for glauconite and celadonite. Muller et al. (2000) indirectly proved for ferrian 2:1 clay minerals to be trans-vacant. They exemplified that the dehydroxylation of celadonite and glauconite is accompanied by a migration of octahedral cations from cis- to trans-sites, thus, tv becomes cv. In glauconite with Fe3+/2+ and Al3+ in the octahedral sheet a reverse cation migration occurs after rehydroxylation. Because of the low Al3+ content for most of the
Figure 4.4 Projection of the octahedral sheet of a dioctahedral 2:1 clay mineral perpendic-ular to the c-axis. a) cis-vacant variety (cv), b) trans-vacant variety (tv), c) defi-nition of the position cis and trans by the position of the hydroxyl groups.
a) b)
c)
M2
M1
M2
2 OH( ) H2O Or+→
57

4. Thermal reactions of smectites and cv - tv ratios
layers in celadonite reverse cation migration does not occur in the octahedral sheet after rehydroxylation. The authors concluded that during rehydroxylation, the layers with a higher Al3+ content are transformed into tv layers whereas layers with a lower Al3+ con-tent preserve the cation distribution of the dehydroxylated form. The authors conclude that the reverse migration of octahedral Al3+ cations to vacant cis-sites of layers may provide a more stable configuration.
4.2 Determination of cis- and trans-vacant proportions in mixtures of smectite
The determination of cis- and trans-vacant proportions was performed using the method proposed by Drits et al. (1998). Defined mixtures of a cis-vacant and a trans-vacant sample were prepared. The < 2 µm fractions of Valdol and Volclay (in percent with respective to dry weight obtained at 375°C of STA) were mixed in the proportions Valdol/Volclay: 100/0 - 80/20 - 60/40 - 40/60 - 20/80 - 0/100 with a total sample mass of 100 g. The cis- and trans-vacant proportions were calculated by fitting the mass spec-trometer curves for evolved water (m/e = 18) and identifying the peakpositions. An inte-grated area of the peaks and its percentages follows. The integrated area is computed from the minimum X of the fitted data to the maximum X of the fitted data. Table 4.1lists the parameters for the fitting procedure. The ratio between the determined areas equals to the ratio between cis- and trans-vacant layers (Drits et al., 1998). The boundary between the peak maxima characteristic for cv and tv was set at 600 °C according to Drits et al. (1998). No sample displayed a peak maximum exactly at 600°C.
Table 4.1 Parameters for the fitting procedure.
In addition to mixtures of the two samples PA-curves (Smykatz-Kloss, 1974) were recorded of each sample. With PA-curve the dependence of a peak temperature to the sample amount is meant according to Smykatz-Kloss (1974). Sample amounts of 20 mg, 40 mg, 60 mg 80 mg and 100 mg were measured. The sample mass was corrected to the
Parameter procedure
baseline second derivative zero
smoothing Savitsky Golay
curve fit individual maxima
function Gauss combination of visual peaks and using the residual pro-cedure (add residuals and vary widths, minimization of the dif-ference between measured and calculated EGA of water)
coefficient of determination curve of residuals must result in a Gauss function
58

4. Thermal reactions of smectites and cv - tv ratios
dry sample mass at 375 °C. At this temperature no hydrated water evolved anymore. Fig-ure 4.5 shows that dehydroxylation temperatures shift to lower dehydroxylation temper-atures with lower sample amounts. This shift became less effective in the mixtures of Valdol and Volclay. Naturally, in mineral mixtures different H2O/OH or CO2 contents result in a different slope of the PA-curves for each component, reflecting the different peak temperature dependence on the amount of a mineral (Smykatz-Kloss, 1974). As the amount of water in the clay minerals is nearly equal (they have a mean difference of 0,8%) the PA-curves of the two smectites indicate only small differences. In the mixtures the shift of the peak temperature occurs only for small amounts. Even for Volclay, the cis-vacant variety peak temperatures below 600 °C were not detected for small sample amounts. Therefore the border of 600 °C is reliable.
While fitting a MS curve of a sample several peaks are possible. Best fitting results were obtained with three to five peaks. Concerning the theoretical occurring bonding types of the cations and to the hydroxyl groups in smectites, six peaks positions were reasonable. However, the sum of peak areas with peak maxima below and above 600 °C are most important for the investigation. Fitting with Gauss Area or Gauss Amplitude yields most reasonable results. This procedure was preferred as most of the curves are symmetrical.
To find the optimum peak positions below curves with a shoulder near 600 °C, a peak position different from that the program proposed has been tested as well as a chross-
Figure 4.5 Curves sample amount (PA-curves) of T DHX of 26/27ValdolC14 < 2 µm frac-tion mixed with 25Volclay < 2 µm. Pure samples and mixtures were measured after equilibration at 53% rh. Sample weights were corrected to dry weight at 375°C.
59

4. Thermal reactions of smectites and cv - tv ratios
check. For example, the program recommends a peak at 610 °C, the peak has been then displaced first to 580 °C and second to 630 °C and the fitting procedure has been repeated. The result for both trials was a peak at 610 °C.
Figure 4.6 and 4.7 present the results of the mixtures of Valdol and Volclay, represent-ing a trans- and a cis-vacant variety. The MS curves of evolved water (m/e = 18, EGA) are given for 300-900 °C. Dehydroxylation takes place above 400 °C. The two samples have distinctly different dehydroxylation temperatures. Volclay reveals unusual peaks at 725 °C and 760 °C. Similar observations were made for samples 16GR01 and 17GR02. As these peaks were apparent only in the Na-saturated < 2 µm and < 0.2 µm fraction they are probably artefacts due to the pretreatment of the samples. Similar effects were reported by Meyer (1972) for soda activated bentonites. Trioctahedral domains are unlikely at these low contents of Mg in the octahedral sheet.
In spite of this, Volclay can be regarded as pure cis-vacant variety. The ratios of the cis- and trans-vacancies in the mixtures were determined from the fitted peaks and their integrated areas regarding the dry mass. The fitting process shows no peaks below 600 °C, the main endothermic reaction has its maximum at 684 °C. Valdol, the trans-vacant variety, dehydroxylates at 558 °C evolving parts of the OH-groups above 600 °C. A cis-vacant proportion of 16% was calculated. With an increasing ratio Volclay/Valdol, the proportion of cis-vacant sheets increases. This is visualized at first sight by the height of the endothermic reactions due to the loss of hydroxyl groups (Figure 4.6) at 680 to 550°C.
Figure 4.6 MS curves of evolved water m/e = 18 (in arbitrary units EGA = evolved gas analysis)..
60

4. Thermal reactions of smectites and cv - tv ratios
A crosscheck was done by calculating the theoretical cis- and trans-proportions which
can be expected from their mass. With the knowledge of the dry sample mass the trans- and cis-vacant proportions in Valdol and Volclay were examined. The difference to the peak area calculation is smaller than 1%. Valdol comprises 16% cis-vacant proportions. These cis-vacant proportions were taken into account for calculation of the ratios in the mixtures by their mass. The relation between mass of Volclay/Valdol and calculated pro-portion cv/tv is exemplified in Figure 4.7. The results described above indicate that STA can serve as a tool to quantify cv/tv proportions in smectites.
4.3 Results: cis- and trans-vacant character of the samples
A wide range of cis- and trans-vacant (cv/tv) proportions was detected for the investi-gated < 0.2 µm fraction of the 30 samples. The cis- and trans-vacant proportions calcu-lated by fitting the mass spectrometer curves for evolved water (m/e = 18) and its integrated peak areas evidenced that pure cis-vacant samples are seldom. Most abundant are mixtures of cis- and trans-vacancies with the dominating proportions of cis-vacan-cies. Pure trans-vacant samples were not found in this sample collection. Table 4.2 pre-sents the cis- and trans-vacant parts of all samples.
Figure 4.7 Calculated cis- and trans-vacant proportions of the investigated sample-mix-tures.
61

4. Thermal reactions of smectites and cv - tv ratios
Table 4.2 Relation of cv and tv parts and application of the classification system. (-) = shoulder, (+) = well resolved peak, (±) = broadened peak of the mass spectrome-ter curve of m/e = 18 (< 0.2 µm fraction).
Sample No. proportion tv [%]
proportioncv [%]
cvcv 75-10%
cv/tvcv 50-75%
tv/cvcv 25-50%
tvcv 25-0%
2LP 11 (-) 89 (+) x
3 7th Mayo 52 (+) 48 (+) x
4JUP 44 (+) 56 (+) x
5MC 52 (-) 48 (+) x
6GPC 82 (+) 18 (+) x
7EMC 0 100 (+) x
8UAS 0 100 (+) x
12TR02 39 (-) 61 (+) x
13TR02 42 (-) 59 (+) x
14TR03 32 (-) 68 (+) x
16GR01 0 100 (+) x
17GR02 5 (-) 95 (+) x
18UA01 29 (-) 71 (+) x
19UA02 28 (±) 72 (+) x
21D01 44 (+) 56 (+) x
24Beid*
* < 2 µm fraction
0 100 (+) x
25 Volclay* 0 100 (+) x
26-27 Val-dol C14*
84 (+) 16 (+) x
28SB 57 (±) 43 (+) x
31BAR3 40 (±) 60 (+) x
32Volclay 0 100 (+) x
33CA 33 (+) 67 (+) x
34M70 36 (±) 64 (±) x
35B31/32 59 (+) 42 (-) x
36M650 74 (+) 26 (+) x
37BB 78 (+) 22 (-) x
38MW 75 (+) 25 (+) x
39GQ_I 24 (-) 76 (+) x x
41ValC18 80 (+) 20 (+) x
42Linden 34 (±) 66 (+) x
62

4. Thermal reactions of smectites and cv - tv ratios
According to the proposed classification system (chapter 1.3) examples for each group (cv, cv/tv, tv/cv and tv) with well and poorly resolved peaks are indicated (figures 1.8 - 1.11). To determine quantitatively the relative proportions of the different layer types each sample was fitted several times. At least the coefficient of determination was R² = 0.999 for most smectites. Only the I/S-mixed layer samples (34M70 and 35B31) revealed values of R² = 0.973.
Most abundant are cv/tv varieties (11 of 30 samples) followed by cv (9) and tv/cv (6) varieties. Only four samples can be classified as tv. Within the cv samples five smectites have 100% cv layers. Other samples comprise small amounts of tv layers indicated by a peak broadened at lower temperatures (Figure 4.8).
The cv/tv samples can be divided into two subgroups. Samples with well resolved peaks in the tv and cv region (Figure 4.9 a) and samples with a broad shoulder below 600 °C (Figure 4.9 b). The samples with a distinct peak in the tv region a content of Fe > 0.3 mol/FU was determined. With increasing amount of Fe, the proportions of the tv lay-ers increased. (The relation between Fe content and tv proportions is discussed in chapter 6.)
Examples for tv/cv varieties are presented in figure 4.10. Varieties with a main peak in the region above 600 °C and a broad shoulder (for example sample 28SB) were also found.
Continuous heating during STA measurements may lead to a broadened dehydroxyla-tion peak and asymmetry (Drits et al, 1998, Guggenheim, 1990). Then, the cv propor-tions may be overestimated which can be the reason for missing pure tv varieties. On the other hand, pure tv smectites should have at least 1.0 Fe mol/FU concerning theoretical
Figure 4.8 Examples of cv varieties. a) Sample 8UAS < 0.2 µm with 100% cv parts. b) Sample 2LP < 0.2 µm with 89% cv and 11% tv parts. Observed = MS curve of m/e = 18 (in arbitrary units EGA = evolved gas analysis).
a) b)
63
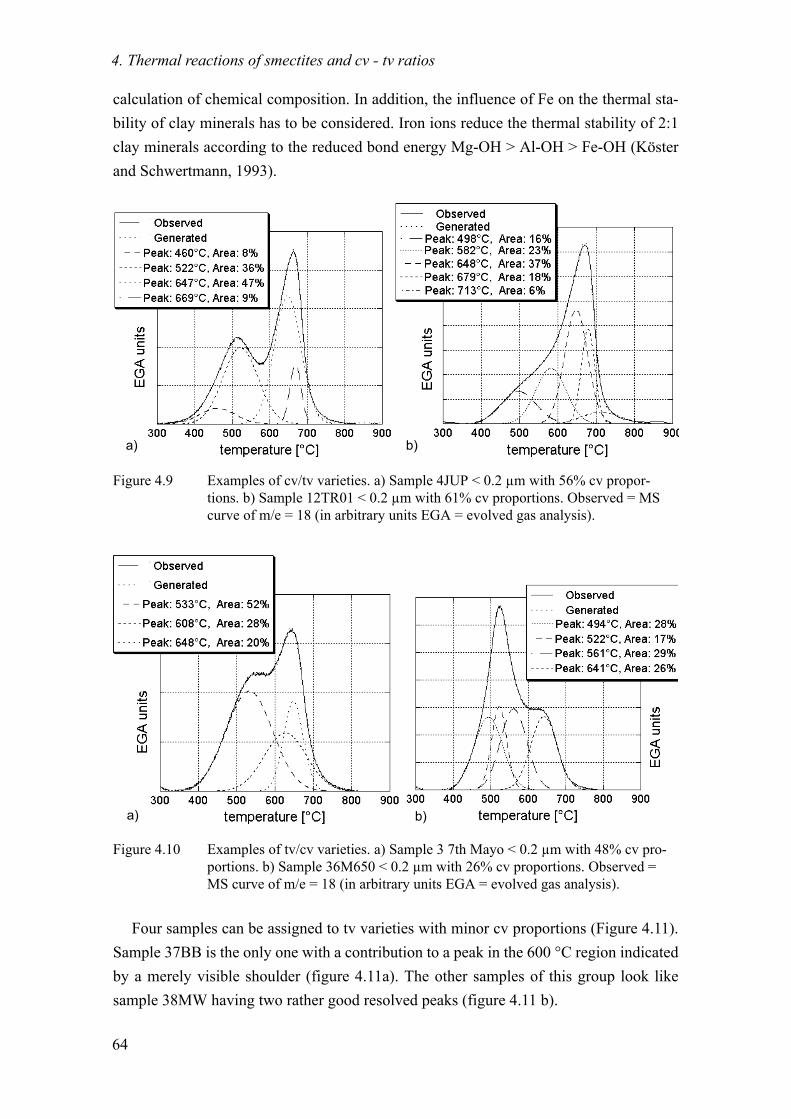
4. Thermal reactions of smectites and cv - tv ratios
calculation of chemical composition. In addition, the influence of Fe on the thermal sta-bility of clay minerals has to be considered. Iron ions reduce the thermal stability of 2:1 clay minerals according to the reduced bond energy Mg-OH > Al-OH > Fe-OH (Köster and Schwertmann, 1993).
Four samples can be assigned to tv varieties with minor cv proportions (Figure 4.11). Sample 37BB is the only one with a contribution to a peak in the 600 °C region indicated by a merely visible shoulder (figure 4.11a). The other samples of this group look like sample 38MW having two rather good resolved peaks (figure 4.11 b).
Figure 4.9 Examples of cv/tv varieties. a) Sample 4JUP < 0.2 µm with 56% cv propor-tions. b) Sample 12TR01 < 0.2 µm with 61% cv proportions. Observed = MS curve of m/e = 18 (in arbitrary units EGA = evolved gas analysis).
Figure 4.10 Examples of tv/cv varieties. a) Sample 3 7th Mayo < 0.2 µm with 48% cv pro-portions. b) Sample 36M650 < 0.2 µm with 26% cv proportions. Observed = MS curve of m/e = 18 (in arbitrary units EGA = evolved gas analysis).
b)a)
a) b)
64

4. Thermal reactions of smectites and cv - tv ratios
Any influence of the dehydration water was not found. This was tested by heating at 105 °C, 200 °C and 350 °C for several samples until mass constance was reached before STA measurements were performed. The mass loss for the dehydroxylation did not change.
The data obtained confirm that STA is a powerful method to calculate the ratio of cis- and trans-vacancies in smectites by integrating evolved water curves of recorded MS curves. Still uncertain is whether the cis- and trans-vacancies are varying within a sheet or some kind of mixed layer minerals developed.
Until now, STA is the best method to determine the structure of the octahedral sheet. Structural insight into the octahedral sheet cannot be obtained by XRD as smectites are turbostratically disordered so that the diagnostic (hkl)- reflections are absent.
Literature
Brigatti, M.F. (1983) Relationship between composition and structure in Fe-rich smectites. Clay Minerals, 18, 177-186.
Cole, W.F. (1955) Interpretation of differential thermal curves of mixed-layer minerals of illite and montmorillonite. Nature, 175, 384-385.
Cole, W.F. and Hosking, J.S. (1957) Clay mineral mixtures and interstratified minerals in The dif-ferential thermal investigation of clays. Mackenzie, R. C. (edt.), Mineralogical Society, London, 248-274.
Drits, V.A., Besson, G. and Muller, F. (1995) An improved model for structural transformations of heat-treated aluminous dioctahedral 2:1 layer silicates. Clays and Clay Minerals, 43, 718-731.
Figure 4.11 Trans-vacant (tv) variety examples. a) Sample 37BB< 0.2 µm with 22% cv pro-portions. b) Sample 38MW < 0.2 µm with 25% cv proportions. Observed = mass spectrometer curve of m/e = 18 (in arbitrary units EGA = evolved gas analysis).
a) b)
65

4. Thermal reactions of smectites and cv - tv ratios
Drits, V.A., Lindgreen, H., Salyn, A.L., Ylagan, R. and McCarty, D.K. (1998) Semiquantitative determination of trans-vacant and cis-vacant 2:1 layers in illites and illite-smectites by thermal analysis and X-ray diffraction. American Mineralogist, 83, 1188-1198.
Emmerich, K., Madsen, F.T. and Kahr, G. (1999) Dehydroxylation behavior of heat-treated and steam treated homoionic cis-vacant montmorillonites. Clays and Clay Minerals, 47, 591-604.
Emmerich, K., Plötze, M. and Kahr, G. (2001) Reversible collapse and Mg2+ release of de- and rehydroxylated homoionic cis-vacant montmorillonites. Applied Clay Science, 19, 143-154.
Greene-Kelly, R. (1966) The montmorillonite Minerals (Smectites) in The differential thermal investigation of clays. Mackenzie, R. C. (edt.), Mineralogical Society, London, 140-164.
Grim, R.E. and Kulbicki, G. (1961) Montmorillonite: High Temperature Reactions and Classifi-cation. The American Mineralogist, 46, 1329-1369.
Guggenheim, S. (1990) The dynamics of thermal decomposition in aluminous dioctahedral 2:1 layer silicates: A crystal chemical model. 9th Internat. Clay Conf., 2, Strasbourg, 99-107.
Güven, N. (1988) Smectites in Hydrous phyllosilicates. Bailey, S. W. (edt.), Mineralogical Soci-ety of America, 497-552.
Heller, L., Farmer, V.C., Mackenzie, R.C., Mitchell, B.D. and Taylor, H.F.W. (1962) The dehy-droxylation and rehydroxylation of triphormic dioctahedral clay minerals. Clay Minerals Bulletin, 5, 56-72.
Köster, H.M. and Schwertmann, U. (1993) Zweischichtminerale in Tonminerale und Tone. Jas-mund, K.et al. (edts.), Steinkopf Verlag, 33-58.
Mackenzie, R.C. (1970) Simple Phyllosilikates based on Gibbsite- and Brucite-like sheets in Dif-ferential thermal analysis. Mackenzie, R. C. (edt.), Academic Press, London, New York, 497-537.
Meyer, W. (1972) Eine Methode zur Qualitätsbestimmung von Bentonit. Gießerei-Rundschau, 6, 66-69.
Muller, F., Drits, V., Plancon, A. and Robert, J.-L. (2000) Structural transformation of 2:1 diocta-hedral layer silicates during dehydroxylation-rehydroxylation reactions. Clays and Clay Minerals, 48, 572-585.
Niederbudde, E.-A., Stanjek, H. and Emmerich, K. (2002) Tonminerale Methodik in Handbuch der Bodenkunde.
Schultz, L.G. (1969) Lithium and potassium absorption, dehydroxylation temperature and struc-tural water content of aluminous smectites. Clays and Clay Minerals, 17, 115-149.
Smykatz-Kloss, W. (1974) Differential Thermal Analysis. Wyllie, P. J. (edt.), Minerals, Rocks and Inorganic Materials, Springer-Verlag, Berlin, 185.
Tsipursky, S.I. and Drits, V.A. (1984) The distribution of octahedral cations in the 2:1 layers of dioctahedral smectites studied by oblique texture electron diffraction. Clay Minerals, 19, 177-192.
66

5. Mössbauer studies
5. Mössbauer studies
Structural formula of four low charged cv and tv (ferrian) beidellitic montmorillonites corrected with respect to Fe2+ contents are presented here. Mössbauer spectra of the bulk material and the < 0.2 µm fraction were taken at room temperature (298 K) and at 4.2 K to identify the presence of iron oxides in the bulk material. Insufficient removal of iron oxides or oxidation of Fe2+ in the smectite structure were also investigated. The purpose was to check the reliability of the structural formula for montmorillonites derived from chemical analyses according to Köster (1977) with special interest to the Fe3+/Fe2+ ratio. The results reveal that Fe2+ in general is located at octahedral sites and does not exceed 5% of the total iron. Fe3+ was only found in octahedral coordination. The structural for-mula did not change significantly involving the correction for Fe2+.
5.1 Introduction
The most reliable method to determine the Fe3+/Fe2+ ratio in clay minerals and the coordination is Mössbauer spectroscopy. The relative amounts of Fe3+ and Fe2+ and their coordination state in the smectite structure can be identified by the isomer shift (IS) and quadrupole splitting (QS). The QS of Fe3+ and Fe2+ in montmorillonites is 0.6 mm/s and 2.69 and the IS is 0.24 and 1.01 mm/s (Wagner and Wagner, 2004). Octahedral and tetra-hedral Fe3+ differ slightly in their isomer shifts (Wagner and Wagner, 2004). Assignment of iron to cis- or trans sites was not performed, though attempts have been made (Car-dile, 1987, Drits et al. 1997). Rancourt (1994) demonstrated for Fe2+ in micas that it is not possible to resolve the octahedral distribution over cis- and trans-sites. Rancourt (1994) states that the local structure (for instance neighboring octahedral cation and tet-rahedral Al and Si) may affect the Mössbauer parameters of Fe2+ more than the cis and trans positions. It is highly probable that this is also valid for Fe3+. Goodman (1978) and Wagner and Wagner (2004) mentioned that the cis-trans isomerism may not be the only reason for different quadrupole splitting. The distribution of the nearest metal ions around a given iron site may also cause different quadrupole splittings.
67

5. Mössbauer studies
5.2 Experimental
Mössbauer spectroscopy was used for 10 smectites with different cv/tv ratios and iron contents and one smectite containing kaolinite which was excluded from the classifica-tion (sample 10MBV < 2 µm).
The bulk material and the purified < 0.2 µm fraction of the samples 5MC, 21D01, 19USA02 and 41ValC18 were investigated (group I). Measurements of the samples 3 7th Mayo, 4JUP, 18USA01, 36M650, 38MW and 39GQ-I were carried out only for the < 0.2 µm fraction (group II). Samples of group I were analyzed using the facility at TU-Munich and were measured at room temperature and liquid helium temperature, 4.2 K. The experiments were carried out by U. Wagner and F. Wagner. Samples of group IIwere recorded at room temperature using the facility of the IMF at FZK Karlsruhe. These experiments were carried out by H. Reuter and S. Schlabach. All spectra were taken at 10 mm/s using the 57Co in Rh source.
5.3 Mössbauer spectra
The Mössbauer spectra displayed that the untreated bulk samples of group I smecites are relatively pure. Only three samples contained appreciable amounts of iron oxides. Except for sample 41ValC18 Fe2+ content was low. In the bulk material of 41ValC18 (Figure 5.1) 38.7% ankerite were observed together with 8.9% hematite. The amount of hematite remained unchanged on cooling to 4.2 K showing a magnetic field of 53.6 T. 13.2% goethite appear with a magnetic field of 50.4 T and about half of the ankerite obtained magnetic ordering (20.7 T) showing an Mössbauer octet. Room temperature measurement of the < 0.2 µm fraction was fitted with two doublets. The main doublet with 96.7% was attributed to octahedral Fe3+, only a very small doublet with 3.3% was assigned to octahedral Fe2+ (Table 5.1 and 5.2). Purification was successful, no ankerite or magnetic components were detected in the < 0.2 µm fraction, only a small amount of a component with paramagnetic order (50.5 T) revealed in the 4.2 K measurement.
Sample 5MC and 21D01 behaved in a similar way. The untreated samples were very pure and only some paramagnetic order arose at 4.2 K. Both < 0.2 µm fractions did not indicate magnetic components neither at room temperature nor at 4.2 K (Figure 5.2 and 5.3).
68

5. Mössbauer studies
Figure 5.1 Mössbauer spectra of sample 41ValC18, bulk and < 0.2 µm, taken at room tem-perature and 4.2 K.
Figure 5.2 Mössbauer spectra of sample 5MC, bulk and < 0.2 µm, taken at room tempera-ture and 4.2 K.
69

5. Mössbauer studies
Bulk material of sample 19USA02 revealed peak doublets for Fe3+ and Fe2+ indicat-ing 93.9% Fe3+ and 6.1% Fe2+. Cooling to 4.2 K indicated 12.2% goethite with a mag-netic field of 50.6 T, QS and IS of -0.167 and 0.216 mm/s. Fe2+ was absent in the purified < 0.2 µm fraction. Fe2+ was probably oxidized in this sample, though in other examined samples the Fe2+ contents were not influenced by the purification process. Room temper-ature measurements of the < 0.2 µm fractions showed iron to be exclusively trivalent. Removal of iron oxides by the dithionite-citrate method according to Mehra and Jackson (1960) reduces Fe3+ to Fe2+ (Stucki and Lear, 1990). Following treatment with H2O2 oxi-dizes Fe2+ to Fe3+. It is conceivable that Fe2+ was partly affected and structural Fe2+ was oxidized also (Stucki et al., 1984). Sample 19USA was the only one with this difference in bulk and < 0.2 µm fraction.
The Mössbauer spectra of pure iron oxides are relatively straight forward compared to the spectra of clay minerals. Iron oxides associated with clays are often poorly crystalline and their parameters may deviate noticeable from the literature data of pure iron oxides (Murad, 1998). The deviations include among others higher quadrupole splittings and line widths in the paramagnetic state. Clay minerals with a low iron content show mag-netic hyperfine splitting with the effect of paramagnetic relaxation (Murad, 1998, Wag-ner and Wagner, 2004). In clay minerals with low iron concentrations, the relaxation of the electronic spins of the iron ions may become so slow, that even in the paramagnetic
Figure 5.3 Mössbauer spectra of sample 21D01, bulk and < 0.2 µm, taken at room temper-ature and 4.2 K.
70

5. Mössbauer studies
state hyperfine interactions occur in the Mössbauer spectra. To detect the paramagnetic relaxation, velocities of 15 to 20 mm/s are necessary. Therefore, it is difficult to assign paramagnetic relaxation definitely to the investigated samples, which were investigated at 10 mm/s. It is most likely that the hyperfine interactions of sample 5MC bulk, 21D01 bulk, 21D01 < 0.2 µm and 41ValC18 < 0.2 µm with a magnetic field of 50.5 - 53.1 T are due to magnetic ordering. The value of 54 T for sample 19USA < 0.2 µm supports the assumption of paramagnetic relaxation according to Murad (1998) and Wagner and Wag-ner (2004).
The quadrupole splittings (QS) and isomer shifts (IS) for the pure montmorillonites are listed in Table 5.1. None of the room temperature spectra of the < 0.2 µm fractions gave any indication of the presence of a magnetically ordered components. The values of QS and IS are consistent with the mean values given for montmorillonites in Wagner and Wagner (2004). QS of Fe3+ and Fe2+ are 0.6 mm/s and 2.69 and for IS 0.24 and 1.01 mm/s. The observed spectra displayed QS between 0.516 - 0.586 mm/s and IS between 0.248 - 0.257 mm/s for Fe3+. All trivalent iron could be attributed to octahedral sites. Very low contents of octahedral Fe2+ displayed values between 2.648 - 2.893 mm/s for QS and 0.850 - 1.085 mm/s for IS.
Figure 5.4 Mössbauer spectra of sample 19USA02, bulk and < 0.2 µm, taken at room temperature and 4.2 K.
71

5. Mössbauer studies
The last sample presented demonstrates the sensitiveness of Mössbauer spectroscopy to iron oxide impurities. However, the data for mixtures of clay minerals cannot be resolved. In sample 10MBV 12.8% of the total iron occur in oxidic form and was detected already at room temperature. At 4.2 K 50.4% of the iron revealed a magneti-cally-split sextet and exhibited a magnetic field of 49.8 T, which is characteristic for goethite at this temperature. A small component of 3.3% with a magnetic field of 53.5 T represents hematite. An equally small amount of 3.4% which was visible in the room temperature spectrum, was oxidized during purification. As expected, goethite was extracted completely in the < 2 µm fraction. Only 6% of the total iron is still visible as a very broad sextet (Figure 5.5), probably due to paramagnetic ordering of the structural iron. This sample contained kaolinite even in the < 0.2 µm fraction, which was not be separated during the purification procedure. Thus, it was not possible to refer the Fe3+/Fe2+ ratio only to montmorillonite. In the recorded room temperature measurement of the < 2µm fraction only 0.25% appeared as Fe2+. In the bulk material two sites for Fe2+ were assigned, one with a QS and IS of 1.400 mm/s and 0.650 mm/s and the other with 2.25 mm/s and 0.850 mm/s. The first site vanished after purification. The presence of kaolin-ite in the < 2 µm fraction was not visible by Mössbauer neither at room temperature nor at 4.2 K. XRD identification is therefore important for the control of impurities by other clay minerals.
Table 5.1 Quadrupole splitting (QS) and isomer shift (IS) of < 0.2 µm fractions taken at room temperature.
Sample no. Species QS [mm/s] IS [mm/s] Area [%]
5MC VIFe3+
VIFe2+
0.572.89
0.250.85
96.83.2
19USA02 VIFe3+
VIFe2+
0.55---
0.26---
100.0---
21D01 VIFe3+
VIFe2+
0.532.73
0.251.09
95.14.9
41ValC18 VIFe3+
VIFe2+
0.522.68
0.250.95
96.73.3
72

5. Mössbauer studies
5.4 Correction of the structural formula
The values for Fe2+ content were used to recalculate the structural formulae according to Köster (1977). Fe2+ does not exceed 5% of total iron for the investigated group I of the smectites (Table 5.2). It is evident from Table 5.3 and 5.4 that the recalculation does not change the structural formula significantly. The concentration of Fe2+ was < 0.02 mol/FU.
The investigated montmorillonites of group II showed similar results. Their recorded room temperature spectra revealed Fe2+ contents only for two samples. Sample 38MW < 0.2 µm has about 3% Fe2+ and 4% for 36M650. Samples 4JUP, 39GQ-I and 3 7th Mayo showed no peak doublet that could be assigned to Fe2+. Conclusively, even ferrian montmorillonites did not contain structural Fe2+.
Köster et al. (1999) demonstrated that ferrian smectites contain octahedral Fe3+. In contrast, nontronite also displays Fe3+ in tetrahedral coordination. Gaudin et al. (2004) reported that tetrahedral Fe3+ does not occur in smectites containing < 33% Fe2O3. Goodman (1976) showed that Fe3+ occurs in nontronites in tetrahedral sites but he did not mention Fe2+.
Figure 5.5 Mössbauer spectra of sample 10MBV, bulk and < 0.2 µm, taken at room temperature and 4.2 K.
73

5. Mössbauer studies
To summarize, Mössbauer spectroscopy of smectites is able to ensure purification of the < 0.2 µm fraction compared to the bulk material. Room temperature measurements of the < 0.2 µm fraction of ferrian montmorillonites indicate that the content of structural iron does not change. Nevertheless, it is likely that oxidation processes occur in some samples. Concerning the investigated samples, the structural formulae show only modest changes when the Fe2+ content is considered. It is not necessary to estimate the Fe2+ con-tent in montmorillonites with low iron contents. The obtained structural formulae are reliable even without determining the Fe2+ content, as Fe2+ does not exceed 0.02 mol/FU.
Table 5.2 Content of Fe2+ and Fe3+ of total iron obtained from room temperature measure-ments.
Sample no. total Fe [%] VIFe3+ [% of total] VIFe2+ [% of total]
5MC 6.36 96.8 3.2
19USA02 5.6 100.0 0.0
21D01 6.16 95.1 4.9
41ValC18 8.65 96.7 3.3
Table 5.3 Calculated structural formulae according to Köster (1977) assuming all iron as Fe3+.
Sample no. IVSi4+ IVAl3+ VIAl3+ VIFe3+ VIMg2+ M+
5MC 3.96 0.04 1.36 0.32 0.34 0.31
19USA02 3.95 0.05 1.42 0.29 0.31 0.29
21D01 3.91 0.09 1.39 0.31 0.34 0.26
41ValC18 3.86 0.14 1.25 0.45 0.37 0.30
Table 5.4 Recalculated structural formulae according to Köster (1977) with the determined Fe2+ amounts.
Sample no. IVSi4+ IVAl3+ VIAl3+ VIFe3+ VIFe2+ VIMg2+ M+
5MC 3.96 0.04 1.36 0.31 0.01 0.34 0.31
19USA02 3.95 0.05 1.42 0.29 0.00 0.31 0.29
21D01 3.91 0.09 1.39 0.30 0.01 0.34 0.26
41ValC18 3.86 0.14 1.25 0.43 0.02 0.37 0.31
74
5. Mössbauer studies
Literature
Cardile, C.M. (1987) Structural studies of montmorillonites by 57Fe Mössbauer spectroscopy. Clay Minerals, 22, 387-394.
Drits, V.A., Dainyak, L.G., Muller, F., Besson, G. and Manceau, A. (1997) Isomorphous cation distribution in celadonites, glauconites and Fe-Illites determined by infrared, Mössbauer and EXAFES spectroscopies. Clay Minerals, 32, 153-179.
Gaudin, A., Petit, S., Rose, J., Martin, F., Decarreau, A., Noack, Y. and Borschneck, D. (2004) The accurate crystal chemistry of ferric smectites from the lateritic nickel ore of Murrin Murrin (Western Australia). II. Spectroscopic (IR and EXAFS) approaches. Clay Miner-als, 39, 453-467.
Goodman, B.A. (1978) An investigation by Mössbauer and EPR spectroscopy of the possible presence of iron-rich impurity phases in some montmorillonites. Clay Minerals, 13, 351-355.
Goodman, B.A., Russell, J.D., Fraser, A.R. and Woodhams, F.W.D. (1976) A Mössbauer and IR spectroscopy study of the structure of nontronite. Clays and Clay Minerals, 24, 53-59.
Köster, H.M. (1977) Die Berechnung kristallchemischer Strukturformeln von 2:1 - Schichtsil-ikaten unter Berücksichtigung der gemessenen Zwischenschichtladungen und Katione-numtauschkapazitäten, sowie der Darstellung der Ladungsverteilung in der Struktur mittels Dreieckskoordinaten. Clay Minerals, 12, 45-54.
Köster, H.M., Ehrlicher, U., Gilg, H.A., Jordan, R., Murad, E. and Onnich, K. (1999) Mineralog-ical and chemical characteristics of five nontronites and Fe-rich smectites. Clay Miner-als, 34, 579-599.
Mehra, O.P. and Jackson, M.L. (1960) Iron oxide removal from soils and clays by a dithionite-citrate-system buffered with sodium bicarbonate. 7th National conference on Clays and Clay Minerals, Washington, D.C., 317-327.
Murad, E. (1998) Clays and clay minerals: What can Mössbauer spectroscopy do to help under-stand them? Hyperfine Interactions, 117, 39-70.
Petit, S., Caillaud, J., Righi, D., Madejova, J., Elsass, F. and Köster, H.M. (2002) Characteriza-tion and crystal chemistry of an Fe-rich montmorillonite from Ölberg, Germany. Clay Minerals, 37, 283-297.
Rancourt, D.G. (1994) Mössbauer spectroscopy of minerals. II. Problem of resolving cis and trans octahedral Fe 2+ sites. Phys. Chem. Minerals, 21, 250-257.
Stucki, J.W., Golden, D.C. and Roth, C.B. (1984) Effects of reduction and reoxidation of struc-tural iron on the surface charge and dissolution of dioctahedral smectites. Clays and Clay Minerals, 32, 350-356.
Stucki, J.W. and Lear, P.R. (1990) Variable oxidation state of iron in the crystal structure of smec-tite clay minerals in Spectroscopic characterization of minerals and their surfaces. Coyne, L. M.et al. (edts.), American Chemcla Society, Los Angeles, 330-358.
Wagner, F.E., Lerf, A., Poyato Ferrara, J., Justo, A. and Perez Rodriguez, J.l. (2000) Mössbauer spectroscopic inverstigation of vermiculites from Spain. ICAM, 2, Göttingen.
Wagner, F.E. and Wagner, U. (2004) Mössbauer spectra of clays and ceramics. Kluwer Academic Publishers, Netherland.
75

5. Mössbauer studies
76

6. Relations between structural properties
6. Relations between structural properties
Chemical composition and layer charge of 28 smectite samples of the < 0.2 µm frac-tion were correlated to their dehydroxylation behavior. The dehydroxylation temperature bears information on the structure of the octahedral sheet. The results indicate a relation between the amount of iron ions, the location of charge and the dehydroxylation temper-ature. Samples with an iron content < 0.3/FU were found to be cis-vacant and those con-taining Fe3+ > 0.3/FU are trans-vacant, mostly with additional cis-vacancies.
6.1 Ternary diagrams and layer charge
Ternary diagrams of octahedral cation distributions have been plotted by several authors. Grim and Kulbicki (1961) first computed octahedral cation compositions of montmorillonites. The main defined types were Wyoming-type, Cheto-type and mixtures of Wyoming- and Cheto-type. Güven (1988) presented a compilation of literature data of e.g. Grim and Kulbicki (1961), Schultz (1969), Weaver and Pollard (1973) and Brigatti (1983).
In the ternary diagram of Grim and Kulbicki (1961) Wyoming-type samples were mainly found in the region Al3+ > 1.65 mol/FU, Mg2+ 0.1-0.25 mol/FU and Fe3+ 0.1-0.3 mol/FU. Güven (1988) restricted the Wyoming-type to the field Al3+ 1.7-1.9 mol/FU, Mg2+ 0.15-0.35 mol/FU and Fe3+ 0.1-0.3 mol/FU. Wyoming-type samples are low charged according to the definition of Schultz (1969).
The Cheto-type was found in the region Al3+ 1.25-1.6 mol/FU, Mg2+ 0.35-0.65 mol/FU and Fe3+ < 0.1 mol/FU in the plot of Grim and Kulbicki (1961) whereas this type comprised to the field Al3+ 1.35-1.55 mol/FU, Mg2+ 0.35-0.5 mol/FU and Fe3+ 0.1-0.2 mol/FU in the plot of Güven (1988). The Cheto-type is commonly defined as high charged montmorillonite. According to Schultz (1969) low charged smectites are defined for layer charges of 0.2 - 0.375 eq/FU and high charged samples lie in the region 0.425 - 0.6 eq/FU.
To plot the octahedral cation distributions for ternary diagrams we used (i) the calcu-lated sum formula according to Stevens (1945) (Figure 6.1) and (ii) the formulae evalu-ated determined by the method of Köster (1977) (Figure 6.2). The calculation of Köster (1977) involves the measured layer charge. The two diagrams did not result in different
77

6. Relations between structural properties
cation distributions but in discrepancies of the layer charges (chapter 3.4). Following the literature data, one would expect fields with low and high charged regions for Wyoming- and Cheto-type samples but no relationship was found which matched the proposed def-initions. Low, medium and high charged montmorillonites/beidellites are distributed ran-domly in the ternary diagram on the basis of the calculated layer charges (Figure 6.1).
Figure 6.1 Octahedral cation distribution following the chemical formula calculated according Stevens (1945). Layer charges derived from the formula after the classification of Schultz (1969).
Figure 6.2 Octahedral cation distribution following the chemical formula calculated according Köster (1977). Layer charges derived from alkylammonium after the classification of Schultz (1969).
Mg2+
Fe3+Al3+190 180 170 160 150 140 130 120 110
ξ (eq/FU)
Mg2+
Fe3+Al3+190 180 170 160 150 140 130 120 110
ξ (eq/FU)
78

6. Relations between structural properties
In the presentation of Figure 6.2 all samples except one belong to low charged smec-tites. As the octahedral cation distribution indicate no relation to the layer charge, a ter-nary diagram in this context is not useful.
6.2 Trans vacancies and layer charge
The total layer charge was related to the proportion of trans-vacancies in the octahe-dral sheet. Discrepancies as mentioned above between calculated and measured charge are presented in Figure 6.3. Total calculated charge shows about 0.2 eq/FU higher values than the measured charges, obtained by intercalation of alkylammonium according to Lagaly and Weiss (1971). No relation between the proportion of trans-vacancies and layer charge, neither of the measured nor of the calculated charge, was detected.
6.3 Influence of substitution on tetrahedral charge and octahedral structure
The Mg2+ content reveals no correlation to the octahedral structure (Figure 6.4a). Cis- and trans-vacancies do not vary significantly as a function of Mg2+. The influence of Mg2+ on the total layer charge is more important than the effect on tetrahedral charge. There is just a tendency of a dependence of Mg2+ to tetrahedral charge. With a decreas-ing amount of Mg(VI)2+ the content of Al(IV)3+ increases (Figure 6.4b)1.
Figure 6.3 Comparison of calculated (from the structural formula of Stevens (1945) and measured layer charge (alkylammonium) related to trans-vacancies.
79

6. Relations between structural properties
The relation of iron to the octahedral sheet structure is highly significant. McCarty and Reynolds (1995) investigated the proportion of cis- and trans-vacant layers and their ordering/disordering in illite/smectite mixed layers. They found an indirect proportional-ity between cis-vacancies and the content of Mg2+ and Fe3+ as cations substituting Al3+
in the octahedral sheets. With increasing Fe3+ and Mg2+ the proportions of cv decreased. According to McCarty and Reynolds (1995) the octahedral sheet contains increasing Al3+ and decreasing Fe3+ when illitisation increases and, therefore, increasing tv propor-tions. The authors mentioned that the iron ions segregated when the proportions of tv increases.
For the investigated smectites the main influence on the trans-vacancies is due to Fe3+
substitution for Al3+ in the octahedral sheet. A linear relationship was found between octahedral iron and trans-vacant sites. With increasing amount of Fe(VI)3+ the tv parts increase. The data show high significance but the regression is far below 1 1 (Figure 6.5a). This is consistent with Cuadros (2002), who stated that iron is associated with cis-sites in smectites.
Further, the relation between iron ions and the tetrahedral charge, which is also posi-tive correlated (Figure 6.5b), has to be considered. The content of Al(IV)3+ increases with the amount of Fe(VI)3+. This is possibly due to a coupled substitution in the tetrahe-dra and octahedra. The coupled substitution of iron ions in the octahedral sheet and Al3+
in the tetrahedral sheet is conceivable due to the ionic radii. Iron ions in the tetrahedral
1.M(VI)n+ means six-fold coordination of a cation (octahedral sheet) and M(IV)n+ means four-fold coordination of a cation (tetrahedral sheet)
Figure 6.4 Relation of Mg(VI)2+ to a) trans vacancies b) tetrahedral charge expressed as Al(IV)3+/FU.
1.R2 is the coefficient of multiple determination. It is the fraction of total variation of Y which is explained by the regression R2= SSregression/SStotal. It ranges from 0 (no explanation of the variati-on) to 1 (a perfect explanation). For each term if P < 0.05, that term was a significant source of Y's variation: [*] P = 0.05-0.01; [**] P = 0.01-0.001, [***] P < 0.001; P > 0.05 = not significant (ns).
R² = 0.0 ns R² = 0.2 ns
a) b)
80
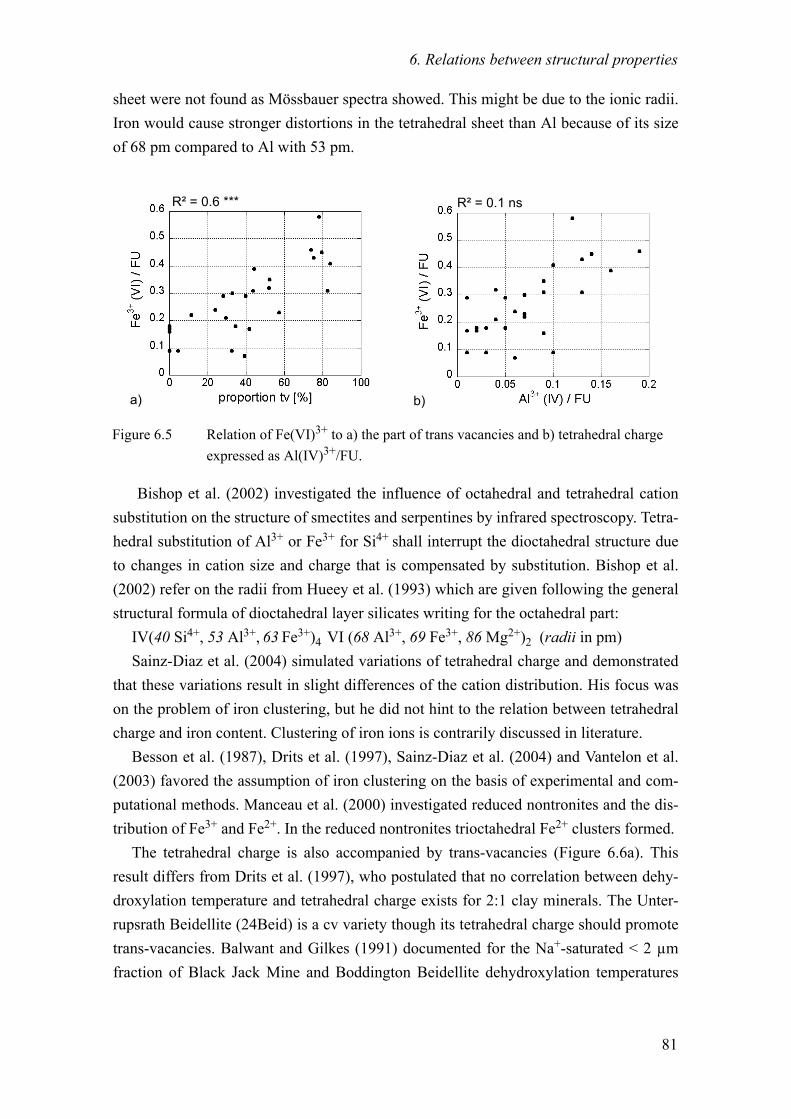
6. Relations between structural properties
sheet were not found as Mössbauer spectra showed. This might be due to the ionic radii. Iron would cause stronger distortions in the tetrahedral sheet than Al because of its size of 68 pm compared to Al with 53 pm.
Bishop et al. (2002) investigated the influence of octahedral and tetrahedral cation substitution on the structure of smectites and serpentines by infrared spectroscopy. Tetra-hedral substitution of Al3+ or Fe3+ for Si4+ shall interrupt the dioctahedral structure due to changes in cation size and charge that is compensated by substitution. Bishop et al. (2002) refer on the radii from Hueey et al. (1993) which are given following the general structural formula of dioctahedral layer silicates writing for the octahedral part:
IV(40 Si4+, 53 Al3+, 63 Fe3+)4 VI (68 Al3+, 69 Fe3+, 86 Mg2+)2 (radii in pm)Sainz-Diaz et al. (2004) simulated variations of tetrahedral charge and demonstrated
that these variations result in slight differences of the cation distribution. His focus was on the problem of iron clustering, but he did not hint to the relation between tetrahedral charge and iron content. Clustering of iron ions is contrarily discussed in literature.
Besson et al. (1987), Drits et al. (1997), Sainz-Diaz et al. (2004) and Vantelon et al. (2003) favored the assumption of iron clustering on the basis of experimental and com-putational methods. Manceau et al. (2000) investigated reduced nontronites and the dis-tribution of Fe3+ and Fe2+. In the reduced nontronites trioctahedral Fe2+ clusters formed.
The tetrahedral charge is also accompanied by trans-vacancies (Figure 6.6a). This result differs from Drits et al. (1997), who postulated that no correlation between dehy-droxylation temperature and tetrahedral charge exists for 2:1 clay minerals. The Unter-rupsrath Beidellite (24Beid) is a cv variety though its tetrahedral charge should promote trans-vacancies. Balwant and Gilkes (1991) documented for the Na+-saturated < 2 µm fraction of Black Jack Mine and Boddington Beidellite dehydroxylation temperatures
Figure 6.5 Relation of Fe(VI)3+ to a) the part of trans vacancies and b) tetrahedral charge expressed as Al(IV)3+/FU.
b)a)
R² = 0.1 nsR² = 0.6 ***
81

6. Relations between structural properties
between 510-530°C, corresponding to tv varieties. These results are in agreement with Tsipursky and Drits (1984) who found that beidellite tends to be tv while montmorillo-nite tends to be mainly cv. The Unterrupsrath Beidellite (24Beid) seems to be an excep-tion with cis-vacancies. It could be that such a relation between tetrahedral charge and trans-vacancies is mainly restricted to montmorillonites.
An explanation is given by Cuadros (2002) who investigated the b-dimension in smectites and the lateral dimension of the octahedral and tetrahedral sheets. A cv sheet is explained to have a smaller b-dimension than a tv sheet. The types of shared edges with hydroxyl and oxide ions are explained to be due to this. The author claims that this could be the reason why a cv sheet is preferred when tetrahedral sheets have minor substitu-tions with a smaller lateral dimension. A tv sheet is preferred when tetrahedral sheets have a larger degree of substitution.
The dominant factor which is related to the tetrahedral charge is definitely Fe3+. This can be seen by the summation of substituting octahedral cations (Mg2+ + Fe3+) plotted against Al(IV)3+ (figure 6.6b). A trend with positive correlation still exists, though, as tendency, Mg2+ is negativly correlated to Al(IV)3+ (Figure 6.4b).
6.4 Octahedral cation distribution
As the layer charge does not allow an assignment to groups in the ternary system of montmorillonite, a possible grouping was investigated considering the tetrahedral substi-tutions and octahedral structure. Figure 6.7 presents the cation distribution plotted against the part of tetrahedral substitution. In figure 6.8 the octahedral cation distribution is plotted in combination with the cv/tv proportion. Samples with 10-50% tetrahedral substitution and cis-and trans-vacancies are randomly distributed. However, two tenden-cies evolved: First, samples with 0-10% tetrahedral charge are situated in the field below
Figure 6.6 Relation of a) tetrahedral charge to trans vacancies and b) octahedral cations Mg2++Fe3+ to Al(IV)3+.
b)a)
R² = 0.3 ** R² = 0.0 ns
82
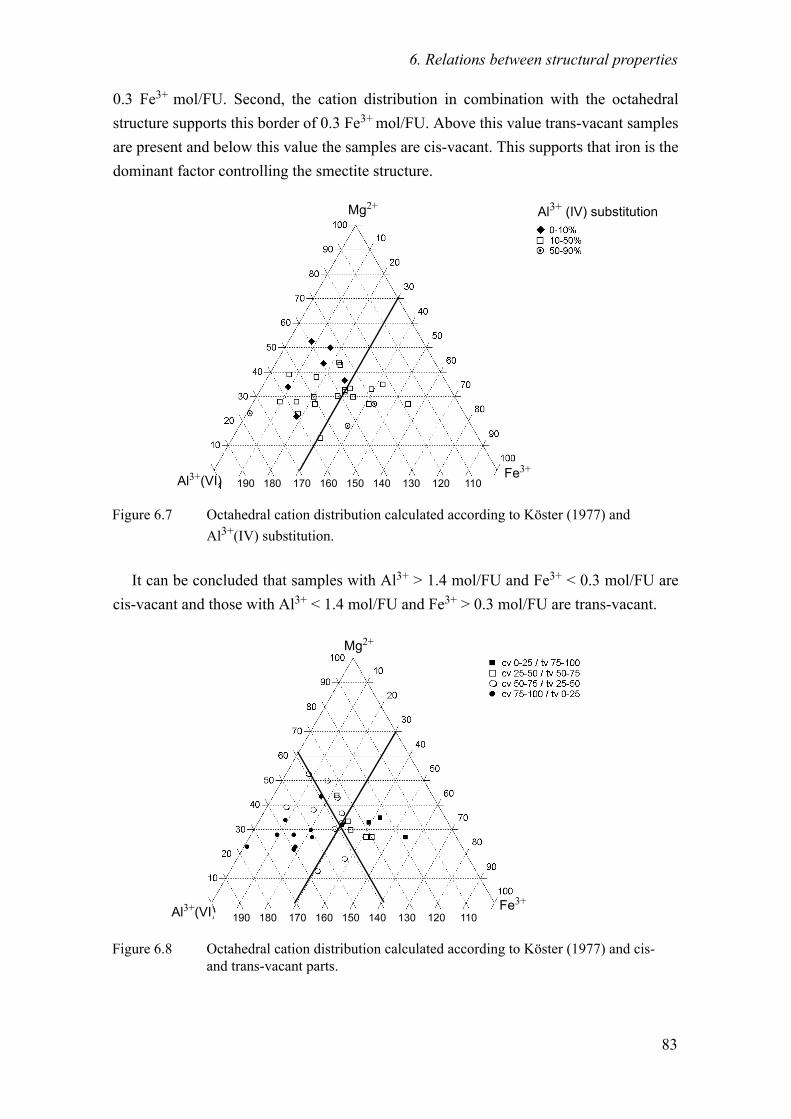
6. Relations between structural properties
0.3 Fe3+ mol/FU. Second, the cation distribution in combination with the octahedral structure supports this border of 0.3 Fe3+ mol/FU. Above this value trans-vacant samples are present and below this value the samples are cis-vacant. This supports that iron is the dominant factor controlling the smectite structure.
It can be concluded that samples with Al3+ > 1.4 mol/FU and Fe3+ < 0.3 mol/FU are cis-vacant and those with Al3+ < 1.4 mol/FU and Fe3+ > 0.3 mol/FU are trans-vacant.
Figure 6.7 Octahedral cation distribution calculated according to Köster (1977) and Al3+(IV) substitution.
Figure 6.8 Octahedral cation distribution calculated according to Köster (1977) and cis- and trans-vacant parts.
Mg2+
Fe3+Al3+(VI) 190 180 170 160 150 140 130 120 110
Al3+ (IV) substitution
Mg2+
Fe3+Al3+(VI) 190 180 170 160 150 140 130 120 110
83

6. Relations between structural properties
Brigatti (1983) designated montmorillonites with an iron content of 15-30% as iron-rich and nontronites were classified to have more than 75% iron. In contrast, Güven (1988) proposed the boundary between montmorillonite and nontronite at 50% iron.
According to Güven (1988) a miscability gap exists between montmorillonite and nontronite. This gap has been discussed contrarily in literature. It is still impossibly to say with any certainty whether a miscibility gap to nontronite/beidellite exists or not. Meunier (2005) points out that the b cell dimensions of beidellite and nontronite are too different to allow a complete substitution. No indication of a complete solid-solution between montmorillonite and beidellite was found by Köster et al. (1999).
Recent studies favor a continuous series between these minerals. Therefore, the range of 15-30% (0.3-0.6 mol/FU) octahedral iron should not be used for the classification. We prefer to use, in the case of no miscibility gap, the IMA rules in combination with the proven borderline of 15% Fe(VI)3+ (0.3 mol/FU). Hence, smectites with an iron content of 15-50% (0.3-1.0 mol/FU) can be classified as ferrian.
Our results and literature data made evident that no miscibility gap exists between montmorillonites, beidellites and nontronites. According to Gaudin et al. (2004a) a chemical continuity exists between nontronite and the so called Fe-montmorillonite end members.
Montmorillonites are most abundant in nature whereas nontronites are seldom. Recently, several authors like Bishop et al. (2002), Brigatti (1983), Gaudin et al. (2004a,b), Köster et al. (1999), Madejová et al. (2000) or Mayayo et al. (2000) investi-gated iron containing smectites ranging from montmorillonites to nontronites. The octa-hedral cation distribution of these studies are presented in Figure 6.9. The ternary system Al3+
2, Mg2+2 and Fe3+
2 shows a continuous substitution of Al/Fe for dioctahedral smec-tites.
Figure 6.9 Octahedral cation distribution in the system Al3+2, Mg2+
2 and Fe3+2 showing a
continuous series between montmorillonites and nontronites.
Al3+ Mg2+
Al3+ Fe3+Al3+2 Fe3+
2
Mg2+ Fe3+
84

6. Relations between structural properties
Petit et al. (2002) examined iron-smectite and differentiated two populations of Fe3+-montmorillonite and an intergrade to nontronite. Fe3+-montmorillonite contains little or no tetrahedral charge with Fe3+ as octahedral cation. The intergrade was considered to be between nontronite (dominant tetrahedral charge) and Fe3+-montmorillonite (dominant octahedral charge).
A major difference between montmorillonite and nontronite occurs as far as only non-tronite shows iron in the tetrahedral sheet (Bishop et al., 1999,Besson et al., 1997, Good-man et al., 1976). In contrast, montmorillonites have no substitutions of Fe3+ for Si4+ as shown by our results and literature (see chapter 5). The occurrence of iron in tetrahedral sites very likely is restricted to nontronites.
Literature
Balwant, S. and Gilkes, R.J. (1991) A potassium rich beidellite from a laterite pallid zone in western australia. Clay Minerals, 26, 233-244.
Besson, G., Drits, V.A., Daynyak, L.G. and Smoliar, B.B. (1987) Analysis of cation distribution in dioctahedral micaceous minerals on the basis of IR spectroscopy data. Clay Minerals, 22, 465-478.
Bishop, J.L., Murad, E. and Dyar, M.D. (2002) The influence of octahedral and tetrahedral cation substitution on the structure of smectites as observed through infrared spectroscopy. Clay Minerals, 37, 61-628.
Bishop, J.L., Murad, E., Madejova, J., Komadel, P., Wagner, U. and Scheinost, A.C. (1999) Visi-ble, Mössbauer and infrared spectroscopy of dioctahedral smectites: Structural analyses of the Fe-bearing smectites Sampor, SWy-1 and SWa-1. Proceedings of the 11th Interna-tional Clay Conference, Ottawa, Canada.
Brigatti, M.F. (1983) Relationship between composition and structure in Fe-rich smectites. Clay Minerals, 18, 177-186.
Brigatti, M.F. and Poppi, L. (1981) A mathematical model to distinguish the members of the dio-ctahedral smectite series. Clay Minerals, 16, 81-89.
Cuadros, J. (2002) Structural insights from the study of Cs-exchanged smectites submitted to wetting and drying cycles. Clay Minerals, 37, 473-486.
Drits, V.A., Dainyak, L.G., Muller, F., Besson, G. and Manceau, A. (1997) Isomorphous cation distribution in celadonites, glauconites and Fe-Illites determined by infrared, Mössbauer and EXAFES spectroscopies. Clay Minerals, 32, 153-179.
Gaudin, A., Petit, S., Decarreau, A., Noack, Y. and Grauby, O. (2004a) The actual crystal chem-istry of ferric smectites from the lateritic nickel ore of Murrin Murrin (Western Austra-lia). I. XRD and muli-scale chemical approaches. Clay Minerals, 39, 453-467.
Gaudin, A., Petit, S., Rose, J., Martin, F., Decarreau, A., Noack, Y. and Borschneck, D. (2004b) The accurate crystal chemistry of ferric smectites from the lateritic nickel ore of Murrin Murrin (Western Australia). II. Spectroscopic (IR and EXAFS) approaches. Clay Miner-als, 39, 453-467.
Goodman, B.A., Russell, J.D., Fraser, A.R. and Woodhams, F.W.D. (1976) A Mössbauer and IR spectroscopy study of the structure of nontronite. Clays and Clay Minerals, 24, 53-59.
Grim, R.E. and Kulbicki, G. (1961) Montmorillonite: High Temperature Reactions and Classifi-cation. The American Mineralogist, 46, 1329-1369.
Güven, N. (1988) Smectites in Hydrous phyllosilicates. Bailey, S. W. (edt.), Mineralogical Soci-ety of America, 497-552.
Hueey, J.E., Keiter, E.A. and Keiter, R.L. (1993) Inorganic chemistry. Principles of structure and
85

6. Relations between structural properties
reactivity. Harper Collins, New York.Köster, H.M. (1977) Die Berechnung kristallchemischer Strukturformeln von 2:1 - Schichtsil-
ikaten unter Berücksichtigung der gemessenen Zwischenschichtladungen und Katione-numtauschkapazitäten, sowie der Darstellung der Ladungsverteilung in der Struktur mittels Dreieckskoordinaten. Clay Minerals, 12, 45-54.
Köster, H.M., Ehrlicher, U., Gilg, H.A., Jordan, R., Murad, E. and Onnich, K. (1999) Mineralog-ical and chemical characteristics of five nontronites and Fe-rich smectites. Clay Miner-als, 34, 579-599.
Lagaly, G. and Weiss, A. (1971) Anordnung und Orientierung kationischer Tenside auf ebenen Silicatoberflächen Teil IV. Kolloid-Zeitschrift und Zeitschrift für Polymere, 243, 48-55.
Madejová, J., Bujdák, J., Petit, S. and Komadel, P. (2000) Effects of chemical compostion and temperature of heating on the infrared spectra of Li-staturated dioctahedral smectites. (I) Mid-infrared region. Clay Minerals, 35, 739-751.
Manceau, A., Drits, V., Lanson, B., Chateigner, D., Wu, J., Huo, D., Gates, W.P. and Stucki, J.W. (2000) Oxidation-reductiuon mechanism of iron in dioctahedral smectites. II. Crystal chemistry of reduced Garfield nontronite. American Mineralogist, 85, 153-172.
Mayayo, M.J., Bauluz, B. and Gonzalez Lopez, J.M. (2000) Variations in the chemistry of smec-tites from the Calatayud Basin (NE Spain). Clay Minerals, 35, 365-374.
McCarty, D.K. and Reynolds jr., R.C. (1995) Rotationally disordered illite/smectite in Paleozoic K-bentonites. Clay and Clay Minerals, 43, 271-284.
Meunier, A. (2005) Clays. Springer, 472.Petit, S., Caillaud, J., Righi, D., Madejova, J., Elsass, F. and Köster, H.M. (2002) Characteriza-
tion and crystal chemistry of an Fe-rich montmorillonite from Ölberg, Germany. Clay Minerals, 37, 283-297.
Sainz-Diaz, C.I., Palin, E.J., Hernández-Laguna, A. and Dove, M.T. (2004) Effect of the tetrahe-dral charge on the order-disorder of the cation distribution in the octahedral sheet of smectites and illites by computional methods. Clays and Clay Minerals, 52, 357-374.
Schultz, L.G. (1969) Lithium and potassium absorption, dehydroxylation temperature and struc-tural water content of aluminous smectites. Clays and Clay Minerals, 17, 115-149.
Stevens, R.E. (1945) A system for calculating analyses of micas and related minerals to end members. U.S. Geol. Survey Bull., 950, 101-119.
Tsipursky, S.I. and Drits, V.A. (1984) The distribution of octahedral cations in the 2:1 layers of dioctahedral smectites studied by oblique texture electron diffraction. Clay Minerals, 19, 177-192.
Vantelon, D., Montarges-Pelletier, E., MIchot, L.J., Briois, V., Pelletier and Thomas, F. (2003) Iron distrubution in the octahedral sheet of dioctahedral smectites. An Fe- K-edge X-ray absorption spectroscopy study. Physics and Chemistry of Minerals, 30, 44-53.
Weaver, C.E. and Pollard, L.D. (1973) The chemistry of clay minerals. Development in sedimen-tology, 213.
86

7. Classification
7. Classification
Smectites expose a wide variety in chemistry, structure, layer charge and location of charges. Trivial names like Wyoming-type do not reflect true combination of these parameters. Consequently, the use of a descriptive classification is proposed here. Con-cerning the characteristics listed in Table (7.1), 96 varieties of the montmorillonite-beid-ellite series exist in theory. Until now, only 7 types of montmorillonites and beidellites are distinguished in literature.
It is obvious, that this wide range of smectites cannot be attributed definitely to these 7 groups. This means, one parameter might lead to the conclusion that, for example, the investigated smectite is a Cheto-type but another parameter indicate a Wyoming-type. Only in a few cases the assignment is possible because the existing definitions by trivial names do not include every feature of the structure.
The advantage of the descriptive system is the combination of parameters, which are used as adjectives. The following Table (7.1) summarizes the limits of each parameter used in the classification scheme.
Table 7.1 Parameters proposed of the new classification system.
Structural feature noun or adjective limits
Layer charge [eq/FU] low-chargedmedium-chargedhigh-charged
0.2-0.3750.375-0.4250.425-0.6
Octahedral structure cv cv/tvtv/cvtv
cv 75-100 / tv 0-25cv 50-75/ tv 25-50cv 25-50 / tv 50-75cv 0-25 / tv 75-100
Fe-content[%] of octahedral / [mol/FU]
---ferrian
0-15 / 0.0-0.315-50 / 0.3-1.0
Location of charge/substitu-tion O / T [%](resulting mineral name)
montmorillonitebeidellitic montmorillonitemontmorillonitic beidellitebeidellite
O 90 - 100 / T 0 - 10O 50 - 90 / T 10 - 50O 10 - 50 / T 50 - 90O 0 - 10 / T 90 - 100
87

7. Classification
Table 7.2 indicates the application of the new classification system for the investi-gated samples. They are grouped according to the combination of occurring parameters. The parameter layer charge refers to the measured charge according to Lagaly (1994). The octahedral structure of the expandable minerals derived from the mass spectrometer curve of evolved water (chapter 4). The identified peaks with maximum below and above 600°C are integrated. The tetrahedral substitution and the iron content are obtained by chemical analysis and evaluation of the chemical formula according to Köster (1977).
.
Table 7.2 Application of the new descriptive classification system.
Sample No. Layer charge
Octahedral structure
Fe-content
Tetrahedral substitution/Mineral
8UAS low cv --- --- montmorillonite
16GR01 low cv --- --- montmorillonite
32Volclay low cv --- --- montmorillonite
2LP low cv --- beidellitic montmorillonite
7EMC low cv --- beidellitic montmorillonite
17GR02 low cv --- beidellitic montmorillonite
25 Volclay low cv --- beidellitic montmorillonite
39GQ-I low cv --- beidellitic montmorillonite
13TR02 low cv-tv --- --- montmorillonite
14TR03 low cv-tv --- --- montmorillonite
31BAR3 low cv-tv --- --- montmorillonite
12TR01 low cv-tv --- beidellitic montmorillonite
18USA01 low cv-tv --- beidellitic montmorillonite
19USA02 low cv-tv --- beidellitic montmorillonite
21D01 low cv-tv --- beidellitic montmorillonite
33CA low cv-tv --- beidellitic montmorillonite
42Linden low cv-tv --- beidellitic montmorillonite
3 7th Mayo low tv-cv --- beidellitic montmorillonite
5MC low tv-cv --- beidellitic montmorillonite
28SB low tv-cv --- beidellitic montmorillonite
37BB low tv-cv ferrian beidellitic montmorillonite
6GPC low tv --- beidellitic montmorillonite
38MW low tv ferrian beidellitic montmorillonite
88

7. Classification
One have to bear in mind that the classifications by trivial names often allow excep-tions. It is important to remark that the classification proposed by Brigatti (1983) seem to be difficult to assign to trivial names. Nevertheless, this classification takes into account precise limits compared to the classification of Schultz (1969). Divergencies are not so evident in the classification of Schultz (1969). Therefore, often an assignment to a trivial name is not possible for the classification of Brigatti (1983) though its definitions are accurate.
The descriptive classification system allows a division of the Wyoming-type and the Otay-type into two sub-groups. The Otay-type corresponds to the Cheto-type of Grim and Kulbicki (1961) and shows no difference in chemical composition or thermal behav-ior. Later publications like those of Brigatti (1983) used the term Otay, which is proposed for further use. The main difference between the Otay-type and the Wyoming-type is the different degree of tetrahedral substitution. Wyoming-type is a beidellitic montmorillo-nite and Otay-type equals pure montmorillonite.
Charges in the descriptive classification are those obtained by the layer charge mea-surement (Lagaly, 1994). In contrast, trivial names were referred to the calculated charges of the chemical formula (Stevens, 1945). Table 7.3 - 7.6 present uncertainties of the application of trivial names. Wyoming- and Otay-type can be described fully as they are most abundant in our sample collection.
Wyoming-type I has to be designated as low-charged cv beidellitic montmorillonite whereas Wyoming-type II corresponds to low-charged cv/tv beidellitic montmorillonite.
Low-charged cv montmorillonites are difficult to classify and belong either to Wyo-ming- or to Otay-type in old classification. They have to be named Otay-type I now. Otay-type II approaches low-charged cv/tv montmorillonites.
26-27 Valdol C14 low tv ferrian beidellitic montmorillonite
41ValC18 low tv ferrian beidellitic montmorillonite
36M650 low tv-cv ferrian montmorillo-nitic beidellite
4JUP low cv-tv --- montmorillo-nitic beidellite
24Beid medium cv --- montmorillo-nitic beidellite
Table 7.2 Application of the new descriptive classification system.
Sample No. Layer charge
Octahedral structure
Fe-content
Tetrahedral substitution/Mineral
89

7. Classification
Table 7.3 Low-charged cv montmorillonites (Otay-type I) and trivial names.
Sample No. Schultz (1969) Brigatti (1983)
8UAS Wyoming-type? Otay-type
16GR01 Wyoming-type assignment not possible
32Volclay Otay- or Wyoming-type? assignment not possible
Table 7.4 Low-charged cv beidellitic montmorillonites / (Wyoming-type I) and trivial names.
Sample No. Schultz (1969) Brigatti (1983)
2LP Wyoming-type Wyoming-type
7EMC Wyoming-type Wyoming-type
17GR02 Wyoming-type Tatilla- or Wyoming-type?
25 Volclay Chambers-type Wyoming-type
39GQ_I Wyoming-type Otay- or Cheto-type?
Table 7.5 Low-charged cv/tv montmorillonites (Otay-type II) and trivial names.
Sample No. Schultz (1969) Brigatti (1983)
13TR02 Otay-type Otay-type
14TR03 Otay-type Otay-type
31BAR3 Otay- or Wyoming-type? assignment not possible
Table 7.6 Low-charged cv/tv beidellitic montmorillonites / Wyoming-type II and trivial names.
Sample No. Schultz (1969) Brigatti (1983)
12TR01 assignment not possible assignment not possible
18USA01 Wyoming-type Wyoming-type
19USA02 Wyoming-type assignment not possible
21D01 assignment not possible assignment not possible
33CA Wyoming-type assignment not possible
42Linden Wyoming-type Chambers-type
90

7. Classification
Chambers-type, formerly used for a mixture of Wyoming- and Cheto-type (=Otay-type) (Grim and Kulbicky, 1961), is only found within the Wyoming-type sub-groups. It is defined by an increased layer charge compared to Wyoming-type samples.
Samples with dominant tv proportions correspond to non-ideal montmorillonites (Table 7.7 - 7.13). Non-ideal montmorillonites and beidellites in the old classifications are samples which could not be assigned to trivial names because of low dehydroxyla-tion temperature or high iron content (chapter 6). The so called iron-rich montmorillo-nites (Brigatti, 1983) are equivalent to low-charged tv beidellitic ferrian montmorillonites.
In general non-ideal (or iron-rich) montmorillonites can be classified as low charged tv (ferrian) beidellitic montmorillonites or as low charged tv/cv beidellitic montmorillo-nites.
Table 7.7 Low-charged tv/cv beidellitic montmorillonites and trivial names.
Sample No. Schultz (1969) Brigatti (1983)
3 7th Mayo non-ideal montmorillonite non-ideal montmorillonite
5MC non-ideal montmorillonite non-ideal montmorillonite
28SB non-ideal montmorillonite non-ideal montmorillonite
Table 7.8 Low-charged tv/cv ferrian beidellitic montmorillonites and trivial names.
Sample No. Schultz (1969) Brigatti (1983)
37BB non-ideal montmorillonite non-ideal montmorillonite
Table 7.9 Low-charged tv ferrian beidellitic montmorillonites and trivial names.
Sample No. Schultz (1969) Brigatti (1983)
38MW non-ideal montmorillonite iron-rich montmorillonite
26-27 Valdol C14* non-ideal montmorillonite iron-rich montmorillonite
41ValC18 non-ideal montmorillonite iron-rich montmorillonite
Table 7.10 Low-charged tv beidellitic montmorillonites and trivial names.
Sample No. Schultz (1969) Brigatti (1983)
6GPC non-ideal montmorillonite non-ideal montmorillonite
91

7. Classification
According to the limitations given by Schultz (1969) and Brigatti (1983) and based on our results, the trivial names are translated into the descriptive names. All montmorillo-nite samples are classified as low- or medium-charged and beidellite as medium-charged (Table 7.14).
Table 7.11 Low-charged tv/cv ferrian montmorillonitic beidellite and trivial names.
Sample No. Schultz (1969) Brigatti (1983)
36M650 non-ideal beidellite iron-rich beidellite
Table 7.12 Low-charged tv/cv montmorillonitic beidellite and trivial names.
Sample No. Schultz (1969) Brigatti (1983)
4JUP non-ideal beidellite non-ideal beidellite
Table 7.13 Medium-charged cv montmorillonitic beidellite and trivial names.
Sample No. Schultz (1969) Brigatti (1983)
24Beid beidellite beidellite
Table 7.14 The new classification system and trivial names, based on literature data given by Schultz (1969) and Brigatti (1983) and our investigation.
Type Descriptive classification
Wyoming I: low-charged cv beidellitic montmorilloniteII: low-charged cv/tv beidellitic montmorillonite
Tatilla medium-charged cv beidellitic montmorillonite
Otay I: low-charged cv montmorilloniteII: low-charged cv/tv montmorillonite
Chambers medium-charged cv/tv beidellitic montmorillonite
Non-ideal beidellite I: low-charged tv/cv montmorillonitic beidelliteII: low-charged tv/cv ferrian montmorillonitic beidellite
Ideal beidellite medium-charged cv montmorillonitic beidellite
Non-ideal montmorillonite low-charged tv ferrian beidellitic montmorillonitelow-charged tv/cv ferrian beidellitic montmorillonitelow-charged tv beidellitic montmorillonitelow-charged tv/cv beidellitic montmorillonite
92

7. Classification
The common classifications considered Wyoming-type as low charged montmorillonite.
Tatilla,- Otay- and Chambers-type were classified as high charged montmorillonites.
These layer charges refer to the calculated charges of the chemical composition. Alky-
lammonium measurements clearly show that most montmorillonites are low charged.
Referring on the K+-test, most samples of Wyoming-type expand over 16.3 Å and Otay-
type expand between 14-16.3 Å in accordance with the literature data. However, all sam-
ples are low charged concerning the measured charge.
Literature
Brigatti, M.F. (1983) Relationship between composition and structure in Fe-rich smectites. Clay Minerals, 18, 177-186.
Grim, R.E. and Kulbicki, G. (1961) Montmorillonite: High Temperature Reactions and Classifi-cation. The American Mineralogist, 46, 1329-1369.
Köster, H.M. (1977) Die Berechnung kristallchemischer Strukturformeln von 2:1 - Schichtsil-ikaten unter Berücksichtigung der gemessenen Zwischenschichtladungen und Katione-numtauschkapazitäten, sowie der Darstellung der Ladungsverteilung in der Struktur mittels Dreieckskoordinaten. Clay Minerals, 12, 45-54.
Lagaly, G. (1994) Layer Charge Determination by Alkylammonium Ions in Layer charge charac-teristics of 2:1 silicate clay minerals. Mermut, A. R. (edt.), The Clay Minerals Society, Boulder, 1-46.
Schultz, L.G. (1969) Lithium and potassium absorption, dehydroxylation temperature and struc-tural water content of aluminous smectites. Clays and Clay Minerals, 17, 115-149.
93

7. Classification
94

8. Summary
8. Summary
Smectites expose a wide variety in chemistry, structure, layer charge and location of charges. The aim of this study was a development of a classification system for smectites especially for montmorillonites based on common classifications of Grim and Kulbicki (1961), Schultz (1969), Güven (1988) and Brigatti (1983). Trivial names like Wyoming-type do not reflect the combination of these parameters.
More sophisticated methods provide insights in layer charge distribution and octahe-dral structure. Based on these informations a classification system for smectites was developed taking into account the layer charge, thermal behavior, tetrahedral substitution and iron. Concerning the characteristics of the descriptive classification 96 varieties of the montmorillonite-beidellite series exist in theory. Until now, only 7 types of montmo-rillonites and beidellites are used in literature. Consequently, the use of a descriptive classification is proposed here.
The chemical composition and layer charge of 28 smectites (< 0.2 µm fractions) were correlated with the dehydroxylation behavior. The dehydroxylation temperature gives information on the structure of the octahedral sheet, i.e. cis- and trans-vacant varieties. The results indicate a relation between the amount of iron ions, the location of the charges and the dehydroxylation temperature. Samples with an iron content < 0.3/FU are cis-vacant and those containing Fe3+ > 0.3/FU are trans-vacant, mostly with additional cis-vacancies.
The calculation of the stoichiometric composition is an important task for the classifi-cation. The essential work of Köster (1977), who involved the measured layer charge into the calculation of the chemical formula is still mostly neglected. The layer charge derived from the chemical formula directly calculated from chemical analyses according to Stevens (1945), exhibit up to 0.2 eq/FU higher values than the actually measured layer charge (alkylammonium method, Lagaly and Weiss (1971), Lagaly (1994). Using Köster´s (1977) method the calculated CEC values are consistent with the measured CEC values. These calculated CEC values are, due to the pH-dependent charge of the edges, mostly 10 to 20% lower than the measured values. In contrast, the calculated CEC according to Stevens (1945) are in general much too high compared to the measured val-ues.
95

8. Summary
The K+-test as a check for the layer charge does not correspond to the measured cation densities. Schultz (1969) and even Christidis and Eberl (2003) referred to layer charges calculated from the analytical formula and not to the measured values. The expendability after potassium saturation and ethylene glycol solvation is related to the layer charge. However, the classification described in literature is not confirmed by our investigation. In addition, the correlation between expendability or the coefficient of variance and the measured layer charge is more significant than in comparison with the calculated layer charge.
Structural insight into the octahedral sheet cannot be obtained by XRD as smectites are turbostratically disordered showing no diagnostic (hkl)-reflections. Drits et al. (1995) established a method to determine the structure of the octahedral sheet by the dehydrox-ylation temperature. Until now, simultaneous thermal analysis is the best method to eval-uate the structure of the octahedral sheet of smectites. The cis- and trans-vacant proportions were calculated by fitting the mass spectrometer curves for evolved water (m/e = 18) and its integrated peak areas. It still remains unsolved whether cis- and trans-vacancies are distributed within an octahedral sheet or the smectites are composed of cv and tv layers as in mixed layer minerals. Most probable is that the cv/tv proportions vary within the layers also from layer to layer. Most montmorillonites exhibit mixtures of cis- and trans-vacancies with emphasis on cis-vacancies. Pure trans-vacant samples were not found in our sample collection, cis-vacancies were detected even in tv designated sam-ples. However, we found samples with only cis-vacancies.
Mössbauer spectroscopy for selected samples discovered that iron occurs to 95-100% as Fe3+ in the octahedral sheet, with Fe2+ contents of only 0% to 5%. Recalculation of the chemical formulae under consideration of the Fe2+ content led to maximum changes of 0.02 mol/FU. Fe3+ ions do not occur in tetrahedral coordination. In general, correction of the stoichiometric composition for montmorillonites with low iron contents is therefore not necessary. The major difference between montmorillonite and nontronite is that only nontronite has iron ions in the tetrahedral sheet (Bishop et al., 1999).
A relation between the total layer charge and the proportion of trans-vacancies in the octahedral sheet was not detected. The content of Mg2+ also does not reveal a correlation to octahedral structure. Cis- and trans-vacancies do not vary significantly as a function of the Mg2+ content. The influence of iron on the octahedral sheet is highly significant.
Our results demonstrate that the iron content is the dominant factor which controls the octahedral sheet structure. A positive correlation exists between the iron content and the cv/tv ratio increasing the number of trans vacancies. The content of iron also influences the tetrahedral substitution, the content of Al(IV)3+ and the proportion of trans-vacancies increases with the amount of Fe(IV)3+. Therefore the tetrahedral substitution is also a function of the number of trans-vacancies. Drits et al. (1997) postulated that no correla-
96

8. Summary
tion between dehydroxylation temperature and the tetrahedral substitution is established in general for 2:1 clay minerals. Rather, it is likely that such a relation is restricted to smectites, especially to montmorillonites.
Samples with an iron content > 0.3 mol/FU are dominantly tv and those with Fe3+ < 0.3 mol/FU are cv varieties. This is consistent with Güven (1988) and Brigatti (1983) who also set the limit at 0.3 mol/FU for iron-rich (ferrian) smectites. The upper limit for ferrian smectites was differently assigned. Brigatti (1983) documented samples with 15-30% of octahedral iron as Fe-rich montmorillonites and beidellites whereas Güven (1988) proposed 15-50% octahedral iron for iron-rich smectites. Güven´s (1988) upper limitations have to be used as our results and literature data did not show a misci-bility gap existing concerning the octahedral iron of montmorillonites, beidellites and nontronites.
Common classifications designated the Wyoming-type as low charged smectite. Tatilla- Otay- and Chambers-types were classified as high charged montmorillonites. Charges in the descriptive classification were the measured layer charges (Lagaly, 1994), whereas the trivial names referred to the calculated charges of chemical formulae accord-ing to Stevens (1945). Alkylammonium measurements clearly show that most montmo-rillonites are low charged. The K+-test shows that most Wyoming-type samples expand above 16.3 Å and Otay-type expand between 14-16.3 Å in accordance with literature. But all samples are low charged concerning the measured charge.
The descriptive classification system allows a division of the Wyoming-type and the Otay-type samples into two subgroups. Otay-type samples correspond to the Cheto-type of Grim and Kulbicki (1961). The main differences between the Otay-type and the Wyo-ming-type is the different tetrahedral substitution. Wyoming-type is beidellitic montmo-rillonite and Otay-type equals pure montmorillonite.
The Wyoming-type I has to be designated now as low-charged cv beidellitic montmo-rillonite whereas the Wyoming-type II corresponds to low-charged cv/tv beidellitic mont-morillonite. Low-charged cv montmorillonites were difficult to classify and belong either to the Wyoming- or to Otay-type in the old classification. They have now to be named Otay-type I . Otay-type II comprises low-charged cv/tv montmorillonite.
Samples with dominant tv proportions correspond to non-ideal montmorillonites. The so called iron-rich montmorillonites (Brigatti, 1983) are low-charged tv (tv/cv) ferrian beidellitic montmorillonites.
Even samples which were not possible to assign to a group in the older classifications can now be classified.
97

8. Summary
98

Appendix
Method description and literature: Chapter 2 „Materials and Methods“
Explanations of the footnotes of the datasheets:
1: Relative error or variance for the single elements determined in XRF
2: Alkylammonium intercalation, nc = chain length
3: CEC obtained by exchange with the copper triethylentatramine complex4: layer charge obtained from structural formula calculation of XRF5: CEC derived from calculated layer charge and molar mass, molar mass obtained from thestrucutral formula calculation of XRF (Stevens, 1945)6: layer charge charge according to Köster (1977)7: CEC obtained by measured layer charge and molar mass, molar mass obtained from strucutral formula calculation based on XRF and measured layer charge (permanent charge) (Köster, 1977)
element SiO2 TiO2 Al2O3 Fe2O3 MnO MgO CaO Na2O K2O LOI
variance 0.43 1.7 1.29 0.48 3.93 0.9 0.85 2.96 4.11 3.86

Appendix
Sample 2 LPlow charged cv beidellitic montmorillonitetrivial name: Wyoming-type I
Stoichiometric composition (< 0.2 µm fraction)
(Stevens, 1945) Me+0.37 (Si3.91 Al3+
0.09) (Al3+1.50 Fe3+
0.22 Mg2+0.28) [O10 (OH)2]
(Köster, 1977) Me+0.29 (Si3.93 Al3+
0.07) (Al3+1.52 Fe3+
0.22 Mg2+0.28) [O10 (OH)2]
XRF analyses of bulk material, < 2 µm and < 0.2 µm fraction
oxides [%]1 SiO2 TiO2 Al2O3 Fe2O3 MnO MgO CaO Na2O K2O LOI
bulk 55.60 0.15 18.27 4.16 0.03 2.70 0.16 3.00 0.22 14.84
< 2 µm 60.28 0.16 20.65 4.50 0.01 2.83 0.03 3.05 0.08 8.10
< 0.2 µm 58.97 0.14 20.31 4.45 0.01 2.84 0.04 2.81 0.05 10.03
Layer charge and cation exchange capacity (< 0.2 µm fraction)
measured calculated calculated
nc 4-18 Cu-Trien (pH=7) Stevens (1945) Köster (1977)
ξ2
[eq/FU]CEC3
[meq/100 g]ξ4
[eq/FU]CEC5
[meq/100 g]ξ6
[eq/FU]CEC7
[meq/100 g]
0.28 94 0.37 99 0.29 76
Charge location (< 0.2 µm fraction)
tetrahedral octahedral % tetrahedral charge
(Stevens, 1945) 0.09 0.28 24
(Köster, 1977) 0.07 0.22 24
Iron content (of octahedral cations) (< 0.2 µm fraction)
Fe3+ [mol/FU] Fe (VI)3+ [%]
(Stevens, 1945) 0.22 11
(Köster, 1977) 0.22 11

Appendix
X-ray diffraction - basal spacing (< 0.2 µm fraction)
Simultaneous Thermal Analysis (< 0.2 µm fraction)
Layer charge - distribution and peak migration (< 0.2 µm fraction)
-60
-50
-40
-30
-20
-10
0
DSC /uV
86
88
90
92
94
96
98
100
TG /%
100 200 300 400 500 600 700 800 900 1000Temperatur /°C
0
0.2
0.4
0.6
0.8
1.0
1.2
1.4
Ionenstrom *10-10 /A
m18
DSC
TG
147 °C
678 °C
871 °C
925 °C
-14.52 %
-9.94 %
-4.58 %
146 °C
680 °C
[6]
[6][7][9]
↑ Exo
temperature /°C EGA m/e = 18
TG /%
nc d(001) nc d(001)
8 13.5 13 15.8
9 13.7 14 16.0
10 13.9 15 16.5
11 14.3 16 17.7
12 15.2 18 18.0
ξ = 0.28
d(00l) air [Å] EG [Å]
d(001) 11.8 17.1
d(002) 8.5
d(003) 5.7
d(004) 3.1 4.3
d(005) 3.4

Appendix
Sample 3 7th Mayolow charged tv/cv beidellitic montmorillonitetrivial name: non-ideal montmorillonite
Stoichiometric composition (< 0.2 µm fraction)
(Stevens, 1945) Me+0.42 (Si3.89 Al3+
0.11) (Al3+1.34 Fe3+
0.35 Mg2+0.31) [O10 (OH)2]
(Köster, 1977) Me+0.31 (Si3.91 Al3+
0.09) (Al3+1.37 Fe3+
0.35 Mg2+0.31) [O10 (OH)2]
XRF analyses of bulk material, < 2 µm and < 0.2 µm fraction
oxides [%]1 SiO2 TiO2 Al2O3 Fe2O3 MnO MgO CaO Na2O K2O LOI
bulk 55.27 0.63 16.40 5.35 0.05 2.34 1.68 2.32 0.72 14.72
< 2 µm 57.39 0.70 17.91 6.45 0.05 2.95 0.07 2.96 0.50 10.65
< 0.2 µm 57.84 0.70 18.31 6.91 0.05 3.08 0.01 2.76 0.42 9.55
Layer charge and cation exchange capacity (< 0.2 µm fraction)
measured calculated calculated
nc 4-18 Cu-Trien (pH=7) Stevens (1945) Köster (1977)
ξ2
[eq/FU]CEC3
[meq/100 g]ξ4
[eq/FU]CEC5
[meq/100 g]ξ6
[eq/FU]CEC7
[meq/100 g]
0.30 89 0.42 111 0.31 80
Charge location (< 0.2 µm fraction)
tetrahedral octahedral % tetrahedral charge
(Stevens, 1945) 0.11 0.31 26
(Köster, 1977) 0.09 0.22 29
Iron content (of octahedral cations) (< 0.2 µm fraction)
Fe3+ [mol/FU] Fe (VI)3+ [%]
(Stevens, 1945) 0.35 35
(Köster, 1977) 0.35 34
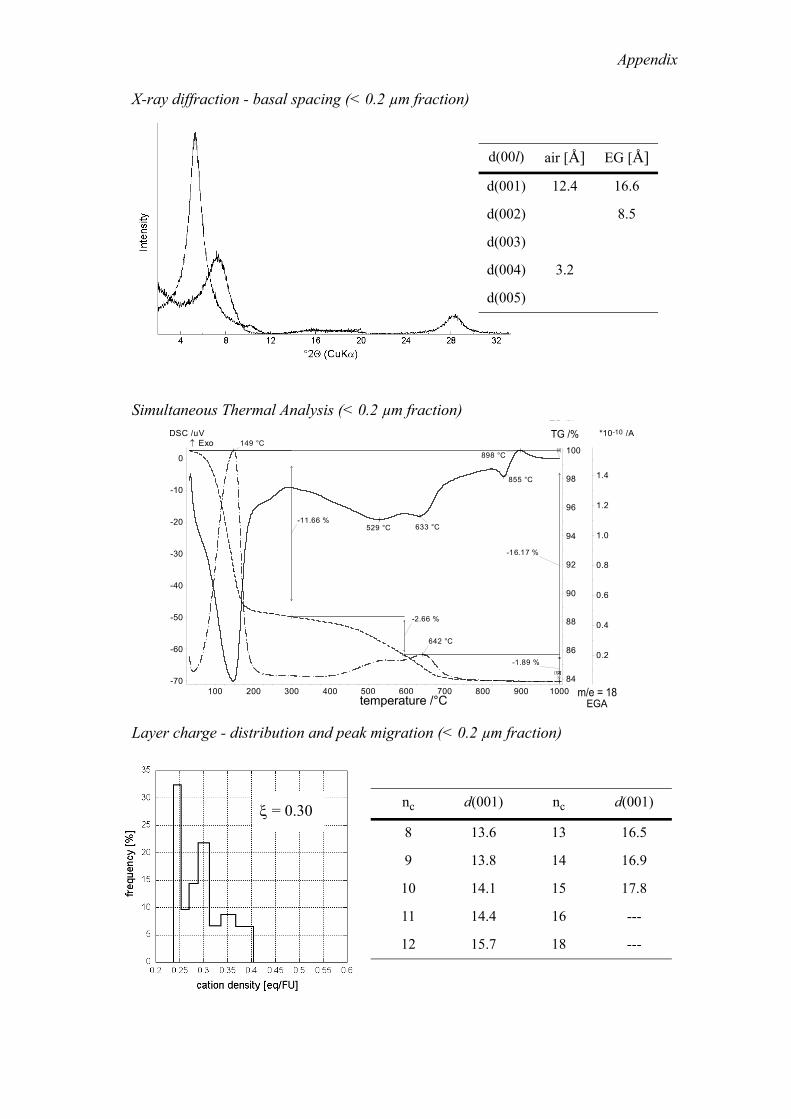
Appendix
X-ray diffraction - basal spacing (< 0.2 µm fraction)
Simultaneous Thermal Analysis (< 0.2 µm fraction)
Layer charge - distribution and peak migration (< 0.2 µm fraction)
0.2
0.4
0.6
0.8
1.0
1.2
1.4
Ionenstrom *10-10 /A
100 200 300 400 500 600 700 800 900 1000Temperatur /°C
-70
-60
-50
-40
-30
-20
-10
0
DSC /uV
84
86
88
90
92
94
96
98
100
TG /%
529 °C 633 °C
855 °C
898 °C
-16.17 %
-11.66 %
-1.89 %
149 °C
642 °C
-2.66 %
[3]
[3][12]
↑ Exo
temperature /°C EGA m/e = 18
TG /%
nc d(001) nc d(001)
8 13.6 13 16.5
9 13.8 14 16.9
10 14.1 15 17.8
11 14.4 16 ---
12 15.7 18 ---
ξ = 0.30
d(00l) air [Å] EG [Å]
d(001) 12.4 16.6
d(002) 8.5
d(003)
d(004) 3.2
d(005)

Appendix
Sample 4JUPlow charged tv/cv montmorillonitic beidellitetrivial name: non-ideal beidellite
Stoichiometric composition (< 0.2 µm fraction)
(Stevens, 1945) Me+0.37 (Si3.82 Al3+
0.18) (Al3+1.42 Fe3+
0.39 Mg2+0.19) [O10 (OH)2]
(Köster, 1977) Me+0.26 (Si3.84 Al3+
0.16) (Al3+1.45 Fe3+
0.39 Mg2+0.19) [O10 (OH)2]
XRF analyses of bulk material, < 2 µm and < 0.2 µm fraction
oxides [%]1 SiO2 TiO2 Al2O3 Fe2O3 MnO MgO CaO Na2O K2O LOI
bulk 56.27 0.75 17.49 5.65 0.02 1.42 1.76 2.50 0.74 12.96
< 2 µm 59.16 0.89 19.75 7.11 0.02 1.82 0.16 2.89 0.49 7.36
< 0.2 µm 56.00 0.75 19.89 7.52 0.02 1.86 0.05 2.70 0.28 10.50
Layer charge and cation exchange capacity (< 0.2 µm fraction)
measured calculated calculated
nc 4-18 Cu-Trien (pH=7) Stevens (1945) Köster (1977)
ξ2
[eq/FU]CEC3
[meq/100 g]ξ4
[eq/FU]CEC5
[meq/100 g]ξ6
[eq/FU]CEC7
[meq/100 g]
0.29 91 0.37 97 0.26 78
Charge location (< 0.2 µm fraction)
tetrahedral octahedral % tetrahedral charge
(Stevens, 1945) 0.18 0.19 49
(Köster, 1977) 0.16 0.10 62
Iron content (of octahedral cations) (< 0.2 µm fraction)
Fe3+ [mol/FU] Fe (VI)3+ [%]
(Stevens, 1945) 0.39 39
(Köster, 1977) 0.39 38

Appendix
X-ray diffraction - basal spacing (< 0.2 µm fraction)
Simultaneous Thermal Analysis (< 0.2 µm fraction)
Layer charge - distribution and peak migration (< 0.2 µm fraction)
0.2
0.4
0.6
0.8
1.0
1.2
1.4
Ionenstrom *10-10 /A
100 200 300 400 500 600 700 800 900 1000Temperatur /°C
-60
-50
-40
-30
-20
-10
0
DSC /uV
86
88
90
92
94
96
98
100
TG /%
148 °C
503 °C 656 °C
866 °C
917 °C
-10.51 %
-2.27 %
-14.99 %
514 °C664 °C
147 °C
-2.22 %
[1]
[1][2]
↑ Exo
temperature /°C EGA m/e = 18
TG /%
nc d(001) nc d(001)
6 13.5 12 15.5
7 13.5 13 16.2
8 13.7 14 16.3
9 13.8 15 17.3
10 14.0 16 18.4
11 14.6 18 ---
ξ = 0.29
d(00l) air [Å] EG [Å]
d(001) 12.4 17.0
d(002) 8.6
d(003) 5.6
d(004) 3.1 4.3
d(005) 3.4

Appendix
Sample 5MClow charged tv/cv beidellitic montmorillonitetrivial name: non-ideal montmorillonite
Stoichiometric composition (< 0.2 µm fraction)
(Stevens, 1945) Me+0.40 (Si3.94 Al3+
0.09) (Al3+1.34 Fe3+
0.32 Mg2+0.34) [O10 (OH)2]
(Köster, 1977) Me+0.232 (Si3.96 Al3+
0.07) (Al3+1.36 Fe3+
0.32 Mg2+0.34) [O10 (OH)2]
XRF analyses of bulk material, < 2 µm and < 0.2 µm fraction
oxides [%]1 SiO2 TiO2 Al2O3 Fe2O3 MnO MgO CaO Na2O K2O LOI
bulk 57.15 0.54 13.05 4.29 0.02 2.40 3.52 0.64 0.27 17.63
< 2 µm 58.13 0.63 15.53 5.64 0.01 2.93 0.05 2.43 0.12 14.17
< 0.2 µm 59.36 0.41 17.56 6.36 0.01 3.40 0.01 2.90 0.12 9.45
Layer charge and cation exchange capacity (< 0.2 µm fraction)
measured calculated calculated
nc 4-18 Cu-Trien (pH=7) Stevens (1945) Köster (1977)
ξ2
[eq/FU]CEC3
[meq/100 g]ξ4
[eq/FU]CEC5
[meq/100 g]ξ6
[eq/FU]CEC7
[meq/100 g]
0.28 81 0.40 106 0.32 75
Charge location (< 0.2 µm fraction)
tetrahedral octahedral % tetrahedral charge
(Stevens, 1945) 0.06 0.34 15
(Köster, 1977) 0.04 0.28 13
Iron content (of octahedral cations) (< 0.2 µm fraction)
Fe3+ [mol/FU] Fe (VI)3+ [%]
(Stevens, 1945) 0.32 32
(Köster, 1977) 0.32 31

Appendix
X-ray diffraction - basal spacing (< 0.2 µm fraction)
Simultaneous Thermal Analysis (< 0.2 µm fraction)
Layer charge - distribution and peak migration (< 0.2 µm fraction)
0.2
0.4
0.6
0.8
1.0
Ionenstrom *10-10 /A
100 200 300 400 500 600 700 800 900 1000Temperatur /°C
-40.0
-35.0
-30.0
-25.0
-20.0
-15.0
-10.0
-5.0
0
DSC /uV
90
92
94
96
98
100
TG /%
140 °C
294 °C
640 °C
854 °C
898 °C
-10.39 %
-5.48 %
139 °C
653 °C
-4.91 %
[3]
[3][12]
↑ Exo
temperature /°C EGA m/e = 18
TG /%
nc d(001) nc d(001)
6 --- 12 14.6
7 13.6 13 15.8
8 13.7 14 16.0
9 13.7 15 16.7
10 13.8 16 17.7
11 13.9 18 18.0
ξ = 0.28
d(00l) air [Å] EG [Å]
d(001) 11.4 16.9
d(002) 8.6
d(003) 5.7
d(004) 3.1
d(005)

Appendix
Sample 6GPClow charged tv beidellitic montmorillonitetrivial name: non-ideal montmorillonite
Stoichiometric composition (< 0.2 µm fraction)
(Stevens, 1945) Me+0.45 (Si3.85 Al3+
0.15) (Al3+1.37 Fe3+
0.31 Mg2+0.33) [O10 (OH)2]
(Köster, 1977) Me+0.34 (Si3.87 Al3+
0.13) (Al3+1.40 Fe3+
0.31 Mg2+0.33) [O10 (OH)2]
XRF analyses of bulk material, < 2 µm and < 0.2 µm fraction
oxides [%]1 SiO2 TiO2 Al2O3 Fe2O3 MnO MgO CaO Na2O K2O LOI
bulk 64.97 0.55 11.35 3.95 0.02 2.05 1.98 0.37 1.39 12.80
< 2 µm 66.22 0.54 13.06 3.96 0.01 2.08 0.04 1.66 1.30 10.76
< 0.2 µm 56.62 0.38 19.00 6.00 0.01 3.29 0.04 2.62 1.41 10.13
Layer charge and cation exchange capacity (< 0.2 µm fraction)
measured calculated calculated
nc 4-18 Cu-Trien (pH=7) Stevens (1945) Köster (1977)
ξ2
[eq/FU]CEC3
[meq/100 g]ξ4
[eq/FU]CEC5
[meq/100 g]ξ6
[eq/FU]CEC7
[meq/100 g]
0.33 75 0.45 118 0.34 89
Charge location (< 0.2 µm fraction)
tetrahedral octahedral % tetrahedral charge
(Stevens, 1945) 0.15 0.30 33
(Köster, 1977) 0.13 0.21 38
Iron content (of octahedral cations) (< 0.2 µm fraction)
Fe3+ [mol/FU] Fe (VI)3+ [%]
(Stevens, 1945) 0.31 31
(Köster, 1977) 0.31 30

Appendix
X-ray diffraction - basal spacing (< 0.2 µm fraction)
Simultaneous Thermal Analysis (< 0.2 µm fraction)
Layer charge - distribution and peak migration (< 0.2 µm fraction)
0.2
0.4
0.6
0.8
1.0
1.2
Ionenstrom *10-10 /A
100 200 300 400 500 600 700 800 900 1000Temperatur /°C
-45.0
-40.0
-35.0
-30.0
-25.0
-20.0
-15.0
-10.0
-5.0
0
DSC /uV
90
92
94
96
98
100
TG /%
146 °C
555 °C
297 °C
864 °C
905 °C
-11.53 %
-6.49 %
-1.17 %
148 °C
289 °C
558 °C
653 °C
-3.88 %
[3]
[3][12]
↑ Exo
temperature /°C EGA m/e = 18
TG /%
nc d(001) nc d(001)
6 13.5 12 17.5
7 13.7 13 17.7
8 13.8 14 18.0
9 14.1 15 ---
10 15.6 16 ---
11 16.6 18 ---
ξ = 0.33
**
* shoulder at 10.3 vanished Sr-saturated
d(00l) air [Å] EG [Å]
d(001) 11.7 16.8
d(002) 8.6*
d(003) 5.6
d(004) 3.1
d(005)

Appendix
Sample 7EMClow charged cv beidellitic montmorillonitetrivial name: Wyoming-type I
Stoichiometric composition (< 0.2 µm fraction)
(Stevens, 1945) Me+0.40 (Si3.87 Al3+
0.13) (Al3+1.55 Fe3+
0.16 Mg2+0.30) [O10 (OH)2]
(Köster, 1977) Me+0.25 (Si3.90 Al3+
0.10) (Al3+1.59 Fe3+
0.16 Mg2+0.30) [O10 (OH)2]
XRF analyses of bulk material, < 2 µm and < 0.2 µm fraction
oxides [%]1 SiO2 TiO2 Al2O3 Fe2O3 MnO MgO CaO Na2O K2O LOI
bulk 64.82 0.15 13.97 2.02 0.01 2.15 2.17 1.18 0.27 12.69
< 2 µm 68.52 0.11 14.77 2.24 0.00 2.06 0.02 2.27 0.04 9.71
< 0.2 µm 66.80 0.11 17.57 2.61 0.00 2.48 0.01 2.70 0.05 7.41
Layer charge and cation exchange capacity (< 0.2 µm fraction)
measured calculated calculated
nc 4-18 Cu-Trien (pH=7) Stevens (1945) Köster (1977)
ξ2
[eq/FU]CEC3
[meq/100 g]ξ4
[eq/FU]CEC5
[meq/100 g]ξ6
[eq/FU]CEC7
[meq/100 g]
0.28 73 0.40 107 0.25 73
Charge location (< 0.2 µm fraction)
tetrahedral octahedral % tetrahedral charge
(Stevens, 1945) 0.13 0.27 33
(Köster, 1977) 0.10 0.15 40
Iron content (of octahedral cations) (< 0.2 µm fraction)
Fe3+ [mol/FU] Fe (VI)3+ [%]
(Stevens, 1945) 0.16 16
(Köster, 1977) 0.16 15

Appendix
X-ray diffraction - basal spacing (< 0.2 µm fraction)
Simultaneous Thermal Analysis (< 0.2 µm fraction)
Layer charge - distribution and peak migration (< 0.2 µm fraction)
0.2
0.4
0.6
0.8
1.0
1.2
Ionenstrom *10-10 /A
100 200 300 400 500 600 700 800 900 1000Temperatur /°C
-50
-40
-30
-20
-10
0
DSC /uV
-12
-10
-8
-6
-4
-2
0
TG /mg
140 °C
310 °C
697 °C
141 °C
310 °C
693 °C
888 °C
952 °C
-7.46 mg
-4.56 mg
[11]
[11][12]
↑ Exo
temperature /°C EGA m/e = 18
TG /%
nc d(001) nc d(001)
6 --- 12 15.2
7 --- 13 15.5
8 13.2 14 15.9
9 13.7 15 16.3
10 13.8 16 17.2
11 14.1 18 18.0
ξ = 0.28
d(00l) air [Å] EG [Å]
d(001) 11.1 17.1
d(002) 8.5
d(003) 5.7
d(004) 3.1
d(005) 3.2

Appendix
Sample 8UASlow-charged cv montmorillonitetrivial name: Otay-type I
Stoichiometric composition (< 0.2 µm fraction)
(Stevens, 1945) Me+0.48 (Si3.97 Al3+
0.03) (Al3+1.38 Fe3+
0.17 Mg2+0.45) [O10 (OH)2]
(Köster, 1977) Me+0.37 (Si3.99 Al3+
0.01) (Al3+1.41 Fe3+
0.17 Mg2+0.45) [O10 (OH)2]
XRF analyses of bulk material, < 2 µm and < 0.2 µm fraction
oxides [%]1 SiO2 TiO2 Al2O3 Fe2O3 MnO MgO CaO Na2O K2O LOI
bulk 60.04 0.19 13.38 2.30 0.03 3.61 1.51 1.15 0.23 17.19
< 2 µm 60.47 0.14 14.91 2.73 0.03 3.74 0.02 2.99 0.06 14.60
< 0.2 µm 63.59 0.15 16.49 3.10 0.03 4.16 0.01 3.31 0.07 8.83
Layer charge and cation exchange capacity (< 0.2 µm fraction)
measured calculated calculated
nc 4-18 Cu-Trien (pH=7) Stevens (1945) Köster (1977)
ξ2
[eq/FU]CEC3
[meq/100 g]ξ4
[eq/FU]CEC5
[meq/100 g]ξ6
[eq/FU]CEC7
[meq/100 g]
0.34 97 0.48 128 0.37 91
Charge location (< 0.2 µm fraction)
tetrahedral octahedral % tetrahedral charge
(Stevens, 1945) 0.03 0.45 6
(Köster, 1977) 0.01 0.36 3
Iron content (of octahedral cations) (< 0.2 µm fraction)
Fe3+ [mol/FU] Fe (VI)3+ [%]
(Stevens, 1945) 0.17 17
(Köster, 1977) 0.17 17

Appendix
X-ray diffraction - basal spacing (< 0.2 µm fraction)
Simultaneous Thermal Analysis (< 0.2 µm fraction)
Layer charge - distribution and peak migration (< 0.2 µm fraction)
1.0
2.0
3.0
4.0
5.0
6.0
Ionenstrom *10-10 /A
100 200 300 400 500 600 700 800 900 1000Temperatur /°C
-70
-60
-50
-40
-30
-20
-10
0
DSC /uV
84
86
88
90
92
94
96
98
100
TG /%
155 °C
305 °C
662 °C
853 °C
-11.88 %
-16.39 %
156 °C
665 °C -4.51 %
[4]
[4][5]
↑ Exo
temperature /°C EGA m/e = 18
TG /%
nc d(001) nc d(001)
6 13.6 12 16.5
7 13.7 13 17.6
8 13.8 14 17.7
9 14.5 15 18.4
10 15.4 16 ---
11 15.7 18 ---
ξ = 0.34
d(00l) air [Å] EG [Å]
d(001) 11.9 16.7
d(002) 8.5
d(003) 5.6
d(004) 3.1
d(005) 3.1

Appendix
Sample 12TR01low charged cv/tv beidellitic montmorillonitetrivial name: Wyoming-type II
Stoichiometric composition (< 0.2 µm fraction)
(Stevens, 1945) Me+0.42 (Si3.93 Al3+
0.07) (Al3+1.54 Fe3+
0.07 Mg2+0.41) [O10 (OH)2]
(Köster, 1977) Me+0.35 (Si3.94 Al3+
0.06) (Al3+1.56 Fe3+
0.07 Mg2+0.41) [O10 (OH)2]
XRF analyses of bulk material, < 2 µm and < 0.2 µm fraction
oxides [%]1 SiO2 TiO2 Al2O3 Fe2O3 MnO MgO CaO Na2O K2O LOI
bulk 62.96 0.13 14.48 0.92 0.03 3.10 1.49 1.16 0.79 14.59
< 2 µm 64.36 0.09 15.24 1.04 0.01 3.19 0.02 2.64 0.12 13.00
< 0.2 µm 61.31 0.07 16.83 1.11 0.01 3.35 0.01 2.76 0.07 14.14
Layer charge and cation exchange capacity (< 0.2 µm fraction)
measured calculated calculated
nc 4-18 Cu-Trien (pH=7) Stevens (1945) Köster (1977)
ξ2
[eq/FU]CEC3
[meq/100 g]ξ4
[eq/FU]CEC5
[meq/100 g]ξ6
[eq/FU]CEC7
[meq/100 g]
0.36 99 0.42 113 0.35 98
Charge location (< 0.2 µm fraction)
tetrahedral octahedral % tetrahedral charge
(Stevens, 1945) 0.07 0.35 17
(Köster, 1977) 0.06 0.29 17
Iron content (of octahedral cations) (< 0.2 µm fraction)
Fe3+ [mol/FU] Fe (VI)3+ [%]
(Stevens, 1945) 0.07 7
(Köster, 1977) 0.07 7

Appendix
X-ray diffraction - basal spacing (< 0.2 µm fraction)
Simultaneous Thermal Analysis (< 0.2 µm fraction)
Layer charge - distribution and peak migration (< 0.2 µm fraction)
0.5
1.0
1.5
2.0
2.5
Ionenstrom *10-10 /A
100 200 300 400 500 600 700 800 900 1000Temperatur /°C
-70
-60
-50
-40
-30
-20
-10
DSC /uV
86
88
90
92
94
96
98
100
TG /%
160 °C
664 °C
879 °C
-14.21 %
-10.16 %
159 °C
-4.05 %
[3]
[3][12]
↑ Exo
temperature /°C EGA m/e = 18
TG /%
nc d(001) nc d(001)
4 13.2 10 15.9
5 13.4 11 16.7
6 13.5 12 17.9
7 13.6 13 ---
8 13.8 14 ---
9 15.7 15 ---
ξ = 0.36
d(00l) air [Å] EG [Å]
d(001) 11.5 16.8
d(002) 8.5
d(003) 5.6
d(004) 3.2
d(005)

Appendix
Sample 13TR02low-charged cv/tv montmorillonitetrivial name: Otay-type II
Stoichiometric composition (< 0.2 µm fraction)
(Stevens, 1945) Me+0.48 (Si3.96 Al3+
0.04) (Al3+1.33 Fe3+
0.17 Mg2+0.53) [O10 (OH)2]
(Köster, 1977) Me+0.35 (Si3.98 Al3+
0.02) (Al3+1.36 Fe3+
0.17 Mg2+0.54) [O10 (OH)2]
XRF analyses of bulk material, < 2 µm and < 0.2 µm fraction
oxides [%]1 SiO2 TiO2 Al2O3 Fe2O3 MnO MgO CaO Na2O K2O LOI
bulk 51.84 0.24 14.92 3.06 0.02 4.96 2.84 1.55 0.30 19.58
< 2 µm 56.44 0.25 16.31 3.19 0.01 5.12 0.07 3.40 0.16 14.69
< 0.2 µm 57.27 0.20 16.79 3.24 0.01 5.16 0.01 3.43 0.10 13.49
Layer charge and cation exchange capacity (< 0.2 µm fraction)
measured calculated calculated
nc 4-18 Cu-Trien (pH=7) Stevens (1945) Köster (1977)
ξ2
[eq/FU]CEC3
[meq/100 g]ξ4
[eq/FU]CEC5
[meq/100 g]ξ6
[eq/FU]CEC7
[meq/100 g]
0.35 113 0.48 128 0.35 94
Charge location (< 0.2 µm fraction)
tetrahedral octahedral % tetrahedral charge
(Stevens, 1945) 0.04 0.44 8
(Köster, 1977) 0.02 0.33 6
Iron content (of octahedral cations) (< 0.2 µm fraction)
Fe3+ [mol/FU] Fe (VI)3+ [%]
(Stevens, 1945) 0.17 17
(Köster, 1977) 0.17 16

Appendix
X-ray diffraction - basal spacing (< 0.2 µm fraction)
Simultaneous Thermal Analysis (< 0.2 µm fraction)
Layer charge - distribution and peak migration (< 0.2 µm fraction)
0.5
1.0
1.5
2.0
Ionenstrom *10-10 /A
100 200 300 400 500 600 700 800 900 1000Temperatur /°C
-60
-50
-40
-30
-20
-10
DSC /uV
86
88
90
92
94
96
98
100
TG /%
159 °C
297 °C
630 °C
837 °C
-14.3
158 °C
637 °C
-9.72 %
-4.59 %
[1]
[1][2]
↑ Exo
temperature /°C EGA m/e = 18
TG /%
nc d(001) nc d(001)
4 --- 10 15.7
5 13.5 11 16.1
6 13.6 12 17.4
7 13.7 13 17.8
8 14.0 14 17.7
9 14.8 15 ---
ξ = 0.35
d(00l) air [Å] EG [Å]
d(001) 12.4 16.7
d(002) 6.2 8.5
d(003)
d(004) 3.1
d(005)

Appendix
Sample 14TR03low-charged cv/tv montmorillonitetrivial name: Otay-type II
Stoichiometric composition (< 0.2 µm fraction)
(Stevens, 1945) Me+0.37 (Si3.97 Al3+
0.03) (Al3+1.39 Fe3+
0.09 Mg2+0.56) [O10 (OH)2]
(Köster, 1977) Me+0.36 (Si3.99 Al3+
0.01) (Al3+1.42 Fe3+
0.09 Mg2+0.56) [O10 (OH)2]
XRF analyses of bulk material, < 2 µm and < 0.2 µm fraction
oxides [%]1 SiO2 TiO2 Al2O3 Fe2O3 MnO MgO CaO Na2O K2O LOI
bulk 51.08 0.08 15.08 1.54 0.06 5.30 3.58 0.08 0.17 22.61
< 2 µm 55.07 0.08 16.40 1.57 0.01 5.24 0.03 3.38 0.04 17.82
< 0.2 µm 59.96 0.08 17.96 1.73 0.01 5.59 0.01 3.67 0.03 10.69
Layer charge and cation exchange capacity (< 0.2 µm fraction)
measured calculated calculated
nc 4-18 Cu-Trien (pH=7) Stevens (1945) Köster (1977)
ξ2
[eq/FU]CEC3
[meq/100 g]ξ4
[eq/FU]CEC5
[meq/100 g]ξ6
[eq/FU]CEC7
[meq/100 g]
0.37 112 0.47 126 0.36 100
Charge location (< 0.2 µm fraction)
tetrahedral octahedral % tetrahedral charge
(Stevens, 1945) 0.09 0.44 6
(Köster, 1977) 0.01 0.35 3
Iron content (of octahedral cations) (< 0.2 µm fraction)
Fe3+ [mol/FU] Fe (VI)3+ [%]
(Stevens, 1945) 0.09 9
(Köster, 1977) 0.09 8

Appendix
X-ray diffraction - basal spacing (< 0.2 µm fraction)
Simultaneous Thermal Analysis (< 0.2 µm fraction)
Layer charge - distribution and peak migration (< 0.2 µm fraction)
0.2
0.4
0.6
0.8
1.0
1.2
1.4
Ionenstrom *10-10 /A
100 200 300 400 500 600 700 800 900 1000Temperatur /°C
-50.0
-45.0
-40.0
-35.0
-30.0
-25.0
-20.0
-15.0
-10.0
-5.0
DSC /uV
88
90
92
94
96
98
100
TG /%
155 °C
643 °C
844 °C
-12.1
-7.26 %
156 °C
646 °C
-4.85 %
[1]
[1][2]
↑ Exo
temperature /°C EGA m/e = 18
TG /%
nc d(001) nc d(001)
5 13.5 11 17.0
6 13.5 12 17.9
7 14.0 13 ---
8 14.0 14 ---
9 15.2 15 ---
10 15.8 16 ---
ξ = 0.37
d(00l) air [Å] EG [Å]
d(001) 11.9 16.6
d(002) 8.5
d(003) 5.6
d(004) 3.2
d(005)

Appendix
Sample 16GR01low-charged cv montmorillonitetrivial name: Otay-type I
Stoichiometric composition (< 0.2 µm fraction)
(Stevens, 1945) Me+0.40 (Si3.95 Al3+
0.05) (Al3+1.56 Fe3+
0.09 Mg2+0.35) [O10 (OH)2]
(Köster, 1977) Me+0.32 (Si3.97 Al3+
0.03) (Al3+1.58 Fe3+
0.09 Mg2+0.35) [O10 (OH)2]
XRF analyses of bulk material, < 2 µm and < 0.2 µm fraction
oxides [%]1 SiO2 TiO2 Al2O3 Fe2O3 MnO MgO CaO Na2O K2O LOI
bulk 55.35 0.14 17.77 1.49 0.01 3.84 0.96 0.64 0.75 18.28
< 2 µm 59.84 0.15 20.25 1.62 0.01 3.42 #DIV/0!
3.14 0.38 10.73
< 0.2 µm 60.46 0.13 20.87 1.74 0.01 3.56 0.01 3.16 0.05 9.70
Layer charge and cation exchange capacity (< 0.2 µm fraction)
measured calculated calculated
nc 4-18 Cu-Trien (pH=7) Stevens (1945) Köster (1977)
ξ2
[eq/FU]CEC3
[meq/100 g]ξ4
[eq/FU]CEC5
[meq/100 g]ξ6
[eq/FU]CEC7
[meq/100 g]
0.31 101 0.40 108 0.32 84
Charge location (< 0.2 µm fraction)
tetrahedral octahedral % tetrahedral charge
(Stevens, 1945) 0.05 0.35 13
(Köster, 1977) 0.03 0.29 9
Iron content (of octahedral cations) (< 0.2 µm fraction)
Fe3+ [mol/FU] VI Fe3+ [%]
(Stevens, 1945) 0.09 9
(Köster, 1977) 0.09 9

Appendix
X-ray diffraction - basal spacing (< 0.2 µm fraction)
Simultaneous Thermal Analysis (< 0.2 µm fraction)
Layer charge - distribution and peak migration (< 0.2 µm fraction)
0.2
0.4
0.6
0.8
1.0
1.2
1.4
1.6
1.8
Ionenstrom *10-10 /A
100 200 300 400 500 600 700 800 900 1000Temperatur /°C
-50
-40
-30
-20
-10
0
DSC /uV
88
90
92
94
96
98
100
TG /%
153 °C
696 °C
743 °C
772 °C895 °C
952 °C
-11.90 %
-7.21 %
-0.00
153 °C
700 °C
779 °C
748 °C
-4.69 %
[1]
[1][2]
↑ Exo
temperature /°C EGA m/e = 18
TG /%
nc d(001) nc d(001)
5 --- 11 15.4
6 --- 12 15.8
7 13.5 13 16.5
8 13.6 14 17.1
9 14.0 15 17.7
10 14.9 16 17.9
ξ = 0.31
d(00l) air [Å] EG [Å]
d(001) 12.3 16.9
d(002) 6.2 8.5
d(003)
d(004) 3.1
d(005)

Appendix
Sample 17GR02low charged cv beidellitic montmorillonitetrivial name: Wyoming-type I
Stoichiometric composition (< 0.2 µm fraction)
(Stevens, 1945) Me+0.38 (Si3.88 Al3+
0.12) (Al3+1.63 Fe3+
0.09 Mg2+0.29) [O10 (OH)2]
(Köster, 1977) Me+0.30 (Si3.90 Al3+
0.10) (Al3+1.65 Fe3+
0.09 Mg2+0.29) [O10 (OH)2]
XRF analyses of bulk material, < 2 µm and < 0.2 µm fraction
oxides [%]1 SiO2 TiO2 Al2O3 Fe2O3 MnO MgO CaO Na2O K2O LOI
bulk 65.27 0.17 12.19 1.56 0.18 2.88 2.30 0.38 0.55 13.48
< 2 µm 72.66 0.19 14.89 1.29 0.00 1.89 0.03 1.88 0.06 6.83
< 0.2 µm 67.63 0.14 17.80 1.45 0.00 2.33 0.01 2.38 0.03 7.96
Layer charge and cation exchange capacity (< 0.2 µm fraction)
measured calculated calculated
nc 4-18 Cu-Trien (pH=7) Stevens (1945) Köster (1977)
ξ2
[eq/FU]CEC3
[meq/100 g]ξ4
[eq/FU]CEC5
[meq/100 g]ξ6
[eq/FU]CEC7
[meq/100 g]
0.29 73 0.38 102 0.30 79
Charge location (< 0.2 µm fraction)
tetrahedral octahedral % tetrahedral charge
(Stevens, 1945) 0.12 0.26 32
(Köster, 1977) 0.10 0.20 33
Iron content (of octahedral cations) (< 0.2 µm fraction)
Fe3+ [mol/FU] Fe (VI)3+ [%]
(Stevens, 1945) 0.09 9
(Köster, 1977) 0.09 9

Appendix
X-ray diffraction - basal spacing (< 0.2 µm fraction)
Simultaneous Thermal Analysis (< 0.2 µm fraction)
Layer charge - distribution and peak migration (< 0.2 µm fraction)
0.2
0.4
0.6
0.8
1.0
1.2
1.4
1.6
1.8
Ionenstrom *10-10 /A
100 200 300 400 500 600 700 800 900 1000Temperatur /°C
-50
-40
-30
-20
-10
0
DSC /uV
90
92
94
96
98
100
TG /%
147 °C
700 °C
925 °C
987 °C
-10.74 %
-6.57 %
148 °C
704 °C
-4.17 %
[1]
[1][2]
↑ Exo
temperature /°C EGA m/e = 18
TG /%
nc d(001) nc d(001)
5 --- 11 14.9
6 --- 12 15.4
7 13.5 13 15.9
8 13.6 14 16.4
9 13.7 15 17.0
10 14.4 16 17.8
ξ = 0.29
d(00l) air [Å] EG [Å]
d(001) 12.4 17.0
d(002) 6.2 8.5
d(003) 5.7
d(004) 3.1
d(005)

Appendix
Sample 18USA01low charged cv/tv beidellitic montmorillonitetrivial name: Wyoming-type II
Stoichiometric composition (< 0.2 µm fraction)
(Stevens, 1945) Me+0.41 (Si3.93 Al3+
0.07) (Al3+1.47 Fe3+
0.21 Mg2+0.31) [O10 (OH)2]
(Köster, 1977) Me+0.26 (Si3.96 Al3+
0.04) (Al3+1.51 Fe3+
0.21 Mg2+0.31) [O10 (OH)2]
XRF analyses of bulk material, < 2 µm and < 0.2 µm fraction
oxides [%]1 SiO2 TiO2 Al2O3 Fe2O3 MnO MgO CaO Na2O K2O LOI
bulk 56.83 0.20 18.05 4.17 0.03 3.06 0.79 2.65 0.34 12.65
< 2 µm 59.19 0.19 19.40 4.08 0.02 3.01 0.03 3.08 0.17 10.53
< 0.2 µm 58.82 0.16 19.51 4.11 0.02 3.13 0.00 3.03 0.08 10.89
Layer charge and cation exchange capacity (< 0.2 µm fraction)
measured calculated calculated
nc 4-18 Cu-Trien (pH=7) Stevens (1945) Köster (1977)
ξ2
[eq/FU]CEC3
[meq/100 g]ξ4
[eq/FU]CEC5
[meq/100 g]ξ6
[eq/FU]CEC7
[meq/100 g]
0.27 93 0.41 109 0.26 72
Charge location (< 0.2 µm fraction)
tetrahedral octahedral % tetrahedral charge
(Stevens, 1945) 0.07 0.34 17
(Köster, 1977) 0.04 0.22 15
Iron content (of octahedral cations) (< 0.2 µm fraction)
Fe3+ [mol/FU] Fe (VI)3+ [%]
(Stevens, 1945) 0.21 21
(Köster, 1977) 0.21 20

Appendix
X-ray diffraction - basal spacing (< 0.2 µm fraction)
Simultaneous Thermal Analysis (< 0.2 µm fraction)
Layer charge - distribution and peak migration (< 0.2 µm fraction)
0.2
0.4
0.6
0.8
1.0
1.2
1.4
1.6
Ionenstrom *10-10 /A
100 200 300 400 500 600 700 800 900 1000Temperatur /°C
-50
-40
-30
-20
-10
0
DSC /uV
90
92
94
96
98
100
TG /%
145 °C
311 °C
681 °C
873 °C
926 °C
-11.28 %
-6.30 %
146 °C
682 °C
-4.98 %
[1]
[1][2]
↑ Exo
temperature /°C EGA m/e = 18
TG /%
nc d(001) nc d(001)
6 --- 12 14.8
7 --- 13 15.4
8 13.6 14 15.9
9 13.6 15 16.4
10 13.7 16 17.5
11 14.0 18 17.9
ξ = 0.27
d(00l) air [Å] EG [Å]
d(001) 11.9 16.8
d(002) 8.5
d(003) 5.6
d(004) 3.1
d(005)

Appendix
Sample 19USA02low charged cv/tv beidellitic montmorillonitetrivial name: Wyoming-type II
Stoichiometric composition (< 0.2 µm fraction)
(Stevens, 1945) Me+0.39 (Si3.94 Al3+
0.06) (Al3+1.40 Fe3+
0.29 Mg2+0.30) [O10 (OH)2]
(Köster, 1977) Me+0.30 (Si3.95 Al3+
0.05) (Al3+1.42 Fe3+
0.29 Mg2+0.31) [O10 (OH)2]
XRF analyses of bulk material, < 2 µm and < 0.2 µm fraction
oxides [%]1 SiO2 TiO2 Al2O3 Fe2O3 MnO MgO CaO Na2O K2O LOI
bulk 42.84 0.84 12.71 5.30 0.10 4.04 9.95 1.78 0.10 20.68
< 2 µm 59.80 1.16 18.25 5.76 0.01 3.05 0.53 2.76 0.05 8.03
< 0.2 µm 60.30 0.23 18.99 5.86 0.00 3.13 0.07 3.05 0.04 8.00
Layer charge and cation exchange capacity (< 0.2 µm fraction)
measured calculated calculated
nc 4-18 Cu-Trien (pH=7) Stevens (1945) Köster (1977)
ξ2
[eq/FU]CEC3
[meq/100 g]ξ4
[eq/FU]CEC5
[meq/100 g]ξ6
[eq/FU]CEC7
[meq/100 g]
0.30 98 0.39 104 0.30 80
Charge location (< 0.2 µm fraction)
tetrahedral octahedral % tetrahedral charge
(Stevens, 1945) 0.09 0.28 24
(Köster, 1977) 0.05 0.25 17
Iron content (of octahedral cations) (< 0.2 µm fraction)
Fe3+ [mol/FU] Fe (VI)3+ [%]
(Stevens, 1945) 0.29 29
(Köster, 1977) 0.29 28

Appendix
X-ray diffraction - basal spacing (< 0.2 µm fraction)
Simultaneous Thermal Analysis (< 0.2 µm fraction)
Layer charge - distribution and peak migration (< 0.2 µm fraction)
0.2
0.4
0.6
0.8
1.0
1.2
Ionenstrom *10-10 /A
100 200 300 400 500 600 700 800 900 1000Temperatur /°C
-40.0
-35.0
-30.0
-25.0
-20.0
-15.0
-10.0
-5.0
DSC /uV
90
92
94
96
98
100
TG /%
142 °C
679 °C
865 °C
916 °C
-10.17 %
-5.25 %
-4.92 %
141 °C
683 °C
[1]
[1][2]
↑ Exo
temperature /°C EGA m/e = 18
TG /%
nc d(001) nc d(001)
6 --- 12 15.7
7 13.6 13 16.2
8 13.6 14 16.9
9 13.7 15 17.5
10 14.5 16 17.6
11 15.2 18 18.0
ξ = 0.30
d(00l) air [Å] EG [Å]
d(001) 12.2 16.6
d(002) 6.1 8.4
d(003) 5.6
d(004) 3.1
d(005)

Appendix
Sample 21D01low charged cv/tv beidellitic montmorillonitetrivial name: Wyoming-type II
Stoichiometric composition (< 0.2 µm fraction)
(Stevens, 1945) Me+0.42 (Si3.89 Al3+
0.11) (Al3+1.36 Fe3+
0.31 Mg2+0.34) [O10 (OH)2]
(Köster, 1977) Me+0.31 (Si3.91 Al3+
0.09) (Al3+1.39 Fe3+
0.31 Mg2+0.34) [O10 (OH)2]
XRF analyses of bulk material, < 2 µm and < 0.2 µm fraction
oxides [%]1 SiO2 TiO2 Al2O3 Fe2O3 MnO MgO CaO Na2O K2O LOI
bulk 52.44 0.32 16.54 5.09 0.05 3.64 1.76 0.31 1.05 18.37
< 2 µm 56.79 0.22 18.67 5.62 0.02 3.41 0.01 2.74 0.57 11.63
< 0.2 µm 58.27 0.18 18.67 6.16 0.02 3.42 #DIV/0!
2.85 0.39 9.71
Layer charge and cation exchange capacity (< 0.2 µm fraction)
measured calculated calculated
nc 4-18 Cu-Trien (pH=7) Stevens (1945) Köster (1977)
ξ2
[eq/FU]CEC3
[meq/100 g]ξ4
[eq/FU]CEC5
[meq/100 g]ξ6
[eq/FU]CEC7
[meq/100 g]
0.29 85 0.42 111 0.31 78
Charge location (< 0.2 µm fraction)
tetrahedral octahedral % tetrahedral charge
(Stevens, 1945) 0.11 0.31 26
(Köster, 1977) 0.09 0.22 29
Iron content (of octahedral cations) (< 0.2 µm fraction)
Fe3+ [mol/FU] Fe (VI)3+ [%]
(Stevens, 1945) 0.31 31
(Köster, 1977) 0.31 30

Appendix
X-ray diffraction - basal spacing (< 0.2 µm fraction)
Simultaneous Thermal Analysis (< 0.2 µm fraction)
Layer charge - distribution and peak migration (< 0.2 µm fraction)
0.2
0.4
0.6
0.8
1.0
1.2
Ionenstrom *10-10 /A
100 200 300 400 500 600 700 800 900 1000Temperatur /°C
-45.0
-40.0
-35.0
-30.0
-25.0
-20.0
-15.0
-10.0
-5.0
0
DSC /uV
88
90
92
94
96
98
100
TG /%
146 °C
511 °C645 °C
850 °C
898 °C
-11.88 %
-6.93 %
-2.66 %
-2.27 %
145 °C
654 °C
518 °C
[1]
[1][2]
↑ Exo
temperature /°C EGA m/e = 18
TG /%
nc d(001) nc d(001)
6 13.4 12 15.6
7 13.6 13 15.9
8 13.8 14 16.6
9 13.8 15 17.6
10 13.8 16 18.2
11 14.2 18 18.2
ξ = 0.29
d(00l) air [Å] EG [Å]
d(001) 12.4 17.0
d(002) 8.5
d(003) 5.6
d(004) 3.1 4.3
d(005) 3.4

Appendix
Sample 24Beidmedium-charged cv montmorillonitic beidellitetrivial name: beidellite
Stoichiometric composition (< 2 µm fraction)
(Stevens, 1945) Me+0.54 (Si3.67 Al3+
0.33) (Al3+1.76 Fe3+
0.01 Mg2+0.24) [O10 (OH)2]
(Köster, 1977) Me+0.39 (Si3.70 Al3+
0.30) (Al3+1.80 Fe3+
0.01 Mg2+0.24) [O10 (OH)2]
XRF analyses of bulk material, < 2 µm fraction
oxides [%]1 SiO2 TiO2 Al2O3 Fe2O3 MnO MgO CaO Na2O K2O LOI
bulk --- --- --- --- --- --- --- --- --- ---
< 2 µm 52.58 0.03 25.37 0.13 0.01 2.31 0.03 4.12 0.03 15.15
< 0.2 µm --- --- --- --- --- --- --- --- --- ---
Layer charge and cation exchange capacity (< 2 µm fraction)
measured calculated calculated
nc 12/18 Cu-Trien (pH=7) Stevens (1945) Köster (1977)
ξ(Olis, 1990)
[eq/FU]CEC3
[meq/100 g]ξ4
[eq/FU]CEC5
[meq/100 g]ξ6
[eq/FU]CEC7
[meq/100 g]
0.30 101 0.54 145 0.38 105
Charge location (< 2 µm fraction)
tetrahedral octahedral % tetrahedral charge
(Stevens, 1945) 0.33 0.21 61
(Köster, 1977) 0.30 0.09 77
Iron content (of octahedral cations) (< 2 µm fraction)
Fe3+ [mol/FU] Fe (VI)3+ [%]
(Stevens, 1945) 0.01 1
(Köster, 1977) 0.01 1

Appendix
X-ray diffraction - basal spacing (< 2 µm fraction)
Simultaneous Thermal Analysis (< 2 µm fraction)
0.50
1.00
1.50
2.00
2.50
3.00
3.50
4.00
Ionenstrom *10-10 /A
100 200 300 400 500 600 700 800 900 1000Temperatur /°C
-60
-50
-40
-30
-20
-10
0
DSC /uV
84
86
88
90
92
94
96
98
100
TG /%
155 °C
691 °C
782 °C
-15.
-11.11 %
-4.84 %
155 °C
696 °C
793 °C
[6]
[6][7]
↑ Exo
temperature /°C EGA m/e = 18
TG /%
d(00l) air [Å] EG [Å]
d(001) 12.5 16.2
d(002) 6.2 8.5
d(003) 5.6
d(004) 3.1
d(005) 3.4

Appendix
Sample 25Volclaylow charged cv beidellitic montmorillonitetrivial name: Wyoming-type I
Stoichiometric composition (< 2 µm fraction)
(Stevens, 1945) Me+0.45 (Si3.97 Al3+
0.03) (Al3+1.54 Fe3+
0.18 Mg2+0.23) [O10 (OH)2]
(Köster, 1977) Me+0.26 (Si3.93 Al3+
0.07) (Al3+1.59 Fe3+
0.18 Mg2+0.23) [O10 (OH)2]
XRF analyses of bulk material, < 2 µm fraction
oxides [%]1 SiO2 TiO2 Al2O3 Fe2O3 MnO MgO CaO Na2O K2O LOI
bulk --- --- --- --- --- --- --- --- --- ---
< 2 µm 56.97 0.13 19.78 3.41 0.00 2.21 0.05 3.26 0.08 13.75
< 0.2 µm --- --- --- --- --- --- --- --- --- ---
Layer charge and cation exchange capacity (< 2 µm fraction)
measured calculated calculated
nc 12/18 Cu-Trien (pH=7) Stevens (1945) Köster (1977)
ξ(Olis, 1990)
[eq/FU]CEC3
[meq/100 g]ξ4
[eq/FU]CEC5
[meq/100 g]ξ6
[eq/FU]CEC7
[meq/100 g]
0.27 87 0.45 120 0.26 73
Charge location (< 2 µm fraction)
tetrahedral octahedral % tetrahedral charge
(Stevens, 1945) 0.07 0.38 16
(Köster, 1977) 0.03 0.23 12
Iron content (of octahedral cations) (< 2 µm fraction)
Fe3+ [mol/FU] Fe (VI)3+ [%]
(Stevens, 1945) 0.18 19
(Köster, 1977) 0.18 18

Appendix
X-ray diffraction - basal spacing (< 2 µm fraction)
Simultaneous Thermal Analysis (< 2 µm fraction)
0.2
0.4
0.6
0.8
1.0
1.2
Ionenstrom *10-9 /A
100 200 300 400 500 600 700 800 900 1000Temperatur /°C
-70
-60
-50
-40
-30
-20
-10
0
DSC /uV
84
86
88
90
92
94
96
98
100
TG /%
152 °C
314 °C
684 °C
-16.58 %
-11.55 %
-10.93 %
-0.62 %
154 °C
683 °C727 °C -5.03 %
[1]
[1][2]
↑ Exo
temperature /°C EGA m/e = 18
TG /%
d(00l) air [Å] EG [Å]
d(001) 12.6 17.0
d(002) 6.2 8.5
d(003) 5.7
d(004) 3.1 4.3
d(005) 3.4

Appendix
Sample 26/27Valdollow charged tv/cv beidellitic ferrian montmorillonitetrivial name: non-ideal / iron-rich montmorillonite
Stoichiometric composition (< 2 µm fraction)
(Stevens, 1945) Me+0.55 (Si3.85 Al3+
0.15) (Al3+1.23 Fe3+
0.41 Mg2+0.34) [O10 (OH)2]
(Köster, 1977) Me+0.27 (Si3.90 Al3+
0.10) (Al3+1.30 Fe3+
0.41 Mg2+0.35) [O10 (OH)2]
XRF analyses of bulk material, < 2 µm fraction
oxides [%]1 SiO2 TiO2 Al2O3 Fe2O3 MnO MgO CaO Na2O K2O LOI
bulk 32.68 2.50 10.59 10.54 0.16 7.04 8.06 0.33 0.33 26.77
< 2 µm 53.05 1.16 16.12 7.43 0.01 3.15 0.07 2.83 1.49 14.23
< 0.2 µm --- --- --- --- --- --- --- --- --- ---
Layer charge and cation exchange capacity (< 2 µm fraction)
measured calculated calculated
nc 12/18 Cu-Trien (pH=7) Stevens (1945) Köster (1977)
ξ(Olis, 1990)
[eq/FU]CEC3
[meq/100 g]ξ4
[eq/FU]CEC5
[meq/100 g]ξ6
[eq/FU]CEC7
[meq/100 g]
0.27 83 0.55 143 0.27 72
Charge location (< 2 µm fraction)
tetrahedral octahedral % tetrahedral charge
(Stevens, 1945) 0.15 0.40 27
(Köster, 1977) 0.10 0.17 37
Iron content (of octahedral cations) (< 2 µm fraction)
Fe3+ [mol/FU] Fe (VI)3+ [%]
(Stevens, 1945) 0.41 42
(Köster, 1977) 0.41 39

Appendix
X-ray diffraction - basal spacing (< 2 µm fraction)
Simultaneous Thermal Analysis (< 2 µm fraction)
0.2
0.4
0.6
0.8
1.0
1.2
Ionenstrom *10-9 /A
100 200 300 400 500 600 700 800 900 1000Temperatur /°C
-70
-60
-50
-40
-30
-20
-10
0
DSC /uV
84
86
88
90
92
94
96
98
100
TG /%
142 °C
558 °C
869 °C
925 °C
-16.78 %
-11.24 %
-3.32 %
-2.21 %
558 °C
[6]
[6][7]
↑ Exo
temperature /°C EGA m/e = 18
TG /%
d(00l) air [Å] EG [Å]
d(001) 12.6 16.8
d(002) 6.2 8.6
d(003) 5.6
d(004) 3.1 4.3
d(005) 3.4
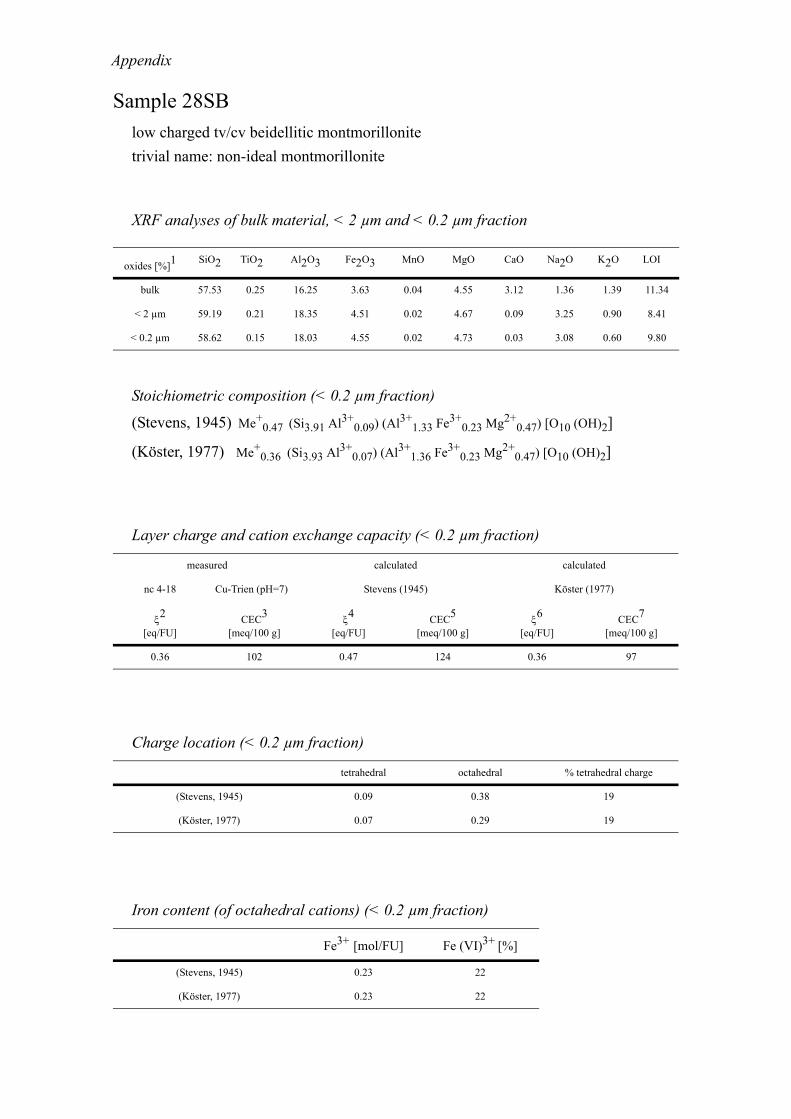
Appendix
Sample 28SBlow charged tv/cv beidellitic montmorillonitetrivial name: non-ideal montmorillonite
Stoichiometric composition (< 0.2 µm fraction)
(Stevens, 1945) Me+0.47 (Si3.91 Al3+
0.09) (Al3+1.33 Fe3+
0.23 Mg2+0.47) [O10 (OH)2]
(Köster, 1977) Me+0.36 (Si3.93 Al3+
0.07) (Al3+1.36 Fe3+
0.23 Mg2+0.47) [O10 (OH)2]
XRF analyses of bulk material, < 2 µm and < 0.2 µm fraction
oxides [%]1 SiO2 TiO2 Al2O3 Fe2O3 MnO MgO CaO Na2O K2O LOI
bulk 57.53 0.25 16.25 3.63 0.04 4.55 3.12 1.36 1.39 11.34
< 2 µm 59.19 0.21 18.35 4.51 0.02 4.67 0.09 3.25 0.90 8.41
< 0.2 µm 58.62 0.15 18.03 4.55 0.02 4.73 0.03 3.08 0.60 9.80
Layer charge and cation exchange capacity (< 0.2 µm fraction)
measured calculated calculated
nc 4-18 Cu-Trien (pH=7) Stevens (1945) Köster (1977)
ξ2
[eq/FU]CEC3
[meq/100 g]ξ4
[eq/FU]CEC5
[meq/100 g]ξ6
[eq/FU]CEC7
[meq/100 g]
0.36 102 0.47 124 0.36 97
Charge location (< 0.2 µm fraction)
tetrahedral octahedral % tetrahedral charge
(Stevens, 1945) 0.09 0.38 19
(Köster, 1977) 0.07 0.29 19
Iron content (of octahedral cations) (< 0.2 µm fraction)
Fe3+ [mol/FU] Fe (VI)3+ [%]
(Stevens, 1945) 0.23 22
(Köster, 1977) 0.23 22

Appendix
X-ray diffraction - basal spacing (< 0.2 µm fraction)
Simultaneous Thermal Analysis (< 0.2 µm fraction)
Layer charge - distribution and peak migration (< 0.2 µm fraction)
0.2
0.4
0.6
0.8
1.0
1.2
1.4
Ionenstrom *10-10 /A
100 200 300 400 500 600 700 800 900 1000Temperatur /°C
-70
-60
-50
-40
-30
-20
-10
0
DSC /uV
84
86
88
90
92
94
96
98
100
TG /%
153 °C
632 °C
838 °C
-16.70 %
-12.20 %
153 °C
642 °C-4.49 %
[3]
[3][12]
↑ Exo
temperature /°C EGA m/e = 18
TG /%
nc d(001) nc d(001)
4 --- 10 15.8
5 13.6 11 16.9
6 13.6 12 18.0
7 13.7 13 17.9
8 14.2 14 ---
9 14.9 15 ---
ξ = 0.36
d(00l) air [Å] EG [Å]
d(001) 12.8 17.0
d(002) 6.2 8.6
d(003) 5.6
d(004) 3.1
d(005) 3.4

Appendix
Sample 31BAR3low-charged cv/tv montmorillonitetrivial name: Otay-type II
Stoichiometric composition (< 0.2 µm fraction)
(Stevens, 1945) Me+0.41 (Si3.97 Al3+
0.03) (Al3+1.33 Fe3+
0.29 Mg2+0.38) [O10 (OH)2]
(Köster, 1977) Me+0.30 (Si3.99 Al3+
0.01) (Al3+1.36 Fe3+
0.29 Mg2+0.88) [O10 (OH)2]
XRF analyses of bulk material, < 2 µm and < 0.2 µm fraction
oxides [%]1 SiO2 TiO2 Al2O3 Fe2O3 MnO MgO CaO Na2O K2O LOI
bulk 57.70 0.64 13.10 4.19 0.04 2.86 1.90 1.79 0.72 16.41
< 2 µm 62.44 0.58 16.78 5.59 0.01 3.71 0.02 2.89 0.54 7.09
< 0.2 µm 58.97 0.31 16.83 5.56 0.01 3.70 0.04 2.73 0.47 11.03
Layer charge and cation exchange capacity (< 0.2 µm fraction)
measured calculated calculated
nc 4-18 Cu-Trien (pH=7) Stevens (1945) Köster (1977)
ξ2
[eq/FU]CEC3
[meq/100 g]ξ4
[eq/FU]CEC5
[meq/100 g]ξ6
[eq/FU]CEC7
[meq/100 g]
0.32 97 0.41 109 0.30 85
Charge location (< 0.2 µm fraction)
tetrahedral octahedral % tetrahedral charge
(Stevens, 1945) 0.03 0.38 7
(Köster, 1977) 0.01 0.29 3
Iron content (of octahedral cations) (< 0.2 µm fraction)
Fe3+ [mol/FU] Fe (VI)3+ [%]
(Stevens, 1945) 0.29 29
(Köster, 1977) 0.29 28

Appendix
X-ray diffraction - basal spacing (< 0.2 µm fraction)
Simultaneous Thermal Analysis (< 0.2 µm fraction)
Layer charge - distribution and peak migration (< 0.2 µm fraction)
0.2
0.4
0.6
0.8
1.0
1.2
1.4
1.6
Ionenstrom *10-10 /A
100 200 300 400 500 600 700 800 900 1000Temperatur /°C
-70
-60
-50
-40
-30
-20
-10
0
DSC /uV
84
86
88
90
92
94
96
98
100
TG /%
150 °C
636 °C
851 °C
894 °C
-15.95 %
-11.66 %
151 °C
645 °C -4.29 %
[3]
[3][8]
↑ Exo
temperature /°C EGA m/e = 18
TG /%
nc d(001) nc d(001)
4 --- 10 14.7
5 --- 11 15.4
6 13.5 12 16.2
7 13.6 13 16.9
8 13.8 14 17.8
9 13.8 15 18.1
ξ = 0.32
d(00l) air [Å] EG [Å]
d(001) 12.7 17.1
d(002) 8.6
d(003) 5.6
d(004) 3.1 4.3
d(005) 3.4

Appendix
Sample 32Volclaylow-charged cv montmorillonitetrivial name: Otay-type I
Stoichiometric composition (< 0.2 µm fraction)
(Stevens, 1945) Me+0.39 (Si3.95 Al3+
0.05) (Al3+1.56 Fe3+
0.18 Mg2+0.22) [O10 (OH)2]
(Köster, 1977) Me+0.28 (Si3.97 Al3+
0.03) (Al3+1.59 Fe3+
0.18 Mg2+0.22) [O10 (OH)2]
XRF analyses of bulk material, < 2 µm and < 0.2 µm fraction
oxides [%]1 SiO2 TiO2 Al2O3 Fe2O3 MnO MgO CaO Na2O K2O LOI
bulk 56.01 0.15 18.41 3.49 0.01 2.28 1.15 2.02 0.51 15.37
< 2 µm 60.75 0.13 21.61 3.76 0.00 2.40 0.01 2.76 0.03 8.24
< 0.2 µm 61.81 0.15 21.41 3.78 0.00 2.32 0.03 2.99 0.10 7.07
Layer charge and cation exchange capacity (< 0.2 µm fraction)
measured calculated calculated
nc 4-18 Cu-Trien (pH=7) Stevens (1945) Köster (1977)
ξ2
[eq/FU]CEC3
[meq/100 g]ξ4
[eq/FU]CEC5
[meq/100 g]ξ6
[eq/FU]CEC7
[meq/100 g]
0.27 81 0.39 105 0.28 73
Charge location (< 0.2 µm fraction)
tetrahedral octahedral % tetrahedral charge
(Stevens, 1945) 0.05 0.34 13
(Köster, 1977) 0.03 0.25 11
Iron content (of octahedral cations) (< 0.2 µm fraction)
Fe3+ [mol/FU] Fe (VI)3+ [%]
(Stevens, 1945) 0.18 19
(Köster, 1977) 0.18 18

Appendix
X-ray diffraction - basal spacing (< 0.2 µm fraction)
Simultaneous Thermal Analysis (< 0.2 µm fraction)
Layer charge - distribution and peak migration (< 0.2 µm fraction)
0.2
0.4
0.6
0.8
1.0
Ionenstrom *10-10 /A
100 200 300 400 500 600 700 800 900 1000Temperatur /°C
-50
-40
-30
-20
-10
0
DSC /uV
88
90
92
94
96
98
100
TG /%
139 °C
697 °C
935 °C
-12.39 %
-7.49 %
139 °C
701 °C
-4.90 %
[7]
[7][12]
↑ Exo
temperature /°C EGA m/e = 18
TG /%
nc d(001) nc d(001)
6 --- 12 14.3
7 --- 13 15.1
8 13.6 14 15.6
9 13.7 15 16.4
10 13.7 16 16.9
11 13.9 18 17.7
ξ = 0.19
d(00l) air [Å] EG [Å]
d(001) 12.5 17.3
d(002) 8.6
d(003) 5.7
d(004) 3.1 4.3
d(005) 3.4

Appendix
Sample 33Calow charged cv/tv beidellitic montmorillonitetrivial name: Wyoming-type II
Stoichiometric composition (< 0.2 µm fraction)
(Stevens, 1945) Me+0.42 (Si3.91 Al3+
0.09) (Al3+1.51 Fe3+
0.30 Mg2+0.12) [O10 (OH)2]
(Köster, 1977) Me+0.31 (Si3.93 Al3+
0.07) (Al3+1.54 Fe3+
0.30 Mg2+0.12) [O10 (OH)2]
XRF analyses of bulk material, < 2 µm and < 0.2 µm fraction
oxides [%]1 SiO2 TiO2 Al2O3 Fe2O3 MnO MgO CaO Na2O K2O LOI
bulk 49.60 0.36 16.79 4.94 0.04 4.01 3.99 0.27 1.38 18.14
< 2 µm 58.11 0.18 18.99 5.59 0.02 3.49 0.03 2.78 0.55 9.92
< 0.2 µm 58.01 0.28 20.20 5.85 0.02 3.19 0.05 2.67 0.96 8.40
Layer charge and cation exchange capacity (< 0.2 µm fraction)
measured calculated calculated
nc 4-18 Cu-Trien (pH=7) Stevens (1945) Köster (1977)
ξ2
[eq/FU]CEC3
[meq/100 g]ξ4
[eq/FU]CEC5
[meq/100 g]ξ6
[eq/FU]CEC7
[meq/100 g]
0.30 87 0.42 111 0.31 81
Charge location (< 0.2 µm fraction)
tetrahedral octahedral % tetrahedral charge
(Stevens, 1945) 0.09 0.33 21
(Köster, 1977) 0.07 0.24 23
Iron content (of octahedral cations) (< 0.2 µm fraction)
Fe3+ [mol/FU] Fe (VI)3+ [%]
(Stevens, 1945) 0.30 32
(Köster, 1977) 0.30 31

Appendix
X-ray diffraction - basal spacing (< 0.2 µm fraction)
Simultaneous Thermal Analysis (< 0.2 µm fraction)
Layer charge - distribution and peak migration (< 0.2 µm fraction)
0.2
0.4
0.6
0.8
1.0
1.2
Ionenstrom *10-10 /A
100 200 300 400 500 600 700 800 900 1000Temperatur /°C
-60
-50
-40
-30
-20
-10
0
DSC /uV
86
88
90
92
94
96
98
100
TG /%
146 °C
288 °C
518 °C 646 °C
850 °C
901 °C
-15.60 %
-10.94 %
146 °C
659 °C
-2.50 %
-2.16 %
[7]
[7][12]
↑ Exo
temperature /°C EGA m/e = 18
TG /%
nc d(001) nc d(001)
6 --- 12 15.3
7 13.6 13 16.5
8 13.7 14 17.6
9 13.9 15 17.9
10 13.9 16 ---
11 14.5 18 ---
ξ = 0.30
d(00l) air [Å] EG [Å]
d(001) 12.8 17.2
d(002) 8.7
d(003) 5.7
d(004) 3.1 4.3
d(005) 3.4

Appendix
Sample 36M650low charged tv/cv montmorillonitic ferrian beidellitetrivial name: non-ideal / iron-rich beidellite
Stoichiometric composition (< 0.2 µm fraction)
(Stevens, 1945) Me+0.34 (Si3.80 Al3+
0.209) (Al3+1.30 Fe3+
0.46 Mg2+0.29) [O10 (OH)2]
(Köster, 1977) Me+0.27 (Si3.81 Al3+
0.19) (Al3+1.32 Fe3+
0.46 Mg2+0.29) [O10 (OH)2]
XRF analyses of bulk material, < 2 µm and < 0.2 µm fraction
oxides [%]1 SiO2 TiO2 Al2O3 Fe2O3 MnO MgO CaO Na2O K2O LOI
bulk 41.07 2.74 13.60 13.59 0.27 2.75 3.43 0.03 0.41 20.18
< 2 µm 53.09 3.65 18.08 8.36 0.02 2.66 0.44 2.45 0.34 9.78
< 0.2 µm 53.03 3.45 17.78 8.47 0.02 2.70 0.08 2.16 0.25 11.18
Layer charge and cation exchange capacity (< 0.2 µm fraction)
measured calculated calculated
nc 4-18 Cu-Trien (pH=7) Stevens (1945) Köster (1977)
ξ2
[eq/FU]CEC3
[meq/100 g]ξ4
[eq/FU]CEC5
[meq/100 g]ξ6
[eq/FU]CEC7
[meq/100 g]
0.30 77 0.34 89 0.27 80
Charge location (< 0.2 µm fraction)
tetrahedral octahedral % tetrahedral charge
(Stevens, 1945) 0.20 0.14 59
(Köster, 1977) 0.19 0.08 77
Iron content (of octahedral cations) (< 0.2 µm fraction)
Fe3+ [mol/FU] Fe (VI)3+ [%]
(Stevens, 1945) 0.46 44
(Köster, 1977) 0.46 43

Appendix
X-ray diffraction - basal spacing (< 0.2 µm fraction)
Simultaneous Thermal Analysis (< 0.2 µm fraction)
Layer charge - distribution and peak migration (< 0.2 µm fraction)
0.2
0.4
0.6
0.8
1.0
1.2
1.4
1.6
1.8
Ionenstrom *10-10 /A
100 200 300 400 500 600 700 800 900 1000Temperatur /°C
-60
-50
-40
-30
-20
-10
0
DSC /uV
86
88
90
92
94
96
98
100
TG /%
147 °C
525 °C
867 °C
900 °C
-15.10 %
-9.85 %
148 °C
522 °C
651 °C
-3.61 %
-1.64 %
[7]
[7][12]
↑ Exo
temperature /°C EGA m/e = 18
TG /%
nc d(001) nc d(001)
6 13.5 12 15.3
7 13.8 13 16.4
8 13.8 14 17.1
9 13.9 15 17.7
10 13.9 16 18.0
11 14.5 18 ---
ξ = 0.30
d(00l) air [Å] EG [Å]
d(001) 12.6 17.1
d(002) 8.6
d(003) 5.6
d(004) 3.1
d(005) 3.4

Appendix
Sample 37BBlow charged tv/cv beidellitic ferrian montmorillonitetrivial name: non-ideal / iron-rich montmorillonite
Stoichiometric composition (< 0.2 µm fraction)
(Stevens, 1945) Me+0.42 (Si3.85 Al3+
0.15) (Al3+1.15 Fe3+
0.58 Mg2+0.27) [O10 (OH)2]
(Köster, 1977) Me+0.25 (Si3.88 Al3+
0.12) (Al3+1.19 Fe3+
0.58 Mg2+0.28) [O10 (OH)2]
XRF analyses of bulk material, < 2 µm and < 0.2 µm fraction
oxides [%]1 SiO2 TiO2 Al2O3 Fe2O3 MnO MgO CaO Na2O K2O LOI
bulk 55.55 0.38 11.63 9.79 0.01 2.07 1.65 2.21 0.41 15.48
< 2 µm 56.26 0.46 16.07 11.22 0.00 2.70 0.01 2.95 0.13 9.67
< 0.2 µm 56.06 0.40 16.07 11.16 0.00 2.69 0.01 2.98 0.11 10.04
Layer charge and cation exchange capacity (< 0.2 µm fraction)
measured calculated calculated
nc 4-18 Cu-Trien (pH=7) Stevens (1945) Köster (1977)
ξ2
[eq/FU]CEC3
[meq/100 g]ξ4
[eq/FU]CEC5
[meq/100 g]ξ6
[eq/FU]CEC7
[meq/100 g]
0.28 91 0.42 109 0.25 74
Charge location (< 0.2 µm fraction)
tetrahedral octahedral % tetrahedral charge
(Stevens, 1945) 0.15 0.27 36
(Köster, 1977) 0.12 0.13 48
Iron content (of octahedral cations) (< 0.2 µm fraction)
Fe3+ [mol/FU] Fe (VI)3+ [%]
(Stevens, 1945) 0.58 58
(Köster, 1977) 0.58 55

Appendix
X-ray diffraction - basal spacing (< 0.2 µm fraction)
Simultaneous Thermal Analysis (< 0.2 µm fraction)
Layer charge - distribution and peak migration (< 0.2 µm fraction)
0.5
1.0
1.5
2.0
Ionenstrom *10-10 /A
100 200 300 400 500 600 700 800 900 1000Temperatur /°C
-60
-50
-40
-30
-20
-10
0
DSC /uV
86
88
90
92
94
96
98
100
TG /%
147 °C
548 °C
887 °C844 °C
-15.60 %
-11.15 %
148 °C
556 °C -4.45 %
[3]
[3][12]
↑ Exo
temperature /°C EGA m/e = 18
TG /%
nc d(001) nc d(001)
6 13.3 12 14.2
7 13.5 13 15.5
8 13.7 14 16.2
9 13.7 15 17.0
10 13.7 16 17.8
11 13.8 18 ---
ξ = 0.28
d(00l) air [Å] EG [Å]
d(001) 12.4 17.1
d(002) 8.6
d(003) 5.6
d(004) 3.1
d(005) 3.4

Appendix
Sample 38MWlow charged cis-vacant montmorillonitetrivial name: Wyoming-type I
Stoichiometric composition (< 0.2 µm fraction)
(Stevens, 1945) Me+0.37 (Si3.85 Al3+
0.15) (Al3+1.31 Fe3+
0.43 Mg2+0.28) [O10 (OH)2]
(Köster, 1977) Me+0.26 (Si3.87 Al3+
0.13) (Al3+1.34 Fe3+
0.43 Mg2+0.28) [O10 (OH)2]
XRF analyses of bulk material, < 2 µm and < 0.2 µm fraction
oxides [%]1 SiO2 TiO2 Al2O3 Fe2O3 MnO MgO CaO Na2O K2O LOI
bulk 48.03 0.18 14.75 9.82 0.05 3.01 1.60 0.09 0.27 21.64
< 2 µm 57.00 0.19 18.40 8.40 0.01 2.73 0.02 2.68 0.10 10.09
< 0.2 µm 56.70 0.18 18.26 8.34 0.01 2.75 0.02 2.81 0.07 10.49
Layer charge and cation exchange capacity (< 0.2 µm fraction)
measured calculated calculated
nc 4-18 Cu-Trien (pH=7) Stevens (1945) Köster (1977)
ξ2
[eq/FU]CEC3
[meq/100 g]ξ4
[eq/FU]CEC5
[meq/100 g]ξ6
[eq/FU]CEC7
[meq/100 g]
0.27 84 0.37 97 0.26 72
Charge location (< 0.2 µm fraction)
tetrahedral octahedral % tetrahedral charge
(Stevens, 1945) 0.15 0.22 41
(Köster, 1977) 0.13 0.13 50
Iron content (of octahedral cations) (< 0.2 µm fraction)
Fe3+ [mol/FU] Fe (VI)3+ [%]
(Stevens, 1945) 0.43 42
(Köster, 1977) 0.43 41

Appendix
X-ray diffraction - basal spacing (< 0.2 µm fraction)
Simultaneous Thermal Analysis (< 0.2 µm fraction)
Layer charge - distribution and peak migration (< 0.2 µm fraction)
0.2
0.4
0.6
0.8
1.0
1.2
1.4
Ionenstrom *10-10 /A
100 200 300 400 500 600 700 800 900 1000Temperatur /°C
-60
-50
-40
-30
-20
-10
0
DSC /uV
86
88
90
92
94
96
98
100
TG /%
143 °C
550 °C
858 °C
900 °C
-15.37 %
144 °C
284 °C
568 °C648 °C
-10.80 %
-4.57 %
[7]
[7][12]
↑ Exo
temperature /°C EGA m/e = 18
TG /%
nc d(001) nc d(001)
6 --- 12 14.0
7 --- 13 14.7
8 13.5 14 16.2
9 13.6 15 16.8
10 13.7 16 17.9
11 14.0 18 ---
ξ = 0.27
d(00l) air [Å] EG [Å]
d(001) 13.1 17.1
d(002) 8.6
d(003) 5.7
d(004) 3.1
d(005) 3.4
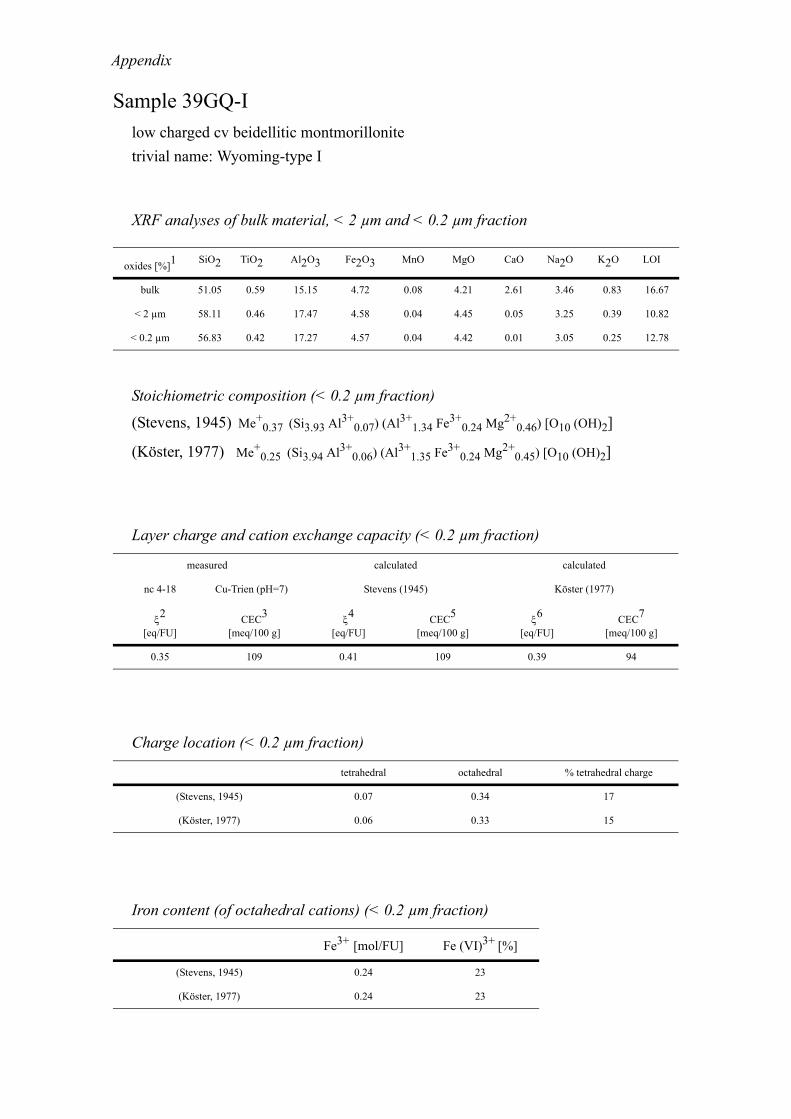
Appendix
Sample 39GQ-Ilow charged cv beidellitic montmorillonitetrivial name: Wyoming-type I
Stoichiometric composition (< 0.2 µm fraction)
(Stevens, 1945) Me+0.37 (Si3.93 Al3+
0.07) (Al3+1.34 Fe3+
0.24 Mg2+0.46) [O10 (OH)2]
(Köster, 1977) Me+0.25 (Si3.94 Al3+
0.06) (Al3+1.35 Fe3+
0.24 Mg2+0.45) [O10 (OH)2]
XRF analyses of bulk material, < 2 µm and < 0.2 µm fraction
oxides [%]1 SiO2 TiO2 Al2O3 Fe2O3 MnO MgO CaO Na2O K2O LOI
bulk 51.05 0.59 15.15 4.72 0.08 4.21 2.61 3.46 0.83 16.67
< 2 µm 58.11 0.46 17.47 4.58 0.04 4.45 0.05 3.25 0.39 10.82
< 0.2 µm 56.83 0.42 17.27 4.57 0.04 4.42 0.01 3.05 0.25 12.78
Layer charge and cation exchange capacity (< 0.2 µm fraction)
measured calculated calculated
nc 4-18 Cu-Trien (pH=7) Stevens (1945) Köster (1977)
ξ2
[eq/FU]CEC3
[meq/100 g]ξ4
[eq/FU]CEC5
[meq/100 g]ξ6
[eq/FU]CEC7
[meq/100 g]
0.35 109 0.41 109 0.39 94
Charge location (< 0.2 µm fraction)
tetrahedral octahedral % tetrahedral charge
(Stevens, 1945) 0.07 0.34 17
(Köster, 1977) 0.06 0.33 15
Iron content (of octahedral cations) (< 0.2 µm fraction)
Fe3+ [mol/FU] Fe (VI)3+ [%]
(Stevens, 1945) 0.24 23
(Köster, 1977) 0.24 23

Appendix
X-ray diffraction - basal spacing (< 0.2 µm fraction)
Simultaneous Thermal Analysis (< 0.2 µm fraction)
Layer charge - distribution and peak migration (< 0.2 µm fraction)
-70
-60
-50
-40
-30
-20
-10
0
DSC /uV
84
86
88
90
92
94
96
98
100
TG /%
100 200 300 400 500 600 700 800 900 1000Temperatur /°C
0.2
0.4
0.6
0.8
1.0
1.2
1.4
1.6
Ionenstrom *10-10 /A
157 °C
641 °C
843 °C
-17.37
-13.18 %
157 °C
653 °C -4.19 %
[7]
[7][12]
↑ Exo
temperature /°C EGA m/e = 18
TG /%
nc d(001) nc d(001)
6 --- 12 17.6
7 13.6 13 17.9
8 13.8 14 17.9
9 14.7 15 ---
10 15.6 16 ---
11 16.5 18 ---
ξ = 0.35
d(00l) air [Å] EG [Å]
d(001) 12.8 16.9
d(002) 8.6
d(003) 5.6
d(004) 3.1 4.3
d(005) 3.4

Appendix
Sample 41Vallow charged tv/cv beidellitic ferrian montmorillonitetrivial name: non-ideal / iron-rich montmorillonite
Stoichiometric composition (< 0.2 µm fraction)
(Stevens, 1945) Me+0.45 (Si3.83 Al3+
0.17) (Al3+1.21 Fe3+
0.45 Mg2+0.37) [O10 (OH)2]
(Köster, 1977) Me+0.30 (Si3.86 Al3+
0.14) (Al3+1.25 Fe3+
0.45 Mg2+0.37) [O10 (OH)2]
XRF analyses of bulk material, < 2 µm and < 0.2 µm fraction
oxides [%]1 SiO2 TiO2 Al2O3 Fe2O3 MnO MgO CaO Na2O K2O LOI
bulk 34.90 1.34 9.44 7.70 0.13 5.11 11.01 2.82 1.36 25.02
< 2 µm 54.31 1.76 16.24 8.36 0.01 3.37 0.45 2.25 1.36 11.22
< 0.2 µm 55.47 0.28 16.94 8.65 0.01 3.55 0.15 2.51 1.11 10.87
Layer charge and cation exchange capacity (< 0.2 µm fraction)
measured calculated calculated
nc 4-18 Cu-Trien (pH=7) Stevens (1945) Köster (1977)
ξ2
[eq/FU]CEC3
[meq/100 g]ξ4
[eq/FU]CEC5
[meq/100 g]ξ6
[eq/FU]CEC7
[meq/100 g]
0.31 85 0.45 117 0.30 83
Charge location (< 0.2 µm fraction)
tetrahedral octahedral % tetrahedral charge
(Stevens, 1945) 0.17 0.28 38
(Köster, 1977) 0.14 0.16 47
Iron content (of octahedral cations) (< 0.2 µm fraction)
Fe3+ [mol/FU] Fe (VI)3+ [%]
(Stevens, 1945) 0.45 44
(Köster, 1977) 0.45 42

Appendix
X-ray diffraction - basal spacing (< 0.2 µm fraction)
Simultaneous Thermal Analysis (< 0.2 µm fraction)
Layer charge - distribution and peak migration (< 0.2 µm fraction)
0.2
0.4
0.6
0.8
1.0
1.2
Ionenstrom *10-10 /A
100 200 300 400 500 600 700 800 900 1000Temperatur /°C
-50
-40
-30
-20
-10
DSC /uV
88
90
92
94
96
98
100
TG /%
m18
DSC
TG
151 °C
555 °C 607 °C
855 °C
889 °C
-12.83 %
-8.07 %
-3.22 %
-1.54 %
148 °C
556 °C 646 °C
[6]
[6][12]
↑ Exo
temperature /°C EGA m/e = 18
TG /%
nc d(001) nc d(001)
6 13.5 12 16.6
7 13.6 13 17.0
8 13.6 14 17.5
9 13.8 15 18.0
10 14.6 16 18.2
11 15.4 18 ---
ξ = 0.31
d(00l) air [Å] EG [Å]
d(001) 12.5 11.0
d(002) 8.6
d(003) 5.7
d(004) 3.1
d(005) 3.4

Appendix
Sample 42Lindenlow charged cv/tv beidellitic montmorillonitetrivial name: Wyoming-type II
Stoichiometric composition (< 2 µm fraction)
(Stevens, 1945) Me+0.36 (Si3.94 Al3+
0.06) (Al3+1.45 Fe3+
0.19 Mg2+0.39) [O10 (OH)2]
(Köster, 1977) Me+0.35 (Si3.95 Al3+
0.05) (Al3+1.46 Fe3+
0.19 Mg2+0.39) [O10 (OH)2]
XRF analyses of < 2 µm fraction
oxides [%]1 SiO2 TiO2 Al2O3 Fe2O3 MnO MgO CaO Na2O K2O LOI
bulk --- --- --- --- --- --- --- --- --- ---
< 2 µm 61.85 0.00 20.09 3.86 0.00 4.08 0.00 2.97 0.00 7.16
< 0.2 µm --- --- --- --- --- --- --- --- --- ---
Layer charge and cation exchange capacity (< 2 µm fraction)
measured calculated calculated
nc 4-18 Cu-Trien (pH=7) Stevens (1945) Köster (1977)
ξ2
[eq/FU]CEC3
[meq/100 g]ξ4
[eq/FU]CEC5
[meq/100 g]ξ6
[eq/FU]CEC7
[meq/100 g]
0.32 103 0.36 96 0.35 86
Charge location (< 2 µm fraction)
tetrahedral octahedral % tetrahedral charge
(Stevens, 1945) 0.06 0.30 17
(Köster, 1977) 0.05 0.30 14
Iron content (of octahedral cations) (< 2 µm fraction)
Fe3+ [mol/FU] Fe (VI)3+ [%]
(Stevens, 1945) 0.19 18
(Köster, 1977) 0.19 17

Appendix
X-ray diffraction - basal spacing (< 2 µm fraction)
Simultaneous Thermal Analysis (< 2 µm fraction)
1.00
2.00
3.00
4.00
5.00
6.00
7.00
8.00
9.00
Ionenstrom *10-10 /A
100 200 300 400 500 600 700 800 900 1000Temperatur /°C
-70
-60
-50
-40
-30
-20
-10
DSC /uV
84
86
88
90
92
94
96
98
100
TG /%
-13.02 %
-4.28 %
-17.29 %
665 °C
156 °C
154 °C
660 °C
844 °C909 °C [1]
[1][2]
↑ Exo
temperature /°C EGA m/e = 18
TG /%
nc d(001) nc d(001)
6 13.6 12 16.4
7 13.8 13 17.0
8 13.9 14 17.4
9 13.9 15 17.7
10 14.6 16 17.7
11 15.0 18 ---
ξ = 0.32
d(00l) air [Å] EG [Å]
d(001) 12.8 17.3
d(002) 6.2 8.6
d(003) 5.7
d(004) 3.1
d(005) 3.4