THERESA NITHILA VINCENT,.pdf
268
A STUDY ON THE INFLUENCE OF PERSONAL VALUES ON THE SHOPPING STYLES OF YOUNG ADULTS TOWARDS PURCHASE OF APPARELS IN BANGALORE CITY, KARNATAKA, INDIA THESIS SUBMITTED TO THE BHARATHIDASAN UNIVERSITY, TRICHY FOR THE AWARD OF THE DEGREE OF DOCTOR OF PHILOSOPHY IN COMMERCE By THERESA NITHILA VINCENT, M.Com, M.Phil Under The Supervision and Guidance of Dr(Mrs)D. CHRISTY SELVARANI, M.Com, M.Phil., MBA., Ph.D. , Associate Professor & Research Advisor of Commerce, Urumu Dhanalakshmi College, Trichy - 620 019. PG AND RESEARCH DEPARTMENT OF COMMERCE, URUMU DHANALAKSHMI COLLEGE, (AFFILIATED TO BHARATHIDASAN UNIVERSITY) TRICHY – 620 019 DECEMBER, 2013
-
Upload
khangminh22 -
Category
Documents
-
view
1 -
download
0
Transcript of THERESA NITHILA VINCENT,.pdf

A STUDY ON THE INFLUENCE OF PERSONAL VALUES ON THE SHOPPING STYLES OF YOUNG ADULTS TOWARDS PURCHASE OF APPARELS IN
BANGALORE CITY, KARNATAKA, INDIA
THESIS SUBMITTED TO THE BHARATHIDASAN UNIVERSITY, TRICHY
FOR THE AWARD OF THE DEGREE OF DOCTOR OF PHILOSOPHY IN COMMERCE
By
THERESA NITHILA VINCENT, M.Com, M.Phil
Under The Supervision and Guidance of
Dr(Mrs)D. CHRISTY SELVARANI, M.Com, M.Phil., MBA., Ph.D., Associate Professor & Research Advisor of Commerce,
Urumu Dhanalakshmi College, Trichy - 620 019.
PG AND RESEARCH DEPARTMENT OF COMMERCE, URUMU DHANALAKSHMI COLLEGE,
(AFFILIATED TO BHARATHIDASAN UNIVERSITY) TRICHY – 620 019
DECEMBER, 2013

Dr(Mrs)D. CHRISTY SELVARANI, M.Com, M.Phil., MBA., Ph.D., Associate Professor & Research Advisor of Commerce, Urumu Dhanalakshmi College, Trichy - 620 019
CERTIFICATE
Certified that the thesis entitled, “A STUDY ON THE
INFLUENCE OF PERSONAL VALUES ON THE SHOPPING
STYLES OF YOUNG ADULTS TOWARDS PURCHASE OF
APPARELS IN BANGALORE CITY, KARNATAKA, INDIA”, is a
bonafide record of work done by Mrs. THERESA NITHILA
VINCENT, under my guidance and supervision during the period
2010 – 2013.
This thesis represents independent work on the part of the
candidate.
Place:
Date:
(D. Christy Selvarani) SUPERVISOR

THERESA NITHILA VINCENT, M.Com, M.Phil. Research Scholar, Department of Commerce, Urumu Dhanalakshmi College, Trichy - 620 019
DECLARATION
I hereby state that the thesis for the Ph.D degree on “A STUDY
ON THE INFLUENCE OF PERSONAL VALUES ON THE
SHOPPING STYLES OF YOUNG ADULTS TOWARDS
PURCHASE OF APPARELS IN BANGALORE CITY,
KARNATAKA, INDIA”, is my original work and that it has not
previously formed the basis for the award of any degree, diploma,
associateship, fellowship or other similar title.
Place:
Date: (Theresa Nithila Vincent)

ACKNOWLEDGEMENTS
First and foremost, I thank God Almighty for His blessings and the Grace that he has given to me to complete this research work.
I record my deep sense of gratitude to my Research Guide Dr(Mrs)D. Christy Selvarani, M.Com, M.Phil., MBA., Ph.D., Associate Professor & Research Advisor of Commerce, Urumu Dhanalakshmi College, Trichy, for her wise guidance, useful suggestions and constructive criticisms. But for her invaluable help and sustained interest and encouragement, completing this work would have been impossible.
I'm grateful to Dr. S. Elango and Dr. Janet Rajakumari, the Doctoral committee members for their support and guidance throughout the course of this research work.
I am grateful to the Principal of Urumu Dhanalakshmi College, Trichy for granting permission and the constant encouragement provided for the successful completion of this research endeavour.
I express my sincere thanks to Dr. N. Subramani, Head, Department of Commerce, and all the faculty members of Urumu Dhanalakshmi College, Trichy for the necessary help extended to me during the research work.
I sincerely thank Ms. Saradha and Dr. P. Geeetha of Christ University for the support in statistical analysis of the data.
On a personal note, I deeply acknowledge and warmly appreciate the encouragement given right from the beginning by my husband, Mr. Vincent and my son Mervyn. I gratefully remember their patience, encouragement, support and understanding during the course of this research work. I am also grateful to my parents for their constant prayers.
I gratefully remember my colleagues, friends and well wishers whose support and encouragement helped me in completing this research work.
Theresa Nithila Vincent
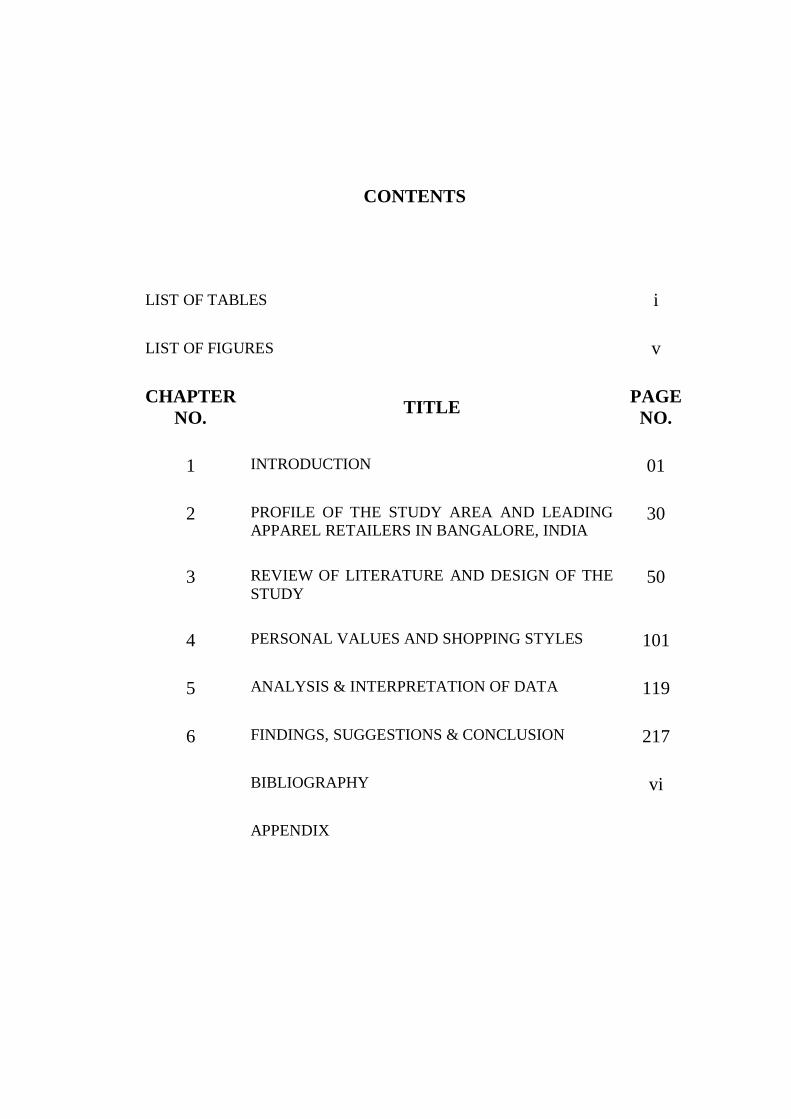
CONTENTS
LIST OF TABLES i
LIST OF FIGURES v
CHAPTER NO. TITLE PAGE
NO.
1 INTRODUCTION 01
2 PROFILE OF THE STUDY AREA AND LEADING APPAREL RETAILERS IN BANGALORE, INDIA
30
3 REVIEW OF LITERATURE AND DESIGN OF THE STUDY
50
4 PERSONAL VALUES AND SHOPPING STYLES 101
5 ANALYSIS & INTERPRETATION OF DATA 119
6 FINDINGS, SUGGESTIONS & CONCLUSION 217
BIBLIOGRAPHY vi
APPENDIX

i
LIST OF TABLES
TABLE NO TITLE PAGE
NO
1 Age Structure Of India’s Population 5
2 Values Dimensions 27
3 Population Of Karnataka 34
4 Population Of Bangalore City [Urban] 35
5 Data Collection Locations 88
6 List of Values: LOV (Original)Kahle 1983 109
7 Description Of Consumer Decision-Making Style/ Traits 112
8 Consumer Styles Inventory CSI (original constructs) 113
9 Gender of Respondents 120
10 Education Level of Respondents 121
11 Regional Background of Respondents 122
12 Reliability Statistics for List of Values 124
13 Hierarchy of Values Important to Young Adults 125
14 Reliability Statistics for Value Dimensions 129
15 Hierarchy of Value Orientations in Young Adults 130
16 Reliability Statistics for Consumer Style Inventory 132
17 Preferred Shopping Style of Young Adults 135
18 Hierarchy of items under Perfectionist/High Quality Conscious style 138
19 Hierarchy of items under Brand Conscious/Price Equals Qualitystyle 139
20 Hierarchy of items under Novelty and Fashion Consciousstyle 139
21 Hierarchy of items under Recreational and Shopping Consciousstyle 140
22 Hierarchy of items under Price Conscious/Value for money style 141
23 Hierarchy of items under Impulsiveness/Careless style 141
24 Hierarchy of items under Confused by Overchoice style 142
25 Hierarchy of items under Habitual/Brand Loyal style 143
26 Intra-Correlations among Value Dimensions 144

ii
TABLE NO TITLE PAGE
NO
27 Intra-Correlations among individual Values 145
28 Intra-Correlations among Shopping Styles 146
29 Correlation between Values and Shopping Styles 149
30 Relationship between the value Sense of Belonging and Shopping Styles 150
31 Relationship between the value Simplicity and Shopping Styles 151
32 Relationship between the value Warm Relationships with Others and Shopping Styles 152
33 Relationship between the value Self-Fulfillment and Shopping Styles 153
34 Relationship between the value Being Well Respected and Shopping Styles 154
35 Relationship between the value Fun and Enjoyment of life and Shopping Styles 155
36 Relationship between the value Security & Comfort and Shopping Styles 156
37 Relationship between the value Self Respect and Shopping Styles 157
38 Relationship between the value Sense of Accomplishment and Shopping Styles 158
39 Relationship between the value Being Independent and Shopping Styles 159
40 Summary of Goodness-of-fit measures for the ‘Consumer Style Inventory’ used in the study - CSI 162
41 Relative Chi Square (CMIN/df) (Chi-square/Degrees of freedom) - CSI 163
42 Baseline Model - CSI 164
43 Parsimony-Adjusted Measures - CSI 166
44 Root Mean Square Error of Approximation (RMSEA) - CSI 167
45 Factors, standardized factor loading, AVE, CR and Coefficient Alpha for Shopping Styles - CSI 168
46 Summary of Goodness-of-fit measures for the ‘Value – Shopping Style’ measurement model - VSM 170

iii
TABLE NO TITLE PAGE
NO
47 Relative Chi Square (CMIN/df) (Chi-square/Degrees of freedom) - VSM 171
48 Baseline Comparisons - VSM 171
49 Parsimony-Adjusted Measures - VSM 172
50 Root Mean Square Error of Approximation (RMSEA) - VSM 172
51 Influence of overall values on the shopping styles of young adults towardsapparels 175
52 Influence of values on the ‘Perfectionist/High Quality Conscious’ shopping style 177
53 Influence of values on the ‘Brand Conscious/Price Equals Quality’ shopping style 178
54 Influence of values on the ‘Novelty and Fashion Conscious’ shopping style 179
55 Influence of values on the ‘Recreational and Shopping Conscious’ shopping style 180
56 Influence of values on the ‘Price Conscious/Value for money’ shopping style 181
57 Indicating influence of values on the ‘Impulsiveness/Careless’ shopping style 182
58 Influence of values on the ‘Confused by Overchoice’ shopping style 183
59 Influence of values on the ‘Habitual/Brand Loyal’ shopping style 184
60 Squared multiple correlations (R squared values) for Shopping Styles 185
61 Nature of Influence of Values on the Perfectionist/High Quality Conscious Shopping Style 186
62 Nature of Influence of Values on the ‘Brand Consciousness/Price Equals Quality’Shopping Style 187
63 Nature of Influence of Values on the ‘Novelty and Fashion Conscious’Shopping Style 188
64 Nature of Influence of Values on the ‘Recreational and Shopping Conscious’ Shopping Style 189
65 Nature of Influence of Values on the ‘Price Conscious/Value for Money’ Shopping Style 190

iv
TABLE NO TITLE PAGE
NO
66 Nature of Influence of Values on the ‘Impulsiveness/Careless’Shopping Style 191
67 Nature of Influence of Values on the ‘Confused by Overchoice’ Shopping Style 192
68 Nature of Influence of Values on the ‘Habitual/Brand Loyal’ Shopping Style 193
69 Differences in mean for shopping styles across gender 196
70 t test for shopping styles across gender 197
71 Differences in mean for shopping styles across Education Levels 199
72 ANOVA Indicating differences in shopping styles across education level of young adults 201
73 Differences in mean for shopping styles across Regions 203
74 ANOVA Indicating differences in mean for shopping styles across Regions 204
75 Differences in Mean for Value Orientations across Gender 206
76 t Test for Value Orientations across Gender 206
77 Differences in Mean for Value Orientations of Young Adults across Regional Background 208
78 ANOVA showing Value Orientations of Young Adults across Regional Background 209
79 Differences in Mean for level of influence of individual Values across Gender 210
80 t Test for Level of Influence of individual Values across Gender 211
81 Differences in Mean for level of influence of individual Values across Regional Background 213
82 ANOVA showing level of influence of individual Values across Regional Background 215

v
LIST OF FIGURES
FIGURE NO TITLE PAGE
NO
1 Map of India - States and Capitals 30
2 Bangalore City Map 33
3 The Value – Shopping Style Model 118
4 Gender Of Respondents 120
5 Educational Level of Respondents 121
6 Regional Background of Respondents 122
7 Path Diagram indicating the Value – Shopping Style Model Fit.
174

1
CHAPTER I
INTRODUCTION
THE INTERNATIONAL RETAIL MARKET ENVIRONMENT
The Global Retail Development IndexTM (GRDI) 20131 outlines some
important changes to the international retail environment. The report states that
developed-world retailing will face stagnant demand and tough price competition.
Emerging markets will enjoy faster growth as populations and incomes rise quite
rapidly.
There are opportunities for retailers seeking to grow and expand in fast-
growing developing markets such as South America, Brazil, Chile, and Uruguay.
The BRIC markets (Brazil, Russia, India, and China) remain as the magnificent
markets for global retailers.
By 2025, most retail investment will be in the developing world. Consumer
spending will be higher than in the developed world and modern retailing formats
will expand to meet the demand for branded, added-value and luxury goods and
services. Investment in modern retailing capacity will induce consumers to move
away from the traditional formats and will lead to increase in consumption2.
International retailers will have to reflect local needs and a significant core of local
retail business will remain.
The internet and social media will play an increasingly important part in
retailing as producers sell directly to consumers, although food and grocery will be
less affected. The integration of the virtual and physical worlds is fundamentally
changing consumers’ purchasing behaviours. There is a gradual diversion of sales
away from the high street and toward the internet. Multichannel shopping will
become more common, combining both internet and traditional shopping
approaches.
1The A.T. Kearney Global Retail Development Index (GRDI)™ 2013. 2 David Hurst, Andrew Black. (2011).The Changing Retailing Environment. International
Economics, IE WIT BP.

2
India was rated as the fifth most attractive emerging retail market in the
Global Retail Development Index of 30 developing countries in 2012. However, the
2013 GRDI places India in the 14 position. India’s Growth has slowed down, but it
is still strong. The global slowdown hasn't spared India, whose GDP growth rate
slipped to 5 percent, down from a 10-year average of 7.8 percent. Same-store sales
volume growth slowed in 2012 across retail, particularly for lifestyle and value-
based formats.
However, the long-term fundamentals remain strong for India, in particular,
the large, young, increasingly brand- and fashion-conscious population.
THE INDIAN RETAIL MARKET ENVIRONMENT
The Indian retail market is the fastest growing sector in the Indian economy
that accounts for 14 -15 percent of its GDP3. It offers tremendous potential to the
modern marketer. A number of changes have taken place on the Indian retail front
such as increasing accessibility of international brands, increasing number of malls
and hypermarkets and easy availability of retail space.
The India Retail Industry is gradually inching its way towards becoming the
next boom industry. The total concept and idea of shopping has undergone a radical
change, in terms of format and consumer buying behaviour, ushering in a revolution
in shopping in India. Indian consumers are demonstrating an increasing interest in
online shopping. The growing online retail market has become a very lucrative
business for international majors entering Indian markets. India has surpassed Japan
to become the world’s third largest Internet user after China and the United States.4
The trend is not only catching up in metros, but in smaller towns and cities as well.
The key factors in the growth of the organized retail sector in India can be
attributed to a large young working population with median age of 24 years, nuclear
families in urban areas and emerging opportunities in the services sector.
The future of the India Retail Industry shows promising growth of the market with
3http://en.wikipedia.org/wiki/Retailing_in_India 4Retail Industry in India. (2013). http://www.ibef.org/industry/retail-india.aspx

3
the government policies becoming more favourable and the emerging technologies
facilitating operations.
In 2012, India's retail sector reached an important landmark: The government
allowed 100 percent foreign direct investment in a single brand for the first time. In
multi-brand retail, the government allowed 51 percent FDI starting in early 2013.
This has opened the doors of the retail sector to international players that comes with
increased benefits to the consumer such as quality products and premium brands and
a boost to the economy. However, there are preconditions about investment,
sourcing, store locations, and state government approval.
Purchasing power of Indian urban consumer is growing and branded
merchandise in categories like Apparels, Cosmetics, Shoes, Watches, Beverages,
Food and even Jewellery, are slowly becoming lifestyle products that are widely
accepted by the urban Indian consumer. Indian retailers must recognize the value of
building their own stores as brands to reinforce their market positioning, to
communicate quality as well as value for money. Sustainable competitive advantage
will be dependent on projecting core values of the organisation in their retail brand
strategy combining products, image and reputation.
As per industry survey about 70 per cent of the retail consumption is
contributed by smaller towns of India. The youth in these pockets, generally try to
connect and get inspired by urban lifestyles and trends. The onset of the mall culture
in the smaller towns is opening up new avenues for the consumer to discover and
adapt to the new trend. These markets are still untapped and open up a plethora of
marketing opportunities. The semi-urban youth is equally digital savvy and in fact
their level of involvement with the digital medium is higher than youth in bigger
cities. Their contribution to e-commerce is more than their metro counter-parts.

4
TEXTILE & APPAREL RETAIL SECTOR IN INDIA5
India is the world’s second largest producer of textiles and garments after
China. The potential size of the Indian textile and apparel industry is expected to
reach US$ 221 billion by 2021, according to Technopak's Textile and Apparel
Compendium 2012. The textile and apparel industry is one of the leading segments
of the Indian economy and the largest source of foreign exchange earnings for India.
This industry accounts for 4 percent of the gross domestic product (GDP), 20
percent of industrial output, and slightly more than 30 percent of export earnings.
The textile and apparel industry employs about 38 million people, making it the
largest source of industrial employment in India. The growth and all round
development of this industry has a direct bearing on the improvement of the
economy of the nation.
Apparel is the second largest consumption category in malls.6 According to the
NCAER study,7consumers in India spend approximately nine percent of their
disposable income on clothing and footwear, compared to five percent for clothing
and shoes in the United States. Clothing expenditures in India tend to be relatively
higher for households with higher incomes.
There is a growing shift in preference towards Western clothing and branded
products, particularly across Tier I cities. Recognizing this, global brands are
making their mark and increasing their presence in India, whilst at the same time;
regional local brands are also increasing their competitive presence. The increasing
disposable incomes across key cities, comfort fitting and rich appeal are the major
factors that are expected to drive the apparel market towards long-term growth.
Apparel companies are expected to branch out to Tier II and Tier III city outlets
across India, which represent as yet an untapped market for branded apparel.
5http://www.ibef.org/industry/textiles.aspx, May 2013; and http://www.researchandmarkets.com/
reports/688195/textile_and_apparel_sector_in_india. 6Jaya Halepete, K.V. Seshadri Iyer. (2008). Multidimensional investigation of apparel retailing in
India.Emerald 36. 7Indian Demographics Report 1998

5
International apparel brands such as Zara, Mango, Arrow and Diesel are
increasing the presence of global brands in India. Certain local players such as Black
Bird, F Square, Ramraj and Mustard have also strengthened their presence in
southern India and provide tough competition to the national and international
brands. These brands are also expanding their base to other parts of India to become
national players8.
The major consumers of the Indian Apparel Market are the young adult
population. According to current estimates, India is one of the youngest countries in
the world in terms of its age structure. More than 50% of India's current
population is below the age of 25 and over 65% is below the age of 35. The table
given below presents the age structure of the population of India.
TABLE: 01
AGE STRUCTURE OF INDIA’S POPULATION
India Population Current Population of India in 2013 - 1,270,272,105 (1.27 billion)
Age structure
(2012 est.)
0-14 years: 29.3% (male 187,386,162/female 165,345,284)
15-24 years: 18.2% (male 116,019,042/female 103,660,359)
25-54 years: 40.2% (male 249,017,538/female 235,042,251)
55-64 years: 6.8% (male 41,035,270/female 40,449,880)
65 years and over: 5.6% (male 31,892,823/female 35,225,003)
Source: http://www.indexmundi.com
The above table gives the estimated youth population structure at the all
India level during 2012. The numbers have changed since and apparently the size of
the youth population has grown tremendously. The population in the age-group of
15-34 increased from 353 million in 2001 to 430 million in 2011. Current
predictions suggest a steady increase in the youth population to 464 million by 2021
and finally a decline to 458 million by 2026.9
8Apparel in India, Euromonitor International. 2012 9The Hindu, April 17 2013.

6
By 2020, India is set to become the world’s youngest country with 64 per
cent of its population in the working age group. It is estimated, the average Indian
will be only 29 years old, compared with the average age of 37 years in China and
the United States, and 45 years in west Europe and Japan. With the West, Japan and
even China aging, this demographic potential offers India and its growing economy
an unprecedented edge that economists believe could add a significant 2 per cent to
the GDP growth rate and result in a massive and growing labour force which will
deliver profound benefits in terms of growth and prosperity.
This massive youth population provides an enormous consumer base for
marketers. Changes in the consumer patterns of young adults started happening with
the increase in availability of malls, cafés and increased disposable income; these
factors have changed the way youth today conduct themselves and manage their
funds. The changing profile of the young adult population is evident in the economic
independence displayed and the disposable income in their hands.
PRESENT DAY YOUNG ADULTS IN INDIA
Youth are emerging as digital shoppers as their comfort level with
technology is incredibly high. It is perceived that young adults feel handicapped
without technology10 and that the internet is providing young people with a platform
to carry out increasing portions of their offline life with regard to searching, seeking
information, creating content and using these inputs to shop online.
Today’s young consumer has developed a strong taste for shopping online. A
study by Microsoft Advertising and Aegis Media reveals that 2011 was a year of
‘digital shoppers’ in which at least 48 per cent of online shopping decisions were
spontaneous. The U’th Time Integrated Media Services quoted that “The primary
source of traffic for online shopping (and other e-commerce portals) plus social
media activity are young consumers (in the age group of 13 to 25). As a result, the
number of online shopping platforms has increased and expanded dramatically over
the last few years. People in the age group of 18-25 comprise a significant share of
10 Microsoft Advertising’s Pre Family Survey 2011

7
sales on these websites. There is also an increasing trend of repeat buying in this age
group. It has now become a regular practice for the young consumer to search for
customer reviews on the web, blogs, consumer forums and other social media
websites to gather insights before purchasing anything. Facebook has become the
most popular source for almost all information.11Prior to purchase what they
consider as assets, such as bikes, cars, mobile phones, branded apparels, etc., they
will search reliable information over internet. They discuss with peer-opinion
leaders among their friendship circle, listen to the experiences (related to that
product) of their close friends, check the credibility of that product in media
(advertisements and promotions) and then convince parents to access the product.
The family and parents are becoming more dependent on the younger members of
the family to take the purchase decision if the product is related to lifestyle and
fashion.
Extensive research is undertaken by young adults on the web about the
company, the quality of customer service, and the kind of products a retailer offers.
The young consumers do not end the purchase process after they acquire the
product, but voice their opinion on the web through various forums, social networks
and viral mail. They are even reactive enough to load a video on YouTube if they
find a fault in the product and these videos are considered to be more reliable and
credible (virally spread by the peer-network) to their peers against the brand or
product.
The young generation trusts friends and alternative media as the major
source of information before taking any decision. They consult each other a lot
more, critique instantly and voice their opinions to the world. Numerous brands,
both from India and outside, have made them spoilt for choice as they are faced with
a bewildering plethora of options in everything they do. And this unlimited choice
also makes them more demanding of a brand, from a brand’s perspective. They want
better quality, more value-for-money, superior experience and more.
11http://pitchonnet.com/blog/2012/08/21/ how-well-do-indian-marketers-understand-the-Indian-
youth/Pallavi Srivastava and ArshiyaKhullar

8
Globalisation and the opening up of the Indian economy have introduced the
Indian society to new cultural and social norms. However, this process has not
eradicated traditional Indian values and beliefs. Young people in particular want the
best of both worlds.
A recent survey by INgene Insights Consultancy reveals that India’s youth
has high respect for their parents for how they have struggled and achieved success
in spite of minimal career options available during their time. Moreover, they have
revealed that their aspiring icons in life are not any celebrity but their father or older
brother(s). Parental authority has considerable leverage in the life of most Indian
youth, though variations are due to education and socio-economic status. The youth
prefer to remain within the cultural codes of their family and social networks. The
vociferous individuality of the Western youth is not present among Indian youth
who are more embedded, and content to be, within the institution of the family. The
family remains a key institution in the life-world of Indian youth.
Dressing up in the latest styles is an important facet of self-expression held
by the youth. Though the modern youth do not run after designer clothes, their
wardrobes are up to date. While, for a casual gathering they might choose to wear
jeans and a branded T-shirt, for more formal occasions they prefer a traditional
dress: the girls will wear saris, while the boys don a sherwani.
Urban India today represents a combination of the traditional and the
modern. In a number of areas, modern values and practices are taking over.
Materialism is increasing; young people today understand the value of money and
believe that India must become a part of the global marketplace to ensure its future
economic success.
Young Adults in Bangalore
A demographically diverse city, Bangalore houses people of different
cultures and it comprises of a dynamic blend of young adults, belonging to various
religions, castes and communities who speak many languages. This diversity of
young adults of Bangalore represents the whole of India. Hence the general profile

9
of the young adult population of India holds good for the city of Bangalore.
Bangalore’s standard of living is better than in other metros. Hence, Bangaloreans’
life-style exhibits high level of brand awareness/consciousness.
Young Adults in Bangalore have information at their finger tips. They are
innovators of new products and trends and are early acceptors of change. This
segment is image conscious and places importance on keeping physically fit. They
are experiential; enjoy the arts and events from music concerts. The young adults
place significant importance on their community and friends. The advent of the
internet enables the youth to communicate with a number of people at one time and
therefore, friends could even include people they haven’t actually met before in
person. The young adult market is extremely media-savvy; they are cynical and
untrusting of advertising and marketing promises. They desire instant interaction
and gratification and they have a short attention span. There is a need to “belong”
and have “control,” they want to feel empowered, confident and independent.
A survey conducted by Hindustan Times and CNN-IBN in 2011 (carried out
by MaRS – Monitoring and Research Systems) on the population aged between 18-
25 years, spread across 18 major cities in India has revealed some very interesting
statistics and reflection of the mindset that youth in a city share. Contrary to what
many believe, majority of the youth do have the habit of saving as the report
suggests. Going by each city, the youth in Bangalore (64.2%) and Mumbai (62.8%)
spend the most. This could also be due to the assumption that they earn/get more
money than their counterparts in other cities. Most of the spending of the sample
population is on mobile phones (39.6%), food (22.6%) and clothes (22.6%); then
come movies (6.2%), personal grooming (4.6%), gifts (1.5%), and sports and gym
(0.7%) coming in with least spending percentage.
The young adult population in Bangalore mostly comprises of college-going
students and young IT professionals. Many of them are migrants to Bangalore for
the purpose of education or employment. Being away from home and on their own,
they have a weekend culture to visit the malls in the city for shopping, watching

10
movies and eating out. They possess a fairly good disposable income and studies
show that spending culture is quite high among them.12
YOUNG ADULTS SHOPPING BEHAVIOUR
Young adults are recognized as a specialized consumer segment for
marketers for many reasons. They are eager to consume and they are conscious of
their experience.13 The young adults within a family often influence the family
purchasing decisions.14 They are recognised as trend setters who influence
consumption change within other market segments. Young people are able to
influence the purchase and decision-making of others.15 At the period of transition
from adolescence to early adulthood, the young adolescents seek to establish their
own individual identity and form behaviour patterns, attitudes, values. They set their
own consumption patterns that extend to their old age. They make purchases to
define themselves and to create an identity of their own making.16 Many of these
patterns are carried well into individuals’ lifetimes.17 They act as agents of change
by influencing the society and culture.18 And from a marketing perspective, young
adults are considered as a market segment that forms a powerful consumer spending
group in their own way.
Globalisation and the subsequent opening up of the Indian economy have
introduced the Indian society to new cultural and social norms. New trends in
fashion, culture and lifestyle are emerging. The increasing reach of satellite
television and the rise in Internet usage has helped to facilitate the spread of these
12Hindustan Times Youth Survey 2011 13Sproles G.B. & Kendall, E.L. (1986).A methodology for profiling consumers’ decision-making
styles.Journal of Consumer Affairs, 20 (2), 267-279 pp. 14Turk, J. L. and N. W. Bell. (1972). “Measuring power in families.” Journal of Marriage and the
Family 34:215-223 pp. 15Grant, I. C. & Waite, K. (2003).Following the yellow brick road - young adults’ experiences of the
information super-highway.Qualitative Market Research: An International Journal, 6 (1), 48-57 pp.
16Holbrook, M. & Schindler, R. M. (1989).Some explanatory findings on the development of musical tastes.Journal of Consumer Research, 16 (1), 119-124 pp.
17Moschis, G. P. (1987). Consumer socialization: a life cycle perspective. Lexington Books. 18Leslie, E., Sparling, P. B. & Owen, N. (2001). University campus settings and the promotion of
physical activity in young adults: lessons from research in Australia and the USA. Health and Education, 101 (3), 116-125 pp.

11
new trends among young people. The younger generations have become more
independent and have accepted new ideas from western cultures.
Young adults attach great meaning to their appearance, and while shopping
for clothes they make their own decisions that will directly affect their appearance.19
The clothes they select become a means for communicating and enhancing
personality, attractiveness and allow them to belong to specific groups.20 Shopping
for apparels is an important part of the overall life pattern for this segment. Apparels
are important for young adults because they can augment social appreciation and
develop a positive self-esteem via their appearance. They are the ultimate decision
makers for the apparel products they consume, even if they are influenced by their
parents or friends.
Though apparently the young adults all over the world display similar
characteristics, a deeper examination reveals the finer differential qualities which are
vital and often ignored while targeting this group as a valued consumer base. While
targeting young adults to sell their product, most fashion retailers in India blindly
follow the trends of U.S.A or Europe without prior survey and understanding,
expecting the Indian young consumer to exhibit similar preferences. These efforts
are unsuccessful.21
The buying behaviour of young adults involves a complex decision-making
process that is influenced by various external factors such as family, peer group,
society, culture and internal factors such as values, motives, perception, attitudes
and life-style. A predominant influencing factor among these is the basic value
system that is imbibed in them from their cultural background and parental
upbringing. Values are also formed through peer group interactions, educational
background and social media.
19UlunAkturan&NurayTezcan (2007).Profiling young adults: decision-making styles of college
students for apparel products. 6ème Journées Normandes De Recherche Sur La Consommation : Société Et Consommations 19-20 pp. Groupe ESC Rouen.
20Tatzel, M. (1982). Skill and motivation in clothes shopping: Fashion-conscious, independent, anxious, and apathetic consumers. Journal of Retailing, 58(4), 90-97 pp.
21KaustavSengupta. (2008). INgene Insights Consultancy.

12
APPARELS - A REFLECTION OF PERSONALITY
It is an universal belief that ‘Clothing Makes the Man (or Woman)’ perfect.
Clothes or apparels are an epitome of a culture. It is the symbol of expression of an
individual’s personality, social status, tastes and preferences, and lends to create
impressions about the wearer. People in different parts of the world have their own
style of dressing which symbolize their culture and status.
In today's diverse and dynamic societies, there is probably no other sphere of
human activity that reflects an individual’s values and life-styles better, than the
apparels that he/she chooses to wear. The dress of an individual is a kind of “Sign
Language” that communicates a complete set of information and is usually the basis
on which immediate impressions are formed. Apparel is a form of artistic expression
that reflects the cognitive, moral and social aspects of human life.
Apparels are worn in a public space. Therefore, it can be said that apparels
contribute to a person's identity as a man or woman.22Apparels articulate meaning
and facilitate construction of identity.23 People form initial impressions of others on
the basis of their physical attributes and observable behaviours.24 Observers can
form judgments based on a person’s conscious clothing decisions or behavioural
residue that reflects one’s personality. In today's multifaceted societies, apparels
deter as well as facilitate communication between highly disjointed social groups.25
Choice in apparels is regarded as claims of individuality that could be self-
directed or other-directed, i.e, individuals may choose apparels that reinforce their
identity or communicate their attitudes and values to others. An individual’s apparel
choices may consciously and unconsciously reflect elements of his or her
personality traits.
22Linda B. Arthur. (1999). Religion, dress and the body. Paperback.Berg Publishers. 23Crane, D. (2000). Fashion and its Social Agendas: class, gender, and identity in clothing. Chicago:
University of Chicago Press, 294 pp. 24Laura P. Naumann, 2009; Express yourself: Manifestations of personality in clothing and
appearance; The University of Texas at Austin. 25Crane, D. (2000) Fashion and Its Social Agendas: Class, Gender and Identity in Clothing,
University of Chicago Press, 294 pp

13
Clothing patterns may be regulated within the peer group by some unwritten
rules. Certain styles and colours of clothes may be approved or disapproved by the
group. Members of the group are expected to follow the group’s trends and even
pressured to dress in the same way. This is referred to as the “peer pressure”.
Clothing that does not conform to the group’s standards and expectations may be
criticized. Sometimes the pressure is gentle and serves just as a source of inspiration
for others. But it can also be strong and cruel, forcing people to either conform or
risk being excluded from the group26.
In western countries such as the United States and the United Kingdom,
culture dictates that youngsters are independent from an early age. They form their
own opinions and decide independently in all matters concerning their lifestyle.
They take independent decisions without consulting their parents and are responsible
and accountable for their actions. They belong to a free society and do not conform
to traditional values/culture in the manner of dressing or choosing clothes.
In countries like Saudi Arabia, Iran and Iraq, cultural traditions and religious
beliefs require people to strictly adhere to the specified norms. The community’s
values and beliefs strongly influence the choice of apparels worn by young adults of
these communities.
India is a country with rich cultural heritage and highly respected value
systems. The joint family system, which is a fundamentally conservative institution,
has given room for the more liberal nuclear family system. This transition has not
eradicated traditional Indian values and beliefs. The family remains a key institution
in the life-world of the Indian youth. Parental authority has considerable leverage in
the life of most Indian youth and they prefer to remain within the cultural codes of
their family and social network.27 Dressing up in the latest styles is an important
facet of self-expression strongly held by the Indian young adult segment. While for a
casual gathering they might choose to be dressed in jeans and perhaps a trendy T-
26Asma Kiran et. Al. (2002). Factors affecting change in the clothing patterns of the adolescent girls;
International Journal Of Agriculture & Biology 1560–8530/2002/04–3–377–378 pp. 27KaustavSengupta. (2008) .INgene Insights Consultancy.

14
shirt, for more formal occasions they prefer a traditional dress that conforms to the
norms, beliefs and value systems of the society.28
PSYCHOGRAPHIC SEGMENTATION OF THE YOUNG ADULTS'
CONSUMER MARKET
Every person in this world is a consumer of an incredible variety of goods
and services. However, each individual has different tastes, likes and dislikes and
follow diverse behavioural patterns while making purchase decisions. Gaining
knowledge of the consumer decision making process is the greatest challenge that
the marketers face world over.
Marketers adopt different strategies to kindle the interest of the consumer
and motivate them to act positively towards their product offerings. These
motivations are referred to as stimuli as they stimulate the buying desire in the
consumer. There are different marketing stimuli that reach consumers every day
which affect them at different levels and dimensions. There are marked behavioural
differences among consumers in the way in which they respond to these stimuli.
Some may prefer the brand, some may look at the price, some may buy the product
for prestige or status and some may respond to the advertisement. Although
marketers recognize the need to understand the differences in consumer behaviour,
rarely do they go beyond the demographic diagnosis of their consumers.
Usually the market is segmented on the basis of demographic variables such
as age, gender and income which fail to capture the complete characteristics of the
consumers. The problem is that even though individuals in a specific demographic
category share some common characteristics, the psychographic characteristics like
values, motivations and beliefs of these groups are not homogeneous.
Psychographics segmentation, based on consumer attitudes, opinions and
values, is a realistic approach that allows the marketer to look at their clients as real
people or entities, and understand how they feel, think, react and evaluate. While
demographic segmentation aims to group the market based on its similarities,
28Voices and Visons from India, 2004 © Commonwealth of Australia

15
psychographic segmentation helps to understand how people are different. The
consumers in the same demographic segment possess different psychographic
characteristics.
Psychographic segmentation helps the seller to determine how they must
approach customers belonging to a particular segment. 29Such segmentation offers
greater worth of the product for the customer. As a consequence, it generates greater
degree of customer satisfaction and customer loyalty, resulting in higher amount of
customer retention. For the marketer, psychographic segmentation helps to increase
the brand value of the company in the eyes of the customer and gives better inputs
for the design of new products that the customer would prefer. In the long run, the
company spends lesser amount of money on marketing as it is easier to target a
specific type of customer base. Thus, a psychographic approach in understanding
consumer behaviour would provide marketers with a distinctive competitive edge in
reaching their customers.
The common psychographic variables are attributes relating to personality,
values, attitudes, interests, and lifestyles. Among these, personal values play an
important role in understanding consumer behaviour as they are more central to an
individual's cognitive system. Marketers, fashion researchers and retailers should
understand how values influence the consumer behaviour and devise marketing
strategies to promote the sales of their product.
Values are commonly regarded as the most deeply rooted, abstract
formulations of how and why consumers behave as they do. Values exert a major
influence on the consumer’s decision making in any situation where a conflict of
choice exists. It is widely accepted that choice criteria are based on an individual's
social values. Personal values are acknowledged as an underlying determinant
29Narang, R. (2010). Psychographic segmentation of youth in the evolving Indian retail market. The
International Review of Retail, Distribution and Consumer Research Vol. 20, No. 5, December 2010, 535–557 pp.

16
of consumers' attitudes and behaviour.30 A significant number of researchers suggest
that values affect various aspects of consumer behaviour and attitudes.31
Values can therefore be said to be mental images that affect a wide range of
specific attitudes. These in turn influence the way a person is likely to behave in a
specific situation, e.g. purchase of new apparels: the evaluation, choosing among
alternatives and finally paying for a particular type of apparels, is largely a function
of core cultural beliefs and values. Values are passed on from parents to children
and are reinforced by the major institutions of society such as schools, business and
government, the mass media, reference groups, etc.32
While connotation differs, there appears to be a general agreement that
values influence consumer behaviour. The purchasing behaviour of the customer
reflects the actions which are based on a consequential relationship between his/her
values and consequential wants and actions.33
30Homer and Kahle.(1988). A structural equation test of the value-attitude-behaviour hierarchy.
Journal of Personality and Social Psychology, 54, 638-646 pp. 31Becker and Connor.(1981).Personal values of the heavy user of mass media. Journal of Advertising
Research, 21, 37-43 pp. 32Lawan, A. Lawan, Ramat Zanna. (2013). Evaluation of socio-cultural factors influencing consumer
buying behaviour of clothes inBorno State, Nigeria; International Journal of Basic and Applied Science, Vol 01, No. 03, Jan 2013, pp. 519-529 pp.
33Kaže, V. (2010).Paradigm shift in consumer segmentation to gain competitive advantages in post-crisis FMCG markets: Lifestyle or social values? The Journal of Economics And Management, 16, 1266-1273 pp.

17
NEED FOR THE STUDY
Apparel manufacturers spend millions in marketing research every year trying to
envisage the changing consumer behaviours. Insight into the consumer buying
behaviour or their decision-making process would help firms and organizations to
improve their marketing strategies by understanding the psychology of how
consumers think, feel, reason, and select between different alternatives; and how the
consumer is influenced by his or her value systems.
A three dimensional marketing strategy is required to ensure success and earn
returns on the investments made by marketers. Firstly, the need is to identify the
most promising target group of consumers for its products. Secondly, the market
must be segmented appropriately. Marketers should move from demographic
segmentation towards psychographic segmentation of the target consumers. Thirdly,
marketers must identify the product categories most preferred and used by the target
group.
The most promising target group of consumers in India are the young adults
due to its demographic dividend. India is considered as the world’s youngest country
in terms of its age structure. Recent studies on demographic profile of India’s
population reveal that more than 50% of the Indians are aged below 25 years and
more than 65% fall below the age of 3534. This indicates that the youth population in
India is a significant proportion of the total population and is emerging as a powerful
consumer segment especially for lifestyle and luxury products.
This predominance of youth in the population is expected to last until the year
2050. The "BRIC Report" (Brazil, Russia, India, China) by Goldman Sachs predicts
that the economies of Brazil, Russia, India and China would become larger forces
over the next 50 years The report states that India's economy could be larger than
Japan's by the year 2032 and that India could show the fastest growth in the next 30
34En.Wikipedia.org

18
years. This demographic potential offers India and its economy an unprecedented
edge, which is a significant competitive advantage.35
Young people in India have emerged as a significant target for many Indian and
foreign apparel companies. The existence of a huge young adult audience who
possess an insatiable requirement for fashion clothing gives tremendous scope for
clothing manufacturers, designers and marketers for business expansion, increased
revenues, higher profits, while at the same time the prevalence of multi-brands
provides tough competition.
The understanding of factors that influence the purchase of global and local
brands among the Indian young adult consumers will help the new retailers, both
domestic and foreign, who want to enter into the Indian market. The companies will
be in a position to understand the complexities of Indian consumers and customize
their products to have the right mix to meet the requirements and extract benefits
from the growing Indian market.
Apparels are one of the most preferred product categories where young adults
also have the authority to make independent buying decisions. It is important to
study the purchase behaviour of young adults towards apparels, because apparels are
the most frequently purchased item by young adults and they become trendsetters
and opinion leaders.36 Whatever young adults do today foreshadows what older
demographic groups will follow in the near future.
As young consumers are an important target group for apparels, it is
necessary to identify the factors that influence the apparels purchase behaviour.
Very less literature is available to know about what this consumer segment looks for
while considering apparel brands. Understanding this large segment appropriately is
crucial for apparel manufacturers and marketers as they promise longevity of market
and exert substantial influence on their parents’, peers as well as their own spending.
35The Hindu, April 17 2013. 36 S.M. Noble et al. (2009). What drives college-age Generation Y consumers? Journal of Business
Research 62, 617–628 pp.

19
In order to understand the influencing factors for purchasers of apparels among
Indian young adults, there is a need to understand their psychographic profiles so
that it becomes easy for the marketers to reach out to them or to target and position
themselves more appropriately. In India, psychographic profiling of consumers is
still in the stage of infancy. There is negligible information available in the public
domain regarding the psychographic profile of the Indian youth in the context of the
changing retail environment.37
It is imperative that a psychographic study be conducted by apparel
manufacturers and marketers to devise more effective strategies to tap this
segment.38 Further, the changing psychographic profile of young adults makes it
even more crucial for a continuous longitudinal study to keep track of changes and
incorporate them in the art of marketing.
Information on young-adult consumers’ decision-making style will be of
much use for organisations targeting Indian markets. Regardless of the fact that the
majority of the young adults are college students who are unemployed and their
earning comes mainly from educational loans and parental contributions, young
adults represent an extremely large and important market segment for many
products and services. They are seen as a lucrative market since they have higher
than average lifetime earnings and are just beginning a major transition period which
is a key time to change previous behaviours.39 Apparel manufacturers and marketers
are keen to target this group because they perceive them as potential loyal customers
both currently and in the future.40
The present study analyses the young adults’ shopping styles for apparels
from a psychographic perspective where values are considered as the underlying
trigger for specific purchase decision-making style. Apparel products are chosen
37Narang, R. (2010). Psychographic segmentation of youth in the evolving Indian retail market. The
International Review of Retail, Distribution and Consumer Research Vol. 20, No. 5, December 2010, 535–557 pp.
38Srivatsa, H.S R. Srinivasan.R. (2007). Banking channel perceptions; An Indian youth perspective 39Warwick, J., P. Mansfield. (2000). Credit card consumers: College students' knowledge and
attitude. Journal of Consumer Marketing 17(7):617-626 pp 40Speer, T. (1998).College come-ons. American Demographics, 20 (3), 41-45. And, Feldman, J.
(1999).Back-to-school buying guide. Money, 28 (9), 165-168 pp.

20
because they are perceived as aesthetic, symbolic products tied to self-presentation.
Knowledge of apparel shopping behaviour will give significant input to develop
and/or test theories of shopping behaviour and could guide future research.
STATEMENT OF THE PROBLEM
The young adult population in India is emerging as a powerful consumer
segment. Understanding this crucial segment in depth is important to develop
specific marketing strategies for business sustainability. The challenge faced by
apparel manufacturers and marketers is to understand the young adults’ buying
behaviour to capture their attention and convert them into consumers who are brand
loyal.
Generalizing the youth segment is a common mistake done by many
manufacturers. Some apparel manufacturers have a tendency to dis-regard the young
adult segment on the assumption that such customers are not brand loyal. Proof for
this is uncertain. On the other hand, there are also those who argue that the purchase
habits developed during the young adult phase can remain with consumers for many
years after.
While this segment is a potentially lucrative target for many apparel
manufacturers and marketers, it is also complex and must be examined carefully.
Young adults perhaps form the most difficult demographic group to communicate
with. Not only they have a short attention span, they are also hard to describe in
terms of media consumption; they are inconsistent in brand preference, and it is
extremely challenging to connect to and hold their attention.
Past studies have attempted to establish an association of values with
consumer buying decision behaviour. Very few studies have been conducted relating
personal values to consumer behaviour of young adults in India. This study aims to
gain an insight into the influence of values on the shopping style of the young adults,
in the age group of 18 – 25 years, towards apparels. Studies based on consumer
values would help marketers understand why they make the choices they do and

21
help them devise more effective strategies to approach consumers belonging to a
particular value segment with appropriate marketing strategies.
It is expected that a psychographic analysis will give a more fine tuned and
accurate result on young adults’ buying behaviour than a general study on
youth.41Hence this study aims to answer the principal research question: Do personal
values influence the Shopping Style of Young Adults towards Purchase of
Apparels?
This study titled “A STUDY ON THE INFLUENCE OF PERSONAL
VALUES ON THE SHOPPING STYLES OF YOUNG ADULTS TOWARDS
PURCHASE OF APPARELS IN BANGALORE CITY, KARNATAKA, INDIA” is
undertaken by the researcher to answer the research question stated above.
SCOPE OF THE STUDY
The study is conducted in the urban areas of Bangalore which has a
cosmopolitan population exhibiting a modern lifestyle. The respondents for the
study are young adults who belong to the age group of 18 – 25 years. The variables
under study are ten values adapted from Kahle’s List of Values- LOV (1983) and
eight shopping styles adapted from Sproles and Kendall Consumer Style Inventory-
CSI (1986) and the demographic profile of the respondents. The study restricts only
to young adult shopping styles towards purchase of apparels.
41Vincent. N & Christy Dr. S. (2011).Psychographic Segmentation of Young Adult Consumers - A key to developing Sustainable Marketing Strategies – Global Journal of Arts & Management – October 2011

22
OBJECTIVES OF THE STUDY
The following are the objectives of the present study:
1) To identify the values which are perceived to be important among young
adults.
2) To segment young adult consumers based on their shopping styles towards
purchase of apparels.
3) To examine the relationship between values and shopping styles of young
adults towards purchase of apparels.
4) To develop a ‘Value-Shopping Style Model’ and analyze the influence of
values on the shopping styles of young adults towards purchase of apparels.
5) To explore the differences in the shopping styles among young adults across
demographics such as gender, education levels and regional background, and
6) To explore the differences in the value perception and value orientation of
young adults across demographics such as gender and regional background.
RESEARCH HYPOTHESES
The study will also endeavour to establish the validity of the research
hypotheses drawn from the objectives and set out below:
H1 There is no significant influence of values on the various shopping
styles of young adults towards purchase of apparels.
H2 There is no significant influence of values on the various dimensions of
the shopping styles of young adults towards purchase of apparels.
H3 There is no significant difference in the shopping styles of young adults
towards purchase of apparels across gender
H4 There is no significant difference in the shopping styles of young adults
towards purchase of apparels across education levels.
H5 There is no significant difference in the shopping styles of young adults
towards purchase of apparels across regional background.

23
H6 There is no significant difference in the orientation of young adults
towards External Values, Internal Interpersonal Values and Internal
Individual Values across gender.
H7 There is no significant difference in the orientation of young adults
towards External Values, Internal Interpersonal Values and Internal
Individual Values across regional background.
H8 There is no significant difference in the level of influence of individual
values on young adults across gender.
H9 There is no significant difference in the level of influence of individual
values on young adults across regional background.
CONCEPTS AND DEFINITIONS
1) Young Adults (Sample Base)
For the purpose of this study young adults refer to Male or Female persons
aged between 18 - 25 years of age. The age reference for young adults is as defined
for youth by the United Nations42 and as defined by India Youth Policy 201043.
Young Adults are a section of the Youth Group. Youth relates to an age
group that is transiting between childhood and adulthood and may comprise of a
conglomeration of sub-groups with differing social roles, expectations and
aspirations. However, there is no uniformity in the definition of youth among
different countries.
International definitions of Youth
The UN defines youth as those in the age-group of 15-24 years.
The UNICEF defines youth in the age bracket of 15-30 years.
The Common Wealth defines youth as those in the age-group of 15 to 29 years.
42 unesco.org/new/en/social-and-human-sciences/themes/youth/youth-definition 43http://yas.nic.in/

24
Tourism Australia defines the youth segment as males and females, aged between 18
and 30 years.
According to the World Bank, ‘The term youth in general refers to those who are
between the ages of 15 to 25.’
US Government describes youth as “A person... under 21 years of age”.
The Tasmanian Government defines youth as “People between the ages of 12 and
25”.
India’s Definition of Youth
India's National Youth Policy (NYP), 2012 aims to cover the age-bracket of 16-
30 years. However, the NYP recognised that all young persons within this age-group
are unlikely to be a homogeneous group, sharing common concerns and needs and
having different roles and responsibilities. Therefore, it further divides this broad
age-bracket into three subgroups:
a) The first sub-group of 16-21 years also covers adolescents whose needs and
areas of concern are substantially different from youth under the other age-
groups.
b) The second sub-group of 21-25 years includes those youth who are in the
process of completing their education and getting into a career.
c) The third sub-group of 26-30 years comprises of young women and men
most of whom have completed their education, including professional, and
are, more or less, settled in their job and in their personal life.
Indian government organisations such as the Indian Youth Congress and the
Akhil Bhartiya Vidyarthi Parishad consider those below the age of 35 as youth.
While the youth affairs ministry allows those in the 15-35 age groups to enrol in
clubs under the Nehru Yuva Kendra Sangthan, the National Youth Corps pegs the
age category at 18-25.

25
2) Values (Independent Variable)
Milton Rokeach (1979), a prominent social psychologist, defines values as
“an enduring belief that a specific mode of conduct or end-state of existence is
personally or socially preferable to an opposite or converse mode of conduct or end-
state of existence. They serve as a standard or criteria to guide not only action but
also judgment, choice, attitude, evaluation, argument, exhortation, rationalization,
and…attribution of causality”.
Values are the core principles that an individual upholds in life which directs
thought and drives action44. Personal values are individuals’ beliefs about what is
right or good and what is wrong or bad, and determine not only what is acceptable
and unacceptable to individuals, but also what people’s needs are, the way they
satisfy those needs, and the way they establish and achieve their goals. Values have
profound influence on consumer behaviour.
The values investigated in the study are: self-respect, security, warm
relationships with others, self fulfillment, a sense of accomplishment, being well
respected, a sense of belonging, fun and enjoyment, simplicity and being
independent.
3) Shopping Style (Dependent Variable)
A Consumer Shopping style is defined as “a mental orientation
characterizing a consumer's approach in making choices. It is a basic consumer
personality, analogous to the concept of personality in psychology”.45 It can be
identified by measuring general orientations of young consumers toward shopping
and buying.
The Consumer Styles Inventory developed by Sproles & Kendall describes
eight mental orientation of consumers in their decision-making process viz.,
44Vincent. N & Christy Dr. S. (2013). Personal values approach for a better understanding of
consumer behaviour. International Journal of Innovative Research & Development, Vol 2 Issue 3 March 2013, pg. 511
45Sproles G.B. & Kendall, E.L. (1986).A methodology for profiling consumers decision-making styles. Journal of Consumer Affairs, 20 (2), 267-279.

26
perfectionist/high-quality conscious; brand conscious/price equals quality; novelty
and fashion conscious; recreational &shopping conscious; price conscious/value-
for-money; impulsiveness/Careless; confused by over-choice; and habitual/brand-
loyal.
4) Psychographics
Psychographics is the study of personality, values, attitudes, interests, and
lifestyles. Since this area of research focuses on interests, activities, and opinions,
they are also called IAO variables. Psychographic studies of individuals or
communities can be valuable in the fields of marketing, demographics, opinion
research and social research in general. They can be contrasted with demographic
variables (such as age and gender), behavioural variables (such as usage rate or
loyalty), and organizational demographic variables (sometimes called firmographic
variables), such as industry, number of employees, and functional area.
When a relatively complete profile of a person or group's psychographic
make-up is constructed, it is called a "psychographic profile". Psychographic
profiles are used in market segmentation as well as in advertising. Psychographics
can also be seen as an equivalent of the concept of "culture" when it is used for
segmentation at a national level. :46
5) Apparels
The Dictionary meaning of the word ‘Apparels’ is ‘Clothing, especially outer
garments; attire.’47 In this study the term apparels refers to all types of outer
garments- formal wear and casual wear, clothing worn by young adults in India.
6) Value Dimensions
Values are beliefs or mental orientations that are independent in nature.
Categorising the individual values into dimensions such as External, Internal
Interpersonal and Internal Individual values provides scope for studies to analyse the
46 http://en.wikipedia.org/wiki/Psychographic 47 www.thefreedictonary.com

27
value orientations of individuals and group them under similar categories for
branding and positioning. According to Kahle’s original value constructs, the nine
independent values were grouped under three categories which are given in the
following table:
TABLE: 02
VALUE DIMENSIONS
S.NO Category of value Value Label 1 External Values Sense of Belonging 2 Being well respected 3 Security 4 Internal Interpersonal Values Warm relationship with others 5 Fun and enjoyment of life 6 Internal Individual Values Self fulfillment 7 Self-respect 8 A sense of accomplishment 9 Excitement
Source: List of Values – Kahle (1983)

28
LIMITATIONS OF THE STUDY
1. This study is limited to young adults who belong to the age group of 18-25
years. Due to limited time and cost constraints it is not possible for the
researcher to cover the population belonging to other age group.
2. Personal values are culture specific and the study pertains to Bangalore City
alone. Hence, findings of the study may not be applicable to other states with
different cultures.
3. The study is conducted by drawing sample respondents from the population
of young adults residing in the cosmopolitan city of Bangalore in India.
Inferences drawn do not provide conclusive evidence to any social
characteristics in particular though they aid in identifying underlying trends.
ORGANISATION OF CHAPTERS
The thesis of the study is divided into six major chapters. The first chapter
deals with an introduction to the International and National Retail market
environment, the Apparel Sector in India, a profile of young adult consumers in
India and psychographic segmentation. The chapter also presents the need for the
study, statement of the problem, research objectives, research hypotheses, concepts
and definitions and limitations of the study.
The second chapter presents a brief profile of Bangalore City, its historical
background, geographic profile, population profile and economic profile and a brief
profile of five leading Garment Manufactures in India who have a large brand
visibility in Bangalore and the Readymade Garments Industry in Bangalore.
The third chapter projects the various literatures reviewed by the researcher
that served as the foundations of this study. The literatures are grouped on variable
basis and presented in a chronological order within the categories. The four
classifications based on variables are: (1) Studies on Values; (2) Studies using
Consumer Styles Inventory; (3) Studies on Young Adults; (4) Studies on
Apparels/clothing buying behaviour. The research gap and the dimension of the
study are also specified. This is continued with the research design giving the blue

29
print of the methodology adopted by the researcher to attend to the research
objectives. It presents a detailed description of the sampling and data collection
procedure, and the frame-work for analysis to establish the findings. A detailed
description of the various analytical tools used is also presented here.
The fourth chapter presents a detailed description on Personal Values and
Shopping Styles. The basis of the model development is elaborated in this chapter.
The chapter finally presents a diagram of the proposed ‘Value-Shopping Style
Model’ tested in the study.
The fifth chapter presents the detailed analysis of the primary data with the
help of statistical tools and the research hypotheses that are being tested. Tables are
supported with detailed interpretations and implications.
The sixth chapter presents the significant findings of the study and deals with
some concrete suggestions and conclusions.

30
CHAPTER II
PROFILE OF THE STUDY AREA AND LEADING APPAREL
RETAILERS IN BANGALORE, INDIA
An understanding of the context in which this study is undertaken is
imperative to draw meaningful insights into the results obtained. In this section a
brief description of the location of the study and the apparels market in Bangalore is
presented. To elaborate, this study has been conducted in the cosmopolitan city of
Bangalore, India. The respondents were young adults in the age group of 18 – 25
years, residing in Bangalore. The study examines the influence of values held by this
consumer segment on their shopping style or purchase decision-making style for
apparels.
PROFILE OF BANGALORE CITY, INDIA
FIG. 1
MAP OF INDIA-STATES AND CAPITALS
Source: www.en.wikipedia.org

31
Bangalore, also known as Bengaluru, is the Capital city of Karnataka.
Bangalore being India’s leading IT exporter and the 4th largest technological hub in
the world and largest in Asia, is known as the Silicon Valley of India. The World
Economic Forum identified Bangalore as the Innovation Cluster. Located on Deccan
Plateau in the South Eastern part of Karnataka, Bangalore is spread across four
zones namely Bangalore North, Bangalore East, Bangalore South and Anekal. A
demographically diverse city, Bangalore is a major economic and cultural hub and
the second fastest growing major metropolis in India with an economic growth of
10.3%. The city possesses world class infrastructure in housing, education &
research. Bangalore is packed with restaurants, clubs, pubs, health spas, amusement
parks, supermarkets, theatres, cinemas, shopping malls, discotheques and other
necessities of a modern-day metropolitan lifestyle.
Bangalore is home to many well-recognized colleges and research
institutions in India. Numerous public sector heavy industries, technology
companies, aerospace, telecommunications, and defence organisations are located in
the city.
Historical Background48
The region of modern day Bangalore was part of several successive South
Indian kingdoms. Between the fourth and the tenth centuries, the Bangalore region
was ruled by the Western Ganga Dynasty of Karnataka, the first dynasty to set up
effective control over the region. The Western Gangas ruled the region initially as a
sovereign power (350 — 550 A. D.), and later as feudatories of the Chalukyas of
Badami, followed by the Rashtrakutas till the tenth century. The Begur Nageshwara
Temple was commissioned around 860 A. D. during the reign of the Western Ganga
King Ereganga Nitimarga I, and extended by his successor Nitimarga II. At the end
of the tenth century, the Cholas from Tamil Nadu began to penetrate in areas east of
Bangalore; they later began to extend their control over parts of present-day
Bangalore, such as Domlur on the eastern side of the city. Around 1004 A.D., during
the reign of Rajendra Chola I, the Cholas defeated the Western Gangas, and
48 http://en.wikipedia.org/wiki/Bangalore

32
captured Bangalore. During this period, the region of Bangalore witnessed the
migration of many groups - warriors, administrators, traders, artisans, pastorals,
cultivators, and religious personnel from Tamil Nadu and other Kannada speaking
regions. The Chokkanathaswamy temple at Domlur, the Aigandapura complex
near Hesaraghatta, Mukthi Natheshwara Temple at Binnamangala, Choleshwara
Temple at Begur, and the Someshwara Temple at Madiwala, all date from the Chola
era.
A succession of South Indian dynasties ruled the region of Bangalore until in
1537 A. D., KempéGowd —a feudatory ruler under the Vijayanagara Empire—
established a mud fort considered to be the foundation of modern Bangalore.
Following transitory occupation by the Mar th s and Mughals, the city remained
under the Mysore kingdom, which is now a part of the Indian state of Karnataka.
Bangalore continued to be a Cantonment of the British and a major city of
the Princely State of Mysore which existed as a nominally sovereign entity of
the British Raj. Following the independence of India in the year 1947, Bangalore
became the capital of Mysore state, and remained capital when the new Indian state
of Karnataka was formed in 1956.
In the 19th century, Bangalore essentially became a twin city whose
residents were predominantly Kannadigas, and the "cantonment" created by the
British, whose residents were predominantly Tamils. Throughout the 19th century,
the Cantonment gradually expanded and acquired a distinct cultural and political
salience as it was governed directly by the British and was known as the Civil and
Military Station of Bangalore. While it remained in the princely territory of Mysore,
the Cantonment had a large military presence and a cosmopolitan civilian population
that came from outside the princely state of Mysore, including Britons, Anglo-
Indians, and migrant Tamil labourers and contractors. The city, on the other hand,
had a largely Kannada-speaking population.
Bangalore experienced rapid growth in the decades 1941–51 and 1971–81,
which saw the arrival of many immigrants from northern Karnataka. By 1961,
Bangalore had become the sixth largest city in India, with a population of

33
1,207,000. In the decades that followed, Bangalore's manufacturing base continued
to expand with the establishment of private companies such as MICO (Motor
Industries Company), which set up its manufacturing plant in the city. Bangalore
experienced a growth in its real estate market in the 1980s and 1990s, spurred by
capital investors from other parts of the country who converted Bangalore's large
plots and colonial bungalows into multi-storied apartments. In 1985, Texas
Instruments became the first multinational corporation to set up base in Bangalore.
Geographical Profile49
Bangalore lies in the southeast of the South Indian state of Karnataka. It is in
the heart of the Mysore Plateau (a region of the larger Precambrian Deccan Plateau)
at an average elevation of 900 metres above sea level. Bangalore experiences
a tropical Savanna climate with distinct wet and dry seasons. Due to its high
elevation, Bangalore usually enjoys a more moderate climate throughout the year,
although occasional heat waves can make things very uncomfortable in the summer.
FIG. 2
BANGALORE CITY MAP
Source: en.wikipedia.org
49 http://en.wikipedia.org/wiki/Bangalore

34
The city is spread over an area of 2190 square kilometres. Its tree-lined
streets and abundant greenery have led to it being called the ‘Garden City’ of India.
It is connected by air, rail and road to all major cities of the country and has direct
international connections to many cities worldwide.
The clean and spacious city of Bangalore has many imposing structures full
of historic and modern architecture. The majestic Vidhana Soudha, a magnificent
post-independence structure housing the State Legislature and Secretariat, stands in
the centre of the city with its attractive dome and galleries. However, since local
entrepreneurs and the technology giant Texas Instruments discovered its potential as
a high-tech city in the early 1980s, Bangalore has seen a major technology boom. It
is now home to more than 250 high-tech companies. Including home-grown giants
like Wipro and Infosys.
Population Profile
TABLE: 03
POPULATION OF KARNATAKA
According to 2011 Population Census:
Population of Karnataka 61,130,704 Males: 3,10,57,742 Females: 3,00,72,962
Population of Karnataka consists of:
Hindu - 83%,
Muslim - 11%,
Christian - 4%,
Jains - 0.78% and Buddhist - 0.73%
Sex Ratio in Karnataka 1000 males for
every 968 females
Source:http://www.indiaonlinepages.com/population/karnataka-population.html
The total population of the State of Karnataka is 61,130,704. This amounts to
5.05% of the total population of India which is 1,21,01,93,422 as per 2011 census
data. The gender ratio is 1000 Males : 968 females for Karnataka, compared to the
940 females to 1000 males for India.
Karnataka is one of the major states of South India. Karnataka is the ninth
largest state in India in terms of Population. According to Population census of

35
2001, the Population of Karnataka was 5.273 crores (52.73 million). The Population
of Karnataka increased by 17.20% as compared to last census of India in 1991.
Karnataka is one of the top states in terms of literacy rate in India. Bangalore is the
top city with a population of over 1 million in Karnataka.
TABLE: 04
POPULATION OF BANGALORE CITY [URBAN]
According to 2011 Population Census:
Population of Bangalore 95,88,910 Males 50,25,498 Females 45,63,412
Population of Bangalore consists of:
Hindu –79.4%,
Muslim – 13.4%,
Christian –5.8%,
Jains –1.1% [Provisional population totals
census of India 2011 Govt of India]
Sex Ratio in Bangalore 1000 males for
every 908 females
Source:http://www.indiaonlinepages.com/
With an estimated population of 9,588,910, according to provisional Census
2011 data, Bangalore is the third most populous city in India and the 18th most
populous city in the world. Bangalore was the fastest-growing Indian metropolis
after New Delhi between 1991 and 2001, with a growth rate of 38% during the
decade. Residents of Bangalore are referred to as Bangaloreans in English and
Bengaloorinavaru in Kannada.
According to the 2011 census of India, 79.4% of Bangalore's population
is Hindu, roughly the same as the national average. Muslims comprise 13.4% of the
population, which again is roughly the same as the national average, while
Christians and Jains account for 5.8% and 1.1% of the population respectively;
double that of their national averages. The city has a literacy rate of 89%. Roughly
10% of Bangalore's population lives in slums, a relatively low proportion when
compared to other cities in the developing world such as Mumbai (50%)
and Nairobi (60%).

36
The official language of the state is Kannada, though, being a cosmopolitan
city many languages are spoken here. In Bangalore there are people speaking
languages such as Kannada(38.38%), Tamil (21.38%), Telugu (16.66%),
Urdu (12.65%), Malayalam (2.99%), Hindi (2.64%), and others. The cosmopolitan
nature of the city has resulted in the migration of people from other states to
Bangalore.50 English is widely understood, and spoken with variable fluency.51
The large number of central government and defence establishments with
many employees from northern India, movies and television have made Hindi a
widely understood language in the city. A majority of them belong to the middle
class and the upper middle class. Bangalore with its high growth rate and population
density has the most skewed sex ratio at 908 females for 1,000 males. According to
the data, literates constitute 76 per cent of the state’s total population aged six and
above and illiterates form 24 percent. Overall, the male literacy rate in the state has
gone up from 76.1 per cent in 2001 to 82.85 per cent in 2011, while female literacy
rate has increased from 56.87 per cent in 2001 to 68.13 per cent in 2011.
Economic Profile
With a Gross Domestic Product of $83 billion, Bangalore is listed 4th among
the top 15 cities contributing to India's overall GDP. Bangalore's
52,346 crore (US$9.6 billion) economy (2006–07 Net District Income) makes it
one of the major economic centres in India, with the value of city's exports
totalling 43,221 crore (US$7.9 billion) in 2004–05. With an economic growth of
10.3%, Bangalore is the second fastest growing major metropolis in India, and is
also the country's fourth largest fast moving consumer goods (FMCG) market. The
large number of information technology companies located in the city contributed
33% of India's 144,214 crores (US$26 billion) IT exports in 2006–07.
With a per capita income of 74,709 (US$1,400) in 2006–07, the city is the
third largest hub for high-net-worth individuals. The high per capita income in
Bangalore can be compared to top cities in the world. This is because most
50http://en.wikipedia.org/wiki/Bangalore 51Provisional Population Totals Census Of India 2011 Govt Of India

37
businesses focus on intellectual property, considered the future of business. As a
result there's a lot of capital flowing into the city. The standard of living is better
than in other metros. Bangaloreans’ life-style exhibits a high level of brand
awareness/consciousness. This is reflected in the increasing number of car and two-
wheeler owners, the number of people eating out and those who splurge on goods of
well-known brands.
The headquarters of several public sector undertakings such as Bharat
Electronics Limited (BEL), Hindustan Aeronautics Limited (HAL), National
Aerospace Laboratories (NAL), Bharat Heavy Electricals Limited (BHEL), Bharat
Earth Movers Limited (BEML) and HMT (formerly Hindustan Machine Tools) are
located in Bangalore. In June 1972 the Indian Space Research Organisation (ISRO)
was established under the Department of Space and headquartered in the city.
Bangalore's IT industry is divided into three main clusters —Software
Technology Parks of India (STPI); International Tech Park, Bangalore (ITPB);
and Electronics City. UB City, the headquarters of the United Breweries Group, is a
high-end commercial zone. Infosys and Wipro, India's third and fourth largest
software companies are headquartered in Bangalore, as are many of the global SEI-
CMM Level 5 Companies
Bangalore is the home to the biggest bio-cluster in India with 137
Biotechnology companies, making it 40% of the total 340 such units in the country;
a total of 87 Fortune MNCs, 2084 IT Companies and 195 BT companies are there in
Karnataka.
Bangalore is a Medical Hub due to the presence of World’s largest ‘healing
centre’ and ‘telemedicine centre’. A ‘Silk City’ with an investment of US $ 14.5
million (INR 70 Crores) is upcoming in the north Bangalore region. Business Week
placed Bangalore among the ‘Global Hot Spots of the 21st Century’.
The garment industries in the State of Karnataka are concentrated in
Bangalore where some of the largest export houses of the country exist. Overseas
buyers view Bangalore as an important location for sourcing of garments after

38
Bombay and Delhi. Brand images are being felt in this region and there is a great
potential for production of value added goods.
Field studies conducted in earlier researches have showed that there are
approximately 40,000 readymade garment-manufacturing units in India. Many
leading world fashion labels are being associated with Indian products. India is
being looked upon as a major supplier of high quality fashion apparels, which are
being appreciated in major international markets.
Cultural Profile
Bangalore is one of the most ethnically diverse cities in the country, with
over 62% of the city's population comprising migrants from other parts of India.
Being the fastest growing city of India, it comprises of a dynamic blend of people,
belonging to various religions, castes and communities. With the introduction of
information technology in the city, it has assumed an international character. IT
professionals not only from the various parts of India, but also that of the world, are
migrating to the city.
Bangalore is also a major centre of Indian classical music and dance. The
cultural scene is very diverse due to Bangalore's mixed ethnic groups, which is
reflected in its music concerts, dance performances and plays. Performances
of Carnatic (South Indian) and Hindustani (North Indian) classical music, and dance
forms like Bharat Natyam, Kuchipudi, Kathakali, Kathak, and Odissi are very
popular. Yakshagana, a theatre art indigenous to coastal Karnataka is often played in
town halls.
The two main music seasons in Bangalore are in April–May during the Ram
Navami festival, and in September–October during the Dusshera festival, when
music activities by cultural organizations are at their peak. Though both classical
and contemporary music are played in Bangalore, the dominant music genre in
urban Bangalore is rock music. Bangalore has its own sub-genre of music,
"Bangalore Rock", which is an amalgamation of classic rock, hard rock and heavy
metal, with a bit of jazz and blues init. Notable bands from Bangalore include The

39
Raghu Dixit Project, Kryptos, Inner Sanctum, Agam, All the Fat Children,
and Swaratma.
Bangalore is home to the Kannada film industry, which churns out about 80
Kannada movies each year. Bangalore also has a very active and vibrant
theatre culture with popular theatres being Ravindra Kalakshetra and the more
recently opened Ranga Shankara. The city has a vibrant English and foreign
language theatre scene with places like Ranga Shankara and Chowdiah Memorial
Hall leading the way in hosting performances leading to the establishment of the
Amateur film industry. Kannada theatre is very popular in Bangalore, and consists
mostly of political satire and light comedy. Plays are organized mostly by
community organizations, but there are some amateur groups which stage plays in
Kannada. Drama companies touring India under the patronage of the British Council
and Max Müller Bhavan also stage performances in the city frequently.
The diversity of cuisine is reflective of the social and economic diversity of
Bangalore. Bangalore has a wide and varied mix of restaurant types and cuisines and
Bangaloreans deem eating out as an intrinsic part of their culture. Roadside
vendors, tea stalls, and South Indian, North Indian, Chinese and Western fast food
are all very popular in the city.
Bangalore has a number of elite clubs like the Century Club, The Bangalore
Golf Club, the Bowring Institute and the exclusive Bangalore Club, which counts
among its previous members Winston Churchill and the Maharaja of
Mysore. Bangalore's pleasant climate makes it a suitable place for a variety of
outdoor sports. Cricket is by far the most popular sport in Bangalore. Sports
personalities from Bangalore include national swimming champion Nisha Millet,
world snooker champion Pankaj Advani and former All England Open badminton
champion Prakash Padukone, former Indian cricket team captains Rahul
Dravid and Anil Kumble.

40
Educational Profile
Until the early 19th century, education in Bangalore was mainly run by
religious leaders and restricted to students of that religion. The western system of
education was introduced during the rule of Mummadi Krishnaraja Wodeyar.
Subsequently, the British Wesleyan Mission established the first English school in
1842, and the Bangalore High School was started by the Mysore Government in
1858.
Primary and secondary education in Bangalore is offered by various schools
which are affiliated to one of the boards of education, such as the Secondary School
Leaving Certificate (SSLC), Indian Certificate of Secondary Education (ICSE),
Central Board for Secondary Education (CBSE), International Baccalaureate (IB),
International general certificate of secondary education (IGCSE) and National
Institute of Open Schooling (NIOS). Schools in Bangalore are either government run
or are private (both aided and un-aided by the government). Bangalore has a
significant number of International Schools due to its expats and IT crowd.
Bangalore District is a renowned centre of learning, with numerous
legendary professional institutions, high schools, colleges and universities.
Premium institutes in the country like IIM Bangalore, National Law School, Indian
Institute of Science, etc. are in Bangalore. Leading international schools like
MallyaAditi International School, Ryan International School, Bangalore
International School attract students from all over the world.
The Bangalore University, established in 1886, provides affiliation to over
500 colleges, with a total student enrolment exceeding 300,000. The university has
two campuses within Bangalore – Jnanabharathi and Central College. University
Visvesvaraya College of Engineering (UVCE) was established in the year 1917, by
Bharat Ratna Sir M. Visvesvaraya. At present, the UVCE is the only engineering
college affiliated to Bangalore University. UVCE is one of the prestigious
institutions in India. Bangalore also has a large number of private Engineering
Colleges affiliated to Visvesvaraya Technological University. Notable among them
particularly for undergraduate degrees are BMS College of Engineering,

41
R.V. College of Engineering, P.E.S. Institute of Technology,M. S. Ramaiah Institute
of Technology, Sir M. Visvesvaraya Institute of Technology and Bangalore Institute
of Technology.
Indian Institute of Science, which was established in 1909 in Bangalore, is
the premier institute for scientific research and study in India. Nationally renowned
professional institutes such as the National Centre for Biological Sciences (NCBS),
University of Agricultural Sciences, Bangalore (UASB), Institute of Bio-informatics
and Applied Biotechnology [IBAB], National Institute of Design(NID), National
Institute of Fashion Technology (NIFT), National Law School of India
University (NLSIU), the Indian Institute of Management, Bangalore (IIM-B),
the Indian Statistical Institute and International Institute of Information Technology,
Bangalore (IIIT-B) are located in Bangalore. The city is also home to the premier
mental health institution in India, The National Institute of Mental Health and Neuro
Sciences (NIMHANS). Bangalore also has some of the best medical colleges in the
country, like St. John's Medical College(SJMC) and Bangalore Medical College and
Research Institute (BMCRI). The M. P. Birla Institute of Fundamental
Research Institute has a branch located in Bangalore.
Readymade Garments Industry in Bangalore52
The garment industries in Karnataka are concentrated in Bangalore where
some of the largest export houses of the country are situated. Today, overseas buyers
view Bangalore as an important location for the sourcing of garments after Bombay
and Delhi.
Brand images are being felt in this region and there is a great potential for
production of value added goods. Garment industries in Bangalore started from the
period of British colonisation. M/s. Bangalore dressmaking Co. was the first unit,
started to manufacture garment in Bangalore during 1940, which was started by
Mr.Vittal Rao. During the rule of British, there was a need of clothing dress
materials. This led to the development of RMG industries in Bangalore. Apart from
RMG industries, there were silk weaving industries in Bangalore, which led to the 52Devaraja, T.S. (2011). Indian Textile and Garment Industry- An Overview

42
development of silk exporters also. After India’s independence in 1947, the
industries started picking up slowly to cater the needs of dresses of the common man
and local market. The industry started flourishing. After the de-reservation of
garments, big players like Mafatlal, Arvind Mills, etc. started entering the field and
occupied places in the sector which indirectly affected the small scale sector.
There are about 3000 RMG units in and around Bangalore. Most of the
buying agencies in the world have established their branch office in the city. Apart
from this, Apparel Park, at Doddaballapur has started functioning in a big way. In
India, RMG units are concentrated in the cities like Delhi, Mumbai, Kolkata,
Bangalore, Chennai, Jaipur, Tirupur, and Ludhiana. There is a difference in the end
products manufactured at Bangalore and other places. RMG are mainly made for
export house. There are many SSI units mainly doing job work providing supports to
the SMEs like GE, Arvind Fashion, Sonal Holding, Texport Syndicate units in the
cluster. The technology and manufacturing processes are the same as those used in
other regions.
In Bangalore, garment units are mainly concentrated in the following areas:
Bommanahalli, Bommasandra, Peenya, Yeswanthpur, Rajajinagar Industrial Estate
and Industrial town. The important products manufactured here are: Ladies Jacket,
Blouses, Churidar sets, Petticoats, and Gents Trousers, Shirts, and T-Shirts.
Development of RMG units in Bangalore was started in the year 1970
onwards by leading exporters like Gokaldas export, Ashoka export, Continental
Exports, Leela Fashions, Texport Overseas etc. Later, small industries (fabricators)
were started by taking the orders from large scale. Most important reasons for
developments of RMG is the availability and sourcing of export fabrics from places
like Salem, Erode and Coimbatore which are nearest to Bangalore. The other
reasons, which contributed for the development of industries, are availability of
space, availability of raw material, skilled labour, existence of airport/cargo
container depot/infrastructure, flexible specialization, entrepreneurship.
There has been increase in the number of RMG units in Bangalore since
1990. At present there are about 900 active readymade garment manufacturers and

43
exporters, the number is likely to increase as per the reports of Apparel Park at
Doddaballapur. Karnataka Industrial Area Development Board is in the process of
acquiring the lands for the further expansion of the park. There are about 1600
fabricators who are doing job work for these exporters, apart from domestic market
needs. There are 50 embroidery units who are supporting these units for value
addition. Broad sub-grouping of the products is as follows: Readymade garments for
Gents: 60%; RMG for ladies: 30%; RMG for kids: 10%. The economy of Bangalore
is inextricably mixed up with that of readymade garment industry. Thirty per cent of
the Readymade Garments of the country are made in this region. This is the third
biggest readymade garment manufacturing cluster in the country.
Brief Profile of Leading Apparel Retailers in India who have a large brand
visibility in Bangalore
Mudra Life Style Limited53
The Mudra Group, started its operations in 1986 and are in the textile
industry having facilities for fabrics & garments manufacturing, processing, design
development and sampling, etc. Mudra manufactures fabrics and garments for
domestic and export market. The brand “MUDRA” has built a strong goodwill for
itself in the domestic market and commands a premium. They are gradually moving
towards garment manufacturing mainly in the designer shirts and ladies wear
segments to capitalize on the huge opportunity unleashed by the removal of
quotas. Mudra’s product portfolio consists offinished fabric; processing and
garments comprising of –Men’s Wear –Shirts; Ladies Wear – Tops, Skirts; and Kids
Wear.
Mudra follows the concept of complete lifestyle for men, women and
children. Mudra caters to well known names in the fashion market with its ability to
offer collections that are set to seasonal fashion trends, colours, patterns and
international designs. To realize the fabric into brilliant expressions of styling, the
company has set in-house state-of-the-art garment manufacturing units, wherein
fabric get realized into quality finished products. Mudra houses the complete 53http://www.mudralifestyle.com/

44
technology for manufacturing the perfect garment that speaks of global lifestyle and
quality. The Garment manufacturing units are equipped with high-tech machines
like Juki stitching, Brother, interlocking, button stitching, automatic cutting, fusion
and automatic steam ironing.
With an annual capacity of 7.20 million garments, Mudra offers high quality
garments for buyers in over 30 countries worldwide. Mudra has spread business
over to both domestic and global customers. It caters to national brands like
Raymonds and Arvind Mills. International houses associated with Mudra are Zara,
Cortefil, Carrefour, Wal-Mart and its brands, like Weekends, George, Non-stop,
Metropolis and other brands like Tricos, American Juliet & Liver Pool.
Mudra has garment manufacturing plants in Bangalore, Daman and Vapi,
India. A Complete range of specialized machines needed for all critical operations
like cutting, sewing, pressing, finishing and quality control are housed under one
roof ensuring speed, consistency and quality.
Gokaldas Exports Ltd54
Gokaldas Exports Ltd (GEL) was incorporated in 1979. GEL is a major
player in the readymade garment industry across the globe. The company which is
an ISO 9001:2000 Certified Company is one of the largest manufacturer/exporter of
Outerwear, Blazers and Pants (Formal and Casuals), Shorts, Shirts, Blouses, Denim
Wear, Swim Wear, Active and Sports Wear.
The subsidiaries of the company are Madhin Trading Pvt Ltd, Magenta
Trading Pvt Ltd, Rafter Trading Pvt Ltd, Reflextion Trading Pvt Ltd, Deejay
Trading Pvt Ltd, Rishikesh Apparels Ltd, Vignesh Apparels Pvt Ltd, SNS Clothing
Pvt Ltd, Seven Hills Clothing Pvt Ltd, Glamourwear Apparels Pvt Ltd, Rajdin
Apparels and All Colour Garments Pvt Ltd. Gokaldas Exports Pvt Ltd and Unique
Creations (Bangalore) Pvt Ltd was merged with the company with effect from 1st
April 2004. During 2004-05, the company had set up three new factories at
54http://www.indiainfoline.com

45
Bangalore-at Bommasandra Industrial Area, at Yeshwanthpur, and one at
Doddaballapur.
The new state-of-the-art laundry facility at Bangalore was commissioned in
June'06. The company also commissioned knit wear unit at Bangalore during 2005-
2006 The expansion programme at Chennai, Hyderabad, and Mysorewas also under
progress during the year.
Gokaldas Exports has four decades of partnering the world's most trusted
fashion labels, 30 state-of-the-art factories and 32,000 employees. Gokaldas have
led the Indian readymade garment industry, year after year, earning customer
loyalty, winning industry awards and growing reputation for reliability. They had
done it by orienting to fashion trends and customer needs, investing in the latest
technology, relentlessly training the highly-skilled workforce and setting the highest
standards in both the production process and the end-product. Shri J. H. Hinduja is
the Founder.
Arvind Limited55
Arvind Ltd is the largest cotton textiles manufacturer and exporter in India.
They are the leading player in the branded garments in the domestic market. The
company's principal business consists of manufacturing and marketing of Denim
Fabric, Shirting Fabric, Shirts, Knitted Fabric and Garments. The company has
acquired the rights to market international brands such as Lee, Wrangler, Arrow and
Tommy Hilfiger in India. The company also owns popular brands such as Newport,
Flying Machine, Excalibur and Ruf&Tuf. Arvind Ltd houses their production
facilities at Ahmedabad, Mehsana, Gandhinagar in Gujarat; Pune in Maharashtra,
and Bangalore in Karnataka.
Arvind Ltd was incorporated in the year 1931 as Arvind Mills Ltd by three
brothers Kasturbhai, Narottambhai and Chimanbhai. In the year 1934, they
established themselves amongst the foremost textile units in the country. They were
the first company to bring globally accepted fabrics such as Denim, yarn dyed
55http://www.arvindmills.com

46
shirting fabrics & wrinkle free gabardines to India in the year 1986. In the year
1987, they started retail outlets for Arrow brand and became the first company to
bring the international shirt brand Arrow to India.
During the year 2003-04, the company expanded their shirts manufacturing
capacity from 2.4 million pieces to 4.8 million pieces per annum. During the same
year, their subsidiary company, Arvind Spinning Ltd commenced their operation. In
March 2005, the company commenced their operations of producing Jeans in
Bangalore with the installed capacity of 4 million pieces per annum. During the year
2005-06, new Denim collection was launched which was aimed at the Super
Premium brands of the USA, Europe, Japan& Korea. The Company has a joint
venture company namely Arvind Murjani Brand Pvt Ltd, through which they hold
license to sell Tommy Hilfiger brand apparel in India. The operations of Arvind
Brands Limited and their subsidiaries were merged with the company with effect
from April 1, 2006. The wholesale branded apparel business of Arvind Fashions Ltd
has been sold to VF Arvind Brands Pvt Ltd with effect from August 31, 2006. In
March 2008, the company signed an exclusive license agreement with the Philips-
Van Heusen Corporation for designing, distribution and retailing of IZOD brand
apparels in India. From May 2008, the company name was changed from Arvind
Mills Ltd to Arvind Ltd.
Arvind has a strong focus on Research and Development for process
improvement, cost reduction and new product development. This is evident in the
fact that Arvind continuously modifies its production process to enhance flexibility
on the use of various types and quality of cotton.
State-of-the-art technology and equipment have made Arvind one of the
leading producers of denim in the world, paving the way for the Company to emerge
as a global textile conglomerate. This cutting edge position comes to Arvind
courtesy technologies such as Open-end Spinning, Foam Finishing, Mercerizing,
Slasher-dyeing, Rope-dyeing, Air-Jet, Projectile and Wet Finishing. Arvind’s quality
fabrics are in high demand in the markets of Europe, US, West Asia, the Far East
and Asia Pacific.

47
Design, Innovations and Sustainability have been their core competency and
have played a key role in their success. The use of sophisticated ultramodern
technology under the guidance of world-renowned designers has enabled Arvind to
deliver many firsts in the international markets. All their products are designed and
modelled on the basis of expert design inputs coming from designers based out of
India, Japan, Italy and the United States. All Arvind Denim products come with the
hallmark of distinctiveness and quality.
Arvind has carved out an aggressive strategy to verticalize its current
operations by setting up world-scale garmenting facilities and offering a one-stop
shop service, by offering garment packages to its international and domestic
customers. With Lee, Wrangler, Arrow and Tommy Hilfiger and its own domestic
brands of Flying Machine, Newport, Excalibur and Ruf&Tuf, Arvindhas set its
vision of becoming the largest apparel brands company in India.
Arvind runs India's largest Value Retail Chain - MegaMart. The MegaMart
format offers a unique and differentiated proposition to the consumers. It offers
mega brands at very low prices and provides a retail experience of a high-end
department store.
Trent Ltd., ‘Westside’56
Established in 1998 as part of the TATA Group, Trent Ltd operates
Westside, one of India’s largest and fastest growing chains of retails stores.
The Westside stores have numerous departments to meet the varied shopping
needs of customers. These include Menswear, Women’s wear, Kid’s wear,
Footwear, Cosmetics, Perfumes and Handbags, Household Accessories, Lingerie,
and Gifts. The company has established 74 Westside departmental stores (measuring
15,000 - 30,000 square feet each) in Ahmedabad, Bangalore, Chandigarh, Chennai,
Delhi, Gurgaon, Ghaziabad & Noida, Hubli, Hyderabad, Indore, Jabalpur, Jaipur,
Kanpur, Kolkata, Ludhiana, Lucknow, Mangalore, Mumbai, Mysore, Nagpur,
Nashik, Pune, Raipur, Rajkot, Surat, Vadodara and Jammu.
56http://www.mywestside.com

48
In a rapidly evolving retail scenario, Westside has carved a niche for its
brand of merchandise creating a loyal following. With a variety of designs and
styles, everything at Westside is exclusively designed and the merchandise ranges
from stylized clothes, footwear and accessories for men, women and children to
well-co-coordinated table linens, artefacts, home accessories and furnishings. Well-
designed interiors, sprawling space, prime locations and coffee shops enhance the
customers’ shopping experience.
Shoppers Stop Ltd.57
An Indian retail sector major, Shoppers Stop Limited (SS) opened its door in
the year 1991, the foundation was made by K Raheja Corp and it was incorporated
on 16th June 1997 as a private limited company. It started operations with the first
store in suburban Mumbai and is now a multi-channel retailer with 24 large format
department stores and online presence.
From its inception, Shoppers Stop has progressed from being a single brand
shop to becoming a Fashion & Lifestyle store for the family. Today, Shoppers Stop
is a household name, known for its superior quality products, services and above all,
for providing a complete shopping experience. It provides retail range of branded
and own label apparel, footwear, perfumes, cosmetics, jewellery, leather products
and accessories, home products, books, music and toys. Shopper’s Stop operates in
the cities of Mumbai, Delhi, Kolkata, Chennai, Bangalore, Hyderabad, Pune, Jaipur
and Gurgaon.
The first store was opened in the year 1991 at Andheri, a suburb in Mumbai,
only with Menswear and the Ladieswear was introduced in the year 1992. After a
year, the company added Children & non-apparels to its list in 1993.
The status of the company was changed to a deemed public limited company
in December of the same incorporation year 1997. SS's status was further converted
to a full-fledged public limited company on 6th October 2003.
57http://corporate.shoppersstop.com/corporate/history.aspx

49
The Company was honoured with Emerging Market Retailer of the Year
award in 2008. In April of the same year, 2008, SS had unveiled its new logo and
introduced the new expression of the brand. SS bagged Department Store of the
Year award in November of the year 2008 for its reputation in the industry.
Shoppers Stop retails products of domestic and international brands such as
Louis Philippe, Pepe, Arrow, BIBA, Gini & Jony, Carbon, Corelle, Magppie, Nike,
Reebok, LEGO, and Mattel. Shopper’s Stop retails merchandise under its own
labels, such as STOP, Kashish, LIFE and Vettorio Fratini, Elliza Donatein,
Acropolis, etc. The company is also a licensee for Austin Reed (London), an
international brand, who’s men's and women's outerwear are retailed in India
exclusively through the chain. In October 2009, Shoppers Stop bought the license
for merchandising Zoozoo, the brand mascot for Vodafone India.
Shoppers Stop introduced international brands like CK Jeans, Tommy
Hilfiger, FCUK, Mustang, Dior, etc. across the stores. The focus of the reposition
was on the service, ambience upgradation and customer connect. Shoppers Stop
connects with the youth audience through adopting the communication routes
relevant to youth, up the fashion quotient through merchandising, and creates an
ambience that connects with their mindset.58
58http://en.wikipedia.org/wiki/Shoppers_Stop

50
CHAPTER III
REVIEW OF LITERATURE & DESIGN OF THE STUDY
The purpose of this research is to explore the influence of personal values on
the young adults’ shopping style for apparels. In this chapter, a review of the
literature pertinent to the study is presented. An examination of studies on the
psychographics and values is followed by a review of studies using the CSI –
Consumer Style Inventory. This is followed by review of studies on youth, and
finally literature relative to apparels/clothing behaviour is examined. The guiding
research questions and the model development were formulated based on these
studies.
STUDIES ON PSYCHOGRAPHICS/VALUES
Munson & McQuarrie (1988),59 tried to shorten the Rokeach Value Survey
(RVS) to reflect on consumption relevant values. Researchers identified a subset of
24 value items as maximally relevant to product consumption. Using this 24 item
subset, the researchers constructed a Values Instrumentality Inventory which
demonstrated satisfactory psychometric properties with respect to its internal
consistency, stability over two independent samples, and factor structure. Thus,
conclusions made were, the values reduction methods investigated here could be
used to purge the RVS of values which are largely irrelevant or tangential to most
consumption behaviors.
Shrum et.al, (1990),60 examined individual differences in the stability of a
target value in the Rokeach Value Survey (RVS). All participants ranked and rated
the values of the RVS and completed a scale measuring private self-consciousness
and the participants in the control condition received no communication. The results
from the study provided a considerable support for reasoning that degrees of private
59Munson, J. M., &McQuarrie, E. F. (1988). Shortening the Rokeach value survey for use in
consumer research. Advances in Consumer Research, 15, 381-386 pp. 60Shrum, L. J., McCarty, J. A., & Loeffler, T. L. (1990). Individual differences in value stability: Are
we really tapping true values. Advances in Consumer Research Volume, 17, 609-615 pp.

51
self-consciousness are related to value stability. Results also indicated that the
individuals who were high in self-consciousness were more aware of the values.
Allen (2001),61 assessed a method for uncovering the direct and indirect
influences of human values on consumer decisions. It was found that the ability to
identify a relationship between consumer values and the image of a product/service
is especially useful in situations where brand image is more important to the
consumer's decision making than the specific features of the product. The results
from the study indicated that the advertiser always faced problems regarding how to
identify which values the consumer associated with the product and how to
incorporate that knowledge into the words and pictures within the advertisement.
Kim(2002),62 developed and tested a conceptual model that featured the role
of personal value structures in guiding individuals’ environmentalism. The study
examined how personal values affected the perception of pro-environmental
attributes and buying-green products. It explored the effects of cultures on personal
value orientations and commitments to pro-environmental behaviours. Thus, as a
result, the study demonstrated that personal values play an important role in
determining individuals' environmental sensibility and suggested that the
relationship between attitudes and behaviour are stronger in some cases than in
others.
Roper (2002),63 conducted a study to identify values of American consumer
groups. Six groups namely: strivers, devouts, creatives, fun seekers, altruists and
intimates. It was found that the strivers are more materialistic than any of the other
groups and they seeded power, wealth and status. Brands were looked into for status
and self-definition and are most likely to attribute wealth and personal success.
Finally, the researcher intimated that the consumers who earned highest house hold
61Allen, M. W. (2001). A practical method for uncovering the direct and indirect relationships
between human values and consumer purchases. The Journal of Consumer Marketing, 18(2), 102-120 pp.
62Kim, Y. (2002). The impact of personal value structures on consumer pro-environmental attitudes, behaviors, and consumerism: A cross-cultural study. ProQuest, UMI Dissertations Publishing.
63Roper, S. W. (2002). New age consumers: attitudes and values. Proquest, 121.

52
income were ranked under family and leisure activities which formed the most
important part of life.
Kittichai (2005),64 the paper attempted to establish the overall hierarchical
flow of the cultural values of materialism, individualism, and collectivism with
regard to consumers’ perceived symbolic and functional roles of price, which in turn
affected the on-going search and mall shopping behaviour for apparel products
based on the combined sample from two cultures, American and Korean. The
findings illustrated the cross-cultural validation using the hierarchical model of
values-price perception on-going search shopping behaviour. However, the
underlying constructs explained that such flow differed considerably across the
cultures. Finally, concluded that a considerable degree of cross-cultural research
recognized the impact of cultural values of individualism and collectivism on
individuals’ consumption behaviour.
Kropp et.al, (2005),65 examined the inter-relationships between values,
collective self-esteem, and consumer susceptibility to interpersonal influence.
Results indicate that external and interpersonal values are positively related to the
normative component of consumer susceptibility to interpersonal influence, while
internal values are negatively related to the normative component of consumer
susceptibility to interpersonal influence. The researchers found that consumer
susceptibility to interpersonal influence is an important factor in many consumer
purchases that related to self-image. It suggested that the relationship of values and
collective self-esteem to consumer susceptibility to interpersonal influence provided
valuable insights to managers regarding consumer purchasing behavior.
Anandan et.al, (2006),66studied the preferences of English newspaper
readers and segmented them on psychographic basis using Values & Life style
64Kittichai, W (2005). A hierarchical model of values, price perception, ongoing search and shopping
behaviors: A cross-cultural comparison. ProQuest, UMI Dissertations Publishing. 65Kropp, F., Lavack, A. M., &Silvera, D. H. (2005). Values and collective self-esteem as predictors
of consumer susceptibility to interpersonal influence among university students. International Marketing Review, 22(1), 7-33 pp.
66C.Anandan, M.Prasanna Mohanraj, &S.Madhu (2006), A Study of the Impact of Values and Lifestyles (VALS) on Brand Loyalty with Special Reference to English Newspapers. Vilakshan, XIMB Journal of Management, 97-102 pp.

53
(VALS), a tool created by the SRI International in 1978 to understand people’s
personality through their behaviours. The researchers analyzed the influence of
psychographic factors on brand loyalty using a Brand Loyalty scale, which
segregated the VALS segments for the study. It was found that Brand image are
related to psychographic profiles of the customers. Thus, based on the findings of
the study, it was suggested that different types of market dominance strategies were
necessary to sustain in the market environment.
Roy &Goswami (2007),67 examined the frequent clothing purchase behavior
of undergraduate urban college-goers in India and also assessed the value-
psychographic traits-clothing (VPC) purchase behavior hierarchy. A List of Values
(LOV) scale was used by the researchers for Exploratory Factor Analysis (EFA)
with principal components analysis and Varimax rotation. The results from the study
indicated that EFA of the LOV scale yielded two dimensions- outer-directed values
and inner-directed values. Thus, the study suggested that the marketers of clothing,
for college-goers should frame his/her product and build communication strategy in
such a way that it appeals to the fashion-conscious and innovative consumers.
Kevin Kuan-shun Chiu (2008),68 adopted a psychographic approach to
study how personal values could be associated with the demographic characteristics
to establish a market segmentation tool to understand the relative perceived
importance among various marketing mix elements for athletic foot wear. Kahle’s
LOV was used to explore the patterns of influence of personal values on consumer’s
decision-making process for a buying behaviour. The major findings indicated that
personal values were far more likely than demographic characteristics to
comprehend the significance that existed among different decision-making criteria
for sport shoes buying behaviour.
67Roy, S., & Goswami, P. (2007). Structural equation modelling of value-psychographic trait-clothing
purchase behavior: a study on the urban college-goers of India. Emerald Group Publishing Limited, 8(4), 269-277 pp.
68Kevin Kuan-Shun Chiu (2008) The Role of Psychographic Approach in Segmenting Young Adults’ Buying Behavior for Athletic Footwear.

54
Vigaray & Hota (2008),69 assessed the regular consumers of fashion
apparel, which focused on extending Schwartz’s motivational typology of values
and measured Spanish consumer values and identified actionable target markets and
consumer segments. The researchers found that there existed significant differences
with respect to Schwartz’s original typology and the differences are consistent with
the nature of values, as different cultures and societies could give origin to similar
value structures, but with values varied somewhat in intensity and direction. Thus,
the results showed that Schwartz’s typology is valid for most part in the Spanish
cultural context.
Thompson (2009),70 explored the validity of three constructs of Kahle’s List
of Values (LOV) - viz., Being Respected, Security and Self-fulfilment. Researcher
used qualitative exploration of the meanings individuals’ attached to the component
values of the LOV. A sample of under-graduate students were selected, using the
diary-interview method, students wrote the subjective definition of each value label
which were later clustered and analyzed using quantitative content analysis. No
single inclusive definition could be derived for any of the values examined from the
study. Thus, the researcher concluded that each value of the LOV was subjected to
the varied interpretations to the respondents. Hence clear definitions to the values
are to be provided in the scale for common understanding of the value labels.
Foula Kopanidis (2009),71 this paper develops a reliable and valid personal
values importance scale (PVIS) using a two phase approach designed to capture the
specific domains of the nine List of Values for application in the context of
education. The role of values as that of standard or criterion used in the formulation
of attitudes and guidance of behaviour is particularly relevant for marketers. Values
impact choice criteria and are instrumental in determining benefit segmentation.
Undergraduate students as a market are recognised as a relevant and important
segment by tertiary institutions, but few studies have taken on an approach to
69Vigaray, M. D. J., & Hota, M. (2008). Schwartz values, consumer values and segmentation: The
spanish fashion apparel case. Lille economic & management, 1-32 pp. 70Thompson (2009), Interpreting Kahle’s List of Values: Being Respected, Security, and Self-
Fulfillment in Context. UW-L Journal of Undergraduate Research XI, 1-9 pp. 71Foula Kopanidis. (2009).Towards the Development of a Personal Values Importance Scale (PVIS) -
Application in Education. ANZMAC 2009

55
examine personal values as an underlying driver. The results showed support that
the LOV scale consists of two underlying dimensions that of ‘internal’ and ‘external
values’. The internal dimension was measured by the four values of ‘self fulfilment’,
‘self of accomplishment’, ‘self respect’, and ‘excitement’. The external dimension
was measured and represented by the values of ‘being well respected’, ‘sense of
belonging’ and ‘warm relationships with others’. The data indicates that these
factors are convergent on these two dimensions and that the relationship of the PVIS
scale developed has discriminant validity.
Kaze & Skapars (2010),72 analysed the consumption patterns and consumer
behaviour in Latvian alcohol market, suggesting a behavioural consumer
segmentation model to the industry to gain competitive advantages. It was proposed
that both life-style and social values as behavioural segmentation approaches which
delivered applicable customer-centric insights and developed the Social Values
Model (Kaze 2010) linking human values, life-style and need states. This model was
applied to the Latvian alcohol market. The findings of the study revealed that life
style based segmentation offers simplicity but is negatively affected by situational
character. However, social values model offer better understanding of consumer
motivation than life style based model.
Mathews & Nagaraj (2010),73 together made a ‘Values, Attitudes and
Lifestyles’ analysis of youth based on gender to identify the behaviour of the youth
with reference to family, fashion, education, brand and shopping activities. For the
purpose of the studying Values, Attitudes and Lifestyles (VALS) a set of 15
statements on Activities, Interests and Opinions (AIOs) were asked to the
respondents. Then the statements were rated on 5 point Likert scale. It proposed that
market segmentation by gender revealed men and women respond differently to
marketing messages, and different marketing appeals influenced them differently.
Thus in order to market effectively the product, the marketers should know that
72Kaze, V., & Skapars, R. (2010). Paradigm shift in consumer segmentation to gain competitive
advantages in post-crisis FMCG markets: Lifestyle or social values? The Journal Of Economics And Management, 16, 1266-1273.
73 Mathews, S., & Nagaraj, H. (2010). An analytical study of vals on youth –implication to marketers.

56
among men and women there are certain differences in values and purchase
motivations on different items.
Narang. R (2010),74aimed to study and identify the psychographic segments
among the Indian youth and compare the results with the youth from other
developing nations. 270 students from various disciplines in the age group of 16-26
from various colleges in Lucknow were selected using stratified sampling method.
The researcher developed an instrument to profile the youth based on
psychographics. The instrument comprised of sixty seven AIO statements drawn
from literature review of previous studies and nine statements based on the LOV
Scale. Finally, the findings revealed that psychographic segmentation would provide
deeper insights into the leisure behaviour, motives, interests and activities of
different segments of the Indian youth to draw more meaningful and effective
marketing strategies for the marketers.
Rebecca Garnett, B.S. (2010)75. The purpose of this study was to determine
the effects of psychographic (shopping orientation, lifestyle, social class),
demographic (gender, ethnicity, age), and geographic (area of residence) variables
on time-related shopping behaviours when shopping for clothing for the self. Data
were collected via a questionnaire with an online survey company. Through analysis
of chi square statistics, ANOVA, Pearson product-moment correlation, and factor
analysis, it was found that psychographics and demographics affected time-related
and other shopping behaviours. Geographics was found to affect shopping
behaviour, but not specifically the time-related shopping behaviours studied. The
study also found that the demographic variables of gender, ethnicity, and age
affected time-related shopping behaviours and shopping preferences. Area of
residence was found to only affect general preference for bricks-and-mortar stores
versus online stores. Age was the only other variable in the study found to affect this
preference. Area of residence seems to be less interconnected to the psychographics
and demographics examined in this study.
74Narang, R. (2010). Psychographic segmentation of youth in the evolving Indian retail market. 75 Rebecca Garnett, B.S. (2010). Examining The Effects of Psychographics, Demographics And
Geographics On Time-Related Shopping Behaviors. University Of North Texas.

57
Fotopoulos et.al, (2011),76 aimed to validate the 42item PVQ (Schwartz's
portrait value questionnaire) typology, which is extensively been used in personal
values research, using a sample that is nationally representative, consisting of 997
consumers. The main objective was to investigate whether higher-than-average
regular purchasing of quality food products (i.e. organic and PDO labelled products)
coincided with stronger identification with specific PVQ values. However, findings
revealed that despite the emergence of a clear relation between consumers' self-
transcendence and security value similarity and higher-than-average frequency of
quality food purchasing, quality food consumers did not form a separate and clearly
diversified cluster if the PVQ inventory functions are treated as a basis for
segmentation. Finally the paper showed that values could be used to meaningfully
segment quality food consumers, but there is still much to learn regarding the
direct and indirect determinants of quality food purchase behaviour.
Jain et.al,(2011),77 explored the relationship between General Values and
Clothing Behaviour of College-going Students. The study was carried out on 160
girls from colleges in Jaipur, Rajasthan. Two scales were used – Ojha’s Value Scale
and Clothing behaviour scale developed by the researchers. Results indicated that,
students place economic value on top and their educational background does make
an impact on clothing behaviour. It was also found that aesthetic and economic
clothing values have more dominant positions in the value configuration of women
than any of the other clothing values.
76Fotopoulos, C., Athanasios, K., & Pagiaslis, A. (2011). Portrait value questionnaire's (pvq)
usefulness in explaining quality food-related consumer behavior. British Food Journal, 113(2).
77Jain, R., Singh, R., & Rankawat, K. (2011). General values and clothing behaviour of college going students.

58
STUDIES USING THE CONSUMER STYLES INVENTORY (CSI) ON
YOUTH
Arroba (1977),78 looked into the increased interest in teaching decision-
making skills, so the need for an empirically-derived classification system of
decision-making behaviours would have its growth and importance. Six styles of
decision making were accordingly isolated and validated by content analysis in the
research. Using cluster analysis, the styles were found to group into types along a
passive-active continuum of involvement in the decision. The results showed that
uses of styles were found to vary across situations, and to be related to the decision's
perceived importance and the decision-maker's control in the particular situation.
Hou & Lin (1986),79 used the CSI on non-student sample to investigate
shopping styles of working Taiwanese female. Both an exploratory factor analysis
and a confirmatory factor analysis were adopted to validate the CSI inventory. The
study also modified the measured items of the CSI, which was originally developed
by Sproles and Kendall (1986), and Susan (2005). A ten factor model was proposed
in the study in order to explore the shopping styles of Taiwanese working female.
Finally, four (Active Fashion Chaser, Value Buyer, Rational Shopper and Opinion
Seeker) of the ten dimensions have been confirmed by the use of the data that as
collected from working female from Kaohsioung and Taipei city in Taiwan.
Sproles & Kendall (1987),80 the research developed a short-form Consumer
Styles Inventory for easy application by classroom teachers. It has helped to
understand the varied approaches consumers use, educate consumers on the
decision-making approaches they pursue, and develop educational and informational
strategies that improve these approaches. In conclusion, it was recommended that
educators administered the Consumer Styles Inventory in the classes and discussed
the results with students in class. These applications would help students to gain
78Arroba, T. (1977). Styles of decision making and their use: An empirical study. British Journal of
Guidance and Counseling, 5(2), 149-158 pp. 79Hou, C., & Lin, Z. H. (1986). shopping styles of working Taiwanese females. Graduate School of
Marketing Management, National Chung Cheng University. 80Sproles, G.B., and Kendall, E.L. (1987). “A Short Test of Consumer Decision Making Styles.” The
Journal of Consumer Affairs, 5, 7-14 pp.

59
understandings while they are learning the consumer styles, and thus help to
improve or redefine the purchasing styles to better reflect the personal interests and
goals.
Sproles & Sproles (1990),81 the study examined the interrelationships
between individual learning styles and specific consumer decision-making styles.
Statistically significant relationships were found between 21 of the 48 learning style-
consumer style characteristic pairs. The research has implied that consumer decision
making is a function of the particular learning style a consumer has pursued. Thus,
the study is one step towards formally delineating the associations of human
learning and consumer decision making, but it is one of many steps that must be
taken before those relationships and their causal nature are to be understood.
Halfstrom, et.al, (1992),82 identified decision-making styles of young
consumers in Korea and investigated if those styles were similar to that of U.S.
young consumers. An instrument, based on previous research in the United States,
was administered to 310 college students in Korea. Data was factor analyzed and
alpha coefficients were computed for scale reliability. Thus, findings indicated the
generality of some consumers’ decision-making styles. Similarities and differences
between cultures were also discussed, and relevant implications were provided.
Durvasula et.al, (1993),83 the study examined the cross-cultural
applicability of a scale for were similar to Sproles and Kendall (1986) and were also
consistent with the stream of research that addressed the cross-cultural
generalizability of consumer behaviour measurement scales and procedures.
Examination of the scale's psychometric properties (i.e., dimensionality and
reliability) offers general support for the scale's applicability to different cultures.
Some differences were detected. However, the paper concluded with a discussion of
81Sproles, E.K., and Sproles, G.B. (1990). “Consumer Decision Making Styles As A Function Of
Individual Learning Styles.” The Journal Of Consumer Affairs, 24(1), 134-147 pp. 82Halfstrom, J. L., Chae, J. S., and Chung, Y. S. (1992). “Consumer Decision Making Styles:
Comparison Between United States and Korean Young Consumers.” Journal of Consumer Affairs, 26(1), 1-11 pp.
83Durvasula, S., Lysonski, S., & Andrews, J. C. (1993). A cross-cultural study of the generalizability of a scale for profiling consumers' decision-making styles. Journal of Consumer Affairs, 27(Summer), 55-65 pp.

60
these differences and the implications of the findings. As a result, their cross-cultural
generalizability remains unknown.
Lysonski et.al, (1996),84 conducted with undergraduate business students in
four countries to investigate the applicability of the Consumer Styles Inventory
keeping intact with other countries. The results of factor analysis were quite similar
to Sproles and Kendall (1986). However, the study confirmed seven of the eight
Sproles and Kendall decision-making styles, which excluded Price Conscious/Value
for Money. It was suggested that decision-making styles from the Consumer Styles
Inventory might be influenced by different cultures in other countries, as well as
different retail environments (types of retail stores available, whether consumers use
credit cards in the particular country). Thus the researchers concluded that there
might be specific decision-making style differences within cultures.
Shim (1996),85 attempted to conceptualize the distinct factors that would
characterize an adolescent’s consumer decision-making style from the perspective of
consumer socialization. Eight consumer decision-making styles were proposed to be
associated with the influence of socialization agents and antecedent variables (e.g.,
social structural and developmental variables). Antecedent variables, especially
social structural variables such as gender, ethnicity, main reason for working, and
the amount of parental allowance, demonstrated significant correlations with
consumer decision-making styles. Antecedent variables, however, were in general
found to be only distantly related to the influence of socialization agents.
Fan& Xiao (1998),86 administered the Sproles and Kendall (1986)
Consumer Styles Inventory to see if the consumer decision-making styles could be
generalised to Chinese college students. Their findings suggested that the decision-
making styles of Impulsive/Careless and Habitual/Brand Loyal were not
characteristic of the Chinese sample.
84Lysonski, S., Durvasula, S. and Zotos, Y. (1996), “Consumer Decision-Making Styles: A
Multicountry investigation”, European Journal of Marketing, Vol. 30, No. 12, pp. 10-21 pp. 85Shim, S. (1996). “Adolescent Consumer Decision Making Styles: The Consumer Socialization
Perspective.” Psychology & Marketing, 13(6), 547-569 pp. 86Jessie X. Fan, Jing J. Xiao (1998), Consumer Decision-Making Styles of Young-Adult Chinese
onsumers. Journal of Consumer Affairs.Volume 32, Issue 2, pages 275–294, Winter 1998.

61
Mitchell & Bates (1998),87 administered the Consumer Styles Inventory in
undergraduate students in the United Kingdom and expanded the categories of
consumer decision-making styles from eight (Sproles & Kendall, 1986) to ten. The
two new categories introduced were Time-Energy Conserving (Hafstrom et.al,
1992) and Store Loyalty. These new categories were re-combined with some
statements from Sproles and Kendall’s (1986) and other consumer decision-making
styles, such as Impulsiveness, Perfectionist and Brand Loyalty.
Siu & Hui (2001),88 the study attempted to validate a widely adopted US-
based Scale, Consumer Style Inventory (CSI), with a sample in China. It resulted in
a 29-item and 8-factor solution. The cross-cultural examination reinforced the
inventory as a universal theory in the area of decision-making style. Thus the overall
results compared favoured to those of the original study and provided a general
support to the inventory. The findings showed that four decision-makings styles,
namely: Perfectionistic, Novelty-Fashion Conscious, Recreational and Brand
Conscious, are common characteristics to both Americans and Chinese. Thus, study
has shed some light to global marketers who intend to enter the China consumer
market.
Walsh et.al, (2001),89tested the generalizability of Sproles and Kendall’s
consumer styles inventory (CSI) in different countries and therefore an attempt was
made to extend the original work which led the authors to test the structure of
decision-making styles of German shoppers and it’s use in segmenting consumers.
The authors concluded that consumers’ decision-making styles could be used as the
basis of segmenting consumers and it was likely that both specific needs and product
and service preferences are associated with these segments. Thus, further research is
required to determine to what extent purchase behavior differed at the product level,
87Mitchell, V.W. & Bates, L. (1998). UK Consumer Decision Making Styles. Journal of Marketing
Management, 14, 199-225 pp. 88Siu, N.Y.M. and Hui, A.S.Y. (2001). “Consumer Decision Making Styles In China: A Cross
Cultural Validation.” Asia Pacific Advances in Consumers Research, 4, 258-262 pp. 89Walsh, G., Thurau, T. H., Mitchell, V. W. and Widmann, K. P. (2001).“Consumers' Decision
Making Style as A Basis For Market Segmentation.” Journal of Targeting, Measurement And Analysis For Marketing, 10(2), 117-131 pp.

62
which would give more information on exactly what the identified segments could
look for in products to satisfy the differing needs.
Canabal (2002),90 the exploratory study investigated the decision-making
styles of young South Indian consumers. The data for the study were collected from
two institutions of higher education in the city of Coimbatore, India in the fall of
1995 utilizing the Consumer Style Inventory (CSI) and also adapted the conceptual
framework to determine applicability of the Consumer Styles Inventory. The results
of the study were compared to similar studies where data from the United States,
Korea and China were analyzed. Five reliable factors and their corresponding
decision - making styles were identified. The findings suggested that Indian
consumers’ impulsiveness were more related to indifference to brands rather than
carelessness of decision-making. The South Indian students tend to be mainly
perfectionists in their market decisions. They look for high quality products and they
also enjoy shopping. However, they can be confused by too many choices and to a
lesser degree these consumers tend to be brand conscious. The study also added a
new category, “dissatisfied/careless,” to reflect the findings.
Ng(2002),91 confirmed the eight-factor model of Sproles & Kendall (1986)
and two more decision-making characteristics were also found as part of the Chinese
Eleven-Factor Model of CSI. The additional factors were labelled as "Time-Energy
Conserving", "Store-Brand-Hopping Consumer", and "Shopping Indifference
Consumer". They thus established the generalizability and applicability of the CSI in
China setting. The study concluded that consumers’ decision-making styles and
profiling their buying characteristics not only determined the success of marketing
segmentation strategy in the real business world, but also improved the academic
research in consumer research discipline.
90Canabal , M. E. (2002). Decision making styles of young south Indian consumers: an exploratory
study. College Student Journal, 36(1). 91Ng, S. W.(2002). Profiling Chinese consumers stylesba cross-cultural generalizability study Of
consumers’ decision-making style. Asia Pacific Advances in Consumer Research ,5, 258- 264 pp.

63
Backwell & Mitchell (2003),92 examined the decision-making styles of adult
female Generation Y consumers in the UK. Five meaningful and distinct decision-
making groups were identified in the study: “recreational quality seekers”,
“recreational discount seekers”, “trend setting loyals”, “shopping and fashion
uninterested” and “confused time/money conserving”. In the further study on
decision-making styles of male consumers in the UK (2004), all of the original eight
traits plus four new traits namely; store-loyal/low-price seeking, time-energy
conserving, confused time restricted and store-promiscuity were also identified. The
study also demonstrated the potential of the CSI for segmenting markets as
meaningful and distinct groups of male consumers with different decision-making
styles. Later (2006), the study used a sample of 480 male and female undergraduate
students in UK, to compare their decision-making styles. They found that nine
decision-making styles were common to both genders. In addition, three new male
traits (store-loyal/low-price seeking, confused time-restricted and store-promiscuity)
and three new female traits (bargain seeking, imperfectionism and store loyal) were
also identified in the study.
Bao et.al, (2003),93 explored the effects of two cultural dimensions, face
consciousness and risk aversion, on consumers’ decision-making styles. Data from
China and the United States show that consumers in the United States differed from
their counterparts in China in decision-making styles. Face consciousness and risk
aversion appeared to contribute to such divergence. Thus, the exploratory study
stimulated scope for further research in order to identify more underlying
contributors rather than merely examining the cross national differences in consumer
decision-making styles.
Kamaruddin & Mokhlis (2003),94 together defined four social structural
variables (social class, gender, ethnicity, residence, and religion) and used it to
92Backwell, C., and Mitchell, V.W. (2003).“Generation Y Female Consumer Decision Making
Styles.”International Journal of Retail & Distribution Management, 3(2), 95-106 pp. 93Bao, Y., Kevin, Z. Z., and Su, C. (2003). “Face Consciousness and Risk Aversion: Do They Affect
Consumer Decision Making?” Psychology & Marketing, 20(8), 733-755 pp. 94Kamaruddin & Mokhlis (2003),Consumer socialization, social structural factors and decision-
making styles: a case study of adolescents in Malaysia. International Journal of Consumer Studies. Volume 27, Issue 2, pages 145–156 pp.

64
determine its influences on consumer decision-making styles. The CSI was
administered to adolescents in secondary schools. Multiple regression analysis
disclosed the differences in decision-making styles between males and females.
Thus, results showed that males tended to be more brand-conscious and females
tended to be more recreational shoppers. Adolescents in urban areas tended to be
more brand-conscious and novelty-conscious than rural adolescents.
Bae (2004),95 earlier studies focused only on general consumer's shopping
behaviors. The main purpose of the study was to apply a consumer decision-
making model based on Consumer Style Inventory (CSI), invented by Sproles and
Kendall (1986), to be more specific on the shopping styles involved in athletic
apparel and to examine whether specific shopping pattern differences existed
between selected university students in the United States and South Korea. As a
result, American and Korean college-aged consumers demonstrated different
shopping patterns on quality, recreation, confusion, fashion, impulse, price, and
brand consciousness.
Chase (2004),96 investigated the relationship between beginning college
students' self-reported mind styles, consumer decision-making styles, and shopping
habits. Three instruments were administered: the Gregorc Style Delineator(TM),
the Consumer Styles Inventory, and a Demographic Survey. Findings showed that
there is a significant relationship between gender and self-reported shopping habits.
Females tend to self-report purchases of clothing more frequently than males. And
as well, a Mann-Whitney Rank Sum Test showed that there was a significant
relationship between gender and the Recreational/Hedonistic consumer decision-
making style. Finally, concluding that females tend to be more recreational shoppers
than then males.
95Bae, S. (2004).Shopping pattern differences of physically active Korean and American university
consumers for athletic apparel. ProQuest, UMI Dissertations Publishing. 96Chase, M. W. (2004). The relationship between mind styles, consumer decision-making styles, and
shopping habits of beginning college students. ProQuest, UMI Dissertations Publishing.

65
Kwan et.al, (2004),97explored young Chinese consumers’ decision-making
behaviour towards casual wear purchase in Mainland China. The Consumer Style
Inventory (CSI), developed by Sproles and Kendall (1986) was adapted in the study
and was administered to 161 University students in Shanghai, Beijing and
Guangzhou in the Mainland. The results showed that six decision-making styles
(recreational and hedonistic consciousness, perfectionism consciousness, confused
by over-choice, habitual and brand loyalty, price and value consciousness and brand
and fashion consciousness) were found in the Mainland. Confirmatory Factor
Analysis (CFA) was first performed with AMOS program for testing the
applicability and appropriateness of Sproles and Kendall’s 8-factor structured
consumer decision-making style model in the study. The results of the CFA
disconfirmed the original structure of Sproles and Kendall’s model, as Goodness of
Fit Index (GFI), Adjusted Goodness of Fit Index (AGFI), Root Mean Square
Residual (RMR) and Comparative Fit Index (CFI) were all fall out of their critical
values. This indicated that there was a bad fit between the original 8 factors
structured model and the data.
However, in the year (2006),98 similar study done subsequently, identified
that seven styles were valid for young clothing consumers in China. Significant
influence of demographic characteristics, such as gender, number of siblings and
birth order on several consumer decision-making styles were also identified. The
findings from the study gave valuable insights for academic practitioners and
clothing marketers into young Chinese consumers' decision-making practices in
terms of casual wear purchases. In addition, they also provided a basis for academic
practitioners for investigating consumer decision-making styles in a more
comprehensive manner.
97Kwan, C. Y., Yeung, K. W., & Au, K. F. (2004). Decision-making behaviour towards casual wear
buying: A study of young consumers in mainland China. Journal Of Management & World Business Research, 1(1).
98Kwan, C. Y. (2006). An investigation on the factors affecting young Chinese consumers' decision-making behaviour towards casual wear purchase. ProQuest, UMI Dissertations Publishing

66
Mitchell & Walsh (2004),99 compared the decision-making styles of male
and female shoppers in Germany. The researchers confirmed the construct validity
of all eight CSI factors for female shoppers and four of the factors for male
shoppers. It was subsequently concluded that male individuals were slightly less
likely to be perfectionists, somewhat less novelty and fashion conscious, and less
likely to be confused when making purchases than their female counterparts.
Wang et.al, (2004),100 studied the relationship between consumers’ decision-
making styles and their choice between domestic and imported brand clothing using
a sample of Chinese consumers. The results indicated that seven decision-making
styles together with other consumer behavioral characteristics can be used to
distinguish and profile consumers who preferred to buy domestic, imported or both
types of clothing. Empirical findings revealed that consumers who preferred to buy
imported brand clothing tend to have a unique lifestyle and shopping orientation that
differed from those who preferred domestic brand clothing. Conceptual
contributions and managerial implications were also discussed.
Akturan & Tezcan (2007),101 the study aimed at profiling young adults as
consumers through their decision-making styles for apparel products. The data was
collected from college students aged 18-24 by face-to-face interviews. The
consumer decision-making styles were measured by the CSI scale (Sproles and
Kendall, 1986) and 2 additional dimensions (shopping influences and reliance on
mass media) taken from Shopping Styles Dimensions (Tai, 2005). As a result of the
exploratory factor analysis six factors were identified. Finally, in order to classify
the respondents through the decision- making styles, cluster analysis was utilized.
The young consumers form a powerful consumer spending group and hence they
were the target group. These groups have their own consumption patterns, motives,
feelings and styles. They have been also nurtured by companies to cement loyalty so
99Bakewell, C. & Mitchell, V. W. (2004).Male consumer decision-making styles. International
Review of Retail, Distribution and Consumer Research, 14(2), 223-240 pp. 100Wang, C.L., Siu, N.Y.M. and Hui, A.S.Y. (2004). “Consumer Decision Making Styles On
Domestic And Imported Brand Clothing.” European Journal Of Marketing, 38(½), 239-252 pp.
101Akturan, U., Tezcan, N., (2007), “Profiling young adults: Decision-making styles of college students for apparel products”, in: 6eme Journees Normandes de Reserchesurla Consommation: Societeetconsommations, Groupe ESC Rouen, Rouen, 19-20 March, 2007.

67
that they would be valuable consumers later. They are also perceived as valuable
early adopters. Thus concluded that the companies need to understand the behaviors
of the target group as a consumer in order to get closer and establish a long term
relationship with them.
Ghodeswar (2007),102 investigated the decision-making style among
students of a Business School in India. Findings revealed seven decision-making
styles which were grouped into six factor structure. Price Consciousness was the
factor which was not confirmed in the study.
Hanzaee & Aghasibeig (2008),103 in an Iranian setting, indicated that
Generation Y male and female consumers differ in their decision-making styles.
However, of the 10-factor solution confirmed for males and 11-factor solution for
females, nine factors were found to be common to both genders. The researchers
regarded the similarity as a result of the changing gender roles in modern Iran.
Unal & Ercis (2008),104 attempted to study consumers’ decision-making
styles with the CSI approach. Males and females living in Erzurum, Turkey,
constituted the population of the study. How gender affected consumers’ decision-
making styles was analyzed in the study. The CSI dealt with the mental orientation
of consumers in making decisions and, therefore, focused on the cognitive and
effective orientations in consumer decision-making and identified eight mental
characteristics of consumer decision-making. According to the results concluded,
male and female consumers had different decision-making styles.
Patel (2008),105 investigated the consumers’ decision making styles in
shopping malls and studied variations in the consumer decision making styles across
different demographic variables. An attempt was made to profile the decision 102Ghodeswar, B. M. (2007). Consumer decision-making styles among Indian students. Alliance
Journal of Business Research, 3(spring), 36-48 pp. 103Hanzaee, K. & Aghasibeig, S. (2008). Generation Y female and male decision-making styles in
Iran: are they different? The International Review of Retail, Distribution and Consumer Research, 18 (5), 521–537 pp.
104UnalS., and Ercis A. (2008). “The Role Of Gender Difference In Determining The Style Of Consumer Decision Making.” Bogazici Journal, 22(1-2), 89-106 pp.
105Patel, V. (2008). “Consumer Decision Making Styles in Shopping Malls: An Empirical Study.” New Age Marketing: Emerging Realities, 627-637 pp.

68
making styles of Indian Consumers in shopping malls. Sproles and Kendall (1986)
identified nine decision making styles while in the study, researcher found only six
decision-making styles in Indian environment. Results showed that single consumers
are more price conscious than married consumers. Young consumers between the
age group of 11-20 years are most recreational in their shopping. Above all Indian
consumers are confused by over choice, novelty conscious, and variety seekers.
Yesilada & Kavas (2008),106 the study investigated whether the CSI could
be generalized to the female consumers living in TRNC. Findings of the study gave
some idea about the decision making styles of the Turkish Cypriots, which might be
of value for the retailers not only in the north, but also in the south of the island as
these consumers preferred to shop from the south as well. The results confirmed
three of the eight original decision making traits and identified five new ones two of
which are somewhat similar to the two original traits. Thus, the CSI’s
generalizability across cultures, have received only limited support from the current
study.
Boonlertvanich (2009),107adapted the Consumer Style Inventory (CSI), to
examine the consumer’s purchasing behaviour of digital still camera market in
Bangkok. Some factors other than the Consumer Style Inventory were added to
increase credibility of the study such as social influence, media influence and
lifestyles. It focused on the relationship among age, gender, income and other
factors with eight styles of consumer decision making. Finally, it was found that
genders had different tastes in their fashion, social habits, brand loyalty, lifestyle
consciousness and style of customers.
Kamaruddin & Kamaruddin (2009),108 the study investigated the Malays’
decision-making styles pertaining to shopping behavior. It also examined the
association between Malays’ cultural value orientations and their decision-making
106Yesilada, F., and Kavas, A. (2008). “Understanding The Female Consumers Decision Making
Styles.” Isletmefakultesidergisi, cilt, 9(2), 167-185 pp. 107Boonlertvanich, K. (2009). Consumer buying and decision making behavior of a digital camera in
Thailand. RU.Int. J. vol. 3(1). 108Kamaruddin, A.R., and Kamaruddin, K. (2009). “Malay Culture and Consumer Decision-Making
Styles: An Investigation On Religious And Ethnic Dimensions.” Journal Kemanusiaan, 14, 37-50 pp.

69
styles. The findings revealed that Malay consumers are quite incompetent in
handling product and market information, resulting in information overload and
confusion. Therefore, the results suggested that formal consumer education should
be introduced in secondary schools in developing knowledgeable and efficient
young consumers.
Mokhlis et.al, (2009),109 investigated the decision-making styles of young
Malay, Chinese and Indian consumers in Malaysia using Consumer Style Inventory
(CSI) developed by Sproles and Kendall (1986). It attempted at verifying the
generalizability of Sproles and Kendall’s CSI across three ethnic groups within a
Malaysian retail environment. However, the results revealed some interesting
patterns in the decision-making traits of young Malay, Chinese and Indian
consumers. Eight meaningful factors resulted for the Malay and Chinese samples,
and six for the Indian sample.Further (2010),110 gave aninsight into similarities and
differences in cognitive structure underlying consumers’ shopping styles. A total of
477 respondents were classified into three groups based on their religious
affiliations: Muslim, Buddhist and Hindu. Exploratory factor analyses were
employed to compare the shopping styles of these three religious micro-cultures.
The results indicated that interesting similarities and differences in consumer
shopping styles existed among the three religious micro-cultures.
Mokhlis & Salleh (2009),111 investigated the differing approaches of male
and female Malaysian consumers toward shopping and buying activities using
Sproles and Kendall’s (1986) Consumer Style Inventory (CSI) on a sample of 386
Malaysian males and females. Exploratory factor analysis was used to understand
the decision-making styles of both genders. Finally, the study revealed new traits for
male and female consumers that were in contrast with the original CSI factors. The
most important finding is that there is an indication of the generality of several
109Moklis, S., and Salleh, H. (2009). “Decision Making Styles Of Young Malay, Chinese And Indian
Consumers In Malaysia.” Asian Social Science, 5(12), 50-59 pp. 110Mokhlis, S., and Salleh, H. (2010). “Religious Contrasts In Consumer Shopping Styles: A Factor
Analytic Comparison.” Journal of Business Studies Quarterly, 2(1), 52-64 pp. 111Mokhlis, S., and Salleh, H. (2009). “An Investigation Of Consumer Decision Making Styles Of
Young Adults In Malaysia.” International Journal Of Business and Management,4(4), 140-148 pp.
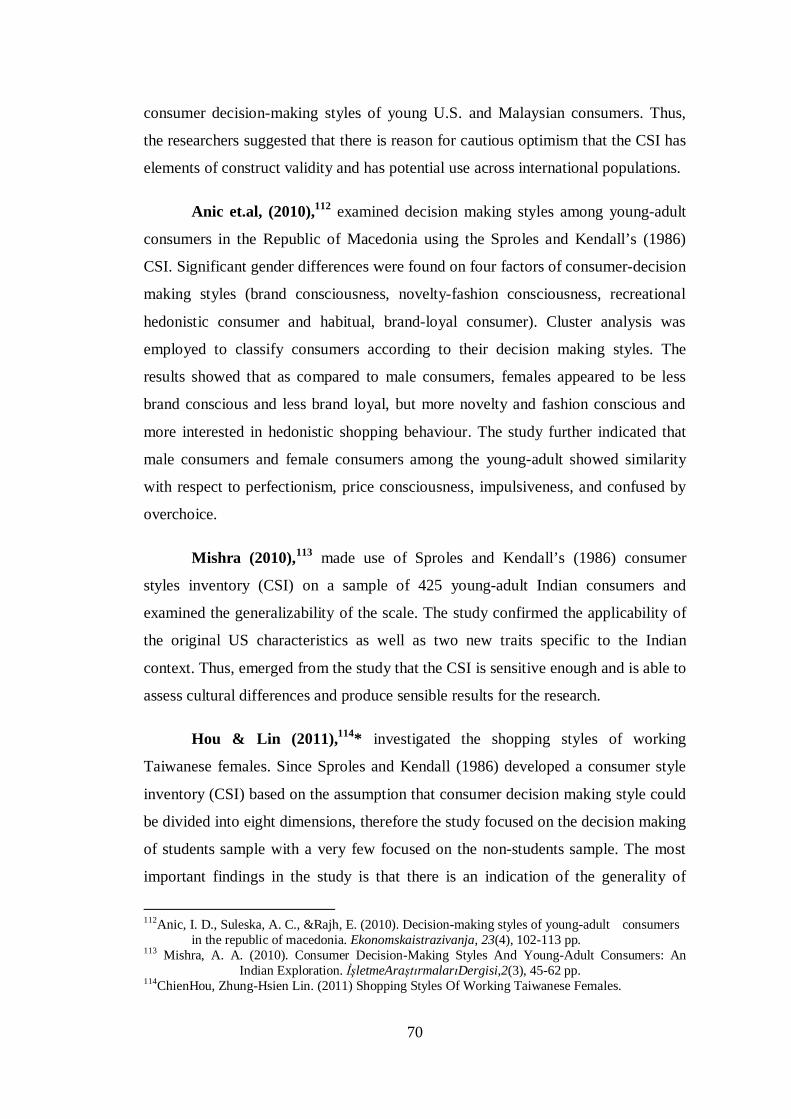
70
consumer decision-making styles of young U.S. and Malaysian consumers. Thus,
the researchers suggested that there is reason for cautious optimism that the CSI has
elements of construct validity and has potential use across international populations.
Anic et.al, (2010),112 examined decision making styles among young-adult
consumers in the Republic of Macedonia using the Sproles and Kendall’s (1986)
CSI. Significant gender differences were found on four factors of consumer-decision
making styles (brand consciousness, novelty-fashion consciousness, recreational
hedonistic consumer and habitual, brand-loyal consumer). Cluster analysis was
employed to classify consumers according to their decision making styles. The
results showed that as compared to male consumers, females appeared to be less
brand conscious and less brand loyal, but more novelty and fashion conscious and
more interested in hedonistic shopping behaviour. The study further indicated that
male consumers and female consumers among the young-adult showed similarity
with respect to perfectionism, price consciousness, impulsiveness, and confused by
overchoice.
Mishra (2010),113 made use of Sproles and Kendall’s (1986) consumer
styles inventory (CSI) on a sample of 425 young-adult Indian consumers and
examined the generalizability of the scale. The study confirmed the applicability of
the original US characteristics as well as two new traits specific to the Indian
context. Thus, emerged from the study that the CSI is sensitive enough and is able to
assess cultural differences and produce sensible results for the research.
Hou & Lin (2011),114* investigated the shopping styles of working
Taiwanese females. Since Sproles and Kendall (1986) developed a consumer style
inventory (CSI) based on the assumption that consumer decision making style could
be divided into eight dimensions, therefore the study focused on the decision making
of students sample with a very few focused on the non-students sample. The most
important findings in the study is that there is an indication of the generality of
112Anic, I. D., Suleska, A. C., &Rajh, E. (2010). Decision-making styles of young-adult consumers
in the republic of macedonia. Ekonomskaistrazivanja, 23(4), 102-113 pp. 113 Mishra, A. A. (2010). Consumer Decision-Making Styles And Young-Adult Consumers: An
Indian Exploration. letmeAra rmalar Dergisi,2(3), 45-62 pp. 114ChienHou, Zhung-Hsien Lin. (2011) Shopping Styles Of Working Taiwanese Females.

71
several working female decision making styles and the CSI has the potential use
across international population.
Radam et.al, (2011),115researched based on the Sproles and Kendall’s
(1986) Consumer Style Inventory (CSI). 200 Chinese consumers in Klang Valley
were selected as sample. Six reliable factors of consumer decision-making styles on
clothing were identified in the study. One of the key findings in the study is the
confirmation of majority of the Chinese consumers in Klang Valley were highly
concerned in price/value of money.
Vieira et.al, (2011),116examined the cross-cultural applicability of CSI scale
for profiling consumers’ decision-making style in Brazil. It was investigated with
the belief that decision-making styles, much like personality traits, are likely to be
largely independent of the culture and descriptive of a personal orientation. The
results showed that the eight factors structure existed such as: Perfectionism or
High-Quality; Brand Consciousness; Novelty-Fashion Consciousness; Recreational
and Hedonistic Shopping Consciousness; Price and Value for Money Shopping
Consciousness; Impulsiveness, Careless Consumer Orientation; Confusion from
over Choice of Brands, Stores and Consumer Information; and Habitual, Brand-
Loyal Orientation. The study concluded that the scale, as an overall, was suitable to
be used in Brazil.
STUDIES ON YOUNG ADULTS / YOUTH
Comegys & Brennan, (2003),117 investigated the online purchase behavior
of a key segment of the population, the “Next Generation” undergraduate college
aged student, from two of the countries the United States and Ireland. Researchers
analyzed how frequently students from each country interactively shop online, how
much they spend, what they buy, as well as analyzed whether the students from the
two countries under study approached the Buyer Decision Process differently in the
115Radam , A. P. A., Ali , M. H., & Leng, Y. S. (2011). Decision-making style of Chinese consumer
on clothing .The Journal of Global Business Management. 116Vieira, V. A., Slongo, L. A., and Torres, C. V. (2011). “Evaluating The Psychometric Properties of
Consumer Decision Making Style Instruments. 117Comegys, C., & Brennan, M. .L. (2003). Students’ online shopping behavior: A dual-country
perspective. Journal of Internet Commerce, 2(2), 69-89 pp.

72
use of the Internet. Thus, the results indicated and concluded that almost all college
students were found to use the Internet and they are an integral part of “Next
Generation”.
Jiyeon Kim, (2003)118. The purpose of this research was to examine the
relationship between college students’ apparel impulse buying behaviours and visual
merchandising. This study provides information as to why visual merchandising
should be considered an important component of a strategic marketing plan in
support of sales increase and positive store/company image. This study further
investigated some external factors that influence impulse buying behaviour. The
results proved that there were significant relationships between college students’
impulse buying behaviour and in-store form/mannequin display and promotional
signage. Even though the window display and floor merchandising did not appear to
significantly lead to college students’ impulse buying behaviour, the results still
suggested that these variables and consumers’ impulse buying behaviour are
significantly correlated.
Sullivan(2004),119 examined socioeconomic characteristics and motivational
factors related to shopping. Additional attitudes toward shopping, direct marketing,
and advertising were also analyzed. The study pointed out a little significant
difference between the two groups with the exception that the Internet shoppers
placed more value on convenience. However, minor differences were found between
education level and age. Thus, the results demonstrated that the internet buyers
lacked strong opinion with the exception of their desires, for convenience when the
shop.
Tremblay(2005),120 invested into the subject of impulse buying which has
been studied since the late 1980's mainly by two teams; one Canadian and one is
American. The Self-Completion Theory and the general literature on impulse
118Jiyeon Kim. (2003). College Students’ Apparel Impulse Buying Behaviors In Relation To Visual
Merchandising. Athens, Georgia. 119Sullivan, D. P. (2004).A profile of generation y online shoppers and its application to
marketing.ProQuest, UMI Dissertations Publishing. 120 Tremblay, A. J. (2005). Impulse buying behavior: Impulse buying behavior among college
students in the borderlands. ProQuest, UMI Dissertations Publishing.

73
purchasing provided the foundation for understanding the purchasing power of
college students in 2004. Therefore, it was observed that some main variables such
as gender, credit money, childhood experiences and obsessive-compulsive disorder
could help explain the high rates of impulse purchases among college students in
America.
Magie(2008),121 examined the fashion involvement of female and
male consumers, aged 13 to 18, residing in the United States and the relationships
among demographic characteristics, lifestyle, usages of fashion information sources,
apparel shopping orientations, patronage behaviours and fashion involvement.
Findings indicated that female teens have higher fashion involvement than male
teens, and lifestyle activities, shopping orientations, and patronage behaviours do
influence fashion involvement.
Szendrey(2008),122 examined the underlying familial/parental factors which
would increase degrees of frugality, an opposite behaviour to that of compulsive
buying. However, results indicated that the proposed model significantly predicted
the degree of undergraduate frugality and that the following four familial/parental
influences are conducive to raising more conscientious consumer- and consumption-
minded students: (1) the perceived degree of frugal behaviours of the family in
which a student was raised, measured by a newly developed scale (statistically
significant, positively related), (2) intergeneration communication relating to
consumer skills (statistically significant, positively related), (3) intangible family
resources such as time and attention, discipline, life skills and instruction, emotional
support and love, and role modelling and guidance (statistically significant,
positively related), and (4) family socioeconomic status including perceived family
financial status, parental education levels, and home ownership status (statistically
significant, negatively related).
121Magie, A. A. (2008). An analysis of lifestyle, shopping orientations, shopping behaviors and
fashion involvement among teens aged 13 to 18 in the United States .ProQuest, UMI Dissertations Publishing.
122Szendrey, J. M. (2008). An empirical consumer behavior study of familial/parental influences on the degree of frugality of undergraduate students. ProQuest, UMI Dissertations Publishing.

74
Bhawnani (2010),123 investigated on what excited the youth, grabs their
attention, interests and influences them. It aimed to capture key youth trends based
on factors such as: Lifestyle, Technology, Entertainment, Education, Career and
Culture. A small survey of youth in Urban India (Delhi) was conducted between the
age group of 16 to 25 years. It studied the lifestyle of youth, their perception and the
buying behaviour. Results showed that Indian youth profile were looking on more
towards factors such as: Freedom to pursue their talents, Fame, Success & Growth,
Fitness freaks, Showcase their strengths and Tech-savvy.
Hemalatha et al, (2010),124investigatedthe behaviour of youth in shopping
malls in a globalised economy. 19–25 years old constituted a bridge between
adolescents and adults when buying behavior is in transition. It would help retailers
to examine current and potential patrons, thereby providing guidance for store
design and marketing communications strategy. The most important factors for
visiting malls is social shopping, idea shopping, role shopping, adventure shopping,
value shopping, gratification shopping, shopping for stress relief, shopping to
alleviate a negative mood, and shopping as a special treat to oneself.
Saleem et al, (2010),125 determined the effect of factors like age, tendency to
spend, post purchase guilt, drive to spend compulsively, and feeling about shopping
and spending and dysfunctional spending on compulsive buying behaviour of youth
in Pakistan. Data was collected from college and university students from Lahore,
Islamabad and Bahawalpur of age 18 to 32 years. The compulsive buying scale
established by Edward (1993) was used to measure compulsive buying of youth in
Pakistan. Results showed that compulsive buyers generally tend to be younger and
also compulsive buyers are motivated by an internal trigger such as shopping and
spending.
123Bhawnani (2010). What all excites the Indian Youth now? 124Hemalatha, K. G., Jagannathan, L., &Ravichandran, K. (n.d.).Shopping behaviour in malls in
globalised economies. 125Saleem , S., Salaria, R., Megha, V. (2010). Few determinants of compulsive buying of youth in Pakistan.

75
4Ps B&M in association with Indian Council for Market Research
(ICMR) & Cvoter, (2011),126 researched to know the Indian youth inside out in
order to showcasean in-depth analysis of the Indian youth (in the age bracket of 18-
25 years) and its unique buying behaviour across product categories. The survey
included responses from 1,628 respondents belonging to 31 different Indian cities.
The target respondents were administered with a structured questionnaire and the
Survey had a good mix of working and non-working individuals. The process was
an attempt to understand the buying behaviour of the youth in categories like mobile
phones, gadgets, internet usage and apparels (especially casual wear). Thus, the
analysis of the survey represented the categorized and the cities’ different tier zones
to further understand the diversity of the Indian youth.
Ram Kulkarni and Dilip Belgaonkar. (2012).127 This paper reports the
results of a study of brand selection and loyalty within the 18–25 age groups of
Indian youth surveyed in Nashik city. The study explores brand loyalty behaviour
across different product categories, and investigates the dimensions that drive
loyalty behaviour within this age group. Finally, the study is concluded stating
Indian youth is more quality conscious, they prefer only brands those are time
tested, performing well and showing consistency in quality of the product. Indian
culture is reflecting in their purchase behaviour as they are more cost conscious and
their choice is utility oriented and not price oriented. They don’t go blindly behind
the brands therefore brands are trying to attract more youth consumer.
STUDIES ON APPARELS / CLOTHING BEHAVIOUR
Forsythe and Thomas (1989),128 conducted a study to find the preference
for natural, synthetic, or blended fibre contents or to link perceptions of fibres with
any particular market segment. The researchers examined fibre content preferences
and perceptions among female apparel consumers and the relationship between fibre
1264PS B&M - ICMR SURVEY, 2011. 127 Ram Kulkarni, Dilip Belgaonkar. (2012). Purchase Behavioral Trends and Brand Loyalty of
Indian Youth with Special Reference to Nashik City.International Conference on Humanity, History and Society.IPEDR vol.34 (2012) © (2012) IACSIT Press, Singapore
128Forsythe, S. M., & Thomas, J. B. (1989). Natural, synthetic, and blended fiber contents: An investigation of consumer preferences and perceptions. Clothing and Textiles Research Journal, 7(3), 60-64 pp.

76
content preference and perceptions and demographic variables. Thus, results from
the study indicated that female apparel shoppers had definite fibre content
preferences for various items of apparel; however, these preferences were not
generally related to demographic characteristics.
Shim et.al, (1989),129assessed the role of external variables on attitudes
toward imported and domestic apparel among college students. External variables
included demographics, clothing attitudes, students' self-perceptions, and level of
fashion involvement. The researchers found that the attitudes toward imported
clothing were influenced by the level of fashion involvement, the prestige clothing
attitude, the social activities clothing attitude, and social acceptance. The results also
indicated that students have more favourable attitude towards domestic apparel than
imported apparel.
Thomas et.al, (1991),130 investigated the underlying dimensions of apparel
involvement in consumers' purchase decisions. The researchers analyzed whether
the apparel involvement is composed of more than one dimension and also
determined whether there is any variation in apparel involvement dimensions with
the help of fibre information sources and demographics. The results from the study
indicated that apparel involvement is composed of more than one dimension and is
partially explained by fibre information sources. It was also found that one of the
two identified apparel involvement dimensions differed based on the consumer
demographic variables.
Huddlestonet.al,(1993),131 assessed whether apparel selection were the
predictors of female consumers' brand orientation. The criteria’s included quality
proneness, fibre consciousness, easy care preference and made in the USA. Data
was collected from 383 female consumers through mailed questionnaire regarding
129Shim, S., Morros, N. J., & Morgan, G. A. (1989). Attitudes toward imported and domestic apparel
among college students: The fishbein model and external variables. Clothing and Textiles Research Journal, 7(4), 8-18 pp.
130Thomas, J. B., Cassil, N. L., & Forsythe, S. M. (1991). Underlying dimensions of apparel involvement in consumers' purchase decisions. Clothing and Textiles Research Journal, 9 (3), 45-48 pp.
131Huddleston, P., Cassil, N. L., & Hamilton, L. K. (1993).Apparel selection criteria as predictors of brand orientation.Clothing and Textiles Research Journal, 12(1), 51-56 pp.

77
brand orientation and apparel selection criteria. The results from the study revealed
that quality proneness and made in the USA were predictors of brand orientation.
The researchers suggested that this would help in planning consumer programs and
as well helps retailers in planning product and promotion mixes, understanding
target consumers, and refining training programs.
Lee&Burns (1993),132 examined the relationships between the criteria that
individuals used in the purchase of clothing and the individual traits of public and
private self-consciousness between two cultural groups namely United States and
Korea. Researchers explored the importance of criteria used in the purchase of
clothing, private and public self-consciousness, and demographic characteristics. It
was also found that a significant interaction effected between self-consciousness and
cultural group for the importance of brand name as a clothing purchase criterion.
The results from the study indicated that there is a significant relationship between
the trait of public self-consciousness and the importance of fashion and
attractiveness as clothing purchase criteria in both cultural groups.
Shim and Kotsiopulos (1993),133 analyzed the typology of apparel shopping
orientation segments among female consumers. The researchers segmented female
apparel shoppers into unique apparel shopping orientation groups and developed a
profile for each segment with respect to information sources, importance of store
attributes, lifestyle activities, patronage behaviour, and demographics. The results
indicated that shopping orientations are a base for segmenting female apparel
shoppers and these groups are unique in consumer buying characteristics. The
characteristics included three factors of information sources (Store Fashion
Service/Promotion, Fashion Publications, and Mass Media) and also five factors of
importance of store attributes (Store Personnel, Visual Image of Store, Customer
Service, Easy Access, and Brand/Fashion).
132Lee, M., & Burns, L. D. (1993). Self-consciousness and clothing purchase criteria of korean and
united states college women. Clothing and Textiles Research Journal, 11(4), 32-40 pp. 133Shim, S., &Kotsiopulos, A. (1993). A typology of apparel shopping orientation segments among
female consumers. Clothing and Textiles Research Journal, 12(1), 73-85 pp.

78
Hines & O'Neal (1995),134 assessed how consumers evaluated clothing
quality by examining the cognitive structure that existed between the evaluated
criteria used to judge quality and personal values. It was also found that consumers
evaluated quality by using attributes that they associated with social, psychological,
economic, physiological, and aesthetic consequences. Results from the study
indicated that for this group of consumers, the concept of perceived clothing quality
included a number of associated concepts at various levels of abstraction. The
researchers finally suggested that a proper study should be carried out to assess how
consumers’ evaluated quality and to include factors other than physical attributes.
Fairhurst et.al, (1996),135 assessed apparel retail buyers' perceptions about
the importance and satisfaction with services available at market shows. Researchers
measured manufacturers’ sales representatives’ perceptions of the importance of the
market services. Data was collected from 161 apparel retail buyers and 146
manufacturers’ sales representatives who attended a local Midwest market show.
The results from the study revealed that apparel retail buyers and manufacturers’
sales representatives differed regarding the importance of five market show services.
As compared to retail buyers, manufacturers’ sales representatives attributed more
importance to help for new retailers, show books, and timing of the markets
Beaudoin et.al., (1998),136 investigated whether females fashion leaders and
fashion followers differed in the attitudes towards buying imported and domestic
apparel products. Data was collected from a sample of 283 female consumers
between 18 and 25 years of age through mailed questionnaire. Results showed that
fashion followers have the same overall attitude toward buying American or
imported apparel. However, fashion leaders have significantly more positive attitude
towards followers for buying imported apparel than buying domestic apparel.
134Hines, J. .D., & O'Neal, G. S. (1995). Underlying determinants of clothing quality: The consumers'
perspective. Clothing and Textiles Research Journal, 13(4), 227-233 pp. 135Fairhurst, A. E., Lennon, S. J., & Yu, H. (1996). Retail buyers' and manufacturers' sales
representatives' perceptions of market show services in small apparel markets. Clothing and Textiles Research Journal, 14(3), 161-168 pp.
136Beaudoin, P., Moore, M. A., & Goldsmith, R. E. (1998). Young fashion leaders’ and followers’ attitudes toward American and imported apparel. Journal of Product & Brand Management.7 (3), 193-207pp.

79
Gaal & Burns (2001),137 conducted a study to identify and clarify important
yet inadequate information in a catalogue’s apparel descriptions, and tested if
clarifications of the descriptions altered consumers’ perceived ability to evaluate the
garments and the degree of perceived risk associated with purchasing the garments.
The researchers conducted an experiment to test whether the changes made to the
descriptions influenced consumers’ perceived ability to evaluate the garments, as
well as consumers' perceived risk associated with purchasing the garments. Thus,
results indicated that changes made regarding the fabric/fibre content increased
participants' perceived ability to evaluate the garments, whereas changes made
regarding the sizing/fit did not. However it did not support the notion that type of
change would alter the degree of perceived risk associated with purchasing the
garments.
Asma Kiran, Ayesha Riaz & Niaz Hussain Malik, (2002)138 Investigated
and explained the factors responsible for the change in clothing patterns of the
adolescent girls, that are yet not clearly defined but are un-ignorable. In order to find
out the affect of various factors likesocial status, education, mass media and peer
pressure on the clothing patterns of young girls, a survey was conducted in the
University of Agriculture Faisalabad by distributing a comprehensive questionnaire
among 102 students of B.Sc. Home Economics classes. Results clearly indicated that
friends, family’s socio-economic status, changing trends and education were the
most important responsible factors. It was also revealed that the adolescent girls
were more impressed by the T.V., fashion shows and magazines while brining
change in their clothing patterns.
Xu & Paulins (2005),139 studied the college students’ attitudes and
behavioral intention of shopping online for apparel products by using the theory of
reasoned action. The results from the study showed that the students, in general, had
137Gaal, B., & Burns, L. D. (2001). Apparel descriptions in catalogs and perceived risk associated
with catalogpurchases .Clothing and Textiles Research Journal, 19(1), 22-30 pp. 138Asma Kiran, Ayesha RiazAndNiaz Hussain Malik. (2002). Factors Affecting Change In The
Clothing Patterns of the Adolescent Girls.International Journal Of Agriculture & Biology 1560–8530/2002/04–3–377–378 pp.
139Xu, Y. &Paulins, V.A. (2005). College students’ attitudes toward shopping online for apparel products: Exploring a rural versus urban campus. Journal of Fashion Marketing & Management 9(4), 420-433 pp.

80
positive attitudes toward shopping online for apparel products and intended to shop
more online for apparel products and had more positive attitudes than those who did
not have the intentions. Internet usage, employment status, and card access had
significantly influenced on students’ attitudes toward online shopping for apparel
products.
Comegys et.al, (2006),140 investigated the online purchase behaviour of
university students, from Finland and USA. The research was carried out to find
whether online shoppers from the two countries approached the consumer buying
decision process differently over time. The results from the study indicated that
online shopping has increased in popularity among both male and female portions of
the target groups in Finland, and more so in the USA. The study found that in both
Finland and USA affordable broadband connections was the main reason that made
people to take online purchase decisions. Thus, the results indicated that it was
worthwhile for e-marketers to keep the customers satisfied. If the e-marketer
satisfied the customer, that customer is a prime candidate for a repurchase. So the e-
marketer who effectively served, satisfied, and delighted the online buyers would
enjoy repeated patronage.
Kim & Jin (2006),141 examined virtual communities of consumption hosted
by companies that sell apparel products. The researcher tried to present a general
overview of the characteristics of virtual communities hosted by apparel retailers.
The results from the study indicated that apparel retailers selling casual merchandise
to the young teen’s market had the strongest representation. Therefore, the study
suggested that the virtual communities should be given more importance by
marketers because it helps them in consumer research and feedback.
Park & Stoel (2006),142 examined the effects of brand familiarity, the
number of pieces of product information presented on a web site, and previous
140Comegys, C., Hannula, M., &Vaisanen, J. (2006).Longitudinal comparison of Finnish and US
online shopping behavior among university students: The five-stage buying decision process. Journal of Targeting, Measurement and Analysis for Marketing, 14(4), 336-356 pp.
141Kim, H.S. & Jin, B. (2006).Exploratory study of virtual communities of apparel retailers .Journal of Fashion marketing and Management.10(1).41-55 pp.
142Park, J. &Stoel, L. (2006).Effect of brand familiarity, experience and information on online apparel purchase. International Journal of Retail & Distribution Management.33 (2), 148-160 pp.

81
online apparel shopping experience on perceived risk and purchase intention. The
results from the study indicated that there is a significant effect of brand familiarity
and previous experience on perceived risk and purchase intention, and no effect of
amount of information on perceived risk and purchase intention. Thus the study
suggested that internet retailers should capitalize on the power of their brand names
to gain advantage.
Cowart & Goldsmith (2007),143 investigated the motivational factors for
online apparel consumption using the Consumer Styles Inventory. Data from a
sample of 357 US college students showed that quality consciousness, brand
consciousness, fashion consciousness, hedonistic shopping, impulsiveness and brand
loyalty were positively correlated with online apparel shopping. Price sensitivity
was negatively correlated with online spending. The findings revealed that
impulsive shoppers spend more for apparel online in a typical month and spend
more time online than other consumers. These findings could lead one to infer that a
substantial number of online apparel purchases are unplanned and precipitous.
Inglessis (2008),144 explored how Hispanic women (living in the United
States) of different levels of acculturation communicated their individual, social and
cultural identities through clothing and appearances. The study demonstrated that,
when it comes to clothing and appearance, Hispanic women have more
commonalities than differences. The values and beliefs are learned early on from
their mothers and maintained through constant interaction with the Hispanic culture
through friends and families. Hispanic cultural values drive theway Hispanic women
communicate, attractiveness, ethnicity and social class. Finally, the study illustrated
the interconnection between the different aspects of the adoption of clothes by
pointing out sensorial experience, fit, and interpersonal influence as the major
drivers of adoption among Hispanic women.
143Cowart, K. O., & Goldsmith, R. E. (2007).The influence of consumer decision-making styles on
online apparel consumption by college students. International Journal of Consumer Studies, 31(6), 639-647 pp.
144Inglessis, M. G. (2008). Communicating through clothing: The meaning of clothing among hispanic women of different levels of acculturation. ProQuest, UMI Dissertations Publishing.
82
Reiley (2008),145 examined the relationship between the desire for a unique
appearance and sources of clothing acquisition- vintage or new clothing. Subjects
were 97 female college students within the age group of 18-25 years, who
purchased clothing from vintage and/or new clothing sources. The survey included
the “desire for unique consumer products” (DUCP) scale developed by Lynn and
Harris (1997a) with eight statements on a 5-point scale. The outcome was that
regular vintage wearers did have a higher desire for unique consumer products
according to the DUCP scale than the new clothing wearers. The regular vintage and
new clothing wearers with high DUCP scores used a greater variety of unique pieces
from different clothing sources and put them together in unexpected ways to create a
unique appearance. Therefore, concluded that those with similar high DUCP scores
created an appearance that was more unique than the wearers with low DUCP
scores.
Zeng (2008),146 investigated Chinese college online apparel shoppers’
decision-making styles and their online apparel shopping behaviours. It explored the
relationships between the decision-making characteristics and the related online
apparel shopping behaviours and consumptions. The results demonstrated that some
of the characteristics of the CSI were related to the frequency of buying apparel
online, and the dollar amount spent online for apparel purchasing. The findings
showed that recreational consciousness, hedonistic consciousness, brand
consciousness, habitual consciousness and brand-loyalty consciousness have
significant correlations with the frequency of online apparel purchases. However,
only brand conscious and habitual conscious, brand-loyalty conscious are
significantly correlated with the amount of money spent online for apparel purchases
by Chinese college students.
145Reiley, K. J. W. (2008). Definitions of uniqueness in terms of individual appearance: Exploring
vintage clothing and new clothing wearers. ProQuest, UMI Dissertations Publishing 146Zeng, Y. (2008). An investigation of decision making style of Chinese college student online
apparel shoppers.Thesis, B.A. Wuhan University Of Science And Engineering, China,, Retrieved from http://etd.lsu.edu/docs/available/etd-11052008 123052/ unrestricted/ Zengthesis.pdf.

83
Mandloi (2010),147 ascertained the buying decision-making styles of Indian
shoppers in Indore shopping malls, so as to provide information to marketers
interested in the decision-making profile of Indian consumers and thus enabling
them to build their marketing efforts accordingly. Results showed that the main
influencing factor which influenced and affected the respondents in order to make
buying decision from shopping malls is brand consciousness. Demographic
variables like age and gender also influenced the customer choices and buying
decision-making style of Indian shoppers.
Meenakshi & Arpita (2010),148 examined the Indian youth's need for
uniqueness (NFU) and their attitudes towards luxury brand as an expression
of individuality. It was apparent that while the NFU is not very high amongst the
Indian youth, luxury brands do symbolize status and individuality to them and serve
a value-expressive function.
Noh &Lee (2011),149 analysed the effects of brand difference on
multichannel apparel shopping behaviors in a multichannel environment. The
researcher investigated the effect of brand difference on the path parameters in the
Structural Equation Model developed by Noh in a multichannel shopping context.
The results revealed that the Structural Equation Model developed by Noh needs to
be applied to each brand separately. Therefore, the researchers suggested that
multiple-group causal models need to be applied to a research dealing with several
groups, such as a research regarding cross-national consumer behaviors that are
important to global marketers.
147Mandloi, M. (2010).A study on buying decision making style of Indian shoppers in Indore
shopping malls. 148Meenakshi, H., &Arpita, K. (2010). Need for uniqueness and consumption behaviour for luxury
brands amongst Indian youth. International Journal of Indian Culture and Business Management, 3(5).
149Noh, M., & Lee, E. J. (2011).Effect of brand difference on multichannel apparel shopping behaviors in a multichannel environment. International Journal of Business and Social Science, 2(18), 24-32 pp.

84
Padmanabhan, Parvathi(2012),150 conducted a study that examined how
young Indian professionals make decisions about apparel products considering the
myriad of options that are now available to them in the marketplace. In this study, a
qualitative approach was used to understand the role of brands in the decision-
making process of young, urban Indian consumers. Data collection took place in
Bangalore, a large city in the South of India. Thirty-four males and females between
the ages of 22 and 35 participated in the study. In addition, consumption behaviours
of young consumers in three shopping malls in and around Bangalore were
observed.
ZeenatIsmail, Sarah Masood and Zainab Mehmood Tawab (2012)151,
conducted a study in order to determine the consumer preferences of global brands
instead of local ones. It is also designed to find out the buying behaviour patterns of
young Pakistani consumers. Consumer evaluates products based on information
cues, which are intrinsic and extrinsic. A number of factors affect the consumer
purchase decisions. The results suggest that most important factors that influence a
consumer’s final decision are the price and quality of the product in question. Since
the consumers usually associate the price of the brand with its quality, a brand
priced too low is generally perceived as a low quality product. Similarly, a product
priced too high may not be affordable by many. Other factors that have an impact on
the consumer preferences are: consumer ethnocentrism, country of origin, social
status, price relativity with the competing brands and family and friends. The
research was conducted in Karachi and the samples selected included 200 people of
age 16-24. The data collected for the research was through a questionnaire and was
conducted in two popular shopping malls of the city and two universities since the
target audience was largely the youth. Calculations were then analyzed and
interpreted using a percentage of respondents and through frequency distribution
tables and charts.
150Padmanabhan, Parvathi. (2012), Foreign Apparel Brands and the Young Indian Consumer: An
Exploration of the Role of Brand in the Decision-Making Process. Directed by Dr. Nancy Hodges.165 pp.
151ZeenatIsmail , Sarah Masood and ZainabMehmoodTawab (2012), Factors Affecting Consumer Preference of International Brands over Local Brands. 2nd International Conference on Social Science and Humanity, IPEDR vol.31 (2012) © (2012) IACSIT Press, Singapore.

85
Lawan and Zanna (2013)152, in their study titled ‘Evaluation of Socio-
Cultural Factors Influencing Consumer Buying Behaviour of Clothes’ assessed the
cultural factors influencing consumer buying behaviour of clothes in Borno State,
Nigeria. The study was specifically carried out to examine the cultural, economic as
well as personal factors influencing clothes buying behaviour. Findings revealed a
highly significant influence of cultural factors on consumer buying behaviour. The
study concluded that culture, either acting independently or in conjunction with
economic and personal factors significantly influences buying behaviour of clothes.
It was recommended that marketing managers should take cognizance of the fact
that socio-cultural factors are some of the fundamental determinants of a person’s
want and behaviour and should therefore be considered when designing clothes for
their markets.
RESEARCH GAP AND DIMENSIONS OF THE PRESENT STUDY
The review based on available literatures at international and national level
has provided an incentive to think on various levels about the present study. It has
shed light on the problem focussed and helped to determine the scope of the study.
The studies on psychographic / values discussed above have mostly explored
the validity and the applicability of the values scales. A couple of studies have
recommended the psychographic approach to market segmentation and have
profiled the segments based on life –style or values. Very Few studies have
attempted to study the relationship between values and consumer behaviour. Only
one study has been conducted in India using the LOV to examine the frequent
clothing purchase behavior of undergraduate urban college-goers in Kolkata, India
(Roy S., Goswami P., 2007). However, the study assessed the value-psychographic
traits-clothing (VPC) purchase behavior hierarchy and did not employ the consumer
Styles Inventory.
152Lawan A. Lawan, Ramat Zanna (2013), Evaluation of Socio-Cultural Factors Influencing
Consumer Buying Behaviour of Clothes in Borno State, Nigeria; International Journal of Basic and Applied Science, Vol 01, No. 03, Jan 2013, pp. 519-529 pp.

86
The review of literature on the Consumer Styles Inventory Many revealed
that many studies have been conducted using the Sproles and Kendall Consumer
Styles inventory, but most of them were done abroad. Further, most of the studies
were undertaken to study the applicability and the generalizability of the CSI in
different countries. Some studies used the CSI to establish gender differences in
consumer decision-making styles. Two distinct studies in India investigated the
decision-making styles of youth, one on the South Indian college-going consumers
in Coimbatore by Canabel, (2002) and Ghodeswar (2007)investigated the decision-
making style among students of a Business School in Mumbai, India. Neither of
these studies used the LOV to explore the influence of values.
The young adult segment has gained considerable importance in the area of
consumer behaviour research. Many studies have been conducted in India on the
youth to understand their diversity and profile youth behaviour based on what
interests’ them and grabs their attention. Studies have attempted to understand their
interests and what influences them, their fashion involvement and their behaviour of
in shopping malls. No study has been conducted to study the values perceived by
them and its influence on their buying behaviour.
The studies on apparels/clothing behaviour predominantly investigated the
clothing patterns among young people, their attitudes towards imported and
domestic apparels, apparel shopping orientation among consumers, how consumers
evaluated clothing quality, factors responsible for the change in clothing patterns,
shopping online for apparel products, and the evaluation of socio-cultural factors
influencing consumer buying behaviour of clothes.
The literatures on psychographics indicate the importance and need for
psychographic segmentation, the studies on CSI indicate its applicability and
generalizability and usefulness in understanding consumer shopping styles, the
literature on youth revealed the need for more specific and in-depth studies to
understand the most promising target group of consumers in India, the young adults,
due to its demographic dividend and the literature on clothing behaviour point that
clothing is an important channel for self expression among the young adults.

87
Summing up, no study has been undertaken so far in Bangalore, India, to
profile the young adults in the age group of 18 – 25 years based on their shopping
styles and explore the influence of personal values on their shopping styles for
apparels.
RESEARCH DESIGN
This study throws insight upon the influence of values on the buying
behaviour of young adults towards apparels. Information regarding the personal
values that are important to the target market would be valuable in the development
of advertising campaigns and other marketing strategies. To date, however, few
studies have been available for bringing to light how consumer choices are
influenced by personal values. It is expected that such a psychographic analysis will
give a more fine tuned and accurate results on young adults buying behaviour than a
general study on youth.
SAMPLE SIZE, SAMPLING TECHNIQUE AND SAMPLE SELECTION
The respondents for the study consist of young adults as defined by the UN
and as defined by India Youth Policy 2010, in the age group of 18-25 years.
Sample size plays an important role in the estimation and interpretation of
results of studies adopting Structural Equation Modelling (SEM). According to
Fidell153 The minimum sample required for adopting any statistical tool should be
greater than or equal to 8k+50, where k = the number of items involved in the
questionnaire. The questionnaire administered by the researcher in this study
included 10 items on ‘Values’ and 24 statements on ‘Shopping Styles’ adding up to
a total of 34 items. Therefore, solving for n, n = 8 (34) + 50 = 322. The total sample
for the present study was 1478 respondents who were young adults in the age group
18-25 years residing in Bangalore.
Non-probability sampling methods such as judgemental and convenient
sampling methods were adopted to select the respondents for the study. Judgmental
153Tabachnick, Linda S. Fidell. (2003). Using Multivariate Statistics (6th Edition). Amazon.com.

88
sampling method was adopted to identify to whom the questionnaire should be
administered. One criteria adopted in the study to select respondents was that they
should be in the age group of 18 – 25 years. Convenient sampling was adopted to
administer the questionnaire to young adult visitors to malls in Bangalore. The
selection of malls was based on the presence of branded apparel retails outlets in
these malls and their proximity to colleges. Many college students and working
people in the age group of 18-25 frequently visit these malls for purchase of
apparels.
The following four popular malls located in prominent locations representing
the four zones in Bangalore city were identified as the data collection points:
TABLE 05
DATA COLLECTION LOCATIONS AND NUMBER OF RESPONDENTS
S.NO MALL LOCATION / AREA No. of Respondents
1 Forum Mall Koramangala, South
Bangalore
438
2 Esteem Mall Hebbal, North Bangalore 321
3 Orion Mall Rajaji Nagar, West
Bangalore
345
4 Phoenix Market City Whitefield, East
Bangalore
374
Total 1478
The study mainly focused on the college-going student population because
the Sproles & Kendall Consumer Style Inventory was meant to be used for the
student population. The original study by Sproles & Kendall154 administered the
Consumer Style Inventory to 482 youth in the United States. The subjects were all
154Sproles, G.B., Kendall, E.L., (1986), “A methodology for profiling consumer decision making
styles”, The Journal of Consumer Affairs, 20 (2): 67-79 pp.

89
high school students in home economics classes. Halfstrom, et.al,155 identified
decision-making styles of young consumers in Korea and administered the CSI to
310 college students in Korea. Lysonski et.al,156 conducted the study with
undergraduate business students in four countries to investigate the applicability of
the Consumer Styles Inventory. Fan &Xiao,157 administered the Consumer Styles
Inventory to see if the consumer decision-making styles could be generalised to
Chinese college students. Canabal (2002),158 investigated the decision -making
styles of young South Indian consumers with data collected from two institutions of
higher education in the city of Coimbatore, India. Ghodeswar,159 investigated the
decision-making style among students of a Business School in India.
PILOT STUDY AND RELIABILITY TEST
A pilot study was conducted on 30 respondents in October 2012. Reliability
test using Cronbach’s coefficient alpha was used to test the reliability of the scales
and assess the internal consistency of individual constructs, subscales and overall
scale. The rule of thumb is that the coefficient alpha must be above 0.7 for the scale
to be reliable.160 The reliability for the present study was significant (Cronbach
Alpha .737). The main study was conducted from November 2012.
155Halfstrom, J. L., Chae, J. S., and Chung, Y. S. (1992). “Consumer Decision Making Styles:
Comparison Between United States and Korean Young Consumers.” Journal of Consumer Affairs, 26(1), 1-11 pp.
156Lysonski, S., Durvasula, S. and Zotos, Y. (1996), “Consumer Decision-Making Styles: A
Multicountry investigation”, European Journal of Marketing, Vol. 30, No. 12, pp. 10-21. 157Jessie X. Fan, Jing J. Xiao (1998), Consumer Decision-Making Styles of Young-Adult Chinese
consumers. Journal of Consumer Affairs. Volume 32, Issue 2, pages 275–294, Winter 1998. 158Canabal , M. E. (2002). Decision making styles of young south Indian consumers: an exploratory
study. College Student Journal, 36(1). 159Ghodeswar, B. M. (2007). Consumer decision-making styles among Indian students. Alliance
Journal of Business Research, 3(spring), 36-48 pp. 160Nunnally, J. C. (1978). Psychometric Theory. Second edition. New York, NY: McGraw-Hill. And, Hair Jr, JF, Anderson, RE, Tatham, RL and Black WC (1998) Multivariate data analysis
fourth edition. Prentice-Hall: London.

90
DATA COLLECTION
Primary data for the study has been collected using a questionnaire
developed by the researcher incorporating two validated tools, one to measure the
independent variable ‘values’ using the LOV - List of Values – Kahle (1983), and
the second to measure the dependent variable ‘Shopping Styles’- using Consumer
Styles Inventory: CSI- (Sproles and Kendall 1986; Sproles and Sproles 1990).
The questionnaire has three sections:
o The first section investigates the demographic profile of the young
adults,
o The second section consists of the modified version of Kahle’s LOV
[List of Values, 1983]
o The third section consists of the adapted version of Sproles & Kendall’s
CSI -Consumer Style Inventory, 1986.
Data collection was spread over a period of five months, from November
2012 to March 2013. Data was collected with the help of research assistants working
in the same department and institution of the researcher. The questionnaire was
given to respondents after enquiring their age and their willingness to participate in
the survey. Respondents were asked to state whether they were studying in
Bangalore in Under Graduate courses, Post Graduate courses or with other
qualifications. The education level of the respondents was also used as parameter to
obtain the demographic profile of the respondents and as a variable for testing
hypothesis.
The questionnaire was administered to a sample of 1600 male and female
young adults falling in the age group of 18-25 years who visited the four malls. Of
the 1600 questionnaires distributed, 1478 questionnaires were deemed valid for data
analysis yielding a response rate of 92%. Such a response rate was considered
sufficient for statistical reliability and generalisability,161 and more satisfactory when
compared with previous research works on consumer decision-making styles. The
161Tabachnick, Linda S. Fidell. (2001). Using Multivariate Statistics (6th Edition). Amazon.com

91
purpose for selecting such a large sample was to reduce the effect of non-sampling
errors.
The sample for the study consists of 54.4 per cent male and 45.6 per cent
female respondents. The respondents were from different regions with diverse
backgrounds ranging from urban to rural which also reflect their differences in
socio-economic status.
Research papers, journals and text books, internet based research libraries
Ebsco Host, SSRN, Jstor were also used extensively for the purpose of this study.
This study is also backed with extensive review of previous literatures under each
variable category of the study, namely Values, Young Adults, and Shopping Style.
PERIOD OF THE STUDY
Data collection for the study commenced in November 2012 and extended
till March 2013. Data analysis and interpretation was done in April & May 2013.
FRAME WORK OF ANALYSIS
The design of analysis of the data to establish the findings to the research
objectives is presented in a sequential manner as described below:
a) General Descriptive analysis based on demographic variables such
gender, educational level and regional back ground of respondents.
This is presented in tables indicating frequencies and percentages and
depicted in bar/pie diagrams. Under descriptive analysis, no attempt
was made to analyze the age of the respondents as it has been
reported that differences in attitudes and behaviour of adolescents
and youth under reference for this study is not due as much to age as
to education cohort.162 It was therefore assumed that no significant
difference would result from analysing differences in the age of the
respondents. 162Haytko, D. L. & Baker, J. (2004). It’s all at the mall: exploring adolescent girl’s experiences.
Journal of Retailing, 80(1), 67-83 pp.

92
b) Descriptive analysis for List of Values, Value dimensions and Shopping
Styles presented in tables indicating Mean and Standard Deviations in
descending order.
c) Reliability tests for List of Values and Shopping Styles indicating
Cronbach alpha.
d) Correlation analysis for testing relationship of overall values to shopping
styles, individual values to shopping styles, value dimensions to
shopping styles. Inter-correlations among values and among shopping
styles are also studied.
e) Structural Equation Modelling, Confirmatory Factor Analysis (CFA),
Goodness of Fit Measures (GFM), Multiple Regressions and Path
analysis for confirming the consumer shopping styles with the original
CSI constructs and testing the ‘Value Shopping-style Model’.
f) Testing of Hypotheses using ANOVA and t-test to study differences in
shopping styles, differences in value orientations and level of influence
of values, based on demographic segmentation variables such as gender,
education level, regional background of respondents, etc.
Description of Statistical Tools Employed
The data was processed and tabulated using Microsoft Excel 2007 and SPSS
version 19. Data analysis was performed by using software packages - IBM SPSS
(Statistical package for Social Sciences) version 19 and AMOS version 16.0.
Statistical Package for the Social Sciences (SPSS)
SPSS program is one of the most widely used tool for analysis within the
social sciences research and has the advantage of wide range of supporting
documentation and text books available to guide the researcher. First, a coding sheet
was prepared for all the questions in the questionnaire and the data was fed in SPSS
data editor. SPSS version 19 was used for all the non-specialist statistical analysis
such as general descriptive analysis, reliability tests, correlation analysis, T-test and

93
ANOVA. The SPSS provides features for descriptive and inferential statistical
analysis.
Analysis of Moment Structures (AMOS)
Analysis of Moment Structures (AMOS) version 16.0, a leading SEM
software package, was used in this study. AMOS is a user friendly software and
widely used within the social sciences research. It is one of the most common
covariance-based Structural Equation Modelling (SEM) techniques. The diagrams in
AMOS are much clearer compared to other software packages. AMOS also has wide
range of supporting documents to guide the researcher. The study used AMOS to
test the confirmation of original factors, model testing and path analysis.
Descriptive statistics
Descriptive statistics was used to compute mean, standard deviation and
percentages. Summary of the data was done using measures of central tendency and
measures of variation. Measures of central tendency included mean and measures of
variation included standard deviation. Mean and standard deviation provided a basic
descriptive feel of the distribution of data (response) for different variables in the
study.
Karl Pearson’s Coefficient of Correlation
Correlation is a statistical analysis that defines the variation in one variable by
the variation in another, without establishing a cause-and-effect relationship.
The coefficient of correlation is a measure of the strength of the relationship
between the variables; that is, how well changes in one variable can be predicted by
changes in another variable.
When using SPSS for Pearson correlation coefficient, the descriptive output
tells us about each set of data (i.e., the mean, standard deviation, and number of
values for each variable), and the correlation matrix in the output tells us how the
data are related. To ascertain if the correlation is statistically significant, the row
labeledsig should be referred. The value in this row is the probability of the null

94
hypothesis being true. For a two-tailed correlation test, the probability of the null
hypothesis (i.e., that there is no relationship between the variables) being true, sig
value should be less than the preset level of significance (typically 0.01 or 0.05). In
such a case, we can reject the null hypothesis and conclude that the relationship
between the variables is statistically significant.
In addition to using the sig value to determine whether to reject or retain the
null hypothesis, there is also another visual indication of statistical significance on
the output. By default, SPSS "flags" (marks) significant relationships with asterisks.
If the sig value is below the preset criterion of significance, SPSS will put asterisks
next the correlation value. Pearson’s correlation coefficient was used to study the
relationship between personal values and shopping styles of young adults.
Structural Equation Modelling (SEM)
Structural Equation Modelling (SEM) is a multivariate statistical
methodology, which takes a confirmatory approach to the analysis of a structural
theory. Structural Equation Modelling is confirmatory process, since it commences
with the specification of a model. It is a multivariate analysis method based on
fitting and testing multiple regression equation as specified by the model. SEM is a
set of techniques which allows examination of relationships between one or multiple
independent variable and one or more dependent variables.163 Though there are
many ways to describe SEM, it is most commonly thought of as a hybrid between
some form of Analysis of Variance (ANOVA)/Regression and some form of Factor
Analysis. In general, it can be remarked that SEM allows one to perform some type
of multilevel Regression/ ANOVA on factors. Structural Equation Modelling
combines two approaches: the predictive approach of econometrics, coupled with
the psychometric approach of inferring latent variables from multiple observed
variables.164 It essentially seeks to answer research questions by combining multiple
regression analysis of factors with exploratory factor analysis. A researcher proposes
a hypothesized series of relationships between the variables under investigation (the 163Tabachnick, Linda S. Fidell. (2001). Using Multivariate Statistics (6th Edition). Amazon.com 164 Chin, W. W. (1998b). The partial least squares approach to structural equation modelling. In G. A.
Marcoulides (Ed.), Modern methods for business research (pp. 295–336). Mahwah, NJ: Lawrence Erlbaum Associates, Inc

95
model) and Structural Equation Modelling enables the reasonableness of t
relationships implied by the model to be assessed. In the present study structural
equation modelling was used to test the Value – Shopping Style Model
(Measurement).
Confirmatory Factor Analysis (CFA)
Confirmatory Factor Analysis (CFA) which is a part of the Structural
Equation Modelling (SEM) techniques can be used to estimate a measurement
model that specifies the relationship between observed indicators and their
underlying latent constructs. The measurement model specifies how latent constructs
are measured by the observed variables. CFA is often used to confirm a factor
structure known beforehand as is the case with the constructs in the study.
In statistics, CFA is a special form of factor analysis. It is used to test
whether measures of a construct are consistent with the researcher’s understanding
of the nature of that construct (factor). In contrast to exploratory factor analysis,
where all loadings are free to vary, CFA allows for the explicit constraint of certain
loadings to be zero. CFA assesses the fit of the model. Model fit measures could be
then obtained to assess how well the proposed model captured the covariance
between all the items on the test. If the fit is poor, it may be due to some items
measuring multiple factors. It might also be that some items within a factor are more
related to each other than others.
Goodness of Fit Measures (GFM)
“Goodness of fit measures” was used to test the appropriateness of the
structural model using the Amos 16.0 software. The overall fit of a model in
Structural Equation Modelling can be assessed using a number of fit indices. There
is a broad consensus that no single measure of overall fit should be relied on
exclusively and a variety of different indices should be consulted.165 There are
several indicators of Goodness-of-fit and most structural equation modelling
scholars recommend evaluating the models by observing more than one of these 165Tanaka, 1993. Tanaka, J.S. (1993). Multifaceted conceptions of fit in structural equation models. In
K.A. Bollen, & J.S. Long (eds.), Testing structural equation models. Newbury Park, CA: Sage

96
indicators.166 Dozens of statistics, besides the value of the discrepancy function at its
minimum, have been proposed as measures of the merit of a mode. Choice of
Goodness-of-fit indexes should be based on careful consideration of critical factors
like sample size, estimation procedure, model complexity and/or violation of the
underlying assumptions of multivariate normality and variable independence.
Validity Measures
The Confirmatory Factor analysis is executed to test the validity of the
instruments through content validity, convergent validity, discriminant validity and
criterion related validity. Content validity refers to the degree which an instrument
covers the meaning of the concepts included in a particular research. For this study,
the content validity of the proposed instrument is adequate enough because the
instrument has been carefully constructed, validated and refined, supported by an
extensive literature review.
Construct validity: Construct validity is the extent to which a set of
measured variables actually represent the theoretical latent construct that they are
designed to measure.167To assess the construct validity of the scale, exploratory and
confirmatory factor analytic procedures were applied.
Convergent validity: Convergent validity is the extent to which indicators
of a specific construct ‘converge’ or share a high proportion of variance in common.
Convergent validity identifies the proportion of variance for each factor. To assess
this, standardized factor loadings in the measurement model were examined,
composite or construct reliability (CR) and average variance extracted (AVE) was
computed.
Construct Reliability (CR) = {(sum of standardized loadings)2} / {(sum of
standardized loadings)2 + (sum of indicator measurement errors)}
166Hu &Bentler (1999).Cutoff criteria for fit indexes in covariance structure analysis: Coventional
criteria versus new alternatives, Structural Equation Modeling, 6(1), 1-55 pp. 167Hair, J. F., Black, W. C., Babin, B. J., Anderson, R. E. &Tatham, R. L. (2005).Multivariate data
analysis (6th Ed.). Upper Saddle River, NJ: Prentice Hall.

97
Multiple Regression and Path Analysis
Regression analysis involves identifying the relationship between a
dependent variable and one or more independent variables. A model of the
relationship is hypothesized, and estimates of the parameter values are used to
develop an estimated regression equation. Various tests are then employed to
determine if the model is satisfactory. If the model is deemed satisfactory, the
estimated regression equation can be used to predict the value of the dependent
variable, given the values for the independent variables.
Path analysis, an extension of multiple regression, lets us look at more than
one dependent variable at a time and allows for variables to be dependent with
respect to some variables and independent with respect to others. Structural equation
modelling extends path analysis by looking at latent variables. A multiple regression
model is drawn as a path analysis.
In addition to being thought of as a form of multiple regression focusing on
causality, path analysis can be viewed as a special case of structural equation
modelling (SEM) – one in which only single indicators are employed for each of the
variables in the causal model. That is, path analysis is SEM with a structural model,
but no measurement model. Other terms used to refer to path analysis include causal
modelling, analysis of covariance structures, and latent variable models.
t Statistic for Equality of Variances
The t-test is used for testing differences between two means. In order to use a
t-test, the same variable must be measured in different groups, at different times, or
in comparison to a known population mean. Comparing a sample mean to a known
population is an unusual test that appears in statistics books as a transitional step in
learning about the t-test. The more common applications of the t-test are testing the
difference between independent groups or testing the difference between dependent
groups.
The independent t-test, also called the two sample t-test or student's t-test, is
an inferential statistical test that determines whether there is a statistically significant

98
difference between the means in two unrelated groups. A t-test for independent
groups is useful when the researcher's goal is to compare the difference between
means of two groups on the same variable. "Independent groups" means that the
groups have different people in them and that the people in the different groups have
not been matched or paired in any way. A t-test for related samples or a t-test for
dependent means is the appropriate test when the same people have been measured
or tested under two different conditions or when people are put into pairs by
matching them on some other variable and then placing each member of the pair into
one of two groups.
The null hypothesis for the independent t-test is that the population means
from the two unrelated groups are equal: H0: 1 = 2
In most cases, we are looking to see if we can show that we can reject the
null hypothesis and accept the alternative hypothesis, which is that the population
means are not equal: HA: 1 2
This requires the setting of a significance level (alpha) that allows us to
either reject or accept the alternative hypothesis. Most commonly, this value is set at
0.05.
"Levene's Test for Equality of Variances" is a test of the homogeneity of
variance assumption. The output in SPSS begins with the means and standard
deviations for the two variables which is key information that will need to be
included in any related research report. The "Mean Difference" statistic indicates the
magnitude of the difference between means. When combined with the confidence
interval for the difference, this information can make a valuable contribution to
explaining the importance of the results. When the value for F is large and the P-
value is less than 0.05, it indicates that the variances are heterogeneous which
violates a key assumption of the t-test.
The first format for "Equal" variances is the standard t-test taught in
introductory statistics. This is the test result that should be reported in a research
report under most circumstances. The second format reports a t-test for "Unequal"

99
variances. This is an alternative way of computing the t-test that accounts for
heterogeneous variances and provides an accurate result even when the homogeneity
assumption has been violated (as indicated by the Levene test). It is rare that one
needs to consider using the "Unequal" variances format because, under most
circumstances, even when the homogeneity assumption is violated, the results are
practically indistinguishable. The output for both formats shows the degrees of
freedom (df) and probability (2-tailed significance). As in all statistical tests, the
basic criterion for statistical significance is a "2-tailed significance" less than 0.05.
Levene's test is used to assess the homogeneity of variance between sets of
scores. It tests the null hypothesis that "there is no significant difference between the
two population variances". A basic assumption underlying the use of parametric
tests such as the t-test or Analysis of Variance is that the variance (degree of spread)
for scores for each variable or condition must be roughly equal. Levene's and some
other tests are used to examine if this is the case.
If the Levene's test produces a non significant result (i.e. p is greater than
0.05), then one should use the "Equal variances are assumed" output. However, if
the Levene's test produces a significant result (i.e. p is less than 0.05) then one
should use the lower line that is labelled "Equal variances are not assumed". In this
case, the result is based on a correction for the lack of homogeneity of variance.
The Levene's test allows researchers to check for equality of variance. If the
spread of the data in the two different groups is different (unequal variances) then,
the Levene's test will reveal this difference in the output. SPSS will generate output
for two different t-tests: equal variances assumed and equal variances NOT
assumed. If the Levene's test is SIGNIFICANT, it means the variances are NOT
equal, so the results of the equal variances NOT assumed should be considered.
If the Levene's test is NOT significant, then the results of the equal variances
assumed t-test should be considered.

100
ANOVA
The ANOVA is a statistical technique which compares different sources of
variance within a data set. The purpose of the comparison is to determine if
significant differences exist between two or more groups. The ANOVA test is used
to determine the impact independent variables have on the dependent variable in a
regression analysis.
The one-way analysis of variance (ANOVA) is used to determine whether
there are any significant differences between the means of two or more independent
(unrelated) groups.
Like the t-test, the ANOVA calculates the ratio of the actual difference to the
difference expected due to chance alone. This ratio is called the F ratio and it can
be compared to an F distribution, in the same manner as a t ratio is compared to a t
distribution. For an F ratio, the actual difference is the variance between groups,
and the expected difference is the variance within groups.
In the ANOVA setting, the observed variance in a particular variable is
partitioned into components attributable to different sources of variation. In its
simplest form, ANOVA provides a statistical test of whether or not the means of
several groups are equal, and therefore generalizes t-test to more than two groups.
Doing multiple two-sample t-tests would result in an increased chance of
committing a type I error. For this reason, ANOVAs are useful in comparing
(testing) three or more means (groups or variables) for statistical significance.

101
CHAPTER IV
PERSONAL VALUES AND SHOPPING STYLES
In this study a ‘Value Shopping Style Model’ is proposed and tested. The
model has been developed on a three-fold phase involving an extensive review of
theory relating to consumer behaviour, review of past studies in the related area that
used value scales and consumer styles inventory, and personal interaction with
apparel manufacturers and marketers.
Theoretical Background of Consumer Behaviour
Consumer behaviour is “the study of individuals, groups, or organizations
and the processes they use to select, secure, use, and dispose of products, services,
experiences, or ideas to satisfy needs and the impacts that these processes have on
the consumer and society.”168
Insight into customer buying behaviour or consumer decision-making
process leads to a better development of an effective marketing strategy.
Understanding buying-related decision-making behaviour of consumers is important
for companies’ strategic marketing activities. Effective communication with
different consumer segments can be made by understanding the psychological
processes that affect consumer behaviour.
A marketer can rarely satisfy everyone in a market. Not everyone likes the
same toothpaste, beverage, automobile, TV channel, mobile handset and perfume.
Therefore, marketers identify and profile distinct groups of buyers who might prefer
or require different products and marketing mixes. Market segmentation is an
essential part of the marketing process. It allows firms to allocate their market into
groups that have the same characteristics which are relevant for decision making in
the marketing strategy.
168Hawkins and Mothersbaugh.(2013). Consumer Behavior. Chapter 1

102
The different types of market segmentation are demographic segmentation,
where marketers divide the market into smaller segments based on gender, age,
marital status, income, family size, occupation, education, religion, race, and
nationality. Geographic segmentation refers to the segmentation of the market
according to geographic criteria such as Nations, States, Regions, Countries, Cities
or Zip codes. Psychographic segmentation is where consumers are divided
according to their lifestyle, attitudes, interests, personality, values and social class.
Behavioural Segmentation is where the segmentation is based on benefits that are
required, purchase occasion, purchase behaviour, usage and perception and beliefs
of consumers.
For many years, demographic segmentation is the basis in which marketers
used to target consumers. Though demographic still continues to be the most
preferred and easier approach to segmentation, researchers have established that
they do not provide a complete understanding of the individual consumer. The basic
difference between the two types is that while demographics segment consumers
based on their similarities, psychographics segment consumers based on their
individual differences. Demographics help to make an initial step into market sizing
and segmentation. Whereas, psychographics helps to understand the psychology of
how a person makes decisions, and their own self-image.
The consumers in the same demographic segment possess divergent
psychographic makeup. Thus, psychographic segmentation allows the marketer to
look at consumers as real people or entities. The demographic and psychographic
approaches are highly complementary and work best together. People hailing from
the same sub-culture, social class and even occupation follow quite different
lifestyles.
Psychographic segmentation offers many benefits to marketers. Besides the
most obvious benefit of increased sales; it also increases the brand value of the
company in the eyes of the customer, provides greater usefulness of the product for
the customer and better inputs for the design of new products that the customer will
like. It also results in lesser amount of money spent on marketing as it is approaches

103
a more specific group. Marketers find it easier to target a specific type of customer
base and derive effective and efficient marketing strategies. A greater degree of
customer satisfaction and customer loyalty leads to higher amount of customer
retention. Psychographics also enables strategic positioning of new products,
repositioning of existing products, develop new product concepts and create new
product opportunities in specific fields.
Psychographics has proven to be a very useful tool for organisations in their
marketing research. It identifies target markets that could not be isolated using only
demographic variables. Psychographics are designed to measure the consumer's
pre-disposition to buy a product and the factors that influence and stimulate buying
behaviour. Researchers have often paid their attention towards psychographics
because of the limitations encountered in demographics. An advantage of
psychographics is that it describes segments in terms that are directly relevant to
advertisement campaign and market planning decisions of organisations.
Psychographic segmentation suffers from the drawbacks of any priori169
segmentation. The most serious problem is that consumers are constantly changing,
so the segmentation framework needs to be changed in order to keep up the pace.
People’s attitudes and circumstances change quickly and it is difficult for fixed
segmentation frameworks to reflect this accurately. On the other hand, behavioural
based schemes can capture the results of these changes as they affect buying
patterns, allowing the marketer to respond.
There are reliability problems in psychographic segmentation. Firstly, there
are no standardized methods to evaluate the stability of the results of psychographic
techniques and uncertainty in this area weakens predictive power. Therefore, it will
create doubts regarding the reliability of the targeted segment and market. The main
problem is that psychographics attempt to measure intangible and diffuse concepts.
Values and attitudes are not easy to measure as every single person has a different
169Meaning: -relating to or denoting reasoning or knowledge which proceeds from theoretical deduction rather than from observation or experience:http://www.oxforddictionaries.com
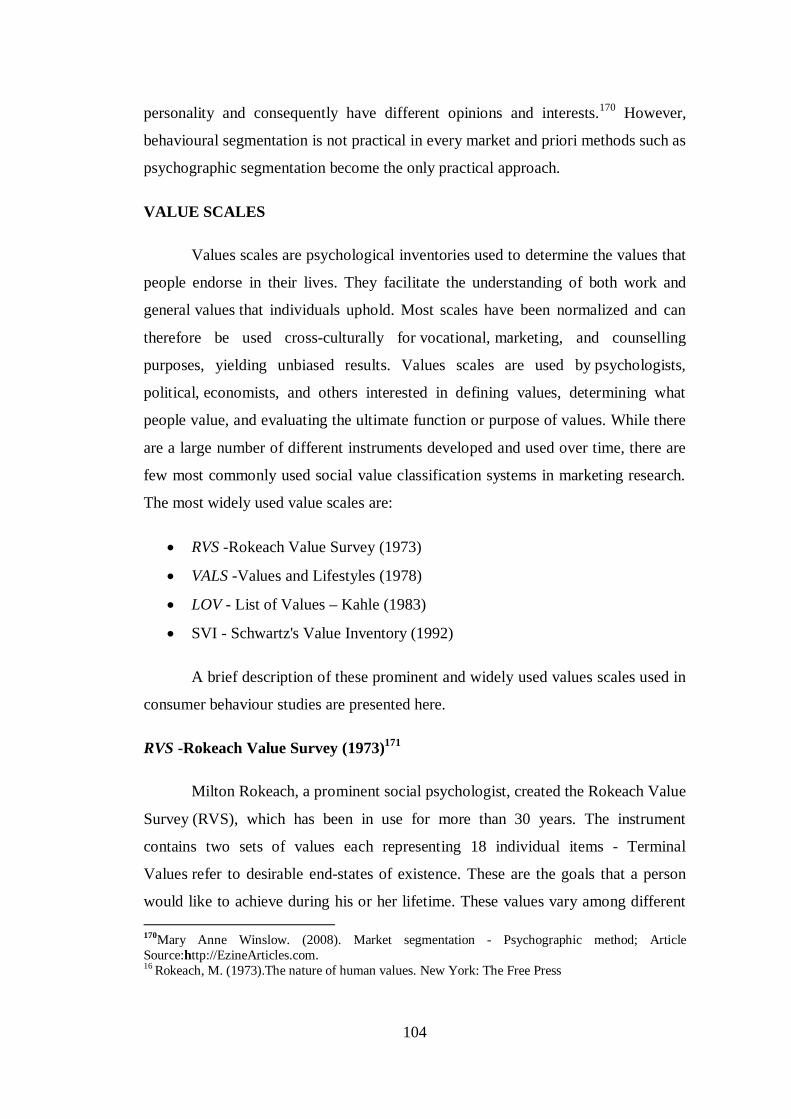
104
personality and consequently have different opinions and interests.170 However,
behavioural segmentation is not practical in every market and priori methods such as
psychographic segmentation become the only practical approach.
VALUE SCALES
Values scales are psychological inventories used to determine the values that
people endorse in their lives. They facilitate the understanding of both work and
general values that individuals uphold. Most scales have been normalized and can
therefore be used cross-culturally for vocational, marketing, and counselling
purposes, yielding unbiased results. Values scales are used by psychologists,
political, economists, and others interested in defining values, determining what
people value, and evaluating the ultimate function or purpose of values. While there
are a large number of different instruments developed and used over time, there are
few most commonly used social value classification systems in marketing research.
The most widely used value scales are:
RVS -Rokeach Value Survey (1973)
VALS -Values and Lifestyles (1978)
LOV - List of Values – Kahle (1983)
SVI - Schwartz's Value Inventory (1992)
A brief description of these prominent and widely used values scales used in
consumer behaviour studies are presented here.
RVS -Rokeach Value Survey (1973)171
Milton Rokeach, a prominent social psychologist, created the Rokeach Value
Survey (RVS), which has been in use for more than 30 years. The instrument
contains two sets of values each representing 18 individual items - Terminal
Values refer to desirable end-states of existence. These are the goals that a person
would like to achieve during his or her lifetime. These values vary among different 170Mary Anne Winslow. (2008). Market segmentation - Psychographic method; Article Source:http://EzineArticles.com. 16 Rokeach, M. (1973).The nature of human values. New York: The Free Press

105
groups of people in different cultures. Instrumental Values refer to preferable modes
of behaviour. These are the means of achieving the terminal values.
The value survey asks subjects to rank the values in order of importance to
them. The actual directions are as follows: “Rank each value in its order of
importance to you. Study the list and think of how much each value may act as a
guiding principle in your life. The Rokeach Value Survey has been extensively used
in empirical research work by psychologists, sociologists and marketers.
Rokeach Value List consists of:
Terminal values: True Friendship, Mature Love, Self-Respect, Happiness,
Inner Harmony, Equality, Freedom, Pleasure, Social Recognition, Wisdom,
Salvation, Family Security, National Security, A Sense of Accomplishment, A
World of Beauty, A World at Peace, A Comfortable Life, An Exciting Life.
Instrumental values: Cheerfulness, Ambition, Love, Cleanliness, Self-
Control, Capability, Courage, Politeness, Honesty, Imagination, Independence,
Intellect, Broad-Mindedness, Logic, Obedience, Helpfulness, Responsibility,
Forgiveness.
VALS -Values and Lifestyles172
VALS (“Values, Attitudes and Lifestyles”) is a proprietary research
methodology used for psychographic market segmentation. VALS was developed in
1978 by social scientist and consumer futurist Arnold Mitchell and his colleagues at
SRI International. It was immediately embraced by advertising agencies, and is
currently offered as a product of SRI's consulting services division. VALS draws
heavily on the work of Harvard sociologist David Riesman and psychologist
Abraham Maslow. Both public television and radio of United States track customer
loyalty using the VALS Psychographic segmentation system developed by SRI
Consulting (Susan Myrland). The basic tenet of VALS is that people express their
personalities through their behaviours. VALS specifically defines consumer
172http://www.strategicbusinessinsights.com/vals/

106
segments on the basis of those personality traits that affect behaviour in the
marketplace. VALS uses psychology to analyze the dynamics underlying consumer
preferences and choices.
However, it should be noted that VALS is a proprietary tool and use of
VALS is restricted to permissions and applicable only within The US.
The VALS segments are as follows:
1. Innovators – Sophisticated, high self esteem, upscale; and image is important
to them.
2. Thinkers – Conservative, practical, income allows many choices; and these
people look for value.
3. Achievers – Goal oriented lifestyle; image is very important to them.
4. Experiencers – Like “cool stuff,” like excitement and variety, and they spend
a high proportion of income on fashion.
5. Believers – Conservative; they like familiar and established brands.
6. Strivers – Trendy and fun loving, money defines success; they are concerned
about the opinion of others.
7. Makers – Practical people, do it yourself, unimpressed by material
possessions; they prefer value to luxury.
8. Survivors – Few resources, buy at a discount, very modest market; they have
little motivation to buy.
Schwartz's Value Inventory (SVI)173
Shalom Schwartz (1992, 1994) used his 'Schwartz Value Inventory' (SVI)
with a wide survey of over 60,000 people to identify common values that acted as
‘guiding principles for one’s life’. Schwartz identified and validated 10 value
domains or distinct value groups with a total of 56 or 57 values included in them.
Values are rated by participants of the survey according to the importance of values
for them. The domains represent either individualistic or collective values, or a
173 Schwartz, S. H. (1992). Universals in the content and structure of values: Theory and empirical
tests in 20 countries. In M. Zanna (Ed.).Advances in experimental social psychology (Vol. 25) (pp. 1-65). New York: Academic Press.

107
combination of them, and are viewed in a framework of four dimensions - openness
to change, self-enhancement, conservation and self-transcendence.
Schwartz Value Inventory assesses for the following values:
Achievement: Personal success through the demonstration of competence in
accordance with society's standards, e.g., ambition.
Benevolence: Preservation and enhancement of the welfare of others in one's
immediate social circle, e.g., forgiveness.
Conformity: Restraint of actions that violate social norms or expectations, e.g.,
politeness.
Hedonism: Personal gratification and pleasure, e.g., enjoyment of food, sex, and
leisure.
Power: Social status, prestige, dominance, and control over others, e.g., wealth.
Security: Safety, harmony, and stability of society, e.g., law and order.
Self-direction: Independent thought and action, e.g., freedom.
Stimulation: Excitement, novelty, and challenge in life, e.g., variety.
Tradition: Respect for and acceptance of one's cultural or religious customs, e.g.,
religious devotion.
Universalism: Understanding, appreciating, and protecting all people and nature,
e.g., social justice, equality, environmentalism.
LOV - List of Values – Kahle (1983)174
The list of values (LOV) is a widely used scale for the measurement of values in
a variety of consumer behaviour contexts. Kahle has suggested that the instrument is
a widely accepted measure for cross-cultural comparison of values. Developed at the
174William O. Bearden, Richard G. Netemeyer. (1999). Handbook of Marketing Scales.Multi-Item
Measures for Marketing and Consumer Behavior Research

108
University of Michigan Survey Research Centre, the LOV is based on the theoretical
contributions Abraham Maslow, Milton Rokeach and Feather.175The LOV items
were derived by culling the values from a much larger pool of values to the nine
LOV items. Initiated by the work of Veroffet al., it was further developed by Lynn
Kahle to address the limitations of the Rokeach Value Survey (RVS) and provide a
more parsimonious measurement of personal values. Kahle first used the LOV scale
in America with 2264 adult respondents. Subsequent research has confirmed the
reliability and validity of the LOV and applied it to many specific consumer
behaviours, including opinion leadership, gift giving, and conformity in dress,
advertising preferences and sports participation.
The List of Values (LOV) typology draws a distinction between external and
internal values, and it notes the importance of interpersonal relations in value
fulfillment, as well as personal factors (i.e., self-respect, self-fulfillment) and a
personal factors (i.e., fun, security, excitement) in value fulfillment. In essence, the
LOV measures those values that are central to people in living their lives,
particularly the values of life’s major roles (i.e., marriage, parenting, work, leisure,
and daily consumptions). The LOV is most closely tied to social adaptation and
many studies suggest that the LOV is related to and/or predictive of consumer
behaviour and related activities.176
The LOV is composed of nine values that can be scored in a number of
ways. Each value can be evaluated on 9- or 10-point scales (very unimportant to
very important), or the values can be rank ordered from most to least important.
Also, some combination of the two methods can be used where each value is rated
on 9- or 10-point scales and then subjects are asked to circle the one or two values
that are most important to them in living their daily lives. The original List of
Values: LOV177 developed by Kahle (1983) consists of the following values:
175Rokeach, Milton J. (1973). The Nature of Human Values, New York: Free Press. Maslow,
Abraham H. (1954), Motivation and Personality, New York: Harper. Feather, Norman T. (1975), Values in Education and Society, New York: Free Press.
176Homer, Pamela and Lynn R. Kahle (1988).A structural equation analysis of the value-attitude-behavior hierarchy.Journal of Personality and Social Psychology, 54, 638–46.
177Kahle, Lynn R. ed. (1983).Social Values and Social Change: Adaptation to Life in America. New York, NY: Praeger Publishers.

109
Table 06
List of Values: LOV (Original)
Kahle 1983
The following are a list of ‘values’ that some people look for or want out of
life. Please study the list carefully and then; Rate each value on how important it is
in your daily life, where 1= least important and 9= very Important.
1(L) 2 3 4 5 6 7 8 9(H)
1. Sense of Belonging
2. Excitement
3. Warm Relationships with others
4. Self-fulfillment
5. Being Well-respected
6. Fun and enjoyment of life
7. Security & Comfort
8. Self-respect
9. A sense of accomplishment
In the original study using LOV by Kahle (1983), only 2% of the sample
endorsed “excitement” as their top value, therefore subsequently, excitement was
collapsed into the “fun and enjoyment in life” category. Kahle’s List of Values does
not dictate that respondents be given definitions of the values which they are asked
to reflect upon. Without a descriptor to establish a common approach to each value,
each respondent to the LOV may not be rating the same set of values. They may be
rating their own subjective interpretations of them instead. The implications are
potentially important because, if certain values have multiple interpretations, the
classification of individuals into value segments on the basis of the single most
important value may be misleading.

110
Giving due consideration to the above two shortcomings of the original
LOV, the scale has been adapted to suit the specific requirements of the present
study which are stated as follows:
a) To remove the value “excitement” as it could be mis-interpreted by
the age group under reference and also because it is similar to the
value “fun & enjoyment in life” as suggested by Kahle.178
b) To add two additional values that are relevant for the study and that
would have a bearing on the manner a person dresses and hence
would have an impact on the clothing purchase decision. The values
added are: ‘Simplicity’ and ‘Being Independent’.
c) To add a descriptor to establish a common approach to each value in
order to avoid subjective/multiple interpretations
THE CONSUMER STYLES INVENTORY [CSI] SPROLES & KENDALL
1986179
A consumer decision-making style is defined as a mental orientation
characterizing a consumer’s approach to make choices. It is a basic consumer
personality, similar to the concept of personality in psychology.180The examination
ofthe decision-making construct can be categorised into three major approaches: the
psychographic/lifestyle approach,181 the consumer typology approach,182 and the
consumer characteristics approach.183 Among these three approaches, the consumer
characteristics approach has been widely acknowledged by consumer researchers as
the most explanatory and powerful construct because it focuses on the cognitive and
affective aspects of consumer behaviour. This approach deals with consumers’
general predisposition towards the act of shopping and describesthe mental
178Kahle, Lynn R. ed. 1983.Social values and social change: adaptation to life in America. New York,
NY: Praeger Publishers. 179Sproles, G.B., Kendall, E.L., (1986), “A methodology for profiling consumer decision making
styles”, The Journal of Consumer Affairs, 20 (2): 67-79 180Sproles G.B. & Kendall, E.L. (1986).A methodology for profiling consumers’ decision-making
styles.Journal of Consumer Affairs, 20 (2), 267-279. 181 Wells, W.D. (1975). Psychographics: A review. Journal of Marketing Research, 11 (May), 196-213. 182Kenson, K. M. (1999). A profile of apparel shopping orientation segments among male consumers.
Unpublished MA, thesis, California State University Long Beach. 183Sproles, E. K. &Sproles, G. B. (1990). Consumer decision-making styles as a function of
individual learning styles. Journal of Consumer Affairs, 24 (1), 134-147.

111
orientation of consumers in their decision-making process.184The underlying idea is
that consumers engage in shopping with certain fundamental decision-making
styles.185
Sproles and Kendall conceptualized the Consumer StylesInventory (CSI),
which is an early attempt to systematically measure shopping orientationsusing
decision-making orientations. One of the most important assumptions of this
approachis that each individual consumer has a specific decision-making style
resulting from acombination of their individual decision making dimensions.
Decision making styles are very important to marketers who want to expand their
products or services into new and overseas markets because, if they can comprehend
the different cultures of these markets, they can easily target their products, services,
locations and promotional efforts according to the types of consumers and identify
the differences and similarities of consumer decision making between different
countries.186
Sproles and Kendall used data from samples of young consumers in the
United States to measure basic characteristics of consumer decision-making styles.
They developed and validated a Consumer Styles Inventory (CSI) for this purpose.
This model has been used internationally by many great researchers to identify the
different shopping characteristics or decision-making styles of consumers. There
have been a substantial number of studies designed to investigate consumer
behaviour.Based on his review of previous literature, Sproles187 initially identified
50 items relating to consumers’ cognitive and affective orientation towards shopping
activities. Subsequently the inventory was refined and a more parsimonious scale
consisting of 40 items was developed. The Consumer Style Inventory (CSI) that
they have developed consists of eight mental consumer style characteristics. Specific
descriptions were given for each style by the authors. 184Lysonski, S., Durvasula, S. &Zotos, Y. (1996). Consumer decision-making styles: a multi-country
investigation. European Journal of Marketing, 30 (12), 10-21. 185SafiekMokhlis and HayatulSafrahSalleh, (2009). Consumer decision-making styles in Malaysia:
An exploratory study of gender differences. European Journal of Social Sciences – Volume 10, Number 4
186Ivan DamirAni , Anita CiunovaSuleska, Edo Rajh. (2010). Decision-making styles of young-adult Ekonomskaistraživanja, Vol. 23, No. 4 (102-113)103
187Sproles, E. K. & Sproles, G. B. (1990). Consumer decision-making styles as a function of individual learning styles. Journal of Consumer Affairs, 24 (1), 134-147.
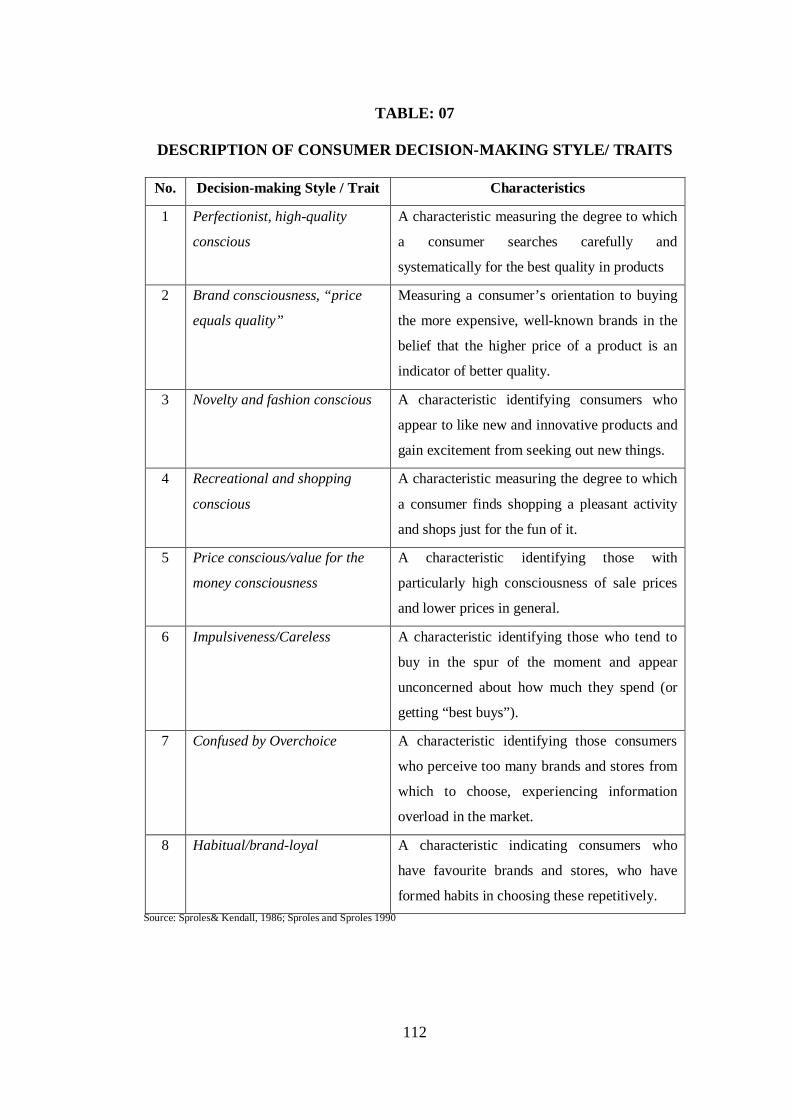
112
TABLE: 07
DESCRIPTION OF CONSUMER DECISION-MAKING STYLE/ TRAITS
No. Decision-making Style / Trait Characteristics
1 Perfectionist, high-quality
conscious
A characteristic measuring the degree to which
a consumer searches carefully and
systematically for the best quality in products
2 Brand consciousness, “price
equals quality”
Measuring a consumer’s orientation to buying
the more expensive, well-known brands in the
belief that the higher price of a product is an
indicator of better quality.
3 Novelty and fashion conscious A characteristic identifying consumers who
appear to like new and innovative products and
gain excitement from seeking out new things.
4 Recreational and shopping
conscious
A characteristic measuring the degree to which
a consumer finds shopping a pleasant activity
and shops just for the fun of it.
5 Price conscious/value for the
money consciousness
A characteristic identifying those with
particularly high consciousness of sale prices
and lower prices in general.
6 Impulsiveness/Careless A characteristic identifying those who tend to
buy in the spur of the moment and appear
unconcerned about how much they spend (or
getting “best buys”).
7 Confused by Overchoice A characteristic identifying those consumers
who perceive too many brands and stores from
which to choose, experiencing information
overload in the market.
8 Habitual/brand-loyal A characteristic indicating consumers who
have favourite brands and stores, who have
formed habits in choosing these repetitively. Source: Sproles& Kendall, 1986; Sproles and Sproles 1990

113
The 40-item Consumer Style inventory (CSI) was tested on a sample of 482
individuals of the US youth population. The subjects were all high school students in
home economics classes. Also for each style, a three-item short form of the scale
is available (i.e., 24 items total). All items are scored on 5-point Likert- type scales
ranging from strongly disagree to strongly agree. Item scores are summed within
each style separately to create composite scores for each style.
The original version on the Consumer Style Inventory is given below:
Table 08
Consumer Styles Inventory CSI (original constructs)
Sproles& Kendall (1986, 1990)
1) Perfectionist/High Quality Conscious (seven-item alpha = 0.74, three-item
alpha = 0.69)
1. Getting very good quality is very important to me.
2. When it comes to purchasing products, I try to get the very best or perfect choice.
3. In general, I usually try to buy the best overall quality.
4. I make a special effort to choose the very best quality products.
5. I really don’t give my purchases much thought or care. *
6. My standards and expectations for products I buy are very high.
7. I shop quickly, buying the first product or brand I find that seems good enough. *
2 Brand Consciousness/Price Equals Quality (six term alpha = 0.75, three –
item alpha=0.63)
1. The well-known national brands are for me.
2. The more expensive brands are usually my choices.
3. The higher the price of the product, the better the quality.
4. Nice department and specialty stores offer me the best products.
5. I prefer buying the best selling brands.
6. The most advertised brands are usually very good choices.

114
3) Novelty and Fashion Conscious (five-item alpha = 0.74, three-item alpha =
0.76)
1. I usually have one or more outfits of the very newest style.
2. I keep my wardrobe up-to-date with the changing fashions.
3. Fashionable, attractive styling is very important to me.
4. To get variety, I shop at different stores and choose different brands.
5. It’s fun to buy something new and exciting.
4 Recreational and Shopping Conscious (five-item alpha = 0.76, three-item
alpha = 0.71)
1. Shopping is not a pleasant activity to me. *
2. Going shopping is one of the most enjoyable activities of my life.
3. Shopping the stores wastes my time.*
4. I enjoy shopping just for the fun of it.
5. I make shopping trips fast. *
5) Price Conscious/Value for the money (alpha = 0.48)
1. I buy as much as possible at sale prices.
2. The lowest price products are usually my choice.
3. I look carefully to find the best value for the money.
6 Impulsiveness/Careless (five-item alpha = 0.48, three-item alpha = 0.41)
1. I should plan my shopping more carefully than I do.
2. I am impulsive when purchasing.
3. Often I make careless purchases I later wish I had not.
4. I take the time to shop carefully for best buys. *
5. I carefully watch how much I spend. *

115
7) Confused by Overchoice (four-item alpha = 0.55, three-item alpha = 0.51)
1. There are so many brands to choose from that I often feel confused.
2. Sometimes its hard to choose which stores to shop.
3. The more I learn about products, the harder it seems to choose the best.
4. All the information I get on the different products confuses me.
8) Habitual/Brand Loyalty (four-item alpha = 0.53, three-item alpha = 0.54)
1. I have favourite brands I buy over and over.
2. Once I find a product or brand I like, I stick with it.
3. I go to the same stores each time I shop.
I change brands I buy regularly. * Notes: * denotes items that require reverse scoring. Items scored on 5-point Likert-
type scales from strongly disagree to strongly agree.
For the purpose of this study the original Consumer Style Inventory was
adapted with the following modifications:
a) The three item short version of the Consumer Style Inventory – i.e.,
the 24 item inventory was used instead of the lengthy 40 item
inventory. This was done keeping in the mind the age group of
respondents who may not have the patience to fill up a lengthy
questionnaire.
b) The original 24 statements were partially re-worded to describe
shopping behaviour towards apparels. This was done to ensure that
every respondent gave his/her opinion for each statement with
apparels as the product to consider for purchase.

116
APPAREL MANUFACTURES/MARKETERS PERSPECTIVES ON THE
PROPOSED VALUE- SHOPPING STYLE MODEL OF THE STUDY
The researcher intended to confirm the appropriateness of the proposed
model directly from the apparel manufacturers, marketers and fashion designers to
ensure that the findings of the study benefit the target audience. A semi-structured
interview was conducted with a randomly selected group of ten individuals working
in Bangalore, comprising of Store Managers of leading apparel brands, fashion
designers in international brand companies and retail apparel marketers. The
summary of the discussion is presented below.
The target customers for most of the respondents were Men/Women/kids of
all age groups. The type of apparels they dealt in varied from Casual wear and
formal wear to all categories of apparels. All the respondents agreed that they design
clothes as per customer needs.
Primarily apparel marketers assess customer needs and preferences with the
help of Fashion/Trends magazines, whereas apparel manufacturers and fashion
designers also conduct their own research to assess their target customer needs and
preferences. While generally profiling young adult consumers for apparels, all the
respondents strongly agreed that young adult consumers are selective about the
clothes they wear; agreed that young adult consumers prefer good quality clothes
and are fashion conscious. They agreed that cultural background and value systems
affect young adults’ apparel buying behaviour. They neither agreed nor disagreed
that young adult consumers are highly brand conscious, are impulsive when
purchasing apparels and are brand loyal.
The modes of advertising that is most effective to reach young adult
consumers were: firstly, the television and secondly, the internet. However, they felt
that it depends on the retail model. If it’s an online retail model then the internet is
the best marketing tool. If it’s an offline retail model, then Television and Fashion
magazines would serve to be more appropriate for marketing. Hoardings and
Newspapers primarily create brand awareness.

117
Most of the manufacturers and marketers had done some research to study
the factors that influence buying behaviour of young adults for apparels. They
expressed that personal values affect the buying behaviour for apparels; however, a
few of them stated that it depends upon which tier/band of income & city were
targeted because values affect buying behaviours in Tier-II and Tier-III cities.
Fashion is the main consideration while selecting apparels by young adults.
All of them agreed that a model that studies the link between personal values and
buying behaviour for apparels would be very useful for the Indian market to help
them develop better marketing strategies.
The given inputs and the intense review of literatures in the related area
supported in developing the ‘Value – Shopping Style Model’ which is proposed
and tested in this study.

118
‘THE VALUE - SHOPPING STYLE MODEL’
Do values influence the Shopping styles of young adults for apparel
purchases? The study aims to establish this relationship by proposing ‘The Value –
Shopping Style Model’ illustrated in Fig. 3 below:
FIG. 3: ‘THE VALUE – SHOPPING STYLE MODEL’ - VSM
The model is proposed and tested to verify the validity of adding two new
values ‘Simplicity’ and ‘Being Independent’ which were not part of the original
LOV developed by Kahle (1983),and the confirmation of the Apparel Shopping
Constructs to the original CSI Constructs developed by Sproles & Kendall (1986).
PERSONAL VALUES
1. Self-respect,
2. Security,
3. Warm relationships with others,
4. Self fulfillment,
5. A sense of accomplishment,
6. Being respected,
7. A sense of belonging,
8. Fun and enjoyment of life,
9. Simplicity
10. Being Independent
SHOPPING STYLES
1. Perfectionist, high quality
conscious consumer
2. Brand conscious, “price equals
quality” consumer
3. Novelty-fashion conscious
consumer
4. Recreational and hedonistic
shopping consciousness
5. Price conscious, “value for
money” consumer
6. Impulsive, careless consumer
7. Confused by overchoice
consumer
8. Habitual, brand loyal consumer
INFLUENCE

119
CHAPTER 5
ANALYSIS AND INTERPRETATION OF DATA
INTRODUCTION
This chapter presents the statistical analysis of the data, its interpretation and
the results. The data is carefully processed, systematically classified, scientifically
analyzed, properly interpreted and rationally concluded and presented in the
following sections.
After the data had been collected, it was processed and tabulated using
Microsoft Excel 2007 and SPSS version 19 (Statistical package for Social Sciences).
The statistical tools employed were Frequency and Percentage distributions, Mean
and Standard Deviation, Cronbach Alpha for reliability. Pearson’s Coefficient of
Correlation was used to study the relationship between values and shopping styles.
The research hypotheses were tested using t statistic and ANOVA. The proposed
model was tested with Structural Equation Modeling using AMOS16. All measures
were subjected to Confirmatory Factor Analysis to provide support for the issues of
dimensionality, i.e., to find out if the dimensions manifested in the present study
conformed to the original model. To evaluate the fit of the models, Chi-square
Goodness of Fit Indices and RMSEA (Root Mean Square Error of Approximation)
were used.188 Regression Analyses were carried out to study the influence of values
on the shopping styles of young adults for apparels. The obtained results have been
presented and interpreted in this chapter.
188 Arbuckle and Wothke,1999

120
DESCRIPTIVE STATISTICS FOR DEMOGRAPHIC VARIABLES
The following section presents descriptive statistics for the demographic
variables such as gender, education level and regional background of the
respondents, in the form of frequency tables and pictorial representation.
TABLE:09 Gender of Respondents
Gender Frequency Percent
Male 804 54.4
Female 674 45.6
TOTAL 1478 100
Source: Primary data FIG.4
Gender of Respondents
Source: Primary data
The above table and figure indicate that total number of respondents for the
study were 1478, of which 804 (54.4%) were male respondents and 674 (45.6%)
were female respondents.
The demographic profile of the respondents for the study more or less
replicates the demographic profile of the population of Bangalore city. The Male :
Female gender ratio is 1000:968 (50.81% : 49.19%) in Karnataka, the ratio of male
and female respondents for the study is 804:674 (54% : 46%).
GENDER OF RESPONDE
NTS0%
Male54.4%
Female45.6%

121
TABLE: 10
Education Level of Respondents
Education Level Frequency Percent
UG 1131 76.5
PG 289 19.6
Others
[Diploma/PUC etc]
58 3.9
TOTAL 1478 100
Source: Primary data
FIG.5
Educational Level of Respondents
Source: Primary data
The above table reveals that 1131 (76.5%) of the respondents were college
going students doing Undergraduate courses, 289 (19.6%) were doing Postgraduate
courses and 58 (3.9%) were PUC or Diploma holders under the age of 25 years.
Bangalore being an important hub for higher learning institutions, the size of
the college-going young adults’ population is considerable. Hence the sample size of
1478 respondents is an ideal representation of this group to draw meaningful
conclusions about the population.
76.5%UG
19.6%PG
3.9%
UGPGOthers

122
The respondents of the study were representing 28 different states of India,
signifying diverse ethnic and cultural background. The respondents were re-grouped
according to the state of origin into four regions as North, South, East and West.
The states covered under the regions are:
Northern Region: Delhi, Haryana, Himachal Pradesh, Jammu & Kashmir, Punjab,
Uttar Pradesh
Southern Region: Karnataka, Tamil Nadu, Andhra Pradesh, Karnataka, Kerala
Eastern Region: Agartala, Assam, Sikkim, Bihar, Jharkand, Manipur, Megalaya,
Nagaland, West Bengal and Odisha
Western Region:Maharashtra, Goa, Gujarat, Madhya Pradesh and Rajasthan
TABLE 11 Regional Background of Respondents
Region Frequency Percent
South 1053 71.2
East 165 11.2
North 156 10.6
West 104 7.0
Total 1478 100
Source: Primary data
FIG. 6 Regional Background of Respondents
Source: Primary data
71.2%
11.2% 10.6% 7%
01020304050607080
South East North West

123
It was found that there were 1053 (71.2 %) respondents hailing from the
Southern part of India, 165 (11.2%) were hailing from the Eastern part, 156 (10.6 %)
respondents were hailing from the Northern part of India, 104 (7%) were hailing
from the Western part of India.
The above table confirms the fact that Bangalore is a cosmopolitan city with
influx of people from all over the country. The demographic profile of Bangalore
city shows that 88% of the population is from the southern states such as Tamil
Nadu, Kerala, Andhra and Karnataka.189This is clearly reflected through the higher
representation of respondents from Southern part of India in the sample of the study.
DESCRIPTIVE STATISTICS FOR INDEPENDENT VARIABLES
The independent variables of the study were personal values adapted from
Kahle’s List of Values (LOV, 1983). The original List of Values had nine values; it
has been modified to suit the requirements of the present study.
a) The value “excitement” found in the original LOV was removed as it
could be mis-interpreted by the age group under reference and also
because it is similar to the value ‘fun & enjoyment in life’.
b) Two values were added to the list that are relevant for the study and
that would have a bearing on the manner a person dresses and hence
would have an impact on the clothing purchase decision. The values
added are: ‘Simplicity’ and ‘Being Independent’. Thus, totally ten
values were used as the independent variables for this study.
To analyze the internal consistency of the independent variablesviz., The List
of Values, a reliability test was carried out and is presented below.
189Source: Bangalore City Development Plan JNNURM.

124
TABLE:12
Reliability Statistics for List of Values
Scale: ALL VARIABLES
Reliability Statistics
Cronbach's Alpha N of Items
.903 10
Source: Primary data
Item-Total Statistics
Scale Mean
if Item
Deleted
Scale
Variance if
Item Deleted
Corrected
Item-Total
Correlation
Cronbach's
Alpha if Item
Deleted
1. Sense of Belonging 65.92 149.876 .609 .897
2.Simplicity 66.69 149.235 .607 .897
3. Warm Relationships with
others 66.50 147.728 .671 .893
4. Self-fulfillment 66.40 146.436 .666 .893
5. Being Well-respected 66.30 145.827 .722 .890
6. Fun and enjoyment of life 66.21 147.035 .641 .895
7. Security & Comfort 66.26 148.205 .637 .895
8. Self-respect 65.94 145.643 .730 .889
9. A sense of
accomplishment 66.37 146.658 .684 .892
10. Being Independent 66.29 146.827 .613 .897
Source: Primary data
It was found that the List of Values (LOV) scale used for assessing the
values cherished by young adults in Bangalore was highly reliable with a
Cronbach’s Alpha value of 0.903.

125
Hierarchy of Values Important to Young Adults
The respondents were asked to rate the ten values on a 9 point scale
according to the level of importance of each value to them. A small descriptor was
provided for each value to establish a common approach to rate each value and
avoid subjective/multiple interpretations.
The following table presents the hierarchy of these values in terms of the
calculated mean values.
Objective 1: To identify the values which are perceived to be important among
young adults.
TABLE: 13
Hierarchy of Values Important to Young Adults
VALUES Mean Std. Deviation
Sense of Belonging 7.71 1.881
Self-respect 7.69 1.870
Fun and enjoyment of life 7.42 1.980
Security & Comfort 7.37 1.938
Being Independent 7.34 2.054
Being Well-respected 7.33 1.868
A sense of accomplishment 7.25 1.906
Self-fulfillment 7.23 1.958
Warm Relationships with others 7.13 1.870
Simplicity 6.94 1.925
Source: Primary data
The above table indicates that among the list of values that young adults
cherish, Sense of Belonging has the highest mean score 7.71, followed by Self-

126
respect which has a mean score of 7.69. Fun and enjoyment of life has a mean score
of 7.42 followed by Security & Comfort with a mean score of 7.37. The value
simplicity has the lowest mean score of 6.94.
The analysis of the perceived level of importance of values among young
adults revealed some very interesting aspects.
1) Among the list of values that young adults in the age group 18-25 perceive to
be important, ‘Sense of belonging’ was rated as the most important value
(mean score 7.71). The feeling that family and friends care about them is
very important to this age group. The institution of the family and the family
support system are the main drivers in life. When this basic feeling of
belonging is established and confirmed in life, it gives a secure feeling that
every challenge can be faced bravely.
2) The second important value for this segment is ‘Self- respect’ (mean score
7.69). Self-esteem, belief in one’s own worth, preserving self-image are very
important to the 18-25 age group of young adults who are predominantly
college going students doing under graduate/post graduate/professional
studies. Though they are mostly under the supervision of their parents, they
do not like to be treated like kids. They expect their parents, teachers and
colleagues to treat them with respect and are very sensitive about this. They
desire to stand up for their beliefs and values.
3) The third important value cherished by young adults is ‘Fun and enjoyment
of life’ (mean score 7.42). Seeking adventure, novelty and change and
enjoying food and leisure very clearly describes the general disposition of
the youth population. It is that phase of life where they lead a carefree life,
not bogged down with work or family responsibilities and seek fun and
enjoyment in all that they do. They also seek adventure in this phase. They
look for Novelty in everything and get bored with tradition. Change is
embraced easily and sought after in all that they do.

127
4) The fourth value cherished by this group is ‘Security & Comfort’ (mean
score 7.37). Safety and secure surroundings are perceived to be important for
the young adults to lead a carefree and happy life. The news items on
violence, terrorism, abduction, murder, rape, abuse and so on, which are
rampant all over India, gives them an insecure feeling.
5) ‘Being Independent’ was considered as the fifth important value (mean
score 7.34) by the respondents. Being self reliant and self-sufficient displays
the characteristic of the present day young generation. They are highly
technology savvy, have knowledge accessible at their finger-tips, and prefer
to work independently.
6) The value considered sixth important to young adults is ‘Being well
respected’ (mean score 7.33). Having social recognition, respect and
approval from others is important to this age group. The young adult
population seeks to be affiliated to groups or individuals who share their
ideals, likes and interests. Being identified as part of the group or at least in
general conforming to the standards of expectations of modern youth culture
is important to them.
7) Sense of accomplishment (mean score 7.25) is the seventh important value
for the young adult population. Being successful and doing something which
was never done before are attributes that can be associated with this age
group. They are go-getters and achievers and desire success in all their
endeavours.
8) Self fulfillment (mean score 7.23) is eighth in the value hierarchy for young
adults. Being creative, enjoying what is being done and achieving inner
harmony is preferred by this group. Satisfaction comes from being happy
with one-self and doing what is pleasing.
9) The value considered ninth important to young adults is ‘Warm
relationships with others’ (mean score 7.13). Maintaining cordial relations
with others is required but not very important to this age group. Being

128
independent is perceived to be more important than warm relationships
others.
10) The least important in the value hierarchy for young adults is ‘Simplicity’
(mean score 6.94). Being unassuming, straight forward, and down to earth
are not the preferred traits for this age group. On the contrary, they prefer to
have the best things in life, high quality items, latest in fashion and
technology. Young adults are attention seekers and love to flaunt and display
their skills, abilities and possessions and are seldom simple.
DESCRIPTIVE STATISTICS FOR VALUE DIMENSIONS
The study also analyses the values orientations of the respondents based on the
value categories mentioned by Kahle in his List of Values (1983). The list of values
is further grouped under three categories as External values, Internal Individual
values and Internal Inter-personal values. Understanding young adult population
based on their value orientations would facilitate apparel manufacturers, marketers
and fashion designers to further fine tune their marketing strategies and cater to this
population segment based on their psychographic attributes.
To analyze the internal consistency of the value dimensions a reliability test
was carried out and is presented below.

129
TABLE: 14
Reliability Statistics for Value Dimensions
Reliability Statistics
Cronbach's Alpha N of Items
.884 3
Source: Primary data
Item-Total Statistics
Scale Mean
if Item
Deleted
Scale
Variance if
Item Deleted
Corrected
Item-Total
Correlation
Cronbach's
Alpha if
Item Deleted
External Values 14.6127 7.787 .772 .838
Internal Interpersonal
Values 14.8100 7.366 .765 .846
Internal Individual
Values 14.7911 7.919 .790 .823
Source: Primary data
It was found that the three dimensions of the value scale were highly reliable
with a Cronbach’s Alpha value of 0.884. This gives further scope to the study to
analyse the relationship and influence of the value dimensions on young adults.

130
The following table presents the hierarchy of value orientations in young
adults in terms of the calculated mean values.
TABLE: 15
Hierarchy of Value Orientations in Young Adults
Value Dimensions Mean Std. Deviation
External Values
[Sense of belonging, Being well
respected, Security & comfort]
7.49 1.48070
Internal Individual Values
[Self-fulfillment, Self respect, A sense
of accomplishment, Simplicity, Being
Independent]
7.31 1.44328
Internal Interpersonal Values
[Warm relationships with others, fun
and enjoyment of life]
7.29 1.57839
Source: Primary data
The above table indicates that most of the young adult respondents attach
greater importance to External values such as Sense of belonging, Being well
respected, Security & Comfort with a mean score of 7.49, followed by Internal
Individual values such as Self-fulfillment, Self respect, Sense of accomplishment,
Simplicity, Being Independent with a mean score of 7.31. Internal Interpersonal
values such as Warm relationships with others, fun and enjoyment of life with a
mean score of 7.29 was comparatively lower in their preference.

131
DESCRIPTIVE STATISTICS FOR DEPENDENT VARIABLES
The Dependent variables of the study were eight shopping styles. The
Consumer Styles Inventory conceptualized by Sproles and Kendall (1986) describes
eight mental orientation of consumers in their decision-making process viz.,
Perfectionist/high-quality conscious; Brand conscious/price equals quality; Novelty
and fashion conscious; Recreational & shopping conscious; Price conscious/value-
for-money; Impulsiveness/Careless; Confused by overchoice; and Habitual/brand-
loyal.
The original instrument had 40 items to measure general orientations towards
shopping. A three-item short form of the scale was also made available (i.e., 24
items total) by the original authors.
For the purpose of this study the original CSI was adapted with the following
modifications:
a) The three item short version of the CSI – i.e., the 24 item inventory was used
instead of the lengthy 40 item inventory. This was done keeping in the mind
the age group of respondents who may not have the patience to fill up a
lengthy questionnaire.
b) The original 24 statements were partially re-worded to describe shopping
behaviour towards apparels. This was done to ensure that every respondent
gave his/her opinion for each statement with apparels as the product to
consider for purchase.
To analyze the internal consistency of the Consumer Style Inventory used in
the study, a reliability test was carried out and is presented below.

132
TABLE: 16
Reliability Statistics for Consumer Style Inventory
Scale: All Variables
Reliability Statistics
Alpha N of Items
.787 24
Source: Primary data
Item-Total Statistics
Scale
Mean if
Item
Deleted
Scale
Variance if
Item Deleted
Corrected
Item-Total
Correlation
Cronbach's
Alpha if Item
Deleted
Getting very good
quality of clothes is
very important to me.
74.04 106.046 .433 .774
When it comes to
purchasing clothes, I
try to get the very best
or perfect choice.
73.92 105.325 .498 .771
In general, I usually try
to buy the best overall
quality of apparels.
74.18 106.217 .462 .773
The well-known
national brands are for
me.
74.81 104.885 .472 .772
The more expensive
brands are usually my
choices.
75.28 103.862 .478 .771

133
The higher the price of
the apparel, the better
the quality.
74.92 106.829 .311 .780
I usually have one or
more outfits of the very
newest style.
74.80 105.293 .449 .773
I keep my wardrobe up-
to-date with the
changing fashions.
75.07 104.006 .473 .771
Fashionable, attractive
styling is very
important to me.
74.71 104.082 .456 .772
Shopping for clothes is
not a pleasant activity
to me.
74.49 111.759 .097 .793
Going shopping for
clothes is one of the
most enjoyable
activities of my life.
74.74 103.828 .403 .775
Shopping the stores for
clothes wastes my time. 74.50 111.057 .144 .789
I buy most of my
clothes at sale prices. 74.75 112.262 .125 .789
The lowest price outfits
are usually my choice. 75.25 116.826 -.090 .800
I look carefully to find
the best value for the
money.
73.92 113.812 .059 .792
I should plan my
shopping more
carefully than I do.
74.39 109.419 .237 .784
I am impulsive when
purchasing clothes. 74.64 107.818 .343 .778

134
Often I make careless
purchases of clothes I
later wish I had not.
74.82 107.902 .266 .783
There are so many
brands to choose from
that I often feel
confused.
74.57 105.414 .401 .775
Sometimes it is hard to
choose which stores to
shop for clothes.
74.47 106.907 .345 .778
The more I learn about
apparel brands, the
harder it seems to
choose the best.
74.58 106.763 .375 .777
I have favourite brands
I buy over and over. 74.53 102.777 .507 .769
Once I find a brand I
like, I stick with it. 74.69 106.200 .362 .777
I go to the same stores
each time I shop. 74.78 108.955 .236 .784
Source: Primary data
The Consumer Style Inventory scale used for identifying the shopping styles
of young adults were found to be highly reliable with an overall Cronbach’s Alpha
value of 0.787.
Segmenting Young Adults Based on Their Shopping Styles
The respondents were asked to score the 24 items of the CSI on 5-point Likert-
type scales ranging from strongly disagree to strongly agree.These24 items were
grouped under the eight shopping styles as prescribed by Sproles and Kendall. Each
style had three items under it. Item scores were summed within each style separately
to create composite scores for each style.

135
The respondents were segmented according to their preferred shopping style
based on the mean values for each shopping style. The results are presented in Table
14 given below:
Objective 2: To segment young-adult consumers based on their shopping styles
towards purchase of apparels.
TABLE: 17
Preferred Shopping Style of Young Adults
Shopping Style Mean Std. Deviation
Perfectionist/High Quality Conscious 3.8207 .77958
Confused by Overchoice 3.3276 .89247
Recreational and Shopping Conscious 3.2832 .95680
Impulsiveness/Careless 3.2551 .77968
Price Conscious/Value for money 3.2251 .65830
Habitual/Brand Loyal 3.1973 .89077
Novelty and Fashion Conscious 3.0063 .88608
Brand Conscious/Price Equals Quality 2.8637 .87226
Source: Primary data
The above table categorizes the entire respondent group of the study into
their preferred shopping style. The results indicate that Perfectionist/High Quality
consciousness (3.8207) was the predominant trigger for young adults in their
purchase-decisions for apparels followed by Confused by Overchoice (3.3276) and
Recreational and Shopping Conscious (3.2832). The Impulsive style had a mean of
3.2551 followed by Price conscious/value for money (3.2251). Brand loyalty had a
mean of (3.1973), Novelty and fashion conscious (3.0063) and the least preferred
shopping style was Brand conscious/price equals quality with a mean of (2.863).

136
The preferred shopping style of young-adult consumers revealed in the above
table is analyzed to describe their apparel shopping behavior.
1. Perfectionist/High Quality Conscious (mean 3.8207) is the predominant
style of young adults in their purchase-decisions for apparels. This group of
respondents seeks to maximize quality by choosing the best products. They
set high standards and have high expectations for the products they buy and
aim to get the best choice and value for money. Being higher in
perfectionism, these consumers could be expected to shop more carefully,
more systematically, or by comparison.
2. Confused by Overchoice (3.3276) is the second style prevalent among the
respondent group. Items loaded on this style suggest that these shoppers feel
confused and overloaded with information. They find it hard to choose the
best clothes or stores to shop. They feel the quantity of different consumer
brands is confusing. The amount of information available about these
different brands adds to confusion. Hence, this factor is named Confused by
Overchoice Consumer. They are aware of the many brands and stores from
which to choose and have difficulty making those choices.
3. Recreational and Shopping Conscious (3.2832) is the third preferred
shopping style of young adults. Items loading on this factor indicate that
shopping is an enjoyable and pleasant activity. Identified characteristics
show that they do not feel that shopping wastes time. Because shopping is
enjoyable, pleasant, fun filled activity.
4. The fourth preferred shopping style among young adults is the
Impulsiveness/Careless style with a mean of 3.2551. Items loaded in this
factor indicate that these shoppers are impulsive and careless in making their
purchases. They regret their impulsive shopping behaviour. Consumers who
score high on this factor tend to buy in the spur of the moment and later
regret their impulsive behaviour. They are also unconcerned about getting
best products by shopping as quickly as they can.

137
5. Price conscious/value for money (3.2251) ranked fifth as the preferred style
of young adults. Consumers of this characteristic look for sale prices and
generally appear to be conscious of lower prices. They tend to carefully
watch their spending and try to get the best value for the money spent on
apparels. This may also be due to the need to drive the maximum value for
their limited resources, which is also in line with theoretical economics as
reported by Schiffman and Kanuk (1997) that consumers, especially low
income earners are always economical in their purchase decision and always
consider functional (quality) aspect of a product in order to make a purchase
that is not just satisfactory but a perfect one (maximum value for money).
6. Habitual, Brand-Loyal Consumer (3.1973), is the sixth preferred shopping
style of young adults. This style reflects the characteristic of shoppers who
are habitual in buying same brands regularly. They have strong loyalty
towards the brands as well as stores. They appear to have favourite brands
and stores and to have formed habits in choosing these.
7. Novelty and fashion conscious (3.0063) is the seventh preferred style of
young adults. Items of this factor indicate that fashionable attractive styling
is important to them. These shoppers compare brands and take time to shop
carefully indicating that they are comparison shoppers. They usually have
one or more outfits of the newest style. They keep up to date with styles and
being in style is important to them.
8. The least manifested shopping style among the young adult respondent group
was Brand Consciousness/Price Equals Quality with a mean of (2.863).
This shopper style prefers buying the best selling and most expensive brands.
They buy the well known national and international brands and shop at nice
department or specialty stores. They tend to buy heavily advertised brands
and equate prices with quality. They tend to believe that a higher price means
better quality and appear to have positive attitudes toward department and
specialty stores. Brand name, quality and the price are the most important
purchasing criteria for these shoppers.

138
SHOPPING STYLE-WISE DESCRIPTIVE STATISTICS
The hierarchy of the three items within each shopping style is studied with
the help of their mean values to gain a deeper understanding of the characteristics of
the respondents who fall under this shopper segment.
In the following section the shopping style-wise mean and standard
deviations along with the Cronbach Alpha value for reliability and internal
consistency of the data is presented.
TABLE:18
Hierarchy of items under Perfectionist/High Quality Conscious style
Perfectionist/High Quality Conscious
Three-item alpha =0.752 Mean Std. Deviation
When it comes to purchasing clothes, I try to get
the very best or perfect choice.
3.95 .943
Getting very good quality of clothes is very
important to me.
3.82 .994
In general, I usually try to buy the best overall
quality of apparels.
3.69 .920
Source: Primary data
The above table describes the hierarchy of the individual items under the
‘Perfectionist/High Quality Conscious’ shopping style. It was found the
shopping attribute ‘When it comes to purchasing clothes, I try to get the very best
or perfect choice’ had the highest mean (3.95) followed by ‘Getting very good
quality of clothes is very important to me’ (3.82) and ‘In general, I usually try to
buy the best overall quality of apparels’ (3.69). This factor is considered highly
reliable with an alpha coefficient of 0.752. This is much higher than the three item
alpha 0.69 obtained in the Sproles and Kendall original study.

139
TABLE: 19
Hierarchy of items under Brand Conscious/Price Equals Quality style
Brand Conscious/Price Equals Quality
Three-item alpha =0.695 Mean Std. Deviation
The well-known national brands are for me. 3.06 1.027
The more expensive brands are usually my choices 2.95 1.185
The higher the price of the apparel, the better the
quality.
2.59 1.109
Source: Primary data
The above table describes the hierarchy of the individual items under the
‘Brand Conscious/Price Equals Quality’ shopping style. It was found that the
shopping attribute ‘The well-known national brands are for me’ had the highest
mean (3.06) followed by ‘The more expensive brands are usually my choices’ (2.95)
followed by ‘The higher the price of the apparel, the better the quality’ (2.59). This
factor is considered reliable with an alpha value of 0.695, which is higher than the
three-item alpha 0.63 obtained in the Sproles and Kendall original study.
TABLE:20
Hierarchy of items under Novelty and Fashion Conscious style
Novelty and Fashion Conscious
Three-item alpha =0.749 Mean
Std.
Deviation
Fashionable, attractive styling is very important to me. 3.16 1.128
I usually have one or more outfits of the very newest style. 3.07 1.028
I keep my wardrobe up-to-date with the changing fashions. 2.79 1.101
Source: Primary data

140
The above table describes the hierarchy of the individual items under the
‘Novelty and Fashion Conscious’ shopping style. It was found the shopping
attribute ‘Fashionable, attractive styling is very important to me’ (3.16) had the
highest mean, followed by ‘I usually have one or more outfits of the very newest
style’ (3.07) followed by ‘I keep my wardrobe up-to-date with the changing
fashions’ (2.79). This factor is accepted to be highly reliable with an alpha value of
0.749, which is almost similar to the three-item alpha 0.76 obtained in the Sproles
and Kendall original study.
TABLE: 21
Hierarchy of items under Recreational and Shopping Conscious style
Recreational and Shopping Conscious
Three-item alpha =0.675 Mean
Std.
Deviation
Shopping for clothes is not a pleasant activity to me. 3.36 1.253
Shopping the stores for clothes wastes my time. 3.36 1.156
Going shopping for clothes is one of the most enjoyable
activities of my life.
3.13 1.269
Source: Primary data
The above table describes the hierarchy of the individual items under the
‘Recreational and Shopping Conscious’ shopping style. It was found the
shopping attribute ‘Shopping for clothes is not a pleasant activity to me’ (3.36) and
‘Shopping the stores for clothes wastes my time’ (3.36) had higher means, followed
by ‘Going shopping for clothes is one of the most enjoyable activities of my life’
(3.13). This factor is accepted to be reliable with an alpha value of 0.675, which is
slightly lower than the three-item alpha 0.71 obtained in the Sproles and Kendall
original study.

141
TABLE:22
Hierarchy of items under Price Conscious/Value for money style
Price Conscious/Value for money
Three-item alpha =0.353 Mean Std. Deviation
I look carefully to find the best value for the money. 3.94 .947
The lowest price outfits are usually my choice. 3.12 .992
I buy most of my clothes at sale prices. 2.61 1.045
Source: Primary data
The above table describes the hierarchy of the individual items under the
‘Price Conscious/Value for money’ shopping style. It was found the shopping
attribute ‘I look carefully to find the best value for the money’ had the highest mean
(3.94), followed by ‘The lowest price outfits are usually my choice’ (3.12), followed
by ‘I buy most of my clothes at sale prices’ (2.61). This factor is the least reliable
with an alpha value of 0.353, which is lower than the three-item alpha 0.48 obtained
in the Sproles and Kendall original study.
TABLE: 23
Hierarchy of items under Impulsiveness/Careless style
Impulsiveness/Careless
Three-item alpha =0.530 Mean
Std.
Deviation
I should plan my shopping more carefully than I do. 3.49 1.063
I am impulsive when purchasing clothes. 3.23 .989
Often I make careless purchases of clothes I later wish I had
not.
3.05 1.187
Source: Primary data

142
The above table describes the hierarchy of the individual items under the
‘Impulsiveness/Careless’ shopping style. It was found that the shopping attribute
‘I should plan my shopping more carefully than I do’ had the highest mean (3.49),
followed by ‘I am impulsive when purchasing clothes’ (3.23), followed by ‘Often I
make careless purchases of clothes I later wish I had not’ (3.05). The above table
also indicates that the scale items were found moderately reliable with Cronbach’s
Alpha value 0.530. However, it is much higher than the three item alpha 0.51
obtained in the Sproles and Kendall original study.
TABLE:24
Hierarchy of items under Confused by Overchoice style
Confused by Overchoice
Three-item alpha =0.761 Mean Std. Deviation
Sometimes it is hard to choose which stores to
shop for clothes.
3.40 1.092
There are so many brands to choose from that I
often feel confused.
3.30 1.119
The more I learn about apparel brands, the
harder it seems to choose the best.
3.29 1.039
Source: Primary data
The above table describes the hierarchy of the individual items under the
‘Confused by Overchoice’ shopping style. It was found that the shopping attribute
‘Sometimes it is hard to choose which stores to shop for clothes’ had the highest
mean (3.40), followed by ‘There are so many brands to choose from that I often feel
confused’ (3.30), and followed by ‘The more I learn about apparel brands, the harder
it seems to choose the best’ (3.29). This factor is considered highly reliable with an
alpha of 0.761, which is much higher than the three item alpha 0.51 obtained in the
Sproles and Kendall original study.

143
TABLE:25
Hierarchy of items under Habitual/Brand Loyal style
Habitual/Brand Loyal
Three-item alpha =0.680 Mean Std. Deviation
I have favourite brands I buy over and over. 3.33 1.149
Once I find a brand I like, I stick with it. 3.17 1.128
I go to the same stores each time I shop. 3.09 1.144
Source: Primary data
The above table describes the hierarchy of the individual items under the
‘Habitual/Brand Loyal’ shopping style. It was found that the shopping attribute ‘I
have favourite brands I buy over and over’ had the highest mean (3.33), followed by
‘Once I find a brand I like, I stick with it’ (3.17), followed by ‘I go to the same
stores each time I shop’ (3.09). An alpha of 0.680 indicates that the reliability of this
factor is good. Compared to the three-item alpha 0.54 obtained in the Sproles and
Kendall original study indicates higher reliability of this factor in the present study.

144
INTRA-CORRELATION WITHIN VARIABLES
Intra – correlations within the variables of the study is calculated using Karl
Pearson’s Co-efficient of Correlation to ascertain the relationships among them.
TABLE:26
Intra-Correlations among Value Dimensions
Correlations
External
values
Internal
Interpersonal
values
Internal
Individual
values
External values
Pearson Correlation 1 .701** .734**
Sig. (2-tailed) .000 .000
N 1477 1477 1477
Internal
Interpersonal values
Pearson Correlation .701** 1 .728**
Sig. (2-tailed) .000 .000
N 1477 1478 1478
Internal Individual
values
Pearson Correlation .734** .728** 1
Sig. (2-tailed) .000 .000
N 1477 1478 1478
**. Correlation is significant at the 0.01 level (2-tailed).
Source: Primary data
The above table indicates that there is a significant positive correlation at
the 0.01 level among the value dimensions. This adds strength to the validity of the
scale used and its dimensionality. It also gives solid grounds for further analysis
using the scale.

145
TABLE:27
Intra-Correlations among individual Values
Correlations
sense
of
belong
Simplicity warm
relationships selfulillment
being
well
respected
fun &
enjoyment
security
&
comfort
self
respect
sense of
accomplishment
being
independent
sense of belong
Pearson
Correlation 1 .444** .530** .450** .539** .445** .475** .486** .403** .338**
Sig. (2-
tailed)
.000 .000 .000 .000 .000 .000 .000 .000 .000
N 1478 1478 1478 1478 1477 1478 1478 1478 1478 1478
simplicity
Pearson
Correlation .444** 1 .575** .474** .479** .402** .389** .476** .444** .404**
Sig. (2-
tailed) .000
.000 .000 .000 .000 .000 .000 .000 .000
N 1478 1478 1478 1478 1477 1478 1478 1478 1478 1478
warm relation-
ships
Pearson
Correlation .530** .575** 1 .538** .538** .468** .455** .503** .464** .404**
Sig. (2-
tailed) .000 .000
.000 .000 .000 .000 .000 .000 .000
N 1478 1478 1478 1478 1477 1478 1478 1478 1478 1478
selfulill-ment
Pearson
Correlation .450** .474** .538** 1 .521** .499** .442** .548** .503** .465**
Sig. (2-
tailed) .000 .000 .000
.000 .000 .000 .000 .000 .000
N 1478 1478 1478 1478 1477 1478 1478 1478 1478 1478
being well
respected
Pearson
Correlation .539** .479** .538** .521** 1 .501** .526** .624** .540** .475**
Sig. (2-
tailed) .000 .000 .000 .000
.000 .000 .000 .000 .000
N 1477 1477 1477 1477 1477 1477 1477 1477 1477 1477
fun &
enjoyment
Pearson
Correlation .445** .402** .468** .499** .501** 1 .506** .512** .499** .456**
Sig. (2-
tailed) .000 .000 .000 .000 .000
.000 .000 .000 .000
N 1478 1478 1478 1478 1477 1478 1478 1478 1478 1478
security &
comfort
Pearson
Correlation .475** .389** .455** .442** .526** .506** 1 .557** .488** .433**
Sig. (2-
tailed) .000 .000 .000 .000 .000 .000
.000 .000 .000
N 1478 1478 1478 1478 1477 1478 1478 1478 1478 1478
self respect
Pearson
Correlation .486** .476** .503** .548** .624** .512** .557** 1 .584** .535**
Sig. (2-
tailed) .000 .000 .000 .000 .000 .000 .000
.000 .000
N 1478 1478 1478 1478 1477 1478 1478 1478 1478 1478
sense of
accomplishmen
t
Pearson
Correlation .403** .444** .464** .503** .540** .499** .488** .584** 1 .608**
Sig. (2-
tailed) .000 .000 .000 .000 .000 .000 .000 .000
.000
N 1478 1478 1478 1478 1477 1478 1478 1478 1478 1478
being
independent
Pearson
Correlation .338** .404** .404** .465** .475** .456** .433** .535** .608** 1
Sig. (2-
tailed) .000 .000 .000 .000 .000 .000 .000 .000 .000
N 1478 1478 1478 1478 1477 1478 1478 1478 1478 1478
**. Correlation is significant at the 0.01 level (2-tailed).
Source: Primary data

146
The above table indicates that there is a significant positive correlation at
the 0.01 level among all the individual values. This adds strength to the validity of
the scale used and its dimensionality. It also gives solid grounds for further analysis
using the scale.
TABLE:28
Intra-Correlations among Shopping Styles
Correlations
perfectionist Brand
conscious novelty Recreational
Price conscious
impulsive confused Brand loyalty
Perfectionist, high-quality conscious
Pearson Correlation
1 .474** .397** .228** -.031 .178** .192** .319**
Sig. (2-tailed)
.000 .000 .000 .235 .000 .000 .000
N 1478 1477 1478 1478 1478 1475 1478 1478
Brand consciousness, “price equals quality”
Pearson Correlation
.474** 1 .470** .089** -.075** .157** .193** .324**
Sig. (2-tailed)
.000
.000 .001 .004 .000 .000 .000
N 1477 1477 1477 1477 1477 1474 1477 1477
Novelty and fashion conscious
Pearson Correlation
.397** .470** 1 .221** -.034 .168** .201** .290**
Sig. (2-tailed)
.000 .000
.000 .187 .000 .000 .000
N 1478 1477 1478 1478 1478 1475 1478 1478
Recreational and shopping conscious
Pearson Correlation
.228** .089** .221** 1 -.109** .049 .071** .066*
Sig. (2-tailed)
.000 .001 .000
.000 .058 .006 .011
N 1478 1477 1478 1478 1478 1475 1478 1478
Price conscious/value for the money consciousness
Pearson Correlation
-.031 -.075** -.034 -.109** 1 .151** .050 .068**
Sig. (2-tailed)
.235 .004 .187 .000
.000 .055 .009
N 1478 1477 1478 1478 1478 1475 1478 1478
Impulsiveness/Careless
Pearson Correlation
.178** .157** .168** .049 .151** 1 .414** .159**
Sig. (2-tailed)
.000 .000 .000 .058 .000
.000 .000
N 1475 1474 1475 1475 1475 1475 1475 1475
Confused by Overchoice
Pearson Correlation
.192** .193** .201** .071** .050 .414** 1 .217**
Sig. (2-tailed)
.000 .000 .000 .006 .055 .000
.000
N 1478 1477 1478 1478 1478 1475 1478 1478
Habitual/brand-loyal
Pearson Correlation
.319** .324** .290** .066* .068** .159** .217** 1
Sig. (2-tailed)
.000 .000 .000 .011 .009 .000 .000
N 1478 1477 1478 1478 1478 1475 1478 1478 **. Correlation is significant at the 0.01 level (2-tailed). *. Correlation is significant at the 0.05 level (2-tailed).
Source: Primary data

147
The above table indicates that there is a significant correlation at the
0.01level (2 tailed)among all the shopping styles and at the 0.05 level (2 tailed) for
the Recreational shopping conscious and Brand loyal shopping styles.
Perfectionist/ high-quality conscious shopping style is significantly
positively correlated at the 0.01 level with six other shopping styles - Brand
consciousness/price equals quality, Novelty and fashion conscious, Recreational and
shopping conscious, Impulsiveness/Careless, Confused by Overchoice, and
Habitual/brand-loyal. There is no significant correlation between the Perfectionist/
high-quality conscious shopping style and the Price conscious/value for the money
shopping style (p value >0.05).
Brand consciousness/price equals quality shopping style is significantly
positively correlated at the 0.01 level with all the other shopping styles -
Perfectionist/ high-quality conscious, Novelty and fashion conscious, Recreational
and shopping conscious, Impulsiveness/Careless, Confused by Overchoice, and
Habitual/brand-loyal shopping styles. There is a significant negative correlation
between the Brand consciousness/price equals quality shopping style and the Price
conscious/value for the money shopping style. This indicates that young adults are
willing to purchase good quality apparels by paying a high price for it. And that they
are more brand and quality conscious rather than being price conscious.
The Novelty and fashion conscious shopping style has a significant positive
correlation at the 0.01 level with all other shopping styles except the Price
conscious/value for the money shopping style. There is no significant correlation
between the Novelty and fashion conscious shopping style and the Price
conscious/value for the money shopping style (p value >0.05).
Recreational and shopping conscious shopping style has a significant
positive correlation at the 0.01 level with all the other shopping styles except the
Impulsiveness/Careless shopping style. There is a significant negative correlation
between the Recreational and shopping conscious shopping style and the Price
conscious/value for the money shopping style. This indicates that young adults who
consider shopping for apparels as a recreational activity are not worried about

148
spending money on apparel purchases. There is no significant correlation between
the Recreational and shopping conscious shopping style and the
Impulsiveness/Careless shopping style shopping style (p value >0.05).
Price conscious/value for the money shopping style has a significant positive
correlation at the 0.01 level with the Impulsiveness/Careless, and Habitual/brand-
loyal shopping styles. There is a significant negative correlation between the Price
conscious/value for the money shopping style and the Brand consciousness/price
equals quality and the Recreational and shopping conscious shopping styles as
indicated above. There is no significant correlation between the Price
conscious/value for the money shopping style and Perfectionist/ high-quality
conscious (p value >0.05), the Novelty and fashion conscious style (p value >0.05)
and Confused by Overchoice (p value> 0.05).
Impulsiveness/Careless shopping style has a significant positive correlation
at the 0.01 level with all the other shopping styles except the Recreational and
shopping conscious shopping style (p value >0.05).
Confused by Overchoice shopping style has a significant correlation at the
0.01 level with all the other shopping styles except the Price conscious/value for the
money shopping style (p value >0.05).
Habitual/brand-loyal shopping style has a significant correlation at the 0.01
levels with all the other shopping styles except Recreational and shopping conscious
shopping style. It is significantly correlated at the 0.05 level with the Recreational
and shopping conscious shopping style (p value <0.05).
INTER-CORRELATIONS BETWEEN VARIABLES
Inter-correlations between Values and shopping styles are calculated using
Karl Pearson’s Co-efficient of Correlation to ascertain the relationships between the
variables of the study.

149
TABLE:29
Correlation between Values and Shopping Styles
Descriptive Statistics
Mean Std. Deviation N
Overall values 7.3655 1.34154 1477
Overall Shopping Styles 3.2443 .44871 1474
Source: Primary data
Correlations
Overall values Overall
shopping
Styles
Overall values
Pearson Correlation 1 .116**
Sig. (2-tailed) .000
N 1477 1473
Overall Shopping
Styles
Pearson Correlation .116** 1
Sig. (2-tailed) .000
N 1473 1474
**. Correlation is significant at the 0.01 level (2-tailed).
Source: Primary data
There is a significant positive correlation at the 0.01 level (2 tailed) among
the values and the shopping styles (p value <0.001). Values indicate a strong
relationship to the shopping styles of young adults.

150
Relationship between Individual Values and Shopping Styles
Objective- 3: To examine the relationship between values and shopping styles
of young adults towards purchase of apparels.
The results of the above analysis indicate that values and shopping styles are
significantly correlated. Further analysis is carried out to identify the relationship of
individual values to the eight dimensions of the shopping style inventory.
The results of Karl Pearson’s Co-efficient of correlation presented in the
following tables reveal the significant relationships between individual values and
specific shopping style.
TABLE: 30 Relationship between the value Sense of Belonging and Shopping Styles
Shopping Styles Sense of Belonging Remark
Perfectionist/High Quality Conscious
Pearson Correlation .109** **. Correlation is significant at the 0.01 level (2-tailed) Sig. (2-tailed) .000
N 1478
Brand Consciousness /Price Equals Quality
Pearson Correlation -.013 Sig. (2-tailed) .628 N 1477
Novelty and Fashion Conscious
Pearson Correlation -.018 Sig. (2-tailed) .494 N 1478
Recreational and Shopping Conscious
Pearson Correlation .078** **. Correlation is significant at the 0.01 level (2-tailed) Sig. (2-tailed) .003
N 1478
Price Conscious/Value for the money
Pearson Correlation .036 Sig. (2-tailed) .167 N 1478
Impulsiveness/Careless Pearson Correlation -.001 Sig. (2-tailed) .960 N 1475
Confused by Overchoice Pearson Correlation .003 Sig. (2-tailed) .911 N 1478
Habitual/Brand Loyalty Pearson Correlation .032 Sig. (2-tailed) .221 N 1478
Source: Primary data
The above table indicates that there is a significant positive relationship at
the 0.01 level between the value ‘Sense of Belonging’ and the Perfectionist/High
Quality Conscious and Recreational and Shopping Conscious styles of young adults.
There were no significant relationships between the other shopping styles and Sense
of Belonging.

151
TABLE: 31 Relationship between the value Simplicity and Shopping Styles
Correlations Shopping Styles Simplicity Remark
Perfectionist/High Quality Conscious
Pearson Correlation .076** **. Correlation is significant at the 0.01
level (2-tailed).1 Sig. (2-tailed) .004 N 1478
Brand Consciousness/Price Equals Quality
Pearson Correlation .003 Sig. (2-tailed) .904 N 1477
Novelty and Fashion Conscious
Pearson Correlation -.021 Sig. (2-tailed) .416 N 1478
Recreational and Shopping Conscious
Pearson Correlation .043 Sig. (2-tailed) .095 N 1478
Price Conscious/Value for the money
Pearson Correlation .062* *. Correlation is significant at the 0.05
level (2-tailed). Sig. (2-tailed) .017 N 1478
Impulsiveness/Careless Pearson Correlation .020 Sig. (2-tailed) .446 N 1475
Confused by Overchoice Pearson Correlation .047 Sig. (2-tailed) .071 N 1478
Habitual/Brand Loyalty Pearson Correlation .084** **. Correlation is
significant at the 0.01 level (2-tailed).
Sig. (2-tailed) .001 N 1478
Source: Primary data
The above table indicates that there is a significant positive relationship level
between the value ‘Simplicity’ and the Perfectionist/High Quality Conscious (p
value <0.01), Price Conscious/Value for the money (p value <0.05) and
Habitual/Brand Loyalty styles (p value <0.01) of young adults. There were no
significant relationships between the other shopping styles and Simplicity.

152
TABLE: 32
Relationship between the value Warm Relationships with Others and Shopping Styles
Correlations Shopping Styles Warm
Relationships with others
Remark
Perfectionist/High Quality Conscious
Pearson Correlation .131** **. Correlation is significant at the
0.01 level (2-tailed).
Sig. (2-tailed) .000
N 1478
Brand Consciousness/Price Equals Quality
Pearson Correlation -.012 Sig. (2-tailed) .654 N 1477
Novelty and Fashion Conscious
Pearson Correlation -.013 Sig. (2-tailed) .623 N 1478
Recreational and Shopping Conscious
Pearson Correlation .092** **. Correlation is significant at the
0.01 level (2-tailed).
Sig. (2-tailed) .000
N 1478
Price Conscious/Value for the money
Pearson Correlation .087** **. Correlation is significant at the
0.01 level (2-tailed).
Sig. (2-tailed) .001
N 1478
Impulsiveness/Careless Pearson Correlation .038 Sig. (2-tailed) .141 N 1475
Confused by Overchoice Pearson Correlation .048 Sig. (2-tailed) .066 N 1478
Habitual/Brand Loyalty Pearson Correlation .031 Sig. (2-tailed) .232 N 1478
Source: Primary data
The above table indicates that there is a significant positive relationship between the
value ‘Warm Relationships with others’ and the Perfectionist/High Quality
Conscious (p value <0.01), Recreational and Shopping Conscious (p value <0.01),
and Price Conscious/Value for the money shopping styles (p value <0.01) of young
adults. There were no significant relationships between the other shopping styles and
Warm Relationships with others.

153
TABLE:33
Relationship between the value Self-Fulfillment and Shopping Styles
Correlations Shopping Styles Self-
Fulfillment Remark
Perfectionist/High Quality Conscious
Pearson Correlation .050 Sig. (2-tailed) .055 N 1478
Brand Consciousness/Price Equals Quality
Pearson Correlation -.042 Sig. (2-tailed) .110 N 1477
Novelty and Fashion Conscious
Pearson Correlation .023 Sig. (2-tailed) .369 N 1478
Recreational and Shopping Conscious
Pearson Correlation .051 Sig. (2-tailed) .051 N 1478
Price Conscious/Value for the money
Pearson Correlation .040 Sig. (2-tailed) .123 N 1478
Impulsiveness/Careless
Pearson Correlation -.055* *. Correlation is significant at the
0.05 level (2-tailed).
Sig. (2-tailed) .034
N 1475
Confused by Overchoice Pearson Correlation .015 Sig. (2-tailed) .553 N 1478
Habitual/Brand Loyalty Pearson Correlation .014 Sig. (2-tailed) .600 N 1478
Source: Primary data
The above table indicates that there is a significant negative relationship
between the value ‘Self-Fulfillment’ and the Impulsiveness/Careless shopping style
of young adults (Pearson’s correlation – 0.055 & p value<0.05). There were no
significant relationship between the other shopping styles and Self-Fulfillment.
Young adults who are self -satisfied and contented with their life do not need
any external motivations. They exhibit stable mindedness and are not impulsive
buyers.

154
TABLE:34
Relationship between the value Being Well Respected and Shopping Styles
Correlations Shopping Styles Being Well
Respected Remark
Perfectionist/High Quality Conscious
Pearson Correlation .150** **. Correlation is significant at the
0.01 level (2-tailed).
Sig. (2-tailed) .000
N 1477
Brand Consciousness/Price Equals Quality
Pearson Correlation .028 Sig. (2-tailed) .284 N 1476
Novelty and Fashion Conscious
Pearson Correlation .057* *. Correlation is significant at the
0.05 level (2-tailed).
Sig. (2-tailed) .028
N 1477
Recreational and Shopping Conscious
Pearson Correlation .099** **. Correlation is significant at the
0.01 level (2-tailed).
Sig. (2-tailed) .000
N 1477
Price Conscious/Value for the money
Pearson Correlation -.006 Sig. (2-tailed) .820 N 1477
Impulsiveness/Careless Pearson Correlation .004 Sig. (2-tailed) .874 N 1474
Confused by Overchoice Pearson Correlation .049 Sig. (2-tailed) .061 N 1477
Habitual/Brand Loyalty
Pearson Correlation .080** **. Correlation is significant at the
0.01 level (2-tailed).
Sig. (2-tailed) .002
N 1477
Source: Primary data
The above table indicates that there is a significant positive relationship
between the value ‘Being Well Respected’ and the Perfectionist/High Quality
Conscious (p value <0.01), Novelty and Fashion Conscious (p value <0.05),
Recreational and Shopping Conscious (p value <0.01), and Habitual/Brand Loyalty
(p value<0.01) shopping styles of young adults. There were no significant
relationships between the other shopping styles and Being Well Respected.

155
TABLE:35 Relationship between the value Fun and Enjoyment of life and Shopping Styles
Correlations Shopping Styles Fun and
Enjoyment of life Remark
Perfectionist/High Quality Conscious
Pearson Correlation .172** **. Correlation is significant at the
0.01 level (2-tailed).
Sig. (2-tailed) .000 N 1478
Brand Consciousness/Price Equals Quality
Pearson Correlation .080** **. Correlation is significant at the
0.01 level (2-tailed).
Sig. (2-tailed) .002 N 1477
Novelty and Fashion Conscious
Pearson Correlation .121** **. Correlation is significant at the
0.01 level (2-tailed).
Sig. (2-tailed) .000 N 1478
Recreational and Shopping Conscious
Pearson Correlation .072** **. Correlation is significant at the
0.01 level (2-tailed).
Sig. (2-tailed) .005 N 1478
Price Conscious/Value for the money
Pearson Correlation -.015 Sig. (2-tailed) .553 N 1478
Impulsiveness/Careless Pearson Correlation .027 Sig. (2-tailed) .297 N 1475
Confused by Overchoice Pearson Correlation .075** **. Correlation is
significant at the 0.01 level (2-
tailed).
Sig. (2-tailed) .004 N 1478
Habitual/Brand Loyalty Pearson Correlation .072** **. Correlation is
significant at the 0.01 level (2-
tailed).
Sig. (2-tailed) .006 N 1478
Source: Primary data
The above table indicates that there is a significant positive relationship
between the value ‘Fun and Enjoyment of life’ and the Perfectionist/High Quality
Conscious (p value <0.01), Brand Consciousness/Price Equals Quality (p value
<0.01), Novelty and Fashion Conscious (p value <0.01), Recreational and Shopping
Conscious (p value <0.01), Confused by Overchoice (p value <0.01) and
Habitual/Brand Loyalty (p value <0.01) shopping styles of young adults. There were
no significant relationships between the other shopping styles and Fun and
Enjoyment of life.

156
TABLE:36 Relationship between the value Security & Comfort and Shopping Styles
Correlations
Shopping Styles Security & Comfort
Remark
Perfectionist/High Quality Conscious
Pearson Correlation .115** **. Correlation is significant at the
0.01 level (2-tailed).
Sig. (2-tailed) .000 N 1478
Brand Consciousness/Price Equals Quality
Pearson Correlation .011 Sig. (2-tailed) .665 N 1477
Novelty and Fashion Conscious
Pearson Correlation .054* *. Correlation is significant at the
0.05 level (2-tailed).
Sig. (2-tailed) .038 N 1478
Recreational and Shopping Conscious
Pearson Correlation .115** **. Correlation is significant at the
0.01 level (2-tailed).
Sig. (2-tailed) .000 N 1478
Price Conscious/Value for the money
Pearson Correlation .029 Sig. (2-tailed) .267 N 1478
Impulsiveness/Careless Pearson Correlation .016 Sig. (2-tailed) .528 N 1475
Confused by Overchoice
Pearson Correlation .069** **. Correlation is significant at the
0.01 level (2-tailed).
Sig. (2-tailed) .008 N 1478
Habitual/Brand Loyalty
Pearson Correlation .064* *. Correlation is significant at the
0.05 level (2-tailed).
Sig. (2-tailed) .015 N 1478
Source: Primary data
The above table indicates that there is a significant positive relationship
between the value ‘Security & Comfort’ and the Perfectionist/High Quality
Conscious (p value <0.01), Novelty and Fashion Conscious (p value <0.05),
Recreational and Shopping Conscious (p value <0.01), Confused by Overchoice (p
value <0.01), and Habitual/Brand Loyalty (p value <0.05), shopping styles of young
adults. There were no significant relationships between the other shopping styles
and Security & Comfort.

157
TABLE:37 Relationship between the value Self Respect and Shopping Styles
Correlations
Shopping Styles Self Respect Remark
Perfectionist/High Quality Conscious
Pearson Correlation .109** **. Correlation is significant at the
0.01 level (2-tailed).
Sig. (2-tailed) .000
N 1478
Brand Consciousness/Price Equals Quality
Pearson Correlation -.036 Sig. (2-tailed) .171 N 1477
Novelty and Fashion Conscious
Pearson Correlation .027 Sig. (2-tailed) .294 N 1478
Recreational and Shopping Conscious
Pearson Correlation .081** **. Correlation is significant at the
0.01 level (2-tailed).
Sig. (2-tailed) .002
N 1478
Price Conscious/Value for the money
Pearson Correlation .020 Sig. (2-tailed) .450 N 1478
Impulsiveness/Careless Pearson Correlation -.027 Sig. (2-tailed) .295 N 1475
Confused by Overchoice Pearson Correlation .006 Sig. (2-tailed) .813 N 1478
Habitual/Brand Loyalty
Pearson Correlation .061* *. Correlation is significant at the
0.05 level (2-tailed).
Sig. (2-tailed) .019
N 1478
Source: Primary data
The above table indicates that there is a significant positive relationship between the
value ‘Self Respect’ and the Perfectionist/High Quality Conscious (p value <0.01),
Recreational and Shopping Conscious (p value <0.01), and Habitual/Brand Loyalty
(p value <0.05) shopping styles of young adults. There were no significant
relationships between the other shopping styles and Self Respect.

158
TABLE:38 Relationship between the value Sense of Accomplishment and Shopping Styles
Correlations
Shopping Styles Sense of Accomplishment
Remark
Perfectionist/High Quality Conscious
Pearson Correlation .150** **. Correlation is significant at
the 0.01 level (2-tailed).
Sig. (2-tailed) .000
N 1478
Brand Consciousness/Price Equals Quality
Pearson Correlation .032 Sig. (2-tailed) .219 N 1477
Novelty and Fashion Conscious
Pearson Correlation .074** **. Correlation is significant at
the 0.01 level (2-tailed).
Sig. (2-tailed) .004
N 1478
Recreational and Shopping Conscious
Pearson Correlation .047 Sig. (2-tailed) .073 N 1478
Price Conscious/Value for the money
Pearson Correlation .051* *. Correlation is significant at the
0.05 level (2-tailed).
Sig. (2-tailed) .050
N 1478
Impulsiveness/Careless Pearson Correlation .020 Sig. (2-tailed) .452 N 1475
Confused by Overchoice
Pearson Correlation .060* *. Correlation is significant at the
0.05 level (2-tailed).
Sig. (2-tailed) .021
N 1478
Habitual/Brand Loyalty Pearson Correlation .046 Sig. (2-tailed) .074 N 1478
Source: Primary data
The above table indicates that there is a significant positive relationship between the
value ‘Sense of Accomplishment’ and the Perfectionist/High Quality Conscious
(p value <0.01), Novelty and Fashion Conscious (p value <0.01), Price
Conscious/Value for the money (p value 0.05), and Confused by Overchoice
(p value <0.05) shopping styles of young adults. There were no significant
relationships between the other shopping styles and Sense of Accomplishment.

159
TABLE:39 Relationship between the value Being Independent and Shopping Styles
Correlations
Shopping Styles Being Independent Remark
Perfectionist/High Quality Conscious
Pearson Correlation .083** **. Correlation is significant at
the 0.01 level (2-tailed).
Sig. (2-tailed) .001
N 1478
Brand Consciousness/Price Equals Quality
Pearson Correlation .022 Sig. (2-tailed) .397 N 1477
Novelty and Fashion Conscious
Pearson Correlation .051 Sig. (2-tailed) .052 N 1478
Recreational and Shopping Conscious
Pearson Correlation .017 Sig. (2-tailed) .509 N 1478
Price Conscious/Value for the money
Pearson Correlation .031 Sig. (2-tailed) .229 N 1478
Impulsiveness/Careless Pearson Correlation .015 Sig. (2-tailed) .571 N 1475
Confused by Overchoice
Pearson Correlation .016 Sig. (2-tailed) .546 N 1478
Habitual/Brand Loyalty
Pearson Correlation .033 Sig. (2-tailed) .208 N 1478
Source: Primary data
The above table indicates that there is a significant positive relationship
between the value ‘Being Independent’ and the Perfectionist/High Quality
Conscious shopping style (p value <0.011) of young adults. There were no
significant relationships between the other shopping styles and Being Independent.

160
STRUCTURAL EQUATION MODELING (SEM)
Structural Equation Modeling (SEM) is a multivariate statistical methodology,
which takes a confirmatory approach to the analysis of a structural theory. Structural
Equation Modeling is confirmatory process, since it commences with the
specification of a model. It is a Multivariate Analysis method based on fitting and
testing multiple regression equation as specified by the model. SEM is a set of
techniques which allows examination of relationships between one or multiple
independent variable and one or more dependent variables.190Though there are many
ways to describe SEM, it is most commonly thought of as a hybrid between some
form of Analysis of Variance (ANOVA)/Regression and some form of Factor
Analysis. In general, it can be remarked that SEM allows the researcher to perform
some type of multilevel Regression/ANOVA on factors. Structural Equation
Modeling combines two approaches: the predictive approach of econometrics,
coupled with the psychometric approach of inferring latent variables from multiple
observed variables. It essentially seeks to answer research questions by combining
multiple regression analysis of factors with exploratory factor analysis. A researcher
proposes a hypothesized series of relationships between the variables under
investigation (the model) and structural equation modeling enables the
reasonableness of t relationships implied by the model to be assessed. In the present
study structural equation modeling was used to test the Value – Shopping Style
Model (Measurement). The first part of structural equation modeling is confirmatory
factor analysis which measures the measurement model if it confirms to the original
model.
CONFIRMATORY FACTOR ANALYSIS (CFA)
Confirmatory Factor Analysis (CFA) which is a part of the Structural
Equation Modeling (SEM) techniques can be used to estimate a measurement model
that specifies the relationship between observed indicators and their underlying
latent constructs. The measurement model specifies how latent constructs are
190Tabachnick, Linda S. Fidell. (2001). Using Multivariate Statistics (6th Edition). Amazon.com

161
measured by the observed variables. CFA is often used to confirm a factor structure
known beforehand as is the case with the constructs in the study.
In statistics, CFA is a special form of factor analysis. It is used to test
whether measures of a construct are consistent with a researcher’s understanding of
the nature of that construct (factor). In contrast to exploratory factor analysis, where
all loadings are free to vary, CFA allows for the explicit constraint of certain
loadings to be zero. CFA assesses the fit of the model. Model fit measures could be
then obtained to assess how well the proposed model captured the covariance
between all the items on the test. If the fit is poor, it may be due to some items
measuring multiple factors. It might also be that some items within a factor are more
related to each other than others.
GOODNESS OF FIT MEASURES (GFM)
“Goodness of fit measures” was used to test the appropriateness of the
structural model using the Amos 16.0 software. The overall fit of a model in
structural equation modeling can be assessed using a number of fit indices. There is
a broad consensus that no single measure of overall fit should be relied on
exclusively and a variety of different indices should be consulted.191 There are
several indicators of Goodness-of-fit and most structural equation modeling scholars
recommend evaluating the models by observing more than one of these indicators.
Dozens of statistics, besides the value of the discrepancy function at its minimum,
have been proposed as measures of the merit of a mode. The choice of Goodness-of-
fit indexes should be based on careful consideration of critical factors like sample
size, estimation procedure, model complexity and/or violation of the underlying
assumptions of multivariate normality and variable independence.192The criteria for
ideal fit indices are relative independence of sample size, accuracy and consistency
to assess different models and ease of interpretation aided by a well-defined pre-set
191Tanaka, 1993. Tanaka, J.S. (1993). Multifaceted conceptions of fit in structural equation models. In
K.A. Bollen, & J.S. Long (eds.), Testing structural equation models. Newbury Park, CA: Sage 192Hu &Bentler (1999). Cutoff criteria for fit indexes in covariance structure analysis: Coventional
criteria versus new alternatives, Structural Equation Modeling, 6(1), 1-55.

162
range.193 The entire set of fit give a good sense of how the model fits the sample
data.
The overall fit of the proposed research model was significant as all measures
of fitness were at acceptable levels indicating the model fits the data well. Model fit
summary is presented in this section. The rule of thumb (to check the model fitness)
was referred from AMOS 16.0 User’s Guide.194
Confirmation of the dimensions of shopping styles among young adults with the
original Sproles& Kendall CSI (1986)
TABLE:40
Summary of Goodness-of-fit measures for the ‘Consumer Style Inventory’ used in the study
Model Fit Assessment Result
2 (chi-square) [CMIN] 1294.180
DF (Degrees of freedom) 224
p-value <.001
PGFI (Parsimony Goodness of Fit Index) .654
NFI (Normed Fit Index) .855
RFI (Relative Fit Index) .806
IFI (Incremental Fit Index) .877
TLI (Tucker-Lewis Coefficient) .834
CFI (Comparative Fit Index) .876
PRATIO (Parsimony Ratio) .747
NCP (Non centrality Parameter) 1070.180
RMSEA(Root Mean Square Error of Approximation) .057
Source: Primary data
193Marsh, H.W., Hau, K-T., & Wen, Z. (2004). In search of golden rules: Comment on hypothesis-
testing approaches to setting cutoff values for fit indexes and dangers of overgeneralizing Hu and Bentler’s (1999) findings. Structural Equation Modeling, 11, 320-341 pp.
194James L. Arbuckle. Amos ™ 16 User’s Guide. (2007)

163
Based on AMOS 16.0 User’s Guide, the measures- of -fit statistics given in
Table No. 37indicate an acceptable and adequate overall level of fit for the entire
sample.A detailed interpretation of each of the Goodness of Fit measures indicated
in the above table is given in the following tables.
TABLE:41
Relative Chi Square (CMIN/df) (Chi-square/Degrees of freedom)
Model NPAR CMIN DF P CMIN/DF
Default model 100 1294.180 224 .000 5.778
Saturated model 324 .000 0
Independence model 24 8943.902 300 .000 29.813
Source: Primary data
CMIN (X2) value is 0.1294.180, Degrees of freedom (df) is 224 and p value
is <.001 which means that the sample fits adequately to the hypothesized network of
relationships in the model. CMIN is the minimum value of the discrepancy C. DF is
the number of degrees of freedom for testing the model df = d = p – q where p is the
number of sample moments and q is the number of distinct parameters. P is the
probability of getting as large a discrepancy as occurred with the present sample
(under appropriate distributional assumptions and assuming a correctly specified
model). That is, P is a “p value” for testing the hypothesis that the model fits
perfectly in the population.
CMIN/DF is the minimum discrepancy divided by its degrees of freedom.
CMIN/DF is 5.77. Several writers have suggested the use of this ratio as a measure
of fit. Marsh and Hocevar195have recommended using ratios as low as 2 or as high as
5 to indicate a reasonable fit. The value reported as X2 is the minimum value of the
fitting function, and it is large compared to its df. X2 is quite sensitive to sample
size, and rejects for smaller and smaller discrepancies as the sample gets bigger. X2
195Marsh, Herbert W.; Hocevar, Dennis. (May 1985). Application of confirmatory factor analysis to
the study of self-concept: First- and higher order factor models and their invariance across groups. Psychological Bulletin, Vol 97(3), May 1985, 562-582. doi: 10.1037/0033-2909.97.3.562.

164
is probably less useful as an indicator than other model fit measures for this model
based on samples as large as this. Whenever the sample used is higher than 200, the
X2 test is not indicative of good or bad adjustment of the model to the data, since the
value of X 2 increase with the increase in sample size.196 This way, whenever the
sample is above 200, this test tends to reject all models, even when these present a
good adjustment. On the contrary, whenever the sample’s dimension is lower than
100, the test will tend to accept all models, even those that do not present an
adequate adjustment.
Comparisons to a Baseline Model
This set of goodness of fit measure compares the researcher’s model to the
fit of another model, usually the independence model. The independence model is
used as the baseline model in AMOS. The object of the exercise is to put the fit of
the proposed model into some perspective. Baseline comparison measures are
described below. The measures included are: Comparative fit index (CFI), Normed
fit index (NFI), Relative fit index (RFI), Incremental fit index (IFI), Tucker-Lewis
Index (TLI).
TABLE:42
Baseline Model
Model NFI Delta1
RFI rho1
IFI Delta2
TLI rho2 CFI
Default model .855 .806 .877 .834 .876
Saturated model 1.000
1.000
1.000
Independence model .000 .000 .000 .000 .000
Source: Primary data
196 Hair, J.F. Jr. , Anderson, R.E., Tatham, R.L., & Black, W.C. (1998). Multivariate Data Analysis, (5th Edition). Upper Saddle River, NJ: Prentice Hall.

165
Comparative fit index (CFI)
CFI (Comparative fit index) is 0.876 indicating a very good fit. Rule of
thumb: CFI values close to 1 indicate a very good fit.
Normed Fit Index (NFI)
Normed fit index (NFI) of the research model is 0.855 indicating good fit. As
per rule of thumb, models with overall fit indices of less than 0.9 can usually be
improved substantially.
Relative Fit Index (RFI)
Relative fit index (RFI) is 0.806 indicating again a very good fit. Rule of
thumb: RFI values close to 1 indicate a very good fit.
Incremental Fit Index (IFI)
Incremental fit index (IFI) is 0.877 indicating good fit. Rule of thumb: IFI
values close to 1 indicate a very good fit.
Tucker-Lewis Index (TLI)
TLI value is 0.834 which shows the proposed model has a very good fit. The
Tucker-Lewis197 coefficient was discussed by Bentler and Bonett, in the context of
analysis of moment structures and is also known as the Bentler-Bonett non-normed
fit index (NNFI).198 The typical range for TLI lies between 0 and 1, but it is not
limited to that range. TLI values close to 1 indicate a very good fit.
Parsimony Adjusted Measures
Parsimony adjusted measures are goodness-of-fit tests penalizing for lack of
parsimony. Parsimony measures lack of parsimony on the rationale that more
complex models will, all other things being equal, generate better fit than less
197L.R. Tucker and C. Lewis.(1973). A reliability coefficient for maximum likelihood factor
analysis.Psychometrika, pages 1–10, 1973. 198P.M. Bentler. (1990). Comparative fit indexes in structural models. Psychological Bulletin, pages
238–246 pp.

166
complex ones. Models with relatively few parameters (and relatively many degrees
of freedom) are sometimes said to be high in parsimony, or simplicity. Models with
many parameters (and few degrees of freedom) are said to be complex, or lacking in
parsimony. This use of the terms simplicity and complexity does not always
conform to everyday usage. While one can inquire into the grounds for preferring
simple, parsimonious models, there does not appear to be any disagreement that
parsimonious models are preferable to complex ones. Various parsimonious adjusted
measures considered here are: Parsimony Ratio (PRATIO), Parsimony Goodness-of-
Fit Index (PGFI).
TABLE:43
Parsimony-Adjusted Measures
Model PRATIO PNFI PCFI
Default model .747 .639 .654
Saturated model .000 .000 .000
Independence model 1.000 .000 .000
Source: Primary data
Parsimony Ratio (PRATIO)
PRATIO value is 0.747 which indicates that 74.7% of the number of
constraints in the independence model is being evaluated in the tested model. The
parsimony ratio expresses the number of constraints in the model being evaluated as
a fraction of the number of constraints in the independence model where d is the
degrees of freedom of the model being evaluated and is the degrees of freedom of
the independence model. The parsimony ratio is used in the calculation of PNFI and
PCFI.
Parsimony Goodness-of-Fit Index (PGFI)
The parsimony goodness of fit index is a variant of GFI. By arbitrary
convention, PGFI >.60 indicates good parsimonious fit, though some authors use the

167
more lenient >.50 criterion. The PGFI for the model is 0.654. A PGFI value that
exceeds 0.5 would indicate the model employed is a perfect fit to the data in the
study.The PGFI is a modification of the GFI that takes into account the degrees of
freedom available for testing the model.
TABLE:44
Root Mean Square Error of Approximation (RMSEA)
Model RMSEA LO 90
HI 90 PCLOSE
Default model .057 .054 .060 .000
Independence model .140 .137 .142 .000
Source: Primary data
RMSEA (root mean square error of approximation) value of .057 indicates
adequate fit. RMSEA is a popular measure of fit, partly because it does not require
comparison with a null model and does not require the author position as a plausible
model in which there is complete independence of the latent variables. It is one of
the fit indexes less affected by sample size. RMSEA has only recently been
recognized as one of the most informative criteria in covariance structure modelling.
The RMSEA takes into account the error of approximation in the population and
asks the question, “How well would the model, with unknown but optimally chosen
parameter values, fit the population covariance matrix if it were available?”. This
discrepancy, as measured by the RMSEA, is expressed per degree of freedom, thus
making the index sensitive to the number of estimated parameters in the model (i.e.,
the complexity of the model); values less than .05 indicate good fit, and values as
high as .08 represent reasonable errors of approximation in the population. RMSEA
values ranging from .08 to .10 indicate mediocre fit and those greater than 0.10
indicate poor fit.
The results of confirmatory factor analysis and goodness of fit test under the
Structural Equation Modeling Technique indicated in Table No. 37 show that the
values of NFI, CFI, RFI, IFI, TLI and RMSEA are values close to 1, within

168
acceptable ranges and shows that the proposed model indicates a good fit to the data.
It is concluded that the dimensions of shopping styles among young adults in
Bangalore city, confirms with the original Sproles & Kendall Consumer Styles
Inventory CSI (1986).
VALIDITY MEASURES
The confirmatory factor analysis has been executed to test the validity of the
instruments through content validity, convergent validity, discriminant validity and
criterion related validity. Content validity refers to the degree which an instrument
covers the meaning of the concepts included in a particular research. For this study,
the content validity of the proposed instrument is adequate enough because the
instrument has been carefully constructed, validated and supported by an extensive
literature review.
TABLE:45
Factors, standardized factor loading, AVE, CR and Coefficient Alpha for Shopping Styles
Shopping Styles Average Variance
Explained (Convergent Validity)
Construct Validity
Perfectionist/High Quality Conscious .55 .78
Confused by Overchoice .33 .50
Recreational and Shopping Conscious .60 .82
Impulsiveness/Careless .58 .80
Price Conscious/Value for money .56 .79
Habitual/Brand Loyal .42 .69
Novelty and Fashion Conscious .63 .83
Brand Conscious/Price Equals Quality .52 .77
Source: Primary data

169
Construct validity: Construct validity is the extent to which a set of
measured variables actually represent the theoretical latent construct they are
designed to measure. It is made up of four components: Convergent Validity,
Discriminant Validity, Nomological Validity and Face validity. To assess the
construct validity of the scale, exploratory and confirmatory factor analytic
procedures were applied.
Convergent validity: Convergent validity is the extent to which indicators
of a specific construct ‘converge’ or share a high proportion of variance in common.
Convergent validity identifies the proportion of variance for each factor. To assess
this, standardized factor loadings in the measurement model were examined,
composite or construct reliability (CR) and average variance extracted (AVE) was
computed.
Construct reliability: Is a measure of reliability and internal consistency
based on the square of the total of factor loadings for a construct.
Construct Reliability (CR) = {(sum of standardized loadings)2} / {(sum of
standardized loadings)2 + (sum of indicator measurement errors)}
CR values should be greater than 0.6 while AVE should be above 0.5. The
construct reliability estimates of the scale exceeded 0.6, indicating fair construct
reliability.
Discriminant Validity: The discriminant validity examines the extent to
which an independent variable is truly distinct from other independent variables in
predicting the dependent variable. It is the extent to which a construct is truly
distinct from other constructs. To substantiate the evidence of discriminant validity,
the values of average variance extracted (AVE) between dimensions were compared
to squared multiple correlations of the two.199 If within each possible pairs of
constructs, the shared variance observed is lower than the minimum of their AVEs,
then discriminant validity is evidenced.200 If all variance extracted (AVE) estimates
199Hair, J., Black, W., Babin, B., Anderson, R., and Tatham, R. (2006). Multivariate Data Analysis,
6th ed. Pearson Prentice Hall, Upper Saddle River, New Jersey 200Fornell&Larcker. (1981). Evaluating structural equation models with unobservable variables and
Measurement error.Journal of Marketing Research. 48: 39-50pp

170
are larger than the corresponding squared inter-construct correlation estimates (SIC)
then, the construct is said to have discriminant validity.
The convergent validity for the CSI scale was analysed and the values of the
standardized loading, AVE, CR and Coefficient Alpha are given in the above Table
42. The values support the internal consistency of the data.
MODEL TESTING
In this study a ‘Value Shopping Style Model’ (VSM) is proposed and tested
to investigate the primary research question, ‘Do values influence the Shopping
styles of young adults for apparel purchases’? Structural Equation Modeling output
results for the proposed model are presented in this section.
Objective 4 -To develop a ‘Value-Shopping Style Model’ and analyze the
influence of values on the shopping styles of young adults towards purchase of
apparels.
TABLE:46
Summary of Goodness-of-fit measures for the ‘Value – Shopping Style’ measurement model - (VSM)
Model Fit Assessment Result 2(chi-square) 3712.878
DF(Degrees of freedom) 519 p-value <.001 PGFI (Parsimony Goodness of Fit Index) 0.655 NFI (Normed Fit Index) 0.723 RFI (Relative Fit Index) 0.683 IFI (Incremental Fit Index) 0.753 TLI (Tucker-Lewis Coefficient) 0.715 CFI (Comparative Fit Index) 0.751 PRATIO (Parsimony Ratio) 0.872 NCP (Non centrality Parameter) 3193.878 RMSEA(Root Mean Square Error of Approximation) 0.065
Source: Primary data

171
A detailed interpretation of each of the Goodness of Fit measures indicated
in the above table is given in the following tables.
TABLE:47
Relative Chi Square (CMIN/df) (Chi-square/Degrees of freedom) (VSM)
Model NPAR CMIN DF P CMIN/DF
Default model 110 3712.878 519 .000 7.154
Saturated model 629 .000 0
Independence model 34 13427.685 595 .000 22.568
Source: Primary data
CMIN (X 2) value is 3712.878, Degrees of freedom (df) is 519 and p value is
<.001 which means that the sample fits adequately to the hypothesized network of
relationships in the model.
TABLE:48
Baseline Comparisons - (VSM)
Model NFI Delta1
RFI rho1
IFI Delta2
TLI rho2 CFI
Default model .723 .683 .753 .715 .751
Saturated model 1.000
1.000
1.000
Independence model .000 .000 .000 .000 .000
Source: Primary data
CFI (Comparative fit index) is 0.751 indicating a very good fit. Rule of
thumb: CFI values close to 1 indicate a very good fit. Normed fit index (NFI) of the
research model is 0.723, indicating a good fit. As per rule of thumb, models with
overall fit indices of less than 0.9 can usually be improved substantially. Relative fit

172
index (RFI) is 0.683 indicating again a very good fit. Rule of thumb: RFI values
close to 1 indicate a very good fit. Incremental fit index (IFI) is 0.753 indicating
good fit. Rule of thumb: IFI values close to 1 indicate a very good fit.TLI value is
0.715 which shows the proposed model has a very good fit. The typical range for
TLI lies between 0 and 1, but it is not limited to that range. TLI values close to 1
indicate a very good fit.
TABLE:49
Parsimony-Adjusted Measures - (VSM)
Model PRATIO PNFI PGFI
Default model .872 .631 .655
Saturated model .000 .000 .000
Independence model 1.000 .000 .000
Source: Primary data
PRATIO value is 0.872 which indicates that 87.2% of the number of
constraints in the independence model is being evaluated in the tested model. PGFI
>0.60 indicates good parsimonious fit, though some authors use the more lenient
>0.50 criterion. The Parsimony goodness-of-fit index is 0.655. This indicates that
the model employed is a perfect fit to the data in the study.
TABLE:50
Root Mean Square Error of Approximation (RMSEA) - (VSM)
Model RMSEA LO 90 HI 90 PCLOSE
Default model .065 .063 .067 .000
Independence model .121 .119 .123 .000
Source: Primary data

173
RMSEA value of 0.065 indicates reasonable fit. Rule of thumb: RMSEA
values less than 0.05 indicate good fit, and values as high as .08 represent reasonable
fit and RMSEA values ranging from 0.08 to 0.10 indicate mediocre fit and those
greater than 0.10 indicate poor fit.
To summarize the results, the values of NFI, CFI, RFI, IFI, and TLI are
values close to 1 and indicate a very good fit and the Root Mean Square Error of
approximation (RMSEA) value .065 is a reasonable fit. The results of Goodness of
Fit tests under the Structural Equation Modeling Technique indicate that the
proposed ‘Value – Shopping Style Model’ - (VSM) fits the data well.
Path Analysis and SEM are extensions of multiple regression, they rely very
heavily on pictures called path diagrams to visualize what’s going on. All of the
variables are represented by rectangles, and each path is represented by a straight
line with an arrow head at one end. The predictor variables are joined by curved
lines with arrow heads at both ends. The straight arrows are the paths, and the
curved ones represent the correlations among the variables. The circle with an
arrow pointing to the dependent variable is the error term, called the disturbance
term in PA and SEM and which is a part of every regression equation (and by
extension, part of every PA and SEM diagram).

174
FIG.7
PATH DIAGRAM INDICATING THE VALUE – SHOPPING STYLE MODEL FIT
As the measurement model proved to be a good fit, the researcher found
scope for testing the Structural Equation Model further using the Path Analysis. The
summary of the results are presented in the following sections.
Perfectionist/High Quality Conscious
S3e111 S2e2
1 S1e31
Brand Conscious/Price Equals Quality
S6e411 S5e5
1 S4e61
Novelty and Fashion Conscious
S9e711 S8e8
1 S7e91
Recreational and Shopping Conscious
S12 e101 1 S11 e11
1 S10 e121
Price Conscious/Value for money
S15e1311 S14e14
1 S13e151
Impulsiveness/Careless
S18 e16 11 S17 e17
1 S16 e18 1
Confused by OverchoiceS19 e191 1
S20 e201
S21 e21 1
Habitual/Brand Loyal lS22 e221
1
S23 e231
S24 e241
values
V1 e25
1
1
V2 e261
V3 e271
V4 e281
V5 e291
V6 e301
V7 e311
V8 e321
V9 e331
V10 e341
e41 1

175
ANALYSIS OF INFLUENCE OF VALUES ON THE SHOPPING STYLES
The principal objective of this research work is to study the influence of
personal values on the young adults shopping styles for apparels in Bangalore City.
Path Analysis (Multiple Regression) was performed on the data, the results are
presented in the following tables.
Path analysis is an extension of Multiple Regression analysis that allows the
researcher to look at more than one dependent variable at a time and allows for
variables to be dependent with respect to some variables and independent with
respect to others. Structural equation modeling extends path analysis by looking at
latent variables.
H1 – There is no significant influence of values on the various shopping
styles of young adults towards purchase of apparels.
TABLE:51
Influence of overall values on the shopping styles of young adults towards apparels
CSI Scale Items
LOV Estimate S.E. C.R. P
Perfectionist/High Quality Conscious <--- values .209 .027 7.878 .000
Habitual/Brand Loyal <--- values .101 .026 3.810 .000
Confused by Overchoice <--- values .121 .033 3.690 .000
Brand Conscious/Price Equals Quality <--- values .072 .022 3.213 .001
Novelty and Fashion Conscious <--- values .148 .029 5.116 .000
Recreational and Shopping Conscious <--- values .128 .033 3.823 .000
Price Conscious/Value for money <--- values .006 .010 .594 .552
Impulsiveness/Careless <--- values .056 .025 2.224 .026 Source: Primary data

176
It was found that there is a significant influence of overall values on the
shopping styles of youth. The highest influence of values was on the
Perfectionist/High Quality Conscious style (P value <.001) followed by Novelty and
Fashion Conscious, Recreational and Shopping Conscious, Confused by
Overchoice, Habitual/Brand Loyal, Brand Conscious/Price Equals Quality and
Impulsiveness/Careless styles. There was no significant influence of values on the
Price Conscious/Value for money style. The table indicates that young adults in
Bangalore are not price conscious when it comes to apparel purchases.
As the above table indicates that values influence all the shopping styles
except the price conscious/value for money style, we reject the null hypothesis and
accept the alternate hypothesis ‘There is significant influence of overall values
on the shopping styles of young adults towards apparel purchases’.

177
Analyzing the Influence of values on the various dimensions of the
shopping style inventory:
H2 – There is no significant influence of values on the various dimensions of
the shopping styles of young adults towards purchase of apparels.
TABLE:52
Influence of values on the ‘Perfectionist/High Quality Conscious’ shopping style
Shopping Style Values Estimate S.E. C.R. P Perfectionist/High Quality Conscious <--- Sense of Belonging .025 .011 2.249 .025
Perfectionist/High Quality Conscious <--- Simplicity -.012 .011 -1.116 .264
Perfectionist/High Quality Conscious <--- Warm Relationships
With Others .035 .011 3.033 .002
Perfectionist/High Quality Conscious <--- Self-Fulfillment -.031 .011 -2.801 .005
Perfectionist/High Quality Conscious <--- Being Well Respected .029 .012 2.471 .013
Perfectionist/High Quality Conscious <--- Fun And Enjoyment of
Life .056 .011 5.105 .000
Perfectionist/High Quality Conscious <--- Security & Comfort .010 .012 .839 .402
Perfectionist/High Quality Conscious <--- Self-Respect .002 .012 .181 .856
Perfectionist/High Quality Conscious <--- A Sense of
Accomplishment .053 .011 4.640 .000
Perfectionist/High Quality Conscious <--- Being Independent -.011 .010 -1.065 .287 Source: Primary data
It was found that there was a significant influence of values, ‘Fun and
Enjoyment of life’ (p value <0.01), ‘A sense of accomplishment’ (p value <0.01),
‘Warm relationships with others’ (p value <0.01),‘Being well respected’ (p value
<0.05), and ‘Sense of belonging’ (p value <0.05), on the Perfectionist/High Quality
Conscious dimension of the shopping styles. Self-fulfillment had a negative
influence (p value <0.01). However, the values Simplicity, Security & Comfort,
Self-respect and Being independent did not have a significant influence on the
Perfectionist/High Quality Conscious shopping style.

178
TABLE:53
Influence of values on the ‘Brand Conscious/Price Equals Quality’ shopping style
Shopping Style
Values Estimate S.E. C.R. P
Brand Conscious/Price Equals Quality <--- Sense Of Belonging -.008 .010 -.746 .455
Brand Conscious/Price Equals Quality <--- Simplicity .007 .010 .661 .509
Brand Conscious/Price Equals Quality <--- Warm Relationships
With Others -.005 .010 -.512 .609
Brand Conscious/Price Equals Quality <--- Self-Fulfillment -.029 .010 -2.800 .005
Brand Conscious/Price Equals Quality <--- Being Well-
Respected .026 .011 2.355 .019
Brand Conscious/Price Equals Quality <--- Fun And Enjoyment
Of Life .052 .010 5.010 .000
Brand Conscious/Price Equals Quality <--- Security & Comfort .000 .011 .030 .976
Brand Conscious/Price Equals Quality <--- Self-Respect -.039 .011 -3.417 .000
Brand Conscious/Price Equals Quality <--- A Sense Of
Accomplishment .016 .010 1.533 .125
Brand Conscious/Price Equals Quality <--- Being Independent .006 .009 .598 .550
Source: Primary data
It was found that there is a significant positive influence of the values Fun
and Enjoyment of Life(p value <0.01), and Being well respected(p value <0.05), on
the ‘Brand Conscious/Price Equals Quality’ dimension of the shopping style
inventory. Self-fulfillment (p value <0.01), and Self respect(p value <0.01), had
negative influence on ‘Brand Conscious/Price Equals Quality’ shopping style.
However, the values Sense of belonging, Simplicity, Warm Relationships, Security
& Comfort, A Sense of Accomplishment and Being independent did not have a
significant influence on the ‘Brand Conscious/Price Equals Quality’ shopping style.

179
TABLE:54 Influence of values on the ‘Novelty and Fashion Conscious’ shopping style
Shopping Style
Values Estimate S.E. C.R. P
Novelty and Fashion Conscious <--- Sense Of
Belonging -.026 .013 -1.942 .052
Novelty and Fashion Conscious <--- Simplicity -.023 .013 -1.818 .069
Novelty and Fashion Conscious <---
Warm Relationships With Others
-.017 .014 -1.265 .206
Novelty and Fashion Conscious <--- Self-Fulfillment -.006 .013 -.459 .646
Novelty and Fashion Conscious <--- Being Well-
Respected .032 .014 2.294 .022
Novelty and Fashion Conscious <--- Fun And
Enjoyment Of Life .065 .013 5.027 .000
Novelty and Fashion Conscious <--- Security &
Comfort .024 .014 1.761 .078
Novelty and Fashion Conscious <--- Self-Respect -.006 .014 -.449 .654
Novelty and Fashion Conscious <--- A Sense Of
Accomplishment .026 .013 1.911 .056
Novelty and Fashion Conscious <--- Being Independent .004 .012 .363 .717
Source: Primary data
It was found that there is a significant influence of the values Fun and
enjoyment of life (p value <0.01), and Being Well-respected (p value <0.05), on the
‘Novelty and Fashion Conscious’ dimension of shopping style inventory. All the
other values did not have a significant influence on this dimension of shopping style
inventory.

180
TABLE:55
Influence of values on the ‘Recreational and Shopping Conscious’ shopping style
Shopping Style
Values Estimate S.E. C.R. P
Recreational and Shopping Conscious’ <--- Sense Of
Belonging .007 .015 .462 .644
Recreational and Shopping Conscious’ <--- Being Well-
Respected .028 .016 1.717 .086
Recreational and Shopping Conscious’ <--- A Sense Of
Accomplishment -.001 .016 -.087 .931
Recreational and Shopping Conscious’ <--- Simplicity -.020 .015 -1.371 .170
Recreational and Shopping Conscious’ <--- Fun And
Enjoyment Of Life .000 .015 .032 .975
Recreational and Shopping Conscious’ <--- Being Independent -.028 .014 -2.030 .042
Recreational and Shopping Conscious’ <--- Security &
Comfort .058 .016 3.552 .000
Recreational and Shopping Conscious’ <---
Warm Relationships With Others
.031 .016 1.985 .047
Recreational and Shopping Conscious’ <--- Self-Fulfillment .004 .015 .290 .772
Recreational and Shopping Conscious’ <--- Self-Respect .002 .017 .099 .921 Source: Primary data
It was found that there is a significant positive influence of the values
Security and Comfort (p value <0.01), and Warm Relationships with others (p value
<0.05), on the ‘Recreational and Shopping Conscious’ dimension of shopping style
inventory. Being Independent (p value <0.05), had a negative influence, on the
‘Recreational and Shopping Conscious’ dimension of shopping style inventory. All
the other values did not have a significant influence on this dimension of shopping
style inventory.

181
TABLE:56
Influence of values on the ‘Price Conscious/Value for money’ shopping style
Shopping Style
Values Estimate S.E. C.R. P
Price Conscious/Value for money <--- Sense Of Belonging .003 .006 .505 .613
Price Conscious/Value for money <--- Simplicity -.003 .005 -.528 .598
Price Conscious/Value for money <--- Warm Relationships
With Others .026 .008 3.364 .000
Price Conscious/Value for money <--- Self-Fulfillment .002 .006 .304 .761
Price Conscious/Value for money <--- Being Well-
Respected -.026 .008 -3.334 .000
Price Conscious/Value for money <--- Fun And Enjoyment
Of Life -.015 .006 -2.393 .017
Price Conscious/Value for money <--- Security & Comfort .002 .006 .262 .794
Price Conscious/Value for money <--- Self-Respect .003 .006 .524 .600
Price Conscious/Value for money <--- A Sense Of
Accomplishment .013 .006 2.115 .034
Price Conscious/Value for money <--- Being Independent .002 .005 .337 .736
Source: Primary data
It was found that there is a significant positive influence of the values Warm
Relationships with others (p value <0.01), and A sense of accomplishment (p value
<0.05), and a significant negative influence of the values Being Well-respected
(p value <0.01), and Fun and enjoyment of life (p value <0.05), on the ‘Price
Conscious/Value for money’ dimension of shopping style inventory. All the other
values did not have a significant influence on this dimension of shopping style
inventory.

182
TABLE:57 Indicating influence of values on the ‘Impulsiveness/Careless’ shopping style
Shopping Style
Values Estimate S.E. C.R. P
Impulsiveness/Careless <--- Sense Of Belonging -.002 .012 -.148 .882
Impulsiveness/Careless <--- Simplicity .013 .012 1.126 .260
Impulsiveness/Careless <---
Warm Relationships With Others
.035 .013 2.697 .007
Impulsiveness/Careless <--- Self-Fulfillment -.041 .012 -3.258 .001
Impulsiveness/Careless <--- Being Well-Respected -.010 .013 -.784 .433
Impulsiveness/Careless <---
Fun And Enjoyment Of Life
.010 .012 .829 .407
Impulsiveness/Careless <--- Security & Comfort .011 .013 .883 .377
Impulsiveness/Careless <--- Self-Respect -.012 .013 -.923 .356
Impulsiveness/Careless <---
A Sense Of Accomplishment
.016 .012 1.299 .194
Impulsiveness/Careless <--- Being Independent .007 .011 .611 .541
Source: Primary data
It was found that there is a significant positive influence of the value Warm
Relationships (p value <0.01), with others and significant negative influence of the
value Self-fulfillment (p value <0.01), on the ‘Impulsiveness/Careless’ dimension of
the shopping inventory. All the other values did not have a significant influence on
this dimension of shopping style inventory.

183
TABLE:58
Influence of values on the ‘Confused by Overchoice’ shopping style
Shopping Style
Values Estimate S.E. C.R. P
Confused by Overchoice <--- Sense Of Belonging -.025 .015 -1.597 .110
Confused by Overchoice <--- Simplicity .024 .015 1.608 .108
Confused by Overchoice <---
Warm Relationships
With Others .022 .016 1.378 .168
Confused by Overchoice <--- Self-Fulfillment -.021 .015 -1.423 .155
Confused by Overchoice <--- Being Well-Respected .008 .016 .503 .615
Confused by Overchoice <---
Fun And Enjoyment of
Life .038 .015 2.562 .010
Confused by Overchoice <--- Security & Comfort .041 .016 2.539 .011
Confused by Overchoice <--- Self-Respect -.030 .017 -1.801 .072
Confused by Overchoice <---
A Sense of
Accomplishment .033 .016 2.110 .035
Confused by Overchoice <--- Being Independent -.018 .014 -1.334 .182
Source: Primary data
It was found that there is a significant influence of the values Fun and
enjoyment of life (p value <0.01), Security & Comfort (p value <0.05), and A sense
of accomplishment (p value <0.05), on the ‘Confused by Overchoice’ dimension of
shopping styles inventory. All the other values did not have a significant influence
on this dimension of shopping style inventory.

184
TABLE:59
Influence of values on the ‘Habitual/Brand Loyal’ shopping style
Shopping Style
Values Estimate S.E. C.R. P
Habitual/Brand Loyal <--- Sense Of Belonging -.005 .012 -.393 .694
Habitual/Brand Loyal <--- Simplicity .032 .012 2.691 .007
Habitual/Brand Loyal <---
Warm Relationships With Others
-.016 .012 -1.270 .204
Habitual/Brand Loyal <--- Self-Fulfillment -.022 .012 -1.841 .066
Habitual/Brand Loyal <--- Being Well-Respected .018 .013 1.380 .168
Habitual/Brand Loyal <--- Fun And Enjoyment of Life .017 .012 1.494 .135
Habitual/Brand Loyal <--- Security & Comfort .009 .013 .705 .481
Habitual/Brand Loyal <--- Self-Respect .022 .013 1.663 .096
Habitual/Brand Loyal <--- A Sense of Accomplishment .001 .012 .120 .904
Habitual/Brand Loyal <--- Being Independent -.002 .011 -.161 .872 Source: Primary data
It was found that there is a significant influence of the value Simplicity (p
value <0.01), on the ‘Habitual/Brand Loyal’ dimension of shopping style. The other
values did not have a significant influence on ‘Habitual/Brand Loyal’ style.
The above Tables 48 to 56 indicate that values influence all the dimensions
of the shopping styles inventory. Hence we reject the null hypothesis and accept
the alternate hypothesis ‘There is significant influence of values on the various
dimensions of the shopping styles of young adults towards purchase of
apparels’.

185
TABLE:60
Squared multiple correlations (R squared values) for Shopping Styles
Shopping Style Estimate
Confused by Overchoice .64
Recreational and Shopping Conscious .59
Novelty and Fashion Conscious .48
Habitual/Brand Loyal .42
Perfectionist/High Quality Conscious .34
Brand Conscious/Price Equals Quality .32
Impulsiveness/Careless .29
Price Conscious/Value for money .05 Source: Primary data
The overall model was significant. The independent variables (values)
explained 64% variation in Confused by Overchoice; 59% variation in Recreational
and Shopping Conscious; 48% variation in Novelty and Fashion Conscious; 42%
variation in Habitual/Brand Loyal; 34% variation in Perfectionist/High Quality
Conscious; 32% variation in Brand Conscious/Price Equals Quality; 29% variation
in Impulsiveness/Careless and 5% variation in Price Conscious/Value for money
style.

186
PROFILING THE YOUNG ADULT SHOPPER BASED ON PERSONAL
VALUES
The following consolidated tables reveal the nature of influence of values on
the various shopping styles of young adults. The nature of influence can be positive,
negative or neutral. A positive influence is when the variable is the underlying
motivation to act in a desired manner in tandem with the purpose. A negative
influence is when the variable is the motivation to act in a manner that is not in
favour of or is against the purpose. A neutral influence is when the variable does not
trigger any response or cause motivation to act in either manner.
Based on the findings of the nature of influence of values, a profile of the
young adult shopping behaviour for apparels can be developed.
TABLE:61
Nature of Influence of Values on the Perfectionist/High Quality Conscious Shopping Style
Shopping Style INFLUENCE OF VALUES
Positive Influence Negative Influence No Influence
Perfectionist/High Quality Conscious
Fun and Enjoyment of Life
A Sense of Accomplishment
Warm Relationships with Others
Being Well- Respected
Sense of Belonging
Self-Ful-fillment
Security and Comfort
Self –Respect Simplicity
Being Independent
Source: Primary data; Ref. Table 52

187
The Perfectionist/High Quality Conscious Shopping Style emerged as the
predominant style of young adults in their purchase-decisions for apparels as per the
mean and standard deviation scores. Values such as fun and enjoyment of life, sense
of accomplishment, warm relationship with others, being well respected and sense
of belonging were the cherished values of this shopper segment.
This group of respondents seeks to maximize satisfaction by
choosing the best quality products. Young adults seek fun and enjoyment of life,
love novelty and change in everything. They like to venture into new domains to
accomplish, and like to maintain cordial relations with family and peer group and
desire social recognition, respect and approval from others. They prefer to wear the
best quality apparels. Wearing high quality apparels adds to their image of being a
perfectionist. For them inter-personal and outer directed values bring in more
satisfaction, than internal individual value such as self-fulfillment (inner harmony)
which had a negative impact on this style segment. Being high in quality
consciousness, they are not simple in nature and self – worth and independence are
attributes that are already satisfied in being perfectionist. Hence values such as
security and comfort, self-respect, simplicity and independence did not have any
separate influence on their shopping style.
TABLE:62
Nature of Influence of Values on the ‘Brand Consciousness/Price Equals Quality’ Shopping Style
Shopping Style INFLUENCE OF VALUES
Positive Influence Negative Influence No Influence
Brand Conscious/ Price Equals Quality
Fun and Enjoyment of Life
Being Well- Respected
Self-Fulfillment Self –Respect
A Sense of Accomplishment
Warm Relationships with Others
Sense of Belonging Security and Comfort Simplicity Being Independent
Source: Primary data; Ref. Table 53

188
The Brand Consciousness/Price Equals Quality’ shopper segment considers
fun and enjoyment in life and being well respected as important values. They are
adventure seeking young adults who enjoy good food, leisure, novelty and change
and desire social recognition, respect and approval from others. They are brand
conscious and prefer to wear expensive branded clothes. Their image and status is
drawn from the expensive branded clothes they wear. They cherish inter-personal
and outer directed values higher rather than internal individual values such as like
self-fulfilment and self-respect which has a negative influence on this shopper
segment. All the other values do not influence the shopping style of this segment
while they shop for apparels.
TABLE:63
Nature of Influence of Values on the‘ Novelty and Fashion Conscious’ Shopping Style
Shopping Style INFLUENCE OF VALUES
Positive Influence Negative Influence No Influence
Novelty and Fashion Conscious
Fun and Enjoyment of Life
Being Well- Respected
A Sense of Accomplishment
Warm Relationships with Others
Sense of Belonging
Self-Fulfillment Security and
Comfort Self –Respect Simplicity Being Independent
Source: Primary data; Ref. Table 54
Young adults sporting the ‘Novelty and Fashion Conscious’ shopping style
cherish the values ‘Fun and enjoyment of life and Being Well-respected’ very
highly. They are similar to the brand conscious shopper in taste and love wearing

189
the latest fashion clothes. They are fun –loving and enjoy best things in life and are
attention seekers. Having social recognition and respect and approval from others is
important to this segment. They cherish inter-personal and outer directed values
higher rather than internal individual values.
All the other values did not have any significant influence on this shopper
segment.
TABLE:64
Nature of Influence of Values on the ‘Recreational and Shopping Conscious’ Shopping Style
Shopping Style INFLUENCE OF VALUES
Positive Influence Negative Influence No Influence
Recreational and Shopping Conscious
Security and Comfort
Warm Relationships with Others
Being Independent
Fun and Enjoyment of Life
Being Well- Respected
A Sense of Accomplishment
Sense of Belonging
Self-Fulfillment Self –Respect Simplicity
Source: Primary data; Ref. Table 55
It was found that there was a significant influence of the values Security and
Comfort, and Warm Relationships with others on the ‘Recreational and Shopping
Conscious’ shopping segment. Shopping is an enjoyable, fun filled activity and
pleasant activity for this group. They do not feel that shopping wastes their time.
They love to maintain good relations with others and go shopping with family and
friends just for the fun of it. They love to be associated with family and peer groups
and do not enjoy being independent which had a negative influence on this shopping
segment. All the other values did not have any significant influence on this shopper
segment.

190
TABLE:65
Nature of Influence of Values on the ‘Price Conscious/Value for Money’ Shopping Style
Shopping Style
INFLUENCE OF VALUES
Positive Influence Negative Influence
No Influence
Price Conscious/Value for money
Warm Relationships with Others
A Sense of Accomplishment
Fun and Enjoyment of Life
Being Well- Respected
Security and Comfort
Being Independent
Sense of Belonging
Self-Fulfillment
Self –Respect
Simplicity Source: Primary data; Ref. Table 56
Young adults embracing the Price Conscious/Value for Money’ shopping
style cherish the values Warm Relationships with others and a sense of
accomplishment highly. Getting best value for the money spent on apparels gives
them a sense of achievement. They share information about best buys with peer
group. The values Being Well-respected and Fun and enjoyment of life had negative
influence on this shopping segment. Internal directed values were more important to
this group than external directed values. This shopper segment seems conscious of
the things they buy and the amount they pay to procure the same. They are the
serious types who are not fun and enjoyment seekers and feel that respect is not
gained only from wearing high priced branded apparels. All the other values did not
have any significant influence on this shopper segment.

191
TABLE:66
Nature of Influence of Values on the ‘Impulsiveness/Careless’ Shopping Style
Shopping Style
INFLUENCE OF VALUES
Positive
Influence
Negative
Influence No Influence
Impulsiveness/
Careless Warm
Relationships
with Others
Self-
Fulfillment
A Sense of
Accomplishment
Fun and
Enjoyment of Life
Being Well-
Respected
Security and
Comfort
Being
Independent
Sense of
Belonging
Self –Respect
Simplicity Source: Primary data; Ref. Table 57
The Impulsiveness/Careless’ shopper segment considers Warm
Relationships with others as the important value to them. These shoppers are
impulsive and careless and tend to make unplanned purchases. They shop to please
others, even when they do not need. Self-fulfillment had a negative influence on
these shoppers indicating that they do not enjoy or approve what they do and regret
their impulsive behaviour. All the other values did not have any significant influence
on this shopper segment.

192
TABLE:67
Nature of Influence of Values on the‘ Confused by Overchoice’ Shopping Style
Shopping
Style
INFLUENCE OF VALUES
Positive Influence Negative
Influence No Influence
Confused by
Overchoice
Security and
Comfort
Fun and
Enjoyment
of Life
A Sense of
Accomplish
ment
Being Well-
Respected
Being Independent
Sense of Belonging
Self –Respect
Self-Fulfillment
Warm Relationships
with Others
Simplicity
Source: Primary data; Ref. Table 58
Young adults falling under the Confused by Overchoice’ segment are
influenced by the values Security & Comfort, Fun and enjoyment of life and A
Sense of Accomplishment. They love fun and adventure, enjoy good food and
leisure and doing new things. They are the easy –going type and find it hard to
choose the best clothes or stores to shop. They find the vast number of different
consumer brands confusing. This shopping style emerged as the second highly
prevalent style describing the young adult population under study. All the other
values did not have any significant influence on this shopper segment.

193
TABLE:68
Nature of Influence of Values on the ‘Habitual/Brand Loyal’ Shopping Style
Shopping Style
INFLUENCE OF VALUES
Positive Influence
Negative Influence No Influence
Habitual/Brand Loyal
Simplicity Being Well- Respected
Being Independent Sense of Belonging Self –Respect Self-Fulfillment
Warm Relationships with Others
Fun and Enjoyment of Life
A Sense of Accomplishment
Security and Comfort Source: Primary data; Ref. Table 59
Simplicity is the only value that influences the ‘Habitual/Brand Loyal’
shopper segment. They are unassuming, straight forward, and down to earth. They
do not flaunt and display their skills, abilities and possessions. As shoppers they are
habitual in buying same brands from the same or familiar stores. They appear to
have favourite brands and stores and to have formed habits in choosing these.
The discussions in this section on influence of values on shopping styles
suggest that values influence all the dimensions of the shopping styles inventory.
From the above tables we can identify the predominant values among the list of ten
values used in this study that influences the young adults shopping styles for
apparels.

194
Values such as ‘Fun and enjoyment of Life’ and ‘Warm Relationship with
others,’ have the highest positive influence on the shopping Styles of young adults
for apparels. They showed a positive influence on four shopping styles. Young
adults enjoy everything in life that brings in entertainment, joy and happiness and
love to share space with their family, friends and peer group. These values positively
influence them to be Perfectionists, High Quality and Brand conscious. They love
high quality branded apparels and prefer to sport the latest in fashion. They are also
recreational shoppers as it is a fun giving activity in the company of their family or
friends. Fun and enjoyment also leads to confusion in their minds when the choice
is many. And sometimes, warm relationship with others, such as parents/family also
makes them to be impulsive and price conscious consumers.
Values such as ‘Being Well Respected’ and ‘Sense of Accomplishment’
have the next level of positive influence on the shopping styles of young adults for
apparels. They showed a positive influence on three shopping styles. The value
‘Being well respected’ positively influence young adults to be perfectionists, brand
conscious and fashion conscious and gain the respect and admiration from social
groups. While the value ‘Sense of Accomplishment’ influences to them to derive a
satisfaction and a feeling of accomplishment when they purchase the best, high
quality apparels (perfectionist) or get want they want at the best price (value for
money). However being in the young adult group of 18-25 years, they are also
indecisive and fickle minded and hence confused with overchoice.
The values ‘Security and Comfort’, ‘Simplicity’ and ‘Sense of Belonging’
have comparatively lesser level of positive influence. They showed a positive
influence on either one or two shopping styles. The value Security and comfort
positively influences young adults to be recreational shoppers and also makes them
confused with the plethora of choices available in the apparel market. Simplicity
makes the shopper go only to the same store or buy the same brand that they are
comfortable with. They do not venture into new areas and are not influenced by
fashion or trends. Sense of belonging leads them to be perfectionist and highly
quality conscious. Wearing the perfect clothes connects them strongly to their family
or peer group.

195
The value Self-Fulfillment shows the highest level of negative influence
affecting three shopping styles. Self-fulfillment is a state of enjoying what is being
done and achieving inner harmony. Satisfaction comes from being happy with one-
self and doing what is pleasing. External motivations do not influence / affect them.
They do not desire external affirmations to be considered as perfectionist like being
brand conscious. They are responsible and shop only when there is a need, hence are
not impulsive or careless shoppers.
The values Self Respect and Being Independent do not show positive
influence on any shopping style for young adults for apparels. These values are
neutral in nature and do not influence most of the shopping styles for apparels.

196
TESTING OF HYPOTHESES BASED ON SHOPPING STYLES AND
DEMOGRAPHIC VARIABLES [GENDER, EDUCATION LEVEL AND
REGION]
In the following section the research hypotheses are tested using ANOVA
and t statistic. To study the differences in shopping styles and value perception and
orientation between male and female respondents, the t test was conducted. In order
to study the differences in shopping styles and value perception and orientations
among the regions, and education levels of respondents, ANOVA was performed.
The results are tabulated, presented and interpreted systematically.
Objective 5- To explore the differences in the shopping styles among young
adults across demographics such as gender, and educational levels and regional
background
H3 - There is no significant difference in the shopping styles of young adults towards
purchase of apparels across gender
TABLE:69
Differences in mean for shopping styles across gender
Gender Mean Std. Deviation
Std. Error Mean
Perfectionist/High Quality Conscious Male 3.7954 .80470 .02838 Female 3.8510 .74784 .02887
Brand Conscious/Price Equals Quality Male 2.9505 .87289 .03078 Female 2.7597 .86069 .03325
Novelty and Fashion Conscious Male 2.9838 .88212 .03111 Female 3.0333 .89071 .03441
Recreational and Shopping Conscious Male 2.9619 .84678 .02986 Female 3.6682 .93933 .03626
Price Conscious/Value for money Male 3.2488 .68814 .02427 Female 3.1967 .61998 .02393
Impulsiveness/Careless Male 3.2313 .76945 .02714 Female 3.2837 .79139 .03055
Confused by Overchoice Male 3.3118 .87650 .03091 Female 3.3465 .91153 .03519
Habitual/Brand Loyal Male 3.2454 .90339 .03186 Female 3.1396 .87259 .03369
Source: Primary data

197
TABLE:70 t test for shopping styles across gender
Levene's Test for Equality of Variances
F Sig. t df Sig. (2-tailed)
Perfectionist/High Quality Conscious
Equal variances assumed
3.224 .073 -1.364 1473 .173
Equal variances not assumed -1.373 1456.060 .170
Brand Conscious/Price Equals Quality
Equal variances assumed
.001 .974 4.204 1472 .000
Equal variances not assumed 4.210 1431.280 .000
Novelty and Fashion Conscious
Equal variances assumed
.671 .413 -1.068 1472 .286
Equal variances not assumed -1.067 1419.489 .286
Recreational and Shopping Conscious
Equal variances assumed
18.634 .000 -15.176
1473 .000
Equal variances not assumed -
15.035 1363.642 .000
Price Conscious/Value for money
Equal variances assumed
8.510 .004 1.512 1473 .131
Equal variances not assumed 1.527 1464.381 .127
Impulsiveness/Careless Equal variances assumed
.129 .719 -1.283 1473 .200
Equal variances not assumed -1.280 1411.277 .201
Confused by Overchoice
Equal variances assumed
.944 .331 -.744 1473 .457
Equal variances not assumed -.741 1404.957 .459
Habitual/Brand Loyal Equal variances assumed
1.598 .206 2.276 1473 .023
Equal variances not assumed 2.283 1442.027 .023
Source: Primary data
It was found that there was a significant difference in shopping styles across
gender (p<0.05) on three factors of consumer-decision making styles (brand
conscious, recreational-hedonistic consumer and habitual brand-loyal consumer).

198
The gender differences in shopping styles indicated above are summarized as
under:
Gender Brand conscious Recreational shopper
Habitual brand-loyal
Male High Low High
Female Low High Low Source: Primary data, Ref. Table 69 & 70
The Brand Conscious/Price Equals Quality factor had a significant difference
across gender. Male respondents were found to be more brand conscious than
female respondents.
The Recreational and Shopping Conscious factor had a significant difference
across gender. Female respondents had higher levels of Recreational and Shopping
Consciousness as compared to male respondents.
The Habitual/Brand Loyal factor had a significant difference across gender.
Male respondents had higher levels of brand loyalty compared to female
respondents.
As gender difference was significant for three shopping styles we reject the
null hypothesis and accept the alternate hypothesis ‘There is significant difference
in the shopping styles of young adults towards purchase of apparels across
gender.’
However, on the other five factors no significant differences (p>0.05) in
consumer decision styles between men and women were found. Those factors are:
perfectionist consumer, novelty and fashion conscious, price consciousness,
impulsive consumer, and confused by overchoice consumer. Both male and female
customers equally pay attention to quality, price, and variety of offered goods, latest
fashion and behave in the same way regarding impulsiveness in decision-making
process.

199
This study found statistically significant gender differences on three factors,
which is in line with most other research (Mitchell and Walsh, 2004). Female
consumer behaviour tends to be similar as indicated in Underhill’s study (1999).
This study further indicates that male consumers became similar like female
consumers among the young-adult consumers with respect to perfectionism, price
consciousness, impulsiveness, and confused by over choice. (Ivan DamirAni , Anita
CiunovaSuleska, Edo Rajh, 2010).
DIFFERENCES IN SHOPPING STYLES ACROSS EDUCATION LEVELS
The total sample for the study was 1478 respondents, which comprised of
76.5% college-going students doing Undergraduate courses, 19.6% doing
Postgraduate courses and 3.9% were working after PUC or Diploma courses.
ANOVA was performed to study the differences in the shopping styles for apparels
due educational background.
H4 - There is no significant difference in the shopping styles of young adults
towards purchase of apparels across education levels.
TABLE:71
Differences in mean for shopping styles across Education Levels
Mean Std. Deviation
Std. Error
95% Confidence Interval for Mean
Lower Bound
Upper Bound
Perfectionist UG 3.8112 .77087 .02279 3.7665 3.8559
PG 3.8628 .78790 .04643 3.7715 3.9542
Other 3.7907 .94847 .14464 3.4988 4.0826
Total 3.8207 .77958 .02030 3.7809 3.8605
Brand conscious UG 2.8523 .88414 .02615 2.8010 2.9036
PG 2.9010 .82917 .04886 2.8049 2.9972
Other 2.9186 .84545 .12893 2.6584 3.1788

200
Total 2.8637 .87226 .02272 2.8192 2.9083
Novelty UG 3.0067 .89750 .02655 2.9546 3.0588
PG 3.0035 .84389 .04973 2.9056 3.1013
Other 3.0155 .87576 .13355 2.7460 3.2850
Total 3.0063 .88608 .02308 2.9611 3.0516
Recreation UG 3.2791 .95519 .02824 3.2237 3.3345
PG 3.3206 .95314 .05616 3.2101 3.4311
Other 3.1395 1.02929 .15696 2.8228 3.4563
Total 3.2832 .95680 .02491 3.2343 3.3320
Priceconscious UG 3.2302 .64668 .01912 3.1927 3.2677
PG 3.2361 .67690 .03989 3.1576 3.3146
Other 3.0155 .80657 .12300 2.7673 3.2637
Total 3.2251 .65830 .01714 3.1915 3.2587
Impulsive UG 3.2646 .78377 .02317 3.2191 3.3100
PG 3.2494 .77214 .04550 3.1599 3.3390
Other 3.0426 .70250 .10713 2.8264 3.2588
Total 3.2551 .77968 .02030 3.2153 3.2950
Confusion UG 3.3198 .89553 .02648 3.2678 3.3717
PG 3.3426 .88253 .05200 3.2402 3.4449
Other 3.4341 .88949 .13565 3.1604 3.7079
Total 3.3276 .89247 .02324 3.2820 3.3732
Brandloyalty UG 3.1716 .90082 .02663 3.1194 3.2239
PG 3.3032 .86388 .05090 3.2030 3.4034
Other 3.1705 .75373 .11494 2.9386 3.4025
Total 3.1973 .89077 .02319 3.1518 3.2428 Source: Primary data

201
TABLE:72 ANOVA Indicating differences in shopping styles across education level of
young adults
ANOVA
Sum of Squares df
Mean Square F Sig.
Perfectionist/ High Quality Conscious
Between Groups
.684 3 .228 .375 .771
Within Groups
895.135 1475 .609
Total 895.819 1478 Brand Conscious/ Price Equals Quality
Between Groups
2.290 3 .763 1.003 .390
Within Groups
1118.429 1475 .761
Total 1120.720 1473 Novelty and Fashion Conscious
Between Groups
.109 3 .036 .046 .987
Within Groups
1156.388 1475 .787
Total 1156.496 1478 Confused by Overchoice
Between Groups
1.457 3 .486 .530 .662
Within Groups
1347.941 1475 .916
Total 1349.399 1478 Recreational and Shopping Conscious
Between Groups
3.841 3 1.280 2.966 .031
Within Groups
634.931 1475 .432
Total 638.772 1478 Price Conscious/ Value for money
Between Groups
2.086 3 .695 1.144 .330
Within Groups
893.952 1475 .608
Total 896.037 1478 Impulsiveness/Careless
Between Groups
.665 3 .222 .278 .841
Within Groups
1173.369 1475 .798
Total 1174.034 1478 Habitual/Brand Loyal
Between Groups
5.049 3 1.683 2.126 .095
Within Groups
1164.540 1475 .792
Total 1169.589 1478 Source: Primary data

202
It was found that there was a significant difference in the shopping styles
across education levels of respondents. PG students were more Recreational and
Shopping Conscious as compared to UG and others (p<0.05).As education level was
significant for Recreational and Shopping Conscious style we reject the null
hypothesis and accept the alternate hypothesis ‘There is significant difference in
the shopping styles of young adults towards purchase of apparels across
education levels.’
However, on the other seven factors no significant differences (p>0.05) in
consumer decision styles across education levels of young adults were found. Most
young adults in the reference age category behave similarly while purchasing
apparels. The less difference in the age of respondents is a rationale to support this
fact.
DIFFERENCES IN SHOPPING STYLES ACROSS REGIONS
H5 - There is no significant difference in the shopping styles of young
adults towards purchase of apparels across regional background.

203
TABLE:73 Differences in mean for shopping styles across Regions
Mean Std. Deviation Std. Error
95% Confidence Interval for Mean
Lower Bound
Upper Bound
Perfectionist/ High Quality Conscious
North .0811128 .93654793 .07887156 -.0748206 .2370461 South -.0437542 1.02012690 .03149680 -.1055582 .0180498 East .1522233 .98710796 .07708018 .0000189 .3044278 West .0224066 .87609373 .08590806 -.1479718 .1927850 Total -.0049152 1.00035740 .02619850 -.0563060 .0464756
Brand Conscious/Price Equals Quality
North -.0868303 1.01382116 .08537914 -.2556294 .0819689 South -.0126457 .99254229 .03064512 -.0727784 .0474871 East .2041854 1.03727296 .08099741 .0442459 .3641249 West -.0160948 .96014072 .09414954 -.2028182 .1706286 Total .0043238 .99921781 .02616866 -.0470084 .0556561
Novelty and Fashion Conscious
North -.1273052 1.06371860 .08958127 -.3044122 .0498018 South .0156108 .99117243 .03060282 -.0444389 .0756606 East .1151740 .98540984 .07694758 -.0367685 .2671166 West -.1018932 1.00617703 .09866378 -.2975695 .0937831 Total .0046073 .99976265 .02618292 -.0467530 .0559675
Confused by Overchoice
North -.0726794 1.03308571 .08700151 -.2446860 .0993273 South .0304228 .99892801 .03084228 -.0300969 .0909424 East -.0012702 1.05728260 .08255990 -.1642950 .1617546 West -.1888453 .89458270 .08772105 -.3628193 -.0148713 Total .0012466 1.00282094 .02626302 -.0502708 .0527639
Recreational and Shopping Conscious
North .1269768 .96595287 .08134791 -.0338524 .2878060 South -.0220780 1.00890181 .03115022 -.0832019 .0390459 East -.0114369 .96498795 .07535290 -.1602306 .1373568 West .0879494 1.02807708 .10081125 -.1119859 .2878847 Total .0013821 1.00158731 .02623071 -.0500719 .0528360
Price Conscious/Value for money
North -.1171347 .98750845 .08316321 -.2815528 .0472834 South .0640978 .92970993 .02870514 .0077717 .1204239 East -.1492174 1.03861140 .08110192 -.3093633 .0109285 West -.2330703 1.44573512 .14176599 -.5142297 .0480891 Total .0013797 .99726207 .02611744 -.0498521 .0526115
Impulsiveness/Careless
North -.0026552 .93768136 .07896702 -.1587773 .1534668
South .0218628 1.02588209 .03167450 -.0402899 .0840154 East -.0715966 .97550983 .07617452 -.2220126 .0788195 West -.0821672 .88800130 .08707569 -.2548613 .0905269 Total .0015586 1.00254354 .02625575 -.67594 .406829
Source: Primary data

204
TABLE:74 ANOVA Indicating differences in mean for shopping styles across Regions
ANOVA
Sum of Squares Df Mean
Square F Sig.
Perfectionist/High Quality Conscious
Between Groups
6.753 3 2.251 2.255 .080
Within Groups
1451.289 1475 .998
Total 1458.042 1478 Brand Conscious/Price Equals Quality
Between Groups
8.068 3 2.689 2.703 .044
Within Groups
1446.654 1475 .995
Total 1454.722 1478 Novelty and Fashion Conscious
Between Groups
5.765 3 1.922 1.926 .123
Within Groups
1450.543 1475 .998
Total 1456.308 1478 Confused by Overchoice
Between Groups
5.423 3 1.808 1.800 .145
Within Groups
1459.809 1475 1.004
Total 1465.232 1478 Recreational and Shopping Conscious
Between Groups
3.608 3 1.203 1.199 .309
Within Groups
1458.021 1475 1.003
Total 1461.629 1478 Price Conscious/Value for money
Between Groups
15.543 3 5.181 5.255 .001
Within Groups
1433.490 1475 .986
Total 1449.033 1478 Impulsiveness/Careless Between
Groups 2.042 3 .681 .677 .566
Within Groups
1462.380 1475 1.006
Total 1464.421 1478
Habitual/Brand Loyal
Between Groups Within Groups Total
4.018 1165.572 1169.589
3 1475 1478
2.009 .792
2.537 .079
Source: Primary data

205
The results indicate that there is a significant difference in shopping styles
across regional back ground of the respondents (p<0.05). Young adults from the
South were more ‘price conscious’ and perceived more value for money as
compared to other regions. Young adults from east were more ‘brand conscious’
compared to other regions.
As the regional background of young adults had a significant influence
on the Price Conscious/ Value for money and Brand Conscious/Price Equals Quality
shopping styles, we reject the null hypothesis and accept the alternate
hypothesis ‘There is significant difference in the shopping styles of young adults
towards purchase of apparels across regional background.’
TESTING OF HYPOTHESES BASED ON VALUES AND
DEMOGRAPHIC VARIABLES [GENDER, EDUCATION LEVEL AND
REGION]
Objective 6 - To explore the differences in value perception and value
orientation of young adults across demographics such as gender and regional
background
Gender based value orientations
H6 -There is no significant difference in the orientation of young adults
towards External Values, Internal Interpersonal Values and Internal Individual
Values across gender.

206
TABLE:75 Differences in Mean for Value Orientations across Gender
Group Statistics
Gender N Mean Std. Deviation
Std. Error Mean
External values Male 804 7.2852 1.52137 .05365
Female 673 7.7439 1.39110 .05362
Internal interpersonal values
Male 804 7.1853 1.62115 .05717
Female 674 7.4206 1.51712 .05844
Internal individual values
Male 804 7.1823 1.48065 .05222
Female 674 7.4656 1.38278 .05326 Source: Primary data
TABLE:76 t Test for Value Orientations across Gender
Levene's Test
for Equality of Variances
F Sig. t df Sig. (2-tailed)
External values
Equal variances assumed
5.315 .021 -5.999 1475 .000
Equal variances not assumed
-6.047 1463.517 .000
Internal interpersonal values
Equal variances assumed
5.032 .025 -2.861 1476 .004
Equal variances not assumed
-2.878 1458.239 .004
Internal individual values
Equal variances assumed
3.908 .048 -3.775 1476 .000
Equal variances not assumed
-3.797 1458.891 .000
Source: Primary data

207
The above table indicates that there is significant difference in the orientation
towards the different category of values among male and female respondents
Female respondents were found to be with higher orientations towards
External Values such as Sense of belonging, Being well respected and Security &
comfort; Internal Interpersonal Values such as Warm relationships with others, fun
and enjoyment of life; and Internal Individual Values such as Self-fulfillment, Self
respect, A sense of accomplishment, Simplicity and Being Independent, than the
male respondents (p<0.01).
As there is a significant difference in the value orientations among male and
female respondents, we reject the null hypothesis and accept the alternate
hypothesis‘ There is significant difference in the orientation of young adults
towards External Values, Internal Interpersonal Values and Internal
Individual Values across gender.’
Region-wise value orientations of respondents
H7 - There is no significant difference in the orientation of young adults
towards External Values, Internal Interpersonal Values and Internal Individual
Values across regional background.

208
TABLE:77
Differences in Mean for Value Orientations of Young Adults across Regional
Background
N Mean Std. Deviation
Std. Error
95% Confidence Interval for Mean
Lower Bound
Upper Bound
External values
North 141 7.5934 1.28365 .10810 7.3797 7.8071
South 1052 7.4591 1.52981 .04717 7.3666 7.5517
East 165 7.4424 1.51200 .11771 7.2100 7.6748
West 104 7.8718 .88413 .08670 7.6999 8.0437
Total 1462 7.4995 1.47155 .03849 7.4241 7.5750
Internal interpersonal values
North 141 7.3050 1.38715 .11682 7.0740 7.5359
South 1053 7.2816 1.61777 .04985 7.1838 7.3794
East 165 7.2121 1.59568 .12422 6.9668 7.4574
West 104 7.5962 1.21894 .11953 7.3591 7.8332
Total 1463 7.2984 1.57007 .04105 7.2178 7.3789
Internal individual values
North 141 7.5248 1.11958 .09429 7.3384 7.7112
South 1053 7.2754 1.49871 .04619 7.1848 7.3660
East 165 7.2242 1.49972 .11675 6.9937 7.4548
West 104 7.6250 .89342 .08761 7.4513 7.7987
Total 1463 7.3185 1.43455 .03751 7.2450 7.3921 Source: Primary data

209
TABLE:78
ANOVA showing Value Orientations of Young Adults across Regional Background
ANOVA
Sum of Squares df Mean
Square F Sig.
External values
Between Groups 17.910 3 5.970 2.767 .041
Within Groups 3145.812 1458 2.158
Total 3163.722 1461
Internal interpersonal values
Between Groups 10.753 3 3.584 1.455 .225
Within Groups 3593.263 1459 2.463
Total 3604.016 1462
Internalindividual values
Between Groups 19.194 3 6.398 3.122 .025
Within Groups 2989.494 1459 2.049
Total 3008.688 1462 Source: Primary data
It was found that respondents from the Western Region display a higher
orientation towards both External Values and Internal Individual Values (p value
<0.05) compared to the other regions.
There is no significant difference in the orientation towards Internal
Interpersonal Values across regional back ground of the respondents.
As there is a significant difference in the value orientations among the
respondents from different regions, we reject the null hypothesis and accept the
alternate hypothesis ‘There is significant difference in the orientation of young
adults towards External Values, Internal Interpersonal Values and Internal
Individual Values across regional background.’
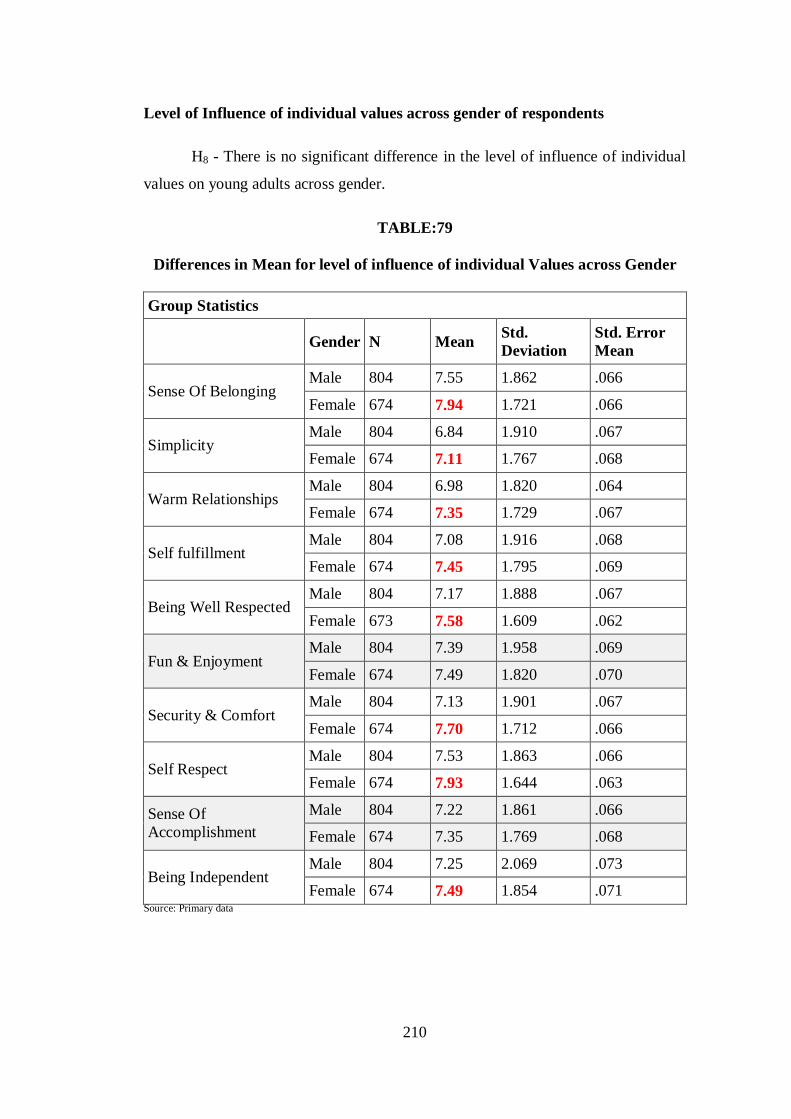
210
Level of Influence of individual values across gender of respondents
H8 - There is no significant difference in the level of influence of individual
values on young adults across gender.
TABLE:79
Differences in Mean for level of influence of individual Values across Gender Group Statistics
Gender N Mean Std. Deviation
Std. Error Mean
Sense Of Belonging Male 804 7.55 1.862 .066
Female 674 7.94 1.721 .066
Simplicity Male 804 6.84 1.910 .067
Female 674 7.11 1.767 .068
Warm Relationships Male 804 6.98 1.820 .064
Female 674 7.35 1.729 .067
Self fulfillment Male 804 7.08 1.916 .068
Female 674 7.45 1.795 .069
Being Well Respected Male 804 7.17 1.888 .067
Female 673 7.58 1.609 .062
Fun & Enjoyment Male 804 7.39 1.958 .069
Female 674 7.49 1.820 .070
Security & Comfort Male 804 7.13 1.901 .067
Female 674 7.70 1.712 .066
Self Respect Male 804 7.53 1.863 .066
Female 674 7.93 1.644 .063
Sense Of Accomplishment
Male 804 7.22 1.861 .066
Female 674 7.35 1.769 .068
Being Independent Male 804 7.25 2.069 .073
Female 674 7.49 1.854 .071 Source: Primary data

211
TABLE:80
t Test for Level of Influence of individual Values across Gender Levene's Test
for Equality of Variances
F Sig. t df Sig. (2-tailed)
sense of belong
Equal variances assumed
12.850 .000 -4.114 1476 .000
Equal variances not assumed
-4.143 1462.013 .000
simplicity
Equal variances assumed
7.445 .006 -2.811 1476 .005
Equal variances not assumed
-2.831 1461.739 .005
warm relationships
Equal variances assumed
.912 .340 -4.012 1476 .000
Equal variances not assumed
-4.030 1453.209 .000
self fulillment
Equal variances assumed
2.595 .107 -3.875 1476 .000
Equal variances not assumed
-3.898 1457.916 .000
being well respected
Equal variances assumed
12.969 .000 -4.389 1475 .000
Equal variances not assumed
-4.452 1474.520 .000
fun & enjoyment
Equal variances assumed
4.937 .026 -.988 1476 .323
Equal variances not assumed
-.994 1460.441 .320

212
security & comfort
Equal variances assumed
11.182 .001 -5.946 1476 .000
Equal variances not assumed
-6.001 1468.399 .000
self respect
Equal variances assumed
14.736 .000 -4.399 1476 .000
Equal variances not assumed
-4.447 1472.046 .000
sense of accomplishment
Equal variances assumed
1.483 .223 -1.321 1476 .187
Equal variances not assumed
-1.327 1452.952 .185
being independent
Equal variances assumed
8.266 .004 -2.298 1476 .022
Equal variances not assumed
-2.320 1469.475 .020
Source: Primary data
The above table indicates that there is significant difference in the level of
influence of individual values among male and female respondents
Female respondents showed higher level of influence of eight values viz.
sense of belonging (p<0.01), simplicity (p<0.01), warm relationship with others
(p<0.01), self-fullfilment (p<0.01), being well respected (p<0.01), security and
comfort (p<0.01), self-respect (p<0.01), being independent (p<0.05).
Fun and enjoyment of life and sense of accomplishment(p>0.05), were the
only two values that did not reveal any significant difference in the level of
influence on male and female respondents.
As there is a significant difference in the level of influence of individual
values among male and female respondents, we reject the null hypothesis and
accept the alternate hypothesis ‘There is significant difference in the level of
influence of individual values on young adults across gender.’

213
Level of Influence of individual values across Regions
H9 - There is no significant difference in the level of influence of individual
values on young adults across regional background.
TABLE:81
Differences in Mean for level of influence of individual Values across Regional Background
N Mean Std. Deviation
Std. Error
95% Confidence Interval for Mean
Lower Bound
Upper Bound
sense of belonging
North 141 7.87 1.573 .132 7.60 8.13
South 1053 7.65 1.880 .058 7.53 7.76
East 165 7.84 1.747 .136 7.57 8.10
West 104 8.20 1.177 .115 7.97 8.43
Total 1463 7.73 1.801 .047 7.64 7.82
simplicity
North 141 6.95 1.834 .154 6.65 7.26
South 1053 6.93 1.868 .058 6.81 7.04
East 165 7.03 1.836 .143 6.75 7.31
West 104 7.22 1.607 .158 6.91 7.53
Total 1463 6.96 1.844 .048 6.87 7.06
warm relationships
North 141 7.13 1.643 .138 6.85 7.40
South 1053 7.13 1.841 .057 7.02 7.24
East 165 7.13 1.668 .130 6.87 7.38
West 104 7.51 1.421 .139 7.23 7.79
Total 1463 7.16 1.778 .046 7.06 7.25
selfulillment
North 141 7.36 1.790 .151 7.06 7.66
South 1053 7.24 1.921 .059 7.12 7.35
East 165 7.10 1.853 .144 6.82 7.39
West 104 7.49 1.344 .132 7.23 7.75
Total 1463 7.25 1.866 .049 7.16 7.35

214
being well respected
North 141 7.50 1.534 .129 7.25 7.76
South 1052 7.31 1.843 .057 7.20 7.42
East 165 7.39 1.731 .135 7.12 7.65
West 104 7.66 1.304 .128 7.41 7.92
Total 1462 7.36 1.771 .046 7.27 7.45
fun & enjoyment
North 141 7.48 1.779 .150 7.19 7.78
South 1053 7.43 1.935 .060 7.32 7.55
East 165 7.30 1.901 .148 7.00 7.59
West 104 7.68 1.566 .154 7.38 7.99
Total 1463 7.44 1.893 .049 7.34 7.54
security & comfort
North 141 7.41 1.871 .158 7.10 7.72
South 1053 7.41 1.839 .057 7.29 7.52
East 165 7.10 1.993 .155 6.80 7.41
West 104 7.75 1.335 .131 7.49 8.01
Total 1463 7.40 1.833 .048 7.30 7.49
self respect
North 141 7.99 1.384 .117 7.76 8.22
South 1053 7.68 1.826 .056 7.57 7.80
East 165 7.56 1.865 .145 7.27 7.84
West 104 8.05 1.234 .121 7.81 8.29
Total 1463 7.73 1.760 .046 7.63 7.82
sense of accomplishment
North 141 7.43 1.649 .139 7.15 7.70
South 1053 7.26 1.868 .058 7.15 7.37
East 165 7.17 1.857 .145 6.88 7.46
West 104 7.54 1.284 .126 7.29 7.79
Total 1463 7.29 1.812 .047 7.19 7.38
being independent
North 141 7.90 1.518 .128 7.65 8.15
South 1053 7.27 2.036 .063 7.14 7.39
East 165 7.26 2.042 .159 6.95 7.57
West 104 7.83 1.554 .152 7.52 8.13
Total 1463 7.37 1.973 .052 7.27 7.47 Source: Primary data

215
TABLE:82
ANOVA showing level of influence of individual Values across Regional Background
ANOVA
Sum of Squares Df Mean
Square F Sig.
sense of belonging
Between Groups 34.581 3 11.527 3.572 .014
Within Groups 4707.772 1459 3.227
Total 4742.353 1462
simplicity
Between Groups 9.143 3 3.048 .896 .442
Within Groups 4961.637 1459 3.401
Total 4970.779 1462
warm relationships
Between Groups 14.013 3 4.671 1.479 .218
Within Groups 4606.455 1459 3.157
Total 4620.468 1462
self fulfillment
Between Groups 11.463 3 3.821 1.098 .349
Within Groups 5078.962 1459 3.481
Total 5090.425 1462
being well respected
Between Groups 15.139 3 5.046 1.611 .185
Within Groups 4567.002 1458 3.132
Total 4582.140 1461
fun & enjoyment
Between Groups 9.790 3 3.263 .911 .435
Within Groups 5228.846 1459 3.584
Total 5238.636 1462

216
security & comfort
Between Groups 27.323 3 9.108 2.721 .043
Within Groups 4882.738 1459 3.347
Total 4910.062 1462
self respect
Between Groups 26.781 3 8.927 2.893 .034
Within Groups 4502.758 1459 3.086
Total 4529.539 1462
sense of accomplishment
Between Groups 12.306 3 4.102 1.250 .290
Within Groups 4788.265 1459 3.282
Total 4800.571 1462
being independent
Between Groups 74.390 3 24.797 6.442 .000
Within Groups 5615.767 1459 3.849
Total 5690.157 1462 Source: Primary data
The above table indicates that there is significant difference in the level of
influence of individual values across regions. Young adults from the West showed a
higher level of influence by the values Sense of Belonging (p<0.05), Security and
comfort (p<0.05) and Self Respect (p<0.05), than the other regions. Young adults
from the North showed higher level of influence of the value Being
Independent(p<0.01).
As there is a significant difference in the level of influence of individual
values across respondents from different regions, we reject the null hypothesis and
accept the alternate hypothesis ‘There is significant difference in the level of
influence of individual values on young adults across regional background.’

217
CHAPTER 6
FINDINGS, SUGGESTIONS & CONCLUSION
The findings of the study are presented in the following sections:
1) The total number of respondents for the study were 1478 young adults, of
which 804 (54.4%) were male respondents and 674 (45.6%) were female
respondents. The demographic profile of the respondents for the study more
or less replicates the demographic profile of the population of Bangalore
city. The Male : Female gender ratio is 1000:968
2) It was found that most of the young adults in the age group 18-25 perceive,
‘Sense of belonging’ as the most important value (mean score 7.71). The
feeling that family and friends care about them is very important to this age
group. The institution of the family and the family support system are the
main drivers in life. When this basic feeling of belonging is established and
confirmed in life, it gives a secure feeling that every challenge can be faced
bravely.
3) Most of the young adult respondents attach greater importance to External
values such as Sense of belonging, Being well respected and Security &
comfort (Mean 7.49).
4) The results indicate that Perfectionist/High Quality Conscious (mean 3.8207)
is the predominant style of young adults in their purchase-decisions for
apparels. This group of respondents seeks to maximize quality by choosing
the best products. They set high standards and have high expectations for the
products they buy and aim to get the best choice and value for money. Being
higher in perfectionism, these consumers could be expected to shop more
carefully, more systematically, or by comparison.
5) The Perfectionist / high-quality conscious shopping style was found to be
significantly positively correlated at the 0.01 level with six other shopping
styles - Brand consciousness/price equals quality, Novelty and fashion

218
conscious, Recreational and shopping conscious, Impulsiveness/Careless,
Confused by Overchoice, and Habitual/brand-loyal. There is no significant
correlation between the Perfectionist/ high-quality conscious shopping style
and the Price conscious/value for the money shopping style (p value >0.05).
6) It was found there is significant positive correlation at the 0.01 level (2
tailed) among the values and the shopping styles (p value <0.001). This
indicates there is a strong relationship between values and shopping styles of
young adults.
7) The study found that the value ‘fun and Enjoyment of life’ showed the
maximum significant positive correlation to six shopping styles viz., the
Perfectionist/High Quality Conscious (p value <0.01), Brand
Consciousness/Price Equals Quality (p value <0.01), Novelty and Fashion
Conscious (p value <0.01), Recreational and Shopping Conscious (p value
<0.01), Confused by Overchoice (p value <0.01) and Habitual/Brand Loyalty
(p value <0.01) shopping styles of young adults. This indicates that young
adults are adventure seeking, and enjoy novelty and change. They are quality
and brand conscious. They are also recreational shoppers and are confused
with the choice of apparel brands available to them.
8) It was found there is significant relationship between the value ‘Sense of
Belonging’ and the Perfectionist/High Quality Conscious and Recreational
and Shopping Conscious styles of young adults.
9) It was found there is significant relationship between the value ‘Simplicity’
and the Perfectionist/High Quality Conscious, Price Conscious/Value for the
money and Habitual/Brand Loyalty styles of young adults.
10) It was found there is significant relationship between the value ‘Warm
Relationships with others’ and the Perfectionist/High Quality Conscious,
Recreational and Shopping Conscious, and Price Conscious/Value for the
money shopping styles of young adults.

219
11) It was found there is significant negative relationship between the value
‘Self-Fulfillment’ and the Impulsiveness/Careless shopping style of young
adults.
12) It was found there is significant relationship between the value ‘Being Well
Respected’ and the Perfectionist/High Quality Conscious, Novelty and
Fashion Conscious, Recreational and Shopping Conscious, and
Habitual/Brand Loyalty shopping styles of young adults.
13) It was found there is significant relationship between the value ‘Fun and
Enjoyment of life’ and the Perfectionist/High Quality Conscious, Brand
Consciousness/Price Equals Quality, Novelty and Fashion Conscious,
Recreational and Shopping Conscious, Confused by Overchoice and
Habitual/Brand Loyalty shopping styles of young adults.
14) It was found there is significant relationship between the value ‘Self
Respect’ and the Perfectionist/High Quality Conscious, Recreational and
Shopping Conscious, and Habitual/Brand Loyalty shopping styles of young
adults.
15) It was found there is significant relationship between the value ‘Sense of
Accomplishment’ and the Perfectionist/High Quality Conscious, Novelty and
Fashion Conscious, Price Conscious/Value for the money, and Confused by
Overchoice shopping styles of young adults.
16) It was found there is significant relationship between the value ‘Being
Independent’ and the Perfectionist/High Quality Conscious shopping style of
young adults.
17) It is found that the results of the Confirmatory Factor Analysis reports that
all partial squared correlation coefficients (R2) for all individual items in
each construct is more than 0.50. This clearly establishes the validity of the
measurement model.

220
18) The results of confirmatory factor analysis and goodness of fit test under the
Structural Equation Modeling Technique indicate that the dimensions of
shopping styles among young adults in Bangalore city, confirms with the
original Sproles & Kendall CSI (1986).
19) The proposed ‘Value - Shopping Style Model’ was tested using Structural
Equation Modelling technique (SEM). The overall fit of the proposed
research model was significant as all measures of fitness were at acceptable
levels indicating the model fits the data well.
Findings from Hypotheses Testing
20) It was found that there is significant influence of overall values on the
shopping styles of young adults towards purchase of apparels. The highest
influence of values was on the Perfectionist/High Quality Conscious style
(P value <.001), followed by Novelty and Fashion Conscious, Recreational
and Shopping Conscious, Confused by Overchoice, Habitual/Brand Loyal,
Brand Consciousness/Price Equals Quality and Impulsiveness/Careless
styles. There was no significant influence of values on the Price
Conscious/Value for the money style.
21) The study reveals that values influence all the dimensions of the shopping
styles inventory.
22) It was found that there is significant influence of values, ‘Fun and Enjoyment
of life’ (p value <0.01), ‘A sense of accomplishment’ (p value <0.01),
‘Warm relationships with others’ (p value <0.01), ‘Being well respected’
(p value <0.05), and ‘Sense of belonging’ (p value <0.05), on the
Perfectionist/High Quality Conscious dimension of the shopping styles.
Self-fulfillment had a negative influence (p value <0.01). However, the
values Simplicity, Security & Comfort, Self-respect and Being independent
did not have a significant influence on the Perfectionist/High Quality
Conscious shopping style.

221
The ‘Perfectionist/High Quality Conscious’ Shopping Style emerged as the
predominant style of young adults in their purchase-decisions for apparels as
per the mean scores, correlation and regression analysis. Values such as fun
and enjoyment of life, sense of accomplishment, warm relationship with
others, being well respected and sense of belonging were the cherished
values of this shopper segment. This group of respondents seeks to maximize
satisfaction by choosing the best quality products. Young adults seek fun and
enjoyment of life, love novelty and change in everything. They like to
venture into new domains to accomplish, and like to maintain cordial
relations with family and peer group and desire social recognition, respect
and approval from others. They prefer to wear the best quality apparels.
Wearing high quality apparels adds to their image of being a perfectionist.
For them inter-personal and outer directed values bring in more satisfaction,
than internal individual value such as self-fulfillment (inner harmony) which
had a negative impact on this style segment. Being high in quality
consciousness, they are not simple in nature and self – worth and
independence are attributes that are already satisfied in being perfectionist.
Hence values such as security and comfort, self-respect, simplicity and
independence did not have any separate influence on their shopping style.
23) It was found that there is significant positive influence of the values Fun and
Enjoyment of Life (p value <0.01), and Being well respected (p value <0.05),
on the ‘Brand Conscious/Price Equals Quality’ dimension of the shopping
style inventory. Self-fulfillment (p value <0.01), and Self respect (p value
<0.01), had negative influence on ‘Brand Conscious/Price Equals Quality’
shopping style. However, the values Sense of belonging, Simplicity, Warm
Relationships, Security & Comfort, A Sense of Accomplishment and Being
independent did not have a significant influence on the ‘Brand
Conscious/Price Equals Quality’ shopping style.
The ‘Brand Consciousness/Price Equals Quality’ shopper segment
considers fun and enjoyment in life and being well respected as important
values. They are adventure seeking young adults who enjoy good food,

222
leisure, novelty and change and desire social recognition, respect and
approval from others. They are brand conscious and prefer to wear expensive
branded clothes. Their image and status is drawn from the expensive branded
clothes they wear. They cherish inter-personal and outer directed values
higher rather than internal individual values such as like self-fulfilment and
self-respect which has a negative influence on this shopper segment. All the
other values do not influence the shopping style of this segment while they
shop for apparels.
24) It was found that there is significant influence of the values Fun and
enjoyment of life (p value <0.01), and Being Well-respected (p value <0.05),
on the ‘Novelty and Fashion Conscious’ dimension of shopping style
inventory. All the other values did not have a significant influence on this
dimension of shopping style inventory.
Young adults sporting the ‘Novelty and Fashion Conscious’ shopping style
cherish the values ‘Fun and enjoyment of life and Being Well-respected’
very highly. They are similar to the brand conscious shopper in taste and
love wearing the latest fashion clothes. They are fun –loving and enjoy best
things in life and are attention seekers. Having social recognition and respect
and approval from others is important to this segment. They cherish inter-
personal and outer directed values higher rather than internal individual
values.
25) It was found that there is significant positive influence of the values Security
and Comfort (p value <0.01), and Warm Relationships with others (p value
<0.05), on the ‘Recreational and Shopping Conscious’ dimension of
shopping style inventory. Being Independent (p value <0.05), had a negative
influence, on the ‘Recreational and Shopping Conscious’ dimension of
shopping style inventory. All the other values did not have a significant
influence on this dimension of shopping style inventory.
The ‘Recreational and Shopping Conscious’ shopping segment considers
shopping is an enjoyable; fun filled activity and pleasant activity. They do

223
not feel that shopping wastes their time. They love to maintain good relations
with others and go shopping with family and friends just for the fun of it.
They love to be associated with family and peer groups and do not enjoy
being independent which had a negative influence on this shopping segment.
All the other values did not have any significant influence on this shopper
segment.
26) It was found that there is significant positive influence of the values Warm
Relationships with others (p value <0.01), and A sense of accomplishment (p
value <0.05), and a significant negative influence of the values Being Well-
respected (p value <0.01), and Fun and enjoyment of life (p value <0.05), on
the ‘Price Conscious/Value for money’ dimension of shopping style
inventory. All the other values did not have a significant influence on this
dimension of shopping style inventory.
Young adults embracing the Price Conscious/Value for Money’ shopping
style cherish the values Warm Relationships with others and a sense of
accomplishment highly. Getting best value for the money spent on apparels
gives them a sense of achievement. They share information about best buys
with peer group. The values Being Well-respected and Fun and enjoyment of
life had negative influence on this shopping segment. Internal directed values
were more important to this group than external directed values. This
shopper segment seems conscious of the things they buy and the amount they
pay to procure the same. They are the serious types who are not fun and
enjoyment seekers and feel that respect is not gained only from wearing high
priced branded apparels. All the other values did not have any significant
influence on this shopper segment.
27) It was found that there is significant positive influence of the value Warm
Relationships (p value <0.01), with others and significant negative influence
of the value Self-fulfillment (p value <0.01), on the
‘Impulsiveness/Careless’ dimension of the shopping inventory. All the

224
other values did not have a significant influence on this dimension of
shopping style inventory.
The Impulsiveness/Careless’ shopper segment considers Warm
Relationships with others as the important value to them. These shoppers are
impulsive and careless and tend to make unplanned purchases. They shop to
please others, even when they do not need. Self-fulfillment had a negative
influence on these shoppers indicating that they do not enjoy or approve
what they do and regret their impulsive behaviour. All the other values did
not have any significant influence on this shopper segment.
28) It was found that there is significant influence of the values Fun and
enjoyment of life (p value <0.01), Security & Comfort (p value <0.05), and
A sense of accomplishment (p value <0.05), on the ‘Confused by
Overchoice’ dimension of shopping styles inventory. All the other values
did not have a significant influence on this dimension of shopping style
inventory.
Young adults falling under the Confused by Overchoice’ segment are
influenced by the values Security & Comfort, Fun and enjoyment of life and
A Sense of Accomplishment. They love fun and adventure, enjoy good food
and leisure and doing new things. They are the easy –going type and find it
hard to choose the best clothes or stores to shop. They find the vast number
of different consumer brands confusing. This shopping style emerged as the
second highly prevalent style describing the young adult population under
study. All the other values did not have any significant influence on this
shopper segment.
29) It was found that there is significant influence of the value Simplicity (p
value <0.01), on the ‘Habitual/Brand Loyal’ dimension of shopping style.
The other values did not have a significant influence on ‘Habitual/Brand
Loyal’ style.

225
Simplicity is the only value that influences the ‘Habitual/Brand Loyal’
shopper segment. They are unassuming, straight forward, and down to earth.
They do not flaunt and display their skills, abilities and possessions. As
shoppers they are habitual in buying same brands from the same or familiar
stores. They appear to have favourite brands and stores and to have formed
habits in choosing these.
30) It is found from the study that the predominant values among the list of ten
values used in this study, that influences the young adults shopping styles for
apparels are Values such as ‘Fun and enjoyment of Life’ and ‘Warm
Relationship with others,’ which have the highest positive influence on the
shopping Styles of young adults for apparels. They showed a positive
influence on four shopping styles. Young adults enjoy everything in life that
brings in entertainment, joy and happiness and love to share space with their
family, friends and peer group. These values positively influence them to be
Perfectionists, High Quality and Brand conscious. They love high quality
branded apparels and prefer to sport the latest in fashion. They are also
recreational shoppers as it is a fun giving activity in the company of their
family or friends. Fun and enjoyment also leads to confusion in their minds
when the choice is many. And sometimes, warm relationship with others,
such as parents/family also makes them to be impulsive and price conscious
consumers.
31) The value Self-Fulfillment shows the highest level of negative influence
affecting three shopping styles viz., Perfectionist/High quality conscious,
Brand Conscious/Price equals quality and Impulsive/Careless shopping
styles.
32) The values Self Respect and Being Independent do not show positive
influence on any shopping style for young adults for apparels. These values
are neutral in nature and do not influence most of the shopping styles for
apparels.

226
33) The findings of the study indicate that there were significant gender
differences on three factors of consumer-decision making styles (brand
conscious, recreational-hedonistic consumer and habitual brand-loyal
consumer). The Brand Conscious/Price Equals Quality factor had a
significant difference across gender. Male respondents were found to be
more brand conscious than female respondents.
The Recreational and Shopping Conscious factor had a significant difference
across gender. Female respondents had higher levels of Recreational and
Shopping Consciousness as compared to male respondents.
The Habitual/Brand Loyal factor had a significant difference across gender.
Male respondents had higher levels of brand loyalty compared to female
respondents.
34) It was found that there is a significant difference (p<0.05) in the shopping
styles across education levels. PG students were more Recreational and
Shopping Conscious as compared to UG and others.
35) Young Adults from the South were more price-conscious and perceived
more value for money as compared to youth from other regions. Further,
young adults from east were more brand conscious compared to their peers
from other regions.
36) Female respondents were found to be with higher orientations towards
External Values such as Sense of belonging, Being well respected and
Security & comfort; Internal Interpersonal Values such as Warm
relationships with others, fun and enjoyment of life; and Internal Individual
Values such as Self-fulfillment, Self respect, A sense of accomplishment,
Simplicity and Being Independent, than the male respondents (p<0.01). The
study revealed that Value orientations are higher in women as compared to
men.
37) Female respondents showed higher level of influence of eight values viz.
sense of belonging (p<0.01), simplicity (p<0.01), warm relationship with

227
others (p<0.01), self-fullfilment (p<0.01), being well respected (p<0.01),
security and comfort (p<0.01), self-respect (p<0.01), being independent
(p<0.05). Fun and enjoyment of life and sense of accomplishment (p>0.05),
were the only two values that did not reveal any significant difference in the
level of influence on male and female respondents.
38) It was found that respondents from the Western Region display a higher
orientation towards both External Values and Internal Individual Values (p
value <0.05) compared to the other regions. There is no significant
difference in the orientation towards Internal Interpersonal Values across
regional back ground of the respondents.
39) Fun and enjoyment of life and sense of accomplishment, were the only two
values that did not reveal any significant difference in the level of influence
on male and female respondents.
40) Young adults from the West showed a higher level of influence by the values
Sense of Belonging (p<0.05), Security and comfort (p<0.05) and Self
Respect (p<0.05), than the other regions. Young adults from the North
showed higher level of influence of the value Being Independent (p<0.01).

228
SUGGESTIONS FOR APPAREL MANUFACTURERS AND FASHION
DESIGNERS
1) Manufacturers and Fashion designers should give utmost importance to the
quality aspects more than any other attribute of the apparel as quality is
considered as the most important criteria for purchase decision for apparels
by young adults.
2) The study revealed that young adults are perfectionists and besides being
quality conscious they also look for value for money in their purchase
decisions for apparels. This aspect should be factored into all product
development decisions for apparels.
3) Manufacturers and Fashion designers should endeavour to understand the
value systems of their target consumers. This calls for research on the ethnic
and cultural background and the value systems of the consumers. For this
purpose, they should conduct surveys with questionnaires that gather data to
understand the underlying values systems. The Value-Shopping Style model
presented through this study can be used by them as a tool to gather more
information about their target consumers.
4) Structured focus group interviews should also be conducted for different age
groups, ethnic groups, education levels and geographic regions to understand
the differences in values, beliefs, and customs that have a direct bearing on
their behaviour as a consumer.
5) Brands have to constantly keep pace with the speed of communication
among young adult peer groups on the latest trends and market environment
and strive to be part of their conversations. Young adults want better quality,
more value-for-money, superior experience and other value add. Though the
modern youth do not run after designer clothes, their wardrobes are up to
date. Most of them make additions to their wardrobes frequently to keep up-
to-date in fashion.

229
6) Brands should enhance their focus on the semi-urban youth market. They are
emerging as digital savvy and even the consumption pattern is growing
rapidly like in the metros. Hence brands should aim at reaching out the semi-
urban young population in a much bigger way by using a mix of various
marketing activities. However, the metro youth require a little more
sophisticated marketing strategy compared to their semi –urban counterparts.
SUGGESTIONS FOR APPAREL MARKETERS / RETAILS OUTLETS
1) There should be a paradigm shift in the mind set of marketers to consider
consumers as individuals with unique values and beliefs that determine their
buying behaviour. They should transcend from focusing on demographic
aspects and move to psychographic aspects.
2) Every group or society has a culture, and cultural influence on the buying
behaviour may vary greatly from place to place. International and National
marketers must understand the underlying culture in each of their markets
and adapt their marketing strategies accordingly.
3) Marketers should always try to study cultural shifts in order to discover new
products that might be the need of the market.
4) Marketers should highlight the quality features of the apparels in
advertisements to attract the attention of this consumer segment.
5) Marketers should frame their product and communication strategy in such a
way that it appeals to the Perfectionist and Quality Conscious young adult
population.
6) Marketers should understand the digital shift that is prevailing in the retail
environment and learn to communicate to the young adults using different
media. They should look at four mediums to connect with young people
namely; television & radio, social media, digital (mobile applications)
and real live space such as music concerts. Social media such as Face Book,

230
Twitter and YouTube is where the youth today interact actively most of the
time.
7) E-commerce can be used effectively to connect with the young adult
population. Marketers can offer additional services such as flexible payment
options, cash on delivery, and flexible return policy. Online shopping comes
with several benefits of shopping convenience, time saving, fuel saving
and privilege of being able to compare brands/styles/prices easily, through
the internet platform.
8) In the context of commercial communication with frequent apparel
purchasers, the marketer should also emphasize outer-directed values such as
‘Fun and enjoyment of Life’ and ‘Warm Relationship with Others’, rather
than inner-directed values such as Self-fulfillment, Self Respect, and Being
Independent. This is because consumers placing importance on outer-
directed values are more likely to be fashion-conscious and recreational than
consumers who give more importance to inner-directed values.
9) Marketers aware of the recreational shoppers among young Indians can
provide pleasant environments that will attract this type of consumer without
neglecting quality.
CONCLUSION
Several managerial implications might be derived from this study. Apparel
manufacturers, fashion designers and marketers might use the findings to segment
consumers according to the value-shopping style segments, to target and position
their products more effectively. Multi-national companies can use the findings of
this study to tailor their marketing strategies to specific characteristics of consumers
while entering the Indian market.
Personal Values may prove to be one of the most powerful explanations of,
and influences on, consumer behaviour. This research will contribute to the body of
consumer behaviour literature by investigating the influence of personal values on
the Consumer decision-making styles of young adults using the List of Values and

231
the Consumer Style Inventory. The study has high relevance from the Indian
context on several aspects due to the following reasons: The study focuses on the
youth population, which is the major demographic dividend of the entire population
of the country. This consumer segment is the trend setters for the others and also
they offer longevity of market. It makes a lot of sense to develop specific marketing
strategies for this segment that would be sustainable in the long run. The study
focuses on apparels which are the most frequently purchased items by young adults.
In India psychographic profiling of consumers is still in its stage of infancy.
The study focuses on values as the important psychographic variable that influences
shopping styles, especially for apparels. This knowledge helps marketers to predict
consumer behaviour more accurately than the other psychographic variables such as
attitudes, product attributes, product classification, and life style.
It is therefore concluded that personal values have significant influence on
the young adults shopping behaviour for apparels in Bangalore, India. The findings
of the present study are statistically relevant and can be used as basis for strategic
decisions-making by apparel manufacturers, fashion designers and marketers.
Findings of the study also contribute to knowledge and theory in the relevant area
and can be used as a model for further research.
SCOPE FOR FURTHER RESEARCH
The study was conducted in the city of Bangalore, and it can be extended to
other parts of the country to substantiate the findings and generalise the apparel
purchasing behaviour of young adults in India.
The age group of the respondents could also be expanded to include
consumers of other or all age groups.
Focussed studies can also be done on only either male or female consumers to
explore in depth the influence of values on their buying behaviour.
In the present study, influence of values on the apparels purchase behaviour is
studied. Other consumer items such as footwear, bags and other accessories,

232
perfumes, FMCG products, durable goods etc., could be considered and the general
values influencing the shopping behaviour could be identified.
The Value-Shopping Style model could be tested with other reference groups
and other consumer items.
The study revealed that the least manifested shopping style among the young
adult respondents in Bangalore is the Brand consciousness / Price equals quality
shopping style. This aspect alone could be researched to confirm its applicability in
other regions and age groups.
The study also revealed that the young adults are price conscious and seek
value for the price paid for the apparels. A further study could be undertaken to
validate this finding with young adult population of other states/regions.
*****

vi
BIBLIOGRAPHY
BOOKS
C.R.Kothari, Research Methodology Methods and Techniques, New Age
International Pvt. Ltd, New Delhi, 2005
Foxall, G.R., Goldsmith, RE and Brown, S. (1998) Consumer Psychology for
Marketing (2nd edition). International Thomson Business Press, London.
Indian Institute of Foreign Trade, Ready-made garment Industry in India, A Study of
Problems and Prospects, New Delhi, 1998.
R. Panneerselvam, Research Methodology, Prentice Hall of India, New Delhi, 2004
S.L. Gupta Sumitra Pal, Consumer Behaviour, An Indian Perspective Text and
Cases. Jain Book Depot, New Delhi, 2011.
S.P. Gupta: Statistical Methods, Sultan Chand Publishers, New Delhi. Edition 2003.
Schiffman, L.G. and Kanuk, L.L. (1987) Consumer Behavior (3rd Edition) Prentice-
Hall International, Englewood Cliffs, N.J.
Saravanavel: Social Research, Himalaya Publishers, New Delhi, Edition 2000.
Wilkinson and Bhandarkan: Methodology and Techniques of Social Research,
Himalaya Publishing House, sixteenth revised edition, Reprint, 2004.
William O. Bearden, Richard G. Netemeyer. (1999). Handbook Of Marketing
Scales. Multi-Item Measures for Marketing and Consumer Behavior
Research
Zikmund, W.G. & d'Amica, M. (1995) Effective Marketing: Creating and Keeping
Customers South Western College Publishing, Cincinnati, Ohio.

vii
AGENCY REPORTS
Hindustan Times Youth Survey 2011
4PS B&M - ICMR SURVEY, 2011.
Provisional Population Totals Census Of India 2011 Govt Of India
Microsoft Advertising’s Pre Family Survey 2011
Retail perspectives from Deloitte, 2013
Indian Demographics Report 1998
Apparel in India, Euromonitor International. 2012
NATIONAL & INTERNATIONAL MAGAZINES/ JOURNALS AND
WORKING PAPERS
Akturan, U., & Tezcan, N. (2007). Profiling young adults: Decision-making styles
of college students for apparel products. Journees Normandes de Recherche
sur la Consommation : Societe et consommations.
Allen, M. W. (2001). A practical method for uncovering the direct and indirect
relationships between human values and consumer purchases. The Journal of
Consumer Marketing, 18(2), 102-120.
C.Anandan, C., Mohanraj. M.P. & S.Madhu (2006), A Study of the Impact of
Values and Lifestyles (VALS) on Brand Loyalty with Special Reference to
English Newspapers. Vilakshan, XIMB Journal of Management, 97-102.
Anic, I. D., Suleska, A. C., & Rajh, E. (2010). Decision-making styles of young-
adult consumers in the Republic of Macedonia. Ekonomska istraživanja,
23(4), 102-113.
Arroba, T. (1977). Styles of decision making and their use: An empirical study.
British Journal of Guidance and Counseling, 5(2), 149-158.

viii
Asma Kiran et. Al; Factors Affecting Change in the Clothing Patterns of The
Adolescent Girls; International Journal Of Agriculture & Biology 1560–
8530/2002/04–3–377–378
Backwell, C., and Mitchell, V.W. (2003). “Generation Y Female Consumer
Decision Making Styles.” International Journal of Retail & Distribution
Management, 3(2), 95-106.
Bae, S. (2004). Shopping pattern differences of physically active Korean and
American university consumers for athletic apparel. ProQuest, UMI
Dissertations Publishing.
Bao, Y., Kevin, Z. Z., and Su, C. (2003). “Face Consciousness and Risk Aversion:
Do They Affect Consumer Decision Making?” Psychology & Marketing,
20(8), 733-755.
Beaudoin, P., Moore, M. A., & Goldsmith, R. E. (1998). Young fashion leaders’ and
followers’ attitudes toward American and imported apparel. Journal of
Product & Brand Management. 7 (3), 193-207.
Beatty, Sharon E., Lynn R. Kahle, Pamela Homer, and Shekhar Misra. (1985).
Alternative measurement approaches to consumer values: The List of Values
and the Rokeach Value Survey,” Psychology & Marketing, 2, 181–200.
Becker and Connor. (1981). Personal Values of the Heavy User of Mass Media.
Journal of Advertising Research, 21, 37-43
Bhawnani (2010). What all excites the Indian Youth now?
Boonlertvanich, K. (2009). Consumer buying and decision making behavior of a
digital camera in Thailand. RU. International. Journal. Vol. 3(1).
Canabal , M. E. (2002). Decision making styles of young south Indian consumers:
an exploratory study. College Student Journal, 36(1).

ix
Chase, M. W. (2004). The relationship between mind styles, consumer decision-
making styles, and shopping habits of beginning college students. ProQuest,
UMI Dissertations Publishing.
Chin, W. W. (1998b). The partial least squares approach to structural equation
modelling. In G. A. Marcoulides (Ed.), Modern methods for business
research (pp. 295–336). Mahwah, NJ: Lawrence Erlbaum Associates, Inc
Comegys, C., & Brennan, M. . L. (2003). Students’ online shopping behavior: A
dual-country perspective. Journal of Internet Commerce, 2(2), 69-89.
Comegys, C., Hannula, M., & Vaisanen, J. (2006). Longitudinal comparison of
Finnish and US online shopping behavior among university students: The
five-stage buying decision process. Journal of Targeting, Measurement and
Analysis for Marketing, 14(4), 336-356.
Cowart, K. O., & Goldsmith, R. E. (2007). The influence of consumer decision-
making styles on online apparel consumption by college students.
International Journal of Consumer Studies, 31(6), 639-647.
DeLace, Jessica. (2011). The Psychology and Behavior of Consumers in the Fashion
Industry.
Devaraja. T.S. Indian Textile and Garment Industry- An Overview, University of
Mysore Hassan, India
Diana Crane. (2000). Fashion and Its Social Agendas: Class, Gender and Identity in
clothing. University of Chicago Press, 2000. 294 pp.
Durvasula, S., Lysonski, S., & Andrews, J. C. (1993). A cross-cultural study of the
generalizability of a scale for profiling consumers' decision-making styles.
Journal of Consumer Affairs, 27(Summer), 55-65.
Elizabeth M Visser and Ronel du Preez. (2001). Apparel shopping orientation: Two
decades of research ISSN 0378-5254. Journal of Family Ecology and
Consumer Sciences. Vol 29.

x
Fairhurst, A. E., Lennon, S. J., & Yu, H. (1996). Retail buyers' and manufacturers'
sales representatives' perceptions of market show services in small apparel
markets. Clothing and Textiles Research Journal, 14(3), 161-168.
Feldman, J. (1999). Back-to-school buying guide. Money, 28 (9), 165-168.
Forsythe, S. M., & Thomas, J. B. (1989). Natural, synthetic, and blended fiber
contents: An investigation of consumer preferences and perceptions.
Clothing and Textiles Research Journal, 7(3), 60-64.
Fotopoulos, C., Athanasios, K., & Pagiaslis, A. (2011). Portrait value questionnaire's
(pvq) usefulness in explaining quality food-related consumer behavior.
British Food Journal, 113(2).
Foula Kopanidis. (2009). Towards the Development of a Personal Values
Importance Scale (PVIS) - Application in Education. ANZMAC 2009.
Gaal, B., & Burns, L. D. (2001). Apparel descriptions in catalogs and perceived risk
associated with catalog purchases . Clothing and Textiles Research Journal,
19(1), 22-30.
Ghodeswar, B. M. (2007). Consumer decision-making styles among Indian students.
Alliance Journal of Business Research, 3(spring), 36-48.
Gosling et al.’s. (2002). Gosling, S. D., Ko, S. J., Mannarelli, T., & Morris, M. E. A
Room with a Cue: Judgments of Personality Based on Offices and
Bedrooms. Journal of Personality and Social Psychology, 82, 379-398.
Grant, I. C. & Waite, K. (2003). Following the Yellow Brick Road - Young Adults’
Experiences of the Information Super-Highway. Qualitative Market
Research: An International Journal, 6 (1), 48-57
Hair, J. F., Black, W. C., Babin, B. J., Anderson, R. E. & Tatham, R. L. (2005).
Multivariate data analysis (6th Ed.). Upper Saddle River, NJ: Prentice Hall.

xi
Hair, J.F.; Ringle, C.M.; Sarstedt, M. (2011). PLS-SEM: Indeed a silver
bullet. Journal of Marketing Theory and Practice, 19 (2), 139-151.
Halfstrom, J. L., Chae, J. S., and Chung, Y. S. (1992). “Consumer Decision Making
Styles: Comparison Between United States and Korean Young Consumers.”
Journal of Consumer Affairs, 26(1), 1-11.
Hanzaee, K. & Aghasibeig, S. (2008). Generation Y female and male decision-
making styles in Iran: are they different? The International Review of Retail,
Distribution and Consumer Research, 18 (5), 521–537
Hemalatha, K. G., Jagannathan, L., & Ravichandran, K. (n.d.). Shopping behaviour
in malls in globalised economies. 3rd IIMA Conference on Marketing
Paradigms for Emerging Economies
Haytko, D. L. & Baker, J. (2004). It’s all at the mall: exploring adolescent girl’s
experiences. Journal of Retailing, 80(1), 67-83.
Hines, J. D., & O'Neal, G. S., (1995). Underlying determinants of clothing quality:
The consumers' perspective. Clothing and Textiles Research Journal, 13(4),
227-233.
Holbrook, M. & Schindler, R. M. (1989). Some Explanatory Findings on the
Development of Musical Tastes. Journal of Consumer Research, 16 (1),
119-124.
Hou, S.C., and Lin, Z.H. (2006). “Shopping Style of Working Taiwanese Females.”
http://bai2006.atisr.org/CD/Papers/2006bai6305.doc accessed on May 15,
2011
Homer, Pamela and Lynn R. Kahle (1988). A structural equation analysis of the
value-attitude-behavior hierarchy. Journal of Personality and Social
Psychology, 54, 638–46.

xii
Hu & Bentler (1999). Cutoff criteria for fit indexes in covariance structure analysis:
Coventional criteria versus new alternatives, Structural Equation Modeling,
6(1), 1-55
Huddleston, P., Cassil, N. L., & Hamilton, L. K. (1993). Apparel selection criteria as
predictors of brand orientation. Clothing and Textiles Research Journal,
12(1), 51-56.
Ian Spero, Merlin Stone, (2004). Agents of change: how young consumers are
changing the world of marketing. Qualitative Market Research: An
International Journal, Vol. 7 Iss: 2, pp.153 - 159
Inglessis, M. G. (2008). Communicating through clothing: The meaning of clothing
among Hispanic women of different levels of acculturation. ProQuest, UMI
Dissertations Publishing.
Ivan Damir Ani , Anita Ciunova Suleska, Edo Rajh. (2010). Decision-making styles
of young-adult Ekonomska istraživanja, Vol. 23, No. 4 (102-113)103
Jain, R., Singh, R., & Rankawat, K. (2011). General values and clothing behaviour
of college going students. Studies on Home and Community Science, Vol.5,
No.1, 2011, p. 13-14
Jaya Halepete, K.V. Seshadri Iyer. (2008). Multidimensional investigation of
apparel retailing in India. Emerald 36.
Jessie X. Fan, Jing J. Xiao (1998), Consumer Decision-Making Styles of Young-
Adult Chinese consumers. Journal of Consumer Affairs. Volume 32, Issue
2, pages 275–294, Winter 1998.
Jiyeon Kim. (2003). College Students’ Apparel Impulse Buying Behaviors In
Relation To Visual Merchandising, Research Thesis, Athens, Georgia.
J. M., & McQuarrie, E. F. (1988). Shortening the Rokeach value survey for use in
consumer research. Advances in Consumer Research, 15, 381-386.

xiii
Kahle, Lynn R. ed. 1983. Social Values and Social Change: Adaptation to Life in
America. New York, NY: Praeger Publishers.
Kamaruddin, A.R., and Kamaruddin, K. (2009). “Malay Culture and Consumer
Decision-Making Styles: An Investigation On Religious And Ethnic
Dimensions.” Journal Kemanusiaan, 14, 37-50.
Kaustav Sengupta. (2008) . INgene Insights Consultancy
Kaze, V., & Skapars, R. (2011). Paradigm shift in consumer segmentation to gain
competitive advantages in post-crisis FMCG markets: Lifestyle or social
values? The Journal Of Economics And Management, 16, 1266-1273.
Kenson, K. M. (1999). A Profile of Apparel Shopping Orientation Segments among
Male Consumers. Unpublished MA, thesis, California State University Long
Beach.
Kevin Kuan-Shun Chiu (2008) The Role of Psychographic Approach in Segmenting
Young Adults’ Buying Behavior for Athletic Footwear.
Kim, Y. (2002). The impact of personal value structures on consumer pro-
environmental attitudes, behaviors, and consumerism: A cross-cultural
study. ProQuest, UMI Dissertations Publishing.
Kim, H.S. & Jin, B. (2006). Exploratory study of virtual communities of apparel
retailers. Journal of Fashion marketing and Management. 10(1). 41-55.
Kittichai, W (2005). A hierarchical model of values, price perception, ongoing
search and shopping behaviors: A cross-cultural comparison. ProQuest, UMI
Dissertations Publishing.
Kropp, F., Lavack, A. M., & Silvera, D. H. (2005). Values and collective self-
esteem as predictors of consumer susceptibility to interpersonal influence
among university students. International Marketing Review, 22(1), 7-33.

xiv
Kulkarni, R., Belgaonkar. D (2012). Purchase Behavioral Trends and Brand Loyalty
of Indian Youth with Special Reference to Nashik City. International
Conference on Humanity, History and Society. IPEDR vol.34 (2012) ©
(2012) IACSIT Press, Singapore
Kwan, C. Y., Yeung, K.W., & Au, K.F. (2004). Decision-making behaviour toward
casual wear buying: A study of young consumers in mainland China. Journal
of Management & World Business Research, 1(1), 1-10.
Kwan, C. Y. (2006). An investigation on the factors affecting young Chinese
consumers' decision-making behaviour towards casual wear purchase.
ProQuest, UMI Dissertations Publishing.
Kwan, C.Y., Yeung, K.W., & Au, K.F. (2008). Relationship between consumer
decision-making styles and lifestyle characteristics: Young fashion
consumers in China. Journal of the Textile Institute, 99(3), 193-209.
Lawan A. Lawan, Ramat Zanna. (2013). Evaluation of Socio-Cultural Factors
Influencing Consumer Buying Behaviour of Clothes in Borno State, Nigeria;
International Journal of Basic and Applied Science, Vol 01, No. 03, Jan
2013, pp. 519-529
Laura P. Naumann. (2009). Express yourself: Manifestations of personality in
clothing and appearance The University of Texas at Austin
Leslie, E., Sparling, P. B. & Owen, N. (2001). University Campus Settings and the
Promotion of Physical Activity in Young Adults: Lessons from Research in
Australia and the USA. Health and Education, 101 (3), 116-125.
Linda B. Arthur. (1999). Religion, Dress and the Body [Paperback], Berg
Publishers; ISBN-10: 1859732976 | ISBN-13: 978-1859732977
Lee, M. & Burns, L. D. (1993). Self-consciousness and clothing purchase criteria of
Korean and United States college women. Clothing and Textiles Research
Journal, 11(4), 13-22.

xv
Lysonski, S., Durvasula, S. & Zotos, Y. (1996). Consumer Decision-Making Styles:
A Multi-Country Investigation. European Journal of Marketing, 30 (12),
10-21.
Magie, A. A. (2008). An analysis of lifestyle, shopping orientations, shopping
behaviors and fashion involvement among teens aged 13 to 18 in the United
States . ProQuest, UMI Dissertations Publishing.
Mathews, S., & Nagaraj, H. (2010). An analytical study of Vals on youth –
Implication to marketers. Management Convergence, Vol 1, No 1
Mary Anne Winslow. (2008). Market Segmentation - Psychographic Method;
Article Source: http://EzineArticles.com.
Meenakshi, H., & Arpita, K. (2010). Need for uniqueness and consumption behavior
for luxury brands amongst Indian youth. International Journal of Indian
Culture and Business Management, 3(5).
Mitchell, V.W. & Bates, L. (1998). UK Consumer Decision Making Styles. Journal
of arketing Management, 14, 199-225.
Mitchell V, Walsh, G, Hennig-Thurau, T, Wiedmann, K-P (2001), 'Consumers'
Decision Making Style as a Basis for Market Segmentation', Journal of
Targeting, Measurement and Analysis for Marketing , 10(2), p.117-131.
Mishra, A.A. (2010). Consumer decision-making styles and young-adult consumers:
An Indian exploration. letme Ara rmalar Dergisi, 2(3), 45-62.
Moschis, G. P. (1987). Consumer Socialization: A Life Cycle Perspective, Lexington, MA:
Lexington Books.
Moklis, S., and Salleh, H. (2009). Decision making styles of young Malay, Chinese
and Indian Consumers in Malaysia. Asian Social Science, 5(12), 50-59.
Mokhlis, S., and Salleh, H. (2009). An investigation of consumer decision making
styles of young adults in Malaysia. International Journal of Business and
Management,4(4), 140-148.

xvi
Mokhlis, S., and Salleh, H. (2010). Religious contrasts in consumer shopping styles:
A Factor Analytic Comparison. Journal of Business Studies Quarterly, 2(1),
52-64.
Mandloi, M. (2010). A study on buying decision making style of Indian shoppers in
Indore shopping malls.
Narang, R. (2010). Psychographic segmentation of youth in the evolving Indian
retail market. The International Review of Retail, Distribution and Consumer
Research Vol. 20, No. 5, December 2010, 535–557.
Noble, s. M., et al. (2009). What drives college-age Generation Y consumers?
Journal of Business Research 62, 617–628.
Noh, M., & Lee, E. J. (2011). Effect of brand difference on multichannel apparel
shopping behaviors in a multichannel environment. International Journal of
Business and Social Science, 2(18), 24-32.
Ng, S. W.(2002). Profiling Chinese consumers stylesba cross-cultural
generalizability study of consumers’ decision-making style. Asia Pacific
Advances in Consumer Research, 5, 258- 264.
Nunnally, J. C. (1978). Psychometric Theory. Second edition. New York, NY:
McGraw-Hill
Padmanabhan, Parvathi, Ph.D. (2012), Foreign Apparel Brands and the Young
Indian Consumer: An Exploration of the Role of Brand in the Decision-
Making Process. Directed by Dr. Nancy Hodges. 165 pp.
Patel, V. (2008). “Consumer Decision Making Styles in Shopping Malls: An
Empirical Study.” New Age Marketing: Emerging Realities, 627-637.
Park, J. & Stoel, L. (2006). Effect of brand familiarity, experience and information
on online apparel purchase. International Journal of Retail & Distribution
Management. 33 (2), 148-160.

xvii
Radam. A., Ali, H. M., & Leng, Y. S. (n.d.). Decision-making style of Chinese
consumer on clothing . University Putra Malaysia, The Journal of Global
Business Management, 7(2).
Reiley, K. J. W. (2008). Definitions of uniqueness in terms of individual appearance:
Exploring vintage clothing and new clothing wearers. ProQuest, UMI
Dissertations Publishing.
Rebecca Garnett, B.S. (2010) .Examining The Effects of Psychographics,
Demographics And Geographics On Time-Related Shopping Behaviors.
University Of North Texas.
Rokeach, M. (1973). The Nature of Human Values. NY: The Free Press.Roper,
Roy, S., & Goswami, P. (2007). Structural equation modeling of value-
psychographic trait-clothing purchase behavior: a study on the urban college-
goers of India. Emerald Group Publishing Limited, 8(4), 269-277.
S. W. (2002). New age consumers: attitudes and values. Proquest, 121.
Safiek Mokhlis and Hayatul Safrah Salleh, (2009). Consumer Decision-Making
Styles in Malaysia: An Exploratory Study of Gender Differences. European
Journal of Social Sciences – Volume 10, Number 4
Saleem , S., Salaria, R., Megha, V. (2010). Few determinants of compulsive buying
of youth in Pakistan.
Seo, J., Hathcote, J. and Sweaney, A. (2001). Casual wears shopping behavior of
college men in Georgia, USA, Journal of Fashion Marketing and
Management, 5(3), 208-222.
Schwartz. (1992). Universals in the Content and Structure of Values: Theoretical
Advances and Empirical Tests in 20 Countries.Advances in experimental
social psychology (Vol. 25) (pp. 1-65). New York: Academic Press.

xviii
Shim, S., Morros, N. J., & Morgan, G. A. (1989). Attitudes toward imported and
domestic apparel among college students: The Fishbein model and external
variables. Clothing and Textiles Research Journal, 7(4), 8-18.
Shim, S., & Kotsiopulos, A. (1993). A typology of apparel shopping orientation
segments among female consumers. Clothing and Textiles Research Journal,
12(1), 73-85.
Shim, S. (1996). Adolescent Consumer Decision Making Styles: The Consumer
Socialization Perspective. Psychology & Marketing, 13(6), 547-569.
Shim, Soyeon and Jennifer L. Maggs. 2005. A psychographic analysis of college
student s alcohol consumption: implications for prevention and consumer
education. Family and Consumer Sciences Research Journal 33(3): 255-273.
Shrum, L. J., McCarty, J. A., & Loeffler, T. L. (1990). Individual differences in
value stability: Are we really tapping true values. Advances in Consumer
Research Volume, 17, 609-615
Siu, N.Y.M. and Hui, A.S.Y. (2001). “Consumer Decision Making Styles in China:
A Cross Cultural Validation.” Asia Pacific Advances In Consumers
Research, 4, 258-262.
Speer, T. (1998). College Come-Ons. American Demographics, 20 (3), 41-45.
Sproles, G. B., & Kendall, E. L. (1986). A methodology for profiling consumers’
decision-making styles. The Journal of Consumer Affairs. 20(2), 267-279
Sproles, G.B., and Kendall, E.L. (1987). “A Short Test of Consumer Decision
Making Styles.” The Journal of Consumer Affairs, 5, 7-14.
Sproles, E.K., and Sproles, G.B. (1990). “Consumer Decision Making Styles as a
Function of Individual Learning Styles.” The Journal Of Consumer Affairs,
24(1), 134-147.

xix
Srivatsa, H.S., Srinivasan. R. (2007). Banking Channel Perceptions; An Indian
Youth perspective
Sullivan, D. P. (2004). A profile of generation y online shoppers and its application
to marketing. ProQuest, UMI Dissertations Publishing.
Szendrey, J. M. (2008). An empirical consumer behavior study of familial/parental
influences on the degree of frugality of undergraduate students. ProQuest,
UMI Dissertations Publishing.
Tabachnick, Linda S. Fidell. (2001). Using Multivariate Statistics (6th Edition).
Amazon.com
Tanaka, 1993. Tanaka, J.S. (1993). Multifaceted conceptions of fit in structural
equation models. In K.A. Bollen, & J.S. Long (eds.), Testing structural
equation models. Newbury Park, CA: Sage
Tatzel, M. (1982). Skill and motivation in clothes shopping: Fashion-conscious,
independent, anxious, and apathetic consumers. Journal of Retailing, 58(4),
90-97.
Thomas, J. B., Cassil, N. L., & Forsythe, S. M. (1991). Underlying dimensions of
apparel involvement in consumers' purchase decisions. Clothing and Textiles
Research Journal, 9 (3), 45-48.
Thompson (2009), Interpreting Kahle’s List of Values: Being Respected, Security,
and Self-fulfillment in Context. UW-L Journal of Undergraduate Research
XI, 1-9.
Tremblay, A. J. (2005). Impulse buying behavior: Impulse buying behavior among
college students in the Borderlands. ProQuest, UMI Dissertations
Publishing.
Turk, J. L. and N. W. Bell. (1972). “Measuring Power in Families.” Journal of
Marriage and theFamily 34:215-223.

xx
Unal S., and Ercis A. (2008). “The Role of Gender Difference In Determining The
Style of Consumer Decision Making.” Bogazici Journal, 22(1-2), 89-106.
Vieira, V. A., Slongo, L. A., and Torres, C. V. (2011). “Evaluating The
Psychometric Properties of Consumer Decision Making Style Instruments”
Retrieved from http://www.ead.fea.usp.br/semead/10semead/sistema/
resultado/TrabalhosPDF/277.pdf.
Vigaray, M. D. J., & Hota, M. (2008). Schwartz values, consumer values and
segmentation: The Spanish fashion apparel case. Lille economie &
management, 1-32.
Vikkraman. P; Sumathi. N. (2012). Purchase Behaviour in Indian Apparel Market:
An Analysis International Journal of Business Economics & Management
Research Vol.2 Issue 2, February 2012, ISSN 2249 8826
Vincent. N & Christy Dr. S. (2011). Psychographic Segmentation of Young Adult
Consumers - A key to developing Sustainable Marketing Strategies – Global
Journal of Arts & Management – October 2011
Vincent. N & Christy Dr. S. (2013). Personal Values Approach for a Better
Understanding of Consumer Behaviour. International Journal of Innovative
Research & Development, Vol 2 Issue 3 March 2013, pg. 511.
Voices and Visons from India, 2004 © Commonwealth of Australia
Walsh, G., Mitchell, V.W., and Thurau, T. H. (2001). “German Consumer Decision
Making Styles.” The Journal of Consumer Affairs, 35(1), 73-95.
Walsh, G., Thurau, T. H., Mitchell, V. W. and Widmann, K. P. (2001). “Consumers'
Decision Making Style as a Basis for Market Segmentation.” Journal of
Targeting, Measurement And Analysis For Marketing, 10(2), 117-131.
Wang, C.L., Siu, N.Y.M. and Hui, A.S.Y. (2004). “Consumer Decision Making
Styles on Domestic and Imported Brand Clothing.” European Journal Of
Marketing, 38 (½), 239-252.

xxi
Warwick, J., P. Mansfield. (2000). Credit Card Consumers: College Students'
Knowledge and Attitude. Journal of Consumer Marketing 17(7):617-626
Wells, W.D. (1975). Psychographics: A review. Journal of Marketing Research, 11
(May), 196-213.
Xu, Y. & Paulins, V.A. (2005). College students’ attitudes toward shopping online
for apparel products: Exploring a rural versus urban campus. Journal of
Fashion Marketing & Management 9(4), 420-433.
Yesilada, F., and Kavas, A. (2008). “Understanding the Female Consumers Decision
Making Styles.” Isletme fakultesi dergisi, cilt , 9(2), 167-185.
Zeenat Ismail , Sarah Masood and Zainab Mehmood Tawab (2012), Factors
Affecting Consumer Preference of International Brands over Local Brands.
2nd International Conference on Social Science and Humanity, IPEDR vol.31
(2012) © (2012) IACSIT Press, Singapore.
Zeng, Y. (2008). An investigation of decision making style of Chinese college
student online apparel shoppers. Thesis, B.A. Wuhan University Of Science
And Engineering, China,, Retrieved from http://etd.lsu.edu/docs/available/etd-
11052008 123052/unrestricted/Zengthesis.pdf.
WEBSITES
www.en.wikipedia.org
www.zenithresearch.org.in
http://www.ibef.org/industry/textiles.aspx, May 2013
http://www.researchandmarkets.com/reports/688195/textile_and_apparel_sector_in_
india
http://yas.nic.in/
http://www.thefreedictonary.com

xxii
unesco.org/new/en/social-and-human-sciences/themes/youth/youth-definition
http://pitchonnet.com/blog/2012/08/21/how-well-do-indian-marketers-understand-
the-Indian-youth/ Pallavi Srivastava and Arshiya Khullar
http://www.atkearney.com/consumer-products-retail/global-retail-development-
index/full-report/-/asset_publisher/oPFrGkbIkz0Q/content/2013-global-
retail-development-index/10192#sthash.BiNogJzz.dpuf
http://www.euromonitor.com/apparel-specialist-retailers-in-india/report
http://www.ibef.org/industry/textiles.aspx, May 2013; and http://www.research
andmarkets.com/reports/688195/textile_and_apparel_sector_in_india
http://www.mudralifestyle.com/
http://www.indiainfoline.com
http://www.arvindmills.com
http://www.mywestside.com
http://corporate.shoppersstop.com/corporate/history.aspx

QUESTIONNAIRE
A STUDY ON THE INFLUENCE OF PERSONAL VALUES ON THE
SHOPPING STYLES OF YOUNG ADULTS TOWARDS PURCHASE OF
APPARELS IN BANGALORE CITY, INDIA
Dear Sir / Madam,
This is an academic research study conducted as part of the PhD program of
Bharathidasan University, Trichy.
Psychographic variables are attributes relating to personality, values, attitudes,
interests, or lifestyles. Of these, Values have profound influence on consumer
behaviour. Values are the core principles that an individual upholds in life
which directs thought and drives action. This study aims to gain an insight into
the influence of values on the youth buying behaviour towards apparels. Studies
on consumer values would help marketers understand why consumers make the
choices they do and help them determine how to approach customers belonging to a
particular segment.
Your participation in the survey is very much appreciated and I assure you that the
information obtained in this study will be kept confidential and will be used only for
research purposes.
Yours Truly, Nithila Vincent Bangalore - 29

QUESTIONNAIRE No:____________
I. DEMOGRAPHIC DETAILS (PLEASE TICK)
a. Gender: Male (______) Female (______)
b. Age: 18-20 (______) 21-23 (______) 24-26 (______)
c. Educational Qualifications: UG (______) PG (______) Others (______)
d. Occupation: UG Student (______) PG student (______)
Private Employed (______) Government employed (______) Self
Employed (______)
e. Annual Income: Nil (_____) less than 50000 p.a (_____)
50,000-1,00,000 p.a (_____) 1 Lac – 3 Lakhs p.a (______)
3 Lakhs-5 Lakhs p.a (______) above 5 lakhs p.a (______)
f. Pocket Money Allowance: Nil (______) less than 500 per month
(______) 500-1000 per month (_____) 1000-3000 per month (_____)
3000-6000 per month (_____) >6000 per month (_____)
g. State of origin: _________________ Mother tongue: _______________

II SURVEY ON VALUES
The following are a list of ‘values’ that some people look for or want out of life. Please study the list carefully and then;
Rate each value on how important it is in your daily life. (1= least important and 9= very Important.. Please mark every item. 1(L) 2 3 4 5 6 7 8 9(H) 1. Sense of Belonging (Feeling that Family & friends care about me)
2. Simplicity (Being unassuming, straight forward, down to earth)
3. Warm Relationships with others (maintain cordial relations)
4. Self-fulfillment (Being creative, enjoy what I do, inner harmony)
5. Being Well-respected (Having social recognition, respect & approval by others)
6. Fun and enjoyment of life (Seeking adventure, Novelty & change, enjoying food & leisure)
7. Security & Comfort (Safety, secure surroundings)
8. Self-respect (Self-esteem, belief in one’s own worth, preserving self-image)
9. A sense of accomplishment (Being successful, doing something that I’ve never done before)
10. Being Independent (Self Reliant, Self Sufficient)

III. CONSUMER SHOPPING STYLES INVENTORY
The following statements describe consumer shopping styles. Please study the list carefully and then indicate your agreement ranging from ‘strongly disagree’ to ‘strongly agree’. Scale: 1- Strongly disagree, 2 – Disagree, 3 – Neither Agree nor Disagree, 4 – Agree, 5 – Strongly Agree
S.No 1 2 3 4 5
1 Getting very good quality of clothes is very important to me.
2 When it comes to purchasing clothes, I try to get the very best or perfect choice.
3 In general, I usually try to buy the best overall quality of apparels.
4 The well-known national brands are for me.
5 The more expensive brands are usually my choices.
6 The higher the price of the apparel, the better the quality.
7 I usually have one or more outfits of the very newest style.
8 I keep my wardrobe up-to-date with the changing fashions.
9 Fashionable, attractive styling is very important to me.
10 Shopping for clothes is not a pleasant activity to me.
11 Going shopping for clothes is one of the most enjoyable activities of my life.
12 Shopping the stores for clothes wastes my time.
13 I buy most of my clothes at sale prices.
14 The lowest price outfits are usually my choice.
15 I look carefully to find the best value for the money.
16 I should plan my shopping more carefully than I do.
17 I am impulsive when purchasing clothes.

18 Often I make careless purchases of clothes I later wish I had not.
19 There are so many brands to choose from that I often feel confused.
20 Sometimes it is hard to choose which stores to shop for clothes.
21 The more I learn about apparel brands, the harder it seems to choose the best.
22 I have favourite brands I buy over and over.
23 Once I find a brand I like, I stick with it.
24 I go to the same stores each time I shop.
Additional Goodness of Fit and Related Measures for the Value-Shopping Style Model
NCP
Model NCP LO 90 HI 90
Default model 3193.878 3004.174 3390.953 Saturated model .000 .000 .000
Independence model 12832.685 12458.923 13212.823
FMIN
Model FMIN F0 LO 90 HI 90
Default model 2.514 2.162 2.034 2.296
Saturated model .000 .000 .000 .000
Independence model 9.091 8.688 8.435 8.946
RMSEA
Model RMSEA LO 90 HI 90 PCLOSE
Default model .065 .063 .067 .000
Independence model .121 .119 .123 .000

AIC
Model AIC BCC BIC CAIC
Default model 3932.878 3938.218
Saturated model 1258.000 1288.534
Independence model 13495.685 13497.336
ECVI
Model ECVI LO 90 HI 90 MECVI
Default model 2.663 2.534 2.796 2.666
Saturated model .852 .852 .852 .872
Independence model 9.137 8.884 9.395 9.138
HOELTER
Model HOELTER .05 HOELTER .01
Default model 228 238
Independence model 72 75
Execution time summary
Minimization: 1.232
Miscellaneous: .094
Bootstrap: .000
Total: 1.326

Inter-construct correlations and Squared Inter-Construct Correlation estimates (SIC) .Correlations: (Group number 1 - Default model)
Shopping Styles
Shopping Styles Estimate SIC
Perfectionist/High Quality Conscious <--> Brand Conscious/Price
Equals Quality 0.648 0.419904
Perfectionist/High Quality Conscious <--> Novelty and Fashion
Conscious 0.51 0.2601
Perfectionist/High Quality Conscious <--> Recreational and Shopping
Conscious 0.313 0.097969
Perfectionist/High Quality Conscious <--> Price Conscious/Value for
money 0.097 0.009409
Perfectionist/High Quality Conscious <--> Impulsiveness/Careless 0.288 0.082944
Perfectionist/High Quality Conscious <--> Confused by Overchoice 0.26 0.0676
Habitual/Brand Loyal <--> Perfectionist/High Quality Conscious 0.469 0.219961
Brand Conscious/Price Equals Quality <--> Novelty and Fashion
Conscious 0.64 0.4096
Brand Conscious/Price Equals Quality <--> Recreational and Shopping
Conscious 0.108 0.011664
Brand Conscious/Price Equals Quality <--> Impulsiveness/Careless 0.243 0.059049
Brand Conscious/Price Equals Quality <--> Confused by Overchoice 0.247 0.061009
Habitual/Brand Loyal
<--> Brand Conscious/Price Equals Quality 0.523 0.273529
Novelty and Fashion Conscious <--> Recreational and Shopping Conscious 0.271 0.073441
Novelty and Fashion Conscious <--> Impulsiveness/Careless 0.264 0.069696
Novelty and Fashion Conscious <--> Confused by Overchoice 0.261 0.068121
Habitual/Brand Loyal <--> Novelty and Fashion Conscious 0.449 0.201601
Recreational and Shopping Conscious <--> Price Conscious/Value for
money 0.053 0.002809
Recreational and Shopping Conscious <--> Impulsiveness/Careless 0.071 0.005041
Recreational and Shopping Conscious <--> Confused by Overchoice 0.079 0.006241
Habitual/Brand Loyal <--> Recreational and Shopping Conscious 0.125 0.015625

Price Conscious/Value for money <--> Impulsiveness/Careless 0.182 0.033124
Price Conscious/Value for money <--> Confused by Overchoice 0.089 0.007921
Habitual/Brand Loyal <--> Price Conscious/Value for money 0.017 0.000289
Impulsiveness/Careless <--> Confused by Overchoice 0.646 0.417316
Habitual/Brand Loyal <--> Confused by Overchoice 0.345 0.119025
Habitual/Brand Loyal <--> Impulsiveness/Careless 0.266 0.070756 Covariances among the Constructs
Estimate S.E. C.R. P
Perfectionist/High Quality Conscious
<--> Brand Conscious/Price Equals Quality
.231 .019 11.902 .000
Perfectionist/High Quality Conscious
<--> Novelty and Fashion Conscious
.233 .020 11.849 .000
Perfectionist/High Quality Conscious
<--> Recreational and Shopping Conscious
.154 .020 7.891 .000
Perfectionist/High Quality Conscious
<--> Price Conscious/Value for money
.053 .018 2.952 .003
Perfectionist/High Quality Conscious
<--> Impulsiveness/Careless .113 .018 6.475 .000
Perfectionist/High Quality Conscious
<--> Confused by Overchoice .137 .019 7.174 .000
Habitual/Brand Loyal
<-->
Perfectionist/High Quality Conscious
.259 .023 11.394 .000
Brand Conscious/Price Equals Quality
<--> Novelty and Fashion Conscious
.263 .023 11.651 .000
Brand Conscious/Price Equals Quality
<--> Recreational and Shopping Conscious
.048 .016 2.915 .004
Brand Conscious/Price Equals Quality
<--> Impulsiveness/Careless .086 .016 5.416 .000
Brand Conscious/Price Equals Quality
<--> Confused by Overchoice .117 .018 6.548 .000
Habitual/Brand Loyal <--> Brand Conscious/Price Equals Quality
.261 .024 10.864 .000

Estimate S.E. C.R. P
Novelty and Fashion Conscious
<--> Recreational and Shopping Conscious
.154 .022 6.965 .000
Novelty and Fashion Conscious
<--> Impulsiveness/Careless .120 .020 6.007 .000
Novelty and Fashion Conscious
<--> Confused by Overchoice
.159 .022 7.174 .000
Habitual/Brand Loyal
<--> Novelty and Fashion Conscious
.286 .026 10.901 .000
Recreational and Shopping Conscious <-->
Price Conscious/Value for money
.036 .023 1.528 .126
Recreational and Shopping Conscious
<--> Impulsiveness/Careless
.035 .021 1.641 .101
Recreational and Shopping Conscious
<--> Confused by Overchoice
.052 .024 2.181 .029
Habitual/Brand Loyal
<--> Recreational and Shopping Conscious
.086 .026 3.303 .000
Price Conscious/Value for money
<--> Impulsiveness/Careless .099 .022 4.550 .000
Price Conscious/Value for money
<--> Confused by Overchoice .065 .024 2.733 .006
Habitual/Brand Loyal <--> Price Conscious/Value for money
.013 .026 .509 .611
Impulsiveness/Careless <--> Confused by Overchoice .339 .030 11.441 .000
Habitual/Brand Loyal <--> Impulsiveness/Careless .147 .025 5.941 .000
Habitual/Brand Loyal <--> Confused by Overchoice .254 .028 9.070 .000