Theory of Constraints Case Study in the Make-to-Order ...
14
Journal of Industrial Engineering and Management JIEM, 2021 – 14(1): 72-85 – Online ISSN: 2013-0953 – Print ISSN: 2013-8423 https://doi.org/10.3926/jiem.3283 Theory of Constraints Case Study in the Make-to-Order Environment Aitor Orue , Aitor Lizarralde , Itxaso Amorrotu , Unai Apaolaza Mondragon Unibertsitatea (Spain) [email protected], [email protected], [email protected], [email protected] Received: July 2020 Accepted: November 2020 Abstract: Purpose: The theory of constraints (TOC) drum-buffer-rope methodology is appropriate when managing a production plant in complex environments, such as make-to-order (MTO) scenarios. However, some difficulties have been detected in implementing this methodology in such changing environments. This case study analyses a MTO company to identify the key factors that influence the execution of the third step of TOC. It also aims to evaluate in more depth the research started by Lizarralde et al. (2020) and compare the results with the existing literature. Design/methodology/approach: The case study approach is selected as a research methodology because of the need to investigate a current phenomenon in a real environment. Findings: In the case study analysed, the protective capacity of non-bottleneck resources is found to the key factor when subordinating the MTO system to a bottleneck (BN). Furthermore, it coincides with one of the two key factors defined by the literature, namely protective capacity and protective inventory. Originality/value: The three key contributions of this study focus on the MTO environment as follows. The first is about identifying the key factors in subordinating the system to the BN (step 3, TOC) according to the existing literature which have been identified through a systematic literature review. The second focuses on identifying the key factors in subordinating the system to the BN through a case study. Finally, the last contribution compares the results obtained in the case study with those obtained in the literature review. Keywords: MTO, TOC, DBR, five focusing steps; protective capacity To cite this article: Orue, A., Lizarralde, A., Amorrotu, I., & Apaolaza, U. (2021). Theory of Constraints Case Study in the Make-to- Order Environment. Journal of Industrial Engineering and Management, 14(1), 72-85. https://doi.org/10.3926/jiem.3283 1. Introduction In today’s globalised environment, existing market competition has driven many companies to migrate from a make-to-stock (MTS) to a make-to-order (MTO) system, which exhibits continual growth in the number of catalogue references and reduced serial batch (De la Calle, Grus & Álvarez, 2017). In this context, MTO companies lead to non-standard product routing on the shop floor with longer lead times than MTS companies (Stevenson, Hendry & Kingsman, 2005). Accordingly, production planning and control systems (PPCSs) have become key elements in managing material flow in production plants (Jaegler, Jaegler, Burlat, Lamouri & Trentesaux, 2018). -72-
-
Upload
khangminh22 -
Category
Documents
-
view
4 -
download
0
Transcript of Theory of Constraints Case Study in the Make-to-Order ...
Journal of Industrial Engineering and ManagementJIEM, 2021 – 14(1): 72-85 – Online ISSN: 2013-0953 – Print ISSN: 2013-8423
https://doi.org/10.3926/jiem.3283
Theory of Constraints Case Study in the Make-to-Order Environment
Aitor Orue , Aitor Lizarralde , Itxaso Amorrotu , Unai Apaolaza
Mondragon Unibertsitatea (Spain)
[email protected], [email protected], [email protected], [email protected]
Received: July 2020Accepted: November 2020
Abstract:
Purpose: The theory of constraints (TOC) drum-buffer-rope methodology is appropriate when managinga production plant in complex environments, such as make-to-order (MTO) scenarios. However, somedifficulties have been detected in implementing this methodology in such changing environments. Thiscase study analyses a MTO company to identify the key factors that influence the execution of the thirdstep of TOC. It also aims to evaluate in more depth the research started by Lizarralde et al. (2020) andcompare the results with the existing literature.
Design/methodology/approach: The case study approach is selected as a research methodologybecause of the need to investigate a current phenomenon in a real environment.
Findings: In the case study analysed, the protective capacity of non-bottleneck resources is found to thekey factor when subordinating the MTO system to a bottleneck (BN). Furthermore, it coincides with oneof the two key factors defined by the literature, namely protective capacity and protective inventory.
Originality/value: The three key contributions of this study focus on the MTO environment as follows.The first is about identifying the key factors in subordinating the system to the BN (step 3, TOC)according to the existing literature which have been identified through a systematic literature review. Thesecond focuses on identifying the key factors in subordinating the system to the BN through a case study.Finally, the last contribution compares the results obtained in the case study with those obtained in theliterature review.
Keywords: MTO, TOC, DBR, five focusing steps; protective capacity
To cite this article:
Orue, A., Lizarralde, A., Amorrotu, I., & Apaolaza, U. (2021). Theory of Constraints Case Study in the Make-to-Order Environment. Journal of Industrial Engineering and Management, 14(1), 72-85. https://doi.org/10.3926/jiem.3283
1. IntroductionIn today’s globalised environment, existing market competition has driven many companies to migrate from amake-to-stock (MTS) to a make-to-order (MTO) system, which exhibits continual growth in the number ofcatalogue references and reduced serial batch (De la Calle, Grus & Álvarez, 2017). In this context, MTO companieslead to non-standard product routing on the shop floor with longer lead times than MTS companies (Stevenson,Hendry & Kingsman, 2005). Accordingly, production planning and control systems (PPCSs) have become keyelements in managing material flow in production plants (Jaegler, Jaegler, Burlat, Lamouri & Trentesaux, 2018).
-72-
Journal of Industrial Engineering and Management – https://doi.org/10.3926/jiem.3283
Several studies have focused on the drum-buffer-rope (DBR) methodology in MTO environments. Theory ofconstraints (TOC)-DBR has proved to be a valid methodology for responding to the problems of MTOenvironments (Chakravorty, 2001; Darlington, Francis, Found & Thomas, 2015; Modi, Lowalekar & Bhatta, 2019;Riezebos, Korte & Land, 2003). However, other studies have detected difficulties in implementing TOC-DBR(Atwater & Chakravorty, 2002; Pretorius, 2014; Wu & Yeh, 2006). To overcome these issues, Lizarralde, Apaolaza andMediavilla (2020) developed a systematic decision-making process to apply DBR in MTO scenarios by proposing achange in the first two steps of TOC methodology. The present research analyses the DBR implementation carriedout by Lizarralde et al. (2020); the objective is to identify the key factors of the implementation on the third TOC stepand compare the results with the existing literature to advance the proposed systematic decision-making process.
This article begins with a literature review in Section 2, where the existing literature on TOC-DBR methodology inMTO companies is analysed with a focus on implementation problems. In Section 3, a systematic review of theliterature in the mentioned field is carried out, taking into account that the research will focus on the identificationof the key factors when implementing the third step of TOC-DBR. In Section 4, the objectives of the article andthe research question (RQ) are defined. Afterwards, in Section 5, the selected research methodology is presentedthrough a case study. The discussion continues in Section 6 with the analysis of the case study, the participation ofthe researchers and the results obtained. In Section 7, the degree to which the research objectives are achieved isanalysed. Finally, the conclusions and future lines of research are presented in Section 8.
2. Literature ReviewTOC is a management methodology based on systems thinking (Boyd & Gupta, 2004). Its main idea is that everysystem has at least one constraint that limits its performance. This constraint is taken as the basis for managing andimproving the system (Goldratt & Cox, 2004). According to Goldratt and Cox (2004), a constraint or bottleneck(BN) is anything that limits a system from achieving higher performance versus its goal.
The five steps of TOC are as follows: (1) identify the system’s BNs, (2) decide how to exploit the BNs, (3)subordinate everything else to the above decision, (4) elevate the system’s BNs and (5) if a BN has been broken in aprevious step, return to Step 1.
The TOC scheduling mechanism, DBR, is a PPCS in shops with BNs, and it addresses both market and physicalconstraints (Thürer, Stevenson, Silva & Qu, 2017). To control the whole system, only accuracy in the BN isrequired, so DBR is a simple approach to carry out (Gupta & Snyder, 2009). Once the restriction is identified, DBRsynchronises the production with the customer’s needs through the rope. It connects the work input with the BN(Thürer et al., 2017). The BN programme is scheduled according to the company’s sales portfolio, and theprogramme criteria are previously defined in the system-exploiting step. Finally, DBR uses drum and shippingbuffers (time or amount of time equivalent to work in progress (WIP)) to allow synchronisation and, at the sametime, protect the system’s performance from variability with low levels of WIP (Thürer et al., 2017). Generally, non-BN resources are not programmed because each operation is governed by the consumption of the buffer (Goldratt& Cox, 2004).
Several studies validated the TOC-DBR methodology for a MTO environment by demonstrating its beneficialeffect on workflow performance through reduced lead times and cycle times and increased revenue (Chakravorty,2001; Darlington et al., 2015; Modi et al., 2019; Riezebos et al., 2003). However, other studies showed thedifficulties in implementing the TOC-DBR methodology in this changing environment. Atwater and Chakravorty(2002) defined several issues, such as quantifying the additional capacity of non-BN resources and the appropriateidentification of the BN, by considering that real environments represent temporary situations and are not realistic.By contrast, Wu and Yeh (2006) analysed the complexity of implementing the DBR methodology in complexmanufacturing environments, focusing on BN re-entry flows and the importance of BN resource sequencing.Finally, Pretorius (2014) identified the shortcomings for decision making that facilitates moving from one step tothe next, in addition to the lack of clarity around the ideal location of constraints.
Several researchers have worked on a series of alternatives to solve the problems raised in the previous section.Pretorius (2014) proposed a decision map that included the five steps of the TOC methodology; the map defined a
-73-
Journal of Industrial Engineering and Management – https://doi.org/10.3926/jiem.3283
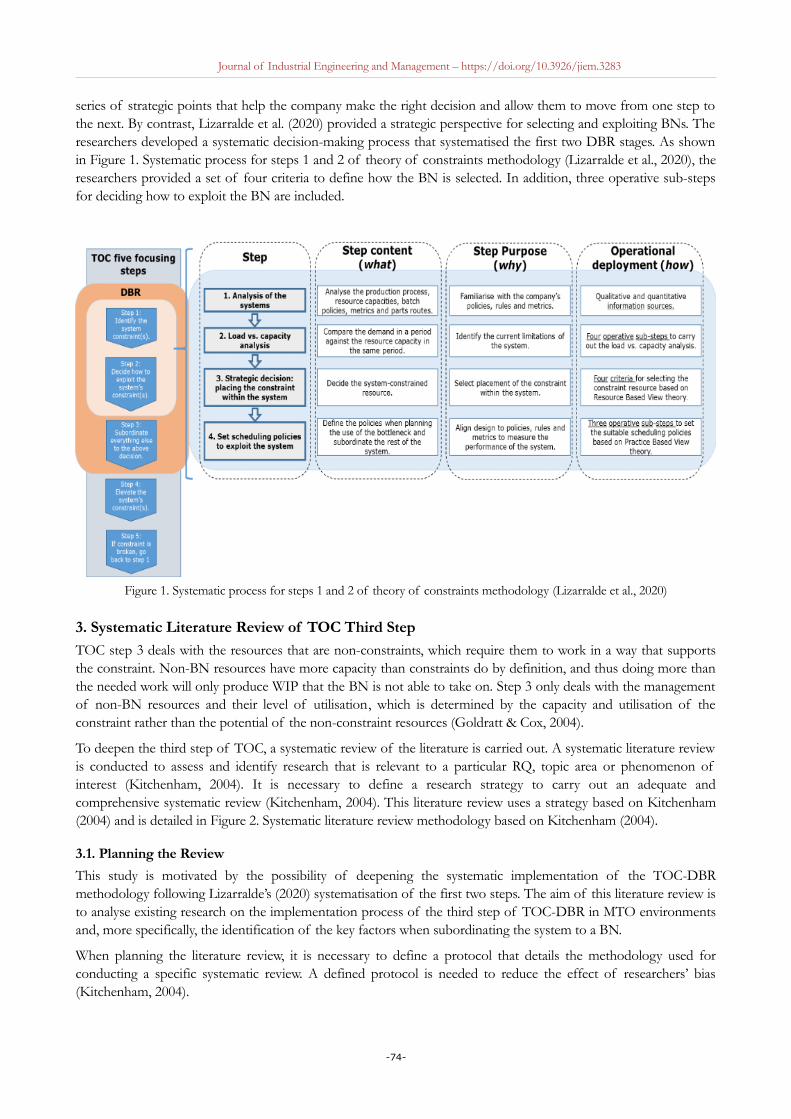
series of strategic points that help the company make the right decision and allow them to move from one step tothe next. By contrast, Lizarralde et al. (2020) provided a strategic perspective for selecting and exploiting BNs. Theresearchers developed a systematic decision-making process that systematised the first two DBR stages. As shownin Figure 1. Systematic process for steps 1 and 2 of theory of constraints methodology (Lizarralde et al., 2020), theresearchers provided a set of four criteria to define how the BN is selected. In addition, three operative sub-stepsfor deciding how to exploit the BN are included.
Figure 1. Systematic process for steps 1 and 2 of theory of constraints methodology (Lizarralde et al., 2020)
3. Systematic Literature Review of TOC Third Step
TOC step 3 deals with the resources that are non-constraints, which require them to work in a way that supportsthe constraint. Non-BN resources have more capacity than constraints do by definition, and thus doing more thanthe needed work will only produce WIP that the BN is not able to take on. Step 3 only deals with the managementof non-BN resources and their level of utilisation, which is determined by the capacity and utilisation of theconstraint rather than the potential of the non-constraint resources (Goldratt & Cox, 2004).
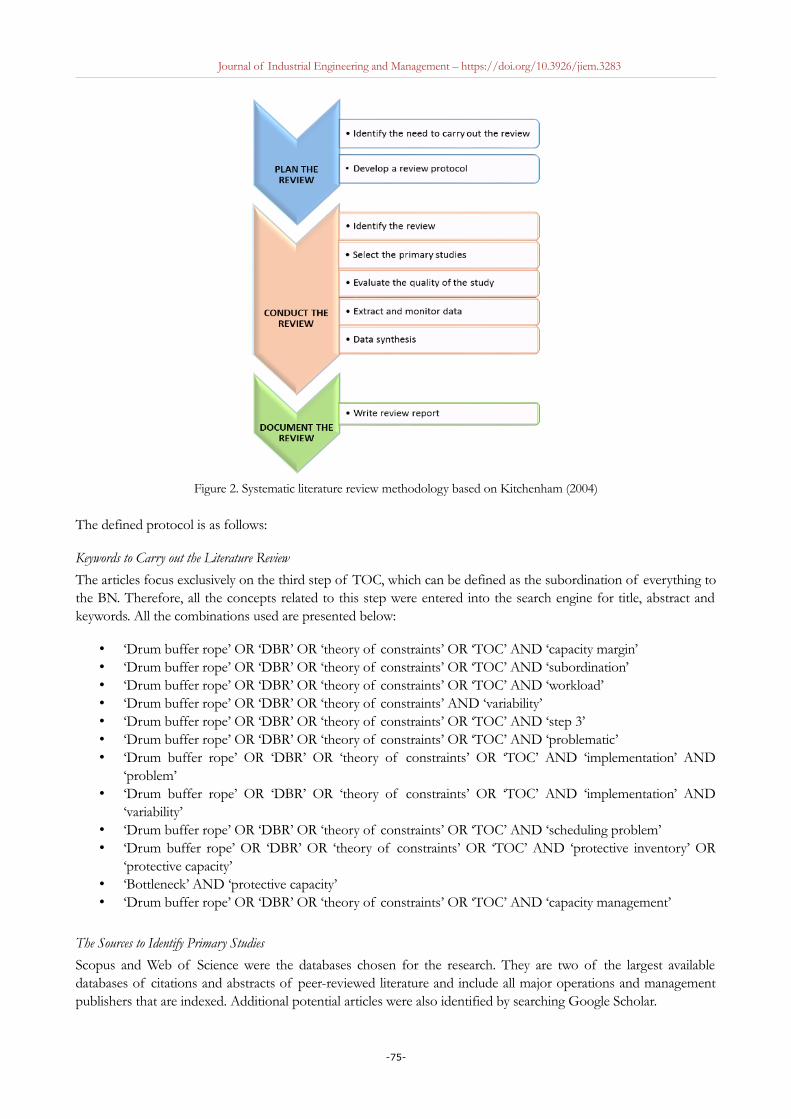
To deepen the third step of TOC, a systematic review of the literature is carried out. A systematic literature reviewis conducted to assess and identify research that is relevant to a particular RQ, topic area or phenomenon ofinterest (Kitchenham, 2004). It is necessary to define a research strategy to carry out an adequate andcomprehensive systematic review (Kitchenham, 2004). This literature review uses a strategy based on Kitchenham(2004) and is detailed in Figure 2. Systematic literature review methodology based on Kitchenham (2004).
3.1. Planning the Review
This study is motivated by the possibility of deepening the systematic implementation of the TOC-DBRmethodology following Lizarralde’s (2020) systematisation of the first two steps. The aim of this literature review isto analyse existing research on the implementation process of the third step of TOC-DBR in MTO environmentsand, more specifically, the identification of the key factors when subordinating the system to a BN.
When planning the literature review, it is necessary to define a protocol that details the methodology used forconducting a specific systematic review. A defined protocol is needed to reduce the effect of researchers’ bias(Kitchenham, 2004).
-74-
Journal of Industrial Engineering and Management – https://doi.org/10.3926/jiem.3283
Figure 2. Systematic literature review methodology based on Kitchenham (2004)
The defined protocol is as follows:
Keywords to Carry out the Literature Review
The articles focus exclusively on the third step of TOC, which can be defined as the subordination of everything tothe BN. Therefore, all the concepts related to this step were entered into the search engine for title, abstract andkeywords. All the combinations used are presented below:
• ‘Drum buffer rope’ OR ‘DBR’ OR ‘theory of constraints’ OR ‘TOC’ AND ‘capacity margin’• ‘Drum buffer rope’ OR ‘DBR’ OR ‘theory of constraints’ OR ‘TOC’ AND ‘subordination’• ‘Drum buffer rope’ OR ‘DBR’ OR ‘theory of constraints’ OR ‘TOC’ AND ‘workload’• ‘Drum buffer rope’ OR ‘DBR’ OR ‘theory of constraints’ AND ‘variability’• ‘Drum buffer rope’ OR ‘DBR’ OR ‘theory of constraints’ OR ‘TOC’ AND ‘step 3’• ‘Drum buffer rope’ OR ‘DBR’ OR ‘theory of constraints’ OR ‘TOC’ AND ‘problematic’• ‘Drum buffer rope’ OR ‘DBR’ OR ‘theory of constraints’ OR ‘TOC’ AND ‘implementation’ AND
‘problem’• ‘Drum buffer rope’ OR ‘DBR’ OR ‘theory of constraints’ OR ‘TOC’ AND ‘implementation’ AND
‘variability’• ‘Drum buffer rope’ OR ‘DBR’ OR ‘theory of constraints’ OR ‘TOC’ AND ‘scheduling problem’• ‘Drum buffer rope’ OR ‘DBR’ OR ‘theory of constraints’ OR ‘TOC’ AND ‘protective inventory’ OR
‘protective capacity’• ‘Bottleneck’ AND ‘protective capacity’• ‘Drum buffer rope’ OR ‘DBR’ OR ‘theory of constraints’ OR ‘TOC’ AND ‘capacity management’
The Sources to Identify Primary Studies
Scopus and Web of Science were the databases chosen for the research. They are two of the largest availabledatabases of citations and abstracts of peer-reviewed literature and include all major operations and managementpublishers that are indexed. Additional potential articles were also identified by searching Google Scholar.
-75-
Journal of Industrial Engineering and Management – https://doi.org/10.3926/jiem.3283
Select the Exclusion and Inclusion Criteria for the Studies
The criteria used to select, analyse and evaluate the articles were as follows: (1) exclusive focus on the third step ofTOC; (2) publication in an academic journal or conference; (3) included case studies, both simulated and real;(4) inclusion of no other methodology; and (5) exclusion of articles written for a final bachelor or master's degree.
Period of Publication
The delimited publication period was from 1990 to 2020. The year 1990 was chosen as the beginning of thepublication period because it denotes when the TOC-DBR methodology began to attract the attention of severalkey authors. The year 2020 was defined as the end date of publications to maximise the number of studies with asmany updates as possible.
Study Quality Assessment
Both quantitative and qualitative documents were considered for this research. The indicators used to evaluate thequality of the selected journals were the Journal Citation Report and SCImago Journal Rank.
3.2. Conduct the Review
An unbiased search strategy was defined to find as many primary studies related to the third step of the TOCmethodology as possible.
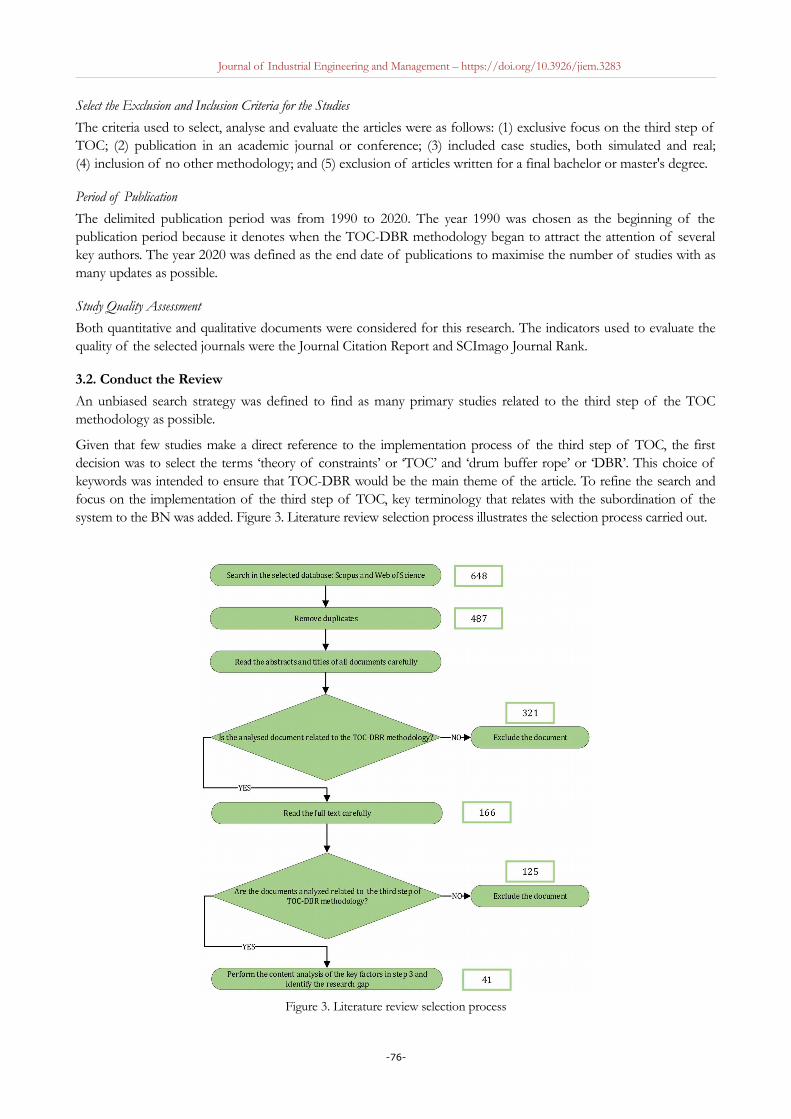
Given that few studies make a direct reference to the implementation process of the third step of TOC, the firstdecision was to select the terms ‘theory of constraints’ or ‘TOC’ and ‘drum buffer rope’ or ‘DBR’. This choice ofkeywords was intended to ensure that TOC-DBR would be the main theme of the article. To refine the search andfocus on the implementation of the third step of TOC, key terminology that relates with the subordination of thesystem to the BN was added. Figure 3. Literature review selection process illustrates the selection process carried out.
Figure 3. Literature review selection process
-76-
Journal of Industrial Engineering and Management – https://doi.org/10.3926/jiem.3283
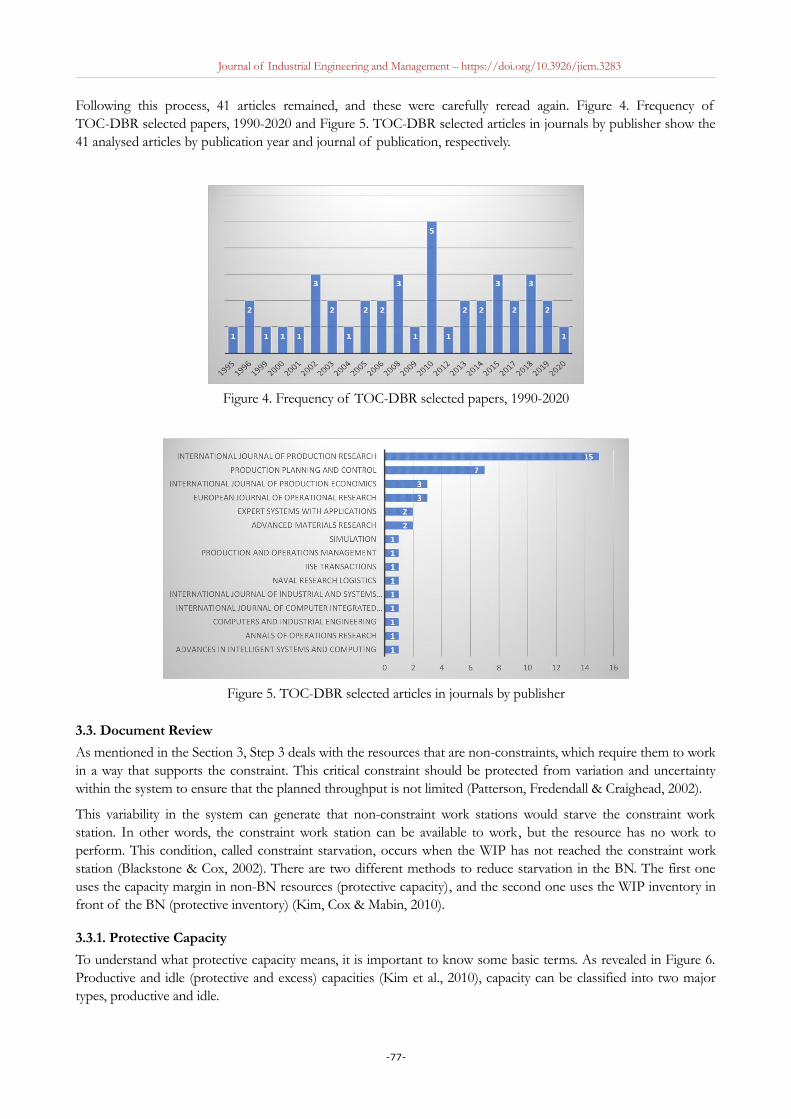
Following this process, 41 articles remained, and these were carefully reread again. Figure 4. Frequency ofTOC-DBR selected papers, 1990-2020 and Figure 5. TOC-DBR selected articles in journals by publisher show the41 analysed articles by publication year and journal of publication, respectively.
Figure 4. Frequency of TOC-DBR selected papers, 1990-2020
Figure 5. TOC-DBR selected articles in journals by publisher
3.3. Document Review
As mentioned in the Section 3, Step 3 deals with the resources that are non-constraints, which require them to workin a way that supports the constraint. This critical constraint should be protected from variation and uncertaintywithin the system to ensure that the planned throughput is not limited (Patterson, Fredendall & Craighead, 2002).
This variability in the system can generate that non-constraint work stations would starve the constraint workstation. In other words, the constraint work station can be available to work, but the resource has no work toperform. This condition, called constraint starvation, occurs when the WIP has not reached the constraint workstation (Blackstone & Cox, 2002). There are two different methods to reduce starvation in the BN. The first oneuses the capacity margin in non-BN resources (protective capacity), and the second one uses the WIP inventory infront of the BN (protective inventory) (Kim, Cox & Mabin, 2010).
3.3.1. Protective Capacity
To understand what protective capacity means, it is important to know some basic terms. As revealed in Figure 6.Productive and idle (protective and excess) capacities (Kim et al., 2010), capacity can be classified into two majortypes, productive and idle.
-77-
Journal of Industrial Engineering and Management – https://doi.org/10.3926/jiem.3283
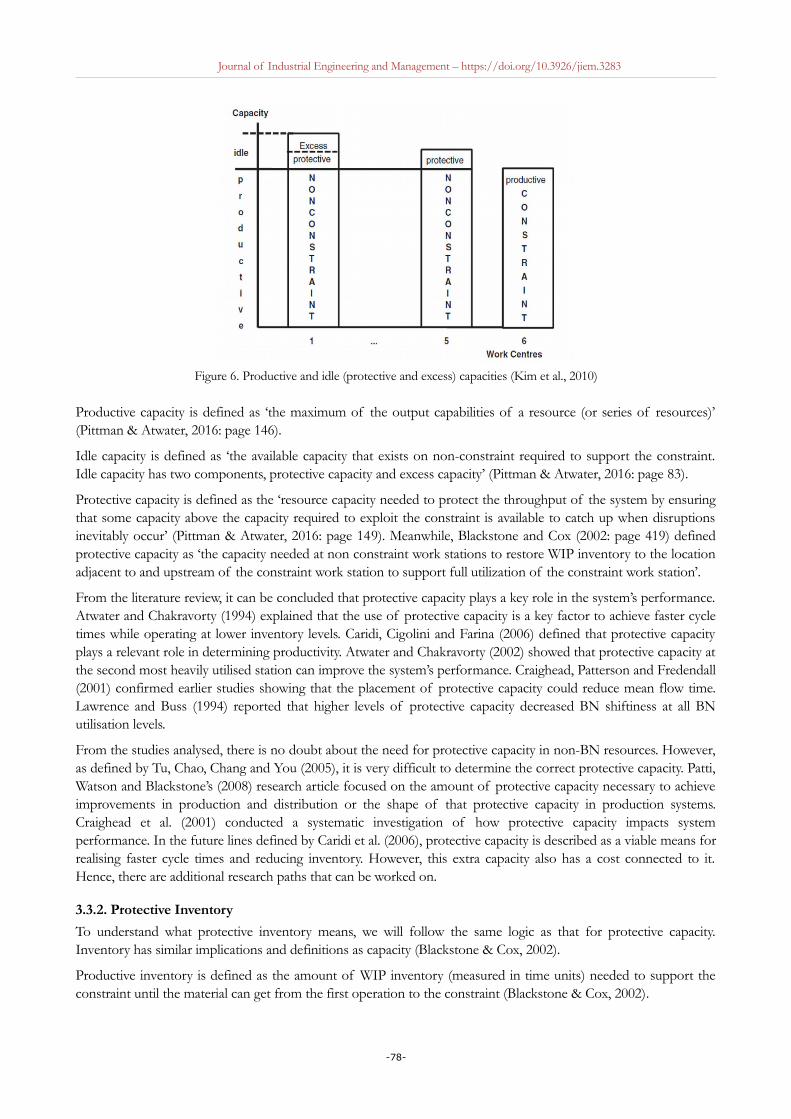
Figure 6. Productive and idle (protective and excess) capacities (Kim et al., 2010)
Productive capacity is defined as ‘the maximum of the output capabilities of a resource (or series of resources)’(Pittman & Atwater, 2016: page 146).
Idle capacity is defined as ‘the available capacity that exists on non-constraint required to support the constraint.Idle capacity has two components, protective capacity and excess capacity’ (Pittman & Atwater, 2016: page 83).
Protective capacity is defined as the ‘resource capacity needed to protect the throughput of the system by ensuringthat some capacity above the capacity required to exploit the constraint is available to catch up when disruptionsinevitably occur’ (Pittman & Atwater, 2016: page 149). Meanwhile, Blackstone and Cox (2002: page 419) definedprotective capacity as ‘the capacity needed at non constraint work stations to restore WIP inventory to the locationadjacent to and upstream of the constraint work station to support full utilization of the constraint work station’.
From the literature review, it can be concluded that protective capacity plays a key role in the system’s performance.Atwater and Chakravorty (1994) explained that the use of protective capacity is a key factor to achieve faster cycletimes while operating at lower inventory levels. Caridi, Cigolini and Farina (2006) defined that protective capacityplays a relevant role in determining productivity. Atwater and Chakravorty (2002) showed that protective capacity atthe second most heavily utilised station can improve the system’s performance. Craighead, Patterson and Fredendall(2001) confirmed earlier studies showing that the placement of protective capacity could reduce mean flow time.Lawrence and Buss (1994) reported that higher levels of protective capacity decreased BN shiftiness at all BNutilisation levels.
From the studies analysed, there is no doubt about the need for protective capacity in non-BN resources. However,as defined by Tu, Chao, Chang and You (2005), it is very difficult to determine the correct protective capacity. Patti,Watson and Blackstone’s (2008) research article focused on the amount of protective capacity necessary to achieveimprovements in production and distribution or the shape of that protective capacity in production systems.Craighead et al. (2001) conducted a systematic investigation of how protective capacity impacts systemperformance. In the future lines defined by Caridi et al. (2006), protective capacity is described as a viable means forrealising faster cycle times and reducing inventory. However, this extra capacity also has a cost connected to it.Hence, there are additional research paths that can be worked on.
3.3.2. Protective Inventory
To understand what protective inventory means, we will follow the same logic as that for protective capacity.Inventory has similar implications and definitions as capacity (Blackstone & Cox, 2002).
Productive inventory is defined as the amount of WIP inventory (measured in time units) needed to support theconstraint until the material can get from the first operation to the constraint (Blackstone & Cox, 2002).
-78-
Journal of Industrial Engineering and Management – https://doi.org/10.3926/jiem.3283
‘From a theory of constraints perspective, idle inventory generally consists of protective inventory and excessinventory’ (Pittman & Atwater, 2016: page 83).
Protective inventory is defined as ‘the amount of inventory required relative to protective capacity in the system toachieve a specific throughput rate at the constraint’ (Pittman & Atwater, 2016: page 149).
Protective inventory has similar concerns as protective capacity. Several studies talk about the need for protectiveinventory to protect the throughput from variability. Blackstone and Cox (2002) spoke about the amount ofprotective WIP that is used to reduce the impact of statistical fluctuation at the non-constraint work stations on theconstraint work station and system throughput. Betterton and Cox (2009: page 68) indicated that ‘for real lines,protective inventory at any point in time, is inventory upstream of the constraint over and above the deterministicproductive number of units. It is WIP inventory that the constraint needs for uninterrupted operation in a non-deterministic system’.
There are certain formulas that aim to calculate the productive inventory needed in the system to maximise thethroughput. For example, Schragenheim and Ronen (1990) described a process for setting these buffers, whichstarts by simply dividing the current lead-time allowance of the company in half and using one portion as theconstraint buffer and one portion as the shipping buffer. Managers can use this approach to determine initial buffersizes and make adjustments over time until optimal buffer sizes are identified.
However, as indicated by Blackstone and Cox (2002), there is no mathematical approach for defining protectiveinventory (or protective capacity). Although an adequate level of protection is needed to reduce the impact ofstatistical fluctuations in the system, the difficulty comes in defining the ‘adequate’ protective inventory (Blackstone& Cox, 2002). As the risk of excess inventory is the increase in WIP and the addition to the production lead time,the minimum levels of protective inventory should therefore be identified (Khalil, Stockton & Fresco, 2008).
From the comprehensive literature review analysis, it can clearly be concluded that the levels of protective capacityand protective inventory play key roles against variability. These protection levels will determine the cycle time andthroughput of the system.
Nevertheless, as Blackstone and Cox (2002) stated in their conclusions, there is no mathematical approach fordefining protective inventory and protective capacity. In addition, it is not clear where protective capacity should beplaced.
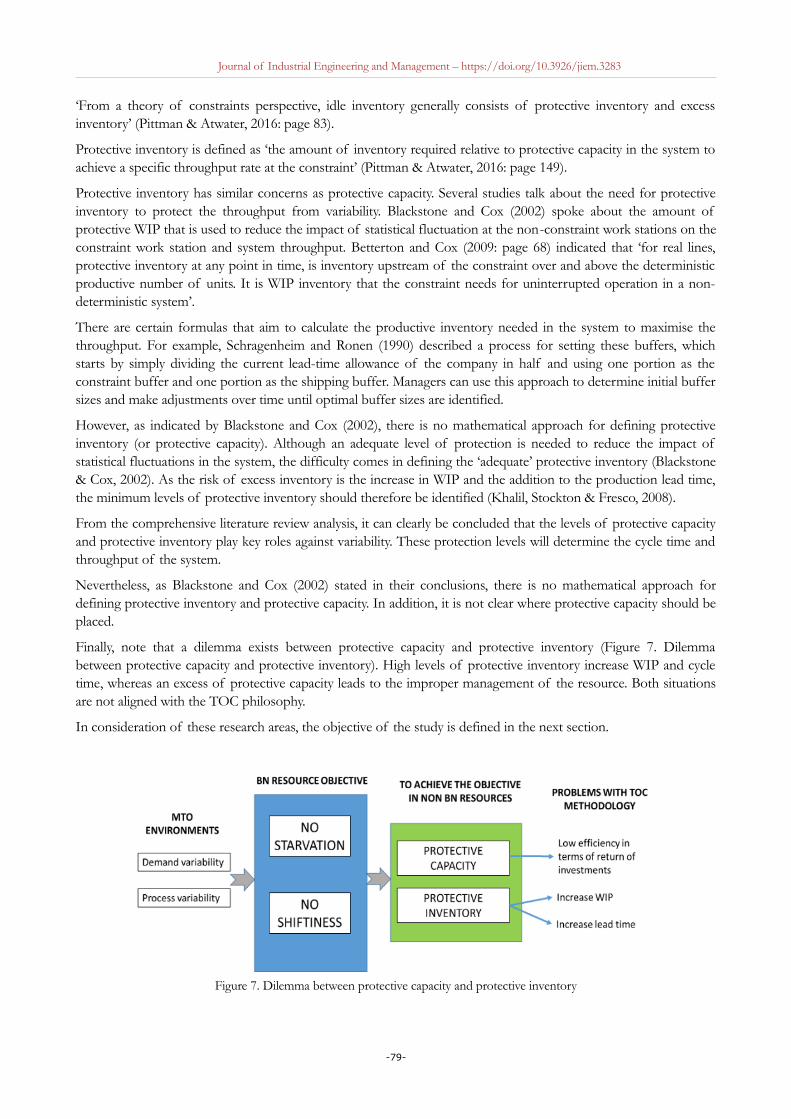
Finally, note that a dilemma exists between protective capacity and protective inventory (Figure 7. Dilemmabetween protective capacity and protective inventory). High levels of protective inventory increase WIP and cycletime, whereas an excess of protective capacity leads to the improper management of the resource. Both situationsare not aligned with the TOC philosophy.
In consideration of these research areas, the objective of the study is defined in the next section.
Figure 7. Dilemma between protective capacity and protective inventory
-79-
Journal of Industrial Engineering and Management – https://doi.org/10.3926/jiem.3283
4. Objective
The aim of this study is to identify the key factors in subordinating the system to the BN (step 3, TOC) in MTOenvironments. Specifically, it expands on the work carried out by Lizarralde et al. (2020) and compares the resultingkey factors with the existing literature. To this end, a case is analysed to try to address the following researchquestion (RQ):
RQ: What are the key factors that influence the subordination of the third step of TOC to enhance operative performance in the DBRimplementation in MTO environments?
Operative performance can be measured in different ways. In this case, the three priority indicators of the casestudy company are used:
1. On time delivery2. Manufacturing lead time3. Inventory level
5. Research Methodology
The case study approach was selected as a research methodology because of the need to investigate a currentphenomenon in a real environment. A case study provides rich knowledge about the specific context to beinvestigated (Yin, 2018). The research methodology used in this case study is based on an exploratory anddescriptive approach, following a qualitative research strategy (Robson, 2002). The unit of analysis to beinvestigated was a single case study of a company, where the implementation of TOC was analysed, with a focuson the third step of the methodology. Information was collected through semi-structured interviews with the mainagents carrying out the implementation (Yin, 2018).
6. Case Analysis6.1. Previous Work: DBR Implementation Process
The case study company where Lizarralde et al. (2020) implemented the DBR process is a leader in thehigh-precision machining market. Located in the Basque Country (Spain), it specialises in providing customisedsolutions to its customers who are spread throughout the world (e.g. vacuum chambers, complex structures,pressure vessels). Its manufacturing assets include different technologies, such as cutting, shot blasting, pickling andpassivating, press forming, welding, painting and machining. Lizarralde et al. (2020) considered this case to be avaluable study because it represented a real MTO company. Two types of manufacturing scenarios exist amongstMTO environments: repeat business customizers and versatile manufacturing companies (VMCs) (Amaro, Hendry& Kingsman, 1999). The case study company can be defined as a VMC. It is organised in a functional way (jobshop) and has a high complexity of management due to the casuistry of its material flows.
Lizarralde et al. (2020) found that the planning process was focused on maximising the performance andproduction of all sections with a local vision. Therefore, each section developed a weekly production plan based onproduction orders with the objective of ‘hours worked per day’. This approach resulted in the company havingproblems in meeting the expectations of timely delivery to the customer, even though the management teamthought the existing capacity was large enough to complete the work according to the due dates. To solve thisproblem, the TOC-DBR methodology evolution developed by Lizarralde within his line of research was applied(Lizarralde, 2020; Lizarralde, Apaolaza & Mediavilla, 2019; Lizarralde et al., 2020). This methodology evolutionincluded a systematic implementation process for the first two steps. First, a system analysis was performed, wherethe manufacturing process, resource capacities, batch policies, metrics and part routes were analysed. Next, a loadversus capacity analysis was conducted. The objective was to compare the demand over a certain period against thecapacity of the resources in the same period. In the next step, a strategic decision was made on where to place therestriction within the system. In this case, it was decided that precision machining was the BN. Finally, schedulingpolicies were defined to exploit the system, specifically, policies about when to plan the use of the BN and thesubordination of the rest of the system.
-80-
Journal of Industrial Engineering and Management – https://doi.org/10.3926/jiem.3283
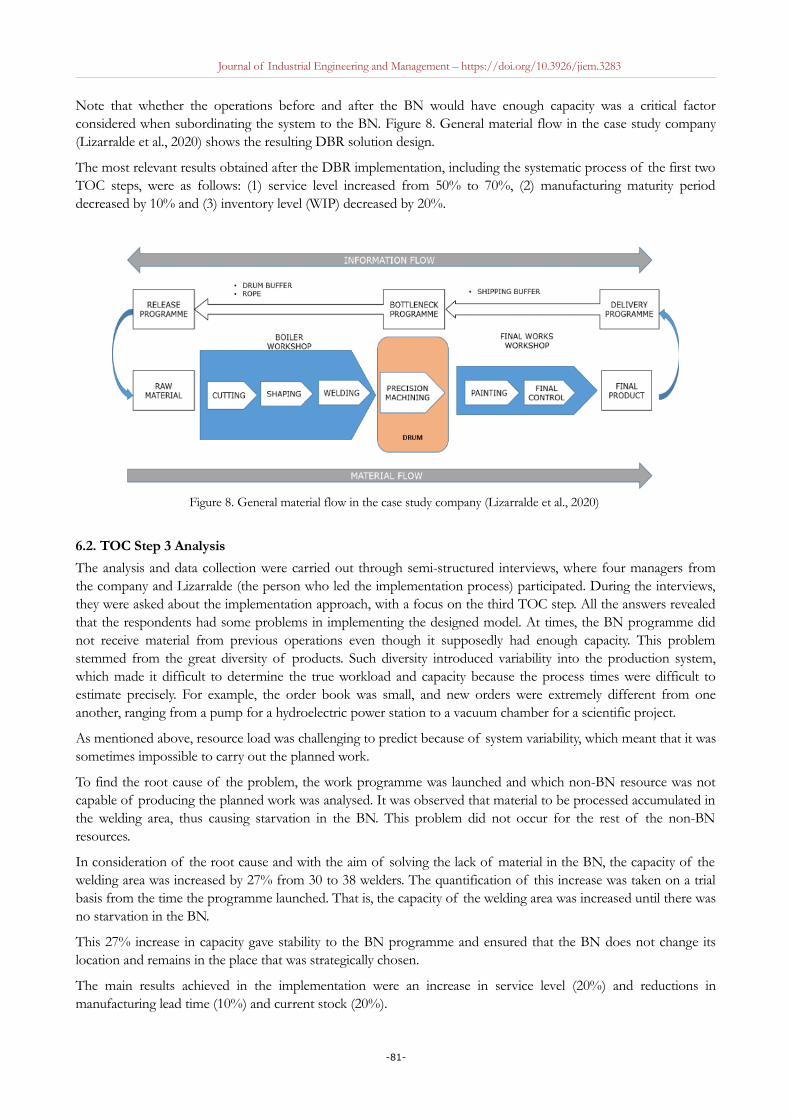
Note that whether the operations before and after the BN would have enough capacity was a critical factorconsidered when subordinating the system to the BN. Figure 8. General material flow in the case study company(Lizarralde et al., 2020) shows the resulting DBR solution design.
The most relevant results obtained after the DBR implementation, including the systematic process of the first twoTOC steps, were as follows: (1) service level increased from 50% to 70%, (2) manufacturing maturity perioddecreased by 10% and (3) inventory level (WIP) decreased by 20%.
Figure 8. General material flow in the case study company (Lizarralde et al., 2020)
6.2. TOC Step 3 Analysis
The analysis and data collection were carried out through semi-structured interviews, where four managers fromthe company and Lizarralde (the person who led the implementation process) participated. During the interviews,they were asked about the implementation approach, with a focus on the third TOC step. All the answers revealedthat the respondents had some problems in implementing the designed model. At times, the BN programme didnot receive material from previous operations even though it supposedly had enough capacity. This problemstemmed from the great diversity of products. Such diversity introduced variability into the production system,which made it difficult to determine the true workload and capacity because the process times were difficult toestimate precisely. For example, the order book was small, and new orders were extremely different from oneanother, ranging from a pump for a hydroelectric power station to a vacuum chamber for a scientific project.
As mentioned above, resource load was challenging to predict because of system variability, which meant that it wassometimes impossible to carry out the planned work.
To find the root cause of the problem, the work programme was launched and which non-BN resource was notcapable of producing the planned work was analysed. It was observed that material to be processed accumulated inthe welding area, thus causing starvation in the BN. This problem did not occur for the rest of the non-BNresources.
In consideration of the root cause and with the aim of solving the lack of material in the BN, the capacity of thewelding area was increased by 27% from 30 to 38 welders. The quantification of this increase was taken on a trialbasis from the time the programme launched. That is, the capacity of the welding area was increased until there wasno starvation in the BN.
This 27% increase in capacity gave stability to the BN programme and ensured that the BN does not change itslocation and remains in the place that was strategically chosen.
The main results achieved in the implementation were an increase in service level (20%) and reductions inmanufacturing lead time (10%) and current stock (20%).
-81-
Journal of Industrial Engineering and Management – https://doi.org/10.3926/jiem.3283
7. Discussion
This section aims to demonstrate that the research objectives were achieved by providing an unambiguous andadequate answer to the RQ. To this end, an overall analysis of the results obtained from the case study presented inthe previous section was carried out.
RQ: What are the key factors that influence the subordination of the third step of TOC to enhance operative performance in the DBRimplementation in MTO environments?
A key factor was identified as follows.
Protective capacity: ensuring a ‘sufficient and necessary’ capacity of non-BN resources.
MTO companies are difficult to manage due to the existing variability. This variability turns out to be higher inVMC-type companies because the demand and workflow casuistry are very complex, which makes it difficult todefine the workload of each resource (Stevenson et al., 2005). For this reason, the system must be protected againstthis variability (Patterson et al., 2002).
This protection of the system is difficult to quantify given that variability in this environment changes according tothe existing demand (Tu et al., 2005). Consequently, the use of protective capacity turns out to be a strategicdecision of the company. Thus, to ensure satisfactory overall performance, the company must have protectionagainst uncertainty at all times. It will likely lead to non-BN resources being idle at times.
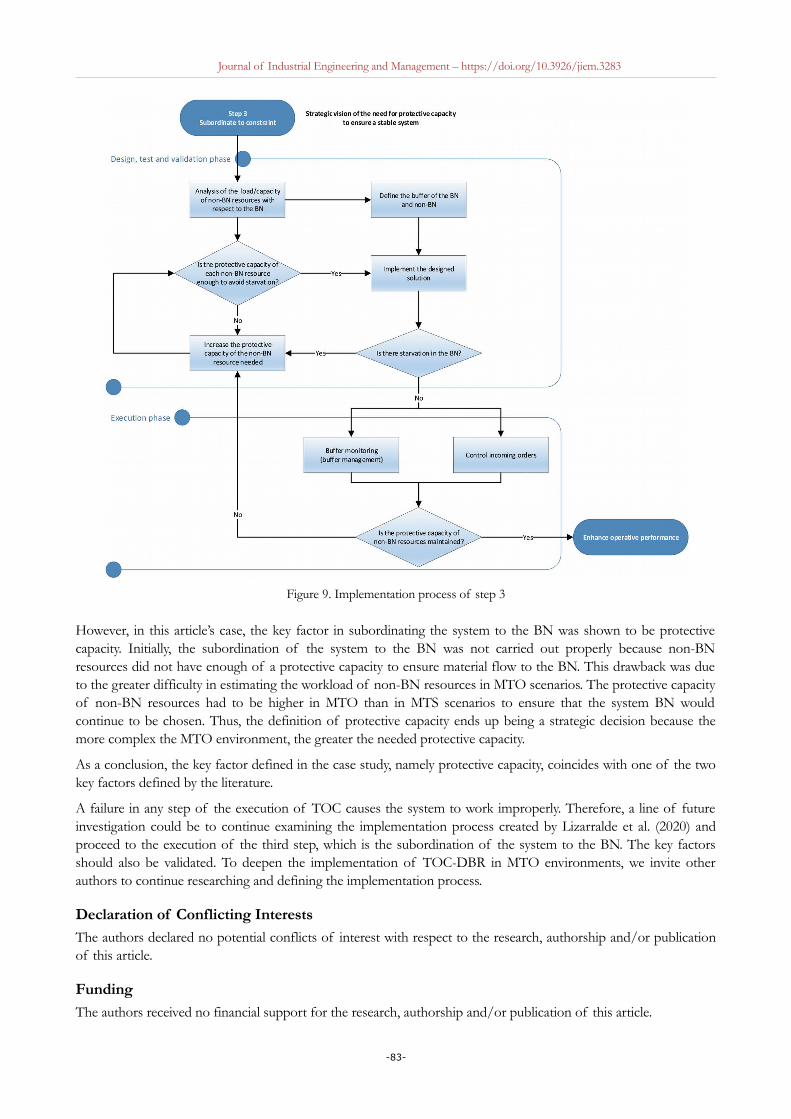
As mentioned above, the quantification of protection is a difficult aspect to define. Consequently, the definition ofan implementation process will help carry it out satisfactorily. This implementation process can be divided into twophases.
In the first phase of design and validation, both the buffers and the protective capacity for non-BN resourcesshould be defined. Then, to ensure that the defined protective capacity is suitable, the designed DBR model mustbe implemented and there should be no starvation in the BN. If there is a lack of material, then protective capacitymust be increased until it becomes sufficient.
The second phase corresponds to the execution phase. Once the system is defined and validated, it must bemonitored and controlled to ensure that the protective capacity remains sufficient over time. To do this, the systemmust control the incoming orders in addition to managing the buffers.
Figure 9. Implementation process of step 3 shows the designed implementation process.
By identifying the key factor and demonstrating the improvement in operative performance, we can state that theresearch objectives were achieved and the RQ was answered.
8. Conclusion and Future ResearchCompanies working in MTO environments have several difficulties in managing production plants because ofmarket uncertainty, that is, they cannot predict demand accurately. For this reason, the appropriate choice of thePPCS is relevant. As presented in this article, several authors have demonstrated that implementing TOC-DBR inMTO environments could provide superior performance and an easy-to-use approach. However, other studies haveshown the problems in implementing the mentioned methodology in this changing environment. To solve theseimplementation problems, authors like Lizarralde et al. (2020) have created a systematic process for the first twoTOC steps. In this article, the TOC-DBR methodology was studied by implementing the mentioned systemicprocess. In conclusion, the implementation of the systematic process of the first two steps is not enough to obtainsatisfactory results. Even if the first two steps of the systematic process are carried out correctly, if the third step isnot correctly analysed and defined, then the result obtained may not be the one expected.
The main contribution of this article is the identification of implications when implementing the third step ofTOC. From the conclusions of the literature review in step 3, the two key factors when implementing the third stepof TOC-DBR are defined, protective capacity and protective inventory.
-82-
Journal of Industrial Engineering and Management – https://doi.org/10.3926/jiem.3283
Figure 9. Implementation process of step 3
However, in this article’s case, the key factor in subordinating the system to the BN was shown to be protectivecapacity. Initially, the subordination of the system to the BN was not carried out properly because non-BNresources did not have enough of a protective capacity to ensure material flow to the BN. This drawback was dueto the greater difficulty in estimating the workload of non-BN resources in MTO scenarios. The protective capacityof non-BN resources had to be higher in MTO than in MTS scenarios to ensure that the system BN wouldcontinue to be chosen. Thus, the definition of protective capacity ends up being a strategic decision because themore complex the MTO environment, the greater the needed protective capacity.
As a conclusion, the key factor defined in the case study, namely protective capacity, coincides with one of the twokey factors defined by the literature.
A failure in any step of the execution of TOC causes the system to work improperly. Therefore, a line of futureinvestigation could be to continue examining the implementation process created by Lizarralde et al. (2020) andproceed to the execution of the third step, which is the subordination of the system to the BN. The key factorsshould also be validated. To deepen the implementation of TOC-DBR in MTO environments, we invite otherauthors to continue researching and defining the implementation process.
Declaration of Conflicting InterestsThe authors declared no potential conflicts of interest with respect to the research, authorship and/or publicationof this article.
Funding
The authors received no financial support for the research, authorship and/or publication of this article.
-83-
Journal of Industrial Engineering and Management – https://doi.org/10.3926/jiem.3283
ReferencesAmaro, G., Hendry, L., & Kingsman, B. (1999). Competitive advantage, customisation and a new taxonomy for non
make-to-stock companies. International Journal of Operations and Production Management, 19(4), 349-371.
Atwater, J.B., & Chakravorty, S.S. (1994). Does protective capacity assist managers in competing along time-based dimensions? Production and Inventory Management Journal, 35(3), 53-59.
Atwater, J.B., & Chakravorty, S.S. (2002). A study of the utilization of capacity constrained resources in drum-buffer-rope systems. Production and Operations Management, 11(2), 259-273. https://doi.org/10.1111/j.1937-5956.2002.tb00495.x
Betterton, C.E., & Cox, J.F. (2009). Espoused drum-buffer-rope flow control in serial lines: A comparative study of simulation models. International Journal of Production Economics, 117(1), 66-79. https://doi.org/10.1016/j.ijpe.2008.08.050
Blackstone, J.H., & Cox, J.F. (2002). Designing unbalanced lines - Understanding protective capacity and protective inventory. Production Planning and Control, 13(4), 416-423. https://doi.org/10.1080/09537280110121091
Boyd, L., & Gupta, M. (2004). Constraints management: What is the theory? International Journal of Operations and Production Management, 24(3-4), 350-371. https://doi.org/10.1108/01443570410524631
Caridi, M., Cigolini, R., & Farina, V. (2006). Designing unbalanced paced lines: A conceptual model and an experimental campaign. Production Planning and Control, 17(5), 464-479. https://doi.org/10.1080/09537280600764394
Chakravorty, S.S. (2001). An evaluation of the DBR control mechanism in a job shop environment. Omega, 29(4), 335-342. https://doi.org/10.1016/S0305-0483(01)00028-7
Craighead, C.W., Patterson, J.W., & Fredendall, L.D. (2001). Protective capacity positioning: Impact on manufacturing cell performance. European Journal of Operational Research, 134(2), 425-438. https://doi.org/10.1016/S0377-2217(00)00266-6
Darlington, J., Francis, M., Found, P., & Thomas, A. (2015). Design and implementation of a drum-buffer-rope pull-system. Production Planning and Control, 26(6), 489-504. https://doi.org/10.1080/09537287.2014.926409
De la Calle, A., Grus, M.E., & Álvarez, E. (2017). Value creation through demand and supply chains: Evidences from Spanish companies. Direccion y Organizacion, 61, 4-11.
Goldratt, E.M., & Cox, J. (2004). The goal. A process of ongoing improvement. (3rd ed.). North River Press. Available at: http://search.ebscohost.com/login.aspx?direct=true&AuthType=shib&db=cat04902a&AN=mon.71968&lang=es&site=eds-live&scope=site&custid=ns106233
Gupta, M.G., & Snyder, D. (2009). Comparing TOC with MRP and JIT: A literature review. International Journal of Production Research, 47(13), 3705-3739. https://doi.org/10.1080/00207540701636322
Jaegler, Y., Jaegler, A., Burlat, P., Lamouri, S., & Trentesaux, D. (2018). The ConWip production control system: A systematic review and classification. International Journal of Production Research, 56(17), 5736-5756. https://doi.org/10.1080/00207543.2017.1380325
Khalil, R.A., Stockton, D.J., & Fresco, J.A. (2008). Managing the effects of variability in drum-buffer-rope systems. International Journal of Industrial and Systems Engineering, 3(1), 53-69. https://doi.org/10.1504/IJISE.2008.015914
Kim, S., Cox, J.F., & Mabin, V.J. (2010). An exploratory study of protective inventory in a re-entrant line with protective capacity. International Journal of Production Research, 48(14), 4153-4178. https://doi.org/10.1080/00207540902991666
Kitchenham, B. (2004). Procedures for Performing Systematic Reviews.
Lawrence, S.R., & Buss, A.H. (1994). Shifting Production Bottlenecks: Causes, Cures, and Conundrums. Production and Operations Management, 3(1), 21-37. https://doi.org/10.1111/j.1937-5956.1994.tb00107.x
Lizarralde, A. (2020). Application of TOC-DBR to make-to-order manufacturing contexts: systematic process for bottleneck identification and explotation based on action research. Mondragon Unibertsitatea.
-84-
Journal of Industrial Engineering and Management – https://doi.org/10.3926/jiem.3283
Lizarralde, A., Apaolaza, U., & Mediavilla, M. (2019). Perspectivas prácticas desde la industria para la identificación del cuello de botella en fábricas “make-to-order”: ¿una decisión estratégica u operativa? Dyna (Spain), 94(1), 507-511. https://doi.org/10.6036/9070
Lizarralde, A., Apaolaza, U., & Mediavilla, M. (2020). A strategic approach for bottleneck identification in make-to-order environments : A drum-buffer-rope action research based case study. Journal of Industrial Engineering and Management, 13(1), 18-37.
Modi, K., Lowalekar, H., & Bhatta, N.M.K. (2019). Revolutionizing supply chain management the theory of constraints way: A case study. International Journal of Production Research, 57(11), 3335-3361. https://doi.org/10.1080/00207543.2018.1523579
Patterson, J.W., Fredendall, L.D., & Craighead, C.W. (2002). The impact of non-bottleneck variation in a manufacturing cell. Production Planning and Control, 13(1), 76-85. https://doi.org/10.1080/0953728011006372
Patti, A.L., Watson, K., & Blackstone, J.H. (2008). The shape of protective capacity in unbalanced production systems with unplanned machine downtime. Production Planning and Control, 19(5), 486-494. https://doi.org/10.1080/09537280802088733
Pittman, P.H., & Atwater, J.B. (2016). APICS dictionary (15th ed.). APICS.
Pretorius, P. (2014). Introducing in-between decision points to TOC ’ s five focusing steps. International Journal of Production Research, November, 37-41. https://doi.org/10.1080/00207543.2013.836612
Riezebos, J., Korte, G.J., & Land, M.J. (2003). Improving a practical DBR buffering approach using Workload Control. International Journal of Production Research, 41(4), 699-712. https://doi.org/10.1080/0020754031000065485
Robson, C. (2002). Real world research: A resource for social scientists and practitioner-researchers. Blackwell Publishing. https://doi.org/10.1016/j.jclinepi.2010.08.001
Schragenheim, E., & Ronen, B. (1990). Drum-buffer-rope shop floor control. Production and Inventory Management Journal, 31(3), 18-22.
Stevenson, M., Hendry, L.C., & Kingsman, B.G. (2005). A review of production planning and control: The applicability of key concepts to the make-to-order industry. International Journal of Production Research, 43(5), 869-898. https://doi.org/10.1080/0020754042000298520
Thürer, M., Stevenson, M., Silva, C., & Qu, T. (2017). Drum-buffer-rope and workload control in high-variety flow and job shops with bottlenecks: An assessment by simulation. International Journal of Production Economics, 188(April), 116-127. https://doi.org/10.1016/j.ijpe.2017.03.025
Tu, Y M., Chao, Y.H., Chang, S.H., & You, H.C. (2005). Model to determine the backup capacity of a wafer foundry. International Journal of Production Research, 43(2), 339-359. https://doi.org/10.1080/0020754042000264554
Wu, H.H., & Yeh, M.L. (2006). A DBR scheduling method for manufacturing environments with bottleneck re-entrant flows. International Journal of Production Research, 44(5), 883-902. https://doi.org/10.1080/00207540500362187
Yin, R.K. (2018). Case study research and applications. Design and methods. (6th ed.). Sage. Available at: http://search.ebscohost.com/login.aspx?direct=true&AuthType=shib&db=cat04902a&AN=mon.148034&lang=es&site=eds-live&scope=site&custid=ns106233
Journal of Industrial Engineering and Management, 2021 (www.jiem.org)
Article’s contents are provided on an Attribution-Non Commercial 4.0 Creative commons International License. Readers areallowed to copy, distribute and communicate article’s contents, provided the author’s and Journal of Industrial Engineering andManagement’s names are included. It must not be used for commercial purposes. To see the complete license contents, please
visit https://creativecommons.org/licenses/by-nc/4.0/.
-85-