
The Water-Energy Nexus: Challenges and Opportunities
258
-
Upload
khangminh22 -
Category
Documents
-
view
2 -
download
0
Transcript of The Water-Energy Nexus: Challenges and Opportunities


U.S. Department of Energy
The Water-Energy Nexus: Challenges and Opportunities JUNE 2014

THIS PAGE INTENTIONALLY BLANK

Table of Contents Foreword ................................................................................................................................................................... i Acknowledgements ............................................................................................................................................. iii Executive Summary.............................................................................................................................................. v
Chapter 1. Introduction ...................................................................................................................................... 1
1.1 Background ................................................................................................................................................. 1
1.2 DOE’s Motivation and Role .................................................................................................................... 3
1.3 The DOE Approach ................................................................................................................................... 4
1.4 Opportunities ............................................................................................................................................. 4
References ........................................................................................................................................................... 6
Chapter 2. Interconnected Water and Energy Systems ......................................................................... 7
2.1 Characteristics and Properties of Water .......................................................................................... 7
2.2 Interconnected Energy and Water Flows ........................................................................................ 9
2.3 Regional and Temporal Variability in Water Accessibility .................................................... 19
2.4 Linkages between the Fuels Life Cycle and Water Quality .................................................... 22
2.5 Challenges and Opportunities ........................................................................................................... 25
References ........................................................................................................................................................ 26
Chapter 3. Implications of Climate Change and Other Trends ......................................................... 29
3.1 Changes in Temperature and Precipitation ................................................................................. 29
3.2 Water Variability .................................................................................................................................... 33
3.3 The Future of Electricity Generation .............................................................................................. 34
3.4 The Future of Hydropower ................................................................................................................ 42
3.5 The Future of Oil and Gas Exploration and Production .......................................................... 45
3.6 The Future of Biofuels .......................................................................................................................... 46
3.7 Challenges and Opportunities ........................................................................................................... 47
References ........................................................................................................................................................ 49
Chapter 4: Decision-Making Landscape .................................................................................................... 51
4.1 Framework for Energy Decision Making ...................................................................................... 51
4.2 Framework for Water Decision Making ........................................................................................ 54
4.3 Sector-Specific Energy-Water Landscape for Decision Making ........................................... 61
4.4 Role of States in Energy-Water Nexus ........................................................................................... 73
4.5 State and Federal Water and Wastewater Facilities ................................................................ 74
4.6 International Comparison of Case Studies ................................................................................... 76
4.7 Challenges and Opportunities ........................................................................................................... 85
References ........................................................................................................................................................ 87
Chapter 5. Technology Research, Development, Demonstration, and Deployment Challenges and Opportunities ....................................................................................................................... 95
5.1 Water for Energy .................................................................................................................................... 96
5.2 Energy For (and From) Water ........................................................................................................ 108
5.3 Sensing, Data Collection, and Information Management ...................................................... 119
5.4 Energy/Water Systems Integration .............................................................................................. 126

5.5 Technology Deployment, Risk Reduction, and Scale-Up ...................................................... 129
5.7 Summary and Conclusion ................................................................................................................. 132
References ...................................................................................................................................................... 133
Chapter 6. Data, Modeling, and Analysis ................................................................................................. 147
6.1 Introduction ........................................................................................................................................... 148
6.2 User/Societal Needs: Modeling, Analysis, and Actionable Science ................................... 149
6.3 Current Capabilities ............................................................................................................................ 154
6.4 Priorities for Modeling and Analysis ............................................................................................ 178
6.5 Summary ................................................................................................................................................. 195
References ...................................................................................................................................................... 198
Chapter 7. Future Opportunities ................................................................................................................ 204
7.1 Technology RDD&D............................................................................................................................. 204
7.2 Analysis and Modeling ....................................................................................................................... 206
7.3 Data ........................................................................................................................................................... 207
7.4 Policy Framework ................................................................................................................................ 208
7.5 Stakeholder Engagement .................................................................................................................. 208
7.6 International Diplomacy ................................................................................................................... 209
7.7 Conclusion .............................................................................................................................................. 209
Appendix A. Sankey Diagram Details and Assumptions ................................................................... 210
A.1 Energy Sources ..................................................................................................................................... 211
A.2 Water Sources ....................................................................................................................................... 216
A.3 End Use Sectors and Distribution.................................................................................................. 219
A.3 Energy Efficiency ................................................................................................................................. 226
A.4 Water Efficiency and Discharge ..................................................................................................... 227
References ...................................................................................................................................................... 229
Appendix B. U.S. Department of Energy Research Funding Opportunity Announcements Relevant to the Water-Energy Nexus ....................................................................................................... 231
B.1 Advanced Research Projects Agency-Energy ........................................................................... 231
B.2 Office of Electricity Delivery and Energy Reliability .............................................................. 231
B.3 Office of Fossil Energy........................................................................................................................ 232
B.4 Research Partnership to Secure Energy for America ............................................................ 232
B.5 Small Business Innovation Research Program ........................................................................ 233
B.6 EERE ......................................................................................................................................................... 233
References ...................................................................................................................................................... 237

i
Foreword Water resource scarcity, variability, and uncertainty are becoming more prominent both domestically and
internationally. Because energy and water are interdependent, the availability and predictability of water
resources can directly affect energy systems. We cannot assume the future is like the past in terms of
climate, technology, and the evolving decision landscape. These issues present important challenges to
address.
While many federal agencies are engaged in the water-energy nexus, the U.S. Department of Energy
(DOE) can play an important role by bringing more science, technology, and analytical capability to the
water-energy nexus, drawing on expertise in research and development (R&D) programs, and engaging
the strengths of the national labs. In addition, many issues surrounding the water-energy nexus affect
assets owned and operated by private sector entities; development of public-private partnerships can help
leverage DOE capacity.
This Water-Energy Nexus: Challenges and Opportunities report builds on the Department‘s previous
work in this area and provides a foundation for future DOE action in response to the challenges before us.
This report presents extensive data and analysis to frame the opportunities. This report is also intended to
encourage others to engage in a dialogue and work together to address the challenges. Systematically and
proactively addressing the water-energy nexus will help us all ensure a reliable and sustainable energy
system.
Ernest J. Moniz

ii
THIS PAGE INTENTIONALLY BLANK

iii
Acknowledgements This report was drafted by the U.S. Department of Energy‘s Water-Energy Technology Team, under the
direction of Diana Bauer, Office of Energy Policy and Systems Analysis (EPSA). Additional principal
authors were Mark Philbrick (EPSA) and Bob Vallario (Office of Science). Lead contributing authors
were Hoyt Battey, Zachary Clement, Fletcher Fields, and Jennifer Li. Jonathan Pershing and Michael
Knotek provided crucial guidance to the team. Substantial contributions were made by a team of experts
throughout the Department, particularly Jay Hnilo, Renu Joseph, Dorothy Koch, and David Lesmes of the
Office of Biological and Environmental Research in the Office of Science; Caitlin Callaghan of the Office
of Electricity Delivery and Energy Reliability; Lucas Adin, Arlene Andersen, Scott Hutchins, Kristen
Johnson, Jeni Keisman, Tim Reinhardt, Bhima Sastri, Devanand Shenoy, and Greg Stillman of the Office
of Energy Efficiency and Renewable Energy; Tom Leckey and Glen McGrath of the Energy Information
Administration; Robert Anderson, Kevin Easley, David Schoeberlein, Peter Whitman, and Craig Zamuda
of the Office of Energy Policy and Systems Analysis; Regis Conrad, Richard Dennis, Christopher Freitas,
and John Litynski of the Office of Fossil Energy; Steve Reeves of the Office of Nuclear Energy; and Sam
Baldwin of the Office of the Undersecretary of Science and Energy. Lauren Barlow of Swarthmore
College and Margaret Cook of the University of Texas provided analytical support. Noel Bakhtian and
Kristen Honey of the Office of Energy Efficiency and Renewable Energy provided invaluable content
editing. The Department‘s National Laboratories, including Ames, Argonne, Brookhaven, Idaho,
Lawrence Berkeley, Lawrence Livermore, Los Alamos, Pacific Northwest, Sandia, Savannah River, and
the National Energy Technology Laboratory, offered extensive substantive comments. Multiple agencies
and departments provided helpful input, including the Army Corps of Engineers, Department of Interior,
Department of Justice, Environmental Protection Agency, Nuclear Regulatory Commission, and
Department of Agriculture. The team gives special thanks to Holmes Hummel and Colin McCormick for
their leadership of the Water-Energy Technology Team. Energetics Incorporated provided additional
editing services.

iv
THIS PAGE INTENTIONALLY BLANK

The Water-Energy Nexus: Challenges and Opportunities June 2014
v
Executive Summary Present day water and energy systems are tightly intertwined. Water is used in all phases of energy
production and electricity generation. Energy is required to extract, convey, and deliver water of
appropriate quality for diverse human uses, and then again to treat wastewaters prior to their return to the
environment. Historically, interactions between energy and water have been considered on a regional or
technology-by-technology basis. At the national and international levels, energy and water systems have
been developed, managed, and regulated independently.
Recent developments have focused national attention on the connections between water and energy
infrastructure. For example, when severe drought affected more than a third of the United States in 2012,
limited water availability constrained the operation of some power plants and other energy production
activities. Hurricane Sandy demonstrated that vital water infrastructure can be impaired when it loses
power. The recent boom in domestic unconventional oil and gas development brought on by hydraulic
fracturing and horizontal drilling has added complexity to the national dialogue about the relationship
between energy and water resources.
Several current trends are further increasing the urgency to address the water-energy nexus in an
integrated and proactive way. First, climate change has already begun to affect precipitation and
temperature patterns across the United States. Second, U.S. population growth and regional migration
trends indicate that the population in arid areas such as the Southwest is likely to continue to increase,
further complicating the management of both energy and water systems. Third, introduction of new
technologies in the energy and the water domains could shift water and energy demands. Finally,
developments in policies addressing water rights and water impacts of energy production are introducing
additional incentives and challenges for decision making.
These trends may present challenges, but they also present opportunities. An integrated, strategic
approach can guide technology research and development (R&D) to address regional water-energy issues
and also have impact at the national and global scale. Enhancing and integrating data and models will
better inform researchers, decision makers, and the public.
This nexus report frames an integrated challenge and opportunity space around the water-energy nexus. It
explains and strengthens the logical structure underpinning the Department of Energy (DOE)‘s long-
standing technology and modeling R&D, and lays the foundation for potential future efforts. The report
is also intended as an invitation for collaboration to DOE‘s many current and potential partners in the
water-energy arena. Many other federal agencies also have important roles and activities at the water-
energy nexus, as do regional, state, tribal, and local authorities. Other important organizations include
private companies, national non-governmental organizations (NGOs), international governments,
universities, and municipal facilities.
Activities discussed in this report are subject to future evaluation to determine the priority, appropriate
agency (private, state, local, or federal) and appropriate share of any cost or responsibilities. Many
federal agencies have missions related to topics and activities discussed in this report and if adopted in
future budgets, such activities could reside at federal agencies other than DOE.

June 2014 The Water-Energy Nexus: Challenges and Opportunities
vi
Motivation and Objectives
The water-energy nexus is integral to two policy priorities for DOE: climate change and energy security.
DOE‘s program offices have addressed relevant aspects of the water-energy nexus for many years;
however, this work has historically been organized on a program-by-program basis, where water has been
considered among a number of other factors. Historically, there has been inadequate attention to the
opportunities to share related R&D and modeling activities across programs. To address this gap, DOE
initiated a department-wide Water-Energy Tech Team (WETT) in the fall of 2012. The team‘s initial
objectives were to increase cohesion within DOE and strengthen outreach to other agencies and key
external stakeholders in this space. WETT developed this nexus report to provide an analytical basis
from which to address these objectives and to provide direction for next steps. WETT‘s preliminary
analysis has led to six guiding strategic pillars:
Optimize the freshwater efficiency of energy production, electricity generation, and end use systems
Optimize the energy efficiency of water management, treatment, distribution, and end use systems
Enhance the reliability and resilience of energy and water systems
Increase safe and productive use of nontraditional water sources
Promote responsible energy operations with respect to water quality, ecosystem, and seismic impacts
Exploit productive synergies among water and energy systems
The report is divided into three parts: 1. Chapters One through Four address motivation and lay out the
dimensions of the water-energy nexus, including physical interconnectivity, future trends, and decision-
making landscape; 2. Chapters Five and Six focus on challenges and opportunities in technology and
modeling R&D; and 3. Chapter Seven highlights future opportunities.
The Water-Energy Nexus
Flows of energy and water are intrinsically interconnected, in large part due to the characteristics and
properties of water that make it so useful for producing energy and the energy requirements to treat and
distribute water for human use. This interconnectivity is illustrated in the Sankey Diagram in Figure
ES.1, which captures the magnitude of energy and water flows in the United States on a national scale.
As shown in the diagram, thermoelectric power generation withdraws large quantities of water for
cooling1 and dissipates tremendous quantities of primary energy due to inefficiencies in converting
thermal energy to electricity. The intensity of water use and energy dissipated varies with generation and
cooling technology.
As the largest single consumer of water, agriculture competes directly with the energy sector for water
resources. However, agriculture also contributes indirectly to the energy sector via production of
biofuels. Both connections will be strained by increasing concerns over water availability and quality. In
addition, water treatment and distribution for drinking water supply and municipal wastewater also
require energy.
Significant aspects of water and energy flows do not appear in Figure ES.1. First, flows will change over
time, and anticipated changes in flows are important to consider when prioritizing investment in
technology and other solutions. Increased deployment of some energy technologies in the future, such as
1 ―Withdrawal‖ designates any water diverted from a surface or groundwater source. ―Consumed water‖ designates
withdrawn water that is not returned to its source (e.g., because it has evaporated, been transpired by plants, or
incorporated into products).

The Water-Energy Nexus: Challenges and Opportunities June 2014
vii
carbon capture and sequestration, could lead to increases in the energy system‘s water intensity, whereas
deployment of other technologies, such as wind and solar photovoltaics could lower it. In addition, there
is significant regional variability in the water and energy systems, their interactions, and resulting
vulnerabilities. For example, producing oil and natural gas through horizontal drilling and hydraulic
fracturing has the potential for localized water quantity and quality impacts that can be mitigated through
fluid lifecycle management. Large volumes of water produced from oil and gas operations in general
present both localized management challenges and potential opportunities for beneficial reuse. The
energy requirements for water systems also have regional variability, based on the quality of water
sources and pumping needs.
Figure ES.1. Hybrid Sankey diagram of 2011 U.S. interconnected water and energy flows. Source: See Appendix A for data sources and calculations
Water availability will affect the future of the water-energy nexus. While there is significant uncertainty
regarding the magnitude of effects, water availability and predictability may be altered by changing
temperatures, shifting precipitation patterns, increasing variability, and more extreme weather. Shifts in
precipitation and temperature patterns—including changes in snowmelt—will likely lead to more regional
variation in water availability for hydropower, biofeedstock production, thermoelectric generation and
other energy needs. Rising temperatures have the potential to increase the demand for electricity for
cooling and decrease the efficiency of thermoelectric generation, as well as increase water consumption
for agricultural crops and domestic use. These changes and variations pose challenges for energy
infrastructure resilience.

June 2014 The Water-Energy Nexus: Challenges and Opportunities
viii
Water and energy needs will also be shaped by population growth and migration patterns, as well as
changes in fuels used and energy technologies deployed. For example, projected population growth in the
arid Southwest will amplify pressure on water and energy systems in that region. Increased production of
oil and gas may increase both localized demand for water and generation of produced water that requires
management. According to Energy Information Administration (EIA) data, planned retirements and
additions of electricity generation units and cooling systems will likely decrease water withdrawals,
increase water consumption, and increase the diversity of water sources used. While many of the forces
affecting the water-energy nexus are out of the federal government‘s direct control, the future of the
nexus hinges on a number of factors that are within the DOE‘s scope of influence, including technology
options, location of energy activities, and energy mix.
The decision-making landscape for the nexus is shaped by political, regulatory, economic, environmental,
and social factors, as well as available technologies. The landscape is fragmented, complex, and
changing; the incentive structures are overlapping but not necessarily consistent. Water is inherently a
multi-jurisdictional management issue and is primarily a state and local responsibility. States and
localities vary in philosophies regarding water rights. There is also variation across states in relevant
energy policies, including renewable portfolio standards, regulation of oil and gas development activities,
and regulation of thermoelectric water intake and discharge. Regulations for both oil and gas
development and thermoelectric water use are currently undergoing substantial change. Energy for water
is also the subject of policy activity at multiple scales, from appliance standards2 to municipal water
treatment funding mechanisms. A more integrated approach to the interconnected energy and water
challenges could stimulate the development and deployment of solutions that address objectives in both
domains.
The water-energy nexus policy challenges are not unique to the United States; many other nations are
addressing the nexus based on their own circumstances. China is coal-rich but water-poor in some
regions, and is adopting direct and indirect measures to reduce water intensity in coal-fired power
generation. Qatar is a hydrocarbon rich but water poor country that is increasingly relying on desalinated
water for drinking, and is employing renewable power and waste heat to power desalination facilities.
Technology RDD&D
There are a number of technologies that support water-efficient energy systems or energy-efficient water
systems. These technologies are at various stages of research, development, demonstration, and
deployment. Figure ES.2 illustrates a range of technologies optimizing water use for energy in waste heat
recovery, cooling, alternate fluids, and process water efficiency.
2 Appliance standards addressing water use can decrease the amount of energy required to move and/or heat the
water.
The Water-Energy Nexus: Challenges and Opportunities June 2014
ix
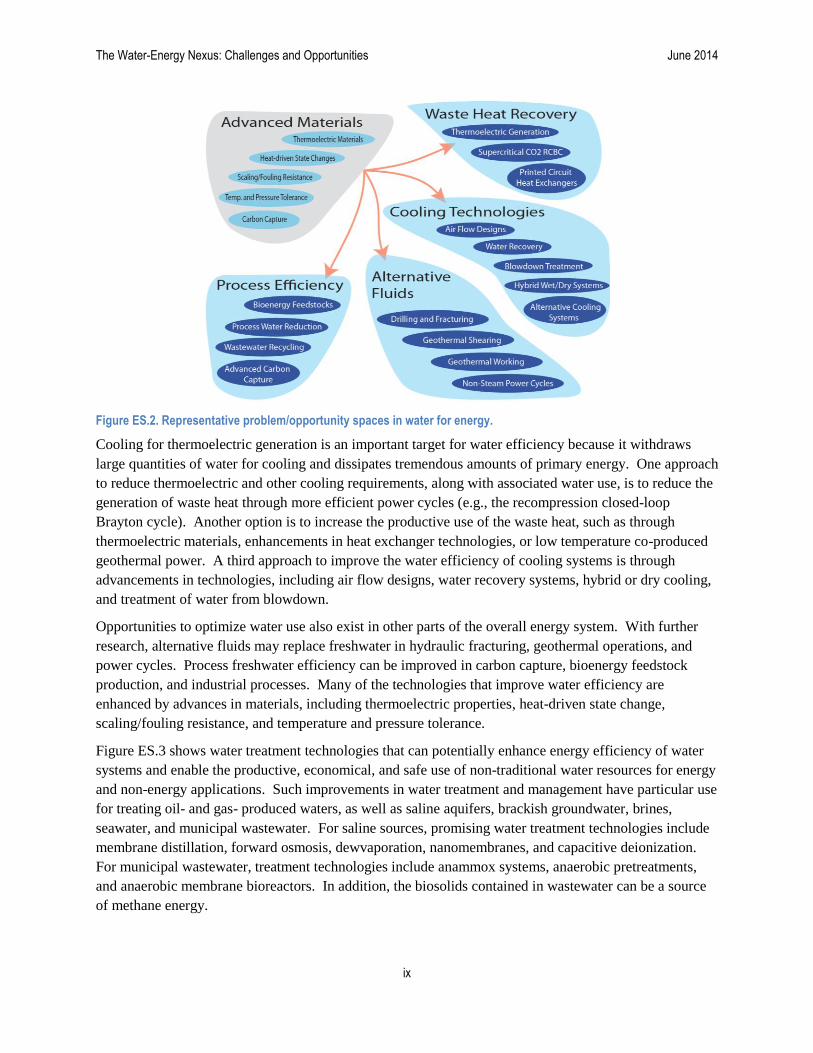
Figure ES.2. Representative problem/opportunity spaces in water for energy.
Cooling for thermoelectric generation is an important target for water efficiency because it withdraws
large quantities of water for cooling and dissipates tremendous amounts of primary energy. One approach
to reduce thermoelectric and other cooling requirements, along with associated water use, is to reduce the
generation of waste heat through more efficient power cycles (e.g., the recompression closed-loop
Brayton cycle). Another option is to increase the productive use of the waste heat, such as through
thermoelectric materials, enhancements in heat exchanger technologies, or low temperature co-produced
geothermal power. A third approach to improve the water efficiency of cooling systems is through
advancements in technologies, including air flow designs, water recovery systems, hybrid or dry cooling,
and treatment of water from blowdown.
Opportunities to optimize water use also exist in other parts of the overall energy system. With further
research, alternative fluids may replace freshwater in hydraulic fracturing, geothermal operations, and
power cycles. Process freshwater efficiency can be improved in carbon capture, bioenergy feedstock
production, and industrial processes. Many of the technologies that improve water efficiency are
enhanced by advances in materials, including thermoelectric properties, heat-driven state change,
scaling/fouling resistance, and temperature and pressure tolerance.
Figure ES.3 shows water treatment technologies that can potentially enhance energy efficiency of water
systems and enable the productive, economical, and safe use of non-traditional water resources for energy
and non-energy applications. Such improvements in water treatment and management have particular use
for treating oil- and gas- produced waters, as well as saline aquifers, brackish groundwater, brines,
seawater, and municipal wastewater. For saline sources, promising water treatment technologies include
membrane distillation, forward osmosis, dewvaporation, nanomembranes, and capacitive deionization.
For municipal wastewater, treatment technologies include anammox systems, anaerobic pretreatments,
and anaerobic membrane bioreactors. In addition, the biosolids contained in wastewater can be a source
of methane energy.

June 2014 The Water-Energy Nexus: Challenges and Opportunities
x
Figure ES.3. Representative problem/opportunity spaces in energy for and from water.
Synergies between water and energy systems offer opportunities to compound benefits of new
technologies. For example, waste heat can be used for desalination and combined heat and power (CHP).
In some cases, water systems can be used for energy storage or electricity demand management. In most
cases the design of these integrated systems requires analysis to characterize the specific economically
and environmentally optimized configurations.
Technology deployment is another important consideration. There are a number of public policy tools
that, if deemed appropriate, can inform and stimulate the adoption of technologies and practices in the
range of markets that have a role in the water-energy nexus. Energy and water utilities, for example, are
characterized by long investment cycles, are subject to a panoply of regulations, and operate under
stringent performance expectations. This combination often constrains operator willingness to undertake
the risks of investing in new technologies. In some cases, loan guarantees and/or public/private
demonstration projects may make such investments more attractive. Consumer markets are largely driven
by price and intangibles, and product lifecycles tend to be shorter. Appliance standards may inform
decision-making in these instances. Business applications such as CHP fall somewhere in between; they
might be well served by opportunities to share best practices and lessons learned.
Data, Modeling, and Analysis
Integrated analysis and modeling of the water-energy nexus requires the simulation of many human and
natural systems and their complex interactions and dynamics. The connection of water and energy to land
is particularly important (Figure ES.4), as are the connections to global and regional climate, technology
options and strategies, and broader aspects of socioeconomic development. The latter includes
population, migration, regional economics, and competing demands for energy, water, and land resources,
to name a few. These simulations necessarily span many temporal and spatial scales; improving the
telescopic capabilities of these interacting systems is a considerable but addressable scientific challenge.

The Water-Energy Nexus: Challenges and Opportunities June 2014
xi
Figure ES.4. Illustration of the significance of land as part of three-way dynamics of E-W-L systems as represented through integrated assessment research. Source: Skaggs et al. 2012
Figure ES.5 illustrates the relation among user/societal needs, current capabilities, and priorities for
modeling and analysis. While DOE and the rest of the federal family have a substantial body of modeling
expertise, there is a need to develop more integrated modeling, data, and information platforms around
use-inspired questions and user driven needs. Ultimately, such work must lead to projections and
scenarios at decision-relevant scales.
Enhanced characterization and communication of uncertainties is also important. In addition, improving
forecasting capacities of extreme events and possible tipping points is needed to inform investment and
siting decisions as well as other potential adaptation options. For DOE, these insights can inform
technology R&D priorities and market evaluation studies. These advances will require integration of
multiple models originally designed for disparate purposes, including the integration of technology-
specific models with larger-scale efforts.
Finally, models require extensive validation with observations and empirical data; the iterative process of
calibration can provide valuable direction to future cycles of both model development and data collection
and, in the end, provision of information in forms that are both accessible and meaningful to a broad
range of users.

June 2014 The Water-Energy Nexus: Challenges and Opportunities
xii
Figure ES.5. Needs, capabilities, and priorities for data modeling and analysis.
Next Steps
The water-energy nexus presents an array of technical and operational challenges at local, regional, and
national scales. DOE can seize the opportunity to meet a key national need for data-driven and empirical
solutions to address these challenges. The next step is for DOE to substantially increase the impact of
ongoing activities by strategically integrating and building on the Department‘s existing technology,
modeling, and data work. Understanding the challenges and developing solutions will necessitate early
engagement with diverse stakeholders, including other federal agencies, state and local governments, and
international partners.
Advances throughout the technology continuum from research through development, demonstration, and
deployment can address key challenges. Potential applications of interest for technology solution cover
several broad areas, including water efficiency in energy systems, energy efficiency in water systems, and
productive use of nontraditional waters. The next step is to conduct a technology research portfolio
analysis, addressing risk, performance targets, potential impacts, R&D pathways, and learning curves. A
strong analysis will highlight potential synergies for technologies that span multiple programs.
Models and analyses are important to inform understanding and decision making across complex coupled
energy and water systems. DOE can direct additional focus on technology models and their integration
into broader multi-scale models addressing energy, water, and land under climate variability and change.
This set of models can form an integrated analytical platform that supports understanding of the current
and potential future interactions among the energy and water systems. The platform can be used to
develop scenarios incorporating factors such as energy technology deployment and climate variability.
The models and scenarios can then inform the technology portfolio analysis described above, as well as

The Water-Energy Nexus: Challenges and Opportunities June 2014
xiii
relevant operations, planning, and other decisions made by stakeholders at scales ranging from facility to
nation and seconds to decades. Characterizing uncertainty and examining extreme events are also
priorities.
There is also an opportunity for DOE and partners to assemble and improve water-energy data related to
energy production and use. For some aspects of the water-energy nexus, considerable data and
information exist, but they are not broadly accessible. Decision making will be improved by integrating
these data into an accessible system designed around the needs of both researchers and users. Other
aspects of the water-energy nexus, such as water quality characteristics of produced waters, suffer from a
lack of consistent and coherent data collection at appropriate levels of granularity. To address these gaps,
DOE can work with other federal agencies and other partners on sensing, surveying, compilation,
analysis, modeling, presentation, and interactive updating of data sets to improve data quality and
usability. This enhanced data system can be used to calibrate the integrated models described above, and
in turn, the models can also be used to inform data collection.
With the importance of water in energy production and the increasing uncertainty of water supply, there is
a growing need for more coherent approach to inform relevant policies. The current water-energy
decision-making landscape is complex and fragmented. The Nation‘s water and energy policies have
been developed independently from one another, and in many cases there are strong regional differences
in policy frameworks and objectives. DOE can build on its modeling and analysis to help illuminate the
key relevant issues brought by the strong interconnections between water and energy systems. In many
cases, these interconnections relate directly to energy system reliability and resilience under changes in
water resources. Reliability and resilience, in turn, align with broad Administration energy policy
initiatives such as the Quadrennial Energy Review and Climate Action Plan. Important work is wide-
ranging, including topics such as the development of metrics describing energy system resilience under
water constraints, analysis of the connections between energy and water efficiency at multiple scales, and
an examination of the impact of infrastructure investment.
Finally, DOE can strengthen its interactions and collaborations with diverse stakeholders. Important
partners span all sectors, including federal agencies, state and local governments, foreign governments,
private industry, academic institutions, NGOs, and citizens. Broad integration and collaboration will
enable more effective research, development, and deployment of key technologies; harmonization of
policies where warranted; shared robust datasets; informed decision making; and public dialogue.

June 2014 The Water-Energy Nexus: Challenges and Opportunities
xiv
THIS PAGE INTENTIONALLY BLANK

The Water-Energy Nexus: Challenges and Opportunities June 2014
1
Chapter 1. Introduction
Water plays a critical role in the generation of electricity and the production of fuels; energy is required to
treat and distribute water. This has been true for many decades, but constraints and vulnerabilities
associated with the water-energy nexus have recently become more prominent, due in part to climate
change. Furthermore, modeling improvements and better system-wide data for weather, climate, and
energy use have led to a more complete understanding of water/energy interdependencies. The inherent
constraints and vulnerabilities present both challenges and opportunities for the energy system.
The water intensity and water impacts of the energy system can be reduced through the development and
deployment of technologies. Data systems and models can improve our understanding of water, energy,
and land interactions now and in the future, and lead to better-informed decision making.
1.1 Background
The nation‘s energy system depends upon water for cooling and other processes. Approximately 40
percent of freshwater withdrawals3 in the United States are used for cooling thermoelectric power plants
(Kenny et al. 2009). Fuel production requires water and can also impact water quality at all points along
its life cycle, including extraction, processing, transportation, and disposal. Some biofeedstocks also rely
on water for irrigation. Just as water is needed to supply energy, energy is required for treatment and
delivery of water for human use.
The water-energy nexus presents many challenges. For thermoelectricity generation, both water quantity
and water temperatures can pose problems. For example, the Millstone Nuclear Power Station in
Connecticut shut down in the summer of 2012 due to high intake water temperatures (Wagman 2013).
Thermoelectric and hydroelectric generation are vulnerable to drought scenarios (Harto and Yan 2011).
The U.S. Environmental Protection Agency (EPA) is currently reviewing and updating its water intake
and effluent regulations for thermoelectric plants, which will further affect decision making.
Produced water from oil and gas production can serve as a water resource; however, there is significant
variation in terms of water quality and quantity within and across plays, complicating management and
treatment. Meanwhile, the production revolution experienced in the U.S. oil and gas sector in recent
years due to the wide application of horizontal drilling and hydraulic fracturing has greatly enhanced
3 ―Withdrawal‖ designates any water diverted from a surface or groundwater source. ―Consumed water‖ designates
withdrawn water that is not returned to its source (e.g., because it has evaporated, been transpired by plants, or
incorporated into products).
Key Messages:
DOE has a long history of working on aspects of the water-energy nexus on a problem-by-problem basis.
Many actors are important to the nexus.
There is a need to analyze the water-energy nexus implications of climate change, changes in energy technology, population pressures, and changes in the policy landscape.
There is an opportunity for technology to address water-energy nexus challenges.
Six pillars provide a foundation for this important work.

June 2014 The Water-Energy Nexus: Challenges and Opportunities
2
domestic energy production. However, the rapid development of shale resources has focused attention on
water use, management, treatment, and disposal. There are also important challenges elsewhere in the
energy-water nexus, including in biofuels, hydropower, and water treatment utilities.
Water issues vary in different regions of the country. The drier Southwest has consistently grappled with
water scarcity for decades, whereas the challenges in the water-abundant Northeast often relate to water
quality and temperature. In some regions, population growth may increase demand for energy and
competing demand for water resources. Climate change impacts such as increased temperatures and
changing precipitation patterns also pose challenges to water availability that could affect operations
across the energy sector.
Changes in the energy system, particularly stemming from the current shift toward higher-efficiency
electricity generation and renewables, will also affect the water-energy nexus. Some renewable energy
sources—such as photovoltaics (PV) and wind energy—require very little water. However, system
interdependencies could lead to unanticipated effects, such as increased reliance on hydropower for
ancillary services to balance intermittent sources. More-efficient thermoelectric generation reduces the
amount of cooling (and therefore water) required. With all other factors being equal, a switch from once-
through cooling to recirculating cooling will reduce withdrawals but increase consumption. Wide-scale
deployment of carbon capture could increase the demand for water to an extent that is dependent on the
technology used.
One additional challenge of the water-energy nexus is the array of decision makers, including state
planners, electric utilities, plant operators, environmental regulators, regional water resource managers,
water utilities, refineries, oil & gas producers, and citizens. While these diverse stakeholders often act
independently and have competing goals, the impacts of their individual decisions are interconnected. In
such a complex, coupled system, identifying and pursuing a collective societal vision is not easy.
A number of recent reports have highlighted different aspects of the water-energy nexus. The National
Research Council highlighted the potential risk to water resources of accelerating biofuels production
(NRC 2008). A significant fraction of U.S. thermoelectric power generation is vulnerable to water
disruption according to the Electric Power Research Institute (EPRI) (EPRI 2011) and the National
Energy Technology Laboratory (NETL) (NETL 2010). Water produced through oil and gas operations is
not well characterized nationally and presents a management challenge (Clark and Veil 2009). According
to DOE, extreme water years will pose challenges for future hydroelectric production (DOE 2013). The
Johnson Foundation has outlined a vision for seeking resilience through interconnection between water
and energy utilities (Johnson Foundation 2013). Several other recent federal climate change reports
highlighted water-energy and water-energy-land interactions (GAO 2009, Skaggs and Hibbard 2012,
Wilbankset al. 2012, DOE 2013); and a recent literature review by Water in the West comprehensively
addressed the nexus (Water in the West 2013).
Meanwhile, the Government Accountability Office (GAO) has issued a series of reports calling for
government action, including improving federal data for power plant water use (GAO 2009), improving
information on water produced during oil and gas production (GAO 2012), and increasing federal
coordination to better manage energy and water tradeoffs (GAO 2012). The American Geophysical
Union (AGU), among other organizations, has also called for government action in areas such as data
management, improved stakeholder coordination, technology investment, modeling tools, infrastructure
financial support, and energy portfolio diversification (AGU 2012).

The Water-Energy Nexus: Challenges and Opportunities June 2014
3
Many federal agencies have a strong role within the research and policy dimensions of the water-energy
nexus, underscoring the importance of a collaborative approach across the federal government. For
example, the Environmental Protection Agency has both a regulatory and a research role related to water
quality in drinking water and waste water treatment, thermoelectric cooling systems, and biofuel
production. The U.S. Department of Agriculture has a strong interest in understanding the effects of
agriculture on water resources and vice versa. Within the U.S. Department of Interior, the U.S. Geological
Survey has responsibility for water-related data and modeling and the Bureau of Reclamation has
responsibility for beneficial use of nontraditional waters. The Army Corps of Engineers is responsible for
managing energy and other uses of waterways. Relevant research throughout the nexus is supported by
the National Science Foundation. The U.S. Department of Homeland Security is responsible for
understanding factors underlying resilience and vulnerability of water and energy infrastructure. The
National Oceanic and Atmospheric Administration and the National Aeronautics and Space
Administration are responsible for both data collection and model development that is relevant to the
nexus.
1.2 DOE’s Motivation and Role
The need to increase understanding and develop solutions across the water-energy nexus aligns with
DOE‘s mission and core competencies. One component of the DOE mission is energy security, and
pursuing energy security requires resilience4 of the energy system. In this case, resilience hinges on
addressing current and potential future vulnerabilities relating to water resource availability and
variability. DOE also has an important role in addressing climate change, which is directly related to
developing strategies for adapting to change in water resources.
Another aspect of the DOE mission is addressing energy challenges through ―transformative science and
technology solutions.‖ DOE offices and laboratories have been engaged for a decade or more in relevant
research and development (R&D) activities that address different aspects of the water-energy nexus. In
the fall of 2012, DOE initiated a Department-wide Water-Energy Tech Team to increase coherence of this
work and strengthen outreach to key external stakeholders.
This report addresses both of these objectives and provides a foundation for increasing the impact of
future work. DOE can contribute to the research and development of technologies that ultimately expand
the array of economic and environmentally sound options for various consumers, ranging from water
treatment plant operators to oil and gas service companies to cooling system installers. In addition, DOE
can play a valuable role by developing a range of analyses and models that contribute to systems
understanding and inform the broad range of decisions made by the various important stakeholders in the
water-energy nexus.
Collaborating with other federal agencies and convening state and local governments, nongovernmental
organizations, and the private sector is also important. Productive interactions can lead to improved data
sets, better technology specification for technology needs, and enhanced policy and decision making that
is informed by modeling insight. DOE can also foster standards development and provide technical
assistance to stimulate technology deployment.
4 Resilience has been defined by the Interagency Climate Change Adaptation Task Force as ―the capacity of a
system to absorb disturbance and still retain its basic function and structure.‖

June 2014 The Water-Energy Nexus: Challenges and Opportunities
4
1.3 The DOE Approach
DOE‘s integrated strategy for addressing challenges across the water-energy nexus rests on six pillars:
Optimize the freshwater efficiency of energy production, electricity generation, and end use systems
Optimize the energy efficiency of water management, treatment, distribution, and end use systems
Enhance the reliability and resilience of energy and water systems
Increase safe and productive use of nontraditional water sources
Promote responsible energy operations with respect to water quality, ecosystem, and seismic impacts
Exploit productive synergies among water and energy systems
The first two pillars are at the core of the water-energy nexus. Reducing the water intensity of the energy
system will require advances in efficiency as well as identification of possible substitutes for fresh water.
Gains in energy efficiency will help reduce the energy intensity of the water system.
The third pillar—enhancing the reliability and resilience of energy and water systems—has its own set of
challenges. An aging energy infrastructure can create vulnerabilities and increase risk, as can climate
change. Whether the solution is high or low tech, building in infrastructure resilience will require careful
consideration of the implications for both energy and water.
The fourth pillar addresses the beneficial use of produced water from oil and gas production, as well as
the productive use of nontraditional water sources (e.g., municipal wastes, seawater, and brackish
groundwater) for energy uses.
The fifth pillar speaks to the connection between energy operations and risks to water quality.
Responsible production can reduce these risks.
The sixth pillar addresses synergies between the water and energy systems, such as using the energy
system‘s waste heat for water distribution and treatment or extracting energy from municipal waste water.
Synergies in the policy dimension also have a role.
1.4 Opportunities
This report aims to frame significant work already underway at DOE in a broader context, and serve as a
foundation for next steps. Abundant opportunities exist to have a positive impact in the water-energy
space. DOE plays a strong role in technology R&D investment and, in general, DOE‘s R&D investments
can ultimately help to increase the range of options available to technology users. Technology R&D
areas to pursue include water treatment, advanced materials, cooling technologies, advanced energy
crops, industrial processes, alternative working fluids, advanced sensors, and water-energy systems
integration.
DOE also has extensive investments in climate and other relevant models. Better integration across this
suite of models can support decision making in the water-energy nexus. Development of enhanced fine-
resolution capabilities, uncertainty characterization, and analysis of extreme events will also be valuable.
Both technology and modeling can be strengthened by more complete and timely data. Better data can
also support general understanding of the evolving water-energy nexus at a range of spatial and temporal
scales.
Sustained engagement on policy at multiple scales can also help increase the impact of DOE‘s work. As
the nation‘s energy system evolves and new infrastructure is deployed, there can be opportunities to

The Water-Energy Nexus: Challenges and Opportunities June 2014
5
incorporate water into energy policy discussions and vice versa. In order to make the most of these
opportunities, communication among multiple actors and stakeholders is essential.
Finally, effectively addressing the water-energy nexus in an integrated fashion requires collaborating with
partners more broadly. Important partners span all sectors—federal agencies, state and local
governments, tribal governments, foreign governments and research institutions, private industry,
academic institutions, nongovernmental organizations, and citizens. Integration and collaboration will
enhance and improve research, development, and deployment of key technologies; harmonize policies
where warranted; facilitate sharing of robust data sets; and inform decision making and public dialogue.
Activities discussed in this report are subject to future evaluation to determine the priority, appropriate
agency (private, state, local, or federal) and appropriate shares of any costs and responsibilities. Many
federal agencies have missions related to topics and activities discussed in this report and if adopted in
future budgets, such activities could reside at federal agencies other than DOE.

June 2014 The Water-Energy Nexus: Challenges and Opportunities
6
References
AGU (American Geophysical Union). 2012. Water-Energy Nexus: Solutions to Meet a Growing Demand.
Washington, DC: AGU.
Clark, C. E. and J. A. Veil. 2009. Produced Water Volumes and Management Practices in the United
States. Argonne, IL: Argonne National Laboratory.
DOE (U.S. Department of Energy). 2013a. Effects of Climate Change on Federal Hydropower: Report to
Congress. Washington, DC: DOE. www1.eere.energy.gov/water/pdfs/hydro_climate_change_report.pdf .
DOE (U.S. Department of Energy). 2013b. U.S. Energy Sector Vulnerabilities to Climate Change and
Extreme Weather. Washington, DC: DOE. http://energy.gov/sites/prod/files/2013/07/f2/20130716-
Energy%20Sector%20Vulnerabilities%20Report.pdf.
EPRI (Electric Power Research Institute). 2011. Water Use for Electricity Generation and Other Sectors:
Recent Changes (1985-2005) and Future Projections (2005-2030). Palo Alto, CA: EPRI.
GAO (U.S. Government Accountability Office). 2009. Energy-Water Nexus: Improvements to Federal
Water Use Data Would Increase Understanding of Trends in Power Plant Water Use. Washington, DC:
GAO.
GAO (U.S. Government Accountability Office). 2012a. Energy-Water Nexus: Coordinated Federal
Approach Needed to Better Manage Energy and Water Tradeoffs. Washington, DC: GAO.
GAO (U.S. Government Accountability Office). 2012b. Energy-Water Nexus: Information on the
Quantity, Quality, and Management of Water Produced during Oil and Gas Production. Washington,
DC: GAO.
Harto, C.B., and Y.E. Yan. 2011. Analysis of Drought Impacts on Electricity Production in the Western
and Texas Interconnections of the United States. Argonne, IL: Argonne National Laboratory.
Johnson Foundation, 2013. Building Resilient Untilities: How Water and Utilities Can Co-Create Their
Futures. Racine, WI: The Johnson Foundation at Wingspread.
Kenny, J.F., et al. 2009. Estimated Use of Water in the United States in 2005. Reston, VA: U.S.
Geological Survey.
NETL (National Energy Technology Laboratory). 2010. Water Vulnerabilities for Existing Coal-fired
Power Plants, DOE/NETL-2010/1429. Washington, DC: U.S. Department of Energy.
NRC (National Research Council). 2008. Water Implications of Biofuels Production in the United States.
Washington, DC: The National Academies Press.
Skaggs, R. and K. Hibbard. 2012. Climate and Energy-Water-Land System Interactions: Technical
Report to the U.S. Department of Energy in Support of the National Climate Assessment. Richland, WA:
Pacific Northwest National Laboratory.
Wagman, D. 2013. "Water Issues Challenge Power Generators." Power Magazine, July 1.
Water in the West. 2013. Water and Energy Nexus: A Literature Review. Stanford, CA: Stanford
University.
Wilbanks, T., et al. 2012. Climate Change and Energy Supply and Use: Technical Report to the U.S.
Department of Energy in Support of the National Climate Assessment. Oak Ridge, TN: Oak Ridge
National Laboratory.

The Water-Energy Nexus: Challenges and Opportunities June 2014
7
Chapter 2. Interconnected Water and Energy Systems
The nation‘s water and energy systems are highly interdependent. Salient connections between water and
energy are found in thermoelectric generation, fuels production, and water treatment. Issues and
problems vary across regions due to differences in water availability and energy technology
infrastructure. Additionally, temporal variability affects energy and water interactions. Increasing the
water efficiency of energy technologies has the potential to reduce some vulnerabilities stemming from
reliance on water. Responsible energy operations can help to protect water resources.
2.1 Characteristics and Properties of Water
Water possesses unique characteristics and properties—specifically, thermal and solvent properties—that
enable it to transfer and store energy. Consequently, water underpins the production of energy and the
generation of electricity. Understanding these properties and the role they play can inform both water
efficiency innovations and the development of substitutes for water in specific energy applications. In
addition, water‘s abundance has enabled its broad application by society.
2.1.1 Abundance
Freshwater has historically been available at a low cost to a large proportion of the United States
population. In 2011, the United States withdrew about 350 billion gallons per day (BGD) of freshwater
and another 60 BGD of saline water (Appendix A).
Energy systems use large quantities of water in part because of water‘s availability. For example,
hydropower, which supplies 7 percent of the nation‘s electricity generation (EIA 2013a), is possible only
because of surface water‘s abundance and its replenishment through precipitation as part of the
hydrologic cycle. While freshwater accounts for the bulk of the nation‘s water use, more abundant saline
or brackish water can be used for some applications, with or without treatment.
Regional and temporal variations in availability affect water usage as well as water and energy
interactions. For example, in the Eastern United States, water has traditionally been considered an
abundant resource, whereas in the drier Southwest, water rights have been an important challenge for
centuries, if not longer (Averyt, Fisher et al. 2011, Cooley, Fulton et al. 2011). Delivery of water in the
Key Messages:
Water and energy systems are physically interconnected; the properties and availability of water have led water to be used in many different ways in the energy system.
Thermoelectric cooling is the largest withdrawer of water nationally; agriculture is the largest consumer.
Improvements in power plant efficiency could lead to substantial reductions in water use for cooling.
Water treatment and pumping use significant energy.
Continued development of non-traditional water will provide additional flexibility for energy systems and other water users.
Some emerging technologies, such as carbon capture, have the potential to increase energy's water intensity; others, such as wind and PV can lower it.
Other important water uses that have regional significance include oil, gas and biofuels.
Water quality risks can be addressed by technology and management.

June 2014 The Water-Energy Nexus: Challenges and Opportunities
8
quantities and qualities necessary to meet human needs requires energy for pumping and treatment,
though the quantities of energy required vary significantly across regions, seasons, and even years. For
example, in years when spring runoff is inadequate in California, the need for groundwater pumping
increases (Kapnick and Hall 2010, Wick, Lee et al. 2012).
2.1.2 Thermal Properties
Water‘s specific heat (4.2 joules/gram-Celsius) is unusually high for a substance that is a liquid at room
temperature (USGS 2013a). This means that it takes a great deal of heat input to make water hotter. In
addition, water‘s latent heat of vaporization—the heat energy required to transform it from liquid to
vapor—is also high (2260 joules/gram) (Wick, Lee et al. 2012). These thermal properties have
implications for the water-energy nexus. First, water is useful as a heat storage medium, such as in home
hot water heaters. In addition, the combination of water‘s high specific heat and high latent heat of
vaporization make it effective as a cooling fluid, such as in thermoelectric power plants.
2.1.3 Phase Transitions
Water is one of very few common substances that occur naturally in solid, liquid, and gaseous forms
within normal temperature ranges at the Earth‘s surface. The transitions between these phases make
water useful for water-energy systems.
The combination of water‘s existence in liquid and solid phases increases its usefulness for hydropower.
Solid water as snowpack functions as a key natural storage mechanism in certain parts of the world. For
example, in California, the vast majority of annual precipitation falls in the winter; summer rains are rare
throughout much of the state. The gradual runoff of snowmelt from the Sierra Nevada Mountains
supplies electricity via hydropower. This is also the case in the Columbia River basin in the Northwest,
where hydropower is an even more critical component of electricity generation (EIA 2013a).
Properties spanning the gas and liquid phases make water useful for the Rankine cycle in power systems
(Rankine 1888). Water has a relatively low boiling point of 212°F (100°C) at which water vaporizes into
a gas (steam). Under the Rankine cycle, energy coming from the combustion of fossil fuel (or from
geothermal sources) is added to steam at constant temperature to increase its pressure. Releasing that
pressure through a turbine allows extraction of some portion of the supplied energy as electricity. The
remaining steam is then condensed (cooled) back to liquid form, and the process begins again. The
Rankine cycle is common to most coal-fired, nuclear, and concentrating solar power (CSP) power plants,
as well as a portion of many natural gas power plants5; as such, it produces the vast majority of electricity
generated in the United States (EIA 2013a).
2.1.4 Other Properties
Water is a very effective solvent. While not everything is soluble in water, many minerals and organic
materials are. This property enables water to be used for washing, such as for solar panels, as well as for
carrying active chemicals, such as in hydraulic fracturing. The solvent properties of water also mean that
water treatment is required to purify water and remove dissolved constituents. Different sources of water
vary in their energy requirements for treatment. Generally, treatment of water that is either high in
5 Natural gas combined cycle turbines, which are becoming increasingly common, typically use a Rankine cycle to
recover leftover energy from their primary Brayton cycle generators, which are essentially stationary jet engines that
produce electricity instead of thrust.

The Water-Energy Nexus: Challenges and Opportunities June 2014
9
salinity, such as produced water from some oil and gas operations, or high in organic material, such as
municipal wastewater, has higher energy requirements (Hancock, Black et al. 2012).
Water is important for biological processes and is fundamental to life. Because water is a raw material in
photosynthesis, it is fundamental to the production of feedstocks for biofuels. Steam (gaseous water) is
chemically reactive at high temperatures, enabling it to be used in a wide variety of industrial processes in
the energy sector, including, but not limited to, the production of hydrogen from methane (Molburg and
Doctor 2003), petroleum refining (EPA 2010), enhanced oil recovery (EPRI 1999), and biofuels refining,
among many others.
2.2 Interconnected Energy and Water Flows
Figure 2.1, a hybrid Sankey diagram6, illustrates energy and water flows through various sectors of the
U.S. economy from withdrawal or extraction through use. Energy flows are shown in green and water
flows are shown in blue. For energy, estimated values are for 2011; for water, values are a composite of
available data from 2005 to 2011. Energy and water sources are on the left side of the diagram, and sinks
are on the right. The widths of the flow lines correspond to the flow magnitude in quadrillion Btu (quads)
per year for energy and BGD for water. The calculations for the flows in the diagram are presented in
Appendix A.
From the diagram, it is clear that water and energy flows are complex and have many interconnections
and interdependencies. The opportunities for large water- and energy-efficiency impacts correspond to
large flows within the diagram. As previously described, water is used in the energy system for cooling,
storage, enhanced oil recovery, and hydraulic fracturing. Water is particularly important in the Rankine
cycle for thermoelectric electricity generation. Energy is also used in the water system, primarily for
pumping and treating public supply and wastewater.
Though the intensity varies with both generation and cooling technologies, thermoelectric cooling
dominates the withdrawals of water and agriculture dominates the consumption of water. The flow from
electricity generation to ―dissipated energy‖ is one of the largest in the diagram (27 quads/year).
Thermoelectric use currently constitutes more than 40 percent of freshwater withdrawals (138 BGD) and
4 percent of freshwater consumption (4.3 BGD). More than 95 percent of saline surface (marine)
withdrawals go to thermoelectric cooling. Thermoelectric cooling is required across a wide range of fuels
and energy sources, including nuclear, natural gas, coal, CSP, and geothermal.
Water and energy are also interconnected in the commercial, industrial, and residential sectors.
Significant quantities of energy are used for heating and pumping water, while significant quantities of
water are used for cooling systems.
Water is also used in small but important ways in fuels production. Irrigation of corn for biofeedstock
production withdraws about 2 BGD. Secondary flooding and enhanced oil recovery consumes a net of
1.2 BGD. Hydraulic fracturing fluids in oil and natural gas production consume about 0.2 BGD.
In addition, there are opportunities for systems synergy in water and wastewater treatment. The energy
used in water supply and wastewater treatment is 0.3 and 0.2 quads per year, respectively. Embedded
energy could potentially be extracted from wastewater, and it has been estimated that ―the energy
6 Sankey diagrams are a specific type of flow diagram in which the width of the arrows is shown proportionally to
the flow quantity. The water-energy diagram is a hybrid because it shows the flows of both water and energy.

June 2014 The Water-Energy Nexus: Challenges and Opportunities
10
contained in wastewater and biosolids exceeds the energy needed for treatment by 10-fold‖ (WERF 2011,
8).

The Water-Energy Nexus: Challenges and Opportunities June 2014
11
Figure 2.1. Hybrid Sankey diagram of interconnected U.S. water and energy flows in 2011. Source: See Appendix A for data sources and calculations
Different regions have different levels of water availability and seasonal variation; the diagram does not
convey regional specifics. In addition, the water flow for hydropower is not included in the diagram
because it is not withdrawn from surface water and its magnitude dwarfs the others in the diagram.
Furthermore, flows that are either small or omitted from the depiction for the sake of national-level clarity
may be highly significant at the regional or local levels, and both seasonal and year-to-year variability are
also salient.
2.2.1 Thermoelectric Cooling
The largest quantity of water use in thermoelectric generation is for cooling and condensing steam as part
of the Rankine cycle, as described in Section 2.1. Power plants differ in the process used to cool the
steam. Most thermoelectric power plants use variations of two different wet cooling technologies: once-
through and wet-recirculating (or cooling tower) cooling systems. In some cases, these systems are used
in combination with an artificial pond.
In its form 923, the U.S. Energy Information Administration (EIA) collects water diversion, withdrawal,
discharge, and consumption data for thermoelectric cooling systems at plants with 100 megawatts (MW)
or greater of generating capacity, which represents 99.2 percent of thermoelectric generation and 97.2
percent of thermoelectric capacity. Figure 2.2 shows power generation, plant water consumption, and
water withdrawal by cooling technology for electricity generation in 2011, from EIA data. (Note that
non-thermoelectric generation is also shown in the diagram for comparison purposes.) Plants using once-
through cooling delivered almost 23 percent of electricity supplies in the United States in 2011 and
withdrew about 64 percent of the overall water withdrawn by power plants. Power plants using wet-
recirculating systems supplied about 35 percent of the electricity generated in the United States in 2011
and withdrew 17 percent of the water withdrawn for electricity. Closed-loop systems consumed about 88
percent of the water consumed by electricity generation in 2011.
Figure 2.2. U.S. power generation, water withdrawal, and water consumption, by cooling type (2011). Data source: EIA Form 860, 923 (EIA 2013b, EIA 2013c )
A much smaller share of plants use dry or hybrid cooling. Dry cooling uses convective heat transfer to air
rather than evaporation as the cooling mechanism (Carney 2011). Hybrid systems use a combination of
wet and dry mechanisms. About 26 percent of the electricity generated in 2011—including hydropower,
natural gas turbines, and wind turbines—did not require cooling.

June 2014 The Water-Energy Nexus: Challenges and Opportunities
12
The type of generation technology also influences the amount of water withdrawn or consumed at the
plant at operation. In general, water use in thermoelectric operations is dominated by cooling. There are
a number of factors that drive the amount of cooling water utilized. In general, more efficient combustion
platforms require less water per kilowatt-hour (kWh) of generation. For example, coal plants that are
operated at supercritical temperature and pressure are more efficient than subcritical plants and require
less cooling. The type of cycle used also has an effect. For example, natural gas combined cycle plants
and integrated gasification combined cycle (IGCC) plants have lower water consumption per kWh of
generation because the majority of the plants‘ output comes from combustion turbines that require
minimal water compared to steam turbines (NETL 2009).
As a thermoelectric generation technology, CSP with recirculating cooling can also consume significant
quantities of water per kWh of generation (Meldrum et al. 2013). For Enhanced Geothermal Systems
(EGS), water consumption for fluid makeup can exceed cooling consumption. Figures 2.3a and 2.3b
illustrate operation withdrawal and consumption values per unit of generation across a range of generation
and cooling technologies.
Figure 2.3a. Operation water withdrawal factors for various thermoelectric generation and cooling technologies. Data source: Meldrum et al. 2013
Abbreviations: CC: Combined Cycle; CFB: Circulating Fluidized Bed; PC: Pulverized Coal; SC: Supercritical Pulverized Coal; IGCC: Integrated Gasification Combined Cycle; CSP: Concentrating Solar Power; EGS: Enhanced Geothermal System. (Note: the scale in these two graphs differs by a factor of 50.)

The Water-Energy Nexus: Challenges and Opportunities June 2014
13
Figure 2.3b. Operation water consumption factors for various thermoelectric generation and cooling technologies. Data source: Meldrum et al. 2013
Abbreviations: Nuc: Nuclear; Nat Gas: Natural Gas; CC: Combined Cycle; CFB: Circulating Fluidized Bed; PC: Pulverized Coal; SC: Supercritical Pulverized Coal; IGCC: Integrated Gasification Combined Cycle; CSP: Concentrating Solar Power; EGS: Enhanced Geothermal System. (Note: the scale in these two graphs differs by a factor of 50.)
As generation and cooling technologies have evolved over time, the amount of water withdrawn per
kilowatt-hour has steadily declined since 1950 (Figure 2.4). However, between 1950 and 1980, the total
amount of water withdrawn across all thermoelectric plants nationally increased steadily and dramatically
relative to irrigation, industry, and public use, before leveling off. The move from once-through to
recirculating cooling technologies associated with reductions in withdrawals per kilowatt-hour are
generally associated with higher water consumption rates, as shown in Figures 2.3a and 2.3b. Moving to
hybrid or dry cooling is a possibility, but these currently have higher capital costs, as well as an energy
penalty. This energy penalty is due to the higher temperature of water entering the compressor in the
steam cycle, particularly under high-temperature ambient conditions. The energy penalty for dry cooling
relative to once-through cooling ranges from 4.2 percent to 16 percent for a 400 MW coal-fired plant,
depending on plant parameters and ambient conditions (Carney 2011).

June 2014 The Water-Energy Nexus: Challenges and Opportunities
14
Figure 2.4. Water use for thermoelectric generation and other sectors. Data source: Kenny et al. 2009; EIA 2011
Near-term infrastructure decisions will impact future water withdrawals and consumption. In addition to
decisions on generation and cooling technologies, deployment of carbon capture and storage (CCS) can
have a significant impact on water consumption. For example, a monoethanolamine carbon dioxide
recovery unit increases water requirements both because its installation decreases the overall energy
efficiency of the plant and because it has a number of cooling subprocesses that require water (NETL
2009). Figure 2.5 shows additional water withdrawal and consumption requirements expected for current
CCS technologies combined with various generation technologies with closed-loop cooling (Meldrum et
al. 2013).
Figure 2.5. Additional water withdrawal and consumption requirements for carbon capture. Data source: Meldrum et al. 2013
In all cases, these withdrawal and recirculating figures are for recirculating cooling. Abbreviations: CC: Combined Cycle; PC:
Pulverized Coal; SC: Supercritical Pulverized Coal; IGCC: Integrated Gasification Combined Cycle.
While the bulk of water withdrawals and consumption for thermoelectric generation over the life cycle
are for plant operation, some water is used in extraction, processing, transport, and end-of-life for
electricity fuels. Table 2.1 shows consumption and withdrawal figures for the extraction, processing, and
transport stages for coal, natural gas, and nuclear fuels on a gallon (gal) per megawatt-hour (MWh) basis.
These additional life cycle stages add as much as 10 percent to the life cycle water consumption of coal

The Water-Energy Nexus: Challenges and Opportunities June 2014
15
cooled with recirculating systems relative to plant operations. They can add 20 percent to the life cycle
water consumption of nuclear plants cooled with recirculating systems.
Table 2.1. Water Consumption and Withdrawal for Fuels Used in Electricity Generation.
Consumption (gal/MWh) Withdrawal (gal/MWh)
Extraction Processing Transport Extraction Processing Transport Coal 3–457 18 <18 3–45 18 1 Natural Gas 1–129 <1 1–310 1–12 <1 4–8 Nuclear 18-–3211 56–8712 18–32 56–140 Source: Meldrum et al. 2013
Values represent medians; ranges represent medians for multiple competing processes.
2.2.2 Transportation Fuels Production
Water is important for production and refining of transportation fuels. For example, the extraction of
fossil fuels uses and produces water. Life cycle management of the various fluids involved—including
hydraulic fracturing fluid, flowback, and produced water—can reduce the quantities of freshwater
required, disposal costs, and environmental risk. Both petroleum fuels and biofuels require water
withdrawal and consumption over their life cycle, including extraction or growing and refining.
Water Life Cycle Management in Fossil Fuels Production
In oil and gas extraction, large quantities of water must be handled for two primary reasons. First,
produced water is a by-product of oil and gas extraction. The volumes of produced water are
significant—in 2007, about 2.4 BGD of produced water came from conventional oil and gas production in
the United States (Clark and Veil 2009). With requisite advances in treatment technologies, this water
has the potential to become an important resource in regions of water constraint for energy as well as
other uses. Second, about 1.2 BGD is used for secondary flooding and enhanced oil recovery (Appendix
A). Relevant research on unconventional oil and gas addressing water lifecycle management is being
conducted by DOE, the Environmental Protection Agency, and the Department of Interior.
In addition, for many wells, hydraulic fracturing is used to stimulate the release of oil or gas resources.
On average, 50,000 to 350,000 gallons of water are required to fracture one well in a coalbed formation,
while between two million and nine million gallons of water are necessary to fracture one horizontal well
in a shale formation (Clark, Horner et al. 2013). With such large quantities of water required, water
supply may become an issue, particularly in arid regions. Water life cycle management can help to
reduce cost, conserve freshwater resources, and prevent risks to water quality. Figure 2.6 shows
hydraulic fracturing fluids and produced water in the context of the fuels production water life cycle.
7 Includes surface, underground, and unspecified extraction.
8 Does not include coal slurry transport.
9 Includes shale and other fracturing.
10 Includes pipeline and liquefied natural gas.
11 Includes in situ leaching, surface extraction, and underground extraction.
12 Includes milling, conversion, enrichment, and fuel fabrication for centrifugal and diffusion enrichment.

June 2014 The Water-Energy Nexus: Challenges and Opportunities
16
Figure 2.6. Fuels production water life cycle.
Well operators are faced with multiple challenges: reducing the amount of freshwater needed for
hydraulic fracturing; finding cost-effective ways to treat flowback and produced water; cutting water
transport, storage, and disposal costs; and addressing environmental and regulatory issues. For both
hydraulically fractured and conventionally produced wells, optimal management strategies across all
stages of the process—water acquisition, storage, transport, treatment, recycling, and disposal—can keep
costs low and maximize water recovery for beneficial use. Increasing the amount of water that is recycled
can reduce subsequent water withdrawals and disposal.
Freshwater for hydraulic fracturing is acquired from either surface water or groundwater resources.
While operators primarily use trucks for shipping the water needed for development, in some cases they
are developing centralized water pipeline systems.
Fracturing fluid is typically mixed on-site. Water, which is most commonly used as the base, is mixed
with chemicals and additives for numerous functions: proppants to keep fractures from closing, gels to
increase the fluid viscosity, acids to help remove drilling mud near the wellbore, biocides to prevent
microbial growth, scale inhibitors to control precipitates, and surfactants to increase the injected fluid
recovery (Kargbo et al. 2010). Once the fracturing fluid has been mixed on the surface, the fluid is
injected into the formation at extremely high pressures through lateral wells, breaking open microscopic
fractures and releasing trapped shale gas. As the number and length of lateral wells per well pad
increases, both the number of injections per well and the volume of water needed per well will increase.
For any given well there may be as many as 15 injections (Kargbo et al. 2010). During this phase,
maintaining well bore integrity is paramount for preventing groundwater contamination.
Depending on geologic conditions, 15 percent to 80 percent of the injected water volume will flow back
to the surface once downhole pressure is released after the well has been hydraulically fractured (EPA
2010b). Flowback, which typically has some of the same characteristics of the injected fluid, is
commonly considered to be fluid that flows from the well after the initial two- to three-week period for a
hydraulically fractured well (Rose et al. 2013). Whether or not a well is hydraulically fractured, brackish
produced water is released throughout the life of the well. Produced water quantity and quality varies
significantly based on the geographical location, type of hydrocarbon produced, and geochemistry of the
producing formation (Guerra et al. 2011). Produced and flowback water has traditionally been viewed by
the industry as waste streams. Flowback water is often stored in specially constructed on-site pits and
tanks before being treated and disposed. Proper management is necessary to prevent unwanted surface
releases that can cause water resource contamination.

The Water-Energy Nexus: Challenges and Opportunities June 2014
17
Flowback and produced water can be treated for recycling, treated for surface discharge, or disposed of in
subsurface injection wells. The quality and quantity of flowback and produced water, along with its
compatibility with receiving water, affects treatment, transportation, and disposal costs. Oil and gas
companies are often operating in areas where water resources are already constrained and management
options are regulated. Where water acquisition and disposal logistics are challenging, companies are
turning to recycling produced water as a solution.
Before flowback and produced water can be reused, it must be diluted with freshwater and/or treated to a
technically acceptable level. The oil and gas industry relies on a diverse array of treatment options that
can adapt to changing needs and environments. Produced water often contains high concentrations of
scale-forming constituents including barium, calcium, iron, magnesium, manganese, and strontium, which
must be reduced to prevent precipitates from forming (Kargbo et al. 2010). Flowback or produced water
with high total dissolved solids, such as in the Marcellus region, can also be diluted with freshwater to
bring the total dissolved solids to a technically acceptable level. Modularity is important for on-site
treatment because natural gas development often occurs in remote areas. The produced water must be
treated to meet regulatory or technical requirements for recycling or subsurface injection. Transporting
produced water to a suitable injection site or municipal treatment facility can be costly (Bloomberg 2013).
There are also some seismic risks associated with subsurface injection in some instances (National
Academies Press 2012).
Water Consumption Intensity for Fuels Production
Water is also important in other aspects of fuels production. Table 2.2 compares ranges of water
consumption for farming, extraction, processing, and refining across a range of transportation fuels on a
gallon-per-mile basis. Notably, biofuels from irrigated feedstocks have the largest life cycle water
consumption, by up to two orders of magnitude. However, in 2008, only about 12 percent of corn
production acreage required irrigation in the main U.S. corn production regions13
(Wu and Chiu 2011)14
.
Water use for primary extraction, secondary extraction through water flooding, and tertiary enhanced
recovery forms a significant fraction of life cycle water consumption and withdrawal for gasoline and
diesel (Wu and Chiu 2011). Refining of both biofuels and petroleum-based fuels requires some water.
Though refining in a dry mill to produce corn ethanol uses approximately three times the amount of water
as petroleum refining per mile driven, refining constitutes a significant portion of the life cycle water
consumption for gasoline. Because more gasoline is produced nationally than ethanol, the overall national
level water consumption for petroleum refining is higher.
13
These are United States Department of Agriculture (USDA) Regions 5, 6, and 7, covering the states of Iowa,
Illinois, Kansas, Ohio, Michigan, Minnesota, Missouri, Nebraska, North Dakota, South Dakota, Wisconsin. This set
of three regions accounts for 89 percent of corn production and 95 percent of ethanol production in the United
States. (Wu and Chiu 2011). 14
However, it is possible that expanded biofuel production can lead to greater corn demand and expansion of corn
production into areas that require greater irrigation. While these areas may not contribute a substantial fraction of
total biofuels, and may not impact national water consumption to a major degree, there could be local impacts.

June 2014 The Water-Energy Nexus: Challenges and Opportunities
18
Table 2.2. Fuels Production Water Intensity (gal/mile).
Consumption Withdrawal
Extraction/ Growing
Processing/ Refining
Extraction/ Growing
Processing/ Refining
Gasoline from Liquid Petroleum 0–0.25 0.05–.1 0–0.25 0.6
Diesel from Liquid Petroleum
0–0.18 0.04–0.09 0–0.18 0.4
E85 from Irrigated Corn Grain
3.0–84 0.1–0.3 6.7–110 0.3–0.4
E85 from Non-Irrigated Corn Grain 0.004–0.006 0.1–0.3 0.08–0.1 0.3–0.4
E85 from Irrigated Corn Stover
2.4–45 0.2–0.3 5.2–64 0.35
E85 from Non-Irrigated Corn Stover
0.003 0.24–0.25 0.7 0.35
Biodiesel from Irrigated Soy
0.6–24 0.002–0.01 1.1–26.2 0.007–0.03
Biodiesel from Non-Irrigated Soy
0.002–0.01 0.002–0.01 0.01 0.007–0.03
Source: King and Webber 2008; with oil extraction adjustments applied to gasoline and diesel calculated from Wu and Chiu 2011
2.2.3 Energy for Water
Water treatment processes require energy (Burton 1996, EPRI 2000). Even freshwater sources rarely
meet drinking water standards under the Safe Drinking Water Act (EPA 1974). National energy demand
for water and wastewater treatment increased by more than 30 percent between 1996 and 2013 (EPRI
2013). These increases are due primarily to increases in population (about 17 percent) and more stringent
water quality regulations. Irrigation for agriculture, inputs for aquaculture, supplies for livestock
watering, and cooling sources for power plants can also require treatment. These uses have different
water quality needs, which may imply different energy requirements for treatment (Guerra, Dahm et al.
2011).
Different water sources also require different treatment intensities. Generally, treatment of water that is
either high in salinity—such as seawater, or produced water from some oil and gas operations—or
contains large amounts of organic material—such as municipal wastewater—has relatively high energy
requirements (Hancock, Black et al. 2012). Thus, as more nontraditional types of water are used, the
associated energy requirements will generally increase. This is illustrated in Table 2.3, which shows the
energy intensity of water treatment and pumping in California. Desalination can be 100 times as energy-
intensive as treatment of freshwater (CEC 2005).
Pumping also has a range of possible energy intensities, depending on the circumstance. The quantity of
energy required for pumping primarily relates to elevation change. As shown in Table 2.3, interbasin
transfer can be an order of magnitude higher in energy intensity than local distribution or groundwater
pumping.

The Water-Energy Nexus: Challenges and Opportunities June 2014
19
Table 2.3. Energy Intensity of Water Treatment and Pumping in California (kWh/MG).
Low High Notes Reference
Treatment
Drinking Water Treatment 100 16000 High: Desalination (CEC 2005)
Wastewater Treatment and Distribution
1100 4600 (CEC 2005)
Pumping
Water Supply/Conveyance 0 14000 High: Interbasin transfer (State Water Project); Low: Gravity fed
(CEC 2005)
Primary Drinking Water Distribution
700 1200 (CEC 2005)
Recycled Water Distribution
400 1200 (CEC 2005)
Groundwater for Agriculture
500 1500 High: CO River Basin Low: North CA Coast
(CPUC 2011)
2.3 Regional and Temporal Variability in Water Accessibility
While the Sankey diagram in Figure 2.1 is quite complicated, the overall water-energy picture is even
more complex. For example, the location where water is needed does not necessarily correspond to the
location where water falls as precipitation. In addition, competition among the uses for water plays out
differently in different locations. Figure 2.7 shows the distribution of average annual precipitation across
the United States. The Southwest is clearly quite dry relative to the rest of the country. Figure 2.8 shows
the distribution of ground and surface freshwater withdrawals. The dry Southwest has a relatively high
demand for water, primarily for agriculture. Figure 2.9 shows that freshwater withdrawals for
thermoelectric power are more broadly distributed in the Southwest. As the figures illustrate, localized
high withdrawal rates in the eastern half of the country often coincide with thermoelectric withdrawals,
potentially making thermoelectric cooling vulnerable in times of drought. In the Southwest and other
areas of low rainfall, there may be opportunities to use nontraditional water, including produced water
from oil production. Figure 2.10 shows the thermoelectric plants that use saline withdrawals. They
primarily use once-through cooling and are located along the coasts.

June 2014 The Water-Energy Nexus: Challenges and Opportunities
20
180.1 or greater
140.1–180.0
120.1–140.0
100.1–120.0
80.1–100.0
70.1–80.0
60.1–70.0
50.1–60.0
40.1–50.0
35.1–40.0
30.1–35.0
25.1–30.0
20.1–25.0
15.1–20.0
10.1–15.0
5.1–10.0
5.0 or less
Figure 2.7. Average annual precipitation (inches) 2005–2009. Source: National Atlas of the United States (USGS 2013b)
1520.01–3750.00
730.01–1520.00
270.01–730.00
85.01–270.00
0.01–85.00
0
Figure 2.8. Water use 2005—total ground and surface freshwater withdrawals (million gallons/day). Source: National Atlas of the United States, (USGS 2013b)

The Water-Energy Nexus: Challenges and Opportunities June 2014
21
1350.01–2650.00
815.01–1350.00
410.01–815.00
135.01–410.00
0.01–135.00
0
Figure 2.9. 2005 total ground and surface freshwater withdrawals for thermoelectric cooling. Source: National Atlas of the United States, (USGS 2013b)
Once-through
Pond
Tower
Figure 2.10. Thermoelectric plants using saline withdrawals. Data source: EIA Form 860(EIA 2013b)
Size of dot indicates design cooling water intake rate at 100% load.
Variation in water availability through time also has implications for thermoelectric generation. Figure
2.11 shows national variation in thermoelectric withdrawal and consumption on a monthly basis based on
EIA data for 2011. Figure 2.12 shows average monthly precipitation and temperature. These graphs
show that the peak withdrawal and consumption corresponds with the peak temperature in July and
August, whereas the highest average precipitation across the United States occurs in April and May.
Min: 2.3 ft3/s
Max: 5,000 ft3/s

June 2014 The Water-Energy Nexus: Challenges and Opportunities
22
Thus, the time of highest water availability does not correspond to the time of highest thermoelectric
water demand.
Figure 2.11. Water use for U.S. electricity generation in 2011: total and per MWh. Data source: EIA Form 923 (EIA 2013c)
Figure 2.12. Climate data for contiguous United States in 2011. Data source: NOAA 2013
2.4 Linkages between the Fuels Life Cycle and Water Quality
Transforming natural resources into fuels for energy requires complex technologies, processes, and
operations, and the extraction, processing, transportation, and storage of fuels can impact water quality

The Water-Energy Nexus: Challenges and Opportunities June 2014
23
(GAO 2012)15
. These complexities increase the risk for operational failure or suboptimal management
practices, which can lead to risks for surface water and groundwater quality (Table 2.4). Technology and
operations management can prevent such negative impacts with a variety of containment technologies and
management strategies across the life cycle. Managing risks at a regional scale, such as across multiple
well sites, can also prevent negative impacts to water quality. There is complementary research being
conducted in this area by DOE, the Environmental Protection Agency, and the Department of Interior
(DOI) as part of a federal multiagency collaboration on unconventional oil and gas research.
2.4.1 Containment Strategies
Across the life cycle, fuels are extracted, transported, and stored. Proper design and construction of wells,
pipelines, and storage tanks can mitigate failures and prevent leaks. For example, complex drilling,
casing, and cementing technologies are used to maintain wellbore integrity while drilling for and
producing hydrocarbons. Maintaining wellbore integrity prevents methane, produced water, and
flowback from escaping into groundwater.
Pipelines are a common transportation medium for oil and natural gas. The most common causes of
pipeline failure are material, weld, and equipment failure; corrosion; excavation damage; and other
outside forces (DOT 2014). Properly designing and constructing pipelines, documenting pipeline
locations, and monitoring pipeline conditions can protect against these failures and subsequent unwanted
releases. Subsurface pipelines in particular must be built to account for their unique operating
environment (Antaki 2003).
Storage containment system integrity is challenged by the corrosive nature of many fuels and wastes.
Unintentional releases from storage and disposal units can contaminate surface water and groundwater
resources. Historically, groundwater contamination from underground storage tanks has been well-
documented (Nadim et al. 2000). Similar to pipelines, the leading causes of failure are corrosion, material
and weld defects, and excavation damage. To reduce failures from corrosion or damage from outside
forces, underground storage tanks are designed with double walls and anticorrosion cathode protection.
Table 2.4. Technical Failures across the Fuel Source Life Cycle Leading to Possible Water Contamination.
Extraction/ Mining/ Feedstock Production
Refining/
Processing/
Enriching
Transportation Fuel and Waste Storage/Disposal
Oil and Gas
Drilling/casing/ cementing failure
Balance of plant failure
Drilling/fracturing fluid storage tank or holding pit failure
Refining facility equipment failure
Pipeline corrosion, material and weld defects, excavation damage
Truck, rail, ship hull failure
Central pipeline water network hub failure
Storage tank corrosion, material and weld defects, excavation damage
Produced water holding pit failure
15
Note that electricity generation can also impact water quality. This issue is covered in detail in Chapter 4. In
addition, airborne particulates and atmospheric deposition of fuels-related pollutants can be potential sources of
water contamination (particularly for coal, biofuels, oil and gas).

June 2014 The Water-Energy Nexus: Challenges and Opportunities
24
Extraction/ Mining/ Feedstock Production
Refining/
Processing/
Enriching
Transportation Fuel and Waste Storage/Disposal
Coal Mine and tailings pile exposures
Processing and washing facility runoff collection failure
Truck, rail, ship hull failure
Pipeline corrosion, material and weld defects, excavation damage
Coal waste holding tank or pit failure
Coal stock storage runoff
Biofuels Nutrient, chemical, and sediment runoff
Refining facility equipment failure
Pipeline corrosion, material and weld defects, excavation damage
Truck, rail, ship hull failure
Storage tank corrosion, material and weld defects, excavation damage
Nuclear Mine and tailings pile exposures
Processing and washing facility runoff collection failure
Refining facility equipment failure
Shielding damage
Truck, rail failure
Spent fuel pool failure
The long-term storage of nuclear fuel and waste presents unique challenges. Nuclear material is
radioactive and must be held in shielded double-walled containers to prevent releases (U.S. Nuclear
Regulatory Commission 2002). The process of enriching uranium produces hazardous by-products that
must be properly contained.
2.4.2 Management of Working Fluids, Storm Water, and Runoff
As discussed in Section 2.2.2, proper management of fluids in oil and gas operations can prevent
unwanted releases into the environment. Other sources of runoff can also lead to water quality issues.
Storm water runoff from oil and gas site construction is a leading cause of surface water impairment (Veil
2010). Increased biofuel feedstock production can lead to agriculture runoff and introduce pesticides,
fertilizers, and sediments into water sources. For agriculture, passive systems are generally used to
control runoff (Dominguez-Faus et al. 2009). Technological advancements that would allow more
widespread use of perennial energy crops like switchgrass and woody crops could also reduce erosion and
nutrient requirements (Dominguez-Faus et al. 2009). For both agriculture and forestry systems,
employing best management practices (BMPs) has been an effective strategy for protecting water quality
and achieving other conservation goals (Biomass Research and Development Board 2011).
Coal and uranium mining can expose metal sulfides in mines and tailings piles, which leads to acid mine
drainage (AMD). The conventional solution for AMD is controlling water flows and treating
contaminated water (Akcil and Koldas 2006). Coal slurry—liquid waste from coal washing or ash mixed
with water—is held in properly maintained storage tanks and holding pits. When holding pits are not
properly designed or maintained, breaches of earthen retaining walls have caused severe impacts (Ruhl et.
al. 2009). Ash is typically disposed of in landfills, which can allow toxic material to seep into
groundwater if not properly managed (Lemly and Skorupa 2012).

The Water-Energy Nexus: Challenges and Opportunities June 2014
25
2.5 Challenges and Opportunities
Across the water-energy system, there are a number of technical challenges and opportunities for
solutions at multiple scales. These include technical solutions from both water-for-energy and energy-
for-water perspectives, as well as analytical tools.
First, the amount of water required for thermoelectric cooling can be dramatically reduced. To do this, a
preferred solution is to reduce dissipated energy by increasing the energy efficiency of the plant. This can
potentially be accomplished by utilizing power cycles with higher theoretical efficiencies and/or recovery
of waste heat. Ensuring capture and reuse of water from cooling towers can also contribute. Finally,
innovations in cooling technology can reduce water consumption, though, if dry cooling is substituted for
wet cooling, there are energy efficiency trade-offs.
Second, as oil and gas development continues to increase in the United States, reuse of produced water
will become more important. A significant percentage of the water used in producing unconventional oil
and gas resources is ultimately injected deep underground. Such disposal effectively removes water from
the global hydrogeological cycle for time frames relevant to water-energy systems and may increase the
risk of induced seismicity in Class 1or Class 2 disposal wells. In addition, a substantial amount of oil and
gas production occurs in relatively dry regions where treated produced water could be put to beneficial
use. Thus, there is benefit in interagency collaborative research addressing water quality, water
availability, air quality, induced seismicity, and mitigating the impacts of development.
Third, given regional constraints on freshwater availability, the continued development of non-traditional
sources such as seawater; brackish groundwater; and wastewater from municipal, industrial, and energy
production will provide additional flexibility for energy systems and other water users. This would
include the direct use of these resources, such as for algae bioenergy feedstock production.
Fourth, responsible operations, including a variety of containment technologies, monitoring systems, and
management strategies, can reduce the risks of operations across the fuels life cycle to surface water and
groundwater quality. These measures are particularly important because the pace of oil and gas
development is increasing and the complexity of operations across the fuel life cycle is high. In the case
of bioenergy, continued use of agricultural and forestry BMPs, as well as development of BMPs for new
feedstocks, will help maintain or improve water quality as bioenergy production expands (Biomass
Research and Development Board 2011).
Finally, these and other issues can be tied together in regionally specific analytical tools to inform
decisions such as water management, energy facility siting, and technology selection. Robust tools will
examine the effects of regional aggregation of activities and explain variation in water resource
availability.

June 2014 The Water-Energy Nexus: Challenges and Opportunities
26
References
Akcil, Ata, and Soner Koldas. 2006. ―Acid Mine Drainage (AMD): causes, treatment, and case studies.‖
Journal of Cleaner Production 14(12–13): 1139–1145.
Antaki, George. 2003. Piping and Pipeline Engineering: Design, Construction, Maintenance, Integrity,
and Repair. New York: Marcel Dekker.
Averyt, K., J. Fisher, A. Huber-Lee, A. Lewis, J. Macknick, N. Madden, J. Rogers, and S. Tellinghuisen.
2011. Freshwater Use by U.S. Power Plants: Electricity’s Thirst for a Precious Resource. Cambridge,
MA: Union of Concerned Scientists.
Biomass Research and Development Board. 2011. Bioenergy Feedstock Best Management Practices.
Washington DC.
Bloomberg. 2013. ―How the Wastewater game is played in the Marcellus.‖ Water Insight—Research
Note. Bloomberg Finance L.P.
Burton, F.L. 1996. A Report that Describes How Energy is Used and Can be Managed Efficiently in
Water and Wastewater Treatment. Palo Alto, CA: Electric Power Research Institute.
California Energy Commission (CEC). 2005. California's Water-Energy Relationship. Sacramento, CA:
CEC.
California Public Untilities Commission (CPUC). 2010. Embedded Energy in Water Studies. Study 1:
Statewide and Regional Water-Energy Relationship. Sacramento, CA: CPUC.
Carney, B. 2011. Reducing Freshwater Consumption at Coal-Fired Power Plants: Approaches Used
Outside the United States. Morgantown, WV: National Energy Technology Laboratory.
Clark, C.E., R.M. Horner, and C.B. Harto. 2013. "Life Cycle Water Consumption for Shale Gas and
Conventional Natural Gas." Environ. Sci. Technol. 47(20): 11829–11836.
Clark, C.E., and J.A. Veil., 2009. "Produced Water Volumes and Management Practices in the United
States. Argonne, IL: Argonne National Laboratory.
Coder, K.D. 1999. Basic Water Properties: Attributes and Reactions Essential for Tree Life. Athens, GA:
University of Georgia.
Cooley, H., J. Fulton, and P.H. Gleick. 2011. Water for Energy: Future Water Needs for Electricity in the
Intermountain West. Oakland, CA: Pacific Institute.
Dominguez-Faus, R., Susan E. Powers, Joel G. Burken, and Pedro J. Alvarez. 2009. ―The Water Footprint
of Biofuels: A Drink or Drive Issue?‖ Environmental Science Technology 43(2009): 3005–2010.
Electric Power Research Institute (EPRI). 1999. Enhanced Oil Recovery Scoping Study. Palo Alto, CA:
EPRI.
Electric Power Research Institute (EPRI). 2000. Water and Sustainability: U.S. Electricity Consumption
for Water Supply & Treatment—The Next Half Century. Palo Alto, CA: EPRI.
Electric Power Research Institute (EPRI). 2013. Electricity and Water Management in the Municipal
Water Supply and Wastewater Industries. Palo Alto, CA: EPRI.

The Water-Energy Nexus: Challenges and Opportunities June 2014
27
EIA (U.S. Energy Information Administration). 2011. Annual Energy Review 2011. Washington, DC:
EIA.
EIA (U.S. Energy Information Administration). 2013a. Annual EnergyOutlook 2013. Washington, DC:
EIA.
EIA (U.S. Energy Information Administration). 2013b. ―Form EIA-860 detailed data – 2011.‖ U.S.
Department of Energy. June 20. Accessed August 2, 2013. www.eia.gov/electricity/data/eia860/.
EIA (U.S. Energy Information Administration). 2013c. ―Form EIA-923 detailed data – 2011,‖ U.S.
Department of Energy, November 12. Accessed December 11, 2013.
www.eia.gov/electricity/data/eia923/
Guerra, K.L., K.G. Dahm, and S. Dundorf. 2011. Oil and Gas Produced Water Management and
Beneficial Use in the Western United States. Denver, CO: U.S. Bureau of Reclamation.
Hancock, N.T., N.D. Black, and T.Y. Cath. 2012. "A comparative life cycle assessment of hybrid osmotic
dilution desalination and established seawater desalination and wastewater reclamation processes." Water
Research 46(4): 1145–1154.
Kapnick, S. and A. Hall. 2010. "Observed Climate-Snowpack Relationships in California and their
Implications for the Future." Journal of Climate 23(13): 3446–3456.
Kargbo, David M., Ron G. Wilhelm, and David J. Campbell. 2010. ―Natural Gas Plays in the Marcellus
Shale: Challenges and Potential Opportunities.‖ Environmental Science & Technology 44(15): 5679.
Kenny, J.F., N.L. Barber, S.S. Hutson, K.S. Linsey, J.K. Lovelace, and M.A. Maupin. 2009. Estimated
Use of Water in the United States in 2005. Reston, VA: U.S. Geological Survey.
King and Webber. 2008. ―Water Intensity of Transportation.‖ Journal of Environmental Science and
Technology 42(21): 7866–7872.
Lemly, Dennis A., and Joseph P. Skorupa. 2012. ―Wildlife and the Coal Waste Policy Debate: Proposed
Rules for Coal Waste Disposal Ignore Lessons from 4 Years of Wildlife Poisoning.‖ Environmental
Science & Technology 46(2012): 8595–8600.
Meldrum, J., S Nettles-Anderson, G Heath and J Macknick, 2013, "Life cycle water use for electricity
generation: a review and harmonization of literature estimates." Environ. Res. Let. 8.
Molburg, J.C. and R.D. Doctor. 2003. Hydrogen from Steam-Methane Reforming with CO2 Capture. 20th
Annual International Pittsburgh Coal Conference. Pittsburgh, PA: Argonne National Laboratory: 21.
Nadim, Farhad, George E. Hoag, Shili Liu, Robert J. Carley, and Peter Zack. 2000. ―Detection and
Remediation of soil and aquifer systems contaminated with petroleum products: an overview.‖ Journal of
Petroleum Science and Engineering 26(2000): 169–178.
National Academies Press, 2012. Induced Seismicity Potential in Energy Technologies. Washington, DC.
National Ocean Atmospheric Administration (NOAA). 2013. "National Climatic Data Center." NOAA.
http://www.ncdc.noaa.gov/cag/. Accessed February 19, 2014.
National Energy Technology Laboratory (NETL). 2009. Water Requirements for Existing and Emerging
Thermoelectric Plant Technologies. Washington, DC: U.S. Department of Energy.

June 2014 The Water-Energy Nexus: Challenges and Opportunities
28
Rankine, W.J.M. 1888. A Manual of the Steam Engine and Other Prime Movers. London: Charles Griffin
and Company.
Rose, Arthur W., Lara O. Haluszczak, and Lee R. Kump. 2013. ―Geochemcial Evaluation of Flowback
Brine from Marcellus Gas Wells in Pennsylvania, USA.‖ Applied Geochemistry 28(2013): 55–61.
Ruhl, Laura, Avner Vengosh, Gary S. Dwywer, Heileen Hsu-Kim, Amrika Deonarine, Mike Bergin, and
Julia Kravchenko. 2009. "Survey of the Potential Environmental and Health Impacts in the Immediate
Aftermath of the Coal Ash Spill in Kingston, Tennessee." Journal of Environmental Science and
Technology 43(16): 6326-6333.
U.S. Department of Transportation (DOT). 2014. All Reported Pipeline Incidents. Pipeline and
Hazardous Materials Safety Administration (PHMSA) Washington, DC: DOT.
U.S. Environmental Protection Agency (EPA). 2010a. Available and Emerging Technologies for
Reducing Greenhouse Gas Emissions from the Petroleum Refining Industry. Research Triangle Park, NC:
EPA.
U.S. Environmental Protection Agency (EPA). 2010b. ―Hydraulic Fracturing Water Cycle.‖ EPA.
www2.epa.gov/hfstudy/hydraulic-fracturing-water-cycle.
U.S. Geological Survey (USGS). 2013a. "Water Properties: Facts and Figures about Water." Accessed
July 18, 2013. http://ga.water.usgs.gov/edu/.
U.S. Geological Survey (USGS). 2013b.National Atlas of the United States. USGS. Accessed February
18, 2014. http://nationalatlas.gov/mapmaker.
U.S. Government Accountability Office (GAO). 2012. Coordinated Federal Approach Needed to Better
Manage Energy and Water Tradeoffs. Washington, DC: GAO.
U.S. Nuclear Regulatory Commission. 2002. Radioactive Waste: Production, Storage, Disposal.
Washington, DC.
Veil, John A. 2010. Water Management Technologies Used by Marcellus Shale Gas Producers. Argonne,
IL: Argonne National Laboratory.
Water Environment Research Foundation (WERF). 2011. Energy Production and Efficiency Research—
The Roadmap to Net-Zero Energy. Alexandria, VA: WERF.
Wick, C.D., A.J. Lee, and S.W. Rick. 2012. "How intermolecular charge transfer influences the air-water
interface." Journal of Chemical Physics 137(15).
Wu, M. and Y. Chiu. 2011. Consumptive Water Use in the Production of Ethanol and Petroleum
Gasoline—2011 Update. Argonne, IL: Argonne National Laboratory.

The Water-Energy Nexus: Challenges and Opportunities June 2014
29
Chapter 3. Implications of Climate Change and Other Trends
The effects of climate change—including rising average temperatures, shifting precipitation patterns,
increasing climate variability, and more frequent extreme weather events—can alter the availability and
predictability of water resources. These effects, combined with population growth, could intensify
existing competition for water resources and impact energy production and distribution. In addition, the
future of the water-energy nexus depends on a number of other factors, including changes to the mix of
fuel sources used in power plants, deployment of advanced generation and cooling technologies,
expansion of natural gas and renewable energy production, and increased utilization of biofuels. The
evolving U.S. energy portfolio combined with advances in technology and modeling creates an
opportunity to effectively manage the interdependencies of the U.S. water and energy systems and
construct a future energy sector that is more resilient and equipped to manage uncertainties in climate
impacts.
3.1 Changes in Temperature and Precipitation
Average temperatures across the United States have increased over the past 100 years, and the rate of
warming has increased over the past several decades (DOE 2013a). Although the extent varies by region,
nearly the entire country has experienced increased average temperatures (Figure 3.1)—a trend that is
expected to continue (NOAA 2013; USGCRP 2009).
Warmer average temperatures and extreme weather events such as heat waves and hurricanes have
implications for the energy sector. For example, thawing permafrost could disrupt oil and gas operations
in Arctic Alaska while more intense storm events and sea-level rise could affect coastal and offshore
energy infrastructure in the lower 48 states (DOE 2013a). However, a longer ice-free season in the Arctic
creates more opportunity for resource extraction. In the electricity sector, higher summer temperatures
result in a compounded challenge of increased demand for cooling and reduced thermal efficiencies for
power plants. Conversely, electricity demand for heating is reduced with higher winter temperatures.
Key Messages:
Changing temperatures, shifting precipitation patterns, increasing climate variability and more frequent extreme weather events can alter the availability and predictability of water and disrupt energy production and distribution.
The future of the water-energy nexus will depend on energy and water needs, which will be shaped by climate change as well as population growth and migration patterns.
There is both regional and seasonal variability in the effects of climate change and other future trends.
High uncertainty underscores the importance of models because exploring interactions and identifying emergent properties enables decision making that is robust to a multitude of possible futures.
The future of the nexus hinges on a number of things that are within the DOE’s long term scope of influence such as technology options, location of energy activities, and fuel source mix.

June 2014 The Water-Energy Nexus: Challenges and Opportunities
30
Figure 3.1. Temperature change in the United States (1901–2012). Source: EPA 2013
Shifts in precipitation patterns including the timing and intensity of rainfall also have implications for the
energy sector. Overall, precipitation in the United States is projected to decrease, but there are regional
and seasonal differences to consider. Summer precipitation is expected to decrease in most states.
However, northern states should see an increase in precipitation during winter and spring (Figure 3.2).
Another important consideration is the fact that more precipitation is expected to fall as rain rather than
snow (USGCRP 2009). This, combined with increasing average temperatures, will likely cause runoff to
begin earlier in the spring, which could affect when water is available for hydropower and other energy
activities (DOE 2013a).
These changes in precipitation can cause problems for power plants if less water is available in the
summer months, when electricity demand for cooling is highest. Shifting precipitation patterns also
present a challenge for bioenergy production. Increasing temperatures may extend the growing season
and open up new areas for cultivation that were previously impractical (DOE 2013a). However, less
precipitation in the summer months may decrease crop yields. The combined effect of temperature and
precipitation changes on bioenergy production will depend on the type of crop and how readily producers
can alter crop mixes.

The Water-Energy Nexus: Challenges and Opportunities June 2014
31
Figure 3.2. Projected future changes in precipitation by 2080–2099. Source: USGCRP 2009
Relative to average seasonal precipitation in 1961–1979 under the A2 emission scenario and simulated by 15 climate models;
hatched areas indicate highest confidence in the projected change.
With less precipitation in some areas, energy producers may turn to groundwater resources to supplement
stressed surface water supplies. For example, 13 percent of current thermoelectric cooling systems use
groundwater, but 30 percent of planned cooling systems are expected to use groundwater (Figure 3.10).
This may be due to the fact that recirculating cooling technologies are becoming more common. Almost
a quarter of current recirculating cooling systems use groundwater, compared to less than 1 percent of
once-through cooling systems (EIA 2013a). Unfortunately, some regions are withdrawing more water
from underground aquifers than is replenished. Between 1900 and 2008, groundwater depletion totaled
approximately 1,000 cubic kilometers, with maximum rates occurring in the 2000 to 2008 time period
(Konikow 2013).
Although the agricultural sector accounts for most of the groundwater withdrawals in the United States
(Figure 2.1), the energy sector must be conscious of this competing use, especially if groundwater
becomes more widely used in thermoelectric cooling operations.
In coastal areas, this issue is exacerbated by increasing saltwater intrusion. Although most coastal
aquifers naturally experience some level of saltwater intrusion, groundwater depletion can cause
excessive amounts of saltwater to flow into these underground layers. Overdrawn aquifers have less

June 2014 The Water-Energy Nexus: Challenges and Opportunities
32
freshwater keeping the impeding saltwater at bay, which allows for more saltwater to move laterally from
the ocean into groundwater sources. This can contaminate the aquifer to the point where it becomes
impractical to use for energy activities as well as non-energy applications (e.g., drinking water).
Furthermore, if global climate change leads to sea level rise, even more saltwater could seep downward
into groundwater supplies. Saltwater intrusion has already had substantial impacts on coastal aquifers in
New Jersey, Southeastern Florida, and Southern California (Barlow and Reichard 2010). However,
coastal areas have already begun to develop ways of using nontraditional water sources, which can help
with this issue.
While projections suggest that higher temperatures and lower precipitation will hit the Southwest region
of the United States the hardest, these regions may be more equipped to effectively manage decreasing
water resources because they have a history of dealing with water scarcity challenges. For example, the
Western Governors‘ Association works with various stakeholders to understand the relationship between
energy and water as they develop strategies to promote water-conscious electricity generation and
transmission (Western Governors‘ Association 2010). Additionally, coastal states have already attempted
to overcome freshwater scarcity by turning to saline water for thermoelectric cooling (Figure 2.10). In
both California and Florida, more than 25 percent of thermoelectric plants use saline water for cooling
purposes, which is much higher than the national average of 6 percent (EIA 2013a). However, concerns
with excessive withdrawals and thermal pollution have compelled the California Water Resources Control
Board to regulate saline water usage in power plants. To comply with the mandated 93 percent reduction
in saline water use, most of the affected power plants are planning on retiring the once-through saline
cooling systems and switching to air cooling or evaporative cooling towers (California State Water
Resources Control Board 2013).
As the effects of climate change unfold, another important consideration for the water-energy nexus is
competing water demand. Higher temperatures and precipitation changes are likely to increase water
stress in some areas. However, competition for water resources in non-energy applications is also
expected to increase as population growth raises demand for things such as domestic water use and
irrigation for food crops (Figure 3.3). Additionally, the energy sector must compete with the water
demands of the natural environment, including plants and wildlife. This can lead to issues for the energy
sector such as greater restrictions on hydropower generation and licensing due to Endangered Species Act
considerations.
Figure 3.3. Projected percent change in population by region of the United States (2000–2030). Data source: U.S. Census Bureau 2005

The Water-Energy Nexus: Challenges and Opportunities June 2014
33
It is important to note that the future impacts of climate change on the energy sector are fairly uncertain
(DOE 2013a). This is largely due to the fact that climate forecasts and the impacts on the energy sector
are at fundamentally different scales. Consequently, current models struggle to adequately characterize
the effects of climate-related events such as storms, sea-level rise, floods, heat waves, and droughts on the
energy sector (Pielke et al. 2012). Chapter 6 provides a more detailed discussion of these issues and
explores possible areas for future modeling and analysis work that can help meet the challenges outlined
in this chapter and the rest of this report.
3.2 Water Variability
Higher average temperatures and less precipitation will require producer adaptability in many areas of the
energy sector. However, this could be increasingly difficult because of the inherent variability in the
water supply. Changes in regional precipitation patterns and more frequent and severe drought and floods
will make it more difficult to predict when and where water will be available. This is especially
problematic when attempting to choose sites for future water-intensive energy activities such as
thermoelectric power plants.
Figure 3.4 shows annual precipitation in the United States over the past seven years. In 2007, the
Southeast experienced relatively low levels of precipitation, but that was quickly followed by a year of
relatively high levels of precipitation in 2009. The Southwest region of the United States saw similar
fluctuations in precipitation. On average, the Southwest receives less precipitation than other areas of the
country, but it experienced especially low levels of precipitation in 2011 and 2012 (PRISM Climate
Group 2013).
Although variability in annual precipitation is a concern, the energy system must also be capable of
handling rapid fluctuations in water availability due to extreme weather events such as droughts and
floods. For example, the severe drought that covered much of the United States in 2012 damaged corn
crops used for ethanol and disrupted barge traffic used to transport petroleum and coal (EIA 2012).
Conversely, too much water due to floods, storm surges, and sea-level rise can also impact the energy
sector by damaging infrastructure and inundating energy facilities. Such was the case in Colorado in
September 2013 when flooding damaged natural gas pipelines and electric power substations and also
forced oil and gas companies to shut down well operations in affected areas.

June 2014 The Water-Energy Nexus: Challenges and Opportunities
34
Figure 3.4. Annual average precipitation, 2006–2012.
Source: PRISM Climate Group 2013
3.3 The Future of Electricity Generation
Thermoelectric power generation accounts for nearly half of the water use in the United States (Figure
2.1). The implications of climate change and other future trends in the area of electricity generation
depend on a number of factors: The location of power plants, the fuel source, the water source, and the

The Water-Energy Nexus: Challenges and Opportunities June 2014
35
type of generation and cooling technology used for future electricity generation can either exacerbate or
mitigate the stress on the water-energy system.
3.3.1 Fuel Sources
In the Reference case for its 2013 Annual Energy Outlook (AEO), EIA projects overall U.S. electricity
generation to increase by 16 percent between 2010 and 2030 (Figure 3.5). Although the overall
generation increases, the energy mix changes as well. Coal‘s share of electricity generation decreases and
is replaced by increased shares for natural gas and renewable sources. While electricity generation using
natural gas is typically water-intensive (Figure 2.3), the water requirements for this additional capacity
will hinge on other plant characteristics such as generation technology (e.g. combined cycle) and type of
cooling system. The additional renewable electricity generation will most likely have relatively low
water withdrawals, but certain types of generation such as CSP and EGS have significant water
consumption factors depending on which generation and cooling technology is being used (Figure 2.3).
It is important to note that EIA‘s Reference case is one of many possible scenarios. For example, if the
United States were to introduce a carbon dioxide emissions price, the energy mix for electricity
generation might look much different (Figure 3.5, Low Carbon case16
). According to EIA, total
electricity generation would decrease and coal would lose almost its entire share to other fuel types.
However, characterizing the water implications of this potential scenario is not straight forward. While
having less coal-fired power would most likely decrease water withdrawals, the precise quantity of water
savings would largely depend on what type of generation technologies and cooling systems the other
sources of electricity used. For example, if the additional generation from natural gas used combined
cycle technologies and also relied on recirculating cooling, water withdrawals would decrease, but water
consumption would increase.
Under an alternative scenario where the United States experiences an increase in domestic production of
oil and gas, EIA predicts an increase in total electricity generation and expects natural gas to claim nearly
40 percent of electricity generation while coal retains a significant share (Figure 3.5, High Oil and Gas
case17
). This large increase in total generation would require developing a significant amount of new
capacity, which would provide an opportunity to make water-conscious decisions when considering the
various generation technology and cooling system options.
The National Renewable Energy Laboratory (NREL) also developed electricity generation projections,
which are presented in Figure 3.5. When compared to EIA‘s Reference case, NREL‘s baseline scenario
assumes less electricity generation in 2030 and is much less optimistic about the future of natural gas.
NREL‘s forecast also shows an increase in coal-fired electricity generation, which was not the case in any
of EIA‘s scenarios. NREL argues that generating 80 percent of electricity from renewable sources by
2050 is a viable future scenario, but that it would require significant advances in areas of the electric
power sector such as transmission, system flexibility, and storage capacity. Under this scenario, nearly
16
Refers to EIA‘s AEO 2013 ―Greenhouse Gas $25‖ scenario, which assumes a carbon dioxide emission price
throughout the economy, starting at $25 per metric ton in 2013 and increasing by 5 percent per year. 17
Refers to EIA‘s AEO 2013 ―High Oil and Gas Resource‖ scenario, which assumes shale gas, tight gas, and tight
oil well estimated ultimate recoveries are 100 percent higher than in the Reference case, and that the maximum well
spacing is 40 acres. The scenario also includes kerogen development, tight oil resources in Alaska, and 50 percent
higher undiscovered resources in Alaska as well as offshore in the lower 48 states than in the Reference case.

June 2014 The Water-Energy Nexus: Challenges and Opportunities
36
half of electricity generation comes from renewable sources in 2030 and only 5 percent comes from
natural gas (Figure 3.5, Renewables case18
).
Figure 3.5. Total U.S. electricity generation in 2010 (billion kWh) and forecasted total U.S. electricity generation in 2030 (billion kWh) by EIA and NREL scenarios and by fuel source. Data source: EIA 2013b and NREL 2012
There are discrepancies between EIA and NREL in 2010 because the NREL scenarios are based on data from 2009
Figure 3.5 illustrates the variety of possible future scenarios for electricity generation, which all have
vastly different implications for the water-energy nexus. The significant variation in each of EIA‘s and
NREL‘s projections suggests a considerable level of uncertainty and illustrates the importance of
pursuing both water- and energy-efficiency measures across all aspects of the electric power sector.
Reviewing planned retirements and proposed additions to generation capacity can be useful when
discussing nearer-term outlooks for the electric power sector and the associated implications for the
water-energy nexus. Figure 3.6 shows the fuel type for the capacity that is planning to retire or proposing
to come online in the next five years. It is important to recognize that these are not projections and are
merely based on what electricity generation plants are reporting. Most of the planned capacity
retirements come from coal-fired power while new natural gas and renewable generation capacity is being
added. There is also some nuclear power expected to come online in the next three to five years.
18
Refers to NREL‘s ―80% RE-ITI‖ scenario, which assumes 80 percent renewable electricity penetration by 2050
and incremental technology improvement.

The Water-Energy Nexus: Challenges and Opportunities June 2014
37
Figure 3.6. Planned retirements and additions of U.S. generation capacity by fuel source (2013–2017). Data source: EIA Form 860 (EIA 2013a)
While it is useful to examine the future of electricity generation at a national level, characterizing water-
energy issues requires consideration of region-specific concerns as well. Figure 3.7 shows the location,
relative capacity, and fuel source for all planned retirements and additions over the next nine years. More
than 90 percent of them are expected to come online by 2016, but some have proposed start dates as late
as 2022 (EIA 2013a). The heavily water-stressed areas in the Western United States that are expected to
experience some of the greatest climate change impacts are planning to use renewable electricity to meet
future demand. This will help ameliorate the issue because renewable electricity generation requires
much less water. However, some renewable sources such as water-cooled CSP or EGS typically consume
more water than traditional sources (i.e., coal, natural gas, and nuclear) (Figure 2.3). It is important to
note that in the West, the agriculture sector uses much more water than thermoelectric power plants do
(Kenny et al. 2009). Retirements and additions of generation units will have a much larger impact in the
East, where a majority of water is withdrawn by thermoelectric power plants. In this area, several large
coal-fired plants are set to retire, which may reduce withdrawal rates. However, the large nuclear

June 2014 The Water-Energy Nexus: Challenges and Opportunities
38
generators planned for the Southeast could have significant water implications given that nuclear plants
tend to have comparatively higher water consumption rates than other types of power plants (Figure 2.3).
Figure 3.7. Planned additions and retirements of generation units by fuel source (2013–2022). Data source: EIA Form 860 (EIA 2013a)
Size of dot indicates nameplate capacity.
3.3.2 Cooling Requirements and Technologies
Another dimension that has important implications for the future of the water-energy nexus is the cooling
requirements for the planned retirements and additions. While more than 90 percent of the capacity set to
Min: 0.4 MW
Max: 2,500 MW
Planned Retirements (40 GW)
Planned Additions (59 GW)

The Water-Energy Nexus: Challenges and Opportunities June 2014
39
retire requires cooling, only 45 percent of the planned additional capacity requires cooling (Figure 3.8).19
However, much of this cooling-free additional capacity will come from gas combustion turbines in new
combined cycle units; although the combustion portions of these proposed combined cycle units will not
require cooling, the steam turbine counterparts will. Some proposed gas combustion turbines will be
retrofitted on existing steam cycle generators in order to create combined cycle units. Therefore, these
units will be generating more electricity without using any additional water for cooling. However, it is
important to note that these gas combustion turbines, like steam turbines, will require some water for
process makeup.
Figure 3.8. Planned additional U.S. electricity generation capacity (MW) by cooling requirement and fuel source (2013–2022). Data source: EIA Form 860 (EIA 2013a)
Beyond merely cooling requirements, it is also important to consider the types of cooling technologies
that the scheduled retirements are using and that the proposed additions are planning to use. Many of the
generation units set to retire by 2022 use once-through cooling technologies, while many of the
anticipated new generation units are expected to use recirculating cooling technologies (Figure 3.9). The
Eastern states will experience the most drastic changes in cooling practices because that is where the
largest planned retirements and additions are scheduled to occur. Figures 3.7 and 3.9 reveal that, in this
region, many large coal-fired power plants using once-through cooling are expected to retire and be
replaced by natural gas and nuclear plants using recirculating technologies. Shifting away from once-
19
Each generator was categorized as either requiring or not requiring cooling based on its prime mover. The
following prime movers were categorized as requiring cooling: steam turbine, including nuclear, geothermal, and
solar steam (does not include combined cycle); combined cycle steam part; combined cycle single shaft (combustion
turbine and steam turbine share a single generator); combined cycle total unit (used only for plants/generators that
are in the planning stage, for which specific generator details cannot be provided); and turbines used in a binary
cycle (including those used for geothermal applications). All others were categorized as not requiring cooling. For
a full list of prime movers, see http://www.eia.gov/survey/form/eia_860/form.pdf.

June 2014 The Water-Energy Nexus: Challenges and Opportunities
40
through cooling will reduce water withdrawals, but using recirculating cooling will increase water
consumption (Figure 2.3).
Figure 3.9. Planned additions and retirements of generation units by cooling technology (2013–2022). Data source: EIA Form 860 (EIA 2013a)
Size of dot indicates nameplate capacity. Grey dots are sites that did not report cooling system operations.
3.3.3 Cooling Water Sources
The future of electricity generation also depends on the types of water sources power plants utilize for
cooling operations. More than 75 percent of existing cooling systems use surface water (Figure 3.10).
However, future systems planning to come online by 2022 are diversifying their water source types. Only
20 percent of proposed cooling systems are planning to use surface water, while 25 percent and 30
Min: 0.4 MW
Max: 2,500 MW
Planned Retirements Requiring Cooling (36 GW)
Planned Additions Requiring Cooling (32 GW)

The Water-Energy Nexus: Challenges and Opportunities June 2014
41
percent plan to use plant discharge and groundwater, respectively. In addition, 17 percent of proposed
systems will not require water because they are dry cooling systems.
A similar trend emerges when examining current and future cooling systems by water type. More than 75
percent of existing systems use fresh water for cooling operations. However, a smaller proportion of
proposed systems are planning to draw from fresh water sources and instead plan to utilize reclaimed
water or dry cooling technologies.
Figure 3.10. Existing and proposed cooling systems by source type and water type. Data source: EIA Form 860 (EIA 2013a)
Proposed systems are scheduled to come online between 2013 and 2022.
As climate change impacts come to bear, the diversification of cooling water sources will help boost
resilience in the electric power sector, especially with a high number of proposed systems turning to
reclaimed plant discharge water and dry cooling. Unfortunately, only 60 cooling systems are expected to
June 2014 The Water-Energy Nexus: Challenges and Opportunities
42
come online in the next 10 years, which is less than 4 percent of the number of existing systems.
Therefore, while it is encouraging that future systems will utilize a wide variety of water sources, existing
systems will need to make some changes in order to have a significant impact.
3.3.4 Carbon Capture and Storage
Another consideration that could have substantial implications for the water-energy nexus is the
deployment of CCS technologies. Widespread use of CCS could mitigate some of the climate change
impacts expected to intensify water stress in some areas. As of April 2011, there were 30 small-scale
CCS facilities operating in the United States (PNNL 2012). In EIA‘s Reference case, only 930 MW of
capacity with CCS are forecasted to come online by 2040 (EIA 2013b). The largest barrier to deployment
is the cost of currently available CCS technologies. Depending on the type of facility, the levelized cost
of energy is anywhere from 36 percent to 78 percent higher for a new power plant using CCS than one
without it (NETL 2010). Even if a carbon dioxide emissions price were introduced (Low Carbon case),
EIA predicts that about 50,000 MW of capacity with CCS will come online by 2040, which is only 4
percent of forecasted capacity.
Even if technological advances in CCS reduce the costs, the water and energy intensities of operating
these systems are also potential barriers to deployment. According to NETL (2010), the parasitic power
required to carry out the carbon capture processes can reduce the net efficiency at a power plant by up to
11 percent. It is important to note that NETL assumes full carbon capture, but partial carbon capture
could be implemented with less of a deleterious effect on power plant operations. Additionally, current
monoethanolamine-based carbon capture technology doubles the water requirements for electricity
generation (Figure 2.5). However, it also produces wastewater that, after treatment, could help meet those
increased water requirements. The water and energy requirements as well as the cost of currently
available CCS technologies underscore the importance of pursuing less water-intensive and more efficient
and cost-effective options for carbon capture technologies. Chapter 5 provides a detailed discussion of
opportunities for technology research and development in the area of CCS.
3.4 The Future of Hydropower
Hydroelectricity accounts for 56 percent of U.S. renewable electricity generation and 7 percent of total
U.S. electricity generation (EIA 2013b). Although hydropower facilities do not technically withdraw or
consume water for generation, there is a consumptive loss of water due to evaporation from reservoirs
created by hydropower facilities. Very few hydroelectric plants are being built in the United States
(Figure 3.11), but those in operation may face significant challenges related to climate change.

The Water-Energy Nexus: Challenges and Opportunities June 2014
43
Figure 3.11. Location and operating status of U.S. hydropower plants. Data source: EIA Form 860 (2013a)
Size of dot indicates nameplate capacity.
The future of hydropower in the water-energy nexus mostly depends on how climate change will impact
the availability and variability of the water resources used for hydroelectricity generation. A recent DOE
report concerning the effects of climate change on federal hydropower predicts a 2 percent reduction in
hydroelectric generation due to changes in the timing and total amount of water from runoff (DOE
2013b). While 2 percent may seem relatively minor, increased frequency and intensity of extreme
weather events (e.g., droughts and floods) pose significant operational challenges.
Increasing temperatures, shifts in precipitation patterns, and more intense floods and droughts can create
unplanned variability in the amount and timing of water available to hydropower plants. This would
affect scheduling and optimizing operations. For example, it could reduce available generation capacity
or, conversely, lead to oversupplies of power when it is not as valuable.
For example, more precipitation falling as rain rather than snow is reducing the amount of snowpack in
some areas (ORNL 2012), which shifts the timing of runoff earlier in the calendar year. Snowpack is an
important reservoir for water required in hydroelectric generation and areas of the Southwest, especially
inland California, have experienced much lower levels of snowpack in recent years (Figure 3.12).
Along with timing and availability implications, decreasing snowpack also means less cold water is
entering rivers from mountain runoff, which increases water temperatures and creates water quality
issues, especially in the hot summer months. Higher air temperatures are also contributing to this water
scarcity problem by increasing evaporation rates for surface waters.
Min: 0.1 MW
Max: 6,809 MW

June 2014 The Water-Energy Nexus: Challenges and Opportunities
44
Figure 3.12. April snowpack from 2010–2013 as a percent of historical median (1981–2010). Source: NRCS 2013

The Water-Energy Nexus: Challenges and Opportunities June 2014
45
3.5 The Future of Oil and Gas Exploration and Production
Oil and gas exploration and production requires water for various activities including drilling and
completion of wells, refining, and transport. Future oil and gas production may be at risk, because
climate change impacts may create problems with water availability in some areas. Water-conscious
operations will become increasingly important because oil and gas production is expected to rise in the
near term (Figure 3.13).
Figure 3.13. Total U.S. energy production in 2010 (quadrillion Btu) and forecasted total U.S. energy production in 2030 by EIA scenario. Data source: EIA 2013b
However, increased oil and gas production could also have benefits for the water-energy nexus. With
more production comes more produced water, which could supplement available supplies and provide
operators with more opportunity for flexible water management strategies (DOE 2013a). There are large
variations in the quality of produced water, so proper treatment is an especially important consideration
(see Chapter 2). In addition, collecting water from each well within a play, transporting that water, and
managing the variability in the flows of produced water over time make it especially challenging to put
the water to productive use.
In the United States, some of the oil and gas resources are located in relatively water-scarce regions,
which could put additional stress on the water system as exploration and production expands. For
example, there are several shale plays in Texas and the Rocky Mountain states (Figure 3.14). Conversely,
there are also several plays in relatively water-abundant regions such as the Northeast. This area of the
country, however, has relatively less experience in the oil and gas industry. Managing produced water
from oil and gas production is a new challenge for the Northeast, and the region is faced with several
regulatory and geological challenges (see Chapter 4). As production expands in this region, it will become
increasingly important to ensure water quality.

June 2014 The Water-Energy Nexus: Challenges and Opportunities
46
Figure 3.14. Shale plays in the lower 48 states. Source: EIA 2011
Regional water availability issues due to climate change are not the only concern for oil and gas
production. Extreme weather events can also disrupt extraction, refining, and distribution of these
resources (DOE 2013a, PNNL 2012, ORNL 2012). For example, increases in the intensity of storms and
sea level rise can affect energy infrastructure located along the coast. More frequent periods of floods and
droughts can interrupt and delay fuel transport by barge due to fluctuating water levels in rivers and ports.
Additionally, fuel transport by railroad has the potential for increased disruption in areas of Southern
California and the Northeast that are prone to flooding.
3.6 The Future of Biofuels
Biofuels currently account for about 9 percent of liquid fuel production in the United States. However,
there is significant uncertainty regarding the future of biofuel production given that the current policy
landscape is in a period of major flux. This is especially true with respect to the Renewable Fuel Standard
(RFS), which has significant implications for domestic biofuel production (see Chapter 4). EIA expects
production to increase in the near term, but fall well short of the RFS target of 36 billion gallons by 2022.
This is largely due to a decline in gasoline consumption not anticipated in 2007 when these targets were
established, as well as sluggish technology and infrastructure deployment (EIA 2013b).
Although the EPA has the authority to adjust the RFS requirements annually, the current requirements
call for 16 billion ethanol-equivalent gallons of cellulosic biofuels by 2022 (Table 4.2). This includes
ethanol or diesel produced from non-food feedstocks such as corn stover, wood and crop residues, and
switchgrass, which all have varying water intensities. Thus, the water implications of the RFS mandate

The Water-Energy Nexus: Challenges and Opportunities June 2014
47
will depend on the mix of feedstocks used to meet the requirement and whether they are irrigated or not
(Table 2.1). In addition, the RFS also calls for 3 billion ethanol-equivalent gallons of other advanced
biofuels such as sugarcane-based ethanol, renewable diesel, and biodiesel. The water implications of this
portion of the RFS are also murky because some feedstocks are more water intensive than others. For
example, biodiesel from algal oils (Beal et al. 2012) and soybean oils (Table 2.1) require much more
water than other types of biofuels.
Other alternative fuels also have important water implications. Synthetic vehicle fuels derived from coal,
natural gas, or biomass require large amounts of water for cooling and as a source of hydrogen atoms.
The potential scale of the synthetic fuels industry and the concentrated regional impacts make it an
important consideration as the future of the water-energy nexus unfolds.
The effects of climate change can also impact predictions for the future of biofuel production. Higher
temperatures and shifting precipitation patterns can either enhance or degrade yields, depending on the
region and type of crop (ORNL 2012). For example, some areas of the country are expected to
experience drier summers with more frequent and intense droughts, which would decrease crop yields and
increase reliance on irrigation. However, at least for the near term, projections for increased precipitation
in the Northern states in the winter and spring could improve yields for some crops (DOE 2013a).
Furthermore, the implications will be very different if feedstock choices shift away from crops and toward
wood and grass sources (ORNL 2012). The eventual impacts also hinge on a number of other factors
including competition with the food production industry for resources such as water and land.
3.7 Challenges and Opportunities
Although impending climate change impacts such as higher temperatures, shifting precipitation patterns,
and more frequent extreme events may intensify water stress in some areas of the United States, there are
opportunities to develop more resilience in the energy system and ensure energy security for future
generations. The future of the water-energy nexus will depend on a number of aspects that are within
DOE‘s long-term scope of influence. DOE has a direct impact on some aspects such as technology
options and has indirect influence over other aspects such as the location of energy activities and fuel
source mix. Decision making in these areas, however, requires better understanding of the impacts of
climate change and other future trends on the water-energy nexus. Chapter 6 discusses DOE‘s current
modeling and analysis capabilities, and prioritizes areas for future work, which can help to more
accurately characterize the future of the nexus.
In the meantime, there are a number of opportunities for DOE and its partners to support the development
of an energy system that is resilient and prepared for the full spectrum of possible futures. For example,
decreasing the water intensity of the electric power sector would make a significant impact. Many water-
intensive plants are retiring and being replaced by natural gas and renewable power plants, which helps to
ease the sector‘s water dependence. However, there is a possibility for further water efficiency gains by
developing and deploying cooling technologies that require less water or do not require any water at all.
Furthermore, discovering practical uses for water from nontraditional sources such as saline water or
reclaimed water could supplement stressed freshwater resources. These and other technology options
with implications for the water-energy nexus are discussed further in Chapter 5.
Other aspects of the energy system are also dependent on water. Oil and gas production is expected to
increase in the near future. This has important implications for the water-energy nexus because this
sector requires water at various points throughout the life cycle. Some resource plays are in relatively

June 2014 The Water-Energy Nexus: Challenges and Opportunities
48
water-abundant regions of the country while others are in more water-stressed areas. Therefore, paying
close attention to water implications when choosing sites for future oil and gas activities will become
increasingly important. Additionally, it is vital to ensure that these activities do not contaminate water
resources. This is especially true in water scarce regions where water resources are more vulnerable to
potential contamination. Although oil and gas production presents many challenges for the water-energy
nexus, the potential benefits from produced water may provide an opportunity to ease water stress in the
oil and gas industry.
Future efforts aimed at strengthening the resilience of the energy system would benefit from more
integrated approaches. As the country‘s energy portfolio evolves and expands, careful planning and
important decisions must be made concerning science and technology options. More integrated thinking
could help ensure that these decisions are made while considering the implications for both the energy
and water systems. This would enable policy makers and other stakeholders to make informed decisions
that advance resilience and safeguard energy security.

The Water-Energy Nexus: Challenges and Opportunities June 2014
49
References
Barlow, Paul M., and Eric G. Reichard. 2010. ―Saltwater intrusion in coastal regions of North America.‖
Hydrogeology Journal 18(1): 247–260.
Beal, Colin M., Robert E. Hebner, Michael E. Webber, Rodney S. Ruoff, A. Frank Seibert, and Carey W.
King. 2012. ―Comprehensive Evaluation of Algal Biofuel Production: Experimental and Target Results.‖
Energies 5(6): 1943–1981.
California State Water Resources Control Board. 2013. ―Once-Through Cooling Fact Sheet.‖ Sacremento,
CA: California State Water Resources Control Board. May 14. Accessed September 16, 2013.
www.swrcb.ca.gov/publications_forms/publications/factsheets/docs/oncethroughcooling.pdf.
DOE (U.S. Department of Energy). 2013a. U.S. Energy Sector Vulnerabilities to Climate Change and
Extreme Weather. Washington, DC: DOE.
DOE (U.S. Department of Energy). 2013b. Effects of Climate Change on Federal Hydropower.
Washington, DC: DOE.
EIA (U.S. Energy Information Administration). 2011. ―Lower 48 states shale plays.‖ U.S. Department of
Energy. May 9. Accessed September 6, 2013. www.eia.gov/oil_gas/rpd/shale_gas.pdf.
EIA (U.S. Energy Information Administration). 2012. ―Today in Energy: Worst Drought in Decades
Could Affect U.S. Energy Markets.‖ U.S. Department of Energy. August 28. Accessed October 29, 2013.
www.eia.gov/todayinenergy/detail.cfm?id=7730.
EIA (U.S. Energy Information Administration). 2013a. ―Form EIA-860 detailed data – 2012,‖ Early
Release. U.S. Department of Energy. June 20. Accessed August 2, 2013.
www.eia.gov/electricity/data/eia860/.
EIA (U.S. Energy Information Administration). 2013b.Annual Energy Outlook 2013. Washington, DC:
EIA.
EPA (U.S. Environmental Protection Agency). 2013. ―Climate Change Indicators in the United States:
U.S. and Global Temperature.‖ EPA. August. Accessed September 2013.
www.epa.gov/climatechange/science/indicators/weather-climate/temperature.html.
Kenny, J.F., et al. 2009. Estimated Use of Water in the United States in 2005. Reston, VA: U.S.
Geological Survey.
Konikow, L.F. 2013. Groundwater Depletion in the United State (1900-2008). Reston, VA: U.S.
Geological Survey.
NETL (National Energy Technology Laboratory). 2010. DOE/NETL Carbon Dioxide Capture and
Storage RD&D Roadmap. Washington, DC: U.S. Department of Energy.
NOAA (National Oceanic and Atmospheric Administration). 2013. Regional Climate Trends and
Scenarios for the U.S. National Climate Assessment. Washington, DC: U.S. Department of Commerce.
NRCS (Natural Resources Conservation Service). 2013. ―Mountain Snowpack Maps for the Western
United States.‖ U.S. Department of Agriculture. April 1. Accessed February 2014.
www.wcc.nrcs.usda.gov/cgibin/westsnow.pl.

June 2014 The Water-Energy Nexus: Challenges and Opportunities
50
NREL (National Renewable Energy Laboratory). 2012. Renewable Electricity Futures Study. Golden,
CO: NREL.
ORNL (Oak Ridge National Laboratory). 2012. Climate Change and Energy Supply and Use: Technical
Report to the U.S. Department of Energy in Support of the National Climate Assessment. Washington,
DC: U.S. Department of Energy.
Pielke Sr., Robert A., Rob Wilby, Dev Niyogi, Faisal Hossain, Koji Dairuku, Jimmy Adegoke, George
Kallos, Timothy Seastedt, and Katharine Suding. 2012. ―Dealing With Complexity and Extreme Events
Using a Bottom-Up, Resource-Based Vulnerability Perspective.‖ Extreme Events and Natural Hazards:
The Complexity Perspective 2012: 345–359.
PNNL (Pacific Northwest National Laboratory). 2012. Climate and Energy-Water-Land System
Interactions: Technical Report to the U.S. Department of Energy in Support of the National Climate
Assessment. Washington, DC: U.S. Department of Energy.
PRISM Climate Group. 2013. ―PRISM Products Matrix.‖ Oregon State University. June 13. Accessed
August 2013. www.prism.oregonstate.edu/recent/.
U.S. Census Bureau. 2005. ―2005 Interim State Population Projections.‖ U.S. Department of Commerce.
Accessed August 2013. www.census.gov/population/projections/data/state/projectionsagesex.html.
USGCRP (U.S. Global Climate Change Research Program). 2009. Global Climate Change Impacts in the
United States. New York: Cambridge University Press.
Western Governors‘ Association. 2010. ―Project Update: The Energy-Water Nexus and Regional
Transmission Planning.‖ Western Governors‘ Association. December. Accessed September 2013.
www.westgov.org/sptsc/meetings/January%202011/briefing/12-2010ewn-rtp.pdf.

The Water-Energy Nexus: Challenges and Opportunities June 2014
51
Chapter 4: Decision-Making Landscape
The water-energy decision landscape is highly complex and fragmented. This is the result of multiple
factors, including the distribution of jurisdictional responsibility among federal, state, and local law-
makers, inherent differences in resource abundance and historical resource development across the nation,
and a diverse set of actors and interests. Nevertheless, there are opportunities for policy harmonization
between the energy and water spheres. Synergistic approaches to energy and water challenges are being
pursued and adopted at various scales domestically and internationally.
The water-energy decision landscape in the United States is affected by both market and non-market
drivers. This report focuses on the most significant energy producers and water utilities and how market
and non-market drivers affect their day-to-day operations and longer-term water-energy-related planning
and investment decisions.20
This chapter begins with a description of the key non-market and market
drivers that are separately at work in the larger energy and water decision landscapes. The complexity of
the decision framework for water is particularly pronounced, given the nature of the resource (i.e., it can
be utilized in multiple states and upstream versus downstream usage), the need for it to serve multiple
purposes (e.g., power generation, biofuel feedstock cultivation, flood risk management, recreation, and
ecosystem management), and site-specific challenges.
This chapter explores these broader decision contexts and frameworks and then moves into a detailed
look at the sector-specific energy-water landscape for oil and gas, electric power, biofuels, and water and
wastewater utilities, with a focus on the major energy-water challenges, regulatory responses, and facility
responses in these sectors. The chapter then turns to the international dimension to learn from some of
the most water-scarce countries in the world about how they address their energy and water needs. The
chapter ends with a list of key challenges and opportunities, both within and across sectors.
4.1 Framework for Energy Decision Making
The fragmented U.S. energy policy framework is shaped by federal, state, and local entities in the form of
laws, regulations, financial incentives/disincentives, and guidelines. International treaties also play a role.
The framework deals with issues related to energy production, distribution, and consumption.
20
This report focuses on the supply side; end-user water-energy decision making and landscapes (e.g., household
appliances) are not covered.
Key Messages:
The water-energy decision landscape is highly fragmented; it is comprised of diverse actors and interests, overlapping but not necessarily consistent incentive structures, and inherent regional variation in water and energy availability.
There is opportunity for policy harmonization between the energy and water spheres.
Synergistic approaches to energy and water challenges can stimulate the development and deployment of solutions that address objectives in both domains.
We can learn from promising models of integrated water-energy decision making at various scales
domestically and internationally.

June 2014 The Water-Energy Nexus: Challenges and Opportunities
52
A number of relevant federal laws have been passed since 1920, and all have shaped the energy policy
landscape of the country. Among Energy Policy Acts, the more overarching or cross-sector energy
policies became a mainstay only after the 1973–1974 Arab oil embargo, commonly referred to as the
1973 oil crisis. The current energy policy landscape is most influenced by three recent acts: the 2005
Energy Policy Act (EPAct 2005), the 2007 Energy Independence and Security Act, and the American
Recovery and Reinvestment Act of 2009. These acts authorized numerous provisions for energy
development— including mandates and incentives for renewable fuels for transportation and power
generation.21
Also highly relevant have been the 1970 Clean Air Act (CAA) and the 1972 and 1990 CAA
Amendments. Additionally, under the 2001 Executive Order (E.O. 13211) any federal agency proposing
a rulemaking deemed to be a ―significant energy action‖ must prepare a Statement of Energy Effects and
submit the Statement to the Office of Information and Regulatory Affairs (OIRA) in the Office of
Management and Budget (OMB). The Statement, or a summary, must be included in the proposed and
final rulemaking notices published by the agency.22
State and regional policies that play a significant role in the overall energy policy development include
renewable portfolio standards (RPSs), also referred to as renewable electricity standards (RESs), and
climate change or greenhouse gas mitigating policies such as California‘s low-carbon fuel standard and
multi-state climate initiatives.23
While such area-specific initiatives include some of the most innovative
and effective energy and climate policies, they have also led to a patchwork of energy and climate
policies across the country. The Obama Administration‘s Blueprint for a Secure Energy Future, rolled
out in March 2011, seeks to develop all U.S. energy sources in a safe and responsible way and builds a
clean and secure energy future (Office of the Press Secretary 2013). In terms of market drivers, relative
fuel prices at the national and regional levels play a big role.
4.1.1 Renewable Energy Mandates
A wide range of federal and state policies can be considered renewable energy mandates. However, the
most significant are the RPSs at the state level. RPSs are designed to require utilities to use renewable
energy. The mechanism stipulates the share of electricity that has to be supplied from renewable
resources by a certain date or year, sometimes with short-term targets. As of January 2012, 30 states had
established RPSs and 7 states had renewable portfolio ―goals,‖ which, unlike RPSs, are not legally
binding (Figure 4.1). Generally, the renewable resources stipulated in RPSs include wind, solar,
geothermal, biomass, and some types of hydroelectricity, but some also include landfill gas, municipal
solid waste, and tidal energy.
Most states set targets for specific renewable generation sources or technologies that reflect the state‘s
resource base or preferences.24
California‘s RPS, for example, requires electric utilities in the state to
21
The acts also authorize energy conservation, such as the Corporate Average Fuel Economy (CAFE) standards and
ENERGY STAR program, and include provisions for responsible ultra-deepwater and unconventional oil and gas
production. 22
A Statement of Energy Effects includes information on any adverse effects on energy supply, distribution, or use,
and reasonable alternatives to the action along with the expected effects of such alternatives on energy supply,
distribution, or use. For more information, see http://energy.gov/sites/prod/files/nepapub/nepa_documents/
RedDont/Req-EO13211energyregs.pdf 23
For more information on multi-state climate initiatives, see www.c2es.org/us-states-regions/regional-climate-
initiatives. 24
For a complete and updated listing, visit the DOE Database of State Incentives for Renewables and Efficiency
(DSIRE) site at www.dsireusa.org/glossary/.

The Water-Energy Nexus: Challenges and Opportunities June 2014
53
derive 33 percent of their retail sales from eligible renewable energy resources in 2020. The law also
established interim targets of 20 percent by the end of 2013, and 25 percent by the end of 2016.
Figure 4.1. States with renewable portfolio standards or goals. Source: Interstate Renewable Energy Council, Database of State Incentives for Renewables & Efficiency (accessed January
2013)
4.1.2 Fuel Prices
The production of natural gas from shale formations has rejuvenated the U.S. natural gas industry and
driven down the price of natural gas in the United States. In 2012, natural gas prices were low enough for
power companies to run natural-gas-fired generation plants more economically than coal plants in many
areas. During those months, coal and natural gas were nearly tied in providing the largest share of total
electricity generation (Figure 4.2). Even though coal plants have recaptured some of the market since
then due to higher natural gas prices, EIA projects that coal-fired generation will steadily fall in the
coming years in part due to the competitiveness of natural gas. The price of renewables, particularly
wind, has also trended down.
Future relative fuel prices are subject to uncertainty. However, even a small change with respect to the
price of natural gas could lead to a large ramp-up in natural gas or renewable-fueled, particularly wind-
fueled, power generation (EPRI 2013).
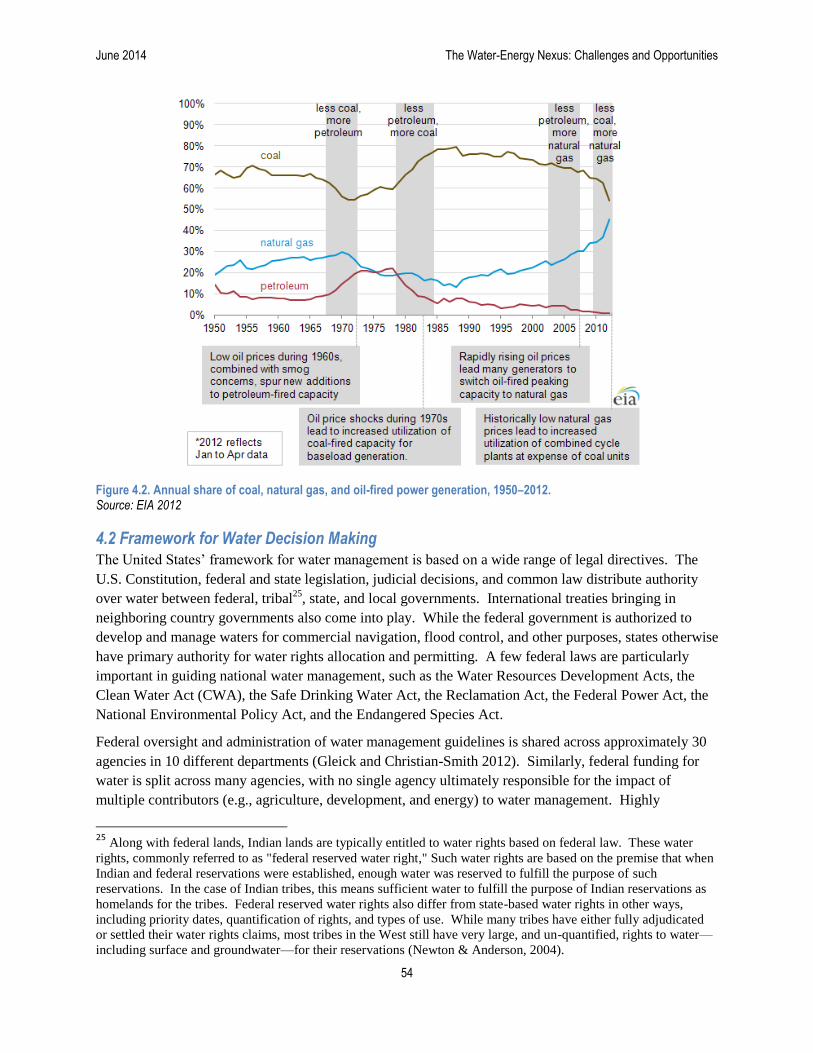
June 2014 The Water-Energy Nexus: Challenges and Opportunities
54
Figure 4.2. Annual share of coal, natural gas, and oil-fired power generation, 1950–2012. Source: EIA 2012
4.2 Framework for Water Decision Making
The United States‘ framework for water management is based on a wide range of legal directives. The
U.S. Constitution, federal and state legislation, judicial decisions, and common law distribute authority
over water between federal, tribal25
, state, and local governments. International treaties bringing in
neighboring country governments also come into play. While the federal government is authorized to
develop and manage waters for commercial navigation, flood control, and other purposes, states otherwise
have primary authority for water rights allocation and permitting. A few federal laws are particularly
important in guiding national water management, such as the Water Resources Development Acts, the
Clean Water Act (CWA), the Safe Drinking Water Act, the Reclamation Act, the Federal Power Act, the
National Environmental Policy Act, and the Endangered Species Act.
Federal oversight and administration of water management guidelines is shared across approximately 30
agencies in 10 different departments (Gleick and Christian-Smith 2012). Similarly, federal funding for
water is split across many agencies, with no single agency ultimately responsible for the impact of
multiple contributors (e.g., agriculture, development, and energy) to water management. Highly
25
Along with federal lands, Indian lands are typically entitled to water rights based on federal law. These water
rights, commonly referred to as "federal reserved water right," Such water rights are based on the premise that when
Indian and federal reservations were established, enough water was reserved to fulfill the purpose of such
reservations. In the case of Indian tribes, this means sufficient water to fulfill the purpose of Indian reservations as
homelands for the tribes. Federal reserved water rights also differ from state-based water rights in other ways,
including priority dates, quantification of rights, and types of use. While many tribes have either fully adjudicated
or settled their water rights claims, most tribes in the West still have very large, and un-quantified, rights to water—
including surface and groundwater—for their reservations (Newton & Anderson, 2004).

The Water-Energy Nexus: Challenges and Opportunities June 2014
55
fragmented authority in managing the country‘s water has presented challenges in improving water
quality in many parts of the country, according to Gleick and Christian-Smith (2012).
4.2.1 Water Rights and Permitting at the State Level
States‘ roles in overseeing water rights allocation and permitting are equally important. State-level water
rights and permitting inform the decision making of any significant water user. Because water issues vary
greatly by region, water resource policies—even policy frameworks—can vary greatly from state to state
(Kimmell and Veil 2009). With respect to surface water, states generally follow some variation of two
governance doctrines—the prior appropriation doctrine and the riparian doctrine. Groundwater
governance is slightly more complex (Table 4.1).
Table 4.1. Framework for Surface Water Law
Legal Framework in the West Western States
Pure prior appropriation (9) Alaska, Arizona, Colorado, Idaho, Montana, Nevada, New Mexico, Utah, and Wyoming
Prior appropriation, formerly riparian (6)
Kansas, North Dakota, South Dakota, Oregon, Texas, and Washington
Mixed riparian-appropriation (3) California, Nebraska, and Oklahoma
Legal Framework in the East Eastern States
Pure riparian (8) New Hampshire, Vermont, Rhode Island, West Virginia, Ohio, Tennessee, Missouri, and Louisiana
Regulated riparian (21) Alabama, Arkansas, Connecticut, Delaware, New York, New Jersey, Maryland, Illinois, Indiana, Iowa, Kentucky, Massachusetts, Pennsylvania, Mississippi, Minnesota, North Carolina, South Carolina, Georgia, Florida, Virginia, and Wisconsin
Source: Gleick and Christian-Smith 2012
Prior Appropriation Doctrine
The vast majority of the states in the arid West follow the prior appropriation doctrine, under which water
allocation is made on a first-come, first-serve basis and not linked to land ownership (Getches 2009).
Because of relative water scarcity, water rights are linked to a specific basin and many states prohibit
transfers between basins. Furthermore, users must prove that their rights are being exercised and put to a
beneficial use or the rights can be deemed abandoned and terminated. In times of water shortage, those
who last obtained a legal right to use the water must yield to the senior right holders, although if any of
the latter‘s rights have not been exercised and put to a beneficial use, such a right could be deemed
forfeited.
Riparian Doctrine
The riparian doctrine, also called the ―common law‖ doctrine, is tied to land ownership and mostly
recognized in Eastern states where water is relatively abundant. Owners of land bordering waterways
have a right to use water that flows past the land for any reasonable purpose. In addition, all landowners
have an equal right to use the water because no one possesses a greater right through prior use. Water
rights may not be bought or sold and when water runs short, users have to ―share the shortage in
proportion to their rights‖ (Kimmell and Veil 2009). About half of the Eastern states have also adopted
what is called regulated riparianism, or water-use permits for non-riparian landowners to acquire water
rights for a limited period of ―reasonable‖ use (Gleick and Christian-Smith 2012).

June 2014 The Water-Energy Nexus: Challenges and Opportunities
56
Figure 4.3. Water governance policies in the United States, by state. Source: Gleick and Christian-Smith 2012
Power plants in riparian areas have had fewer issues finding and using surface water for cooling, mainly
due to relative water abundance. As a result, open-loop cooling, which requires higher water withdrawal
but also enables greater generation efficiency, is more prevalent in these areas. As shown in Figure 4.4,
power plants in riparian states withdraw more water on a per-power-plant and average basis than plants in
prior appropriation states.26
Power plants in areas generally following prior appropriation rules (Western
states) do seem more prone to utilizing non-surface water or alternative sources of water (e.g., brackish
water, seawater, reclaimed water, and groundwater) (Figures 4.5 and 4.6).
26
This is based on both fresh and non-fresh water source use.

The Water-Energy Nexus: Challenges and Opportunities June 2014
57
Figure 4.4. Average water withdrawal and consumption per power plant in areas of riparian, prior appropriation, and hybrid or other doctrine. Data source: EIA Form 860, 923 (EIA 2013a, EIA 2013b)27
Figure 4.5. Percent of water withdrawn and consumed at thermoelectric power plants by water source in four regions of the United States. Data source: EIA Form 860, 923 (EIA 2013a, EIA 2013b)28
27
The type of water governance information is from Gleick and Christian-Smith (2012). ―Riparian‖ includes pure
riparian and regulated riparian states. ―Prior Appropriation‖ includes states that have been prior appropriation
doctrine implementers all along (pure prior appropriation states) or currently prior appropriation states that are
formerly riparian states (prior appropriation, formerly riparian states). ―Hybrid‖ or ―Other‖ includes states that
implement both prior appropriation and riparian doctrines and states like Hawaii that has a completely different
doctrine than other states. 28
Regional breakdowns are as follows: Southwest—California, Arizona, Utah, Nevada, Colorado, New Mexico,
Wyoming; Southeast—Alabama, Arkansas, Florida, Georgia, Louisiana, Mississippi, North Carolina, South

June 2014 The Water-Energy Nexus: Challenges and Opportunities
58
Figure 4.6. Percent of water withdrawn and consumed at thermoelectric power plants by water quality type in four regions of the United States. Data source: EIA Form 860, 923 (EIA 2013a, EIA 2013b)
Some of the Western states administer a hybrid doctrine. In general, these are states that initially
enforced a riparian rights system and continue to recognize riparian uses even though they later adopted a
prior appropriations doctrine. Three western states that follow a hybrid system—California, Nebraska,
and Oklahoma—allow riparian landowners under some circumstances to assert new uses superior to those
with appropriative rights.
Water oversight is not necessarily looser in the relatively more water-abundant riparian states.
Additionally, in regulated riparian states such as Georgia, power plants, like all other users, must apply
for a permit to withdraw water from the state permitting agency (Kimmell and Veil 2009).29
Groundwater Allocation Policies
Groundwater rights and laws are extremely complex in the United States because several overarching
doctrines come into play, including absolute ownership, reasonable use, correlative rights, and prior
appropriation (Gleick and Christian-Smith 2012). The absolute ownership doctrine, most evident in
Indiana, Maine, and Texas, does not limit the amount of groundwater withdrawn by the overlying
landowner even if the withdrawal could harm existing uses. The reasonable use doctrine, in contrast,
prohibits waste and limits water usage to overlying land unless it can be transported without harming
other overlying owners (Goldfarb 1988). Neither absolute ownership nor the reasonable use doctrine
considers the total demand on the aquifer or the impact of groundwater overdraft.
Approaches that consider aggregate water demand and the impact on groundwater do exist, including
Section 858 of the Restatement of Torts, which states that a groundwater user can only withdraw water if
Carolina, Tennessee; Northeast (and Ohio)—Connecticut, Delaware, Massachusetts, Maryland, New Hampshire,
New Jersey, New York, Ohio, Pennsylvania, Rhode Island, and Vermont. 29
In Georgia, the state Environmental Protection Division staff works with power plant developers to mitigate water
concerns prior to permit approval, and thus far has not had to deny a water withdrawal permit due to insufficient
water (Mittal and Gaffigan 2009).
The Water-Energy Nexus: Challenges and Opportunities June 2014
59
it is done without (1) unreasonably affecting other users by lowering the water table or pressure, (2)
exceeding his or her share of the total annual supply, or (3) affecting surface water supplies (Gleick and
Christian-Smith 2012). Section 858 or a variation of it is applied in Michigan, Ohio, Wisconsin,
Arkansas, Florida, Nebraska, New Jersey, and Missouri (Goldfarb 1988).
In reality, however, applying any of the legal frameworks to control total demand has been challenging
due to a lack of reporting and monitoring of groundwater use. Increasingly, states are practicing some
level of tracking and oversight. For example, New Mexico has a statewide water management system
based on basin-wide adjudications. Nebraska regulates groundwater pumping through natural resource
districts, while in Kansas local residents form groundwater management districts and apply their own
standards to prevent overdraft. However, some regions do still suffer from groundwater overdraft (Gleick
and Christian-Smith 2012).
Relatively more stringent surface water regulations can lead to more groundwater use and vice versa.
Lower surface water availability coupled with more stringent policies regarding surface water
withdrawals has contributed to a higher percentage of groundwater, effluent, and recycled water use for
cooling in Western states. However, in recent years, some of these states have instituted more stringent
groundwater policies for thermoelectric cooling. Arizona, which sets no limit on water used by
thermoelectric power plants, nevertheless requires larger thermoelectric power plants (plants of 100 MW
capacity or more) to apply for a groundwater permit in active groundwater management areas (Mittal and
Gaffigan 2009). Some of these states have also denied groundwater permits to power plants to protect
groundwater resources (Clean Air Task Force and the Land and Water Fund of the Rockies 2003; Adams-
Ockrassa 2010).
4.2.2 Commissions, Compacts, and Treaties
Watersheds often cross multiple state and even national boundaries. In the United States, states have
formed water commissions or compacts to govern their shared water resources (Kimmell and Veil 2009).
Such commissions and compacts typically include multiple entities such as Indian tribes and a set of
federal agencies (particularly the U.S. Army Corps of Engineers and the U.S. Bureau of Reclamation);
disagreements or disputes are settled at the federal level (USBR 2008).
The rapid growth in shale resource development in recent years has impacted multiple watersheds in the
United States, and more generally, North America. Several water commissions have responded to the new
challenges posed both in terms of water quantity and quality. The Susquehanna River Basin Commission
has updated its regulations to address the rapidly expanding shale gas development. The commission
bases its permitting on the frequent monitoring and cumulative impact assessments of water quality; it
also encourages, even facilitates, ways to lower freshwater use (Richenderfer 2013).
The United States also shares multiple water resources with other nations; more than 60 percent of the
nation‘s land area is in a river basin or watershed that also includes some land in Canada or Mexico.
Some of these areas are of growing economic and political importance (Gleick and Christian-Smith
2012). The majority of U.S. international watersheds lie almost entirely in the United States, including
the Mississippi, Columbia, Rio Grande, and Colorado River basins (shared with either Canada or
Mexico). Some of the larger basins lie in relatively water-abundant regions, while others are in areas of
increasing water scarcity. Several of these trans-boundary water resources are covered under formally
negotiated international treaties and agreements. For example, the Columbia River basin hydropower and

June 2014 The Water-Energy Nexus: Challenges and Opportunities
60
flood control operations are governed, among other federal laws, by a treaty between the United States
and Canada. The treaty is currently undergoing a review (Box 4.1).
The International Joint Commission (IJC), which oversees the Great Lakes, is the largest international
water governance body in which the United States participates.30
In regulating shared water uses, the IJC
has to take into account the needs of a wide range of water uses, including drinking water, commercial
shipping, hydroelectric power generation, agriculture, industry, fishing, recreational boating, and
shoreline property. The International Boundary and Water Commission, another example of transnational
shared management of natural resources, oversees the U.S.-Mexico water treaty over several river basins,
including the Colorado and Rio Grande basins (Mumme 2003).
New, emerging challenges are demanding new efforts and approaches by the various commissions
(Gleick and Christian-Smith 2012). Concerns generally involve water allocation decisions, rapid
industrialization and urbanization, growing demand for water, worsening water-quality problems,
ecosystem well-being, and climate change (Jones 1999). Some of the shared water resources also face
concerns from new energy projects, including coal and coalbed methane, tar sands, and hydraulic
fracturing (Gleick and Christian-Smith 2012).
30
Visit the IJC website for more information: www.ijc.org/en_/.
Box 4.1. International Columbia River Treaty 2014/2024 Review
The Columbia River Treaty is an international agreement between Canada and the United States for the cooperative development and operation of the water resources of the Columbia River Basin. The treaty specifies the conditions for the operation of dams and water storage to provide the mutual benefit of both nations. In a reflection of the times in which it was negotiated, the treaty emphasizes hydroelectricity and flood risk management. The provisions of the treaty do not directly address some issues that have grown in importance over the years, such as endangered species recovery and ecosystems restoration.
Power and Flood Risk Management Provisions
Under the terms of the treaty, Canada operates its reservoir storage for optimum power generation downstream in Canada and the United States. In addition, Canada is obligated to operate reservoir storage under a flood risk management operating plan that attempts to eliminate or reduce all flood damages in both Canada and the United States. The United States paid Canada a lump sum for flood risk management through 2024. The United States is also required to return one-half of the downstream power benefits (the ―Canadian Entitlement‖) to Canada (BPA, 2013b).
Treaty Review
While the treaty has no specified end date, either Canada or the United States may unilaterally terminate most provisions of the treaty in 2024 with a minimum of 10 years’ advance notice. Because the notice period begins in 2014, a review is currently underway to evaluate the benefits and costs associated with alternative treaty futures. The U.S. Department of State is reviewing a December 2013 a Regional Recommendation on the treaty on possible changes to the treaty, developed over several years through discussions with regional interests. The Regional Recommendation sets out nine key principles for modernizing the treaty, relating to the multi-purposes of the Columbia River (BPA, 2013b).

The Water-Energy Nexus: Challenges and Opportunities June 2014
61
4.2.3 Water Pricing and Costs
In the United States, as in the case of most countries, the price of water is set based on principles that
include affordability and accessibility by either public or private entities. Water is not traded, for the
most part, and does not flow to the user willing to pay the highest price. The price typically does not
reflect the specific supply technique (e.g., gravity based, pumped) or treatment process applied (e.g.,
physical, chemical, or biological). The existing water price also does not capture region-specific water
conditions or relative water scarcity/abundance. In the relatively water-poor West, for example, some
water rate structures can promote inefficient water use (Western Resource Advocates 2013).
As a result, the cost of water can be a small share of overall energy production cost, even for water-
intensive users (e.g., power plants for thermoelectric cooling, oil and gas companies for oil and gas
extraction, and certain biofuel generations). Nevertheless, evolving regulations have induced some
internalization of the hidden costs or risks of untreated wastewater and effluent to human health and
ecological sustainability. The cost of water treatment or disposal for the water-intensive energy producers
can already be high and potentially involve energy-intensive processes. Furthermore, rising water stress
and water supply uncertainties due to climate change and increasing competition have added new costs to
water- and energy-intensive water/energy systems for private and public owners alike.
4.3 Sector-Specific Energy-Water Landscape for Decision Making
There are significant differences in water use and oversight across the major energy producing sectors of
oil and gas, electric power, and biofuels. The production revolution experienced in the U.S. oil and gas
sector in recent years due to the wide application of horizontal drilling and hydraulic fracturing has
greatly increased domestic energy production. The increasing availability of shale gas in particular is
contributing to new growth in U.S. manufacturing and tipped the power sector fuel mix in favor of natural
gas (EIA 2013c).
The rapid development of unconventional resources in different U.S. regions also required a fast ramp-up
in government oversight at different levels, particularly regarding water use, treatment, and disposal. In
comparison, the U.S. power sector has experienced relatively incremental development both in terms of
the level of production and oversight. A major push in the United States for biofuels development was
based on the sound principles of enhancing energy security, increasing renewable fuel use in
transportation, and greenhouse gas emissions mitigation. However, the growth of the U.S. biofuels sector
has been faced with infrastructural and technical constraints, slow technological developments for
second-generation biofuels, and for biofuels in general potentially high water requirements (Chiu et al.
2009, Chiu et al. 2013a, Chiu et al. 2013b). Ongoing research and development (R&D) efforts have
revealed some ways to mitigate the water intensity and water quality impacts of biofuel development.
U.S. water and wastewater treatment facilities are taking major steps to conserve water and energy,
including a push to re-conceptualize wastewater treatment facilities as resource recovery entities.
4.3.1 Onshore Oil and Gas Production
Over the last decade, North American energy production has been significantly augmented by the
growing accessibility and affordability of unconventional resources,31
predominantly oil and gas from
31
Unconventional oil and gas resources include hydrocarbons extracted from coal beds (coalbed methane), shale
deposits, and tight sands.

June 2014 The Water-Energy Nexus: Challenges and Opportunities
62
U.S. shale basins. In the meantime, multiple regions have been developing appropriate rules and
guidelines to ensure responsible usage and treatment of produced water.
Produced Water and Conventional Management Practices
Whether hydrocarbons are being extracted from conventional or unconventional geologic formations
(e.g., shale basins), the use of water is paramount. From site preparation and drilling to hydraulic
fracturing to the treatment, recycling, and reuse of water from production, operators and regulators must
consider water accessibility, quantity, quality, treatment, and disposition issues.
In addition to managing water use from drilling through well completion phases, operators must also
handle wastewaters that are a by-product of resource extraction (see Chapter 2). Water used in and
originating from resource extraction not returned to the water cycle or beneficially reused is permanently
disposed of in underground injection control (UIC) wells authorized by regulatory permits. These UIC
wells are often former production wells, which are fairly abundant and commonly used in mature oil and
gas production regions. However, other regions are stressed by not having ready access to UIC wells or
sufficient treatment plant capacity to handle the rapid pace of oil and gas development.32
In addition, in
some newer production areas, drillers encountering infrastructure limitations are having to ship
wastewater by rail or truck to treatment facilities and injection facilities across state lines for recycle and
reuse or waste disposition.
Regulatory Responses to Rapid Production Growth
Federal and state officials across the nation are examining environmental implications of oil and gas
operations to, in many cases, address the challenges and rapid changes brought about by the
unconventional oil and gas revolution.33
At the federal level, legislative proposals to regulate hydraulic
fracturing have emerged; however, identical proposed legislation introduced in the last two sessions of
Congress failed to advance in either the House or the Senate.34
The Federal Government is working with states and other key stakeholders to help ensure that natural gas
extraction does not come at the expense of public health and the environment. In terms of executive
actions, for example, the EPA issued permitting guidance for hydraulic fracturing operations that inject
fluid mixtures containing diesel fuels. EPAct 2005 provides statutory authority for EPA to develop UIC
Class II permitting guidance.35
32
Even in cases where facilities in these areas have legitimate capacity, facilities may need to be upgraded to treat
the volumes of chemicals and dissolved solids extracted from oil and gas operations in these regions. According to
the U.S. Geological Survey, disposal of Marcellus Shale liquids in Pennsylvania requires the liquids to be processed
through wastewater treatment plants, but the effectiveness of standard wastewater treatments on these fluids is
inadequate. In particular, salts and other dissolved solids in brines are not usually removed successfully by
wastewater treatment, and reports of high salinity in some Appalachian rivers have been linked to the disposal of
Marcellus Shale brines (USGS 2009). 33
Several federal statutes govern water use and protection in oil and gas operations, including the National
Environmental Policy Act, CWA, the Safe Drinking Water Act, the Oil Pollution Act, and EPAct 2005. 34
In May 2013, U.S. Congresswoman Diana DeGette (D-CO) joined her colleague Rep. Chris Gibson (R-NY) to
introduce the Fracturing Responsibility and Awareness of Chemicals Act (FRAC Act). In June 2013, U.S. Senator
Robert Casey, Jr. (D-PA) reintroduced the FRAC Act to the U.S. Senate, matching the legislation introduced
previously in the U.S. House of Representatives. 35
From the onset of the UIC program, Class II wells have been those associated with oil and gas storage and
production as well as injection and enhanced oil recovery.

The Water-Energy Nexus: Challenges and Opportunities June 2014
63
In addition, The Clean Water Act (CWA) effluent guidelines program sets national standards for
industrial wastewater discharges based on best available technologies that are economically achievable.
Except in limited circumstances, effluent guidelines for oil and gas extraction prohibit the on-site direct
discharge of wastewater from shale gas extraction into U.S. waters. While some of the wastewater from
shale gas extraction is reused or re-injected, a significant amount still requires disposal. However, no
comprehensive set of national standards exists at this time for the disposal of wastewater discharged from
natural gas extraction activities. As a result, some shale gas wastewater is transported to treatment
plants or private centralized waste treatment facilities (CWTs), many of which are not properly equipped
to treat this type of wastewater. As part of the CWA planning process, EPA announced a schedule to
develop standards for wastewater discharges produced by natural gas extraction from underground shale
formations and potentially coalbed methane.
At the state and local levels, as well as some regional cases (e.g., River Basin Commissions), jurisdictions
have promulgated or are developing new requirements to exert greater regulatory control over hydraulic
fracturing operations, with an aim to rigorously promote environmental protection and maintain public
health and safety. Pennsylvania has developed new requirements that prohibit wastewaters from natural
gas wells to be discharged into state waters unless the volumes are first treated to remove salt content
(National Driller 2010). Recently, there has been an increase in recycling in the Pennsylvania Marcellus,
with about 85 percent of wastewater recycled in 2012 (Bloomberg 2013). Wastewaters not recycled for
beneficial reuse are typically treated and/or disposed of in Class II disposal wells.36
In the case of
Pennsylvania, these wastewaters are typically transported to Ohio for injection disposal (Bloomberg
2013).
Operators in mature oil and gas ―patch‖ states such as Texas have widespread access to UIC Class II
wells. Thus, absent statutory or regulatory mandates requiring treatment, recycling, and reuse of
wastewaters, operators have lacked incentive, given the costs associated with wastewater treatment and
recycling. However, because several progressive operators want to maintain their ability to operate and
enhance their reputation as solid environmental stewards, and because the economics are favorable under
certain conditions, recycling is picking up in areas of Texas where dwindling water supplies are inhibiting
production. In fact, Texas recently passed legislation to encourage greater water recycling in oil and gas
production.
Potential Water Contamination and State-Level Responses
In general, regulators are focused on the potential contamination of groundwater and surface water from
hydraulic fracturing chemical mixtures as well as salts, heavy metals, and radionuclides. For example, at
the federal level, Congress has requested that EPA conduct a study to better understand the impacts of
hydraulic fracturing on drinking water resources37
. At the state level, there is a constantly evolving
patchwork of policy responses to ensure operators and regulators effectively manage potential water
supply and quality issues arising from hydraulic fracturing. Some jurisdictions (e.g., New York) have
enacted drilling moratoria in certain resource basins and watersheds in an effort to protect water quality
36
These Class II wells are currently regulated by EPA and states to ensure that formations other than the target
repository are not contaminated; however, some jurisdictions do not allow permitting of such wells. 37
For more information, visit www2.epa.gov/hfstudy

June 2014 The Water-Energy Nexus: Challenges and Opportunities
64
(Efstathiou Jr. 2010), while others (e.g., Vermont) have instituted moratoria on hydraulic fracturing and
discharge of hydraulic fracturing wastes [H 464 2012] or chemical disclosure requirements.38
Some state regulations prevent potential contamination of fresh water resources as well as conserve these
resources by requiring use of alternative water sources. Pennsylvania has passed a law encouraging the
use of alternative water sources for hydraulic fracturing, namely acid mine water whenever
environmentally safe and economically feasible [SR 202, 2011]. Some states mandate remedial measures
in dealing with water contaminated by well operation. For example, a law passed in Virginia in 2009
requires an operator of a gas well to replace water supplies contaminated by operation of the well [S 1460
2009]. Other states, such as Texas, include water for oil and gas among the beneficial uses allowed to
withdraw groundwater.39, 40
Potential Fluid Migration
Regulations involving more rigorous standards for well completion and cementing are emerging,
providing a legal basis—rather than just an industry standard or best practice, neither of which is subject
to enforcement measures—to prevent chemical migration and groundwater contamination. The proper
closure of abandoned wells is also an important factor in preventing chemical migration and possibly
impairing water resources.41
Centralized Cross-State Information Disclosure Resources
There is growing pressure on operators—from regulators, shareholders, and communities where drilling
occurs—to disclose and provide greater transparency of chemicals used in hydraulic fracturing. States are
moving forward with new mandates to drive greater transparency and disclosure of hydraulic fracturing
chemical use.
The Groundwater Protection Council and the Interstate Oil and Gas Compact Commission recently
established a joint initiative designed to protect water resources by implementing a web-based
information system—FracFocus —that collects, maintains, and discloses data and other details associated
with hydraulic fracturing (IOGCC/GWPC 2010).42
This voluntary database, which is being continuously
improved, is populated by operator submissions of chemical data related to hydraulic fracturing fluid
mixtures. This provides a vital resource for regulators, emergency responders, and concerned citizens to
monitor the chemicals and the disclosure of chemicals used in hydraulic fracturing.
38
Wyoming, for example, has enacted the nation‘s first chemical disclosure mandate to shed light on the precise
compounds used in hydraulic fracturing fluid mixtures. Colorado has issued similar requirements, as have
legislators in Texas and Louisiana, who passed hydraulic fracturing fluid chemical disclosure legislation in 2011 and
2012, respectively (HB 3328, 2011 and H 957, 2012). 39
Texas Administrative Code §§36.3 and 36.5. 40
More relaxed groundwater policies in Texas that allow groundwater to be used in treating fluids returned to the
wellpad following hydraulic fracturing have resulted in considerable expansion of these practices. Water use for
hydraulic fracturing in Texas, including fresh and non-fresh water sources, now constitutes 1 percent of total water
consumption in the state. Some areas in the state have experienced higher activity levels than others (Nicot and
Scanlon 2012), while other jurisdictions have prohibited or restricted these practices due to water supply concerns
(Lee 2011). 41
In addition, Colorado and other states have instituted drilling requirements that are sensitive to the pressurization
of the target formation during the hydraulic fracturing and resource extraction process. These measures are designed
to protect the integrity of the formation and to minimize or eliminate the potential for chemical migration and
subsequent contamination (COGCC, n.d.). 42
FracFocus is the chemical disclosure registry cited in the current draft of the DOI‘s proposed rulemaking for
advancing safe and sustainable drilling on public lands managed by the department‘s Bureau of Land Management.

The Water-Energy Nexus: Challenges and Opportunities June 2014
65
In addition, a number of states now require operators to disclose chemicals deployed in hydraulic
fracturing mixtures and propping agents on FracFocus. This chemical disclosure registry is also being
considered as a potential vehicle in a proposed federal rulemaking for advancing chemical disclosure in
drilling and hydraulic fracturing on public lands managed by the U.S. Department of the Interior (DOI)
Bureau of Land Management.
4.3.2 Offshore Oil and Gas Production
U.S. offshore oil and gas production is overseen by coastal state or federal authorities, depending on the
distance from shore. In 1953, Congress passed the Submerged Land Act, which recognized state
ownership of the seabed within three nautical miles (six kilometers [km]) (or nine nautical miles in the
case of Texas and the Gulf coast of Florida and three imperial nautical miles in the case of Louisiana) of
the shore. That same year Congress also passed the Outer Continental Shelf Lands Act, which established
the federal government jurisdiction over minerals on and under the seabed farther offshore from state
waters. Historically, offshore drilling began by extending known coastal oil and gas production out into
the ocean, and thus most U.S. offshore drilling has taken place in areas off the coasts of Louisiana, Texas,
California, and Alaska, proximate to onshore oil and gas fields.
Leasing and drilling of offshore seabed under federal authorities is controlled by two independent DOI
bureaus: the Bureau of Safety and Environmental Enforcement (BSEE) and the Bureau of Ocean Energy
Management (BOEM), which replaced the U.S. Minerals Management Service in October 2011. BSEE‘s
functions include the development and enforcement of safety and environmental regulations, permitting
offshore exploration, development and production, inspections, offshore regulatory programs, oil spill
response, and newly formed training and environmental compliance programs.43
BOEM‘s functions
include offshore leasing, resource evaluation, review and administration of oil and gas exploration and
development plans, renewable energy development, National Environmental Policy Act analysis, and
environmental studies. BOEM issues leases through competitive bidding by sealed bids. The
government also receives a fixed annual rental based on the area for non-producing leases, and a
percentage of the market value of any oil or gas produced and sold (royalty).44
There are a number of state moratoria on offshore drilling, most of which were established for
environmental protection reasons. At the federal level, Congress imposed a moratorium on drilling
directly or directionally beneath the Great Lakes in 2002. The ban was made permanent by EPAct 2005.
In the Gulf of Mexico, the Gulf of Mexico Energy Security Act of 2006 declared a section of the central
part and most of the eastern part off limits to oil and gas leasing until 2022.
The Deepwater Horizon oil spill45
that took place between April 20 and July 15 of 2010 originated from
an explosion of the Macondo well located approximately 41 miles (66 km) off the Louisiana coast. The
explosion claimed 11 lives and the total discharge of 4.9 million barrels of oil, the result of oil gushing
from a well just above the sea floor for 87 days before being successfully capped, represents the largest
accidental marine oil spill in the history of the petroleum industry.
In the wake of the Deepwater Horizon incident, the Obama Administration put in place new safeguards to
protect the environment and offshore oil and gas workers‘ safety. The new measures include heightened
drilling safety standards to reduce the chances that a loss of well control might occur (spill prevention), a
43
Visit the BSEE website for more information: www.bsee.gov/. 44
Visit the BOEM website for more information: www.boem.gov/. 45
Also referred to as the BP oil spill, the BP oil disaster, the Gulf of Mexico oil spill, and the Macondo blowout.

June 2014 The Water-Energy Nexus: Challenges and Opportunities
66
new focus on containment capabilities in the event of an oil spill, and strengthened offshore workplace
safety regulations. The newly created BSEE within DOI issued tightened well-bore requirements
following two extensive public comments periods.46
In terms of significant water-energy nexus issues confronting industry and regulators alike in the offshore
space, the offshore handling, treatment, and disposal of produced water is a substantial challenge. For
example, the costs to ship water to land-based treatment and disposal facilities can be significant.
Presently, some operators are exploring the viability of a rig-based treatment capability that would either
allow for ocean discharge following treatment or reinjection. In addition, a down-hole treatment and
injection capability that would eliminate pumping water to the platform may be another viable option.
4.3.3 Biofuels
In an effort to diversify transportation fuels, the Energy Independence and Security Act of 2007 (EISA
2007) broadened the scope and time horizon of the original Renewable Fuel Standard (RFS) created
under EPAct 2005. Now known as RFS 2, the standard is administered by EPA and provides a
mandatory market for qualifying biofuels. RFS 2 increased the mandated volumes of biofuels (overall
and specific), extended the time frame for the program through 2022 (Table 4.2), and created four
separate but nested categories: total renewable fuels, advanced biofuels, biomass-based diesel, and
cellulosic biofuels.47
Corn-starch-derived ethanol is capped at 15 billion gallons in 2015 and beyond,
while a ramp-up is mandated for cellulosic and biomass-based diesel, along with the ―other‖ category, to
reach an annual combined 21 billion gallons by 2022.
The RFS 2 also stipulated new criteria for the inclusion of biofuels, including minimum thresholds of life
cycle greenhouse gas (GHG) performance and land use restrictions (Schnepf and Yacobucci 2013).
While no specific metrics were statutorily assigned, water is an important element of the biofuels supply
chain, both in feedstock production and biofuels processing. The importance of water in the sustainability
of biofuels production was recognized in EISA 2007. While biofuel use of water was not included in a
specific metric in the mandates through 2022, statutorily required studies of the environmental impact of
the RFS called for in Section 204 included water acreage and the function of water. Furthermore, EISA
Section 202 specifically mentioned water quality and water supply as criteria in developing mandates for
additional years not specifically mentioned in the text. A major challenge in meeting the expanded
biofuel mandates is that ethanol, the source of most U.S. biofuels, is nearing the maximum demand or
―blend wall,‖ given the 10 percent maximum ethanol-to-gasoline mix and a current overall gasoline
demand level of about 130 billion gallons per year. EPA has taken regulatory action to allow commercial
sale of E15 under certain conditions.48
However, there would be significant technological, infrastructure,
and market barriers to achieving substantial penetration of high level ethanol blends as a motor fuel.
46
For more information, visit www.bsee.gov/Regulations-and-Guidance/index.aspx. 47
Some examples of advanced biofuels include biomass-based diesel, imported Brazilian sugarcane ethanol, and
biofuels from cellulosic materials (including non-starch parts of the corn plant such as stalk and cob). The total
advanced biofuel mandate for 2013 is 2.75 billion gallons (ethanol equivalent). 48
For more information, visit www.epa.gov/otaq/regs/fuels/additive/e15/index.htm.

The Water-Energy Nexus: Challenges and Opportunities June 2014
67
Table 4.2. Renewable Fuel Standard under EPAct 2005 and EISA 2007 (billions of ethanol-equivalent gallons)
RFS2 biofuel mandate
Portion to be from advanced biofuels
RFSI biofuel Cap on corn Biomass-
mandate in Total starch-based EPAct of renewable derived Total non-
Year 2005 fuels ethanol corn starch Cellulosic diesela Otherb 2006 4.0 — — — — — —
2007 4.7 — — — — — —
2008 5.4 9.00 9.00 0.00 0.00 0.00 0.00
2009 6.1 11.10 10.50 0.60 0.00 0.00 — d2010 6.8 12.95 12.00 0.95 0.0065c 1.15 —
2011 7.4 13.95 12.60 1.35 0.006e 0.80 0.14
2012 7.5 15.20 13.20 2.00 0.00e 1.00 0.50 g2013 7.6 (est.) 16.55 13.80 2.75 0.014g 1.28 0.82 h2014 7.7 (est.) 18.15 14.40 3.75 1.75 1.28 0.08 h2015 7.8 (est.) 20.50 15.00 5.50 3.00 1.28 0.58 h2016 7.9 (est.) 22.25 15.00 7.25 4.25 1.28 1.08 h2017 8.1 (est.) 24.00 15.00 9.00 5.50 1.28 1.58 h2018 8.2 (est.) 26.00 15.00 11.00 7.00 1.28 2.08 h2019 8.3 (est.) 28.00 15.00 13.00 8.50 1.28 2.58 h2020 8.4 (est.) 30.00 15.00 15.00 10.50 1.28 2.58 h2021 8.5 (est.) 33.00 15.00 18.00 13.50 1.28 2.58 h2022 8.6 (est.) 36.00 15.00 21.00 16.00 1.28 3.08
i i i i i 2023 — a ―Biomass-based diesel‖ is reported in actual gallons rather than ethanol-equivalent gallons. b ―Other‖ advanced biofuels is a residual category left over after the ethanol-equivalent gallons of cellulosic and biodiesel biofuels are subtracted from the ―Total‖ advanced biofuels mandate. c The initial EISA cellulosic biofuels mandate for 2010 was for 100 million gallons. On February 3, 2010, EPA revised this mandate downward to 6.5 million ethanol-equivalent gallons. d The biomass-based diesel mandate for 2010 combines the original EISA mandate of 0.65 billion gallons with the 2009 mandate of 0.5 billion gallons. e The initial RFS for cellulosic biofuels for 2011 was 250 million gallons. In November 2010 EPA revised this mandate downward to 6.0 million ethanol-equivalent gallons. f The initial RFS for cellulosic biofuels for 2012 was 500 million gallons. In December 2011 EPA revised this mandate downward to 10.45 million ethanol-equivalent gallons. In January 2013, the U.S. Court of Appeals for D.C. vacated EPA’s initial cellulosic mandate for 2012 and remanded EPA to replace it with a revised mandate. On February 28, 2013, EPA dropped the 2012 RFS for cellulosic biofuels to zero. g The initial 2013 cellulosic RFS was 1.0 bilion gallons. In January 2013, EPA revised this mandate to 14 million ethanol equivalent gallons. The 2013 biodiesel mandate was revised upwards from 1.0 billion gallons to 1.28 billion gallons actual volume. h To be determined by EPA through a future rulemaking, but no less than 1.0 billion gallons. i To be determined by EPA through a future rulemaking.
Source: Schnepf and Yacobucci 2013; with adjustments made to convert “Other” to ethanol-equivalent gallons
At 12.9 billion gallons, fuel ethanol consumption approached the blend wall in 2012. Bio-mass based
diesel consumption was about 900 million gallons, with the remainder of the 1 billion gallon mandate
from carried-over RINs from previous years. EPA revised its mandated volume for cellulosic biofuels
downward both in 2012 and 2013 due to technical difficulties in ramping up production. More recently,
EPA proposed to reduce the 2014 overall renewable fuel requirements from the original target level of
18.15 billion gallons to 15.21 billion gallons, and to reduce the 2014 target volume of corn-based ethanol
to about 13 billion gallons, down from the original target level of 14.4 billion gallons (EPA 2013a).

June 2014 The Water-Energy Nexus: Challenges and Opportunities
68
4.3.4 Electric Power Sector and Thermoelectric Plants
The U.S. power sector includes the generation, transmission, distribution, and regulation of electricity for
industrial, commercial, public, and residential users. In recent years, it has undergone changes driven by
the abundant natural gas supply and push for renewable power generation, among other factors. Such
drivers and U.S. policy incentives for renewable energy could compound the challenges many coal-fired
units already face from aging infrastructure and the increasing uncertainty of water availability. Plant
owners face myriad challenges, including recent and anticipated environmental regulations; these, among
other factors, are informing plant owners‘ decisions about whether to retrofit or retire their units.
For electricity generation, existing and new thermoelectric (i.e., coal, oil, gas, and nuclear) plants could be
among the entities regulated under the CWA with respect to effluent discharges and cooling water intake
structures. The regulation of effluent discharge for contaminants and temperature limit (via the CWA
Section 316 [a] provisions) is generally enforced by the states‘ National Pollutant Discharge Elimination
System (NPDES) permitting authority (Kimmell and Veil 2009).
Currently, there are several federal proposed guidelines and rulemakings related to water and
thermoelectric power plants; chief among them are the proposed steam electric plant effluent discharge
guideline and the cooling water intake rule. Even at the proposed stage, these potential regulatory
activities have already impacted decision making at the plant level (Box 4.2).
Effluent Regulation – Contaminants
According to EPA, steam electric power plants (i.e., thermoelectric plants that are non-combined cycle
plants) contribute more than half of the toxic pollutants discharged to water bodies by all industrial
categories currently regulated in the Unites States (EPA 2013b). On April 19, 2013, EPA signed a notice
of proposed rulemaking to revise the technology-based effluent guidelines and standards that would
Box 4.2 Power Plant Response to High Water Temperatures
In addition to dwindling water supplies, high temperatures can create issues for power plants with maximum intake or effluent temperature limits. Some power plants simply reduce or stop electricity production in high-temperature situations. Other plants have pursued longer-term solutions to combat their problems.
The Millstone Nuclear Power Station in Connecticut, which shut down in the summer of 2012 due to high intake water temperatures, has since applied for an operating license amendment from the Nuclear Regulatory Commission to use intake water at a higher temperature: 80°F instead of 75°F (Wagman 2013).
In Alabama, Browns Ferry nuclear had to curtail power generation in 2010 when a heat wave caused high intake water temperature (Freedman 2012). Operators of Browns Ferry nuclear added a small auxiliary cooling tower on the discharge canal as a ―helper‖ tower to cool the effluent water before discharge (NRC 2012).
In Texas, which has hotter-than-average temperatures and lower-than-average flows, some thermoelectric power plants have had to curtail electricity generation. At least one power plant has applied for and been granted permission to have an increase in discharge temperature for the summer (EPA 2013e). The Electric Reliability Council of Texas (ERCOT) has suggested that it might bring mothballed plants online to cover the lost generation (Fowler 2011). In an effort to encourage planning for water supplies, ERCOT has also begun requiring new power plants to verify their water rights before it will include the power plants in its planning models (Pickrell 2013).
The Water-Energy Nexus: Challenges and Opportunities June 2014
69
strengthen controls on discharges from certain steam electric power plants. The rulemaking targets
metals including mercury, arsenic, lead, and selenium, as well as nutrients. With respect to existing
sources, the rulemaking considers four different alternatives for regulating such discharges (78 F.R.
34433, 2013). The requirements are estimated to reduce pollutant discharges by 470 million to 2.62
billion pounds and reduce water use by 50 billion to 103 billion gallons per year. EPA‘s analysis
estimates 0.32 gigawatts (GW) of generating capacity out of the more than 1,000 GW that make up the
nation‘s electric generating capacity would likely retire due to this proposed rule (EPA 2013b).
Besides posing risks to human health, contaminants from power plant effluents also impact ecological
systems. Including the toxic metals previously mentioned, power plant effluents also contain suspended
solids, oil and grease, and other chemicals that impact the quality of water (EPA 2013c).
Effluent Regulation—Temperature
Heat is a unique type of pollutant. It is not toxic in the traditional sense, but it can accumulate, and
excessive heat upsets ecosystems (Veil 1993). Upon entering a body of water, heat rapidly dissipates to
the surrounding water and to the atmosphere. Hotter water holds less dissolved oxygen—this can create
dead zones in water bodies. Heat is not included in the EPA list of priority pollutants (EPA 2013dc);
however, EPA regulates thermal discharges through effluent temperature limits set by the NPDES
program authorized by Section 316(a) of the CWA.49
Power plants that withdraw water and then release
it back into the environment at an elevated temperature must comply with temperature limits under the
NPDES program (Veil 1993). At higher temperatures of intake water, power plants may reduce
electricity production to meet the discharge temperature limit or risk paying fines (Kimmell and Veil
2009). Figure 4.7 shows U.S.-wide violations of average monthly discharge temperature limits between
January 2008 and December 2011.
Cooling Water Intake Structures
Section 316(b) of the CWA—the authority under which EPA regulates a power plant‘s cooling water
intake structure (CWIS)—requires that the location, design, construction, and capacity of a power plant‘s
CWIS reflect the best technology available (BTA) to minimize adverse environmental impacts, including
the mortality of fish and other aquatic organisms caused by impingement and entrainment (EPA 2010b).
Impingement occurs when a CWIS traps aquatic life against its screen. Entrainment occurs when a CWIS
draws aquatic organisms into the facility and exposes them to pressure and high temperature (EPA 2002).
Under a consent decree with environmental groups, EPA divided the Section 316(b) rulemaking into three
phases. All new facilities except offshore oil and gas exploration facilities were addressed in Phase I in
December 2001, and all new offshore oil and gas exploration facilities were later addressed as part of
Phase III in June 2006. For new facilities with a design flow of greater than 2 million gallons per day
(MGD) and at least one CWIS that will use at least 25 percent of the water it withdraws for cooling
purposes, the EPA, through its Phase I regulations, defines closed-cycle cooling structures or the
equivalent as the BTA for mitigating fish impacts. As a result, new facilities are focusing their designs
more on closed-cycle cooling.
49
Section 316(a) of the CWA allows a thermal discharger to seek effluent temperature permit variances by
demonstrating that less stringent thermal effluent limitations would still protect aquatic life (Veil 1993).

June 2014 The Water-Energy Nexus: Challenges and Opportunities
70
Figure 4.7. Thermoelectric power plants in the United States, indicating average monthly discharge temperature violations between January 2008 and December 2011. Source: EPA 2013e
Existing large electric-generating facilities were addressed in Phase II in February 2004. However, Phase
II and the existing facility elements of Phase III were remanded to EPA for reconsideration as a result of
legal proceedings in 2009 and 2010, respectively. The agency has been working on a revised rule for
both types of facilities and published a proposed rule in April 2011 (EPA 2011).
As part of its state NPDES permitting authority, in July 2011, the New York State Department of
Environmental Conservation (DEC) issued a policy identifying closed-cycle cooling or the equivalent as
the BTA to minimize adverse environmental impacts in the state (NYSDEC 2011). The policy also
identified dry cooling as the performance goal for new industrial facilities sited in the marine and coastal
district (NYSDEC 2011). Through this policy, the DEC intends to minimize or eliminate the use of once-
through cooling water from the surface waters of New York State (NYSDEC 2011).
In addition, the California State Water Resources Control Board adopted the Policy on the Use of Coastal
and Estuarine Waters for Power Plant Cooling on May 4, 2010. The policy applies to the 19 existing
power plants (including 2 nuclear plants) that currently have the ability to withdraw more than 15 BGD
from the State‘s coastal and estuarine waters via once-through cooling. The Board selected closed-cycle
wet cooling as the BTA because it allows permittees to either reduce intake flow and velocity (Track 1) or
reduce impacts to aquatic life comparably by other means (Track 2) to control or mitigate the entrainment
and impingement of marine life (SWRCB 2013).
Nuclear Safety Regulations
The temperature of cooling water intake is also under the purview of the Nuclear Regulatory Commission
(NRC), with respect to nuclear plants due to safety implications. When the intake water gets too warm,
some nuclear plants might have to reduce generation for reactor safety. Some nuclear plants use a turbine

The Water-Energy Nexus: Challenges and Opportunities June 2014
71
condenser CWIS to source water to cool safety-related equipment. In this case, the NRC sets an intake
temperature limit.
Equipment cooling water is frequently sourced underground through a well; however, if this water has the
same source as the water used for condenser cooling, and if the source water body temperature exceeds
the NRC limit, the plant has to shut down. This requirement is in place not because the plant would be
unable to operate the condenser and generate electricity, but because the water temperature would have
exceeded the NRC‘s limit for water used to cool the safety equipment.50
This type of response happened
in Connecticut in the summer of 2012 at Millstone Nuclear Power Station, and in the summer of 2013 the
Pilgrim Nuclear Power Station in Massachusetts came close to shutting down (Legere 2013).
Water Policies Affecting Hydropower
Hydropower generation is highly efficient compared to other forms of power generation. It is the largest
contributor of renewable power generation in the United States, and its current installed capacity is 79
GW. The best sites for large hydropower projects (plants with a capacity larger than 2,000 MW) in the
United States have been tapped (Gleick and Christian-Smith 2012), and new large hydropower projects
are not considered likely to occur in the country due to significant environmental impacts that the public
is not willing to accept.
The management of large hydro infrastructure has evolved over the years to reflect the inclusion of
purposes beyond the more traditional purposes of power generation, irrigation, and flood risk
management. The inclusion of the newer purposes of navigation, recreational use, and ecosystem
sustainability has made it increasingly necessary for more and more flexible hydro management and water
sharing among all parties.
Interest in small hydropower projects (units no more than 30 MW capacity) has been building, along with
pumped storage units, in the United States over the last decade. Currently, 92 percent of existing turbines
are classified as small or low power and account for only 20 percent of hydropower generation. The
untapped potential of small hydropower in the United States could be sizable (ORNL, NHA, and HRF
2010). There is also potential in generating power from existing dams that are currently unequipped to do
so. A 2012 DOE report estimates that, without building a single new dam, these available hydropower
resources, if fully developed, could provide an electrical generating capacity of more than 12 GW, or
approximately 15 percent of current U.S. hydropower capacity (Hadjerioua et al. 2012). The potential for
additional pumped-storage hydroelectricity also appears sizable; nearly 60 GW of pumped storage
facilities are currently in the Federal Energy Regulatory Commission (FERC) licensing queue (FERC
2013).51
Based on a study by DOE‘s Oak Ridge National Laboratory, there is also an estimated 68 GW of
potential run-of-river power generation in the United States (NHAAP, n.d.).
50
The systems and equipment cooled by service water within a nuclear power plant include emergency diesel
generators; auxiliary feed water pumps; residual heat removal heat exchangers and pumps; containment building air
coolers; safety-related equipment room coolers and bearing coolers; component cooling water (between component
and safety-related service water); and control room heating, ventilation, and air conditioning (William Skaff,
Nuclear Energy Institute, email correspondence, September 24, 2013). 51
Pumped storage is market-limited, not resource limited. If market factors were resolved (namely reducing
permitting barriers and setting an appropriate ―price‖ for stored power), this would greatly open up the opportunities
for large-scale pumped storage development in the United States (DOE Office of Energy Efficiency and Renewable
Energy, personal communication).

June 2014 The Water-Energy Nexus: Challenges and Opportunities
72
Licensing and regulatory policies at the federal and state levels also impact hydropower investments.
More than half of the nation‘s hydro capacity is under the licensing (including renewal) authority of
FERC. The average time for obtaining the necessary FERC license for a pumped storage or small hydro
project is six years. The 2013 Hydro Efficiency Act targeting small hydro projects that recently passed
both houses of Congress and signed into law by President Obama is expected to expedite FERC‘s review
of smaller hydro projects and even grant licensing exemptions under certain circumstances (FERC 2014).
Financial incentives for hydropower currently exist at the state level in the forms of Production Tax
Credits and Renewable Tax Credits for efficiency improvements at existing hydro facilities and new and
smaller hydropower projects (EIA 2013d).
Two characteristics about hydropower have made it the renewable energy of choice for grid-connected
power generation: its pumped storage and flexible response time akin to that of natural gas plants (Hoyt
Battey, DOE Office of Energy Efficiency and Renewable Energy, personal communication, 2013).
However, some issues related to the integration of hydro and wind power generation have emerged (Box
4.3).
In terms of water use, studies focusing on the Southwestern United States have highlighted instances
when a significant amount of water has been evaporated and consumed from hydropower reservoirs,
Box 4.3. Hydro-Wind Integration
On the surface, hydroelectric and wind power appear to be a perfect match. Hydroelectric systems typically have ample installed generation capacity; this capacity can be ramped up and down relatively quickly—a good match for variable wind power. In addition, wind energy reduces the use of stored water, which allows more long-term flexibility for hydro. Hydroelectric and wind energy have been excellent complements in many instances, but some integration issues have arisen when relatively large amounts of wind capacity are installed, even giving rise to counterintuitive results such as negative power pricing.
One example is the Bonneville Power Administration’s (BPA’s) 2011 episode of ―oversupply‖ or high wind/high water. BPA markets a largely hydro system with more than 22 GW of hydro capacity (BPA and the U.S. Army Corps of Engineers 2013a). BPA also manages the bulk of transmission balancing services in the Pacific Northwest. In recent years, more than 4 GW of wind capacity has been added to BPA’s control area. In the spring, when heating and cooling loads are low, the winds are blustery, and the snow melt is flowing through the rivers of the Northwest, there can be excess power available.
In the spring of 2011, wind and water contributed enough energy to cause a problem. BPA curtailed wind generation, because sending excess water or the dams' spillways rather than through turbines would violate dissolved gas limits established to protect salmon. The wind generators, led by PacifiCorp and Iberdrola, argued that BPA was using its transmission market power to discriminate against wind farms and protect its own public utility customers from costs they would otherwise bear because of excess hydro generation. FERC ultimately agreed with BPA’s use of its Oversupply Management Protocol, but did not agree with BPA splitting the costs evenly among public power and wind generation (Sonya Baskerville, BPA, email correspondence, 02/13/14).
A variety of solutions are being explored (BPA, Sonya Baskerville, email correspondence, 02/13/14).

The Water-Energy Nexus: Challenges and Opportunities June 2014
73
particularly large reservoirs.52
However, given the multipurpose nature of most hydro projects, it is
difficult to attribute the share of the evaporation specific to power generation (Hoyt Battey, DOE Office
of Energy Efficiency and Renewable Energy, personal communication, August 7, 2013).
4.4 Role of States in Energy-Water Nexus
4.4.1 Water Permitting
Few states have policies regarding water use at power plants. In some states, a centralized agency
considers applications to build new power plants. In other states, applications might be filed with
multiple state agencies including state water regulators and public utility commissions. State water
regulators issue permits for power plants to regulate water use and ensure compliance with relevant
regulations. The main role of public utility commissions is to approve rates; however, some also consider
whether specific power plant design and cooling technologies are reasonable. In states where a
centralized agency looks at water use by power plants, plants might have permits denied due to a lack of
sufficient water resources or the impact the plant might have on other water users in the area. The
increased scrutiny allows the governing body to evaluate the effect on all water users in the network
rather than one plant‘s needs.
States in water-stressed areas such as Texas and the Southwest have more stringent water requirements
for power generators. In Texas, the state‘s independent system operator, the Electric Reliability Council
of Texas (ERCOT), has begun requiring new generators to provide proof of water rights before the
council will include them in their grid planning (Pickrell 2013). Plants cannot connect to the electricity
transmission network if they are not included in grid planning.
In Arizona, the state permitting authority reviews environmental concerns when certifying proposed
plants (Mittal and Gaffigan 2009). The authority has denied at least one power plant its Certificate of
Environmental Compatibility due to the potential for groundwater depletion and the loss of habitat for an
endangered species.
In California, the California Energy Commission (CEC), the organization in charge of energy policy and
planning, requires power plant developers to consider zero-liquid discharge technologies, such as dry
cooling, unless the use of those technologies would be ―environmentally undesirable or economically
unsound‖ (Mittal and Gaffigan 2009). The agency also reviews permit applicants with regard to water
needs and impacts. CEC staff members evaluate how the proposed water use might affect other users in
the area and the effect to the overall water supply in the state. CEC coordinates with other agencies,
including the State Water Resources Control Board, and ensures that power plant developers have
considered the viability of alternative cooling technologies and water sources and addressed the
implications of wastewater disposal and any effect on water supply and water quality in the state.
4.4.2 Drought Planning
In 1982, only three states had a formal drought plan. As of 2006, 37 states had a drought plan. Only two
of these states, Ohio and Missouri, classify water use into essential, important, and non-essential
categories in the event of a drought (Kimmell and Veil 2009). For both of these states, water use by
power plants is classified as an essential use and is unrestricted or less restricted during a drought.
Connecticut, Indiana, and Maryland also categorize water uses, although only for non-essential water
52
Personal communication, Hoyt Battey, DOE Office of Energy Efficiency and Renewable Energy, August 7, 2013.

June 2014 The Water-Energy Nexus: Challenges and Opportunities
74
users. South Dakota and Colorado specify preferred uses in situations where all legal uses cannot be fully
supplied (Hrezo et al. 1986).
States that operate under a prior appropriation water regime could adjust their priorities in a drought. For
example, during a drought in Texas, the Executive Director of the Texas Commission on Environmental
Quality can announce a priority cutoff date for withdrawal but give allowances to ―water rights holders
that benefit the health and welfare of the state,‖ which often include power plants.53
The Executive
Director recently used this practice on the Brazos River, allowing power plants on the river to keep
operating despite their junior priority dates.
4.5 State and Federal Water and Wastewater Facilities
With respect to energy-for-water, water and wastewater utilities are the most prominent entities. EPRI
estimated in 2013 that the annual energy usage by the water and wastewater industry is slightly less than 2
percent of total U.S. electricity consumption (Amarnath et al. 2013). At an average energy cost of $0.075
per kWh, the cost for providing safe drinking water and wastewater treatment is approximately $7.5
billion per year (EPA 2010c).
There is mounting evidence that the nation‘s water and wastewater infrastructure is deteriorating (Gleick
and Christian-Smith 2012). EPA‘s latest 2008 Clean Watersheds Needs Survey (CWNS) showed a
funding gap of $298.1 billion in capital needs as of January 1, 2008, in addressing the nation‘s water
quality needs in the next 20 years. This includes $105 billion needed for building new wastewater
treatment plants and updating existing facilities, $83 billion for pipe repair and new pipes, and $64 billion
for combined sewer overflow corrections.54
The EPA‘s 2011 fifth national assessment of system
infrastructure needs, the Drinking Water Infrastructure Needs (DWNS) Survey, identified $384.2 billion
in in infrastructure investment needs over the next 20 years to ensure the continued provision of safe
drinking water.55
This includes $247.5 billion needed for transmission and distribution pipe repair and
new pipes, $72.5 billion for treatment plants, and $60 billion for source and storage projects. Box 4.4
describes the funding mechanism for water and wastewater facilities in the United States.
U.S. water and wastewater utilities are putting more of an emphasis on water reuse and improving energy
and water efficiency, which will benefit both water and energy conservation. In recent years, some states
have started to promote decentralized systems that require much less energy for delivery and much lower
infrastructure costs. A number of states have also instituted standards for household appliances that are
stricter than national water conservation standards (Gleick and Christian-Smith 2012).
53
Texas Administrative Code §§36.3 and 36.5. 54
In many cities, the combined sewer systems that collect sanitary sewage and storm water runoff in a single pipe
system more and more frequently exceed capacity, leading to serious water pollution problems due to sewage
overflows. As early as 2002, EPA estimated that each year combined sewer outfalls spilled 1.2 trillion gallons of
storm water and wastewater into the environment, posing human health and environmental risks (CBO 2002). 55
The DWNS report is available at http://water.epa.gov/grants_funding/dwsrf/index.cfm.

The Water-Energy Nexus: Challenges and Opportunities June 2014
75
Major efforts are also underway at the federal level to promote water recycling, greater energy and water
efficiency at water and wastewater utilities, and the transformation of wastewater facilities into resource
recovery entities.56
The ENERGY STAR program is a voluntary program established by EPA in 1995 to
leverage long-standing technology expertise to reduce greenhouse gas emissions. As part of this effort,
DOE‘s Lawrence Berkeley National Laboratory (LBNL) helped EPA generate the 2010 EPA ENERGY
STAR resource guide, which was integrated into EPA‘s ―Ensuring a Sustainable Future: An Energy
Management Guidebook for Wastewater and Water Utilities‖ and describes resources for cost-effectively
improving the energy efficiency of U.S. public drinking water facilities.57
Additionally, EPA‘s Office of Wastewater Management has issued important guidelines such as the 2012
Guidelines for Water Reuse; Ensuring a Sustainable Future: An Energy Management Guidebook for
Wastewater and Water Utilities58
; A Primer on Energy Efficiency for Municipal Water and Wastewater
Utilities59
; Evaluation of Energy Conservation Measures for Wastewater Treatment Facilities60
; and
Energy Efficiency in Water and Wastewater Facilities: A Guide to Development and Implementing
Greenhouse Gas Reduction Programs.61
EPA has also begun implementing an Integrated Municipal
Storm-water and Wastewater Planning Approach Framework.62
EPA‘s Green Infrastructure initiative
focuses attention on treating storm water as a valuable resource rather than a problem. The initiative is in
tandem with growing efforts to transform wastewater treatment facilities into wastewater resource
recovery facilities that produce clean water, recover energy, and generate nutrients (EPA 2012; WERF
2011).
56
Eight federal agencies, ranging from the Bureau of Reclamation to the Bureau of Indian Affairs, provide grants
and loans for municipal water recycling projects through 17 different programs (Gleick and Christian-Smith 2012). 57
The guide can be found at www.escholarship.org/uc/item/6bg9f6tk. 58
http://water.epa.gov/infrastructure/sustain/upload/Final-Energy-Management-Guidebook.pdf 59
http://www.esmap.org/esmap/publication?title=A+Primer+on+Energy+Efficiency+for+Municipal
+Water+and+Wastewater 60
http://water.epa.gov/scitech/wastetech/upload/Evaluation-of-Energy-Conservation-Measures-for-Wastewater-
Treatment-Facilities.pdf 61
http://www.epa.gov/statelocalclimate/documents/pdf/wastewater-guide.pdf 62
http://cfpub.epa.gov/npdes/integratedplans.cfm
Box 4.4 Funding Mechanism for Water and Wastewater Facilities in the United States
The vast majority of funds for water and wastewater infrastructure development, rehabilitation, and operations, come from the utility fees users pay to receive water services.
Local governments and municipalities provide about 90 percent of government funding. States collectively contribute about 4 percent, and the federal government provides the remaining 6 percent. The State Revolving Funds (SRFs) contributed by multiple federal agencies are the chief source of federal investments in water and wastewater systems.
Also known as the Clean Water and Drinking Water State Revolving Fund programs, the SRFs have provided more than $100 billion in funding from their inception in 1987 to 2013 (EPA 2014). The DWSRFs have provided more than $25 billion since it began in 1997. In 2009, the federal government gave a sizable boost to SRFs by way of the American Recovery and Reinvestment Act, which provided $2 billion and $4 billion for local water and waste infrastructure improvements, respectively (Gleick and Christian-Smith 2012).

June 2014 The Water-Energy Nexus: Challenges and Opportunities
76
The EPA WaterSense program contributes to greater water efficiency among utilities, manufacturers,
retailers, and consumers through the labeling of products and services that save water and by ensuring
product performance. The ―products‖ labeled include single-family and multi-family homes, landscape
practices, and best management practices for commercial and institutional facilities.63
Between its
inception of 2006 and the end of 2012, the program is estimated to have saved a cumulative 487 billion
gallons of water and 64.7 billion kWh of electricity (EPA 2013f). The EPA has also has developed a
strategy to guide the work that EPA and State agencies do to implement Clean Water At and Safe
Drinking Water Act programs as the climate changes.64
4.6 International Comparison of Case Studies
Many countries around the globe already face water constraints, as shown in Figure 4.8. The United
States has experienced water constraints in power generation in nearly every region (DOE 2013);
however, compared to some of the other countries also experiencing such constraints, the United States is
relatively water rich and has perhaps lacked drivers for reducing water use. Depending on the energy and
water resource endowments, past policies, and current policy framework, the world‘s most water-poor
countries face different challenges in ensuring greater reliability in both water and energy (Table 4.3).
This section delineates how some of these countries have responded to the challenges by way of policy
mandates and incentives, as well as both direct and indirect measures to reduce water use.
Figure 4.8. Global Water Stress Map (Water Stress = Withdrawals/Available Flow). Source: World Resources Institute Aqueduct Water Risk Atlas
In terms of the relative importance of energy versus water policy making, internationally, energy
provision (e.g., coal, nuclear, hydro, and biofuels) has generally dominated the policy landscape and its
impacts on water have been downplayed. This is largely due to the fact that water tends to be relatively
63
For more information, visit www.epa.gov/WaterSense/docs/ws_accomplishments2012_spreads_508.pdf. 64
See National Water Program 2012 Strategy: Response to Climate Change; EPA, 2012.
http://water.epa.gov/scitech/climatechange/2012-National-Water-Program-Strategy.cfm
The Water-Energy Nexus: Challenges and Opportunities June 2014
77
cheap and less emphasized for economic development. In some cases, climate policy has shifted the
energy mix to be less GHG intensive, although the associated water impacts are still largely downplayed.
In response to continuously rising energy and water demand, severely water-poor countries have turned to
energy-intensive water provision (e.g., desalination in Singapore and Qatar). Some of the most prominent
water-poor yet hydrocarbon-rich countries have also taken up highly energy-intensive water projects (e.g.,
desalination and inter-basin transfers) as a result of an energy-water mismatch and sometimes significant
water quality issues due to decades of poor water management (e.g., China, India, and Australia).
On the positive side, these countries are also adopting both direct and indirect approaches to increase
energy-water efficiency, particularly in coal power generation, and moving toward much more integrated
energy-water policy making (Box 4.5).
Most of these water scarce countries are also taking a wide range of initiatives to integrate policy designs,
both within sectors and across energy, water, as well as climate policy arenas. Multiple studies have
identified barriers to achieving such policy integration by country as well as country groupings. The
United States can draw lessons from such studies also in terms of how water-scarce countries are
integrating energy, water, and climate policy-making to maximize water and energy productivity (King et
al. 2013; Hussey and Pittock 2012; Pittock 2011; and Hoff 2011).
4.6.1 Australia
Endowed with great energy resources yet water poor, Australia has implemented water markets and water
trading to improve the efficiency of water use. The country is also implementing state-specific water
caps, and each state must submit an implementation plan that adheres to the state government‘s water
policy and the priorities of the National Water Initiative (NWI).
Australia is endowed with large coal resources and in 2012 exported coal valued at 14 percent of the
country‘s annual gross domestic product (GDP) (BREE 2012). In light of its water scarcity, Australia has
undertaken both direct and indirect approaches to reduce freshwater consumption in its coal sector,
specifically supercritical steam cycles, dry cooling, turbine upgrades, coal drying, and in-plant water
recycling (NETL 2011). The country is also exploring costlier options, including retrofitting coal units
totaling 3,020 MW of existing capacity for dry bottom ash handling (NETL 2011).65
Beyond its coal
sector, Australia has been less inclined to implement energy-conserving technologies. The country also
has one of the lowest gasoline and diesel tax rates among Organisation for Economic Co-operation and
Development countries and is one of the highest carbon dioxide emitters on a per capita basis.
65
Dry bottom ash handling does not require water for cooling and conveyance (NETL 2011).

June 2014 The Water-Energy Nexus: Challenges and Opportunities
78
For water supply, Australia is increasingly turning to seawater desalination, particularly in light of the
severe and prolonged drought from 1997–2009. Aware of the energy intensity of typical desalination
processes, Australia is investing in renewable desalination as well as waste-heat-powered desalination.
Among other projects under development, Australia‘s largest solar stations are being constructed on the
Midwest coast to supply 10 percent of the total energy required by the Southern Seawater Desalination
Plant. A mineral processing plant with available waste heat is being developed to power desalination, in
collaboration with one of Australia‘s research centers, specifically the National Centre of Excellence in
Desalination (NCEDA). NCEDA and the Australian Water Recycling Centre of Excellence are two
research centers created by the Australian government as part of the NWI‘s efforts to increase the
country‘s water resilience. To lower the carbon footprint of desalination, water utilities in Australia are
also purchasing more renewable energy, particularly wind, to offset the power fueled by fossil fuels
(Palmer 2012). Efforts are also underway to engender more coherent water-energy policy making in
Australia (King et al. 2013).
4.6.2 Brazil
In order to reduce oil dependence and imports, Brazil started a National Alcohol program in 1975 that has
made rainfed sugarcane ethanol a significant fuel for its domestic fleet. More than 50 percent of Brazilian
made cars today are flexfuel cars that can run on 25 percent to 100 percent ethanol. However, the
expansion in biofuel production over the last decade has led to water and soil issues, as well as some
irrigation-based sugarcane cultivation for biofuels in the South. The Brazilian government has responded
with some measures to preserve water resources in the agricultural sector that include agro-ecological
zoning and fertigation (a more efficient way of fertilizing by dissolving fertilizer into the irrigation
system).
Despite the fact that 85 percent of Brazil‘s electricity is already generated from hydro resources, Brazil‘s
National Energy Plan stipulates an additional 95,000 MW of hydro capacity by 2030. Brazil has a
commitment to minimizing human and environmental impacts from hydro projects and historically has
Box 4.5. Direct and Indirect Approaches to Reduce Freshwater Consumption at Thermoelectric Plants
Direct approaches are aimed specifically at reducing water consumption; they include dry cooling, dry bottom ash handling, low-water-consuming emissions-control technologies, water metering and monitoring, reclaiming water from in-plant operations (e.g., recovery of cooling tower water for boiler makeup water, reclaiming water from flue gas desulfurization systems), and desalination.
Some of the direct approaches, such as dry air cooling, desalination, and recovery of cooling tower water for boiler makeup water, are costly and deployed primarily in countries with severe water shortages.
Indirect approaches reduce water consumption while meeting other objectives, such as improving plant efficiency. Plants with higher efficiency use less energy to produce electricity, and because greater energy production requires greater cooling water needs, increased efficiency will help reduce water consumption. Approaches for improving efficiency (and for indirectly reducing water consumption) include increasing the operating steam parameters (temperature and pressure); using more efficient coal-fired technologies such as cogeneration, integrated gasification combined cycle, and direct firing of gas turbines with coal; replacing or retrofitting existing inefficient plants to make them more efficient; installing high-performance monitoring and process controls; and coal drying (NETL 2011).

The Water-Energy Nexus: Challenges and Opportunities June 2014
79
employed environmentally conscious hydropower design. Nevertheless, some are championing a greater
consideration of other options, such as updating existing dams, in order to minimize additional ecological
impacts and water consumed via reservoir water evaporation.
4.6.3 China
Although 70 percent of China‘s electricity already comes from coal, the country still holds a lot of
untapped coal potential. China ranks third in the world in terms of coal reserves, after the United States
and Russia (EIA 2014). Of the nearly 1 million MW of coal-fired generation expected to come online
worldwide in the next 25 years, China is projected to contribute nearly 75 percent of that, approximately
750,000 MW (NETL 2011).
While China is the world‘s largest producer and consumer of coal, it is also one the world‘s driest
countries (Schneider 2010). Furthermore, most of China‘s coal bases are located in the water-stressed
northwest region. As an example, Inner Mongolia holds 26 percent of China‘s coal reserves but only 1.6
percent of its water (Shifflett 2013).
China‘s 11th Five-Year Plan (for 2006 to 2010) has been described as a turning point with respect to
energy and water and casts greater conservation and efficiency as key priorities. Accordingly, China has
been implementing several direct and indirect (e.g., by efficiency improvements) approaches to reduce
freshwater consumption in coal power generation. The measures have included the following: replacing
and retrofitting small, inefficient plants; increasing use of supercritical and ultracritical units; using dry
cooling; exploring integrated gasification combined cycle (IGCC); and using desalination at power plants
(NETL 2011).
China is also mitigating the impact of its scarce water resources by ―rationalizing‖ the exploitation and
allocation of water, building green infrastructure, and applying anti-flood engineering. In addition, China
has pursued more integrated policy making in order to achieve both water and energy savings. The
government appointed the powerful National Reform and Development Commission to lead the National
Climate Change Program, which has publicly expressed its commitment to ―integrate climate change
policy with other interrelated policies.‖(Pittock 2011).

June 2014 The Water-Energy Nexus: Challenges and Opportunities
80
Table 4.3. Comparison of Drivers and Approaches for Reducing Freshwater Consumption
Country Primary energy mix (%)66
Fuel mix for power generation (%)67
Drivers for reducing freshwater consumption
Approaches for reducing freshwater consumption/impact in energy generation
Major climate, energy, and water plans
Whether integrated policy making is apparent, strengths, and remaining challenges
Australia 36% Oil 33% Coal 25% NG 2% Hydro
69% Coal 20% NG 7% Hydro 2% Wind
Coal projected to continue dominance; many areas subject to prolonged drought; groundwater use restricted
Coal – Supercritical steam cycles, dry cooling, turbine upgrades, coal drying, in-plant water cycling
Carbon Pollution Reduction Scheme Bill 2009; National Climate Change Adaptation Framework 2007; Renewable Energy Demo Program 2009; Global CCS Institute 2009; Low Emissions Tech Demo Fund 2006; Competitive Water Markets under 2007 Water Act; National Water Initiative 2004
No apparent integration; strong water governance mechanism; data collection by multiple organizations can be more coordinated
Brazil
47% Oil 35% Hydro 8% NG
85% Hydro 10% NG/ biomass 4% Nuclear
Water impact beginning to show from biofuel production; large hydro addition planned
Hydro – Commitment to minimize impacts from hydro, though not considering upgrading existing dams Biofuel – Agroecological zoning; fertigation
National Energy Plan 2005–2030; 2006 hydroelectricity plan; National Water Act 1997 and plan
No apparent integration; Climate change policy processes will potentially help integrate policies due to top-level leadership, engagement of influential institutions, and multi-stakeholder and inter-governmental bodies
66
The primary energy mix data is based on consumption and was gathered from the following sources: most recent
EIA country analysis brief on respective countries and the energy database of the International Energy Agency. 67
For China, the power generation fuel mix is for installed capacity; for the rest of the countries, the power
generation fuel mix is for actual generation.

The Water-Energy Nexus: Challenges and Opportunities June 2014
81
Country Primary energy mix (%)66
Fuel mix for power generation (%)67
Drivers for reducing freshwater consumption
Approaches for reducing freshwater consumption/impact in energy generation
Major climate, energy, and water plans
Whether integrated policy making is apparent, strengths, and remaining challenges
China 70% Coal 19% Oil 6% Hydro
65% Coal 22% Hydro 3% NG 1% Nuclear
Coal expected to continue dominance; China is the 3rd driest country in the world; specific policies for reducing freshwater consumption
Coal – replace, retrofit small, inefficient plants; increase use of supercritical and ultracritical units; dry cooling; exploring IGCC; desalination at power plants Hydro – Commitment to minimize impacts from hydro
National Climate Change program; Water law 2002; renewable energy targets
Some integration already; pronounced commitment to integrate climate policy with other policies and to reduce the vulnerability of water resources; tensions between energy and water due to large-scale hydro and bioenergy projects planned
France
45% Nuclear68 29% Oil 14% NG 2% Hydro
78% Nuclear 11% Hydro
Nuclear expected to continue dominance; many areas are drought-prone
Nuclear – Potential goal to reduce its dependency from 75% to 50% by 202569
Potential new goal of lowering emissions 30% by 2020 through significant building sector and renewable power measures70
Some integration due to EU processes
Qatar
77% NG 23% Petroleum
99% NG Limited freshwater availability
Power generation: Move toward zero-water-consuming solar power generation Water supply: Move toward solar-powered desalination for water provision
National plan to adopt renewable energy to meet domestic energy demand growth and for the 2022 World Cup
Growing energy and water integration
68
Statistics for France‘s primary energy mix were gathered from the International Energy Agency, via
http://www.iea.org/stats/WebGraphs/FRANCE4.pdf. 69
Information about France‘s goal to reduce its nuclear production was gathered from the New York Times, via
www.nytimes.com/2012/09/15/world/europe/energy-policy-divides-governing-coalition-in-
france.html?pagewanted=all&_r=0. 70
Information about France‘s potential new goal of lowering emissions was gathered from the Worldwatch Institute,
via www.worldwatch.org/analysis-france%E2%80%99s-climate-bill-green-deal-or-great-disillusion.

June 2014 The Water-Energy Nexus: Challenges and Opportunities
82
Country Primary energy mix (%)66
Fuel mix for power generation (%)67
Drivers for reducing freshwater consumption
Approaches for reducing freshwater consumption/impact in energy generation
Major climate, energy, and water plans
Whether integrated policy making is apparent, strengths, and remaining challenges
India 41% Coal 23% Petroleum 23% Solid biomass and waste 8% NG
70% Coal 12% Hydro 10% Biomass
High and rising demand for power; demand-supply gap for power; coal expected to dominate; aging coal plants
Coal – Increase efficiency; use advance supercritical steam parameters; replace/retrofit old inefficient plants; reuse and recycle wastewater; researching IGCC Hydro – Exploring pumped storage hydro
National Action Plan on Climate Change 2008; Energy Policy 2007, National Water Policy 2002; 2006 Environmental Policy
No apparent integration
Singapore 90% Petroleum 10% NG
78% NG 18% Petroleum products
Water poor and energy poor
Water supply – Recycle wastewater Power supply –Exploring CHP
National water conservation initiative, exploring scale up of CHP
Strong energy-water integration
Source: NETL 2011; EIA 2013e, 2013f, 2013g, 2013h, 2013i, 2014; IEA Databases; Pittock 2011
4.6.4 India
India‘s water situation may be even more serious than China‘s. Approximately 52 percent of India‘s
population lives in water-scarce regions, and 73 percent of the country‘s electricity capacity resides in
water-scarce or stressed locations (CNA 2013). The country relies mostly on coal for fuel and power
generation. It is the world‘s third-largest producer and consumer of coal, although the country‘s coal is of
low quality and electricity production fueled by domestic coal is highly inefficient. India started to
import metallurgical coal in 2003 and has been doing so at an increasing pace. Currently, coal fuels
approximately 70 percent of India‘s power generation, and it is expected to remain the dominant energy
source in India through at least 2050.
About one-third of the country‘s coal plants are old and inefficient, according to a World Bank study
(Sibley 2009). Meanwhile, an estimated 33 percent of the households in India do not have access to
electricity (Real Clear Energy 2012). The aging coal infrastructure, together with the need to meet the
demand-supply gap for electricity, leads to opportunities to bring in much more energy- and water-
efficient technologies as well as renewables.
By 2010, the country has sketched out 16 large (4,000 MW or above), efficient, coal units that use
advanced supercritical steam parameters in nine different states. New coal plants are also mandated to
achieve a gross efficiency level of 38 percent to 40 percent, compared to the prevailing 36 percent.
Through retrofits and early retirements, the existing fleet has also become more energy and water
efficient. R&D funding has been provided to explore additional options such as IGCC and supercritical
technologies (NETL 2011).
4.6.5 France
With more than 75 percent of its 119 GW of installed generating capacity coming from nuclear power and
11 percent coming from hydropower, the existing electric power system in France is highly water-

The Water-Energy Nexus: Challenges and Opportunities June 2014
83
dependent. The majority of the country‘s nuclear reactors (44 of 58) require fresh water for cooling, with
two-thirds of these utilizing cooling towers and the remaining one-third employing once-through cooling
using river or lake water (World Nuclear Association 2013).
In August 2003, a severe heat wave affecting the cooling capacity at nuclear and coal plants led
Électricité de France, the national utility and operator of nuclear power reactors, to temporarily raise the
maximum allowed water temperature of water discharged from these plants (Tagliabue 2003). Even with
the allowance, 17 nuclear reactors and one coal plant had to shut down (Kanter 2007).71
The 2003 heat
wave also impacted hydropower generation (Tagliabue 2003), although two years prior in the summer of
2001, France‘s hydropower reservoir levels had already fallen to 40 percent full capacity, the lowest on
record.
Similar situations occurred during heat waves in 2006 and 2009. During the heat waves of 2006, 17
reactors had to shut down or limit their power output. In 2009, a power workers‘ strike combined with a
drought took 20 GW of France‘s nuclear generating capacity offline (Pagnamenta 2009). As a result, in
October 2009, France became a net importer of electricity, the first time in 27 years (RTE 2009).
The shortfall in the country‘s hydropower production has continued. In 2011, a report stated that the
country has had to increase fossil fuel production for electricity generation due to hydropower shortfalls
(ICIS 2011).
4.6.6 Qatar
Hydrocarbon rich yet water poor, the small country of Qatar enjoys the world‘s highest GDP per capita
from oil and gas exports. In recent years, however, it has realized the need for more integrated water-
energy decision making, due in large part to a growing middle class coupled with rising water and energy
demand.
Qatar holds the world‘s third-largest natural gas reserves and is the world‘s largest supplier of liquefied
natural gas (LNG). Qatar is also a member of the Organization of the Petroleum Exporting Countries
(OPEC) and a significant net exporter of oil (EIA 2013f). The country is one of the driest countries in the
world, which poses particular challenges when it comes to the provision of drinking water. Qatar depends
on the energy-intensive process of desalinizing seawater for water provision, although some of Qatar‘s
desalination utilizes waste heat by co-locating with power generation. The country is also moving toward
powering desalination with next-generation solar power, which consumes no water. Such a pairing will
also help the country optimize its desalination potential (WaterWorld 2013; QNSFP 2011).72
For water
provision, the country is undertaking steps to conserve water and increase water supply.
For power generation, the country is trying to rely less on natural gas and move toward much more
renewable and alternative energies, including solar. The country currently has no nuclear power plants,
but is in the process of deciding whether to pursue nuclear power. Nuclear generation would likely rely
on seawater for cooling. More generally, the country has a chief priority of using less valuable
hydrocarbon-based fuels and much more renewable and alternative energies, including solar, to meet
domestic energy needs, leading to lower water demand.
71
In addition, Électricité de France was forced to buy power from neighboring countries on the open market, where
demand drove the price of a megawatt hour as high as €1,000, or $1,350, compared to the average price of about €95
per megawatt hour during summer months in France (Kanter 2007). 72
Qatar plans to build at least two new desalination plants that would come online by 2015 (Hackley 2013).

June 2014 The Water-Energy Nexus: Challenges and Opportunities
84
In addition to developing additional desalinization facilities, the country is making an integrated effort to
scrutinize current water use and identify opportunities for water recycling. It is also advocating water
conservation through a water conservation program that shares basic water conservation techniques with
the public through social media (Khatri 2013).
4.6.7 Singapore
Singapore has almost no indigenous hydrocarbon resources and must import all of its crude oil, which
goes mostly into the petrochemical and refining sector (EIA 2013g).73
The country also imports natural
gas to fuel most of its power generation. Modest consumption of coal and renewable resources fuels the
rest of the power generation. As the country‘s demand for natural gas grows, it will need to augment gas
imported via pipeline with LNG imports. Singapore has limited land and faces feedstock constraints on
renewable resources, including biofuels. However, the government has invested in solar energy
development and has attracted some of the world‘s largest producers to set up solar energy manufacturing
facilities in Singapore (EIA 2013g).74
Though Singapore has relied on Malaysia to meet nearly all of its water needs since 1927, it adopted
innovative water policies in recent years and is now about 50 percent self-reliant for water. Such policies
have included reclaiming water, desalinating water, appropriate pricing, water conservation, and energy
efficiency. After extensive campaigns, the government in recent years was able to convince Singaporeans
to accept water reclaimed from former wastewater as drinking water, or NEWater. NEWater now meets
approximately 30 percent of Singapore‘s water needs.
Desalination has been another important source of water supply for Singaporeans. Singapore opened its
first desalination plant in 2005, and the country now meets about 10 percent of its water needs through
desalinated water.
On the demand side, over the years the government has waged successful campaigns to promote water
conservation. Domestic per capita water consumption fell from 176 liters to 160 liters per day from 1994
to 2005, and the country is targeting a further drop to 140 liters per day by 2030. Singapore‘s simple
water tariff system, which discourages overuse while assisting low-income families, has contributed to
the overall reduction in water demand. The fact that water (in addition to electricity and fuel) is not
generally subsidized has also helped enhance cost recovery on investments for infrastructure
improvements.
Both desalination and the production of NEWater require energy-intensive processes or technologies such
as advanced membrane treatment. In response, the country plans to reduce the energy it takes to produce
water by a factor of one-half or one-third, according to its Minister for Environment and Water Resources
(Teh 2013). Historically, Singapore was able to reduce its overall energy intensity by 15 percent between
1990 and 2005 due to the adoption of better technology in power generation and efficiency improvements
in other sectors (NEA 2012).
73
The petrochemical industry is the backbone of Singapore‘s economy and features world-class refining, storage,
and distribution infrastructure (EIA 2013b). 74
Norway‘s Renewable Energy Corporation established the world‘s largest solar panel manufacturing complex in
Singapore, and the companies Solar Energy Power and Eco-Solar set up their Asia-Pacific headquarters in
Singapore (EIA 2013b).

The Water-Energy Nexus: Challenges and Opportunities June 2014
85
4.7 Challenges and Opportunities
The energy-water decision landscape is highly fragmented. It comprises a diverse set of actors and
interests, overlapping but not necessarily consistent incentive structures, and inherent regional variation in
water and energy availability. There is, however, opportunity for policy harmonization between the
energy and water spheres. The energy-water decision landscape is starting to attract attention and gain
awareness as a result of the increasing importance of water in energy production, rising uncertainty of
water supply, and similar trends at the global scale. Synergistic approaches to energy and water
challenges that address objectives in both domains are being explored and adopted at various scales. The
need to replace aging energy infrastructure provides another opportunity to bring in technologies that are
more energy efficient and resilient to varying water variability. Lessons learned from successful
watershed management and integrated policy-making framework could also aid in the move toward a
coherent energy-water decision framework.
The following sections detail sector-specific and integrated challenges and opportunities.
4.7.1 Electric Power Sector
In the electric power sector, both market and non-market drivers are incentivizing a movement toward
cleaner hydrocarbon and renewable options that also pose opportunities for adopting energy- and water-
efficient technologies. Challenges there include ensuring positive interaction between hydro and wind as
well as between renewable and baseload power generation.
For DOE, continuous research, development, and deployment of water-conserving and energy-efficient
technologies can add value. Additionally, other tools that could be useful include modeling tools that can
inform plant-level operations and transmission planning during periods of water stress. Engagement and
dialogue among the regional power balancing authorities, private utilities, FERC, and DOE can enhance
the adoption of more energy- and water-efficient systems.
4.7.2 Oil and Gas Sector
The unconventional development of the oil and gas sector in the United States has generated opportunities
as well as challenges both for the sector and more broadly. Moving forward, continuous efforts and
funding toward closing the data gaps (delineated below) with respect to hydraulic fracturing and the
associated water will improve understanding and engage DOE in preventing potential impacts. It is also
important to note that base-case data gathering or baseline setting for comparison with post-production
drilling and hydraulic fracturing activities and continuous monitoring of oil and gas production activities
using hydraulic fracturing need to become a standard.
4.7.3 Biofuels Sector
Biofuels are an important part of our national energy mix. With that understanding, DOE-supported
R&D efforts have generated key insights regarding the water and carbon footprint of various biofuel
options. DOE-supported analyses of various RFS pathways have and can continue to inform the policy
design of RFSs, and the finalization of annual targets, within EPA. Research and analysis can inform all
interested parties of the vulnerability of biofuel production to potential water challenges.
4.7.4 Water Sector
Thanks to the support of multiple federal agencies, U.S. water and wastewater treatment facilities are
utilizing various funding opportunities to re-conceptualize wastewater treatment facilities as resource

June 2014 The Water-Energy Nexus: Challenges and Opportunities
86
recovery centers. At the same time, infrastructure challenges within the water sector remain significant in
many parts of the country with respect to drinking and wastewater facilities. Additionally, multiple
programs, including the ENERGY STAR Certified Products Program, which DOE supports with EPA,
have induced the development and adoption of energy- and water-efficient products and services.
Continued efforts to identify opportunities and promote adoption of energy--efficient technologies that are
resilient to variable water availability are needed.
4.7.5 Policy Integration
As evident from the international case studies presented, the energy-water nexus is becoming more and
more relevant across the globe while integrated energy-water policy framework is increasingly vital,
including the setting of national energy and water goals relating to energy and water. The United States
should pay closer attention to wide range of efforts in water-scarce countries to integrate energy and water
policy making to maximize water and energy productivity, including the multiple studies that have
identified barriers to integrated policy designs. Domestically, successful integrated watershed and basin
management experiences, including the experience of the Susquehanna River Basin Commission, should
be studied for potential wider application.

The Water-Energy Nexus: Challenges and Opportunities June 2014
87
References
Adams-Ockrassa, Suzzane. 2010. ―Hualapai Must Be Dry to Fly.‖ Daily Miner, October 21.
www.kingmandailyminer.com/main.asp?SectionID=1&SubsectionID=1&ArticleID=40780.
Amarnath, A., B. Goldstein, et al. (2013). Electricity Use and Management in the Municipal Water
Supply and Wastewater Industries. Palo Alto, CA, Electric Power Research Institute: 194.
Bloomberg. 2013. ―How the Wastewater game is played in the Marcellus.‖ Water Insight—Research
Note. Bloomberg Finance L.P.
BPA (Bonneville Power Administration) and the U.S. Army Corps of Engineers. 2009. Columbia River
Treaty History and 2014/2024 Review. Portland, OR, and Washington, DC: Bonneville Power
Administration and the U.S. Army Corps of Engineers. www.bpa.gov/news/pubs/GeneralPublications/crt-
Columbia-River-Treaty-History-and-2010-2024-Review.pdf.
BPA (Bonneville Power Administration) and the U.S. Army Corps of Engineers. 2013a. ―BPA Facts.‖
Portland, OR, and Washington, DC: Bonneville Power Administration and the U.S. Army Corps of
Engineers. www.bpa.gov/news/pubs/GeneralPublications/gi-BPA-Facts.pdf.
BPA (Bonneville Power Administration) and the U.S. Army Corps of Engineers. 2013b. ― U.S. Entity
Regional Recommendation for the Future of the Columbia River Treaty after 2024.‖ Portland, OR, and
Washington, DC: Bonneville Power Administration and the U.S. Army Corps of Engineers.
http://www.crt2014-2024review.gov/Files/Regional%20Recommendation%20Final, %2013%20DEC%202013.pdf
BREE (Bureau of Resources and Energy Economics). 2012. Resources and Energy Quarterly: June
quarter 2012. Canberra, Australia: Government of Australia. June.
www.bree.gov.au/documents/publications/req/req-jun-2012.doc.
CBO (Congressional Budget Office). 2002. Future Investment in Drinking Water and Wastewater
Infrastructure. Washington, DC: CBO. www.cbo.gov/publication/14205.
Chiu, Y., B. Walseth and S. Suh. 2009. ―Water embodied in bioethanol in the United States,‖ Environ.
Sci. Technol. 43: 2688-2692.
Chiu, Y. and M. Wu. 2013a. ―Water footprint of biofuel produced from forest wood residue via a mixed
alcohol gasification process,‖ DOI: 10.1088/1748-9326/8/3/035015. Environ. Res. Lett. 8(3).
Chiu, Yi-Wen and May Wu. 2013b. ―Considering water availability and wastewater resources in the
development of algal bio-oil.‖ Biofuels, Bioprod. Bioref. 7: 406–415.
Clean Air Task Force and the Land and Water Fund of the Rockies. 2003. The Last Straw: Water Use by
Power Plants in the Arid West. Hewlett Foundation Energy Series. San Francisco, CA: the Energy
Foundation, and Menlo Park, CA: The Hewlett Foundation. April. www.circleofblue.org/waternews/wp-
content/uploads/2010/10/laststraw2009.pdf.
CNA (CNA Analysis & Solutions). 2013. China and India Energy-Water Study Results. Alexandria, VA:
CNA. (to be released).
COGCC (Colorado Oil and Gas Conservation Commission). n.d. ―Final Amended Rules.‖ COGCC.
http://cogcc.state.co.us/.

June 2014 The Water-Energy Nexus: Challenges and Opportunities
88
Demissie, Y., E. Yan, and M. Wu. 2012. ―Assessing Regional Hydrology and Water Quality Implications
of Large-Scale Biofuel Feedstock Production in the Upper Mississippi River Basin.‖ Environ. Sci.
Technol. 46: 9174−9182.
DOE (U.S. Department of Energy). 2013. U.S. Energy Sector Vulnerabilities to Climate Change and
Extreme Weather. Washington, DC: DOE. July. http://energy.gov/sites/prod/files/2013/07/f2/20130710-
Energy-Sector-Vulnerabilities-Report.pdf.
Efstathiou Jr., Jim. 2010. ―New York Senate Approves Halt to Shale Gas Drilling Over Water Safety.‖
Bloomberg News, August 4. www.bloomberg.com/news/2010-08-04/new-york-s-senate-approves-
drilling-moratorium-on-natural-gas-from-shale.html.
EIA (Energy Information Administration). 2012. ―Competition among fuels for power generation driven
by changes in fuel prices.‖ Today in Energy. July 13. Washington, DC: U.S. Department of Energy.
http://www.eia.gov/todayinenergy/detail.cfm?id=7090
EIA (U.S. Energy Information Administration). 2013a. ―Form EIA-860 detailed data – 2011.‖ U.S.
Department of Energy. June 20. Accessed August 2, 2013. www.eia.gov/electricity/data/eia860/.
EIA (U.S. Energy Information Administration). 2013b. ―Form EIA-923 detailed data – 2011,‖ U.S.
Department of Energy, November 12. Accessed December 11, 2013.
www.eia.gov/electricity/data/eia923/
EIA (Energy Information Administration). 2013c. AEO 2014 Early Release Overview. Washington, DC:
U.S. Department of Energy, http://www.eia.gov/forecasts/aeo/er/pdf/0383er(2014).pdf
EIA (Energy Information Administration). 2013d. ―Today in Energy: Feed-in tariff: A policy tool
encouraging deployment of renewable electricity technologies.‖ U.S. Department of Energy,
www.eia.gov/todayinenergy/detail.cfm?id=11471.
EIA (Energy Information Administration). 2013e. Australia Country Analysis Brief. Washington, DC:
U.S. Department of Energy. www.eia.gov/countries/cab.cfm?fips=AS.
EIA (Energy Information Administration). 2013f. Brazil Country Analysis Brief. Washington, DC: U.S.
Department of Energy. www.eia.gov/countries/cab.cfm?fips=BR.
EIA (Energy Information Administration). 2013g. Qatar Country Analysis Brief. Washington, DC: U.S.
Department of Energy. www.eia.gov/countries/cab.cfm?fips=QA.
EIA (Energy Information Administration). 2013h. Singapore Country Analysis Brief. Washington, DC:
U.S. Department of Energy. www.eia.gov/countries/cab.cfm?fips=SN.
EIA (Energy Information Administration). 2013i. India Country Analysis Brief. Washington, DC: U.S.
Department of Energy. www.eia.gov/countries/cab.cfm?fips=IN
EIA (Energy Information Administration). 2014. China Country Analysis Brief. Washington, DC: U.S.
Department of Energy. www.eia.gov/countries/cab.cfm?fips=CH.
EPA (Environmental Protection Agency.) 2002. Response to Public Comment: CWA Section 316(b) New
Facility Rule—Final. January 2.
http://water.epa.gov/lawsregs/lawsguidance/cwa/316b/phase1/upload/2009_04_02_316b_phase1_author.

The Water-Energy Nexus: Challenges and Opportunities June 2014
89
EPA (Environmental Protection Agency). 2004. 2004 Guidelines for Water Reuse, EPA 625-R-04-108.
Washington, DC: EPA. nepis.epa.gov/Adobe/PDF/30006MKD.pdf.
EPA (Environmental Protection Agency). 2010b. Cooling Water Intake Structure. EPA. Accessed August
17, 2013. http://cfpub.epa.gov/npdes/indpermitting/cwis.cfm.
EPA (Environmental Protection Agency). 2010c. Evaluation of Energy Conservation Measures for
Wastewater Treatment Facilities, EPA 832-R-10-005. Washington, DC: EPA. September.
http://water.epa.gov/scitech/wastetech/upload/Evaluation-of-Energy-Conservation-Measures-for-
Wastewater-Treatment-Facilities.pdf.
EPA (Environmental Protection Agency). 2010d. ―Clean Watersheds Needs Survey 2008 Report to
Congress.‖ Washington, DC: EPA. Accessed September 10, 2013.
http://water.epa.gov/scitech/datait/databases/cwns/upload/2008rtcfactsheet.pdf
EPA (Environmental Protection Agency). 2011. ―Proposed Regulations to Establish Requirements for
Cooling Water Intake Structures at Existing Facilities,‖ EPA 820-F-11-002. Washington, DC: EPA.
EPA (Environmental Protection Agency). 2013a. ―Renewable Fuel Standard (RFS).‖ EPA. Last updated
November. http://www.epa.gov/OTAQ/fuels/renewablefuels/.
EPA (Environmental Protection Agency). 2013b. Proposed Effluent Limitation Guidelines & Standards
for the Steam Electric Power Generating Industry, 821-F-13-002. Washington, DC: EPA.
EPA (Environmental Protection Agency). 2013c. ―Proposed Effluent Guidelines for the Steam Electric
Power Generating Category.‖ EPA. Last updated August 30.
http://water.epa.gov/scitech/wastetech/guide/steam-electric/proposed.cfm.
EPA (Environmental Protection Agency). 2013d. ―Priority Pollutants.‖ EPA. Last updated July 25.
http://water.epa.gov/scitech/methods/cwa/pollutants.cfm.
EPA (Environmental Protection Agency). 2013e. Enforcement and Compliance History Online: CWA
Effluent Report. EPA. Accessed August 16. http://echo.epa.gov/.
EPA (Environmental Protection Agency). 2013f. ―WaterSense: Milestones.‖ EPA. Last updated
November 8, 2013. www.epa.gov/WaterSense/about_us/milestones.html.
EPA (Environmental Protection Agency). 2014. Office of Wastewater Management 2013 Annual Report.
Washington, DC: EPA. http://water.epa.gov/resource_performance/upload/2013-OWM-Annual-
Report.pdf
EPRI (Electric Power Research Institute). 2013. ―Cost and Performance of Generation Technologies.‖
(presented at Energy and Climate Change Research Seminar, May 22).
FERC (Federal Energy Regulatory Commission). 2013. ―Pumped Storage Projects.‖
www.ferc.gov/industries/hydropower/gen-info/licensing/pump-storage.asp.
FERC (Federal Energy Regulatory Commission). 2014. ―Hydropower Regulatory Efficiency Act of
2013.‖ January 16, 2014. https://www.ferc.gov/legal/staff-reports/2014/01-16-14-efficiency-act-2013.pdf.
Fowler, T. 2011. ―More Power Plant Woes Likely if Texas Drought Drags into Winter.‖ Fuel Fix, August
24. http://fuelfix.com/blog/2011/08/24/more-power-plant-woes-likely-if-texas-drought-drags-into-winter/.
June 2014 The Water-Energy Nexus: Challenges and Opportunities
90
Freedman, A. 2012. ―Heat and Drought Pose Risks for Nuclear Plants.‖ Climate Central. July 18.
http://www.climatecentral.org/blogs/heat-and-drought-pose-risks-for-nuclear-power-plants
Getches, David H. 2009. Water Law in a Nutshell. St. Paul, MN: West Publishing Co.
Gleick, Peter H. and Juliet Christian-Smith. 2012. A Twenty-First Century US Water Policy. New York:
Oxford University Press.
Goldfarb, W. 1988. Water Law. Chelsea, MI: Lewis Publishers.
Hackley, Randall. 2013. ―Desalination Plants to Fuel Qatar Infrastructure Boom, GWI Says,‖ Bloomberg,
June 21. www.bloomberg.com/news/2013-06-21/desalination-plants-to-fuel-qatar-infrastructure-boom-
gwi-says.html.
Hadjerioua, Boualem, Yaxing Wei, and Shih-Chieh Kao. 2012. An Assessment of Energy Potential at
Non-Powered Dams in the United States. Prepared by Oak Ridge National Laboratory, Oak Ridge, TN.
Washington, DC: U.S. Department of Energy, Office of Energy Efficiency and Renewable Energy, Wind
and Water Power Program. www1.eere.energy.gov/water/pdfs/npd_report.pdf.
Hoff, H. 2011. Understanding the nexus: background paper for the Bonn211 Nexus Conference: The
Water, Energy, and Food Security Nexus. Stockholm Environment Institute, Stockholm, Sweden.
Hrezo, Margaret S., Phyllis G. Bridgeman, and William R. Walker. 1986. ―Integrating Drought Planning
Into Water Resources Management.‖ Natural Resources Journal 26: 141–167.
http://lawlibrary.unm.edu/nrj/26/1/08_hrezo_integrating.pdf.
Hussey, Karen and Jamie Pittock. 2012. ―The Energy-Water Nexus: Managing the Links between Energy
and Water for a Sustainable Future.‖ Ecology and Society 17(1): 31–39.
HTF (Hypoxia Task Force). 2013. Reassessment 2013: Assessing Progress Made Since 2008.
Washington, DC: U.S. Environmental Protection Agency, Office of Wetlands, Oceans, and Watersheds,
Mississippi River/Gulf of Mexico Watershed Nutrient Task Force.
http://water.epa.gov/type/watersheds/named/msbasin/upload/hypoxia_reassessment_508.pdf.
ICIS. 2011. ―France Powers up Fossil Fuels to Cover Hydro‘s Drought-induced Shortfall.‖ ICIS, May 27.
www.icis.com/heren/articles/2011/05/27/9464317/france-powers-up-fossil-fuels-to-cover-hydros-
drought-induced-shortfall.html.
IEA (International Energy Agency). IEA Databases. Accessed, October – November, 2013.
IOGCC/GWPC (Interstate Oil and Gas Compact Commission/Ground Water Protection Council). 2010.
―IOGCC/GWPC to Coordinate Hydraulic Fracturing Chemical Registry.‖ Groundwork, October 18.
http://groundwork.iogcc.org/news/iogccgwpc-to-coordinate-hydraulic-fracturing-chemical-registry.
Jones, P. 1999. ―The U.S. Mexico Boundary Waters Regime and North American Environmental
Agreements: What Lessons for International Water Agreements‘ Compliance Mechanisms?‖ CEMMLP
Annual Review 3, article 7. Dundee: The Centre for Energy, Petroleum and Mineral Law and Policy.
Univeristy of Dundee, Scotland, UK.
Kanter, James. 2007. ―Climate change puts nuclear energy into hot water.‖ New York Times, March 20.
www.nytimes.com/2007/05/20/health/20iht-nuke.1.5788480.html?pagewanted=all&_r=0.

The Water-Energy Nexus: Challenges and Opportunities June 2014
91
Khatri, Shabina. 2013. ―New desalination plant to help Qatar deal with increasingly thirsty population.‖
Doha News, January 8. http://dohanews.co/post/40004733308/new-desalination-plant-to-help-qatar-deal-
with.
Kimmell, T. A., and J. A. Veil. 2009. Impact of Drought on U.S. Steam Electric Power Plant Cooling
Water Intakes and Related Water Resources Management Issues. DOE/NETL-2009/1364. Prepared by
Argonne National Laboratory, Argonne, IL. Washington, DC: U.S. Department of Energy, National
Energy Technology Laboratory.
King, Casey, Shlynn S. Stillwell, Kely M. Twomey, and Michael E. Webber. 2013. ―Coherence between
Water and Energy Policies.‖ National Resources Journal 53: 117–215.
http://lawlibrary.unm.edu/nrj/53/1/NMN101.pdf.
Lee, M. 2011. ―Parched Texans Impose Water-Use Limits for Fracking Gas Wells.‖ Bloomberg Business
Week, October 6. www.businessweek.com/news/2011-10-06/parched-texans-impose-water-use-limits-for-
fracking-gas-wells.html.
Legere, C. 2013. ―Seawater temps too high for Pilgrim cooling.‖ Cape Cod Times, July 18. Accessed
August 17. www.capecodonline.com/apps/pbcs.dll/article?AID=/20130718/NEWS/307180318/-
1/NEWS01
Mittal, A., and M. Gaffigan. 2009. Energy-Water Nexus: Improvements to Federal Water Use Data
Would Increase Understanding of Trends in Power Plant Water Use. Washington, DC: U.S. Government
Accountability Office.
Mumme, S.P. 2003. ―Revisiting the 1944 Water Treaty: Reflections on the Rio Grande Drought Crises
and Other Matters.‖ Journal of the Southwest 45(4): 649–670.
National Driller. 2010. ―Water Treatment Key to Natural Gas Drilling.‖ National Driller, March 1.
www.nationaldriller.com/Articles/Feature_Article/BNP_GUID_9-5-2006_A_10000000000000763103.
NEA (National Environment Agency) of Singapore. 2012. E2 Singapore. Singapore: NEA.
http://app.e2singapore.gov.sg/DATA/0/docs/Booklet/E2S%20Publication.pdf.
Newton, N. J. and R. Anderson. 2004. Cohen's Handbook of Federal Indian Law 2005 Edition. Lexus
Nexus Publisher.
NHAAP (National Hydropower Asset Assessment Program). n.d. ―New Stream-reach Development
Resource Assessment.‖ NHAAP. http://nhaap.ornl.gov/nsd.
Nicot, J. and B. Scanlon. 2012. ―Water Use for Shale-Gas Production in Texas, U.S.‖ Environmental
Science & Technology 46: 3580–3586.
NRC (United States Nuclear Regulatory Commision). 2012. ―Generic Environmental Impact Statement
for License Renewal of Nuclear Plants (NUREG-1437 Vol. 1) Part 2.‖ March 29. www.nrc.gov/reading-
rm/doc-collections/nuregs/staff/sr1437/v1/part02.html
NYSDEC (New York State Department of Environmental Conservation). 2011. Best Technology
Available (BTA) for Cooling Water Intake Structures, CP #52. Albany, NY: NYSDEC.

June 2014 The Water-Energy Nexus: Challenges and Opportunities
92
OCR (Office of Columbia River). 2013. Columbia River Treaty Review: Draft Regional
Recommendation. Olympia, WA: Washington State Department of Ecology. September 20.
www.ecy.wa.gov/programs/WR/cwp/images/pdf/DRRFinal.pdf.
Office of the Press Secretary. 2013. ―FACT SHEET: President Obama‘s Blueprint for a Clean and Secure
Energy Future.‖ Washington, DC: the White House. www.whitehouse.gov/the-press-
office/2013/03/15/fact-sheet-president-obama-s-blueprint-clean-and-secure-energy-future.
ORNL (Oak Ridge National Laboratory), National Hydropower Association (NHA), and Hydropower
Research Foundation (HRF). 2010. Small Hydropower Technology: Summary Report on a Summit
Meeting Convened by Oak Ridge National Laboratory, the National Hydropower Association, and the
Hydropower Research Foundation. Oak Ridge, TN: Oak Ridge National Laboratory.
www.esd.ornl.gov/WindWaterPower/SmallHydroSummit.pdf.
Pagnamenta, Robin. 2009. ―France imports UK electricity as plants shut.‖ The Times, July 3.
www.thetimes.co.uk/tto/business/industries/utilities/article2198065.ece.
Palmer, Neil. 2012. ―World Environment Day: Desalination and Green Energy in Australia.‖ National
Centre of Excellence in Desalination, June 12. http://desalination.edu.au/2012/06/world-environment-
day-desalination-and-green-energy-in-australia/.
Pickrell, Emily. 2013. ―Drought puts drain on water supplies for power plants.‖ Fuel Fix, February 6.
Accessed August 17. http://fuelfix.com/blog/2013/02/06/drought-puts-drain-on-water-supplies-for-power-
plants/6/drought-puts-drain-on-water-supplies-for-power-plants/.
Pittock, Jamie. 2011. ―National Climate Change Policies and Sustainable Water Management: Conflicts
and Synergies.‖ Ecology and Society 16(2): 25.
Profita, Cassandra. 2011. ―What BPA's new rates mean for the wind industry.‖ Oregon Public
Broadcasting, August 3. www.opb.org/news/blog/ecotrope/what-bpas-new-rates-mean-for-the-wind-
industry/.
QNFSP (Qatar National Food Security Programme). 2011. ―Desalination.‖ QNFSP.
www.qnfsp.gov.qa/programme/water/water-strategy/desalination.
Rea, Matt and Nancy Stephan. 2011. ―2014/2024 Review: Columbia River Treaty: Overview of
Preliminary Phase 2 Alternatives.‖ Presentation. www.crt2014-2024review.gov/Files/Sept-
Oct%202011%20Overview%20of%20Draft%20Alternatives.pdf.
Real Clear Energy. 2012. ―Electrification in India.‖ Real Clear Energy. Accessed August 20.
www.realclearenergy.org/charticles/2012/08/06/electrification_in_india_106654.html.
Richenderfer, Jim. 2013. ―Susquehanna River Basin Commission.‖ Presentation at the National Capital
Area Chapter of U.S. Assoc. for Energy Economics Energy-Water Nexus, April 9, 2013.
http://csis.org/files/attachments/130409_Richenderfer.pdf.
RTE (Reseau de Transport d‘Electricite). 2009. The French Electricity Report 2009. Paris: RTE.
www.rte-france.com/uploads/media/pdf_zip/publications-annuelles/rte-be09-en-02.pdf.
Schneider, K. 2010. ―China‘s Climate Emissions Are Global Issue, But Water Scarcity Is Greater
Domestic Priority.‖ Circle of Blue, October 7. www.circleofblue.org/waternews/2010/world/chinas-
climate-emissions-are-a-global-issue-but-water-scarcity-is-a-greater-domestic-priority.

The Water-Energy Nexus: Challenges and Opportunities June 2014
93
Schnepf, Randy and Brent D. Yacobucci. 2013. Renewable Fuel Standard (RFS): Overview and Issues.
Washington, DC: Congressional Research Service. March 14. www.fas.org/sgp/crs/misc/R40155.pdf.
Shifflett, Susan. 2013. ―Photo Essay: Wuhai City Coal Complex Shows Costs of China‘s Energy
Demands.‖ China Environment Forum, Woodrow Wilson Center, August 20.
http://wilsoncenter.org/article/photo-essay-wuhai-city-coal-complex-shows-costs-china‘s-energy-
demands.
Sibley, L. 2009. Is CCS an Option for India? October 12. www.sustainabilityoutlook.in/news/report-ccs-
option-india.
Sickinger, Ted. 2012. ―BPA braces for strong spring runoff, excess power and wind power cuts.‖ The
Oregonian, April 6.
www.oregonlive.com/environment/index.ssf/2012/04/wind_farms_bpa_brace_for_power.html.
Smart Energy Universe. 2013. ―BPA Revises Policy For Managing Seasonal Power Oversupply.‖ Smart
Energy Universe. http://smartenergyuniverse.com/regulatory/13880-bpa-revises-policy-for-managing-
seasonal-power-oversupply.
SWRCB (State Water Resource Control Board). 2013. ―Ocean Standards - CWA §316(b) Regulation:
Cooling Water Intake Structures Once-Through Cooling.‖ California Environmental Protection Agency.
Accessed September 10. www.swrcb.ca.gov/water_issues/programs/ocean/cwa316/.
Tagliabue, John. 2003. ―Utilities in Europe Seek Relief from the Heat,‖ New York Times, August 12.
www.nytimes.com/2003/08/12/world/utilities-in-europe-seek-relief-from-the-heat.html.
Teh, Agnes. 2013. ―Singapore to Focus on Energy-Water Nexus,‖ Bloomberg Brief: Clean Energy &
Carbon, January 21. www.bloombergbriefs.com/files/CleanEnergyCarbonP1_012113.pdf.
USBR (Bureau of Reclamation). 2008. ―The Law of the River.‖ U.S. Department of the Interior.
www.usbr.gov/lc/region/g1000/lawofrvr.html.
USGS (U.S. Geological Survey). 2009. Water Resources and Natural Gas Production from the Marcellus
Shale. Washington, DC: U.S. Department of the Interior. http://pubs.usgs.gov/fs/2009/3032/pdf/FS2009-
3032.pdf.
Veil, J. A. 1993. Impact on the Steam Electric Power Industry of deleting section 316(a) of the Clean
Water Act: Energy and Environmental Impacts, ANL/EAIS-5. Argonne, IL: Argonne National
Laboratory.
Wagman, D. 2013. ―Water Issues Challenge Power Generators.‖ Power Magazine.
www.powermag.com/water-issues-challenging-power-generators/?pagenum=1.
WaterWorld. 2013. ―Will Qatar Turn the Arabian tide to RO desalination?‖ WaterWorld 27(1).
www.waterworld.com/articles/wwi/print/volume-27/issue-1/regional-spotlight/middle-east-africa/will-
qatar-turn.html.
WERF (Water Environment Research Foundation). 2011. Energy Production and Efficiency Research –
The Roadmap to Net-Zero Energy. Alexandria, VA: WERF.
www.werf.org/lift/docs/tfadocs/ENER1_factsheet.aspx.

June 2014 The Water-Energy Nexus: Challenges and Opportunities
94
Western Resource Advocates. 2013. ―Water Rate Structures: Structuring Water Rates to Promote
Conservation.‖ Western Resource Advocates. www.westernresourceadvocates.org/water/rates.php.
Wigmosta, Mark S., et al. 2011. ―National microalgae biofuel production potential and resource demand.‖
Water Resources Research 47: W00H04.
World Nuclear Association. 2013. ―Nuclear Power in France.‖ World Nuclear Association. www.world-
nuclear.org/info/Country-Profiles/Countries-A-F/France/.
Wu, M., M. Mintz, M. Wang, and S. Arora. 2009. ―Water Consumption in the Production of Ethanol and
Petroleum Gasoline.‖ Environmental Management 44: 981–997.
Wu, M., Y. Chiu, and Y. Demissie. 2012a. ―Quantifying the Regional Water Footprint of Biofuel Using
Multiple Analytical Tools.‖ Water Resource Research 48: W10518.
Wu, M., Y. Demissie, and E. Yan. 2012b. ―Assessing the Impact of Future Biofuel Scenario on Water
Quality and Water Cycle Dynamics.‖ Biomass & Bioenergy 41(2012): 44–56.

The Water-Energy Nexus: Challenges and Opportunities June 2014
95
Chapter 5. Technology Research, Development, Demonstration, and Deployment
Challenges and Opportunities
The array of diverse issues in the water-energy nexus discussed in the preceding chapters point to a
corresponding variety of potential technological solutions. DOE can facilitate the development and
implementation of solutions relevant to its mission in this domain. Research and development (R&D)
opportunities exist for both crosscutting fundamental science and applied application-specific
technologies.
This chapter targets currently visible challenges and opportunities for DOE in technology research,
development, demonstration, and deployment (RDD&D). Section 5.1 explores these areas as they apply
to optimizing the freshwater efficiency of energy production, electricity generation, and end-use systems
(water for energy). More efficient utilization of waste heat at power plants and advances in cooling
systems are key opportunities for reducing water use in the energy sector. Conversely, Section 5.2
examines the potential for optimizing the energy efficiency of water management, treatment, distribution,
and end-use systems (energy for water). This includes advances in wastewater treatment and desalination
techniques, which can reduce the energy required to treat water and enable the economic use of
nontraditional waters.
The complexity of the water-energy nexus demands investigation beyond specific technologies. For
example, Section 5.3 discusses advances in sensing, data collection, and information management, all of
which can enable more efficient operations and informed policies by providing higher-quality or more
Key Messages:
Advances in technology can increase the options available to decision makers at all scales.
The DOE has a constructive role to play throughout the interdependent cycles of technology research, development, demonstration, and deployment.
Cost-effective recovery of dissipated energy from electricity generation is a key opportunity for energy and water savings, and will be essential in enabling the diffusion of carbon capture and storage.
Advances in cooling systems could significantly reduce water usage and capital costs.
Alternatives to freshwater have the potential to reduce the local water footprint of unconventional oil and gas operations, and facilitate geothermal energy production in water-stressed regions.
Innovative desalination techniques, particularly those that utilize waste heat, can both reduce the energy required to treat water, and enable the economic use of nontraditional waters.
Treatment efficiencies and energy recovery options create the possibility for a growing percentage of treated wastewaters in the United States to achieve net-zero energy consumption, and even to become net producers of energy under favorable circumstances.
Standards for appliances such as refrigerators and water heaters have made a significant contribution to energy efficiency; additional opportunities may exist.
Improvements in distributed sensing, data collection, analysis, and reporting would benefit multiple aspects of the water-energy nexus.
Conceiving and managing water and energy systems as an integrated whole could yield beneficial synergies.

June 2014 The Water-Energy Nexus: Challenges and Opportunities
96
timely information. Section 5.4 explores areas for DOE to facilitate water and energy systems
integration. Approaching the water-energy system as an integrated whole illuminates a set of possibilities
that may not be evident from individual standpoints. Power plants, desalination operations, municipal
wastewater treatment facilities, food and other organic product processes, and carbon capture and
sequestration projects can all potentially benefit from synergistic designs.
When developing a suite of solutions, it is important to consider that the state of development for each
technology varies, which implies a different set of constructive responses. Section 5.5 describes
opportunities at later stages in the RDD&D cycle. Appliance standards, loan guarantees, public-private
partnerships, and innovative approaches to small business support are all approaches that may help clean
water-energy technologies penetrate the marketplace.
5.1 Water for Energy
Figure 5.1 depicts selected areas where DOE RDD&D could contribute to water-energy challenges. The
broad categories are drawn from the intersection between the flows presented in the Sankey diagram in
Chapter 2, the strategic pillars articulated in Chapter 1, and direct input from DOE programs and national
laboratories. Use-inspired basic research could aid in the development of advanced materials with
application to several different needs, each of which has specific requirements. Further RDD&D would
be necessary in order to incorporate these materials into operational systems capable of delivering
technically and economically relevant performance improvements in each category.
One of the clearest messages from the Sankey diagram is that the United States emits a tremendous
amount of energy from the cooling towers and flue gases of thermoelectric power plants. Therefore,
improvements in power plant efficiency (and thus less waste heat), the recovery of waste heat (or
pressure), and reductions in water use for power plant cooling all represent obvious opportunities.
Alternative power cycles that have higher efficiencies, such as one described below based on supercritical
carbon dioxide (SCO2), offer significant improvements in efficiency, as well as reductions in materials
and other requirements. Systems that can efficiently recover dissipated energy, such as solid-state
thermoelectric generators (TEGs),75
thermophotovoltaics, improved heat recovery steam generators, and
others, present the potential for substantial benefits. Improvements in cooling technologies, particularly
those that utilize air cooling or hybrid air/water systems, have the potential to reduce cooling water
withdrawal and consumption volumes dramatically. Further development to improve efficiencies, lower
costs, address operational issues, and demonstrate adequate performance in field conditions at scale are
generally needed for these technologies.
Alternatives to water in primary energy production and electricity generation present another area of
potential opportunity. For example, current hydraulic fracturing fluids for oil and gas recovery are largely
comprised of water, but alternatives such as liquid petroleum gas (LPG) and SCO2 may have promise in
certain plays. Novel materials customized for geothermal shearing applications are another possibility,
and SCO2 is also under consideration as an alternative working fluid for geothermal generation.
Alternatives to water for bottoming cycles, such as those found in natural gas and integrated gasification
75
It is important to distinguish between large-scale—hundreds of megawatts—thermal power plants that use gas
turbine and/or steam Rankine power cycles for generation (and are frequently termed thermoelectric power plants)
and solid-state TEGs that make use of a totally different mechanism for generating power, known as the Seebeck
effect, and individually generate a few watts.

The Water-Energy Nexus: Challenges and Opportunities June 2014
97
combined cycle plants (NGCC and IGCC, respectively), are also under consideration. All of these
possibilities are discussed in greater detail in Section 5.1.4.
Water- and energy-intensive industrial processes constitute another area for exploration. Possibilities for
efficiency improvements include biofuels production, forest products, food processing, and refining and
chemical manufacturing, among others. Further, currently proven CCS technologies are water- and
energy-intensive; reductions in the water and energy footprints of CCS are important targets.
Figure 5.1. Representative problem/opportunity spaces in water for energy.
5.1.1 Advanced Materials
Tailored materials hold promise for improving the cost and performance of existing systems and enabling
the development of new classes of technologies. For example, recent breakthroughs in TEG materials
with superior properties might enable economically feasible applications beyond traditional niches. For
improved heat transfer, materials that improve scaling, fouling, and corrosion resistance would be
valuable in facilitating the use of degraded and nontraditional waters in power plant cooling or other
applications. In addition, for thermal power generation cycles, materials that enable operations at higher
temperatures and pressures with increased durability are desirable. More detailed descriptions are found
below.
Thermoelectric Generation and Heat Transfer
Materials that enhance the conversion of heat to electricity could reduce the amount of energy dissipated
in power production and various industrial processes. Improvements in thermal conductivity would
benefit cooling applications, as would fouling- and scaling-resistant surfaces. Finally, materials with the
ability to withstand high temperatures and pressure over time would facilitate the adoption of supercritical
power cycles.

June 2014 The Water-Energy Nexus: Challenges and Opportunities
98
Thermoelectric Generation
Approximately 90 percent of the world‘s electricity is generated by heat engines that use fossil fuel
combustion as a heat source and typically operate at 30 percent to 40 percent efficiency (IEA 2012).
While materials that manifest the Seebeck and Peltier effects of directly converting heat into electricity
and vice-versa have been known for more than a century, recent developments have renewed practical
interest. These effects can be enhanced by reducing thermal conduction while maintaining or even
increasing electric conductivity in certain types of materials. This understanding is being applied in new
materials, especially complex alloys known as Skutterudites (Tritt 2011) and hierarchical nanostructures
(Biswas et al. 2012), which have demonstrated significant performance improvements. Fundamental
work remains to better understand structure-property relationships and to apply them to achieve higher
conversion efficiencies and lower costs.
Improved Heat Transfer for Given Surface Area for Cooling
Heat exchangers must efficiently and cost-effectively transfer heat between two media. Conditions may
extend to high temperatures and pressures, large temperature gradients (and the resulting thermal
stresses), severe corrosive or oxidative environments, severe abrasion, or extreme scaling by mineral
deposits, among others. Heat exchangers in mobile applications, such as a vehicle radiator, require low
weight.
Identification, development, and deployment of advanced materials can improve heat exchanger design,
performance, and cost effectiveness. These materials should maintain their strength and structural
integrity across the aforementioned operating conditions with high reliability and a long service life while
cost-effectively serving their particular application. Important applications include thermoelectric power
plants, vehicle radiators, and a wide variety of industrial processes.
Nano-Enhanced Working and Cooling Fluids for Improved Heat Transfer
Fluids with entrained nanoparticles, or nanofluids, have shown promise as heat exchanger working fluids
(Kim et al. 2013). In particular, nano-metal organic heat carriers entrained within working fluids have the
potential to boost heat carrying capacity, which could improve the efficiency of both cooling systems and
power cycles. Research in these areas is at an early stage of development; much work remains to produce
technically and economically feasible solutions. However, these novel materials do show promise in
theory and in the laboratory (Aristov 2013; McGrail et al. 2013; Yu et al. 2013) and merit further
investigation.
Flow Improvements throughout Water-Energy System Life Cycles
Pipes and other components of water-energy systems are vulnerable to scaling, corrosion, and biofouling.
Over time, these phenomena degrade plant performance, and can lead to significant failures.
Development of innovative materials resistant to chemical, physical, and biological agents as well as
processes of erosion and corrosion could improve efficiency and reduce life cycle costs. These
developments are particularly important in enabling the use of nontraditional waters in recirculating
cooling systems.

The Water-Energy Nexus: Challenges and Opportunities June 2014
99
Corrosion and Scaling Resistance
Development of corrosion- and scale-resistant materials is essential for minimizing treatment and makeup
water requirements in closed-loop cooling systems using nontraditional waters, as well as for supporting
advancements in power plant efficiency such as super-critical operation. There are potential synergies
with the materials development needs for high-pressure and high-temperature applications noted below,
as well as the heat exchanger applications noted above.
Biofouling Resistance
Biofouling (the accumulation of waterborne organisms such as bacteria or protozoa on structures exposed
to water) has wide-ranging impacts in energy and water systems. It reduces the efficiency of heat
transfer, increases flow resistance and thus the energy required for pumping, and initiates or promotes
corrosion of equipment. While effective treatment techniques exist, further efficiencies are possible,
particularly in minimizing the use of aggressive chemicals for cleaning. Materials with intrinsic
biofouling resistance, for example those that present surfaces less conducive to the formation of biofilms,
could reduce treatment requirements while simultaneously reducing potentially environmentally
deleterious waste discharges.
High-Temperature and High-Pressure Materials
As detailed in previous sections, substances in supercritical form, most notably carbon dioxide (CO2), are
garnering increasing interest in energy applications. Above a combination of temperature and pressure
levels that varies by material, some substances act as both gasses and liquids. This supercritical
phenomenon offers several advantages in engineering power cycles (Feher 1968; Ma and Turchi 2011;
Robb 2012). However, the conditions required to establish and maintain supercritical conditions pose
substantial materials challenges.
SCO2 Applications
Practical implementation of an SCO2 recompression closed-loop Brayton cycle (RCBC) requires
advances in materials science. The identification and certification of materials for use in the turbo-
expander, recuperators, piping, valves, pressure vessels, seals, and bearings requires significant
consideration for high-efficiency configurations with temperatures above 1,300°F (~700°C). This is
especially important for direct-fired fossil fuel cycles where products of combustion are included in the
gas stream. For high temperatures, nickel-based alloys certified for ultra-supercritical (USC) steam
cycles are a starting point for evaluating existing materials. For high side temperatures below 1,200°F
(~650°C), stainless steels are suitable for CO2 service. Seals and secondary components will require
additional investigation of non-metallic materials.
Supercritical Steam Applications
By increasing steam temperature and pressure into the USC region—above 3,500 pounds per square inch
(psi) and 1100°F (~600° C) (Keairns et al. 2012)—the thermal efficiency of new pulverized coal power
plants could be increased by 10 percent to 15 percent compared with existing supercritical systems.
Achieving USC operating conditions will require boiler and steam turbine materials that have
significantly better high-temperature creep, fatigue, and corrosion resistance than existing boiler and
steam turbine materials, and with an expected life of 30 years. Such materials also must have good
forming and welding properties. The DOE Advanced Ultra Supercritical (AUSC) R&D program has
focused on existing polycrystalline nickel superalloy compositions and modified forms of those alloys to

June 2014 The Water-Energy Nexus: Challenges and Opportunities
100
adapt them to the demanding requirements of an AUSC power plant operating at 1400°F (760°C) and
4500 psi to 5000 psi (EPRI 2008; EPRI 2013).
Other crosscutting R&D projects have focused on developing less expensive alloys, and on developing
computational methods to predict the long-term corrosion and mechanical strength behavior of materials
when exposed to USC temperatures and pressures. Such computational methods will help to reduce the
time and cost of identifying and qualifying new and existing alloys for use in USC plants.
Advanced Carbon Capture Materials
The current state of the art in post-combustion carbon capture is based on monoethanolamine (MEA) in
aqueous solutions. However, these technologies impose energy and water performance penalties and
would increase the cost of electricity generation relative to comparable plants without capture (NETL
2010). Improved materials are key in developing second-generation and transformational systems for
pre-combustion (applicable to IGCC coal plants), post-combustion (relevant to all fossil fuel plants, both
future and existing), and oxy-combustion (an alternative to current coal and natural gas electricity
generation strategies) capture. There are three relevant classes of materials: solvents, sorbents, and
membranes (NETL 2013a).
Desirable properties for these materials include, but are not limited to: increased CO2 loading, mimizing
regenerative energy requirements, faster reaction kinetics, enhanced durability, and reduced costs. For
example, ionic liquids and non-aqueous solvents show promise in enhancing CO2 capture performance
and reducing the amount of energy required in solvent regeneration (Privalova et al. 2013; Romanos et al.
2013; Zhang et al. 2013a). Various solid sorbents such as alkali metal carbonates (Zhao et al. 2013a),
calcium-based materials (Yang et al. 2010; Blamey et al. 2011), and metal-organic frameworks (Hedin et
al. 2013) have also demonstrated potential at the laboratory scale. Advanced membranes offer another set
of possibilities for gas and gas-liquid separations (Zhai and Rubin 2013). DOE is currently testing many
of these technologies at the bench and small pilot scales with industrial partners. However, in order to
attain commercial success starting in 2020, all of these potential solutions will need demonstration in
fully functional systems, which are discussed further in Section 5.1.5.
5.1.2 Waste Heat Recovery
One of the most dramatic messages from the Sankey diagram in Chapter 2 is the amount of primary
energy that is dissipated into the atmosphere through flue gases and cooling operations from
thermoelectric power plants. Turning this waste heat into a resource rather than a cooling burden
represents a significant opportunity to save both energy and water. Additionally, while power plants are
the most obvious example, similar conditions exist in energy-intensive industries such as cement, metals
smelting, refining, chemicals, and steel production. The realm of possibility also includes distributed
sources such as vehicles, CHP, and district water heating. The examples listed below are illustrative;
future analyses will undoubtedly uncover others.
Thermoelectric Generation
Unlike thermoelectric power plants, which use heat to drive turbines of various kinds to generate
electricity, thermoelectric devices produce electricity directly when subjected to a temperature gradient.
As noted in Section 5.1.1, recent scientific advances have broadened and expanded practical interest in
thermoelectric materials. However, cost and performance challenges remain in bringing expanded
applications to market. Even though waste heat is nominally free in energetic terms, retrofitting (e.g., a

The Water-Energy Nexus: Challenges and Opportunities June 2014
101
coal-fired power plant with a thermoelectric recovery system) would require significant capital
investment.
Much of DOE‘s work to date has focused on vehicle exhaust, with some promising results (Crane 2013).
However, with appropriate cost reductions, systems based on these technologies could be widely
applicable (NETL 2001). The key challenge outside of the materials domain is cost reduction for at-scale
systems. While some valuable modeling work has been published for energy recovery from flue systems
in coal-fired power plants (Silaen et al. 2013; Yazawa et al. 2013), no operational systems have been
constructed at scale.
SCO2 Recompression Closed-Loop Brayton Cycle (RCBC)
Supercritical carbon dioxide (SCO2) in an RCBC is a strong candidate for both energy and water savings
that has demonstrated positive results at pilot scales (Turchi 2013). The cycle gains efficiency primarily
by recovering waste heat and reducing parasitic loads for recompression, both of which also reduce
cooling requirements. Further, the cycle is potentially applicable to all kinds of fossil fuel combustion,
including retrofits of existing coal plants (EPRI 2013), nuclear reactors, and CSP towers. The latter is
particularly relevant because the best CSP sites tend to occur in desert environments, where water is at a
premium. If realized and widely deployed, SCO2 RCBC cycles could provide increases in primary
energy efficiency, reductions in greenhouse gas emissions per kilowatt hour (kWh) of electricity
generated for fossil-fueled plants, and decreases in water withdrawal and consumption.
Although the idea is not new (Angelino 1968; Feher 1968), DOE has recently produced a working
prototype that demonstrates basic technological viability (Robb 2012). Existing coal technologies range
between 35 percent and 42 percent in fuel-to-electricity efficiency, with further improvements foreseen
(Phillips 2011). A recent analysis by EPRI projects that SCO2 RCBC cycles could provide a 3.3 to 4.3
percentage point improvement in total plant efficiency, even compared to advanced ultra-critical steam
systems projected at 48.8 percent (EPRI 2013). The same report also anticipates gains in retrofitting
existing subcritical plants with SCO2 RCBC topping cycles.
SCO2‘s supercritical point is at 87.8° (31°C) and 7.38 megapascals (MPa),76
much lower than that of
water. This fact facilitates the engineering of cycles that avoid the complications associated with phase
changes, although careful design and operation is necessary to account for seasonal variations (Singh et
al. 2013) and other process factors (Sarkar 2009; Ma and Turchi 2011; Le Moullec 2013; White et al.
2013). At their respective supercritical points, CO2 has a density that is 45 percent higher than water (467
kilograms per cubic meter [kg/m3] vs. 322 kg/m
3), which allows for reductions in both energy
requirements for compression and size and material requirements for relevant turbomachinery (Turchi
2013).
The main components of an RCBC system include compressors, heat exchangers (recuperators), a turbo-
expander (turbine), piping, and control valves, as depicted in Figure 5.2.
76
Standard atmospheric pressure at sea level is 101.325 kilopascals.

June 2014 The Water-Energy Nexus: Challenges and Opportunities
102
HEAT SOURCE
PRECOOLER
LOW TEMP RECUPERATOR
HIGH TEMPRECUPERATOR
EXPANDER
COMPRESSOR
RE-COMPRESSOR
P6 P7a P8
P1
P2
P3
P5
P7b
P7
P4
P4b
COOLING OUT COOLING IN
P4a
Figure 5.2. Diagram of a typical RCBC system. Source: National Energy Technology Laboratory
Implementation of this system at commercial scales poses at least four critical challenges. The first is the
development of materials that can withstand the requisite pressures and temperatures over economically
meaningful product lifetimes, as discussed in Section 5.1.1. This is particularly relevant to the high-
temperature recuperator input at P2 in Figure 5.2.
Second, turbo-expanders (P1) designed for SCO2 service are unique to SCO2 power cycles and face
design challenges associated with high power densities and the differences between ideal gas models and
real gas behaviors. For example, high fluid density near the critical point leads to high wheel loading,
while material compatibility and operating temperatures impose a significant limitation on seal and
bearing design and materials selection.
Third, heat exchanger design has a significant influence on cycle performance, physical layout, and
capital costs. Of the commercially available heat exchangers, printed circuit heat exchangers (PCHEs)
offer the highest performance in the smallest package, but at a high cost. The impact of heat exchanger
cost and size must be addressed through refinements to the PCHE manufacturing process or through the
development of new fabrication techniques for compact micro-channel heat exchangers. The design of
highly effective heat exchangers must address the impact of temperature and pressure on fluid density and
heat capacity, particularly with respect to the effects of recuperator operations on the compressor input
stream at P5 in Figure 5.2.
Finally, controlling the cycle under various environmental conditions requires further exploration of the
critical parameters and adjustment options.
In summary, RCBC power cycles utilizing SCO2 present a significant opportunity that merits further
investigation at commercially relevant scales.

The Water-Energy Nexus: Challenges and Opportunities June 2014
103
5.1.3 Cooling Technologies
The Sankey diagram in Chapter 2 (Figure 2.1) points out that thermoelectric cooling is the largest driver
of water withdrawals, at 196 BGD, just under half of the total U.S. withdrawals for all purposes. The
fundamental requirement for cooling in modern steam power cycles is to transfer residual energy left after
power extraction via intricate turbine systems to the environment in order to condense the working fluid
back to a liquid as input to the next heating cycle. Water has been the medium of choice to perform this
cooling work, both because of its high specific heat capacity for direct transfer, and due to the
effectiveness of evaporation of water as a heat release mechanism. However, in an increasingly water-
constrained world, alternatives merit investigation.
Air-cooling and hybrid wet/dry systems offer the possibility of 80 percent or better reductions in
withdrawals for coal-fired plants, including the requirements of ancillary systems, as well as improvement
in consumption, but they face significant adoption challenges. For example, existing air-cooled options
have higher capital costs and expanded physical footprints, and reduce power output on the hottest days,
when demand tends to be highest (Zhai and Rubin 2010). Hybrid systems mitigate these problems,
particularly in dry climates where their wet system performance is not constrained by humidity, but
introduce additional layers of complexity, which translate into increased capital costs compared to
traditional wet-cooling systems. The RDD&D challenge is to promote the development of systems that
are economically feasible for deployment if EPA regulations under Clean Water Act sections 316(a) and
(b)77
are promulgated.
Advancements in Air Flow Design and Water Recovery
Potential benefits of cost-effective advanced technologies for improved airflow design and water recovery
include:
Removal of barriers to the deployment of novel water recovery technologies, such as the Air2Air™
condensing module (NETL 2012b), which may achieve water consumption reductions of up to 18
percent. With modifications to the heat exchanger, this cooling tower could be used as a freshwater
source, with impaired water used as the cooling source and the condensed water from the cooling
tower collected and used as freshwater, thus using the waste heat as a water purification method.
Further R&D to determine the applicability of early-stage breakthrough air-cooled heat exchanger
technologies, such as the Sandia Cooler (Matulka 2012), which may have the potential to reduce the
power load of cooling by as much as 15 percent.
Further development and deployment of advanced continuous nanofiltration technologies, which may
be able to reduce water consumption for blowdown by as much as 40 percent. This is an example of
how the water treatment examples mentioned in Section 5.2 could find productive application in
water-for-energy applications.
Deployment of advanced technologies for hybrid cooling, such as thermosyphon cooler technology,
has the potential to reduce annual evaporative losses, makeup water requirements, and blow-down
volumes for thermoelectric power plants by up to 75 percent, without sacrificing output on hot
summer days.
77
See Chapter 2 for additional details on Clean Water Act sections 316 (a) and (b).

June 2014 The Water-Energy Nexus: Challenges and Opportunities
104
Alternative Cooling Systems
There are a number of alternatives to water- and air-based techniques for cooling. Sorption, magnetic
refrigeration, thermoelectric cooling, electrocaloric cooling, and thermoacoustic technologies are all
candidates (Brown and Elliot 2005). While many of these technologies are at a very early stage of
development or have been deployed only for residential applications, it is conceivable that some of them
could be applicable to power plants. Clearly, significant breakthroughs would be needed in materials
research, fabrication technologies, and systems integration to bring these technologies to market at
relevant scales.
5.1.4 Alternative Working Fluids
Given the expectation of increased competition in certain regions, the search for alternatives to freshwater
in energy production and electricity generation is likely to increase in urgency. While nontraditional
waters, including recycled flowback water in hydraulic fracturing, are used today (Cooley and Donnelly
2012), there is still ample room for expanded usage in geothermal operations and power generation
cycles, among other opportunities (Carney 2011). Options under consideration include, but are not
limited to, brackish groundwater, LPG, produced waters from oil and gas operations, municipal and
industrial wastewaters, as well as SCO2. Availability of sufficient quantities of nontraditional resources at
the point of need is a key issue, just as it is for freshwater. Given freshwater‘s abundance and valuable
properties, it will likely retain a critical role in power cycles and other applications for the foreseeable
future. However, exploring alternatives is vital in order to reduce freshwater use for power generation
and thereby increase the supply available for other uses, such as drinking and agriculture.
Alternative Drilling and Fracturing Fluids
Increasing demand for water for drilling and hydraulic fracturing in oil and gas fields has required
operators to find alternatives to local freshwater sources. Recycling of flowback and produced waters for
reuse in subsequent wells has rapidly gained currency in the Marcellus basin in Pennsylvania and
neighboring states in recent years.
Although significant strides have been made, challenges remain in extending these treatment and
management practices to other geographic areas. For example, a report on alternative sources in the
Barnett field (Texas) reviewed three potential options: treated wastewater outfalls, small bodies of surface
water outside state regulation, and small groundwater reservoirs outside the main regional aquifer.
Results indicate that all three sources are susceptible to drought conditions, and geographical and
ownership fragmentation will tend to increase transaction costs (Hayes and Severin 2012). Further, each
geology is unique, requiring precise matching of the fracturing fluid to the characteristics of the
formation, and treatment of these non-traditional waters for use in hydraulic fracturing operations may not
be economically feasible in all regions.
Additionally, CO2 and other alternatives, including liquid natural gas, are under active consideration as
viable replacements for water in drilling and hydraulic fracturing applications (Ishida et al. 2012; Torabi
et al. 2012). In certain geologies, such as clays, water may prove suboptimal as a fracturing fluid. CO2 is
already in widespread use for enhanced oil recovery (EPRI 1999), but the requirements for fracturing can
be quite different.
Of the total water used by the oil and gas industry, hydraulic fracturing consumes about 89 percent,
drilling uses 10 percent, with infrastructure uses consuming the remainder (Hayes and Severin 2012).
Further investigation could help to match prospective geologies with various non-water alternatives, and

The Water-Energy Nexus: Challenges and Opportunities June 2014
105
help to maximize estimated ultimate recovery (EUR), which would in turn minimize both unit costs and
normalized emissions (Alvarez et al. 2012).
Geothermal Shearing Fluids
For geothermal applications, injection fluid is used to change pore pressure within already stressed rock
joints, resulting in shear propagation of fractures rather than inducing new ones. The pressure increase
dilates existing joints, and thus facilitates slippage along existing fractures. Unlike hydraulic fracturing,
the process does not require the use of proppants to hold the spaces open. Instead, the rough surfaces of
the rock planes tend to ride up on each other, thereby creating an aperture that allows subsequent fluid
access for heat exchange. Shearing fluids are often composed almost entirely of water, but can contain
small amounts of tracers.
Tracers are introduced to the system via injection in order to characterize the timing and distribution of
their return to a production well. This can establish fluid resident times, fluid sweep volumes, and other
reservoir properties. New tracers are being developed to enhance the information collected and to
uniquely tag one well within a multi-well field. DNA-type tracers are intended for the latter purpose,
where a unique chemical signature is injected within one well to determine where that well‘s fluids are
produced or to verify that well is not contributing to a leak or unwanted upward migration of fluid
(Foppen et al. 2011; Aquilanti et al. 2013).
Temperatures in geothermal applications are higher than those typically found in oil and gas operations,
and can approach 480°F to 570°F (250°C to 300°C). Elements of traditional fracturing fluids tend to
break down at these heat levels; cost-effective EGS would benefit from the development of improved
alternatives. Chemically reactive polymers, including switchable CO2-expanded hydrogels, are one
option. Several of these materials expand upon exposure to CO2, and the reaction is reversible. This
implies that a sequence of injecting these materials and then forcing CO2 to the target area could stimulate
the slippage of pre-existing stresses. Pacific Northwest National Laboratory (PNNL) has demonstrated a
greater than 100 percent volume increase under relevant pressure/temperature conditions from the
hydrogel state (Fernandez 2013). This new class of shearing fluids provides an opportunity to generate
pore pressure changes from chemical reaction energies, which would result in less water used per
stimulation job compared to current hydraulic injections.
Geothermal Working Fluids
In EGSs, the majority of water consumption over the life cycle occurs during the operational stage (Clark
et al. 2013). This is a contrast to hydraulic fracturing for unconventional oil and gas, where the bulk of
the water is used in preparing the formation for production. For EGS, the consumption is a result of
belowground operational leakage that occurs within a stimulated reservoir. With significant geothermal
resources in water-stressed regions, using water more efficiently and relying on alternative waters are
important to the long-term growth and success of large-scale geothermal electricity generation.
Fortunately, existing projects such as the Geysers have had success in maintaining productivity while
utilizing more than 10 million gallons per day of municipal wastewater piped from the city of Santa Rosa,
California (CEC 2002).
Availability of sufficient quantities and qualities of nontraditional waters (e.g., brackish or saline
groundwater, desalination brines, and industrial or municipal wastewater) is a key factor in assessing
feasibility of utilizing alternative working fluids at a particular location. Geothermal power plant
operations can be affected by elevated concentrations of noncondensable gases; constituents associated

June 2014 The Water-Energy Nexus: Challenges and Opportunities
106
with scale and corrosion including silicon dioxide (silica), metal sulfides, and calcium carbonate (calcite);
and naturally occurring radioactive materials (NORMs). These are very similar to the challenges
encountered in reusing produced waters for hydraulic fracturing. Application of alternative waters to
geothermal environments may benefit from selection of waters with low TDS concentrations or selective
treatment and removal of these constituents (Mishra et al. 2011).
Under certain reservoir conditions, supercritical78
CO2 is superior to water in its ability to mine heat from
hot fractured rock (Pruess 2006), because some of the same properties (e.g., fluid density near the
supercritical point) that provide benefits to the RCBC cycles articulated in Section 5.1.1 are also
applicable in geothermal applications. Additionally, geologic sequestration of CO2 would occur as an
ancillary benefit.
Concomitant carbon storage within sedimentary formations and geothermal power generation has been
further studied by LBNL and the University of Minnesota through simulation (Randolph and Saar 2011).
A planned pilot field test (fiscal year 2014) at the Southeast Regional Carbon Sequestration Partnership
(SECARB) DOE Office of Fossil Energy demonstration site seeks to validate the self-circulation behavior
of CO2 (so called thermosiphon [Atrens et al. 2009]). Mixing other materials with CO2 may also improve
performance under certain circumstances (Yin et al. 2013).
Fossil and Renewable Electricity Generation Working Fluids
Organic Rankine cycles are similar to steam Rankine cycles, but use organic working fluids with low
boiling points (e.g., isopentane, isobutane, R-245fa) to recover heat from lower-temperature heat sources.
Such cycles are limited to a very narrow temperature range—usually 200°F to 300°F (~90°C to 150°C)—
and have low efficiencies. However, they can enable the use of sources that otherwise could not be
tapped, such as lower-temperature geothermal and produced water resources. Transcritical cycles, which
include both supercritical and subcritical states, and SCO2 are also options for low-temperature bottoming
cycles (Frank et al. 2012; Kim et al. 2012b).
5.1.5 Water Efficiency and Quality in Industrial-Scale Energy Production Processes
Water quantity and quality is relevant to various stages of energy production processes. Minimizing
water impacts of biofuel production will require continuing advances toward crops that do not require
irrigation, implementing nutrient-reduction and erosion-prevention strategies to protect water quality, and
reducing water use and managing wastewater within biorefineries. Additionally, current amine-based
carbon capture processes increase the water intensity of thermoelectric generation, and there are
opportunities for improvement (Rubin et al. 2012).
Biomass Water Requirements and Water Quality Impacts
Feedstocks for bioenergy include existing crops and biomass residues as well as new herbaceous, woody,
and algal varieties. Water demand and water quality impacts vary greatly within and across these
feedstock categories. Water sources to support crop growth include rainwater, groundwater, and surface
water. Water quality impacts arise from cultivation practices that contribute to fertilizer, pesticides, and
sediment runoff into streams, lakes, groundwater, and the ocean. Challenges remain in enhancing
nutrient- and water-use efficiencies; precise resource delivery (e.g., water, nutrient, pest management);
and developing optimum harvest timing, frequency, and intensity options that account for sub-field and
78
Supercritical materials exhibit the properties of both liquids and gasses above a certain combination of
temperature and pressure specific to the substance.

The Water-Energy Nexus: Challenges and Opportunities June 2014
107
landscape-scale variability in order to maximize crop yield while minimizing deleterious environmental
impacts. Salt-tolerant species (halophytes) may also offer feedstock possibilities on degraded lands, or
allow the use of brackish waters for irrigation (Abideen et al. 2011).
Significant potential exists to design feedstock production systems that improve water quality relative to
current technologies and practices. For example, feedstocks such as perennial herbaceous and wood
plants (such as switchgrass, poplar, or willow) allow for reduced energy intensity in management
practices compared to conventional crops, and have deeper roots that maintain nutrients and soil health.
Shifting land use toward such feedstocks can then reduce chemical and sediment runoff attributed to
agricultural and other activities.Remaining challenges include further development of ―passive‖
fertilization concepts, understanding where to place bioenergy crops within a field or watershed to
maximize recovery and reuse of nutrients, and integrated landscape analysis tools that support
management decision making.
Biorefinery Water Consumption and Wastewater
Existing biorefineries, predominantly corn ethanol plants, have dramatically reduced their consumptive
water use through efficiency and recycling improvements from an average of 4.7 gallons of water per
gallon of ethanol in 2003 to a current industry average of 2.7 (Wu et al. 2009; Mueller and Kwik 2013).
The corn ethanol industry maintains that near-net-zero water consumption is possible with additional
capital investment in existing commercial technology (e.g., through process optimization, capturing of
water vapor from the dryer, and boiler condensate recycling). However, new conversion technologies
that produce energy from cellulosic, algae, or other biomass materials will require additional learning to
reduce process water requirements and discharge.
For example, some conversion processes require significant water use and waste disposal to remove the
pretreatment chemicals used to deconstruct cellulosic biomass into fermentable sugars. The development
of enzymes and microbes that are tolerant to pretreatment chemicals would improve performance and
reduce costs. Process intensification throughout unit operations, such as more efficient reactors,
innovative separation technologies, or dynamic equipment operations that reduce processing time, could
also reduce the consumptive water use of new biomass conversion technologies (Wu 2012).
Similar to power plant cooling, a significant source of water loss in biorefineries and most industrial
operations that use steam is process water that is periodically purged from boilers and cooling towers to
remove mineral buildup (blowdown water). R&D into recycling these waters and reducing the frequency
of blowdowns, such as some of the materials work detailed in Section 5.1.1, could reduce water
consumption, as could R&D into more efficient techniques for generating steam and cooling process
streams. The kinds of improved heat exchange materials and processes described in Sections 5.1.1 and
5.1.2 could also be applicable to biorefineries. Additionally, lignin, which is usually used as boiler fuel,
can be converted to value-added products such as carbon fiber. Organic by-products resulting from
pretreatment and fermentative biorefinery processes can be removed from wastewater via low-
temperature processes such as anaerobic digestion or microbial fuel cells instead of being concentrated in
the evaporator to generate boiler fuel (Borole 2011).
Biorefineries requiring on-site wastewater treatment would also benefit from improvements in anaerobic
digestion and cheaper and more efficient membrane separations. Technologies exist to treat wastewater
by anaerobic digestion, filtration, and sterilization to make potable water, but these technologies are
currently cost prohibitive for many industrial applications. R&D that combines unit operations via

June 2014 The Water-Energy Nexus: Challenges and Opportunities
108
process intensification or other new developments could reduce these costs. One possibility for
biorefinery wastewater treatment is microbial electrolysis, which generates hydrogen while
simultaneously cleaning the wastewater (Borole and Mielenz 2011; Borole et al. 2013).
Systems Water Efficiency in Carbon Capture
In order to produce tangible results, the kinds of materials advances suggested in Section 5.1.1 have to be
incorporated into functional systems. The energy, water, and cost performance penalties associated with
current MEA technologies for carbon capture are primarily attributable to the energy and water
requirements for solvent regeneration (Bourcier et al. 2011; Tidwell et al. 2013). Numerous alternatives
to MEA-based systems are under investigation, many of which have the potential to reduce both energy
and water requirements (Keairns et al. 2012). Promising possibilities include, but are not limited to,
advanced solvents and membranes (Boot-Handford et al. 2014), calcium-looping strategies (Alonso et al.
2010; Blamey et al. 2010), metal-organic frameworks (D'Alessandro et al. 2010), and microbial
approaches (Kumar et al. 2010). Work remains at the pilot and demonstration scales to prove the
technical and economic feasibility of alternatives to MEA processes that deliver energy, water, and cost
savings compared to existing options. Additionally, CCS technologies need to be considered in local and
regional contexts, as national-scale analyses can mask particular temporal and spatial vulnerabilities.
5.2 Energy For (and From) Water
Delivering water of acceptable quality for various geographically dispersed human activities requires
energy. While reliable data is noticeably scarce—that gap is a focus of Section 5.3—energy for water
probably comprises 3 percent to 3.5 percent of total U.S. electricity consumption, including pumping for
irrigation and large-scale conveyance, while excluding end uses such as home water heating (CPUC
2010; Sanders and Webber 2012; Amarnath et al. 2013; Marks et al. 2013; Stanford 2013).79
There are
also possibilities for recovering the energy (and resources) present in various produced and waste waters,
to the degree that at least one municipal water utility in the United States has achieved net-zero energy
consumption on an annual basis (WEF 2012).
The productive use of ―nontraditional‖ waters is particularly applicable in regions facing the probability
of chronic freshwater shortages. The relevance to energy has two elements: 1) ―nontraditional‖ water for
energy applications and 2) beneficial use of produced waters from energy operations. Figure 5.3 starts
with ―nontraditional‖ waters in the upper left-hand corner because they are relevant to many of the
RDD&D opportunities in this area. It further separates wastewater treatment, which primarily targets
organic materials, and desalination, which focuses on the removal of inorganics. There are specific
opportunities in both of these areas, but it is important to recognize that organics and inorganics are
almost always both present in practice; Figure 5.3 is necessarily an oversimplification. It also highlights
resource recovery, which includes options for producing energy from produced and wastewater streams,
both organic and inorganic. Finally, it incorporates several bidirectional arrows to emphasize that there
are multiple ways to combine individual technological innovations into more comprehensive systems,
foreshadowing the opportunities in water-energy systems integration discussed in Section 5.4.
79
Amarnath et al. calculate slightly less than 2 percent as a total figure for water and wastewater systems, but they
do not include energy required for long-distance conveyance, such as the California and Arizona Water Projects
(CPUC 2010), and they also do not account for groundwater pumping for irrigation. This report estimates total
electricity use for irrigation between 30 and 50 TWh/year, based on factors reported by Water in the West (Stanford
2013), and supported by (Marks et al. (2013)), which estimates a figure of 10 TWh/year for irrigation in California
alone.

The Water-Energy Nexus: Challenges and Opportunities June 2014
109
Figure 5.3. Representative problem/opportunity spaces in energy for and from water.
Nontraditional waters vary widely in quality, and there are several relevant metrics. For example, total
dissolved solids (TDS) is a loose measure of salinity, and is measured in milligrams per liter (mg/L). It is
also a rough proxy for toxicity to terrestrial and fresh water aquatic life forms. Total suspended solids
(TSS) characterizes the mass of relatively large particles, both organic and inorganic, present in the water.
In practical terms, it evaluates how ―clear‖ the water is. For example, the Mississippi River below New
Orleans is high in TSS (very brown), while snowmelt directly off a glacier in Greenland would score low
on this scale (clear). Biochemical oxygen demand (BOD) evaluates the prevalence of organic materials
and can also indicate the presence of hydrocarbon residues. In addition to TDS, TSS, and BOD, other
contaminants of concern such as barium, boron, arsenic, and naturally occurring radioactive materials
(NORMs) that may not be adequately addressed by traditional wastewater processes may require removal
as well, depending on water source and end-use requirements.
Treatment is almost always required to bring nontraditional waters to the quality levels necessary to meet
human domestic, agricultural, and industrial needs, as well as to provide for ecologically compatible
discharges from human systems. A critical consideration in the use of nontraditional water sources is
exactly what solid, chemical, and biological constituents need to be handled to make the water usable for
a particular application. This determination is specific to particular combinations of sources and
demands, and even to temporal variations in the quality of influx as well as effluent requirements. For
example, water temperature changes both with season and time of day, and can affect the efficiency of
both wastewater treatment and power plant cooling, requiring careful monitoring and process tuning.
Generally, successful treatment requires a tailored combination of technologies and processes. It is also
important to recall distinctions of geographic and political scale. For example, while municipal water
treatment comprises only 1 percent to 2 percent of U.S. national electricity consumption (Amarnath et al.
2013), it can represent the largest single electricity usage (and expense) for a given municipality (WERF
2011; WEF 2012).

June 2014 The Water-Energy Nexus: Challenges and Opportunities
110
Figure 5.3 parallels Figure 5.1 in depicting problem/opportunity spaces at varying levels of technological
development. Some solutions, such as capacitive deionization (CDI) and various pressure-retarded
osmosis strategies for recovering energy from produced waters, have generally not advanced beyond
bench-scale demonstrations. Alternatively, there are wastewater treatment and waste-to-energy
technologies such as anammox processes and thermal hydrolysis that are proven in Europe but scantily
deployed in the United States (WEF 2013). This continuum suggests that a portfolio approach to
RDD&D might benefit from diversity in matching activities to technology developmental levels as well
as in particular solutions. It also suggests that DOE might want to consider different strategies at various
levels of RDD&D, a notion developed further in later sections of this chapter.
Figure 5.3 also contains some very intentional omissions that may benefit from a brief explanation. First,
it does not include pumping, even though such activities represent a significant percentage of energy use
for water in the United States. DOE‘s Building Technologies Office is developing pumping standards;
those issues are deferred to Section 5.5 because they represent more of a deployment issue than a pure
R&D challenge. Similarly, Figure 5.3 does not incorporate discussions of appliance efficiency standards
in areas such as water heating, refrigerators, laundry, and dishwashers, among others. DOE already has
standards in place in these areas, and is developing more in the instance of commercial washing machines
and icemakers. These standards have provided clear savings in terms of both energy and water, and may
benefit from future updates.
5.2.1 Desalination
Seawater constitutes a relatively infinite resource, and desalination has been practiced at commercial
scales for decades. Thermal methods such as multistage flash and multiple effect distillation are still
widely utilized in areas where energy is plentiful and freshwater is scarce, such as the Middle East (NRC
2008). However, techniques that depend on boiling water are necessarily energy-intensive. Reverse
osmosis (RO), often in combination with nanofiltration (NF), have emerged as the predominant
technologies used in desalination operations in the United States, as they are significantly less energy-
intensive than traditional thermal techniques. However, both capital and energy costs are still high, thus
opportunities for improvement remain. Further, while seawater has been used for once-through cooling of
power plants, challenges remain in employing it for recirculating systems.
Brackish groundwater is also an important potential resource for energy uses in water-scarce regions. It
also requires less energy to treat than seawater. Additionally, produced waters from oil and gas,
geothermal production, and potentially carbon capture and storage operations tend to be high in salinity.
Beneficial use of these waters presents a significant opportunity, and requires cost and energy-efficient
desalination solutions in order to gain market penetration. Finally, the heat, pressure, and salinity
available in produced waters from energy operations constitute potential energy resources that could be
used either to generate electricity or reduce the costs of in-situ desalination.
Alternatives to Reverse Osmosis
RO involves mechanically forcing water through semi-permeable membranes that restrict the passage of
dissolved salts. Energy, particularly electricity, constitutes the bulk of RO operational costs. While
further advances in pretreatment (notably nanofiltration) and membrane technology have some potential
for further improvements, they will necessarily be incremental, as RO is nearing its practical limits (NRC
2008; Carter 2013). Additionally, RO, like all forms of desalination, produces a concentrated brine waste

The Water-Energy Nexus: Challenges and Opportunities June 2014
111
stream, the disposal of which is a challenge for land-locked systems. Currently available solutions are
energy- and land-intensive, which presents an opportunity for improvement. One of the best paths
forward may be to improve recovery ratios, as doing so reduces the volume of brine requiring disposal.
Another possibility is processes that can utilize relatively low-grade waste heat, such as several of the
technologies articulated in Table 5.1. A third option is to integrate desalination more tightly with
electricity generation, wastewater treatment, and productive utilization of produced waters, which is
discussed in more detail in Section 5.4.
Table 5.1. Reverse Osmosis and Selected Alternatives
Treatment Method
Reverse Osmosis (RO)
Features
Pressure-driven membrane process
Pretreatment required to prevent membrane fouling
Seawater recovery 30–60%
Brackish water recovery 50–80%
Strength(s)
Dominant technology in the United States
Effectively removes salts
Viable for large-scale (>25 million gallons per day) operations
Works with seawater
Weakness(es)
Energy intensive
Relatively low recovery creates large brine volumes
Does not remove all contaminants (e.g., boron)
Cost-prohibitive for high TDS waters
Current membranes prevent higher-pressure operation
Nanofiltration
Pressure-driven membrane process
Lower pressures than RO
Performs well for lower-salinity water
Different pollutants can be removed in the same filtration
Can selectively retain healthy trace minerals in drinking water
Removes many potential RO/forward osmosis membrane foulants
Inadequate contact time can limit contaminant removal
Primarily viable as a pretreatment step
step Proven technology
Forward Osmosis (FO)
Osmotic pressure-gradient-driven membrane process
Pretreatment required to prevent fouling
Seawater recovery >60% demonstrated
Brackish water recovery >90% demonstrated (in conjunction with RO)
Pressure-assisted FO also an
Effectively removes salts and other contaminants, including boron and arsenic
Substantial reduction in energy requirements compared to RO
First commercial-scale deployments in operation in Middle East
Generation of sufficient osmotic pressure still challenging for high-TDS feed waters
Improved membranes needed to maximize performance
option

June 2014 The Water-Energy Nexus: Challenges and Opportunities
112
Treatment Method
Membrane Distillation
Features
Lower-temperature alternative to traditional thermal techniques
Relies on evaporation rather than boiling
Membranes select for water vapor versus liquid water
Strength(s)
Water quality competitive with traditional thermal techniques
Can effectively use waste heat
Relatively small footprint, low capital
Weakness(es)
Not fully proven for large-scale applications
Volatile contaminants may require pretreatment
Membrane degradation issues not fully understood
costs
Relatively insensitive to feed TDS levels
Dewvaporation
Novel use of heat transfer and energy recovery in a humidification/ dehumidification process
First two commercial plants operational in 2012, treating produced waters from Marcellus shale play in PA
Operates at atmospheric pressures
Recovery rates >90%
Removes heavy metals, organics, and radionuclides
Water quality competitive with traditional thermal techniques
Efficient use of low-grade heat
Relatively insensitive to feed TDS levels
Absence of membranes reduces fouling potential
Lower capital and operating costs
Smaller footprint
Requires large heat transfer areas
May be sensitive to ambient temperature and humidity conditions
Needs relatively low-temperature sink
More energy intensive if waste heat is not available
Capacitive Deionization
Ion removal via electric charge
Adsorption/desorption cycle
Energy reductions versus RO possible for brackish water
Relatively low capital costs
Possibility for energy
Currently limited to waters <5,000 mg/L TDS
At lab/bench scale of development
recovery
Hybrid Systems
All of the above systems can be combined in hybrid treatment trains
Possibilities for enhanced recovery, system energy usage
Strengths of single technologies can be synergistic in sequence
Opportunities for beneficial use of brines
Additional complexity compared to single-technology systems
Additional design and testing required for commercialization

The Water-Energy Nexus: Challenges and Opportunities June 2014
113
Treatment Method
Nanoenhanced
Features
Enabling technologies for a
Strength(s)
Improved fouling
Weakness(es)
Potential for Membranes variety of treatment strategies resistance undesirable release of
Nanoporous materials offer Customized membranes nanoparticles
possibilities for improved for specific Consequences of selectivity and permeance contaminants nanoparticle release to
Embedded nanoparticles Reductions in capacitive the environment poorly
allow highly tailored polarization characterized
membrane designs Multilayered Early stage of
Nanostructured materials may engineering could technological
support higher-pressure increase strength and development
operation performance
Enhanced flux over time Source: NRC 2008; Drewes 2009; Kim et al. 2012a; Mossad and Zou 2012; Zhao et al. 2012
As indicated by the bolding in Table 5.1, the combination of nanofiltration and RO represents the
currently commercialized state of the art in the United States. There are several alternatives under
development with the potential to reduce electricity usage and costs, utilize waste heat more effectively,
and improve recovery rates:
Forward Osmosis (FO)
FO is a membrane-based separation process that uses the osmotic pressure gradient between a
concentrated ―draw‖ solution and a feed stream to drive water flux across a semi-permeable membrane.
The primary requirement for draw solutions is to find a mixture with enough osmotic potential to power
the trans-membrane transfer, which is particularly problematic for high-TDS feed streams. Other
challenges include selecting a draw solute that is either desirable to have in the product water or that may
be easily and economically removed (Li et al. 2013). For example, a draw solution comprised of a
combination of ammonia and CO2 dissolved in water requires only small quantities of electrical power
(<0.25 kWh/m3) combined with low-quality heat (less than 120°F [~50°C]), which could be provided as a
waste heat stream from industrial or power production processes. Under these conditions, and given a
sufficient difference in osmotic pressure, FO can be competitive with RO systems (Chung et al. 2012;
Kim et al. 2012a; Zhao et al. 2012).
At least one commercial system is in operation on the Arabian Peninsula, but widespread deployment will
require additional proof of cost-effective operation under a variety of conditions (Phuntsho et al. 2012).
Additional challenges include management of membrane fouling (Liu and Mi 2012; Zhang et al. 2012),
maximizing boron and arsenic removal (Jin et al. 2012; Kim et al. 2012a), and overcoming problems with
capacitive polarization (Chung et al. 2012; Zhao et al. 2012). In short, while FO has achieved some
market success, substantial RDD&D work remains in order for this method to compete with RO (and
more traditional thermal techniques) in a broad array of applications.
Membrane Distillation
This suite of technologies can be conceived as a low-temperature alternative to traditional thermal
methods. There are a variety of configurations under consideration; all of them encourage the
evaporation of water and utilize membranes that are porous to water vapor but not liquid water or
dissolved contaminants (Creusen et al. 2013). They share the thermal advantage of relative insensitivity

June 2014 The Water-Energy Nexus: Challenges and Opportunities
114
to TDS levels at much lower energy intensities than methods that rely on boiling water (Jansen et al.
2013). This implies the possibility of utilizing waste heat to power the desalination process—a
significant boon in locations where it is available (see Section 5.4). As with all membrane-based
processes, fouling of various kinds is a potential issue (Winter et al. 2012), as is membrane lifetime,
which connects back to the materials challenges raised in Section 5.1.1, and further discussed later in this
section. This family of solutions is at an intermediate level of development and offers significant
potential for advances in energy-efficient treatment of high-TDS waters.
Dew Evaporation (Dewvaporation)
In this process developed with DOE funding (NETL 2011), a stream of heated air is humidified by a
falling film of saline water along one side of a heat transfer surface, which leads to evaporation. On the
other side, the vapor condenses under cooler conditions and the condensation process releases heat
through the heat transfer surface to the evaporation side, thus recapturing much of the latent heat of
vaporization. The potential benefits of this process include an efficient use of low-grade heat or solar
energy; tolerance for the high TDS levels found in e.g. the Marcellus shale; a small footprint; and low
capital costs compared to conventional thermal desalination methods. However, the system requires large
heat transfer areas, is quite sensitive to atmospheric conditions, and needs a low-temperature sink to
permit condensation. Two commercial-scale plants are in operation in Pennsylvania to treat produced
waters from oil and gas operations (Altela 2013).
Capacitive Deionization
In its simplest form, CDI does not utilize membranes. Instead, it relies on a relatively small direct current
(DC) and voltages to attract salt ions to positively and negatively charged electrodes, leaving a relatively
pure stream of water. When the electrodes reach their assimilation capacity, the current is removed or
reversed, allowing flushing of concentrated brine. While it may only be suitable for relatively clean
brackish waters (TDS less than 5,000 mg/L), this family of technologies has the potential to be more
energy efficient than RO for these sources (Zhao et al. 2013b). It is also less capital intensive than RO;
therefore, it may be a niche solution for groundwater treatment in remote locations, although fouling can
be an issue under certain conditions (Mossad and Zou 2012). It is also possible that innovations could
increase the salinity of water that could be treated economically.
CDI also offers the possibility of energy recovery in the desorption phase, although work remains in
optimizing cycle parameters and developing anode and cathode materials with improved performance
under realistic conditions (Demirer et al. 2013; Długołęcki and van der Wal 2013; Zhang et al. 2013b). A
variant encases the electrodes in selective membranes, which improves efficiency by preserving their
adsorption capacity through multiple cycles (Zhao et al. 2013c). While practical applications are likely
limited to brackish water treatment, additional investigation could produce competitive systems for water-
stressed environments.
Hybrid Systems
One example of combined processes is a project that is developing a robust, low-energy, dual hybrid
membrane system that can provide water quality comparable to RO and is powered by waste heat. The
hybrid system takes advantage of combining an FO system with membrane distillation technology.
Minimally treated wastewater is sent to an FO system containing a salt draw solution on the permeate side
of the membrane. The higher osmotic potential in the salt solution drives the filtration process. The
resulting feed water, consisting of mainly dissolved solids with little organic content, is passed through to

The Water-Energy Nexus: Challenges and Opportunities June 2014
115
the membrane distillation system. The feed water evaporates due to moderate heating by industrial waste
heat and the vapor is transported across a membrane for collection by condensation. The quality of the
resulting water is comparable to distilled water and is suitable for direct reuse. The remaining solution
containing non-volatile solutes and salt is sent back to the FO system as the draw solution (DOE 2013a).
Another example is a hybrid microbial fuel-cell-desalination method (Borole and Tsouris 2010). It is a
synergistic process that uses energy generated from microbial fuel cells for removal of salts from
produced water or brackish water via CDI, improving energy efficiency and concentrating the brine
solution.
Nanostructured and Nanoenhanced Membranes
Membrane technologies are applicable to multiple water treatment techniques, and advances at the
nanoscale are promising on several fronts (Akar et al. 2013; O'Dea et al. 2013; Tokman et al. 2013).
Possibilities include nanostructured surfaces, as control over features at this scale allows fine-tuning of
flux, selectivity, and membrane strength for optimal performance (Qi et al. 2012; Liao et al. 2013).
Alternatively, the introduction of e.g. carbon nanomaterials such as nanotubes and graphene offer a
unique combination of robustness, precise control over potential bonding sites, and ease of
functionalization to create desirable membrane characteristics (Dumee et al. 2013). Both kinds of
nanoscale solutions also show promise in reducing various kinds of fouling—perhaps the key challenge in
the cost-effective deployment of advanced membrane systems (Jin et al. 2012; Liu and Mi 2012).
Emerging Requirements for Nontraditional Waters
In addition to alternatives to RO, the desire to expand utilization of nontraditional waters is increasing the
importance of specific requirements for particular water sources. Individual needs include:
Developing lower-cost, ideally portable options for high-TDS waters, such as those from the
Marcellus play (Haluszczak et al. 2013), to minimize waste volumes requiring transport and
underground injection, and to facilitate reuse in hydraulic fracturing.
Removing boron, reducing sodium/chlorine ratios, and taking other steps necessary to make coal bed
methane water from the Powder River Basin suitable for irrigation, livestock watering, and stream
flow supplementation (Guerra et al. 2011). Selective removal of boron could also be beneficial in
reuse of flowback waters for hydraulic fracturing.
Formulating and implementing cost-effective strategies to remove high levels of radium and other
NORMs from produced waters from unconventional oil and gas that minimize the volume and hazard
of waste streams (Hayes and Severin 2012).
Improving treatment and management processes for nontraditional waters in recirculating cooling
systems, including (but not limited to) waters from saline formations used for CO2 sequestration
(Lawson et al. 2012; Safari et al. 2013).
Many of the aforementioned technologies can help meet these requirements, but fine-tuning would be
necessary to match treatment trains with particular projects (Drewes 2009).
5.2.2 Municipal and Industrial Wastewater Treatment
The second major category of opportunity in water treatment involves wastewaters of all kinds. Recent
estimates suggest that at least 1 percent of U.S. electricity is consumed in municipal wastewater treatment
alone (Amarnath et al. 2013). These figures are based on estimates rather than actual measurements, and
do not include efficiency enhancement possibilities in the industrial sector, most notably food processing,
chemicals, and forest products, but also steel and cements. The lack of solid data in these areas is a good

June 2014 The Water-Energy Nexus: Challenges and Opportunities
116
example of the data gaps discussed in Section 5.3. It is also important to point out that water treatment
and delivery often comprises municipalities‘ largest use of electricity; national summaries can obscure
local realities. In any case, the existing information is sufficient to support some high-level conclusions in
terms of municipal wastewater.
One set of promising possibilities involves the replacement of aerobic treatments, which consume 50
percent to 65 percent of the electricity in traditional treatment streams, with anaerobic alternatives
(McCarty et al. 2011). Another entails pretreatment techniques that enhance the production of biogas
from anaerobic digesters, reduce the volume of sludge requiring disposal, and enhance the resilience of
such facilities to power outages (Neyens and Baeyens 2003). A third group of opportunities offers
significant energy savings in the removal of nitrogen, a growing area of energy consumption, driven by
expectations of expanded regulatory requirements (Joss et al. 2011).
Anaerobic Membrane Bioreactors
While anaerobic treatment processes substantially reduce or eliminate the energy requirements for
aeration, they have traditionally faced challenges, particularly in temperate climates where water influx
temperatures are frequently suboptimal for the biological processes involved. However, the incorporation
of membranes into the treatment train via anaerobic membrane bioreactors (AnMBR) has changed the
equation. Membranes allow retention of the relatively slow-growing anaerobic bacteria, decrease the
start-up time from months to weeks, and allow for a smaller plant footprint (Lin et al. 2013). These
solutions allow the separation of hydraulic retention time, which must be short for high-volume
applications, from solid retention time, which has to be long for effective anaerobic processing. While
challenges remain with respect to fouling and operation under a wide variety of input conditions (Smith et
al. 2012), the potential for these systems to contribute to net-zero wastewater treatment plants (WWTPs)
is significant. AnMBR also has possible applications in biorefining, including algal facilities.
Thermal Hydrolysis
Thermal hydrolysis is a pretreatment process for anaerobic digestion that can increase biogas production
by 10 percent to 50 percent (WEF 2013). While commercially deployed in Europe, the utility for the
Washington D.C. area‘s scheduled startup in 2014 is the first known production application of this
technology in the United States.
Anammox Processes
Removal of nitrogen (in the form of ammonium and nitrate) from municipal wastewaters is becoming
increasingly important in certain key watersheds in order to mitigate the expansion of biological ―dead
zones.‖ Traditional practices of ammonium removal are among the most energy-intensive segments of
wastewater processing and require substantial chemical inputs. The relatively recent discovery of anoxic
ammonium-oxidizing bacteria (anammox) offers a promising alternative for energy savings of as much as
70 percent (Kartal et al. 2010). Anammox can be combined with AnMBR, but questions remain about
process stability and start-up times, even though systems are in commercial operation (Joss et al. 2011).
Additionally, details of the metabolism, structure, and genetic sequencing of the organisms remain an
active area of scientific debate, so there may be fundamental research opportunities as well (Kartal et al.
2011). Denitrification is also key in making municipal wastewaters suitable for power plant cooling
applications, since cooling towers present favorable conditions for the undesirable growth of pathogenic
microorganisms (Li et al. 2011; Lawson et al. 2012).

The Water-Energy Nexus: Challenges and Opportunities June 2014
117
Ultraviolet (UV) Light-Emitting Diode (LED) Disinfection and Organics Remediation
UV-C radiation, particularly in the range between 260 and 275 nanometers, is effective in neutralizing
bacteria, viruses, Giardia, and Cryptosporidium, the last two of which are resistant to traditional chlorine
treatments (Crawford et al. 2005). It is increasingly used in both drinking water and wastewater treatment
in the United States, and continued growth is expected. Current mercury-vapor lamps operate at
suboptimal wavelengths, have relatively short bulb lives, and contain significant amounts of mercury.
UV-C LEDs have the potential to overcome all three shortcomings, but have not yet attained the
efficiencies necessary for cost-effective large-scale applications (Gneissl et al. 2010). Also, UV-C LEDs
have promise in treating heavy hydrocarbon contaminants (Hofman-Caris et al. 2010), such as are often
present in produced waters from oil wells.
Siloxane Removal in Anaerobic Digester Gas
Siloxanes are substances with various organic groups attached to silicon-oxygen backbones. There are
two basic forms, linear and cyclical, and both are increasingly used in industrial processes and personal
care products. As a result, concentrations in municipal wastewater are increasing (Dewil et al. 2006).
Several siloxane compounds, notably Octamethylcyclotetrasiloxane (D4) and
Decamethylcyclopentasiloxane (D5), are commonly entrained in methane streams from anaerobic
digesters (Ajhar et al. 2010).
When oxidized, siloxanes produce silica, which then forms scales within the energy recovery systems.
These deposits reduce heat transfer and flow efficiency, and can also release chunks that can damage
turbines, heat exchangers, and other components. Fuel cell operations are also adversely impacted, and
the precise tolerance levels of different kinds of systems are not fully understood (Papadias et al. 2011).
While effective treatment methods have been commercialized, systems currently on the market add as
much as 20 percent relative to the levelized cost of electricity from fuel cells using biogas from
wastewater as a feedstock. Alternatives such as membrane treatment (Ajhar et al. 2012), peroxidation
(Appels et al. 2008), and others are under development, but none have penetrated markets in a significant
way. Given the expected growth in electricity generation from biogas, improved treatment solutions
could have significant commercial impact.
5.2.3 Resource/Energy Recovery from Wastewaters
In theory, municipal wastewaters contain 5 to 10 times as much chemical and thermal energy as is
currently required to treat these water to meet discharge standards (WERF 2011). While only a portion of
the potential is recoverable in practice, it is feasible for wastewater treatment plants to become net
producers of energy (Frijns et al. 2013). Fuel cells are one recovery option, as are strategies for
recovering energy from biosolids (DOE 2013l), and there are also possibilities of extracting both nutrients
and valuable inorganic materials such as lithium from various waste streams. Multiple combinations of
algae and nontraditional waters afford further opportunity, as does the translation of relatively low-grade
heat from produced waters into electricity.
Microbial Fuel Cells
Microbial fuel cells (MFCs) and their variants harness the products of the microbial breakdown of
compounds in wastewaters to generate electricity or products such as hydrogen while cleaning the water.
Bacterial decomposition of the organic matter takes place in a chamber at the anode of an MFC and

June 2014 The Water-Energy Nexus: Challenges and Opportunities
118
generates protons, which travel to the cathode by passing through a cation-selective membrane, and
electrons, which travel to the cathode through an external circuit, producing an electrical current.
MFCs and related technologies are in an early development phase. A small number of ongoing
demonstrations and laboratory-scale projects aim to understand and improve microbial activity, material
properties, and system design. Key challenges include:
Understanding the effect of conditions such as temperature and bacterial population on net energy
generation, degree of water cleanup, and processing time required for different wastewaters.
Developing lower-cost, more durable materials (i.e., electrodes and membranes) that are compatible
with the microbes while retaining or improving efficiency properties.
Moving from bench-scale testing to larger-scale systems that use actual wastewaters, preferably under
field conditions, to evaluate system designs and identify issues in both scaling-up and long-term
performance.
The benefit of MFC technology is its ability to treat water with minimal energy input and in some cases
with net positive energy output. This technology has significant potential due to its energy efficiency and
applicability to dilute wastewater treatment where implementation of anaerobic digestion becomes
impractical (Pham et al. 2006).
”Tri-generation” Fuel Cells
High-temperature fuel cells such as solid oxide and molten carbonate fuel cells (SOFCs and MCFCs,
respectively) are promising candidates for converting biogas to electricity because of their potential for
high efficiency (Williams et al. 2006). MCFCs at wastewater treatment plants can also be run in ―tri-
generation‖ mode to co-produce power, heat, and hydrogen (combined heat, hydrogen, and power, or
CHHP). DOE recently co-funded development of the world‘s first tri-generation station, located at the
Orange County Sanitation District‘s WWTP in Fountain Valley, California (DOE 2011d). The Fountain
Valley energy station produces approximately 250 kW of power from wastewater for use by the WWTP,
with nearly zero criteria pollutant emissions. It also provides hydrogen to a nearby fueling station for fuel
cell electric vehicles. The primary challenge remaining for SOFC and MCFC systems is to reduce costs
by a factor of two to four while improving durability (NETL 2013b).
Algal Bioenergy Production Using Nontraditional Waters
Growing algae biomass using non-potable water sources such as wastewater from agricultural runoff,
municipal or industrial waste sources, produced water, brackish water, or seawater would reduce demand
on limited freshwater sources (Brennan and Owende 2010; Venteris et al. 2013). Using nutrient-laden
water may also minimize inputs of synthetic fertilizers and create new options for algae-based treatment
of produced or impaired water sources, including possibilities for carbon capture (Razzak et al. 2013).
However, life cycle approaches are essential in determining overall energy and resource balances at a full
system level (Menger-Krug et al. 2012). Further, nontraditional water resources can contain organic and
inorganic constituents not suitable for algae growth or downstream processing technologies. Cost-
effective technologies that identify water constituents, remove toxic or inhibitory compounds, and
optimize integrated systems for algae growth, overall productivity, and downstream processing will be
necessary to realize full market potential (Kumar et al. 2010).

The Water-Energy Nexus: Challenges and Opportunities June 2014
119
Energy and Nutrient Recovery from Biosolids
Potential exists to recover solid materials (biosolids) from wastewater and convert them into high-value
nutrient products and salable energy (e.g., heat, power, transport fuels). Work remains to understand and
fully characterizethe composition of the solids (often location specific) and developing catalysts
(chemical and biological) to: (1) break down the biosolids into usable compounds; and (2) synthesize
components into high-value products or fuels. Process improvements in the efficiency of organic and
inorganic solids recovery offer another area of potential improvement. Additional challenges include
better chemical characterization techniques, separations and filtration technologies, catalysis (bio and
chemical), reactor feeding systems, reactor design, and process modeling and optimization (DOE 2013l).
Recovery of Valuable Inorganics from Produced Waters
Rare earth and near-critical metals such as tellurium and lithium are important for a variety of energy
technologies, such as solar panels, batteries, thermoelectric materials, and permanent magnets for plug-in
hybrid vehicles and wind turbine generators. Several of these substances are subject to supply risk in the
face of ever increasing demand (DOE 2011b). At many geothermal facilities, valuable minerals may be
available at high concentrations, but extraction of pure species tends to be difficult, expensive, and risky.
Developing systems capable of economically capturing, concentrating, and/or purifying these materials
could provide additional revenue streams to geothermal operators while providing access to strategic
resources for the entire clean energy sector.
Oil and Gas Produced Waters Treatment Using Intrinsic Energy
It is estimated that an average of 21 billion barrels of water is produced annually from oil and gas wells
within the United States (Clark and Veil 2009). There is the possibility of using either the heat or
pressure that is sometimes available from these waters to drive water treatment processes, such as FO or
RO, and there may also be similar opportunities with produced waters from CCS (Klise et al. 2013), as
further detailed in Section 5.4.2. Another option for high-TDS waters may be to use the salinity to
generate electricity via pressure-retarded osmosis (Han et al. 2013; Kim and Elimelech 2013). Yet
another pathway would be to employ associated gas that is currently being flared to power a low-
temperature thermal process such as membrane distillation. While there are some pilot systems in
operation, work remains to understand the economic viability of such solutions, and to develop a more
systemic understanding of mapping solutions to varying conditions among and within basins. The
subsurface characterization efforts described in Section 5.3.3 are an essential part of this understanding.
5.3 Sensing, Data Collection, and Information Management
Sections 5.1 and 5.2 targeted possible technological solutions that could make direct contributions to
optimizing the use of water for energy and energy for water, respectively. There is another category of
technologies, techniques, practices, and systems that have the potential to inform better decisions about
energy and water by providing more, higher quality, or more timely information.
5.3.1 Advanced Sensors and Analytics
Many aspects of the water-energy nexus suffer from a lack of reliable and reasonably pervasive
measurement-based data. Too often, the literature depends on either formula-based estimates or seminal
work that is decades old, and does not reflect current realities. The development of relatively low-cost
networks of widely distributed sensors, some of them remote, some with real-time reporting capabilities,

June 2014 The Water-Energy Nexus: Challenges and Opportunities
120
with attendant summarization and analytic capacities, would provide a ground-truthed basis for further
analysis, modeling, and decision support.
Subsurface Sensing and Characterization
Induced seismicity and groundwater contamination are among the key concerns for both unconventional
oil and gas development and EGS. Enhanced subsurface sensing, analysis, and visualization capabilities
are critical in detecting the possibility of problems before they occur.
High-resolution microseismic measurements have demonstrated the ability to detect pre-existing
fractures beyond the capacities of commonly utilized methods. This information will also be vital in
the development of improved capabilities to model the potential extent and direction of proposed
induced fractures. DOE has shown the feasibility of downward-looking vertical seismic profiling
using next-generation accelerometers (as geophones). Development of next-generation high-
frequency/low-noise seismic receivers would allow the demonstration of enhanced three-dimensional
seismic volume mappings as compared to existing techniques.
Improved down-hole sensors and real-time monitoring to improve understanding of wellbore integrity
failures, increase capabilities to predict probable failures (e.g., induced seismicity, methane migration
to groundwater), and monitor drilling and fracturing conditions such as temperature and pressure,
would have significant value in real-time well management for both oil and gas and geothermal
operations. Accumulation of data over time would also inform further analysis and modeling efforts.
DOE is pursuing a number of activities aimed at numerical simulation of coupled geothermal
reservoir behavior at all scales and time frames relevant for hydrothermal and EGS developments
(Williams et al. 2010). These numerical simulations are supported with geophysical imaging and
constraining field data of fracture geometries, stress state and change during stimulation operations,
and geochemistry. An explicit objective within this portfolio of research is to better understand fluid
circulation paths within hydrothermal/EGS reservoirs, with the opportunity to develop engineering
methods to minimize subsurface working fluid losses.
Tracers are chemicals injected into the flow stream of a production or injection geothermal well to
determine fluid pathways and other reservoir properties (Redden et al. 2010). They can be classified
into two main groups: (1) conservative tracers and (2) smart tracers. Conservative tracers are an
established technology used to determine fluid path (well connectivity), fluid velocity, swept volume,
and reservoir geometry. Smart tracers are a technology that is under development, and these tracers
allow for additional measurements beyond those of conservative tracers, including but not limited to
determination of surface area for heat exchange, fracture spacing, fracture aperture, and reservoir
temperature and pressure (Rose et al. 2011).
One important objective is to understand the evolution of reservoirs during normal operations as well as
during EGS stimulation activities. Developing innovative data collection technologies and techniques,
such that reservoir inputs and behavior can be accurately measured and correlated to reservoir evolution
and permeability enhancement, is a key element. Tracer technologies and interpretation techniques can
assist in yielding some of these critical geothermal reservoir parameters. By integrating tracer and tracer
analysis techniques with technologies such as reservoir engineering, geophysics, geochemistry, long-term
monitoring, geology, modeling, and high-temperature tools, among others, a more complete
understanding of geothermal reservoirs, and their relationship to water resource requirements, could be
obtained.

The Water-Energy Nexus: Challenges and Opportunities June 2014
121
Remote Sensing
Remote sensing is another avenue of relevance to the water-energy nexus. For example, the National
Drought Monitoring Center uses National Aeronautics and Space Administration (NASA) satellite data as
part of a suite of sources to provide weekly updates on groundwater levels and soil moisture levels at
various depths (NDMC 2013). NETL has employed helicopter-based techniques to monitor produced
waters from coal-bed methane in the Powder River Basin (NETL 2004) and to locate abandoned oil and
gas wells via the magnetic signatures of steel casings (Hammack and Veloski 2006). NASA has a
CubeSat Launch Initiative that allocates launch capacity to standard form ―nanosatellites‖ on a
competitive basis (NASA 2013). This program, which employs relatively cheap, disposable sensing
platforms, has the potential to dramatically expand low-earth orbital coverage for a variety of
applications. These are only a few of the possibilities for remote sensing to contribute to water-energy
solutions; further exploration would undoubtedly uncover additional opportunities.
Rapid and Portable Technologies for Analysis of Produced Water
Enhancements in portable, low-cost characterization methods of produced waters from oil, gas, and
geothermal operations could be a significant component of a cradle-to-grave monitoring network.
Current sampling methods are time consuming and expensive, and generally require sophisticated human
intervention. Automated devices with capabilities for unattended data collection, in-situ data processing,
and built-in data communications, coupled with geographic information system (GIS)-based integration
tools, could significantly enhance understanding of variances in produced water qualities with and across
basins, thereby informing treatment and management strategies. Such devices could also be valuable for
near-real-time analysis in industrial water treatment facilities where water quality could vary significantly
by delivery.
Low-Cost Methane Detection Sensing Systems and Remote Sensor Networks
Methane leakage from unconventional shale gas development has become a highly salient and
controversial issue (e.g. Howarth et al. 2011; Burnham et al. 2012; Laurenzi and Jersey 2013). The
obvious water-energy link is with potential methane contamination of groundwater sources of drinking
water (Osborn et al. 2011). However, there are also subtler connections. Observations of surface
methane during well development might serve as proxies to identify well bore integrity problems or the
presence of shallower gas formations above the target shales. Additionally, there is substantial
uncertainty about the contributions of well completions and liquids unloading, both of which involve
water, to overall methane leakage rates (Allen et al. 2013). Finally, tracking volatile organic compounds,
which are frequently co-released with methane, could assist in forensic identification, as well as inform
on-site risk mitigation activities.
The development of a multitiered network of methane sensors would be of significant benefit in
addressing these issues. The volume of unconventional oil and gas development, combined with the
current uncertainties over methane leakage rates from these activities (e.g. Howarth et al. 2011; Burnham
et al. 2012; Weber and Clavin 2012; Larson 2013), speaks to the potential value of networks of remote
measurement devices to provide an empirical basis for analysis. Questions remain about the optimal
points of intervention, but this is clearly an area of R&D opportunity.
Smart Meters for Water and Wastewater Treatment Operations
While smart meters are increasingly deployed in electrical grids, monitoring of the water infrastructure
lags significantly (WEF 2012). Networks of remote, automated leak detection could help in prioritizing

June 2014 The Water-Energy Nexus: Challenges and Opportunities
122
repairs to aging water infrastructure, with concomitant energy savings, particularly in locales with high
embedded energy costs of water (Klein 2005; Stokes and Horvath 2009), such as Southern California and
the Southwest. Additionally, more sophisticated process sensing would aid in enrolling drinking and
wastewater treatment systems in automated demand response programs, which often facilitate energy
efficiency gains as well (Daw et al. 2012).
5.3.2 Expanded Survey Data Collection and Synthesis
Even where sensor networks are in place, as is the case for energy and water metering, the data is not
always publicly available or lacks the resolution desirable for certain analysis needs. Surveys are, in
many cases, the best tool available for periodic collection of aggregate information. Although self-
reported information has its limitations (Averyt et al. 2013), EIA relies heavily on this method, with full
awareness of the necessity for disciplined quality control techniques. For example, EIA uses surveys to
collect detailed information on water use and other characteristics of cooling systems at electric power
plants (Box 5.1).
Commercial Water and Energy Consumption Survey Data
While the U.S. Geological Survey (USGS) compiles a summary of water uses every five years, most
recently published in 2009 (Kenny et al. 2009), it has not included water consumption since 1995.
Although the forthcoming report, based on 2010 data, will include information from a new power plant
consumption model, this area will still comprise a data gap.
EIA gathers and publishes information on energy use in commercial buildings in its Commercial
Buildings Energy Consumption Survey (CBECS) quadrennially, but the water use data collected is
limited. Starting with the CBECS 2012 collection, EIA plans to publish water consumption for
commercial buildings, broken out by principal building activity and region where the survey results meet
EIA‘s data quality standards.
The U.S. Government Accountability Office has highlighted opportunities for better coordination (GAO
2009), and collaboration between EIA and USGS is ongoing. However, work remains in collecting,
analyzing, and reporting all of the information of material value in this area.
Energy Usage by Water Utilities
As noted in previous sections, energy usage in delivering water services represents a non-trivial portion of
U.S. electricity consumption and may present significant opportunities for both efficiency and renewable
generation. However, measurement-based data is sorely lacking in this industry as well. CBECS does
not include municipal water utilities, which provide 85 percent of the water services in the United States.
The unit of analysis in CBECS is a commercial building, not a utility providing water and associated
services.
As previously cited, EPRI published an update of its earlier estimates in December 2013 (Amarnath et al.
2013). This report, while extremely valuable, still relies on engineering calculations, not data from actual
meters. The development and deployment of low-cost smart water meters would facilitate the requisite
data collection, but analysis, interpretation, and publication of the information would also be helpful in
order to deliver tangible value. Such meters might be embedded in pipelines, with the capability for real-
time detection and communication of pressure differentials to a central control system, thereby enabling
faster leak correction. More comprehensive energy metering of subsystems could also facilitate
determination of optimal points for efficiency investments.

The Water-Energy Nexus: Challenges and Opportunities June 2014
123
Residential Water Use
EIA quadrennially collects residential energy use information via its Residential Energy Consumption
Survey (RECS), most recently in 2009. The current instrument includes a few questions on aspects of
water usage, but collecting total water consumption and verifying that consumption with water suppliers
would require significant additional effort. Detailed information about home water usage could inform
DOE appliance standards and would also be valuable to EPA.
5.3.3 Ongoing Information Management Systems
Data collection via sensors, surveys, or other means is necessary but not sufficient to ensure the
availability and quality of information needed to support decision making. Large volumes of data require
Box 5.1. EIA Power Plant Cooling Water Data
In fulfilling its mission to collect, analyze, and disseminate energy information, EIA collects information from electric power plants. In addition to collecting generation and fuel consumption data for these plants, EIA collects data from power plant operators describing operating and design parameters of steam cooling systems using two forms: Form EIA-923 ―Power Plant Operations Report‖ and Form EIA-860 ―Annual Electric Generator Report.‖ While both forms collect plant information from all grid-connected plants larger than 1 MW, cooling system data is limited to plants where the steam-generating units have a combined nameplate capacity of 100 MW or greater. This threshold excludes many geothermal plants, so data from those facilities is not captured.
For those larger plants, Form EIA-923 identifies the monthly cooling system status (e.g., operating, testing, or on stand-by) and the monthly measured or estimated consumption and temperatures of cooling water used by the system. This form collects operational parameters for existing operating cooling systems. In addition to the monthly system hours in service, the form collects rates of withdrawal, diversion, discharge, and consumption based on the type of system and also the average and maximum monthly water temperatures measured at the plant intake and outflow points. The form also collects chlorine infusion (if any) used in the process.
In a similar fashion, Form EIA-860 identifies cooling system design characteristics and their relationships to the plant’s boilers and generators. This form collects the cooling system type (e.g., once-through, recirculating, hybrid, dry, or other); the name and type of the source of intake water (e.g., ground, surface, seawater, or other); the type of water (e.g., fresh, brackish, or saline); the volume and surface area of cooling ponds; and the designed flow rate and power consumption of cooling towers. The form also collects the total installation costs of ponds and towers. In addition to existing plants and cooling systems, Form EIA-860 collects information for planned systems including those under construction. The form also collects the distance from shore and surface depth of plant intake and outflow points.
Power plants and their respective generators, boilers, and cooling systems are assigned unique identifiers. Consequently, the operational and design characteristics for cooling systems collected by each form can be combined into a single, consistent multiyear data set for analysis. However, achieving homogeneous cooling system operational data definitions across years is limited by the fact that not all data was collected in all years. For example, prior to 2007, cooling system data was collected on Form EIA-767 ―Annual Steam-Electric Plant Operation and Design Report.‖ That survey was discontinued in 2005 but its elements were brought back in 2007 by being split between Form EIA-860 and Form EIA-923, as appropriate.

June 2014 The Water-Energy Nexus: Challenges and Opportunities
124
well-defined technical protocols and systems for storage and organization as well as active management.
The latter becomes particularly important in ongoing operations; maintaining the accuracy and integrity
of databases of any size and significance requires input screening, validation, error correction, and
presentation management, among other vital administrative tasks. In short, successful information
systems require sustained organizational commitment, and they need to provide tangible value to users in
order to justify such an investment.
There are at least four areas associated with the water-energy nexus that could benefit from additional
attention to data collection and information management: the uses, characteristics, and ultimate fate of
water used in oil and gas production; the characteristics of deep saline reservoirs suitable for carbon
sequestration; water consumption based on metered data; and energy use in water systems. Coordinated,
more systematic efforts could materially increase the quality of information available to public and
private decision makers at multiple scales.
Characterization of Waters and Water Management Strategies in Oil and Gas Production
While there are efforts underway to compile a national repository of cradle-to-grave data on waters used
in oil and gas production, particularly the rapidly growing unconventional sector (GWPC 2013), up-to-
date online access to aggregate information remains problematic (Box 5.2). Although hard data is
available for some states, and both quality and accessibility have improved in recent years, it still requires
a substantive research project to produce even a coherent national snapshot based on past data (Clark and
Veil 2009). There are a number of areas where better information would offer value, and would require
enhanced cooperation among federal agencies (e.g. USGS, EPA, and DOE), cognizant state entities, and
private stakeholders such as the Groundwater Protection Council (GWPC):
A detailed, frequently updated (at least quarterly) compilation of the volumes, sources, and ultimate
destinations of water used in oil and gas production. The sources and destinations should be
geocoded to allow mapping of transfers between watersheds; for example, the Susquehanna and the
Ohio River basins.
A statistically significant sample of both the volumes and chemical characteristics of waters injected
into and recovered from various basins and plays. It is critical that this dataset be based on actual
measurements, rather than engineering calculations or factor-based estimates. This data should also
include geospatial coordinates in order to allow for regional pattern identification and differentiation.
Detailed information about the prevalence and nature of treatment and management options in use.
Again, the sampling strategy needs to include enough data to characterize variations among and
within plays at a statistically significant level.
Enhanced analysis of permit violations and other release incidents, coded by location and operator.
All of the above would benefit from standardization in data collection and reporting, which suggests a
constructive role for various standards organizations (e.g., Institute of Electrical and Electronics
Engineers [IEEE], American National Standards Institute [ANSI], International Organization for
Standardization [ISO], among others).
Data on the temperature and pressures available at the surface from these waters appears to be sparse.
It is possible that these produced waters contain energy resources that could be put to beneficial use,
but, as discussed in Section 5.4, more investigation is required in order to understand the distribution
of energy recovery potential, and economically feasible deployment opportunities.

The Water-Energy Nexus: Challenges and Opportunities June 2014
125
Improved Understanding of Subsurface Waters
Information on fresh surface waters in the United States is available from USGS. Most states also have a
handle on this data, although substantial work is required to produce a national aggregation. Fresh
groundwater is also fairly well characterized in terms of location and quality, particularly where it is in
active use as a source for municipal, agricultural, or other human uses.
The data available for saline and brackish aquifers is sparser. While NETL has taken some very valuable
steps in characterizing the potential availability of geological formations suitable for carbon sequestration
(NETL 2012a), particularly via its network of regional partnerships (NETL 2003), site-specific analysis is
a necessary precursor to widespread commercial operation of CCS systems. In particular, currently
available information regarding porosity, permeability, the correlation of salinities with depth in particular
plays, and other key factors is only sufficient to support probability-distribution-based modeling at a
macro scale (Klise et al. 2013). Successful implementation of CCS will require enhanced location-
specific characterizations, and additional steps along the path to development of a more comprehensive
nationwide database would provide particular sites with a better starting point for analysis.
Box 5.2. Cradle-to-Grave Water Information in Unconventional Oil and Gas
Active management is required at multiple junctures within the life cycle of water for unconventional oil and gas operations. Effective management requires adequate data, and the current state of the art includes a number of information gaps, particularly in terms of aggregated water data at the basin, regional, and national scales (GAO 2012). There is no cradle-to-grave repository of information about the sources, volumes, quality at all stages, and ultimate disposition of water in fuels production. As a result, the current ―gold standard‖ is a snapshot painstakingly pieced together from myriad sources that relies on estimates in many instances and is based on data prior to the recent explosion in hydraulic fracturing activity (Clark and Veil 2009, 64).
DOE has supported the development of FracFocus, a collaboration between the Groundwater Protection Council and the Interstate Oil and Gas Compact Commission. While participation has been growing dramatically and an increasing number of states now require operators to report data through this vehicle, even FracFocus 2.0 is limited to water injected into wells for purposes of hydraulic fracturing (GWPC and IOGCC 2013). There are no plans to incorporate volumes of flowback and produced waters, nor original water sources, and characterization of water quality is limited to self-reporting.
Various states, notably Pennsylvania and Colorado, stand out as exemplars of data collection and in making the data available to independent researchers (Guerra et al. 2011; Haluszczak et al. 2013). The data situation is likely to improve as more states move toward implementation of specific regulation of unconventional oil and gas operations, and with pending regulations from the Bureau of Land Management (BLM 2012). However, individual state activities will not produce a national aggregation of key water data in the absence of additional intervention.
In summary, the current state of the art of life cycle information about water use in unconventional oil and gas operations is fragmented and incomplete. A comprehensive database as called for by the Shale Gas Committee of the Secretary of Energy Advisory Board (SEAB) in 2011 (SEAB 2011) would significantly improve national and regional understanding of the implications of water use throughout the life cycle of unconventional oil and gas production. Such an undertaking is not a one-time venture. As SEAB notes, it would require ongoing support in order to achieve maximum effectiveness.

June 2014 The Water-Energy Nexus: Challenges and Opportunities
126
Improved characterization of subsurface resources is also important for the beneficial use of
nontraditional waters in applications beyond carbon sequestration. While some work has been done
(Tidwell et al. 2013), additional specificity is needed in order to assess economic viability in specific
locations for particular uses. The USGS is conducting a survey of brackish groundwater resources that
could be of great future value. However, the results of their work are not yet available as this report goes
to press. Presaging Section 5.4.2, a few studies have explored possibilities of using produced water from
CCS for beneficial purposes (Bourcier et al. 2011; Sullivan et al. 2013). However, a much more detailed
characterization of the distribution of temperatures and pressures available from subsurface sources
suitable to power useful work at the surface is necessary in order to inform rigorous viability assessments.
5.4 Energy/Water Systems Integration
Continuing the expansion from the specific technologies explored in previous segments of this chapter,
this section focuses explicitly on opportunities for integrated energy and water systems. Visualizing
energy and water as interconnected systems to be managed as an integrated whole both illuminates
opportunities that might not otherwise be apparent and surfaces hard trade-offs. California and the
intermountain West have been forced to cope with issues of this nature for decades, and the problems are
increasingly applicable in other regions. The notion of potential synergies between power plants,
nontraditional waters, desalination, and wastewater treatment is well established. The challenges lie in
identifying and developing specific economically and environmentally preferable solutions.
The RDD&D opportunities in this area are less about individual innovations than they are about the
integration of technology, data, and policy. For example, meta-questions might include:
Under what conditions are the integration of power production, wastewater treatment, and
desalination economically and environmentally feasible?
To what degree do such conditions obtain in various regions of the United States, and what local
factors need to be included in future evaluations?
What regulatory, policy, and market obstacles hinder formation of a closer relationship between
energy, drinking water, and wastewater utilities?
Where can distributed renewable systems provide reliable power for water conveyance?
Again, these barriers may be highly localized, so targeted case studies may be one appropriate research
method.
Additional opportunities exist in resource mapping to support the integration of energy and water
systems. Examples include, but are not limited to, connecting brackish water resources with potential
energy demand (Tidwell et al. 2013), mapping the siting implications of the combination of insolation and
freshwater availability for algal biofuel production (Wigmosta et al. 2011), and overlaying candidate
formations for CO2 sequestration with existing and potential unconventional oil and gas plays. These
kinds of decision-support systems also connect with the modeling and analysis discussion in Chapter 6
because they frequently require future projections at multiple temporal and spatial scales.
Analysis is not the only option available in this area. Targeted regional workshops could bring together
technologists, policy makers, and analysts/modelers who do not necessarily attend the same conferences.
Standards work could also be of value; for example, interoperability protocols for automated demand
response in wastewater treatment and other applications (Thompson et al. 2010; Kiliccote et al. 2012).
Many of the deployment support options articulated in Section 5.5 could also be relevant. The key
The Water-Energy Nexus: Challenges and Opportunities June 2014
127
question in this section is how best to bring its multiple, diverse capabilities to bear in ways that facilitate
the delivery of synergistic, mission-relevant results.
5.4.1 Use of Nontraditional Waters for Power Plant Applications
NETL has produced a wealth of information on the possibilities of and requirements for using
nontraditional waters in power plant applications, primarily cooling and flue gas desulfurization (FGD)
(Munson et al. 2009). Municipal wastewaters are a particularly attractive option: 81 percent of proposed
power plants could meet cooling water needs with water from publicly owned treatment works (POTWs )
within a 10-mile radius; the number rises to 97 percent with a 25-mile radius (Vidic and Dzom 2009).
Brackish and saline groundwaters are also candidates, as are seawater and produced waters from oil, gas,
coal, and CCS operations. Several such systems are in commercial operation, especially in Florida, and
potential exists for many more with appropriate preventions against corrosion, scaling, and biofouling, the
targets of several of the materials opportunities identified in Section 5.1.1.
5.4.2 Co-Locating Electricity Generation, Desalination, Fuel Production, and Water Treatment/Distribution
Locating energy and water-intensive facilities in conjunction with each other affords a number of
possibilities for the output of one process to serve as the input for another. While there are instances of
these ―industrial ecology‖ approaches in operation, notably in the co-location of desalination with
electricity generation in Tampa and San Diego and PV-powered pumps for irrigation in India, many more
opportunities exist.
Shared Intake/Outflow Structures
All systems that draw and discharge large amounts of water are subject to EPA regulations under the
Clean Water Act. As noted in Section 4.3.4, issues of concern include impingement and entrainment of
marine organisms, as well as the temperature and salinity of discharges. Sharing of intake and outflow
structures among power plants, desalination facilities, and municipal wastewater treatment operations
allows allocation of the capital costs of Clean Water Act 316(b) mitigation measures across multiple
budgets. Further, mixing wastewater and power plant emissions with the reject brines from desalination
can dilute salinities. Finally, adding cooler wastewater and desalination effluents to power plant
discharges can assist in compliance with Clean Water Act 316(a) thermal limits. However, it is important
to note that any such co-location must take into account the possibility that existing once-though cooling
systems may be phased out under Clean Water Act 316(b), as is currently occurring in California
(SWRCB 2010).
Waste Heat Reutilization
Many of the most promising desalination technologies in Section 5.2.1 can utilize waste heat, which
power plants have in abundance. Coupling electricity generation with either desalination or wastewater
treatment can utilize that waste heat productively. For example, in the case of an FO/membrane
distillation combination, a properly scaled desalination operation could meet the vast majority of its
energy needs via unwanted steam from a thermoelectric plant. The same waste heat could supply an
anaerobic digester or thermal hydrolysis unit at a wastewater facility, freeing up the outputs of a CHP
system for other uses. While careful planning, design, and scaling would be required, the potential of
these kinds of synergies merits further investigation. Additionally, productive use of waste heat decreases
power plant cooling requirements.

June 2014 The Water-Energy Nexus: Challenges and Opportunities
128
Beneficial Use of Produced Waters from Carbon Capture and Storage
Sequestration of CO2 in saline aquifers may require the production of substantial quantities of produced
water in order to avoid induced seismicity, improve reservoir storage efficiency, and guide CO2 plumes
(Stauffer et al. 2011). While such waters would likely require treatment prior to utilization in cooling
systems, the volumes available may be sufficient to replace or even exceed the increased water
requirements of carbon capture (Ciferno et al. 2010; Klise et al. 2013). Additionally, the combination of
heat, pressure, and salinity in these waters may present opportunities for energy recovery (Newmark et al.
2010). Where available, the elevated pressure could drive RO processes (Bourcier et al. 2011). Some
reservoirs will be warm enough to power low-temperature geothermal generation, similar to produced
waters from oil and gas (DOE 2013i). In cases where TDS is above that of seawater, the salinity gradient
could provide a source of electricity that might offset some of the treatment costs (Feinberg et al. 2013;
Han et al. 2013; Kim and Elimelech 2013). In short, there are several ways in which produced water from
CCS operations could serve as a resource, but work is required to bring these potential applications to
market.
5.4.3 Energy Storage and Demand Management
Improved Integration of Hydropower and Renewables
Many recent publications have highlighted the advantages of utilizing hydropower and pumped-storage
for grid stability and the integration of other types of renewable energy (Acker 2011). Most existing
hydropower and pumped-storage facilities are also inherently linked to freshwater systems, and must
consider the many other existing uses of these bodies of water. While pumped storage installations
require surface infrastructure to minimize evaporative losses, they are less subject to seasonal variation
and can use nontraditional waters. The growth in deployments of pumped-storage facilities is particularly
apparent in Europe, where more than 10 GW of capacity is expected to come online in the next 8 to 10
years (Fisher et al. 2013).
EIA estimates that more than 22 GW of pumped hydro capacity is in operation in the United States (EIA
2013). FERC lists 16.5 GW of licensed pumped hydro facilities online (FERC 2014b), and another 48
GW of pumped hydro facilities have preliminary permits pending as of August 2013 (FERC 2014a).
DOE is actively engaged in developing new technology and improving tools to increase its ability to
evaluate the contributions of hydropower and pumped storage technologies to the U.S. electric grid.
In recent years, DOE supported an ongoing project to demonstrate the country‘s first advanced, variable-
speed pumped-storage project (in partnership with the Sacramento Municipal Utility District in
California) (DOE 2011a). DOE is working to improve high-resolution computer modeling and
simulation of hydropower and advanced pumped-storage facilities, providing a comprehensive study of
technical and market operations, economics, and value to power system operation (ANL 2012).
Additionally, as part of DOE‘s Office of Electricity Delivery and Energy Reliability Energy Storage
Systems Program, a national storage assessment indicated the economic potential for pumped hydro
storage plants for the entire United States, subdivided into 19 regions (Viswanathan et al. 2013). Finally,
as stipulated in the Hydropower Regulatory Efficiency Act of 2013, DOE will also be responsible for
conducting a study of the technical flexibility of existing U.S. pumped-storage facilities, and the potential
for new or upgraded facilities to support intermittent renewable electric energy generation and provide
grid reliability benefits.

The Water-Energy Nexus: Challenges and Opportunities June 2014
129
Demand Response in Wastewater and Agricultural Irrigation Systems
Demand response, the voluntary reduction of electricity consumption by commercial and industrial
facilities in response to conditions of grid stress, is gaining currency as a grid management strategy, as
well as a revenue source for participants (SCE 2008). WWTPs are large consumers of electricity, and
tend to have large amounts of buffer capacity, making them ideal candidates for participation in demand
response programs (Goli et al. 2011). However, care is required to avoid degradation of effluent quality,
and to incorporate site-specific requirements. Fully automated systems may also offer the possibility of
providing ancillary services such as frequency and voltage regulation (Kiliccote et al. 2012). California
has been a leader in this area; the rest of the country may present a significant opportunity for expansion.
Similar potential may exist in groundwater pumping for irrigation (Marks et al. 2013).
Integration of Electricity Generation with Brackish Water Desalination for Energy Storage
In theory, it might be viable to combine renewables with fossil generation and brackish water desalination
as a form of energy storage. For example, in Texas, surplus wind energy that would otherwise be
curtailed due to transmission and demand limitations could be used to pump brackish groundwater to the
surface for later treatment. Similar possibilities might be available in locations such as the Bakken tight
oil field, where associated natural gas that might otherwise be flared could power the pumping and
treatment of brackish groundwater as a source for further hydraulic fracturing operations (Kurz et al.
2011). The economics of such opportunities would be highly location-specific and depend on a favorable
conjunction of surplus resources and local demand; the requisite capital expenses for desalination
facilities will probably not justify part-time operation in most cases. Nevertheless, there may be
possibilities to reduce waste that merit further investigation.
Nontraditional Hydropower Technologies
There are many new technologies under development that can capture energy and reduce electricity usage
in U.S. water infrastructure, including municipal water supply and irrigation, wastewater treatment
systems, and low-head non-powered dams. DOE has been actively engaged in supporting cost reduction
and demonstration of these new technologies (DOE 2013g). Under the Hydropower Regulatory
Efficiency Act of 2013, DOE will also be responsible for conducting a study on the range of opportunities
for potential energy generation in man-made water conduits and delivering a report to Congress on the
results.
5.5 Technology Deployment, Risk Reduction, and Scale-Up
Within DOE‘s mission, the Energy Policy Act of 2005, Section 979 (42 U.S.C. § 16319) directs the
Secretary to ―carry out a program of research, development, demonstration, and commercial application‖
for both energy for water and water for energy. Prior sections of this chapter have emphasized
technology R&D, data collection and information management, and the potential of integrated water-
energy strategies. This section, however, is about markets and policies—and about what DOE can do to
enable the adoption of beneficial technologies and practices.
Discerning a proper role for DOE in deployment support requires a delicate balance. On one hand, with a
few exceptions, DOE does not generate electricity or provide tap water, nor does it manufacture
technologies at commercial scale. Primary responsibility for providing these vital services lies with the
municipal and private sectors. At the same time, solutions that provide public goods such as renewable
energy and clean water face many barriers to market entry, tangled jurisdictions and divergent policy
incentives among them, so there is a clear role for an RDD&D champion to assist in overcoming such

June 2014 The Water-Energy Nexus: Challenges and Opportunities
130
obstacles (Branscomb and Auerswald 2002; Jaffe et al. 2005; Gallagher et al. 2006; Nemet and Kammen
2007). The distributed nature of the water-energy nexus underscores the need for regionally
differentiated approaches (Glassman et al. 2011).
It is important to recall that different markets have varying characteristics and will require a range of
carefully tuned strategies. Energy and water utilities, for example, are characterized by long investment
cycles subject to various levels of regulation, include both public and private actors, and operate under
stringent performance expectations. This combination often constrains operators‘ willingness to
undertake the risks of investing in new technologies. In some cases, loan guarantees and/or public/private
demonstration projects may make such investments more attractive. Consumer markets are driven more
by price and intangibles, and product life cycles tend to be shorter. Appliance standards may inform
decision-making in these instances. Business applications such as CHP fall somewhere in between; they
might be well served by the publication of economic analyses or workshops offering opportunities to
share best practices and lessons learned.
The combination of regional differences, specific market challenges, and the diversity of the
technological problem space within the water-energy domain suggests a portfolio approach to RDD&D
strategy development. Deployment support merits consideration as part of such a portfolio, given the
strong public goods component of both energy and water services. In fact, how to integrate deployment,
as well as policy and the analysis/modeling approaches articulated in Chapter 6, with the ―traditional‖
technology R&D opportunities outlined in Sections 5.1 and 5.2 is a key challenge for the immediate
future. The portfolio analysis and technology roadmapping activities discussed in Chapter 7 present
opportunities to develop such synergistic strategies; doing so successfully will be a nontrivial
undertaking.
The balance of this section presents more specific programs and activities. The list is by no means
complete; rather, it seeks to provide a starting point for the future interactions sketched in Chapter 7.
5.5.1 Loan Guarantee Programs
DOE‘s loan guarantee authorities are a tangible vehicle available to facilitate deployment of innovative
energy technologies that may have positive water implications. Securing financing for the first project of
its kind is always challenging. Providing loan guarantees to well-vetted, high-risk efforts helps to reduce
risk for subsequent proposals, and thereby facilitates private-sector adoption of technologies that deliver
public benefits.
DOE has used its loan guarantee authority to support several CSP projects in the Southwest, some of
which are utilizing air cooling (DOE 2011c), as well as dry-cooled geothermal projects (DOE 2009). In
December 2013, DOE published a new solicitation making $8 billion in loan guarantee authority
available to support advanced fossil energy technologies, some of which could have positive water
implications (DOE 2013j).
5.5.2 Fostering Standards Development
As noted previously, DOE has statutory authority over many appliance standards and is moving to
incorporate water metrics therein as authorized by law. There are also non-regulatory opportunities; the
ongoing collaborations between DOE and EPA in the ENERGY STAR and Natural Gas STAR programs
are successful examples.

The Water-Energy Nexus: Challenges and Opportunities June 2014
131
There may be additional possibilities, both domestically and internationally. For example, California is
investigating how best to portray regional differences in the embedded energy in water, and how to
deploy such statistics as useful decision-support tools (CPUC 2010). As water stress increases in other
regions, California (and the Middle East, the Western Mediterranean, and Singapore) is likely to be
viewed as a model for adaptive management strategies. While bodies such as the International Standards
Organization have developed a number of related standards, there is still very little activity specific to the
water-energy nexus.
One example of how the development of standards can advance nexus efficiencies involves pumps; DOE
has regulatory authority over pumps, including water pumps. EPRI estimates that delivery and treatment
of drinking water consumes nearly 40 terawatt-hours (TWh) of electricity per year in the United States, or
slightly more than 1 percent of electricity usage (Amarnath et al. 2013). Pumping comprises 90% of the
consumption, so improvements in pumping systems offer a significant opportunity for improvement.
Notably, the EPRI figure does not include conveyance or pumping for irrigation. For example, in 2010,
California used approximately 9 TWh for long-distance water conveyance and approximately 6 TWh for
groundwater pumping for irrigation (CPUC 2010). Although California‘s water geography is unique and
consumption varies both temporally and spatially, the available data strongly suggests that pumping is a
significant consumer of electricity nationwide.
In response to this opportunity, DOE is considering energy conservation standards for industrial pumps
through a negotiated rulemaking process. This could result in significant energy savings through
minimum efficiency standards. While the precise scope of the standards is yet to be finalized, the general
range of pumps for which standards are being considered in the negotiated rulemaking represents up to 70
percent of industrial pump sales by value (DOE 2013f).
5.5.3 Technical Assistance
In addition to its R&D work, a critical function of DOE‘s Advanced Manufacturing Office (AMO) is to
provide technical assistance to existing industrial customers and other large energy users. Other parts of
DOE, such as the Office of Electricity Delivery and Energy Reliability, the Federal Energy Management
Program, and the Weatherization and Intergovernmental Programs Office, offer analogous services. For
its part, AMO delivers this technical assistance through nationally recognized programs.
Industrial Assessment Centers
AMO is partnering with 24 universities nationwide to perform energy audits of manufacturing facilities.
In more than 30 years, the program has performed more than 16,000 assessments identifying an average
of $47,000 in annual savings in each study (DOE 2013h). The Industrial Assessment Centers (IACs)
have recently engaged with EPA in a pilot effort to target energy efficiency in drinking and wastewater
treatment facilities.
Combined Heat and Power Technical Assistance Partnerships (CHP TAPs)
AMO has competitively selected seven regional partnerships to provide stakeholders with the resources
necessary to identify CHP market opportunities and support implementation of cost-effective CHP
systems in industrial, commercial, institutional, and other applications (DOE 2013d). Providing national
coverage, the CHP TAPs perform market opportunity analyses, education/outreach, and technical
assistance activities to support market transformation. Larger wastewater plants routinely incorporate

June 2014 The Water-Energy Nexus: Challenges and Opportunities
132
anaerobic digestion as a key element of the treatment process, but many have not yet incorporated full
CHP systems to maximize potential benefits.
Public-Private Partnership Challenges
In collaboration with other parts of DOE as well as the private and municipal sections, AMO is leading
two challenges of relevance to the water-energy nexus. The first is the Better Buildings Challenge, which
is working with more than 300 private- and public-sector partners to reduce energy use in buildings. It
has secured commitments of more than $2 billion in non-federal financing and recruited more than 2
billion square feet in participation to date (DOE 2013b). The second is the Better Plants Challenge, a
subprogram of the Better Buildings Challenge that explicitly targets energy use in manufacturing (DOE
2013c).
Both of these challenges rely on private-sector partners to make voluntary, yet binding commitments to
quantifiable and verifiable energy efficiency targets. .
5.7 Summary and Conclusion
There are significant opportunities for water-energy solutions in the national interest. While the nature of
the appropriate federal contribution varies by stage of technological development, there are multiple
opportunities to engage constructively. Chapter 6 complements the discussion of technology
development and helps identify and motivate further technology RDD&D. Just as the intervention
strategies available vary by stage of technological development, detailed examination of the intersections
between analysis/modeling and technology RDD&D may generate additional ideas for constructive
collaboration.
There are problem spaces where technological development could help in solving problems relevant to
DOE‘s mission. There are also data collection and information management possibilities, as well as
needs for integrated analysis and modeling to inform future decisions. The question that remains to be
answered is what role is appropriate for the public sector.

The Water-Energy Nexus: Challenges and Opportunities June 2014
133
References
Abideen, Z., R. Ansari, et al. (2011). "Halophytes: Potential source of ligno-cellulosic biomass for ethanol
production." Biomass & Bioenergy 35(5): 1818-1822.
ACE, DOE, et al. (2012). Memorandum of Understanding for Hydropower: Two Year Progress Report.
Washington, DC, U.S. Army Corps of Engineers, Department of Energy, and Department of the Interior:
41.
Acker, T. L. (2011). Hydroelectric Industry's Role in Integration Wind Energy. Montreal, CEATI
International, Inc.: 140.
Ajhar, M., S. Bannwarth, et al. (2012). "Siloxane removal using silicone-rubber membranes." Separation
and Purification Technology 89: 234-244.
Ajhar, M., M. Travesset, et al. (2010). "Siloxane removal from landfill and digester gas - A technology
overview." Bioresource Technology 101(9): 2913-2923.
Akar, N., B. Asar, et al. (2013). "Investigation of characterization and biofouling properties of PES
membrane containing selenium and copper nanoparticles." Journal of Membrane Science 437: 216-226.
Allen, D. T., V. M. Torres, et al. (2013). "Measurements of methane emissions at natural gas production
sites in the United States." Proceedings of the National Academy of Sciences of the United States of
America 110(44): 17768-17773.
Alonso, M., N. Rodriguez, et al. (2010). "Carbon dioxide capture from combustion flue gases with a
calcium oxide chemical loop. Experimental results and process development." International Journal of
Greenhouse Gas Control 4(2): 167-173.
Altela (2013). "Treating Water Naturally." Altela, Inc. Accessed August 21, 2013,
http://www.altelainc.com/.
Alvarez, R. A., S. W. Pacala, et al. (2012). "Greater focus needed on methane leakage from natural gas
infrastructure." Proceedings of the National Academy of Sciences of the United States of America
109(17): 6435-6440.
Amarnath, A., B. Goldstein, et al. (2013). Electricity Use and Management in the Municipal Water
Supply and Wastewater Industries. Palo Alto, CA, Electric Power Research Institute: 194.
Angelino, G. (1968). "Carbon Dioxide Condensation Cycles For Power Production." Journal for
Engineering for Power 90(3): 287-295.
ANL (2012). "Modeling and Analysis of Value of Advanced Pumped Storage Hydropower in the U.S."
Argonne National Laboratory. Accessed September 19, 2013, http://www.dis.anl.gov/psh.
Appels, L., J. Baeyens, et al. (2008). "Siloxane removal from biosolids by peroxidation." Energy
Conversion and Management 49(10): 2859-2864.
Aquilanti, L., F. Clementi, et al. (2013). "A DNA tracer used in column tests for hydrogeology
applications." Environmental Earth Sciences 70(7): 3143-3154.
Aristov, Y. I. (2013). "Challenging offers of material science for adsorption heat transformation: A
review." Applied Thermal Engineering 50(2): 1610-1618.

June 2014 The Water-Energy Nexus: Challenges and Opportunities
134
Atrens, A. D., H. Gurgenci, et al. (2009). "CO2 Thermosiphon for Competitive Geothermal Power
Generation." Energy & Fuels 23(1): 553-557.
Audretsch, D. B. and E. E. Lehmann (2005). "Does the knowledge spillover theory of entrepreneurship
hold for regions?" Research Policy 34(8): 1191-1202.
Averyt, K., J. Macknick, et al. (2013). "Water use for electricity in the United States: an analysis of
reported and calculated water use information for 2008." Environmental Research Letters 8(1).
Biswas, K., J. Q. He, et al. (2012). "High-performance bulk thermoelectrics with all-scale hierarchical
architectures." Nature 489(7416): 414-418.
Blamey, J., E. J. Anthony, et al. (2010). "The calcium looping cycle for large-scale CO2 capture."
Progress in Energy and Combustion Science 36(2): 260-279.
Blamey, J., N. P. M. Paterson, et al. (2011). "Reactivation of a CaO-based sorbent for CO2 capture from
stationary sources." Proceedings of the Combustion Institute 33: 2673-2681.
BLM (2012). "Oil and Gas; Well Stimulation, Including Hydraulic Fracturing, on Federal and Indian
Lands." Federal Register 77(92): 27691-27711.
Boot-Handford, M. E., J. C. Abanades, et al. (2014). "Carbon capture and storage update." Energy &
Environmental Science 7(1): 130-189.
Borole, A. P. (2011). "Improving energy efficiency and enabling water recycling in biorefineries using
bioelectrochemical systems." Biofuels Bioproducts & Biorefining-Biofpr 5(1): 28-36.
Borole, A. P., C. Y. Hamilton, et al. (2013). "Conversion of Residual Organics in Corn Stover-Derived
Biorefinery Stream to Bioenergy via a Microbial Fuel Cell." Environmental Science & Technology 47(1):
642-648.
Borole, A. P. and J. R. Mielenz (2011). "Estimating hydrogen production potential in biorefineries using
microbial electrolysis cell technology." International Journal of Hydrogen Energy 36(22): 14787-14795.
Borole, A. P. and C. Tsouris (2010). Treatment of Produced Water Using Microbial Fuel Cells. American
Institute of Chemical Engineers (AiChE) Annual Meeting, Salt Lake City, UT, November 8-10. AiChE.
Bourcier, W. L., T. J. Wolery, et al. (2011). "A preliminary cost and engineering estimate for desalinating
produced formation water associated with carbon dioxide capture and storage." International Journal of
Greenhouse Gas Control 5(5): 1319-1328.
Branscomb, L. M. and P. E. Auerswald (2002). Between Invention and Innovation: An Analysis of
Funding for Early-Stage Technology Development. Gaithersburg, MD, National Institute of Standards
and Technology.
Brennan, L. and P. Owende (2010). "Biofuels from microalgae-A review of technologies for production,
processing, and extractions of biofuels and co-products." Renewable & Sustainable Energy Reviews
14(2): 557-577.
Brown, E. and R. N. Elliot (2005). Potential Energy Savings in the Agricultural Sector. Washington, DC,
American Council for an Energy-Efficient Economy: 24.
Burnham, A., J. Han, et al. (2012). "Life-Cycle Greenhouse Gas Emissions of Shale Gas, Natural Gas,
Coal, and Petroleum." Environmental Science & Technology 46(2): 619-627.

The Water-Energy Nexus: Challenges and Opportunities June 2014
135
Carney, B. (2011). Institutional Impediments to Using Alternative Water Sources in Thermoelectric
Power Plants. Morgantown, WV, National Energy Technology Laboratory.
Carter, N. T. (2013). Desalination and Membrane Technologies: Federal Research and Adoption Issues
Washington, DC, Congressional Research Service: 18.
CEC (2002). Santa Rosa Geysers Recharge Project: Final Report. Sacramento, CA, California Energy
Commission: 61.
Chung, T. S., S. Zhang, et al. (2012). "Forward osmosis processes: Yesterday, today and tomorrow."
Desalination 287: 78-81.
Ciferno, J., S. Plasynski, et al. (2010). DOE/NETL Advanced Carbon Dioxide Capture Program:
Technology Update. Washington, DC, National Energy Technology Laboratory: 350.
Clark, C. E., C. B. Harto, et al. (2013). Life Cycle Water Consumption and Water Resource Assessment
for Utility-Scale Geothermal Systems: An In-depth Analysis of Historical and Forthcoming EGS Projects.
Argonne, IL, Argonne National Laboratory: 148.
Clark, C. E. and J. A. Veil (2009). Produced Water Volumes and Management Practices in the United
States. Argonne, IL, Argonne National Laboratory: 64.
Cooley, H. and K. Donnelly (2012). Hydraulic Fracturing and Water Resources: Separating the Frack
from the Fiction. Oakland, CA, Pacific Institute: 35.
CPUC (2010). Statewide and Regional Water-Energy Relationship. Embedded Energy in Water Studies.
Sacramento, CA, California Public Utilities Commission: 155.
Crane, D. (2013). "Thermoelectric Waste Heat Recovery Program for Passenger Vehicles." U.S.
Department of Energy, Office of Energy Efficiency and Renewable Energy. Accessed December 9, 2013,
http://www4.eere.energy.gov/vehiclesandfuels/resources/merit-
review/sites/default/files/ace080_crane_2013_o.pdf.
Crawford, M. H., M. A. Banas, et al. (2005). Final LDRD Report: Ultraviolet Water Purification Systems
for Rural Environments and Mobile Applications. Albuquerque, New Mexico, Sandia National
Laboratories: 37.
Creusen, R., J. van Medevoort, et al. (2013). "Integrated membrane distillation-crystallization: Process
design and cost estimations for seawater treatment and fluxes of single salt solutions." Desalination 323:
8-16.
Cumming, D. and N. Dai (2010). "Local bias in venture capital investments." Journal of Empirical
Finance 17(3): 362-380.
D'Alessandro, D. M., B. Smit, et al. (2010). "Carbon Dioxide Capture: Prospects for New Materials."
Angewandte Chemie-International Edition 49(35): 6058-6082.
Daw, J., K. Hallet, et al. (2012). Energy Efficiency Strategies for Municipal Wastewater Treatment
Facilities Golden, CO, National Renewable Energy Laboratory: 25.
Demirer, O. N., R. M. Naylor, et al. (2013). "Energetic performance optimization of a capacitive
deionization system operating with transient cycles and brackish water." Desalination 314(0): 130-138.

June 2014 The Water-Energy Nexus: Challenges and Opportunities
136
Dewil, R., L. Appels, et al. (2006). "Energy use of biogas hampered by the presence of siloxanes." Energy
Conversion and Management 47(13-14): 1711-1722.
Długołęcki, P. and A. van der Wal (2013). "Energy Recovery in Membrane Capacitive Deionization."
Environmental Science & Technology 47(9): 4904-4910.
DOE (2009). Environmental Assessment for Department of Energy Loan Guarantee for U.S.
Geothermal‘s Neal Hot Springs Geothermal Facility in Vale, Oregon. Washington, DC, U.S. Department
of Energy, Loan Guarantee Office: 69.
DOE (2011a). 2011 Water Power Technologies Peer Review Report. Washington, DC, U.S. Department
of Energy, Office of Energy Efficiency and Renewable Energy: 322.
DOE (2011b). Critical Materials Strategy. Washington, DC, U.S. Department of Energy: 196.
DOE (2011c). "Department of Energy Offers $2 Billion in Conditional Loan Guarantee Commitments for
Two California Concentrating Solar Power Plants." U.S. Department of Energy, Loan Guarantee Office.
Accessed February 20, 2014, http://energy.gov/articles/department-energy-offers-2-billion-conditional-
loan-guarantee-commitments-two-california.
DOE (2011d). "Energy Department Applauds World‘s First Fuel Cell and Hydrogen Energy Station in
Orange County." U.S. Department of Energy, Office of Energy Efficiency and Renewable Energy.
Accessed December 22, 2013, http://energy.gov/articles/energy-department-applauds-world-s-first-fuel-
cell-and-hydrogen-energy-station-orange.
DOE (2013a). Advanced, Energy-Efficient Hybrid Membrane System for Industrial Water Reuse.
Washington, DC, U.S. Department of Energy, Office of Energy Efficiency and Renewable Energy: 2.
DOE (2013b). "Better Buildings Challenge." U.S. Department of Energy, Office of Energy Efficiency
and Renewable Energy. Accessed December 27, 2013, http://www4.eere.energy.gov/challenge/.
DOE (2013c). "Better Plants Challenge." U.S. Department of Energy, Office of Energy Efficiency and
Renewable Energy. Accessed December 27, 2013,
http://www1.eere.energy.gov/manufacturing/tech_assistance/betterplants/.
DOE (2013d). "Clean Energy Application Centers" U.S. Department of Energy, Office of Energy
Efficiency and Renewable Energy. Accessed September 25, 2013,
http://www1.eere.energy.gov/manufacturing/distributedenergy/ceacs.html.
DOE (2013e). Department of Energy: FY 2014 Congressional Budget Request. Washington, DC, U.S.
Department of Energy, Office of Chief Financial Officer: 633.
DOE (2013f). Energy Conservation Standards Rulemaking Framework Document for Commercial and
Industrial Pumps. Washington, DC, Department of Energy: 134.
DOE (2013g). Hydropower Projects: Fiscal Years 2008 - 2012. Washington, DC, Department of Energy:
16.
DOE (2013h). "Industrial Assessment Centers." U.S. Department of Energy, Office of Energy Efficiency
and Renewable Energy. Accessed September 25, 2013,
https://www1.eere.energy.gov/manufacturing/tech_assistance/iacs.html.

The Water-Energy Nexus: Challenges and Opportunities June 2014
137
DOE (2013i). "Low-Temperature and Co-produced Geothermal Resources." U.S. Department of Energy,
Office of Energy Efficiency and Renewable Energy. Accessed January 16, 2014,
http://www1.eere.energy.gov/geothermal/low_temperature_resources.html.
DOE (2013j). "Notice of availability of and request for comments regarding Draft Solicitation for
Advanced Fossil Energy Projects. ." Federal Register 78(131): 41046-41047.
DOE (2013k). "Solar Incubator Program." U.S. Department of Energy, Office of Energy Efficiency and
Renewable Energy. Accessed January 20, 2014,
http://www1.eere.energy.gov/solar/sunshot/incubator.html.
DOE (2013l). WASTE: Waste Applications for Sustainable Technologies for Energy (RFI). Golden, CO,
U.S. Department of Energy, Office of Energy Efficiency and Renewable Energy: 7.
Drewes, J. E. (2009). An Integrated Framework for Treatment and Management of Produced Water.
Golden, CO, Colorado School of Mines: 158.
Dumee, L., J. Lee, et al. (2013). "Fabrication of thin film composite poly(amide)-carbon-nanotube
supported membranes for enhanced performance in osmotically driven desalination systems." Journal of
Membrane Science 427: 422-430.
EIA (2013). "Pumped storage provides grid reliability even with net generation loss." U.S. Energy
Information Administration. Accessed February 19, 2014,
http://www.eia.gov/todayinenergy/detail.cfm?id=11991.
EPRI (1999). Enhanced Oil Recovery Scoping Study. Palo Alto, CA, Electric Power Research Institute:
148.
EPRI (2008). Engineering and Economic Evaluation of 1300°F Series Ultra-Supercritical Pulverized Coal
Power Plants: Phase 1. Palo Alto, CA, Electric Power Research Institute: 196.
EPRI (2013). Modified Brayton Cycle for use in Coal-Fired Power Plants. Palo Alto, CA, Electric Power
Research Institute: 66.
Feher, E. G. (1968). Investigation of Supercritical (Feher) Cycle. Dayton, OH, USAG: 152.
Feinberg, B. J., G. Z. Ramon, et al. (2013). "Thermodynamic Analysis of Osmotic Energy Recovery at a
Reverse Osmosis Desalination Plant." Environmental Science & Technology 47(6): 2982-2989.
FERC (2014a). "Issued Preliminary Permits for Pumped Storage Projects." Federal Energy Regulatory
Commission. Accessed February 19, 2014, http://www.ferc.gov/industries/hydropower/gen-
info/licensing/pump-storage/issued-permits.pdf.
FERC (2014b). "Licensed Pumped Storage Projects." Federal Energy Regulatory Commission. Accessed
February 19, 2014, http://www.ferc.gov/industries/hydropower/gen-info/licensing/pump-storage/licensed-
projects.pdf
Fernandez, C. A. (2013). "Reservoir Stimulation Optimization with Operational Monitoring for Creation
of Enhanced Geothermal Systems." U.S. Department of Energy, Office of Energy Efficiency and
Renewable Energy. Accessed January 13, 2014,
http://www1.eere.energy.gov/geothermal/pdfs/reservoir_optimization_geo_sys_peer2013.pdf.

June 2014 The Water-Energy Nexus: Challenges and Opportunities
138
Ferrary, M. and M. Granovetter (2009). "The role of venture capital firms in Silicon Valley's complex
innovation network." Economy and Society 38(2): 326-359.
Fisher, R. K., J. Koutnik, et al. (2013). "What Drives Pumped Storage Development in Europe and the
USA?" Hydro Review Worldwide 21(3).
Foppen, J. W., C. Orup, et al. (2011). "Using multiple artificial DNA tracers in hydrology." Hydrological
Processes 25(19): 3101-3106.
Foxon, T. J. (2010). "Stimulating investment in energy materials and technologies to combat climate
change: an overview of learning curve analysis and niche market support." Philosophical Transactions of
the Royal Society a-Mathematical Physical and Engineering Sciences 368(1923): 3469-3483.
Frank, E. D., J. L. Sullivan, et al. (2012). "Life cycle analysis of geothermal power generation with
supercritical carbon dioxide." Environmental Research Letters 7(3).
Frijns, J., J. Hofman, et al. (2013). "The potential of (waste)water as energy carrier." Energy Conversion
and Management 65: 357-363.
Gallagher, K. S., J. P. Holdren, et al. (2006). Energy-technology innovation. Annual Review of
Environment and Resources. 31: 193-237.
GAO (2009). Energy-Water Nexus: Improvements to Federal Water Use Data Would Increase
Understanding of Trends in Power Plant Water Use Washington, DC, Government Accountability Office:
78.
GAO (2012). Energy-Water Nexus: Information on the Quantity, Quality, and Management of Water
Produced during Oil and Gas Production. Washington, DC, Government Accountability Office: 56.
Glassman, D., M. Wucker, et al. (2011). The Water-Energy Nexus: Adding Water to the Energy Agenda.
New York, NY, World Policy Institute: 35.
Gneissl, M., T. Kolbe, et al. (2010). Report within WP2.5: Compact Units for Decentralised Water
Supply. Nieuwegein, the Netherlands, Techneau: 36.
Goli, S., D. Olsen, et al. (2011). 2008-2010 Research Summary: Analysis of Demand Response
Opportunities in California Industry. Berkeley, CA, Lawrence Berkeley National Laboratory: 52.
Guerra, K. L., K. G. Dahm, et al. (2011). Oil and Gas Produced Water Management and Beneficial Use in
the Western United States. Denver, CO, U.S. Bureau of Reclamation: 129.
GWPC (2013). "Frac Focus: Chemical Disclosure Registry." Ground Water Protection Council.
Accessed August 25, 2013, http://fracfocus.org/.
GWPC and IOGCC (2013). "FracFocus 2.0." Groundwater Protection Council, Interstate Oil and Gas
Compact Commission. Accessed September 19, 2013, http://fracfocus.org/.
Haluszczak, L. O., A. W. Rose, et al. (2013). "Geochemical evaluation of flowback brine from Marcellus
gas wells in Pennsylvania, USA." Applied Geochemistry 28(0): 55-61.
Hammack, R. W. and G. A. Veloski (2006). "Helicopter surveys for locating wells and oilfield
infrastructure " University of Tulsa. Accessed December 17, 2013,
http://ipec.utulsa.edu/Conf2006/Papers/Hammack_7.pdf.

The Water-Energy Nexus: Challenges and Opportunities June 2014
139
Han, G., S. Zhang, et al. (2013). "High performance thin film composite pressure retarded osmosis (PRO)
membranes for renewable salinity-gradient energy generation." Journal of Membrane Science 440: 108-
121.
Hayes, T. and B. F. Severin (2012). Barnett and Appalachian Shale Water Management and Reuse
Technologies. Des Plaines, IL, Gas Technology Institute: 165.
Hedin, N., L. Andersson, et al. (2013). "Adsorbents for the post-combustion capture of CO2 using rapid
temperature swing or vacuum swing adsorption." Applied Energy 104: 418-433.
Hofman-Caris, C. H. M., D. J. H. Harmsen, et al. (2010). Degradation of priority compounds by UV and
UV oxidation. Nieuwegein, The Netherlands, Techneau: 46.
Howarth, R. W., R. Santoro, et al. (2011). "Methane and the greenhouse-gas footprint of natural gas from
shale formations." Climatic Change 106(4): 679-690.
IEA (2012). World Energy Outlook 2012. Paris, International Energy Agency: 548.
Ishida, T., K. Aoyagi, et al. (2012). "Acoustic emission monitoring of hydraulic fracturing laboratory
experiment with supercritical and liquid CO2." Geophysical Research Letters 39.
Jaffe, A. B., R. G. Newell, et al. (2005). "A tale of two market failures: Technology and environmental
policy." Ecological Economics 54(2-3): 164-174.
Jansen, A. E., J. W. Assink, et al. (2013). "Development and pilot testing of full-scale membrane
distillation modules for deployment of waste heat." Desalination 323: 55-65.
Jenkins, J., D. Swezey, et al. (2011). "Solyndra's Failure Is No Reason To Abandon Federal Energy
Innovation Policy." Forbes. Accessed December 27, 2013,
http://www.forbes.com/sites/energysource/2011/09/02/solyndras-failure-is-no-reason-to-abandon-federal-
energy-innovation-policy/.
Jin, X., Q. H. She, et al. (2012). "Removal of boron and arsenic by forward osmosis membrane: Influence
of membrane orientation and organic fouling." Journal of Membrane Science 389: 182-187.
Joss, A., N. Derlon, et al. (2011). "Combined Nitritation-Anammox: Advances in Understanding Process
Stability." Environmental Science & Technology 45(22): 9735-9742.
Kartal, B., J. G. Kuenen, et al. (2010). "Sewage Treatment with Anammox." Science 328(5979): 702-703.
Kartal, B., W. J. Maalcke, et al. (2011). "Molecular mechanism of anaerobic ammonium oxidation."
Nature 479(7371): 127-U159.
Keairns, D., R. Newby, et al. (2012). Current and Future Technologies for Power Generation with Post-
Combustion Carbon Capture. Morgantown, WV, National Energy Technology Laboratory: 229.
Kenny, J. F., N. L. Barber, et al. (2009). Estimated Use of Water in the United States in 2005. Reston,
VA, U.S. Geological Survey.
Kiliccote, S., P. Price, et al. (2012). Field Testing of Automated Demand Response for Integration of
Renewable Resources in California‘s Ancillary Services Market for Regulation Products. Berkeley, CA,
Lawrence Berkeley National Laboratory: 39.

June 2014 The Water-Energy Nexus: Challenges and Opportunities
140
Kim, C., S. Lee, et al. (2012a). "Boron transport in forward osmosis: Measurements, mechanisms, and
comparison with reverse osmosis." Journal of Membrane Science 419: 42-48.
Kim, S., H. Chung, et al. (2013). "The study of heat transfer for nanofluid with carbon nano particle in an
exhaust gas recirculation (EGR) cooler." Heat and Mass Transfer 49(7): 1051-1055.
Kim, Y. C. and M. Elimelech (2013). "Potential of osmotic power generation by pressure retarded
osmosis using seawater as feed solution: Analysis and experiments." Journal of Membrane Science 429:
330-337.
Kim, Y. M., C. G. Kim, et al. (2012b). "Transcritical or supercritical CO2 cycles using both low- and
high-temperature heat sources." Energy 43(1): 402-415.
Klein, G. (2005). California's Water – Energy Relationship. Sacramento, CA, California Energy
Commission: 180.
Klise, G. T., J. D. Roach, et al. (2013). "The cost of meeting increased cooling-water demands for CO2
capture and storage utilizing non-traditional waters from geologic saline formations." Hydrogeology
Journal 21(3): 587-604.
Kumar, A., S. Ergas, et al. (2010). "Enhanced CO2 fixation and biofuel production via microalgae: recent
developments and future directions." Trends in Biotechnology 28(7): 371-380.
Kurz, B. A., D. J. Stepan, et al. (2011). Evaluation of Brackish Groundwater Treatment for use in
Hydraulic Fracturing of the Bakken Play, North Dakota. Bakken Water Opportunities Assessment. Grand
Forks, ND, University of North Dakota: 62.
Larson, E. D. (2013). Natural Gas & Climate Change. Princeton, NJ, Climate Central: 50.
Laurenzi, I. J. and G. R. Jersey (2013). "Life Cycle Greenhouse Gas Emissions and Freshwater
Consumption of Marcellus Shale Gas." Environmental Science & Technology 47(9): 4896-4903.
Lawson, R. L., J. R. Lyman, et al. (2012). Impact of Municipal, Industrial, and Commercial Water Needs
on the Energy Water Nexus: Challenges, Solutions, and Recommendations. Washington, DC, Atlantic
Council: 40.
Le Moullec, Y. (2013). "Conceptual study of a high efficiency coal-fired power plant with CO2 capture
using a supercritical CO2 Brayton cycle." Energy 49: 32-46.
Li, D., X. Y. Zhang, et al. (2013). "Forward osmosis desalination using polymer hydrogels as a draw
agent: Influence of draw agent, feed solution and membrane on process performance." Water Research
47(1): 209-215.
Li, H., S. H. Chien, et al. (2011). "Escalating Water Demand for Energy Production and the Potential for
Use of Treated Municipal Wastewater." Environmental Science & Technology 45(10): 4195-4200.
Liao, Y., R. Wang, et al. (2013). "Fabrication of polyvinylidene fluoride (PVDF) nanofiber membranes
by electro-spinning for direct contact membrane distillation." Journal of Membrane Science 425: 30-39.
Lin, H. J., W. Peng, et al. (2013). "A review on anaerobic membrane bioreactors: Applications,
membrane fouling and future perspectives." Desalination 314: 169-188.

The Water-Energy Nexus: Challenges and Opportunities June 2014
141
Liu, Y. L. and B. X. Mi (2012). "Combined fouling of forward osmosis membranes: Synergistic foulant
interaction and direct observation of fouling layer formation." Journal of Membrane Science 407: 136-
144.
Ma, Z. and C. Turchi (2011). "Advanced Supercritical Carbon Dioxide Power Cycle Configurations for
Use in Concentrating Solar Power Systems." National Renewable Energy Laboratory. Accessed August
28, 2013, http://www.nrel.gov/docs/fy11osti/50787.pdf.
Marks, G., E. Wilcox, et al. (2013). Opportunities for Demand Response in California Agricultural
Irrigation: A Scoping Study. Berkeley, CA, Lawrence Berkeley National Laboratory: 82.
Matulka, R. (2012). "Sandia Cooler Blows Traditional CPU Coolers Away." U.S. Department of Energy,
Office of Energy Efficiency and Renewable Energy. Accessed January 13, 2014,
http://energy.gov/articles/sandia-cooler-blows-traditional-cpu-coolers-away.
McCarty, P. L., J. Bae, et al. (2011). "Domestic Wastewater Treatment as a Net Energy Producer-Can
This be Achieved?" Environmental Science & Technology 45(17): 7100-7106.
McGrail, B. P., P. K. Thallapally, et al. (2013). "Metal-organic heat carrier nanofluids." Nano Energy
2(5): 845-855.
Menger-Krug, E., J. Niederste-Hollenberg, et al. (2012). "Integration of Microalgae Systems at Municipal
Wastewater Treatment Plants: Implications for Energy and Emission Balances." Environmental Science
& Technology 46(21): 11505-11514.
Mishra, G. S., W. E. Glassley, et al. (2011). "Realizing the geothermal electricity potential-water use and
consequences." Environmental Research Letters 6(3).
Mossad, M. and L. D. Zou (2012). "A study of the capacitive deionisation performance under various
operational conditions." Journal of Hazardous Materials 213: 491-497.
Mueller, S. and J. Kwik (2013). 2012 Corn Ethanol: Emerging Plant Energy and Environmental
Technologies. Chicago, Il, University of Illinois, Chicago: 31.
Munson, R., J. Murphy, et al. (2009). Use of Non-Traditional Water for Power Plant Applications: An
Overview of DOE/NETL R&D Efforts. Pittsburgh, PA, National Energy Technology Laboratory: 98.
NASA (2013, November 18, 2013). "Announcement of CubeSat Launch Initiative." National
Aeronautics and Space Administration. Accessed December 17, 2013,
http://www.nasa.gov/sites/default/files/files/20130812-CLSI-Announcement-of-Opportunity.pdf.
NDMC (2013). "Groundwater and Soil Moisture Conditions from GRACE Data Assimilation." National
Drought Monitoring Center. Accessed December 17, 2013,
http://drought.unl.edu/MonitoringTools/NASAGRACEDataAssimilation.aspx.
Nemet, G. F. and D. M. Kammen (2007). "US energy research and development: Declining investment,
increasing need, and the feasibility of expansion." Energy Policy 35(1): 746-755.
NETL (2001). Evaluate & Demonstrate Broad Applications for Thermoelectric Devicdes for DOE's
Office of Industrial Technologies. Morgantown, WV, National Energy Technology Laboratory: 118.

June 2014 The Water-Energy Nexus: Challenges and Opportunities
142
NETL (2003). "Carbon Storage: Regional Carbon Sequestration Partnerships." National Energy
Technology Laboratory. Accessed September 1, 2013,
http://www.netl.doe.gov/technologies/carbon_seq/infrastructure/rcsp.html.
NETL (2010). DOE/NETL Carbon Dioxide Capture and Storage RD&D Roadmap. Morgantown, WV,
National Energy Technology Laboratory: 78.
NETL (2011). "An Integrated Water Treatment Technology Solution for Sustainable Water Resource
Management in the Marcellus Shale." National Energy Technology Laboratory. Accessed August 21,
2013, http://www.netl.doe.gov/technologies/oil-
gas/Petroleum/projects/Environmental/Produced_Water/00833_MarcellusWater.html.
NETL (2012a). "National Carbon Sequestration Database and Geographic Information System
(NATCARB)." National Energy Technology Laboratory. Accessed September 1, 2013,
http://www.netl.doe.gov/technologies/carbon_seq/natcarb/index.html.
NETL (2012b). "Power Plant Water Management: Improvement to Air2Air® Technology to Reduce
Freshwater Evaporative Cooling Loss." National Energy Technology Laboratory. Accessed January 13,
2014, http://www.netl.doe.gov/technologies/coalpower/ewr/water/pp-mgmt/air2air.html.
NETL (2013a). DOE/NETL Advanced Carbon Dioxide Capture R&D Program: Technology Update.
Morgantown, WV, National Energy Technology Laboratory: 719.
NETL (2013b). Office of Fossil Energy, Solid Oxide Fuel Cells Program: 2013 Project Portfolio.
Pittsburgh, PA, National Energy Technology Laboratory: 114.
Newmark, R. L., S. J. Friedmann, et al. (2010). "Water Challenges for Geologic Carbon Capture and
Sequestration." Environmental Management 45(4): 651-661.
Neyens, E. and J. Baeyens (2003). "A review of thermal sludge pre-treatment processes to improve
dewaterability." Journal of Hazardous Materials 98(1-3): 51-67.
NRC (2008). Desalination: A National Perspective. Washington, DC, National Research Council: 255.
O'Dea, J. R., N. J. Economou, et al. (2013). "Surface Morphology of Nafion at Hydrated and Dehydrated
Conditions." Macromolecules 46(6): 2267-2274.
Osborn, S. G., A. Vengosh, et al. (2011). "Methane contamination of drinking water accompanying gas-
well drilling and hydraulic fracturing." Proceedings of the National Academy of Sciences of the United
States of America 108(20): 8172-8176.
Papadias, D. D., S. Ahmed, et al. (2011). Fuel Quality Issues in Stationary Fuel Cell Systems. Argonne,
IL, Argonne National Laboratory: 40.
Pham, T. H., K. Rabaey, et al. (2006). "Microbial fuel cells in relation to conventional anaerobic digestion
technology." Engineering in Life Sciences 6(3): 285-292.
Phillips, J. (2011). U.S. Program for Advanced Ultrasupercritical (A-USC) Coal Fired Power Plants. Palo
Alto, CA, Electric Power Research Institute: 13.
Phuntsho, S., S. Vigneswaran, et al. (2012). "Influence of temperature and temperature difference in the
performance of forward osmosis desalination process." Journal of Membrane Science 415: 734-744.

The Water-Energy Nexus: Challenges and Opportunities June 2014
143
Picarro (2013). "Scientific Instruments." Picarro, Inc. Accessed August 19, 2013,
http://www.picarro.com/products_solutions/scientific_instruments.
Privalova, E. I., E. Karjalainen, et al. (2013). "Imidazolium-Based Poly(ionic liquid)s as New Alternatives
for CO2 Capture." Chemsuschem 6(8): 1500-1509.
Pruess, K. (2006). "Enhanced geothermal systems (EGS) usingCO(2) as working fluid - A novel approach
for generating renewable energy with simultaneous sequestration of carbon." Geothermics 35(4): 351-
367.
Qi, S. R., W. Y. Li, et al. (2012). "Influence of the properties of layer-by-layer active layers on forward
osmosis performance." Journal of Membrane Science 423: 536-542.
Randolph, J. B. and M. O. Saar (2011). "Combining geothermal energy capture with geologic carbon
dioxide sequestration." Geophysical Research Letters 38.
Razzak, S. A., M. M. Hossain, et al. (2013). "Integrated CO2 capture, wastewater treatment and biofuel
production by microalgae culturing-A review." Renewable & Sustainable Energy Reviews 27: 622-653.
Redden, G., M. Stone, et al. (2010). Tracers for Characterizing Enhanced Geothermal Systems. Thirty-
Fifth Workshop on Geothermal Reservoir Engineering, Stanford, CA, February 1-3. Stanford University.
Robb, D. (2012). "CO2 Turbines Could Boost Simple Cycle Efficiency Beyond 50% and Reduce
Turbomachinery Footprint by 100 Times." Turbomachinery International 53(5): 22-28.
Romanos, G. E., L. F. Zubeir, et al. (2013). "Enhanced CO2 Capture in Binary Mixtures of 1-Alkyl-3-
methylimidazolium Tricyanomethanide Ionic Liquids with Water." Journal of Physical Chemistry B
117(40): 12234-12251.
Rose, P., D. Riasetto, et al. (2011). Quantum Dots as Tracers in Geothermal and EGS Reservoirs. Thirty-
Sixth Workshop on Geothermal Reservoir Engineering, Stanford, CA, January 31 - February 2. Stanford
University.
Rubin, E. S., H. Mantripragada, et al. (2012). "The outlook for improved carbon capture technology."
Progress in Energy and Combustion Science 38(5): 630-671.
Safari, I., M. E. Walker, et al. (2013). "Utilization of municipal wastewater for cooling in thermoelectric
power plants." Fuel 111: 103-113.
Sanders, K. T. and M. E. Webber (2012). "Evaluating the energy consumed for water use in the United
States." Environmental Research Letters 7(3).
Sarkar, J. (2009). "Second law analysis of supercritical CO2 recompression Brayton cycle." Energy 34(9):
1172-1178.
SCE (2008). Demand Response Feasibility Study for the Sewage Treatment Industry. Rosemead, CA,
SCE: 59.
SEAB (2011). Shale Gas Subcommittee Second Ninety-Day Report. Washington, DC, DOE: 23.
Silaen, A., B. Wu, et al. (2013). Numerical Model of Thermoelectric Topping Cycle of Coal-fired Power
Plant. American Society of Mechanical Engineers 2013 4th Micro/Nanoscale Heat & Mass Transfer
International Conference. Hong Kong, China, ASME: 6.

June 2014 The Water-Energy Nexus: Challenges and Opportunities
144
Singh, R., S. A. Miller, et al. (2013). "Dynamic characteristics of a direct-heated supercritical carbon-
dioxide Brayton cycle in a solar thermal power plant." Energy 50(0): 194-204.
Smith, A. L., L. B. Stadler, et al. (2012). "Perspectives on anaerobic membrane bioreactor treatment of
domestic wastewater: A critical review." Bioresource Technology 122: 149-159.
Stanford (2013). "Water and Energy Nexus: A Literature Review." Stanford University. Accessed
January 7, 2014, http://waterinthewest.stanford.edu/sites/default/files/Water-Energy_Lit_Review.pdf.
Stauffer, P. H., G. N. Keating, et al. (2011). "Greening Coal: Breakthroughs and Challenges in Carbon
Capture and Storage." Environmental Science & Technology 45(20): 8597-8604.
Stokes, J. R. and A. Horvath (2009). "Energy and Air Emission Effects of Water Supply." Environmental
Science & Technology 43(8): 2680-2687.
Sullivan, E. J., S. Chu, et al. (2013). "A method and cost model for treatment of water extracted during
geologic CO2 storage." International Journal of Greenhouse Gas Control 12: 372-381.
SWRCB (2010). "Ocean Standards - CWA §316(b) Regulation." California Environmental Protection
Agency. Accessed September 22, 2013,
http://www.waterboards.ca.gov/water_issues/programs/ocean/cwa316/policy.shtml.
Thompson, L., A. Lekov, et al. (2010). Opportunities for Open Automated Demand Response in
Wastewater Treatment Facilities in California – Phase II Report: San Luis Rey Wastewater Treatment
Plant Case Study. Berkeley, CA, Lawrence Berkeley National Laboratory: 77.
Tidwell, V., L. A. Malczynski, et al. (2013). "Potential Impacts of Electric Power Production Utilizing
Natural Gas, Renewables and Carbon Capture and Sequestration on U.S. Freshwater Resources."
Environmental Science & Technology.
Tokman, M., J. H. Lee, et al. (2013). "Electric Field-Driven Water Dipoles: Nanoscale Architecture of
Electroporation." Plos One 8(4).
Torabi, F., A. Q. Firouz, et al. (2012). "Comparative evaluation of immiscible, near miscible and miscible
CO2 huff-n-puff to enhance oil recovery from a single matrix-fracture system (experimental and
simulation studies)." Fuel 93(1): 443-453.
Tritt, T. M. (2011). Thermoelectric Phenomena, Materials, and Applications. Annual Review of Materials
Research, Vol 41. D. R. Clarke and P. Fratzl. 41: 433-448.
Turchi, C. (2013). "10 MW Supercritical CO2 Turbine." National Renewal Energy Laboratory. Accessed
August 28, 2013,
http://www1.eere.energy.gov/solar/sunshot/pdfs/progress_report_sunshot_nrel_sco2_fy13_q2.pdf.
Venteris, E. R., R. L. Skaggs, et al. (2013). "A GIS Cost Model to Assess the Availability of Freshwater,
Seawater, and Saline Groundwater for Algal Biofuel Production in the United States." Environmental
Science & Technology 47(9): 4840-4849.
Vidic, R. D. and D. A. Dzom (2009). Reuse of Treated Internal or External Wastewaters in the Cooling
Systems of Coal Based Thermoelectric Power Plants. Pittsburgh, PA, National Energy Technology
Laboratory: 445.

The Water-Energy Nexus: Challenges and Opportunities June 2014
145
Viswanathan, V., M. Kintner-Meyer, et al. (2013). National Assessment of Energy Storage for Grid
Balancing and Arbitrage, Phase II, Volume 2: Cost and Performance Characterization. Richland, WA,
Pacific Northwest National Laboratory: 78.
Weber, C. L. and C. Clavin (2012). "Life Cycle Carbon Footprint of Shale Gas: Review of Evidence and
Implications." Environmental Science & Technology 46(11): 5688-5695.
WEF (2012). Driving Water and Wastewater Utilities to More Sustainable Energy Management.
Alexandria, VA, Water Environment Federation: 16.
WEF (2013). "NBP Webcast: Thermal Hydrolysis Comes to America: DC Water's Digestion Project."
Water Environment Federation. Accessed August 2, 2013,
http://www.wef.org/Conferences/page_webcasts_details.aspx?id=6442451700.
WERF (2011). Energy Production and Efficiency Research - The Roadmap to Net-Zero Energy.
Alexandria, VA, Water Environment Reserch Foundation: 8.
White, C., A. Heldrich, et al. (2013). Supercritical CO2 Power Cycles – Brayton Cycle Analysis.
Morgantown, WV, NETL: 96.
Wigmosta, M. S., A. M. Coleman, et al. (2011). "National microalgae biofuel production potential and
resource demand." Water Resources Research 47.
Williams, M., P. Reimus, et al. (2010). Development of Models to Simulate Tracer Tests for
Characterization of Enhanced Geothermal Systems. Richland, WA, Pacific Northwest National
Laboratory: 44.
Williams, M. C., J. Strakey, et al. (2006). "US DOE fossil energy fuel cells program." Journal of Power
Sources 159(2): 1241-1247.
Winter, D., J. Koschikowski, et al. (2012). "Desalination using membrane distillation: Flux enhancement
by feed water deaeration on spiral-wound modules." Journal of Membrane Science 423: 215-224.
Wu, M. (2012). "Assessing Impact of Biofuel Production on Regional Water Resource Use and
Availability." Argonne National Laboratories. Accessed January 20, 2014,
http://www1.eere.energy.gov/bioenergy/pdfs/wu_webinar.pdf.
Wu, M., M. Mintz, et al. (2009). "Water Consumption in the Production of Ethanol and Petroleum
Gasoline." Environmental Management 44(5): 981-997.
Yang, Y. P., R. R. Zhai, et al. (2010). "Integration and evaluation of a power plant with a CaO-based CO2
capture system." International Journal of Greenhouse Gas Control 4(4): 603-612.
Yazawa, K., Y. Rui Koh, et al. (2013). "Optimization of Thermoelectric Topping Combined Steam
Turbine Cycles for Energy Economy." Applied Energy 109: 1-9.
Yin, H., A. S. Sabau, et al. (2013). "Mixtures of SF6-CO2 as working fluids for geothermal power
plants." Applied Energy 106: 243-253.
Yu, N., R. Z. Wang, et al. (2013). "Sorption thermal storage for solar energy." Progress in Energy and
Combustion Science 39(5): 489-514.

June 2014 The Water-Energy Nexus: Challenges and Opportunities
146
Zhai, H. and E. S. Rubin (2013). "Techno-Economic Assessment of Polymer Membrane Systems for
Postcombustion Carbon Capture at Coal-Fired Power Plants." Environmental Science & Technology
47(6): 3006-3014.
Zhai, H. B. and E. S. Rubin (2010). "Performance and cost of wet and dry cooling systems for pulverized
coal power plants with and without carbon capture and storage." Energy Policy 38(10): 5653-5660.
Zhang, F., Y. Gao, et al. (2013a). "Regeneration performance of amino acid ionic liquid (AAIL) activated
MDEA solutions for CO2 capture." Chemical Engineering Journal 223: 371-378.
Zhang, J. S., W. L. C. Loong, et al. (2012). "Membrane biofouling and scaling in forward osmosis
membrane bioreactor." Journal of Membrane Science 403: 8-14.
Zhang, W., M. Mossad, et al. (2013b). "A study of the long-term operation of capacitive deionisation in
inland brackish water desalination." Desalination 320(0): 80-85.
Zhao, C. W., X. P. Chen, et al. (2013a). "Capturing CO2 in flue gas from fossil fuel-fired power plants
using dry regenerable alkali metal-based sorbent." Progress in Energy and Combustion Science 39(6):
515-534.
Zhao, R., S. Porada, et al. (2013b). "Energy consumption in membrane capacitive deionization for
different water recoveries and flow rates, and comparison with reverse osmosis." Desalination 330(0): 35-
41.
Zhao, S. F., L. Zou, et al. (2012). "Recent developments in forward osmosis: Opportunities and
challenges." Journal of Membrane Science 396: 1-21.
Zhao, Y., Y. Wang, et al. (2013c). "Performance comparison and energy consumption analysis of
capacitive deionization and membrane capacitive deionization processes." Desalination 324(0): 127-133.

The Water-Energy Nexus: Challenges and Opportunities June 2014
147
Chapter 6. Data, Modeling, and Analysis
Faced with an ever-growing national reliance on modeling predictions for decision making, investments,
planning and preparation, and response, DOE assets can be developed and deployed as a resource for
water-energy nexus modeling and analysis. For DOE and many others, there are significant issues
regarding the resiliency, reliability, and competitiveness of the U.S. energy system. Against this
backdrop and driven by the practical constraints of individual organizational imperatives and foci, DOE
has amassed a substantial set of core competencies that can be leveraged for this endeavor.
A substantial portion—but not all—of these modeling and analysis capabilities reside within the DOE
national laboratories. Cross-programmatic synthesis has benefitted from collaborations, but the efforts
and results to date have been largely ad hoc. Additionally, there are key gaps in the models, data, and
Key Messages:
DOE has extensive capabilities in multi-system, multi-scale modeling, analysis, advanced computation, and data management.
Analysis at the water-energy nexus is complex and affected by many moving parts including supplies and demands, land use and land cover, population/migration, climate and weather, technologies, policies, and regional economics.
Robust data- and model-driven methodologies are frequently cited as needs to accommodate the large uncertainties of regional water-energy planning efforts.
Quantitative and qualitative scenarios, ranges versus single estimates, probabilistic approaches, insights into potential system shocks and extremes, and improved overall characterization of uncertainties are strategically important end goals shared by users.
Information needs span a broad range of spatial and temporal scales, which necessitates both improved interoperability across data and modeling platforms as well as improved capacity for ―telescopic‖ resolution.
Substantial data, both observational and model-generated, exist in highly distributed systems across DOE and the federal family that, if made more accessible and consistent through a layered, data-analytic platform, could revolutionize insights and analyses at the water-energy nexus.
DOE’s integrated assessment modeling (energy-environment-economics), detailed energy systems and technology modeling, water modeling (substantial but part of a broader interagency portfolio), infrastructure impacts modeling, and regional climate modeling and analysis are important modeling capabilities.
No single data, modeling, or analysis system will meet every need for every user, and there is scientific basis and strength in pursuing complementary efforts while evolving to a more integrated, federated system of capabilities where the whole is more than the sum of the parts and new, transformative capabilities emerge.
Model intercomparison projects have proven to be important mechanisms for producing data products of broad use, developing key insights, driving community collaborations and synthesis, and identifying research gaps and needs.
Ultimately, risk and uncertainty visualization and communication methods are critically important tools for interpreting, simplifying, and conveying the messages emerging from complex scientific
findings.

June 2014 The Water-Energy Nexus: Challenges and Opportunities
148
underlying science that must be addressed to answer the critical questions raised by the user communities,
both within DOE and by many of DOE‘s primary external stakeholders.
This chapter highlights key aspects of user needs, existing DOE capabilities, and corresponding modeling
and analysis priorities. This general relationship is depicted in Figure 6.1 (with examples) and forms the
basis for the major sections that follow.
Figure 6.1. Needs, capabilities, and priorities for data, modeling and analysis.
6.1 Introduction
The beginning of the 21st century has been marked by changes in population, demographics, and
migration patterns; increased frequency and intensity of extreme weather events; changing characteristics
of regional climate and hydrologic cycles; growing human influences on land use and land cover with
significant human feedbacks to regional climate systems and local weather patterns; increasing demands
for energy; increasing competition for water and changes in water supply; rapid evolution of technology
options and performance; and a global economy with strong and sometimes rapid influences on U.S.
regional economic development. In short, the world—and the climate system—is changing at an ever-
increasing pace. Some of these changes have been or will be predictable or potentially predictable—for
example, the increased likelihood of droughts, heat waves, and floods—while others—such as the rapid
evolution of shale gas—have been or will be surprises. Ultimately, public- and private-sector decision
makers need to rely on the very best science and decision-support tools while recognizing the presence of
large uncertainties: uncertainties in human and natural systems and their complex interdependencies.
With this recognition and a deeper appreciation for the pace and consequences of a changing climate,
there is a need for DOE to keep pace by improving and deepening its capabilities to simulate the future
under various scenarios. Several prominent, recent workshops have developed insights into these needs,

The Water-Energy Nexus: Challenges and Opportunities June 2014
149
documenting their conclusions in the reports shown in Figure 6.2. These joint meetings featured
researchers, users, and leading agencies.
Figure 6.2. Recent workshops and reports have highlighted user needs and needed research. Source: Office of Science 2012; Wind and Water Program 2012; Skaggs et al. 2012, 152; Mai et al. 2012; Wilbanks et al. 2012; Wilbanks and Fernandez 2014
6.2 User/Societal Needs: Modeling, Analysis, and Actionable Science
Companies, communities, states, and federal agencies are making large investments and are planning for
the future, but plans based on long-term historical data for climate, river flows, and extreme events are
becoming less relevant in a world that is rapidly changing. Additionally, spatial and temporal planning
scales vary by need and type of user. Long-term development planning must explicitly consider site-
specific real-time operational constraints and the associated risks to technical, economic, and
environmental sustainability. Common user needs include accurate data, information, and projections for
sustainable operations and development planning. Some operational and planning responses occur on the
order of seconds, minutes, and days, while others span seasons, years, even several decades or longer.
Energy-water interactions affect all regions of the United States, but often the problems vary across
regions depending on the climate, topography, population density, and level and type of energy and
economic development. Additionally, because energy and water systems are generally adapted to the
existing climate, significant changes of weather, weather extremes, and land use changes will almost
always require some costly adjustment, as illustrated in the following examples:
Water supply for energy demands and changing loads: Different energy systems, whether for cooling,
hydropower, or other forms of renewable energy supplies, often require water resources and storage with
flexibility to manage changes in energy demand, which may vary over seconds and hours, with diurnal

June 2014 The Water-Energy Nexus: Challenges and Opportunities
150
and seasonal variability. Better prediction allows for better deployment of existing resources; however, as
climate changes, the statistics of weather and the natural processes that result in runoff and ultimately
surface water flows or aquifer storage will change. This suggests the need for a different mix of capacity
that is less dependent on weather. If river temperatures routinely become higher, reliance on once-
through cooling of thermal power plants may risk capacity availability during peak demands. If river
flow changes in amounts or timing, it could limit or increase the potential to use existing hydro capacity
to back up variable generation resources. In addition to meeting the needs of energy demands with
changing water supplies, both water and energy demands will undoubtedly change with time as they are
influenced by many factors, including climate change. Peak and base demands, corresponding to extreme
events such as droughts and heat waves, are likely to pose significant challenges whether for dealing with
the energy requirements for cooling in urban systems or the changing water demands for agricultural,
biofuels, and food security.
Energy supply for water demands: Cities and communities must ensure that they have reliable clean
water supplies, and groundwater pumping, inter-basin transfers, and purification systems use energy.
Many questions remain unanswered:
Will new, more distant sources be needed?
Can diverse sources improve reliability?
How will changing precipitation and temperature affect surface flows, water quality, and groundwater
recharge?
Will rising seas create brackish surface or groundwater that is now a source of freshwater supply?
These challenges have varying time scales. For example, cities and communities must respond
immediately in the face of a tropical or severe storm, such as Superstorm Sandy or Hurricane Katrina,
while also planning long term for new infrastructure investments to reduce city, community, and system
vulnerabilities.
Resilience of biomass systems: Biomass is seen as a potentially reliable domestic source of energy for
electricity generation and fuels production. However, it is unclear if changes in climate, water supplies,
and crop irrigation demands will undermine that reliability. It is also unclear whether energy conversion
facilities would need to draw on a larger market for biomass crops if local biomass crop production
becomes more variable, and how transportation costs would affect energy use and the competitiveness of
biofuels. These questions have different time scales and require varying predictive capacity. In addition,
if facilities are built and running and large segments of the nation experience severe droughts, the impact
on long-term resiliency planning and options analysis, including transportation infrastructure, where to
locate, and the development of diversified suppliers, is unclear. Markets for food can absorb higher costs
than fuel markets, so energy production could suffer catastrophic declines with severe droughts. Society
must consider how biomass will meet baseline capacity for fuels and power amid changes in climate,
water supplies, and societal needs.
Regional Differences: In principle, arid regions would benefit from more water, but large increases will
over-run water channels and vegetation in arid areas is not able to buffer rain events, so extreme
precipitation often leads to flash flooding, erosion, and siltation of water storage systems. All of these
factors imperil energy, water, and transportation infrastructure. If these areas become drier, challenges
emerge in the allocation of competing demands for water across urban, energy, and agricultural uses,

The Water-Energy Nexus: Challenges and Opportunities June 2014
151
among others. The most recent projections suggest less water in the Southwest, leading to substantial
forest cover reduction, but possibly more extreme rain events.
Beyond extreme events, weather change in general brings challenges because it impacts snow pack
elevation and the timing of snow melt, exacerbating flooding, drought, and environmental stressors.
Hydro capacity and water management in the Pacific Northwest will be affected by changes in the timing
and amount of snowmelt. Agriculture and river and barge traffic in the Mississippi rivershed may be
severely affected by either flooding or river levels that are too low, interrupting the flow of agricultural
inputs or the transport of crops. Other modes of transport such as rail or truck may have greater energy
requirements, leading to higher costs. While the Southeast is seen as a humid and moist area of the
country, in recent years it has been plagued by drought that has imperiled water supplies, sometimes
followed by years of extreme flooding. Tropical storms that are more powerful or longer-lived may make
the Northeast more vulnerable, and as seen in the case of Superstorm Sandy, and could damage port
facilities and power stations or substations, ultimately disrupting energy and water supply and distribution
systems.
Users—including federal, state, and local governments as well as industry and academia—have a diverse
set of modeling and analysis needs. Box 6.1, although not comprehensive, illustrates the scope and
diversity of different user needs.
These needs include national- and regional-scale vulnerability assessments for electricity and power plant
operations, energy requirements of water resource management, electricity demand, and distribution
(Arent et al. 2013), all with implications for economic growth and well-being. A probabilistic perspective
is an essential component of the vulnerability information needs. Second, user needs include data,
information, and projections for sustainable development planning—integrating development and
resource needs with changing resource availabilities and evaluation of robust options in the face of
inevitable uncertainties (Blanc et al. 2013). The private sector and local governments are also concerned
about investment, technology selection, and siting decisions: are large-scale investments at risk, can they
be retrofitted as resources change, are there more or less vulnerable technology choices, and will these
options have operational reliability? Investors are interested in the likelihood of different technology
penetration scenarios and research and development (R&D) insights—in essence, where and how to use
technology R&D dollars effectively.
Ultimately, users are interested in adaptation strategies and implications for integrated systems design and
siting of technologies in the face of global change that are robust to changing weather extremes and that
contribute to mitigating sources of environmental problems as well as to adapting to the outcomes. They
need simple indicators of change to benchmark actions and investments as they go forward.

June 2014 The Water-Energy Nexus: Challenges and Opportunities
152
Traditionally, the water-energy topic, when viewed through the lens of individual energy technology
systems, tends to isolate just water and energy systems. In the case of some specific yet highly important
technologies, including biofuels and hydropower, and for broader sustainability and resource planning at
regional scales, three major systems come into play: energy, water, and land.
Figure 6.3 illustrates the interactions of these three systems, reflecting the importance of considering land
as part of integrative modeling and analysis efforts. Considering the importance of resource modeling
and vulnerability assessments, especially as it pertains to fundamental issues of water supply, regional
Box. 6.1. User/Societal Needs
People, communities, states, resource management agencies, and private-sector companies across
the country face varied but important planning decisions that will affect the livability and
competitiveness of the nation.
National and regional-scale assessments
• Impacts on power plant cooling, hydropower, bioenergy, and other regional energy systems
• Implications for electricity and other national and regional energy distribution systems
• Cascading, multi-sector dependencies and vulnerabilities
• Energy for future water management
• Aggregate damages and economic implications
• Water transfer and boundary issues
Sustainable development planning
• Integrated resource planning
• Sustainability options analysis
Investment and siting decisions
• Facility siting and environmental and economic analysis
• Technology selection and deployment
• Retrofit and/or capital turnover
• Integrated systems designs/perspectives
• Operational reliability
Adaptation strategies
• Implications of adaptation strategies and options
• Global change and other stressors
• Means, extremes, and the implications for vulnerable systems
• Mitigation versus adaptation and search for co-benefits
• Indicators of change
Technology analysis and R&D insights
• Technology performance (including economic), water efficiency, and demands
• Technology penetration constraints

The Water-Energy Nexus: Challenges and Opportunities June 2014
153
hydrological cycles, and major competing uses for water and the implications for energy systems, much
of what follows in this chapter will adopt the broader scope of energy-water-land (E-W-L) interactions.
Figure 6.3. Illustration of the significance of land as part of three-way dynamics of E-W-L systems as represented through integrated assessment research. Source: Skaggs et al. 2012
With respect to user needs, uncertainty is not a new concept or unique to decisions affected by E-W-L
interactions. For example, well-developed methodologies exist to account for uncertainty in investment
decisions—insurance and other financial instruments are available to spread or pool risks, and people
regularly operate within the uncertainty of weather forecasts. What is new is that the statistics of climate
and weather events are changing. Further, while decision makers have learned to live with uncertainty, in
very few cases they do undertake formal assessments of decision making under uncertainty. Instead,
rules of thumb, building codes, engineering practice, and regulations have been developed, incorporating
experience gained over decades. Unfortunately, these are predicated on a stationary climate system and
need to be revised and updated. Examples include designated flood zones, building codes, coastal
setbacks, water allocation rules, drought and flood emergency planning, and infrastructure location and
resiliency (Lickley et al. 2013).
Whereas current standards and codes have been developed in part based on significant past experience,
revisions need to more explicitly recognize the non-stationary climate system and more formally assess
best practices for the changed conditions. In the absence of relevant historical experience, the community

June 2014 The Water-Energy Nexus: Challenges and Opportunities
154
must rely on formal risk assessment, modeling, and decision analysis. Also novel when examining Earth
system changes is the stronger interconnections among regions and sectors. In part, the growing world
population and economic growth have made the world more interconnected, and Earth‘s water, land, and
energy resources are stretched thinner. However, the phenomenon of global environmental change with
physical tele-connections in the Earth system means that crop failures or water shortage in one region
may have reflections across the globe.
Traditional methods of pooling risk or diversifying supply may not be as effective if disasters are
widespread or in an economic system with global supply chains that can be disrupted with cascading
effects. This topic was specifically addressed by Working Group II in the Intergovernmental Panel on
Climate Change (IPCC) 5th Assessment where the Group highlighted the need for more research at the E-
W-L nexus (Arent et al. 2014).
6.3 Current Capabilities
DOE has developed substantial modeling and analysis capabilities that can be directly applied to the
water-energy nexus, including modeling of human systems, modeling of Earth systems, and integrated
modeling of both human and Earth systems. DOE also has capabilities in crosscutting modeling and
analysis, as well as in computation, software, observations, and the user interface. This section includes
an overview of these major areas, summarized in Box 6.2, to provide a context for the priorities discussed
in subsequent sections.
Research communities that have been studying the Earth system have evolved with time and have begun
the transition to a next generation of models, tools, and assessment techniques. A particular focus has
been to advance the representation of water resources and hydrological processes at various levels of
process, spatial, and temporal detail. The climate modeling community has been building the capacity to
incorporate multiple changes that are affecting the Earth system. The integrated assessment modeling
community has been focusing on representing the dynamics of human systems and the interconnections
with Earth systems, as well as end-to-end uncertainty quantification. The impacts, adaptation, and
vulnerability modeling community has been working to develop methods that incorporate climate and
economic assessments into the decisions of stakeholders in order to increase resiliency in the face of
changing conditions.
Each of these communities has been developing the capability to represent hydrology, water resources,
and land as they interact with energy; however, some of these efforts are nascent. Early efforts to link
these models and analysis efforts has begun, but a priority for the future is tighter coupling and closer
interaction in producing scenarios, sharing data, and working in public-private partnerships to provide a
consistent and integrated view of the future that is relevant for energy-water-related investments and
management decisions.
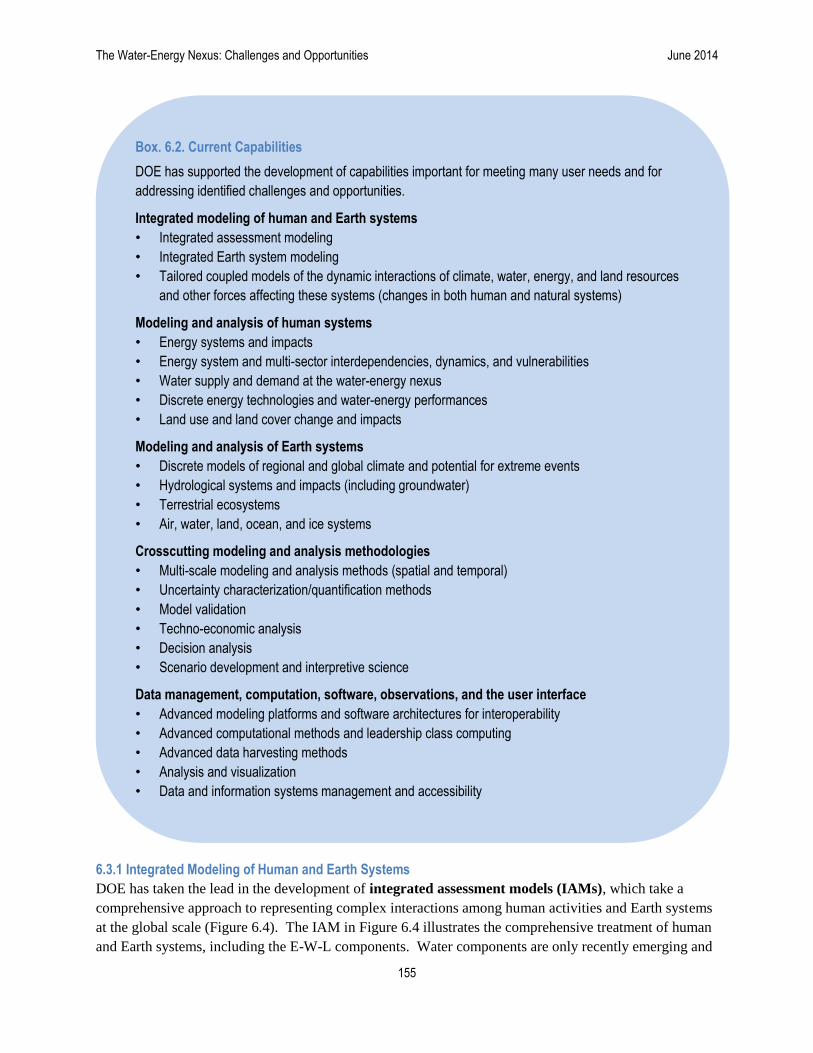
The Water-Energy Nexus: Challenges and Opportunities June 2014
155
6.3.1 Integrated Modeling of Human and Earth Systems
DOE has taken the lead in the development of integrated assessment models (IAMs), which take a
comprehensive approach to representing complex interactions among human activities and Earth systems
at the global scale (Figure 6.4). The IAM in Figure 6.4 illustrates the comprehensive treatment of human
and Earth systems, including the E-W-L components. Water components are only recently emerging and
Box. 6.2. Current Capabilities
DOE has supported the development of capabilities important for meeting many user needs and for
addressing identified challenges and opportunities.
Integrated modeling of human and Earth systems
• Integrated assessment modeling
• Integrated Earth system modeling
• Tailored coupled models of the dynamic interactions of climate, water, energy, and land resources
and other forces affecting these systems (changes in both human and natural systems)
Modeling and analysis of human systems
• Energy systems and impacts
• Energy system and multi-sector interdependencies, dynamics, and vulnerabilities
• Water supply and demand at the water-energy nexus
• Discrete energy technologies and water-energy performances
• Land use and land cover change and impacts
Modeling and analysis of Earth systems
• Discrete models of regional and global climate and potential for extreme events
• Hydrological systems and impacts (including groundwater)
• Terrestrial ecosystems
• Air, water, land, ocean, and ice systems
Crosscutting modeling and analysis methodologies
• Multi-scale modeling and analysis methods (spatial and temporal)
• Uncertainty characterization/quantification methods
• Model validation
• Techno-economic analysis
• Decision analysis
• Scenario development and interpretive science
Data management, computation, software, observations, and the user interface
• Advanced modeling platforms and software architectures for interoperability
• Advanced computational methods and leadership class computing
• Advanced data harvesting methods
• Analysis and visualization
• Data and information systems management and accessibility

June 2014 The Water-Energy Nexus: Challenges and Opportunities
156
scale and data challenges are formidable. DOE has supported the development of two such models for
more than 20 years: the Integrated Global Systems Model (IGSM), developed at the Massachusetts
Institute of Technology (MIT) (Prinn et al. 1999; Sokolov et al. 2009; Prinn et al. 2011; Prinn 2013); and
the Global Change Assessment Model (GCAM), developed at the Joint Global Change Research Institute,
a collaboration between PNNL and the University of Maryland (Edmonds and Reilly 1985; Calvin et al.
2011; Thomson et al. 2011; Wise and Calvin 2011; Kim et al. 2012). This support has made the United
States a leader in the development of this full-system approach to representing the interaction of human
activity and Earth systems.
Figure 6.4. Stylized representation of an IAM Source: Office of Science 2009
For numerical efficiency, these models have been developed with relatively coarse resolution; however,
the full-system approach and numerical efficiency allow the study of feedbacks and quantification of
uncertainty, taking into account uncertainties in both natural and human systems that no other class of
models can provide. With improved computational power, it is now possible to increase the resolution of
these models, and this capability continues to develop. A good example of the power of this approach is
the potential of bioenergy and water-land interactions as represented in MIT‘s IGSM (Figure 6.5)
(Strzepek et al. 2013; Blanc et al. 2013). With more than 20 years of development, IAMs are now able to
examine the dynamics of coupled human and Earth systems and the specific roles of technology, energy
system pathways, natural resource constraints (such as water), and many other aspects of human decisions
and influence, all within economic- and risk-based frameworks (Hallgren et al. 2013; Reilly et al. 2012,
2013; Reilly 2012, Schlosser and Strzepek 2013, Prinn et al. 2011).

The Water-Energy Nexus: Challenges and Opportunities June 2014
157
Figure 6.5. Energy-Water Land-Dynamics in MIT’s Integrated Global Systems Model Source: Schlosser et al. 2014; Blanc et al. 2013; Prinn 2013
Many of the important interactions between natural and human systems involve E-W-L interactions, and
initial explorations with these models have focused here. An important example for linkages among
water for irrigation, energy, industrial, and environmental uses is the potential implications of bioenergy
expansion. The availability of sufficient land for both food and bioenergy depends on how climate
change will affect water resources and crop productivity, and agriculture is itself dependent on energy.
The changing land cover that might occur with significant biofuel expansion could itself change the
radiative and hydrological balance, as represented in Figure 6.5.
IAMs have served a dual role and emerged as tools that bridge the science and applied research
components within DOE. Fundamental science research and modeling of both natural and human
systems provides the basic quantification of key relationships in IAMs and offers a method of evaluating
the performance of IAM components. Not widely known, IAMs provide major contributions to the
efforts of the large-scale Climate Modeling Intercomparison Project (CMIP) (WCRP 2014) and the
international activities of the IPCC, providing emissions and land use projections for the next century.
The major climate modeling communities around the world, working through scores of Earth system
models (ESMs), depend on these IAM simulations and projections for conducting these model
experiments.
A key focus over the last few years has been the move to incorporate water more directly into these
models, and progress has been paced with available funding, as illustrated in Figure 6.6 with a
representation of the Joint Global Change Research Institute IAM, GCAM.

June 2014 The Water-Energy Nexus: Challenges and Opportunities
158
Figure 6.6. GCAM represents details of E-W-L system interactions within the integrated assessment model framework, reaching down to levels that can then interact with the impacts, adaptation, and vulnerability research community. Source: Figure courtesy of Mohamad Hejazi, PNNL.
Core capabilities exist and continue to evolve, but scale and time step issues pose formidable challenges.
Aspects of water movement are also challenging; for example, river routing and groundwater
representations are poorly characterized.
Figure 6.7. Change in water scarcity conditions between 2005 and 2095* Source: Hejazi et al. 2013
Calculated on the basis of future water availability and potential demand as reflected in a no-climate policy scenario and a single
set of technology assumptions.
Figure 6. PNNL’s GCAM represents details of energy-water-land system interactions within the integrated assessment model framework, reaching down to levels that can then interact with the Impacts, Adaptation, and Vulnerability research community.
The Water-Energy Nexus: Challenges and Opportunities June 2014
159
Ultimately, such models are capable of understanding many aspects of E-W-L dynamics, including future
water stresses under different economic and energy technology development assumptions. An illustration
of such a representation is contained in Figure 6.7. Substantial work is needed for E-W-L in further
developing component models of population, migration, land use, land cover, river routing, regional
economics, and technology.
With the success and promise of these global system models and the need for greater resolution to meet
the needs of users, a recent focus has developed around regional integrated assessment models (RIAMs)
(Hibbard and Janetos 2013). The climate, economic, and other components of an RIAM require boundary
conditions from global models. The scope of RIAMs includes the effects of water on energy operations
and infrastructure through flooding/storm surge induced by extreme events and sea level rise. Its focus on
a smaller region allows for high-resolution detail (e.g., focus on the United States while retaining at least
some aspects of interaction with the global system). Data limitations that can underpin regional
perspectives pose challenges at increasingly finer scales. Significant effort is often required to reconcile
large data sets that span various natural and human system domains, are created and compiled by different
sources, and typically reside at different spatial and temporal scales. Efforts to advance a regional
integrated assessment modeling framework have achieved some progress but have slowed recently due to
resource shortfalls. The RIAM effort is focused on a Gulf Coast test bed with an emphasis on modeling
thermo-electric cooling vulnerabilities and their impacts on the overall grid reliability of the region (tied
to stream flow and temperatures) at finer scales in an IAM framework.
One noteworthy development is that, with increasing resolution, there is greater potential to represent
processes and issues developed by the impacts, adaptation, and vulnerability (IAV) research community
and to build closer ties between the IAM and IAV communities. In part to assess impacts, and in part to
identify challenges and needs for future IAM research, DOE sponsored such a cross-disciplinary team in
preparation of a major technical input to the U.S. National Climate Assessment.
Figure 6.8. E-W-L interactions document. Source: Skaggs et al. 2012,

June 2014 The Water-Energy Nexus: Challenges and Opportunities
160
The report, shown in Figure 6.8, highlights the modeling element needs as well as elements that must be
addressed in future IAMs. As illustrated in Skaggs et al. (2012), Figure 6.3, and the four examples in
Box 6.1 and Box 6.2, it is no surprise that a major finding of the report is that water is needed for
energy but also that increased energy may be needed to manage water resources and needs in the
future. Presently, only simple representations are included in the IAMs, and few, if any, of the
representations are of feedbacks to the climate system.
Figure 6.9. Integrated Earth System Model Source: ORNL 2012
Modeling the fully integrated natural and human components of the water cycle is a significant scientific
challenge that is well aligned with DOE‘s mission needs. As envisioned, IAMs are directly coupled with
complex, computationally demanding ESMs—in this situation, the Community Earth System Model
(CESM) or what appears to be the evolving DOE successor to the joint (CESM) (NCAR 2013) venture
with the National Science Foundation (NSF). The result is a new class of models, the integrated Earth
system model (iESM), depicted in Figure 6.9. iESMs are being developed to include human and natural
systems with highly resolved land, atmosphere, and ocean components. They require high-end
computational resources but are needed to understand the role of fundamental processes as they affect
Earth system response. iESMs is particularly useful at examining detailed, high-resolution processes and
exploring highly detailed and spatially and temporally demanding insights on system behaviors.
Efforts to date have been limited to understanding land exchanges between the two underlying models.
Although the models represent powerful tools for deep dives, the computational demands of these models
limit their ability to explore decision space and uncertainties that span the coupled human-Earth system.
For example, exploring different energy futures and different technology pathways can require tens of
thousands of runs and advanced analysis tools for characterizing the resulting output response surfaces,
drawing from approximate dynamic programming, Monte Carlo simulations, and other analytical

The Water-Energy Nexus: Challenges and Opportunities June 2014
161
methods. However, the deep knowledge created by iESMs can be fed back to IAMs, which contain their
own reduced form representations of ESMs, called Earth models of intermediate complexity (EMICs)
(Zickfeld et al. 2013).
Ultimately, neither modeling domain alone is capable of such penetrating insights, and for the land
dimension alone, some of the insights have already transformed the understanding of the coupled system
and may very well impact the next round of CMIP, scenarios development for that process, and the model
experiments that will underpin future work of the IPCC. When models from the two domains were
merged as part of early experiments, it forced more complete reconciliation of land use and land cover
that is not possible with the soft handoffs of the present IPCC process. The resulting hard coupling
produced land use drivers for the ESMs that fundamentally changed albedo with a noticeable end-of-
century temperature shift (e.g., Reilly et al. 2012; Hallgren et al. 2013). The implications for
understanding potential regional climate impacts for the United States under different policy scenarios are
significant and have energized the climate modeling community. Additionally, direct climate; land; and,
in the future, hydrologic parameters of interest from these deep iESM runs will be of direct interest for
many of the technology model components for the limited set of assumptions and climate states that they
are able to run.
6.3.2 Modeling and Analysis of Human Systems
To serve user needs with decision-support tools, it is necessary to understand and represent human
activities and technologies, as well as their interactions with market forces for a range of decisions that
affect E-W-L interactions (Schlosser et al. 2014; Blanc et al. 2013). As previously noted, this research
and modeling often serves as a foundation for IAM representation of human activity and is needed to
provide a richer representation of decision making and market forces. At least three major areas of
human systems modeling are considered highly relevant: (1) impacts, adaptation and vulnerability (IAV)
models with their emphasis on particular human systems and complex coupling of diverse systems, for
example, interdependencies among various sectors and forms of infrastructure; (2) energy and technology
system models that treat the energy sector, and the collective technology behaviors of the energy sector,
in an E-W-L framework; and (3) detailed models of specific technologies and production processes that
may represent physical or economic flows required for the production, conversion, delivery and efficient
use of energy in its various forms.
IAV Models
IAV models are evolving and beginning to emerge as productive tools for exploring the interdependencies
and dynamics of infrastructure and infrastructure-supplied services across sectors. Additionally, more
detailed models of potential climate impacts on the energy system are leading to new ways of thinking
about energy systems vulnerabilities in a changing climate. A body of such work has focused on extreme
storm events. For example, researchers funded by DOE, notably Seth Guikema from Johns Hopkins
University, were widely interviewed during and immediately following Hurricane Sandy in connection
with a DOE co-funded modeling capability that predicted, with uncanny accuracy, the nature and extent
of East Coast power disruptions. Considerable opportunity exists to advance capabilities for similar IAV
work in drought and inland flood prediction (Lickley et al. 2013; Blanc et al. 2013). More broadly,
research needs in modeling energy system and connected energy and related infrastructure needs are
outlined in two recent reports for the U.S. National Climate Assessment (Figure 6.10). The companion
reports outline the current state of knowledge, the research challenges, and modeling needs and

June 2014 The Water-Energy Nexus: Challenges and Opportunities
162
opportunities. Although broader in scope, both reports identify significant E-W-L dimensions and
modeling needs/opportunities. Recently, the U.S. government published a document on the benefits of
increasing the grid resilience to weather outages (White House 2013).
Figure 6.10. Companion reports for the U.S. National Climate Assessment. Source: Wilbanks and Bilello 2014; Wilbanks and Fernandez 2014
Energy and Technology System Models
These models have a long history of development and use within DOE. Examples of energy and
technology systems models include the Regional Energy Deployment System (ReEDS) model (Short et
al. 2011) developed at the National Renewable Energy Laboratory (NREL) with a focus on electricity,
and especially the representation of renewable electricity; EIA‘s National Energy Modeling System
(NEMS) (EIA 2009), the central projection model for DOE; and the Connected Infrastructure Dynamics
Model (CIDM) of Oak Ridge National Laboratory, Sandia National Laboratories (SNL), and Los Alamos
National Laboratory (LANL). CIDM—originally developed by the U.S. Department of Homeland
Security (DHS) with application for disaster response but now funded by DOE—is an open-source
framework enabling research into the vulnerability of energy and water infrastructure to changing climate.
These different approaches have developed overlapping representations of E-W-L interactions, but they
generally are complementary. For example, MIT and NREL collaborated to develop a model of the U.S.
economy linked to the ReEDs model (Figure 6.11) (Baker et al. 2014; Rausch and Mowers 2012). Blanc
et al. (2013), extended the MIT IGSM for the continental United States to address E-W-L issues by
linking the MIT U.S. Regional Energy Policy (USREP) model with the NREL ReEDS model for
electricity deployment, as well as the MIT Withdrawal and Consumption for Thermoelectric Systems
(WICSTs) model. Insights into changes in water stress due to alternative energy pathways and climate
policies are made possible with these early-stage model couplings and tools.
As previously described, understanding complex infrastructure interdependencies is a significant
modeling challenge. A stylized representation of the layered approach taken in the CIDM is reflected in
the second report in Figure 6.10 and illustrated in Figure 6.12. As indicated by Wilbanks and Fernandez
(2014), this representation of infrastructure interconnections is derived from the Critical Infrastructure
Decision Support System (CIPDSS), developed for DHS National Infrastructure Simulation and Analysis

The Water-Energy Nexus: Challenges and Opportunities June 2014
163
Centers at LANL and SNL. Developed separately with support from DOE and others, however, CIDM is
different from CIPDSS in architecture, granularity, and openness. Proposals have emerged to couple
CIDMs directly to IAMs, and one area of potential focus is on the implications of water and water
infrastructures on energy infrastructures, and vice versa. Discussions are evolving with DHS, NGA, and
others about joint opportunities related to the CIDM approach.
Figure 6.11. Linking an economy-wide model with a detailed electricity-sector model and a water model provides spatial detail to represent renewable electricity (Gunturu and Schlosser 2012) and water resources (Strzepek et al. 2013). Source: Gunturu and Schlosser 2012; Strzepek et al. 2013
Figure 6.12. The connected layer approach used in CIDM IAV analyses. Source: Wilbanks and Fernandez 2014
The U.S. Regional Economic Policy (USREP) model estimates energy demand by fuel type
The Regional Energy Deployment System (ReEDS) model produces electricity by fuel type and cooling type (once through and recycle)
The WIthdrawal and Consumption for Thermoelectric Systems (WICTS) model estimates water withdrawal and consumption
The Water Resource Systems (WRS) model allocates water across sectors
CRITICAL INFRASTRUCTURE MODELS ARE
CHARACTERIZED BY INTERDEPENDENCIES
– BOTH ENGINEERED AND SOCIO-TECHNICAL
LINKAGES

June 2014 The Water-Energy Nexus: Challenges and Opportunities
164
Importantly, the energy system is influenced by the other systems and, in turn, influences the other
systems, presenting the opportunity for cascading risks and vulnerabilities. Opportunities exist to further
develop the E-W-L dimensions of this modeling framework. A recent white paper written by leaders
within the CIDM and IAM modeling communities identifies potential topics that span the two disciplines
and modeling domains. For example, one idea centered on exploring what changes may emerge in future
infrastructure based on IAM projections, by region, as a basis for CIDM analyses of future regional
vulnerabilities. Both the PNNL and MIT teams, as well as EPRI and LANL, identified opportunities; in
particular, the MIT team identified opportunities to explore the water-infrastructure (including energy
infrastructure) nexus as a priority topic (Lickley et al. 2013; Blanc et al. 2013).
Technology-Specific Models
Technology-specific performance, siting, and deployment models have previously incorporated some
dimensions of water-related interactions or dependencies, but increasingly there is urgency to expand the
capabilities for robust modeling beyond individual technology sectors, given the potential growth and
evolving complexity of water stresses in many parts of the United States. If developed with a focus on
integrating the outputs and results of energy technology-specific models with larger regional- and
national-scale analysis capabilities, these models could significantly advance connectivity with IAMs and
IAV models. Recent reports highlight new modeling capabilities and point strongly to needs for
expanded model and data development. Three such reports are noted in Figure 6.13.
Figure 6.13. Illustrative reports discussing E-W-L interactions. Source: Mai et al. 2012; ORNL 2011; DOE 2013
Beyond what is reflected in these recent reports, individual technology offices within DOE (e.g.,
Bioenergy, Oil & Gas, Coal, Nuclear, and Geothermal) have dedicated significant effort toward
producing information that characterizes and models the water uses and interactions of various energy
technologies. Examples include the following:
Quantifying water demands for microalgae biofuels production.

The Water-Energy Nexus: Challenges and Opportunities June 2014
165
Synthesizing the types and amounts of produced water from different methods of gas recovery.
Identifying withdrawal and consumption demands for all existing and planned coal-fired power plants
in the lower 48 states.
Establishing life cycle water use information for fuels analyzed in the Greenhouse gases, Regulated
Emissions, and Energy in Transportation (GREET™) model for greenhouse gas (GHG) emissions
(Center for Transportation Research 2013).
Models exist for simulation and optimization of operations at the plant and network levels, as well as for
short- and long-term network and regional planning. The highly proprietary nature of data on
installations in the energy industry is a challenge for representing the existing system with great detail and
accuracy. There is a clear need for collaborative public-private partnerships in this area; for example, to
accurately represent cooling technologies at power plants to estimate plant-scale cooling water
withdrawals. Data is essential for the development of empirical models and the validation of process-
based models.
Examples of current and emerging DOE capabilities for major technology categories include the
following:
Thermoelectric Generation: Some of the more advanced and integrated efforts to date have had a
regional focus. A project supported by the Office of Electricity Delivery and Energy Reliability seeks to
map current and future water demands by the energy sector (i.e., thermoelectric generation, fuel
extraction, and biofuels), projected water demands by the non-thermoelectric sector (e.g., municipal,
industrial, agricultural), water availability, and the cost of water. In terms of water availability and cost,
five unique sources are considered, including unappropriated (available by permit) surface water,
unappropriated groundwater, appropriated (a transfer from another use) water, municipal wastewater, and
brackish groundwater. Mapping is accomplished for the 17 conterminous Western states at the eight-digit
hydrologic unit code level (more than 1,200 watersheds). This project is helping to bring together energy
planners and water managers within their respective interconnections, informing resource planning by
such organizations as the Western Electricity Coordinating Council (WECC), the Western Governors‘
Association (WGA), the Western States Water Council, and ERCOT. Technical support is provided by
SNL with assistance from Argonne National Laboratory (ANL), Idaho National Laboratory, NREL,
PNNL, the University of Texas, and EPRI. Figure 6.14 provides an illustration of the output.
The Energy-Water Decision Support System is an integrated capability developed by the DOE Office of
Electricity Delivery and Energy Reliability, as part of the above mentioned project, that utilizes
technology-specific models from coal, gas, and nuclear to investigate water stress implications of
different modeled scenarios, including the transmission planning scenarios put forward by WECC, WGA,
and the ERCOT. Efforts are currently underway exploring the implications of expanding this capability
to the East.
In another project, Strzepek et al. (2012) of MIT is in the final stage of developing a model to project
stream temperatures driven by alternative climates and thermal generating scenarios at the more than
2,000 U.S. Geological Survey (USGS) Hydrologic Units Calculation (HUC) watersheds for the
continental United States. This model analyzes whether mixing zone and far field temperature in each
HUC violates EPA standards as well as the resulting loss of generating capacity under changes in
temperature and flows (Lickley et al. 2013).

June 2014 The Water-Energy Nexus: Challenges and Opportunities
166
Figure 6.14. Thermoelectric consumptive water use by energy type for Western regions. Source: SNL, n.d.
The Upstream Dashboard Tool (Tidwell et al. 2009) is a free, online tool developed by the DOE Office of
Fossil Energy‘s National Energy Technology Laboratory (NETL) that allows users to customize and
analyze the environmental impact of various fuels before the fuels are used to create power (Skone 2012).
For example, to evaluate electricity production using pulverized coal, the environmental impacts of the
coal‘s entire life cycle—from mining through transportation to combustion and end use—are considered.
While this tool is largely focused on holistically evaluating GHG emissions, water use and consumption
are considered in the assessment tool, and capabilities could be expanded to include greater levels of
detail with respect to water-specific requirements and interactions.
Natural Gas and Petroleum Fuels Production: The Comprehensive Lifecycle Planning and
Management System for Addressing Water Issues Associated With Shale Gas Development (Daniel
2012), which is supported by the DOE Fossil Energy‘s Office of Oil and Natural Gas, will facilitate
option and trade-off analysis in New York, Pennsylvania, and West Virginia and simplify the permitting
and reporting processes by assisting regulators in (1) studying the cumulative impacts of development on
water resources; (2) conserving water; and (3) managing disposal options across a region.
Biomass/Biofuels: The Biomass Assessment Tool (BAT), developed by the DOE EERE Bioenergy
Technologies Office (BETO) (Wigmosta et al. 2011), realistically addresses the critical questions
surrounding the amounts of energy that can be produced from microalgae; where production can occur;

The Water-Energy Nexus: Challenges and Opportunities June 2014
167
and how much land, water, and nutrient resources will be required. It allows for evaporation estimation;
national assessment of freshwater supply; and consumptive use, water routing, and trade-off analysis.80
The goals of EERE‘s Water Footprint Assessment to Address Water Consumption, Water Quality, and
Resource Availability are (1) to quantify relationships between biofuel production and water issues
(including water use, water quality, and water resource availability); and (2) to develop an interactive,
online, open-access water-footprint assessment tool. It addresses the unique characteristic of spatial and
temporal variability of water resources, water use through the entire biofuel life cycle, and potential
impacts under competing water demands at the regional scale by developing an integrated analytical
framework that is tailored to biofuel production pathways by incorporating the hydrologic cycle with
geospatial resolution.
MIT has developed a set of models for assessing irrigation water demands: CliCrop (Fant et al. 2012) and
the Community Land Model-Agriculture module (CLM-AG) (Gueneau et al. 2012). These models are
designed to assess the irrigation water demand at the county level for scenarios of land use and for
alternative climates. The models are able to assess the water requirements for irrigated biofuel and
corresponding vulnerabilities to changing temperatures and precipitation patterns.
Geothermal: Water-Use, Resource and Water Quality Assessment of Geothermal Systems. DOE‘s
Geothermal Technologies Office is working with power plant operators to measure water consumption
and the variability of water use in cooling operations, field operations, and other power plant uses in an
effort to identify opportunities to improve water use efficiency and reduce consumption. These include
recent analyses of current information about the life cycle water requirements of geothermal electric
power generating systems and the water quality of geothermal waters, along with an assessment of
freshwater demand for future growth in utility-scale geothermal power generation and an analysis of
freshwater use in low-temperature geopressured geothermal power generation systems (Clark 2011).
The Geothermal Electricity Technology Evaluation Model (GETEM) is an economics/performance
spreadsheet model (Entingh 2006) that was originally developed to provide both a method for quantifying
the total levelized power generation cost from geothermal energy and a means of assessing how
technology advances might impact those generation costs. In its current form, it considers some water
interactions such as potential losses in EGS reservoirs, amounts of cooling water required, and the costs
of water used for various operations, but there is the potential to expand its capabilities to more
holistically consider different possible sources of water and the incorporation of different treatment and
processing technologies that may be needed.
Hydropower: In recent years DOE‘s Wind and Water Power Technologies Office has supported a team
of four national laboratories to develop and demonstrate a suite of advanced, integrated analytical tools—
the Hydropower Water-Use Optimization Toolset—to assist managers and operators of hydropower
systems to operate plants more efficiently and respond to varying hydrologic conditions, resulting in more
energy and grid services from available water resources while enhancing environmental benefits. The
toolset includes components for hydrologic forecasting, seasonal hydro-systems analysis, day-ahead
scheduling and real-time operations, and environmental performance analysis, in addition to a graphical
user interface and a shared database (Figure 6.15) (Mahalik 2012). The system is currently being
demonstrated at the Oroville Complex on the Feather River in California with the California Department
80
The tool has been formally recognized by the American Geophysical Union with an Editor‘s Choice Award,
which are given to the top 1 percent of peer-reviewed publications.

June 2014 The Water-Energy Nexus: Challenges and Opportunities
168
of Water Resources, on the Aspinall Cascade portion of the Colorado River with the Western Area Power
Administration and the U.S. Bureau of Reclamation, on the Conowingo Dam Complex on the
Susquehanna River with Exelon, and on the Seattle City Light hydropower complex with Seattle City
Light.
Figure 6.15. Conceptual Design of the Hydropower Water-Use Optimization Toolset.
Hydropower/Water Quality Interaction Modeling Improvement. Hydropower plants can provide
significant flexibility and resiliency to the electric grid, but they must carefully manage their operations to
protect water quality. In 2011, hydropower water quality interactions were at the center of a conflict
between wind energy developers and the Bonneville Power Administration concerning the curtailment of
wind plants (FERC 2011). To address potential future issues of this nature, DOE has initiated
collaborative projects with the U.S. Army Corps of Engineers and the Bureau of Reclamation to advance
water quality modeling capabilities, with the goal of preserving both generation and flexibility and giving
hydropower operators better tools to understand changing water quality conditions. Efforts are currently
focused on the Columbia River Basin to enhance tools to predict total dissolved gas concentrations below
hydropower dams to protect aquatic life and allow for greater operational flexibility, and in the
Cumberland River in Kentucky and Tennessee to manage temperature and dissolved oxygen issues.
Solar: The System Advisor Model, developed by the DOE Solar Technologies Office and NREL,
calculates total annual water consumption in cubic meters for cooling and mirror washing for CSP
technologies, integrated in a model that is mainly designed for solar installation cost, efficiency, and
performance analysis (Gilman and Dobos 2012).
Carbon Sequestration: Developed in partnership with NETL and SNL, the Water, Energy, and Carbon
Sequestration Simulation Model (Kobos et al. 2011) can be used at the local, regional, and national scales
to address potentially combined systems using coal or natural-gas-fired power plants, a geologic carbon

The Water-Energy Nexus: Challenges and Opportunities June 2014
169
sequestration system in saline formations, and water extraction and treatment. With such a combined
system for geologic storage of carbon dioxide (CO2) in saline formations, treated saline formation water
could also be used as cooling water in the power plant. This model allows for sensitivity analyses for
capital costs, variables costs, CO2 sequestration, and water treatment systems costs, and allows for
decision makers to understand the economic benefits and trade-offs of this combined system. It also
gives interested individuals or groups the ability to simulate custom power plants, CO2 sequestration, and
water use scenarios for different regions of the country and to understand the associated economics,
longevity, and potential of the CO2 sequestration and water extraction systems.
CO2-PENS, developed by LANL for DOE‘s Carbon Sequestration Program, is a systems-level model that
can be used to perform techno-economic assessment of the feasibility of large-scale deployment of
geologic CO2 sequestration technology in various types of geologic formations, including saline aquifers.
The model is currently being used as part of DOE‘s National Risk Assessment Partnership to determine
the long-term risks associated with CO2 storage. One critical aspect of CO2-PENS is the ability to
perform cost-benefit analysis of the production of saline waters to minimize risk and its treatment for
various types of beneficial use, ranging from agricultural to industrial. The model is designed to
effectively take into account variability in regional and geologic constraints and assess their impact on the
overall effectiveness of water production and treatment.
A key aspect of all water demand models is that water requirements are impacted by climate
(temperature, humidity, solar radiation), and technologies are impacted by both climate and water supply.
Consequently, geospatial modeling is a key aspect of any water-use modeling due to varying climate,
water supply variation, and location of energy facilities. It should also be noted that some energy systems
are so closely tied to many E-W-L interactions (such as the production of biomass/biofuels and
hydropower) that they are most effectively and appropriately modeled within a systems model that
incorporates an entire river basin. Finally, with the potential for increasingly scarce water and greater
recognition of the disposal of waste or contaminated water, there is increasing need to develop better
representation of nontraditional sources of water in energy production models, including those
technologies capable of producing clean water either from saltwater or brackish water, reusing grey water,
or cleaning sources of water such as those produced in fossil fuels production.
Ultimately, many different technology-specific capabilities and models exist within DOE for analyzing
and understanding the cost, performance, siting considerations, and impacts of different energy
technologies; they all incorporate or consider the use of and interactions with water resources in different
ways. Technology-specific models can be extremely important because they can feed information into
larger-scale integrated and regional models that can help policy makers and decision makers carefully
consider infrastructure investment decisions and identify long-term areas of risk related to changing
climactic conditions. However, technology models can also be equally valuable in helping to understand
and utilize information that is produced by IAMs and IAV models to shape future technology
development. R&D for new energy systems that is better informed by likely future water constraints,
sensitivities, and interactions will certainly be of higher value.
6.3.3 Modeling and Analysis of Earth Systems
Through DOE and other federal agency support, the climate community has undergone tremendous
growth in computational capabilities over recent decades. The scientific community now maintains and
continually develops a wide range of models of the climate and earth system. Global models of the

June 2014 The Water-Energy Nexus: Challenges and Opportunities
170
physical, thermodynamic, and chemical properties of the ocean-land-atmosphere system have been the
computational mainstay of climate change research. More recently, climate models have been further
enhanced to enable a class of ESMs that now allow for projections and numerical experimentation of
global ecological and biological activity that necessarily interacts with the climate system.
As these global models have progressed with greater process-level detail, so has their resolution in space
and time. This increased resolution also allows for explicit treatment of processes that were once at the
―sub-grid‖ scale of the global models. However, with that, the growth in the computational burden of
required calculations is exponential, and practical limitations of even the largest computer clusters require
global climate models and ESMs to be run over targeted areas of interest, which typically are at the
continental scale. These ―regional‖ climate models and ESMs are becoming increasingly important for
interdisciplinary studies of the natural environment and their impacts on built and managed systems.
Further, highly detailed models used in operational weather forecasts are now being employed in these
―climate‖ or ―earth-system‖ frameworks and are allowing for further detailed exploration that has never
been seen before.
Nevertheless, the complexity of these modeled systems is extensive, and thus the implications of model
uncertainties require rigorous sensitivity studies as well as very large ensembles for climate and
environmental projections (Monier et al. 2013b). In some cases, impact assessment tools require greater
detail or additional environmental variables that cannot be efficiently or sufficiently provided by these
global and regional climate models/ESMs, and as a result, a number of statistically based methods have
been developed to satisfy these research needs (Tebaldi and Arblaster 2013; Schlosser et al. 2013). The
spectrum of these models covers a large set of research needs that can be carried forward to meet the
challenges of this program plan (Monier et al. 2014).
DOE is a major supporter of regional and global climate modeling that is designed to advance the
predictive understanding of Earth’s climate. The models accomplish this goal by focusing on
scientific analysis of the dominant sets of governing processes that describe climate change on regional
scales, evaluating robust methods to obtain higher spatial resolution for projections of climate and Earth
system change, and diagnosing model systems that are cause for uncertainty in regional climate
projections (e.g., Monier et al. 2013a; Schlosser et al. 2014). Corresponding analytic efforts focus on
sensitivity studies and applications of regional and global ESMs to gain insights into various aspects of
the climate system, including, but not limited to, the understanding of feedbacks within the climate
system, detection and attribution studies, developing capabilities for decadal predictability, systematic
evaluation of extremes (Monier and Gao 2014; Gao et al. 2013b), and uncertainty characterization.
Regional and global climate modeling investments are also dedicated to the development of metrics for
model validation; these metrics in turn may be used to inform the model development strategies for
DOE‘s Earth system modeling and integrated assessment modeling to improve understanding of coupled
systems behavior, such as water resources (Schlosser et al. 2014; Blanc et al. 2013; Strzepek et al. 2013;
Baker et al. 2013), which is critical for the energy mission.
Work in regional and global climate modeling also attempts to understand and analyze extreme events,
including floods and droughts, potential abrupt system changes (e.g., Gao et al. 2013a), and tipping
points, and how these events are affected in a changing climate. Further emphasis is placed on
multivariate and multi-stressor extremes, such as simultaneous combinations of hot, dry, and windy
conditions and hot, moist, and stagnant conditions, and on characterizing the frequency and degree by

The Water-Energy Nexus: Challenges and Opportunities June 2014
171
which given thresholds are exceeded, as well as quantifying uncertainties. Figure 6.16 illustrates
modeling to understand the changes in maximum daily precipitation.
Figure 6.16. Estimates over land of the 20-year return value of December-January-February maximum daily precipitation from observations and Community Atmosphere Model (CAM) 5.1 at three horizontal resolutions.
One weakness of these hydrological models is the process understanding and detail of groundwater and
groundwater-surface exchanges. For example, river routing and groundwater representations, among
other critical basin-scale processes, are poorly characterized. DOE supports subsurface biogeochemical
research (SBR), which seeks to advance a predictive understanding of the biogeochemical structure and
function of subsurface environments to enable systems-level environmental analysisand decision support.
Included is the development of models and tools to characterize how the interactions of contaminants,
carbon, and nutrients affect mobility, reactivity, and stability in complex subsurface environments that
encompass the vadose and saturated zones as well as key interfaces between groundwaters and surface
waters. A priority for the SBR program is to develop genome-enabled biogeochemical models of the
multi-scale structure and function of watersheds, which are key components of terrestrial ecosystems.
Efforts in this domain improve understanding of subsurface hydrology with subsequent implications for
modeling groundwater and the integrated regional water cycle.
DOE also supports major developments in high-resolution ESMs; advancing a major community
ESM; and advancing physical representations for clouds, aerosols (e.g., Wang 2013), sea ice, land
ice, ocean, land hydrology, land/ocean biogeochemistry (e.g., Saikawa et al. 2013), and human
activities (the latter discussed previously in the context of iESMs). The ESM goals are to improve the
CESM fidelity that is critical for understanding climate change, system feedbacks, and potential tipping
points, and to discern climate interactions with past and possible future energy pathways. Model
development requires testing and improving individual model components and the coupled climate

June 2014 The Water-Energy Nexus: Challenges and Opportunities
172
system. A critical challenge is to maximize model performance by identifying the optimal combination of
model resolution and process representation that provides informative climate representation for DOE
needs. ESM also links its atmospheric research and terrestrial and ecosystems science research programs
with the global modeling community, using process and observational research to improve climate
models while also identifying gaps and uncertainties in the climate models to guide and prioritize critical
process research. The overarching goal is to simulate climate over decadal-to-centennial time scales,
projecting Earth system changes in coming decades as needed for DOE science and mission as well as
providing research that underpins regional and global modeling activities.
DOE investigators have extensive expertise in modeling hydrological processes over a wide range of
spatial and temporal scales and for a variety of applications. Hydrologic models are software tools
that simulate the processes of transforming atmospheric water to land-based water elements. On the land
surface, these water elements consist of snow and ice pack, glaciers, runoff, stream flow, lakes, reservoirs,
and wetlands. In the subsurface, water exists as soil moisture in the upper unsaturated zone, and as
groundwater in shallow and deep aquifers. Hydrologic models are driven by observed or modeled
atmospheric variables that exist at a wide range of spatial and temporal scales.
The primary application of hydrologic models is as input for management, planning, and design of water
resource, agricultural, and environmental systems. They can be very data- and computationally intensive
when modeling at the watershed scale. Hydrologic models are divided into surface models that simulate
the surface and sub-surface runoff (soil-moisture-based) with some estimating recharge to the
groundwater, and groundwater models that focus on the hydrodynamics of groundwater flows, given
sources (e.g., recharge—natural and human, river interaction) and sinks (e.g., pumping, river inaction).
Many of the processes are modeled in the land surface components of global and regional integrated
assessment models but at scales that do not fit with planning and design. Increasingly, aspects of these
hydrologic models are being merged or incorporated into various land-water elements of IAMs, regional
climate and hydrological models, and ESMs.
Hydrological processes in ESMs are represented by the interaction of atmospheric and land modules that
have been developed using primarily top-down approaches. Increasing amounts of resolution and
mechanistic detail are incorporated into ESMs to better capture the structure and function of Earth‘s
climate system, including the water cycle. DOE reactive transport codes have been developed to model
contaminant fate and transport through soil and groundwater systems at much smaller spatial and
temporal scales. These reactive transport codes have primarily been developed using bottom-up
approaches to capture, with relatively high resolution and mechanistic detail, the hydrological and
biogeochemical structure and function of subsurface systems. Historically, these two scales of model
development have been separate activities performed by separate communities of scientists. However,
with the increasing power of modern computers and emerging multi-scale and multi-physics
computational frameworks, it is becoming possible to develop more seamless approaches to modeling
hydrological processes in terrestrial environments.
Terrestrial processes have been represented in global climate models and ESMs, regional climate models,
and in various other land models, but for the most part these models are unable to simulate or predict
important small-scale processes that affect the hydrological cycle at both regional and global scales.
Successful management of water resources requires an understanding of both the temporal and spatial
variability (and extremes), as well as the average (and cumulative) changes in the hydrological cycle
(Strzepek et al. 2013). Better coupling of processes across scales is needed to capture both drought events

The Water-Energy Nexus: Challenges and Opportunities June 2014
173
and, at smaller scales, floods. Furthermore, the integral role of human interactions within terrestrial
hydrological systems needs to be more fully and accurately captured through models in order to advance
the predictive understanding of the overall system as well as for decision support.
There are significant challenges in understanding the integrated impacts that changes in climate have on
land, energy, and water systems, where ―land‖ includes terrestrial ecosystems that are critical at the
interface. These four systems are coupled, complex, and interdependent with other sectors, including
agriculture, municipal, and environmental users. Simple examples include the following: (1) changes in
climate lead to changes in snow pack location, quantity, and melt dynamics, which substantially impact
timing and quantities of available water in rivers and reservoirs; (2) climate changes impact forest stress,
leading to changes in mortality due to drought, insects, and fire. These contribute to changes in land
cover and ecosystems that then impact flooding, infrastructure vulnerability, the sedimentation of
reservoirs, and the reliability of water for energy and other stakeholders.
6.3.4 Crosscutting Modeling and Analysis Capabilities and Methodologies
Various crosscutting capabilities within DOE are essential for modeling and analysis of the energy-water
nexus:
Multi-scale modeling and analysis
Uncertainty characterization
Calibrated and systematic characterization, attribution, and detection of extremes
Model validation
Life cycle analysis (LCA) and techno-economic analysis
Scenario development and interpretive science
DOE‘s capabilities in these areas are extensive, including, but not limited to: (1) the multi-scale methods
previously illustrated through RIAM and the climate-computation Scientific Discovery through Advanced
Computing (SciDAC) project effort; (2) the uncertainty characterization methods supported across all of
the modeling platforms, including a recent DOE Early Career Award on technological uncertainty and
climate change; (3) the model validation methods inherent in ESM activities and emerging as part of the
Program for Inter-Model Development, Testing, and Diagnostics for the IAM communities; (4) the
extensive work in LCA and techno-economic analysis undertaken within each of the core energy-water
technology programs; and (5) the scenario development work in many fields.
Additionally, DOE has significant capabilities in characterizing and detecting extremes. Facilitating a
straightforward comparison of extreme event occurrence rates between models and observations yields
limited information about the fidelity of the model formulation. For instance, it provides no information
about whether the model produces extreme events at inappropriate times (e.g., extreme events resulting
from forcing that would not produce extreme events in reality) or whether it misses extreme events that
should occur. DOE has the capability to assess, through a systematic, cyclic, hindcast-based framework,
the configuration-consistency of extreme events in CESM. These techniques are more broadly applicable
to ESMs (Gao et al. 2013b).
Model validation is also a critically important dimension of model development. Validation and
intercomparison efforts establish credibility for the modeling efforts and help in understanding and
improving model construction and addressing various sources of uncertainties, from data to model
structure. DOE has significant capabilities in validating large, complex models, from the large climate

June 2014 The Water-Energy Nexus: Challenges and Opportunities
174
model intercomparison efforts, such as the Lawrence Livermore National Laboratory (LLNL) Program
for Climate Model Diagnosis and Intercomparison (PCMDI) (LLNL 2014), to the Program for Integrated
Assessment Model Development, Diagnosis, and Intercomparison led by Stanford University (Weyant
2010) in a consortium of other universities and two national laboratories, including LLNL.
The development of ESMs utilizes DOE computational expertise under the Office of Advanced Scientific
Computing Research SciDAC program to optimize model performance on leadership computer systems
and to construct variable and high-resolution model versions for improved climate and process
representation. Of particular significance is the development of sophisticated frameworks to test, analyze,
calibrate, visualize, and validate model results in order to calibrate the model against measurements,
including DOE atmospheric and terrestrial data.
Important in the mix of DOE capabilities is the ability to conduct techno-economic analyses and LCAs.
Such capabilities are substantial within the DOE, researcher, contractor, and collaborator communities
and are strongly tied to the energy applied research communities. One such capability is GREET, which
is represented in Figure 6.17. GREET is an LCA model that evaluates the environmental impacts of
alternative transportation fuels and vehicle technologies. The assessment categories within the current
GREET model include life cycle energy use (e.g., fossil, petroleum, natural gas, coal, and renewable),
GHG emissions (e.g., CO2, methane, and nitrous oxide), and criteria air-pollutant (CAP) emissions (e.g.,
VOCs, carbon monoxide, NOx, SOx, and particulate matter). GREET has been developed by ANL since
1995, in partnership with DOE and the Vehicle Technologies Office, and has expanded over the years.
The most recent version of GREET (GREET1_2012 rev.2, released December 2012) (Center for
Transportation Research 2013) evaluates more than 100 pathways, 90 vehicle technologies, and 10
aircraft classes. The model is being used by more than 20,000 users worldwide, spanning academia,
industry, and government organizations, and it is publicly available for free download from the GREET
website.
Water use is an emerging category of interest to LCAs of alternative fuels because the production of most
energy feedstocks and fuels requires significant water use. Fossil feedstock sources such as natural gas,
crude oil, and oil sands require significant volumes of water for extraction. Similarly, biofeedstocks such
as corn and cellulosic biomass need water for growth. Converting these conventional feedstocks and
biofeedstocks to fuels requires additional energy and water consumption. For example, producing
electricity at thermal power plants requires a substantial amount of water to cool the equipment and
complete the power cycle.
Competing fuel production pathways can strain available water resources and raise the potential of water
supply and demand imbalance at a regional level. Addressing the potential regional imbalance requires
the examination of the growing needs for water use in different energy production systems. With recent
support from BETO, ANL has been examining water withdrawal and consumption for biofuel production
pathways, electricity generation systems, and crude oil pathways. In addition, ANL‘s water footprint
analysis for BETO examines the impacts of fuel production pathways on potential regional water stress.
These include fresh surface water and groundwater (also known as ―blue water‖), rainfalls (also known as
―green water‖), and water required to dilute pollutants to meet specific quality standards (also known as
―grey water‖). The gaps in water use analysis include water use for certain energy feedstocks that were
not examined in depth such as natural gas, coal, nuclear, and crude oil. Other gaps include water use for
hydrogen production processes of interest to EERE‘s Fuel Cell Technologies Office. Water use can be
gradually added to the current LCA assessment metrics within the GREET model (e.g., energy use, GHG

The Water-Energy Nexus: Challenges and Opportunities June 2014
175
emissions, and CAP emissions). The life cycle water use will be established initially for production
processes of fuels that are commonly used as feed or fuel in pathways within the GREET model (e.g.,
electricity, diesel, and natural gas) and can be followed by implementing water use LCAs for fuel
products that are of interest to other DOE technology programs.
Figure 6.17. GREET is an LCA model that evaluates the environmental impacts of alternative transportation fuels and vehicle technologies (Center for Transportation Research 2013). Source: ANL, n.d.
Scenario development and use has critical implications for planning and decision making and is also a
major component of science. Recognizing the uncertainties inherent in models, in particular models of
the Earth system with extremely long time horizons, and for human systems over centuries or more, it is
critical to understand projections in the context of potential ranges, and the ―fat tails‖ of distributions, as
well as the central tendencies. Both quantitative and qualitative scenarios frequently help bridge the
divide between projection uncertainty and meaningful interpretations of the data for various user
communities. Even within the research community, and for research applications, scenarios are important
tools. For example, scenarios for both emissions and land use are key outputs from IAMs that drive the
climate models in CMIP, underlying the core modeling runs in both the IPCC and for the U.S. National
Climate Assessment. DOE has considerable experience in scenario development, with its researchers
participating as central architects of the CMIP process and serving as one of the four main teams

June 2014 The Water-Energy Nexus: Challenges and Opportunities
176
contributing to the scenario modeling runs. Additionally, DOE is co-leading and/or participating in
various interagency efforts through the U.S. Global Change Research Program (USGCRP 2013) that
address scenarios of human systems and socioeconomic change and climate and environmental change.
6.3.5 Data Management, Computation, Software, Observations, and the User Interface
DOE has extensive experience in managing large data sets for analyses at the energy-water nexus. In
particular, DOE provides data management, analytics, and accessibility for such diverse observational and
model data as the following:
1. Energy systems and technologies, from data maintained by EIA to the many separate data systems
maintained for programmatic interests in hydropower, biofuels, geothermal, thermoelectric cooling,
grid reliability, and more.
2. Water, surface-atmosphere fluxes, river routing, and subsurface, including groundwater from some of
the programs identified above, as well as subsurface science, integrated assessment research,
terrestrial and ecosystem science, atmospheric sciences and radiation measurement, and Earth system
modeling.
3. Global and regional Earth system information, including climate data from regional and global
analysis, Earth system modeling, integrated assessment modeling, and the Earth System Grid
Federation.
4. Population and land cover from security, vulnerability, and siting research.
Additionally, DOE is a principal steward for the Earth System Grid Federation and the distributed data
sets that underlie CMIP, providing the major foundations for Working Group I of the IPCC. DOE also
invests in Ultrascale Visualization Climate Data Analysis Tools (UV-CDAT), a tool developed for model
data manipulation, analysis, and visualization to manage, access, and interpret very large data sets.
Beyond these various tools, DOE also maintains databases specifically tailored to regional energy-water
use, for example in the Western states, and remote-based systems such as LANDSCAN that can provide
insights into population, land use, the built environment, and more.
DOE also has experience in developing data ―crawler‖ and accessibility tools to manipulate and analyze
diverse information sets in more synthesized ways. Such integrated capabilities enable the combined
analysis data maintained across several agency platforms. This will prove a critical diagnostic
interoperability because many of the key hydrological data sets are resident on other agency data systems,
while more of the energy-related data systems exist within DOE. Data quality, consistency, and gaps
should not be underestimated and will be a major challenge. Such an effort at integration will begin to
highlight and focus efforts on those issues, responding to user needs.
In a recent activity, a modest collaboration with the National Oceanic and Atmospheric Administration
(NOAA) Weather Services led to the first, use-inspired visualization tool for access and visualization of
DOE-generated climate model outputs, CMIP ensemble outputs, and observational data, the latter
maintained by NOAA. It is important to recognize that accessibility and visualization has two
dimensions—tools for scientists and the producers of the information and toolsets for other users, such as
planners, analysts, and science translators. For much of DOE‘s climate-related activities, toolsets have
been principally aligned for the former, thus creating a need to provide accessibility and utility to a
broader range of mission-oriented users. DOE expects to maintain and critically extend present work,
whereby diagnostic tools developed in the DOE open-source framework (for climate) will be made
readily available to both public and private entities. The hope is that these tools, embodied in a free

The Water-Energy Nexus: Challenges and Opportunities June 2014
177
repository, will empower easier access to federated diverse data sets. Presently these tools exist for
climate-scale data; however, the hope is to have these extended to other users such as land-use
professionals and ecologists.
Figure 6.18. illustrates DOE‘s capabilities in managing data and tools for analysis. The evolving DOE
Earth System Grid Center for Enabling Technologies provides climate researchers worldwide with access
to the data, information, models, analysis tools, and computational resources required to make sense of
enormous climate simulation data sets.
Figure 6.18. Evolution of the DOE Earth System Grid Center for Enabling Technologies Source: Williams et al. 2007
DOE has been a major supporter of the computational facilities required for all of the previously
discussed modeling systems, all of which are computationally intensive. A dedicated high-performance
computer, named Evergreen, was funded under the American Recovery and Reinvestment Act for use by
the IAM community. With emerging capabilities in analyzing issues at the E-W-L interface, even if
constrained by progress and challenges in multi-scale simulation, there have been notable
accomplishments. In one example, a collaboration across organizational elements under SciDAC, a
project on Predicting Ice Sheet and Climate Evolution at Extreme Scales (PISCEES) is developing better
computer models of large ice sheets to improve future sea level rise projections (Leng et al. 2013). In
particular, multi-scale formulations of ice sheet dynamics are being implemented to represent the wide
range of spatial scales in a robust, accurate, and scalable manner. In addition, PISCEES scientists are
creating new tools and techniques for validating ice sheet simulation results against observations and
providing estimates of the uncertainty surrounding future projections. Such research and improved

June 2014 The Water-Energy Nexus: Challenges and Opportunities
178
insights into sea level rise have important implications not only for infrastructure vulnerabilities, but also
for understanding salt water intrusion into freshwater systems.
Figure 6.19. Multiagency capabilities for collaboration on modeling water cycle extremes. Source: Office of Science 2012
6.4 Priorities for Modeling and Analysis
In the interagency environment, DOE has significant ties in modeling and analysis and both leads and
contributes through formal and informal mechanisms such as bilateral and multilateral agency-to-agency
agreements, as well as numerous structured interagency activities. For example, DOE is a significant
participant in such as the U.S. Global Change Research Program; the Committee on Environment, Natural
Resources, and Sustainability; and the IPCC. Notably, several interagency working group activities are
increasingly focused on water and integrative modeling and scenario development, and DOE figures
prominently as a partner in these activities.
As previously noted, DOE has conducted numerous workshops in recent years to develop grand
challenges for research. A a recent DOE workshop on ―Community Modeling and Long-Term

The Water-Energy Nexus: Challenges and Opportunities June 2014
179
Predictions of the Integrated Water Cycle‖ reflected a major effort toward an interagency approach for
this important subject area. Figure 6.19 illustrates some of these connections and Figure 6.20 illustrates
an example of the output from one such workshop that helped inform DOE and broader research efforts in
modeling and analysis. Participants analyzed six major topics and the corresponding white papers and
consolidated their thoughts around three science grand challenges. Additionally, the participants
identified separate integrative modeling experiments that could serve as foci for channeling progress on
crosscutting elements and to robustly test and advance modeling capabilities in a defined application
environment.
Figure 6.20. Output of a recent DOE workshop on modeling and analysis of the integrated regional water cycle, consolidating thoughts around three grand challenges. Source: Office of Science 2012
Based on a stakeholder engagement process and this deliberate department-wide planning process, five
key priority areas for modeling and analysis have been identified for activities at the E-W-L nexus. These
are designed to generate information and insights relevant to user needs as well as advance fundamental
understanding in key areas of inquiry. They are also intended to build from and extend existing
capabilities.
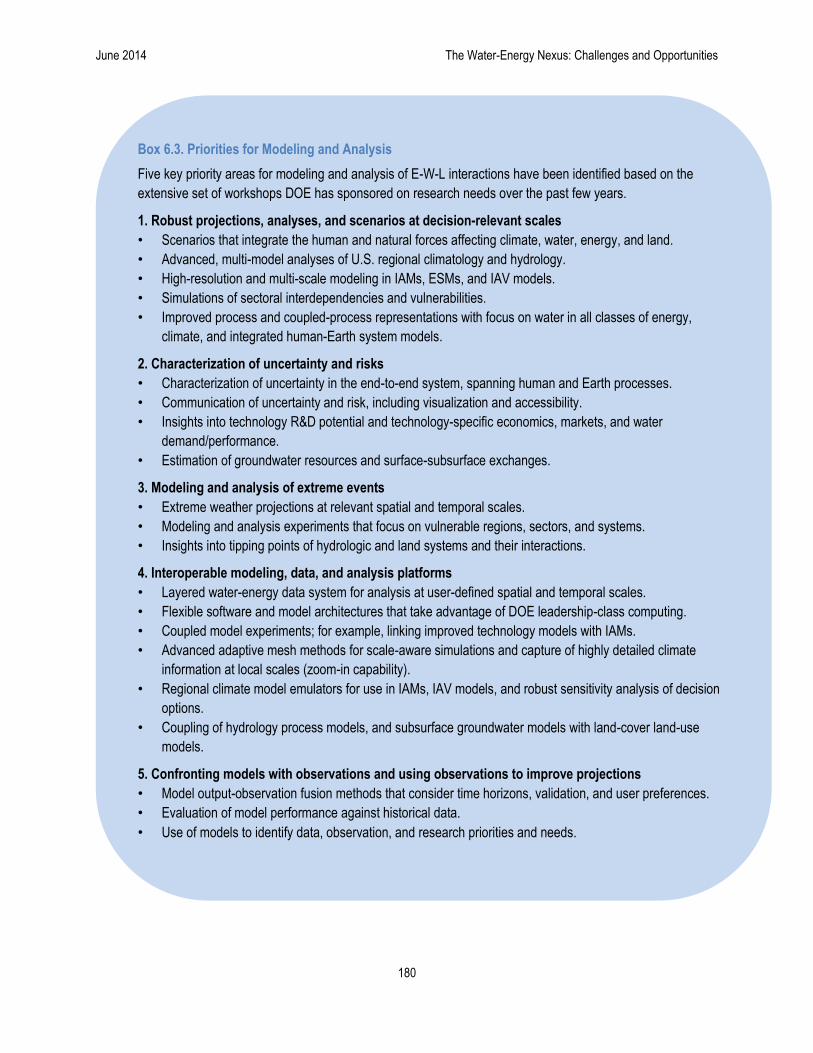
June 2014 The Water-Energy Nexus: Challenges and Opportunities
180
Box 6.3. Priorities for Modeling and Analysis
Five key priority areas for modeling and analysis of E-W-L interactions have been identified based on the
extensive set of workshops DOE has sponsored on research needs over the past few years.
1. Robust projections, analyses, and scenarios at decision-relevant scales
• Scenarios that integrate the human and natural forces affecting climate, water, energy, and land.
• Advanced, multi-model analyses of U.S. regional climatology and hydrology.
• High-resolution and multi-scale modeling in IAMs, ESMs, and IAV models.
• Simulations of sectoral interdependencies and vulnerabilities.
• Improved process and coupled-process representations with focus on water in all classes of energy,
climate, and integrated human-Earth system models.
2. Characterization of uncertainty and risks
• Characterization of uncertainty in the end-to-end system, spanning human and Earth processes.
• Communication of uncertainty and risk, including visualization and accessibility.
• Insights into technology R&D potential and technology-specific economics, markets, and water
demand/performance.
• Estimation of groundwater resources and surface-subsurface exchanges.
3. Modeling and analysis of extreme events
• Extreme weather projections at relevant spatial and temporal scales.
• Modeling and analysis experiments that focus on vulnerable regions, sectors, and systems.
• Insights into tipping points of hydrologic and land systems and their interactions.
4. Interoperable modeling, data, and analysis platforms
• Layered water-energy data system for analysis at user-defined spatial and temporal scales.
• Flexible software and model architectures that take advantage of DOE leadership-class computing.
• Coupled model experiments; for example, linking improved technology models with IAMs.
• Advanced adaptive mesh methods for scale-aware simulations and capture of highly detailed climate
information at local scales (zoom-in capability).
• Regional climate model emulators for use in IAMs, IAV models, and robust sensitivity analysis of decision
options.
• Coupling of hydrology process models, and subsurface groundwater models with land-cover land-use
models.
5. Confronting models with observations and using observations to improve projections
• Model output-observation fusion methods that consider time horizons, validation, and user preferences.
• Evaluation of model performance against historical data.
• Use of models to identify data, observation, and research priorities and needs.

The Water-Energy Nexus: Challenges and Opportunities June 2014
181
The five major areas, detailed in this section, are the following:
1. Robust projections, analyses, and scenarios at decision-relevant scales
2. Characterization of uncertainty and risks
3. Modeling and analysis of extreme events
4. Interoperable modeling, data, and analysis platforms
5. Confronting models with observations and using observations to improve projections
These topics are identified and contained in Box 6.3, along with illustrative examples of key sub-topics.
Collectively, they form a basis for directing existing resources and, in some cases, identifying priorities
for new funding needs.
Achieving these objectives will depend on continuing advances in basic science, analysis, and modeling
as well as linkages and further development in applied modeling and analysis. These priorities are a
necessary complement to ensure that the nation can fully take advantage of the growing understanding of
how human activities and Earth systems affect one another. Experience suggests that, in directly
addressing problems users face, there are strong feedbacks in terms of informing where advances in more
basic research would have high payoff.
6.4.1 Robust Projections, Analyses, and Scenarios at Decision-Relevant Scales
Increasingly, decision makers require information about global change that is not limited to climate
change. Factors that often influence climate change are similarly impacted by climate change. Socio-
economic, environmental, and climate-related scenarios are needed that address a broad range of energy-
water planning needs. For example, interagency working groups identified population/migration, land-
use/land-cover change, and regional economics as key areas for which improved quantitative and
qualitative scenarios are needed. Climate is often examined as just one stressor as part of a more
integrated planning process involving humans, engineered systems, and natural systems and resources.
With respect to climate-related scenarios and as an overarching theme, future developments need to focus
on greater spatial resolution, greater integration, and long-term projections. Projections must incorporate
not only long-term forcing factors, but also drivers that may have equally or larger effects in the next 5 to
30 years, the period of most interest for users. The sequential nature of water use is another important
consideration, especially for water modeling scenarios. Contingent use aspects involve an
upstream/downstream consideration because downstream water quality is affected by upstream uses.
Water quantity, quality, and timing are often important factors for surface water and groundwater users.
In terms of spatial resolution, resource management and investment decisions need site-specific
information, but even the most highly resolved global climate models (GCMs) remain relatively coarse.
The demand for information on the nature and scope of climate change at the local and regional levels is
growing exponentially in both the scientific and decision-making communities. Overall, the supply of
this information and the quality control mechanisms evaluating what has been produced are falling further
behind this growing demand by the day. However, DOE is currently investing in adaptive mesh.
Additionally, comprehensive comparison of various modeling methodologies and existing projection data
sets has been sparse. Entities conducting local assessments—whether for energy resilience, water supply,
public health, coastal management, or other sectors—must essentially use an unsorted array of often
contradictory information to assess vulnerability.

June 2014 The Water-Energy Nexus: Challenges and Opportunities
182
In addition, potentially valuable approaches are being left on the table. The use of Regional Climate
Models (RCMs) to downscale native GCM output, despite having potential advantages over statistical
methods, has been the subject of only limited investment in the United States. Nevertheless, no
projections using RCMs exist for the contiguous United States at a resolution higher than 50 kilometers
(km), except for a handful of individual, uncoordinated experiments developed primarily at universities.
In contrast, European, Canadian, and East Asian modeling centers have been coordinating development of
these projections for several years and are currently producing output using multiple RCMs and an
ensemble of GCMs at a resolution of 10 to 12 kilometers and less. One promising approach could be the
structured model comparisons described in Box 6.4.
Box 6.4. RMIP and Multi-Model Analysis Methods for Projections and Scenarios for U.S. Regional Climates
Model intercomparison projects have proven to be important ways to structure interactions and compare models, revealing differences and driving research forward to understand these differences while producing data products of broad use. The World Climate Research Programme’s CORDEX has been designed to advance regional modeling skills tied to global modeling prediction capabilities. To date, the United States has not become an active participant.
A U.S. Regional Modeling Intercomparison Project (USRMIP) has been contemplated with similar goals to CORDEX, but it is also envisioned to go beyond CORDEX protocols in several important ways.
• First, mirroring and learning from the work already being done in Europe and Canada, it will target
higher spatial resolution output than the 50 km called for in CORDEX—as elsewhere, this might reach
10–12 km spatial scales for the conterminous United States and higher resolutions (cloud permitting,
cloud resolving) for selected regions.
• Second, important work is currently being done at global modeling centers in the United States and
elsewhere to advance higher-resolution runs using coupled GCMs, ESMs, and atmosphere-only
models with prescribed sea surface temperature (SST). These efforts offer opportunities to compare
higher-resolution outputs directly from GCMs with those produced using nested RCMs and those
using statistically downscaled products in a comprehensive RMIP. The project will compare
projections resulting from this dynamical downscaling experiment with statistical downscaling data sets
currently in use in the United States in order to discern the comparative advantages of each approach
for different purposes, for different parameters of interest (e.g., precipitation versus temperature), and
at different costs.
• A final, major opportunity exists to incorporate human influences at regional scales, including land
cover, water use, and technology pathways, to better understand and project the direct, local effects
on microclimates and regional weather patterns.
Discussions with water utility users have indicated that the 10–12 km spatial scales that might be the focus of such an activity are essential for water management districts and the range of potential community planning uses at the water-energy nexus. Building from this new capability, USRMIP has the potential to move U.S. scenario-building capabilities even further by working to reconcile and build on both model- and observational data-driven approaches, recognizing that both bring different and complementary strengths and respond differently to various users’ needs.

The Water-Energy Nexus: Challenges and Opportunities June 2014
183
An integrated regional modeling intercomparison project (RMIP)/Coordinate Regional
Downscaling Experiment (CORDEX) program has the potential to provide for the first time in the
United States a comprehensive comparison of the three leading techniques for producing climate change
projections—dynamical downscaling, statistical downscaling, and high-resolution general circulation
models. Such an effort could substantially advance the science of regional-scale modeling and, in the
process, offer enhanced clarity to decision makers regarding the availability, nature, and value of climate
projection tools to meet burgeoning assessment needs. Complementary modeling approaches using
GCMs with regional models or statistical and synoptic approaches can provide more resolved
projections.
In terms of relevant time scales, very short-term forecasts and projections in the minutes-to-days-to-
months timeframe use very different methods than projections in the decades-to-centuries time frame.
The former often rely heavily on data assimilation. Longer-term projections require incorporation of
processes that can change and respond to climate forcing. Human systems are inherently local and
regional in scales, but their individual and collective influences can span local to global scales through
exchanges with the atmosphere, land, and ocean. The influences extend to less readily measured, but
equally significant, transfers of water within human systems such as the virtual water trade.
An important challenge for modeling the coupled human-Earth systems is addressing the multi-scale
aspects introduced by human systems. Modeling approaches such as nested, global high-resolution, and
variable-resolution models offer telescoping capability to the very fine resolutions where human systems
and their impacts may be more realistically simulated, but the relative merits of these different approaches
remain to be evaluated. Figure 6.21 presents a schematic showing the characteristic space-time scales of
atmospheric processes, terrestrial processes, and human systems in the integrated water cycle. These
processes span a continuum of scales in both space and time, with significant overlaps among the
processes of the three systems.
Figure 6.21. Characteristic space-time scales of atmospheric processes, terrestrial processes, and human systems in the integrated water cycle. Source: Office of Science 2012

June 2014 The Water-Energy Nexus: Challenges and Opportunities
184
A particular challenge for forecasts is the intermediate term of 5 to 30 years, which is most relevant
for investment and planning decisions. Many climate and impacts assessments have focused on 50- or
100-year projections, where the signal of climate change clearly rises out of the noise of natural climate
variability (Paltsev et al. 2013). While important for understanding the long-term implications of global
change, few investment and management decisions that need to be made today are strongly dependent on
the very long term. This intermediate time period likely needs development of new approaches that can
provide realistic scenarios. The 5 to 30 year horizon needs to be a critical focus.
With respect to spatial scale, new adaptive mesh methods are under development to allow global
models to “zoom in” over regions of interest, preserving the large-scale dynamics while also
providing highly detailed climate simulation at local scales. Figure 6.22 depicts a Community
Atmosphere Model—Spectral Element (CAM-SE) (atmosphere) model mesh that is 1 degree outside and
⅛ degree resolution inside, with smooth transition. It is the setup used for a project centered over DOE‘s
SGP ARM site. The default version uses the same physics across the mesh, but advancements underway
may allow ―scale-aware‖ cloud parameterizations to work across scales. This ―zoom-in‖ capability, if
successful, will have broad applicability to other component processes and systems. This is a significant
capability advanced by DOE, and new methods such as this may better incorporate regional energy, land-
use, and economic factors.
Figure 6.22. CAM-SE (atmosphere) model mesh. Source: Taylor et al. 2012
A challenge for integration, especially for the forecast period of 5 to 30 years, is how best to incorporate
multiple forces of change that will affect specific users and the investment choices they make. Over a
period of 50 or 100 years, and given the current trajectory of changes in emissions and other forcing
agents, CO2 and other long-lived GHGs are likely to be the dominant forcing agents that affect global
climate means. However, over the shorter term, regional and local changes in aerosols, land cover, and
urbanization can easily be more important in determining the regional and local climate. A large volcanic

The Water-Energy Nexus: Challenges and Opportunities June 2014
185
eruption that delivered reflective aerosols high in the atmosphere could easily lead to significant cooling
for one or two years. Changes in land cover and in the local demands for water are likely to have much
greater effects on overall water supply and quality. Scenarios and advice based only on scenarios with
long-lived GHGs or even adding the radiative effects of aerosols almost certainly will be misleading. If
incomplete scenarios are used and proven wrong, confidence in the process will be undermined.
Integrated, multi-sectoral analyses are needed to project changing demands and resource
availability. Models and scenarios need to continue and expand their emphasis on E-W-L interactions
and technologies that are or could be used. The tremendous progress made in this area over the past
several years still falls far short of what users require. While energy production requires significant water
resources, collection and distribution of water for human and irrigation needs requires significant amounts
of energy. Additionally, irrigation of biofuels will require energy for water supply, land preparation,
agricultural chemical production and application, and harvesting and delivery. Energy for water
modeling needs to be better incorporated in existing technology models in IAMs, RIAMs, and other
model systems.
Further developments would also incorporate greater detail on E-W-L connections; for example, on water
use by the electricity sector (Baker et al. 2013; Arent et al. 2013). CIDM includes details on all
infrastructure in the United States and could utilize economic, climate, and water runoff scenarios from
IAMs and RIAMs to assess future vulnerability. Further development of these linkages—either as fully
coupled models or as soft connections—and working with the IAV community are high priorities for
developing improved methods for assessing impacts, adaptation, and vulnerability that would be useful to
the private sector and to states, regions, and communities. Efforts need to incorporate technological
descriptions of both how water is needed for energy production and how energy is needed for water
supply for current technologies and for technologies that may become important for the future.
Ultimately, a strategic energy-water analysis capability at DOE would necessarily involve the
creation of robust scenarios. Associated efforts would advance the fundamental approaches to scenario
formulation, projections and insights that underpin the scenarios, and specific tools for analysis and
communication of scenarios. Such an undertaking can benefit from interagency collaboration. The
scenarios themselves can serve the analytic needs of many agencies, working from consistent scenarios
improves analysis across agencies, and the scenarios themselves are strengthened by the disciplinary
expertise of each agency. DOE has helped to motivate the recent formation of an interagency working
group that has led to discussions on needs, opportunities, and potential paths forward. Additionally, the
Sankey diagram presented in Chapter 2 (Figure 2.1) has been used to characterize present energy
and water flows and their interactions. One significant, untapped resource may be using these
diagrams to analyze and visualize scenarios of regional change, underpinned by deep data- and
model-driven analyses.
6.4.2 Characterization of Uncertainty and Risks
Even small numbers of simulation runs using large ESMs tax supercomputer capabilities. However,
effective quantification of uncertainties requires large ensembles of simulations to map out the full space.
This type of effort also requires attention to the structural uncertainty of different models as well as to
parametric uncertainty. Finally, it requires a modeling strategy intended to explore the full range of
possible outcomes given the knowledge of processes that contribute to change.

June 2014 The Water-Energy Nexus: Challenges and Opportunities
186
Multiple strategies will be needed to investigate the range and likelihood of different climate outcomes
for decision-relevant time scales. This will, no doubt, include continued development of very-high-
resolution ESMs; application and further development of RCMs; reduced form climate emulators that can
be flexibly benchmarked to more detailed models or archived model simulations; and further integration
of broader economic data, activities, and trends relevant to regional and local conditions and decisions.
Uncertainty analysis must be extended to socio-economic drivers of change. Attention is, again,
especially needed for time frames relevant to users and their decision-making needs—the 5 to 30 year
horizons. Scenarios and projections need to effectively quantify uncertainty at relevant time and
space scales.
Just as important as estimating uncertainty and risks is the effective communication of uncertainty and
risks. Communicating risk is its own specialty and the subject of considerable past and ongoing research,
especially by other agencies such as NSF. However, in a recent example (depicted in Figure 6.23), a risk
communication visual created by MIT received broad media attention (Sokolov et al. 2009). This work
attempts to communicate climate risks using a familiar reference—a roulette wheel. This wheel depicts
their estimate of the range of probability of potential global temperature change over the next 100 years if
no policy change is enacted on curbing GHG emissions. This and other effective tools for
communicating uncertainty and risks must be developed to simplify and express the essence of
complex scientific findings (Monier et al. 2013a; Schlosser et al. 2013; Webster et al. 2012; Prinn et
al. 2011). However, the tools and techniques may need to be contextualized for the various users and
parameters of interest at the water-energy nexus.
Figure 6.23. The MIT ―roulette wheel‖ depicting the range of probability of global temperature change over the next 100 years if no policy change is enacted on curbing GHG emissions. Source: MIT Joint Program on the Science and Policy of Global Change.
6.4.3 Modeling and Analysis of Extreme Events
A critical concern is the potential magnification of extreme events in an altered climate or environment
and the impacts and strategic adaptation considerations these events have on the natural and built

The Water-Energy Nexus: Challenges and Opportunities June 2014
187
environments within the E-W-L nexus. Changes in average conditions can alter crop productivity, water
temperatures, and water supply, among other disruptions, but the most severe damages to infrastructure
and production occur when there are climate events that exceed the designed or planned climate
tolerances. Dams and levees are designed to manage floods but only to given flood stage. If the design
tolerance is exceeded, the results can be catastrophic because urban and energy infrastructure has been
developed under the assumption that these structures would provide protection.
Global and regional climate models and ESMs have undertaken deliberate development activities to
improve the representation of extreme events. These are important endeavors toward the reliability of
global and regional climate forecasts. However, in the context of making forecasts ―actionable,‖ many of
these achievements have not aligned sufficiently with the specific information needs of decision makers
and the input (parameters, spatial and temporal scales, etc.) required by complex, science-driven, decision
analysis tools. To date, this is certainly justifiable; IAMs and IAVs have only recently become mature
enough to warrant such consideration.
The pursuit of high-fidelity extreme event simulation should continue under the auspice of scientific
discovery and understanding (Gao et al. 2013b). This type of effort presents a formidable challenge
because it will demand the collection, coordination, and collaboration of observation and model groups to
distinguish and isolate these critical events. Distinguishing and isolating the events will allow researchers
to determine the resiliency, thresholds, and vulnerabilities of natural and built environments to the degree
to which a detectable change must be resolved in order for an altered decision to be warranted. These
considerations must also consider the fact that, as existing managed and built systems expand and new
infrastructure is deployed (under adaptation or policy incentives), the extreme events and conditions that
these systems are vulnerable to will change. As such, climate models and ESMs must target efforts to
improve the fidelity on extremes that matter now and in the future under an array of possible socio-
economic pathways and development (Monier and Gao 2014). The Earth-system, climate, economic, and
infrastructure/engineering systems communities are now poised to take on this next challenge. Federal
agencies must cooperate to facilitate integration across these communities and target research and
development on the extreme events that matter most to decision makers.
6.4.4 Interoperable Modeling, Data, and Analysis Platforms
Modeling around climate and climate change has proceeded to a large extent as a research tool. As it
moves toward application, there is a need for increased recognition and focus on real, every day decisions
that determine the construction and maintenance of infrastructure that may last for decades, whether it be
the height of bridges and seawalls, the storm resilience of the energy grid, the integrity of water systems
under floods and drought, and vulnerabilities spanning dependencies across such systems. Modelers
cannot wait for years to perfect projections, and there will always be unresolvable uncertainties. Thus,
modeling, and analysis efforts must focus on ways to represent uncertainties and ensure that users can
take advantage of results from the multiple tools available.
The modeling community must (1) develop flexible models capable of producing large ensembles to
quantify uncertainty; (2) develop modeling platforms for structured collaboration across
disciplines, modeling groups, and federal agencies to compare, link, and evaluate models and
results; (3) focus on greater compatibility among models and model platforms to accelerate the
development of modeling capability and facilitate use and integration of different models; and (4)

June 2014 The Water-Energy Nexus: Challenges and Opportunities
188
work toward more standardized, modularized software architecture to allow for reassembly and
exchange of model components to better understand structural uncertainties.
To focus on impacts and adaptation in the E-W-L space, a specific focus is warranted on integrating
subsurface water and groundwater into integrated E-W-L models and including IAM feedbacks (water
and land use) into regional climate and hydrological models (regional integrated water cycle models).
The hydrologic dimensions represent a formidable, unfunded challenge. Interests and opportunities are
high, and the science community has outlined a bold research vision in a recent report, Community
Modeling and Long-Term Predictions of the Integrated Water Cycle, from a workshop held September 24
to 26, 2012, in Washington DC (Figure 6.24). The workshop‘s results outline a bold vision for modeling
the coupled human-Earth system and the regional integrated water cycle, built around ESMs; IAMs;
subsurface and hydrology models (including groundwater); and new multi-scale methods for simulating
regional hydrologic cycles, water supply, and demand. Important to this coupled system perspective is
the ability to examine the influences of changes to energy, water, and land systems over time, as well as
their feedbacks to U.S. subregional climate and weather patterns due to soil moisture, albedo, aerosols,
and other significant feedback processes.
The goal of the workshop was to identify challenges and plan the development of next-generation human-
Earth system models for improving long-term projections of the regional-scale integrated water cycle.
The workshop charted a path forward for synthesizing components in new and directed ways and
developing essential new model features and capabilities. The workshop also delivered transformational
insights into long-term, climate-influenced regional water resources and energy, water, and land systems
interdependencies and dynamics. It also informed the observational communities about the needs for new
data that will enhance community modeling capabilities. From the key topics and science grand
challenges came crosscutting modeling needs and the idea for several integrative modeling experiments.
Figure 6.24. Community Modeling and Long-Term Predictions of the Integrated Water Cycle: Results from the September 2012 DOE-led science community workshop. Source: Office of Science 2012

The Water-Energy Nexus: Challenges and Opportunities June 2014
189
Having an application and user focus to the research requires a somewhat different set of research
strategies than pure basic research. The broader stakeholder and user community requires the ability to
combine different models of varying resolution and detail depending on user needs. This community
requires tools to analyze and visualize results. Models and results must be broadly accessible to users and
stakeholders.
Accessibility also reinforces the credibility of modeling and analysis platforms by allowing the broader
research community to use, evaluate, and assess the platforms. Model interoperability, tools for analysis
and visualization, and open access are important for speeding research and improvement. Even with a
continuing strong focus on knowledge creation within the research community, that knowledge and the
feedback of information needs take on greater significance and relevance to the extent that the results can
be assimilated and used by the broader community of federal resource management agencies, state and
local governments, and private-sector decision makers.
Transformational data management, analysis, and visualization tools are needed. A substantial new
opportunity exists in creating a layered, federated information system for research, analysis, and decision
making at the energy-water nexus. Model projections and observations as well as a host of other data
would be accessible and layered by sector and/or topic, including in-place energy and water
infrastructure; energy and water demands; stream flows and temperatures; land surface temperatures;
groundwater resources; climate projections and scenarios; and model and observational topics pertaining
to socioeconomic change—population/migration, land use and land cover, energy demands and supplies,
water demands and supplies, and evolving regional economics.
Visualization tools and analysis software are needed that will speed up and improve the analysis of data—
both model output and observational data—helping researchers understand and communicate the insights
and implications of more integrated analysis efforts. DOE‘s approach and adherence to an open-source
diagnostic library will help diverse user communities. The federated approach will provide seamless
access to key DOE entities and select components of other agency and information systems (which is
particularly important for the distributed data on water), providing substantial leverage for current
investments. A key feature would be the layering and flexible access and analytics at user-defined spatial
and temporal scales. These comprehensive tools will allow central access to the most commonly required
information at the energy-water nexus, allowing rapid translation of massive data to understandable
forms. Such tools would aid in exploring systems dynamics and sensitivities, uncertainty
characterization, development of model- and data-driven case studies, and analysis of results from studies
of policies and options.
There is an increasing need to accelerate model interoperability to answer the pressing questions at
the water-energy nexus. The scope of models is rarely neatly arranged so that outputs of one model are
direct inputs of another. Climate models may include land surface models and produce runoff, while
water resource modeling may have its own land surface model.
Spatial and temporal scales vary greatly. IAMs often perform calculations at 5- or 10-year intervals at
national or regional levels, while technology models need annual, monthly, or hourly data. Water models
focus on river sheds. Economic models may represent the electricity sector, but not with the detail of a
model focused on renewable generation. Linkage may require iteration to achieve consistency of variables
such as demand and supply or prices in each component.

June 2014 The Water-Energy Nexus: Challenges and Opportunities
190
Fundamentally, a new suite of multi-scale and multi-physics modeling architectures and analysis tools is
required to establish a more complete and seamless approach to modeling the regional hydrological cycle.
The need for a transformative approach has been widely recognized by the hydrological community,
which has been trying for many years to gain support for the development of a community hydrological
modeling platform (e.g., the Consortium of Universities for the Advancement of Hydrologic Science, Inc.
[CUAHSI] Community Hydrologic Modeling Platform [CHyMP]). However, the scope of the project has
exceeded the resources that are available across the relevant agencies. Furthermore, the development of a
new suite of multi-scale and multi-physics modeling architectures and analysis tools is a computational
science grand challenge that extends far beyond modeling hydrological processes. Such a large
investment in a new modeling framework could be developed within the context of the entire integrated
Earth system, and it should serve the needs of a broad community of scientists, modeling disciplines, and
decision makers.
As illustrated in Figure 6.25, the new architectures should be modular and hierarchical, enabling
interoperability and extensibility. These frameworks could form the basis for the development of a more
seamless approach to detailed process models spanning energy, water, and land, providing more plug-
and-play capabilities tailored around specific information needs and scales of interest. Corresponding
analysis tools would provide increased productivity and agility, leading to more robust uncertainty
quantification.
Figure 6.25. Potentially transformative architectures and analysis tools: Modular, interoperable, extensible, agile, easy to use.
These new architectures will provide a common framework to integrate top-down and bottom-up
developments (modules) so that scientists and scientific communities (e.g., hydrologists, climate
scientists, integrated assessment modelers, and bio-geochemists) can work in parallel across a wide range
of scales and processes. The new architectures and tools will also enable a graded approach to
understanding the system structure and function, to iteratively assess how much mechanistic detail or
resolution is actually necessary to capture the system behavior, or to answer specific questions about the
system structure and function. Furthermore, the new modular and hierarchical architectures will enable
the development of improved parameterizations (reduced physics formulations) and agile testing of these
formulations within the modular framework. Lastly, a common set of modeling and analysis tools will be
available to a broad community of scientists and practitioners to use for basic and applied science as well

The Water-Energy Nexus: Challenges and Opportunities June 2014
191
as decision support. Such capabilities could conceivably transform the largely separate work of the
energy, water, and land modeling and analysis communities.
This is a grand vision that requires a phased approach to model development in which an integrated team
of domain scientists and computer scientists works together to design and develop the code through
scientifically driven use cases. Advancing the predictive understanding of the terrestrial hydrological
cycle through such a framework provides a compelling use case to drive these model developments and
advance the understanding of the integrated water cycle.
There are a number of challenges to achieving these goals. Research teams have deep knowledge and
experience with different software platforms, and retraining them or reprogramming complex models in
common language is demanding, time consuming, and costly. Additionally, computer programming
specialists may be able to convert and link code, but identifying what variables to link and how they need
to be transformed requires technical expertise. It is a large coordination effort to get many different
communities with different modeling traditions to agree on common platforms and data standards.
DOE needs to ensure the accessibility of decision-support tools, models, and data. As previously
stated, broad access by the research community is essential for speeding the development of models and
data systems and creating credibility. Broad access allows users to develop use-specific scenarios and
analyses. Specific needs include open-source community modeling; accessible, multi-scale, geospatially
referenced E-W-L data; and other use-inspired ways to access models, data, analysis (e.g., sector,
technology, application, spatial, and temporal), and central access points with a web presence as a
gateway to available resources.
With respect to the development of effective user interfaces, research-focused efforts will rarely allocate
scarce funds to the design and implementation of broad user interfaces, accessibility, or visualization
tools. For this topic, it is critical—today more than ever—that the research community provides funds for
experts with specialized skills in human-computer interaction to be integral parts of research teams for the
design of such tools. The scale of the effort is similar to when major commercial software developers
release complex software that must work on multiple platforms without major bugs as well as be broadly
usable by the targeted customer base. An expansive diagnostic toolset that has been tested and validated
will be of use to both the public and private sectors.
6.4.5 Confronting Models with Observations and Using Observations to Improve Projections
Data and observational needs are significant across all of the proposed activities, including the following
broad areas:
Hydrological/climate data
Water supply
Water demand
Managed water resource systems
Extreme events
Socioeconomic data (e.g., population/migration, land cover and land use)
Energy systems and technology data (including infrastructure connections and urban systems)
It is important to note that potential users of model scenarios and projections are also direct users of
historical data and trends. At some level, the fact that many planners and local assessments still base
most of their decisions on analysis of historical data and trends is evidence of the remaining challenges

June 2014 The Water-Energy Nexus: Challenges and Opportunities
192
for the modeling community in producing ―actionable‖ projections. Strzepek et al. (2012) and Blanc et al.
(2013) recently discovered a number of gaps and discrepancies in E-W-L data sets from different U.S.
government, nongovernmental organization, and commercial databases. Efforts to improve and
harmonize E-W-L data are vital for accurate models and insightful policy assessments.
Confronting models with observations will potentially reveal projection usefulness (as measured by their
realism in simulating past and present-day climates). Inadequacies will likely suggest avenues for
parameterization improvement and/or the inclusion of missing mechanisms. Data assimilation methods
used in weather forecasts need to be widely adopted by climate and IAM modeling where the models are
adjusted by assimilated data. The intent is to run the model over a known period and adjust it back closer
to observations via assimilation. At some point, the model generates a forecast (that is not adjusted) and,
through examination of the rapid divergence of variables of interest in the model compared to
observations, helps to pin-point model physics deficiencies. One specific approach is the use of formal
Observing System Simulation Experiments (OSSEs) (Box 6.5).
Hydrological/Climate Data
The hydrologic cycle has been observed extensively at the local watershed level for more than a century,
and within the past century the deployment of routine and targeted in situ methods (i.e., rain/river gauges,
eddy-flux towers, airborne remote sensing) has provided information relevant to operational,
management, and research needs at the field, river basin, and continental scales. Within the past few
decades, the ability of researchers to monitor the continental global water and energy cycles has advanced
through the growing wealth of satellite information and data-assimilation methods. Coordinated efforts to
measure a common set of variables over a particular region and time period across all of these monitoring
Box. 6.5. Observing System Simulation Experiment (OSSE)-type modeling and data studies
OSSEs are structured experiments designed to identify data that would most improve forecasts, and can
thus by used to optimize data collection and observation networks. An additional value delivered through
integrated modeling is the ability to inform the evolving strategy for the relevant reporting and observing
networks by multiple federal agencies (e.g., DOE, the National Aeronautics and Space Administration
[NASA], NOAA, USGS, the U.S. Department of Agriculture, and EPA).
Models lend themselves to experiments with ―what-if‖ scenarios. For example, what additional physical
measurements and socio-economic data would improve the accuracy of the information provided to decision
makers? Are multiple measurement systems required to avoid the influence of potential biases? Would it
be possible to improve the model framework performance if there were more observations or estimates of
key variables?
These numerical experiments allow quantification of the reduction in uncertainty that may be achievable by
future monitoring systems. The observing system simulation experiments would inform observation system
design by highlighting areas of the world that require increased measurement coverage, identifying new
variables that should be measured, and determining precisions that are required in order for maximum
emission estimate error reduction to be achieved using the fewest additional observations.

The Water-Energy Nexus: Challenges and Opportunities June 2014
193
systems has proven the value of integrated observations—particularly for calibration of satellite retrievals
as well as characterization of environmental variability across scales.
Nevertheless, challenges remain in researchers‘ ability to reliably measure key water-cycle fluxes (e.g.,
evapotranspiration and groundwater recharge) and state/storage variables (e.g., soil moisture, groundwater
storage, clouds, and water vapor). These challenges include the ability to measure these variables to
satisfy water (and energy) balance, whether at the local, regional, or global scale. Further, measurements
of extreme events are plagued not only by limited sample sizes (in time), but also by instrumentation
failure (particularly in the case of in situ instruments) or poor quality in measurements during extreme
conditions (e.g., wind-speed retrievals over oceans during high winds); therefore, monitored data on
extreme events considerably limit the amount and quality of empirical evidence on the nature of extremes
and their impacts. A coordinated effort to improve the resiliency and reliability of measurement
capabilities and targeted efforts to measure extreme events that matter most to the current (and potentially
future) natural, managed, and built environments—while preserving the balance of water flux/storage
exchange—is an area of great opportunity for the integrated E-W-L nexus research community and could
prove a breakthrough in ―actionable‖ information for decision makers.
Water Supply
Analyzing historical natural hydrological conditions with observed data or modeling future conditions
under climate change requires hydrologic data, including stream flow data, that are unaffected by humans.
Human influences include artificial diversions, storage, or other works of man in or on the natural stream
channels.‖ Such pristine data is needed comprehensively for all U.S. watersheds at least at the more than
2,000 HUC8-Level basins. Current USGS stream flow records are for managed or affected flows. USGS
does have a data set—the Hydro-Climatic Data Network—of watersheds with stream-flow record and
little to no human impact, but this data only represents a very small part of the United States. Techniques
exist to develop ―naturalized‖ flows from gauge records, but they are very tedious and labor intensive,
and in many cases the comprehensive data needed is not available in time series form or at all. Such data
sets are needed to calibrate climate and land surface models to better understand how man-made
interventions have affected water flows.
Water Demand
Models of water demand at temporal and spatial scales provide useful information regarding E-W-L
interactions, but they require observations to be calibrated and validated. Data is needed as annual and
monthly time series at a minimum resolution of the USGS HUC8 level. USGS currently produces a
national water use analysis every five years. The data is reported by county, and only for annual water
withdrawals. Formerly, consumption and withdrawal information were reported by USGS at the HUC8
catchment level. In many cases the data is not measured data, but instead derived from models and
measureable drivers such as area irrigated. Data on energy generation and thermal electric cooling
withdrawals, accounting for about half of total U.S. withdrawals, is reported by USGS. However, this
data does not match the DOE database, and only approximately 30 percent of power plants report their
water use data.
Irrigation accounts for 37 percent of total freshwater withdrawals nationally and more than 70 percent in
the 17 conterminous Western states, as reported by USGS. The U.S. Department of Agriculture‘s Farmer
and Rancher Irrigation Survey (FRIS), which is carried out every five years but off cycle with other
USGS reports, provides detailed irrigation data by crop, but it is reported by state. There are some major

June 2014 The Water-Energy Nexus: Challenges and Opportunities
194
differences in the USGS and FRIS data for certain regions, and work is needed to harmonize these data
sets.
Managed Water Resource Systems
Data on the more than 50,000 reservoirs in the United States is now considered classified information,
and security clearance is needed to obtain it. Once obtained, the only available data is on maximum
storage and normal storage; there is no information on dead storage or flood control storage, which is
needed to determine active or usable storage. These data are required physical input parameters for basin
scale management models. In addition, there is little readily accessible data on reservoir operations,
evaporative losses, or releases at any time scale. Design data on the 500 hydropower facilities greater
than 50 MW is available, but there is little data on operation and production. Data on inter-basin transfer
of water resources is very limited.
Extreme Events
Flood control is a very important part of the U.S. water management system, and many large reservoirs
are multipurpose. More information is needed on flood control infrastructure as well as the impacts of
observed floods. The energy system can be highly vulnerable to extreme events such as flooding or
drought. Data obtained during extreme weather events provide baselines against which to test and
evaluate modeled results. It also provides the only means to validate damage functions of engineered
systems due to high winds, flooding, and/or drought conditions (Lickley et al. 2013).
Socioeconomic Data
Water demand is driven by the needs of the population—urban and rural—and the economy for water
withdrawals and consumption. While data does exist for current conditions, information on the location
and structure (urban/rural) of future populations and the location of water-intensive industries and energy-
extracting and -producing facilities, in addition to changes in irrigated areas, is crucial to modeling the
water supply/demand balance, and the E-W-L policy discussion is limited. Additionally, land use and
land cover change is a key determinant in runoff and land-atmosphere moisture exchanges that are critical
for understanding water availability, both surface and subsurface.
Energy Systems and Technology Data
The collection and management of diverse data spanning energy systems, technology, infrastructure
connections (and services), and urban systems in a more seamless and accessible form will serve the
interests of both the research and user communities. DOE maintains large and diverse data systems, but
in discussions regarding the energy-water nexus, it is clear that there are gaps in the data and room to
improve data through common, accessible interfaces. However, it is also apparent that some of the
required information is proprietary, and initial discussions have highlighted the need for acquiring
information through alternative—potentially surrogate—metrics.
Research at the E-W-L nexus ultimately seeks to develop predictive capability that is useful to private-
and public-sector decision makers and resource managers. However, as previously noted, many users
currently base their decisions on observed conditions and recent trends. A key priority is ensuring needed
data is collected and readily available as data products for private- and public-sector uses, in addition to
being available for research and model development. Data for research and direct application can be
highly complementary. In collecting data for research and model development purposes, additional
attention is needed to ensure that the data is generally available and in a useful form. This is undoubtedly

The Water-Energy Nexus: Challenges and Opportunities June 2014
195
a major undertaking, but the potential payoff is enormous. Synthesizing diverse data sets and organizing,
evaluating, and providing appropriate visualization, accessibility, and diagnostic tools for a broad range of
both scientific and decision-relevant uses are grand challenges and priority opportunities for DOE and the
broader data management, monitoring, and observations community
6.5 Summary
The current fragmented approach to model development and data collection, while historically suited to
the individual needs of different organizations within DOE, falls short of the highly leveraged capability it
could represent and is in many ways impenetrable as a collective capability. However, DOE and its
national laboratories have the capability to undertake such a complex, diverse set of computational
modeling and conceptual challenges, and to connect with universities, industry, and other government
agencies.
The ambitious elements of such a program plan include the following:
Improved end-to-end modeling at the E-W-L nexus, from the integrated human-Earth system; to the
natural climate system; to regional water and land resources and dynamics; to implications for
infrastructure, energy, and water systems; and down to the individual technologies and impacts.
A transformational conversion for interoperable modeling through software and computational
architectures that span the many diverse domains of the climate and E-W-L nexus.
More integrated regional hydrology models that encompass groundwater and bring new subsurface
tool sets to bear on regional hydrology.
Advanced analysis and visualization tools for flexible, contextualized studies; decision support;
uncertainty quantification; and scenario development.
Distributed, agile, open-access data systems built to accommodate user needs for flexible spatial and
temporal scaling of model outputs and observational data sets.
The most common theme and compelling need throughout this list of ideas is for a unifying DOE
framework that integrates and synthesizes across model, data, and analytic components. The major
elements and implied challenges are reflected in Figure 6.26. Significant DOE leadership and attention
will be required to achieve this level of integration, interoperability, and connectivity spanning the basic
and applied research domains.

June 2014 The Water-Energy Nexus: Challenges and Opportunities
196
Figure 6.26. An integrating framework for data, modeling, and analysis at the water-energy nexus. Vision of DOE data, modeling, and analysis capabilities working flexibly, and in concert, to provide scenarios, projections, and
data for the needs of the nation.
Additionally, there are significant R&D challenges within each area. The various individual challenges
have been well characterized in many recent reports and through the body of this report. A dedication of
resources and, with it, a dedicated commitment by DOE will be required to transition to a next-generation
capability within each domain and to build the bridges for the integrated framework. The required,
integrated capabilities for robust and accessible data for E-W-L systems are mostly conceptual and will
require substantial effort. There is, however, capacity for rapid development.
The needs of the nation are known, research directions that can help meet those needs have been
identified, and first steps have been taken to realize this vision through the creation of this conceptual
outline and chapter on data, modeling, and analysis. The challenge is to move forward with the resolve
and resources to achieve this vision. In achieving these goals, DOE is well poised with the infrastructure,
intellectual capital, and core competencies to deliver results for this major national challenge. In
particular, DOE can build from the following:
Leadership-class capabilities in managing large, accessible data sets; high-performance computing;
and software architectures.
Substantial, diverse, and highly relevant modeling capabilities.
A multidisciplinary national laboratory complex with major collaborative linkages to university
research centers.
Strong interagency collaborations, existing and emerging.
Partnerships and a history of working with state and local authorities, major industries, and these
entities‘ research components.

The Water-Energy Nexus: Challenges and Opportunities June 2014
197
To elevate this water-energy data, modeling, and analysis framework beyond the concept level,
connections must be made among basic and applied research and operations. This can lead to early
successes, while also paving the way toward more ambitious future undertakings.

June 2014 The Water-Energy Nexus: Challenges and Opportunities
198
References
ANL (Argonne National Laboratory). n.d. ―Vehicle Cycle (GREET 2 Series).‖
http://greet.es.anl.gov/index_files/greet-chart1.jpg.
Arent, D., J. Pless, T. Mai, R. Wiser, M. Hand, S. Baldwin, G. Heath, J. Macknick, M. Bazilian, A.
Schlosser, and P. Denholm. 2013. ―Implications of high renewable electricity penetration in the U.S. for
water use, greenhouse gas emissions, land-use, and materials supply.‖ Applied Energy, in press.
http://dx.doi.org/10.1016/j.apenergy.2013.12.022.
Baker, J., K.M. Strzepek, W. Farmer, and C.A. Schlosser. 2013. ―Quantifying the impact of renewable
electricity futures on cooling water use.‖ Journal of the American Water Resources Association, in press.
Blanc, É., K. Strzepek, C.A. Schlosser, H.D. Jacoby, A. Gueneau, C. Fant, S. Rausch, and J.M. Reilly.
2013. Analysis of U.S. Water under Climate Change, MIT JPSPGC Report 239. Cambridge, MA:
Massachusetts Institute of Technology Joint Program on the Science and Policy of Global Change.
http://globalchange.mit.edu/files/document/MITJPSPGC_Rpt239.pdf.
Calvin, K., et al. 2011. ―GCAM Main Page.‖ University of Maryland. Last modified August 21, 2012.
https://wiki.umd.edu/gcam/.
Center for Transportation Research. 2013. GREET Life-Cycle Model. Argonne, IL: Argonne National
Laboratory. http://greet.es.anl.gov/files/greet-model.
Clark, C. E., C. B. Harto, and W. A. Troppe. 2011. Water Resource Assessment of Geothermal Resources
and Water Use in Geopressured Geothermal Systems. Argonne, IL: Argonne National Laboratory,
Environmental Science Division.
www1.eere.energy.gov/geothermal/pdfs/geothermal_water_assessment_use.pdf.
Daniel, Arthur, J. 2012. Comprehensive Lifecycle Planning And Management System For Addressing
Water Issues Associated With Shale Gas Development In New York, Pennsylvania, And West Virginia.
Technical Report. ALL Consulting, LLC., 1718 South Cheyenne Avenue, Tulsa, Oklahoma, 74119.
DOE (U.S. Department of Energy). 2013. Effects of Climate Change on Federal Hydropower: Report to
Congress. Washington, DC: DOE. www1.eere.energy.gov/water/pdfs/hydro_climate_change_report.pdf.
Edmonds, J., and J.M. Reilly. 1985. Global Energy: Assessing the Future. New York: Oxford University
Press.
EIA (U.S. Energy Information Administration). 2009. ―The National Energy Modeling System: An
Overview 2009.‖ EIA. www.eia.doe.gov/oiaf/aeo/overview/.
Entingh, Daniel J. 2006. DOE Geothermal Electricity Technology Evaluation Model (GETEM): Volume
I—Technical Reference Manual. Washington, DC: U.S. Department of Energy.
www1.eere.energy.gov/geothermal/pdfs/getem_vol_i_technical_manual.pdf.
Fant, C., A. Gueneau, K. Strzepek, S. Awadalla, W. Farmer, E. Blanc, and C. A. Schlosser. 2012.
CliCrop: a Crop Water-Stress and Irrigation Demand Model for an Integrated Global Assessment
Modeling Approach, MIT JPSPGC Report 214. Cambridge, MA: Massachusetts Institute of Technology
Joint Program on the Science and Policy of Global Change.
http://globalchange.mit.edu/files/document/MITJPSPGC_Rpt214.pdf.

The Water-Energy Nexus: Challenges and Opportunities June 2014
199
FERC (Federal Energy Regulatory Commission). 2011. ―Order Granting Petition: Iberdrola Renewables,
Inc., PacifiCorp, NextEra Energy Resources, LLC, Invenergy Wind North America LLC, and Horizon
Wind Energy LLC v. Bonneville Power Administration,‖ 137 FERC ¶ 61,185. Washington, DC: FERC.
www.ferc.gov/EventCalendar/Files/20111207083529-EL11-44-000.pdf.
Gao, X., C. Adam Schlosser, A. Sokolov, K.W. Anthony, Q. Zhuang, and D. Kicklighter. 2013a.
―Permafrost Degradation and Methane: Low Risk of Biogeochemical Climate-Warming Feedback.‖
Geophysical Research Letters 8(3): 035014.
Gao, X., C.A. Schlosser, P. Xie, E. Monier, and D. Entekhabi. 2013b. An Analogue Approach to Identify
Extreme Precipitation Events: Evaluation and Application to CMIP5 Climate Models in the United
States, MIT JPSPGC Report 253. Cambridge, MA: Massachusetts Institute of Technology Joint Program
on the Science and Policy of Global Change.
http://globalchange.mit.edu/files/document/MITJPSPGC_Rpt253.pdf.
Gilman, P., and A. Dobos. 2012. System Advisor Model, SAM 2011.12.2: General Description, NREL
Report No. TP-6A20-53437. Golden, CO: National Renewable Energy Laboratory.
www.nrel.gov/docs/fy12osti/53437.pdf.
Gueneau, Arthur, C. Adam Schlosser, Kenneth M. Strzepek, Xiang Gao, and Erwan Monier. 2012.
CLM-AG: An Agriculture Module for the Community Land Model version 3.5. MIT Joint Program
Report No. 220. http://globalchange.mit.edu/files/document/MITJPSPGC_Rpt229.pdf
Gunturu, U.B., and C.A. Schlosser. 2012. ―Characterization of wind power resource in the United States.‖
Atmospheric Chemistry and Physics 12: 9687–9702.
Hallgren, W., C.A. Schlosser, E. Monier, D. Kicklighter, A. Sokolov, and J. Melillo. 2013. ―Climate
impacts of a large-scale biofuels expansion.‖ Geophysical Research Letters 40: 1624–1630.
Hejazi, M.I., J. Edmonds, L. Clarke, P. Kyle, E. Davies, V. Chaturvedi, M. Wise, P. Patel, J. Eom, and K.
Calvin. 2013. ―Integrated assessment of global water scarcity over the 21st century: Global water supply
and demand under extreme radiative forcing.‖ Hydrology and Earth System Sciences Discussion 10:
3327–3381. doi: 10.5194/hessd-10-3327-2013.
Hibbard K.A. and A.C. Janetos. 2013. ―The Regional Nature of Global Challenges: A Need and Strategy
for Integrated Regional Modeling.‖ Climatic Change 118(3–4): 565–577. doi: 10.1007/s10584-012-0674-
3. http://link.springer.com/article/10.1007%2Fs10584-012-0674-3.
Kim, Son H., Jae Edmonds, Josh Lurz, Steven J. Smith, and Marshall Wise. 2012. ―The ObjECTS
framework for integrated assessment: hybrid modeling of transportation. The Energy Journal Special
Issue #2 (2012): 63–92.
Kobos, Peter H., Jesse D. Roach, Geoff T. Klise, Jim L. Krumhansl, Jason E. Heath, Thomas A. Dewers,
David J. Borns, Andrea McNemar, and Malynda A. Cappelle. 2011. Expanding the Potential for Saline
Formations: Modeling Carbon Dioxide Storage, Water Extraction and Treatment for Power Plant
Cooling, SAND2011-2713C. Albuquerque, NM: Sandia National Laboratories.
Leng, W., L. Ju, M. Gunzburger, and S. Price. 2013. ―Manufactured solutions and the verification of
three-dimensional Stokes ice-sheet models.‖ The Cryosphere 7: 19–29. doi:10.5194/tc-7-19-2013.

June 2014 The Water-Energy Nexus: Challenges and Opportunities
200
Lickley, M.J., N. Lin, and H.D. Jacoby. 2013. Protection of Coastal Infrastructure under Rising Flood
Risk, MIT JPSPGC Report 240. Cambridge, MA: Massachusetts Institute of Technology Joint Program
on the Science and Policy of Global Change.
http://globalchange.mit.edu/files/document/MITJPSPGC_Rpt240.pdf.
LLNL (Lawrence Livermore National Laboratory). 2014. ―Program for Climate Model Diagnosis and
Intercomparison (PCMDI).‖ LLNL. www-pcmdi.llnl.gov/.
Mahalik, M., T. Veselka, A. Mahajan, and F. T. Bui. 2012. ―Application of a New Tool to Optimize
Hydropower Day-Ahead Scheduling and Real-Time Operations.‖ Proceedings of HydroVision
International 2012, Louisville, KY, July 2012.
Mai, T., R. Wiser, D. Sandor, G. Brinkman, G. Heath, P. Denholm, D. J. Hostick, N. Darghouth, A.
Schlosser, and K. Strzepek. 2012. Exploration of High-Penetration Renewable Electricity Futures. Vol. 1
of Renewable Electricity Futures Study, NREL/TP-6A20-52409-1. Golden, CO: National Renewable
Energy Laboratory.
Monier, E., and X. Gao. 2014. ―Climate change impacts on extreme events in the United States: an
uncertainty analysis.‖ Climatic Change, in press. doi:10.1007/s10584-013-1048-1.
Monier, E., X. Gao, J.R. Scott, A.P. Sokolov, and C.A. Schlosser. 2014: ―A framework for modeling
uncertainty in regional climate change.‖ Climatic Change, in press.
Monier, E., J.R. Scott, A.P. Sokolov, C.E. Forest, and C.A. Schlosser. 2013a. ―An integrated assessment
modeling framework for uncertainty studies in global and regional climate change: the MIT IGSM-CAM
(version 1.0).‖ Geoscience Model Development 6: 2063–2085.
Monier, E., A. Sokolov, A. Schlosser, J. Scott, and X. Gao. 2013b. ―Probabilistic projections of 21st
century climate change over Northern Eurasia.‖ Environmental Research Letters 8(4): 045008.
NCAR (National Center for Atmospheric Research). 2013. ―Community Earth System Model
homepage.‖ NCAR. www2.cesm.ucar.edu/.
Office of Science. 2009. Science challenges and future directions: Climate change integrated assessment
research. Washington, DC: U.S. Department of Energy.
http://science.energy.gov/~/media/ber/pdf/ia_workshop_low_res_06_25_09.pdf.
Office of Science. 2012. Community Modeling and Long-Term Predictions of the Integrated Water Cycle:
Report from the September 2012 Workshop, DOE/SC-0155. Washington, DC: U.S. Department of
Energy. http://science.energy.gov/~/media/ber/pdf/workshop%20reports/Water_Cycle_Report_HR.pdf.
ORNL (Oak Ridge National Laboratory). 2011. U.S. Billion-Ton Update: Biomass Supply for a Bioenergy
and Bioproducts Industry, ORNL/TM-2011/224. Washington, DC: U.S. Department of Energy.
ORNL (Oak Ridge National Laboratory). 2012. ―Improving the Representations of Human-earth System
Interactions.‖ U.S. Department of Energy. http://climatemodeling.science.energy.gov/projects/improving-
representations-human-earth-system-interactions.
Paltsev, S., E. Monier, J. Scott, A. Sokolov, and J. Reilly. 2013: ―Integrated economic and climate
projections for impact assessment.‖ Climatic Change, in press. doi: 10.1007/s10584-013-0892-3.

The Water-Energy Nexus: Challenges and Opportunities June 2014
201
Prinn, R. 2013. ―Development and Application of Earth System Models.‖ Proceedings of the National
Academy of Sciences 110: 3673–3680.
Prinn, R., H. Jacoby, A. Sokolov, C. Wang, X. Xiao, Z. Yang, R. Eckaus, P. Stone, D. Ellerman, J.
Melillo, J. Fitzmaurece, D. Kicklighter, G. Holian, and Y. Liu. 1999. ―Integrated global system model for
climate policy assessment: feedbacks and sensitivity studies.‖ Climatic Change 41: 469–546.
Prinn, R., S. Paltsev, A. Sokolov, M. Sarofim, J. Reilly, and H. Jacoby. 2011. ―Scenarios with MIT
Integrated Global Systems Model: significant global warming regardless of different approaches.‖
Climatic Change 104: 515–537.
Rausch, S. and M. Mowers. 2012. "Distributional and Efficiency Impacts of Clean and Renewable
Energy Standards for Electricity." MIT Joint Program on the Science and Policy of Global Change
Report Series. No. 225. July.
Reilly, J. 2012. ―Green Growth and the Efficient Use of Natural Resources.‖ Energy Economics 34: 85–
93.
Reilly, J., J. Melillo, Y. Cai, D. Kicklighter, A. Gurgel, S. Paltsev, T. Cronin, A. Sokolov, and A.
Schlosser. 2012. ―Using Land to Mitigate Climate Change: Hitting the Target, Recognizing the Trade-
offs.‖ Environmental Science and Technology 46(11): 5672–5679.
Reilly, J.M., S. Paltsev, K. Strzepek, N.E. Selin, Y. Cai, K.-M. Nam, E. Monier, S. Dutkiewicz, J. Scott,
M. Webster, and A. Sokolov. 2013. ―Valuing climate impacts in integrated assessment models: the MIT
IGSM.‖ Climatic Change 117: 561–573.
Saikawa, E., C.A. Schlosser, and R.G. Prinn. 2013. ―Global modeling of soil nitrous oxide emissions
from natural processes.‖ Global Biogeochemical Cycles 27(3): 972–989.
Schlosser, C.A., X. Gao, K. Strzepek, A. Sokolov, C.E. Forest, S. Awadalla, and W. Farmer. 2013.
―Quantifying the Likelihood of Regional Climate Change: A Hybridized Approach.‖ Journal of Climate
26: 3394–3414.
Schlosser, C.A., and K. Strzepek. 2013. Regional climate change of the greater Zambezi river basin: A
hybrid assessment, UNU-WIDER Working Paper No. 2013/71. Helsinki, Finland: United Nations
University World Institute for Development Economics Research.
www.wider.unu.edu/publications/working-papers/2013/en_GB/wp2013-071/.
Schlosser, C.A., K.M. Strzepek, X. Gao, A. Gueneau, C. Fant, S. Paltsev, B. Rasheed, T. Smith-Greico,
É. Blanc, H.D. Jacoby, and J.M. Reilly. 2014. The future of global water stress, MIT JPSPGC Report
254. Cambridge, MA: Massachusetts Institute of Technology Joint Program on the Science and Policy of
Global Change. http://globalchange.mit.edu/files/document/MITJPSPGC_Rpt254.pdf.
Short, Walter, Patrick Sullivan, Trieu Mai, Matthew Mowers, Caroline Uriarte, Nate Blair, Donna
Heimiller, and Andrew Martinez. 2011. Regional Energy Deployment System (ReEDS), NREL/TP-6A20-
46534NREL/TP. Golden, CO: National Renewable Energy Laboratory.
www.nrel.gov/analysis/reeds/pdfs/reeds_documentation.pdf.
Skaggs, R., K. A. Hibbard, T. C. Janetos, and J. S. Rice. 2012. Climate and Energy-Water-Land System
Interactions: Technical Report to the U.S. Department of Energy in Support of the National Climate
Assessment, PNNL-21185. Richland, WA: Pacific Northwest National Laboratory.

June 2014 The Water-Energy Nexus: Challenges and Opportunities
202
Skone, Timothy. 2012. NETL Upstream Dashboard Tool, NETL/DOE-2012/1539. Morgantown, WV:
National Energy Technology Laboratory.
SNL (Sandia National Laboratories). n.d. ―Thermoelectric and Consumptive Use and Power Plants
(Current).‖ http://energy.sandia.gov/wp/wp-content/gallery/uploads/thermoelectricPowerPlants.png.
Sokolov, A., P.H. Stone, C.E. Forest, R.G. Prinn, M.C. Sarofim, M. Webster, S. Paltsev, C.A. Schlosser,
D. Kicklighter, S.Dutkiewicz, J. Reilly, C. Wang, B. Felzer, and H.D. Jacoby. 2009. ―Probabilistic
forecast for 21st century climate based on uncertainties in emissions (without policy) and climate
parameters.‖ Journal of Climate 22(19): 5175–5204. doi: http://dx.doi.org/10.1175/2009JCLI2863.1
Strzepek, K., J. Baker, W. Farmer, and C. Adam Schlosser. 2012. Modeling Water Withdrawal and
Consumption for Electricity Generation in the United States, Report 222. Cambridge, MA: Massachusetts
Institute of Technology Joint Program on the Science and Policy of Global Change.
Strzepek, K., C.A. Schlosser, A. Gueneau, X. Gao, E. Blanc, C. Fant, B. Rasheed, and H.D. Jacoby. 2013.
―Modeling water resource systems within the framework of the MIT Integrated Global System Model:
IGSM-WRS.‖ Journal of Advances in Modeling Earth Systems 5(3): 638–653.
Taylor, Mark, Oksana Guba, Mike Levy, and James Overfelt. 2012. ―Variable Resolution Experiments
Using CAM-SE.‖ Presentation, 2012 PDEs on the Sphere, Isaac Newton Institute for Mathematical
Sciences, September 24–28. www.newton.ac.uk/programmes/AMM/seminars/2012092809251.pdf.
Tebaldi, C., and J.M. Arblaster. 2013. ―Pattern scaling: a review of its strengths and limitations, and an
update on the latest model simulations.‖ Climatic Change, in press.
Thomson, A., et al. 2011. ―RCP4.5: a pathway for stabilization of radiative forcing by 2100.‖ Climatic
Change 109: 77–94.
Tidwell, V.C., P.H. Kobos, L. Malczynski, G. Klise, and W. Hart. 2009. Decision Support for Integrated
Water-Energy Planning, SAND Report SAND2009. Albuquerque, NM: Sandia National Laboratories.
USGCRP (U.S. Global Change Research Program). 2013. ―U.S. Global Change Research Program
homepage.‖ USGCRP. www.globalchange.gov/.
Wang, C. 2013. ―Impact of anthropogenic absorbing aerosols on clouds and precipitation: A review of
recent progresses.‖ Atmospheric Research 122: 237–249.
WCRP (World Climate Research Programme). 2014. ―Coupled Model Intercomparison Project.‖ WCRP.
http://cmip-pcmdi.llnl.gov/.
Webster, M., A. Sokolov, J. Reilly, C. Forest, S. Paltsev, A. Schlosser, C. Wang, D. Kicklighter, M.
Sarofim, J. Melillo, R. Prinn, and H. Jacoby. 2012. ―Analysis of Climate Policy Targets under
Uncertainty.‖ Climatic Change 112: 569–583.
Weyant, John. 2010. ―Program on Integrated Assessment Model Development, Diagnostics and Inter-
Model Comparisons (PIAMDDI): An Overview.‖ Presentation, IAMC Annual Meeting, Washington, DC,
October 29. http://emf.stanford.edu/files/docs/262/PIAMDDI_Overview.pdf.
White House. 2013.
http://energy.gov/sites/prod/files/2013/08/f2/Grid%20Resiliency%20Report_FINAL.pdf

The Water-Energy Nexus: Challenges and Opportunities June 2014
203
Wigmosta, M.S., A.M. Coleman, R.J. Skaggs, M.H. Huesemann, and L.J. Lane. 2011. ―National
Microalgae Biofuel Production Potential and Resource Demand.‖ Water Resources Research 47, in press.
doi: 10.1029/2010WR009966.
Wilbanks, Thomas, and Dan Bilello. 2014. Climate Change and Energy Supply and Use: Technical
Report for the U.S. Department of Energy in Support of the National Climate Assessment. Washington,
DC: Island Press.
Wilbanks, T., D. Bilello, D. Schmalzer, D. Arent, J. Buizer, H. Chum, J. Dell, J. Edmonds, G. Franco, R.
Jones, S. Rose, N. Roy, A. Sanstad, S. Seidel, J. Weyant, and D. Wuebbles. 2012. Climate Change and
Energy Supply and Use: Technical Report for the U.S. Department of Energy in Support of the National
Climate Assessment. Oak Ridge, TN: Oak Ridge National Laboratory.
Wilbanks, Thomas, and Steve Fernandez. 2014. Climate Change and Infrastructure, Urban Systems, and
Vulnerabilities: Technical Report for the U.S. Department of Energy in Support of the National Climate
Assessment. Washington, DC: Island Press.
Williams, Dean N., David E. Bernholdt, Ian T. Foster, and Don E. Middleton. 2007. The Earth System
Grid Center for Enabling Technologies: Enabling Community Access to Petascale Climate Datasets.
CTWatch Quarterly. http://www.ctwatch.org/quarterly/articles/2007/11/the-earth-system-grid-center-for-
enabling-technologies-enabling-community-access-to-petascale-climate-datasets/
Wind and Water Program. 2012. Water Power for a Clean Energy Future, DOE/GO-102012-3545.
Washington, DC: U.S. Department of Energy, Office of Energy Efficiency and Renewable Energy.
www.nrel.gov/docs/fy12osti/54310.pdf.
Wise, M. A., and K. Calvin. 2011. GCAM 3.0 Agriculture and Land Use Modeling: Technical
Description of Modeling Approach. Richland, WA: Pacific Northwest National Laboratory.
https://wiki.umd.edu/gcam/images/8/87/GCAM3AGTechDescript12_5_11.pdf.
Zickfeld, K., M. Eby, A.J. Weaver, E. Crespin, T. Fichefet, H. Goosse, G. Philippon-Berthier, N.R.
Edwards, P.B. Holden, A.V. Eliseev, I.L. Mokhov, G. Feulner, H. Kienert, M. Perrette, T. Schneider von
Deimling, C.E. Forest, F. Joos, R. Spahni, M. Steinacher, M. Kawamiya, K. Tachiiri, D. Kicklighter, E.
Monier, A. Schlosser, A.P. Sokolov, R. Spahni, M. Steinacher, K. Tachiiri, K.S. Tokos, M. Yoshimori, N.
Zeng, and F. Zhao. 2013. ―Long-term Climate Change Commitment and Reversibility: An EMIC
Intercomparison.‖ Journal of Climate 26(16): 5782–5809.

June 2014 The Water-Energy Nexus: Challenges and Opportunities
204
Chapter 7. Future Opportunities
There is abundant opportunity for DOE to positively impact the water-energy space. This report has
summarized much of DOE‘s ongoing work. The next step is to identify high-impact opportunities
aligned with the Department‘s mission.
There are opportunities in technology research, development, demonstration, and deployment (RDD&D);
modeling and analysis; and data relevant to the water-energy nexus. Given the tight physical coupling
between water and energy systems and current challenges in policy synchronization, analysis of water
issues can also lead to more robust energy policy development. Outreach and stakeholder engagement
can ensure that both technologies and models are useful to an appropriately broad set of stakeholders.
International scientific collaboration can strengthen the intellectual foundation in all areas and help to
solve common problems.
Through this set of activities, DOE can address the pillars first outlined in Chapter 1. These pillars apply
at local, regional, national and global scales for current and future energy and water systems:
Optimize the freshwater efficiency of energy production, electricity generation, and end use systems
Optimize the energy efficiency of water management, treatment, distribution, and end use systems
Enhance the reliability and resilience of energy and water systems
Increase safe and productive use of nontraditional water sources
Promote responsible energy operations with respect to water quality, ecosystem, and seismic impacts
Exploit productive synergies among water and energy systems
7.1 Technology RDD&D
DOE can play a variety of constructive roles throughout the processes of technology RDD&D. Building
on the preliminary analysis in Chapter 5, the next step is a more in-depth analysis of promising
opportunities for technology RDD&D investment in the context of ongoing investments by DOE, other
agencies, and the private sector. For technologies that directly affect water use in energy and energy use
in water, useful analyses include an assessment of the technologies‘ prospective impacts on water and
energy use in the context of future national energy technology trajectories.
Regional vulnerabilities and needs are also important. Useful analyses will review the RDD&D state of
the art in detail, articulate the rationale for potential federal activities, and identify next steps. Analysis of
costs, benefits, and impact are also important. Targeted requests for information, stakeholder workshops,
Key Messages:
Technology RDD&D can ultimately increase the array of options available to users to help address the six pillars.
Integrated modeling and analysis can inform decision making at multiple scales.
Improved datasets can help inform systems understanding, prioritize problems, and inform decisions.
Outreach and policy engagement can help to focus collective attention on solving priority problems.
The next step is to identify more specifically portfolio gaps, performance targets, investment opportunities,
and strategic collaborations.

The Water-Energy Nexus: Challenges and Opportunities June 2014
205
and expert elicitation can inform this analysis. The following topic areas are a starting point for more in-
depth technology analysis.
7.1.1 Water for Energy
Cooling
Thermoelectric power plants are the largest single source of water withdrawals in the United States.
Population pressures, drought conditions, and possible future regulations will constrain water availability.
Current alternatives to water-based cooling are expensive and impose operational penalties. More-
efficient and less-expensive options could have a significant impact on water withdrawal and
consumption.
Waste Heat Recovery
Thermoelectric power plants currently convert less than half of their primary energy to electricity. Most
of the balance is dissipated into the atmosphere via flue gases and cooling towers. There are promising
options to recover substantial amounts of this waste heat and reduce the need for cooling. Lower grade
waste heat can also potentially be recovered from oil and gas wells and used for low temperature co-
produced geothermal energy.
Process Water Efficiency and Quality
There are opportunities to improve water efficiency in industrial processes, including, but not limited to,
CCS, biorefineries, and advanced perennial feedstocks for bioenergy.
Alternatives to Fresh Water in Energy Production
There are opportunities to explore the use of substances such as supercritical carbon dioxide, nitrogen,
novel nanomaterials, and liquid hydrocarbons as replacements for water in subsurface stimulation for oil
and gas extraction or geothermal heat recovery. There are also opportunities to pursue entirely new and
different approaches, such as using accelerants for energetic fracturing.
Hydropower
New hydropower technologies for unpowered dams possess potential for electricity generation.
Additionally, human conveyances such as irrigation canals and drinking and wastewater flows provide
opportunities for nontraditional hydropower technology development while minimizing civil works and
environmental impact.
7.1.2 Energy for and from Water
Desalination
Improvements in reverse osmosis, the dominant desalination process in the United States, are nearing
their practical limits. Attractive alternatives exist, particularly those that utilize waste heat, but they have
not been commercialized at scale. These treatment techniques could enable beneficial use of produced
waters from oil and gas, CCS, and geothermal operations.
Net-Zero Municipal Wastewater Treatment
Advances in both energy efficiency of treatment processes and energy recovery from municipal waste
treatment can lead to treatment systems that produce as much or more energy than they consume.

June 2014 The Water-Energy Nexus: Challenges and Opportunities
206
7.1.3 Sensors
Data and information is crucial to inform operations and decision-making within the water-energy nexus.
In some cases advances in low cost sensors, such as those to monitor geothermal reservoirs or wellbore
integrity, would be valuable. In addition low-cost networks of remote sensors could provide substantial
benefit in areas for monitoring water losses and water quality across the energy system. Such sensor
networks could produce measurement-based data sets to support future analysis and modeling efforts.
7.1.4 Deployment
There are near-term opportunities to stimulate deployment of key technologies and systems to increase
the on-the-ground impact of research. For example, enhancement of DOE‘s existing technical assistance
programs has the potential to stimulate the deployment of technologies ranging from CHP to wastewater
treatment. DOE can also help to accelerate the deployment of key technologies in the water-energy space
by pursuing research to bring costs down and developing standards.
7.2 Analysis and Modeling
DOE‘s multi-scale modeling, analysis, and advanced computation across multiple systems can form the
foundation for an integrated water-energy analytical capability to serve the nation. Water-energy
interactions affect all regions of the United States, but problems often vary across regions depending on
the climate, topography, population density, policy framework, and level and type of energy and
economic development. An integrated analytical platform featuring a range of models can support
understanding of current and potential future interactions among the energy and water systems, as well as
inform relevant decisions at scales ranging from facility to nation and from seconds to decades.
The focus of these decisions can also vary greatly. National- and regional-scale vulnerability assessments
range from characterizing the multidimensional implications of changing water availability and
temperature of water resources for power plant operations to understanding potential cascading failures
across multiple infrastructure systems. Sustainable development planning includes integrated energy,
water, and land resource planning. For example, it is important to consider tradeoffs between water
impacts and CO2 emissions. Models can also be used to inform facilities‘ investment, technology
selection, and siting decisions, as well as to explore technology penetration scenarios to help inform
technology research and development investment prioritization. For many of these decisions, because
energy infrastructure systems generally have been designed for the historical climate, significant changes
of weather patterns and extremes can often require costly adjustment. In general, models that inform
these decisions must take into account sustained conditions, variations, and shocks with respect to water
resource quantity and quality. They must have a strong link to appropriately detailed technology models.
An integrated water-energy analytical platform must account for many variables, including supply and
demand, land use and land cover, population/migration, climate and weather, technologies, policies, and
regional economics. DOE‘s integrated assessment modeling (energy-environment-economics), detailed
energy systems and technology modeling, water modeling, infrastructure impacts modeling, and regional
climate modeling and analysis are cornerstone modeling capabilities. Because information needs span a
broad range of spatial and temporal scales, improved interoperability across data and modeling platforms
and improved capacity for telescopic resolution are needed. No single data, modeling, or analysis system
will meet every need for every user. There is scientific basis and strength in pursuing complementary
individual models while evolving to a more integrated, federated system of capabilities where the whole

The Water-Energy Nexus: Challenges and Opportunities June 2014
207
is more than the sum of the parts. With such an integrated analytical platform, new, transformative
capabilities can emerge.
Though the decision and planning applications for models and analysis are quite varied, users share some
common strategically important needs that should guide the development of the analytical platform.
These needs include quantitative and qualitative scenarios, probabilistic approaches, insights into
potential system shocks and extremes, and improved overall characterization of uncertainties in the 5 to
30 year time horizon. In addition, risk and uncertainty visualization and communication methods are
critically important tools for interpreting, simplifying, and conveying the messages emerging from
complex scientific findings.
7.3 Data
DOE and federal partners are responsible for collecting and aggregating a large number of data sets that
have relevance in the water-energy space. There are opportunities both to improve data collection and to
connect existing data sets in ways that support advancements in technology RDD&D, modeling, and
analysis. DOE will benefit from employing a strategic approach that prioritizes data gaps to be addressed,
identifies opportunities to improve data stewardship, and connects data sets so that data are more
accessible and usable.
A number of aspects of the water-energy nexus suffer from a lack of reliable, consistent, and regionally
distributed measurement-based or even survey data. As such, the state of knowledge tends to consist of
periodic snapshots based on estimates and incomplete information. Improvements can be made across all
aspects of data stewardship, including determining what to measure, placing sensors (or issuing surveys),
measuring and collecting data, data quality control, data synthesis, and sharing data in an accessible
format. Additional data sets that would be useful include the uses, characteristics, and ultimate fate of
water used in oil and gas production and characterization of deep saline reservoirs suitable for carbon
sequestration. DOE can also examine data collected by EIA and other DOE offices and make
recommendations for enhancements or extensions. In addition, DOE will pursue opportunities for
expanded collaboration with other federal and state agencies, building on existing efforts with USGS.
While there is a need for additional data, there is already substantial observational and model-generated
data in highly distributed systems across the federal family. There is an opportunity to substantially
enhance analytical insights by making these data more accessible and consistent through a layered, data-
analytic platform. Connecting existing and new data sets into a layered information system would make
them more accessible to inform near-term and long-term energy resiliency planning, energy operational
response strategies, and strategic analysis. Open-source data systems, architectures, interfaces, and
standards could enable incorporation of a range of data, such as energy and water infrastructure
characteristics, energy and water demands, stream flows and temperatures, land surface temperatures,
groundwater resources, produced water quantity and quality, and climate projections.
Developed with nested spatial and temporal scales, the layered data platform would be a potentially
transformative tool. Information could reside on many host computers. In pursuing the data system,
DOE would align its work with the Administration‘s open data initiative, utilizing to the extent possible
data standards and extensible metadata.

June 2014 The Water-Energy Nexus: Challenges and Opportunities
208
7.4 Policy Framework
As described in Chapter 4, national, regional, and local water policies can shape the decision-making
landscape for the planning, deployment, and operations of the nation‘s energy system. In many cases, as
the nation‘s energy system evolves and new infrastructure is deployed, there is a window of opportunity
to incorporate water into energy policy discussions and vice versa. In order to make the most of this
policy window, communication among actors across multiple sectors is essential. With outreach and
information, decision makers can develop policies with the integrated system in mind. Modelers can
develop analytical tools that are useful for decision makers. Technology researchers can focus their
efforts where there is need.
The current water-energy policy landscape is complex and fragmented. The nation‘s water and energy
policies have been developed independently of each other, and in many cases there are strong regional
differences in policy frameworks and objectives. With the importance of water in energy production and
the increasing uncertainty of water supply for energy uses, there is a growing need for a more coherent
approach. DOE assist through analysis of the challenges and opportunities brought by the strong
interconnections between water and energy systems. Such work can be aligned with broad
Administration energy policy initiatives such as the Quadrennial Energy Review and the Climate Action
Plan.
An effective policy framework includes several elements:
Future policy scenarios incorporating climate change and energy technology deployment trajectories
can inform understanding of potential constraints and infrastructure vulnerabilities at national and
regional scales. The energy and water flows within these scenarios can be presented in the form of a
Sankey diagram similar to that shown in Chapter 2.
A set of metrics to describe energy system resilience under water constraints, water resource
variability, and extreme events can help inform private sector investment and operations.
Water and energy efficiency are linked, at many scales and in many contexts. A more systematic
understanding of these linkages could broadly inform energy and water policy in multiple contexts at
multiple scales.
DOE can maintain active engagement with relevant regulatory processes to provide constructive input
and help inform its research investment.
7.5 Stakeholder Engagement
Many entities have interests and knowledge in the water-energy nexus, including other federal agencies;
state, regional, tribal, and local authorities; the private sector; and nongovernmental organizations. Both
water and energy management frequently cross jurisdictional boundaries. There are instances where
collaboratively developed models, data, tools, technologies, and policy innovations can assist these
stakeholder groups in addressing water-energy nexus challenges. Active engagement with stakeholders
can increase the impact of work of DOE and its partners through sharpening the problem definition,
increasing the array of solutions sought and developed, and increasing the diffusion of those solutions.
Convening stakeholders at a regional level can help identify common problems and pathways toward
mutual solutions for topics ranging from identifying potential synergies between hydroelectric and other
renewable power generation, to approaches supporting capital investment in deployment of advanced
thermoelectric cooling technologies, to technology and operational approaches to responsible oil and gas

The Water-Energy Nexus: Challenges and Opportunities June 2014
209
production. There is also the opportunity to bridge between water and energy domains. Drinking water
and wastewater authorities are increasingly viewing energy as a critical element in their future planning.
In parallel, the energy community is increasingly recognizing the vital importance of water to energy
production, particularly in water-stressed regions. Convening these groups—and others, such as
agricultural interests— would enable examination of coupled efficiency, synergies between systems,
technology deployment opportunities, and climate resilience.
At the federal level, there are multiple agencies with research and policy interests in various aspects of the
water-energy nexus. DOE has several existing memoranda of understanding and cooperative
arrangements with its sister agencies, most notably a tri-agency agreement with the DOI and the U.S.
Army Corps of Engineers on hydropower, and a tri-agency agreement with the EPA and DOI on
unconventional oil and gas. There may be opportunities to enhance the activities under these existing
partnerships and pursue additional collaboration. Topics of broad potential interest include water for
fuels production, energy in wastewater, and integrated models.
7.6 International Diplomacy
DOE can leverage existing relationships with international stakeholders to exchange information and
collaborate on research in the water-energy nexus domain. The challenges in the water-energy nexus are
global and, in many cases, problems are more acute overseas. For example, freshwater availability in the
Middle East is more constrained. Planned electricity generation expansion is likely to compete for water
with other needs in key water-stressed regions. Working with these international stakeholders through
bilateral and multilateral engagements will support valuable cross country learning on technology- and
policy-based strategies.
7.7 Conclusion
The water-energy nexus is an important focus area for the nation and the world. Because the water-
energy nexus is a complex network of problems, actors, and contexts, DOE‘s mission-related
contributions to federal efforts must be based on an integrated approach to bring the highest impact for its
investments. A nuanced understanding of the nexus‘ multiple facets can help focus and prioritize DOE‘s
relevant research and other activities. A high-impact strategy would cut across modeling, data,
technology, and policy analysis. Cross-sector and cross-disciplinary outreach is required at multiple
scales to ensure that the broadest possible set of stakeholders is helping to identify the problems and has
access to the best solutions.

June 2014 The Water-Energy Nexus: Challenges and Opportunities
210
Appendix A. Sankey Diagram Details and Assumptions The Water/Energy Sankey diagram is comprised of both energy and water sources, sinks, and flows.
Energy is measured in quadrillion Btus (Quads) per year. The diagram shows energy consumption by end
use sectors as well as a respective sectors wasted energy. The majority of energy data is from EIA‘s 2011
Annual Energy Review (AER). Along with energy, the diagram shows end use sectors water withdrawals
from various sources and whether the water is discharged after use or consumed. Water is measured in
billions of gallons per day (BGD). The methodologies and sources of information are detailed in the
sections below. The appendix covers the diagram from left to right.
EIA reports energy consumption for five sectors: transportation, residential, commercial, industrial, and
electric power. USGS reports water use differently, reporting sector withdrawals by: public supply,
domestic, irrigation, livestock, aquaculture, industrial, mining, and thermoelectric power. Our analysis
combines irrigation, aquaculture, and livestock water withdrawals as agriculture withdrawals. Mining
withdrawals not associated with oil and gas extraction are combined with the industrial sectors. The
residential sector on the diagram corresponds to the residential energy category from EIA and the
domestic water category from USGS. The agriculture sector in the diagram represents the irrigation water
category from USGS minus the volume of water estimated for biofeedstock production. The water used
for hydraulic fracturing, enhanced oil recovery, and biomass feedstock production is represented as direct
withdrawals on the far left of the diagram.

The Water-Energy Nexus: Challenges and Opportunities June 2014
211
For the end use sectors, energy consumption is represented by the green portion of the box and water use
is represented by the blue portion of the box. In general, values below 0.5 quads per year and 0.5 BGD
are not included in the diagram or calculations, with some exceptions. Most values in the diagram are
rounded to the nearest whole number. In this appendix, items that were excluded from the diagram are
denoted with an asterisk (*).
A.1 Energy Sources
A.1.1 Petroleum
Energy (35 Quads/year, 2011)
Definition: The amount of petroleum for energy services is based on petroleum product supplied (EIA
2012). EIA defines petroleum products supplied as, ―field production plus oxygenates production plus
processing gain plus net imports minus stock change plus adjustments. Total products supplied includes
natural gas plant liquids, unfinished oils, aviation gasoline blending components, and finished petroleum
products‖ (EIA, 2012).
Each sector‘s petroleum definition is slightly different. Petroleum in the commercial, industrial, and
transportation sectors does not include biofuels that have been blended with petroleum. Biofuels used in
the commercial, industrial and transportation sectors are included under ―A.1.2 Biomass.‖
Calculation: The total petroleum consumption is calculated by adding each individual sector‘s use of
petroleum for energy services.
Energy Flows to End Use Sectors
From: To: Quads/year
Petroleum Transportation 25.1
Petroleum Commercial 0.7
Petroleum Industrial 8.1
Petroleum Residential 1.1
Petroleum Electricity generation 0.3*
Water (2.4 BGD, 2007)
Definition: This is the water used to extract petroleum in the United States, which includes water for
primary recovery, secondary flooding, enhanced oil recovery (EOR), and hydraulic fracturing. These
water requirements are represented in the diagram as a line from fresh ground water and fresh surface
water to petroleum. Produced water is discussed in ―A.2 Water Sources.‖
Calculation: In 2007, 3.47 million bbl/d of oil are produced onshore in the United States (Wu et al 2011).
The average water injected, weighted by recovery technology production, is 8.0 gal water/gal of crude
(Wu et al 2011). The total amount of fresh water used for petroleum recovery is 1.2 BGD (Wu et al
2011). This does not include produced water.
3.47 million bbl/d X 42 gals/bbl X 8 gals water/gal crude = 1.2 BGD for EOR
The data to partition ground and surface is unavailable, so a 50-50 split between fresh surface and fresh
ground water is depicted in the diagram(see Section A.2, Fresh Surface and Ground Water).
Water for hydraulic fracturing is also used to extract petroleum from unconventional sources. See the
natural gas water section (A.1.3) for calculations.

June 2014 The Water-Energy Nexus: Challenges and Opportunities
212
Water Flows to End Use Sectors
From: To: BGD
Fresh Surface & Ground Water Petroleum (EOR) 1.2
Produced Water Petroleum & Natural Gas 1.2
Fresh Surface & Ground Water Petroleum & Natural Gas (Hydraulic Fracturing) 0.2
A.1.2 Biomass
Energy (4 Quads/year, 2011)
Definition: Residential biomass is wood and wood derived fuels. Commercial, industrial, and
transportation biomass includes wood and wood-derived fuels; municipal solid waste from biogenic
sources, landfill gas, sludge waste, agricultural byproducts, and other biomass; and fuel ethanol. The
transportation sector also includes biodiesel (EIA 2012).
Calculation: The total biomass consumed is calculated by adding each individual sectors use of biomass
for energy services.
Energy Flows to End Use Sectors
From: To: Quads/Year
Biomass Transportation 1.2
Biomass Industrial 2.3
Biomass Commercial 0.1*
Biomass Residential 0.4*
Biomass Electricity generation 0.4*
Water (2.0 BGD, 2011)
Definition: This is the amount of water consumed during biomass irrigation and refining (Wu et al.
2011). In the diagram, the water that is withdrawn for biomass represents water consumed during biomass
energy production and therefore is added to the total amount of consumed water. A line is not drawn
from biomass to consumption.
Calculation: The calculation of water consumption for biomass focuses on corn ethanol production
because corn ethanol is the dominant biofuel produced in the United States (Wu et al. 2011).
The USDA has established 10 farm production regions in the United States. In 2008, three regions
accounted for 88 percent of corn ethanol production. Fifty percent of corn ethanol production was from
Region 5 (Iowa, Indiana, Illinois, Ohio, and Missouri), 15 percent of corn ethanol production was from
Region 6 (Minnesota, Wisconsin, and Michigan), and 23 percent of corn ethanol production was from
Region 7 (North Dakota, South Dakota, Nebraska, and Kansas). The regional shares of corn ethanol
production closely match the regional shares of corn production (Wu et al. 2011).
The level of irrigation across regions varies. The total water consumption accounts for corn irrigation and
ethanol production with mass based co-product allocation. In 2008, Region 5 had a water consumption
factor of 11 gallons of water per gallon of ethanol, Region 6 had a water consumption factor of 17 gallons
of water per gallon of ethanol, and Region 7 had a water consumption factor of 160 gallons of water per
gallon of ethanol (Wu et al. 2011). These 2008 regional water consumption factors and ethanol
production shares were used to estimate the total water consumption for biofuels in 2011.
2011 estimated corn ethanol production
Region Share
of corn ethanol
Capacity Consumption
Factor Ethanol Production
Water Consumption

The Water-Energy Nexus: Challenges and Opportunities June 2014
213
production(%) (gal/gal) (billion Gallons)
(BGD)
Region 5 50 6.8 11 7.0 0.2
Region 6 15 2 17 2.1 0.1
Region 7 23 3.1 160 3.2 1.4
Other 12 1.6 45 1.7 0.3
In 2011, the U.S.‘s total biofuels production was 13.9 billion gallons (EIA 2012); the ethanol plant
production capacity was 13.6 billion gallons (EIA 2011). Almost all of the ethanol plants were in full
capacity of production or even exceeded the designed capacity in the past 5-10 years. To be reasonable,
the actual production number of 13.9 billion gallons reported by USDA and EIA was used in the
calculation.
2011 regional corn ethanol production distribution is assumed to be similar to the regional corn ethanol
production distribution in 2008. The final 12 percent of production capacity is assumed to have a water
consumption factor equal to the weighted average of the first three regions.
Each region‘s 2008 share of corn ethanol production was multiplied by the 2011 total ethanol production.
This gave us the corn ethanol production of each region. Then each region‘s corn ethanol capacity was
multiplied by its respective consumption factor to arrive at the total water consumption. Finally, the sum
of water used in each region was used to estimate the total water consumed for the total ethanol
production in 2011.
Both fresh surface and ground water are used for the irrigation and refining of biomass. However,
because the majority of water used is ground water and to increase the readability of the diagram, only a
line from ground water is included in the diagram.
Water Flows to End Use Sectors
From: To: BGD
Fresh Groundwater Biomass 2.0
A.1.3 Natural Gas
Energy (25 Quads/year, 2011)
Definition: The amount of natural gas for energy services is based on natural gas consumption. Natural
gas consumed is calculated by EIA by compiling surveys of natural gas production, transmission, and
distribution companies and from surveys of electric power generators. Natural gas consists largely of
methane and other hydro carbons (EIA 2012)
Calculation: The total natural gas consumption is calculated by adding each individual sectors use of
natural gas for energy services.
Energy Flows to End Use Sectors
From: To: Quads/year
Natural gas Transportation 0.7
Natural gas Residential 4.8
Natural gas Commercial 3.2
Natural gas Industrial 8.3
Natural gas Electricity generation 7.7

June 2014 The Water-Energy Nexus: Challenges and Opportunities
214
Water (0.2 BGD, 2011)
Definition: This is the amount of water withdrawn and used for hydraulic fracturing in oil and gas
production (Ceres 2013).
Calculation: Hydraulic fracturing used an estimated 65.8 billion gallons of water over a 21 month time
frame starting in January 2011 through September 2012 (Ceres 2013)—FracFocus well numbers are
under-reported by 60 percent (Ceres 2013)—65.8 billion gallons was converted to BGD and then divided
by 60 percent (Ceres 2013). The 0.2 BGD calculated includes water for hydraulic fracturing of oil and
natural gas wells that is withdrawn from both fresh surface and fresh ground water. The diagram shows
equal flows from each source of water for hydraulic fracturing to petroleum and natural gas (see Section
A.2, Fresh Surface and Ground Water).
Water Flows to End Use Sectors
From: To: BGD
Fresh Surface & Ground Water Natural gas & petroleum (Hydraulic Fracturing) 0.2
Produced Water Natural gas & petroleum 1.2
The relative proportions of fresh ground and fresh surface water for hydraulic fracturing is unknown, so
an equal split between fresh surface and fresh ground water and petroleum and natural gas is depicted in
the diagram. The produced water from natural gas production is typically disposed of in underground
injection wells or recycled. The amount of water disposed of in underground injection wells is included
in the diagram with the volume of produced water to injection (see Section A.2.6, Produced Water).
A small line representing recycled produced water for natural gas recover is depicted in the diagram, but
the relative proportions of produced water used for petroleum recover and natural gas recover is
unknown. Therefore, the volume of recycled produced water for natural gas recovery is included with the
volume of produced water used for petroleum recovery (see Section A.2.6, Produced Water).
A.1.4 Coal
Energy (20 Quads/year, 2011)
Definition: The amount of coal for energy services is based on EIA consumption estimates for
bituminous coal, sub-bituminous coal, lignite, anthracite, and waste coal (EIA 2012).
Calculation: The total coal consumed is calculated by adding each individual sectors use of coal for
energy services.
Energy Flows to End Use Sectors
From: To: Quads/Year
Coal Industrial 1.6
Coal Electricity generation 18.0
Coal Commercial 0.1*
Water
Definition: The water needed for coal mining and extraction is included in the industrial sector
withdrawals. Using table 2.1 and the EIA Annual Energy Outlook (AEO) Reference Case, a range of
0.01 BGD and 0.21 BGD were estimated for coal extraction.

The Water-Energy Nexus: Challenges and Opportunities June 2014
215
A.1.5 Nuclear (8 Quads/year, 2011)
Definition: This is the amount of nuclear electricity generated (EIA 2012).
Calculation: ―Nuclear electricity net generation is converted to Btus using the nuclear heat rate‖ (EIA
2012). The total amount of nuclear electricity is calculated by adding each individual sector‘s use of
nuclear electricity for energy services.
Energy Flows to End Use Sectors
From: To: Quads/Year
Nuclear Electricity generation 8.3
A.1.6 Hydro (3 Quads/year, 2011)
Definition: This is the amount of hydroelectricity generated (EIA 2012). Conventional hydroelectricity is
generated from flowing water that is not created by pumped storage. In the diagram, only water
withdrawals are considered, thus excluding in stream water use for hydro.
Calculation: The calculation for hydroelectricity uses the EIA conversion method. ―Conventional
hydroelectricity net generation is converted to Btus using the fossil-fuels heat rate‖ (EIA 2012). The total
amount of hydroelectricity is calculated by adding each individual sector‘s use of hydroelectricity for
energy services.
Energy Flows to End Use Sectors
From: To: Quads/year
Hydro Electricity generation 3.2
A.1.7 Geothermal (0.2 Quads/year, 2011)
Definition: This is the amount of geothermal electricity generated. Geothermal includes heat pump and
direct use energy.
Calculation: The calculation for geothermal uses the EIA conversion method. ―Geothermal electricity
net generation is converted to Btus using the fossil-fuels heat rate‖ (EIA 2012). The total geothermal
electricity generation is calculated by adding each individual sectors use of geothermal electricity for
energy services.
Energy Flows to End Use Sectors
From: To: Quads/year
Geothermal Electricity generation 0.2
A.1.8 Wind/Solar (1.3 Quads/year, 2011)
Wind (1.2 Quads/year, 2011)
Definition: This is the total wind electricity generated (EIA 2012).
Calculation: ―Wind electricity net generation is converted to Btu using the fossil-fuels heat rate‖ (EIA
2012). The total wind electricity generation is calculated by adding each individual sectors use of wind
electricity for energy services.
Energy Flows to End Use Sectors
From: To: Quads/year
Wind Electricity generation 1.2

June 2014 The Water-Energy Nexus: Challenges and Opportunities
216
Solar (0.1 Quads/ year, 2011)
Definition: Solar is photovoltaic electricity net generation (EIA 2012) and includes photovoltaic energy
used in industrial, commercial, and electricity generation sectors (EIA 2012).
Calculation: ―Solar electricity is converted to Btu using the fossil-fuels heat rate‖ (EIA 2012). The total
solar electricity generation is calculated by adding each individual sectors use of solar electricity for
energy services.
Energy Flows to End Use Sectors
From: To: Quads/year
Solar Electricity generation 0.1
A.2 Water Sources
A.2.1 Fresh Surface Water (264 BGD, 2005)
Definition: Fresh surface water is ―Surface water withdrawals that contain less than 1,000 milligrams per
liter (mg/L) of dissolved solids‖ (USGS 2009).
Calculation: the total fresh surface withdrawal is calculated by adding all withdrawals by end use sectors,
including water for biomass production and hydraulic fracturing.
Water Flows to End Use Sectors
From: To: BGD
Fresh surface Public supply 29.6
Fresh surface Agriculture 80.6
Fresh surface Industrial 14.6
Fresh surface Thermo electric cooling 138.0
Fresh surface Residential 0.1*
A.2.2 Fresh Ground Water (82 BGD, 2005)
Definition: Fresh ground water is ―Ground water withdrawals that contain less than 1,000 milligrams per
liter (mg/L) of dissolved solids‖ (USGS 2009).
Calculation: The total fresh ground withdrawal is calculated by adding all withdrawals by end use
sectors.
Water Flows to End Use Sectors
From: To: BGD
Fresh Ground Public supply 14.6
Fresh Ground Residential 3.7
Fresh Ground Irrigation 56.7
Fresh Ground Industrial 3.5
Fresh Ground Thermo electric cooling 0.5*
Fresh Ground Biofuels 2.1
A.2.3 Saline Surface Water (57 BGD, 2005)
Definition: ―Saline surface water withdrawals represent water that contains 1,000 mg/L or more of
dissolved solids‖ (USGS 2009).
Calculation: The total saline surface withdrawal is calculated by adding all withdrawals by end use
sectors.
Water Flows to End Use Sectors
From: To: BGD

The Water-Energy Nexus: Challenges and Opportunities June 2014
217
Saline surface Industrial 1.3
Saline surface Thermo electric cooling 55.7
A.2.4 Saline Ground Water (2 BGD, 2005)
Definition: Saline ground water represents ―Ground water withdrawals that contains 1,000 mg/L or more
of dissolved solids‖ (USGS 2009).
Calculation: The total saline ground withdrawal is calculated by adding all withdrawals by end use
sectors. USGS reports 1.5 BGD of saline withdrawal by the mining sector. In the diagram, this volume of
water appears as produced water.
Water Flows to End Use Sectors
From: To: BGD
Ground saline Industrial 0.3*
Ground saline Thermo electric cooling 1.5
Ground saline to Industrial = 1.5 BGD – 1.2 BGD = 0.3 BGD
A.2.5 Fresh Surface and Ground Water
Definition: Water used for hydraulic fracturing, enhanced oil recovery, and biomass irrigation is sourced
from both surface and ground water. Only the combination of surface water and ground water is
estimated; however, for the purpose of the diagram, the total volumes are equally divided. The exact
amount withdrawn for each use from each water source is unknown.
Water Flows to End Use Sectors
From: To: BGD
Fresh surface and Fresh ground water Natural gas and Petroleum (Hydraulic Fracturing) 0.2
Fresh surface and fresh ground water Petroleum (EOR) 1.2
A.2.6 Produced Water (2.4 BGD, 2007)
Definition: Produced water, ―is found in the same formations as oil and gas. When oil and gas are
produced to the surface, produced water is brought to the surface, too‖ (Clark and Veil 2009). The
diagram shows produced water only from the petroleum box to enhance readability. In reality, produced
water is also a byproduct of natural gas production.
Produced water must be managed. The most common management strategies include injection for
enhanced recovery (EOR or hydraulic fracturing), injection for disposal, and surface discharge. In 2009,
Argonne National Laboratory estimated produced water volumes for 2007 using a variety of methods.
Produced water volumes were , ―provided directly to Argonne by state agencies, obtained via published
report or electronically, obtained via electronic database, obtained from websites in a form other than a
published report or electronic database, obtained from EIA, or produced water volumes were estimated
from production volumes‖ (Clark and Veil 2009).
Water/oil ratios and water/gas ratios were calculated for the states that distinguished produced water
volumes by hydrocarbon type. Not all states provided this information and therefore ratios could not be
calculated for each state. The table below shows the states with the 10 highest volumes of produced
water and the water/oil and water/gas ratios, if the ratios were able to be calculated (Clark and Veil 2009).
Note that the ratios vary by nearly three orders of magnitude.
2007 Produced Water Information

June 2014 The Water-Energy Nexus: Challenges and Opportunities
218
State ranked by amount of produced
water
Produced Water (BGD)
Water/oil Ratio
Water/gas Ratio
1. Texas 0.85 - -
2. California 0.29 10.5 7.6
3. Wyoming 0.27 - -
4. Oklahoma 0.25 - -
5. Kansas 0.14 21.8 1208
6. Louisiana 0.13 - -
7. Alaska 0.09 2.9 4.4
8. New Mexico 0.08 9 91.5
9. Colorado 0.04 - -
10. Mississippi 0.04 13.5 35.9
Pennsylvania 0.0005 - -
North Dakota 0.02 3 18
Produced water volumes from oil and gas production was estimated at 2.42 BGD in 2007 (Clark and Veil
2009). Understanding how oil and gas production has changed between 2007 and 2011, then cross
referencing with what is known about produced water in 2007 can help explain how produced water
volumes have changed in the same time period.
In 2007, unconventional gas accounted for 16 percent of U.S. gas production (EIA 2013b). Since then,
the U.S. energy landscape has changed dramatically. In 2011, unconventional gas accounted for 36
percent of U.S. gas production with shale gas production increasing by 327 percent (EIA 2013b). Since
unconventional gas is known to typically produce less water on a per volume basis, the changing blend of
conventional and unconventional gas is likely to have an impact on water/gas ratios.
Oil production has increased 11 percent from 2007 to 2011. During the same time period, conventional
gas production has decreased 12 percent, while unconventional gas production has increased 158 percent.
The majority of new gas production—defined as a state‘s net increase in gas production as part of the
U.S. total increase in gas production—has come from Texas (21 percent), Louisiana (35 percent), and
Pennsylvania (24 percent). No information on water/gas ratios is provided for any of these three states.
The states with the largest share of the U.S. net increase in oil production between 2007 and 2011 were
Texas (46 percent) and North Dakota (35 percent). A water/oil ratio is available only for North Dakota.
Oil Production By State (100,000 bbl/year) Gas Production By State (1,000 Mmcf)
State 2007 2011 Change % of
New
State 2007 2011 Change % of
New
Texas 391 531 140 46 Texas 6,961 7,935 974 21
California 219 194 -25 - California 339 279 -60 0
Wyoming 54 55 1 0.2 Wyoming 2,258 2,375 117 2
Oklahoma 64 77 13 4 Oklahoma 1,784 1,889 -105 2
Kansas 37 42 5 2 Kansas 367 310 -57 0
Louisiana 77 69 -8 - Louisiana 1,383 3,041 1658 35
Alaska 264 205 -59 - Alaska 3,479 3,163 -316 -
New Mexico 59 71 12 4 New Mexico 1,555 1,286 -269 -
Colorado 26 39 13 4 Colorado 1,255 1,649 394 8
Mississippi 21 24 3 1 Mississippi 273 443 -170 4
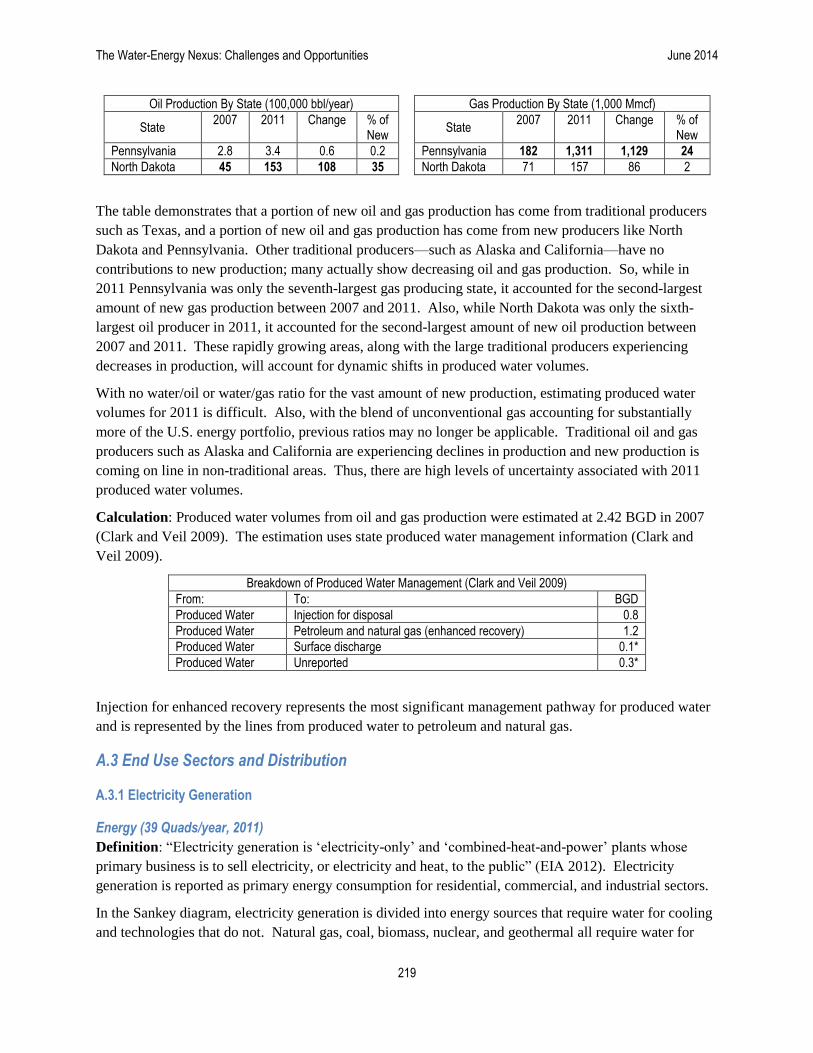
The Water-Energy Nexus: Challenges and Opportunities June 2014
219
Oil Production By State (100,000 bbl/year) Gas Production By State (1,000 Mmcf)
State 2007 2011 Change % of
New
State 2007 2011 Change % of
New
Pennsylvania 2.8 3.4 0.6 0.2 Pennsylvania 182 1,311 1,129 24
North Dakota 45 153 108 35 North Dakota 71 157 86 2
The table demonstrates that a portion of new oil and gas production has come from traditional producers
such as Texas, and a portion of new oil and gas production has come from new producers like North
Dakota and Pennsylvania. Other traditional producers—such as Alaska and California—have no
contributions to new production; many actually show decreasing oil and gas production. So, while in
2011 Pennsylvania was only the seventh-largest gas producing state, it accounted for the second-largest
amount of new gas production between 2007 and 2011. Also, while North Dakota was only the sixth-
largest oil producer in 2011, it accounted for the second-largest amount of new oil production between
2007 and 2011. These rapidly growing areas, along with the large traditional producers experiencing
decreases in production, will account for dynamic shifts in produced water volumes.
With no water/oil or water/gas ratio for the vast amount of new production, estimating produced water
volumes for 2011 is difficult. Also, with the blend of unconventional gas accounting for substantially
more of the U.S. energy portfolio, previous ratios may no longer be applicable. Traditional oil and gas
producers such as Alaska and California are experiencing declines in production and new production is
coming on line in non-traditional areas. Thus, there are high levels of uncertainty associated with 2011
produced water volumes.
Calculation: Produced water volumes from oil and gas production were estimated at 2.42 BGD in 2007
(Clark and Veil 2009). The estimation uses state produced water management information (Clark and
Veil 2009).
Breakdown of Produced Water Management (Clark and Veil 2009)
From: To: BGD
Produced Water Injection for disposal 0.8
Produced Water Petroleum and natural gas (enhanced recovery) 1.2
Produced Water Surface discharge 0.1*
Produced Water Unreported 0.3*
Injection for enhanced recovery represents the most significant management pathway for produced water
and is represented by the lines from produced water to petroleum and natural gas.
A.3 End Use Sectors and Distribution
A.3.1 Electricity Generation
Energy (39 Quads/year, 2011)
Definition: ―Electricity generation is ‗electricity-only‘ and ‗combined-heat-and-power‘ plants whose
primary business is to sell electricity, or electricity and heat, to the public‖ (EIA 2012). Electricity
generation is reported as primary energy consumption for residential, commercial, and industrial sectors.
In the Sankey diagram, electricity generation is divided into energy sources that require water for cooling
and technologies that do not. Natural gas, coal, biomass, nuclear, and geothermal all require water for

June 2014 The Water-Energy Nexus: Challenges and Opportunities
220
cooling, while wind, hydro, and PV solar do not. CSP is not included because of current low generation
levels.
Calculation: The total amount of electricity generation/distribution is calculated by adding up the
primary energy consumption of each end use sector.
Energy Flows to End Use Sectors
From: To: Quads/year
Electricity generation Residential 4.9
Electricity generation Commercial 4.0
Electricity generation Industrial 3.3
Electricity generation Public supply 0.3
Electricity generation Wastewater treatment 0.2
Water (196 BGD total, 57 BGD saline, 139 BGD fresh) (2011)
Definition: The amount of water used for thermoelectric cooling. An adjustment from USGS‘s 2005
estimate to the 2011 estimate was performed to account for old plants that have retired and new plants
that have come online since 2005. EIA (2013d) and USGS data was compared and there was significant
difference between the two data sets.
Water for thermo electric cooling is either consumed, discharged to surface water, or discharged into the
ocean.
Calculation: The estimate for 2011 withdrawals for thermo electric cooling is calculated using USGS
2005 withdrawal data, EIA form 860 data, and Meldrum, et al (2013) consumption factors. It is assumed
plants retiring between 2005 and 2011 were operating at a lower fraction of their nameplate capacity (25
percent) than plants that came online over the same period (75 percent)
Since 2005, plants with a total nameplate capacity of 25,034 MW that required cooling were retired, 99
percent of which was coal, natural gas, and petroleum that used steam as a prime mover (EIA 2013c).
Assuming a capacity factory of 25 percent for retired plants and that all retiring plants (coal, natural gas,
petroleum) used once through cooling technology with a withdrawal factor of 35,000 gal/MWh
(Meldrum, et al 2013), plants withdrawing 5.1 BGD were retired.
Since 2005, 33,958 MW have come online, 96 percent of which is coal steam or natural gas combined
cycle (EIA 2013c). Assuming a capacity factor of 75 percent for new plants and that all new plants use
recirculating technology (withdrawal factors of 250 gals/MWh for gas and 813 gals/MWh for coal),
plants withdrawing 0.3 BGD came online.
USGS reported 201 BGD of withdrawal in 2005 for thermoelectric cooling. The estimate provided here
accounts for a decrease of 4.8h BGD of withdrawal. Using the relative proportion of fresh and surface
withdrawal to the total withdrawal for thermoelectric cooling (71 percent fresh, 29 percent saline), a
decrease of 3.4 BGD of fresh water withdrawal and a decrease of 1.4 BGD of saline withdrawal is
represented in the diagram. After estimating the decreases, the total withdrawal is adjusted to 196 BGD
in 2011
Water Flows to End Use Sectors
From: To: BGD
Fresh Surface Thermoelectric cooling 138.6
Saline surface Thermoelectric cooling 55.3
Saline ground Thermoelectric cooling 1.5

The Water-Energy Nexus: Challenges and Opportunities June 2014
221
Fresh Ground Thermoelectric cooling 0.5*
A.3.2 Public Supply
Energy (0.1 Quad/year,2011)
Definition: The amount of energy needed for pumping and aeration of publically available water.
Calculation: The electricity needed for public supply is estimated using a methodology applied to data
from the U.S. Environmental Protection Agency‘s Fiscal Year 2011 Drinking Water and Ground Water
Statistics report (EPRI 2013).
In 2011, 39.2 billion kWh was used for public water supply and treatment (EPRI 2013), which converts to
0.13 Quads/year.
Energy Flows to End Use Sectors
From: To: Quads/year
Electricity Generation Public Supply 0.1
Water (44 BGD, 2005)
Definition: Public supply refers to ―water withdrawn by public and private water suppliers that provide
water to at least 25 people or have a minimum of 15 connections. Public-supply water is delivered to
users for domestic, commercial, and industrial purposes. It is also used for public services‖ (USGS 2009).
Calculation: The amount public supply is calculated by adding fresh surface and ground water
withdrawals. No saline withdrawals are included.
Public supply deliveries are equal to end use sector withdrawals from the public supply. Commercial and
industrial sector deliveries from the public supply are estimated using the percentages below. End use
sector withdrawals are estimated using:
Residential sector delivery = 58% (USGS 2009) x total public supply (USGS 2009)
Commercial sector delivery = 30% (USGS 1998) x total public supply (USGS 2009)
Industrial sector delivery = 12% (USGS 1998) x total public supply (USGS 2009)
Residential deliveries in 2005 / total public supply in 2005 = 58%
12% Industrial sector deliveries are assumed to have remained constant since 1995.
Commercial sector deliveries = 100% - 58% - 12%
Water Flows to End Use Sectors
From: To: BGD
Public supply Residential 25.6
Public supply Commercial 13.3
Public supply Industrial 5.3
A.2.4 Transportation
Energy (27 Quads/year, 2011)
Definition: ―An energy-consuming sector that consists of all vehicles whose primary purpose is
transporting people and/or goods from one physical location to another. Included are automobiles; trucks;
buses; motorcycles; trains, subways, and other rail vehicles; aircraft; and ships, barges, and other
waterborne vehicles. Vehicles whose primary purpose is not transportation (e.g., construction cranes and

June 2014 The Water-Energy Nexus: Challenges and Opportunities
222
bulldozers, farming vehicles, and warehouse tractors and forklifts) are classified in the sector of their
primary use‖ (EIA 2012).
Calculation: The amount of energy for the transportation sector is calculated by adding primary energy
contributions from the different energy sources.
The transportation sector is assumed to be 20 percent efficient; 80 percent of the total energy used in the
transportation sector becomes dissipated energy (LLNL 2012).
Energy Flows to End Use Sectors
From: To: Quads/year
Petroleum Transportation 25.1
Biofuels Transportation 1.2
Natual gas Transportation 0.7
Water
Definition: The water withdrawal for transportation is negligible and therefore not included in the
diagram.
Calculation: N/A
A.2.5 Residential
Energy (11 Quads/year, 2011)
Definition: ―An energy-consuming sector that consists of living quarters for private households.
Common uses of energy associated with this sector include space heating, water heating, air conditioning,
lighting, refrigeration, cooking, and running a variety of other appliances. The residential sector excludes
institutional living quarters‖ (EIA 2012).
Calculation: The amount of energy for the residential sector is calculated by adding primary energy
contributions from the different energy sources plus electricity retail sales.
The residential sector is assumed to be 80 percent efficient; 20 percent of the total energy used in the
residential sector becomes dissipated energy (LLNL 2012).
Energy Flows to End Use Sectors
From: To: Quads/year
Petroleum Residential 1.1
Electricity generation Residential 4.9
Natural gas Residential 4.8
Biofuels Residential 0.4*
Water (29 BGD, 2005)
Definition: Residential water use ―includes indoor and outdoor uses at residences. Common indoor water
uses are drinking, food preparation, washing clothes and dishes, and flushing toilets. Common outdoor
uses are watering lawns and gardens and washing cars. Domestic water is either self-supplied or pro-
vided by public suppliers. Self-supplied domestic water use is usually withdrawn from a private source,
such as a well, or captured as rainwater in a cistern. Domestic deliveries are provided to homes by public
suppliers‖ (USGS 2009).
Calculation: Water use for the residential sector is calculated by adding the residential share of fresh
surface and ground water delivery from public supply.

The Water-Energy Nexus: Challenges and Opportunities June 2014
223
Water Flows to End Use Sectors
From: To: BGD
Public Supply Residential 25.6
Fresh ground Residential 3.7
Fresh surface Residential 0.1*
A.2.6 Commercial
Energy (8 Quads/year, 2011)
Definition: The commercial sector is ―an energy-consuming sector that consists of service-providing
facilities and equipment of: businesses; Federal, State, and local governments; and other private and
public organizations, such as religious, social, or fraternal groups. The commercial sector includes
institutional living quarters. Common uses of energy associated with this sector include space heating,
water heating, air conditioning, lighting, refrigeration, cooking, and running a wide variety of other
equipment. This sector includes generators that produce electricity and/or useful thermal output primarily
to support the activities of the above-mentioned commercial establishments‖ (EIA 2012).
Calculation: The amount of energy for the commercial sector is calculated by adding primary energy
contributions from the different energy sources plus electricity retail sales.
Since EIA includes waste water treatment and water pumping with the commercial sector, the estimated
electricity used for public supply and waste water treatment is subtracted from electricity deliveries to the
commercial sector. Those flows are represented separately as energy flows from electricity generation to
public supply and waste water treatment respectively.
The commercial sector is assumed to be 80 percent efficient; 20 percent of the total energy used in the
commercial sector becomes dissipated energy (LLNL 2012).
Energy Flows to End Use Sectors
From: To: Quads/year
Petroleum Commercial 0.7
Natural gas Commercial 3.2
Electricity generation Commercial 4.0
Coal Commercial 0.1*
Biomass Commercial 0.1*
Water (13 BGD, 2005)
Definition: Commercial water is ―use water for motels, hotels, restaurants, office buildings, other
commercial facilities, military and nonmilitary institutions. Water may be obtained from a public-supply
system or may be self-supplied.‖ Commercial water use was combined with public use and system water
losses. Public water use is ―water supplied from a public supplier and used for such purposes as
firefighting, street washing, flushing of water lines, and maintaining municipal parks and swimming
pools.‖ (USGS 2009).
Calculation: All water for commercial use is assumed to come from the public supply. Commercial
water use includes commercial water withdrawal and public use and systems losses. Public supply
deliveries to the commercial sector are 30 percent of total public supply deliveries. Commercial water
withdrawal represents 15 percent and public use and system losses are another 15 percent.
Commercial water withdrawal from public supply = 30% x public supply
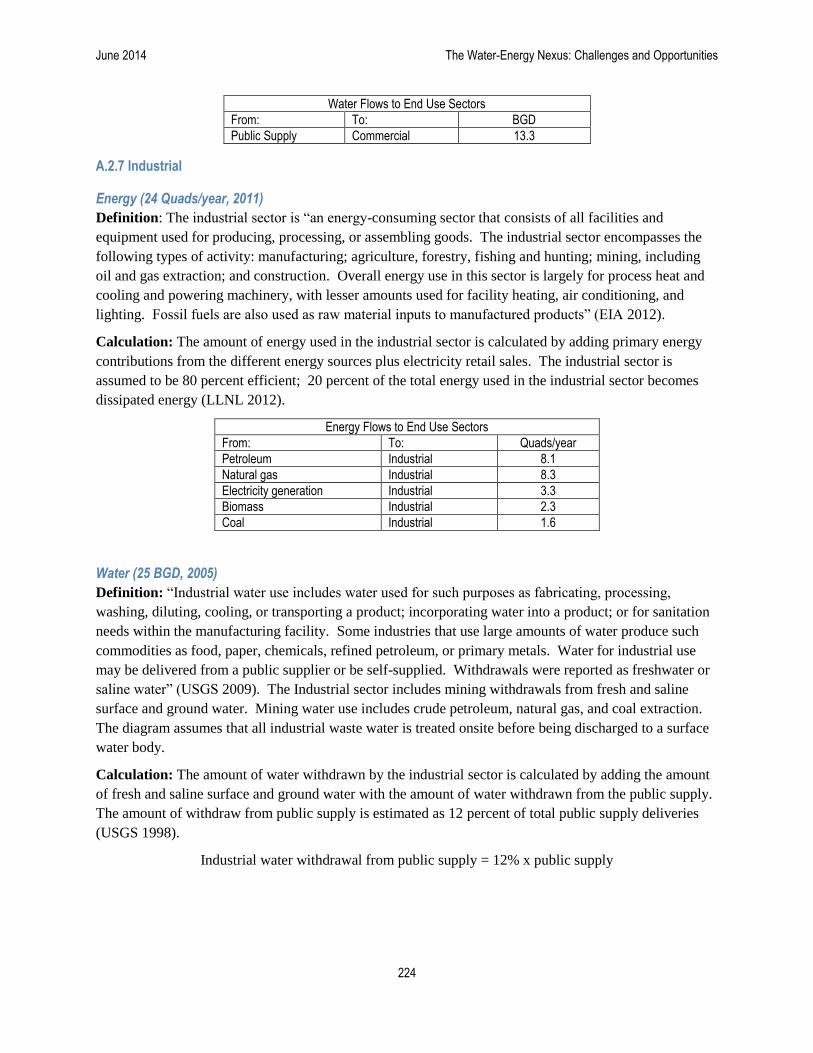
June 2014 The Water-Energy Nexus: Challenges and Opportunities
224
Water Flows to End Use Sectors
From: To: BGD
Public Supply Commercial 13.3
A.2.7 Industrial
Energy (24 Quads/year, 2011)
Definition: The industrial sector is ―an energy-consuming sector that consists of all facilities and
equipment used for producing, processing, or assembling goods. The industrial sector encompasses the
following types of activity: manufacturing; agriculture, forestry, fishing and hunting; mining, including
oil and gas extraction; and construction. Overall energy use in this sector is largely for process heat and
cooling and powering machinery, with lesser amounts used for facility heating, air conditioning, and
lighting. Fossil fuels are also used as raw material inputs to manufactured products‖ (EIA 2012).
Calculation: The amount of energy used in the industrial sector is calculated by adding primary energy
contributions from the different energy sources plus electricity retail sales. The industrial sector is
assumed to be 80 percent efficient; 20 percent of the total energy used in the industrial sector becomes
dissipated energy (LLNL 2012).
Energy Flows to End Use Sectors
From: To: Quads/year
Petroleum Industrial 8.1
Natural gas Industrial 8.3
Electricity generation Industrial 3.3
Biomass Industrial 2.3
Coal Industrial 1.6
Water (25 BGD, 2005)
Definition: ―Industrial water use includes water used for such purposes as fabricating, processing,
washing, diluting, cooling, or transporting a product; incorporating water into a product; or for sanitation
needs within the manufacturing facility. Some industries that use large amounts of water produce such
commodities as food, paper, chemicals, refined petroleum, or primary metals. Water for industrial use
may be delivered from a public supplier or be self-supplied. Withdrawals were reported as freshwater or
saline water‖ (USGS 2009). The Industrial sector includes mining withdrawals from fresh and saline
surface and ground water. Mining water use includes crude petroleum, natural gas, and coal extraction.
The diagram assumes that all industrial waste water is treated onsite before being discharged to a surface
water body.
Calculation: The amount of water withdrawn by the industrial sector is calculated by adding the amount
of fresh and saline surface and ground water with the amount of water withdrawn from the public supply.
The amount of withdraw from public supply is estimated as 12 percent of total public supply deliveries
(USGS 1998).
Industrial water withdrawal from public supply = 12% x public supply

The Water-Energy Nexus: Challenges and Opportunities June 2014
225
A.2.8 Agriculture
Energy
Definition: The amount of energy used for agriculture is included with industrial activities (EIA 2012).
The energy required for operating equipment, facilities, and pumping irrigation water.
Calculation: Using Table 2.3 Energy Intensity of Water Treatment and Pumping in California (500 to
1500 kWh/MG) and the amount of ground water used in agriculture (57 BGD), a range of 0.04 to 0.11
Quads/year are estimated for pumping groundwater for agriculture. Electricity use for ground water
pumping does not appear as a separate line in the diagram.
Energy Flows to End Use Sectors
From: To: Quads/year
Ground water Industrial 0.04 - 0.11*
Water (137 BGD, 2005)
Definition: Agriculture water use includes irrigation of any type, water use for agricultural operations,
aquaculture operations, and livestock production. ―Irrigation water use includes water that is applied by
an irrigation system to sustain plant growth in all agricultural and horticultural practices. Irrigation also
includes water that is applied for pre-irrigation, frost protection, application of chemicals, weed control,
field preparation, crop cooling, harvesting, dust suppression, leaching salts from the root zone, and water
lost in conveyance. Irrigation of golf courses, parks, nurseries, turf farms, cemeteries, and other self-
supplied landscape-watering uses also are included. Irrigation water use includes self-supplied
withdrawals and deliveries from irrigation companies, irrigation districts, cooperatives, or governmental
entities. All irrigation withdrawals were considered freshwater. Irrigated acres were reported by three
types of irrigation methods: sprinkler, micro irrigation, and surface (flood) systems‖ (USGS 2009).
Calculation: Only fresh surface and ground water withdrawal are assumed. Withdrawal for Aquaculture
and Livestock were added to Agriculture. The amount of water withdrawal estimated for biomass (2
BGD) was subtracted.
Water Flows to End Use Sectors
From: To: BGD
Fresh Surface Agriculture 80.5
Fresh Ground Agriculture 56.7
A.2.9 Waste Water Treatment
Energy (0.1 Quad/year, 2008)
Definition: Electricity is used for both public and private wastewater treatment facilities. Electricity
consumption wastewater treatment and water supply is based on a 2002 projection to 2010 (EPRI 2002).
Waste water treatment is divided into privately operated wastewater treatment facilities and publically
owned treatment works (POTWs)
Calculation: The electricity needed for municipal waste water treatment is estimated using a
methodology applied to data from the U.S. Environmental Protection Agency‘s 2008 Clean Watershed
Needs Survey report (EPRI 2013).
In 2008, 30.2 billion kWh was used for public water supply and treatment (EPRI 2013), which converts to
0.1 Quads/year.

June 2014 The Water-Energy Nexus: Challenges and Opportunities
226
Energy Flows to End Use Sectors
From: To: Quads/year
Electricity Generation Waste Water Treatment 0.1
Water (30 BGD, 2005)
Definition: The amount of residential and commercial water that is treated. Some industrial water is also
discharged to municipal waste water treatment plants; however, this flow was not included in the
diagram.
Calculation: Assume 100 percent of the surface discharge from residential and commercial sectors goes
to waste water treatment. Also assume 100 percent of water treated is released to surface discharge.
Water Flows to End Use Sectors
From: To: BGD
Residential Waste Water Treatment 19.6
Commercial Waste Water Treatment 10.4
A.3 Energy Efficiency
A.3.1 Dissipated Energy (60 Quads/year, 2011)
Definition: A physical process by which energy comes not only unavailable but irrecoverable in any
form.
Calculation:
Transport (21.3): The transportation sector is assumed to be 21 percent efficient; 79 percent of energy
into the transportation sector becomes dissipated energy (LLNL 2012).
Residential (4.0): The residential sector is assumed to be 65 percent efficient; 35 percent of energy
into the residential sector becomes dissipated energy (LLNL 2012).
Commercial (2.7): The residential sector is assumed to be 65 percent efficient; 35 percent of energy
into the commercial sector becomes dissipated energy (LLNL 2012).
Industrial (4.7): The industrial sector is assumed to be 80 percent efficient; 20 percent of energy into
the industrial sector becomes dissipated energy (LLNL 2012).
Electricity generation (27.1): Dissipated energy from electricity generation is the amount of energy
not used as electricity. Dissipated energy from electricity generation is calculated by subtracting
electricity use from the total energy content of fuels used to create electricity. Electricity use is
reported for residential, commercial, and industrial sectors (LLNL 2012).
Dissipated energy = total energy content of fuels – electricity used
A.3.2 Energy Services (37 Quads/year, 2011)
Definition: Energy used
Calculation:
Transport (5.7): The transportation sector is assumed to be 21 percent efficient; 79 percent of energy
into the transportation sector becomes dissipated energy (LLNL 2012).
Residential (7.3): The residential sector is assumed to be 65 percent efficient; 35 percent of energy
into the residential sector becomes dissipated energy (LLNL 2012).

The Water-Energy Nexus: Challenges and Opportunities June 2014
227
Commercial (4.9): The residential sector is assumed to be 65 percent efficient; 35 percent of energy
into the commercial sector becomes dissipated energy (LLNL 2012).
Industrial (18.9): The industrial sector is assumed to be 80 percent efficient; 20 percent of energy into
the industrial sector becomes dissipated energy (LLNL 2012).
A.4 Water Efficiency and Discharge
A.4.1 Consumed Water (116 BGD, 2008 - 2011)
Definition: ―The part of water withdrawn that is evaporated, transpired, incorporated into products or
crops, consumed by humans or livestock, or otherwise removed from the immediate water environment‖
(USGS 2009).
Calculation:
Residential (7.6 BGD): The amount of residential water consumed is assumed to be 26 percent of the
total residential water used (USGS 1998).
Commercial (2 BGD): The amount of water consumed by the commercial sector is 15 percent of total
water used (USGS 1998).
Industrial (3.8 BGD): The amount of water consumed by the industrial sector is 15 percent of total
water used (USGS 1998).
Agriculture (96 BGD): Irrigation is assumed to consume 70 % percentof water used. Consumption
from aquaculture and livestock is included. The estimation is based on the following assumptions: ―In
1995, USGS estimated that 61% of irrigation water use was consumptive, 20% was returned and 19%
was lost in conveyance. It is assumed that some progress has been made in irrigation efficiency,
which would increase the consumptive percentage in agriculture, and that some conveyance losses
can be considered to be consumptive.‖ (LLNL 2011).
Thermoelectric cooling (4.3 BGD): n 2008, thermoelectric cooling consumed 4.3 BGD (Averyt et al.
2013).
Consumption estimates were considered from the following studies:
Various Consumption Estimates
Author Title Year Consumption
LLNL Estimated Water Flows in 2005 2005 13 BGD
Dept. of Energy LLNL adjusted 2011 12.6 BGD
Averyt et al. Water Use for Electricity in the United States 2008 4.3 BGD
USGS Estimated Use of Water in the U.S in 1995 1995 3.7 BGD
EIA EIA 923 Form 2010 3.3 BGD
As demonstrated by the table, a wide variation in possible estimates exists with uncertainty associated
with each. LLNL‘s reported number was adjusted to an estimate for 2011 using a similar methodology as
the thermo electric withdrawal estimate. The Averyt et al. consumption value was selected as it represents
the median value.
A.4.2 Ocean Discharge (60 BGD, 2011)
Definition: Ocean discharge is the percentage of each sector‘s total water use that is discharged to the
ocean (LLNL 2012). The methodology uses state by state coastal population percentages to calculate

June 2014 The Water-Energy Nexus: Challenges and Opportunities
228
each state‘s volume of ocean water discharged. For landlocked states, the amount of water supplied by
and returned to the ocean is zero (LLNL 2012).
Calculation:
Residential (2.1 BGD): 7 percent of the total residential water used is discharged to ocean (LLNL
2012).
Commercial (0.9 BGD): 7 percent of the total commercial water used is discharged to ocean (LLNL
2012).
Industrial (1.7 BGD): 7 percent of the total industrial water used is discharged to ocean (LLNL 2012).
Agriculture: Assume no water used in agriculture is discharged to the ocean (LLNL 2012).
Thermoelectric cooling (55 BGD): Approximately 28 percent of water withdrawn for thermo electric
cooling is discharged to the ocean. The estimation is based on the following assumption: ―Power
plants cooled with ocean water that have once-through cooling designs and are assumed to return
98.5% of saline surface and groundwater used in thermoelectric cooling to the ocean while the
remainder is consumed. Water returned to the ocean from recirculating power plants using saline
surface-and groundwater is assumed to be 25% of that withdrawn from the ocean while the remaining
75% is consumed during the process. These two calculated values are summed to represent the total
amount of water returned to the ocean from thermoelectric cooling processes‖ (LLNL 2012)
Total Returned to Ocean = (98.5% x Once through Saline) + (25% x recirculating saline)
A.4.3 Surface Discharge (227 BGD, 2011)
Definition: Water discharged to surface water bodies such as rivers, lakes, ponds, and streams.
Calculation: Each calculation is performed using:
Surface Discharge = Total water – water consumed – water discharge to ocean
Waste Water Treatment (30 BGD): All water sent to waste water treatment facilities is then
discharged to surface waters such as rivers and lakes. The remainder of used residential and
commercial water that is not consumed or returned to the ocean is returned to a waste water treatment
facility for treatment.
Industrial (19.6 BGD): The remainder of used industrial water that is not consumed or returned to the
ocean is returned to surface waters such as rivers and lakes (LLNL 2012).
Agriculture (41.1 BGD): Approximately 21 percent of water withdrawn for agriculture is discharged
to the surface. Consumption from aquaculture and livestock is included. The used water that is not
consumed is discharged to surface water (LLNL 2012).
Thermoelectric cooling (136.4 BGD): The remainder of all water withdrawn by the thermoelectric
sector minus the water consumed and minus the water discharged to the ocean, is returned to the
surface (LLNL 2012).

The Water-Energy Nexus: Challenges and Opportunities June 2014
229
References
Averyt, K.,Macknick, J., Rogers, J., Madden, N., Fisher, J., Meldrum, J., Newmark, R. ―Water Use for
Electricity in the United States: An Analysis of reported and Calculated Water Use Information for 2008‖.
Environmental Research Letters. 2013.
C.A. Smith, A.J. Simon, F.D. Belles. ―Estimated Water Flows in 2005 United States‖. Lawrence
Livermore National Laboratory (LLNL). 2011.
C.E. Clark and J.A. Veil. ―Produced Water Volumes and Management Practices in the United States‖.
Argonne National Laboratory (ANL). 2009.
EIA (U.S. Energy Information Administration). 2011. ―Form EIA-819M Monthly Oxygenate Report.‖
U.S. Department of Energy. November 29. Accessed November 1, 2013.
http://www.eia.gov/petroleum/ethanolcapacity/archive/2011/index.cfm.
EIA (U.S. Energy Information Administration). 2012. 2011 Annual Energy Review. Washington, DC:
EIA.
EIA (U.S. Energy Information Administration). 2013a. Annual Energy Outlook 2013. Washington, DC:
EIA.
EIA (U.S. Energy Information Administration). 2013b. ―Natural Gas Gross Withdrawals and
Production.‖ U.S. Department of Energy. Accessed November 1, 2013.
http://www.eia.gov/dnav/ng/ng_prod_sum_dcu_NUS_m.htm.
EIA (U.S. Energy Information Administration). 2013c. ―Form EIA-860 detailed data – 2011,‖ Early
Release. U.S. Department of Energy. June 20. Accessed August 2, 2013.
www.eia.gov/electricity/data/eia860/.
EIA (U.S. Energy Information Administration). 2013d. ―Form EIA-923 detailed data – 2011,‖ U.S.
Department of Energy, November 12. Accessed December 11, 2013.
www.eia.gov/electricity/data/eia923/
EPRI (Electric Power Research Institute). ―Electricity Use and Management in the Municipal Water
Supply and Wastewater Industries‖. Palo Alto, CA. 2013.
Freyman, Monika and Ryan Salmon. ―Hydraulic Fracturing & Water Stress: Growing Competitive
Pressures for Water‖. Ceres. 2013.
Kenny, J.F., Nancy L. Barber, Susan S. Hutson, Kristin S. Linsey, John K. Lovelace, and Molly A.
Maupin. ―Estimated Use of Water in the United States in 2005‖. U.S. Geological Survey Circular 1344.
2009.
LLNL (Lawrence Livermore National Laboratory). ―Estimate Energy Use in 2011‖. 2012.
Meldrum, J.,Nettles-Anderson, S., Heath, G., Macknick, J. ―Life Cycle Water Use For Electricity
Generation: A review and Harmonization of Literature Estimates.‖ Environmental Research Letter 8
015031. 2013.
Solley, Wayne B., Robert R. Pierce, and Howard A. Perlman. ―Estimated Use of Water in the United
States in 1995‖. U.S. Geological Survey Circular 1200. 1998.

June 2014 The Water-Energy Nexus: Challenges and Opportunities
230
Wu, May and Yiwen Chiu. ―Consumptive Water Use in the Production of Ethanol and Petroleum
Gasoline – 2011 Update‖. Argonne National Laboratory (ANL). 2011.

The Water-Energy Nexus: Challenges and Opportunities June 2014
231
Appendix B. U.S. Department of Energy Research Funding Opportunity
Announcements Relevant to the Water-Energy Nexus This appendix provides information on recent awards under various research Funding Opportunity
Announcements (FOAs) issued by the U.S. Department of Energy (DOE) related to the water-energy
nexus. Specific water-energy projects are described in the program office‘s section where funding
originated. The sections below can be used to match funded projects with the FOAs the projects are
derived from, showing the links between water-energy program needs and the eventual research projects
addressing those needs.
B.1 Advanced Research Projects Agency-Energy
The mission of the Advanced Research Projects Agency-Energy (ARPA-E) is to identify and fund
research to translate science into breakthrough technologies that, if successfully developed, will create the
foundation for entirely new industries. In 2012, ARPA-E used an Open FOA to invest in a variety of
projects that explore different aspects of the water energy nexus. The three projects totaling $4.5 million
are high risk and focus applied research to create real-world solutions to important problems that could
provide technological leaps in the water-energy space (ARPA-E FOA a & b, 2012).
Table B.1. Recent ARPA-E funding for projects associated with the water-energy nexus
Institution Objective Year
Funded
Massachusetts Institute of
Technology
Develop a water purification technique for water with high salt
content that requires less power than competing technologies and
would also remove other contaminants such as metals and
microorganisms.
2012
University of North Dakota Develop an air-cooled device for power plants that helps maintain
water and power efficiency during electricity production with low
environmental impact.
2012
Wyss Institute at Harvard
University
Develop self-repairing coatings for the inside surfaces of oil and
water pipes to reduce friction and potentially reduce energy use by
up to 50%.
2012
B.2 Office of Electricity Delivery and Energy Reliability In 2009, the Office of Electricity Delivery and Energy Reliability (OE) issued a FOA calling for research
related to interconnection-level electric Infrastructure planning (NETL, 2009). Using funds appropriated
by the American Recovery and Reinvestment Act of 2009, the FOA lead to funding for one water-energy
project that examines water availability for thermoelectric cooling and competing uses under water
stressed conditions.
Table B.2. Recent OE funding for projects associated with water-energy nexus
Institution Objective Year
Funded
Sandia National
Laboratory and other
supporting national
laboratories
Develop an Energy-Water Decision Support System (DSS) to enable
planners in the Western and Texas Interconnections to analyze the
implications of water stress for transmission and resource planning.
2010

June 2014 The Water-Energy Nexus: Challenges and Opportunities
232
B.3 Office of Fossil Energy
The Office of Fossil Energy (FE) often works with the National Energy Technology Laboratory (NETL)
when issuing FOAs. In 2012 and 2013, NETL released FOAs related to unconventional oil and gas
technologies (NETL FOA, 2012 & 2013). The purpose of these FOAs was to usher research to increase
domestic oil and natural gas production, assure the reliability of the natural gas delivery system, and
produce a cleaner environment through R&D implementation. Because of the water resources needed for
oil and gas production and the subsequent water management issues, many FE projects inherently deal
with water-energy nexus issues.
Table B.3. Recent FE and NETL funding for projects associated with the water-energy nexus
Institution Objective Year
Funded
University of Pittsburgh Design, synthesize, and characterize a cost effective CO2 thickener
for improved mobility control during CO2-enhanced oil recovery to
potentially eliminate water injection for mobility control.
2012
Ground Metrics, Inc. Evaluation of depth to surface electromagnetic (DSEM) imaging for
improved hydrofracture monitoring to reduce cost and use of fracture
fluid by reducing the number of fracture stages.
2013
Oceanit Laboratories Demonstrate the capability of real-time sensing of Nanite for
improving the long-term wellbore integrity and zonal isolation in
shale gas.
2013
University of Texas at
Austin
Develop nanoparticle-stabilized foams to improve performance of
water-less hydraulic fracturing.
2013
B.4 Research Partnership to Secure Energy for America In addition to the above research, FE and NETL provide oversight and review of the Research Partnership
to Secure Energy for America (RPSEA). RPSEA was established in 2006 by section 999 of the Energy
Policy Act of 2005. NETL selected RPSEA to manage the distribution of $375 million over 10 years for
research and development to enable new technologies necessary to produce more secure, abundant, and
affordable domestic energy supplies and meet the nation‘s growing need for domestic hydrocarbon
resources (RPSEA, n.d. a). In 2011, the Small Producers Program FOAs and Unconventional Resources
Program FOAs funded 10 projects related to the water-energy nexus totaling $17.1 million. Funding
decisions have not yet been made from a 2013 RPSEA FOA.
Table B.4. Recent RPSEA funding for projects associated with the water-energy nexus
Institution Objective Year
Funded
GSI Environmental Inc Reduce the environmental impact of gas shale development through
advanced analytical methods for air and stray gas emissions and
produced brine characterization.
2011
Southern Research
Institute
Determine an integrated approach for advanced treatment of shale gas
fracturing water to produce NPDES quality water.
2011
Battelle Memorial
Institute
Develop framework for subsurface brine disposal in the Northern
Appalachian Basin.
2011
Petroleum Research
Recovery Center of
New Mexico Tech
Upscale the cost-effective humidification dehumidification (HDH)
treatment process of produced water using co-produced energy
sources.
2011

The Water-Energy Nexus: Challenges and Opportunities June 2014
233
Institution Objective Year
Funded
Utah Geological
Survey
Create basin-scale produced water management tools and options
using GIS based models and statistical analysis of shale gas/tight sand
reservoirs and their produced water streams in the Uinta Basin.
2011
University of Texas at
Austin
Reduce excess water production and improve oil recovery in mature oil
fields using advanced particle gels.
2011
Gas Technology
Institute
Develop advanced hydraulic fracturing methods to minimize the amount
of water and additives needed for stimulation.
2011
Colorado School of
Mines
Advance a web-based tool for unconventional natural gas development
with a focus on flowback and produced water characterization,
treatment, and beneficial use.
2011
Colorado State
University
Develop a GIS-based tool for optimized fluid management in shale gas
operations.
2011
The University of
Missouri
Study and pilot test of preformed particle gel conformance control
combined with surfactant treatment.
2011
B.5 Small Business Innovation Research Program
In addition to the above research, FE and the Office of Science, Basic Energy Sciences (BES), have
awarded the following projects directed at reduced water usage in power plants.
Table B.5. Recent FE and BES funding for projects associated with the water-energy nexus
Institution Objective Year
Funded
Ultramet Design, fabricate, and test heat exchangers based on high thermal conductivity, high-permeability open-cell foam. The high surface area of the foam, combined with its high thermal conductivity and low pressure drop, enables it to achieve high efficiency.
2014
Advanced Cooling
Technologies, Inc.
Enhance the condensation heat transfer within the condensing tubes using a cost effective coating method, thereby improving dry cooling efficiency. Additionally, a representative dry cooling system for a large power generation facility (~1.8 GWt) will be modeled using experimentally determined heat transfer coefficients to reveal the improvement in, not only dry cooling efficiency, but also power generation efficiency.
2014
Altex Technologies Corp. Condenser heat transfer and pressure drop models were developed and utilized to design full scale and test article condensers that have optimal performance, size, weight and cost. A subscale condenser test article was then manufactured and tested and test results showed volume reductions of 63% and pressure drop reductions of 52%, versus conventional dry cooling condensers. These advantages result in a 43% to 48% reduction in condenser total cost, versus conventional dry condensers.
2013
B.6 EERE
The program offices within the Office of Energy Efficiency and Renewable Energy (EERE) have unique
missions and are therefore investing in an array of approaches to discovering possible solutions for water-
energy challenges.

June 2014 The Water-Energy Nexus: Challenges and Opportunities
234
B.6.1 Advanced Manufacturing Office
The mission of the Advance Manufacturing Office (AMO) is to advance manufacturing science and
technology to enable rapid, low-cost, energy-efficient manufacturing. Through a 2011 Innovative
Manufacturing Initiative FOA, AMO has funded one research project at the water-energy nexus.
Table B.6. Recent AMO funding for projects associated with the water-energy nexus
Institute Objective Year
Funded
Research Triangle
Institute
Develop and demonstrate an advanced, energy-efficient hybrid
membrane system that enables the reuse of more than 50% of a
facilities wastewater, decreasing wastewater discharge and recovering
industrial waste heat.
2012
B.6.2 Bioenergy Technologies Office
An objective of the Bioenergy Technologies Office (BETO) is to fund research to support outdoor
phototrophic algae R&D related to water use in algal production systems. In 2013, BETO released a
FOA to provide advancements in sustainable algal production. One of the awarded projects develops
water recycling during algal production.
Table B.7. Recent BETO funding for projects associated with the water-energy nexus
Institute Objective Year
Funded
California Polytechnic
State University
Develop and demonstrate efficient recycling of water and nutrients in
algal biofuels production to allow at least 75% of the water and
nutrients to be recycled, without significant losses in the stability and
productivity of the algae.
2013
B.6.3 Fuel Cell Technologies Office
The hydrogen and fuel cell technologies that are required to produce hydrogen are varied. In 2012, the
Fuel Cell Technologies Office (FCTO) used the Small Business Innovation Research (SBIR) funds to
support one project to examine using wastewater for hydrogen production.
Table B.8. Recent FCTO funding for projects associated with the water-energy nexus
Institute Objective Year
Funded
Arbsource LLC Tempe, AZ
Halve the cost of supplying low-energy high-quality wastewater
treatment for food and beverage processors, while producing
hydrogen from wastewater.
2012
B.6.4 Water Power Program
In 2013, the Water Power Program release three FOAs (Water Power Program, 2013) specific to the
water-energy nexus: the Marine and Hydrokinetics Environmental Effects Assessment and Monitoring,
the Marine and Hydrokinetics System Performance Advancement, and the Marine and Hydrokinetic
Testing Infrastructure Development. The Water Power Program funded 15 projects associated with the
water-energy nexus from three FOAs totaling $15.7 million.
Table B.9 Recent Water Power Program funding for projects associated with the water-energy nexus
Institute Objective Year
Funded

The Water-Energy Nexus: Challenges and Opportunities June 2014
235
Institute Objective Year
Funded
Dehlsen Associates, LLC Develop advanced controls software for the multi-pod Centipod
wave device. The new software will help predict future wave
conditions and provide control signals to adjust current system
settings to make the Centipod’s power output more responsive,
maximizing energy capture, reducing loading, and increasing power
plant durability
2013
Ocean Renewable Power
Company, LLC
Investigate, analyze, and model a control system for the grid-
connected TidGen System that predicts tidal conditions based on
measurements ahead of the device, and uses them to adjust
turbine settings for optimal performance. The improved control
scheme could more efficiently harvest energy from highly turbulent
water.
2013
Resolute Marine Energy,
Inc
Develop a feedback control algorithm for a wave energy converter
device. The algorithms will factor in wave dynamics and local data,
ultimately establishing a decision system sensitive to wave
forecasts and measurement errors. The company estimates will
produce improvements in capture efficiency, capacity, and energy
cost.
2013
ABB, Inc Build a compact direct-drive generator and demonstrate its viability
in Resolute Marine Energy’s SurgeWECTM wave energy device.
The goal is to produce a generator 50 percent smaller than a
traditional direct-drive generator.
2013
Columbia Power
Technologies
Demonstrate the use of a novel, high-performance power take-off
module, drivetrain, and generator assembly that converts
mechanical energy into electricity. The project seeks to not only
improve cost competitiveness, but also reduce maintenance costs
in deployed wave energy devices.
2013
Ocean Renewable Power
Company, LLC
Develop and test a common set of components for an advanced
power take-off system, drivetrain and generator assembly. In
addition, the company will conduct studies to measure the
component and system performance benefits and to identify how
best to incorporate these components into their existing turbine
technologies. This project seeks to improve the components
power-to-weight ratio and availability.
2013
Ocean Energy USA, LLC Develop and conduct wave-tank testing on a cost-effective hull
design for their deep-water wave energy device.
2013
Ocean Power
Technologies, Inc
Developing the float and spar components of their PowerBuoy
wave energy converter. These two components account for 50
percent of the device’s mass, so improving materials,
manufacturability, and durability of the float and spar could reduce
the cost of energy and significantly improve the device’s power-to-
weight ratio.
2013
University of Maine Use data on the interactions of fish with ORPC’s TidGen tidal
turbine to predict the probability of fish encountering marine and
hydrokinetic devices.
2013

June 2014 The Water-Energy Nexus: Challenges and Opportunities
236
Institute Objective Year
Funded
Electric Power Research
Institute, Inc
Assess how electromagnetic fields generated by undersea
electricity transmission may affect marine species. The project will
investigate whether the electromagnetic fields around the power
cable alter the behavior or path of fish along a migratory corridor
and find out whether the electromagnetic fields help guide
migratory movements or create obstacle to migration.
2013
Oak Ridge National
Laboratory
Quantify the distribution, behavioral response, and general patterns
of fish movement around an operating tidal energy turbine.
2013
University of Washington Characterize the behavioral responses of killer whales, harbor
porpoises, and fin-footed marine mammals, such as seals, sea
lions, walruses, to the sounds produced by tidal turbines.
2013
Oregon State University Measure changes in sound levels from the installation and
operation of a wave energy converter in the coastal ocean,
including comparison with other natural and man-made sources
near the project site.
2013
Oregon State University Characterize fish communities near wave energy deployments in
Oregon and compare them to adjacent natural reefs and quantify
differences in fish attraction between an energy-producing wave
device and a non-energy-producing analysis platform anchored in
the same habitat.
2013
Florida Atlantic University Characterize the electromagnetic field emissions at the Navy’s
South Florida Ocean Measurement Facility—an in-water test facility
that consists of a number of bottom-mounted sensors for
measuring and characterizing acoustic and electromagnetic
signatures of submarines—as representative of a location where
marine and hydrokinetic devices may be sited.
2013

The Water-Energy Nexus: Challenges and Opportunities June 2014
237
References
AMO (Advanced Manufacturing Office). n.d. ―Advanced Manufacturing Office.‖ U.S. Department of
Energy, Office of Energy Efficiency and Renewable Energy. www1.eere.energy.gov/manufacturing/.
AMO (Advanced Manufacturing Office). 2011. ―DE-FOA-0000560, Innovative Manufacturing
Initiative.‖ U.S. Department of Energy, Office of Energy Efficiency and Renewable Energy.
www1.eere.energy.gov/manufacturing/financial/solicitations_detail.asp?sol_id=422.
ARPA-E (Advanced Research Projects Agency – Energy). 2012a. ―DE-FOA-0000670, Open Funding
Opportunity Announcement.‖ U.S. Department of Energy. https://arpa-e-
foa.energy.gov/FileContent.aspx?FileID=ec1551c4-26d5-4302-ba58-a06d823c3def.
ARPA-E (Advanced Research Projects Agency – Energy). 2012b. ―ARPA-E Project Selections – Open
FOA – Advanced Fuels.‖ Washington, DC: U.S. Department of Energy. http://arpa-
e.energy.gov/sites/default/files/documents/files/OPEN%202012%20Project%20Descriptions.pdf.
NETL (National Energy Technology Laboratory). n.d. ―Key Staff.‖ U.S. Department of Energy.
www.netl.doe.gov/about/organization.html.
NETL (National Energy Technology Laboratory). 2009. ―DE-FOA-0000068, Recovery Act-Resource
Assessment and Interconnection-Level Transmission Analysis and Planning.‖ U.S. Department of
Energy. www.grants.gov/web/grants/view-opportunity.html?oppId=47961.
NETL (National Energy Technology Laboratory). 2010. Research Call to DOE/Federal Laboratories:
Technical Support for Interconnection-Level Electric Infrastructure Planning, RC-BM-2010.
Washington, DC: U.S. Department of Energy.
http://energy.gov/sites/prod/files/oeprod/DocumentsandMedia/Research_Call.pdf.
NETL (National Energy Technology Laboratory). 2012. ―DE-FOA-0000724, FY2012 Unconventional
Gas and Oil Technologies.‖ U.S. Department of Energy. www.grants.gov/web/grants/view-
opportunity.html?oppId=170615.
NETL (National Energy Technology Laboratory). 2013. ―DE-FOA-0000894, FY2013 Unconventional
Gas and Oil.‖ U.S. Department of Energy. www.fedconnect.net/FedConnect/?doc=DE-FOA-
0000894&agency=DOE.
RPSEA (Research Partnership to Secure Energy for America). n.d. a. ―About RPSEA.‖ RPSEA.
www.rpsea.org/about/.
RPSEA (Research Partnership to Secure Energy for America). n.d. b. ―RFP List.‖ RPSEA.
http://www.rpsea.org/rfps/.
SNL (Sandia National Laboratories). 2014. ―Energy and Water in the Western and Texas Interconnects.‖
U.S. Department of Energy. Last modified April 25, 2013. http://energy.sandia.gov/?page_id=1741.
Water Power Program. n.d. ―Water Power Program.‖ U.S. Department of Energy.
www1.eere.energy.gov/water/.
Water Power Program. 2013. ―Energy Department Invests $16 Million to Harness Wave and Tidal
Energy.‖ U.S. Department of Energy, Office of Energy Efficiency and Renewable Energy. August 2013.
www1.eere.energy.gov/water/news_detail.html?news_id=19575.

June 2014 The Water-Energy Nexus: Challenges and Opportunities
238
Winaught, Carla. 2014. ―Spreadsheet with NETL Unconventional Gas and Oil Technologies FOA info.‖