The use of routine preoperative tests for elective surgery
237
EVIDENCE, METHODS & GUIDANCE Preoperative Tests The use of routine preoperative tests for elective surgery Appendices, Guidelines & Information National Institute for Clinical Excellence JUNE 2003 Developed by the National Collaborating Centre for Acute Care
-
Upload
khangminh22 -
Category
Documents
-
view
0 -
download
0
Transcript of The use of routine preoperative tests for elective surgery

E V I D E N C E , M E T H O D S & G U I D A N C E
Preoperative TestsThe use of routine preoperative tests for elective surgeryAppendices, Guidelines & Information
National Institute for Clinical Excellence
J U N E 2 0 0 3
Developed by the National Collaborating Centre for Acute Care
Preoperative TestsThe use of routine preoperativetests for elective surgeryAppendices, Guidelines& Information
E V I D E N C E , M E T H O D S & G U I D A N C E

AppendicesAppendix 1 Results of a Systematic Review of the
Literature for Routine Preoperative Testing 3
Appendix 2 Examples of Surgical Procedures
by Severity of Grading 93
Appendix 3 Phase A consensus questionnaire (results) 95
Appendix 4 Phase B consensus questionnaire (results) 147
Appendix 5 Economics of routine preoperative testing 201
Full guideline “Preoperative tests: the use of routine tests
for elective surgery. Evidence, Methods & Guidance
NICE guideline
Information for the Public
2 P R E O P E R A T I V E T E S T S
Contents

The methods used for this systematic review are
presented in Chapter 2 of the full NICE guideline
for preoperative testing. The search strategy and
data extraction forms used are appended to this
results section.
1 Preoperative chest radiographs
1.1 Characteristics of the studiesIn our search of the literature from 1995 to 2001,
we identified a total of ten papers that studied
preoperative chest radiographs. Nine of these
papers reported abnormal outcome data, eight
reported changes in clinical management and
five reported postoperative complications. In
combination with the 28 papers identified in the
Health Technology Assessment (HTA) report, this
review includes 38 papers that studied preoperative
chest radiographs. The characteristics of the 38
papers are summarised in Table 1.1. All the studies
identified were case series.
3A P P E N D I X 1
Appendix 1: Results of a Systematic Review ofthe Literature for Routine Preoperative Testing
T A B L E 1 .1 Characteristics of the eligible studies of preoperative chest radiographs
First author and Country Study sample Type of surgery Abnormal test Change in clinical Postoperative
year of publication (age) management complications
Krupski USA 161 Major vascular surgery ✓ ✓ ✓
20001 (46 to 81 years)
Silvestri Italy 6111 General, orthopaedics, ✓
19992 (not stated) ophthalmology,
gynaecology, urology
Pal Karachi 320 General ✓ ✓
19983 (not stated)
Ishaq Karachi 477 General, urology, ✓ ✓
19974 (> 40 years) gynaecology, obstetrics
Wattsman USA 142 Ambulatory surgery ✓ ✓ ✓
19975 (17 to 76 years)
Bouillot France 3959 General, gastrointestinal ✓ ✓
19966 (15 to 99 years)
Clelland USA 238 Orthopaedic ✓ ✓ ✓
19967 (37 to 94 years)
Khong Hong Kong 203 Orthopaedic ✓ ✓ ✓
19968 (21 to 98 years)
Ranparia USA 236 Prostatectomy ✓
19969 (33 to 84 years)
Boland USA 100 Internal medicine ✓ ✓
199510 (43 to 75 years)

T A B L E 1 .1 Characteristics of the eligible studies of preoperative chest radiographs continued
First author and Country Study sample Type of surgery Abnormal test Change in clinical Postoperative
year of publication (age) management complications
Perez* Spain 3131 General, trauma, ✓ ✓
199511 (0 to 98 years) gynaecology, paediatric
Adams* USA 169 (adults) General ✓ ✓
199212
MacDonald* UK 147 Orthopaedic ✓
199213 (> 60 years)
Sommerville* South Africa 797 General, obstetrics and ✓ ✓
199214 (0 to 80 years) gynaecology, ear, nose and
throat (ENT), orthopaedics,
urology, ophthalmology,
plastic surgery, maxillofacial
Bhuripanyo* Thailand 1013 ENT, general, gynaecology, ✓ ✓ ✓
199015 (> 15 years) obstetrics, ophthalmology,
orthopaedics
Gagner* Canada 1000 Not stated ✓ ✓
199016 (0 to 70 years)
McCleane* UK 687 Not stated ✓
198917 (0 to 81 years)
Charpak* France 866 General, orthopaedic, ✓ ✓ ✓
198818 (not stated) gynaecology, obstetrics
Ogunseyinde* Nigeria 203 Not stated ✓
198819 (1 to 79 years)
Tape* USA 318 Vascular ✓ ✓
198820 (24 to 90 years)
Umbach* Germany 1175 Gynaecology ✓ ✓ ✓
198821 (0 to > 80 years)
Boghosian* USA 136 General, ophthalmology, ✓ ✓
198722 (60 to 93 years) orthopaedics, urology
McKee* UK 397 Genera ✓ ✓ ✓
198723 (not stated)
Mendelson* USA 369 General ✓
198724 (not stated)
Turnbull* Canada 1010 General ✓ ✓ ✓
198725 (adults)
Weibman* USA 734 Not stated ✓ ✓
198726 (adults)
Wiencek* USA 403 Not stated ✓ ✓
198727 (mean 54 years)
Muskett* USA 200 Cardiothoracic, ENT, general, ✓ ✓
198628 (mean 56 years) neurosurgery, ophthalmology,
orthopaedics, plastic surgery,
urology
4 P R E O P E R A T I V E T E S T S

T A B L E 1 .1 Characteristics of the eligible studies of preoperative chest radiographs continued
First author and Country Study sample Type of surgery Abnormal test Change in clinical Postoperative
year of publication (age) management complications
Rucker* USA 905 Plastic surgery, ✓ ✓
198329 (not stated) gynaecology, general
ophthalmology, ENT,
orthopaedics
Seymour* UK 233 Not stated ✓ ✓
198230 (> 60 years)
Törnebrant* Sweden 100 General, orthopaedics, urology ✓
198231 (> 70 years)
Wood* USA 1924 ENT, general, ophthalmology, ✓ ✓
198132 (0 to 19 years) orthopaedics, urology
Farnsworth* USA 350 Not stated ✓
198033 (0 to 14 years)
Rossello* Peurto Rico 690 Not stated ✓ ✓
198034 (< 14 years)
Loder* UK 1000 Dental, gynaecology, ENT, ✓
197835 (not stated) ophthalmology, general,
orthopaedics
Petterson* USA 1530 Dental, ENT, gastrointestinal, ✓ ✓
197736 (adult + children) ophthalmology, orthopaedics,
urology
Sane* USA 1500 Not stated ✓ ✓
197737 (0 to 19 years)
Rees* UK 667 Not stated ✓
197638 (not stated)
* Papers included in the HTA review
5A P P E N D I X 1
The results of the 38 studies, which documented the
findings from a total of 27,432 preoperative chest
radiographs, are summarised in Table 1.2.

6 P R E O P E R A T I V E T E S T S
TA
BL
E 1
.2Su
mm
ary
of p
reop
erat
ive
ches
t ra
diog
raph
res
ults
(in
clud
es r
outi
ne a
nd in
dica
ted
test
s)
FIR
ST
AU
TH
OR
NU
MB
ER
OF
AB
NO
RM
AL
CH
AN
GE
S I
NP
OS
TO
PE
RA
TIV
EP
RO
SP
EC
TIV
EC
ON
SE
CU
TIV
EA
SA
GR
AD
ES
TE
ST
S#
RE
SU
LTS
CL
INIC
AL
MA
NA
GE
ME
NT
CO
MP
LIC
AT
ION
SR
OU
TIN
ED
AT
AR
EC
RU
ITM
EN
TS
TA
TE
D
(N)
N (
%)
N (
%)
N (
%)
Kru
pski
1161
4
2 (
28
.1)
8 (
5.0
) 8
(5
.0)
Not
stat
ed
x ✓
x
Silv
estr
i2611
1
1116
(18
.3)
313
(5
.1)
Routi
ne
only
✓
x A
SA I
to V
Pal3
32
0
192
(6
0)
1 (
0.3
) R
outi
ne
only
x
x x
Isha
q445
2
20
3 (
44
.9)
1 (
0.2
) R
outi
ne
only
x
✓x
Wat
tsm
an5
22
3
(13
.6)
0
0
Routi
ne
& i
ndic
ated
✓
✓A
SA I
to I
II
Boui
llot6
20
92
12
5 (
6.0
) 2
(0
.1)
Routi
ne
only
✓
✓x
Clel
land
72
38
N
ot
stat
ed
1 (
0.4
) 1.4
(5
.0)
Not
stat
ed
✓x
x
Kho
ng8
20
3
93
(45
.8)
3 (
1.5
) 3
(1.5
) R
outi
ne
only
x
✓A
SA I
to I
I
Ranp
aria
92
36
2
8 (
11.9
) N
ot
stat
ed
x x
x
Bola
nd10
61
4
(6
.6)
1(1
.6)
Routi
ne
only
x
x x
Pere
z11*
21
51
48
5 (
22
.6)
45
(2
.1)
Routi
ne
only
x
x A
SA I
to I
I
Ada
ms1
2*
13
3
6 (
4.5
) 0
R
outi
ne
only
x
x x
Mac
Don
ald1
3*
14
5
7 (
4.8
) R
outi
ne
only
✓
x x
Som
mer
ville
14*
31
9
48
(15
.0)
4 (
1.3
) R
outi
ne
& i
ndic
ated
x x
ASA
I t
o I
V
Bhur
ipan
yo15
*
93
3
181
(19
.4)
34
(3
.6)
0
Routi
ne
only
✓
✓x
Gag
ner1
6*
10
00
74
(7.
4)
0
Not
stat
ed
x x
x
McC
lean
e17*
2
97
12
7 (
43
.3)
Routi
ne
& i
ndic
ated
✓
x A
SA I
to V
Char
pak1
8*
11
01
5
68
(5
2.0
) 51
(4
.6)
193
(3
4.0
) R
outi
ne
& i
ndic
ated
✓
x x
Ogu
nsey
inde
19*
2
03
12
2 (
60
.1)
(13
.3)
Routi
ne
only
x
✓x
Tape
20*
3
36
11
6 (
34
.5)
12 (
3.6
) R
outi
ne
only
x
x x
Um
bach
21*
117
5
118
(10
.0)
15 (
1.3
) 14
(1.2
) R
outi
ne
& i
ndic
ated
x
✓x

7A P P E N D I X 1
TA
BL
E 1
.2Su
mm
ary
of p
reop
erat
ive
ches
t ra
diog
raph
res
ults
(in
clud
es r
outi
ne a
nd in
dica
ted
test
s) co
nti
nued
FIR
ST
AU
TH
OR
NU
MB
ER
OF
AB
NO
RM
AL
CH
AN
GE
S I
NP
OS
TO
PE
RA
TIV
EP
RO
SP
EC
TIV
EC
ON
SE
CU
TIV
EA
SA
GR
AD
ES
TE
ST
S#
RE
SU
LTS
CL
INIC
AL
MA
NA
GE
ME
NT
CO
MP
LIC
AT
ION
SR
OU
TIN
ED
AT
AR
EC
RU
ITM
EN
TS
TA
TE
D
(N)
N (
%)
N (
%)
N (
%)
Bogh
osia
n22*
13
6
88
(6
4.7
) 12
(8
.8)
Routi
ne
only
x
x x
McK
ee2
3*
3
27
12
1 (
37
) 1
(0
.3)
27
(8.3
) R
outi
ne
& i
ndic
ated
✓
x x
Men
dels
on24*
3
32
6
2 (
18
.7)
Routi
ne
only
x
x x
Turn
bull2
5*
6
91
38
(5
.5)
8 (
1.2
) 3
(0.4
) R
outi
ne
only
x
x x
Wei
bman
26*
7
34
21
3 (
29
.0)
38
(5
.2)
Routi
ne
only
x
✓x
Wie
ncek
27*
2
37
101
(4
2.6
) 10
(4
.0)
Routi
ne
& i
ndic
ated
✓
✓x
Mus
kett
28*
11
9
35
(2
9.4
) 6
(5
.0)
Routi
ne
& i
ndic
ated
x
✓x
Ruck
er2
9*
3
68
1
(0
.3)
0
0
Routi
ne
only
x
x x
Seym
our3
0*
2
33
13
4 (
57.
5)
10
(5
.8)
Routi
ne
only
✓
x x
Törn
ebra
ndt3
1*
91
4
3 (
47.
3)
Routi
ne
& i
ndic
ated
x
✓x
Woo
d32*
74
9
35
(4
.7)
3 (
0.4
) R
outi
ne
only
x
x x
Farn
swor
th3
3*
3
50
31
(8
.9)
Routi
ne
& i
ndic
ated
x
x x
Ross
ello
34*
6
82
2
0 (
2.9
) 2
(2
.4)
0
Routi
ne
& i
ndic
ated
x
x x
Lode
r35*
10
00
97
(9
.7)
Routi
ne
only
x
✓x
Pett
erso
n36*
15
27
13
4 (
8.8
) 2
(0.0
1)
Routi
ne
only
x
✓x
Sane
37*
15
00
11
1 (
7.4
) 5
7(3
.8)
Routi
ne
only
✓
✓x
Rees
38*
66
7
29
9 (
44
.8)
Routi
ne
only
x
✓x
*Pap
ers
incl
uded
in t
he
HTA
rev
iew
#Th
e num
ber
of
test
s ca
rrie
d o
ut
may
dif
fer
from
the
sam
ple
siz
e in
som
e st
udie
s. T
his
occ
urs
in p
aper
s re
port
ing t
he
resu
lts
of
mult
iple
pre
oper
ativ
e te
sts
bec
ause
not
all
of
pat
ients
in t
he
study
sam
ple
rec
eive
d a
ll th
epre
oper
ativ
e te
sts
det
aile
d i
n t
he
pap
er.

Table 1.2 shows that the proportion of abnormal
preoperative chest radiographs varied greatly across
studies and ranged from 0.3%29 to 64.7%.22 The
proportion of patients who had had a preoperative
chest radiograph and who subsequently underwent
a change in clinical management ranged from
0% in four studies5,12,16,29 to 13.3% in a further
study.19 The proportion of patients who had had a
preoperative chest radiograph and who suffered
postoperative complications ranged from 0% in four
studies5,15,29,34 to 34.0% in a further study.18
The wide variation in the results may be explained
at least in part by heterogeneity in the study
populations and outcome measures. The impact of
four major sources of heterogeneity on the outcome
of the studies was explored in this review. The quality
of the study design was the first source of variation.
For example the quality of the study design was
regarded as highest in papers where data had been
collected prospectively and where patients had
been recruited consecutively. The second source
of variation was the composition of the study
population. Variation arose for example, from
differences in the age range of study participants
and their American Society of Anesthesiologists
(ASA) grades. The third source of variation
considered arose from differences in the criteria
that each study used as a basis for testing. For
example, some studies included patients having
routine preoperative chest radiographs only, whereas
other studies included patients who had either
routine or indicated preoperative tests. Finally, the
fourth important source of variation arose from
differences in the definitions of the outcome
variables. Differences occurred between studies
in, for example, the definitions used to determine
abnormal test results, in what was considered
a change in clinical management and in the
postoperative complications that were reported.
These four major sources of heterogeneity are
considered separately in the following sections.
In each section, we have tried to identify the effect
of variations in a particular feature across all studies
and, where possible, the effect of variations in that
feature within each of the studies. This univariate
approach assumes that different aspects of
heterogeneity are independent of each other,
for example that the choice of different criteria for
patient inclusion is not associated with differences in
the study populations. Although this assumption may
not be true, there were too few data (insufficient
number of papers within strata of different aspects
of heterogeneity) or inadequate information (papers
did not report data in sufficient detail) to explore
heterogeneity in a multivariate manner. However,
we were able to explore variation both between
studies, where confounding from different aspects of
heterogeneity that are not independent of each other
is likely to have existed, and within studies, where
confounding of this kind is controlled to some extent.
1.2 Heterogeneity in the quality of thestudy designStudies in which data are collected prospectively or in
which patients are recruited consecutively are more
likely to be representative and have complete data
and, therefore, are less likely to be susceptible to
bias than studies in which data are collected
retrospectively or where patients are recruited
selectively. We hypothesised that the proportions of
abnormal preoperative chest radiographs, changes in
clinical management and postoperative complications
may differ between the studies with high (prospective
studies with consecutive recruitment of patients) and
low (retrospective studies with nonconsecutive
recruitment of patients) quality designs.
We investigated the effects of variations in the quality
of the study design on the proportions of abnormal
preoperative chest radiographs, changes in clinical
management and postoperative complications
across the identified studies. Five studies collected
data prospectively and recruited consecutive
patients,5,6,15,27,37 and seven studies collected data
prospectively but did not state that the sample of
patients was consecutive.2,7,13,17,18,23,30 Eleven
studies collected data retrospectively for a sample
of consecutive patients,1,4;8,19,21,27,28,31,35,36,38
while 15 studies collected data retrospectively
and did not state that the sample patients was
consecutive.3,9-12,14,16,20,22,24,25,29,32-34 The results
of these studies are summarised in Table 1.3.
There was little difference in the average proportion
of postoperative complications, the proportions
of abnormal preoperative chest radiographs and
changes in clinical management by quality of
study design.
8 P R E O P E R A T I V E T E S T S

1.3 Heterogeneity in the composition ofthe study population
1.3.1 Age rangeGiven that the prevalence of cardiopulmonary
disease increases with age, we hypothesised that the
proportion of patients with abnormal preoperative
chest radiographs would be higher in studies of
older patient populations.
We investigated the effects of variations in the age
range of the study population on the proportions of
abnormal preoperative chest radiographs, changes in
clinical management and postoperative complications
across the identified studies. Twenty of the studies
included adults only1,4-10,12,15,18,20,25-28 with four
of these studies including adults over 60 years
only.13,22,30,31 Ten studies included both adults
and children2,11,14,16,17,19,21,24,29,36 and four studies
included children only.32-34,37 The remaining four
studies did not specify the age range of their study
population.3,23,35,38 The proportions of abnormal
chest radiographs, changes in clinical management
and postoperative complications in the study
populations according to age group are summarised
in Table1.4.
9A P P E N D I X 1
T A B L E 1 . 3 Summary of abnormal chest radiographs and changes in clinicalmanagement or postoperative complications in study populationsaccording to study quality indicators
Q U A L I T Y % A B N O R M A L T E S T % C H A N G E I N C L I N I C A L % P O S T O P E R A T I V E
I N D I C A T O R (Number of Studies) M A N A G E M E N T C O M P L I C A T I O N S
(Number of Studies) (Number of Studies)
Mean* Maximum Minimum Mean* Maximum Minimum Mean* Maximum Minimum
P C 12.0 (5 42.6 6.0 2.2 (4) 4.0 0 0 (3) 0.1 0
P N 35.5 (6) 57.5 4.8 2.6 (4) 5.1 0.3 13.1 (4) 34.0 5.0
R C 21.9 (11) 60.1 9.6 6.9 (8) 13.3 0.2 0.4 (3) 5.0 1.2
R N 14.8 (15) 64.7 0.3 0.9 (10) 2.4 0 0.3 (5) 8.8 0
P = prospective data collection; R = retrospective data collection; C = consecutive recruitment of patients; N = nonconsecutive
recruitment of patients; * weighted means were produced to reflect the different numbers of patients in each study. It was not
possible to produce a distributional statistic reflecting this weight.
T A B L E 1 . 4 Summary of abnormal chest radiographs and changes in clinicalmanagement or postoperative complications in study populationsaccording to age group
A G E % A B N O R M A L T E S T % C H A N G E I N C L I N I C A L % P O S T O P E R A T I V E
R A N G E (Number of Studies) M A N A G E M E N T C O M P L I C A T I O N S
(Number of Studies) (Number of Studies)
Mean* Maximum Minimum Mean* Maximum Minimum Mean* Maximum Minimum
Adults
> 60 years 43.6 (4) 64.7 4.8 (0) (0) (0) 7.3 (2) 8.8 5.8
Adults only 24.9 (15) 52.0 5.5 2.5 (13) 5.2 0 5.5 (9) 34.0 0
Children
& adults 20.5 (10) 60.1 0.3 1.4 (7) 5.1 0 0.6 (2) 1.2 0
Children only 6.0 (4) 8.9 2.9 2.2 (3) 3.8 0.4 0 (2) 0 0
Not stated 37.9 (4) 60.0 9.7 0.3 (2) 0.3 0.3 8.3 (1)
*weighted means

After calculating weighted means, we found that the
average proportion of abnormal preoperative chest
radiographs tended to be highest in studies that
included adults aged 60 years or over (43.6%),
followed by studies that included adults only
(24.9%) and studies that included both adults and
children (20.5%). The mean proportion of abnormal
preoperative chest radiographs tended to be lowest
in studies that included children only (6.0%). A
similar pattern occurred with the mean proportion of
patients requiring a change in clinical management
and patients with postoperative complications.
We then investigated the effects of variations in the
age of the study population on the proportion of
abnormal preoperative chest radiographs within the
identified studies. This was possible for 11 of the
studies, where the proportion of abnormal chest
radiographs was stratified according to patient’s
age group.2,4,14-17,19,21,23,29,38 The results of these
studies are summarised in Table 1.5.
The proportion of abnormalities found on
preoperative chest radiographs rose with age in all
of the studies, except that by Ogunseyinde et al.19
Between the ages of 40 and 60 years the rise in
the number of abnormal preoperative chest
radiograph findings appeared to be the greatest.
1.3.2 ASA gradesWe hypothesised that the proportion of patients with
abnormal preoperative chest radiographs would be
greater in studies reporting test results for patients
with higher ASA grades.
We investigated the effects of variations in the ASA
grade of patients in the study population on the
proportions of abnormal preoperative chest
radiographs, changes in clinical management and
postoperative complications across the identified
studies. Only six of the 38 studies reported ASA
grades.2,5,8,11,14,17 Two studies consisted of ASA
grade I and II patients only,8,11 one study consisted
of patients of ASA grades I to III only,5 one study
consisted of patients of ASA grades I to IV only14
and the remaining two studies consisted of patients
of ASA grades I to V.2,17 Table 1.6 summarises
the proportions of abnormal chest radiographs,
changes in clinical management and postoperative
complications according to the ASA grade of the
patients in the study population.
10 P R E O P E R A T I V E T E S T S
T A B L E 1 . 5 Summary of abnormal preoperative chest radiograph findings (%) by age
A G E ( Y E A R S )
First author 0 to 10 11 to 20 21 to 30 31 to 40 41 to 50 51 to 60 61 to 70 71 to 80 80+
Ishaq4 3.2 15.6
McKee23 7.7 17.0 40 44.2
Silvestri2* 2 8.8
Bhuripanyo15 5.4 8.3 28.7 40.8
Rees38 0 0 3.2 12.9 19.3 39.7 43.3 61.8 68.8
Rucker29** 10 10 8 16 45 40
Ogunseyinde19 0 0 0 0 61.9 91.8 40 57.1
McCleane17 0 11 30 9 0 59 58 52 45
Gagner16 3 3 1 n/s n/s n/s n/s 56
Sommerville14 2.8 1.2 2.4 1.5 6.3 7.7 9.8 13.3 20.0
Umbach21 3.0 6.2 10.9 13.3 27.2 33.3
*Figures show change in anaesthetic management in patients with abnormal chest radiographs;
** % abnormal findings in patients with risk factors for abnormal chest radiographs; n/s = not stated.

Given the small number of studies that included
patients of ASA grades I to II, I to III, I to IV and I to
V, and the fact that we do not know the distribution
of patients within each of the ASA categories, it is
difficult interpret whether the apparent trend for a
decrease in the mean proportion of abnormal chest
radiographs with increasing ASA grade is real, arises
from confounding or represents a chance association.
However, when we investigated the effects of
variations in ASA grade on the proportion of
abnormal preoperative chest radiographs in the two
studies that stratified the proportion of abnormal
preoperative chest radiographs by ASA grade,2,17
the proportion of abnormal preoperative chest
radiographs increased with patients’ ASA grades.
The results are summarised in Table 1.7.
1.4 Heterogeneity in criteria forpreoperative testingAlthough authors did not state their definitions of
‘routine’ preoperative tests, we have assumed a
routine preoperative investigation to be a test that is
carried out preoperatively on all patients and is not
directly related to the planned procedure or the
patients’ condition. In some studies, authors included
patients who were described as undergoing routine
preoperative tests as well as patients undergoing
indicated preoperative tests. None of these studies
presented the proportions of abnormal preoperative
tests, changes in clinical management and
postoperative complications separately for patients
who had routine or indicated tests; the data were
combined for both groups of patients. Therefore,
we hypothesised that the proportions of abnormal
preoperative chest radiographs, changes in clinical
management and postoperative complications would
be lower in study populations where all the patients
had routine preoperative chest radiographs compared
to study populations containing patients undergoing
routine or indicated preoperative chest radiographs.
We investigated the effects of variations in the
criteria for preoperative testing on the proportions
of abnormal preoperative chest radiographs,
changes in clinical management and postoperative
complications across the identified studies. Twenty
three studies included patients undergoing routine
T A B L E 1 . 7 Summary of abnormalpreoperative chest radiographfindings (%) according topatients ASA grade
A S A G R A D E
Study I II III IV + V
McCleane17 4 25 52 81
Silvestri2 3.1 15.5
11A P P E N D I X 1
T A B L E 1 . 6 Summary of abnormal chest radiographs and changes in clinicalmanagement or postoperative complications in study populationsaccording to ASA grades
A S A % A B N O R M A L T E S T % C H A N G E I N C L I N I C A L % P O S T O P E R A T I V E
G R A D E (Number of Studies) M A N A G E M E N T C O M P L I C A T I O N S
(Number of Studies) (Number of Studies)
Mean* Maximum Minimum Mean* Maximum Minimum Mean* Maximum Minimum
Stated 19.3 (6) 45.8 4.0 4.0 (5) 5.1 0 0 (2) 1.5 0
I to II 24.8 (2) 45.8 22.8 2.0 (2) 2.1 1.5 1.5 (1)
I to III 13.6 (1) 0 (1) 0 (1)
I to IV 15.0 (1) 1.3 (1)
I to V 17.6 (2) 18.3 4.0 5.1 (1) (0)
Not stated 16.2 (32) 64.7 0.3 1.4 (20) 13.3 0 0.6 (12) 8.8 0
*weighted means

preoperative chest radiographs only,2-4,6,8,10-13,15,19,
20,22,24-26,29,30,32,35-38 whereas 11 studies included
a combination of patients undergoing either routine
and indicated tests (Table 1.2).5,14,17,18,21,23,27,28,31,
33,34 The other four studies did not state whether
they included patients receiving routine or indicated
preoperative chest radiographs.1,7,9,16 Table 1.8
summarises the proportions of abnormal chest
radiographs, changes in clinical management and
postoperative complications according to whether
the study population included routine only or both
routine and indicated preoperative chest radiographs.
Table 1.8 shows that in the studies including routine
tests only, the average proportion of abnormal chest
radiographs (17.7%) was similar to that in studies
including both routine and indicated tests (18.1%).
Given that none of the authors defined routine or
indicated tests, the similarity in the results in Table
1.8 might have arisen because the authors described
the basis for testing differently. In any series of
patients, some of the individuals having preoperative
chest radiographs may have had comorbid conditions
that would be classified as indications for carrying
out the test although the test may have been
administered on a routine basis. In such cases, the
preoperative chest radiograph may have been
classified as routine by some authors because it was
carried out regardless of the fact that the patient had
a comorbid condition, while other authors may have
classified the test as indicated simply because of the
presence of the comorbid condition.
It was not possible to investigate the effects of
variations in the criteria for preoperative testing on
the proportions of abnormal preoperative chest
radiographs, changes in clinical management and
postoperative complications within the identified
studies because studies that included only patients
for whom preoperative tests were indicated were
excluded in the initial stages of our systematic
review. In addition, none of the eligible studies
reported data separately for routine and indicated
preoperative chest radiographs.
1.5 Heterogeneity in the definition of theoutcome variables
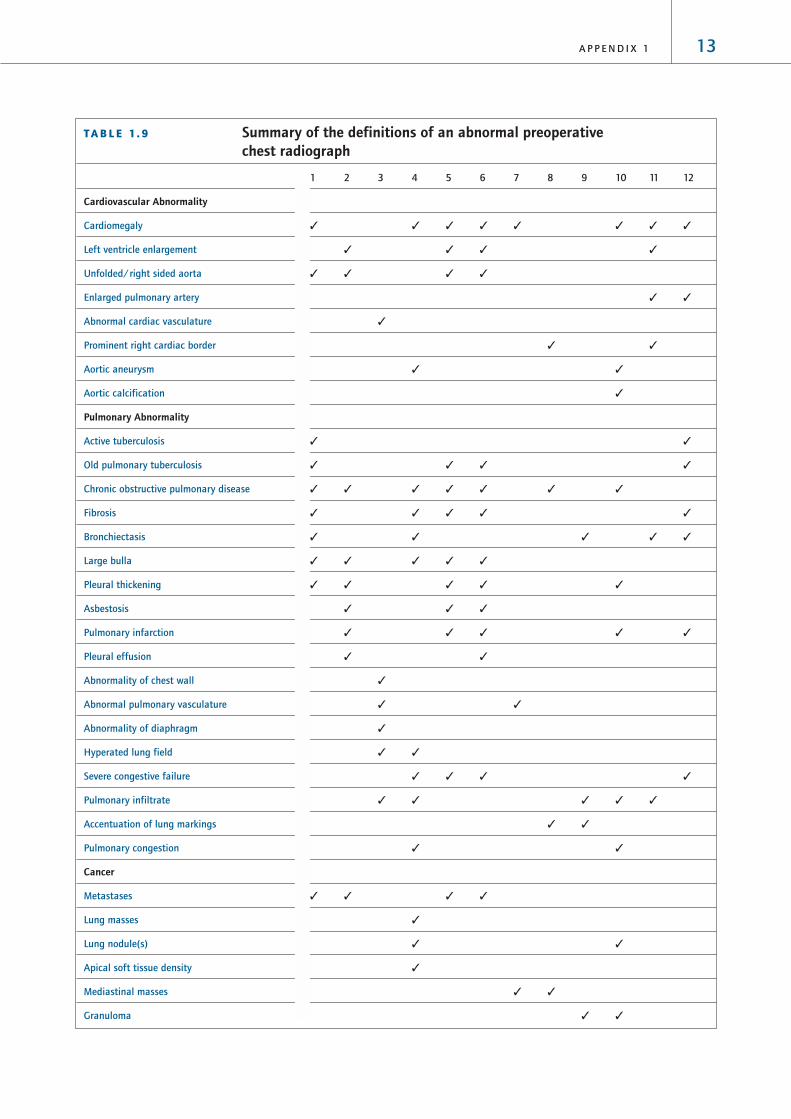
1.5.1 Definition of an abnormal chest radiograph
We investigated the variability of the definition of
abnormal preoperative chest radiographs across the
identified studies. Twelve of the 38 papers included
definitions of an abnormal chest radiograph.2,4,8,20-
22,30,32-34,37,38 The definition of an abnormal chest
radiograph in each of the studies is summarised
in Table 1.9.
12 P R E O P E R A T I V E T E S T S
T A B L E 1 . 8 Summary of abnormal chest radiographs, changes in clinicalmanagement and postoperative complications according to thecriteria for preoperative testing
C R I T E R I A % A B N O R M A L T E S T % C H A N G E I N C L I N I C A L % P O S T O P E R A T I V E
F O R T E S T (Number of Studies) M A N A G E M E N T C O M P L I C A T I O N S
(Number of Studies) (Number of Studies)
Mean* Maximum Minimum Mean* Maximum Minimum Mean* Maximum Minimum
Routine only 17.7 (23) 64.7 0.3 2.6 (15) 13.3 0 0.2 (8) 8.8 0
Routine &
indicated 18.1 (11) 52.0 2.9 1.5 (7) 5.0 0 1.0 (4) 34.0 0
Not stated 9.0 (3) 28.1 7.4 0.6 (3) 5.0 0 5.0 (2) 5.0 5.0
*weighted means
13A P P E N D I X 1
T A B L E 1 . 9 Summary of the definitions of an abnormal preoperativechest radiograph
1 2 3 4 5 6 7 8 9 10 11 12
Cardiovascular Abnormality
Cardiomegaly ✓ ✓ ✓ ✓ ✓ ✓ ✓ ✓
Left ventricle enlargement ✓ ✓ ✓ ✓
Unfolded/right sided aorta ✓ ✓ ✓ ✓
Enlarged pulmonary artery ✓ ✓
Abnormal cardiac vasculature ✓
Prominent right cardiac border ✓ ✓
Aortic aneurysm ✓ ✓
Aortic calcification ✓
Pulmonary Abnormality
Active tuberculosis ✓ ✓
Old pulmonary tuberculosis ✓ ✓ ✓ ✓
Chronic obstructive pulmonary disease ✓ ✓ ✓ ✓ ✓ ✓ ✓
Fibrosis ✓ ✓ ✓ ✓ ✓
Bronchiectasis ✓ ✓ ✓ ✓ ✓
Large bulla ✓ ✓ ✓ ✓ ✓
Pleural thickening ✓ ✓ ✓ ✓ ✓
Asbestosis ✓ ✓ ✓
Pulmonary infarction ✓ ✓ ✓ ✓ ✓
Pleural effusion ✓ ✓
Abnormality of chest wall ✓
Abnormal pulmonary vasculature ✓ ✓
Abnormality of diaphragm ✓
Hyperated lung field ✓ ✓
Severe congestive failure ✓ ✓ ✓ ✓
Pulmonary infiltrate ✓ ✓ ✓ ✓ ✓
Accentuation of lung markings ✓ ✓
Pulmonary congestion ✓ ✓
Cancer
Metastases ✓ ✓ ✓ ✓
Lung masses ✓
Lung nodule(s) ✓ ✓
Apical soft tissue density ✓
Mediastinal masses ✓ ✓
Granuloma ✓ ✓

Table 1.9 shows that the definitions of an abnormal
chest radiograph were not consistent across the
studies. These differences in definitions may
represent a source of heterogeneity amongst the
study results. However, authors did not report
whether these definitions of abnormal chest
radiographs were determined prior to assessment, or
whether the published definitions merely reflected
the abnormalities that were observed. Given this
uncertainty it is not sensible to investigate further
differences in the definitions of an abnormal
preoperative chest radiograph.
1.5.2 Definition of a change in clinical management
We investigated the variability of the definition of
a change in clinical management in patients who
had had a preoperative chest radiograph in the
identified studies. Twenty four studies reported
changes in clinical management as an outcome
variable.1-9,11,12,14,15,18,23,25-27,30,32-34,36,37 Of these
24 studies, 13 specified definitions of a change
in clinical management. These definitions are
summarised in Table 1.10 along with the proportion
of all patients with abnormal chest radiographs who
underwent that change in clinical management
where these data were available.
14 P R E O P E R A T I V E T E S T S
T A B L E 1 . 9 Summary of the definitions of an abnormal preoperativechest radiograph continued
1 2 3 4 5 6 7 8 9 10 11 12
Skeletal abnormality
Collapsed T5 vertebra ✓
Rib deformity ✓
Old rib fracture ✓ ✓ ✓ ✓
Disc degeneration ✓ ✓ ✓ ✓ ✓
Hemivertebra and spina bifida ✓ ✓ ✓
Osteogenesis imperfecta ✓
Degenerative joint disease ✓ ✓
Other
Calcified lymph nodes ✓ ✓ ✓ ✓ ✓ ✓
Cervical spondylosis ✓ ✓ ✓ ✓
Kyphosis and scoliosis ✓ ✓ ✓ ✓ ✓ ✓
Pectus excavatum ✓ ✓ ✓
Goitre ✓ ✓
Pneumoconiosis ✓ ✓ ✓
Ecchondroma ✓ ✓
Arthritides ✓ ✓
Atelectasis ✓ ✓ ✓ ✓ ✓ ✓
Thyroglossal cyst ✓
Pneumonia ✓ ✓
1: Khong8; 2: Ishaq4; 3: Silvestri2; 4: Tape20; 5: Seymour30; 6: Rees38; 7: Sane37; 8: Farnsworth33;
9: Rossello34; 10: Boghosian22; 11: Wood32; 12: Umbach21.

Table 1.10 shows that the definitions of a change in
clinical management were not consistent across the
studies. Six of the 13 studies in Table 1.10 reported a
delay in surgery or changes in anaesthetic technique
as the only changes in clinical management. The
remaining seven studies used a broader definition for
changes in clinical management and, therefore, are
likely to report higher rates of change in clinical
management than the studies using the narrower
definition. However, as with the definition of an
abnormal preoperative chest radiograph, these data
may simply reflect changes in clinical management
that occurred, rather than predefined actions that
were considered to represent changes in clinical
management. Again, given this uncertainty it is not
sensible to investigate further differences in the
definitions as a source of heterogeneity across the
study populations.
1.5.3 Definition of postoperative complications
We investigated the variability of the definition
of postoperative complications in patients who had
had preoperative chest radiographs. Fifteen papers
investigated postoperative complications.1,4-9,15,18,21-
23,25,30,34 Six of the studies reported the proportion
of postoperative complications in patients with
abnormal preoperative chest radiographs although
they did not specify what the complications
were.7,18,22,23,30,34 In the remaining nine
papers1,4-6,8,9,15,21,25, there were no postoperative
complications in four studies1,5,15,25 and the
results of the other five studies4,6,8,9,21 are
summarised in Table 1.11.
Table 1.11 shows that the postoperative
complications that were reported were not consistent
across the studies. Again these data may simply
reflect postoperative complications that were
observed so it is not sensible to investigate further
differences in the definitions as a source of
heterogeneity across the study populations.
15A P P E N D I X 1
T A B L E 1 .10 Summary of changes in clinical management in patients who had hadabnormal preoperative chest radiographs
1 2 3 4 5 6 7 8 9 10 11 12 13
Surgery delayed 1.5 0.7 0.4 0.8 0.4 0.3 0.3 0.01 0.4
Change in medical decision 1.9
Change of operation
Different surgical approach
Refusal of surgery 5.0
Change to anaesthetic 0.2 2.3 ✓ 2.4 0.6
Chest physiotherapy 0.4
Specific monitoring ✓
Change in drugs
New consultation 0.8 3.2 1.1
Total 1.5 0.2 3.8 0.4 4.0 5.0 0.4 0.3 5.1 4.6 0.01 0.4 2.1
1: Khong8; 2: Ishaq4; 3: Sane37; 4: Wood32; 5: Wiencek27; 6: Krupski1; 7: Clelland7; 8: McKee23; 9:
Silvestri2; 10: Charpak18; 11: Petterson36; 12: Turnbull25; 13: Perez11.

16 P R E O P E R A T I V E T E S T S
It is also difficult to interpret the meaning of the
postoperative complication data because the
postoperative complications recorded in the data were
not necessarily complications related to preoperative
chest radiographs. Despite the fact that the patient
had had a preoperative chest radiograph,
postoperative complications still occurred.
1.6 Diagnostic accuracyNone of the studies investigated the diagnostic
accuracy of the preoperative chest radiograph for
predicting changes in clinical management. However,
from the data presented it was possible to calculate
positive predictive values for a change in clinical
management for 20 papers. The positive predictive
values indicate the percentage of patients with
abnormal chest radiographs who subsequently
underwent changes in clinical management. The
results are summarised in Table 1.12.
The positive predictive value for predicting a change
in clinical management ranged from 0% in four
studies12,16,20,22 to 51.4% in a further study.37
However, it is difficult to interpret the meaning
of the positive predictive values from Table 1.12
because of the heterogeneous nature of the
studies as outlined in Section 1.
T A B L E 1 .11 Summary of changes in clinical management in patients who had hadabnormal preoperative chest radiographs
P O S T O P E R A T I V E C O M P L I C A T I O N Khong8 Bouillot6 Krupski1 Turnbull25 Umbach21
Pulmonary
Pleural effusion ✓
Pneumothorax ✓
Pulmonary oedema ✓
Acute respiratory distress syndrome ✓
Pulmonary embolism ✓
Lung complication 0.4
Extrathoracic complications 0.9
Cardiopulmonary complications 0.3
Cardiac
Malignant hypertension 0.5
Femoral artery pseudoaneurysm 1.2
Myocardial infarction
Skeletal
Limb loss 1.2
Other
Nonspecific fever 1.0
Atelectasis ✓
Pneumonia ✓
Prosthetic graft infection 0.6
Wound infection 0.6
Anoxic brain injury 0.6
Death
Total 1.5 0.1 5.0 0.4 1.2

17A P P E N D I X 1
T A B L E 1 .12 Calculated estimates of thepositive predictive value ofpreoperative chest radiographsto predict changes in clinicalmanagement
Positive predictive value for predicting a
First author change in clinical management (%)
Krupski1 19.0
Ishaq4 0.5
Bouillot6 7.4
Khong8 3.2
Adams12 0
Sommerville14 8.3
Bhuripanyo15 18.8
Gagner16 0
Charpak18 9.5
Tape20 0
Umbach21 12.7
Boghosian22 0
McKee23 0.8
Turnbull25 21.1
Weibman26 17.8
Wiencek27 9.9
Wood32 8.6
Rossello34 10.0
Petterson36 1.5
Sane37 51.4

18 P R E O P E R A T I V E T E S T S
2 Preoperative electrocardiograms
2.1 Characteristics of the studiesIn our search of the literature from 1995 to 2001,
we identified a total of 13 papers that studied
preoperative electrocardiograms (ECGs). Twelve of
these papers reported abnormal outcome data, two
reported changes in clinical management and nine
reported postoperative complications. In combination
with the 16 papers identified in the HTA report, this
review includes 29 papers that studied preoperative
ECGs. The characteristics of the 29 papers are
summarised in Table 2.1. All of the studies were
case series.
T A B L E 2 .1 Characteristics of the eligible studies of preoperative ECGs
First author and Country Study sample Type of surgery Abnormal test Change in clinical Postoperative
year of publication (age) management complications
Gauss Germany 185 Vascular and abdominal ✓ ✓
200139 (> 38 years)
French UK 127 Orthopaedic ✓ ✓
199940 (> 55 years)
Haug USA 380 Dentoalveolar ✓
199941 (15 to 54 years)
Murdoch Scotland 1185 Day surgery ✓ ✓ ✓
199942 (not stated)
Rosenfeld USA 1006 Cataract surgery ✓ ✓
199943 (20 to 96 years)
Polanczyk USA 4181 Orthopaedic, thoracic, ✓
199844 (> 50 years) abdominal, vascular, general
Biavati USA 355 Otolaryngology ✓ ✓
199745 (< 18 years)
Landesberg USA and Israel 405 Vascular ✓ ✓
199746 (adults)
Tait USA 1000 Not stated ✓ ✓
199747 (18 to 88 years)
Callaghan UK 354 Dental, general, ENT vascular, ✓
199548* (> 16 years) neurosurgery, ophthalmology,
urology
Lui USA 952 Not stated ✓
199549 (21 to 96 years)
Perez Spain 3131 Not stated ✓ ✓
199511* (not stated)
Allman UK 325 General, vascular ✓
199450 (> 40 years)
Kirwin USA 96 Vascular ✓ ✓
199351 (42 to 96 years)
Older Australia 187 Abdominal ✓ ✓
199352 (> 60 years)
Adams USA 169 General ✓ ✓
199212* (adult)

The results of the 29 studies, which documented
the findings from a total of 16,754 preoperative
ECGsECGs are reported in Table 2.2.
19A P P E N D I X 1
T A B L E 2 .1 Characteristics of the eligible studies of preoperative ECGs continued
First author and Country Study sample Type of surgery Abnormal test Change in clinical Postoperative
year of publication (age) management complications
Bhuripanyo Thailand 395 Gynaecology, ENT, ✓ ✓ ✓
199253* (40 to 77 years) orthopaedics, obstetrics,
general ophthalmology,
Gold USA 751 Not stated ✓ ✓
199254* (14 to 88 years)
MacDonald UK 147 Orthopaedics ✓ ✓
199213* (> 60 years)
Somerville South Africa 797 Not stated ✓ ✓
199214* (0 to 80 years)
McCleane UK 877 Not stated ✓
199055* (not stated)
Yipintsoi Thailand 424 General, gynaecology, ✓ ✓
198956* (not stated) ENT, ophthalmology,
orthopaedics
Charpak France 3866 General, gynaecology, ✓ ✓
198857* (adults) ophthalmology, plastic
surgery, obstetrics
Johnson USA 212 General, gynaecology, ✓ ✓ ✓
198858* (adults) ENT, ophthalmology,
orthopaedics, urology,
plastic surgery
Turnbull Canada 1010 General ✓ ✓ ✓
198725* (adults)
Carliner USA 198 Cardiothoracic, general, r ✓ ✓
198659* (> 40 years) vascula
Muskett USA 200 Cardiothoracic, , urology, ✓ ✓ ✓
198628* (not stated) neurosurgery, plastic surgery,
ENT, general orthopaedics,
ophthalmology
Paterson UK 267 Not stated ✓ ✓ ✓
198360* (not stated)
Seymour UK 222 General ✓ ✓
198361* (> 65 years)
*Papers included in the HTA review

20 P R E O P E R A T I V E T E S T S
TA
BL
E 2
.2Su
mm
ary
of p
reop
erat
ive
elec
troc
ardi
ogra
m s
tudy
res
ults
fro
m t
he e
ligib
le s
tudi
es (
incl
udes
rou
tine
and
indi
cate
d te
sts)
ST
UD
YN
UM
BE
R O
FA
BN
OR
MA
LC
HA
NG
ES
IN
PO
ST
OP
ER
AT
IVE
PR
OS
PE
CT
IVE
CO
NS
EC
UT
IVE
AS
A G
RA
DE
S
TE
ST
S#
RE
SU
LTS
CL
INIC
AL
MA
NA
GE
ME
NT
CO
MP
LIC
AT
ION
SR
OU
TIN
ED
AT
AR
EC
RU
ITM
EN
TS
TA
TE
D
(N)
N (
%)
N (
%)
N (
%)
Gau
ss3
918
54
0 (
21.6
)16
(8
.6)
Routi
ne
only
✓✓
ASA
I t
o I
V
Fren
ch4
012
74
2 (
33
.1)
Routi
ne
only
xx
ASA
I t
o I
II
Hau
g41
24
00
Routi
ne
& i
ndic
ated
xx
ASA
I t
o I
I
Mur
doch
42
154
40
(2
6.0
)8
(5
.3)
0R
outi
ne
& i
ndic
ated
xx
x
Rose
nfel
d43
10
06
52
3 (
54
.5)
376
(37.
4)
Routi
ne
only
✓✓
x
Pola
nczy
k44
4181
25
6 (
6.1
)R
outi
ne
only
✓✓
ASA
I t
o I
V
Biav
ati4
56
54
(6
.2)
4 (
6.2
)N
ot
stat
edx
xx
Land
esbe
rg4
64
05
134
(3
3.1
)19
(4
.7)
Routi
ne
only
xx
x
Tait
47
57
321
1 (
36
.8)
129
(2
2.5
)R
outi
ne
only
✓✓
ASA
I t
o I
I
Calla
ghan
48*
23
05
7 (
24
.8)
Routi
ne
& i
ndic
ated
xx
X
Lui4
95
37
17 (
3.2
)N
ot
stat
edx
xA
SA I
to I
V
Pere
z11*
24
01
25
0(1
0.4
)2
5 (
1.0
)R
outi
ne
only
xx
ASA
I t
o I
I
Allm
an5
0
32
56
4 (
19.7
)R
outi
ne
only
xx
ASA
I t
o I
I
Kir
win
519
69
(9
.4)
21 (
21.9
)R
outi
ne
only
xx
x
Old
er5
2187
55
(2
9.4
)14
(7.
5)
Not
stat
edx
xx
Ada
ms1
2*
90
12 (
13.3
)0
Routi
ne
only
xx
x
Bhur
ipan
yo5
3*
39
513
0 (
32
.9)
10
(2
.5)
5 (
1.3
)R
outi
ne
only
✓✓
x
Gol
d54*
751
321
(4
2.7
)12
(1.6
)R
outi
ne
& i
ndic
ated
xx
ASA
I t
o I
II
Mac
dona
ld13
*14
53
(2
.1)
3 (
2.1
)3
(2
.1)
Routi
ne
only
xx
x

21A P P E N D I X 1
TA
BL
E 2
.2Su
mm
ary
of p
reop
erat
ive
elec
troc
ardi
ogra
m s
tudy
res
ults
fro
m t
he e
ligib
le s
tudi
es (
incl
udes
rou
tine
and
indi
cate
d te
sts)
conti
nued
ST
UD
YN
UM
BE
R O
FA
BN
OR
MA
LC
HA
NG
ES
IN
PO
ST
OP
ER
AT
IVE
PR
OS
PE
CT
IVE
CO
NS
EC
UT
IVE
AS
A G
RA
DE
S
TE
ST
S#
RE
SU
LTS
CL
INIC
AL
MA
NA
GE
ME
NT
CO
MP
LIC
AT
ION
SR
OU
TIN
ED
AT
AR
EC
RU
ITM
EN
TS
TA
TE
D
(N)
N (
%)
N (
%)
N (
%)
Som
mer
ville
14*
29
05
2 (
17.9
)4
(1.4
)R
outi
ne
only
xx
ASA
I t
o I
V
McC
lean
e55*
87
73
95
(45
.0)
Routi
ne
only
xx
ASA
I t
o V
Yipi
ntso
i56*
424
61
(14
.4)
7 (
1.7
)R
outi
ne
only
xx
x
Char
pak5
7*
1610
60
9 (
37.
8)
116
(7.
2)
Routi
ne
& i
ndic
ated
✓✓
x
John
son5
8*
212
140
(6
6.0
)0
0N
ot
stat
ed✓
✓x
Turn
bull2
5*
63
2101
(6.0
)0
12 (
1.9
)N
ot
stat
edx
xx
Carli
ner5
9*
198
125
(6
3.1
)6
(3
.0)
Routi
ne
only
✓✓
x
Mus
kett
28*
145
53
(3
6.5
)2
(1.4
)0
Routi
ne
& i
ndic
ated
✓✓
x
Pate
rson
60*
26
78
2 (
22
.3)
4 (
1.5
)0
Routi
ne
only
✓✓
x
Seym
our6
1*
22
217
5 (
78
.8)
18
(8
.1)
Routi
ne
only
xx
x
*Pap
ers
incl
uded
in t
he
HTA
rev
iew
#Th
e num
ber
of
test
s ca
rrie
d o
ut
may
dif
fer
from
the
sam
ple
siz
e in
som
e st
udie
s. T
his
occ
urs
in p
aper
s re
port
ing t
he
resu
lts
of
mult
iple
pre
oper
ativ
e
test
s bec
ause
not
all
of
pat
ients
in t
he
study
sam
ple
rec
eive
d a
ll th
e pre
oper
ativ
e te
sts
det
aile
d i
n t
he
pap
er.

We found wide variation in the reported proportion
of abnormal preoperative ECGs. The proportion
of abnormal ECGs ranged from 0% in one study41
to 78.8% in a further study.61 The proportion of
patients who had had preoperative ECGs and
subsequently underwent a change in clinical
management ranged from 0% in three studies12,25,58
to 37.4% in a further study.43 The proportion of
patients who had had preoperative ECGs and who
then suffered postoperative complications ranged
from 0% in five studies28,41,42,58,60 to 22.5% in a
further study.47
As described in Section 1, the wide variation in
the results may be explained at least in part by
heterogeneity in the study populations. The impact
of four major sources of heterogeneity on the
outcome of the preoperative ECG studies will be
considered separately in the following sections.
2.2 Heterogeneity in the quality of thestudy designAs described in Section 1, studies in which data are
collected prospectively and in which patients are
recruited consecutively are less susceptible to
bias than studies in which data are collected
retrospectively or where patients are recruited
selectively. Therefore, we hypothesised that the
proportions of abnormal preoperative ECGs,
changes in clinical management and postoperative
complications might differ according to the quality
of the study design.
We investigated the effects of variations in the
quality of the study design on the proportions of
abnormal ECGs, changes in clinical management and
postoperative complications across the identified
studies. Ten studies collected data prospectively and
recruited consecutive patients28,39,43,44,47,53,57-60
and 19 studies collected data retrospectively and
did not state that the sample of patients was
consecutive.11-14,25,40-42,45,46,48-52,54-56,61
Table 2.3 provides a summary of the proportions
of abnormal preoperative ECGs, changes in clinical
management and postoperative complications across
studies according to study quality indicators.
There was little difference in the proportion of
abnormal preoperative ECGs between prospective and
retrospective studies (21.8% and 22.5%, respectively).
However, the average proportion of patients
undergoing a change in clinical management or
postoperative complications tended to be higher in
the prospective studies compared to the retrospective
studies (4.9% and 1.2%, respectively).
2.3 Heterogeneity in the composition of thestudy population
2.3.1 Age range
Given that the prevalence of comorbid diseases
increases with age, we hypothesised that the
proportion of patients with abnormal preoperative
ECGs would be higher in studies of older patient
populations.
22 P R E O P E R A T I V E T E S T S
T A B L E 2 . 3 Summary of abnormal ECGs, changes in clinical management andpostoperative complications in study populations according to studyquality indicators
Q U A L I T Y % A B N O R M A L T E S T % C H A N G E I N C L I N I C A L % P O S T O P E R A T I V E
I N D I C A T O R (Number of Studies) M A N A G E M E N T C O M P L I C A T I O N S
(Number of Studies) (Number of Studies)
Mean* Maximum Minimum Mean* Maximum Minimum Mean* Maximum Minimum
P C 21.8 (9) 66.0 21.6 5.8 (6) 37.4 0 4.9 (8) 22.5 0
P N (0)
R C 22.5 (19) 91.4 0 0.5 (6) 5.3 0 1.2 (11) 8.1 0
R N (0)
P = prospective data collection; R = retrospective data collection; C = consecutive recruitment of patients; N = recruitment of
patients that was not stated as consecutive; * weighted means were produced to reflect the different numbers of patients in each
study. It was not possible to produce a distributional statistic reflecting this weight.

We investigated the effects of variations in the age
range of the study population on the proportions of
abnormal preoperative ECGs, changes in clinical
management and postoperative complications across
the identified studies. Nineteen studies included
adults only,12,13,25,39,40,43,44,46-53,57-59,61 one study
included children only,45 three studies included both
adults and children14,41,54 and the remaining studies
did not specify the age range of their patient
population.11,28,42,55,56,60
Table 2.4 provides a summary of the proportions
of abnormal preoperative ECGs, changes in clinical
management and postoperative complications
across studies according to age group of the
study population.
Table 2.4 shows that the average proportion of
abnormal preoperative ECGs tended to be highest in
studies that included elderly adults (42.1%),
followed by studies that included both adults and
children (35.0%) and tended to be lowest in studies
that included children only (6.2%).
We then investigated the effects of variations in the
age of the study population on the proportion of
abnormal preoperative ECGs within the identified
studies. This was possible for five of the studies,
which stratified the proportion of electrocardiogram
abnormalities by age.14,53-55,60 The results are
summarised in Table 2.5.
23A P P E N D I X 1
T A B L E 2 . 4 Summary of abnormal preoperative ECGs, changes in clinicalmanagement and postoperative complications in study populationsby age group
A G E % A B N O R M A L T E S T % C H A N G E I N C L I N I C A L % P O S T O P E R A T I V E
R A N G E (Number of Studies) M A N A G E M E N T C O M P L I C A T I O N S
(Number of Studies) (Number of Studies)
Mean* Maximum Minimum Mean* Maximum Minimum Mean* Maximum Minimum
Adults
> 60 years 42.1 (3) 78.8 2.1 2.1 (1) 6.3 (3) 8.1 2.1
Adults only 19.9 (16) 66.0 3.2 12.7 (6) 37.4 0 6.7 (8) 22.5 0
Children &
adults 35.0 (3) 42.7 0 1.4 (1) 1.5 (2) 1.6 0
Children only 6.2 (1) (0) 6.2 (1)
Not stated 20.6 (6) 45.0 10.4 1.3 (4) 5.2 1 0.7 (4) 1.7 0
*weighted means
T A B L E 2 . 5 Summary of abnormal preoperative electrocardiogram findings (%) by age
A G E ( Y E A R S )
First author 0 to 10 11 to 20 21 to 30 31 to 40 41 to 50 51 to 60 61 to 70 71 to 80 80+
Sommerville14 0 0 0 2.9 4.5 17.6 16.4 16.7 20.0
Paterson60 – – – 3.8 5.7 26.3 42.6 61.2 64.3
McCleane55 0 0 12 7 21 41 58 79 64
Bhuripanyo53 – – – – 26.9 30.0 34.0 35.2
Gold54 37 36 44 62
24 P R E O P E R A T I V E T E S T S
From Table 2.5 it can be seen that in all of the studies
the proportion of abnormal preoperative ECGs rose as
age increased. The rise in the ECG abnormality rate
appeared to be greatest between the ages of 40 and
60 years, increasing from an average of 4.6% in 30
to 40-year-olds to 18.9% and 31.8% in 40 to 50 and
50 to 60-year-olds, respectively.
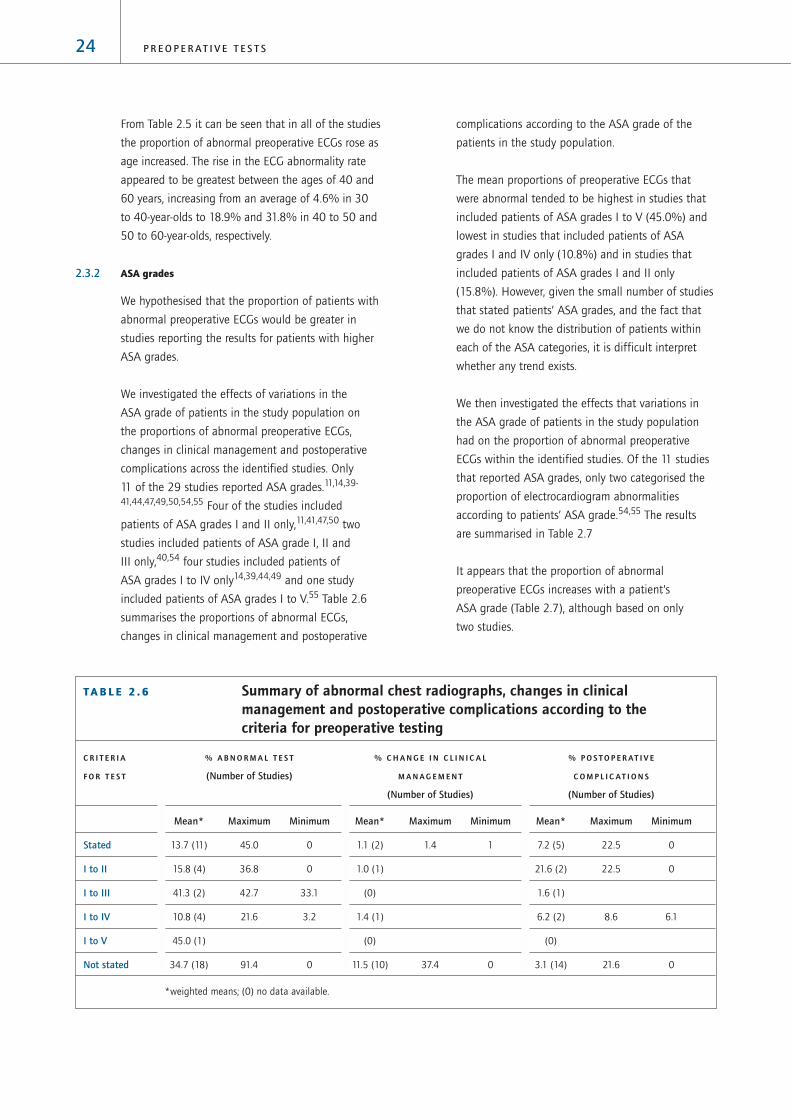
2.3.2 ASA grades
We hypothesised that the proportion of patients with
abnormal preoperative ECGs would be greater in
studies reporting the results for patients with higher
ASA grades.
We investigated the effects of variations in the
ASA grade of patients in the study population on
the proportions of abnormal preoperative ECGs,
changes in clinical management and postoperative
complications across the identified studies. Only
11 of the 29 studies reported ASA grades.11,14,39-
41,44,47,49,50,54,55 Four of the studies included
patients of ASA grades I and II only,11,41,47,50 two
studies included patients of ASA grade I, II and
III only,40,54 four studies included patients of
ASA grades I to IV only14,39,44,49 and one study
included patients of ASA grades I to V.55 Table 2.6
summarises the proportions of abnormal ECGs,
changes in clinical management and postoperative
complications according to the ASA grade of the
patients in the study population.
The mean proportions of preoperative ECGs that
were abnormal tended to be highest in studies that
included patients of ASA grades I to V (45.0%) and
lowest in studies that included patients of ASA
grades I and IV only (10.8%) and in studies that
included patients of ASA grades I and II only
(15.8%). However, given the small number of studies
that stated patients’ ASA grades, and the fact that
we do not know the distribution of patients within
each of the ASA categories, it is difficult interpret
whether any trend exists.
We then investigated the effects that variations in
the ASA grade of patients in the study population
had on the proportion of abnormal preoperative
ECGs within the identified studies. Of the 11 studies
that reported ASA grades, only two categorised the
proportion of electrocardiogram abnormalities
according to patients’ ASA grade.54,55 The results
are summarised in Table 2.7
It appears that the proportion of abnormal
preoperative ECGs increases with a patient’s
ASA grade (Table 2.7), although based on only
two studies.
T A B L E 2 . 6 Summary of abnormal chest radiographs, changes in clinicalmanagement and postoperative complications according to thecriteria for preoperative testing
C R I T E R I A % A B N O R M A L T E S T % C H A N G E I N C L I N I C A L % P O S T O P E R A T I V E
F O R T E S T (Number of Studies) M A N A G E M E N T C O M P L I C A T I O N S
(Number of Studies) (Number of Studies)
Mean* Maximum Minimum Mean* Maximum Minimum Mean* Maximum Minimum
Stated 13.7 (11) 45.0 0 1.1 (2) 1.4 1 7.2 (5) 22.5 0
I to II 15.8 (4) 36.8 0 1.0 (1) 21.6 (2) 22.5 0
I to III 41.3 (2) 42.7 33.1 (0) 1.6 (1)
I to IV 10.8 (4) 21.6 3.2 1.4 (1) 6.2 (2) 8.6 6.1
I to V 45.0 (1) (0) (0)
Not stated 34.7 (18) 91.4 0 11.5 (10) 37.4 0 3.1 (14) 21.6 0
*weighted means; (0) no data available.

2.4 Heterogeneity in criteria for preoperativetestingAlthough authors did not state their definitions of
‘routine’ preoperative tests, we have assumed a
routine preoperative investigation to be a test carried
out on all patients preoperatively that is not directly
related to the planned procedure or the patients’
condition. In some studies, authors included patients
who were described as undergoing routine
preoperative tests as well as patients undergoing
indicated preoperative tests. None of these studies
presented the proportions of abnormal preoperative
tests, changes in clinical management and
postoperative complications separately for patients
who had routine tests and for patients who had
indicated tests, instead the data were combined for
both groups of patients. Therefore, we hypothesised
that the proportions of abnormal preoperative
ECGs, changes in clinical management and
postoperative complications would be lower in study
populations where all the patients had routine
preoperative ECGs compared to study populations
containing patients undergoing either routine or
indicated preoperative ECGs.
We investigated the effects of variations in the
criteria for preoperative testing on the proportions
of abnormal preoperative ECGs, changes in clinical
management and postoperative complications across
the identified studies. Eighteen of the studies
included patients undergoing routine preoperative
ECGs only, whereas six of the studies included a
combination of both routine and indicated tests
(Table 2.2). Table 2.8 provides a summary of the
proportions of abnormal preoperative ECGs,
changes in clinical management and postoperative
complications in study populations according to
whether the study population included routine
only or both routine and indicated tests.
Table 2.8 shows that in the studies that included
routine tests only, the mean proportion of abnormal
preoperative ECGs tended to be lower (18.4 %) than
in studies which included both routine and indicated
tests (37.0%).
It was not possible to investigate the effects of
variations in the criteria for preoperative testing on
the proportions of abnormal preoperative ECGs,
25A P P E N D I X 1
T A B L E 2 . 7 Summary of abnormal preoperative electrocardiogram findings (%)by ASA grade
A S A G R A D E
Study Number of patients I II III IV + V
McCleane55 877 1 31 79 91
Gold54 751 31 47 67
T A B L E 2 . 8 Summary of abnormal preoperative ECGs, changes in clinicalmanagement and postoperative complications according to thecriteria for preoperative testing
Q U A L I T Y % A B N O R M A L T E S T % C H A N G E I N C L I N I C A L % P O S T O P E R A T I V E
F O R T E S T (Number of Studies) M A N A G E M E N T C O M P L I C A T I O N S
(Number of Studies) (Number of Studies)
Mean* Maximum Minimum Mean* Maximum Minimum Mean* Maximum Minimum
Routine only 18.4 (18) 91.4 0 8.9 (7) 37.4 0 14.3 (11) 22.5 0
Routine &
indicated 37.0 (6) 42.7 0 4.3 (3) 7.2 1.4 1.1 (4) 1.6 0
Not stated 19.4 (5) 66.0 3.2 0 (2) 0 0 2.7 (4) 7.5 0
*weighted means

changes in clinical management and postoperative
complications within the identified studies because
studies that included only patients for whom
preoperative tests were indicated were excluded in
the initial stages of our systematic review and none
of the eligible studies reported data separately for
routine and indicated preoperative ECGs.
2.5 Heterogeneity in the definition of theoutcome variables
2.5.1 Definition of an abnormal ECG
We investigated the variability of the definition
of an abnormal preoperative ECG across the
identified studies. Eleven papers reported
definitions of an abnormal ECG. The reported
definitions are summarised in Table 2.9.
Table 2.9 shows that the definitions of an abnormal
ECG were not consistent across the studies. These
differences in definitions may represent a source
of heterogeneity amongst the study results.
However, authors did not report whether their
definitions of abnormal ECGs were determined
prior to assessment, or whether their published
definitions merely reflected the abnormalities that
were observed. Given this uncertainty it is not
sensible to investigate further differences in the
definitions of an abnormal ECG.
26 P R E O P E R A T I V E T E S T S
T A B L E 2 . 9 Summary of the definitions of an abnormal preoperative ECG
1 2 3 4 5 6 7 8 9 10 11
Presence of ST segment depression (20%) ✓ ✓ ✓ ✓ ✓
Q waves > 0.4 seconds duration ✓ ✓ ✓ ✓
>25% R wave ✓ ✓ ✓ ✓
ST segment depressions of 0.1mV or more ✓ ✓ ✓ ✓
PR interval ✓
AV conduction abnormalities ✓ ✓ ✓
Atrial or left ventricular hypertrophy ✓ ✓ ✓ ✓
Myocardial ischaemia and infarction ✓ ✓ ✓
Minnesota codes to identify Q/QS patterns ✓
QRS axis deviation ✓ ✓
T wave items ✓ ✓
Ventricular function defects ✓
Arrhythmias ✓
Left axis deviation without left anterior hemiblock ✓
Counterclockwise rotation ✓ ✓
Clockwise rotation ✓
Sinus tachycardia ✓
Sinus bradycardia ✓ ✓
Atrial fibrillation ✓
Supraventricular tachycardia ✓
Frequent ventricular ectopic beats ✓
Bundle branch block ✓ ✓
1: Allman50; 2: French40; 3: Tait47; 4: Gauss39; 5: Kirwin51; 6: Landesberg46; 7: Carliner59;
8: Lui49; 9: Seymour61; 10: Paterson60; 11: Bhuripanyo53.
27A P P E N D I X 1
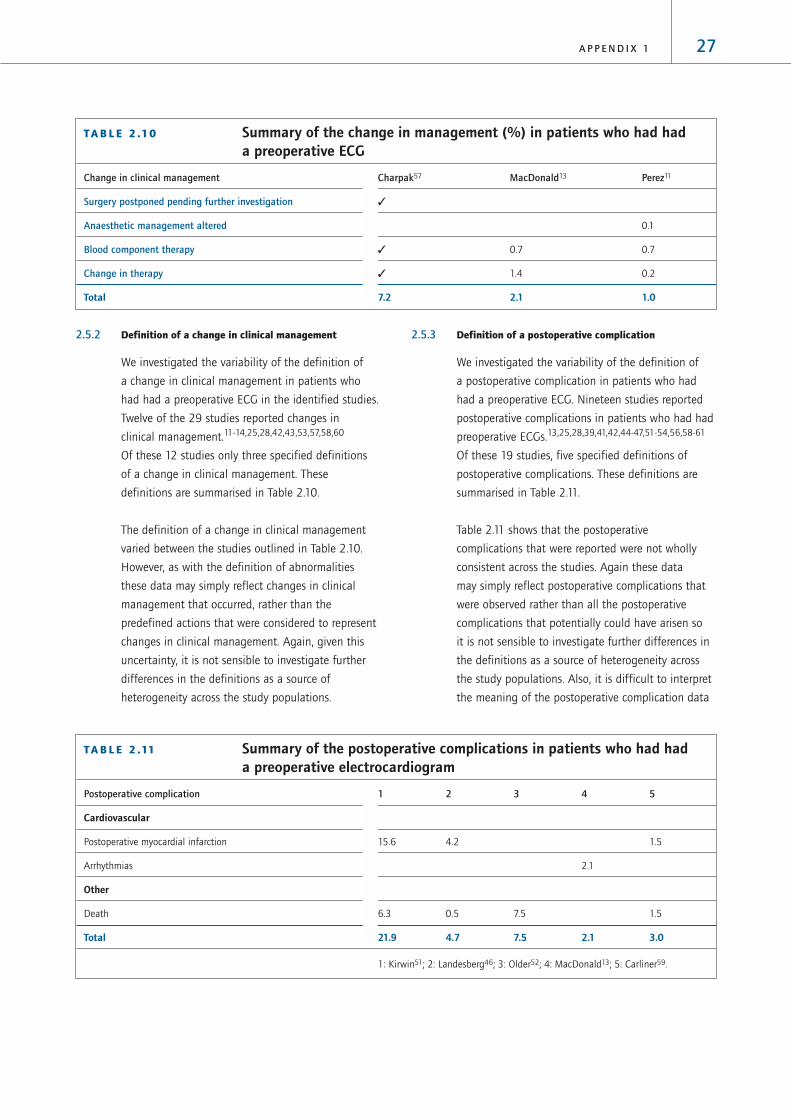
2.5.2 Definition of a change in clinical management
We investigated the variability of the definition of
a change in clinical management in patients who
had had a preoperative ECG in the identified studies.
Twelve of the 29 studies reported changes in
clinical management.11-14,25,28,42,43,53,57,58,60
Of these 12 studies only three specified definitions
of a change in clinical management. These
definitions are summarised in Table 2.10.
The definition of a change in clinical management
varied between the studies outlined in Table 2.10.
However, as with the definition of abnormalities
these data may simply reflect changes in clinical
management that occurred, rather than the
predefined actions that were considered to represent
changes in clinical management. Again, given this
uncertainty, it is not sensible to investigate further
differences in the definitions as a source of
heterogeneity across the study populations.
2.5.3 Definition of a postoperative complication
We investigated the variability of the definition of
a postoperative complication in patients who had
had a preoperative ECG. Nineteen studies reported
postoperative complications in patients who had had
preoperative ECGs.13,25,28,39,41,42,44-47,51-54,56,58-61
Of these 19 studies, five specified definitions of
postoperative complications. These definitions are
summarised in Table 2.11.
Table 2.11 shows that the postoperative
complications that were reported were not wholly
consistent across the studies. Again these data
may simply reflect postoperative complications that
were observed rather than all the postoperative
complications that potentially could have arisen so
it is not sensible to investigate further differences in
the definitions as a source of heterogeneity across
the study populations. Also, it is difficult to interpret
the meaning of the postoperative complication data
T A B L E 2 .10 Summary of the change in management (%) in patients who had hada preoperative ECG
Change in clinical management Charpak57 MacDonald13 Perez11
Surgery postponed pending further investigation ✓
Anaesthetic management altered 0.1
Blood component therapy ✓ 0.7 0.7
Change in therapy ✓ 1.4 0.2
Total 7.2 2.1 1.0
T A B L E 2 .11 Summary of the postoperative complications in patients who had hada preoperative electrocardiogram
Postoperative complication 1 2 3 4 5
Cardiovascular
Postoperative myocardial infarction 15.6 4.2 1.5
Arrhythmias 2.1
Other
Death 6.3 0.5 7.5 1.5
Total 21.9 4.7 7.5 2.1 3.0
1: Kirwin51; 2: Landesberg46; 3: Older52; 4: MacDonald13; 5: Carliner59.

because the postoperative complications recorded in
the data were not necessarily complications relating
to the preoperative ECGs. Despite the fact that the
patient had had a preoperative ECG, postoperative
complications still occurred.
2.6 Diagnostic accuracySix of the studies investigated the diagnostic
accuracy of the preoperative ECG. The results of
these six studies are summarised in Table 2.12.
Sensitivity ranged from 8% in one study45 to 85% in
a further study.59 Specificity and positive predictive
values ranged from 41% and 22%, respectively,
in one study59 to 100% and 73%, respectively,
in a further study.45 Negative predictive values
ranged from 77.5% in one study47 to 100% in
a further study.45
From the data presented in each of the papers it
was possible to calculate positive predictive values
for predicting a change in clinical management for
seven studies. The positive predictive value indicates
the percentage of people with an abnormal
preoperative ECG that subsequently underwent
changes in clinical management. The results are
summarised in Table 2.13.
The positive predictive value for predicting a change
in clinical management ranged from 0% in two
studies12,25 to 36.3% in a further study.43 However,
it is difficult to interpret the meaning of the positive
predictive values from Table 2.13 because of the
heterogeneous nature of the studies as outlined
in Section 1.
28 P R E O P E R A T I V E T E S T S
T A B L E 2 .12 Summary of the diagnostic accuracy of preoperative ECGs
S T U D Y O U T C O M E S E N S I T I V I T Y S P E C I F I C I T Y P O S I T I V E N E G A T I V E
( % ) ( % ) P R E D I C T I V E P R E D I C T I V E
V A L U E ( % ) V A L U E ( % )
Allman50 Detecting silent myocardial ischaemia 25 95 55 84
in patients who are hypertensive and
taking antihypertensive medication
Biavati45 Detecting a complicated postoperative 8 100 73 100
course in children < 18 years
Gauss39 Detecting postoperative cardiac 53 82 22 95
morbidity and mortality
Tait47 Detecting postoperative Not stated Not stated 25.4* 78.7*
cardiovascular events 17.6** 77.5**
Gold54 Detecting adverse events 75 58 Not stated Not stated
Carliner59 Detecting adverse cardiovascular events 85 41 22 Not stated
*Patients with cardiovascular risk factors; ** patients with no cardiovascular risk factors.
T A B L E 2 .13 Calculated estimates of thepositive predictive value ofpreoperative ECGs to predictchanges in clinicalmanagement
Positive predictive value for predicting a
First author change in clinical management (%)
Murdoch42 20.0
Rosenfeld43 36.3
Perez11 9.5
Adams12 0
Bhuripanyo53 7.7
Turnbull25 0
Paterson60 4.9

29A P P E N D I X 1
3 Preoperative haemoglobin, haematocritand full blood count tests
3.1 Characteristics of the studiesIn our search of the literature from 1995 to 2001 we
identified six studies of preoperative haemoglobin,
haematocrit and full blood counts (FBCs). All of these
papers reported abnormal outcome data, three papers
also reported changes in clinical management and
three papers reported postoperative complications.
In combination with the 23 papers identified in the
HTA report, this review included 29 papers that
studied preoperative haemoglobin, haematocrit
and FBCs. The characteristics of the 29 papers are
summarised in Table 3.1. All studies were case series.
T A B L E 3 .1 Characteristics of eligible studies of preoperative haemoglobin,haematocrit and FBC tests
First author and Country Study sample Type of surgery Abnormal test Change in clinical Postoperative
year of publication (age) management complications
Dzankic USA 544 Not stated ✓
200162 (70 to 100 years)
Gabriel France 1706 ENT ✓ ✓ ✓
200063 (0 to 15 years)
Haug USA 458 Oral, maxillofacial ✓ ✓
199941 (15 to 54 years)
Wojtkowski USA 140 Cardiology ✓
199964 (0 to 19 years)
Cherng Taiwan 74 Cardiac ✓ ✓
199865 (not stated)
Meneghini USA 1884 Not stated ✓ ✓ ✓
199866 (0 to 8 years)
Houry USA 3242 Urology, gynaecology, ✓
199567* (16 to 99 years) thoracic, vascular, general,
endocrine
Perez Spain 3131 Not stated ✓ ✓
199511* (not stated)
Close USA 96 ENT ✓ ✓
199468* (1 to 40 years)
Kozak USA 305 Fibre-optic bronchoscopy ✓ ✓
199469* (not stated)
Hoare UK 372 ENT ✓ ✓ ✓
199370* (2 to 15 years)
MacPherson South Africa 159 Cardiothoracic, general ✓ ✓
199371* (not stated)
Adams USA 169 General ✓ ✓
199212* (adults)
Baron USA 1863 Not stated ✓ ✓
199272* (< 18 years)
MacDonald UK 147 Orthopaedics ✓
199213* (> 60 years)

The results of the 29 papers, which documented the
findings from a total of 29,362 preoperative
haemoglobin and haematocrit tests, 15,283
preoperative platelet counts and 5,101 preoperative
white blood cell counts are reported in Table 3.2.
30 P R E O P E R A T I V E T E S T S
T A B L E 3 .1 Characteristics of eligible studies of preoperative haemoglobin,haematocrit and FBC tests continued
First author and Country Study sample Type of surgery Abnormal test Change in clinical Postoperative
year of publication (age) management complications
Narr USA 3782 Not stated ✓ ✓
199173* (not stated)
Roy Canada 2000 Not stated ✓ ✓ ✓
199174* (0 to 18 years)
Bolger USA 52 ENT ✓ ✓
199075* (not stated)
Nigam UK 250 ENT ✓ ✓
199076* (3 to 12 years)
O’Connor USA 486 ENT, general, urology ✓ ✓
199077* (< 18 years) orthopaedics
Jones UK 346 Orthopaedics ✓
198978* (children)
Charpak France 3866 General, gynaecology, ✓ ✓
198857* (adults) obstetrics, plastic surgery,
orthopaedics
Rohrer USA 282 General, vascular ✓ ✓
198879* (not stated)
Turnbull Canada 1010 General ✓ ✓ ✓
198725* (adults)
Muskett USA 200 Cardiothoracic, ENT, general, ✓ ✓
198628* (not stated) neurosurgery, ophthalmology,
urology, orthopaedics,
plastic surgery
Kaplan USA 2000 Not stated ✓ ✓ ✓
198580* (0 to 75 years)
Ramsey USA 92 Cardiothoracic ✓ ✓
198381* (0 to 75 years)
Wood USA 1924 Urology, ophthalmics, ✓ ✓ ✓
198132* (0 to 14 years) orthopaedics, general ENT
Rossello Puerto Rico 690 Not stated ✓ ✓
198034* (< 14 years)
*papers included in the HTA review
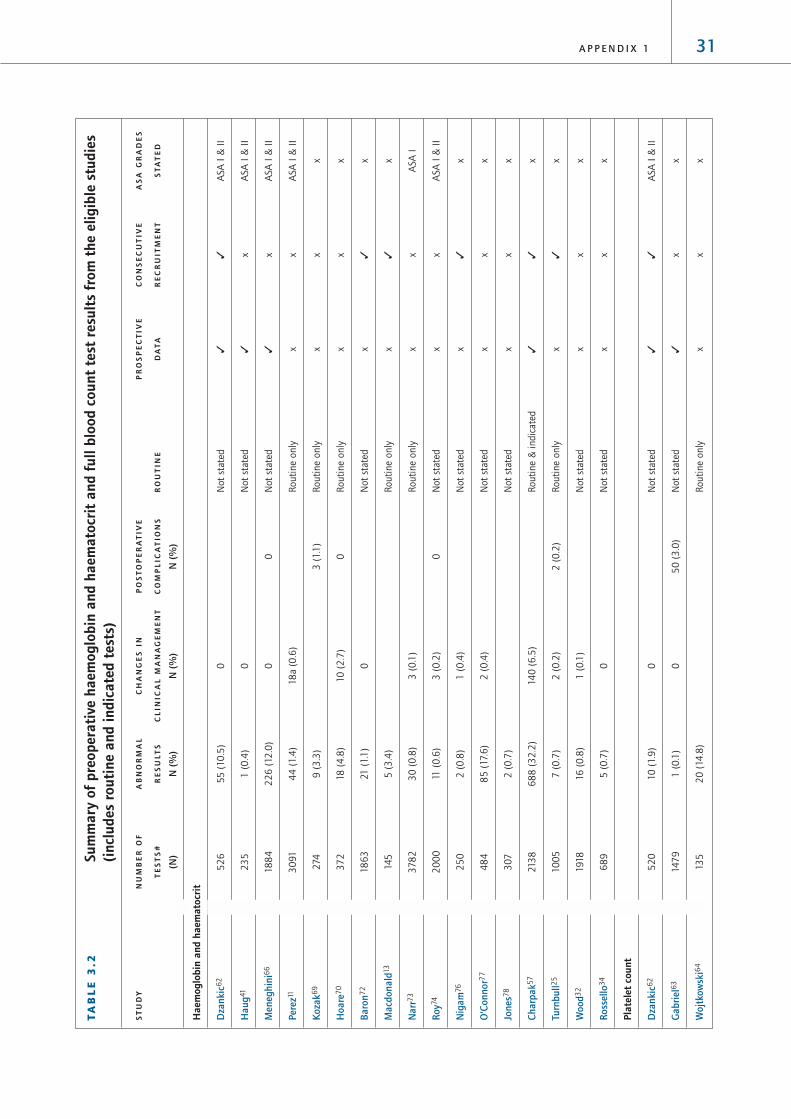
31A P P E N D I X 1
TA
BL
E 3
.2Su
mm
ary
of p
reop
erat
ive
haem
oglo
bin
and
haem
atoc
rit
and
full
bloo
d co
unt
test
res
ults
fro
m t
he e
ligib
le s
tudi
es(i
nclu
des
rout
ine
and
indi
cate
d te
sts)
ST
UD
YN
UM
BE
R O
FA
BN
OR
MA
LC
HA
NG
ES
IN
PO
ST
OP
ER
AT
IVE
PR
OS
PE
CT
IVE
CO
NS
EC
UT
IVE
AS
A G
RA
DE
S
TE
ST
S#
RE
SU
LTS
CL
INIC
AL
MA
NA
GE
ME
NT
CO
MP
LIC
AT
ION
SR
OU
TIN
ED
AT
AR
EC
RU
ITM
EN
TS
TA
TE
D
(N)
N (
%)
N (
%)
N (
%)
Hae
mog
lobi
n an
d ha
emat
ocri
t
Dza
nkic
62
52
655
(10
.5)
0N
ot
stat
ed✓
✓A
SA I
& I
I
Hau
g41
23
51
(0
.4)
0N
ot
stat
ed✓
xA
SA I
& I
I
Men
eghi
ni6
618
84
22
6 (
12.0
)0
0N
ot
stat
ed✓
xA
SA I
& I
I
Pere
z11
30
914
4 (
1.4
)18
a (0
.6)
Routi
ne
only
xx
ASA
I &
II
Koza
k69
274
9 (
3.3
)3
(1.1
)R
outi
ne
only
xx
x
Hoa
re7
037
218
(4
.8)
10
(2
.7)
0R
outi
ne
only
xx
x
Baro
n72
18
63
21 (
1.1
)0
Not
stat
edx
✓x
Mac
dona
ld13
145
5 (
3.4
)R
outi
ne
only
x✓
x
Nar
r73
37
82
30
(0
.8)
3 (
0.1
)R
outi
ne
only
xx
ASA
I
Roy7
42
00
011
(0
.6)
3 (
0.2
)0
Not
stat
edx
xA
SA I
& I
I
Nig
am76
25
02
(0
.8)
1 (
0.4
)N
ot
stat
edx
✓x
O’C
onno
r77
48
48
5 (
17.6
)2
(0
.4)
Not
stat
edx
xx
Jone
s78
307
2 (
0.7
)N
ot
stat
edx
xx
Char
pak5
721
38
68
8 (
32
.2)
140
(6
.5)
Routi
ne
& i
ndic
ated
✓✓
x
Turn
bull2
510
05
7 (
0.7
)2
(0
.2)
2 (
0.2
)R
outi
ne
only
x✓
x
Woo
d32
1918
16
(0
.8)
1 (
0.1
)N
ot
stat
edx
xx
Ross
ello
34
68
95
(0
.7)
0N
ot
stat
edx
xx
Plat
elet
cou
nt
Dza
nkic
62
52
010
(1.9
)0
Not
stat
ed✓
✓A
SA I
& I
I
Gab
riel6
314
79
1 (
0.1
)0
50
(3
.0)
Not
stat
ed✓
xx
Woj
tkow
ski6
413
52
0 (
14.8
)R
outi
ne
only
xx
x

32 P R E O P E R A T I V E T E S T S
TA
BL
E 3
.2Su
mm
ary
of p
reop
erat
ive
haem
oglo
bin
and
haem
atoc
rit
and
full
bloo
d co
unt
test
res
ults
fro
m t
he e
ligib
le s
tudi
es(i
nclu
des
rout
ine
and
indi
cate
d te
sts)
conti
nued
ST
UD
YN
UM
BE
R O
FA
BN
OR
MA
LC
HA
NG
ES
IN
PO
ST
OP
ER
AT
IVE
PR
OS
PE
CT
IVE
CO
NS
EC
UT
IVE
AS
A G
RA
DE
S
TE
ST
S#
RE
SU
LTS
CL
INIC
AL
MA
NA
GE
ME
NT
CO
MP
LIC
AT
ION
SR
OU
TIN
ED
AT
AR
EC
RU
ITM
EN
TS
TA
TE
D
(N)
N (
%)
N (
%)
N (
%)
Cher
ng6
56
83
4 (
50
)2
(2
.7)
Routi
ne
only
✓x
x
Pere
z11
307
213
(0
.4)
18
a (0
.6)
Routi
ne
only
xx
ASA
I &
II
Clos
e68
90
1 (
1.1
)0
Routi
ne
only
✓x
x
Koza
k69
274
9 (
3.3
)0
Routi
ne
only
xx
x
Mac
pher
son7
111
11
(0
.9)
0R
outi
ne
only
xx
x
Nar
r73
37
82
46
(1.2
)0
Routi
ne
only
xx
ASA
I
Bolg
er7
55
20
0N
ot
stat
edx
xx
Char
pak5
72
90
65
( 8
.0)
1(0
.3)
Routi
ne
& i
ndic
ated
✓✓
x
Rohr
er7
916
313
(8
.0)
0R
outi
ne
only
✓x
X
Turn
bull2
510
05
00
0R
outi
ne
only
x✓
x
Kap
lan8
04
07
3 (
0.7
)0
0R
outi
ne
only
xx
x
Ram
sey8
19
20
0N
ot
stat
edx
xx
Whi
te b
lood
cel
l cou
nt
Hau
g41
23
51
(0
.4)
0N
ot
stat
ed✓
xA
SA I
& I
I
Pere
z11
30
53
27
(0
.9)
18
a (0
.6)
Routi
ne
only
xx
ASA
I &
II
Turn
bull2
5
10
05
1 (
0.1
)0
0R
outi
ne
only
x✓
x
Mus
kett
28
155
54
(3
4.8
)8
(5
.2)
Not
stat
edx
✓x
Ross
ello
34
68
612
0 (
17.5
)9
(1.3
)N
ot
stat
edx
xx
*Pap
ers
incl
uded
in t
he
HTA
rev
iew

33A P P E N D I X 1
The proportions of abnormal preoperative
haemoglobin and haematocrit tests ranged
from 0.4% in one study41 to 32.2% in a further
study.57 The proportion of patients who had had
preoperative haemoglobin and haematocrit tests
and who subsequently underwent a change in
clinical management ranged from 0% in five
studies34,41,62,66,72 to 6.5% in a further study.57
The proportion of patients who had had preoperative
haemoglobin and haematocrit tests and who
then suffered postoperative complications ranged
from 0% in three studies66,70,74 to 1.1% in a
further study.69
The proportions of abnormal preoperative platelet
counts ranged from 0% in three studies25,75,81
to 50% in a further study.65 The proportion of
patients who had had preoperative platelet count
tests and subsequently underwent a change in
clinical management ranged from 0% in seven
studies25,62,63,69,79-81 to 0.3% in a further study.57
The proportion of patients who had had preoperative
platelet count tests and who then suffered
postoperative complications ranged from 0% in seven
studies25,68,71,73,75,80 to 3% in a further study.63
The proportions of abnormal preoperative white
blood cell counts ranged from 0.1% in one study25
to 34.8% in a further study.28 The proportion of
patients who had had preoperative white blood cell
counts and subsequently underwent a change in
clinical management ranged from 0% in two
studies25,41 to 5.2% in a further study.28 The
proportion of patients who had had preoperative
white blood cell counts and who then suffered
postoperative complications ranged from 0% in
one study25 to 0.6% in a further study.11
As described in Section 1, the wide variation in
the results may be explained at least in part by
heterogeneity in the study populations. The impact
of four major sources of heterogeneity on the
outcome of the preoperative haemoglobin,
haematocrit and FBC test studies will be considered
separately in the following sections.
3.2 Heterogeneity in the quality of thestudy designAs described in Section 1, studies in which data
are collected prospectively and in which patients
are recruited consecutively are less susceptible
to bias than studies in which data are collected
retrospectively and where patients are recruited
selectively. Therefore, we hypothesised that the
proportions of abnormal preoperative haemoglobin,
haematocrit and FBC tests, changes in clinical
management and postoperative complications might
differ according to the quality of the study design.
We investigated the effects of variations in the quality
of the study design on the proportions of abnormal
preoperative haemoglobin, haematocrit and FBC tests,
changes in clinical management and postoperative
complications across the identified studies. Three
studies collected data prospectively and recruited
consecutive patients,57,62,67 six studies collected data
prospectively and did not state that the sample of
patients was consecutive,41,63,65,66,68,79 five studies
collected data retrospectively and recruited
consecutive patients13,25,28,72,76 and 15 studies
collected data retrospectively and did not state that
the sample of patients was consecutive.11,12,32,64,69-
71,73-75,77-81 Table 3.3 provides a summary of the
proportions of abnormal preoperative haemoglobin,
haematocrit and FBC tests and changes in clinical
management and postoperative complications across
studies according to study quality indicators.

The average proportions of abnormal preoperative
haemoglobin and haematocrit tests and changes
in clinical management tended to be higher in
prospective studies compared to retrospective studies.
There were no other clear patterns with preoperative
haemoglobin, haematocrit and FBC test results for
changes in clinical management or postoperative
complications with quality of study design.
3.3 Heterogeneity in the composition of thestudy population
3.3.1 Age range
Given that the prevalence of comorbid diseases
increases with age, we hypothesised that the
proportion of patients with abnormal preoperative
haemoglobin, haematocrit and FBC tests would be
higher in studies of older patient populations.
We investigated the effects of variations in the age
range of the study population on the proportions of
abnormal preoperative haemoglobin, haematocrit
and FBC tests, changes in clinical management and
postoperative complications across the identified
studies. Five of the studies included adults
only,12,13,25,57,62, two of which only included adults
aged over 60 years,13,62 ten of the studies included
children only,32,34,63,66,70,72,74,76-78 six of the studies
included adults and children41,64,67,68,80,81 and
eight of the studies did not state the age range
of their study population.11,28,65,69,71,73,75,79
Table 3.4 provides a summary of the proportions
34 P R E O P E R A T I V E T E S T S
T A B L E 3 . 3 Summary of abnormal preoperative haemoglobin, haematocrit and FBCtests, changes in clinical management or postoperative complicationsin study populations according to study quality indicators
Q U A L I T Y % A B N O R M A L T E S T % C H A N G E I N C L I N I C A L % P O S T O P E R A T I V E
I N D I C A T O R (Number of Studies) M A N A G E M E N T C O M P L I C A T I O N S
(Number of Studies) (Number of Studies)
Mean* Maximum Minimum Mean* Maximum Minimum Mean* Maximum Minimum
Haemoglobin and haematocrit
P C 27.9 (2) 32.2 10.5 5.3 (2) 6.5 0 (0)
P N 10.7 (2) 12.0 0.4 0 (2) 0 0 0 (1)
R C 1.1 (4) 3.4 0.7 0.1 (3) 0.4 0 0.2 (1)
R N 1.7 (9) 17.6 0.6 0.3 (7) 2.7 0 0 (3) 1.1 0
Platelet count
P C 9.3 (2) 22.4 1.9 0 (2) 0.3 0 (0)
P N 2.7 (4) 50.0 0.1 0 (2) 0 0 3.2 (3) 3.4 0
R C 0 (1) 0 (1) 0 (1)
R N 1.2 (8) 14.8 0 0 (5) 0.2 0 0.2 (6) 0.6 0
White blood cell count
P C (0)
P N 0.1 (1) 0 (1) (0)
R C 4.7 (2) 34.8 0.1 0.7 (2) 5.2 0 0 (1)
R N 4.0 (2) 17.5 0.9 1.3 (1) 0.6 (1)
P = prospective data collection; R = retrospective data collection; C = consecutive recruitment of patients; N = nonconsecutive
recruitment of patients; *weighted means were produced to reflect the different numbers of patients in each study. It was not
possible to produce a distributional statistic reflecting this weight.
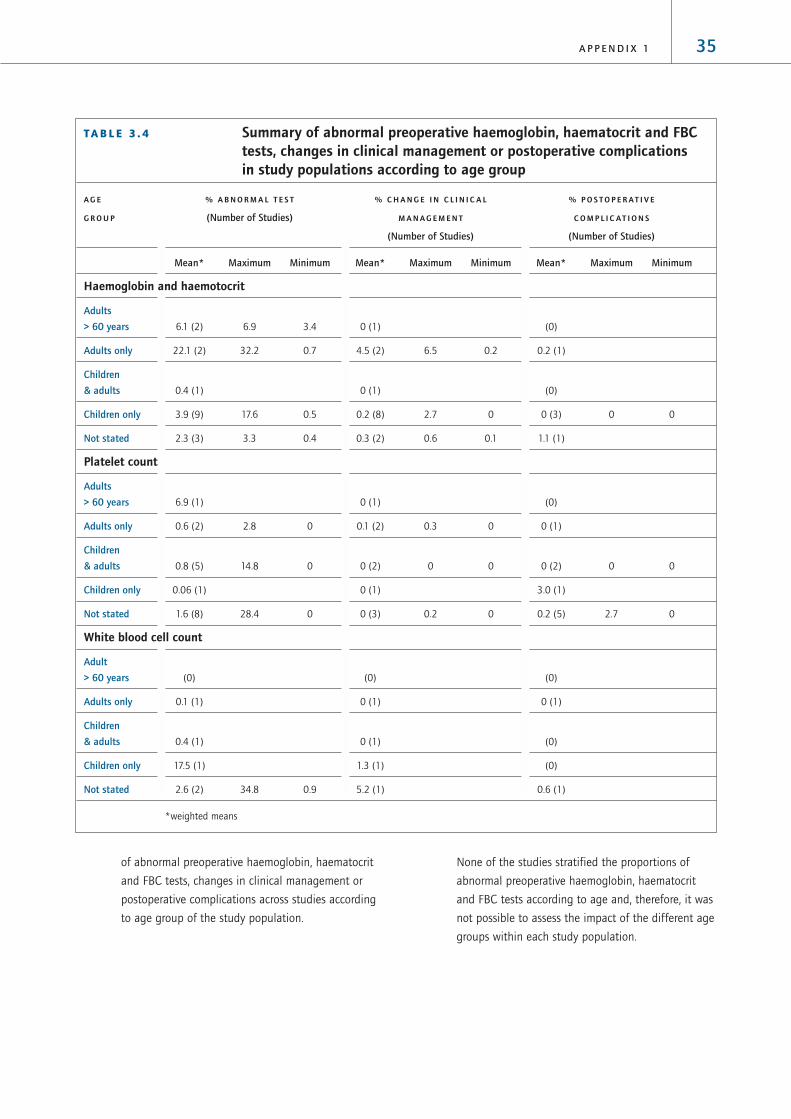
35A P P E N D I X 1
of abnormal preoperative haemoglobin, haematocrit
and FBC tests, changes in clinical management or
postoperative complications across studies according
to age group of the study population.
None of the studies stratified the proportions of
abnormal preoperative haemoglobin, haematocrit
and FBC tests according to age and, therefore, it was
not possible to assess the impact of the different age
groups within each study population.
T A B L E 3 . 4 Summary of abnormal preoperative haemoglobin, haematocrit and FBCtests, changes in clinical management or postoperative complicationsin study populations according to age group
A G E % A B N O R M A L T E S T % C H A N G E I N C L I N I C A L % P O S T O P E R A T I V E
G R O U P (Number of Studies) M A N A G E M E N T C O M P L I C A T I O N S
(Number of Studies) (Number of Studies)
Mean* Maximum Minimum Mean* Maximum Minimum Mean* Maximum Minimum
Haemoglobin and haemotocrit
Adults
> 60 years 6.1 (2) 6.9 3.4 0 (1) (0)
Adults only 22.1 (2) 32.2 0.7 4.5 (2) 6.5 0.2 0.2 (1)
Children
& adults 0.4 (1) 0 (1) (0)
Children only 3.9 (9) 17.6 0.5 0.2 (8) 2.7 0 0 (3) 0 0
Not stated 2.3 (3) 3.3 0.4 0.3 (2) 0.6 0.1 1.1 (1)
Platelet count
Adults
> 60 years 6.9 (1) 0 (1) (0)
Adults only 0.6 (2) 2.8 0 0.1 (2) 0.3 0 0 (1)
Children
& adults 0.8 (5) 14.8 0 0 (2) 0 0 0 (2) 0 0
Children only 0.06 (1) 0 (1) 3.0 (1)
Not stated 1.6 (8) 28.4 0 0 (3) 0.2 0 0.2 (5) 2.7 0
White blood cell count
Adult
> 60 years (0) (0) (0)
Adults only 0.1 (1) 0 (1) 0 (1)
Children
& adults 0.4 (1) 0 (1) (0)
Children only 17.5 (1) 1.3 (1) (0)
Not stated 2.6 (2) 34.8 0.9 5.2 (1) 0.6 (1)
*weighted means

3.3.2 ASA grades
We hypothesised that the proportions of patients with
abnormal preoperative haemoglobin, haematocrit and
FBC tests would be greater in studies reporting the
results for patients with higher ASA grades.
We investigated the effects of variations in the ASA
grades of patients in the study population on the
proportions of abnormal preoperative haemoglobin,
haematocrit and FBC tests, changes in clinical
management and postoperative complications
across the identified studies.
Of the 30 studies of preoperative haemoglobin,
haematocrit and FBC tests, only six categorised
patients according to ASA grade. These six studies
included patients of ASA grades I and II
only.11,41,62,66,73,74 Table 3.5 summarises the
proportions of abnormal haemoglobin, haematocrit
and FBC tests, changes in clinical management and
postoperative complications according to the ASA
grade of the patients in the study population.
The average proportions of abnormal preoperative
haemoglobin and haematocrit tests and white blood
cell counts tended to be higher in studies that did
not state ASA grades (9.0% and 9.5%, respectively)
compared to studies that included patients of ASA
grades I and II only (3.7% and 0.9%, respectively).
None of the identified studies stratified the
proportions of abnormal preoperative haemoglobin,
haematocrit and FBC tests according to ASA grades.
Therefore it was not possible to investigate the
effects of variations in the ASA grade of patients in
the study population on the proportions of abnormal
preoperative haemoglobin, haematocrit and FBC tests
within the identified studies.
3.4 Heterogeneity in criteria for preoperativetestingAlthough authors did not state their definitions of
‘routine’ preoperative tests, we have assumed a
routine preoperative investigation to be a test carried
out on all patients preoperatively that is not directly
related to the planned procedure or the patients’
condition. In some studies, authors included
patients who were described as undergoing routine
preoperative tests as well as patients undergoing
indicated preoperative tests. None of these studies
presented the proportions of abnormal preoperative
tests, changes in clinical management and
36 P R E O P E R A T I V E T E S T S
T A B L E 3 . 5 Summary of abnormal haemoglobin, haematocrit and FBC tests,changes in clinical management and postoperative complicationsin study populations according to ASA grades
A S A % A B N O R M A L T E S T % C H A N G E I N C L I N I C A L % P O S T O P E R A T I V E
G R A D E (Number of Studies) M A N A G E M E N T C O M P L I C A T I O N S
(Number of Studies) (Number of Studies)
Mean* Maximum Minimum Mean* Maximum Minimum Mean* Maximum Minimum
Haemoglobin and haematocrit
I to II 3.7 (6) 12 0.4 0.2 (6) 0.6 0 0 (2) 0 0
Not stated 9.0 (11) 32.2 0.5 1.6 (8) 6.5 0 0.1 (3) 1.1 0
Platelet count
I to II 1.5 (3) 6.9 1.0 0 (1) 0.2 (2) 0.6 0
Not stated 1.1 (14) 28.4 0 0 (8) 0.3 0 0.7 (7) 3 0
White blood cell count
I to II 0.9 (2) 0.9 0.4 0 (1) 0. 6 (1)
Not stated 9.5 (3) 34.8 0.1 0.9 (3) 5.2 0 0 (1)
*weighted means

postoperative complications separately for patients
who had routine tests and for patients who had
indicated tests, instead the data were combined for
both groups of patients. Therefore, we hypothesised
that the proportions of abnormal preoperative
haemoglobin or haematocrit, and FBC tests,
changes in clinical management and postoperative
complications would be lower in study populations
where all the patients had routine preoperative
tests compared to study populations containing
patients undergoing either routine or indicated
preoperative tests.
We investigated the effects of variations in the
criteria for preoperative testing on the proportions of
abnormal preoperative haemoglobin or haematocrit
FBC tests, changes in clinical management and
postoperative complications across the identified
studies. Thirteen of the studies included patients
undergoing routine preoperative haemoglobin,
haematocrit or FBC tests, three of the studies
included a combination of both routine and
indicated preoperative haemoglobin, haematocrit
or FBC tests and 14 studies did not state their
criteria for preoperative testing. Table 3.6 provides
a summary of the proportions of abnormal
preoperative haemoglobin, haematocrit or FBC tests,
changes in clinical management and postoperative
complications in study populations according to
whether the study population included routine
only or both routine and indicated tests.
There were too few studies that included both
routine and indicated tests to be able to compare
the effects of differences in the criteria for testing
in the studies of preoperative haemoglobin,
haematocrit and FBC investigations.
37A P P E N D I X 1
T A B L E 3 . 6 Summary of abnormal preoperative haemoglobin, haematocrit and FBCtests, changes in clinical management and postoperative complicationsaccording to the criteria for preoperative testing
C R I T E R I A % A B N O R M A L T E S T % C H A N G E I N C L I N I C A L % P O S T O P E R A T I V E
F O R T E S T (Number of Studies) M A N A G E M E N T C O M P L I C A T I O N S
(Number of Studies) (Number of Studies)
Mean* Maximum Minimum Mean* Maximum Minimum Mean* Maximum Minimum
Haemoglobin and haematocrit
Routine only 2.2 (6) 4.8 0.7 0.4 (4) 2.7 0.1 0.1 (3) 1.1 0
Routine &
indicated 32.2 (1) 6.5 (1) 0.1 (1)
Not stated 3.9 (10) 17.6 0.4 0.1 (9) 0.4 0 0 (2) 0 0
Platelet count
Routine only 4.1 (9) 28.4 0 0 (3) 0 0 0.2 (7) 2.7 0
Routine &
indicated 2.8 (3) 8 0.7 0.2 (3) 0.3 0 (0)
Not stated 1.6 (4) 6.9 0 0 (3) 0 0 2.2 (2) 3 0
White blood cell count
Routine only 0.7 (2) 0.9 0.1 0 (1) 0 (2) 0.6 0
Routine &
indicated (0) (0) (0)
Not stated 16.3 (3) 34.8 0.4 1.6 (3) 5.2 0 (0)
*weighted means

It was not possible to investigate the effects of
variations in the criteria for preoperative testing
on the proportions of abnormal preoperative
haemoglobin and haematocrit and FBC tests,
changes in clinical management and postoperative
complications within the identified studies because
studies that included only patients for whom
preoperative tests were indicated were excluded in
the initial stages of our systematic review and none
of the eligible studies reported data separately for
routine and indicated preoperative haemoglobin,
haematocrit and FBC tests.
3.5 Heterogeneity in the definition of theoutcome variables
3.5.1 Definition of normal/abnormal preoperative
haemoglobin, haematocrit and FBC tests
We investigated the variability of the definition
of normal/abnormal preoperative haemoglobin,
haematocrit and FBC tests across the identified
studies. Ten studies provided a definition of
their criteria for normal/abnormal preoperative
haemoglobin and haematocrit tests, platelet count
and white blood cell count. These definitions are
summarised in Table 3.7.
38 P R E O P E R A T I V E T E S T S
T A B L E 3 . 7 Definition of normal preoperative haemoglobin and haematocrit,platelet count and white blood cell count
1 2 3 4 5 6 7 8 9
Haemoglobin
Male 14 to 17 g/dl; female 12 to 16 g/dl ✓
Male 14 to 18 g/dl; female 12 to 16 g/dl
Male 13.5 to 17.5 g/dl, female 12 to 16 g/dl ✓
10 to 17 g/dl ✓
> 100 g/l ✓
0 to 3 months > 100 g/dl; 4 to 12 months > 105 g/dl ✓
Haematocrit
Male 41 to 53%; female 36 to 46% ✓
Male 42 to 52%; female 37 to 47%
Platelet count
100 to 400 103/mm3 ✓
130 to 400 103/mm3
140 to 450 103/mm3 ✓
150 to 400 103/mm3 ✓
150 to 450 103/mm3 ✓ ✓
100,000 to 400,000 /ml ✓
> 100 000/l ✓
White blood cell count
3.1 to 11 103/mm3 ✓
4.8 to 10.8 k/mm3
1: Houry67; 2: Cherng65; 3: MacPherson71; 4: Roy74; 5: Narr73;
6: Kaplan80; 7: Ramsey81; 8: Charpak57; 9: O’Connor77.

Table 3.7 shows that there were differences between
the definitions of normal/abnormal preoperative
haemoglobin, haematocrit and FBC tests. However,
the differences in the definitions were small and
therefore, were not likely to have been a great source
of heterogeneity across the different studies.
3.5.2 Definition of a change in clinical management
We investigated the variability of the definition of
a change in clinical management in patients who
had had preoperative haemoglobin, haematocrit
and FBC tests in the identified studies. Eight of the
studies reported definitions of changes in clinical
management in patients who had had preoperative
haemoglobin, haematocrit and FBC tests. These
definitions are summarised in Table 3.8.
Table 3.8 shows that the definitions of changes in
clinical management differ across the identified
studies. However, these data may simply reflect
changes in clinical management that took place
rather than predefined actions that were considered
to represent changes in clinical management.
Therefore, it is not sensible to investigate further
differences in the definitions as a source of
heterogeneity across the study populations.
3.5.3 Definition of postoperative complications
We investigated the variability of the definitions
of postoperative complications in patients who
had had preoperative haemoglobin, haematocrit
and FBC tests. Two studies reported definitions of
postoperative complications. These definitions are
summarised in Table 3.9.
3.6 Diagnostic accuracyTwo of the identified studies investigated the
diagnostic accuracy of preoperative haemoglobin and
haematocrit tests and white blood cell counts.25,82
The results are summarised in Table 3.10.
39A P P E N D I X 1
T A B L E 3 . 8 Summary of changes in clinical management (%) in patients who hadhad preoperative haemoglobin, haematocrit and FBC tests
Change in clinical management 1 2 3 4 5 6 7 8
Postponed operations ✓ ✓ ✓ ✓ ✓ ✓
Additional tests ✓ ✓
New treatment ✓
Anaesthetic vigilance ✓
Change in anaesthetic ✓ ✓ ✓
Blood transfusion ✓ ✓
Careful haemostasis ✓
Alteration in surgery ✓ ✓
Reoperation ✓
Total 0 0.05 0.2 6.5 0.6 0.1 0.2 2.7
1: Haug41; 2: Wood32; 3: Turnbull25; 4: Charpak57; 5: Perez11;
6: Narr73; 7: Roy74; 8: Hoare70.
T A B L E 3 . 9 Summary of the definitions ofpostoperative complications(%) in patients who hadpreoperative haemoglobin,haematocrit and FBC tests
Postoperative complications Perez11 Hoare70
Perioperative blood loss ✓
Hospital admission after day case surgery ✓
Total 0.6 0

From the data presented in each of the papers it
was possible to calculate positive predictive values
for predicting a change in clinical management in
nine of the studies of preoperative haemoglobin
or haematocrit tests, four of the studies of
preoperative platelet counts and three of the
studies of preoperative white blood cell counts.
The positive predictive value indicates the percentage
of patients with abnormal haemoglobin, haematocrit
and FBCs that subsequently underwent a change in
clinical management. The results are summarised
in Table 3.11.
The positive predictive value of preoperative
haemoglobin and haematocrit tests for predicting
a change in clinical management ranged from 0%
in 2 studies34,72 to 55.6% in a further study.70
The positive predictive value of preoperative
platelet counts for predicting a change in clinical
management was 0% in all of the studies in which
this value was calculated.25,73,79,80 The positive
predictive value of preoperative white blood cell
counts for predicting a change in clinical
management ranged from 0% in one study25 to
14.8% in a further study.28 However, it is difficult
to interpret the meaning of the positive predictive
values from Table 3.9 because of the heterogeneous
nature of the studies as outlined in Section 1.
40 P R E O P E R A T I V E T E S T S
T A B L E 3 .10 Summary of the diagnostic accuracy of preoperative haemoglobin andhaematocrit tests and white blood cell count
S T U D Y O U T C O M E T E S T S E N S I T I V I T Y S P E C I F I C I T Y P O S I T I V E N E G A T I V E
( % ) ( % ) P R E D I C T I V E P R E D I C T I V E
V A L U E ( % ) V A L U E ( % )
Williams82 Not stated Haematocrit 36 79
Turnbull25 Determining operative Haemoglobin 28.6 98.6
complications/change White blood cell count 0 89.0
in clinical management
T A B L E 3 .11 Calculated estimates of thepositive predictive value ofpreoperative haemoglobin,haematocrit and FBC tests topredict changes in clinicalmanagement
Positive predictive value for predicting a
First author change in clinical management (%)
Haemogloblin
and haematocrit
Hoare70 55.6
Baron72 0
Narr73 10.0
Nigam76 50.0
O’Connor77 2.4
Turnbull25 28.6
Wood32 10.0
Rossello34 0
Roy74 27.3
Platelet count
Rohrer79 0
Turnbull25 0
Kaplan80 0
Narr73 0
White blood
cell count
Turnbull25 0
Rossello34 7.5
Muskett28 14.8
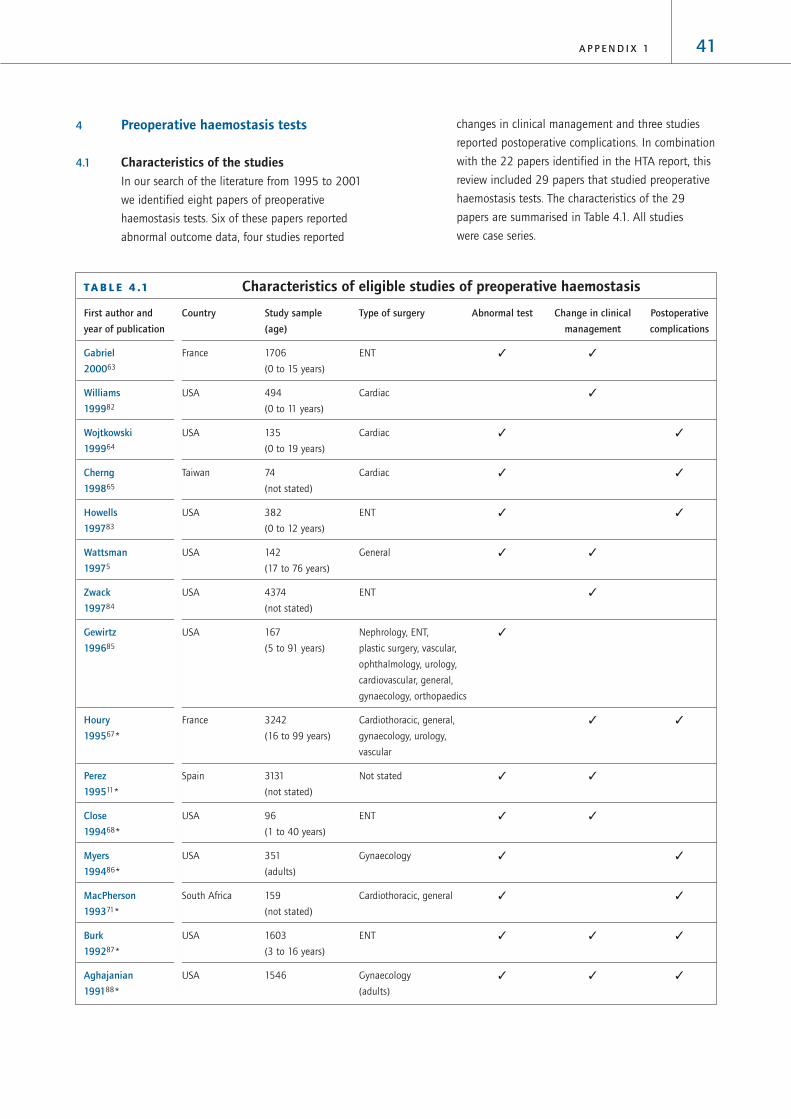
41A P P E N D I X 1
4 Preoperative haemostasis tests
4.1 Characteristics of the studies In our search of the literature from 1995 to 2001
we identified eight papers of preoperative
haemostasis tests. Six of these papers reported
abnormal outcome data, four studies reported
changes in clinical management and three studies
reported postoperative complications. In combination
with the 22 papers identified in the HTA report, this
review included 29 papers that studied preoperative
haemostasis tests. The characteristics of the 29
papers are summarised in Table 4.1. All studies
were case series.
T A B L E 4 .1 Characteristics of eligible studies of preoperative haemostasis
First author and Country Study sample Type of surgery Abnormal test Change in clinical Postoperative
year of publication (age) management complications
Gabriel France 1706 ENT ✓ ✓
200063 (0 to 15 years)
Williams USA 494 Cardiac ✓
199982 (0 to 11 years)
Wojtkowski USA 135 Cardiac ✓ ✓
199964 (0 to 19 years)
Cherng Taiwan 74 Cardiac ✓ ✓
199865 (not stated)
Howells USA 382 ENT ✓ ✓
199783 (0 to 12 years)
Wattsman USA 142 General ✓ ✓
19975 (17 to 76 years)
Zwack USA 4374 ENT ✓
199784 (not stated)
Gewirtz USA 167 Nephrology, ENT, ✓
199685 (5 to 91 years) plastic surgery, vascular,
ophthalmology, urology,
cardiovascular, general,
gynaecology, orthopaedics
Houry France 3242 Cardiothoracic, general, ✓ ✓
199567* (16 to 99 years) gynaecology, urology,
vascular
Perez Spain 3131 Not stated ✓ ✓
199511* (not stated)
Close USA 96 ENT ✓ ✓
199468* (1 to 40 years)
Myers USA 351 Gynaecology ✓ ✓
199486* (adults)
MacPherson South Africa 159 Cardiothoracic, general ✓ ✓
199371* (not stated)
Burk USA 1603 ENT ✓ ✓ ✓
199287* (3 to 16 years)
Aghajanian USA 1546 Gynaecology ✓ ✓ ✓
199188* (adults)

The results of the 29 studies, which documented
the findings from a total of 20,705 preoperative
prothrombin (PT) and 21,626 preoperative partial
thromboplastin (PTT) tests are reported in Table 4.2.
42 P R E O P E R A T I V E T E S T S
T A B L E 4 .1 Characteristics of eligible studies of preoperative haemostasis continued
First author and Country Study sample Type of surgery Abnormal test Change in clinical Postoperative
year of publication (age) management complications
Bolger USA 52 ENT ✓
199075* (not stated)
Schmidt USA 91 ENT ✓ ✓
199089* (not stated)
Charpak France 3866 General, gynaecology, ✓ ✓
198857* (adults) obstetrics, plastic
surgery, orthopaedics
Rohrer USA 282 General, vascular ✓ ✓
198879* (not stated)
Manning USA 994 (children) ENT ✓ ✓
198790*
Turnbull Canada 1010 (adults) General ✓ ✓ ✓
198725*
Muskett USA 200 Cardiothoracic, ENT, ✓ ✓
198628* (not stated) general, neurosurgery,
ophthalmology, urology,
orthopaedics, plastic surgery
Suchman USA 2134 Not stated ✓ ✓
198691* (not stated)
Kaplan USA 2000 Not stated ✓ ✓
198580* (not stated)
Ramsey USA 92 Cardiothoracic ✓
198381* (0 to 75 years)
Eisenberg USA 750 General, obstetrics, gynaecology ✓ ✓
198293* (not stated)
Rossello Puerto Rico 690 Not stated ✓ ✓ ✓
198034* (< 14 years)
Robbins USA 1025 Not stated ✓
197994* (not stated)
Rader USA 165 Urology ✓
197895* (adults)
* Papers included in the HTA review

43A P P E N D I X 1
TA
BL
E 4
.2Su
mm
ary
of p
reop
erat
ive
haem
osta
sis
test
stu
dy r
esul
ts f
rom
the
elig
ible
stu
dies
(i
nclu
des
rout
ine
and
indi
cate
dte
sts)
ST
UD
YN
UM
BE
R O
FA
BN
OR
MA
LC
HA
NG
ES
IN
PO
ST
OP
ER
AT
IVE
PR
OS
PE
CT
IVE
CO
NS
EC
UT
IVE
AS
A G
RA
DE
S
TE
ST
S#
RE
SU
LTS
CL
INIC
AL
MA
NA
GE
ME
NT
CO
MP
LIC
AT
ION
SR
OU
TIN
ED
AT
AR
EC
RU
ITM
EN
TS
TA
TE
D
(N)
N (
%)
N (
%)
N (
%)
Prot
hrom
bin
Gab
riel6
314
79
3 (
0.2
)0
Not
stat
edx
¸x
Will
iam
s82
49
40
24
(4
.9)
Not
stat
ed✓
✓x
How
ells
83
261
07
(2
.7)
Routi
ne
only
x✓
x
Mac
Pher
son7
1*
111
00
Routi
ne
only
x✓
x
Turn
bull2
5*
213
00
0R
outi
ne
only
✓✓
x
Rade
r95*
16
50
Routi
ne
& i
ndic
ated
x✓
x
Zwac
k84
4374
14
3a
(1.0
)N
ot
stat
ed✓
✓x
Rohr
er7
9*
123
1 (
0.8
)0
Routi
ne
only
✓✓
ASA
I t
o I
V
Clos
e68*
90
1 (
1.1
)6
a (6
.6)
Routi
ne
only
x✓
ASA
I t
o I
I
Schm
idt8
9*
911
(1.1
)0
Routi
ne
only
x✓
x
Char
pak5
7*
93
512
1 (
12.9
)27
(2
.9)
Routi
ne
only
xx
ASA
I t
o V
Kap
lan8
0*
201
2 (
1.0
)R
outi
ne
only
x✓
x
Burk
87*
16
03
3 (
0.2
)0
0R
outi
ne
only
x✓
x
Ram
sey8
1*
92
3 (
3.3
)R
outi
ne
only
x✓
x
Bolg
er7
5*
52
3 (
5.8
)N
ot
stat
edx
✓x
Agh
ajan
ian8
8*
154
63
0 (
1.9
)0
0R
outi
ne
only
x✓
x
Cher
ng6
56
83
4 (
50
.0)
6a
(8.1
)R
outi
ne
& i
ndic
ated
✓✓
x
Gew
irtz
85
16
73
9 (
23
.4)
Routi
ne
only
x✓
x
Mye
rs8
6*
351
4 (
1.1
)0
0R
outi
ne
only
x✓
x
Eise
nber
g93*
25
64
(1.6
)0
Routi
ne
only
x✓
x
Man
ning
90*
99
34
8 (
4.8
)2
(0
.2)
Not
stat
ed✓
✓x

44 P R E O P E R A T I V E T E S T S
TA
BL
E 4
.2Su
mm
ary
of p
reop
erat
ive
haem
osta
sis
test
stu
dy r
esul
ts f
rom
the
elig
ible
stu
dies
(i
nclu
des
rout
ine
and
indi
cate
dte
sts)
conti
nued
ST
UD
YN
UM
BE
R O
FA
BN
OR
MA
LC
HA
NG
ES
IN
PO
ST
OP
ER
AT
IVE
PR
OS
PE
CT
IVE
CO
NS
EC
UT
IVE
AS
A G
RA
DE
S
TE
ST
S#
RE
SU
LTS
CL
INIC
AL
MA
NA
GE
ME
NT
CO
MP
LIC
AT
ION
SR
OU
TIN
ED
AT
AR
EC
RU
ITM
EN
TS
TA
TE
D
(N)
N (
%)
N (
%)
N (
%)
Mus
kett
28*
128
5 (
3.9
)0
Routi
ne
only
xx
x
Hou
ry6
7*
324
251
2 (
15.8
)27
(0
.8)
79
(2
.4)
Not
stat
edx
✓x
Pere
z11*
30
44
7 (
0.2
)47
a (1
.5)
Not
stat
edx
✓x
Ross
ello
34*
62
69
(1.4
)0
0N
ot
stat
ed✓
✓x
Woj
tkow
ski6
413
5 1
34
9 (
6.7
)6
(4
.4)
Not
stat
ed✓
✓x
Part
ial t
hrom
bopl
asti
n
Gab
riel6
314
79
48
(3
.2)
0N
ot
stat
edx
✓x
Will
iam
s82
49
40
24
(4
.9)
Not
stat
ed✓
✓x
Woj
tkow
ski6
413
513
(10
.0)
6 (
4.4
)6
(4
.4)
Routi
ne
only
x✓
x
Cher
ng6
56
83
4a
(50
.0)
6 (
8.1
)R
outi
ne
only
x✓
x
How
ells
83
261
39
(14
.9)
3 (
1.1
)0
Routi
ne
only
✓✓
x
Wat
tsm
an5
315
(16
.1)
00
Routi
ne
& i
ndic
ated
✓✓
ASA
I t
o I
II
Zwac
k84
4374
43
a (1
.0)
Routi
ne
& i
ndic
ated
x✓
x
Gew
irtz
85
16
73
4 (
20
.4)
Not
stat
ed✓
✓x
Hou
ry6
7*
22
913
40
(14
.8)
1(0
.0)
79
(3
.4)
Routi
ne
only
✓✓
ASA
I t
o I
V
Pere
z11*
29
57
8 (
0.3
)47
a (1
.5)
Routi
ne
only
✓✓
ASA
I &
II
Clos
e68*
90
14 (
15.6
)6
a (
6.7
)R
outi
ne
only
x✓
x
Mye
rs8
6*
351
8 (
2.3
)1
(0
.3)
0R
outi
ne
only
xx
ASA
I t
o V
Mac
Pher
son7
1*
111
8 (
7.2
)0
Routi
ne
only
x✓
x
Burk
87*
16
03
27
(1.7
)0
0R
outi
ne
only
x✓
x
Bolg
er7
5*
52
6 (
11.5
)N
ot
stat
edx
✓x
Schm
idt8
9*
914
(4
.4)
0R
outi
ne
only
x✓
x

45A P P E N D I X 1
TA
BL
E 4
.2Su
mm
ary
of p
reop
erat
ive
haem
osta
sis
test
stu
dy r
esul
ts f
rom
the
elig
ible
stu
dies
(i
nclu
des
rout
ine
and
indi
cate
dte
sts)
conti
nued
ST
UD
YN
UM
BE
R O
FA
BN
OR
MA
LC
HA
NG
ES
IN
PO
ST
OP
ER
AT
IVE
PR
OS
PE
CT
IVE
CO
NS
EC
UT
IVE
AS
A G
RA
DE
S
TE
ST
S#
RE
SU
LTS
CL
INIC
AL
MA
NA
GE
ME
NT
CO
MP
LIC
AT
ION
SR
OU
TIN
ED
AT
AR
EC
RU
ITM
EN
TS
TA
TE
D
(N)
N (
%)
N (
%)
N (
%)
Char
pak5
7*
95
276
(8
.0)
27
(2
.8)
Routi
ne
& i
ndic
ated
✓✓
x
Rohr
er7
9*
123
3(2
.4)
0R
outi
ne
only
x✓
x
Man
ning
90*
99
311
(1.1
)0
Routi
ne
only
x✓
x
Turn
bull2
5*
210
3 (
1.4
)3
(1.4
)0
Routi
ne
only
x✓
x
Mus
kett
28*
126
5 (
4.0
)0
Not
stat
ed✓
✓x
Such
man
91*
213
43
47
(16
.3)
130
(6
.1)
Routi
ne
only
x✓
x
Kap
lan8
0*
199
1 (
0.5
)R
outi
ne
only
xx
x
Ram
sey8
1*
92
11 (
12.0
)N
ot
stat
edx
✓x
Eise
nber
g93*
147
3 (
2.0
)1
(0
.7)
Not
stat
edx
xx
Ross
ello
34*
67
82
5 (
3.6
)1
(0
.1)
0N
ot
stat
ed✓
✓x
Robb
ins9
4*
10
25
143
(14
.0)
Routi
ne
only
x✓
x
Rade
r95*
16
50
Not
stat
ed✓
✓x
*Pap
ers
incl
uded
in t
he
HTA
rev
iew
#Th
e num
ber
of
test
s ca
rrie
d o
ut
may
dif
fer
from
the
sam
ple
siz
e in
som
e st
udie
s. T
his
occ
urs
in p
aper
s re
port
ing t
he
resu
lts
of
mult
iple
pre
oper
ativ
e te
sts
bec
ause
not
all
of
pat
ients
in t
he
study
sam
ple
rec
eive
d a
ll th
e pre
oper
ativ
e te
sts
det
aile
d i
n t
he
pap
er
a PT
and P
TT c
om
bin
ed

There was a wide variation in the reported
proportions of abnormal preoperative haemostasis
tests. The proportions of abnormal preoperative PT
test results ranged from 0% in three studies63,87,11
to 50.0% in a further study.65 The proportion
of patients who had had preoperative PT tests
and who subsequently underwent a change in
clinical management ranged from 0% in eight
studies25,28,34,63,79,86-88 to 4.9% in a further
study.82 The proportion of patients who had had
preoperative PT tests and who subsequently suffered
postoperative complications ranged from 0% in six
studies25,34,71,86-89,93 to 8.1% in a further study.65
The proportions of abnormal preoperative PTT
test results ranged from 0% in one study95 to
50.0% in a further study.65 The proportion of
patients who had had preoperative PTT tests
and who subsequently underwent a change in
clinical management ranged from 0% in six
studies5,28,63,79,87,90 to 4.9% in a further study.82
The proportion of patients who had had preoperative
PTT tests and who subsequently suffered
postoperative complications ranged from 0%
in eight studies5,25,34,71,83,86,87,89 to 8.1% in a
further study.65
As described in Section 1, the wide variation in
the results may be explained at least in part by
heterogeneity in the study populations. The impact of
four major sources of heterogeneity on the outcome
of the preoperative haemostasis test studies will be
considered separately in the following sections.
4.2 Heterogeneity in the quality of thestudy designAs described in Section 1, studies in which data
are collected prospectively and in which patients
are recruited consecutively are less likely to be
susceptible to bias than studies in which data are
collected retrospectively and where patients are
recruited selectively. Therefore, we hypothesised
that the proportions of abnormal preoperative
haemostasis tests, changes in clinical management
and postoperative complications might differ
according to the quality of the study design.
We investigated the effects of variations in the
quality of the study design on the proportions of
abnormal haemostasis tests, changes in clinical
management and postoperative complications across
the identified studies. Ten studies collected data
46 P R E O P E R A T I V E T E S T S
T A B L E 4 . 3 Summary of abnormal haemostasis tests and changes in clinicalmanagement or postoperative complications in study populationsby study quality indicators
Q U A L I T Y % A B N O R M A L T E S T % C H A N G E I N C L I N I C A L % P O S T O P E R A T I V E
I N D I C A T O R (Number of Studies) M A N A G E M E N T C O M P L I C A T I O N S
(Number of Studies) (Number of Studies)
Mean* Maximum Minimum Mean* Maximum Minimum Mean* Maximum Minimum
Prothrombin
P C 13.6 (6) 23.4 0 1.5 (5) 4.9 0 1.4 (3) 2.7 0
R C 1.0 (16) 50.0 0 0.4 (8) 1.5 0 0.1 (10) 8.1 0
R N 1.1 (2) 1.1 1 0 (1) 0 (1)
Partial thromboplastin
P C 2.1 (8) 20.4 0 3.4 (8) 7.3 0 0.8 (4) 2.3 0
R C 5.3 (15) 45.9 1 0.4 (8) 4.4 0 0.9 (8) 8.1 0
R N 1.7 (2) 2.3 0.5 0.3 (1) 0 (1)
P = prospective data collection; R = retrospective data collection; C = consecutive recruitment of patients; N = nonconsecutive
recruitment of patients; * weighted means were produced to reflect the different numbers of patients in each study. It was not
possible to produce a distributional statistic reflecting this weight.

prospectively and recruited consecutive patients,
18 studies collected data retrospectively recruited
consecutive patients and two papers collected data
retrospectively and did not state that the sample of
patients was consecutive. The results are summarised
in Table 4.3.
The average proportions of abnormal preoperative
PT tests, changes in clinical management and
postoperative complications tended to be higher in
prospective studies compared to retrospective studies.
For preoperative PTT tests, there was no clear pattern
with abnormal test results, changes in clinical
management and postoperative complications
and study design.
4.3 Heterogeneity in the composition of thestudy population
4.3.1 Age range
Given that the prevalence of comorbid diseases
increases with age, we hypothesised that the
proportion of patients with abnormal preoperative
haemostasis tests would be higher in studies
reporting older patient populations.
We investigated the effects of variations in the age
range of the study population on the proportions
of abnormal preoperative haemostasis tests,
changes in clinical management and postoperative
complications across the identified studies. Five
studies included adults only,25,57,86,88,95 six studies
included children only,34,63,82,83,87,90 seven studies
included both adults and children5,64,67,68,80,81,85
and 11 studies did not state the age range of their
patient population.11,28,65,71,75,79,84,89,91,93,94
Table 4.4 provides a summary of the mean
proportions of abnormal preoperative haemostasis
tests, changes in clinical management and
postoperative complications across studies according
to age group of the study population.
Table 4.4 shows that the average proportion of
abnormal preoperative haemostasis test tended to be
higher in studies that included adults only (PT 4.8%,
PTT 5.2%) compared to studies that included adults
47A P P E N D I X 1
T A B L E 4 . 4 Summary of abnormal preoperative haemostasis tests, changes inclinical management and postoperative complications in studypopulations by age group
A G E % A B N O R M A L T E S T % C H A N G E I N C L I N I C A L % P O S T O P E R A T I V E
G R O U P (Number of Studies) M A N A G E M E N T C O M P L I C A T I O N S
(Number of Studies) (Number of Studies)
Mean* Maximum Minimum Mean* Maximum Minimum Mean* Maximum Minimum
Prothrombin
Adults only 4.8 (5) 12.9 0 0.8 (4) 2.9 0 0 (3) 0 0
Adults
& children 1.4 (5) 23.4 1 7.3 (1) 2.2 (3) 6.6 2.4
Children only 2.2 (5) 14.9 0.1 0.4 (4) 4.9 0 0.2 (4) 2.7 0
Not stated 0.7 (10) 50.0 0 0.7 (6) 1.5 0 0.1 (5) 8.1 0
Partial thromboplastin
Adults only 5.2 (4) 8 0 1.8 (3) 2.8 0.3 0 (2) 0 0
Adults
& children 2.0 (6) 20.4 0.5 6.1 (3) 7.3 0 2.2 (4) 6.7 0
Children only 2.6 (5) 14.9 1.1 0.5 (6) 4.9 0 0 (3) 0 0
Not stated 5.0 (11) 45.9 0.3 0.5 (5) 1.5 0 1.0 (5) 8.1 0
*weighted means

and children or children only. However, the average
proportion of patients who had preoperative
haemostasis tests and who subsequently underwent
changes in clinical management or who had
postoperative complications tended to be highest in
studies that included adults and children. None of
the studies stratified the proportion of abnormal
haemostasis tests according to age, therefore it was
not possible to assess the impact of the different age
groups within each study population on the results.
4.3.2 ASA grades
We hypothesised that the proportion of patients with
abnormal preoperative haemostasis tests would be
greater in studies reporting results for patients with
higher ASA grades.
We investigated the effects of variations in the ASA
grade of patients in the study population on the
proportions of abnormal preoperative haemostasis
tests, changes in clinical management and
postoperative complications across the identified
studies. Of the 30 studies of preoperative haemostasis
only four classified comorbidities by grading patients
according to ASA status.5,11,67,86 One of the studies
included patients of ASA grades I and II only,11 one of
the studies included patients of ASA grades I to III
only,5 one study included patients of ASA grades I to
IV only67 and one study included patients of ASA
grades I to V.86 Table 4.5 summarises the proportions
of abnormal haemostasis tests, changes in clinical
management and postoperative complications by the
ASA grade of the patients in the study population.
Given the small number of studies that included
patients of known ASA grades and the fact that we
do not know the distribution of patients within each
of the ASA categories it is difficult to interpret the
data for separate ASA grade groups.
48 P R E O P E R A T I V E T E S T S
T A B L E 4 . 5 Summary of abnormal haemostasis tests, changes in clinicalmanagement or postoperative complications in study populationsaccording to ASA grade
A S A % A B N O R M A L T E S T % C H A N G E I N C L I N I C A L % P O S T O P E R A T I V E
G R A D E (Number of Studies) M A N A G E M E N T C O M P L I C A T I O N S
(Number of Studies) (Number of Studies)
Mean* Maximum Minimum Mean* Maximum Minimum Mean* Maximum Minimum
Prothrombin
Stated 7.7 (3) 15.0 0.2 1.1 (3) 1.5 0 2.4 (1)
I to II 0.2 (1) 1.5 (1) (0)
I to III (0) (0) (0)
I to IV 15.8 (1) 0.8 (1) 2.4 (1)
I to V 1.1 (1) 0 (1) 0 (1)
Not stated 2.6 (22) 45.9 0 0.7 (11) 4.9 0 0.2 (12) 8.1 0
Partial thromboplastin
Stated 6.4 (4) 16.1 0.3 3.8 (4) 7.3 0 1.1 (3) 3.4 0
I to II 0.3 (1) 1.5 (1) (0)
I to III 16.1 (1) 0 (1) 0 (1)
I to IV (0) 7.3 (1) 2.3 (1)
I to V 2.3 (1) 0.3 (1) 0 (1)
Not stated 5.3 (23) 45.9 0 0.7 (13) 4.9 0 0.7 (11) 8.1 0
*weighted means

We then investigated the effects that variations in
the ASA grade of patients in the study population
had on the proportion of abnormal preoperative
haemostasis tests within the identified studies.
Only one of the studies categorised the proportion
of abnormal preoperative haemostasis tests
according to ASA grade.67 The results are
summarised in Table 4.6.
As there is only one study, we cannot conclude that
these data (Table 4.6) indicate the proportion of
abnormal preoperative haemostasis test results
increased with patients’ ASA grades.
4.4 Heterogeneity in criteria forpreoperative testingAlthough authors did not state their definitions of
‘routine’ preoperative tests, we have assumed a
routine preoperative investigation to be a test carried
out on all patients preoperatively that is not directly
related to the planned procedure or the patients’
condition. In some studies, authors included patients
who were described as undergoing routine
preoperative tests as well as patients undergoing
indicated preoperative tests. None of these studies
presented the proportions of abnormal preoperative
tests, changes in clinical management and
postoperative complications separately for patients
who had routine tests and for patients who had
indicated tests, instead the data were combined for
both groups of patients. Therefore, we hypothesised
that the proportions of abnormal preoperative
haemostasis tests, changes in clinical management
and postoperative complications would be lower in
study populations where all the patients had routine
preoperative haemostasis tests compared to study
populations containing patients undergoing either
routine or indicated preoperative haemostasis tests.
We investigated the effects of variations in the criteria
for preoperative testing on the proportions of
abnormal preoperative haemostasis tests, changes in
clinical management and postoperative complications
across the identified studies. Seventeen of the studies
49A P P E N D I X 1
T A B L E 4 . 6 Summary of abnormalpreoperative haemostasis tests(%) by ASA grade
S T U D Y A S A G R A D E A S A G R A D E
I A N D I I I I I A N D I V
Houry67 8.6 91.4
T A B L E 4 . 7 Summary of abnormal preoperative haemostasis tests, changes inclinical management and postoperative complications according tocriteria for preoperative testing
C R I T E R I A % A B N O R M A L T E S T % C H A N G E I N C L I N I C A L % P O S T O P E R A T I V E
F O R T E S T (Number of Studies) M A N A G E M E N T C O M P L I C A T I O N S
(Number of Studies) (Number of Studies)
Mean* Maximum Minimum Mean* Maximum Minimum Mean* Maximum Minimum
Prothrombin
Routine only 3.2 (14) 50.0 0 1.1 (7) 1.5 0 0.8 (12) 8.1 0
Routine
& indicated 2.2 (2) 12.9 0.5 1.3 (3) 2.9 0 (0)
Not stated 2.5 (8) 23.4 0 0.7 (4) 4.9 0 0 (2) 0 0
Partial thromboplastin
Routine only 4.9 (15) 50.0 0.3 1.9 (9) 7.3 0 1.4 (11) 8.1 0
Routine
& indicated 1.5 (3) 16.1 1 1.3 (4) 2.8 0 0 (1)
Not stated 3.8 (8) 20.4 0 0.7 (4) 4.9 0 0 (2) 0.7 0
*weighted means

50 P R E O P E R A T I V E T E S T S
T A B L E 4 . 8 Definition of normal haemostasis tests
1 2 3 4 5 6 7 8 9 10 11 12 13 14 15 16 17 18
Prothrombin
> 10 seconds ✓
9 to 13 seconds ✓
10 to 13 seconds ✓
10.5 to 12.5 seconds ✓ ✓
11.5 to 13.5 seconds ✓
< 11.5 seconds
< 12.6 seconds ✓
< 13.6 seconds ✓
Prolonged by 1.5 seconds# ✓ ✓
> 70% of control data
Partial thromboplastin
18 to 26 seconds ✓
23 to 36 seconds ✓
24 to 36 seconds ✓
24 to 38 seconds ✓
25 to 40 seconds ✓
25 to 44 seconds ✓
26 to 32 seconds ✓
32 to 46 seconds ✓
< 26.5 seconds ✓
< 33 seconds
< 36 seconds ✓
< 37.5 seconds ✓
< 39 seconds ✓
Prolonged by 1.5 seconds# ✓
Prolonged by 2 seconds# ✓
1.2 times < control data ✓
2 SD < or > mean control data ✓
1: Wattsman5; 2: Cherng65; 3: Howells83; 4: Houry67; 5: Gabriel63; 6: Wojtkowski64; 7: Charpak57; 8: Ramsey81;
9: Kaplan80; 10: Rohrer79; 11: MacPherson71; 12: Robbins94; 13: Eisenberg93; 14: Suchman91; 15: Schmidt89;
16: Aghajanian88; 17: Burk87; 18: Myers.86
#definition of an abnormal haemostasis test

included patients undergoing routine preoperative
haemostasis tests only, whereas four of the studies
included a combination of routine and indicated
preoperative haemostasis tests. Table 4.7 provides a
summary of the proportions of abnormal preoperative
haemostasis tests, changes in clinical management
and postoperative complications in study populations
according to whether the study population included
routine only or both routine and indicated tests.
Table 4.7 shows that in those studies including
routine tests only the average proportions of
abnormal preoperative PT and PTT tests, changes
in clinical management and postoperative
complications tended to be higher than in studies
including both routine and indicated tests.
It was not possible to investigate the effects of
variations in the criteria for preoperative testing
on the proportions of abnormal preoperative
haemostasis tests, changes in clinical management
and postoperative complications within the identified
studies because studies that included only patients
for whom preoperative tests were indicated were
excluded in the initial stages of our systematic review
and none of the eligible studies reported data
separately for routine and indicated preoperative
haemostasis tests.
4.5 Heterogeneity in the definition of theoutcome variables
4.5.1 Definition of a normal/abnormal haemostasis test
We investigated the variability of the definition
of normal/abnormal preoperative haemostasis
tests across the identified studies. Eighteen of
the studies specified definitions of normal
preoperative haemostasis tests. These definitions
are listed in Table 4.8.
Table 4.8 shows that definitions of normal/abnormal
preoperative haemostasis tests varied across studies.
However, the differences in the definitions were
small and, therefore, were not likely to have been a
great source of heterogeneity across the studies.
4.5.2 Definition of a change in clinical management
We investigated the variability of the definition of a
change in clinical management in patients who had
had preoperative haemostasis tests in the identified
studies. Nine of the identified studies of preoperative
haemostasis testing specified their definition of a
change in clinical management. In five a change
in clinical management was defined as blood
transfusion requirement,64,67,93,95,96 and in the
other four a broader definition of changes were
used (Table 4.9).
The changes in clinical management described in
each of the papers outlined in Table 4.9 vary across
the studies. However, these data may simply reflect
changes in clinical management that were observed
rather than predefined actions that were considered
to represent changes in clinical management. Again,
given this uncertainty, it is not sensible to investigate
further differences in the definitions as a source of
heterogeneity across the study populations.
51A P P E N D I X 1
T A B L E 4 . 9 Summary of the changes inmanagement (%) in patientswho had had preoperativehaemostasis tests
Change in clinical management 1 2 3 4
Postponed operations ✓ 0.2
Modification in surgery ✓ ✓
Additional tests ✓
New treatment 0.6
Anaesthetic vigilance 0.1
Change in anaesthetic technique 7.3
Blood transfusion 0.8
Careful haemostasis 1.2
Total 8.7 2.8 1.5 0
1: Houry67; 2: Charpak57; 3: Perez11; 4: Aghajanian88.

4.5.3 Definition of postoperative complications
We investigated the variability of the definition of
a postoperative complication in patients who had
had preoperative haemostasis tests. Nine studies
reported peri- or postoperative bleeding as the
only postoperative complication and three studies
detailed broader definitions of postoperative
complications (Table 4.10).
These data may simply reflect postoperative
complications that were observed so it is not sensible
to investigate further differences in the definitions
as a source of heterogeneity across the study
populations. Also, it is difficult to interpret the
meaning of the postoperative complication data
because the postoperative complications recorded in
the data were not necessarily complications relating
to preoperative haemostasis tests. Despite the fact
that the patient had had a preoperative haemostasis
test, postoperative complications still occurred.
4.6 Diagnostic accuracy Four of the studies investigated the diagnostic
accuracy of preoperative haemostasis tests.
The results from these four studies are presented
in Table 4.11.
Sensitivity ranged from 3% for PT and PTT combined
in one study87 to 54% for PT in a further study.82
Specificity ranged from 70% for PT in one study82 to
99% for PT and PTT combined in a further study.87
Positive and negative predictive values ranged from
0% and 93.4%, respectively, for PT in one study25 to
7% and 98%, respectively, for PT and PTT combined
in a further study.87
From the data presented in each of the papers it
was possible to calculate positive predictive values
of preoperative haemostasis tests for predicting a
change in clinical management for nine studies.
The positive predictive values indicate the percentage
of patients with abnormal haemostasis tests who
underwent a change in clinical management.
The results are summarised in Table 4.12.
52 P R E O P E R A T I V E T E S T S
T A B L E 4 .10 Summary of postoperativecomplications (%) in patientswho had had preoperativehaemostasis tests
Postoperative complication 1 2 3
Mortality 1.5
Haemorrhage related mortality 0.2
Reoperation to control haemorrhage 0.7
Early bleeders < 24h postoperative 0
Delayed bleeders 0
Haemorrhage 2.1 0
Treatment required for bleeding 4.0
Total 2.4 6.1 0
1: Houry67; 2: Suchman91; 3: Aghajanian88.
T A B L E 4 .11 Summary of the diagnostic accuracy of preoperative haemostasis tests
S T U D Y O U T C O M E S E N S I T I V I T Y S P E C I F I C I T Y P O S I T I V E N E G A T I V E
( % ) ( % ) P R E D I C T I V E P R E D I C T I V E
V A L U E ( % ) V A L U E ( % )
Williams82 Identifying bleeders PT – 54 PT – 70
PTT – 27 PTT – 90
Turnbull25 Determining operative complications/ PT – not stated PT – 93.4
change in clinical management PTT – 0 PTT – 93.7
Suchman91 Determining intra- or postoperative PTT – 33.3 PTT – 83.9 PTT – 2.1* PTT – 0.9**
haemorrhagic complications
Burk87 Predicting postoperative bleeding PT + PTT – 3 PT + PTT – 99 PT + PTT – 7 PT + PTT – 98
*positive likelihood ratio; **negative likelihood ratio.
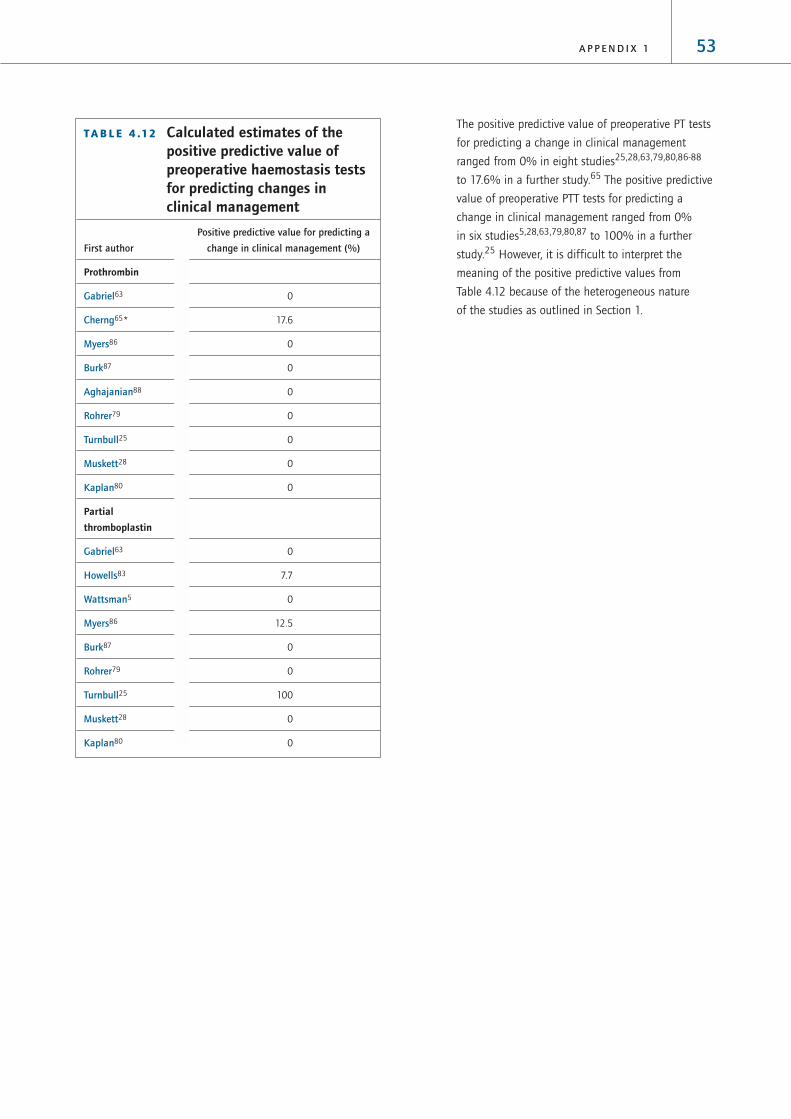
The positive predictive value of preoperative PT tests
for predicting a change in clinical management
ranged from 0% in eight studies25,28,63,79,80,86-88
to 17.6% in a further study.65 The positive predictive
value of preoperative PTT tests for predicting a
change in clinical management ranged from 0%
in six studies5,28,63,79,80,87 to 100% in a further
study.25 However, it is difficult to interpret the
meaning of the positive predictive values from
Table 4.12 because of the heterogeneous nature
of the studies as outlined in Section 1.
53A P P E N D I X 1
T A B L E 4 .12 Calculated estimates of thepositive predictive value ofpreoperative haemostasis testsfor predicting changes inclinical management
Positive predictive value for predicting a
First author change in clinical management (%)
Prothrombin
Gabriel63 0
Cherng65* 17.6
Myers86 0
Burk87 0
Aghajanian88 0
Rohrer79 0
Turnbull25 0
Muskett28 0
Kaplan80 0
Partial
thromboplastin
Gabriel63 0
Howells83 7.7
Wattsman5 0
Myers86 12.5
Burk87 0
Rohrer79 0
Turnbull25 100
Muskett28 0
Kaplan80 0

54 P R E O P E R A T I V E T E S T S
5 Preoperative biochemistry tests
5.1 Characteristics of the studies In our search of the literature from 1995 to 2001, we
identified two studies of preoperative biochemistry
testing. Both of these papers reported abnormal
test outcome data, one reported changes in clinical
management and one reported postoperative
complications. In combination with the seven
papers identified in the HTA report, this review
includes nine studies of preoperative biochemical
testing. The characteristics of the nine papers are
summarised in Table 5.1. All the studies identified
were case series.
The results of the nine studies, which documented
the findings from a total of 7,623 preoperative
electrolyte tests, 6,988 preoperative urea/creatinine
tests and 8,215 preoperative glucose tests, are
summarised in Table 5.2.
T A B L E 5 .1 Characteristics of eligible studies of preoperative biochemical testing
First author and Country Study sample Type of surgery Abnormal test Change in clinical Postoperative
year of publication (age) management complications
Dzankic USA 544 Not stated ✓ ✓
200162 (70 to 100 years)
Meneghini USA 1884 Not stated ✓ ✓ ✓
199866 (0 to 8 years)
Perez Spain 3131 Not stated ✓ ✓
199511* (not stated)
Adams USA 1050 General ✓ ✓
199212* (adults)
Narr USA 3782 Not stated ✓ ✓
199173* (not stated)
Jones UK 346 (children) Orthopaedics ✓
198978*
Charpak France 3866 General, gynaecology, ✓ ✓
198857* (adults) obstetrics, plastic surgery,
orthopaedic
Turnbull Canada 1010 General ✓ ✓ ✓
198725* (adults)
Kaplan USA 2000 Not stated ✓
198580* (not stated)
*Papers included in the HTA review
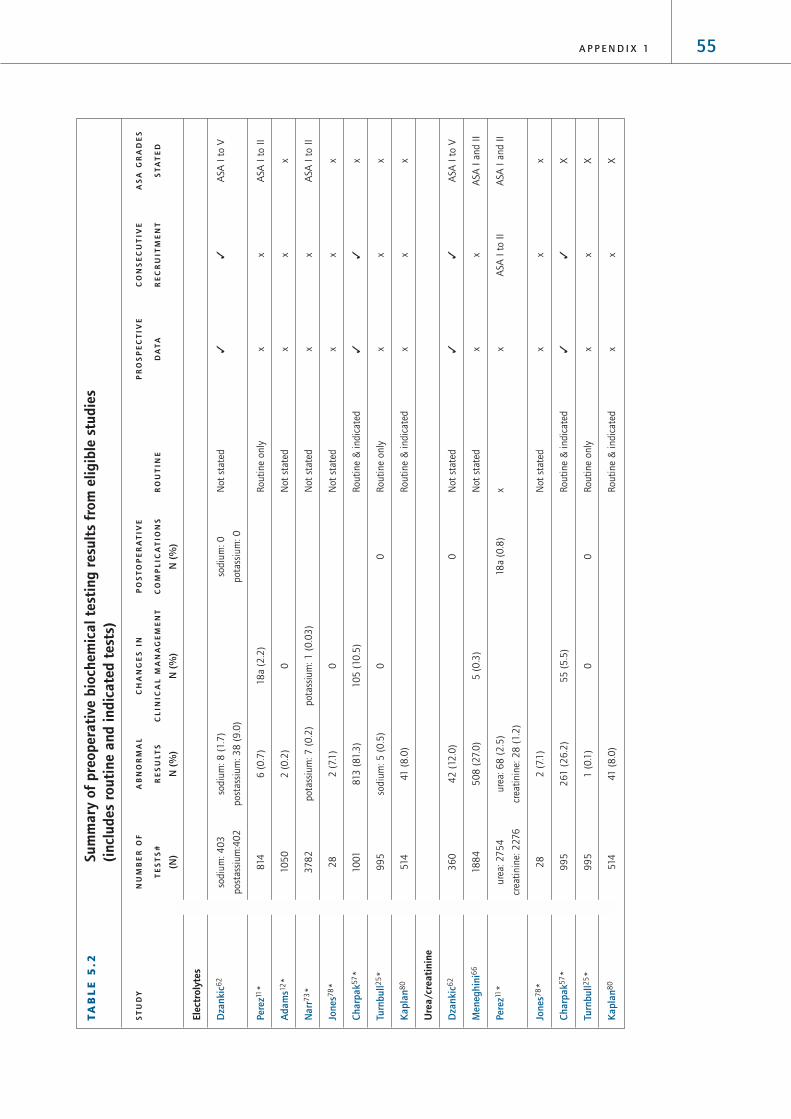
55A P P E N D I X 1
TA
BL
E 5
.2Su
mm
ary
of p
reop
erat
ive
bioc
hem
ical
tes
ting
res
ults
fro
m e
ligib
le s
tudi
es
(inc
lude
s ro
utin
e an
d in
dica
ted
test
s)
ST
UD
YN
UM
BE
R O
FA
BN
OR
MA
LC
HA
NG
ES
IN
PO
ST
OP
ER
AT
IVE
PR
OS
PE
CT
IVE
CO
NS
EC
UT
IVE
AS
A G
RA
DE
S
TE
ST
S#
RE
SU
LTS
CL
INIC
AL
MA
NA
GE
ME
NT
CO
MP
LIC
AT
ION
SR
OU
TIN
ED
AT
AR
EC
RU
ITM
EN
TS
TA
TE
D
(N)
N (
%)
N (
%)
N (
%)
Elec
trol
ytes
Dza
nkic
62
sodiu
m: 4
03
sodiu
m: 8
(1.7
)so
diu
m: 0
Not
stat
ed✓
✓A
SA I
to V
post
assi
um
:40
2
post
assi
um
: 3
8 (
9.0
)pota
ssiu
m: 0
Pere
z11*
814
6 (
0.7
)18
a (2
.2)
Routi
ne
only
xx
ASA
I t
o I
I
Ada
ms1
2*
10
50
2 (
0.2
)0
Not
stat
edx
xx
Nar
r73*
37
82
pota
ssiu
m: 7
(0
.2)
pota
ssiu
m: 1
(0
.03
)N
ot
stat
edx
xA
SA I
to I
I
Jone
s78*
28
2 (
7.1
)0
Not
stat
edx
xx
Char
pak5
7*
10
01
813
(81.3
)10
5 (
10
.5)
Routi
ne
& i
ndic
ated
✓✓
x
Turn
bull2
5*
99
5so
diu
m: 5
(0
.5)
00
Routi
ne
only
xx
x
Kap
lan8
051
441
(8
.0)
Routi
ne
& i
ndic
ated
xx
x
Ure
a/cr
eati
nine
Dza
nkic
62
36
04
2 (
12.0
)0
Not
stat
ed✓
✓A
SA I
to V
Men
eghi
ni6
618
84
50
8 (
27.
0)
5 (
0.3
)N
ot
stat
edx
xA
SA I
and I
I
Pere
z11*
ure
a: 2
75
4ure
a: 6
8 (
2.5
)18
a (0
.8)
xx
ASA
I t
o I
IA
SA I
and I
I
crea
tinin
e: 2
276
crea
tinin
e: 2
8 (
1.2
)
Jone
s78*
28
2 (
7.1
)N
ot
stat
edx
xx
Char
pak5
7*
99
52
61
(2
6.2
)55
(5
.5)
Routi
ne
& i
ndic
ated
✓✓
X
Turn
bull2
5*
99
51
(0
.1)
00
Routi
ne
only
xx
X
Kap
lan8
051
441
(8
.0)
Routi
ne
& i
ndic
ated
xx
X

56 P R E O P E R A T I V E T E S T S
TA
BL
E 5
.2Su
mm
ary
of p
reop
erat
ive
bioc
hem
ical
tes
ting
res
ults
fro
m e
ligib
le s
tudi
es
(inc
lude
s ro
utin
e an
d in
dica
ted
test
s) c
onti
nued
ST
UD
YN
UM
BE
R O
FA
BN
OR
MA
LC
HA
NG
ES
IN
PO
ST
OP
ER
AT
IVE
PR
OS
PE
CT
IVE
CO
NS
EC
UT
IVE
AS
A G
RA
DE
S
TE
ST
S#
RE
SU
LTS
CL
INIC
AL
MA
NA
GE
ME
NT
CO
MP
LIC
AT
ION
SR
OU
TIN
ED
AT
AR
EC
RU
ITM
EN
TS
TA
TE
D
(N)
N (
%)
N (
%)
N (
%)
Glu
cose
Dza
nkic
62
251
17 (
7.0
)0
Not
stat
ed✓
✓A
SA I
to I
I
Pere
z11*
27
72
143
(5
.2)
18
a (0
.7)
Routi
ne
only
xX
ASA
I t
o I
I
Nar
r73*
37
82
70
(1.9
)6
(0
.2)
Not
stat
edx
XA
SA I
to I
I
Char
pak5
7*
70
55
04
(71
.5)
15 (
2.1
)R
outi
ne
& i
ndic
ated
✓✓
X
Turn
bull2
5*
random
: 3
96
1 (
2.5
)0
1 (
0.3
)R
outi
ne
only
xX
X
fast
ing: 4
0
Kap
lan8
04
64
25
(5
.4)
Routi
ne
& i
ndic
ated
xx
X
*Pap
ers
incl
uded
in t
he
HTA
rev
iew
#Th
e num
ber
of
test
s ca
rrie
d o
ut
may
dif
fer
from
the
sam
ple
siz
e in
som
e st
udie
s. T
his
occ
urs
in p
aper
s re
port
ing t
he
resu
lts
of
mult
iple
pre
oper
ativ
e te
sts
bec
ause
not
all
of
pat
ients
in t
he
study
sam
ple
rec
eive
d a
ll th
e pre
oper
ativ
e te
sts
det
aile
d i
n t
he
pap
er
a Fig
ure
rep
rese
nts
pro
port
ion f
or
all
bio
chem
istr
y te
sts

There was wide variation in the reported proportion
of abnormal preoperative biochemistry tests. For
example, Table 5.2 shows that the proportions of
abnormal preoperative electrolyte tests ranged
from 0.2% for sodium and potassium in one study12
to 81.3% for sodium and potassium in another
study.57 The proportions of abnormal preoperative
creatinine/urea tests ranged from 0.1% in one
study25 to 27.0% in a further study66 and the
proportions of abnormal preoperative glucose tests
ranged from 1.9% in one study73 to 71.5% in
another study.57
There was also variation in the reported proportion
of patients who had had preoperative biochemistry
tests and who subsequently underwent a change in
clinical management. For example, the proportion of
patients who had preoperative electrolyte tests and
who underwent a change in clinical management
ranged from 0% for sodium and potassium in three
studies12,25,78 to 10.5% in a further study.57
The proportion of patients who had preoperative
creatinine/urea tests and who subsequently
underwent a change in clinical management ranged
from 0% in one study25 to 5.5% in a further
study.57 The proportion of patients who had
preoperative glucose tests and who subsequently
underwent a change in clinical management ranged
from 0% in one study25 to 2.1% in a further study.57
There was less variation in the reported proportion
of patients who had had preoperative biochemistry
tests and who subsequently suffered postoperative
complications. For example, the proportion of patients
who had preoperative electrolyte tests and who
suffered postoperative complications was 0% in both
studies that measured this outcome variable.25,62
The proportion of patients who had preoperative
creatinine/urea tests and who suffered postoperative
complications ranged from 0% in two studies25,62
to 0.8% in a further study11 and the proportion of
patients who had preoperative glucose tests and who
suffered postoperative complications ranged from 0%
in one study62 to 0.7% in a further study.11
As described in Section 1, the variation in the results
may be explained at least in part by heterogeneity in
the study populations. The impact of four major
sources of heterogeneity on the outcome of the
preoperative biochemistry test studies will be
considered separately in the following sections.
5.2 Heterogeneity in the quality of thestudy designAs described in Section 1, studies in which data
are collected prospectively and in which patients
are recruited consecutively are less susceptible to
bias than studies in which data are collected
retrospectively or where patients are recruited
selectively. Therefore, we hypothesised that
the proportions of abnormal preoperative
biochemistry tests, changes in clinical management
and postoperative complications might differ
according to the quality of the study design.
We investigated the effects of variations in the
quality of the study design on the proportions of
abnormal biochemistry tests, changes in clinical
management and postoperative complications
across the identified studies. Two studies collected
prospective data and recruited consecutive
patients57,62 and seven studies collected data
retrospectively and did not state that the sample of
patients was consecutive.11,12,25,66,73,78,80 The results
from these studies are summarised in Table 5.3.
57A P P E N D I X 1

There was little difference in the average proportion
of abnormal preoperative electrolyte and glucose
tests between prospective and retrospective studies
(1.0% and 1.6%, respectively). However, the average
proportion of abnormal preoperative urea/creatinine
tests tended to be higher in retrospective studies
compared to prospective studies (9.7% and 1.0%,
respectively). For all preoperative biochemistry tests
the average proportion of patients undergoing a
change in clinical management tended to be
higher in the prospective studies compared to the
retrospective studies. Similarly for preoperative
urea/creatinine and glucose tests, the average
proportion of postoperative complications tended
to be higher in the prospective studies compared
to the retrospective studies.
5.3 Heterogeneity in the composition of thestudy population
5.3.1 Age range
Given that the prevalence of comorbid diseases
increases with age, we hypothesised that the
proportion of patients with abnormal preoperative
biochemistry tests would be higher in studies of
older patient populations.
We investigated the effects of variations in the
age range of the study population on the proportions
of abnormal preoperative biochemistry tests,
changes in clinical management and postoperative
complications across the identified studies.
Three papers did not state an age range,11,73,80
three papers included studies of adults only12,25,57
and one study included adults over 60-years-old
only.62 The remaining two studies included
children only.66,78 The proportions of abnormal
biochemistry tests, changes in clinical management
and postoperative complications in the study
populations according to age group are
summarised in Table 5.4.
58 P R E O P E R A T I V E T E S T S
T A B L E 5 . 3 Summary of abnormal biochemistry tests,changes in clinicalmanagement and postoperative complications in study populationsaccording to study quality indicators
Q U A L I T Y % A B N O R M A L T E S T % C H A N G E I N C L I N I C A L % P O S T O P E R A T I V E
I N D I C A T O R (Number of Studies) M A N A G E M E N T C O M P L I C A T I O N S
(Number of Studies) (Number of Studies)
Mean* Maximum Minimum Mean* Maximum Minimum Mean* Maximum Minimum
Electrolytes
P C 1.0 (2) 81.3 1.7 10.5 (1) 0(1)
R N 1.6 (6) 7.1 0 0.4 (5) 2.2 0 0 (1) 0 0
Urea/Creatinine
P C 1.0 (2) 26.2 12.0 5.5 (1) 0 (1)
R N 9.7 (5) 27.0 0.2 0.1 (2) 0.3 0 0.3 (2) 0.8 0
Glucose
P C 1.0 (2) 71.5 7.0 2.1 (1) 0 (1)
R N 1.6 (4) 5.4 0.4 0.1 (2) 0.2 0 0.4 (2) 0.7 0.3
P = prospective data collection; R = retrospective data collection; C = consecutive recruitment of patients; N = nonconsecutive
recruitment of patients; * weighted means were produced to reflect the different numbers of patients in each study. It was not
possible to produce a distributional statistic reflecting this weight.

Table 5.4 shows that the average proportion of
abnormal preoperative electrolyte tests was highest
in studies that included adults (28.0%) and lowest
in studies that included children only (7.1%).
However, the average number of abnormal
preoperative urea/creatinine tests was highest in
studies of children (26.7%) and lowest in elderly
adults (12.0%).
As one of the studies stratified the proportion of
abnormal biochemistry tests by age, it was not
possible to assess the impact of the different age
groups within each study population.
5.3.2 ASA grades
We hypothesised that the proportion of patients with
abnormal preoperative biochemistry tests would be
greater in studies reporting test results for patients
with higher ASA grades.
We investigated the effects of variations in the ASA
grade of patients in the study population on the
proportions of abnormal preoperative biochemistry
tests, changes in clinical management and
postoperative complications across the identified
studies. Presence of comorbidities were classified
according to ASA grades in four of the nine
papers.11,62,66,73 Three of these studies included
patients of ASA grades I and II only11,66,73 and
59A P P E N D I X 1
T A B L E 5 . 4 Summary of abnormal preoperative biochemistry tests, changesin clinical management and postoperative complications in studypopulations by age group
A G E % A B N O R M A L T E S T % C H A N G E I N C L I N I C A L % P O S T O P E R A T I V E
R A N G E (Number of Studies) M A N A G E M E N T C O M P L I C A T I O N S
(Number of Studies) (Number of Studies)
Mean* Maximum Minimum Mean* Maximum Minimum Mean* Maximum Minimum
Electrolytes
Adults
> 60 years 1.7 (1) (0) 0 (1)
Adults only 28.0 (3) 81.3 0 3.4 (3) 10.5 0 0 (1)
Children only 7.1 (1) 0 (1) (0)
Not stated 0.5 (3) 0.8 0.2 0.6 (2) 2.2 0 (0)
Urea/Creatinine
Adults
> 60 years 12.0 (1) (0) 0 (1)
Adults only 13.2 (2) 26.2 0.2 2.8 (2) 5.5 0 0 (1)
Children only 26.7 (2) 27.0 7.1 0.3 (1) (0)
Not stated 1.2 (2) 1.3 0.8 (0) 0.8 (1)
Glucose
Adults
> 60 years 7.0 (1) (0) 0 (1)
Adults only 46.4 (2) 71.5 1.8 1.3 (2) 2.1 0 0.3 (1)
Children only (0) (0) (0)
Not stated 1.6 (3) 5.4 0.4 0.2 (1) 0.7 (1)
*weighted means

the fourth study included patients of ASA grades I
to V.62 Table 5.5 summarises the proportions of
abnormal biochemistry tests, changes in clinical
management and postoperative complications
according to the ASA grade of the patients in the
study population.
Given the small number of studies that included
patients of ASA grades I to II, or I to V, and the fact
that we do not know the distribution of patients
within each of the ASA categories it is not possible
to interpret the data for separate ASA grade groups.
None of the identified studies stratified the
proportion of abnormal preoperative biochemistry
tests according to ASA grade. Therefore it was
not possible to investigate the effects of variations
in the ASA grade of patients on the proportion of
abnormal preoperative biochemistry tests within
the identified studies.
5.4 Heterogeneity in criteria forpreoperative testingAlthough authors did not state their definitions of
‘routine’ preoperative tests, we have assumed a
routine preoperative investigation to be a test carried
out on all patients preoperatively that is not directly
related to the planned procedure or the patients’
condition. In some studies, authors included patients
who were described as undergoing routine
preoperative tests as well as patients undergoing
indicated preoperative tests. None of these studies
presented the proportions of abnormal preoperative
tests, changes in clinical management and
postoperative complications separately for patients
who had routine tests and for patients who had
indicated tests, instead the data were combined for
both groups of patients. Therefore, we hypothesised
that the proportions of abnormal preoperative
biochemistry tests, changes in clinical management
60 P R E O P E R A T I V E T E S T S
T A B L E 5 . 5 Summary of abnormal biochemistry tests and changes in clinicalmanagement or postoperative complications in study populationsby ASA grade
A S A % A B N O R M A L T E S T % C H A N G E I N C L I N I C A L % P O S T O P E R A T I V E
G R A D E (Number of Studies) M A N A G E M E N T C O M P L I C A T I O N S
(Number of Studies) (Number of Studies)
Mean* Maximum Minimum Mean* Maximum Minimum Mean* Maximum Minimum
Electrolytes
Stated 1.4 (3) 9.0 0.2 0.6 (2) 2.2 0 0 (1)
I to II 1.4 (2) 0.7 0.2 0.6 (2) 2.2 0 (0)
I to V 1.7 (1) (0) 0 (1)
Not stated 23.9 (5) 81.3 0 2.9 (4) 10.5 0 0 (1)
Urea/Creatinine
Stated 13.0 (3) 27.0 1.3 0.3 (1) 0.4 (2) 0.8 0
I to II 13.1 (2) 27.0 1.3 0.3 (1) 0.8 (1)
I to V 12.0 (1) (0) 0 (1)
Not stated 10.6 (2) 26.2 0.2 2.2 (2) 5.5 0 0 (1)
Glucose
Stated 1.5 (3) 1.9 0.4 0.2 (1) 0.3 (2) 0.7 0
I to II 1.0 (3) 1.9 0.4 0.2 (1) 0.7 (1) 0
I to V 7.0 (1) (0) 0 (1)
Not stated 34.3 (3) 71.5 1.8 0.9 (2) 2.1 0 0.3 (1)
*weighted means

and postoperative complications would be lower in
study populations where all the patients had routine
preoperative biochemistry tests compared to study
populations containing patients undergoing either
routine or indicated preoperative biochemistry tests.
We investigated the effects of variations in the
criteria for preoperative testing on the proportions
of abnormal preoperative biochemistry tests,
changes in clinical management and postoperative
complications across the identified studies. Two of
the studies included patients undergoing routine
preoperative biochemistry tests only, whereas two
of the studies included a combination of patients
undergoing either routine and indicated tests
(Table 5.1). Five studies did not state their criteria for
preoperative testing. Table 5.6 provides a summary
of the proportions of abnormal preoperative
biochemistry tests, changes in clinical management
and postoperative complications in study populations
according to whether the study population included
routine only or both routine and indicated tests.
Table 5.6 shows that for all biochemistry tests, the
mean proportions of abnormal preoperative tests
tended to be lower in studies that included routine
tests only compared to studies that included both
routine and indicated biochemistry tests.
It was not possible to investigate the effects of
variations in the criteria for preoperative testing
on the proportions of abnormal preoperative
biochemistry tests, changes in clinical management
and postoperative complications within the identified
studies because studies including only patients
for whom preoperative tests were indicated were
excluded in the initial stages of our systematic review
and none of the eligible studies reported data
separately for routine and indicated preoperative
biochemistry tests.
61A P P E N D I X 1
T A B L E 5 . 6 Summary of abnormal preoperative biochemistry tests, changes inclinical management and postoperative complications according tothe criteria for preoperative testing
C R I T E R I A % A B N O R M A L T E S T % C H A N G E I N C L I N I C A L % P O S T O P E R A T I V E
F O R T E S T (Number of Studies) M A N A G E M E N T C O M P L I C A T I O N S
(Number of Studies) (Number of Studies)
Mean* Maximum Minimum Mean* Maximum Minimum Mean* Maximum Minimum
Electrolytes
Routine only 0.5 (2) 0.7 0 0.6 (2) 2.2 0 0 (1)
Routine
& indicated 53.7 (2) 81.3 0.8 10.5 (1) (0)
Not stated 0.4 (4) 9.0 0.2 0 (3) 0 0 0 (1)
Urea/creatinine
Routine only 1.0 (2) 1.3 0.2 0 (1) 0.5 (2) 0.8 0
Routine
& indicated 17.5 (2) 26.2 0.8 5.5 (1) (0)
Not stated 13.0 (3) 27.0 7.1 0.3 (1) 0 (1) 0.8 0
Glucose
Routine only 0.6 (2) 1.8 0.4 0 (1) 0.5 (2) 0.7 0.3
Routine
& indicated 45.3 (2) 71.5 5.4 2.1 (1) (0)
Not stated 2.2 (2) 7.0 1.9 0.2 (1) 0 (1)
*weighted means

5.5 Heterogeneity in the definition of theoutcome variables
5.5.1 Definition of a normal/abnormal biochemistry test
We investigated the variability of the definition of
a normal/abnormal preoperative biochemistry
test across the identified studies. Four studies
specified definitions of normal preoperative
biochemistry test results.57,73,80,62 These
definitions are listed in Table 5.7.
Table 5.7 shows that the definitions of
normal/abnormal preoperative biochemistry tests
varied across studies. However, the differences in
the definitions were small and, therefore, were not
likely to have been a great source of heterogeneity
across the studies.
5.5.2 Definition of a change in clinical management
We investigated the variability of the definition of a
change in clinical management in patients who had
had a preoperative biochemistry test in the identified
studies. Nine of the studies reported changes in
clinical management. Change in clinical management
was reported as delay or cancellation of surgery in
three studies25,57,66 and alterations in treatment in
two studies.11,12 No studies specified their definitions
of change in clinical management further.
62 P R E O P E R A T I V E T E S T S
T A B L E 5 . 7 Summary of the reported definitions of normal preoperativebiochemistry test results
Charpak57 Narr73 Kaplan80 Dzankic62
Electrolytes – Sodium
126 to 147 mEq/l ✓
135 to 145 mmol/l ✓
135 to 147 mEq/l
136 to 144 µmol/l ✓
< 2 times SD of mean ¸
Electrolytes – Potassium
3.5 to 5 mmol/l ✓ ✓
3.5 to 5.3 µmol/l ✓
< 2 times SD of mean ✓
Creatinine
40 to 110 µmol/l ✓
0.5 to 1.2 mg/dl ✓
0.5 to 1.4 mg/dl
> 1.5 mg/dl ✓
Urea
7 to 22 mg/dl
<7.5 mmol/l ✓
Glucose
3.5 to 5.5 mmol/l ✓
65 to 110 mg/dl ✓
70 to 110 mg/dl
< 200 mg/dl ✓

5.5.3 Definition of postoperative complications
We investigated the variability of the definition of
postoperative complications in patients who had
had preoperative biochemistry tests. Three studies
reported postoperative complications.25,62,66 Two
of these three studies provided a definition of this
outcome variable62,66 and these definitions are
summarised in Table 5.8.
The postoperative complications described in each
of the papers outlined in Table 5.8 are varied.
However, these data may simply reflect postoperative
complications that were observed rather than all the
postoperative complications that potentially could
have arisen. Given this uncertainty it is not sensible
to investigate further differences in the definitions
as a source of heterogeneity across the study
populations. Also, it is difficult to interpret the
meaning of the postoperative complication data
because the postoperative complications recorded
in the data were not necessarily related to
preoperative biochemistry tests. Despite the fact
that the patient had had preoperative biochemistry
tests, postoperative complications still occurred.
5.6 Diagnostic accuracy Of the nine studies investigating preoperative
biochemistry testing, only one reported the
diagnostic accuracy of the tests.25 This study found
that the positive predictive values for electrolyte
and glucose determinations were 2.6% and 8.8%,
respectively, and the negative predictive values
were 98.0% and 87.5%, respectively.
From the data presented in each of the papers,
it was possible to calculate positive predictive values of
preoperative biochemistry tests for predicting a change
in clinical management for three studies. The positive
predictive values indicate the percentage of patients
with abnormal biochemistry tests who subsequently
underwent a change in clinical management.
The results are summarised in Table 5.9.
63A P P E N D I X 1
T A B L E 5 . 8 Summary of the definitionsof postoperative complicationsin studies of preoperativebiochemistry testing
Postoperative complications Dzankic621 Meneghini66
Cardiovascular
Ischaemic cardiac complications ✓
Myocardial infarctions ✓
Heart failure ✓
Dysrhythmia ✓
CVA/TIA ✓
Pulmonary
Respiratory failure ✓
Pleural effusion ✓
Other
Death ✓
Hepatic/gastrointestinal complications ✓
Infection ✓
Delirium ✓
Aspiration pneumonia ✓
Renal complications ✓
Reoperation ✓
Thromboembolic events ✓
Mild perioperative oxygen desaturation ✓
Laryngospasm ✓
Persistent vomiting ✓
Fever ✓
Postoperative restlessness ✓
Wound complications ✓
T A B L E 5 . 9 Calculated estimates of thepositive predictive value ofpreoperative biochemistrytests to predict changes inclinical management
Positive predictive value for predicting a
First author change in clinical management (%)
Electrolytes
Adams12 0
Narr73 14.3
Turnbull25 0
Urea/creatinine
Meneghini66 1.0
Turnbull25 0

The positive predictive value of preoperative
electrolyte tests for predicting a change in clinical
management ranged from 0% in two studies12,25 to
14.3% in a further study.73 The positive predictive
value of preoperative urea/creatinine tests for
predicting a change in clinical management ranged
from 0% in one study25 to 1.0% in a further study.66
The positive predictive value of preoperative glucose
tests for predicting a change in clinical management
ranged from 0% in one study25 to 8.6% in a further
study.73 However, it is difficult to interpret the
meaning of the positive predictive values from
Table 5.9 because of the heterogeneous nature
of the studies as outlined in Section 1.
6 Preoperative urine testing
6.1 Characteristics of the resultsIn our search of the literature from 1995 to 2001, we
identified a total of six papers of preoperative urine
testing. All of the papers reported abnormal test
result data and changes in clinical management or
postoperative complications. In combination with the
nine papers identified in the HTA report, this review
includes 15 studies of preoperative urine testing.
The characteristics of these studies are summarised
in Table 6.1. All of the studies were case series.
64 P R E O P E R A T I V E T E S T S
T A B L E 6 .1 Characteristics of eligible studies of preoperative urine testing
First author and Country Study sample Type of surgery Abnormal test Change in clinical Postoperative
year of publication (age) management complications
Haug USA 458 Oral, maxillofacial ✓ ✓
199941 (15 to 54 years)
Meneghini USA 1884 Not stated ✓ ✓
199866 (0 to 8 years)
Wattsman USA 142 General ✓ ✓
19975 (17 to 76 years)
Bhuripanyo Thailand 1316 Not stated ✓ ✓
199597 (> 15 years)
Boland USA 100 Not stated ✓ ✓
199510 (43 to 75 years)
Adams UK 169 (adults) General ✓ ✓
199212*
MacDonald 147 Orthopaedics ✓
199213* (> 60 years)
O’Connor USA 486 ENT, general, urology, ✓ ✓
199077* (< 18 years) orthopaedics
Lawrence USA 200 Orthopaedics ✓ ✓ ✓
198898* (> 15 years)
Akin USA 301 (adults) Not stated ✓ ✓
198799*
Turnbull Canada 1010 (adults) General ✓ ✓ ✓
198725*
Kroenke USA 3987 Not stated ✓ ✓
1986100* (19 to 95 years)

The results of the 15 studies, which documented the
findings from a total of 8,083 preoperative urine
tests, are summarised in Table 6.2.
We found a wide variation in the results. The
proportion of preoperative urine tests that were
abnormal ranged from 0.8% in one study41 to
34.1% in a further study.99 The proportion of
patients who had preoperative urine tests and
who subsequently underwent a change in clinical
management ranged from 0% in two studies41,66
to 14.3% in a further study (although this was
from a very small sample size).5 The proportion of
patients who had preoperative urine tests and who
subsequently suffered postoperative complications
was only reported in two studies (0% in one study98
and 0.6% in the other25).
As described in Section 1, the wide variation in
the results may be explained at least in part by
heterogeneity in the study populations. The impact
of four major sources of heterogeneity on the
outcome of the preoperative urine test studies will
be considered separately in the following sections.
6.2 Heterogeneity in the quality of thestudy designAs described in Section 1, studies in which data
are collected prospectively and in which patients
are recruited consecutively are less susceptible
to bias than studies in which data are collected
retrospectively and where patients are recruited
selectively. Therefore, we hypothesised that the
proportions of abnormal preoperative urine tests,
changes in clinical management and postoperative
complications might differ according to the quality
of the study design.
We investigated the effects of variations in the
quality of the study design on the proportions
of abnormal urine tests, changes in clinical
management and postoperative complications across
the identified studies. Two studies collected data
prospectively and recruited consecutive patients, two
studies collected data prospectively and did not state
that the sample of patients was consecutive. Four
studies collected data retrospectively and recruited
consecutive patients and seven papers collected data
retrospectively and did not state that the sample of
patients was consecutive. The results of these studies
are summarised in Table 6.3.
65A P P E N D I X 1
T A B L E 6 .1 Characteristics of eligible studies of preoperative urine testing continued
First author and Country Study sample Type of surgery Abnormal test Change in clinical Postoperative
year of publication (age) management complications
Muskett USA 200 Cardiothoracic, ENT, ✓ ✓
198628* (not stated) neurosurgery, general,
ophthalmology, plastic
surgery, urology, orthopaedics
Wood USA 1924 ENT, ophthalmology, ✓ ✓
198132* (0 to 19 years) general, orthopaedics,
urology
Rossello Puerto Rico 690 Not stated ✓ ✓
198034* (< 14 years)
*papers included in the HTA review
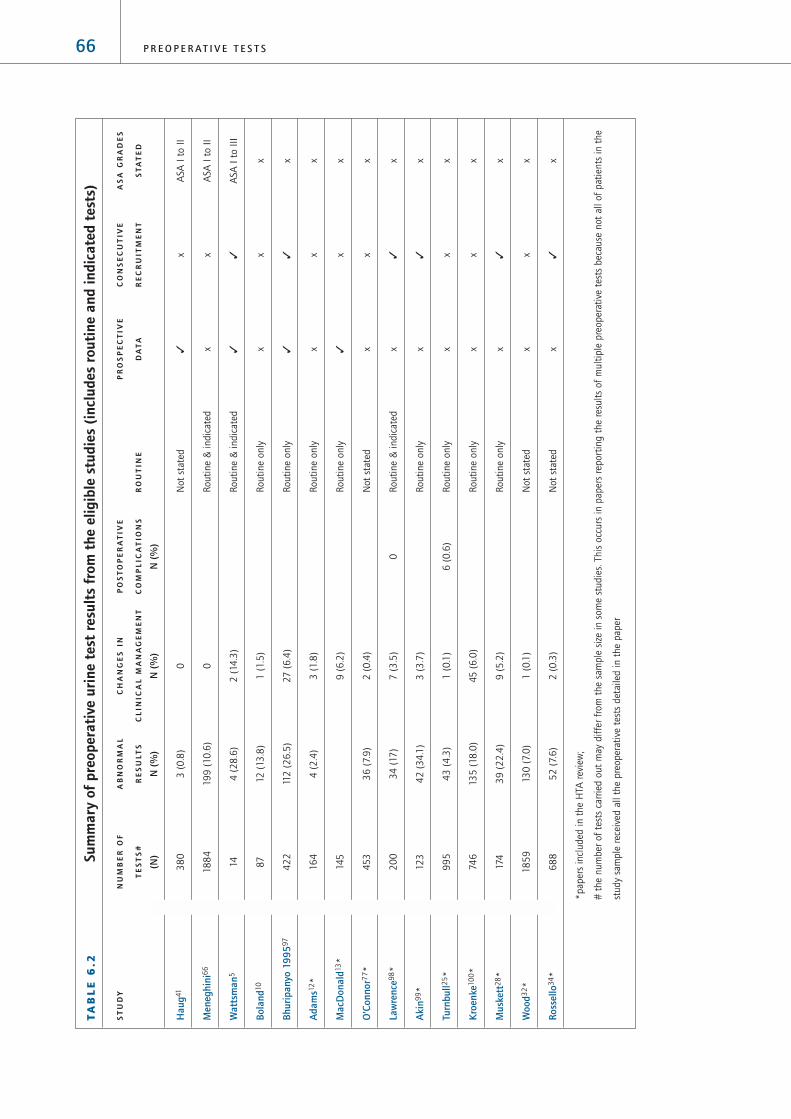
66 P R E O P E R A T I V E T E S T S
TA
BL
E 6
.2Su
mm
ary
of p
reop
erat
ive
urin
e te
st r
esul
ts f
rom
the
elig
ible
stu
dies
(in
clud
es r
outi
ne a
nd in
dica
ted
test
s)
ST
UD
YN
UM
BE
R O
FA
BN
OR
MA
LC
HA
NG
ES
IN
PO
ST
OP
ER
AT
IVE
PR
OS
PE
CT
IVE
CO
NS
EC
UT
IVE
AS
A G
RA
DE
S
TE
ST
S#
RE
SU
LTS
CL
INIC
AL
MA
NA
GE
ME
NT
CO
MP
LIC
AT
ION
SR
OU
TIN
ED
AT
AR
EC
RU
ITM
EN
TS
TA
TE
D
(N)
N (
%)
N (
%)
N (
%)
Hau
g41
38
03
(0
.8)
0N
ot
stat
ed✓
xA
SA I
to I
I
Men
eghi
ni6
618
84
199
(10
.6)
0R
outi
ne
& i
ndic
ated
xx
ASA
I t
o I
I
Wat
tsm
an5
144
(2
8.6
)2
(14
.3)
Routi
ne
& i
ndic
ated
✓✓
ASA
I t
o I
II
Bola
nd10
87
12 (
13.8
)1
(1.5
)R
outi
ne
only
xx
x
Bhur
ipan
yo 1
9959
74
22
112
(2
6.5
)27
(6
.4)
Routi
ne
only
✓✓
x
Ada
ms1
2*
16
44
(2
.4)
3 (
1.8
)R
outi
ne
only
xx
x
Mac
Don
ald1
3*
145
9 (
6.2
)R
outi
ne
only
✓x
x
O’C
onno
r77*
45
33
6 (
7.9
)2
(0
.4)
Not
stat
edx
xx
Law
renc
e98*
20
03
4 (
17)
7 (
3.5
)0
Routi
ne
& i
ndic
ated
x✓
x
Aki
n99*
123
42
(3
4.1
)3
(3
.7)
Routi
ne
only
x✓
x
Turn
bull2
5*
99
54
3 (
4.3
)1
(0
.1)
6 (
0.6
)R
outi
ne
only
xx
x
Kro
enke
10
0*
746
135
(18
.0)
45
(6
.0)
Routi
ne
only
xx
x
Mus
kett
28*
174
39
(2
2.4
)9
(5
.2)
Routi
ne
only
x✓
x
Woo
d32*
18
59
130
(7.
0)
1 (
0.1
)N
ot
stat
edx
xx
Ross
ello
34*
68
85
2 (
7.6
)2
(0
.3)
Not
stat
edx
✓x
*pap
ers
incl
uded
in t
he
HTA
rev
iew
;
# t
he
num
ber
of
test
s ca
rrie
d o
ut
may
dif
fer
from
the
sam
ple
siz
e in
som
e st
udie
s. T
his
occ
urs
in p
aper
s re
port
ing t
he
resu
lts
of
mult
iple
pre
oper
ativ
e te
sts
bec
ause
not
all
of
pat
ients
in t
he
study
sam
ple
rec
eive
d a
ll th
e pre
oper
ativ
e te
sts
det
aile
d i
n t
he
pap
er

The average proportions of abnormal preoperative
urine tests and changes in clinical management
tended to be higher in prospective consecutive
studies, compared to retrospective consecutive
studies. However there are too few data on which
to base any conclusions.
6.3 Heterogeneity in the composition of thestudy population
6.3.1 Age range
Given that the prevalence of comorbid diseases
increases with age, we hypothesised that the
proportion of patients with abnormal preoperative
urine tests would be higher in studies of older
patient populations.
We investigated the effects of variations in the age
range of the study population on the proportions of
abnormal preoperative urine tests, changes in clinical
management and postoperative complications across
the identified studies. One study included adults
> 60-years-only,13 five studies included adults
only,10,12,25,99,100 four studies included adults and
children,5,41,98,101 four studies included children
only32,34,66,77 and one study did not state the age
range of its patient population.28 Table 6.4 provides
a summary of the mean proportions of abnormal
preoperative urine tests, changes in clinical
management or postoperative complications
across studies according to age group of the
study population.
Table 6.4 shows that the average proportion of
abnormal preoperative urine tests tended to be
higher in studies that included adults and children
(17.4%) than in studies that included children only
(8.6%). The average proportion of patients who had
preoperative urine tests and who subsequently
underwent a change in clinical management tended
to be highest in studies including adults aged over
60 years (6.2%) and lowest in studies including
children only (0.1%).
We then investigated the effects of variations in
the age of the study population on the proportion
of abnormal preoperative urine tests within the
identified studies. Only one study stratified the
proportion of patients with abnormal preoperative
urine test results by age.101 This study showed that
adults ≤ 40-years-old had fewer abnormal urine test
results (28.1%) than adults > 40-years-old (48.7%);
however, this is evidence from one study only.
67A P P E N D I X 1
T A B L E 6 . 3 Summary of abnormal preoperative urine tests and changes in clinicalmanagement or postoperative complications in study populationsaccording to study quality indicators
Q U A L I T Y % A B N O R M A L T E S T % C H A N G E I N C L I N I C A L % P O S T O P E R A T I V E
I N D I C A T O R (Number of Studies) M A N A G E M E N T C O M P L I C A T I O N S
(Number of Studies) (Number of Studies)
Mean* Maximum Minimum Mean* Maximum Minimum Mean* Maximum Minimum
P C 26.6 (2) 28.6 26.5 6.7 (2) 14.3 6.4 (0)
P N 0.9 (1) 2.4 (2) 6.2 0 (0)
R C 14.6 (4) 51.9 7.6 1.8 (4) 5.2 0.3 0 (1)
R N 9.1 (7) 18.1 1.0 0.8 (7) 6.0 0 0.6 (1)
P = prospective data collection; R = retrospective data collection; C = consecutive recruitment of patients; N = nonconsecutive
recruitment of patients; * weighted means were produced to reflect the different numbers of patients in each study. It was not
possible to produce a distributional statistic reflecting this weight.

6.3.2 ASA grades
We hypothesised that the proportion of patients with
abnormal preoperative urine tests would be greater
in studies reporting test results for patients with
higher ASA grades.
We investigated the effects of variations in the ASA
grade of patients in the study population on the
proportions of abnormal preoperative urine tests,
changes in clinical management and postoperative
complications across the identified studies. Three of
the 15 studies stated patients’ ASA grades.5,41,66
Two of these studies included patients of ASA
grades I and II only41,66 and the third study included
patients of ASA grades I to III only.5 Table 6.5
summarises the proportions of abnormal urine tests,
changes in clinical management and postoperative
complications according to the ASA grade of the
patients in the study population.
Based on data from only three studies, Table 6.5
shows that the average proportions of abnormal
urine test results and changes in clinical
management rise with increasing ASA grade.
None of the identified studies stratified the
proportion of abnormal preoperative biochemistry
68 P R E O P E R A T I V E T E S T S
T A B L E 6 . 4 Summary of abnormal preoperative urine tests, changes in clinicalmanagement and postoperative complications in study populationsaccording to age group
A G E % A B N O R M A L T E S T % C H A N G E I N C L I N I C A L % P O S T O P E R A T I V E
R A N G E (Number of Studies) M A N A G E M E N T C O M P L I C A T I O N S
(Number of Studies) (Number of Studies)
Mean* Maximum Minimum Mean* Maximum Minimum Mean* Maximum Minimum
Adults
> 60 years (0) 6.2 (1) (0)
Adults only 11.6 (5) 51.9 1 2.5 (5) 6 0 0.6 (1)
Adults
& children 17.4 (4) 28.6 0.9 4.1 (4) 14.3 0 0 (1)
Children only 8.6 (4) 10.6 7 0.1 (4) 0.4 0 (0)
Not stated 22.4 (1) 5.2 (1) (0)
*weighted means
T A B L E 6 . 5 Summary of abnormal urine tests, changes in clinical managementand postoperative complications in study populations according toASA grades
A S A % A B N O R M A L T E S T % C H A N G E I N C L I N I C A L % P O S T O P E R A T I V E
G R A D E (Number of Studies) M A N A G E M E N T C O M P L I C A T I O N S
(Number of Studies) (Number of Studies)
Mean* Maximum Minimum Mean* Maximum Minimum Mean* Maximum Minimum
Stated 9.6 (3) 28.6 0.9 0.1 (3) 14.3 0 (0)
I to II 9.5 (2) 10.6 0.9 0.0 (2) 0 0 (0)
I to III 28.6 (1) 14.3 (1) (0)
Not stated 10.7 (11) 51.9 1 17.6 (12) 6.4 0 0.1 (2) 0.6 0
*weighted means

tests according to ASA grade. Therefore it was not
possible to investigate the effects of variations in the
ASA grade of patients on the proportion of abnormal
preoperative urine tests within the identified studies.
6.4 Heterogeneity in criteria forpreoperative testingAlthough authors did not state their definitions of
‘routine’ preoperative tests, we have assumed a
routine preoperative investigation to be a test carried
out on all patients preoperatively that is not directly
related to the planned procedure or the patients’
condition. In some studies, authors included patients
undergoing routine preoperative tests as well as
patients undergoing indicated preoperative tests.
None of these studies presented the proportions of
abnormal preoperative tests, changes in clinical
management and postoperative complications
separately for patients who had routine tests and
for patients who had indicated tests, instead the
data were combined for both groups of patients.
Therefore, we hypothesised that the proportions of
abnormal preoperative urine tests, changes in clinical
management and postoperative complications would
be lower in study populations where all the patients
had routine preoperative urine tests compared to
study populations containing patients undergoing
either routine or indicated preoperative urine tests.
We investigated the effects of variations in the
criteria for preoperative testing on the proportions of
abnormal preoperative urine tests, changes in clinical
management and postoperative complications across
the identified studies. Eight studies included patients
undergoing routine preoperative urine tests only,
whereas three studies included a combination of
patients undergoing either routine or indicated tests,
and a further three studies did not specify their
criteria (Table 6.1). The proportions of abnormal
preoperative urine tests, changes in clinical
management and postoperative complications in
study populations according to whether the study
population included routine only or both routine and
indicated tests is summarised in Table 6.6.
Table 6.6 shows, contrary to our hypothesis, that
for those studies including routine tests only, the
average proportions of abnormal urine tests and
changes in clinical management or postoperative
complications tended to be higher than in studies
including both routine and indicated tests.
It was not possible to investigate the effects of
variations in the criteria for preoperative testing on
the proportions of abnormal preoperative urine tests,
changes in clinical management and postoperative
complications within the identified studies because
studies that only included patients for whom
preoperative tests were indicated were excluded in
the initial stages of our systematic review and none
of the eligible studies reported data separately for
routine and indicated preoperative urine tests.
69A P P E N D I X 1
T A B L E 6 . 6 Summary of abnormal preoperative urine tests, changes in clinicalmanagement and postoperative complications according to the criteriafor preoperative testing
C R I T E R I A % A B N O R M A L T E S T % C H A N G E I N C L I N I C A L % P O S T O P E R A T I V E
F O R T E S T (Number of Studies) M A N A G E M E N T C O M P L I C A T I O N S
(Number of Studies) (Number of Studies)
Mean* Maximum Minimum Mean* Maximum Minimum Mean* Maximum Minimum
Routine only 14.0 (7) 51.9 1.0 3.5 (8) 6.4 0 0.6 (1)
Routine
& indicated 11.3 (3) 28.6 10.6 0.4 (3) 14.3 0 0 (1)
Not stated 6.8 (4) 7.9 0.9 0.1 (4) (0)
*weighted means

6.5 Heterogeneity in the definition of theoutcome variables
6.5.1 Definition of a normal/abnormal urine test
We investigated the variability of the definition
of normal/abnormal preoperative urine tests
across the identified studies. Six studies specified
definitions of normal/abnormal preoperative urine
test results.5,32,77,98,100,101 These definitions are
listed in Table 6.7.
Table 6.7 shows that there were differences between
the definitions of normal/abnormal preoperative
urine tests. However, the differences in the
definitions were small and, therefore, were not likely
to have been a great source of heterogeneity across
the different studies.
6.5.2 Definition of a change in clinical management
We investigated the variability of the definition of
a change in clinical management in patients who
had had preoperative urine tests in the identified
studies. All of the studies reported changes in
clinical management as a result of abnormal
preoperative urine test results. The change in
clinical management outcome variable was
reported as delay or cancellation of surgery in six
studies25,32,34,58,77,98 and alterations in treatment
in a further four studies.12,28,99,100 Four studies
specified a broader definition of changes in clinical
management,10,13,66,101 and these descriptions are
summarised in Table 6.8.
70 P R E O P E R A T I V E T E S T S
T A B L E 6 . 7 Summary of the reported definitions of normal preoperative urinetest results
1 2 3 4 5 6
Urine protein
< trace ✓ ✓ ✓ ✓
< 1+ ✓ ✓
Urine glucose
< trace ✓ ✓ ✓
< 1+ ¸
White blood cells
< 2 cells per high power field ✓
< 3 cells per high power field ✓
< 5 cells per high power field ✓ ✓ ✓
< 10 per high power field ✓
Red blood cells
< 2 cells per high power field ✓ ✓ ✓
< 5 cells per high power field ✓ ✓
< 10 per high power field ✓
Bacteria
< 1+ ✓
Acetone
< 1+ ✓
1: Bhuripanyo97; 2: Wood32; 3: O’Connor77; 4: Lawrence98; 5: Kroenke100;
6: Wattsman5.

The changes in clinical management described in
each of the papers outlined in Table 6.8 vary across
the studies. However, these data may simply reflect
changes in clinical management that were observed
rather than predefined actions that were considered
to represent changes in clinical management.
Therefore, it is not sensible to investigate further
differences in the definitions as a source of
heterogeneity across the study populations.
6.5.3 Definition of postoperative complications
We attempted to investigate the variability of the
definition of a postoperative complications in
patients who had had preoperative urine tests.
However, neither of the two papers that reported
postoperative complications provided a definition
of this outcome variable.
6.6 Diagnostic accuracyOf the 15 studies investigating preoperative urine
testing, only one reported the diagnostic accuracy
of the test.25 This study found that the positive
predictive value for preoperative urine tests was
11.7% and the negative predictive value was 95.7%.
From the data presented in each of the papers it was
possible to calculate positive predictive values of
preoperative urine tests for predicting a change in
clinical management for 11 studies. The positive
predictive values indicate the percentage of patients
with abnormal preoperative urine tests that
subsequently underwent a change in clinical
management. The results are summarised in Table 6.9.
The positive predictive value of preoperative urine
tests for predicting a change in clinical management
ranged from 0% in three studies12,41,66 to 33.3% in
a further study.100 However, it is difficult to interpret
the meaning of the positive predictive values from
Table 6.9 because of the heterogeneous nature of
the studies as outlined in Section 1.
71A P P E N D I X 1
T A B L E 6 . 8 Summary of the definitions of change in clinical management (%)in studies of preoperative urine testing
1 2 3 4
Medical consultation ✓
Changes in anaesthetic technique ✓
Medication or additional investigation required 0.05 ✓
Postponement or cancellation of surgery ✓
Longer hospital stay ✓
Total 0.05 6.2 0 1.5
1: Bhuripanyo101; 2: MacDonald13;
3: Meneghini66; 4: Boland10.
T A B L E 6 . 9 Calculated estimates of thepositive predictive value ofpreoperative urine tests forpredicting changes in clinicalmanagement
Positive predictive value for predicting a
First author change in clinical management (%)
Haug41 0
Meneghini66 0
Wattsman5 50
Bhuripanyo97 24.1
Boland10 8.3
Adams12 0
Turnbull25 2.3
Kroenke100 33.3
Muskett28 23.1
Wood32 0.4
Rossello34 3.8

7 Preoperative pregnancy tests
7.1 Characteristics of the resultsIn our search of the literature from 1966 to 2001
we identified a total of seven papers that studied
preoperative (urine) pregnancy tests. All of these
papers reported positive test data and changes in
clinical management and one study reported
postoperative complications. The HTA report did
not include studies of preoperative pregnancy
testing, therefore this review includes only the
seven papers we identified. The characteristics
of the seven papers are summarised in Table 7.1.
All the studies were case series.
The results of the seven papers, which documented
the findings from a total of 4,902 preoperative
pregnancy tests, are summarised in Table 7.2.
The proportion of preoperative pregnancy tests that
were positive varied from 0% in one study107 to
2.2% in a further study.106 In all studies, except
one103, where previously unknown pregnancy was
discovered, all patients with a positive test had a
change in clinical management.102,104-106,107,108
7.2 Variation in the resultsThe variation in the positive test findings may be
explained by the differences in the ages of the study
populations. For example, the highest rate of positive
preoperative pregnancy test findings (2.2%) occurred
in the only study of adults only106 and the lowest
rate (0%) occurred in the study of children aged 10
to 17 years only.107
There were no data to analyse differences in results
according to quality of papers, ASA grade or age.
7.3 Consistency of the results In all but one of the studies, where a positive
preoperative test was identified surgery was always
either cancelled or postponed because of the risk of
fetal injury or loss. In only one patient with a positive
preoperative pregnancy test was surgery carried out
without change in anaesthetic technique (due to the
urgent nature of the operation) and miscarriage
followed surgery.103 Previously unknown pregnancies
were subsequently terminated after surgery had been
cancelled in four of seven women in one study106
and in three of seven women in a further study.105
The changes in clinical management in patients with
positive preoperative pregnancy tests are summarised
in Table 7.3.
72 P R E O P E R A T I V E T E S T S
T A B L E 7.1 Characteristics of eligible studies of preoperative pregnancy testing
First author and Country Study sample Type of surgery Abnormal test Change in clinical Postoperative
year of publication (age) management complications
Hennrikus USA 532 Orthopaedic surgery ✓ ✓ (0)
2001102 (12 to 19 years)
Wheeler USA 261 Not stated ✓ ✓ ✓
1999103 (10 to 34 years)
Pierre USA 801 Not stated ✓ ✓ (0)
1998105 (12 to 21 years)
Twersky USA 315 Not stated ✓ ✓ (0)
1996106 (24 to 35 years)
Azzam USA 412 Not stated ✓ ✓ (0)
1996104 (10.5 to 20 years)
Malviya USA 525 Not stated ✓ ✓ (0)
1995107 (10 to 17 years)
Manley USA 2056 Not stated ✓ ✓ (0)
1995108 (not stated)
(0) not applicable because surgery cancelled in all cases of previously unknown pregnancy

7.4 Is history a reliable marker for pregnancy?Four of the papers addressed the question
of whether history is a reliable marker for
pregnancy.103,105,107,108 In one of the papers, asking
a patient if there was any possibility that she might
be pregnant was found to be a sufficient marker for
pregnancy.107 In this study no previously unknown
pregnancies were identified in a series of 508 10 to
17-year-olds. Although eight patients stated that
there was a possibility that they may be pregnant,
their pregnancy tests were negative. The remaining
three studies found that for all women of child
bearing age, history was not a sufficient marker for
73A P P E N D I X 1
TA
BL
E 7
.2Su
mm
ary
of p
reop
erat
ive
preg
nanc
y te
stin
g st
udy
resu
lts
ST
UD
YN
UM
BE
R O
FA
BN
OR
MA
LC
HA
NG
ES
IN
PO
ST
OP
ER
AT
IVE
PR
OS
PE
CT
IVE
CO
NS
EC
UT
IVE
AS
A G
RA
DE
S
TE
ST
S#
RE
SU
LTS
CL
INIC
AL
MA
NA
GE
ME
NT
CO
MP
LIC
AT
ION
SR
OU
TIN
ED
AT
AR
EC
RU
ITM
EN
TS
TA
TE
D
(N)
N (
%)
N (
%)
N (
%)
Hen
nrik
us10
25
32
5 (
0.9
)5
(0
.9%
)R
outi
ne
only
x✓
x
Whe
eler
10
32
35
3 (
1.3
)3
(1.3
)1
(0
.4)
Routi
ne
only
✓x
x
Pier
re10
58
01
4 (
0.5
)4
(0
.5)
Routi
ne
only
xx
x
Twer
skey
10
631
57
(2
.2)
7 (
2.2
)R
outi
ne
only
✓✓
x
Azz
am10
4
412
5 (
1.2
)5
(1.2
)R
outi
ne
only
✓x
x
Mal
viya
107
50
80
0R
outi
ne
only
✓x
x
Man
ley1
08
20
56
7 (
0.3
)7
(0
.3)
Routi
ne
only
✓x
x
#Th
e num
ber
of
test
s ca
rrie
d o
ut
may
dif
fer
from
the
sam
ple
siz
e in
som
e st
udie
s. T
his
occ
urs
in p
aper
s re
port
ing t
he
resu
lts
of
mult
iple
pre
oper
ativ
e te
sts
bec
ause
not
all
of
pat
ients
in t
he
study
sam
ple
rec
eive
d a
ll th
e pre
oper
ativ
e te
sts
det
aile
d i
n t
he
pap
er
TA
BL
E 7
.3Ch
ange
s in
clin
ical
man
agem
ent
in p
atie
nts
(%)
wit
h po
siti
vepr
eope
rati
ve p
regn
ancy
tes
ts
Chan
ge in
clin
ical
man
agem
ent
Hen
nrik
us10
2W
heel
er10
3Pi
erre
10
5M
anle
y10
8Tw
ersk
y10
6A
zzam
10
4
Surg
ery
post
poned
10
0 (
n=
5)
67
(n=
2)
10
0 (
n=
4)
10
0 (
n=
7)
10
0 (
n=
7)
60
(n=
3)
Anae
sthet
ic t
echniq
ue
alte
red
40
(n=
2)

pregnancy.103,105,108 For example, in one of the
studies, seven previously unknown pregnancies were
identified in a series of 2056 women of child bearing
age. In all seven cases, the women had denied the
possibility of pregnancy in preoperative interview.108
In another of the studies where four previously
unknown pregnancies were identified in a series of
801 adolescents aged 12 to 21 years, three of the
four patients denied the possibility of pregnancy and
two of the four patients denied being sexually
active.105 In the third of the studies, three previously
unknown pregnancies were identified in a series of
235 women aged 10 to 34 years.
8 Preoperative sickle cell testsIn our search of the literature from 1966 to 2001
we did not identify any papers that reported primary
outcome data for children or adults undergoing
elective surgery who had had generic (‘routine’)
preoperative sickle cell tests.
9 Preoperative lung function tests
9.1 Characteristics of the studiesIn our search of the literature from 1966 to 2001,
we identified a total of ten papers that studied
preoperative lung function tests. All of these papers
reported abnormal outcome data, none reported
changes in clinical management and eight reported
postoperative complications. The characteristics of
the ten papers are summarised in Table 9.1. All the
identified studies were case series.
The results of the ten studies, which documented the
findings from a total of 2,407 preoperative lung
function tests, are summarised in Table 9.2.
74 P R E O P E R A T I V E T E S T S
T A B L E 9 .1 Characteristics of the eligible studies of preoperative lung function tests
First author and Country Study sample Type of surgery Abnormal test Change in clinical Postoperative
year of publication (age) management complications
Brady USA 820 Vascular ✓ ✓
2000109 (60 to 80 years)
Chandra USA 22 Cardiac ✓
1998110 (14 to 52 years)
Kuwano India 178 Oncology ✓ ✓
1998111 (not stated)
Barisione Italy 361 Laparotomy ✓ ✓
1997112 (25 to 91 years)
Castro USA 362 Liver transplant ✓
1996113 (not stated)
Durand France 114 Vascular ✓ ✓
1994114 (53 to 75 years)
Durand France 149 Cardiac ✓ ✓
1993115 (58 to 60 years)
Poe USA 209 Cholecystectomy ✓ ✓
1988116 (20 to 70 years)
Kim Korea 78 Abdominal surgery ✓ ✓
1987117 (not stated)
Crapo USA 114 Gastrointestinal ✓ ✓
1986118 (29 to 46 years)

75A P P E N D I X 1
TA
BL
E 9
.2Su
mm
ary
of p
reop
erat
ive
lung
fun
ctio
n te
st r
esul
ts
FIR
ST
NU
MB
ER
OF
AB
NO
RM
AL
CH
AN
GE
S I
NP
OS
TO
PE
RA
TIV
EP
RO
SP
EC
TIV
EC
ON
SE
CU
TIV
EA
SA
GR
AD
ES
AU
TH
OR
TE
ST
S#
RE
SU
LTS
CL
INIC
AL
MA
NA
GE
ME
NT
CO
MP
LIC
AT
ION
SR
OU
TIN
ED
AT
AR
EC
RU
ITM
EN
TS
TA
TE
D
(N)
N (
%)
N (
%)
N (
%)
Brad
y10
98
20
376
(45
.9)
22
(2
.7)
Not
stat
edx
xx
Chan
dra1
10
22
Res
tric
tive
16
(7
2.7
)N
ot
stat
ed✓
xx
Obst
ruct
ive
6
(27.
2)
Kuw
ano1
1117
87
3(4
1.0
)4
3(2
4.2
)N
ot
stat
edx
xx
Baris
ione
112
361
Res
tric
tive
91(2
5.2
) R
estr
icti
ve
1
(0.3
) N
ot
stat
edx
✓x
Obst
ruct
ive
79
(21.9
)O
bst
ruct
ive
3
5
(9.7
)
Cast
ro11
33
62
Res
tric
tive
56
(15
.5)
Not
stat
edx
xx
Obst
ruct
ive
23
(6.4
)
Dur
and1
1411
4FE
V1
14(1
2.0
)N
ot
stat
edx
✓x
VC
15(1
3.0
)
FEV
1:V
C3
8(3
3.0
)
Dur
and1
1514
9FE
V1
9(6
.0)
FEV
13
(2
.0)
Not
stat
edx
✓x
VC
23
(1
5.4
)V
C
5
(3.4
)
Poe1
16
20
9FE
V1
5(2
.4)
31
(14
.8%
)N
ot
stat
ed✓
xx
VC
16
(7.7
)
Kim
117
78
FEV
15
(6
.4)
5
(6.4
)N
ot
stat
edx
xx
Crap
o118
114
FEV
16
(5
.3)
4
(3.5
)N
ot
stat
ed✓
✓x
VC
4
(3
.5)
FEV
1:V
C7
(6.1
)
FEV
1=
forc
ed e
xpir
atory
volu
me
in 1
sec
ond; V
C =
vit
al c
apac
ity;
FEV
1:V
C =
rat
io o
f fo
rced
exp
irat
ory
volu
me
in 1
sec
ond t
o v
ital
cap
acit
y

Table 9.2 shows that the proportion of abnormal
preoperative lung function tests varied greatly across
studies. For restrictive disease the proportion of
abnormal preoperative lung function tests ranged
from 15.5%113 to 72.7%.110 For obstructive disease
the proportion of abnormal preoperative lung
function tests ranged from 6.4%113 to 27.2%.110
The proportion of patients who suffered postoperative
complications ranged from 0.3% in patients with
restrictive disease112 to 24.2% in patients with either
restrictive or obstructive disease.111
For the different preoperative lung function tests
individually, the proportion of abnormal preoperative
FEV1 tests ranged from 2.4%116 to 12.0%.114
The proportion of abnormal preoperative VC tests
ranged from 3.5%118 to 15.4%.115 The proportion
of patients with an abnormal preoperative FEV1:VC
ratio ranged from 6.1%118 to 33.3%.114
As described in Section 1, the wide variation in
the results may be explained at least in part by
heterogeneity in the study populations. The impact of
four major sources of heterogeneity on the outcome
of the preoperative lung function test studies will be
considered separately in the following sections.
9.2 Heterogeneity in the quality of thestudy designAs described in Section 1, studies in which data
are collected prospectively and in which patients
are recruited consecutively are less susceptible
to bias than studies in which data are collected
retrospectively or where patients are recruited
selectively. Therefore, we hypothesised that the
proportions of abnormal preoperative lung function
tests and postoperative complications might differ
according to the quality of the study design.
76 P R E O P E R A T I V E T E S T S
T A B L E 9 . 3 Summary of abnormal lung function tests and postoperativecomplications in study populations according to study quality indicators
Q U A L I T Y % A B N O R M A L T E S T % P O S T O P E R A T I V E C O M P L I C A T I O N S
I N D I C A T O R (Number of Studies) (Number of Studies)
Mean* Maximum Minimum Mean* Maximum Minimum
P C
P N
R C
R N
P = prospective data collection; R = retrospective data collection; C = consecutive recruitment of patients;
N = nonconsecutive recruitment of patients; *weighted means were produced to reflect the different numbers of patients in each
study. It was not possible to produce a distributional statistic reflecting this weight. #restrictive and obstructive disease combined
2.7#24.2#6.5 (2)#
FEV1 3.5 (1)
41.0#45.9#
45.0 (2)#
Restrictive 15.5 (1)
Obstructive 6.4 (1)
FEV1 6.4 (1)
Restrictive 0.3 (1)
Obstructive 9.7 (1)
FEV1 2.0 (1)
VC 3.4 (1)
FEV1
6.0V
C 13.0
FEV1 12.0
VC 15.4
Restrictive 25.2 (1)
Obstructive 21.9 (1)
FEV1 8.6 (2)
VC 14.4 (2)
FEV11:VC 33.0 (1)
14.8 (1)Restrictive 72.7 (1)
Obstructive 27.2 (1)
FEV1 2.4 (1)
VC 7.7 (1)
3.5
FEV1 5.3 (1)
VC 3.5 (1)
FEV1:VC 6.1 (1)

We investigated the effects of variations in the
quality of the study design on the proportions of
abnormal lung function tests and postoperative
complications across the identified studies. One
study collected data prospectively and recruited
consecutive patients,118 two studies collected data
prospectively and did not state that the sample of
patients was consecutive,110,116 three studies
collected data retrospectively for a sample of
consecutive patients112,114,115 and four studies
collected data retrospectively and did not state that
the sample of patients was consecutive.109,111,113,117
The results from these studies are summarised
in Table 9.3.
Table 9.3 shows that there were too few studies
within each of the quality indicator categories to
be able to compare trends in the proportions of
abnormal preoperative lung function tests and
postoperative complications across the studies.
9.3 Heterogeneity in the composition of thestudy population
9.3.1 Age range
Given that the prevalence of comorbid diseases
increases with age, we hypothesised that the
proportion of patients with abnormal preoperative
lung function tests would be higher in studies of
older patient populations.
We investigated the effects of variations in the age
range of the study population on the proportions
of abnormal preoperative lung function tests and
postoperative complications across the identified
studies. Six studies included adults only,109,112,114-
116,118 one of which was in adults aged 60 years
and over,109 one study included both adults
and children110 and the remaining three studies
did not specify the age range of their patient
populations.111,113,117 Table 9.4 provides a summary
of the proportions of abnormal preoperative
lung function tests and postoperative complications
across studies according to the age group of the
study population.
Table 9.4 shows that there were too few studies
within each of the age group categories to be able
to compare trends in the proportions of abnormal
preoperative lung function tests and postoperative
complications across the studies.
None of the studies stratified the proportion of
abnormal lung function tests according to age,
77A P P E N D I X 1
T A B L E 9 . 4 Summary of abnormal preoperative lung function tests andpostoperative complications in study populations by age group
A G E % A B N O R M A L T E S T % P O S T O P E R A T I V E C O M P L I C A T I O N S
R A N G E (Number of Studies) (Number of Studies)
Mean* Maximum Minimum Mean* Maximum Minimum
Adults only
Not stated
*weighted means; #data for restrictive and obstructive disease combined; $data for FEV1 and VC combined.
2.7#24.2#24.2 (1)#
FEV1 3.5 (1)
41.0 (1)#
Restrictive 15.5 (1)
Obstructive 6.4 (1)
FEV1 6.4 (1)
(0)Restrictive 72.7 (1)
Obstructive 27.2 (1)
Children
& adults
3.5 $14.8 $
Restrictive 0.3 (1)
Obstructive 9.7 (1)
FEV1 2.0 (1)
VC 3.4 (1)
9.2 (2) $
FEV1 2.4 (4)
VC 3.5 (4)
FEV1:VC 6.1 (2)
FEV1 12.0 (4)
VC 15.4 (4)
FEV1:VC 33.0 (2)
Restrictive 25.2 (1)
Obstructive 21.9 (1)
FEV1 5.7 (4)
VC 9.9 (4)
FEV1:VC 19.6 (2)
2.7 (1)45.9 (1)Adult
> 60 years

therefore it was not possible to assess the impact of
different age groups within each study population
on the results.
9.3.2 ASA grades
We hypothesised that the proportion of patients with
abnormal preoperative lung function tests would be
greater in studies of patients with higher ASA grades.
However, none of the studies of preoperative lung
function tests reported the ASA grades of the
patients in the study population. Therefore, it was
not possible to assess the impact of different ASA
grades either across or within each study population
on the results.
9.4 Heterogeneity in criteria forpreoperative testingAlthough authors did not state their definitions of
‘routine’ preoperative tests, we have assumed a
routine preoperative investigation to be a test carried
out on all patients preoperatively that is not directly
related to the planned procedure or the patients’
condition. In some studies, authors included patients
undergoing routine preoperative tests as well as
patients undergoing indicated preoperative tests.
None of these studies presented the proportions
of abnormal preoperative tests and postoperative
complications separately for patients who had
routine tests and for patients who had indicated
tests, instead the data were combined for both
groups of patients. Therefore, we hypothesised that
the proportions of abnormal preoperative lung
function tests and postoperative complications would
be lower in study populations where all the patients
had routine preoperative lung function tests
compared to study populations containing patients
undergoing either routine or indicated preoperative
lung function tests. However, none of the studies
of preoperative lung function tests included their
criteria for carrying out the preoperative lung
function test. Therefore, it was not possible to assess
the impact of the criteria for testing on the results
either across or within each study population.
9.5 Heterogeneity in the definition of theoutcome variables
9.5.1 Definition of an abnormal lung function tests
We investigated the variability of the definition of
normal/abnormal preoperative lung function tests
across the identified studies. Eight papers reported
definitions of an abnormal lung function test. The
reported definitions are summarised in Table 9.5.
Table 9.5 shows that the definitions of an abnormal
lung function test were not consistent across the
studies. However, the differences in the definitions
were small and, therefore, were not likely to have
been a great source of heterogeneity across
the studies.
9.5.2 Definition of a change in clinical management
None of the studies of preoperative lung function
tests reported changes in clinical management
in patients who had abnormal results.
9.5.3 Definition of postoperative complications
We investigated the variability of the definition of a
postoperative complication in patients who had had
a preoperative lung function test. Eight studies
reported postoperative complications in patients who
had had preoperative ECGs. Each of these eight
studies specified definitions of postoperative
complications. These definitions are summarised
in Table 9.6.
78 P R E O P E R A T I V E T E S T S

79A P P E N D I X 1
T A B L E 9 . 5 Summary of the definitions of an abnormal preoperative lungfunction test
1 2 3 4 5 6 7 8
FEV1
FEV1 < 70% of theoretical values ✓ ✓
FEV1 < 1.5 l ✓
FEV1 < 1.0 litre ✓
FEV1 < 1 95% confidence interval below the predicted value ¸
VC
VC < 75% of theoretical values ✓
VC < 80% ✓
VC < 2.5 litre ✓¸
VC < 1 95% confidence interval below the predicted value
FEV1:VC
FEV1:VC < 65% of theoretical values ¸
FEV1:VC < 1 95% confidence interval below the predicted value ✓
Obstructive disease
Observed values < 80% of the predicted values for
FVC, FEV1, MEF, PEFR and MVV ✓
FEV1:IVC below normal range ✓
FEV1:FVC 2SD below the predicted normal range ✓
Restrictive disease
Observed FVC value > 80% of predicted value and
FEV1:FVC ratio < 70% of predicted value ✓
TLC < lower limit of normal range ✓
TLC 2 SD below the predicted normal value ✓
1: Chandra110; 2:Kuwano111; 3: Barisione112; 4: Castro113;
5: Durand (1994)114; 6: Durand (1993)115; 7: Kim117; 8: Crapo118.
VC = forced vital capacity; FEV1 = forced expiratory volume in one
second; MEF = mid expiratory flow rate; PEFR = peak expiratory flow
rate; MVV = maximum volume ventilation; IVC = inspiratory vital
capacity; TLC = total lung capacity.

Table 9.6 shows that the range of postoperative
complications were not clearly reported across the
studies. Therefore, these data are difficult to interpret.
9.6 Diagnostic accuracyNone of the studies investigated the diagnostic
accuracy of the preoperative lung function tests.
Given that none of the studies reported data for
changes in clinical management in patients who had
had preoperative lung function tests, it was not
possible to calculate positive predictive values for
predicting a change in clinical management for
any of the studies.
10 Preoperative blood gas tests
10.1 Characteristics of the studiesIn our search of the literature from 1966 to 2001,
we identified a total of four papers that studied
preoperative blood gas tests. All of these papers
reported abnormal outcome data, one reported
changes in clinical management and three reported
postoperative complications. The characteristics of
the four papers are summarised in Table 10.1.
All the identified studies were case series.
The results of the four studies, which documented
the findings from a total of 372 preoperative blood
gas tests, are summarised in Table 10.2.
80 P R E O P E R A T I V E T E S T S
T A B L E 9 . 6 Summary of the postoperative complications (%) in patients who hadhad a preoperative lung function test
Postoperative complication 1 2 3 4 5 6 7 8
Death within 30 days of surgery 2.7 3.4 1.8 4.7 0 0.9
Pulmonary complications (atelectasis, bronchitis, pneumonia) 7.9 15.0 14.8 6.4
Severe respiratory complications: atelectasis, pleural
effusion/infection, chest infection, productive cough,
dyspnoea, chest pain or discomfort, tachycardia, acute
respiratory failure, requirement for intubation 10.0
Cardiac complications 12.0
Renal failure 11.0
Any complications 12.9 2.6
Total 2.7 24.2 10.0 n/s n/s 14.8 6.4 3.5
1: Brady109; 2: Kuwano111; 3: Barisione112; 4: Durand (1994)114;
5: Durand (1993)115; 6: Poe116; 7: Kim117; 8: Crapo118; n/s not stated.
T A B L E 10 .1 Characteristics of the eligible studies of preoperative blood gas tests
First author and Country Study sample Type of surgery Abnormal test Change in clinical Postoperative
year of publication (age) management complications
Durand France 149 Cardiac ✓ ✓
1993115 (58 to 60 years)
Durand France 114 Vascular ✓ ✓
1994114 (53 to 75 years)
Kim Korea 78 Abdominal surgery ¸ ✓
1987117 (not stated)
Turnbull Canada 1010 Cholecystectomy ✓ ✓
198725 (not stated)

Table 10.2 shows that the proportion of abnormal
preoperative blood gas tests varied across studies.
For example, the proportion of abnormal
preoperative PaO2 tests ranged from 0%25 to
22.0%.114 There were no changes in clinical
management in the single study that reported this
outcome measure.25 The proportion of patients who
suffered postoperative complications ranged from
1.8% in one study115 to 5.1% in a further study.117
As described in Section 1, the variation in the results
may be explained at least in part by heterogeneity
in the study populations. The impact of four major
sources of heterogeneity on the outcome of the
preoperative blood gas test studies will be considered
separately in the following sections.
10.2 Heterogeneity in the quality of thestudy designAs described in Section 1, studies in which data are
collected prospectively and in which patients are
recruited consecutively are less susceptible to
bias than studies in which data are collected
retrospectively or where patients are recruited
selectively. Therefore, we hypothesised that the
proportions of abnormal preoperative blood gas
tests, changes in clinical management and
postoperative complications might differ according
to the quality of the study design.
We investigated the effects of variations in the
quality of the study design on the proportions of
abnormal blood gas tests, changes in clinical
management and postoperative complications across
the identified studies. One study collected data
prospectively and did not state that the sample of
patients was consecutive,25 two studies collected
data retrospectively for a sample of consecutive
patients114,115 and one study collected data
retrospectively and did not state that the sample
of patients was consecutive.117 The results from
these studies are summarised in Table 10.3.
81A P P E N D I X 1
TA
BL
E 1
0.2
Sum
mar
y of
pre
oper
ativ
e bl
ood
gas
test
res
ults
FIR
ST
AU
TH
OR
NU
MB
ER
OF
AB
NO
RM
AL
CH
AN
GE
S I
NP
OS
TO
PE
RA
TIV
EP
RO
SP
EC
TIV
EC
ON
SE
CU
TIV
EA
SA
GR
AD
ES
TE
ST
S#
RE
SU
LTS
CL
INIC
AL
MA
NA
GE
ME
NT
CO
MP
LIC
AT
ION
SR
OU
TIN
ED
AT
AR
EC
RU
ITM
EN
TS
TA
TE
D
(N)
N (
%)
N (
%)
N (
%)
Dur
and1
1411
4PaO
22
5 (
22
.0)
Not
stat
edx
✓x
Dur
and1
1514
9PaO
28
(5
.4)
PaO
22
(
1.8
)N
ot
stat
edx
✓x
Kim
117
78
PaO
26
(7.
7)
PaO
24
(
5.1
)N
ot
stat
edx
xx
Turn
bull2
531
PaO
2&
PaC
O2
0 (
0)
Not
stat
ed✓
xx
0 (
0)

Table 10.3 shows that there were too few studies
within each of the quality indicator categories to be
able to compare trends in the proportions of
abnormal preoperative blood gas tests and
postoperative complications across the studies.
10.3 Heterogeneity in the composition of thestudy population
10.3.1 Age range
Given that the prevalence of comorbid diseases
increases with age, we hypothesised that the
proportion of patients with abnormal preoperative
blood gas tests would be higher in studies of older
patient populations.
We investigated the effects of variations in the age
range of the study population on the proportions
of abnormal preoperative blood gas tests, changes
in clinical management and postoperative
complications across the identified studies. Two
studies included adults only114,115 and the remaining
two studies did not specify the age range of their
patient population.25,117 Table 10.4 provides a
summary of the proportions of abnormal preoperative
blood gas tests, changes in clinical management and
postoperative complications across studies according
to the age group of the study population.
Table 10.4 shows that there were too few studies
within each of the age group categories to be able
to compare trends in the proportions of abnormal
preoperative blood gas tests and postoperative
complications across the studies.
None of the studies stratified the proportion of
abnormal blood gas tests according to age, therefore
it was not possible to assess the impact of the
different age groups within each study population
on the results.
82 P R E O P E R A T I V E T E S T S
T A B L E 10 . 3 Summary of abnormal blood gas tests, changes in clinical managementand postoperative complications in study populations according tostudy quality indicators
Q U A L I T Y % A B N O R M A L T E S T % C H A N G E I N C L I N I C A L % P O S T O P E R A T I V E
I N D I C A T O R (Number of Studies) M A N A G E M E N T C O M P L I C A T I O N S
(Number of Studies) (Number of Studies)
Mean* Maximum Minimum Mean* Maximum Minimum Mean* Maximum Minimum
P N 0 (1) 0 (1) (0)
R C 13.7 (2) 22.0 5.4 (0) 1.8 (1)
R N 7.7 (1) (0) 5.1 (1)
P = prospective data collection; R = retrospective data collection; C = consecutive recruitment of patients; N = recruitment of
patients that was not stated as consecutive; * weighted means were produced to reflect the different numbers of patients in each
study. It was not possible to produce a distributional statistic reflecting this weight.
T A B L E 10 . 4 Summary of abnormal preoperative blood gas tests, changes in clinicalmanagement and postoperative complications in study populationsby age group
A G E % A B N O R M A L T E S T % C H A N G E I N C L I N I C A L % P O S T O P E R A T I V E
R A N G E (Number of Studies) M A N A G E M E N T C O M P L I C A T I O N S
(Number of Studies) (Number of Studies)
Mean* Maximum Minimum Mean* Maximum Minimum Mean* Maximum Minimum
Adults only 13.7 (2) 22.0 5.4 (0) 1.8 (1)
Not stated 3.9 (2) 7.7 0 0 (1) 5.1 (1)
*weighted means

10.3.2 ASA grades
We hypothesised that the proportion of patients with
abnormal preoperative blood gas tests would be
greater in studies of patients with higher ASA grades.
However, none of the studies of preoperative blood
gas tests reported the ASA grades of the patients in
the study population. Therefore, it was not possible
to assess the impact of different ASA grades either
across or within each study population on the results.
10.4 Heterogeneity in criteria forpreoperative testingAlthough authors did not state their definitions
of ‘routine’ preoperative tests, we have assumed a
routine preoperative investigation to be a test carried
out on all patients preoperatively that is not directly
related to the planned procedure or the patients’
condition. In some studies, authors included patients
undergoing routine preoperative tests as well as
patients undergoing indicated preoperative tests.
None of these studies presented the proportions of
abnormal preoperative tests, changes in clinical
management and postoperative complications
separately for patients who had routine tests and for
patients who had indicated tests, instead the data
were combined for both groups of patients. Therefore,
we hypothesised that the proportions of abnormal
preoperative blood gas tests, changes in clinical
management and postoperative complications would
be lower in study populations where all the patients
had routine preoperative blood gas tests compared to
study populations containing patients undergoing
either routine or indicated preoperative blood gas
tests. However, none of the studies of preoperative
blood gas tests included their criteria for carrying out
the test. Therefore, it was not possible to assess the
impact of the criteria for testing on the results either
across or within each study population.
10.5 Heterogeneity in the definition of theoutcome variables
10.5.1 Definition of an abnormal blood gas tests
We investigated the variability of the definition of
normal/abnormal preoperative blood gas tests
across the identified studies. Three papers reported
definitions of an abnormal blood gas test. The
reported definitions are summarised in Table 10.5.
Table 10.5 shows that the definitions of an abnormal
blood gas test were not consistent across the studies.
However, the differences in the definitions were
small and, therefore, were not likely to have been a
great source of heterogeneity across the studies.
10.5.2 Definition of a change in clinical managementOnly one of the four studies of preoperative blood
gas tests reported changes in clinical management in
patients who had abnormal results and no definition
of what constituted a change in clinical management
was presented.25
10.5.3 Definition of postoperative complicationsWe investigated the variability of the definition of a
postoperative complication in patients who had had
a preoperative blood gas test. Two of the four studies
reported postoperative complications in patients who
had had preoperative blood gas tests. Both of these
studies specified definitions of postoperative
complications (Table 10.6).
83A P P E N D I X 1
T A B L E 10 . 5 Summary of the definitions ofan abnormal preoperativeblood gas test
Durand Durand
(1994)114 (1993)115 Kim117
Pa02
< 9 kPa ✓
< 8.5 kPa ✓
< 65 mmHg ✓
T A B L E 10 . 6 Summary of the postoperativecomplications (%) in patientswho had had preoperativeblood gas tests
Durand
Postoperative complication (1994)114 Kim117
Postoperative mortality 1.8
Pulmonary complications (atelectasis,
respiratory failure, mild hypoxaemia) 5.1
Total 1.8 5.1

Table 10.6 shows that the definitions of
postoperative complications reported in the two
studies differed.
10.6 Diagnostic accuracyNone of the studies investigated diagnostic accuracy
of the preoperative blood gas test for predicting
changes in clinical management. However, from the
data presented it was possible to calculate a positive
predictive value for predicting a change in clinical
management for one paper. The positive predictive
value indicates the percentage of patients with
abnormal preoperative blood gas tests who
subsequently underwent changes in clinical
management. In the single study where it was
possible to calculate this value, the positive predictive
value of preoperative blood gas tests for predicting
a change in clinical management was 0%.25
TABLE A1.i Search Terms for Medline for All Tests
No. Search strategy
Type of patient settig
1. explode ‘Ambulatory-Care’/all subheadings in
MIME,MJME
2. explode ‘Ambulatory-Surgical-Procedures’/all
subheadings in MIME,MJME
3. explode ‘Surgical-Procedures-Elective’/all
subheadings in MIME,MJME
4. explode ‘Preoperative-Care’/all subheadings in
MIME,MJME
5. ‘Surgery-’/all subheadings in MIME,MJME
6. elective surg*
7. ambulatory surg*
8. preop or pre-op or preoperative or pre operative
or preoperative
9. 1 or 2 or 3……… or 8
Diagnostic tests study designs
10. ‘Diagnostic-Tests-Routine’/all subheadings in
MIME,MJME
11. (diagnostic or laboratory) near (test or tests or
testing)
12. explode ‘Sensitivity-and-Specificity’/all
subheadings in MIME,MJME
13. ‘ROC-Curve’/all subheadings in MIME,MJME
14. ‘Predictive-Value-of-Tests’/all subheadings in
MIME,MJME
15. explode ‘Mass-Screening’/all subheadings in
MIME,MJME
16. sensitivit*
17. specificit*
18. predictive value*
19. accuracy
20. likelihood ratio*
21. screening
22. false negative*
23. 10 or 11 or 12……… or 22
Excluded citation terms
24. (animal in tg) not ((human and animal) in tg)
25. (comment or editorial or letter or news) in pt)
26. 24 or 25
Combination of above terms
27. (9 and 23) not 26
The terms for each test were combined using the
AND boolean operator with the above search strategy
Search Terms for Medline for Specific Tests
Phase A TestsChest x-rays
1 ‘Radiography-’/all subheadings in MIME,MJME
2 explode ‘Radiography-Thoracic’/all subheadings in
MIME,MJME
3 (chest or thoracic) and (xray* or x-ray* or
radiograph* or roentgenography)
4 1 or 2 or 3
ECG
1. explode ‘Electrocardiography-’/all subheadings
in MIME,MJME
2. ecg or electrocardiogra*
3. 1 or 2
Haemoglobin and Blood Counts
1. explode ‘Hemoglobins-’/all subheadings in
MIME,MJME
2. hemoglobin* or haemoglobin*
3. explode ‘Blood-Cell-Count’/all subheadings in
MIME,MJME
4. blood count
5. white blood cell count
6. leukocyte count
7. platelet count
8. 1 or 2 or 3 ……….. or 7
84 P R E O P E R A T I V E T E S T S

Haemostasis
1. ‘Hemostasis-’/all subheadings in MIME,MJME
2. ‘Hemostasis-Surgical’/all subheadings in
MIME,MJME
3. ‘Hematologic-Tests’/all subheadings in
MIME,MJME
4. haemostasis or hemostasis
5. hematologic test* or haematologic test*
6. explode ‘Blood-Coagulation-Tests’/all
subheadings in MIME,MJME
7. ‘Blood-Coagulation’/all subheadings in
MIME,MJME
8. blood coagulation test*
9. partial thromboplastin time or PTT
10. international normalized ratio or international
normalised ratio or INR
11. prothrombin time
12. bleeding time
13. whole blood coagulation time
14. 1 or 2 or 3……….or 13
Biochemistry Tests
1. ‘Biochemistry-’/all subheadings in MIME,MJME
2. ‘Blood-Chemical-Analysis’/all subheadings in
MIME,MJME
3. ‘Glucose-Tolerance-Test’/all subheadings in
MIME,MJME
4. glucose tolerance or glucose test or glucose tests
5. ‘Diagnostic-Techniques-Urological’/all
subheadings in MIME,MJME
6. ‘Urinalysis-’/all subheadings in MIME,MJME
7. urine analysis or urinalysis or dipstick
8. ‘Kidney-Function-Tests’/all subheadings in
MIME,MJME
9. (kidney function or renal function) near (test or
tests or testing)
10. ‘Electrolytes-’/all subheadings in MIME,MJME
11. electrolyte*
12. ‘Creatinine-’/all subheadings in MIME,MJME
13. creatinine
14. ‘Blood-Urea-Nitrogen’/all subheadings in
MIME,MJME
15. blood urea nitrogen
16. 1 or 2 or 3 ………or 15
Blood Sugar
1. ‘Blood-Glucose’/all subheadings in MIME,MJME
2. blood sugar or blood glucose
3. glucose test*
4. 1 or 2 or 3
Pregnancy Tests
1. explode ‘Pregnancy-Tests’/all subheadings in
MIME,MJME
2. pregnancy test or pregnancy tests
3. 1 or 2
Sickle Cell
1. explode ‘Hemoglobinopathies-’/all subheadings
in MIME,MJME
2. hemoglobinopath* or haemoglobinopath*
3. sickle cell
4. 1 or 2 or 3
Phase B TestsRespiratory Function Tests
1. ‘Respiratory Function Tests’/all subheadings in
MIME,MJME
2. ‘Airway-Resistance’/all subheadings in
MIME,MJME
3. ‘Lung-Volume-Measurements’/all subheadings in
MIME,MJME
4. ‘Vital-Capacity’/all subheadings in MIME,MJME
5. explode ‘Forced-Expiratory-Flow-Rates’/all
subheadings in MIME,MJME
6. explode ‘Forced-Expiratory-Volume’/all
subheadings in MIME,MJME
7. (pulmonary function or respiratory function or
lung function) near (test or tests or testing)
8. forced expiratory volume or fev
9. peak expiratory flow rate or pef
10. forced expiratory flow rate*
11. vital capacity or VC
12. 1 or 2 or 3 ……….. or 11
Blood Gases
1. explode ‘Blood-Gas-Analysis’/all subheadings in
MIME,MJME
2. blood gas or blood gases
3. 1 or 2
Search Terms for All Embase TestsType of patient setting
1. “Elective-Surgery”/all subheadings
2. “Ambulatory-Surgery”/all subheadings
3. explode “Preoperative-Period”/all subheadings
85A P P E N D I X 1

4. explode “Ambulatory-Care”/ all subheadings
5. “Surgery”/ all subheadings
6. preop or pre-op or preoperative or preoperative
or “pre operative”
7. elective surg*
8. ambulatory surg*
9. 1 or 2 or 3 ………or 8
Diagnostic tests study designs
10. “Sensitivity-and-Specificity”/ all subheadings
11. explode “Prediction-and-Forecasting”/ all
subheadings
12. explode “Mass-Screening”/ all subheadings
13. sensitiv*
14. specificit*
15. predictive value*
16. accuracy
17. likelihood ratio*
18. screening
19. false negative*
20. “Diagnostic Test”/ all subheadings
21. (diagnostic or laboratory) near (test or tests or
testing)
22. 10 OR 11 OR 12…….OR 21
Excluded citation terms
23. (animal in tg) not ((human and animal) in tg)
Combination of above terms
24. (9 and 22) not 23
The terms for each test were combined using the
AND boolean operator with the above search strategy
Search Terms for Embase for Specific Tests
Phase A TestsChest x-rays
1. ‘Radiography-’/all subheadings
2. explode ‘Thorax-Radiography’/all subheadings
3. (chest or thoracic) and (xray* or x-ray* or
radiograph* or roentgenography)
4. 1 or 2 or 3
ECG
1. ‘Electrocardiography-’/all subheadings
2. ecg or electrocardiogra*
3. 1 or 2
Haemoglobin and Blood Counts
1. explode ‘Hemoglobins-’/all subheadings
2. hemoglobin* or haemoglobin*
3. explode ‘Blood-Cell-Count’/all subheadings
4. blood count
5. white blood cell count
6. leukocyte count
7. platelet count
8. 1 or 2 or 3 ……….. or 7
Haemostasis
1. ‘Hemostasis-’/all subheadings
2. ‘Blood-Examination’/all subheadings
3. haemostasis or hemostasis
4. hematologic test* or haematologic test*
5. explode ‘Blood-Clotting-Tests’/all subheadings
6. ‘Blood-Coagulation’/all subheadings
7. blood coagulation test*
8. partial thromboplastin time or PTT
9. international normalized ratio or international
normalised ratio or INR
10. prothrombin time
11. bleeding time
12. whole blood coagulation time
13. 1 or 2 or 3……….or 12
Biochemistry Tests
1. ‘Biochemistry-’/all subheadings
2. ‘Blood-Chemistry’/all subheadings
3. explode ‘Glucose-Tolerance-Test’/all subheadings
4. glucose tolerance or glucose test or glucose tests
5. ‘Diagnostic-Techniques-Urological’/all
subheadings
6. explode ‘Urinalysis-’/all subheadings
7. urine analysis or urinalysis or dipstick
8. ‘Kidney-Function-Tests’/all subheadings
9. (kidney function or renal function) near (test or
tests or testing)
10. ‘Electrolytes-’/all subheadings
11. electrolyte*
12. ‘Creatinine-’/all subheadings
13. creatinine
14. ‘Urea-Nitrogen-Blood-Level’/all subheadings
15. blood urea nitrogen
16. 1 or 2 or 3 ………or 15
86 P R E O P E R A T I V E T E S T S

Blood Sugar
1. “Glucose-Blood-Level”/ all subheadings
2. blood sugar or blood glucose
3. glucose test*
4. 1 or 2 or 3
Pregnancy Tests
1. explode ‘Pregnancy-Tests’/all subheadings
2. pregnancy test or pregnancy tests
3. 1 or 2
Sickle Cell
1. explode ‘Hemoglobinopathies-’/all subheadings
2. hemoglobinopath* or haemoglobinopath*
3. sickle cell
4. 1 or 2 or 3
Phase B TestsRespiratory Function Tests
1. “Lung-Function-Test”/ all subheadings
2. explode “Lung-Volume”/ all subheadings
3. explode “Respiratory-Airflow”/ all subheadings
4. (pulmonary function or respiratory function or
lung function) near (test or tests or testing)
5. peak expiratory flow or pef
6. forced expiratory flow
7. forced expiratory volume or fev
8. vital capacity or vc
9. forced respiratory function
10. 1 or 2 or 3 ……….. or 9
Blood Gases
1. explode “Blood-Gas-Analysis”/ all subheadings
2. blood gas or blood gases
3. 1 or 2
Search Terms to Filter Economic Papers from SearchResults for Medline and Embase
cost OR costs OR cost-effective OR cost-effectiveness
OR costeffective OR costeffectiveness OR cost-benefit
OR benefit-cost OR cost-effect* OR costeffect* OR
cost-benefi* OR benefit-cost* OR benefitcost* OR
costbenefi* OR cost-utility OR economic OR cost-
utility* OR costutility* OR economics OR econom*
OR economics[MESH] OR “cost-effective” OR “cost-
effectiveness” OR “cost-benefit” OR “benefit-cost” OR
“cost-utility”OR costing OR costings OR costed OR
QALY OR life-year OR “life year”
TABLE A1.ii: Data extraction formStudy ID, authors
Type of paper
Year
Country
Tests considered
Population from which sample was drawn
Number
Age group
Diagnostic group
Study design
Clinical Setting
Surgical Specialities
Inclusion/exclusion criteria
Methods
Objectives specified in methods section
Outcomes specified in methods section (incl process,
criteria etc)
Prospective or retrospective data collection
Recruitment of consecutive patients
Test status: routine; indicated or mixture
Results
Number of tests performed
Results of tests
Number of abnormal results
Number of ‘significant’ abnormal results (?)
Outcome (process, criteria etc) if in results
Type of management changes recorded, if specified
Number of abnormal results leading to management
changes
Types of adverse patient events, if recorded
Number of abnormal results in which an adverse
patient event was recorded
Number of adverse events in which abnormal results
were not recorded
Is test judged to be clinical useful?
Main findings
Table A1.iii: Data extraction form to assess qualityof case series papers
Quality assessment for case series
1. Case series collected in more than one centre,
ie multicentre study
2. Is the hypothesis/aim/objective of the study
clearly described?
3. Are the inclusion and exclusion criteria
(case definition) clearly reported?
87A P P E N D I X 1

4. Is there a clear definition of the outcomes
reported?
5. Were data collected prospectively?
6. Is there an explicit statement that patients were
recruited consecutively?
7. Are the main findings of the study clearly
described?
8. Are outcomes stratified? (eg by disease stage,
abnormal test results, patient characteristics)
Yes=1
No =0
Score: __/ 8
88 P R E O P E R A T I V E T E S T S

1. Krupski WC, Nehler MR, Whitehill TA, Lawson RC, Strecker PK, Hiatt
WR. Negative impact of cardiac evaluation before vascular surgery.
Vasc Med 2000; 5:3–9.
2. Silvestri L, Maffessanti M, Gregori D, Berlot G, Gullo A. Usefulness of
routine pre-operative chest radiography for anaesthetic management:
a prospective multicentre pilot study. Eur J Anaesthesiol 1999;
16:749–760.
3. Pal KM, Khan IA, Safdar B. Preoperative work up: are the requirements
different in a developing country? J Pak Med Assoc 1998; 48:339–341.
4. Ishaq M, Kamal RS, Aqil M. Value of routine preoperative chest X-ray
in patients over the age of 40 years. J Pak Med Assoc 1997;
47:279–281.
5. Wattsman TA, Davies RS. The utility of preoperative laboratory
testing in general surgery patients for outpatient procedures. Am
Surg 1997; 63:81–90.
6. Bouillot JL, Fingerhut A, Paquet JC, Hay JM, Coggia M. Are routine
preoperative chest radiographs useful in general surgery? A
prospective, multicentre study in 3959 patients. Association des
Chirurgiens de l’Assistance Publique pour les Evaluations medicales.
Eur J Surg 1996; 162:597–604.
7. Clelland C, Worland RL, Jessup DE, East D. Preoperative medical
evaluation in patients having joint replacement surgery: added
benefits. South Med J 1996; 89:958–960.
8. Khong PL, Peh WCG, Irwin MG, Gunawardene WMS, Luk KDK. Utility
of routine pre-operative chest x-rays. Asian J Surg 1996; 19:41–44.
9. Ranparia DJ, Hart L, Assimos DG. Utility of chest radiography and
cystoscopy in the evaluation of patients with localized prostate
cancer. Urology 1996; 48:72–74.
10. Boland BJ, Wollan PC, Silverstein MD. Review of systems, physical
examination, and routine tests for case-finding in ambulatory
patients. Am J Med Sci 1995; 309:194–200.
11. Perez A, Planell J, Bacardaz C, Hounie A, Franci J, Brotons C et al.
Value of routine preoperative tests: a multicentre study in four
general hospitals. Br J Anaesth 1995; 74:250–256.
12. Adams JG, Weigelt JA, Poulos E. Usefulness of preoperative
laboratory assessment of patients undergoing elective herniorrhaphy.
Arch Surg 1992; 127:801–804.
13. MacDonald JB, Dutton MJ, Stott DJ, Hamblen DL. Evaluation of pre-
admission screening of elderly patients accepted for major joint
replacement. Health Bull (Edinb) 1992; 50:54–60.
14. Sommerville TE, Murray WB. Information yield from routine pre-
operative chest radiography and electrocardiography. S Afr Med J
1992; 81:190–196.
15. Bhuripanyo K, Prasertchuang C, Chamadol N, Laopaiboon M,
Bhuripanyo P. The impact of routine preoperative chest X-ray in
Srinagarind Hospital, Khon Kaen. J Med Assoc Thai 1990; 73:21–28.
16. Gagner M, Chiasson A. Preoperative chest x-ray films in elective
surgery: a valid screening tool. Can J Surg 1990; 33:271–274.
17. McCleane GJ. Routine preoperative chest X-rays. Ir J Med Sci 1989;
158:67–68.
18. Charpak Y, Blery C, Chastang C, Szatan M, Fourgeaux B. Prospective
assessment of a protocol for selective ordering of preoperative chest x-
rays. Can J Anaesth 1988; 35:259–264.
19. Ogunseyinde AO. Routine preoperative chest radiographs in non-
cardiopulmonary surgery. Afr J Med Med Sci 1988; 17:157–161.
20. Tape TG, Mushlin AI. How useful are routine chest x-rays of
preoperative patients at risk for postoperative chest disease? J Gen
Intern Med 1988; 3:15–20.
21. Umbach GE, Zubek S, Deck HJ, Buhl R, Bender HG, Jungblut RM.
The value of preoperative chest x-rays in gynecological patients. Arch
Gynecol Obstet 1988; 243:179–185.
22. Boghosian SG, Mooradian AD. Usefulness of routine preoperative
chest roentgenograms in elderly patients. J Am Geriatr Soc 1987;
35:142–146.
23. McKee RF, Scott EM. The value of routine preoperative investigations.
Ann R Coll Surg Engl 1987; 69:160–162.
24. Mendelson DS, Khilnani N, Wagner LD, Rabinowitz JG. Preoperative
chest radiography: value as a baseline examination for comparison.
Radiology 1987; 165:341–343.
25. Turnbull JM, Buck C. The value of preoperative screening
investigations in otherwise healthy individuals. Arch Intern Med
1987;147:1101–1105.
26. Weibman MD, Shah NK, Bedford RF. Influence of preoperative chest
x-rays on the preoperative management of cancer patients.
Anesthesiology 1987; 67:A332.
89P R E O P E R A T I V E T E S T S
Bibliography

27. Wiencek RG, Weaver DW, Bouwman DL, Sachs RJ. Usefulness of
selective preoperative chest x-ray films. A prospective study. Am Surg
1987; 53:396–398.
28. Muskett AD, McGreevy JM. Rational preoperative evaluation.
Postgrad Med J 1986; 62:925–928.
29. Rucker L, Frye EB, Staten MA. Usefulness of screening chest
roentgenograms in preoperative patients. JAMA 1983;
250:3209–3211.
30. Seymour DG, Pringle R, Shaw JW. The role of the routine pre-
operative chest x-ray in the elderly general surgical patient. Postgrad
Med J 1982; 58:741–745.
31. Tõrnebrandt K, Fletcher R. Pre-operative chest x-rays in elderly
patients. Anaesthesia 1982; 37:901–902.
32. Wood RA, Hoekelman RA. Value of the chest x-ray as a screening
test for elective surgery in children. Pediatrics 1981; 67:447–452.
33. Farnsworth PB, Steiner E, Klein RM, SanFilippo JA. The value of
routine preoperative chest roentgenograms in infants and children.
JAMA 1980; 244:582–583.
34. Rossello PJ, Ramos CA, Mayol PM. Routine laboratory tests for
elective surgery in pediatric patients: are they necessary? Bol Asoc
Med P R 1980; 72:614–623.
35. Loder RE. Routine pre-operative chest radiography. 1977 compared
with 1955 at Peterborough District General Hospital. Anaesthesia
1978; 33:972–974.
36. Petterson SR, Janower ML. Is the routine preoperative chest film of
value? Appl Radiol 1977; 6:70.
37. Sane SM, Worsing RA, Wiens CW, Sharma RK. Value of preoperative
chest x-ray examinations in children. Pediatrics 1977; 60:669–672.
38. Rees AM, Roberts CJ, Bligh AS, Evans KT. Routine preoperative chest
radiography in non-cardiopulmonary surgery. BMJ 1976;
1:1333–1335.
39. Gauss A, Rohm HJ, Schauffelen A, Vogel T, Mohl U, Straehle A et al.
Electrocardiographic exercise stress testing for cardiac risk
assessment in patients undergoing noncardiac surgery.
Anesthesiology 2001; 94:38–46.
40. French GW, Lam WH, Rashid Z, Sear JW, Foex P, Howell S. Peri-
operative silent myocardial ischaemia in patients undergoing lower
limb joint replacement surgery: an indicator of postoperative
morbidity or mortality? Anaesthesia 1999; 54:235–240.
41. Haug RH, Reifeis RL. A prospective evaluation of the value of
preoperative laboratory testing for office anesthesia and sedation. J
Oral Maxillofac Surg 1999; 57:16–20.
42. Murdoch CJ, Murdoch DR, McIntyre P, Hosie H, Clark C. The pre-
operative ECG in day surgery: a habit? Anaesthesia 1999;
54:907–908.
43. Rosenfeld SI, Litinsky SM, Snyder DA, Plosker H, Astrove AW,
Schiffman J. Effectiveness of monitored anesthesia care in cataract
surgery. Ophthalmology 1999; 106:1256–1260.
44. Polanczyk CA, Goldman L, Marcantonio ER, Orav EJ, Lee TH.
Supraventricular arrhythmia in patients having noncardiac surgery:
clinical correlates and effect on length of stay. Ann Intern Med
1998; 129:279–285.
45. Biavati MJ, Manning SC, Phillips DL. Predictive factors for respiratory
complications after tonsillectomy and adenoidectomy in children.
Arch Otolaryngol Head Neck Surg 1997; 123:517–521.
46. Landesberg G, Einav S, Christopherson R, Beattie C, Berlatzky Y,
Rosenfeld B et al. Perioperative ischemia and cardiac complications
in major vascular surgery: importance of the preoperative twelve-lead
electrocardiogram. J Vasc Surg 1997; 26:570–578.
47. Tait AR, Parr HG, Tremper KK. Evaluation of the efficacy of routine
preoperative electrocardiograms. J Cardiothorac Vasc Anesth 1997;
11:752–755.
48. Callaghan LC, Edwards ND, Reilly CS. Utilisation of the pre-operative
ECG. Anaesthesia 1995; 50:488–490.
49. Liu S, Paul GE, Carpenter RL, Stephenson C, Wu R. Prolonged PR
interval is a risk factor for bradycardia during spinal anesthesia. Reg
Anesth 1995; 20:41–44.
50. Allman KG, Muir A, Howell SJ, Hemming AE, Sear JW, Foex P.
Resistant hypertension and preoperative silent myocardial ischaemia
in surgical patients. Br J Anaesth 1994; 73:574–578.
51. Kirwin JD, Ascer E, Gennaro M, Mohan C, Jonas S, Yorkovich W et al.
Silent myocardial ischemia is not predictive of myocardial infarction
in peripheral vascular surgery patients. Ann Vasc Surg 1993;
7:27–32.
52. Older P, Smith R, Courtney P, Hone R. Preoperative evaluation of
cardiac failure and ischemia in elderly patients by cardiopulmonary
exercise testing. Chest 1993; 104:701–704.
53. Bhuripanyo K, Prasertchuang C, Viwathanatepa M, Khumsuk K,
Sornpanya N. The impact of routine preoperative electrocardiogram
in patients age > or = 40 years in Srinagarind Hospital. J Med Assoc
Thai 1992; 75:399–406.
54. Gold BS, Young ML, Kinman JL, Kitz DS, Berlin J, Schwartz JS. The
utility of preoperative electrocardiograms in the ambulatory surgical
patient. Arch Intern Med 1992; 152:301–305.
55. McCleane GJ,.McCoy E. Routine pre-operative electrocardiography. Br
J Clin Pract 1990; 44:92–95.
56. Yipintsoi T, Vasinanukorn P, Sanguanchua P. Is routine pre-operative
electrocardiogram necessary? J Med Assoc Thai 1989; 72:16–20.
57. Charpak Y, Blery C, Chastang C, Ben Kemmoun R, Pham J, Brage D
et al. Usefulness of selectively ordered preoperative tests. Med Care
1988; 26:95–104.
58. Johnson H, Knee-Ioli S, Butler TA, Munoz E, Wise L. Are routine
preoperative laboratory screening tests necessary to evaluate
ambulatory surgical patients? Surgery 1988; 104:639–645.
59. Carliner NH, Fisher ML, Plotnick GD, Moran GW, Kelemen MH,
Gadacz TR et al. The preoperative electrocardiogram as an indicator
of risk in major noncardiac surgery. Can J Cardiol 1986; 2:134–137.
90 P R E O P E R A T I V E T E S T S

60. Paterson KR, Caskie JP, Galloway DJ, McArthur K, McWhinnie DL.
The preoperative electrocardiogram: an assessment. Scott Med J
1983; 28:116–118.
61. Seymour DG, Pringle R, MacLennan WJ. The role of the routine pre-
operative electrocardiogram in the elderly surgical patient. Age
Ageing 1983; 12:97–104.
62. Dzankic S, Pastor D, Gonzalez C, Leung JM. The prevalence and
predictive value of abnormal preoperative laboratory tests in elderly
surgical patients. Anesth Analg 2001; 93:301–308.
63. Gabriel P, Mazoit X, Ecoffey C. Relationship between clinical history,
coagulation tests, and perioperative bleeding during tonsillectomies
in pediatrics. J Clin Anesth 2000; 12:288–291.
64. Wojtkowski TA, Rutledge JC, Matthews DC. The clinical impact of
increased sensitivity PT and APTT coagulation assays. Am J Clin
Pathol 1999; 112:225–232.
65. Cherng YG, Chao A, Shih RL, Lin CS, Chan WH, Huang CH et al.
Preoperative evaluation and postoperative prediction of hemostatic
function with thromboelastography in patients undergoing redo
cardiac surgery. Acta Anaesthesiol Sin 1998; 36:179–186.
66. Meneghini L, Zadra N, Zanette G, Baiocchi M, Giusti F. The
usefulness of routine preoperative laboratory tests for one-day
surgery in healthy children. Paediatr Anaesth 1998; 8:11–15.
67. Houry S, Georgeac C, Hay JM, Fingerhut A, Boudet MJ. A prospective
multicenter evaluation of preoperative hemostatic screening tests.
The French Associations for Surgical Research. Am J Surg 1995;
170:19–23.
68. Close HL, Kryzer TC, Nowlin JH, Alving BM. Hemostatic assessment
of patients before tonsillectomy: a prospective study. Otolaryngol
Head Neck Surg 1994; 111:733–8.
69. Kozak EA,.Brath LK. Do “screening” coagulation tests predict
bleeding in patients undergoing fiberoptic bronchoscopy with
biopsy? Chest 1994; 106:703–705.
70. Hoare TJ. Pre-operative haemoglobin estimation in paediatric ENT
surgery. J Laryngol Otol 1993; 107:1146–1148.
71. MacPherson CR, Jacobs P, Dent DM. Abnormal peri-operative
haemorrhage in asymptomatic patients is not predicted by laboratory
testing. S Afr Med J 1993; 83:106–108.
72. Baron MJ, Gunter J, White P. Is the pediatric preoperative hematocrit
determination necessary? South Med J 1992; 85:1187–1189.
73. Narr BJ, Hansen TR, Warner MA. Preoperative laboratory screening in
healthy Mayo patients: cost- effective elimination of tests and
unchanged outcomes. Mayo Clin Proc 1991; 66:155–159.
74. Roy WL, Lerman J, McIntyre BG. Is preoperative haemoglobin testing
justified in children undergoing minor elective surgery? Can J
Anaesth 1991; 38:700–703.
75. Bolger WE, Parsons DS, Potempa L. Preoperative hemostatic
assessment of the adenotonsillectomy patient. Otolaryngol Head
Neck Surg 1990; 103:396–405.
76. Nigam A, Ahmed K, Drake-Lee AB. The value of preoperative
estimation of haemoglobin in children undergoing tonsillectomy.
Clin Otolaryngol 1990; 15:549–551.
77. O’Connor ME, Drasner K. Preoperative laboratory testing of children
undergoing elective surgery. Anesth Analg 1990; 70:176–180.
78. Jones MW, Harvey IA, Owen R. Do children need routine
preoperative blood tests and blood cross matching in orthopaedic
practice? Ann R Coll Surg Engl 1989; 71:1–3.
79. Rohrer MJ, Michelotti MC, Nahrwold DL. A prospective evaluation of
the efficacy of preoperative coagulation testing. Ann Surg 1988;
208:554–557.
80. Kaplan EB, Sheiner LB, Boeckmann AJ, Roizen MF, Beal SL, Cohen SN
et al. The usefulness of preoperative laboratory screening. JAMA
1985; 253:3576–3581.
81. Ramsey G, Arvan DA, Stewart S, Blumberg N. Do preoperative
laboratory tests predict blood transfusion needs in cardiac
operations? J Thorac Cardiovasc Surg 1983;85:564–569.
82. Williams GD, Bratton SL, Riley EC, Ramamoorthy C. Coagulation
tests during cardiopulmonary bypass correlate with blood loss in
children undergoing cardiac surgery. J Cardiothorac Vasc Anesth
1999; 13:398–404.
83. Howells RC, Wax MK, Ramadan HH. Value of preoperative
prothrombin time/partial thromboplastin time as a predictor of
postoperative hemorrhage in pediatric patients undergoing
tonsillectomy. Otolaryngol Head Neck Surg 1997; 117:628–632.
84. Zwack GC, Derkay CS. The utility of preoperative hemostatic
assessment in adenotonsillectomy. Int J Pediatr Otorhinolaryngol
1997; 39:67–76.
85. Gewirtz AS, Miller ML, Keys TF. The clinical usefulness of the
preoperative bleeding time. Arch Pathol Lab Med 1996;
120:353–356.
86. Myers ER, Clarke-Pearson DL, Olt GJ, Soper JT, Berchuck A.
Preoperative coagulation testing on a gynecologic oncology service.
Obstet Gynecol 1994; 83:438–444.
87. Burk CD, Miller L, Handler SD, Cohen AR. Preoperative history and
coagulation screening in children undergoing tonsillectomy.
Pediatrics 1992; 89:691–695.
88. Aghajanian A, Grimes DA. Routine prothrombin time determination
before elective gynecologic operations. Obstet Gynecol 1991;
78:837–839.
89. Schmidt JL, Yaremchuk KL, Mickelson SA. Abnormal coagulation
profiles in tonsillectomy and adenoidectomy patients. Henry Ford
Hosp Med J 1990; 38:33–35.
90. Manning SC, Beste D, McBride T, Goldberg A. An assessment of
preoperative coagulation screening for tonsillectomy and
adenoidectomy. Int J Pediatr Otorhinolaryngol 1987; 13:237–244.
91. Suchman AL, Mushlin AI. How well does the activated partial
thromboplastin time predict postoperative hemorrhage? JAMA 1986;
256:750–753.
91B I B L I O G R A P H Y

92. Lundberg GD. Is there a need for routine preoperative laboratory
tests? JAMA 1985; 253:3589.
93. Eisenberg JM, Clarke JR, Sussman SA. Prothrombin and partial
thromboplastin times as preoperative screening tests. Arch Surg
1982; 117:48–51.
94. Robbins JA, Rose SD. Partial thromboplastin time as a screening test.
Ann Intern Med 1979; 90:796–797.
95. Rader ES. Hematologic screening tests in patients with operative
prostatic disease. Urology 1978; 11:243–246.
96. MacPherson DS, Snow R, Lofgren RP. Preoperative screening: value of
previous tests. Ann Intern Med 1990; 113:969–973.
97. Bhuripanyo K, Prasertchuang C, Khumsuk K, Sornpanya N,
Patoombal N, Wangsai W. The impact of routine preoperative
urinalysis in Srinagarind Hospital, Khon Kaen. J Med Assoc Thai
1995; 78:94–98.
98. Lawrence VA, Kroenke K. The unproven utility of preoperative
urinalysis. Clinical use. Arch Intern Med 1988; 148:1370–1373.
99. Akin BV, Hubbell FA, Frye EB, Rucker L, Friis R. Efficacy of the routine
admission urinalysis. Am J Med 1987; 82:719–22.
100. Kroenke K, Hanley JF, Copley JB, Matthews JI, Davis CE, Foulks CJ et
al. The admission urinalysis: impact on patient care. J Gen Intern
Med 1986; 1:238–242.
101. Bhuripanyo K, Khumsuk K, Sornpanya N, Wangsai W, Patoombal N.
The impact of routine preoperative complete blood count (CBC) in
elective operations in Srinagarind Hospital. J Med Assoc Thai 1995;
78:42–47.
102. Hennrikus WL, Shaw BA, Gerardi JA. Prevalence of positive
preoperative pregnancy testing in teenagers scheduled for
orthopedic surgery. J Pediatr Orthop 2001; 21:677–679.
103. Wheeler M, Cote CJ. Preoperative pregnancy testing in a tertiary care
children’s hospital: a medico-legal conundrum. J Clin Anesth 1999;
11:56–63.
104. Azzam FJ, Padda GS, DeBoard JW, Krock JL, Kolterman SM.
Preoperative pregnancy testing in adolescents. Anesth Analg 1996;
82:4–7.
105. Pierre N, Moy LK, Redd S, Emans SJ, Laufer MR. Evaluation of a
pregnancy-testing protocol in adolescents undergoing surgery. J
Pediatr Adolesc Gynecol 1998; 11:139–141.
106. Twersky RS, Singleton G. Preoperative pregnancy testing: “justice and
testing for all”. Anesth Analg 1996; 83:438–439.
107. Malviya S, D’Errico C, Reynolds P, Huntington J, Voepel-Lewis T,
Pandit UA. Should pregnancy testing be routine in adolescent
patients prior to surgery? Anesth Analg 1996; 83:854–858.
108. Manley S, de Kelaita G, Joseph NJ, Salem MR, Heyman HJ.
Preoperative pregnancy testing in ambulatory surgery. Incidence and
impact of positive results. Anesthesiology 1995; 83:690–693.
109. Brady AR, Fowkes FGR, Greenhalgh RM, Powell JT, Ruckley CV,
Thompson SG. Risk factors for postoperative death following elective
surgical repair of abdominal aortic aneurysm: Results from the UK
Small Aneurysm Trial. Br J Surg 2000; 87:742–749.
110. Chandra A, Srivastava S, Dilip D. Spirometric changes following
open-heart surgery on rheumatic mitral valves. Asian Cardiovasc
Thorac Ann 1998; 6:28–33.
111. Kuwano H, Sumiyoshi K, Sonoda K, Kitamura K, Tsutsui S, I, Toh Y et
al. Relationship between preoperative assessment of organ function
and postoperative morbidity in patients with oesophageal cancer.
Eur J Surg 1998; 164:581–586.
112. Barisione G, Rovida S, Gazzaniga GM, Fontana L. Upper abdominal
surgery: Does a lung function test exist to predict early severe
postoperative respiratory complications? Eur Respir J 1997;
10:1301–1308.
113. Castro M, Krowka MJ, Schroeder DR, Beck KC, Plevak DJ, Rettke SR
et al. Frequency and clinical implications of increased pulmonary
artery pressures in liver transplant patients. Mayo Clin Proc 1996;
71:543–551.
114. Durand M, Combes P, Drouet N, Chichignoud B, Magne JL, Girardet
P. Predictive value of preoperative pulmonary function tests and
blood gases analysis before abdominal aortic surgery. J Cardiothorac
Vasc Anesth 1994; 8:9.
115. Durand M, Combes P, Eisele JH, Contet A, Blin D, Girardet P.
Pulmonary function tests predict outcome after cardiac surgery. Acta
Anaesthesiol Belg. 1993; 44:17–23.
116. Poe RH, Kallay MC, Dass T, Celebic A. Can postoperative pulmonary
complications after elective cholecystectomy be predicted? Am J Med
Sci 1988; 295:29–34.
117. Kim SK, Chang J, Ahn CM, Sohn HY, Kim K. Relationship between
the result of preoperative pulmonary function test and postoperative
pulmonary complications. J Korean Med Sci 1987; 2:71–74.
118. Crapo RO, Kelly TM, Elliott CG, Jones SB. Spirometry as a
preoperative screening test in morbidly obese patients. Surgery
1986; 99:763–768.
92 P R E O P E R A T I V E T E S T S

Grade 1 Grade 2
AF1 Release of entrapment of peripheral nerve at wrist (A61) AC1 Extracranial extirpation of vagus nerve (A27)
DA1 Clearance of external auditory canal (D07) AG1 Electroconvulsive therapy (A83)
DB3 Drainage of middle ear (D15) B28 Other excision of breast
EA1 Operations on septum of nose (E03) CG1 Extraction of lens (C71,C72,C74)
EA2 Operations on external nose (E09) CG2 Prosthesis of lens (C75)
E36 Diagnostic endoscopic examination of larynx DB1 Operations on mastoid (D10-D12)
EE2 Endoscopic operations on bronchus (E48-E51) DB2 Repair of eardrum (D14)
FB2 Simple extraction of tooth (F10) EC1 Operations on adenoids (E20)
G16 Diagnostic fibreoptic endoscopic examination/oesophagus E34 Microtherapeutic endoscopic operations on larynx
G45 Diagnostic fibreoptic endoscopic exam/upper gastrointe E35 Other therapeutic endoscopic operations on larynx
M45 Diagnostic endoscopic examination of bladder FB1 Surgical removal of tooth (F09)
NA2 Operations on hydrocele sac (N11) FD1 Excision of tonsil (F34)
NB1 Excision of vas deferens (N17) FE1 Excision of salivary gland (F44)
NC1 Operations on prepuce (N30) G14, G15, G17-G19 Endoscopic operations on oesophagus
PA1 Operations on bartholin gland (P03) G43, G44 Endoscopic operations on upper gastrointestinal tract
SA1 Extirpation of lesion of skin or subcutaneous tissue (S05-S11) HB2 Endoscopic operations on colon (H20-H28)
SA4 Suture of skin or subcutaneous tissue (S41-S42) HD1 Operations on haemorrhoid (H51-H53)
SA5 Incision of skin or subcutaneous tissue (S47) JC1 Endoscopic operations on bile and pancreatic ducts (J38-J45)
KC3 Transluminal operations on coronary artery (K49-K51)
Grade 3 LG1 Operations on varicose vein of leg (L85-L87)
BB1 Excision of thyroid gland (B08) MA3 Endoscopic operations on kidney (M09-M11)
B27 Total excision of breast MB1 Endoscopic operations on ureter (M26-M30)
EE1 Operations on trachea (E39-E44) M42-M44 Endoscopic operations on bladder
GA2 Operations on diaphragmatic hernia (G23-G25) NA1 Placement of testis in scrotum (N08-N09)
MC1 Open operations on bladder (M34-M41) QA1 Operations on cervix uteri (Q01-Q05)
MD1 Operations on outlet of female bladder (M51-M58) QA3 Evacuation of contents of uterus (Q10-Q11)
MD2 Open excision of prostate (M61) QB2 Open occlusion of fallopian tube (Q27-Q28)
M65 Endoscopic resection of outlet of male bladder QB3 Endoscopic occlusion of fallopian tube (Q35-Q36)
93A P P E N D I X 2
Appendix 2: Examples of Surgical Proceduresby Severity Grading

M66 Other therapeutic endoscopic operations on outlet of male bladder RB2 Manipulative delivery (R19-R23)
M67 Other therapeutic endoscopic operations on prostate RB3 Normal delivery (R24)
PB1 Repair of prolapse of vagina (P22-P23) SA3 Skin graft operations (S33-S39)
QA2 Excision of uterus (Q07-Q08) TB1 Operations on inguinal hernia (T19-T21)
QB1 Excision of adnexa of uterus (Q22-Q24) TB2 Operations on other abdominal hernia (T22-T27)
QB4 Other endoscopic operations on fallopian tube (Q37-Q39) TC1 Endoscopic operations on peritoneum (T42-T43)
RB1 Caesarean delivery (R17-R18) WB2 Division of bone (W12-W16)
Grade 3 Grade 2
SA2 Skin flap operations (S17-S31) WB3 Reduction of fracture of bone (W19-W26)
WB1 Excision of bone (W06-W08) WB4 Graft of bone marrow (W34)
WC3 Prosthetic replacement of head of femur (W46-W48) WC6 Reduction of traumatic dislocation of joint (W65-W67)
WC4 Prosthetic replacement of other articulation (W49-W54) WC7 Open operations on semilunar cartilage (W70)
WC5 Fixation of joint (W59-W64) WC8 Endoscopic operations on joint (W82-W88)
XA1 Amputation (X07-X12) XB1 Compensation for renal failure (X40-X42)
XA2 Operations for sexual transformation (X15)
XA3 Corrections of congenital deformity of limb (X19-X27)
Grade 4 Neurosurgery
EF1 Operations on lung (E53-E59) AA1 Excision of lesion of tissue of brain (A02)
GB1 Excision of stomach (G27-G28)
HB1 Excision of colon (H04-H11) Cardiovascular surgery
HC1 Excision of rectum (H33) KC1 Replacement of coronary artery (K40-K44)
MA1 Transplantation of kidney (M01) KC2 Other bypass of coronary artery (K45-K46)
MA2 Excision of kidney (M02-M03)
WC1 Total prosthetic replacement of hip joint (W37-W39)
WC2 Total prosthetic replacement of other joint (W40-W45)
94 P R E O P E R A T I V E T E S T S

ADULTS, CHEST X-RAY
Cost estimates: low £10.00 mid £20.50 upper £31.00
To what extent is a chest x-ray indicated for ‘normal healthy patients’ (ie ASA Grade 1) of different ages, undergoing
different types of surgery? For each of the ages shown below, please indicate your agreement with the following
statements by ringing one or more numbers in each column:
ADULTS, CHEST X-RAY
1.1 “A chest x-ray is indicated preoperatively in a normal healthy adult having elective Grade 1 surgery,
aged as shown.”
≥16 & <40 ≥40 & <60 ≥60 & <80 ≥80
Age – years
Comments:
1
3
4 9
9
8
7
6
5
4
3
2
1
1
1
6 9
9
8
7
6
5
4
3
2
1
1
7 9
9
8
7
6
5
4
3
2
1
1
7 9
9
8
7
6
5
4
3
2
1
Strongly agree
Strongly disagree
95A P P E N D I X 3
Appendix 3: Phase A ConsensusQuestionnaire (Results)

1.2 “A chest x-ray is indicated preoperatively in a normal healthy adult having elective Grade 2 surgery,
aged as shown.”
≥16 & <40 ≥40 & <60 ≥60 & <80 ≥80
Age – years
Comments:
1.3 “A chest x-ray is indicated preoperatively in a normal healthy adult having elective Grade 3 surgery,
aged as shown.”
≥16 & <40 ≥40 & <60 ≥60 & <80 ≥80
Age – years
Comments:
2 1
2 2
1
2
2 5
9
8
7
6
5
4
3
2
1
9 1
2
2
1 1
3 6
9
8
7
6
5
4
3
2
1
1
1 1
6 8
9
8
7
6
5
4
3
2
1
1
1 1
6 8
9
8
7
6
5
4
3
2
1
Strongly agree
Strongly disagree
1
1
1
2
3 9
9
8
7
6
5
4
3
2
1
1
1
1
1
4 9
9
8
7
6
5
4
3
2
1
1
7 9
9
8
7
6
5
4
3
2
1
1
7 9
9
8
7
6
5
4
3
2
1
Strongly agree
Strongly disagree
96 P R E O P E R A T I V E T E S T S

1.4 “A chest x-ray is indicated preoperatively in a normal healthy adult having elective Grade 4 surgery,
aged as shown.”
≥16 & <40 ≥40 & <60 ≥60 & <80 ≥80
Age – years
Comments:
1.5 “A chest x-ray is indicated preoperatively in a normal healthy adult having elective neurosurgery,
aged as shown.”
≥16 & <40 ≥40 & <60 ≥60 & <80 ≥80
Age – years
Comments:
2 1
2
1 1
2 1
2
5
9
8
7
6
5
4
3
2
1
1 1
4 1
2
3
5
9
8
7
6
5
4
3
2
1
1
1
3
3 9
9
8
7
6
5
4
3
2
1
1
1
3
1 9
9
8
7
6
5
4
3
2
1
Strongly agree
Strongly disagree
5 2
1
1
1
1 3
1 2
9
8
7
6
5
4
3
2
1
5 1
1
1
1 5
1 2
9
8
7
6
5
4
3
2
1
7
1
1 2
1
4 7
9
8
7
6
5
4
3
2
1
1
1
1 1
1
5 7
9
8
7
6
5
4
3
2
1
Strongly agree
Strongly disagree
97A P P E N D I X 3

1.6 “A chest x-ray is indicated preoperatively in a normal healthy adult having elective cardiac surgery,
aged as shown.”
≥16 & <40 ≥40 & <60 ≥60 & <80 ≥80
Age – years
Comments:
ADULTS, RESTING ECG
Cost estimates: low £11.00 mid £26.00 upper £37.00
To what extent is a resting ECG indicated for ‘normal healthy patients’ (ie ASA Grade 1) of different ages, undergoing
different types of surgery? For each of the ages shown below, please indicate your agreement with the following
statements by ringing one or more numbers in each column:
2.1 “A resting ECG is indicated preoperatively in a normal healthy adult having elective Grade 1 surgery,
aged as shown.”
≥16 & <40 ≥40 & <60 ≥60 & <80 ≥80
Age – years
Comments:
3 8
1
1
2 1
1
9
8
7
6
5
4
3
2
1
3 7
1 1
3 1
1
9
8
7
6
5
4
3
2
1
1 3
1
1 1
1 2
4 3
9
8
7
6
5
4
3
2
1
1
1
1
6 8
9
8
7
6
5
4
3
2
1
Strongly agree
Strongly disagree
7 9
1
9
8
7
6
5
4
3
2
1
7 9
1
9
8
7
6
5
4
3
2
1
7 9
1
9
8
7
6
5
4
3
2
1
7 9
1
9
8
7
6
5
4
3
2
1
Strongly agree
Strongly disagree
98 P R E O P E R A T I V E T E S T S

2.2 “A resting ECG is indicated preoperatively in a normal healthy adult having elective Grade 2 surgery,
aged as shown.”
≥16 & <40 ≥40 & <60 ≥60 & <80 ≥80
Age – years
Comments:
2.3 “A resting ECG is indicated preoperatively in a normal healthy adult having elective Grade 3 surgery,
aged as shown.”
≥16 & <40 ≥40 & <60 ≥60 & <80 ≥80
Age – years
Comments:
6 9
1
1
9
8
7
6
5
4
3
2
1
6 9
1
1
9
8
7
6
5
4
3
2
1
3 4
1 1
1
1 2
2 2
9
8
7
6
5
4
3
2
1
1
2 1
5 8
9
8
7
6
5
4
3
2
1
Strongly agree
Strongly disagree
4 8
1
1
1 1
1
9
8
7
6
5
4
3
2
1
3 8
1
3 1
1
9
8
7
6
5
4
3
2
1
1 3
2
1 1
1 1
4 3
9
8
7
6
5
4
3
2
1
1
1
1
6 8
9
8
7
6
5
4
3
2
1
Strongly agree
Strongly disagree
99A P P E N D I X 3

2.4 “A resting ECG is indicated preoperatively in a normal healthy adult having elective Grade 4 surgery,
aged as shown.”
≥16 & <40 ≥40 & <60 ≥60 & <80 ≥80
Age – years
Comments:
2.5 “A resting ECG is indicated preoperatively in a normal healthy adult having elective neurosurgery,
aged as shown.”
≥16 & <40 ≥40 & <60 ≥60 & <80 ≥80
Age – years
Comments:
7 9
1
9
8
7
6
5
4
3
2
1
7 9
1
9
8
7
6
5
4
3
2
1
2 4
1 1
1
1
1 1
2 3
9
8
7
6
5
4
3
2
1
1
1
2 1
4 8
9
8
7
6
5
4
3
2
1
Strongly agree
Strongly disagree
7 1
1
8
9
8
7
6
5
4
3
2
1
7 8
2
9
8
7
6
5
4
3
2
1
3 7
1
2 2
1 1
9
8
7
6
5
4
3
2
1
1
1
1 2
5 7
9
8
7
6
5
4
3
2
1
Strongly agree
Strongly disagree
100 P R E O P E R A T I V E T E S T S

2.6 “A resting ECG is indicated preoperatively in a normal healthy adult having elective Grade cardiac surgery,
aged as shown.”
≥16 & <40 ≥40 & <60 ≥60 & <80 ≥80
Age – years
Comments:
ADULTS, FULL BLOOD COUNT
Cost estimates: low £0.70 mid £2.35 upper £4.05
To what extent is a full blood count indicated for ‘normal healthy patients’ (ie ASA Grade 1) of different ages and gender,
undergoing different types of surgery? For each of the ages shown below, please indicate your agreement with the
following statements, separately for males (M) and females (F), by ringing one or more numbers in each column:
3.1 “A full blood count is indicated preoperatively in a normal healthy adult having elective Grade 1 surgery, aged as shown.”
≥16 & <40 ≥40 & <60 ≥60 & <80 ≥80
Age – years
Comments:
M F
7 7
1 1
1 1
1 1
M F
3 3
1 1
2 2
1 1
9
8
7
6
5
4
3
2
1
M F
7 7
1 1
2 2
M F
3 3
1 1
1 1
1 1
1 1
9
8
7
6
5
4
3
2
1
M F
1 1
1
1
1 1
7 7
M F
1 1
1 1
2 2
3 3
9
8
7
6
5
4
3
2
1
M F
1
1
9 9
M F
1
1 1
6 5
9
8
7
6
5
4
3
2
1
Strongly agree
Strongly disagree
7 109
8
7
6
5
4
3
2
1
7 109
8
7
6
5
4
3
2
1
7 109
8
7
6
5
4
3
2
1
7 109
8
7
6
5
4
3
2
1
Strongly agree
Strongly disagree
101A P P E N D I X 3
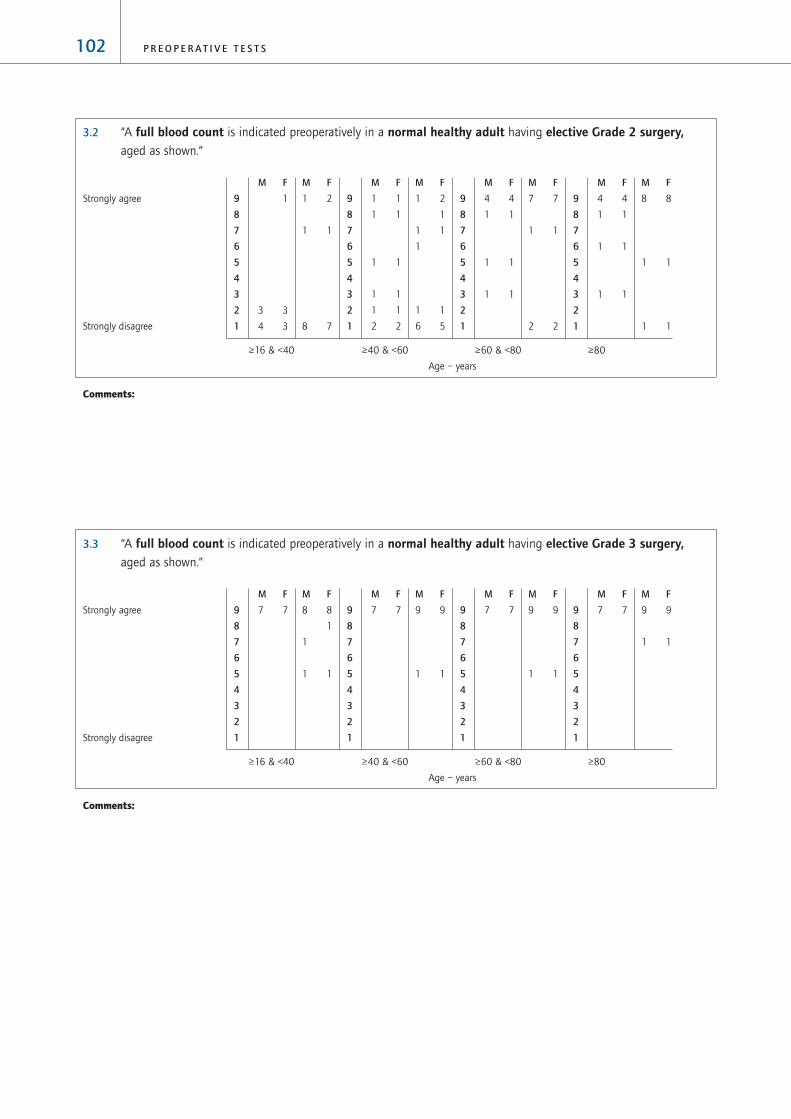
3.2 “A full blood count is indicated preoperatively in a normal healthy adult having elective Grade 2 surgery, aged as shown.”
≥16 & <40 ≥40 & <60 ≥60 & <80 ≥80
Age – years
Comments:
3.3 “A full blood count is indicated preoperatively in a normal healthy adult having elective Grade 3 surgery, aged as shown.”
≥16 & <40 ≥40 & <60 ≥60 & <80 ≥80
Age – years
Comments:
M F
9 9
1 1
M F
7 79
8
7
6
5
4
3
2
1
M F
9 9
1 1
M F
7 79
8
7
6
5
4
3
2
1
M F
9 9
1 1
M F
7 79
8
7
6
5
4
3
2
1
M F
8 8
1
1
1 1
M F
7 79
8
7
6
5
4
3
2
1
Strongly agree
Strongly disagree
M F
8 8
1 1
1 1
M F
4 4
1 1
1 1
1 1
9
8
7
6
5
4
3
2
1
M F
7 7
1 1
2 2
M F
4 4
1 1
1 1
1 1
9
8
7
6
5
4
3
2
1
M F
1 2
1
1 1
1
1 1
6 5
M F
1 1
1 1
1 1
1 1
1 1
2 2
9
8
7
6
5
4
3
2
1
M F
1 2
1 1
8 7
M F
1
3 3
4 3
9
8
7
6
5
4
3
2
1
Strongly agree
Strongly disagree
102 P R E O P E R A T I V E T E S T S

3.4 “A full blood count is indicated preoperatively in a normal healthy adult having elective Grade 4 surgery, aged as shown.”
≥16 & <40 ≥40 & <60 ≥60 & <80 ≥80
Age – years
Comments:
3.5 “A full blood count is indicated preoperatively in a normal healthy adult having elective neurosurgery, aged as shown.”
≥16 & <40 ≥40 & <60 ≥60 & <80 ≥80
Age – years
Comments:
M F
7 7
1 1
2 2
M F
7 79
8
7
6
5
4
3
2
1
M F
6 6
1 1
1 1
2 2
M F
7 79
8
7
6
5
4
3
2
1
M F
6 6
1 1
3 3
M F
7 79
8
7
6
5
4
3
2
1
M F
6 6
1 1
3 3
M F
7 79
8
7
6
5
4
3
2
1
Strongly agree
Strongly disagree
M F
10 10
M F
7 79
8
7
6
5
4
3
2
1
M F
10 10
M F
7 79
8
7
6
5
4
3
2
1
M F
10 10
M F
7 79
8
7
6
5
4
3
2
1
M F
10 10
M F
7 79
8
7
6
5
4
3
2
1
Strongly agree
Strongly disagree
103A P P E N D I X 3

3.6 “A full blood count is indicated preoperatively in a normal healthy adult having elective cardiac surgery, aged as shown.”
≥16 & <40 ≥40 & <60 ≥60 & <80 ≥80
Age – years
Comments:
ADULTS, TESTS OF HAEMOSTASIS
Cost estimates: low £1.50 mid £3.65 upper £5.85
To what extent are tests of haemostasis indicated for ‘normal healthy patients’ (ie ASA Grade 1) of different ages,
undergoing different types of surgery? For each of the ages shown below, please indicate your agreement with the
following statements by ringing one or more numbers in each column:
4.1 “Tests of haemostasis are indicated preoperatively in a normal healthy adult having elective Grade 1 surgery, aged as shown.”
≥16 & <40 ≥40 & <60 ≥60 & <80 ≥80
Age – years
Comments:
7
1
9
9
8
7
6
5
4
3
2
1
7
1
9
9
8
7
6
5
4
3
2
1
7
1
9
9
8
7
6
5
4
3
2
1
7
1
9
9
8
7
6
5
4
3
2
1
Strongly agree
Strongly disagree
M F
9 9
1 1
M F
7 79
8
7
6
5
4
3
2
1
M F
9 9
1 1
M F
7 79
8
7
6
5
4
3
2
1
M F
9 9
1 1
M F
7 79
8
7
6
5
4
3
2
1
M F
9 9
1 1
M F
7 79
8
7
6
5
4
3
2
1
Strongly agree
Strongly disagree
104 P R E O P E R A T I V E T E S T S

4.2 “Tests of haemostasis are indicated preoperatively in a normal healthy adult having elective Grade 2 surgery, aged as shown.”
≥16 & <40 ≥40 & <60 ≥60 & <80 ≥80
Age – years
Comments:
4.3 “Tests of haemostasis are indicated preoperatively in a normal healthy adult having elective Grade 3 surgery, aged as shown.”
≥16 & <40 ≥40 & <60 ≥60 & <80 ≥80
Age – years
Comments:
1
1
1
1
2 1
3 7
9
8
7
6
5
4
3
2
1
1
1
1
1
2 1
3 7
9
8
7
6
5
4
3
2
1
1
1
1
1
1 1
4 7
9
8
7
6
5
4
3
2
1
1
1
1
1
1 1
4 7
9
8
7
6
5
4
3
2
1
Strongly agree
Strongly disagree
7
1
1
8
9
8
7
6
5
4
3
2
1
7
1
1
8
9
8
7
6
5
4
3
2
1
7
1
9
9
8
7
6
5
4
3
2
1
7
1
9
9
8
7
6
5
4
3
2
1
Strongly agree
Strongly disagree
105A P P E N D I X 3

4.4 “Tests of haemostasis are indicated preoperatively in a normal healthy adult having elective Grade 4 surgery, aged as shown.”
≥16 & <40 ≥40 & <60 ≥60 & <80 ≥80
Age – years
Comments:
4.5 “Tests of haemostasis are indicated preoperatively in a normal healthy adult having elective neurosurgery aged as shown.”
≥16 & <40 ≥40 & <60 ≥60 & <80 ≥80
Age – years
Comments:
5 1
2
2
7
9
8
7
6
5
4
3
2
1
5 1
2
2
7
9
8
7
6
5
4
3
2
1
5 1
2
2
7
9
8
7
6
5
4
3
2
1
5 1
1
1
2
7
9
8
7
6
5
4
3
2
1
Strongly agree
Strongly disagree
3
1
2 1
1
1 1
7
9
8
7
6
5
4
3
2
1
3
1
2 1
1
1 1
7
9
8
7
6
5
4
3
2
1
3
1
1 1
1
1
2 7
9
8
7
6
5
4
3
2
1
3
1
1 1
1
1
2 7
9
8
7
6
5
4
3
2
1
Strongly agree
Strongly disagree
106 P R E O P E R A T I V E T E S T S

4.6 “Tests of haemostasis are indicated preoperatively in a normal healthy adult having elective cardiac surgery aged as shown.”
≥16 & <40 ≥40 & <60 ≥60 & <80 ≥80
Age – years
Comments:
ADULTS, RENAL FUNCTION TESTS (ie potassium, sodium, creatinine, urea)
Cost estimates: low £1.40 mid £3.40 upper £5.40
To what extent are renal function tests indicated for ‘normal healthy patients’ (ie ASA Grade 1) of different ages,
undergoing different types of surgery? For each of the ages shown below, please indicate your agreement with the
following statements by ringing one or more numbers in each column:
5.1 “Renal function tests are indicated preoperatively in a normal healthy adult having elective Grade 1 surgery, aged as shown.”
≥16 & <40 ≥40 & <60 ≥60 & <80 ≥80
Age – years
Comments:
1
1 3
2
3 1
1
5
9
8
7
6
5
4
3
2
1
1
2 3
3
1
7
9
8
7
6
5
4
3
2
1
1
1
1
5 9
9
8
7
6
5
4
3
2
1
1
7 9
9
8
7
6
5
4
3
2
1
Strongly agree
Strongly disagree
6 1
1
1
2
6
9
8
7
6
5
4
3
2
1
6 1
1
1
2
6
9
8
7
6
5
4
3
2
1
6 1
1
1
2
6
9
8
7
6
5
4
3
2
1
6 1
1
1
2
6
9
8
7
6
5
4
3
2
1
Strongly agree
Strongly disagree
107A P P E N D I X 3

5.2 “Renal function tests are indicated preoperatively in a normal healthy adult having elective Grade 2 surgery, aged as shown.”
≥16 & <40 ≥40 & <60 ≥60 & <80 ≥80
Age – years
Comments:
5.3 “Renal function tests are indicated preoperatively in a normal healthy adult having elective Grade 3 surgery, aged as shown.”
≥16 & <40 ≥40 & <60 ≥60 & <80 ≥80
Age – years
Comments:
6 8
1
1
1
9
8
7
6
5
4
3
2
1
6 6
1 1
1
1
1
9
8
7
6
5
4
3
2
1
6 5
1 1
1
3
9
8
7
6
5
4
3
2
1
5 3
1 1
1
1 2
3
9
8
7
6
5
4
3
2
1
Strongly agree
Strongly disagree
1 3
3
4
1
1
1
3
9
8
7
6
5
4
3
2
1
1 3
3
1
2
2
1
1
3
9
8
7
6
5
4
3
2
1
1
1
2
2
4 7
9
8
7
6
5
4
3
2
1
1
1 1
6 8
9
8
7
6
5
4
3
2
1
Strongly agree
Strongly disagree
108 P R E O P E R A T I V E T E S T S

5.4 “Renal function tests are indicated preoperatively in a normal healthy adult having elective Grade 4 surgery, aged as shown.”
≥16 & <40 ≥40 & <60 ≥60 & <80 ≥80
Age – years
Comments:
5.5 “Renal function tests are indicated preoperatively in a normal healthy adult having elective neurosurgery, aged as shown.”
≥16 & <40 ≥40 & <60 ≥60 & <80 ≥80
Age – years
Comments:
7 9
1
9
8
7
6
5
4
3
2
1
7 9
1
9
8
7
6
5
4
3
2
1
7 8
2
9
8
7
6
5
4
3
2
1
7 8
2
9
8
7
6
5
4
3
2
1
Strongly agree
Strongly disagree
7 9
1
9
8
7
6
5
4
3
2
1
7 8
1
1
9
8
7
6
5
4
3
2
1
7 7
1
2
9
8
7
6
5
4
3
2
1
7 6
1
3
9
8
7
6
5
4
3
2
1
Strongly agree
Strongly disagree
109A P P E N D I X 3

5.6 “Renal function tests are indicated preoperatively in a normal healthy adult having elective cardiac surgery, aged as shown.”
≥16 & <40 ≥40 & <60 ≥60 & <80 ≥80
Age – years
Comments:
ADULTS, BLOOD GLUCOSE TESTING
Cost estimates: low £1.05 mid £2.30 upper £3.60
To what extent is blood glucose testing indicated for ‘normal healthy patients’ (ie ASA Grade 1) of different ages,
undergoing different types of surgery? For each of the ages shown below, please indicate your agreement with the
following statements by ringing one or more numbers in each column:
6.1 “Blood glucose testing is indicated preoperatively in a normal healthy adult having elective Grade 1 surgery, aged as shown.”
≥16 & <40 ≥40 & <60 ≥60 & <80 ≥80
Age – years
Comments:
1
7 9
9
8
7
6
5
4
3
2
1
1
7 9
9
8
7
6
5
4
3
2
1
1
7 9
9
8
7
6
5
4
3
2
1
1
7 9
9
8
7
6
5
4
3
2
1
Strongly agree
Strongly disagree
7 9
1
9
8
7
6
5
4
3
2
1
7 9
1
9
8
7
6
5
4
3
2
1
7 9
1
9
8
7
6
5
4
3
2
1
7 9
1
9
8
7
6
5
4
3
2
1
Strongly agree
Strongly disagree
110 P R E O P E R A T I V E T E S T S

6.2 “Blood glucose testing is indicated preoperatively in a normal healthy adult having elective Grade 2 surgery, aged as shown.”
≥16 & <40 ≥40 & <60 ≥60 & <80 ≥80
Age – years
Comments:
6.3 “Blood glucose testing is indicated preoperatively in a normal healthy adult having elective Grade 3 surgery, aged as shown.”
≥16 & <40 ≥40 & <60 ≥60 & <80 ≥80
Age – years
Comments:
5
1 1
2 1
4 3
9
8
7
6
5
4
3
2
1
5
1 1
2 1
4 3
9
8
7
6
5
4
3
2
1
5
2 1
5 4
9
8
7
6
5
4
3
2
1
4
2 2
5 4
9
8
7
6
5
4
3
2
1
Strongly agree
Strongly disagree
2
3
7 5
9
8
7
6
5
4
3
2
1
2
3
7 5
9
8
7
6
5
4
3
2
1
1
2
1
1
7 5
9
8
7
6
5
4
3
2
1
1
1
7 8
9
8
7
6
5
4
3
2
1
Strongly agree
Strongly disagree
111A P P E N D I X 3

6.4 “Blood glucose testing is indicated preoperatively in a normal healthy adult having elective Grade 4 surgery, aged as shown.”
≥16 & <40 ≥40 & <60 ≥60 & <80 ≥80
Age – years
Comments:
6.5 “Blood glucose testing is indicated preoperatively in a normal healthy adult having elective neurosurgery, aged as shown.”
≥16 & <40 ≥40 & <60 ≥60 & <80 ≥80
Age – years
Comments:
8
2 1
1
1
3 1
9
8
7
6
5
4
3
2
1
8
2 1
1
1
3 1
9
8
7
6
5
4
3
2
1
8
1
1
1
4 2
9
8
7
6
5
4
3
2
1
7
1
1
1
1
4 2
9
8
7
6
5
4
3
2
1
Strongly agree
Strongly disagree
5
2 1
2 1
3 3
9
8
7
6
5
4
3
2
1
5
2 1
2 1
3 3
9
8
7
6
5
4
3
2
1
5
1
2 1
4 4
9
8
7
6
5
4
3
2
1
4
2 2
5 4
9
8
7
6
5
4
3
2
1
Strongly agree
Strongly disagree
112 P R E O P E R A T I V E T E S T S

6.6 “Blood glucose testing is indicated preoperatively in a normal healthy adult having elective cardiac surgery, aged as shown.”
≥16 & <40 ≥40 & <60 ≥60 & <80 ≥80
Age – years
Comments:
ADULTS, URINE ANALYSIS (‘dipstick’ for protein, bilirubin, glucose, ketones, blood, UTIs)
Cost estimates: low £0.15 mid £0.21 upper £0.27
To what extent is urine analysis indicated for ‘normal healthy patients’ (ie ASA Grade 1) of different ages, undergoing
different types of surgery? For each of the ages shown below, please indicate your agreement with the following
statements by ringing one or more numbers in each column:
7.1 “Urine analysis is indicated preoperatively in a normal healthy adult having elective Grade 1 surgery, aged as shown.”
≥16 & <40 ≥40 & <60 ≥60 & <80 ≥80
Age – years
Comments:
5 1
1
1 9
9
8
7
6
5
4
3
2
1
5 1
1
1
9
9
8
7
6
5
4
3
2
1
5
1
1 1
9
9
8
7
6
5
4
3
2
1
4
2
1
1 9
9
8
7
6
5
4
3
2
1
Strongly agree
Strongly disagree
8
1 1
2
4 1Gr
9
8
7
6
5
4
3
2
1
8
1 1
2
4 1
9
8
7
6
5
4
3
2
1
8
2
5 2
9
8
7
6
5
4
3
2
1
7
1
2
5 2
9
8
7
6
5
4
3
2
1
Strongly agree
Strongly disagree
113A P P E N D I X 3

7.2 “Urine analysis is indicated preoperatively in a normal healthy adult having elective Grade 2 surgery, aged as shown.”
≥16 & <40 ≥40 & <60 ≥60 & <80 ≥80
Age – years
Comments:
7.3 “Urine analysis is indicated preoperatively in a normal healthy adult having elective Grade 3 surgery, aged as shown.”
≥16 & <40 ≥40 & <60 ≥60 & <80 ≥80
Age – years
Comments:
6 1
1
9
9
8
7
6
5
4
3
2
1
6 1
1
9
9
8
7
6
5
4
3
2
1
6
1
1
9
9
8
7
6
5
4
3
2
1
6
1
1
9
9
8
7
6
5
4
3
2
1
Strongly agree
Strongly disagree
6 1
1
9
9
8
7
6
5
4
3
2
1
5 1
1
1
9
9
8
7
6
5
4
3
2
1
5
1
1 1
9
9
8
7
6
5
4
3
2
1
4
2
1
1 9
9
8
7
6
5
4
3
2
1
Strongly agree
Strongly disagree
114 P R E O P E R A T I V E T E S T S

7.4 “Urine analysis is indicated preoperatively in a normal healthy adult having elective Grade 4 surgery, aged as shown.”
≥16 & <40 ≥40 & <60 ≥60 & <80 ≥80
Age – years
Comments:
7.5 “Urine analysis is indicated preoperatively in a normal healthy adult having elective neurosurgery, aged as shown.”
≥16 & <40 ≥40 & <60 ≥60 & <80 ≥80
Age – years
Comments:
6 2
1
8
9
8
7
6
5
4
3
2
1
6 2
1
8
9
8
7
6
5
4
3
2
1
6 1
1
1
8
9
8
7
6
5
4
3
2
1
6 1
1
1
8
9
8
7
6
5
4
3
2
1
Strongly agree
Strongly disagree
6 1
1
1
8
9
8
7
6
5
4
3
2
1
6 1
1
1
8
9
8
7
6
5
4
3
2
1
6
1
1
9
9
8
7
6
5
4
3
2
1
6
1
1
9
9
8
7
6
5
4
3
2
1
Strongly agree
Strongly disagree
115A P P E N D I X 3

7.6 “Urine analysis is indicated preoperatively in a normal healthy adult having elective cardiac surgery, aged as shown.”
≥16 & <40 ≥40 & <60 ≥60 & <80 ≥80
Age – years
Comments:
CHILDREN, CHEST X-RAY
Cost estimates: low £10.00 mid £20.50 upper £31.00
To what extent is urine analysis indicated for ‘normal healthy patients’ (ie ASA Grade 1) of different ages, undergoing
different types of surgery? For each of the ages shown below, please indicate your agreement with the following
statements by ringing one or more numbers in each column:
8.1 “A chest x-ray is indicated preoperatively in a normal healthy child having elective Grade 1 surgery, aged as shown.”
<6 mths ≥6 & <12mths ≥1 & <5yr ≥5 & <12yr ≥12 & <16yr
Age – months/years
Comments:
1
7 10
9
8
7
6
5
4
3
2
1
1
7 10
9
8
7
6
5
4
3
2
1
1
7 10
9
8
7
6
5
4
3
2
1
1
7 10
9
8
7
6
5
4
3
2
1
1
7 10
9
8
7
6
5
4
3
2
1
Strongly agree
Strongly disagree
6 1
1
9
9
8
7
6
5
4
3
2
1
6 1
1
9
9
8
7
6
5
4
3
2
1
6
1
1
9
9
8
7
6
5
4
3
2
1
6
1
1
9
9
8
7
6
5
4
3
2
1
Strongly agree
Strongly disagree
116 P R E O P E R A T I V E T E S T S
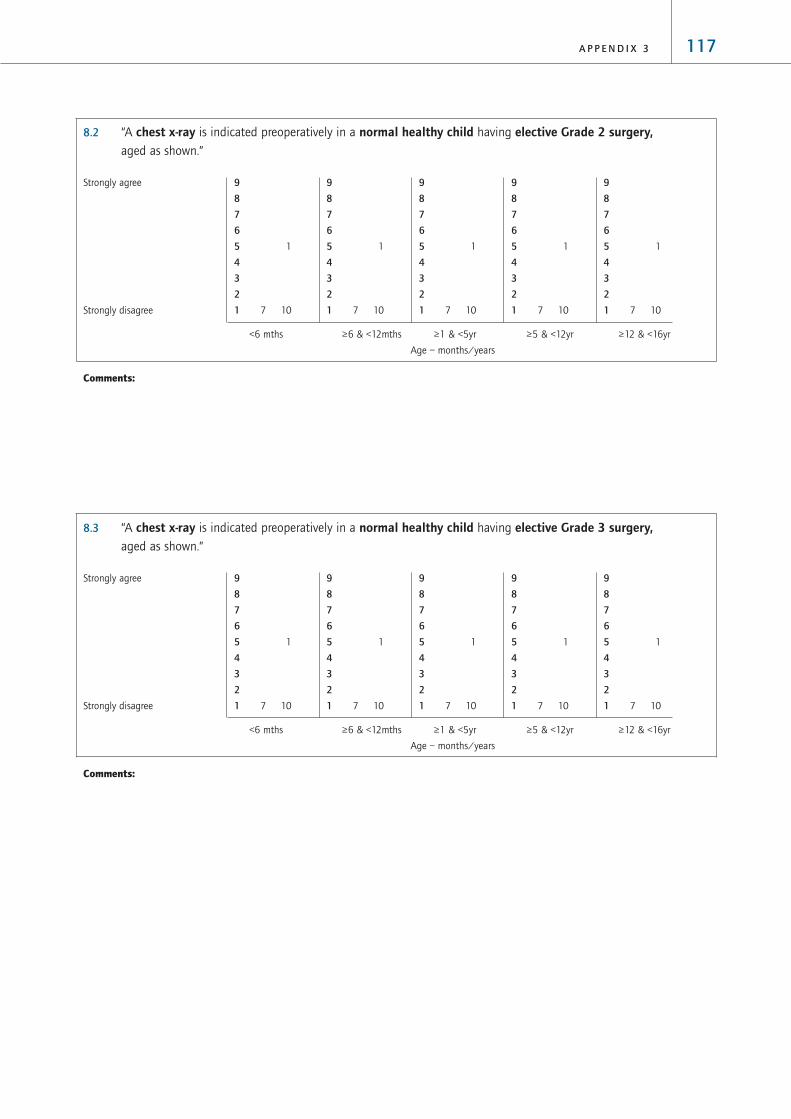
8.2 “A chest x-ray is indicated preoperatively in a normal healthy child having elective Grade 2 surgery, aged as shown.”
<6 mths ≥6 & <12mths ≥1 & <5yr ≥5 & <12yr ≥12 & <16yr
Age – months/years
Comments:
8.3 “A chest x-ray is indicated preoperatively in a normal healthy child having elective Grade 3 surgery, aged as shown.”
<6 mths ≥6 & <12mths ≥1 & <5yr ≥5 & <12yr ≥12 & <16yr
Age – months/years
Comments:
1
7 10
9
8
7
6
5
4
3
2
1
1
7 10
9
8
7
6
5
4
3
2
1
1
7 10
9
8
7
6
5
4
3
2
1
1
7 10
9
8
7
6
5
4
3
2
1
1
7 10
9
8
7
6
5
4
3
2
1
Strongly agree
Strongly disagree
1
7 10
9
8
7
6
5
4
3
2
1
1
7 10
9
8
7
6
5
4
3
2
1
1
7 10
9
8
7
6
5
4
3
2
1
1
7 10
9
8
7
6
5
4
3
2
1
1
7 10
9
8
7
6
5
4
3
2
1
Strongly agree
Strongly disagree
117A P P E N D I X 3

8.4 “A chest x-ray is indicated preoperatively in a normal healthy child having elective Grade 4 surgery, aged as shown.”
<6 mths ≥6 & <12mths ≥1 & <5yr ≥5 & <12yr ≥12 & <16yr
Age – months/years
Comments:
8.5 “A chest x-ray is indicated preoperatively in a normal healthy child having elective neurosurgery, aged as shown.”
<6 mths ≥6 & <12mths ≥1 & <5yr ≥5 & <12yr ≥12 & <16yr
Age – months/years
Comments:
1 1
6 10
9
8
7
6
5
4
3
2
1
1 1
6 10
9
8
7
6
5
4
3
2
1
1 1
6 10
9
8
7
6
5
4
3
2
1
1 1
6 10
9
8
7
6
5
4
3
2
1
1 1
6 10
9
8
7
6
5
4
3
2
1
Strongly agree
Strongly disagree
1
7 10
9
8
7
6
5
4
3
2
1
1
7 10
9
8
7
6
5
4
3
2
1
1
7 10
9
8
7
6
5
4
3
2
1
1
7 10
9
8
7
6
5
4
3
2
1
1
7 10
9
8
7
6
5
4
3
2
1
Strongly agree
Strongly disagree
118 P R E O P E R A T I V E T E S T S

8.6 “A chest x-ray is indicated preoperatively in a normal healthy child having elective cardiac surgery, aged as shown.”
<6 mths ≥6 & <12mths ≥1 & <5yr ≥5 & <12yr ≥12 & <16yr
Age – months/years
Comments:
CHILDREN, RESTING ECG
Cost estimates: low £11.00 mid £26.00 upper £37.00
To what extent is a resting ECG indicated for ‘normal healthy children’ (ie ASA Grade 1) of different ages, undergoing
different types of surgery? For each of the ages shown below, please indicate your agreement with the following
statements by ringing one or more numbers in each column:
9.1 “A resting ECG is indicated preoperatively in a normal healthy child having elective Grade 1 surgery, aged as shown.”
<6 mths ≥6 & <12mths ≥1 & <5yr ≥5 & <12yr ≥12 & <16yr
Age – months/years
Comments:
1
7 10
9
8
7
6
5
4
3
2
1
1
7 10
9
8
7
6
5
4
3
2
1
1
7 10
9
8
7
6
5
4
3
2
1
1
7 10
9
8
7
6
5
4
3
2
1
1
7 10
9
8
7
6
5
4
3
2
1
Strongly agree
Strongly disagree
7 8
3
9
8
7
6
5
4
3
2
1
7 8
3
9
8
7
6
5
4
3
2
1
7 8
3
9
8
7
6
5
4
3
2
1
7 8
3
9
8
7
6
5
4
3
2
1
7 8
3
9
8
7
6
5
4
3
2
1
Strongly agree
Strongly disagree
119A P P E N D I X 3

9.2 “A resting ECG is indicated preoperatively in a normal healthy child having elective Grade 2 surgery, aged as shown.”
<6 mths ≥6 & <12mths ≥1 & <5yr ≥5 & <12yr ≥12 & <16yr
Age – months/years
Comments:
9.3 “A resting ECG is indicated preoperatively in a normal healthy child having elective Grade 3 surgery, aged as shown.”
<6 mths ≥6 & <12mths ≥1 & <5yr ≥5 & <12yr ≥12 & <16yr
Age – months/years
Comments:
1
7 10
9
8
7
6
5
4
3
2
1
1
7 10
9
8
7
6
5
4
3
2
1
1
7 10
9
8
7
6
5
4
3
2
1
1
7 10
9
8
7
6
5
4
3
2
1
1
7 10
9
8
7
6
5
4
3
2
1
Strongly agree
Strongly disagree
1
7 10
9
8
7
6
5
4
3
2
1
1
7 10
9
8
7
6
5
4
3
2
1
1
7 10
9
8
7
6
5
4
3
2
1
1
7 10
9
8
7
6
5
4
3
2
1
1
7 10
9
8
7
6
5
4
3
2
1
Strongly agree
Strongly disagree
120 P R E O P E R A T I V E T E S T S

9.4 “A resting ECG is indicated preoperatively in a normal healthy child having elective Grade 4 surgery, aged as shown.”
<6 mths ≥6 & <12mths ≥1 & <5yr ≥5 & <12yr ≥12 & <16yr
Age – months/years
Comments:
9.5 “A resting ECG is indicated preoperatively in a normal healthy child having elective neurosurgery, aged as shown.”
<6 mths ≥6 & <12mths ≥1 & <5yr ≥5 & <12yr ≥12 & <16yr
Age – months/years
Comments:
1
7 10
9
8
7
6
5
4
3
2
1
1
7 10
9
8
7
6
5
4
3
2
1
1
7 10
9
8
7
6
5
4
3
2
1
1
7 10
9
8
7
6
5
4
3
2
1
1
7 10
9
8
7
6
5
4
3
2
1
Strongly agree
Strongly disagree
1
7 10
9
8
7
6
5
4
3
2
1
1
7 10
9
8
7
6
5
4
3
2
1
1
7 10
9
8
7
6
5
4
3
2
1
1
7 10
9
8
7
6
5
4
3
2
1
1
7 10
9
8
7
6
5
4
3
2
1
Strongly agree
Strongly disagree
121A P P E N D I X 3

9.6 “A resting ECG is indicated preoperatively in a normal healthy child having elective Grade cardiac surgery, aged as shown.”
<6 mths ≥6 & <12mths ≥1 & <5yr ≥5 & <12yr ≥12 & <16yr
Age – months/years
Comments:
CHILDREN, FULL BLOOD COUNT
Cost estimates: low £0.70 mid £2.35 upper £4.05
To what extent is a resting ECG indicated for ‘normal healthy children’ (ie ASA Grade 1) of different ages, undergoing
different types of surgery? For each of the ages shown below, please indicate your agreement with the following
statements by ringing one or more numbers in each column:
10.1 “A full blood count is indicated preoperatively in a normal healthy child having elective Grade 1 surgery, aged as shown.”
<6 mths ≥6 & <12mths ≥1 & <5yr ≥5 & <12yr ≥12 & <16yr
Age – months/years
Comments:
1
1
6 10
9
8
7
6
5
4
3
2
1
1
1
6 10
9
8
7
6
5
4
3
2
1
1
1
6 10
9
8
7
6
5
4
3
2
1
1
1
6 10
9
8
7
6
5
4
3
2
1
1
1
6 10
9
8
7
6
5
4
3
2
1
Strongly agree
Strongly disagree
6 11
1
9
8
7
6
5
4
3
2
1
6 11
1
9
8
7
6
5
4
3
2
1
6 11
1
9
8
7
6
5
4
3
2
1
6 11
1
9
8
7
6
5
4
3
2
1
6 11
1
9
8
7
6
5
4
3
2
1
Strongly agree
Strongly disagree
122 P R E O P E R A T I V E T E S T S

10.2 “A full blood count is indicated preoperatively in a normal healthy child having elective Grade 2 surgery, aged as shown.”
<6 mths ≥6 & <12mths ≥1 & <5yr ≥5 & <12yr ≥12 & <16yr
Age – months/years
Comments:
10.3 “A full blood count is indicated preoperatively in a normal healthy child having elective Grade 3 surgery, aged as shown.”
<6 mths ≥6 & <12mths ≥1 & <5yr ≥5 & <12yr ≥12 & <16yr
Age – months/years
Comments:
5 1
2 1
7
2
9
8
7
6
5
4
3
2
1
5 1
2 1
7
2
9
8
7
6
5
4
3
2
1
5 2
2 1
6
2
9
8
7
6
5
4
3
2
1
5 2
2 1
6
2
9
8
7
6
5
4
3
2
1
5 2
2 1
6
2
9
8
7
6
5
4
3
2
1
Strongly agree
Strongly disagree
1
1
1
5 10
9
8
7
6
5
4
3
2
1
1
1
6 10
9
8
7
6
5
4
3
2
1
1
1
6 10
9
8
7
6
5
4
3
2
1
1
1
6 10
9
8
7
6
5
4
3
2
1
1
1
6 10
9
8
7
6
5
4
3
2
1
Strongly agree
Strongly disagree
123A P P E N D I X 3

10.4 “A full blood count is indicated preoperatively in a normal healthy child having elective Grade 4 surgery, aged as shown.”
<6 mths ≥6 & <12mths ≥1 & <5yr ≥5 & <12yr ≥12 & <16yr
Age – months/years
Comments:
10.5 “A full blood count is indicated preoperatively in a normal healthy child having elective neurosurgery, aged as shown.”
<6 mths ≥6 & <12mths ≥1 & <5yr ≥5 & <12yr ≥12 & <16yr
Age – months/years
Comments:
7 1
10
9
8
7
6
5
4
3
2
1
7 1
10
9
8
7
6
5
4
3
2
1
7 1
10
9
8
7
6
5
4
3
2
1
7 1
10
9
8
7
6
5
4
3
2
1
7 1
10
9
8
7
6
5
4
3
2
1
Strongly agree
Strongly disagree
7 3
7
1
9
8
7
6
5
4
3
2
1
6 3
1
7
1
9
8
7
6
5
4
3
2
1
6 3
1
7
1
9
8
7
6
5
4
3
2
1
6 3
1
7
1
9
8
7
6
5
4
3
2
1
6 3
1
7
1
9
8
7
6
5
4
3
2
1
Strongly agree
Strongly disagree
124 P R E O P E R A T I V E T E S T S

10.6 “A full blood count is indicated preoperatively in a normal healthy child having elective cardiac surgery, aged as shown.”
<6 mths ≥6 & <12mths ≥1 & <5yr ≥5 & <12yr ≥12 & <16yr
Age – months/years
Comments:
CHILDREN, TESTS OF HAEMOSTASIS
Cost estimates: low £1.50 mid £3.65 upper £5.85
To what extent are tests of haemostasis indicated for ‘normal healthy children’ (ie ASA Grade 1) of different ages,
undergoing different types of surgery? For each of the ages shown below, please indicate your agreement with the
following statements by ringing one or more numbers in each column:
11.1 “Tests of haemostasis are indicated preoperatively in a normal healthy child having elective Grade 1 surgery, aged as shown.”
<6 mths ≥6 & <12mths ≥1 & <5yr ≥5 & <12yr ≥12 & <16yr
Age – months/years
Comments:
1
7 10
9
8
7
6
5
4
3
2
1
1
7 10
9
8
7
6
5
4
3
2
1
1
7 10
9
8
7
6
5
4
3
2
1
1
7 10
9
8
7
6
5
4
3
2
1
1
7 10
9
8
7
6
5
4
3
2
1
Strongly agree
Strongly disagree
7 119
8
7
6
5
4
3
2
1
7 119
8
7
6
5
4
3
2
1
7 119
8
7
6
5
4
3
2
1
7 119
8
7
6
5
4
3
2
1
7 119
8
7
6
5
4
3
2
1
Strongly agree
Strongly disagree
125A P P E N D I X 3

11.2 “Tests of haemostasis are indicated preoperatively in a normal healthy child having elective Grade 2 surgery, aged as shown.”
<6 mths ≥6 & <12mths ≥1 & <5yr ≥5 & <12yr ≥12 & <16yr
Age – months/years
Comments:
11.3 “Tests of haemostasis are indicated preoperatively in a normal healthy child having elective Grade 3 surgery, aged as shown.”
<6 mths ≥6 & <12mths ≥1 & <5yr ≥5 & <12yr ≥12 & <16yr
Age – months/years
Comments:
1
1
6 10
9
8
7
6
5
4
3
2
1
1
1
6 10
9
8
7
6
5
4
3
2
1
1
1
6 10
9
8
7
6
5
4
3
2
1
1
1
6 10
9
8
7
6
5
4
3
2
1
1
1
6 10
9
8
7
6
5
4
3
2
1
Strongly agree
Strongly disagree
1
7 10
9
8
7
6
5
4
3
2
1
1
7 10
9
8
7
6
5
4
3
2
1
1
7 10
9
8
7
6
5
4
3
2
1
1
7 10
9
8
7
6
5
4
3
2
1
1
7 10
9
8
7
6
5
4
3
2
1
Strongly agree
Strongly disagree
126 P R E O P E R A T I V E T E S T S

11.4 “Tests of haemostasis are indicated preoperatively in a normal healthy child having elective Grade 4 surgery, aged as shown.”
<6 mths ≥6 & <12mths ≥1 & <5yr ≥5 & <12yr ≥12 & <16yr
Age – months/years
Comments:
11.5 “Tests of haemostasis are indicated preoperatively in a normal healthy child having elective neurosurgery, aged as shown.”
<6 mths ≥6 & <12mths ≥1 & <5yr ≥5 & <12yr ≥12 & <16yr
Age – months/years
Comments:
5
1
1
2
9
9
8
7
6
5
4
3
2
1
5
1
1
2
9
9
8
7
6
5
4
3
2
1
5
1
1
2
9
9
8
7
6
5
4
3
2
1
5
1
1
2
9
9
8
7
6
5
4
3
2
1
5
1
1
2
9
9
8
7
6
5
4
3
2
1
Strongly agree
Strongly disagree
2 1
1 1
4 9
9
8
7
6
5
4
3
2
1
2 1
1 1
4 9
9
8
7
6
5
4
3
2
1
2 1
1 1
4 9
9
8
7
6
5
4
3
2
1
2 1
1 1
4 9
9
8
7
6
5
4
3
2
1
2 1
1 1
4 9
9
8
7
6
5
4
3
2
1
Strongly agree
Strongly disagree
127A P P E N D I X 3

11.6 “Tests of haemostasis are indicated preoperatively in a normal healthy child having elective cardiac surgery, aged as shown.”
<6 mths ≥6 & <12mths ≥1 & <5yr ≥5 & <12yr ≥12 & <16yr
Age – months/years
Comments:
CHILDREN, RENAL FUNCTION TESTS (ie potassium, sodium, creatinine, urea)
Cost estimates: low £1.40 mid £3.40 upper £5.40
To what extent are renal function tests indicated for ‘normal healthy children’ (ie ASA Grade 1) of different ages,
undergoing different types of surgery? For each of the ages shown below, please indicate your agreement with the
following statements by ringing one or more numbers in each column:
12.1 “Renal function tests are indicated preoperatively in a normal healthy child having elective Grade 1 surgery, aged as shown.”
<6 mths ≥6 & <12mths ≥1 & <5yr ≥5 & <12yr ≥12 & <16yr
Age – months/years
Comments:
1
7 10
9
8
7
6
5
4
3
2
1
1
7 10
9
8
7
6
5
4
3
2
1
1
7 10
9
8
7
6
5
4
3
2
1
1
1
7 9
9
8
7
6
5
4
3
2
1
1
7 10
9
8
7
6
5
4
3
2
1
Strongly agree
Strongly disagree
7
8
3
9
8
7
6
5
4
3
2
1
7
10
1
9
8
7
6
5
4
3
2
1
7
10
1
9
8
7
6
5
4
3
2
1
7
10
1
9
8
7
6
5
4
3
2
1
7
10
1
9
8
7
6
5
4
3
2
1
Strongly agree
Strongly disagree
128 P R E O P E R A T I V E T E S T S
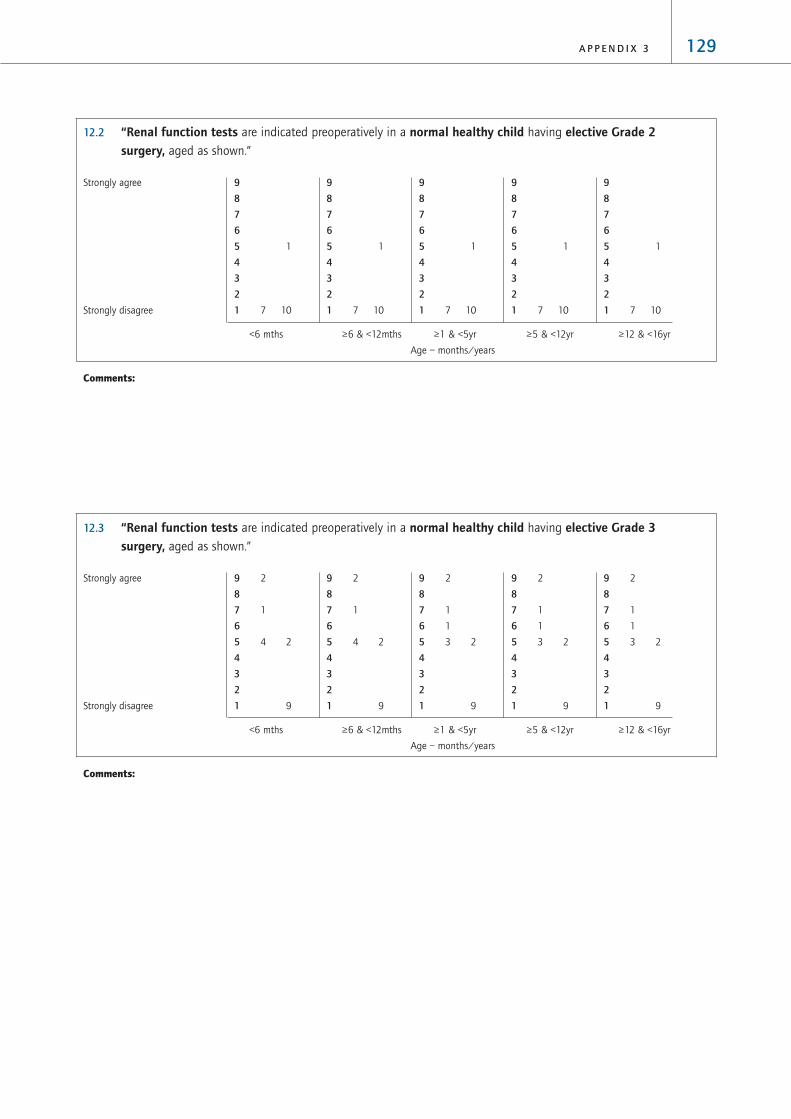
12.2 “Renal function tests are indicated preoperatively in a normal healthy child having elective Grade 2 surgery, aged as shown.”
<6 mths ≥6 & <12mths ≥1 & <5yr ≥5 & <12yr ≥12 & <16yr
Age – months/years
Comments:
12.3 “Renal function tests are indicated preoperatively in a normal healthy child having elective Grade 3 surgery, aged as shown.”
<6 mths ≥6 & <12mths ≥1 & <5yr ≥5 & <12yr ≥12 & <16yr
Age – months/years
Comments:
2
1
1
3 2
9
9
8
7
6
5
4
3
2
1
2
1
1
3 2
9
9
8
7
6
5
4
3
2
1
2
1
1
3 2
9
9
8
7
6
5
4
3
2
1
2
1
4 2
9
9
8
7
6
5
4
3
2
1
2
1
4 2
9
9
8
7
6
5
4
3
2
1
Strongly agree
Strongly disagree
1
7 10
9
8
7
6
5
4
3
2
1
1
7 10
9
8
7
6
5
4
3
2
1
1
7 10
9
8
7
6
5
4
3
2
1
1
7 10
9
8
7
6
5
4
3
2
1
1
7 10
9
8
7
6
5
4
3
2
1
Strongly agree
Strongly disagree
129A P P E N D I X 3

12.4 “Renal function tests are indicated preoperatively in a normal healthy child having elective Grade 4 surgery, aged as shown.”
<6 mths ≥6 & <12mths ≥1 & <5yr ≥5 & <12yr ≥12 & <16yr
Age – months/years
Comments:
12.5 “Renal function tests are indicated preoperatively in a normal healthy child having elective neurosurgery, aged as shown.”
<6 mths ≥6 & <12mths ≥1 & <5yr ≥5 & <12yr ≥12 & <16yr
Age – months/years
Comments:
6 7
1 1
2
1
9
8
7
6
5
4
3
2
1
6 7
1 1
2
1
9
8
7
6
5
4
3
2
1
6 7
1 1
2
1
9
8
7
6
5
4
3
2
1
6 7
1 1
2
1
9
8
7
6
5
4
3
2
1
6 7
1 1
2
1
9
8
7
6
5
4
3
2
1
Strongly agree
Strongly disagree
6
1
2
1
8
9
8
7
6
5
4
3
2
1
6
1
2
1
8
9
8
7
6
5
4
3
2
1
6
1
2
1
8
9
8
7
6
5
4
3
2
1
6
1
2
1
8
9
8
7
6
5
4
3
2
1
6
1
2
1
8
9
8
7
6
5
4
3
2
1
Strongly agree
Strongly disagree
130 P R E O P E R A T I V E T E S T S

12.6 “Renal function tests are indicated preoperatively in a normal healthy child having elective cardiac surgery, aged as shown.”
<6 mths ≥6 & <12mths ≥1 & <5yr ≥5 & <12yr ≥12 & <16yr
Age – months/years
Comments:
CHILDREN, BLOOD GLUCOSE TESTING
Cost estimates: low £1.05 mid £2.30 upper £3.60
To what extent is blood glucose testing indicated for ‘normal healthy children’ (ie ASA Grade 1) of different ages,
undergoing different types of surgery? For each of the ages shown below, please indicate your agreement with the
following statements by ringing one or more numbers in each column:
13.1 “Blood glucose testing are indicated preoperatively in a normal healthy child having elective Grade 1 surgery, aged as shown.”
<6 mths ≥6 & <12mths ≥1 & <5yr ≥5 & <12yr ≥12 & <16yr
Age – months/years
Comments:
1
7 10
9
8
7
6
5
4
3
2
1
1
7 10
9
8
7
6
5
4
3
2
1
1
7 10
9
8
7
6
5
4
3
2
1
1
7 10
9
8
7
6
5
4
3
2
1
1
7 10
9
8
7
6
5
4
3
2
1
Strongly agree
Strongly disagree
7 9
1
1
9
8
7
6
5
4
3
2
1
7 9
1
1
9
8
7
6
5
4
3
2
1
7 9
1
1
9
8
7
6
5
4
3
2
1
7 9
1
1
9
8
7
6
5
4
3
2
1
7 9
1
1
9
8
7
6
5
4
3
2
1
Strongly agree
Strongly disagree
131A P P E N D I X 3
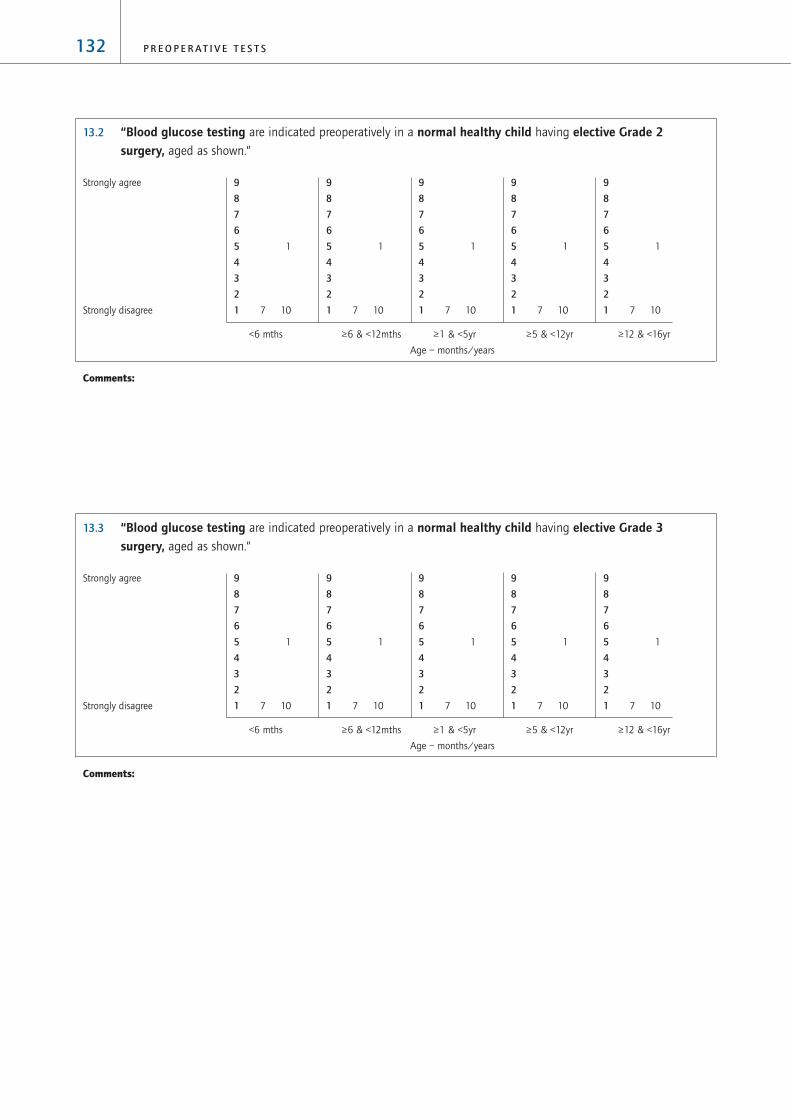
13.2 “Blood glucose testing are indicated preoperatively in a normal healthy child having elective Grade 2 surgery, aged as shown.”
<6 mths ≥6 & <12mths ≥1 & <5yr ≥5 & <12yr ≥12 & <16yr
Age – months/years
Comments:
13.3 “Blood glucose testing are indicated preoperatively in a normal healthy child having elective Grade 3 surgery, aged as shown.”
<6 mths ≥6 & <12mths ≥1 & <5yr ≥5 & <12yr ≥12 & <16yr
Age – months/years
Comments:
1
7 10
9
8
7
6
5
4
3
2
1
1
7 10
9
8
7
6
5
4
3
2
1
1
7 10
9
8
7
6
5
4
3
2
1
1
7 10
9
8
7
6
5
4
3
2
1
1
7 10
9
8
7
6
5
4
3
2
1
Strongly agree
Strongly disagree
1
7 10
9
8
7
6
5
4
3
2
1
1
7 10
9
8
7
6
5
4
3
2
1
1
7 10
9
8
7
6
5
4
3
2
1
1
7 10
9
8
7
6
5
4
3
2
1
1
7 10
9
8
7
6
5
4
3
2
1
Strongly agree
Strongly disagree
132 P R E O P E R A T I V E T E S T S

13.4 “Blood glucose testing are indicated preoperatively in a normal healthy child having elective Grade 4 surgery, aged as shown.”
<6 mths ≥6 & <12mths ≥1 & <5yr ≥5 & <12yr ≥12 & <16yr
Age – months/years
Comments:
13.5 “Blood glucose testing are indicated preoperatively in a normal healthy child having elective neurosurgery,aged as shown.”
<6 mths ≥6 & <12mths ≥1 & <5yr ≥5 & <12yr ≥12 & <16yr
Age – months/years
Comments:
1
1
1
5 10
9
8
7
6
5
4
3
2
1
1
1
1
5 10
9
8
7
6
5
4
3
2
1
1
1
1
5 10
9
8
7
6
5
4
3
2
1
1
1
1
5 10
9
8
7
6
5
4
3
2
1
1
1
1
5 10
9
8
7
6
5
4
3
2
1
Strongly agree
Strongly disagree
1
7 10
9
8
7
6
5
4
3
2
1
1
7 10
9
8
7
6
5
4
3
2
1
1
7 10
9
8
7
6
5
4
3
2
1
1
7 10
9
8
7
6
5
4
3
2
1
1
7 10
9
8
7
6
5
4
3
2
1
Strongly agree
Strongly disagree
133A P P E N D I X 3

13.6 “Blood glucose testing are indicated preoperatively in a normal healthy child having elective cardiac surgery,aged as shown.”
<6 mths ≥6 & <12mths ≥1 & <5yr ≥5 & <12yr ≥12 & <16yr
Age – months/years
Comments:
CHILDREN, URINE ANALYSIS (‘dipstick’ for protein, bilirubin, glucose, ketones, blood, UTIs)
Cost estimates: low £0.15 mid £0.21 upper £0.27
To what extent is urine analysis indicated for ‘normal healthy children’ (ie ASA Grade 1) patients of different ages,
undergoing different types of surgery? For each of the ages shown below, please indicate your agreement with the
following statements by ringing one or more numbers in each column:
14.1 “Urine analysis is indicated preoperatively in a normal healthy child having elective Grade 1 surgery,aged as shown.”
<6 mths ≥6 & <12mths ≥1 & <5yr ≥5 & <12yr ≥12 & <16yr
Age – months/years
Comments:
1
1
5 10
9
8
7
6
5
4
3
2
1
1
1
5 10
9
8
7
6
5
4
3
2
1
1
1
5 11
9
8
7
6
5
4
3
2
1
1
1
5 11
9
8
7
6
5
4
3
2
1
1
1
5 11
9
8
7
6
5
4
3
2
1
Strongly agree
Strongly disagree
2
1
1 1
5 8
9
8
7
6
5
4
3
2
1
2
1
1 1
5 8
9
8
7
6
5
4
3
2
1
2
1
1 1
5 8
9
8
7
6
5
4
3
2
1
2
1
1 1
5 8
9
8
7
6
5
4
3
2
1
2
1
1 1
5 8
9
8
7
6
5
4
3
2
1
Strongly agree
Strongly disagree
134 P R E O P E R A T I V E T E S T S

14.2 “Urine analysis is indicated preoperatively in a normal healthy child having elective Grade 2 surgery,aged as shown.”
<6 mths ≥6 & <12mths ≥1 & <5yr ≥5 & <12yr ≥12 & <16yr
Age – months/years
Comments:
14.3 “Urine analysis is indicated preoperatively in a normal healthy child having elective Grade 3 surgery,aged as shown.”
<6 mths ≥6 & <12mths ≥1 & <5yr ≥5 & <12yr ≥12 & <16yr
Age – months/years
Comments:
4
3
10
1
9
8
7
6
5
4
3
2
1
0
4
3
10
1
9
8
7
6
5
4
3
2
1
0
4
3
10
1
9
8
7
6
5
4
3
2
1
0
4
3
10
1
9
8
7
6
5
4
3
2
1
0
4
3
10
1
9
8
7
6
5
4
3
2
1
0
Strongly agree
Strongly disagree
1
1
5 11
9
8
7
6
5
4
3
2
1
1
1
5 11
9
8
7
6
5
4
3
2
1
1
1
5 11
9
8
7
6
5
4
3
2
1
1
1
5 11
9
8
7
6
5
4
3
2
1
1
1
5 11
9
8
7
6
5
4
3
2
1
Strongly agree
Strongly disagree
135A P P E N D I X 3

14.4 “Urine analysis is indicated preoperatively in a normal healthy child having elective Grade 4 surgery,aged as shown.”
<6 mths ≥6 & <12mths ≥1 & <5yr ≥5 & <12yr ≥12 & <16yr
Age – months/years
Comments:
14.5 “Urine analysis is indicated preoperatively in a normal healthy child having elective neurosurgery, aged as shown.”
<6 mths ≥6 & <12mths ≥1 & <5yr ≥5 & <12yr ≥12 & <16yr
Age – months/years
Comments:
5
2
10
1
9
8
7
6
5
4
3
2
1
0
5
2
10
1
9
8
7
6
5
4
3
2
1
0
5
2
10
1
9
8
7
6
5
4
3
2
1
0
5
2
10
1
9
8
7
6
5
4
3
2
1
0
5
2
10
1
9
8
7
6
5
4
3
2
1
0
Strongly agree
Strongly disagree
4
1
2
10
1
9
8
7
6
5
4
3
2
1
0
4
1
2
10
1
9
8
7
6
5
4
3
2
1
0
4
1
2
10
1
9
8
7
6
5
4
3
2
1
0
4
1
2
10
1
9
8
7
6
5
4
3
2
1
0
4
1
2
10
1
9
8
7
6
5
4
3
2
1
0
Strongly agree
Strongly disagree
136 P R E O P E R A T I V E T E S T S

14.6 “Urine analysis is indicated preoperatively in a normal healthy child having elective cardiac surgery, aged as shown.”
<6 mths ≥6 & <12mths ≥1 & <5yr ≥5 & <12yr ≥12 & <16yr
Age – months/years
Comments:
TESTING FOR SICKLE CELL DISEASE/TRAIT
Cost estimates: low £1.50 mid £2.30 upper £3.10
ETHNICITY
To what extent is testing for sickle cell disease / trait indicated for ‘normal healthy patients’ (ie ASA Grade 1) with
differing ethnic origins, undergoing elective surgery? Please indicate your agreement with the following statements
by ringing one or more numbers in each row.
15.1 Testing for sickle cell disease/trait is indicated preoperatively in a normal healthy patient with a southern
European/Mediterranean ethnic origin.
1 1 1 4
1 3 2 3 1 1
0 1 2 3 4 5 6 7 8 9
Disagree Agree
5
2
10
1
9
8
7
6
5
4
3
2
1
0
5
2
10
1
9
8
7
6
5
4
3
2
1
0
5
2
10
1
9
8
7
6
5
4
3
2
1
0
5
2
10
1
9
8
7
6
5
4
3
2
1
0
5
2
10
1
9
8
7
6
5
4
3
2
1
0
Strongly agree
Strongly disagree
137A P P E N D I X 3

15.2 Testing for sickle cell disease/trait is indicated preoperatively in a normal healthy patient with a Middle
Eastern/Arabic ethnic origin.
2 1 4
1 3 2 3 1 1
0 1 2 3 4 5 6 7 8 9
Disagree Agree
15.3 Testing for sickle cell disease/trait is indicated preoperatively in a normal healthy patient with a south Asian
(Indian sub-continent) ethnic origin.
2 1 4
1 3 2 3 1 1
0 1 2 3 4 5 6 7 8 9
Disagree Agree
15.4 Testing for sickle cell disease/trait is indicated preoperatively in a normal healthy patient with some other
Asian (ex-Soviet republics, etc.) ethnic origin.
1 1 1 4
1 4 2 3 1
0 1 2 3 4 5 6 7 8 9
Disagree Agree
15.5 Testing for sickle cell disease/trait is indicated preoperatively in a normal healthy patient with an Oriental/Far
eastern (Chinese/Japanese) ethnic origin.
5 1 1
1 5 1 3 1
0 1 2 3 4 5 6 7 8 9
Disagree Agree
138 P R E O P E R A T I V E T E S T S

15.6 Testing for sickle cell disease/trait is indicated preoperatively in a normal healthy patient with a north African
ethnic origin
1 6
1 1 1 1 7
0 1 2 3 4 5 6 7 8 9
Disagree Agree
15.7 Testing for sickle cell disease/trait is indicated preoperatively in a normal healthy patient with a west African
ethnic origin.
1 6
1 1 9
0 1 2 3 4 5 6 7 8 9
Disagree Agree
15.8 Testing for sickle cell disease/trait is indicated preoperatively in a normal healthy patient with a
south/sub-saharan African ethnic origin.
1 6
1 1 9
0 1 2 3 4 5 6 7 8 9
Disagree Agree
15.9 Testing for sickle cell disease/trait is indicated preoperatively in a normal healthy patient with
1 6
1 1 1 9
0 1 2 3 4 5 6 7 8 9
Disagree Agree
139A P P E N D I X 3

15.10 Testing for sickle cell disease/trait is indicated preoperatively in a normal healthy patient with a North
American Indian ethnic origin.
5 1 1
1 5 1 3 1
0 1 2 3 4 5 6 7 8 9
Disagree Agree
15.11 Testing for sickle cell disease/trait is indicated preoperatively in a normal healthy patient with a South
American Indian ethnic origin.
5 1 1
1 5 1 3 1
0 1 2 3 4 5 6 7 8 9
Disagree Agree
15.12 Testing for sickle cell disease/trait is indicated preoperatively in a normal health patient with an
Aboriginal/Maori ethnic origin.
5 1 1
1 5 1 3 1
0 1 2 3 4 5 6 7 8 9
Disagree Agree
Comments:
140 P R E O P E R A T I V E T E S T S

DETERMINING ETHNICITY
How should the ethnic origin of a patient be determined? Please indicate your agreement with the following statements
by ringing one or more numbers in each row. (‘Relevant ethnic origin’ means an ethnic origin for which sickle cell testing
is indicated, as documented by your responses to the above questions.)
16.1 Ethnicity should be determined by asking the patient about the ethnic origin of his/her parents.
1 2 1 3
1 1 1 2 6
0 1 2 3 4 5 6 7 8 9
Disagree Agree
16.2 If either of the patient’s parents has a relevant ethnic origin (consistent with the answers given above), the patient
should be tested for sickle cell disease/trait.
1 1 2 3
1 1 9
0 1 2 3 4 5 6 7 8 9
Disagree Agree
16.3 Ethnicity should be determined from the patient’s appearance.
2 1 1 3
1 1 1 2 1 4 1
0 1 2 3 4 5 6 7 8 9
Disagree Agree
16.4 If the patient has a foreign appearance and his/her parentage cannot be determined, the patient should be tested
for sickle cell disease/trait
1 1 2 1 2
1 1 1 3 1 4
0 1 2 3 4 5 6 7 8 9
Disagree Agree
141A P P E N D I X 3

16.5 If the patient does not have a foreign appearance and his/her parentage cannot be determined, the patient should
be tested for sickle cell disease/trait.
4 1 1 1
1 3 2 1 3 1
0 1 2 3 4 5 6 7 8 9
Disagree Agree
16.6 If it is not possible to establish that a patient has a North-European/Caucasian ethic origin, the patient should be
tested for sickle cell disease/trait.
2 1 3 1
1 3 3 3 1
0 1 2 3 4 5 6 7 8 9
Disagree Agree
16.7 The difficulties of establishing confidently whether or not testing for sickle cell disease/trait is indicated mean that
all patients undergoing elective surgery should be tested for sickle cell disease/trait.
6 1
1 7 2 1
0 1 2 3 4 5 6 7 8 9
Disagree Agree
142 P R E O P E R A T I V E T E S T S
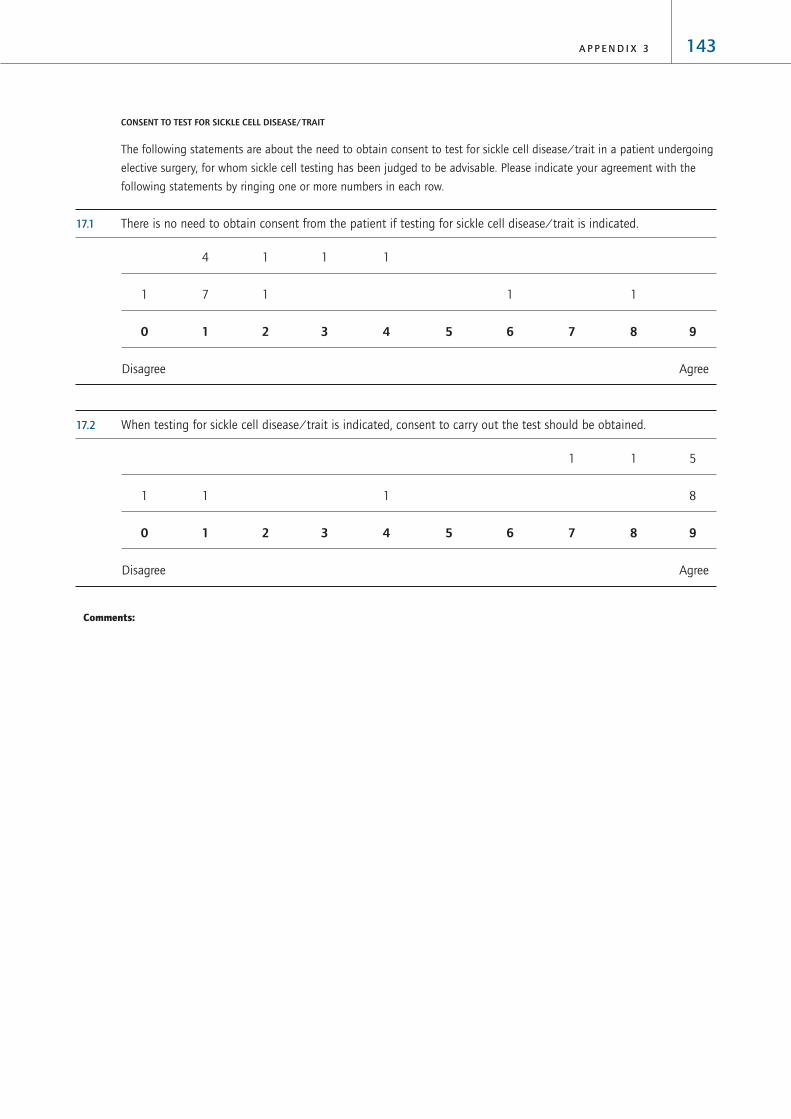
CONSENT TO TEST FOR SICKLE CELL DISEASE/TRAIT
The following statements are about the need to obtain consent to test for sickle cell disease/trait in a patient undergoing
elective surgery, for whom sickle cell testing has been judged to be advisable. Please indicate your agreement with the
following statements by ringing one or more numbers in each row.
17.1 There is no need to obtain consent from the patient if testing for sickle cell disease/trait is indicated.
4 1 1 1
1 7 1 1 1
0 1 2 3 4 5 6 7 8 9
Disagree Agree
17.2 When testing for sickle cell disease/trait is indicated, consent to carry out the test should be obtained.
1 1 5
1 1 1 8
0 1 2 3 4 5 6 7 8 9
Disagree Agree
Comments:
143A P P E N D I X 3

TESTING FOR PREGNANCY
Cost estimates: low £1.50 mid £2.25 upper £3.00
To what extent is testing for pregnancy indicated for ‘normal healthy women’ (ie ASA Grade 1) of reproductive age,
undergoing elective surgery? Please indicate your agreement with the following statements by ringing one or more
numbers in each row.
17.1 Testing for pregnancy is indicated preoperatively in a normal health female patient of reproductive age, despite
having a history of last menstrual period
1 1 2 1 2
1 1 1 1 3 4
0 1 2 3 4 5 6 7 8 9
Disagree Agree
17.2 Testing for pregnancy is indicated preoperatively in a normal healthy female patient of reproductive age, who
asserts that it is impossible that she is pregnant
5 1 1
1 1 1 3 5
0 1 2 3 4 5 6 7 8 9
Disagree Agree
17.3 Testing for pregnancy is indicated preoperatively in a normal healthy female patient of reproductive age, who
says that it is possible she may be pregnant
7
1 10
0 1 2 3 4 5 6 7 8 9
Disagree Agree
144 P R E O P E R A T I V E T E S T S

17.4 Testing for pregnancy is indicated preoperatively in a normal healthy female patient aged between 12 and
16 years
2 1 1 1 2
1 1 2 1 1 5
0 1 2 3 4 5 6 7 8 9
Disagree Agree
Comments:
CONSENT TO TESTING FOR PREGNANCY
The following statements are about the need to obtain consent to test for pregnancy in a female patient of reproductive
age, undergoing elective surgery. Please indicate your agreement with the following statements by ringing one or more
numbers in each row.
18.1 There is no need to obtain consent from the patient if she is of reproductive age.
6 1
1 5 4 1
0 1 2 3 4 5 6 7 8 9
Disagree Agree
145A P P E N D I X 3

18.2 When testing for pregnancy in a female patient of reproductive age, consent to carry out the test should be
obtained.
1 6
1 1 2 7
0 1 2 3 4 5 6 7 8 9
Disagree Agree
Comments:
146 P R E O P E R A T I V E T E S T S

ADULTS, CHEST X-RAY
Cost estimates: low £10.00 mid £20.50 upper £31.00
To what extent is a chest X-ray indicated for patients with cardiovascular comorbidity of different ages, undergoing
different types of surgery? For each of the ages shown below, please indicate your agreement with the following
statements, separately for patients with mild (ie ASA Grade 2) and severe (ie ASA Grade 3) cardiovascular comorbidity,
by ringing one or more numbers in each column:
1.1 “A chest X-ray is indicated preoperatively in an adult with cardiovascular comorbidity having electiveGrade 1 surgery, aged as shown.”
A S A 2 A S A 3 A S A 2 A S A 3 A S A 2 A S A 3 A S A 2 A S A 3
≥16 & <40 ≥40 & <60 ≥60 & <80 ≥80
Age – years
1.2 “A chest X-ray is indicated preoperatively in an adult with cardiovascular comorbidity having electiveGrade 2 surgery, aged as shown.”
A S A 2 A S A 3 A S A 2 A S A 3 A S A 2 A S A 3 A S A 2 A S A 3
≥16 & <40 ≥40 & <60 ≥60 & <80 ≥80
Age – years
8 2
1
1
1 2
1
1
2
3 1
3
3
1
2
1 5
9
8
7
6
5
4
3
2
1
8 1
1
1
1
1
1
1
2
2
3
2
2
1
1
2
1 7
9
8
7
6
5
4
3
2
1
5 1
2
2
1
1
1
3
1 2
1
2
3
1 1
2
2 7
9
8
7
6
5
4
3
2
1
5 1
1
3
1
1
1
2
2 2
1
1
3
1
2
1
1
3 6
9
8
7
6
5
4
3
2
1
Strongly agree
Strongly disagree
7 1
1
1 3
1
1
2 2
3
1
1
1
1
2
2
4 4
9
8
7
6
5
4
3
2
1
7 1
1
1
2
1
2
2 2
3
1
1
1
2
4 7
9
8
7
6
5
4
3
2
1
4 1
1
1
1
1
1
4
3 2
2
1
2 1
2
4 7
9
8
7
6
5
4
3
2
1
5 1
1
1
1
1
1
3
3 2
1
1
1 1
1
2
6 6
9
8
7
6
5
4
3
2
1
Strongly agree
Strongly disagree
147A P P E N D I X 4
Appendix 4: Phase B ConsensusQuestionnaire (Results)

1.3 “A chest X-ray is indicated preoperatively in an adult with cardiovascular comorbidity having electiveGrade 3 surgery, aged as shown.”
A S A 2 A S A 3 A S A 2 A S A 3 A S A 2 A S A 3 A S A 2 A S A 3
≥16 & <40 ≥40 & <60 ≥60 & <80 ≥80
Age – years
1.4 “A chest X-ray is indicated preoperatively in an adult with cardiovascular comorbidity having electiveGrade 4 surgery, aged as shown.”
A S A 2 A S A 3 A S A 2 A S A 3 A S A 2 A S A 3 A S A 2 A S A 3
≥16 & <40 ≥40 & <60 ≥60 & <80 ≥80
Age – years
11 5
1
1
1
10 3
1
1
2
2
9
8
7
6
5
4
3
2
1
11 5
1
1
1
10 2
1
1
1
1
3
9
8
7
6
5
4
3
2
1
10 5
1
1
1
1
9 2
1
1
1
1 1
3
9
8
7
6
5
4
3
2
1
11 9
1
1
1
8 2
1
1
1
1
1
1 3
9
8
7
6
5
4
3
2
1
Strongly agree
Strongly disagree
10 2
1 1
1
3
1
8 1
1
1 1
1
1
1
1
3
9
8
7
6
5
4
3
2
1
10 2
1
1
1
3
1
7 1
2
1
1
1
1
2
3
9
8
7
6
5
4
3
2
1
10 2
1
4
2
6 1
2
1
1
3
1 4
9
8
7
6
5
4
3
2
1
9 2
2
4
2
6
1
1
2
1
1
1
1 5
9
8
7
6
5
4
3
2
1
Strongly agree
Strongly disagree
148 P R E O P E R A T I V E T E S T S

To what extent is a chest X-ray indicated for patients with respiratory comorbidity of different ages, undergoing different
types of surgery? For each of the ages shown below, please indicate your agreement with the following statements,
separately for patients with mild (ie ASA Grade 2) and severe (ie ASA Grade 3) respiratory comorbidity, by ringing
one or more numbers in each column:
1.5 “A chest X-ray is indicated preoperatively in an adult with respiratory comorbidity having electiveGrade 1 surgery, aged as shown.”
A S A 2 A S A 3 A S A 2 A S A 3 A S A 2 A S A 3 A S A 2 A S A 3
≥16 & <40 ≥40 & <60 ≥60 & <80 ≥80
Age – years
1.6 “A chest X-ray is indicated preoperatively in an adult with respiratory comorbidity having electiveGrade 2 surgery, aged as shown.”
A S A 2 A S A 3 A S A 2 A S A 3 A S A 2 A S A 3 A S A 2 A S A 3
≥16 & <40 ≥40 & <60 ≥60 & <80 ≥80
Age – years
10 2
1
1
2
1
1
1
5 1
2
1 1
2
1
1
1 4
9
8
7
6
5
4
3
2
1
9 1
1 1
3
1
1
1 1
4 1
1
1
1
2
1
2
2 4
9
8
7
6
5
4
3
2
1
9 1
1
1
2
1
1
1
1 1
2 1
2
2
3
1
2
2 4
9
8
7
6
5
4
3
2
1
9 1
1
1
1
2
1
1 2
2 1
1
1
2
2
1
1
3 5
9
8
7
6
5
4
3
2
1
Strongly agree
Strongly disagree
1 2
1
1
1 2
1
1
1
4 1
2
1
2 1
1 1
1
1 4
9
8
7
6
5
4
3
2
1
9 1
1 1
1 3
1
1
1
3 1
3
2
1 1
1
2
1 4
9
8
7
6
5
4
3
2
1
7 1
2
1 1
2
1 1
1
1
1
2 1
1
5
1 1
3 2
3 4
9
8
7
6
5
4
3
2
1
7 1
2
1
1 1
1
2
1
2
9
1
1
1
2 2
6 5
9
8
7
6
5
4
3
2
1
Strongly agree
Strongly disagree
149A P P E N D I X 4

1.7 “A chest X-ray is indicated preoperatively in an adult with respiratory comorbidity having electiveGrade 3 surgery, aged as shown.”
A S A 2 A S A 3 A S A 2 A S A 3 A S A 2 A S A 3 A S A 2 A S A 3
≥16 & <40 ≥40 & <60 ≥60 & <80 ≥80
Age – years
1.8 “A chest X-ray is indicated preoperatively in an adult with respiratory comorbidity having electiveGrade 4 surgery, aged as shown.”
A S A 2 A S A 3 A S A 2 A S A 3 A S A 2 A S A 3 A S A 2 A S A 3
≥16 & <40 ≥40 & <60 ≥60 & <80 ≥80
Age – years
11 5
1
1
1
10 2
5
1 2
1
2
9
8
7
6
5
4
3
2
1
11 4
1
1
2
10 2
1
1
1
4
9
8
7
6
5
4
3
2
1
11 4
1
3
9 2
1
1
2
4
9
8
7
6
5
4
3
2
1
11 3
1
3
1
9 2
1
1
2
4
9
8
7
6
5
4
3
2
1
Strongly agree
Strongly disagree
11 3
1
1
3
11 2
1
1
1
3
9
8
7
6
5
4
3
2
1
11 3
1
4
9 2
1
1
1 5
9
8
7
6
5
4
3
2
1
11 3
5
8 2
1
1
1
1 5
9
8
7
6
5
4
3
2
1
11 2
1
4
1
7 1
1
1
1
1
1 5
9
8
7
6
5
4
3
2
1
Strongly agree
Strongly disagree
150 P R E O P E R A T I V E T E S T S

To what extent is a chest X-ray indicated for patients with comorbidity from renal disease of different ages, undergoing
different types of surgery? For each of the ages shown below, please indicate your agreement with the following
statements, separately for patients with mild (ie ASA Grade 2) and severe (ie ASA Grade 3) comorbidity from renal
disease, by ringing one or more numbers in each column:
1.9 “A chest X-ray is indicated preoperatively in an adult with comorbidity from renal disease having electiveGrade 1 surgery, aged as shown.”
A S A 2 A S A 3 A S A 2 A S A 3 A S A 2 A S A 3 A S A 2 A S A 3
≥16 & <40 ≥40 & <60 ≥60 & <80 ≥80
Age – years
1.10 “A chest X-ray is indicated preoperatively in an adult with comorbidity from renal disease having electiveGrade 2 surgery, aged as shown.”
A S A 2 A S A 3 A S A 2 A S A 3 A S A 2 A S A 3 A S A 2 A S A 3
≥16 & <40 ≥40 & <60 ≥60 & <80 ≥80
Age – years
3
1
3
1 2
1 1
1 1
1 4
2
1
1
2
1 3
4 5
9
8
7
6
5
4
3
2
1
3
1
2
1 2
2
1 2
1 4
1
1
1
4
1
2 2
4 6
9
8
7
6
5
4
3
2
1
1
1
2 2
1
2
2 2
2 4
1
2 2
8 6
9
8
7
6
5
4
3
2
1
1
3 1
1
1
3 3
2 4
1
2 1
8 7
9
8
7
6
5
4
3
2
1
Strongly agree
Strongly disagree
1
1
1
2
2
2
1 1
1
3 4
1
1
1
1
1 3
6 5
9
8
7
6
5
4
3
2
1
1
1
1
1 2
1
1
2 2
3 4
1
1
1 2
8 6
9
8
7
6
5
4
3
2
1
1
1 2
1
2
1 2
5 4
1
2 2
8 6
9
8
7
6
5
4
3
2
1
1
1 1
1
1
1 2
6 5
1
1 1
9 7
9
8
7
6
5
4
3
2
1
Strongly agree
Strongly disagree
151A P P E N D I X 4

1.11 “A chest X-ray is indicated preoperatively in an adult with comorbidity from renal disease having electiveGrade 3 surgery, aged as shown.”
A S A 2 A S A 3 A S A 2 A S A 3 A S A 2 A S A 3 A S A 2 A S A 3
≥16 & <40 ≥40 & <60 ≥60 & <80 ≥80
Age – years
1.12 “A chest X-ray is indicated preoperatively in an adult with comorbidity from renal disease having electiveGrade 4 surgery, aged as shown.”
A S A 2 A S A 3 A S A 2 A S A 3 A S A 2 A S A 3 A S A 2 A S A 3
≥16 & <40 ≥40 & <60 ≥60 & <80 ≥80
Age – years
Also, please consider:
> whether there are special kinds of surgery for which a chest X-ray may be required?
> If a patient had two or more of the three co-morbidities considered here (but, overall, still classified as ASA grade 2
(or ASA grade 3)), would additional tests be required, ie tests over and above the tests you have indicated would be
required for each comorbidity separately?
10 2
1
1
1
4
5 2
2
1
1
1
1
1 5
9
8
7
6
5
4
3
2
1
9 2
2
1
1
4
6 2
1
1
1
1
1 6
9
8
7
6
5
4
3
2
1
9
2 1
1
1
1
4
5
1 1
1
2
1
1
1 6
9
8
7
6
5
4
3
2
1
8
3 1
2
1
4
4
2 1
1 1
1
1
2 6
9
8
7
6
5
4
3
2
1
Strongly agree
Strongly disagree
6
3 2
1
1
1
1
4
3
2
2
1
1
1
3 5
9
8
7
6
5
4
3
2
1
6
3
1
2
1
1
1
4
3
3
1 1
1 1
3 6
9
8
7
6
5
4
3
2
1
5
4
1
1 2
1
1
4
2
3
2 1
1
4 6
9
8
7
6
5
4
3
2
1
3
5
1
1
1 3
1
4
1
3
1
1 1
5 7
9
8
7
6
5
4
3
2
1
Strongly agree
Strongly disagree
152 P R E O P E R A T I V E T E S T S

ADULTS, ELECTROCARDIOGRAPHY (resting ECG)
Cost estimates: low £11.00 mid £26.00 upper £37.00
To what extent is a resting ECG indicated for patients with cardiovascular comorbidity of different ages, undergoing
different types of surgery? For each of the ages shown below, please indicate your agreement with the following
statements, separately for patients with mild (ie ASA Grade 2) and severe (ie ASA Grade 3) cardiovascular
comorbidity, by ringing one or more numbers in each column:
2.1 “A resting ECG is indicated preoperatively in an adult with cardiovascular comorbidity having electiveGrade 1 surgery, aged as shown.”
A S A 2 A S A 3 A S A 2 A S A 3 A S A 2 A S A 3 A S A 2 A S A 3
≥16 & <40 ≥40 & <60 ≥60 & <80 ≥80
Age – years
2.2 “A resting ECG is indicated preoperatively in an adult with cardiovascular comorbidity having electiveGrade 2 surgery, aged as shown.”
A S A 2 A S A 3 A S A 2 A S A 3 A S A 2 A S A 3 A S A 2 A S A 3
≥16 & <40 ≥40 & <60 ≥60 & <80 ≥80
Age – years
10 8
1
10 6
1
2
9
8
7
6
5
4
3
2
1
10 8
1
10 6
1
2
9
8
7
6
5
4
3
2
1
10 8
1
10 6
1
1
1
9
8
7
6
5
4
3
2
1
10 8
1
10 6
1
1
1
9
8
7
6
5
4
3
2
1
Strongly agree
Strongly disagree
10 7
1 1
10 6
1
9
8
7
6
5
4
3
2
1
10 7
1 1
10 6
1
9
8
7
6
5
4
3
2
1
10 7
1 1
10
1
9
8
7
6
5
4
3
2
1
10 5
1 1
2
10 4
1
1
1
1
1
9
8
7
6
5
4
3
2
1
Strongly agree
Strongly disagree
153A P P E N D I X 4
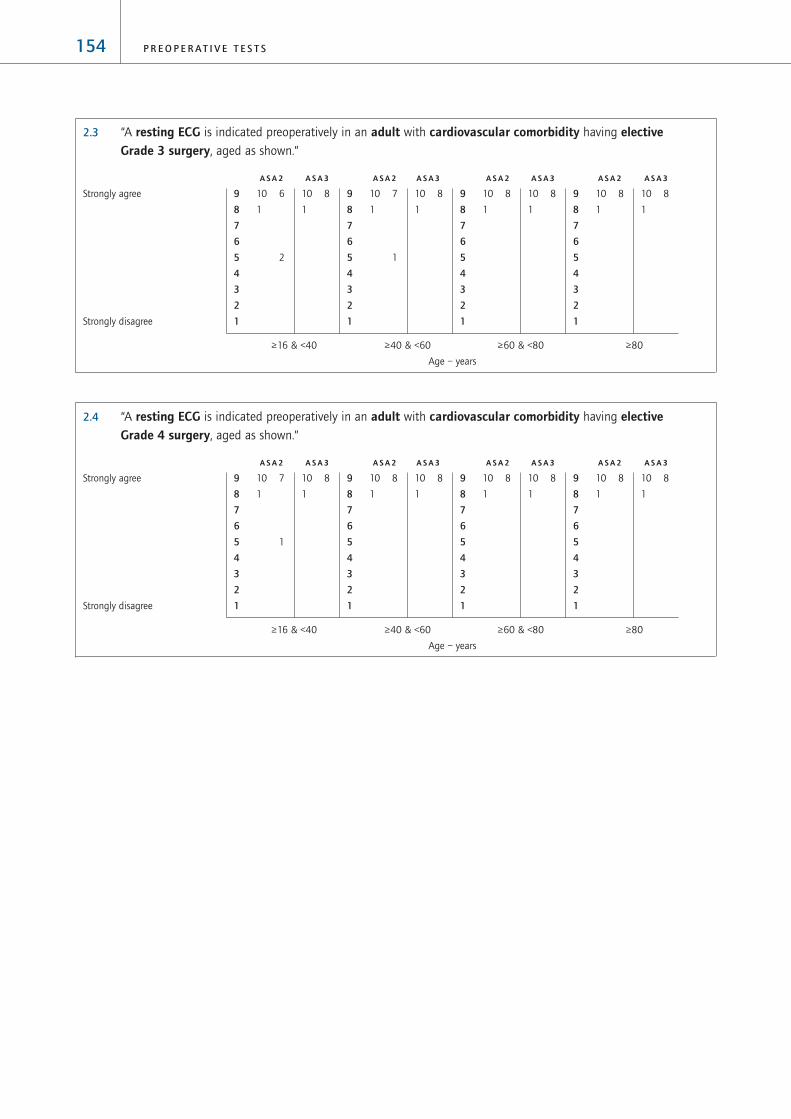
2.3 “A resting ECG is indicated preoperatively in an adult with cardiovascular comorbidity having electiveGrade 3 surgery, aged as shown.”
A S A 2 A S A 3 A S A 2 A S A 3 A S A 2 A S A 3 A S A 2 A S A 3
≥16 & <40 ≥40 & <60 ≥60 & <80 ≥80
Age – years
2.4 “A resting ECG is indicated preoperatively in an adult with cardiovascular comorbidity having electiveGrade 4 surgery, aged as shown.”
A S A 2 A S A 3 A S A 2 A S A 3 A S A 2 A S A 3 A S A 2 A S A 3
≥16 & <40 ≥40 & <60 ≥60 & <80 ≥80
Age – years
10 8
1
10 8
1
9
8
7
6
5
4
3
2
1
10 8
1
10 8
1
9
8
7
6
5
4
3
2
1
10 8
1
10 8
1
9
8
7
6
5
4
3
2
1
10 8
1
10 7
1
1
9
8
7
6
5
4
3
2
1
Strongly agree
Strongly disagree
10 8
1
10 8
1
9
8
7
6
5
4
3
2
1
10 8
1
10 8
1
9
8
7
6
5
4
3
2
1
10 8
1
10 7
1
1
9
8
7
6
5
4
3
2
1
10 8
1
10 6
1
2
9
8
7
6
5
4
3
2
1
Strongly agree
Strongly disagree
154 P R E O P E R A T I V E T E S T S

To what extent is a resting ECG indicated for patients with respiratory comorbidity of different ages, undergoing
different types of surgery? For each of the ages shown below, please indicate your agreement with the following
statements, separately for patients with mild (ie ASA Grade 2) and severe (ie ASA Grade 3) respiratory comorbidity,
by ringing one or more numbers in each column:
2.5 “A resting ECG is indicated preoperatively in an adult with respiratory comorbidity having electiveGrade 1 surgery, aged as shown.”
A S A 2 A S A 3 A S A 2 A S A 3 A S A 2 A S A 3 A S A 2 A S A 3
≥16 & <40 ≥40 & <60 ≥60 & <80 ≥80
Age – years
2.6 “A resting ECG is indicated preoperatively in an adult with respiratory comorbidity having electiveGrade 2 surgery, aged as shown.”
A S A 2 A S A 3 A S A 2 A S A 3 A S A 2 A S A 3 A S A 2 A S A 3
≥16 & <40 ≥40 & <60 ≥60 & <80 ≥80
Age – years
9 5
1 1
1 2
7 4
3 1
1 2
1
9
8
7
6
5
4
3
2
1
9 4
1 2
1 2
7 2
3 2
1 3
1
9
8
7
6
5
4
3
2
1
3 2
2
1 1
1 1
2
1
1
1
2 1
1
3
2 1
1 2
1
1
3 4
9
8
7
6
5
4
3
2
1
2 2
2
1
1 1
1 1
1
4 3
1 2
1
1 2
8 4
9
8
7
6
5
4
3
2
1
Strongly agree
Strongly disagree
10 4
1 1
3
7 3
3
1 1
1
1
2
9
8
7
6
5
4
3
2
1
10 4
1
1
3
8 3
2
1 1
1
1
2
9
8
7
6
5
4
3
2
1
2
4
2
1 1
1 3
1
2 2
2
2
1 1
2 4
1 1
3 5
9
8
7
6
5
4
3
2
1
1 2
1
1
1 1
1 2
1
5 3
1
1 1
2 1
7 6
9
8
7
6
5
4
3
2
1
Strongly agree
Strongly disagree
155A P P E N D I X 4

2.7 “A resting ECG is indicated preoperatively in an adult with respiratory comorbidity having electiveGrade 3 surgery, aged as shown.”
A S A 2 A S A 3 A S A 2 A S A 3 A S A 2 A S A 3 A S A 2 A S A 3
≥16 & <40 ≥40 & <60 ≥60 & <80 ≥80
Age – years
2.8 “A resting ECG is indicated preoperatively in an adult with respiratory comorbidity having electiveGrade 4 surgery, aged as shown.”
A S A 2 A S A 3 A S A 2 A S A 3 A S A 2 A S A 3 A S A 2 A S A 3
≥16 & <40 ≥40 & <60 ≥60 & <80 ≥80
Age – years
10 6
1
1
1
10 6
1
1
1
9
8
7
6
5
4
3
2
1
10 6
1
1
1
10 6
1
1
1
9
8
7
6
5
4
3
2
1
10 6
1
1
1
7 2
3
1
1 3
1
1
9
8
7
6
5
4
3
2
1
9 2
2 1
1
2
1
1
5
2
2
2
1
1 3
1 2
9
8
7
6
5
4
3
2
1
Strongly agree
Strongly disagree
9 6
1
1
1 1
8 6
2
1
1 1
9
8
7
6
5
4
3
2
1
9 6
1
1
1
7 5
3
1
1 1
1
9
8
7
6
5
4
3
2
1
6 3
3 1
1
1
1 3
4 1
2 1
3
1
1
3
2 1
9
8
7
6
5
4
3
2
1
5 2
2 1
1 1
2
3 2
1
3 1
1
2 1
1 2
4 3
9
8
7
6
5
4
3
2
1
Strongly agree
Strongly disagree
156 P R E O P E R A T I V E T E S T S

To what extent is a resting ECG indicated for patients with comorbidity from renal disease of different ages, undergoing
different types of surgery? For each of the ages shown below, please indicate your agreement with the following
statements, separately for patients with mild (ie ASA Grade 2) and severe (ie ASA Grade 3) comorbidity from renal
disease, by ringing one or more numbers in each column:
2.9 “A resting ECG is indicated preoperatively in an adult with comorbidity from renal disease having electiveGrade 1 surgery, aged as shown.”
A S A 2 A S A 3 A S A 2 A S A 3 A S A 2 A S A 3 A S A 2 A S A 3
≥16 & <40 ≥40 & <60 ≥60 & <80 ≥80
Age – years
2.10 “A resting ECG is indicated preoperatively in an adult with comorbidity from renal disease having electiveGrade 2 surgery, aged as shown.”
A S A 2 A S A 3 A S A 2 A S A 3 A S A 2 A S A 3 A S A 2 A S A 3
≥16 & <40 ≥40 & <60 ≥60 & <80 ≥80
Age – years
10 6
1
2
7 6
3
1
1
1
9
8
7
6
5
4
3
2
1
10 5
1
1
1
1
5 5
3
1
2
1
1
1
9
8
7
6
5
4
3
2
1
6 1
1 1
1
1 1
3
2 2
3 1
1
1 3
3
1
3 3
9
8
7
6
5
4
3
2
1
5 1
1
1
1 1
1 2
3 3
1
2
2
1 3
2 1
6 3
9
8
7
6
5
4
3
2
1
Strongly agree
Strongly disagree
10 5
1
3
4 5
4
2
1
2
1
9
8
7
6
5
4
3
2
1
9 4
2
1
2
1
4 4
4
1
1
1
2
1
1 1
9
8
7
6
5
4
3
2
1
3 1
2
1
1 1
2
1
1
3 3
2
2
1
2
3 1
1
3 4
9
8
7
6
5
4
3
2
1
2 1
1
1
1 1
1
1 2
4 4
2
2
1
3 1
6 4
9
8
7
6
5
4
3
2
1
Strongly agree
Strongly disagree
157A P P E N D I X 4

2.11 “A resting ECG is indicated preoperatively in an adult with comorbidity from renal disease having electiveGrade 3 surgery, aged as shown.”
A S A 2 A S A 3 A S A 2 A S A 3 A S A 2 A S A 3 A S A 2 A S A 3
≥16 & <40 ≥40 & <60 ≥60 & <80 ≥80
Age – years
2.12 “A resting ECG is indicated preoperatively in an adult with comorbidity from renal disease having electiveGrade 4 surgery, aged as shown.”
A S A 2 A S A 3 A S A 2 A S A 3 A S A 2 A S A 3 A S A 2 A S A 3
≥16 & <40 ≥40 & <60 ≥60 & <80 ≥80
Age – years
Also, please consider:
> whether there are special kinds of surgery for which a resting ECG may be required?
> If a patient had two or more of the three co-morbidities considered here (but, overall, still classified as ASA grade 2
(or ASA grade 3)), would additional tests be required, ie tests over and above the tests you have indicated would be
required for each comorbidity separately?
10 6
1
1
1
10 6
1
2
9
8
7
6
5
4
3
2
1
10 6
1
2
9 6
2
2
9
8
7
6
5
4
3
2
1
9 5
1 1
1
1
1
8 2
2
1
1
2
2
1
9
8
7
6
5
4
3
2
1
9 1
1 2
1 3
1
1
7 1
1
3
1
1
1
2
2
9
8
7
6
5
4
3
2
1
Strongly agree
Strongly disagree
10 6
1
1
1
9 6
2
2
9
8
7
6
5
4
3
2
1
10 6
1
2
8 6
2
1
2
9
8
7
6
5
4
3
2
1
7 4
1 1
2
1
1
1
1
5 2
2
1
3 1
2
1
1 1
9
8
7
6
5
4
3
2
1
6 2
1 1
1 1
1
1
1
1
1 2
3 1
1
1
2 1
1 2
1 1
3 2
9
8
7
6
5
4
3
2
1
Strongly agree
Strongly disagree
158 P R E O P E R A T I V E T E S T S
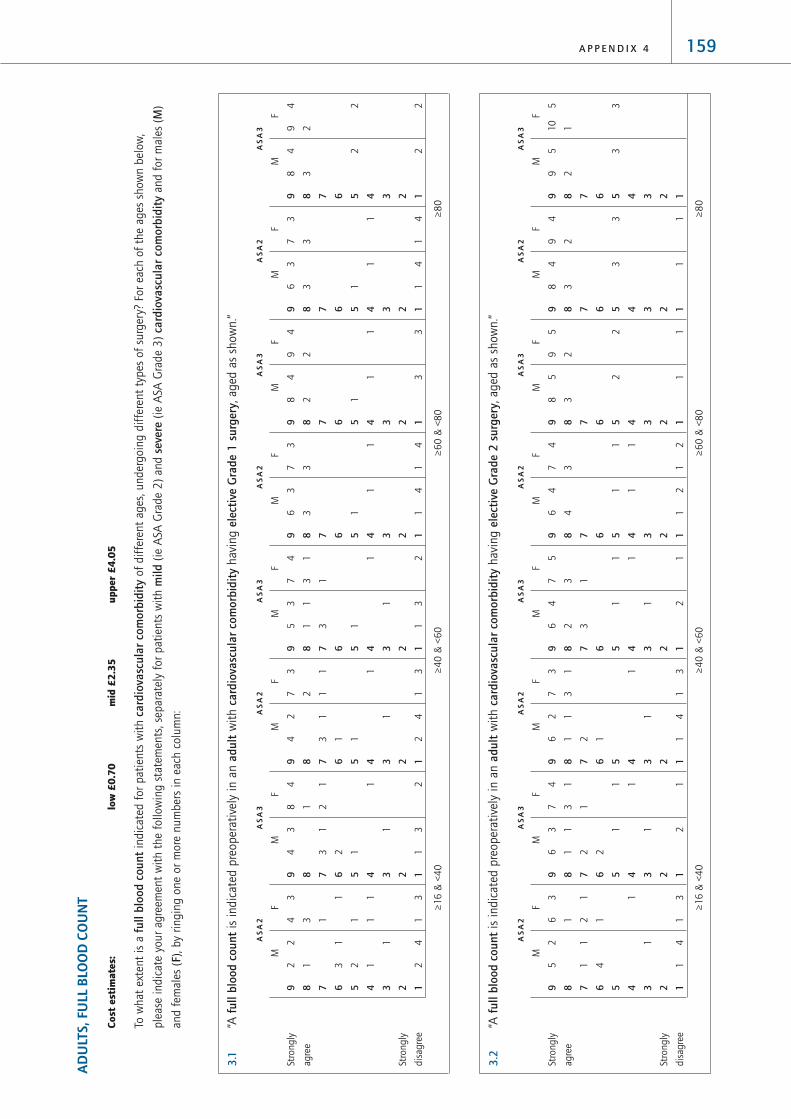
159A P P E N D I X 4
AD
ULT
S, F
ULL
BLO
OD
COU
NT
Co
st e
stim
ate
s:
low
£0
.70
mid
£2
.35
up
per
£4
.05
To w
hat
ext
ent
is a
ful
l blo
od c
ount
indic
ated
for
pat
ients
wit
h c
ardi
ovas
cula
r co
mor
bidi
tyof
dif
fere
nt
ages
, under
goin
g d
iffe
rent
types
of
surg
ery?
For
each
of
the
ages
show
n b
elow
,
ple
ase
indic
ate
your
agre
emen
t w
ith t
he
follo
win
g s
tate
men
ts, se
par
atel
y fo
r pat
ients
wit
h m
ild(i
e A
SA G
rade
2)
and s
ever
e(i
e A
SA G
rade
3)
card
iova
scul
ar c
omor
bidi
tyan
d f
or
mal
es (
M)
and f
emal
es (
F), by
ringin
g o
ne
or
more
num
ber
s in
eac
h c
olu
mn:
3.1
“A f
ullb
lood
cou
ntis
indic
ated
pre
oper
ativ
ely
in a
n a
dult
wit
h c
ardi
ovas
cula
r co
mor
bidi
tyhav
ing e
lect
ive
Gra
de 1
sur
gery
, ag
ed a
s sh
ow
n.”
AS
A2
AS
A3
AS
A2
AS
A3
AS
A2
AS
A3
AS
A2
AS
A3
≥16
& <
40
≥4
0 &
<6
0≥
60
& <
80
≥8
0
3.2
“A f
ull b
lood
cou
ntis
indic
ated
pre
oper
ativ
ely
in a
n a
dult
wit
h c
ardi
ovas
cula
r co
mor
bidi
tyhav
ing e
lect
ive
Gra
de 2
sur
gery
, ag
ed a
s sh
ow
n.”
AS
A2
AS
A3
AS
A2
AS
A3
AS
A2
AS
A3
AS
A2
AS
A3
≥16
& <
40
≥4
0 &
<6
0≥
60
& <
80
≥8
0
F
10
5
1
3
M
95
2
3
9 8 7 6 5 4 3 2 1
F
94
2
3 1
M
84
3
3 1
9 8 7 6 5 4 3 2 1
F
95
2
2 1
M
85
3
2 1
9 8 7 6 5 4 3 2 1
F
74
3
1 1
12
M
64
4
1 1
12
9 8 7 6 5 4 3 2 1
F
75
3 1
1 1 1
M
64
2 3
1 1 2
9 8 7 6 5 4 3 2 1
F
73
31 1
13
M
62
11
2 1
1
14
9 8 7 6 5 4 3 2 1
F
74
31
1
1 1 1
M
63
11
2 2
1 1 2
9 8 7 6 5 4 3 2 1
F
63
1 21
1
1
13
M
52
11
4
1
14
9 8 7 6 5 4 3 2 1
Stro
ngly
agre
e
Stro
ngly
dis
agre
e
F
94
2
2 2
M
84
3
2 2
9 8 7 6 5 4 3 2 1
F
73
3
1
14
M
63
3 1
1
14
9 8 7 6 5 4 3 2 1
F
94
2
1 3
M
84
2 1
1 3
9 8 7 6 5 4 3 2 1
F
73
3
1
14
M
63
3 1
1
14
9 8 7 6 5 4 3 2 1
F
74
31
1
1 2
M
53
11
3 1
1
13
9 8 7 6 5 4 3 2 1
F
73
2 11 1
13
M
42
31
1 1
1
24
9 8 7 6 5 4 3 2 1
F
84
1 21 1 2
M
43
31
2 1
1
13
9 8 7 6 5 4 3 2 1
F
43
3 1
1
1 11
13
M
22
1 31
2 1
1
24
9 8 7 6 5 4 3 2 1
Stro
ngly
agre
e
Stro
ngly
dis
agre
e

3.3
“A f
ull
bloo
d co
unt
is i
ndic
ated
pre
oper
ativ
ely
in a
n a
dult
wit
h c
ardi
ovas
cula
r co
mor
bidi
tyhav
ing e
lect
ive
Gra
de 3
sur
gery
, ag
ed a
s sh
ow
n.”
AS
A2
AS
A3
AS
A2
AS
A3
AS
A2
AS
A3
AS
A2
AS
A3
≥16
& <
40
≥4
0 &
<6
0≥
60
& <
80
≥8
0
3.4
“A f
ull
bloo
d co
unt
is i
ndic
ated
pre
oper
ativ
ely
in a
n a
dult
wit
h c
ardi
ovas
cula
r co
mor
bidi
tyhav
ing e
lect
ive
Gra
de 4
sur
gery
, ag
ed a
s sh
ow
n.”
AS
A2
AS
A3
AS
A2
AS
A3
AS
A2
AS
A3
AS
A2
AS
A3
≥16
& <
40
≥4
0 &
<6
0≥
60
& <
80
≥8
0
F
10
8
1
M
10
8
1
9 8 7 6 5 4 3 2 1
F
10
8
1
M
10
8
1
9 8 7 6 5 4 3 2 1
F
10
8
1
M
10
8
1
9 8 7 6 5 4 3 2 1
F
10
8
1
M
10
8
1
9 8 7 6 5 4 3 2 1
F
10
8
1
M
10
8
1
9 8 7 6 5 4 3 2 1
F
10
8
1
M
10
8
1
9 8 7 6 5 4 3 2 1
F
10
8
1
M
10
8
1
9 8 7 6 5 4 3 2 1
F
10
8
1
M
10
8
1
9 8 7 6 5 4 3 2 1
Stro
ngly
agre
e
Stro
ngly
dis
agre
e
F
10
8
1
M
10
8
1
9 8 7 6 5 4 3 2 1
F
10
8
1
M
10
8
1
9 8 7 6 5 4 3 2 1
F
10
7
1
1
M
10
7
1
1
9 8 7 6 5 4 3 2 1
F
10
7
1
1
M
10
7
1
1
9 8 7 6 5 4 3 2 1
F
96
21 1
M
96
2
1 1
9 8 7 6 5 4 3 2 1
F
96
21 1
M
86
3
1 1
9 8 7 6 5 4 3 2 1
F
96
21 1
M
96
2
1 1
9 8 7 6 5 4 3 2 1
F
86
31 1
M
86
2 11 1
9 8 7 6 5 4 3 2 1
Stro
ngly
agre
e
Stro
ngly
dis
agre
e
160 P R E O P E R A T I V E T E S T S

To w
hat
ext
ent
is a
ful
l blo
od c
ount
indic
ated
for
pat
ients
wit
h r
espi
rato
ry c
omor
bidi
tyof
dif
fere
nt
ages
, under
goin
g d
iffe
rent
types
of
surg
ery?
For
each
of
the
ages
show
n b
elow
, ple
ase
indic
ate
your
agre
emen
t w
ith t
he
follo
win
g s
tate
men
ts, se
par
atel
y fo
r pat
ients
wit
h m
ild(i
e A
SA G
rade
2)
and s
ever
e(i
e A
SA G
rade
3)
resp
irato
ry c
omor
bidi
tyan
d f
or
mal
es (
M)
and
fem
ales
(F), b
y ri
ngin
g o
ne
or
more
num
ber
s in
eac
h c
olu
mn:
3.5
“A f
ull b
lood
cou
ntis
indic
ated
pre
oper
ativ
ely
in a
n a
dult
wit
h r
espi
rato
ry c
omor
bidi
tyhav
ing e
lect
ive
Gra
de 1
sur
gery
, ag
ed a
s sh
ow
n.”
AS
A2
AS
A3
AS
A2
AS
A3
AS
A2
AS
A3
AS
A2
AS
A3
≥16
& <
40
≥4
0 &
<6
0≥
60
& <
80
≥8
0
3.6
“A f
ull b
lood
cou
ntis
indic
ated
pre
oper
ativ
ely
in a
n a
dult
wit
h r
espi
rato
ry c
omor
bidi
tyhav
ing e
lect
ive
Gra
de 2
sur
gery
, ag
ed a
s sh
ow
n.”
AS
A2
AS
A3
AS
A2
AS
A3
AS
A2
AS
A3
AS
A2
AS
A3
≥16
& <
40
≥4
0 &
<6
0≥
60
& <
80
≥8
0
F
10
5
1
1 2
M
10
5
1
1 2
9 8 7 6 5 4 3 2 1
F
10
3
1
1 3 1
M
83
2
1
1
3 1
9 8 7 6 5 4 3 2 1
F
10
3
12 3
M
10
3
12 3
9 8 7 6 5 4 3 2 1
F
92
2
1 1 3 1
M
72
3
1
11 3 1
9 8 7 6 5 4 3 2 1
F
10
3
12 3
M
82
32 2 1 1
9 8 7 6 5 4 3 2 1
F
51
2 2
1 2 2
1 12
M
31
3 1 11
12 1
1
1
12
9 8 7 6 5 4 3 2 1
F
82
31 1 2 2
M
72
21
21 1 1 2
9 8 7 6 5 4 3 2 1
F
51
2 1
1 1
21 1
13
M
31
1 4
1
21 2
11
9 8 7 6 5 4 3 2 1
Stro
ngly
agre
e
Stro
ngly
dis
agre
e
F
95
2
1 1 1
M
95
2
1 1 1
9 8 7 6 5 4 3 2 1
F
62
41 1 2 1
11
M
62
41 1 2 2
11
9 8 7 6 5 4 3 2 1
F
93
22 2 1
M
93
22 2 1
9 8 7 6 5 4 3 2 1
F
52
4 11 1 1
13
M
52
4
1
11 1
13
9 8 7 6 5 4 3 2 1
F
72
21
11
1
2 2
M
72
21 1
2
1 1 2
9 8 7 6 5 4 3 2 1
F
21
1 3 1
1
11
11
1 14
M
11
1 2 11
1 11
11
34
9 8 7 6 5 4 3 2 1
F
62
11
2 11 1
1
3
M
52
11
2
1
1
1
1 13
9 8 7 6 5 4 3 2 1
F
1
2 2 12
11
54
M
1
2 1 11
11
11
54
9 8 7 6 5 4 3 2 1
Stro
ngly
agre
e
Stro
ngly
dis
agre
e
161A P P E N D I X 4

3.7
“A f
ull b
lood
cou
ntis
indic
ated
pre
oper
ativ
ely
in a
n a
dult
wit
h r
espi
rato
ry c
omor
bidi
tyhav
ing e
lect
ive
Gra
de 3
sur
gery
, ag
ed a
s sh
ow
n.”
AS
A2
AS
A3
AS
A2
AS
A3
AS
A2
AS
A3
AS
A2
AS
A3
≥16
& <
40
≥4
0 &
<6
0≥
60
& <
80
≥8
0
3.8
“A f
ull b
lood
cou
ntis
indic
ated
pre
oper
ativ
ely
in a
n a
dult
wit
h r
espi
rato
ry c
omor
bidi
tyhav
ing e
lect
ive
Gra
de 4
sur
gery
, ag
ed a
s sh
ow
n.”
AS
A2
AS
A3
AS
A2
AS
A3
AS
A2
AS
A3
AS
A2
AS
A3
≥16
& <
40
≥4
0 &
<6
0≥
60
& <
80
≥8
0
F
10
8
1
M
110
8
1
9 8 7 6 5 4 3 2 1
F
10
8
1
M
10
8
1
9 8 7 6 5 4 3 2 1
F
10
8
1
M
110
8
1
9 8 7 6 5 4 3 2 1
F
10
1
M
10
1
9 8 7 6 5 4 3 2 1
F
10
8
1
M
10
8
1
9 8 7 6 5 4 3 2 1
F
10
8
1
M
10
8
1
9 8 7 6 5 4 3 2 1
F
10
8
1
M
10
8
1
9 8 7 6 5 4 3 2 1
F
10
7
11
M
10
7
11
9 8 7 6 5 4 3 2 1
Stro
ngly
agre
e
Stro
ngly
dis
agre
e
F
10
6
12
M
10
6
12
9 8 7 6 5 4 3 2 1
F
10
6
12
M
10
6
12
9 8 7 6 5 4 3 2 1
F
10
5
11 1 1
M
10
5
11 1 1
9 8 7 6 5 4 3 2 1
F
10
5
11 1 1
M
10
5
11 1 1
9 8 7 6 5 4 3 2 1
F
10
5
11 1 1
M
10
5
11 1 1
9 8 7 6 5 4 3 2 1
F
10
5
11 1 1
M
10
5
11 1 1
9 8 7 6 5 4 3 2 1
F
10
5
11 1 1
M
10
5
11 1 1
9 8 7 6 5 4 3 2 1
F
10
4
12 1 1
M
10
4
12 1 1
9 8 7 6 5 4 3 2 1
Stro
ngly
agre
e
Stro
ngly
dis
agre
e
162 P R E O P E R A T I V E T E S T S

To w
hat
ext
ent
is a
full
bloo
d co
unt
indic
ated
for
pat
ients
wit
h c
omor
bidi
ty f
rom
ren
al d
isea
seof
dif
fere
nt
ages
, under
goin
g d
iffe
rent
types
of
surg
ery?
For
each
of
the
ages
show
n b
elow
,
ple
ase
indic
ate
your
agre
emen
t w
ith t
he
follo
win
g s
tate
men
ts, se
par
atel
y fo
r pat
ients
wit
h m
ild(i
e A
SA G
rade
2)
and s
ever
e(i
e A
SA G
rade
3)
com
orbi
dity
fro
m r
enal
dis
ease
and f
or
mal
es(M
) an
d f
emal
es (
F), by
ringin
g o
ne
or
more
num
ber
s in
eac
h c
olu
mn:
3.9
“A f
ull b
lood
cou
ntis
indic
ated
pre
oper
ativ
ely
in a
n a
dult
wit
h c
omor
bidi
ty f
rom
ren
al d
isea
sehav
ing e
lect
ive
Gra
de 1
sur
gery
, ag
ed a
s sh
ow
n.”
AS
A2
AS
A3
AS
A2
AS
A3
AS
A2
AS
A3
AS
A2
AS
A3
≥16
& <
40
≥4
0 &
<6
0≥
60
& <
80
≥8
0
3.10
“A f
ull b
lood
cou
ntis
indic
ated
pre
oper
ativ
ely
in a
n a
dult
wit
h c
omor
bidi
ty f
rom
ren
al d
isea
sehav
ing e
lect
ive
Gra
de 2
sur
gery
, ag
ed a
s sh
ow
n.”
AS
A2
AS
A3
AS
A2
AS
A3
AS
A2
AS
A3
AS
A2
AS
A3
≥16
& <
40
≥4
0 &
<6
0≥
60
& <
80
≥8
0
F
117 1
M
117 1
9 8 7 6 5 4 3 2 1
F
115 1 2
M
115 1 2
9 8 7 6 5 4 3 2 1
F
117 1
M
117 1
9 8 7 6 5 4 3 2 1
F
10
5
1
3
M
95
2
3
9 8 7 6 5 4 3 2 1
F
117 1
M
10
7
1
1
9 8 7 6 5 4 3 2 1
F
84
21 3
1
M
64
31
1
3
1
9 8 7 6 5 4 3 2 1
F
117 1
M
117 1
9 8 7 6 5 4 3 2 1
F
74
1 11
13
1
M
4
1 11
13
1
9 8 7 6 5 4 3 2 1
Stro
ngly
agre
e
Stro
ngly
dis
agre
e
F
117 1
M
117 1
9 8 7 6 5 4 3 2 1
F
10
5
1
3
M
10
5
1
3
9 8 7 6 5 4 3 2 1
F
117 1
M
117 1
9 8 7 6 5 4 3 2 1
F
85
1 1 1
3
M
85
1 1 1
3
9 8 7 6 5 4 3 2 1
F
117 1
M
10
7
1
1
9 8 7 6 5 4 3 2 1
F
54
21
1 1
3
1 1
M
44
21
1 2
3
1 1
9 8 7 6 5 4 3 2 1
F
117 1
M
10
7
1
1
9 8 7 6 5 4 3 2 1
F
43
4 11
14
1
M
43
3 11
1 13
11
9 8 7 6 5 4 3 2 1
Stro
ngly
agre
e
Stro
ngly
dis
agre
e
163A P P E N D I X 4

3.11
“A f
ull b
lood
cou
ntis
indic
ated
pre
oper
ativ
ely
in a
n a
dult
wit
h c
omor
bidi
ty f
rom
ren
al d
isea
sehav
ing e
lect
ive
Gra
de 3
sur
gery
, ag
ed a
s sh
ow
n.”
AS
A2
AS
A3
AS
A2
AS
A3
AS
A2
AS
A3
AS
A2
AS
A3
≥16
& <
40
≥4
0 &
<6
0≥
60
& <
80
≥8
0
3.12
“A f
ull b
lood
cou
ntis
indic
ated
pre
oper
ativ
ely
in a
n a
dult
wit
h c
omor
bidi
ty f
rom
ren
al d
isea
sehav
ing e
lect
ive
Gra
de 4
sur
gery
, ag
ed a
s sh
ow
n.”
AS
A2
AS
A3
AS
A2
AS
A3
AS
A2
AS
A3
AS
A2
AS
A3
≥16
& <
40
≥4
0 &
<6
0≥
60
& <
80
≥8
0
F
10
8
M
118
9 8 7 6 5 4 3 2 1
F
118
M
118
9 8 7 6 5 4 3 2 1
F
118
M
118
9 8 7 6 5 4 3 2 1
F
118
M
118
9 8 7 6 5 4 3 2 1
F
118
M
118
9 8 7 6 5 4 3 2 1
F
118
M
118
9 8 7 6 5 4 3 2 1
F
118
M
118
9 8 7 6 5 4 3 2 1
F
118
M
118
9 8 7 6 5 4 3 2 1
Stro
ngly
agre
e
Stro
ngly
dis
agre
e
F
118
M
118
9 8 7 6 5 4 3 2 1
F
118
M
118
9 8 7 6 5 4 3 2 1
F
118
M
118
9 8 7 6 5 4 3 2 1
F
118
M
118
9 8 7 6 5 4 3 2 1
F
118
M
118
9 8 7 6 5 4 3 2 1
F
117 1
M
117 1
9 8 7 6 5 4 3 2 1
F
118
M
118
9 8 7 6 5 4 3 2 1
F
117 1
M
117 1
9 8 7 6 5 4 3 2 1
Stro
ngly
agre
e
Stro
ngly
dis
agre
e
164 P R E O P E R A T I V E T E S T S

ADULTS, TESTS OF HAEMOSTASIS
Cost estimates: low £1.50 mid £3.65 upper £5.85
To what extent are tests of haemostasis indicated for patients with cardiovascular comorbidity of different ages,
undergoing different types of surgery? For each of the ages shown below, please indicate your agreement with the
following statements, separately for patients with mild (ie ASA Grade 2) and severe (ie ASA Grade 3) cardiovascular
comorbidity, by ringing one or more numbers in each column:
4.1 “Tests of haemostasis are indicated preoperatively in an adult with cardiovascular comorbidity having
elective Grade 1 surgery, aged as shown.”
A S A 2 A S A 3 A S A 2 A S A 3 A S A 2 A S A 3 A S A 2 A S A 3
≥16 & <40 ≥40 & <60 ≥60 & <80 ≥80
Age – years
4.2 “Tests of haemostasis are indicated preoperatively in an adult with cardiovascular comorbidity having
elective Grade 2 surgery, aged as shown.”
A S A 2 A S A 3 A S A 2 A S A 3 A S A 2 A S A 3 A S A 2 A S A 3
≥16 & <40 ≥40 & <60 ≥60 & <80 ≥80
Age – years
1
11 7
1
11 7
9
8
7
6
5
4
3
2
1
1
11 7
1
11 7
9
8
7
6
5
4
3
2
1
1
11 7
1
11 7
9
8
7
6
5
4
3
2
1
1
11 7
1
11 7
9
8
7
6
5
4
3
2
1
Strongly agree
Strongly disagree
1
11 7
1
11 7
9
8
7
6
5
4
3
2
1
1
11 7
1
11 7
9
8
7
6
5
4
3
2
1
1
11 7
1
11 7
9
8
7
6
5
4
3
2
1
1
11 7
1
11 7
9
8
7
6
5
4
3
2
1
Strongly agree
Strongly disagree
165A P P E N D I X 4
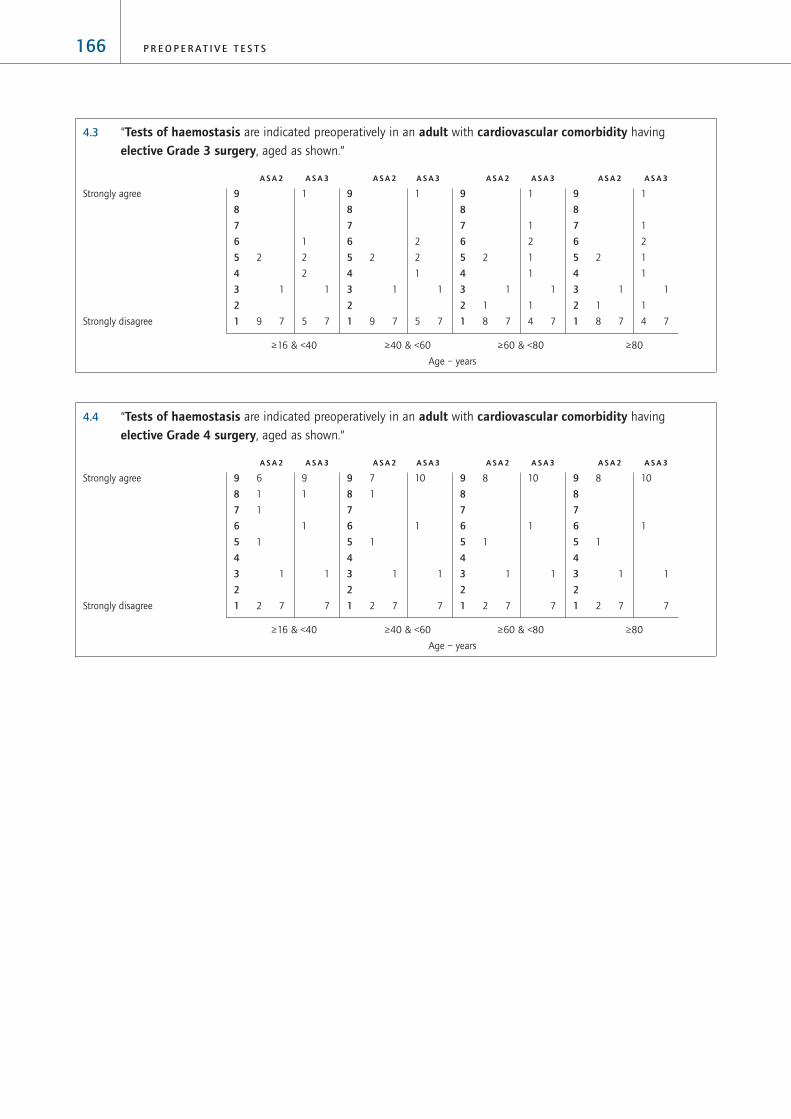
4.3 “Tests of haemostasis are indicated preoperatively in an adult with cardiovascular comorbidity having
elective Grade 3 surgery, aged as shown.”
A S A 2 A S A 3 A S A 2 A S A 3 A S A 2 A S A 3 A S A 2 A S A 3
≥16 & <40 ≥40 & <60 ≥60 & <80 ≥80
Age – years
4.4 “Tests of haemostasis are indicated preoperatively in an adult with cardiovascular comorbidity having
elective Grade 4 surgery, aged as shown.”
A S A 2 A S A 3 A S A 2 A S A 3 A S A 2 A S A 3 A S A 2 A S A 3
≥16 & <40 ≥40 & <60 ≥60 & <80 ≥80
Age – years
10
1
1
7
8
1
1
2 7
9
8
7
6
5
4
3
2
1
10
1
1
7
8
1
1
2 7
9
8
7
6
5
4
3
2
1
10
1
1
7
7
1
1
1
2 7
9
8
7
6
5
4
3
2
1
9
1
1
1
7
6
1
1
1
1
2 7
9
8
7
6
5
4
3
2
1
Strongly agree
Strongly disagree
1
1
2
1
1
1
1
4 7
2
1
1
8 7
9
8
7
6
5
4
3
2
1
1
1
2
1
1
1
1
4 7
2
1
1
8 7
9
8
7
6
5
4
3
2
1
1
2
2
1
1
5 7
2
1
9 7
9
8
7
6
5
4
3
2
1
1
1
2
2
1
5 7
2
1
9 7
9
8
7
6
5
4
3
2
1
Strongly agree
Strongly disagree
166 P R E O P E R A T I V E T E S T S

To what extent are tests of haemostasis indicated for patients with respiratory comorbidity of different ages,
undergoing different types of surgery? For each of the ages shown below, please indicate your agreement with the
following statements, separately for patients with mild (ie ASA Grade 2) and severe (ie ASA Grade 3) respiratory
comorbidity, by ringing one or more numbers in each column:
4.5 “Tests of haemostasis are indicated preoperatively in an adult with respiratory comorbidity having
elective Grade 1 surgery, aged as shown.”
A S A 2 A S A 3 A S A 2 A S A 3 A S A 2 A S A 3 A S A 2 A S A 3
≥16 & <40 ≥40 & <60 ≥60 & <80 ≥80
Age – years
4.6 “Tests of haemostasis are indicated preoperatively in an adult with respiratory comorbidity having
elective Grade 2 surgery, aged as shown.”
A S A 2 A S A 3 A S A 2 A S A 3 A S A 2 A S A 3 A S A 2 A S A 3
≥16 & <40 ≥40 & <60 ≥60 & <80 ≥80
Age – years
1
11 7
1
11 7
9
8
7
6
5
4
3
2
1
1
11 7
1
11 7
9
8
7
6
5
4
3
2
1
1
11 7
1
11 7
9
8
7
6
5
4
3
2
1
1
11 7
1
11 7
9
8
7
6
5
4
3
2
1
Strongly agree
Strongly disagree
1
11 7
1
11 7
9
8
7
6
5
4
3
2
1
1
11 7
3
11 7
9
8
7
6
5
4
3
2
1
1
11 7
1
11 7
9
8
7
6
5
4
3
2
1
1
11 7
1
11 7
9
8
7
6
5
4
3
2
1
Strongly agree
Strongly disagree
167A P P E N D I X 4

4.7 “Tests of haemostasis are indicated preoperatively in an adult with respiratory comorbidity having
elective Grade 3 surgery, aged as shown.”
A S A 2 A S A 3 A S A 2 A S A 3 A S A 2 A S A 3 A S A 2 A S A 3
≥16 & <40 ≥40 & <60 ≥60 & <80 ≥80
Age – years
4.8 “Tests of haemostasis are indicated preoperatively in an adult with respiratory comorbidity having
elective Grade 4 surgery, aged as shown.”
A S A 2 A S A 3 A S A 2 A S A 3 A S A 2 A S A 3 A S A 2 A S A 3
≥16 & <40 ≥40 & <60 ≥60 & <80 ≥80
Age – years
5
1
1
1
1
3 7
6
2
1
1
2 7
9
8
7
6
5
4
3
2
1
6
2
1
1
2 7
6
2
1
1
2 7
9
8
7
6
5
4
3
2
1
6
2
1
1
2 7
6
2
1
1
2 7
9
8
7
6
5
4
3
2
1
6
2
1
1
2 7
5
1
2
1
1
2 7
9
8
7
6
5
4
3
2
1
Strongly agree
Strongly disagree
1
1
2
8 7
1
2
9 7
9
8
7
6
5
4
3
2
1
1
2
9 7
1
2
9 7
9
8
7
6
5
4
3
2
1
1
1
10 7
1
1
10 7
9
8
7
6
5
4
3
2
1
1
1
10 7
1
1
10 7
9
8
7
6
5
4
3
2
1
Strongly agree
Strongly disagree
168 P R E O P E R A T I V E T E S T S

To what extent are tests of haemostasis indicated for patients with comorbidity from renal disease of different ages,
undergoing different types of surgery? For each of the ages shown below, please indicate your agreement with the
following statements, separately for patients with mild (ie ASA Grade 2) and severe (ie ASA Grade 3) comorbidity
from renal disease, by ringing one or more numbers in each column:
4.9 “Tests of haemostasis are indicated preoperatively in an adult with comorbidity from renal disease having
elective Grade 1 surgery, aged as shown.”
A S A 2 A S A 3 A S A 2 A S A 3 A S A 2 A S A 3 A S A 2 A S A 3
≥16 & <40 ≥40 & <60 ≥60 & <80 ≥80
Age – years
4.10 “Tests of haemostasis are indicated preoperatively in an adult with comorbidity from renal disease having
elective Grade 2 surgery, aged as shown.”
A S A 2 A S A 3 A S A 2 A S A 3 A S A 2 A S A 3 A S A 2 A S A 3
≥16 & <40 ≥40 & <60 ≥60 & <80 ≥80
Age – years
2
3
1
2
6 5
1
1
2
8 7
9
8
7
6
5
4
3
2
1
2
3
1
2
6 5
1
1
2
8 7
9
8
7
6
5
4
3
2
1
2
3
1
2
6 5
1
1
2
8 7
9
8
7
6
5
4
3
2
1
2
3
1
2
6 5
1
1
2
8 7
9
8
7
6
5
4
3
2
1
Strongly agree
Strongly disagree
1
1 3
1
2
6 5
1
1
2
8 7
9
8
7
6
5
4
3
2
1
1
1 3
1
2
6 5
1
1
2
8 7
9
8
7
6
5
4
3
2
1
1
1 3
1
2
6 5
1
1
2
8 7
9
8
7
6
5
4
3
2
1
1
1 3
1
2
6 5
1
1
2
8 7
9
8
7
6
5
4
3
2
1
Strongly agree
Strongly disagree
169A P P E N D I X 4

4.11 “Tests of haemostasis are indicated preoperatively in an adult with comorbidity from renal disease having
elective Grade 3 surgery, aged as shown.”
A S A 2 A S A 3 A S A 2 A S A 3 A S A 2 A S A 3 A S A 2 A S A 3
≥16 & <40 ≥40 & <60 ≥60 & <80 ≥80
Age – years
4.12 “Tests of haemostasis are indicated preoperatively in an adult with comorbidity from renal disease having
elective Grade 4 surgery, aged as shown.”
A S A 2 A S A 3 A S A 2 A S A 3 A S A 2 A S A 3 A S A 2 A S A 3
≥16 & <40 ≥40 & <60 ≥60 & <80 ≥80
Age – years
9 1
1
5
1
1 1
7
1
1
3
1
2 4
9
8
7
6
5
4
3
2
1
9 1
1
5
1
1 1
7
1
1
3
1
2 4
9
8
7
6
5
4
3
2
1
9 1
1
5
1
1 1
7
2
3
1
2 4
9
8
7
6
5
4
3
2
1
9 1
1
5
1
1 1
6
1
2
3
1
2 4
9
8
7
6
5
4
3
2
1
Strongly agree
Strongly disagree
4 1
1
1
1 4
1
3 3
1
1
1 3
2
1
5 5
9
8
7
6
5
4
3
2
1
4 1
1
1
1 4
1
3 3
1
1
1 3
2
1
5 5
9
8
7
6
5
4
3
2
1
4 1
1
2 4
1
3 3
1
1
1 3
1
1
6 5
9
8
7
6
5
4
3
2
1
4 1
1
2 4
1
3 3
1
1
1 3
1
1
6 5
9
8
7
6
5
4
3
2
1
Strongly agree
Strongly disagree
170 P R E O P E R A T I V E T E S T S

ADULTS, RENAL FUNCTION TESTS (ie potassium, sodium, creatine, urea)
Cost estimates: low £1.40 mid £3.40 upper £5.40
To what extent are renal function tests indicated for patients with cardiovascular comorbidity of different ages,
undergoing different types of surgery? For each of the ages shown below, please indicate your agreement with the
following statements, separately for patients with mild (ie ASA Grade 2) and severe (ie ASA Grade 3) cardiovascular
comorbidity, by ringing one or more numbers in each column:
5.1 “Renal function tests are indicated preoperatively in an adult with cardiovascular comorbidity having
elective Grade 1 surgery, aged as shown.”
A S A 2 A S A 3 A S A 2 A S A 3 A S A 2 A S A 3 A S A 2 A S A 3
≥16 & <40 ≥40 & <60 ≥60 & <80 ≥80
Age – years
5.2 “Renal function tests are indicated preoperatively in an adult with cardiovascular comorbidity having
elective Grade 2 surgery, aged as shown.”
A S A 2 A S A 3 A S A 2 A S A 3 A S A 2 A S A 3 A S A 2 A S A 3
≥16 & <40 ≥40 & <60 ≥60 & <80 ≥80
Age – years
9 8
2
8 6
1
2
2
9
8
7
6
5
4
3
2
1
9 8
2
5
1
2
9
8
7
6
5
4
3
2
1
9 7
2 1
7 3
1 1
3
4
9
8
7
6
5
4
3
2
1
7 7
4 1
5 3
1 1
5
4
9
8
7
6
5
4
3
2
1
Strongly agree
Strongly disagree
9 7
2
1
8 5
1
2
1
2
9
8
7
6
5
4
3
2
1
9 7
2
1
7 4
1 1
3
1
2
9
8
7
6
5
4
3
2
1
8 5
2 1
1
1
1
7 3
1
3
1
2
2
9
8
7
6
5
4
3
2
1
8 5
2 1
1 1
1
4 3
1
3 1
1
1 2
1 2
9
8
7
6
5
4
3
2
1
Strongly agree
Strongly disagree
171A P P E N D I X 4

5.3 “Renal function tests are indicated preoperatively in an adult with cardiovascular comorbidity having
elective Grade 3 surgery, aged as shown.”
A S A 2 A S A 3 A S A 2 A S A 3 A S A 2 A S A 3 A S A 2 A S A 3
≥16 & <40 ≥40 & <60 ≥60 & <80 ≥80
Age – years
5.4 “Renal function tests are indicated preoperatively in an adult with cardiovascular comorbidity having
elective Grade 4 surgery, aged as shown.”
A S A 2 A S A 3 A S A 2 A S A 3 A S A 2 A S A 3 A S A 2 A S A 3
≥16 & <40 ≥40 & <60 ≥60 & <80 ≥80
Age – years
11 811 89
8
7
6
5
4
3
2
1
11 811 89
8
7
6
5
4
3
2
1
11 810 8
1
9
8
7
6
5
4
3
2
1
11 810 8
1
9
8
7
6
5
4
3
2
1
Strongly agree
Strongly disagree
11 811 89
8
7
6
5
4
3
2
1
11 811 89
8
7
6
5
4
3
2
1
11 89 7
2
1
9
8
7
6
5
4
3
2
1
11 89 7
2
1
9
8
7
6
5
4
3
2
1
Strongly agree
Strongly disagree
172 P R E O P E R A T I V E T E S T S
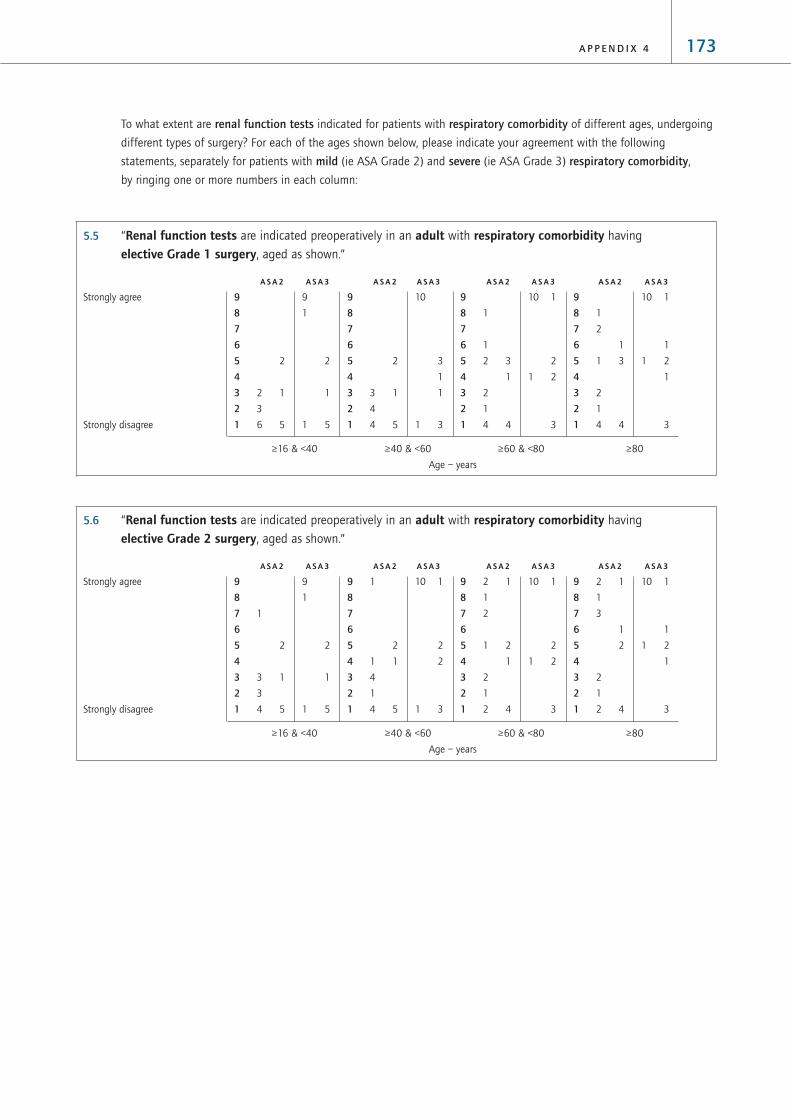
To what extent are renal function tests indicated for patients with respiratory comorbidity of different ages, undergoing
different types of surgery? For each of the ages shown below, please indicate your agreement with the following
statements, separately for patients with mild (ie ASA Grade 2) and severe (ie ASA Grade 3) respiratory comorbidity,
by ringing one or more numbers in each column:
5.5 “Renal function tests are indicated preoperatively in an adult with respiratory comorbidity having
elective Grade 1 surgery, aged as shown.”
A S A 2 A S A 3 A S A 2 A S A 3 A S A 2 A S A 3 A S A 2 A S A 3
≥16 & <40 ≥40 & <60 ≥60 & <80 ≥80
Age – years
5.6 “Renal function tests are indicated preoperatively in an adult with respiratory comorbidity having
elective Grade 2 surgery, aged as shown.”
A S A 2 A S A 3 A S A 2 A S A 3 A S A 2 A S A 3 A S A 2 A S A 3
≥16 & <40 ≥40 & <60 ≥60 & <80 ≥80
Age – years
10 1
1
1 2
1
3
2 1
1
3
1
2
2
1
2 4
9
8
7
6
5
4
3
2
1
10 1
2
1 2
3
2 1
1
2
1 2
1
2
1
2 4
9
8
7
6
5
4
3
2
1
10 1
2
2
1 3
1
2
1 1
4
1
4 5
9
8
7
6
5
4
3
2
1
9
1
2
1
1 5
1
2
3 1
3
4 5
9
8
7
6
5
4
3
2
1
Strongly agree
Strongly disagree
10 1
1
1 2
1
3
1
2
1
1 3
2
1
4 4
9
8
7
6
5
4
3
2
1
10 1
2
1 2
3
1
1
2 3
1
2
1
4 4
9
8
7
6
5
4
3
2
1
10
3
1
1
1 3
2
3 1
4
4 5
9
8
7
6
5
4
3
2
1
9
1
2
1
1 5
2
2 1
3
6 5
9
8
7
6
5
4
3
2
1
Strongly agree
Strongly disagree
173A P P E N D I X 4

5.7 “Renal function tests are indicated preoperatively in an adult with respiratory comorbidity having
elective Grade 3 surgery, aged as shown.”
A S A 2 A S A 3 A S A 2 A S A 3 A S A 2 A S A 3 A S A 2 A S A 3
≥16 & <40 ≥40 & <60 ≥60 & <80 ≥80
Age – years
5.8 “Renal function tests are indicated preoperatively in an adult with respiratory comorbidity having
elective Grade 4 surgery, aged as shown.”
A S A 2 A S A 3 A S A 2 A S A 3 A S A 2 A S A 3 A S A 2 A S A 3
≥16 & <40 ≥40 & <60 ≥60 & <80 ≥80
Age – years
11 810 8
1
9
8
7
6
5
4
3
2
1
11 810 8
1
9
8
7
6
5
4
3
2
1
11 810 8
1
9
8
7
6
5
4
3
2
1
11 7
1
9 7
1
1
1
9
8
7
6
5
4
3
2
1
Strongly agree
Strongly disagree
11 810 6
1
5
1
9
8
7
6
5
4
3
2
1
11 7
1
10 5
1
1
1
1
9
8
7
6
5
4
3
2
1
10 6
1
1
1
8 3
1
1
1
2 2
9
8
7
6
5
4
3
2
1
10
1 6
1
1
8 3
1
1
1
1 2
1
1
9
8
7
6
5
4
3
2
1
Strongly agree
Strongly disagree
174 P R E O P E R A T I V E T E S T S

To what extent are renal function tests indicated for patients with comorbidity from renal disease of different ages,
undergoing different types of surgery? For each of the ages shown below, please indicate your agreement with the
following statements, separately for patients with mild (ie ASA Grade 2) and severe (ie ASA Grade 3) comorbidity
from renal disease, by ringing one or more numbers in each column:
5.9 “Renal function tests are indicated preoperatively in an adult with comorbidity from renal disease having
elective Grade 1 surgery, aged as shown.”
A S A 2 A S A 3 A S A 2 A S A 3 A S A 2 A S A 3 A S A 2 A S A 3
≥16 & <40 ≥40 & <60 ≥60 & <80 ≥80
Age – years
5.10 “Renal function tests are indicated preoperatively in an adult with comorbidity from renal disease having
elective Grade 2 surgery, aged as shown.”
A S A 2 A S A 3 A S A 2 A S A 3 A S A 2 A S A 3 A S A 2 A S A 3
≥16 & <40 ≥40 & <60 ≥60 & <80 ≥80
Age – years
.
11 811 89
8
7
6
5
4
3
2
1
11 810 8
1
9
8
7
6
5
4
3
2
1
10 8
1
10 8
1
9
8
7
6
5
4
3
2
1
10 8
1
10 8
1
9
8
7
6
5
4
3
2
1
Strongly agree
Strongly disagree
10 8
1
10 8
1
9
8
7
6
5
4
3
2
1
10 8
1
10 8
1
9
8
7
6
5
4
3
2
1
10 8
1
10 8
1
9
8
7
6
5
4
3
2
1
10 8
1
10 8
1
9
8
7
6
5
4
3
2
1
Strongly agree
Strongly disagree
175A P P E N D I X 4
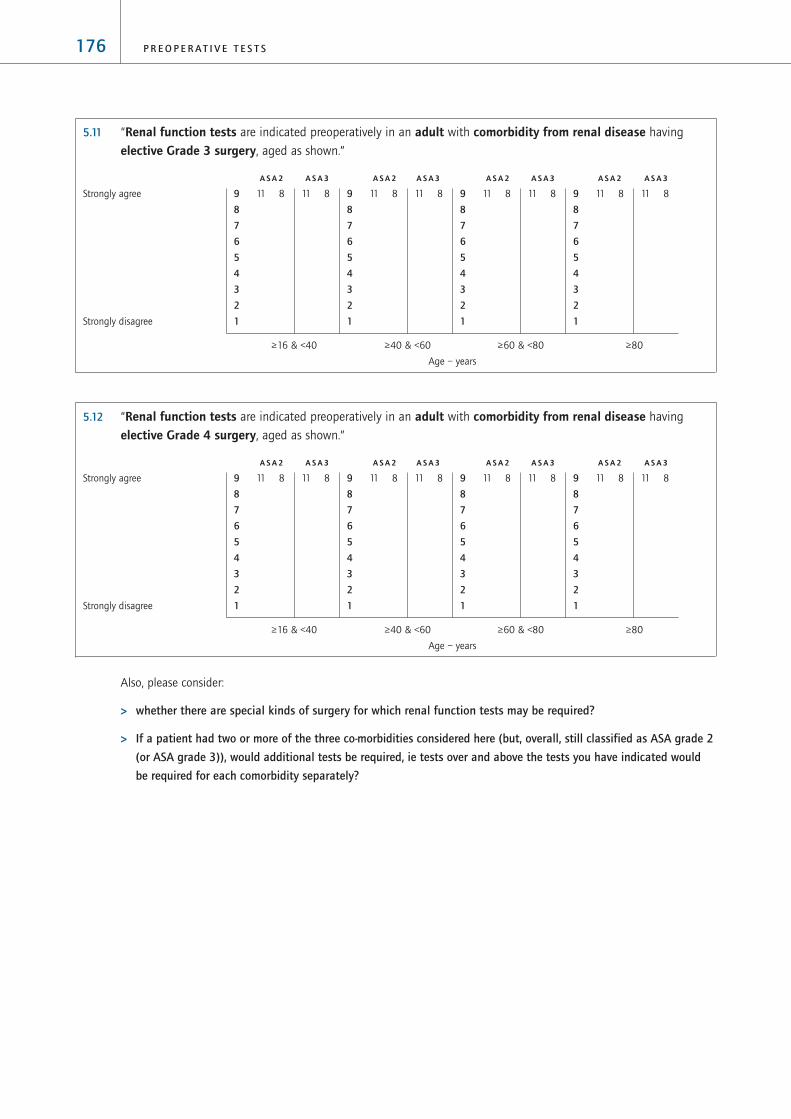
5.11 “Renal function tests are indicated preoperatively in an adult with comorbidity from renal disease having
elective Grade 3 surgery, aged as shown.”
A S A 2 A S A 3 A S A 2 A S A 3 A S A 2 A S A 3 A S A 2 A S A 3
≥16 & <40 ≥40 & <60 ≥60 & <80 ≥80
Age – years
5.12 “Renal function tests are indicated preoperatively in an adult with comorbidity from renal disease having
elective Grade 4 surgery, aged as shown.”
A S A 2 A S A 3 A S A 2 A S A 3 A S A 2 A S A 3 A S A 2 A S A 3
≥16 & <40 ≥40 & <60 ≥60 & <80 ≥80
Age – years
Also, please consider:
> whether there are special kinds of surgery for which renal function tests may be required?
> If a patient had two or more of the three co-morbidities considered here (but, overall, still classified as ASA grade 2
(or ASA grade 3)), would additional tests be required, ie tests over and above the tests you have indicated would
be required for each comorbidity separately?
11 811 89
8
7
6
5
4
3
2
1
11 811 89
8
7
6
5
4
3
2
1
11 811 89
8
7
6
5
4
3
2
1
11 811 89
8
7
6
5
4
3
2
1
Strongly agree
Strongly disagree
11 811 89
8
7
6
5
4
3
2
1
11 811 89
8
7
6
5
4
3
2
1
11 811 89
8
7
6
5
4
3
2
1
11 811 89
8
7
6
5
4
3
2
1
Strongly agree
Strongly disagree
176 P R E O P E R A T I V E T E S T S

ADULTS, RANDOM BLOOD GLUCOSE TESTING
Cost estimates: low £1.05 mid £2.30 upper £3.60
To what extent is random blood glucose testing indicated for patients with cardiovascular comorbidity of different
ages, undergoing different types of surgery? For each of the ages shown below, please indicate your agreement with the
following statements, separately for patients with mild (ie ASA Grade 2) and severe (ie ASA Grade 3) cardiovascular
comorbidity, by ringing one or more numbers in each column:
6.1 “Blood glucose testing are indicated preoperatively in an adult with cardiovascular comorbidity having
elective Grade 1 surgery, aged as shown.”
A S A 2 A S A 3 A S A 2 A S A 3 A S A 2 A S A 3 A S A 2 A S A 3
≥16 & <40 ≥40 & <60 ≥60 & <80 ≥80
Age – years
6.2 “Blood glucose testing are indicated preoperatively in an adult with cardiovascular comorbidity having
elective Grade 2 surgery, aged as shown.”
A S A 2 A S A 3 A S A 2 A S A 3 A S A 2 A S A 3 A S A 2 A S A 3
≥16 & <40 ≥40 & <60 ≥60 & <80 ≥80
Age – years
1
2
1
1
8 6
1
2
1
9 6
9
8
7
6
5
4
3
2
1
1
2
1
1
8 6
1
2
1
9 6
9
8
7
6
5
4
3
2
1
1
2
1
1
8 6
1
2
1
9 6
9
8
7
6
5
4
3
2
1
1
2
1
9 6
1
2
1
9 6
9
8
7
6
5
4
3
2
1
Strongly agree
Strongly disagree
2
1
1
9 6
2
1
10 6
9
8
7
6
5
4
3
2
1
2
1
1
9 6
2
1
10 6
9
8
7
6
5
4
3
2
1
2
1
1
9 8
2
1
10 6
9
8
7
6
5
4
3
2
1
2
1
10 6
2
1
10 8
9
8
7
6
5
4
3
2
1
Strongly agree
Strongly disagree
177A P P E N D I X 4

6.3 “Blood glucose testing are indicated preoperatively in an adult with cardiovascular comorbidity having
elective Grade 3 surgery, aged as shown.”
A S A 2 A S A 3 A S A 2 A S A 3 A S A 2 A S A 3 A S A 2 A S A 3
≥16 & <40 ≥40 & <60 ≥60 & <80 ≥80
Age – years
6.4 “Blood glucose testing are indicated preoperatively in an adult with cardiovascular comorbidity having
elective Grade 4 surgery, aged as shown.”
A S A 2 A S A 3 A S A 2 A S A 3 A S A 2 A S A 3 A S A 2 A S A 3
≥16 & <40 ≥40 & <60 ≥60 & <80 ≥80
Age – years
3
2
1
1
6 6
3
2
1
7 6
9
8
7
6
5
4
3
2
1
3
2
1
1
6 6
3
2
1
7 6
9
8
7
6
5
4
3
2
1
3
2
1
7 6
3
2
8 6
9
8
7
6
5
4
3
2
1
3
2
8 6
3
2
8 6
9
8
7
6
5
4
3
2
1
Strongly agree
Strongly disagree
3
2
1
1
6 6
3
2
1
7 6
9
8
7
6
5
4
3
2
1
3
2
1
1
6 6
3
2
1
7
9
8
7
6
5
4
3
2
1
3
1
7 6
3
2
8 6
9
8
7
6
5
4
3
2
1
3
2
8 6
3
2
8 6
9
8
7
6
5
4
3
2
1
Strongly agree
Strongly disagree
178 P R E O P E R A T I V E T E S T S

To what extent is random blood glucose testing indicated for patients with respiratory comorbidity of different ages,
undergoing different types of surgery? For each of the ages shown below, please indicate your agreement with the
following statements, separately for patients with mild (ie ASA Grade 2) and severe (ie ASA Grade 3) respiratory
comorbidity, by ringing one or more numbers in each column:
6.5 “Blood glucose testing are indicated preoperatively in an adult with respiratory comorbidity having
elective Grade 1 surgery, aged as shown.”
A S A 2 A S A 3 A S A 2 A S A 3 A S A 2 A S A 3 A S A 2 A S A 3
≥16 & <40 ≥40 & <60 ≥60 & <80 ≥80
Age – years
6.6 “Blood glucose testing are indicated preoperatively in an adult with respiratory comorbidity having
elective Grade 2 surgery, aged as shown.”
A S A 2 A S A 3 A S A 2 A S A 3 A S A 2 A S A 3 A S A 2 A S A 3
≥16 & <40 ≥40 & <60 ≥60 & <80 ≥80
Age – years
2
1
1
8 7
2
1
9 7
9
8
7
6
5
4
3
2
1
2
1
1
8 7
2
1
9 7
9
8
7
6
5
4
3
2
1
1
1
1
1
8 7
1
1
1
9 7
9
8
7
6
5
4
3
2
1
1
1 1
9 7
1 1
10 7
9
8
7
6
5
4
3
2
1
Strongly agree
Strongly disagree
1
1
10 7
1
11 7
9
8
7
6
5
4
3
2
1
1
1
10 7
1
11 7
9
8
7
6
5
4
3
2
1
1
1
10 7
1
11 7
9
8
7
6
5
4
3
2
1
1
1
10 7
1
11 7
9
8
7
6
5
4
3
2
1
Strongly agree
Strongly disagree
179A P P E N D I X 4

6.7 “Blood glucose testing are indicated preoperatively in an adult with respiratory comorbidity having
elective Grade 3 surgery, aged as shown.”
A S A 2 A S A 3 A S A 2 A S A 3 A S A 2 A S A 3 A S A 2 A S A 3
≥16 & <40 ≥40 & <60 ≥60 & <80 ≥80
Age – years
6.8 “Blood glucose testing are indicated preoperatively in an adult with respiratory comorbidity having
elective Grade 4 surgery, aged as shown.”
A S A 2 A S A 3 A S A 2 A S A 3 A S A 2 A S A 3 A S A 2 A S A 3
≥16 & <40 ≥40 & <60 ≥60 & <80 ≥80
Age – years
3 1
1
1
1
6 6
2 1
1
1
8 6
9
8
7
6
5
4
3
2
1
3 1
1
1
1
6 6
2 1
1
1
8 6
9
8
7
6
5
4
3
2
1
3 1
1
1
1
6 6
2 1
1
9 6
9
8
7
6
5
4
3
2
1
2 1
1
1
1
7 6
1 1
1
1
9 6
9
8
7
6
5
4
3
2
1
Strongly agree
Strongly disagree
3
1
1
1
6 7
2
1
1
8 7
9
8
7
6
5
4
3
2
1
3
1
1
1
6 7
2
1
8
9
8
7
6
5
4
3
2
1
3
1
1
1
6 7
2
1
9 7
9
8
7
6
5
4
3
2
1
2
1
1
1
7 7
1
1 1
9 7
9
8
7
6
5
4
3
2
1
Strongly agree
Strongly disagree
180 P R E O P E R A T I V E T E S T S

To what extent is random blood glucose testing indicated for patients with comorbidity from renal disease of different
ages, undergoing different types of surgery? For each of the ages shown below, please indicate your agreement with the
following statements, separately for patients with mild (ie ASA Grade 2) and severe (ie ASA Grade 3) comorbidity from
renal disease, by ringing one or more numbers in each column:
6.9 “Blood glucose testing are indicated preoperatively in an adult with comorbidity from renal disease having
elective Grade 1 surgery, aged as shown.”
A S A 2 A S A 3 A S A 2 A S A 3 A S A 2 A S A 3 A S A 2 A S A 3
≥16 & <40 ≥40 & <60 ≥60 & <80 ≥80
Age – years
6.10 “Blood glucose testing are indicated preoperatively in an adult with comorbidity from renal disease having
elective Grade 2 surgery, aged as shown.”
A S A 2 A S A 3 A S A 2 A S A 3 A S A 2 A S A 3 A S A 2 A S A 3
≥16 & <40 ≥40 & <60 ≥60 & <80 ≥80
Age – years
1
1
1 2
1
8 5
1
1 2
1
8 6
9
8
7
6
5
4
3
2
1
1
1
1 2
1
8 5
1
2
1
9 6
9
8
7
6
5
4
3
2
1
1
1
1 2
1
8 5
1
2
10 6
9
8
7
6
5
4
3
2
1
1
1
2
10 5
1
2
10 6
9
8
7
6
5
4
3
2
1
Strongly agree
Strongly disagree
1
1 3
1
8 5
1
2
1
9 6
9
8
7
6
5
4
3
2
1
1
1 3
1
8 5
1
2
1
9 6
9
8
7
6
5
4
3
2
1
1
1 3
1
8 5
1
2
10 6
9
8
7
6
5
4
3
2
1
1
1 3
9 5
1
2
10 6
9
8
7
6
5
4
3
2
1
Strongly agree
Strongly disagree
181A P P E N D I X 4

6.11 “Blood glucose testing are indicated preoperatively in an adult with comorbidity from renal disease having
elective Grade 3 surgery, aged as shown.”
A S A 2 A S A 3 A S A 2 A S A 3 A S A 2 A S A 3 A S A 2 A S A 3
≥16 & <40 ≥40 & <60 ≥60 & <80 ≥80
Age – years
6.12 “Blood glucose testing are indicated preoperatively in an adult with comorbidity from renal disease having
elective Grade 4 surgery, aged as shown.”
A S A 2 A S A 3 A S A 2 A S A 3 A S A 2 A S A 3 A S A 2 A S A 3
≥16 & <40 ≥40 & <60 ≥60 & <80 ≥80
Age – years
3 1
2
1
1
7 4
3 1
1
1
1
7 5
9
8
7
6
5
4
3
2
1
3 1
2
1
1
7 4
3 1
1
1
1
7 5
9
8
7
6
5
4
3
2
1
3 1
2
1
1
7 4
2 1
1
1
9 5
9
8
7
6
5
4
3
2
1
2 1
2
1
9 4
2 1
1
1
9 5
9
8
7
6
5
4
3
2
1
Strongly agree
Strongly disagree
2
2
1 3
1
7 3
2
1
1 2
1
1
7 4
9
8
7
6
5
4
3
2
1
2
2
1 3
1
7 3
2
1
1 2
1
1
7 4
9
8
7
6
5
4
3
2
1
2
2
3
1
8 3
2
1
2
1
9 4
9
8
7
6
5
4
3
2
1
1
1
2
3
1
8 3
1
1
1
2
1
9 4
9
8
7
6
5
4
3
2
1
Strongly agree
Strongly disagree
182 P R E O P E R A T I V E T E S T S

ADULTS, URINE ANALYSIS (‘dipstick’ for protein, bilirubin, glucose, ketones, blood, UTIs)
Cost estimates: low £0.15 mid £0.21 upper £0.27
To what extent is urine analysis indicated for patients with cardiovascular comorbidity of different ages, undergoing
different types of surgery? For each of the ages shown below, please indicate your agreement with the following
statements, separately for patients with mild (ie ASA Grade 2) and severe (ie ASA Grade 3) cardiovascular comorbidity,
by ringing one or more numbers in each column:
7.1 “Urine analysis are indicated preoperatively in an adult with cardiovascular comorbidity having
elective Grade 1 surgery, aged as shown.”
A S A 2 A S A 3 A S A 2 A S A 3 A S A 2 A S A 3 A S A 2 A S A 3
≥16 & <40 ≥40 & <60 ≥60 & <80 ≥80
Age – years
7.2 “Urine analysis are indicated preoperatively in an adult with cardiovascular comorbidity having
elective Grade 2 surgery, aged as shown.”
A S A 2 A S A 3 A S A 2 A S A 3 A S A 2 A S A 3 A S A 2 A S A 3
≥16 & <40 ≥40 & <60 ≥60 & <80 ≥80
Age – years
8 2
1
3 5
7 2
1
4 5
9
8
7
6
5
4
3
2
1
8 2
1
3 5
7 2
1
4 5
9
8
7
6
5
4
3
2
1
7 2
1 1
3 5
6 2
1 1
4 5
9
8
7
6
5
4
3
2
1
6 2
1 1
4 5
5 2
1 1
5 5
9
8
7
6
5
4
3
2
1
Strongly agree
Strongly disagree
8 2
1
3 5
7 2
1
4 5
9
8
7
6
5
4
3
2
1
8 2
1
3 5
7 2
1
4 5
9
8
7
6
5
4
3
2
1
8 2
1
3 5
7 2
1
4 5
9
8
7
6
5
4
3
2
1
6 2
1 1
4 5
5 2
1 1
5 5
9
8
7
6
5
4
3
2
1
Strongly agree
Strongly disagree
183A P P E N D I X 4

7.3 “Urine analysis are indicated preoperatively in an adult with cardiovascular comorbidity having
elective Grade 3 surgery, aged as shown.”
A S A 2 A S A 3 A S A 2 A S A 3 A S A 2 A S A 3 A S A 2 A S A 3
≥16 & <40 ≥40 & <60 ≥60 & <80 ≥80
Age – years
7.4 “Urine analysis are indicated preoperatively in an adult with cardiovascular comorbidity having
elective Grade 4 surgery, aged as shown.”
A S A 2 A S A 3 A S A 2 A S A 3 A S A 2 A S A 3 A S A 2 A S A 3
≥16 & <40 ≥40 & <60 ≥60 & <80 ≥80
Age – years
9 3
1
1
2 3
9 3
1
1
2 3
9
8
7
6
5
4
3
2
1
9 3
1
1
2 3
9 3
1
1
2 3
9
8
7
6
5
4
3
2
1
9 3
1
1
2 3
9 3
1
1
2 3
9
8
7
6
5
4
3
2
1
9 3
1
1
2 3
9 3
1
1
2 3
9
8
7
6
5
4
3
2
1
Strongly agree
Strongly disagree
9 2
1
2 5
9 2
1
2 5
9
8
7
6
5
4
3
2
1
9 2
1
2 5
9 2
1
2 5
9
8
7
6
5
4
3
2
1
9 2
1
2 5
9 2
1
2 5
9
8
7
6
5
4
3
2
1
8 2
1 1
2 5
8 2
1 1
2 5
9
8
7
6
5
4
3
2
1
Strongly agree
Strongly disagree
184 P R E O P E R A T I V E T E S T S

To what extent is urine analysis indicated for patients with respiratory comorbidity of different ages, undergoing
different types of surgery? For each of the ages shown below, please indicate your agreement with the following
statements, separately for patients with mild (ie ASA Grade 2) and severe (ie ASA Grade 3) respiratory comorbidity,
by ringing one or more numbers in each column:
7.5 “Urine analysis are indicated preoperatively in an adult with respiratory comorbidity having
elective Grade 1 surgery, aged as shown.”
A S A 2 A S A 3 A S A 2 A S A 3 A S A 2 A S A 3 A S A 2 A S A 3
≥16 & <40 ≥40 & <60 ≥60 & <80 ≥80
Age – years
7.6 “Urine analysis are indicated preoperatively in an adult with respiratory comorbidity having
elective Grade 2 surgery, aged as shown.”
A S A 2 A S A 3 A S A 2 A S A 3 A S A 2 A S A 3 A S A 2 A S A 3
≥16 & <40 ≥40 & <60 ≥60 & <80 ≥80
Age – years
7 2
1 1
3 5
8 2
1
3 5
9
8
7
6
5
4
3
2
1
8 2
1
3 5
8 2
1
3 5
9
8
7
6
5
4
3
2
1
7 2
1 1
3 5
6 2
1 1
4 5
9
8
7
6
5
4
3
2
1
6 2
1 1
1
3 5
5 2
1 1
1
4 5
9
8
7
6
5
4
3
2
1
Strongly agree
Strongly disagree
7 2
1
4 5
7 2
1
4 5
9
8
7
6
5
4
3
2
1
7 2
1
4 5
7 2
1
4 5
9
8
7
6
5
4
3
2
1
7 2
1
4 5
7 2
1
4 5
9
8
7
6
5
4
3
2
1
5 2
1 1
5 5
5 2
1 1
5 5
9
8
7
6
5
4
3
2
1
Strongly agree
Strongly disagree
185A P P E N D I X 4

7.7 “Urine analysis are indicated preoperatively in an adult with respiratory comorbidity having
elective Grade 3 surgery, aged as shown.”
A S A 2 A S A 3 A S A 2 A S A 3 A S A 2 A S A 3 A S A 2 A S A 3
≥16 & <40 ≥40 & <60 ≥60 & <80 ≥80
Age – years
7.8 “Urine analysis are indicated preoperatively in an adult with respiratory comorbidity having
elective Grade 4 surgery, aged as shown.”
A S A 2 A S A 3 A S A 2 A S A 3 A S A 2 A S A 3 A S A 2 A S A 3
≥16 & <40 ≥40 & <60 ≥60 & <80 ≥80
Age – years
9 3
1
2 4
9 3
1
2 4
9
8
7
6
5
4
3
2
1
9 3
1
2 4
9 3
1
2 4
9
8
7
6
5
4
3
2
1
9 3
1
2 4
9 3
1
2 4
9
8
7
6
5
4
3
2
1
9 3
1
2 4
9 3
1
2 4
9
8
7
6
5
4
3
2
1
Strongly agree
Strongly disagree
9 2
1
2 5
9 2
1
2 5
9
8
7
6
5
4
3
2
1
9 2
1
2 5
9 2
1
2 5
9
8
7
6
5
4
3
2
1
9 2
1
2 5
9 2
1
2 5
9
8
7
6
5
4
3
2
1
9 2
1
2 5
8 2
1 1
2 5
9
8
7
6
5
4
3
2
1
Strongly agree
Strongly disagree
186 P R E O P E R A T I V E T E S T S

To what extent is urine analysis indicated for patients with comorbidity from renal disease of different ages, undergoing
different types of surgery? For each of the ages shown below, please indicate your agreement with the following
statements, separately for patients with mild (ie ASA Grade 2) and severe (ie ASA Grade 3) comorbidity from renal
disease, by ringing one or more numbers in each column:
7.9 “Urine analysis are indicated preoperatively in an adult with comorbidity from renal disease having
elective Grade 1 surgery, aged as shown.”
A S A 2 A S A 3 A S A 2 A S A 3 A S A 2 A S A 3 A S A 2 A S A 3
≥16 & <40 ≥40 & <60 ≥60 & <80 ≥80
Age – years
7.10 “Urine analysis are indicated preoperatively in an adult with comorbidity from renal disease having
elective Grade 2 surgery, aged as shown.”
A S A 2 A S A 3 A S A 2 A S A 3 A S A 2 A S A 3 A S A 2 A S A 3
≥16 & <40 ≥40 & <60 ≥60 & <80 ≥80
Age – years
9 1
1
1
2 5
9 1
1
1
2 5
9
8
7
6
5
4
3
2
1
9 1
1
1
2 5
9 1
1
1
2 5
9
8
7
6
5
4
3
2
1
9 1
1
1
2 5
9 1
1
1
2 5
9
8
7
6
5
4
3
2
1
8 1
1 1
1
2 5
8 1
1 1
1
2 5
9
8
7
6
5
4
3
2
1
Strongly agree
Strongly disagree
9 1
1
1
2 5
9 1
1
1
2 5
9
8
7
6
5
4
3
2
1
9 1
1
1
2 5
9 1
1
1
2 5
9
8
7
6
5
4
3
2
1
9 1
1
1
2 5
9 1
1
1
2 5
9
8
7
6
5
4
3
2
1
8 1
1
1
3 5
8 1
1
1
3 5
9
8
7
6
5
4
3
2
1
Strongly agree
Strongly disagree
187A P P E N D I X 4

7.11 “Urine analysis are indicated preoperatively in an adult with comorbidity from renal disease having
elective Grade 3 surgery, aged as shown.”
A S A 2 A S A 3 A S A 2 A S A 3 A S A 2 A S A 3 A S A 2 A S A 3
≥16 & <40 ≥40 & <60 ≥60 & <80 ≥80
Age – years
7.12 “Urine analysis are indicated preoperatively in an adult with comorbidity from renal disease having
elective Grade 4 surgery, aged as shown.”
A S A 2 A S A 3 A S A 2 A S A 3 A S A 2 A S A 3 A S A 2 A S A 3
≥16 & <40 ≥40 & <60 ≥60 & <80 ≥80
Age – years
9 1
1
1
2 5
9 1
1
1
2 5
9
8
7
6
5
4
3
2
1
9 1
1
1
2 5
9 1
1
1
2 5
9
8
7
6
5
4
3
2
1
9 1
1
1
2 5
9 1
1
1
2 5
9
8
7
6
5
4
3
2
1
9 1
1
1
2 5
9 1
1
1
2 5
9
8
7
6
5
4
3
2
1
Strongly agree
Strongly disagree
9 1
1
1
2 5
9 1
1
1
2 5
9
8
7
6
5
4
3
2
1
9 1
1
1
2 5
9 1
1
1
2 5
9
8
7
6
5
4
3
2
1
9 1
1
1
2 5
9 1
1
1
2 5
9
8
7
6
5
4
3
2
1
9 1
1
1
2 5
9 1
1
1
2 5
9
8
7
6
5
4
3
2
1
Strongly agree
Strongly disagree
188 P R E O P E R A T I V E T E S T S

ADULTS, TESTING OF BLOOD GASES
Cost estimates: low £2.60 mid £3.10 upper £3.60
To what extent is testing of blood gases indicated for patients with cardiovascular comorbidity of different ages,
undergoing different types of surgery? For each of the ages shown below, please indicate your agreement with the
following statements, separately for patients with mild (ie ASA Grade 2) and severe (ie ASA Grade 3) cardiovascular
comorbidity, by ringing one or more numbers in each column:
8.1 “Testing of blood gases are indicated preoperatively in an adult with cardiovascular comorbidity having
elective Grade 1 surgery, aged as shown.”
A S A 2 A S A 3 A S A 2 A S A 3 A S A 2 A S A 3 A S A 2 A S A 3
≥16 & <40 ≥40 & <60 ≥60 & <80 ≥80
Age – years
8.2 “Testing of blood gases are indicated preoperatively in an adult with cardiovascular comorbidity having
elective Grade 2 surgery, aged as shown.”
A S A 2 A S A 3 A S A 2 A S A 3 A S A 2 A S A 3 A S A 2 A S A 3
≥16 & <40 ≥40 & <60 ≥60 & <80 ≥80
Age – years
11 811 8
9
8
7
6
5
4
3
2
111 811 8
9
8
7
6
5
4
3
2
111 811 8
9
8
7
6
5
4
3
2
111 811 8
9
8
7
6
5
4
3
2
1
Strongly agree
Strongly disagree
11 811 8
9
8
7
6
5
4
3
2
111 811 8
9
8
7
6
5
4
3
2
111 811 8
9
8
7
6
5
4
3
2
111 811 8
9
8
7
6
5
4
3
2
1
Strongly agree
Strongly disagree
189A P P E N D I X 4

8.3 “Testing of blood gases are indicated preoperatively in an adult with cardiovascular comorbidity having
elective Grade 3 surgery, aged as shown.”
A S A 2 A S A 3 A S A 2 A S A 3 A S A 2 A S A 3 A S A 2 A S A 3
≥16 & <40 ≥40 & <60 ≥60 & <80 ≥80
Age – years
8.4 “Testing of blood gases are indicated preoperatively in an adult with cardiovascular comorbidity having
elective Grade 4 surgery, aged as shown.”
A S A 2 A S A 3 A S A 2 A S A 3 A S A 2 A S A 3 A S A 2 A S A 3
≥16 & <40 ≥40 & <60 ≥60 & <80 ≥80
Age – years
1
1
1
9 7
1
10 8
9
8
7
6
5
4
3
2
1
1
1
3
9 7
1
10 8
9
8
7
6
5
4
3
2
1
1
1
1
9 7
1
10 8
9
8
7
6
5
4
3
2
1
1
1
1
9 7
1
10 8
9
8
7
6
5
4
3
2
1
Strongly agree
Strongly disagree
1
10 811 8
9
8
7
6
5
4
3
2
1
1
10 811 8
9
8
7
6
5
4
3
2
1
1
10 811 8
9
8
7
6
5
4
3
2
1
1
10 811 8
9
8
7
6
5
4
3
2
1
Strongly agree
Strongly disagree
190 P R E O P E R A T I V E T E S T S

To what extent is testing of blood gases indicated for patients with respiratory comorbidity of different ages,
undergoing different types of surgery? For each of the ages shown below, please indicate your agreement with the
following statements, separately for patients with mild (ie ASA Grade 2) and severe (ie ASA Grade 3) respiratory
comorbidity, by ringing one or more numbers in each column:
8.5 “Testing of blood gases are indicated preoperatively in an adult with respiratory comorbidity having
elective Grade 1 surgery, aged as shown.”
A S A 2 A S A 3 A S A 2 A S A 3 A S A 2 A S A 3 A S A 2 A S A 3
≥16 & <40 ≥40 & <60 ≥60 & <80 ≥80
Age – years
8.6 “Testing of blood gases are indicated preoperatively in an adult with respiratory comorbidity having
elective Grade 2 surgery, aged as shown.”
A S A 2 A S A 3 A S A 2 A S A 3 A S A 2 A S A 3 A S A 2 A S A 3
≥16 & <40 ≥40 & <60 ≥60 & <80 ≥80
Age – years
1
1
2
1
10 4
1
11 7
9
8
7
6
5
4
3
2
1
1
1
2
1
10 4
1
11 7
9
8
7
6
5
4
3
2
1
1
2
1
1
10 4
1
11 7
9
8
7
6
5
4
3
2
1
1
2
2
10 4
1
11 7
9
8
7
6
5
4
3
2
1
Strongly agree
Strongly disagree
1
2
10 6
1
11 7
9
8
7
6
5
4
3
2
1
1
2
10 6
1
11 7
9
8
7
6
5
4
3
2
1
1
1
1
10 6
1
11 7
9
8
7
6
5
4
3
2
1
1
1
1
10 6
1
11 7
9
8
7
6
5
4
3
2
1
Strongly agree
Strongly disagree
191A P P E N D I X 4

8.7 “Testing of blood gases are indicated preoperatively in an adult with respiratory comorbidity having
elective Grade 3 surgery, aged as shown.”
A S A 2 A S A 3 A S A 2 A S A 3 A S A 2 A S A 3 A S A 2 A S A 3
≥16 & <40 ≥40 & <60 ≥60 & <80 ≥80
Age – years
8.8 “Testing of blood gases are indicated preoperatively in an adult with respiratory comorbidity having
elective Grade 4 surgery, aged as shown.”
A S A 2 A S A 3 A S A 2 A S A 3 A S A 2 A S A 3 A S A 2 A S A 3
≥16 & <40 ≥40 & <60 ≥60 & <80 ≥80
Age – years
3 1
4
1
1 1
1
5 2
1
1
1
1
8 6
9
8
7
6
5
4
3
2
1
3 1
4
1
1 1
1
5 2
1
1
1
1
1
8 6
9
8
7
6
5
4
3
2
1
2 1
3
1
1 2
1
6 2
1
1
1
1
1
8 6
9
8
7
6
5
4
3
2
1
2 1
3
1
1 2
1
6 2
1
1
1
1
1
8 6
9
8
7
6
5
4
3
2
1
Strongly agree
Strongly disagree
2
1
3
1
1 2
7 2
1
1 5
1
9 6
9
8
7
6
5
4
3
2
1
2
1
3
1
1 2
7 2
1
1 1
1
9 6
9
8
7
6
5
4
3
2
1
2
1
1
1 1
5
8 2
1
1
1
10 6
9
8
7
6
5
4
3
2
1
2
1
1
1 1
3
8 2
1
1
1
10 6
9
8
7
6
5
4
3
2
1
Strongly agree
Strongly disagree
192 P R E O P E R A T I V E T E S T S

To what extent is testing of blood gases indicated for patients with comorbidity from renal disease of different ages,
undergoing different types of surgery? For each of the ages shown below, please indicate your agreement with the
following statements, separately for patients with mild (ie ASA Grade 2) and severe (ie ASA Grade 3) comorbidity
from renal disease, by ringing one or more numbers in each column:
8.9 “Testing of blood gases are indicated preoperatively in an adult with comorbidity from renal disease having
elective Grade 1 surgery, aged as shown.”
A S A 2 A S A 3 A S A 2 A S A 3 A S A 2 A S A 3 A S A 2 A S A 3
≥16 & <40 ≥40 & <60 ≥60 & <80 ≥80
Age – years
8.10 “Testing of blood gases are indicated preoperatively in an adult with comorbidity from renal disease having
elective Grade 2 surgery, aged as shown.”
A S A 2 A S A 3 A S A 2 A S A 3 A S A 2 A S A 3 A S A 2 A S A 3
≥16 & <40 ≥40 & <60 ≥60 & <80 ≥80
Age – years
1
1
1
10 6
1
1
11 6
9
8
7
6
5
4
3
2
1
1
1
1
10 6
1
1
1
10 6
9
8
7
6
5
4
3
2
1
1
1
11 6
1
1
11 6
9
8
7
6
5
4
3
2
1
1
1
11 6
1
1
11 6
9
8
7
6
5
4
3
2
1
Strongly agree
Strongly disagree
1
11 7
1
11 7
9
8
7
6
5
4
3
2
1
1
11 7
1
11 7
9
8
7
6
5
4
3
2
1
1
11 7
1
11 7
9
8
7
6
5
4
3
2
1
1
11 7
1
11 7
9
8
7
6
5
4
3
2
1
Strongly agree
Strongly disagree
193A P P E N D I X 4

8.11 “Testing of blood gases are indicated preoperatively in an adult with comorbidity from renal disease having
elective Grade 3 surgery, aged as shown.”
A S A 2 A S A 3 A S A 2 A S A 3 A S A 2 A S A 3 A S A 2 A S A 3
≥16 & <40 ≥40 & <60 ≥60 & <80 ≥80
Age – years
8.12 “Testing of blood gases are indicated preoperatively in an adult with comorbidity from renal disease having
elective Grade 4 surgery, aged as shown.”
A S A 2 A S A 3 A S A 2 A S A 3 A S A 2 A S A 3 A S A 2 A S A 3
≥16 & <40 ≥40 & <60 ≥60 & <80 ≥80
Age – years
1
1
3
1
10 3
1
1
11 6
9
8
7
6
5
4
3
2
1
1
1
3
1
10 3
1
1
11 6
9
8
7
6
5
4
3
2
1
1
1
3
1
10 3
1
1
11 6
9
8
7
6
5
4
3
2
1
1
1
3
1
10 3
8
1
11 6
9
8
7
6
5
4
3
2
1
Strongly agree
Strongly disagree
1
1
1
10 6
1
1
11 6
9
8
7
6
5
4
3
2
1
1
1
1
10 6
1
1
11 6
9
8
7
6
5
4
3
2
1
1
1
1
10 6
1
1
11 6
9
8
7
6
5
4
3
2
1
1
1
1
10 6
1
1
11 6
9
8
7
6
5
4
3
2
1
Strongly agree
Strongly disagree
194 P R E O P E R A T I V E T E S T S

ADULTS, LUNG FUNCTION TESTS (forced expiratory volume and vital capacity)
Cost estimates: low £1.40 mid £2.10 upper £2.80
To what extent are lung function tests indicated for patients with cardiovascular comorbidity of different ages,
undergoing different types of surgery? For each of the ages shown below, please indicate your agreement with the
following statements, separately for patients with mild (ie ASA Grade 2) and severe (ie ASA Grade 3) cardiovascular
comorbidity, by ringing one or more numbers in each column:
9.1 “Lung function tests are indicated preoperatively in an adult with cardiovascular comorbidity having
elective Grade 1 surgery, aged as shown.”
A S A 2 A S A 3 A S A 2 A S A 3 A S A 2 A S A 3 A S A 2 A S A 3
≥16 & <40 ≥40 & <60 ≥60 & <80 ≥80
Age – years
9.2 “Lung function tests are indicated preoperatively in an adult with cardiovascular comorbidity having
elective Grade 2 surgery, aged as shown.”
A S A 2 A S A 3 A S A 2 A S A 3 A S A 2 A S A 3 A S A 2 A S A 3
≥16 & <40 ≥40 & <60 ≥60 & <80 ≥80
Age – years
11 811 8
9
8
7
6
5
4
3
2
111 811 8
9
8
7
6
5
4
3
2
111 811 8
9
8
7
6
5
4
3
2
111 811 8
9
8
7
6
5
4
3
2
1
Strongly agree
Strongly disagree
11 811 8
9
8
7
6
5
4
3
2
111 811 8
9
8
7
6
5
4
3
2
111 811 8
9
8
7
6
5
4
3
2
111 811 8
9
8
7
6
5
4
3
2
1
Strongly agree
Strongly disagree
195A P P E N D I X 4

9.3 “Lung function tests are indicated preoperatively in an adult with cardiovascular comorbidity having
elective Grade 3 surgery, aged as shown.”
A S A 2 A S A 3 A S A 2 A S A 3 A S A 2 A S A 3 A S A 2 A S A 3
≥16 & <40 ≥40 & <60 ≥60 & <80 ≥80
Age – years
9.4 “Lung function tests are indicated preoperatively in an adult with cardiovascular comorbidity having
elective Grade 4 surgery, aged as shown.”
A S A 2 A S A 3 A S A 2 A S A 3 A S A 2 A S A 3 A S A 2 A S A 3
≥16 & <40 ≥40 & <60 ≥60 & <80 ≥80
Age – years
1
1
2
2
8 5
1
1
10 7
9
8
7
6
5
4
3
2
1
1
2
1 2
8 5
1
1
10 7
9
8
7
6
5
4
3
2
1
1
2
1 2
8 5
1
1
10 7
9
8
7
6
5
4
3
2
1
1
2
1 2
8 5
1
1
10 7
9
8
7
6
5
4
3
2
1
Strongly agree
Strongly disagree
1
2
10 6
1
11 7
9
8
7
6
5
4
3
2
1
1
2
10 6
1
11 7
9
8
7
6
5
4
3
2
1
1
2
10 6
1
11 7
9
8
7
6
5
4
3
2
1
1
2
10 6
1
11 7
9
8
7
6
5
4
3
2
1
Strongly agree
Strongly disagree
196 P R E O P E R A T I V E T E S T S

To what extent are lung function tests indicated for patients with respiratory comorbidity of different ages,
undergoing different types of surgery? For each of the ages shown below, please indicate your agreement with the
following statements, separately for patients with mild (ie ASA Grade 2) and severe (ie ASA Grade 3) respiratory
comorbidity, by ringing one or more numbers in each column:
9.5 “Lung function tests are indicated preoperatively in an adult with respiratory comorbidity having
elective Grade 1 surgery, aged as shown.”
A S A 2 A S A 3 A S A 2 A S A 3 A S A 2 A S A 3 A S A 2 A S A 3
≥16 & <40 ≥40 & <60 ≥60 & <80 ≥80
Age – years
9.6 “Lung function tests are indicated preoperatively in an adult with respiratory comorbidity having
elective Grade 2 surgery, aged as shown.”
A S A 2 A S A 3 A S A 2 A S A 3 A S A 2 A S A 3 A S A 2 A S A 3
≥16 & <40 ≥40 & <60 ≥60 & <80 ≥80
Age – years
4 1
1
1 1
1
3
3 4
1
1
1
10 6
9
8
7
6
5
4
3
2
1
4
1
1
1 1
1
3
3 4
1
1
1
10 6
9
8
7
6
5
4
3
2
1
4
1
1
1 1
3
3 5
1
1
10 7
9
8
7
6
5
4
3
2
1
4
1
1
1 1
3
3 5
1
1
10 7
9
8
7
6
5
4
3
2
1
Strongly agree
Strongly disagree
3 1
1
3
1
4 6
1
1
10 7
9
8
7
6
5
4
3
2
1
3
1
1
3
1
4 6
1
1
10 7
9
8
7
6
5
4
3
2
1
3
1
1
3
1
4 6
1
1
10 7
9
8
7
6
5
4
3
2
1
1
1
1
1
1
3
1
4 6
1
1
10 7
9
8
7
6
5
4
3
2
1
Strongly agree
Strongly disagree
197A P P E N D I X 4

9.7 “Lung function tests are indicated preoperatively in an adult with respiratory comorbidity having
elective Grade 3 surgery, aged as shown.”
A S A 2 A S A 3 A S A 2 A S A 3 A S A 2 A S A 3 A S A 2 A S A 3
≥16 & <40 ≥40 & <60 ≥60 & <80 ≥80
Age – years
9.8 “Lung function tests are indicated preoperatively in an adult with respiratory comorbidity having
elective Grade 4 surgery, aged as shown.”
A S A 2 A S A 3 A S A 2 A S A 3 A S A 2 A S A 3 A S A 2 A S A 3
≥16 & <40 ≥40 & <60 ≥60 & <80 ≥80
Age – years
3 5
2
2
3
1
1
2
1 1
2
1 1
1
9 3
9
8
7
6
5
4
3
2
1
3 5
2
2
3
1
1
2
1 1
2
1 1
1
9 3
9
8
7
6
5
4
3
2
1
3 4
3
2
2
1
1
2 1
1 1
1
1
2
1
9 3
9
8
7
6
5
4
3
2
1
3 4
3
2
2
1 1
1
2
1 1
1
1
2
1
9 3
9
8
7
6
5
4
3
2
1
Strongly agree
Strongly disagree
3 3
3
2
1
1
1
4 1
1
1
1 1
10 4
9
8
7
6
5
4
3
2
1
3 3
3
2
1
1
1
4 1
1
1
1 1
1
10 4
9
8
7
6
5
4
3
2
1
3 2
3
1
1
1 1
1
1
4 1
1
1
1 1
1
10 4
9
8
7
6
5
4
3
2
1
3 2
3
1
1
1
1 1
1
4 1
1
1
1
1
1
10 4
9
8
7
6
5
4
3
2
1
Strongly agree
Strongly disagree
198 P R E O P E R A T I V E T E S T S

To what extent are lung function tests indicated for patients with comorbidity from renal disease of different ages,
undergoing different types of surgery? For each of the ages shown below, please indicate your agreement with the
following statements, separately for patients with mild (ie ASA Grade 2) and severe (ie ASA Grade 3) comorbidity
from renal disease, by ringing one or more numbers in each column:
9.9 “Lung function tests are indicated preoperatively in an adult with comorbidity from renal disease having
elective Grade 1 surgery, aged as shown.”
A S A 2 A S A 3 A S A 2 A S A 3 A S A 2 A S A 3 A S A 2 A S A 3
≥16 & <40 ≥40 & <60 ≥60 & <80 ≥80
Age – years
9.10 “Lung function tests are indicated preoperatively in an adult with comorbidity from renal disease having
elective Grade 2 surgery, aged as shown.”
A S A 2 A S A 3 A S A 2 A S A 3 A S A 2 A S A 3 A S A 2 A S A 3
≥16 & <40 ≥40 & <60 ≥60 & <80 ≥80
Age – years
1
10 811 8
9
8
7
6
5
4
3
2
1
1
10 811 8
9
8
7
6
5
4
3
2
111 811 8
9
8
7
6
5
4
3
2
111 811 8
9
8
7
6
5
4
3
2
1
Strongly agree
Strongly disagree
1
10 811 8
9
8
7
6
5
4
3
2
111 811 8
9
8
7
6
5
4
3
2
111 811 8
9
8
7
6
5
4
3
2
111 811 8
9
8
7
6
5
4
3
2
1
Strongly agree
Strongly disagree
199A P P E N D I X 4

9.11 “Lung function tests are indicated preoperatively in an adult with comorbidity from renal disease having
elective Grade 3 surgery, aged as shown.”
A S A 2 A S A 3 A S A 2 A S A 3 A S A 2 A S A 3 A S A 2 A S A 3
≥16 & <40 ≥40 & <60 ≥60 & <80 ≥80
Age – years
9.12 “Lung function tests are indicated preoperatively in an adult with comorbidity from renal disease having
elective Grade 4 surgery, aged as shown.”
A S A 2 A S A 3 A S A 2 A S A 3 A S A 2 A S A 3 A S A 2 A S A 3
≥16 & <40 ≥40 & <60 ≥60 & <80 ≥80
Age – years
1
1
1
1
9 6
1
10 8
9
8
7
6
5
4
3
2
1
1
1 1
1
9 6
1
10 8
9
8
7
6
5
4
3
2
1
1
1
1
10 611 8
9
8
7
6
5
4
3
2
1
1
1
1
10 611 8
9
8
7
6
5
4
3
2
1
Strongly agree
Strongly disagree
1
2
9 8
1
10 8
9
8
7
6
5
4
3
2
1
1
1
9 811 8
9
8
7
6
5
4
3
2
1
1
10 811 8
9
8
7
6
5
4
3
2
1
1
10 811 8
9
8
7
6
5
4
3
2
1
Strongly agree
Strongly disagree
200 P R E O P E R A T I V E T E S T S

1.1 IntroductionPreoperative testing represents a major drain on
health service resources internationally. It has been
estimated that the annual cost of preoperative
evaluation in the USA was as much as $30bn in the
1980s1 with diagnostic testing being a substantial
component. The figure for the UK is unknown. The
cost is likely to be substantially less in the UK, given
that salaries, overheads and the frequency of testing
are all lower and that the US figure may reflect
charges rather than costs. However, with 6.2 million
admissions in England containing at least one
surgical procedure in the financial year 2000/2001
(source: Hospital Episode Statistics:
http://www.doh.gov.uk/hes/) the annual cost of
‘routine’ preoperative testing is likely to be at least in
the 10s of £m. It is the subject of the economic
component of this review to try to assess whether this
is money that is well spent or whether the UK NHS
could increase health gain by redeploying its valuable
resources. Certainly a particular test is likely to be
good value for money (ie cost-effective) for some
groups of patients and less good value for others.
1.2 Background
1.2.1 Health economics and clinical guidelinesThe explicit use of economic evaluation in clinical
guideline development is a recent, but international,
phenomenon. In the USA, the Committee on Clinical
Practice Guidelines has recommended that every
clinical guideline include cost information for
alternative patient management strategies.2 In the
UK, the remit of the National Institute for Clinical
Excellence (NICE) is to produce national clinical
guidelines that address cost-effectiveness as well as
clinical effectiveness.
The reasoning behind the application of economic
criteria to clinical guidelines is that no health system
anywhere in the world has enough resources to
provide every potentially beneficial preventative,
diagnostic, curative and palliative procedure.
Therefore, there is a need to redeploy resources to
those procedures where the potential health gain is
greatest. This requires abandoning practices that are
relatively poor value for money.
There is a well-developed methodological literature
for assessing the relative cost-effectiveness (value for
money) of different health care procedures2–6. There is
still some debate over some of the specific methods
of economic evaluation in health care but essentially
there are six steps to evaluating the relative
efficiency of any procedure.
1. Identify the target group (eg male preoperative
patients aged > 50 years), the procedure to be
evaluated (eg preoperative resting ECG) and
its alternative strategy (eg no preoperative
resting ECG).
2. Identify all the important health and resource
outcomes that are likely to differ between the
procedure and its alternative.
3. Measure the differences in identified health and
resource outcomes.
4. Estimate the value of the health gain and the
value of the resource use. [Resource use is
valued in terms of its monetary value, its
economic cost. Health gain is sometimes valued
in monetary terms, but more often a
nonpecuniary measure such as the quality-
adjusted life-year (QALY) is used].
201A P P E N D I X 5
Appendix 5: Economics of RoutinePreoperative Testing

5. Estimate the ratio of net health gain to net
resource cost (eg the cost per QALY gained) and
compare this with the ratios estimated for other
commonly used health programmes to assess its
relative efficiency. The estimation of net health
gain and net cost requires some kind of model
(such as a decision analysis) to combine
probability and outcome information.
6. Consider the robustness of the cost-effectiveness
estimate in terms of statistical precision and
generalisability to other settings.
Ideally one would repeat each of these steps for each
procedure considered within the guideline (and within
each procedure, for each relevant patient subgroup).
This would allow us to see for which group of patients
the procedure is good value for money.
1.2.2 Health and resource outcomes for routinepreoperative testingStep 1 – Eleven tests were identified for inclusion in
the systematic review (Chapter 3): chest x-ray, resting
ECG, full blood count (FBC), haemostasis, renal
function, random glucose, urine dipstick, sickle cell,
pregnancy, blood gases and lung function.
Patient subgroups identified for the purposes of the
consensus process were defined by the following
characteristics:
> Gender (pregnancy test only)
> Age group
> ASA grade
> Presence of a particular (common) comorbidity
> Grade of surgery
> Ethnic group (sickle cell test only)
Step 2 – A general scheme for the health and
resource outcomes of preoperative testing is shown
in Table 1. The level of each component will differ
between tests and patient subgroups. Description of
some of the components (eg changes to surgical
practice arising from the test and complications
occurring) can be found for each test under the
relevant section of the systematic review (Chapter 3).
However, quantitative measurement of the change in
resource use resulting from these clinical outcomes is
not available anywhere in the published literature.
Some components are of less importance than others
are. For example, the iatrogenic effects of testing
should (hopefully) be small (perhaps negligible)
compared with the health gain from avoiding
complications. Testing has both positive and negative
effects on health; likewise there are both positive and
negative effects on resource use (see Table 1). For
some of the components we cannot even say which
direction the change in outcome will be. Hence it is
impossible to say a priori whether or not the test is
beneficial overall and whether or not it is cost saving
overall without having some kind of measurement
and valuation of the component parts.
Steps 3 & 4 – In the literature there has been some
measurement of A1 and A2 (Table 1), but only in
terms of number of patients affected not in terms of
the health gain per patient (see main systematic
review Chapter 3). The cost of items B2 and B4
appear in the literature; evidence is presented in
Sections 1.4.1 and 1.4.2. There is no evidence for any
of the other components in the literature.
Steps 5 & 6 – In Section 1.4.3 below, an attempt is
made to combine all the available evidence to try to
assess the cost-effectiveness of the different
preoperative tests.
1.2.3 Current practice in England and WalesThere are no widely accepted clinical guidelines on
preoperative testing. However, the Oxford Handbook of
Clinical Medicine, currently in its fifth edition, is perhaps
a reasonable indicator of typical current practice in the
UK. The recommendations are essentially as follows:
Routine testing – ‘most patients’
> Urine and electrolytes
> FBC
> Blood glucose
Age indications
> Chest x-ray: > 65 years
> Resting ECG: > 65 years
202 P R E O P E R A T I V E T E S T S

Other indications
> Chest x-ray: diagnosis/pathology/symptoms of
cardiorespiratory disease
> Resting ECG: poor exercise tolerance or history
of heart disease, hypertension or rheumatic fever
> Haemostasis: history of liver disease, massive
blood loss or use of heparin/warfarin
> Blood glucose – diabetes
> Sickle cell test: origins in Africa, West Indies,
Mediterranean and other malarial regions
(including most of India)
Anecdotal evidence would suggest that the
adherence to these guidelines is variable between
institutions and, in particular, the sickle cell test is
rarely performed on potential surgical candidates.
Recommendations were also made for a few other
specific tests, not considered in this review, including
liver function, thyroid function, HIV and cross-
matching.
The recommendations in other medical textbooks do
differ from these. For example the Oxford Handbook
of Surgery recommends the use of ECG in all patients
over the age of 50 (rather than 65). However, the
Oxford Handbook of Clinical Medicine is more
influential in the UK medical education system and
is therefore more likely to reflect current practice.
Having an approximate definition of current practice
is important when it comes to estimating the cost
impact of the guidelines – see Section 1.3.4.
1.3 MethodsThe Health Technology Assessment (HTA)
programme’s systematic review of routine
preoperative testing did not investigate cost and
cost-effectiveness.7 Indeed, after thorough searching,
we did not come across a comprehensive review of
this subject in the published literature. Hence the
systematic literature review that follows (see Section
1.3.2) may be useful. However, such a review is
unlikely to capture all of the resource and health
implications of preoperative testing strategies that
would be relevant to the NHS.
The economic review presented in this chapter has
four components:
> estimation of unit costs of the tests under
consideration;
> a review of the literature around the economics
of preoperative testing;
> simple economic modelling of the cost-
effectiveness of preoperative testing in England
and Wales; and
> simple economic modelling of the cost impact of
preoperative testing in England and Wales.
1.3.1 Unit costs of testsA dual methodology was used to collect unit cost
figures:
• review of the literature of the last six years; and
• collection of cost data from a small sample of
hospital laboratories.
For each test, the upper and lower estimates of unit
cost (from both methods combined) were noted and
the mid-point calculated. These figures were
incorporated into the consensus documents.
Literature review
A search was carried out to find any costing or
economic information regarding the selected tests
(Table A1.i, Appendix 1). This was not restricted to
the surgical context, as the cost of the test should be
identical or similar regardless of the setting (with the
exception of point-of-care testing). It is worth noting
that any search for published unit costs is likely to be
relatively insensitive because a unit cost is usually
only a small component of an economic evaluation
and hence is unlikely to get a mention in the
abstract or Medical Subject Headings (MeSH®). The
search was initially limited to studies conducted in
the UK NHS because staff costs and overheads vary
considerably between health systems. Given the
rapidly developing technology in the diagnostic field
the search was limited to the years 1995-2001. In
addition to the databases searched for the main
203A P P E N D I X 5

systematic review (Chapter 3), two specific health
economic databases were searched:
> Health Economic Evaluations Database
(http://www.ohe-heed.com); and
> NHS Economic Evaluations Database
(http://nhscrd.york.ac.uk/nhsdhp.htm).
Both databases include studies from the UK and
overseas and both have relatively complex and
comprehensive strategies for screening the medical
and economic literature. The latter database reviews
only full economic evaluations (ie those that
systematically consider both cost and health effect),
whereas the former has a broader remit and reviews
all identified economic analyses. Abstracts and/or
database reviews of the papers found were reviewed
by the health economist and were discarded if they
appeared not to contain a unit cost for any of the
tests under study. Costs extracted were inflated to
April 2001 prices using the health component of the
Retail Prices Index.
Given the low number of relevant UK studies found,
data were also collected from overseas studies. These
costs were converted to pound sterling using GDP
purchasing power parities for the relevant year and
then inflated. Most of the overseas costs pertained
to the USA. After converting charges to costs using
ratios from the US Government’s Health Care
Financing Administration, the estimates were in
the region of five to ten times higher than those
estimated for the UK, as would be expected.
Consequently all non-UK unit cost estimates were
excluded on the grounds of noncomparability.
Primary data collection
Six district general hospital laboratories around
England and Wales were approached for unit cost
information. Three hospitals responded, supplying
almost complete information as requested: Luton
and Dunstable Hospital, South Tyneside Hospital
and Sunderland City Hospital. Unit costs were
also available from research recently conducted
at Central Middlesex Hospital.
The chief scientific officers in both the haematology
and biochemistry laboratories filled in a
questionnaire. They were asked to specify what
components were included in their cost estimates
and how the estimates were calculated. Additional
information was also collected, such as model of
equipment used; volume of tests performed etc.
The data were collected using a study form (see
Annex at the end of this chapter). The form was
developed after detailed discussion with staff at
one of the centres (Luton and Dunstable Hospital).
For the urinalysis dipstick, costs were extracted from
the British National Formulary.
1.3.2 Review of preoperative evaluation costingstudiesUsing the same search strategy as for the main
systematic review in Chapter 3, but with an
additional filter to locate costing information (Table
A1.i, Appendix 1), a search was performed on the
databases searched in the main review plus the two
health economic databases referred to above.
Abstracts of papers found were reviewed by the
health economist and were discarded only if:
> they appeared not to contain any economic
data; or
> if their focus was not preoperative testing.
Relevant references in the bibliographies of reviewed
papers were also identified and reviewed. Unlike the
extraction of unit costs, overseas studies were
included. This was justified because
> there were very few UK studies;
> the studies contain, in addition to unit costs,
resource use data, which does not vary between
health systems as much as unit costs do; and
> study of overseas methods might be useful for
the development of our own cost analysis (see
Section 1.3.3).
As with the main review formal differentiation of
study quality was not carried out because all studies
were case series. This meant that methodological
quality was consistently poor across all studies
reported. The data summarised for each study
include country, surgical setting, sample size,
incremental cost, incremental cost per patient,
incremental cost-effectiveness and cost comparison
204 P R E O P E R A T I V E T E S T S

made. In some cases incremental cost or cost-
effectiveness was not presented in the paper,
but could be calculated from evidence that was
presented. Some studies looked at the cost of
preoperative testing as part of an evaluation of
preoperative evaluation clinics. These studies were
summarised separately.
1.3.3 Modelling of cost-effectiveness of preoperativetesting for England and WalesFor each test a very simple decision analytic model
was constructed like the one represented by the
decision tree in Figure 1. A decision analysis simply
calculates an overall outcome, for example cost,
as the sum of all the individual outcomes, each
weighted by the probability of that individual
outcome occurring. The costs of the tests themselves
were estimated from the literature and from a small
sample of NHS Trusts (see Section 1.3.1). However, as
noted in Table 1, the overall ‘incremental’ cost of
testing to the NHS also includes certain costs arising
as a consequence of testing (B2-B9) and there may
be costs incurred by the patient and their families
(C1-C5). An approximate cost of further diagnostic
testing (B2) was estimated by assuming that it
consisted of one extra outpatient appointment for all
those patients with an initial positive test. This cost
is clearly tentative as the real cost is unknown and
varies according to the test taken, and we know that
for a proportion of tests the results are not read.
The mean cost of a surgical outpatient appointment
was extracted from the NHS Reference Costs
2000 database.
The NHS reference cost database8 contains
accounting cost data from every NHS hospital trust.
Each trust reports an average cost per hospital
episode, categorised by type of visit (eg outpatient,
elective inpatient etc), clinical specialty and
Healthcare Resource Group (HRG). The NHS
Reference Costs 2000 database contains information
for 69.4 million hospital episodes amounting to 88%
of annual expenditure on services by NHS hospitals.
Accounting practices do vary between hospitals but
the costs should reflect the full cost of the service
(including direct, indirect and overhead costs),
as described in the NHS Costing Manual.9
The health outcomes and the remaining potential
cost components were considered too difficult to
quantify, even approximately, using the available
evidence. Usable evidence would require specifically
designed prospective studies of each test.
The systematic review did not find any evidence of
changes to health outcomes. Some studies provided
enough evidence to allow the calculation of the
proportion of tests that resulted in a change in
management. Hence cost-effectiveness for each test
was calculated in terms of the incremental cost per
change in management. To estimate the probability
of a change in management, data on the following
were taken from the main systematic review
(Chapter 3):
> abnormal test result rates (for each test this was
the average of all relevant studies that included
only ASA 1 and 2 patients weighted by study
size); and
> positive predictive value (for each test this was
the average of all relevant studies weighted
by study size).
Comparisons between tests would have to be very
cautious given that the typical change in patient
management and the resulting health outcome are
likely to vary greatly between the tests. Sensitivity
analyses were conducted to test the sensitivity of
the results to the model parameters.
> For the unit costs, the range was used.
> For the cost of an outpatient visit, the range
was used.
> For the probabilities, the most extreme estimates
from the literature review were taken (except
where the most extreme estimate was zero –
in this case the lowest estimate above zero
was used).
1.3.4 Modelling the cost impact of the newpreoperative testing guidelinesThe cost of implementing the guidelines proposed
in this document (Chapter 6) was calculated by
estimating the expected number of each test that
would be indicated by the guidelines and multiplying
these numbers by the unit costs (Section 1.3.1).
205A P P E N D I X 5

The number of surgical procedures
Data on all the elective hospital Finished Consultant
Episodes (FCEs) in England in 2000/2001 that
contained at least one surgical procedure (n=4.7
million FCEs) were obtained from the Hospital
Episode Statistics (HES) section of the Department of
Health. The data were categorised by procedure code
(OPCS4) and five year age bands. Emergency and
maternity episodes were not included.
Severity of surgical procedures
Three surgical research fellows filled in a survey.
They were given a list of the summary groups of
procedures (HES Table 4) and asked to grade each
one according to the severity of surgery (related to
the physiological stress involved). The responders felt
that some categories were too broad. For each of
these cases the broad category was broken down
into their three-digit OPCS4 codes (for example we
omitted BD1 excision of breast and replaced it with
two separate categories: B27 Total excision of breast
and B28 Other excision of breast). After all three
responders had completed the questionnaire,
differences between responses were noted and the
responders were asked to reach a consensus on each
category. The resulting scheme is presented in Table
2. Applying this grading system to the HES data
allowed the breakdown of FCEs by age and severity
of surgery as in Table 3. The severity grading system
covered 57% of surgical procedures. The remaining
43% were then allocated to each of the severity
categories so as to keep the proportions of each
grade the same within each age band (Table 4).
Number of patients with comorbidity
The guideline outlined in Chapter 6 recommends
testing by severity score, age and evidence of
comorbidity. Using more HES data, the number of
FCEs were categorised according to whether they had
one of the three comorbidities. All of the nonprimary
diagnosis fields were searched for the ICD-10 codes
presented in Table 5. It was assumed that the
incidence of comorbidity would be age-related but
would be independent of severity of surgery, a
logistically necessary simplification. Hence the age-
specific incidence of each comorbidity was multiplied
with the age-specific relative frequency of each
severity category, giving the number of FCEs
presented in Table 6.
The costs of testing
The annual cost of testing was calculated simply by
considering the categories of patients where testing
is recommended, finding the estimated numbers of
patients in these categories (Tables 4 and 6) and
multiplying them by the mid-point estimates of the
unit costs. Our estimates omit the cost of further
diagnostic testing, which we tentatively estimated
in Section 1.3.3. Also omitted were the cost
components B3-B9 and C1-C5 identified in Table 1
for which evidence is not currently available.
For a number of patient categories the Guideline
Development Group (GDG) could not come to a
consensus on whether or not to test. For the purpose of
costing the guideline we took two extreme scenarios. In
the first scenario, we assume that in the areas that a
consensus had not been achieved, the test is ALWAYS
carried out (the ‘broad guideline’). In the alternative
scenario, we assume that for these grey areas the test is
NEVER carried out (the ‘narrow guideline’).
Finally to get number of tests for England and Wales
instead of just England, all the figures were adjusted
up by a factor of 5.9%. (The populations of England
and Wales are 50.0 and 2.9 million, respectively;
Source: ONS estimate for mid-2000.)
The cost impact
To estimate the cost impact of the guideline we need
to know the number of routine preoperative tests
being carried out at present. We do not know the
frequency of testing currently so the current system
was estimated by taking a set of existing guidelines,
the Oxford Handbook of Clinical Medicine (see
Section 1.2.3). The following, slightly stylised,
definition of these guidelines used was:
> FBC, renal function and random blood glucose
tests for all patients.
> chest x-ray and ECG for all patients over 65.
> chest x-ray for those with respiratory
comorbidity.
> ECG and chest x-ray for those with
cardiovascular comorbidity.
206 P R E O P E R A T I V E T E S T S

The cost impact was estimated to be approximately
equal to the cost of these guidelines subtracted from
the cost of the guidelines presented in Chapter 6.
If not an accurate estimate of the actual cost impact,
this should at least indicate the difference in cost
between the new guidelines and one set of existing
guidelines. However, even this cost difference does
not include the broader and longer term cost
consequences (Table 1). A range was calculated for
the cost impact using the ranges for the unit costs.
Pregnancy testing and sickle cell testing
These two tests were treated separately both because
they were not related to severity of surgery and
because there were no obvious differences between
these guidelines and those of the Oxford handbook.
The number of surgical FCEs relating to women
between the ages of 15 and 50 years was taken from
HES data. Data on the breakdown of the general
population (for Great Britain 2000-01) were taken
from the official statistics. The incidence of surgical
operations was assumed to be the same for these
groups as for the rest of the population (adjustments
were not made for age).
1.4 Results1.4.1 Unit costs of tests
Unit cost data was collected from four laboratories
and extracted from 16 articles relating to the UK
NHS.10-25 Data were also extracted from a further
34 overseas studies (28 from USA). However, as
expected the unit costs appeared to be quite
different in the overseas papers (in the case of the
USA, the reported costs/charges were up to ten
times the cost estimated in UK studies) and therefore
all non-UK studies were excluded on the grounds of
noncomparability. Initially 1437 abstracts were
reviewed to see if they were likely to contain
unit costs.
Table 7 presents the range and mid-point estimates
of unit cost for each test based on the UK cost
estimates. Chest x-ray and ECG were, not surprisingly,
considerably more expensive than laboratory tests.
The urinalysis dipstick was cheapest of all. Full blood
count had the broadest relative range and ECG the
broadest absolute range.
Components of cost estimates
The cost estimates, both collected directly, or taken
from the literature, essentially include the following
components:
> cost of consumables, eg x-ray film, chemical
reagents, testing kit, etc;
> laboratory staff time; and
> capital equipment costs, eg laboratory
analysers, etc.
The exceptions are the Sickledex test, pregnancy test
and urinalysis dipstick, where the cost estimates
include only the cost of the kit itself. Calculating
overheads for diagnostic tests is a difficult task
and is not carried out consistently in all institutions.
The laboratories approached did not include
nondepartmental overheads in their estimates,
although this component may have been included
in some of the estimates from the literature. Hence
these unit costs are underestimates inasmuch as they
do not necessarily include overheads nor do they
include the cost of the clinicians’ time in ordering
and interpreting these results. These omissions are
unlikely to affect the estimates greatly in absolute
terms (as the clinician time involved will be small for
most instances of testing), however, for the urinalysis
dipstick the difference will be proportionately quite
high, as the cost of the kit itself is minimal.
Also excluded were the economic costs associated
with testing incurred by the patients themselves. If
patients are given an additional appointment for the
purposes of testing then the patient cost might be
fairly substantial. If, however, the tests are carried out
while patients are attending the hospital for some
other reason, perhaps as part of the normal work-up
for the surgery, then the incremental private cost of
testing is likely to be negligible.
Cost savings from elimination of unwarranted tests
If the number of the tests were to be reduced, the
proportion of the cost that would be saved in the
short term varies between the tests.
> For the kits (pregnancy, urinalysis and
Sickledex), the full cost of the kit would
be recovered.
207A P P E N D I X 5

> For the other pathology tests, the reagent costs
would be recovered in the short term. Many
laboratories now purchase their equipment on
the basis of ‘reagent contracts’, such that there
is no fixed cost for the equipment but
laboratories pay a mark-up on the reagents they
purchase. In this case the capital cost as well as
the reagent cost is recovered in the short term.
Also in the short term, laboratory staff time will
be freed up.
> For ECG and chest x-ray, consumable costs will
be recovered in the short term and staff time
will be freed up, but capital costs will only be
recovered in the long term if at all. Although
these capital cost savings may not be realised
financially, they should still be considered to be
opportunity costs as they may allow the use of
the facilities for additional patients.
1.4.2 Review of preoperative evaluation costingstudies
Cost analyses of preoperative testing
We identified 13 papers that had conducted formal
or informal cost analyses of preoperative testing.
A further six studies had considered the cost of
preoperative testing in the context of evaluating
preoperative evaluation clinics; these are reported
separately. The characteristics of the 13 studies
are summarised in Table 8.
All the studies were coming from the perspective of
seeking to reduce preoperative testing, hence total
cost savings (at the sample, hospital or national
level) or costs saved per patient were the outcomes
used. Three studies used charges instead of economic
costs.26-28
The studies were heterogeneous in the following
respects:
> tests being evaluated;
> target population (age, type of surgery etc);
> collection of data (prospectiveness,
consecutiveness);
> health service setting (country, health financing
system, specialist ordering the test, timing of
test etc); and
> cost measures employed.
In addition they varied as to the testing strategies
being compared. The comparisons made were as
follows:
1. Routine testing versus indicated testing;26–29
2. Observed current practice versus indicated
testing;10,28,30–32
3. Observed current practice versus not
testing;26,33,34
4. Routine testing versus no testing;15,27,35–37 and
5. Observed change in practice over time.28
In these studies ‘observed current practice’ was
different to routine testing, inasmuch as for each test
not every patient was tested. ‘Indicated testing’
varied between studies. They included specific clinical
indications ascertained from physical examination or
case history, as well as age, gender and occasionally
some other sociodemographic variable. It would seem
that only Kaplan et al30 did not include age as an
indication. Comparison 1, best answers the
theoretical question about what is the incremental
cost of routine testing. However comparison 2 may
give a more realistic estimate of cost savings actually
achievable, given that it is quite rare for every
patient to receive every test at a given institution.
Comparison 3 may give an accurate estimate of cost
savings but only if not testing really is a clinically
acceptable option. Likewise comparison 4 is relevant
if routine testing is in current practice. The ‘not
testing’ option is more acceptable if the population
is narrowly defined (eg only ASA grade 1 patients)
and/or the study is concentrating on a single test.
This was the case for all those studies that conducted
comparisons 3 and 4.
The comparison chosen was related to the
methodology taken (or vice versa). For example,
a study calculating the cost savings of not testing
compared with routine testing, only requires
knowledge of the unit cost of the test and the size
of the target population. One comparing current
208 P R E O P E R A T I V E T E S T S

practice with indicated testing must measure the
prevalence of the test in a sample population and
must identify in which cases that test was indicated
according to a specific protocol.
The results of the studies are summarised in Table 9.
The largest estimate of potential cost saving was
$190 per patient.29 Narr et al33 estimated a potential
cost saving achievable in the USA of between $3bn
and $4bn. Macario et al28 found that expenditure on
preoperative testing was already declining by 1987,
but that the reduction in test ordering was only a
fraction of what could be achieved if a move to
indication-only testing were to take place. They
reported that there had been a reduction in
indicated testing, as well as a reduction in
nonindicated testing. Routine testing was by
definition more costly than either of its comparators.
Likewise, observed practice was by definition more
costly than not testing. Those studies comparing
current practice with indicated practice all found
potential for cost saving. The South African study31
found that indicated testing would imply less use of
chest x-rays but more use of ECG, however the cost
savings attributable to the former more than offset
the additional costs of the latter. An additional
unpublished study, not included in the table, found
potential cost savings of moving from current
practice to indication-only testing of £21,000-
£28,000 for a particular district general hospital
in England (personal communication: John Carlisle).
With one exception, all studies considered only
the cost of the test itself in the calculation of
incremental cost. Hoare36 included the costs
attributable to lost theatre time and the cost of
following up positive test results in terms of extra
clinic visits. They attributed £50 for waste of theatre
time and another £50 for an extra clinic visit for
each of the occasions (10/372) when surgery was
delayed due to a positive test result.
Cost-effectiveness of preoperative testing
Of course the lowest cost strategy need not be the
best value for money. Routine testing could, in
theory, be good value for money (ie cost-effective)
if there is a relatively substantial health gain.
Of the 13 cost studies identified, six provided some
kind of estimate of cost-effectiveness (Tables 8 and
9). The measure of effectiveness varied between the
studies as follows:
> Number of clinically significant abnormal test
results;27,30,31,35
> Number of clinically significant abnormal test
results that changed treatment;26
> Number of complications averted;34,35 and
> Number of lives saved.30
By definition, these studies found that testing did
detect clinically significant surgical risk factors as well
as increasing costs (even in ASA grade 1 patients).
Only the study that estimated the number of lives
saved30 can be compared with other interventions
and at $4.2m per life-saved this is considerably less
cost-effective than a lot of publicly funded health
care interventions. However, their calculation of
effectiveness is questionable. They assume that
surgical mortality for patients with an abnormal test
result is only 1 in 500 and that acting on the test
results prevents half of these deaths. They do not
support this assumption with evidence.
The estimates of cost per complication averted, from
Turnbull and Buck34 (various tests) and from Archer
et al35 (chest x-ray), would represent good value for
money if the complication averted were death. The
less serious the complication, the less cost-effective
is the test.
The cost of preoperative assessment clinics
We identified eight papers that had conducted
formal or informal cost analyses of preoperative
evaluation clinics. One study was excluded because
it only considered the cost of the clinic itself and did
not estimate the incremental cost savings. This was
an important omission given that one of the main
reasons for establishing such a clinic is to reduce
unnecessary expenditure. The characteristics of the
remaining studies are summarised in Table 10.
All seven studies compared the cost of preoperative
evaluation in an anaesthetist-led outpatient clinic
with the cost of surgeon-led preoperative evaluation
209A P P E N D I X 5

after inpatient admission. Each study compared two
patient cohorts apart from:
> Pollard et al38 who made a before and after
comparison of financial records (a top-down
costing approach compared with the bottom-up
costing method of the other studies); and
> France et al39 who, after calculating the cost of
preoperative testing in Belgium using a cohort of
patients, applied the 59.3% reduction in cost
estimated by Fischer.40 This method is only likely
to be accurate if the testing norms in Belgium are
similar to those observed by Fischer before the
introduction of the preoperative evaluation clinic.
Not every study stated the timing of the clinic
relative to surgery, and there was some disparity
between those that did. Two studies saw all of their
patients within the two weeks before surgery,
whereas in MacDonald et al41 patients were seen
within three months of surgery.
Four studies39,40–43 measured only the cost of
preoperative testing (Table 11). McDonald et al41 also
measured the other running costs of the outpatient
clinic, as did Boothe et al44 who also considered the
cost of operating theatre time and time in hospital.
Pollard et al38 estimated the cost of time in hospital
but not the cost of preoperative testing.
The studies were also heterogeneous in the
following respects:
> Preoperative tests being included (although
those that did measure them included a whole
battery of tests);
> target population (age, type of surgery etc);
> collection of data (prospectiveness,
consecutiveness);
> health service setting (country, health financing
system, specialist ordering the test, timing of
test etc); and
> cost measures employed.
The results of the studies are summarised in Table
12. All studies measuring preoperative testing found
a cost saving associated with reduced testing in the
preoperative evaluation clinic arm, with the exception
of MacDonald et al41 who only measured laboratory
costs in that arm. The three studies that considered
other cost components, all found overall cost savings
with the introduction of the preoperative evaluation
clinic. The largest estimate of potential cost saving
from reduced preoperative testing was $112 per
patient.40 Boothe et al44 estimated an overall cost
saving of Can$366 per patient.
Only one study has attempted to estimate the cost
savings associated with fewer surgical cancellations,44
however other studies have measured the change in
the number of cancellations and these have been
summarised by Fischer.40 Estimates range between
20% and 88% (see Table 13), so clearly the potential
for cost saving in this area could be quite substantial.
1.4.3 Cost-effectiveness of preoperative testing inEngland and WalesTable 14 shows estimates of the cost per change in
management. On the basis of these cost per change
in management figures, pregnancy testing, urine
dipsticks and full blood count appear to be the most
cost-effective for the asymptomatic patient;
haemostasis, renal function and chest x-ray the least
cost-effective. Interestingly these estimated cost-
effectiveness rankings are almost identical to those
of Robbins and Mushlin37 published more than
twenty years earlier, despite very different absolute
estimates of the cost per case (see Table 15). The
only anomaly is urinalysis, which drops down to fifth
ranking if just protein is analysed, but moves up to
first place if both bacteriuria and chronic renal
disease are included. Given the uncertainty about
unit costs and detection rates the overall correlation
might be largely spurious.
Table 16 shows that the results, in terms of cost
per change in management, were sensitive to the
estimates of the model parameters. In particular, the
model was highly sensitive to the broad range of
estimates of the probability of a positive test result
and the positive predictive value.
Even if the estimates of cost per change in
management were relatively precise, it would still not
be clear which tests are cost-effective (ie good value
for money) and which are not. To properly assess cost-
210 P R E O P E R A T I V E T E S T S

effectiveness, we would need to know how often a
change in management affects patient outcomes and
what these outcomes are. If a life was saved in every
ten changes of management, then it is likely that all of
these tests would be considered cost-effective (Table
17). The tests could also be cost-effective, if they were
to lead to substantial improvements in quality of life
but no improvement in life expectancy. On the other
hand, if for example a life was saved in every 10,000
tests and there was no substantial improvement in
patient quality of life then none of the tests are likely
to be cost-effective in nonindicated patients (Table 17).
1.4.4 The cost impact of these preoperative testingguidelinesTables 18 to 20 show the annual number of tests for
England associated with these guidelines and those
of the Oxford Handbook of Clinical Medicine. It
would appear that the expected number of routine
preoperative tests associated with these NICE
guidelines are 3.2m (0.7 per patient), with an
additional 13.6m tests (2.9 per patient) up to the
discretion of clinicians for those areas where the
guidelines were inconclusive (the broad guideline).
For each test the narrow NICE guideline represents
fewer tests than the Oxford Handbook. The broad
guideline, however, represents fewer of some (chest
x-ray, FBC, renal function and blood glucose) and
more of others (urine, haemostasis, blood gases, lung
function and ECG).
Table 21 shows the costs of the tests for England
and Wales. The tests recommended in this guideline
would cost approximately £35.6m compared with
an estimated cost of £130.9m associated with the
guidelines contained in the Oxford Handbook.
However, in the unlikely event that tests were carried
out in all those cases where this guideline could not
make a recommendation, then the cost of testing
could be as much as £138.5m. Testing for pregnancy
could cost another £2.0m and the sickle cell test
possibly £0.8m
The comparison with the Oxford Handbook suggests
that the NICE guidelines could potentially save tens
of £m but this would depend on the current
situation in Trusts across the country and this we do
not know. Anecdotal evidence would suggest that
sickle cell testing is not common at present. This
would represent an additional cost. None of these
calculations take into account the broader resource
consequences in terms of subsequent further
diagnostic testing and changes to surgical
procedures. Neither can the precise effect of this
change in practice on quality of care and health
outcomes be determined. The magnitude of costs
and cost savings were quite sensitive to the unit
costs used, as represented by the sensitivity intervals
in Table 21.
1.5 DiscussionThe literature review appears to show that there
is potential for substantial cost savings when
preoperative testing is reduced. Naturally the extent
of potential cost savings depends, among other
factors, on one’s starting point. This varies not just
between countries but also between and within
institutions. In England and Wales, the current
situation is not very clear. The magnitudes of cost
savings as estimated in the literature are unlikely to
be accurate for the NHS. In particular, the results of
those studies conducted overseas are inapplicable.
Our own cost impact analysis suggested that the
guidelines contained in this document could
potentially reduce testing costs in England and
Wales, when compared with an alternative set of
guidelines. However, current practice across the
country is unclear and therefore the magnitude and
even the direction of the change in cost are
uncertain. Furthermore, the reduction of testing
might not save money overall. For example, testing
might lead to a reduction in the number of (risky)
surgical procedures carried out; it might reduce
litigation costs and the resource consequences of
diagnosing chronic conditions are uncertain.
Quantitative evidence for these resource outcomes
and for the net health gain associated with testing
is nonexistent.
A model of the cost-effectiveness of routine
preoperative testing was constructed for England
and Wales. This went further than the evidence in
the literature, because it used unit cost estimates
that are more suitable for the NHS and because it
included an approximate estimate of the costs of
further investigations. However, the results were not
robust to the variability in its parameters (especially
211A P P E N D I X 5

those taken from the systematic review) and the
model omitted a number of potentially important
health and resource outcomes.
The effect on patient outcomes (in terms of
morbidity and mortality) of these interventions has
not been measured, hence all estimates of cost-
effectiveness have been based on intermediate
outcomes or have been entirely speculative (or both).
There are iatrogenic effects associated with some
tests. One would hope that these risks are
outweighed by the health gain associated with
testing but again there is no quantitative evidence to
support this assertion.
In conclusion, there is no good evidence that routine
preoperative testing is or is not cost-effective. In
particular the evidence base is lacking in terms of:
> the quality of evidence for the number of cases
detected;
> the health outcomes associated with detecting a
case; and
> resources used (and their cost) as a consequence
of detecting a case.
The context of testing may have important resource
implications. A number of studies have found that
anaesthetist-led preoperative evaluation clinics can
save substantially on resource use. The literature
suggests that valuable health service resources could
be saved if:
> staff responsible for ordering tests are those
that are best informed about the utility of
testing (be they surgeons or anaesthetists);
> wherever possible tests should be conducted in
advance of the day of surgery to avoid last-
minute cancellations and to ensure optimal use
of operating theatres (perhaps in a dedicated
preoperative evaluation clinic); and
> staff should check that the test has not already
been recently ordered.
1.6 AcknowledgementsFor assistance in collecting data from hospital
laboratories we would like to thank Reinhold Gruen,
Andrew Hutchings and Jenny Roberts (London
School of Hygiene and Tropical Medicine), Richard
Gray (South Tyneside Health Care NHS Trust), Colin
Smith (City Hospitals Sunderland NHS Trust), David
Mills and Richard Ball (Luton and Dunstable
Hospitals Trust).
212 P R E O P E R A T I V E T E S T S

213A P P E N D I X 5
T A B L E 1 Health and resource consequences of preoperative testing
Consequences of testing Net social effect*
A. Patient health
A1. Reduced number of perioperative complications +ve
� Life expectancy
� Quality of life
A2. Early diagnosis of serious condition +ve
� Life expectancy
� Quality of life
A3. Increased knowledge about own health +ve (-ve?)
� Quality of life
A4. Iatrogenic effects of tests (eg effects of radiation) -ve
� Life expectancy
� Quality of life
A5. Iatrogenic effects of additional diagnostic procedures arising from +ve initial tests (eg complications
from diagnostic surgical procedures)
� Life expectancy
� Quality of life -ve
A6. Anxiety associated with positive test results (including false positive results) -ve
� Quality of life
B. Health service resource use
B1. Use of test itself -ve
� Consumables
� Staff time
� Equipment
� Overheads
B2. Use of additional diagnostic procedures arising from +ve initial tests -ve
� Consumables
� Staff time
� Equipment
� Overheads
B3. Treatment of iatrogenic effects of testing and further diagnostic procedures -ve
� Consumables
� Staff time
� Equipment
� Overheads
B4. Delay to surgical procedure arising from +ve test result -ve
� Wasted theatre time
B5. Change to surgical procedure (including cancellation) arising from +ve diagnosis +ve/-ve
�/� Consumables
�/� Staff time
�/� Equipment
�/� Overheads

214 P R E O P E R A T I V E T E S T S
T A B L E 1 Health and resource consequences of preoperative testing continued
Consequences of testing Net social effect*
B. Health service resource use (continued)
B6. Treatment of surgical complications +ve
� Consumables
� Staff time
� Equipment
� Overheads
B7. Care for newly diagnosed serious condition +ve/-ve
�/� Consumables
�/� Staff time
�/� Equipment
�/� Overheads
B8. Change in lifetime care associated with change in life expectancy +ve/-ve
�/� Consumables
�/� Staff time
�/� Equipment
�/� Overheads
B9. Litigation costs arising from failure to avoid a complication +ve
� Legal expenses
[� Compensation – in social terms this is a transfer rather than a cost]
C. Resource use of patient & family members
C1. Attendance for test -ve
� Income from work (or leisure time)
� Transport to clinic
C2. Attendance for further diagnostic procedures -ve
� Income from work (or leisure time)
� Transport to clinic
C3. Treatment of iatrogenic effects of testing and further diagnostic procedures -ve
� Income from work (or leisure time)
� Transport to clinic
� Non-NHS resources (eg private prescriptions)
C4. Treatment of surgical complications +ve
� Income from work (or leisure time)
� Transport to clinic
� Non-NHS resources (eg private prescriptions)
C5. Treatment of diagnosed serious condition +ve/-ve+ve/-ve
�/� Income from work (or leisure time)
�/� Transport to clinic
�/� Non-NHS resources (eg private prescriptions)
* Any kind of resource use has a negative effect for society because those resources can not then be used for some other beneficial purpose.

215A P P E N D I X 5
T A B L E 2 Surgical procedures by severity grading
Grade 1 Grade 2
AF1 Release of entrapment of peripheral nerve at wrist (A61) AC1 Extracranial extirpation of vagus nerve (A27)
DA1 Clearance of external auditory canal (D07) AG1 Electroconvulsive therapy (A83)
DB3 Drainage of middle ear (D15) B28 Other excision of breast
EA1 Operations on septum of nose (E03) CG1 Extraction of lens (C71,C72,C74)
EA2 Operations on external nose (E09) CG2 Prosthesis of lens (C75)
E36 Diagnostic endoscopic examination of larynx DB1 Operations on mastoid (D10-D12)
EE2 Endoscopic operations on bronchus (E48-E51) DB2 Repair of eardrum (D14)
FB2 Simple extraction of tooth (F10) EC1 Operations on adenoids (E20)
G16 Diagnostic fibreoptic endoscopic examination/oesophagus E34 Microtherapeutic endoscopic operations on larynx
G45 Diagnostic fibreoptic endoscopic exam/upper gastrointe E35 Other therapeutic endoscopic operations on larynx
M45 Diagnostic endoscopic examination of bladder FB1 Surgical removal of tooth (F09)
NA2 Operations on hydrocele sac (N11) FD1 Excision of tonsil (F34)
NB1 Excision of vas deferens (N17) FE1 Excision of salivary gland (F44)
NC1 Operations on prepuce (N30) G14, G15, G17-G19 Endoscopic operations on oesophagus
PA1 Operations on bartholin gland (P03) G43, G44 Endoscopic operations on upper gastrointestinal tract
SA1 Extirpation of lesion of skin or subcutaneous tissue (S05-S11) HB2 Endoscopic operations on colon (H20-H28)
SA4 Suture of skin or subcutaneous tissue (S41-S42) HD1 Operations on haemorrhoid (H51-H53)
SA5 Incision of skin or subcutaneous tissue (S47) JC1 Endoscopic operations on bile and pancreatic ducts (J38-J45)
KC3 Transluminal operations on coronary artery (K49-K51)
Grade 3 LG1 Operations on varicose vein of leg (L85-L87)
BB1 Excision of thyroid gland (B08) MA3 Endoscopic operations on kidney (M09-M11)
B27 Total excision of breast MB1 Endoscopic operations on ureter (M26-M30)
EE1 Operations on trachea (E39-E44) M42-M44 Endoscopic operations on bladder
GA2 Operations on diaphragmatic hernia (G23-G25) NA1 Placement of testis in scrotum (N08-N09)
MC1 Open operations on bladder (M34-M41) QA1 Operations on cervix uteri (Q01-Q05)
MD1 Operations on outlet of female bladder (M51-M58) QA3 Evacuation of contents of uterus (Q10-Q11)
MD2 Open excision of prostate (M61) QB2 Open occlusion of fallopian tube (Q27-Q28)
M65 Endoscopic resection of outlet of male bladder QB3 Endoscopic occlusion of fallopian tube (Q35-Q36)
M66 Other therapeutic endoscopic operations on outlet of male bladder RB2 Manipulative delivery (R19-R23)
M67 Other therapeutic endoscopic operations on prostate RB3 Normal delivery (R24)
PB1 Repair of prolapse of vagina (P22-P23) SA3 Skin graft operations (S33-S39)
QA2 Excision of uterus (Q07-Q08) TB1 Operations on inguinal hernia (T19-T21)
QB1 Excision of adnexa of uterus (Q22-Q24) TB2 Operations on other abdominal hernia (T22-T27)
QB4 Other endoscopic operations on fallopian tube (Q37-Q39) TC1 Endoscopic operations on peritoneum (T42-T43)
RB1 Caesarean delivery (R17-R18) WB2 Division of bone (W12-W16)

216 P R E O P E R A T I V E T E S T S
T A B L E 2 Surgical procedures by severity grading continued
Grade 3 Grade 2
SA2 Skin flap operations (S17-S31) WB3 Reduction of fracture of bone (W19-W26)
WB1 Excision of bone (W06-W08) WB4 Graft of bone marrow (W34)
WC3 Prosthetic replacement of head of femur (W46-W48) WC6 Reduction of traumatic dislocation of joint (W65-W67)
WC4 Prosthetic replacement of other articulation (W49-W54) WC7 Open operations on semilunar cartilage (W70)
WC5 Fixation of joint (W59-W64) WC8 Endoscopic operations on joint (W82-W88)
XA1 Amputation (X07-X12) XB1 Compensation for renal failure (X40-X42)
XA2 Operations for sexual transformation (X15)
XA3 Corrections of congenital deformity of limb (X19-X27)
Grade 4 Neurosurgery
EF1 Operations on lung (E53-E59) AA1 Excision of lesion of tissue of brain (A02)
GB1 Excision of stomach (G27-G28)
HB1 Excision of colon (H04-H11) Cardiovascular surgery
HC1 Excision of rectum (H33) KC1 Replacement of coronary artery (K40-K44)
MA1 Transplantation of kidney (M01) KC2 Other bypass of coronary artery (K45-K46)
MA2 Excision of kidney (M02-M03)
WC1 Total prosthetic replacement of hip joint (W37-W39)
WC2 Total prosthetic replacement of other joint (W40-W45)
T A B L E 3 FCEs with surgical operations
Surgery 0-14 15-39 40-59 60-80 80+ All ages
Grade 1 97,116 192,466 291,724 366,247 87,214 1,034,767
Grade 2 71,671 367,694 318,908 402,523 144,538 1,305,334
Grade 3 5,906 30,113 64,321 64,891 12,106 177,337
Grade 4 629 3,589 18,740 74,151 15,109 112,218
Neurosurgery 131 338 368 222 7 1,066
Cardiovascular 7 100 5,144 11,826 283 17,360
All graded 175,460 594,300 699,205 919,860 259,257 2,648,082
Not graded 130,343 404,265 657,572 710,880 129,114 2,032,174
All 305,803 998,565 1,356,777 1,630,740 388,371 4,680,256

217A P P E N D I X 5
T A B L E 4 FCEs with surgical operations (after allocating previously ungraded FCEs)
Surgery 0-14 15-39 40-59 60-80 80+ All ages
Grade 1 169,260 323,389 566,078 649,288 130,648 1,838,662
Grade 2 124,913 617,813 618,827 713,598 216,520 2,291,671
Grade 3 10,293 50,597 124,812 115,040 18,135 318,877
Grade 4 1,096 6,030 36,364 131,456 22,634 197,580
Neurosurgery 228 568 714 394 10 1,914
Cardiovascular 12 168 9,982 20,965 424 31,551
T A B L E 5 Definition of comorbidities (ICD-10 codes)
Cardiovascular
Any of:
I00-I052 Diseases of the heart
C38, C781, D15, D383 Cancer of the heart
Respiratory (chronic)
Any of:
J41-J99 Chronic diseases of the lung
A15-A19 TB
C33, C34, C39, C780-C783, D02, D14, D38 Lung and other respiratory cancers
Renal
Any of:
N00-N19 Chronic diseases of the kidney
C64, C790, D300, D301, D410, D411 Cancer of the kidney

218 P R E O P E R A T I V E T E S T S
T A B L E 6 FCEs with surgical operations (after allocating previouslyungraded FCEs)
Cardiovascular comorbidity
Surgery 0-14 15-39 40-59 60-80 80+ All ages
Grade 1 811 3,015 41,203 128,428 29,905 203,363
Grade 2 599 5,760 45,043 141,149 49,561 242,111
Grade 3 49 472 9,085 22,755 4,151 36,512
Grade 4 5 56 2,647 26,002 5,181 33,891
Neurosurgery 1 5 52 78 2 139
Cardiovascular 0 0 0 0 0 0
1,466 9,308 98,030 318,411 88,800 516,015
Respiratory comorbidity
Surgery 0-14 15-39 40-59 60-80 80+ All ages
Grade 1 6,511 9,437 24,718 42,212 5,887 87,868
Grade 2 4,805 18,028 27,022 46,393 9,756 109,516
Grade 3 396 1,476 5,450 7,479 817 15,239
Grade 4 42 176 1,588 8,546 1,020 9,442
Neurosurgery 9 17 31 26 0 91
Cardiovascular 0 5 436 1,363 19 1,508
11,763 29,139 59,245 106,018 17,499 223,664
Renal comorbidity
Surgery 0-14 15-39 40-59 60-80 80+ All ages
Grade 1 982 1,796 6,940 9,650 1,473 20,651
Grade 2 725 3,431 7,586 10,606 2,441 25,739
Grade 3 60 281 1,530 1,710 204 3,582
Grade 4 6 33 446 1,954 255 2,219
Neurosurgery 1 3 9 6 0 22
Cardiovascular 0 1 122 312 5 354
1,774 5,545 16,633 24,237 4,378 52,567

219A P P E N D I X 5
T A B L E 7 Unit costs of tests
Cost per patient tested (April 2001 UK£):
Lower Mid Upper
Chest x-ray 10.00 20.50 31.00
Resting ECG 11.00 26.00 37.00
Full blood count 0.70 2.35 4.05
Haemostasis (PT & PTT) 1.50 3.65 5.85
Urinalysis dipstick 0.15 0.21 0.27
Blood glucose 1.05 2.30 3.60
Renal function (Na, K, Cr, U) 1.40 3.40 5.40
Sickle cell (Sickledex) 1.50 2.30 3.10
Pregnancy 1.50 2.25 3.00
Arterial blood gases 2.60 3.10 3.60
Lung function (spirometry) 1.40 2.10 2.80

220 P R E O P E R A T I V E T E S T S
TA
BL
E 8
Econ
omic
ana
lyse
s of
pre
oper
ativ
e te
stin
g –
stud
y ch
arac
teri
stic
s
Firs
t au
thor
Ye
arCo
untr
yPa
tien
tsTy
pe o
f su
rger
yTy
pe o
f te
stCo
st c
ompa
rison
Type
of
anal
ysis
Econ
omic
out
com
e m
easu
re
Ada
ms2
619
92
USA
Gro
up 1
(n=
10
5)
had
Ele
ctiv
e H
ernio
rrhap
hy
Var
ious
Obse
rved
pra
ctic
e vs
C
ost
-eff
ecti
venes
s C
ost
per
abnorm
al t
est
that
no c
om
orb
idit
ynot
test
ing
anal
ysis
chan
ged
tre
atm
ent
Gro
up 2
(n=
64
) had
(c
har
ges
not
cost
s)
know
n c
om
orb
idit
y(s)
(13
to 8
0 y
ears
)
Arc
her3
519
93
Can
ada
Rev
iew
of
21 s
tudie
sV
ario
us
Ches
t x-
ray
Routi
ne
test
ing v
s C
ost
-eff
ecti
venes
s 1. C
ost
per
abnorm
alit
y
not
test
ing
anal
ysis
2. C
ost
per
clin
ical
ly s
ignif
ican
t
abnorm
alit
y
3. C
ost
per
hea
lth b
enef
it
Kap
lan3
019
85
USA
20
00
pat
ients
Var
ious
Var
ious
labora
tory
O
bse
rved
pra
ctic
e vs
C
ost
-eff
ecti
venes
s 1. C
ost
of
Non-indic
ated
tes
ts p
er
test
sin
dic
ated
tes
ting
anal
ysis
hosp
ital
per
yea
r
2. C
ost
per
ext
ra s
ignif
ican
t
abnorm
alit
y
3. C
ost
per
lif
e-sa
ved
Kett
ler2
719
96
USA
Azz
am e
t al
,19
96
45
Var
ious
Pre
gnan
cyR
outi
ne
test
ing v
s C
ost
-eff
ecti
venes
s C
ost
per
pre
gnan
cy d
etec
ted
412
(10
to 2
0 y
ears
)not
test
ing
anal
ysis
(char
ges
not
cost
s)
Robb
ins3
719
79
USA
UK
& U
S m
orb
idit
y V
ario
us
Var
ious
Routi
ne
test
ing v
s C
ost
-eff
ecti
venes
s C
ost
per
cas
e fo
und
surv
ey d
ata
on p
rev
not
test
ing
anal
ysis
Som
mer
ville
3119
92
South
Afr
ica
797
pat
ients
Gen
eral
, obst
etri
cs a
nd
Ches
t x-
ray,
EC
GO
bse
rved
pra
ctic
e vs
C
ost
-eff
ecti
venes
s 1. C
ost
sav
ings
for
sam
ple
(0 t
o 8
0 y
ears
)gyn
aeco
logy,
EN
T,
indic
ated
tes
ting
anal
ysis
2. C
ost
per
cas
e det
ecte
d
ort
hopae
dic
s, u
rolo
gy,
ophth
alm
olo
gy,
pla
stic
surg
ery,
max
illofa
cial
Turn
bull3
419
87
Can
ada
25
70
Chole
cyst
ecto
my
Var
ious
Obse
rved
pra
ctic
e vs
C
ost
-eff
ecti
venes
s 1. C
ost
s sa
ved p
er p
atie
nt
not
test
ing
anal
ysis
2. C
ost
per
com
plic
atio
n a
vert
ed
Calla
ghan
10
199
5U
K3
54
adult
sG
ener
al, neu
rolo
gy,
EN
T,
EC
GO
bse
rved
pra
ctic
e vs
C
ost
anal
ysis
Pote
nti
al c
ost
sav
ings
(17
to 8
9 y
ears
)ophth
alm
olo
gy,
uro
logy,
in
dic
ated
tes
ting
den
tal,
vasc
ula
r
Hoa
re3
619
93
UK
37
2 c
hild
ren
EN
TFB
CR
outi
ne
test
ing v
s C
ost
anal
ysis
Cost
sav
ings
of
test
ing, c
linic
vis
its
(2 t
o 1
5 y
ears
)not
test
ing
& t
hea
tre
tim
e
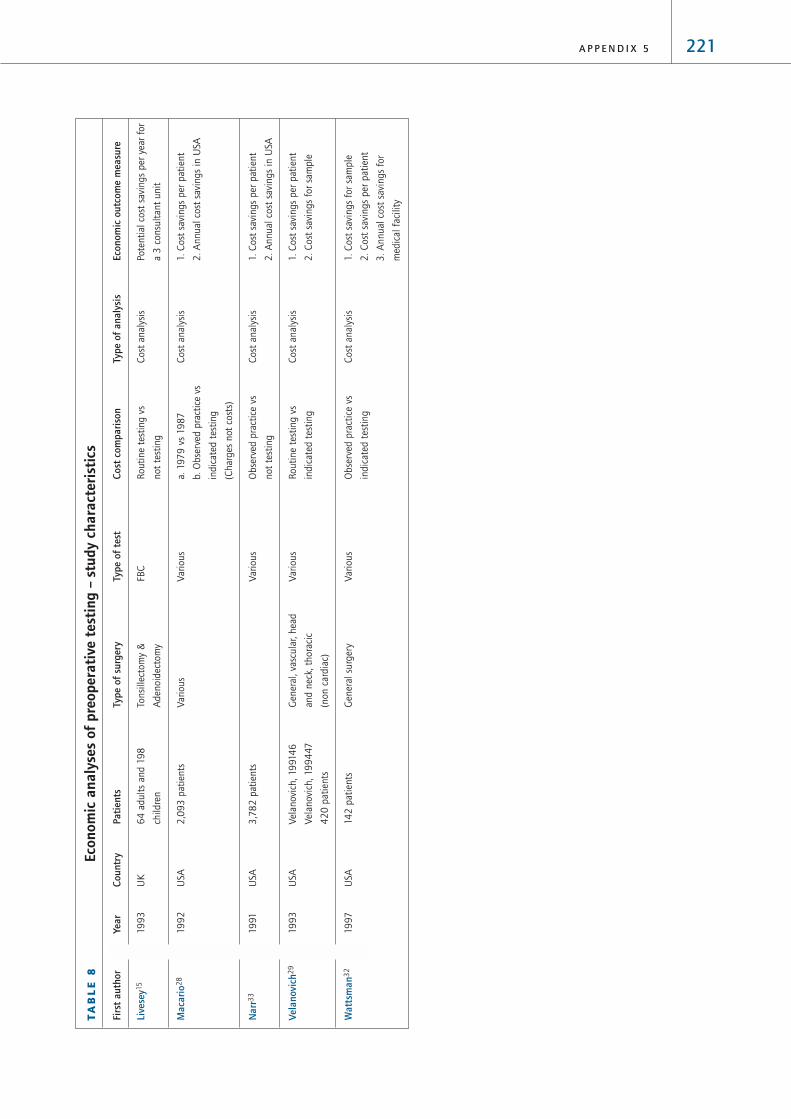
221A P P E N D I X 5
TA
BL
E 8
Econ
omic
ana
lyse
s of
pre
oper
ativ
e te
stin
g –
stud
y ch
arac
teri
stic
s
Firs
t au
thor
Ye
arCo
untr
yPa
tien
tsTy
pe o
f su
rger
yTy
pe o
f te
stCo
st c
ompa
rison
Type
of
anal
ysis
Econ
omic
out
com
e m
easu
re
Live
sey1
519
93
UK
64
adult
s an
d 1
98
To
nsi
llect
om
y &
FB
CR
outi
ne
test
ing v
s C
ost
anal
ysis
Pote
nti
al c
ost
sav
ings
per
yea
r fo
r
child
ren
Aden
oid
ecto
my
not
test
ing
a 3
consu
ltan
t unit
Mac
ario
28
199
2U
SA2
,09
3 p
atie
nts
Var
ious
Var
ious
a. 1
97
9 v
s 19
87
Cost
anal
ysis
1. C
ost
sav
ings
per
pat
ient
b. O
bse
rved
pra
ctic
e vs
2
. A
nnual
cost
sav
ings
in U
SA
indic
ated
tes
ting
(Char
ges
not
cost
s)
Nar
r33
1991
USA
3,7
82
pat
ients
Var
ious
Obse
rved
pra
ctic
e vs
C
ost
anal
ysis
1. C
ost
sav
ings
per
pat
ient
not
test
ing
2. A
nnual
cost
sav
ings
in U
SA
Vela
novi
ch2
919
93
USA
Vel
anovi
ch, 19
914
6G
ener
al, va
scula
r, hea
d
Var
ious
Routi
ne
test
ing v
s C
ost
anal
ysis
1. C
ost
sav
ings
per
pat
ient
Vel
anovi
ch, 19
94
47
and n
eck,
thora
cic
indic
ated
tes
ting
2. C
ost
sav
ings
for
sam
ple
42
0 p
atie
nts
(non c
ardia
c)
Wat
tsm
an3
219
97
USA
142
pat
ients
Gen
eral
surg
ery
Var
ious
Obse
rved
pra
ctic
e vs
Cost
anal
ysis
1. C
ost
sav
ings
for
sam
ple
indic
ated
tes
ting
2. C
ost
sav
ings
per
pat
ient
3. A
nnual
cost
sav
ings
for
med
ical
faci
lity

222 P R E O P E R A T I V E T E S T S
TA
BL
E 9
Econ
omic
ana
lyse
s of
pre
oper
ativ
e te
stin
g –
cost
of
rout
ine
test
ing
Firs
t au
thor
Ye
arCu
rren
cyCo
st c
ompa
rison
Type
of
test
Incr
emen
tal c
ost
per
pati
ent
Incr
emen
tal t
otal
cos
tIn
crem
enta
l cos
t-eff
ecti
vene
ss
Ada
ms2
619
92
US$
Obse
rved
pra
ctic
e vs
V
ario
us
Gro
up1
: $
175
Gro
up1
: $
18
,397
for
sam
ple
Gro
up1
: $
18
,397
per
abnorm
al t
est
that
1991
not
test
ing
Gro
up2
: $
66
Gro
up2
: $
12,7
07
for
sam
ple
chan
ged
tre
atm
ent
(char
ges
not
cost
s)G
roup2
: $
4,2
36
per
abnorm
al t
est
that
chan
ged
tre
atm
ent
Arc
her3
519
93
Can
ada$
Routi
ne
test
ing v
s C
hes
t x-
ray
$2
3C
an$
2,3
00
Cost
per
abnorm
alit
y
199
2not
test
ing
Can
$2
3,0
00
per
clin
ical
ly s
ignif
ican
t
abnorm
alit
y
Can
$11
5,0
00
-Can
$4
60
,00
0 p
er h
ealt
h b
enef
it
Kap
lan3
019
85
US$
Obse
rved
pra
ctic
e vs
V
ario
us
labora
tory
$
95
,80
0 a
nnual
ly f
or
inst
ituti
on
$4
,17
0 p
er e
xtra
sig
nif
ican
t ab
norm
alit
y
198
5in
dic
ated
tes
ting
test
s$
4.2
m p
er l
ife
save
d
Kett
ler2
719
96
US$
Routi
ne
test
ing v
s Pre
gnan
cy$
25
$1,0
50
per
pre
gnan
cy d
etec
ted i
n a
dole
scen
ts
199
5not
test
ing
$7,
75
0 p
er p
regnan
cy d
etec
ted i
n a
dult
s
(char
ges
not
cost
s)
Robb
ins3
719
79
US$
Routi
ne
test
ing v
s V
ario
us
Var
ious
from
$1,4
00
per
cas
e fo
und w
ith
197
8not
test
ing
pre
gnan
cy t
esti
ng t
o $
1.1
m w
ith P
TT
Som
mer
ville
3119
92
South
Afr
ican
Obse
rved
pra
ctic
e vs
C
hes
t x-
ray
R5
.73
R4
,56
5 f
or
sam
ple
Indic
ated
: R
134
per
cas
e det
ecte
d; N
on-
Ran
din
dic
ated
tes
ting
indic
ated
age>
60
: R
26
2 p
er c
ase
det
ecte
d;
1991
Non-indic
ated
age<
60
: R
2,3
61
per
cas
e
det
ecte
d
EC
G-R
3.7
0-R
2,9
52
for
sam
ple
Indic
ated
: R
58
per
cas
e det
ecte
d; N
on-
indic
ated
age>
40
: R
24
3 p
er c
ase
det
ecte
d;
Non-indic
ated
age<
40
: R
39
6 p
er c
ase
det
ecte
d
Turn
bull3
419
87
US?
$O
bse
rved
pra
ctic
e vs
V
ario
us
$10
2.9
7$
10
4,0
00
$2
6,0
00
per
com
plic
atio
n a
vert
ed
not
test
ing
Calla
ghan
10
199
5U
K£
Obse
rved
pra
ctic
e vs
EC
G£
2.5
0£
88
5 f
or
sam
ple
199
4in
dic
ated
tes
ting
(2 w
eek
inta
ke f
or
unit
)
Hoa
re3
619
93
UK
£R
outi
ne
test
ing v
s La
b c
ost
s: £
21.5
1C
ost
s fo
r unit
per
yea
r:
199
3not
test
ing
FBC
Was
ted t
hea
tre
tim
e: £
1.0
4La
b c
ost
s: £
80
00
Ext
ra c
linic
vis
its:
£1.0
4W
aste
d t
hea
tre
tim
e: £
50
0
Ext
ra c
linic
vis
its:
£5
00

223A P P E N D I X 5
TA
BL
E 9
Econ
omic
ana
lyse
s of
pre
oper
ativ
e te
stin
g –
cost
of
rout
ine
test
ing
conti
nued
Firs
t au
thor
Ye
arCu
rren
cyCo
st c
ompa
rison
Type
of
test
Incr
emen
tal c
ost
per
pati
ent
Incr
emen
tal t
otal
cos
tIn
crem
enta
l cos
t-eff
ecti
vene
ss
Live
sey1
519
93
UK
£R
outi
ne
test
ing v
s FB
C£
2.5
0£
2,0
00
for
a 3
consu
ltan
t
199
2not
test
ing
unit
per
yea
r
Mac
ario
28
199
2U
S$a.
197
9 v
s 19
87
Var
ious
a. $
7.0
8a.
$3
20
m i
n U
SA p
er y
ear
1991
b. O
bse
rved
pra
ctic
e vs
b. $
48
.47
b. $
1.3
bn i
n U
SA p
er y
ear
indic
ated
tes
ting
(Char
ges
not
cost
s)
Nar
r33
1991
US$
Obse
rved
pra
ctic
e vs
V
ario
us
$3
5.9
5$
2.9
bn-$
4.3
bn i
n U
SA p
er y
ear
198
8not
test
ing
Vela
novi
ch2
919
93
US$
Routi
ne
test
ing v
s V
ario
us
$19
0.4
8>$
80
,00
0 f
or
sam
ple
indic
ated
tes
ting
Wat
tsm
an3
219
97
US$
Obse
rved
pra
ctic
e vs
V
ario
us
$6
0.3
7$
8,5
73
for
sam
ple
199
4in
dic
ated
tes
ting
$41
3,4
67
for
med
ical
fac
ility

224 P R E O P E R A T I V E T E S T S
TA
BL
E 1
0Co
st a
naly
ses
of p
reop
erat
ive
eval
uati
on c
linic
s –
stud
y ch
arac
teri
stic
s
Firs
t au
thor
Ye
arCo
untr
yM
etho
ds*
Pati
ents
*Ty
pe o
f su
rger
yTi
me
betw
een
eval
uati
on
and
surg
ery
Boot
he4
419
95
Can
ada
Ret
rosp
ecti
ve c
om
par
ison o
f tw
o c
ohort
s (m
atch
ed f
or
A=
53
; B
=11
Lapar
osc
opic
chole
cyst
ecto
my
Not
spec
ifie
d
post
oper
ativ
e LO
S)
Fisc
her4
019
96
USA
Ret
rosp
ecti
ve c
om
par
ison o
f tw
o c
ohort
sA
=4
,313
; B
=3
,576
Var
ious
Not
spec
ifie
d
Fran
ce3
919
97
Bel
giu
mSi
ngle
ret
rosp
ecti
ve c
ohort
for
curr
ent
cost
and u
sed 5
9%
B
=2
,10
3 p
atie
nts
V
ario
us
Not
applic
able
reduct
ion f
rom
Fis
cher
40
(Hau
cott
e et
al,
199
64
8)
Mac
Don
ald4
119
92
UK
Cost
mea
sure
d f
or
single
cohort
. N
um
ber
that
would
hav
e A
=14
7 e
lder
ly p
atie
nts
Maj
or
join
t re
pla
cem
ent
Wit
hin
3 m
onth
s
nee
ded
surg
ery
post
poned
was
est
imat
ed o
n t
he
bas
ic o
f te
st r
esult
s
Polla
rd3
819
96
USA
Bef
ore
and a
fter
com
par
ison o
f fi
nan
cial
rec
ord
sN
ot
applic
able
Not
spec
ifie
dW
ithin
30
day
s
Pow
er4
219
99
Aust
ralia
Com
par
ison o
f a
pro
spec
tive
cohort
wit
h a
ret
rosp
ecti
ve c
ohort
A=
201
; B
=16
8G
ener
al, EN
TW
ithin
2 w
eeks
Star
snic
43
1997
USA
Com
par
ison o
f tw
o p
rosp
ecti
ve c
oncu
rren
t co
hort
sA
=1,5
19; B
=1,5
43
Sam
e-day
surg
ery
Wit
hin
2 w
eeks
* A
= p
reoper
ativ
e ev
aluat
ion i
n a
nae
sthet
ist-
led o
utp
atie
nt
clin
ic; B
= p
reoper
ativ
e ev
aluat
ion o
n i
npat
ient
surg
ical
adm
issi
on.

225A P P E N D I X 5
T A B L E 11 Cost analyses of preoperative evaluation clinics – cost components measured
F I R S T A U T H O R Y E A R C O S T S I N C L U D E D E C O N O M I C O U T C O M E M E A S U R E
Clinic Tests Theatre Inpatient
costs time stay
Boothe44 1995 Yes Yes Yes Yes 1. Cost savings per patient
2. Annual cost savings at institution
Fischer40 1996 No Yes No No 1. Cost savings per patient
2. Annual cost savings at institution
France39 1997 No Yes No No Annual cost savings in Belgium
MacDonald41 1992 Yes Yes* No Yes Cost of clinic for sample
Pollard38 1996 No No No Yes Annual cost savings of the clinic
Power42 1999 No Yes No No 1. Cost savings per patient
2. Annual cost savings for hospital
per year
Starsnic43 1997 No Yes No No 1. Cost savings per patient
2. Annual cost savings for hospital
* MacDonald et al calculated additional costs instead of cost savings. This is because this cost component was not measured
incrementally; testing costs were not estimated for the control group.
T A B L E 12 Cost analyses of preoperative evaluation clinics – cost savings
F I R S T A U T H O R Y E A R C U R R E N C Y I N C R E M E N T A L C O S T S AV I N G S I N C R E M E N T A L C O S T S AV I N G S
– P R E O P E R A T I V E T E S T I N G – A L L C O M P O N E N T S
per patient total per patient total
Boothe44 1995 Canadian $ Lab: Can$1.17 Can$366.38 Can$758,767 annually
1992/3 Rad: Can$25.49 for hospital
Fischer40 1996 US $ $112.09 $1.01m annually
1995 for hospital
France39 1997 Belgian Franc 2,212BEF 1,247m BEF annually
1996 for Belgium
MacDonald41 1992 UK £ -£25.37* £3,730 for sample £33.74 £4,960 for sample
1991
Pollard38 1996 US $ $530,000 annually
1995 for hospital
Power42 1999 Australian $ 1997 AUS$25.44 AUS$57,600 annually
for hospital
Starsnic43 1997 US $ 1996 $20.89 $173,799
* MacDonald et al calculated additional costs instead of cost savings. This is because this cost component was not measured
incrementally; testing costs were not estimated for the control group.

226 P R E O P E R A T I V E T E S T S
T A B L E 13 Reduction in day-of-surgery cancellations attributable to preoperativeevaluation clinics
First author Year Sample size* % decrease
Boothe44 1995 A=53; B=11 60%
Fischer40 1996 A=4,313 ; B=3,576 88%
Hand49 1990 4,100 50%
Macarthur50 1991 1,042 80%
Pollard38 1996 Not specified 20%
* Total sample, not just cancellations. A=preoperative evaluation in anaesthetist-led outpatient clinic;
B=preoperative evaluation on inpatient surgical admission.
T A B L E 14 Estimated cost per change in management in ASA grade 1 and 2 patients
T E S T C O S T O F T E S T PA T I E N T S W I T H P O S I T I V E PA T I E N T S W I T H C O S T P E R
P E R PA T I E N T A N A B N O R M A L P R E D I C T E D A C H A N G E I N C H A N G E I N
T E S T R E S U LT V A L U E O F T E S T M A N A G E M E N T M A N A G E M E N T
a b c d=bc e=(a+89b)/d Rank
Chest x-ray £20.50 4.0% 11.7% 0.5% £5,100 6
ECG £26.00 16.0% 13.2% 2.1% £1,900 4
Haemoglobin 3.7% 14.1% 0.5%
White cells 0.9% 4.3% 0.0%
Platelet count 1.5% 0.0% 0.0%
FBC £2.35 6.1% 0.6% £1,400 3
Prothrombin 0.2% 0.1% 0.00%
PTT 0.3% 14.1% 0.04%
Haemostasis £3.65 0.5% 0.04% £9,600 8
Electrolytes 1.4% 10.9% 0.2%
Cr/U 13.1% 0.7% 0.1%
Kidney £3.40 14.5% 0.2% £6,900 7
Glucose £2.30 1.0% 6.8% 0.1% £4,700 5
Urine £0.21 9.5% 15.4% 1.5% £590 2
Pregnancy £2.25 0.6% 97.7% 0.6% £480 1
A=mid-point estimate from Table 7 above.
b=weighted mean for ASA grade 1-2 only.
In e, £89 is the average cost for a general surgery outpatient appointment. For ease of presentation,
the figures in column e are presented to two significant figures.

227A P P E N D I X 5
T A B L E 15 Comparison with Robbins and Mushlin
T E S T T H I S S T U D Y R O B B I N S A N D M U S H L I N 37
Cost per change Rank Cost per case Rank
Chest x-ray £5,100 6 $500,000 7
ECG £1,900 4 $20,000 4
FBC £1,400 3 $1,100 2
Haemostasis £9,600 8 $1.1m 8
Kidney £6,900 7 $30,000 5
Glucose £4,700 5 $4,000 3
Urinalysis £590 2 $30,000* 5
Pregnancy £480 1 $1,400 1
* Urine protein test only. If bacteriuria and chronic renal disease are also tested this figure falls to
$1,100 per case found.
T A B L E 16 Cost per change in management – sensitivity analysis
T E S T B A S E L I N E U N I T C O S T C O S T O F F U R T H E R P R O B A B I L I T Y O F P O S I T I V E
E S T I M A T E O F T E S T D I A G N O S I S P O S I T I V E T E S T P R E D I C T I V E
R E S U LT V A L U E
Low High Low High Low High Low High
Chest x-ray £5,100 £2,887 £7,357 £4,603 £5,948 £58,946 £1,028 £120,300 £1,170
ECG £1,900 £1,198 £2,432 £1,447 £2,647 £6,847 £892 £5,133 £693
FBC £1,400 £1,092 £1,689 £723 £2,440 £4,670 £976 £8,760 £355
Haemostasis £9,600 £4,562 £14,765 £8,889 £10,742 £9,605 £1,527 £17,727 £1,222
Kidney £6,900 £6,013 £7,694 £3,136 £12,766 £16,256 £812 * £4,923
Glucose £4,700 £2,858 £6,615 £3,801 £6,129 £9,783 £1,359 * £3,709
Urinalysis £590 £589 £597 £196 £1,224 £730 £581 £4,561 £182
Pregnancy £480 £347 £603 £412 £574 £858 £196 £696 £464
* The only study(s) with a lower estimate of positive predictive value had an estimate of zero. In this case a low estimate of
cost-effectiveness can not be computed as the estimated.

228 P R E O P E R A T I V E T E S T S
T A B L E 17 Estimated cost per life saved in ASA grade 1 and 2 patients
Proportion of changes in management that save a life (speculative)
Test 10% 1% 0.1% 0.01%
Chest x-ray £51,000 £510,000 £5,100,000 £51,000,000
ECG £19,000 £190,000 £1,900,000 £19,000,000
FBC £14,000 £140,000 £1,400,000 £14,000,000
Haemostasis £96,000 £960,000 £9,600,000 £96,000,000
Kidney £69,000 £690,000 £6,900,000 £69,000,000
Glucose £47,000 £470,000 £4,700,000 £47,000,000
Urine £5,900 £59,000 £590,000 £5,900,000
Pregnancy £4,800 £48,000 £480,000 £4,800,000
The numbers in bold would be considered cost-effective using the UK Department of Transport threshold
of £902,500 per life saved.51
T A B L E 18 Recommended tests – NICE guideline (narrow)
T E S T S P E R F O R M E D A D D I T I O N A L A L L T E S T S
R E G A R D L E S S O F T E S T S F O R
C O M O R B I D I T Y C O M O R B I D PA T I E N T S
Cardiovascular Respiratory Renal
Chest x-ray 31,551 0 0 0 31,551
ECG 667,669 376,857 0 11,052 1,055,579
FBC 1,467,141 0 0 0 1,467,141
Haemostasis 0 0 0 0 0
Renal 363,124 200,266 0 45,733 609,123
Blood glucose 0 0 0 0 0
Urine 0 0 0 0 0
Blood gases 0 0 0 0 0
Lung function 0 0 0 0 0
ALL TESTS 2,529,486 577,123 0 56,785 3,163,394

229A P P E N D I X 5
T A B L E 19 Recommended tests – NICE guideline (broad)
T E S T S P E R F O R M E D A D D I T I O N A L A L L T E S T S
R E G A R D L E S S O F T E S T S F O R
C O M O R B I D I T Y C O M O R B I D PA T I E N T S
Cardiovascular Respiratory Renal
Chest x-ray 319,219 453,366 182,753 16,822 972,160
ECG 3,376,636 9,303 1,652 3,745 3,391,336
FBC 2,878,804 49,978 52,183 12,166 2,993,131
Haemostasis 229,949 0 0 3,725 233,675
Renal 2,259,977 95,021 27,022 19,752 2,401,772
Blood glucose 2,087,238 0 0 0 2,087,238
Urine 4,386,083 0 0 0 4,386,083
Blood gases 0 70,485 211,901 6,871 289,257
Lung function 0 0 26,973 0 26,973
ALL TESTS 15,537,906 678,153 502,484 63,082 16,781,625
T A B L E 2 0 Recommended tests – Oxford Handbook
T E S T S P E R F O R M E D A D D I T I O N A L A L L T E S T S
R E G A R D L E S S O F T E S T S F O R
C O M O R B I D I T Y C O M O R B I D PA T I E N T S
Cardiovascular Respiratory Renal
Chest x-ray 1,627,448 170,243 113,614 0 1,911,305
ECG 1,627,448 170,243 0 0 1,797,691
FBC 4,680,256 0 0 0 4,680,256
Haemostasis 0 0 0 0 0
Renal 4,680,256 0 0 0 4,680,256
Blood glucose 4,680,256 0 0 0 4,680,256
Urine 0 0 0 0 0
Blood gases 0 0 0 0 0
Lung function 0 0 0 0 0
ALL TESTS 17,295,664 340,486 113,614 0 17,749,764

230 P R E O P E R A T I V E T E S T S
T A B L E 21 Cost of routine preoperative testing in England and Wales
N U M B E R O F T E S T S C O S T P E R Y E A R ( £ M I L L I O N )
P E R Y E A R M I L L I O N
Mid-point Sensitivity range
NICE guidelines* – narrow 3.35 35.59 (14.62, 52.17)
NICE guidelines* – broad 17.77 138.54 (59.80, 203.20)
Oxford Handbook* 18.80 130.88 (56.79, 197.85)
Increment (Oxford vs narrow) 15.45 95.29
Increment (Oxford vs broad) 1.03 -7.66
Pregnancy test (women aged 15-50) 0.87 1.97 (1.31, 2.62)
Sickle cell test (all black) 0.12 0.27 (0.18, 0.37)
Sickle cell test (all non-white) 0.35 0.81 (0.53, 1.09)
* Excluding pregnancy and sickle cell tests.

231A P P E N D I X 5
F I G U R E 1 Cost-effectiveness model
Test
Change in management
No change in management
i
ii
iii
P2
1–P2P1
-ve
1–P1
+ve
P1=Probability of a +ve test resultP2=Positive predictive value for a change in management
Cost of test Cost of furtherinvestigation

232 P R E O P E R A T I V E T E S T S
Ann
ex: U
nit
cost
s –
data
col
lect
ion
form
Ann
ex T
able
1 U
nit
cost
of
preo
pera
tive
tes
ts
Typ
e o
f te
stN
am
e &
typ
e o
f ca
pit
al
eq
uip
men
t u
sed
V
olu
me o
f te
sts (
tota
lTo
tal
co
st p
er
pa
tien
t te
sted
(£
)
(or
if k
it u
sed
in
stea
d,
na
me o
f k
it)
nu
mb
er
ca
rrie
d o
ut
by
exclu
din
g
inclu
din
g o
verh
ea
ds
the l
ab
in
on
e y
ea
r)o
verh
ea
ds
(if
kn
ow
n)
Ren
al f
unct
ion t
ests
(U
, C
r, N
a, K
)
Glu
cose
tes
ts
Uri
ne
anal
ysis
(dip
stic
k)
Full
hae
moglo
bin
count
Hae
most
asis
Sick
le s
olu
bili
ty t
est
Hb e
lect
rophore
sis
Pre
gnan
cy t
est
Live
r fu
nct
ion t
ests
(ple
ase
spec
ify)
Thyr
oid
funct
ion t
ests
Blo
od v
isco
sity
tes
t
Theo
phyl
line
test
Cal
cium
tes
t
Blo
od g
ases
tes
t

233A P P E N D I X 5
Ann
ex T
able
2 C
ompo
nent
s of
uni
t co
st
For
each
tes
t, w
hic
h i
tem
s w
ere
incl
uded
in t
he
esti
mat
e of
unit
cost
rec
ord
ed i
n A
nnex
Tab
le 1
? (p
leas
e ti
ck)*
Typ
e o
f te
stR
ea
gen
tsC
ap
ita
lS
taff
tim
eQ
ua
lity
co
ntr
ol
eq
uip
men
t(I
nt
& E
xt)
Ma
inte
na
nce
Oth
er
co
nsu
ma
ble
s
Ren
al f
unct
ion t
ests
(U
, C
r, N
a, K
)
Glu
cose
tes
ts
Uri
ne
anal
ysis
(dip
stic
k)
Full
hae
moglo
bin
count
Hae
most
asis
Sick
le s
olu
bili
ty t
est
Hb e
lect
rophore
sis
Pre
gnan
cy t
est
Live
r fu
nct
ion t
ests
(ple
ase
spec
ify)
Thyr
oid
funct
ion t
ests
Blo
od v
isco
sity
tes
t
Theo
phyl
line
test
Cal
cium
tes
t
Blo
od g
ases
tes
t

234 P R E O P E R A T I V E T E S T S
Ann
ex T
able
3 B
reak
dow
n of
uni
t co
st
If i
nfo
rmat
ion a
vaila
ble
, fo
r ea
ch t
est
ple
ase
giv
e a
bre
ak d
ow
n o
f th
e co
st p
er t
est:
Typ
e o
f te
stC
ost
per
pa
tien
t te
sted
(£
)
Ren
al f
unct
ion t
ests
(U
, C
r, N
a, K
)
Glu
cose
tes
ts
Uri
ne
anal
ysis
(dip
stic
k)
Full
hae
moglo
bin
count
Hae
most
asis
Sick
le s
olu
bili
ty t
est
Hb e
lect
rophore
sis
Pre
gnan
cy t
est
Live
r fu
nct
ion t
ests
(ple
ase
spec
ify)
Thyr
oid
funct
ion t
ests
Blo
od v
isco
sity
tes
t
Theo
phyl
line
test
Cal
cium
tes
t
Blo
od g
ases
tes
t
Rea
gen
tsC
ap
ita
l
eq
uip
men
t
Sta
ff t
ime
Qu
ali
ty c
on
tro
l
(In
t &
Ex
t)
Ma
inte
na
nce
Oth
er
co
nsu
ma
ble
s
Tota
l co
st p
er
pa
tien
t te
sted
(exclu
din
g
overh
ea
ds)

1 Marcello PW, Roberts PL. “Routine” preoperative studies. Which
studies in which patients? Surg Clin North Am 1996; 76:11-23.
2 Institute of Medicine. Guidelines for clinical practice: from
development to use. Washington DC: National Academy Press; 1992.
3 Drummond MF, O’Brien B, Stoddart GL, Torrance GW. Methods for
the economic evaluation of health care programmes. Second Edition.
Oxford: Oxford Medical Publications; 1997.
4 Gold MR, Siegel JE, Russell LB, Weinstein MC (Eds.). Cost-
effectiveness in health and medicine. New York City: Oxford
University Press; 1996.
5 National Institute for Clinical Excellence. Guidance for manufacturers
and sponsors. London: National Institute for Clinical Excellence; 2001.
6 Weinstein MC, Siegel JE, Gold MR, Kamlet MS, Russell LB.
Recommendations of the Panel on Cost-effectiveness in Health and
Medicine. JAMA 1996; 276:1253-1258.
7 Munro J, Booth A, Nicholl J. Routine preoperative testing: a
systematic review of the evidence. Health Technol Assess 1997;
1(12).
8 NHS Executive. Reference Costs 2000. London: Department of
Health; 2001.
9 NHS Executive. NHS Costing Manual. Leeds: Department of Health;
2001.
10 Callaghan LC, Edwards ND, Reilly CS. Utilisation of the pre-operative
ECG. Anaesthesia 1995; 50:488-490.
11 Fenwick EA, Briggs AH, Hawke CI. Management of urinary tract
infection in general practice: a cost-effectiveness analysis. Br J Gen
Pract 2000; 50:635-639.
12 Hayes PD, Lloyd AJ, Lennard N, Wolstenholme JL, London NJ, Bell PR
et al. Transcranial Doppler-directed Dextran-40 therapy is a cost-
effective method of preventing carotid thrombosis after carotid
endarterectomy. Eur J Vasc Endovasc Surg 2000; 19:56-61.
13 Hunt MT, Woodhouse CR. Cost-effectiveness of investigations for
invasive bladder cancer. J R Soc Med 1987; 80:143-144.
14 Karnon J, Zeuner D, Ades AE, Efimba W, Brown J, Yardumian A. The
effects of neonatal screening for sickle cell disorders on lifetime
treatment costs and early deaths avoided: a modelling approach. J
Public Health Med 2000; 22:500-511.
15 Livesey JR. Are haematological tests warranted prior to
tonsillectomy? J Laryngol Otol 1993; 107:205-207.
16 Molyneux EM, Robson WJ. A dipstick test for urinary tract infections.
J Accid Emerg Med 1995; 12:191-193.
17 Murray ET, Fitzmaurice DA, Allan TF, Hobbs FD. A primary care
evaluation of three near patient coagulometers. J Clin Pathol 1999;
52:842-845.
18 Pearson M, Layton C. Value of the chest radiograph before cardiac
catheterisation in adults. Br Heart J 1994; 72:505.
19 Preston A, O’Donnell T, Phillips CA. Screening for urinary tract
infections in a gynaecological setting: validity and cost-effectiveness
of reagent strips. Br J Biomed Sci 1999; 56:253-257.
20 Ratcliffe J, Ryan M, Tucker J. The costs of alternative types of routine
antenatal care for low-risk women: shared care vs care by general
practitioners and community midwives. J Health Serv Res Policy
1996;1:135-140.
21 Roberts JA, Upton PA, Azene G. Escherichia coli O157:H7; an
economic assessment of an outbreak. J Public Health Med 2000;
22:99-107.
22 Robertson JF, Whynes DK, Dixon A, Blamey RW. Potential for cost
economies in guiding therapy in patients with metastatic breast
cancer. Br J Cancer 1995; 72:174-177.
23 Scott A, Currie N, Donaldson C. Evaluating innovation in general
practice: a pragmatic framework using programme budgeting and
marginal analysis. Fam Pract 1998; 15:216-222.
24 Underwood SR, Godman B, Salyani S, Ogle JR, Ell PJ. Economics of
myocardial perfusion imaging in Europe—the EMPIRE Study. Eur
Heart J 1999; 20:157-66.
25 Zeuner D, Ades AE, Karnon J, Brown J, Dezateux C, Anionwu EN.
Antenatal and neonatal haemoglobinopathy screening in the UK:
review and economic analysis. Health Technol Assess 1999; 3(11).
26 Adams JG, Weigelt JA, Poulos E. Usefulness of preoperative
laboratory assessment of patients undergoing elective herniorrhaphy.
Arch Surg 1992; 127:801-804.
27 Kettler RE. The cost of preoperative pregnancy testing. Anesth Analg.
1996; 83:439-440.
235B I B L I O G R A P H Y
Bibliography

28 Macario A, Roizen MF, Thisted RA, Kim S, Orkin FK, Phelps C.
Reassessment of preoperative laboratory testing has changed the
test-ordering patterns of physicians. Surg Gynecol Obstet 1992;
175:539-547.
29 Velanovich V. How much routine preoperative laboratory testing is
enough? Am J Med Qual 1993; 8:145-151.
30 Kaplan EB, Sheiner LB, Boeckmann AJ, Roizen MF, Beal SL, Cohen SN
et al. The usefulness of preoperative laboratory screening. JAMA
1985; 253:3576-81.
31 Sommerville TE, Murray WB. Information yield from routine pre-
operative chest radiography and electrocardiography. S Afr Med J
1992; 81:190-196.
32 Wattsman TA, Davies RS. The utility of preoperative laboratory
testing in general surgery patients for outpatient procedures. Am
Surg 1997; 63:81-90.
33 Narr BJ, Hansen TR, Warner MA. Preoperative laboratory screening in
healthy Mayo patients: cost- effective elimination of tests and
unchanged outcomes. Mayo Clin Proc 1991; 66:155-159.
34 Turnbull JM, Buck C. The value of preoperative screening
investigations in otherwise healthy individuals. Arch Intern Med
1987; 147:1101-1105.
35 Archer C, Levy AR, McGregor M. Value of routine preoperative chest
x-rays: a meta-analysis. Can J Anaesth 1993; 40:1022-1027.
36 Hoare TJ. Pre-operative haemoglobin estimation in paediatric ENT
surgery. J Laryngol Otol 1993; 107:1146-1148.
37 Robbins JA, Mushlin AI. Preoperative evaluation of the healthy
patient. Med Clin North Am 1979; 63:1145-1156.
38 Pollard JB, Zboray AL, Mazze RI. Economic benefits attributed to
opening a preoperative evaluation clinic for outpatients. Anesth
Analg 1996; 83:407-410.
39 France FH, Lefebvre C. Cost-effectiveness of preoperative
examinations. Acta Clin Belg 1997; 52:275-286.
40 Fischer SP. Development and effectiveness of an anesthesia
preoperative evaluation clinic in a teaching hospital. Anesthesiology
1996; 85:196-206.
41 MacDonald JB, Dutton MJ, Stott DJ, Hamblen DL. Evaluation of pre-
admission screening of elderly patients accepted for major joint
replacement. Health Bull (Edinb) 1992; 50:54-60.
42 Power LM, Thackray NM. Reduction of preoperative investigations
with the introduction of an anaesthetist-led preoperative assessment
clinic. Anaesth Intensive Care 1999; 27:481-488.
43 Starsnic MA, Guarnieri DM, Norris MC. Efficacy and financial benefit
of an anesthesiologist-directed university preadmission evaluation
center. J Clin Anesth 1997; 9:299-305.
44 Boothe P, Finegan BA. Changing the admission process for elective
surgery: an economic analysis. Can J Anaesth 1995; 42:391-394.
45 Azzam FJ, Padda GS, DeBoard JW, Krock JL, Kolterman SM.
Preoperative pregnancy testing in adolescents. Anesth Analg 1996;
82:4-7.
46 Velanovich V. The value of routine preoperative laboratory testing in
predicting postoperative complications: a multivariate analysis.
Surgery 1991; 109:236-243.
47 Velanovich V. Preoperative laboratory screening based on age,
gender, and concomitant medical diseases. Surgery. 1994; 115:56-
61.
48 Haucotte G, Lefèbvre CH, Bauwens P, Vandermeersch E. Etude
BIOMED, Evaluation du bilan préopératoire. Rapport au Ministère de
la Santé Publique et de l’Environnement, Brussels; 1996.
49 Hand R, Levin P, Stanziola A. The cause of cancelled elective surgery.
Qual Asur Utilization Rev 1990, 5:2-6.
50 Macarthur A, Macarthur C, Bevan J. Preoperative assessment clinic
reduces day surgery cancellations [abstract]. Anesthesiology 1991;
75:A11091.
51 Department for Transport, Local Government and the Regions.
Highway economics note 1: 2000. London: Department for
Transport, Local Government and the Regions; 2000.
236 P R E O P E R A T I V E T E S T S