The Use of Invertebrates to Detect Small-scale Habitat Heterogeneity and its Application to...
21
THE USE OF INVERTEBRATES TO DETECT SMALL-SCALE HABITAT HETEROGENEITY AND ITS APPLICATION TO RESTORATION PRACTICES ANTHONY J. PIK ∗ , J. M. DANGERFIELD, ROGER A. BRAMBLE, CRAIG ANGUS and DAVID A. NIPPERESS Commonwealth Key Center for Biodiversity and Bioresources, Division of Life and Environmental Sciences, Macquarie University, NSW, Australia ( ∗ author for correspondence, e-mail: [email protected]) (Received 3 October 2000; accepted 2 May 2001) Abstract. Recent conceptual and technological solutions to biodiversity assessment allow large numbers of invertebrate specimens to be processed rapidly and provide researchers and practitioners with a unique tool for characterizing habitats. One application of these advances is the ability to detect and monitor small-scale habitat heterogeneity and so provide a measure of ecosystem res- toration. This case study presents a test of the efficacy of using invertebrates to assess and monitor ecological restoration following bush regeneration. Eight contiguous habitat patches within a suburb of northern Sydney, Australia, were selected to represent areas that had undergone different bush regeneration techniques. A nearby and relatively undisturbed area of bushland was also sampled. A total of 57 806 ground-active invertebrate specimens from 35 different orders were collected in pitfall traps. 1 246 ant (Formicidae) specimens were further sorted into 46 ant morphospecies from 20 genera. Analyses of the three taxonomic data sets, including two different data transformations, demonstrated that: (i) invertebrate communities successfully characterized different sites, providing a high degree of differentiation among sites; (ii) ordinations of the sites allowed visual assessment of the impact of each management technique on the habitat relative to undisturbed habitats; and (iii) characterization of sites could be achieved using abundance classes or binary counts of ant morphospecies, representing potential cost and time savings. The project duration was a total of three person weeks and cost less than US$3,000 (1999 prices) to complete. Measurement of invertebrate assemblages will provide a tool for both rapid assessment of management decisions and a means by which to implement adaptive management and restoration. Keywords: adaptive management and restoration, ants, ecological monitoring and assessment, inverte- brate assemblages, rapid biodiversity assessment, taxonomic sufficiency 1. Introduction Invertebrates are useful indicators of ecological change due to their abundance, diversity, ease of collection, rapid response to environmental perturbation and their ecological importance (Rosenberg et al., 1986; Majer, 1989). As changes in as- semblage composition are rapid in space and time (Disney, 1986), especially when compared to plants, invertebrates provide a sensitive indication of changes to eco- system processes. Consequently, terrestrial invertebrates are featured increasingly Environmental Monitoring and Assessment 75: 179–199, 2002. © 2002 Kluwer Academic Publishers. Printed in the Netherlands.
Transcript of The Use of Invertebrates to Detect Small-scale Habitat Heterogeneity and its Application to...

THE USE OF INVERTEBRATES TO DETECT SMALL-SCALE HABITATHETEROGENEITY AND ITS APPLICATION TO RESTORATION
PRACTICES
ANTHONY J. PIK∗, J. M. DANGERFIELD, ROGER A. BRAMBLE, CRAIG ANGUSand DAVID A. NIPPERESS
Commonwealth Key Center for Biodiversity and Bioresources, Division of Life and EnvironmentalSciences, Macquarie University, NSW, Australia
(∗ author for correspondence, e-mail: [email protected])
(Received 3 October 2000; accepted 2 May 2001)
Abstract. Recent conceptual and technological solutions to biodiversity assessment allow largenumbers of invertebrate specimens to be processed rapidly and provide researchers and practitionerswith a unique tool for characterizing habitats. One application of these advances is the ability todetect and monitor small-scale habitat heterogeneity and so provide a measure of ecosystem res-toration. This case study presents a test of the efficacy of using invertebrates to assess and monitorecological restoration following bush regeneration. Eight contiguous habitat patches within a suburbof northern Sydney, Australia, were selected to represent areas that had undergone different bushregeneration techniques. A nearby and relatively undisturbed area of bushland was also sampled.A total of 57 806 ground-active invertebrate specimens from 35 different orders were collected inpitfall traps. 1 246 ant (Formicidae) specimens were further sorted into 46 ant morphospecies from20 genera. Analyses of the three taxonomic data sets, including two different data transformations,demonstrated that: (i) invertebrate communities successfully characterized different sites, providinga high degree of differentiation among sites; (ii) ordinations of the sites allowed visual assessmentof the impact of each management technique on the habitat relative to undisturbed habitats; and(iii) characterization of sites could be achieved using abundance classes or binary counts of antmorphospecies, representing potential cost and time savings. The project duration was a total of threeperson weeks and cost less than US$3,000 (1999 prices) to complete. Measurement of invertebrateassemblages will provide a tool for both rapid assessment of management decisions and a means bywhich to implement adaptive management and restoration.
Keywords: adaptive management and restoration, ants, ecological monitoring and assessment, inverte-brate assemblages, rapid biodiversity assessment, taxonomic sufficiency
1. Introduction
Invertebrates are useful indicators of ecological change due to their abundance,diversity, ease of collection, rapid response to environmental perturbation and theirecological importance (Rosenberg et al., 1986; Majer, 1989). As changes in as-semblage composition are rapid in space and time (Disney, 1986), especially whencompared to plants, invertebrates provide a sensitive indication of changes to eco-system processes. Consequently, terrestrial invertebrates are featured increasingly
Environmental Monitoring and Assessment 75: 179–199, 2002.© 2002 Kluwer Academic Publishers. Printed in the Netherlands.

180 A. J. PIK ET AL.
in conservation evaluation and environmental monitoring and assessment (Hollo-way and Stork, 1991; Kim, 1993; Kremen et al., 1993). For example, ants havebeen used as indicators of restoration success following mining (e.g., Andersen,1997) as they respond to disturbance and changes in vegetative cover, plant speciesrichness, litter development and show a clear successional response (Majer, 1985;Andersen, 1997; Majer and Nichols, 1998).
While the relationship between biodiversity and ecosystem process is not fullyunderstood (Walker, 1992; Lawton, 1995), it is accepted that species richness hasan important role to play in the maintenance of basic processes such as waterand nutrient cycling and energy flow (Main, 1993; Tilman and Downing, 1994).Biodiversity, therefore, is an essential component of ecosystem restoration andarthropods constitute approximately 90% of all non-microbial species (Pimentelet al., 1992). The contribution of arthropods and other invertebrates to restora-tion are considerable given, for example, their role as soil engineers (Young etal., 1998), pollinators (Janzen, 1987) and suppressors of pest species (Kogan andLattin, 1993). Recognition of their indicator qualities and key roles in ecologicalprocesses suggests that measurement of invertebrate assemblages may provide auseful tool for the assessment and monitoring of ecological restoration.
It is recognised that assessment of ecological restoration should consider as-pects of ecosystem functioning, not just a superficial appraisal of an environments’general appearance (Van Horne, 1983; Ewel, 1987). The restoration of processesand interactions between biological components, as opposed to just the restorationof individual biological components, is a more efficient way to gauge successfulrestoration but is generally not accurately assessed in most ecological restorationprojects (Cairns, 1995; Chapman and Underwood, 1995; Urbanska et al., 1997).The problem is how to match the measurable properties of the system to restorationobjectives so as to establish which management regime may potentially achievethe desired outcome. An assessment of invertebrate composition in response torestoration efforts would provide an indication of the processes that both restoreand maintain ecosystems because invertebrates include a wide range of functionalgroups and are likely to provide an integrated measure of system processes.
There have been numerous statements of the difficulties involved in the inclu-sion of invertebrates for environmental monitoring and assessment. These havegenerally stemmed from the fact that identification methods are often slow andrequire taxonomic specialists. Recent developments in methods for rapid biod-iversity assessment (RBA), including the sorting of specimens to morphospecies(Oliver and Beattie, 1993), have made the identification of large numbers of speci-mens to species level tractable. The approach is to identify specimens to a nominalspecies level (morphospecies) by making simple external morphological compar-isons between specimens, removing the requirement for species to be assignedwithin their global phylogeny. RBA is much faster than traditional taxonomic ap-proaches and frees time to process a greater number of specimens from morefrequent collection events.

THE USE OF INVERTEBRATES IN ECOLOGICAL MONITORING OF RESTORATION 181
Another method of circumventing the taxonomic impediment associated withinvertebrates is the use of higher taxonomic ranks. Taxonomic sufficiency is thepragmatic concept of identifying specimens only to a level of taxonomic resol-ution necessary to satisfy the objectives of a project (Ellis, 1985). For example,in freshwater and marine pollution assessment and monitoring studies, changes inthe richness and composition of benthic communities identified using species-leveldata were also identified using higher taxa, including phyla (e.g., Vanderklift et al.,1996; Olsgard et al., 1998). Suprisingly, very little research has been conducted onthe potential of this approach in studies of terrestrial invertebrate assemblages. Wil-liams and Gaston (1994) have shown that family richness is a good predictor of spe-cies richness for British butterflies and Pik et al. (1999) have demonstrated genericsurrogacy for Australian ants in a highly modified terrestrial environment. How-ever, more validations are needed to assess the efficacy of taxonomic sufficiency inthe provision of data for land management decisions.
Recent information technology solutions to invertebrate biodiversity assessmenthave also facilitated their inclusion in environmental monitoring and assessment.We recently reported on the use of virtual assessment systems (Oliver et al., 2000)to assist in the sorting of invertebrate specimens and increase the number of spe-cimens processed. Our virtual assessment system, BioTrack� (BioTrack� is nowa registered name), employs the use of digital images to assist in the identificationof specimens, bar-code technology to track samples and specimens as they areprocessed, and a powerful relational database for the management of biodiversitydata. Use of these information technology solutions and conceptual developmentsto process large numbers of specimens provides researchers and practitioners withsufficient resolution for a unique signature of each habitat sampled and informationto answer specific research, resource and land management questions.
This article reports on the use of BioTrack� to investigate if invertebrate as-semblages provide sufficient resolution to detect and quantify small-scale habitatheterogeneity. The study area consisted of a single patch of highly degraded rem-nant bushland within which discrete areas had undergone different bush regener-ation techniques. The purpose of this study was not to comparatively assess thesetechniques, rather, to demonstrate that invertebrates may be used to characterizedifferent areas of bush that had undergone different approaches to managementand therefore provide a measurable property by which restoration efforts can begauged. This provides an initial test of the efficacy of invertebrates as indicat-ors of restoration success. We also compared the ant genus and morphospeciescomposition on these sites to provide increasing sensitivity in compositional com-parisons. This study, therefore, also provides information on the use of taxonomicsufficiency in characterizations of habitats, which has important implications forthe cost, speed, and use of non-specialists in assessments. We suggest that becauseinvertebrates both mediate and integrate a suite of important ecological processesrelevant to the objectives of restoration, invertebrate assemblages will provide avaluable indicator of restoration success.

182 A. J. PIK ET AL.
2. Methods
2.1. STUDY SITES
The study was conducted within remnant bushland in Beecroft, a northern sub-urb of Sydney, Australia. The area undergoing bush regeneration was a narrowstrip of vegetation of approximately 5 ha, situated in an established residentialsuburb (between 33◦45′47.1′′S, 145◦03′55.0′′E and 33◦45′58.2′′S, 145◦03′13.3′′E)and bordered by residential gardens and roads. A small creek flows along the longaxes of the remnant. Parts of the remnant were heavily weed infested, notablywith Ligustrum lucidum (large-leaved privet) and Tradescantia albiflora (wander-ing jew) and a range of bush regeneration methods had been applied to removeand deter weed development. A total of eight sampling sites were selected withinthis remnant using a combination of the quality of historical information on theirmanagement and the size and discrete nature of the patch on the ground. Thesetreatments represented a range of disturbance histories, bush regeneration tech-niques, and ages since weed management was introduced. A brief account of thetreatment histories is given in Appendix 1 and summarized in Table I.
An area of natural woodland (33◦45′25.2′′S, 151◦03′49.4′′E) was chosen forcomparison and was described by Smith and Smith (1990) as ‘Tall Open-forest’dominated by Eucalyptus pilularis, Angophora costata, Syncarpia glomulifera to-gether with E. gummifera, E. piperita and E. resinifera. There was also a richunderstory of more than 23 shrub species. This habitat was geographically near tothe remnant, relatively undisturbed, and representative of the expected vegetationon this soil type. Two separate sites within this habitat were selected as controls.
TABLE I
Summary descriptions of bush regeneration practices at thesample sites
Site Description
1 Weeding and regeneration pile burns
2 Clearing and pile burns
3 Spraying and weeding
4 Clearing, pile burns and planting
5 Weeding, clearing, pile burns and planting
6 Mowing
7 Weeding, spraying, mulch and planting
8 Machine clearing
C1 and C2 Undisturbed bushland

THE USE OF INVERTEBRATES IN ECOLOGICAL MONITORING OF RESTORATION 183
2.2. INVERTEBRATE SAMPLING AND IDENTIFICATION
At each site, 5 pitfall traps were installed in a line running parallel to the contourof the land with 5 m between adjacent traps. Prior to installing each trap, a uniquecollection bar-code was affixed to the trap and a bar-code with the same identifierplaced on a field data sheet that reflected the location of that particular trap withinthe site. Each trap consisted of a 6.5 cm diameter × 10 cm deep plastic containerburied flush with the soil surface and contained 200 mL of preservative solution(50% ethanol and 50% ethylene glycol). Traps were left open for one week inAugust 1999. Whilst the traps were open, the field data sheets were used to prepareand customize the relational database Biota (Colwell, 1996) for entry of specimendata.
The invertebrates from each trap were first sorted to order and placed in separ-ate vials filled with 75% ethanol. A unique specimen bar-code was affixed to theoutside of each vial and used to tag the specimens in each vial to the appropriatecollection record (trap record) in Biota. All vials containing ants were further sortedto genus using a standard key (Shattuck, 1999) and then assigned to morphospeciesusing a virtual catalogue of digital ant images. Specimens that were not matchedwith the database, representing new morphospecies, had their image captured andthen transferred to the virtual database and made available for comparison withthe remaining ant specimens. The use of a virtual catalogue of images to identifyspecimens enables: (1) more rapid identification as the process involves scrollingthrough images rather than removing specimens from potentially hundreds of vialsdepending on the taxa being studied; (2) minimal handling of valuable voucherspecimens which reduces accidental damage and deterioration; (3) any numberof operators to sort specimens from the same taxon as the voucher collection issimultaneously available across a local area network; and (4) increases in both thecost-efficiency and quality of identifications by non-specialists.
The quality of the digital images will determine the ability of a virtual referencecollection to achieve its primary goal; specimen identification. The image acquisi-tion workstation used for this study consisted of a 3 CCD video-rate camera and anOlympus SZH10 research dissecting microscope (optics; objective 1 X, minimumzoom setting of 0.7 X, photo-eyepiece 1.6 X, video adapter 0.31 X). Video-ratecameras also need a framegrabber installed within the computer to digitize theincoming analog signal. We used a professional grade PCI bus framegrabber thatcaptures color images of 768 × 576 × 24 bit resolution from color video cameras.
Specimens of each identified morphospecies from each trap were placed inseparate vials, given a unique specimen bar-code and tagged to the appropriatecollection record in Biota. Data matrices with the abundance for each level oftaxonomic resolution, that is, orders, genera and morphospecies, were producedusing the export functions of Biota.

184 A. J. PIK ET AL.
3. Analyses
One-way ANOVA was used to test for differences in the abundance of all inverteb-rates and ants among sites and the richness of invertebrate orders and ant generaand morphospecies among sites. Student Newman Keul’s (SNK) test was used forpost-hoc multiple comparisons.
Differences among assemblages from the different sites for the three taxonomicdata sets were investigated using the numerical classification package PRIMER
(Clarke and Warwick, 1994). Ordinations were produced for untransformed,log10(x + 1) transformed and binary (presence/absence) data using a Bray-Curtismeasure of association. These transformations were used to differentially weightthe contributions of common and rare taxa to the analyses. Multivariate analysesbased on untransformed data may lead to an interpretation of community struc-ture in which the contribution of a few relatively abundant taxa dominates thepattern (Clarke, 1993). Differences among assemblages from the different siteswere tested for significance using the analysis of similarities procedure (ANOSIM
within PRIMER) (Clarke, 1993).To identify the taxa principally responsible for determining the sample group-
ings observed in the ordinal and ant morphospecies ordinations, a similarity per-centages procedure (SIMPER within PRIMER) was performed (Clarke, 1993). Thisprocedure calculates the average dissimilarity between all pairs of inter-groupsamples (e.g., every trap from one site is paired with every trap from other sites)and then calculates the separate contributions from each taxa to the average dis-similarity. Good discriminating taxa will have a large contribution to the dissimil-arity between sites and will have done so consistently with all comparisons madebetween traps. This procedure therefore determines which taxa are likely to act asgood discriminators when comparing sites.
4. Results
A total of 57 809 invertebrate specimens from 50 pitfall traps were sorted into 35orders. The majority of these individuals were springtails (89%) with mites, ants,beetles and flies each accounting for approximately 2% of the total abundance.More than two-thirds of the orders were represented by less than 100 individu-als. These abundance patterns are typical of most biological diversity with strongdominance by one or a few groups and many rare types. The 1 246 ants collectedwere further sorted into 20 genera, of which the genus Rhytidoponera accounted for76% of the abundance. Among the 20 genera were 46 morphospecies with Rhytido-ponera0001 contributing 75% of the total abundance. As with the ordinal data, theants were dominated by one genus and one morphospecies with the majority ofother genera and morphospecies being relatively rare.

THE USE OF INVERTEBRATES IN ECOLOGICAL MONITORING OF RESTORATION 185
Figure 1. (a) Total invertebrate abundance within each site (ANOVA: F9,40 = 4.84, P = <0.001).(b) Ant abundance within each site (ANOVA: F9,40 = 24.1, P = <0.0001).
Figure 2. Number of orders (ANOVA: F9,40 = 4.8, P = 0.0002), ant genera (ANOVA: F9,40 = 2.4, P= 0.03) and ant morphospecies (ANOVA: F9,40 = 2.3, P = 0.03) at each site. Within each taxonomiccategory, different letters indicate significantly different groups identified by Student Newman-Keulsresults.

186 A. J. PIK ET AL.
There was a significant difference in total abundance (Figure 1a) and ant abund-ance (Figure 1b) among sites. Total abundance was lowest in the two control sitesand site six and highest in sites seven and four. Ant abundance was also highest insite four. There was a significant difference in ordinal, ant genus and ant morpho-species richness among sites (Figure 2). Post-hoc tests revealed, however, thatcomparisons of genus richness among sites produced only two groupings and com-parisons of morphospecies richness produced only one grouping (Figure 2). Withinall sites, except control site one, ordinal richness was highest followed by morpho-species then genus richness.
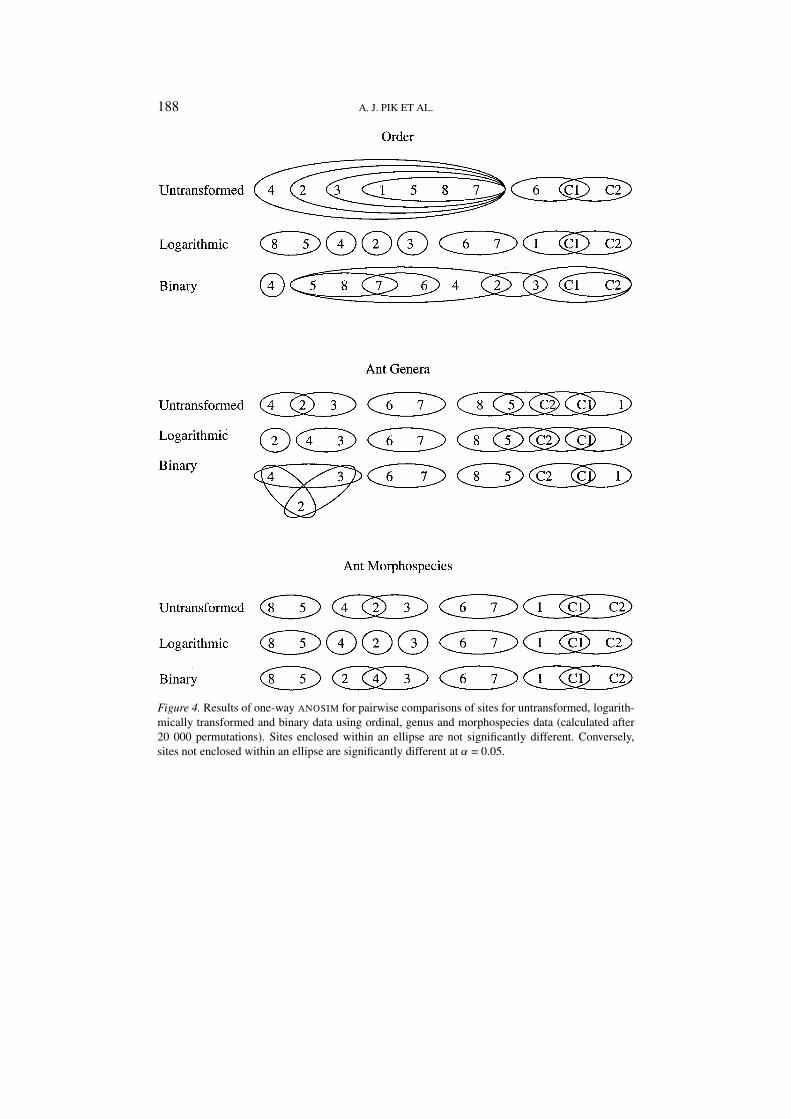
Ordinations for the three data sets (untransformed, logarithmic and binary) us-ing ordinal, genus and morphospecies data are presented in Figure 3. For eachordination scatterplot, each symbol represents an individual trap and the distanceapart of symbols reflects their biological distance in terms of ordinal or ant compos-ition. ANOSIM results are summarized in Figure 4. Sites contained within an ellipseare not significantly different in terms of their biological composition whilst sites indifferent ellipses are significantly different. Using untransformed ordinal data, trapswere tightly clustered on the ordination scatterplot, allowing little differentiationbetween sites (Figure 3). ANOSIM supported this visual interpretation with a highdegree of overlap among sites (Figure 4). Clearer differentiation between sites waspossible using logarithmic data where the contribution of the more abundant taxato the analyses was reduced. This was also reflected in the ANOSIM results wheresites four, two and three were significantly different from all other sites and theremaining sites, except control site one, were only similar to one other site. Thislevel of differentiation, however, was lost when the data set was reduced to just thepresence or absence of orders.
Untransformed ant genus data provided clearer differentiation of sites than un-transformed ordinal data (Figure 3). ANOSIM results showed six sites as similar toonly one other site and four sites similar to two other sites (Figure 4). This levelof differentiation was improved slightly using logarithmic data where site two wassignificantly different to all other sites. Binary data distinguished sites eight andfive as significantly different from control site two but site two was not significantlydifferent to sites four and three. For untransformed data, morphospecies providedthe best level of site differentiation (Figures 3 and 4). Logarithmic morphospeciesdata produced the same site differentiation as that observed for logarithmicallytransformed ordinal data (Figure 4). Morphospecies binary data provided very sim-ilar results to that observed for logarithmic data, except that site four was similarto sites two and three, and identical results to untransformed morphospecies data(Figure 4). At all levels of data and taxonomic treatment, the two control sites werenot significantly different from one another (Figure 4). Logarithmic data, at allthree taxonomic levels, provided the clearest differentiation between sites.
In comparisons of a control site with the regeneration sites, SIMPER analysesrevealed that the orders Acarina, Blattodea and Coleoptera were good discrimin-atory taxa, contributing between 36 and 50% of the dissimilarity between sites.

THE USE OF INVERTEBRATES IN ECOLOGICAL MONITORING OF RESTORATION 187
Figure 3. Ordinations using untransformed, logarithmically transformed and binary data at ordinal,genus and morphospecies taxonomic levels. Stress values are shown within each ordination scatter-plot. At the morphospecies taxonomic level one trap from site five has been removed as it representedan extreme outlier that prevented clear presentation of the remaining traps. One trap from site threeand eight did not contain any ants and is therefore not represented at the genus and morphospeciestaxonomic levels.
188 A. J. PIK ET AL.
Figure 4. Results of one-way ANOSIM for pairwise comparisons of sites for untransformed, logarith-mically transformed and binary data using ordinal, genus and morphospecies data (calculated after20 000 permutations). Sites enclosed within an ellipse are not significantly different. Conversely,sites not enclosed within an ellipse are significantly different at α = 0.05.

THE USE OF INVERTEBRATES IN ECOLOGICAL MONITORING OF RESTORATION 189
TABLE IIa
Summary of SIMPER results for comparisons of control site 1 with allother sites. Untransformed ant morphospecies data presented
Morphospecies Ratio Percentage Cumulative
contribution percentage
Site 1
Notoncus0001 0.97 16.91 16.91
Aphaenogaster0001 1.60 16.13 33.04
Meranoplus0001 1.17 15.56 48.60
Site 2
Rhytidoponera0002 3.51 31.28 31.28
Aphaenogaster0001 2.67 19.86 51.14
Pheidole0006 3.70 18.17 69.31
Site 3
Rhytidoponera0002 4.25 43.64 43.64
Aphaenogaster0001 3.07 26.28 69.92
Linepithema0001 0.78 8.84 78.76
Site 4
Rhytidoponera0002 4.85 41.34 41.34
Aphaenogaster0001 2.84 19.58 60.92
Linepithema0001 0.78 6.69 67.60
Site 5
Aphaenogaster0001 3.48 26.54 26.54
Linepithema0001 0.89 10.21 36.75
Linepithema0003 0.73 10.02 46.77
Site 6
Aphaenogaster0001 1.98 26.53 26.53
Pheidole0003 1.70 14.48 41.01
Notoncus0004 1.33 14.06 55.07
Site 7
Aphaenogaster0001 2.46 21.59 21.59
Pheidole0003 1.76 17.06 38.65
Pheidole0001 1.15 11.57 50.22
Site 8
Aphaenogaster0001 2.91 32.43 32.43
Paratrechina0002 0.91 13.45 45.88
Paratrechina0001 0.90 11.22 57.10

190 A. J. PIK ET AL.
TABLE IIb
Summary of SIMPER results for comparisons of control site 1 with allother sites. Log transformed ant morphospecies data presented
Morphospecies Ratio Percentage Cumulative
contribution percentage
Site 1
Aphaenogaster0001 1.57 30.46 30.46
Notoncus0001 0.95 16.35 46.81
Linepithema0001 0.77 13.89 60.70
Site 2
Rhytidoponera0002 3.68 38.89 38.89
Aphaenogaster0001 1.89 19.59 58.48
Pheidole0006 2.76 17.33 75.81
Site 3
Rhytidoponera0002 4.90 52.67 52.67
Aphaenogaster0001 2.11 24.22 76.88
Linepithema0001 0.77 8.24 85.12
Site 4
Rhytidoponera0002 5.00 50.60 50.60
Aphaenogaster0001 1.91 18.73 69.34
Linepithema0001 0.75 6.34 75.68
Site 5
Aphaenogaster0001 2.31 30.86 30.86
Linepithema0001 0.89 11.97 42.83
Linepithema0003 0.66 10.62 53.45
Site 6
Aphaenogaster0001 1.68 31.80 31.80
Pheidole0003 1.64 14.33 46.13
Notoncus0004 1.32 11.22 57.35
Site 7
Aphaenogaster0001 1.81 24.37 24.37
Pheidole0003 1.74 18.98 43.34
Pheidole0001 1.13 11.84 55.18
Site 8
Aphaenogaster0001 2.28 38.28 38.28
Linepithema0001 0.77 12.94 51.22
Paratrechina0002 0.87 11.60 62.82

THE USE OF INVERTEBRATES IN ECOLOGICAL MONITORING OF RESTORATION 191
TABLE IIc
Summary of SIMPER results for comparisons of control site 1 withall other sites. Binary ant morphospecies data presented
Morphospecies Ratio Percentage Cumulative
contribution percentage
Site 1
Meranoplus0001 1.17 21.71 21.71
Notoncus0001 0.92 17.86 39.58
Rhytidoponera0001 0.78 14.04 53.61
Site 2
Rhytidoponera0002 3.33 20.22 20.22
Aphaenogaster0001 3.33 20.22 40.44
Pheidole0006 3.33 20.22 60.66
Site 3
Rhytidoponera0002 3.17 29.59 29.59
Aphaenogaster0001 3.17 29.59 59.18
Notoncus0001 0.77 11.39 70.58
Site 4
Rhytidoponera0002 3.82 22.35 22.35
Aphaenogaster0001 3.82 22.35 44.70
Pheidole0006 0.78 9.20 53.90
Site 5
Aphaenogaster0001 5.62 22.05 22.05
Linepithema0003 0.78 9.48 31.52
Linepithema0001 0.85 9.07 40.59
Site 6
Aphaenogaster0001 2.23 21.58 21.58
Notoncus0004 1.32 16.45 38.03
Pheidole0003 1.55 14.58 52.61
Site 7
Aphaenogaster0001 3.33 18.39 18.39
Pheidole0003 1.69 15.81 34.20
Pheidole0001 1.06 11.28 45.48
Site 8
Aphaenogaster0001 3.49 26.67 26.67
Paratrechina0002 0.91 15.17 41.83
Paratrechina0001 0.94 11.50 53.33

192 A. J. PIK ET AL.
Inspection of the raw data supported this result with the orders Acarina and Co-leoptera having relatively low abundance to complete absence from the controlsites and Blattodea only being present in the control sites except for one trapin site three. The ratio values from SIMPER analyses of the ant morphospeciesdata (Tables IIa–c) provided an indication of how consistently particular morpho-species contribute to the dissimilarity in site comparisons. Morphospecies withrelatively high ratio values are likely to be good discriminating species in futuresite comparisons. The percentage contribution that each morphospecies makes tothe average dissimilarity between sites is also presented. At all three levels ofdata treatment, Rhytidoponera0002 and Aphaenogaster0001 are identified as goodindicators, contributing between 18 and 53% of the dissimilarity between sites. Insite comparisons, the first three morphospecies contributed between 41 and 85% ofthe dissimilarity observed.
This study required a total of three person weeks to complete, including theinstallation of traps, processing of specimens and data output, and cost less thanUS$3,000 at 1999 prices. Each pitfall trap took an average of 116 min to sort allspecimens to order and ant morphospecies identifications took less than one weekto complete.
5. Discussion
The aim of this study was to determine if measurement of invertebrate assemblagesprovided a level of sensitivity sufficient to detect and quantify small-scale habitatheterogeneity. The highly localized impacts of different bush regeneration practicesresulted in changes to invertebrate abundance and composition that were detec-ted at ordinal level and with ant genera and morphospecies. Ordinations, provid-ing graphical representation of invertebrate assemblages, and ANOSIM analysessuccessfully characterized different sites and demonstrated discernible biologicaldifferences among sites. We suggest that these statistical differences can be com-bined with biological knowledge of taxa to provide subtle characterization andmonitoring of restoration practices. We agree with assertions by Majer (1997)and McGeoch (1998) that the use of invertebrates as ecological indicators for themonitoring and assessment of restoration practices has not been fully developedand suggest that this study lends support for future research and development ofinvertebrate indicators.
As invertebrates integrate a wide variety of ecosystem processes, interpreta-tion of the assemblage patterns and presence or absence of particular taxa allowsa greater understanding of the impacts of management. For example, ant genusrichness was highest in one of the control sites and two regeneration sites (five andone). These sites exhibited relatively high structural habitat diversity, increasing thevariety of nest and foraging sites available for ants. A relationship between ant rich-ness and structural diversity of habitats has been demonstrated (e.g., Greenslade

THE USE OF INVERTEBRATES IN ECOLOGICAL MONITORING OF RESTORATION 193
and Halliday, 1983; Major et al., 1984) and practices that promote habitat structureshould allow colonization by more ant species. These trends were similar withordinal richness and suggest that techniques that maintain structural diversity in thehabitat during restoration may allow the persistence and colonisation of a greatervariety of invertebrates and so maintain important ecosystem processes.
At all three levels of ordinal data treatment, some of the larger separation dis-tances between traps on the ordinations were observed between a control site andsite eight within which no regeneration works had commenced. These differenceswere principally the result of two taxa, Acarina and Blattodea, which accountedfor approximately 25% of the dissimilarity between the two sites. Blattodea wasonly found in the two control sites. This taxon is commonly found in leaf litter,under bark or in and under rotting wood (New, 1996) and hence at one level,these discriminations reflect broad habitat requirements for higher taxa. However,because traits that characterise higher taxa are likely to be deeply entrenched inthe phylogeny of these organisms, their absence from regenerating sites suggeststhat the regeneration methods employed may represent a too severe disturbance. Adepleted compliment of soil invertebrates also tends to affect the balance and ratesof nutrient cycling (Lavelle, 1994), a situation that will not encourage the return ofnative plant species.
At a finer taxonomic resolution SIMPER analyses revealed one Rhytidoponeraand one Aphaenogaster morphospecies as good discriminating taxa in compar-isons of the control site with regenerating sites. Species belonging to the genusRhytidoponera are recognised as opportunists that are characteristic of disturbedenvironments (Andersen, 1995). Sites with recently completed regeneration workhad a very high abundance of Rhytidoponera0002 relative to the control site withinwhich it was not recorded. Pile burning, weeding that involves almost total groundcover clearance, and drainage improvements, are common activities for bush regen-eration in urban woodland remnants and all these activities tend to either disturbthe ground layer and/or reduce ground cover for some time. Such activities repres-ent a relatively stressful and disturbed environment for many ant species and maytherefore prevent their colonization.
The use of morphospecies in restoration projects overcomes the taxonomicimpediment that has traditionally limited the use of invertebrates. When the re-quirement is to characterize sites for monitoring and assessment, morphospeciesinventories can provide a high level of site differentiation from staff that havereceived minimal taxonomic training. As logarithmic data provided the best level ofsite differentiation, abundance classes could be used which would entail consider-able cost and time savings. However, as morphospecies presence-absence data gavesimilar results to log data, this may represent the most cost-effective approach. Thecombination of taxonomic resolution and data treatment will represent a trade-offbetween the level of biological information required and project constraints, suchas funding, time and the level of expertise of participants. The use of informationtechnology options brings morphospecies approaches within the reach of non-

194 A. J. PIK ET AL.
specialist taxonomists and the ability to process many thousands of specimens fromtens of taxa provides sufficient data points for statistically robust analyses.
Currently, most bush regeneration efforts are evaluated through botanical sur-veys or visual assessments. However, these methods cannot gauge whether a fullrange of ecosystem properties has been restored. As invertebrates integrate a widerange of environmental attributes, they represent useful indicators of the devel-opment of stability and ecological sustainability (Good, 1996); two stated goalsof the bush regeneration industry (Buchanan, 1993). This study has demonstratedthat ordinations of invertebrate assemblages will provide a sensitive measure ofthe relative impacts of different bush regeneration practices on the environment.Visual representations of biological distance among sites allows comparisons ofareas undergoing restoration to be made with reference or ‘target’ habitats thatrepresent areas exhibiting stability and ecological sustainability. Furthermore, bymonitoring the relative positions of regeneration and control sites on ordinationscatterplots over time, it is possible to assess the progress of areas undergoingrestoration.
A major challenge for environmental science is to devise indicators of ecosys-tem health and restoration that meet the needs of both scientists and the community.These indicators need to be rapid, easily collected, readily identified and cost-effective in their use. These criteria need to be fulfilled as biological assessmentwill be both necessary and include large and significant tracts of landscape, as wellas many small remnants, with only limited resources. It is also valuable that theseindicators are biological and so provide an integration of abiotic conditions, currentecology and history. Analyses of invertebrate assemblages satisfy all these criteriaand provide a sensitive indication of where an ecosystem is in response to manage-ment practices and how far the process must go before effective and sustainablegoals are achieved. The virtual assessment system and conceptual approaches tobiodiversity assessment used in this article suggest that it is both possible and cost-effective to use invertebrates to inform environmental management in restorationpractices.

THE USE OF INVERTEBRATES IN ECOLOGICAL MONITORING OF RESTORATION 195
Appendix 1 – Description of Study Sites
SITE 1
Date Activity Comments
January–July1995
Weeding Midstory was predominately Small and Large-leavedPrivet (Ligustrum sinense and L. lucidum), Lantana(Lantana camara), Wandering Jew (Tradescantia albi-flora) and Pittosporum (Pittosporum undulatum). Privetand Lantana cut and poisoned.
13/06/1995 Regenerationpile burns
August 1995 Weeding Small and Large-leaved privet cut and poisoned.
16/10/1995 Regenerationpile burns andgeneralregenerationburn
Large number of pile burns in close proximity to oneonother. The general regeneration burn was hot, dry andfast. Good rain followed the burn resulting in excellentregeneration of many native species.
SITE 2
Date Activity Comments
1983 Clearing Predominantly midstory of Privet (Ligustrum sinenseand L. Lucidum), Lantana (Lantana camara) and Pitto-sporum (Pittosporum undulatum). After initial clearingand follow-up removal of weeds, a heavy growth ofEhrharta grass became established. The area has beenmaintained as a lawn with regular mowing and no regen-eration has occurred.
1983–June 1999 Repeated wastevegetation pileburns
01/08/1999 Ceased mowingof grass
September 1999onwards
Gradualreclamation ofmown area
Site management plan will involve the gradual expansionof the adjacent bush area, including: spot spray Ehrhartagrasses, hand-weeding around patches of native grasses,weed mat and planting.
SITE 3
Date Activity Comments
September 1999onwards
Spraying andweeding
Selective spraying and weeding of Wandering Jew (Tra-descantia albiflora) and Honeysuckle (Banksia sp).
196 A. J. PIK ET AL.
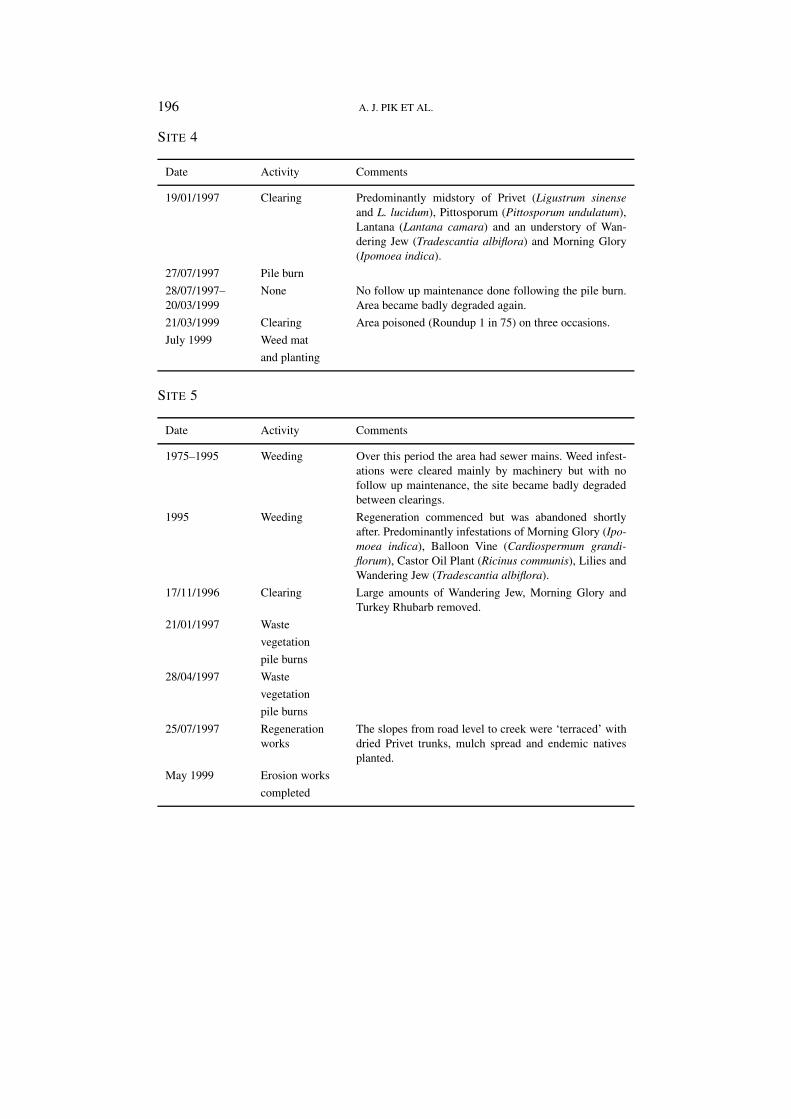
SITE 4
Date Activity Comments
19/01/1997 Clearing Predominantly midstory of Privet (Ligustrum sinenseand L. lucidum), Pittosporum (Pittosporum undulatum),Lantana (Lantana camara) and an understory of Wan-dering Jew (Tradescantia albiflora) and Morning Glory(Ipomoea indica).
27/07/1997 Pile burn
28/07/1997–20/03/1999
None No follow up maintenance done following the pile burn.Area became badly degraded again.
21/03/1999 Clearing Area poisoned (Roundup 1 in 75) on three occasions.
July 1999 Weed mat
and planting
SITE 5
Date Activity Comments
1975–1995 Weeding Over this period the area had sewer mains. Weed infest-ations were cleared mainly by machinery but with nofollow up maintenance, the site became badly degradedbetween clearings.
1995 Weeding Regeneration commenced but was abandoned shortlyafter. Predominantly infestations of Morning Glory (Ipo-moea indica), Balloon Vine (Cardiospermum grandi-florum), Castor Oil Plant (Ricinus communis), Lilies andWandering Jew (Tradescantia albiflora).
17/11/1996 Clearing Large amounts of Wandering Jew, Morning Glory andTurkey Rhubarb removed.
21/01/1997 Waste
vegetation
pile burns
28/04/1997 Waste
vegetation
pile burns
25/07/1997 Regenerationworks
The slopes from road level to creek were ‘terraced’ withdried Privet trunks, mulch spread and endemic nativesplanted.
May 1999 Erosion works
completed

THE USE OF INVERTEBRATES IN ECOLOGICAL MONITORING OF RESTORATION 197
SITE 6
Grassed area adjacent to site 7. Sampled to provide an indication of invertebrate fauna presentbefore regeneration activities were commenced at site 7.
SITE 7
Date Activity Comments
20/04/1999 Weeding andspraying. Mulchadded andplantingcommenced
Plantings reflected original vegetation of area. Included:Turpentine (Syncarpia glomulifera), Blackbutt (Euca-lyptus pilularis), wattle and Kangaroo grass (Themedaaustralis).
SITE 8
Badly degraded following disturbance when a sewer was put through. Weed infestations clearedover a long period, mainly by machinery, but no follow up maintenance. Privet (Ligustrum sin-ense and L. lucidum) cut and poisoned by the bushcare group but no regeneration work hadcommenced. Council to install ‘Wetlands’ in 2000.
Acknowledgements
This study was conducted in the BioTrack� laboratory of the CommonwealthKey Centre for Biodiversity and Bioresources as part of a Masters course withthe Graduate School of the Environment, Macquarie University. Hornsby ShireCouncil, Sydney, generously provided relevant information and permission to con-duct the field survey within the Shire. The authors also wish to thank DorothyDoolan and the Bambara Bushcare group for the provision of site histories. This iscontribution number 318 of the Commonwealth Key Centre for Biodiversity andBioresources.
References
Andersen, A. N.: 1995, ‘A classification of Australian ant communities, based on functional groupswhich parallel plant life-forms in relation to stress and disturbance’, J. Biogeog. 22, 15–29.
Andersen, A. N.: 1997, ‘Ants as Indicators of Ecosystem Restoration Following Mining: A Func-tional Group Approach’, in P. Hale and D. Lamb (eds), Conservation Outside Nature Reserves,University of Queensland, Australia, pp. 319–325.
Buchanan, R. A.: 1993, ‘What Are We Aiming For? Ecological Aims and Goals’, in Urban Bushland:Making Bush Regeneration Work,http://ecofriends.nccnsw.org.au/bushland/reference/mbrw/mbrw03.html

198 A. J. PIK ET AL.
Cairns J. (ed.): 1995, Rehabilitating Damaged Ecosystems, CRC Press, Florida.Chapman, M. G. and Underwood, A. J.: 1995, ‘Concepts and Issues in Restoration of Mangrove
Forests in Urban Environments’, in N. Klomp and I. Lunt (eds), Frontiers in Ecology. Buildingthe Links, Elsevier Science, Oxford, pp. 103–114.
Clarke, K. R.: 1993, ‘Non-parametric analyses of changes in community structure’, Aust. J. Ecol. 18,117–143.
Clarke, K. R. and Warwick, R. M.: 1994, Change in Marine Communities: An Approach to StatisticalAnalysis and Interpretation, Hitchings and Mason, Plymouth.
Colwell, R. K.: 1996, Biota. The Biodiversity Database Manager, Sunderland (Ma), SinauerAssociates.
Disney, R. H. L.: 1986, ‘Assessments using Invertebrates: Posing the Problem’, in M. B. Usher (ed.),Wildlife Conservation Evaluation, Chapman and Hall, London, pp. 271–293.
Ellis, D.: 1985, ‘Taxonomic sufficiency in pollution assessment’, Mar. Pollut. Bull. 16, 459.Ewel, J. J.: 1987, ‘Restoration is the Ultimate Test of Ecological Theory’, in W. R. Jordan III, M. E.
Gilpin, and J. D. Aber (eds) Restoration Ecology: A Synthetic Approach to Ecological Research,Cambridge University Press, Cambridge, pp. 31–33.
Good, J. A.: 1996, ‘Evaluating the Success of Soil and Habitat Restoration using Soil Fauna asIndicators’, in P. S. Giller and A. A. Myers (eds), Disturbance and Recovery in EcologicalSystems, Royal Irish Academy, Dublin, pp. 182–194.
Greenslade, P. J. M. and Halliday, R. B.: 1983, ‘Colony dispersion and relationships of meat antsIridomyrmex purpureus and allies in an arid locality in South Australia’, Insectes Soc. 30, 82–99.
Holloway, J. D. and Stork, N. E.: 1991, ‘The Dimensions of Biodiversity: The use of Invertebratesas Indicators of Human Impact’, in D. L. Hawkesworth (ed.), The Biodiversity of Microorgan-isms and Invertebrates: Its Role in Sustainable Agriculture, CAB International, Wallingford,pp. 37−62.
Janzen, D. H.: 1987, ‘Insect diversity of a Costa Rican dry forest: Why keep it, and how?’, Biol. J.Linn. Soc. 30, 343–356.
Kim, K. E. C.: 1993, ‘Biodiversity, conservation and inventory: Why insects matter’, Biod. Conserv.2, 191–214.
Kogan, M. and Lattin, J. D.: 1993, ‘Insect conservation and pest management’, Biod. Conserv. 2,242–257.
Kremen, C., Colwell, R. K., Erwin, T. L., Murphy, D. D., Noss, R. F. and Sanjayan, M. A.:1993, ‘Terrestrial arthropod assemblages: their use in conservation planning’, Conserv. Biol. 7,796−808.
Lawton, J. H.: 1995, ‘Ecological experiments with model systems’, Science 269, 328–331.Lavelle, P., Dangerfield, J. M., Fragoso, C., Lopez-Hernandez, D., Eschenbrenner, V., Brussard, L.
and Pashanasi, B.: 1994, ‘The Relationship between Soil Macrofauna and Tropical Soil Fertility’,in P. L. Woomer and M. J. Swift (eds), The Biological Management of Tropical Soil Fertility, JohnWiley & Sons, Chichester.
Main, A. R.: 1993, ‘Landscape Reintegration: Problem Definition’, in R. J. Hobbs andD. A. Saunders (eds), Reintegrating Fragmented Landscapes: Towards Sustainable Productionand Nature Conservation, Springer-Verlag, New York, pp. 189–208.
Majer, J. D.: 1985, ‘Recolonization by ants of rehabilitated mineral sand mines on North StradbrokeIsland, Queensland, with particular reference to seed removal’, Aust. J. Ecol. 10, 31–48.
Majer, J. D. (ed.): 1989, Animals in Primary Succession. The Role of Fauna in Reclaimed Lands,Cambridge University Press, Cambridge.
Majer, J. D., Day, J. E., Kabay, E. D. and Perriman, W. S.: 1984, ‘Recolonization by ants in bauxitemines rehabilitated by a number of different methods’, J. Appl. Ecol. 21, 355–375.
Majer, J. D.: 1997, ‘Invertebrates Assist the Restoration Process: An Australian Perspective’, inKrystyna M. Urbanska, Nigel R. Webb and Peter J. Edwards (eds), Restoration Ecology andSustainable Development, Cambridge University Press, Cambridge, pp. 213–237.

THE USE OF INVERTEBRATES IN ECOLOGICAL MONITORING OF RESTORATION 199
Majer, J. D. and Nichols, G.: 1998, ‘Long-term recolonization patterns of ants in Western Australianrehabilitated bauxite mines with reference to their use as indicators of restoration success’, J.Appl. Ecol. 35, 161–182.
McGeoh, M. A.: 1998, ‘The selection, testing and application of terrestrial insects as bioindicators’,Biol. Rev. 73, 181–201.
New, T. R.: 1996, Name that Insect. A Guide to the Insects of Southeastern Australia, OxfordUniversity Press, Melbourne.
Oliver, I. and Beattie, A. J.: 1993, ‘A possible method for the rapid assessment of biodiversity’,Conserv. Biol. 7, 562–568.
Oliver, I., Pik, A., Britton, D., Dangerfield, J. M., Colwell, R. K. and Beattie, A. J.: 2000, ‘Virtualbiodiversity assessment systems’, Bioscience. 50(5), 441–450.
Olsgard, F., Somerfield, P. J. and Carr, M. R.: 1998, ‘Relationships between taxonomic resolution,macrobenthic community patterns and disturbance’, Mar. Ecol. Prog. Ser. 172, 25–36.
Pik, A. J., Oliver, I. and Beattie, A. J.: 1999, ‘Taxonomic sufficiency in ecological studies of terrestrialinvertebrates’, Aust. J. Ecol. 24, 555–562.
Pimentel, D., Stachow, U., Takacs, D. A., Brubaker, H. W., Dumas, A. R., Meaney, J. J.,O’Neil, J. A. S., Onsi, D. E. and Corzilius, D. B.: 1992, ‘Conserving biological diversity inagricultural/forestry systems’, BioScience 42(5), 354–362.
Rosenburg, D. M., Danks, H. V. and Lehmkuhl, D. M.: 1986, ‘Importance of insects in environmentalimpact assessment’, Environ. Manag. 10(6), 773–783.
Shattuck, S. O.: 1999, Australian Ants: Their Biology and Identification, CSIRO Publishing,Melbourne.
Smith, P. J. and Smith, J. E.: 1990, Hornsby Shire Bushland Survey, Consultancy report commis-sioned by Hornsby Shire Council, Sydney.
Tilman, D. and Downing, J. A.: 1994, ‘Biodiversity and stability in grasslands’, Nature 367, 363–365.Urbanska, K. M., Webb, N. R. and Edwards, P. J. (eds): 1997, Restoration Ecology and Sustainable
Development, Cambridge University Press, Cambridge.Vanderklift, M. A., Ward, T. J. and Jacoby, C. A.: 1996, ‘Effect of reducing taxonomic resolution on
ordinations to detect pollution-induced gradients in macrobenthic infaunal assemblages’, Mar.Ecol. Prog. Ser. 136, 137–145.
Van Horne, B.: 1983, ‘Density as a misleading indicator of habitat quality’, Wild. Manag. 47,893−901.
Walker, B. H.: 1992, ‘Biodiversity and ecological redundancy’, Conserv. Biol. 6, 18–23.Williams, P. H. and Gaston, K. J.: 1994, ‘Measuring more of biodiversity: can higher-taxon richness
predict wholesale species richness?’, Biol. Conserv. 67, 211–17.Young, I., Blanchart, E., Chenu, C., Dangerfield, J. M., Fragoso, C., Grimaldi, M., Ingram, J. S. S.
and Jocteur Monrozier, L.: 1998, ‘The interaction of soil biota and soil structure under globalchange’, Glob. Change Biol. 4, 703–712.