Racial Harassment, Ethnic Concentration and Economic Conditions
Upload
khangminh22Category
view
1download
0
DOCUMENT RESUME
ED 101 177 CE 002 946
AUTHOR Atwater, David C.; And OthersTITLE The Unobtrusive Measurement of Racial Bias Among
Recruit Classification Specialists.INSTITUTION Navy Personnel Research and Development Center, San
Diego, Calif.REPORT NO NPHDC-TR-75-6PUB DATE Oct 74NOTE 67p.
EDRS PRICE MF-$0.76 HC-$3.32 PLUS POSTAGEDESCRIPTORS *Bias; Data Collection; *Military Personnel; Military
Training; *Personnel Selection; *Racial Attitudes;*Racial Discrimination; Facial Factors
ABSTRACTUnobtrusively-gathered historical data documenting
decisions made in the Navy's recruit classification process wereutilized to determine whether there were significant differencesbetween black and white classification interviewers in theirtreatment of black and white recruits. Decisions involving 17,752recruits (2,413 black) and 46 classifiers (el black) wereinvestigated. Criteria designed to reflect type of assignment andquality of assignment were analyzed to determine if variouscombinations of recruit and classifier race could account forcriterion variance. The nature of the classification procedureresulted in the essentially random assignment of black and whiterecruits to black and white classifiers. This permits a number ofinteresting comparisons and obviates numerous problems inherent inracial bias studies. The major hypothesis that black and whiteclassifiers would be differentially biased in their treatment ofblack and white recruits was not supported. A second hypothesis thatclassifiers within either racial group world be differentially biasedwas also not supported. Sample sizes were so large that classifierbias accounting for as little as one percent of the criterionvariance would have been detected as significant. Thus, there wasneither statistically significant nor practically significant biasdetected among classification specialists. (Author /SA -)

Ic 4 .'A'
r,
, 1,kt
t
I,a,
,, ,, r, 1,
iI
,, I 'Ii.,, ,. t I ,..)1.1'i' ' , '''', ' 3I
.
!, '',....,1 I P .. "I .
....'; !",`
.0
, 1
tr7-7: 7.41:.0-
_
S DEPARTMENTOf
u
ram it.4
EO.JCATIONILWE1.F
ARE
14AtiONPA.iNstiTUIE
OF
EOUCAI101400( , ,,, k NI ,A, lit 4 N WV 07,
W I
101 Pt H.,()N (04 014(,AN/f.1,().4()W,,,IN
Al .1Pl),N1', (11
,51 ,i7l l)1/ 4)1N()N.,
'11 %71l7 00 Nl,1 NI ( I ',.,'.14,,,
1+1 1411
7,1 N1 (11AA NA 1,014111
,14..1,11114 t)I
V DU(Al ,oN 14011,1ON
ow 4104.,/
1.
,,,,1. .
'4 c,,.,, ' .il . ''' ' 'I.' !, ?;.. A A A'4' e ..)'. , , l' ' t
T'., ... ,Ai 1 :A. ,. - ...,.....,...11. eft.7:' .hi!.'t%-t.,-1111'..lorialaiLojr..uLai.:1',111,'

NPRDC TR 75-6 October 1974
THE UNOBTRUSIVE MEASUREMENT OF RACIAL BIAS AMONG
RECRUIT CLASSIFICATION SPECIALISTS
David C. AtwaterEdward F. Alf., Jr.Norman M. Abrahams
This report was prepared under the
Navy Manpower Research and Development Program of the
Office of Naval Research under Project Orders3-0204 and 4-0104, Work Unit NuMbar NR 156-028
Reviewed byMartin F. Wiskoff
Approved byJames J. Regan
Technical Director
Navy Personnel Research and Development Center
San Diego, California 92152
Approved for public release; distribution unlimited
3

UNCLASSIFIED
SECURITY 4.:LASSIFICATION OF THIS PAGE (When bete Entered)
REPORT DOCUMENTATION PAGEREAD INSTRUcTIONS
BEFORE COMPLETING FORM
1 REPORT NUMBER
NPRDC TR 75-6
2, GOVT ACCFSSION NO. 3. RECIPIEN'T't. CATALOG NUMBER
4. TITLF, (end Subtitle) S. TYPE OF REPORT & PERIOD COVERED
THE UNOBTRUSIVE MEASUREMENT OF RACIAL BIAS Final Report
AMONG RECRUIT CLASSIFICATION SPECIALISTS 1 Jan 1973 to 30 Jun 1974
6 PErtr.",RMING ORG. REPORT NUMBER
7. AUTHOR(*) B. CO.' H.4.7;T OR GRANT NUMBER(s)
David C. Atwater, Edward F. Alf., Jr.,
Norman M. Abrahams
9. PERFORMING ORGANIZATION NAME-AND ADDRESS 10. PROGRAM ELEMENT, PROJECT, TASKAREA & WORK UNIT NUMBERS
Navy Personnel Research and Development Center 62755N, RF55-521,San Diego, California 92152 . RF55-521-102, NR-156-028
i I. CONTROLLING OFFICE NAME AND ADDRESS 12. REPORT DATE .
Personnel and Training Research Programs October 1974Office of Naval Research (Code 458) 13. NUMBER OF PAGES
Arlington, Virginia 22217 65
14. MONITORING AGENCY NAME & ADDRESS(if different from Controllin Offke) IS. SECURITY CLASS. (of this report)
UNCLASSIFIED
IS., DECLASSIFICATION/DOWNGRADING
N/ASCHEOULE
US. DISTRIBUTION STATEMENT (of this Report)
Approved for public release; distribution unlimited
17. DISTRIBUTION STATEMENT (of the abstract entered in Block 20, if different from Report)
18. SUPPLEMENTARY NOTES
19. KEY WORDS (Continuo on reverse side if necessary end kientlly by block number)
Unobtrusive measuresRacial biasRecruit classificationInterviewer bias
20. ABSTRACT (Continue on ravers. aid. if ncssary and lOyeoly by block number)
Unobtrusively-gathered historic:al data documenting decisions made in the.
Navy's recruit classification procesv wore utilized to determine whether there
were significant differences between Ilack and white classification interviewers
in their treatment of black and white! rec,ruits. The nature of the classifi-
cation procedure resulted in the essentially random assignment of black and
white recruits to black and white c1.Lasif4ers. This permits a number of
interesting comparisons and obviates ru.'erous problems inherent in racial
bias studies. (See reverse.) 110 ,-DD IF,°A:m73 1473 EDITION OF 1 NOV 6$ 15 OBSOLETE UNCLASSIFIED
CLASSIFICATION OF THIS PAGE (When bate Filtered)

Ut4CLAbblelEu
SECURITY CLASSIFICATION OF THIS PAOC(Whon Datil infor.d)
20. ABSTRACT (cont'd)
The major hypothesis that black and white classifiers would be differen-ti.oily biased in their treatment of black and white recruits was not supported.A second hypothesis that classifiers with'n either racial group would bedifferentially biased in their treatment of black and white recruits was alsonot supported.
Sample sizes were so large that classifier bias accounting for as littleas one percent of the criterion variance would have been detected assignificant. Thus, there was neither statistically nor practicallysignificant bias detected among classification specialists.
UNCLASSIFIED
SICUNITY CLASSIFICATION OF THIS PA011(1Pflon Data ffnhotd)

FOREWORD
This research was performed under Exploratory DevelopmentTask Area PF55-521-102 and Work Unit Number NR-156-028 (TheUnobtrusive Measurement of Racial Bias in Decisions RegardingAssignment of Recruits Following Basic Training). It was
supported by Personnel and Training Research Programs of theOffice of Naval Research.
Appreciation is expressed to the personnel from the recruitclassification offices at the Recruit Training Centers, San Diego,Great Lakes, and Orlando, for their cooperation in providing dataused in this investigation. The assistance of PN1 Robert J.Fangman of the recruit classification office, San Diego, wasparticularly helpful.
J. J. CLARKINCommanding Officer
v
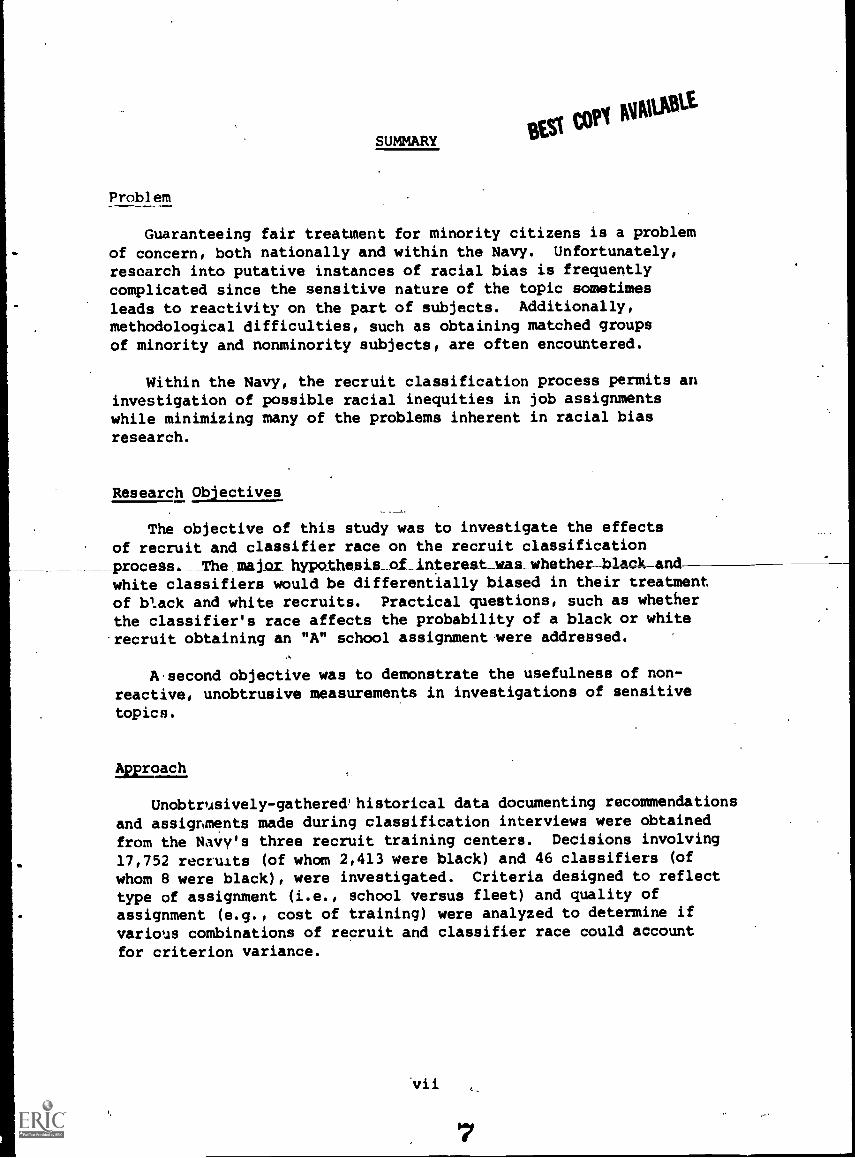
SUMMARY
Problem
Guaranteeing fair treatment for minority citizens is a problemof concern, both nationally and within the Navy. Unfortunately,
research into putative instances of racial bias is frequentlycomplicated since the sensitive nature of the topic sometimes
leads to reactivity on the part of subjects. Additionally,
methodological difficulties, such as obtaining matched groupsof minority and nonminority subjects, are often encountered.
Within the Navy, the recruit classification process permits aninvestigation of possible racial inequities in job assignmentswhile minimizing many of the problems inherent in racial biasresearch.
Research Objectives
The objective of this study was to investigate the effectsof recruit and classifier race on the recruit classification
_process.____The_majnr hypothesis ofinterest was whether black_andwhite classifiers would be differentially biased in their treatmentof black and white recruits. Practical questions, such as whetherthe classifier's race affects the probability of a black or whiterecruit obtaining an "A" school assignment were addressed.
Asecond objective was to demonstrate the usefulness of non-reactive, unobtrusive measurements in investigations of sensitive
topics.
Approach
Unobtrusively - gathered' historical data documenting recommendations
and assignments made during classification interviews were obtainedfrom the Navy's three recruit training centers. Decisions involving
17,752 recruits (of whom 2,413 were black) and 46 classifiers (of
whom 8 were black), were investigated. Criteria designed to reflect
type of assignment (i.e., school versus fleet) and quality of
assignment (e.g., cost of training) were analyzed to determine ifvarious combinations of recruit and classifier race could account
for criterion variance.
'vii
7

Results
The major hypothesis that black and white classifiers mightbe differentially biased in their treatment of black and whiterecruits was not supported. A second hypothesis that classifierswithin either racial group might be differentially biased in theirtreatment of black and white recruits was not supported.
Conclusions
Within the limits of the conditions studied, there.was nosignificant differential bias among classification specialistsin their recommendations for, or assignments to, school trainingfor black and white recruits. Possible generalization to classi-fication under other circumstances, such as at Navy recruitingstations, must await replicated studies in such settings.
Sviii

TABLE OF CONTENTS
FOREWORD
SUMMARY
BACKGROUND
Page
vii
The Role of the Classification SpecialistFocus of Study 2
The Need for Empirical Research 2
Difficulties in Studying Racial Bias 3
Distortions in self-report data 3
Confounding of variables 3
Reactive effects 3
Unobtrusive Measurement of Racial Bias 3
Absence of self-report data 4
Absence of confounding 4
Absence of reactive effects 4
Disadvantages in using archival data' 5
PURPOSE 5
PROCEDURE
Recruit Classification and Assignment 5
Emphasis of the Present Study 7
Subjects 8
Recruits 8
Classification interviewers 9

Page
Criteria 9
"A" school assignment 9
Cost of "A" school training 9
Length of "A" school training 9
Racial saturation index 11
Recommendation index 11
Auxiliary Measures 11
Statistical Analysis 12
Randomness of assignment 12
Racial bias 12
RESULTS
Randomness of Assignment 12
Chi square analyses 12
Analyses of variance 14
Summary of random assignment analyses 14
Racial Bias 18
Descriptive statistics 18
Analyses of variance . 18
Overall summary table 1-
Bias related to classifier race 18
Bias among individual classifiers 18
Other Significant Factors Related to "A" School
Criteria 42
Rtcmit race 42
Classifier differences in final assignment . . . . 42
CONCLUSIONS 43
REFERENCES 45
DISTRIBUTION LIST 49
x
10

LIST OF TABLES
Table Page
1 Number of Recruits and Classifiers at EachNaval Training Center 10
2 Expected Mean Squares for Three-Factor Design:Factors A and B Fixed; Factor C Random, andNested Under Factor A
3 Chi Square Analyses for Random Assignment of Blackand White Recruits to Classifiers
4 Chi Square Values Based on Number of Black andWhite Recruits Assigned to Each Classifierby Training Center
5 Analyses of Variance of Mean Test Scores (GCT + ART)of Black and White Recruits Seen by EachClassifier
13
15
1.6
17
6 Average Criterion Scores for Non-School GuaranteedBlack and White Recruits Seen by Each Classifier:San Diego Sample; Final Assignment Criterion(n=3,299) 19
7 Average Criterion Scores for Non - School GuaranteedBlack and White Recruits Seen by Each Classifier:Great Lakes Sample; Final Assignment Criterion(n=3,622) 20
Average Criterion Scores for Non-School GuaranteedBlack and White Recruits Seen by Each Classifier:Orlando Sample; Final Assignment Criterion(n=3,285)
9 Average Criterion Scores for Black and White RecruitsSeen by Each Classifier: San Diego Sample;
Cost Criterion (n=6,275) .
10 Average Criterion Scores for Black and White RecruitsSeen by Each Classifier: Great Lakes Sample;
Cost Criterion (n=5,627) .
xi
11
21
22
23

Table Page
11 Average Criterion Scores for Black and WhiteRecruits Seen by Each Classifier: OrlandoSample; Cost Criterion (n=5,850) 24
12 Average Criterion Scores for Black and WhiteRecruits Seen by Each Classifier: San DiegoSample; Length Criterion (n=6,275) I 25
13 Average Criterion Scores for Black and WhiteRecruits Seen by Eeoh Classifier: Great Lakes
Sample; Length Criterion (n=5,627) 26
14 Average Criterion Scores for,Plack and WhiteRecruits Seen by Each Classifier: OrlandoSample; Length Criterion (n=5,850) 27
15 Average Criterion Scores for Black and WhiteRecruits Seen Ly Each Classifier: San Diego
Sample; Saturation Criterion (n=6,275)
16 Average Criterion Scores for Black and White'Recruits Seen by Each Classifier: Great Lakes
Sample; Saturation Criterion (n=5,627)
_ 28
29
17 Average Criterion Scores for Black and WhiteRecruits Seen by Each Classifier: OrlandoSample; Saturation Criterion (n=5,850) 30
18 Average Criterion Scores for Black and WhiteRecruits Seen by Each Classifier: San Diego
Sample; Recommendation Criterion (n=6,275) 31
19 Average Criterion Scores for Black and WhiteRecruits Seen by Each ClassIfier: Great LakesSample; Recommendation Criterion (n=5,627) 32
20 Average Criterion Scores for Black and WhiteRecruits Seen by Each Classifier: OrlandoSample; Recommendation Criterion (n=5,850) 33
21 Analysis of Variance Summary Tables for the FinalAssignment Criterion 34
xii

Table Page
22 Analysis of. Variarce Summary Tables for theSchool Cest Criterion 35
:3 Analysis of Variance Summary Tables for theSchool Length Criterion 36
24 Analysis of Variance Summary Tables for theSaturatior. Criterion 37
25 Analysis of VariLnce Summan Tables for theRecommendation Criterion 38
26 Grand Summary Table: Bias Criteria 39
13

LIST OF FIGURES
Figure
1 Recruit classification and assignmentsequence
14xiv
Page
6

THE UNOBTRUSIVE MEASUREMENT OF RACIAL BIAS AMONG
RECRUIT CLASSIFICATION SPECIALISTS
BACKGROUND
Guaranteeing fair treatment for black citizens is a major
national problem. One factor leading to the continued low status
of some minority groups is the limited educational opportunities
available to them. Bias in educational assignment can lead to
limited opportunities for appropriate training, and consequently
to limited job options. Equal opportunity programs, school
integration programs, retraining programs, and non-discriminatory
legislation are directed at assuring this fair treatment.
Navy policies and programs parallel this national concern.
Navy directives (e.g., CNO/VCNO, 1971) specify that each qualified
black recruit shall have the opportunity to receive the "A" school
training for which ne is qualified.
One of the functions of Navy directives regarding "A" school
opportunities for minority members is to increase training
opportunities for blacks. This, in turn, can lead to expanded
job opportunities, increased job satisfaction, increased lifetime
earnings, and a generally higher socioeconomic status for the
groups involved.
The Role of the Classification Specialist
Although many phases of the Navy assignment process are fairly
automatic and computerized, there are still phases in which human
judgment and human interaction play a major role. In anything as
important as determining what may well be an individual's lifetime
career, it is important to take advantage of all the resources of
human intuition and guidance, as well as all scientific knowledge
regarding the relations of aptitudes and interests to performance.
Perhaps the most crucial human role in the Navy assignment
process is that played by the Navy classification specialists.

These specialists work with the individual recruits, consideringtheir abilities and interests, backgrounds, stated preferences,and ()tiler less tangible factors, in arriving at a recommendedrecruit assignment. It is this classifier who, in-borderlinecases, will make the difference between an appropriate schoolassignment, or no school assignment at all. His particulartalents and expertise may well make the difference between theopportunity for enhanced socioeconomic status, and the denial ofthat opportunity. Thus, it is important to focus attention onthe way the classifier plays his role in the assignment process.
Focus of the Study
The present study focuses on: (1) the development and measure-ment of various indexes that reflect the quality of recommendationsand final assignments received by each recruit, and (2) the effectsof interviewer race on these indexes for black and white recruits.The five indicators utilized in assessing quality of assignmentinclude: (1) school versus non-school assignment, (2) cost ofschool training, (3) length of school training, (4) racialcomposition of assignment, and (5) ratio of school recommendationsto all recommendations. A classifier's bias cannot be assessed onthese indicators in an absolute sense, but individual classifierswithin a race may be compared to each other and black classifiersmay he compared with white classifiers in their treatment of blackand white recruits. Differential bias will be shown if the criterionscores of black recruits relative to thoseof white recruits areassociated with the race of the classifier or with individual classi-fiers within race.
The Need for Empirical Research
The notion that there may be differences in bias amongclassifiers is largely speculation at the moment, because hereto-fore no research has been performed to investigate the possibilitythat such bias exists. Opinions have been expressed that blackclassifiers will send more black recruits to school than willwhite classifiers; others assert just the opposite. The presentresearch was motivated by the belief that the examination ofempirical evidence might be useful in resolving this issue.

BEST COPY AVAILABLE
DifficulLius in Studyia Racial Bias
Several difficulties, such as reliance on self-report data andinodequate expor imental control, have interfered with the objectiveltudy ()f sensitive topics such as bias. Some of these difficultiesar.! discussed below.
Distortions in self-report data. Sattler (1970) cites numerouscases where the verbal reports of subjects are influenced by therace of the interviewer. Distorted reporting may occur when (1)two subjects interact (for example, a client and a therapist ofdifferent races) or (2) an investigator and a subject interact(for example, when a client evaluates his client-therapist inter-action for an outside investigator). Both types of distortionare potential problems in investigating racial bias.
Confounding of variables. In comparing minority and nonminoritygroups, measurement of racial bias is often confounded by groupdifferences on other variables. For example, in measuring bias,it has often been necessary to compare the treatment received byconveniently available groups of minority and nonminority indi-vidual'_;. Frequently, such groups differ not only in race but alsoin terms of average educational, occupational, and income levels.To the extent that such variables do influence the decisions madeor treatments received by individuals, any measure of bias willbe confounded. Even if the groups could be matched on these
'variables, there would remain a host of other variables, unknownand little imagined, upon which the groups would still differ.
Reactive effects. When subjects are aware that their behavioris being studied, they are likely to modify their behavior accordingly.Thus, the activities and hypotheses of the investigator may distort theprocess being observed.
Unobtrusive Measurement of. Racial Bias
The Navy recruit classification procedure provides an excellentmeans for minimizing the difficulties outlined above. During theclassification procedure, enlisted personnel appear together as a
173

company, at a specified time, for individual classification inter-views. The recruits, both black and white, are assigned toclassifiers, who are also black cx white. The assignment ofrecruits to classifiers is designed to preclude recruits fromchoosing the classifier they will see, and to assure that classifiersdo not pick the recruits they will interview.
Informal observation of this procedure led the investigatorsto believe that an essentially random assignment process wouldresult. It was expected that each classifier would interview agroup of recruits in which the proportion of minority recruitswould be equivalent. Other characteristics of the group ofrecruits should also be equivalent. For example, the blackrecruits interviewed by white classifiers should have aptitudetest scores and experiences equivalent to those interviewed by
4olack classifiers. If these assumptions can be verified, severalinteresting comparisons are possible. For example, the number andquality of school assignments.given to black recruits by. black andby white classifiers could be contrasted. Data for the study can beobtained from existing Navy records containing assignment recommenda-tions made by the classifier and the actual assignment each recruitreceived.
Absence of self-report data. Since the necessary information canbe obtained from Navy records, there is no need to gather distortion-prone self-report data.
AbsenCe of confounding. By focusing on the differential treatmentof random groups of black and white recruits, confounding due todifferences in variables such as educational, occupational, andincome levels would be overcome. The randomization procedure wouldeliminate the necessity for matching, which would be ineffective inany event.
Absence of reactive effects. Since historical data could beused, the behaviors being investigated would already have occurred.As a consequence, the possibilities of the experimenter influencingthe subjects' responses is .,recluded.
18 4

DI.Idvantages in using archival data. There are, of course,
disadvantages when using data gathered by others. There is always
risk that unknown factors present when the data were producedmay cause selective deposit of material. Additionally, there maybe temporal or geographic variation in the data - gathering procedures
which, if unknown, may be misleading. Finally, the data as originallyproduced may not be in the most convenient form for the investigator's
analyses. In the present study, it was felt that these potentialdisadvantages were more than offset by the advantages of non-reactivityand low cost.
PURPOSE
The purpose of the present study was to determine whetherthere are significant differences in racial bias it "A" schoolassignment practices among recruit classification specialists.More specifically, the purpose was to determine whether thesepractices differ significantly between black and white classifiers,and among classifiers of the same race.
PROCEDURE
The present study was conducted unobtrusively within thegeneral framework of the ongoing classification and assignmentprocess. Information regarding the recommended and actualassignments of recruits, the racial membership and test scoresof recruits, and the racial membership of classifiers was obtainedfrom routinely collected Navy records.
Recruit Classification and Assignment
Figure 1 provides a schematic representation of the Navyrecruit classification and assignment process in use at the time of
5
19

A
B
C
D
E
APTITUDE TESTING
Navy Basic Test Battery
ORIENTATION TO NAVY JOBS
Discussions on Navy Occupational
Ratings and Classification Procedures
1
CLASSIFICATION INTERVIEW
Occupational Recommendations and.
Preferences Determined
AUTOMATED ASSIGNMENT PROCESS
(COMPASS II)
ASSIGNMENT ORDERS PUBLISHEDI
Fig. 1. Recruit classification and assignment sequence.
206

this study. The five stages, labeled A through E in Figure 1,
are described briefly below.
a. During the first week of the recruit training cycle,recruits are administered a battery of tests measuring verbal,mechanical, clerical, and arithmetic abilities. One or more
special tests may also be included. These test scores are used by
the classification interviewer in formulating assignment recommenda-
tions.
b. In preparation for their classification interview, recruits
receive several hours of formal orientation to Navy jobs. They
attend several classes in which Navy occupational ratings arediscussed at length. They are also given information about theclassification interview, so they will know how their expressedjob preferences are taken into account by the interviewer, and
what options exist.
c. The next step is the classification interview proper.During the interview the classifier makes up to five schcol and/or
fleet assignment recommendations for each recruit. These. recommenda-
tions are based on Basic Test Battery (BTB) and special test scores,civilian job experience, educational background, hobbies, and
interests. Each recommendation is given a Recommendation LevelCode (RLC) that indicates, on a 5-point scale, the interviewer's
appraisal of the recruit's fitness for the recommended assignment.
d. The classifer's recommendations are then considered in a
computerized system, COMPASS II, which determines the actual assign-
ments. The objectives of the system are to maximize quota accommodations
given the pool of talent available, minimize transportation costs, and
maximize both adherence to interviewer recommendations, and the
probability of success in schools.
e. The school assignments are transmitted to the Naval Training
Centers near the end of recruit training, usually by the end of the
eighth week.
Emphasis of the Present Study
The present atudy will concentrate on the events surrounding
the classification interview (stage C, Figure 1), and on the
eventual actual assignment of the recruits (stage E, Figure 1).
217

Subjects
Samples were gathered at the three Naval Training Centers atSan Diego, Great Lakes, and Orlando. Subjects were classificationinterviewers and the recruits they classified during specified 4month periods.
The exact time period was chosen for each center to maxi-lizethe numbers of black classifiers available through the entire timeperiod investigated. At San Diego and Creat Lakes, the period wasJanuary through April, 1972. At Orlando, the time period wasJanuary through April, 1973. The race of the recruit and of theclassification interviewer were independent variables of interest.
Recruits. There are three general categories of recruit
subjects.
(1) Specific school guarantee. These recruits arespecific "A" school guarantee by the recruiter in tl'e
Since the classifier does not determine their eventualthese recruits were not included in the study.
given afield.
assignment,
(2) Occupational speciall guarantee. These recruits are
guaranteed "A" school training within a general occupational area.For most occupational specialties, there are several "A" schools
available within the area. The classifier makes recommendationsthat may determine which of these schools the recruit will attend.
Recruits in occupational specialty areas where, because of quotademands, only one school was available, were eliminated from the
study since the classifier had no impact on their final assignment.
(3) Non-school Guarantee. These men arrive at recruit training
with no "A" school guarantee of any type. If results of tests
administered during recruit training indicate they are schooleligible, they, may be recommended for "A" school by the classifier.
28

BEST COPY AVAILABLE
Classification interviewers. The recommendations and assignmentmade by classification interviewers on duty during the time periodinve5tiated at each training crater were tabulated. Classifiers inan "ilaci-r-intruction" capacity were eliminated from the analysessince, they, in general, interviewed relatively few recruits, and thosethev did interview were not randomly assigned to them.
Table 1 presents the number of recruits and classifiers at eachtraining center. Entries for recruits indicate the total number ofoceupational specialty and non-school guarantee recruits includedin the study. Entries within parentheses are the number of non-school
guarantee recruits in each sample. This subset of non-school guaranteerecruits was used in analyzing the "A" school assignment criterion(described below). All other criteria utilized the combined sampleof occupational specialty and non-school guarantee recruits.
Criteria
Five criterion measures, as described below, were used in the
present study. The first four criteria were derived from the actualfinal assignment received by each recruit. The fifth criterionvariable, recommendation index, was derived solely from the recom-mendations given to each recruit by his classifier, irrespectiveof his actual assignment.
"A" school assignment. For each non-school guaranteed recruit,
whether or not he finally received an "A" school assignment wasrecorded as a dichotomous criterion.
Cost of "A" school training. For each recruit assigned to "A"
school, the cost for his particular "A" school training was recorded.This cost information was obtained from a Bureau of Naval Personnel
publication (NAVPERS 18660). Fleet assignees received an "A" school
training cost value of zero.
Length of "A" school training. For each recruit assigned to"A" school, the length of training at the particular "A" school
23
9

TABLE 1
Number of Recruits and Classifiers at Each
Naval Training Center
Training Centers
Subjects
San Diego
Great Lakes
Orlando
Totals
Recruits
Black
439
(387)a
989
(886)
985
(828)-
2,413
(2,101)
White
5,836
(2,912)
4,638
(2,736)
4,865
(2,457)
15,339
(8,105)
Total
6,275
(3,299)
5,627
(3,622)
5,850
(3,285)
17,752
(10,206)
Classifiers
Black
31
48
White
16
13
938
Total
19
14
13
46
Note.--
aNumbers in parentheses indicate the number of non-school guaranteed recruits within
each category.

to which he was assigned was recorded. this school lengthinformation was obtained from a Bureau of Naval Personnel
publication (NAVPERS 18660). Fleet assignees received a length
of "A" school training value of zero.
Racial saturation index. The proportion of black recruits
assigned to each school was recorded. The racial saturation index
value for any given recruit was the proportion of black recruits in
the school to which he was assigned. For a recruit assigned to the
fleet, his racial saturation index was the proportion of black recruits
in the sample who were assigned directly to the fleet.
Recommendation index. The recommendation index (RI) is computed
using the formula:
RI -ERLC for "A" school recommendations
ERLC for all recommendations
where RLC stands for a 5-point recommendation level code. This
formula, which yields scores ranging from .00 to 1.00, was devised
to capture, as closely as possible, the likelihood that an individual
recruit with a given set of recommendations would be assigned by the
computer to "A" school. If, for example, a recruit had no schoolrecommendations, he would receive an RI of .00, while a recruit
with only school recommendations would have an RI of 1.00. Recruits
with mixed school and nonschool recommendations receive intermediate .
RI scores. It was hoped that this measure would provide some insight
into the classification tactics used by the interviewers.
Auxiliary Measures
General Classification Test (GCT) and Arithmetic Test (ARI)
scores from the Navy BTB were recorded for each recruit in the
present study. The sum of these two test scores (hereafterreferred to as GCT + ARI) is often used as an index of general
intellectual level. As described below, this sum was used to
compare the average quality of recruits interviewed by each
classifier.
25
11

Statistical Analysis
Randomness of assignment. Initially, two preliminary analyseswere performed to check on the randomness of assignment of recruits
to classifiers. First, a chi square analysis was performed todetermine whether the proportion of black recruits seen by eachclassifier differed significantly. Second, an analysis of varianceusing GCT + ARI as the dependent variable was performed to determineif the quality of recruits differed significantly among classifiers.
Racial bias. For each criterion of interest, an overall analysiswas performed as a 3-factor hierarchical design. Factor A was the
race of the classifier, factor B was the race of the recruit, andfactor C was the individual classifier, nested under classifier race.In this design, factors A and B aLe regarded as fixed factors, andfactor C is regarded as a random factor.
Table 2 presents the sources of variance, together with theexpected mean squares for the complete design. The terminology
in Table 2 is that employed by Myers (1972). The expectations for
the mean squares were derived from Winer (1971, p. 363, Table 15.12-2).
In the present analysis, it was necessary to employ an unweightedmean analysis at two levels of the design, because: (a) different
numbers of classifiers were nested under each race, and (b) differentnumbers of black and white recruits were nested under each classifier.The procedures for handling these problems are outlined in Winer(1962, pp. 374-378) and in Myers (1966, pp. 104-111).
From Table 2, it can be seen that A should be tested againstC/A, B and AB against BC/A, and C/A and BC/A against S/ABC.
RESULTS
Randomness of Assignment
Chi square analyses. The chi square analyses to verify therandomness of assignment of recruits to black and white classifiers
2612

TABLE 2
Expected Mean Sq' :ares for Three-Factor Design:
Factors A and B Fixed; 'a! for C Random,
and Nested Under Fi,ctor A
Source of Variance Expected Mean Square
A
C/A
B
AB
2a2
+ nboc
2+ nbc0
A
2 2ae
+ hbac
a2
+ no + nace2
2 2ae
2+ no
BC+ nC 0
AB
BC/A a + naBC
S/ABC a2
Note. In this table there are a levels of A, b levels of
B, c levels of C, and n S's per treatment group.
2'7

were performed separately for each training center. The resultsof these analyses are presented in Table 3.
It can be seen that, although these values are nonsignificantat San Diego and Orlando, the chi square value at Great Lakes wassignificant beyond the .001 level. Information obtained from theGreat Lakes classifiers indicated that, for a period of time, blackrecruits were lining up outside the black classif'-r's door, ratherthan going randomly to the next available classifies. This, amongother factors, distorted the randomness of assignment of GreatLakes.
To check further on the randomness of assignment, a more detailedanalysis was performed to determine whether the proportions of blackand white recruits interviewed by each classifier were significantlydifferent. The results of these analyses are preepnted in Table 4.
Again, it can be seen that the chi square values for the SanDiego and Orlando analyses are nonsignificant, whereas the chi squarevalue for Great Lakes is again highly significant. Although thisfinding is important, it jeopardizes the research design only if aconcomitant deviation is found in the quality of recruits assignedto classifiers.
Analyses of variance. Analyses of variance were performed onthe sum GCT + ARI for each recruit to determine whether the qualityof recruits interviewed differed significantly among classifiers.These analyses were performed separately for black and white recruitsat each training center. The analysis of variance summary table ispresented in Table 5.
Inspection of Table 5 reveals that the P tests are not significantat all three training centers. Thus, there was no significantdifference in the quality of recruits seen by different classifierswithin each of the three training centers.
S.Aman! of randLm assignment analyses. No evidence was foundat San Diego or Orlando to reject the hypothesis of random assign-ment. At Great Lakes, although there were significant differencesin the proportion of black recruits assigned to each classifier,there appear to be no significant difZerences in the quality ofrecruits seen by different classifiers, thus permitting analysisof the bias criteria.

TABLE 3
Chi Sauare Analyses for Random Assignment of Black andWhite Recruits to Classifiers
San Diego
Black White
Recruits Recruits X2Totals
Black Classifiers 54 659 713
White Classifiers 385 5,177 5,562
439 5,836 6,275
.412
Great LakesBlack White
Recruits Recruits Totals x2
Black Classifiers. 65 176 241 15.341**
White Classifiers 924 4,462 5,396
989 4,638 5,627
Orlando
Black WhiteRecruits Recruits Totals X2
Black Classifiers 375 1,752 2,1271.500
White Classifiers 610 3,113 3,723
985 4,865 5,850
***Significant at the .001 level.
29
15

TABLE 4
Chi Square Values Based on Number of Black and WhiteRecruits Assigned to Each Classifier
by Train'ng Center
Training Center X2 df Significance
San Diego
Great Lakes
Orlando
23.47 18
39.12 13 .001
17.85 12 111. OM OM Oa
a
Note.
aIndicates a nonsignificant chi square value.
16
30

TABLE 5BEST cart AVAIIABLE
Anolv,!; of Vorionce of Moon Test. Scores (i;CT ARI) of Blackond White Reeruit!-; Seen by Each Classifinr
San Diego
Sample Source df SS MS
Total 438 91,820Black
A 18 2,892 160.7 .76Recruits
S/A 420 88,9213 211.7
Total 5,835 1,490,028White
A 18 5,198 288.8 1.13Recruits
S/A 5,817 1,484,830 255.3
Great Lakes
Sample Source df SS MS F
BlackRecruits
WhiteRecruits
Total 988 164,262
A 13 1,118 86.0 .51
S/A 975 163,144 167.3
Total 4,637 1,267,474
A 13 5,841 449.3 1.65
S/A 4,624 1,261,633 272.8
Orlando
Sample Source df SS MS
BlackRecruits
Total 984 143,732
A 12 1,373 114.4 .78
S/A 972 142,359 146.5
WhiteRecruits
Total 4,864 1,150,591
A 12 3,941 328.4 1.39
S/A 4,852 1,146,650 236.3
3117

Racial. L as
Descriptive statistics. For each criterion, an average scorewas computed separately for the black and white recruits seen byeach classifier at each training center. These means, togetherwith the number of observations upon which each mean was.based,are presented in Tables 6 through 20.
Analyses of variance. A separate 3-factor analysis of variancewas performed on each of the five criteria at each training center,thereby providing a total of 15 analyses. In each analysis, factorA represented the race of the classifier, factor B represented therace of the recruit, and factor C represented the individualclassifier within each race. The summary tables for these analysesare presented in Tables 21 through 25.
Overall summary table. In order to present the "A" schoolcriteria findings more concisely, the F ratios for all fivecriteria were summarized in a single table. This summary ispresented in Table 26.
Bias related to classifier race. A major hypothesis of thepresent study was that.black and white classifiers might bedifferentially biased in their treatment of black and whiterecruits. This hypothesis was in no way supported by the presentstudy.
If such bias existed, it would be revealed in the AB inter-actions of the analyses of variance based on the "A" school criteria.At each training center, and for each "A" school criterion, this ABinteraction term was nonsignificant. In fact, about half of theF ratios for this interaction were greater than 1.00, and half wereless. This pattern is closely consistent with the null hypothesisthat there is no bias related to the classifier's race.
Bias among individual classifiers. A second hypothesis ofinterest in the present study was that classifiers within eitherracial group might be differentially biased in their treatment ofblack and white recruits. The present study offers no support forthis hypothesis.
32 18

TABLE 6
Average Criterion Scores for Non-School Guaranteed Black and WhiteRecruits Seen by Each Classifier: San Diego Sample;
Final Assignment Criterion(n =3, 299)
Classifier RaceClassifier Black Recruits White Recruits
Number Mean n Mean -n..._ ..._
Black1 .10002 .1600
3 .3000
White
1 .2857
2 .11543 .3600
4 .2857
5 .2500
6 .3548
7 .0000
8 .0000
9 .3448
10 .1500
11 .3077
12 .1818
13 .4500
14 .3793
15 .0000
16 .1667
10 .5615 13025 .5938 160
10 .6094 64
35 .5614 228
26 .5871 201
25 .5670 194
14 .4388 98
20 .5828 175
31 .6042 240
8 .3415 41
3 .4054 37
29 .4798 198
20 .5492 193
26 .6100 200
22 .4661 .118
20 .5771 201
29 .5846 195
4 .6061 33
30 .6456 206
3319

TABLE 7
Average Criterion Scores for Non-School Guaranteed Black and WhiteRecruits Seen by Each Classifier: Great Lakes Sample;
Final Assignment Criterion(n=3,622)
Classifier RaceClassifier
Number
Black1
White
1
2
3
4
5
6
7
8
9
10
11
12
13
Black Recruits White RecruitsMean n Mean n
.2586 58 .3738 107
.1935 31 .2500 88
.1875 96 .4489 323
.0923 65 .3250 200
.0635 63 .3656 186
.0690 58 .4670 197
.0536 112 .4010 384
.1587 63 .4479 192
.1023 88 .3906 256
.2368 76 .5030 165
.1064 47 .4247 186
.0000 8 .3404 47
.1719 64 .3774 204
.2456 57 .4279 201
34 20

TABLE 8
Average Criterion ScoreS for Non-School Guaranteed Black and WhiteRecruits Seen by Each Classifier: Orlando Sample;
Final Assignment Criterion(n=3,285)
Classifier RaceClassifierNumber
Black Recruits White RecruitsMean n Mean n
1 .1455 55 .2678 183
Black 2 .1410 78 .2353 204
3 .1569 102 .2939 262
4 .1053 76 .2467 227
- - wie 11 mi. OW 4 MI 4 MI
1 .0877 57 .2643 193
2 .0694 72 .1972 213
3 .0000 9 .0857 35
White 4 .0517 58 .2353 187
5 .2041 49 .1414 996 .0849 106 .2826 361
7 .0833 24 .1077 65
8 .0901 111 .2476 315
9 .0323 31 .3451 113
3521

TABLE 9
Average Criterion Scores for Black and White Recruits Seenby Each Classifier: San Diego Sample;
Cost Criterion(n=6,275)
Classifier RaceClassifier Black Recruits White Recruits
Number Mean n Mean n.....
Black
White
1 1796.08 12 2176.93 230
2 521.45 31 2023.19 298
3 752.73 11 2360.60 131
1 548.08 36 2245.03 454
2 1257.35 31 2212.50 420
3 962.39 26 2292.40 403
4 960.56 16 2133.64 200
5 1330.50 26 2183.95 378
6 1227.46 35 2246.41 424
7 0.00 8 2306.98 81
8 185.32 5 1671.51 53
9 1227.12 33 2088.54 381
10 434.71 21 2221.61 380
11 917.43 30 2426.88 434
12 455.46 24 2246.75 262
13 951.35 23 1997.06 399
14 1354.29 34 2128.20 393
15 0.00 4 2434.21 85
1, 461.06 33 2526.36 430
36 22

TABLE 10
Average Criterion Scores for Black and White Recruits Seenby Each Classifier: Great Lakes Sample;
Cost Criterion(n=5,627)
Classifier RaceClassifier Black Recruits White Recruits
Number Mean n Mean n
Black
White
1 678.83 65 1774.97 176
1 457.09 34 1579.85 143
2 682.50 109 1994.78 551
3 352.38 71 1915.02 350
4 354.21 70 1995.63 324
5 351.02 66 2014.45 319
6 299.74 123 2049.59 6537 616.39 70 1947.42 323
8 605.72 105 1987.76 4399 687.49 83 2197.40 263
10 432.35 51 2280.74 352
11 0.00 8 1611.99 74
12 685.03 73 1939.80 350
13 653.59 61 1836.09 321

TABLE 11
Average Criterion Scores for Black and White Recruits Seen
by Each Classifier: Orlando Sample;
Cost Criterion(n=5,850)
Classifier RaceClassifier Black Recruits White Recruits
Number Mean n Mean n
Black
White
38
1 1019.13 68 2348.86 387
2 1129.90 105 2135.95 424
3 758.04 120 2193.65 517
4 463.35 82 1934.24 424
1 657.64 69 2101.49 395
2 483.14 79 2002.04 410
3 814.82 11 1972.72 71
4 525.46 65 2069.69 343
5 626.50 52 1996.46 187
6 794.41 131 1986.26 688
7 595.64 25 1417.41 106
8 881.48 138 2111.73 641
9 674.35 40 2660.R1 272
24
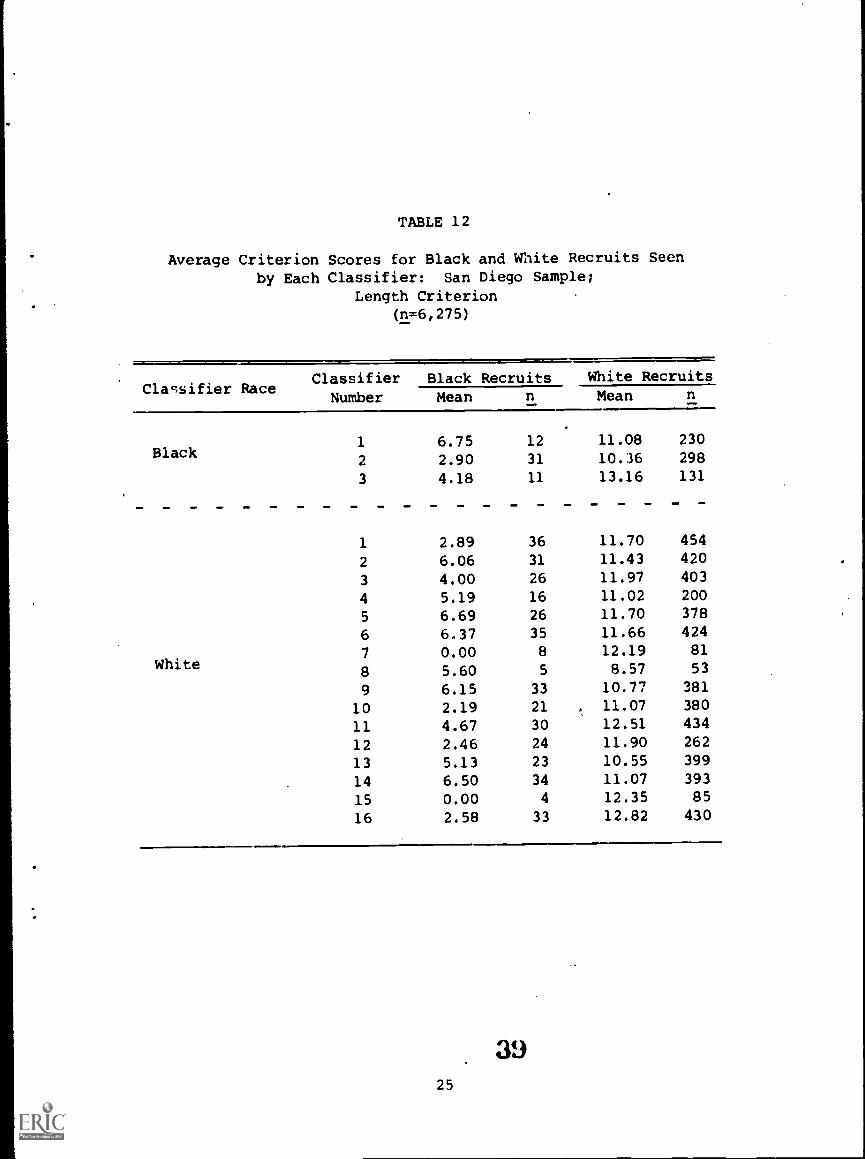
TABLE 12
Average Criterion Scores for Black and White Recruits Seenby Each Classifier: San Diego Sample;
Length Criterion(n=6,275)
Classifier RaceClassifier Black Recruits White Recruits
Number Mean n Mean n
Black
White
1 6.752 2.90
3 4.18
1 2.89
2 6.06
3 4.00
4 5.19
5 6.696 6.37
7 0.00
8 5.60
9 6.1510 2.19
11 4.67
12 2.4613 5.13
14 6.50
15 0.0016 2.58
12 11.08 230
31 10.36 298
11 13.16 131
aft ml
36 11.70 454
31 11.43 420
26 11.97 403
16 11.02 200
26 11.70 378
35 11.66 424
8 12.19 81
5 8.57 53
33 10.77 381
21 11.07 380
30 12.51 434
24 11.90 262
23 10.55 399
34 11.07 393
4 12.35 85
33 12.82 430
3925

TABLE 13
Average Criterion Scores for Black and White Recruits Seen
by Each Classifier: Great Lakes Sample;
Length Criterion(n=5,627)
Classifier RaceClassifier
NumberBlack Recruits White Recruits
Mean n Mean n
Black1 3.79 65 9.90 176
alw IMP - -1 2.71 34 7.98 143
2 3.62 109 10.42 551
3 1.87 71 9.71 350
4 1.'7 70 10.42 324
5 2.02 66 10.08 319
White 6 1.60 123 10.68 653
7 3.21 70 10.19 323
8 3.10 105 10.49 439
9 3.60 83 10.78 263
10 2.35 51 11.71 352
11 0.00 8 8.47 74
12 3.59 73 9.73 350
13 3.49 61 9.92 321
4026

TABLE 14
Average Criterion Scores for Black and White Recruits Seenby Each Classifier: Orlando Sample;
Length Criterion(n=5,850)
Classifier RaceClassifier Black Recruits White Recruits
Number Mean n Mean n
Black
1 5.60 68 11.76 387
2 5.60 105 11.07 424
3 3.94 120 11.30 517
4 2.49 82 9.78 424
White
1 3.52 69 10.78 395
2 2.62 79 10.54 410
3 4.27 11 10.52 71
4 2.73 65 10.38 343
5 2.98 52 9.67 187
6 3.97 131 10.32 688
7 2.88 25 7.08 106
8 4.51 138 10.97 641
9 3.43 40 13.60 272
27

TABLE 15
Average Criterion Scores for Black and White Recruits Seenby Each Classifier: San Diego Sample;
Saturation Criterion(n=6,275)
Classifier RaceClassifier Black Recruits White Recruits
Number Mean n Mean
Black
White
1 .2138
2 .2173
3 .2100
1 .2145
2 .2218
3 .2012
4 .1982
5 .1898
6 .1859
7 .2730
8 .1908
9 .1998
10 .2457
11 .1897
12 .2329
13 .1697
14 .1910
15 .2730
16 .2264
12 .1102 230
31 .0986 298
11 .0958 131
36 .1020 454
31 .0986 420
26 .1014 403
16 .1128 200
26 .0969 378
35 .1043 424
8 .1263 81
5 .1464 53
33 .1114 381
21 .1000 380
30 .0926 434
24 .1045 262
23 .0993 399
34 .1034 393
4 .0765 85
33 .0922 430
42
28

TABLE 16
Average Criterion Scores for Black and White Recruits Seenby Each Classifier: Great Lakes Sample;
Saturation Criterion(n=5,627)
Classifier RaceClassifier Black Recruits White Recruits
Number Mean . n Mean n
Black
White
1 .2179
1 .2256
2 .2193
3 .2477
4 .24395 .2412
6 .2496
7 .2252
8 .2258
9 .2237
10 .2421
11 .2730
12 .2207
13 .2230
65 .1404 176
111P
34 .1568 143
109 .1295 551
71 .1440 350
70 .1299 324
66 .1312 319
123 .1367 653
70 .1317 323
105 .1293 439
83 .1211 263
51 .1218 352
8 .1451 74
73 .1348 350
61 .1390 321
43
29

TABLE 17
Average Criterion Scores lur 131ack Atid Wnilc! RectuiLs Seen
by Each Classifier: Orlando Sample;
Saturation Criterion(n =5, 850)
Cla.sifier RaceClassifier.
Number
Black
White
1
2
3
4
1
2
3
4
5
6
7
8
9
Black Recruits White Recruits
Mean n Mean
.2138 68 .1250 387
.1987 105 .1308 424
.2170 120 .1285 517
.2390 82 .1365 424
.2278 69 .1306 395
.2430 79 .1402 410
.2334 11 .1455 71
.2413 65 .1427 343
.2251 52 .1498 187
.2254 131 .1316 6138
.2530 25 .1721 106
.2217 138 .1316 641
.2291 40 .1076 272
44 30

TABLE 18
Average Criterion Scores for Black and White Recruits Seenby Each Classifier: San Diego Sample;
Recommendation Criterion(n=6,275)
Classifier RaceClassifier Black Recruits White Recruits
Number Mean n Mean n
Black1 .1388
2 .2208
3 .2610
White
1 .1956
2 .1189
3 .3002
4 .2027
5 .2782
6 .2498
7 .0000
8 .4000
9 .3008
10 .1227
11 .2383
12 .2152
13 .3104
14 .3456
15 .0000
16 .1826
12 .4375 230
31 .4273 298
11 .4692 131
36 .4848 454
31 .4915 420
26 .5184 403
16 .4038 200
26 .4765 378
35 .4210 424
8 .4040 81
5 .3364 53
33 .4711 381
21 .4643 380
30 .5023 434
24 .4729 262
23 .4965 399
34 .5312 393
4 .5302 85
33 .4726 430
45
31

TABLE 19
Average Criterion Scores for Black and White Recruits Seen
by Each Classifier: Great Lakes Sample;
Recommendation Criterion(n=5,627)
Classifier RaceClassifier Black Recruits White Recruits
Number Mean n Mean n
Black
White
1
1
2
3
4
5
6
7
8
9
10
11
12
13
.2764 65
.2235 34
.2040 109
.1045 71
.1264 70
.1369 66
.1119 123
.1427 70
.1893 105
.2396 83
.1217 51
.0000 8
.1638 73
.2267 61
.3858 176
.3018 143
.4405 551
.3691 350
.3918 324
.4612 319
.4177 653
.4085 323
.3941 439
.4175 263
.3893 352
.4128 74
.3717 350
.4703 321
4632

TABLE 20
Average Criterion Scores for Black and White Recruits Seenby Each Classifier: Orlando Sample;
Recommendation Criterion(n=5,850)
Classifier RaceClassifier Black Recruits White Recruits
Number Mean Mean
Black
1 .2163
2 .2718
3 .1981
4 .1280
White
1 .1577
2 .1099
3 .0606
4 .1064
5 .2368
6 .1950
7 .0542
8 .1850
9 .1587
68 .3204 387
105 .3230 424
120 .3182 517
82 .3358 424
69 .3522 395
79 .2809 410
11 .2352 71
65 .3293 343
52 .2773 187
131 .3348 688
25 .3360 106
138 .3287 641
40 .3540 272
47
33

TABLE 21
Analysis of Variance Summary Tables for theFinal As Criterion
San Diego Sample
Source of Variation SS df MS
A: Classifier Race .0005 1 .0005 -__ a
C/A: Classifier WithinRace .3008 17 .0177 1.69*
B: . Recruit Race .6412 1 .6412 75.26***
AB .0101 1 .0101 1.19
BC/A .1448 17 .0085 1M. MIN 4M
S/ABC 34.2800 3261 .0105
Great Lakes Sample
Source of Variation SS df MS
A: Classifier Race .0052 1 .0052
C/A: Classifier WithinRace .0778 12 .0065 2.03*
B: Recruit Race .0683 1 .0683 18.16**
AR .0108 1 .0108 2.87
BC/A .0451 12 .0038 1.19
S/1BC 11.6300 3594 .0032
Orlando Sample
Source of Variation SS df MS
A: Classifier Race .0161 1 .0161 4.38
C/A: Classifier WithinRace .0403 11 .0037 1.38
B: Recruit Race .0919 . 1 .0919 20.85***
AB .0000 1 .0000
BC/A .0485 11 .0044 1.64
S/A3C 8.7418 3259 .0027
Note.
`;Indicates F ratio equal to, or less than, 1.00.
*Significant at the .05 level.**Significant at the .01 level.
***Significant at the .001 level.
34

TABLE 22
Analysis of Variance Summary Tables'for theSchool Cost Criterion
San Diego Sample
Source of Variation SS df MS F
A: Classifier Race 68,634.4 1 68,634.4 AM OM =lb
C/A: Classifier WithinRace 2,310,391.5 17 135,905.4 OM OM OM.
B: Recruit Race 8,581,695.9 1 8,581,695.9 56.70***
AB 98,678.4 1 98,678.4BC/A 2,572,924.3 17 151,348.5 1.06
S/ABC 890,757,689.0 6237 142,818.3
Source of Variation
Great Lakes Sample
SS df MS F
A: Classifier Race 379.0 1 379.0 - - -C/A: Classifier Within
Race 650,620.4 12 54,218.0 1.04
B: Recruit Race 3,068,919.0 1 3,068,919.0 118.83***
AB 66,588.4 1 66,588.4 2.58
BC/A 309,903.4 12 25,825.0 oMP
S/ABC 290,993,671.0 5599 51,972.0
Orlando Sample
Source of Variation SS df MS F
A: Classifier Race 114,582.5 1 114,582.5 1.56C/A: Classifier Within
Race 806,646.0 11 73,312.0 1.34
B: Recruit Race 9,894,830.1 1 9,894,830.1 224.70***
AB 3,760.1 1 3,760.1
BC/A 484,525.1 11 44,048.0S/ABC 319,058,142.0 5824 54,783.0
*Significant at the .05 level.**Significant at the .01 level.
***Significant at the .001 level.
49
35

TABLE 23
Analysis of Variance Summary Tables for theSchool Length Criterion
San Diego Sample
Source of Variation SS df MS F
A: ClaF;s1fior klco .30 1 .30
C/A: Cla6s1fier WithinRace 35.40 17 2.08
B: Recruit Race 255.71 1 255.71 66.12***
AB .25 1 .25
BC/A 65.74 17 3.87 1.15
S/ABC 20,948.40 6237 3.36
Source of Variation
Great Lakes Sample
SS df MS F
A: Classifier Race .58 1 .58
C/A: Classifier WithinRace 16.22 12 1.35 1.08
B: Recruit Race 86.24 1 86.24 118.50***
AB .93 1 .93 1.38
BC/A 8.74 12 .73
S/1BC 7,025.31 5599 1.25
Orlando Sample
Source of Variation SS df MS F
A: Classifier Race 3.21 1 3.21 1.50
C/A: Classifier WithinRace 23.52 11 2.14 1.60
B: Br:(!ruit Race 252.89 1 252.89 242.10***
AB 1.94 1 1.94 1.86
BC/A 11.49 11 1.04
S/ABC 7,845.60 5824 1.34
*Significant at the .05 level.
**Significant at the .01 level.
***Significant at the .001 level.
.

TABLE 24
Analysis of Variance Summary Tables for theSaturation Criterion
San Diego Sample
Source of Variation SS df MS
A: Classifier Race .0000 1 .0000 an...Mane
C/A: Classifier WithinRace .0078 17 .0005 1.25
B: Recruit Race .0615 1 .0615 107.10***
AB .0000 1 .0000 ___
BC/A .0098 17 .0006 1.50
SABC 2.2140 6237 .0004
Great Lakes Sample
Source of Variation SS df MS F
A: Classifier Race .0001 1 .0001 elM
C/A: Classifier WithinRace .0025 12 .0002 1.49
B: Recruit Race .0147 1 .0147 108.74***
AB .0002 1 .0002 2.00
BC/A .0016 12 .0001
S/ABC .8144 5599 .0001
Source of Variation
Orlando Sample
SS df MS F
A: Classifier Race .0009 1 .0009 3.04
C/A: Classifier WithinRace . .0032 11 .0003 1.92*
B: Recruit Race .0454 1 .0454 487.86***
AB .0001 1 .0001 MIONIOIM
BC/A .0010 11 .0001 MIO AND M.
S/ABC .8882 5824 .0002
*Significant at the .05 level.**Significant at the .01 level.
***Significant at the .001 level.
5137

TABLE 25
Analysis of Variance ::ummary Tables for theRecommendation Criterion
San Diego Sample
Source of Variation SS df MS
A:
C/A:
I,:
AR
RC/A
S/ABC
Classifier RaceClassifier Within
Race,
Recruit Race
.0015
.1125
.3016
.0000
.1298
36;5908
1
17
1
1
17
6237
.0015
.0066
.30.16
.0000
.007h
.0059
1.28
39.H***
1.30
Great Lakes Sample
Source of Variation SS dt MS
A:
C/A:
B:
ABBC/AS/MC
Classifier RaceClassifier Within
RaceRecruit Race
.0052
.0367
.0601
.0092
.0373
12.6434
1
12
1
1
12
5599
.0052
.0031
.0601
.0092
.0031
.0022
1.69
1.39
19.34***
2.97
1.41
Orlando Sample
Source of. Variation SS df MS F
A: Classifier Race .0072 1 .0072 2.56
C/A: Classifier WithinRace .0310 11 .0028 1.43
B: Recruit Race .1202 1 .1202 56.02***
AB .0039 1 .0039 1.81
BC/A .0236 11 .0021 1.09
S/ABC 11.4740 5824 .0020
*Significant at the .05 level.
**Significant at the .01 level.
***Significant at the .001 level.
5238

TABLE 26
Grand Summary Table:
Bias Criteria
Source of Variation
F Ratios
Final Assignment
School Cost
San
Great
Diego
Lakes
Orlando
San
Great
Diego
Lakes
Orlando
A:
Classifier Race
4.38
1.56
C/A:
Classifier Within
Race
1.69*
2.03*
1.38
1.04
1.34
B:
Recruit Race
75.26***
18.16**
20.85***
56.70***
118.83***
224.70***
AB
1.19
2.87
2.58
BC/A
1.19
1.64
1.06
S/ABC
(Continued on next page)
*Significant at
the
.05
level.
**Significant at
the
.01
level.
***Significant at
the
.001
level.

TABLE 26 (continued)
F Ratios
Source of Variation
School Length
Racial Satunition
San
Diego
Great
Lakes
Orlando
San
Great
Diego
Lakes
Orlando
A:
Classifier Race
1.50
3.04
C/A:
Classifier Within
Race
1.08
1.60
1.25
1.49
1.92*
B:
Recruit Race
66.12***
118.50***
242.10***
107.10***
108.74***
487.86***
AB
L.38
1.86
2.00
BC/A
1.15
1.50
S/ABC
(Continued on next page)
*Significant
at
the
.05
**Significant
at
the
.01
***Significant
at
the
.001
level.
level.
level.
rip
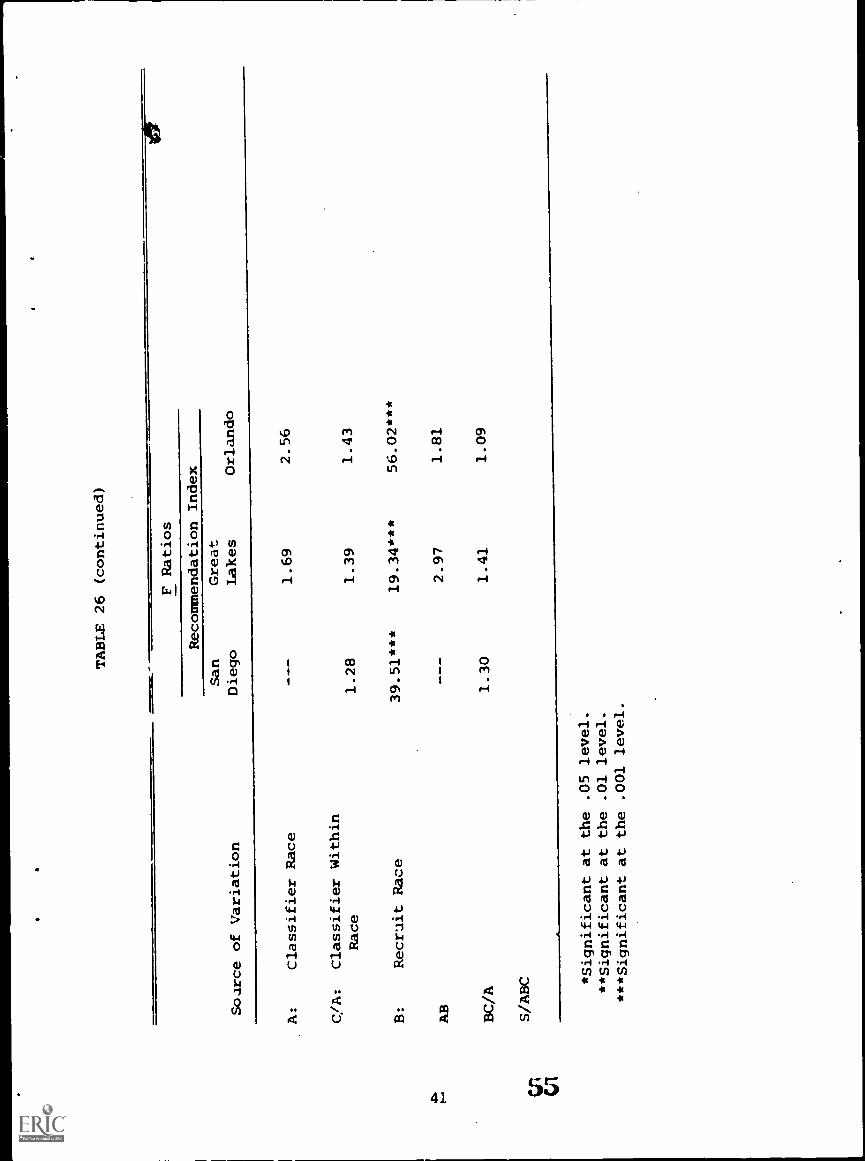
TABLE 26 (continued)
F Ratios
Soarce of Variation
Recommendation Index
San
Diego
Great
Lakes
Orlando
A:
Classifier Race
1.69
2.56
C/A:
Classifier Within
Race
1.28
1.39
1.43
B:
Recruit Race
39.51***
19.34***
56.02***
AB
2.97
1.81
BC/A
1.30
1.41
1.09
S/ABC *Significant at
the
.05
level.
**Significant at
the
.01
level.
***Significant at
the
.001
level.

1.ias among classifiers would be revealed by the BC/A inter -act ions of the analyses of variance based on the "A" school criteria.It can be seen by examining Table 26 that none of the 15 SC /A inter-actions eomputed reached the .05 level of significance, and that 10of the 15 F ratios were less than 1.00. Thus, there is no reason tobelieve that individual classifiers differ significantly in theirdifferential assignments of black and white recruits.
Other Significant Factors Related to "A" School Criteria
Recruit race. Table 26 reveals a large and significant maineffect for factor B, recruit race, for all criteria. This indicatesthat in general, white recruits are more likely to receive "A" schoclassignments than are black recruits. Further, the training receivedb., white recruits is likely to be longer, more expensive, and inratings where there are fewer black recruits.
This finding does not represent differential bias, since itcharacterizes black and white classifiers alike, and is characteristicof classifiers within race. More likely, it represents the fact thatwhite recruits are more likely than black recruits, on the average,to have met the background and aptitude requirements for "A" schooltraining, particularly in the more technical ratings.
Classifier differences in final assignment. The only otherfactor upon which significant differences were obtained was theC/A factor. At San Diego and Great Lakes, this effect was signi-ficant for the final assignment criterion, and at Orlando it wassignificant for the racial saturation criterion. This findingindicates significant individual differences between classificationspecialists in their treatment of recruits, regardless of their ownor the recruits' race.
Omega square (w7) values were computed to determine theproportion of the total variance accounted for by classifierdifferenes. For the final assignment criterion, W2 values forthe C factor were .013 at San Diego and .007 at Great Lakes. Thesecorrespond roughly to correlations of .12 and .09, respectively.,For the racial saturation index criterion, the C effect had an (0'value of .006 at Orlando, corresponding roughly to a correlationof about .08. Thus, while these C/A effects are statistically
56
42

significant, they account for only about 1 percent of thecriterion variance, and fall in a range that generally isregarded as not reflecting any practical significance. The
statistical significance arose primarily due to the large samplesizes in the present investigation,
CONCLUSIONS
Within the limits of the conditions studied, there is nosignificant differential bias among classification specialistsin their recommendations for, and assignment to, school trainingfor black and white recruits. Sample sizes were so large thatbias accounting for as little as 1 percent of the criterionvariance would have been detected as significant. Thus, therewas neither statistically nor practically significant bias presentamong classification specialists. Since samples were drawn fromall three major Navy training centers, these findings can beconsidered to be generally true for Navy classification in thesesettings. Possible generalization to classification under otherconditions, such as at the Navy recruiting stations, must awaitreplicated studies in such settings.
43

REFERENCES
58
45

0131\1-
so's'REFERENCES
Bureau of Naval Personnel, Washington, D. C. Annual training
lime and cost for Navy ratings and NECs. (NAVPERS 18660,
FY-73 edition.)
Chief of Naval Operations/Vice Chief of Naval Operations, Action
Sheet #613-71, Opportunity for minority enlisted personnel,
of 16 July 1971.
Myers, J. L. Fundamentals of experimental design. Boston: Allyn
and Bacon, 1966.
Myers, J. L. Fundamentals Df experimental design, (2nd ed.). Boston:
Allyn and Bacon, 1972.
Sattler, J. M. Racial "experimenter effects" in experimentation,
testing, interviewing, and psychotherapy. Psychological
Bulletin, 1970, 73, 137-160.
Winer, B. J. Statistical principles in experimental design. New
York: McGraw-Hill, 1962.
Winer, B. J. Statistical principles in experimental design,(2nd ed.).
New York: McGraw-Hill, 1971.
47
5.9

DISTRIBUTION LIST
ONR Distribution
!)t. Marshall J. Farr, DirectorPersonnel & Training ResearchPrograms
Office of Naval Research(Code 458)
Arlington, VA 22217 (4)
oaR Branch Office.4495 Summer St.
Boston, MA 02210
Attn: Research Psychologist (1)
ONR Branch Office536 S. Clark St.Chicago, IL 60605
Attn: M. A. Bertin
DirectorNaval Research Laboratory
(Code 2627)
Washington, DC 20390
Special Assistant for
ManpowerOASN (M&RA)Pentagon, Rm. 4E794Washington, DC 20350
Chief of Naval Reserve(Code 3055)
New Orleans, LA 70146
Dr. Lee MillerNaval Air Systems CommandAIR-413EWashin(7ton, DC 20361
CAPT Ouida C. Upchurch, USN
Program4bordinatorBureau of Medicine & Surgery
(Code 71G)
Washington, DC 20372
(1)
(6)
(1)
(1)
(1)
(1)
49
ChiefBureau of Medicine & SurgeryResearch Division
(Code 713)
Washington, DC 20372
Mr. Arnold RubinsteinNaval Material Command
(NAVMAT 03424)
Rm. 820, Crystal Plaza #6Washington, DC 20360
Dr. Richard J. NiehausOffice of Civilian Manpower
Management(Code 06A)
Washington, DC 20390
Department of the NavyOffice of Civilian Manpower
Management(Code 263)
Washington, DC 20390
Dr. William L. MaloyPrincipal Civilian Advisor
for Education & TrainingNaval Training Command
(Code 01A)
Pensacola, FL 32508
Dr. Alfred F. Smode,Staff Consultant
Training Analysis &Evaluation Group
Naval Training EquipmentCenter (Code N -OOT)
Orlando, FL 32813
Dr. Banns H. WolffTechnical Dir. (Code N-2)
Naval Training EquipmentCenter
Orlando, FL 32813
60

Special Assistant to theChief of Naval Personnel(P(.r--oc)
Hur-itt of Naval Prs-nnelWashington, DC 20370
Dr. H. Wallace Sinaikoc/o Office of Naval Research
(Code 450)
,zesychological Sciences Div.4P Arlington, VA 22217
4.1! Deputy & Chief ScientistOffice of Naval Research
(Code 102)
Arlington, VA 22217
Manager, Program in ManpowerR&D
Office of Naval Research(Code 450)
Arlington, VA 22217
Chairman, Planning Committeefor the Program in ManpowerR&D
Office of Naval Research(Code 430)
Arlington, VA 22217
Assistant Chief for ResearchOffice of Naval Research
(Code 400)
Arlie ,ton, VA 22217
Director of ResearchOffice of Naval Research
(Code 401)
Arlington, VA 22217
Head of Manpower Training& Reserve Group(OP -964D)
Pentagon, km. 4/638Washington, DC 20350
Assistant to the AssistantDeputy Chief. of Naval
Operations (Mnpower)(OP-018'1,2)
(1) Pentagon, Rm. 4E473Washington, DC 20350
(4)
Deputy Director, ProgramMgmt. Office
Naval Material Command(03PB)
Crystal Plaza #6, Rm. 868Arlington, VA .20360
Assistant for Research Liaison(1) Bureau of Naval Personnel
(Pers-Or)
Arlington Annex, Rm. 1416Washington, DC 20370
Head, Program Development &(12) Coordination Branch
Bureau of Naval Personnel(Pers-225)
Washington, DC 20370
(1)
(1)
HeadquartersU. S. Army Admin. CenterPersonnel Admin. CombatDevelopment ActivityATCP-HRO
Ft. Benjamin Harrison, IN46249
Armed Forces Staff CollegeNorfolk, VA 23511
Attn: Library
(1) Deputy CommanderU. S. Army Institute ofAdministration
Fort Benjamin Harrison,IN 46216
Attn: EA
(1)
61
(1)
(1)
(1)
(1)
( 1 )

Dr..Stanloy L. CohenU. S. Army Research Institute1300 Wilson Blvd.Arlington, VA 22209
Dr. Ralph DusekU. S. Army Research Institute1300 Wilson Blvd.Arlington, VA 22209
Mr. Edmund F. FuchsU. S. Army Research Institute1300 Wilson Blvd.Arlington, VA 22209
Dr. J. E. UhlanerTechnical DirectorU. S. Army Research Institute1300 Wilson Blvd.Arlington, VA 22209
Research Branch (AF/DPXYR)Pentagon, Rm. 5C428Washington, DC 20330
Dr. Robert A. Bottenberg(AFHRL/SM)
Stop #63Lackland AFB, TX 78236
Dr. Martin Rockway (AFHRL/TT)Lowry AFB, Colorado 80230
AFOSR/NL1400 Wilson Blvd.Arlington, VA 22209
Mr. E. A. DoverManpower Measurement Unit
(Code MPI)
Arlington Annex, Rm. 2413Arlington, VA 20380
Commandant of the Marine CorpsHeadquarters, U. S. Marine
Corps(Code MPI-20)
Washington, DC 20380
(1)
(1)
(1)
(1)
(1)
(1)
(1)
(1)
Director, Office of ManpowerUtilization
Headquarters, Marine.Corps(Code MPU)
MCB (Building 2009)
QuanticD, VA 22134
Dr. A. L. SlafkoskyScientific. Advisor
(Code RD-1)
Headquarters, U. S. MarineCorps
Washington, DC 20380
Director for Manpower ResearchOffice of the Secretary of
DefensePentagon, Rm . 3D129Washington, DC 20301
(1)
(1)
(1)
Assistant Director forEnvironmental & Life Sciences
Office of the Director ofDefense Research & Engineering
Pentagon, Rm. 3D129Washington, DC 20301 (1)
Military Assistant for HumanResources
Office of the Director ofDefense Research & Engineering
Pentagon, Rm. 3D129Washington, DC 20301
Special Assistant for AllVolunteer Force Action
OSD (M&RA)Rm. 2C270, PentagonWashington, DC 20301
Dr. Louis A. MedinOAD (E&LS) ODDR&EPentagon, Rm. 3D129Washington, DC 20301
COZ51
(1)
(1)
(1)

I;!'( )f, H(.nty H. Taylor, truwFor Hunkirr
Re, -II
UAD (EtvLS) ODDRNP. ntagon, Rm. 3D129
Washington, DC 20301
COL Austin W. KiblerAdvanced Research Projects
AgencyHuman Resources ResearchOffice
1400 Wilson Blvd.
Arlington, VA 22209
Dr. Lorraine D. EydePersonnel Research & Develop-ment Center
U. S. Civil Service Commission1900 E. Street, NWWashington, DC 20415
Dr. William Gorham, DirectorPersonnel Research & Develop-ment Center
U. S. Civil Service Commission1900 E. Street, NWWashington, DC 20415
Dr. Vern UrryPersonnel Research & Develop-ment Center
U. S. Civil Service Commission1900 E. Street, NWWashington, DC 20415
Dr. John AnnettThe Open UniversityMilton KeynesBuckinghamshireEngland
Dr. Richard C. AtkinsonStanford UniversityD(Tt. of Psychology:Hanford, eA 940P)
(1)
(1)
(1)
(1)
(1)
(1)
(1)
63
Dr. Gerald V. BarrettUniversity of AkronDept. of PsychologyAkron, OH 44325
Dr. Bernard M. BassUniversity of RochesterManagement Research Cente'r
Rochester, NY 1462
Dr. Philip G. BernardB-K Dynamics, Inc.2351 Shady Grove RoadRockville, MD 20850
Dr. Jack R. BorstingU. S. Naval Postgraduate SchoolDept. of Operations ResearchMonterey, CA 93940
Dr. David G. BowersUniversity of MichiganInstitute for Social ResearchAnn Arbor, MI 48106
Mr. Michael W. BrownOperations Research, Inc.
1400 Spring St.Silver Spring, MD 20910
Gentry Research Corporation4113 Lee HighwayArlington, VA 22207
Dr. A. CharnesBEB 512University of TexasAustin, TX 78712
Dr. Kenneth E. ClarkUniversity of RochesterCollege of Arts & SciencesRiver. Campus StationRochester, NY 14627
(1)
(1)
(1)
(1)
(1)
(1)
(1)
(1)

Dean W. W. CooperClrnoyie-Mellon UniversitySehoo: of Urban & Public
Afiairs
Pittsburgh, PA 15213
Dr. Rene' V. DawisUniversity of MinnesotaDept. of PsychologyMinneapolis, MN 55455
Dr. Norman R. DixonRm. 170190 Lothrop St.Pittsburgh, PA 15260
Dr. Robert DubinUniv. of CaliforniaGraduate School of
AdministrationIrvine. CA 92664
Dr. Marvin D. DunnetteUniversity of MinnesotaDept. of PsychologyMinneapolis, MN 55455
ERICProcessing & Reference
Facility4833 Rugby AvenueBethesda, MD 20014
Dr. Barry M. FeinbergBureau of Social Science
Research, Inc.1990 M. Street, NWWashington, DC 20036
Dr. Victor FieldsMontgomery CollegeDept. of PsychologyRockville, MD 20850
Dr. Edwin A. FleishmanAmerican Institutes for
ResearchFoxhall Square
:1) 3301 Now Mexico Ave, NWWashington, DC 20016
nr. Robert Glaser, Directoruniversity of Pittsburgh
(1) Learning Research &Development Center
Pittsburgh, PA 15213
Dr. Gloria L. Grace(1) System Development Corp
2500 Colorado Ave.Santa Monica, CA 90406
M.. Harry H. HarmanEducational Testing Service
(1) Princeton, NJ 08540
Dr. Richard S. HatchDecision Systems Associates,
Inc.
(1) 11428 Rockville PikeRockville, MD 20852
HumRRODivision No. 3P.O. Box 5787
(1) Presidio of Monterey,CA 93940
HumRRODivision No. 4, InfantryP.O. Box 2086
(1) Fort Benning, GA 31905
Dr. Lawrence B. JohnsonLawrence Johnson &Associates, Inc.
(1) 200 S. Street, NW, Suite 502Washington, DC 20009
53 64
(1)
(1)
(1)
(1)
(1)
(1)
(1)
(1)

Dr. E.-f.ra KrondelUniver:1117 of Pennsylvania
Dept. of Operations ResearchPhiladelphia, PA 19104
Mr. W. E. LassiterData Solutions Corporation5272 River Road, Suite 100Bethesda, MD 20016
Dr. Ernest J. McCormickPurdue UniversityDept. of Psychological
SciencesLafayette, IN 47907
Dr. Robert R. MackieHuman Factors Research, Inc.6780 Cortona Dr.Santa Barbara Research ParkGoleta, CA 93017
(1)
(1)
(1)
Dr. Leo Munday, Vice-PresidentAmerican College Testing
ProgramP.O. Box 1b8Iowa City, IA .52240
Mr. Luigi Petrullo2431 N. Edgewood StreetArlington, VA 22207
Dr. Diane M. Ramsey-KleeR-K Research & System Design
3947 Ridgemont Dr.Malibu, CA 90265
Dr. Joseph W. RigneyUniv. of Southern CaliforniaBehavioral Technology
Laboratories3717 South Grandbos Angeles, CA 90007
Dr. Leonard L. Rosenbaum,Chairman
Montgomery CollegeDept. of.PsychologyRockville, MD 20850
(1)
(1)
(1)
(1)
(1)
Dr. George E. RowlandRowland and Company, inc.P.O. Box 61Haddonfield, NJ 08033
Dr. Arthur I. SiegelApplied Psychological. Services
404 East Lancaster Ave.Wayne, PA 19087
Dr. C. Harold Stone1428 Virginia Ave.Glendale, CA 91202
Dr. David J. WeissUniversity of MinnesotaDept. of PsychologyM.rdieapolis, MN 55455
NPRDC Distribution
Assistant Secretary of the Navy (Manpower & Reserve Affairs) (2)
Assistant Secretary of the Navy (Research & Development)Chief of Naval Operations:
(0P-39)
tiP-59)
(0P-098T)
(0P-099) (2)
(0P-964)
(0P-987E)
Chief of Naval Personnel:(Pers-Od) (Pers-212)
(Pers-1) (Pers-226)(Pers-5) (Pers-51)
(Pers-6) (Pers-52)
(Pers -lOc) (Pers-524)
(Pers-2x) (Pers-61)
Chief of Naval Technical TrainingChief of Naval Education & Training (CNET N-33)Chief of Naval Material (NMAT-0308)Chief of Naval Education and Training SupportOffice of Assistant Secretary of Defense (M&RA)Commander in Chief, U. S. Pacific FleetCommander in Chief, U. S. Atlantic FleetCommander SECOND FleetCommander THIRD FleetCommander Training Command, U. S. Pacific FleetCommander Training Command, U. S. Atlantic FleetCommander, Navy Recruiting Command:
(Code 00)
(Code 015)
(Code 20)(Code 20a)
(Code 312)
(Code 22)
(Code 24)
(Code 33)
Commander, Naval Training Center, Great LakesCommander, Naval Training Center, OrlandoCommander, Naval Training Center, San DiegoCommander, Naval Electronics Laboratory Center (2)
Commanding Officer, Manpower & Material Analysis Center, PacificCommanding Officer, Navy Medical Neuropsychiatric Research UnitCommanding Officer, Naval Aerospace Medical Institute (2)
Commanding Officer, Naval Education & Training Program DevelopmentCenter (2)

)If icor, Nava I Development & Trd 1 in ing Cent er (( de DL:ii)
c or , Nnva 1 Submarine Medical Center (.!)
cor.viii. I oft Ler, Nava I Mod cal Research Inst i tuti.
Command officer, Service School Command, Naval Training Center,
BainbridgeC-mmonding Officer, Service School Command, Naval Training Center,
i:reat Lakes
Commanding Officer, Service School Command, Naval Training Center,Orlando
Commanding Officer, Service School Command, Naval Training Center,San Diego
Commanding Officer, Naval Training Equipment CenterCommanding Officer, Naval Education & Training Support Center, Pacificcfnter for Naval AnalysesChi.,f of Rr!seach & Development, U. S. ArmyD. Army Enlisted Evaluation Center (2)
Human Resources Development Div., U. S. Army Personnel &Administration Combat Developments Activity, Fort Benjamin Harrison
Army Research Institute for Behavioral & Social SciencesCommander, Personnel Research Div., Air Force Human Resources
Laboratory, Lackland Air Force Base (2)
Personnel Research Div., Air Force Human Resources Laboratory(APSC), Lackland Air Force Base (2)
Occupational Research Div., Air Force Human Resources Laboratory(AFSC) , Lackland Air Force Base
Headquarters, U. S. Marine Corps (Code MPI)Commandant, U. S. Coast Guard (Code B-5)Superintendent, U. S. Naval AcademySuperintendent, U. S. Air Force AcademySuperintendent, Naval Postgraduate SchoolSuperintendent, U. S. Military AcademySuperintendent, U. S. Coast Guard AcademyNational R,-search CouncilNational Science FoundationScience & Technology Div., Library of CongressDirector, Defense Documentation Center (12)
56
67
Copyright © 2022 FDOKUMEN