THE UNIVERSITY OF HULL Factors affecting customer loyalty ...
418
THE UNIVERSITY OF HULL Factors affecting customer loyalty of different strategic groups in the Vietnamese supermarket sector being a Thesis submitted for the Degree of Doctor of Philosophy in the University of Hull by THI DIEM EM NGUYEN BA, Business Administration, University of Economics Ho Chi Minh city (Vietnam), 2006 MSc, International Business and Management, University of East London (United Kingdom), 2012 January 2019
-
Upload
khangminh22 -
Category
Documents
-
view
0 -
download
0
Transcript of THE UNIVERSITY OF HULL Factors affecting customer loyalty ...

THE UNIVERSITY OF HULL
Factors affecting customer loyalty of different strategic groups in the
Vietnamese supermarket sector
being a Thesis submitted for the Degree of Doctor of Philosophy
in the University of Hull
by
THI DIEM EM NGUYEN
BA, Business Administration, University of Economics Ho Chi Minh city (Vietnam), 2006
MSc, International Business and Management, University of East London (United Kingdom),
2012
January 2019

i
ABSTRACT
The main objective of this research is to investigate factors affecting customer loyalty of
different supermarket strategic groups, as the term of strategic groups in the grocery sector
appears to have been ignored by most researchers and the topic of comprehensive factors
affecting customer loyalty are is under-researched. There were two main phases of emperical
research, including expert and supermarket-consumer interviews (Phase One) and
questionnaire survey (Phase Two). In particular, there were 3055 questionnaires collected
from 17 March 2018 to 27 July 2018 in the Vietnamese supermarkets through many
channels, including email, postal and face-to-face contact. After data screening, 2913
questionnaires remained in the dataset. The three main quantitative techniques used were
exploratory factor analysis (EFA), confirmatory factor analysis (CFA) and structural equation
modelling (SEM). The research used both SPSS and AMOS 24. The results revealed there are
seven main direct indicators for customer loyalty: retail brand experience, service quality
related to in-store employees’ knowledge and attitudes toward consumers, customer
satisfaction, promotion effects, switching costs, e-service quality related to a core e-service
quality scale, and alternative attractiveness. In that, customer satisfaction can explain only
17.8 percent variation in customer loyalty. In addition, price, habit and income also have a
slight positive impact on customer loyalty. This research also revealed seven main factors
directly and positively affecting customer satisfaction: customer perceived value, in-store
logistics, service quality related to service employees’ knowledge and attitudes toward
consumers, store image, customer experience, product quality, and alternative attractiveness
negatively relating to customer satisfaction. Besides that, switching costs and price also have
a slight direct impact on customer satisfaction. Furthermore, this research also found factors
directly and positively affecting customer perceived value, including price, in-store logistics,
trust, promotion effects, e-service quality related to a core e-service quality scale, service
quality and customer service, and that switching costs are negatively associated with
customer perceived value. The research also investigated differences across groups, including
strategic groups, age ranges, location, gender, income, education level and occupation. The
results showed that there were differences between groups regarding factors affecting
customer loyalty, customer satisfaction and customer perceived value. It is believed that the
research will prove meaningful for both academia and practitioners in understanding issues
relating to factors affecting customer loyalty, especially since multigroup analysis was
conducted to examine different relationships between constructs in the researched model; the
research also revealed that the term ‘strategic groups’ in the grocery sector should not be
ignored. The revised research framework generated in this research can be applied in any
industry or market. There are some limitations to this research which are presented in section
8.3 and recommendations for future research.

ii
ACKNOWLEDGEMENT
My PhD has been one of the most incredible milestones in my life and especially my
academic career. Spending more than 2 years full-time research with ceaseless self-learning
motivation, I have become more knowledgeable which I hope will enable me to contribute
more to the quality of education in my country, Vietnam. This thesis would have been
impossible to complete without support and encouragement from my family, supervisors and
friends.
First of all, I would like to express my deepest gratitude to my family who have
always been there to support me during my research journey, especially my mother and father
who always encourage me and give me their unconditional love. In addition, two other people
that have always been there to encourage me are my cutest baby girl, Nguyen Xuan Huyen
Anh and my partner, Charles Buchanan-Price, without whom I might not have been able to
achieve the necessary application to complete my PhD journey. Again, thank you and I love
you all, my lovely family.
Secondly, I would like to express my grateful appreciation to my first supervisor,
Professor David Bruce Grant and my second supervisor, Professor Christopher Bovis of the
University of Hull who have always shown their support and dedication while advising and
guiding my PhD work. Their valuable direction from the start of my PhD facilitated and
enhanced my whole research journey. Thanks to my supervisors’ encouragement and
guidance, I undertook self-study on quantitative research which I consider a significant
achievement in my PhD journey, and the acquisition of knowledge has been beneficial and
supportive throughout my PhD work and will remain so for the remainder of my future
academic career. Besides that, any problems related to my academic work have been guided
and quickly solved by my two incredible supervisors. I learned many things from them, have
received valuable detailed feedback at our frequent meetings, and have continually been
made aware of the importance of the quality and consistency of my work. Without my
supervisors’ dedicated and patient support, I may not have been able to complete my PhD
work. Again, Professor Grant and Professor Bovis, I feel honoured to have been one of your
PhD students.
Thirdly, I would like to thank all of my friends, colleagues and previous students who
have supported me during the data collection process; without your support, I would not have
been able to collect sufficient data to support my work. Especially, I would like to express my
appreciation to Associate Professor Xuan Lan Pham, University of Economics Ho Chi Minh
City, who is an expert in strategy and retailing in Vietnam, whose comments on the
Vietnamese retailing strategic groups facilitated my research. Thanks for your networking
introductions which enabled me to connect with other experts and participants.
Last but not least, I would like to thank John Balcombe, retired Strategy Advisor to
the BBC Trust, who has supported me immensily with his unquestionably professional
proofreading.

iii
ABSTRACT ............................................................................................................................................ i
ACKNOWLEDGEMENT .................................................................................................................... ii
LIST OF FIGURES ........................................................................................................................... viii
LIST OF TABLES ................................................................................................................................ x
LIST OF APPENDICES .................................................................................................................... xii
LIST OF ABBREVIATIONS ........................................................................................................... xiii
Chapter 1: Introduction ....................................................................................................................... 1
1.1 INTRODUCTION .............................................................................................................................. 1
1.2. RESEARCH BACKGROUND ............................................................................................................ 1
1.3. CONTEXT OF STUDY ..................................................................................................................... 3
1.4. RESEARCH OBJECTIVES ................................................................................................................ 4
1.5. RESEARCH QUESTIONS ................................................................................................................. 4
1.6. RESEARCH METHODOLOGY .......................................................................................................... 5
1.7. POTENTIAL CONTRIBUTIONS OF THIS RESEARCH ......................................................................... 5
1.8. THESIS OUTLINE ........................................................................................................................... 6
Chapter 2: Literature review ............................................................................................................... 9
2.1. AN APPROACH USED FOR SEARCHING LITERATURE REVIEW ........................................................ 9
2.2. LITERATURE REVIEW- STRATEGIC GROUPS ............................................................................... 12
2.2.1. Introduction ......................................................................................................................... 12
2.2.2. Business strategy and its performance ................................................................................ 12
2.2.3. Strategic groups................................................................................................................... 15
2.2.3.1. The origins of strategic group theory ........................................................................... 15
2.2.3.2. Strategic group theory .................................................................................................. 18
2.2.4. Competitive positioning and competitive analysis ............................................................. 24
2.2.5. Summary ............................................................................................................................. 25
2.3. RETAIL INDUSTRY ...................................................................................................................... 26
2.3.1. Introduction ......................................................................................................................... 26
2.3.2. Retail ................................................................................................................................... 26
2.3.2.1. Definition of retail and brief report on current global retail industry .......................... 26
2.3.2.2. Trends in the retailing industry .................................................................................... 30
2.3.2.3. Types of Retailers ........................................................................................................ 32
2.3.2.4. Issues related to customer buying behavior ................................................................. 32
2.3.3. Summary ............................................................................................................................. 34
2.4. THE VIETNAMESE RETAIL INDUSTRY INSIGHTS ......................................................................... 34
2.4.1. Introduction ......................................................................................................................... 34
2.4.2. Overview about the Vietnamese retail industry .................................................................. 34
2.4.2.1. Traditional retail channels: Wet markets, “Mon and Pop” small independent grocery
stores ......................................................................................................................................... 41
2.4.2.2 E-commerce .................................................................................................................. 42
2.4.3. PESTEL analysis- Industry life cycle and the five forces model ........................................ 43
2.4.4. Drivers of change in the retail industry in Vietnam ............................................................ 52
2.4.4.1. The government’s control ............................................................................................ 52
2.4.4.2. Consumer behaviour patterns ....................................................................................... 52
2.4.4.3. E-commerce ................................................................................................................. 53
2.4.5. Summary ............................................................................................................................. 53

iv
2.5. CUSTOMER LOYALTY ................................................................................................................. 53
2.5.1. Introduction ......................................................................................................................... 53
2.5.2. Consumer tastes, consumer habits, consumer preferences and consumer behaviour ......... 54
2.5.3. Customer experience and customer perceived value .......................................................... 56
2.5.4. Consumer satisfaction ......................................................................................................... 64
2.5.5. Perceived switching barriers ............................................................................................... 68
2.5.6. Brand experience................................................................................................................. 73
2.5.7. Service quality .................................................................................................................... 76
2.5.8. Corporate factors ................................................................................................................. 81
2.5.8.1. In-store logistics and store image ................................................................................. 81
2.5.8.2. Store accessibility and loyalty ...................................................................................... 87
2.5.8.3. Customer service .......................................................................................................... 89
2.5.8.4. E-service quality .......................................................................................................... 92
2.5.8.5. Loyalty programmes and promotion effects ................................................................ 94
2.5.8.6. Product quality and price ............................................................................................. 96
2.5.9. Corporate social responsibility, corporate image and customer loyalty ............................. 97
2.5.10. Trust ................................................................................................................................ 100
2.5.11. Habit ................................................................................................................................ 100
2.5.12. Customer loyalty ............................................................................................................. 101
2.5.13. Research gaps, proposed research framework and hypotheses ....................................... 103
2.5.13.1. Research gaps ........................................................................................................... 103
2.5.13.2. The proposed conceptual research framework and hypotheses ............................... 105
2.5.14. Summary ......................................................................................................................... 109
Chapter 3: Research Methodology .................................................................................................. 111
3.1. INTRODUCTION ......................................................................................................................... 111
3.2. RESEARCH OBJECTIVES AND RESEARCH QUESTIONS RESTATED .............................................. 111
3.3. RESEARCH PHILOSOPHY AND RESEARCH PARADIGMS ............................................................. 112
3.3.1. Research philosophy and research paradigms ................................................................... 112
3.3.2. Apply paradigms to the thesis research ............................................................................. 116
3.4. ETHICAL THEORIES ................................................................................................................... 118
3.4.1. Philosophy and normative ethical theories ....................................................................... 118
3.4.2. Ethical paradigm and its implication................................................................................. 120
3.5. RESEARCH PROCESS ................................................................................................................. 121
3.6. THE CHOICE OF RESEARCH METHODOLOGY ............................................................................. 123
3.7. RESEARCH METHOD: PHASE ONE_ STEP ONE_EXPERT INTERVIEWING .................................. 126
3.7.1. Chosen research strategies: semi-structured interview ..................................................... 126
3.7.2. Sample and contacting the experts .................................................................................... 127
3.7.3. Interviewing guide development ....................................................................................... 129
3.7.3.1. Preparing an interview guide ..................................................................................... 130
3.7.3.2. Core questions ............................................................................................................ 132
3.7.3.3. Translation and back translation ................................................................................ 134
3.7.3.4. Conclusion ................................................................................................................. 136
3.7.4. Data collection .................................................................................................................. 136
3.7.5. Data analysis ..................................................................................................................... 137
3.8. RESEARCH METHOD: PHASE ONE _STEP TWO_SUPERMARKET CONSUMER INTERVIEWING ... 138
3.8.1. Sample size and contact .................................................................................................... 138
3.8.2. Interviewing contents ........................................................................................................ 139

v
3.8.3. Telephone and Internet-mediated interviews .................................................................... 139
3.8.4. Data analysis ..................................................................................................................... 140
3.9. RESEARCH METHOD: PHASE TWO_ QUESTIONNAIRE SURVEY................................................. 140
3.9.1. Survey Questionnaire ........................................................................................................ 140
3.9.2. Initial design and planning ................................................................................................ 141
3.9.2.1. Sampling frame identification .................................................................................... 142
3.9.2.2. Sample size ................................................................................................................ 142
3.9.2.3. Sampling design/sampling selection .......................................................................... 143
3.9.2.4. Locations selected for the study ................................................................................. 144
3.9.3. Scale Development, Reliability, Validity and replication ................................................. 144
3.9.3.1. Scale development ..................................................................................................... 145
3.9.3.2. Reliablility - Replication - Validity............................................................................ 146
3.9.4. Triangulation ..................................................................................................................... 150
3.9.5. Questionnaire Design and questionnaire construction ...................................................... 151
3.9.6. Data collection .................................................................................................................. 154
3.9.7. Data analysis ..................................................................................................................... 157
3.9.7.1. Exploratory factor analysis ........................................................................................ 158
3.9.7.2. Confirmatory factor analysis ...................................................................................... 159
3.9.7.3. Structural Equation Modeling_Goodness of fit ......................................................... 159
3.10. CONCLUSION .......................................................................................................................... 162
Chapter 4: Phase One - Qualitative data analysis.......................................................................... 164
4.1. STEP ONE - ANALYSIS FOR EXPERT INTERVIEWING: STRATEGIC GROUP MAPPING ................. 164
4.1.1. Introduction ....................................................................................................................... 164
4.1.3. Data analysis and discussion ............................................................................................. 165
4.1.4. Conclusion ........................................................................................................................ 170
4.1.5. Summary ........................................................................................................................... 170
4.2. STEP TWO - ANALYSIS FOR CONSUMER INTERVIEWING: CUSTOMER LOYALTY PERCEPTION .. 170
4.2.1. Introduction ....................................................................................................................... 170
4.2.3. Data analysis and discussion ............................................................................................. 173
4.2.4. Conclusion ........................................................................................................................ 190
Chapter 5: Phase Two - Quantitative data analysis ....................................................................... 193
Survey Descriptive Statistics and Exploratory Factor Analysis ................................................... 193
5.1. INTRODUCTION ......................................................................................................................... 193
5.2. DATA PREPARATION AND DATA SCREENING ............................................................................ 193
5.2.1. Data preparation ................................................................................................................ 193
5.2.2. Data screening ................................................................................................................... 193
5.2.2.1. Missing data ............................................................................................................... 193
5.2.2.2. Identification of outliers ............................................................................................. 194
5.2.2.3. Normality test - statistics ............................................................................................ 195
5.2.3. Response rate and Non-response bias ............................................................................... 196
5.3. DESCRIPTIVE STATISTICS ......................................................................................................... 197
5.3.1. Respondent demographic data .......................................................................................... 197
5.3.2. Shopping behaviour - Respondents’ choices .................................................................... 199
5.3.3. Mean and standard deviation values for all constructs ..................................................... 199
5.4. INTERNAL CONSISTENCY .......................................................................................................... 201
5.5. EXPLORATORY FACTOR ANALYSIS ........................................................................................... 203
5.5.1. The results from Exploratory factor analysis .................................................................... 203

vi
5.5.2. Conclusion ........................................................................................................................ 206
5.6. THE REVISED MODEL ................................................................................................................ 206
Chapter 6: Confirmatory factor analysis and structural equation modelling ............................ 208
(Construct validation and hypothesis testing) ................................................................................ 208
6.1. INTRODUCTION ......................................................................................................................... 208
6.2. UNIDIMENSIONALITY - INITIAL MODEL FIT .............................................................................. 208
6.3. CONSTRUCT VALIDITY ............................................................................................................. 211
6.3.1. Convergent and discriminant validity ............................................................................... 211
6.3.1.1. Convergent validity .................................................................................................... 211
6.3.1.2. Discriminant validity .................................................................................................. 211
6.3.1.3. Criteria summarizing.................................................................................................. 212
6.3.2. Results from construct validity ......................................................................................... 212
6.3.2.1. Convergent validity .................................................................................................... 212
6.3.2.2. Discriminant validity .................................................................................................. 216
6.3.2.3. Conclusion ................................................................................................................. 220
6.4. COMMON METHOD BIAS ........................................................................................................... 220
6.5. FINAL MEASUREMENT MODEL FIT ............................................................................................ 220
6.6. STRUCTURAL MODELS .............................................................................................................. 221
6.6.1. Multivariate assumptions .................................................................................................. 221
6.6.1.1. Outliers and influentials ............................................................................................. 221
6.6.1.2. Multicollinearity analysis ........................................................................................... 222
6.6.2. Structural model validity ................................................................................................... 224
6.6.3. Results from hypothesis testing ........................................................................................ 225
6.6.3.1. Direct effects .............................................................................................................. 225
6.6.3.4. Multigroup analysis.................................................................................................... 231
6.6.3.4.1. Comparison between retail strategic groups ....................................................... 231
6.6.3.4.2. Comparison between gender ............................................................................... 236
6.6.3.4.3. Comparison between income groups .................................................................. 237
6.6.3.4.4. Comparison between location ............................................................................. 240
6.6.3.4.5. Comparison between age groups ........................................................................ 242
6.6.3.4.6. Comparison between occupation ........................................................................ 246
6.6.3.4.7. Comparison between education levels ................................................................ 249
6.6.3.5. Conclusion ................................................................................................................. 251
Chapter 7: Discussion of the findings .............................................................................................. 252
7.1. INTRODUCTION ......................................................................................................................... 252
7.2. DIRECT EFFECTS’ DISCUSSION .................................................................................................. 252
7.2.1. Results from all hypotheses related to customer perceived value (CPV) ......................... 252
7.2.2. Results from all hypotheses related to customer satisfaction (CS) ................................... 257
7.2.3. Results from all hypotheses related to customer loyalty (CL) .......................................... 263
7.3. MULTI-GROUP COMPARISONS’ DISCUSSION (COMPARISONS ACROSS GROUPS FOR FACTORS
RELATED TO CUSTOMER LOYALTY) ................................................................................................ 272
Chapter 8: Conclusion ...................................................................................................................... 279
8.1. INTRODUCTION ......................................................................................................................... 279
8.2. SUMMARY OF MAIN FINDINGS .................................................................................................. 279
8.2.1. Conclusions regarding the research questions .................................................................. 279
8.2.2. Other conclusions .............................................................................................................. 284

vii
8.2.3. Contributions to theory, methodology and practice .......................................................... 285
8.2.3.1 Contribution to theory ................................................................................................. 285
8.2.3.2. Contribution to methodological level......................................................................... 286
8.2.3.3. Contribution to practice ............................................................................................. 288
8.3. THESIS LIMITATIONS AND RECOMMENDATIONS FOR FUTURE RESEARCH ............................... 290
REFERENCES .................................................................................................................................. 293
APPENDICES ................................................................................................................................... 329

viii
LIST OF FIGURES
Figure 1.1: A structure of thesis .............................................................................................................. 8
Figure 1.2: The process of selecting articles reviewed for this study ................................................... 11
Figure 2.2.1: The basic SCP model....................................................................................................... 18
Figure 2.2.2: Ilustrative map of the US chain saw industry .................................................................. 22
Figure 2.2.3: Average net profit before tax for market specialisation and company ownership .......... 22
Figure 2.2.4: Average net profit before tax for company’s pricing strategy and most important
customer type ........................................................................................................................................ 23
Figure 2.2.5: Strategic groups scheme .................................................................................................. 23
Figure 2.2.6: BCG matrix ..................................................................................................................... 25
Figure 2.2.7: Porter’s Five Forces Model – Fundamental determinants of industry competition ........ 25
Figure 2.3.1: Distribution Channel ....................................................................................................... 27
Figure 2.3.2: Top 250 quick statistics, FY2015 .................................................................................... 27
Figure 2.3.3: The top 20 global retailers, FY 2014 ............................................................................... 28
Figure 2.3.4: The top 20 global retailers, FY 2015 ............................................................................... 29
Figure 2.3.5: Global retail geographic analysis .................................................................................... 30
Figure 2.3.6: Stages in the Buying Process ........................................................................................... 33
Figure 2.4.1: The population pyramid of Vietnam ............................................................................... 35
Figure 2.4.2: Vietnam’s urban population ............................................................................................ 43
Figure 2.4.3: PESTLE analysis ............................................................................................................. 44
Figure 2.4.4: Vietnam inflation rate ...................................................................................................... 46
Figure 2.4.5: Vietnam GDP per capita .................................................................................................. 48
Figure 2.4.6: Industry life-cycle ............................................................................................................ 49
Figure 2.4.7: The Five Forces model .................................................................................................... 50
Figure 2.5.1: Factors affecting customer behaviour.............................................................................. 54
Figure 2.5.2: Application of the sequential incident technique to touch point research ....................... 58
Figure 2.5.3: Some ways in which customers measure their satisfaction ............................................. 66
Figure 2.5.4: Elements of customer service .......................................................................................... 66
Figure 2.5.5: The conceptual framework .............................................................................................. 71
Figure 2.5.6: Determinants of Perceived Service Quality..................................................................... 79
Figure 2.5.7: Service Quality Model ..................................................................................................... 79
Figure 2.5.8: Five dimensions of SERVQUAL model ......................................................................... 80
Figure 2.5.9: Entities in retail store operation ....................................................................................... 83
Figure 2.5.10: In-store logistics process ............................................................................................... 84
Figure 2.5.11: The relationship between in-store logistic, customer satisfaction and customer loyalty
.............................................................................................................................................................. 86

ix
Figure 2.5.12: The customer service factors ......................................................................................... 91
Figure 2.5.13: Historical development of service quality scale in online retail .................................... 93
Figure 2.5.14: The conceptual framework of e-service quality ............................................................ 93
Figure 2.5.15: Empirically validated model: coefficients ..................................................................... 94
Figure 2.5.16: General frustration model .............................................................................................. 96
Figure 2.5.17: Final causal relationships for virtual mobile service ..................................................... 98
Figure 2.5.18: Structural model estimation in the hotel sample ........................................................... 99
Figure 2.5.19: The proposed conceptual model of this research ......................................................... 107
Figure 3.1: Different logics used in quantitative and qualitative studies ............................................ 115
Figure 3.2: The research process......................................................................................................... 122
Figure 3.3: The research process onion .............................................................................................. 123
Figure 3.4: Steps in the process of conducting a mixed methods study.............................................. 124
Figure 3.P: Procedure of two phases conducted in this research ........................................................ 125
Figure 3.5: Formulating questions for an interview guide .................................................................. 130
Figure 3.6: Some main questions that should be covered in all qualitative interviews ..................... 132
Figure 3.7: Data collection processes in Phase One ........................................................................... 137
Figure 3.8: Planning a survey ............................................................................................................. 141
Figure 3.9: Stage in the development of the loyalty scale .................................................................. 145
Figure 3.10: Testing goodness of measures-forms of reliability and validity ..................................... 146
Figure 3.11: Data collection process applied in Phase Three ............................................................. 156
Figure 3.12: Types of questionnaire ................................................................................................... 157
Figure 3.R: Main results from two phases .......................................................................................... 163
Figure 4.1: Contents of Chapter 5 and Chapter 6................................................................................ 192
Figure 5.1: Normal Probability Plot .................................................................................................... 196
Figure 5.2: The revised model for main study .................................................................................... 207
Figure 6.1: Results from CFA_1strun .................................................................................................. 209
Figure 6.2: Results from outlier testing_Cook’s distance analysis ..................................................... 222
Figure 6.3: The second SEM (SEM_2nd
run) ....................................................................................... 225
Figure 6.4: The results of revised model of this research ................................................................... 230

x
LIST OF TABLES
Table LR (Literature review) 1-2: Literature review approach .............................................................. 9
Table 2.3.1: Types of Retailers ............................................................................................................. 32
Table 2.4.1: Main supermarkets in Vietnam ......................................................................................... 40
Table 2.4.2: Vietnam’s Grocery Retail Sales by Channel, trillion VND .............................................. 41
Table 2.5.1: Summary of experience antecedent researches ................................................................. 58
Table 2.5.2: Experience Measurement Method .................................................................................... 59
Table 2.5.3: Items for scale development ............................................................................................. 60
Table 2.5.4: Variables used for the retail brand experience (RBE) model ........................................... 76
Table 2.5.5: Differences between products and services ...................................................................... 78
Table 2.5.6: Retail site store location selection main criteria comparison martrix ............................... 88
Table 2.5.7: Comparison matrix of sub criteria for store location main criteria ................................... 88
Table 3.1: Comparison of positivism and interpretivism paradigms .................................................. 114
Table 3.2: Comparison of quantitative and qualitative methodologies ............................................... 115
Table 3.3: Distinction between Quantitative and Qualitative Data ..................................................... 117
Table 3.4: Comparisions between purposive and probability sampling techniques ........................... 128
Table 3.5: Advantages of non-probability sampling techniques ......................................................... 129
Table 3.6: Structural of semi-structured interview protocol in Phase One (Step One) ....................... 134
Table 3.7: Translation techniques for questionnaires ......................................................................... 135
Table 3.8: The process of data analysis .............................................................................................. 138
Table 3.9: Advantages of Probability Sampling Techniques .............................................................. 144
Table 4.1: Details of interviewees from Phase One (supermarket consumers) .................................. 172
Table 4.2: Interviewees’ descriptive information ............................................................................... 173
Table 5.2: The descriptive statistics for all items in the dataset .......................................................... 201
Table 5.3: All remained variables after EFA ...................................................................................... 205
Table 6.1: Model fit of CFA_1strun .................................................................................................... 210
Table 6.3: Results from CFA_2thrun_Discriminant validity checking ............................................... 216
Table 6.4: Results from CFA_2nd
run, the correlation between RBEX and other constructs .............. 217
Table 6.5: Model fit from CFA_3rd
run ............................................................................................... 217
Table 6.6: Results from CFA_3thrun_ Discriminant validity checking .............................................. 217
Table 6.7: Results from data analysis (CFA_3rd
run) .......................................................................... 218
Table 6.8: Model fit of CFA_4thrun .................................................................................................... 218
Table 6.9: Results from CFA_4thrun_ Discriminant validity checking .............................................. 219
Table 6.11: Summarising results of CFA model fit ............................................................................ 220
Table 6.12: Results from zero constraints test .................................................................................... 220
Table 6.13: Multicollinearity analysis ................................................................................................ 224

xi
Table 6.14: Summarising results from SEM running (SEM_1strun, SEM_2
ndrun) ............................ 226
Table 6.M.1: Multigroup analysis for COOP or BIGC ad LOTTE MART ........................................ 232
Table 6.M.2: Multigroup analysis for COOP or BIGC and VINMART ............................................ 234
Table 6.M.3: Multigroup analysis for Lotte Mart and Vinmart .......................................................... 235
Table 6.M.4: Multigroup analysis for COOP or BIGC and AEON .................................................... 236
Table 6.M.5: Multigroup analysis for gender ..................................................................................... 237
Table 6.M.6: Multigroup analysis for “under 5 million VND (GB£170)” and “from 5 to 10 million
VND (GB£170-340)” income groups ................................................................................................. 238
Table 6.M.7: Multigroup analysis for “under 5 million VND (GB£170)” and “from 10 to 20 million
VND (GB£340-680)” income groups ................................................................................................. 239
Table 6.M.8: Multigroup analysis for Ho Chi Minh and Hanoi ......................................................... 240
Table 6.M.9: Multigroup analysis for Ho Chi Minh and Da Nang ..................................................... 241
Table 6.M.10: Multigroup analysis for Can Tho and Binh Duong ..................................................... 242
Table 6.M.11: Multigroup analysis for “18-22 and 22-30” age groups .............................................. 243
Table 6.M.12: Multigroup analysis for “22-30 and above 55” age groups ......................................... 244
Table 6.M.13: Multigroup analysis for “18-22 and 41-55” age groups .............................................. 245
Table 6.M.14: Multigroup analysis for “23-30 and 41-40” age groups .............................................. 246
Table 6.M.15: Multigroup analysis for “housewife and office staffs” occupation groups ................. 247
Table 6.M.16: Multigroup analysis for “students and self employment” occupation groups ............. 248
Table 6.M.17: Multigroup analysis for “self employment and office staffs” occupation groups ....... 249
Table 6.M.18: Multigroup analysis for “A levels and college, university” groups ............................ 250
Table 6.M.19: Multigroup analysis for “GCSE’s and college, university” groups ............................ 250
Table 7.1: Factors directly affecting customer perceived value.......................................................... 253
Table 7.2: Factors directly affecting customer satisfaction ................................................................ 258
Table 7.3: Factors directly affecting customer loyalty ........................................................................ 264

xii
LIST OF APPENDICES
Appendix 2.1 - All hypotheses proposed in this research ................................................................... 329
Appendix 2.2 - Linkage between hypotheses and research questions ............................................... 331
Appendix 2.3 - Latent factors and manifest varibles used in this research ......................................... 332
Appendix 3.1 – Research Ethics approval letter ................................................................................. 334
Appendix 3.2 - Guide used for expert’s semi-structured interviews................................................... 335
Appendix 3.3 – Questionnaire used in supermarkets’ consumer interviewing ................................... 337
Appendix 3.4 – Questionnaire survey ................................................................................................. 340
Appendix 3.5 - Measurement variables used from Section 2 to Section 6 in the questionnaire (Phase
Two) and code book for other questions used in questionnaire .......................................................... 349
Appendix 4.1 – Some more direct quote of supermarket’s consumer interviewing in Phase One ..... 354
Appendix 5.1 – Results from Tests of normality ................................................................................ 365
Appendix 5.2 - Normal probability plots ............................................................................................ 368
Appendix 5.3 – Independent samples test (Non-bias response).......................................................... 370
Appendix 5.4- Full pie-charts summarises all respondents’ demographic information...................... 374
Appendix 5.5 – The shopping behaviours of Vietnamese supermarket consumers ............................ 375
Appendix 5.6 – Internal consistency of all researched constructed before EFA ................................ 378
Appendix 5.7- KMO and Barlett’s Test- Communalities (EFA) ........................................................ 384
Appendix 5.8 - Total Variance Explained (EFA) ............................................................................... 385
Appendix 5.9 - Pattern matrix (EFA) .................................................................................................. 387
Appendix 5.10 – All measurement variables remained after EFA ..................................................... 390
Appendix 6.1 - Results from CFA_2ndrun ........................................................................................ 393
Appendix 6.2- The final CFAmodel_Results from CFA_4thrun_after construct validity checking ... 394
Appendix 6.3- Common method bias testing ...................................................................................... 395
Appendix 6.4 - The initial SEM (SEM_1strun) and its results ........................................................... 396
Appendix 6.5 - SEM_2rdrun_Final .................................................................................................... 397
Appendix 6.6 - Summarising all hypothesis testing results ................................................................ 399
Appendix 7.1- Comparison across groups for factors related to customer loyalty ............................. 400
Appendix 7.2- Comparison across groups for factors related to customer satisfaction ...................... 401
Appendix 7.3- Comparison across groups for factors related to customer perceived value ............... 403
xiii
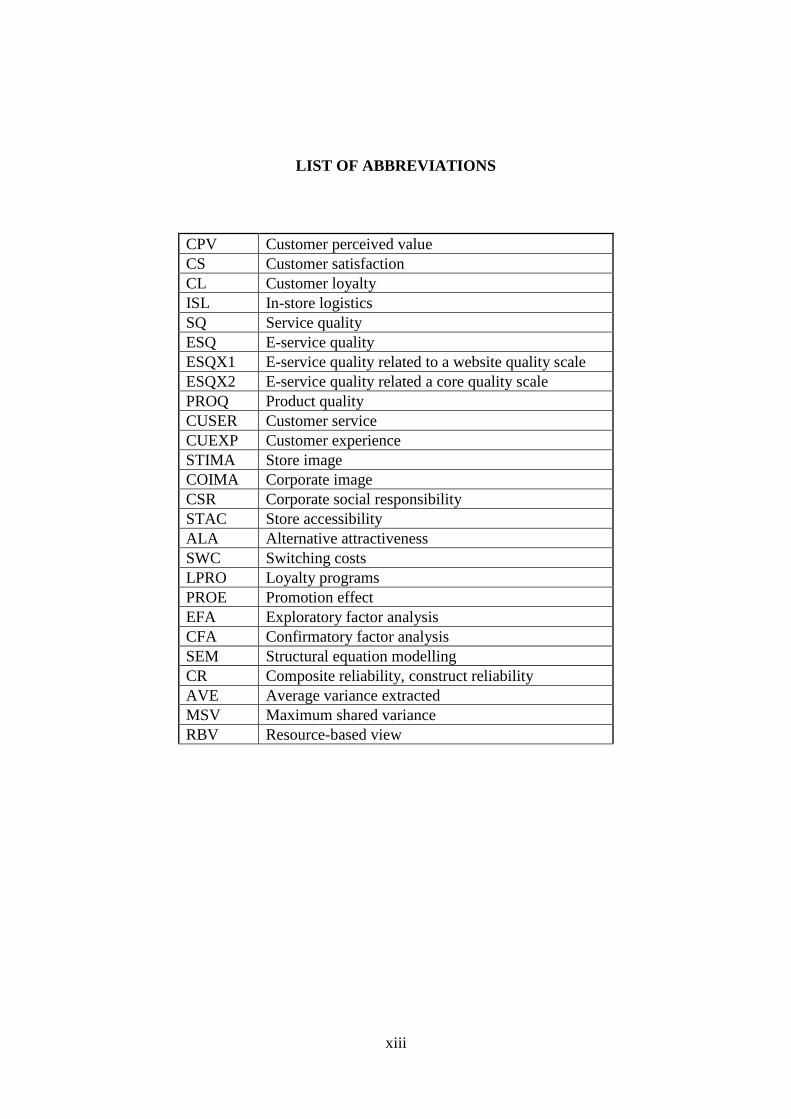
LIST OF ABBREVIATIONS
CPV Customer perceived value
CS Customer satisfaction
CL Customer loyalty
ISL In-store logistics
SQ Service quality
ESQ E-service quality
ESQX1 E-service quality related to a website quality scale
ESQX2 E-service quality related a core quality scale
PROQ Product quality
CUSER Customer service
CUEXP Customer experience
STIMA Store image
COIMA Corporate image
CSR Corporate social responsibility
STAC Store accessibility
ALA Alternative attractiveness
SWC Switching costs
LPRO Loyalty programs
PROE Promotion effect
EFA Exploratory factor analysis
CFA Confirmatory factor analysis
SEM Structural equation modelling
CR Composite reliability, construct reliability
AVE Average variance extracted
MSV Maximum shared variance
RBV Resource-based view

1
Chapter 1: Introduction
1.1 Introduction
This introductory chapter presents some general background to the research conducted
by the researcher before explaining the context in which the empirical work will be explored.
Then, research problems will be indicated, followed by the approach used to investigate the
topics and will conclude with the structure of this thesis and its conclusions.
1.2. Research background
There are continuously debated theories related to customer loyalty and how firms can
achieve sustainable development. These issues are apparently proved to have a strong impact
on firms’ survival associated with their profits. The initial idea for this research in my area of
expertise, with five years experience researching the strategic management angle in business,
parallel with the question of how to keep customers loyal to a business. For this reason, the
researcher was skeptical about the term of strategic-groups in marketing, particularly when
looking at the relationships between factors affecting customer loyalty, which had been
largely under-researched. For example, whether satisaction is a main indicator of customer
loyalty as well as whether differences between factors affecting customer loyalty in a specific
industry exist in regarding to income, gender, location, age group, occupation and education
levels. The following contents will pave the way for the whole research by demonstrating
some basic information related to this research project.
The trends of globalisation and integration have made the world come closer and
customers around the world tend to move to the same consumption style. However, in many
cases, there are still different consumer behaviours in specific industries. The meaningful
considered question by most researchers and business practitioners is which factors affect
customer loyalty (El-Andt and Eid, 2016; Perez and Bosque, 2015; Gurlek et al., 2017;
Chang and Yeh, 2017; Chen and Hu, 2013) in specific business sectors. Customer loyalty is
defined as “a deeply held commitment to re-buy, re-patronise a preferred product or service
consistently in the future, thereby causing repetitive same-brand or same brand-set
purchasing, despite situational influences and marketing efforts having the potential to cause
switching behaviour” (Oliver, 1997:392). Many firms compete fiercely to attract more

2
customers. Customer loyalty is an ultimate goal and dream of all retailers; it could help firms
increase from 25-85 percent profit (Reichheld et al., 1990). According to Mutum et al.,
(2014), Stan et al. (2013), Qui et al. (2015), customers tend to be loyal to firms that offer
superior value compared to their rivals, and these customers are willing to have an intensive
relationship with firms over time that can help firms save much money for their marketing
campaigns as they launch new products or offer new services.
Based on strategic theories used in specific industries, different strategic groups might
have different factors affecting customer loyalty. Leask and Parker (2006) define a strategic
group as a group of corporations that employ the same or similar strategies in a specific
industry. The term strategic group seeks to identify configurations based on observing
firms’ behaviour and then explain differential performance. Similar characteristics of such
group will likely relate to cost structure, formal organisation, control systems, management
rewards and punishment. Such groups are important for retail logistics and supply chain
management (SCM) as different strategic positions of grocery retailers will shape their retail
supply chains and replenishment and fulfillment activities. However, previous research has
appeared not to investigate factors affecting customer loyalty in different strategic groups,
rather it examined specific industries and extrapolated results to the whole industry. This
means that the differences between strategic groups in the same industry have been ignored.
In addition, the relationship between customer satisfaction and customer loyalty as well as
which factors may affect customer loyalty has been unceasingly debated between scholars.
Kursunluoglu (2014:538) found “customer service had effects on customer satisfaction” and
“customer service could explain 13.9 percent of total variance in customer satisfaction and
12.5 percent of total variance in customer loyalty”. Kumar et al. (2013:258) demonstrated
that although there is a positive relationship between customer satisfaction and customer
loyalty, the variance that could be explained by just a satisfaction is very small (around 8
percent). Therefore, they proposed scholars should investigate customer loyalty with many
other variables such as customer perceived value, switching barriers and relational variables
such as trust, commitment, relationship age, and loyalty programme membership. In
contrast, Lou and Bhattacharya (2006) and Oliver (1997), Kim et al. (2004), Shankar et al.
(2003), Chadha and Kapoor (2009) found that customer satisfaction is a major driver of
customer loyalty and it is well-known and confirmed by many other researchers. Besides
that, factors constitute customer perceived value and customer satisfaction have also been
debated among scholars. Most studies, which relate to customer loyalty in the retailing

3
industry, have separately explored customer loyalty and specific factors such as brand
image, social responsibility, and switching cost. There is no research examining many such
factors simultaneously affecting customer loyalty.
Vietnam’s retail market is characterised as being one of the most dynamic markets in the
region with high annual growth rates. Hanoi and Ho Chi Minh City have been ranked
amongst the top 10 Asian cities for retail expansion in 2014. With a population of more than
93 million people, about 70 percent of them aged from 16 to 64 which is a factor in the
potential growth of the retail industry; this figure is also known as the “Golden retail index”
(Oxford Business Group, 2017) and Vietnam was placed sixth in the 2017 Global Retail
Development Index (GRDI) (Vietnamnet, 2017). In addition, from 2015 to 2020, Vietnam’s
urban population is forecast to grow by 2.6%, one of the highest growth rates in the region
(Retail in Asia, 2016; Le, 2016). With the population’s high propensity to absorb new things
and readily change consumption habits, the Vietnamese retail market can promise a huge
potential for both domestic as well as foreign investors. However, to the best of my
knowledge, there is no comprehensive published paper investigating customer loyalty in the
supermarket sector in Vietnam as well as Vietnamese consumption style. Therefore, in this
research, factors affecting customer loyalty of different strategic groups in the Vietnamese
food and consumer-goods industry will be explored. The findings will be of potential benefit
to all business and academic researchers, and strategic decision makers when they look at
customer loyalty of a specific industry in Vietnam, especially in applied business strategies
for sustainable success.
1.3. Context of study
Therefore, the aim of this thesis is to investigate factors affecting customer loyalty of
different strategic groups in Vietnamese supermarkets, as the term strategic groups in the
grocery sector has been ignored by most researchers and the topic of comprehensive factors
affecting customer loyalty is under-researched. The Vietnamese supermarkets have been
selected for four main reasons. Firstly, Vietnam’s retail industry is one of the most dynamic
markets in the region with high annual growth rates; there is a huge potential platform with
“Golden retail index” and profits as well as market share that investors can invest their
money to (Oxford Business Group, 2017). Secondly, supermarkets in Vietnam have been
generating a large amount of revenue compared to other modern retail formats (Vo, 2017).
Thirdly, it might be interesting to investigate customer loyalty in the Vietnamese retail

4
market due to a huge different culture across the country which could generate informative
findings. Finally, scholars understand the Vietnamese retail market via news posted in social
media and online newspapers in Vietnam, there are a limited number of official papers
published about the Vietnamese retail industry. Via this research, scholars and practitioners
can fully understand the whole picture of the Vietnamese retail industry, which will be
presented in Chapter 2.
1.4. Research objectives
Based on the background information the research objectives are as follows:
Provide insights into the Vietnamese retailing industry; classify all current
supermarket firms in Vietnam to their proper strategic groups.
Investigate factors directly affecting customer loyalty, customer satisfaction and
customer perceived value in Vietnamese supermarkets by simultaneously researching
and comparing different strategic groups.
Examine whether there are differences between factors affecting customer loyalty
based on age groups, location, income, gender, occupation and education level.
1.5. Research questions
There are five research questions proposed in this study based on the foregoing
background and research objectives:
RQ1: What factors directly affect customer loyalty in the Vietnamese supermarket sector and
at which level?
RQ2: Is customer satisfaction a major indicator for customer loyalty or not?
RQ3: What factors directly affect customer perceived value, customer satisfaction in the
Vietnamese supermarket sector and at what level?
RQ4: Are there any differences in terms of factors affect customer loyalty between strategic
groups in the Vietnamese retail industry?
RQ5: Are there differences between the factors affecting customer loyalty in the retail
industry based on income, gender, location, age groups, occupation and education levels?

5
1.6. Research methodology
Based on research objectives and research questions presented above, both primary data
and secondary data should be collected in order to answer the questions of which factors
affect customer loyalty and at what level. Therefore, this research is going to use a mixed
method involving both qualitative and quantitative research. Full explanation as to why this
methology should be used in this research will be presented in Chapter 3. The main
ontological and epistemological stances in this research are objectivism and positivism
respectively. The empirical study follows Cannon (2004) who suggested steps in the process
of conducting a mixed method which is believed to be the best way to investigate the gaps
presented later and answer all research questions, and it is comprised of two phases: Phase
One (Step One) is a strategic group mapping that all current supermarkets in Vietnam will be
grouped into different strategic groups based on interviewing experts in the Vietnamese retail
industry. Phase One (Step Two) is an inductive phase that will involve conducting semi-
structured interviews with about 21 consumers who currently shop at supermarkets across the
country, five main markets investigated will be Ho Chi Minh, Hanoi, Can Tho, Da Nang and
Binh Duong. Lastly, Phase Two will be a deductive phase that will consist of an edited
questionnaire survey related to factors affecting customer loyalty in Vietnam to test and
validate the variables and constructs which would be built based on background literature, the
conceptual model proposed in 2.5.13.2 and the results from Phase One (Step Two). In Phase
Two, descriptive statistics, including data frequencies, means, standard deviations and cross-
tabulation will be demonstrated. Exploratory factor analysis (EFA) will be used to examine
the data sets from the questionnaire and explore any latent constructs, remove duplicated
variables, determine underlying dimensions or factors which are not known a priori in a set of
correlated variables (Hair et at., 2011). Confirmatory factor analysis (CFA) and structural
equation modelling (SEM) will be used in this research to determine the validity, reliability
and relationships between many remaining variables after EFA. An analysis of SEM will also
be used in this research in order to demonstrate the relationships between constructs (Hair et
at., 2011).
1.7. Potential contributions of this research
Firsly, this research is going to generate a comprehensive research framework of factors
influencing customer loyalty, customer satisfaction and customer perceived value which can
be used by other researchers in the future to investigate other markets and industries. Based

6
on would-be-collected data in the Vietnamese grocery sector, the researcher will confirm the
relationship between constructs involved, which are benificial for practitioners, as well as
answer the question of whether satisfaction is a main indicator of customer loyalty. In
addition, the researcher expects to prove that the term strategic groups in any industry should
not be ignored when conducting multigroup analysis. The next potential contributions would
be mediation and moderation effects if possible. Finally, differences between the factors
affecting customer loyalty in the retail industry based on income, gender, location, age
groups, occupation and education levels will be revealed.
1.8. Thesis outline
The thesis is divided into 8 chapters. After this introductory chapter, the contents are as
follow:
Chapter 2: The objective of this chapter is presenting literature related to a research topic.
Section 2.1 will indicate the approach used for searching literature review.
Section 2.2 named “Literature review - strategic groups” has three main parts.
First, it provides knowledge around strategic groups, including emphasising the
importance of business strategy, review about some origins of strategic group
theories (resource based view and industrial theory), brief insight about strategic
group theory as well as how to shape firms into their specific groups. Then,
some literature related to competitive positioning and analysis will also be
mentioned. This section aims to demonstrate the meaning of strategic groups.
Then, Section 2.3 named “Retail industry”, will present a brief report on current
global retail industry, followed by trends in the retailing industry, which are
growing diversity of retail formats and globalisation, social media-driven
economy, changes in customers’ preferences. Then, the section will summarise
types of retailers and indicate many issues related to customer buying
behaviour.
Section 2.4 named “The Vietnamese retail industry – insights”, will demonstrate
the Vietnamese retail industry insight. In that, it focuses on the supermarket
format for food and consumer goods as well as current traditional retail channels
in Vietnam (wet or flea market, “Mom and Pop” small independent grocery
stores). Firstly, an overview of the Vietnamese retail industry, customer

7
preference will be explored, followed by PESTLE analysis, industry life cycle
and the five forces model applied in the Vietnamese retail industry. Finally,
drivers of change in the Vietnamese retail industry, which include the impact of
government control, consumer behaviour patterns, and e-commerce will be
presented.
Finally, Section 2.5 named “Literature review - Customer loyalty”, provides a
review of many aspects of customer loyalty such as customer taste and
preferences, customer experience and customer perceived value, customer
satisfaction, perceived switching cost and switching barriers, brand experience,
service quality and further dimensions related to corporate factors such as in-
store logistics and store image, store accessibility and store loyalty, customer
service, e-service quality and product quality. Finally, the debate around factors
affecting customer loyalty will be discussed and the research framework and
hypotheses will be proposed.
Chapter 3 : This chapter defines the research approaches and methodologies undertaken in
this thesis; it also indicates some issues relating to research quality, data
collection and analysis methods used during research (there are two phases of
empirical research conducted in this area).
Chapter 4: This chapter provides qualitative data analysis (results from Phase One - Step
One and Step Two).
Chapter 5: This chapter refers to the main study of this research, named “Survey descriptive
statistics and exploratory factor analysis” (Phase Two - Questionnaire survey).
Chapter 6: This chapter presents results from confirmatory factor analysis and structural
equation modelling (Phase Two - Questionnaire survey).
Chapter 7: This chapter aims to provide the interpretation of the findings and discussion.
Chapter 8: Conclusion of the research and the many implications that can be made. The
limitations of this research are also presented, followed by suggestions for future
research around the investigated topic.
Figure 1 will present the above information in a chart form:

8
Chapter 1: Introduction
Chapter 5: Phase Two – Survey
Descriptive Statistics and
Exploratory Factor Analysis
Chapter 6: Confirmatory factor
analysis and structural equation
modelling (Construct validation and
hypothesis testing)
Chapter 7: Discussion the findings
Chapter 2: Literature review
Chapter 3: Research methodology
Chapter 4: Qualitative data analysis
(Phase One)
Chapter 8: Conclusion
Figure 1.1: A structure of thesis
Based on these foundations, the next chapter will explore literature related to the research
topic.

9
Chapter 2: Literature review
2.1. An approach used for searching literature review
This aim of this section is to present an approach used for exploring the literature review.
Literature review plays a vital role in the development of any research area. It summarises
and establishes connections between previous works, demonstrates different streams and
results which can help researchers identify research gaps and provides opportunities for
proposing research directions (Martins and Pato, 2019). According to Webster and Watson
(2002:xv-xvi), “a high quality review is complete and focuses on concepts. A complete
review covers relevent literature on the topic and is not confined to one research
methodology, one set of journals, or one geographic region). Therefore, they suggested a
structured approach to determine source materials for literature review, including three main
steps: step one “the major contributions are likely to be in the leading journals”, focusing on
well-established journals of specific areas can be considered; step two of the process is “go
backward” by review citations for the articles identified in step 1 to decide which prior
articles should be examined; step three is “go forward” by using online database for that
specific field to identify articles citing the key articles identified in the previous steps, highly
related papers should be included in the review. Also, Webster and Watson (2002) also
suggested how to structure the review and they introduced both a concept-centric approach
and an author-centric approach which can be brieftly presented as follows:
Table LR (Literature review) 1-2: Literature review approach
Adapted from Salipante et al. (1982)

10
The above process can synthesise all highly-related papers which will be used to review.
As mentioned previously, the main objective of this research is to investigate factors affecting
customer loyalty of different strategic groups in the Vietnamese supermarket sector.
Therefore, it will relate to four themes/concepts: Strategic Groups, Retail Industry, the
Vietnamese Retail Context and Customer Loyalty. While exploring the literature reviewing
process, the research is going to focus on these themes in Chapter 2.
In order to engage deeply with the literature, all reading materials being used in this
research will be from online databases and books offered by University of Hull. In that,
reading some major books related to the retailing industry such as Levy and Weitz (2004),
Dawson and Lee (2004), Dawson et al. (2008) will enable the researcher to develop an
insight into the retailing industry, although it should be noted that the books noted above
were written by the UK’s retailing experts. In addition, following and adapting the guidance
of Webster and Watson (2002) on how to write a literature review, online database is now the
main resource for literature exploring. In these online databases, there are a huge number of
journals offered. The basic technique for searching is using key words relating to the four
themes mentioned above and some further key words attaching to those themes. Firstly, the
researcher is going to search the main keyword, and read many papers around that topic. And
then, if that reading highlights some new themes, the researcher will use the newly
highlighted keywords to explore the theme in greater depth. From the outset, the four main
themes mentioned above, revealed 2567 papers from 2007 to present. After eliminating
duplication, and loosely-related papers (2279), and based on specific research objectives and
concentrating on abstracts of papers found, there remained 288 papers which were used for
this thesis. The above filtering process was applied thoroughly for searching each core theme.
In references, the majority of listed papers were used for sourcing literature reviewed in this
thesis and articles selected for reviewing in this study should have been published in well-
established journals. For example, in order to explore the theories relating to strategic groups,
the researcher is going to employ an advanced search for “STRATEGIC GROUPS” with
updated papers (ie. an ideal paper can be after 2007), and then discover new keywords such
as “the origins of strategic groups” or “business strategy”. In respect of customer loyalty, the
keywords “CUSTOMER LOYALTY” will be searched first, only to discover a number of
new keywords based on this theme, such as “customer satisfaction”, “customer perceived
value”, “service quality”, “in-store logistics”, “customer behaviour” and so forth. This
technique will be applied to all four key themes. However, there are not many official

11
published reviews about the Vietnamese retailing industry on the two databases above, the
researcher will search the keywords “THE VIETNAMESE RETAIL INDUSTRY” via
Google and select high quality and reliable online magazines or news items to review in
respect of this theme. The above process explains how the literature review should be
structured and created. It guarantees that the following review (Chapter 2) matches with the
research’s objectives. The following figure (Figure 1.2) will briefly illustrate the process by
which the papers were filtered for this study:
Figure 1.2: The process of selecting articles reviewed for this study
Outline of literature review
In Chapter 2, the researcher is going to review all literature around the research topic
based on the themes indicated above. First, literature surrounding strategic groups will be
investigated (Section 2.2), followed by a review of the retailing industry (Section 2.3). Then,
Section 2.4 is going to demonstrate insights into the Vietnamese retail industry. Finally, many
factors related to customer loyalty will be presented (Section 2.5). The links between these
four themes can be explained as follows. Section 2.2: “Strategic groups” will investigate
theories related to strategic groups, the definition of strategic groups and why this term
should be considered; via the review, the potential outcome will help readers understand
clearly that researching customer loyalty in a retail industry should be linked with “strategic
groups” because each group of firms might have different factors affecting customer loyalty.
Section 2.3: “The retailing industry” will demonstrate and draw a clear picture of the current

12
situation of the global retailing industry, which is beneficial to give insight into the industry.
Then, Section 2.4: “the Vietnamese retail industry” will also shed light on the Vietnamese
current retail situation and its competitive environment, as well as drivers of change in this
industry in the Vietnamese market. Finally, in section 2.5: “Customer loyalty”, will review
all possible factors that might affect customer loyalty which can lead to research gaps,
research questions and hypotheses for this research and constitute to propose the conceptual
research framework of this thesis.
2.2. Literature review- Strategic groups
2.2.1. Introduction
As mentioned in the research objectives, this research will explore factors affecting
customer loyalty of different strategic groups in the Vietnamese supermarket sector.
Therefore, it will be evident that literature around strategic groups should be investigated. In
this part, the researcher sheds light on the linkage between business strategy and firms’
performance, followed by theories relating to strategic groups, including its origins and
strategic group mapping; finally, competitive positioning and competitive analysis are also
examined.
2.2.2. Business strategy and its performance
With the continued changing business environment, those who intend to survive in a
market place will need to consider their business strategies and make them fit with the
existing environment. Business strategy has generated a significant interest amongst scholars
and practitioners (Bapat and Mazumdar, 2015). The concept of strategy was articulated as the
so-called “mean” to help firms reach their business goals and the vital objective of business
strategy is to improve and increase firms’ performance by matching firms’ internal
competencies and values to its external environment (Porter, 1983; Zott and Amit, 2008). It
can help firms shape themselves into different business strategy groups in specific industries.
Varadarajan et al. (2011) and Gupta (2012: 170) stated “business strategy specifies how
business will compete in the marketplace”. Allen (2007) found that lacking strategic focus is
the main reason which has led many Japanese firms to fail; he also demonstrated how firms
such as Honda, Sony and Nintendo have succeeded in their businesses and how they “rise to
global dominance by their well-developed and defined corporate strategies”.

13
Fierce competition motivates firms to seek specific ways to compete with rivals and use
their own competitive advantages to consciously shape and proactively formulate their future
goals before conducting any business action (Bhimani and Langfield-Smith, 2007). Many
previous studies indicate the positive linkage between firms’ business strategy and firms’
performance (Kim et al., 2004; Parnel, 2010; Dess and Davis, 1984). There are a number of
approaches investigating strategy typologies and it has been proposed as follows: Utterback
and Abernathy (1975) proposed three approaches which are sales maximising, cost
maximising and performance maximising; Abell (1980) introduced the concepts of
differentiation and focus/niche orientation. Venkatraman (1989), Veett et al. (2009) also
identified three viable approaches, including “building, holding and harvesting”. Miles and
Snow (1978; 1986) identified four different strategic approaches which are analysers,
defenders, reactors and prospectors. Porter (1980) stated that organisations can apply low-
cost strategy, differentiation strategy, and focus or combination strategy based on their own
competitive advantages and their resources. These typologies have received much attention
and have become the most cited and tested, and most criticised by other scholars (Veett et al.,
2009). Cost leadership refers to producing low-cost products, which are supposed to provide
low-prices as a result, to make price-sensitive customers satisfied. This group can be divided
into two sub groups: type 1 which implies to offer products and service at the lowest price in
the market; and type 2 referred to as “low-cost best value” that offer customers the best price
value in the market. In this case, firms might discontinue any activities where they do not
enjoy cost advantages and could outsource these activities to firms possessing cost
advantages. Cost leadership can be achieved via mass production, economies of scale, access
to raw materials, mass distribution, or effective input cost (Allen et al., 2007). Type 2 of the
main strategies mentioned by Porter (1980) is referred to as “differentiation” which offers
exceptional characteristics and unique products and services to relatively price-insensitive
customers who are willing to pay a premium price. These unique characteristics are product
quality, after-sales support or high perceived value based on brand name. In addition, “focus
strategy” was introduced later by Porter, which serves the needs of a niche market, namely
“low-cost focus” and “best value focus”. These strategic-frameworks have been highly used
by scholars and practitioners. Helms et al. (1992), Wright et al. (1990) found that businesses
with a low-cost strategy might perform well because their low-cost position allows them to
attract more customers from other firms by offering products with low prices as a result.
Wortzel (1987) and Varadarajan (1985) stated that with a mature business environment (the
mature phase in an industry’s life cycle), firms tend to apply differentiation strategy to

14
achieve competitive advantages, whereas the low-cost strategy is thought to have no material
effect on businesses.
Porter (1996) stated that firms should choose only one of these strategies; if they confuse
or target their strategies somewhere in the middle, they might get stuck due to the inherent
differentiation between strategies (Acquaah and Yasai-Ardekani, 2008). However, there are
groups of researchers who encourage firms to use the combination strategy (differentiation
and cost leadership), since they proved that combination strategy is more effective (Kim et
al., 2004; Baroto et al., 2012, Miller and Dess, 1993; Walker and Ruekert, 1987). Some
organisasions such as Tesco, Toyota, IKEA have applied it successfully by offering low-cost
products and products with unique and competitive features simultaneously. These strategies
have created an unrivaled performance, which is beneficial to firms to some extent
(Soltanizadesh et al, 2016). It is clear that there are a number of factors influencing firms’
performance, including strategic behavioural emphasis, structural characteristics and business
strategy (Olson et al., 2005). Firms can shape their business strategies based on competitor
orientation, customer orientation, internal/cost orientation and innovation orientation (Bendle
and Vandenbosch, 2014; Montgomery et al., 2005; Kumar et al., 2011; Pleshko et al., 2014;
Kurmet and Vadi, 2013). For example, firms with competitor orientation might focus on how
to beat their rivals in a specific time, rather than finding the way to maximise their profits
(Bendle and Vandenbosch, 2014).
There are a limited number of studies about strategy in retailing (Dawson and Sparks,
1982; Fernie et al., 2010; Fernie and Spark, 2004; Levy and Weitz, 2004). Researchers tried
to form retail firms’ strategic types and explored the linkage between strategic choice and
firms’ performance (McGree and Petersen, 2000; Conant et al., 1993). Based on the strategic
options of Porter (1980), some scholars have also considered a business strategy in retail
markets in terms of low cost, differentiation and focus strategies (Helms et al., 1992; Dwyer
and Oh, 1988). The options chosen depended on price leadership orientation, merchandise
differentiation (Parks and Mason, 1990) or product market approach (Ansoff, 1957) such as
productivity improvement, penetration, market development and diversification. Hawes and
Crittenden (1984) investigated strategy in retail industry at a functional level, and found the
different performance between different strategic groups which were formed by firms’ scope
and resource allocation (Flavan and Polo, 1999; Carrol et al., 1992). For small retailers,
strategies might only be based on product specialisation or customisation and customer

15
service perspectives (Covin and Covin, 1990) and firms can differentiate themselves from
others via functional levels of strategies.
2.2.3. Strategic groups
2.2.3.1. The origins of strategic group theory
Resource-based view (RBV) theory
The resource-based view argues that firms with differences in resources and capabilities
are a foundation of different firms’ performance (Reger and Huff, 1993; Rouse and
Daellenbach, 1999; Goh et al., 2007; Solesvik and Westhead, 2010, Barney, 2001;
McNamara et al., 2003). In other words, the key difference amongst firms is their resources
and how they are used, deployed, or allocated by firms (Short et al., 2003). In the early
nineteenth century, Ricardo (1817) indicated that certain plots of land possessing natural
resources or similar advantages enabled their owners to earn more money via renting the
land, thanks to the increasing growth of surrounding cities and industrialised areas, with the
resultant scarcity of free land. The resource-based view is a major grounded theory in
strategic management (Liang et al., 2010). The first notion of a resource-based view had been
mentioned by Penrose (1959:7) who proposed that an organisation should be viewed as “a
collection of human and physical resources bound together in an administrative framework,
the boundaries of which are determined by the area of administrative coordination and
authoritative communication”. Then, Wernerfelt (1984) published an influential article which
explored firms’ resources and investigated how they affected firm outcomes. While these
foundation notions helped many researchers understand, the process still remained unclear.
Barney (1991) articulated these ideas in a comprehensive way in terms of looking at the
linkage between firms’ resources and sustainable competitive advantages. He indicated all
assets firms’ attributed could lead them to be more effective and efficient in their businesses.
Different classification of resources has been raised in the literature (Grant, 1991; Barney,
1991; Amit and Schoemaker, 1993; Bogaert et al., 1994). These resources were divided into
three groups including human capital, physical capital and organisational capital (Barney,
1991). Foss (1996) proposed two groups which are property-based and knowledge-based
resources. Olavarrieta and Ellinger (1997) combined these classifications and proposed three
categories including input factors (logistics-related input factors such as raw factors and raw
skills) which can be applied or transformed into firms’ assets. For example, good inventory

16
systems, efficient picking and loading skills, using effective computer-operating skills can
lead to firms’ higher performance. The second group is assets such as patents, brand names,
and all visible resources. The third group is capabilities. They also differentiated assets and
capabilities, with capabilities relating to the action of ‘doing’ while assets are associated with
the act of ‘having”. However, Somsuk et al. (2012) classified resources into four categories:
human, technological, financial and organisational. These can be tangible or intangible assets
(Barney, 1991, 2007) that can provide sustainable competitive advantages for firms if those
resources have VRIN characteristics (Valuable, Rare, Imperfectly imitable and Non-
substitutable). It is clear that other firms can hold and imitate tangible resources and deploy
these resources as implementing their businesses, but capabilities or the so-called knowledge-
based resources (intangible assets) cannot be easy to capture. These things can make the
differences between firms (Brush et al., 2001; Ray et al., 2004; Currie, 2003; Teece, 1998).
“The more a capability is utilised, the more it can be refined and the more sophisticated and
difficult to imitate it becomes” (Olavarrieta and Ellinger, 1997: 563). Barney (1991: 102) also
indicated situations when a firm can enjoy a sustainable competitive advantage “when it is
implementing a ‘value creating strategy’ not simultaneously being implemented by any
current or potential competitors and when these other firms are unable to duplicate the
benefits of this strategy”. In other words, a competitive advantage can be sustained as there is
no floor for other organisations to imitate or duplicate all successful strategies generated by
the firm. However, Smith et al. (1996) indicated some problematic aspects of the above
statement. Firstly, it is impossible to realise that current and potential rivals have ceased to
strive to duplicate one’s competitive advantage or will not seek a way to do so in the future.
Secondly, Barney (1991) did mention about RBV with focusing mostly on the outcomes and
avoiding mention of the process of building competitive advantages which can be created via
organisational learning.
Under the resource-based view, firms with valuable resource might obtain more
competitive advantages, but the criteria for “valuable aspects” is still unclear and depend on
specific cases (Priem and Butler, 2001). Traditional strategy models, such as Michael Porter’s
five forces model, have focused on analysing the company’s external competitive
environment and did not investigate inside the firm. In contrast, the RBV theory highlights
the importance of matching and fitting the firms’ internal capabilities and the external market
context in which the firm operates. Most researchers have confirmed that it is critical to
determine a strategic action based on individual firms’ resources and capabilities; and the

17
strategies used should allow each company simultaneously to best deploy its core
competencies and fit with the external environment.
Industrial organisation theory
“The theory of industrial organisation (IO) has by and large viewed the industry as a
homogeneous unit. Firms in an industry are assumed to be alike in all economically important
dimensions except for their size” (Porter, 1979:214). It aims to explain the differences in
performance amongst firms (Foss, 1996; Scherer and Ross, 1990; Michael, 2003). The
essence of IO had been developed by Chamberlin (1933), Sweezy (1939), Mason (1949),
Bain (1956, 1968), Caves and Porter (1977) and their followers. They stated that firms’
performance critically depends on the characteristics of the industrial environment where
firms compete with others. In IO theory, the structure-conduct-performance (SCP)
framework, which is also known as the Bain/Mason paradigm (Figure 2.2.1) investigates how
the structure of an industry (all factors which generate market competitiveness) influence the
conduct (the behaviours and strategies used) and firms’ performance (Lipczynski and Wilson,
2004). In that, firm conduct dimension relates to how firms compete in the market place, their
own strategies performance or firms’ choices in relation to price, quality, the level of
expansion, and advertising; performance was evaluated based on many factors which are
“allocative efficiency (profitability), technical efficiency (cost minimization), innovativeness
and others” (Porter, 1983:176). There are two perspectives being considered in SCP trilogy;
Bain (1956; 1968) stated that a structure has a significant effect on firms’ performance. In
order to estimate firms’ future performance, some factors which are barriers to entry, the
number of firms that get involved in the industry, their size and distribution systems, the level
of product differentiation and the overall elasticity of demand for the product should be
considered carefully. Another perspective also based on the above dimension, due to firms’
conduct being determined by industry structure, in the process of estimating firms’
performance, researchers “could ignore conduct and look directly at the industry structure in
trying to explain performance” (Porter, 1983: 176). This framework also considers how
public policies may affect firms’ structures and strategies. It is clear that the SCP approach
strives to explain and estimate the effects of market structure and conduct on the performance
of firms in an industry (Van Cayseele and Van Den Bergh, 1999; Lopez, 2001).

18
Figure 2.2.1: The basic SCP model (Source: Adapted from Porter, 1983:176)
There are a number of contrary schools of thoughts about the problematic aspects of the
SCP framework and disagreement about the idea of predicting performance mainly based on
industry structure (Phillip, 1976; Clarke, 1985); these groups argue that the IO framework is
stark and built on a limited number of factors related to industry structure (such as entry
barriers), whereas factors that affect competition and performance in industries could depend
on how business strategies are shaped and conducted.
2.2.3.2. Strategic group theory
The literature on “strategic groups” has generated an ongoing debate amongst scholars
and practitioners (Panagiotou, 2005; Lawless et al., 1989; McNamara et al., 2002). The
above two mentioned theories (RBV and IO) can be used to explain the nature of how
strategic groups were constituted. Both RBV and IO theory have shaped and provided a good
tool with which strategic management researchers can compare and contrast groups of firms
(Leask and Parker, 2006). Cool and Schendel (1987) found that the combination between
firms’ characteristics, environmental factors and strategic choices may shape company
performance. Fiegenbaum and Thomas (1995) indicated that by breaking the industry into
smaller groups of firms, forming them into the same strategic groups and looking at their
associated actions or their performance, the firms in that group can use these valuable
characteristics as a reference when making their own strategic decisions and it can be seen
that those who make “similar invesments are more likely to have similar drivers of
profitability” (Michael, 2015:201).
There are two perspectives of competitive strategy which are normally explored by
strategic researchers: resource pattern and strategic scope commitment; it can be seen clearly
that industries possess many segmentations, and many firms enjoy multi-segmentation, while
some firms serve only one segment (since they are heterogeneous in term of possessed
resources and used strategies). Firms having similar resources and scope characteristics can
be demonstrated; Leask and Parker (2006) and Porter (1980:129) define a strategic group as a
group of corporations that employ the same or similar strategies in a specific industry. The

19
term “strategic groups” was mentioned by Hunt (1972) who sought to identify configurations
based on observing firms’ behaviour in the US home appliance industry and then explain
their differing performances. He supposed this group enjoyed the same characteristics which
related to “cost structure, formal organisation, control systems, management rewards and
punishment”.
Levy and Weitz (2008) indicated that “the retailing format refers to the structures for
sequencing and organising the selected retailing activities into coherent processes that fulfill
the customer experience. Specially, the format represents a combination of particular levels
of each element of the retailing mix, such as product assortment, pricing strategy, location,
customer interface, and so forth” (Sorescu et al., 2011:S5).
As Porter discovered, individual strategic group members face similar threats and
opportunities in the competitive market. A strategic group might include only one or more
members (Müller-Stewens, 2005). A further definition provided by Porter (1979), Cool and
Schendel (1987), is that a strategic group is seen as “a set of firms competing within an
industry on the basis of similar combinations of scope and resource commitments”, these
firms follow similar strategies “in terms of the key variables and competing with each other
within an industry”, and that they share “similar strategic logics and dimensions”. These
dimensions can be brand identification, specialisation, price policy, channel selection,
technological leadership, product quality, vertical integration and cost position (Porter, 1980)
Mascarenhas and Aaker (1989) indicated that mobility barriers (barriers to entry and exist)
can differentiate between groupings of businesses. In that, mobility barriers impede the
movement flow of firms in the same industry from one strategic group to another (Caves and
Porter, 1977). A strategic group owning high mobility barriers is more insulated from
competitors and has a stronger bargaining power (Porter, 1979).
A firm’s strategic choice can be divided into three classes: doing better at their current
group, moving to their favourably targeted group (Porter, 1980) and creating a new strategic
group (Duan and Jin, 2014). It is conceived that moving successfully to other groups is
extremely difficult and the majority of firms would probably not be able to move to a target
group in the short term. In addition, performance is constituted by many factors, and
members of the same strategic group can experience them differently; a high average
profitability “does not mean that every member in the group performs well” (Cool and
Schendel, 1988, Porter, 979). Therefore, moving to other groups may not be a feasible choice.

20
Strategic groups demonstrate a real picture of industry competition and many firms and
competitors can fall into different competing clusters (Reger and Huff, 1993). It helps
marketers and strategic managers to better understand the complexities of the competitive
landscape in the industry and strategic groups which they belong to. In fact, companies in
specific industries often differentiate against other companies via a number of factors such as
used distribution channels, the market segments they serve, product quality, technological
leadership, customer service, pricing policy, R&D cost, advertising policy and promotion.
Based on the above differences, it can be observed that many groups of companies have been
appearing as a cluster with each member in that group pursuing a similar strategy – a strategic
group. Therefore, strategic group includes competitors with similar conditions, competitive
approaches in the markets, similar market position, structure and competitive beliefs. There
are some basic characteristics of strategic groups which are mentioned by many researchers:
firms have a tendency to compete mostly with other firms in same strategic groups because
they all have similar resources (Cool and Schendel, 1987; Dranove et al., 1998), “strategic
group members operate on comparable strategic dimension” (Adejuwon, 2014; Porter, 1979;
Peteraf and Shanley, 1997, Ferguson et al., 2000); the performance of firms in that group is
likely to be similar (Cool and Schendel, 1987; Barney and Hoskisson, 1990); group members
are likely to react similarly to any opportunities and threats arising (Panagiotou, 2007).
Therefore, managers’ perceptions of their rivalry are formed by a group structure, rather than
looking at each firm’s competitive action.
The notion of strategic groups can be utilised to evaluate the positioning strategies of
firms; it enables firms to undertake an arguably more insightful investigation of the industry,
its competitive behaviour between groups, and to analyse the group’s structure. Besides that,
firms can clearly realise the number of possible and effective strategies that other competitors
used in order to succeed (Reger and Huff, 1993) and those who are intending entering into
the industry can easily find a place to insert their businesses as well as competing effectively
from the start. In other words, strategic groups include firms pursuing the same positioning
strategies (cost leadership/differentiation/ focus or combined strategies); at the same time,
they serve the same or relatively similar target groups of customers. Therefore, as a result, the
key factors for success (KFS) might be similar, they also face similar opportunities and
challenges in their business context (Panagiotou, 2005, 2006a). However, empirical studies
have produced equivocal evidence about the relationship between different strategic groups

21
chosen and their performance. Therefore, it is difficult to formulate advice on which groups
that firms should consider entering into (Leask and Parker, 2007).
However, other researchers gave completely contrary ideas about what factors should be
used to form strategic groups.
There are many tools to recognise where and which strategic group a specific firm
belongs to, the so-called strategic group mapping. The first step is to examine the firm’s
position against five competitive forces (Porter, 1980), looking at the power of buyer and
supplier, the competitive ability of that firm among competitors as well as competitive level,
how new entrants affect firm’s business and the threat of substitutes. These findings will
formulate firm’s strengths and weaknesses. The next step is to explore firms’ competitive
advantages based on firms’ positioning and its own resources. Firms having the same
strengths and weaknesses at the same competitive environment might react similarly toward
any changes. Then, looking at strategies used by the firms: their competitive advantages,
business structure, development orientation and goals; if these dimensions are similar, they
should be placed in the same strategic group (Feka et al., 1997).
Moreover, if firms develop the same strategic dimensions with the same level, including
the level of diversification, the degree of vertical integration, distribution channel, market
segmentation, expanding orientation and so forth, they also should be named in the same
strategic group (Feka et al., 1997). In that, strategic distance, which was first introduced by
Porter (1979), describing “the degree of dissimilarity among firms’ strategies” and
differentiating “their relative positions within strategic groups” (Duan and Jin, 2014:1860)
should be considered during the analysis process.
Porter (1980) introduced the Strategic Group Map (figure 2.2.2). He indicated many
strategic dimensions and mapping strategic groups as shown in figure 1 as taking two
dimensions and comparisons at a time. Then, McNamee and McHugh (1989) adapted and
named it the “Group Competive Intensity Map” (GCIM) which clustered firms based on both
“strategies used” and “its structure” (Figure 2.2.2); the structural and strategic determinants
which were considered include company ownership, company activity, degree of
specialisation, company size, company pricing strategy (Figure 2.2.3). For example, firms are
grouped based on companies’ pricing strategy and most important customer type (Figure
2.2.4).

22
Figure 2.2.2: Ilustrative map of the US chain saw industry
(Source: Porter, 1980:153; McNamee and McHugh, 1989:90)
Figure 2.2.3: Average net profit before tax for market specialisation and company
ownership
(Source: McNamee and McHugh, 1989:90)

23
Figure 2.2.4: Average net profit before tax for company’s pricing strategy and most
important customer type (McNamee and McHugh, 1989:96)
Here is the example of mapping strategic groups in the Fashion industry (Bonetti and
Schiavone, 2014) (Figure 2.2.5), they also shed light on some main features of the identified
strategic groups including design, manufacturing, branding and distribution.
Figure 2.2.5: Strategic groups scheme
(Source: Bonetti and Schiavone, 2014:64)

24
In this research, the instruction of identifying a strategic group in the Vietnamese
supermarket industry will be investigated fully in Section 2.3.
2.2.4. Competitive positioning and competitive analysis
Over the years, researchers have been using the concept of strategic groups to investigate
firms’ competitive behaviour/reaction (Smith et al., 1997; Peng et al., 2004; Park and Yoo,
2016) and competitive positioning (Flavian and Polo, 1999; McNamara et al., 2002). Park
and Yoo (2016:684) stated “a firms’ competitive reaction should be understood as a series of
managerial actions over time” and their research indicated that firms indeed react to each
other. Giaglish and Fouskas (2011:1257) found “perceptions of competition intensity,
substitution threats and increased buyer powers are associated with broader and more
innovative competitive reactions”. Competitive reaction can be a part of analysing
competitive positioning (Horta and Camanho, 2014). Competitive positioning refers to firms’
relative posture in terms of the competitive space where firms are currently operating (Kale
and Arditi, 2002; Horta and Camanho, 2014). In other words, Fleisher and Bensoussan
(2007) defined competitive position of an organisation as “the position of an organisation
compared to its competitors in the same market or industry” (Viet and Yeo, 2017:20). There
are some ways to define competitive positioning in a specific industry, but the most
applicable accepted approach has been from Porter (1980) which categorises mode and scope
of competition. Mode of competition refers to the way in which firms achieve their
competitive advantages (i.e. via innovation, time, cost or quality) while the scope of
competition refers to the breadth of firms’ operation (i.e. scope of offered products/services,
narrow or broad market approach). Then, many researchers examined competitive positioning
based on the previous theories, such as McGee and Thomas (1986), Dikmen et al. (2009) or
Lahti (1983) who characterises competitive positioning using the size and nature of product’s
variables. Ramsler (1982) used size and geographic scope variables in the banking sector.
McNamara et al. (2003) found that differences in performance within strategic groups exist
due to different firm’s competitive positioning.
There are some analytical methods often being deployed to measure and identify the
competitive position of firms, such as Porter’s Five Forces; Strengths, Weakness,
Opportunities and Threat analysis (SWOT analysis); McKinsey Matrix; the Boston
Consulting Group (BCG) matrix (Dyson, 1990) but the BCG matrix is predominantly used in
competitive positioning compared to others (Viet and Yeo, 2017) (Figure 2.2.6, Figure 2.2.7).

25
The following figures indicate a brief review of these approaches; it will be explored in detail
with direct application to the Vietnamese supermarket industry in section 2.4.
Figure 2.2.6: BCG matrix (Adapted from Porter, 1983:177)
Figure 2.2.7: Porter’s Five Forces Model – Fundamental determinants of industry
competition (Adapted from Porter, 1983:177)
2.2.5. Summary
The above is a review of some of the literature relating to strategic groups, including the
link between business strategy and firms’ performance, some background theories that have
shaped strategic groups, Resource Based View (RBV) and Industrial Organisation theory.

26
This is followed by a brief literature review of competitive positioning and competitive
analysis which is fully investigated. All of the above information can briefly describe and
explain the meaning of strategic groups and how they are constituted as well as partly
demonstrating insight into why strategic groups should be considered, since it can be noted
that different groups of firms might have different advantages and the term “customer
loyalty” might be defined differently between groups. This is considered as a fundamental
point leading to the necessity of this research. The next part is going to briefly review the
meaning of “Retail industry” which is one of the four main themes.
2.3. Retail industry
2.3.1. Introduction
In this section, retailing industry insight is going to be examined, including the retailing
concept, trends in the retailing industry, types of retailers, retail channels; followed by a brief
review of customer buying behaviour and some retail logistics issues.
2.3.2. Retail
2.3.2.1. Definition of retail and brief report on current global retail industry
There appears to be mutually inconsistent definitions of retailing among researchers
(Peterson and Balasubramanian, 2002; Dawson et al., 2008). Retailing is defined as “the set
of business activities that adds value to the products and services sold to consumers for their
personal or family use” (Levy and Weitz, 2004:6). Kotler et al. (2013:386) presents
“Retailing includes all the activities involved in selling goods or services to the final
consumer for personal, non-business use”. Researchers have argued retailing is not just about
selling products in store, it also involves the sale of services such as a home-delivered pizza,
overnight lodging in a motel, a videotape rental. Hassan et al. (2013:584) stated “retailing
begins as a local activity, which involves a transaction where the buyer intends to consume a
product” (Severin et al., 2001; Liao et al., 2008). Over the past few decades, there has been a
significant transformation of the retailing industry, consumers have gradually moved from
traditional shops to modern retailing channels (Morganosky, 1997; Hassan et al., 2013), many
newcomers and huge retailers penetrating the retail market have threatened and grasped the
opportunity of small local grocery stores (Hare, 2003; Gonzalez-Benito, 2005).

27
Figure 2.3.1 demonstrates the basic steps of a distribution channel; there remains a
question as to why manufacturers do not normally sell their products directly to consumers
At least part of the answer should result from a fuller understanding of the functions of
retailers. According to Levy and Weitz (2004), retailers hold many functions, including
providing an assortment of products and services, breaking bulk, holding inventory,
providing services.
Figure 2.3.1: Distribution Channel
(Source: Adapted from Levy and Weitz, 2004:7)
Picture of current global retailing industrys
Figure 2.3.2 presents “Top 250 quick statistics, FY2015” (Deloitte, 2017:4)
Figure 2.3.2: Top 250 quick statistics, FY2015
(Source: Deloitte, 2017:4)

28
The following figures present top 20 global retailers in 2014 (Deloitte, 2016:12) and top
20 global retailers in 2015 (Deloitte (2017:4; CEOWORLD Magazine, 2017) (Figure 2.3.3,
2.3.4). The full report provides top 250 global retailers in 2014 and 2015 (Deloitte, 2016;
2017). Looking through the lists below, store-based sales have overwhelmed e-commerce,
Walmart is still a king of the retail jungle followed by a warehouse club operator Costco with
$116.1 billion retail revenue compared to Walmarts $482 billion. “The majority of the largest
global retailers remain involved in the food sector. More than half of the 200 largest retailers
have supermarket, warehouse, hypermarket, or cash and carry formats, or some combination
of them” (Levy and Weitz, 2004:12; Deloitte, 2017)
Figure 2.3.3: The top 20 global retailers, FY 2014 (Deloitte. 2016:12)

29
Figure 2.3.4: The top 20 global retailers, FY 2015
(Source: Deloitte, 2017:17; CEOWORLD Magazine, 2017)

30
Geographic review
Figure 2.3.5: Global retail geographic analysis
(Source: Deloitte, 2017:24)
Asia’s grocery market is currently the biggest globally, with a predicted 6.3%
compound annual growth rate up to 2021. The region is estimated to reach US$4.8 trillion by
2021, the same size in terms of sales volume as that of Europe and North America
collectively (RetailinAsia, 2017).
2.3.2.2. Trends in the retailing industry
Over the past few decades, many new retail formats have been developed, consumers
can buy products via many platforms (both online and offline channels) or in many formats.

31
For example, Tesco has developed their food retailing formats in the UK targeting different
groups of segmentations such as superstores, large supermarkets, Tesco Metro, Tesco
Express, combination gasoline and convenience stores, Tesco Extra and hypermarkets (Levy
and Weitz, 2004). Historically, retailing has been a local business. Stores were operated in
order to serve and fulfill the needs of the local community, and “retailing is now an
international activity” (Dawson et al., 2006:1). There are some reasons why some firms
choose to expand globally, whereas some others do not. For example, Wal-mart and France’s
Carrefour offer an amazing customer value through their efficient distribution and
communication system; McDonald and KFC attract their hungry customers everywhere they
are located. However, many retailers have also failed at attempts to expand their markets due
to different reasons such as wrong expansion strategies, misunderstanding market needs and
culture. According to Deloitte report (2016) with the title named “Global powers of retailing
2016: Navigating the new digital divide”, and Deloitte report (2017) with “Retail trends: The
art and science of customers”, the two reports indicated “We are living in the customer-
driven economy” (Deloitte, 2017:6). In previous years, research on the retailing sector
focused on globalisation (Levy and Weitz, 2004). Now, the retail trends for 2017 are focused
on three main areas.
“The first is changing preferences, including the trend toward
owning less and living in the social media-driven economy. The
second is changing retail formats through the blurring of sectors
and proliferation of on-demand fulfillment. The third is the
transformative possibilities from living with exponential
technologies, both in the store and beyond” (Deloitte, 2017:6)
These trends are not new but it is still interesting, retailers understand that technology
has moved to a fundamental issue and customers are finding new and surprising products and
experiences (Deloitte, 2017). With regard to preferences, retailers have now tried to fulfill
customers’ needs at different levels and have found their own niche markets. “Fewer, Better
Things” or “Less is more” is a slogan of Cuyana which is an e-commerce retailer located in
San Francisco (Fastcompany, 2016). As customers’ tastes have been changing, they prefer
products with good quality. Retailers have moved away from mass production or are showing
a tendency to shift away from fast fashion’s traditional business model, and create their new

32
programmes like “H&M Conscious” (Deloitte, 2017:6). Consumers define themselves by the
products they buy and experience they have. Thanks to social media, the trends and the
power of sharable retail experience have affected a loyal customer base. Besides the above
mentioned retail format, due to low barriers to entry, many “new retailers” make their
presence felt in retail markets as “pop-up” stores; the format of “order-by-phone” television
networks and e-commerce platforms has also become popular. In order to fulfill and serve
customers, one-hour delivery service, home delivery and order online pick up in store have
been introduced by many retailers such as Carrefour to create better customers’ on-demand
shopping experience (Deloitte, 2017). This process requires the partnership between
technology and delivery firms, traditional grocers and big retailers. For example, Sprout
Farmers Market cooperates with Amazon to provide fresh products for Amazon Prime
delivery in some specific areas.
All international activities can be related to the sources of goods for resale, the operation
of shops, and use of foreign labour and international expansion.
2.3.2.3. Types of Retailers
According to Levy and Weitz (2008), there are many approaches to categorise retail
format into different groups, but generally, it can be divided and summarised as follows
(Table 2.3.1)
Table 2.3.1: Types of Retailers (Adapted from Levy and Weitz, 2008)
2.3.2.4. Issues related to customer buying behavior
The behaviour of retail consumers has been explored in much previous research (Sinha
and Banerjee, 2004; Levy and Weitz, 2004; Prasad and Aryasri, 2011, Mukherjee et al.,
Food retailers General merchandise retailers Nonstore retail formats Service
retailers
Conventional
supermarkets
Discount stores Electronic retailing
Big Box food retailers Specialty stores Catalog and Direct-Mail
retailing
Convenience stores Category specialist Direct selling
Department stores Television home shopping
Drugstores Vending machine retailing
Off-Price retailers
Value retailers

33
2012). According to Levy and Weitz (2004), there are three types of customer decision-
making process, including extended problem solving, limited problem solving and habitual
decision making. Extended problem solving is a purchase process that customers devote
significant time and effort to explore and compare products between many retailers due to its
estimated risks or uncertainty. Limited problem solving is a purchase decision process
referring a moderate time and effort involved due to customers’ previous experience, they
rely more on their personal knowledge about products rather than scrutinise all alternatives.
However, if competitors want to attract more customers, they might need to offer more
available information and service to get noticed and stimulate a purchase decision from these
potential customer groups by using prominent displays and creating a positive store
environment, or the so-called “impulse buying” (Mohan et al., 2013; Bellini et al., 2017).
Habitual decision making involves little or no conscious effort, “I will buy the same thing I
bought last time from the same store” (Levy and Weitz, 2004:110). The second issue relating
to customer buying behaviour is their buying process, there are five stages in the buying
process as selecting a retailer (Levy and Weitz, 2004:111) (Figure 2.3.6) It includes need
recognition, search for information about retailers, evaluate and select a retailer, visit stores
or internet site or look through catalogues, repeat store patronage if a successful purchase
decision has been made previously.
Figure 2.3.6: Stages in the Buying Process (adapted from Levy and Weitz, 2004:111)

34
The next issue is social factors influencing customer buying decisions. These social
factors include customers’ beliefs, attitudes, values and customer social environment which
are family related factors, reference group and culture (Levy and Weitz, 2008). All of the
above indicated elements create different choices between consumers.
2.3.3. Summary
This part has briefly reviewed the retailing concept as well as presenting information
about current top global retailers, geographical overview, followed by trends in the retailing
industry, types of retailers, retail channels; finally, issues related to customer buying
behaviour were indicated. The purpose of this part is to demonstrate an insight into the
current situation of global retail markets as well as types of retail channels and retailers. The
next part is going to explore the Vietnamese retail industry.
2.4. The Vietnamese retail industry insights
2.4.1. Introduction
This section will demonstrate the whole picture of the Vietnamese retail industry,
particularly supermarket format. From the beginning, the section is going to present an
overview of the Vietnamese retail industry, its current situation as well as M&A activities,
followed by an investigation of the Vietnamese traditional retail channels, and e-commerce in
Vietnam. Then, this chapter will present PESTLE analysis, industry life cycle and the five-
force analysis in order to clarify the current competitive environment of the Vietnamese retail
industry. Finally, drivers of change in the retail industry in Vietnam will be investigated.
2.4.2. Overview about the Vietnamese retail industry
Vietnam’s retail market is characterised as being one of the most dynamic markets in the
region with high annual growth rates. Hanoi and Ho Chi Minh City have been ranked
amongst the top 10 Asian cities for retail expansion in 2014 (Tuoitrenews, 2014). With a
population of more than 93 million people, about 70 percent of them aged from 16 to 64 is a
factor in the potential growth of the retail industry, this figure is also described as the
“Golden retail index” (Oxford Business Group, 2017) and Vietnam was placed sixth in the
2017 Global Retail Development Index (GRDI) (Vietnamnet, 2017). Per capita income has
been rising, the rate of urbanisation is high, living conditions have been improved, the

35
economic environment is stable and corporate income tax tends to decrease; sixty per cent of
the population are aged under 35 and have a vibrant interest in global trends and brands, the
average Vietnamese income has risen from US$433 to US$ 2200 per year in just five years,
which enables Vietnamese consumers to afford products and services from international
brands. “The World Bank has forecast that Vietnam’s $200 billion economy is likely to grow
to a trillion dollars by 2035, with more than half of its population, compared with only 11
percent today, expected to join the ranks of the global middle class with consumption of $15
a day or more” (RetailinAsia, 2017). These facts make the Vietnamese retail industry more
attractive in investors’ eyes. In particular, Ho Chi Minh city, Ha Noi, Hai Phong, Da Nang,
Dong Nai, Can Tho, Nha Trang can be considered as potentially significant developed areas
where income has presented much higher than the national average - about two to three times
higher. In fact, Vietnam’s urban middle-class is a target group for most modern retail chains
(Le, 2016; Vo, 2017). In addition, the current low retail density in Hanoi and Ho Chi Minh,
remains at a modest level of 0.26 and 0.12 m2 of retailer/ per person respectively, and is
significantly lower than other cities in the region such as Bangkok, Singapore and Kuala
Lumpur (HANOITIMES, 2017). Vietnam has a variety of retail channels including
traditional markets such as wet markets, flea markets, small independent grocery shops;
modern channels such as hypermarkets, supermarkets, shopping malls, department stores,
convenience stores, and e-channels (Dao, 2016). In Vietnam, small independent grocers and
wet markets are not large and well-equipped; they could not have an excellent-service-offered
as modern retail channels do but they are available at every corner of the market.
Figure 2.4.1: The population pyramid of Vietnam (Central Intelligence Agency, 2017)

36
Vietnam officially opened the retail market for foreign investors from 01/01/2009, before
that if foreign investors wanted a presence in Vietnam, they needed to cooperate with
Vietnamese firms to legalise their businesses. Thanks to having become an official member
of WTO in 2007, Vietnam has been able to fully open the door for foreign retailers to invest
in Vietnam. Under this agreement, from January 2015, foreign retailers are allowed to
establish their businesses in Vietnam with 100% foreign capital (Business Development
Group Vietnam, 2016). The retail market in Vietnam has been heating up since 2014, many
foreign investors have significantly penetrated Vietnamese retail market using mergers and
acquisition of local chains (Thailand investors; AEON (Japan), Emart (largest Korean
supermarket chain), Auchan (France)) and now compete directly with current domestic
supermarket retailers (RetailinAsia, 2016; Le, 2016). Smaller retailers who are unable to cope
with the new demands might run the risk of going out of business. More than that, foreign
investors have actively built their own distribution channels and expanded the number of
stores. These foreign retailers have many advantages in terms of capital and managerial
skills, but their most significant limitation is their level of understanding of local consumer
habits and Vietnamese taste. A lively picture of Vietnam’s retail markets in recent years
shows mergers and acquisitions (M&A), e-commerce, and fast-growth among some of the
new entrants. According to a report released by the Ministry of Industry and Trade (MIT)
(2017), foreign retail firms account for “17 % retail market share in shopping centers and
supermarkets, 70% in convenience stores, 15% in minimarts, and around 50% in online, TV
and phone sales” (Oxford Business Group, 2017).
Considering M&A activities, AEON from Japan (the largest retailer in Japan by sales
revenue) acquired 30% and 49% of local Fivimart (22 stores) and Citimart (27 stores)
respectively and renamed the stores to “Aeon Citimart” and “Aeon Fivimart” (The Japan
Times, 2015) and now have a presence in four malls in Vietnam (two in Ho Chi Minh city,
one in Binh Duong and one in Hanoi). They expect to invest in 20 further stores by 2020.
Vingroup, which is one of Vietnam’s leading conglomerates about involved in significant
property development and is a new player in the retail sector, acquired Ocean Retail Group,
Maximark and Vinamart and then established their own retail network named VinMart
(Nikkei Asian Review, 2016). VinGroups’s retail section was also crowned the fastest
growing retailer in Vietnam in 2016. Its retail network now consists of over 930 stores,
including 10 Vincom department stores, Vinmart supermarkets, Vinmart+ convenience
stores, Vinpro electronics stores, VinDS consumer lifestye specialty stores (Myhanoi, 2017;

37
Vo, 2017). They are considered to have strengthened the domestic retail sector in the face of
increasingly fierce competition from foreign players by applying many incentives in order to
improve product quality and hygiene standards, such as cooperating with local suppliers for
fresh fruit and vegetables and now offer premium quality at affordable prices. The vice
chairman of VinGroup has talked about the aims of their incentive programme being “to
promote domestic production and to build national brands with international standards to best
serve the local consumers” (VNExpress, 2016).
Many of Thailand’s conglomerates have penetrated the Vietnamese retail market; in
2016, TTC Group bought Metro Cash & Carry Vietnam, which is a wholesale operation
formerly belonging to METRO Group (a German owned company, including 19 stores and
related real eastate portfolio with a total value of US$704.1 million) renamed it MM Mega
Market Chain. Central Group, also from Thailand, acquired Big C Vietnam supermarkets (34
stores) (orginally owned by the Casino Group from France) at a cost of US$1.14 billion. In
2016 Central Group also bought a 49% stake in electronics retailer Nguyen Kim; this group
has also brought Marks & Spencer, Zara, H&M to Vietnam (VNExpress, 2016; Vietnam
Investment Review, 2016; VN Express International, 2016; Oxford Business Group, 2017).
Meanwhile, starting from 4 hypermarkets in 2012, Lotte Mart from South Korea had
reached 14 supermarkets by 2015 and is forecast to increase to 60 stores by 2020; E-mart,
which is South Korea’s leading retailer, invested US$ 60 million in a shopping center in north
Ho Chi Minh City. In 2015, Auchan (France) opened 3 stores under the “Simply” brand and
plans to reach 6 stores over the next few years. In addition, Takashimaya, a luxury Japanese
shopping center operator, has also established its first center (the Saigon Center) in Ho Chi
Minh City). This center is considered to be the main competitor of Vincom center (from
Vietnamese VinGroup).
Co.opMart is the leading food retailer in Vietnam with 33 supermarkets located in Ho
Chi Minh City and 51 stores across the country. Its owner (Saigon Coop) has also diversified
their retail network by developing more than 100 Coop Food convenience stores across Ho
Chi Minh city and offer many kinds of fresh produce.
In the north of the country, starting from 2006, the Hanoi Trading Corporation (Hapro)
had one department store and 21 supermarkets in many major northern cities such as Hanoi,

38
Thai Nguyen, Hai Duong, Thanh Hoa, Bac Can and Ninh Binh; by the end of 2015 they also
have 20 stores in Hanoi (Vo, 2017).
Convenience stores and mini-marts are the fastest-growing segment in Vietnam’s retail
sector. Circle K and Familymart entered the market in 2009 and have continued to expand
since. In particular, FamilyMart plans to establish more than 800 franchised stores by 2020,
7-Eleven entered the market in July 2017 and plan to expand to more than 1,000 stores in the
coming decade (Vietnamnet, 2017). “Convenience stores in Vietnam have become popular
destinations for young consumers to shop and hang out, as the stores provide them with an
air-conditioned environment, well-organised shelves and seating areas, high quality products
and, in some stores, free Wi-Fi”, according to the head of international grocery research
organisation IGD (RetailinAsia, 2017).
All of these factors have demonstrated a lively modern picture of the Vietnamese retail
sector and suggests that consumers will be likely to benefit from greater variety and choice
(Oxford Business Group, 2017).
There are currently approximately 800 supermarkets, 160 department stores and
shopping malls, 8.600 traditional markets, and more than 1 million family-run retail shops
across the country; it is forecast that the sector will double in the next four years, with the aid
of government-backed development plans. Many supermarkets are formed under different
strategic groups and formats: and while some of them are dominant compared to some others,
no single organisation can be responsible for more than 50% of the market, since these
markets are still considered to be a scattered industry, and a fragmented market (Nguyen,
2017; Oxford Business Group, 2017).
Vietnamese consumers are getting used to modern retail stores which can accommodate
changing needs with a greater variety of goods and services, instead of giving top priority to
traditional markets. Accordingly, the traditional needs for fresh produce might be gradually
replaced by a huge range of processed foods in order to satisfy the needs of the majority of
those who work full time.
According to Oxford Business Group (2017), Vietnamese retail turnover reached $117.6
billion in 2016, and sales rose 10.2 per cent year-on-year. This revenue growth rate was
relatively high compared to other markets in the region. Data from EuroMonitor International
showed that Vietnam’s consumer spending is about to grow 47 percent in the next four years

39
to $184.9 billion (VNExpress, 2017). However, supermarkets, convenience stores and
shopping malls accounted for 25 percent of total customer spending and this figure is
expected to rise to 45 per cent in the near future (2020). In addition, from 2015 to 2020,
Vietnam’s urban population is forecast to grow by 2.6%, one of the highest growth rates in
the region (RetailinAsia, 2016; Le, 2016). Unsuprisingly, food safety and hygiene have had a
significant effect on Vietnamese consumers’s food-purchasing decisions as many cases of
food poisoning have been reported. Customers have become more aware of food quality and
food origins. Customers of traditional retail channels do not know exactly where food comes
from (Vo, 2017). Therefore, the modern retail market in Vietnam has much further scope for
development. According to RetailinAsia (2017), the modern channel has been expanding
significantly and as predicted, the country will have about 1200-1300 supermarkets and more
than 300 large malls, and thousands of convenience stores by 2020. As reported by the HCM
Union of Business Association, Vietnamese goods used to account for 80-90% of the total
volume of sales in most retail channels. However, when foreign-invested retailers have
entered the market, foreign commodities assumed the dominant position and Vietnamese
producers find it difficult to present their products in foreign-invested retail networks
(RetailinAsia, 2017) due to the trade off between price and quality. “Foreign investors not
only dominate the retail market but also swap Vietnamese products off the shelves for their
own items”, reported by VNExpress (2016). To illustrate this situation, Vu Vinh Phu,
chairman of the Hanoi Supermarket Association (VNExpress, 2016) stated that:
“A bottle of vegetable oil sold in a locally-owned supermarket is always more
expensive than the same product sold in a foreign-owned supermarket”
Some popular retail brands in Vietnam are: Vinmart+, Circle K, Shop&Go, FamilyMart
(convenience stores), Ministop, 7-Eleven, B’s Mart; Vinmart, Big C, Co.opMart, Fivimart,
Citimart, Simply Mart (supermarkets), and Vincom, Aeon, Lotte, Parkson, Takashimaya
(shopping centers) (British Business Group Vietnam, 2016). The following table (Table
2.4.1) will present the numbers of supermarket in Vietnam:

40
Retailer Name and
Outlet type
Ownership No of
stores
Location Purchasing Agent Type
AEON Fivimart
Supermarkets
Share-holding
company, major
shareholders is
AEON (Japan)
and Fivimart (VN)
24 Hanoi Mainly from importers and distributors
AEON Citimart
Supermarkets
Share-holding
company, major
shareholders is
AEON (Japan)
and Dong Hung
(VN)
27 Mainly in Ho Chi Minh City Mainly from local producers,
importers and distributors
An Phu
Supermarket
State-owned
company
1 Ho Chi Minh City Mainly from local producers,
importers and distributors
Big C
Hypermarkets and
Supermarket
100% owned by
Central Group
Thailand
34 20 cities and provinces across
country, including Bac Giang,
Binh Dinh, Binh Duong, Can
Tho, Da Nang, Dong Nai,
Hanoi, Hai Duong, Hai Phong,
Khanh Hoa, Lam Dong, Nam
Dinh, Nghe An, Binh Dinh, Phu
Tho, Quang Ninh, Thanh Hoa,
Hue, Ho Chi Minh City, Vinh
Phuc
-Dry foods and beverages mainly from
local producers, importers, distributors
and wholesalers.
-Direct imports of fresh and frozen
products (perishable food products)
- Own-produced products with BigC
labeled.
Co.opMart
Supermarkets
Local, its owner is
Saigon Coop (VN)
80 40 cities and provinces across
the countries
-Mainly from local producers,
importers, distributors and
wholesalers.
-Partly direct imports of food and
beverages.
-Own-produced products with BigC
labeled
Hapro
One departstore and
20 supermarket
State-owned
company
21 Hanoi and Nothern provinces Mainly from local producers,
importers, distributors
Intimext
Supermarket and
department stores
Joint-stock
company
14 Hanoi, Hai Phong, Hai Duong,
Nghe An, Da Nang
Mainly from importers and distributors
K-mart
Supermarket
Foreign-invested
company (Korea)
1 Ho Chi Minh City Mainly from local producers,
importers and distributors
Lotte Mart
Supermarket and
hypermarket
Foreign-invested
company (Korea)
14 Ho Chi Minh (5), Binh Duong
(1), Dong Nai (1), Phan Thiet
(1), Da Nang (1), Vung Tau (1),
Hanoi (2), Can Tho (1), Nha
Trang (1)
-Mainly from local producers,
importers, distributors and
wholesalers.
-Direct imports of fresh and frozen
products (perishable food products)
Saigon Trading
Corporation
(SATRA)
Supermarkets
State-owned
company
3 Ho Chi Minh City -Mainly from local producers,
importers and distributors.
Sapomart
Supermarket
Hiway Co., ltd
Private-owned
company
3 Hanoi -Mainly from local producers,
importers and distributors.
Vinmart
Supermarket
Private-owned
company (VN)
80 Nationwide - Dry foods and beverages mainly from
local producers/ importers/distributors
and wholesalers. - Direct imports of
fresh and frozen products (perishable
food products).
Table 2.4.1: Main supermarkets in Vietnam
(Source: Global Agricultural Information Network, 2017:1013)

41
2.4.2.1. Traditional retail channels: Wet markets, “Mon and Pop” small independent
grocery stores
As briefly reviewed from the beginning, traditional markets have been a dominant retail
channel in Vietnam despite the significant growth of modern retail networks. Vietnamese
consumers tend to go to wet markets, flea markets and “Mom and Pop” small independent
grocery stores for daily food and grocery shopping. Normally, these stores do not require
business licenses or a huge amount of capital to start up. “Wherever a new residential area is
built, a wet market is likely formed” (Global Agricultural Information Network, 2017:16).
These markets and stores mainly serve housewives who prefer to walk or use motobikes to go
to the nearest wet markets or “mom and pop” store to buy daily fresh produce and
consumables for families. They have been popularised in both rural urban areas when most
motobikers “stop by small stores along the streets to quickly purchase groceries rather than
having to park and line up at busy counters in supermarkets or modern convenience stores”
(Global Agricultural Information Network, 2017:16). There are currently approximately
8,600 traditional markets, and more than 1 million family-run retail shops across the country
(Nguyen, 2017; Oxford Business Group, 2017; Global Agricultural Information Network,
2017).
Table 2.4.2: Vietnam’s Grocery Retail Sales by Channel, trillion VND
(Adapted by Vo, 2017)
There are many reasons why traditional Vietnamese grocery channels have been
financially dominant compared to modern grocery channels. As noted, most supermarkets,

42
hypermarkets and convenience stores are located in large cities and urban areas. Meanwhile,
70% percent of Vietnamese customers live in rural areas where modern channels are not
available. It takes time for consumers’ habits to gradually change from the traditional to the
modern. In addition, card payment for daily groceries used in Vietnam is not popularised,
consumers prefer paying cash and shopping quickly at traditional grocery retailers (Myhanoi,
2017). According to the latest Future of Grocery Report prepared by Nielsen, one-third of
Vietnamese consumers (34%) love shopping at hypermarkets, supermarkets and other
modern channels. Currently, in most large cities and urban areas, the strengths of
convenience stores and supermarkets lie in their convenience levels, which are not only about
location advantages but also about a variety of services or products offered, followed by
affordable prices and a customer-friendly environment (Myhanoi, 2017).
2.4.2.2 E-commerce
E-commerce is growing in Vietnam and sales are expected to grow 22 per cent to
account for 1.2 per cent of the total retail market by the end of 2017. According to the
Vietnam E-Commerce and Information Technology Agency (VECITA), the online shopping
trend is growing rapidly in Vietnam and it is forecast that 30 percent of the population will
buy goods and services over the internet by 2020. The report in 2015 on Vietnam E-
commerce stated that Vietnamese consumers spent about US$ 4.07 billion shopping online;
this figure is still comparatively small compared to other Asian countries, with China having
reached US$617 billion and South Korea reached US$39 billion (RetailinAsian, 2016).
According to Internet World Statistics, Vietnam is currently ranked 18th
in the world in terms
of the number of internet users with more than 54 percent of the population online. Many
famous e-commerce foreign-origin websites such as Lazada, Zalora and domestic ones such
as Adayroi.com, Thegioididong.com, Tiki.com and Sendo.com have joined Vietnamese retail
markets and provide consumers with a variety of fashion, electronic goods, books and even
food. Especially in large cities such as Ho Chi Minh, Ha Noi, Da Nang, Hai Phong, Can Tho,
there are thousands of small private online businesses operating via Facebook and other
social media channels selling their products online. In other words, people can sell and buy
everything they want via Facebook and websites; customers can pay cash when they receive
products (cash on delivery-COD- payment method) but there is no official data about the total
sales on these channels because there are still a number of private online businesses operating
without paying tax and dealing only in cash. Therefore, it is not easy to calculate the correct

43
sales revenue from this channel. Currently, some of Vietnam’s major supermarkets have
applied online selling channels which enable consumers to buy groceries online.
Figure 2.4.2: Vietnam’s urban population (The World Bank, 2017)
Ho Chi Minh and Hanoi are considered to be the main destinations for most investors
with high urbanisation percentages of 82.5% and 43% respectively and over US$2,500 per
capita income.
In 2016, 34% of Vietnam’s population was concentrated in cities, compared with 30.5 %
in 2010. It can be seen that most supermarkets are located in large cities, and that the
potential opportunity for investors who can easily access urban areas (rather than rural ones)
and extend their reach into previously untapped markets is significant.
2.4.3. PESTEL analysis- Industry life cycle and the five forces model
PESTEL analysis- Industry life cycle
Porter’s Five Forces and PESTLE analysis are considered as two sets of business tools
for facilitating analysis of the macro business environment in order to help firms recognise
their current situation and improve their competitive position in specific industries. PESTLE
identifies how various macro environmental factors might influence all activities of an
industry, and such analysis, can explain indirect effects on firms. It helps firms exploit
opportunities and evaluate markets and their potential development. On the other hand,

44
Porter’s Five Forces will give every single firm an understanding of the competitive
landscape and all leading forces inside the industry which affect their competitive standing.
PESTLE analysis includes: Polical, Economic, Sociocultural, Technological, Legal and
Environmental factors. Applying PESTLE analysis directly to Vietnam’s Retail Industry,
there are a number of factors being considered as follows:
Figure 2.4.3: PESTLE analysis (Haberberg and Rieple, 2008)
Political and legal factors can have a significant effect on the retail industry. Vietnam has
a stable political environment; there is no social unrest or action to provoke the current
government, issues relating to the political landscape and trade regulation have not changed
frequently, and the government has a reasonable development path for the Vietnamese
economy. Alongside its accession to the WTO in 2006 (effective in 2007), Vietnam has fully
opened doors in its distribution sector, thereby allowing 100% direct foreign investment in
many fields including commercial production and distribution. In many big cities, the legal
framework has focused on facilitating foreign and domestic investment allowing
development of businesses in food distribution, supporting them if they diversify into the
supermarket sector, accelerating the urbanisation process, gradually eliminating street
vendors and unofficial traditional markets. After careful consideration the government
ensures the retail industry develops as planned by proposing many strategies for specific
areas. In that, there will be plenty of goods ranging from consumer goods to food and
diversification simultaneously amongst all retail business models such as shopping malls,

45
supermarkets, convenience stores, hypermarkets, department stores and so forth. However,
corruption could be considered as a barrier for all investors as administrative procedures are
complicated and it takes a long time to deal with government due to their antiquated
managerial style.
Regarding economic factors, it can be seen that a retail sector will be strongly affected by
the economic environment. Thanks to rapid economic development and a relatively high and
stable GDP growth rate, the economy is growing (estimated 6.6 percent growth in 2017),
Vietnamese customers’ expenditure has increased significantly year-on-year, and industrial
competitive pressures could be reduced to some extent (Vietnamnet, 2017). Many investors
recognised this and there has been massive penetration into this sector. Besides that, as
indicated above, urbanisation also contributes to the development of retail industries. In
Vietnam, supermarkets or shopping malls have not traditionally existed in rural and poor
areas. Instead, people have official, unofficial and spontaneously-established traditional
markets. In respect of interest rates, any slight changes definitely affect the economy;
currently, the Vietnamese economy follows “market mechanism”, as interest rate changes
will lead to fluctuations in investment or spending. As interest rates decrease, the lower cost
of capital has led to investment increasing in many projects because most Vietnamese
projects are mainly borrowing-intensive; consumption has also increased as people are
reluctant to save when interest rates are low. Of course the opposite applies when interest
rates increase. Therefore, the interest rate is an effective tool for government in regulating the
economy. Besides that, with Vietnam’s retail market revealing its potential for development
and attracting many large foreign investors, the effect of currency exchange rates needs to be
considered: many foreign firms importing their products to sell in supermarkets and
shopping malls, will definitely see product prices and customer purchasing behaviour
affected by fluctuating exchange rates. Currently, the inflation rate in Vietnam has been
reduced, and has fluctuated in recent years around 2.5-5%.

46
Figure 2.4.4: Vietnam inflation rate (Trading Economics, 2017)
Regarding social and cultural factors, shopping at traditional and spontaneous markets
and buying food from street vendors is a habit amongst Vietnamese customers, and can be
regarded as a constituent of Vietnamese cultural identity. Vietnamese everyday food
preparation is sophisticated with the use of many varied ingredients. Vietnamese people have
a tendency to prefer buying ingredients in unprocessed and fresh form, to enable them to use
varied cooking techniques. All of their food requirements can easily be met at their traditional
markets with their location advantages. However, those who have regard to food hygiene and
product origin, and are prepared to accept fake or low-quality products with high-prices
might have gradually changed their purchasing behaviour and begun to move to

47
supermarkets, shopping malls or convenience stores. Besides that, many consumers prefer to
frequent shopping malls due to the variety of products and services offered. Unemployment
rates in Vietnam have decreased, living standards are improving, and consumers’ needs are
increasing at both quali and quanti levels. According to Statistic, Vietnam’s retail market has
grown 10.2 percent over the past year with total sales reaching $118 billion (VNExpress,
2017) and more than 85% of city dwellers prefer to shop at supermarkets or stores rather than
traditional markets. In addition, some households with limited shopping time on weekdays
might choose supermarkets for food purchase at the weekend. This is a big opportunity for
firms to explore and meet market demands.
Labour costs in Vietnam remain low, the general salary for normal supermarket such as
customer service or cashiers is about GB£150/month if they are official and full-time; part
time students or workers will be paid based on their total time of working, and normally it is
about 50p/hour. Many firms have identified Vietnam as a potential market with abundant
labour force and cheap labour costs.
With 70 percent of the population aged from 16 to 64 and high urbanisation rates,
Vietnam is gradually moving from “feeding and clothing oneself properly” to “creature
comforts”, especially amongst young citizens in cities. As the population pyramid of Vietnam
indicates, there are many different age ranges of consumers; firms need to consider their
localised demographic environment in order to meet their target customers’ needs as well as
offering the right products and price positioning to them. Customer power will be considered
in the next part (Five-Force analysis).
Currently supermarkets, shopping malls or convenience stores are mostly located in big
cities - firms ignore small towns and rural areas due to their lower purchasing power.
Besides, there are many additional reasons which can explain investors’ choices. Education in
big cities is generally better than elsewhere. In fact, education has been seen to influence
consumers’ behaviour: educated Vietnamese people living in cities are more concerned about
product quality and hygiene factors rather than price and convenience factors. They have
higher earning potential and independence in their expenditure, with enhanced needs and
longer shopping time. In some big cities, there are also huge differences in consumption;
immigrants and members of different social classes are consumers in the same marketplace.
Therefore, food firms have built their businesses in Vietnam based on their own development
strategies and the market segmentation that they are serving.

48
In addition, the proportion of males and females is not uniform across age groups (see
Figure 2.3.1). Generally it is women who make decisions as to which food and household
items are purchased because they are mostly responsible for cooking, and housework.
Vietnamese males do not usually cook, and women enjoy shopping more than men. This
factor should not be ignored as firms attempt to penetrate retail markets and plan marketing
campaigns.
Average income of people who live in big cities is much higher than elsewhere and there
is a big gap between rich and poor people in Vietnam. According to Tradingeconomics
(2017), in 2016, Vietnamese average income is 1,770 USD/year, and that of inhabitants of
big cities such as Ho Chi Minh, Ha Noi and Da Nang, Hai Phong is much higher.
Figure 2.4.5: Vietnam GDP per capita (Trading Economics, 2017)
Marital status and areas where people live affect retail business in many ways. Due to
high property prices in Ho Chi Minh City and Hanoi, and in line with traditional culture,
some couples live with their parents; this fact might influence food purchasing patterns.
Regarding technological factors, importing new technologies into business can be an
advantage for the organisation as well as its customers. It facilitates firms in improving the
stocking and distribution process. Technological equipment used in Vietnam’s supermarkets
or stores, including all computing systems that have smart functions are being designed to
align with supermarkets’ business models. Currently, all Vietnamese supermarket chains
have applied modern technologies in managing and controlling their back office and front
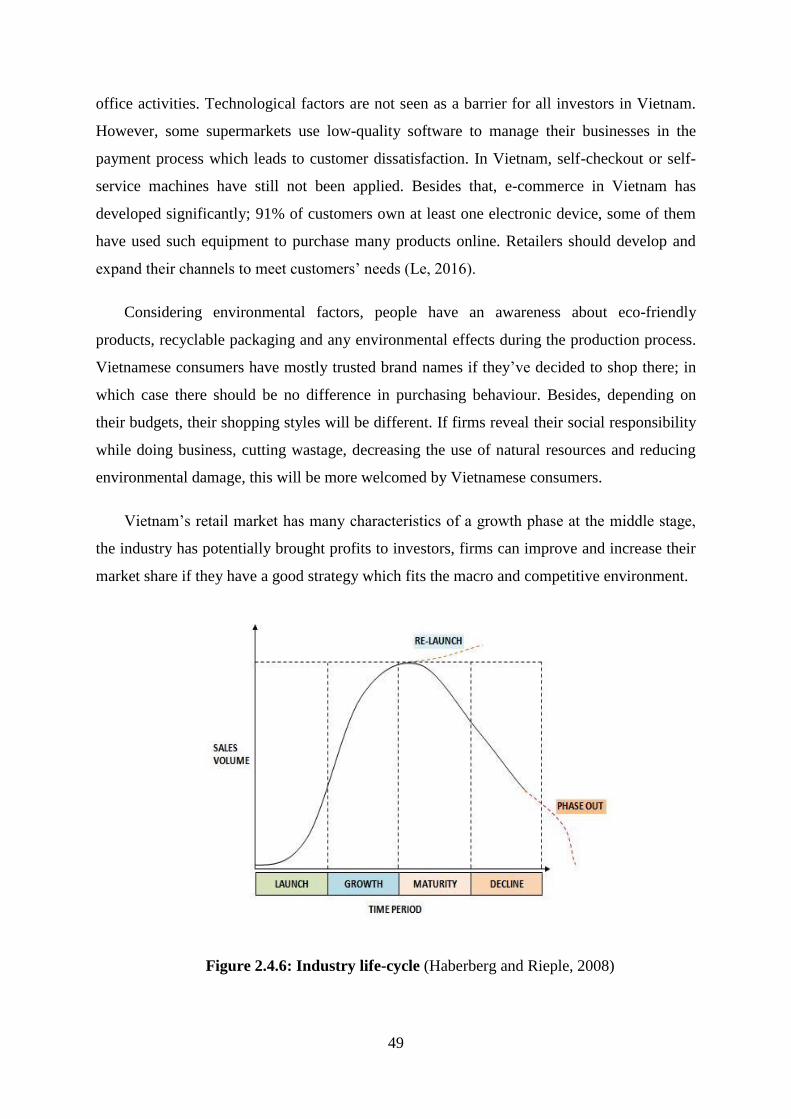
49
office activities. Technological factors are not seen as a barrier for all investors in Vietnam.
However, some supermarkets use low-quality software to manage their businesses in the
payment process which leads to customer dissatisfaction. In Vietnam, self-checkout or self-
service machines have still not been applied. Besides that, e-commerce in Vietnam has
developed significantly; 91% of customers own at least one electronic device, some of them
have used such equipment to purchase many products online. Retailers should develop and
expand their channels to meet customers’ needs (Le, 2016).
Considering environmental factors, people have an awareness about eco-friendly
products, recyclable packaging and any environmental effects during the production process.
Vietnamese consumers have mostly trusted brand names if they’ve decided to shop there; in
which case there should be no difference in purchasing behaviour. Besides, depending on
their budgets, their shopping styles will be different. If firms reveal their social responsibility
while doing business, cutting wastage, decreasing the use of natural resources and reducing
environmental damage, this will be more welcomed by Vietnamese consumers.
Vietnam’s retail market has many characteristics of a growth phase at the middle stage,
the industry has potentially brought profits to investors, firms can improve and increase their
market share if they have a good strategy which fits the macro and competitive environment.
Figure 2.4.6: Industry life-cycle (Haberberg and Rieple, 2008)

50
Analysing the competitive environment of Vietnam retail industry using Porter’s Five
Forces model
Figure 2.4.7: The Five Forces model (Haberberg and Rieple, 2008)
As indicated above, Vietnam’s retail market holds potential and there are a significant
number of buyers (consumers) who buy many products at supermarkets and stores. They
have a variety of choices in choosing the brand name and stores they will go to and they can
change to other stores and brand names easily without paying any significant switching costs.
Household products and consumer goods can be standardised or undifferentiated; consumers
can mostly find products anywhere (supermarkets, traditional markets and so forth). Besides
that, with abundant information about product quality, easy to access producer reliability
checking as well as many firms offering the same service, consumers in retail markets are
considered to having a high power. Currently, shopping malls in Vietnam rent a space in their
areas to other companies who want to sell some products inside the mall; these big customers
also have a high power, if supermarkets or the investors of that mall increase rent per square
foot or change their business policies (the number of events organised, marketing campaigns
etc.), their big customers might choose another mall depending on how much commitment
they have to their current location.
Regarding the power of suppliers for supermarkets or shopping malls and convenience
stores, they have low power compared to the firms because of the existence of other high
quality and abundant suppliers in the markets. Suppliers are always threatened by the
growing ability of other suppliers who offer firms a better deal. There are many suppliers for

51
supermarkets from processed food, household goods and electrical providers to fresh food
and vegetables, but it is not difficult to change and choose new suppliers. Therefore, both
supermarkets and their suppliers need to consider carefully any mutual policies.
According to Haberberg and Rieple (2008), there are three types of substitution in
analysing competitive environment. Considering retail markets, there are no products which
can carry out the same function as foodstuffs, but some alternative products can be
substituted for existing consumer goods; even in the area of food, there are plenty of
alternative food and drinks if consumers choose to change preferences. Music or drinks and
other items might fulfill similar psychological needs to some foods and consumer goods;
cinemas, holidays or buying a new bike might be considered as an alternative use of
spending power to buying goods in supermarkets. In retail markets, all products are regarded
as potential substitutes for different industries and categories. The examples above express
different levels of substitution and it is possible to reduce demand for a particular product, as
there is a threat of consumers switching to the alternatives (Porter, 1980). Therefore, there is
a significant threat of substitution in this industry.
Regarding the power of intensity of competitive rivalry, there are plenty of firms
participating and competing in Vietnam’s retail market to attract a higher market share; they
are from different strategic groups and different business formats. There are number of
dominant firms in the market, many new big firms having entered and created a new
competitive landscape in recent years. However, Vietnam’s retail market is identified as a
fragmented market, and the competition level is high.
Entry barriers influence the level of threat of new entrants in many industries. In
Vietnam, the grocery market has been transformed into supermarket-dominated businesses.
In the retail market, entry barriers are low, firms with strong financial status and good
managerial skills can easily enter this industry, the level of success depends on how well
organised the businesses are, and what strategies are used. This is because of the
fragmentation level of retail markets in Vietnam, and the many grocery business formats.
Therefore, the threat of new entrants is high.
Besides Five-forces, complementary products should be considered. In the automotive
industry for example, insurance and financial services casn be demonstrated to be
complementary products; while in the retail industry, all products and services offered by
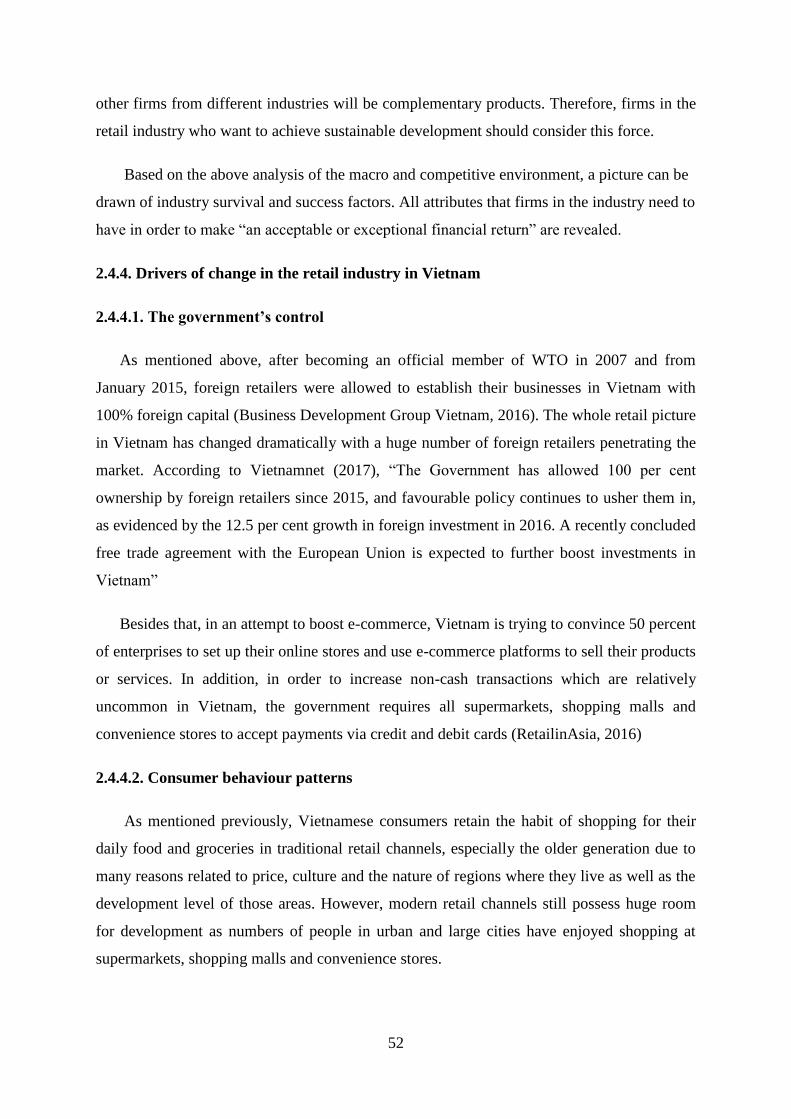
52
other firms from different industries will be complementary products. Therefore, firms in the
retail industry who want to achieve sustainable development should consider this force.
Based on the above analysis of the macro and competitive environment, a picture can be
drawn of industry survival and success factors. All attributes that firms in the industry need to
have in order to make “an acceptable or exceptional financial return” are revealed.
2.4.4. Drivers of change in the retail industry in Vietnam
2.4.4.1. The government’s control
As mentioned above, after becoming an official member of WTO in 2007 and from
January 2015, foreign retailers were allowed to establish their businesses in Vietnam with
100% foreign capital (Business Development Group Vietnam, 2016). The whole retail picture
in Vietnam has changed dramatically with a huge number of foreign retailers penetrating the
market. According to Vietnamnet (2017), “The Government has allowed 100 per cent
ownership by foreign retailers since 2015, and favourable policy continues to usher them in,
as evidenced by the 12.5 per cent growth in foreign investment in 2016. A recently concluded
free trade agreement with the European Union is expected to further boost investments in
Vietnam”
Besides that, in an attempt to boost e-commerce, Vietnam is trying to convince 50 percent
of enterprises to set up their online stores and use e-commerce platforms to sell their products
or services. In addition, in order to increase non-cash transactions which are relatively
uncommon in Vietnam, the government requires all supermarkets, shopping malls and
convenience stores to accept payments via credit and debit cards (RetailinAsia, 2016)
2.4.4.2. Consumer behaviour patterns
As mentioned previously, Vietnamese consumers retain the habit of shopping for their
daily food and groceries in traditional retail channels, especially the older generation due to
many reasons related to price, culture and the nature of regions where they live as well as the
development level of those areas. However, modern retail channels still possess huge room
for development as numbers of people in urban and large cities have enjoyed shopping at
supermarkets, shopping malls and convenience stores.

53
In addition, pricing has also been ranked as the most crucial decision-making factor
during the purchase. Going to supermarkets, Vietnamese consumers expect to obtain good
quality products at reasonable prices. Therefore, retailers should consider the price-quality
equation amongst their development strategies for doing business in Vietnam.
2.4.4.3. E-commerce
Online shopping for food and grocery products has been prevalent in Vietnam. There is
no data about how much money online customers have spent for food and products via online
channels, but more and more people these days have chosen foods and grocery as well as
other products online. In this research, the researcher will not concentrate thoroughly on
exploring factors affecting customer loyalty at e-commerce level. However, as a part of
research objectives, the researcher is going to investigate the relationship between how e-
service quality directly and indirectly influences customer loyalty.
2.4.5. Summary
This part has presented a panorama of the Vietnamese retail industry, including an
overview of the Vietnamese retail industry, its current situation, the current competitive
environment (via PESTLE analysis), industry life cycle and five-force analysis. Finally,
drivers of change in the Vietnamese retail industry in Vietnam were investigated. The next
part is going to present all literature around the main theme of this research: CUSTOMER
LOYALTY.
2.5. Customer loyalty
2.5.1. Introduction
According to Walton, (the founder of Wal-Mart): “There is only one boss - the customer,
and he can fire everybody in the company from the chairman on down, simply by spending
his money somewhere else” (Entrepreneur, 2017). The terms “The customer comes first” or
“The customer is king” are often used in business, slogans considered natural because firms’
final objectives are increasing their profits and image via customer satisfaction and customer
loyalty (Fornell et al., 1996; Qui et al., 2015; Bouzaabia et al., 2013). The following parts
will present many factors which might create customer loyalty.

54
2.5.2. Consumer tastes, consumer habits, consumer preferences and consumer
behaviour
Retailers have realised that understanding their customers deeply can enhance loyalty
and their firms’ performance (Reed et al., 2000). Food choice is seemingly simple but in fact
it is a significantly complicated process of getting the right level of customer choice and
knowing the reasons why they choose it. According to Hawkins and Mothersbaugh (2007),
all marketing decisions are mostly made based on assumptions and knowledge of consumer
behaviour, Consumer behaviour demonstrates the picture of how people make decisions
about what they want, need, select and buy between different alternatives such as brands,
products and retailers. It is vital to understand customer behaviour in order to explore how
potential customers will respond to new products or services, and help firms recognise the
gap they need to fulfill in specific industries (Levy and Weitz, 2008).
Figure 2.5.1: Factors affecting customer behaviour
(Adapted from Levy and Weitz, 2008:123)
There are three factors affecting consumer behaviour: personal, psychological and social.
Personal factors explain differences between people within groups, the decisions they make
will be based on their individual characteristics, unique habits and interests. This factor is
informed by age, gender, background, culture and other personal issues (Levy and Weitz,
2008; Kopalle et al., 2010; Johnson et al., 2012). For example, older people will use their
money differently for daily spending compared to young people. Social factors lead to
different consumer behaviour. These include social class (income, education level, living

55
conditions), and social interaction (the relationship at school, work, community). These
factors have a significant effect on how people respond to new products and marketing
messages as well as how a purchasing decision is made. Besides that, each customer will
respond and have different ways to respond to the information from marketers because they
have different mindsets, perceptions and attitudes, the so-called psychological factors. In
particular, consumers might change their needs and demands based on how they feel
personally. Besides that, customer behaviour is also shown when customers are
satisfied/dissatisfied with products or services, the frequency of repeat purchasing, and word-
of-mouth (Wong and Sohal, 2003). Customer behaviour can be affected by cultural variables
(Kopalle et al., 2010; Johnson et al., 2002). Customer satisfaction and loyalty can be different
between countries based on customer behaviour even though scholars use the same index.
The word “taste” can refer to many forms which result from how products are displayed,
prepared and cooked. Currently, supermarkets offer a huge range of fresh produce, own label
processed and branded food from various locations, along with their recipes. It can be seen
that food taste preferences are affected by the culture people live within. It leads to
constituting customers’ tastes and habits. Therefore, if firms wish to succeed, they need to
understand all factors contributing to taste and habit such as cultural factors, which are
believed to affect how firms structure themselves as well as shape their marketing strategies
(Johansson, 2000; Sudharshan and Mild, 2017). As Wright et al. (2001) note “food taste
preference has been closely linked to cultural development”. Hofstede (1980; 1984) identifies
culture as “the collective programming of the mind” which allow the differences between
groups to develop. The term consumer preferences is often used in marketing and it refers to
the likelihood of choosing one thing over another (Bruwer et al., 2011; Alphonce et al.,
2015). Pelsmaeker et al. (2017) showed that consumer taste is a key driver of consumer
preferences.
“Consumers’ preference for retail stores is affected by assortment, price offers,
transactional convenience and shopping experience” (Arpita, 2014:536; Miranda et al., 2005,
Lee at al., 2008; Carpenter and Moore, 2006). It is clear that consumer preferences have a
significant impact on consumer behaviour, and customer perceived value can potentially
affect customer behaviour which leads to their purchasing intention (Sirdeshmukh et al.,
2002; Li and Petrick, 2008). “From customers’ perspectives, gaining value and being
satisfied are essential consumption outcomes that influence buying behaviour and post

56
purchase behaviour (Keng et al., 2007)” (El-Adly and Eid, 2016:220). The research from
Alphone et al. (2015) showed that consumers are willing to pay a premium for both organic
and fair-trade produce. It is all about consumer preferences. These findings can be linked
with customer perceived value and it is supposed that there is a relationship between
customer preferences and customer perceived value. It is noted that preferences are
independent of income and price. Ability to purchase goods might not determined by a
consumer’s likes or dislikes. However, despite on-going research around consumer
preferences, consumer behaviour and customer perceived value, the current literature seems
to lack formative studies of how consumer preferences or demographic information affect
customer perceived value and satisfaction.
In this research, strategic groups/supermarkets where consumers choose to shop, age,
gender, location where they stay (5 main cities of data collection) and income will be used to
explore the relationship between constructs (customer perceived value, customer satisfaction,
customer loyalty). The hypotheses will be proposed at section 2.5.13.2.
2.5.3. Customer experience and customer perceived value
Customer experience
Customers have more power than ever due to a variety of available products and services
offered; the increasing competition in the marketplace has given customers more choices.
They do not just want to own or consume products or services; what they are looking for is
unique and memorable experiences (Pine and Gilmore, 1999; Grewal et al., 2009; 2017;
Lemon and Vehoef, 2016; Puccinelli et al., 2009; Kumar et al., 2013). According to Babin et
al. (1994) consumers evaluated a retail store in many ways which include stores’ functional
quality as well as its “emotional-induced quality”. For example, consumers visit
supermarkets not simply for food purchasing purposes but also for enjoyment and
entertainment. They will evaluate services and improve brand image as a result of how much
fun and enjoyment they have received (Srivastava and Kaul, 2016).
Customer experience is a subject which has been mentioned, researched by many
practitioners and researchers in recent times. It is a key strategic objective for firms (Johnston
and Kong, 2011). This term is firstly revealed by Holbrook and Hirshman (1982) who
indicate that elements of pleasure, beauty, symbolic meaning, creativity and emotion can help
firms understand better consumer behaviour. Pine and Gilmore (1999) stated that experience

57
should be considered as the development of economic value and firms do not sell the
experience, they offer tangible facilities and intangible assets in their business environment
through which consumers can experience the services or products offered. It will be possible
for firms to control the customer experience as expected. In that, consumers always have an
experience as using products or service offered by firms, this experience can be regarded as
good, bad or indifferent. Pine and Gilmore (1999:89) also elucidated that “experience as
inherently personal, existing only in the mind of an individual who has been engaged on an
emotional, physical, intellectual, or even spiritual level”. The clear and comprehensive way
of explaining customer experience is defined by Gentile et al. (2007: 397) “originating from a
set of interactions between a customer and a product, a company or a part of the organisation,
which provokes a reaction. This experience is strictly personal and implies customer’s
involvement at different levels. However the concept of involvement is different from that of
customer experience”
From the beginning, researchers focused on the emotion of consumers at the time they
consume, interact with firms’ services, products (Holbrook and Hirshman, 1982). However,
there is no consensus about which factors constitute customer experience. Firms cannot fully
control customer experience via advertising, store displays, service interface, these
experiences might be influenced by other factors such as customer interaction and their
shopping purposes (Klaus abd Maklan, 2012; Meyer and Schwager, 2007, Hume et al.,
2006). Verhoef et al. (2009) describe experience as involving “cognitive, social, affective and
physical nature”. Consumption is not only the activity that occurs before and after
purchasing, it can be grouped into four stages including pre-consumption experience,
purchasing experience; core consumption experience and a remembered consumption
experience (Caru and Cova; 2003 and Arnould et al., 2002). Therefore, it needs to consider
the so-called “touch points” which is the process that customers actually get involved or
interact with firms in direct and indirect ways (Zomerdijk and Voss, 2010; Martin et al.,
2015, Lemke et al., 2011, Gremler, 2004; Juttner et al., 2013) (Figure 2.5.2)

58
Figure 2.5.2: Application of the sequential incident technique to touch point research
(Source: Adaped by Stein and Ramaseshan, 2016:9)
Experience is something personal, unique and different consumers will definitely hold a
different level of experience (Schmitt, 1999; 2003). Many researchers have used their own
variables (Table 2.5.1) to looking at customer experience (Grewal et al., 2009; Verhoef et al.,
2009; Berry et al., 2002; Gentile et al., 2007; Naylor et al., 2008, Hsu and Tsou, 2011; Sheng
and Teo, 2012; Nasermoadeli et al., 2013) and regard it as a part of consumer behaviour.
Table 2.5.1: Summary of experience antecedent researches (Andajani, 2015:632)
There are some methods used to measure customer experience, the following table which
is adapted by Andajani (2015) (Table 2.5.2)

59
Note: CEI (Consumer Experience Index); EXQ (Customer service experience)
Table 2.5.2: Experience Measurement Method (Adapted by Andajani, 2015:631)
According to Schmitt (1999), there are five different types of experiences to be
considered, which are “think, feel, act, sense and relate” and the marketers should integrate
all of these things to generate customers’ holistic experience and then Fornerino et al. (2006)
identified five dimensions of customer experiences including “sensorial-perceptual, affective
and physical-behaviour and social and cognitive (facets)”
Retail customer experience
Terblanche and Boshoff (2001) identified retail customer experience as all elements that
encourage or impede customers during the process of interaction between them and retailers.
Customer interaction can be activities about searching information, selecting stores to go,
purchase and post-purchase stages (Lucas, 1999; Wong and Sohal, 2006; Grewal et al.,
2009). The finding of Berry et al. (1990) stated that retailing is all about creating customer
experience by connecting with their emotions, emphasising reasonable price, saving
customers’ time and energy, giving them respectfulness. In the current competitive
marketplace, firms that offer a superior shopping experience tend to be more successful

60
(Baker et al., 2002, Spena et al., 2012); Jones et al. (2010) propose that retailers can use
immersive technology to stimulate and energise customers’ shopping experience.
As mentioned above, many definitions about customer experience have been stated, and
retail customer experience can be defined as “the sum total of cognitive, emotional, sensorial
and behavioural responses produced during the entire buying process, involving an integrated
series of interaction with people, objects, processes and environment in retailing” (Shilpa and
Rajnish:792). Positive emotions are highly associated with a good shopping behaviour and
outcomes (Machleit and Eroglu, 2000). There are four dimensions which can characterise
retail customer experiences, namely joy, mood, leisure and distinctive, it is researched by
Shilpa and Rajnish, 2013 based on many variables which can affect customer experience
(Table 2.5.3)
Table 2.5.3: Items for scale development (Shilpa and Rajnish, 2013:794)
Despite the on-going conceptual development of customer experience and its constructs,
there is a limited number of studies investigating its impacts on customer perceived value,
customer satisfaction and loyalty (Lemke et al., 2011; Maklan and Klaus, 2011; Verhoef et
al., 2009, Bagdare and Jain (2013). However, many current studies about customer

61
experience use the reflective method rather than applying formative approach. Some scholars
explored the link between customer experience and its outcomes such as customer
satisfaction and customer loyalty, ignoring mediating or moderating variables (Bagdare and
Jain, 2013). In the research of Lin and Bennet (2014), they found that customer experience is
positively related to overall satisfaction and the hypothesis that loyalty programme
membership positively moderates the relationship between customer experience and
customer satisfaction was rejected. Terblanche (2018) indicated that customer experience has
a significant direct impact on customer satisfaction. Therefore, whether the positive
relationship between customer experience and customer satisfaction exists is going to be
investigated in this thesis, the hypothesis can be seen in section 2.5.13.2.
Customer perceived value
Regarding customer perceived value, it has recently received significant attention in the
marketing field (Ulaga and Eggert, 2006) because it has a crucial role in predicting purchase
behaviour (Chen and Dubinsky, 2003; Chang and Wang, 2011) and contributes to firms’
strategy-adjustment, and it also constitutes customer loyalty in an electronic business by
decreasing the possibility of customer seeking alternative service providers (Anderson and
Srinivasan, 2003). And customer perceived value is a cornerstone of marketing and
competitive strategic research (Lindgreen and Wynstra, 2005: Khalifa, 2004). Past research
defined perceived value in a simple way as it refers to a trade-off between price and quality,
this concept is considered insufficient in modern marketing (Rintamaki et al., 2006) and then
it is re-defined by many researchers and marketers (Chen and Dubinsky, 2003; Chi and
Kilduff, 2011; Davis and Hodges, 2012).
Zeithaml (1988) introduced the concept of “perceived value” which is the relationship
between benefits and sacrifices, this term is assessed in terms of comparing between many
firms leading to the whole picture of “how buyers choose a certain product or supplier over
others” (Ulaga and Eggert, 2006; Anderson et al., 2000; Hanninen and Karjaluoto, 2017:
606).
Zeithaml (2000) defined perceived value as the overall assessment of customers toward
the products or services offered by suppliers based on what they received directly, in that
brand image, store attributes are also considered. In a similar vein, Leroi-Werelds et al.
(2014:430), Kotler and Keller (2009), Velimirivic et al. (2011), (El-Adly and Eid, 2016:220),

62
customer perceived value is “a trade-off between what they get (i.e., benefits) for what they
give (i.e., price or sacrifice)”. The benefits component would include a perceived service
quality and a number of psychological benefits which competitors might not imitate easily
(Parasuraman and Grewal, 2000). The sacrifices components related to the form of monetary
and non-monetary prices (time, effort, energy) that consumers contribute at the purchasing
process. However, Sheth et al. (1991) stated that value perceived is not just quality and price
issues, it might also be affected by other social, emotional and epistemic factors.
Perceived value is developed based on “Equity Theory” (Yang and Peterson, 2004), those
who get involved in the exchange process might feel equally treated if there exists a good
balance about what is given and received.
There are two value perceptions which are considered in many literatures: functional
motives refer to tangible things such as price, quality, convenience; non-functional motives
(symbolic value) related to all intangible wants such as social and emotional needs (Chen and
Hu, 2010). Keng et al. (2007) indicated that perceived excellence value refer to what
consumers feel about the product performance and appreciate a service provider for all
professional and reliable service delivered. Therefore, service quality can be a good indicator
of a measure of customer values (Vera, 2015).
There are two theories used to explain perceived value: means-end chain theory and
economic theory of utility. Means-end chain theory is identified by Gutman (1982); it
explains how specific attributes of products or services (the means) are associated with
personal values (the ends). The theory suggested that customers are more likely to choose
products or services that closely obtain the consequences that they desire. This means that
customers will find the floors that can provide better values. Via this theory, marketers and
researchers will understand consumers and which factors affect perceived value. Especially,
the means-end chain theory is often applied in the food retailing industry and it helps firms
inform their business strategies (Devlin et al., 2003). The economic theory of utility presents
that customers will try to obtain maximum utility with minimum resources, such as time and
budget (Henderson and Quandt, 1958), these theories can explain customer perceived value
to some extent.
It is supposed that customer perceived value can potentially affect customer behaviour
which leads to their purchasing intention (Sirdeshmukh et al., 2002; Li and Petrick, 2008).

63
“From customers’ perspectives, gaining value and being satisfied are essential consumption
outcomes that influence buying behaviour and post purchase behaviour (Keng et al., 2007)”
(El-Adly and Eid, 2016:220)
A number of measurements have been developed in order to measure “perceived value”,
the uni-dimensional measure (Patterson and Spreng, 1997; Cronin et al., 2000; Eggert and
Ulaga, 2002) has been applied by many researchers with a limited number of items that
represent a perception of value. However, the determinants of perceived value are different
among consumers (Sweeney, 2003). Boltom and Drew (1991) indicated the above
measurement has a lack of validity. Chang and Wang (2011:350) concluded that “customers
with a high perceived value have a stronger relationship between satisfaction and customer
loyalty than customers with a low perceived value”. In that, customer loyalty has been
regarded as one of the most vital factors contributing to firms’ profitability. If customer
perceived value is not understood thoroughly, the higher loss of customers would result as a
result of their dissatisfaction (Anderson and Srinivasan, 2003; Chiou, 2004; Tsai et al., 2006).
However, it needs to be noted that customers might be satisfied with products or services
delivered, but still not consider them good value (Petrick, 1999). Therefore, customer
satisfaction and customer loyalty are the two crucial factors revealing real customer perceived
values. In practice, many researchers have focused on the relationship between customer
perceived value and customer satisfaction/customer loyalty. Chang and Wang (2011) viewed
consumer loyalty (including repetitive purchase intentions and positive word-of-mouth
communication) as a dependent variable; customer perceived value and satisfaction as
independent variables when they researched online customers’ behaviour. The result
demonstrated a positive relationship between satisfaction - perceived value and customer
loyalty. It indicated “satisfaction has a higher impact on customer loyalty at higher levels of
customer perceived value (β=0.697, t=9.916) than at lower customer perceived value
(β=0.572, t=8.779)” (Chang and Wang, 2011:349). In addition, many researchers have
supported and found the positive relationship between customer perceived value and
customer satisfaction, in other words, customer perceived value is considered as a positive
and direct antecedent of customer satisfaction, such as El-Adly and Eid (2016), Babin et al.
(2007), Zameer et al. (2015), Ryu et al. (2008), Walsh et al. (2011), Lin and Wang (2006),
Tung (2004). However, in the findings of Ishaq (2012), he indicated that customer perceived
value is positively and directly related to customer loyalty. However, Bei and Chiao (2001),
El-Adly and Eid (2016) also found only the indirect relationship existed between these two

64
variables. In accordance with previous studies, the hypotheses of whether customer perceived
value is positively associated to customer satisfaction and customer loyalty will be proposed
in section 2.5.13.2.
2.5.4. Consumer satisfaction
Consumer satisfaction is explored by many scholars, the notion of it stems from
consumption experience (Eklof, 2000; Fornell et al., 1996, Anderson et al., 1994;
Parasuraman et al., 1988; Mohajerani and Miremadi, 2012; Torres and Kline, 2013).
Kursunluoglu (2014:529), Oliver (1999) stated “Satisfaction is a degree of meeting the needs
at the end of a purchase”. Kotler and Keller (2009:789) defined customer satisfaction as “a
person’s feeling of pleasure or disappointment that results from comparing a product’s
perceived performance or outcome with his/her expectations” (Oliver, 1981; Tse and Wilton,
1988). Parasuraman et al., (1988) introduced the disconfirmation paradigm, they stated that
customer satisfaction is a post-decision experience in which customers will evaluate how
much that retailers could meet their expectations. Mittal and Frennea (2010:3) defined that
“customer satisfaction is a customers’ post-consumption evaluation of a product or service”.
The well-accepted definition in the literature is from Calder et al. (2013) who defined
customer satisfaction as an overall summary evaluation of consumption experience.
Therefore, the level of customer satisfaction depends on the gap between expectation and
perceived performance. It is also a good indicator of firms’ future performance, a crucial
dimension to long-term business success (Zeithaml et al., 1996; Sarlak and Fard, 2009;
Ashlay et al., 2010; Tuli and Bharadwaj, 2009; Lo, 2012), firms in the hotel industry will be
unable to compete with their competitors if they cannot satisfy their customers (Forozia et al.,
2013). And firms with highly satisfied customers will get higher economic returns (Yeung et
al., 2002). Dominici and Guzzo (2010) indicated that the cost of appealing to new consumers
is much higher than that of retaining the existing one, although keeping customers loyal is a
complex issue. Evaluating customer satisfaction has been the largest annual market research
spending that firms made (Wilson, 2002). In looking at customer satisfaction, firms can
recognise their strengths and weaknesses; if firms can fulfill their customer needs, they will
receive customer satisfaction in return and vice versa.
There is no officially accepted model or measurement scale being used for customer
satisfaction. It is recognised as an exploratory dimension rather than a comprehensive model
(Gilbert and Velourtsou, 2006). In food service, customer satisfaction can be measured by a

65
variety of elements, namely service quality, hygiene, atmosphere and product quality (Yuksel
and Yuksel, 2002). In the research of Emery and Fredendall (2002), they indicated that in
restaurant services, customer satisfaction is significantly influenced by employee behaviour
in the interaction process between them and their customers (Hennig-Thurau, 2004; Wall and
Berry, 2007; Baker et al., 2013), in the retail industry, every department and employee should
focus on who their customers are and their requirements as they are more demanding in a
competitive marketplace (Asher, 1989)
Customer satisfaction can only occur in the case of customer services matching
customers’ expectation (meet or exceed) (Beran and Evans, 2010). In literature, there are two
approaches of customer satisfaction that are highly accepted. The first one is “the expectancy-
disconfirmation approach” which is defined by Parasuranman et al. (1988) and Zeithaml et al.
(1996). It is mainly based on the comparison between customers’ expectation and their actual
perceived experience. The second one is “the performance-only approach”, the level of
satisfaction is evaluated based on each time purchasing activities occurred (Oliver, 1997).
Many researchers have also classified customer satisfaction into two types: attribute
satisfaction and overall satisfaction. “Attribute satisfaction relates to customers’ satisfied
cognitive mindset with products or services offered by firms, “Overall satisfaction” is
regarded as “pleasurable fulfillment” which refers to the effective responses of consumers
toward an offered product or service (Chiou and Droge, 2006; Machleit and Mantel, 2001;
Oliver, 1999)
Asher (1989:93) mentioned various questions that customers might ask themselves to
determine whether services delivered can be considered satisfying (Figure 2.5.3), and “the
more knowledge we have of customers’ needs, the better we will be able to respond”.

66
Figure 2.5.3: Some ways in which customers measure their satisfaction
(Asher, 1989:93)
La Londe and Zinszer (1987) divided customer service into three stages and in these
stages, customers will interact directly or indirectly with firms’ service (Figure 2.5.4)
Figure 2.5.4: Elements of customer service
(La Londe and Zinszer, 1987, Adapted by Negel and Cilliers, 1990:28)

67
Krampf et al. (2003) mentioned a confirmation and disconfirmation paradigm by
comparing expectations and perceived performance which are considered as cognitive
constructs (Westbrook and Oliver, 1991).
Determinants of customer satisfaction
There is some research on which factors might affect customer satisfaction. According to
Fornell et al. (1996), three antecedents which are perceived value, perceived quality and
customer expectation have been revealed. Service quality has a strong positive effect on
customer satisfaction and loyalty (Bolton and Drew, 1991; Siu and Cheung, 2001; Cronin et
al., 2000; Athanassopoulos, 2000). The research applied in a retail store (Sivadas and Baker-
Prewitt, 2000) also presented that service quality affects satisfaction, and that loyalty is
influenced by both service quality and satisfaction.
Expectancy Disconfirmation Theory (Tse et al., 1990; Oliver, 1997) can be used to
measure customer satisfaction. The theory focuses on comparing perceived performance level
and customer initial expectations. If products or services delivered are worse than expected,
“negative disconfirmation” would be a result; if it is better, the result is “positive
disconfirmation” (Oliver et al, 1997).
The relationship between satisfaction and loyalty has been increasingly explored in the
literature, especially in the retailing industry (Yang and Peterson, 2004; Lam et al., 2004;
Chen and Tsai, 2008; Liu and Jang, 2009; Pan et al., 2012; Bouzaabia et al., 2013). Loyalty is
developed in three steps, including cognitive loyalty, emotional and intentional loyalty
(Oliver, 1999). After consumers compare their actual experiences with their expectations,
they might be satisfied with the service provider or not, and these factors will affect the level
of intentional loyalty (Anderson et al., 1994, 1997). The findings from Perez and Bosque
(2015:22) showed that “customer satisfaction significantly and positively affected customer
recommendation (β=0.59, p<0.05) and repurchase behaviours (β=0.82, p<0.05)”. Chang and
Wang (2011:346) also concluded that “customer satisfaction has a significant impact on
customer loyalty (β=0.84m t-value= 4.81)”. There are a number of other researchers
supporting the above results, such as, Rahman et al. (2016), Chen (2012), Bouzaabia et al.
(2013), Kim et al. (2004), El-Adly and Eid (2016), Liu et al. (2011), Chang and Yeh (2017),
Kitapci et al. (2013), Han et al. (2011b). Wong and Sohal (2003) investigated customer
satisfaction in the retail industry, and concluded that the greater degree of consumer

68
experience satisfaction with retailers, the higher probability of them revisiting the retailers.
This finding is consistent with the study from Calvo-Porral and Levy-Mangin (2015) that
customer satisfaction is negatively related to customer switching intentions. However, some
researchers also prove that customer satisfaction does not equate to customer loyalty (Mutum
et al., 2014; Qui et al., 2015; Stan et al., 2013; Kumar et al., 2013). Particularly, “That is,
satisfaction leads to loyalty but that loyalty can only be achieved in the presence of other
factors (Oliver, 1999)” (Qui et al., 2015:92). In addition, according to Mutum et al.
(2014:947), satisfaction might not be the best predictor of customer loyalty and “the presence
(or lack) of switching barriers may be the reason a customer stays with (or leaves) a firm”.
Besides that, “there is evidence that satisfaction and loyalty are not always strongly
correlated” (Miranda et al., 2005; Baumann et al., 2012:149; Mittal and Lassar, 1998); these
scholars stated that in most studies weak association between customer satisfaction and
customer loyalty were revealed. Jones and Sasser (1995) concluded that “the only true
loyalists were the totally satisfied customers” (Baumann, 2012:149). In addition, Sivadas and
Baker-Prewitt (2000) found that satisfaction was found to have no significant direct impact
on store loyalty. Kumar et al. (2013:246) found the link between customer satisfaction and
customer loyalty “ is not as strong as it is believed to be and customer satisfaction is not
enough to explain loyalty”, Kumar et al. (2013:246) also concluded “the variance explained
by just satisfaction is rather small - around 8 percent”. These findings have left the above
relationship endlessly debated. The hypothesis related to whether customer satisfaction is
positively associated with customer loyalty will be proposed in section 2.5.13.2.
2.5.5. Perceived switching barriers
The relationship between perceived switching barriers, switching behaviour and
customer retention has been explored by many scholars in recent years (Jones et al., 2000;
Stant et al., 2013, Mutum et al., 2014; Liu et al., 2011; Tung et al., 2011; Koutsothanassi,
2017). It can be seen that consumer switching leads to decreased sales and market share as
well as increased costs that firms might need to spend in order to attract more new customers
(Terblanche and Boshoff, 2010).
Switching barriers have been explored widely in marketing literature (Mutum et al.,
2014) and there is no consensus between scholars as to its definition (Yang and Peterson,
2004; Tsai and Huang, 2007; Li et al., 2007). Switching barriers represent many factors
which provide additional costs to customers if they want to change to alternative providers

69
(Jones et al., 2000). Also, Fornell (1992) and Tung et al. (2011) stated that switching barriers
include all reasons that impede and hinder customers from switching to competitors. The
existing literature has demonstrated two groups of switching barriers: positive and negative
(Han and Hyun, 2012; Han et al., 2011b; Jones et al., 2000). The positive switching barriers
based on relational benefits or loyalty programme benefits in which service providers have
invested time, money and effort in building a relationship with their existing customers,
creating commitment and emotional attachment to firms. Such benefits can be specially
targeted offers, social status improvement or confidence. Such benefits can deter customers
from moving to competitors due to the unavailability of offered benefits (Han et al., 2011 a,
b). The negative switching barriers apply to all negative reasons which present in a
relationship (Hirschman, 1970) such as non-monetary, monetary costs or all sacrifices which
consumers have to pay in order to move to other providers (Han et al., 2009), and switching
costs which are considered as negative switching barriers.
Consumers can easily compare information between different service providers, they
might switch to other alternative providers if there is no or low switching cost (Anderson and
Srinivasann, 2003; Terblanche and Boshoff, 2010; Valenzuela, 2012). Switching can be
considered as a possible route consumers may take if current service or product-providers
cannot satisfy them (Hsu, 2014). Perceived switching cost refers to the perception of
customers about money, effort and time associated with platform changing (Jones et al.,
2007). Shafei and Tabaa (2016), Lam et al. (2004) defined switching costs as the cost
involved in changing from one supplier to another, consumers tend to remain on the same
platform if perceived switching cost is high. For example, in a mobile phone context, various
costs associated with platform changing might impede customers in switching. These costs
can be extra spending for other devices which must be associated with the new device that
customers intend to buy; or time and effort that customers need to assimilate in order to use
new products, or perceived loss of past investment (Guiltinan, 1989). In addition, Lee et al.
(2001) argued that unsatisfied customers would not switch to other providers because high
switching costs occurred. According to Becker (1960); Farrell and Rusbult (1981), in their
research on employee turnover, they concluded that employees are less likely to switch jobs
if the switching costs increase. Porter (1980:10) identified switching costs as “one-time costs
facing the buyer of switching from one supplier’s product to another”. The nature of
switching costs varies across industries (Fornell, 1992).

70
According to Bitner (1995), Burnham et al. (2003), Edward and Sahadev (2011), El-
Manstrly (2016), Al-Hawari (2014), perceived switching costs can be divided into three
groups: monetary costs, psychological costs and relational costs. The monetary costs refer to
the benefits lost in giving up the current providers (commission, past investment, benefits
from loyalty programmes) and cost to buy a new one from alternative providers. The
psychological costs related to customers’ feelings and attitudes toward their new choices, the
anxiety that occurs during the switching process due to uncertain consequences. Chen and
Hitt (2002); Wathne et al. (2001), Aydin et al. (2005), Lee et al. (2001) also call these costs
“procedural costs” or “information costs” which include economic risk costs, search and
evaluation costs, adaptation costs and set-up cost. The final cost is a relational one; it refers to
“personal relationship loss costs” with the supplier’s staffs or “brand relationship loss costs”
with their current brand (Burnham et al., 2003; Patterson and Smith, 2003). Due to the above
listed perceived costs of switching, the possibility of customers’ leaving has been reduced.
Some researchers concluded that dissatisfied customers do not exit the service platform due
to high switching costs (Beerli et al., 2004, Colgate and Lang, 2001).
Satisfaction might interact with other factors in the decision-making process. The
interactions between switching cost or alternative attractiveness and satisfaction can
determine continuance intention (Shin and Kim, 2008; Alderfer, 1969; Bansal et al., 2004). In
many cases, consumers are satisfied with products and services delivered, but if the cost and
benefits of switching are beneficial for consumers, they might be willing to switch to other
providers. Consumers with different levels of satisfaction might perceive the switching cost
value differently. For example, with those who are satisfied, the motivation to switch is low,
so the switching cost is considered as unnecessary and unwanted but for those who are
unsatisfied, the cost of switching to other service providers is regarded as necessary in order
to fulfill the needs that their current providers cannot meet (Hsu, 2014). Therefore,
unsatisfied consumers might be less sensitive toward switching cost compared to satisfied
individuals. Another factor to be considered is the attractiveness of the available alternatives
(AAA) (Jones et al., 2000). This AAA construct is positively related to exit and negatively to
loyalty (Ping, 1993; Rusbult et al., 1982). When the perception of AAA is low, customers
have a tendency towards retention and more loyalty due to low perceived benefits of
switching providers (Anderson and Narus, 1990; Colgate and Norris, 2001; Mutum et al.,
2014).

71
Some evidence from previous research indicates that switching barriers are positively
associated with loyalty (Fornel, 1992; Ping, 1993; Aydin and Ozer, 2005; Shafei and Tabaa,
2016, Koutsothanassi et al., 2017). This factor is concerned as one of the most vital indicators
of customer loyalty. When switching barriers are high, the option to exit will be limited and
customers might have a tendency towards loyalty (Hirschman, 1970; Jones et al., 2007;
Mutum et al., 2014). De Ruyter et al. (1998), Qui et al. (2015:92) also found that “in the
industries characterised by relatively low switching costs, customers are less likely loyal
compared to service industries with relatively high switching costs”, they examine more
carefully the perceived service quality compared to customers with high switching cost
(Jones et al., 2000). Han et al. (2011a, b) indicated that negative and positive switching
barriers can moderate the link between satisfaction and switching intention. However, Lam
et al. (2004) did not demonstrate support for the above in his research. The view that
customer satisfaction is the main indicator of customer loyalty has been explored by many
scholars, Cronin and Taylor (1992) stated that customer satisfaction behaviour can lead to
loyalty, but loyalty cannot be guaranteed only by satisfaction, other factors should be
concerned, it is “switching cost” (Olivier, 1999).
Figure 2.5.5: The conceptual framework (Mutum et al., 2014: 945)
According to Mutum et al. (2014:947), “past studies on switching behaviour have failed
to distinguish between consumers at various levels of loyalty by assuming that they are all
similar” (see Figure 2.5.5). Another proposed model was researched by Qui et al. (2015),
Stan et al. (2013), Tung et al. (2012), Kim et al. (2004), Liu et al. (2011), Rosario and Foxall
(2006) and it investigated the relationship between switching barriers and customer loyalty.

72
They found that switching costs which were assessed in terms of price sensitivity have a
strong, positive and direct impact on customer loyalty and it also moderates the link between
customer satisfaction and customer loyalty. In other words, “as switching costs increase, the
association between customer satisfaction and customer loyalty diminishes and also as
customer satisfaction increases, the effect of switching costs on customer loyalty decreases”
(Stan et al., 2013:1549). The same results were found by Han et al. (2011a,b), Jones et al.
(2000): “the negative association between switching costs and loyalty in that customers feel
locked in the relationship when they perceive a high level of switching costs” (Qui et al.,
2015:92). Lam et al. (2004) revealed switching costs positively affect customer loyalty in
terms of recommendation and repatronage. Koutsothanassi et al. (2017:434) concluded that
“the switching barriers explained more than 40 per cent of customer loyalty”. All of the
above findings were consistent with the previous research from Jones et al. (2000) that
“higher perceived switching costs and lower attractiveness of competing alternatives are
associated with higher repurchase intentions” (Tung et al., 2011: 32). However, on the other
hand, Burnham et al. (2003) explored the case of financial switching costs and found that
switching costs have the lowest influence on customer loyalty and the findings from Tung et
al. (2011:35) showed that “the relationship between the attractiveness of alternatives and
loyalty is not significant” and Kim et al. (2004) found the impact of switching barriers on
customer loyalty, but not much compared to the customer satisfaction dimension. In the
research of Calvo-Porral and Levy-Mangin (2015), they found that the attractiveness of
alternatives is positively related to customer switching intentions. Picón et al. (2014) stated
that satisfaction might determine the expected advantages and disadvantages of switching and
then turn to loyalty decision, they argued that when consumers’ level of satisfaction is high,
consumers will perceive higher opportunity costs or loss of satisfaction related to switching;
regarding alternative attractiveness, Ghazali et al (2016) demonstrated the perception that
alternative attractiveness most likely depends on satisfaction level. Yang and Peterson (2004)
argued that when the level of satisfaction with one provider is higher, consumers tend to
perceive a low attractiveness from other providers. However, there is no consensus about the
role of switching costs and alternative attractiveness in the relationship between customer
satisfaction and customer loyalty. Many researchers found switching costs and alternative
attractiveness as mediators in the relationship between customer satisfaction and customer
loyalty (Picón et al., 2014; Malzler et al., 2015; Chuah et al, 2017). However, the relationship
between customer satisfaction and switching barriers (switching costs and alternative
attractiveness) can be mutual. That switching costs and alternative attractiveness increase can

73
influence the level of customer satisfaction. The higher perceived attractiveness from other
providers might decrease satisfaction levels, and if switching costs are highly perceived
customer perceived value might decrease and consumers tend to remain satisfied with current
providers; in other words, dissatisfied consumers might feel trapped and forced to remain
with current providers in the case of higher perceived switching costs.
Chuah et al. (2017) also found that alternative attractiveness significantly moderated
the relationship between satisfaction and loyalty while switching costs did not. Edward et al.
(2010), Jones et al. (2000), Lee et al. (2001), Yang and Peterson (200), Stan et al. (2013),
Kim et al. (2018), Chang and Chen (2009) found that switching costs moderate the
relationship between customer satisfaction and customer loyalty. However, Chuah et al.
(2017) when they could not find switching costs as a moderator in the above relationship
(β=0.002, p=0.687>0.05) and Qui et al. (2015) found the same result as investigating the case
of low-tariff hotels.
Kim et al. (2018) could not find alternative attractiveness is a moderator of the above
relationship. In contrast, Jones et al. (2000); Sharma (2003), Chuah et al. (2017), Wu (2011b)
where they found alternative attractiveness moderates the relationship between customer
satisfaction and customer loyalty. Therefore, it can be seen that there remains no consensus
among researchers in relationships (direct, mediating and moderating) between the above-
mentioned variables. Based on the above review, different results have been found by
researchers; therefore, this research is going to investigate whether positive direct
relationships between switching cost and customer perceived value/customer
satisfaction/customer loyalty exist and whether alternative attractiveness is negatively
associated with customer satisfaction and customer loyalty. The hypotheses will be proposed
in section 2.5.13.2.
2.5.6. Brand experience
In recent years, brands have become more than just a logo on products, they help firms
infuse many distinct values into their products and services in order to appeal to consumers.
According to De Chernatony and Riley (1998), brand is one of the most important assets that
all firms who want to achieve sustainable development should possess. Based on many
previous reliable findings, consumers are likely to pay more for the brand that they are

74
committed to because they perceive many values that other providers could not fulfill or
imitate (Jacoby and Chestnut, 1978; Perssemier, 1959; Reichheld, 1996).
Brand experience is defined as “the sensations, feelings, cognitions, and behavioural
responses evoked by brand-related stimuli that are part of a brand design and identity,
packaging, communications, and environments” (Brakus et al., 2009:53; Lin, 2015:2254).
Another way of explaining brand experience can be “the customer experience that originates
from a set of interactions between a customer and a product, a company, or a part of its
organisation, which provoke a reaction. This experience is strictly personal and implies the
customer’s involvement at different levels (rational, emotional, sensorial, physical and
spiritual” (Gentile et al., 2007:397). The fact that customers encounter and interact with
touch-points such as the brand stores’ physical and non-physical dimensions will definitely
influence and shape their brand experiences. These brand experiences can be pitted at an
emotional level, which allow customers to differentiate between different brands (Brakus et
al., 2009; Sahin et al., 2011; Hagtvedt and Patrick, 2009). The notion of brand experience
was introduced by Holbrook et al. (1982). It will be created as customers encounter and use
the brand, share with others their feelings about the brand, check promotion programmes, and
events offered by that brand (Ambler et al., 2002). Iglesias et al. (2011), Ishida and Taylor
(2012), tested the linkage between brand experience and brand loyalty, and identified three
aspects of brand experience which are sensory, behavioural and affective via research into
many industries (cars, laptops, mobile phones, televisions) and then Brakus et al. (2009)
propose two more dimensions, namely “cognitive and social”. Sensory experience refers to
consumers’ senses of sight, hearing, smell, taste and touch. The behavioural dimension refers
to physical and bodily experiences (sleeping in a hotel bed). The affective dimension implies
all emotions and internal true feelings, sentiments of customers towards the brand (warm
welcome by retail stores’ staff). Cognitive experience includes all thoughts of customers
towards the brand. Social dimension satisfies customers’ needs by making them feel more
connected to the brand. (Brakus et al., 2009; Zarantonello and Schmitt, 2010). In these four
dimensions, sensory elements can be seen as the most important indicator of brand
experience (Barnes et al., 2014).
One of the most significant indicators of a successful brand is not lying about the number
of customers buying products once, but rather the number of repeat consumers (Jacoby and
Chestnut, 1978). Besides that, many marketing researchers have done much research around

75
brand loyalty (Copeland, 1923; Cunningham, 1956; Ha, 1998) and revealed three vital
dimensions including attitudinal, normative and behavioural. Based on these dimensions,
Gouraris and Stathakopoulos (2014) demonstrated four brand-loyalty types: no loyalty,
inertia loyalty, covetous loyalty and premium loyalty. In this research, no loyalty means
people know the brand, but never buy anything from the brand, inertia loyalty refers to
consumers who do not find the brand favourable but they repeat purchase due to its
convenience and no commit to that brand, they might switch to other providers if needed.
Covetous loyalty implies a permanent emotional attachment to the brand and customers want
to own any products from that brand, but these customers might not make any purchasing
transactions due to its expensive price (Goldsmith and Pan, 2008). Finally, premium loyalty
applies to those who are committed, emotionally attached and repeatedly buy goods of the
brand.
There is little research on retail brand experience; retail brand is seen as “a group of the
retailer’s outlets which carry a unique name, symbol, logo or a combination thereof” (Zentes
et al., 2008:167), they are completely different from product brands. After interaction and
engagement processes, including pre-purchase, purchase and post purchase stages with many
activities delivered by retail brands, customers have their own experience and determine
whether they should stay with that brand or not (Bagdare and Jain, 2013). Ailawadi and
Keller (2004:338) argued that “retailers are obviously in an ideal position to create
experiences that may involve their own private labels, manufacturer brands, or not be tied to
a specific product but the store as a whole”. As Das et al. (2012:101) indicated “As a
shopper, we most often take the name of a particular retail store. If somebody asks us “where
are you going for shopping?” we do not take the name of the brand of the product which we
intend to purchase”. Retail brand relates to selling both merchandise (tangibles) and services
(intangibles). According to Mathwick et al. (2011) customers buy products not only because
of their good brand but also the experiential value that customers experience by the brand.
Customer experience is positively associated with brand experiences (Dabholkar et al., 1996)
and effectively managing customer experience can lead to customer loyalties (Grewal et al.,
2009; Verhoef et al., 2009).
There are a number of factors which can affect brand experience, including in-store
experiences (store design and service interface) (Kumar and Kim, 2014; Bonnin and Goudey,
2012), critical service experiences (Vazquez et al., 2001), shopping experiences (Borges et

76
al., 2010; Singh and Prashar, 2014) and price and assortment (Baker et al, 2002). The
following tables can summarise many studies about retail brand experience (RBE) model:
Table 2.5.4: Variables used for the retail brand experience (RBE) model
(Khan and Rahman, 2015:63)
A comprehensive qualitative analysis from Khan and Rahman (2015) has given eight
dimensions of the retail brand experience, excluding number nine and ten in the above table
(customer satisfaction and brand loyalty) (Table 2.5.4) Kim et al. (2015), Ha and Perks
(2005), Khan and Rahman (2015:66), Ishida and Taylor (2012) verified that “retail brand
experience influences both customer satisfaction and brand loyalty”. There are a limited
number of studies (Mathwick et al., 2011; Bagdare and Jain, 2013; Ailawadi and Keller,
2004) investigating the above-mentioned relationship. Therefore, in this research, the links
between these dimensions will be investigated in the context of the Vietnamese retail industry
and the research is going to discover whether there is a positive direct relationship between
brand experience and customer satisfaction/ customer loyalty. In accordance with previous
studies, the hypotheses mentioned above will be proposed in section 2.5.13.2.
2.5.7. Service quality
Consumers tend to become more demanding these days as many firms get involved in
business. If firms cannot serve and meet their customers’ needs and wants, they will lose
them and definitely affect their profits and eventually fail (Rao and Kelkar, 1997; Yoo and

77
Park, 2007). According to Berry et al. (1988), service quality is considered as a significant
variable which contributes to firms’ success. It has received much attention from market
researchers for years (Izogo and Ogba, 2015). Service quality related to all judgments made
by customers “who compare their expectations with the service they perceive to have
received” (Gronroos, 1984:38), this term having a close relationship and is usually mistaken
for the term customer satisfaction, it cannot be interchangeable, although they both are terms
which are used to compare the expectation of quality and the actual service offered (Hussain
et al., 2015). However, service quality is “an overall evaluation of the services and
satisfaction concerned with the overall evaluation of the experience with those services”
(Dauda and Lee, 2016:844; Geore and Kumar, 2014). Parasuraman et al. (1988:17) also
defined service quality as “the degree of discrepancy between customers’ normative
expectations from the service and their perceptions of the service performance”. In fact,
service quality is a vital element in creating and increasing customer satisfaction (Szwarc,
2005; Baki et al., 2009). More and more firms have stated that high customer satisfaction can
be traced back to good service quality (Szwarc, 2005). In that, management and employee
commitment has played a crucial role in service quality (Moshin and Lockyer, 2010).
There are three types of services being identified by many researchers: pure service
(firms interact with customers at service providing process, such as a restaurant, nursing
home); mixed service (firms interact with their customers at both face-to-face and back
office, such as commercial airline); quasi-manufacturing service (firms present no face-to-
face contact with their customers, such as telesales, credit card). In retail markets, firms sell
their products to customers, but simultaneously offer service to them and the service quality
is one of the most vital dimensions which can attract more customers if they perceive that
service to be beneficial. According to Steven et al. (1995) in research on customers at
restaurants, he stated that the perception of customers on service quality will be based on at
least two factors: what is provided and how it was delivered. There are differences between
services and goods in the way they can be perceived and evaluated (Zemke, 1992) (Table
2.5.5)

78
Table 2.5.5: Differences between products and services (Zemke, 1992)
Basically, customers do not evaluate services simply based on the service outcome, they
also consider how services are delivered and they have judgment and comparison between
their expectation and the actual service offering (Zeithaml et al., 1990). The conclusion of
good service will be reached if the perceptions meet or exceed expectations and it will
become problematic if perceived service quality is below expectations (Ahmed and Shoeb,
2009)
The problem is that the quality of service is not easy to measure and evaluate
(Parasuraaman et al., 1988) while in the competitive marketplace, it is necessary to
understand how customers measure service quality (Bayraktaroglu and Atrek). From the
beginning, Perasuraman et al. (1985) introduced a PZB service quality model (Parasuraman,
Zeithaml and Berry) by using ten key categories named “service quality determinants” (see
Figure 2.5.6) and the after use factor analysis method to explore the scale of service quality
with the standard of good reliability and validity, the scale is defined using five factors and
22 service quality questions.

79
Figure 2.5.6: Determinants of Perceived Service Quality
(Source Parasuraman et al., 1985:48)
Figure 2.5.7: Service Quality Model (Parasuraman et al., 1985:44)
There are five gaps indicated in the above SERVQUAL model (the gap theory) (Figure
2.5.7). Gap 1 is the discrepancy between customer expectation and management cognition,

80
gap 2 related to the discrepancy between firms’ perception of customer expectation and
service quality specifications, gap 3 implies the discrepancy between service quality standard
and the actual service delivered, gap 4 refers to the discrepancy between provided service and
what is communicated externally and gap 5 is the discrepancy between expected service and
customer perceived service. Curry (1999), Luk and Layton (2002) stated that the gap model
can be considered as one of the best received and most heuristically valuable contributions to
the service literature.
In marketing, the approach dominantly accepted and used to measure service quality is
the SERVQUAL scale which was introduced by Parasuraman et al. (1988). This tool
compares customers’ expectations before using services and their actual perception after
services are delivered (Gronroos, 1982; Juwaheer, 2004; Antony et al., 2004; Gounaris, 2005;
Jiang et al., 2000; Mostafa, 2005; Wicks and Chin, 2008; Chen et al., 2007; Hu et al., 2010),
and Q (service quality) = P (perceptions) – E (expectations). There are five dimensions being
considered in the SERVQUAL model, including tangible, responsiveness, reliability,
empathy and assurance. A SERVQUAL score can be evaluated by each dimension above
(Figure 2.5.8)
Figure 2.5.8: Five dimensions of SERVQUAL model
(Parasuraman et al., 1985, adapted by Gupta and Chen, 1995, Lee et al., 2011)
Another school of thought indicated some deficiencies and inconsistencies of this model
due to its limited application in pure service settings such as health care and banking. They
analysed based on their own research topic (Cronin and Taylor, 1994; Finn and Lamb, 1991;
Johnson et al., 1995) and use their amended models, namely SERVPERF (Cronin and
Taylor, 1992) which has been confirmed by many scholars as measuring service quality and
customer satisfaction and the “Non-difference”concept (Brown et al., 1993). Babakus and

81
Boller (1992) stated that dimensions of service quality should be considered in a specific type
of service. Mei et al. (1999) used the model HOLSERV which is developed from
SERVQUAL; in this model, they indicated three factors which can be used to evaluate
service quality, including employees, tangibles and reliability. Specifically, employees were
considered as the most important dimension. Dabholkar et al. (1996) proposed and developed
a Retail Service Quality Scale which includes five factors: “physical dimension, reliability,
personal interaction, problem solving and policy”.
Jamal and Anastasiadou (2007:38) stated that “despite significant interest in service
quality and its dimensions, very little research has investigated the effects of specific
dimensions of service quality on satisfaction and loyalty”. Kitapci et al. (2013) examined the
effects of specific dimensions of service quality on satisfaction and loyalty in supermarkets;
they found that “independent variables together describe 56 percent of customer satisfaction
variability” (Kitapci et al., 2013:248). Among the 5 dimensions presented in Figure 2.5.8,
empathy dimension was found to have a stronger connection with customer satisfaction than
the other four service quality dimensions; reliability dimension is not significantly associated
with customer satisfaction (Kitapci et al., 2013). Cronin et al. (2000), Dauda and Lee (2016),
Kim et al. (2004), Hsieh and Hiang (2004), Liu et al. (2011), Sivadas and Baker-Prewitt
(2000), Chang and Yeh (2017) found that there is a strong positive relationship between
service quality and customer satisfaction. And the studies from Bauer et al. (2006), Turel and
Serenko (2006) and Wang et al. (2004), Hsu (2006), Zameer et al. (2015), Jiang et al. (2018)
showed that service quality has a direct and positive impact on customer perceived value
which has been shown to generate loyalty. In this case, service quality might also indirectly
affect customer loyalty via customer satisfaction. In accordance with previous studies, the
hypotheses related to whether service quality is positively associated with customer perceived
value, customer satisfaction and customer loyalty will be proposed in section 2.5.13.2.
2.5.8. Corporate factors
2.5.8.1. In-store logistics and store image
There is a slowly growing body of literature exploring in-store logistics, in the so-called
“last 50 metres” (McKinnon et al., 2007), aiming to meet customers’ needs at store level by
assuring “demand-driven on-shelf availability” (Reiner et al., 2013; Fisher et al., 2000;
Kotzab et al., 2007; Kotzab and Teller, 2005). The in-store logistics process includes all flow

82
activities from the unloading bay of a store onwards to storage, handling, transport, shelf-
stacking and replenishment, (including return services and disposal) (Gudehus and Kotzab,
2012; Kotzab and Teller, 2005). According to Samli et al. (2005), Bouzaabia et al.
(2013:112), in-store logistics operations include “handling, arranging, ordering and
processing of merchandise within the store”. The purpose of these activities is ensuring the
availability of products in stores; it plays a crucial role in retail stores because no product
available means no purchasing transaction occurs (Kotzab and Teller, 2005). Therefore,
“product presence can be regarded as one observable outcome of in-store logistics operation”
(Bouzaabia et al., 2013:116). Van Zelst et al. (2009) revealed the cost structure of one
European retail chain in his research: 45% of the cost is used for in-store logistics operation,
22% for transportation and 33% for warehousing. It cannot be ignored that “shelf
management” is an important part of in-store logistics; it refers to the job that always make
products available on the shelf by checking replenishment. In that, poor in-store logistics
means that products are not available during consumers’ shopping process, even though the
store has that product in stock. “Stock-outs” might affect customer satisfaction and customer
loyalty to some extent. Other dimensions of in-store logistics are product information,
shopping convenience, return services. It includes all activities which can facilitate customers
during the shopping process and post-purchasing, such as checkout lanes which can affect
waiting time; and available return services (Bouzaabia et al., 2013); effective in-store
logistics means offering “the quantities of products as requested by end-users at lowest cost
possible” (Kotzab and Teller, 2005:596). The two researchers also identified four in-store
problem areas: knowledge of cost and service levels, standardisation, qualified personnel and
store design.
Mou et al. (2017) identify three entities in retail store operation: customers, employees
and products and they explore the relationship between them (Figure 2.5.9). Customers
encounter products via purchasing, returning activities, employees can advise and give
suitable information about products or services to customers; products’ attributes, their
availability and employees’ behaviour have influenced customer experience and satisfaction
in many ways. In-store logistics activities reveal the constant interaction between these
entities, therefore the perfect combination between all the above factors will lead to effective
in-store logistics.

83
Figure 2.5.9: Entities in retail store operation (Mou et al., 2017:402)
The following in-store logistics process is comprehensively presented by Kotzab and
Teller (2005) (Figure 2.5.10), it has been explained step-by-step and fully describes the
logistics operation within stores. There are eight steps in in-store logistics process. The first
step, “Delivery/receipt” occurs as products are delivered to stores from a distribution center;
store employees will take over and control the delivery with receipt. The second step refers to
“Transport I” with incoming products either being transferred directly to the shelves
(“Storage II”) or to the store’s storage area (“Storage I”-third step). In this third step, products
which are allocated specific storage areas can be re-packaged or split up into small units. The
next step named “Transport II”, products will be transported from the storage area to the
shelves. Then, the process of handling products; putting them on the shelves, shelf filling,
product presentation and inventory control are named “Handling/Storage II”. The next step,
“Processing of transactions” is where end-users pay for their purchasing activities. It also
relates to the seventh step -“Re-order”- via which retailers guarantee the availability of the
products’ flow (incoming and outgoing products in stores), in other words, these are
inventory activities. Finally, “Disposal/recycling” in which all damaged or broken products
will be either recycled or removed from the shelves.

84
Figure 2.5.10: In-store logistics process (Kotzab and Teller, 2005:597)
All the above in-store logistics activities will enables consumers to find and purchase
product easily, affecting the customer experience, customer satisfaction and loyalty to some
extent (Kotzab and Teller, 2005).
Store attributes have played a vital role in generating customer satisfaction and loyalty.
Many studies have explored the role of store attributes in the retail industry. Based on their
research, “store atmosphere, store image, parking facility, lifestyle, merchandise,
convenience and location” should be considered (Finn, 2004; Nikhashemi et al., 2016: 433).
Du Preez et al. (2008) proposed eight dimensions of store attribute including promotion,
convenience, atmosphere, institutional, facilities, merchandise, sales personnel and service.
Baket et al. (2002) and Mohan et al. (2013:1713) also mentioned stores’ layout which “refers
to the way in which products, shopping carts, and aisles are arranged, the size and shape of
those items, and spatial relationships among them”. It is clear that most customers decide to

85
buy some products in a specific supermarket due to its good store image (Hartman and Spiro,
2005; Saraswat et al., 2010). Store image can be defined as the personality of a store in
customers’ mindset (Burt and Mavromatis, 2006; Chang and Tu, 2005). According to De
Ruyter (1998:34), store image as “the complex of a consumer’s perception of a store on
different (salient) attributes”. In other words, Mafini and Dhurup (2015:1296), Saraswat et al.
(2010:168) defined store image as “the symbolic, experiential expression of the manner in
which consumers see or visualise a store”. It is an important driver of customer satisfaction
(Du Preez et al., 2008a) as it “provides value-added benefits to the shopper” (Saraswat et al.
(2010:169). It reflects the set of beliefs about stores’ relative attractiveness which are
perceived by consumers. These perceptions might be different across countries, market
sectors and store formats (Martineau, 1958; Burt and Mavromatis, 2006; Hirschman et al.,
1978). Amine and Cadenat (2003) identified three important noticeable cues that affect
customers’ perceptions about store image, namely the store’s appearance, employees and
promotional materials. In retail business, there are three explored dimensions about retailing
experience which directly relate to store image The first one called “physical environment”
refers to how a store is decorated, logically labeled, category arrangement and a good layout
that leads to consumers moving efficiently through stores, and how it enables customers
easily and quickly to find products (Titus and Everett, 1995; Richardson et al., 1996; Teller
and Dennis, 2012). Some stores create a convenient infrastructure by applying shopping
carts, signage and so forth or offering a variety of services which can facilitate consumers
during shopping time (self-service technologies such as self-checking the quantity of fruits
bought, self-check out machines and sales advice) (Bouzaabia et al., 2013). The second
dimension relates to the merchandise that a store sells (Bloemer and De Ruyter, 1988), the
third one refers to the interaction between consumers and store personnel (Baker et al, 1994;
Semeijn et al., 2004). Store image is different among customers and it reflects how customers
experience a store. Besides that, store image can also be created by word of mouth and
marketing programmes.
Much empirical attention has been placed on five dimensions of store image which are
store assistance, store atmosphere, store appeal, promotion and store accessibility (Mafini and
Dhurup, 2015). Besides that, location, parking facility, clean and spacious environmental
atmosphere, display features are factors investigated by Chen and Hu (2010), Jinfeng and
Zhilong (2009), Fung et al. (2013).

86
As mentioned above, there are the link between store image and personal values which
feature in means-end chain theory (Gutman, 1982), and store image definitely affects store
choices and customer loyalty (Osman, 1973; Arons, 1961; Malhotra, 1983). The following
figure 2.5.11 being researched by Bouzaabia et al. (2013) can make all the above theories
clearer:
Figure 2.5.11: The relationship between in-store logistic, customer satisfaction and
customer loyalty (Bouzaabia et al., 2013:121)
In the studies of Bouzaabia et al. (2013), Poncin and Mimoun (2014), Carpenter and
Moore, (2009), Shobeiri et al. (2013), Sivadas and Jindal (2017), a strong association
between store image and satisfaction was found (see Figure 2.5.19) and there is a direct
positive relationship between in-store logistics performance and satisfaction. In addition, the
researchers also found that “the effects of perceived in-store logistics performance on
satisfaction are partially mediated by store image” (Bouzaabia et al., 2013:121). These
findings are consistent with the study from Samili et al. (2005), Arnold et al. (2005), Ltifi and
Gharbi (2015), Mou et al. (2017) who presented that in-store logistics can help customers
navigate the retail servicescape efficiently and effectively, via improving customer

87
experience and satisfaction. Conversely the future patronage intention would be adversely
affected as customers experience the consequences of inadequate in-store logistics. However,
the research of Andaleeb and Conway (2016) revealed a contradictory result of store image
related to atmospherics not having a significant impact on customer satisfaction. In current
literature, the number of studies which have concentrated on investigating how in-store
logistics affect customer perceived value and customer satisfaction in different retail formats
is still limited, even though there are a number of papers exploring in-store logistics. In
accordance with previous studies, the hypotheses of whether in-store logistics have a positive
impact on customer-perceived value and customer satisfaction and whether store image is
positively associated with customer satisfaction will be proposed in section 2.5.13.2.
2.5.8.2. Store accessibility and loyalty
Store accessibility is regarded as customer perceptions about convenience location of
stores in terms of speed, simplicity and ease (Teller and Reutterer, 2008). There are well-
established variables which significantly influence store choice and switching behaviour
(Seiders et al., 2005; Gauri et al., 2008b), including “competitive intensity”- the number of
competitors in the industry (Sloot et al., 2005) and “distance to the next rivals” (Gauri et al.,
2008b). Via these, the importance of store location and its accessibility in terms of loyalty
can be seen. Retail gravitation theory refers to the trade-off between the distance to a store
and its attractiveness: busy or time limited consumers might choose an alternative stores or
brands located nearer their houses instead of remaining loyal to specific brands or stores
located further away. Consumers always seek the optimal choice which is beneficial to them
(Jacoby et al., 1976).
Store loyalty can be defined as “the intention and readiness to repurchase at a particular
store or recommend a store” (Swoboda et al., 2013:252; Oliver, 1999; Evanschitzky and
Wunderlich, 2006). As explained above, before deciding where to buy products, customers
tend to compare many retailers, and if the competitive level is high and rivals are located near
focal retailers, customers will have more choices and have a tendency to be less loyal to the
focal retailer, thus the competitive advantage of firms can be eroded (Seiders et al, 2005)
Erbiyik et al. (2012:1046) summarised some of the previous studies around retail store
site location and presented some criteria they believed firms consider before establishing new
stores (Table 2.5.7; 2.5.8). Finally, Erbiyik et al. (2012) proposed 5 groups, including costs,

88
competition conditions, traffic density, physical features and location of stores which they
tested with samples in Turkey.
Table 2.5.6: Retail site store location selection main criteria comparison martrix
(Erbiyik et al., 2012:1410)
Table 2.5.7: Comparison matrix of sub criteria for store location main criteria
(Erbiyik et al., 2012:1411)
Based on the findings of Erbiyik et al. (2012:1410), “traffic density” and “competition
conditions” are the most important factors that retailers prioritise and consider before setting
a new store. Retail stores are often located on the main street and in the shopping centre.
Retailers might need to strike a balance between firms’ advantages and stores’ location in
order to attract more customers.
According to Swoboda et al., (2013:253), “the retail brand of a chain store retailer acts as
an umbrella that comprises each individual store”, each store has different characteristics and
advantages even if they are homogeneous in terms of decoration, products and managerial
style. In this research, Swoboda et al., (2013) found a strong relationship between store
accessibility and customer loyalty. In addition, they also emphasised that “a high level of
competitive intensity significantly decreases the effect of store accessibility on store loyalty”
(Swoboda et al., 2013:258). In other words, “the store accessibility of the focal retailer is less
important for securing consumer loyalty if there are more shopping alternatives in an area”

89
and “when the distance to the next shopping alternative for a specific product is greater, store
accessibility is more important” (Swoboda et al., 2013:258). In current literature, there seems
to be a lack of studies looking at whether there is a positive relationship between store
accessibility and loyalty. Therefore, this relationship is going to be proposed at 2.5.13.2 and
investigated in this thesis (Chapter 6).
2.5.8.3. Customer service
Over the past two decades, literature in marketing has explored the importance of
customer service as well as its effect on customer satisfaction and customer loyalty (Berman
and Evans, 2010; Levy and Weitz, 2007; Innis and La Londe, 1994). Providing excellent
customer service is the best way to distinguish a firm from its rivals (Lovelock, 2001;
Kanovska, 2009) and can be considered as a firms’ strategic weapon (Abu-ELSamen et al.,
2011). Many empirical studies have found that if customers are treated well, they have a
tendency to perceive positively anything offered by the service provider, reducing their
complaints and being more loyal, behaving cooperatively and being willing to pay higher
prices (Woods, 1999; Akroush et al., 2005; Stamatis, 1996).
Customer service is defined as all activities delivered by retailers, which can improve
customer perceived value during the shopping process (Levy and Weitz, 2007; Lusch et al.,
2011). It includes tangible or intangible values that firms provide consumers in an indirect or
direct way (Kursunluoglu, 2011). To create long-term customer satisfaction, it is not enough
to offer high quality products , customer services such as home delivery, sales and after-sale
services, information desk provision, payment facilitation, free car parks, clean restrooms,
and customer complaint points are all required (Kursunluoglu, 2014). Excellent customer
service is significantly positively associated with consumer spending (American Express
global customer service barometer, 2011), customer satisfaction and loyalty as well as
positive words-of-mouth (Zeithaml, 2000; Durvasula et al., 2005). Poor customer service is
directly related to increased customer switching and dissatisfaction (Bitner et al., 2000;
Rightnow Technologies Inc., 2010). Employees have a vital role in delivering services.
Lounsbury et al. (2012:518), Occupational Information Network (2012) reported many
attributes that employees need to own in order to deliver excellent customer services, which
are “attention to detail, integrity, dependability; stress tolerance, self-control; social
orientation and concern for others”. Staff needs to be more friendly, empathetic and attentive
(Baydoun et al., 2011). Frei and McDaniel (1998), Mount et al. (1998), Hu and Jasper (2006);

90
Hu (2011), Hurley (1998) found a strongly positive relationship between customer service
quality and employees’ personalities, the Big Five Model of personality includes “Openness,
conscientiousness, extraversion, agreeableness, emotional stability”. Gundala (2010)
confirmed that consumers will return to stores as they find sales personnel who are friendly,
supportive, courteous and attentive during clothing shopping processes. It also helps the store
improve their store image.
Kursunluoglu (2014) has found eight main variables of customer service in his
comprehensive research (see Figure 2.5.12) which are classified as follow: “Basic customer
service” such as having accurate price tags, short waiting time during the consumer check-out
process, clean restrooms offered, easy product return policy, quickly solved customer
complaints, good ventilation systems, free offered vehicles such as wheelchairs and
escalators for disabled consumers, well-organised shopping centres; “Incentive customer
service” such as notice boards, lost property units, free call centres, guarantee and repair
services, customer information units, free buses offered for customers to reach shopping
centres, free home delivery services for high spenders; “Facilitative customer service” such
as free car parks, rest areas for customers, ATM machines; “Customer service about
payment” that facilitate consumers during their payment, retailers need to accept a variety of
payment methods; “Customer service about atmosphere” which deliver nice music, provide
some quiet and luxury shopping atmosphere; “Customer services in Encounter Stage” that
offer free gift wrap services, genial employees who can give all the information customers
may request; “Informative customer service” refers to how in-store advice to customers on
how products should be used, the provision of informative websites and good marketing
brochures.

91
Figure 2.5.12: The customer service factors (Kursunluoglu, 2014:535, 536)
Kursunluoglu (2014:538) found “customer service had effects on customer satisfaction”
and “customer service could explain 13.9 percent of total variance in customer satisfaction
and 12.5 percent of total variance in customer loyalty” as exploring the above presented eight
factors about customer service in the shopping centre. In addition, Kursunluoglu
(2014:539,549) also stated that “comparing with other antecedents of satisfaction and loyalty,
customer service effects are not so powerful”. As looking at how these single factors affect
customer satisfaction and loyalty, Kursunluoglu (2014:541) concluded that “CSA, ICS, CSE,
CSP have effects on satisfaction and loyalty, whereas BCS, FCS, CSC, InCS do not affect
satisfaction and loyalty” (see Figure 2.5.12) and there are three variables only affecting
loyalty: incentive customer services, customer services in the encounter stage, and customer
services surrounding payment. And Mangnale and Chavan (2012) indicated that customer

92
service has a positive impact on customer perceived value. There has been an ongoing debate
among researchers on the topic of the relationship between customer service and other
constructs. In this research, the question of whether customer service positively affects
customer perceived value will be examined. The hypotheses will be proposed at section
2.5.13.2.
2.5.8.4. E-service quality
E-service quality is a part of service quality. In recent years, the internet has become a
vital channel for selling most goods and services (Teo, 2006; Zeithaml et al., 2002). “The
internet provides a marketplace where buyers and sellers conduct transactions directly,
interactively” (Yun and Good, 2007:4). The theoretical background of e-service quality has
been created based on the approach of Zeithaml et al. (2000, 2002). These scholars suggested
the framework named e-SERVQUAL. The research on e-service quality has been conducted
by many researchers (Brady and Cronin, 2011; Collier and Bienstock, 2006; Fassnacht and
Koese (2006), Rowley (2006). Figure 2.4.13 presents the historical development of service
quality scales in online retail (Kalia, 2017:631). In the research of Zemblyte (2015), he
proposed the research framework based on previous studies with 14 dimensions forming in
three scales (see Figure 2.5.14) but the results do not support the suggested three scales
(Figure 2.5.14), he concluded that “e-service quality from the customers’ perspective is a
four-dimensional construct, i.e. composed of four dimensions: compensation, responsiveness
and fulfillment, website operation, and reliability” (Zemblyte, 2015:806). And the most
important dimension is the compensation which explained 41.89% of e-service quality,
followed by responsiveness and fulfillment (20.17%), website operation (5.41%) and
reliability (3.69%).

93
Figure 2.5.13: Historical development of service quality scale in online retail
(Kalia, 2017:631)
Figure 2.5.14: The conceptual framework of e-service quality (Zemblyte, 2015:803)
The research from Yun and Good (2007), showed that e-service can improve e-tail store
image (online retail store image), affect customer perceived value and customer loyalty.
Ribbink et al. (2004:446) found “the e-service quality dimension of assurance, i.e. trusting
the merchant, influence loyalty via e-trust and e-satisfaction. Other e-quality dimensions,
such as ease of use, e-scape, responsiveness and customisation influence e-loyalty mainly
indirectly, via satisfaction”. In the online environment, e-satisfaction, which largely explains
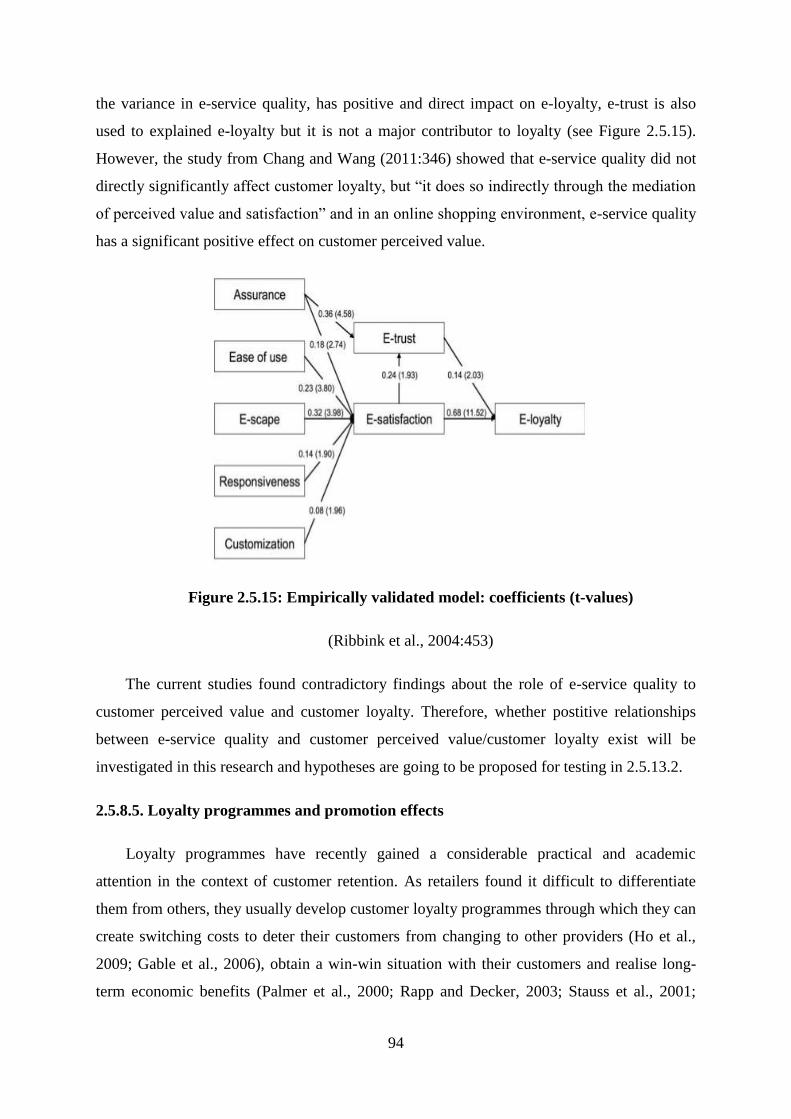
94
the variance in e-service quality, has positive and direct impact on e-loyalty, e-trust is also
used to explained e-loyalty but it is not a major contributor to loyalty (see Figure 2.5.15).
However, the study from Chang and Wang (2011:346) showed that e-service quality did not
directly significantly affect customer loyalty, but “it does so indirectly through the mediation
of perceived value and satisfaction” and in an online shopping environment, e-service quality
has a significant positive effect on customer perceived value.
Figure 2.5.15: Empirically validated model: coefficients (t-values)
(Ribbink et al., 2004:453)
The current studies found contradictory findings about the role of e-service quality to
customer perceived value and customer loyalty. Therefore, whether postitive relationships
between e-service quality and customer perceived value/customer loyalty exist will be
investigated in this research and hypotheses are going to be proposed for testing in 2.5.13.2.
2.5.8.5. Loyalty programmes and promotion effects
Loyalty programmes have recently gained a considerable practical and academic
attention in the context of customer retention. As retailers found it difficult to differentiate
them from others, they usually develop customer loyalty programmes through which they can
create switching costs to deter their customers from changing to other providers (Ho et al.,
2009; Gable et al., 2006), obtain a win-win situation with their customers and realise long-
term economic benefits (Palmer et al., 2000; Rapp and Decker, 2003; Stauss et al., 2001;

95
Bolton et al., 2000; Verhoef, 2003; Yi and Yeon, 2003; Noordhoff et al., 2004, Gustafsson et
al., 2004). These benefits can be monetary or non-monetary incentives such as rebates,
bonuses or services (Mulhern and Duffy, 2004). Lin and Bennett (2014:933) defined loyalty
programmes as “an organised marketing activity that offers a firm’s customers additional
incentives, rewards or benefits to entice them to be more loyal”. The loyalty programmes also
“allow retailers to develop new ways of measuring and managing their business and their
customers’ experiences” (Dunne and Lusch, 2004:392; Levy and Weitz, 2004:341; Gable et
al., 2006:36; Gable et al., 2008)
There has been a limited number of studies exploring the relationship between loyalty
programmes and customer loyalty On the one hand, Walsh et al., (2008); Ho et al. (2009),
Noordhoff et al. (2004), Gustafsson et al. (2004), Bowen and McCan (2015), Roehm et al.
(2002), Halberg (2004), Verhoef (2003), Lewis (2004), Bolton et al. (2000) found a
positively strong relationship between the loyalty programmes offered and customer loyalty.
On the other hand, other studies showed an inconsistent or even contradictory result, in the
study of Stauss et al. (2005) also indicated that loyalty programmes can frustrate their
customers and decrease the level of customer retention (see Figure 2.5.16). Four categories of
incidents, including inaccessibility, worthlessness, qualification barrier and redemption costs
might frustrate customers. Hansen (2000:429) proved that “customer-value-oriented
differentiation in loyalty programmes may be perceived by customers as discriminatory and
unfair”. Gustafsson et al. (2004) also found “some operational problems in collecting
promised incentives for loyal behaviour and complicated operational procedures of a telecom
company’s customer club are perceived negatively by customers” (Stauss et al., 2005:231).
The research from Lacey and Morgan (2008:9) showed that “no evidence is found in support
of H2b for how membership in loyalty programmes increases customers’ willingness to share
information”, “no evidence for H4b is found to demonstrate that loyalty programme
membership positively impacts the relationship between committed customers and their
willingness to engage in word-of-mouth referrals” and “no evidence is found in support of
H5b that loyalty programme membership positively magnifies the influence of the relationship
between commitment and increased repatronage intentions”. The study from Lin and Bennett
(2014) showed the hypothesis that loyalty programme membership positively moderates the
relationship between customer experience and customer satisfaction to be rejected. However,
the findings from Chen and Wang (2009) showed that loyalty points can be considered as a
switching barrier and hold a moderating effect playing a vital role in customer loyalty. The

96
previous findings continue to be debated among scholars. Therefore, the relationship between
loyalty programs and customer loyalty should be investigated in this research.
Figure 2.5.16: General frustration model (Stauss et al., 2005:236)
Promotion can be considered as an effort to increase sales in the short-term (Bawa and
Shoemaker, 1987; Smith and Sinha, 2000). Previous studies investigated the link between
sales promotion effects and switching barriers as well as their influence on customer loyalty.
The study from Tung et al. (2011) found that promotion effects have a significant positive
impact on loyalty. This result is consistent with previous findings from Thaler (1985),
Zeithaml (1988), Grewal et al. (1998). And the research of Kim (2019) suggested that
customers’ perceived (un)fairness could be affected by the selection of price promotion.
Therefore, whether there are postive relationships between promotion effects and customer
loyalty/customer perceived value will be investigated in this research. The hypotheses will be
proposed in 2.5.13.2.
2.5.8.6. Product quality and price
Empirical studies have paid considerable attention in researching factors affecting
customer satisfaction, they found that a products’ quality (Hansen, 2003; Huddleston et al.,
2009), service quality (Jayawardhena and Farrell, 2011; Nesset et al., 2011) and the product
assortment (Pan and Zinkhan, 2006; Hoch et al., 1999) are definitely good indicators. It can
be noted that product quality has both subjective and objective dimensions. The subjective
aspect refers to the quality of products perceived by customers (Anselmsson et al., 2007), in
which customers could make a judgment about product quality based one product-associated
attributes (Zeithaml, 1988) but actually it might be impossible to make accurate judgment

97
about the quality of ingredients and components included inside products (objective
dimension). Therefore, all judgments about product quality based on customers’ viewpoints
are regarded as subjective. In the process of evaluating food quality, customers can perceive
taste, quality of ingredients, nutritional information, freshness, naturalness, appearance or
even the odour of products (Anselmsson et al., 2007; Grunert, 2005). Lloyd and Luk (2010)
listed price, service quality and product quality as the top three drivers of customer perceived
value. Jiang et al. (2018) endorsed that product quality and price have a positive impact on
customer perceived value with beta value of 0.210 and 0.120 respectively. Eid (2015), Eid
and El-Gohary (2015), El-Adly’s research (2018) shows that price has a significant direct
positive effect on customer satisfaction (0.140) and customer loyalty (0.088 with p-value
<0.05). In accordance with previous studies, the hypotheses about the positive relationships
between price/ product quality and customer perceived value, customer satisfaction and
customer loyalty will be proposed in section 2.5.13.2.
2.5.9. Corporate social responsibility, corporate image and customer loyalty
Corporate social responsibility (CSR) activities are considered as “long-term
investments” and are a tool in ensuring firms’ long-term sustainable development (Gurlek et
al., 2017:409). They can help firms attract the attention of customers via their activities. The
research of Marin et al. (2009) and Martinez et al. (2014) demonstrated that customers pay
more attention to firms who engage positively with social and environmental issues.
Although CSR is a popular topic in literature, scholars have not agreed a comprehensively
accepted definition of CSR (Mackenzie and Peters, 2014). Garay and Font (2012) define CSR
as “the voluntary contribution of companies to environmental, economic and social
development”, Nicolau (2008) defines it as “a company’s obligation to be accountable to all
of its stakeholders affected by its operations and activities” (Gurlek et al., 2017:411). Or CSR
refers to all ethical and responsible manner of firms toward its stakeholders around firms’
external and internal environment (Aktan and Boru, 2007; Park et al., 2014).
Corporate image can be defined as the overall impression of consumers on the physical
and behavioural attributes of the company (Barich and Kotler, 1991; Nguyen and Leblanc,
2001; Rehman, 2012). Or Keller (1993) defined that corporate image is “the perception of an
organisation held in the consumer memory, which works as a filter influencing the perception
of the company” (Calvo-Porral and Levy-Mangin, 2015:127). It stems from all of the
customer experiences (Lai et al., 2009) and their perceptions. It can be seen that corporate

98
social responsibility might affect corporate image. Some previous empirical studies found
that corporate image has no direct effect on customer loyalty (Aydin and Ozer, 2005; Lai et
al., 2009) but corporate image can enhance customer satisfaction (Lai et al., 2009; Chang and
Yeh, 2017). However, the studies from Ball et al. (2006), Nguyen and Leblanc (2001),
Flavian et al. (2005) showed that corporate image is related to the customer retention
likelihood and customer loyalty; Calvo-Porral and Levy-Mangin (2015) found that customer
satisfaction is significantly affected by corporate image (see Figure 2.5.17)
Figure 2.5.17: Final causal relationships for virtual mobile service
(Calvo-Porral and Levy-Mangin, 2015:134)
According to Salmones et al. (2009) and Perez and Bosque (2015:5) “loyalty behaviour
is one of the most representative ways in which customer express their satisfaction with
corporate performance, and it is closely linked to the profitability of companies” (Figure
2.4.26). Many researchers have explored the relationship between CSR and loyalty
behaviour, but the results of all previous studies generate controversy when empirical
evidence keeps showing many contradictory findings. On the one hand, Perez et al. (2013),
Mandhachitara and Poolthong (2011), Leaniz and Rodriguez (2015), Ofluoglu and Atilgan
(2014), Liu et al. (2014) found that there is a positive relationship between CSR image and
customer loyalty. Perez and Bosque (2015) found that the CSR image included CSR society,
CSR customers, CSR employees affect customer loyalty via customer satisfaction (see Figure
2.4.26). Specifically, “customer perception about the CSR oriented to customers also
significantly and positively impacted customer satisfaction, but, again, the perceptions of
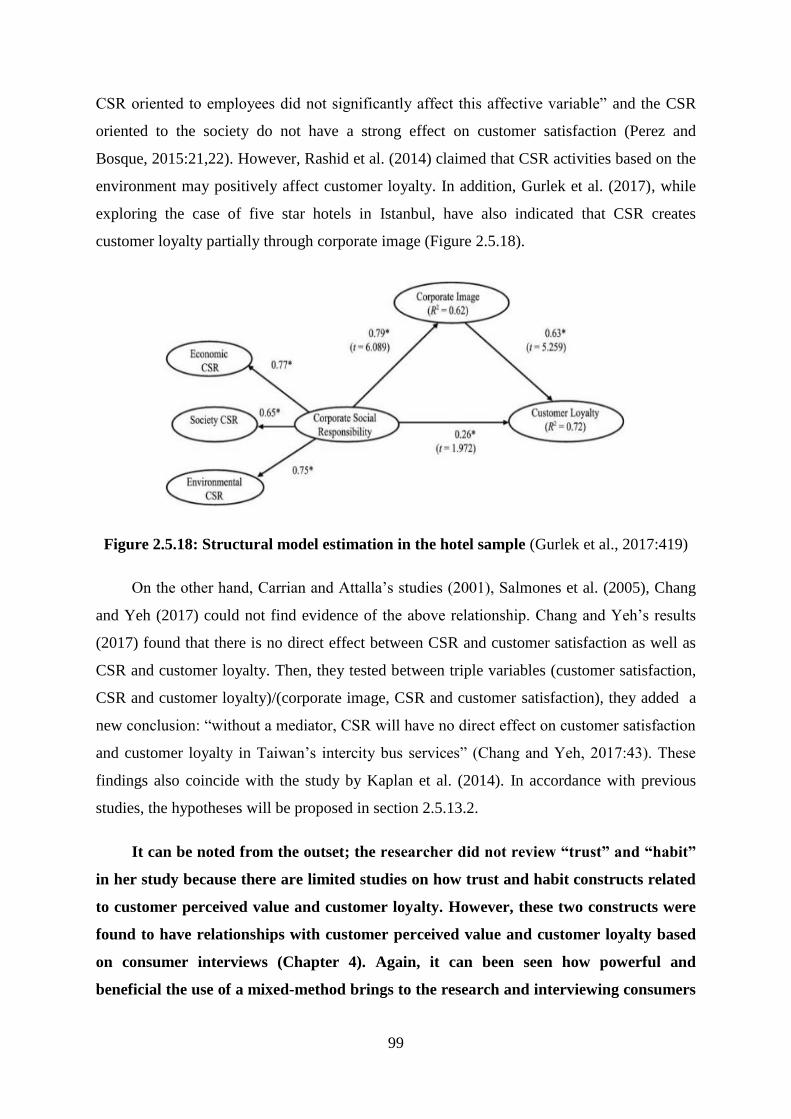
99
CSR oriented to employees did not significantly affect this affective variable” and the CSR
oriented to the society do not have a strong effect on customer satisfaction (Perez and
Bosque, 2015:21,22). However, Rashid et al. (2014) claimed that CSR activities based on the
environment may positively affect customer loyalty. In addition, Gurlek et al. (2017), while
exploring the case of five star hotels in Istanbul, have also indicated that CSR creates
customer loyalty partially through corporate image (Figure 2.5.18).
Figure 2.5.18: Structural model estimation in the hotel sample (Gurlek et al., 2017:419)
On the other hand, Carrian and Attalla’s studies (2001), Salmones et al. (2005), Chang
and Yeh (2017) could not find evidence of the above relationship. Chang and Yeh’s results
(2017) found that there is no direct effect between CSR and customer satisfaction as well as
CSR and customer loyalty. Then, they tested between triple variables (customer satisfaction,
CSR and customer loyalty)/(corporate image, CSR and customer satisfaction), they added a
new conclusion: “without a mediator, CSR will have no direct effect on customer satisfaction
and customer loyalty in Taiwan’s intercity bus services” (Chang and Yeh, 2017:43). These
findings also coincide with the study by Kaplan et al. (2014). In accordance with previous
studies, the hypotheses will be proposed in section 2.5.13.2.
It can be noted from the outset; the researcher did not review “trust” and “habit”
in her study because there are limited studies on how trust and habit constructs related
to customer perceived value and customer loyalty. However, these two constructs were
found to have relationships with customer perceived value and customer loyalty based
on consumer interviews (Chapter 4). Again, it can been seen how powerful and
beneficial the use of a mixed-method brings to the research and interviewing consumers

100
in the specific market (Vietnam) can justify and fill the gaps between the future
proposed research framework which is built based on literature review and the real
situation of Vietnamese supermarket consumers’ perception connected to customer
lotalty. Therefore, they will be added to the original proposed research framework and
it will be reviewed as follows:
2.5.10. Trust
Yaqub et al. (2010) stated the crucial role of trust in firms’ success or failure. Many
researchers viewed “trust as a perceived confidence benefit, which reduces anxiety and
increases comfort as a result of customers knowing what to expect from a service provider”
(Henning-Thurau et al., 2002, Singh and Sirdeshmukh, 2000; El-Manstrly, 2016:146).
Sirdeshmukh et al. (2002) argued that trust generates customer perceived value via offering
rational benefits and removing all uncertainty related to a relational exchange. Guenzi et al.
(2009), Konuk (2018), Walter and Ritter (2003) and Ponte et al. (2015) found that trust
enhances customer perceived value by reducing non-monetary costs perceived, such as the
effort and time for consumers to find their appropriate providers, then affecting customer
loyalty as well. In particular, Konuk (2009) found that trust is positively related to customer
perceived value (β= 0.45, p<0.001) while Guenzi et al. (2009) found that trust in the store
can explain 32.6 percent of variation in perceived value and trust in the sales person has no
impact on perceived value. From these results, it is plausible to expect that customers with
higher trust can lead to higher perceived value; the hypothese will be proposed in section
2.5.13.2.
2.5.11. Habit
Consumer habits are defined as natural responses of people towards consumption
activities, which are affected by many factors, including their surrounding environment
(Verplanken and Aarts, 1999). Habits allow people in their own ways to use their finite
resources to make the best consumption style choices. Marketers have to consider, as they
attempt to attract more customers and serve many segments whether the consumer is resistant
to immediately changing their habits because it might cost additional resources (Wood and
Neal, 2009). In many cases, consumers might express their loyalty because of habit issues.
For instance, consumers may be “lazy” towards finding other providers, or may struggle to
change their current habits and tend to be loyal to their existent providers (Liu et al., 2015).

101
The study of Liu et al. (2015) shows that habit is a strong determinant of loyalty (beta value
is 0.39). In accordance with previous studies, the hypothis will be proposed in section
2.5.13.2.
2.5.12. Customer loyalty
Customer loyalty is an ultimate goal and dream of all retailers; it could help firms
increase from 25-85 percent profit (Reichheld et al., 1990). According to Reichheld (1996),
Chang and Yeh (2017) customers tend to be loyal to firms that offer superior value compared
to their rivals, and these customers are willing to have an intensive relationship with firms
over time that can help firms save much money for their marketing campaigns as they launch
new products or offer new services. These factors can contribute to firm’s higher profit.
Therefore, customer retention can be seen as a critical factor to firms’ survival (Hoffman and
Lowitt, 2008). Customer loyalty is defined by many researchers in different ways. However,
they all have two dimensions, which are: customers repeatedly purchase a good or service;
and having favourable attitudes toward a good or service offered by companies (Kim et al.,
2004, Reynolds and Arnold, 2006; Athavale et al., 2015). Customer loyalty is defined as “a
deeply held commitment to re-buy, re-patronise a preferred product or service consistently in
the future, thereby causing repetitive same-brand or same brand-set purchasing, despite
situational influences and marketing efforts having the potential to cause switching
behaviour” (Oliver, 1997:392). Many firms compete fiercely to get more customers. It can be
seen that price is one of the factors influencing customer loyalty; however, competitive
pricing might not guarantee customer loyalty in the long-term (Scott, 2001; Schultz and
Bailey, 2000). From the beginning, Oliver (1999) classified loyalty in four steps which are
cognitive, affective, conative and action. The study from Sivadas and Baker-Prewitt
(2000:78) in a retail store setting found a strong support for the model, in that “cognitive
loyalty is a significant predictor of affective loyalty; affective loyalty is a strong predictor of
conative loyalty and conative loyalty significantly affects action loyalty”. Then, Bowen and
Chen (2001), Khan (2009), Chiu et al. (2013) have divided loyalty into two groups including
behavioural and attitudinal. Behavioural loyalty reflects customers’ action of repetitive
purchasing of products (Kandampully and Suhartanto, 2000). However, in some cases,
consumers repeatedly purchase but it cannot be seen as loyalty due to situational effects such
as low price, constant promotion programmes and proximity (Hartmann and Ibanez, 2007).
Therefore, many researchers have indicated that behavioural approach was not sufficient to

102
explain customer loyalty. Attitudinal loyalty relates to customers’ psychological and
sensation orientation, they have a positive feeling about retailers and are willing to introduce
others to buy products or services from the retailers, reflect a positive word-of-mouth
communication (Kursunluoglu, 2014; Martinez and Rodriguez del Bosque, 2013). Rowley
(2005) proposed that customer loyalty should be separately classified into four groups:
“captive, convenience-seeker, contented and committed”. But the most widely accepted and
applied classification about customer loyalty is still “behavioural and attitudinal aspects”
(Han et al., 2011; Bowen and Chen, 2001)
Based on the above analysis, most retailers’ growth goals should be generating a
customer loyalty strategy and explore deeply which factors have a significant effect on
customer loyalty. Customer defection risk within the retail industry remains relatively high.
Hoffman and Lowitt (2008) found that 70 percent of US consumers demonstrated their
faithfulness to their favourite retailers, but in the case of properly enticed programmes offered
by rivals, 85 percent of these so-called loyal customers are willing to switch immediately.
As explained above, customer loyalty is affected by many factors, and any improvement
in customer loyalty will lead to increased firms’ profits (Hallowell, 1996; Aksu, 2006).
Researchers have investigated the structural linkage between customer loyalty and its
predictors. It has attracted great interest from academics and practitioners. In typical service
quality - customer satisfaction and loyalty has been explored (Orel and Kara, 2014; Storbacka
and Strandvik, 1994; Caruana, 2002; Namukasa, 2013; Chen and Hu, 2013). Service quality
has been considered as the key driver of loyalty (Lai et al., 2009). However, some researchers
have also proved that customer satisfaction is a weak indicator in terms of customer loyalty
(El-Adly and Eid, 2016; Prentice, 2014). From these studies, customers were happy and
highly satisfied with products or services offered, but they did not return and repeatedly
purchase (Prentice, 2014; Kale and Klusberger, 2007; Zeithaml et al., 1996; Reichheld and
Sasser, 1990; Barber et al., 2010). In addition, Prentice (2014) confirms that, depending on
the industry which firms are serving, service quality might not always generate customer
satisfaction and loyalty; via the research he proved that there are some dimensions of service
quality (model presented above) expressing negative effects on customers’ favourable
behaviour. Therefore, the relationship between these factors is still being debated, and there is
little homogeneity over the operationalisation of the construct of loyalty amongst researchers.
Agustin and Singh (2005) found that “relational trust and value are the strongest determinants

103
of loyalty rather than satisfaction” and “service quality was also found as an antecedent of
customer loyalty (Wong and Sohal, 2003)” (Kursunluoglu, 2014:532). Kumar et al.
(2013:258) demonstrated that although there is a positive relationship between customer
satisfaction and customer loyalty, the variance explained by just satisfaction is very small
(around 8 percent), therefore, they proposed scholars should investigate customer loyalty
with many other variables such as customer perceived value, switching barriers and relational
variables such as trust, commitment, relationship age, and loyalty programme membership
(Bowen and Shoemker, 1998; Hennig-Thurau et al., 2002; Matzler et al., 2008; Lin and Lee,
2012). Other studies investigated customer loyalty and they considered service quality,
satisfaction, perceived value, price, brand image, and identity as antecedents of loyalty
(Barber et al., 2010; Kuenzel and Halliday, 2010; Ryu et al., 2012; Marinkovic et al., 2013).
In contrast, Lou and Bhattacharya (2006) and Oliver (1997), Kim et al. (2004), Shankar et al.
(2003), Chadha and Kapoor (2009), Chang and Yeh (2017) found that customer satisfaction
is a major driver of customer loyalty and it is well-known and confirmed by many
researchers.
In section 2.5, much literature has been explored to consider the relationship between
various dimensions to determine whether it affects customer loyalty. However, there remain
different findings among scholars. Therefore, the following proposed research framework
will be applied in this thesis in the context of the Vietnamese retail industry to determine
whether there is support for or against the previous differing schools of thought.
2.5.13. Research gaps, proposed research framework and hypotheses
2.5.13.1. Research gaps
The above presents all relevant literature relating to the research topic. From the
beginning, I have indicated the approaches used for searching literature and proposed four
main themes that the research should investigate; the outline of the whole literature review
part had been presented, followed by examining the four main themes (Section 2.2 to Section
2.5). At the end of these reviews, literature on Strategic Groups, Retail Industry, The
Vietnamese Retailing Industry, and Customer Loyalty has supported and clarified the
research topic. Based on this review, the research’s gaps can be listed as follows:
1. The relationship between customer satisfaction and customer loyalty, factors
influencing satisfaction, customer perceived value as well as which factors

104
affecting customer loyalty are still being debated between scholars (see Chapter 2
section 2.5).
2. Most studies, which relate to customer loyalty in the retailing industry, have
separately explored customer loyalty and specific factors such as customer
satisfaction, store image, corporate image, social responsibility, switching cost,
available alternative attractiveness, and loyalty programmes. There is no research
examining how many factors simultaneously affect customer loyalty.
3. There is no comprehensive published paper investigating customer loyalty in the
supermarket sector in Vietnam as well as Vietnamese consumption style.
4. Previous research has not investigated factors affecting customer loyalty in
different strategic groups, rather they have examined specific industries and
generalised for the whole industry. Based on strategic theories in a specific
industry, different strategic groups might have different factors affecting customer
loyalty. It means that the differences between strategic groups in the same
industry have been ignored (Section 2.5 reviewed factors which relate to customer
loyalty. However, no research has been linked with strategic terms - section 2.2.
Therefore, such research is needed).
5. Differences in relationships between constructs based on income, location,
gender, age and occupation have been under-researched.
This research aims to investigate and fill the above mentioned gaps via answering five
questions as follows:
RQ1: What factors directly affect customer loyalty in the Vietnamese supermarket sector and
at which level?
RQ2: Is customer satisfaction a major indicator for customer loyalty or not?
RQ3: What factors directly affect customer perceived value, customer satisfaction in the
Vietnamese supermarket sector and at what level?
RQ4: Are there any differences in terms of factors affecting customer loyalty between
strategic groups in the Vietnamese retail industry?
RQ5: Are there differences between the factors affecting customer loyalty in the retail
industry based on income, gender, location, age groups, occupation and education levels?

105
2.5.13.2. The proposed conceptual research framework and hypotheses
In the end of each sub-section of section 2.5, the researcher has reviewed and debated
a contradictory relationship between many related dimensions among scholars. These on-
going debates reveal support for the related findings and lead to different schools of thoughts,
some scholars have supported, and others have not. In particular, there remains no consensus
in the literature on which factors affect customer loyalty.
The following path model of latent factors (Figure 2.5.19) is proposed based on
results from the literature review where contradictory findings from different groups of
researchers have been found, and the gaps which are presented above. The main reason for
creating this model is to clarify the gaps based on the literature review and provide a direction
for this study. Figure 2.5.19 is also considered as the proposed conceptual model of this
research. The procedure of creating Figure 2.5.19 is going to be presented as follows. The
initial outline of figure 2.5.19 was created based on three main themes, including constructs
named “customer perceived value”, “customer satisfaction” and “customer loyalty”. In this
research, due to objectives of the research, there were only three constructs being treated as
dependent factors. The researcher again re-checked from the available literature and
investigated factors that might directly and indirectly affect “customer perceived value”,
“customer satisfaction” and “customer loyalty”. Then, the initial research framework was
drawn. After that, the researcher continued to propose linkages/connections between factors
based on the results of the literature review of which the hypotheses are based on. After this,
the researcher built manifest variables which related to its latent factors based on the
literature review. In some cases, manifest variables used in this research are a combination
between reliable manifest variables created and used by many well reputed academic
researchers in the retail field. In order to make sure that all relevant items (constructs) were
included, the researcher re-checked both the latent constructs and manifest variables related
to customer perceived value, customer satisfaction and customer loyalty. There are some
other factors mentioned in other research, such as how reputation affects customer loyalty;
but it was not investigated in the review because the manifest variables which are used to
measure “reputation” construct are also used to measure “corporate social
responsibility/brand retail experience/store image”. As a result, the researcher examined
thoroughly to make sure that all necessary manifest variables were included. In later research,

106
if these variables load the same content to explain latent variables, they will be removed
automatically during the process of exploratory factor analysis (EFA).
It can be noted again from the outset, the researcher did not review “trust” and “habit”
in her study. However, these two constructs were found to have relationships with customer
perceived value and customer loyalty based on consumer interviews (Chapter 4). Therefore,
they have been added to the original proposed research framework, and “trust” and “habit”
constructs are shown in a bold red colour in this framework. Control variables including
income, location, age, gender and strategic groups will be input into the model during
hypothesis testing in order to investigate whether these variables affect the three main
dependent variables (customer perceived value, customer satisfaction and customer loyalty;
hypothesis 1 to hypothesis 5).

107
+ H6
+H14
+H12A
+H7B +H16 +H25
+H26 +H18 +H15
+H11B
-H10B
+H11A
+H9B
H6
+ H7A
+H8
+H
22
B
+H23
Figure 2.5.19: The proposed conceptual model of this research
Instore
logistics
ssss
E-service
quality
Service
quality
Customer
service
Customer
experience
Retail brand
experience
Product
quality Price
Corporate social
responsibility
Store
image
Habit
Trust
Switching
costs
Alternative
attractivenes
s
Loyalty
programs
Promotion
effects
CUSTOMER
PERCEIVED VALUE
Store
accessibility
CUSTOMER
LOYALTY
Gender Age Location
s
Income Strategic groups
CUSTOMER
SATISFACTION
Corporate
image
Constructs added from the
findings of Phase Two:
TRUST and HABIT Control variables
7 items 6 items 10 items 3 items 6 items 3 items
3 items
6 items
4 items
4 items
6 items 3 items 3 items
4 items 10 items
6 items
4 items
7
ite
ms

108
All hypotheses of this reseach are presented in Appendix 2.1 and Appendix 2.2 to
demonstrate a link between hypotheses and research questions which can be briefly presented
here:
Research questions Hypotheses
RQ1: What factors directly affect customer
loyalty in the Vietnamese supermarket and at
which level?
Customer loyalty: H1C, H2C, H3C, H4C, H5C
H7B, H8, H9C, H10B, H12C, H15, H17C,
H17D, H18, H19B, H20C, H21C, H22B, H26
RQ2: Is customer satisfaction a major
indicator for customer loyalty or not?
H8
RQ3: What factors directly affect customer
perceived value, customer satisfaction in the
Vietnamese supermarket and at which level?
Customer perceived value: H1A, H2A, H3A,
H4A, H5A, H9A, H12A, H13A, H16, H17A,
H17B, H19A, H20A, H21A, H22A, H25
Customer satisfaction: H1B, H2B, H3B, H4B,
H5B, H6, H7A, H9B, H10A, H12B, H13B, H14,
H20B, H21B, H24
RQ4: Are there any differences in terms of
factors affecting customer loyalty between
strategic groups in the Vietnamese retail
industry?
Multigroup analysis
RQ5: Are there differences between the
factors affecting customer loyalty in the retail
industry based on income, gender, location,
age groups, occupation and education levels?
Multigroup analysis
All control varibles will be tested as to whether they affect customer perceived value
(H1A, H2A, H3A, H4A, H5A), customer satisfaction (H1B, H2B, H3B, H4B, H5B) and
customer loyalty (H1C, H2C, H3C, H4C, H5C) or not. Appendix 2.3 sumarises the latent
factors and manifest variables used in this research.
With the above research framework and based on research objectives presented at
chapter 1, the researcher is going to conduct many qualitative and quantitative steps based on
Cannon (2004), who proposed steps in the process of conducting a mixed method, in order to
achieve the research’s objectives:

109
Step 1: Conducting experts’ inteviewing in order to divide supermarkets into their right
groups.
Step 2: Conducting supermarket-consumer interviewing in order to justify the
proposed research framework and investigate whether other factors, which have not
been investigated in the literature part, should be considered in the Vietnamese grocery
market.
Step 3: Using EFA (exploratory factor analysis) technique for all manifest variables to
examine its consistency and what variables should be remained or eliminated from the
data set.
Step 4: Revising the model
Step 5: Test CFA (confirmatory factor analysis) and SEM (structural equation
modeling) to investigate the research questions and achieve the research’s ojectives.
Besides that, multigroup comparisons across groups (which is considered as advanced
SEM exploration) for factors relating to customer satisfaction, customer perceived value and
customer loyalty will be investigated at chapter 6.
2.5.14. Summary
This part is considered as a main theme of the review. It explores many factors related
to and possibly affecting customer loyalty. From the beginning of this section, the researcher
presented a literature review on consumers’ preferences, consumer behaviour, customer
experience, customer perceived value and customer satisfaction; followed by perceived
switching cost and switching barriers, brand experience and service quality. The section had
also covered corporate factors which might indirectly influence the main theme of “customer
loyalty” such as in-store logistics, store image, store accessibility, customer service, e-service
quality and product quality. Then, corporate social responsibility, trust and habit were also
investigated. Finally, some basic reviews around customer loyalty and the debate between
scholars about factors affecting customer loyalty was presented, followed by indications of
the research gaps; discussion of the proposed research framework and hypothesis of this

110
research. The next chapter is going to present how the research will be conducted (Chapter 3:
research methodology).

111
Chapter 3: Research Methodology
3.1. Introduction
Previous chapters can be regarded as a secondary data source in order to present much
background information relating to customer loyalty, different strategic groups, the retail
industry and the Vietnamese retail industry. This chapter is going to present the research
methodology applied, the researcher will first restate research objectives and research
questions, highlight differences between philosophical stances and paradigms, then indicate
the applied philosophy and paradigm for this research. This will be followed by the research
process and research methodology.
3.2. Research objectives and research questions restated
The research objectives are as follows:
Providing insights about the Vietnamese retailing industry, classify all current
supermarket firms in Vietnam into their correct strategic groups.
Investigating factors directly affecting customer loyalty, customer satisfaction and
customer perceived value in Vietnamese supermarkets by simultaneously researching
and comparing different strategic groups.
Examining whether there are differences between factors affecting customer loyalty
based on age groups, location, income, gender, occupation and education levels.
There are five research questions proposed in this study:
RQ1: What factors directly affect customer loyalty in the Vietnamese supermarket sector and
at what level?
RQ2: Is customer satisfaction a major indicator for customer loyalty or not?
RQ3: What factors directly affect customer perceived value, customer satisfaction in the
Vietnamese supermarket sector and at what level?
RQ4: Are there any differences in terms of factors affecting customer loyalty between
strategic groups in the Vietnamese retail industry?

112
RQ5: Are there differences between the factors affecting customer loyalty in the retail
industry based on income, gender, location, age groups, occupation and education levels?
3.3. Research philosophy and research paradigms
3.3.1. Research philosophy and research paradigms
Before examining the research paradigm, it is crucial to absorb knowledge about all
assumptions demonstrated in the research philosophy. These assumptions relate to how
knowledge is developed and analysed as well as its impacts on future applied research
methodology (Sauders et al., 2007; Guba, 1990; Chua, 1986). This part will shed light on
three philosophical stances which underpin the research paradigm: ontology, epistemology
and methodology (Guba and Lincoln, 2005; Bryman and Bell, 2011). Ontology is concerned
with the nature of reality. From this viewpoint, the reason of the existence can be drawn
(Chua, 1986), which answer how the world looks (Solem, 2003; Bryman and Bell, 2007), and
“whether the social world is external to social actors or the social actors fashion it” (Sobh and
Perry, 2006:1200). Epistemology refers to the nature of knowledge and how the knowledge
can be obtained. As Saunders et al. (2007: 102) stated epistemology deal with “what
constitutes acceptable knowledge in the field of study”, and “in the discipline” (Bryman and
Bell, 2011:15). In fact, it is all based on the theory of knowledge, “grounds of knowledge”
(Burrell and Morgan, 1979:1), demonstrating how a researcher views the world, and which
knowledge is valid and accepted. Therefore, epistemology indicated the natural relationship
between the knower (researchers) and the known (the research topic) to some extent (Guba,
1990:18). Methodology is related to the question of how the knowledge is obtained.
According to Guba (1990), this philosophical assumption will definitely facilitate researchers
(the inquirer, the knower) in finding a way of obtaining knowledge. There are relationships
between these philosophical stances. The epistemological viewpoints have been impacted by
ontological choices (Sarantakos, 2005; Collis and Hussey, 2009) and the choice of research
methodology has been traced back from these two stances (Burrell and Morgan, 1979).
There are two aspects of ontology being considered: objectivism and subjectivism
(Saunders et al., 2009). Objectivism believes that there is an independent relationship
between social actors and social entities which are already in existence. On the other hand,
subjectivism supports the view that “social phenomena are created from the perceptions and
consequent actions of social actors” (Saunders et al., 2009:111; Holden and Lynch, 2004).
Saunders et al. (2012) indicated that subjectivism concerns reality as a socially constructed

113
factor in the social context; based on this viewpoint, researchers seem to concentrate more on
interpreting participants’opinions in specific situations in order to claim new arguments and
knowledge.
The two main epistemological stances are positivism and interpretivism (Collis and
Hessey, 2009). Positivist researchers conduct their study based on a value-free approach and
dichotomous thinking, all obtained knowledge should be observable and measurable,
researchers become an objective existence; they often ignore their own feelings or
interaction-involved during the research process, large samples are used to test the theory by
drawing hypothesis and conducting the research via quantitative methods to generate
objective results with high levels of crediblity and reliability (Holden and Lynch, 2004,
Easterby-Smith et al. 2012). It examines the relationship between variables (independent and
dependent ones). In contrast, interpretivists argued in different ways which indicate the action
of relying on data and number results being conducted by positivists is not enough (Näslund,
2002). Therefore, social interactions should be taken into account. Their actions aim to
develop new theories to some extent by applying qualitative research with small samples
(Meredith, 1988). Under this epistemological standpoint, the interrelationship between
researchers and what is being researched is impossible to separate during the research process
(Mangan et al. (2004). The findings can reach “a causal explanation of its cause and effects”
(Maxwell, 2005:88). The result can be less reliable compared to quantitative method, but it is
still considered highly valid as its degree of generalisation is high (Collis and Hussey, 2009).
The following table can demonstrate the differences between these two epistemological
paradigms and the main characteristics of these two methodologies:

114
Table 3.1: Comparison of positivism and interpretivism paradigms
There are two methodologies being used in the research, including quantitative and
qualitative. As mentioned, the methodology can be characterised by the chosen paradigmatic
philosophy and research can be conducted in deductive or inductive ways. Deductive
approach is usually associated with positivism and quantitative research, while inductive is
suitable for interpretivism and qualitative research (Saunder et al., 2009). The deductive
approach related to “testing a theory” via theoretical hypotheses which can be developed
through literature review, from which many variables have been constructed. This method
usually applies to surveys and questionnaires (Collis and Hussey, 2003). On the other hand,
the inductive approach deals with the context and “building and generating theories”
(Bryman, 2012). Via this method, many viewpoints around the topic can be revealed and it is
not easy to turn the research findings into specific theory. Therefore, researchers often use
this technique within a limited setting and context. Empirical measurement is regarded as the
main methodology in a scientific method (Orlikowski and Baroudi, 1991). In many cases,
researchers have managed to integrate the two approaches in the research process (Lee, 1991;
Morgan, 2007; Bryman, 2012).

115
Table 3.2: Comparison of quantitative and qualitative methodologies
Figure 3.1: Different logics used in quantitative and qualitative studies
Besides that, according to Saunders et al. (2008), there are two more philosophies which
are realism and pragmatism might need to be considered. The view of pragmatism posited

116
that “study what interests you and is of value to you” (Tashakkori and Teddlie, 1998:30),
whereas realism refers that objects are supposed to exist independently to the human mind
(Saunders et al., 2009).
3.3.2. Apply paradigms to the thesis research
Based on the research topic previously stated, the aim of the research will be
demonstrated as follows: firstly, the research will provide insights into the Vietnamese
retailing industry, classifying all current supermarket firms in Vietnam to their right strategic
groups. Secondly, this thesis is going to investigate factors affecting customer loyalty in the
Vietnamese supermarket sector by simultaneously researching and comparing different
strategic groups. Thirdly, the research is going to examine whether there are differences
between factors affecting customer loyalty based on age groups, location, income, gender,
occupation and education levels.
It can be noted that there is no right or wrong paradigm, the chosen paradigm entirely
depends on the researcher but they must be aware of the paradigm being affected by the
nature of conducting research, philosophical standpoints as well as the research purposes
(Mackenzie and Knipe, 2006). In this thesis, the research topic related to strategy, marketing
and in-store logistics management areas which follow the scientific method and this area was
posited as belonging mostly to the positivist paradigm (Mentzer and Flint, 1997; Aastrup and
Halldorsson, 2008; Grant, 2003;). However, based on the indicated research objectives, some
of them are exploratory in nature, strategic group mapping, and consumer preferences.
Therefore, the thesis will employ a combination of ontological stances which are objectivism
and subjectivism, in appropriate ways. In other words, objectivism is a dominant stance; the
results from quantitative data collection will clearly answer the research questions. The
research follows the epistemological standpoints of both positivism and interpretivism but the
dominant stance applied is positivism. As a result, the research will use both quantitative and
qualitative research methods to answer research questions. Bazely (2003), Burke and
Onwuegbuzie (2005) indicate that this method is the use of mixed data, including both text
and numerical and using alternative tools (analysis and statistics). In that, researchers might
apply a qualitative method in one phase and use a quantitative method in another phase
during the research period, and data are integrated and mixed (Creswell et al., 2004).
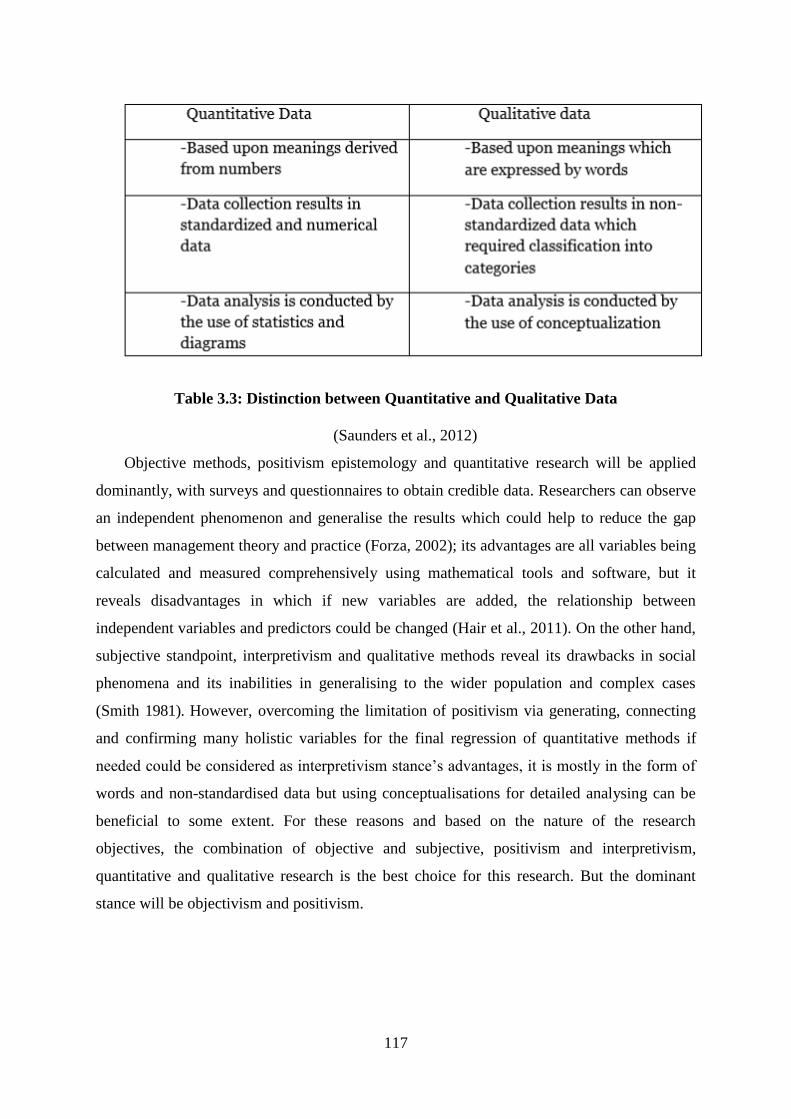
117
Table 3.3: Distinction between Quantitative and Qualitative Data
(Saunders et al., 2012)
Objective methods, positivism epistemology and quantitative research will be applied
dominantly, with surveys and questionnaires to obtain credible data. Researchers can observe
an independent phenomenon and generalise the results which could help to reduce the gap
between management theory and practice (Forza, 2002); its advantages are all variables being
calculated and measured comprehensively using mathematical tools and software, but it
reveals disadvantages in which if new variables are added, the relationship between
independent variables and predictors could be changed (Hair et al., 2011). On the other hand,
subjective standpoint, interpretivism and qualitative methods reveal its drawbacks in social
phenomena and its inabilities in generalising to the wider population and complex cases
(Smith 1981). However, overcoming the limitation of positivism via generating, connecting
and confirming many holistic variables for the final regression of quantitative methods if
needed could be considered as interpretivism stance’s advantages, it is mostly in the form of
words and non-standardised data but using conceptualisations for detailed analysing can be
beneficial to some extent. For these reasons and based on the nature of the research
objectives, the combination of objective and subjective, positivism and interpretivism,
quantitative and qualitative research is the best choice for this research. But the dominant
stance will be objectivism and positivism.

118
3.4. Ethical theories
3.4.1. Philosophy and normative ethical theories
In the research process, researchers might need to consider ethical issues (Šmajs et al.,
2012). In a general sense, the term ethics is derived from the Greek word “ethos” which deals
with an individual’s fundamental views toward life (Sroka and Lorinczy, 2015). It refers to “a
set of moral norms, principles or values that guide peoples’ behaviour” (Sherwin, 1983;
Brunk, 2010:255), the moral principle that “individuals inject into their decision processes”
(Salehi et al., 2012:3). In the business research perspective, ethical issues relate to the
question of how researchers characterise and clarify their research topics, design their
research, and the ways in which they approach, collect, process and save data; how they
analyse and write up data collected in a moral way (Saunders et al., 2009, Cooper and
Schindler, 2008). However, “moral sentiments can be either neutral, or negatively/positively
valenced”. It means that the terms “ethical” or “unethical” demonstrate an individual’s
subjective moral judgment of which one is considered as right or wrong and good or bad
things (Brunk, 2010:255).
From philosophical perspectives, there are two fundamental normative ethical principles,
including “deontology” and “teleology” (Shanahan and Hyman, 2003). Deontology posits: “a
good will is good not because of what its effects or accomplishes, nor because of its fitness to
attain some proposed end: it is good only through its willing”, good in itself. The most
important rule in the deontological principle is: people evaluate the action as right or wrong
because of its truly right characteristics judged by higher social moral duties, norm or the
law, not because the better outcome of an action is expected (Barnett et al., 2005). On the
other hand, teleology refers to the consequences of an action, “the greatest good for the
greatest number”. Those who have supported this standpoint indicated that if stealing can
lead to a good outcome and maximises pleasure for all people in a community, it is definitely
considered as a right action and worthy of support (Sekaran, 2003).
“Kantian ethics” are considered an ethical paradigm which represents the deontological
standpoint. Kant (1979c:67) quoted: “always regard every man as an end in himself, and
never use him merely as a means to your ends”. It means that each person has their own
personal life and their purposes for living, treating them as an object to be exploited for our
purposes is considered as totally wrong (Reynolds and Bowie, 2004). This stance prefers the

119
character of an action itself to the consequences of an action. Kant (1979) noted that lying is
wrong, even if it could be qualified to some extent as telling lies to friends about how good
their haircut is for a complimentary purpose (Forsyth, 1992). The Kantian ethics approach
has been applied by many researchers in business research (Petkus and Woodruff’s, 1992;
Rust et al, 2000; Ohreen and Petry, 2012; Vitell et al., 2001; Perrini et al., 2006; Mohr et al.,
2001). It has revealed a significant impact on both academic perspectives and business
practice. Kantian ethics were developed after social contract theory -“contractarian ethics”-
which considered that a person’s moral and/or political obligation has been dependant on a
contract or agreement among them to the form of the society in which they live (Skinner,
1996; Stomp, 2008; Locke, Rousseu, 1762).
“Utilitarianism” posited its contrary viewpoints compared to “Kantian ethics”, this
stance was developed based on teleology. As noted by Mill (1963-1991) “the life of a
dissatisfied Socrates is better than the life of a happy fool”, meaning that it will be better to
be a human dissatisfied than a pig satisfied. There are two different viewpoints about
happiness and the consequence of an action in this stance. Bentham supposed that the quality
of pleasure is equal, but Mill’s argument is that “simple pleasures” seem to be preferred by
individuals who have no experience with high art and they are not in a proper position to
judge if needed. Based on this, Mill proposed that extra voting power should be granted to
university graduates on the grounds that they were in a better position for judging what would
be best for society. As demonstrated above, “the greatest-happiness principle” has been
applied in this perspective, the outcome of an action should be taken into account in partly
considering the character of an action (Shanahan and Hyman, 2003).
Beside the two main ethical paradigms above, “virtue ethics” (charactered-based ethics)
should be considered. This stance is centred around the idea of individual character rather
than result-based ethics (utilitarianism) or the character of an action (Kantian ethics). It
means that virtue ethics is person-based rather than action-based. This standpoint deals with
the rightness or wrongness of individuals’ action as well as providing a guidance that
demonstrates which characteristics and behaviour of a good person should be in order to
make them more achievable. Gotsis and Kortezi (2013) and McPherson (2013) have applied
this concept into their recent research.

120
3.4.2. Ethical paradigm and its implication
Understanding all ethical paradigms has facilitated the research process for all
researchers (Robson, 2002). There are many cases where researchers changed the data and
explained the results in an appropriate way, applied any means if needed in order to obtain
the best outcome as expected (utilitarianism). However, instead of using this teleological
view, my current research inclines to the view of the character of an action itself and using
apparent methods during the research process rather than taking the viewpoints of researchers
into account and considering them as a central stance (virtue ethics). Based on this, Kantian
ethics based on the deontological perspective are regarded as the best ethical standpoint for
the current research.
Based on the research project proposed and comprehensive understanding of the
philosophy, paradigm, ethical issues, there are many issues related to ethics that should be
considered in the study. As Saunders et al. (2009:184) stated that ethical issues related to
“questions about how we formulate and clarify our research topic, design our research and
gain access, collect data, process and store our data, analyse data and write up our research
findings in a moral and responsible way”. Therefore the ethical issues of the whole research
process should be considered comprehensively and equally (Healey, 1991). Firstly, the study
involves clarifying the research topic and designing the research. From academic
perspectives, it would be better if the topic is explored comprehensively and designed in an
appropriate way based on literature review and research designed by many previous good-
quality published papers. In this process, philosophy and paradigm reveal their significant
influence and their strongly-connected relationship with ethical issues (Wells, 1994).
Secondly, both secondary data and primary data (surveys, questionnaires), in which human
participants get involved, are used. When using secondary data, ethical issues might occur,
the sources of secondary data should be reliable, and how the data is stored should also be
checked in order to make all data collected credible. In addition, applying Kantian ethics lead
the research nature to be more about the character of an action, treating people involved as an
object to be exploited for our purposes is considered as totally wrong; it means that the
freedom of participants in the survey (joining without reluctance) and their personal
information and viewpoints need to be put in proper places and under careful usage with
respectable consideration. Thirdly, to avoid subjective selectivity and bias occurring during
the data collection process, strict standards will be set by the researcher. These actions will

121
facilitate the reliability and validity of the research. Fourthly, analysing data by applying
many analysis tools (using SPSS, conducting multivariate analysis, exploring exploratory
factor analysis, confirmatory factor analysis and structural equation modelling might be
suitable for this study) could lead to breaking the law of Kantian ethics because researchers
can use different statistical methods and technique to get the best outcomes (Saunder and
Savulescu, 2008). This problem will be considered during my research process. Finally,
writing up the results could be significantly affected by the writer’s viewpoints, thanks to the
philosophy and paradigm that the research has followed; the writing process would be
apparent and would reveal its objective consequences. Besides that, to prevent all problems
raised, 18 ethical principles for research and the code of practice on research misconduct in
the guide for the code of ethics published by Hull University Business School (HUBS, 2005)
should be followed comprehensively (See Appendix 3.1 for research ethics approval letter
used for conducting this research).
3.5. Research process
As conducting any research, a research process is considered as a vital step to help
researchers understand and commit with a right research path. One of the main reasons for
considering it is that research can take more time with many related considerations. It is a set
of activities unfolding over time. During the research process, researchers might slightly
change or modify their research ideas, but it would be useful if they know their own research
objectives and have a specific plan for the research (Ghauri and Gronhaug, 2010). At
different stages, they might confront different issues, clarifying the research process will help
them perform tasks systematically and be able to check what is to be done at a particular
stage (Sekaran and Bougie, 2010). For example, researchers need to clarify and understand
their research objectives, exploit some necessary literature in order to support the research
process before collecting the data. A typical research process has been proposed by Ghauri
and Gronhaug (2010) (Figure 3.2). However, depending on the purpose of a research project,
these steps can be different. According to Morgan (1993), Pettigrew (1985), Bryman (1988),
in reality, the research process is not so orderly and sequentially presented as in Figure 3.2.

122
Figure 3.2: The research process
(Ghauri and Gronhaug, 2010:30)
According to Saunder et al. (2016), researchers might need to follow the precise number
of stages to complete the research, but it might vary, normally they include clarification and
formulation of the topic, reviewing literature, choosing philosophical approach, designing the
research, collecting data, data analysis and writing up. The following research process onion
can visualise the above statement (Saunders et al., 2003:83; 2016:164). This onion
demonstrates the number of choices, including philosophical orientation, research
approaches, paradigms, strategies and steps that researchers can follow (Figure 3.3).

123
Figure 3.3: The research process onion (Saunders et al., 2003:83; 2016:164)
3.6. The choice of research methodology
This research is conducted based on the typical question of “What factors affect X
(dependent variables) and at which level?” as well as exploring differences between groups.
As presented above, qualitative research is generally associated with the phenomenological
paradigm and quantitative methodology relates to positivism (Mangan et al., 2004).
Combined with the research objectives, this research is going to use mixed methods (as
mentioned above) in order to achieve and maintain the accuracy, reliability and integrity of
the research. The qualitative research includes semi-structured expert interviews, which will
help the researcher identify “strategic groups” within the Vietnamese supermarkets in order
to facilitate the subsequent comparison of groups; semi-structure interviewing consumers will
also help the researcher justify and validate her proposed research framework, with constructs
added after interviewing if required. The use of quantitative research in the form of
questionnaires will provide data which allows the researcher to answer the previously
mentioned question of “at which level”. Therefore, it should follow the steps mentioned in
the Cannon’s research (2004) (see Figure 3.4).

124
Figure 3.4: Steps in the process of conducting a mixed methods study
(Adapted from Cannon, 2004)
After reviewing all previous literature related to customer loyalty in general and
customer loyalty in the supermarket sector in particular, and looking at the relationship
between variables affecting customer loyalty, the next step is to conduct a pilot study by
interviewing a number of customers and re-build the research model (Mentzer and Flint,
1997) then, develop measurables for these final variables in questionnaires before doing a
survey. There exists a reason why the above issues have been encouraged in many research
projects. All variables built from previous research might not be suitable with the current
research due to different objectives, samples and research methods; a pilot study via
interview can improve the level of validity of the research before doing specific structured
questionnaires.

125
As explained from the beginning, the research focuses on the context in Vietnam, all data
collected will be in the Vietnamese market. For the quantitative phase, many steps will be
conducted before testing the hypothesis, such as checking the reliability and validity of all
data collected via analytical methods in SPSS, analysing EFA (exploratory factor analysis) to
remove duplicated variables. Besides that, confirmatory factor analysis can be applied due to
the existing of sub-variables in each variable; an analysis of SEM is also used in this research
in order to demonstrate the relationships between many variables.
The following figure (Figure 3.P) is going to summarise two phases that will be
conducted in this research:
Figure 3.P: Procedure of two phases conducted in this research
(Source: from the researcher)

126
3.7. Research method: Phase One_ Step One_Expert interviewing
3.7.1. Chosen research strategies: semi-structured interview
It is clear that the research relates to factors affecting customer loyalty of different
strategic groups. Therefore, before investigating other issues, definition of strategic groups
and how supermarkets can be divided into their strategic groups should be explored. Besides
that, this study is going to collect data in Vietnam to examine the proposed research
framework, interviewing experts in retailing and the grocery sector is needed in order to
classify firms into a specific strategic group. This phase will allow the researcher to conduct
multigroup analysis later to investigate differences between groups (which can facilitate an
answer to research questions 4 and 5).
In general, a strategy has been regarded as “a plan of action to achieve a goal” (Saunders
et al.; 2016:177). Therefore, a research strategy refers to a plan of how researchers conduct
their research to achieve their research objectives. According to Denzin and Lincohn (2011),
it is all about methodological issues which is a link between a research philosophy and choice
of methods used to collect and analyse collected data. It is clear that the chosen research
strategy is guided by research questions and must meet research objectives.
The Phase One interviews are regarded as qualitative research interviews. There are
many available types of interview. Converse and Schuman (1974:53; cited in Denzin and
Lincoln, 2000:650) noted that “There is no single interview style that fits every occasion or
all respondents”. However, a semi-structured interview is the choice of this research due to its
natural match to this research’s interest. Reasons are going to be explained as follows.
According to Doody and Noonan (2013), Saunders et al. (2016), considering the nature of
semi-structured interviews, researchers might need to prepare a clear list of questions and the
checklist of specific questions related to a topic that they are going to investigate. Based on
this, interviewers can drive a conversation and explore deeply all main points. Depending on
the flow of a conversation; the order of these structured questions can be changed. During the
interview process, interviewers can also add some further questions, such new questions are
obviously not presented in the interview guide but the interviewers create new questions
based on picking up on things said by interviewees and the interviewees have a great deal of
leeway in how to reply, meaning they are free to answer in their own styles while the
researcher can prompt on the main issues, the research’s viewpoints and let interviewees give

127
ideas to explore whether new insights have been demonstrated or not. In this way, some areas
which had not previously being considered will be addressed fully. These strategies can be
beneficial to the analysis process as the researcher can compare and contrast across the case.
With unstructured interviews, it can be easy to lead to a huge range of topics and
answers that can impede the analysis process due to lack of information focus; the researcher
could then not easily compare or contrast interview results (Collis and Hussey, 2009). Group
interviews could not be conducted in this research because the respondents are to be found at
different locations and they offered different schedules for participating in the research.
There are different types of semi-structured interviews; in this research, an interview
may be conducted on a one-to-one basis via three available options such as “face-to-face”,
telephone, internet-mediated (electronic) interviews. With PHASE ONE, named “expert
interviewing”, face-to-face is considered the best choice when the interviewer can explore
more deeply the expert’s comments about retail strategic groups in Vietnam as well as his/her
point of view about the Vietnamese retail market and the development direction.
3.7.2. Sample and contacting the experts
The objective of Phase One is to group the Vietnamese supermarkets into different
strategic groups. Many methods can be used to obtain such observations as an analysis of
firms’ development strategies and resources (strategic theories presented in Chapter 2,
section 2.1). Besides that, interviewing some experts in strategy in the Vietnamese retail
industry can create more reliable findings. In this thesis, the researcher is going to combine
these two techniques.
Teddie and Tashakkori (2009) suggest two types of sampling that researchers can use,
including probability and non-probability (purposive) sampling. Differences between the
two are presented below (Table 3.4).

128
Table 3.4: Comparisions between purposive and probability sampling techniques
(Teddie and Tashakkori, 2009: 179, adapted by Chaisurayakarn, 2015:115)
The main objective of this phase is to group Vietnamese supermarkets into correct
groups and the potential interviewees will be experts in retail and stategy. What is needed is
experts who can most likely offer valuable information. Based on the differences and the
research purpose, a non-probability method which includes “the purposive expert sampling”
will be chosen (Bird et al., 1996). According to Sekaran and Bougie (2011), Oliver (2006),
purposive sampling is the method where respondents are selected based on a variety of
criteria which can include their relevance, their specialist knowledge of the research topic or
the willingness to participate in the research. It means that after understanding the purpose
of the research, the researcher will identify a predetermined target group.

129
There are four purposive sampling techniques, including convenience sampling,
judgmental sampling, snowball sampling and quota sampling techniques, differences
between these four techniques and their advantages are presented in Table 3.5. In this phase,
judgmental sampling technique with some specific characteristics is applied due to the
technique’s nature presented in Table 3.5 and the researcher will use her judgment to contact
an expert in retailing. The researcher has a good knowledge of strategy, based on good
academic and business experience in Vietnam.
Table 3.5: Advantages of non-probability sampling techniques
(Source: Bryman and Bell (2015); Malhotra et al. (2012), Chaisurayakarn (2015:95))
3.7.3. Interviewing guide development
There are two areas which will be discussed during the interviewing process, including
strategic groups and customer loyalty. “The key to a successful interview is careful
preparation” (Saunders et al., 2016:401). They indicate that the “five Ps” can be remembered:
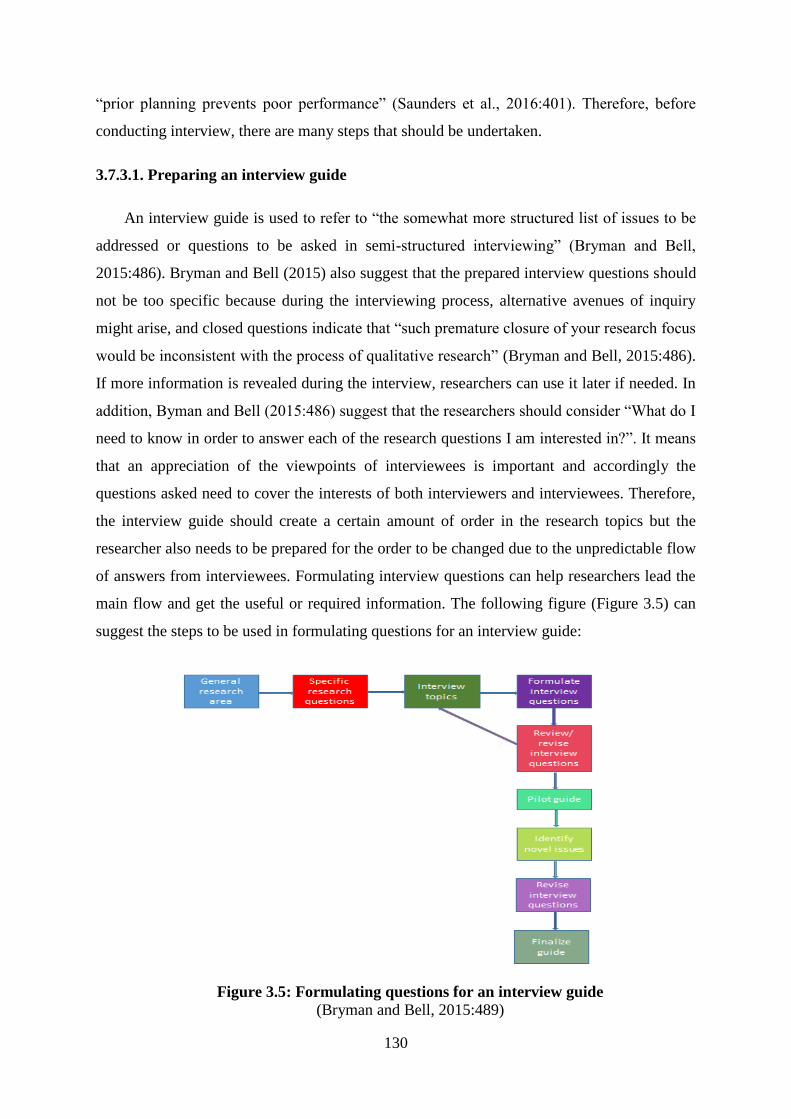
130
“prior planning prevents poor performance” (Saunders et al., 2016:401). Therefore, before
conducting interview, there are many steps that should be undertaken.
3.7.3.1. Preparing an interview guide
An interview guide is used to refer to “the somewhat more structured list of issues to be
addressed or questions to be asked in semi-structured interviewing” (Bryman and Bell,
2015:486). Bryman and Bell (2015) also suggest that the prepared interview questions should
not be too specific because during the interviewing process, alternative avenues of inquiry
might arise, and closed questions indicate that “such premature closure of your research focus
would be inconsistent with the process of qualitative research” (Bryman and Bell, 2015:486).
If more information is revealed during the interview, researchers can use it later if needed. In
addition, Byman and Bell (2015:486) suggest that the researchers should consider “What do I
need to know in order to answer each of the research questions I am interested in?”. It means
that an appreciation of the viewpoints of interviewees is important and accordingly the
questions asked need to cover the interests of both interviewers and interviewees. Therefore,
the interview guide should create a certain amount of order in the research topics but the
researcher also needs to be prepared for the order to be changed due to the unpredictable flow
of answers from interviewees. Formulating interview questions can help researchers lead the
main flow and get the useful or required information. The following figure (Figure 3.5) can
suggest the steps to be used in formulating questions for an interview guide:
Figure 3.5: Formulating questions for an interview guide (Bryman and Bell, 2015:489)

131
There are some elements that interviewers can consider before the interview. Making
sure the researcher is familiar with the interviewee’s work; and life in order to facilitate the
quality of the interview. For instance, the demographic questions are not aimed in this case
but knowing the information can help the interviewer understand some basic background
about the participants. In addition, preparing a good digital recorder is also important because
many interviews are unsuccessful due to poor recording or technogical mistakes; ensuring a
quiet location for interviewing is also important. During the interview, interviewers should
try to use simple/relevant and transparent questioning techniques, and should avoid using
complex or difficult theoretical terms. The interviewer should also take notes of a general
kind such as name, age, gender, education level and so forth, to provide context. After the
interview, interviewers should take notes about how the interview went/where the interview
has been conducted (including place (offline) and online if needed) and all related matters
that arose during the interview (Bryman and Bell, 2015). Besides that, managing logistical
and resource issues needs to be considered and prepared for, such as interview scheduling,
interview management, recording and transcription issues, time available, how long the
interview should take and how much it will cost.
There are some techniques available which may enhance the quality of data collected.
After interview, interviewers should give interviewees an opportunity to comment fully about
the topics covered or raise any related issues that the interviewee believes might be
interesting or beneficial to the research; this process is referred to as “catch-all” or
“doorknob” questions. Some researchers advise that taking notes during interview or after
leaving the interview can be beneficial in many ways (Bryman and Bell, 2015; Saunder et al.,
2016). They also suggested that interviewers can test their understanding by summarizing all
information provided during interview and asking interviewees to comment or check if the
summary is correct, and interviewees can be invited to add further points at the end. This
process can avoid bias or misinterpretation of results. The ideal situation would be if
interviewees are able to proofread interview transcripts in order to check their accuracy.
The interviews will be conducted in Vietnamese, and will then be translated to English
for analysis; the researcher intends to perform the initial translation then have it checked to
improve accuracy.
There are some main questions that should be covered in all qualitative interviews
regardless of the core topic (Bryman and Bell, 2015, adapted by Rafi-Ul-Shan (2015:129);

132
Saunders et al., 2016). The interview should be started with an introduction; researchers
should demonstrate clearly the purpose of the interview and request the interviewee’s
permission for recording. The following guide should be applied during interviewing process
(Figure 3.6):
Figure 3.6: Some main questions that should be covered in all qualitative interviews
(Bryman and Bell, 2015; adapted by Rafi-Ul-Shan (2015:129); Saunders et al., 2016)
This guide can facilitate the interview process and improve the quality of information
collected; in the next section, core questions will be discussed.
3.7.3.2. Core questions
There are three main themes in this interview, including the current retail situation,
strategic groups and customer loyalty. The intended questions are related to these themes in
order to explore experts’ views and probe for sub-topics. There are 6 questions which are
presented in the above three main themes (2 main questions per theme). The first question in
the interview guide is used to investigate the brief comments of experts about the current

133
state of the Vietnamese retail industry. The purpose of the second question is to investigate
the state of the Vietnamese supermarket sector as well as the competitive environment. Then,
at theme 2- question 3, experts will be asked to comment how firms are grouped into strategic
groups in general as well as a specific technique that can be use. The next question in the
interview guide was created to ask the specialists about grouping Vietnamese supermarkets
into different strategic groups by giving him/her a prepared list of current main Vietnamese
supermarkets. During the answering of this question, specialists will be asked to explain why
he/she chose to allocate supermarkets to specific strategic groups. For theme 3, the experts
will demonstrate their wisdom and knowledge of customer loyalty based on the designed
questions, specifically, question 5: “Based on your previous own research and experience,
which possible factors might affect customer loyalty?”. With this question, the interviewer
will listen and take note of experts’ comments, then the proposed research framework created
at CHAPTER 2, section 2.5.13.2 should be shown in order to elicit further information from
the experts. The interview will be ended by the sixth question: “What is the linkage between
customer perceived value, customer satisfaction and customer loyalty?”. These two questions
in Theme 3 will help in exploring and understanding more about the relationship between the
many factors which will be tested later under the experts’ points of view. All of the six main
questions which will be asked during this interview process can be presented as follow:
The current retail situation
Question 1: Can you give me a brief review of the overall situation in the Vietnamese retail
industry?
Question 2: What about the situation in the supermarket sector as well as the competitive
environment? Do you have any comments?
Strategic groups
Question 3: Normally, how can we group firms into their right strategic groups? Which
techniques can we use?
Question 4: Based on the Table 2.3.1, there are 12 supermarkets in Vietnam, how can we
group them into different strategic groups? Why?

134
Customer loyalty
Question 5: Based on your previous own research and experience, which possible factors
might affect customer loyalty?
Question 6: What do you consider to be the linkage between customer perceived value,
customer satisfaction and customer loyalty?
Therefore, the following table presents questions for interviewing:
Question Explanation
PHASE1_Q1 Participants were asked to give a brief review about the overall
situation of the Vietnamese retail industry. Besides that, the
interviewer asked about the current role traditional markets in
Vietnam and how cultural factors affect consumer behavior. The
interviewees are free to present his/her viewpoints.
PHASE1_Q2 Participants were asked to give their viewpoints about the current
situation of supermarket sector as well as their competitive
environment in Vietnam.
PHASE1_Q3 Participants were asked for their opinion of techniques that can be
used to group firms into their right strategic groups.
PHASE1_Q4 Participants were asked for groupping 12 main Vietnamese
supermarkets to their right strategic groups. The interviewer show
the list of supermarkets (see Table 2.3.1). The respondents were
also asked the reasons about their choices.
PHASE1_Q5 Participants were asked to present which possible factors might
affect customer loyalty based on their professional.
PHASE1_Q6 Participants were asked to present the linkage between customer
perceived value, customer satisfaction and customer loyalty.
Table 3.6: Structural of semi-structured interview protocol in Phase One (Step One)
See Appendix 3.2 for full guide of expert’s interviewing.
3.7.3.3. Translation and back translation
Back translation is a good technique which has been widely applied by researchers to test
the accuracy of translations in order to avoid mistakes occurring during the translation
process, particularly in cross-cultural research (Douglas and Craig, 2007; Saunders et al.
(2016). It is crucial if the questionnaires are to have the same meaning to all respondents. For
this reason, Saunders et al. (2016) suggested to follow up the guidelines of Usunoer (1998).
These guidelines presented that researchers should be aware of many criteria when

135
translating, including lexical meaning, idiomatic meaning, experiential meaning, grammar
and syntax. In this study, all of the above criteria were carefully applied to guarantee that the
translating process was deployed correctly. Usunoer (1998) also outlined some techniques for
translating, including direct translation, back-translation, parallel translation and mixed
techniques. The following table (Table 3.7) will summarise the approaches, advantages and
disadvantages of each technique.
Direct translation Back-translation Parallel translation Mixed-techniques
Approach Source questionnaire
to target questionnaire
Source questionnaire
to target questionnaire
to source
questionnaire;
comparison of two
new source
questionnaires,
creation final version
Source questionnaire
to target questionnaire
by two or more
independent
translators; comparison
of two target
questionnaires,
creation final version
Back-translation
undertaken by two or
more independent
translators, comparison
of two new source
questionnaires, creation
final version
Advantages Easy to implement,
relatively inexpensive
Likely to discover
most problems
Lead to good wording
of target questionnaire
Ensures best match
beween source and
target questionnaires
Disadvantage Can lead to many
discrepancies
(including those
relating to meaning)
between source and
target questionnaire
Requires two
translators, one a
native speaker of the
source language, the
other a native speaker
of the target language
Cannot ensure that
lexical, idiomatic and
experiential meanings
are kept in target
questionnaire
Costly, requires two or
more independent
translator. Implies hat
the source questionnaire
can also be changed.
Table 3.7: Translation techniques for questionnaires
Source: Developed from Usunier (1998), adapted by Saunders et al. (2016:465)
According to Malhotra et al. (2012) “Back translation is a translation technique that
translates a questionnaire from the base language to the one into which the questionnaire is
being translated. This version is then retranslated back into the original language by
someone whose native language is the base language”. In this research, translation/back
translation was applied. The targeted respondents of this research are Vietnamese. Therefore,
the languague used in the questionnaire should be translated into Vietnamese. Performing a
direct word-for-word translation might prove problematic; therefore thanks to the good
knowledge of academic research and the English level reached, the researcher has the ability
to translate the whole questionnaire to Vietnamese by herself. She then employed a highly
experienced certified and qualified translator to check. At the same time the researcher asked
her peers who have the same academic level and good English to double check. The next step

136
was that the questionnaire had been delivered to another independent professional translator
to translate the questionnaire back to English. In this step, face-to-face discussion between
the researcher and a language expert was needed in which the researcher was able to explain
some business terminology to the language expert to make sure that the final Vietnamese
version (a target questionnaire) correctly reflects the right content of the original English
version (a source questionnaire). In order to ensure the accuracy and validity of the
translation process, the language expert should compare differences between the original
English version and the later translated version: if there are no differences between the two
versions, the Vietnamese version can be used to distribute to respondents. If there are
differences between versions, corrections should be made until the content of the Vietnamese
version matches the original English version. It needs to be noted that the source version
should be initially checked by a native speaker before conducting a translation process.
3.7.3.4. Conclusion
The above interview guide will be applied in Phase One, it presents some main steps to
formulate the questions, how the interview is to be conducted, some techniques to enhance
the quality of data being collected, what kind of main questions will be covered and so forth.
The following part will demonstrate the data collection and analysis strategy.
3.7.4. Data collection
Regarding data collection, there are four steps that can be applied in this phase. The
interview protocol will cover the main themes relating to strategic groups and customer
loyalty. Then, deciding the sampling type and interviewing appointments are the next steps.
As presented above, the judgmental sampling technique will be used because the respondents
should be retailing and strategy experts. It means that the information provided by them is
highly valuable and reliable. Making the appointments and getting respondents’ approval can
be done via email, telephone. The place and time of interview is mainly depending on the
respondents’ choice. The next step will be conducting an interview and the interview guide
will be presented. The final step in this phase is transcript, coding and analysis (Figure 3.7).
Each interview was fully transcribed by the researcher in a Word version in both
Vietnamese and English.

137
Figure 3.7: Data collection processes in Phase One
Adapted from Churchill and Lacobucci (2010)
3.7.5. Data analysis
The interviewing time was one hour and thirty minutes. According to Ghauri and
Gronhaug (2002), Malhotra et al. (2012), Chaisurayakarn (2015:99), there are four steps that
should be covered in the qualitative approach. At the first step, the data collected from
interviews will be completely transcribed. The next step is data reduction, it refers to the
process of selecting useful data for research. In this step, the different categories will be
divided into different groups, named data coding. Data display and data verification are the
two final steps; presenting the results by comparing, analysing and discussing the
phenomenon. This semi-structured interview was conducted on 10 March 2018, it was audio-
recorded and the interviewer also took notes during the interview.

138
Table 3.8: The process of data analysis
(Source: Adapted form Ghauri and Gronhaug (2002), Miles et al. (2014), Malhotra et al.
(2012), Chaisurayakarn (2015:99))
3.8. Research method: Phase One _Step Two_Supermarket consumer interviewing
Reasons why this phase should be conducted are going to be presented. After literature
review, the research framework has been proposed. However, it should be noted that
depending on the market, there are different factors which might affect customer loyalty and
based on some suggestions of Cannon (2004) about using a mix method. Interviewing can
qualitatively justify whether the proposed research model is ready for collecting quantitative
data or not. Therefore, conducting supermarket consumers’ interviewing will help the
researcher add some more constructs, as to what can affect customer loyalty in the
Vietnamese market if needed - and information collected in this phase would be better used
to explain the relationship between constructs later on (Phase Two).
3.8.1. Sample size and contact
Differences between probability and non-probability techniques and Table 3.5 present
advantages of non-probability sampling techniques. Based on purposes of this phase on
investigating consumers’ loyalty behaviour or which factors might affect customer loyalty in
order to justify the proposed research framework, purposive sampling will be chosen and
snowball sampling techniques applied. In this technique, the researcher will actively plan
which supermarket’s consumers are going to be intereviewed based on region, income,
educational level, age range and gender and so forth. It is convenient and the researcher can

139
ask interviewees to introduce further interviewees if possible with different demographic
backgrounds, so that later information collected can be more reliable. As recommended by
Saunders et al. (2016) and Creswell (2013), researchers should expect to undertake from 5 to
30 interviews. In this phase, about 20 interviews will be conducted. These twenty
supermarket consumers have been chosen based on the differences of geographical areas, age
ranges, income, frequency of consumption, education levels and so forth. As is the nature of
snowball sampling techniques, the researcher made contact with people that she knows and
asked for interviews and requests for introductions of further potential participants. Lists of
interviewees will be presented in Chapter 4.
3.8.2. Interviewing contents
As explained in the previous part (methodology), semi-structured interviews will be
applied in this phase. The steps to create the interview guide were previously noted. The
interview contents were generated based on the main objectives of this research and the main
interview themes derived from previous reviewed literature. “Without at least some focus,
your interview will lack a sense of direction and purpose” (Saunders et al., 2016:402).
According to Saunders et al. (2016), starting with listing a set of themes that reflect the
variables being studied is a crucial step, followed by creating a question in each theme.
During creating the guide, researchers should try to ensure a logical order of questions and a
readily comprehensible language.
There are 35 questions which probe supermarket consumers’ perception about their
loyalty level, which main factors can affect their loyalty as well as exploring other new
factors which have not been mentioned in the literature review and the proposed research
framework (see figure 2.5.19). Back-to-back translation techniques will also be applied in
this phase (See Appendix 3.3 for full guide to supermarkets’ consumer interviewing).
3.8.3. Telephone and Internet-mediated interviews
Most in-depth or semi-structured interviews occur on a face-to-face basis. However,
thanks to the development of video telephony, interviews can be conducted via a video/audio
calling service. Besides that, internet-mediated interviewing is also considered, using mobile
and computing technologies via the internet (Saunders et al., 2016). There are many
advantages and disadvantages of these interviewing methods. Reseachers can easily reach
different geographically dispersed populations that they wish to interview with low cost and

140
flexible time. Disadvantages include technical issues. Applying the nature and objectives of
this research, 40% of interviews will be telephone and Internet-mediated interviews because
the researcher conducts the interviews with 21 supermarket consumers across the country.
There are 5 interviews being conducted face-to-face and 16 interviews via telephone and
Internet-mediated approach.
3.8.4. Data analysis
Due to the research objectives and in order to answer the five main research questions,
quantitative methods will be dominantly used, the researcher is not going to use Nvivo for
data analysis in this phase, comparision on cross cases will be used.
3.9. Research method: Phase Two_ Questionnaire survey
As briefly presented in Figure 3.P, there are two phases being conducted in this
empirical study. Step one of Phase One aims to divide Vietnamese supermarkets into their
right strategic groups by interviewing experts in the retailing industry in order to facilitate
future analysis (differences between strategic groups - answering question 4). Step two of
Phase One (supermarket consumers’ interviewing) aims to reveal factors which might affect
customer loyalty in the Vietnamese market. As a result, if some more factors are revealed,
they will be added to initial proposed questionnaires and prepared for survey in order to
collect quantitative data and answer all research questions.
3.9.1. Survey Questionnaire
The survey strategy is usually associated with a deductive research approach. The
purpose of conducting surveys might vary, but it is normally used to answer “who”, “what”,
“where”, “how much” and “how many” questions. In this way, a survey is applied for
exploratory and descriptive research and can clarify how respondents or the population
perceive/behave or think in relation to a specific issue through many quantitative analysis
tools (Saunders et al., 2016). Surveys and questionnaires are the dominant data collection
methods in business studies. The benefits of this method are to allow researchers to collect
and analyse data systematically via a formulated and structured question. According to Gill
and Johnson (1991), before conducting a survey, researchers should re-check and can follow
a pattern as suggested below (Figure 3.8):

141
Figure 3.8: Planning a survey (Gill and Johson, 1991:76-7)
However, surveys hold some potential weaknesses in which low response rate can be
considered, this problematic issue might reduce the ability to generalise the results to the
entire population (Snow and Thomas, 1994); another issue can relate to response errors due
to some ambiguous wording in questionnaires (Mangione, 1998).
3.9.2. Initial design and planning
The objective of initial design and planning is to make sure that a survey questionnaire is
strongly linked to the research questions, research objectives and all literature review
previously presented. Therefore, deciding what data needs to be collected is crucial, “the
questionnaire offers only one chance to collect the data as it is often difficult to identity
respondents or to return to collect additional information” said by Saunders et al. (2016:444).
The steps of this stage include sampling frame identification, sample size and sampling
design.

142
3.9.2.1. Sampling frame identification
Saunders et al. (2016:277) defined “the sampling frame for any probability sample is a
complete list of all the cases in the target population from which your sample will be drawn”.
The objective of this research is concerned with supermarket consumers at five main cities
regardless of age range, gender, education level, income and other background issues.
Therefore, the sample frame is all supermarket consumers at the targeted cities. However, it
seems impossible to generate the complete list of supermarket consumers in the target cities,
the intended sampling frame can be drawn from this explanation that there are a huge number
of people who are using supermarkets in the targeted cities.
3.9.2.2. Sample size
After literature review part and interview, there are 19 factors listed which might
demonstrate the multi-relationships between the researched issue, including in-store logistics,
service quality, e-service quality, product quality, price, customer service, customer
experience, brand experience, store image, corporate image, loyalty programmes, switching
cost, alternative attractiveness, store accessibility, corporate social responsibility, promotion
effects, customer perceived value, customer satisfaction and customer loyalty. However,
Phase 2 has revealed two other factors which should be considered as well, including TRUST
and HABIT. So there are 21 factors in total, in the case of every single factor is evaluated by
3 variables as Peter (1979) indicated that multiple-item scales are constructed to increase
validity and reliability, the minimum size of this step should be 21*3*5= 315 because
according to Hair et al. (2010), the number of the sample size should be five times bigger
than the number of variables. However, after PHASE 1, there are five strategic groups in the
Vietnamese supermarkets. In order to compare and contrast differences between the five
strategic groups, the minimum size should be 315*5= 1,575. As explained, there are five
different main areas in Vietnam where supermarkets seem to be significantly developed;
these areas can be a good representative in main urban cities in Vietnam, including Ha Noi,
Da Nang, Ho Chi Minh, Binh Duong and Can Tho. In fact, there are 111 variables as
presented at Table 3.11 (next part). Therefore, total sample size should be at least 111*5*5 (5
different strategic groups) = 2,775. When the data collection process is completed, there
might be some questionnaires which could be removed from the whole data set due to
incompletion or wrong formatting. Therefore, it should be recommended that the researcher
might expect to get 3,000 questionnaires from 5 different cities.

143
3.9.2.3. Sampling design/sampling selection
Saunders et al. (2016) demonstrated available sampling techniques that researchers can
use, including probability or representative sampling and non-probability sampling. “With
probability samples, the chance or probability of each case being selected from the target
population is known and is usually equal for all cases” (Saunder et al., 2016:275). And “For
non-probability samples, the probability of each case being selected from the target
population is not known” (Saunder et al., 2016:276). Table 3.5 revealed the differences
between probability sampling and non-probability sampling, because of the nature and
objectives of this research with a large number of questionnaires needing to be collected, the
probability sampling technique will be applied. There are four probability sampling
techniques, which are summarised in Table 3.9, used to choose the sampling. The advantages
of each technique are also demonstrated. According to Saunders et al. (2016:290) “Stratified
random sampling is a modification of random sampling in which you divide target population
into two or more relevant and significant strata based on one or a number of attributes”.
Based on the above explanation (section 3.9.2.2), around 555 samples should be collected in
each city in order to get the target of 2,775 samples (see section 3.9.2.4 below), stratified
random sampling relates to dividing the target population and choosing a random sample.
After considering the nature of each technique and its advantages, stratified random sampling
will be used in this phase (PHASE TWO).

144
Table 3.9: Advantages of Probability Sampling Techniques
(Source: Bryman and Bell (2015), Malhotra et al. (2012), Saunders et al. (2016), adapted by
Chaisurayakarn (2015:104))
3.9.2.4. Locations selected for the study
The empirical research has been conducted in five huge markets in Vietnam, including
Ha Noi, Da Nang, Binh Duong, Ho Chi Minh and Can Tho. There are some reasons why
these cities have been chosen. Most supermarkets are located in these areas (see Table 2.3.1).
Therefore, total revenues of the Vietnamese supermarket sector will be mainly generated
from the above mentioned five cities. Besides that, these areas seem to have a different
culture and consumption style from different parts of the country. In particular, Ha Noi
represents the northern side, Da Nang is from the middle of the country, Ho Chi Minh city
and Binh Duong represent the south side, Can Tho is a big city in the Mekong Delta. If the
data has been collected from these big markets and different cultures, it might be beneficial
for explaining and revealing the whole picture of the Vietnamese supermarket sector.
3.9.3. Scale Development, Reliability, Validity and replication
As known, research philosophy and paradigms can shape the research process and the
way the research should be conducted. It also affects the validity and reliability of research

145
findings. In every research, research quality issues have always been regarded as one of the
top priorities, how to obtain good quality data is part of this process. According to Ghauri and
Gronhaug (2010), the quality of collected information depends highly on the procedures of
measurement applied during the data gathering period. Without measurement, it seems to be
difficult to comment on business behaviour or any business phenomena (Hair et al., 2011). In
other words, scales of measurement should be scrutinised in order to improve reliability and
validity.
3.9.3.1. Scale development
The nature of this research is associated with exploring many possible factors
influencing customer loyalty and at which levels these factors affect loyalty or relationships
between variables. From a psychological perspective, the perceived value of customers as
well as their feelings are necessary and hold a vital role during a data measuring process. The
broadly applicable scale development paradigm proposed by Churchill (1979) has been
developed by Gerbing and Anderson (1988), Nunnally and Bernstein (1994) and McMullan
(2005), they proposed five stages that researchers can apply to develop the loyalty scale.
What follows is based on much previous literature on customer loyalty reviewed by Bearden
et al. (1993) and De Vaus (1996) (see Figure 3.9).
Figure 3.9: Stage in the development of the loyalty scale (McMullan, 2005: 473)
A scale is defined as “a measurement tool that can be used to measure a question with a
predetermined number of outcomes” (Hair et al., 2011: 215). There are many types of scales
that can be used in business such as nominal scale, ordinal scale, interval scale, ratio scale,
but it is clear that these types of scale can be divided into two groups including metric
(Likert, numerical, semantic differential, graphic ratings) and non-metric scale (categorical,
rank order, sorting, constant sum) (Hair et al., 2011). Based on research objectives and the
nature of this research, Likert scales, which “are generally treated as interval scales” (Sekaran
and Bougie, 2013:221), will be used. Likert scales often use “a five-point scale to assess the

146
strength of agreement or disagreement about a statement” (Hair et al., 2011: 221). At each
point, researchers can develop a specific label to demonstrate the feelings of respondents.
Some researchers use a seven-point Likert scale to emphasise a variety of levels of feelings or
respondents’ agreement. If researchers present many statements which relate to one concept
and then combine all these individual statement ratings, the result is referred to as a
summated rating scale (Hair et al., 2011) which is widely used in business research (Sekaran
and Bougie, 2013). Besides, another version of a Likert scale named “behavioural intention
scale” which has been used in business can help researchers explore how likely customers are
to indicate some types of behaviour. For example, with the question “how likely are you to
purchase a new laptop in the next 12 months”, researchers use a seven-point Likert scale from
1 to 7 to demonstrate from “Not likely at all” to “highly likely” (Hair et al., 2011).
Braunsberger and Gates (2009:220) described a basic Likert scale as follows: “the left-hand
anchor read “greatest disagreement”, the scale midpoint “neither agree nor disagree”, and the
right-hand anchor “greatest agreement”. In questions which are assessed by the scale point,
respondents are asked to mark in the space on the scale point to express their choices.
3.9.3.2. Reliablility - Replication - Validity
Bryman and Bell (2015) indicated three of the most important criteria for the business
research’s evaluation, reliability, replication and validity. Sekaran and Bougie (2013)
presented the diagram of testing goodness of measures as doing research (Figure 3.10).
Figure 3.10: Testing goodness of measures-forms of reliability and validity
(Sekaran and Bougie, 2013:226)

147
Reliability
Reliability is concerned with the consistency of the research finding, “a survey
instrument (questionnaire) is regarded as reliable if its repeated application results in
consistent scores” (Hair et al., 2011: 233). It means that the findings might be unchanged or
slightly changed across the research. In order to be reliable as a scale, questions which will be
answered by respondents should be consistent and be highly correlated. Malhotra et al.
(2012) and Veiga Dias et al. (2016:) have also indicated that reliability, which “consists in
assessing to what extent a scale is able to produce consistent results when systematic
repetitions are done” when “the measurement procedure is free of random mistakes”, should
be considered properly during the research process. Hair et al. (2011) and Malhotra et al.
(2012) indicated that there are three categories which should be noticed in terms of concern
about reliability.
Stability of measures presents “the ability of a measure to remain the same over time”
(Sekaran and Bougie, 2013:229). There are two tests of stability, namely test-retest reliability
and parallel-form reliability. Test-retest reliability is applied by repeated measurement of the
same group of respondents in terms of other factors remaining unchanged in order to check
whether a measure is stable, then researchers can compare how similar these results are, if
they are relatively similar or similar, it can be confirmed that the findings reach a high test-
retest reliability. However, in reality, it is sometimes not practical to have the same groups of
respondents taking a survey twice. Besides that, during the survey period, even the same
respondents answers might be different due to being influenced by other external factors, for
example, their feelings might change at two different survey dates. Parallel-form reliability
can be used to solve the above indicated problematic issue. It was first introduced by Mitchell
(1996) under the name of “alternative form”. In order to assess this type of reliability,
researchers can develop two equivalent forms of the construct, both forms having comparable
items and the same response format; if both results are highly correlated, it can be concluded
that the measures are reasonably reliable.
Internal consistency reliability is used to assess the reliability of a set of items (named “a
summated scale”) by investigating its homogeneity. In other words, these items should “hang
together as a set” (Sekaran and Bougie, 2013:229). Consistency can be assessed through the
interitem consistency reliability and split-half reliability tests. Interitem consistency reliability
is a test of the consistency of respondents’ answers to all the items in a measure. For

148
example, asking customers three questions related to their satisfaction levels, returning and
recommendations to friends about specific restaurants, if they are highly satisfied, they
should mark “definitely return” or will “definitely recommend to friends”, there are
consistencies between the respondents’ answers, the measures are considered as reliable. The
test of interitem consistency reliability include Cronbach’s coefficient alpha (Cronbach,
1946), which is used for multipoint-scaled items, and the Kuder-Richardson formulas
(Kurder and Richardson, 1937), used for dichotomous items. In these tests, the higher the
coefficients, the better measuring instrument. Hair et al. (2011) suggested that if the alpha
coefficient is higher than 7, the strength of association is regarded as good, it means that “the
questions combined in the scale are measuring the same thing” (Saunder et al., 2016:451).
The split-half reliability test refers to “the correlations between two halves of an instrument”
(Sekaran and Bougie, 2013: 229). In other words, researcher can randomly split into two
equal groups of scale items and examine their correlations and the higher the correlations, the
better the reliability. SEM reliability is evaluated by means of the square of the estimated
correlation value (R2), the value of construct reliability is computed from the squared sum of
factor loading (L) for each construct and the sum of the error variance terms (e) for a
construct. Furthermore, the average variance extracted (AVE) can be used to test a reliability.
It is measured as the total of squared standardised factor loading (L) divided by the number of
items (n). According to Hair et al. (2010), AVE should be equal to or higher than 0.5.
Validity
Validity is a test of how well a developed instrument can measure the right concept or
whether a variable can reflect properly the concept that researchers want to explore.
Regarding the quality issue of the research, the term of validity refers to “the validity of the
measurement instrument itself” (Sekaran and Bougie, 2013:225). There are several types of
validity test being used to examine the goodness of measures. Bryman and Bell (2015)
suggested six available applicable tests, including faced validity, concurrent validity,
predictive validity, construct validity, convergent validity and discriminant validity.
However, Sekaran and Bougie (2013) categorised the above indicated tests into three groups
(Figure 3.6): logical (content) validity, criterion-related validity, and congruent (construct)
validity.
Logical validity (content validity) ensures that the developed measures through previous
literature conclude an adequate and representative set of items that can reflect the concept. In

149
this research, pre-testing the measurement can be used to determine content validity by
sending the questionnaire to a small number of respondents for review before sending to all
participants. Face validity refers to some items that researchers thought that it could measure
the concept. In reality, some researchers do not treat face validity as a part of content validity.
Crocker and Algina (1986) suggested that researchers might exploit the four following steps
in order to effectively assess content validity: identify the research’s interest area, collect
resident domain experts, develop applicable matching methodology, then analyse the findings
from the matching task. Exploratory factor analysis is often used in this case to filter out or
reduce unnecessary variables, improve the research’s validity. Criterion-related validity is a
test being used to measure how well the test scores to some specific criterion. The criterion
can be another test measuring close to the same thing as the test being evaluated is purported
to measure or some type of outcome (Sekaran and Bougie, 2013). For example, test for
leadership skills will match the test scores with the traits and attributes associated with known
leaders. Criterion related validity is classified into either predictive validity or concurrent
validity. Predictive validity relates to the criterion being located in the future. Concurrent
validity is established when the predictor and criterion data are collected simultaneously and
“when the scale discriminates individuals who are known to be different; that is, they should
score differently on the instrument” (Sekaran and Bougie, 2013:226). For example, working
behaviour between two different work ethic groups should be different, if the same score is
the result, it can be clear that the research validity is low. Construct validity refers to how
well the result attained from the test measure used fit with previous related theories that the
test is designed.
Sekaran and Bougie (2013) stated that there are two different types of validity test in this
category, including convergent validity and discriminant validity. Convergent validity is
established when the scores obtained from two independent measurements presenting the
same concept are becoming highly correlated (Sekaran and Bougie, 2013; Malhotra et al.,
2012). There are many ways to investigate the convergent validity of research. In this
research, a factor loading, the average variance extracted (AVE) for the item loading on a
construct will be examined. High factor loading might imply high convergent validity; the
coefficient of a factor loading should be higher than 0.5 and that of AVE can be acceptable if
above 0.4. Besides that, composite reliability (C.R) is also a convergent validity indicator; the
C.R value should be 0.7 or higher, in some cases equal or higher than 0.6 is acceptable (Hair
et al., 2010).

150
Discriminant validity is “the extent to which a scale does not correlate with other
constructs from which it is supposed to differ” (Grant, 2003:202; Churchill, 1987; Malhotra
and Birks, 2000). Testing for discriminant validity is very important for research in terms of
guaranteeing an absence of overlap between measures of constructs (Bryman and Bell, 2015),
it means that this test “provided support for its distinctiveness” (Little et al., 2012:417).
According to Hair et al. (2010), discrimimant validity is supported when the AVE for a
construct is higher than the square correlation (R2) between that construct and other
constructs.
Replication
Replication might happen when researchers choose to replicate the findings of others.
There are many reasons which can explain why researchers may do this, such as there being a
gap or an ambiguous mind about previous research findings due to an external effect and
different markets or research environment. Bryman and Bell (2015:50) stated “if a researcher
does not spell out his or her procedures in great detail, replication is impossible”, they also
indicated that replication in business research is not common, but it still happens. For
example, Burawoy (1979) found by accident that his research using case study analysis in a
US factory has been investigated by Donal Roy three decades earlier, and then he thought
about treating his research work as replication. Burawoy (2003:650) wrote “I knew that to
replicate Roy’s study would not earn me a dissertation let alone a job…In academia, the real
reward comes not from replication but from originality”. Therefore, when planning research,
researchers should carefully consider whether their research replicates the work of someone
else.
3.9.4. Triangulation
Triangulation is highly recommended by researchers in any business research in order to
increase the quality of research, such as the level of validity and reliability (Bryman and Bell,
2015). As Denzin (1978:294), triangulation is defined as “the combination of methodologies
in the study of same phenomenon”, in other words, it refers to the use of different research
approaches, methods, techniques in the same study to help in reducing the bias level in data
sources, producing more objective and valid results.

151
3.9.5. Questionnaire Design and questionnaire construction
It can be noted that well-designed questions are the skeleton of any good research study.
Steps which can be followed to create the questionnaire are quite similar to the protocol at
Phase 1 (Figure 3.12). After Phase 1, there are two factors added, namely TRUST and
HABIT, which might affect customer loyalty. There will be SEVEN SECTIONS in the final
questionnaire (Table 3.10), including:

152
Section Number of
factors/questi
ons
Name of factors Number of
variables
Section 1: Supermarket
shopping behavior
20 questions These questions are going to explore the
shopping behavior of supermarket
consumers and their viewpoints about
many factors related to loyalty.
Section 2: Customers’
response
3 factors Customer perceived value 6
Customer satisfaction 5
Customer loyalty 5
Section 3: Perception of
Quality
5 factors In-store logistics 7
Service quality 6
E-service quality 10
Product quality 4
Price 3
Section 4: Perception of
Customer Service
3 factors Customer service 10
Customer experience 4
Retail brand experience 6
Section 5: Perception of
supermarket image
3 factors Store image 7
Corporate image 3
Corporate social
responsibility
6
Section 6: Other features of
supermarkets
7 factors TRUST 4
HABIT 3
Store accessibility 3
Alternative attractiveness 4
Switching costs 6
Loyalty programs 6
Promotion effects 3
TOTAL VARIABLES 111
Section 7: Demographic
information
8 questions These questions are going to investigate
demographic information
Table 3.10: Final questionnaire’s structure
Respondents were asked to register their choices at each question in the questionnaire, a
majority of the questionnaire being single option questions. However, there are still some
questions allowing respondents more than one option. According to Bourque and Clark
(1994) and Saunders et al. (2016), researchers might do one of the things below when
designing individual questions, including: adopt questions used in other questionnaires, adapt
questions used in other questionnaires, and develop their own questions. It depends on the
research nature and its objectives as well as needed available questionnaires. There are many
types of questions which could be considered, such as: open questions, list questions,

153
category questions, ranking questions, rating questions, quantity questions, matrix questions
and combining rating questions into scales (Saunders et al., 2016). The questionnaire in this
research combined many of the above listed types of questions in order to explore and
measure factors which might affect customer loyalty. In particular, rating questions mostly
frequently utilise the Likert-style rating in which the respondent is asked how strong she or
he agrees or disagrees with a statement or series of statements (Saunders et al., 2016:457).
There is no consensus about how many points should be used in a Likert scale. Regarding
statements which were used to measure factors from Section 2 to Section 7, matrix questions
are applied, participants were asked to indicate on a five-point Likert scale whether they
agreed or disagreed with a series of statements (where 1 means “completely disagree” , 2
means “disagree”, 3 means “neutral”, 4 means “agree”, 5 means “completely agree”).
In order to create good-quality findings, the questionnaire created should be reliable, up-
to-date and fit the research objectives. The wording of each question requires careful
consideration to ensure that the responses are valid. “The questions will need to be checked
within the context for which they were written rather than in abstract to ensure they are not
misread and that they do not encourage a particular answer” (Saunders et al., 2016:462).
Besides other questions from section 1 and section 7, from section 2 to section 6, the
researcher has built many statements (variables) which can be used to measure the factors.
All of these statements have been applied to test related factors by many famous academic
researchers. Six statements used to measure customer perceived value are adapted from
Chang and Wang (2011). The abbreviation form can be noted as “6-customer perceived
value-Chang and Wang (2011)”. Applying the same process to other factors, the results will
be presented as follows:
1. 6-customer perceived value-Chang and Wang (2011) and Eggert and Helm (2000)
2. 5-customer satisfaction- Kitapci (2013), Lin (2014), El-Adly (2016), Bouzaabia
(2013)
3. 5-customer loyalty- Swoboda (2013), Srivastava (2016), Lin (2014), Terblanche
(2018), Oliver (1997), El-Adly (2016)
4. 7-in-store-logistics- Bouzaabia (2013)
5. 6- service quality- Liu et al. (2011), Jiang et al. (2018)
6. 10- e-service quailty- Zemblyte (2015)
7. 4-product quality- Jiang et al. (2018)
8. 3-price- Jiang et al. (2018), Emi Moriuchi (2016)
9. 10- customer service-Kursunluoglu (2014)
10. 4-customer experience- Srivastava (2016)
11. 6-retail brand experience-Khan and Rahman (2016)

154
12. 7-store image- Bouzaabia (2013), Jiang et al. (2018)
13. 3-corporate image- Calvo (2015)
14. 6-corporate social responsibility- Perez (2015)
15. 4-trust- Lombart (2014)
16. 3-habit- Olsen (2013)
17. 3-store accessibility- Swoboda (2013)
18. 4-alternative attractiveness- Calvo (2015), Tung (2011)
19. 6-switching costs- Tung (2011), Qui et al. (2015), Liu et al. (2011)
20. 6-loyalty programs- Stathopoulou (2016)
21. 3-promotion effects- Emi Moriuchi (2016), Tung (2011)
(Appendix 3.4 demonstrates questionnaire survey of this phase and Appendix 3.5
presents where the statements which are used to measure the researched factors come from
and code book for other questions used in questionnaire).
All items in the questionnaire created in this research were adapted from published
works that relate to the research topic.
In this phase, translation and back translation which was mentioned in section 3.7.3.3
will also be applied before conducting the survey.
3.9.6. Data collection
This research utilised quantitative surveys for data collection. This method was used
because of its nature fitting the positivist perspective as explained. Saunders et al. (2016)
present many types of questionnaire which are drawn as follows; in this step, self-completed
postal (mail) questionnaires, where the questionnaire was posted to respondents who return
them by post after completion and delivery and collection questionnaire, where the
questionnaire was delivered by hand to each respondent and collected later. Other survey
alternatives including internet questionnaire (web questionnaire and mobile questionnaire),
interviewer-completed (telephone questionnaire and face-to-face questionnaire) (Saunders et
al., 2016) were not selected due to time and cost constraints. In addition, it might take
respondents 15-20 minutes to complete the whole questionnaire, other survey alternatives as
presented above seem to be impossible to deploy.
Due to a large number of data which needs to be collected, postal or mail questionnaires
enable researchers access to large groups of supermarket consumers easily with wide
geographic coverage at relatively low cost. The preferred data collection approach in this case

155
is getting the hard-copy of the survey in order to facilitate data input later. The issues can be
noted in Phase Two as follows: response rate might not be high due to consumers being
unwilling to answer the survey or being biased by other factors. According to Saunders et al.
(2016), response rate in this method is normally 30% to 50%, the answers from respondents
might be contaminated by consultation with others or in some cases, it being impossible to
determine that targed respondents have actually generated the replies received. The final
issue can be invalid answers or mistakes occurring in replies because some consumers might
not answer all questions or some of them might automatically tick the same box for all
multiple-choice questions. In order to avoid low response rate, when sending the
questionnaire, the researcher had used a professional cover letter from Hull University to
explain the purposes of the research and its expected meaningful contribution. In addition, the
researcher stated clearly in her personalised cover letter that all return postage would be free
of charge. In other words, respondents would not be charged with paying the fee. In addition
before doing surveys at the supermarkets, the researcher might encounter difficulties in
obtaining supermarkets’ permission for conducting surveys at their premises.
Besides that, the researcher asked every single friend currently working at different
companies in Vietnam for their help in completing at least 20 questionnaires by sending
copies to their colleagues and returning them once completed. There are 300 questionnaires
expected to be completed in this way at each targeted city (20*15, 15 is the number of people
being asked for this support). In total, it could be expected to get 300*5=1500 completed
questionnaires if the response rate was high. Thanks to 5 year-experience in teaching, the
researcher has a good relationship with some big companies who have supported students to
develop their practical skills. Therefore, these resources might be used. As a lecturer, the
reseacher can easily access another source: students, who are also supermarket consumers.
Besides that, going to supermarkets and conducting a survey in order to access other groups
of consumers is also a possible choice but it costs time and money.
The steps of data collection and data analysis can be summarised as follows (Figure
3.11). The time period for data collection of PHASE TWO was from 16 March to 28 July
2018. The researcher used many possible ways to get the questionnaire completed by
respondents by sending the questionnaires directly and indirectly to respondents and
travelling to the five different cities to deploy her data collection strategy. There are 8 steps in
this data collection process:

156
1. Develop a questionnaire
protocol
2. Back translation
4. Check sample frame and
contact for surveys
3. Pilot survey
6. Follow up and remind the
deadline
5. Professional letter and
questionnaire will be sent to
respondents based on their
preferable channel
7. Collecting questionnaires from
differences sources, input data
and coding
8. Data analysis
Questionnaire will be created based on previous literature
review, the research objectives and some new factors
revealed after Phase 1 if needed.
Back translation and cross-checking will be applied in order
to improve the accuracy and reliability level.
10 pilot surveys should be done in this step to check
understanding, jargon or language on the provided
Vietnamese version.
Checking the list of potential respondents and contact for
surveys
Sending all of supported documents and the questionnaire to
respondents
Following up and sending the reminder for deadline
Gathering questionnaires from different sources, inputting
data to Excel, coding and input the whole data to SPSS
e file to SPSS
EFA/CFA/SEM
Figure 3.11: Data collection process applied in Phase Three
Source: Adapted from Churchill and Lacobucci (2010)

157
Figure 3.12: Types of questionnaire (Saunders et al., 2016:440)
3.9.7. Data analysis
For quantitative data, this section generally demonstrates the tests undertaken. First of
all, descriptive statistics which relate to data frequencies, means, and standard deviations will
be presented. Exploratory factor analysis (EFA) is used to examine the data sets from the
questionnaire and explore any latent constructs, remove duplicated variables, determine
underlying dimensions or factors which are not known a priori in a set of correlated variables
(Hair et at., 2011). Confirmatory factor analysis (CFA) and structural equation modelling
(SEM) will be used in this research to determine the validity, reliability and relationships
between many remaining variables after EFA. There are two main approaches to estimate the
relationships in a structural equation model (Hair et al., 2010), including covariance-based
SEM (CB-SEM) and variance-based partial least squares SEM (PLS-SEM) approach. “PLS-
SEM is the preferred method when the research objective is theory development and
explanation of variance (prediction of the constructs” (Hair et al., 2014:14), PLS-SEM works
effectively with small sample sizes and PLS-SEM can not be applied when structural models
content circular relationships between the latent variables (in this case, customer perceived
value, customer satisfaction and customer loyalty are dependent variables and their inter-
relationship will be investigated). However, CB-SEM can resolve the above limitations as
this research is expected to collect more than about 2500 questionaires in order to compare
between strategic groups (111 variables and many strategic groups in the retail industry),
therefore, CB-SEM will be chosen. An analysis of CB-SEM is also used in this research in
158
order to demonstrate the relationships between many variables using regression and
covariance among latent constructs or variables (Grant, 2003; Hair et al., 2011). These
analyses will be presented in Chapter 5-6. The AMOS program will be used to run the data
because AMOS Graphic (which is a part of AMOS software), can help to formulate a
publication-quality path diagram quickly, it can be more comfortable for researchers to work
within graphical interface rather than a more traditional programming interface (Byrne,
2010). Chang et al. (2016) and Jarvis et al. (2003) analysed and discussed the difference
between formative and reflective measures, and how they were handled in SEM; the key
difference between these two measures is the direction of the “causal” arrow in a conceptual
framework which shows whether a construct indicates manifest variables (formative) or vice-
versa (reflective). In this research, with all constructs, covariation among the measures is
caused by, and therefore reflects, variation in underlying latent factors. In other words, the
direction of causality is from a construct to the indicators, changes in constructs are
hypothesized to cause changes in the indicators (Jarvis et al., 2003). Therefore, a measure of
these constructs in this research is referred to as a reflective and it is shown in Figure 6.1 and
Appendix 6.4.
3.9.7.1. Exploratory factor analysis
“Factor analysis provides the tools for analysing the structure of the interrelationship
(correlation) among a large number of variables by defining sets of variables that are highly
intercorrelated, known as factor (Hair et al., 2010:94). The next step of EFA should be CFA
(confirmation factor analysis). EFA is considered as a data reduction method (Pallant, 2017).
The critical assumptions of factor analysis
Firstly, Hair et al. (2010) recommend that in order to use EFA, the minimum sample size
should be 50 observations and a desired ratio of 5 observations per variable is needed.
Secondly, the statistically significant Barlett’s test of sphericity with sig.<.05 which indicates
that sufficient correlations exist among variables should be applied, followed by checking the
index of KMO (Kaiser-Meyer-Olkin) measure of sampling adequacy. The KMO should be
higher than 0.5, according to Hair et al. (2010), KMO values between 0.5 to 0.7 are
acceptable, higher than 0.7 is great. In this research, all variables after internal consistency
(reliability and correlation) step will be used for EFA.

159
Factor analysis related issues
There are many analysis and rotation methods used in EFA, due to the nature of the
research that conducting CFA after EFA, a principal axis factoring and Promax rotation will
be used. There are some criteria in this step: factors with eigenvalues should be greater than
1, the extraction sums of squared loadings (cumulative) should be higher than 60%. In
addition, all factor loading coefficients need to be greater than 0.5 and that no factor-cross
loading occurred is also needed.
3.9.7.2. Confirmatory factor analysis
CFA related to reliability, convergent and discriminant validity testing, the detail criteria
will be presented at chapter 6 (section 6.3).
3.9.7.3. Structural Equation Modeling_Goodness of fit
The chi-square (2) GOF is used to investigate the differences between the observed
and estimated covariance matrices (Hair et al., 2010); it is calculated as follows:
2 = (N-1) (observed sample covariance matrix-SEM estimated covariance matrix)
In that, N is the overall sample size. “As the sample size increases, power increases and
the chi-square test can return a statistically significant outcome even when the model fits the
data reasonably well. The null hypothesis is “no difference in the two covariance matrices”.
The expected situation is no difference between the two matrices. If the chi-square >0.5, the
null hypothesis will be accepted. An option to balance against large sample sizes driving
statistical significance is to divide the chi-square value by the degrees of freedom (df) in the
analysis” (Meyers et al., 2013:870). This figure is called the normed chi-square or chi-square
ratio (2/df), if
2/df is less than 2, the model is considered as a good fit (Byrne, 1989), if it is
from 2 to 5, the model is considered as an acceptable fit (Marsh and Hocevar, 1985). The
smaller index indicates better-fitting models. However, according to Hair et al. (2010:667),
“the statistical test or resulting p-value is less meaningful as sample sizes become large or the
number of observed variables becomes large”. Therefore, considering another index is
necessary.

160
Absolute fit indices
“Absolute fit measures indicate how well the proposed interrelationships between the
variables match the interrelationship between the actual or observed interrelationships”
(Meyers et al., 2013:870). The five most common absolute fit indices are the chi-square, the
chi-square divided by the degrees of freedom test (as presented above), the goodness-of-fit
index (GFI), the root mean square error of approximation (RMSEA), the root mean square
residual (RMSR).
The goodness-of-fit index (GFI) demonstrates the proportion of variance in the sample
correlation/covariance accounted for by the predicted model, with the value range between 0
(no fit) to 1 (a perfect fit), it means that GFI explain how well a currently proposed theory fit
the sample data, that GFI is equal or higher than 0.9 will be considered as an acceptable
model (Hair et al., 2010; Tabachnick and Fidell, 2007).
The root mean square error of approximation (RMSEA) is “the average of the residuals
between the observed correlation/covariance from the sample and the expected model
estimated for the population” (Meyer et al., 2003:871), it presents how well the proposed
model fits a whole population. An acceptable value of RMSEA is between 0.05 and 0.08
(MacCallum et al., 1996). “Lower RMSEA values indicate better fit” (Hair et al., 2010:667)
The root mean square residual (RMR) and standardised root mean residual (SRMR):
RMR is “a measure of the average size of the residuals between actual covariance and the
proposed model covariance” (Meyer et al., 2003:871). MacCallum et al. (2009) indicated that
SRMR demonstrates how closely the model fits the correlations among the measured
variables. “A rule of thumb is that an SRMR over 0.1 suggests a problem with fit”. Therefore,
the smaller the RMSR, the better the fit with a target value 0.05 or less (Hair et al.,
2010:668).
Relative fit indices
Relative fit measures are also known as “comparisons with baseline measures or
incremental fit measure. It indicates the relative position on this continuum between worst fit
to perfect fit, with values greater than 0.9 suggesting an acceptable model fit between the
model and the data” (Meyer et al., 2013:871). Common relative fit measures are the
comparative fit index (CFI) which compares a model to the data, the normed fit index (NFI),

161
the incremental fit index (IFI), the Tucker-Lewis index (TLI) which compares a proposed
model’s fit to a null model. All these indices should be equal or higher than 0.9 (Byrne, 2010;
Knight et al., 1994, Hair et al., 2010)
Parsimonious fit measures
Parsimonious fit measures are sometimes called “adjusted fit measures”, it is used to
adjust for an inflated fit bias. “Parsimonious fit measures have no generally accepted
cutoff…It is recommended to compare two competing models, and the model with the higher
parsimonious fit measure should be judged as superior” (Meyer et al., 2013:872). Common
parsimonious fit measures are the adjusted GFI (AGFI) and the parsimonious GFI (PGFI), the
parsimonious NFI (PNFI). The model with AGFI and PGFI equal or higher than 0.9 can be
seen as an acceptable fit (Kelloway, 1998) and ideally, that PNFI is equal or greater than 0.5
indicates an acceptable model (Mulaik et al., 1989). The following table (Table 3.11) will
summarise the criteria of a goodness-of-fit indices mentioned above:
Type of model
fit indices
Model fit indices Recommended
value
References
Absolute fit
indices
Chi-square 2 >0.05 Hair et. Al (2010)
Chi-square ratio 2/df < 2 Byrne (1989)
Goodness-of-fit index GFI ≥ 0.9 Hair et al. (2010), Tabachnick and
Fidell, (2007)
Root mean square error of approximation RMSEA 0.05-0.08 MacCallum et al. (1996)
The standardised root mean residual SRMR ≤ 0.08 MacCallum et al. (2009)
Relative fit
indices
Comparative fit index CFI ≥ 0.9 Byrne (2010); Knight et al. (1994),
Hair et al. (2010), Garver and
Mentzer (1999)
Normed fit index NFI ≥ 0.9
Incremental fit index IFI ≥ 0.9
Tucker-Lewis index TLI ≥ 0.9
Parsimonious
fit indices
Adjusted GFI index AGFI ≥0.9 Kelloway (1998), Hair et al (2010)
Parsimonious GFI index PGFI ≥0.9 Kelloway (1998)
Parsimonious NFI index PNF ≥ 0.5 Mulaik et al. (1989)
Table 3.11: The criteria of a goodness-of-fit indices for the measurement model validity
Garver and Mentzert (1999) suggested three ideal GOF indices, including RMSEA, CFI
and TLI. According to Hair et al. (2010) and Garver and Mentzert (1999), there are three
measures to improve the model fit. Firstly, checking factor loadings at standardised
regression weight, that the values are equal or greater than 0.5 would be considered as
acceptable values. In the case of the values lower than 0.5, the items should be removed from
the data set and the analysis rerun. Secondly, standardised residuals (SRs): the large residual
value strongly affects the model fit, if any variable demonstrates an SRs value greater than 2

162
it should be removed from the dataset. Lastly, the model fit can be improved by modification
indices. The lower chi-square, the fitter model, each MI value illustrates the expected change
in chi-square and the expected parameter estimate. MI can suggest which items should be
connected first to improve the chi-square index. The higher MI should be prioritised for
modification first (Garver and Mentzer, 1999) and then the model should be re-calculated.
3.10. Conclusion
This chapter has presented the research methodology applied by highlighting differences
between philosophical stances and paradigms, ethical paradigms, then indicating the applied
philosophy, paradigm and ethical stance for this research. In addition, the chapter also
indicates how the research will be conducted by demonstrating research design, research
process and research method for two phases. The next chapter is going to analyse the
qualitative data collected from expert and supermarket’s consumer interviewing.
The following figure (Figure 3.R) will briefly demonstrate results from two phases:

163
Figure 3.R: Main results from two phases

164
Chapter 4: Phase One - Qualitative data analysis
This chapter will analyse the data collected from interviewing both experts and
supermarkets’ consumers. Based on the research objectives, the researcher should achieve
dividing Vietnamese supermarkets into different strategics in order to investigate differences
between groups regarding factors affecting customer loyalty. Therefore, interviewing experts
is essential; section 4.1 will provide analysis for expert interviewing which includes strategic-
group mapping as well as the current competitive environment of the Vietnamese retail
industry. In the literature review, all possible factors influencing customer perceived value,
customer satisfaction and customer loyalty have been presented; however, due to a different
industry life cycle, culture as well as customer behavior, interviewing Vietnamese
supermarkets’ consumers should be conducted in order to find whether there are other factors
affecting customer perceived value, customer satisfaction and customer loyalty that have not
been explored in this section of the review. In addition, this process will be beneficial for the
quantitative research later in this research. If any other new factors are found, they will be
added to questionaires and measurable variables for these constructs will be built before
conducting surveys. In section 4.2, there are 35 questions asked during customer inteviewing,
analysis of which is necessary and will support the researcher to explain the quantitative
results thoroughly.
4.1. Step One - Analysis for expert interviewing: Strategic group mapping
4.1.1. Introduction
Data collection method for this phase was presented at section 3.8; this part is going to
analyse the collected data from expert interviewing, followed by discussion, then, ended
with some considerations after expert interviewing.
4.1.2. Expert’s information
After contacting specialists, only one expert is available for interviewing. Although the
sample size is small with one participant, the quality of research and interview as well as the
information collected can be considered as high because this expert has been listed in the top

165
specialists in strategy in Vietnam. Besides that, with one hour and thirty-minute interview,
the desired information was succesfully collected.
The expert is Xuan Lan Pham, he is currently working at the university of Economics Ho
Chi Minh City, with 40 years-experience at both academic and business circle, he is well-
known as a top retailing and strategy expert in Vietnam. He has done much research related
to customer satisfaction, customer loyalty and business strategy.
The answers below are re-written by the researcher based on the information collected
from expert’s comments.
4.1.3. Data analysis and discussion
PHASE1_Q1_Participants were asked to give a brief review about the overall situation
of the Vietnamese retail industry. Besides that, the interviewer asked about the current
role of traditional markets in Vietnam and how cultural factors affect consumer
behavior. The interviewees are free to present his/her viewpoints.
The following information was collected from the Vietnamese retailing and strategy
expert. He presented his views on the overall situation in the Vietnamese retail industry. In
Vietnam, supermarkets have impressed with large realignment from being regarded as
unprofessional to professional and have reached international standards about how
supermarkets should be formed and served. Supermarkets used to sell some normal consumer
products with average quality. However, they have covered different kinds of grocery items
and diversified their categories, serving different segments with large scale and being
rewarded by building retail brand names in the long-term. In the past decade, the incredible
development of retailing formats and competition between firms in order to gain market share
have led to a colourful and varied retailing landscape. In particular, the market is currently
undergoing many mergers and accquisition activities between firms, and fierce competition
with the entry of many strong foreign retailers. The traditional market itself has a certain role
in the Vietnamese community, due to the fierce competition from other retailing formats, the
traditional markets have gradually changed the way they work in the big cities with more
civilization, and they have arranged their activities, as well as selling many items associated
with the traditional consumption culture of Vietnamese people. Besides that, as a result of
globalisation, many people have been changing their consumption styles and begun to prefer
products with foreign brand names. The population is also getting used to the term “fast

166
food”. In general, many retail stores have established complex formats serving consumers not
only with grocery products but also fresh food, entertainment, fashion and so forth, followed
by the integration of advertising and media industries with names such as Cresent Mall, Aeon
Mall, Vivo City and so forth… Most of them have a modern and professional look, and enjoy
comprehensively professional logistics services.
PHASE 1_Q2: Participants were asked to give their viewpoints about the current
situation of the supermarket sector as well as the competitive environment in Vietnam.
Vietnamese supermarkets have been developed through three stages. At the first phase,
supermarkets served many main daily consumption needs such as flip-flops, household
utensils, pet food, flowers, electronic items, food, grocery products, bakery, clothing,
television and furniture. Typically, Maximax, Coopmart and BigC supermarket, they all still
have a certain position and some of them are holding court and becoming leaders with huge
market share in the consumer goods market. They can be considered as enjoying similar
popularity to that of Walmart in the United State. The second stage has marked the
emergence of specialised supermarkets with specific products or functions, with many
wholesale formats being established and indirectly competing with supermarkets in the first
stage (Metro or Aeon). The third stage (for about the last six or seven years) is the current
situation where supermarkets are serving the multi-segments such as daily food, groceries,
entertainment and its services, drugstores, beauty parlours, barber shop, fashion and so forth.
These formats have attracted consumers from different groups, especially at the weekend,
when people enjoy a day shopping and using the other comprehensive services offered
nearby. With this format, supermarkets have integrated with many other retailers, alliances
with famous-drink and food brand names, pulling other retail groups to operate in the same
areas in order to cross-serve their consumers. It can be said that “everything people need to
enjoy their days, they have it in here”. The idea of gathering possible services needed by
consumers in the same place is a great improvement in the Vietnamese retailing industry.
There are many services and products offered for children as well, such as ground play,
English centres for both children and adults. This also is a reason that retailers can attract
more familyconsumer groups. Besides that, some banks have located in this supermarket
format as well in order to facilitate their customers during the shopping process or other
personal requirements. Accordingly, the advertising industry also follows and penetrates to
these multi-purpose supermarkets. The whole integrated provision of services has led to

167
greater efficiency of the supermarkets which can replace other supermarket formats in the
future. However, compared to the UK supermarkets, other integrated establishments such as
gas stations, car washes, bill-paying service and repair shops have not appeared in Vietnam.
Regarding the competitive environment, strong and full development is the current
nature of Vietnamese supermarkets in the last five years. With the supermarket format,
strategic groups are clearly separated but the development is still not synchronised.
Differences and variety of functions are also a factor that can facilitate grouping a client-
group flow. For instance, with daily shopping for groceries, Vietnamese consumers usually
choose Coopmart and Big C; shopping with entertainment services, consumers choose a
multi-functional supermarket. Besides that, wholesale supermarkets are still competing with
other strategic groups to some extent, the main competitive point is to focus on selling
foreign products and specialised items with large quantities, and in return consumers can
enjoy reasonable prices. The level of competition and attractiveness between strategic groups
is different. Therefore, competitive forces at each strategic group will be different. However,
the summarised analysis that follows can demonstrate a five forces review affecting the
retailing industry: consumers have a high power; suppliers have a low power compared to
supermarkets themselves; and there is a significant threat of substitution; the Vietnamese
retail market is identified as fragmented, competition is high; the threat of new entrants is
high (full explanation was presented in section 2.3.3.2).
Besides that, there is competition between different strategic groups and within groups,
groups located near each other in the strategic group map usually attract more consumers
from other groups by using marketing with good promotion and services offered,
concentrating on specilised products. For instance, that Lotte and Aeon offer multi-functional
products and services leads other supermakets to mimic these improvements and apply to
their business model. Therefore, fierce and ceaseless competition between supermarkets is
happening. The term “ecosystem-strategic supermarkets” or “Supermarket Ecosystem” can
be used in this situation. In that, supermarkets are much more than large grocery stores, they
also offer various business integrations and are operating as commercial centres. Services
offered attached to supermarkets have been considered as one of the main factors that can
attract more consumers. This business format has been becoming very popular in Vietnam.

168
PHASE1_Q3: Participants were asked for their opinion of techniques that can be used
to group firms into their right strategic groups
That checking similar points between supermarkets in many ways such as from the
products and services offered, degree of specilisation, company structure, prices, targeted
segmentations, firms’ size, brand name building, expanding strategies, the ways of
competition or alliance and so forth can facilitate strategic group mapping process. The main
technique should follow Porter’s guide (1980) which was presented in section 2.1.3.2.
PHASE1_Q4: Participants were asked to group the 12 main Vietnamese supermarkets
to their right strategic groups. The interviewer showed the list of supermarkets (Table
2.3.1). The respondents were also asked the reasons for their choices.
There are 12 main supermarkets in Vietnam, located across the country (Table 2.3.1).
Based on the technique suggested by Porter (1980), Vietnamese supermarkets can be grouped
into five different strategic groups, based on recommendation from an expert in retailing from
Vietnam, as follow:
1. GROUP 1: Group of specilised daily consumer goods: firms in this group have
covered a wide geographical area across the country, the business focus to serve
consumers with their basic daily consumption of food, grocery products, household
utensils. Typical of this group is Coopmart and BigC.
2. GROUP 2: Group of Multipurpose premium supermarkets1: operating under
ecosystem-strategic format but choose to locate at prime locations and luxury areas,
focus on a group of rich people living at newly created cities, luxury apartments,
especially concentrating only on retail sales rather than wholesale. Typical of this
group is Lotte.
3. GROUP 3: Premium supermarket chains with convenience stores: the
characteristics of this group are high quality products such as fresh meats and organic
vegetables without chemical pesticides; products with clear origin, especially fruits.
They also offer daily consumer goods but with premium quality and cover a huge
geographical area in a main city with flexible stores allocated, especially, a majority
of their customers being people who live in new urban segments and areas. Besides
that, they have expanded markets with a huge amount of convenience stores in urban
areas in order to attract more customers, compared to GROUP 1, GROUP 3 is

169
considered as a “premium” group with premium price charging. Typical of this group
is Vinmart.
4. GROUP 4: Group of Multipurpose supermarkets 2: operating under ecosystem-
strategic format including Aeon mall, Vivo city, Cresent mall or wholesale format as
Metro. These groups often locate in crowded areas but far away from the central area.
5. GROUP 5: Other supermarkets
It can be noted that “ecosystem supermarkets or malls” in Vietnam might be different
from the concept in western areas, malls in Vietnam are characterised by a form of large
battlefield. Many stalls and areas in the whole supermarkets or a mall are not owned by
supermarket owners. They are from different small retailers who sign a partnership contract
or even just rent a space for their business. There is a good linkage between many retailers;
they compete with each other or even with supermarkets themselves. Besides that, when
supermarkets integrate with other attached businesses, they create a favourable business
environment to avoid fierce competition. For example, at the food court, there is a limitation
on the number of country-specific restaurants and variety of choices of food from different
countries. These stores will be asked to move out if they cannot achive a business with good
profits. In another scenario, the supermarket owner will give a chance for potential and good
firms moving in. In general, the decision of which firms can move in and integrate with the
supermarket business is very selective. Supermarkets itself have more power than other small
retailers and always choose “win-win” strategies. The mall and multifunctional supermarkets
also compete fiercely and threaten to take over market share from other strategic groups; the
form of ecosystem in supermarkets is significantly successful in Vietnam.
PHASE1_Q5: Participants were asked to present which possible factors might affect
customer loyalty based on their profession.
Besides many factors presented at literature part, “the customer-oriented business model”
should be considered. In many cases, customers tend to be loyal to supermarkets because they
are happy with a specific business model. For example, consumers can claim that they are
loyal to multi-functional supermarkets because “everything they need, it will be fulfilled
there”
PHASE1_Q6: Participants were asked to present the linkage between customer
perceived value, customer satisfaction and customer loyalty.

170
There is a certain linkage between customer perceived value, customer satisfaction and
customer loyalty. However, it depends on the situation and individual perceived value, the
linkage level might be different. These differences will be tested and discussed in Chapter 6
and 7.
4.1.4. Conclusion
Many main points collected from the expert interview, including the current situation in
the Vietnamese retail industry, and specifically the supermarket sector; the comments on
competitive business environment; the suggested techniques to group firms to strategic
groups, then appling these techniques in practice, the case in Vietnamese supermarket sector.
Via this interview, the brief picture about the Vietnamese retailing industry, particularly the
supermarket sector was presented. In the end, the expert commented, noticed and dicussed
some futher factors which might affect customer loyalty, apart from the one presented at the
literature review part.
4.1.5. Summary
This section investigated the strategic groups in the Vietnamese supermarket sector.
From the beginning, data collection method that expert interviewing was mainly used had
been indicated, after interviewing, data analysis and discussion parts were presented with the
result and clear explanation why the Vietnamese supermarket firms have been placed in their
specific strategic groups.
4.2. Step two - Analysis for consumer interviewing: Customer loyalty perception
4.2.1. Introduction
This section aims to explore the customer loyalty perception or behaviour of customers
from the Vietnamese supermarket and traditional retail channels. Data collection method was
introduced in section 3.8. This section is going to analyse and discuss the collected data.
4.2.2. Details of Interviewees (supermarket consumers)
As mentioned in section 3.8.1, about 20 interviews should be conducted. However, in the
process of contacting the interviewees, some of them responded lately and confirmed whether
they could attend the interview or not. In the end, there were 21 interviews being

171
implemented. Details of all interviewees are presented in Table 4.1. The rule of coding
interviewees can be described as follows: HCM for “Ho Chi Minh”, CT for “Can Tho”, BD
for “Binh Duong”, HN for “Hanoi”, DN for “Da Nang” - this information explains where
consumers are currently living (locations); a number after a location illustrate the number of
consumers interviewed in that location; M and F in a code demonstrates “male” and “female”
respectively; the two numbers after M or F present interviewees’ ages. Besides that, time,
date as well as collection method, recording status is also reported in Table 4.1. That
respondents have a different demographic information and stay at different areas will
contribute to create a more reliable result.

172
Interviewee’s
code
Time Date Collection
method
1 HCM1_M60 19:00-20:00 11/03/2018 Face-to-face No recorded
2 HCM2_M27 11:10-11:50 12/03/2018 Online via Skype No recorded
3 HCM3_F35 12:00-13:00 12/03/2018 Face-to-face Recorded
4 HCM4_F45 17:15-18:00 13/03/2018 Online via Skype Recorded
5 HCM5_F60 19:00-20:00 13/03/2018 Face-to-face Recorded
6 HCM6_F33 10:30- 11:00 14-15/03/2018 Online via Skype Recorded
7 CT1_M27 9:45-10:45 13/03/2018 Online via Skype Recorded
8 CT2_F35 15:00-16:00 14/03/2018 Online via Skype Recorded
9 CT3_M53 11:00-12:00 15/03/2018 Online via Skype Recorded
10 BD1_F31 14:00-15:00 16/03/2018 Face-to-face No recorded
11 BD2_F30 22:00-23:00 12/03/2018 Online via Skype Recorded
12 BD3_F26 16:00-17:00 16/03/2018 Face-to-face No recorded
13 HN1_F24 22:00-23:00 13/03/2018 Online via Skype Recorded
14 HN2_F30 15:30-16:30 12/03/2018 Online via Skype Recorded
15 HN3_M24 14:00-15:00 12/03/2018 Online via Skype Recorded
16 HN4_F26 12:30-13:30 12/03/2018 Phone call No recorded
17 HN5_F56 9:00-10:00 15/03/2018 Online via Skype Recorded
18 DN1_F24 15:00-16:00 13/03/2018 Online via Skype Recorded
19 DN2_F35 10:00-11:00 14/03/2018 Online via Skype Recorded
20 DN3_M18 10:00-11:00 17/03/2018 Online via Skype No recorded
21 DN4_F19 15:00-16:00 17/03/2018 Online via Skype No recorded
Table 4.1: Details of interviewees from Phase One
(supermarket consumers)
Some descriptive information about interviewees will be briefly summarsied as follow
(Table 4.2):

173
LOCATION Frequency Percent Notes
Ho Chi Minh 6 28.57%
Southern Can Tho 3 14.29%
Binh Duong 3 14.29%
Ha Noi 5 23.81% Northern
Da Nang 4 19.05% Middle
Total 21 100%
GENDER Frequency Percent
Male 6 28.57%
Female 15 71.43%
Total 21 100%
OCCUPATION Frequency Percent
Students 2 9.52%
Self employment 3 14.29%
Office staffs 5 23.81%
Housewife 8 38.10%
Unemployment 0 0.00%
Other 3 14.29%
Total 21 100%
AGE RANGE Frequency Percent
Under 18 0 0.00%
18-22 2 9.52%
23-30 9 42.86%
31-40 5 23.81%
41-55 2 9.52%
Above 55 3 14.29%
Total 21 100%
EDUCATION LEVEL Frequency Percent
Under high school 1 4.76%
Under college 4 19.05%
College, undergraduate 16 76.19%
Total 21 100%
Table 4.2: Interviewees’ descriptive information
4.2.3. Data analysis and discussion
There were 21 respondents who are supermarket consumers in this phase, they are from
different locations in Vietnam and different age ranges, interviewees’ information was
presented in detail in section 3.9.1. There were 35 questions in the interview, all questions
were coded with the structure “P2_Qi”, for example, P2_Q1 means “Phase 2 and question 1”,
i means the question’s numbers (see appendix 4.1 for full used questionnaires). The full
results will be presented as follow:

174
With P2_Q1, when asked which supermarkets exist in your cities, all interviewees
named supermarkets located in their areas, such as Coopmart, BigC, Lotte, Vinmart, Aeon,
Metro, Vinatext and Auchan. However, there are some respondents who remain confused
about the terms supermarket, hypermarket, department stores, shopping mall, convenience
stores; they started to name where they have gone for shopping.
With P2_Q2, when asked how often respondents go to supermarkets, there are many
answers which can be divided into 4 groups. The first group includes people who usually go
to supermarkets around twice or three times a week, such as HN5_F56, HCM5_F60,
BD2_F30, HCM4_F45, 100% of the respondents of this group are female and a housewife
which allows them to have more time for shopping at supermarkets. HN5_F56 stated “I have
retired and currently live with my husband, I have a very free and flexible time, so I often go
to a supermarket, three or four times a week, sometimes just looking and going around but
finally, I bought many items. Normally, I go there to buy daily food and keep it in a fridge, I
live in an apartment where supermarkets are just under or near my building”. In this group,
BD2_F30 go to shop at a supermarket every day because she is working in the supermarket.
Another group is going to supermarkets once a week, such as HCM_M60, CT1_27,
HCM6_F33, HN2_F30, HN1_F24, HN3_M24. Depending on the nature of their jobs, some
people go at the weekend with family, some of them go to supermarkets to shop for the whole
family when they are free. In this group, HN1_F24 said “ I usually go to supermarkets with
my mum to buy food or consumption products for family, but I do not really care about
buying consumption stuffs because I have no right to decide which products should I buy and
use, my mum is in charge, for daily foods, she choose traditional markets. For me, I just buy
some skincare products at a supermarket”. Vietnamese family-focused culture has affected
consumption behaviour. Normally, one person in the family will be in charge with daily food
and consumption products, other members in the family tend to eat and use already-bought
products without complaining.
Some respondents go to supermarkets twice a month because of their habits of going to
supermarkets with the whole family and buying many goods which are sufficient for them to
use until next shopping time, such as HN4_26, DN2_F35, HCM3_F35, CT3_M53. The final
group does not usually go to supermarkets, once a month or once every three months, such as
HCM2_M28, CT2_F35, DN1_F24. Some people in this group also stay with a big family,

175
they are not in charge of buying grocery products, some of them choose to shop at traditional
markets due to their job nature which always keeps them busy.
With P2_Q3, when asked whether preferring shopping at supermarkets or traditional
markets, a majority of respondents such as HN4_F26, HN1_F24, HCM1_M60, HCM6_F33,
DN1_F24, BD3_F26 chose supermarkets because of advantages such as clean and fresh
atmosphere, trustworthy and diversed goods as well as its types, a variety of delicious and
fresh food, not worrying about bargains because clearly presented prices, good returns
policies, nice and polite attitude of in-store staff, safe household utensils offered, clearly
stated origin, an eye-catchingly display, easy to find, especially, the comfortable feelings of
whether purchasing or not after checking without worrying annoyed anyone. Besides that,
thanks to home-delivery service offered, consumers can buy as much as they want without
thinking about being too heavy to carry home; products from supermarket seem to have a
higher quality compared to the one at traditional markets.
However, there are some consumers preferring shopping at traditional markets such as
CT1_M27, HN3_M24, CT3_M53. They explained some disadvantages of shopping at
supermarkets and reasons why they choose traditional markets. CT1_ M27 said: “I think
shopping at traditional markets is very convenient, it is near my house and I just drive my
scooter to there and get what I want immediately; I do not need to wait for parking or long-
queuing when checking out. Besides that, many fresh vegetables and meats are available
there. Many special home-made products and some kinds of nice fishes are not sold in
supermarkets. However, sometimes I am suspicious about the quality of meats or their
origins, I usually go to specialised meat shops to shop separately. In general, I feel free to
shop at traditional markets, easy to buy and choose”.
With P2_Q4, as mentioning supermarkets, some respondents indicated their most
familiar supermarket brand names but it is not always their loyalty choice. For example,
HCM1_M60 named Lotte as his most familiar, but he is loyal to Coopmart, DN2_F24 named
Vinmart as her most familiar but she is loyal to BigC. They gave a reason for this answer as
some firms have done a good marketing campaign, built a strong brand image as well as
covered all media channels, easy-to-remember slogans. Therefore, they always think about
these brand names when mentioning supermarkets. However, for choosing which one for
shopping and being loyal to, they might need to consider many factors. Other respondents are
loyal to their most familiar supermarkets, HCM5_F60 explained that a mentioned

176
supermarket is her top choice because she goes there to shop every day, it is near her area,
she gets used to where the products that she needs are and the supermarket offers an
affordable price. Besides that, she got a loyalty card that allows her to accumulate points
doing any transaction, thanks to an integrated system across the country, she can obtain
points regardless of where products have been bought, this is not the case in other
supermarkets. HN5_F56 is loyal to Vinmart due to many reasons, but she stated she has no
choice, the most important factors affecting her choice is convenience in terms of location, as
she explained, the supermarket is next to her apartment and offers an excellent customer
service. In the case, if closer supermarkets existed, she might move there if all other factors
remained the same. BD3_F26 thinks about Lottemart and always shops there due to its
convenient location and accessibility, the supermarket is near her house and its Korean brand
name gives her a feeling of good quality.
With P2_Q5, most of respondents explaining their main purpose of going to
supermarkets is to buy daily consumption products, some of them are looking for other
service attached in order to relax and spend time with family. Some respondents explained
that they have no time, so buying groceries is their main purpose, if they want to relax, they
might choose a shopping mall with many luxury skin care and household utensils provided, at
the same time, their families still have a choice of different services offered (HN2_F30,
DN2_F35). It can be noted that some consumers going to supermarkets just buy their
intended-to-buy items and finish their shopping quickly, they have no demand for additional
services. HN1_F24 told that she usually goes to a supermarket with her mother when her
mother hears about special discount campaigns at that supermarket.
With P2_Q6, when asked about factors influencing their loyalty to supermarkets and
listing their important factors. It seems to be different between consumers due to their
different education levels, income, and locations. HCM3_F35 mentioned about the
importance of service quality offered, clean toilets provided and origins of products. Other
respondents such as BD1_F18, CT2_F35 mentioned location accessibilities, quality of
products, prices, no scandal occurred, nice corporate image and store image. CT2_F35
mentioned that habit is her top criteria in term of loyalty “BigC is a first supermarket in my
area, I have come there first and bought many products, now I feel very familiar and become
its frequent and loyal customer”. CT3_M53 is loyal to his current chosen supermarket
because of super-friendly well-trained and supportive in-store staffs, nice store atmosphere

177
and its convenient location. HN4_F21 did present her impression with customer services
offered by her favourite supermarket “I went there shopping with family, we bought many
products and it was so heavy that we could not carry home, thanks to excellent customer
services, they sent it to my house after we pay 2 hours, it was such amazing service”.
DN2_F35 mentioned about how trust affecting her loyalty “Majority of products I bought
from Metro are traded under foreign brand names, I love and trust foreign products, when I
came there, I was so confident to buy many things”. However, there are a number of
respondents (HN1_F24) presenting that products’ price is the reason why they are loyal to
supermarkets. Therefore, it can be seen that income has affected customer loyalty to some
extent. HN2_F30 who stays in luxury apartments in a new urban area presented that product
quality and convenient location accessibility are the most important factors in her case.
Besides the above factors, HN5_F56 and HCM4_45 also choose Vinmart to be loyal to
because Vinmart has a variety of product ranges and promotion programmes, a premium
price is not a problem for her, she prefers to buy there because of big size supermarket which
allows her to enjoy shopping there. In addition, she is currently a housewife, obtaining points
as conducting any purchase is also here favourite thing. BD3_F26 clearly indicated five top
factors what she considers which supermarkets to be loyal to “For me, there are five main
factors, including convenient location accessibility, clearly stated product origin, attractive
promotion programmes, quick home delivery service, spacious parking area”. DN4_F19
emphasised the importance of in-store staff attitude. She claimed that this is a most crucial
factor if firms want to keep consumers loyal to them, if staff express disrespectful behaviour
and seem not to be supportive, she might move to other retailers even though the original
supermarket satisfies all of her needs. There are some respondents stating that they are not
loyal to a supermarket, they buy products depending on convenience levels, such as
HCM2_M28, HN1_F24. But when asked about their views of factors influencing customer
loyalty, they mentioned price first, convenient location and then customer services.
In general, by using this question, all of the factors presented in the literature review had
been mentioned by all respondents. However, there are two more factors, including TRUST
and HABIT that have been reviewed, the researcher will add these two new factors to her
research framework and be ready for creating scale for future survey (PHASE TWO).
With P2_Q7, considering factors affecting customer satisfaction, a majority of
respondents emphasise the importance of good customer services, friendly well-trained in-

178
store staff, product quality, excellent in-store logistics and promotion programmes.
HN3_M24 added “Every single time I go to Aeon supermarkets, their staff bowed low and
gave me a friendly smile, I feel respected”. CT3_M53 considered that price is not the
important factor when considering his satisfaction, in-store logistics should be mentioned.
HCM2_M28, HN5_F60 and DN3_M18 indicate a fresh atmosphere and well-arranged
shelves in stores make them feel good and satisfy. HCM6_F36 explained how customer
services affected their satisfaction. HN5_F56, DN2_F35, HCM4_F45 and HCM3_F35
indicated that product quality is the most important factor to them, they choose and satisfy
with their current supermarket because good quality products are offered. The level of
satisfaction might mainly depend on how well the products provided are in this case. In
addition, many respondents, such as BD3_F26, HCM3_F35, HN2_F30, CT1_M27 presented
that a supermarket brand name and firm image are having a significant influence on them. In
general, when consumers perceive high-value reception when shopping, they will be more
satisfied.
With P2_Q8, respondents started to share their satisfied/unsatisfied experience with the
interviewer, there are many explanations above about how to make consumers satisfied, such
as free and quick home delivery service, friendly staff, nice and free wrapping service, this
section will mainly emphasize an unsatisfied experience. HN2_F30, HN3_M24 felt annoyed
with many things, including long-time waiting for payment, changing the location of product
display, mistaken price or no price or code stated, no supported payment services such as
creating mobile applications that consumers can pay via scanning code. CT1_M27 narrated
that “some shelves are always out of stock, promotional areas look messy, there are no staff
there to tidy up, I feel uncomfortable”. HN1_F24 expressed her unsatisfactory experience
when in-store staff at a supermarket showed their disrespectful and unsupportive behaviour to
her and ignored her question. In conclusion, consumers complain about long-queue waiting
as checkout, no flexible problem solving, and unfriendly staff. DN4_F19 bought an expired
cake because she forgot to check the product’s date when buying, she had supposed that all
products in supermarkets have been checked carefully. She expressed her disappointed
behaviour and clearly stated that she will not come there again. HN4_F26 complained that in-
store staff were not proactively introducing their promotional programmes to her. HN3_M24
complained about supermarkets’ consumers having to pay a parking fee, she said that “I
usually drive my scooter to supermarkets, I feel a bit annoyed when I need to pay a parking
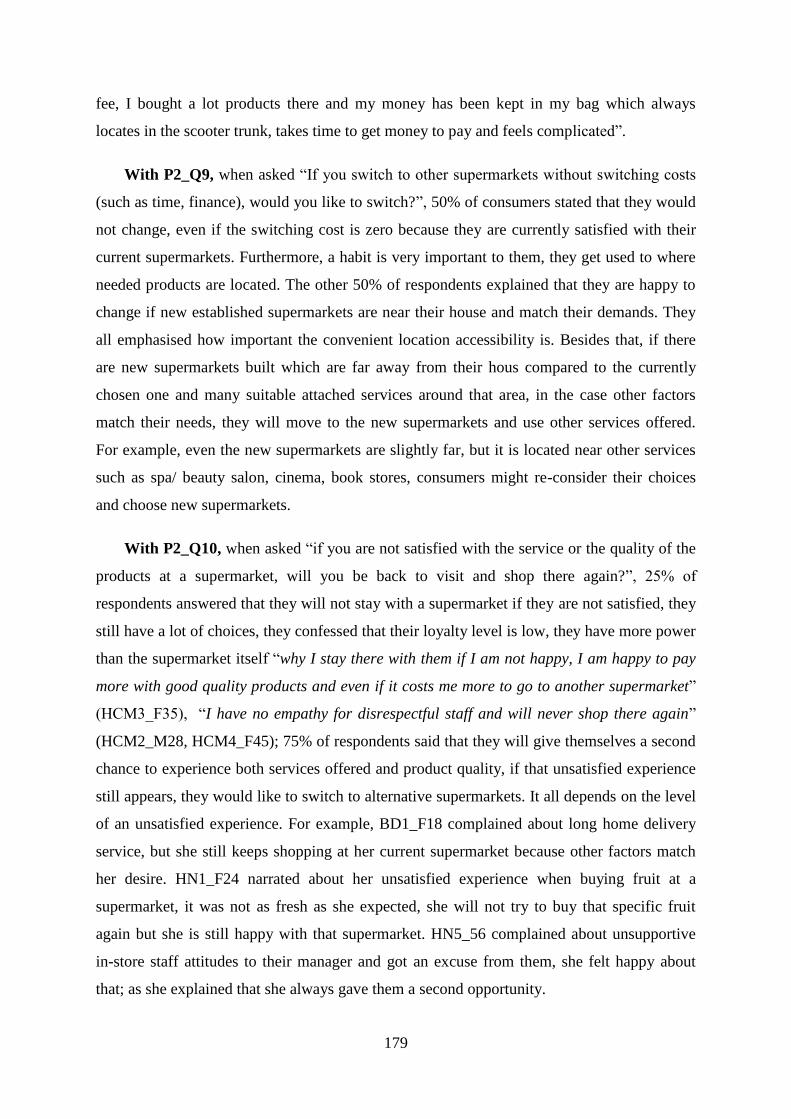
179
fee, I bought a lot products there and my money has been kept in my bag which always
locates in the scooter trunk, takes time to get money to pay and feels complicated”.
With P2_Q9, when asked “If you switch to other supermarkets without switching costs
(such as time, finance), would you like to switch?”, 50% of consumers stated that they would
not change, even if the switching cost is zero because they are currently satisfied with their
current supermarkets. Furthermore, a habit is very important to them, they get used to where
needed products are located. The other 50% of respondents explained that they are happy to
change if new established supermarkets are near their house and match their demands. They
all emphasised how important the convenient location accessibility is. Besides that, if there
are new supermarkets built which are far away from their hous compared to the currently
chosen one and many suitable attached services around that area, in the case other factors
match their needs, they will move to the new supermarkets and use other services offered.
For example, even the new supermarkets are slightly far, but it is located near other services
such as spa/ beauty salon, cinema, book stores, consumers might re-consider their choices
and choose new supermarkets.
With P2_Q10, when asked “if you are not satisfied with the service or the quality of the
products at a supermarket, will you be back to visit and shop there again?”, 25% of
respondents answered that they will not stay with a supermarket if they are not satisfied, they
still have a lot of choices, they confessed that their loyalty level is low, they have more power
than the supermarket itself “why I stay there with them if I am not happy, I am happy to pay
more with good quality products and even if it costs me more to go to another supermarket”
(HCM3_F35), “I have no empathy for disrespectful staff and will never shop there again”
(HCM2_M28, HCM4_F45); 75% of respondents said that they will give themselves a second
chance to experience both services offered and product quality, if that unsatisfied experience
still appears, they would like to switch to alternative supermarkets. It all depends on the level
of an unsatisfied experience. For example, BD1_F18 complained about long home delivery
service, but she still keeps shopping at her current supermarket because other factors match
her desire. HN1_F24 narrated about her unsatisfied experience when buying fruit at a
supermarket, it was not as fresh as she expected, she will not try to buy that specific fruit
again but she is still happy with that supermarket. HN5_56 complained about unsupportive
in-store staff attitudes to their manager and got an excuse from them, she felt happy about
that; as she explained that she always gave them a second opportunity.

180
With P2_Q11, when asked “how does store image affect your purchasing perceptions
and your satisfaction?”, all of the respondents mentioned in-store decoration and atmosphere
as well as the layout of shelves, the service attitude of in-store staff.
With P2_Q12, when asked “Which kinds of supermarket do you wish to shop? Please
describe?”, besides all of the factors which can make consumers satisfied as presented above
such as free parking service, well-trained and supportive staff, excellent in-store logistics,
good product quality, reasonable price, a variety of products offered, quick checkout services,
many respondents mentioned about their dream supermarkets. HN1_F24, HN2_F30 expected
supermarkets have an electronic board that they can select a wanted product and pay when
driving out, in this way they explained about how they can save their shopping time,
HCM6_F33 also dream about supermarkets applying modern technology where she just
chooses products and the products were sent to her house later. HCM1_60, CT1_M27 expect
that Vietnamese supermarkets have self-checkout service machines. However, the majority of
Vietnamese is still using cash in their daily spending, the self-checkout service machines
cannot be applied unless the number of people using card has been significantly increased.
HN3_M24 recommended that “if consumers who usually buy a lot of products at
supermarkets, they can register an account with a detailed bank card, when they shop, they
will be distributed a small machine which can scan a product barcode and automatically pay
when checking out. It would be perfect” or HCM3_F35 suggested that “Should Vietnamese
supermarkets apply Argos’s business model that using catalogues and electric board to sell
their products”
With P2_Q13, when asked “Does corporate image affect your choice in choosing which
supermarkets to go?”, 100 % of participants said “YES” and they started to explain a reason.
Some respondents considered about where supermarkets’ brand names are coming from,
including domestic and foreign brand name. They demonstrated that foreign supermarkets
give them a reliable feeling. It generates a positive effect in the purchase decision.
With P2_Q14, whether corporate social responsibility (CSR) affects your choice in
choosing which supermarkets to go or not, some respondents said that they will lose trust in
supermarkets which do not have a positive corporate social responsibility, in the case they
have alternative choices, they might move to new supermarkets, if not, they might stay to
shop at that supermarket because “in fact, a negative CSR does not directly affect my choice
as my benefit is still there” CT3_M53 said, HN2_F30 stated that “I will choose to shop there

181
if that negative level is low because a supermarket is near my house”. However, she also
added that CSR affects corporate image, that supermarkets contributing to society such as
sponsoring social-cultural events or free events for children will create consumer trust.
Although some consumers do not care about CSR, if supermarkets treat their employees
nicer, employees might be happy and give consumers a better service. Some serious situation
such as business from supermarket seriously affect a natural environment and cause pollution
and damage people’s living environment, all respondents will commit not to shop at that
supermarket anymore. All respondents expressed their disappointed behaviour to firms who
do not pay taxes, but some of them still choose to shop at these supermarkets due to its
indirect effect to them.
With P2_Q15, when asked “Do you think loyalty programmes such as bonus points,
discounts and gifts will affect your decision?”, the majority of the respondents stated that
bonus points or discounts slightly stimulate their purchase decision if product quality remains
unchanged. If other supermarkets which are further from consumers’ houses offer an
attractive promotion, consumers tend to move to that supermarket to experience discounted
shopping but all of the participants supposed that they will not change supermarkets which
they are currently loyal to. In the case, supermarkets offer good promotion programmes, but
their employees show disrespect to consumers or behave in unsupportive ways, respondents
will commit not to go to that supermarket for shopping as well. HCM5_F60 is happy with her
current supermarket when she usually receives free gifts from the supermarket at the end of
each year, even she did reward her points and expressed that she has no desire looking for
alternative supermarkets. In this way, it can be noted that when consumers perceive a high
value offered, they might be satisfied and loyal to supermarkets. However, some respondents
seem to be not really interested in loyalty and promotion programmes, product quality and
how well supermarkets’ employees treat them are the most important factors (HN5_F56,
BD1_F18, DN3_M18 and HCM_F35).
With P2_Q16, when asked “If other supermarkets offer appealling promotions or
discounts, would you be ready to switch to them?”, 100% of the respondents answered “NO”
due to their current choices matching their needs and fitting their situations. Switching and
being committed to a new supermarket takes time and costs. As a result, people are afraid to
change if new benefits provided are low. However, if some expensive products such as
television, washing machine and other electronic devices, consumers might wish to move to a

182
discounting supermarket to experience promotion programmes but they will not switch
permanently. In the case, newly-established supermarkets are located near consumers’ areas
and offer an attractive promotion programmes, consumers will give it a go. In Vietnam, there
is a supermarket which commits to their customers that they always offer the lowest price
compared to the same products from other firms, if their clients detect any of their products at
a higher price, clients can give the bills with lower prices offered the supermarket and will
get the voucher of 10,000 VND (32 pence) in return. In this way, this supermarket has
attracted a huge amount of customers at that segmentation.
With P2_Q17, as being given a follow situation “Suppose you are always loyal to
specific supermarket A, if supermarket B opens a store near you or easier for you to get there,
do you wish to switch to shop at supermarket B?”, a majority of the respondents emphasized
that they will give a newly-established supermarket B a try because convenient location
accessibility is also an important factor regarding customer loyalty. However, after
experiencing, if other demanded factors are equal or slightly higher than supermarket A, they
will definitely switch to shop at supermarket B. Some of the respondents chose to open their
choices if the above presented thing happens, they might choose to shop at both supermarkets
depending on how much time they have (HCM4_F45, CT2_F35). CT1_M27 mentioned
about a price factor in this case, he supposed that if supermarket B locates near his house and
offers a slightly higher price compared to supermarket A but other factors are the same, he
will switch to supermarket B.
With P2_Q18, when asked “Do you concern about online service at supermarkets such
as online ordering or home delivery, consulting chat?”. 25% of the respondents expressed
their concerns about online service at supermarkets, they have used the service many times
and have been satisfied with the service provided; this group includes BD2_F30, BD1_F18,
HN4_F26, HCM3_F35, BD3_F26, they explained they were working full-time in an office,
and can save much time by using online services; 50% of the respondents explained that they
are not concerned about the online service due to many reasons related to trust, web interface,
payment method, minimum amount of spending, age range. HCM1_M60, HCM5_60,
HCM4_F45 and CT3_M53 presented their lack of interest in online services. According to
them, they are getting older and due to not experiencing the internet when they were young,
they find difficulty in online buying; 25% of respondents expressed their concerns about
online services, however, they have never experienced the online service offered and will

183
consider using it in the future if they can. Besides that, when asked “What do you want from
supermarkets’s online service?”, the group of those who are interested in supermarkets’
online services started to list many expectations such as free and quick home delivery service,
highly-invested web interface, notifying promotion events via email, telephone consultations,
same product quality offered as advertised.
With P2_Q19, when asked “Do you think your favourite supermarkets meet your needs
(products, services?)”, 100% of the respondents said “YES” if regarding daily consumption
products. However, other products such as clothing, cosmetics and specific fruit and meat,
consumers might choose to shop at other favourite stores depending on their demand. For
example, HN5_F56 narrated “I always buy fresh meat at a store which is near my house, they
offer such amazing premium fresh meat that I could not find in supermarket A”. The majority
of participants agreed with the following statement “each consumer has their own needs and
demands, it depends on many factors to decide consumer behaviour as they all are from
different backgrounds, financial status and education levels”.
With P2_Q20, when asked “Do you think the price at this supermarket is reasonable?”,
100% of the respondents said “YES” because that is their choice. Price is not the most
important factor in choosing which supermarkets to shop and be loyal with, it depends on
many other factors. HN2_F30, HCM3_F35, HN4_F26 stated that although being aware of
paying higher prices in their current supermarkets, in return, they believe that the offered
product quality is much higher and other attached services are premium as well. There are
some supermarkets offering cheap prices and amazing deals, but the consumers doubt about
the origin of products and its quality.
With P2_Q21, when asked for commenting about consumer service at the current
chosen supermarkets, consumers expressed their satisfied behaviour as supermarkets provide
a free cash withdrawal machine near the check-out gate and clean toilets inside supermarkets.
However, some consumers complained about a narrow parking space that they could not
easily find spaces for their cars or scooters (BD2_F30), HCM6_F33 expect that supermarkets
should offer playgrounds for children as well, in this way she can enjoy shopping as her
husband looked after children at the playground, BD3_F26 expects that supermarkets in
Vietnam should offer self-checkout machines that those who buy a small amount of product
can check out easily without long-queue waiting and in the case consumers forget their bank
cards, they can pay directly via check out machines after other information authentication is

184
provided. HCM3_F35 felt annoyed with consumer service in some cases “I saw that staff at
information unit gather to talk in one place instead of detaching themselves from each other
to consult consumers as needed”.
With P2_Q22, when asked about the feeling when consumers shop at supermarkets,
100% of the respondents illustrated that they feel comfortable, excited and relaxed thanks to
an in-store fresh atmosphere and friendly staffs. HCM3_F35 feel respected and confident
with product origin and quality. Some of the participants feel curious about new products
offered such as childrens games, new taste of products, newly applied modern-technology
games, areas for specific premium foods or products and so forth. However, some male
respondents just feel convenience issue as having a shorter shopping time compared to
female. HCM2_M28 said “I just pop in to buy the products I intended to buy, having no time
for going around, thanks to a convenient location, my transaction finished in 10-20 mins
every single shopping time”. BD2_F30 usually go to premium supermarket, she explained “I
feel the luxury shopping atmosphere here and always be respected”. HCM4_F45 explained
why she did not choose supermarket A because of its cramped shopping space with crowded
people, even if supermarket A offers a lower price. CT2_F35 emphasised the importance of
attached services in supermarkets such as bookstores, good coffee brand names, these things
also are a factor that attracts consumers to go to supermarkets for shopping.
With P2_Q23, when asked their retail brand experience, respondents expressed their
own feelings as follow. CT_F35 considered her current chosen supermarket is a familiar
brand with consumers thanks to its long history, reliable reputation and family-oriented
products provided. BD2_F30 felt a strong impression with her current chosen retail brand
name as this brand name has penetrated the Vietnamese market later compared to others, but
thanks to good quality products and premium attached services offered. In addition, a strong
foreign brand name has also generated trust in consumers’ mind. HN1_F24 mentioned that
free-bus services offered from country areas to a place where her chosen supermarket is
located stimulates shopping and makes consumers feel more respected and more than
welcomed. Therefore, her brand experience is good and she expressed how excited she was to
wait for many beneficial events offered by this brand name. CT1_M27 always feels good
about his current chosen supermarkets as considering their brand name. However, when
sharing about their brand experience, the participants had started to compare and explain why
they choose a specific brand instead of others to be loyal to. The majority of them agreed that

185
brand experience affects their choices and behaviour to some extent. For example, when
mentioning the brand name of supermarket A, they feel it is trustworthy, offers premium
services and products, regarding the brand name of supermarket B, they note an affordable
price, cramped stores with not very logical shelves allocated, normal products and services
offered. However, in some cases, consumers still choose supermarket B depending on their
needs and situations. Besides that, wide geographic coverage is also a factor that creates a
good feeling about a retail brand name in consumers’ minds. HN2_F30 has been impressed
about a significantly developed supermarket chain which has expanded to more than 150
stores, including large and medium-size supermarkets and convenience stores after two years
established in Vietnam. When mentioning a brand name experience, logo and brand identity
should be considered; 100% of the respondents admitted that the colour and how the logo of
specific brand name is designed are also considered as the crucial factors to decide the first
impression of consumers about a specific brand. Besides that, DN4_F19 appreciated her
current chosen supermarket where all problems occurred has been quickly solved and staff
are always friendly and supportive. For example, when she complained about too-loud-
broadcast music in a store, a supermarket quickly adjusted the sound and did not forget to
give her an excuse. Therefore, she presented that this supermarket is the best one in Vietnam
thanks to an excellent experience perceived. DN2_F35 did experience many supermarkets
and stated “I used to shop at supermarket X, however, these days, there are a huge number of
products made in China, I doubt about the quality of Chinese products, especially foods,
fruits. I moved to supermarket Y and always think that the brand name of supermarket B
remind me about not good quality products from China”. Therefore, somehow, how good
retail brand experience is has also been affected by in-store products provided.
With P2_Q24, when asked to comment about in-store logistics service of a supermarket
where respondents go to shop, BD2_F30 stated that “It is perfect, thanks to excellent in-store
logistics service provided, I find products easily and quickly, its logically allocated shelves
and adequate products on shelves always make me feel comfortable. Enthusiastic staff offer a
friendly support. I have no complaint about their in-store logistics services”. However,
DN3_M18 complained about prices being wrongly stated on products sometimes and “due to
its small size, supermarkets could not offer a wide variety of food choices”. HCM3_F35
showed her satisfaction when her favourite supermarket offers a small and nicely designed
bag, in which consumers can leave their unwanted products, located near a cashier counter
before checking out. She explained “I could not find these bags at other supermarkets,

186
normally consumers might randomly put on the way to the cashier”. Furthermore, shopping
carts have been mentioned, thanks to clean and spacious shopping carts with many designed
choices which offer a seat for a baby, HCM3_F35 feel safe and extremely happy to shop at a
supermarket. Another note related to in-store logistics, CT2_F35 commented that discounted
products should be checked constantly and neatly arranged, when consumers choose these
products, it always makes it a bit messy there. She also noted “A supermarket should not put
these discounted products near a main entrance gate, I feel not very nice and neat”.
With P2_Q25, when asked about a loyalty level regarding to supermarket brand name,
35% of the respondents gave 3 points if considering on scale 1 to 5. There are 10% of the
respondents showing that they have no loyalty at all. The 55% of the participants showed
their loyalty commitments to supermarkets due to many reasons provided, such as,
convenient location advantages, habit, trust, having loyalty cards, high level of satisfaction,
good store image and brand image perceived.
With P2_Q26, when asked about the satisfaction level of services offered, a majority of
the respondents showed their satisfaction and started to explain why they are satisfied. Most
of them mentioned about how good they feel at getting a respected and supportive behaviour
from supermarket staff. For them, this factor is very important. Other in-store services and
online services had also been mentioned. They all agreed that the more good services offered,
the better consumer returning ratio is.
With P2_Q27, the respondents started to list many factors affecting their choices in
favourite supermarkets chosen for grocery shopping. Diversified goods with good quality
provided, friendly and supportive staffs, reasonable prices and convenient store accessibility,
logical decoration are their top criteria. However, they also explained that they love to shop at
supermarket X because supermarket X offer good quality fresh food with an affordable price
and specific products that other supermarkets do not have, but stores from supermarket X are
always located far away from the city centre, consumers choose to be loyal to supermarket Y
due to other reasons. Some respondents mentioned about the level of trust in supermarket
brand names, good word-of-mouth from other consumers and clean atmosphere also are their
criteria.
With P2_Q28, when asked about whether price is the main factor of choosing which
supermarkets respondents should use, 80% of the participants said “NO”, 20% of them said

187
“YES”. It can be easily seen that the group saying “Yes” has a lower income compared to the
other group: they have a tight budget for grocery spending. Therefore, prices are considered
as the most important factor and they accept products with normal quality, they understand
how consumers expect to have a premium quality if they do not want to pay more. Another
group claimed that although price is an important factor because consumers have different
income levels, an affordable price is mentioned above depending on consumers’ income
levels and how to choose supermarkets to go for shopping depends on many factors. “After
considering an acceptable product quality, price and habit might be next criteria” some
respondents said. Respondents from higher income group have clearly stated that “There is
no room for expecting a lower price charged if consumers want a premium product and
excellent other attached services provided, in this case, prices are not a big problem, we are
happy to pay more to get that such premium offers”.
With P2_Q29, when asked how supermarkets’ brand names affect consumer choices, a
majority of respondents agreed that brand names do significantly influence their choices, it
depends on how retail brand names were positioned and the image created. For example, with
long-time good reputation built, supermarkets might create trust in consumer mind that their
products and services offered are guaranteed. In addition, word of mouth from consumers
who do experience a supermarket is also important. On the other hand, some consumers said
that a retail brand name does not affect their choices, such as DN4_F19, HN5_F60,
HCM2_F28. HN5_F60 stated that “A HABIT is more important than a brandname, in my
case, I usually go to supermarket A, in the future, if the supermarket decided to change their
brand name, I would still choose it regardless of the brand name they want to change to
because I am used to where products are located and I love their shopping atmosphere.
However, if they changed their business model and strategies, changed everything, I would
need to reconsider”
With P2_Q30, when asked about whether consumers agree with a following statement:
“I choose supermaket A because of its good store image created”. 50% of the respondents
explained that store image is a crucial factor, in the case that other factors match or exceed
their expectations but they might feel annoyed and unpleasant if bad store image provided
such as cramped and dirty in-store atmosphere, illogically allocated shelves as well as
products, unfriendly, irresponsible and unsupportive in-store staff. They all argued that they
cannot be satisfied with supermarkets in such circumstances and emphasised that to be loyal

188
with a specific supermarket brand name, they have considered many factors, and store image
seems to be an important factor. However, the rest explained that store image seems not to
significantly affect their choices, they argued that being a supermarket, at least store image
should be above average in order to make it work and compete with others.
With P2_Q31, as being given the situation as follow “Suppose that there are two
different supermarkets that you feel satisfied, all other factors are the same, one of these is a
domestic brand name, another is foreign brand name, which one will you choose? Why?”,
14% of the respondents said that a foreign brand name and a domestic brand name do not
affect their choices, they have considered many other factors, and moved around
supermarkets if needed. BD3_F26 claimed “each brand name or supermarket have their own
strengths and advantages which offer specific products or services that other supermarkets
do not. Therefore, I am happy to move around them to get the best things”. 28.5% of the
participants chose foreign brand name supermarkets, even if foreign and domestic ones offer
them the same products or services. They feel more trusting with a foreign brand name which
often provides better products and professional services, the name of brand name can classify
customer segmentation. Roughly 57.5 % of the respondents chose a domestic brand name if
other factors offered are similar. They all claimed that being Vietnamese, they are so happy
to support the development of domestic firms, give their contributions to help domestic
supermarkets generate and position their brand names in consumers’ minds. However, I
emphasised that their choices only happen if other factors offered are similar. Besides that,
they showed their excitement if a domestic firm creates a nice foreign brand name, even the
name might be an abbreviation of a group of Vietnamese words, it sounds more interesting to
them.
With P2_Q32, when asked “In your family, who are in charge with buying grocery
products? How many people in your house now? Do you cook/eat separately or together?”,
90% of the respondents said that a housewife is in charge with grocery shopping and daily
food. Normally, in Vietnam, those who stay in the same house which include two to eight
people always share their foods at every single meal, in other words, they do not eat
separately, those who are in charge with cooking will cook for the whole family. 10% of the
participants showed that due to the nature of their jobs, they could be not in charge with
cooking, the husbands usually go to supermarkets or traditional markets for shopping.

189
With P2_Q33, when asked “Where do you usually go for daily food and grocery?”, 52%
of the respondents said that they often go to traditional markets to immediately and easily
grab what they want for daily food cooking. However, for other grocery products, they have
two choices, if they need something immediately, they prefer to go to some small private
shops located near their houses to get it; if they want to purchase some products which can be
used in long-term and with a large amount, they will choose supermarkets which offer a
wider choice of products. They also buy food at supermarkets as much as they can. 48% of
the participants always buy their food and grocery products at supermarkets due to many
reasons as follows: being a housewife, they have time to shop at supermarkets every day or
some times per week; due to the nature of work, they have no time to go traditional markets
each morning, supermarkets will be their choice in the evening. Besides that, some
respondents prefer the relaxing feelings of shopping at supermarkets,
With P2_Q34, as being asked “Are you loyal to a supermarket brand name or their
specific store?”, 57% of the respondents admited that they are loyal to a specific store of a
supermarket brandname, surprisingly, 100% of these consumers mentioned about convenient
store accessibility in which it is located near their houses or its convenient locations.
HN2_F30 claimed that she does not have time to move around and be loyal to a specific store
which is located next to her children’s school. Instead of just staying in front of a school to
wait for picking up her son, she pops to the store for shopping around 30 minutes to one hour
every weekday afternoon. 19 % of the participants said that they are loyal to a specific brand
name, they can move around other stores of the same brand name to experience. HCM3_F35
claimed that “When I travel for work, I always give my favourite supermarket brand name a
top priority and find their stores in that place, I love a main colour designed in their stores”.
24 % of the respondents explained that depending on each specific situation, they are happy
to experience other supermarket brand names as well as stores. However, they also emphasise
that they might give a nearest store a go in the case of quick shopping and its convenient
benefits,and go to a store which provides a specialised product. Their choices are flexible and
they might not want to commit themselves to a specific store or brand name.
With P2_Q35, when asked to comment about the following statement that “In Vietnam,
the majority of people who are in charge with buying foods, grocery products is a housewife,
man do not usually deal with this thing”, 80.9% of the respondents said that they agreed with
the above statement. Due to a different culture, in Vietnam, housewives/females are mainly in

190
charge with daily cooking for a group of two to eight people who stay in the same house.
They all claimed that the man in their houses might suggest the names of preferred meals but
the final choice significantly depends on the woman, HN1_F 24 said “My dad have no
interest in going to the stalls of vegetable, meat or cooking stuff in supermarkets, he goes
there with us and then go straight to check the counter of electronic products and other
household utensils, he might tell my mum which kinds of food he want to eat but he is not a
final decision maker”, 19.1 % of the participants doubt that the above presented statement
might partly wrong, it depends on each specific family and their situation. Although they
accepted that the statement seems to demonstrate a true thing in Vietnam, but their situations
are different in which their husbands have contributed 50% to 80% of the grocery purchase
decision, 100% of these families are a modern single-family where the wife and husband
equally share jobs and help each other in everything.
In the end of an interview, the interviewer asked interviewees to give their viewpoints
about issues related to customer loyalty. One conclusion can be drawn that consumers who
are from different backgrounds, education levels, income, locations, living styles, gender and
age range have different views about loyalty and which supermarkets they choose to shop as
well as the criteria given (See Appendix 4.1 which briefly presents some direct quotes from
supermarket’s consumer interviews).
4.2.4. Conclusion
The above analysis explored the customer loyalty perception or behaviour of customers
from the Vietnamese supermarket sector and traditional retail channels. TRUST and HABIT
were considered as factors influencing customer loyalty. Therefore, after this interview
process, the literature review on the relationship between customer loyalty and TRUST and
HABIT were investigated and added into the original literature review section, followed
by added hypotheses in section 2.4.13.2 (H25 and H26).
“H25: Trust positively affects customer perceived value
H26: Habit positively affects customer loyalty”
Based on this result, building a scale for both TRUST and HABIT constructs were
conducted and added to the originally proposed questionnaire. It is noted that the above
qualitative analysis can examine consumers’ perception and behaviour, in order to understand
the relationship between researched constructs and which level they affect each other,
quantitative research will be conducted in the next two chapters (Chapter 5 and Chapter 6).

191
Phase one-step two examines which possible factors might affect their loyalty; the next
two chapters will demonstrate results from quantitative research. The figure 4.1 below will
sumarise main contents presented in chapter 5 and 6.

192
Chapter 5
Chapter 6
Figure 4.1: Contents of Chapter 5 and Chapter 6
Structural equation modelling: the relationship between researched
constructs revealed
Multigroup analysis: strategic groups and other differences between on
income, gender, location, age groups, occupation and education levels
Passed non response bias test
67.31% response rate
Passed confirmatory factor analysis after removing two variables
(RBEX4 and RBEX5)
Exploratory factor analysis: 63 remained variables - “Corporate image” has been eliminated.
- “E-service quality” has been divided into two small constructs
Internal consistency (section 5.4):
removed 5 variables
Descriptive statistics
Data screening
3055->2913

193
Chapter 5: Phase Two - Quantitative data analysis
Survey Descriptive Statistics and Exploratory Factor Analysis
5.1. Introduction
In this chapter, data preparation and screening will be presented first. In this section,
normality testing will be presented, followed by response rate, response and non-response
bias. Then, the results from descriptive statistics are demonstrated, followed by results from
exploratory factor analysis.
5.2. Data preparation and data screening
5.2.1. Data preparation
Data was created based on the answers collected from questionnaires. Firstly, creating a
codebook is essential (Appendix 3.5), followed by presenting a structured data file. Then, all
data was input to Microsoft Excel 2010 and modified if necessary during examination.
5.2.2. Data screening
5.2.2.1. Missing data
According to Hair et al. (2010), there are many initial steps to undertake before factor
analysis is attempted. All data collected was initially input to Microsoft Excel 2010, and then
it was checked for any data missed. There were 3055 questionnaires collected from 17 March
2018 to 27 July 2018. After checking the raw input data, there were 57 surveys which have
been removed from the data set due to the huge amount of data missed (case screening). Then
data was checked for unengaged responses: participants who enter the exact same value for
every single survey item (meaning they had similarly answered every Likert-scale item).
There were 85 cases of unengaged responses found. These were also removed from the data
set. There were 2913 remaining questionnaires which were coded and input to the software
named SPSS, version 24. The researcher also used the “replace missing value” tool to input
some minor missing values (8 cases). As a result, there were 2913 questionnaires used for
further investigation.

194
5.2.2.2. Identification of outliers
“Outliers, or extreme responses, may unduly influence the outcome of any multivariate
analysis. It is an observation with a unique combination of characteristics identifiable as
distinctly different from the other observations” (Hair et al., 2010:64). Hair et al. (2010)
identify four classes of outliers as follows:
1. From “a procedural error”, including a data entry error or wrong coding created.
2. An observation that “occurs as the result of an extraordinary event”. For instance,
when tracking average daily rainfall, a hurricane occurring once or twice in a month
might affect the whole data set.
3. Extraordinary observations, researchers can use their own judgment in the
retention/deletion decision.
4. Observations that “fall within the ordinary range of values on each of the variables”
In this research, all variables have been checked for outliers. According to Hair et al.
(2010:66), setting the threshold for designation of outliers should be done first. The common
approach is “converting the data values to standard scores, which have a mean of 0 and a
standard deviation of 1”. For sample size is higher than 80, outliers typically are defined as
cases with standard scores up to 4. According to Gaskin and Lim (2017), outliers do not
really exist in Likert-scales because respondents’ answers are from 1 to 5 or 1 to 7 depending
on their viewpoints. Outliers should be checked on continuous variables such as age,
experience and income if respondents point out a specific number based on their case. The
boxplot can be used to detect outliers. However, in this study, outlier detection is not even
possible on continuous variables because the researcher created specific questionnaires based
on age and income ranges which were coded as 1, 2, 3, 4 or 5 in the dataset.
Hair et al. (2010:67) stated “Our belief is that they (outliers) should be retained unless
demonstrable proof indicates that they are truly aberrant and not representative of any
observations in the population”. The final decision on retaining these variables which will be
made at the EFA step.
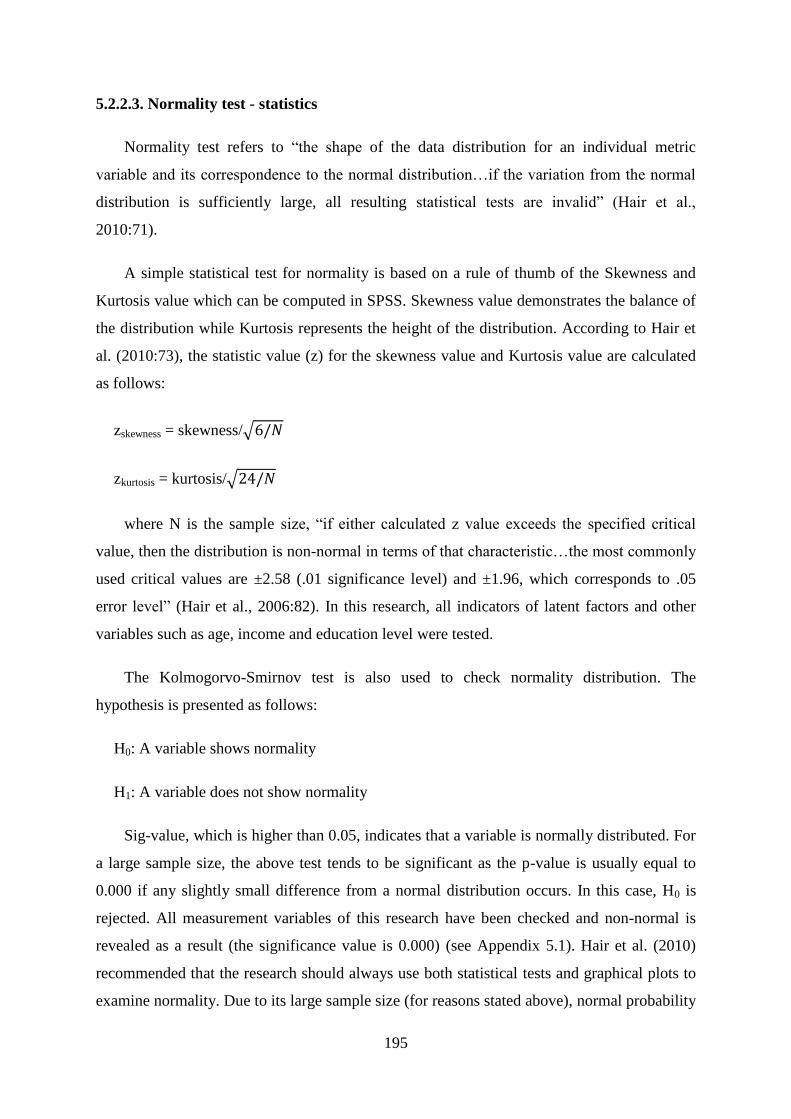
195
5.2.2.3. Normality test - statistics
Normality test refers to “the shape of the data distribution for an individual metric
variable and its correspondence to the normal distribution…if the variation from the normal
distribution is sufficiently large, all resulting statistical tests are invalid” (Hair et al.,
2010:71).
A simple statistical test for normality is based on a rule of thumb of the Skewness and
Kurtosis value which can be computed in SPSS. Skewness value demonstrates the balance of
the distribution while Kurtosis represents the height of the distribution. According to Hair et
al. (2010:73), the statistic value (z) for the skewness value and Kurtosis value are calculated
as follows:
zskewness = skewness/√6/𝑁
zkurtosis = kurtosis/√24/𝑁
where N is the sample size, “if either calculated z value exceeds the specified critical
value, then the distribution is non-normal in terms of that characteristic…the most commonly
used critical values are ±2.58 (.01 significance level) and ±1.96, which corresponds to .05
error level” (Hair et al., 2006:82). In this research, all indicators of latent factors and other
variables such as age, income and education level were tested.
The Kolmogorvo-Smirnov test is also used to check normality distribution. The
hypothesis is presented as follows:
H0: A variable shows normality
H1: A variable does not show normality
Sig-value, which is higher than 0.05, indicates that a variable is normally distributed. For
a large sample size, the above test tends to be significant as the p-value is usually equal to
0.000 if any slightly small difference from a normal distribution occurs. In this case, H0 is
rejected. All measurement variables of this research have been checked and non-normal is
revealed as a result (the significance value is 0.000) (see Appendix 5.1). Hair et al. (2010)
recommended that the research should always use both statistical tests and graphical plots to
examine normality. Due to its large sample size (for reasons stated above), normal probability

196
plots (P-P or Q-Q plot) were used to re-check the results. According to Palant (2007), plots
reasonably clustered around a straight line indicate normality distribution. All data is used to
examine Q-Q plot, the results showed that the data set is considered as a normal distribution
(Q-Q plot can be used to test every single variable; however, Appendix 5.2 shows Q-Q test
for each construct, the results for each variable are relatively the same). Therefore, the data
were not transformed. Figure 5.1 presents Q-Q plot for measured item “CPV”.
Figure 5.1: Normal Probability Plot
5.2.3. Response rate and Non-response bias
There were 3500 questionnaires printed and soft copies of questionnaires sent to
supermarket consumers of different strategic groups in different ways from 17 March to 27
July 2018, 2356 original printed questionnaires were returned, 699 hard copies of
questionnaires originating from email were returned back by post. In the case of printed
questionnaires, the response rate was 67.31%. Unfortunately, soft copies of the questionnaire
were sent to respondents via multiple channels, so the response rate was impossible to
identify. In total, 3055 questionnaires were returned.
Non-response bias is defined as “not the number of non-respondents, but the possibility
of bias” (Oppenheim, 1992:106, content hull). Saunders et al. (2007) stated that non-
respondents who refuse to respond to questionnaires or respond late might generate different
findings for specific phenomena. In this research, the non-response bias test was examined

197
based on questionnaires returned late (Armstrong and Overton, 1977). The data collected was
divided into four quarters based on the order of receipt of questionnaires. Independent sample
t-test was used to investigate the difference between first quarter and last quarter. A new
qualitative variable was created named “NONBIAS” with the value of 1 in the dataset
represented for the first quarter, the value of 2 represented for the fourth (last) quarter. All
112 measured items were checked. The results of independent samples t-test are shown in
Appendix 5.3. According to Pallant (2007), if the significance level of Levene’s test is less
than 0.05, the t-value examined will be placed at the second line (equal variances not
assumed); if the significance level of Levene’s test is more than 0.05, the t-value examined
will be placed at the first line (equal variances assumed). At t-test column, that Sig (2-tailed)
is lower than 0.05 means a significant difference between two examined groups occurred and
that Sig (2-tailed) is higher than 0.05 mean no significant difference occurred between two
examined groups (in this case early and late respondents).
In this research (see Appendix 5.3), the majority of of p-values (Sig 2 tailed) are higher
than 0.05, 9 out of 112 variables having a p-value lower than 0.05. Therefore, at 95%
confidence interval, there were no statistically significant differences in the mean values for
all examined measurement variables between early and late respondents.
5.3. Descriptive statistics
5.3.1. Respondent demographic data
In data collected via different channels (email, face-to-face and post) there were 143
questionnaires removed from the dataset due to issues of uncompleted information and
unengagement. The demographic information from the remaining 2913 respondents will be
briefly presented in Table 5.1. There are around 500-700 surveys collected at each targeted
city; roughly 69% female respondents and 30.5% male; 30.3 % of respondents are students,
office staff and housewives are 24.5% and 27.9% respectively; monthly income of
respondents is dominantly around GB£170-680; the majority of respondents aged from 18 to
22 (41.5%), 23 to 30 (21.1%), above 55 (17.2%) and 85% of participants possess A levels.

198
LOCATION Frequency Percent
Hanoi 727 25
Da Nang 488 16.8
Ho Chi Minh 679 23.3
Binh Duong 517 17.7
Can Tho 502 17.2
Total 2913 100
GENDER Frequency Percent
Male 889 30.5
Female 2002 68.7
Prefer not to say 22 0.8
Total 2913 100
OCCUPATION Frequency Percent
Students 882 30.3
Self-employment 217 7.4
Office staffs 714 24.5
Housewife 813 27.9
Unemployment 19 0.7
Prefer not to say 268 9.2
Total 2913 100
MONTHLY INCOME Frequency Percent
Lower than 5 million VND (170 GBP) 1275 43.8
From 5 to 10 million VND (170-340GBP) 853 29.3
From 10 to 20 million VND (340-680GBP) 686 23.5
From 20 to 50 million VND (680-1700 GBP) 65 2.2
Higher than 50 million (above 1700 GBP) 34 1.2
Total 2913 100
AGE RANGE Frequency Percent
Under 18 25 0.9
18-22 1210 41.5
23-30 616 21.1
31-40 303 10.4
41-55 259 8.9
Above 55 500 17.2
Total 2913 100
EDUCATION LEVEL Frequency Percent
GCSE’s 235 8.1
A levels 2477 85
College, undergraduate 201 6.9
Total 2913 100
Table 5.1: Summary of respondents’ profile
How demographic information affecting the relationship between constructs will be
examined in the secrtion covering multigroup analysis (section 6.6.3.4).

199
5.3.2. Shopping behaviour - Respondents’ choices
In this research, shopping behaviour is also briefly investigated through 20 questions.
The results are presented at Appendix 5.5.
5.3.3. Mean and standard deviation values for all constructs
Twenty-one constructs with all variables were examined in this research. The standard
deviation values of all measured items are considered relatively high. As noted, a 5-point
Likert scale has been used to measure all items, with 1 meaning “strongly disagree”, 2
“disagree”, 3 “neutral = neither agree nor disagree”, 4 “agree” and 5 “strongly agree”.

200
Descriptive Statistics
Minimum Maximum Mean Std.
Deviation
CPV1 1 5 3.57 0.887
CPV2 1 5 3.74 0.914
CPV3 1 5 3.71 0.870
CPV4 1 5 3.80 0.854
CPV5 1 5 3.69 0.890
CPV6 1 5 3.44 0.909
CS1 1 5 3.08 0.889
CS2 1 5 3.42 0.847
CS3 1 5 3.53 0.844
CS4 1 5 3.45 0.901
CS5 1 5 2.28 1.268
CL1 1 5 3.46 0.950
CL2 1 5 2.88 1.063
CL3 1 5 3.38 0.915
CL4 1 5 3.53 0.949
CL5 1 5 3.39 0.995
ISL1 1 5 3.59 1.021
ISL2 1 5 3.74 0.953
ISL3 1 5 3.94 0.948
ISL4 1 5 3.97 0.935
ISL5 1 5 3.89 0.908
ISL6 1 5 3.76 0.986
ISL7 1 5 3.88 0.929
SQ1 1 5 3.34 0.930
SQ2 1 5 3.45 0.879
SQ3 1 5 3.63 0.848
SQ4 1 5 3.45 0.919
SQ5 1 5 3.69 0.908
SQ6 1 5 3.75 0.909
ESQ1 1 5 3.19 0.993
ESQ2 1 5 3.26 1.021
ESQ3 1 5 3.42 0.952
ESQ4 1 5 3.51 0.950
ESQ5 1 5 3.58 0.937
ESQ6 1 5 3.63 0.952
ESQ7 1 5 3.30 1.002
ESQ8 1 5 3.36 0.937
ESQ9 1 5 3.44 0.938
ESQ10 1 5 3.50 0.954
PROQ1 1 5 3.88 0.910
PROQ2 1 5 3.87 0.855
PROQ3 1 5 3.60 0.868
PROQ4 1 5 3.64 0.871
PRICE1 1 5 3.65 0.906
PRICE2 1 5 3.44 1.037
PRICE3 1 5 3.57 0.899
CUSER1 1 5 3.05 1.076
CUSER2 1 5 3.48 1.060
CUSER3 1 5 3.31 1.014
CUSER4 1 5 3.36 0.970
CUSER5 1 5 3.79 0.986
CUSER6 1 5 3.61 1.042
CUSER7 1 5 3.58 0.980
CUSER8 1 5 3.45 1.044
CUSER9 1 5 3.41 1.008
CUSER10 1 5 3.48 1.008
CUEXP1 1 5 3.59 0.894
CUEXP2 1 5 3.63 0.910
CUEXP3 1 5 3.70 0.871
CUEXP4 1 5 3.70 0.940
RBEX1 1 5 3.48 0.956
RBEX2 1 5 3.59 0.894
RBEX3 1 5 3.37 1.001
RBEX4 1 5 3.59 0.909
RBEX5 1 5 3.58 0.901
RBEX6 1 5 3.06 1.042
STIMA1 1 5 3.54 0.889
STIMA2 1 5 3.47 0.926
STIMA3 1 8 3.55 0.879
STIMA4 1 5 3.67 0.891
STIMA5 1 5 3.56 0.904
STIMA6 1 5 3.59 0.877
STIMA7 1 5 3.71 0.875
COIMA1 1 5 3.74 0.870
COIMA2 1 5 3.81 0.865
COIMA3 1 5 3.65 0.893
CSR1 1 5 3.55 0.879
CSR2 1 5 3.48 0.898
CSR3 1 5 3.63 0.863
CSR4 1 5 3.65 0.864
CSR5 1 5 3.70 0.852
CSR6 1 5 3.71 0.893
TRUST1 1 5 3.61 0.902
TRUST2 1 5 3.71 0.851
TRUST3 1 5 3.69 0.877
TRUST4 1 5 3.62 0.907
HABIT1 1 5 3.71 0.953
HABIT2 1 5 3.65 0.937
HABIT3 1 5 3.67 0.925
STAC1 1 5 3.75 0.967
STAC2 1 5 3.82 0.940
STAC3 1 5 3.84 0.940
ALA1 1 5 3.14 1.021
ALA2 1 5 3.38 0.965
ALA3 1 5 3.19 1.026
ALA4 1 5 3.29 1.006
SWC1 1 5 3.04 1.063
SWC2 1 5 2.95 1.102
SWC3 1 5 3.17 1.040
SWC4 1 5 3.24 1.062
SWC5 1 5 3.21 1.078
SWC6 1 5 3.33 1.054
LPRO1 1 5 3.59 0.982
LPRO2 1 5 3.73 0.938
LPRO3 1 5 3.72 0.941
LPRO4 1 5 3.65 0.941
LPRO5 1 5 3.53 0.986

201
LPRO6 1 5 3.44 1.061
PROE1 1 5 3.65 0.874
PROE2 1 5 3.79 0.896
PROE3 1 5 3.81 0.894
Table 5.2: The descriptive statistics for all items in the dataset
That the mean values of 4 variables of CL (customer loyalty) are from 3.38 to 3.53,
except that of CL2 (“I am willing to pay more as compared to other retailers for the products
I buy from this retailer”) which is 2.88 shows that participants might be loyal to supermarkets
but it does not mean that they will be happy to pay more for that loyalty.
That RBEX6 represents for “Stories of this brand stimulate my curiosity” having a mean
of 3.06 indicates that respondents seem to be neutral to this statement.
That SWC1 (Switching to other providers will bring economic loss) and SWC2
(Switching to other providers will bring psychological burden) having mean values of 3.04
and 2.95 respectively also shows that participants chose to be neutral on these statements.
Maybe, they could not find a huge switching cost loss when moving to shop at other retailers.
That respondents chose average of 3.19 and 3.26 for ESQ1 and ESQ2 (“Organisation
compensates me when what I ordered does not arrive on time”, “Organisation picks up items
I want to return with minimum hassle” respectively) means that they do not really agree or
disagree about these statements, since return services in Vietnam are still not developed.
ALA1 represents for “Probably, I would be satisfied with another company”, has a mean
value of 3.14, and people tend to agree with this statement but not totally.
ISL5 stating “In this supermarket, all products can be easily reached” and CPV4
“Compared to the price we pay, we get reasonable quality”, showmean values of 3.8 and 3.89
respectively, meaning that a majority of respondents agree with these statements.
5.4. Internal consistency
All 112 measured items were examined for reliability (internal consistency) by checking
Cronbach’s alpha coefficients and correlation between variables (including inter-item
correlation and item-total correlations). Hair et al. (2010) and Pallant (2007), stated that the
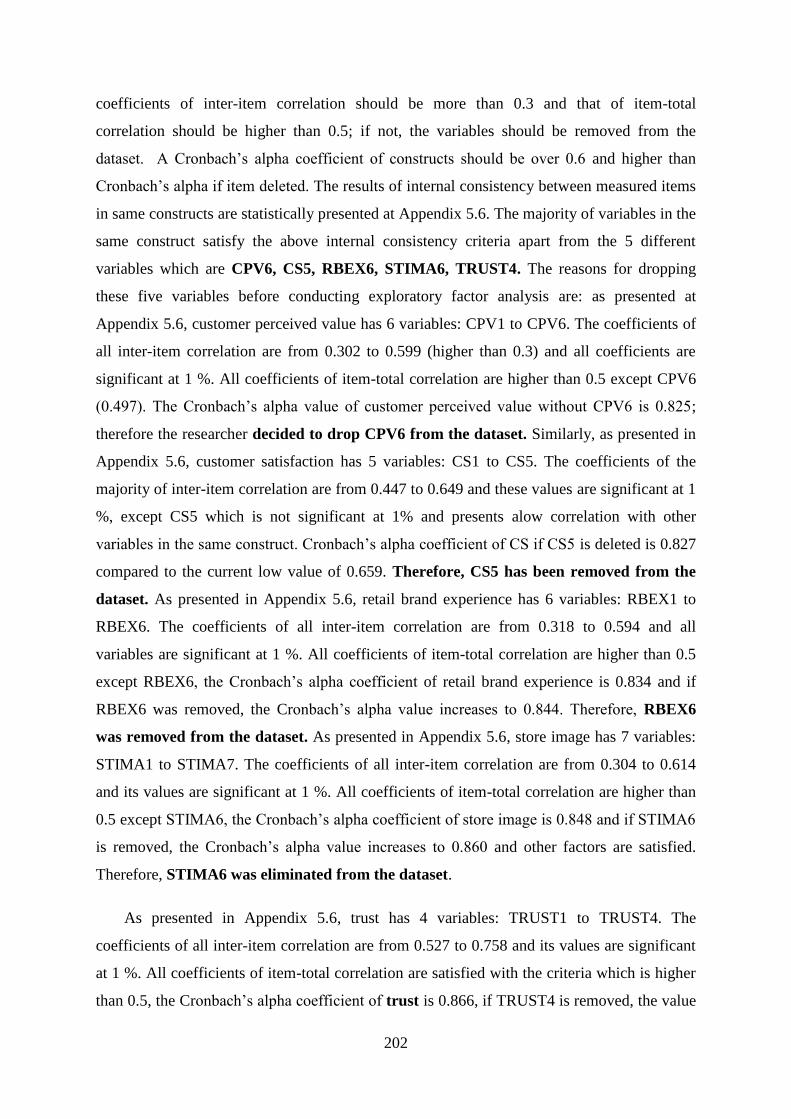
202
coefficients of inter-item correlation should be more than 0.3 and that of item-total
correlation should be higher than 0.5; if not, the variables should be removed from the
dataset. A Cronbach’s alpha coefficient of constructs should be over 0.6 and higher than
Cronbach’s alpha if item deleted. The results of internal consistency between measured items
in same constructs are statistically presented at Appendix 5.6. The majority of variables in the
same construct satisfy the above internal consistency criteria apart from the 5 different
variables which are CPV6, CS5, RBEX6, STIMA6, TRUST4. The reasons for dropping
these five variables before conducting exploratory factor analysis are: as presented at
Appendix 5.6, customer perceived value has 6 variables: CPV1 to CPV6. The coefficients of
all inter-item correlation are from 0.302 to 0.599 (higher than 0.3) and all coefficients are
significant at 1 %. All coefficients of item-total correlation are higher than 0.5 except CPV6
(0.497). The Cronbach’s alpha value of customer perceived value without CPV6 is 0.825;
therefore the researcher decided to drop CPV6 from the dataset. Similarly, as presented in
Appendix 5.6, customer satisfaction has 5 variables: CS1 to CS5. The coefficients of the
majority of inter-item correlation are from 0.447 to 0.649 and these values are significant at 1
%, except CS5 which is not significant at 1% and presents alow correlation with other
variables in the same construct. Cronbach’s alpha coefficient of CS if CS5 is deleted is 0.827
compared to the current low value of 0.659. Therefore, CS5 has been removed from the
dataset. As presented in Appendix 5.6, retail brand experience has 6 variables: RBEX1 to
RBEX6. The coefficients of all inter-item correlation are from 0.318 to 0.594 and all
variables are significant at 1 %. All coefficients of item-total correlation are higher than 0.5
except RBEX6, the Cronbach’s alpha coefficient of retail brand experience is 0.834 and if
RBEX6 was removed, the Cronbach’s alpha value increases to 0.844. Therefore, RBEX6
was removed from the dataset. As presented in Appendix 5.6, store image has 7 variables:
STIMA1 to STIMA7. The coefficients of all inter-item correlation are from 0.304 to 0.614
and its values are significant at 1 %. All coefficients of item-total correlation are higher than
0.5 except STIMA6, the Cronbach’s alpha coefficient of store image is 0.848 and if STIMA6
is removed, the Cronbach’s alpha value increases to 0.860 and other factors are satisfied.
Therefore, STIMA6 was eliminated from the dataset.
As presented in Appendix 5.6, trust has 4 variables: TRUST1 to TRUST4. The
coefficients of all inter-item correlation are from 0.527 to 0.758 and its values are significant
at 1 %. All coefficients of item-total correlation are satisfied with the criteria which is higher
than 0.5, the Cronbach’s alpha coefficient of trust is 0.866, if TRUST4 is removed, the value

203
of Cronbach’s alpha increases to 0.876. Therefore, the researcher decided to drop
TRUST4 from the dataset and other factors are satisfied.
In conclusion, there are 111 measured variables used in the questionnaire; based on the
above analysis, 5 items were eliminated from the dataset before further analysis, including:
CPV6, CS5, RBEX6, STIMA6, TRUST4.
5.5. Exploratory factor analysis
5.5.1. The results from Exploratory factor analysis
All variables after internal consistency checking were used for the next step (EFA). Due
to a huge number of variables, EFA was iterated and computed many times until a clean
pattern matrix was revealed. In this analysis step, Principal axis factoring and Promax
rotation method were used because of its nature and these methods could generate a pattern
matrix that facilitates later confirmatory factor analysis. There were 49 variables eliminated.
The results of Barlett test of sphericity is significant with chi-square is 105721.538 and df is
1953, p-value is 0.000< 0.0001. The KMO value is 0.966 which is higher than 0.5 (Appendix
5.7.) It means that the data set was appropriate for factor analysis and the following results
are statistically significant (Hair et al., 2010). Appendix 5.8 shows 21 factors extracted with
63 remained variables, with 63.50% of total variance. The results show that the eigenvalues
of all factors are higher than 1, the current variables and data are reliable; all factor loading
coefficients are higher than 0.5 and no cross-loading factors found in pattern matrix.
Therefore, there is no problem with convergent and discriminant validity. Other variables
were dropped one by one from the data set because of its low factor loadings and cross-
loading problems and the Cronbach’s alpha of all extracted constructs shows its values of
higher than 0.7. The name of each remaining construct was coded at the dataset as the below
table (Table 5.3).

204
Variables Deleted variables Remained Variables Cronbach's alpha Before After
CPV
CPV1 CPV1
0.79 6 3
CPV2 CPV2
CPV3 CPV3
CPV4 CPV4
CPV5 CPV5
(Customer perceived value) CPV6 CPV6
CS
CS1 CS1
0.819 6 3
CS2 CS2
CS3 CS3
CS4 CS4
CS5 CS5
(Customer satisfaction) CS6 CS6
CL
CL1 CL1
0.8 5 3
CL2 CL2
CL3 CL3
CL4 CL4
(Customer loyalty) CL5 CL5
ISL
ISL1 ISL1
0.769 7 3
ISL2 ISL2
ISL3 ISL3
ISL4 ISL4
ISL5 ISL5
ISL6 ISL6
(In-store logistics) ISL7 ISL7
SQ
SQ1 SQ1
0.813 6 3
SQ2 SQ2
SQ3 SQ3
SQ4 SQ4
SQ5 SQ5
(Service quality related to service employees) SQ6 SQ6
ESQX2
ESQ1 ESQ1
0.796
10 6
ESQ2 ESQ2
ESQ3 ESQ3
ESQ4 ESQ4
ESQ5 ESQ5
(E-service quality related to E-S-QUAL) ESQ6 ESQ6
ESQX1
ESQ7 ESQ7
0.86 ESQ8 ESQ8
ESQ9 ESQ9
(E-service quality related to W-S-QUAL) ESQ10 ESQ10 (2 FACTORS)
PROQ
PROQ1 PROQ1
0.799 4 3 PROQ2 PROQ2
PROQ3 PROQ3
(Product quality) PROQ4 PROQ4
PRICE PRICE1 PRICE1
0.807 3 3 PRICE2 PRICE2
(Price) PRICE3 PRICE3
CUSER
CUSER1 CUSER1
0.797 10 2
CUSER2 CUSER2
CUSER3 CUSER3
CUSER4 CUSER4
CUSER5 CUSER5
CUSER6 CUSER6
CUSER7 CUSER7
CUSER8 CUSER8
CUSER9 CUSER9
(Customer service) CUSER10 CUSER10
CUEXP
CUEXP1 CUEXP1
0.848 4 3 CUEXP2 CUEXP2
CUEXP3 CUEXP3
(Customer experience) CUEXP4 CUEXP4

205
RBEX
RBEX1 RBEX1
0.817 6 4
RBEX2 RBEX2
RBEX3 RBEX3
RBEX4 RBEX4
RBEX5 RBEX5
(Retail brand experience) RBEX6 RBEX6
STIMA
STIMA1 STIMA1
0.805 10 3
STIMA2 STIMA2
STIMA3 STIMA3
STIMA4 STMA4
STIMA5 STMA5
STIMA6 STMA6
(Store image) STIMA7 STMA7
COIMA (CONSTRUCT DELETED)
COIMA1 COIMA1
3 0 COIMA2 COIMA2
COIMA3 COIMA3
CSR
CSR1 CSR1
0.832 6 3
CSR2 CSR2
CSR3 CSR3
CSR4 CSR4
CSR5 CSR5
(Corporate social responsibility) CSR6 CSR6
TRUST
TRUST1 TRUST1
0.876 4 3 TRUST2 TRUST2
TRUST3 TRUST3
(Trust) TRUST4 TRUST4
HABIT HABIT1 HABIT1
0.82 3 3 HABIT2 HABIT2
(Habit) HABIT3 HABIT3
STAC STAC1 STAC1
0.911 3 3 STAC2 STAC2
(Store accessibility) STAC3 STAC3
ALA
ALA1 ALA1
0.838 4 3 ALA2 ALA2
ALA3 ALA3
(Alternative attractiveness) ALA4 ALA4
SWC
SWC1 SWC1
0.813 6 3
SWC2 SWC2
SWC3 SWC3
SWC4 SWC4
SWC5 SWC5
(Switching costs) SWC6 SWC6
LPRO
LPRO1 LPRO1
0.859 6 3
LPRO2 LPRO2
LPRO3 LPRO3
LPRO4 LPRO4
LPRO5 LPRO5
(Loyalty programs) LPRO6 LPRO6
PROE PROE1 PROE1
0.847 3 3 PROE2 PROE2
(Promotion effect) PROE3 PROE3
Total 111 63
Table 5.3: All remained variables after EFA
Source: Results from the author’s data analysis

206
5.5.2. Conclusion
There were 21 factors extracted with 63 remained variables which are named above, all
constructs achieved reliability as all Cronbach’s alpha coefficients are higher 0.7, there is no
problem with convergent and discriminant issues in exploratory factor analysis (loading
coefficients are higher than 0.5 and no cross-loading existed). Appendix 5.10 presents names
of all measurement variables remaining after EFA. All variables of COIMA (“corporate
image” construct) have been eliminated from the dataset due to convergent and discriminant
issues. “E-service quality” construct has been divided into two small constructs,
including e-service quality related to a core e-service quality scale (E-S-QUAL of ESQ4,
ESQ5 and ESQ6), and e-service quality related to website quality scale (W-S-QUAL of
ESQ7, ESQ8 and ESQ9). It can be noted that manifest variables for “e-service quality”
constructs used in this research were created and tested by Zemblyte (2015). Via EFA
process and with interaction between a number of factors, the statistical results revealed that
scales for “e-service quality” constructs should be divided into two different constructs. Then,
the researcher named these as noted above. In conclusion, two constructs for e-service
quality will be presented in the revised model and there is no “corporate image” factor
included. It means that hypothesis 23 and hypotheis 24 will not be able to be investigated,
and hypotheses related to e-service quality (H17X1 and H17X2) will be changed to H17A,
H17B, H17C and H17D which are:
H17A: E-service quality about X1 (W-S-QUAL) has a significant positive effect on customer
perceived value
H17B: E-service quality X2 (E-S-QUAL) has a significant positive effect on customer
perceived value
H17C: E-service quality X1 (W-S-QUAL) has a significant positive effect on customer
loyalty
H17D: E-service quality X2 (E-S-QUAL) has a significant positive effect on customer
loyalty
The next part will demonstrate the revised model after EFA and the next chapter will
present construct validation and hypothesis testing.
5.6. The revised model

207
+ H6
+H14
+H12A
+H7B +H16 +H25
+H26 +H18 +H15
+H11B
-H10B
+H11A
+H9B
H6
+ H7A
+H8
+H
22
B
Figure 5.2: The revised model for main study
`
In-store
logistics
ssss
A core e-
service
quality
Service
quality
Customer
service
Customer
experience
Retail brand
experience
Product
quality
Price Corporate social
responsibility
Store
image
Habit
Trust
Switching
costs
Alternative
attractivenes
s
Loyalty
programs
ss
Promotion
effects
CUSTOMER
PERCEIVED VALUE
Store
accessibility
CUSTOMER
LOYALTY
Gender Age Location
s
Income Strategic groups
CUSTOMER
SATISFACTION
Control variables
3 items 3 items 3 items 3 items 3 items 3 items 3 items 3 items
3 items 2 items
3 items
4 items
3 items
3
ite
ms
3 items
3 items
Website
quality
scale
3 items
3 items

208
Chapter 6: Confirmatory factor analysis and structural equation modelling
(Construct validation and hypothesis testing)
6.1. Introduction
This chapter is going to examine construct reliability and validity and test hypotheses
proposed in section 2.5.13.2, including factors directly influencing customer perceived value,
customer satisfaction, customer loyalty, and multigroup analysis across groups.
6.2. Unidimensionality - Initial model fit
According to Hair et al. (2010:696), “Unidimensionality measures mean that a set of
measured variables (indicators) can be explained by only one underlying construct”. In order
to investigate construct unidimensionality, initial model fit and other factors such as factor
loadings (acceptable above 0.5), modification index and standardised residual should be
checked.

209
Figure 6.1: Results from CFA_1strun

210
All factors extracted, including 63 variables were input to AMOS version 24 for
confirmation factor analysis. The initial goodness of fit was checked and presented as
follows:
Measure Estimate Threshold Interpretation
CMIN 6201.062 -- --
DF 1680 -- --
CMIN/DF 3.691 <5 Acceptable
CFI 0.956 >0.95 Excellent
SRMR 0.029 <0.08 Excellent
RMSEA 0.03 <0.06 Excellent
PClose 1 >0.05 Excellent
Table 6.1: Model fit of CFA_1strun
(Source: Data analysis results from the author)
CFA_1strun: P-value =0.000, cmin/df = 3.691 < 5 which is the threshold of acceptable
model, CFI=0.956>0.95, SRMR=0.029<0.08, RMSEA=0.030<0.06 and
PCLOSE=1.000>0.05, TLI=0.949 >0.9, GFI=0.928>0.9. It means that the model fit is
confirmed as excellent (Kelloway, 1998; Hair et al., 2010; MacCallum et al., 2009;
Tabachnick and Fidell, 2007).
There are some ways to improve model fit by using MI (modification index) and residual
moments to reduce CMIN/DF which expected to be lower than 3 to get the excellent level of
fit. The threshold for MI was set above 4 and covariance had been drawn between the
following variables within its constructs: e56-e58 (PROQ2-PROQ3), e45-e46 (TRUST1-
TRUST3), e25-e26 (PROE2-PROE3), e2-e3(ESQ7-ESQ9), e32-e33(HABIT1-HABIT3),
e35-e36(PRICE1-PRICE3), e62-e63(STIMA1-STIMA3), e47-e48(CS1-CS2), e41-e42
(CUEXP2-CUEXP3), e51-e52(CSR3-CSR5), e11-e12(CPV2-CPV4), e57-e58(PROQ1-
PROQ3), e17-e18(ISL1-ISL3), e28-e29(SQ5-SQ6), e39-e40(RBEX1-RBEX5), e8-
e9(LPRO2-LPRO4), e23-e24(CL3-CL5), e14-e15(SWC2-SWC4), e38-e40 (RBEX4-
RBEX5). According to Hair et al. (2010), using MI is acceptable to improve model fit, but
covariance should be drawn between variables in the same construct.
After MI, the whole model was run again, named CFA_2nd
run. The result is presented as
follows: CFA_2nd
run: P-value =0.000, cmin/df = 3.294 < 5 which is the threshold of
acceptable model, CFI=0.963>0.95, SRMR=0.024<0.08, RMSEA=0.028<0.06 and
PCLOSE=1.000>0.05, TLI=0.956 >0.9, GFI=0.936>0.9. The model is considered as an
excellent fit (Appendix 6.1).

211
6.3. Construct validity
“Construct validity is the extend to which a set of measured items actually reflects the
theoretical latent construct those items are designed to measure” (Hair et al., 2010:708). The
following contents will provide the criteria for construct validity test, followed by statistical
results from construct validity testing.
6.3.1. Convergent and discriminant validity
6.3.1.1. Convergent validity
That all indicators of a specific construct converge or share a high proportion of variance
is known as convergent validity (Hair et al., 2010). There are many ways to examine
convergent validity through factor loading, construct reliability and average variance
extracted. Firstly, factor loadings which should be higher than 0.5 or ideally 0.7 or higher.
Secondly, the average variance extracted (AVE) is the mean variance extracted for the items
loading on a construct. It is calculated by using standardised loading:
AVE= ∑ 𝑳𝒊^𝟐𝒏
𝒊=𝟏
𝒏
While Li represents the standardised factor loading and i is the number of items. That the
value of AVE is 0.5 or higher suggests adequate convergence.
Thirdly, construct reliability (composite reliability) is also considered an indicator of
convergent validity, it can be computed from the squared sum of factor loadings (Li) for each
construct and the sum of the error variance terms for a construct (ei) as follows:
CR= (∑ 𝑳𝒊)^𝟐𝒏
𝒊=𝟏
(∑ 𝑳𝒊)^𝟐𝒏𝒊=𝟏 + (∑ 𝒆𝒊)𝒏
𝒊=𝟏
The value of construct reliability is higher than 0.7 suggesting a good reliability.
6.3.1.2. Discriminant validity
“Discriminant validity is the extent to which a construct is truly distinct from other
constructs” (Hair et al., 2010:710). There are two criteria used for discriminant validity: the
variance extracted value should be higher than maximum shared variance (MSV) which is the

212
square of inter-correlation between two constructs and the square root of AVE should be
greater than inter-construct correlations (Fornell and Larcker, 1981).
6.3.1.3. Criteria summarizing
The criteria can be summarised as follows:
Convergent validity: CR > 0.7, AVE ≥ 0.5
Discriminant validity: AVE>MSV and the square root of AVE should be greater than inter-
construct correlations.
6.3.2. Results from construct validity
6.3.2.1. Convergent validity
Three main criteria of convergent validity were examined by the researcher. The results
are shown as follows:

213
Loadings Squared
loadings AVE 1-squared loading CR
ESQX1
ESQ8 <--- ESQX1 0.844 0.712
0.707
0.288 (Total loadings)^2 6.360
ESQ7 <--- ESQX1 0.862 0.743 0.257 total (1-squared loading) 0.879
ESQ9 <--- ESQX1 0.816 0.666 0.334 CR 0.879
STAC
STAC2 <--- STAC 0.91 0.828
0.665
0.172 (Total loadings)^2 5.837
STAC3 <--- STAC 0.879 0.773 0.227 total (1-squared loading) 1.006
STAC1 <--- STAC 0.627 0.393 0.607 CR 0.853
LPRO
LPRO3 <--- LRPO 0.853 0.728
0.672
0.272 (Total loadings)^2 6.037
LPRO2 <--- LRPO 0.818 0.669 0.331 total (1-squared loading) 0.985
LPRO4 <--- LRPO 0.786 0.618 0.382 CR 0.860
CPV
CPV3 <--- CPV 0.742 0.551
0.580
0.449 (Total loadings)^2 5.212
CPV2 <--- CPV 0.795 0.632 0.368 total (1-squared loading) 1.261
CPV4 <--- CPV 0.746 0.557 0.443 CR 0.805
SWC
SWC3 <--- SWC 0.766 0.587
0.626
0.413 (Total loadings)^2 5.626
SWC4 <--- SWC 0.791 0.626 0.374 total (1-squared loading) 1.123
SWC2 <--- SWC 0.815 0.664 0.336 CR 0.834
ALA
ALA4 <--- ALA 0.84 0.706
0.637
0.294 (Total loadings)^2 5.707
ALA3 <--- ALA 0.823 0.677 0.323 total (1-squared loading) 1.090
ALA2 <--- ALA 0.726 0.527 0.473 CR 0.840
ISL
ISL2 <--- ISL 0.7 0.490
0.514
0.510 (Total loadings)^2 4.610
ISL1 <--- ISL 0.771 0.594 0.406 total (1-squared loading) 1.459
ISL3 <--- ISL 0.676 0.457 0.543 CR 0.760
CL
CL4 <--- CL 0.807 0.651
0.571
0.349 (Total loadings)^2 5.117
CL5 <--- CL 0.758 0.575 0.425 total (1-squared loading) 1.288
CL3 <--- CL 0.697 0.486 0.514 CR 0.799
PROE
PROE2 <--- PROE 0.781 0.610
0.602
0.390 (Total loadings)^2 5.406
PROE3 <--- PROE 0.733 0.537 0.463 total (1-squared loading) 1.195
PROE1 <--- PROE 0.811 0.658 0.342 CR 0.819
SQ
SQ5 <--- SQ 0.758 0.575
0.557
0.425 (Total loadings)^2 5.013
SQ6 <--- SQ 0.763 0.582 0.418 total (1-squared loading) 1.328
SQ4 <--- SQ 0.718 0.516 0.484 CR 0.791
HABIT
HABIT2 <--- HABIT 0.768 0.590
0.639
0.410 (Total loadings)^2 5.746
HABIT3 <--- HABIT 0.825 0.681 0.319 total (1-squared loading) 1.083
HABIT1 <--- HABIT 0.804 0.646 0.354 CR 0.841
PRICE
PRICE2 <--- PRICE 0.676 0.457
0.648
0.543 (Total loadings)^2 5.765
PRICE1 <--- PRICE 0.847 0.717 0.283 total (1-squared loading) 1.055
PRICE3 <--- PRICE 0.878 0.771 0.229 CR 0.845
CUEXP
CUEXP2 <--- CUEXP 0.775 0.601
0.635
0.399 (Total loadings)^2 5.707
CUEXP3 <--- CUEXP 0.793 0.629 0.371 total (1-squared loading) 1.096
CUEXP1 <--- CUEXP 0.821 0.674 0.326 CR 0.839

214
TRUST
TRUST2 <--- TRUST 0.863 0.745
0.693
0.255 (Total loadings)^2 6.220
TRUST1 <--- TRUST 0.867 0.752 0.248 total (1-squared loading) 0.920
TRUST3 <--- TRUST 0.764 0.584 0.416 CR 0.871
RBEX
RBEX2 <--- RBEX 0.75 0.563
0.518
0.438 (Total loadings)^2 8.283
RBEX4 <--- RBEX 0.699 0.489 0.511 total (1-squared loading) 1.927
RBEX1 <--- RBEX 0.731 0.534 0.466 CR 0.811
RBEX5 <--- RBEX 0.698 0.487 0.513
CS
CS2 <--- CS 0.805 0.648
0.588
0.352 (Total loadings)^2 5.262
CS1 <--- CS 0.687 0.472 0.528 total (1-squared loading) 1.237
CS3 <--- CS 0.802 0.643 0.357 CR 0.810
CSR
CSR4 <--- CSR 0.804 0.646
0.634
0.354 (Total loadings)^2 5.703
CSR3 <--- CSR 0.806 0.650 0.350 total (1-squared loading) 1.099
CSR5 <--- CSR 0.778 0.605 0.395 CR 0.838
ESQX2
ESQ5 <--- ESQ 0.786 0.618
0.567
0.382 (Total loadings)^2 5.094
ESQ4 <--- ESQ 0.715 0.511 0.489 total (1-squared loading) 1.299
ESQ6 <--- ESQ 0.756 0.572 0.428 CR 0.797
PROQ
PROQ2 <--- PROQ 0.833 0.694
0.623
0.306 (Total loadings)^2 5.593
PROQ1 <--- PROQ 0.781 0.610 0.390 total (1-squared loading) 1.132
PROQ3 <--- PROQ 0.751 0.564 0.436 CR 0.832
CUSER
CUSER1 <--- CUSER 0.761 0.579
0.670
0.421 (Total loadings)^2 2.667
CUSER3 <--- CUSER 0.872 0.760 0.240 total (1-squared loading) 0.660
CR 0.801
STIMA
STIMA2 <--- STIMA 0.733 0.537
0.608
0.463 (Total loadings)^2 5.448
STIMA1 <--- STIMA 0.844 0.712 0.288 total (1-squared loading) 1.177
STIMA3 <--- STIMA 0.757 0.573 0.427 CR 0.822
Table 6.2: Values of CR and AVE of all constructs
(Source: Data analysis results from the author)
All the above results were calculated in the case of the whole model achieving an excellent fit
(CFA_2nd
run) with P-value =0.000, cmin/df = 3.294 < 5 which is the threshold of acceptable
model, CFI=0.963>0.95, SRMR=0.024<0.08, RMSEA=0.028<0.06 and
PCLOSE=1.000>0.05, TLI=0.956 >0.9, GFI=0.936>0.9. The model is considered as an
excellent fit (Figure 6.2). It means that the results from construct validity and discriminant
validity checking are reliable.

215
How to manually calculate the values of CR and AVE for ESQX1 will be presented in
detail below:
(Total loadings)^2 of ESQX1= (0.844+0.862+0.816) ^ 2
The sum of the error variance of ESQX1= total (1-squared loading) = (0.288+0.257+0.334)
Construct reliability of ESQX1 is calculated as follows:
CR (ESQX1) = (Total loadings)^2 of ESQX1
(𝑇𝑜𝑡𝑎𝑙 𝑙𝑜𝑎𝑑𝑖𝑛𝑔𝑠)2𝑜𝑓 𝐸𝑆𝑄𝑋1+𝑡𝑜𝑡𝑎𝑙 (1−𝑠𝑞𝑢𝑎𝑟𝑒𝑑 𝑙𝑜𝑎𝑑𝑖𝑛𝑔)
= (0.844+0.862+0.816)^2
((0.844+0.862+0.816)2+(0.288+0.257+0.334))
= 0.879
Average variance extracted of ESQX1 is calculated as follows:
Total squared loadings of ESQX1= (0.712+0.743+0.666)
AVE (ESQX1) = 𝑡𝑜𝑡𝑎𝑙 𝑠𝑞𝑢𝑎𝑟𝑒𝑑 𝑙𝑜𝑎𝑑𝑖𝑛𝑔𝑠
𝑡ℎ𝑒 𝑛𝑢𝑚𝑏𝑒𝑟 𝑜𝑓 𝑖𝑡𝑒𝑚𝑠 𝑖𝑛 𝑡ℎ𝑒 𝑐𝑜𝑛𝑠𝑡𝑟𝑢𝑐𝑡
= (0.712+0.743+0.666)
3
= 0.707
The CR of ESQX1 is 0.879 which is higher than 0.7, and the value of AVE is 0.707
which is higher than 0.5 and all of loadings of ESQ8, ESQ7, ESQ9 are 0.844, 0.862, 0.816
respectively which are above 0.5. All values including CR, AVE and loading coefficients are
satisfied. Therefore, ESQX1 has no problem with convergent validity.
Applying the same calculation techniques as presented above to investigate a convergent
validity of other factors, all examined constructs have no problem with convergent validity
when composite reliability are all higher than 0.7, the value of AVE of all constructs is higher
than 0.5 and the loading coefficients of all variables in the same constructs are above 0.5 (See
Table 6.2).
In conclusion, the whole model achieved excellent fit and all 21 extracted factors
achieved convergent validity when all CR value of constructs are higher than 0.7, the value of

216
AVE of all constructs are higher than 0.5 and the loading coefficients of all items in each
construct are higher than 0.5. All constructs have no problem with convergent validity.
6.3.2.2. Discriminant validity
By using Amos version 24 to compute the value of maximum shared variance (MSV),
the square root of AVE, inter-construct correlations, the results are shown as follows:
Table 6.3: Results from CFA_2th
run_Discriminant validity checking
(Source: Data analysis results from the author)
Master validity plugin used is from Gaskin and Lim (2016)
As summarised in section 6.3.1.3, the criteria of constructs getting discriminant validity
are: AVE>MSV and the square root of AVE should be greater than inter-construct
correlations. The results from table 6.3 show that all constructs achieved its discriminant
validity except a RBEX construct when the square root of the AVE for RBEX is less than its
correlation with CUEXP and CSR. While the square root of the AVE for RBEX is 0.720, its
correlation with CUEXP and CSR are 0.791*** and 0.727*** respectively, and in this case,
the value of AVE (0.518) is less than the value of MSV (0.626). Therefore, only RBEX could
not get discriminant validity at the second run of CFA (CFA_2nd
run). In order to solve this
problem, RBEX is examined. As the result of CFA_2nd
run, RBEX was found to have strong
correlation with CUEXP, the correlation value is 0.791 and RBEX5 showed its lowest
loading for RBEX with the coefficient of 0.698 (table 6.2). Therefore, RBEX5 was removed
from the model after CFA_2nd
run. CFA_3rd
run was conducted in order to check RBEX
discriminant validity.

217
Table 6.4: Results from CFA_2nd
run, the correlation between RBEX and other
constructs
(Source: Data analysis results from the author)
After removing RBEX5, CFA_3rd
run with P-value =0.000, cmin/df = 3.298 < 5 which is
the threshold of acceptable model, CFI=0.964>0.95, SRMR=0.024<0.08,
RMSEA=0.028<0.06 and PCLOSE=1.000>0.05, TLI=0.957 >0.9, GFI=0.937>0.9. The
model is remaining as excellent fit.
Measure Estimate Threshold Interpretation
CMIN 5282.769 -- --
DF 1602 -- --
CMIN/DF 3.298 <5 Acceptable
CFI 0.964 >0.95 Excellent
SRMR 0.024 <0.08 Excellent
RMSEA 0.028 <0.06 Excellent
PClose 1 >0.05 Excellent
Table 6.5: Model fit from CFA_3rd
run
(Source: Data analysis results from the author)
Table 6.6: Results from CFA_3th
run_ Discriminant validity checking
(Source: Data analysis results from the author)
Master validity plugin used is from Gaskin and Lim (2016)

218
The results from table 6.6 show that all constructs achieved their discriminant validity
except a RBEX construct when the square root of the AVE for RBEX is still less than its
correlation with CUEXP. While the square root of the AVE for RBEX is 0.732, its
correlation with CUEXP and 0.788***, and this case, the value of AVE (0.535) is less than
the value of MSV (0.605). Therefore, only RBEX could not get discriminant validity at the
second run of CFA (CFA_3rd
run). In order to solve this problem, RBEX is examined. As the
result of CFA_3rd
run, RBEX was found to have strong correlation with CUEXP, the
correlation value is 0.778 and RBEX4 showed its lowest loading for RBEX with the
coefficient of 0.697. Therefore, RBEX4 was removed from the model after CFA_3rd
run.
CFA_4th
run was conducted in order to check RBEX discriminant validity, other constructs in
the model have no problem with discriminant validity.
Table 6.7: Results from data analysis (CFA_3rd
run)
(Source: Data analysis results from the author)
After removing RBEX4, CFA_4th
run with P-value =0.000, cmin/df = 3.166 < 5 which is
the threshold of acceptable model, CFI=0.966>0.95, SRMR=0.024<0.08,
RMSEA=0.027<0.06 and PCLOSE=1.000>0.05, TLI=0.960 >0.9, GFI=0.941>0.9. The
model is remaining as excellent fit.
Measure Estimate Threshold Interpretation
CMIN 4882.727 -- --
DF 1542 -- --
CMIN/DF 3.166 <5 Acceptable
CFI 0.966 >0.95 Excellent
SRMR 0.024 <0.08 Excellent
RMSEA 0.027 <0.06 Excellent
Pclose 1 >0.05 Excellent
Table 6.8: Model fit of CFA_4th
run

219
Table 6.9: Results from CFA_4th
run_ Discriminant validity checking
(Source: Data analysis results from the author)
At the fourth CFA running (CFA_4th
run), the results showed no discriminant validity
concerns for all constructs when the AVE values were higher than 0.5 and higher than MSV,
the square root value of AVE for all constructs is greater than that of inter-construct
correlations. Therefore, all constructs achieved its discriminant validity. All values of AVE
and CR of 21 constructs were re-calculated (Table 6.10).
Number Constructs CR AVE
1 ESQX1 0.879 0.707
2 STAC 0.853 0.665
3 LPRO 0.86 0.672
4 CPV 0.805 0.58
5 SWC 0.833 0.625
6 ISL 0.76 0.514
7 ALA 0.84 0.636
8 CL 0.799 0.571
9 PROE 0.819 0.601
10 SQ 0.791 0.558
11 HABIT 0.841 0.639
12 PRICE 0.845 0.648
13 RBEX 0.745 0.594
14 CUEXP 0.838 0.634
15 TRUST 0.871 0.693
16 CS 0.809 0.587
17 CSR 0.838 0.634
18 ESQX2 0.797 0.567
19 PROQ 0.832 0.622
20 CUSER 0.801 0.669
21 STIMA 0.822 0.607
Table 6.10: Final results from CFA_4thrun_Values of AVE and CR of all constructs
(Source: Data analysis results from the author)

220
6.3.2.3. Conclusion
There are no convergent validity and discriminant validity concerns for all constructs.
After CFA_4th
run, RBEX5, RBEX4 have been eliminated, there are 61 measured variables
remaining in 21 factors in the dataset. The model is remaining as an excellent fit (Appendix
6.2). The following table summarises the four CFA running:
Measure CMIN/DF CFI SRMR RMSEA Pclose GFI TLI p-value Model fit
CFA_1strun 3.691 0.956 0.029 0.03 1 0.928 0.949 0 With 63 variable, then MI checking Excellent
Estimate
CFA_2ndrun 3.294 0.963 0.024 0.028 1 0.936 0.956 0 Run after MI checking Excellent
CFA_3rdrun 3.298 0.964 0.024 0.028 1 0.937 0.957 0 RBEX5 removed =>62 variables remained Excellent
CFA_4thrun 3.166 0.966 0.024 0.027 1 0.941 0.96 0 RBEX4 removed=>61 variables remained Excellent
Threshold <5 >0.95 <0.08 <0.06 >0.05 >0.9 >0.9 <0.001
Table 6.11: Summarising results of CFA model fit
6.4. Common method bias
X2 DF Delta p-
value
Unconstrained Model 4857.06 1543 X2=0.000
1.000
Zero Constrained Model 4857.06 1543 DF=0
Table 6.12: Results from zero constraints test
(Tool used from Gaskin and Lim, 2017)
It can be noted that P-value is 1.000 >0.05. The null hypothesis cannot be rejected (i.e.,
the constrained and unconstrained models are the same or “invariant”). It was unable to
detect any specific response bias affecting the model. Therefore, no bias distribution test was
made (of equal constraints). With CLF, the model fit remained unchanged. The above result
demonstrated that common method bias is not a threat in this research (Appendix 6.3 presents
full results of common method bias testing).
6.5. Final measurement model fit
As presented above, the model fit after CFA_4th
run is considered as an excellent fit. The
final model fit is demonstrated as below with P-value =0.000, cmin/df = 3.166 < 5 which is
the threshold of acceptable model, CFI=0.966>0.95, SRMR=0.024<0.08,
RMSEA=0.027<0.06 and PCLOSE=1.000>0.05, TLI=0.960 >0.9, GFI=0.941>0.9. The
model is remaining as excellent fit.

221
6.6. Structural models
6.6.1. Multivariate assumptions
6.6.1.1. Outliers and influentials
“Outliers are observations with a unique combination of characteristics identifiable as
distinctly different from the other observations” (Hair et al., 2010:64). The assumption of
multivariate statistical analyses requires no multivariate outliers. Some methods to detect
outliers in multivariate analysis, are Mahalanobis’S Distance (MD) or Cook’s D. In this
research, Cook’s D method was used.
There are several different thresholds to detect outliers, if its value (Cook’s distance) is
greater than 1, it is an influential record. Therefore, it should be removed from the dataset
before multivariate analysis is conducted. In the graph, the bigger the number presented; the
bigger influence that observation response has on the regression between the examined
variables.

222
Figure 6.2: Results from outlier testing_Cook’s distance analysis
In this research, Cook’s distance analysis was checked three times between many
dependent variables and independent variables to determine if any (multivariate) influential
outliers existed. No case observed a Cook’s distance greater than 1. The values of Cook’s
distances in all cases were lower than 0.035 (very small). Therefore, there is no problem with
multivariate outliers.
6.6.1.2. Multicollinearity analysis
Multicollinearity occurs when two or more independent variables are highly correlated, it
makes interpretation less reliable. The value of tolerance and MAX-VIF in regression can be

223
used to check this phenomenon (Hair et al., 2010). According to Hair et al. (2010), if the
value of tolerance is higher than 0.1 and MAX-VIF is below 10, there will be no
multicollinearity occurring.

224
Table 6.13: Multicollinearity analysis
(Source: Data analysis results from the author)
The result shows that VIF of all constructs checked are lower than 10 and the values of
tolerance are far higher than 0.1. Therefore, there is no problem with multicollineary in this
research.
6.6.2. Structural model validity
After modifying the model fit and drawing the links which represent relationships
between constructs, in this step, 5 variables: INCOME, LOCATION, AGE, GENDER, Q4
(which strategic groups or supermarkets that respondents often choose to shop?) were input
to the model to investigate the relationships between them and 3 dependent variables (CPV,
CS, CL). The initial SEM was created. At SEM_1strun, the model is fit with P-value =0.000,
cmin/df = 9.307, CFI=0.997>0.95, SRMR=0.005<0.08, RMSEA=0.053<0.06 and
PCLOSE=0.207>0.05, TLI=0.955>0.9, GFI=0.995>0.9. The model fits and results are
reliable (see Appendix 6.4 for the model and full statistical results).

225
6.6.3. Results from hypothesis testing
6.6.3.1. Direct effects
At SEM_1strun, the model is fit with P-value =0.000, cmin/df = 9.307, CFI=0.997>0.95,
SRMR=0.005<0.08, RMSEA=0.053<0.06 and PCLOSE=0.207>0.05, TLI=0.955>0.9,
GFI=0.995>0.9. The model is fit and results are reliable. The result shows that CUEXP,
PROQ, RBEX, CSR, INCOME, GENDER, LOCATION, AGE do not affect customer
perceived value (CPV); GENDER, AGE, Q4, STAC do not affect customer satisfaction (CS),
Q4, LOCATION, AGE, GENDER, CSR, PROQ, CPV do not affect customer loyalty (CL)
when its p-value is higher than 0.05. Therefore, the relationships between these items and
CPV, CS, CL should be removed from the model in order to achieve a better fit.
SEM_2nd
run was conducted (Figure 6.3), P-value =0.000, cmin/df = 5.915,
CFI=0.998>0.95, SRMR=0.006<0.08, RMSEA=0.041<0.06 and PCLOSE=0.991>0.05,
TLI=0.978>0.9, GFI=0.995>0.9. The model retains its excellent fit (see Appendix 6.5 for full
results)
Figure 6.3: The second SEM (SEM_2nd
run)

226
The results are summarised in the following table:
Measure CMIN/DF CFI SRMR RMSEA Pclose GFI TLI p-
value Model fit
SEM SEM_1strun 9.307 0.997 0.005 0.053 0.207 0.995 0.955 0.000
Initial SEM, then remove all relationships that are not significant
Excellent
SEM_2rdrun 5.915 0.998 0.006 0.041 0.991 0.995 0.978 0.000 Final SEM used Excellent
Threshold >0.95 <0.08 <0.06 >0.05 >0.9 >0.9 <0.001
Table 6.14: Summarising results from SEM running (SEM_1strun, SEM_2
ndrun)
The relationships between constructs relating to customer perceived value (CPV) have
been presented at table 6.15. In that, H20A, H13A, H23, H19A, H17B, H9A, H12A, H16,
H5A have shown statistically significant results as P-value was lower than 0.05, the “***” at
p-value represents for its values of lower than 0.001. Therefore, these hypotheses were
supported.
The hypotheses of H21A, H22A, H1A, H2A, H3A, H4A were not supported when its p-
values were higher than 0.05. The hypothesis of H17A is statistically significant as its p-value
was lower than 0.05 but not supported because the standardised loading was -0.113 which is
inconsistent with the hypothesis that there is a positive relationship between ESQX1 and
CPV.
In such tables, a light green colour represents “supported” result, light amber
demonstrates “supported (weak)” and mixed pink and light red will illustrate “not supported”.
Yellow presents for “significant but not supported”.
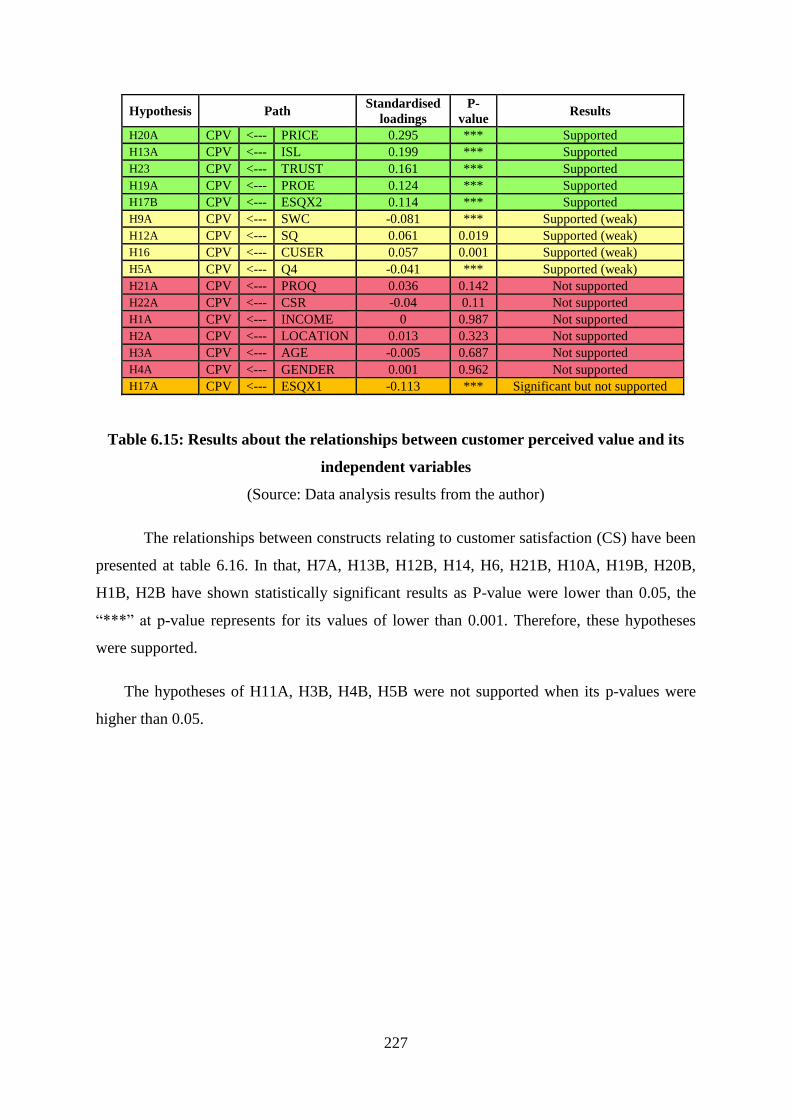
227
Hypothesis Path Standardised
loadings
P-
value Results
H20A CPV <--- PRICE 0.295 *** Supported
H13A CPV <--- ISL 0.199 *** Supported
H23 CPV <--- TRUST 0.161 *** Supported
H19A CPV <--- PROE 0.124 *** Supported
H17B CPV <--- ESQX2 0.114 *** Supported
H9A CPV <--- SWC -0.081 *** Supported (weak)
H12A CPV <--- SQ 0.061 0.019 Supported (weak)
H16 CPV <--- CUSER 0.057 0.001 Supported (weak)
H5A CPV <--- Q4 -0.041 *** Supported (weak)
H21A CPV <--- PROQ 0.036 0.142 Not supported
H22A CPV <--- CSR -0.04 0.11 Not supported
H1A CPV <--- INCOME 0 0.987 Not supported
H2A CPV <--- LOCATION 0.013 0.323 Not supported
H3A CPV <--- AGE -0.005 0.687 Not supported
H4A CPV <--- GENDER 0.001 0.962 Not supported
H17A CPV <--- ESQX1 -0.113 *** Significant but not supported
Table 6.15: Results about the relationships between customer perceived value and its
independent variables
(Source: Data analysis results from the author)
The relationships between constructs relating to customer satisfaction (CS) have been
presented at table 6.16. In that, H7A, H13B, H12B, H14, H6, H21B, H10A, H19B, H20B,
H1B, H2B have shown statistically significant results as P-value were lower than 0.05, the
“***” at p-value represents for its values of lower than 0.001. Therefore, these hypotheses
were supported.
The hypotheses of H11A, H3B, H4B, H5B were not supported when its p-values were
higher than 0.05.

228
Hypothesis Path Standardised
loadings P-value Results
H7A CS <--- CPV 0.301 *** Supported
H13B CS <--- ISL 0.24 *** Supported
H12B CS <--- SQ 0.214 *** Supported
H14 CS <--- STIMA 0.188 *** Supported
H6 CS <--- CUEXP 0.148 *** Supported
H21B CS <--- PROQ 0.144 *** Supported
H10A CS <--- ALA -0.113 *** Supported
H9B CS <--- SWC 0.071 *** Supported (weak)
H20B CS <--- PRICE 0.051 *** Supported (weak)
H1B CS <--- INCOME 0.025 0.007 Supported (weak)
H2B CS <--- LOCATION 0.02 0.024 Supported (weak)
H11A CS <--- RBEX 0.03 0.139 Not supported
H3B CS <--- AGE 0.006 0.546 Not supported
H4B CS <--- GENDER 0.018 0.05 Not supported
H5B CS <--- Q4 0.003 0.722 Not supported
Table 6.16: Results about the relationships between customer satisfaction and its
independent variables
(Source: Data analysis results from the author)
The relationships between constructs related to customer loyalty (CL) have been
presented at table 6.17. In that, H11B, H12C, H8, H19B, H9C, H17D, H10B, , H20C, H24,
H1C have shown its statistical significantly results as P-value were lower than 0.05, the
“***” at p-value represents for its values of lower than 0.001. Therefore, these hypotheses
were supported.
The hypotheses of H7B, H22B, H21C, H5C, H2C, H3C, H4C were not supported when
its p-values were higher than 0.05. The hypotheses of H17C, H15, H18 were statistically
significant as its p-value was lower than 0.5 but not supported because the standardized
loading was -0.076, -0.069, -0.038 respectively which is inconsistent with hypothesis that
there are a positive relationship between ESQX1, STAC, LPRO and CS.

229
Hypothesis
Path Standardised
loadings
P-
value Results
H11B CL <--- RBEX 0.306 *** Supported
H12C CL <--- SQ 0.179 *** Supported
H8 CL <--- CS 0.178 *** Supported
H19B CL <--- PROE 0.141 *** Supported
H9C CL <--- SWC 0.113 *** Supported
H17D CL <--- ESQX2 0.106 *** Supported
H10B CL <--- ALA -0.101 *** Supported
H20C CL <--- PRICE 0.069 *** Supported (weak)
H24 CL <--- HABIT 0.057 *** Supported (weak)
H1C CL <--- INCOME 0.024 0.017 Supported (weak)
H7B CL <--- CPV -0.158 0.126 Not supported
H22B CL <--- CSR -0.013 0.547 Not supported
H21C CL <--- PROQ -0.015 0.474 Not supported
H5C CL <--- Q4 -0.022 0.056 Not supported
H2C CL <--- LOCATION 0.009 0.441 Not supported
H3C CL <--- AGE -0.016 0.135 Not supported
H4C CL <--- GENDER 0.009 0.4 Not supported
H17C CL <--- ESQX1 -0.076 *** Significant but not supported
H15 CL <--- STAC -0.069 *** Significant but not supported
H18 CL <--- LPRO -0.038 0.018 Significant but not supported
Table 6.17: Results about the relationships between customer loyalty and its
independent variables
(Source: Data analysis results from the author)
The results can be summarized as follows (Figure 6.9) and the number is the path
coefficients, the significant influences are black-solid lines, significant influences are black-
dash lines and yellow dash lines represent for a statistically significant result but not
supported compared with original proposed hypotheses.

230
-0.101***
0.0
57***
0.301***
0.0
61***
Having a direct effect
Having no direct effects
Significantly but not supported
Figure 6.4: The results of revised model of this research
Instore
logistics
ssss
A core e-
service
quality
Service
qauality
Customer
service
Customer
experience
Retail brand
experience
Product
quality Price
Corporate social
responsibility
Store
image
Habit
Trust
Switching
costs
Alternative
attractiveness
Loyalty
programs
ss
Promotion
effects
CUSTOMER
PERCEIVED VALUE
Store
accessibility
CUSTOMER
LOYALTY
CUSTOMER
SATISFACTION
Gender Age Strategic groups Income Location Control variables *** p<0.001, ** p<0.01, * p<0.05
Website
quality
scale

231
6.6.3.4. Multigroup analysis
Multigroup analysis is designed to investigate whether the model is the same between
groups. Prior to the structural invariance test, measurement invariance should be assessed to
determine if the model is invariant across examined groups. This test is regarded as another
type of moderation test (Hair et al., 2006). The chi-square difference test is a well-known
acceptable method for assessing measurement invariance. The chi-square test showing p-
value being higher than 0.05 means that the measurement models are invariant. This research
used the chi-square test to investigate between many groups including strategic groups
(between different supermarket business models), gender, income, age ranges, locations,
occupation and education levels. In addition, in some cases, when the chi-square test cannot
present the whole results, critical ratio (z-score) will be used to investigate differences
between groups (section 6.6.3.4.6.2 and 6.6.3.4.6.3). It should be noted that this section will
only present all statistical results about diffences across groups for factors related to customer
perceived value, customer satisfaction and customer loyalty which are fully summarised at
Appendix 7.1, 7.2, 7.3. Discussion will be presented in Chapter 7. However, based on the
objectives of this research, the researcher is only going to fully investigate and discuss
differences between groups for factors related to customer loyalty, which will be presented at
section 7.5.
6.6.3.4.1. Comparison between retail strategic groups
The following contents will present the statistical results of multigroup analysis, see
section 4.1.2 (Phase One - Section two-question 4) for understanding how supermarkets were
divided into different strategic groups (different supermarket business models). The brief
summaryg of the five main strategic Vietnamese supermarkets is demonstrated as below:
GROUP 1: The group of specilised daily consumer goods (Coopmart or BigC)
GROUP 2: The group of multipurpose premium supermarkets 1 (Lotte mart)
GROUP 3: Premium supermarket chains with convenience stores (Vinmart)
GROUP 4: The group of multipurpose supermarkets 2 (Aeon)
GROUP 5: Other supermarkets

232
Comparison between COOP or BIGC ad LOTTE MART
The model is fit with P-value =0.000, cmin/df = 3.083, CFI=0.997>0.95,
SRMR=0.006<0.08, RMSEA=0.032<0.06 and PCLOSE=1.000>0.05, TLI=0.974>0.9,
GFI=0.993>0.9. The model is fit and results are reliable.
X2 DF
Unconstrained 154.168 50
Constrained 213.898 83
P-Value 0.003
Path Name
Coopmart
or BigC
Beta
Lotte Mart
Beta
Difference in
Betas
P-Value for
Difference Interpretation
SQ → CPV. 0.062† 0.209** -0.147 0.069 The positive relationship between CPV and SQ is stronger for Lotte Mart.
ESQX2 → CL. 0.043 0.208*** -0.165 0.014 The positive relationship between CL and ESQX2 is stronger for Lotte Mart.
ALA → CL. -0.060*** -0.228*** 0.168 0.000 The negative relationship between CL and ALA is stronger for Lotte Mart.
ISL → CS. 0.208*** 0.306*** -0.098 0.079 The positive relationship between CS and ISL is stronger for Lotte Mart.
PRICE → CL. 0.061** 0.158*** -0.096 0.055 The positive relationship between CL and PRICE is stronger for Lotte Mart.
INCOME → CS. 0.011 0.084*** -0.073 0.01 The positive relationship between CS and INCOME is stronger for Lotte Mart.
PROE → CPV. 0.153*** 0.024 0.129 0.028 The positive relationship between CPV and PROE is stronger for Coopmart or BigC.
SQ → CS. 0.224*** 0.107* 0.117 0.030 The positive relationship between CS and SQ is stronger for Coopmart or BigC.
RBEX → CL. 0.326*** 0.219*** 0.107 0.088 The positive relationship between CL and RBEX is stronger for Coopmart or BigC.
STIMA → CS. 0.216*** 0.129** 0.087 0.088 The positive relationship between CS and STIMA is stronger for Coopmart or BigC.
Table 6.M.1: Multigroup analysis for COOP or BIGC ad LOTTE MART
(Source: Data analysis results from the author
Tool used from Gaskin and Lim (2018))
The p-value of the chi-square difference test is significant as p-value is 0.003 which is
lower than 0.1 (10%). Therefore, the model differs across groups.
The main differences between the two groups will present as follows. Consumers from
the group of multipurpose premium supermarkets 1 (Lotte mart) are concerned more with
service and e-service quality while consumers from the group of specilised daily consumer
goods (Coopmart or BigC) are not. In that, there is a positive and strong relationship between
service quality and customer perceived value, between e-service quality related to E-S-QUAL
and customer loyalty was found in the group of multipurpose premium supermarkets while
that relationship at the group of specilised daily consumer goods were not found.

233
The strong impact of promotion on customer perceived value of consumers from the
group of specilised daily consumer goods was not replicated among consumers from the
group of multipurpose premium supermarkets 1. The impact of service quality and store
image on customer satisfaction is stronger for the group of specilised daily consumer goods
and the level of consumers’ retail brand experience affecting customer loyalty in this group is
also higher than the group of multipurpose premium supermarkets 1.
Especially, at the group of multipurpose premium supermarkets 1, if consumers perceive
high alternative attractiveness, the level of loyalty decreases by 22.8%, while this figure of
consumers from the group of specialised daily consumer goods is only 6%. At the group of
multipurpose premium supermarkets 1, price was found to have a strong and positive impact
on customer loyalty. However, among the group of specialised daily consumer goods, price
has a low impact on customer loyalty, and it can explain only 6.1% variation in customer
loyalty.
The positive relationship between customer satisfaction and in-store logistics is stronger
for the group of multipurpose premium supermarkets 1. Income was found to have a slightly
positive influence on customer satisfaction at the group of multipurpose premium
supermarkets 1 while this relationship could not be found at the group of specialised daily
consumer goods. At the group of multipurpose premium supermarkets 1, consumers with
higher income seem to be more satisfied than consumers with lower income.
Comparison between COOP or BIGC ad VINMART
The model is fit with P-value =0.000, cmin/df = 3.652, CFI=0.997>0.95,
SRMR=0.008<0.08, RMSEA=0.030<0.06 and PCLOSE=1.000>0.05, TLI=0.976>0.9,
GFI=0.994>0.9. The model is fit and results are reliable.

234
X2 DF
Unconstrained 181.62 50
Constrained 238.59 83
P-Value 0.006
Path Name
Coopmart
or BigC
Beta
Vinmart
Beta
Difference
in Betas
P-Value for
Difference Interpretation
ESQX2 → CL. 0.043 0.159*** -0.116 0.043 The positive relationship between CL and ESQX2 is stronger for Vinmart.
PRICE → CPV. 0.263*** 0.365*** -0.102 0.015 The positive relationship between CPV and PRICE is stronger for Vinmart.
CUEXP → CS. 0.119*** 0.219*** -0.1 0.045 The positive relationship between CS and CUEXP is stronger for Vinmart.
ALA → CL. -0.060*** -0.172*** 0.113 0.001 The negative relationship between CL and ALA is stronger for Vinmart.
STIMA → CS. 0.216*** 0.107** 0.109 0.019 The positive relationship between CS and STIMA is stronger for Coopmart or BigC.
Table 6.M.2: Multigroup analysis for COOP or BIGC and VINMART
(Source: Data analysis results from the author
Tool used from Gaskin and Lim (2018))
The p-value of the chi-square difference test is significant as p-value is 0.006 which is
lower than 0.1 (10%). Therefore, the model differs across groups.
At the group of premium supermarket chain with convenience stores, higher perceived
alternative attractiveness decreases the loyal level, alternative attractiveness can negatively
explain 17.2 percent variation in customer loyalty, while the figure of the group of specialised
daily consumer goods is only 6 percent. This research also revealed that e-service quality
related to E-S-QUAL is one of the main indicators of customer loyalty at the group of
premium supermarket chain with convenience stores, while there was no suchrelationship
found at the group of specialised daily consumer goods.
The positive relationships between price and customer perceived value, customer
experience and customer satisfaction are stronger for the group of premium supermarket
chain with convenience stores. In contrast, the postive relationship between store image and
customer satisfaction is stronger for the group of specialised daily consumer goods.

235
Comparison between Lotte Mart and Vinmart
The model is fit with P-value =0.000, cmin/df = 2.126, CFI=0.997>0.95,
SRMR=0.009<0.08, RMSEA=0.035<0.06 and PCLOSE=0.997>0.05, TLI=0.968>0.9,
GFI=0.990>0.9. The model is fit and results are reliable.
X2 DF
Unconstrained 106.32 50
Constrained 150.05 83
P-Value 0.1
Path Name Lotte Mart
Beta
Vinmart
Beta
Difference
in Betas
P-Value for
Difference Interpretation
SQ → CPV. 0.209** -0.032 0.241 0.014 The positive relationship between CPV and SQ is stronger for Lotte Mart.
PRICE → CL. 0.158*** 0.009 0.149 0.016 The positive relationship between CL and PRICE is stronger for Lotte Mart.
CUSER → CPV. -0.008 0.119** -0.128 0.031 The positive relationship between CPV and CUSER is stronger for Vinmart.
SQ → CS. 0.107* 0.220*** -0.113 0.067 The positive relationship between CS and SQ is stronger for Vinmart.
Table 6.M.3: Multigroup analysis for Lotte Mart and Vinmart
(Source: Data analysis results from the author
Tool used from Gaskin and Lim (2018))
The p-value of the chi-square difference test is not significant at 10% as p-value is much
higher than 0.1. However, there are some small differences about relationships between
constructs which should be examined.
Price was found to have no impact on customer loyalty and service quality has no
influence on customer perceived value at the group of premium supermarket chain with
convenience stores, while the above relationship was found at the group of multipurpose
premium supermarkets 1. At the group of multipurpose premium supermarkets 1, service
quality is one of the main indicators of customer perceived value and it can explain 20.9
percent variation in customer perceived value and the figure of how price influences
customer loyalty is 15.8 percent. At the group of premium supermarket chain with
convenience stores, no such relationships were found. In contrast, at the group of
multipurpose premium supermarkets 1, customer service was found having no impact on
customer perceived value while at the group of premium supermarket chain with convenience
stores, customer service can describe 11.9 percent variation in customer perceived value. The
final difference between these two groups is the effect of service quality on customer
satisfaction which is strongest for the group of premium supermarket chains with
convenience stores.

236
Comparison between COOP or BIGC and AEON
The model is fit with P-value =0.000, cmin/df = 2.847, CFI=0.997>0.95,
SRMR=0.006<0.08, RMSEA=0.032<0.06 and PCLOSE=1.000>0.05, TLI=0.977>0.9,
GFI=0.993>0.9. The model is fit and results are reliable.
X2 DF
Unconstrained 142.368 50
Constrained 186.359 83
P-Value 0.096
Path Name
Coopmart
or BigC
Beta
Aeon Beta Difference
in Betas
P-Value
for
Difference
Interpretation
PROE → CL. 0.170*** 0.019 0.151 0.034 The positive relationship between CL and PROE is stronger for Coopmart or BigC.
ESQX2 → CL. 0.043 0.173* -0.13 0.094 The positive relationship between CL and ESQX2 is stronger for Aeon.
TRUST → CPV. 0.130*** 0.278*** -0.148 0.063 The positive relationship between CPV and TRUST is stronger for Aeon.
ALA → CS. -0.105*** -0.173*** 0.067 0.065 The negative relationship between CS and ALA is stronger for Aeon.
SQ → CS. 0.224*** 0.323*** -0.099 0.055 The positive relationship between CS and SQ is stronger for Aeon.
PROQ → CS. 0.119*** 0.300*** 0.181 0.006 The positive relationship between CS and PROQ is stronger for Aeon.
Table 6.M.4: Multigroup analysis for COOP or BIGC and AEON
(Source: Data analysis results from the author
Tool used from Gaskin and Lim (2018))
The p-value of the chi-square difference test is significant as p-value is 0.096 which
lower than 0.1 (10%). Therefore, the model differs across groups.
Promotion is one of the main indicators of customer loyalty at the group of specialised
daily consumer goods but no above impact was found at the group of multipurpose
supermarkets 2. In contrast, e-service quality related to E-S-QUAL can positively describe
17.3 percent variation in customer loyalty at the group of multipurpose supermarkets 2 but it
has no effect on customer loyalty at the group of specialised daily consumer goods. The
positive relationship between trust and customer peceived value, alternative
attractiveness/service quality/product quality and customer satisfaction is stronger for the
group of multipurpose supermarkets 2.
6.6.3.4.2. Comparison between gender
The model is fit with P-value =0.000, cmin/df = 3.652, CFI=0.997>0.95,
SRMR=0.008<0.08, RMSEA=0.030<0.06 and PCLOSE=1.000>0.05, TLI=0.976>0.9,
GFI=0.994>0.9. The model is fit and results are reliable.

237
X2 DF
Unconstrained 197.232 54
Constrained 250.172 88
P-Value 0.02
Path Name MALE
Beta
FEMALE
Beta
Difference
in Betas
P-Value for
Difference Interpretation
PRICE → CPV. 0.220*** 0.326*** -0.105 0.039 The positive relationship between CPV and PRICE is stronger for FEMALE.
ALA → CS. -0.139*** -0.102*** -0.037 0.054 The negative relationship between CS and ALA is stronger for MALE.
PROE → CL. 0.212*** 0.110*** 0.102 0.032 The positive relationship between CL and PROE is stronger for MALE.
Table 6.M.5: Multigroup analysis for gender
(Source: Data analysis results from the author
Tool used from Gaskin and Lim (2018))
The p-value of the chi-square difference test is significant as p-value is 0.02 which is
lower than 0.1 (10%). Therefore, the model differs across groups.
Detailed investigation of the relationship between constructs of male and female was
conducted. The main differences between female and male perceptions are presented as
follows. That the positive relationship between price and customer perceived value is
stronger for females means that their perceived value is strongly affected by price; the
influence level is weaker for male. The negative relationship between alternative
attractiveness and customer satisfaction is stronger for males. Higher perceived alternative
attractiveness leads to reductions in the level of satisfaction and this relationship is weaker for
females. Another result relating to gender-group comparison is that the positive relationship
between promotion and customer loyalty is stronger for males. It means that promotion
effects lead to stronger loyalty behaviour for males where promotion can explain 21.2 % in
variation of customer loyalty while that for females is 11%.
6.6.3.4.3. Comparison between income groups
Based on the market where the data for research was collected income which is lesthan 5
million VND (GB£170) is considered “low”; income from 5 to 10 million VND (GB£170-
340) is considered “medium”; income from 10-20 million VND (GB£340-680) is considered
“medium-high”, and income from 20-50 million VND (GB£680-1700GBP) is considered
“high” (Based on comments of the retailing expert Pham Xuan Lan, who is an associate

238
professor at University of Economics Ho Chi Minh City in Vietnam, collected at Phase One
in this research,)
Comparison between income of “under 5 million VND (GB£170GB)” and “from 5 to 10
million VND (GB£170-340 GBP)” groups
The model is fit with P-value =0.000, cmin/df = 3.084, CFI=0.997>0.95,
SRMR=0.006<0.08, RMSEA=0.031<0.06 and PCLOSE=1.000>0.05, TLI=0.976>0.9,
GFI=0.993>0.9. The model is fit and results are reliable.
X2 DF
Unconstrained 160.36 52
Constrained 238.89 84
P-Value 0.000
Path Name
Under 5
million VND
Beta
From 5-10
million
VND Beta
Difference
in Betas
P-Value
for
Difference
Interpretation
SQ → CPV. 0.006 0.156** -0.15 0.016 The positive relationship between CPV and SQ is stronger for From 5-10 million VND.
CUSER → CPV. 0.035 0.106*** -0.072 0.086 The positive relationship between CPV and CUSER is stronger for From 5-10 million VND.
PRICE → CPV. 0.351*** 0.189*** 0.162 0.000 The positive relationship between CPV and PRICE is stronger for Under 5 million VND.
CPV → CS. 0.287*** 0.346*** -0.058 0.057 The positive relationship between CS and CPV is stronger for From 5-10 million VND.
STIMA → CS. 0.238*** 0.121*** 0.117 0.007 The positive relationship between CS and STIMA is stronger for Under 5 million VND.
SQ → CL. 0.131*** 0.284*** -0.154 0.011 The positive relationship between CL and SQ is stronger for From 5-10 million VND.
PRICE → CL. 0.111*** -0.029 0.139 0.001 The positive relationship between CL and PRICE is stronger for Under 5 million VND.
Table 6.M.6: Multigroup analysis for “under 5 million VND (GB£170)” and “from 5 to
10 million VND (GB£170-340)” income groups
(Source: Data analysis results from the author
Tool used from Gaskin and Lim (2018))
The p-value of the chi-square difference test is significant as p-value is 0.000 which
lower than 0.1 (10%). Therefore, the model differs across groups.
The above results show that service quality which relates to how service employees treat
their consumers and customer service only influence customer perceived value in a medium
income group; while with low income consumers (under GB£170 per month), the
relationship between service quality and customer service on customer perceived value was
not supported. Besides that, price has a strong and positive impact on customer perceived
value among low income consumers, with the influence level decreasing among medium
income group. In particular, price can explain 35.1 % variation of customer perceived value
in low income groups, while with an average income group, the figure is 18.9%.

239
At low income, service quality can explain 13.1 % in variation of customer loyalty,
while the figure for the medium income group is 28.4 %. Consumers with medium incomes
consider that service quality is one of the main indicators of their loyalty behaviour. The
results also revealed that low income groups consider price is one of the main factors
affecting their loyalty behaviour but price has no effect on customer loyalty in medium
income groups. The positive relationship between store image and customer satisfaction is
stronger for the group of low income consumers while the relationship between customer
perceived value and customer satisfaction is stronger for the group of medium income
consumers.
Comparison between income of “under 5 million VND (GB£170)” and “from 10 to 20
million VND (GB£340-680)” groups
The model is fit with P-value =0.000, cmin/df = 2.533, CFI=0.998>0.95,
SRMR=0.006<0.08, RMSEA=0.028<0.06 and PCLOSE=1.000>0.05, TLI=0.981>0.9,
GFI=0.994>0.9. The model is fit and results are reliable.
X2 DF
Unconstrained 131.69 52
Constrained 167.27 84
P-Value 0.304
Path Name
Under 5
million VND
Beta
From 10-20
million VND
Beta
Difference
in Betas
P-Value
for
Difference
Interpretation
ISL → CS. 0.262*** 0.145*** 0.117 0.013 The positive relationship between CS and ISL is stronger for Under 5 million VND.
SQ → CS. 0.183*** 0.282*** -0.099 0.063 The positive relationship between CS and SQ is stronger for From 10-20 million VND.
Table 6.M.7: Multigroup analysis for “under 5 million VND (GB£170)” and “from 10 to
20 million VND (GB£340-680)” income groups
(Source: Data analysis results from the author
Tool used from Gaskin and Lim (2018))
The p-value of the chi-square difference test is not significant at 10% as p-value is much
higher than 0.1. However, there are some small differences about relationships between
constructs which should be examined. The results show that the level of service quality
affecting customer satisfaction is higher for the group of medium-high income consumers,
service quality can explain 28.2% variation of customer satisfaction at medium-high income
consumers while that of low income consumers is 18.3%. In-store logistics have a stronger
impact on customer satisfaction at the group of low income consumers.

240
6.6.3.4.4. Comparison between location
Between Ho Chi Minh and Hanoi
The model is fit with P-value =0.000, cmin/df = 2.812, CFI=0.997>0.95,
SRMR=0.008<0.08, RMSEA=0.036<0.06 and PCLOSE=1.000>0.05, TLI=0.969>0.9,
GFI=0.991>0.9. The model is fit and results are reliable.
X2 DF
Unconstrained 140.606 50
Constrained 182.478 83
P-Value 0.138
Path Name HCM
Beta
Hanoi
Beta
Difference
in Betas
P-Value for
Difference Interpretation
PRICE → CPV. 0.213*** 0.377*** -0.164 0.002 The positive relationship between CPV and PRICE is stronger for Hanoi.
ISL → CS. 0.172*** 0.277*** -0.105 0.053 The positive relationship between CS and ISL is stronger for Hanoi.
HABIT → CL. 0.108*** 0.034 0.074 0.091 The positive relationship between CL and HABIT is stronger for HCM.
RBEX → CL. 0.238*** 0.352*** -0.115 0.05 The positive relationship between CL and RBEX is stronger for Hanoi.
ESQX2 → CL. 0.158*** 0.063 0.095 0.089 The positive relationship between CL and ESQX2 is stronger for HCM.
Table 6.M.8: Multigroup analysis for Ho Chi Minh and Hanoi
(Source: Data analysis results from the author
Tool used from Gaskin and Lim (2018))
The p-value of the chi-square difference test is not significant at 10% as p-value is much
higher than 0.1. However, there are some small differences about relationships between
constructs which should be examined. Based on the statistical results, the positive
relationship between price and customer perceived value is stronger in Hanoi. It showed that
supermarket consumers in Hanoi are concerned more about price and price can explain 37.7
percent variation in customer perceived value in Hanoi while that in Ho Chi Minh is 21.3
percent. That the positive relationship between in-store logistics and customer satisfation is
stronger for Hanoi means that consumers in Hanoi consider in-store logistic to be one of the
important indicators of satisfaction, while the relationship between ISL and CS in Ho Chi
Minh is weaker. In this research, habit and e-service quality related to E-S-QUAL were found
to have a strong and positive impact on customer loyalty for consumers from Ho Chi Minh.
However, in Hanoi, habit and e-service quality related to E-S-QUAL was found not to have
arelationship with customer loyalty.
The level of retail brand experience (RBEX) affects customer loyalty is different across
locations, in Hanoi, RBEX can describe 35.2 percent variation in customer loyalty but that of
Ho Chi Minh is only 23.8 percent.

241
Between Ho Chi Minh and Da Nang
The model is fit with P-value =0.000, cmin/df = 1.946, CFI=0.998>0.95,
SRMR=0.008<0.08, RMSEA=0.028<0.06 and PCLOSE=1.000>0.05, TLI=0.969>0.9,
GFI=0.993>0.9. The model is fit and results are reliable.
X2 DF
Unconstrained 97.307 50
Constrained 152.317 83
P-Value 0.009
Path Name HCM
Beta
Da Nang
Beta
Difference
in Betas
P-Value for
Difference Interpretation
PRICE → CPV. 0.213*** 0.363*** -0.15 0.027 The positive relationship between CPV and PRICE is stronger for Da Nang.
SQ → CL. 0.268*** 0.099 0.169 0.045 The positive relationship between CL and SQ is stronger for HCM.
Table 6.M.9: Multigroup analysis for Ho Chi Minh and Da Nang
(Source: Data analysis results from the author
Tool used from Gaskin and Lim (2018))
The p-value of the chi-square difference test is significant as p-value is 0.009 which
lower than 0.1 (10%). Therefore, the model differs across groups.
In Ho Chi Minh, service quality was found to have a strong and positive impact on
customer loyalty. However, there was no such relationship in the case of Da Nang. That price
positively affects customer perceived value is stronger in Da Nang means that consumers
from Da Nang are more sensitive about price than consumers in Ho Chi Minh; price can
explain 36.3 percent variation in customer perceived value in Da Nang while the figure for
Ho Chi Minh is only 21.3 percent.
Between Can Tho and Binh Duong
The model is fit with P-value =0.000, cmin/df = 2.852, CFI=0.995>0.95,
SRMR=0.008<0.08, RMSEA=0.043<0.06 and PCLOSE=0.928>0.05, TLI=0.958>0.9,
GFI=0.988>0.9. The model is fit and results are reliable.

242
X
2 DF
Unconstrained 143.125 50
Constrained 202.897 83
P-Value 0.003
Path Name Can Tho
Beta
Binh Duong
Beta
Difference
in Betas
P-Value for
Difference Interpretation
ALA → CS. -0.091*** -0.129*** 0.038 0.069 The negative relationship between CS and ALA is stronger for Binh Duong.
SQ → CS. 0.145*** 0.257*** -0.112 0.04 The positive relationship between CS and SQ is stronger for Binh Duong.
Table 6.M.10: Multigroup analysis for Can Tho and Binh Duong
(Source: Data analysis results from the author
Tool used from Gaskin and Lim (2018))
The p-value of the chi-square difference test is significant as p-value is 0.003 which
lower than 0.1 (10%). Therefore, the model differs across groups.
There are two main differences between Can Tho and Binh Duong: service quality has a
stronger positive influence on customer satisfaction in Binh Duong - 25.7 percent variation in
customer satisfaction in Binh Duong and only 14.5 percent in Can Tho. The negative
relationship between alternative attractiveness and customer satisfaction is stronger for Binh
Duong with significantly reducing satisfaction levels while the level at Can Tho is lower,
where alternative attractiveness can negatively explain 9.1 percent variation in customer
satisfaction.
6.6.3.4.5. Comparison between age groups
Comparison between 18-22 and 22-30
The model is fit with P-value =0.000, cmin/df = 2.788, CFI=0.997>0.95,
SRMR=0.005<0.08, RMSEA=0.031<0.06 and PCLOSE=1.000>0.05, TLI=0.973>0.9,
GFI=0.993>0.9. The model is fit and results are reliable.

243
X2 DF
Unconstrained 150.555 54
Constrained 203.086 88
P-Value 0.022
Table 6.M.11: Multigroup analysis for “18-22 and 22-30” age groups
(Source: Data analysis results from the author
Tool used from Gaskin and Lim (2018))
The p-value of the chi-square difference test is significant when p-value of 0.022 is lower
than 0.1 (10%). Therefore, the model differs across groups. Customer service and service
quality were found to have a strong positive influence on customer perceived value among
the group of 23-30 year-olds. However, a similar relationship could not be found among the
group of 18-22 year-olds. Consumers of lower ages areconcerned more about price and store
image while consumers of older age groups are concerned more about service quality and
promotions. The positive relationship between trust and customer perceived value is stronger
for 18-22 year-old consumers.
Comparison between 22-30 and above 55 year-old groups
The model is fit with P-value =0.000, cmin/df = 2.174, CFI=0.997>0.95,
SRMR=0.011<0.08, RMSEA=0.032<0.06 and PCLOSE=1.000>0.05, TLI=0.973>0.9,
GFI=0.991>0.9. The model is fit and results are reliable.
Path Name 18-22
Beta
23-30
Beta
Difference
in Betas
P-Value for
Difference Interpretation
CUSER → CPV. 0.027 0.113** -0.086 0.074 The positive relationship between CPV and CUSER is stronger for 23-30.
PRICE → CPV. 0.360*** 0.189*** 0.171 0.002 The positive relationship between CPV and PRICE is stronger for 18-22.
PROE → CPV. 0.082** 0.196*** -0.114 0.037 The positive relationship between CPV and PROE is stronger for 23-30.
TRUST → CPV. 0.206*** 0.104* 0.103 0.08 The positive relationship between CPV and TRUST is stronger for 18-22.
SQ → CPV. 0.000 0.180** -0.179 0.013 The positive relationship between CPV and SQ is stronger for 23-30.
STIMA → CS. 0.206*** 0.109** 0.097 0.069 The positive relationship between CS and STIMA is stronger for 18-22.
SQ → CL. 0.105** 0.229*** -0.124 0.071 The positive relationship between CL and SQ is stronger for 23-30.

244
X2 DF
Unconstrained 119.679 54
Constrained 163.499 88
P-Value 0.121
Path Name 23-30
Beta
above 55
Beta
Difference
in Betas
P-Value
for
Difference
Interpretation
SQ → CPV. 0.180** -0.008 0.188 0.046 The positive relationship between CPV and SQ is stronger for 23-30.
STIMA → CS. 0.109** 0.217*** -0.108 0.067 The positive relationship between CS and STIMA is stronger for above 55.
SWC → CS. 0.059* 0.148*** -0.088 0.014 The positive relationship between CS and SWC is stronger for above 55.
SWC → CL. 0.117*** 0.234*** -0.117 0.011 The positive relationship between CL and SWC is stronger for above 55.
Table 6.M.12: Multigroup analysis for “22-30 and above 55” age groups
(Source: Data analysis results from the author
Tool used from Gaskin and Lim (2018))
The p-value of the chi-square difference test is not significant at 10% as p-value is higher
than 0.1. However, there are some small differences about relationships between constructs
which should be examined. The above results show that there is no relationship between
service quality and customer perceived value to be found in the group of consumers who are
over 55, while service quality can explain 18 percent variation in customer perceived value
among the group of consumers who are 23-30 years old. Store image in the group of over 55s
was found to have a positive and stronger impact on customer satisfaction than that of the
group of 23-30 year-olds. The positive relationship between switching cost and customer
loyalty is stronger for the group of over 55s; loyal consumers with higher perceived switching
cost will continue to be loyal and at the group of over 55s, switching cost can explain 23.4
percent variation in customer loyalty while that of the group of 23-30 year-olds is only 11.7
percent. The positive relationship between switching costs and customer satisfaction is
stronger for the group of over 55s. Consumers with higher perceived switching cost will
remain to be satisfied and among the over 55s, switching cost can explain 14.8 percent
variation in customer satisfaction while that of the 23-30 year-olds is only 5.9 percent.
Comparison between 18-22 and 41-55
The model is fit with P-value =0.000, cmin/df = 2.326, CFI=0.997>0.95,
SRMR=0.011<0.08, RMSEA=0.030<0.06 and PCLOSE=1.000>0.05, TLI=0.975>0.9,
GFI=0.993>0.9. The model is fit and results are reliable.

245
X
2 DF
Unconstrained 125.618 54
Constrained 169.276 88
P-Value 0.124
Path Name 18-22
Beta
41-55
Beta
Difference
in Betas
P-Value for
Difference Interpretation
TRUST → CPV. 0.206*** 0.061 0.145 0.070 The positive relationship between CPV and TRUST is stronger for 18-22.
CS → CL. 0.304*** 0.023 0.281 0.063 The positive relationship between CL and CS is stronger for 18-22.
SWC → CL. 0.090*** -0.001 0.091 0.092 The positive relationship between CL and SWC is stronger for 18-22.
SQ → CPV. 0.000 0.198* -0.198 0.041 The positive relationship between CPV and SQ is stronger for 41-55.
PROE → CL. 0.112*** 0.390*** -0.278 0.001 The positive relationship between CL and PROE is stronger for 41-55.
PRICE → CL. 0.050* 0.160* -0.109 0.076 The positive relationship between CL and PRICE is stronger for 41-55.
SQ → CL. 0.105** 0.295** -0.190 0.061 The positive relationship between CL and SQ is stronger for 41-55.
Table 6.M.13: Multigroup analysis for “18-22 and 41-55” age groups
(Source: Data analysis results from the author
Tool used from Gaskin and Lim (2018))
The p-value of the chi-square difference test is not significant at 10% as p-value is much
higher than 0.1. However, there are some small differences about relationships between
constructs which should be examined. The postive relationships between trust and customer
perceived value, customer satisfaction and customer loyalty, switching costs and customer
loyalty are only significant among the group of 18-22 year-olds. Among the 41-55 year-olds,
customer satisaction was found to have no relationship with customer loyalty; trust has no
impact on customer perceived value, and switching costs do not affect customer loyalty. In
contrast, service quality was found to have no impact on customer perceived value among 18-
22 year-olds while it singificantly influences customer perceived value among 441-55 year-
olds. The positive relationships between promotion/price/service quality and customer loyalty
are much stronger for 41-55 year-olds.
Comparison between “23-30 and 31-40” age groups
The model is fit with P-value =0.000, cmin/df = 2.645, CFI=0.995>0.95,
SRMR=0.011<0.08, RMSEA=0.042<0.06 and PCLOSE=0.929>0.05, TLI=0.954>0.9,
GFI=0.987>0.9. The model is fit and results are reliable.

246
X2 DF
Unconstrained 142.841 54
Constrained 192.766 88
P-Value 0.038
Path Name 31-40
Beta 23-30 Beta
Difference
in Betas
P-Value for
Difference Interpretation
SWC → CPV. -0.015 -0.123*** 0.107 0.046 The negative relationship between CPV and SWC is stronger for 23-30.
CPV → CS. 0.214*** 0.327*** -0.112 0.03 The positive relationship between CS and CPV is stronger for 23-30.
PRICE → CL. -0.051 0.084* -0.135 0.02 The positive relationship between CL and PRICE is stronger for 23-30.
ESQX2 → CL. -0.017 0.120** -0.137 0.089 The positive relationship between CL and ESQX2 is stronger for 23-30.
Table 6.M.14: Multigroup analysis for “23-30 and 41-40” age groups
(Source: Data analysis results from the author
Tool used from Gaskin and Lim (2018))
The p-value of the chi-square difference test is significant when p-value of 0.038 is lower
than 0.1 (10%). Therefore, the model differs across groups. The relationships between e-
service quality related to E-S-QUAL/price and customer loyalty, switching costs and
customer perceived value are only supported among23-30s. Price and e-service quality
relating to E-S-QUAL have no effect on customer loyalty and switching costs have no impact
on customer perceived value among 31-40 year-olds. The positive relationship between
customer perceived value and customer satisfaction is stronger for the group of 23-30 year-
old consumers.
6.6.3.4.6. Comparison between occupation
Comparison between housewife and office staffs
The model is fit with P-value =0.000, cmin/df = 2.065, CFI=0.998>0.95,
SRMR=0.007<0.08, RMSEA=0.026<0.06 and PCLOSE=1.000>0.05, TLI=0.982>0.9,
GFI=0.994>0.9. The model is fit and results are reliable.

247
X2 DF
Unconstrained 111.504 54
Constrained 153.266 88
P-Value 0.169
Table 6.M.15: Multigroup analysis for “housewife and office staffs” occupation groups
(Source: Data analysis results from the author
Tool used from Gaskin and Lim (2018))
The p-value of the chi-square difference test is not significant at 10% as p-value is higher
than 0.1. However, there are some small differences about relationships between constructs
which should be examined. Service quality and habit was found to have a postive impact on
customer perceived value among the group of office staff while service quality and habit was
found having no influence on customer perceived value among the group of housewives.
Housewives are more sensitive about price compared to office staff; price can describe 31.2
percent variation in customer perceived value among the group of housewives while that of
office-staff is only 20%.
Comparison between students and self employment
In this analysis, some errors occurred; the researcher could not find p-value for
difference between the two groups. Therefore, additional z-score based on critical ratios were
examined to investigate differences between constructs. The results are shown as follows:
The model is fit with P-value =0.000, cmin/df = 2.402, CFI=0.996>0.95, SRMR=0.007<0.08,
RMSEA=0.036<0.06 and PCLOSE=0.999>0.05, TLI=0.966>0.9, GFI=0.990>0.9. The model
is fit and results are reliable.
Path Name Housewife
Beta
Office
staffs Beta
Difference
in Betas
P-Value for
Difference Interpretation
PRICE → CPV. 0.312*** 0.200*** 0.112 0.04 The positive relationship between CPV and PRICE is stronger for Housewife.
SQ → CPV. 0.026 0.153** -0.127 0.095 The positive relationship between CPV and SQ is stronger for Office staffs.
HABIT → CL. 0.024 0.105*** -0.081 0.052 The positive relationship between CL and HABIT is stronger for Office staffs.

248
X2 DF
Unconstrained 132.155 55
Constrained 178.224 88
P-Value 0.065
Path Name Students
Beta
Self
employment
Beta
Difference
in Betas
P-Value for
Difference z-score
STIMA → CS. 0.231*** 0.068 0.164 NaN -2.318**
PROQ → CS. 0.157*** 0.008 -0.165 NaN 2.137**
RBEX → CL. 0.332*** 0.152* 0.18 NaN -2.365**
Notes: *** p-value < 0.01; ** p-value < 0.05; * p-value < 0.10
Table 6.M.16: Multigroup analysis for “students and self employment” occupation
groups
(Source: Data analysis results from the author
Tool used from Gaskin and Lim (2018))
The p-value of the chi-square difference test is significant when p-value of 0.065 is lower
than 0.1 (10%). Therefore, the model differs across groups. The positive impact between
store image and product quality on customer satisfaction is only for the group of student
consumers. For the group of self employed consumers, the positive relationships between
store image/product quality and customer sastisfaction were not supported. Besides that, the
positive relationship between retail brand experience and customer loyalty is stronger for the
group of student consumers.
Comparison between self employed and office staff
At this analysis, some errors occurred; the researcher could not find p-value for
difference between the two groups. Therefore, additional z-score based on critical ratio were
examined to investigate differences between constructs. The results are shown as follow: The
model is fit with P-value =0.000, cmin/df = 2.276, CFI=0.997>0.95, SRMR=0.007<0.08,
RMSEA=0.0376<0.06 and PCLOSE=0.994>0.05, TLI=0.968>0.9, GFI=0.994>0.9. The
model is fit and results are reliable.

249
X2 DF
Unconstrained 124.682 55
Constrained 163.41 88
P-Value 0.227
Path Name Self employment
Beta
Office
staffs Beta
Difference in
Betas
P-Value for
Difference z-score
PROQ → CS. 0.008 0.119*** 0.127 NaN -1.768*
RBEX → CL. 0.152* 0.321*** -0.169 NaN 2.301**
Table 6.M.17: Multigroup analysis for “self employment and office staffs” occupation
groups
(Source: Data analysis results from the author
Tool used from Gaskin and Lim (2018))
The p-value of the chi-square difference test is not significant at 10% as p-value is higher
than 0.1. However, there are some small differences about relationships between constructs
which should be examined. The positive relationships between product quality and customer
satisfaction only presents for the group of office staff. There is no relationship between
product quality and customer satisfaction among the group of self employmed. In addtion, the
positive relationship between retail brand experience and customer loyalty is stronger for the
group of office staff.
6.6.3.4.7. Comparison between education levels
Comparison between “A levels and college, university” groups
The model is fit with P-value =0.000, cmin/df = 3.480, CFI=0.9978>0.95,
SRMR=0.007<0.08, RMSEA=0.030<0.06 and PCLOSE=1.000>0.05, TLI=0.975>0.9,
GFI=0.994>0.9. The model is fit and results are reliable.

250
X2 DF
Unconstrained 187.942 54
Constrained 229.499 88
P-Value 0.175
Table 6.M.18: Multigroup analysis for “A levels and college, university” groups
(Source: Data analysis results from the author
Tool used from Gaskin and Lim (2018))
The p-value of the chi-square difference test is not significant at 10% as p-value is higher
than 0.1. However, there are some small differences about relationships between constructs
which should be examined. The relationship between customer satisfaction and customer
loyalty; trust and customer perceived value is much stronger for the group of college and
undergraduate consumers.
Comparison between “GCSE’s and college, university” groups
The model is fit with P-value =0.000, cmin/df = 2.794, CFI=0.989>0.95,
SRMR=0.007<0.08, RMSEA=0.030<0.06 and PCLOSE=1.000>0.05, TLI=0.975>0.9,
GFI=0.994>0.9. The model is fit and results are reliable.
X2 DF
Unconstrained 153.039 55
Constrained 217.024 88
P-Value 0.001
Path Name GCSE’s Beta College-U
Beta
Difference
in Betas
P-Value
for
Difference
Interpretation
ESQX1 → CL. -0.150** 0.128* -0.277 0.000 The relationship between CL and ESQX1 is negative for GCSE’s and positive for College-
U.
Table 6.M.19: Multigroup analysis for “GCSE’s and college, university” groups
(Source: Data analysis results from the author
Tool used from Gaskin and Lim (2018))
Path Name A levels
Beta
College+
U Beta
Difference
in Betas
P-Value
for
Difference
Interpretation
TRUST → CPV. 0.172*** 0.343*** -0.171 0.056 The positive relationship between CPV and TRUST is stronger for College+ U.
CS → CL. 0.145** 0.406** -0.262 0.097 The positive relationship between CL and CS is stronger for College+ U.

251
The p-value of the chi-square difference test is significant when p-value of 0.001 is lower
than 0.1 (10%). Therefore, the model differs across groups. The relationship between e-
service quality related to W-S-QUAL and customer loyalty is negative for the GCSE’s group
of consumers and positive for college and undergraduate group of consumers.
6.6.3.5. Conclusion
This chapter presented a construct validation and hypothesis testing results and answered
the research questions. In that, all constructs remaining had no problem with covergent and
discriminant validity and achieved a high level of reliability. The direct relationships between
constructs have also been investigated. In addition, multigroup analysis was conducted in
order to investigate where factors affecting customer loyalty, customer satisfaction, and
customer perceived value are different across groups of supermarket business models
(strategic groups), income, location, age ranges, gender, and occupation. Full statistical
results can be seen at Appendix 6.3 and Appendix 7.1, 7.2 and 7.3. The next chapter is going
to discuss these findings.

252
Chapter 7: Discussion of the findings
7.1. Introduction
This chapter is going to discuss all research findings based on statistical tests found in
previous chapters. Results of direct effects related to customer perceived value, customer
satisfaction, customer loyalty will be presented first, followed by multigroup analysis. Then,
general discussion between all constructs will also be demonstrated.
7.2. Direct effects’ discussion
7.2.1. Results from all hypotheses related to customer perceived value (CPV)
In the retailing context, there are five main factors constituting customer perceived value,
including Price, In-store logistics, Trust, Promotion and E-service quality related to E-S-
QUAL. These factors positively affect customer perceived value. Besides that, switching
costs are also considered, higher switching costs can slightly decrease customer perceived
value to some extent. A good quality service related to in-store employees’ knowledge and
attitudes to consumers and customer service leads to quick checkout time (no waiting and
quick transactions conducted) and also contributes to higher customer perceived value.
However, the level of impact of these three factors (switching costs, service quality and
customer service) on customer perceived value is lower compared to the first five indicators
presented above. Besides that, in the Vietnamese retail market, strategic groups (different
supermarket business models) are affecting the level of customer perceived value as well.
The following part will demonstrate and investigate all constructs having a direct effect
on customer perceived value in detail. Based on the statistical results, factors having the most
important impact on customer perceived value will be presented first.

253
Dependent
variable Hypotheses Constructs Loadings
CPV
H20A 1 PRICE 0.295
H13A 2 ISL 0.199
H25 3 TRUST 0.161
H19A 4 PROE 0.124
H17B 5 ESQX2 0.114
H9A 6 SWC -0.081
H12A 7 SQ 0.061
H16 8 CUSER 0.057
H5A 9 Q4 -0.041
H21A
PROQ
Not
supported
H22A CSR
H1A INCOME
H2A LOCATION
H3A AGE
H4A GENDER
H17A ESQX1
Table 7.1: Factors directly affecting customer perceived value
According to the statistical testing results, H20A was supported, good price offered
positively affects customer perceived value (0.295). This finding is consistent with the study
of Jiang et al. (2018) and Lloyd and Luk (2010) where they found price has a positive impact
on customer perceived value. It must be noted that the results do not mean that when products
price increases, customers will have a higher perceived value. In this context, there are 3
reliable items used for a “price” construct, including “Good at this store are reasonably
priced”, “The prices of the products in this supermarket are cheaper than others”, and “Goods
at this store offer value for money”. Therefore, the finding means that the more prices offer a
reasonable value, the higher customer perceived value will be. The investigated structural
model revealed that price is the most important factor affecting customer perceived value in
the retail context. Again, this finding is similar with Lloyd and Luk (2010) as they listed price
at the top three drivers of customer perceived value.
That H13A was supported means in-store logistics have a strong and positive effect on
customer perceived value (0.199). In previous studies, there was no research on how in-store
logistics affect customer perceived value; a majority of research only investigated the
relationship between in-store logistics and customer satisfaction. In this retail context, in-
store logistics are built by three main variables which relate to how well-stocked shelves are,
the lack of problems when returning merchandise to stores and sufficient shopping carts
being offered. Compared to other factors influencing customer perceived value, in-store
logistics is in second position with a high loading of 0.199. This means that changes in in-

254
store logistics can explain 19.9 percent of changes in the value of how consumers’
perceptions are. Therefore, in order to achieve a higher perceived behaviour from consumers,
firms should invest more in their in-store logistics activities.
Trust was found to have a positive effect on customer perceived value (0.161) (H25 was
supported). This relationship is significantly strong and positioned in third place in all
possible factors affecting customer perceived value. This result shows that when consumers
trust retailers, their perceived values are definitely high. The “trust” construct was built by
three items, including “I trust this retailer”, “I consider that to shop in the stores of this
retailer is a guarantee”, and “I believe that this retailer is honest/sincere towards its
consumers”. Based on the scales, consumers appreciate more how the retailer treats them and
that leads them to believe shopping in the store is always guaranteed. This finding is
consistent with some previous studies, such as Walter and Ritter (2003) and Ponte et al.
(2015), who found that trust enhances customer perceived value by reducing non-monetary
costs perception (such as the effort and time consumers take to find their appropriate
providers). However, in this study, trust was found to have no direct relationship with
customer satisfaction and loyalty, but that indirect relationships existed (). This finding is
inconsistent with some previous studies, such as Lin et al. (2011), Martinez and Rodriguez
del Bosque (2013), Rasheed and Abadi found that there is a positive relationship between
trust and loyalty. In particular, Rasheed and Abadi stated that 35.3 percent of variation in
customer loyalty can be explained by trust while Ningsih and Segoro (2014:1018) stated “if
trust in the brand increased for one unit then the customer loyalty would increase for 0.114
points, assuming other independent variable value is fixed”.
That H19A was supported means that promotions positively affect customer perceived
value (0.124). In this research, the “promotion” construct is considered as one of the main
drivers of customer perceived value. The more promotion activities are offered, the higher
customer perceived value is. As presented in the literature review, a majority of research has
investigated how promotion influences customer loyalty but left the relationship between
promotion and customer perceived value under-researched. These results contribute how
customer perceived value is constituted in the retail context. It can be explained as follows:
when consumers notice promotion activities from a supermarket that are beneficial for them
during a shopping trip, they are more likely to perceive higher values about that supermarket.

255
Regarding e-service quality, after EFA step, in this research e-service quality was
divided into two areas as mentioned in the review part: e-service quality about website
quality scale (W-S-QUAL) and about a core e-service quality scale (E-S-QUAL). However,
only H17B (of e-service quality related to E-S-QUAL having a significant positive effect on
customer perceived value) was supported and its statistical p-value is lower than 0.05 and the
loading is 0.114. This finding is consistent with the studies of Yun and Good (2007), and
Chang and Wang (2011) who found that e-service quality has a significant positive effect on
customer perceived value. As presented in the literature review part, this construct related to
reliability, fulfillment, efficiency and privacy/security; higher e-service quality about these
terms will lead to higher perceived customer value. In the retail context, e-service quality (E-
S-QUAL) is considered one of the main drivers of customer perceived value. The H17A (E-
service quality about website (website quality scale: W-S-QUAL) has a significant positive
effect on customer perceived value) was statistically significant but not supported with the
loading of -0.113. In this research, website quality scale was found to have a significant
negative impact on customer perceived value. This is an unexpected result. There are three
main items used to measure this construct, including “Organisation’s site loads its pages fast
and easy”, “Organisation’s site enables me to complete a transaction quickly”, “Organisation
presents guarantee and privacy policy on its site”. Based on the statistical result, customer
perceived value is high even though E-S-QUAL decreases. It contradicts the theory where the
high e-service quality related to websites leads to higher customer perceived value. It means
that e-service quality related to websites cannot explain consumers’ perceptions. In this case,
low e-service quality related to websites in parallel with high e-service quality related to E-S-
QUAL is possibly creating a higher customer perceived value.
That H9A was supported means that switching costs have a negative effect on customer
perceived value (-0.081). It can be noted that there has been no previous research on how
switching costs influence customer perceived value. This research indicates that even the
relationship between these two constructs is weak but increasing switching costs will lead to
lower customer perceived value. This can be explained as follows: consumers might claim
that they are stuck in their current supermarkets’ clutches and the possibility of moving to
other supermarkets is relatively low because of high switching costs. As a result, their
perceived values toward a current chosen supermarket are more likely to decrease.

256
That H12A was supported means that there is a positive relationship between service
quality and customer perceived value (0.061). The finding is compatible with previous
studies, Rasheed and Abadi (2014), Malik (2012) and Jiang et al. (2018) which showed that
service quality has a direct and positive impact on customer perceived value. In this research,
service quality mostly related to in-store staff knowledge and attitudes toward consumers, but
the positive relationship between service quality and customer perceived value is not as high
as expected. Compared to other main drivers of customer perceived value, in-store
employees’ knowledge and behaviour explains just 6.1 percent of customer perceived value,
while Rasheed and Abadi (2014:303) stated that “32.6 percent of variation in perceived value
can be described by service quality”. In addition, Lloyd and Luk (2010) listed service quality
in the list of the top three drivers of customer perceived value. In Jiang et al. (2018), service
quality is the most important indicator of customer perceived value. With the comprehensive
research conducted, the findings of this research can be reliable, indicating that service
quality is not considered to be one of the main drivers of customer perceived value. However,
it is one of the main indicators of customer satisfaction and customer loyalty.
That H16 was supported means that higher customer service, the better customer
perceived value (0.057). The finding is consistent with the study of Mangnale and Chavan
(2012) who indicated that customer service has a positive impact on customer perceived
value. In this research, customer service does not have a strong effect on customer perceived
value and customer service can explain 5.7 percent of variation in customer perceived value.
There are only 2 remaining main items used to measure customer service in this research (see
Appendix 5.10), including “having a short waiting time at the checkouts”, “doing faster
transactions without waiting customers”. The finding demonstrates that customer perceived
value will be higher if there are short checkouts times and transactions are completed faster.
However, if compared to other antecedents of customer perceived value, the customer service
effects are not so powerful. The above result is also consistent with Kursunluoglu’s study
(2014).
That H5A was supported means that people who choose different groups of supermarkets
for shopping have different customer perceived value. In this research, “Q4” qualitative
variable covers supermarkets where consumers usually choose to shop (different supermarket
business models), 1 was coded for “Cooopmart and BigC”, 2 was “Lotte Mart”, 3 was
“Vinmart”, 4 was “Aeon”, and 5 was “other supermarkets”. That the loading value is -0.041

257
means that the higher choice of Q4, the lower customer perceived value is. In other words,
consumers who choose to shop at Coopmart or BigC, Lotte Mart and Vinmart will have a
higher perceived value compared to that of Aeon or other supermarkets in general.
According to the test results, H21A (Good product quality is positively associated with
customer perceived value) was not statistically significant or supported. This finding is
inconsistent with previous research where Jiang et al. (2018) found a positive relationship
between product quality and customer perceived value; Lloyd and Luk (2010) found that
product quality is in the list of the top three drivers of customer perceived value. In general,
this research shows that higher product quality will lead to increases in the level of customer
satisfaction (see section 7.2.2). In addition, there was no relationship found between
corporate social responsibility and customer perceived value (H22A). According to the
statistical testing results, H1A, H2A, H3A, H4A (income has an effect on customer perceived
value, location where people stay has an effect on customer perceived value, age range
affects customer perceived value, Gender affects customer perceived value) were not
supported. These variables are not statistically found to have an affect on customer perceived
value.
7.2.2. Results from all hypotheses related to customer satisfaction (CS)
There are 7 main factors directly influencing customer satisfaction in the retailing
industry, which will be named in decreasing order of importance: customer perceived value,
in-store logistics, service quality related to in-store employees’ knowledge and attitudes
toward consumers, store image, customer experience, product quality and alternative
attractiveness. Besides that, switching costs and price also have a relatively slight direct
impact on customer satisfaction. Considering qualitative variables, income and the location in
which consumers stay slightly affects a satisfied behaviour. The results show that people with
higher income seem to be more satisfied; supermarkets’ consumers in Ho Chi Minh, Binh
Duong and Can Tho are more satisfied compared to those of Ha Noi and Da Nang. Retail
brand experience was found not to have a relationship with customer satisfaction in this
study. In addition, age range, gender and strategic groups also do not influence customer
satisfaction.
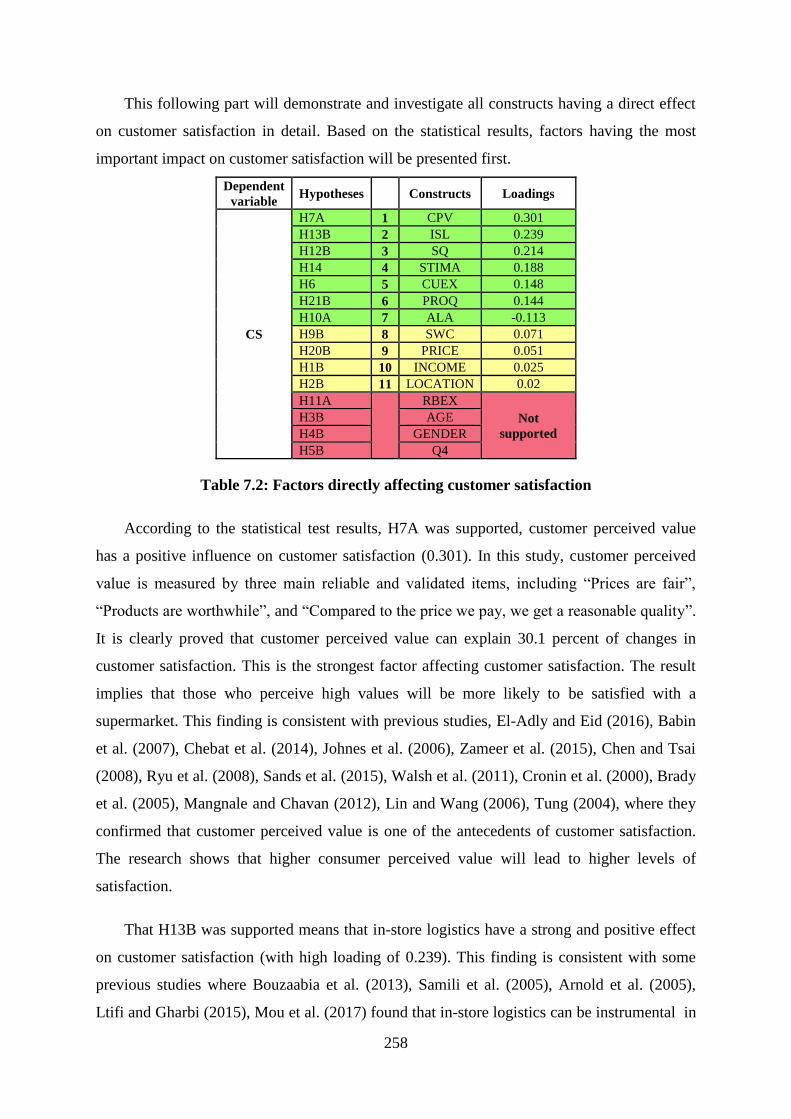
258
This following part will demonstrate and investigate all constructs having a direct effect
on customer satisfaction in detail. Based on the statistical results, factors having the most
important impact on customer satisfaction will be presented first.
Dependent
variable Hypotheses Constructs Loadings
CS
H7A 1 CPV 0.301
H13B 2 ISL 0.239
H12B 3 SQ 0.214
H14 4 STIMA 0.188
H6 5 CUEX 0.148
H21B 6 PROQ 0.144
H10A 7 ALA -0.113
H9B 8 SWC 0.071
H20B 9 PRICE 0.051
H1B 10 INCOME 0.025
H2B 11 LOCATION 0.02
H11A
RBEX
Not
supported
H3B AGE
H4B GENDER
H5B Q4
Table 7.2: Factors directly affecting customer satisfaction
According to the statistical test results, H7A was supported, customer perceived value
has a positive influence on customer satisfaction (0.301). In this study, customer perceived
value is measured by three main reliable and validated items, including “Prices are fair”,
“Products are worthwhile”, and “Compared to the price we pay, we get a reasonable quality”.
It is clearly proved that customer perceived value can explain 30.1 percent of changes in
customer satisfaction. This is the strongest factor affecting customer satisfaction. The result
implies that those who perceive high values will be more likely to be satisfied with a
supermarket. This finding is consistent with previous studies, El-Adly and Eid (2016), Babin
et al. (2007), Chebat et al. (2014), Johnes et al. (2006), Zameer et al. (2015), Chen and Tsai
(2008), Ryu et al. (2008), Sands et al. (2015), Walsh et al. (2011), Cronin et al. (2000), Brady
et al. (2005), Mangnale and Chavan (2012), Lin and Wang (2006), Tung (2004), where they
confirmed that customer perceived value is one of the antecedents of customer satisfaction.
The research shows that higher consumer perceived value will lead to higher levels of
satisfaction.
That H13B was supported means that in-store logistics have a strong and positive effect
on customer satisfaction (with high loading of 0.239). This finding is consistent with some
previous studies where Bouzaabia et al. (2013), Samili et al. (2005), Arnold et al. (2005),
Ltifi and Gharbi (2015), Mou et al. (2017) found that in-store logistics can be instrumental in

259
helping customers navigate the retail servicescape efficiently and effectively, thereby
improving customer experience and satisfaction; and the future patronage intention would be
adversely affected were customers to experience the consequences of inadequate in-store
logistics. The scale of in-store logistics in this study is built by three reliable items and
proved its validity via CFA: “In this supermarket, the shelves are well-stocked”, “no
problems when returning merchandise”, and “in this supermarket, there are enough shopping
carts”. In-store logistics is the second strongest factor affecting customer satisfaction (0.239),
the first place is customer perceived value with loading of 0.301. It is clear that the better in-
store logistics provided will lead to higher levels of customer satisfaction because consumers
can more easily find and return products to shelves, while products always being available
during consumers’ shopping process can improve consumer experience and make them
happier.
H12B was supported, demonstrating there is a positive relationship between service
quality and customer satisfaction (0.214). This finding is consistent with Cronin et al. (2000),
Dauda and Lee (2016), Kim et al. (2004), Hsieh and Hiang (2004), Liu et al. (2011), Sivadas
and Baker-Prewitt (2000), Chang and Yeh (2017) who found there is a strong positive
relationship between service quality and customer satisfaction, while the studies from Bauer
et al. (2006), Turel and Serenko (2006) and Wang et al. (2004), Hsu (2006), Zameer et al.
(2015), Szwarc (2005); Baki et al. (2009) stated that service quality is a vital element in
creating and increasing customer satisfaction, and more and more firms have stated that high
customer satisfaction can be traced back to good service quality (Szwarc, 2005). Kitapci et al.
(2013) examined the effects of specific dimensions of service quality on satisfaction in
supermarkets, and found that “independent variables together describe 56 percent of customer
satisfaction variability” (Kitapci et al., 2013:248). The above conclusion is slightly at odds
with findings of this research, where service quality related to in-store staff knowledge and
attitudes toward consumers can explain 21.4 percent of variation in customer satisfaction if
other variables remain unchanged. In this research, service quality scale is built on many
items and in the end, three main items used are related to in-store employees, including
“Service employees at this store have a good product knowledge”, “service employees at this
store are willing to help customers”, and “service employees at this store showed respect to
me”. It can be seen that employee behaviour towards consumers and their knowledge are the
important indicators for customer satisfaction. Therefore, it can be said that the behaviour of
in-store employees strongly affects customer satisfaction. Based on our qualitative research

260
(data from the interviews), all respondents expressed the importance of staff behaviour to
them; if consumers are happy with everything but in-store staff fail to show respect or
support, consumers will choose not to shop at that store again if there are other available
alternatives. The service quality related to in-store employees’ knowledge and attitudes
toward consumers is endorsed as one of the main drivers of customer satisfaction which is
placed third among factors influencing customer satisfaction. It contradicts the finding of
Gallarza and Saura (2006) where they did not find that service quality is an antecedent of
satisfaction in a travel-related context.
According to the statistical test results, H14 was supported - store image is positively
associated with customer satisfaction (0.188). This finding is consistent with previous studies
where Bouzaabia et al. (2013), Poncin and Mimoun (2014), Carpenter and Moore, (2009),
Shobeiri et al. (2013), Sivadas and Jindal (2017) found a strong association between store
image and satisfaction. It is an important driver of customer satisfaction (Du Preez et al.,
2008a) as it “provides value-added benefits to the shopper” (Saraswat et al. (2010:169). It
reflects the set of beliefs about stores’ relative attractiveness which are perceived by
consumers. In the list of 11 main factors affecting customer satisfaction, store image has
been placed fourth. The store image construct is built by three reliable items and proved its
validity via CFA: “The supermarket offers high-quality merchandise”, “All brands you
planned to buy were available”, and “Physical facilities are visually appealing”. These factors
in store image strongly contribute to the creation of customer satisfaction. In other words,
higher achieved customer sastifaction can be traced back to higher perceived store image.
However, the research of Andaleeb and Conway (2016) revealed a partly contradictory result
of store image relating to atmospherics not having a significant impact on customer
satisfaction.
That H6 was supported means that customer experience has a positive effect on customer
satisfaction (0.148). It means that if other measured constructs remain unchanged, customer
experience can explain 14.8 percent of variation in customer satisfaction. This finding is
consistent with the studies of Lin and Bennet (2014) and Terblanche (2018), who found that
customer experience is positively related to overall satisfaction. In this thesis, customer
experience has been measured by the following three reliable and validated items: “The
shopping experience is refreshing”, “The store has a welcoming atmosphere and the
temperature inside the store is comfortable”, and “The shopping experience made me relaxed

261
and comfortable”. These factors could lead to higher customer satisfaction. In other words,
the result from this research indicates that good consumer experience will lead to higher
customer satisfaction.
According to the statistical test results, H21B was supported - good product quality is
positively associated with customer satisfaction (0.144). As explained in the literature review,
all judgments about product quality based on customers’ views and mindsets are regarded as
subjective and there has been limited research on how product quality directly influences
customer satisfaction. Most research has focused on the relationship between product
attributes and customer satisfaction, Wang et al. (2018) found there are strong linkages
between products’ attributes and customer satisfaction. The results of this research are
consistent and indirectly endorse the study of Wang et al. (2018) and El-Adly’s research
(2018) that the higher offered product quality will lead to higher levels of customer
satisfaction and product quality is confirmed as one of the main indicators of customer
satisfaction as consumers often expect to buy a product with good quality.
That H10A, H9B was supported means that high-perceived alternative attractiveness has
a negative influence on customer satisfaction (beta value is -0.113), switching costs have a
positive effect on customer satisfaction (beta value is 0.071). It means that when more
competitors are available, consumers tend not to remain satisfied with their current
supermarket. They might always be looking for a chance to switch if other benefits are
available. In that, alternative attractiveness can negatively explain 11.3 percent of variation in
satisfied behaviour, and if switching costs are high, consumers seem to be more satisfied with
their current grocery retailers because they might be afraid of changing to new retailers with
much effort in cost and time.
According to the results, H20B was statistically supported - good price offered positively
affects customer satisfaction (0.051). The relationship between price and customer
satisfaction is complicated. “Customers with lower incomes might have wished the product
could be cheaper, so their satisfaction decreased with the increase in price” (Wang et al.,
2018:4). Those who usually buy moderately-priced products might have a higher income
compared to the above group medium priced items relatively correlates to their quality. In
this case, the higher priced products would enhance customer satisfaction (Wang et al.,
2018). Eid (2015), Eid and El-Gohary (2015), El-Adly’s research (2018) shows that price has
a significant direct positive effect on customer satisfaction (0.140). It does not mean that

262
when price increases, consumers will be more satisfied. Based on the measured items of a
“Price” constructs, the above result means that consumers will be more satisfied if products
are offered at a reasonable price. The level of price influence on customer satisfaction in this
study was found to have much lower effects compared to other main indicators presented
above; not only that, Kim et al. (2016) could not find a relationship between price of
smartphones and customer satisfaction.
Besides that, in this research, H1B was supported; income has a positive effect on
customer satisfaction with beta value of 0.025. In that, if income increases, the level of
customer satisfaction slightly increases. And H2B was also supported; the location where
people stay has an effect on customer satisfaction (0.020). In this research, “1” was coded for
“Ha Noi”, “2” was Da Nang, “3” was “Ho Chi Minh”, “4” was “Binh Duong”, and “5” was
“Can Tho”. The positive relationship between location and customer satisfaction shows that
supermarket consumers in Ho Chi Minh, Binh Duong and Can Tho tend to be more satisfied
with their current supermarkets than that of Ha Noi and Da Nang. The reason could be that
the consumption style in the south is more generous than that of the north, and consumers
easily adapt and accept mistakes or changes.
Retail brand experience was found to have no direct relationship with customer
satisfaction (H11A). This finding is inconsistent with previous findings such as Kim et al.
(2015), Ha and Perks (2005), Khan and Rahman (2015), Ishida and Taylor (2012), where
they verified that retail brand experience directly influences customer satisfaction. There are
two main measured items of this construct, including “When I think of excellence, I think of
this retail brand name”, “I feel good of this retail brand because of their simple and better
structured bills”. Based on the statistical results, retail brand experience could not prove a
direct and positive relationship with customer satisfaction. However, in this study, retail
brand experience was found to be the most important indicator for customer loyalty
(presented at section 7.2.3).
H3B, H4B and H5B (age ranges affect customer satisfaction, gender affects customer
satisfaction, people who choose different supermarkets for shopping have different behaviour
on customer satisfaction respectively) were not supported. It means that age ranges, gender,
strategic groups do not show any impact on customer satisfaction.

263
7.2.3. Results from all hypotheses related to customer loyalty (CL)
There are 7 main indicators for customer loyalty in the retailing industry, which are, in
descending order: retail brand experience, service quality related to in-store employees’
knowledge and attitudes toward consumers, customer satisfaction, promotion effects,
switching costs, e-service quality related to E-S-QUAL scale and alternative attractiveness. In
this finding, switching barriers showed a strong relationship with customer loyalty. Besides
that, price, store accessibility and habit also have a weak impact on customer loyalty. There is
a negative relationship between store accessibility and customer loyalty found. This is an
unexpected result. However, that consumers find it easy to access a supermarket does not
guarantee that they will be loyal to that supermarket; in this research, the easier access to
supermarkets, the lower the level of loyalty as a result because of consumers having a variety
of choices (high alternative attractiveness) and other benefits from other competitors (better
service quality, better brand name positioning and better promotion activities etc.). Higher
income consumers were found to be more loyal than lower income consumers in general.
Loyalty programmes were found as having a negative relationship with customer loyalty due
to programmes frustrating consumers to some extent. Customer perceived value, product
quality and corporate social responsibility were found to have no direct impact on customer
loyalty. Qualitative variables including age, gender, location of consumers and which
supermarkets they choose to frequent was found to have no influence on customer loyalty as
well.
The following part will demonstrate and investigate all constructs having a direct effect
on customer loyalty in detail. Based on the statistical results, factors having the most
important impact on customer loyalty will be presented first.

264
Dependent
variable Hypotheses Constructs Loadings
CL
H11B 1 RBEX 0.306
H12C 2 SQ 0.179
H8 3 CS 0.178
H19B 4 PROE 0.141
H9C 5 SWC 0.113
H17D 6 ESQX2 0.106
H10B 7 ALA -0.101
H20C 8 PRICE 0.069
H26 9 HABIT 0.057
H1C 10 INCOME 0.024
H7B
CPV
Not
supported
H22B CSR
H21C PROQ
H5C Q4
H2C LOCATION
H3C AGE
H4C GENDER
H17C ESQX1
H15 STAC
H18 LPRO
Table 7.3: Factors directly affecting customer loyalty
According to the statistical test results, H11B was supported, customer loyalty is
positively affected by retail brand experience (0.306). This finding is consistent with previous
studies where Khan and Rahman (2015:66), Ishida and Taylor (2012) verified that “retail
brand experience influences brand loyalty”. In this research, retail brand experience was
found to be the most important factor affecting customer loyalty and it can explain 30.6
percent of variation in consumer loyal behaviour. In SEM model, “retail brand experience”
construct is built based on two main reliable items which have been validated at CFA,
including “When I think of excellence, I think of this retail brand name”, “I feel good with
this brand name because of their simple and better structured bills”. It is endorsed that when
supermarkets can create good brand names in consumers’ minds and also generate a good
brand experience, consumers will be more loyal to them; consumers are more likely to pay
more for the brand that they are committed to because they perceive many values that other
providers could not fulfill or imitate.
That H12C was supported means that the higher service quality offered leads to higher
levels of customer loyalty (0.179). The finding is consistent with previous studies, such as
Gallarza and Saura (2006); Eid (2015); Bolton and Drew (1991); Sivadas and Baker-Prewitt
(2000); Siu and Cheung (2001); Cronin et al. (2000); Athanassopoulos (2000), they also
found that service quality has a strong positive effect on loyalty. In this context, service

265
quality was built based on three main items related to in-store employees’ knowledge and
attitudes toward consumers and service quality was found having a significant direct positive
impact on customer loyalty. If other variables remain unchanged, service quality can directly
explain 17.9 percent of variation in customer loyalty. The qualitative research shows that 100
percent of consumers interviewed endorsed that they might not be loyal to supermarkets
where service staff do not show respect or support to them even if other factors match with
their demands. However, the research of Chang and Yeh (2017) shows that there is no direct
relationship between service quality and customer loyalty, service quality affects customer
loyalty via a mediation of customer satisfaction.
According to the statistical test results, H8 was supported, customer satisfaction is
directly and positively associated with customer loyalty (0.178). This finding is consistent
with many previous studies where Perez and Bosque (2015), Rahman et al. (2016), Carpenter
(2008), Chen (2012), Bouzaabia et al. (2013), Kim et al. (2004), Babin et al. (2005), El-Adly
and Eid (2016), Liu et al. (2011), Lin and Bennett (2014), Han and Hyun (2012), Chang and
Yeh (2017), Kitapci et al. (2013), Han et al. (2011b) and Lee et al. (2007), Wong and Sohal
(2003), Calvo-Porral and Levy-Mangin (2015). They found that there are positively strong
relationships between customer satisfaction and customer loyalty. Chang and Wang
(2011:346) also concluded that “customer satisfaction has a significant impact on customer
loyalty (β=0.84m t-value= 4.81)”. However, in this research, the relationship between
customer satisfaction and customer loyalty has not proved as strong as expected, if all other
investigated variables remain unchanged, customer satisfaction can explain 17.8 percent of
variation in customer loyalty. This finding is consistent with some studies where researchers
have suggested that other groups of researchers have exaggerated the strength of the
relationship between customer satisfaction and loyalty. Miranda et al. (2005), Baumann et al.
(2012), Mutum et al. (2014), Cronin and Taylor (1992), Oliva et al. (1992), Mittal and Lassar
(1998) presented that there is evidence that satisfaction and loyalty are not always strongly
correlated. Mutum et al. (2014:947), suggests satisfaction might not be the best predictor of
customer loyalty and “the presence (or lack) of switching barriers may be the reason why
customers stay with (or leave) a firm”. Kumar et al. (2013:246) also concluded “the variance
explained by just satisfaction is rather small - around 8 percent”. In constrast, Liu et al (2015)
found that customer satisfaction itself is not an indicator for customer loyalty as they found
no relationship between customer satisfaction and customer loyalty. It can be noted that
satisfied consumers can be either loyal or not loyal to supermarkets, it might depend on

266
switching barriers, higher alternative attractiveness, and lower switching costs might lead
satisfied consumers to switch to other providers and lower perceived alternative
attractiveness and higher switching costs might keep satisfied consumers loyal to their current
supermakets. However, unsatisfied consumers might have no loyalty if they have an
opportunity to switch. In the list of 7 main factors constituting customer loyalty, customer
satisfaction is placed third, after retail brand experience and service quality.
That H19B was supported means that promotion has a positive effect on customer
loyalty (0.141). This finding is consistent with previous studies which investigated the link
between sales promotion efforts and customer loyalty. Tung et al. (2011), Thaler (1985),
Zeithaml (1988), Grewal et al. (1998) found that promotion effects have a significant positive
impact on loyalty (see Figure 2.4.13). Kim (2017) found that “the experience of the previous
promotion in the initial stage could influence retention decisions substatially later”. In this
study, in the list of 12 main factors affecting customer loyalty in the retailing industry,
promotion effects are fourth with a relatively high loading of 0.141 compared to how
customer satisfaction affecting customer loyalty (0.178). The “promotion effects” construct
was built on three reliable scales and proved its validity via CFA, including “I find the
promotional activities of this supermarket to be very persuasive and positive”, “My
purchasing willingness arises from the promotional activities”, and “It is well worth going
shopping during the period of a sales promotion”. That promotion effects have a significant
positive relationship with customer loyalty can inform retailers that appealing promotion
activities are not only one of the main drivers for higher customer perceived value but also
one of the main indicators for customer loyalty as well. In this context, efficient promotion
effects can contribute 14.1 percent of variation in customer loyalty.
According to the statistical test results, H9C was supported, high-perceived switching
costs have a positive influence on customer loyalty (0.113) and H11B was also supported,
high-perceived alternative attractiveness has a negative influence on customer loyalty (-
0.101). These findings are consistent with previous research (Anderson and Narus, 1990;
Colgate and Norris, 2001; Mutum et al., 2014, Kim et al., 2018) where they found that when
the perception of alternative attractiveness is low, customers have a tendency towards
retention and more loyalty due to low perceived benefits of switching providers. Hirschman
(1970); Jones et al. (2007), Liu et al. (2011) and Mutum et al., (2014) presented that when
switching barriers are high, the option to exit will be limited and customers might have a

267
tendency towards loyalty. Qui et al. (2015:92) also found that “in the industries characterised
by relatively low switching costs, customers are less likely loyal compared to service
industries with relatively high switching costs”. Tung et al. (2011:32) found that “higher
perceived switching costs and lower attractiveness of competing alternatives are associated
with higher repurchase intentions”. However, they could not find a link between alternative
attractiveness and loyalty (p value is higher than 0.05). In this thesis, the relationship between
switching cost and customer loyalty is positive, higher switching costs lead consumers to be
more loyal to retailers and its loading is relatively high (0.113) as it explains 11.3 percent of
loyal behaviour compared to that of 40% found by Koutsothanassi et al. (2017) and the
finding from Ningsih and Segoro (2014:1018) that “if the variables of switching cost
increased for one unit, the customer loyalty would increase for 0.241 points, assuming that
other independent variable value was fixed”. Besides that, alternative attractiveness
negatively affects customer loyalty, if there are more options, many competitors are
available, and consumers tend not to be loyal to retailers. In other words, if alternative
competitors are highly available, consumers’ loyal behaviour toward their current retailers is
decreasing by 10.1 percent. These findings are slightly different with the study of Burnham et
al. (2003) where they found that switching costs have the lowest influence on customer
loyalty and the findings from Tung et al. (2011:35) which showed that “the relationship
between the attractiveness of alternative and loyalty is not significant” (see Figure 2.4.13)
and Kim et al. (2004) who found the impact of switching barriers on customer loyalty, but not
much compared to the customer satisfaction dimension. In conclusion, in this study,
switching barriers including switching costs and alternative attractiveness are considered as
one of the main factors affecting customer loyalty.
H17D was supported, (E-service quality about a core e-service quality scale (E-S-
QUAL)) has a significant positive effect on customer loyalty (0.106) while H17C (E-service
quality about website quality scale (W-S-QUAL)) has a significant positive effect on
customer loyalty was statistically significant, but not supported. The result showed that a
website quality scale has a negative impact on customer loyalty (-0.076). This is an
unexpected result: with a low loading website, consumers still remain loyal to supermarkets.
This result can be explained as follows: because the study did not separate e-loyal consumers
and offline loyal consumers, W-S-QUAL could not explain the whole customer loyalty
behaviour. Besides that, as noted and proved in H17D, E-S-QUAL related to reliability,
fulfillment, efficiency and privacy/security, the higher e-service quality about theseterms will

268
lead to higher customer loyalty behaviour. E-S-QUAL can explain 10.9 percent of the
variation in customer loyalty in general. In a retailing context, e-service quality (E-S-QUAL)
is considered one of the main drivers of customer loyalty. Based on the statistical results,
customer loyalty increases even as E-S-QUAL decreases. It contradicts the theory that high e-
service quality relating to a website leads to higher customer loyalty. In this case, low e-
service quality relating to awebsite in parallel with high e-service quality related to E-S-
QUAL is still possible, creating a higher level of loyalty. The finding is partially consistent
with Yun and Good’s study (2007) where they confirmed that e-service can improve
customer loyalty. Ribbink et al. (2004:446) found “the e-service quality dimension of
assurance, i.e. trusting the merchant, influences loyalty via e-trust and e-satisfaction”. And
the study from Chang and Wang (2011:346) showed that e-service quality did not directly
significantly affect customer loyalty, but “it does so indirectly through the mediation of
perceived value and satisfaction”. However, in this research, e-service quality related to E-S-
QUAL was found to have a significant direct impact on customer loyalty.
In this research, H20C was supported - good price offered positively affects customer
loyalty (0.069). The positive direct relationship was found. This finding is consistent with
previous studies where Eid (2015), Eid and El-Gohary (2015), El-Adly’s research (2018)
shows that price has a direct positive effect on customer loyalty (0.088 with p-value <0.05).
In this study, a realistic price paid can explain 6.9 percent of variation in consumers’ loyal
behaviour. Compared to other indicators, price shows a weak effect on customer loyalty.
According to the statistical test results, H26 (Habit positively affects customer loyalty)
was supported. In this study, the “habit” construct was built on three reliable and validated
items: “I have been doing for a long time (shopping at this supermarket)”, “I have no need to
think about doing (shopping at this supermarket),”, “I do without thinking (getting used to
knowing the products I need are, and in many convenient ways)”. However, the effect of
habit on customer loyalty is weak with a beta value of 0.057. This suggests that a habitual
behaviour relatively contributes to customer loyalty to some extent. The study of Liu et al.
(2015) was consistent with this research finding where they also found the positively direct
linkage between customer loyalty and habit. However, in their studies, habit is a strong
determinant of loyalty (beta value is 0.39). This can be explained as follows. Although it can
not deny the role of habit in shopping, consumers are likely to choose where they often shop
and be loyal to that place if alternative choice is limited. However, based on the results from

269
supermarket consumer interviews, the level of habit influencing customer loyalty is different
across age ranges and locations where consumers stay. For instance, older consumers are
afraid to change to a new store or a new brand name because they claim that they will be not
familiar with where products are located at their new choice while young consumers are
happy to try to shop at new places. Consumers who stay in an urban area where supermarkets
are located near their houses or childrens’ schools will choose to shop and be loyal to
supermarkets surrounding these areas or those who do not have much time to shop might
continue to shop at their current supermarkets, otherwise they will shop anywhere they want
if there are no constraints. These reasons can lead to different statistical results between
studies. This study can endorse that habit positively affects customer loyalty but the impact is
relatively weak.
That H1C was supported means that income has a positive effect on customer loyalty. In
this study, income shows it has a weak positive direct impact on customer loyalty with
loading of 0.024. It reveals that consumers with higher incomes, might have slightly higher
levels of loyalty than those who have lower incomes. There has been no previous research on
how income affects consumer loyalty.
H7B (Customer perceived value has a direct positive impact on customer loyalty) was
not supported. This can be explained as follows. Due to the existence of other constraints,
such as time limitation, inconvenient locations, prices, and different interests between
members of a family, consumers might perceive high value from a specific supermarket but it
does not mean that they are definitely loyal to that supermarket. The finding of this research
is inconsistent with the studies of Ishaq (2012), Cronin et al. (2000), Chen and Chen (2010),
Ryu e al. (2012), Choi et al. (2004), Pura (2005), El-Manstrly (2016), they found that
customer perceived values are positively and directly related to customer loyalty, Rasheed
and Abadi (2014:303) stated that “46.5 percent of variation in customer loyalty can be
described by perceived value”. However, Bei and Chiao (2001), El-Adly and Eid (2016)
found only an indirect relationship existing between these two variables. In this research, as
explained above, customer perceived value was found only to have a direct impact on
customer satisfaction and its indirect relationship with customer loyalty is mediated by
customer satisfaction; no direct impact was found.
That H22B (Corporate social responsibility is directly and positively associated with
customer loyalty) was not supported means that there is no direct relationship between CSR

270
and customer loyalty. This finding is consistent with some previous studies where Carrian
and Attalla’s studies (2001), Kaplan et al. (2014), Chang and Yeh (2017), Salmones et al.
(2005), Chang and Yeh (2017) also could not find a relationship. Chang and Yeh’s results
(2017) found that there is no direct effect between CSR and customer loyalty. The
relationship will exist when a mediator, corporate image, existed, (Chang and Yeh, 2017;
Gurlek et al., 2017). Therefore, corporate image could be tested as a mediator in the
relationship between CSR and customer loyalty. However, in this research, measured items
proposed for “corporate image” had been removed from the whole dataset due to its low
loading or cross-factor loading reasons. Therefore, the proposed mediating relationships
could not be tested. In contrast, Yusof et al. (2015) found CSR relating to customer centricity
have a direct positive effect on customer loyalty and other groups of researchers, such as
Perez et al. (2013), Mandhachitara and Poolthong (2011), Leaniz and Rodriguez (2015),
Ofluoglu and Atilgan (2014), Liu et al. (2014) found that there is a positive relationship
between CSR image and customer loyalty.
In this research, product quality was found to have no direct relationship with customer
loyalty (H21C). As presented previously, product quality is one of the main indicators of
customer satisfaction. That H2C, H3C, H4C, H5C (location where people stay has an effect
on customer loyalty, age range affects customer loyalty, gender affects customer loyalty,
People who choose different supermarkets for shopping have different behaviour on customer
loyalty) were not supported mean that locations, age ranges and gender, supermarkets’
choices do not show their impact on consumers’ loyalty behaviour.
H15, store accessibility positively affects customer loyalty, is statistically significant but
not supported. According to the statistical result, store accessibility has a slight negative
impact on customer loyalty. This is an unexpected result. However, in this case, it can be
explained as follows. If there is plenty of alternative attractiveness, other competitors are
located near focal retailers where consumers usually choose to shop, the level of loyalty in
this case could not be guaranteed and explained by store accessibility of a focal retailer.
Consumers tend to compare focal retailers and other competitors if competition level is high
and competitive advantages may erode (Seiders et al., 2005). Therefore, consumers have a
tendency to be less loyal to a focal retailer. The finding is inconsistent with Swoboda et al.
(2013) who found store accessibility of a focal retailer to have a positive impact on its store
loyalty and store accessibilty of competitors to have a negative influence on store loyalty

271
towards the focal retailer. However, Swoboda et al. (2013:253) and Gounaris and
Stathakopoulos (2004) emphasised that “customers tend to be less loyal to a focal retailer
when the brand schemes of its competitors are more positive, perceptions of competitors may
affect store loyalty towards the focal retailer negatively if equally strong retailers are
competing with one another”. Therefore, in this result, the hypothesis of store accessibility
(of a focal retailer) having a positive effect on customer loyalty was not supported. And it can
be noted that the effect of location accessibility on store loyalty depends on the local
competitive context. Again, this finding partly endorsed the above statement of Swoboda et
al. (2013).
H18 (Loyalty programmes have a positive effect on customer loyalty (-0.041)) was
statistically significant but not supported. In this research, loyalty programmes were found to
have a negative relationship with customer loyalty. The finding is consistent with Lin and
Bennett (2014) and Stauss et al. (2005) who indicated that loyalty programmes can frustrate
their customers and decrease the level of customer retention to some extent. As presented at
the literature review part, Gustafsson et al. (2004), Lacey and Morgan (2008:9) stated “no
evidence is found in support of H2b for how membership in loyalty programmes increases
customers’ willingness to share information”, “no evidence for H4b is found to demonstrate
that loyalty programme membership positively impacts the relationship between committed
customers and their willingness to engage in word-of-mouth referrals” and “no evidence is
found in support of H5b that loyalty programme membership positively magnifies the
influence of the relationship between commitment and increased repatronage intentions”.
Stauss et al. (2005:231) explained “some operational problems in collecting promised
incentives for loyal behaviour and complicated operational procedures of a telecom
company’s customer club are perceived negatively by customers”. The finding from this
research can be explained as above. Loyalty programmes somehow frustrate their customers
if there are problems occurring during the rewarding process. In this research, loyalty
programmes construct is built based on the three reliable scales and proved its validity via
CFA; “collecting points is entertaining”, “When I redeem my points, I am good at myself”,
and “I belong to a community of people who share the same values”, retailers should
carefully consider how to use their loyalty programmes to stimulate shopping and retain their
valuable consumers rather than frustrating them and make them feel uncomfortable. The
finding is not compatible with Chen and Wang (2009), Walsh et al. (2008); Ho et al. (2009),
Noordhoff et al. (2004), Gustafsson et al. (2004), Bowen and McCan (2015), Roehm et al.

272
(2002), Halberg (2004), Verhoef (2003), Lewis (2004), Bolton et al. (2000) where they found
a positively strong relationship between the loyalty programmes offered and customer
loyalty.
7.3. Multi-group comparisons’ discussion (Comparisons across groups for factors
related to customer loyalty)
This research used chi-square test to investigate between many groups, including
strategic groups (between different supermarket business models), income, gender, age range,
location, occupation and education level. The full statistical results were presented at section
6.6.3.4. Appendix 7.1, 7.2 and 7.3 systematically present the results from comparisions across
groups for factors related to customer loyalty, customer satisfaction and customer perceived
value respectively. However, based on the objectives of this research, only differences across
groups for factors related to customer loyalty will be fully discussed (see Appendix 7.1).
Regarding differences between strategic groups, e-service quality related to E-S-QUAL
has a strong and positive impact on customer loyalty at three groups, including the group of
multipurpose premium supermarkets 1 (Lotte mart), premium supermarket chains with
convenience stores (Vinmart), the group of multipurpose supermarkets 2 (Aeon) but e-service
quality related to E-S-QUAL was found to have no effect on customer loyalty among the
specialised daily consumer goods store (BigC or Co.opmart). The reason could be that
consumers from the group of specialised daily consumer goods prefer to come direct to
supermarkets and buy products, the rate of online shopping of this group would therefore be
lower than other supermarket groups and therefore e-service quality is a factor that does not
influence customer loyalty here. It can be seen that three other groups differently position
their target markets and consumers; the real situation showed that these three groups are
actively using e-stores for online grocery selling and participants who choose to shop at the
group of specilised daily consumer goods might not use their e-stores. Besides that,
consumers who choose to shop at the group of multipurpose premium supermarkets 1 (Lotte
mart) are more likely to have a relatively high income and good education levels that enables
them to shop online or groups of office workers who do not have much time for offline
shopping. In addition, promotion effects have positive relationship with customer loyalty at
the group of specialised daily consumer goods but at the group of multipurpose supermarkets
2 (Aeon), this relationship was not supported. It is noted that supermarkets at the group of
specialised daily consumer goods usually offer a reasonable price and discount in order to

273
keep their target consumers and promotion is one of their tools to attract consumers.
However, in the group of multipurpose supermarkets 2, there are a variety of attached
products offered and services instead of just daily consumer goods. It means that promotion
in this group is not an indicator for customer loyalty.
At the group of multipurpose premium supermarkets 1, higher perceived alternative
attractiveness will lead to decreases in the level of consumer loyalty toward their current
supermarket, alternative attractiveness can negatively explain 22.8 percent variation in
customer loyalty, this figure at premium supermarket chains with convenience stores is 17.2
percent and at the group of specialised daily consumer goods is only just 0.6 percent. These
findings showed that consumers from the group of multipurpose premium supermarkets 1
will be less loyal to their supermarkets than other groups when they perceive high alternative
attractiveness. It can be noted that a majority of consumers from the group of multipurpose
premium supermarkets 1 and premium supermarket chains with convenience stores have a
medium and high income; they are concerned more about product quality and service quality,
and they might be willing to switch to other providers since they can, even if it costs them
more money and time to switch. Consumers from the group of specialised daily consumer
goods usually choose daily consumer goods with reasonable prices; in this case, the low
perceived alternative attractiveness could not be a main reason for them to stay loyal, and
their loyal behaviour might be down to other factors. Besides that, the research found that
price has a positive influence on customer loyalty at the group of multipurpose premium
supermarkets 1 but this relationship was not supported at premium supermarket chains with
convenience stores and at the group of specialised daily consumer goods, the effect was
relatively weak (6.1%). As presented above, consumers of premium supermarket chains with
convenience stores do not have much concern about price issues as consumers of this group
have a high income and are concerned more about hygiene issues, product origins, location
advantages, product quality, service quality and so forth; that price has a strong and positive
influence on customer loyalty at the group of multipurpose premium supermarkets 1 does not
mean that consumers in this group expect to buy products at low price, based on the
measurement scales of price constructs and in this case, reasonable price means that “goods
at this store offer value for money” (PRICE3 variable), in accordance with the results from
consumer interview, consumers explained that price is important when they shop at
supermarkets. However, in return, other factors such as good product quality, service and
relaxing shopping environment are also important. Balancing between what they got and

274
what they sacrified is a result of consumer perceived value, higher perceived value consumers
of this group seem to be happy to pay more to get “good value” products. Therefore, price is
also one of the indicators of customer loyalty to some extent.
Retail brand experience was found to have a stronger impact on customer loyalty for the
group of specialised daily consumer goods, compared with the group of multipurpose
premium supermarkets 1. At the group of specialised daily consumer goods, retail brand
experience can explain 32.6 percent variation in customer loyalty, this figure for the group of
multipurpose premium supermarkets 1 is 21.9 percent. In this research, that retail brand
experience was found as the most important indicator of customer loyalty presents that
consumers are concerned more about retail brand name and their brand experience. The
difference between two above examined groups can be explained as follows: supermarkets of
the group of specialised daily consumer goods have been one of the first supermarkets
established in the Vietnamese grocery market; consumers remember their brand name with
images of “supermarkets for the family”. Therefore, the brands created have been deeply
ingrained in consumers’ memories. In addition, offering a variety of daily consumer goods
connected with family-focused culture with a reasonable price can lead to a higher loyal
behaviour among consumers.
Regarding gender, this research found that the positive relationship between promotion
and customer loyalty is stronger for males. It means that promotion effects lead to loyalty
behaviour is stronger for males; with males, promotion can explain 21.2 percent variation in
customer loyalty, while for females it is 11 percent. In Vietnam, a female is normallhy the
person in charge of grocery shopping. Their loyal behaviour can be explained by many
factors. Males are regarded as easy consumers in terms of shopping behaviour. The finding
above showed that males are more strongly iinfluenced by the level of promotion. For
instance, males are often in charge of shopping for household electrical appliances and
technical equipment or ‘quick’ grocery shopping at supermarkets, where promotions can be
linked with their behaviour.
Regarding income, at the low income group, service quality can explain 13.1 percent in
variation of customer loyalty, while that of the medium income group is 28.4 percent. The
medium income group considers that service quality is one of the main indicators of their
loyalty behaviour. Due to the higher income, the medium income group of consumers expect
to have a higher service quality, in the case of high perceived alternative attractiveness, they

275
are more likely to switch to other providers if service quality is low. There are other factors,
such as price and promotion which are more important than service quality in explaining the
loyal behaviour of consumers from the low income group. Coincidentally, the research found
that the low income group considers price to be one of the main factors affecting their loyalty
behaviour but price has no effect on customer loyalty at medium income group. It can be
easily explained that low income consumers with limited budgets, price can be their most
considered factor.
Regarding location, in Ho Chi Minh, habit and e-service quality related to E-S-QUAL
have been considered as one of the main indicators of customer loyalty while in Hanoi, these
relationships were not supported. Differences between locations can be explained as follows:
different regions have different consumption styles and their perception of loyalty is
different, these differences can be traced back to different cultures across the country. In
addition, comparison with Ho Chi Minh, the level of retail brand experience influencing
customer loyalty is stronger in Hanoi (see Appendix 7.1 for full comparisons across groups).
It is noted that consumers in Hanoi have different spending lifestyles, formality is popular
and a brand name seems to be more important. Those who have a good retail brand name
tend to be more loyal in Hanoi; they are less likely to change to something new (such as
choosing a new supermarket to shop when they are happy with a current supermarket brand
name) and in general, consumers in Ho Chi Minh, with generous spending styles will find it
easier to change or try new things. These differences can partly explain why the level of retail
brand experience influence on customer loyalty is stronger in Hanoi. The research also found
that service quality is also one of main indicators of customer loyalty in Ho Chi Minh but in
Da Nang, service quality was found to have no direct impact on customer loyalty. This can be
explained that with a high level of alternative attractiveness in Ho Chi Minh, consumers will
find other better providers if the service quality of supermarkets is low and based on the
statistical results, there are five main factors affecting customer loyalty in Da Nang: retail
brand experience, customer satisfaction, alternative attractiveness, promotion and switching
costs with coefficients of 0.347, 0.257, -0.172, 0.138 and 0.128 respectively; how supportive
service employees are does not affect customer loyalty. Besides that, the results also show
that in Da Nang service quality is one of the main indicators of customer satisfaction which is
directly connected to customer loyalty. Consumers in Da Nang are satisfied because of high
service quality which indirectly leads to loyal behaviour. For other places such as Binh

276
Duong and Can Tho, the researcher only found differences relating to customer satisfaction
across locations.
Regarding age ranges, customer satisfaction has a strong and positive impact on
customer loyalty among 18-22 year-olds, however, among 41-55 year-olds, customer
satisfaction was found to have no relationship with customer loyalty. In Vietnam, consumers
aged from 18 to 22 years old are more likely to have less money which leads to limited
spending budgets compared with 41-55 year-olds; when they are satisfied they tend to be
more loyal while the older group (41-55 year-olds) will normally having a higher shopping
budget, higher demand for products and better alternative choices as well as brand name
issues. Satisfaction in this case cannot guarantee for their loyal behaviour. In addition, higher
perceived switching costs will lead the group of 18-22 year-olds to stay loyal to their current
supermarkets while there is no linkage between switching costs and customer loyalty among
41-55 year old consumers. The reason could be that the group of 18-22 year-olds are afraid of
switching costs and have an easier shopping behaviour than another group when their
shopping budgets are limited. In contrast, among the 41-55 year-olds are not concerned about
switching costs and are willing to pay more or travel a longer distance to their favourite
supermarkets. They have a variety of choice, so satisfaction will not lead to loyalty. Their
loyal behaviour could be explained by other factors. Besides that, as explained above, in
Vietnam, a majority of consumers from the 18-22 year-old group have no income or low
income compared to other groups as they are still experiencing their education at universities
or colleges. Their shopping expenditure seems to be much lower than other groups. In
addition, between these two groups, the impact of promotion/price/service quality on
customer loyalty is much stronger among 41-55 year-olds. This group considers
promotion/service quality as factors contributing towards a good and enjoyable shopping
experience. They might be more loyal to supermarkets if good promotion programmes and
higher service quality were offered.
Between the 23-30 and 31-40 year-old groups, e-service quality related to E-S-QUAL
was found to only have a positive and strong relationship with customer loyalty with the
group of 23-30 year-old consumers and at this group, price slightly affects customer loyalty
while price has no influence on customer loyalty among the 31-40 year-olds. It can be noticed
that the group of 23-30 year-olds are mostly actively using online shopping, and older groups
of consumers might mostly choose to shop ‘offline’ at stores. These things explain why no

277
relationship could be found between e-service-quality and customer loyalty among 31-40
year-olds. Price was found to have no relationship with customer loyalty among the older
consumer group as their loyal behaviour could be explained by other factors, such as product
quality, brand name preference, habit or service quality. In addition, in this research, the
relationship between service quality and customer loyalty is stronger for the group of 23-30
year old consumers, compared with the group of 18-22 year olds. Consumers aged from 23 to
30 might more likely choose to switch to other providers if low service quality is perceived.
Again, it can be endorsed that the impact of service quality on customer loyalty is stronger
for older groups as explained above.
The linkage between switching costs and customer loyalty is stronger for the group of
over 55 year-oldss, compared with the group of 23-30 year-olds. When switching costs are
highly perceived, the group of over 55 year old consumers tends to remain to be loyal to
supermarkets as they are afraid of change and investing time and money to find alternative
providers.
Regarding occupation, the results show that habit is one of the main indicators of
customer loyalty among office staff while no relationship between these two constructs was
found at the group of housewives. The reason could be that office staff usually do not have
sufficient time for shopping at supermarkets compared to housewives who always have
plenty of shopping time. A construct “habit” includes three variables related to saving time (1
variable) and how familiar consumers are with where products are located in stores (2
varibales). Therefore, habit strongly influences the loyal behaviour of office staff. Eventually,
the office staff will choose to shop at their normal shopping place and are averse to change
because of their limited shopping time and the convenience of supermarket locations will
facilitate their shopping while the housewives loyal behaviour can be affected by other
factors, such as retail brand experience, service quality, promotion, switching costs and price.
The statistical results also demonstrate that customer satisfaction does not affect customer
loyalty among housewives. In addition, between three groups (students, self employment and
office staff), the positive relationship between retail brand experience and customer loyalty is
strongest for the group of students, followed by office staff and retail brand experience can
only explain 15.2 percent of the variation in customer loyalty among the self employed. The
reason could be that self employed customers are more likely to be motivated by service
quality rather than the retail brand experience while students and office staffs will likely have

278
a fixed route to and from their place of work or study, so they may be more likely to shop at
supermarket that they perceive provide good retail brand experience and a good location.
Regarding education levels, two main differences were found between three groups.
Among college/undergraduates, the relationship between customer satisfaction and customer
loyalty is much stronger, compared with the group of A levels consumers. Customer
satisfaction can positively describe 40.6 percent variation in customer loyalty among college
and undergraduate consumers while the figure for the group of A level consumers is 14.5
percent. In fact, among college/undergraduate consumers, customer satisfaction is considered
the most important indicator of customer loyalty while the top three factors deciding
customer loyalty of A level consumers are retail brand experience, service quality and
customer satisfaction. The reason could be that A-level consumers often stay with their
parents, so their shopping choices will depend on their parent’s decisions. In this case,
satisfaction might not guarantee loyal behaviour from A-level consumers. The group of
college/undergraduate consumers are more likely to have their own spending budgets and can
control their shopping decisions, so when they are satisfied with a supermarket, they will be
more loyal.
The results show that e-service quality related to W-S-QUAL (website quality scale) has
a positive impact on customer loyalty among college/undergraduate consumers but a negative
impact was found at the group among GCSE’s consumers. The reason could be that
consumers from the GCSE group are less likely to be in charge of supermarket shopping, the
results show that even when good website quality is provided, consumers of this group still
do not show loyalty to their supermarkets. In contrast, among consumers from the
college/undergraduate group who can use the internet for supermarket online shopping, the
provision of a good quality website can explain 12.8 percent of the variation in customer
loyalty.
The next chapter completes the thesis with conclusion, contributions, limitation and futur
research opportunities.

279
Chapter 8: Conclusion
8.1. Introduction
The aim of this thesis is to investigate factors affecting customer loyalty of different
strategic groups in the Vietnamese supermarket sector. In order to achieve this main aim,
many interviews and tests were conducted and the results have been shown and discussed
from chapter 4 to chapter 7. This chapter is going to summarise the main findings by briefly
presenting conclusions relating to the research questions, followed by other main results
found and contributions to theory, methodology and practice. Then, limitations of the
research will be demonstrated as well as recommendations for future research.
8.2. Summary of main findings
8.2.1. Conclusions regarding the research questions
RQ1: What factors directly affect customer loyalty in the Vietnamese supermarket
sector and at which level?
The results show that there are seven main indicators for customer loyalty in the retailing
industry, in descending order: retail brand experience, service quality related to service
employees’ knowledge and attitudes toward consumers, customer satisfaction, promotion
effects, switching costs, e-service quality related to E-S-QUAL scale and alternative
attractiveness. Retail brand experience can positively describe 30.6 percent variation in
customer loyalty, service quality c17.9 percent and customer satisfaction 17.8 percent. The
figures of promotion effects, switching costs, e-service quality related to E-S-QUAL scale
and alternative attractiveness are 14.1%, 11.3%, 10.6% and 10.1% respectively. In the
research findings, six out of the seven factors show a strong positive relationship with
customer loyalty; the exception being alternative attractiveness. Thus, for example, when
consumers’ retail brand experience is high, their loyalty will be high; when service
employees show respect and supportive knowledge to consumers, consumers will be loyal to
firms. This research confirms that customer satisfaction has a positive impact on customer
loyalty, but the influence’s level is not as high as expected. Again, customer satisfaction can
explain 17.8 percent variation in customer loyalty. Promotion is considered to be one of the
main indicators of customer loyalty in the supermarket sector, being fourth in the list of main

280
elements influencing customer loyalty. Effective promotions will lead to higher loyal
behaviour among consumers. Switching barriers were seen to have a strong relationship with
customer loyalty. When satisfied consumers perceive higher switching costs, they retain
loyalty with their current supermarket, while higher perceived alternative attractiveness leads
to a low level of loyalty. Besides that, price, habit and income also have a slight positive
impact on customer loyalty. Higher income consumers were found to be more loyal than
lower income consumers in general.
A negative relationship between store accessibility and customer loyalty was found. This
was an unexpected result. However, that consumers find it easy to access to supermarkets
does not guarantee that they will be loyal to supermarkets; in this research, the easier access
to supermarkets, the lower level of loyalty due to consumers having a variety of choices
(alternative attractiveness) leading to better benefits offered from other competitors. For
example: better service quality, better brand name positioning or better promotion activities.
Loyalty programmes were found to have a negative relationship with customer loyalty in this
research due to programmes often frustrating consumers to some extent. Customer perceived
value, product quality and corporate social responsibility were found to have no direct impact
on customer loyalty. The hypothesis that e-service quality related to W-S-QUAL scale has a
positive impact on customer loyalty was not supported. Furthermore, qualitative variables
including age range, gender and location where consumers stay and which supermarkets they
choose to frequent were found to have no influence on customer loyalty.
RQ2: Is customer satisfaction a major indicator for customer loyalty or not?
The finding from this research confirmed that satisfaction is considered as one of the
main indicators of customer loyalty (as presented above). However, the level of impact was
not as high as expected - customer satisfaction can describe only 17.8 percent variation in
customer loyalty.
RQ3: What factors directly affect customer perceived value and customer satisfaction
in the Vietnamese supermarket sector and at what level?
Customer perceived value
This research found factors directly affecting customer perceived value which will be
demonstrated as follows in decending order of importance: price, in-store logistics, trust,

281
promotion effects, e-service quality related to E-S-QUAL, switching costs, service quality
and customer service (see Table 7.1). The majority of these factors have a positive impact on
customer perceived value, with the exception of switching costs. For example, the better the
price offered, the higher the perceived value for consumers, and effective in-store logistics
will lead to higher customer perceived value. However, higher perceived switching costs will
decrease customer perceived value.
Customer satisfaction
This research revealed seven main factors directly affecting customer satisfaction in the
Vietnamese supermarket sector, which in decreasing order of importance are: customer
perceived value, in-store logistics, service quality related to service employees’ knowledge
and attitudes toward consumers, store image, customer experience, product quality and
alternative attractiveness. In particular, the first six factors showed a strong and positive
relationship with customer satisfaction. Customer perceived value is considered the main
indicator of customer loyalty, it can explain 30.1 percent variation in customer loyalty, in-
store logistics also demonstrated its vital role with customer satisfaction: with 23.9 percent
variation in customer satisfaction; the figures for service quality, store image, customer
experience, and product quality are 21.4 %, 18.8%, 14.8% and 14.4% respectively. In order
to maintain or improve customer satisfaction, these top six factors should be comprehensively
considered. The research also presented that alternative attractiveness can negatively explain
11.3 percent variation in customer satisfaction. When customers perceive high alternative
attractiveness, their level of satisfaction might decrease, and they might choose to switch to
other retailers if necessary. Besides that, switching costs and price also have a slightly direct
impact on customer satisfaction. Considering qualitative variables, income and location
where consumers stay slightly affects satisfaction behaviour. The results show that people
with higher incomes seem to be more satisfied than the group of lowincome consumers,
consumers in Ho Chi Minh, Binh Duong and Can Tho are more satisfied compared to those
in Ha Noi and Da Nang. Besides that, in this research, retail brand experience was found to
have no relationship with customer satisfaction but it is a main indicator of customer loyalty
which was presented in RQ1 at section 8.2.1. In addition, age range, gender, and supermarket
business models do not influence the level of customer satisfaction.

282
RQ4: Are there any differences in terms of factors affecting customer loyalty between
strategic groups in the Vietnamese retail industry?
In order to answer this question, multi-group analysis was conducted between researched
supermarkets. As analysed in chapter 4, there are five main strategic groups in the
Vietnamese supermarket sector (see section 4.1.2 for strategic group mapping). The
researcher used AMOS version 24 to investigate all possible differences between
supermarket business models. The full analysis was presented in section 7.5 and brief results
can be summarised as follows.
E-service quality relating to E-S-QUAL has a strong and positive impact on customer
loyalty in three groups, including the group of multipurpose premium supermarkets 1 (Lotte
mart), premium supermarket chains with convenience stores (Vinmart), and the group of
multipurpose supermarkets 2 (Aeon) but e-service quality relating to E-S-QUAL was found
to have no effect on customer loyalty in the group of specialised daily consumer goods (BigC
or Coopmart). In addition, promotion effects have a positive relationship with customer
loyalty at the group of specialised daily consumer goods but this relationship was not
supported at the group of specialised daily consumer goods. Price has a positive influence on
customer loyalty at the group of multipurpose premium supermarkets 1 but this relationship
was not supported at premium supermarket chains with convenience stores and at the group
of specialised daily consumer goods, the effect was relatively small (6.1%). At the group of
multipurpose premium supermarkets 1, higher perceived alternative attractiveness will lead to
decreases in the level of consumer loyalty towards their current supermarket, alternative
attractiveness can negatively explain 22.8 percent variation in customer loyalty, this figure at
premium supermarket chains with convenience stores is 17.2 percent and at the group of
specialised daily consumer goods is only 0.6 percent. Retail brand experience was found to
have a stronger impact on customer loyalty for the group of specialised daily consumer
goods, compared to the group of multipurpose premium supermarkets 1 (see Appendix 7.1
for full comparison across strategic groups).

283
RQ5: Are there differences between the factors affecting customer loyalty in the retail
industry based on income, gender, locations, age groups, occupation and
education levels?
Differences in relationships between many constructs in the final researched model were
presented and discussed in detail in section 6.6.3.4.2 (gender), 6.6.3.4.3 (income groups),
6.6.3.4.4 (locations), 6.6.3.4.5 (age ranges), 6.6.3.4.6 (ocupation) (see Appendix 7.1 for full
comparision across groups for factors related to customer loyalty). This section is going to
briefly sumarise the results.
Among the low income group, service quality can explain 13.1 percent variation in
customer loyalty, while that of the medium income group is 28.4 percent. The medium
income group considers that service quality is one of the main indicators of their loyalty
behaviour. The research found that the low income group considers price is one of the main
factors affecting their loyalty behaviour while price was found to have no effect on customer
loyalty among the medium income group.
Regarding gender, this research found that the positive relationship between promotion
and customer loyalty is stronger for males. It means that promotion effects lead to stronger
loyalty behaviour among males; promotion can explain 21.2 percent variation in customer
loyalty while for females it is 11 percent.
As for location, in Ho Chi Minh habit and e-service quality related to E-S-QUAL are
considered the main indicators of customer loyalty while in Hanoi, these relationships were
unsupported; service quality is also a main indicator of customer loyalty in Ho Chi Minh but
in Da Nang, service quality was found to have no impact on customer loyalty. In addition,
compared with Ho Chi Minh, the level of retail brand experience influencing customer
loyalty is stronger in Hanoi. In other places such as Binh Duong and Can Tho, the researcher
only found differences relating to customer satisfaction across locations.
In terms of age ranges, customer satisfaction has a strong and positive impact on
customer loyalty among 18-22 year-olds, however, among 41-55 year-old consumers,
customer satisfaction was found to have no relationship with customer loyalty. Higher
perceived switching costs will lead 18-22 year old consumers to stay loyal to their current
supermarket while there is no linkage between switching costs and customer loyalty among
41-45 year old consumers. Between these two groups, the impact of promotion/price/service

284
quality on customer loyalty is much stronger for 41-55 year- old consumers. Between the 23-
30 and 31-40 year-old groups, e-service quality related to E-S-QUAL was found only to have
a positive strong relationship with customer loyalty with 23-30 year-olds and in this group,
price slightly affects customer loyalty while price has no influence on customer loyalty
among 31-40 year-old consumers. In addition, the relationship between service quality and
customer loyalty is stronger for 23-30 year-olds, compared with 18-22 year-olds; the linkage
between switching costs and customer loyalty is stronger among over 55 yearolds, compared
with 23-30 year-olds.
Regarding occupation, the results show that habit is one of the main indicators of
customer loyalty in the group of office staff while no relationship was found between these
two constructs among housewives. The statistical results also demonstrate that customer
satisfaction does not affect customer loyalty among housewives. In addition, between three
groups (students, self employmed and office staff), the positive relationship between retail
brand experience and customer loyalty is strongest for students, followed by office staff, and
retail brand experience can only explain 15.2 percent of variation in customer loyalty in the
self employed.
Regarding education levels, two main differences were found between three groups.
Among college/undergraduate consumers, the relationship between customer satisfaction and
customer loyalty is much stronger, compared with to the A level group. Customer satisfaction
can positively describe 40.6 percent variation in customer loyalty among college and
undergraduate consumers while that figure for the group of A level consumers is 14.5
percent. In fact, among college/undergraduate consumers, customer satisfaction is considered
the most important indicator of customer loyalty while the top three factors deciding
customer loyalty among A level consumers are retail brand experience, service quality and
customer satisfaction. The results also demonstrated that e-service quality related to W-S-
QUAL (website quality scale) has a positive impact on customer loyalty among
college/undergraduate consumers but a negative impact among GCSE consumers.
8.2.2. Other conclusions
Regarding how qualitative variables affect three dependent constructs (customer
perceived value, customer satisfaction and customer loyalty), supermarket business models
(strategic groups) were found to have an impact on customer perceived value, meaning that

285
consumers who choose to shop at thespecialised daily consumer goods group (Coopmart or
BigC), the group of Multipurpose premium supermarkets 1 (Lotte Mart) and Premium
supermarket chains with convenience stores (Vinmart) have a slightly higher perceived value
compared to that of the group of Multipurpose supermarkets 2 (Aeon) or other supermarkets.
Income and location have a slightly positive impact on the level of customer satisfaction,
meaning that if income increases, the level of customer satisfaction slightly increases and
supermarket consumers in Ho Chi Minh, Binh Duong and Can Tho tend to be more satisfied
with their current supermarket than those of Ha Noi and Da Nang. Income was also found to
have a slightly positive influence on customer loyalty, meaning that consumers with higher
income, might in general have a higher.
8.2.3. Contributions to theory, methodology and practice
8.2.3.1 Contribution to theory
This research has three main contributions to the theory. Firstly, as presented at 2.4.5
(literature review section) and the results’ discussion at 7.2.2, switching costs and alternative
attractiveness in this research were treated as independent variables in comparison to
customer satisfaction (dependent variables). This research argues that the relationship
between customer satisfaction and switching barriers (switching costs and alternative
attractiveness) can be mutual, that switching costs and increases in alternative attractiveness
can influence the level of satisfaction. The higher perceived attractiveness of other providers
might decrease satisfaction levels and if switching costs are highly perceived, customer
perceived value might decrease and consumers tend to remain satisfied with current
providers; in other words, dissatisfied consumers might feel trapped and forced to remain
with current providers in the case of higher perceived switching costs. In previous research,
some researchers found that alternative attractiveness and switching costs can be both
mediators and moderators in the relationship between customer satifaction and customer
loyalty, meaning that they investigated how customer satisfaction affects perceived switching
costs and perceived alternative attractiveness. In contrast, based on the above arguments and
statistical results in this research, in the future, researchers can also examine how perceived
switching costs and perceived alternative attractiveness influence the level of customer
satisfaction.

286
Secondly, it is demonstrated in the review section that all theories related to the
relationships between constructs has already existed but testing theories have generated many
contrasting results and this research provides a comprehensive research model relating to
customer loyalty, customer satisfaction and customer perceived value in that all possible
factors which might affect these three dependent constructs were proposed (figure 2.5.19 -
the proposed conceptual framework), particularly, in the Vietnamese supermarket sector,
figure 6.4 has been chosen as a final model related to the research topic. The proposed
conceptual framework (figure 2.5.19) can be employed to investigate relationships between
many related constructs in different contexts, such as in different industries or in other
developing countries or developed countries with mature life cycles in their supermarket
sector. Besides that, the research indicated many qualitative variables such as age ranges,
income, location, gender, and occupation could be regarded as control variables which might
affect relationships between constructs; in this case, multigroup analysis should be examined.
Thirdly, the research has extended existing theories by investing and introducing the
term “strategic groups” of supermarket business models in relationships between constructs
in the proposed research model. The research findings presented the idea that the
relationships between constructs are different across strategic groups. For instance,
“consumers from the group of multipurpose premium supermarkets are concerned more
about service quality and e-service quality while consumers from the group of specialised
daily consumer goods do not. There is a positive and strong relationship between service
quality and customer perceived value, between e-service quality related to E-S-QUAL and
customer loyalty among the group of multipurpose premium supermarkets while that
relationship was not foubnd amongthe group of specialised daily consumer goods; at the
group of multipurpose premium supermarkets, price was found to have a strong and positive
impact on customer loyalty, however, at the group of specialised daily consumer goods, price
has a low impact on customer loyalty, and it can explain only 6.1% variation in customer
loyalty. Promotion is one of the main indicators of customer loyalty at the group of
specialised daily consumer goods but no above impact was found in the group of
multipurpose supermarkets 2.” (see detail analysis in section 7.5).
8.2.3.2. Contribution to methodological level
This research used the mix method of using both qualtitative and quantitative research.
The reseach shows that this mix method is the best way to deal with research topics related to

287
“What factors affect X (dependent variables) and at which level?”. Because of the nature of
this research, mapping the strategic groups that investigated supermarkets belong to was
conducted through expert interview; then, using qualitative research first via consumer
interviewing allowed the researcher to amend questionnaires to include enquiries that were
not included in the original proposed questionnaire. In this research, after consumer
interviewing, two more constructs, “TRUST” and “HABIT” were added into questionnaires.
The contents of questionnaires were also re-checked by experts in order to guarantee their
content validity. These results can again emphasise the importance of mixed methods in this
area; as the research focusing on how these two new constructs related to customer perceived
value, customer loyalty has been limited, interviewing (a qualitative research) helps the
researcher fully explore whether there are any other factors which might influence customer
perceived value, customer satisfaction and customer loyalty in a specific context – the
supermarket sector in Vietnam in this case. This process is highly recommended in exploring
relationships between factors.
The next steps were using many statistical techniques in exploratory factor analysis to
investigate the reliability of constructs, convergent and discriminant validity. Then,
confirmatory factor analysis also allowed the researcher to test reliability, convergent and
discriminant validity to re-endorse a valid and reliable level of all researched constructs. The
final scales used for all constructs in this reseach can be employed in other research.
To date and to the author’s knowledge, this is the first research using multigroup analysis
techniques in SEM to comprehensively investigate differences every single relationship in the
whole research model. Multigroup analysis demonstrates its significant impact on marketing
research, without this test, differences between groups might not be able to be explored. In
this research, differences between age range, income, location, gender, occupation,
supermarket business models and consumers’ education levels were examined, and the results
indicated that there are significant differences between groups. In order to acheive these
results, the newest updated function of AMOS version 24 and a Plugin tool named
“Invariance” from Gaskin and Lim (2018) were utilised. These tools facilitated the conduct of
the research conducted. It can be noticed that the “Invariance” tool cannot be run with
previous versions of AMOS. In the future, all valuable Plugin functions of AMOS version
24are strongly recommended for use in order to quickly and comprehensively achieve
statistical results.

288
8.2.3.3. Contribution to practice
The research achieved the orginal objectives of investigating relationships between other
independent constructs and customer loyalty. In addition, the research also revealed the list of
factors directly influencing customer perceived value and customer satisfaction. Besides that,
multigroup analysis, including age ranges, income, location, gender, occupation, educational
levels and supermarket business models were investigated as well. These efforts have brought
many advantatges for both academia and practitioners. This section is going to demonstrate
how the research contributes to practice.
The whole final research model revealed relationships between constructs. Practitioners
can perceive a brief insight into the linkages between customer percieved value, customer
satisfaction and customer loyalty.
In a supermarket sector, the top 9 factors affecting customer perceived value are price,
in-store logistics, trust, promotion, e-service quality related to E-S-QUAL, switching costs,
service quality andcustomer service (Table 7.1 presented the influence level). Therefore, in
order to achieve higher perceived value from consumers, practitioners should offer a
reasonable price, effective in-store logistics, build trust, offer more appealing promotion
activities, improve e- service quality related to E-S-QUAL, customer service and service
quality (especially service-employees’ knowledge and how they treat consumers) should be
considered carefully.
In a supermarket sector, the top 9 factors affecting customer satisfaction arecustomer
perceived value, in-store logistics, service quality, store image, customer experience, product
quality, alternative attractiveness, switching costs and price (Table 7.2 presented the
influence level). Therefore, in order to achive higher satisfaction from consumers,
practitioners should consider how to improve their perceived value (the above presented
contents); at the same time, in-store logistics, service quality (how service employees treat
consumers), store image are also considered to be main indicators of customer satisfaction.
Many consumers informed that in-store logistics had created comfortable feelings while
shopping because they knew where products were located and other logistics activities
facilitate their shopping; satisfaction will be a result if efficient in-store logistics are provided.
Besides that, creating a decent shopping environment leads to good customer experience
contributing to customer satisfaction. Price also affects the level of satisfaction. This research

289
found that switching costs and alternative attractiveness have an impact on customer
satisfaction, but these are regarded as external factors. However, practitioners should be
aware of the influencing level of these two factors in order to know how to keep current
consumers satisfied and avoid switching to other providers.
In the supermarket sector, the top 9 factors affecting customer loyalty are retail brand
experience, service quality, customer satisfaction, promotion, switching costs, e-service
quality related to E-S-QUAL, alternative attractiveness, price and habit (Table 7.3 presented
the influence level). Therefore, in order to keep consumers loyal, practitioners should be
aware of the importance of brand experience and making efforts to build a good brand name
in consumers’ minds. Good service quality relating to employees’ specialised knowledge and
how they treat consumers are also vital to keeping consumers loyal. Therefore, training of
staff should be one of the top priorities. The level of satisfaction also positively relates to the
level of loyalty. This research indicates that satisfaction is not the only way to engender
consumer loyalty. Practitioners should consider offering more appealing promotional
activities, improving e-service-quality related to E-S-QUAL and offering reasonable prices.
Again, two external factors (switching costs and alternative attractiveness) should be
considered by practitioners in order to avoid and reduce the level of consumers’ switching to
other providers. Besides that, consumer habits have also proved to have a slight linkage with
consumer loyal behaviour.
Apart from the contributions to practice presented above, the research explored
multigroup analysis (section 7.5) which is also considered as a main contributon;
practitioners can gain insights into how different relationships bexist etween constructs across
location, gender, income, occupation, education levels and supermarket business models.
Based on this, at each supermarket location, practitioners might employ different business
strategies in order to ensure their consumers achieve higher perceived values, satisfaction and
loyalty. Besides that, with each supermarket model, practitioners know where to improve to
get a higher loyalty level from consumers.
Based on the above results and suggestions, retailers who are already present in a retail
sector should know which strategic groups they belong to, and in order to gain more market
share and improve their profits; enhancing customer loyalty should be considered as one of
top priorities in firms. In addition, understanding the model applied in different groups can be
beneficial to retailers to some extent, retailers can attract their potential consumers who are

290
currently loyal to different supermarkets by improving service quality, brand experience, in-
store logistics as well as which promotion activities should be applied. For those who
potentially enter the retail sector, in particular supermarkets – future investors; the findings
from this research demonstrate its significant influence which domestic and foreign investors
will notice which customer segmentations or which kind of business models they should
invest to, based on their own competitive advantages in order to succeed in the Vietnamese
supermarket sector.
8.3. Thesis limitations and Recommendations for future research
There are some limitations to this research which will be presented below, followed by
recommendations for future research.
Due to a huge number of constructs researched, during exploratory factor analysis,
“COIMA”-corporate image construct has been eliminated from the data set. In order to
explain this problem, it is believed that the scale created for COIMA with 3 variables might
have a weak correlation with other variables in the dataset or other strong variables loading
for other constructs which can partly explain “corporate image” constructs such as store
image, in-store logistics and corporate social responsibility. Therefore, other research should
re-build the scales for corporate image.
The next limitation is that only three dependent variables have been investigated,
including customer perceived value, customer satisfaction and customer loyalty; in the
original proposed framework some other factors were also to be treated as dependent
variables such as trust (<--satisfaction), corporate image (<-- corporate social responsibility),
trust (<--store image), service quality (<--CSR), switching costs (<--customer satisfaction)
and alternative attractiveness (<-- customer satisfaction). However, with the complicated
research framework, the research could not cover every single relationship proposed and
found by other researchers. In the future, researchers can investigate these relationships
depending on research objectives.
Based on the main objectives of this research, mediation and moderation effects between
some constructs have not been investigated. In future, researchers could explore whether
customer satisfaction mediates relationships between customer experience, customer
perceived value, alternative attractiveness, service quality and customer loyalty (as has been
proposed by some researchers), and whether customer perceived value mediates relationships

291
between in-store logistics, customer service, trust and customer satisfaction. In addition,
whether loyalty programme membership moderates the relationship between customer
experience and customer satisfaction; whether switching costs moderate the relationship
between customer satisfaction and customer loyalty; and whether alternative attractiveness
moderates the relationship between customer satisfaction and customer loyalty.
One of the initial objectives of this research was to investigate the shopping behaviour of
Vietnamese supermarket consumers. Therefore, at the section one of the research
questionnaire, there are 20 questions relating to shopping behaviour. However, due to word
limitations and the main objectives having been given a higher priority for investigation, this
research did not investigate shopping behaviour generally and briefly presented at Appendix
5.5. In the future, depending on research objectives, researchers should explore shopping
behaviour in order to fully explain later statistical results.
The data for this research was collected at five main locations in Vietnam, whih have
mainly contributed to total supermarket revenue. This means that the level of competitors in
these areas is relatively high; so consumers might perceive higher alternative attractiveness
and switching costs. Further research should also try to collect data in areas with lower
competition to compare against this research to examine whether differences exist and which
factors affect customer loyalty in areas of lower competition.
At multigroup analysis, the research could not investigate deeply every single difference
between two constructs across groups due to word limitations, and the main objectives of this
research are not to explore every single difference, only the main differences across strategic
groups and factors relating to customer loyalty. The research showed statistical results at
section 6.6.3.4 and briefly presented the findings but could not fully explain all findings at
section 7.5. In future, researchers could conduct research by examining other groups and
different relationships between constructs and customer satisfaction, customer perceived
value (see statistical results at Appendix 7.2 and Appendix 7.3) more deeply. Furthermore,
due to limited participants from high income groups, the researcher could not investigate how
different the relationships between constructs are between low and high income groups. In
future, other researchers could try to collect more data from consumers of a high income
group in order to investigate these relationships. Besides that, even with up-to-date statistical
tools, this thesis only explores the differences between two-groups through investigating the
chi-square test due to limitation of the current research tool; in future, if new multigroup

292
analysis tools exist which allow researchers investigate differences between more than 2
groups, it would be ideal for researchers to compare differences between more than two
groups.
Finally, the proposed research framework could be replicated in order to investigate
whether results are different across markets (developing and developed countries), industries
(an eletronic sector and a retail sector) and contexts (between multichannel/omnichanel
contexts and traditional ones). In addition, variations between the shopping behaviors of
different generations should also be considered important to investigate in the future.

293
REFERENCES
Abu-ELSamen, A. A, Akroush, M.N., Al-Khawaldeh, F. M. and Al-Shibly, M. S. (2011) “Towards
an integrated model of customer service skills and customer loyalty: The mediating role of
customer satisfaction”, International Journal of Commerce and Management, 21(4), pp.349-380.
Adejuwon, O. O. (2014). “Regulation and strategic group dynamics of the Nigerian
telecommunications industry”, African Journal of Economic and Management Studies, 5(2), pp.
209-232.
Agustin, C. and Singh, J. (2005), “Curvilinear effects of consumer loyalty determinants in relational
exchanges”, Journal of Marketing Research, 42(1), pp. 96-108.
Ahmed, S.M.Z. and Shoeb, M.Z.H. (2009), “Measuring service quality of a public university
library in Bangladesh using SERVQUAL”, Performance Measurement and Metrics, 10(1),
pp. 17‐32.
Ailawadi, K.L. and Keller, K.L. (2004). Understanding retail branding: conceptual insights and
research priorities. Journal of Retail, 80 (4), pp. 331-342.
Akehurst, G. P. (1983), “Concentration in retail distribution: measurement and
significance”, Service Industries Journal, 3(2), pp. 161-79.
Akroush, M., Shibly, M. and Khawaldeh, F. (2005), “The effect of services marketing mix
elements on customers satisfaction in the comprehensive motor insurance: an empirical
investigation of customers perspectives in Jordan”, Journal of Financial and Commercial
Studies/Managerial Sciences‐Cairo University, 32, pp. 439‐72.
Aksu, A.A. (2006), “Gap analysis in customer loyalty: a research in 5-star hotels in the Antalya region
of Turkey”, Quality and Quantity, 40(2), pp. 187-205.
Aktan, C.C. and Börü, D. (2007), “Kurumsal sosyal sorumluluk”, in Aktan, C.C. (Ed.), Kurumsal
Sosyal Sorumluluk, is¸letmeler ve Sosyal Sorumluluk, I˙GI˙AD Yayınları, Istanbul, pp. 11-36.
Alderfer, C. P. (1969). An empirical test of a new theory of human needs. Organisational behavior
and Human Performance, 4(2), pp. 142-175.
Al-Hawari, M.A. (2014), “Emotional stability and switching barriers in the retail banking context”,
Managing Service Quality: An International Journal, 24(5), pp. 469-486.
Alphonce, R., Temu, A. and Almli, V. L. (2015), “European consumer preference for African dried
fruits”, British Food Journal, 117(7), pp.1886-1902.
Ambler, T., Bhattacharya, C. B., Edell, J., Keller, K. L., Lemon, K. N., & Mittal, V. (2002). Relating
brand and customer perspectives on marketing management. Journal of Service Research, 5(1),
pp.13-25.
American Express (2011). Global customer service barometer. [Online]. Available at:
www.thatscustomerfocus.com/global_service_barometer_press_release.html (Accessed 15
October 2017)
Amine, A. and Cadenat, S. (2003). Efficient retail assortment: a consumer choice evaluation
perspective. International Journal of Retail and Distribution Management, 31(10), 486-497
Amit, R. and Schoemaker, P.J. (1993, “Strategic assets and organizational rent”, Strategic
Management Journal, 14(1), pp. 33‐46.
Andajani, E. (2015). Understanding Customer Experience Management in Retailing. Procedia -
Social and Behavioral Sciences, 211, pp. 629 – 633.
Anderson, E., Fornell, C. and Lehman, D. (1994) Customer satisfaction. Mark. Share Profitab. Find.
Swed. J. Mark., 58 (3), pp. 53-66

294
Anderson, E.W., Fornell, C. and Lehmann, D.R. (1994), “Customer satisfaction, market share and
profitability: findings from Sweden”, Journal of Marketing, 58(3), pp. 53-66.
Anderson, E.W., Fornell, C. and Rust, R.T. (1997), "Customer satisfaction, productivity, and
profitability: differences between goods and services", Marketing Science, 16(2), pp. 129-145.
Anderson, J.C. and Narus, J. A. (1990). “A model of distributor firm and manufacturer firm working
partnerships”. Journal of Marketing, 54 (1), pp. 42-58
Anderson, R.E. and Srinivasan, S.S. (2003), “E‐satisfaction and e‐loyalty: a contingency
framework”, Psychology and Marketing, 20(2), pp. 123‐38.
Anselmsson, J., Johansson, U. and Persson, N. (2007), “Understanding price premium for
grocery products: a conceptual model of customer-based brand equity”, Journal of Product and
Brand Management, 16(6), pp. 401-414.
Antony, J., Antony, F. J. and Ghosh, S. (2004), “Evaluating service quality in a UK hotel chain:
a case study”, International Journal of Contemporary Hospitality Management , 16(6), pp. 380‐
4.
Arnold, M.J., Reynolds, K.E., Ponder, N. and Lueg, J.E. (2005), “Customer delight in a retail context:
investigating delightful and terrible shopping experiences”, Journal of Business Research, Vol. 58
No. 8, pp. 1132-1145.
Arons, L. (1961), “Does TV viewing influence store image and shopping frequency?”, Journal
of Retailing, 37(3), pp. 1‐13.
Arpita, K. (2014). “Consumer-small retailer relationships in Indian retail”, Facilities, 32( 9/10),
pp.533-553.
Asher, M. (1989) “Measuring Customer Satisfaction”, The TQM Magazine, 1(2), pp.93-96.
Ashley, C., S.M. Noble, N. Donthu and K.N. Lemon. (2011).Why customers won't relate: Obstacles
to relationship marketing engagement, Journal of Business Research, 64, pp. 749-756
Athanassopoulos, A.D. (2000), "Customer satisfaction cues to support market segmentation and
explain switching behaviour", Journal of Business Research, 47(3), pp. 191-207.
Athavale, A.S., Banahan, B.F.III, Bentley, J.P. and West-Strum, D.S. (2015), “Antecedents and
consequences of pharmacy loyalty behavior”, International Journal of Pharmaceutical and
Healthcare Marketing, Vol. 9 No. 1, pp. 36-55.
Aydin, S. and Ozer, G. (2005), “National customer satisfaction indices: an implementation in the
Turkish mobile telephone market”, Marketing Intelligence and Planning, 23(5), pp. 486-504.
Aydin, S. and Özer, G. (2005). The analysis of antecedents of customer loyalty in the Turkish mobile
telecommunication market. European Journal of Marketing, 39, pp. 910-925.
Aydin, S., Özer, G. and Arasil, Ö. (2005). “Customer loyalty and the effect of switching costs as a
moderator variable”. Marketing Intelligence & Planning, 23, pp. 89-103.
Azuma, N. and Fernie, J. (2001) “Retail marketing strategies and logistical operations at a
Japanese grocery supermarket chain – case study of Summit Inc.”, International Journal of Retail
& Distribution Management, 29(6), pp.282-297,
Babakus, E. and Boller, G. W. (1992). An empirical assessment of the SERVQUAL scale. Journal of
Business Research, 24, pp. 253-68.
Babin, B., Lee, Y., Kim, E. and Griffin, M. (2005). Modeling consumer satisfaction and word-of-
mouth: restaurant patronage in. Korea Journal of Service Marketing. 19 (3), 133–139.
Bagdare, S. and Jain, R. (2013), “Measuring retail customer experience”, International Journal of
Retail & Distribution Management, 41(10), pp. 790-804.
Bain, J. S. (1968). Industrial Organisation (2nd
edn.). Wiley: New York

295
Bain, J.S. (1956), Barriers to New Competition, Harvard University Press, Cambridge, MA.
Baker, J., Parasuraman, A. , Grewal, D. and Voss, G.B. (2002), “The influence of multiple store
environment cue on perceived merchandise value and patronage intentions”, Journal of
Marketing, 66(2), pp. 120-141.
Baker, J., Grewal, D. and Parasuraman, A. (1994), “The influence of store environment on quality and
store image”, Journal of the Academy of Marketing Science, 22(4), pp. 328-339.
Baker, J., Parasuraman, A., Grewal, D. and Voss, G.B. (2002), The influence of multiple store
environment cues on perceived merchandise value and patronage intentions, Journal of Marketing,
66(2), pp. 120-141.
Baker, M., Murrmann, S. K. and Green,C. (2013). Dining in the city: server behaviors, time
preferences, and the effect of urbanization in restaurants, J. Foodserv. Business Research, 16 (2),
pp. 113-138.
Baker, J., Parasuraman, A., Grewal, D. and Voss, G. B. (2002) The influence of multiple store
environment cue on perceived merchandise value and patronage intentions. Journal of
Marketing, 66 (2), pp. 120-141
Baki, B., Basfirinci, C.S., Cilingir, Z. and Murat, A.R.I. (2009), “An application of integrating
SERVQUAL and Kano's model into QFD for logistics services: a case study from Turkey”, Asia
Pacific Journal of Marketing and Logistics, 21(1), pp. 106‐26.
Ball, D., Coelho, P. S., & Vilares, M. J. (2006) Service personalization and loyalty. Journal of
Services Marketing, 20: 391–403.
Bansal, H.S., Irving, P.G. and Taylor, S. F. (2004) A three-component model of customer to service
providers. Journal of Academic Marketing Science, 32 (3) (2004), pp. 234-250.
Barber, N., Goodman, R.J. and Goh, B.K. (2010), “Restaurant consumers repeat patronage: a service
quality concern”, International Journal of Hospitality Management, 30(2), pp. 329-336.
Barnes, S. and Vidgen, R. (2000), “Webqual : an exploration of web-site quality”, Proceedings of the
Eighth European Conference on Information Systems, Vienna, July 3-5.
Barnes, S. J., Mattsson, J. and Sørensen, F. (2014). Destination brand experience and visitor behavior:
testing a scale in the tourism context. Annals of Tourism Research, 48, pp. 121-139
Barnes, S.J. and Vidgen, R. (2003), “Measuring web site quality improvements: a case study of the
forum on strategic management knowledge exchange”, Industrial Management & Data Systems,
103(5), pp. 297-309.
Barney, J. B. (1991). Firm resources and sustained competitive advantage. Journal of Management,
17, pp. 99–120.
Barney, J. B. (2001). Resource-based theories of competitive advantage: A ten-year retrospective on
the resource-based view. Journal of Management, 27(6), 643–650.
Barney, J.B. (2007), Gaining and Sustaining Competitive Advantage, Prentice‐Hall, Upper
Saddle River, NJ.
Barney, J.B. and Hoskisson, R.E. (1990), “Strategic groups: untested assertions and research
proposals”, Managerial and Decision Economics, 11(3), pp. 187-198.
Bauer, H. H., Falk, T. And Hammerschmidt, M. (2006) eTransQual: A transaction process-based
approach for capturing service quality in online shopping. Journal of Business Research, 59(7):866–
875.
Bauer, H.H., Falk, T. and Hammerschmidt, M. (2006), “eTransQual: a transaction process-based
approach for capturing service quality in online shopping”, Journal of Business Research, 59(7), pp.
866-875.
296
Baumann, C., Elliott, G. and Burton, S. (2012) “Modeling customer satisfaction and loyalty: survey
data versus data mining”, Journal of Services Marketing, 26(3), pp.148-157.
Baydoun, R., Rose, D. and Emperado, T. (2001), “Measuring customer service orientation: an
examination of the validity of the customer service profile”, Journal of Business and
Psychology, 15(4), pp. 605‐20.
Bayraktaroglu, G. and Atrek, B. (2010), “Testing the superiority and dimensionality of
SERVQUAL vs SERVPERF in higher education”, The Quality Management Journal, 17(1),
pp. 47‐59.
Becker, H. S. (1960). “Notes on the Concept of Commitment”. American Journal of Sociology, 66,
pp. 32-42
Beerli, A., Martin, J. D., and Quintana, A. (2004). A model of customer loyalty in the retail banking
market. European Journal of Marketing, 38(1/2), pp. 253-275.
Bei, L.T. and Chiao, Y.C. (2001). An integrated model for the effects of perceived product, perceived
service quality, and perceived price fairness on consumer satisfaction and loyalty. Journal of
Consumer Satisfaction, Disatisfaction and complaining behavior, 14, pp. 125–140.
Bellini, S., Cardinali, M. G. And Grandi, B. (2017). A structural equation model of impulse buying
behaviour in grocery retailing, Journal of Retailing and Consumer Services, 36, pp. 164–171.
Berman, B. and Evans, J.R. (2010). Retail Management. Prentice Hall, New Jersey, NJ.
Bernd Stauss, Maxie Schmidt, Andreas Schoeler, (2005) “Customer frustration in loyalty programs”,
International Journal of Service Industry Management,16(3), pp.229-252.
Berry, L.L., Parasuraman, A. and Zeithaml, V.A. (1988), “The service quality puzzle”, Business
Horizon, 31(5), pp. 35‐43.
Bilgihan, A., Kandampully, J. and Zhang, T. (2016), “Towards a unified customer experience in
online shopping environments: Antecedents and outcomes”, International Journal of Quality and
Service Sciences, 8(1), pp.102-119.
Birtwistle, G. (2001), “Customer and company perspectives of store positioning: a study of the
UK specialist menswear fashion sector”, PhD thesis.
Bitner, M. J. (1995). “Building service relationships: It's all about promises”. Journal of the Academy
of Marketing Science, 23, pp. 246-251.
Bitner, M., Brown, S. and Meuter, M. (2000), “Technology infusion in service
encounters”, Journal of the Academy of Marketing Science, 28(1), pp. 138‐49.
Bloemer, J. and De Ruyter, K. (1998), “On the relationship between store image, store satisfaction
and store loyalty”, European Journal of Marketing, 32(5/6), pp. 499-513.
Bogaert, I., Maertens, R. and Van Cauwenbergh, A. (1994, “Strategy as a situational puzzle: the
fit of components”, in Hamel, G. and Heene, A. (Eds), Competence‐Based Competition, John
Wiley, Chichester.
Bolton, R. N., Kannan, P.K., & Bramlett, M.D. (2000). Implications of loyalty program membership
and service experiences for customer retention and value. Journal of the Academy of Marketing
Science, 28, pp. 95-108.
Bolton, R.N. and Drew, J.H. (1991), “A multistage model of customers' assessments of service
quality and value”, Journal of Consumer Research, 17(4), pp. 875‐84.
Bonetti, E. and Schiavone, F. (2014). Identifying and Mapping Strategic Groups in the Fashion
Industry. International Studies of Management and Organisation, 44 (1), pp. 55–69.
Bonnin, G. and Goudey, A. (2012). The kinetic quality of store design: an exploration of its influence
on shopping experience. Journal of Retailing and Consumer Services, 19 (6), pp. 637–643.

297
Borges, A. Chebat, J. C. and Babin, B. J. (2010). Does a companion always enhance the shopping
experience?. Journal of Retailing and Consumer Services, 17 (4), pp. 294-299
Bouzaabia, O., Allard, C. R. and Semeijin, J. (2013). Managing in-store logistics: a fresh perspective
on retail service. Journal of Service Management; Bingley 24.2 , pp.112-129.
Bowen, J. and Shoemaker, S. (1998), “Loyalty: a strategic commitment”, Cornell Hotel and
Restaurant Administrative Quarterly, 39(1), pp. 12-25.
Brady, M. K., and Cronin, J. J. (2001). Some new thoughts on conceptualizing perceived service
quality: a hierarchical approach. Journal of Marketing, 65, pp. 34-49
Brady, M.K., Knight, G.A., Cronin, J.J., Jr., Hult, G.T.M. and Keillor, B.D. (2005), “Removing the
contextual lens: a multinational, multi-setting comparison of service evaluation models”, Journal of
Retailing, 81(3), pp. 215-230.
Brakus, J.J., Schmitt, B.H., and Zarantonello, L. (2009). Innovated brand experience: What is it? How
is it measured? Does it affect loyalty? Journal of Marketing, 73(May), pp. 52–68.
British Business Group Vietnam (2016). Vietnam retail sector briefing 2016. [Online]. Available at:
http://www.ukabc.org.uk/wp-content/uploads/2017/05/BBGV_Business_Centre_-
_Vietnam_Retail_Sector_Briefing_2016_-_Final.pdf (Accessed 23 October 2017).
Brown, T.J., Churchill, G.A. and Peter, J.P. (1993), “Research note: improving the measurement
of service quality”, Journal of Retailing, 69(1), pp. 127‐39.
Brush, C.G., Greene, P.G., Hart, M.M. and Haller, H.S. (2001), “From initial idea to unique
advantage: the entrepreneurial challenge of constructing a resource base”, The Academy of
Management Executive, 15(1), pp. 64‐78.
Bruwer, J., Saliba, A. and Miller, B. (2011), “Consumer behaviour and sensory preference
differences: implications for wine product marketing”, Journal of Consumer Marketing, 28(1),
pp.5-18.
Bryan, A. and Bell, E. (2007). Business research methods. 2nd
. New York: Oxford Universiy Press
Inc.
Bryman and Bell (2015). Business research methods. (4th edn.). Oxford University Press: UK.
Burawoy, M. (1979). Manufacturing consent. Chicago: University of Chicago Press.
Burawoy, M. (2003). “Revisits: An outline of a Theory of Reflexive Ethnography”. American
Sociological Review, 68, pp. 645-79.
Burnham, T. A., Frels, J. K. and Mahajan, V. (2003). “Consumer switching costs: a typology,
antecedents and consequences”. Journal of the Academy of Marketing Science, 31 (2), pp. 109-126.
Burnham, T., Frels, J. and Mahajan, V. (2003). Consumer switching costs: A typology, antecedents,
and consequences. Journal of the Academy of Marketing Science, 31, pp. 109-126
Burt, S. and Mavromatis, A. (2006), “The international transfer of store brand image”, International
Review of Retail Distribution and Consumer Research, 16(4), pp. 395-413.
Business Development Group Vietnam (2016). Overview of the retail market in Vietnam. [Online].
Available at: http://bdg-vietnam.com/de/about/news/details/items/overview-of-the-retail-market-in-
vietnam/ (Accessed 23 October 2017)
Byrne, B.M. (2010). Structural Equation Modeling with AMOS: Basic concepts, Application, and
Programming. (2nd
ed.). Routledge: New York.
Calder, B.J., Isaac, M.S. and Malthouse, E.C. (2013), “Taking the customer’s point-of-view:
engagement or satisfaction?”, Marketing Science Institute Working Paper Series Report, pp. 13-102.

298
Calvo-Porral, C. and Levy-Mangin, O. P. (2015) Smooth operators? Drivers of customer satisfaction
and switching behavior in virtual and traditional mobile services. Revista Española de Investigación
de Marketing ESIC,19, pp. 124-138.
Carpenter, J.M. (2008). Consumer shopping value, satisfaction and loyalty in discount retailing.
Journal of Retailing and Consumer Services. 15 (5), pp. 358–363.
Carpenter, J.M. and Moore, M. (2006), “Consumer demographics, store attributes, and retail format
choice in the US grocery market”, International Journal of Retail and Distribution Management,
34(6), pp. 434-452.
Carpenter, J.M., Moore, M. (2009). Utilitarian and hedonic shopping value in the US discount sector.
Journal of Retailing and Consumer Services, 16(1), 68–74.
Carrigan, M. and Attalla, A. (2001), “The myth of the ethical consumer – do ethics matter in purchase
behaviour?”, The Journal of Consumer Marketing, 18(7), pp. 560-577.
Caru, A. and Cova, B. (2003). Revisiting consumptionexperience: A more humble but complete view
of the concept. Marketing Theory, 3(2), pp.267–286.
Caves, R. E . and Porter, M. E. (1977). From entry barriers to mobility barriers: conjectural decisions
and contrived deterrence to new competition. Quarterly Journal of Economic, 91, pp. 241-262.
Central Intelligence Agency (2017). The World Factbook — Central Intelligence Agency. [Online]
Available at: https://www.cia.gov/library/publications/the-world-factbook/geos/vm.html (Accessed 23
October 2017)
CEOWorld Magazine (2017). Giants Of Retail: The World’s 25 Largest Retailers By Revenue, 2017.
[Online]. Available at: http://ceoworld.biz/2017/01/24/giants-retail-worlds-25-largest-retailers-
revenue-2017/ (Accessed 12 October 2017).
Chadha, S. and Kapoor, D. (2009), “Effect of switching cost, service quality and customer
satisfaction on customer loyalty of cellular service providers in Indian market”, The ICFAI
University Journal of Marketing Management, 1, pp. 23‐37.
Chamberlin, E.H. (1933), The Theory of Monopolistic Competition, Harvard University
Press, Cambridge, MA.
Chang, H. H. and Wang, H.W. (2011), “The moderating effect of customer perceived value on online
shopping behavior”, Online Information Review, 35 (3), pp. 333 – 359.
Chang, W., Franke, G.R. and Lee, N. (2016). Comparing reflective and formative measures: New
insights from relevant simulations. Journal of Business Research, 69, pp. 3177-3185.
Chang, Y. and Yeh, C. (2017) Corporate social responsibility and customer loyalty in intercity bus
services. Transport Policy, 59, pp. 38-45.
Chattopadhyay, A. and Laborie, J. L. (2005). Managing brand experience: the market contact audit.
Journal of Advertising Research, 45 (1), pp. 9-16.
Chebat, J., Michon, R., Haj-Salem, N., Oliveira, S. (2014). The effects of mall renovation on shopping
values, satisfaction and spending behaviour. Journal of Retailing and Consumer Services, 21 (4), pp.
610–618.
Chen, C.F. and Tsai, M.H. (2008). Perceived value, satisfaction, and loyalty of TV travel product
shopping: involvement as a moderator. Tourism Management. 29 (6), pp. 1166–1171.
Chen, C.F., Chen, F.S., 2010. Experience quality, perceived value, satisfaction and behavioral
intentions for heritage tourists. Tourism Management, 31(1), p. 29–35.
Chen, P.T., and Hu, H.H. (2010). The effect of relational benefits on perceived value in relation to
customer loyalty: An empirical study in the Australian coffee outlets industry. International journal of
hospitality management, 29(3), pp. 405-412.

299
Chen, S.C. (2012). The customer satisfaction–loyalty relation in an interactive e-service setting: the
mediators. Journal of Retailing and Consumer Services. 19 (2), pp. 202–210.
Chen, S.H., Yang, C.C. and Yeh, T.M. (2007), “Service quality attributes determine
improvement priority”, The TQM Magazine, 19(2), pp. 162‐75.
Chen, Z. and Dubinsky, A. (2003) A Conceptual model of perceived customer value in E-commerce:
a preliminary investigation. Psychology and Marketing, 20 (4), pp. 323-347.
Chen, P. T. and Hu, H.H.S. (2013). “The mediating role of relational benefit between service quality
and customer loyalty in airline industry”. Total Quality Management and Business Excellence, 24 (9),
pp. 1084-1095.
Chen, P. Y. and Hitt, L. (2002). Measuring switching costs and their determinants in internet enabled
businesses: A study of the online brokerage industry. Information Systems Research, 13 (3), pp. 255-
274
Chi, T. and Kilduff, P.P. (2011). Understanding consumer perceived value of casual sportswear: an
empirical study. Jounal of Retailing and Consumer Services, 18 (5), pp. 422-429.
Chiou, J-S. & Droge, C. (2006). Service Quality, Trust, Specific Asset Investment, And Expertise:
Direct And Indirect Effects In A Satisfaction-Loyalty Framework. Journal of the Academy of
Marketing Science, 34(4), pp. 613-627.
Chiu, C.M., Cheng, H.L., Huang, H.Y. and Chen, C.F. (2013), “ Exploring individuals' subjective
well-being and loyalty towards social network sites from the perspective of network externalities: the
Facebook case “, International Journal of Information Management , 33(3), pp. 539 - 552 .
Choi, K.S., Cho, W.H., Lee, S., Lee, H. and Kim, C. (2004). The relationships among quality, value,
satisfaction and behavioral intention in health care provider choice: a South Korean study. Journal of
Business Research, 57(8), pp. 913–921.
Chuah, S. H., Marimuthu, M., Kandampully, J. and Bilgihan, A. (2017). What drives gen Y loyalty?
Understanding the mediated moderating roles of switching costs and alternative attractiveness in the
value-satisfaction loyalty chain. Journal of Retailing and consumer services, 36, pp.124-136.
Churchill, G. A. (1987). Marketing Research: Methodological Foundations (4th edn.). New York: The
Dryden Press.
Clarke, R. (1985), Industrial Economics, Blackwell, Oxford.
Colgate, M. and Lang, B. (2001), Switching barriers in consumer markets: an investigation of the
financial services industry, Journal of Consumer Marketing, 18(4), pp. 332-47.
Colgate, M. and Norris, M. (2001), Developing a comprehensive picture of service failure,
International Journal of Service Industry Management, 12(3), pp. 215-233.
Collier, J. E. and Bienstock, C. C. (2006). Measuring service quality in e-retailing. Journal of Service
Research, 8, pp. 260-275.
Cool, K. O. and Schendel, D. (1987). Strategic group formation and performance: The case of the
U.S. pharmaceutical industry, 1963–1982. Management Science, 33(9), 1102–1124.
Coomber, L. and Poore, J. (2013). From good to branded: using immersive design to deliver a positive
brand experience for British gas. Journal of Brand Strategy, 1 (4), pp. 318-326.
Copeland (1923). Relation of consumers' buying habits to marketing methods. Harvard Business
Review, 1 (3), pp. 282-289.
Crocker, L. and Algina, J. (1986) Introduction to Classical and Modern Test Theory. Philadelphia:
Harcourt Brace Jovanovich College Publishers.
Cronin, J. and Taylor, S. (1994), “SERVPERF versus SERVQUAL: reconciling performance‐
based and perception minus expectations measurement of service quality”, Journal of
Marketing, 58(1), pp. 125‐31.

300
Cronin, J.J. and Taylor, S. A. (1992). Measuring Service Quality: A Reexamination and Extension,
Journal of Marketing, 56(3), pp. 55-68.
Cronin, J.J. Jr, Brady, M.K. and Hult, G.T.M. (2000), “Assessing the effects of quality, value,
and customer satisfaction on consumer behavioural intentions in service environments”, Journal
of Retailing, 76(2), pp. 193‐218.
Cronin, J.J. and Taylor, S.A. (1992), “Measuring service quality: a reexamination and
extension”, Journal of Marketing, 56(July), pp. 55‐68.
Cronin, J.J., Brady, M.K. and Hult, G.T.M. (2000). Assessing the effects of quality, value, and
customer satisfaction on consumer behavioral intentions in service environments. Journal of
Retailing, 76 (2), 193–218.
Crosby, L.A., Johnson, S.L. (2007). Experience required. Marketing Management. 16 (4), p. 20–28.
Cunningham, R. M. (1956). Brand loyalty-what, where, how much .Harvard Business Review, 34 (1),
pp. 116-128.
Currie, W.L. (2003), “A knowledge‐based risk assessment framework for evaluating web‐
enabled application outsourcing projects”, International Journal of Project Management, 21(3),
pp. 207‐217.
Curry, A. (1999), “Innovation in public service management”, Managing Service Quality, 9(3), pp.
180-190.
Dabholkar, P. A., Thorpe, D. I. and Rentz, J. O. 1996). A measure of service quality for retail stores:
scale development and validation. Journal of The Academy and Marketing Science, 24 (1), pp. 3-16
Dallas News (2016). In the bag: Sprouts pairs with Amazon for Dallas grocery deliveries. [Online].
Available at: http://www.dallasnews.com/ business/business/2016/06/02/in-the-bag-sprouts-pairs-
withamazon-for-dallas-grocery-deliveries (Accessed 10 October 2017)
Dang. V. L. and Yeo, G. T. (2017). A Competitive Strategic Position Analysis of Major Container
Ports in Southeast Asia. The Asian Journal of Shipping and Logistics. 33(1), pp. 19-25.
Dao, M. H. (2016). The opportunities and challenges of Vietnam’s convenience store, learning from
Taiwan. Journal of Cultural Enterprise and Management, 15, p. 1-24.
Dauda, S. Y. and Lee, J. (2016), “Quality of service and customer satisfaction: a conjoint analysis for
the Nigerian bank customers”, International Journal of Bank Marketing, 34(6), pp.841-867.
Davis, L and Hodges, N. (2012).Consumer shopping value: an investigation of shopping trip value,
in-store shopping value and retail format. Jounal of Retailing and Consumer Services, 19 (2), pp. 229-
239.
Dawson, J. and Lee, J. (2004). International Retailing Plans and Strategies in Asia. NY: International
Business Press.
Dawson, J. and Sparks, L. (1982). “Retailing developments and enterprise zones”, Retail and
Distribution Management, 10(1), pp.43-46.
Dawson, J., Findlay, A. and Sparks, L. (2008). The retailing reader. Routledge: London and New
York.
Dawson, J., Larke, R. and Mukoyama, M. (2006). Strategic issues in international retailing.
Routledge.
De Chernatony, L. and Riley, F.D.O. (1998) Expert practitioners' views on roles of brands:
Implications for marketing communications. Journal of Marketing Communications, 4 (2), pp. 87-
100.
De Ruyter, K., Wetzels, M., Bloemer, J., 1998. On the relationship between perceived service quality,
service loyalty and switching costs. International Journal of Service Industry Management. 9 (5),
436–453.

301
Deloitte (2016). Global Powers of Retailing 2016-Navigating the new digital divide [Online].
Available at: https://www2.deloitte.com/content/dam/Deloitte/sg/Documents/consumer-business/sea-
cb-global-powers-of-retailing-2016.pdf (Accessed 11 October 2017).
Deloitte (2017). Global powers of retailing 2017- The art and science of customers. [Online].
Available at: https://www2.deloitte.com/content/dam/Deloitte/global/Documents/consumer-industrial-
products/gx-cip-2017-global-powers-of-retailing.pdf (Accessed 11 October 2017).
Denzin, N. K. and Lincoln, Y. S. (2011). “Introduction: The discipline and practice of qualitative
research” in N. K. Denzin and Y. S. Lincoln (eds) The Sage Handbook of Qualitative Research (4th
edn). London: Sage, p. 1-19.
Devlin, D., Birtwistle, G. and Macedo, N. (2003) “Food retail positioning strategy: a means‐end
chain analysis”, British Food Journal, 105(9), pp.653-670.
Dick, A. and Basú, K. (1994). “Customer loyalty: Toward an integrated conceptual framework”.
Journal of the Academy of Marketing Science, 22 (2), pp. 99-113.
Dickinson, R. and Cooper, B. (1992), "The emergence of cost-based strategies in
retailing", Journal of Marketing Channels, 2(1), pp. 29-46.
Dikmen, I., Birgonul, M. T. and Budayan, C. (2009). Group analysis in the construction industry.
Journal of Construction Engineering and Management, 135(4), pp. 288–297.
Ribbink, D., Van Riel, A.C.A., Liljander, V. and Streukens, S. (2004) “Comfort your online customer:
quality, trust and loyalty on the internet”, Managing Service Quality: An International Journal, 14(6),
pp.446-456
Ding, D.X., Hu, P.J.H. and Sheng, O.R.L. (2011), “e-SELFQUAL: a scale for measuring online self-
service quality”, Journal of Business Research, 64(5), pp. 508-515.
Dominici, G., and Guzzo, R. (2010). Customer satisfaction in the hotel industry: A case study from
Sicily. International Journal of Marketing Studies, 2(2), p. 3-12.
Du Preez, R., Visser, E. and Van Noordwyk, H.J. (2008a). Store image: towards conceptual model
part 1. South African Journal of Industrial Technology, 34(2), p. 50-58.
Du Preez, R., Visser, E., & Van Noordwyk, H.J. (2008b). Store image: scale implementation part 3.
South African Journal of Industrial Technology, 34(2), p. 69-78.
Duan, X. and Jin, Z. (2014). “Positioning decisions within strategic groups: The influences of
strategic distance, diversification and media visibility”, Management Decision, 52(10), pp.1858-
1887.
Duan, X. and Jin, Z. (2014). “Positioning decisions within strategic groups: The influences of
strategic distance, diversification and media visibility”, Management Decision, 52(10), pp.1858-
1887.
Dunne, P. and Lusch, R.F. (2004), Retailing, South Western, Mason, OH.
Dyson, R. (1990). Strategic planning: models and analytical techniques. England: Wiley.
Ecommerce News (2015) The state of online grocery retail in Europe. [Online]. Available at:
https://ecommercenews.eu/the-state-of-onlinegrocery-retail-in-europe/ (Accessed 15 October 2017)
Edward, M. and Sahadev, S. (2011), “Role of switching costs in the service quality, perceived value,
customer satisfaction and customer retention linkage”, Asia Pacific Journal of Marketing and
Logistics, 23(3), pp. 327-345.
Egan, J. (2011). Relationship marketing: exploring relational strategies in marketing (4th ed.).
Financial Times/ Prentice Hall.
Eggert, A. and Helm, S. (2000). “Relationship transparency in Business Markets: A conceptualisation
and empirical investigation”. An article posted at:

302
https://www.researchgate.net/publication/228467680_Relationship_Transparency_in_Business_Mark
ets_A_Conceptualisation_and_Empirical_Investigation.
Eggert, A. and Ulaga, W. (2002), “Customer perceived value: a substitute for satisfaction in
business markets?”, Journal of Business & Industrial Marketing, 17(2/3), pp. 107‐18.
Eid, R. (2015). Integrating Muslim customer perceived value, satisfaction, loyalty and retention in the
tourism industry: an empirical study. International Journal of Tourism Research, 17(3), pp. 249-260.
Eid, R. and El-Gohary, H. (2015). The role of Islamic religiosity on the relationship between
perceived value and tourist satisfaction. Tourism Management, 46, pp. 477-488.
Eklof, J. A. (2000). European customer satisfaction index pan-European telecommunication sector
report based on the pilot studies. European Organization for Quality and European Foundation for
Quality Management, Stockholm, Sweden, p. 1999.
El-Adly, M. and Eid, R. (2016). An empirical study of the relationship between shopping
environment, customer perceived value, satisfaction, and loyalty in the UAE malls context. Journal of
Retailing Consumer service, 31, pp. 217–227.
El-Adly, M.I. (2018). Modelling the relationship between hotel perceived value, customer satisfaction
and customer loyalty. Journal of Retailing and Consumer Services, p. 1-34. [Online]. Available at:
https://doi.org/10.1016/j.jretconser.2018.07.007
El-Manstrly, D. (2016) “Enhancing customer loyalty: critical switching cost factors”, Journal of
Service Management, 27(2), pp.144-169.
Emery, C. and Fredendall, L. (2002) “The effect of teams on firm profitability and customer
satisfaction”, Journal of Service Research 4 (3) (2002), pp. 217-229.
Entrepreneur (2017). Sam Walton- Bargain Basement Billionaire. [Online]. Available at :
https://www.entrepreneur.com/article/197560 (Accessed 15 October 2017)
Erbiyik, H., Ozcan, S. and Karaboga, K. (2012). Retail store location selection problem with multiple
analytical hierarchy process of decision making an application in Turkey. Procedia - Social and
Behavioral Sciences, 58, pp. 1405 – 1414
Evanschitzky, H., Wunderlich, M., 2006. An examination of moderator effects in the four-stage
loyalty model. Journal of Service Research, 8 (4), 330–345.
Farrell, D. and Rusbult, C. E. (1981). Exchange Variables as Predictors of Job Satisfaction, Job
Commitment, and Turnover: The Impact of Rewards, Costs, Alternatives, and Investments.
Organizational Behavior and Human Performance, 27 (1981), pp. 78-95.
Fassnacht, M., & Koese, I. (2006). Quality of electronic services – conceptualizing and testing a
hierarchical model. Journal of Service Research, 9, pp. 19-37.
Fastcompany(2016). Cuyana: The clothing brand that plans to scale by asking women to buy fewer
things. [Online]. Available at: https://www. fastcompany.com/3061008/cuyana-the-clothing-brand-
thatplans-to-scale-by-asking-women-to-buy-fewer-thingsn (Accessed 13 October 2017)
Ferguson, T.D. , Deephouse, D.L. and Ferguson, W.L. (2000), “Do strategic groups differ in
reputation?”, Strategic Management Journal, 21, pp. 1195-1214.
Fernie, J. and Sparks, L and McKinnon, A. C. (2010) “Retail logistics in the UK: past, present
and future”, International Journal of Retail & Distribution Management, 38(11/12), pp.894-914.
Fernie, J. and Sparks, L. (2009), Logistics and Retail Management; Emerging Issues and
Challenges in the Retail Supply Chain. (3rd ed.). Kogan Page, London.
Fiegenbaum, H. and Thomas. (1995). Strategic groups as reference groups: Theory, modeling
and empirical examination of industry and competitive strategy, Strategic Management Journal,
16, pp. 461 - 476.

303
Finn, A. (2004). A reassessment of the dimensionality of retail performance: a multivariate
generalizability theory perspective. Journal of Retailing and Consumer Services, 11(4), pp. 235-245.
Finn, D.W. and Lamb, C.W. (1991), “An evaluation of the SERVQUAL scale in retail setting”
in Solomon, R.H. (Ed.), Advances in Consumer Research, 18, Association of Consumer
Research, Provo, UT.
Fisher, M.L., Raman, A. and McClelland, A.S. (2000), “Rocket science retailing is almost here:
are you ready?”, Harvard Business Review, 78(4), pp. 115-124.
Flavian, C., Guinalıu, M. and Torres, E. (2005), “The influence of corporate image on consumer trust
a comparative analysis in traditional versus internet banking”, Internet Research, 15(4), pp. 447-470.
Fornell, C. (1992). A national customer satisfaction barometer: the Swedish experience. Journal of
Marketing, 56 (1), pp. 6-21
Fornell, C. and Larcker, D. F. (1981). Evaluating structural equation models with unobservable
variables and measurement error. Journal of marketing research, 18(1), pp. 39-50.
Fornell, C., Johnson, M.D., Anderson, E.W., Cha, J. and Bryant, B.E. (1996), “The American
customer satisfaction index: nature, purpose, and findings”, Journal of Marketing, 60(4), pp. 7-18.
Foss, N. J. (1996). Research in strategy, economics, and Michael Porter. Journal of Management
Studies, 33(1), p. 1–24.
Foss, N.J. (1996), “Knowledge‐based approaches to the theory of the firm: some critical
comments”, Organization Science, 7(5), pp. 470‐476.
Francis, J. and White, L. (2002a), “PIRQUAL: a scale for measuring customer expectations and
perceptions of quality in internet retailing”, AMA Winter Educators’ Conference: Marketing Theory
and Applications, pp. 263-270
Francis, J.E. and White, L. (2002b), “Exploratory and confirmatory factor analysis of the perceived
internet retailing quality model”, ANZMAC 2002 Conference Proceedings, pp. 1791-1796.
Frei, R.L. and McDaniel, M.A. (1998), “Validity of customer service measures in personnel
selection: a review of criterion and construct evidence”, Human Performance, 11(1), pp. 1‐27.
Fung, K. K., King, C., Sparks, B., and Wang, Y. (2013). The influence of customer brand
identification on hotel brand evaluation and loyalty development. International journal of hospitality
management, 34, 31-41.
Gable, M., Fiorito, S.S. and Topol, M.T. (2008), “An empirical analysis of the components of retailer
customer loyalty programs”, International Journal of Retail & Distribution Management, 36(1), pp.
32-49.
Gallarza, M. G. and Saura, I.G. (2006). Value dimensions, perceived value, satisfaction and loyalty:
an investigation of university students’ travel behaviour. Tourism Management, 27(3), pp. 437-452.
Ganesh, J., Arnold, M. J. and Reynolds, K. E. (2000). “Understanding the customer base of service
providers: An examination of the difference between switchers and stayers”, The Journal of
Marketing, 64 (July), pp. 65-87
Garay, L. and Font, X. (2012), “Doing good to do well? Corporate social responsibility reasons,
practices and impacts in small and medium accommodation enterprises”, International Journal of
Hospitality Management, 31(2), pp. 329-337.
García de Leaniz, P.M. and del Bosque Rodríguez, I.R. (2015), “Exploring the antecedents of hotel
customer loyalty: a social identity perspective”, Journal of Hospitality Marketing & Management,
24(1), pp. 1-23.
García de los Salmones, M.M., Crespo, A. and del Bosque, I.R. (2005), “Influence of corporate social
responsibility on loyalty and valuation of services”, Journal of Business Ethics, 4(61), pp. 369-385.
Gaskin, J. and Lim, J. (2016), “Master Validity Tool”, AMOS Plugin. Gaskination's StatWiki.

304
Gaskin, J. and Lim, J. (2017), “CFA Tool”, AMOS Plugin. Gaskination's StatWiki.
Gaskin, J. and Lim, J. (2018), “Multigroup Analysis”, AMOS Plugin. Gaskination's StatWiki.
Gauri, D.K., Trivedi, M., Grewal, D., 2008b. Understanding the determinants of retail strategy: an
empirical analysis. Journal of Retailing, 84 (3), pp. 256–267.
Gentile, C., Spiller, N., & Noci, G. (2007). How to sustain the customer experience: An overview of
experience components that co-create value with the customer. European Management Journal,
25(5), pp. 395-410.
George, A. and Kumar, G.G. (2014), “Impact of service quality dimensions in internet banking on
customer satisfaction”, Decision, 41(1), pp. 73-85.
Ghauri, P. and Gronhaug, K. (2010). Research method in Business studies. (4th edn.). UK: Pearson
Education Limited.
Ghazali, E., Nguyen, B., Mutum, D. S., Mohd-Any, A. A. (2016). Constructing online switching
barriers: examining the effects of switching costs and alternative attractiveness on e-store loyalty in
online pure-play retailers. Electronic Marketing, 26(2), pp. 157-171.
Giaglish, G. M. and Fouskas, K. G. (2011) “The impact of managerial perceptions on
competitive response variety”, Management Decision, 49(8), pp.1257-1275.
Gilbert, G. and Veloutsou, C. (2006), “A cross‐industry comparison of customer
satisfaction”, The Journal of Services Marketing, 20, pp. 298‐308.
Global Agricultural Information Network (2017). Vietnam Retail Foods, Sector Report 2016.
[Online]. Available at:
https://gain.fas.usda.gov/Recent%20GAIN%20Publications/Retail%20Foods_Hanoi_Vietnam_3-7-
2017.pdf (Accessed 20 October 2017)
Goh, M., Prakash, S. and Yeo, R. (2007), “Resource‐based approach to IT shared services in a
manufacturing firm”, Industrial Management & Data Systems, 107(2), pp. 251‐70.
Gonzalez-Benito, O. (2005), “Spatial competitive interaction of retail store formats: modeling
proposal and empirical results”, Journal of Business Research, 58, pp. 457-466.
Gounaris, S. and Stathakopoulos, V. (204). Antecedents and consequences of brand loyalty: An
empirical study. Journal of Brand Management, 11 (4), pp. 283-306.
Gounaris, S. (2005), “Measuring service quality in b2b services: an evaluation of SERVQUAL
scales vis‐à‐vis the INDSERV scale”, Journal of Services Marketing, 19(6), pp. 421‐35.
Grant, D. B. (2003). A study of customer service, customer satisfaction and service quality in the
logistics function of the UK food processing industry. PhD dissertation. University of Edinburgh.
Grant, R.M. (1991), “The resource‐based theory of competitive advantage”, California
Management Review, 33(3), pp. 114‐35.
Gremler, D. D. (2004). The critical incident technique in service research. Journal of Service
Research. 7 (1), pp. 65–89.
Grewal, D., Levy, M. and Kumar, V. (2009), “Customer experience management in retailing: an
organizing framework”, Journal of Retailing, 85(1), pp. 1-14.
Grewal, D., Monroe, K. B., & Krishnan, R. (1998). The effects of price-comparison advertising on
buyers' perceptions of acquisition value, transaction value, and behavioral intentions. The Journal of
Marketing, 62(2), 46-59.
Grewal, D., Roggeveen, A.L., Sisodia, R. and Nordfält, J. (2017), “Enhancing Customer Engagement
Through Consciousness,” Journal of Retailing, 93, 55–64.
Grewal, D., Levy, M. and Lehmann, D.R. (2004), “Retail branding and customer loyalty: an
overview”, Journal of Retailing, 80(4), pp. 9-12.

305
Griffin, J. and Herres, R. T. (2002). Customer loyalty: how to earn it, how to keep it. Jossey-Bass, San
Francisco, CA.
Grönroos, C. (1982), Strategic Management and Marketing in the Service Sector, Swedish
School of Economics and Business Administration, Helsingfors.
Grönroos, C. (1984), “A service quality model and its marketing implications”, European
Journal of Marketing, 18(4), pp. 36‐44.
Grunert, K.G. (2005), “Food quality and safety: consumer perception and demand”, European
Review of Agricultural Economics, 32(3), pp. 369-391.
Gudehus, T. and Kotzab, H. (2012). Comprehensive Logistic. Springer, Heidelberg.
Guenzi, P. and Johnson, M.D. and Castaldo, S. (2009) “A comprehensive model of customer trust in
two retail stores”, Journal of Service Management, 20(3), pp. 290-316, https://
doi.org/10.1108/09564230910964408.
Guenzi, P., Johnson, M. D., Castaldo, S. (2009). A comprehensive model of customer trust in two
retail stores. Journal of Service Management, 20(3), pp. 290-316.
Guiltinan, J.P. (1989), “A Classification of Switching Costs with Implications for Relationship
Marketing,” in 1989 AMA Winter Educators’ Conference: Marketing Theory and Practice, T. L.
Childers, R. P. Bagozzi, et al., eds. Chicago, IL: AMA, 216-220.
Gundala, R.R. (2010). Retail store image: a study of the Cyprus clothing industry. International
Journal of Management & Marketing Research, 3(3), 67-81.
Gupta, A. and Chen, I. (1995). “Service quality: implications for management development”.
International Journal of Quality & Reliability Management, 12(7), pp.28-35.
Gupta, S. (2012) "Interdependence between experience marketing and business strategy", Journal
of Indian Business Research, 4(3), pp.170-193.
Gurlek, M., Duzgun, E. and Uygur, E. M. (2017), “How does corporate social responsibility create
customer loyalty? The role of corporate image”, Social Responsibility Journal, 13(3), pp.409-427.
Gustafsson, A., Roos, I. and Edvardsson, B. (2004), “Customer clubs in a relationship perspective: a
telecom case”, Managing Service Quality, 14(2-3), pp. 157-68.
Gutman, J. (1982), “A means‐end chain model based on consumer categorisation
processes”, Journal of Marketing, 46(2), pp. 60‐72.
Ha, C. L. (1988). The theory of reasoned action applied to brand loyalty. Journal of Product and
Brand Management, 7 (1), pp. 51-61
Ha, H.Y. and Perks, H. (2005). Effects of consumer perceptions of brand experience on the web:
brand familiarity, satisfaction and brand trust. Journal of Consumer Behaviour, 4(6), pp. 438-452.
Hagtvedt, H. and Patrick, V. M. (2009). The broad embrace of luxury: Hedonic potential as a driver of
brand extendibility. Journal of Consumer Psychology, 19 (4), pp. 608-618
Hair, J. F., Celsi, M. W., Money, A. H., Samouel, P. and Page, M. J (2011). Essentials of Business
Research Methods (2nd
edn.). M. E. Sharpe: London.
Hair, J.F., Black, W.C., Babin, B.J. and Anderson, R.E. (2010). Multivariate Data Analysis: a global
perspective. (7th ed.) Prentice Hall, Upper Saddle River, New Jersey.
Hair, J.F., Hult, G.T.M, Ringle, C.M. and Sarstedt, M. (2014). A primer on partial least squares
structural equation modeling (PLS-SEM). Sage Publication: Los Angeles.
Hallberg, G. (2004), “Is your loyalty programme really building loyalty? Why increasing emotional
attachment, not just repeat buying, is key to maximising programme success”, Journal of Targeting,
Measurement & Analysis for Marketing, 12(3), pp. 231-41.

306
Hallowell, R. (1996). The relationships of customer satisfaction, customer loyalty, and profitability:
an empirical study. International Journal of Service Industry Management, 7 (4), pp. 27-42.
Han, H. and Hyun, S. S. (2012) An extension of the four-stage loyalty model: the critical role of
positive switching barriers. Journal of Travel and Tourism Marketing, 29(1), pp. 40-56.
Han, H., Back, K. J. and Kim, Y. H. (2011) A multidimensional scale of switching barriers in the
full-service restaurant industry. Cornell Hospitality Quarterly, 52(1), pp. 54-63.
Han, H., Hyun, S.S. (2012). An extension of the four-stage loyalty model: the critical role of positive
switching barriers. Journal of Travel and Tourism Marketing. 29 (1), pp. 40–56.
Han, H., Kim, W. and Hyun, S. S. (2011b). “Switching intention model development: role of service
performances, customer satisfaction, and switching barriers in the hotel industry”. International
Journal of Hospitality Management, 30 (3) (2011), pp. 619-629.
Han, H., Kimb, Y. and Kima, E. (2011), “Cognitive, affective, conative, and action loyalty: testing the
impact of inertia”, International Journal of Hospitality Management, 30(1), pp. 1108-1119.
Hänninen, N. and Karjaluoto, H. (2017). Environmental values and customer-perceived value in
industrial supplier relationships. Journal of Cleaner Production, 156, pp. 604-613.
HANOITIMES (2017). Fierce competition in Vietnam retail market. [Online]. Available at:
http://hanoitimes.com.vn/economy/trade-service/2017/10/81E0B98D/fierce-competition-in-vietnam-
retail-market/ (Accessed 22 October 2017)
Hansen, T. (2003), “Intertype competition: specialty food stores competing with supermarkets”,
Journal of Retailing and Consumer Services, 10(1), pp. 35-49.
Hansen, U. (2000), “Lost in relationship-marketing space: the limitations of relationship marketing
from the perspective of the consumer”, in Hennig-Thurau, T. and Hansen, U. (Eds), Relationship
Marketing, Springer, Berlin, pp. 415-35.
Hare, C. (2003), “The food-shopping experience: a satisfaction survey of older Scottish consumers”,
International Journal of Retail & Distribution Management, 31(5), pp. 244-255.
Hartman, K. B., & Spiro, R. L. (2005). Recapturing store image in customer-based store equity: a
construct conceptualization. Journal of Business Research, 58(8), 1112-1120.
Hartmann, P. and Ibanez, V.A. (2007), “Managing customer loyalty in liberalized residential energy
markets: the impact of energy branding”, Energy Policy, 35(4), pp. 2661-2672.
Hassan, H., Sade, A. B. and Rahman, M. S. (2013). “Malaysian hypermarket retailing
development and expansion”, International Journal of Retail & Distribution Management, 41(8),
pp.584-595.
Hawes, J.M. and Crittenden, W.P. (1984), “A taxonomy of competitive retailing
strategies”, Strategic Management Journal, 5(3), pp. 275-87.
Heide, J.B. & Weiss A.M. (1995). Vendor Consideration And Switching Behavior For Buyers In
HighTechnology Markets. Journal of Marketing, 59 (July) 30-43.
Helms, M.M, Haynes, P.J. and Cappel, S.D. (1992). “Competitive strategies and business
performance within the retailing industry”, International Journal of Retail & Distribution
Management, 20(5).
Henderson, J. M. and Quandt, R. E. (1958). Microeconomic theory a mathematical approach. New
York, McGraw-Hill, 1958.
Hennig-Thurau, T. (2004) Customer orientation of service employees: its impact on customer
satisfaction, commitment, and retention, International Journal of Service Industry
Management., 15 (5), pp. 460-478.

307
Henning-Thurau, T., Gwinner, K.P. and Gremler, D.D. (2002), “Understanding relationship
marketing outcomes: an integration of relational benefits and relationship quality”, Journal of Service
Research, 4(3), pp. 230-247.
Hirschman, A. O. (1970). Exit, Voice and Loyalty: Responses to Decline in Firms, Organizations, and
States. Harvard University Press, Cambridge, MA.
Hirschman, E.C., Greenberg, B. and Robertson, D.H. (1978), “The intermarket reliability of retail
image research: an empirical examination”, Journal of Retailing, 54(1), pp. 3-12.
Ho, R. Huang, l., Huang, S., Lee, T., Rosten, A. and Tang, C.S. (2009) “An approach to develop
effective customer loyalty programs: The VIP program at T&T Supermarkets Inc.”, Managing
Service Quality: An International Journal, 19(6), pp.702-720.
Hoch, S.J., Bradlow, E.T. and Wansink, B. (1999), “The variety of an assortment”, Marketing
Science, 18(4), pp. 527-546.
Hoffman, J. L. and Lowitt, E. M. (2008). “A better way to design loyalty programs”, Strategy &
Leadership, 36(4), pp.44-47.
Hofstede, G. (1980), Culture’s Consequences: International Differences in Work Related
Values, Sage Publications, Beverly Hills, CA.
Hofstede, G. (1984), “Cultural dimensions in management and planning”, Journal of
Management, pp. 81‐99.
Holbrook, M.B. & Hirschman, E.C. (1982). The experiential aspects of consumption: Consumer
fantasy, feelings and fun. Journal of Consumer Research, 9(2) (p.132–140).
Holloway, B. and Beaty, S. (2003). Service failure in online retailing: A recovery opporturnity.
Journal of Service Research, 6(2003), pp. 92-105.
Homburg, C., Koschate, N. and Hoyer,W. D. (2006). The role of cognition and affect in the formation
of customer satisfaction: a dynamic perspective. Journal of Marketing, 70 (3), pp. 21-31.
Horta, I. M. and Camanho, A. S. (2014) Competitive positioning and performance assessment in the
construction industry (2014). Expert Systems with Applications, 41(4-1), pp. 974-983.
Hsieh, Y.-C., and Hiang, S.-T. (2004). A study of the impacts of service quality on relationship
quality in search-experience-credence services. Total Quality Management, 15(1), 43–58.
Hsu, H. (2006). An empirical study of website quality, customer value, and customer satisfaction
based on e-shop. The Business Review, 5(1), pp. 190–193.
Hsu, J. S. (2014). Understanding the role of satisfaction in the formation of perceived switching value.
Decision Support Systems, 59, pp. 152-162.
Hu, H. (2011). Chinese consumers’ store image formation and its impact on patronage behaviour.
Academy of Marketing Studies Journal, 15(2), 83-102.
Hu, H. and Jasper, C.R. (2006). Social cues in the store environment and their impact on store image.
International Journal of Retail & Distribution Management, 34(1), 25-48.
Hu, H., Lee, Y. and Yen, T. (2010) “Service quality gaps analysis based on Fuzzy linguistic
SERVQUAL with a case study in hospital out‐patient services”, The TQM Journal, 22(5),
pp.499-515.
Huddleston, P., Whipple, J., Mattick, R.N. and Lee, S.J. (2009), “Customer satisfaction in food
retailing: comparing specialty and conventional grocery stores”, International Journal of Retail
and Distribution Management, 37(1), pp. 63-80.
Hume, M., Sullivan, M. G., Peter, W. L. and Winzar, H. (2006). Understanding service experience in
non-profit performing arts: implications for operations and service management. Journal of
Opernations Management, 24 (4), pp. 304-324.

308
Hunt, M.S. (1972), Competition in the major home appliance industry, 1960-1970, Harvard
University, Cambridge, MA.
Hurley, R.F. (1998), “Customer service behavior in retail settings: a study of the effect of
service provider personality”, Journal of the Academy of Marketing Sciences, 26(2), pp. 115‐
227.
Hussain, R., Nasser, A.A. and Hussain, Y.K. (2015), “Service quality and customer satisfaction
of a UAE-based airline: an empirical investigation”, Journal of Air Transport Management,
42(1), pp. 167-175.
Iglesias, O., Singh, J.J. and Batista-Foguet, J. M. (2011). The role of brand experience and affective
commitment in determining brand loyalty. Journal of Brand Management, 18 (8), pp. 570-582.
Ishida, C. and Taylor, S. A.(2012). Retailer brand experience, brand experience congruence, and
consumer satisfaction. Journal of Consumer Satisfaction, Dissatisfaction & Complaining Behavior,
25, pp. 63-79.
Izogo, E.E. and Ogba, I.-I. (2015), “Service quality, customer satisfaction and loyalty in
automobile repair services sector”, International Journal of Quality and Reliability
Management, 32(3), pp. 250-269.
J. Lee, J. Lee, L. Feick (2001).The impact of switching cost on the customer satisfaction–loyalty link:
Mobile phone service in France.Journal of Service Marketing, 15 (1), pp. 35-48
Jacoby, J., Szybillo, G.J., Berning, C.K., 1976. Time and consumer behavior: an interdisciplinary
overview. Journal of Consumer Research, 2(4), pp. 320–339.
Jacoby, J. and Chestnut, R. W (1978). Brand loyalty: Measurement and management. John Wiley &
Sons: New York.
Jamal, A. and Anastasiadou, K. (2007), “Investigating the effects of service quality dimensions and
expertise on loyalty”, European Journal of Marketing, 43(3/4), pp. 398-420.
Janda, S., Trocchia, P.J. and Gwinner, K.P. (2002), “Consumer perceptions of internet retail service
quality”, International Journal of Service Industry Management, 13(5), pp. 412-431.
Jarvis, C.B., Mackenzie, S. B. and Podsakoff, P.M. (2003). A critical review of construct indicators
and measurement model misspecification in marketing and consumer research. Journal of Consumer
Research, 30, pp.199-218.
Jayawardhena, C. and Farrell, A.M. (2011), “Effects of retail employees' behaviours on
customers' service evaluation”, International Journal of Retail & Distribution Management,
39(3), pp. 203-217.
Jiang, J. J., Klein, G. and Crampton, S. M. (2000), “A note on SERVQUAL reliability and
validity in information system service quality measurement”, Decision Sciences, 31(3), pp. 725‐
44.
Jiang, K., Luk, S. T. and Cardinali, S. (2018). The role of pre-consumption experience in perceived
value of retailer brands: Consumers' experience from emerging markets. Journal of Business
Research. Elsevier, 86(C), pp. 374-385.
Jinfeng, W. and Zhilong, T. (2009). The impact of selected store image dimensions on retailer equity:
Evidence from 10 Chinese hypermarkets. Journal of Retailing and Consumer Services, 16(6), pp.
486-494.
Johansson, J. (2000), Global Marketing, McGraw Hill, New York, NY, pp. 60‐1.
Johnson, M.D., Herrmann, A. and Gustafsson, A. (2002), “Comparing customer satisfaction across
industries and countries”, Journal of Economic Psychology, 23(6), pp. 749-769.
Johnson, R., Tsiros, M. and Lancioni, R.A. (1995), “Measuring service quality: a system
approach”, Journal of Services Marketing, 9(5), pp. 6‐19.

309
Jones, M. A., Mothersbaugh, D. L. and Beatty, S. E. (2000). Switching barriers and repurchase
intentions in services. Journal of Retailing. 76(2), pp. 259-274.
Jones, M. and Suh, J. (2000). Transaction-Specific Satisfaction And Overall Satisaction: An Empirical
Analysis. Journal of Services Marketing, 14 (2) 147-159.
Jones, M., Reynolds, K. and Arnold, M. (2006). Hedonic and utilitarian shopping value: investigating
differential effects on retail outcomes. Journal of Business Research, 59 (9), 974–981.
Jones, M.A., Reynolds, K.E.,Mothersbaugh, D.L. and Beatty, S.E. (2007), “The positive and negative
effects of switching costs on relational outcomes”, Journal of Service Research, 9(4), pp. 335-355.
Jones, P., Comfort, D. , Clarke-Hill, C. and Hillier, D. (2010), “Retail experience stores:
experiencing the brand first hand”, Marketing Intelligence and Planning, 28(3), pp. 241-248.
Jones, M.A. and Mothersbaugh, D. L. and Beatty, S. E. (2000). Switching barriers and repurchase
intentions in services, Journal of Retailing, 76(2), pp. 259-274.
Jones, T. and Sasser, W. E. (1995). Why satisfied customer defect. Harvard Business Review.
November–December. pp. 88-99.
Jüttner, Uta, Dorothea, Schaffner, Katharina, Windler, Stan, Maklan (2013). Customer service
experiences: developing and applying a sequential incident laddering technique. European Journal of
Marketing. 47 (5/6), 738–769.
Juwaheer, T. D. (2004), “Exploring international tourists' perceptions of hotel operations by
using a modified SERVQUAL approach – a case study of Mauritius”, Managing Service
Quality, 14(5), pp. 350‐64.
Kale, S. And Arditi, D. (2002). Competitive positioning in united states construction industry. Journal
of Construction Engineering and Management, 128 (3), pp. 238-247.
Kale, S. H. and Klugsberger, P. (2007). “Reaping rewards”. Marketing Management.16 (4), p. 14-18.
Kalia, P. (2017) “Service quality scales in online retail: methodological issues”, International Journal
of Operations & Production Management, 37(5), pp.630-663
Kandampully, J. and Suhartanto, D. (2000), “Customer loyalty in the hotel industry: the role of
customer satisfaction and image”, International Journal of Contemporary Hospitality Management,
12(6), pp. 346-351.
Kanovska, L. (2009), “Customers service and their role for industrial small and medium
companies”, Economics and Management, 14(4), pp. 413‐20.
Kaplan, S., de Abreu e Silva, J., Di Ciommo, F. (2014). “The relationship between young people's
transit use and their perceptions of equity concepts in transit service provision”. Transport Policy, 36,
pp. 79–87.
Keller, K. L. (1993). Conceptualizing measuring and managing customer-based brand equity. Journal
of Marketing, 57, pp. 1-22.
Keng, C.J., Huang, T.L., Zheng, L.J., Hsu, M.K. (2007). Modeling service encounters and customer
experiential value in retailing: an empirical investigation of shopping mall customers in Taiwan.
International Journal of Service Industry Management. 18 (4), pp. 349–367.
Khalifa, A.S. (2004), “Customer value: a review of recent literature and an integrative
configuration”, Management Decision, 42(5), pp. 645‐66.
Khan, B.M. ( 2009 ), “Consumers and their brands: deciphering dimensions of loyalty”, International
Journal of Business Insights & Transformation , 2(1), pp. 84 - 92 .
Khan, I. and Rahman, Z. (2015). Brand experience anatomy in retailing: An interpretive structural
modeling approach. Journal of Retailing and Consumer Services, 24, pp. 60–69.

310
Kim, J. (2019). The impact of different price promotions on customer retention. Journal of Retailing
and Consumer Services, 46, pp. 95-102.
Kim, J. W, Lee, F. and Suh, Y.G. (2015). Satisfaction and loyalty from shopping mall experience and
brand personality. Services Marketing Quarterly, 36(1), pp. 62-76.
Kim, M., Kim, J.H. and Lennon, S.J. (2006), “Online service attributes available on apparel retail web
sites: an E-S-QUAL approach”, Managing Service Quality, 16(1), pp. 51-77.
Kim, M., Park, M., Park, J., Kim, J. and Kim, E. (2018). The role of multidimensional switching
barriers on the cognitive and affective satisfaction-loyalty link in mobile communication services:
Coupling in moderating effects. Computers in Human Behavior, 87, pp. 212-223.
Kim, M., Park, M. and Jeong, D. (2004), “The effects of customer satisfaction and switching
barrier on customer loyalty in Korean mobile telecommunication services”, Telecommunication
Policy, 2, pp. 145‐59.
Kim, W.G., Jin-Sun, B., Kim, H.J., 2008. Multidimensional customer-based Brand equity and its
consequences in mid-priced hotels. Journal of Hospitality and Tourism Research. 32, pp. 235–254.
Kitapci, O., Dortyol, I. T., Yaman, Z. and Gulmez, M. (2013) “The paths from service quality
dimensions to customer loyalty: An application on supermarket customers”, Management Research
Review, 36(3), pp.239-255
Klaus, P. and Maklan, S. (2012), “EXQ: a multiple-item scale for assessing service experience”,
Journal of Service Management, 23(1), pp. 5-33.
Klint, M. B. and Sjoberg, U. (2003) “Towards a comprehensive SCP‐model for analysing
strategic networks/alliances”, International Journal of Physical Distribution & Logistics
Management, 33(5), pp. 408-426.
Kontot, K., Hamali, J. and Abdullah, F. (2016).Determining Factors of Customers’ Preferences: A
Case of Deposit Products in Islamic Banking. Procedia - Social and Behavioral Sciences, 224, pp.
167 – 175.
Konuk, F. A. (2018) The role of store image, perceived quality, trust and perceived value in predicting
consumers’ purchase intentions towards organic private label food. Journal of Retailing and consumer
service, 43, pp.304-310.
Konuk, F.A. (2018). The role of store image, perceived quality, trust and perceived in predicting
consumers’ purchase intensions towards organic private label food. Journal of Retailing and
Consumer Services, 43, pp. 304-310.
Kopalle, P.K., Lehmann, D.R. and Farley, J.U. (2010) “Consumer expectations and culture: the effect
of belief in Karma in India”, Journal of Consumer Research, 37(2), pp. 251-263.
Kopalle, P.K., Lehmann, D.R. and Farley, J.U. (2010), “Consumer expectations and culture: the effect
of belief in Karma in India”, Journal of Consumer Research, 37(2), pp. 251-263.
Kotler, P. and Keller, K. L. (2009). “Marketing management” (13th ed). New Jersey: Pearson
Education Inc, Upper Saddle River: NJ (2009).
Kotler, P., Armstrong, G., Harris, L. and Piercy, N. (2013). Principles of marketing European edition.
(6th edn.). Edinburgh: Pearson Education Limited.
Kotzab, H. and Teller, C. (2005), “Development and empirical test of a grocery retail instore
logistics model”, British Food Journal, 107(8), pp.594-605.
Kotzab, H., Reiner, G. and Teller, C. (2007), Beschreibung, Analyse und Bewertung von Instore -
Logistikprozesse, Zeitschrift für Betriebswirtschaft, 77(11), pp. 1135-1158.
Koutsothanassi, E., Bouranta, N. and Psomas, E. (2017), “Examining the relationships among service
features, customer loyalty and switching barriers in the Greek banking sector”, International Journal
of Quality and Service Sciences, 9(3/4), pp.425-440.

311
Krampf, R., Ueltschy, L. and d'Amico, M. (2003), “The contribution of emotion to consumer
satisfaction in the service setting”, Marketing Management Journal, 13, pp. 32‐52.
Kuenzel, S. and Halliday, S.V. (2010), “The chain of effects from reputation and brand personality
congruence to brand loyalty: the role of brand identification”, Journal of Targeting, Measurement and
Analysis for Marketing, 18(3/4), pp. 167-176.
Kumar, A. and Kim, Y. K. (2015). The store-as-a-brand strategy: the effect of store environment on
customer responses. Procedia - Social and Behavioral Sciences, 207, pp. 196 – 205.
Kumar, V., Pozza, I.D. and Ganesh, J. (2013), “Revisiting the satisfaction – loyalty relationship:
empirical generalizations and directions for future research”, Journal of Retailing, 89(3), pp. 246-262.
Kursunluoglu, E. (2011), “Customer service effects on customer satisfaction and customer loyalty: a
field research in shopping centers in Izmir city – Turkey”, International Journal of Business and
Social Science, 2(17), pp. 52-59.
Kursunluoglu, E. (2014). “Shopping centre customer service: creating customer satisfaction and
loyalty”, Marketing Intelligence & Planning, 32(4), pp.528-548.
La Londe, B.J. and Zinszer, P.H. (1987) “Customer Service: Meaning and Measurement”, in Stock,
J.R. and Lambert, D.M. (Eds.), Strategic Logistics Management, 2nd
ed.. Irwin, Homewood, Illinois,
p. 117.
Lacey, R. and Morgan, R. M. (2008) “Customer advocacy and the impact of B2B loyalty programs”,
Journal of Business & Industrial Marketing, 24(1), pp.3-13.
Lahti, A. (1983). Strategy and performance of a firm: An empirical investigation in the knitwear
industry in Finland in 1969–1981. Helsinki, helsinki school of economics edition (pp. 185–203).
Lai, F., Griffin, M. and Babin, B.J.(2009). How quality, value, image, and satisfaction create loyalty
at a Chinese telecom. Journal of Business Research. 62 (10), pp. 980–986.
Lam, S.Y., Venkatesh, S., Erramilli, K.M. & Bvsan, M. (2004). Customer Value, Satisfaction,
Loyalty, And Switching Costs: An Illustration From A Business-to-Business Service Context, Journal
of the Academy of Marketing Science, 32(3), pp. 293-311.
Lam, S.Y.,Venkatesh, S., Erramilli,K.M., Bvsan, M., 2004. Customer value, satisfaction, loyalty, and
switching costs: an illustration from a business-to-business service context. Journal of the Academy of
Marketing Science, 32 (3), 293–311
Lawless, M.W., Bergh, D.D. and Wilsted, W.D. (1989), “Performance variations among
strategic group members: an examination of individual firm capacity”, Journal of Management,
15(4), pp. 649‐61.
Le, T. (2016). Sức Hút Hấp Dẫn Từ Miếng Bánh Bán Lẻ Tại Việt Nam | Attractions from the Retail in
Vietnam. [online] JLL. Available at: http://www.joneslanglasalle.com.vn/vietnam/vi-vn/news/64/suc-
hut-tu-mieng-banh-ban-le-tai-viet-nam [Accessed 30 Apr. 2017].
Leask, G. and Parker, D. (2006). “Strategic group theory: review, examination and application in
the UK pharmaceutical industry”, Journal of Management Development, 25(4), pp.386-408
Leask, G. and Parker, D. (2007), “Strategic groups, competitive groups and performance within
the UK pharmaceutical industry: improving our understanding of the competitive process”,
Strategic Management Journal, 28(7), pp. 723-745.
Lee, C., Yoon, Y., Lee, S. (2007). Investigating the relationships among perceived value, satisfaction,
and recommendations: the case of the Korean DMZ. Tourism Management. 28 (1), 204–214.
Lee, J., Kim, H., Ko, Y.J. and Sagas, M. (2011), “The influence of service quality on satisfaction and
intention: a gender segmentation strategy”, Sport Management Review, 14, pp. 54-63.

312
Lee, S-E., Johnson, K.K.P. and Gahring, S.A. (2008), “Small-town consumers’ disconfirmation of
expectations and satisfaction with local independent retailers”, International Journal of Retail and
Distribution Management, 36(2), pp. 143-157.
Lee, J., Lee, J and Feick, L. (2001). cThe impact of switching costs on the customer satisfaction–
loyalty link: mobile phone service in France”, Journal of Service Marketing, 15 (1), pp. 35-48.
Lemke, F., Clark, M. and Wilson, H. (2011), “Customer experience quality: an exploration in
business and consumer contexts using repertory grid technique”, Journal of the Academy of
Marketing Science, 39(6), pp. 846-869.
Lemon, K. N. and Vehoef, p. C. (2016), “Understanding Customer Experience Throughout the
Customer Journey,” Journal of Marketing, 80 (6), p. 69–96.
Leroi-Werelds, S., Streukens, S., Brady, M.K. and Swinnen, G. (2014), “Assessing the value of
commonly used methods of measuring customer value: a multi-setting empirical study”, Journal of
the Academy of Marketing Science, Vol. 42 No. 4, pp. 430-451.
Levy, M. and Weitz, B. A. (2004). Retailing management. (5th edn.). McGraw Hill: New York
Levy, M. and Weitz, B. A. (2008), Retailing Management (7th edn.). McGraw-Hill/Irwin
Levy, M. and Weitz, B.A. (2007), Retailing Management (6th edn.). McGraw Hill, New York, NY.
Lewis, M. (2004). The influence of loyalty programs and short-term promotions on customer
retention. Journal of Marketing Research, 41(3), 281-292.
Li, D., Browne, G.J. and Wetherbe, J. C. (2007). Online consumers׳ switching behaviour: a buyer–
seller relationship perspective. Journal of Electronic and Commerce, 5 (1) (2007), pp. 30-42
Li, X. R., & Petrick, J. F. (2008). Examining the antecedents of brand loyalty from an investment
model perspective. Journal of Travel Research, 47(1), 25-34.
Liang, T.P., You, J.J. and Liu, C.C. (2010), “A resource‐based perspective on information
technology and firm performance: a meta analysis”, Industrial Management & Data Systems,
110(8), pp. 1138‐58.
Liao, S.H., Chen, C.M. and Wu, C.H. (2008), “Mining customer knowledge for product line and
brand extension in retailing”, Expert Systems with Application, 34, pp. 1763-1776.
Lin, C.P., Chen, S.C., Chiu, C.K. and Le, W.Y (2011). Understanding purchase intention during
product-harm crises: moderating effects of perceived corporate ability and corporate social
responsibility, Journal of Business Ethics, 102(3), pp. 455-471.
Lin, H. H., and Wang, Y. S. (2006). An examination of the determinants of customer loyalty in
mobile commerce contexts. Information and Management, 43(3):271–282.
Lin, M. and Lee, B.Y. (2012), “The influence of website environment on brand loyalty: brand trust
and brand affect as mediators”, International Journal of Electronic Business Management, 10(4), pp.
308-321.
Lin, Y. H. (2015) Innovative brand experience's influence on brand equity and brand satisfaction.
Journal of Business Research, 68 (2015), pp. 2254–2259.
Lindgreen, A. and Wynstra, F. (2005), “Value in business markets: what do we know? Where
are we going?”, Industrial Marketing Management, 34(7), pp. 732‐48.
Lipczynski, J. and Wilson, J. (2004), The Economics of Business Strategy, Prentice‐
Hall, Englewood Cliffs, NJ.
Little, L. M., Kluenper, D., Nelson, D. L., and Gooty, J. (2012). “Development and Validation of the
Interpersonal Emotion Management Scale”. Journal of Occupational and Organisational Psychology,
85(2), pp. 407-20.

313
Liu, C., Guo, Y. M. and Lee, C. (2011). The effects of relationship quality and switching barriers on
customer loyalty. International Journal of Information Management, 31, pp. 71–79.
Liu, M. T., Wong, I. A., Rongwei, C. and Tseng, t. (2014) “Do perceived CSR initiatives enhance
customer preference and loyalty in casinos?”, International Journal of Contemporary Hospitality
Management, 26(7), pp.1024-1045.
Liu, X., He, M., Gao, F. and Xie, P. (2008). An empirical study of online shopping customer
satisfaction in China: A holistic perspective. International Journal of Retail and Distribution
Management, 36(11), pp. 919-940.
Lo, S. C. (2012). A Study of Relationship Marketing on Customer Satisfaction. Journal of Social
Sciences, 8(1), pp. 91-94.
Lombart, C. and Louis, D. (2014). A study of the impact of corporate social responsibility and price
image on retailer personality and consumers’ reactions (satsfaction, trust and loyalty to the retailer).
Journal of Retail and Consumer service, 21(4), pp.630-642.
López, E. (2001), “New anti‐merger theories: a critique”, Cato Journal, 20(3), pp. 359‐78.
Lounsbury, J. W., Foster, N., Carmody, P. C., Kim, J. Young, Gibson, L. W. and Drost, A. W.
(2012) “Key personality traits and career satisfaction of customer service workers”, Managing
Service Quality: An International Journal, 22(5), pp.517-536.
Lovelock, C. (2001), Services Marketing People, Technology, Strategy, 4th ed., Prentice‐
Hall, Upper Saddle River, NJ.
Ltifi, M. and Gharbi, J. (2015). The effect of logistics performance in retail store on happiness and
satisfaction of consumers. Procedia Economics and Finance, 23, pp. 1347-1353.
Lucas, J.L. (1999), “The critical shopping experience”, Marketing Management, pp. 60-62,
Spring.
Luk, Sh.T.K. and Layton, R. (2002), “Perception Gaps in customer expectations: Managers versus
service providers and customers”, The Service Industries Journal, 22(2), pp. 109-128.
Lundqvist, A., Liljander, V., Gummerus, J. and Van Riel. A. (2012). The impact of storytelling on the
consumer brand experience: the case of a firm-originated story. Journal of Brand Management,
20 (4), pp. 283-297
Luo, X. and Bhattacharya, C.B. (2006), “Corporate social responsibility, customer satisfaction,
and market value”, Journal of Marketing, 70 (October), pp. 1‐18.
Lusch, R.F., Dunne, P.M. and Carver, J.R. (2011), Introduction to Retailing, Cengage Learning,Ohio,
OH.
Machleit, K.A. & Mantel, S.P. (2001). Emotional Response And Shopping Satisfaction: Moderating
Effects Of Shopper Attributions. Journal of Business Research, 54(2), pp. 97–106.
Machleit, K.A. and Eroglu, S.A. (2000), Describing and measuring emotional response to shopping
experience, Journal of Business Research, 49, pp. 101-111.
Mackenzie, M. and Peters, M. (2014), “Hospitality managers’ perception of corporate social
responsibility: an explorative study”, Asia Pacific Journal of Tourism Research, 19(3), pp. 257-272.
Mafini, C. and Dhurup, M. (2015). Drivers Of Customer Loyalty In South African Retail Stores. The
Journal of Applied Business Research, 31(4), pp. 1295-1310.
Maklan, S. and Klaus, P. (2011), “Customer experience: are we measuring the right things?”,
International Journal of Market Research, 53(6), pp. 771-792.
Malhotra, N. K. and Birks, D. F. (2000). Marketing Research: An Applied Approach (European Edn.).
London: FT Prentice-Hall.
Malhotra, N. (1983), A threshold model of store choice, Journal of Retailing, 59(2), pp. 3‐21.

314
Mandhachitara, R. and Poolthong, Y. (2011), “A model of customer loyalty and corporate social
responsibility”, Journal of Services Marketing, 25(2), pp. 122-133.
Mangan, J., Lalwani, C. and Gardner, B. (2004). Combining quantitative and qualitative
methodologies in logistics research. International Journal of Physical Distribution and Logistics
Management, 34(7), pp. 565-578.
Mangnale, V.S. and Chavan, J. (2012), “Measuring customer satisfaction in Indian banking industry”,
Indian Streams Research Journal, 2(10), p. 2-8.
Marin, L., Ruiz, S. and Rubio, A. (2009), “The role of identity salience in the effects of corporate
social responsibility on consumer behavior”, Journal of Business Ethics, 84(1), pp. 65-78.
Marinkovic, V., Senic, V., Ivkov, D., Dimitrovski, D. and Bjelic, M. (2013), “The antecedents of
satisfaction and revisit intentions for full-service restaurants”, Marketing Intelligence & Planning,
32(3), pp. 311-327.
Martin, J., Mortimer, G. and Andrews, L. (2015). Re-examining online customer experience to
include purchase frequency and perceived risk. Journal of Retailing and Customer Services, 25,
pp. 81-95.
Martineau, P. (1958), “The personality of the retail store”, Harvard Business Review, 58(1), pp. 47-
55.
Martínez, P. and Rodríguez del Bosque, I. (2013). CSR and customer loyalty: the roles of trust,
customer identification with the company and satisfaction. International Jounal of Hospitality
Management, 35, p.89-99.
Martins, C.L. and Pato, M.V. (2019). Supply chain sustainability: A tertiary literature review. Journal
of Cleaner Production. Available online 28th of March 2019 at:
https://doi.org/10.1016/j.jclepro.2019.03.250.
Mason, E.S. (1949), “The current state of the monopoly problem in the United States”, Harvard
Law Review, 62, pp. 1265‐85.
Mathwick, C., Malhotra, N. and Rigdon, E. (2001), Experiential value: conceptualization,
measurement and application in the catalog and Internet shopping environment , Journal of
Retailing, 77(1), pp. 39-56.
Matzler, K., Grabner-Krauter, S. and Bidmon, S. (2008), “Risk aversion and brand loyalty: the
mediating role of brand trust and brand affect”, Journal of Product & Brand Management, 17(3), pp.
154-162.
Matzler, K., Strobl, A., Thurner and Fuller, J. (2015). Switching experience, customer satisfaction,
and switching cost in the ICT industry, Joural of Service Management, 26(1), pp. 117-136.
McGee, J. and Thomas, H. (1986). Strategic groups: Theory, research and taxonomy. Strategic
Management Journal, 7(2), 141–160.
McKinnon, A.C., Mendes, D. and Nababteh, M. (2007), “In-store logistics: an analysis of on-shelf
availability and stockout responses for three product groups”, International Journal
of Logistics Research and Applications, 10(3), pp. 251-268.
McNamara, G., Deephouse, D. L. and Luce, R. A. (2003). Competitive positioning within and across
a strategic group structure: The performance of core, secondary, and solitary firms. Strategic
Management Journal, 24(2), 161–181.
McNamara, G.M., Luce, R.A. and Thompson, G.H. (2002), “Examining the effect of complexity
in strategic group knowledge structures on firm performance”, Strategic Management Journal,
23, pp. 153‐70.
McNamee, P. and McHugh, M. (1989). The group competitive intensity map: a means of displaying
competitive position, The Strategic Management Journal, Forthcoming.

315
McNamee, P. and McHugh, M. (1989). Mapping competitive groups in the clothing industry. Long
Range Planning, 22(5), pp.89-97.
Mei AWO, Dean AM, White CJ (1999). Analyzing service quality in the hospitality industry.
Managing Service Quality, 9 (2), 136-143.
Meyer, C. and Schwager, A. (2007). Understanding customer experience. Harvard Business Review,
85 (2), pp. 116-126
Michael, S. C. (2003), TWO FACES OF STRATEGIC GROUP THEORY, in Fred
Dansereau, Francis J. Yammarino (ed.) Multi-Level Issues in Organizational Behavior and
Strategy (Research in Multi Level Issues, Volume 2) Emerald Group Publishing Limited, pp.199
– 209
Michael, S. C. (2015). Two faces of strategic group theory. Multi level issues in Organisational
Behavior and Strategy, 2, pp.199-209.
Miranda, M.J., Konya, L. and Havrila, I. (2005), “Shoppers’ satisfaction levels are not the only key to
store loyalty”, Marketing Intelligence and Planning, 23(2), pp. 220-232.
Mitchell, V. (1996). “Assessing the reliability and validity of questionnaires: An empirical example”.
Journal of Applied Management Studies, 5(2), pp. 199-207.
Mittal, B. and Lassar, W.M. (1998), “Why do customers switch? The dynamics of satisfaction versus
loyalty”, Journal of Services Marketing, 12(3), pp. 177-94.
Mittal, V. and Frennea, C. (2010), Customer Satisfaction: A Strategic Review and Guidelines for
Managers, Marketing Science Institute, Cambridge, MA.
Mohajerani, P., and Miremadi, A. (2012). Customer satisfaction modeling in hotel industry: A case
study of Kish Island in Iran. International Journal of Marketing Studies, 4(3), pp. 134-152.
Mohan, G., Sivakumaran, B. and Sharma, P. (2013). Impact of store environment on impulse
buying behavior, European Journal of Marketing, 47(10), pp.1711-1732
Mohsin, A. and Lockyer, T. (2010). Customer’s perception of service quality in luxury hotels in New
Delhi, India: anexploratory study, Int. J. of Contemp. Hospitality Manag, 22 (2), pp. 160-173.
Morganosky, M.A. (1997), “Format change in US grocery retailing”, International Journal of Retails
& Distribution Management, 25(6), pp. 211-218.
Mostafa, M. M. (2005), “An empirical study of patients' expectations and satisfactions in
Egyptian hospitals”, International Journal of Health Care Quality Assurance, 18(7), pp. 516‐
32.
Mou, S., Robb, D. J. and DeHoratius, N. (2017). Retail store operations: Literature review and
research directions. European Journal of Operational Research, p. 1-24.
Mount, M.K., Barrick, M.R. and Stewart, G.L. (1998), “Five‐factor model of personality and
performance in jobs involving interpersonal interactions”, Human Performance, 11(2/3),
pp. 145‐65.
Mukherjee, A., Satija,D., Goval, T. M., Mantrala, M. K. And Zou, S. (2012) (2012), “Are Indian
consumers brand conscious? Insights for global retailers”, Asia Pacific Journal of Marketing and
Logistics, 24(3), pp.482-499.
Mulhern, T. and Duffy, D. (2004), “Building loyalty at things remembered”, The Journal of
Consumer Marketing, 21(1), pp. 62-6.
Mutum, D., Ghazali, E. M., Nguyen, B. and Arnott, D. (2014). Online loyalty and its interaction with
switching barriers. Journal of Retailing and Consumer Services, 21(6), pp. 942-949.
Myhanoi (2017). Convenience stores sway VN’s retail market.[Online]. Available at:
https://www.myhanoi.info/2017/09/convenience-stores-sway-vns-retail-market/ (Accessed 22
October 2017)

316
Myhanoi (2017). Traditional groceries still financially powerful retail channel. [Online]. Available
at: https://www.myhanoi.info/2017/04/traditional-groceries-still-FINANCIALLY-powerful-retail-
channel/ (Accessed 23 October 2017)
Nagel, P. and Cilliers, W. (1990), “Customer Satisfaction: A Comprehensive Approach”,
International Journal of Physical Distribution & Logistics Management, 20(6), pp. 2-46.
Namukasa, J. (2013). The influence of airline service quality on passenger satisfaction and loyalty.
Total Quality Management Journal, 25 (5), pp. 520-532.
Nesset, E., Nervik, B. and Helgesen, O. (2011), “Satisfaction and image as mediators of store
loyalty drivers in grocery retailing”, The International Review of Retail, Distribution and
Consumer Research, 21(3), pp. 267-292.
Nguyen, N., & Leblanc, G. (2001)Corporate image and corporate reputation in consumers’ retention
decisions in services. Journal of Retailing and Consumer Services,8, pp. 227–236.
Nguyen, Y. H. (2017). Vietnam retail sales soar in 2016. [Online]. Available at:
https://insideretail.asia/2017/01/06/vietnam-retail-sales-soar-in-2016/ (Accessed 04 August 2017)
Nicolau, J.L. (2008), “Corporate Social Responsibility: worth-creating activities”, Annals of Tourism
Research, 35(4), pp. 990-1006.
Nikhashemi, S. R., Tarofder, A. K., Gaur, S. S. and Haque, A. (2016). The Effect of Customers’
Perceived Value of Retail Store on Relationship between Store Attribute and Customer Brand
Loyalty: Some Insights from Malaysia. Procedia Economics and Finance, 37, pp. 432-438.
Nikkei Asian Review, 2016. Vingroup aims to dominate retail in Vietnam.[Online] Available at:
http://asia.nikkei.com/Business/AC/Vingroup-aims-to-dominate-retail-in-Vietnam (Accessed 23
October 2017)
Ningsih, S. M. and Segoro, W. (2014). The influence of customer satisfaction, switching cost and
trusts in a brand on customer loyalty - the survey on student as im3 users in Depok, Indonesia.
Procedia - Social and Behavioral Sciences, 143, pp. 1015 – 1019.
Nysveen, H., Pedersen, P.E. and Skard, S. (2013). Brand experiences in service organizations:
exploring the individual effects of brand experience dimensions. Journal of Brand
Management, 20 (5), pp. 404-423.
Occupational Information Network (O*NET) (2012). O*NET: customer service representative.
[Online]. Available at: http://online.onetcenter.org (Accessed 10 August, 2017)
Olavarrieta, S. and Ellinger, A. E. (1997). “Resource‐based theory and strategic logistics
research”, International Journal of Physical Distribution & Logistics Management, 27(9/10), pp.
559-587.
Oliva, T.A., Oliver, R.L. and Macmillan, I.C. (1992), “A catastrophe model for developing service
satisfaction strategies”, Journal of Marketing, 56(3), pp. 83-95.
Oliver, R. (1999). Whence consumer loyalty?. Journal of Marketing, 63 (4), pp. 33-44.
Oliver, R. L. (1981). “Measurement and evaluation of satisfaction processes in retail Settings”.
Journal of Retail., 57, pp. 25-48.
Oliver, R. L. (1997). Satisfaction: A Behavioral Perspective on the Consumer. McGraw Hill, New
York.
Oliver, R.L. (1999). “Whence consumer loyalty?”, Journal of Marketing, 63(4), pp. 33-44.
Oliver, R.L. (1997), Satisfaction: A Behavioral Perspective on the Customer , Irwin McGraw‐
Hill, Boston, MA.
Oliver, R.L., Rust, R.T. and Varki, S. (1997), “Customer delight: foundations, findings, and
managerial insights”, Journal of Retailing, 73(3), pp. 311-336.

317
Osman, M.Z. (1973), A conceptual model of retail image influences on loyalty patronage
behaviour, International Review of Retail Distribution and Consumer Research , 2, pp. 133‐48.
Oxford Business Group (2017). Foreign brands eyeing Vietnam due to growing young population and
liberalising reforms. [Online]. Available at: https://www.oxfordbusinessgroup.com/overview/talking-
shop-growing-young-population-and-liberalising-reforms-have-foreign-brands-eyeing-vietnam
(Accessed 23 October 2017)
Palmer, A., McMahon-Beattie, U. and Beggs, R. (2000), “Influences on loyalty programme
effectiveness: a conceptual framework and case study investigation”, Journal of Strategic Marketing,
Vol. 8 No. 1, pp. 47-66.
Pan, Y. and Zinkhan, G.M. (2006), Determinants of retail patronage: a meta-analytical
perspective, Journal of Retailing, 82(3), pp. 229-243.
Panagiotou, G. (2006). The impact of managerial cognitions on the structure‐conduct‐
performance (SCP) paradigm: A strategic group perspective , Management Decision, 44(3),
pp.423-441.
Panagiotou, G. (2004), “Managerial cognitions of competitive landscapes: a strategic group
analysis”, unpublished PhD thesis, University of Nottingham, Nottingham.
Panagiotou, G. (2005), “Cognition of competitive environments: a strategic group analysis”,
unpublished PhD thesis, Nottingham University, Nottingham.
Panagiotou, G. (2007), “Reference theory: strategic groups and competitive benchmarking”,
Management Decision, 45(10), pp. 1595-1621.
Parasuraman, A. and Grewal, D. (2000), The impact of technology on the quality‐value‐loyalty
chain: a research agenda, Journal of the Academy of Marketing Science, 28(1), pp. 168‐74.
Parasuraman, A., Zeithaml, V.A. and Malhotra, A. (2005), “E-S-QUAL: a multiple-item scale for
assessing electronic service quality”, Journal of Service Research, 7(10), pp. 1-21.
Parasuraman, A., Zeithaml, V.A. and Berry, L.L. (1988), “SERVQUAL: a multiple‐item scale
for measuring consumer perceptions of service quality”, Journal of Retailing, 64(1), pp. 12‐40.
Park, B.I., Chidlow, A. and Choi, J. (2014), “Corporate social responsibility: stakeholders influence
on MNEs’ activities”, International Business Review, 23(5), pp. 966-980.
Park, J. and Yoo, S. (2016) “Are competitive reactions changing over time?”. Management
Decision, 54(3), pp.683-699
Patterson, P. G. and T. Smith (2003).A cross-cultural study of switching barriers and propensity to
stay with service providers. Journal of Retailing, 79 (2), pp. 107-120
Patterson, P.G. and Spreng, R.A. (1997), “Modeling the relationship between perceived value,
satisfaction and repurchase intentions in a business‐to‐business, service context: an empirical
examination”, International Journal of Service Industry Management , 8(5), pp. 415‐32.
Pelsmaeler, S. D., Schoutten, J. J., Lagast, S., Dewettinck, K. and Gellynck, X. (2017). Is taste the key
driver for consumer preference? A conjoint analysis study. Food Quality and Preference, 62, pp. 323–
331
Penrose, E.T., (1959). The Theory of the Growth of the Firm, US:New York
Perez, A., Rodríguez del Bosque, I., 2015. Corporate social responsibility and customer loyalty:
exploring the role of identification, satisfaction and type of company. Journal of Service Marketing.
29 (1), 15–25.
Pérez, A., Salmones, M.M. and Rodríguez del Bosque, I. (2013), “The effect of corporate associations
on consumer behaviour”, European Journal of Marketing, 47(1/2), pp. 218-238.
Pessemier, E. A.(1959). A new way to determine buying decisions. The Journal of Marketing, 24 (2),
pp. 41-46.

318
Peteraf, M. and Shanley, M. (1997), Getting to know you: a theory of strategic group identity,
Strategic Management Journal, 18, pp. 165-186.
Peterson, R. A. and Balasubramanian, S. (2002). Retailing in the 21th century: reflections and
prologue to research. Journal of Retailing, 78, pp. 9-16.
Petrick, J.F. (1999), “An examination of the relationship between golf travelers' satisfaction,
perceived value and loyalty and their intentions to revisit”, dissertation, Clemson University,
Clemson, SC.
Phillips, A. (1976), “A critque of empirical studies of relations between market structure and
profitability”, Journal of Industrial Economics, 24, pp. 242‐49.
Picón, A., Castro, I., Roldán, J. L. (2014). The relationship between satisfaction and loyalty: a
mediator analysis. Journal of Business Research, 67 (5), pp.746-751.
Pine, J. & Gilmore, J.H. (1999). The Experience Economy: Work is Theatre and Every Business a
Stage. Harvard Business School Press, Boston.
Ping, R. A. (1993). The effects of satisfaction and structural constraints on retailer exiting, voice,
loyalty, opportunism, and neglect. Journal of Retailing, 69 (3), pp. 320-352.
Ponte, E.B., Carvajal-Trujillo, E. and Escobar-Rodríguez, T. (2015), “Influence of trust and perceived
value on the intention to purchase travel online: integrating the effects of assurance on trust
antecedents”, Tourism Management, 47(April), pp. 286-302.
Porter, M. E (1983). Industrial Organization and the Evolution of Concepts for Strategic Planning:
The New Learning. Managerial and Decision Economics. 4(3), pp.172-179.
Porter, M. E. (1980). Competitive Strategy: Techniques for Analysing Industries and Competitors.
The Free Press, New York.
Porter, M. E. (1983). Industrial Organization and the Evolution of Concepts for Strategic Planning:
The New Learning. Managerial and Decision Economics, 4(3), pp. 172.
Porter, M. E. (1998 [1980]), Competitive Strategy. The Free Press, New York, NY.
Porter, M.E. and Kramer, M.R. (2006), “The link between competitive advantage and corporate social
responsibility”, Harvard Business Review, 84(12), pp. 78-92.
Porter, M.E. (1979), The structure within industries and companies performance, Review of
Economics and Statistics, 61(2), pp. 214-227.
Porter, M.E. (2008), “The five competitive forces that shape strategy”, Harvard Business
Review, 86(1), pp. 79-93.
Prasad, C. J. and Aryasri, A. R. (2011), “Effect of shopper attributes on retail format choice
behaviour for food and grocery retailing in India”, International Journal of Retail & Distribution
Management, 39(1), pp.68-86.
Prentice, C. (2014). Who stays, who walks, and why in high-intensity service contexts. Journal of
Business Research, 67 (4), pp. 608-614.
Puccinelli, N., Goodstein, R.C., Grewal, D., Price, R., Raghubir, P. and Stewart, D. (2009),
“Customer Experience Management in Retailing: Understanding the Buying Process,” Journal of
Retailing, 85 (1), 15–30.
Pura, M. (2005). Linking perceived value and loyalty in location-based mobile services. Managing
Service quality: International Journal, 15(6), pp.509-538.
Qui, H., Ye, B. H., Bai, B. and Wang, W. H. (2015). “Do the roles of switching barriers on customer
loyalty vary for different types of hotels?”, International Journal of Hospitality Management, 46,
pp.89–98.

319
Rahman, O., Wong, K. and Yu, H. (2016). The effects of mall personality and fashion orientation on
shopping value and mall patronage intension. Journal of Retailing and Consumer Services, 28 (1),
155–164.
Rahman, Z. (2016). “Retail brand experience: scale development and validation”, Journal of
Product & Brand Management, 25(5), pp.435-451.
Ramsler, M. (1982). Strategic groups and foreign market entry in global banking competition. Ph.D.
dissertation, Harvard University, United States.
Rao, C.P. and Kelkar, M.M. (1997), Relative impact of performance and importance ratings on
measurement of service quality, Journal of Professional Services Marketing, 15(2), pp. 69‐86.
Rapp, R. and Decker, A. (2003), “Loyalita¨tsprogramme – Bestandsaufnahme und kritische
Wertung”, in Payne, A. and Rapp, R. (Eds), Handbuch Relationship Marketing, 2nd ed., Munich, pp.
197-218.
Rasheed, F. A. and Abadi, M. F. (2014). Impact of service quality, trust and perceived value on
customer loyalty in Malaysia services industries. Procedia - Social and Behavioral Sciences, 164, pp.
298 – 304.
Rashid, N.R., Rahman, N.I. and Khalid, S.A. (2014), “Environmental corporate social responsibility
(ECSR) as a strategic marketing initiative”, Procedia, Social and Behavioral Sciences, Vol. 130, pp.
499-508.
Ray, G., Barney, J.B. and Muhanna, W.A. (2004), “Capabilities, business processes, and
competitive advantage: choosing the dependent variable in empirical tests of the resource‐based
view”, Strategic Management Journal, 25(1), pp. 23‐37
Reed, Z., McIlveen, H. and Strugnell, C. (2000), “The retailing environment in Ireland and its effect
on the chilled ready meal market”, Journal of Consumer Studies and Home Economics, 24(4), pp.
234-41.
Reger, R. and Huff, A.S. (1993), Strategic groups: a cognitive perspective, Strategic
Management Journal, 14, pp. 103‐24.
Rehman, M. (2012), “Relationship among corporate image, intangible perceived quality, choosing,
habit and customer loyalty”, Management & Marketing, X(1), pp. 183-197.
Reichheld, F. F., Markey Jr, R.G. and Hopton, C. (2000). The loyalty effect-the relationship between
loyalty and profits. European Business Journal, 12 (3), p. 134.
Reichheld, F., Sasser, W. and Earl, J.r. (1990). Zero defections: quality comes to services.
Harvard Business Review, 5, pp. 105‐11.
Reichheld, F.F. (1996). The Loyalty Effect. Boston. MA: Harvard Business School Press.
Reichheld, F.F. (1996).Learning from customer defections. Harvard Business Review (1996), pp. 56-
69.
Reichheld, F.F. and Sasser, W.E. Jr (1990), “Zero defections: quality comes to services”, Harvard
Business Review, 68(5), pp. 105-111.
Reiner, G. , Teller, C. and Kotzab, H. (2013), “Analyzing the efficient execution of in-store
logistics processes in grocery retailing – the case of dairy products”, Production and Operations
Management, 22(4), pp. 924-939.
RetailinAsia (2016). One third of all Vietnamese will shop online by 2020. [Online]. Available at:
http://retailinasia.com/in-markets/south-east-asia/vietnam/one-third-of-all-vietnamese-will-shop-
online-by-2020/ (Accessed 22 October 2017)
RetailinAsia (2017). Vietnam’s retail market hits $118 billion amid M&A spree. [Online]. Available
at: http://retailinasia.com/in-markets/south-east-asia/vietnam/vietnams-retail-market-hits-118-billion-
amid-ma-spree/ (Accessed 23 October 2017)

320
RetailinAsia (2017). Vietnam’s retail sales leap to US$118 billion. [Online]. Available at:
http://retailinasia.com/in-markets/south-east-asia/vietnam/vietnams-retail-sales-leap-to-us118-billion/
(Accessed 22 October 2017)
Ricardo, D. (1817). Principles of political economy and taxation. London: J. Murray.
Richardson, P., Jain, A.K. and Dick, A.S. (1996), “The influence of store aesthetics on the evaluation
of private label brands”, Journal of Product & Brand Management, 5(1), pp. 19-28.
RightNow Technologies Inc (2010), “Customer experience impact: North America.
[Online].Available at: www.rightnow.com/resources (accessed March 15, 2011).
Rintamäki, T., Kanto, A., Kuusela, H., & Spence, M. T. (2006). Decomposing the value of
department store shopping into utilitarian, hedonic and social dimensions: Evidence from Finland.
International Journal of Retail & Distribution Management, 34(1), 6-24.
Robertson, N., McDonald, H., Leckie, C., McQuilken, L., 2016. Examining customer evaluations
across different self-service technologies. Journal of Service Marketing, 30 (1), 88–102.
Roehm, M.L., Pullins, E.B. and Roehm, H.A. Jr (2002), “Designing loyalty-building programs for
packaged goods brands”, Journal of Marketing Research (JMR), 39(2), pp. 202-13.
Rosario V'azquez-Carrasco, & Foxall, G. R. (2006). Positive vs. negative switching barriers: The
influence of service consumers' need for variety. Journal of Consumer Behavior, 5, pp. 367-379.
Rouse, M. J. and Daellenbach, U. S. (1999). Rethinking research methods for the resource-based
perspective: Isolating sources of sustainable competitive advantage. Strategic Management Journal,
20, 487–494.
Rowley, J. (2005), “The four Cs of customer loyalty”, Marketing Intelligence and Planning, 23(6),
pp. 574-581.
Rowley, J. (2006). An analysis of the e-service literature: towards a research agenda. Internet
Research, 16, pp.339-359.
Roy, S. K., Balaji, M. S., Nguyen, B. and Melewar, T. C. (2017). Constituents and consequences of
smart customer experience in retailing. Technological Forecasting & Social Change, 124, pp. 257–
270
Ruekert, R. (1992), “Developing a market orientation: an organisational strategy perspective”,
International Journal of Marketing, 9(3), pp. 225-245.
Rusbult, C. E., Zembrodt, I.M. and Gunn, L.K (1982). Exit, voice, loyalty, and neglect: responses to
dissatisfaction in romantic involvements. Journal of Personality and Social Psychology, 43(6), pp.
1230-1242.
Rust, R.T., Zahorik, A. J. and Keiningham, T. L. (1995). Return on quality (ROQ): making service
quality financially accountable. Journal of Marketing, 59 (2), pp. 58-70.
Ryu, K., Han, H. and Kim, T. (2008). The relationships among overall quick-casual restaurant image,
perceived value, customer satisfaction, and behavioral intentions. International Journal of Hospitality
Management. 27 (3), pp.459–469.
Ryu, K., Lee, H. and Kim, W.G. (2012), “The influence of the quality of the physical environment,
food, and service on restaurant image, customer perceived value, customer satisfaction, and
behavioral intentions”, International Journal of Contemporary Hospitality Management, 24(2), pp.
200-223.
Ryu, K., Lee, H.R. and Gon Kim, W. (2012). The influence of the quality of the physical
environment, food, and service on restaurant image, customer perceived value, customer satisfaction,
and behavioral intentions. International Journal of Contemporary Hospitality Management, 24(2), pp.
200–223.

321
Sahin, A., Zehir, C., and Kitapçı, H. (2011). The effects of brand experiences, trust and satisfaction on
building brand loyalty; an empirical research on global brands. Procedia-Social and Behavioral
Sciences, 24, pp. 1288-1301.
Salipante, P., Notz, W. and Bigelow, J. (1982). “A matrix approach to literature reviews” in Research
in Organisational Behavior, B.M. Staw and L.L. Cummings (eds.), JAI Press, Greenwich, CT, 1982,
pp.321-348.
Salmones, M.M., Pérez, A. and Rodríguez del Bosque, I. (2009), “The social role of financial
companies as a determinant of consumer behaviour”, International Journal of Bank Marketing, 27(6),
pp. 467-485.
Samli, A.C., Pohlen, T.L. and Jacobs, L. (2005), “Developments in retail logistics: towards generating
more consumer value”, Journal of Marketing Channels, 13(2), pp. 81-98.
Sands, S., Oppewal, H., Beverland, M., 2015. How in-store educational and entertaining events
influence shopper satisfaction. Journal of Retailing and Consumer Services. 23, pp. 9–20.
Saraswat, A., Mammen, T., Aagja, J.P., & Tewari, R. (2010). Building store brands using image
differentiation. Journal of Indian Business Research, 2(3), pp. 166-180.
Sarlak, M.A. and R.S. Fard. (2009). The impact of CRM on the customer satisfaction in agricultural
bank, American Journal of Economics and Business Administration, 1, pp. 167-172.
Saunders, M., Lewis, P. and Thornhill, A. (2016). Research methods for business students. 7th edn.
Harlow: Financial Times/ Prentice Hall.
Scherer, F. M., & Ross, D. (1990). Industrial market structure and economic performance. Boston:
Houghton Mifflin.
Schmitt, B.H. (1999). Experiential Marketing. The Free Press, New York.
Schmitt, B.H. (2003). Customer Experience Management: An evolutionary Approach to Connecting
with Your Customer. Wiley and Sons, New Jersey
Schultz, D.E. and Bailey, S. (2000), “Customer/brand loyalty in an interactive
marketplace”, Journal of Advertising Research, 40, pp. 41‐52.
Scott, R.C. (2001).“Establishing and maintaining customer loyalty and employee identification
in the new economy”, Management Communication Quarterly, 14(1), pp. 629‐36.
Seiders, K., Voss, G.B., Grewal, D. and Godfrey, A.L., (2005). Do satisfied customers buy more?
Examining moderating influences in a retailing context. Journal of Marketing, 69(4), pp. 26–43.
Sekaran, U. and Bougie, R. (2010). Research method for Business: A skill building approach. (5th
edn.). UK: John Wiley and Sons Ltd.
Sekaran, U. and Bougie, R. (2013). Research Methods for Business (6th edn.). John Wiley & Sons Ltd:
UK
Semeijn, J., Van Riel, A.C.R. and Ambrosini, A.B. (2004), “Consumer evaluations of store brands:
effects of store image and product attributes”, Journal of Retailing and Consumer Services, 11(4), pp.
247-258.
Severin, V., Louviere, J.J. and Finn, A. (2001), “The stability of retail shopping choices over time and
across countries”, Journal of Retailing, 77, pp. 185-202.
Shafei, I. and Tabaa, H. (2016), “Factors affecting customer loyalty for mobile telecommunication
industry”, EuroMed Journal of Business, 11(3), pp. 347 -361.
Shankar, V., Smith, A. K. and Rangaswamy, A. (2003), “Customer Satisfaction and Loyalty in Online
and Offline Environments,” International Journal of Research in Marketing, 20, pp. 153–75.
Shilpa, B. and Rajnish, J. (2013), “Measuring retail customer experience”, International Journal of
Retail & Distribution Management, 41(10), pp.790-804.

322
Shin, D. H. and Kim, W. Y. (2008). Forecasting customer switching intention in mobile service: an
exploratory study of predictive factors in mobile number portability. Technological Forecasting and
Social Change, 75 (6) (2008), pp. 854-874.
Shobeiri, S., Laroche, M., Mazaheri, E., 2013. Shaping E-retailer's website personality: the
importance of experiential marketing. Journal of Retailing and Consumer Services. 20 (1), pp. 102–
110.
Short, J. C., Palmer, T.B and Ketchen, D. J. (2003), MULTI-LEVEL INFLUENCES ON FIRM
PERFORMANCE: INSIGHTS FROM THE RESOURCE-BASED VIEW AND STRATEGIC
GROUPS RESEARCH, in Fred Dansereau, Francis J. Yammarino (ed.) Multi-Level Issues in
Organizational Behavior and Strategy (Research in Multi Level Issues, 2. Emerald Group
Publishing Limited, pp.155 – 187.
Singh, H. and Prashar, S. (2014). Anatomy of shopping experience for malls in Mumbai: A
confirmatory factor analysis approach. Journal of Retailing and Consumer Services, 21 (2), pp. 220-
228.
Singh, J. and Sirdeshmukh, D. (2000), “Agency and trust mechanisms in customer satisfaction and
loyalty judgments”, Journal of the Academy of Marketing Science, 28(1), pp. 150-67.
Sinha, P.K. and Banerjee, A. (2004), “Store choice behaviour in an evolving market”, International
Journal of Retail & Distribution Management, 32(10), pp. 482-94.
Sirdeshmukh, D., Singh, J. and Sabol, B. (2002), “Consumer trust, value, and loyalty in relational
exchanges”, Journal of Marketing, 66(1), pp. 15-37.
Siu, N.Y.M. and Cheung, J.T. (2001), “A measure of retail service quality”, Marketing Intelligence
and Planning, 19(2), pp. 88-96.
Sivadas, E. and Baker-Prewitt, J.L. (2000), “An examination of the relationship between service
quality, customer satisfaction, and store loyalty”, International Journal of Retail and Distribution
Management, 28(2), pp. 73-82.
Sivadas, E., Jindal, R.P. (2017). Alternative measures of satisfaction and word of mouth. Journal of
Service Marketing. 31 (2), pp. 119–130.
Sloot, L.M., Verhoef, P.C., Franses, P.H., 2005. The impact of brand equity and the hedonic level of
products on consumer stock-out reactions. Journal of Retailing, 81(1), 15–34.
Smith, K. A., Vasudevan, S. P. and Tanniru, M. R(1996), “Organizational learning and resource‐
based theory: an integrative model”, Journal of Organizational Change Management, 9(6), pp.41-
53.
Solesvik, M.Z. and Westhead, P. (2010), “Partner selection for strategic alliances: case study
insights from the maritime industry”, Industrial Management & Data Systems, 110(6), pp. 841‐
60
Somsuk, N., Wonglimpivarat, J. and Laosirihongthong, T. (2012), “Technology business incubators
and industrial development: resource‐based view”, Industrial Management & Data Systems,
112(2), pp.245-267,
Sorescu, A., Frambach, R. T., Singh, J., Rangaswamy, A. and Bridges, C. (2011). Innovations in
Retail Business Models, Journal of Retailing, 87S (1), pp. S3–S16.
Spena, T.R. , Carida, A. , Colurcio, M. and Melia, M. (2012), “Store experience and co-creation:
the case of temporary shop”, International Journal of Retail & Distribution Management , 40(1),
pp. 21-40.
Srinivasan, S. S. and Till, B. D. (2002). Evaluation of search, experience and credence attributes: role
of brand name and product trial. Journal of Product and Brand Management, 11 (7), pp. 417-431.
Srivastava, M. and Kaul, D. (2016). Exploring the link between customer experience–loyalty–
consumer spend. Journal of Retailing and Consumer Services, 31, pp. 277–286.
323
Stamatis, D. (1996), Total Quality Service: Principles, Practices, and Implementation, St Lucie
Press, Delray Beach, FL.
Stan, V., Caemmerer, B. and Cattan-Jallet, R. (2013). Customer Loyalty Development: The Role Of
Switching Costs. The Journal of Applied Business Research, 29(5), pp. 1541-1554.
Stein, A. and Ramaseshan, B. (2016). Towards the identification of customer experience touch point
elements. Journal of Retailing and Consumer Services, 30, p. 8–19.
Stevens, P., Knutson, B. and Patton, M. (1995). DINESERV: a tool for measuring service quality in
restaurants, Cornell Hotel & Restaurant Admin, 36 (2), 56-60.
StockbizVN (2016). In 2016: GDP growth rate is 6,3% and inflation rate is about 4.75-4.9%.
[Online]. Available at: https://www.stockbiz.vn/News/2016/12/27/708636/nam-2016-tang-truong-
gdp-uoc-6-3-lam-phat-khoang-4-75-4-9.aspx (Accessed 5 August 2017)
Sudharshan, D. and Mild, A. (2017), “Changes in customer preference heterogeneity patterns: a
simulation study”, Journal of Modelling in Management, 12(2), pp.303-319.
Sweeney, J.C. (2003), “Customer perceived value”, in McColl‐Kennedy, J. (Ed.), Services
Marketing: A Managerial Approach, John Wiley & Sons, Brisbane.
Sweezy, P. (1939), “Demand under conditions of oligopoly”, Journal of Political Economy, 47,
pp. 568‐73.
Swoboda, B., Berg, B., Schramm-Klein, H. and Foscht, T. (2013). The importance of retail brand
equity and store accessibility for store loyalty in local competition. Jounal of Retailing and Consumer
Services, 20(3), pp. 251-262.
Szwarc, P. (2005). Researching Customer Satisfaction and Loyalty: How to Find Out what People
Really Think. Kogan Page, London
T.L Childers, R.P Bagozzi, J.P Peter (Eds.), (1989). AMA Winter Educators’ Conference: Marketing
Theory and Practice, American Marketing Association, Chicago, IL (1989), pp. 216-220.
Teece, D.J. (1998), “Capturing value from kowledge assets: the new economy, markets for
know‐how, and intangible assets”, California Management Review, 40(3), pp. 55‐79.
Teller, C. and Reutterer, T. (2008). The evolving concept of retail attractiveness: what makes retail
agglomerations attractive when customers shop at them?, Journal of Retailing and Consumer
Services, 15(3), 127–143.
Teller, C. and Dennis, C. (2012). The Effect of ambient scent on consumers'perception, emotions and
behaviour – a critical review. Journal of Marketing Management, 28 (1/2), pp. 14-36.
Teo, T.S.H. (2006), “To buy or not to buy online: adopters and non-adopters of online shopping in
Singapore”, Behaviour & Information Technology, 25(6), pp. 497-509.
Terblanche, N. S. (2018). Revisiting the supermarket in-store customer shopping experience. Journal
of Retailing and Consumer Services, 40, pp. 48–59.
Terblanche, N.S. and Boshoff, C. (2010), “Quality, value, satisfaction and loyalty amongst race
groups: a study of customers in the South African fast food industry”, South African Journal of
Business Management, 41(1), pp. 1‐9.
Thaler, R. (1985). Mental accounting and consumer choice. Marketing Science, 4(3), 199-214.
The Japan Times (2015). Aeon announces tie-up with major Vietnamese retailers.[Online] Available
at: http://www.japantimes.co.jp/news/2015/01/28/business/corporate-business/aeon-announces-tie-up-
with-majorvietnamese-retailers/#.V_tRheB97IU (Accessed 23 October 2017)
The World Bank (2017). Urban population (% of total)- Vietnam.[Online]. Available at:
https://data.worldbank.org/indicator/SP.URB.TOTL.IN.ZS?end=2016&locations=VN&page=4&start
=2000&view=chart (Accessed 23 October 2017)

324
Titus, P.A. and Everett, P.B. (1995), “The consumer retail search process: a conceptual model and
research agenda”, Journal of the Academy of Marketing Science, 23(2), pp. 106-119.
Torres EN, Kline S (2013). From customer satisfaction to customer delight; creating a new standard
of service for the hotel industry. International Journal of Contemporary Hospitality Management, 25
(5), 642-659.
Trading Economics (2017). Vietnam GDP per capita [Online]. Available at:
https://tradingeconomics.com/vietnam/gdp-per-capita (Accessed 23 October 2017)
Trading Economics (2017). Vietnam Inflation rate [Online]. Available at:
https://tradingeconomics.com/vietnam/inflation-cpi (Accessed 23 October 2017)
Tsai, H.T and Huang, H. C. (2007). Determinants of e-repurchase intentions: an integrative model of
quadruple retention drivers. Information and Management, 44 (3) (2007), pp. 231-239
Tse, D. K and Wilton, P. C. (1988). “Models of consumer satisfaction formation: an extension”.
Journal of Marketing Research, 25 (2), pp. 204-212.
Tuli, K.R. and S.G. Bharadwaj. (2009).Customer satisfaction and stock returns risk, Journal of
Marketing, pp. 27-45
Tung, G., Kuo, C. and Kou, Y. (2011). PROMOTION, SWITCHING BARRIERS, AND LOYALTY,
Australian Journal of Business and Management Research, 1(2), pp. 30-44.
Tung, L. L. (2004) Service quality and perceived value’s impact on satisfaction, intention and usage
of short message service (SMS). Information Systems Frontiers, 6(4):353–368.
Tuoitrenews (2014). Retailers eye Vietnam for future expansion: report. [Online]. Available at:
https://tuoitrenews.vn/business/20863/top-regional-retailers-eye-vietnam-for-future-expansion
(Accessed 2 November 2017)
Turel, O., & Serenko, A. (2006). Satisfaction with mobile services in Canada: An empirical
investigation. Telecommunications Policy, 30(5/6):314–331.
Underwood, R. L. (2003). The communicative power of product packaging: creating brand identity
via lived and mediated experience. Journal of Marketing Theory and Practice, 11 (1), pp. 62-76.
Feka, V. Xouris, D. and Tsiotras, G. (1997), “Mapping strategic groups: an international
example”, Journal of Business & Industrial Marketing, 12(1), pp.66-75.
Valenzuela, F.R. (2012), “The effect of switching barriers types on customer loyalty”, International
Review of Business Research Papers, 18(1), pp. 1-19.
Van Cayseele, P. and Van Den Bergh, R. (1999), “Antitrust law, 5300”, in Bouckaert, B. and De
Geest, G. (Eds), Encyclopaedia of Law and Economics, Edward Elgar, Cheltenham.
Van Zelst S, van Donselaar K, van Woensel T, Broekmeulen R, Fransoo J (2009) Logistics drivers for
shelf stacking in grocery retail stores: potential for efficiency improvement. International Journal of
Production Economics, 121(2), pp. 620–632.
Varadarajan, P.R. (1985) A Two-factor Classification of Competitive Strategy Variables, Strategic
Management Journal, 6, pp. 357-375.
Varadarajan, P.R., Jayachandran, S. and White, J.C. (2001), “Strategic interdependence in
organizations: deconglomeration and marketing strategy”, Journal of Marketing, 65(1), pp. 15‐
28.
Vazquez, R., Rodrı́guez-Del Bosque, I. A., Ma Dı́az, A. and Ruiz, A. V. (2001) Service quality in
supermarket retailing: identifying critical service experiences. Journal of Retailing and Consumer
Services, 8 (1), pp. 1-14.
Velimirović, D., Velimirović, M.and Stanković, R. (2011) Role and importance of key performance
indicators measurement. Serbian Journal of Management, 6(1): 63-72.
325
Vera, J. (2015) “Perceived brand quality as a way to superior customer perceived value crossing
by moderating effects”, Journal of Product & Brand Management, 24(2), pp.147-156.
Verhoef, P. C. (2003). Understanding the effect of customer relationship management efforts on
customer retention and customer share development. The Journal of Marketing, 67(4), 30-4.
Verhoef, P.C., Lemon, K.N. , Parasuraman, A. , Roggeveen, A. , Tsiros, M. and Schlesinger,
L.A. (2009), “Customer experience creation: determinants, dynamics and management
strategies”, Journal of Retailing , 85(1), pp. 31-41.
Verplanken, B. and Aarts, H. (1999). Habit, attitude, and planned behavior: Is habit an empty
construct or an interesting case of goal-directed automaticity? European Review of Social
Psychology, 10, pp.101–134.
Vietnam Investment Review (2016). Thai TCC Group becomes new owner of METRO Cash & Carry
Vietnam.[Online] Available at: http://www.vir.com.vn/thai-tcc-group-becomes-new-owner-of-metro-
cash-carry-vietnam.html (Accessed 23 October 2017).
Vietnamnet (2017). Vietnam placed 6th in 2017 Goblal Retail Development Index. [Online]. Available
at: http://english.vietnamnet.vn/fms/business/179900/vietnam-placed-6th-in-2017-global-retail-
development-index.html (Accessed 22 October 2017).
VinanetVN (2016). General Statistic Office: Inflation rate has been successfully controlled. [Online].
Available at: http://vinanet.vn/kinhte-taichinh/tong-cuc-thong-ke-lam-phat-nam-2016-duoc-kiem-
soat-thanh-cong-659280.html (Accessed 5 August 2017).
VN Express International, 2016. Big C Vietnam to change name next year.[online] Available at:
http://e.vnexpress.net/news/business/big-c-vietnam-to-change-name-next-year-3418968.html
(Accessed 23 October 2017).
VNExpress (2016). Big C Vietnam to change name next year. [Online]. Available at:
https://e.vnexpress.net/news/business/big-c-vietnam-to-change-name-next-year-3418968.html
(Accessed 22 October 2017).
VNExpress (2016). Foreign invasion threatens domestic retail market share. [Online]. Available at:
https://e.vnexpress.net/news/business/markets/foreign-invasion-threatens-domestic-retail-market-
share-3406399.html (Accessed 23 October 2017)
VNExpress (2017). Vietnam's retail market hits $118 billion amid M&A spree. [Online]. Available at:
https://e.vnexpress.net/news/business/vietnam-s-retail-market-hits-118-billion-amid-m-amp-a-spree-
3522985.html (Accessed 22 October 2017).
Vo, K. (2017). Vietname Retail Foods- Sector report 2016 (Online). Available at:
https://gain.fas.usda.gov/Recent%20GAIN%20Publications/Retail%20Foods_Hanoi_Vietnam_3-7-
2017.pdf (Accessed 10 October 2017).
Wall, E. A. and Berry, L. L. 2007). The combined effects of the physical environment and employee
behavior on customer perception of restaurant service quality, Cornell Hotel Restaur. Adm. Q., 48 (1),
pp. 59-69.
Walsh, G., Evanschitzky, H. and Wunderlich, M. (2008), “Identification and analysis of moderator
variables investigating the customer satisfaction-loyalty link”, European Journal of Marketing,
42(9/10), pp. 977-1004.
Walter, A. and Ritter, T. (2003), “The influence of adaptations, trust, and commitment on value‐
creating functions of customer relationships”, Journal of Business and Industrial Marketing, 18(4/5),
pp. 353-365.
Wang, Y., Lo, H. P. and Yang, Y. (2004) An integrated framework for service quality, customer
value, satisfaction: Evidence from China’s telecommunication industry. Information Systems
Frontiers, 6(4), pp. 325–340.

326
Wang, Y., Lu, X. and Tan, Y. (2018). “Impact of product attributes on customer satisfaction: an
analysis of online reviews for washing machines”. Electronic Commerce Research and Application,
29, p. 1-11.
Wathne, K., Biong, H. and Heide, J. B. (2001). Choice of supplier in embedded markets: Relationship
and marketing program effects. The Journal of Marketing, 65, pp. 54-66.
Webster, J. and Watson, R.T. (2002). Analysing the past to prepare for the future: writing a literature
review. MIS Quarterly, 26, 2 (Jun.), pp. xiii-xxiii.
Wernerfelt, B. (1984). A resource-based view of the firm. Strategic Management Journal, 5, pp. 171–
180.
Westbrook, R.A. and Oliver, R.L. (1991), “The dimensionality of consumption emotion patterns
and customer satisfaction”, Journal of Consumer Research, 18, pp. 84‐91.
Whelan, S and Wohlfeil, M. (2006). Communicating brands through engagement with “lived”
experiences. Journal of Brand Management. 13 (4–5), pp. 313-329.
Wicks, A.M. and Chin, W.W. (2008), “Measuring the three process segments of a customer's
service experience for an out‐patient surgery center”, International Journal of Health Care
Quality Assurance, 21(1), pp. 24‐38.
Wolfinbarger, M. and Gilly, M.C. (2002), ComQ: Dimensionalizing, Measuring and Predicting
Quality of the E-tail Experience (No. 02-100), Marketing Science Institute, Cambridge, MA.
Wolfinbarger, M. and Gilly, M.C. (2003), “eTailQ: dimensionalizing, measuring and predicting etail
quality”, Journal of Retailing, 79(3), pp. 183-198.
Wong, A. and Sohal, A. (2003) “Service quality and customer loyalty perspectives on two levels
of retail relationships”, Journal of Services Marketing, 17(5), pp.495-513,
Wong, A. and Sohal, A. (2003), “A critical incident approach to the examination of customer
relationship management in a retail chain: an exploratory study”, Qualitative Market Research:
An International Journal, 6(4), pp. 248‐62.
Wong, A. and Sohal, A.S. (2006), “Understanding the quality of relationships in consumer
services: a study in a retail environment”, International Journal of Quality and Reliability
Management, 23(3), pp. 244-264.
Wood, W. and Neal, D. T. (2009). The habitual consumer. Journal of Consumer Psychology, 19(4),
579–592.
Woods, J. (1999), “Customer service, value, and the systems view”, in Zemke, R. and Woods,
J. (Eds), Best Practices in Customer Service, American Management Association, HRD
Press, Amherst, MA, pp. 3‐9 (first AMACOM edition)
Wortzel, L.H. (1987). Retailing Strategies for Today's Mature Marketplace. The Journal of Business
Strategy, 7, pp. 45-56.
Wright, P., Hotard, D., Kroll, M. and Tanner, J., “Rivalry among Firms: Evidence from the Apparel
Industry”, in Dean, B.V. (Ed.), Strategic Management: Methods and Studies, Elsevier Science
Publishers, New York, NY, 1990.
Wright, L. T., Nancarrow, C. and Pamela, M. H. (2001). “Food taste preferences and cultural
influences on consumption”, British Food Journal, 103(5), pp.348-357.
Wu, L. W. (2011b). Satisfaction, inertia and customer loyalty in the varying levels of the zone of
tolerance and alternative attractiveness. Journal of Service and Marketing, 25(5), pp.310-322.
Yang, Z. and Peterson, R.T. (2004), “Customer perceived value, satisfaction, and loyalty: the role of
switching costs”, Psychology and Marketing, 21(10), pp. 799-822.
Yang, Z. and Peterson, R. T (2004). Customer perceived value, satisfaction, and loyalty: the role of
switching costs. Psychology and Marketing, 21(10), pp. 799-822

327
Yeung, M., Chew‐Ging, L. and Ennew, C. (2002), “Customer satisfaction and profitability: a
reappraisal of the nature of the relationship”, Journal of Targeting, Measurement and Analysis
for Marketing, 11(1), pp. 24‐33.
Yong Liu, Shengli Deng, Feng Hu, Xiaoyu Chen, (2015) “The impacts of unique service resources
and habit on e-service loyalty in a highly competitive market”, Journal of Systems and Information
Technology, 17(4), pp.336-350
Yoo, B. and Donthu, N. (2001), “Developing a scale to measure the perceived quality of an internet
shopping site (SITEQUAL)”, Quarterly Journal of Electronic Commerce, 2(1), pp. 31-47.
Yoo, D. K. and Park, J. A. (2007). Analyzing relationships among employees, customers, and
financial performance, Int. J. of Quality & Reliability Manag, 24 (9), pp. 908-926.
Yuksel, A. and Yuksel, F. (2002). Measurement of tourist satisfaction with restaurant services: a
segment-based approach, Journal of Vacation Marketing, 9(1), pp. 52-68.
Yun, Z. and Good, L. K. (2007) “Developing customer loyalty from e‐tail store image attributes”,
Managing Service Quality: An International Journal, 17(1), pp.4-22
Yusof, J. M., Manan. H. A., Karim, N. A., Kassim, N. A. M. (2015). Procedia- Social and Behavioral
Sciences, 170, pp.109-119.
Zameer, H., Tara, A., Kausar, U. and Mohsin, A. (2015) “Impact of service quality, corporate image
and customer satisfaction towards customers’ perceived value in the banking sector in Pakistan”,
International Journal of Bank Marketing, 33(4), pp.442-456.
Zarantonello, L. and Schmitt, B. H. (2013). The impact of event marketing on brand equity: the
mediating roles of brand experience and brand attitude. International Journal of Advertising, 32 (2),
pp. 255-280
Zarantonello, L. and Schmitt, B.H. (2010), “Using the brand experience scale to profile
consumers and predict consumer behavior”, Journal of Brand Management, 17(7), pp. 532-40.
Zeithaml, V. A. (1988). Consumer perceptions of price, quality, and value: A means-end model and
synthesis of evidence. Journal of Marketing, 52, p. 2-22.
Zeithaml, V. A., Parasuraman, A. and Malhotra A. (2000). A Conceptual Framework for
Understanding e-Service Quality: Implications for Future Research and Managerial Practice.
Marketing Science Institute, Cambridge, MA, Report No. 00-115.
Zeithaml, V.A. (2000), “Service quality, profitability, and the economic worth of customers:
what we know and what we need to learn”, Journal of the Academy of Marketing Science, 28(1),
pp. 67‐85
Zeithaml, V.A., Parasuraman, A. and Malhotra, A. (2002), “Service quality delivery through websites:
a critical review of extant knowledge”, Journal of the Academy of Marketing Science, 30(4), pp. 362-
75.
Zeithaml, V.A., Parasuraman, A. and Berry, L.L. (1990) Delivering Quality Service: Balancing
Customer Perceptions and Expectations, The Free Press, New York, NY.
Zeithaml, V. A., Berry, L.L. and Parasuraman, A. (1996). “The behavioral consequences of service
quality”. Journal of Marketing, pp. 31-46.
Zemblyte, J. (2015). The Instrument for Evaluating E-Service Quality. Procedia - Social and
Behavioral Sciences, 213, pp. 801 – 806.
Zemke, R. (1992) “The emerging art of service management”, Training, January, pp. 37‐42.
Zentes, J., Morschett, D. and Schramm-Klein, H. (2008). Brand personality of retailers-an analysis of
its applicability and its effect in store loyalty. The International Review of Retail, Distribution and
Consumer Research, 18, pp. 167-184.
328
Zhibin Lin, Dag Bennett, (2014). Examining retail customer experience and the moderation effect of
loyalty programmes. International Journal of Retail & Distribution Management, 42(10), pp. 929-
947.
Zomerdijk, L. G. and Voss, C. A. Service design for experience-centric services. Journal of Service
Research, 13 (1), pp. 67-82.

329
APPENDICES
Appendix 2.1 - All hypotheses proposed in this research
Direct effects
H1A: Income has a positive effect on customer perceived value
H1B: Income has a positive effect on customer satisfaction
H1C: Income has a positive effect on customer loyalty
H2A: Location where people stay has a positive effect on customer perceived value
H2B: Location where people stay has a positive effect on customer satisfaction
H2C: Location where people stay has a positive effect on customer loyalty
H3A: Age positively affects customer perceived value
H3B: Age positively affects customer satisfaction
H3C: Age positively affects customer loyalty
H4A Gender positively affects customer perceived value
H4B Gender positively affects customer satisfaction
H4C: Gender positively affects customer loyalty
H5A: People who choose different supermarkets for shopping have different customer
perceived value
H5B: People who choose different supermarkets for shopping have different behavior on
customer satisfaction
H5C: People who choose different supermarkets for shopping have different behavior on
customer loyalty
H6: Customer experience has a positive effect on customer satisfaction
H7A: Customer perceived value has a positive influence on customer satisfaction
H7B: Customer perceived value has a direct positive impact on customer loyalty
H8: Customer satisfaction is directly and positively associated with customer loyalty
H9A: Switching costs have a negative effect on customer perceived value
H9B: Switching costs have a positive effect on customer satisfaction
H9C: High-perceived switching costs have a positive influence on customer loyalty
H10A: High-perceived alternative attractiveness has a negative influence on customer
satisfaction
H10B: High-perceived alternative attractiveness has a negative influence on customer loyalty
H11A: Customer satisfaction is positively affected by retail brand experience
H11B: Customer loyalty is positively affected by retail brand experience
H12A: There is a positive relationship between service quality and customer perceived value
H12B: There is a positive relationship between service quality and customer satisfaction
H12C: Service quality positively affects customer loyalty.
H13A: In-store logistics have a strong and positive effect on customer perceived value
H13B: In-store logistics have a strong and positive effect on customer satisfaction
H14: Store image is positively associated with customer satisfaction
H15: Store accessibility positively affects customer loyalty

330
H16: The higher customer service, the better customer perceived value
H17X1: E-service quality has a positive effect on customer perceived value
H17X2: E-service quality has a positive effect on customer loyalty
H18: Loyalty programs have a positive effect on customer loyalty
H19A: Promotion effects positively affect customer perceived value
H19B: Promotion has a positive effect on customer loyalty
H20A: Good price offered positively affects customer perceived value
H20B: Good price offered positively affects customer satisfaction
H20C: Good price offered positively affects customer loyalty
H21A: Good product quality is positively associated with customer perceived value
H21B: Good product quality is positively associated with customer satisfaction
H21C: Good product quality is positively associated with customer loyalty
H22A: Cooperate social responsibility is directly and positively associated with customer
perceived value
H22B: Cooperate social responsibility is directly and positively associated with customer
loyalty
H23: Corporate social responsibility positively affects corporate image
H24: Corporate image positively affects customer satisfaction
H25: Trust positively affects customer perceived value
H26: Habit positively affects customer loyalty

331
Appendix 2.2 - Linkage between hypotheses and research questions
Research questions Hypotheses
RQ1: What factors directly affect customer
loyalty in the Vietnamese supermarket and at
which level?
Customer loyalty: H1C, H2C, H3C, H4C, H5C
H7B, H8, H9C, H10B, H12C, H15, H17C,
H17D, H18, H19B, H20C, H21C, H22B, H26
RQ2: Is customer satisfaction a major
indicator for customer loyalty or not?
H8
RQ3: What factors directly affect customer
perceived value, customer satisfaction in the
Vietnamese supermarket and at which level?
Customer perceived value: H1A, H2A, H3A,
H4A, H5A, H9A, H12A, H13A, H16, H17A,
H17B, H19A, H20A, H21A, H22A, H25
Customer satisfaction: H1B, H2B, H3B, H4B,
H5B, H6, H7A, H9B, H10A, H12B, H13B, H14,
H20B, H21B, H24
RQ4: Are there any differences in terms of
factors affecting customer loyalty between
strategic groups in the Vietnamese retail
industry?
Multigroup analysis
RQ5: Are there differences between the
factors affecting customer loyalty in the retail
industry based on income, gender, location,
age groups, occupation and education levels?
Multigroup analysis

332
Appendix 2.3 - Latent factors and manifest varibles used in this research
Manifest variables Sources
Customer
perceived value
CPV1 Products are valuable
Chang and Wang (2011) CPV2 Prices are fair
CPV3 Products are worthwhile
CPV4 Compared to the price we pay, we get reasonable quality
Eggert and Helm (2000) CPV5 Compared to the quality we get, we pay a reasonable price
CPV6 The purchasing relationship delivers us superior net-value.
Customer
satisfaction
CS1 Complete service offered by a supermarket is significantly above expected
Kitapci (2013) CS2 In general, my satisfaction level related to the supermarket that I have already dealt with is high
CS3 Assuming you view your entire experience with the supermarket, overall you are very satisfied with
the supermarket
CS4 Shopping at the supermarket has been an enjoyable experience Lin (2014), El-Adly (2016)
CS5 I am disappointed to have been in this store Bouzaabia (2013)
Customer loyalty
CL1 In the near future, I am sure to repurchase at this supermarket and buy more at this one than at
another retailer Swoboda (2013)
CL2 I am willing to pay more as compared to other retailers for the products I buy from this retailer Srivastava (2016)
CL3 I will say positive things about the retailers and recommend it to others Srivastava (2016), El-Adly (2016)
CL4 I would consider the supermarket my first choice to do shopping Lin (2014), Terblanche (2018)
CL5 I will always continue to choose the products of this grocery store instead others Oliver (1997)
In-store logistics
ISL1 In the supermarket, the shelves are well-stocked
Bouzaabia (2013)
ÍSL2 No problems when returning merchandise
ISL3 In the supermarket, there are enough shopping carts
ISL4 In this supermarket, sufficient carrier bags are provided by the cashiers
ISL5 In this supermarkets, all products can be easily reached
ÍSL6 Prices on the product labels are correct
ISL7 The sell-by date is well indicated on the products
Service quality
SQ1 I would say that the quality of my interaction with the provider’s employees is high
Liu et al. (2011) SQ2 I always have an excellent experience when I interact with my service provider
SQ3 I feel good about what my service provider provides to its customers.
SQ4 Service employees at this store have good product knowledge Jiang et al. (2018) SQ5 Service employees at this store are willing to help customers
SQ6 Service employees at this store showed respect to me
E-service quality
ESQ1 Organisation compensates me when what I ordered does not arrive on time
Zemblyte (2015)
ESQ2 Organisation picks up items I want to return with minimum hassle
ESQ3 Organisation makes accurate services (accurate records of consumers, accurate account, etc..)
ESQ4 Organisation provides me with different options for payment, delivering and/or returning items
ESQ5 Organisation is truthful about its offerings, it has in stock the items it claims to have
ESQ6 Organisation offers a clear return policy and guarantee
ESQ7 Organisation’s site loads it pages fast and easy
ESQ8 Organisation’s site enables me to complete a transaction quickly
ESQ9 Organisation presents guarantee and privacy policy on its site
ESQ10 My order is quickly confirmed and kept by the organisation
Product quality
PROQ1 This store has a lot of variety
Jiang et al. (2018)
PROQ2 Products in this store are of consistent quality
PROQ3 Products available in this store are good workmanship
PROQ4 Products in this store are of good design
Price
PRICE1 Goods at this store are reasonably priced Jiang et al. (2018)
PRICE2 The prices of the products in this supermarket are cheaper than others Emi Moriuchi, 2016
PRICE3 Goods at this store offer value for money Jiang et al. (2018)
Customer service
CUSER1 Having a short waiting time at the checkouts
Kursunluoglu (2014)
CUSER2 Having clean restrooms
CUSER3 Doing faster transactions without waiting customers
CUSER4 Having easy product return policy
CUSER5 Always having an available slot in the car park
CUSER6 Broadcasting nice music inside the supermarket
CUSER7 Providing noiseless shopping possibility
CUSER8 Having informative in-store employees in encounter stage

333
CUSER9 Having a beautiful gift wrap
CUSER10 Doing demonstrations about how to use the product
Customer
experience
CUSEXP1 The shopping experience is refreshing
Srivastava (2016)
CUSEXP2 The store has a welcoming atmosphere and the temperature inside the store is comfortable
CUSEXP3 The shopping experience made me relaxed and comfortable
CUSEXP4 I did not feel deceived by the service staff (such as pricing, special deals, discounts, gifts etc)
Retail brand
experience
RBEXP1 When I think of excellence, I think of this retail brand name
Khan and Rahman (2016)
RBEXP2 I feel good with this retail brand because of their simple and better structured bills
RBEXP3 Point-of-sales contact produces a strong impression on my intellect
RBEXP4 Helping nature of salespersons at this retail brand name has built a better shopping experience
RBEXP5 I find events of this retail brand interesting in the sensory way
RBEXP6 Stories of this brand stimulate my curiosity
Store image
STIMA1 The supermarket offers high-quality merchandise
Bouzaabia (2013)
STIMA2 All brands you planned to buy were available
STIMA3 Physical facilities are visually appealing
STIMA4 It is easy to find products in promotion
STIMA5 Employees are well informed, courteous and supportive
STIMA6 The layout of this store is attractive Jiang et al. (2018)
STIMA7 The atmosphere in this store is pleasant
Corporate image
COIMA1 This company has a good image among consumers Calvo (2015) COIMA2 I have a good image about the company
COIMA3 This company has a good image compared to other competing companies
Corporate social
responsibility
CSR1 The supermarket concern with respecting and protecting the natural environment
Perez (2015)
CSR2 They contribute money to cultural and social events
CSR3 This supermarket treats its customer honestly
CSR4 This supermarket makes an effort to know customers’ needs.
CSR5 This supermarket offers safety at work to its employees
CSR6 This supermarket treats its employees fairly (without discrimination and abuses)
Trust
TRUST1 I trust this retailer
Lombart (2014) TRUST2 I consider that to shop in the stores of this retailer is a guarantee
TRUST3 I believe that this retailer is honest/sincere towards its consumers
TRUST4 This retailer regularly renews itself to meet the needs of its customers
Habit
HABIT1 I have been doing for a long time (shopping at this supermarket)
Olsen (2013) HABIT2 I have no need to think about doing (shopping at this supermarket)
HABIT3 I do without thinking (getting used to know where is the products I need, and in many convenient
ways)
Store accessibility
STAC1 I can get to store X quickly
Swoboda (2013) STAC2 I can get to store X without problems
STAC3 I can get to store easily
Alternative
attractiveness
ALA1 Probably, I would be satisfied with another company Calvo (2015)
ALA2 There are other good companies to choose from
ALA3 I need to change the place for shopping, there are other good department stores to choose from Tung (2011)
ALA4 I would be more satisfied with the products and services of other department stores
Switching costs
SWC1 Switching to other providers will bring economic loss Liu et al. (2011)
SWC2 Switching to other providers will bring psychological burden
SWC3 Search and evaluate the untested service department store costs you time and effort Tung (2011)
SWC4 An uncertainty feeling is relative to the untested service department store
SWC5 In general, it will be a hassle switching to another hotel Qui et al. (2015) SWC6 If I switch to a new brand name, I will miss some of the services and benefits by the loyalty program
from this brand name (mileage and membership service)
Loyalty programs
LPRO1 I shop at a lower financial cost (I save money)
Stathopoulou (2016)
LPRO2 Collecting points is entertaining
LPRO3 When I redeem my points, I am good at myself
LPRO4 I belong to a community of people who share the same values
LPRO5 They take better care of me
LPRO6 I feel I am more distinguished than other customers
Promotion effects

334
Appendix 3.1 – Research Ethics approval letter
PROE1 I find the promotional activities of this online supermarket to be very persuasive and positive Emi Moriuchi (2016)
PROE2 My purchasing willingness arises from the promotional activities Tung (2011)
PROE3 It is well worth going shopping during the period of a sales promotion

335
Appendix 3.2 - Guide used for expert’s semi-structured interviews
Expert’s semi-structured interviews
Factors affecting customer loyalty of different strategic groups in the Vietnamese
supermarket sector
I am a lecturer at the University of Economics and Finance Ho Chi Minh City, Vietnam and a
researcher at the University of Hull, United Kingdom. I am conducting a research study
investigating factors affecting customer loyalty of different strategic groups in the
Vietnamese supermarket sector.
I believe this research may interest you as an expert in strategy and hence invite you to
participate in this study. I would be grateful if you could spare between 60 and 75 minutes to
complete the interview below. If you would like to receive a copy of the aggregate results of
this interview, please provide your e-mail address at the end of the interview.
Participation in this study is voluntary. All information you provide is strictly confidential.
Your name and other details will not appear in the report resulting from this study. Only the
researchers associated with this project will have access to the data. There are no known or
anticipated risks to you as a participant in this study.
Should you have any concerns about the conduct of this research study, please contact me as
follows: Thi Diem Em Nguyen, Business School, University of Hull, Cottingham Road, Hull,
HU6 7RX; Tel No (+44) 7895890826/ (+84) 963694050; Email [email protected].
If you are content to participate in this research project, I would be grateful if you could sign
the following Statement.
By completing this interview, I consent and understand that
1. Answers to the interview questions will be coded and no names or other personal data
other than general demographic data will be collected, i.e. participants will be fully
anonymous to the researchers.
2. Aggregated results will be used for research purposes and may be reported in scientific and
academic journals, but no individual results, i.e. at respondent level, will be released.
3. I am free to withdraw consent at any time during the interview simply by abandoning the
interview in which case participation in the research study will immediately cease and any
information obtained to that point will not be used.
Signed: ____________________________________ Date: ____________

336
The current retail situation
Question 1: Can you give me a brief review of the current overall state of the Vietnamese
retail industry?
Question 2: Do you have any comments on the situation in the supermarket sector as well as
the competitive environment?
Strategic groups
Question 3: Normally, how can we group firms into their right strategic groups? Which
techniques can we use?
Question 4: Based on the Table 2.3.1 (shown during interview process), there are 12
supermarkets in Vietnam, how can we group them into different strategic groups and why?
Customer loyalty
Question 5: Based on your previous research and experience, which possible factors might
affect customer loyalty?
Question 6: Do you consider there is a linkage between customer perceived value, customer
satisfaction and customer loyalty?

337
Appendix 3.3 – Questionnaire used in supermarkets’ consumer interviewing
SEMI-STRUCTURED INTERVIEW GUIDE FOR SUPERMARKET CONSUMERS
I am a lecturer at the University of Economics and Finance Ho Chi Minh City, Vietnam and a
researcher at the University of Hull, United Kingdom. I am conducting a research study
investigating factors affecting customer loyalty of different strategic groups in the
Vietnamese supermarket sector.
I believe this research may interest you as a supermarket consumer and hence invite you to
participate in this study. I would be grateful if you could take between 50 and 60 minutes to
complete the interview. If you would like to receive a copy of the aggregate results of this
interview, please provide your e-mail address at the end of the interview.
Participation in this study is voluntary. All information you provide is strictly confidential.
Your name and other details will not appear in the report resulting from this study. Only the
researchers associated with this project will have access to the data. There are no known or
anticipated risks to you as a participant in this study.
Should you have any concerns about the conduct of this research study, please contact me as
follows: Thi Diem Em Nguyen, Business School, University of Hull, Cottingham Road, Hull,
HU6 7RX; Tel No (+44) 7895890826/ (+84) 963694050; Email [email protected].
If you are content to participate in this research project, I would be grateful if you could sign
the following Statement.
By completing this interview, I consent and understand that
1. Answers to the interview questions will be coded and no names or other personal data
(other than general demographic data) will be collected, i.e. participants will be fully
anonymous to the researchers.
2. Aggregated results will be used for research purposes and may be reported in scientific and
academic journals, but no individual results, i.e. at participant level, will be released.
3. I am free to withdraw consent at any time during the interview completion by simply
abandoning the interview in which case participation in the research study will immediately
cease and any information obtained to that point will not be used.
Signed: ____________________________________ Date: ____________
Time of the interview:______to _________

338
1. Which supermarkets do you have in your city? Please name them.
2. How many times a week do you visit a supermarket?
3. Do you prefer shopping at supermarkets or traditional markets, and for what reasons?
4. As regards supermarkets, which is uppermost most in your mind, and why? Is this
always your top choice?
5. Can you tell me the main reason for preferring this supermarket?
6. Which factors influence your loyalty to the supermarket? Please list at least 5 factors
in descending order of preference?
7. What factors affect your satisfaction with the supermarket?
8. Please recount your past experiences, both good and bad about the quality of service
at this supermarket.
9. If you could switch to other supermarkets without incurring switching costs (such as
time, finance), would you be willing to switch?
10. If you are not satisfied with the service or the quality of the products at a supermarket,
will you continue to visit and shop there?
11. In your opinion, how does store image affect your perception of a supermarket
perceptions and your satisfaction with the shopping experience?
12. At which kinds of supermarkets do you wish to shop? Please describe.
13. Does corporate image affect your choice as to which supermarkets to use?
14. Does corporate social responsibility affect your choice as to which supermarkets to
frequent?
15. Do you think loyalty programmes such as bonus points, discounts and gifts will affect
your decision?
16. If other supermarkets offer appealing promotions or discounts, would you be ready to
switch to them?
17. If you are consistently loyal to a specific supermarket, would the opening of a rival
supermarket in a convenient location near to you cause you to consider switching to
the new supermarket (Suppose you are always loyal to specific supermarket A, if
supermarket B opens a store near you or easier for you to get there, do you wish to
switch to shop at supermarket B?)
18. Do you use online service at supermarkets (such as online ordering or home delivery
or product discussions)? What do you expect from supermarkets online service?
19. Do you consider your preferred supermarket meets your needs in respect of products
and services?
20. Do you think the prices at your preferred supermarket are reasonable?
21. With regard to customer service at this supermarket can you list what factors you are
satisfied and dissatisfied with?
22. When you shop at the supermarket, how do you feel? (For example are you relaxed,
are you respected, do you find the experience enjoyable?)
23. What are your views on the supermarket’s branding? Please tell me more about your
opinion of the importance of branding?
24. Please share with me your thoughts about the supermarket’s in-store logistic services?
(For example, are the shelves well-stocked, is it easy to make returns, can all products

339
be easily located and reached, are there sufficient shopping carts, are correct prices
displayed on the product labels?)
25. Are you loyal to that supermarket brand? Please rank from 1 to 5 (1 means “very
loyal”, 5 means “not very loyal”)
26. Are you satisfied with the service quality offered? On a scale of 1 to 5, how satisfied
are you (with 1 suggesting “very dissatisfied”, and 5 meaning “very satisfied”)? Did
staff respond enthusiastically and courteously when asked for asdsistance?
27. Regarding supermarkets generally, what criteria will you use to choose your
favourite?
28. Do you consider price to be the main factor choosing which supermarkets you should
use? If not, please explain.
29. Does a supermarket’s brand name affect your choice?
30. “I choose this supermarket’s brand name because it projects a good store image”. Do
you agree with this statement?
31. Suppose that there are two different supermarkets with which you feel satisfied, all
other factors being equal, with one supermarket being a domestic brand name, and the
other having a foreign brand name, which one will you choose, and hy?
32. In your family, who is responsible for buying grocery products? How many people
live in your house? Do you cook/eat separately or together?
33. Where do you usually go to buy daily food and groceries?
34. Are you loyal to a particular supermarket brand name or a specific store?
35. “In Vietnam, the majority of people who are responsible for buying foods and
grocery products are housewives, men do not usually deal with these matters”. Do
you agree with this statement?
Gender :
Age :
Location :
Thank you for your participation!
With kind regards,
Thi Diem Em Nguyen

340
Appendix 3.4 – Questionnaire survey
FACTORS AFFECTING CUSTOMER LOYALTY OF DIFFERENT GROUPS IN THE VIETNAMESE SUPERMARKET SECTOR
I am a lecturer at the University of Economics and Finance Ho Chi Minh city, Vietnam and a
researcher at the University of Hull, United Kingdom. I am conducting a research study
investigating factors affecting customer loyalty of different strategic groups in the
Vietnamese supermarket sector.
I believe this research may interest you as a supermarket consumer and hence invite you to
participate in this study. I would be grateful if you could take between 15 and 20 minutes to
complete the survey below. If you would like to receive a copy of the aggregate results of
this survey research, please provide your e-mail address at the end of the survey.
Participation in this study is voluntary. All information you provide is strictly confidential.
Your name and other details will not appear in the report resulting from this study. Only the
researchers associated with this project will have access to the data. There are no known or
anticipated risks to you as a participant in this study.
Should you have any concerns about the conduct of this research study, please contact me as
follows: Thi Diem Em Nguyen, Business School, University of Hull, Cottingham Road, Hull,
HU6 7RX; Tel No (+44) 7895890826/ (+84) 963694050; Email [email protected].
If you are content to participate in this research project, I would be grateful if you could sign
the following Statement.
By completing this survey I consent and understand that
1. Answers to the survey questions will be coded and no names or other personal data other
than general demographic data will be collected, i.e. participants will be fully anonymous to
the researchers.
2. Aggregated results will be used for research purposes and may be reported in scientific and
academic journals, but no individual results, i.e. at respondent level, will be released.
3. I am free to withdraw consent at any time during completion of the survey simply by
abandoning the survey in which case participation in the research study will immediately
cease and any information obtained to that point will not be used.
Signed: ____________________________________ Date: ____________
Time of survey:______to _________

341
Section 1: Supermarket shopping behaviour
1. Overall, where do you prefer to go for grocery shopping?
□ Supermarkets □ Traditional markets □ Other
2. How often do you go to traditional markets?
Once a day Twice a week Three times a week
Once a month Twice a month Other
3. How often do you go to supermarkets?
Once a day Twice a week Three times a week
Once a month Twice a month Other
4. Which supermarket do you usually go? (Please just choose one option)
Co.opmart or Big C
Lotte Mart
Vinmart
AEON
Other; please name __________
5. Do you have any loyalty cards from the supermarket which you have just chosen as your
answer to Question 4?
Yes No
6. For hHow long have you possessed the card?
I have no loyalty card
Less than 1 year
1-3 years
More than 3 years
7. Do you consider you are loyal to the supermarket chosen in question 4?
Yes No
From the following questions, when a supermarket is mentioned, please answer in respect
of the supermarket you normally use as noted in your answer to Question 4 above.
8. How satisfied are you with the supermarket? (1 meaning “very dissatisfied”, 5 meaning
“very satisfied”)
1 2 3 4 5
9. How satisfied are you with the service quality offeredby this supermarket? (where 1 means
“very dissatisfied”, and 5 means “very satisfied”)
1 2 3 4 5

342
10. Do you think your favourite supermarkets meet your needs?
□ Yes □ No □ Partly met
11. If you are not satisfied with the service or the quality of the products at the supermarket, will
you continue to visit and shop there?
□ Yes □ No
12. Will you still stay with your favourite supermarket even if you see alternative attractiveness
offered by other supermarkets?
□ Yes □ No
13. “I choose this supermarket’s brand name because it projects a good store image”. Do you
agree with the above statement?
□ Yes □ No
14. Do you think loyalty programmes such as bonus points, discounts and gifts will affect your
decision?
□ Yes □ No
15. If other supermarkets offer appealing promotions or discounts, would you be willing to
switch to them?
□ Yes □ No
16. How many loyalty cards do you have for grocery shopping from different supermarkets?
0 1 2 3 More than 4
17. If you are consistently loyal to a specific supermarket would the opening of a rival
supermarket in a convenient location near to you cause you to consider switching to the new
supermarket?
□ Yes □ No
18. Does a supermarket’s brand name affect your choices?
□ Yes □ No
19. Suppose that there are two different supermarkets with which you feel satisfied, all other
factors being equal, with one supermarket being a domestic brand name, and the other
having a foreign brand name, which one will you choose?
Domestic brand name Foreign brand name
20. Are you responsible for buying grocery products for the whole family or for yourself?
The whole family Myself

343
I am not in charge with buying grocery products
Section 2: Customers’ response
Note: The following questions should still be answered by reference to the
supermarket noted in your answer to Question 4, Part 1.
Please indicate your level of agreement towards the following statements using a scale from 1 to
5, where 1 means “strongly disagree” and 5 means “strongly agree”:
Statements 1 2 3 4 5
Customer perceived value
Products are valuable □ □ □ □ □
Prices are fair □ □ □ □ □
Products are worthwhile □ □ □ □ □
Compared to the price we pay, we get reasonable quality □ □ □ □ □
Compared to the quality we get, we pay a reasonable price □ □ □ □ □
The purchasing relationship delivers us superior net-value. □ □ □ □ □
Customer satisfaction
Complete service offered by a supermarket is significantly above expected □ □ □ □ □
In general, my satisfaction level relating to the supermarket that I deal with is high □ □ □ □ □
Assuming you view your entire experience with the supermarket, overall you are very satisfied with the supermarket
□ □ □ □ □
Shopping at the supermarket has been an enjoyable experience □ □ □ □ □
I am disappointed to have been in this store □ □ □ □ □
Customer loyalty
In the near future, I am sure to repurchase at this supermarket and buy more here than at another retailer
□ □ □ □ □
I am willing to pay more as compared to other retailers for the products I buy from this retailer □ □ □ □ □
I will say positive things about the retailer and recommend it to others □ □ □ □ □
I would consider the supermarket my first choice for shopping □ □ □ □ □
I will always continue to choose the products of this grocery storeahead of others □ □ □ □ □
Section 3: Perception of Quality
Note: as before, these questions should be answered by reference to the
supermarket named in your answer to Question 4, Part 1.
Please indicate your level of agreement towards the following statements using a scale from 1 to
5, where 1 means “strongly disagree” and 5 means “strongly agree”:
Statements 1 2 3 4 5
In-store logistics
In the supermarket, the shelves are well-stocked □ □ □ □ □
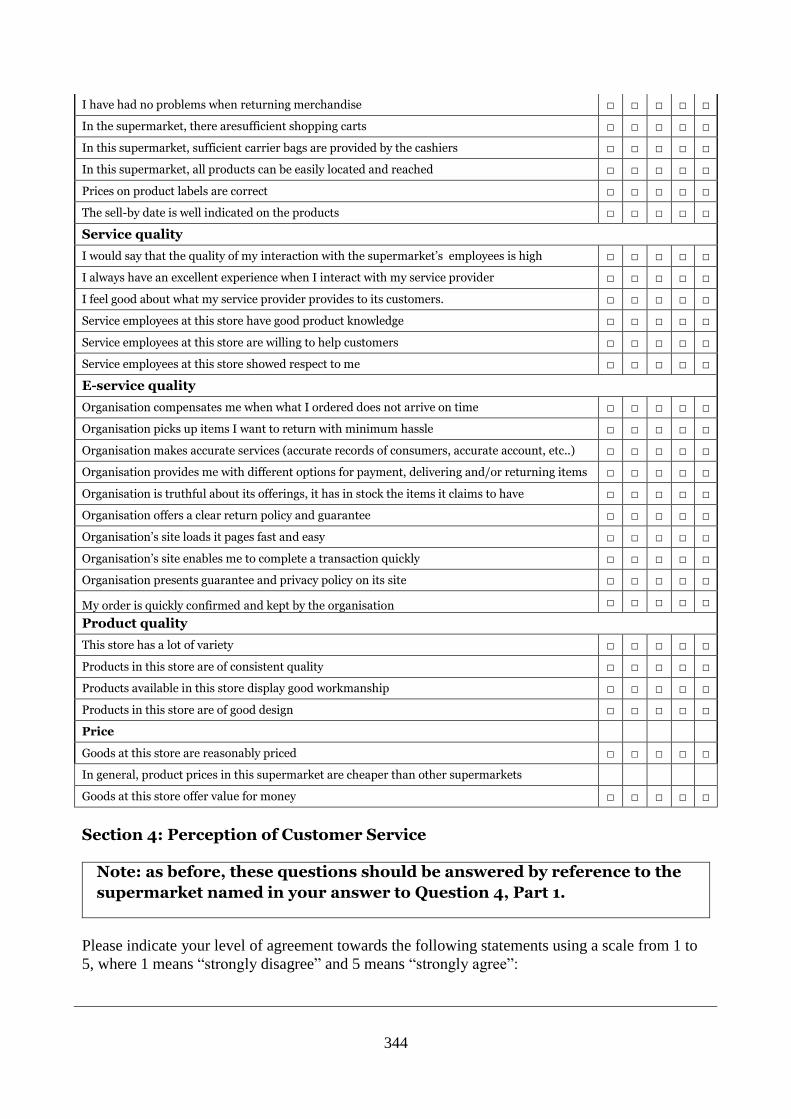
344
I have had no problems when returning merchandise □ □ □ □ □
In the supermarket, there aresufficient shopping carts □ □ □ □ □
In this supermarket, sufficient carrier bags are provided by the cashiers □ □ □ □ □
In this supermarket, all products can be easily located and reached □ □ □ □ □
Prices on product labels are correct □ □ □ □ □
The sell-by date is well indicated on the products □ □ □ □ □
Service quality
I would say that the quality of my interaction with the supermarket’s employees is high □ □ □ □ □
I always have an excellent experience when I interact with my service provider □ □ □ □ □
I feel good about what my service provider provides to its customers. □ □ □ □ □
Service employees at this store have good product knowledge □ □ □ □ □
Service employees at this store are willing to help customers □ □ □ □ □
Service employees at this store showed respect to me □ □ □ □ □
E-service quality
Organisation compensates me when what I ordered does not arrive on time □ □ □ □ □
Organisation picks up items I want to return with minimum hassle □ □ □ □ □
Organisation makes accurate services (accurate records of consumers, accurate account, etc..) □ □ □ □ □
Organisation provides me with different options for payment, delivering and/or returning items □ □ □ □ □
Organisation is truthful about its offerings, it has in stock the items it claims to have □ □ □ □ □
Organisation offers a clear return policy and guarantee □ □ □ □ □
Organisation’s site loads it pages fast and easy □ □ □ □ □
Organisation’s site enables me to complete a transaction quickly □ □ □ □ □
Organisation presents guarantee and privacy policy on its site □ □ □ □ □
My order is quickly confirmed and kept by the organisation □ □ □ □ □
Product quality
This store has a lot of variety □ □ □ □ □
Products in this store are of consistent quality □ □ □ □ □
Products available in this store display good workmanship □ □ □ □ □
Products in this store are of good design □ □ □ □ □
Price
Goods at this store are reasonably priced □ □ □ □ □
In general, product prices in this supermarket are cheaper than other supermarkets
Goods at this store offer value for money □ □ □ □ □
Section 4: Perception of Customer Service
Note: as before, these questions should be answered by reference to the
supermarket named in your answer to Question 4, Part 1.
Please indicate your level of agreement towards the following statements using a scale from 1 to
5, where 1 means “strongly disagree” and 5 means “strongly agree”:

345
Statements 1 2 3 4 5
Customer service
The supermarket has a short waiting time at the checkouts □ □ □ □ □
Has clean restrooms □ □ □ □ □
Offers faster transactions without waiting customers □ □ □ □ □
Has an easy product return policy □ □ □ □ □
Always has available slots in the car park □ □ □ □ □
Broadcasts nice music □ □ □ □ □
Provides noiseless shoppin □ □ □ □ □
Has informative in-store employees in encounter stage □ □ □ □ □
Has a beautiful gift wrap □ □ □ □ □
Does demonstrations about how to use the product □ □ □ □ □
Customer experience
The shopping experience is refreshing □ □ □ □ □
The store has a welcoming atmosphere and the temperature inside the store is comfortable □ □ □ □ □
The shopping experience made me relaxed and comfortable □ □ □ □ □
I did not feel deceived by the service staff (such as on pricing, special deals, discounts, gifts etc) □ □ □ □ □
Retail brand experience
When I think of excellence, I think of this retail brand name □ □ □ □ □
I feel good with this retail brand because of their simple and better structured bills □ □ □ □ □
Points-of-sale contact produces a strong impression on my intellect □ □ □ □ □
The nature of salespeople at this retail brand name has built a better shopping experience □ □ □ □ □
I find events of this retail brand interesting in the sensory way □ □ □ □ □
Stories of this brand stimulate my curiosity □ □ □ □ □
Section 5: Perception of supermarket image
Note: as before, these questions should be answered by reference to the
supermarket named in your answer to Question 4, Part 1)
Please indicate your level of agreement towards the following statements using a scale from 1 to
5, where 1 means “strongly disagree” and 5 means “strongly agree”:
Statements 1 2 3 4 5
Store image
The supermarket offers high-quality merchandise □ □ □ □ □
All brands you planned to buy were available □ □ □ □ □
Physical facilities are visually appealing □ □ □ □ □
It is easy to find products on promotion □ □ □ □ □
Employees are well informed, courteous and supportive □ □ □ □ □
The layout of this store is attractive □ □ □ □ □
The atmosphere in this store is pleasant □ □ □ □ □
Corporate image
This company has a good image among consumers □ □ □ □ □

346
I have a good image about the company □ □ □ □ □
This company has a good image compared to other competing companies □ □ □ □ □
Corporate social responsibility
The supermarket respects and protects the natural environment □ □ □ □ □
They contribute money to cultural and social events □ □ □ □ □
This supermarket treats its customer honestly □ □ □ □ □
This supermarket makes an effort to know customers’ needs. □ □ □ □ □
This supermarket offers safety at work to its employees □ □ □ □ □
This supermarket treats its employees fairly (without discrimination and abuse0) □ □ □ □ □
Section 6: Other features of supermarkets Note: as above
Please indicate your level of agreement towards the following statements using a scale from 1 to
5, where 1 means “strongly disagree” and 5 means “strongly agree”
Statements 1 2 3 4 5
Trust
I trust this retailer □ □ □ □ □
I consider that to shop in the stores of this retailer provides a guarantee □ □ □ □ □
I believe that this retailer is honest/sincere toward its consumers □ □ □ □ □
This retailer regularly renews itself to meet the needs of its consumers □ □ □ □ □
Habit
I have been shopping at this supermarket for a longtime □ □ □ □ □
I have no need to think about shopping at this supermarket □ □ □ □ □
I do it without thinking (being used to where the products I need are located , and in many convenient ways)
□ □ □ □ □
Store accessibility
I can get to store X quickly □ □ □ □ □
I can get to store X without problems □ □ □ □ □
I can get to store easily □ □ □ □ □
Alternative attractiveness
Probably, I would be satisfied with another company □ □ □ □ □
There are other good companies to choose from □ □ □ □ □
I need to change the place for shopping, there are other good department stores to choose from □ □ □ □ □
I would be more satisfied with the products and services of other department stores □ □ □ □ □
Switching costs
Switching to other providers will bring economic loss □ □ □ □ □
Switching to other providers will bring psychological burden □ □ □ □ □
Search and evaluate the untested service department store costs you time and effort □ □ □ □ □
An uncertain feeling is relative to the untested service department store □ □ □ □ □
In general, it will be a hassle switching to another provider □ □ □ □ □
If I switch to a new brand name, I will miss some of the services and benefits of the loyalty programme from this brand name (mileage and membership service)
□ □ □ □ □
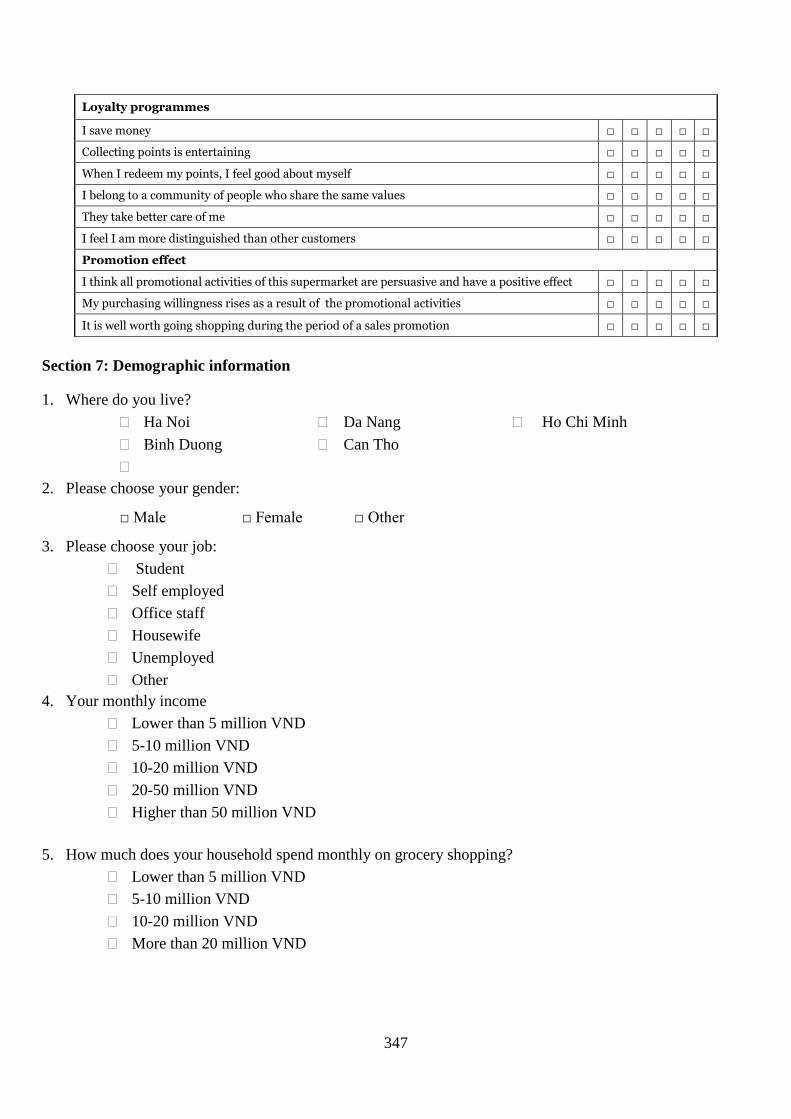
347
Section 7: Demographic information
1. Where do you live?
Ha Noi Da Nang Ho Chi Minh
Binh Duong Can Tho
2. Please choose your gender:
□ Male □ Female □ Other
3. Please choose your job:
Student
Self employed
Office staff
Housewife
Unemployed
Other
4. Your monthly income
Lower than 5 million VND
5-10 million VND
10-20 million VND
20-50 million VND
Higher than 50 million VND
5. How much does your household spend monthly on grocery shopping?
Lower than 5 million VND
5-10 million VND
10-20 million VND
More than 20 million VND
Loyalty programmes
I save money □ □ □ □ □
Collecting points is entertaining □ □ □ □ □
When I redeem my points, I feel good about myself □ □ □ □ □
I belong to a community of people who share the same values □ □ □ □ □
They take better care of me □ □ □ □ □
I feel I am more distinguished than other customers □ □ □ □ □
Promotion effect
I think all promotional activities of this supermarket are persuasive and have a positive effect □ □ □ □ □
My purchasing willingness rises as a result of the promotional activities □ □ □ □ □
It is well worth going shopping during the period of a sales promotion □ □ □ □ □

348
6. Your age range:
Under 18 18-22 23-30
31-40 41-55 Above 55
7. Your education level:
GCSE’s A levels College, undergraduate Postgraduate
If you would like to receive a report of findings from this survey, please provide us your
contact details. We understand and respect your rights to privacy.
Name :
Mailing address:
Thank you for your participation
With kind regards,
Thi Diem Em Nguyen

349
Appendix 3.5 - Measurement variables used from Section 2 to Section 6 in the
questionnaire (Phase Two) and code book for other questions used in questionnaire
Section 1 of questionnaire
Coding is presented in “BOLD” style as bellow:
Q1: Overall, where do you prefer to go for grocery shopping?
1 = Supermarkets
2 = Traditional markets
3 = Other
Q2: How often do you go to traditional markets?
1 = Once a day 2 = Twice a week 3 = Three times a week
4 = Once a month 5 = Twice a month 6 = Other
Q3: How often do you go to supermarkets?
1 = Once a day 2 = Twice a week 3 = Three times a week
4 = Once a month 5 = Twice a month 6 = Other
Q4: Which supermarket do you usually go? (Please just choose one option)
1 = Co.opmart or Big C
2 = Lotte Mart
3 = Vinmart
4 = AEON
5 = Other, please name it __________
Q5: Do you have any loyalty cards from the supermarket which you have just chosen at
Question 4?
1 = Yes
2 = No
Q6: How long have you used it?
1 = I have no loyalty card
2 = Less than 1 year
3 = 1-3 years
4 = More than 3 years
Q7: Do you think that you are loyal to the above chosen supermarket (question 4)?
1 = Yes
2 = No
Q8: How satisfied are you with the above chosen supermarket on a scale of 1 to 5? (1 means
“very dissatisfied”, 5 means “very satisfied”)
1 = 1

350
2 = 2
3 = 3
4 = 4
5 = 5
Q9: How satisfied are you with the offered service quality by this supermarket on a scale of 1
to 5? (1 means “very dissatisfied”, 5 means “very satisfied”)
1 = 1
2 = 2
3 = 3
4 = 4
5 = 5
Q10: Do you think your favorite supermarkets meet your needs?
1 = Yes
2 = No
3 = Partly met
Q11: If you are not satisfied with the service or the quality of the products at a supermarket,
will you back to visit and shop there again?
1 = Yes
2 = No
Q12: Will you still stay with your favorite supermarket if you see an alternative attractiveness
from other supermarkets?
1 = Yes
2 = No
Q13: “I choose this supermarket’s brand name because its good store image”. Do you agree
with the above statement?
1 = Yes
2 = No
Q14: Do you think loyalty programs such as bonus points, discounts and gifts will affect your
decision?
1 = Yes
2 = No
Q15: If other supermarkets offer appeal promotions or discounts, would you be ready to
switch to them?
1 = Yes
2 = No
Q16: How many loyalty cards do you have for grocery shopping from different supermarkets?
1 = 0
2 = 1
3 = 2
4 = 3
5 = More than 4

351
Q17: Suppose you are always loyal to specific supermarket A, if supermarket B opens a store near
you or easier for you to get there and suppose that other factors meet your requirements, do you
wish to switch to shop at supermarket B?
1 = Yes
2 = No
Q18: Does the supermarket’s brand name affect your choices?
1 = Yes
2 = No
Q19: Suppose that there are two different supermarkets that you feel satisfied, all other factors are
the same, one of these is a domestic brand name, another is foreign brand name, which one will
you choose?
1 = Domestic brand name
2 = Foreign brand name
Q20: Are you in charge with buying grocery products for the whole family or for yourself?
1 = The whole family
2 = Myself
3 = I am not in charge with buying grocery products
Coding for measured variables is presented as followed:
Manifest variables Sources
Customer
perceived value
CPV1 Products are valuable
Chang and Wang (2011) CPV2 Prices are fair
CPV3 Products are worthwhile
CPV4 Compared to the price we pay, we get reasonable quality Eggert and Helm (2000)
CPV5 Compared to the quality we get, we pay a reasonable price
CPV6 The purchasing relationship delivers us superior net-value.
Customer
satisfaction
CS1 Complete service offered by a supermarket is significantly above expected Kitapci (2013) CS2 In general, my satisfaction level related to the supermarket that I have already dealt with is high
CS3 Assuming you view your entire experience with the supermarket, overall you are very satisfied with
the supermarket
CS4 Shopping at the supermarket has been an enjoyable experience Lin (2014), El-Adly (2016)
CS5 I am disappointed to have been in this store Bouzaabia (2013)
Customer loyalty
CL1 In the near future, I am sure to repurchase at this supermarket and buy more at this one than at
another retailer
Swoboda (2013)
CL2 I am willing to pay more as compared to other retailers for the products I buy from this retailer Srivastava (2016)
CL3 I will say positive things about the retailers and recommend it to others Srivastava (2016), El-Adly (2016)
CL4 I would consider the supermarket my first choice to do shopping Lin (2014), Terblanche (2018)
CL5 I will always continue to choose the products of this grocery store instead others Oliver (1997)
In-store logistics
ISL1 In the supermarket, the shelves are well-stocked
Bouzaabia (2013)
ÍSL2 No problems when returning merchandise
ISL3 In the supermarket, there are enough shopping carts
ISL4 In this supermarket, sufficient carrier bags are provided by the cashiers
ISL5 In this supermarkets, all products can be easily reached
ÍSL6 Prices on the product labels are correct
ISL7 The sell-by date is well indicated on the products
Service quality
SQ1 I would say that the quality of my interaction with the provider’s employees is high Liu et al. (2011) SQ2 I always have an excellent experience when I interact with my service provider
SQ3 I feel good about what my service provider provides to its customers.
SQ4 Service employees at this store have good product knowledge
Jiang et al. (2018) SQ5 Service employees at this store are willing to help customers

352
SQ6 Service employees at this store showed respect to me
E-service quality
ESQ1 Organisation compensates me when what I ordered does not arrive on time
Zemblyte (2015)
ESQ2 Organisation picks up items I want to return with minimum hassle
ESQ3 Organisation makes accurate services (accurate records of consumers, accurate account, etc..)
ESQ4 Organisation provides me with different options for payment, delivering and/or returning items
ESQ5 Organisation is truthful about its offerings, it has in stock the items it claims to have
ESQ6 Organisation offers a clear return policy and guarantee
ESQ7 Organisation’s site loads it pages fast and easy
ESQ8 Organisation’s site enables me to complete a transaction quickly
ESQ9 Organisation presents guarantee and privacy policy on its site
ESQ10 My order is quickly confirmed and kept by the organisation
Product quality
PROQ1 This store has a lot of variety
Jiang et al. (2018) PROQ2 Products in this store are of consistent quality
PROQ3 Products available in this store are good workmanship
PROQ4 Products in this store are of good design
Price
PRICE1 Goods at this store are reasonably priced Jiang et al. (2018)
PRICE2 The prices of the products in this supermarket are cheaper than others Emi Moriuchi, 2016
PRICE3 Goods at this store offer value for money Jiang et al. (2018)
Customer service
CUSER1 Having a short waiting time at the checkouts
Kursunluoglu (2014)
CUSER2 Having clean restrooms
CUSER3 Doing faster transactions without waiting customers
CUSER4 Having easy product return policy
CUSER5 Always having an available slot in the car park
CUSER6 Broadcasting nice music inside the supermarket
CUSER7 Providing noiseless shopping possibility
CUSER8 Having informative in-store employees in encounter stage
CUSER9 Having a beautiful gift wrap
CUSER10 Doing demonstrations about how to use the product
Customer
experience
CUSEXP1 The shopping experience is refreshing
Srivastava (2016)
CUSEXP2 The store has a welcoming atmosphere and the temperature inside the store is comfortable
CUSEXP3 The shopping experience made me relaxed and comfortable
CUSEXP4 I did not feel deceived by the service staff (such as pricing, special deals, discounts, gifts etc)
Retail brand
experience
RBEXP1 When I think of excellence, I think of this retail brand name
Khan and Rahman (2016)
RBEXP2 I feel good with this retail brand because of their simple and better structured bills
RBEXP3 Point-of-sales contact produces a strong impression on my intellect
RBEXP4 Helping nature of salespersons at this retail brand name has built a better shopping experience
RBEXP5 I find events of this retail brand interesting in the sensory way
RBEXP6 Stories of this brand stimulate my curiosity
Store image
STIMA1 The supermarket offers high-quality merchandise
Bouzaabia (2013)
STIMA2 All brands you planned to buy were available
STIMA3 Physical facilities are visually appealing
STIMA4 It is easy to find products in promotion
STIMA5 Employees are well informed, courteous and supportive
STIMA6 The layout of this store is attractive Jiang et al. (2018)
STIMA7 The atmosphere in this store is pleasant
Corporate image
COIMA1 This company has a good image among consumers Calvo (2015) COIMA2 I have a good image about the company
COIMA3 This company has a good image compared to other competing companies
Corporate social
responsibility
CSR1 The supermarket concern with respecting and protecting the natural environment
Perez (2015) CSR2 They contribute money to cultural and social events
CSR3 This supermarket treats its customer honestly
CSR4 This supermarket makes an effort to know customers’ needs.
CSR5 This supermarket offers safety at work to its employees
CSR6 This supermarket treats its employees fairly (without discrimination and abuses)
Trust
TRUST1 I trust this retailer
Lombart (2014) TRUST2 I consider that to shop in the stores of this retailer is a guarantee
TRUST3 I believe that this retailer is honest/sincere towards its consumers
TRUST4 This retailer regularly renews itself to meet the needs of its customers

353
Section 7 of questionnaire (demographic information)
Coding is presented in “BOLD” style as bellow:
LOCATION = Where do you live?
1 = Ha Noi 2 = Da Nang 3 = Ho Chi Minh
4 = Binh Duong 5 = Can Tho
GENDER = Please choose your gender
1 = Male
2 = Female
3 = Prefer not to say
OCCUPATION = Please choose your job
1 = Students
2 = Self employment
3 = Office staffs
4 = Housewife
5 = Unemployment
6 = Other
Habit
HABIT1 I have been doing for a long time (shopping at this supermarket)
Olsen (2013) HABIT2 I have no need to think about doing (shopping at this supermarket)
HABIT3 I do without thinking (getting used to know where is the products I need, and in many convenient
ways)
Store accessibility
STAC1 I can get to store X quickly Swoboda (2013)
STAC2 I can get to store X without problems
STAC3 I can get to store easily
Alternative
attractiveness
ALA1 Probably, I would be satisfied with another company Calvo (2015)
ALA2 There are other good companies to choose from
ALA3 I need to change the place for shopping, there are other good department stores to choose from Tung (2011)
ALA4 I would be more satisfied with the products and services of other department stores
Switching costs
SWC1 Switching to other providers will bring economic loss Liu et al. (2011)
SWC2 Switching to other providers will bring psychological burden
SWC3 Search and evaluate the untested service department store costs you time and effort Tung (2011)
SWC4 An uncertainty feeling is relative to the untested service department store
SWC5 In general, it will be a hassle switching to another hotel Qui et al. (2015) SWC6 If I switch to a new brand name, I will miss some of the services and benefits by the loyalty program
from this brand name (mileage and membership service)
Loyalty programs
LPRO1 I shop at a lower financial cost (I save money)
Stathopoulou (2016) LPRO2 Collecting points is entertaining
LPRO3 When I redeem my points, I am good at myself
LPRO4 I belong to a community of people who share the same values
LPRO5 They take better care of me
LPRO6 I feel I am more distinguished than other customers
Promotion effects
PROE1 I find the promotional activities of this online supermarket to be very persuasive and positive Emi Moriuchi (2016)
PROE2 My purchasing willingness arises from the promotional activities Tung (2011)
PROE3 It is well worth going shopping during the period of a sales promotion

354
INCOME = Your monthly income
1 = Lower than 5 million VND (170 GBP)
2 = 5-10 million VND (170-340 GBP)
3 = 10-20 million VND (340-680 GBP)
4 = 20-50 million VND (680-1700 GBP)
5 = higher than 50 million VND (1700 GBP)
FAMILY’S EXPENDITURE = How much does your household monthly spend on grocery
shopping?
1 = Lower than 5 million VND (170 GBP)
2 = 5-10 million VND (170 - 340 GBP)
3 = 10-20 million VND (340 – 680 GBP)
4 = more than 20 million VND (680 GBP)
AGE = Your age range
1 = Under 18 2 = 18-22 3 = 23-30
4 = 31-40 5 = 41-55 6 = Above 55
EDUCATION = Your education level
1 = GCSE’s 2 = A levels
3 = College/undergraduate 4 = Postgraduate
Appendix 4.1 – Some more direct quote of supermarket’s consumer interviewing in
Phase One

355
Question 2: Do you often go to the supermarket? How many times a week?
BD2_F30 go to shop at a supermarket every day because she is working in the
supermarket, she stated, “I work at that supermarket, so I buy fresh food daily and other
consumption products here after finishing my daily job, I am so happy and always choose
supermarkets, I have no time to go to traditional markets”.
HN4_26 stated, “My family usually goes to supermarkets together, twice a month to buy
long-term-used consumption products and spend around six to seven million VND (200-250
GBP) each time. I think a supermarket that I choose to shop, named Lotte is much expensive
compared to other one, but I believed products provided with such amazing quality, most of
them are foreign brand name, I prefer toothpaste, shower gel, foreign household utensils here,
sometimes we also buy imported fresh fruits and fresh meat”.
DN2_F35 stated, “I go to a supermarket normally twice a month to buy milk and cheese
for my baby, when I go there to buy these special products, I buy consumption stuffs as well, I
have never wanted to buy milk the traditional markets, I think that buying milk should be done
at supermarkets, especially, foreign brand name because I believe their guaranteed quality and
there are also a variety of choices and price”
Question 3: Do you prefer shopping at supermarkets or traditional markets? Why?
DN2_F35 showed her trust in supermarkets by saying “I always choose to shop at a
supermarket because I think that the quality of products here has been guaranteed, especially
milks which I usually buy for my children, I have always been suspicious about the quality and
origin of dairy products being sold outside and at traditional markets”.
HCM6_33 stated, “I prefer shopping at supermarkets as no one feel annoyed if I do not
buy anything after checking for a while, I feel comfortable and relaxed, especially, I always
know how much I am going to pay, I am happy to check and take products back if I feel I do
not need or in the case I do not bring enough money”, BD3_F26 stated “I prefer to shop at
supermarkets because they clearly state products’ origin, expire date and price, I feel safe with
foods here. In addition, there are many promotion programs that I can consider to choose
between two different types of brand name”
However, there are some consumers preferring shopping at traditional markets such as
CT1_M27, HN3_M24, CT3_M53. They explained some disadvantages of shopping at
supermarkets and reasons why they choose traditional markets. CT1_ M27 said: “I think
shopping at traditional markets is very convenient, it is near my house and I just drive my
scooter to there and get what I want immediately; I do not need to wait for parking or long-
queuing when checking out. Besides that, many fresh vegetables and meats are available there.
Many special home-made products and some kinds of nice fishes are not sold in supermarkets.
However, sometimes I am suspicious about the quality of meats or their origins; I usually go

356
to specilised meat shops to shop separately. In general, I feel free to shop at traditional
markets, easy to buy and choose”.
HN3_M24 said, “It is very convenient to shop at traditional markets, it is near my house,
products’ prices at traditional markets are cheaper, I do not usually buy a lot, so supermarkets
are not a choice for me. However, sometimes I go there with family in the weekend to enjoy
going around and using other services offered such as cinema, fast foods”
CT3_M53 stated, “Regarding buying daily food, I prefer to go traditional markets because
fresh and delicious food is sold here every day, in supermarkets I feel that fish and vegetables
might be presented there a little longer than at the traditional market. However, when I need
to buy clothes, I choose supermarkets because as you know, I am a man, going to the
traditional markets and buying is not convenient, in Vietnam, a man might not go to markets
and choose clothes for himself, wife is doing these things, people might notice if I go there, I
feel not comfortable, but with supermarkets, no one is going to notice. In addition, in-store
staffs in a supermarket are not chasing me to buy, I feel uncomfortable with chasing-to-sell
things which usually happen at the outside shops”
HCM4_F45 prefer both, depending on situation, “If I just buy some products with a small
amount, I will choose traditional market because buying transaction is faster, I do not have a
lot of time, when I need something, I run to the traditional market which is 200m away from
my house, very convenient. I choose to buy long-term used products at supermarkets such as
toothpaste, household products, salt, sugar, toilet roll, shower gel. And I just do it when I have
a plenty of time, normally at evening”
Question 4: Mentioning supermarkets, which one is in your top of mind? Why? Is it
always your top choice?
CT1_M27 stated, “Considering supermarkets, my top of mind is Coopmart, because it is a
first supermarket established in my city, my mom and I always go there for shopping, I think
that I will not change my habit, always choose Coopmart, I trust the firms more when they
show their social responsibility, such as sponsoring many youth activities in my university and
spending money to help narrowed families in my province”. HCM4_F45 stated, “I think about
Auchan supermarket immediately and I always choose to shop there because it is next to my
house, very convenient. More than that, I am happy with in-store staffs here, they show their
respect to me and they are really supportive when I asked them to find products that I need,
in-store decoration makes me feel relaxed and very comfortable, compared to the
uncomfortable feelings perceived from other supermarkets with complicated decoration and
close shelves allocated”.
HN3_F24 explained more about why she always stays with her favorite supermarket, “I
choose Big C because its long business history, I trust the way they are doing their business,
if I drive my scooter one to two kilometers more, I can easily find other supermarkets but their
brand names could not give me the feeling of trust”.
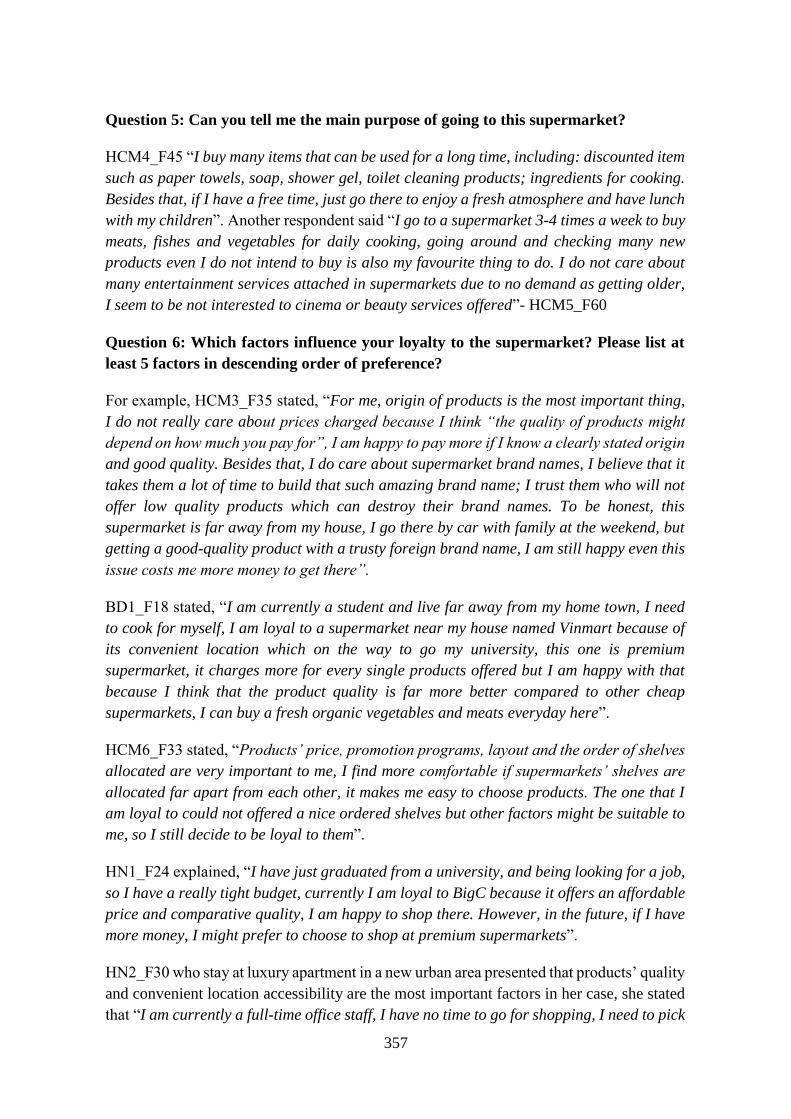
357
Question 5: Can you tell me the main purpose of going to this supermarket?
HCM4_F45 “I buy many items that can be used for a long time, including: discounted item
such as paper towels, soap, shower gel, toilet cleaning products; ingredients for cooking.
Besides that, if I have a free time, just go there to enjoy a fresh atmosphere and have lunch
with my children”. Another respondent said “I go to a supermarket 3-4 times a week to buy
meats, fishes and vegetables for daily cooking, going around and checking many new
products even I do not intend to buy is also my favourite thing to do. I do not care about
many entertainment services attached in supermarkets due to no demand as getting older,
I seem to be not interested to cinema or beauty services offered”- HCM5_F60
Question 6: Which factors influence your loyalty to the supermarket? Please list at
least 5 factors in descending order of preference?
For example, HCM3_F35 stated, “For me, origin of products is the most important thing,
I do not really care about prices charged because I think “the quality of products might
depend on how much you pay for”, I am happy to pay more if I know a clearly stated origin
and good quality. Besides that, I do care about supermarket brand names, I believe that it
takes them a lot of time to build that such amazing brand name; I trust them who will not
offer low quality products which can destroy their brand names. To be honest, this
supermarket is far away from my house, I go there by car with family at the weekend, but
getting a good-quality product with a trusty foreign brand name, I am still happy even this
issue costs me more money to get there”.
BD1_F18 stated, “I am currently a student and live far away from my home town, I need
to cook for myself, I am loyal to a supermarket near my house named Vinmart because of
its convenient location which on the way to go my university, this one is premium
supermarket, it charges more for every single products offered but I am happy with that
because I think that the product quality is far more better compared to other cheap
supermarkets, I can buy a fresh organic vegetables and meats everyday here”.
HCM6_F33 stated, “Products’ price, promotion programs, layout and the order of shelves
allocated are very important to me, I find more comfortable if supermarkets’ shelves are
allocated far apart from each other, it makes me easy to choose products. The one that I
am loyal to could not offered a nice ordered shelves but other factors might be suitable to
me, so I still decide to be loyal to them”.
HN1_F24 explained, “I have just graduated from a university, and being looking for a job,
so I have a really tight budget, currently I am loyal to BigC because it offers an affordable
price and comparative quality, I am happy to shop there. However, in the future, if I have
more money, I might prefer to choose to shop at premium supermarkets”.
HN2_F30 who stay at luxury apartment in a new urban area presented that products’ quality
and convenient location accessibility are the most important factors in her case, she stated
that “I am currently a full-time office staff, I have no time to go for shopping, I need to pick

358
up my baby every afternoon at 5:30 pm, after considering products’ quality, the advantage
of nice location is a reason I always choose Vinmart as it is located near my building. I
have a quick shopping there every afternoon. Other grocery and consumption products, I
will do it at the weekend at a bigger store, the same brand name (Vinmart) as well because
I trust them, the Vingroup built this new urban city, with good reputation and long-
business history in Vietnam, their supermarket brand name is Vinmart, everything I need,
I can buy in this area, why not be loyal to them?”.
HN5_F56 also choose Vinmart to be loyal to because Vinmart have a variety of product
ranges and promotion program, a premium price is not a problem for her, she prefers to
buy there because of big size supermarket which allows her to enjoy shopping there. In
addition, she is currently a housewife, obtaining points as conducting any purchase is also
here favorite thing, she stated “accumulating points and getting a reward later stimulate
my purchase, sometimes I just need to buy around 300,000 VND (10 GBP) but that the
offer is buying 20 GBP and get a free gift or double-point offered at a specific day
stimulate me to buy more. In the end, I usually buy more than what I intended to buy”.
HCM5_F60 also have the same point of view, “When I buy products in Coopmart,
accumulated points will be rewarded later, three months or at the end of the year, I got a
really nice gift from them, thanks for being loyal, I was so happy last year when they sent
a gift to my house. Although the value of a received gift is not high, the feeling of getting
free gift made me feel happier. I think that all older people might have the same feeling
like me. Besides that, for me habit is very important factor. I am 60 years old now, I am
afraid to change and being used to with everything inside the supermarket. For example,
I know where the products I need are located, I can easily reach them, by this way, I can
save a lot of time”.
HCM4_45 added some more information about promotion programs “for some products,
if a supermarket gives a huge discount, I will buy more and store them in my house, I am
going to buy less and just enough to use in a short-term, wait for a next promotion
campaign if I can not get a good deal”. She also explained that stable prices charged is
also her criteria, “I do want to shop at supermarkets which constantly adjust their
products’ price, increase prices when they have a hot item or the demand of consumers is
high, Auchan offered a bit higher price compared to other supermarkets but they keep
their product prices stable”.
Question 7: What factors affect your satisfaction with the supermarket?
CT2_F35 stated, “I used to shop at BigC when it is first established in my city, but I had
a bad experience with not very friendly staffs there, so I have decided to shop at Coopmart
where staffs are more friendly and always support me with their happy faces and smiles,
even Coopmart is far from my house compared to easily reached BigC, I still choose
Coopmart”. HN4_26 added, “I think that the consultant way of in-store staffs is very
important. I can say that all staffs at my favorite supermarkets are so nice, they walked
me to the shelves to find stuffs with their smiling faces”.

359
CT3_M53 considered that price is not the important factor when considering his
satisfaction, in-store logistic should be mentioned; he said, “I like that supermarket because
all shelves are logically allocated, it makes me easy to find products that I need”. DN4_F19
stated that “to make me satisfied, product quality is the most important factor, then
problems solved quickly by in-store staffs should be considered”. DN2_F35 said, “if other
factors are the same, I might choose and be happy with supermarkets where I can pay for
my products easier and quicker”.
HCM6_F36 stated that “Free home delivery service from my favorite market is very
convenient to me as I always buy a large amount of products, I knowing their policy is to
offer this free service when you buy more than 500,000 VND (17 GBP) within 7 kilometers.
However, that time I bought 4 million VND (130 GBP), they were so flexible to send the
items to my house”.
Question 8: Tell me the experience you have/ have not enjoyed about the service at
the supermarket you have been before?
HCM6_F33 told, “The promotion program is generally written, so I was very confused.
For example, consumers will get a free gift item if they buy more than 300,000 VND
(approximately 10 GBP). I bought more than 900,000 VND (nearly 30 GBP), I requested
for having 3 gifts, but cashiers said no to me and I wanted to split the bills, they were not
flexible to solve these problems for me and cannot accept splitting the bills as well as
giving me a three free gifts. I think in this case, they should clearly state the condition of
this promotion program as well as being more flexible to support me”.
HN3_M24 said “I still remember that when I chose the discount product, 30% discount
with the final price is 100, 000 VND, I bought many different items and forgot to check
when they gave me a bill. When I backed home, I realized that that item was not selling
with a sale price because there was no sale barcode in there. I think that some consumers
take the new one to this area and no staffs came there to check. I was confused and paid a
higher price than I expected. I felt not happy about that”.
Besides that, HCM3_F35 said “the only place for payment is located at the first floor, I
drove my car and parked it the third floor and just need to buy some household utensils
there, it took time for me to go down to the first floor and back to the third floor. I suggest
the supermarket should have checkout areas at each floor”.
BD2_F30 shared “that supermarkets slightly change a product price in the upward
direction, but the system has not updated as well as supermarkets have not put a new price
on displayed products makes consumers so annoyed when they pay”.
HN4_F26 complained that in-store staffs were not proactively introduce their promotional
programs to her “when I checked out, they did not tell me if I buy more than one million
VND (33 GBP), they will give me a 5% direct discount at that day, I could not save my
money as I bought 970,000 VND. I felt so regret”

360
Question 11: In your opinion, how does store image affect your purchasing’s
perceptions and your satisfaction?
HCM6_F33 stated “store image has a significant effect to my satisfaction and purchase
perception, the good decoration as well as a layout of how well products being allocated
makes me feel comfortable, I will buy more. My current supermarket arranges products
logically, for example, next to dry food stalls like noodle, soy sauce will have condiments,
canned food. If the supermarket constantly changes their store layout, I might feel
disappointed as I could not easily find items”, HN5_F56 “store image is very important, if
supermarkets are spaciously and logically decorated, I feel better, when mention about store
image, I immediately think about how I feel about store when shopping”, HN4_26
emphasized that “the main theme color covered inside supermarkets is very important,
consumers might feel good with specific color, such as green, blue or red”, BD3_F26 “if
that supermarkets have a good store image, clean and fresh atmosphere make me trust them
more and might stimulate my purchasing decision, if a store is decorated in cramped
conditions, I will not go there, I still have a plenty of choices”.
BD2_30 “I suppose that store image is a crucial factor as considering my purchase decision,
it decides that whether should I spend money to buy products or not, spacious walkways are
important, one more thing I can say, my favorite supermarket has a way and toilet for
disable, I think they are really thoughtful, I do appreciate this thing”. CT3_M53 added that
“Besides a logical and eye-catching store decoration, that how well in-store staffs treat me
is also important, if the two presented factor happen, I will pay more because I feel satisfied.
To me, product price is not the main factor”. HN3_M24 “Supermarket A always plays a
relaxing music, easy to hear, the main color in the shop is not too glamorous, I feel
comfortable, I will never shop at supermarket B again because it is too bright”
Question 13: Does corporate image affect your choice in choosing which supermarkets
to go?
HN2_F30 “The positive feeling of corporate image creates my trust and commitment. For
example, Vinmart supermarket is from Vingroup which is a biggest group in Vietnam
investing into many projects and fields such as real estate, hospital, university and school
with trusty reputation, when I think about Vinmart, I think about premium quality with fresh
meats, clearly stated product origin and organic vegetables it does really affect my choice”.
BD3_F26 presented “corporate image creates a credibility of that business, it is a first
criteria when I choose which supermarkets to go”. HCM1_M60 “Considering a corporate
image, my favorite supermarket gives me a safe and peaceful feeling when their marketing
campaigns always emphasize how their consumption products build happiness within
families. I think that they are so smart as using family-focused emotional marketing videos”.
CT1_M27 emphasized “If firms cannot create a good image, I will never choose them. For
example, I do not supermarket A because they have a bad image, people keep telling me

361
about the not clearly stated origin of products offered and sometimes they offer an expired
product with good deal but I think that it is so immoral”. DN3_M18 added “if I need to
choose one between two different supermarkets which are a new-developed supermarket
and well-developed and trusty supermarket, I will go for the second one because it takes
supermarket a long time to build their images, I do not want to give a try with untested
one”.
Question 14: Does corporate social responsibility affect your choice in choosing which
supermarkets to go?
HCM4_F45 presented “If supermarkets pay their employees a lower wage compared to
what that position expected to be paid and firms not paying taxes, I will stop shopping
there, even I am satisfied with all other things, I might choose different brand names, even
it might be far away from my house”
Question 15: Do you think loyalty programs such as bonus points, discounts and gifts
will affect your decision?
HCM4_F45 clearly stated, “There are a plenty of supermarkets which are located near my
house, but I still choose supermarket A because I got a loyalty card there 5 years ago,
currently, every single transaction above 1 million VND (approximately 33 GBP), I will
get 5% off compared to other supermarkets which currently offer accumulating points or
lower-rate discounts, thanks to being a long-term loyal customer, I got such an amazing
deal, even supermarket A is not near my house, I definitely always choose them and
encourage my family and other friends to shop there as well”.
Question 17: Suppose you are always loyal to specific supermarket A, if supermarket
B opens a store near you or easier for you to get there, do you wish to switch to shop
at supermarket B?
DN2_F35 stated, “if supermarket B offers an equal product quality compared to
supermarket A, I will move to supermarket B because I can save much time”, CT3_M53
added “each supermarket has its own strength but I would give supermarket B a go and
reconsider after shopping there”. However, there are some participants explained “I will
not switch to supermarket B because I get used to with where my needed products are at
supermarkets A, habit is more important. If consumers buy many products at the same time,
I think that location might be not a big problem for them” (HN3_M24).
Question 18: Do you concern about online service at supermarkets such as online
ordering or home delivery, consulting chat? What do you want from supermarkets’
online service?
HN6_F33 stated that “To be honest, online services at supermarkets in Vietnam have been
very ineffective, because consumers normally want to look at a needed product and pay on

362
the chosen items, they are so afraid of low product quality if shopping online happen,
especially with fresh fruits and meats and vegetables”. CT2_F35 noted, “I do not care
about this service at a supermarket because in-store shopping time makes me feel more
comfortable and I can spend a good time with family there as well”. “With an online
service, supermarkets always set a minimum amount of money that consumers spend in
order to deliver to consumers’ house, I do not usually buy a lot. In addition, last time when
I checked a supermarket A’s website, I feel that the interface was not eye-catching, they
did not update details on pricing, product description as well as size of products in the case
I wanted to buy fruits. So, I do not care about these services. Currently, I am still vague
about whether other supermarkets have online services or not” DN1_F24 said.
Question 20: Do you think the price at this supermarket is reasonable?
HCM4_F45 stated, “I have not compared the prices between supermarkets, I think that my
current chosen supermarkets offer a bit slightly higher price, but I do not care much, above
all other things, I feel respected as all of in-store staffs at the supermarket have treated me
so well, I feel extremely satisfied”
Question 21: Your ideas about customer service at this supermarket? Can you tell me
what things you are satisfied and not satisfied with their customer service?
CT2_F35 narrated “I feel satisfied with their consumer services such as free parking fee,
fresh shopping atmosphere provided, quick checkout process with staffs always smiling,
clearly noted that how to use products, friendly and supportive staffs, free wrapping service
offered. I have never experienced any unsatisfied thing there”. HCM4_F45 stated, “I did
buy a washing machine there and there were some technical problems occurred after one
week of using, I contacted to a supermarket and they offered me such quick and amazing
service to solve my problems. I feel happy about that and I always choose them”. HN2_F30
stated, “I am happy with the way how supermarkets solve occurred problems, when I paid
for my shopping, the price charged was different with the stated prices that I saw on
products, I claimed it and managers immediately came to the cashier to check and happily
solved my problem and not forget to give me an excuse as keeping waiting that long”.
Question 22: When you shop at the supermarket, how do you feel? (Relaxed,
respected, enjoyable?)
HCM6_F33 “I feel freedom and comfortable as having much time to go around, it is not a
tight squeeze, nice music played stimulate my purchase decision, compared to rushed
shopping behaviors at traditional markets each morning, I feel more relaxed with
supermarkets”.

363
Question 23: What do you think about the brand? (Retail brand experience). Please
tell me more about your brand experience?
HCM4_F45 “the retail brand name gives me the feeling of trust as their stores are always
clean, fresh, spacious and friendly decorated. They have created a nice shopping space
which provides a pleasure and better shopping experience”.
CT1_M27 always feel good about his current chosen supermarkets as considering their
brand name, he explained “Its high prestige with high social responsibility, unified system
within supermarket chain, long history and good services and products offered make me
trust them more and enjoy a comfortable feeling when shopping. The belief is far more
compared to other factors, I have ever seen any brand name created and built better as my
current one”.
Question 24: Give me your comments about their in-store logistic services? (The
shelves are well-stocked, easy returning, all products can be easily reached, enough
shopping carts, correct prices on the product labels..)
HCM5_F60 said, “constantly checking products on shelves and supplementing new
products have made a big difference between supermarkets, I might feel frustrated if I saw
the information of temporarily out-of-stock products”.
Question 25: Are you loyal to that supermarket brand? Please rank from 1 to 5 (1
means “very loyal”, 5 means “not very loyal”)
CT3_M53 explained, “That I am loyal to supermarket X is not because I am completely
satisfied with services and products offered, it is all because of its convenient store
accessibility and habit, in the future, if there are some alternative choices, I might consider
and experience other brand names”. HN3_M24 added “My chosen supermarket is not the
best choice, I know, but I accept it and happy, but I need to admit that my loyalty level is
not high, I am happy to try other supermarkets if needed”.
HCM2_M28 said “Although I have a loyalty card but I always forgot it at home and have
no interested in accumulating points, for me convenient factor is the most important, I
usually move around supermarkets for shopping, each supermarket has its own advantages
and strength, I might not commit myself with any supermarkets”.

364
Question 26: Are you satisfied with the offered service quality? How satisfied are you
on a scale of 1 to 5? (1 means “very dissatisfied”, 5 means “very satisfied”, did staff
respond enthusiastically when you asked?)
HN5_F60 narrated, “My apartment is located at 25th floor, I always buy many items at a
supermarket which is under my building and their service staffs help me bring these stuffs
to my apartment, sometimes I bought grocery products and asked them send it to my son
house which is 5 km away from their current store, they still offer me free delivery. Of
course, I bought more than 700,000 VND each time (approximately 23GBP). I am so happy
with this amazing service”.
Question 30: “I choose this supermarket’s brand name because its good store image”.
Do you agree with the above statement?
HN4_F26 said, “Store image is not a main factor why I choose a supermarket to go for
grocery shopping, there are a plenty of other crucial elements. However, if I say that store
image do not influence my choice, maybe it is wrong too. If I need to rank a number of
important factors which affects my choice, store image will be placed at the end of the list”.
BD2_F30 stated that the above presented statement provided by the interviewer is wrong
“because store image partly affects my choice, thanks to its convenience, I choose it”
Question 31: Suppose that there are two different supermarkets that you feel satisfied,
all other factors are the same, one of these is a domestic brand name, and another is
foreign brand name, which one will you choose? Why?
HN2_F30 said, “The foreign brand name seems to be really attractive, posh, considering
psychological factor, I feel more confident to shop without constantly checking where
products come from. Besides that, my experience proves me that a foreign firm has
comprehensively and properly invested their stores and attached services provided, such
as spacious parking areas, spacious stores designed with logically allocated shelves and
decoration, for me, shopping there something like relaxing moment after a long-day work”.
Question 33: Where do you usually go for daily food and grocery?
HN2_F30 explained, “thanks to convenient attached services offered at my apartment,
supermarkets are located at every single building, I pop to the store and get my foods and
grocery products easily. I have no interested in shopping at traditional markets and other
private grocery stores”
Question 34: Are you loyal to a supermarket brand name or their specific store?
HN4_F26 said, “I am loyal to that specific store as it is near my house because I bought a
lot of things, it seems to be heavy and I might feel tired if I choose other stores.
Furthermore, I get used to with their decoration and which areas products are allocated,
habit is very important too, I save much time and feel more comfortable”.

365
Appendix 5.1 – Results from Tests of normality
Tests of Normality
Kolmogorov-Smirnov
a Shapiro-Wilk
Statistic df Sig. Statistic df Sig.
CPV1 .234 2913 .000 .875 2913 .000
CPV2 .227 2913 .000 .878 2913 .000
CPV3 .236 2913 .000 .874 2913 .000
CPV4 .242 2913 .000 .865 2913 .000
CPV5 .240 2913 .000 .874 2913 .000
CPV6 .229 2913 .000 .888 2913 .000
CS1 .257 2913 .000 .882 2913 .000
CS2 .225 2913 .000 .876 2913 .000
CS3 .251 2913 .000 .872 2913 .000
CS4 .222 2913 .000 .890 2913 .000
CS5 .219 2913 .000 .848 2913 .000
CL1 .209 2913 .000 .893 2913 .000
CL2 .189 2913 .000 .915 2913 .000
CL3 .213 2913 .000 .891 2913 .000
CL4 .233 2913 .000 .889 2913 .000
CL5 .192 2913 .000 .903 2913 .000
ISL1 .240 2913 .000 .887 2913 .000
ISL2 .248 2913 .000 .878 2913 .000
ISL3 .232 2913 .000 .855 2913 .000
ISL4 .245 2913 .000 .846 2913 .000
ISL5 .251 2913 .000 .858 2913 .000
ISL6 .241 2913 .000 .876 2913 .000
ISL7 .247 2913 .000 .860 2913 .000
SQ1 .205 2913 .000 .895 2913 .000
SQ2 .220 2913 .000 .885 2913 .000
SQ3 .256 2913 .000 .871 2913 .000
SQ4 .207 2913 .000 .892 2913 .000
SQ5 .251 2913 .000 .876 2913 .000
SQ6 .240 2913 .000 .873 2913 .000
ESQ1 .226 2913 .000 .897 2913 .000
ESQ2 .204 2913 .000 .905 2913 .000
ESQ3 .215 2913 .000 .893 2913 .000
ESQ4 .210 2913 .000 .893 2913 .000
ESQ5 .223 2913 .000 .886 2913 .000
ESQ6 .219 2913 .000 .886 2913 .000

366
ESQ7 .199 2913 .000 .901 2913 .000
ESQ8 .213 2913 .000 .894 2913 .000
ESQ9 .212 2913 .000 .890 2913 .000
ESQ10 .202 2913 .000 .891 2913 .000
PROQ1 .268 2913 .000 .854 2913 .000
PROQ2 .271 2913 .000 .854 2913 .000
PROQ3 .236 2913 .000 .875 2913 .000
PROQ4 .234 2913 .000 .876 2913 .000
PRICE1 .248 2913 .000 .879 2913 .000
PRICE2 .187 2913 .000 .904 2913 .000
PRICE3 .220 2913 .000 .885 2913 .000
CUSER1 .187 2913 .000 .913 2913 .000
CUSER2 .213 2913 .000 .899 2913 .000
CUSER3 .191 2913 .000 .907 2913 .000
CUSER4 .206 2913 .000 .900 2913 .000
CUSER5 .240 2913 .000 .871 2913 .000
CUSER6 .228 2913 .000 .888 2913 .000
CUSER7 .237 2913 .000 .885 2913 .000
CUSER8 .213 2913 .000 .900 2913 .000
CUSER9 .190 2913 .000 .903 2913 .000
CUSER10 .209 2913 .000 .899 2913 .000
CUEXP1 .234 2913 .000 .879 2913 .000
CUEXP2 .227 2913 .000 .884 2913 .000
CUEXP3 .238 2913 .000 .874 2913 .000
CUEXP4 .245 2913 .000 .875 2913 .000
RBEX1 .209 2913 .000 .895 2913 .000
RBEX2 .230 2913 .000 .883 2913 .000
RBEX3 .199 2913 .000 .900 2913 .000
RBEX4 .228 2913 .000 .885 2913 .000
RBEX5 .211 2913 .000 .883 2913 .000
RBEX6 .213 2913 .000 .909 2913 .000
STIMA1 .230 2913 .000 .878 2913 .000
STIMA2 .222 2913 .000 .892 2913 .000
STIMA3 .228 2913 .000 .883 2913 .000
STIMA4 .256 2913 .000 .876 2913 .000
STIMA5 .228 2913 .000 .886 2913 .000
STIMA6 .221 2913 .000 .881 2913 .000
STIMA7 .241 2913 .000 .874 2913 .000
COIMA1 .254 2913 .000 .866 2913 .000
COIMA2 .254 2913 .000 .864 2913 .000
COIMA3 .227 2913 .000 .879 2913 .000
CSR1 .217 2913 .000 .882 2913 .000

367
CSR2 .226 2913 .000 .883 2913 .000
CSR3 .234 2913 .000 .875 2913 .000
CSR4 .247 2913 .000 .872 2913 .000
CSR5 .236 2913 .000 .868 2913 .000
CSR6 .220 2913 .000 .871 2913 .000
TRUST1 .261 2913 .000 .867 2913 .000
TRUST2 .270 2913 .000 .865 2913 .000
TRUST3 .250 2913 .000 .873 2913 .000
TRUST4 .248 2913 .000 .876 2913 .000
HABIT1 .245 2913 .000 .880 2913 .000
HABIT2 .222 2913 .000 .885 2913 .000
HABIT3 .234 2913 .000 .883 2913 .000
STAC1 .227 2913 .000 .879 2913 .000
STAC2 .233 2913 .000 .871 2913 .000
STAC3 .236 2913 .000 .868 2913 .000
ALA1 .194 2913 .000 .911 2913 .000
ALA2 .202 2913 .000 .901 2913 .000
ALA3 .200 2913 .000 .911 2913 .000
ALA4 .196 2913 .000 .907 2913 .000
SWC1 .192 2913 .000 .914 2913 .000
SWC2 .188 2913 .000 .916 2913 .000
SWC3 .200 2913 .000 .910 2913 .000
SWC4 .180 2913 .000 .911 2913 .000
SWC5 .183 2913 .000 .912 2913 .000
SWC6 .185 2913 .000 .905 2913 .000
LPRO1 .231 2913 .000 .886 2913 .000
LPRO2 .243 2913 .000 .875 2913 .000
LPRO3 .228 2913 .000 .879 2913 .000
LPRO4 .227 2913 .000 .882 2913 .000
LPRO5 .206 2913 .000 .892 2913 .000
LPRO6 .192 2913 .000 .902 2913 .000
PROE1 .245 2913 .000 .873 2913 .000
PROE2 .243 2913 .000 .871 2913 .000
PROE3 .250 2913 .000 .866 2913 .000
a. Lilliefors Significance Correction

368
Appendix 5.2 - Normal probability plots

369

370
Appendix 5.3 – Independent samples test (Non-bias response)
Independent Samples Test
Levene's Test for
Equality of
Variances
t-test for Equality of Means
F Sig. t df Sig. (2-
tailed)
Mean
Difference
Std. Error
Difference
95% Confidence Interval of the
Difference
Lower Upper
CPV1 Equal variances assumed 0.441 0.507 1.924 1454 0.055 0.085 0.044 -0.002 0.172
Equal variances not assumed 1.924 1453.716 0.055 0.085 0.044 -0.002 0.172
CPV2 Equal variances assumed 1.225 0.269 1.260 1454 0.208 0.058 0.046 -0.032 0.148
Equal variances not assumed 1.260 1451.797 0.208 0.058 0.046 -0.032 0.148
CPV3 Equal variances assumed 0.408 0.523 2.745 1454 0.006 0.121 0.044 0.034 0.207
Equal variances not assumed 2.745 1453.880 0.006 0.121 0.044 0.034 0.207
CPV4 Equal variances assumed 0.522 0.470 0.721 1454 0.471 0.032 0.044 -0.054 0.118
Equal variances not assumed 0.721 1452.940 0.471 0.032 0.044 -0.054 0.118
CPV5 Equal variances assumed 0.787 0.375 2.214 1454 0.027 0.102 0.046 0.012 0.192
Equal variances not assumed 2.214 1452.057 0.027 0.102 0.046 0.012 0.192
CPV6 Equal variances assumed 3.724 0.054 3.695 1454 0.000 0.170 0.046 0.080 0.261
Equal variances not assumed 3.695 1453.130 0.000 0.170 0.046 0.080 0.261
CS1 Equal variances assumed 0.204 0.651 1.278 1454 0.201 0.058 0.045 -0.031 0.146
Equal variances not assumed 1.278 1453.066 0.201 0.058 0.045 -0.031 0.146
CS2 Equal variances assumed 0.025 0.875 0.317 1454 0.752 0.014 0.043 -0.071 0.099
Equal variances not assumed 0.317 1453.760 0.752 0.014 0.043 -0.071 0.099
CS3 Equal variances assumed 0.090 0.764 -0.569 1454 0.569 -0.025 0.043 -0.110 0.060
Equal variances not assumed -0.569 1452.483 0.569 -0.025 0.043 -0.110 0.060
CS4 Equal variances assumed 0.202 0.653 -0.641 1454 0.521 -0.030 0.047 -0.123 0.062
Equal variances not assumed -0.641 1453.311 0.521 -0.030 0.047 -0.123 0.062
CS5 Equal variances assumed 5.667 0.017 2.882 1454 0.004 0.181 0.063 0.058 0.305
Equal variances not assumed 2.882 1453.120 0.004 0.181 0.063 0.058 0.305
CL1 Equal variances assumed 0.435 0.510 1.138 1454 0.255 0.056 0.049 -0.041 0.153
Equal variances not assumed 1.138 1453.650 0.255 0.056 0.049 -0.041 0.153
CL2 Equal variances assumed 0.743 0.389 3.008 1454 0.003 0.163 0.054 0.057 0.270
Equal variances not assumed 3.008 1452.908 0.003 0.163 0.054 0.057 0.270
CL3 Equal variances assumed 0.758 0.384 1.546 1454 0.122 0.073 0.047 -0.020 0.165
Equal variances not assumed 1.546 1453.849 0.122 0.073 0.047 -0.020 0.165
CL4 Equal variances assumed 1.680 0.195 0.169 1454 0.866 0.008 0.049 -0.088 0.104
Equal variances not assumed 0.169 1449.243 0.866 0.008 0.049 -0.088 0.104
CL5 Equal variances assumed 0.595 0.441 1.094 1454 0.274 0.056 0.051 -0.045 0.157
Equal variances not assumed 1.094 1452.093 0.274 0.056 0.051 -0.045 0.157
ISL1 Equal variances assumed 0.569 0.451 -0.284 1454 0.777 -0.015 0.053 -0.120 0.089
Equal variances not assumed -0.284 1451.279 0.777 -0.015 0.053 -0.120 0.089
ISL2 Equal variances assumed 0.103 0.748 -0.448 1454 0.655 -0.022 0.049 -0.118 0.074
Equal variances not assumed -0.448 1451.932 0.655 -0.022 0.049 -0.118 0.074

371
ISL3 Equal variances assumed 0.290 0.591 -1.348 1454 0.178 -0.066 0.049 -0.162 0.030
Equal variances not assumed -1.348 1453.739 0.178 -0.066 0.049 -0.162 0.030
ISL4 Equal variances assumed 0.147 0.701 -1.781 1454 0.075 -0.088 0.049 -0.185 0.009
Equal variances not assumed -1.781 1453.984 0.075 -0.088 0.049 -0.185 0.009
ISL5 Equal variances assumed 9.079 0.003 -2.541 1454 0.011 -0.121 0.048 -0.214 -0.028
Equal variances not assumed -2.541 1451.712 0.011 -0.121 0.048 -0.214 -0.028
ISL6 Equal variances assumed 0.551 0.458 -0.541 1454 0.589 -0.027 0.051 -0.127 0.072
Equal variances not assumed -0.541 1451.014 0.589 -0.027 0.051 -0.127 0.072
ISL7 Equal variances assumed 3.769 0.052 -0.574 1454 0.566 -0.027 0.048 -0.121 0.066
Equal variances not assumed -0.574 1438.059 0.566 -0.027 0.048 -0.121 0.066
SQ1 Equal variances assumed 1.540 0.215 2.396 1454 0.017 0.115 0.048 0.021 0.210
Equal variances not assumed 2.396 1453.856 0.017 0.115 0.048 0.021 0.210
SQ2 Equal variances assumed 1.202 0.273 2.498 1454 0.013 0.114 0.046 0.024 0.204
Equal variances not assumed 2.498 1453.458 0.013 0.114 0.046 0.024 0.204
SQ3 Equal variances assumed 0.332 0.565 0.063 1454 0.950 0.003 0.044 -0.083 0.089
Equal variances not assumed 0.063 1452.934 0.950 0.003 0.044 -0.083 0.089
SQ4 Equal variances assumed 0.036 0.849 0.317 1454 0.751 0.015 0.048 -0.078 0.109
Equal variances not assumed 0.317 1453.844 0.751 0.015 0.048 -0.078 0.109
SQ5 Equal variances assumed 0.155 0.694 0.634 1454 0.526 0.030 0.048 -0.063 0.124
Equal variances not assumed 0.634 1453.882 0.526 0.030 0.048 -0.063 0.124
SQ6 Equal variances assumed 1.319 0.251 1.250 1454 0.211 0.059 0.047 -0.034 0.152
Equal variances not assumed 1.250 1452.932 0.211 0.059 0.047 -0.034 0.152
ESQ1 Equal variances assumed 2.857 0.091 0.428 1454 0.668 0.022 0.051 -0.079 0.123
Equal variances not assumed 0.428 1452.144 0.668 0.022 0.051 -0.079 0.123
ESQ2 Equal variances assumed 0.609 0.435 1.357 1454 0.175 0.073 0.054 -0.032 0.178
Equal variances not assumed 1.357 1453.881 0.175 0.073 0.054 -0.032 0.178
ESQ3 Equal variances assumed 0.978 0.323 0.166 1454 0.868 0.008 0.050 -0.089 0.106
Equal variances not assumed 0.166 1452.940 0.868 0.008 0.050 -0.089 0.106
ESQ4 Equal variances assumed 0.325 0.569 0.740 1454 0.459 0.037 0.050 -0.061 0.135
Equal variances not assumed 0.740 1452.896 0.459 0.037 0.050 -0.061 0.135
ESQ5 Equal variances assumed 0.010 0.921 1.572 1454 0.116 0.077 0.049 -0.019 0.173
Equal variances not assumed 1.572 1453.856 0.116 0.077 0.049 -0.019 0.173
ESQ6 Equal variances assumed 0.864 0.353 0.987 1454 0.324 0.049 0.050 -0.049 0.148
Equal variances not assumed 0.987 1453.616 0.324 0.049 0.050 -0.049 0.148
ESQ7 Equal variances assumed 0.513 0.474 -0.295 1454 0.768 -0.015 0.051 -0.116 0.085
Equal variances not assumed -0.295 1453.210 0.768 -0.015 0.051 -0.116 0.085
ESQ8 Equal variances assumed 0.491 0.484 -0.678 1454 0.498 -0.033 0.049 -0.128 0.062
Equal variances not assumed -0.678 1450.699 0.498 -0.033 0.049 -0.128 0.062
ESQ9 Equal variances assumed 1.015 0.314 -1.538 1454 0.124 -0.074 0.048 -0.169 0.020
Equal variances not assumed -1.538 1450.551 0.124 -0.074 0.048 -0.169 0.020
ESQ10 Equal variances assumed 3.984 0.046 0.252 1454 0.801 0.012 0.049 -0.084 0.109
Equal variances not assumed 0.252 1445.371 0.801 0.012 0.049 -0.084 0.109
PROQ1 Equal variances assumed 0.531 0.466 -1.350 1454 0.177 -0.063 0.047 -0.155 0.029
Equal variances not assumed -1.350 1453.171 0.177 -0.063 0.047 -0.155 0.029
PROQ2 Equal variances assumed 0.993 0.319 -0.709 1454 0.479 -0.032 0.045 -0.119 0.056
Equal variances not assumed -0.709 1453.694 0.479 -0.032 0.045 -0.119 0.056
PROQ3 Equal variances assumed 2.283 0.131 -0.875 1454 0.382 -0.038 0.044 -0.125 0.048
Equal variances not assumed -0.875 1451.641 0.382 -0.038 0.044 -0.125 0.048
PROQ4 Equal variances assumed 1.616 0.204 -0.490 1454 0.624 -0.022 0.045 -0.110 0.066
Equal variances not assumed -0.490 1453.373 0.624 -0.022 0.045 -0.110 0.066
PRICE1 Equal variances assumed 0.186 0.666 -0.782 1454 0.434 -0.037 0.047 -0.130 0.056
Equal variances not assumed -0.782 1452.335 0.434 -0.037 0.047 -0.130 0.056
PRICE2 Equal variances assumed 0.005 0.944 -0.909 1454 0.364 -0.048 0.053 -0.152 0.056
Equal variances not assumed -0.909 1453.990 0.364 -0.048 0.053 -0.152 0.056
PRICE3 Equal variances assumed 0.008 0.930 -1.272 1454 0.203 -0.059 0.046 -0.150 0.032
Equal variances not assumed -1.272 1453.486 0.203 -0.059 0.046 -0.150 0.032
CUSER1 Equal variances assumed 2.977 0.085 0.875 1454 0.382 0.049 0.057 -0.061 0.160
Equal variances not assumed 0.875 1452.168 0.382 0.049 0.057 -0.061 0.160

372
CUSER2 Equal variances assumed 0.040 0.842 -4.531 1454 0.000 -0.254 0.056 -0.364 -0.144
Equal variances not assumed -4.531 1453.977 0.000 -0.254 0.056 -0.364 -0.144
CUSER3 Equal variances assumed 3.012 0.083 0.462 1454 0.644 0.025 0.054 -0.080 0.130
Equal variances not assumed 0.462 1450.344 0.644 0.025 0.054 -0.080 0.130
CUSER4 Equal variances assumed 0.026 0.873 -0.725 1454 0.468 -0.036 0.049 -0.132 0.061
Equal variances not assumed -0.725 1453.698 0.468 -0.036 0.049 -0.132 0.061
CUSER5 Equal variances assumed 4.047 0.044 -1.616 1454 0.106 -0.084 0.052 -0.186 0.018
Equal variances not assumed -1.616 1453.419 0.106 -0.084 0.052 -0.186 0.018
CUSER6 Equal variances assumed 0.466 0.495 -1.736 1454 0.083 -0.093 0.054 -0.199 0.012
Equal variances not assumed -1.736 1453.991 0.083 -0.093 0.054 -0.199 0.012
CUSER7 Equal variances assumed 0.369 0.544 -1.497 1454 0.135 -0.080 0.053 -0.184 0.025
Equal variances not assumed -1.497 1453.895 0.135 -0.080 0.053 -0.184 0.025
CUSER8 Equal variances assumed 1.620 0.203 -0.760 1454 0.448 -0.041 0.054 -0.148 0.065
Equal variances not assumed -0.760 1450.809 0.448 -0.041 0.054 -0.148 0.065
CUSER9 Equal variances assumed 1.926 0.165 -1.089 1454 0.276 -0.056 0.052 -0.158 0.045
Equal variances not assumed -1.089 1452.606 0.276 -0.056 0.052 -0.158 0.045
CUSER10 Equal variances assumed 0.011 0.918 0.924 1454 0.356 0.048 0.052 -0.054 0.150
Equal variances not assumed 0.924 1453.925 0.356 0.048 0.052 -0.054 0.150
CUEX1 Equal variances assumed 7.772 0.005 -0.059 1454 0.953 -0.003 0.047 -0.095 0.089
Equal variances not assumed -0.059 1437.836 0.953 -0.003 0.047 -0.095 0.089
CUEX2 Equal variances assumed 0.826 0.364 -1.920 1454 0.055 -0.092 0.048 -0.186 0.002
Equal variances not assumed -1.920 1451.732 0.055 -0.092 0.048 -0.186 0.002
CUEX3 Equal variances assumed 0.064 0.800 -1.773 1454 0.076 -0.080 0.045 -0.168 0.008
Equal variances not assumed -1.773 1451.857 0.076 -0.080 0.045 -0.168 0.008
CUEX4 Equal variances assumed 0.658 0.417 -0.721 1454 0.471 -0.036 0.050 -0.133 0.062
Equal variances not assumed -0.721 1450.754 0.471 -0.036 0.050 -0.133 0.062
RBEX1 Equal variances assumed 3.396 0.066 1.847 1454 0.065 0.092 0.050 -0.006 0.190
Equal variances not assumed 1.847 1446.559 0.065 0.092 0.050 -0.006 0.190
RBEX2 Equal variances assumed 0.461 0.497 -0.029 1454 0.977 -0.001 0.047 -0.093 0.091
Equal variances not assumed -0.029 1453.929 0.977 -0.001 0.047 -0.093 0.091
RBEX3 Equal variances assumed 0.003 0.958 0.607 1454 0.544 0.032 0.052 -0.071 0.134
Equal variances not assumed 0.607 1453.881 0.544 0.032 0.052 -0.071 0.134
RBEX4 Equal variances assumed 1.356 0.244 0.550 1454 0.583 0.026 0.047 -0.067 0.119
Equal variances not assumed 0.550 1451.469 0.583 0.026 0.047 -0.067 0.119
RBEX5 Equal variances assumed 0.257 0.612 0.356 1454 0.722 0.016 0.046 -0.074 0.107
Equal variances not assumed 0.356 1453.608 0.722 0.016 0.046 -0.074 0.107
RBEX6 Equal variances assumed 1.198 0.274 -0.660 1454 0.509 -0.036 0.054 -0.142 0.070
Equal variances not assumed -0.660 1453.901 0.509 -0.036 0.054 -0.142 0.070
STIMA1 Equal variances assumed 2.362 0.125 -0.781 1454 0.435 -0.036 0.046 -0.125 0.054
Equal variances not assumed -0.781 1446.242 0.435 -0.036 0.046 -0.125 0.054
STIMA2 Equal variances assumed 0.000 0.995 -1.570 1454 0.117 -0.076 0.048 -0.170 0.019
Equal variances not assumed -1.570 1453.802 0.117 -0.076 0.048 -0.170 0.019
STIMA3 Equal variances assumed 0.646 0.422 -1.762 1454 0.078 -0.081 0.046 -0.171 0.009
Equal variances not assumed -1.762 1453.930 0.078 -0.081 0.046 -0.171 0.009
STIMA4 Equal variances assumed 0.014 0.907 -0.809 1454 0.419 -0.037 0.046 -0.127 0.053
Equal variances not assumed -0.809 1452.149 0.419 -0.037 0.046 -0.127 0.053
STIMA5 Equal variances assumed 0.164 0.685 -1.225 1454 0.221 -0.058 0.047 -0.150 0.035
Equal variances not assumed -1.225 1453.674 0.221 -0.058 0.047 -0.150 0.035
STIMA6 Equal variances assumed 1.113 0.292 0.331 1454 0.741 0.027 0.083 -0.135 0.190
Equal variances not assumed 0.331 976.424 0.741 0.027 0.083 -0.135 0.190
STIMA7 Equal variances assumed 0.000 0.989 -1.220 1454 0.223 -0.056 0.046 -0.147 0.034
Equal variances not assumed -1.220 1452.561 0.223 -0.056 0.046 -0.147 0.034
COIMA1 Equal variances assumed 0.917 0.338 0.581 1454 0.561 0.026 0.045 -0.062 0.114
Equal variances not assumed 0.581 1453.911 0.561 0.026 0.045 -0.062 0.114
COIMA2 Equal variances assumed 0.000 0.989 -0.031 1454 0.976 -0.001 0.045 -0.089 0.086
Equal variances not assumed -0.031 1450.589 0.976 -0.001 0.045 -0.089 0.086
COIMA3 Equal variances assumed 0.018 0.894 0.178 1454 0.859 0.008 0.046 -0.082 0.099
Equal variances not assumed 0.178 1453.986 0.859 0.008 0.046 -0.082 0.099

373
CSR1 Equal variances assumed 0.082 0.774 -0.388 1454 0.698 -0.018 0.046 -0.108 0.072
Equal variances not assumed -0.388 1453.656 0.698 -0.018 0.046 -0.108 0.072
CSR2 Equal variances assumed 0.258 0.611 -0.176 1454 0.860 -0.008 0.047 -0.100 0.083
Equal variances not assumed -0.176 1453.853 0.860 -0.008 0.047 -0.100 0.083
CSR3 Equal variances assumed 0.122 0.727 -0.464 1454 0.642 -0.021 0.044 -0.108 0.066
Equal variances not assumed -0.464 1453.971 0.642 -0.021 0.044 -0.108 0.066
CSR4 Equal variances assumed 8.450 0.004 -1.535 1454 0.125 -0.069 0.045 -0.156 0.019
Equal variances not assumed -1.535 1448.714 0.125 -0.069 0.045 -0.156 0.019
CSR5 Equal variances assumed 0.048 0.827 -0.949 1454 0.343 -0.041 0.043 -0.126 0.044
Equal variances not assumed -0.949 1453.243 0.343 -0.041 0.043 -0.126 0.044
CSR6 Equal variances assumed 5.621 0.018 -1.089 1454 0.276 -0.051 0.047 -0.142 0.041
Equal variances not assumed -1.089 1450.275 0.276 -0.051 0.047 -0.142 0.041
TRUST1 Equal variances assumed 0.082 0.774 0.764 1454 0.445 0.036 0.047 -0.056 0.127
Equal variances not assumed 0.764 1452.531 0.445 0.036 0.047 -0.056 0.127
TRUST2 Equal variances assumed 1.366 0.243 -0.537 1454 0.591 -0.023 0.043 -0.109 0.062
Equal variances not assumed -0.537 1453.912 0.591 -0.023 0.043 -0.109 0.062
TRUST3 Equal variances assumed 0.436 0.509 -0.301 1454 0.764 -0.014 0.046 -0.103 0.076
Equal variances not assumed -0.301 1453.761 0.764 -0.014 0.046 -0.103 0.076
TRUST4 Equal variances assumed 1.236 0.266 -0.503 1454 0.615 -0.023 0.046 -0.114 0.068
Equal variances not assumed -0.503 1453.827 0.615 -0.023 0.046 -0.114 0.068
HABIT1 Equal variances assumed 0.177 0.674 0.435 1454 0.664 0.022 0.051 -0.077 0.121
Equal variances not assumed 0.435 1452.970 0.664 0.022 0.051 -0.077 0.121
HABIT2 Equal variances assumed 1.052 0.305 0.562 1454 0.574 0.027 0.049 -0.068 0.123
Equal variances not assumed 0.562 1452.153 0.574 0.027 0.049 -0.068 0.123
HABIT3 Equal variances assumed 0.579 0.447 0.228 1454 0.819 0.011 0.048 -0.083 0.105
Equal variances not assumed 0.228 1453.479 0.819 0.011 0.048 -0.083 0.105
STAC1 Equal variances assumed 5.340 0.021 3.069 1454 0.002 0.155 0.051 0.056 0.254
Equal variances not assumed 3.069 1448.267 0.002 0.155 0.051 0.056 0.254
STAC2 Equal variances assumed 0.013 0.910 1.231 1454 0.218 0.060 0.049 -0.036 0.157
Equal variances not assumed 1.231 1453.754 0.218 0.060 0.049 -0.036 0.157
STAC3 Equal variances assumed 0.367 0.545 1.372 1454 0.170 0.067 0.049 -0.029 0.164
Equal variances not assumed 1.372 1453.246 0.170 0.067 0.049 -0.029 0.164
ALA1 Equal variances assumed 0.371 0.543 1.626 1454 0.104 0.087 0.053 -0.018 0.191
Equal variances not assumed 1.626 1449.192 0.104 0.087 0.053 -0.018 0.191
ALA2 Equal variances assumed 0.669 0.414 1.405 1454 0.160 0.071 0.051 -0.028 0.171
Equal variances not assumed 1.405 1450.032 0.160 0.071 0.051 -0.028 0.171
ALA3 Equal variances assumed 0.171 0.679 1.927 1454 0.054 0.104 0.054 -0.002 0.211
Equal variances not assumed 1.927 1452.587 0.054 0.104 0.054 -0.002 0.211
ALA4 Equal variances assumed 0.396 0.529 1.536 1454 0.125 0.082 0.054 -0.023 0.188
Equal variances not assumed 1.536 1453.999 0.125 0.082 0.054 -0.023 0.188
SWC1 Equal variances assumed 0.107 0.743 -1.376 1454 0.169 -0.076 0.055 -0.183 0.032
Equal variances not assumed -1.376 1453.567 0.169 -0.076 0.055 -0.183 0.032
SWC2 Equal variances assumed 4.637 0.031 -0.888 1454 0.375 -0.051 0.057 -0.163 0.061
Equal variances not assumed -0.888 1448.192 0.375 -0.051 0.057 -0.163 0.061
SWC3 Equal variances assumed 1.434 0.231 0.281 1454 0.779 0.015 0.054 -0.090 0.121
Equal variances not assumed 0.281 1451.601 0.779 0.015 0.054 -0.090 0.121
SWC4 Equal variances assumed 1.754 0.186 -0.943 1454 0.346 -0.052 0.055 -0.161 0.056
Equal variances not assumed -0.943 1447.757 0.346 -0.052 0.055 -0.161 0.056
SWC5 Equal variances assumed 0.227 0.634 -1.415 1454 0.157 -0.080 0.056 -0.190 0.031
Equal variances not assumed -1.415 1452.241 0.157 -0.080 0.056 -0.190 0.031
SWC6 Equal variances assumed 0.055 0.815 -1.034 1454 0.301 -0.058 0.056 -0.167 0.052
Equal variances not assumed -1.034 1453.554 0.301 -0.058 0.056 -0.167 0.052
LPRO1 Equal variances assumed 0.022 0.881 0.348 1454 0.728 0.018 0.051 -0.083 0.118
Equal variances not assumed 0.348 1453.859 0.728 0.018 0.051 -0.083 0.118
LPRO2 Equal variances assumed 2.626 0.105 0.559 1454 0.576 0.027 0.049 -0.069 0.124
Equal variances not assumed 0.559 1450.758 0.576 0.027 0.049 -0.069 0.124
LPRO3 Equal variances assumed 1.205 0.272 1.412 1454 0.158 0.070 0.050 -0.027 0.167
Equal variances not assumed 1.412 1451.670 0.158 0.070 0.050 -0.027 0.167

374
LPRO4 Equal variances assumed 0.704 0.402 -0.275 1454 0.783 -0.014 0.050 -0.112 0.084
Equal variances not assumed -0.275 1453.286 0.783 -0.014 0.050 -0.112 0.084
LPRO5 Equal variances assumed 2.404 0.121 -0.422 1454 0.673 -0.022 0.052 -0.124 0.080
Equal variances not assumed -0.422 1451.005 0.673 -0.022 0.052 -0.124 0.080
LPRO6 Equal variances assumed 5.606 0.018 -0.099 1454 0.921 -0.005 0.055 -0.114 0.103
Equal variances not assumed -0.099 1446.632 0.921 -0.005 0.055 -0.114 0.103
PROE1 Equal variances assumed 0.038 0.845 -0.781 1454 0.435 -0.036 0.046 -0.125 0.054
Equal variances not assumed -0.781 1453.913 0.435 -0.036 0.046 -0.125 0.054
PROE2 Equal variances assumed 0.072 0.788 0.059 1454 0.953 0.003 0.047 -0.089 0.094
Equal variances not assumed 0.059 1453.909 0.953 0.003 0.047 -0.089 0.094
PROE3 Equal variances assumed 0.128 0.720 -0.847 1454 0.397 -0.040 0.047 -0.132 0.052
Equal variances not assumed -0.847 1453.952 0.397 -0.040 0.047 -0.132 0.052
Appendix 5.4 - Full pie-charts summarises all respondents’ demographic information
24.96%
16.75%
23.31% 17.75%
17.23% Hanoi
Da Nang
Ho Chi Minh
Binh Duong
Can Tho
LOCATION 30.52%
68.73%
0.76%
Male
Female
Other
GENDER
0.86%
41.54%
21.15% 10.40%
8.89%
17.16% AGE RANGE Under 18
18-22
23-30
31-40
41-55
Above 55
8.07%
85.03%
6.90%
EDUCATION LEVEL
Under highschool
Under college
College,undergraduate
30.28%
7.45%
24.51%
27.91%
0.65% 9.20%
OCCUPATION Students
Self employment
Office staffs
Housewife
Unemployment
Other

375
Appendix 5.5 – The shopping behaviours of Vietnamese supermarket consumers 1. Overall, where do you prefer to go for grocery shopping?
Frequency Percent
Supermarkets 1420 48.75
Traditional markets 1386 47.58
Others 107 3.67
Total 2913 100.00
2. How often do you go to traditional markets?
Frequency Percent
Once a day 821 28.18
Twice a week 617 21.18
Three times a week 463 15.89
Once a month 339 11.64
Twice a month 256 8.79
Others 417 14.32
Total 2913 100.00
3. How often do you go to supermarkets?
Frequency Percent
Once a day 164 5.63
Twice a week 612 21.01
Three times a week 216 7.42
Once a month 764 26.23
Twice a month 732 25.13
Others 425 14.59
Total 2913 100.00
43.77%
29.28%
23.55%
2.23% 1.17% INCOME
Lower than 5 milion VND (170 GBP)
From 5 to 10 million VND (170-340GBP)
From 10 to 20 million VND (340-650GBP)
From 20 to 50 million VND (650-1620 GBP)
Higher than 50 million (above 1620 GBP)
55.58% 34.64%
8.10% 1.68% FAMILY'S EXPENDITURE FOR MONTHLY GROCERIES
Lower than 5 million VND (170 GBP)
From 5 to 10 million VND (170-5XX GBP)
From 10 to 20 million VND (5XX - 650GBP)
More than 20 million (650GBP)

376
4. Which supermarket do you usually go? (Please just choose one option)
Frequency Percent
Coopmart or BigC 1585 54.41
Lotte Mart 398 13.66
Vinmart 528 18.13
AEON 268 9.20
Others 134 4.60
Total 2913 100.00
5. Do you have any loyalty cards from the supermarket which you have just chosen at Question 4?
Frequency Percent
Yes 1656 56.85
No 1257 0.43
Total 2913 100.00
6. How long have you used it?
Frequency Percent
I have no loyalty card 1242 42.64
Less than 1 year 653 22.42
1-3 years 665 22.83
More than 3 years 353 12.12
Total 2913 100.00
7. Do you think that you are loyal to the above chosen supermarket (question 4)?
Frequency Percent
Yes 1805 61.96
No 1108 38.04
Total 2913 100.00
8. How satisfied are you with the above chosen supermarket on a scale of 1 to 5? (1 means “very
dissatisfied”, 5 means “very satisfied”)
Frequency Percent
1 26 0.89
2 94 3.23
3 936 32.13
4 1495 51.32
5 362 12.43
Total 2913 100.00
9. How satisfied are you with the offered service quality by this supermarket on a scale of 1 to 5? (1
means “very dissatisfied”, 5 means “very satisfied”)
Frequency Percent
1 19 0.65
2 131 4.50
3 948 32.54
4 1450 49.78
5 365 12.53
Total 2913 100.00
10. Do you think your favorite supermarkets meet your needs?
Frequency Percent
Yes 1004 34.47
No 380 13.04
Partly 1529 52.49
Total 2913 100.00
11. If you are not satisfied with the service or the quality of the products at a supermarket, will you back
to visit and shop there again?
Frequency Percent
Yes 1541 52.90
No 1365 46.86
Total 2913 100.00

377
12. Will you still stay with your favorite supermarket if you see an alternative attractiveness from other
supermarkets?
Frequency Percent
Yes 1468 50.39
No 1445 49.61
Total 2913 100.00
13. “I choose this supermarket’s brand name because its good store image”. Do you agree with the above
statement?
Frequency Percent
Yes 1699 58.32
No 1214 41.68
Total 2913 100.00
14. Do you think loyalty programs such as bonus points, discounts and gifts will affect your decision?
Frequency Percent
Yes 2216 76.07
No 697 23.93
Total 2913 100.00
15. If other supermarkets offer appeal promotions or discounts, would you be ready to switch to them?
Frequency Percent
Yes 2156 74.01
No 757 25.99
Total 2913 100.00
16. How many loyalty cards do you have for grocery shopping from different supermarkets?
Frequency Percent
0 1056 36.25
1 777 26.67
2 655 22.49
3 322 11.05
More than 4 103 3.54
Total 2913 100.00
17. Suppose you are always loyal to specific supermarket A, if supermarket B opens a store near you or
easier for you to get there and suppose that other factors meet your requirements, do you wish to switch
to shop at supermarket B?
Frequency Percent
Yes 2483 85.24
No 430 14.76
Total 2913 100.00
18. Does the supermarket’s brand name affect your choices?
Frequency Percent
Yes 2102 72.16
No 811 27.84
Total 2913 100.00
19. Suppose that there are two different supermarkets that you feel satisfied, all other factors are the
same, one of these is a domestic brand name, another is foreign brand name, which one will you choose?
Frequency Percent
Domestic brand name 1766 60.62
Foreign brand name 1147 39.38
Total 2913 100.00
20. Are you in charge with buying grocery products for the whole family or for yourself?
Frequency Percent
The whole family 1390 47.72
Myself 1264 43.39
I am not in charge with buying grocery
products 259 8.89
Total 2913 100.00

378
Appendix 5.6 – Internal consistency of all researched constructed before EFA
1. Internal consistency of customer perceived value (CPV)
Note: **. Correlation is significant at the 0.01 level (2-tailed).
Items Mean Std. Deviation
Inter-item correlations Corrected
Item-Total
Correlation
Cronbach's
alpha
Cronbach's
Alpha if
Item
Deleted CPV1 CPV2 CPV3 CPV4 CPV5 CPV6
CPV1 3.57 0.887 1 0.525
0.831
0.819
CPV2 3.74 0.914 .508** 1 0.65 0.794
CPV3 3.71 0.87 .477** .599** 1 0.667 0.791
CPV4 3.8 0.854 .380** .529** .543** 1 0.666 0.791
CPV5 3.69 0.89 .335** .446** .470** .579** 1 0.617 0.801
CPV6 3.44 0.909 .302** .332** .374** .427** .476** 1 0.497 0.825
2. Internal consistency of customer satisfaction (CS)
Items Mean Std.
Deviation
Inter-item correlations Corrected
Item-Total
Correlation
Cronbach's
alpha
Cronbach's
Alpha if Item
Deleted
CS1 CS2 CS3 CS4 CS5
CS1 3.08 0.889 1 0.594
0.659
0.527
CS2 3.42 0.847 .616** 1 0.592 0.534
CS3 3.53 0.844 .542** .649** 1 0.567 0.545
CS4 3.45 0.901 .447** .505** .526** 1 0.529 0.556
CS5 2.28 1.268 .093** -0.03 -0.04 .068** 1 0.032 0.827
3. Internal consistency of customer loyalty (CL)
Items Mean Std.
Deviation
Inter-item correlations Corrected
Item-Total
Correlation
Cronbach's
alpha
Cronbach's
Alpha if Item
Deleted CL1 CL2 CL3 CL4 CL5
CL1 3.46 0.95 1 0.587
0.821
0.794
CL2 2.88 1.063 .403** 1 0.517 0.817
CL3 3.38 0.915 .485** .442** 1 0.65 0.777
CL4 3.53 0.949 .498** .381** .588** 1 0.675 0.769
CL5 3.39 0.995 .470** .437** .507** .623** 1 0.656 0.773

379
4. Internal consistency of in-store logistics (ISL)
5. Internal consistency of service quality (SQ)
Items Mean Std.
Deviation
Inter-item correlations Corrected
Item-Total
Correlation
Cronbach's
alpha
Cronbach's
Alpha if
Item
Deleted SQ1 SQ2 SQ3 SQ4 SQ5 SQ6
SQ1 3.34 0.930 1 0.678
.876
0.855
SQ2 3.45 0.879 .679** 1 0.712 0.849
SQ3 3.63 0.848 .532** .632** 1 0.667 0.857
SQ4 3.45 0.919 .533** .541** .522** 1 0.676 0.855
SQ5 3.69 0.908 .486** .479** .511** .553** 1 0.683 0.854
SQ6 3.75 0.909 .473** .485** .466** .540** .685** 1 0.665 0.857
6. Internal consistency of e-service quality (ESQ)
Items Mean Std.
Deviation
Inter-item correlations Corrected
Item-Total
Correlation
Cronbach's
alpha
Cronbach's
Alpha if
Item
Deleted ISL1 ISL2 ISL3 ISL4 ISL5 ISL6 ISL7
ISL1 3.59 1.021 1 0.598
.855
0.838
ISL2 3.74 0.953 .553** 1 0.627 0.833
ISL3 3.94 0.948 .507** .519** 1 0.645 0.831
ISL4 3.97 0.935 .382** .442** .560** 1 0.623 0.834
ISL5 3.89 0.908 .408** .428** .464** .529** 1 0.631 0.833
ISL6 3.76 0.986 .415** .406** .395** .430** .513** 1 0.606 0.836
ISL7 3.88 0.929 .398** .425** .405** .431** .456** .547** 1 0.597 0.837
Items Mea
n
Std.
Deviatio
n
Inter-item correlations Corrected
Item-Total
Correlatio
n
Cronbac
h's alpha
Cronba
ch's
Alpha if
Item
Deleted
ESQ
1
ESQ
2
ESQ
3
ESQ
4
ESQ
5
ESQ
6
ESQ
7
ESQ
8
ESQ
9
ESQ1
0
ESQ1 3.19 0.993 1 0.633
.908
0.901
ESQ2 3.26 1.021 .634** 1 0.650 0.900
ESQ3 3.42 0.952 .552** .556** 1 0.680 0.898
ESQ4 3.51 0.950 .452** .484** .548** 1 0.657 0.900
ESQ5 3.58 0.937 .436** .476** .521** .575** 1 0.660 0.900
ESQ6 3.63 0.952 .433** .527** .508** .526** .594** 1 0.653 0.900
ESQ7 3.30 1.002 .457** .407** .452** .438** .455** .419** 1 0.672 0.899
ESQ8 3.36 0.937 .441** .439** .472** .473** .461** .456** .733** 1 0.720 0.896
ESQ9 3.44 0.938 .444** .429** .483** .453** .469** .461** .607** .682** 1 0.704 0.897
ESQ10 3.50 0.954 .395** .406** .451** .466** .443** .462** .541** .633** .670** 1 0.665 0.899

380
7. Internal consistency of product quality (PROQ)
Items Mean Std.
Deviation
Inter-item correlations Corrected
Item-Total
Correlation
Cronbach's
alpha
Cronbach's
Alpha if
Item
Deleted PROQ1 PROQ2 PROQ3 PROQ4
PROQ1 3.88 0.910 1 0.599
.824
0.802
PROQ2 3.87 0.855 .650** 1 0.727 0.743
PROQ3 3.60 0.868 .468** .598** 1 0.672 0.768
PROQ4 3.64 0.871 .405** .522** .605** 1 0.602 0.799
8. Internal consistency of price (PRICE)
Items Mean Std.
Deviation
Inter-item correlations Corrected
Item-Total
Correlation
Cronbach's
alpha
Cronbach's
Alpha if
Item
Deleted PRICE1 PRICE2 PRICE3
PRICE1 3.65 0.906 1 0.651
.807
0.740
PRICE2 3.44 1.037 .572** 1 0.653 0.744
PRICE3 3.57 0.899 .592** .593** 1 0.668 0.724
9. Internal consistency of customer service (CUSER)
Items Mean
Std.
Deviatio
n
Inter-item correlations Correct
ed Item-
Total
Correla
tion
Cronb
ach's
alpha
Cronbach's
Alpha if
Item
Deleted
CUSE
R1 2 3 4 5 6 7 8 9 10
CUSER1 3.05 1.076 1 0.571
.884
0.876
CUSER2 3.48 1.060 .450** 1 0.622 0.872
CUSER3 3.31 1.014 .664** .555** 1 0.679 0.868
CUSER4 3.36 0.970 .478** .463** .574** 1 0.630 0.872
CUSER5 3.79 0.986 .280** .443** .383** .420** 1 0.539 0.878
CUSER6 3.61 1.042 .274** .413** .351** .403** .504** 1 0.591 0.875
CUSER7 3.58 0.980 .406** .412** .451** .412** .414** .578** 1 0.642 0.871
CUSER8 3.45 1.044 .361** .400** .426** .417** .359** .466** .519** 1 0.643 0.871
CUSER9 3.41 1.008 .338** .411** .417** .396** .326** .400** .434** .581** 1 0.617 0.873
CUSER10 3.48 1.008 .397** .391** .437** .422** .326** .387** .422** .536** .607** 1 0.619 0.873

381
10. Internal consistency of customer experience (CUEXP)
Items Mean Std.
Deviation
Inter-item correlations Corrected
Item-Total
Correlation
Cronbach's
alpha
Cronbach's
Alpha if
Item
Deleted CUEXP1 CUEXP2 CUEXP3 CUEXP4
CUEXP1 3.59 0.894 1 0.691
.848
0.805
CUEXP2 3.63 0.910 .643** 1 0.727 0.789
CUEXP3 3.70 0.871 .645** .666** 1 0.742 0.784
CUEXP4 3.70 0.940 .476** .526** .552** 1 0.591 0.848
11. Internal consistency of retail brand experience (RBEX)
Items Mean Std. Deviation Inter-item correlations Corrected
Item-Total
Correlation
Cronbach's
alpha
Cronbach's
Alpha if Item
Deleted RBEX1 RBEX2 RBEX3 RBEX4 RBEX5 RBEX6
RBEX1 3.48 0.956 1 0.63
0.834
0.803
RBEX2 3.59 0.894 .594** 1 0.662 0.797
RBEX3 3.37 1.001 .474** .510** 1 0.626 0.804
RBEX4 3.59 0.909 .465** .532** .540** 1 0.657 0.798
RBEX5 3.58 0.901 .500** .502** .529** .576** 1 0.662 0.797
RBEX6 3.06 1.042 .348** .339** .318** .351** .371** 1 0.439 0.844
12. Internal consistency of store image (STIMA)
Items Mean
Std.
Devia
tion
Inter-item correlations Corrected
Item-Total
Correlation
Cronbach'
s alpha
Cronbach's
Alpha if Item
Deleted STIMA1 2 3 4 5 6 7
STIMA1 3.54 0.889 1 0.628
.848
0.825
STIMA2 3.47 0.926 .614** 1 0.641 0.823
STIMA3 3.55 0.879 .561** .561** 1 0.692 0.816
STIMA4 3.67 0.891 .471** .519** .564** 1 0.643 0.823
STIMA5 3.56 0.904 .428** .436** .475** .498** 1 0.623 0.825
STIMA6 3.60 1.281 .304** .335** .395** .361** .391** 1 0.477 0.860
STIMA7 3.71 0.875 .471** .428** .520** .477** .568** .412** 1 0.645 0.823
13. Internal consistency of corporate image (COIMA)
Items Mean Std.
Deviation
Inter-item correlations Corrected
Item-Total
Correlation
Cronbach's
alpha
Cronbach's
Alpha if
Item
Deleted COIMA1 COIMA2 COIMA3
COIMA1 3.74 0.870 1 0.714
0.831
0.742
COIMA2 3.81 0.865 .720** 1 0.741 0.714
COIMA3 3.65 0.893 .555** .590** 1 0.617 0.837

382
14. Internal consistency of corporate social responsibility (CSR)
Items Mean Std.
Deviation
Inter-item correlations Corrected
Item-Total
Correlation
Cronbach's
alpha
Cronbach's
Alpha if
Item
Deleted CSR1 CSR2 CSR3 CSR4 CSR5 CSR6
CSR1 3.55 0.879 1 0.691
.886
0.867
CSR2 3.48 0.898 .611** 1 0.662 0.872
CSR3 3.63 0.863 .594** .595** 1 0.741 0.859
CSR4 3.65 0.864 .539** .535** .647** 1 0.724 0.862
CSR5 3.70 0.852 .558** .485** .597** .626** 1 0.720 0.863
CSR6 3.71 0.893 .492** .467** .534** .564** .629** 1 0.659 0.873
15. Internal consistency of trust (TRUST)
Items Mean Std.
Deviation
Inter-item correlations Corrected
Item-Total
Correlation
Cronbach's
alpha
Cronbach's
Alpha if
Item
Deleted TRUST1 TRUST2 TRUST3 TRUST4
TRUST1 3.61 0.902 1 0.766
.866
0.808
TRUST2 3.71 0.851 .758** 1 0.782 0.803
TRUST3 3.69 0.877 .642** .709** 1 0.725 0.825
TRUST4 3.62 0.907 .559** .523** .527** 1 0.599 0.876
16. Internal consistency of habit (HABIT)
Items Mean Std.
Deviation
Inter-item correlations Corrected
Item-Total
Correlation
Cronbach's
alpha
Cronbach's
Alpha if
Item
Deleted HABIT1 HABIT2 HABIT3
HABIT1 3.71 0.953 1 0.640
.820
0.785
HABIT2 3.65 0.937 .604** 1 0.708 0.716
HABIT3 3.67 0.925 .558** .647** 1 0.672 0.753
17. Internal consistency of store accessibility (STAC)
Items Mean Std.
Deviation
Inter-item correlations Corrected
Item-Total
Correlation
Cronbach's
alpha
Cronbach's
Alpha if
Item
Deleted STAC1 STAC2 STAC3
STAC1 3.76 1.356 1 0.590
.813
0.889
STAC2 3.82 0.940 .569** 1 0.751 0.680
STAC3 3.84 0.940 .550** .801** 1 0.734 0.695

383
18. Internal consistency of alternative attractiveness (ALA)
Items Mean Std.
Deviation
Inter-item correlations Corrected
Item-Total
Correlation
Cronbach's
alpha
Cronbach's
Alpha if
Item
Deleted ALA1 ALA2 ALA3 ALA4
ALA1 3.14 1.021 1 0.695
.866
0.838
ALA2 3.38 0.965 .619** 1 0.701 0.836
ALA3 3.19 1.026 .592** .597** 1 0.729 0.824
ALA4 3.29 1.006 .604** .609** .692** 1 0.741 0.819
19. Internal consistency of switching costs (SWC)
Items Mean Std.
Deviation
Inter-item correlations Corrected
Item-Total
Correlation
Cronbach's
alpha
Cronbach's
Alpha if Item
Deleted SWC1 SWC2 SWC3 SWC4 SWC5 SWC6
SWC1 3.04 1.063 1 0.640
.879
0.865
SWC2 2.95 1.102 .680** 1 0.724 0.851
SWC3 3.17 1.040 .526** .617** 1 0.710 0.854
SWC4 3.24 1.062 .472** .548** .614** 1 0.709 0.854
SWC5 3.21 1.078 .461** .531** .558** .629** 1 0.694 0.856
SWC6 3.33 1.054 .434** .489** .501** .552** .589** 1 0.636 0.866
20. Internal consistency of loyalty programs (LPRO)
Items Mean Std.
Deviation
Inter-item correlations Corrected
Item-Total
Correlation
Cronbach's
alpha
Cronbach's
Alpha if
Item Deleted LPRO1 LPRO2 LPRO3 LPRO4 LPRO5 LPRO6
LPRO1 3.59 0.982 1 0.668
.888
0.874
LPRO2 3.73 0.938 .671** 1 0.723 0.866
LPRO3 3.72 0.941 .604** .709** 1 0.741 0.863
LPRO4 3.65 0.941 .561** .626** .677** 1 0.768 0.859
LPRO5 3.53 0.986 .502** .488** .549** .620** 1 0.706 0.868
LPRO6 3.44 1.061 .411** .443** .461** .593** .690** 1 0.631 0.882
21. Internal consistency of promotion effects (PROE)
Items Mean Std.
Deviation
Inter-item correlations Corrected
Item-Total
Correlation
Cronbach's
alpha
Cronbach's
Alpha if
Item
Deleted PROE1 PROE2 PROE3
PROE1 3.65 0.874 1 0.661
.847
0.836
PROE2 3.79 0.896 .639** 1 0.762 0.738
PROE3 3.81 0.894 .585** .717** 1 0.720 0.780

384
Appendix 5.7- KMO and Barlett’s Test- Communalities (EFA)
KMO and Bartlett's Test
Kaiser-Meyer-Olkin Measure of
Sampling Adequacy. 0.966
Bartlett's
Test of
Sphericity
Approx. Chi-
Square 105721.538
df 1953
Sig. 0
Communalities
Initial Extraction
CPV2 0.497 0.623
CPV3 0.467 0.602
CPV4 0.431 0.495
CS1 0.479 0.566
CS2 0.572 0.709
CS3 0.535 0.595
CL3 0.438 0.493
CL4 0.544 0.735
CL5 0.491 0.556
ISL1 0.480 0.574
ISL2 0.437 0.575
ISL3 0.415 0.494
SQ4 0.468 0.497
SQ5 0.565 0.704
SQ6 0.569 0.682
ESQ4 0.444 0.526
ESQ5 0.518 0.643
ESQ6 0.493 0.565
ESQ7 0.613 0.684
ESQ8 0.650 0.826
ESQ9 0.543 0.588
PROQ1 0.527 0.559
PROQ2 0.591 0.809
PROQ3 0.479 0.500
PRICE1 0.548 0.623
PRICE2 0.487 0.649
PRICE3 0.556 0.608
CUSER1 0.496 0.645
CUSER3 0.550 0.706
CUEXP1 0.585 0.651
CUEXP2 0.567 0.677
CUEXP3 0.579 0.658
RBEX1 0.506 0.552
RBEX2 0.515 0.579
RBEX4 0.509 0.565
RBEX5 0.489 0.536
STIMA1 0.597 0.663
STIMA2 0.504 0.609
STIMA3 0.481 0.539
CSR3 0.549 0.624
CSR4 0.563 0.659
CSR5 0.520 0.592
TRUST1 0.684 0.765
TRUST2 0.688 0.788
TRUST3 0.603 0.646
HABIT1 0.523 0.574
HABIT2 0.532 0.706
HABIT3 0.534 0.612
STAC1 0.667 0.730
STAC2 0.728 0.827
STAC3 0.701 0.779
ALA2 0.459 0.534
ALA3 0.561 0.694
ALA4 0.563 0.705
SWC2 0.506 0.604
SWC3 0.514 0.681
SWC4 0.457 0.546
LPRO2 0.576 0.661
LPRO3 0.615 0.769
LPRO4 0.558 0.623
PROE1 0.540 0.578
PROE2 0.616 0.782
PROE3 0.578 0.663
Extraction Method: Principal
Axis Factoring.

385
Appendix 5.8 - Total Variance Explained (EFA)
Total Variance Explained
Factor
Initial Eigenvalues Extraction Sums of Squared Loadings
Rotation Sums of Squared
Loadingsa
Total % of
Variance Cumulative
% Total
% of Variance
Cumulative %
Total
1 21.243 33.718 33.718 20.881 33.145 33.145 9.209
2 3.098 4.918 38.636 2.733 4.339 37.484 10.622
3 2.422 3.845 42.481 2.111 3.351 40.834 10.098
4 1.931 3.065 45.546 1.575 2.500 43.334 10.424
5 1.735 2.754 48.300 1.427 2.266 45.600 5.398
6 1.663 2.639 50.939 1.285 2.040 47.639 10.500
7 1.485 2.357 53.296 1.132 1.797 49.436 3.374
8 1.352 2.146 55.442 1.003 1.593 51.029 11.408
9 1.292 2.051 57.493 0.920 1.460 52.489 10.644
10 1.287 1.916 59.410 0.867 1.376 53.865 11.436
11 1.273 1.782 61.191 0.760 1.206 55.071 12.226
12 1.265 1.720 62.911 0.713 1.132 56.203 11.375
13 1.247 1.578 64.489 0.678 1.076 57.279 14.268
14 1.235 1.554 66.043 0.634 1.007 58.287 13.655
15 1.189 1.548 67.591 0.607 0.964 59.251 14.068
16 1.176 1.452 69.044 0.552 0.876 60.127 12.544
17 1.135 1.342 70.385 0.495 0.785 60.912 14.347
18 1.102 1.316 71.701 0.456 0.724 61.636 12.698
19 1.094 1.294 72.995 0.433 0.687 62.323 13.459
20 1.047 1.263 74.259 0.417 0.662 62.985 9.087
21 1.022 1.094 75.353 0.325 0.515 63.500 13.718
22 0.921 0.986 76.339
23 0.871 0.906 77.245
24 0.743 0.861 78.106
25 0.620 0.826 78.932
26 0.504 0.800 79.731
27 0.490 0.778 80.510
28 0.484 0.769 81.279
29 0.468 0.744 82.022
30 0.465 0.738 82.760
31 0.454 0.720 83.480
32 0.447 0.709 84.189
33 0.441 0.700 84.889
34 0.417 0.662 85.552
35 0.409 0.650 86.202
36 0.402 0.638 86.839
37 0.393 0.623 87.462
38 0.384 0.609 88.072
39 0.377 0.598 88.670
40 0.374 0.594 89.264
41 0.370 0.587 89.851
42 0.364 0.577 90.429
43 0.357 0.567 90.995
44 0.347 0.552 91.547

386
45 0.338 0.536 92.083
46 0.332 0.527 92.610
47 0.330 0.523 93.133
48 0.323 0.512 93.646
49 0.317 0.503 94.149
50 0.309 0.490 94.639
51 0.303 0.480 95.119
52 0.298 0.473 95.593
53 0.294 0.466 96.059
54 0.289 0.459 96.518
55 0.284 0.451 96.969
56 0.276 0.438 97.407
57 0.270 0.429 97.836
58 0.267 0.424 98.260
59 0.253 0.402 98.663
60 0.231 0.367 99.029
61 0.228 0.362 99.392
62 0.201 0.318 99.710
63 0.183 0.290 100.000
Extraction Method: Principal Axis Factoring.
a. When factors are correlated, sums of squared loadings cannot be added to obtain a total variance.

387
Appendix 5.9 - Pattern matrix (EFA)
Pattern matrix
Cronbach's alpha
Factor
1 2 3 4 5 6 7 8 9 10 11 12 13 14 15 16 17 18 19 20 21
STAC ESQX1 LPRO CPV SWC ISL ALA CL PROE HABIT SQ PRICE CUEXP TRUST RBEX CS CSR ESQX2 PROQ CUSER STIMA
0.911 0.86 0.859 0.79 0.813 0.769 0.838 0.8 0.847 0.82 0.813 0.807 0.847 0.876 0.817 0.819 0.832 0.796 0.799 0.797 0.805
STAC2 0.914
STAC3 0.884
STAC1 0.841
ESQ8 0.961
ESQ7 0.771
ESQ9 0.647
LPRO3 0.919
LPRO2 0.797
LPRO4 0.728
CPV3 0.813
CPV2 0.785
CPV4 0.629
SWC3 0.871
SWC4 0.743
SWC2 0.708
ISL2 0.804
ISL1 0.659
ISL3 0.646
ALA4 0.831
ALA3 0.826
ALA2 0.724
CL4 0.922
CL5 0.685
CL3 0.635
PROE2 0.918
PROE3 0.805
PROE1 0.565
HABIT2 0.914

388
HABIT3 0.732
HABIT1 0.605
SQ5 0.873
SQ6 0.805
SQ4 0.537
PRICE2 0.894
PRICE1 0.687
PRICE3 0.605
CUEXP2 0.861
CUEXP3 0.783
CUEXP1 0.713
TRUST2 0.911
TRUST1 0.816
TRUST3 0.69
RBEX2 0.735
RBEX4 0.651
RBEX5 0.632
RBEX1 0.625
CS2 0.874
CS1 0.773
CS3 0.657
CSR4 0.817
CSR3 0.738
CSR5 0.736
ESQ5 0.832
ESQ4 0.709
ESQ6 0.665
PROQ2 1.016
PROQ1 0.601
PROQ3 0.556
CUSER1 0.807
CUSER3 0.781
STIMA2 0.812
STIMA1 0.643
STIMA3 0.59

389
Extraction Method: Principal Axis Factoring.
Rotation Method: Promax with Kaiser Normalization.
a. Rotation converged in 9 iterations.

390
Appendix 5.10 – All measurement variables remained after EFA
Factors and its variables
Customer perceived value (CPV)
CPV2 Prices are fair
CPV3 Products are worthwhile
CPV4 Compared to the price we pay, we get reasonable quality
Customer satisfaction (CS)
CS1 Complete service offered by a supermarket is significantly above expected
CS2 In general, my satisfaction level related to the supermarket that I have already dealt with is high
CS3 Assuming you view your entire experience with the supermarket, overall you are very satisfied with
the supermarket
Customer loyalty (CS)
CL3 I will say positive things about the retailers and recommend it to others
CL4 I would consider the supermarket my first choice to do shopping
CL5 I will always continue to choose the products of this grocery store instead others
In-store logistics (ISL)
ISL1 In the supermarket, the shelves are well-stocked
ÍSL2 No problems when returning merchandise
ISL3 In the supermarket, there are enough shopping carts
Service quality (SQ)
SQ4 Service employees at this store have good product knowledge
SQ5 Service employees at this store are willing to help customers
SQ6 Service employees at this store showed respect to me
E-service quality 1 (ESQX2)
ESQ4 Organisation provides me with different options for payment, delivering and/or returning items
ESQ5 Organisation is truthful about its offerings, it has in stock the items it claims to have
ESQ6 Organisation offers a clear return policy and guarantee
E-service quality (ESQX1)
ESQ7 Organisation’s site loads it pages fast and easy
ESQ8 Organisation’s site enables me to complete a transaction quickly
ESQ9 Organisation presents guarantee and privacy policy on its site
Product quality (PROQ)
PROQ1 This store has a lot of variety
PROQ2 Products in this store are of consistent quality
PROQ3 Products available in this store are good workmanship

391
Price
PRICE1 Goods at this store are reasonably priced
PRICE2 The prices of the products in this supermarket are cheaper than others
PRICE3 Goods at this store offer value for money
Customer service
CUSER1 Having a short waiting time at the checkouts
CUSER3 Doing faster transactions without waiting customers
Customer experience
CUSEXP1 The shopping experience is refreshing
CUSEXP2 The store has a welcoming atmosphere and the temperature inside the store is comfortable
CUSEXP3 The shopping experience made me relaxed and comfortable
Retail brand experience
RBEXP1 When I think of excellence, I think of this retail brand name
RBEXP2 I feel good with this retail brand because of their simple and better structured bills
RBEXP4 Helping nature of salespersons at this retail brand name has built a better shopping experience
RBEXP5 I find events of this retail brand interesting in the sensory way
Store image
STIMA1 The supermarket offers high-quality merchandise
STIMA2 All brands you planned to buy were available
STIMA3 Physical facilities are visually appealing
Corporate social responsibility
CSR3 This supermarket treats its customer honestly
CSR4 This supermarket makes an effort to know customers’ needs.
CSR5 This supermarket offers safety at work to its employees
Trust
TRUST1 I trust this retailer
TRUST2 I consider that to shop in the stores of this retailer is a guarantee
TRUST3 I believe that this retailer is honest/sincere towards its consumers
Habit
HABIT1 I have been doing for a long time (shopping at this supermarket)
HABIT2 I have no need to think about doing (shopping at this supermarket)
HABIT3 I do without thinking (getting used to know where is the products I need, and in many convenient
ways)
Store accessibility
STAC1 I can get to store X quickly
STAC2 I can get to store X without problems
STAC3 I can get to store easily

392
Alternative attractiveness
ALA2 There are other good companies to choose from
ALA3 I need to change the place for shopping, there are other good department stores to choose from
ALA4 I would be more satisfied with the products and services of other department stores
Switching costs
SWC2 Switching to other providers will bring psychological burden
SWC3 Search and evaluate the untested service department store costs you time and effort
SWC4 An uncertainty feeling is relative to the untested service department store
Loyalty programs
LPRO2 Collecting points is entertaining
LPRO3 When I redeem my points, I am good at myself
LPRO4 I belong to a community of people who share the same values
Promotion effects
PROE1 I find the promotional activities of this online supermarket to be very persuasive and positive
PROE2 My purchasing willingness arises from the promotional activities
PROE3 It is well worth going shopping during the period of a sales promotion

393
Appendix 6.1 - Results from CFA_2ndrun

394
Appendix 6.2 - The final CFAmodel_Results from CFA_4th
run_after construct validity
checking

395
Appendix 6.3 - Common method bias testing

396
Appendix 6.4 - The initial SEM (SEM_1strun) and its results
Model Fit Summary
CMIN
Model NPAR CMIN DF P CMIN/DF
Default model 332 176.828 19 0 9.307
Saturated model 351 0 0
Independence model 26 60829.115 325 0 187.167
RMR, GFI
Model RMR GFI AGFI PGFI
Default model 0.002 0.995 0.915 0.054
Saturated model 0 1
Independence model 0.21 0.152 0.085 0.141
Baseline Comparisons
Model NFI RFI IFI TLI
CFI Delta1 rho1 Delta2 rho2
Default model 0.997 0.95 0.997 0.955 0.997
Saturated model 1 1 1
Independence model 0 0 0 0 0
Parsimony-Adjusted Measures
Model PRATIO PNFI PCFI
Default model 0.058 0.058 0.058
Saturated model 0 0 0
Independence model 1 0 0
NCP
Model NCP LO 90 HI 90

397
Default model 157.828 118.947 204.18
Saturated model 0 0 0
Independence model 60504.115 59696.987 61317.53
FMIN
Model FMIN F0 LO 90 HI 90
Default model 0.061 0.054 0.041 0.07
Saturated model 0 0 0 0
Independence model 20.889 20.778 20.5 21.057
RMSEA
Model RMSEA LO 90 HI 90 PCLOSE
Default model 0.053 0.046 0.061 0.207
Independence model 0.253 0.251 0.255 0
AIC Model AIC BCC BIC CAIC
Default model 840.828 847.043 2825.172 3157.172
Saturated model 702 708.57 2799.906 3150.906
Independence model 60881.115 60881.601 61036.52 61062.52
ECVI
Model ECVI LO 90 HI 90 MECVI
Default model 0.289 0.275 0.305 0.291
Saturated model 0.241 0.241 0.241 0.243
Independence model 20.907 20.63 21.186 20.907
HOELTER
Model
HOELTER HOELTER
0.05 0.01
Default model 497 596
Independence model 18 19
Appendix 6.5 - SEM_2rdrun_Final
Model Fit Summary
CMIN
Model NPAR CMIN DF P CMIN/DF
Default model 249 159.718 27 0 5.915
Saturated model 276 0 0
Independence model 23 55899.123 253 0 220.945
RMR, GFI
Model RMR GFI AGFI PGFI
Default model 0.003 0.995 0.952 0.097
Saturated model 0 1
Independence model 0.222 0.154 0.077 0.141
Baseline Comparisons
Model
NFI RFI IFI TLI CFI
Delta1 rho1 Delta2 rho2
Default model 0.997 0.973 0.998 0.978 0.998
Saturated model 1 1 1

398
Independence model 0 0 0 0 0
Parsimony-Adjusted Measures
Model PRATIO PNFI PCFI
Default model 0.107 0.106 0.106
Saturated model 0 0 0
Independence model 1 0 0
NCP
Model NCP LO 90 HI 90
Default model 132.718 96.628 176.318
Saturated model 0 0 0
Independence model 55646.123 54872.365 56426.167
FMIN
Model FMIN F0 LO 90 HI 90
Default model 0.055 0.046 0.033 0.061
Saturated model 0 0 0 0
Independence model 19.196 19.109 18.844 19.377
RMSEA
Model RMSEA LO 90 HI 90 PCLOSE
Default model 0.041 0.035 0.047 0.991
Independence model 0.275 0.273 0.277 0
AIC
Model AIC BCC BIC CAIC
Default model 657.718 661.857 2145.976 2394.976
Saturated model 552 556.587 2201.635 2477.635
Independence model 55945.123 55945.506 56082.593 56105.593
ECVI
Model ECVI LO 90 HI 90 MECVI
Default model 0.226 0.213 0.241 0.227
Saturated model 0.19 0.19 0.19 0.191
Independence model 19.212 18.946 19.48 19.212
HOELTER
Model
HOELTER HOELTER
0.05 0.01
Default model 732 857
Independence model 16 17

399
Appendix 6.6 - Summarising all hypothesis testing results
CUSTOMER PERCEIVED VALUE
H20A Good price offered positively affects customer perceived value PRICE 0.295 Supported
H13A In-store logistics have a strong and positive effect on customer perceived value ISL 0.199 Supported
H25 Trust positively affects customer perceived value TRUST 0.161 Supported
H19A Promotion effects positively affect customer perceived value PROE 0.124 Supported
H17B E-service quality X2 (E-S-QUAL) has a significant positive effect on customer perceived value ESQX2 0.114 Supported
H9A Switching costs have a negative effect on customer perceived value SWC -0.081 Supported
H12A There is a positive relationship between service quality and customer perceived value SQ 0.061 Supported
H16 The higher customer service, the better customer perceived value CUSER 0.057 Supported
H5A People who choose different supermarkets for shopping have different customer perceived value Q4 -0.041 Supported
H21A Good product quality is positively associated with customer perceived value PROQ Not supported
H22A Cooperate social responsibility is directly and positively associated with customer perceived value CSR Not supported
H1A Income has a positive effect on customer perceived value INCOME Not supported
H2A Location where people stay has a positive effect on customer perceived value LOCATION Not supported
H3A Age positively affects customer perceived value AGE Not supported
H4A Gender positively affects customer perceived value GENDER Not supported
H17A E-service quality about X1 (W-S-QUAL) has a significant positive effect on customer perceived
value ESQX1
Significant but not
supported
CUSTOMER SATISFACTION
H7A Customer perceived value has a positive influence on customer satisfaction CPV 0.301 Supported
H13B In-store logistics have a strong and positive effect on customer satisfaction ISL 0.239 Supported
H12B There is a positive relationship between service quality and customer satisfaction SQ 0.214 Supported
H14 Store image is positively associated with customer satisfaction STIMA 0.188 Supported
H6 Customer experience has a positive effect on customer satisfaction CUEX 0.148 Supported
H21B Good product quality is positively associated with customer satisfaction PROQ -0.144 Supported
H10A High-perceived alternative attractiveness has a negative influence on customer satisfaction ALA -0.113 Supported
H9B Switching costs have a positive effect on customer satisfaction SWC 0.071 Supported
H20B Good price offered positively affects customer satisfaction PRICE 0.051 Supported
H1B Income has a positive effect on customer satisfaction INCOME 0.025 Supported
H2B Location where people stay has a positive effect on customer satisfaction LOCATION 0.024 Supported
H11A Customer satisfaction is positively affected by retail brand experience RBEX Not supported
H3B Age positively affects customer satisfaction AGE Not supported
H4B Gender positively affects customer satisfaction GENDER Not supported
H5B People who choose different supermarkets for shopping have different behavior on customer
satisfaction Q4 Not supported
CUSTOMER LOYALTY
H11B Customer loyalty is positively affected by retail brand experience RBEX 0.306 Supported
H12C Service quality positively affects customer loyalty. SQ 0.179 Supported
H8 Customer satisfaction is directly and positively associated with customer loyalty CS 0.178 Supported
H19B Promotion has a positive effect on customer loyalty PROE 0.141 Supported
H9C High-perceived switching costs have a positive influence on customer loyalty SWC 0.113 Supported
H17D E-service quality X2 (E-S-QUAL) has a significant positive effect on customer loyalty ESQX2 0.106 Supported
H10B High-perceived alternative attractiveness has a negative influence on customer loyalty ALA -0.101 Supported
H20C Good price offered positively affects customer loyalty PRICE 0.069 Supported
H26 Habit positively affects customer loyalty HABIT 0.057 Supported
H1C Income has a positive effect on customer loyalty INCOME 0.024 Supported
H7B Customer perceived value has a direct positive impact on customer loyalty CPV Not supported
H22B Cooperate social responsibility is directly and positively associated with customer loyalty CSR Not supported
H21C Good product quality is positively associated with customer loyalty PROQ Not supported
H5C People who choose different supermarkets for shopping have different behavior on customer
loyalty Q4 Not supported
H2C Location where people stay has a positive effect on customer loyalty LOCATION Not supported
H3C Age positively affects customer loyalty AGE Not supported
H4C Gender positively affects customer loyalty GENDER Not supported
H17C E-service quality X1 (W-S-QUAL) has a significant positive effect on customer loyalty ESQX1 Significant but not supported
H15 Store accessibility positively affects customer loyalty STAC Significant but not
supported
H18 Loyalty programs have a positive effect on customer loyalty LPRO Significant but not supported

400
Appendix 7.1- Comparison across groups for factors related to customer loyalty
Supermarket business model
Path Name
Coopmart or
BigC Beta
Lotte Mart
Beta
Difference
in Betas
P-Value for
Difference Interpretation
ESQX2 → CL. 0.043 0.208*** -0.165 0.014 The positive relationship between CL and ESQX2 is stronger for Lotte Mart.
RBEX → CL. 0.326*** 0.219*** 0.107 0.088 The positive relationship between CL and RBEX is stronger for Coopmart or BigC.
PRICE → CL. 0.061** 0.158*** -0.096 0.055 The positive relationship between CL and PRICE is stronger for Lotte Mart.
ALA → CL. -0.060*** -0.228*** 0.168 0.000 The negative relationship between CL and ALA is stronger for Lotte Mart.
Path Name Coopmart or
BigC Beta Vinmart Beta
Difference
in Betas
P-Value for
Difference Interpretation
ESQX2 → CL. 0.043 0.159*** -0.116 0.043 The positive relationship between CL and ESQX2 is stronger for Vinmart.
ALA → CL. -0.060*** -0.172*** 0.113 0.001 The negative relationship between CL and ALA is stronger for Vinmart.
Path Name Lotte Mart
Beta Vinmart Beta
Difference
in Betas
P-Value for
Difference Interpretation
PRICE → CL. 0.158*** 0.009 0.149 0.016 The positive relationship between CL and PRICE is stronger for Lotte Mart.
Path Name Coopmart or
BigC Beta Aeon Beta
Difference
in Betas
P-Value for
Difference Interpretation
ESQX2 → CL. 0.043 0.173* -0.13 0.094 The positive relationship between CL and ESQX2 is stronger for Aeon.
PROE → CL. 0.170*** 0.019 0.151 0.034 The positive relationship between CL and PROE is stronger for Coopmart or BigC.
GENDER
Path Name MALE Beta
FEMALE
Beta
Difference
in Betas
P-Value for
Difference Interpretation
PROE → CL. 0.212*** 0.110*** 0.102 0.032 The positive relationship between CL and PROE is stronger for MALE.
INCOME
Path Name
Under 5
million VND
Beta
From 5-10
million VND
Beta
Difference
in Betas
P-Value for
Difference Interpretation
SQ → CL. 0.131*** 0.284*** -0.154 0.011 The positive relationship between CL and SQ is stronger for From 5-10 million
VND.
PRICE → CL. 0.111*** -0.029 0.139 0.001 The positive relationship between CL and PRICE is stronger for Under 5 million
VND.
LOCATION
Path Name HCM Beta Hanoi Beta
Difference
in Betas
P-Value for
Difference Interpretation
HABIT → CL. 0.108*** 0.034 0.074 0.091 The positive relationship between CL and HABIT is stronger for HCM.
ESQX2 → CL. 0.158*** 0.063 0.095 0.089 The positive relationship between CL and ESQX2 is stronger for HCM.
RBEX → CL. 0.238*** 0.352*** -0.115 0.050 The positive relationship between CL and RBEX is stronger for Hanoi.
Path Name HCM Beta Da Nang Beta Difference
in Betas
P-Value for
Difference Interpretation
SQ → CL. 0.268*** 0.099 0.169 0.045 The positive relationship between CL and SQ is stronger for HCM.
AGE RANGES
Path Name 18-22 Beta 23-30 Beta
Difference
in Betas
P-Value for
Difference Interpretation
SQ → CL. 0.105** 0.229*** -0.124 0.071 The positive relationship between CL and SQ is stronger for 23-30.
Path Name 18-22 Beta 41-55 Beta Difference
in Betas
P-Value for
Difference Interpretation
CS → CL. 0.304*** 0.023 0.281 0.063 The positive relationship between CL and CS is stronger for 18-22.
SWC → CL. 0.090*** -0.001 0.091 0.092 The positive relationship between CL and SWC is stronger for 18-22.

401
PROE → CL. 0.112*** 0.390*** -0.278 0.001 The positive relationship between CL and PROE is stronger for 41-55.
PRICE → CL. 0.050* 0.160* -0.109 0.076 The positive relationship between CL and PRICE is stronger for 41-55.
SQ → CL. 0.105** 0.295** -0.19 0.061 The positive relationship between CL and SQ is stronger for 41-55.
Path Name 23-30 Beta above 55 Beta
Difference
in Betas
P-Value for
Difference Interpretation
SWC → CL. 0.117*** 0.234*** -0.117 0.011 The positive relationship between CL and SWC is stronger for above 55.
Path Name 23-30 Beta 31-40 Beta Difference
in Betas
P-Value for
Difference Interpretation
PRICE → CL. 0.084* -0.051 -0.135 0.020 The positive relationship between CL and PRICE is stronger for 23-30.
ESQX2 → CL. 0.120** -0.017 -0.137 0.089 The positive relationship between CL and ESQX2 is stronger for 23-30.
OCCUPATION
Path Name Housewife Beta
Office staffs
Beta
Difference
in Betas
P-Value for
Difference Interpretation
HABIT → CL. 0.024 0.105*** -0.081 0.052 The positive relationship between CL and HABIT is stronger for Office staffs.
Path Name Students Beta
Self
employment
Beta
Difference
in Betas
P-Value for
Difference z-score
RBEX → CL. 0.332*** 0.152* 0.18 NaN -2.365**
Path Name
Self
employment
Beta
Office staffs
Beta
Difference
in Betas
P-Value for
Difference z-score
RBEX → CL. 0.152* 0.321*** -0.169 NaN 2.301**
EDUCATION LEVEL
Path Name A levels Beta
College+ U
Beta
Difference
in Betas
P-Value for
Difference Interpretation
CS → CL. 0.145** 0.406** -0.262 0.097 The positive relationship between CL and CS is stronger for College+ U.
Path Name GCSE's Beta College+U
Beta
Difference
in Betas
P-Value for
Difference Interpretation
ESQX1 → CL. -0.150** 0.128* -0.277 0.000 The relationship between CL and ESQX1 is negative for GCSE's and positive for
College-U.
Appendix 7.2- Comparison across groups for factors related to customer satisfaction
Supermarket business model
Path Name
Coopmart
or BigC
Beta
Lotte Mart
Beta
Difference
in Betas
P-Value for
Difference Interpretation
SQ → CS. 0.224*** 0.107* 0.117 0.03 The positive relationship between CS and SQ is stronger for Coopmart or BigC.
STIMA → CS. 0.216*** 0.129** 0.087 0.088 The positive relationship between CS and STIMA is stronger for Coopmart or BigC.
ISL → CS. 0.208*** 0.306*** -0.098 0.079 The positive relationship between CS and ISL is stronger for Lotte Mart.
INCOME → CS. 0.011 0.084*** -0.073 0.01 The positive relationship between CS and INCOME is stronger for Lotte Mart.
Path Name
Coopmart
or BigC
Beta
Vinmart
Beta
Difference
in Betas
P-Value for
Difference Interpretation
CUEXP → CS. 0.119*** 0.219*** -0.1 0.045 The positive relationship between CS and CUEXP is stronger for Vinmart.
STIMA → CS. 0.216*** 0.107** 0.109 0.019 The positive relationship between CS and STIMA is stronger for Coopmart or BigC.
Path Name
Coopmart
or BigC
Beta
Aeon Beta Difference
in Betas
P-Value for
Difference Interpretation
ALA → CS. -0.105*** -0.173*** 0.067 0.065 The negative relationship between CS and ALA is stronger for Aeon.
SQ → CS. 0.224*** 0.323*** -0.099 0.055 The positive relationship between CS and SQ is stronger for Aeon.
PROQ → CS. 0.119*** 0.300*** 0.181 0.006 The positive relationship between CS and PROQ is stronger for Aeon.

402
Path Name Lotte Mart
Beta
Vinmart
Beta
Difference
in Betas
P-Value for
Difference Interpretation
SQ → CS. 0.107* 0.220*** -0.113 0.067 The positive relationship between CS and SQ is stronger for Vinmart.
INCOME
Path Name
Under 5
million
VND Beta
From 5-10
million
VND Beta
Difference
in Betas
P-Value for
Difference Interpretation
CPV → CS. 0.287*** 0.346*** -0.058 0.057 The positive relationship between CS and CPV is stronger for From 5-10 million
VND.
STIMA → CS. 0.238*** 0.121*** 0.117 0.007 The positive relationship between CS and STIMA is stronger for Under 5 million
VND.
Path Name
Under 5
million
VND Beta
From 10-20
million
VND Beta
Difference
in Betas
P-Value for
Difference Interpretation
ISL → CS. 0.262*** 0.145*** 0.117 0.013 The positive relationship between CS and ISL is stronger for Under 5 million VND.
SQ → CS. 0.183*** 0.282*** -0.099 0.063 The positive relationship between CS and SQ is stronger for From 10-20 million
VND.
LOCATION
Path Name HCM Beta Hanoi Beta Difference
in Betas
P-Value for
Difference Interpretation
ISL → CS. 0.172*** 0.277*** -0.105 0.053 The positive relationship between CS and ISL is stronger for Hanoi.
Path Name Can Tho
Beta
Binh Duong
Beta
Difference
in Betas
P-Value for
Difference Interpretation
ALA → CS. -0.091*** -0.129*** 0.038 0.069 The negative relationship between CS and ALA is stronger for Binh Duong.
SQ → CS. 0.145*** 0.257*** -0.112 0.04 The positive relationship between CS and SQ is stronger for Binh Duong.
AGE RANGES
Path Name 18-22 Beta 23-30 Beta Difference
in Betas
P-Value for
Difference Interpretation
STIMA → CS. 0.206*** 0.109** 0.097 0.069 The positive relationship between CS and STIMA is stronger for 18-22.
Path Name 23-30 Beta above 55
Beta
Difference
in Betas
P-Value for
Difference Interpretation
STIMA → CS. 0.109** 0.217*** -0.108 0.067 The positive relationship between CS and STIMA is stronger for above 55.
SWC → CS. 0.059* 0.148*** -0.088 0.014 The positive relationship between CS and SWC is stronger for above 55.
Path Name 31-40 Beta 23-30 Beta Difference
in Betas
P-Value for
Difference Interpretation
CPV → CS. 0.214*** 0.327*** -0.112 0.030 The positive relationship between CS and CPV is stronger for 23-30.
GENDER
Path Name MALE Beta FEMALE
Beta
Difference
in Betas
P-Value for
Difference Interpretation
ALA → CS. -0.139*** -0.102*** -0.037 0.054 The negative relationship between CS and ALA is stronger for MALE.
OCCUPATION
Path Name Students
Beta
Self
employment
Beta
Difference
in Betas
P-Value for
Difference z-score
STIMA → CS. 0.231*** 0.068 0.164 NaN -2.318**
PROQ → CS. 0.157*** 0.008 -0.165 NaN 2.137**
Path Name
Self
employment
Beta
Office staffs
Beta
Difference
in Betas
P-Value for
Difference z-score
PROQ → CS. 0.008 0.119*** 0.127 NaN -1.768*

403
Appendix 7.3- Comparison across groups for factors related to customer perceived value
Supermarket business models
Path Name Coopmart or
BigC Beta
Lotte Mart
Beta
Difference
in Betas
P-Value for
Difference Interpretation
SQ → CPV. 0.062† 0.209** -0.147 0.069 The positive relationship between CPV and SQ is stronger for Lotte Mart.
PROE → CPV. 0.153*** 0.024 0.129 0.028 The positive relationship between CPV and PROE is stronger for Coopmart or BigC.
Path Name Coopmart or
BigC Beta
Vinmart
Beta
Difference
in Betas
P-Value for
Difference Interpretation
PRICE → CPV. 0.263*** 0.365*** -0.102 0.015 The positive relationship between CPV and PRICE is stronger for Vinmart.
Path Name Lotte Mart
Beta
Vinmart
Beta
Difference
in Betas
P-Value for
Difference Interpretation
SQ → CPV. 0.209** -0.032 0.241 0.014 The positive relationship between CPV and SQ is stronger for Lotte Mart.
CUSER → CPV. -0.008 0.119** -0.128 0.031 The positive relationship between CPV and CUSER is stronger for Vinmart.
Path Name Coopmart or
BigC Beta Aeon Beta
Difference
in Betas
P-Value for
Difference Interpretation
TRUST → CPV. 0.130*** 0.278*** -0.148 0.063 The positive relationship between CPV and TRUST is stronger for Aeon.
INCOME
Path Name
Under 5
million VND
Beta
From 5-10
million
VND Beta
Difference
in Betas
P-Value for
Difference Interpretation
SQ → CPV. 0.006 0.156** -0.15 0.016 The positive relationship between CPV and SQ is stronger for From 5-10 million VND.
CUSER → CPV. 0.035 0.106*** -0.072 0.086 The positive relationship between CPV and CUSER is stronger for From 5-10 million
VND.
PRICE → CPV. 0.351*** 0.189*** 0.162 0.000 The positive relationship between CPV and PRICE is stronger for Under 5 million VND.
LOCATION
Path Name HCM Beta Hanoi Beta Difference
in Betas
P-Value for
Difference Interpretation
PRICE → CPV. 0.213*** 0.377*** -0.164 0.002 The positive relationship between CPV and PRICE is stronger for Hanoi.
Path Name HCM Beta Da Nang
Beta
Difference
in Betas
P-Value for
Difference Interpretation
PRICE → CPV. 0.213*** 0.363*** -0.15 0.027 The positive relationship between CPV and PRICE is stronger for Da Nang.
AGE RANGES
Path Name 18-22 Beta 23-30 Beta Difference
in Betas
P-Value for
Difference Interpretation
CUSER → CPV. 0.027 0.113** -0.086 0.074 The positive relationship between CPV and CUSER is stronger for 23-30.
PRICE → CPV. 0.360*** 0.189*** 0.171 0.002 The positive relationship between CPV and PRICE is stronger for 18-22.
PROE → CPV. 0.082** 0.196*** -0.114 0.037 The positive relationship between CPV and PROE is stronger for 23-30.
TRUST → CPV. 0.206*** 0.104* 0.103 0.080 The positive relationship between CPV and TRUST is stronger for 18-22.
SQ → CPV. 0.000 0.180** -0.179 0.013 The positive relationship between CPV and SQ is stronger for 23-30.
Path Name 23-30 Beta above 55
Beta
Difference
in Betas
P-Value for
Difference Interpretation
SQ → CPV. 0.180** -0.008 0.188 0.046 The positive relationship between CPV and SQ is stronger for 23-30.
Path Name 18-22 Beta 41-55 Beta Difference
in Betas
P-Value for
Difference Interpretation
TRUST → CPV. 0.206*** 0.061 0.145 0.070 The positive relationship between CPV and TRUST is stronger for 18-22.

404
SQ → CPV. 0.000 0.198* -0.198 0.041 The positive relationship between CPV and SQ is stronger for 41-55.
Path Name 31-40 Beta 23-30 Beta Difference
in Betas
P-Value for
Difference Interpretation
SWC → CPV. -0.015 -0.123*** 0.107 0.046 The negative relationship between CPV and SWC is stronger for 23-30.
GENDER
Path Name MALE Beta FEMALE
Beta
Difference
in Betas
P-Value for
Difference Interpretation
PRICE → CPV. 0.220*** 0.326*** -0.105 0.039 The positive relationship between CPV and PRICE is stronger for FEMALE.
EDUCATION LEVEL
Path Name A levels Beta
College+ U
Beta
Difference
in Betas
P-Value for
Difference Interpretation
TRUST → CPV. 0.172*** 0.343*** -0.171 0.056 The positive relationship between CPV and TRUST is stronger for College+ U.
OCCUPATION
Path Name
Housewife
Beta
Office staffs
Beta
Difference
in Betas
P-Value for
Difference Interpretation
PRICE → CPV. 0.312*** 0.200*** 0.112 0.04 The positive relationship between CPV and PRICE is stronger for Housewife.
SQ → CPV. 0.026 0.153** -0.127 0.095 The positive relationship between CPV and SQ is stronger for Office staffs.